UNITED STATES
SECURITIES AND EXCHANGE COMMISSION
Washington, D.C. 20549
FORM N-CSR
CERTIFIED SHAREHOLDER REPORT OF REGISTERED MANAGEMENT INVESTMENT
COMPANIES
Investment Company Act file number 811-05201
Thornburg Investment Trust
(Exact name of registrant as specified in charter)
c/o Thornburg Investment Management, Inc.
2300 North Ridgetop Road, Santa Fe, New Mexico 87506
(Address of principal executive offices) (Zip code)
Garrett Thornburg, 2300 North Ridgetop Road, Santa Fe, New Mexico 87506
(Name and address of agent for service)
Registrant’s telephone number, including area code: 505-984-0200
Date of fiscal year end: September 30
Date of reporting period: March 31, 2017
Item 1. Reports to Stockholders
The following Semi-annual reports are attached hereto, in order:
Thornburg Low Duration Municipal Fund
Thornburg Limited Term Municipal Fund
Thornburg Intermediate Municipal Fund
Thornburg Strategic Municipal Income Fund
Thornburg California Limited Term Municipal Fund
Thornburg New Mexico Intermediate Municipal Fund
Thornburg New York Intermediate Municipal Fund
Thornburg Limited Term U.S. Government Fund
Thornburg Limited Term Income Fund
Thornburg Low Duration Income Fund
Thornburg Strategic Income Fund
Thornburg Value Fund
Thornburg International Value Fund
Thornburg Core Growth Fund
Thornburg International Growth Fund
Thornburg Investment Income Builder Fund
Thornburg Global Opportunities Fund
Thornburg Developing World Fund
Thornburg Better World International Fund
Thornburg Capital Management Fund
Thornburg Long/Short Equity Fund
Semi-Annual Report March 31, 2017 THORNBURG LOW DURATION MUNICIPAL FUND

About Thornburg Investment Management
It’s more than what we do. It’s how we do it.
At Thornburg, we are very different in how we think, invest, and are structured. We believe this difference is what makes us successful in helping individuals reach their long-term financial goals.
How we THINK Flexible Perspective Our perspective on investment opportunities is more flexible than most, viewing a wide range of opportunities beyond conventional boundaries to find hidden value.
Collaboration Collectively, we hone ideas via borderless cross-pollination for better judgment and better results.
How we INVEST Portfolio Construction Disciplined construction guided more by our convictions than convention. CONVICTION Thorough analysis and our relative-value framework lead to conviction in our securities selection. UNCONVENTIONAL Active management means we seek the best value for our clients rather than using conventional benchmarks as our starting point.
How we’re Structured for Excellence How we think and how we invest is made possible by how we’re structured. TEAM APPROACH FAR FROM THE HERD ACCESS & TRANSPARENCY
2 Semi-Annual Report
Semi-Annual Report
Thornburg Low Duration Municipal Fund
March 31, 2017
| | | | |
SHARE CLASS | | NASDAQ SYMBOL | | CUSIP |
Class A | | TLMAX | | 885-216-788 |
Class I | | TLMIX | | 885-216-770 |
Minimum investments for Class I shares may be higher than those for Class A shares. Class I shares may not be available to all investors.
Investments carry risks, including possible loss of principal. Portfolios investing in bonds have the same interest rate, inflation, and credit risks that are associated with the underlying bonds. The value of bonds will fluctuate relative to changes in interest rates, decreasing when interest rates rise. Unlike bonds, bond funds have ongoing fees and expenses. Please see the Fund’s prospectus for a discussion of the risks associated with an investment in the Fund. Investments in the Fund are not FDIC insured, nor are they bank deposits or guaranteed by a bank or any other entity.
Semi-Annual Report 3
| | |
| Letter to Shareholders | | |
| |
Thornburg Low Duration Municipal Fund | | March 31, 2017 (Unaudited) |
April 28, 2017
Dear Fellow Shareholder:
We are pleased to present the semi-annual report for Thornburg Low Duration Municipal Fund. The net asset value (NAV) of the Class A shares decreased by 1 cent to $12.33 per share during the six-month period ended March 31, 2017. If you were with us the entire period, you received dividends of 3 cents per share. Dividends were higher for Class I shares to account for varying class-specific expenses. The Class A shares of your Fund underperformed the index with a 0.17% total return (without sales charge) for the six months ended March 31, 2017, compared to the 0.35% return for the BofA Merrill Lynch 1-3 Year U.S. Municipal Securities Index.
The Fund’s duration as well as curve positioning added 0.10% to relative performance. The Fund’s credit allocations added another 0.03%. Other risk factors contributed 0.08% to performance. Fund expenses accounted for the remaining differences.
The Municipal Bond Market
After a few years of relative quiet in the municipal bond market, things heated up following the election of Donald Trump in 2016. While stocks were rallying, bond prices, particularly municipal bond prices, came under pressure. Bond yields initially rose after the election based on expectations for greater infrastructure spending, stronger growth and higher inflation. The uptick in rates led mutual fund investors to sell their shares, which caused municipal bond mutual funds to sell their bonds to meet those redemptions. After significant inflows in January to September of 2016, investors pulled $26 billion from municipal bond funds in November and December, some of which was related to tax-loss selling.
When the calendar turned in 2017, these outflows slowed and the municipal bond market produced positive returns. A contributing factor to positive returns was a decline in municipal bond issuance, as during the first quarter of 2017, the supply of new municipal bonds declined by 12% from the same time last year.
The value metrics we use at Thornburg suggest that the municipal bond market continues to price in the rosiest of scenarios moving forward, as investors have been pushed out of the risk spectrum. That is why we have Thornburg Low Duration Municipal Fund positioned in the lower end of its respective risk spectrum. In this environment, we continue to keep duration shorter, credit quality higher and we maintain higher levels of reserves.
Inside the Risk Metrics
Real yields, which indicate how much yield over inflation investors are being paid to own municipal bonds, increased over the six-month period. As of September 30, 2016, 10-year AAA general obligation (GO) bonds were yielding 1.64% and the Core Personal Consumption Expenditures Index (PCE) was running at 1.70%, so investors were earning less than inflation. By the end of February 2017, the yield on 10-year AAA GO bonds had increased to 2.30%, while Core PCE was running at 1.80%. While certainly more interesting at the end of the period, the 0.5% real yield was significantly less than the average of 2% investors have earned over the past 20 years.
The second thing to consider is credit spreads, which reflect the incremental yield an investor earns from owning a lower-rated credit versus a higher-rated credit, and which today remain narrow. As of March 31, 2017, an investor earned about 1.28% more for owning a 10-year BBB revenue bond versus a 10-year AAA GO bond. That is slightly higher than the average 0.75% an investor earned between 1994 and 2007. However, in 2007, approximately 50% of the new-issue municipal bond market was insured by AAA/AAA municipal bond insurers. Today, there are no AAA/AAA municipal bond insurers, and insurance coverage generally accounts for only 6% to 8% of the new-issue municipal bond market.
Finally, the slope of the yield curve, which tracks how much incremental yield an investor earns by owning securities with longer maturities, is slightly flatter than historical averages. Currently, investors are earning about 1.4% more for owning a 10-year AAA GO municipal bond, versus a one-year AAA GO municipal bond. Since 1994, an investor earned on average almost 1.6% to extend maturities from one to 10 years.
The Economy and Tax Reform
The U.S. economy continued its slow recovery in 2016, growing at a rate of 1.6% for 2016 in aggregate.
Unemployment continued to tick down. During the six-month period ended March 31, 2017, the U.S. economy added 976,000 jobs and by the end of the period the unemployment rate had fallen to 4.5%. Inflation remained stable, with the Core PCE Index reading 1.75% through March, below the Fed’s 2% target range.
Taken in aggregate, the economy continues to grow, jobs are being added and inflation has remained contained to date. In an effort to keep the economy in check, the U.S. Federal Reserve raised the Fed funds rate in December of 2016, and again in March of 2017.
The economic health of the municipal bond market appears steady with a couple of notable exceptions. The drama in Puerto Rico is still playing out; the only winners are the consultants and lawyers hired by all sides.
Elsewhere, Bloomberg provides a heat map of the economic health of U.S. states, covering the period from the fourth quarter of 2015 through the fourth quarter of 2016 (the most
4 Semi-Annual Report
| | |
Letter to Shareholders, Continued | | |
| |
Thornburg Low Duration Municipal Fund | | March 31, 2017 (Unaudited) |
recent data available). The majority of the states appear healthy except those with heavy dependence on oil, gas, and coal. The energy-dependent states should improve if oil can maintain prices above $50/barrel.
Tax reform is the second highest priority of President Trump’s and the Republican-led House agenda—second only to health care reform. The most important items in the tax proposals for the owners of municipal bonds (individuals as well as corporations) are those relevant to investment income. By lowering the effective tax rate on competing sources of income, prices of municipal bonds would most likely fall (yields would increase) to become more competitive with these alternative sources of income. There are a number of proposals that have been brought forth, and we believe that if tax reform is enacted, it will be something different than any one of these specific proposals.
President Trump’s tax reform proposal (released Thursday, April 27, 2017) called for the elimination of the deduction for state and local taxes on an individual’s federal tax return. This would, if adopted, have significant impacts for residents of high-tax states. The near-term effects on the economy would be minimal, but long term, residents would have less money in their pockets to spend, the cost of residing in high-tax states would increase and might cause out-migration and lower growth.
Conclusion
We continue to run this portfolio as an actively managed laddered portfolio. Laddering a portfolio is a simple way to diversify its investment along its entire investment universe. While past performance does not guarantee future results, our study showed that this structure outperformed other structures around 60% of the time and added 0.15% to 0.25% of total return annually from 1997 through 2016.* Our view is that the current investment environment is not compensating investors enough to take on extra risk, so we have positioned our portfolios at the lower end of their risk spectrums.
Thank you for your continued trust in us, and please know that the co-managers of this Fund are invested alongside you.
Sincerely,
| | | | |
 | | | |  |
| Christopher Ryon,CFA | | | | Nicholos Venditti,CFA |
| Portfolio Manager | | | | Portfolio Manager |
| Managing Director | | | | Managing Director |
| * | We examined three hypothetical portfolios of bonds from December 1997 to December 2016. One using a laddering strategy, one using a barbell strategy, and a third using a bullet strategy. For the laddering strategy, the BofA Merrill Lynch 1–12 Year Municipal Index was used as a proxy, since, similar to a ladder, it contains bonds relatively evenly spread across all maturities within the index. The barbell strategy is a duration management technique wherein bonds are clustered at the two extremes of a maturity range. For the barbell strategy, the BofA Merrill Lynch 1–3 Year Municipal Index and BofA Merrill Lynch 8–12 Year Municipal Index were combined. The two indices were weighted in such a way as to give them the same duration as the broader 1–12 Year Index, and each year the portfolio was re-weighted back to the original index weights. This was done to make the two portfolios duration-neutral so that the impact of the strategy chosen could be isolated. The bullet strategy invests at the duration midpoint of the portfolio, therefore the BofA Merrill Lynch 6–8 Year Index was used to represent the bullet strategy. For additional information, see www.thornburg.com/whyladder. Past performance does not guarantee future results. |
The laddering strategy does not assure or guarantee better performance and cannot eliminate the risk of investment losses.
The matters discussed in this report may constitute forward-looking statements made pursuant to the safe harbor provisions of the Securities Litigation Reform Act of 1995. These include any advisor or portfolio manager prediction, assessment, analysis or outlook for individual securities, industries, investment styles, market sectors and/or markets. These statements involve risks and uncertainties. In addition to the general risks described for each fund in its current prospectus, other factors bearing on these reports include the accuracy of the advisor’s or portfolio manager’s forecasts and predictions, the appropriateness of the investment strategies designed by the advisor or portfolio manager and the ability of the advisor or portfolio manager to implement their strategies efficiently and successfully. Any one or more of these factors, as well as other risks affecting the securities markets generally, could cause the actual results of any fund to differ materially as compared to its benchmarks.
The views expressed are subject to change and do not necessarily reflect the views of Thornburg Investment Management, Inc. This information should not be relied upon as a recommendation or investment advice and is not intended to predict the performance of any investment or market.
Semi-Annual Report 5
| | |
| Performance Summary | | |
| |
Thornburg Low Duration Municipal Fund | | March 31, 2017 (Unaudited) |
AVERAGE ANNUAL TOTAL RETURNS
| | | | | | | | | | | | |
| | | 1-YR | | | 3-YR | | | SINCE
INCEP. | |
A Shares (Incep: 12/30/13) | | | | | | | | | | | | |
Without sales charge | | | 0.15 | % | | | 0.29 | % | | | 0.29 | % |
With sales charge | | | -1.36 | % | | | -0.22 | % | | | -0.18 | % |
I Shares (Incep: 12/30/13) | | | 0.43 | % | | | 0.49 | % | | | 0.48 | % |
30-DAY YIELDS, A SHARES
(with sales charge)
| | | | |
Annualized Distribution Yield | | | 0.60 | % |
SEC Yield | | | 0.62 | % |
Performance data shown represents past performance and is no guarantee of future results. Investment return and principal value will fluctuate so shares, when redeemed, may be worth more or less than their original cost. Current performance may be lower or higher than quoted. For performance current to the most recent month end, visit thornburg.com or call 800-847-0200. The performance information does not reflect the deduction of taxes that a shareholder would pay on distributions or the redemption of Fund shares. Returns reflect the reinvestment of dividends and capital gains. Class A shares are sold with a maximum sales charge of 1.50%. There is no sales charge for Class I shares.
GROWTH OF A HYPOTHETICAL $10,000 INVESTMENT
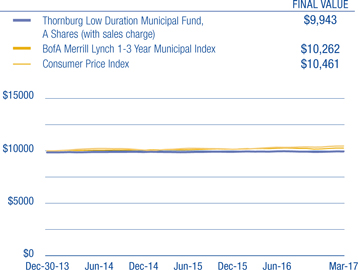
As disclosed in the most recent prospectus, the total annual fund operating expenses are as follows: A shares, 2.19%; I shares, 0.72%. Thornburg Investment Management and/or Thornburg Securities Corporation have contractually agreed to waive fees and reimburse expenses through at least April 10, 2018, for some of the share classes, resulting in net expense ratios of the following: A shares, 0.70%; I shares, 0.50%. For more detailed information on fund expenses and waivers/reimbursements please see the Fund’s prospectus. Without the fee waivers and expense reimbursements, the Annualized Distribution yield would have been 0.19%, and the SEC yield would have been 0.21%.
Glossary
The BofA Merrill Lynch 1-3 Year Municipal Securities Index is a subset of the BofA Merrill Lynch U.S. Municipal Securities Index including all securities with a remaining term to final maturity less than 3 years.
The BofA Merrill Lynch indices used in the Ladder vs Barbell & Bullet study are model portfolios of municipal obligations throughout the United States, with maturities ranging either from one to three years, six to eight years, eight to twelve years, or one to twelve years. These indices are subsets of the BofA Merrill Lynch U.S. Municipal Securities Index, which is comprised of U.S. dollar denominated investment grade tax-exempt debt publicly issued by U.S. states and territories, and their political subdivisions, in the U.S. domestic market. Qualifying securities must have at least a one-year remaining term to final maturity, a fixed coupon schedule and an investment grade rating.
The performance of any index is not indicative of the performance of any particular investment. Unless otherwise noted, index returns reflect the reinvestment of income dividends and capital gains, if any, but do not reflect fees, brokerage commissions or other expenses of investing. Investors may not make direct investments into any index.
Annualized Distribution Yield – The distribution yield reflects actual distributions made to shareholders. The annualized distribution yield is calculated by summing the last 30 days of income at a given month end and annualizing to a 360-day year. The result is divided by the ending maximum offering price or net asset value.
Bond Credit Ratings (Credit Quality) – A bond credit rating assesses the financial ability of a debt issuer to make timely payments of principal and interest. Ratings of AAA (the highest), AA, A, and BBB are investment-grade quality. Ratings of BB, B, CCC, CC, C and D (the lowest) are considered below investment grade, speculative grade, or junk bonds.
Insured Bonds – Individual bonds are sometimes insured by private companies. The insurance guarantees the payment of principal and interest on a bond issue if the issuer defaults. Mutual funds are not insured, even if the underlying bonds are insured.
Core Personal Consumption Expenditure Index (Core PCE) – Core Personal Consumption Expenditure Index is a measure of the Personal Consumption Expenditure Index that excludes the more volatile and seasonal food and energy prices.
Credit Spread/Quality Spread – The difference between the yields of securities with different credit qualities.
Effective Duration – A bond’s sensitivity to interest rates, incorporating the embedded option features, such as call provisions. Bonds with longer durations experience greater price volatility than bonds with shorter durations.
Fed Funds Rate – The interest rate at which a depository institution lends immediately available funds (balances at the Federal Reserve) to another depository institution overnight.
General Obligation Bond (GO) – A municipal bond backed by the credit and “taxing power” of the issuing jurisdiction rather than the revenue from a given project.
Laddering – Laddering involves building a portfolio of bonds with staggered maturities so that a portion matures each year. Money that comes in from maturing bonds is typically invested in bonds with longer maturities at the far end of the portfolio.
Revenue Bond – A bond on which the debt service is payable solely from the revenue generated from the operation of the project being financed or a category of facilities, or from other non-tax sources.
Yield Curve – A line that plots the interest rates, at a set point in time, of bonds having equal credit quality, but differing maturity dates.
6 Semi-Annual Report
| | |
| Fund Summary | | |
| |
Thornburg Low Duration Municipal Fund | | March 31, 2017 (Unaudited) |
OBJECTIVES AND STRATEGIES
The Fund seeks current income exempt from federal income tax, consistent with preservation of capital (may be subject to Alternative Minimum Tax).
This Fund invests principally in a laddered portfolio of municipal bonds with a dollar-weighted average duration of normally no more than three years. Laddering involves building a portfolio of bonds with staggered maturities so that a portion of the portfolio matures each year. Cash from maturing bonds, if not needed for other purposes, is typically invested in bonds with longer maturities at the far end of the ladder. We regard the strategy as a good compromise for managing different types of risk.
PORTFOLIO LADDER
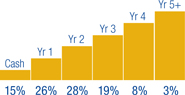
Percent of portfolio maturing in each year. Cash includes cash equivalents and other.
SECURITY CREDIT RATINGS†
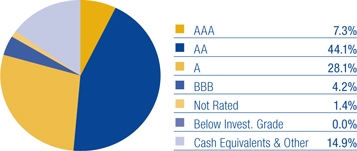
A bond credit rating assesses the financial ability of a debt issuer to make timely payments of principal and interest. Ratings of AAA (the highest), AA, A, and BBB are investment-grade quality. Ratings of BB, B, CCC, CC, C and D (the lowest) are considered below investment grade, speculative grade, or junk bonds. Credit quality ratings for Thornburg’s municipal portfolios used the highest rating available from either Standard & Poor’s or Moody’s Investors Service.
KEY PORTFOLIO ATTRIBUTES
| | | | |
Number of Bonds | | | 107 | |
| |
Effective Duration | | | 1.3 Yrs | |
| |
Average Maturity | | | 1.5 Yrs | |
There is no guarantee that the Fund will meet its investment objectives.
All data is subject to change. Charts may not add up to 100% due to rounding.
Semi-Annual Report 7
| | |
| Schedule of Investments | | |
| |
Thornburg Low Duration Municipal Fund | | March 31, 2017 (Unaudited) |
| | | | | | | | | | | | |
ISSUER-DESCRIPTION | | CREDIT RATING†
S&P/ MOODY’S | | | PRINCIPAL
AMOUNT | | | VALUE | |
ALABAMA — 1.38% | | | | | | | | | | | | |
City of Mobile Industrial Development Board, 1.85% due 6/1/2034 (Alabama Power Company Barry Plant) | | | A-/A1 | | | $ | 1,000,000 | | | $ | 1,002,600 | |
ARIZONA — 1.39% | | | | | | | | | | | | |
Arizona School Facilities Board, 5.00% due 7/1/2017 (State School Land Trust; Insured: AMBAC) | | | NR/NR | | | | 1,000,000 | | | | 1,010,280 | |
ARKANSAS — 0.43% | | | | | | | | | | | | |
Board of Trustees of the University of Arkansas, 4.00% due 11/1/2018 (Fayetteville Campus) | | | NR/Aa2 | | | | 295,000 | | | | 308,815 | |
CALIFORNIA — 6.36% | | | | | | | | | | | | |
California Statewide Communities Development Authority, 5.25% due 7/1/2017 (St. Joseph Health System; Insured: AGM) (ETM) | | | AA/NR | | | | 100,000 | | | | 101,141 | |
California Statewide Communities Development Authority, 5.00% due 5/15/2019 (Irvine East Campus Apartments) | | | NR/Baa1 | | | | 655,000 | | | | 699,658 | |
California Statewide Communities Development Authority, 5.00% due 5/15/2020 (Irvine East Campus Apartments) | | | NR/Baa1 | | | | 565,000 | | | | 616,240 | |
City of Chula Vista, 1.65% due 7/1/2018 (San Diego Gas & Electric Co.) | | | A+/Aa2 | | | | 1,000,000 | | | | 1,000,590 | |
City of Los Angeles GO, 3.00% due 6/29/2017 (Cash Flow Management) | | | SP-1+/Mig1 | | | | 500,000 | | | | 502,450 | |
County of Los Angeles GO, 3.00% due 6/30/2017 (Cash Management Program) | | | SP-1+/Mig1 | | | | 500,000 | | | | 502,895 | |
Jurupa Public Financing Authority, 4.00% due 9/1/2017 | | | BBB+/NR | | | | 100,000 | | | | 101,085 | |
Riverside County Public Financing Authority, 4.00% due 9/1/2017 (Hemet Project) | | | A+/NR | | | | 485,000 | | | | 491,484 | |
Successor Agency to the Redevelopment Agency of the City of Chino, 5.00% due 9/1/2017 (Merged Chino Areas 2001 and 2003 and Central City Redevelopment Projects; Insured: BAM) | | | AA/NR | | | | 300,000 | | | | 305,148 | |
Successor Agency to the Redevelopment Agency of the Richmond Community, 4.00% due 9/1/2017 (Harbour and Merged Area Redevelopment Projects; Insured: BAM) | | | AA/NR | | | | 300,000 | | | | 303,735 | |
COLORADO — 2.89% | | | | | | | | | | | | |
City & County of Denver COP, 0.95% due 12/1/2029 put 4/3/2017 (Wellington E. Webb Municipal Office Building; SPA: JPMorgan Chase Bank, N.A.) (daily demand notes) | | | AA+/Aa1 | | | | 1,400,000 | | | | 1,400,000 | |
City of Aurora COP, 5.00% due 12/1/2019 (Sports Park and E-911 Projects) | | | AA-/Aa2 | | | | 365,000 | | | | 398,445 | |
Regional Transportation District COP, 5.00% due 6/1/2017 (FasTracks Transportation System) | | | A/Aa3 | | | | 300,000 | | | | 302,088 | |
CONNECTICUT — 3.79% | | | | | | | | | | | | |
State of Connecticut GO Floating Rate Note, 1.54% due 6/15/2018 (Various Capital Projects) | | | AA-/Aa3 | | | | 1,000,000 | | | | 1,003,360 | |
a State of Connecticut Health and Educational Facilities Authority, 1.65% due 11/15/2029 (Ascension Health Credit Group) | | | AA+/Aa2 | | | | 1,750,000 | | | | 1,754,287 | |
FLORIDA — 4.26% | | | | | | | | | | | | |
County of Osceola, 5.00% due 10/1/2017 (Transportation Capital Improvements; Insured: AMBAC) | | | A+/A1 | | | | 150,000 | | | | 152,940 | |
Hillsborough County IDA, 5.65% due 5/15/2018 (Tampa Electric Co.) | | | BBB+/A3 | | | | 200,000 | | | | 209,424 | |
JEA, 0.90% due 10/1/2038 put 4/3/2017 (Water and Sewer System; SPA: U.S. Bank, N.A.) (daily demand notes) | | | AA+/Aa2 | | | | 2,510,000 | | | | 2,510,000 | |
Volusia County Educational Facilities Authority, 3.00% due 10/15/2017 (Embry-Riddle Aeronautical University, Inc.) | | | NR/Baa1 | | | | 105,000 | | | | 105,826 | |
Volusia County Educational Facilities Authority, 3.00% due 10/15/2018 (Embry-Riddle Aeronautical University, Inc.) | | | NR/Baa1 | | | | 120,000 | | | | 122,301 | |
GEORGIA — 1.31% | | | | | | | | | | | | |
City of Atlanta, 3.00% due 1/1/2018 (BeltLine Project) | | | NR/A2 | | | | 340,000 | | | | 344,627 | |
City of Atlanta, 4.00% due 1/1/2019 (BeltLine Project) | | | NR/A2 | | | | 580,000 | | | | 605,973 | |
GUAM — 3.28% | | | | | | | | | | | | |
Government of Guam, 3.00% due 11/15/2017 (Various Capital Projects) | | | A/NR | | | | 300,000 | | | | 302,214 | |
Government of Guam, 4.00% due 11/15/2018 (Economic Development) | | | A/NR | | | | 275,000 | | | | 283,453 | |
Government of Guam, 5.00% due 11/15/2018 (Economic Development) | | | A/NR | | | | 400,000 | | | | 418,644 | |
Government of Guam, 5.00% due 1/1/2019 (Economic Development) | | | A/NR | | | | 1,000,000 | | | | 1,049,720 | |
Guam Power Authority, 5.00% due 10/1/2020 (Electric Power System; Insured: AGM) | | | AA/A2 | | | | 300,000 | | | | 329,847 | |
IDAHO — 0.69% | | | | | | | | | | | | |
State of Idaho GO, 2.00% due 6/30/2017 | | | SP-1+/Mig1 | | | | 500,000 | | | | 501,330 | |
ILLINOIS — 11.99% | | | | | | | | | | | | |
Chicago O’Hare International Airport, 5.00% due 1/1/2018 (2016 Airport Projects) | | | A/NR | | | | 500,000 | | | | 514,860 | |
Chicago O’Hare International Airport, 5.00% due 1/1/2019 (2016 Airport Projects) | | | A/NR | | | | 500,000 | | | | 533,065 | |
Chicago Park District GO, 5.00% due 1/1/2020 (Capital Improvement Plan) | | | AA+/Ba1 | | | | 500,000 | | | | 539,510 | |
Chicago Transit Authority, 5.00% due 12/1/2017 (Rail Car and Rail System Improvements) | | | AA/A1 | | | | 1,165,000 | | | | 1,191,982 | |
City of Chicago, 5.00% due 1/1/2020 | | | AA/NR | | | | 600,000 | | | | 636,642 | |
County of Cook GO, 5.00% due 11/15/2019 (Capital Improvement Plan) | | | AA-/A2 | | | | 615,000 | | | | 662,669 | |
8 Semi-Annual Report
| | |
| Schedule of Investments, Continued | | |
| |
Thornburg Low Duration Municipal Fund | | March 31, 2017 (Unaudited) |
| | | | | | | | | | | | |
ISSUER-DESCRIPTION | | CREDIT RATING†
S&P/ MOODY’S | | | PRINCIPAL
AMOUNT | | | VALUE | |
Du Page County High School District No. 88, 3.00% due 1/15/2020 (Addison Trail and Willowbrook High Schools) | | | NR/Aa1 | | | $ | 1,245,000 | | | $ | 1,296,630 | |
Illinois Finance Authority, 5.00% due 11/15/2017 (Rush University Medical Center) | | | A+/A1 | | | | 1,000,000 | | | | 1,024,420 | |
Illinois Finance Authority, 5.00% due 8/15/2018 (Silver Cross Hospital and Medical Centers) | | | NR/Baa1 | | | | 500,000 | | | | 522,800 | |
Illinois Finance Authority, 5.00% due 11/15/2018 (Rush University Medical Center) | | | A+/A1 | | | | 500,000 | | | | 529,660 | |
State of Illinois, 4.00% due 6/15/2019 (Build Illinois Program) | | | AAA/Baa2 | | | | 520,000 | | | | 549,229 | |
State of Illinois, 5.00% due 6/15/2020 (Build Illinois Program) | | | AAA/NR | | | | 535,000 | | | | 589,436 | |
Town of Cicero GO, 5.00% due 1/1/2018 (Cicero and Laramie Development Areas; Insured: AGM) | | | AA/A2 | | | | 125,000 | | | | 128,390 | |
INDIANA — 1.56% | | | | | | | | | | | | |
City of Evansville, 5.00% due 1/1/2018 (Waterworks District; Insured: BAM) | | | AA/NR | | | | 810,000 | | | | 833,458 | |
Hammond Multi-School Building Corp., 4.00% due 7/15/2017 (Educational Facilities) (State Aid Withholding) | | | AA+/NR | | | | 300,000 | | | | 302,721 | |
KANSAS — 3.25% | | | | | | | | | | | | |
Kansas DFA, 5.00% due 12/1/2018 (Department of Commerce Impact Program) | | | A+/A3 | | | | 1,250,000 | | | | 1,319,937 | |
Topeka Public Building Commission, 5.00% due 6/1/2018 (10th and Jackson Projects; Insured: Natl-Re) | | | AA-/A3 | | | | 1,000,000 | | | | 1,045,210 | |
KENTUCKY — 2.87% | | | | | | | | | | | | |
Commonwealth of Kentucky State Property and Buildings Commission, 5.00% due 11/1/2019 (Project No. 112) | | | A/Aa3 | | | | 1,000,000 | | | | 1,088,250 | |
b Louisville/Jefferson County Metropolitan Government, 1.50% due 10/1/2033 (Louisville Gas and Electric Company) | | | NR/NR | | | | 1,000,000 | | | | 1,000,490 | |
LOUISIANA — 0.14% | | | | | | | | | | | | |
City of New Orleans, 5.00% due 12/1/2017 (Water System Facilities Capital Improvement Program) | | | A-/NR | | | | 100,000 | | | | 102,527 | |
MASSACHUSETTS — 2.77% | | | | | | | | | | | | |
City of Quincy GO, 2.00% due 6/16/2017 (Capital Improvements) | | | SP-1+/NR | | | | 500,000 | | | | 501,120 | |
Massachusetts Housing Finance Agency, 2.00% due 6/1/2019 (Low and Moderate Income Housing) | | | AA-/Aa3 | | | | 1,500,000 | | | | 1,509,840 | |
MICHIGAN — 3.20% | | | | | | | | | | | | |
Berkley School District GO, 4.00% due 5/1/2018 (Educational Facilities; Insured: Q-SBLF) | | | AA-/NR | | | | 1,000,000 | | | | 1,031,510 | |
Charles Stewart Mott Community College GO, 5.00% due 5/1/2018 (Higher Education Facilities) | | | A+/NR | | | | 750,000 | | | | 782,077 | |
Michigan Finance Authority, 5.00% due 5/1/2018 (School District of the City of Detroit; Insured: Q-SBLF) | | | AA-/NR | | | | 250,000 | | | | 260,183 | |
Northville Public Schools GO, 5.00% due 5/1/2017 (Educational Facilities; Insured: Q-SBLF) | | | NR/Aa1 | | | | 250,000 | | | | 250,865 | |
MISSOURI — 2.75% | | | | | | | | | | | | |
Missouri Health and Educational Facilities Authority, 0.90% due 9/1/2030 put 4/3/2017 (Washington University; SPA: JPMorgan Chase Bank, N.A.) (daily demand notes) | | | AAA/Aaa | | | | 2,000,000 | | | | 2,000,000 | |
NEVADA — 0.49% | | | | | | | | | | | | |
City of Reno GO, 5.00% due 6/1/2017 (Fire Protection Projects) | | | A-/A1 | | | | 200,000 | | | | 201,368 | |
Washoe County School District GO, 5.25% due 6/1/2017 (Educational Facilities; Insured: AGM) | | | AA/Aa3 | | | | 150,000 | | | | 151,115 | |
NEW JERSEY — 8.39% | | | | | | | | | | | | |
Essex County Improvement Authority GO, 4.00% due 10/1/2017 (County Correctional Facility) | | | NR/Aa2 | | | | 545,000 | | | | 552,859 | |
New Jersey EDA, 5.00% due 6/15/2019 | | | BBB+/Baa1 | | | | 550,000 | | | | 579,997 | |
New Jersey EDA, 5.50% due 12/15/2019 (School Facilities Construction; Insured: AMBAC) | | | BBB+/Baa1 | | | | 200,000 | | | | 215,468 | |
New Jersey Health Care Facilities Financing Authority, 5.00% due 1/1/2018 (Hackensack University Medical Center; Insured: AGM) | | | AA/A2 | | | | 150,000 | | | | 154,309 | |
New Jersey Higher Educational Assistance Authority, 5.00% due 12/1/2017 (Student Loans) | | | AA/Aa2 | | | | 515,000 | | | | 527,381 | |
New Jersey Transit Corp., 5.00% due 9/15/2019 (Urban Public Transportation Capital Improvement) | | | A/A3 | | | | 1,250,000 | | | | 1,323,737 | |
New Jersey Transportation Trust Fund Authority, 5.00% due 6/15/2020 (State Transportation System Improvements) | | | A+/Baa1 | | | | 500,000 | | | | 532,725 | |
New Jersey Transportation Trust Fund Authority, 5.50% due 12/15/2020 (State Transportation System Improvements; Insured: Natl-Re) | | | AA-/A3 | | | | 2,000,000 | | | | 2,210,840 | |
NEW MEXICO — 1.39% | | | | | | | | | | | | |
County of Taos, 3.00% due 4/1/2018 (County Educational Improvements; Insured: BAM) | | | AA/NR | | | | 1,000,000 | | | | 1,013,140 | |
NEW YORK — 7.18% | | | | | | | | | | | | |
City of New York GO, 5.00% due 8/1/2017 (Capital Projects) | | | AA/Aa2 | | | | 500,000 | | | | 506,995 | |
City of New York GO, 5.00% due 8/1/2019 (Capital Projects) | | | AA/Aa2 | | | | 450,000 | | | | 489,492 | |
Lake Placid Central School District GO, 5.00% due 6/15/2017 (Educational Facilities; Insured: Natl-Re) (State Aid Withholding) | | | NR/Aa3 | | | | 200,000 | | | | 201,666 | |
Monroe County Industrial Development Corp., 4.00% due 1/15/2018 (Monroe Community College Association; Insured: AGM) | | | AA/A2 | | | | 200,000 | | | | 204,356 | |
New York City Municipal Water Finance Authority, 0.96% due 6/15/2048 put 4/3/2017 (Water & Sewer System; SPA: Mizuho Bank, Ltd.) (daily demand notes) | | | AA+/Aa1 | | | | 600,000 | | | | 600,000 | |
Semi-Annual Report 9
| | |
| Schedule of Investments, Continued | | |
| |
Thornburg Low Duration Municipal Fund | | March 31, 2017 (Unaudited) |
| | | | | | | | | | | | |
ISSUER-DESCRIPTION | | CREDIT RATING†
S&P/ MOODY’S | | | PRINCIPAL
AMOUNT | | | VALUE | |
New York City Municipal Water Finance Authority, 0.95% due 6/15/2050 put 4/3/2017 (Water & Sewer System; SPA: JPMorgan Chase Bank, N.A.) (daily demand notes) | | | AA+/Aa1 | | | $ | 700,000 | | | $ | 700,000 | |
New York City Transitional Finance Authority, 0.96% due 11/1/2022 put 4/3/2017 (World Trade Center Recovery; SPA: Landesbank Hessen-Thuringen) (daily demand notes) | | | AAA/Aa1 | | | | 400,000 | | | | 400,000 | |
New York City Transitional Finance Authority, 0.96% due 8/1/2031 put 4/3/2017 (City Capital Projects; SPA: Landesbank Hessen-Thuringen) (daily demand notes) | | | AAA/Aaa | | | | 500,000 | | | | 500,000 | |
New York City Transitional Finance Authority, 0.90% due 8/1/2039 put 4/3/2017 (City Capital Projects; SPA: U.S. Bank, N.A.) (daily demand notes) | | | AAA/Aa1 | | | | 500,000 | | | | 500,000 | |
Tobacco Settlement Asset Securitization Corp., 5.00% due 6/1/2021 | | | A/NR | | | | 1,000,000 | | | | 1,116,570 | |
NORTH CAROLINA — 1.04% | | | | | | | | | | | | |
State of North Carolina, 4.00% due 3/1/2023 (Federal Aid Highway Projects) | | | AA/A2 | | | | 750,000 | | | | 758,947 | |
OKLAHOMA — 1.85% | | | | | | | | | | | | |
Oklahoma DFA, 5.00% due 8/15/2018 (INTEGRIS Health) | | | AA-/Aa3 | | | | 270,000 | | | | 284,834 | |
Tulsa County Industrial Authority, 5.50% due 9/1/2018 (Jenks Public Schools) | | | AA-/NR | | | | 1,000,000 | | | | 1,062,250 | |
OREGON — 0.69% | | | | | | | | | | | | |
State of Oregon GO, 2.00% due 6/30/2017 (Cash Management) | | | SP-1+/Mig1 | | | | 500,000 | | | | 501,530 | |
PENNSYLVANIA — 9.12% | | | | | | | | | | | | |
City of Philadelphia, 5.00% due 10/1/2017 (Pennsylvania Gas Works) | | | A/Baa1 | | | | 200,000 | | | | 203,848 | |
City of Philadelphia, 5.00% due 7/1/2018 (Pennsylvania Gas Works) | | | AA/A2 | | | | 350,000 | | | | 366,401 | |
City of Philadelphia, 5.00% due 10/1/2020 (Pennsylvania Gas Works) | | | A/Baa1 | | | | 500,000 | | | | 552,690 | |
Coatesville Area School District GO, 5.00% due 8/1/2021 (Insured: AGM) (State Aid Withholding) | | | AA/A2 | | | | 1,000,000 | | | | 1,124,040 | |
East Allegheny School District GO, 2.00% due 4/1/2017 (Insured: BAM) (State Aid Withholding) | | | AA/Ba1 | | | | 300,000 | | | | 300,000 | |
Hospitals & Higher Education Facilities Authority of Philadelphia, 0.95% due 7/1/2041 put 4/3/2017 (The Children’s Hospital of Philadelphia; SPA: Wells Fargo Bank, N.A.) (daily demand notes) | | | AA/Aa2 | | | | 1,300,000 | | | | 1,300,000 | |
Lancaster County Hospital Authority, 5.00% due 11/1/2018 (Masonic Villages Project) | | | A/NR | | | | 1,500,000 | | | | 1,581,165 | |
Lehigh County IDA, 0.90% due 2/15/2027 put 8/15/2017 (PPL Electric Utilities Corp.) | | | A/A1 | | | | 1,000,000 | | | | 999,890 | |
Wilson School District GO, 3.00% due 6/1/2017 (State Aid Withholding) | | | AA/NR | | | | 200,000 | | | | 200,722 | |
SOUTH CAROLINA — 1.55% | | | | | | | | | | | | |
City of North Charleston Public Facilities Corp. COP, 5.00% due 10/1/2017 (Convention Center Complex) | | | AA-/NR | | | | 300,000 | | | | 306,153 | |
Kershaw County Public Schools Foundation, 4.00% due 12/1/2017 (Kershaw County School District) | | | A-/A1 | | | | 500,000 | | | | 510,250 | |
Piedmont Municipal Power Agency, 5.00% due 1/1/2018 (Catawba Project) | | | AA/A3 | | | | 300,000 | | | | 308,940 | |
TEXAS — 9.13% | | | | | | | | | | | | |
City of Dallas GO, 5.00% due 2/15/2021 (Trinity River Corridor Infrastructure) | | | AA-/A1 | | | | 1,000,000 | | | | 1,112,610 | |
City of Houston, 4.00% due 9/1/2017 (Convention & Entertainment Facilities Department) | | | A-/A2 | | | | 200,000 | | | | 202,492 | |
City of Houston, 4.00% due 9/1/2018 (Convention & Entertainment Facilities Department) | | | A-/A2 | | | | 675,000 | | | | 701,656 | |
City of Houston Higher Education Finance Corp., 5.00% due 8/15/2018 (KIPP Program; Guaranty: PSF) | | | AAA/NR | | | | 970,000 | | | | 1,022,428 | |
City of San Antonio, 2.25% due 2/1/2033 (Electric and Gas Systems) | | | AA-/NR | | | | 1,000,000 | | | | 1,020,260 | |
Coastal Water Authority, 4.00% due 12/15/2017 (City of Houston Projects) | | | AA/NR | | | | 905,000 | | | | 924,874 | |
Dallas Independent School District GO, 5.00% due 2/15/2036 put 2/15/2020 (School District Buildings Renovations; Insured: PSF-GTD) | | | AAA/Aaa | | | | 325,000 | | | | 355,342 | |
Harris County Cultural Education Facilities Finance Corp., 0.95% due 9/1/2031 put 4/3/2017 (Texas Medical Center; LOC: JPMorgan Chase Bank, N.A.) (daily demand notes) | | | AA+/Aa1 | | | | 1,300,000 | | | | 1,300,000 | |
WASHINGTON — 1.64% | | | | | | | | | | | | |
King County Public Hospital District No. 2 GO, 5.00% due 12/1/2018 (Evergreen Health) | | | NR/Aa3 | | | | 835,000 | | | | 888,240 | |
Ocean Beach School District No. 101 GO, 4.00% due 12/1/2017 (Educational Facilities) | | | NR/A1 | | | | 300,000 | | | | 305,949 | |
WEST VIRGINIA — 0.28% | | | | | | | | | | | | |
Mason County, 1.625% due 10/1/2022 put 10/1/2018 (Appalachian Power Company) | | | A-/Baa1 | | | | 200,000 | | | | 199,984 | |
WISCONSIN — 1.00% | | | | | | | | | | | | |
Wisconsin Health & Educational Facilities Authority, 1.25% due 8/15/2025 put 8/15/2017 (Aurora Health Care, Inc.) | | | NR/A2 | | | | 725,000 | | | | 724,913 | |
| | | | | | | | | | | | |
TOTAL INVESTMENTS — 98.06% (Cost $71,188,276) | | | | | | | | | | $ | 71,290,507 | |
OTHER ASSETS LESS LIABILITIES — 1.94% | | | | | | | | | | | 1,413,771 | |
| | | | | | | | | | | | |
NET ASSETS — 100.00% | | | | | | | | | | $ | 72,704,278 | |
| | | | | | | | | | | | |
10 Semi-Annual Report
| | |
| Schedule of Investments, Continued | | |
| |
Thornburg Low Duration Municipal Fund | | March 31, 2017 (Unaudited) |
Footnote Legend
| † | Credit ratings are unaudited. Rating changes may have occurred subsequent to the reporting period end. Bonds issued with a maturity of one year or less are assigned Moody’s ratings from MIG-1 to MIG-4 and Standard and Poor’s ratings from SP-1+ to SP-3 with MIG-1 and SP-1+ being the strongest ratings. |
| a | Segregated as collateral for a when-issued security. |
Portfolio Abbreviations
To simplify the listings of securities, abbreviations are used per the table below:
| | |
| AGM | | Insured by Assured Guaranty Municipal Corp. |
| AMBAC | | Insured by American Municipal Bond Assurance Corp. |
| BAM | | Insured by Build America Mutual Insurance Co. |
| COP | | Certificates of Participation |
| DFA | | Development Finance Authority |
| EDA | | Economic Development Authority |
| ETM | | Escrowed to Maturity |
| | |
| GO | | General Obligation |
| IDA | | Industrial Development Authority |
| JEA | | Jacksonville Electric Authority |
| Natl-Re | | Insured by National Public Finance Guarantee Corp. |
| PSF | | Guaranteed by Permanent School Fund |
| Q-SBLF | | Insured by Qualified School Bond Loan Fund |
See notes to financial statements.
Semi-Annual Report 11
| | |
| Statement of Assets and Liabilities | | |
| |
Thornburg Low Duration Municipal Fund | | March 31, 2017, (Unaudited) |
| | | | |
ASSETS | | | | |
Investments at value (cost $71,188,276) (Note 3) | | $ | 71,290,507 | |
Cash | | | 662,897 | |
Receivable for fund shares sold | | | 1,399,950 | |
Interest receivable | | | 663,751 | |
Prepaid expenses and other assets | | | 35,955 | |
| | | | |
Total Assets | | | 74,053,060 | |
| | | | |
| |
LIABILITIES | | | | |
Payable for investments purchased | | | 1,253,909 | |
Payable for fund shares redeemed | | | 56,971 | |
Payable to investment advisor and other affiliates (Note 4) | | | 7,321 | |
Accounts payable and accrued expenses | | | 28,759 | |
Dividends payable | | | 1,822 | |
| | | | |
Total Liabilities | | | 1,348,782 | |
| | | | |
| |
NET ASSETS | | $ | 72,704,278 | |
| | | | |
NET ASSETS CONSIST OF | | | | |
Distribution in excess of net investment income | | $ | (192 | ) |
Net unrealized appreciation on investments | | | 102,231 | |
Accumulated net realized gain (loss) | | | (41,956 | ) |
Net capital paid in on shares of beneficial interest | | | 72,644,195 | |
| | | | |
| | $ | 72,704,278 | |
| | | | |
NET ASSET VALUE | | | | |
| |
Class A Shares: | | | | |
Net asset value and redemption price per share ($22,265,414 applicable to 1,805,450 shares of beneficial interest outstanding - Note 5) | | $ | 12.33 | |
Maximum sales charge, 1.50% of offering price | | | 0.19 | |
| | | | |
Maximum offering price per share | | $ | 12.52 | |
| | | | |
| |
Class I Shares: | | | | |
Net asset value, offering and redemption price per share ($50,438,864 applicable to 4,091,661 shares of beneficial interest outstanding - Note 5) | | $ | 12.33 | |
| | | | |
See notes to financial statements.
12 Semi-Annual Report
| | |
| Statement of Operations | | |
| |
Thornburg Low Duration Municipal Fund | | Six Months Ended March 31, 2017 (Unaudited) |
| | | | |
INVESTMENT INCOME | | | | |
Interest income (net of premium amortized of $615,403) | | $ | 383,156 | |
| | | | |
| |
EXPENSES | | | | |
Investment advisory fees (Note 4) | | | 127,770 | |
Administration fees (Note 4) | | | | |
Class A Shares | | | 10,976 | |
Class I Shares | | | 11,581 | |
Distribution and service fees (Note 4) | | | | |
Class A Shares | | | 17,914 | |
Transfer agent fees | | | | |
Class A Shares | | | 12,949 | |
Class I Shares | | | 4,953 | |
Registration and filing fees | | | | |
Class A Shares | | | 11,539 | |
Class I Shares | | | 12,686 | |
Custodian fees (Note 2) | | | 13,345 | |
Professional fees | | | 20,827 | |
Accounting fees (Note 4) | | | 728 | |
Trustee fees | | | 1,298 | |
Other expenses | | | 5,292 | |
| | | | |
Total Expenses | | | 251,858 | |
Less: | | | | |
Expenses reimbursed by investment advisor (Note 4) | | | (68,468 | ) |
Investment advisory fees waived by investment advisor (Note 4) | | | (14,521 | ) |
| | | | |
Net Expenses | | | 168,869 | |
| | | | |
Net Investment Income | | | 214,287 | |
| | | | |
REALIZED AND UNREALIZED GAIN (LOSS) | | | | |
Net realized gain (loss) on investments | | | (18,623 | ) |
Net change in unrealized appreciation (depreciation) on investments | | | 60,804 | |
| | | | |
Net Realized and Unrealized Gain | | | 42,181 | |
| | | | |
Net Increase in Net Assets Resulting from Operations | | $ | 256,468 | |
| | | | |
See notes to financial statements.
Semi-Annual Report 13
| | |
| Statements of Changes in Net Assets | | |
| |
Thornburg Low Duration Municipal Fund | | |
| | | | | | | | |
| | | SIX MONTHS ENDED
MARCH 31, 2017* | | | YEAR ENDED
SEPTEMBER 30, 2016 | |
INCREASE (DECREASE) IN NET ASSETS FROM | | | | | | | | |
| | |
OPERATIONS | | | | | | | | |
Net investment income | | $ | 214,287 | | | $ | 189,076 | |
Net realized gain (loss) on investments | | | (18,623 | ) | | | (18,130 | ) |
Net unrealized appreciation (depreciation) on investments | | | 60,804 | | | | (17,236 | ) |
| | | | | | | | |
Net Increase (Decrease) in Net Assets Resulting from Operations | | | 256,468 | | | | 153,710 | |
| | |
DIVIDENDS TO SHAREHOLDERS | | | | | | | | |
From net investment income | | | | | | | | |
Class A Shares | | | (55,408 | ) | | | (9,876 | ) |
Class I Shares | | | (159,071 | ) | | | (179,200 | ) |
| | |
FUND SHARE TRANSACTIONS (NOTE 5) | | | | | | | | |
Class A Shares | | | 17,972,715 | | | | 971,622 | |
Class I Shares | | | 11,876,098 | | | | (3,150,597 | ) |
| | | | | | | | |
Net Increase (Decrease) in Net Assets | | | 29,890,802 | | | | (2,214,341 | ) |
| | |
NET ASSETS | | | | | | | | |
Beginning of Period | | | 42,813,476 | | | | 45,027,817 | |
| | | | | | | | |
| | |
End of Period | | $ | 72,704,278 | | | $ | 42,813,476 | |
| | | | | | | | |
Distribution in excess of net investment income | | $ | (192 | ) | | $ | — | |
See notes to financial statements.
14 Semi-Annual Report
| | |
| Notes to Financial Statements | | |
| |
Thornburg Low Duration Municipal Fund | | March 31, 2017 (Unaudited) |
NOTE 1 – ORGANIZATION
Thornburg Low Duration Municipal Fund (the “Fund”) is a diversified series of Thornburg Investment Trust (the “Trust”). The Trust is organized as a Massachusetts business trust under a Declaration of Trust dated June 3, 1987 and is registered as a diversified, open-end management investment company under the Investment Company Act of 1940, as amended. The Fund is currently one of twenty-one separate series of the Trust. Each series is considered to be a separate entity for financial reporting and tax purposes and bears expenses directly attributable to it. The Fund’s investment objective is to seek current income exempt from federal income tax consistent with preservation of capital.
The Fund currently offers two classes of shares of beneficial interest: Class A and Institutional Class (“Class I”). Each class of shares of the Fund represents an interest in the same portfolio of investments, except that (i) Class A shares are sold subject to a front-end sales charge collected at the time the shares are purchased and bear a service fee, (ii) Class I shares are sold at net asset value without a sales charge at the time of purchase and may be subject to a service fee, and (iii) the respective classes may have different reinvestment privileges and conversion rights. Additionally, the Fund may allocate among its classes certain expenses, to the extent allocable to specific classes, including transfer agent fees, government registration fees, certain printing and postage costs, and administrative and legal expenses. Currently, class specific expenses of the Fund are limited to service and distribution fees, administration fees, and certain registration and transfer agent expenses.
The following is a summary of significant accounting policies followed by the Fund in the preparation of its financial statements. The Fund prepares its financial statements in conformity with United States generally accepted accounting principles (“GAAP”), including investment company accounting and reporting guidance in the Financial Accounting Standards Board (the “FASB”) Accounting Standard Codification Topic 946.
NOTE 2 – SIGNIFICANT ACCOUNTING POLICIES
Security Valuation: All investments in securities held by the Fund are valued as described in Note 3.
Allocation of Income, Gains, Losses and Expenses: Net investment income (other than class specific expenses) and realized and unrealized gains and losses are allocated daily to each class of shares based upon the relative net asset value of outstanding shares (or the value of the dividend-eligible shares, as appropriate) of each class of shares at the beginning of the day (after adjusting for the current capital shares activity of the respective class). Expenses common to all Funds are allocated among the Funds comprising the Trust based upon their relative net asset values or other appropriate allocation methods. Operating expenses directly attributable to a specific class are charged against the operating income of that class.
Dividends and Distributions to Shareholders: Dividends and distributions to shareholders, which are determined in accordance with federal income tax regulations and may differ from GAAP, are recorded on the ex-dividend date. Ordinary income distributions, if any, are declared daily and paid monthly. Capital gain distributions, if any, are declared and paid annually and more often if deemed necessary by the Advisor. Dividends are paid and are reinvested in additional shares of the Fund at net asset value per share at the close of business on the ex-dividend date, or at the shareholder’s option, paid in cash.
Investment Income: Interest income is accrued as earned. Premiums and discounts are amortized and accreted, respectively, to call dates or maturity dates using the effective yield method of the respective investments. These amounts are included in Interest income on the Statement of Operations.
Custodian Fees: Custodian fees disclosed in the Statement of Operations may include interest expenses incurred by the Fund on any cash overdrafts of its custodian account during the period. Such cash overdrafts may result from the effects of failed trades in portfolio securities and from cash outflows resulting from unanticipated shareholder redemption activity. The Fund pays interest to its custodian on any such cash overdraft at a rate equal to 2.50% of the overdraft amount in excess of $50,000.
Investment Transactions: Investment transactions are accounted for on a trade date basis. Realized gains and losses from the sale of investments are recorded on an identified cost basis.
When-Issued and Delayed Delivery Transactions: The Fund may engage in when-issued or delayed delivery transactions. To the extent the Fund engages in such transactions, it will do so for the purpose of acquiring portfolio investments consistent with the Fund’s investment objectives and not for the purpose of investment leverage or to speculate on interest rate or market changes. At the time the Fund makes a commitment to purchase an investment on a when-issued or delayed delivery basis, the Fund will record the transaction and reflect the value in determining its net asset value. When effecting such transactions, assets of an amount sufficient to make payment for the portfolio investments to be purchased will be segregated on the Fund’s records on the trade date. Investments purchased on a when-issued or delayed delivery basis do not earn interest until the settlement date.
Semi-Annual Report 15
| | |
| Notes to Financial Statements, Continued | | |
| |
Thornburg Low Duration Municipal Fund | | March 31, 2017 (Unaudited) |
Guarantees and Indemnifications: Under the Trust’s organizational documents (and under separate agreements with the independent Trustees), its officers and Trustees are provided with an indemnification against certain liabilities arising out of the performance of their duties to the Fund. In the normal course of business the Trust may also enter into contracts with service providers that contain general indemnifications. The Trust’s maximum exposure under these arrangements is unknown. However, based on experience, the Trust expects the risk of loss to be remote.
Use of Estimates: The preparation of financial statements in conformity with GAAP requires management to make estimates and assumptions that affect the reported amounts of assets and liabilities and disclosure of contingent assets and liabilities at the date of the financial statements and the reported amounts of increases (decreases) in net assets from operations during the reporting period. Actual results could differ from those estimates.
Federal Income Taxes: It is the policy of the Trust to comply with the provisions of the Internal Revenue Code applicable to regulated investment companies and to distribute to shareholders substantially all investment company taxable income including net realized gains on investments (if any), and tax exempt income of the Fund. Therefore, no provision for federal income or excise tax is required.
The Fund files income tax returns in United States federal and applicable state jurisdictions. The statute of limitations on the Fund’s tax return filings generally remains open for the three years following a return’s filing date. The Fund has analyzed its tax positions taken on Federal income tax returns for all open tax years and has concluded that no provision for income tax is required in the financial statements.
At March 31, 2017, information on the tax components of capital was as follows:
| | | | |
Cost of investments for tax purposes | | $ | 71,188,276 | |
| | | | |
Gross unrealized appreciation on a tax basis | | $ | 145,856 | |
Gross unrealized depreciation on a tax basis | | | (43,625 | ) |
| | | | |
Net unrealized appreciation (depreciation) on investments (tax basis) | | $ | 102,231 | |
| | | | |
At March 31, 2017, the Fund had deferred tax basis capital losses occurring subsequent to October 31, 2015 through September 30, 2016 of $1,645. For tax purposes, such losses will be recognized in the year ending September 30, 2017.
At March 31, 2017, the Fund had cumulative tax basis capital losses of $21,688, (of which $1,073 are short-term and $20,615 are long-term) generated after September 30, 2011, which may be carried forward to offset future capital gains. To the extent such carryforwards are used, capital gain distributions may be reduced to the extent provided by regulations. Such capital loss carryforwards do not expire.
NOTE 3 – SECURITY VALUATION
Valuation of the Fund’s portfolio investment securities is performed in accordance with policies and procedures adopted by and under the oversight of the Trustees.
The Trustees of the Trust have appointed Thornburg Investment Management, Inc., the Trust’s investment advisor (the “Advisor”) to assist the Trustees in obtaining market values for portfolio investments, evaluate and monitor professional pricing service providers appointed by the Trustees’ Audit Committee (the “Audit Committee”) to assist in determining fair values for portfolio investments, assist in calculating fair values for portfolio investments in certain circumstances, and to perform other functions in connection with the valuation of investments. The Advisor acts through its Valuation and Pricing Committee (the “Committee”) and other employees of the Advisor. The Committee regularly reviews its own valuation calculations, as well as the valuations, valuation techniques and services furnished by pricing service providers, considers circumstances which may require valuation calculations by the Committee, and reviews previous valuation calculations. The Committee reports to the Audit Committee on the Committee’s activities, the performance of pricing service providers, and other matters relating to valuation of portfolio investments.
In those instances when the Committee assists in calculating a fair value for a portfolio investment, the Committee seeks to determine the price that the Fund would reasonably expect to receive upon a sale of the investment in an orderly transaction between market participants on the valuation date. The Committee customarily utilizes quotations from securities broker dealers in calculating valuations, but also may utilize prices obtained from pricing service providers or other methods approved by the Audit Committee. Because fair values calculated by the Committee are estimates, the calculation of a value for an investment may differ from the price that would be realized by the Fund upon a sale of the investment, and the difference could be material to the Fund’s financial statements. The Committee’s calculation of a fair value for an investment may also differ from the prices obtained by other persons (including other mutual funds) for the investment.
Valuation of Securities: Debt obligations held by the Fund which are not listed or traded on exchanges or for which no reported market exists are ordinarily valued at the valuation obtained from a pricing service provider approved by the Audit Committee.
16 Semi-Annual Report
| | |
| Notes to Financial Statements, Continued | | |
| |
Thornburg Low Duration Municipal Fund | | March 31, 2017 (Unaudited) |
In any case when a pricing service provider fails to provide a valuation for a debt obligation held by the Fund, the Committee calculates a fair value for the obligation using alternative methods under procedures approved by the Audit Committee. Additionally, in cases when management believes that a valuation obtained from a pricing service provider merits review for significant reasons, the Committee decides whether or not to use the valuation calculated by the pricing service provider or to use an alternative method approved by the Audit Committee to calculate a fair value for the obligation.
Valuation Hierarchy: The Fund categorizes its investments based upon the inputs used in valuing those investments, according to a three-level hierarchy established in guidance from FASB. Categorization of investments using this hierarchy is intended by the FASB to maximize the use of observable inputs in valuing investments and minimize the use of unobservable inputs by requiring that the most observable inputs be used when available. Observable inputs are those that market participants would use in valuing an investment based on available market information. Unobservable inputs are those that reflect assumptions about the information market participants would use in valuing an investment. An investment’s level within the hierarchy is based on the lowest level input that is deemed significant to the valuation. The methodologies and inputs used to value investments are not necessarily indications of the risk or liquidity associated with those investments.
Various inputs are used in calculating valuations for the Fund’s investments. These inputs are generally summarized according to the three-level hierarchy below:
Level 1: Quoted prices in active markets for identical investments.
Level 2: Other direct or indirect significant observable inputs (including quoted prices for similar investments in active markets and other observable inputs, such as interest rates, prepayment rates, credit risk, etc.).
Level 3: Significant unobservable inputs (including the Committee’s own assumptions in calculating the fair values of investments).
Valuations for debt obligations held by the Fund are typically calculated by pricing service providers approved by the Audit Committee and are characterized as Level 2 within the valuation hierarchy.
In a limited number of cases the Committee calculates a fair value for investments using broker quotations or other methods approved by the Audit Committee. When the Committee uses a single broker quotation to calculate a fair value for an investment without other significant observable inputs, or if a fair value is calculated using other significant inputs that are considered unobservable, the investment is characterized as Level 3 within the hierarchy. Other significant unobservable inputs used to calculate a fair value in these instances might include an income-based valuation approach which considers discounted anticipated future cash flows from the investment, and application of discounts due to the nature or duration of any restrictions on the disposition of the investment.
Valuations based upon the use of inputs from Levels 1, 2 or 3 may not represent the actual price received upon the disposition of an investment, and the Fund may receive a price that is lower than the valuation based upon these inputs when it sells the investment.
The following table displays a summary of the fair value hierarchy measurements of the Fund’s investments as of March 31, 2017. In any instance when valuation inputs from more than one level are used to determine the fair value of a specific investment, the investment is placed in the level of the table based upon the lowest level input that is significant in determining the fair value of the investment:
| | | | | | | | | | | | | | | | |
| | | FAIR VALUE MEASUREMENTS AT
MARCH 31, 2017 | |
| | | TOTAL | | | LEVEL 1 | | | LEVEL 2 | | | LEVEL 3 | |
Assets | | | | | | | | | | | | | | | | |
Investments in Securities | | | | | | | | | | | | | | | | |
Municipal Bonds | | $ | 71,290,507 | | | $ | — | | | $ | 71,290,507 | | | $ | — | |
| | | | | | | | | | | | | | | | |
Total Investments in Securities | | $ | 71,290,507 | | | $ | — | | | $ | 71,290,507 | | | $ | — | |
In accordance with the guidance prescribed in Accounting Standards Update No. 2011-04, it is the policy of the Fund to recognize transfers between levels and the underlying events which caused the movement. The Fund recognized no transfers between levels for the six months ended March 31, 2017.
Semi-Annual Report 17
| | |
| Notes to Financial Statements, Continued | | |
| |
Thornburg Low Duration Municipal Fund | | March 31, 2017 (Unaudited) |
NOTE 4 – INVESTMENT ADVISORY FEE AND OTHER TRANSACTIONS WITH AFFILIATES
Pursuant to an investment advisory agreement, the Advisor serves as the investment advisor and performs services for the Fund for which the fees are payable at the end of each month. Under the investment advisory agreement, the Fund pays the Advisor a management fee based on the daily net assets of the Fund at an annual rate as shown in the following table:
Management Fee Schedule
| | | | |
DAILY NET ASSETS | | FEE RATE | |
Up to $ 1 billion | | | 0.400 | % |
Next $ 500 million | | | 0.300 | |
Next $ 500 million | | | 0.250 | |
Over $ 2 billion | | | 0.225 | |
The Fund’s effective management fee for the six months ended March 31, 2017 was 0.40% of the Fund’s average net assets (before applicable management fee waiver of $14,521).
The Fund pays to the Advisor the costs of personnel who perform certain accounting services for the Fund. For the six months ended March 31, 2017 the Fund paid $728 to the Advisor for these accounting services. The Trust has also entered into administrative service agreements with the Advisor, whereby the Advisor will perform certain administrative services related to each class of the Fund’s shares, and for which fees will be payable at an annual rate of up to .125 of 1% per annum of the average daily net assets attributable to each class of shares. Total administrative service fees incurred by each class of shares of the Fund for the six months ended March 31, 2017, are set forth in the Statement of Operations.
The Trust has an underwriting agreement with Thornburg Securities Corporation (the “Distributor”), an affiliate of the Advisor, which acts as the distributor of the Fund’s shares. For the six months ended March 31, 2017, the Distributor has advised the Fund that it earned net commissions aggregating $128 from the sale of Class A shares.
Pursuant to a service plan under Rule 12b-1 of the Investment Company Act of 1940, the Fund may pay to the Distributor or securities dealers and other financial institutions at the Distributor’s direction an amount not to exceed .25 of 1% per annum of the average daily net assets attributable to Class A shares of the Fund to obtain various shareholder and distribution related services. For the six months ended March 31, 2017, there were no 12b-1 service plan fees charged for Class I shares. The Advisor and the Distributor each may pay out of its own resources additional expenses for distribution of the Fund’s shares and shareholder services.
The Advisor and Distributor have contractually agreed to waive fees and reimburse expenses incurred by the Fund so that actual expenses of certain share classes do not exceed levels as specified in the Fund’s most recent prospectus. The agreement may be terminated by the Fund at any time, but may not be terminated by the Advisor or Distributor before April 10, 2018, unless the Advisor ceases to be the investment advisor to the Fund or the Distributor ceases to be the distributor of the Fund prior to that date. The Advisor and Distributor may recoup amounts waived or reimbursed during the fiscal year if actual expenses fall below the contractual limit during that year.
For the six months ended March 31, 2017, the Advisor voluntarily waived Fund level investment advisory fees of $14,521. The Advisor contractually reimbursed certain class specific expenses, administrative fees, and distribution fees of $39,248 for Class A shares and $29,220 for Class I shares.
Certain officers and Trustees of the Trust are also officers or directors of the Advisor and Distributor. The compensation of independent Trustees is borne by the Trust.
The percentage of direct investments in the Fund held by Trustees and Officers of the Trust and the Advisor is approximately 44.73%.
The Fund may purchase or sell securities from, or to an affiliated fund, provided the affiliation is due solely to having a common investment advisor, common officers, or common trustees, and provided that all such transactions will comply with Rule 17a-7 under the 1940 Act. For the six months ended March 31, 2017, the Fund had transactions with affiliated funds of $3,358,907 in purchases.
18 Semi-Annual Report
| | |
| Notes to Financial Statements, Continued | | |
| |
Thornburg Low Duration Municipal Fund | | March 31, 2017 (Unaudited) |
NOTE 5 – SHARES OF BENEFICIAL INTEREST
At March 31, 2017, there were an unlimited number of shares with no par value of beneficial interest authorized. Transactions in shares of beneficial interest were as follows:
| | | | | | | | | | | | | | | | |
| | | SIX MONTHS ENDED | | | YEAR ENDED | |
| | | MARCH 31, 2017 (UNAUDITED) | | | SEPTEMBER 30, 2016 (AUDITED) | |
| | | SHARES | | | AMOUNT | | | SHARES | | | AMOUNT | |
Class A Shares | | | | | | | | | | | | | | | | |
Shares sold | | | 2,887,118 | | | $ | 35,513,788 | | | | 179,515 | | | $ | 2,217,348 | |
Shares issued to shareholders in reinvestment of dividends | | | 4,426 | | | | 54,550 | | | | 796 | | | | 9,845 | |
Shares repurchased | | | (1,429,719 | ) | | | (17,595,623 | ) | | | (101,677 | ) | | | (1,255,571 | ) |
| | | | | | | | | | | | | | | | |
| | | | |
Net increase (decrease) | | | 1,461,825 | | | $ | 17,972,715 | | | | 78,634 | | | $ | 971,622 | |
| | | | | | | | | | | | | | | | |
Class I Shares | | | | | | | | | | | | | | | | |
Shares sold | | | 1,972,253 | | | $ | 24,262,786 | | | | 1,018,022 | | | $ | 12,579,199 | |
Shares issued to shareholders in reinvestment of dividends | | | 12,452 | | | | 153,404 | | | | 14,105 | | | | 174,307 | |
Shares repurchased | | | (1,018,677 | ) | | | (12,540,092 | ) | | | (1,287,521 | ) | | | (15,904,103 | ) |
| | | | | | | | | | | | | | | | |
| | | | |
Net increase (decrease) | | | 966,028 | | | $ | 11,876,098 | | | | (255,394 | ) | | $ | (3,150,597 | ) |
| | | | | | | | | | | | | | | | |
NOTE 6 – INVESTMENT TRANSACTIONS
For the six months ended March 31, 2017, the Fund had purchase and sale transactions of investments (excluding short-term investments) of $31,764,518 and $11,515,430, respectively.
OTHER NOTES
Risks: The Fund’s investments subject it to risks including, but not limited to, credit risk, interest rate risk, management risk, market and economic risk, and liquidity risk. Please see the Fund’s prospectus for a discussion of the risks associated with an investment in the Fund.
Subsequent Events: Fund management believes no events have occurred between March 31, 2017 and the date of issuance of the financial statements that require adjustment to or disclosure in the accompanying financial statements.
Semi-Annual Report 19
Financial Highlights
Thornburg Low Duration Municipal Fund
| | | | | | | | | | | | | | | | | | | | | | | | | | | | | | | | | | | | | | | | | | | | | | | | | | | | | | |
| | | PER SHARE PERFORMANCE (FOR A SHARE OUTSTANDING THROUGHOUT THE PERIOD) | | RATIOS TO AVERAGE NET ASSETS | | | SUPPLEMENTAL DATA | |
UNLESS
OTHERWISE
NOTED,
PERIODS
ARE
FISCAL
YEARS
ENDED
SEPT. 30, | | NET ASSET
VALUE
BEGINNING
OF PERIOD | | | NET
INVESTMENT
INCOME
(LOSS)+ | | | NET
REALIZED &
UNREALIZED
GAIN (LOSS)
ON
INVESTMENTS | | | TOTAL
FROM
INVESTMENT
OPERATIONS | | | DIVIDENDS
FROM NET
INVESTMENT
INCOME | | | DIVIDENDS
FROM NET
REALIZED
GAINS | | TOTAL
DIVIDENDS | | | NET
ASSET
VALUE
END
OF
PERIOD | | NET
INVESTMENT
INCOME
(LOSS) (%) | | | EXPENSES,
AFTER
EXPENSE
REDUCTIONS
(%) | | | EXPENSES,
AFTER
EXPENSE
REDUCTIONS
AND NET OF
CUSTODY
CREDITS (%) | | | EXPENSES,
BEFORE
EXPENSE
REDUCTIONS
(%) | | | TOTAL
RETURN
(%)(a) | | | PORTFOLIO
TURNOVER
RATE (%)(a) | | NET ASSETS
AT END OF
PERIOD
(THOUSANDS) | |
CLASS A SHARES | | | | | | | | | | | | | | | | | | | | | | | | | | | | | | | | | | | | | | | | | | | | | | | |
2017(b)(c) | | $ | 12.34 | | | | 0.04 | | | | (0.02 | ) | | | 0.02 | | | | (0.03 | ) | | — | | | (0.03 | ) | | $12.33 | | | 0.63 | (e) | | | 0.63 | (e) | | | 0.63 | (e) | | | 1.13 | (e) | | | 0.17 | | | 23.48 | | $ | 22,265 | |
2016(c) | | $ | 12.35 | | | | 0.03 | | | | (0.01 | ) | | | 0.02 | | | | (0.03 | ) | | — | | | (0.03 | ) | | $12.34 | | | 0.24 | | | | 0.70 | | | | 0.70 | | | | 2.19 | | | | 0.15 | | | 21.17 | | $ | 4,241 | |
2015(c) | | $ | 12.34 | | | | 0.02 | | | | 0.01 | | | | 0.03 | | | | (0.02 | ) | | — | | | (0.02 | ) | | $12.35 | | | 0.15 | | | | 0.67 | | | | 0.67 | | | | 2.85 | | | | 0.22 | | | 20.53 | | $ | 3,273 | |
2014(c)(d) | | $ | 12.31 | | | | 0.02 | | | | 0.03 | | | | 0.05 | | | | (0.02 | ) | | — | | | (0.02 | ) | | $12.34 | | | 0.20 | (e) | | | 0.66 | (e) | | | 0.65 | (e) | | | 3.14 | (e) | | | 0.40 | | | 4.54 | | $ | 2,751 | |
CLASS I SHARES | | | | | | | | | | | | | | | | | | | | | | | | | | | | | | | | | | | | | | | | | | | | | | | |
2017(b) | | $ | 12.34 | | | | 0.04 | | | | (0.01 | ) | | | 0.03 | | | | (0.04 | ) | | — | | | (0.04 | ) | | $12.33 | | | 0.69 | (e) | | | 0.49 | (e) | | | 0.49 | (e) | | | 0.66 | (e) | | | 0.25 | | | 23.48 | | $ | 50,439 | |
2016 | | $ | 12.35 | | | | 0.05 | | | | (0.01 | ) | | | 0.04 | | | | (0.05 | ) | | — | | | (0.05 | ) | | $12.34 | | | 0.43 | | | | 0.50 | | | | 0.50 | | | | 0.72 | | | | 0.36 | | | 21.17 | | $ | 38,572 | |
2015 | | $ | 12.34 | | | | 0.04 | | | | 0.01 | | | | 0.05 | | | | (0.04 | ) | | — | | | (0.04 | ) | | $12.35 | | | 0.32 | | | | 0.50 | | | | 0.50 | | | | 0.82 | | | | 0.40 | | | 20.53 | | $ | 41,755 | |
2014(d) | | $ | 12.31 | | | | 0.04 | | | | 0.03 | | | | 0.07 | | | | (0.04 | ) | | — | | | (0.04 | ) | | $12.34 | | | 0.42 | (e) | | | 0.44 | (e) | | | 0.44 | (e) | | | 1.77 | (e) | | | 0.56 | | | 4.54 | | $ | 12,672 | |
| (a) | Not annualized for periods less than one year. |
| (b) | Unaudited Six Month Period Ended March 31. |
| (c) | Sales loads are not reflected in computing total return. |
| (d) | Fund commenced operations on December 30, 2013. |
| + | Based on weighted average shares outstanding. |
See notes to financial statements.
| | | | |
| 20 Semi-Annual Report | | | | Semi-Annual Report 21 |
| | |
| Expense Example | | |
| |
Thornburg Low Duration Municipal Fund | | March 31, 2017 (Unaudited) |
As a shareholder of the Fund, you incur two types of costs:
| | (1) | transaction costs, including |
(a) sales charges (loads) on purchase payments, for Class A shares;
(b) a deferred sales charge on redemptions of any part or all of a purchase of $1 million of Class A shares within 12 months of purchase;
| | (2) | ongoing costs, including management fees; distribution and/or service (12b-1) fees; and other Fund expenses. |
This example is intended to help you understand your ongoing costs (in dollars) of investing in the Fund and to compare these costs with the ongoing costs of investing in other mutual funds.
The example is based on a $1,000 investment beginning on October 1, 2016, and held until March 31, 2017.
| | | | | | | | | | | | |
| | | BEGINNING
ACCOUNT VALUE
10/1/16 | | | ENDING
ACCOUNT VALUE
3/31/17 | | | EXPENSES PAID
DURING PERIOD†
10/1/16–3/31/17 | |
Class A Shares | | | | | | | | | | | | |
Actual | | $ | 1,000.00 | | | $ | 1,001.66 | | | $ | 3.17 | |
Hypothetical* | | $ | 1,000.00 | | | $ | 1,021.77 | | | $ | 3.20 | |
Class I Shares | | | | | | | | | | | | |
Actual | | $ | 1,000.00 | | | $ | 1,002.54 | | | $ | 2.44 | |
Hypothetical* | | $ | 1,000.00 | | | $ | 1,022.50 | | | $ | 2.46 | |
| † | Expenses are equal to the annualized expense ratio for each class (A: 0.63%; I: 0.49%) multiplied by the average account value over the period, multiplied by 182/365 to reflect the one-half year period. |
| * | Hypothetical assumes a rate of return of 5% per year before expenses. |
ACTUAL EXPENSES
For each class of shares, the first line of the accompanying table provides information about actual account values and actual expenses. You may use the information in this line, together with the amount you invested, to estimate the expenses that you paid over the period. Simply divide your account value by $1,000 (for example, an $8,600 account value divided by $1,000 = 8.6), then multiply the result by the number in the first line for your class of shares under the heading entitled “Expenses Paid During Period” to estimate the expenses you paid on your account during this period.
HYPOTHETICAL EXAMPLE FOR COMPARISON PURPOSES
For each class of shares, the second line of the accompanying table provides information about hypothetical account values and hypothetical expenses based on the Fund’s actual expense ratio and an assumed rate of return of 5% per year before expenses, which is not the Fund’s actual return. The hypothetical account values and expenses may not be used to estimate the actual ending account balance or expenses you paid for the period. You may use this information to compare the ongoing costs of investing in the Fund and other funds. To do so, compare this 5% hypothetical example with the 5% hypothetical examples that appear in the shareholder reports of the other funds.
Please note that the expenses shown in the table are meant to highlight your ongoing costs only and do not reflect any transactional costs, such as sales charges (loads), redemption fees, or exchange fees. Therefore, the second line of the table for each class of shares is useful in comparing ongoing costs only, and will not help you determine the relative total costs of owning different funds. In addition, if these transactional costs were included, your costs would have been higher.
22 Semi-Annual Report
| | |
| Other Information | | |
| |
Thornburg Low Duration Municipal Fund | | March 31, 2017 (Unaudited) |
PORTFOLIO PROXY VOTING
Policies and Procedures:
The Trust has delegated to Thornburg Investment Management, Inc. (the “Advisor”) voting decisions respecting proxies for the Fund’s voting securities. The Advisor makes voting decisions in accordance with its Proxy Voting Policy. A description of the Policy is available (i) without charge, upon request, by calling the Advisor toll-free at 1-800-847-0200, (ii) on the Thornburg website at www.thornburg.com, and (iii) on the Securities and Exchange Commission’s website at www. sec. gov.
Information regarding how proxies were voted is available on or before August 31 of each year for the twelve months ending the preceding June 30. This information is available (i) without charge, upon request by calling the Advisor toll-free at 1-800-847-0200, (ii) on the Thornburg website at www.thornburg.com, and (iii) on the Securities and Exchange Commission’s website at www.sec.gov.
AVAILABILITY OF QUARTERLY PORTFOLIO SCHEDULE
The Fund files with the Securities and Exchange Commission schedules of its portfolio holdings on Form N-Q for the first and third quarters of each fiscal year. The Fund’s Forms N-Q are available on the Commission’s website at www.sec.gov, or may be reviewed and copied at the Commission’s Public Reference Room in Washington, D.C. Information on the operation of the Public Reference Room may be obtained by calling 1-800-SEC-0330. The Fund also makes this information available on its website at www.thornburg.com/download or upon request by calling 1-800-847-0200.
Semi-Annual Report 23
Trustees’ Statement to Shareholders
Readopted September 12, 2016
The Trustees believe current and prospective shareholders should know how we discharge our responsibilities in supervising the Funds’ investment advisor and in reviewing the advisor’s contract for renewal. Since 2005, we have issued a statement which sets out clearly the three principal guidelines that we follow in supervising the Trust’s investment advisor on your behalf. In accordance with our customary practice, in September of this year we again reviewed our statement and concluded we should reissue this statement outlining the principal features of our supervision of the advisor’s performance of investment management services for the Funds.
We begin with the premise that each shareholder selected his or her Fund because its investments are managed by the investment advisor identified in the prospectus and in accordance with the objective and policies described in the prospectus. We realize, as each of you do, that if you believe that your Fund’s stated objective and policies no longer serve your personal investment goals, you can sell your shares and leave the Fund.
Therefore, we believe that our primary supervisory task – our principal obligation to you – is to assess the nature and quality of the advisor’s services, and to confirm that the advisor actively and competently pursues the Fund’s objective, in accordance with the policies set out in the prospectus. To do this, we meet regularly with management to review your Fund’s portfolio and to discuss the advisor’s specific actions and judgments in pursuing the Fund’s objective. We do not substitute our own judgment for the advisor’s decisions in selecting investments; the advisor is paid to exercise its informed judgment on investment decisions, and we seek to confirm, in reviewing the advisor’s performance, that the advisor is doing just that.
Second, we are conscious of costs and the effect that costs have on shareholders’ returns. We try to make sure that your Fund’s fees and costs are reasonable in relationship to the services rendered and that they are generally in line with those charged by other expert investment advisors, consistent with our belief that the Fund’s investors searched for and expect that expertise and attention and have decided to pay a reasonable price for it. We do not put the management contract “out to bid” as a matter of course, and we would not do so unless we had concluded that the advisor materially had failed to pursue the Fund’s objectives in accordance with its policies, or for other equally important reasons. We believe that any other approach would be inconsistent with your interests and contrary to your expectations when you bought shares of the Fund in the first place.
Finally, because we believe that most Thornburg Fund shareholders have invested with a long-term perspective, we try not to focus too much on the fashions of the moment and on short-term performance. The market will not favor any specific investment objective or set of policies at all times and under all economic circumstances. A fund will experience periods of both high and low returns relative to other funds and other investments. Even if one of our Funds is not favored by the market at a particular time, we believe that the advisor is nonetheless obliged to remain true to the Fund’s objective and policies, and we watch to see that it does so.
Trustees of Thornburg Investment Trust
24 Semi-Annual Report
Thornburg Funds
Thornburg Investment Management is a privately-owned global investment firm that offers a range of solutions for retail and institutional investors. Founded in 1982 and headquartered in Santa Fe, New Mexico, we manage approximately $49 billion (as of March 31, 2017) across U.S. mutual funds, separate accounts for high-net-worth investors and institutional accounts, and UCITS funds for non-U.S. investors.
The fund outlined in this report is one of many equity and fixed-income products available from Thornburg Investment Management.
EQUITY FUNDS
| | • | | Thornburg Investment Income Builder Fund |
| | • | | Thornburg Global Opportunities Fund |
| | • | | Thornburg International Value Fund |
| | • | | Thornburg Better World International Fund |
| | • | | Thornburg International Growth Fund |
| | • | | Thornburg Developing World Fund |
| | • | | Thornburg Core Growth Fund |
FIXED INCOME FUNDS
| | • | | Thornburg Low Duration Income Fund |
| | • | | Thornburg Limited Term U.S. Government Fund |
| | • | | Thornburg Limited Term Income Fund |
| | • | | Thornburg Strategic Income Fund |
| | • | | Thornburg Low Duration Municipal Fund |
| | • | | Thornburg Limited Term Municipal Fund |
| | • | | Thornburg Intermediate Municipal Fund |
| | • | | Thornburg California Limited Term Municipal Fund |
| | • | | Thornburg New Mexico Intermediate Municipal Fund |
| | • | | Thornburg New York Intermediate Municipal Fund |
| | • | | Thornburg Strategic Municipal Income Fund |
ALTERNATIVE FUNDS
| | • | | Thornburg Long/Short Equity Fund |
Before investing, carefully consider the Fund’s investment goals, risks, charges, and expenses. For a prospectus or summary prospectus containing this and other information, contact your financial advisor or visit thornburg.com. Read it carefully before investing.
For additional information, please visit thornburg.com
Thornburg Investment Management, Inc. 2300 North Ridgetop Road, Santa Fe, NM 87506
Semi-Annual Report 25
This page intentionally left blank.
26 Semi-Annual Report
This page intentionally left blank.
Semi-Annual Report 27

| | |
To receive shareholder reports, prospectuses, and proxy statements electronically, go to www.thornburg.com/edelivery. This Semi-Annual Report is submitted for the general information of shareholders of the Fund. It is not authorized for distribution to prospective investors in the Fund unless preceded or accompanied by an effective prospectus. | | 
|
| |
| | | | |
| Investment Advisor: | | Distributor: | | |
| Thornburg Investment Management® | | Thornburg Securities Corporation® | | |
| 800.847.0200 | | 800.847.0200 | | TH3053 |
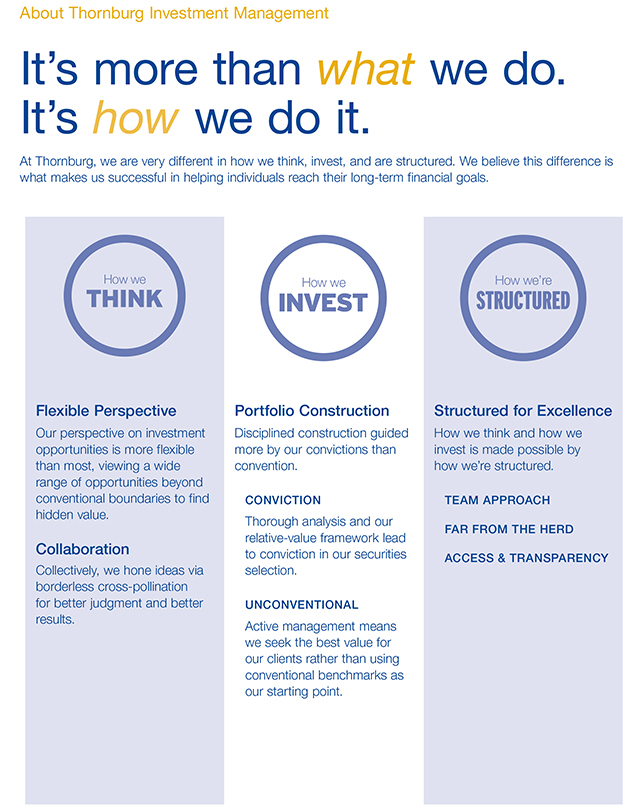
About Thornburg Investment Management
It’s more than what we do.
It’s how we do it.
At Thornburg, we are very different in how we think, invest, and are structured We believe this difference is what makes us successful in helping individuals reach their long-term financial goals.
Flexible Perspective Our perspective on investment opportunities is more flexible than most, viewing a wide range of opportunities beyond conventional boundaries to find hidden value.
Collaboration Collectively, we hone ideas via borderless cross-pollination for better judgment and better results.
Convention
Portfolio Construction Disciplined construction guided more by our convictions than Convention.
CONVICTION Thorough analysis and our relative-value framework lead to conviction in our securities selection
UNCONVENTIONAL Active management means we seek the best value for our clients rather than using conventional benchmarks as our starting point.
Structured for Excellence How we think and how we invest is made possible by how we’re structured.
TEAM APPROACH
FAR FROM THE HERD
ACCESS & TRANSPARENCY
2 Semi-Annual Report
Semi-Annual Report
Thornburg Limited Term Municipal Fund
March 31, 2017
| | | | |
SHARE CLASS | | NASDAQ SYMBOL | | CUSIP |
Class A | | LTMFX | | 885-215-459 |
Class C | | LTMCX | | 885-215-442 |
Class I | | LTMIX | | 885-215-434 |
Minimum investments for Class I shares may be higher than those for other classes. Class I shares may not be available to all investors.
Investments carry risks, including possible loss of principal. Portfolios investing in bonds have the same interest rate, inflation, and credit risks that are associated with the underlying bonds. The value of bonds will fluctuate relative to changes in interest rates, decreasing when interest rates rise. Unlike bonds, bond funds have ongoing fees and expenses. Please see the Fund’s prospectus for a discussion of the risks associated with an investment in the Fund. Investments in the Funds are not FDIC insured, nor are they bank deposits or guaranteed by a bank or any other entity.
Semi-Annual Report 3
Letter to Shareholders
| | |
| |
Thornburg Limited Term Municipal Fund | | March 31, 2017 (Unaudited) |
April 28, 2017
Dear Fellow Shareholder:
We are pleased to present the semi-annual report for Thornburg Limited Term Municipal Fund. The net asset value (NAV) of the Class A shares decreased by 32 cents to $14.31 per share during the six-month period ended March 31, 2017. If you were with us the entire period, you received dividends of 11.54 cents per share. If you reinvested your dividends, you received 11.57 cents per share. Dividends were lower for Class C shares and higher for Class I shares to account for varying class-specific expenses. The Class A shares of your Fund underperformed the index with a negative 1.40% total return (without sales charge) for the six months ended March 31, 2017, compared to the negative 0.90% return for the BofA Merrill Lynch 1-10 Year U.S. Municipal Securities Index.
The Fund’s duration and curve positioning detracted 0.08% from relative performance while ratings factors detracted 0.07%. Other risk factors added 0.01% to relative performance. Fund expenses accounted for any remaining differences.
The Municipal Bond Market
After a few years of relative quiet in the municipal bond market, things heated up following the election of Donald Trump in 2016. While stocks were rallying, bond prices, particularly municipal bond prices, came under pressure. Bond yields initially rose after the election based on expectations for greater infrastructure spending, stronger growth and higher inflation. The uptick in rates led mutual fund investors to sell their shares, which caused municipal bond mutual funds to sell their bonds to meet those redemptions. After significant inflows in January to September of 2016, investors pulled $26 billion from municipal bond funds in November and December, some of which was related to tax-loss selling.
When the calendar turned in 2017, these outflows slowed and the municipal bond market produced positive returns. A contributing factor to positive returns was a decline in municipal bond issuance, as during the first quarter of 2017, the supply of new municipal bonds declined by 12% from the same time last year.
The value metrics we use at Thornburg suggest that the municipal bond market continues to price in the rosiest of scenarios moving forward, as investors have been pushed out of the risk spectrum. That is why we have Thornburg Limited Term Municipal Fund positioned in the lower end of its respective risk spectrum. In this environment, we continue to keep duration shorter, credit quality higher and we maintain higher levels of reserves.
Inside the Risk Metrics
Real yields, which indicate how much yield over inflation investors are being paid to own municipal bonds, increased over the six-month period. As of September 30, 2016, 10-year AAA general obligation (GO) bonds were yielding 1.64% and the Core Personal Consumption Expenditures Index (PCE) was running at 1.70%, so investors were earning less than inflation. By the end of February 2017, the yield on 10-year AAA GO bonds had increased to 2.30%, while Core PCE was running at 1.80%. While certainly more interesting at the end of the period, the 0.5% real yield was significantly less than the average of 2% investors have earned over the past 20 years.
The second thing to consider is credit spreads, which reflect the incremental yield an investor earns from owning a lower-rated credit versus a higher-rated credit, and which today remain narrow. As of March 31, 2017, an investor earned about 1.28% more for owning a 10-year BBB revenue bond versus a 10-year AAA GO bond. That is slightly higher than the average 0.75% an investor earned between 1994 and 2007. However, in 2007, approximately 50% of the new-issue municipal bond market was insured by AAA/AAA municipal bond insurers. Today, there are no AAA/AAA municipal bond insurers, and insurance coverage generally accounts for only 6% to 8% of the new-issue municipal bond market.
Finally, the slope of the yield curve, which tracks how much incremental yield an investor earns by owning securities with longer maturities, is slightly flatter than historical averages. Currently, investors are earning about 1.4% more for owning a 10-year AAA GO municipal bond, versus a one-year AAA GO municipal bond. Since 1994, an investor earned on average almost 1.6% to extend maturities from one to 10 years.
The Economy and Tax Reform
The U.S. economy continued its slow recovery in 2016, growing at a rate of 1.6% for 2016 in aggregate.
Unemployment continued to tick down. During the six-month period ended March 31, 2017, the U.S. economy added 976,000 jobs and by the end of the period the unemployment rate had fallen to 4.5%. Inflation remained stable, with the Core PCE Index reading 1.75% through March, below the Fed’s 2% target range.
Taken in aggregate, the economy continues to grow, jobs are being added and inflation has remained contained to date. In an effort to keep the economy in check, the U.S. Federal Reserve raised the Fed funds rate in December of 2016, and again in March of 2017.
The economic health of the municipal bond market appears steady with a couple of notable exceptions. The drama in
4 Semi-Annual Report
| | |
Letter to Shareholders, Continued | | |
| |
Thornburg Limited Term Municipal Fund | | March 31, 2017 (Unaudited) |
Puerto Rico is still playing out; the only winners are the consultants and lawyers hired by all sides.
Elsewhere, Bloomberg provides a heat map of the economic health of U.S. states, covering the period from the fourth quarter of 2015 through the fourth quarter of 2016 (the most recent data available). The majority of the states appear healthy except those with heavy dependence on oil, gas, and coal. The energy-dependent states should improve if oil can maintain prices above $50/barrel.
Tax reform is the second highest priority of President Trump’s and the Republican-led House agenda—second only to health care reform. The most important items in the tax proposals for the owners of municipal bonds (individuals as well as corporations) are those relevant to investment income. By lowering the effective tax rate on competing sources of income, prices of municipal bonds would most likely fall (yields would increase) to become more competitive with these alternative sources of income. There are a number of proposals that have been brought forth, and we believe that if tax reform is enacted, it will be something different than any one of these specific proposals.
President Trump’s tax reform proposal (released Thursday, April 27, 2017) called for the elimination of the deduction for state and local taxes on an individual’s federal tax return. This would, if adopted, have significant impacts for residents of high-tax states. The near-term effects on the economy would be minimal, but long term, residents would have less money in their pockets to spend, the cost of residing in high-tax states would increase and might cause out-migration and lower growth.
Conclusion
We continue to run this portfolio as an actively managed laddered portfolio. Laddering a portfolio is a simple way to diversify its investment along its entire investment universe. While past performance does not guarantee future results, our study showed that this structure outperformed other structures around 60% of the time and added 0.15% to 0.25% of total return annually from 1997 through 2016.* Our view is that the current investment environment is not compensating investors enough to take on extra risk, so we have positioned our portfolios at the lower end of their risk spectrums.
Thank you for your continued trust in us, and please know that the co-managers of this Fund are invested alongside you.
| | |
| Sincerely, | | |
| |
 | |  |
| Christopher Ryon,CFA | | Nicholos Venditti,CFA |
| Portfolio Manager | | Portfolio Manager |
| Managing Director | | Managing Director |
| * | We examined three hypothetical portfolios of bonds from December 1997 to December 2016. One using a laddering strategy, one using a barbell strategy, and a third using a bullet strategy. For the laddering strategy, the BofA Merrill Lynch 1–12 Year Municipal Index was used as a proxy, since, similar to a ladder, it contains bonds relatively evenly spread across all maturities within the index. The barbell strategy is a duration management technique wherein bonds are clustered at the two extremes of a maturity range. For the barbell strategy, the BofA Merrill Lynch 1–3 Year Municipal Index and BofA Merrill Lynch 8–12 Year Municipal Index were combined. The two indices were weighted in such a way as to give them the same duration as the broader 1–12 Year Index, and each year the portfolio was re-weighted back to the original index weights. This was done to make the two portfolios duration-neutral so that the impact of the strategy chosen could be isolated. The bullet strategy invests at the duration midpoint of the portfolio, therefore the BofA Merrill Lynch 6–8 Year Index was used to represent the bullet strategy. For additional information, see www.thornburg.com/whyladder. Past performance does not guarantee future results. |
The laddering strategy does not assure or guarantee better performance and cannot eliminate the risk of investment losses.
The matters discussed in this report may constitute forward-looking statements made pursuant to the safe harbor provisions of the Securities Litigation Reform Act of 1995. These include any advisor or portfolio manager prediction, assessment, analysis or outlook for individual securities, industries, investment styles, market sectors and/or markets. These statements involve risks and uncertainties. In addition to the general risks described for each fund in its current prospectus, other factors bearing on these reports include the accuracy of the advisor’s or portfolio manager’s forecasts and predictions, the appropriateness of the investment strategies designed by the advisor or portfolio manager and the ability of the advisor or portfolio manager to implement their strategies efficiently and successfully. Any one or more of these factors, as well as other risks affecting the securities markets generally, could cause the actual results of any fund to differ materially as compared to its benchmarks.
The views expressed are subject to change and do not necessarily reflect the views of Thornburg Investment Management, Inc. This information should not be relied upon as a recommendation or investment advice and is not intended to predict the performance of any investment or market.
Semi-Annual Report 5
| | |
| Performance Summary | | |
| |
Thornburg Limited Term Municipal Fund | | March 31, 2017 (Unaudited) |
AVERAGE ANNUAL TOTAL RETURNS
| | | | | | | | | | | | | | | | | | | | |
| | | 1-YR | | | 3-YR | | | 5-YR | | | 10-YR | | | SINCE
INCEP. | |
A Shares (Incep: 9/28/84) | | | | | | | | | | | | | | | | | | | | |
Without sales charge | | | -0.50 | % | | | 1.27 | % | | | 1.40 | % | | | 3.00 | % | | | 4.87 | % |
With sales charge | | | -1.98 | % | | | 0.76 | % | | | 1.09 | % | | | 2.84 | % | | | 4.82 | % |
C Shares (Incep: 9/1/94) | | | | | | | | | | | | | | | | | | | | |
Without sales charge | | | -0.73 | % | | | 1.05 | % | | | 1.15 | % | | | 2.74 | % | | | 3.29 | % |
With sales charge | | | -1.22 | % | | | 1.05 | % | | | 1.15 | % | | | 2.74 | % | | | 3.29 | % |
I Shares (Incep: 7/5/96) | | | -0.19 | % | | | 1.58 | % | | | 1.73 | % | | | 3.34 | % | | | 3.88 | % |
30-DAY YIELDS, A SHARES
(with sales charge)
| | | | |
Annualized Distribution Yield | | | 1.54 | % |
SEC Yield | | | 1.04 | % |
GROWTH OF A HYPOTHETICAL $10,000 INVESTMENT
Performance data shown represents past performance and is no guarantee of future results. Investment return and principal value will fluctuate so shares, when redeemed, may be worth more or less than their original cost. Current performance may be lower or higher than quoted. For performance current to the most recent month end, visit thornburg.com or call 800-847-0200. The performance information does not reflect the deduction of taxes that a shareholder would pay on distributions or the redemption of Fund shares. Returns reflect the reinvestment of dividends and capital gains. Class A shares are sold with a maximum sales charge of 1.50%. Class C shares include a 0.50% CDSC for the first year only. There is no sales charge for Class I shares.
As disclosed in the most recent prospectus, the total annual fund operating expenses are as follows: A shares, 0.72%; C shares, 0.96%; I shares, 0.41%.
Glossary
The BofA Merrill Lynch 1-10 Year Municipal Securities Index is a subset of the BofA Merrill Lynch U.S. Municipal Securities Index including all securities with a remaining term to final maturity less than 10 years.
The BofA Merrill Lynch indices used in the Ladder vs Barbell & Bullet study are model portfolios of municipal obligations throughout the United States, with maturities ranging either from one to three years, six to eight years, eight to twelve years, or one to twelve years. These indices are subsets of the BofA Merrill Lynch U.S. Municipal Securities Index, which is comprised of U.S. dollar denominated investment grade tax-exempt debt publicly issued by U.S. states and territories, and their political subdivisions, in the U.S. domestic market. Qualifying securities must have at least a one-year remaining term to final maturity, a fixed coupon schedule and an investment grade rating.
The performance of any index is not indicative of the performance of any particular investment. Unless otherwise noted, index returns reflect the reinvestment of income dividends and capital gains, if any, but do not reflect fees, brokerage commissions or other expenses of investing. Investors may not make direct investments into any index.
Annualized Distribution Yield – The distribution yield reflects actual distributions made to shareholders. The annualized distribution yield is calculated by summing the last 30 days of income at a given month end and annualizing to a 360-day year. The result is divided by the ending maximum offering price or net asset value.
Bond Credit Ratings (Credit Quality) – A bond credit rating assesses the financial ability of a debt issuer to make timely payments of principal and interest. Ratings of AAA (the highest), AA, A, and BBB are investment-grade quality. Ratings of BB, B, CCC, CC, C and D (the lowest) are considered below investment grade, speculative grade, or junk bonds.
Insured Bonds – Individual bonds are sometimes insured by private companies. The insurance guarantees the payment of principal and interest on a bond issue if the issuer defaults. Mutual funds are not insured, even if the underlying bonds are insured.
Core Personal Consumption Expenditure Index (Core PCE) – Core Personal Consumption Expenditure Index is a measure of the Personal Consumption Expenditure Index that excludes the more volatile and seasonal food and energy prices.
Credit Spread/Quality Spread – The difference between the yields of securities with different credit qualities.
Effective Duration – A bond’s sensitivity to interest rates, incorporating the embedded option features, such as call provisions. Bonds with longer durations experience greater price volatility than bonds with shorter durations.
Fed Funds Rate – The interest rate at which a depository institution lends immediately available funds (balances at the Federal Reserve) to another depository institution overnight.
General Obligation Bond (GO) – A municipal bond backed by the credit and “taxing power” of the issuing jurisdiction rather than the revenue from a given project.
Laddering – Laddering involves building a portfolio of bonds with staggered maturities so that a portion matures each year. Money that comes in from maturing bonds is typically invested in bonds with longer maturities at the far end of the portfolio.
Revenue Bond – A bond on which the debt service is payable solely from the revenue generated from the operation of the project being financed or a category of facilities, or from other non-tax sources.
Yield Curve – A line that plots the interest rates, at a set point in time, of bonds having equal credit quality, but differing maturity dates.
6 Semi-Annual Report
| | |
| Fund Summary | | |
| |
Thornburg Limited Term Municipal Fund | | March 31, 2017 (Unaudited) |
OBJECTIVES AND STRATEGIES
The Fund’s primary investment objective is to obtain as high a level of current income exempt from federal individual income tax as is consistent, in the view of the Fund’s investment advisor, with preservation of capital (may be subject to Alternative Minimum Tax).
The secondary goal of the Fund is to reduce expected changes in its share price compared to longer intermediate and long-term bond portfolios.
This Fund is a laddered portfolio of municipal bonds with a dollar-weighted average maturity of normally less than five years. Laddering involves building a portfolio of bonds with staggered maturities so that a portion of the portfolio matures each year. Cash from maturing bonds, if not needed for other purposes, is typically invested in bonds with longer maturities at the far end of the ladder. We regard the strategy as a good compromise for managing different types of risk.
LONG-TERM STABILITY OF PRINCIPAL
Net Asset Value History of A Shares
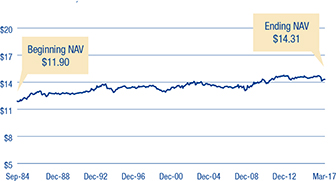

Lipper Best Short-Intermediate Municipal Debt Fund (Class I Shares)
10-year period ended 11/30/16, among 41 funds.
Lipper Fund Awards are granted annually to the fund in each Lipper classification that consistently delivered the strongest risk-adjusted performance (calculated with dividends reinvested and without sales charge). Fund Classification Awards are given for three-year, five-year, and ten-year periods. Thornburg did not win the award for any other time period. Past performance does not guarantee future results. From Thomson Reuters Lipper Awards, © 2017 Thomson Reuters. All rights reserved. Used by permission and protected by the Copyright Laws of the United States. The printing, copying, redistribution or retransmission of this Content without express permission is prohibited.
SECURITY CREDIT RATINGS
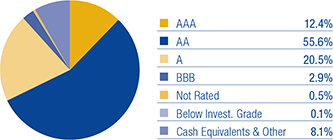
A bond credit rating assesses the financial ability of a debt issuer to make timely payments of principal and interest. Ratings of AAA (the highest), AA, A, and BBB are investment-grade quality. Ratings of BB, B, CCC, CC, C and D (the lowest) are considered below investment grade, speculative grade, or junk bonds. Credit quality ratings for Thornburg’s municipal portfolios used the highest rating available from either Standard & Poor’s or Moody’s Investors Service.
PORTFOLIO LADDER
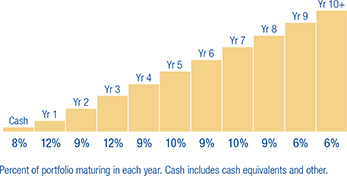
KEY PORTFOLIO ATTRIBUTES
| | | | |
Number of Bonds | | | 1,928 | |
| |
Effective Duration | | | 3.5 Yrs | |
| |
Average Maturity | | | 4.2 Yrs | |
There is no guarantee that the Fund will meet its investment objectives.
All data is subject to change. Charts may not add up to 100% due to rounding.
Semi-Annual Report 7
| | |
| Schedule of Investments | | |
| |
Thornburg Limited Term Municipal Fund | | March 31, 2017 (Unaudited) |
| | | | | | | | | | | | |
ISSUER-DESCRIPTION | | CREDIT RATING†
S&P/ MOODY’S | | | PRINCIPAL
AMOUNT | | | VALUE | |
ALABAMA — 1.16% | | | | | | | | | | | | |
Alabama Public School & College Authority, 5.00% due 6/1/2019 (Education System Capital Improvements) | | | AA/Aa1 | | | $ | 770,000 | | | $ | 834,256 | |
Alabama Public School & College Authority, 5.00% due 6/1/2019 (Education System Capital Improvements) | | | AA/Aa1 | | | | 4,840,000 | | | | 5,243,898 | |
Alabama Public School & College Authority, 5.00% due 6/1/2020 (Education System Capital Improvements) | | | AA/Aa1 | | | | 5,085,000 | | | | 5,658,893 | |
Alabama Public School & College Authority, 5.00% due 6/1/2021 (Education System Capital Improvements) | | | AA/Aa1 | | | | 5,335,000 | | | | 6,081,740 | |
Alabama Public School & College Authority, 5.00% due 6/1/2022 (Education System Capital Improvements) | | | AA/Aa1 | | | | 5,605,000 | | | | 6,505,835 | |
Alabama Public School & College Authority, 5.00% due 6/1/2023 (Education System Capital Improvements) | | | AA/Aa1 | | | | 735,000 | | | | 865,389 | |
Alabama State Board of Education, 3.00% due 5/1/2017 (Calhoun Community College) | | | NR/A1 | | | | 2,070,000 | | | | 2,073,188 | |
Alabama State Board of Education, 3.00% due 5/1/2018 (Calhoun Community College) | | | NR/A1 | | | | 2,130,000 | | | | 2,163,739 | |
Alabama State Board of Education, 4.00% due 5/1/2019 (Calhoun Community College) | | | NR/A1 | | | | 2,195,000 | | | | 2,295,136 | |
Alabama State Board of Education, 4.00% due 5/1/2020 (Calhoun Community College) | | | NR/A1 | | | | 1,000,000 | | | | 1,062,290 | |
Alabama State Board of Education, 4.00% due 5/1/2021 (Calhoun Community College) | | | NR/A1 | | | | 1,000,000 | | | | 1,074,110 | |
Alabama State Board of Education, 4.00% due 5/1/2022 (Calhoun Community College) | | | NR/A1 | | | | 1,230,000 | | | | 1,328,966 | |
City of Birmingham GO, 4.00% due 8/1/2017 (Government Services) | | | AA/Aa2 | | | | 2,760,000 | | | | 2,789,891 | |
City of Birmingham GO, 5.00% due 2/1/2018 (Government Services) | | | AA/Aa2 | | | | 2,000,000 | | | | 2,068,540 | |
City of Mobile GO, 5.00% due 2/15/2019 pre-refunded 2/15/2018 | | | NR/NR | | | | 1,205,000 | | | | 1,247,898 | |
City of Mobile GO, 5.00% due 2/15/2019 | | | AA-/Aa2 | | | | 795,000 | | | | 822,276 | |
City of Mobile Industrial Development Board, 1.85% due 6/1/2034 put 3/20/2017 (Alabama Power Company Barry Plant) | | | A-/A1 | | | | 20,000,000 | | | | 20,052,000 | |
East Alabama Health Care Authority GO, 5.00% due 9/1/2021 | | | A/NR | | | | 1,245,000 | | | | 1,397,413 | |
East Alabama Health Care Authority GO, 5.00% due 9/1/2022 | | | A/NR | | | | 800,000 | | | | 899,856 | |
Montgomery Waterworks and Sanitation, 5.00% due 9/1/2019 | | | AAA/Aa1 | | | | 3,375,000 | | | | 3,555,697 | |
UAB Medicine Finance Authority, 5.00% due 9/1/2025 (University Hospital) | | | AA-/A1 | | | | 1,670,000 | | | | 1,975,794 | |
UAB Medicine Finance Authority, 5.00% due 9/1/2026 (University Hospital) | | | AA-/A1 | | | | 4,940,000 | | | | 5,880,527 | |
UAB Medicine Finance Authority, 5.00% due 9/1/2027 (University Hospital) | | | AA-/A1 | | | | 2,305,000 | | | | 2,699,916 | |
University of Alabama at Birmingham Hospital, 5.25% due 9/1/2017 (ETM) | | | NR/A1 | | | | 2,500,000 | | | | 2,546,225 | |
University of Alabama at Birmingham Hospital, 5.00% due 9/1/2018 (ETM) | | | NR/A1 | | | | 1,700,000 | | | | 1,795,319 | |
| | | |
ALASKA — 0.47% | | | | | | | | | | | | |
Alaska Housing Finance Corp., 5.00% due 12/1/2018 pre-refunded 12/1/2017 (State Capital Project; Insured: Natl-Re) | | | AA-/Aa2 | | | | 1,610,000 | | | | 1,654,774 | |
Alaska Housing Finance Corp., 5.00% due 12/1/2018 (State Capital Project; Insured: Natl-Re) | | | AA+/Aa2 | | | | 390,000 | | | | 400,409 | |
Alaska Industrial Development & Export Authority GO, 5.00% due 4/1/2017 (DeLong Mountain Transportation Project) | | | AA+/Aa3 | | | | 3,000,000 | | | | 3,000,000 | |
Alaska Industrial Development & Export Authority GO, 5.00% due 4/1/2018 (DeLong Mountain Transportation Project) | | | AA+/Aa3 | | | | 2,455,000 | | | | 2,552,857 | |
City of Valdez, 5.00% due 1/1/2021 (BP Pipelines (Alaska), Inc. Project) | | | A-/A2 | | | | 12,000,000 | | | | 13,271,160 | |
City of Valdez, 5.00% due 1/1/2021 (BP Pipelines (Alaska), Inc. Project) | | | A-/A2 | | | | 3,700,000 | | | | 4,091,941 | |
North Slope Borough GO, 5.00% due 6/30/2017 (ETM) | | | AA-/Aa2 | | | | 5,700,000 | | | | 5,759,451 | |
North Slope Borough GO, 5.00% due 6/30/2017 | | | AA/Aa2 | | | | 3,100,000 | | | | 3,133,046 | |
| | | |
ARIZONA — 2.35% | | | | | | | | | | | | |
Arizona Board of Regents, 5.00% due 8/1/2020 (University of Arizona SPEED) | | | A+/Aa3 | | | | 575,000 | | | | 641,838 | |
Arizona Board of Regents, 5.00% due 8/1/2023 (University of Arizona SPEED) | | | A+/Aa3 | | | | 800,000 | | | | 939,184 | |
Arizona Board of Regents, 5.00% due 8/1/2024 (University of Arizona SPEED) | | | A+/Aa3 | | | | 550,000 | | | | 651,057 | |
Arizona Board of Regents COP, 5.00% due 7/1/2018 (Arizona State University; Insured: Natl-Re) | | | AA-/A1 | | | | 1,285,000 | | | | 1,297,477 | |
Arizona Board of Regents COP, 3.00% due 9/1/2018 (Northern Arizona University Projects) | | | A/A2 | | | | 1,000,000 | | | | 1,024,110 | |
Arizona Board of Regents COP, 5.00% due 7/1/2019 (Arizona State University; Insured: Natl-Re) | | | AA-/A1 | | | | 3,735,000 | | | | 3,771,939 | |
Arizona Board of Regents COP, 3.00% due 9/1/2019 (Northern Arizona University Projects) | | | A/A2 | | | | 2,525,000 | | | | 2,612,264 | |
Arizona Board of Regents COP, 5.00% due 9/1/2019 (Arizona State University) | | | AA-/A1 | | | | 1,085,000 | | | | 1,175,402 | |
Arizona Board of Regents COP, 5.00% due 9/1/2020 (Northern Arizona University Projects) | | | A/A2 | | | | 1,000,000 | | | | 1,100,650 | |
Arizona Board of Regents COP, 5.00% due 9/1/2020 (Arizona State University) | | | AA-/A1 | | | | 3,170,000 | | | | 3,508,683 | |
Arizona Board of Regents COP, 5.00% due 9/1/2021 (Arizona State University) | | | AA-/A1 | | | | 4,020,000 | | | | 4,536,892 | |
Arizona Board of Regents COP, 5.00% due 6/1/2022 (Arizona State University) | | | A+/Aa3 | | | | 6,080,000 | | | | 6,977,226 | |
Arizona Board of Regents COP, 5.00% due 9/1/2022 (Northern Arizona University Projects) | | | A/A2 | | | | 2,500,000 | | | | 2,846,400 | |
Arizona Board of Regents COP, 5.00% due 9/1/2022 (Arizona State University) | | | AA-/A1 | | | | 4,380,000 | | | | 4,997,317 | |
Arizona Board of Regents COP, 5.00% due 9/1/2023 (Northern Arizona University Projects) | | | A/A2 | | | | 3,325,000 | | | | 3,784,515 | |
Arizona Board of Regents COP, 5.00% due 9/1/2023 (Arizona State University) | | | AA-/A1 | | | | 5,580,000 | | | | 6,422,357 | |
Arizona HFA, 5.25% due 1/1/2018 (Banner Health) | | | AA-/NR | | | | 3,500,000 | | | | 3,612,420 | |
Arizona HFA, 5.00% due 7/1/2018 (Dignity Health) | | | A/A3 | | | | 1,470,000 | | | | 1,539,634 | |
Arizona HFA, 5.00% due 7/1/2019 (Dignity Health) | | | A/A3 | | | | 1,365,000 | | | | 1,477,558 | |
Arizona HFA, 5.00% due 7/1/2020 (Dignity Health) | | | A/A3 | | | | 1,290,000 | | | | 1,390,685 | |
Arizona HFA, 5.00% due 12/1/2022 (Scottsdale Lincoln Hospitals) | | | NR/A2 | | | | 1,600,000 | | | | 1,850,544 | |
Arizona HFA, 5.00% due 12/1/2024 (Scottsdale Lincoln Hospitals) | | | NR/A2 | | | | 1,500,000 | | | | 1,766,955 | |
Arizona School Facilities Board, 5.00% due 7/1/2017 (State School Land Trust; Insured: AMBAC) | | | NR/NR | | | | 2,965,000 | | | | 2,995,480 | |
Arizona School Facilities Board, 5.00% due 7/1/2018 (State School Land Trust; Insured: AMBAC) | | | NR/NR | | | | 4,540,000 | | | | 4,757,375 | |
Arizona School Facilities Board COP, 5.25% due 9/1/2023 pre-refunded 9/1/2018 (School Site and Building Projects) | | | AA-/Aa3 | | | | 1,315,000 | | | | 1,392,953 | |
Arizona Transportation Board, 5.00% due 7/1/2019 | | | AA+/Aa2 | | | | 3,510,000 | | | | 3,815,791 | |
Arizona Transportation Board, 5.00% due 7/1/2021 | | | AA+/Aa2 | | | | 7,465,000 | | | | 8,546,679 | |
Arizona Transportation Board, 5.00% due 7/1/2022 | | | AA+/Aa2 | | | | 5,000,000 | | | | 5,742,300 | |
City of Glendale IDA, 5.00% due 5/15/2017 (Midwestern University) | | | A/NR | | | | 1,440,000 | | | | 1,446,998 | |
8 Semi-Annual Report
| | |
| Schedule of Investments, Continued | | |
| |
Thornburg Limited Term Municipal Fund | | March 31, 2017 (Unaudited) |
| | | | | | | | | | | | |
ISSUER-DESCRIPTION | | CREDIT RATING†
S&P/ MOODY’S | | | PRINCIPAL
AMOUNT | | | VALUE | |
City of Phoenix Civic Improvement Corp., 5.00% due 7/1/2022 | | | AA+/Aa3 | | | $ | 1,250,000 | | | $ | 1,448,500 | |
City of Phoenix Civic Improvement Corp., 5.00% due 7/1/2023 | | | AA+/Aa3 | | | | 1,830,000 | | | | 2,151,037 | |
City of Phoenix Civic Improvement Corp., 5.00% due 7/1/2024 | | | AA+/Aa3 | | | | 2,000,000 | | | | 2,380,720 | |
City of Phoenix Civic Improvement Corp., 5.00% due 7/1/2025 | | | AA+/Aa3 | | | | 3,500,000 | | | | 4,212,215 | |
City of Tucson, 5.00% due 7/1/2022 (Street and Highway Projects) | | | AA+/A1 | | | | 2,135,000 | | | | 2,453,265 | |
City of Yuma Municipal Property Corp., 5.00% due 7/1/2018 pre-refunded 7/1/2017 (Water and Wastewater System; Insured: Syncora) | | | A+/A1 | | | | 2,130,000 | | | | 2,152,386 | |
Pima County, 4.50% due 7/1/2017 (Ina & Roger Road Wastewater Reclamation Facilities; Insured: AGM) | | | AA/A2 | | | | 5,040,000 | | | | 5,087,578 | |
Pima County, 5.00% due 7/1/2017 (Ina & Roger Road Wastewater Reclamation Facilities) | | | AA/NR | | | | 2,750,000 | | | | 2,779,370 | |
Pima County, 3.00% due 7/1/2018 (Ina & Roger Road Wastewater Reclamation Facilities) | | | AA/NR | | | | 500,000 | | | | 512,890 | |
Pima County, 5.00% due 7/1/2018 (Ina & Roger Road Wastewater Reclamation Facilities; Insured: AGM) | | | AA/A2 | | | | 5,000,000 | | | | 5,253,550 | |
Pima County, 5.00% due 7/1/2018 (Ina & Roger Road Wastewater Reclamation Facilities) | | | AA/NR | | | | 2,000,000 | | | | 2,101,420 | |
Pima County, 5.00% due 7/1/2018 (Ina & Roger Road Wastewater Reclamation Facilities) | | | AA/NR | | | | 700,000 | | | | 735,497 | |
Pima County, 5.00% due 7/1/2020 (Ina & Roger Road Wastewater Reclamation Facilities) | | | AA/NR | | | | 500,000 | | | | 558,845 | |
Pima County, 3.00% due 7/1/2021 (Ina & Roger Road Wastewater Reclamation Facilities) | | | AA/NR | | | | 1,200,000 | | | | 1,273,320 | |
Pima County, 5.00% due 7/1/2021 (Ina & Roger Road Wastewater Reclamation Facilities) | | | AA/NR | | | | 400,000 | | | | 458,316 | |
Pima County, 3.00% due 7/1/2022 (Ina & Roger Road Wastewater Reclamation Facilities) | | | AA/NR | | | | 1,325,000 | | | | 1,409,456 | |
Pima County, 5.00% due 7/1/2022 (Ina & Roger Road Wastewater Reclamation Facilities) | | | AA/NR | | | | 500,000 | | | | 583,490 | |
Pima County COP, 5.00% due 12/1/2017 (Sewer System & Fleet Services Facilities Expansion) | | | A+/NR | | | | 1,395,000 | | | | 1,433,321 | |
Pima County COP, 5.00% due 12/1/2018 (Sewer System & Fleet Services Facilities Expansion) | | | A+/NR | | | | 2,700,000 | | | | 2,873,151 | |
Pima County COP, 5.00% due 12/1/2019 (Sewer System & Fleet Services Facilities Expansion) | | | A+/NR | | | | 1,500,000 | | | | 1,639,095 | |
Pima County COP, 5.00% due 12/1/2020 (Sewer System & Fleet Services Facilities Expansion) | | | A+/NR | | | | 765,000 | | | | 853,579 | |
Pima County COP, 5.00% due 12/1/2021 (Sewer System & Fleet Services Facilities Expansion) | | | A+/NR | | | | 1,220,000 | | | | 1,382,150 | |
Pima County COP, 5.00% due 12/1/2022 (Sewer System & Fleet Services Facilities Expansion) | | | A+/NR | | | | 1,275,000 | | | | 1,455,719 | |
Pinal County, 5.00% due 8/1/2019 (Detention and Training Facilities) | | | AA-/NR | | | | 1,115,000 | | | | 1,208,459 | |
Pinal County, 5.00% due 8/1/2021 (Detention and Training Facilities) | | | AA-/NR | | | | 1,775,000 | | | | 2,012,548 | |
Pinal County, 5.00% due 8/1/2023 (Detention and Training Facilities) | | | AA-/NR | | | | 1,100,000 | | | | 1,281,016 | |
Pinal County, 5.00% due 8/1/2024 (Detention and Training Facilities) | | | AA-/NR | | | | 700,000 | | | | 823,963 | |
Pinal County, 5.00% due 8/1/2025 (Hunt Highway (Phases III-V), Ironwood Drive, Public Safety Radio & Court Buildings) | | | AA-/NR | | | | 3,000,000 | | | | 3,524,130 | |
Pinal County, 5.00% due 8/1/2025 (Detention and Training Facilities) | | | AA-/NR | | | | 1,500,000 | | | | 1,778,205 | |
Scottsdale IDA, 5.00% due 9/1/2019 (Scottsdale Healthcare) | | | NR/A2 | | | | 6,885,000 | | | | 7,256,308 | |
State of Arizona Department of Administration, 5.00% due 7/1/2018 (State Lottery; Insured: AGM) | | | AA/A1 | | | | 8,370,000 | | | | 8,776,112 | |
State of Arizona Department of Administration, 5.00% due 7/1/2020 (State Lottery; Insured: AGM) | | | AA/A1 | | | | 8,705,000 | | | | 9,664,813 | |
| | | |
ARKANSAS — 0.28% | | | | | | | | | | | | |
Board of Trustees of the University of Arkansas, 3.00% due 11/1/2023 (Fayetteville Campus Athletic Facilities) | | | NR/Aa2 | | | | 615,000 | | | | 647,041 | |
City of Fort Smith, 3.50% due 10/1/2017 (Water and Sewer System Construction; Insured: AGM) | | | AA/NR | | | | 1,930,000 | | | | 1,954,241 | |
City of Fort Smith, 4.00% due 10/1/2018 (Water and Sewer System Construction; Insured: AGM) | | | AA/NR | | | | 1,000,000 | | | | 1,041,570 | |
City of Fort Smith, 4.00% due 10/1/2019 (Water and Sewer System Construction; Insured: AGM) | | | AA/NR | | | | 1,670,000 | | | | 1,773,540 | |
Jefferson County, 4.00% due 6/1/2017 (Jefferson Regional Medical Center; Insured: AGM) | | | AA/NR | | | | 1,375,000 | | | | 1,381,930 | |
Jefferson County, 1.55% due 10/1/2017 (Entergy Arkansas, Inc. Project) | | | A/A2 | | | | 10,000,000 | | | | 10,024,700 | |
Jefferson County, 4.50% due 6/1/2018 (Jefferson Regional Medical Center; Insured: AGM) | | | AA/NR | | | | 1,495,000 | | | | 1,551,287 | |
Jefferson County, 4.50% due 6/1/2019 (Jefferson Regional Medical Center; Insured: AGM) | | | AA/NR | | | | 1,580,000 | | | | 1,682,036 | |
| | | |
CALIFORNIA — 8.88% | | | | | | | | | | | | |
Alameda County COP, 5.00% due 12/1/2017 (Santa Rita Jail; Insured: AMBAC) | | | AA/NR | | | | 1,220,000 | | | | 1,253,172 | |
Alameda County Joint Powers Authority, 5.00% due 12/1/2021 (Alameda County Medical Center Highland Hospital) | | | AA/Aa1 | | | | 1,000,000 | | | | 1,154,130 | |
Alameda County Joint Powers Authority, 5.00% due 12/1/2022 (Alameda County Medical Center Highland Hospital) | | | AA/Aa1 | | | | 2,000,000 | | | | 2,344,920 | |
Alameda County Joint Powers Authority, 5.00% due 12/1/2023 (Alameda County Medical Center Highland Hospital) | | | AA/Aa1 | | | | 3,200,000 | | | | 3,796,640 | |
Anaheim Public Financing Authority, 0% due 9/1/2022 (Public Improvements; Insured: AGM) | | | AA/A2 | | | | 3,250,000 | | | | 2,813,037 | |
Brentwood Infrastructure Financing Authority, 5.00% due 11/1/2017 (Redevelopment Agency of the City of Brentwood; Insured: AGM) | | | AA/NR | | | | 965,000 | | | | 987,195 | |
Brentwood Infrastructure Financing Authority, 5.25% due 11/1/2018 (Redevelopment Agency of the City of Brentwood: Insured: AGM) | | | AA/NR | | | | 1,020,000 | | | | 1,084,189 | |
Brentwood Infrastructure Financing Authority, 5.25% due 11/1/2019 (Redevelopment Agency of the City of Brentwood; Insured: AGM) | | | AA/NR | | | | 725,000 | | | | 794,578 | |
Cabrillo USD GO, 0% due 8/1/2021 (Educational Facilities; Insured: AMBAC) | | | NR/NR | | | | 1,000,000 | | | | 910,830 | |
California Educational Facilities Authority, 5.00% due 4/1/2017 (Pitzer College) | | | NR/A2 | | | | 1,460,000 | | | | 1,460,000 | |
California Educational Facilities Authority, 5.00% due 4/1/2021 (Chapman University) | | | NR/A2 | | | | 4,870,000 | | | | 5,475,925 | |
California HFFA, 5.50% due 2/1/2019 (Community Developmental Disabilities Program; Insured: California Mtg Insurance) | | | AA-/NR | | | | 2,865,000 | | | | 3,087,668 | |
California HFFA, 5.75% due 2/1/2020 (Community Developmental Disabilities Program; Insured: California Mtg Insurance) | | | AA-/NR | | | | 1,975,000 | | | | 2,213,857 | |
California HFFA, 5.00% due 3/1/2020 (Dignity Health) | | | A/A3 | | | | 4,400,000 | | | | 4,844,048 | |
California HFFA, 5.75% due 2/1/2021 (Community Developmental Disabilities Program; Insured: California Mtg Insurance) | | | AA-/NR | | | | 1,695,000 | | | | 1,960,149 | |
California HFFA, 5.00% due 3/1/2021 (Dignity Health) | | | A/A3 | | | | 3,450,000 | | | | 3,891,772 | |
California HFFA, 5.25% due 3/1/2022 (Dignity Health) | | | A/A3 | | | | 7,020,000 | | | | 7,919,683 | |
California HFFA, 5.00% due 7/1/2043 put 10/15/2020 (St. Joseph Health System) | | | AA-/Aa3 | | | | 5,000,000 | | | | 5,576,700 | |
California School Cash Reserve Program Authority, 2.00% due 6/30/2017 | | | SP-1+/NR | | | | 6,000,000 | | | | 6,016,260 | |
Semi-Annual Report 9
| | |
| Schedule of Investments, Continued | | |
| |
Thornburg Limited Term Municipal Fund | | March 31, 2017 (Unaudited) |
| | | | | | | | | | |
ISSUER-DESCRIPTION | | CREDIT RATING†
S&P/ MOODY’S | | PRINCIPAL
AMOUNT | | | VALUE | |
California State Economic Recovery GO, 5.00% due 7/1/2020 pre-refunded 7/1/2019 | | AA+/Aaa | | $ | 4,200,000 | | | $ | 4,564,938 | |
California State Housing Finance Agency, 2.50% due 12/1/2017 (One Santa Fe Apartments Multi-Family Housing; Collateralized: GNMA) | | NR/Aa1 | | | 595,000 | | | | 595,678 | |
California State Public Works Board, 5.00% due 9/1/2017 (Regents of University of California; Insured: Natl-Re) (ETM) | | AA+/Aaa | | | 3,000,000 | | | | 3,053,040 | |
California State Public Works Board, 5.00% due 11/1/2017 (California State University) (ETM) | | A+/Aaa | | | 3,000,000 | | | | 3,074,040 | |
California State Public Works Board, 5.00% due 11/1/2018 (California State University) (ETM) | | A+/Aaa | | | 2,700,000 | | | | 2,870,370 | |
California State Public Works Board, 5.00% due 4/1/2020 (California School for the Deaf Riverside Campus) | | A+/A1 | | | 1,585,000 | | | | 1,756,513 | |
California State Public Works Board, 5.00% due 6/1/2020 (Yuba City Courthouse) | | A+/A1 | | | 1,675,000 | | | | 1,864,593 | |
California State Public Works Board, 5.00% due 6/1/2020 (Coalinga State Hospital) | | A+/A1 | | | 5,685,000 | | | | 6,328,485 | |
California State Public Works Board, 5.00% due 10/1/2020 (California State University) | | A+/A1 | | | 1,000,000 | | | | 1,122,720 | |
California State Public Works Board, 5.00% due 11/1/2020 (Various Capital Projects) | | A+/A1 | | | 1,500,000 | | | | 1,687,485 | |
California State Public Works Board, 5.00% due 4/1/2021 (California School for the Deaf Riverside Campus) | | A+/A1 | | | 890,000 | | | | 1,010,880 | |
California State Public Works Board, 5.00% due 6/1/2021 (Yuba City Courthouse) | | A+/A1 | | | 1,250,000 | | | | 1,425,138 | |
California State Public Works Board, 5.00% due 6/1/2021 (Coalinga State Hospital) | | A+/A1 | | | 5,000,000 | | | | 5,700,550 | |
California State Public Works Board, 5.00% due 10/1/2021 (Various Capital Projects) | | A+/A1 | | | 1,000,000 | | | | 1,147,510 | |
California State Public Works Board, 5.00% due 11/1/2021 (Various Capital Projects) | | A+/A1 | | | 1,750,000 | | | | 2,011,030 | |
California State Public Works Board, 5.00% due 11/1/2021 (Laboratory Facility and San Diego Courthouse) | | A+/A1 | | | 750,000 | | | | 861,870 | |
California State Public Works Board, 5.00% due 4/1/2022 (California School for the Deaf Riverside Campus) | | A+/A1 | | | 500,000 | | | | 577,550 | |
California State Public Works Board, 5.00% due 6/1/2022 (Coalinga State Hospital) | | A+/A1 | | | 11,555,000 | | | | 13,388,432 | |
California State Public Works Board, 5.00% due 11/1/2022 (Laboratory Facility and San Diego Courthouse) | | A+/A1 | | | 10,075,000 | | | | 11,759,540 | |
California State Public Works Board, 5.00% due 6/1/2023 (Yuba City Courthouse) | | A+/A1 | | | 1,900,000 | | | | 2,230,828 | |
California State Public Works Board, 5.00% due 11/1/2024 (Various Capital Projects) | | A+/A1 | | | 4,500,000 | | | | 5,380,065 | |
California State Public Works Board, 5.00% due 11/1/2024 (Laboratory Facility and San Diego Courthouse) | | A+/A1 | | | 2,050,000 | | | | 2,410,001 | |
California State Public Works Board, 5.00% due 11/1/2025 (Various Capital Projects) | | A+/A1 | | | 12,145,000 | | | | 14,643,469 | |
California State Public Works Board, 5.00% due 11/1/2026 (Various Capital Projects) | | A+/A1 | | | 12,080,000 | | | | 14,625,618 | |
California Statewide Communities Development Authority, 5.00% due 4/1/2019 (Kaiser Foundation Hospitals) | | AA-/NR | | | 27,000,000 | | | | 29,071,980 | |
California Statewide Communities Development Authority, 5.00% due 7/1/2020 pre-refunded 1/1/2019 (Aspire Public Schools; LOC: PCSD Guaranty Pool I, LLC) | | NR/NR | | | 1,280,000 | | | | 1,331,021 | |
Castaic Lake Water Agency COP, 0% due 8/1/2023 (Water System Improvement; Insured: AMBAC) | | AA+/NR | | | 10,125,000 | | | | 8,614,856 | |
Castaic USD GO, 0% due 5/1/2018 (Insured: Natl-Re) | | AA-/NR | | | 1,300,000 | | | | 1,247,207 | |
Central Valley Financing Authority, 5.00% due 7/1/2017 (Carson Ice) | | AA-/Aa3 | | | 600,000 | | | | 606,348 | |
Central Valley Financing Authority, 5.00% due 7/1/2019 (Carson Ice) | | AA-/Aa3 | | | 1,750,000 | | | | 1,896,335 | |
Chula Vista COP, 5.25% due 3/1/2018 (ETM) | | AA-/NR | | | 1,170,000 | | | | 1,216,940 | |
Chula Vista COP, 5.25% due 3/1/2019 (ETM) | | AA-/NR | | | 1,235,000 | | | | 1,333,244 | |
City of Los Angeles GO, 3.00% due 6/29/2017 (Cash Flow Management) | | SP-1+/Mig1 | | | 48,800,000 | | | | 49,039,120 | |
City of Redding COP, 5.00% due 6/1/2020 pre-refunded 6/1/2018 (City Electric System; Insured: AGM) | | NR/A2 | | | 2,290,000 | | | | 2,398,363 | |
City of Redding COP, 5.00% due 6/1/2020 (City Electric System; Insured: AGM) | | NR/A2 | | | 1,665,000 | | | | 1,742,073 | |
Clovis USD GO, 0% due 8/1/2019 (Insured: Natl-Re) | | AA/A3 | | | 2,685,000 | | | | 2,592,072 | |
Community Facilities District No. 86-1 of the Irvine USD, 5.25% due 9/1/2018 (Educational Facilities; Insured: AGM) | | AA/NR | | | 3,000,000 | | | | 3,170,250 | |
Community Facilities District No. 86-1 of the Irvine USD, 5.25% due 9/1/2019 (Educational Facilities; Insured: AGM) | | AA/NR | | | 3,000,000 | | | | 3,273,420 | |
County of Los Angeles COP, 0% due 9/1/2017 (Disney Parking Garage and Walt Disney Concert Hall; Insured: AMBAC) | | AA/A1 | | | 1,200,000 | | | | 1,195,500 | |
County of Los Angeles Redevelopment Refunding Authority, 5.00% due 6/1/2020 (Bunker Hill Project) | | AA/NR | | | 1,730,000 | | | | 1,915,594 | |
County of Los Angeles Redevelopment Refunding Authority, 5.00% due 12/1/2020 (Bunker Hill Project) | | AA/NR | | | 3,805,000 | | | | 4,266,699 | |
County of Los Angeles Redevelopment Refunding Authority, 5.00% due 6/1/2021 (Bunker Hill Project) | | AA/NR | | | 360,000 | | | | 407,815 | |
County of Los Angeles Redevelopment Refunding Authority, 5.00% due 12/1/2021 (Bunker Hill Project) | | AA/NR | | | 5,805,000 | | | | 6,637,321 | |
County of Los Angeles Redevelopment Refunding Authority, 5.00% due 6/1/2022 (Bunker Hill Project) | | AA/NR | | | 1,645,000 | | | | 1,887,391 | |
County of Los Angeles Redevelopment Refunding Authority, 5.00% due 12/1/2022 (Bunker Hill Project) | | AA/NR | | | 5,000,000 | | | | 5,777,900 | |
County of Los Angeles Redevelopment Refunding Authority, 5.00% due 6/1/2023 (Bunker Hill Project) | | AA/NR | | | 450,000 | | | | 523,175 | |
County of Los Angeles Redevelopment Refunding Authority, 5.00% due 12/1/2023 (Bunker Hill Project) | | AA/NR | | | 6,875,000 | | | | 8,044,506 | |
County of Los Angeles Redevelopment Refunding Authority, 5.00% due 6/1/2024 (Bunker Hill Project) | | AA/NR | | | 4,775,000 | | | | 5,594,676 | |
County of Los Angeles Redevelopment Refunding Authority, 5.00% due 12/1/2024 (Bunker Hill Project) | | AA/NR | | | 5,150,000 | | | | 6,066,545 | |
County of Monterey COP, 5.00% due 8/1/2018 (2009 Refinancing Project; Insured: AGM) | | AA/Aa3 | | | 2,260,000 | | | | 2,378,944 | |
County of Riverside, 3.00% due 10/11/2017 | | NR/Mig1 | | | 4,050,000 | | | | 4,095,603 | |
County of Solano COP, 5.00% due 11/15/2017 (1999 Capital Improvement Program) | | AA/Aa3 | | | 1,580,000 | | | | 1,618,663 | |
County of Ventura COP, 5.25% due 8/15/2017 (Healthcare Clinic Facilities) (ETM) | | AA+/NR | | | 1,635,000 | | | | 1,662,681 | |
Escondido Union High School District GO, 0% due 11/1/2020 (Insured: Natl-Re) | | AA-/A3 | | | 2,655,000 | | | | 2,486,885 | |
Irvine USD Community Facilities District No. 86-1, 5.25% due 9/1/2017 (Acquisition of Public Facilities; Insured: AGM) | | AA/NR | | | 5,000,000 | | | | 5,088,150 | |
Los Angeles Convention and Exhibition Center Authority, 5.00% due 8/15/2018 (ETM) | | A+/NR | | | 2,295,000 | | | | 2,422,051 | |
Los Angeles County Public Works Financing Authority, 5.00% due 8/1/2018 (Multiple Capital Projects) | | AA/Aa3 | | | 4,000,000 | | | | 4,216,000 | |
Los Angeles County Public Works Financing Authority, 5.00% due 8/1/2019 (Multiple Capital Projects) | | AA/Aa3 | | | 17,935,000 | | | | 19,520,633 | |
Los Angeles USD COP, 5.00% due 10/1/2017 (Educational Facilities and Information Technology Infrastructure; Insured: AMBAC) | | A+/A1 | | | 2,445,000 | | | | 2,495,514 | |
Los Angeles USD COP, 5.50% due 12/1/2018 (Educational Facilities and Information Technology Infrastructure) | | A+/A1 | | | 4,600,000 | | | | 4,936,030 | |
Los Angeles USD COP, 5.50% due 12/1/2019 (Educational Facilities and Information Technology Infrastructure) | | A+/A1 | | | 7,040,000 | | | | 7,815,878 | |
Los Angeles USD GO, 5.00% due 7/1/2018 pre-refunded 7/1/2017 (Educational Facilities and Information Technology Infrastructure; Insured: AGM) | | AA/Aa2 | | | 4,000,000 | | | | 4,042,240 | |
10 Semi-Annual Report
| | |
| Schedule of Investments, Continued | | |
| |
Thornburg Limited Term Municipal Fund | | March 31, 2017 (Unaudited) |
| | | | | | | | | | | | |
ISSUER-DESCRIPTION | | CREDIT RATING†
S&P/ MOODY’S | | | PRINCIPAL
AMOUNT | | | VALUE | |
Los Angeles USD GO, 5.00% due 7/1/2022 (Educational Facilities and Information Technology Infrastructure) | | | AA-/Aa2 | | | $ | 12,260,000 | | | $ | 14,340,890 | |
Los Angeles USD GO, 5.00% due 7/1/2023 (Educational Facilities and Information Technology Infrastructure) | | | AA-/Aa2 | | | | 11,950,000 | | | | 14,220,380 | |
Los Angeles USD GO, 5.00% due 7/1/2024 (Educational Facilities and Information Technology Infrastructure) | | | AA-/Aa2 | | | | 10,640,000 | | | | 12,831,946 | |
Metropolitan Water District of Southern California, 1.07% due 7/1/2030 | | | AAA/Aa1 | | | | 8,500,000 | | | | 8,500,000 | |
Metropolitan Water District of Southern California, 1.07% due 7/1/2036 | | | A-1+/Aa1 | | | | 12,000,000 | | | | 12,000,000 | |
Mount San Antonio Community College GO, 0% due 8/1/2017 (Insured: Natl-Re) (ETM) | | | AA/Aa1 | | | | 5,000,000 | | | | 4,986,100 | |
Needles USD GO, 0% due 8/1/2023 | | | AA-/A3 | | | | 1,005,000 | | | | 860,210 | |
North City West School Facilities Financing Authority, 5.00% due 9/1/2023 (Carmel Valley Educational Facilities; Insured: AGM) | | | AA/NR | | | | 4,545,000 | | | | 5,276,200 | |
Northern California Power Agency, 5.00% due 7/1/2017 (Hydroelectric Project) | | | A+/A1 | | | | 1,000,000 | | | | 1,010,580 | |
Northern California Power Agency, 5.00% due 6/1/2018 (Lodi Energy Center) | | | A-/A2 | | | | 4,480,000 | | | | 4,689,126 | |
Northern California Power Agency, 5.00% due 7/1/2019 (Hydroelectric Project) | | | A+/A1 | | | | 1,000,000 | | | | 1,084,550 | |
Northern California Power Agency, 5.00% due 7/1/2020 (Hydroelectric Project) | | | A+/A1 | | | | 1,325,000 | | | | 1,434,260 | |
Oakland State Building Authority, 5.00% due 12/1/2018 (Elihu M. Harris State Office Building) | | | A+/A1 | | | | 7,240,000 | | | | 7,715,451 | |
Oakland USD GO, 5.00% due 8/1/2022 (Construction & Modernization Project; Insured: AGM) | | | AA/Aa3 | | | | 2,240,000 | | | | 2,621,875 | |
Oakland USD GO, 5.00% due 8/1/2023 (Construction & Modernization Project; Insured: AGM) | | | AA/Aa3 | | | | 1,290,000 | | | | 1,534,532 | |
Oakland USD GO, 5.00% due 8/1/2024 (Construction & Modernization Project; Insured: AGM) | | | AA/Aa3 | | | | 1,500,000 | | | | 1,807,755 | |
Oakland USD GO, 5.00% due 8/1/2025 (Construction & Modernization Project; Insured: AGM) | | | AA/Aa3 | | | | 1,750,000 | | | | 2,128,875 | |
Orange County Public Financing Authority, 5.00% due 7/1/2017 (Insured: Natl-Re) | | | AA/Aa2 | | | | 1,245,000 | | | | 1,257,886 | |
Palo Alto USD GO, 0% due 8/1/2019 | | | AAA/Aaa | | | | 1,000,000 | | | | 968,980 | |
Palomar Community College District GO, 0% due 8/1/2021 | | | AA/Aa1 | | | | 2,560,000 | | | | 2,371,072 | |
Rocklin USD GO, 0% due 8/1/2022 (Insured: Natl-Re) | | | AA-/Aa2 | | | | 3,910,000 | | | | 3,485,335 | |
Sacramento City Financing Authority, 0% due 12/1/2019 (Merged Downtown & Oak Park; Insured: Natl-Re) | | | AA-/A3 | | | | 2,920,000 | | | | 2,781,884 | |
Sacramento City Financing Authority, 0% due 12/1/2021 (Merged Downtown & Oak Park; Insured: Natl-Re) | | | AA-/A3 | | | | 1,600,000 | | | | 1,443,008 | |
Sacramento City USD GO, 5.00% due 7/1/2021 (Educational Facilities Improvements) | | | A+/Aa3 | | | | 3,265,000 | | | | 3,707,767 | |
Sacramento Cogeneration Authority, 5.00% due 7/1/2017 (Procter & Gamble) | | | AA-/Aa3 | | | | 750,000 | | | | 758,070 | |
San Diego Convention Center Expansion Financing Authority, 5.00% due 4/15/2020 | | | AA-/NR | | | | 4,000,000 | | | | 4,422,400 | |
San Diego Convention Center Expansion Financing Authority, 5.00% due 4/15/2021 | | | AA-/NR | | | | 3,000,000 | | | | 3,399,870 | |
San Diego Convention Center Expansion Financing Authority, 5.00% due 4/15/2022 | | | AA-/NR | | | | 8,000,000 | | | | 9,211,760 | |
San Diego USD GO, 5.50% due 7/1/2020 (Educational System Capital Projects; Insured: Natl-Re) | | | AA-/Aa2 | | | | 10,000,000 | | | | 11,352,700 | |
San Francisco Building Authority, 5.00% due 12/1/2018 (San Francisco Civic Center Complex) | | | A+/A1 | | | | 13,130,000 | | | | 13,992,247 | |
San Joaquin Delta Community College District GO, 0% due 8/1/2019 (Insured: AGM) | | | AA/Aa2 | | | | 7,600,000 | | | | 7,099,616 | |
Santa Ana Financing Authority, 6.25% due 7/1/2018 (Police Administration & Holding Facility; Insured: Natl-Re) (ETM) | | | AA-/A3 | | | | 2,017,500 | | | | 2,150,272 | |
Santa Ana Financing Authority, 6.25% due 7/1/2018 (Police Administration & Holding Facility; Insured: Natl-Re) | | | AA-/A3 | | | | 2,017,500 | | | | 2,141,132 | |
Santa Ana USD GO, 0% due 8/1/2019 (Insured: Natl-Re) | | | AA-/A3 | | | | 3,425,000 | | | | 3,306,461 | |
Santa Fe Springs Community Development Commission, 0% due 9/1/2024 (Consolidated Redevelopment Project; Insured: Natl-Re) | | | AA-/A3 | | | | 7,000,000 | | | | 5,543,510 | |
South San Francisco USD GO, 4.00% due 6/15/2018 (Educational Facilities) (ETM) | | | SP-1+/NR | | | | 5,130,000 | | | | 5,316,424 | |
Southeast Resource Recovery Facilities Authority, 5.25% due 12/1/2017 (Insured: AMBAC) | | | AA-/Aa3 | | | | 2,000,000 | | | | 2,000,000 | |
State of California Economic Recovery GO, 5.00% due 7/1/2018 (ETM) | | | AA+/Aaa | | | | 3,105,000 | | | | 3,262,051 | |
State of California Economic Recovery GO, 5.00% due 7/1/2018 (ETM) | | | AA+/Aaa | | | | 895,000 | | | | 940,269 | |
State of California GO, 4.75% due 4/1/2018 (Various Purposes) | | | AA-/Aa3 | | | | 1,250,000 | | | | 1,298,375 | |
State of California GO, 5.00% due 9/1/2020 (Various Purposes) | | | AA-/Aa3 | | | | 10,000,000 | | | | 11,220,400 | |
State of California GO, 5.00% due 9/1/2021 (Various Purposes) | | | AA-/Aa3 | | | | 5,000,000 | | | | 5,736,500 | |
State of California GO, 5.00% due 8/1/2026 (Various Purposes) | | | AA-/Aa3 | | | | 17,850,000 | | | | 21,629,380 | |
State of California GO, 5.00% due 8/1/2027 (Various Purposes) | | | AA-/Aa3 | | | | 12,445,000 | | | | 14,916,204 | |
Tuolumne Wind Project Authority, 5.00% due 1/1/2018 | | | AA-/A2 | | | | 2,000,000 | | | | 2,062,660 | |
Tuolumne Wind Project Authority, 5.00% due 1/1/2019 | | | AA-/A2 | | | | 2,000,000 | | | | 2,138,400 | |
Tustin Community Redevelopment Agency, 4.00% due 9/1/2017 (Tustin Redevelopment) (ETM) | | | A/NR | | | | 935,000 | | | | 947,492 | |
Tustin Community Redevelopment Agency, 4.00% due 9/1/2019 pre-refunded 9/1/2018 (Tustin Redevelopment) | | | A/NR | | | | 1,010,000 | | | | 1,072,176 | |
Tustin Community Redevelopment Agency, 4.00% due 9/1/2020 pre-refunded 9/1/2018 (Tustin Redevelopment) | | | A/NR | | | | 1,050,000 | | | | 1,114,638 | |
West Contra Costa USD GO, 0% due 8/1/2022 (Educational Facilities; Insured: AGM) | | | AA/Aa3 | | | | 4,000,000 | | | | 3,546,800 | |
West Covina Redevelopment Agency, 6.00% due 9/1/2022 (Fashion Plaza) | | | NR/NR | | | | 6,075,000 | | | | 6,855,334 | |
| | | |
COLORADO — 0.89% | | | | | | | | | | | | |
City & County of Denver, 5.00% due 11/15/2017 (Airport System Capital Improvements; Insured: Natl-Re) | | | AA-/A1 | | | | 1,000,000 | | | | 1,025,310 | |
City & County of Denver COP, 5.00% due 12/1/2020 (Buell Theatre Property) | | | AA+/Aa2 | | | | 3,065,000 | | | | 3,440,003 | |
City & County of Denver COP, 5.00% due 12/1/2021 (Buell Theatre Property) | | | AA+/Aa2 | | | | 3,825,000 | | | | 4,381,117 | |
City & County of Denver COP, 5.00% due 12/1/2023 (Buell Theatre Property) | | | AA+/Aa2 | | | | 1,720,000 | | | | 2,027,656 | |
City & County of Denver School District No. 1 COP, 4.00% due 12/15/2019 (Eastbridge Elementary and Conservatory Green K-8 Schools) | | | NR/Aa3 | | | | 400,000 | | | | 425,848 | |
City & County of Denver School District No. 1 COP, 4.00% due 12/15/2020 (Eastbridge Elementary and Conservatory Green K-8 Schools) | | | NR/Aa3 | | | | 600,000 | | | | 646,770 | |
City & County of Denver School District No. 1 COP, 5.00% due 12/15/2021 (Eastbridge Elementary and Conservatory Green K-8 Schools) | | | NR/Aa3 | | | | 1,000,000 | | | | 1,132,560 | |
City & County of Denver School District No. 1 COP, 5.00% due 12/15/2022 (Eastbridge Elementary and Conservatory Green K-8 Schools) | | | NR/Aa3 | | | | 1,030,000 | | | | 1,179,505 | |
Semi-Annual Report 11
| | |
| Schedule of Investments, Continued | | |
| |
Thornburg Limited Term Municipal Fund | | March 31, 2017 (Unaudited) |
| | | | | | | | | | | | |
ISSUER-DESCRIPTION | | CREDIT RATING†
S&P/ MOODY’S | | | PRINCIPAL
AMOUNT | | | VALUE | |
City & County of Denver School District No. 1 COP, 5.00% due 12/15/2023 (Eastbridge Elementary and Conservatory Green K-8 Schools) | | | NR/Aa3 | | | $ | 1,180,000 | | | $ | 1,366,263 | |
City of Longmont, 6.00% due 5/15/2019 | | | AA+/NR | | | | 3,215,000 | | | | 3,516,245 | |
Colorado Department of Corrections COP, 5.00% due 3/1/2018 (Colorado Penitentiary II) (ETM) | | | AA-/Aa2 | | | | 1,590,000 | | | | 1,649,227 | |
Colorado Educational & Cultural Facilities Authority, 5.00% due 6/1/2018 (National Conference of State Legislatures) | | | A/A3 | | | | 1,625,000 | | | | 1,665,706 | |
Colorado Educational & Cultural Facilities Authority, 5.00% due 6/1/2020 (National Conference of State Legislatures) | | | A/A3 | | | | 1,805,000 | | | | 1,958,244 | |
Colorado Educational & Cultural Facilities Authority, 5.00% due 6/1/2021 (National Conference of State Legislatures) | | | A/A3 | | | | 1,000,000 | | | | 1,101,430 | |
Colorado HFA, 5.25% due 5/15/2017 (Northern Colorado Medical Center; Insured: AGM) (ETM) | | | AA/NR | | | | 1,185,000 | | | | 1,191,541 | |
Colorado HFA, 5.00% due 7/1/2017 (Catholic Health Initiatives) | | | BBB+/Baa1 | | | | 175,000 | | | | 176,460 | |
Colorado HFA, 5.25% due 5/15/2019 (Northern Colorado Medical Center; Insured: AGM) (ETM) | | | AA/NR | | | | 2,225,000 | | | | 2,416,083 | |
Colorado HFA, 5.00% due 5/15/2025 (Northern Colorado Medical Center) | | | A+/NR | | | | 565,000 | | | | 662,931 | |
Colorado HFA, 5.00% due 5/15/2026 (Northern Colorado Medical Center) | | | A+/NR | | | | 740,000 | | | | 874,192 | |
El Paso County COP, 4.00% due 12/1/2021 (Pikes Peak Regional Development Center) | | | AA/Aa2 | | | | 1,000,000 | | | | 1,086,640 | |
El Paso County COP, 5.00% due 12/1/2023 (Pikes Peak Regional Development Center) | | | AA/Aa2 | | | | 1,330,000 | | | | 1,534,873 | |
El Paso County Falcon School District No. 49 COP, 5.00% due 12/15/2020 | | | NR/Aa3 | | | | 350,000 | | | | 391,503 | |
El Paso County Falcon School District No. 49 COP, 5.00% due 12/15/2023 | | | NR/Aa3 | | | | 945,000 | | | | 1,103,713 | |
El Paso County Falcon School District No. 49 COP, 5.00% due 12/15/2024 | | | NR/Aa3 | | | | 655,000 | | | | 772,383 | |
Park Creek Metropolitan District, 5.00% due 12/1/2017 (Insured: AGM) (ETM) | | | AA/NR | | | | 1,525,000 | | | | 1,566,694 | |
Park Creek Metropolitan District, 5.50% due 12/1/2018 (Insured: AGM) (ETM) | | | AA/NR | | | | 1,200,000 | | | | 1,286,448 | |
Park Creek Metropolitan District, 5.50% due 12/1/2019 (Insured: AGM) (ETM) | | | AA/NR | | | | 1,000,000 | | | | 1,109,010 | |
Regents of the University of Colorado COP, 5.00% due 11/1/2017 (UCDHSC Fitzsimons Academic Facilities) | | | AA-/Aa2 | | | | 850,000 | | | | 870,409 | |
Regional Transportation District COP, 5.00% due 6/1/2018 (FasTracks Transportation System) | | | A/Aa3 | | | | 1,750,000 | | | | 1,829,362 | |
Regional Transportation District COP, 5.00% due 6/1/2019 (FasTracks Transportation System) | | | A/Aa3 | | | | 4,730,000 | | | | 5,111,947 | |
Regional Transportation District COP, 5.00% due 6/1/2020 (FasTracks Transportation System) | | | A/Aa3 | | | | 3,655,000 | | | | 4,055,296 | |
Regional Transportation District COP, 5.50% due 6/1/2021 (FasTracks Transportation System) | | | A/Aa3 | | | | 2,370,000 | | | | 2,671,606 | |
Regional Transportation District COP, 5.00% due 6/1/2023 (North Metro Rail Line) | | | A/Aa3 | | | | 4,000,000 | | | | 4,669,080 | |
Regional Transportation District COP, 5.00% due 6/1/2024 (North Metro Rail Line) | | | A/Aa3 | | | | 4,000,000 | | | | 4,646,840 | |
| | | |
CONNECTICUT — 2.13% | | | | | | | | | | | | |
City of Hartford GO, 5.00% due 10/1/2022 (Various Public Improvements; Insured: AGM) | | | AA/A2 | | | | 1,765,000 | | | | 1,971,434 | |
City of Hartford GO, 5.00% due 7/1/2024 (Various Public Improvements; Insured: AGM) | | | AA/A2 | | | | 800,000 | | | | 901,032 | |
City of Hartford GO, 5.00% due 7/1/2025 (Various Public Improvements; Insured: AGM) | | | AA/A2 | | | | 1,020,000 | | | | 1,141,972 | |
City of West Haven GO, 4.00% due 8/1/2018 (Insured: AGM) | | | AA/A2 | | | | 2,080,000 | | | | 2,152,467 | |
Connecticut Housing Finance Authority, 0.96% due 11/15/2036 put 4/3/2017 (Housing Mortgage Financing Program; SPA: JPMorgan Chase Bank, N.A.) (daily demand notes) | | | AAA/Aaa | | | | 1,935,000 | | | | 1,935,000 | |
Connecticut Housing Finance Authority, 0.96% due 5/15/2039 put 4/3/2017 (Housing Mortgage Financing Program; SPA: JPMorgan Chase Bank, N.A.) (daily demand notes) | | | AAA/Aaa | | | | 42,865,000 | | | | 42,865,000 | |
State of Connecticut GO, 1.71% due 9/15/2019 (Various Capital Projects) | | | AA-/Aa3 | | | | 1,000,000 | | | | 1,000,080 | |
State of Connecticut GO, 5.00% due 9/1/2023 (Educational Facilities) | | | AA-/Aa3 | | | | 5,550,000 | | | | 6,400,870 | |
State of Connecticut GO, 5.00% due 5/15/2024 (Various Capital Projects) | | | AA-/Aa3 | | | | 20,000,000 | | | | 23,113,400 | |
State of Connecticut GO, 5.00% due 6/15/2024 (Educational Facilities) | | | AA-/Aa3 | | | | 19,385,000 | | | | 22,418,365 | |
State of Connecticut GO, 5.00% due 8/15/2024 (Various Capital Projects) | | | AA-/Aa3 | | | | 1,845,000 | | | | 2,131,012 | |
State of Connecticut GO, 5.00% due 5/15/2025 (Various Capital Projects) | | | AA-/Aa3 | | | | 12,500,000 | | | | 14,533,875 | |
State of Connecticut GO, 5.00% due 6/15/2025 (Educational Facilities) | | | AA-/Aa3 | | | | 11,015,000 | | | | 12,815,292 | |
State of Connecticut GO, 5.00% due 5/15/2026 (Various Capital Projects) | | | AA-/Aa3 | | | | 7,000,000 | | | | 8,170,960 | |
State of Connecticut GO Floating Rate Note, 1.56% due 9/15/2018 (Various Capital Projects) | | | AA-/Aa3 | | | | 725,000 | | | | 725,660 | |
State of Connecticut GO Floating Rate Note, 1.44% due 9/15/2024 put 9/15/2017 (Various Capital Projects) | | | AA/Aa3 | | | | 10,000,000 | | | | 10,002,600 | |
| | | |
DELAWARE — 0.03% | | | | | | | | | | | | |
Delaware Transportation Authority, 5.00% due 7/1/2020 (Transportation System) | | | AA+/Aa2 | | | | 500,000 | | | | 560,205 | |
Delaware Transportation Authority, 5.00% due 7/1/2022 (Transportation System) | | | AA+/Aa2 | | | | 1,440,000 | | | | 1,687,579 | |
| | | |
DISTRICT OF COLUMBIA — 0.21% | | | | | | | | | | | | |
District of Columbia, 4.00% due 4/1/2017 (National Public Radio) (ETM) | | | AA-/A2 | | | | 1,830,000 | | | | 1,830,000 | |
District of Columbia, 5.00% due 4/1/2018 (National Public Radio) (ETM) | | | NR/NR | | | | 750,000 | | | | 780,352 | |
District of Columbia, 5.00% due 4/1/2018 (National Public Radio) | | | AA-/A2 | | | | 995,000 | | | | 1,034,661 | |
District of Columbia, 5.00% due 4/1/2019 (National Public Radio) | | | AA-/A2 | | | | 805,000 | | | | 863,870 | |
District of Columbia, 5.00% due 4/1/2020 (National Public Radio) | | | AA-/A2 | | | | 1,890,000 | | | | 2,081,589 | |
District of Columbia GO, 6.00% due 6/1/2018 (Insured: Natl-Re) | | | AA/Aa1 | | | | 5,000,000 | | | | 5,292,300 | |
District of Columbia GO, 5.25% due 6/1/2020 (Insured: Syncora) | | | AA/Aa1 | | | | 3,005,000 | | | | 3,376,328 | |
| | | |
FLORIDA — 6.88% | | | | | | | | | | | | |
Alachua County School Board COP, 5.00% due 7/1/2022 (Educational Facilities) | | | A+/Aa3 | | | | 1,600,000 | | | | 1,809,504 | |
Alachua County School Board COP, 5.00% due 7/1/2023 (Educational Facilities) | | | A+/Aa3 | | | | 2,250,000 | | | | 2,573,572 | |
Broward County, 5.00% due 9/1/2017 (Port Facilities) | | | A-/A1 | | | | 2,820,000 | | | | 2,861,651 | |
Broward County, 4.00% due 10/1/2017 (Airport, Marina & Port Improvements) | | | A+/A1 | | | | 500,000 | | | | 507,525 | |
Broward County, 5.00% due 10/1/2017 (Airport, Marina & Port Improvements) | | | A+/A1 | | | | 1,000,000 | | | | 1,020,030 | |
12 Semi-Annual Report
| | |
| Schedule of Investments, Continued | | |
| |
Thornburg Limited Term Municipal Fund | | March 31, 2017 (Unaudited) |
| | | | | | | | | | |
ISSUER-DESCRIPTION | | CREDIT RATING†
S&P/ MOODY’S | | PRINCIPAL
AMOUNT | | | VALUE | |
Broward County, 5.50% due 9/1/2018 (Port Facilities) | | A-/A1 | | $ | 3,500,000 | | | $ | 3,687,670 | |
Broward County, 4.00% due 10/1/2018 (Airport, Marina & Port Improvements) | | A+/A1 | | | 425,000 | | | | 442,574 | |
Broward County, 5.00% due 10/1/2018 (Airport, Marina & Port Improvements) | | A+/A1 | | | 500,000 | | | | 528,085 | |
Broward County, 5.50% due 9/1/2019 (Port Facilities) | | A-/A1 | | | 2,800,000 | | | | 3,041,752 | |
Broward County, 5.00% due 10/1/2019 (Airport, Marina & Port Improvements) | | A+/A1 | | | 1,000,000 | | | | 1,088,130 | |
Broward County, 4.00% due 10/1/2020 (Airport, Marina & Port Improvements) | | A+/A1 | | | 1,660,000 | | | | 1,790,061 | |
Broward County, 5.00% due 10/1/2020 (Airport, Marina & Port Improvements) | | A+/A1 | | | 2,000,000 | | | | 2,229,100 | |
Broward County School Board COP, 5.00% due 7/1/2017 (Educational Facilities; Insured: Natl-Re) | | AA-/Aa3 | | | 1,000,000 | | | | 1,010,300 | |
Broward County School Board COP, 5.00% due 7/1/2021 (Educational Facilities) | | A+/Aa3 | | | 4,000,000 | | | | 4,523,080 | |
Broward County School Board COP, 5.00% due 7/1/2022 (Educational Facilities) | | A+/Aa3 | | | 4,580,000 | | | | 5,254,130 | |
Broward County School Board COP, 5.00% due 7/1/2023 (Educational Facilities) | | A+/Aa3 | | | 3,000,000 | | | | 3,487,980 | |
Broward County School Board COP, 5.00% due 7/1/2023 (Educational Facilities) | | A+/Aa3 | | | 2,000,000 | | | | 2,325,320 | |
Broward County School Board COP, 5.00% due 7/1/2024 (Educational Facilities) | | A+/Aa3 | | | 4,000,000 | | | | 4,692,520 | |
Broward County School Board COP, 5.00% due 7/1/2024 (Educational Facilities) | | A+/Aa3 | | | 2,000,000 | | | | 2,346,260 | |
Broward County School Board COP, 5.00% due 7/1/2025 (Educational Facilities) | | A+/Aa3 | | | 7,000,000 | | | | 8,268,610 | |
Broward County School Board COP, 5.00% due 7/1/2025 (Educational Facilities) | | A+/Aa3 | | | 5,000,000 | | | | 5,906,150 | |
City of Fort Myers, 5.00% due 12/1/2018 (Gulf Breeze Loan Program; Insured: Natl-Re) | | AA-/Aa3 | | | 2,195,000 | | | | 2,249,370 | |
City of Fort Myers, 5.00% due 10/1/2023 (Utility Systems Capital Projects) | | A+/Aa3 | | | 3,360,000 | | | | 3,830,534 | |
City of Gainesville, 0.95% due 10/1/2026 put 4/3/2017 (Utilities System; SPA: Landesbank Hessen-Thuringen) (daily demand notes) | | AA-/Aa2 | | | 18,410,000 | | | | 18,410,000 | |
City of Gainesville, 0.96% due 10/1/2026 put 4/3/2017 (Utilities System; SPA: Landesbank Hessen-Thuringen) (daily demand notes) | | AA-/Aa2 | | | 26,885,000 | | | | 26,885,000 | |
City of Jacksonville, 5.00% due 10/1/2017 | | AA-/Aa3 | | | 1,000,000 | | | | 1,020,710 | |
City of Jacksonville, 5.00% due 10/1/2018 | | AA-/Aa3 | | | 1,050,000 | | | | 1,111,803 | |
City of Jacksonville, 5.00% due 10/1/2019 | | AA-/Aa3 | | | 500,000 | | | | 545,745 | |
City of Jacksonville, 5.00% due 10/1/2020 | | AA-/Aa3 | | | 1,000,000 | | | | 1,120,350 | |
City of Jacksonville, 5.00% due 10/1/2023 | | AA-/Aa3 | | | 1,105,000 | | | | 1,296,916 | |
City of Lakeland, 5.00% due 10/1/2017 (Energy System; Insured: AGM) | | AA/Aa3 | | | 7,105,000 | | | | 7,252,145 | |
City of Lakeland, 5.00% due 10/1/2019 (Energy System; Insured: AGM) | | AA/Aa3 | | | 5,000,000 | | | | 5,460,700 | |
City of Lakeland, 5.00% due 11/15/2019 (Lakeland Regional Health Systems) | | NR/A2 | | | 5,655,000 | | | | 6,137,994 | |
City of Lakeland, 5.00% due 10/1/2020 (Energy System; Insured: AGM) | | AA/Aa3 | | | 1,695,000 | | | | 1,900,231 | |
City of Lakeland, 5.00% due 11/15/2025 (Lakeland Regional Health Systems) | | NR/A2 | | | 1,945,000 | | | | 2,258,203 | |
City of Lakeland, 5.00% due 11/15/2026 (Lakeland Regional Health Systems) | | NR/A2 | | | 1,925,000 | | | | 2,246,417 | |
City of Miami, 5.00% due 1/1/2018 (Street & Sidewalk Improvement Program; Insured: Natl-Re) | | AA-/A2 | | | 1,970,000 | | | | 2,023,426 | |
City of North Miami Beach, 5.00% due 8/1/2017 (North Miami Beach Water Project) | | A+/NR | | | 750,000 | | | | 760,320 | |
City of North Miami Beach, 3.00% due 8/1/2018 (North Miami Beach Water Project) | | A+/NR | | | 1,280,000 | | | | 1,313,037 | |
City of North Miami Beach, 5.00% due 8/1/2019 (North Miami Beach Water Project) | | A+/NR | | | 1,650,000 | | | | 1,780,103 | |
City of North Miami Beach, 5.00% due 8/1/2020 (North Miami Beach Water Project) | | A+/NR | | | 780,000 | | | | 859,537 | |
City of North Miami Beach, 5.00% due 8/1/2021 (North Miami Beach Water Project) | | A+/NR | | | 1,000,000 | | | | 1,124,480 | |
City of Tampa, 5.00% due 11/15/2017 (BayCare Health System) | | NR/Aa2 | | | 1,215,000 | | | | 1,245,448 | |
Florida Higher Educational Facilities Financing Authority, 5.25% due 4/1/2017 (Nova Southeastern University) (ETM) | | A-/Baa1 | | | 1,325,000 | | | | 1,325,000 | |
Florida Higher Educational Facilities Financing Authority, 5.25% due 4/1/2018 (Nova Southeastern University) (ETM) | | A-/Baa1 | | | 2,630,000 | | | | 2,742,432 | |
Florida Higher Educational Facilities Financing Authority, 5.00% due 4/1/2019 (University of Tampa) | | A-/NR | | | 1,225,000 | | | | 1,308,545 | |
Florida Higher Educational Facilities Financing Authority, 5.00% due 4/1/2019 (Nova Southeastern University) | | A-/Baa1 | | | 1,035,000 | | | | 1,100,940 | |
Florida Higher Educational Facilities Financing Authority, 5.50% due 4/1/2019 (Nova Southeastern University) (ETM) | | A-/Baa1 | | | 1,705,000 | | | | 1,851,408 | |
Florida Higher Educational Facilities Financing Authority, 5.00% due 4/1/2020 (Nova Southeastern University) | | A-/Baa1 | | | 1,190,000 | | | | 1,293,090 | |
Florida Higher Educational Facilities Financing Authority, 5.00% due 4/1/2022 (University of Tampa) | | A-/NR | | | 620,000 | | | | 698,573 | |
Florida State Board of Governors, 4.00% due 7/1/2020 (University System Capital Improvements) | | AA/Aa2 | | | 4,055,000 | | | | 4,379,359 | |
Florida State Board of Governors, 4.00% due 7/1/2021 (University System Capital Improvements) | | AA/Aa2 | | | 4,215,000 | | | | 4,621,663 | |
Florida State Board of Governors, 4.00% due 7/1/2022 (University System Capital Improvements) | | AA/Aa2 | | | 4,385,000 | | | | 4,869,674 | |
Florida State Department of Transportation GO, 5.00% due 7/1/2018 | | AAA/Aa1 | | | 3,000,000 | | | | 3,062,310 | |
Highlands County HFA, 5.00% due 11/15/2017 (Adventist Health System Sunbelt Group) | | AA/Aa2 | | | 3,200,000 | | | | 3,280,576 | |
Highlands County HFA, 5.00% due 11/15/2019 (Adventist Health System Sunbelt Group) | | AA/Aa2 | | | 3,000,000 | | | | 3,283,800 | |
Hillsborough County, 5.00% due 11/1/2018 (Court Facilities) | | AA/A1 | | | 4,210,000 | | | | 4,471,062 | |
Hillsborough County, 5.00% due 11/1/2019 (Court Facilities) | | AA/A1 | | | 4,420,000 | | | | 4,835,613 | |
Hillsborough County, 5.00% due 11/1/2020 (Court Facilities) | | AA/A1 | | | 4,645,000 | | | | 5,211,133 | |
Hillsborough County, 5.00% due 11/1/2021 (Court Facilities) | | AA/A1 | | | 4,880,000 | | | | 5,590,089 | |
Hillsborough County, 5.00% due 11/1/2021 (Jail and Storm Water Projects) | | AA/A1 | | | 2,300,000 | | | | 2,634,673 | |
Hillsborough County, 5.00% due 11/1/2022 (Jail and Storm Water Projects) | | AA/A1 | | | 3,005,000 | | | | 3,488,685 | |
Hillsborough County IDA, 5.65% due 5/15/2018 (Tampa Electric Co.) | | BBB+/A3 | | | 3,200,000 | | | | 3,350,784 | |
Hillsborough County School Board COP, 5.25% due 7/1/2017 (Educational Facilities; Insured: Natl-Re) | | AA-/Aa2 | | | 1,300,000 | | | | 1,314,261 | |
Jacksonville Economic Development Commission, 6.00% due 9/1/2017 (Florida Proton Therapy Institute) | | NR/NR | | | 985,000 | | | | 1,001,026 | |
JEA, 5.00% due 10/1/2018 (Water and Sewer System) | | AAA/Aa2 | | | 1,500,000 | | | | 1,589,100 | |
JEA, 5.00% due 10/1/2023 (Electric System) | | A+/Aa3 | | | 1,395,000 | | | | 1,642,850 | |
JEA, 5.00% due 10/1/2024 (Electric System) | | A+/Aa3 | | | 1,200,000 | | | | 1,416,192 | |
Lake County School Board COP, 5.25% due 6/1/2017 (Insured: AMBAC) | | A/NR | | | 2,000,000 | | | | 2,014,540 | |
Semi-Annual Report 13
| | |
| Schedule of Investments, Continued | | |
| |
Thornburg Limited Term Municipal Fund | | March 31, 2017 (Unaudited) |
| | | | | | | | | | |
ISSUER-DESCRIPTION | | CREDIT RATING†
S&P/ MOODY’S | | PRINCIPAL
AMOUNT | | | VALUE | |
Lake County School Board COP, 5.25% due 6/1/2018 (Insured: AMBAC) | | A/NR | | $ | 1,475,000 | | | $ | 1,544,237 | |
Lee County School Board COP, 5.00% due 8/1/2023 (School Facilities Improvements) | | AA-/Aa3 | | | 1,000,000 | | | | 1,165,200 | |
Lee County School Board COP, 5.00% due 8/1/2024 (School Facilities Improvements) | | AA-/Aa3 | | | 2,000,000 | | | | 2,341,820 | |
Manatee County, 4.00% due 10/1/2017 (Public Utilities Improvements) | | NR/Aa2 | | | 1,000,000 | | | | 1,015,810 | |
Manatee County, 5.00% due 10/1/2018 (County Capital Projects) | | NR/Aa2 | | | 2,400,000 | | | | 2,541,264 | |
Manatee County, 5.00% due 10/1/2021 (County Capital Projects) | | NR/Aa2 | | | 2,775,000 | | | | 3,182,398 | |
Manatee County, 5.00% due 10/1/2024 (Public Utilities Improvements) | | NR/Aa2 | | | 500,000 | | | | 596,020 | |
Manatee County, 5.00% due 10/1/2025 (Public Utilities Improvements) | | NR/Aa2 | | | 470,000 | | | | 559,408 | |
Manatee County School District, 5.00% due 10/1/2025 (School Facilities Improvements; Insured: AGM) | | AA/NR | | | 900,000 | | | | 1,065,663 | |
Manatee County School District, 5.00% due 10/1/2027 (School Facilities Improvements; Insured: AGM) | | AA/NR | | | 2,000,000 | | | | 2,365,180 | |
Marion County School Board COP, 5.00% due 6/1/2018 (Insured: BAM) | | AA/A2 | | | 2,500,000 | | | | 2,607,700 | |
Marion County School Board COP, 5.00% due 6/1/2019 (Insured: BAM) | | AA/A2 | | | 2,635,000 | | | | 2,832,203 | |
Marion County School Board COP, 5.00% due 6/1/2020 (Insured: BAM) | | AA/A2 | | | 2,760,000 | | | | 3,026,119 | |
Marion County School Board COP, 5.00% due 6/1/2021 (Insured: BAM) | | AA/A2 | | | 2,505,000 | | | | 2,800,916 | |
Marion County School Board COP, 5.00% due 6/1/2024 (Insured: BAM) | | AA/A2 | | | 3,065,000 | | | | 3,522,880 | |
Miami Beach GO, 4.00% due 9/1/2019 | | AA+/Aa2 | | | 2,745,000 | | | | 2,916,425 | |
Miami Beach GO, 5.00% due 9/1/2020 | | AA+/Aa2 | | | 3,720,000 | | | | 4,141,439 | |
Miami Beach GO, 4.00% due 9/1/2021 | | AA+/Aa2 | | | 1,015,000 | | | | 1,112,379 | |
Miami Beach GO, 5.00% due 9/1/2022 | | AA+/Aa2 | | | 1,000,000 | | | | 1,124,690 | |
Miami-Dade County, 0% due 10/1/2017 (Professional Sports Franchise Facilities; Insured: AGM) | | AA/A1 | | | 2,435,000 | | | | 2,417,468 | |
Miami-Dade County, 0% due 10/1/2018 (Professional Sports Franchise Facilities; Insured: AGM) | | AA/A1 | | | 5,385,000 | | | | 5,240,197 | |
Miami-Dade County, 0% due 10/1/2019 (Professional Sports Franchise Facilities; Insured: AGM) | | AA/A1 | | | 2,170,000 | | | | 2,054,231 | |
Miami-Dade County, 5.00% due 7/1/2023 (Transit System) | | AA/A1 | | | 1,000,000 | | | | 1,162,020 | |
Miami-Dade County, 5.00% due 7/1/2024 (Transit System) | | AA/A1 | | | 5,565,000 | | | | 6,522,403 | |
Miami-Dade County, 5.00% due 7/1/2025 (Transit System) | | AA/A1 | | | 3,650,000 | | | | 4,311,489 | |
Miami-Dade County, 5.00% due 10/1/2025 (Miami International Airport) | | A/A2 | | | 2,500,000 | | | | 2,922,225 | |
Miami-Dade County Expressway Authority, 5.00% due 7/1/2019 (Toll System; Insured: AGM) | | AA/A2 | | | 7,530,000 | | | | 8,131,722 | |
Miami-Dade County Expressway Authority, 5.00% due 7/1/2024 (Toll System) | | A/A2 | | | 2,000,000 | | | | 2,348,440 | |
Miami-Dade County Expressway Authority, 5.00% due 7/1/2025 (Toll System) | | A/A2 | | | 2,000,000 | | | | 2,331,080 | |
Miami-Dade County GO, 5.25% due 7/1/2018 (Building Better Communities) | | AA/Aa2 | | | 5,040,000 | | | | 5,307,926 | |
Miami-Dade County School Board COP, 5.00% due 5/1/2022 (Educational Facilities Improvements) | | A/A1 | | | 3,405,000 | | | | 3,908,872 | |
Miami-Dade County School Board COP, 5.00% due 5/1/2023 (Educational Facilities Improvements) | | A/A1 | | | 4,130,000 | | | | 4,791,089 | |
Miami-Dade County School Board COP, 5.00% due 5/1/2024 (Educational Facilities Improvements) | | A/A1 | | | 8,000,000 | | | | 9,343,680 | |
Miami-Dade County School Board COP, 5.00% due 5/1/2025 (Educational Facilities Improvements) | | A/A1 | | | 15,000,000 | | | | 17,653,350 | |
Miami-Dade County School Board COP, 5.00% due 5/1/2031 put 5/1/2024 (Educational Facilities Improvements) | | A/A1 | | | 2,425,000 | | | | 2,806,089 | |
Orange County HFA, 5.00% due 10/1/2017 (Orlando Health, Inc.) | | A/A2 | | | 1,980,000 | | | | 2,019,798 | |
Orange County HFA, 5.25% due 10/1/2019 (Orlando Health, Inc.) | | A/A2 | | | 6,050,000 | | | | 6,625,718 | |
Orange County HFA, 6.25% due 10/1/2021 (Orlando Health, Inc.; Insured: Natl-Re) | | AA-/A2 | | | 1,870,000 | | | | 2,062,704 | |
Orange County HFA, 5.375% due 10/1/2023 (Orlando Health, Inc.) | | A/A2 | | | 4,150,000 | | | | 4,530,845 | |
Orange County School Board COP, 5.00% due 8/1/2019 (Educational Facilities) | | NR/Aa2 | | | 1,000,000 | | | | 1,086,950 | |
Orange County School Board COP, 5.00% due 8/1/2020 (Educational Facilities) | | NR/Aa2 | | | 1,695,000 | | | | 1,892,213 | |
Orange County School Board COP, 5.00% due 8/1/2021 (Educational Facilities) | | NR/Aa2 | | | 2,100,000 | | | | 2,398,011 | |
Orange County School Board COP, 5.00% due 8/1/2022 (Educational Facilities) | | NR/Aa2 | | | 1,825,000 | | | | 2,114,317 | |
Orange County School Board COP, 5.00% due 8/1/2023 (Educational Facilities) | | NR/Aa2 | | | 1,540,000 | | | | 1,803,355 | |
Orange County School Board COP, 5.00% due 8/1/2024 (Educational Facilities) | | NR/Aa2 | | | 1,445,000 | | | | 1,701,516 | |
Orange County School Board COP, 5.00% due 8/1/2025 (Educational Facilities) | | NR/Aa2 | | | 1,190,000 | | | | 1,411,697 | |
Palm Beach County HFA, 5.00% due 12/1/2020 (Boca Raton Regional Hospital) | | BBB+/NR | | | 600,000 | | | | 663,612 | |
Palm Beach County School Board COP, 5.00% due 8/1/2018 (Educational Facilities) | | NR/Aa3 | | | 800,000 | | | | 841,768 | |
Palm Beach County School Board COP, 4.00% due 8/1/2019 (Educational Facilities) | | NR/Aa3 | | | 940,000 | | | | 996,635 | |
Palm Beach County School Board COP, 5.00% due 8/1/2020 (Educational Facilities) | | NR/Aa3 | | | 1,090,000 | | | | 1,213,432 | |
Palm Beach County School Board COP, 4.00% due 8/1/2021 (Educational Facilities) | | NR/Aa3 | | | 3,835,000 | | | | 4,190,658 | |
Palm Beach County School Board COP, 5.00% due 8/1/2022 (Educational Facilities) | | NR/Aa3 | | | 1,000,000 | | | | 1,153,490 | |
Palm Beach County School Board COP, 5.00% due 8/1/2022 (Educational Facilities) | | NR/Aa3 | | | 1,660,000 | | | | 1,914,793 | |
Palm Beach County School Board COP, 5.00% due 8/1/2023 (Educational Facilities) | | NR/Aa3 | | | 3,500,000 | | | | 4,091,745 | |
Palm Beach County School Board COP, 5.00% due 8/1/2023 (Educational Facilities) | | NR/Aa3 | | | 1,000,000 | | | | 1,169,070 | |
Palm Beach County School Board COP, 5.00% due 8/1/2024 (Educational Facilities) | | NR/Aa3 | | | 3,595,000 | | | | 4,249,110 | |
Palm Beach County School Board COP, 5.00% due 8/1/2024 (Educational Facilities) | | NR/Aa3 | | | 1,275,000 | | | | 1,506,986 | |
Polk County, 4.00% due 10/1/2020 (Water and Wastewater Utility Systems; Insured: AGM) | | AA/Aa3 | | | 3,100,000 | | | | 3,356,649 | |
Polk County, 3.00% due 10/1/2021 (Water and Wastewater Utility Systems; Insured: AGM) | | AA/Aa3 | | | 3,125,000 | | | | 3,283,594 | |
Polk County, 5.00% due 10/1/2023 (Water and Wastewater Utility Systems) | | AA/Aa3 | | | 1,420,000 | | | | 1,630,856 | |
Putnam County Development Authority, 5.35% due 3/15/2042 put 5/1/2018 (Seminole Project; Insured: AMBAC) | | A-/A3 | | | 10,200,000 | | | | 10,632,684 | |
Putnam County Development Authority, 5.35% due 3/15/2042 put 5/1/2018 (Seminole Project; Insured: AMBAC) | | A-/A3 | | | 4,225,000 | | | | 4,404,224 | |
Reedy Creek Improvement District, 5.00% due 10/1/2017 (Walt Disney World Resort Complex Utility Systems) | | A/A1 | | | 400,000 | | | | 408,204 | |
Reedy Creek Improvement District, 5.00% due 10/1/2018 (Walt Disney World Resort Complex Utility Systems) | | A/A1 | | | 755,000 | | | | 798,971 | |
Reedy Creek Improvement District, 5.00% due 10/1/2021 (Walt Disney World Resort Complex Utility Systems) | | A/A1 | | | 1,200,000 | | | | 1,356,660 | |
Reedy Creek Improvement District, 5.00% due 10/1/2022 (Walt Disney World Resort Complex Utility Systems) | | A/A1 | | | 625,000 | | | | 714,231 | |
14 Semi-Annual Report
| | |
| Schedule of Investments, Continued | | |
| |
Thornburg Limited Term Municipal Fund | | March 31, 2017 (Unaudited) |
| | | | | | | | | | | | |
ISSUER-DESCRIPTION | | CREDIT RATING†
S&P/ MOODY’S | | | PRINCIPAL
AMOUNT | | | VALUE | |
Reedy Creek Improvement District, 5.00% due 6/1/2023 (Buena Vista Drive Corridor Improvements) | | | AA-/Aa3 | | | $ | 1,940,000 | | | $ | 2,270,634 | |
Reedy Creek Improvement District, 5.00% due 10/1/2023 (Walt Disney World Resort Complex Utility Systems) | | | A/A1 | | | | 750,000 | | | | 864,518 | |
Reedy Creek Improvement District GO, 5.00% due 6/1/2021 (Walt Disney World Resort Complex Utility Systems) | | | AA-/Aa3 | | | | 500,000 | | | | 567,600 | |
Reedy Creek Improvement District GO, 5.00% due 6/1/2023 (Walt Disney World Resort Complex Utility Systems) | | | AA-/Aa3 | | | | 860,000 | | | | 1,006,570 | |
Reedy Creek Improvement District GO, 5.00% due 6/1/2024 (Walt Disney World Resort Complex Utility Systems) | | | AA-/Aa3 | | | | 850,000 | | | | 1,003,638 | |
Reedy Creek Improvement District GO, 5.00% due 6/1/2025 (Walt Disney World Resort Complex Utility Systems) | | | AA-/Aa3 | | | | 2,000,000 | | | | 2,383,260 | |
South Florida Water Management District COP, 5.00% due 10/1/2017 (Everglades Restoration Plan) | | | AA/Aa3 | | | | 2,750,000 | | | | 2,806,402 | |
South Florida Water Management District COP, 5.00% due 10/1/2018 (Everglades Restoration Plan) | | | AA/Aa3 | | | | 2,500,000 | | | | 2,645,600 | |
South Florida Water Management District COP, 5.00% due 10/1/2019 (Everglades Restoration Plan) | | | AA/Aa3 | | | | 1,500,000 | | | | 1,635,300 | |
South Florida Water Management District COP, 5.00% due 10/1/2020 (Everglades Restoration Plan) | | | AA/Aa3 | | | | 1,780,000 | | | | 1,989,702 | |
South Florida Water Management District COP, 5.00% due 10/1/2021 (Everglades Restoration Plan) | | | AA/Aa3 | | | | 1,750,000 | | | | 1,998,325 | |
South Florida Water Management District COP, 5.00% due 10/1/2022 (Everglades Restoration Plan) | | | AA/Aa3 | | | | 2,000,000 | | | | 2,315,540 | |
South Lake County Hospital District, 5.00% due 10/1/2025 | | | NR/A2 | | | | 4,140,000 | | | | 4,514,422 | |
South Miami HFA, 5.00% due 8/15/2017 (Baptist Health) | | | AA-/Aa3 | | | | 4,610,000 | | | | 4,680,210 | |
Sunshine State Governmental Financing Commission, 5.00% due 9/1/2021 (Miami-Dade County Program; Insured: AGM) | | | AA/Aa3 | | | | 5,000,000 | | | | 5,698,250 | |
Sunshine State Governmental Financing Commission, 5.00% due 9/1/2021 (Miami-Dade County Program) | | | AA-/Aa3 | | | | 1,450,000 | | | | 1,651,826 | |
Sunshine State Governmental Financing Commission, 5.00% due 9/1/2022 (Miami-Dade County Program) | | | AA-/Aa3 | | | | 2,000,000 | | | | 2,309,840 | |
Sunshine State Governmental Financing Commission, 5.00% due 9/1/2023 (Miami-Dade County Program) | | | AA-/Aa3 | | | | 2,100,000 | | | | 2,457,798 | |
Sunshine State Governmental Financing Commission, 5.00% due 9/1/2024 (Miami-Dade County Program) | | | AA-/Aa3 | | | | 1,725,000 | | | | 2,006,917 | |
Tampa Bay Regional Water Supply Authority, 5.00% due 10/1/2017 | | | AA+/Aa1 | | | | 5,615,000 | | | | 5,733,420 | |
Tampa Bay Regional Water Supply Authority, 5.00% due 10/1/2018 | | | AA+/Aa1 | | | | 2,890,000 | | | | 3,063,689 | |
Tampa Bay Regional Water Supply Authority, 5.00% due 10/1/2019 | | | AA+/Aa1 | | | | 3,000,000 | | | | 3,285,390 | |
University of North Florida Foundation, Inc., 0.90% due 5/1/2028 put 4/3/2017 (Parking Facility; LOC: Wachovia Bank, N.A.) (daily demand notes) | | | AA-/NR | | | | 5,300,000 | | | | 5,300,000 | |
Volusia County Educational Facilities Authority, 4.00% due 10/15/2017 (Embry-Riddle Aeronautical University, Inc.; Insured: AGM) | | | AA/A2 | | | | 1,030,000 | | | | 1,046,192 | |
Volusia County Educational Facilities Authority, 5.00% due 10/15/2018 (Embry-Riddle Aeronautical University, Inc.; Insured: AGM) | | | AA/A2 | | | | 2,075,000 | | | | 2,191,055 | |
Volusia County Educational Facilities Authority, 5.00% due 10/15/2019 (Embry-Riddle Aeronautical University, Inc.; Insured: AGM) | | | AA/A2 | | | | 2,350,000 | | | | 2,552,170 | |
Volusia County Educational Facilities Authority, 5.00% due 10/15/2023 (Embry-Riddle Aeronautical University, Inc.) | | | NR/Baa1 | | | | 700,000 | | | | 793,555 | |
Volusia County Educational Facilities Authority, 5.00% due 10/15/2024 (Embry-Riddle Aeronautical University, Inc.) | | | NR/Baa1 | | | | 650,000 | | | | 739,252 | |
Volusia County Educational Facilities Authority, 5.00% due 10/15/2025 (Embry-Riddle Aeronautical University, Inc.) | | | NR/Baa1 | | | | 400,000 | | | | 454,288 | |
Volusia County School Board COP, 5.00% due 8/1/2024 (University High School, River Springs Middle School) | | | NR/Aa3 | | | | 1,000,000 | | | | 1,181,950 | |
| | | |
GEORGIA — 1.53% | | | | | | | | | | | | |
Athens-Clarke County Unified Government Development Authority, 4.00% due 6/15/2017 (UGAREF Bolton Commons, LLC) | | | NR/Aa2 | | | | 495,000 | | | | 498,252 | |
Athens-Clarke County Unified Government Development Authority, 5.00% due 6/15/2019 (UGAREF Bolton Commons, LLC) | | | NR/Aa2 | | | | 400,000 | | | | 433,044 | |
Athens-Clarke County Unified Government Development Authority, 4.00% due 6/15/2020 (UGAREF Bolton Commons, LLC) | | | NR/Aa2 | | | | 395,000 | | | | 427,027 | |
Athens-Clarke County Unified Government Development Authority, 5.00% due 6/15/2022 (UGAREF Central Precinct, LLC) | | | NR/Aa2 | | | | 800,000 | | | | 923,096 | |
Athens-Clarke County Unified Government Development Authority, 5.00% due 6/15/2023 (UGAREF Central Precinct, LLC) | | | NR/Aa2 | | | | 470,000 | | | | 549,693 | |
Athens-Clarke County Unified Government Development Authority, 5.00% due 6/15/2024 (UGAREF Central Precinct, LLC) | | | NR/Aa2 | | | | 520,000 | | | | 614,063 | |
City of Atlanta, 5.00% due 11/1/2017 (Water & Wastewater System; Insured: AGM) | | | AA/Aa2 | | | | 4,745,000 | | | | 4,860,351 | |
City of Atlanta, 5.00% due 1/1/2018 (Hartsfield-Jackson Atlanta International Airport) | | | NR/Aa3 | | | | 2,100,000 | | | | 2,164,176 | |
City of Atlanta, 5.00% due 1/1/2019 (Hartsfield-Jackson Atlanta International Airport) | | | NR/Aa3 | | | | 3,145,000 | | | | 3,358,105 | |
City of Atlanta, 6.00% due 11/1/2019 (Water & Wastewater System) | | | AA-/Aa2 | | | | 5,650,000 | | | | 6,327,435 | |
City of Atlanta, 5.00% due 1/1/2020 (BeltLine Project) | | | NR/A2 | | | | 410,000 | | | | 446,769 | |
City of Atlanta, 5.00% due 1/1/2020 (Hartsfield-Jackson Atlanta International Airport) | | | NR/Aa3 | | | | 6,000,000 | | | | 6,590,820 | |
City of Atlanta, 5.25% due 1/1/2020 (Hartsfield-Jackson Atlanta International Airport) | | | NR/Aa3 | | | | 5,000,000 | | | | 5,526,000 | |
City of Atlanta, 5.00% due 1/1/2021 (BeltLine Project) | | | NR/A2 | | | | 175,000 | | | | 190,892 | |
City of Atlanta, 5.00% due 1/1/2021 (Hartsfield-Jackson Atlanta International Airport) | | | NR/Aa3 | | | | 7,000,000 | | | | 7,685,300 | |
City of Atlanta, 5.50% due 1/1/2021 (Hartsfield-Jackson Atlanta International Airport) | | | NR/Aa3 | | | | 3,525,000 | | | | 4,030,273 | |
City of Atlanta, 5.00% due 11/1/2021 (Water & Wastewater System) | | | AA-/Aa2 | | | | 2,500,000 | | | | 2,871,700 | |
City of Atlanta, 5.00% due 11/1/2022 (Water & Wastewater System) | | | AA-/Aa2 | | | | 1,000,000 | | | | 1,166,140 | |
City of Atlanta, 5.00% due 1/1/2023 (Airport Passenger Facility) | | | AA-/Aa3 | | | | 1,000,000 | | | | 1,159,210 | |
City of Atlanta, 5.00% due 11/1/2023 (Water & Wastewater System) | | | AA-/Aa2 | | | | 1,130,000 | | | | 1,336,056 | |
City of Atlanta, 5.00% due 1/1/2024 (Airport Passenger Facility) | | | AA-/Aa3 | | | | 1,350,000 | | | | 1,596,078 | |
City of Atlanta, 5.00% due 11/1/2024 (Water & Wastewater System) | | | AA-/Aa2 | | | | 1,000,000 | | | | 1,196,090 | |
City of Atlanta, 5.00% due 1/1/2025 (Airport Passenger Facility) | | | AA-/Aa3 | | | | 1,645,000 | | | | 1,945,986 | |
City of Atlanta, 5.00% due 1/1/2025 (Airport Passenger Facility) | | | AA-/Aa3 | | | | 2,500,000 | | | | 2,960,900 | |
City of Atlanta, 5.00% due 11/1/2025 (Water & Wastewater System) | | | AA-/Aa2 | | | | 1,000,000 | | | | 1,201,910 | |
Development Authority of Bartow County, 2.70% due 8/1/2043 put 8/23/2018 (Georgia Power Co. Plant Bowen Project) | | | A-/A3 | | | | 6,000,000 | | | | 6,074,880 | |
Fulton County Development Authority, 5.00% due 10/1/2022 (Georgia Tech Athletic Association) | | | NR/A2 | | | | 4,550,000 | | | | 5,223,081 | |
Fulton County Facilities Corp. COP, 5.00% due 11/1/2017 (Public Purpose Project) | | | AA/Aa2 | | | | 8,400,000 | | | | 8,600,172 | |
Fulton County Facilities Corp. COP, 5.00% due 11/1/2019 (Public Purpose Project) | | | AA/Aa2 | | | | 6,600,000 | | | | 7,203,504 | |
Hospital Authority of Gwinnett County, 5.00% due 7/1/2023 (Gwinnett Hospital System, Inc.; Insured: AGM) | | | NR/A2 | | | | 5,000,000 | | | | 5,366,100 | |
LaGrange-Troup County Hospital Authority, 5.00% due 7/1/2018 (West Georgia Health Foundation, Inc.) | | | A+/Aa2 | | | | 1,070,000 | | | | 1,091,700 | |
Semi-Annual Report 15
| | |
| Schedule of Investments, Continued | | |
| |
Thornburg Limited Term Municipal Fund | | March 31, 2017 (Unaudited) |
| | | | | | | | | | | | |
ISSUER-DESCRIPTION | | CREDIT RATING†
S&P/ MOODY’S | | | PRINCIPAL
AMOUNT | | | VALUE | |
Main Street Natural Gas, Inc., 5.00% due 3/15/2018 (Georgia Gas) | | | BBB+/Baa1 | | | $ | 5,000,000 | | | $ | 5,141,200 | |
Municipal Electric Authority of Georgia, 6.60% due 1/1/2018 (Insured: Natl-Re) | | | AA-/A1 | | | | 120,000 | | | | 124,184 | |
State of Georgia GO, 5.00% due 7/1/2017 (Capital Projects) | | | AAA/Aaa | | | | 8,625,000 | | | | 8,717,115 | |
Valdosta and Lowndes County Hospital Authority, 5.00% due 10/1/2022 (South Medical Center) | | | AA-/Aa2 | | | | 1,500,000 | | | | 1,713,390 | |
| | | |
GUAM — 0.57% | | | | | | | | | | | | |
Government of Guam, 5.25% due 12/1/2017 (Layon Solid Waste Disposal Facility) (ETM) | | | BBB+/NR | | | | 2,000,000 | | | | 2,058,800 | |
Government of Guam, 5.50% due 12/1/2018 (Layon Solid Waste Disposal Facility) (ETM) | | | BBB+/NR | | | | 3,000,000 | | | | 3,220,530 | |
Government of Guam, 5.00% due 1/1/2019 (Economic Development) | | | A/NR | | | | 680,000 | | | | 713,809 | |
Government of Guam, 5.00% due 11/15/2019 (Various Capital Projects) | | | A/NR | | | | 1,000,000 | | | | 1,070,420 | |
Government of Guam, 5.50% due 12/1/2019 (Layon Solid Waste Disposal Facility) (ETM) | | | BBB+/NR | | | | 2,000,000 | | | | 2,222,300 | |
Government of Guam, 5.00% due 11/15/2020 (Various Capital Projects) | | | A/NR | | | | 1,500,000 | | | | 1,624,860 | |
Government of Guam, 5.00% due 11/15/2021 (Various Capital Projects) | | | A/NR | | | | 2,210,000 | | | | 2,420,878 | |
Government of Guam, 5.00% due 11/15/2022 (Various Capital Projects) | | | A/NR | | | | 2,960,000 | | | | 3,260,292 | |
Government of Guam, 5.00% due 11/15/2023 (Various Capital Projects) | | | A/NR | | | | 6,280,000 | | | | 6,901,469 | |
Government of Guam, 5.00% due 11/15/2024 (Various Capital Projects) | | | A/NR | | | | 4,500,000 | | | | 4,933,440 | |
Guam Government Waterworks Authority, 5.25% due 7/1/2020 (Water & Wastewater System Improvements) | | | A-/Baa2 | | | | 300,000 | | | | 329,826 | |
Guam Government Waterworks Authority, 5.25% due 7/1/2022 (Water & Wastewater System Improvements) | | | A-/Baa2 | | | | 1,050,000 | | | | 1,181,040 | |
Guam Government Waterworks Authority, 5.25% due 7/1/2023 (Water & Wastewater System Improvements) | | | A-/Baa2 | | | | 645,000 | | | | 730,869 | |
Guam Power Authority, 5.00% due 10/1/2019 (Electric Power System; Insured: AGM) | | | AA/A2 | | | | 1,000,000 | | | | 1,078,390 | |
Guam Power Authority, 5.00% due 10/1/2020 (Electric Power System; Insured: AGM) | | | AA/A2 | | | | 1,500,000 | | | | 1,649,235 | |
Guam Power Authority, 5.00% due 10/1/2022 (Electric Power System; Insured: AGM) | | | AA/A2 | | | | 6,340,000 | | | | 7,167,180 | |
| | | |
HAWAII — 1.43% | | | | | | | | | | | | |
City and County of Honolulu GO, 5.00% due 11/1/2019 (Capital Improvements) | | | NR/Aa1 | | | | 3,620,000 | | | | 3,973,348 | |
City and County of Honolulu GO, 5.00% due 11/1/2020 (Capital Improvements) | | | NR/Aa1 | | | | 8,265,000 | | | | 9,311,349 | |
City and County of Honolulu GO, 5.00% due 11/1/2021 (Capital Improvements) | | | NR/Aa1 | | | | 2,770,000 | | | | 3,192,009 | |
City and County of Honolulu GO, 5.00% due 11/1/2022 (Capital Improvements) | | | NR/Aa1 | | | | 1,750,000 | | | | 2,053,433 | |
City and County of Honolulu GO, 5.00% due 11/1/2022 (Capital Improvements) | | | NR/Aa1 | | | | 6,695,000 | | | | 7,855,846 | |
County of Hawaii GO, 5.00% due 9/1/2021 (Capital Improvements) | | | AA-/Aa2 | | | | 2,165,000 | | | | 2,486,914 | |
County of Hawaii GO, 5.00% due 9/1/2021 (Capital Improvements) | | | AA-/Aa2 | | | | 1,500,000 | | | | 1,723,035 | |
County of Hawaii GO, 5.00% due 9/1/2022 (Capital Improvements) | | | AA-/Aa2 | | | | 1,250,000 | | | | 1,462,100 | |
County of Hawaii GO, 5.00% due 9/1/2022 (Capital Improvements) | | | AA-/Aa2 | | | | 1,000,000 | | | | 1,169,680 | |
County of Hawaii GO, 5.00% due 9/1/2023 (Capital Improvements) | | | AA-/Aa2 | | | | 1,000,000 | | | | 1,186,630 | |
County of Hawaii GO, 5.00% due 9/1/2023 (Capital Improvements) | | | AA-/Aa2 | | | | 800,000 | | | | 949,304 | |
County of Hawaii GO, 5.00% due 9/1/2023 (Capital Improvements) | | | AA-/Aa2 | | | | 1,500,000 | | | | 1,779,945 | |
County of Hawaii GO, 5.00% due 9/1/2023 (Capital Improvements) | | | AA-/Aa2 | | | | 1,000,000 | | | | 1,186,630 | |
County of Hawaii GO, 5.00% due 9/1/2023 (Capital Improvements) | | | AA-/Aa2 | | | | 1,000,000 | | | | 1,186,630 | |
County of Hawaii GO, 5.00% due 9/1/2024 (Capital Improvements) | | | AA-/Aa2 | | | | 1,430,000 | | | | 1,712,668 | |
County of Hawaii GO, 5.00% due 9/1/2024 (Capital Improvements) | | | AA-/Aa2 | | | | 2,000,000 | | | | 2,395,340 | |
County of Hawaii GO, 5.00% due 9/1/2024 (Capital Improvements) | | | AA-/Aa2 | | | | 1,515,000 | | | | 1,814,470 | |
County of Hawaii GO, 5.00% due 9/1/2025 (Capital Improvements) | | | AA-/Aa2 | | | | 2,000,000 | | | | 2,420,100 | |
County of Hawaii GO, 5.00% due 9/1/2025 (Capital Improvements) | | | AA-/Aa2 | | | | 1,255,000 | | | | 1,518,613 | |
County of Hawaii GO, 5.00% due 9/1/2026 (Capital Improvements) | | | AA-/Aa2 | | | | 1,500,000 | | | | 1,813,575 | |
County of Hawaii GO, 5.00% due 9/1/2026 (Capital Improvements) | | | AA-/Aa2 | | | | 2,085,000 | | | | 2,520,869 | |
County of Hawaii GO, 5.00% due 9/1/2026 (Capital Improvements) | | | AA-/Aa2 | | | | 500,000 | | | | 604,525 | |
State of Hawaii GO, 5.00% due 11/1/2017 (Hawaiian Home Lands Settlement) | | | AA+/Aa1 | | | | 12,000,000 | | | | 12,295,200 | |
State of Hawaii GO, 5.00% due 11/1/2018 (Hawaiian Home Lands Settlement) | | | AA+/Aa1 | | | | 20,000,000 | | | | 21,269,600 | |
State of Hawaii GO, 5.00% due 12/1/2019 (Hawaiian Home Lands Settlement) (ETM) | | | NR/NR | | | | 1,545,000 | | | | 1,698,372 | |
State of Hawaii GO, 5.00% due 12/1/2019 (Hawaiian Home Lands Settlement) | | | AA+/Aa1 | | | | 1,455,000 | | | | 1,601,402 | |
State of Hawaii GO, 5.00% due 12/1/2020 (Hawaiian Home Lands Settlement) | | | AA+/Aa1 | | | | 2,500,000 | | | | 2,823,050 | |
State of Hawaii GO, 5.00% due 12/1/2021 (Hawaiian Home Lands Settlement) | | | AA+/Aa1 | | | | 3,000,000 | | | | 3,462,390 | |
State of Hawaii GO, 5.00% due 12/1/2022 (Hawaiian Home Lands Settlement) | | | AA+/Aa1 | | | | 940,000 | | | | 1,073,659 | |
State of Hawaii GO, 5.00% due 12/1/2022 pre-refunded 12/1/2021 (Hawaiian Home Lands Settlement) | | | NR/NR | | | | 3,060,000 | | | | 3,535,402 | |
| | | |
IDAHO — 0.64% | | | | | | | | | | | | |
Idaho HFA, 5.00% due 12/1/2022 (Trinity Health Credit Group) | | | AA-/Aa3 | | | | 1,000,000 | | | | 1,162,990 | |
Idaho HFA, 5.00% due 12/1/2023 (Trinity Health Credit Group) | | | AA-/Aa3 | | | | 2,200,000 | | | | 2,589,158 | |
Idaho HFA, 5.00% due 12/1/2024 (Trinity Health Credit Group) | | | AA-/Aa3 | | | | 1,000,000 | | | | 1,187,200 | |
Regents of the University of Idaho, 5.25% due 4/1/2041 put 4/1/2021 | | | A+/Aa3 | | | | 12,890,000 | | | | 14,511,304 | |
State of Idaho GO, 2.00% due 6/30/2017 | | | SP-1+/Mig1 | | | | 25,825,000 | | | | 25,893,695 | |
| | | |
ILLINOIS — 6.77% | | | | | | | | | | | | |
Board of Education of the City of Chicago GO, 0% due 12/1/2020 (Educational Facilities; Insured: BHAC) | | | AA+/Aa1 | | | | 12,000,000 | | | | 10,786,320 | |
Board of Trustees of Southern Illinois University, 5.25% due 4/1/2020 (Housing & Auxiliary Facilities; Insured: Natl-re) | | | AA-/A3 | | | | 1,000,000 | | | | 1,089,450 | |
Chicago Midway International Airport, 5.00% due 1/1/2022 | | | A/A3 | | | | 800,000 | | | | 909,768 | |
Chicago Midway International Airport, 5.00% due 1/1/2023 | | | A/A3 | | | | 1,900,000 | | | | 2,193,569 | |
16 Semi-Annual Report
| | |
| Schedule of Investments, Continued | | |
| |
Thornburg Limited Term Municipal Fund | | March 31, 2017 (Unaudited) |
| | | | | | | | | | |
ISSUER-DESCRIPTION | | CREDIT RATING†
S&P/ MOODY’S | | PRINCIPAL
AMOUNT | | | VALUE | |
Chicago Midway International Airport, 5.00% due 1/1/2024 | | A/A3 | | $ | 1,000,000 | | | $ | 1,166,520 | |
Chicago O’Hare International Airport, 5.00% due 1/1/2018 (2016 Airport Projects) | | A/NR | | | 6,750,000 | | | | 6,950,610 | |
Chicago O’Hare International Airport, 5.00% due 1/1/2019 (2015 Airport Projects) | | A/NR | | | 3,000,000 | | | | 3,198,390 | |
Chicago O’Hare International Airport, 5.00% due 1/1/2019 (2016 Airport Projects) | | A/NR | | | 8,500,000 | | | | 9,062,105 | |
Chicago O’Hare International Airport, 5.00% due 1/1/2020 (2015 Airport Projects) | | A/NR | | | 2,350,000 | | | | 2,576,070 | |
Chicago O’Hare International Airport, 5.00% due 1/1/2021 (2015 Airport Projects) | | A/NR | | | 3,000,000 | | | | 3,360,420 | |
Chicago O’Hare International Airport, 5.00% due 1/1/2022 (Capital Development Programs) | | A/A2 | | | 5,835,000 | | | | 6,477,609 | |
Chicago O’Hare International Airport, 5.00% due 1/1/2027 (2016 Airport Projects) | | A/NR | | | 1,750,000 | | | | 2,046,870 | |
Chicago Park District GO, 4.00% due 1/1/2018 (Capital Improvement Plan) | | AA+/NR | | | 945,000 | | | | 962,180 | |
Chicago Park District GO, 4.00% due 1/1/2018 (Capital Improvement Plan) | | AA+/NR | | | 1,250,000 | | | | 1,272,725 | |
Chicago Park District GO, 4.00% due 1/1/2018 (Capital Improvement Plan) | | AA+/NR | | | 1,420,000 | | | | 1,445,816 | |
Chicago Park District GO, 5.00% due 1/1/2018 (Capital Improvement Plan) | | AA+/Ba1 | | | 1,150,000 | | | | 1,179,440 | |
Chicago Park District GO, 4.00% due 1/1/2019 (Capital Improvement Plan) | | AA+/NR | | | 820,000 | | | | 851,496 | |
Chicago Park District GO, 4.00% due 1/1/2019 (Capital Improvement Plan) | | AA+/NR | | | 1,745,000 | | | | 1,812,025 | |
Chicago Park District GO, 4.00% due 1/1/2020 (Capital Improvement Plan) | | AA+/NR | | | 815,000 | | | | 857,714 | |
Chicago Park District GO, 4.00% due 1/1/2020 (Capital Improvement Plan) | | AA+/NR | | | 2,730,000 | | | | 2,873,079 | |
Chicago Park District GO, 5.00% due 1/1/2020 (Capital Improvement Plan) | | AA+/Ba1 | | | 530,000 | | | | 571,881 | |
Chicago Park District GO, 5.00% due 1/1/2021 (Capital Improvement Plan) | | AA+/NR | | | 2,840,000 | | | | 3,123,546 | |
Chicago Park District GO, 5.00% due 1/1/2022 (Capital Improvement Plan) | | AA+/NR | | | 1,940,000 | | | | 2,158,638 | |
Chicago Park District GO, 5.00% due 1/1/2022 (Capital Improvement Plan) | | AA+/NR | | | 1,485,000 | | | | 1,652,359 | |
Chicago Park District GO, 5.00% due 1/1/2023 (Capital Improvement Plan) | | AA+/NR | | | 1,675,000 | | | | 1,881,695 | |
Chicago Park District GO, 5.00% due 1/1/2023 (Capital Improvement Plan) | | AA+/NR | | | 3,215,000 | | | | 3,611,731 | |
Chicago Park District GO, 5.00% due 1/1/2023 (Capital Improvement Plan) | | AA+/NR | | | 1,605,000 | | | | 1,803,057 | |
Chicago Park District GO, 5.00% due 1/1/2024 (Capital Improvement Plan) | | AA+/NR | | | 1,305,000 | | | | 1,476,986 | |
Chicago Park District GO, 5.00% due 1/1/2024 (Capital Improvement Plan) | | AA+/NR | | | 1,340,000 | | | | 1,516,599 | |
Chicago Park District GO, 5.00% due 1/1/2024 (Capital Improvement Plan) | | AA+/NR | | | 1,760,000 | | | | 1,991,950 | |
Chicago Park District GO, 5.00% due 1/1/2025 (Capital Improvement Plan) | | AA+/NR | | | 610,000 | | | | 693,326 | |
Chicago School Reform Board of Trustees of the Board of Education GO, 5.25% due 12/1/2021 (School District Capital Improvement Program; Insured: Natl-Re) | | AA-/A3 | | | 1,500,000 | | | | 1,608,030 | |
Chicago Transit Authority, 5.25% due 6/1/2017 (Federal Transit Program-Rail Systems; Insured: AGM) | | A/A3 | | | 3,000,000 | | | | 3,019,140 | |
Chicago Transit Authority, 5.50% due 6/1/2018 (Federal Transit Program-Rail Systems; Insured: AGM) | | A/A3 | | | 2,500,000 | | | | 2,609,525 | |
City of Chicago, 4.00% due 1/1/2018 (Wastewater Transmission System) | | A/Baa3 | | | 1,475,000 | | | | 1,500,149 | |
City of Chicago, 5.00% due 1/1/2018 (Wastewater Transmission System) | | A/NR | | | 2,500,000 | | | | 2,561,150 | |
City of Chicago, 5.00% due 1/1/2019 (Wastewater Transmission System) | | A/NR | | | 1,750,000 | | | | 1,843,817 | |
City of Chicago, 5.00% due 1/1/2020 (Wastewater Transmission System) | | A/NR | | | 1,000,000 | | | | 1,075,950 | |
City of Chicago, 5.00% due 1/1/2020 (Project Fund; Insured: AGM) | | AA/A2 | | | 1,320,000 | | | | 1,337,160 | |
City of Chicago, 5.50% due 1/1/2020 (Wastewater Transmission System; Insured: BHAC) | | AA+/Aa1 | | | 1,250,000 | | | | 1,286,638 | |
City of Chicago, 5.00% due 1/1/2021 (Riverwalk Expansion Project; Insured: AGM) | | BBB-/Ba1 | | | 1,410,000 | | | | 1,493,824 | |
City of Chicago, 5.00% due 1/1/2021 (Wastewater Transmission System) | | A/NR | | | 1,000,000 | | | | 1,094,180 | |
City of Chicago, 5.00% due 1/1/2022 (Wastewater Transmission System) | | A/NR | | | 2,000,000 | | | | 2,214,040 | |
City of Chicago, 5.00% due 1/1/2023 (Riverwalk Expansion Project; Insured: AGM) | | BBB-/Ba1 | | | 1,000,000 | | | | 1,066,720 | |
City of Chicago, 5.00% due 1/1/2023 (Wastewater Transmission System) | | A/NR | | | 3,000,000 | | | | 3,351,540 | |
City of Chicago, 5.00% due 1/1/2023 (Chicago Midway Airport) | | A/A3 | | | 6,215,000 | | | | 7,175,280 | |
City of Chicago, 5.00% due 1/1/2024 (Wastewater Transmission System) | | A/NR | | | 6,250,000 | | | | 7,012,437 | |
City of Chicago, 5.00% due 1/1/2024 (Chicago Midway Airport) | | A/A3 | | | 16,060,000 | | | | 18,363,807 | |
City of Chicago, 5.00% due 1/1/2024 (Project Fund) | | AA/Ba1 | | | 5,510,000 | | | | 5,707,038 | |
City of Chicago, 5.00% due 1/1/2025 (Wastewater Transmission System) | | A/NR | | | 4,500,000 | | | | 5,074,920 | |
City of Chicago, 5.00% due 1/1/2026 (Project Fund) | | AA/Ba1 | | | 6,030,000 | | | | 6,207,342 | |
City of Chicago, 5.00% due 1/1/2027 (Project Fund) | | AA/Ba1 | | | 6,310,000 | | | | 6,482,326 | |
City of Chicago, 5.00% due 11/1/2027 (Water System Improvements) | | A/NR | | | 1,250,000 | | | | 1,406,013 | |
City of Chicago Board of Education GO, 5.00% due 12/1/2018 (Insured: Natl-Re) | | AA-/A3 | | | 1,000,000 | | | | 1,028,450 | |
City of Chicago Building Acquisition Certificates GO, 5.40% due 1/1/2018 (Parking Facility Improvements; Insured: AGM) | | AA/A2 | | | 570,000 | | | | 572,029 | |
City of Chicago School Reform Board of Trustees GO, 5.25% due 12/1/2017 (Insured: Natl-Re) | | AA-/A3 | | | 4,100,000 | | | | 4,161,336 | |
City of Mount Vernon GO, 4.00% due 12/15/2019 (Various Municipal Capital Improvements; Insured: AGM) | | AA/A2 | | | 1,000,000 | | | | 1,062,970 | |
City of Mount Vernon GO, 4.00% due 12/15/2020 (Various Municipal Capital Improvements; Insured: AGM) | | AA/A2 | | | 785,000 | | | | 844,731 | |
City of Mount Vernon GO, 4.00% due 12/15/2021 (Various Municipal Capital Improvements; Insured: AGM) | | AA/A2 | | | 1,640,000 | | | | 1,750,405 | |
City of Quincy, 5.00% due 11/15/2017 (Blessing Hospital) | | A/A2 | | | 500,000 | | | | 511,450 | |
City of Waukegan GO, 5.00% due 12/30/2019 (Lakehurst Redevelopment Project; Insured: AGM) | | NR/A2 | | | 1,935,000 | | | | 2,092,799 | |
City of Waukegan GO, 5.00% due 12/30/2020 (Lakehurst Redevelopment Project; Insured: AGM) | | NR/A2 | | | 1,000,000 | | | | 1,102,520 | |
City of Waukegan GO, 5.00% due 12/30/2021 (Lakehurst Redevelopment Project; Insured: AGM) | | NR/A2 | | | 2,100,000 | | | | 2,350,719 | |
City of Waukegan GO, 5.00% due 12/30/2022 (Lakehurst Redevelopment Project; Insured: AGM) | | NR/A2 | | | 1,000,000 | | | | 1,129,680 | |
Community College District No. 503 GO, 5.00% due 12/1/2021 (Black Hawk College; Insured: AGM) | | AA/NR | | | 3,365,000 | | | | 3,787,980 | |
Community College District No. 503 GO, 5.00% due 12/1/2023 (Black Hawk College; Insured: AGM) | | AA/NR | | | 4,155,000 | | | | 4,751,118 | |
Community College District No. 503 GO, 5.00% due 12/1/2024 (Black Hawk College; Insured: AGM) | | AA/NR | | | 3,415,000 | | | | 3,932,099 | |
Community College District No. 516 GO, 4.50% due 12/15/2020 (Waubonsee Community College) | | NR/Aa1 | | | 1,325,000 | | | | 1,465,688 | |
Community College District No. 516 GO, 5.00% due 12/15/2021 (Waubonsee Community College) | | NR/Aa1 | | | 6,175,000 | | | | 7,086,492 | |
Semi-Annual Report 17
| | |
| Schedule of Investments, Continued | | |
| |
Thornburg Limited Term Municipal Fund | | March 31, 2017 (Unaudited) |
| | | | | | | | | | |
ISSUER-DESCRIPTION | | CREDIT RATING†
S&P/ MOODY’S | | PRINCIPAL
AMOUNT | | | VALUE | |
Community High School District No. 127 GO, 7.375% due 2/1/2020 (Lake County-Grayslake Educational Facilities.; Insured: Syncora) | | AA+/NR | | $ | 1,000,000 | | | $ | 1,151,570 | |
Community Unit School District No. 200 GO, 5.25% due 10/1/2023 (DuPage County Educational Facilities; Insured: FSA) | | AA/Aa3 | | | 1,000,000 | | | | 1,089,990 | |
Community Unit School District No. 302 GO, 0% due 2/1/2021 (Kane & DeKalb County Educational Facilities; Insured: Natl- Re) | | NR/Aa3 | | | 3,165,000 | | | | 2,872,364 | |
Community Unit School District No. 428 GO, 0% due 1/1/2021 (DeKalb County Educational Facilities) | | AA-/Aa2 | | | 6,140,000 | | | | 5,627,371 | |
Community Unit School District No. 5 GO, 5.00% due 4/15/2024 (Insured: BAM) | | AA/Aa3 | | | 450,000 | | | | 521,424 | |
Community Unit School District No. 5 GO, 5.00% due 4/15/2025 (Insured: BAM) | | AA/Aa3 | | | 600,000 | | | | 701,208 | |
Community Unit School District No. 5 GO, 5.00% due 4/15/2026 (Insured: BAM) | | AA/Aa3 | | | 600,000 | | | | 704,988 | |
Cook County Community College District No. 508 GO, 5.00% due 12/1/2020 (City Colleges of Chicago) | | A+/NR | | | 1,220,000 | | | | 1,335,815 | |
Cook County Community College District No. 508 GO, 5.00% due 12/1/2021 (City Colleges of Chicago) | | A+/NR | | | 1,000,000 | | | | 1,106,410 | |
Cook County Community College District No. 508 GO, 5.00% due 12/1/2022 (City Colleges of Chicago) | | A+/NR | | | 1,250,000 | | | | 1,397,350 | |
Cook County Community College District No. 508 GO, 5.00% due 12/1/2023 (City Colleges of Chicago) | | A+/NR | | | 3,300,000 | | | | 3,702,831 | |
Cook County Community College District No. 508 GO, 5.00% due 12/1/2024 (City Colleges of Chicago) | | A+/NR | | | 1,000,000 | | | | 1,105,980 | |
Cook County Community College District No. 508 GO, 5.25% due 12/1/2025 (City Colleges of Chicago) | | A+/NR | | | 1,625,000 | | | | 1,808,869 | |
Cook County Community College District No. 508 GO, 5.25% due 12/1/2026 (City Colleges of Chicago) | | A+/NR | | | 1,690,000 | | | | 1,872,266 | |
Cook County School District No. 97 GO, 9.00% due 12/1/2018 (Village of Oak Park; Insured: Natl-Re) | | NR/Aa2 | | | 4,000,000 | | | | 4,490,760 | |
County of Cook GO, 5.00% due 11/15/2019 (Capital Improvement Plan) | | AA-/A2 | | | 3,690,000 | | | | 3,976,012 | |
County of Cook GO, 4.00% due 11/15/2020 (Capital Improvement Plan) | | AA-/A2 | | | 925,000 | | | | 982,406 | |
County of Cook GO, 5.00% due 11/15/2020 (Capital Improvement Plan) | | AA-/A2 | | | 3,590,000 | | | | 3,850,634 | |
County of Cook GO, 5.00% due 11/15/2020 (Capital Improvement Plan) | | AA-/A2 | | | 2,000,000 | | | | 2,193,360 | |
County of Cook GO, 4.00% due 11/15/2021 (Capital Improvement Plan) | | AA-/A2 | | | 2,000,000 | | | | 2,136,920 | |
County of Cook GO, 5.00% due 11/15/2021 (Capital Improvement Plan) | | AA-/A2 | | | 5,000,000 | | | | 5,566,600 | |
County of Cook GO, 5.00% due 11/15/2021 (Capital Improvement Plan) | | AA-/A2 | | | 2,105,000 | | | | 2,343,539 | |
County of Cook GO, 4.00% due 11/15/2022 (Capital Improvement Plan) | | AA-/A2 | | | 1,000,000 | | | | 1,072,980 | |
County of Cook GO, 5.00% due 11/15/2022 (Capital Improvement Plan) | | AA-/A2 | | | 1,500,000 | | | | 1,689,960 | |
Du Page County High School District No. 88, 3.00% due 1/15/2020 (Addison Trail and Willowbrook High Schools) | | NR/Aa1 | | | 2,630,000 | | | | 2,739,066 | |
Forest Preserve District of Cook County GO, 5.00% due 11/15/2021 | | AA/A2 | | | 1,500,000 | | | | 1,658,730 | |
Forest Preserve District of DuPage County GO, 5.00% due 11/1/2020 | | AAA/Aaa | | | 500,000 | | | | 560,010 | |
Forest Preserve District of DuPage County GO, 5.00% due 11/1/2021 | | AAA/Aaa | | | 1,425,000 | | | | 1,629,858 | |
Forest Preserve District of DuPage County GO, 5.00% due 11/1/2022 | | AAA/Aaa | | | 900,000 | | | | 1,043,055 | |
Forest Preserve District of DuPage County GO, 5.00% due 11/1/2023 | | AAA/Aaa | | | 1,300,000 | | | | 1,523,795 | |
Forest Preserve District of DuPage County GO, 5.00% due 11/1/2024 | | AAA/Aaa | | | 5,000,000 | | | | 5,900,650 | |
Illinois Educational Facilities Authority, 5.25% due 3/1/2034 put 3/1/2018 (Art Institute of Chicago) | | NR/NR | | | 3,600,000 | | | | 3,708,360 | |
Illinois Educational Facilities Authority, 3.40% due 11/1/2036 put 11/1/2017 (Field Museum of Natural History) | | A/NR | | | 1,300,000 | | | | 1,312,025 | |
Illinois Finance Authority, 5.00% due 11/1/2017 (Rush University Medical Center; Insured: Natl-Re) (ETM) | | AA-/Aaa | | | 1,000,000 | | | | 1,024,190 | |
Illinois Finance Authority, 5.00% due 12/1/2017 (Columbia College) (ETM) | | BBB+/NR | | | 1,395,000 | | | | 1,433,139 | |
Illinois Finance Authority, 5.50% due 11/1/2018 (Advocate Health Care) | | AA+/Aa2 | | | 1,000,000 | | | | 1,044,160 | |
Illinois Finance Authority, 5.25% due 5/1/2019 (Educational Advancement Fund, Inc.) | | NR/Baa3 | | | 4,675,000 | | | | 4,683,836 | |
Illinois Finance Authority, 5.00% due 4/1/2020 (Advocate Health Care) | | AA+/Aa2 | | | 1,315,000 | | | | 1,406,287 | |
Illinois Finance Authority, 5.00% due 11/15/2020 (Rush University Medical Center) | | A+/A1 | | | 290,000 | | | | 323,585 | |
Illinois Finance Authority, 5.00% due 11/15/2021 (Rush University Medical Center) | | A+/A1 | | | 250,000 | | | | 284,553 | |
Illinois Finance Authority, 4.00% due 12/1/2021 (Trinity Health) | | AA-/Aa3 | | | 1,000,000 | | | | 1,088,500 | |
Illinois Finance Authority, 5.00% due 11/15/2022 (Rush University Medical Center) | | A+/A1 | | | 250,000 | | | | 288,093 | |
Illinois Finance Authority, 5.00% due 8/1/2023 (Advocate Health Care) | | AA+/Aa2 | | | 565,000 | | | | 657,824 | |
a Illinois Finance Authority, 5.00% due 11/15/2023 (Rush University Medical Center) | | A+/A1 | | | 1,000,000 | | | | 1,162,120 | |
Illinois Finance Authority, 5.00% due 8/1/2024 (Advocate Health Care) | | AA+/Aa2 | | | 800,000 | | | | 942,608 | |
Illinois Finance Authority, 5.00% due 11/15/2024 (Rush University Medical Center) | | A+/A1 | | | 500,000 | | | | 584,550 | |
Illinois Finance Authority, 5.00% due 8/1/2025 (Advocate Health Care) | | AA+/Aa2 | | | 1,400,000 | | | | 1,635,368 | |
Illinois Finance Authority, 5.00% due 11/15/2025 (Rush University Medical Center) | | A+/A1 | | | 1,655,000 | | | | 1,926,006 | |
Illinois Finance Authority, 5.00% due 11/1/2030 put 1/15/2020 (Advocate Health Care) | | AA+/Aa2 | | | 1,250,000 | | | | 1,368,838 | |
Illinois Finance Authority, 0.95% due 8/15/2038 put 4/3/2017 (Northwestern Memorial Hospital; SPA: Northern Trust Co.) (daily demand notes) | | AA+/Aa2 | | | 33,370,000 | | | | 33,370,000 | |
Illinois State Toll Highway Authority, 5.00% due 1/1/2023 | | AA-/Aa3 | | | 4,000,000 | | | | 4,629,800 | |
Illinois State Toll Highway Authority, 5.00% due 1/1/2024 | | AA-/Aa3 | | | 6,500,000 | | | | 7,608,965 | |
Illinois State Toll Highway Authority, 5.00% due 1/1/2025 | | AA-/Aa3 | | | 6,500,000 | | | | 7,128,940 | |
Kane McHenry Cook & DeKalb Counties Unit School District No. 300 GO, 0% due 12/1/2021 (Insured: AMBAC) (ETM) | | NR/Aa3 | | | 765,000 | | | | 705,139 | |
Kane McHenry Cook & DeKalb Counties Unit School District No. 300 GO, 0% due 12/1/2021 (Insured: AMBAC) | | NR/Aa3 | | | 1,235,000 | | | | 1,092,802 | |
Kane McHenry Cook & DeKalb Counties Unit School District No. 300 GO, 5.00% due 1/1/2024 | | AA/NR | | | 7,150,000 | | | | 8,215,350 | |
McHenry County Conservation District GO, 5.00% due 2/1/2021 | | AA+/Aa1 | | | 2,325,000 | | | | 2,613,858 | |
McHenry County Conservation District GO, 5.00% due 2/1/2025 | | AA+/Aa1 | | | 2,000,000 | | | | 2,360,100 | |
Metropolitan Pier & Exposition Authority, 5.00% due 12/15/2020 (McCormick Place Expansion) | | BBB-/NR | | | 4,000,000 | | | | 4,302,840 | |
Railsplitter Tobacco Settlement Authority, 5.00% due 6/1/2019 | | A/NR | | | 22,000,000 | | | | 23,645,600 | |
Railsplitter Tobacco Settlement Authority, 5.125% due 6/1/2019 | | A/NR | | | 6,780,000 | | | | 7,305,179 | |
State of Illinois, 5.00% due 6/15/2021 pre-refunded 6/15/2019 (Build Illinois) | | AAA/NR | | | 9,945,000 | | | | 10,768,645 | |
State of Illinois, 5.00% due 6/15/2023 (Build Illinois) | | AAA/NR | | | 5,825,000 | | | | 6,666,596 | |
18 Semi-Annual Report
| | |
| Schedule of Investments, Continued | | |
| |
Thornburg Limited Term Municipal Fund | | March 31, 2017 (Unaudited) |
| | | | | | | | | | | | |
ISSUER-DESCRIPTION | | CREDIT RATING†
S&P/ MOODY’S | | | PRINCIPAL
AMOUNT | | | VALUE | |
State of Illinois, 5.00% due 6/15/2025 (Build Illinois) | | | AAA/NR | | | $ | 8,825,000 | | | $ | 10,228,440 | |
State of Illinois, 5.00% due 6/15/2026 (Build Illinois) | | | AAA/NR | | | | 8,825,000 | | | | 10,302,658 | |
State of Illinois, 5.00% due 6/15/2027 (Build Illinois) | | | AAA/NR | | | | 5,825,000 | | | | 6,847,113 | |
Town of Cicero Cook County GO, 5.00% due 1/1/2019 (Cicero and Laramie Development Areas; Insured: AGM) | | | AA/A2 | | | | 2,000,000 | | | | 2,118,980 | |
Town of Cicero Cook County GO, 5.00% due 12/1/2019 (Cicero and Laramie Development Areas) | | | A+/NR | | | | 1,070,000 | | | | 1,149,490 | |
Town of Cicero Cook County GO, 5.00% due 1/1/2020 (Cicero and Laramie Development Areas; Insured: AGM) | | | AA/A2 | | | | 1,450,000 | | | | 1,572,684 | |
Town of Cicero Cook County GO, 5.00% due 1/1/2021 (Cicero and Laramie Development Areas; Insured: AGM) | | | AA/A2 | | | | 1,250,000 | | | | 1,380,500 | |
Town of Cicero GO, 5.00% due 1/1/2018 (Cicero and Laramie Development Areas; Insured: AGM) | | | AA/A2 | | | | 2,375,000 | | | | 2,439,410 | |
University of Illinois Board of Trustees COP, 5.00% due 10/1/2019 pre-refunded 10/1/2017 (Insured: AGM) | | | AA/NR | | | | 1,045,000 | | | | 1,067,070 | |
University of Illinois Board of Trustees COP, 5.00% due 10/1/2019 (Insured: AGM) | | | AA/NR | | | | 955,000 | | | | 973,632 | |
Village of Melrose Park, 5.20% due 7/1/2018 (Insured: Natl-Re) | | | AA-/A3 | | | | 1,190,000 | | | | 1,202,102 | |
Village of Tinley Park GO, 4.00% due 12/1/2022 | | | AA+/NR | | | | 625,000 | | | | 688,144 | |
Will & Kendall Counties Plainfield Community Consolidated School District 202 GO, 5.00% due 1/1/2023 (Capital Improvements; Insured: BAM) | | | AA/Aa2 | | | | 8,050,000 | | | | 9,256,212 | |
Will & Kendall Counties Plainfield Community Consolidated School District 202 GO, 5.00% due 1/1/2024 (Capital Improvements; Insured: BAM) | | | AA/Aa2 | | | | 4,580,000 | | | | 5,317,838 | |
Will & Kendall Counties Plainfield Community Consolidated School District 202 GO, 5.00% due 1/1/2025 (Capital Improvements; Insured: BAM) | | | AA/Aa2 | | | | 8,495,000 | | | | 9,943,397 | |
Will County Valley View Community Unit School District No. 365 GO, 0% due 11/1/2018 (Insured: AGM) | | | AA/Aa2 | | | | 3,370,000 | | | | 3,282,548 | |
| | | |
INDIANA — 1.77% | | | | | | | | | | | | |
Avon Community School Building Corp., 5.00% due 7/15/2017 (Insured: AMBAC) (State Aid Withholding) | | | AA+/NR | | | | 2,500,000 | | | | 2,529,925 | |
b Avon Community School Building Corp., 4.00% due 7/15/2018 | | | AA+/NR | | | | 1,000,000 | | | | 1,035,800 | |
b Avon Community School Building Corp., 4.00% due 7/15/2019 | | | AA+/NR | | | | 1,000,000 | | | | 1,059,010 | |
b Avon Community School Building Corp., 5.00% due 7/15/2021 | | | AA+/NR | | | | 2,200,000 | | | | 2,490,312 | |
b Avon Community School Building Corp., 5.00% due 7/15/2022 | | | AA+/NR | | | | 1,000,000 | | | | 1,148,950 | |
b Avon Community School Building Corp., 5.00% due 7/15/2023 | | | AA+/NR | | | | 600,000 | | | | 699,366 | |
b Avon Community School Building Corp., 5.00% due 7/15/2024 | | | AA+/NR | | | | 285,000 | | | | 335,063 | |
b Avon Community School Building Corp., 5.00% due 7/15/2025 | | | AA+/NR | | | | 600,000 | | | | 711,744 | |
b Avon Community School Building Corp., 5.00% due 7/15/2026 | | | AA+/NR | | | | 700,000 | | | | 833,077 | |
b Avon Community School Building Corp., 5.00% due 7/15/2027 | | | AA+/NR | | | | 1,345,000 | | | | 1,614,215 | |
Board of Trustees for the Vincennes University, 4.00% due 6/1/2018 | | | NR/Aa3 | | | | 1,000,000 | | | | 1,032,740 | |
Board of Trustees for the Vincennes University, 5.00% due 6/1/2020 | | | NR/Aa3 | | | | 1,000,000 | | | | 1,111,490 | |
City of Carmel Redevelopment Authority, 5.00% due 8/1/2021 (Road and Intersection Improvements) | | | AA+/NR | | | | 2,405,000 | | | | 2,720,416 | |
City of Carmel Redevelopment Authority, 5.00% due 8/1/2022 (Road and Intersection Improvements) | | | AA+/NR | | | | 2,510,000 | | | | 2,877,439 | |
City of Carmel Redevelopment District COP, 5.75% due 7/15/2022 pre-refunded 1/15/2021 (CFP Energy Center, LLC Installment Purchase Agreement) | | | NR/NR | | | | 2,760,000 | | | | 3,062,910 | |
City of Fort Wayne, 2.00% due 12/1/2017 (Waterworks Utility Improvements) | | | NR/Aa3 | | | | 1,175,000 | | | | 1,183,507 | |
Duneland School Building Corp., 0% due 2/1/2020 (State Aid Withholding) | | | A/NR | | | | 2,970,000 | | | | 2,821,233 | |
Duneland School Building Corp., 0% due 8/1/2020 (State Aid Withholding) | | | A/NR | | | | 3,470,000 | | | | 3,258,712 | |
Duneland School Building Corp., 0% due 2/1/2021 (State Aid Withholding) | | | A/NR | | | | 2,770,000 | | | | 2,568,455 | |
Duneland School Building Corp., 0% due 8/1/2021 (State Aid Withholding) | | | A/NR | | | | 3,270,000 | | | | 2,994,012 | |
Hamilton Southeastern Consolidated School Building Corp., 5.00% due 7/15/2021 (Educational Facilities; Insured: State Intercept) | | | AA+/NR | | | | 1,230,000 | | | | 1,398,399 | |
Hamilton Southeastern Consolidated School Building Corp., 5.00% due 7/15/2022 (Educational Facilities; Insured: State Intercept) | | | AA+/NR | | | | 885,000 | | | | 1,021,166 | |
Hamilton Southeastern Consolidated School Building Corp., 5.00% due 7/15/2023 (Educational Facilities; Insured: State Intercept) | | | AA+/NR | | | | 570,000 | | | | 663,423 | |
Hamilton Southeastern Consolidated School Building Corp., 5.00% due 1/15/2024 (Educational Facilities; Insured: State Intercept) | | | AA+/NR | | | | 525,000 | | | | 613,084 | |
Indiana Bond Bank, 5.00% due 10/15/2017 (Special Gas Program) | | | NR/A3 | | | | 5,000,000 | | | | 5,100,900 | |
Indiana Bond Bank, 5.00% due 8/1/2021 (Columbus Learning Center) | | | AA/NR | | | | 1,300,000 | | | | 1,463,553 | |
Indiana Finance Authority, 5.00% due 5/1/2017 (Parkview Health Systems) | | | A+/Aa3 | | | | 1,000,000 | | | | 1,003,450 | |
Indiana Finance Authority, 5.00% due 9/15/2017 (Marian University Health Sciences) | | | BBB-/NR | | | | 1,940,000 | | | | 1,961,359 | |
Indiana Finance Authority, 4.00% due 5/1/2018 (Community Health Network) | | | A/A2 | | | | 2,820,000 | | | | 2,906,377 | |
Indiana Finance Authority, 5.25% due 7/1/2018 (Wabash Correctional Facilities) | | | AA+/Aa1 | | | | 1,000,000 | | | | 1,052,260 | |
Indiana Finance Authority, 5.25% due 7/1/2018 (Rockville Correctional Facilities) (ETM) | | | AA+/Aa1 | | | | 2,150,000 | | | | 2,264,853 | |
Indiana Finance Authority, 5.00% due 9/15/2018 (Marian University Health Sciences) | | | BBB-/NR | | | | 1,790,000 | | | | 1,847,316 | |
Indiana Finance Authority, 5.00% due 11/1/2018 (Indianapolis Airport) | | | AA+/Aa2 | | | | 2,750,000 | | | | 2,918,272 | |
Indiana Finance Authority, 5.00% due 11/1/2018 (Sisters of St. Francis Health Services, Inc.) | | | NR/Aa3 | | | | 1,250,000 | | | | 1,322,975 | |
Indiana Finance Authority, 5.00% due 5/1/2019 (Community Health Network) | | | A/A2 | | | | 1,790,000 | | | | 1,921,458 | |
Indiana Finance Authority, 5.00% due 9/15/2019 (Marian University Health Sciences) | | | BBB-/NR | | | | 1,250,000 | | | | 1,310,250 | |
Indiana Finance Authority, 5.00% due 3/1/2020 (Indiana University Health System) | | | AA-/Aa3 | | | | 5,000,000 | | | | 5,522,250 | |
Indiana Finance Authority, 5.00% due 5/1/2020 (Community Health Network) | | | A/A2 | | | | 860,000 | | | | 947,711 | |
Indiana Finance Authority, 5.00% due 9/15/2020 (Marian University Health Sciences) | | | BBB-/NR | | | | 2,245,000 | | | | 2,383,719 | |
Indiana Finance Authority, 5.00% due 3/1/2021 (Indiana University Health System) | | | AA-/Aa3 | | | | 9,880,000 | | | | 11,169,241 | |
Indiana Finance Authority, 5.00% due 5/1/2021 (Community Health Network) | | | A/A2 | | | | 2,250,000 | | | | 2,536,335 | |
Semi-Annual Report 19
| | |
| Schedule of Investments, Continued | | |
| |
Thornburg Limited Term Municipal Fund | | March 31, 2017 (Unaudited) |
| | | | | | | | | | | | |
ISSUER-DESCRIPTION | | CREDIT RATING†
S&P/ MOODY’S | | | PRINCIPAL
AMOUNT | | | VALUE | |
Indiana Finance Authority, 5.00% due 9/15/2021 (Marian University Health Sciences) | | | BBB-/NR | | | $ | 2,320,000 | | | $ | 2,482,145 | |
Indiana Finance Authority, 5.00% due 10/1/2021 (CWA Authority, Inc. Wastewater System Project) | | | AA/NR | | | | 500,000 | | | | 570,250 | |
Indiana Finance Authority, 5.00% due 3/1/2022 (Indiana University Health System) | | | AA-/Aa3 | | | | 3,240,000 | | | | 3,628,476 | |
Indiana Finance Authority, 5.00% due 5/1/2022 (Community Health Network) | | | A/A2 | | | | 1,230,000 | | | | 1,409,445 | |
Indiana Finance Authority, 5.00% due 5/1/2022 (Parkview Regional Medical Center) | | | A+/Aa3 | | | | 1,135,000 | | | | 1,307,111 | |
Indiana Finance Authority, 5.00% due 10/1/2023 (CWA Authority, Inc. Wastewater System Project) | | | AA/NR | | | | 1,000,000 | | | | 1,171,040 | |
Indiana Finance Authority, 5.00% due 10/1/2024 (CWA Authority, Inc. Wastewater System Project) | | | AA/NR | | | | 500,000 | | | | 592,130 | |
Indiana HFFA, 5.00% due 10/1/2027 put 6/1/2017 (Ascension Health) | | | NR/Aa3 | | | | 6,590,000 | | | | 6,635,076 | |
Knox Middle School Building Corp., 0% due 1/15/2020 (Insured: Natl-Re) (State Aid Withholding) | | | AA-/A3 | | | | 1,295,000 | | | | 1,213,117 | |
Lake Central Multi-District School Building Corp., 4.00% due 1/15/2019 (Educational Facilities) (State Aid Withholding) | | | AA+/A2 | | | | 1,000,000 | | | | 1,045,630 | |
Lake Central Multi-District School Building Corp., 5.00% due 7/15/2019 (Educational Facilities) (State Aid Withholding) | | | AA+/A2 | | | | 1,680,000 | | | | 1,815,408 | |
Lake Central Multi-District School Building Corp., 4.00% due 1/15/2020 (Educational Facilities) (State Aid Withholding) | | | AA+/A2 | | | | 1,345,000 | | | | 1,428,309 | |
Lake Central Multi-District School Building Corp., 5.00% due 7/15/2020 (Educational Facilities) (State Aid Withholding) | | | AA+/A2 | | | | 1,170,000 | | | | 1,294,699 | |
Lake Central Multi-District School Building Corp., 4.00% due 1/15/2021 (Educational Facilities) (State Aid Withholding) | | | AA+/A2 | | | | 1,250,000 | | | | 1,346,150 | |
Lake Central Multi-District School Building Corp., 5.00% due 7/15/2021 (Educational Facilities) (State Aid Withholding) | | | AA+/A2 | | | | 1,250,000 | | | | 1,412,237 | |
Lake Central Multi-District School Building Corp., 4.00% due 1/15/2022 (Educational Facilities) (State Aid Withholding) | | | AA+/A2 | | | | 1,455,000 | | | | 1,574,339 | |
Lake Central Multi-District School Building Corp., 5.00% due 7/15/2022 (Educational Facilities) (State Aid Withholding) | | | AA+/A2 | | | | 1,000,000 | | | | 1,144,610 | |
Perry Township Multischool Building Corp., 4.00% due 1/15/2018 (Educational Facilities) (State Aid Withholding) | | | AA+/NR | | | | 1,000,000 | | | | 1,023,930 | |
Perry Township Multischool Building Corp., 3.00% due 1/10/2019 (Educational Facilities) (State Aid Withholding) | | | AA+/NR | | | | 1,000,000 | | | | 1,029,820 | |
Perry Township Multischool Building Corp., 4.00% due 7/10/2019 (Educational Facilities) (State Aid Withholding) | | | AA+/NR | | | | 1,000,000 | | | | 1,058,340 | |
Perry Township Multischool Building Corp., 5.00% due 7/10/2020 (Educational Facilities) (State Aid Withholding) | | | AA+/NR | | | | 2,090,000 | | | | 2,310,579 | |
Perry Township Multischool Building Corp., 5.00% due 7/10/2021 (Educational Facilities) (State Aid Withholding) | | | AA+/NR | | | | 1,000,000 | | | | 1,130,860 | |
Whitko High School Building Corp., 4.00% due 7/15/2018 (School Corp. Capital Improvements) (State Aid Withholding) | | | AA+/NR | | | | 1,025,000 | | | | 1,063,776 | |
Zionsville Community Schools Building Corp., 5.00% due 7/15/2019 (Insured: AGM) (State Aid Withholding) | | | AA/A2 | | | | 1,100,000 | | | | 1,193,841 | |
| | | |
IOWA — 0.35% | | | | | | | | | | | | |
Des Moines Independent Community School District, 4.00% due 6/1/2019 (School Infrastructure; Insured: AGM) | | | AA/A2 | | | | 3,870,000 | | | | 4,086,062 | |
Des Moines Independent Community School District, 4.00% due 6/1/2020 (School Infrastructure; Insured: AGM) | | | AA/A2 | | | | 3,990,000 | | | | 4,281,031 | |
Des Moines Independent Community School District, 4.00% due 6/1/2021 (School Infrastructure; Insured: AGM) | | | AA/A2 | | | | 4,125,000 | | | | 4,437,593 | |
Des Moines Independent Community School District, 4.00% due 6/1/2022 (School Infrastructure; Insured: AGM) | | | AA/A2 | | | | 2,140,000 | | | | 2,297,354 | |
Iowa Finance Authority, 5.00% due 8/15/2017 (Iowa Health System; Insured: AGM) (ETM) | | | NR/Aa3 | | | | 990,000 | | | | 1,005,563 | |
Iowa Finance Authority, 5.00% due 2/15/2018 (Iowa Health System; Insured: AGM) | | | NR/Aa3 | | | | 1,405,000 | | | | 1,450,915 | |
Iowa Finance Authority, 5.00% due 7/1/2022 (Genesis Health System) | | | NR/A1 | | | | 1,735,000 | | | | 2,003,942 | |
Iowa Finance Authority, 5.00% due 7/1/2023 (Genesis Health System) | | | NR/A1 | | | | 2,000,000 | | | | 2,343,160 | |
Iowa Finance Authority, 5.00% due 7/1/2024 (Genesis Health System) | | | NR/A1 | | | | 2,350,000 | | | | 2,729,243 | |
| | | |
KANSAS — 0.90% | | | | | | | | | | | | |
Johnson County USD No. 512 GO, 4.00% due 10/1/2017 (Shawnee Mission School District) | | | NR/Aaa | | | | 6,700,000 | | | | 6,808,272 | |
Kansas DFA, 5.00% due 4/1/2020 (National Bio and Agro-Defense Facility) | | | A+/Aa3 | | | | 6,980,000 | | | | 7,676,744 | |
Kansas DFA, 5.00% due 12/1/2020 (New Jobs Training; Insured: BAM) | | | AA/NR | | | | 1,500,000 | | | | 1,634,355 | |
Kansas DFA, 5.00% due 4/1/2021 (National Bio and Agro-Defense Facility) | | | A+/Aa3 | | | | 5,075,000 | | | | 5,710,593 | |
Kansas DFA, 5.00% due 4/1/2022 (National Bio and Agro-Defense Facility) | | | A+/Aa3 | | | | 2,730,000 | | | | 3,113,046 | |
Kansas DFA, 5.00% due 4/1/2023 (National Bio and Agro-Defense Facility) | | | A+/Aa3 | | | | 8,110,000 | | | | 9,367,699 | |
Kansas DFA, 5.00% due 4/1/2024 (National Bio and Agro-Defense Facility) | | | A+/Aa3 | | | | 9,275,000 | | | | 10,744,253 | |
Kansas DFA, 5.00% due 4/1/2025 (National Bio and Agro-Defense Facility) | | | A+/Aa3 | | | | 7,280,000 | | | | 8,369,233 | |
Unified Government of Wyandotte County-Kansas City, 5.00% due 9/1/2022 (Utility Systems Improvement) | | | A+/A3 | | | | 2,000,000 | | | | 2,300,960 | |
Unified Government of Wyandotte County-Kansas City, 5.00% due 9/1/2023 (Utility Systems Improvement) | | | A+/A3 | | | | 1,000,000 | | | | 1,164,510 | |
Unified Government of Wyandotte County-Kansas City, 5.00% due 9/1/2024 (Utility Systems Improvement) | | | A+/A3 | | | | 600,000 | | | | 706,278 | |
Wyandotte County USD No. 500 GO, 5.00% due 9/1/2025 (General Improvement) | | | AA-/Aa2 | | | | 3,300,000 | | | | 3,929,046 | |
Wyandotte County USD No. 500 GO, 5.00% due 9/1/2026 (General Improvement) | | | AA-/Aa2 | | | | 2,375,000 | | | | 2,848,314 | |
| | | |
KENTUCKY — 1.86% | | | | | | | | | | | | |
Commonwealth of Kentucky State Property and Buildings Commission, 5.00% due 11/1/2021 (Project No. 112) | | | A/Aa3 | | | | 10,000,000 | | | | 11,399,700 | |
Commonwealth of Kentucky State Property and Buildings Commission, 5.00% due 11/1/2023 (Project No. 112) | | | A/Aa3 | | | | 20,000,000 | | | | 23,365,000 | |
Commonwealth of Kentucky State Property and Buildings Commission, 5.00% due 11/1/2025 (Project No. 112) | | | A/Aa3 | | | | 25,000,000 | | | | 29,183,500 | |
Commonwealth of Kentucky State Property and Buildings Commission, 5.00% due 11/1/2026 (Project No. 112) | | | A/Aa3 | | | | 20,000,000 | | | | 23,543,400 | |
Kentucky Economic DFA, 0% due 10/1/2019 (Norton Healthcare, Inc.; Insured: Natl-Re) | | | AA-/A3 | | | | 5,000,000 | | | | 4,718,050 | |
Kentucky Economic DFA, 0% due 10/1/2020 (Norton Healthcare, Inc.; Insured: Natl-Re) | | | AA-/A3 | | | | 9,600,000 | | | | 8,784,480 | |
Kentucky Economic DFA, 0% due 10/1/2021 (Norton Healthcare, Inc.; Insured: Natl-Re) | | | AA-/A3 | | | | 2,885,000 | | | | 2,560,668 | |
Kentucky Economic DFA, 0% due 10/1/2023 (Norton Healthcare, Inc.; Insured: Natl-Re) | | | AA-/A3 | | | | 4,195,000 | | | | 3,453,492 | |
Lexington-Fayette Urban County Government Public Facilities Corp., 5.00% due 6/1/2022 (Eastern State Hospital) | | | A/Aa3 | | | | 6,165,000 | | | | 6,942,222 | |
Louisville/Jefferson County Metropolitan Government, 5.00% due 10/1/2024 (Norton Healthcare, Inc.) | | | A-/NR | | | | 1,000,000 | | | | 1,158,880 | |
Louisville/Jefferson County Metropolitan Government, 5.00% due 10/1/2025 (Norton Healthcare, Inc.) | | | A-/NR | | | | 1,200,000 | | | | 1,396,008 | |
Louisville/Jefferson County Metropolitan Government, 5.00% due 10/1/2026 (Norton Healthcare, Inc.) | | | A-/NR | | | | 3,000,000 | | | | 3,498,180 | |
b Louisville/Jefferson County Metropolitan Government, 1.50% due 10/1/2033 (Louisville Gas and Electric Company) | | | NR/NR | | | | 12,725,000 | | | | 12,731,235 | |
20 Semi-Annual Report
| | |
| Schedule of Investments, Continued | | |
| |
Thornburg Limited Term Municipal Fund | | March 31, 2017 (Unaudited) |
| | | | | | | | | | | | |
ISSUER-DESCRIPTION | | CREDIT RATING†
S&P/ MOODY’S | | | PRINCIPAL
AMOUNT | | | VALUE | |
LOUISIANA — 2.48% | | | | | | | | | | | | |
City of Bossier, 4.00% due 12/1/2018 (Public Improvements; Insured: AGM) | | | AA/Aa3 | | | $ | 2,020,000 | | | $ | 2,111,365 | |
City of Bossier, 4.50% due 12/1/2021 (Public Improvements; Insured: AGM) | | | AA/Aa3 | | | | 2,240,000 | | | | 2,503,782 | |
City of Lafayette, 5.00% due 11/1/2019 (Utilities System Improvements) | | | AA-/A1 | | | | 1,000,000 | | | | 1,093,050 | |
City of New Orleans GO, 4.00% due 12/1/2017 (Public Improvements) | | | AA-/A3 | | | | 750,000 | | | | 764,940 | |
City of New Orleans GO, 4.00% due 10/1/2018 (Audubon Park Aquarium; Insured: AGM) | | | AA/NR | | | | 1,110,000 | | | | 1,147,229 | |
City of New Orleans GO, 4.00% due 12/1/2018 (Public Improvements) | | | AA-/A3 | | | | 700,000 | | | | 731,801 | |
City of New Orleans GO, 4.00% due 12/1/2019 (Public Improvements) | | | AA-/A3 | | | | 750,000 | | | | 799,628 | |
City of New Orleans GO, 5.00% due 12/1/2019 (Public Improvements; Insured: AGM) | | | AA-/A3 | | | | 3,080,000 | | | | 3,364,068 | |
City of New Orleans GO, 5.00% due 12/1/2020 (Public Improvements) | | | AA-/A3 | | | | 1,315,000 | | | | 1,467,842 | |
City of New Orleans GO, 5.00% due 12/1/2020 (Public Improvements; Insured: AGM) | | | AA-/A3 | | | | 3,250,000 | | | | 3,627,747 | |
City of New Orleans GO, 5.00% due 12/1/2021 (Public Improvements) | | | AA-/A3 | | | | 1,200,000 | | | | 1,365,900 | |
City of New Orleans GO, 5.00% due 12/1/2021 (Public Improvements; Insured: AGM) | | | AA-/A3 | | | | 5,700,000 | | | | 6,488,025 | |
City of Shreveport, 5.00% due 12/1/2020 (Water and Sewer System; Insured: BAM) | | | AA/A3 | | | | 7,770,000 | | | | 8,648,632 | |
City of Shreveport, 5.00% due 12/1/2021 (Water and Sewer System; Insured: BAM) | | | AA/A3 | | | | 8,185,000 | | | | 9,264,438 | |
City of Shreveport, 5.00% due 12/1/2022 (Water and Sewer System; Insured: BAM) | | | AA/A3 | | | | 6,460,000 | | | | 7,394,116 | |
City of Shreveport, 5.00% due 12/1/2023 (Water and Sewer System; Insured: BAM) | | | AA/A3 | | | | 4,245,000 | | | | 4,913,036 | |
City of Shreveport, 5.00% due 12/1/2024 (Water and Sewer System; Insured: BAM) | | | AA/A3 | | | | 4,490,000 | | | | 5,224,295 | |
Consolidated Sales Tax District A of the Parish of LaFourche, 4.00% due 3/1/2021 (Roads, Bridges & Drainage Works) | | | A/NR | | | | 1,990,000 | | | | 2,153,319 | |
Consolidated Sales Tax District A of the Parish of LaFourche, 4.00% due 3/1/2022 (Roads, Bridges & Drainage Works) | | | A/NR | | | | 1,545,000 | | | | 1,682,366 | |
East Baton Rouge Sewerage Commission, 5.00% due 2/1/2023 (Wastewater System Improvements) | | | AA-/Aa3 | | | | 450,000 | | | | 521,766 | |
East Baton Rouge Sewerage Commission, 5.00% due 2/1/2024 (Wastewater System Improvements) | | | AA-/Aa3 | | | | 1,000,000 | | | | 1,171,170 | |
East Baton Rouge Sewerage Commission, 5.00% due 2/1/2025 (Wastewater System Improvements) | | | AA-/Aa3 | | | | 700,000 | | | | 826,581 | |
Ernest N. Morial - New Orleans Exhibition Hall Authority, 5.00% due 7/15/2020 (Convention Center) | | | NR/A1 | | | | 1,000,000 | | | | 1,111,340 | |
Ernest N. Morial - New Orleans Exhibition Hall Authority, 5.00% due 7/15/2021 (Convention Center) | | | NR/A1 | | | | 780,000 | | | | 885,027 | |
Ernest N. Morial - New Orleans Exhibition Hall Authority, 5.00% due 7/15/2022 (Convention Center) | | | NR/A1 | | | | 1,000,000 | | | | 1,148,680 | |
Ernest N. Morial - New Orleans Exhibition Hall Authority, 5.00% due 7/15/2023 (Convention Center) | | | NR/A1 | | | | 1,000,000 | | | | 1,137,710 | |
Jefferson Sales Tax District Parish of Jefferson, 5.00% due 12/1/2018 (Sewerage Capital Project; Insured: AGM) | | | AA/A2 | | | | 2,000,000 | | | | 2,128,600 | |
Louisiana Energy & Power Authority, 5.00% due 1/1/2020 (Rodemacher Unit No. 2 Power) | | | A-/Baa1 | | | | 1,000,000 | | | | 1,091,660 | |
Louisiana Energy & Power Authority, 5.00% due 1/1/2021 (Rodemacher Unit No. 2 Power) | | | A-/Baa1 | | | | 1,000,000 | | | | 1,117,820 | |
Louisiana Energy & Power Authority, 5.00% due 6/1/2022 (LEPA Unit No. 1 Power; Insured: AGM) | | | AA/A2 | | | | 1,000,000 | | | | 1,155,770 | |
Louisiana Energy & Power Authority, 5.00% due 1/1/2023 (Rodemacher Unit No. 2 Power) | | | A-/Baa1 | | | | 1,740,000 | | | | 1,991,621 | |
Louisiana Energy & Power Authority, 5.00% due 6/1/2023 (LEPA Unit No. 1 Power; Insured: AGM) | | | AA/A2 | | | | 750,000 | | | | 879,045 | |
Louisiana Local Govt Environmental Facilities & Community Development Authority, 4.00% due 10/1/2017 (Town of Vinton Public Power Authority; Insured: AGM) | | | AA/NR | | | | 1,000,000 | | | | 1,012,460 | |
Louisiana Local Govt Environmental Facilities & Community Development Authority, 5.00% due 3/1/2018 (Independence Stadium) (ETM) | | | A/NR | | | | 1,000,000 | | | | 1,037,160 | |
Louisiana Local Govt Environmental Facilities & Community Development Authority, 4.50% due 10/1/2018 (Town of Vinton Public Power Authority; Insured: AGM) | | | AA/NR | | | | 1,000,000 | | | | 1,041,750 | |
Louisiana Local Govt Environmental Facilities & Community Development Authority, 4.00% due 12/1/2018 (Bossier Parish Community College — Campus Facilities Project, Inc.) | | | A+/NR | | | | 2,655,000 | | | | 2,781,537 | |
Louisiana Local Govt Environmental Facilities & Community Development Authority, 4.50% due 10/1/2019 (Town of Vinton Public Power Authority; Insured: AGM) | | | AA/NR | | | | 1,000,000 | | | | 1,062,550 | |
Louisiana Local Govt Environmental Facilities & Community Development Authority, 4.00% due 12/1/2019 (Bossier Parish Community College — Campus Facilities, Inc. Project) | | | A+/NR | | | | 1,310,000 | | | | 1,395,910 | |
Louisiana Local Govt Environmental Facilities & Community Development Authority, 5.00% due 12/1/2020 (Bossier Parish Community College — Campus Facilities, Inc. Project) | | | A+/NR | | | | 1,200,000 | | | | 1,338,948 | |
Louisiana Offshore Terminal Authority, 5.00% due 10/1/2018 (Deepwater Oil Port-Loop LLC) | | | BBB/NR | | | | 22,140,000 | | | | 23,202,277 | |
Louisiana Offshore Terminal Authority, 2.20% due 10/1/2040 put 10/1/2017 (Deepwater Oil Port-Loop LLC) | | | BBB/NR | | | | 6,000,000 | | | | 6,022,020 | |
Louisiana Public Facilities Authority, 5.00% due 5/15/2017 (Ochsner Clinic Foundation) | | | NR/Baa1 | | | | 750,000 | | | | 753,773 | |
Louisiana Public Facilities Authority, 5.00% due 5/15/2017 (Ochsner Clinic Foundation) (ETM) | | | NR/NR | | | | 285,000 | | | | 286,493 | |
Louisiana Public Facilities Authority, 5.00% due 5/15/2018 pre-refunded 5/15/2017 (Ochsner Clinic Foundation) | | | NR/NR | | | | 550,000 | | | | 552,866 | |
Louisiana Public Facilities Authority, 5.00% due 5/15/2018 (Ochsner Clinic Foundation) | | | NR/Baa1 | | | | 1,450,000 | | | | 1,456,931 | |
Louisiana Public Facilities Authority, 5.00% due 6/1/2022 (Hurricane Recovery Program) | | | NR/A1 | | | | 2,945,000 | | | | 3,351,646 | |
Louisiana Public Facilities Authority, 5.00% due 6/1/2023 (Hurricane Recovery Program) | | | NR/A1 | | | | 5,000,000 | | | | 5,763,150 | |
Louisiana State Office Facilities Corp., 5.00% due 5/1/2018 (State Capitol) | | | NR/A1 | | | | 2,500,000 | | | | 2,607,475 | |
Louisiana State Office Facilities Corp., 5.00% due 5/1/2021 (State Capitol) | | | NR/A1 | | | | 4,595,000 | | | | 5,050,548 | |
New Orleans Regional Transit Authority, 5.00% due 12/1/2017 (Streetcar Rail Lines; Insured: AGM) | | | AA/Aa3 | | | | 755,000 | | | | 775,483 | |
New Orleans Regional Transit Authority, 5.00% due 12/1/2019 (Streetcar Rail Lines; Insured: AGM) | | | AA/Aa3 | | | | 1,000,000 | | | | 1,093,830 | |
New Orleans Regional Transit Authority, 5.00% due 12/1/2021 (Streetcar Rail Lines; Insured: AGM) | | | AA/Aa3 | | | | 1,000,000 | | | | 1,106,580 | |
New Orleans Regional Transit Authority, 5.00% due 12/1/2022 (Streetcar Rail Lines; Insured: AGM) | | | AA/Aa3 | | | | 1,110,000 | | | | 1,235,175 | |
Parish of LaFourche, 5.00% due 1/1/2019 (Roads, Highways & Bridges) | | | AA-/NR | | | | 595,000 | | | | 633,169 | |
Parish of LaFourche, 5.00% due 1/1/2022 (Roads, Highways & Bridges) | | | AA-/NR | | | | 415,000 | | | | 470,934 | |
Parish of LaFourche, 5.00% due 1/1/2023 (Roads, Highways & Bridges) | | | AA-/NR | | | | 515,000 | | | | 590,968 | |
Parish of Orleans School District GO, 5.00% due 9/1/2018 (Insured: AGM) | | | AA/Aa3 | | | | 4,800,000 | | | | 5,040,288 | |
Parish of Orleans School District GO, 5.00% due 9/1/2020 (Insured: AGM) | | | AA/Aa3 | | | | 3,840,000 | | | | 4,235,443 | |
Semi-Annual Report 21
| | |
| Schedule of Investments, Continued | | |
| |
Thornburg Limited Term Municipal Fund | | March 31, 2017 (Unaudited) |
| | | | | | | | | | | | |
ISSUER-DESCRIPTION | | CREDIT RATING†
S&P/ MOODY’S | | | PRINCIPAL
AMOUNT | | | VALUE | |
Parish of Plaquemines Law Enforcement District GO, 5.00% due 9/1/2019 | | | A+/NR | | | $ | 1,005,000 | | | $ | 1,071,561 | |
Parish of Plaquemines Law Enforcement District GO, 5.00% due 9/1/2021 pre-refunded 9/1/2019 | | | A+/NR | | | | 1,115,000 | | | | 1,217,000 | |
Parish of St. Charles, 4.00% due 12/1/2040 put 6/1/2022 (Valero Energy Corp. Refinery) | | | BBB/Baa2 | | | | 14,195,000 | | | | 14,892,116 | |
Parish of Terrebonne Hospital Service District No. 1, 4.00% due 4/1/2017 (Terrebonne General Medical Center) | | | A/A3 | | | | 1,000,000 | | | | 1,000,000 | |
Parish of Terrebonne Hospital Service District No. 1, 5.00% due 4/1/2018 (Terrebonne General Medical Center) | | | A/A3 | | | | 1,000,000 | | | | 1,037,920 | |
Parish of Terrebonne Hospital Service District No. 1, 5.00% due 4/1/2019 (Terrebonne General Medical Center) | | | A/A3 | | | | 1,810,000 | | | | 1,938,076 | |
Parish of Terrebonne Hospital Service District No. 1, 5.00% due 4/1/2021 (Terrebonne General Medical Center) | | | A/A3 | | | | 2,320,000 | | | | 2,539,797 | |
| | | |
MAINE — 0.08% | | | | | | | | | | | | |
Maine Governmental Facilities Authority, 5.00% due 10/1/2020 (Augusta & Machias Courthouses) | | | AA-/Aa3 | | | | 1,245,000 | | | | 1,386,270 | |
Maine Governmental Facilities Authority, 5.00% due 10/1/2021 (Augusta & Machias Courthouses) | | | AA-/Aa3 | | | | 1,315,000 | | | | 1,494,879 | |
Maine Governmental Facilities Authority, 5.00% due 10/1/2022 (Augusta & Machias Courthouses) | | | AA-/Aa3 | | | | 1,175,000 | | | | 1,352,766 | |
Maine Governmental Facilities Authority, 5.00% due 10/1/2023 (Augusta & Machias Courthouses) | | | AA-/Aa3 | | | | 1,445,000 | | | | 1,683,569 | |
| | | |
MARYLAND — 0.44% | | | | | | | | | | | | |
Maryland Economic Development Corp., 5.00% due 6/1/2021 (Public Health Laboratory) | | | AA+/Aa1 | | | | 8,725,000 | | | | 9,953,829 | |
Maryland Economic Development Corp., 4.00% due 6/1/2022 (Public Health Laboratory) | | | AA+/Aa1 | | | | 8,245,000 | | | | 8,951,184 | |
Prince George’s County GO, 5.00% due 9/15/2017 (Consolidated Public Improvements) | | | AAA/Aaa | | | | 12,340,000 | | | | 12,578,162 | |
| | | |
MASSACHUSETTS — 1.29% | | | | | | | | | | | | |
Berkshire Wind Power Cooperative Corp., 5.00% due 7/1/2017 | | | A/NR | | | | 2,540,000 | | | | 2,564,943 | |
Berkshire Wind Power Cooperative Corp., 5.00% due 7/1/2018 | | | A/NR | | | | 2,825,000 | | | | 2,954,837 | |
Berkshire Wind Power Cooperative Corp., 5.00% due 7/1/2019 | | | A/NR | | | | 2,765,000 | | | | 2,980,172 | |
Berkshire Wind Power Cooperative Corp., 5.00% due 7/1/2020 | | | A/NR | | | | 2,965,000 | | | | 3,260,344 | |
City of Quincy GO, 2.00% due 6/16/2017 (Capital Improvements) | | | SP-1+/NR | | | | 6,870,000 | | | | 6,885,389 | |
Massachusetts Development Finance Agency, 3.00% due 7/1/2018 (Mount Auburn Hospital Health Records System) | | | A-/A3 | | | | 1,000,000 | | | | 1,021,630 | |
Massachusetts Development Finance Agency, 5.00% due 7/1/2022 (Mount Auburn Hospital Health Records System) | | | A-/A3 | | | | 2,750,000 | | | | 3,143,718 | |
Massachusetts Development Finance Agency, 5.00% due 7/1/2023 (Mount Auburn Hospital Health Records System) | | | A-/A3 | | | | 4,000,000 | | | | 4,630,400 | |
Massachusetts Development Finance Agency, 5.00% due 7/1/2023 (CareGroup Healthcare) | | | A-/A3 | | | | 2,500,000 | | | | 2,901,900 | |
Massachusetts Development Finance Agency, 5.25% due 10/1/2023 (Simmons College) | | | BBB+/Baa1 | | | | 595,000 | | | | 683,084 | |
Massachusetts Development Finance Agency, 5.00% due 7/1/2024 (Mount Auburn Hospital Health Records System) | | | A-/A3 | | | | 6,050,000 | | | | 7,077,713 | |
Massachusetts Development Finance Agency, 5.00% due 7/1/2024 (CareGroup Healthcare) | | | A-/A3 | | | | 3,020,000 | | | | 3,533,007 | |
Massachusetts Development Finance Agency, 5.00% due 7/1/2025 (Mount Auburn Hospital Health Records System) | | | A-/A3 | | | | 2,465,000 | | | | 2,907,714 | |
Massachusetts Development Finance Agency, 5.00% due 7/1/2025 (CareGroup Healthcare) | | | A-/A3 | | | | 2,500,000 | | | | 2,949,000 | |
Massachusetts Development Finance Agency, 5.00% due 7/1/2026 (CareGroup Healthcare) | | | A-/A3 | | | | 3,000,000 | | | | 3,564,090 | |
Massachusetts Development Finance Agency, 5.75% due 12/1/2042 pre-refunded 5/1/2019 (Dominion Energy Brayton Point Station Units 1 and 2) | | | BBB/Baa2 | | | | 2,000,000 | | | | 2,188,700 | |
Massachusetts Educational Financing Authority, 5.50% due 1/1/2018 | | | AA/NR | | | | 11,170,000 | | | | 11,532,466 | |
Massachusetts Educational Financing Authority, 5.75% due 1/1/2020 | | | AA/NR | | | | 7,500,000 | | | | 8,267,700 | |
Massachusetts Health & Educational Facilities Authority, 5.00% due 7/1/2018 (UMass Memorial Health Care) | | | BBB+/Baa3 | | | | 4,290,000 | | | | 4,474,599 | |
Massachusetts Health & Educational Facilities Authority, 0.95% due 7/1/2044 put 4/3/2017 (Baystate Medical Center; LOC: JPMorgan Chase Bank, N.A.) (daily demand notes) | | | AA+/Aa1 | | | | 2,770,000 | | | | 2,770,000 | |
Massachusetts Housing Finance Agency, 2.00% due 6/1/2019 (Low and Moderate Income Housing) | | | AA-/Aa3 | | | | 11,915,000 | | | | 11,993,162 | |
| | | |
MICHIGAN — 3.45% | | | | | | | | | | | | |
Board of Governors of Wayne State University, 5.00% due 11/15/2022 (Educational Facilities and Equipment) | | | A+/Aa3 | | | | 425,000 | | | | 487,909 | |
Board of Governors of Wayne State University, 5.00% due 11/15/2023 (Educational Facilities and Equipment) | | | A+/Aa3 | | | | 305,000 | | | | 355,261 | |
Board of Governors of Wayne State University, 5.00% due 11/15/2024 (Educational Facilities and Equipment) | | | A+/Aa3 | | | | 515,000 | | | | 602,478 | |
Board of Governors of Wayne State University, 5.00% due 11/15/2025 (Educational Facilities and Equipment) | | | A+/Aa3 | | | | 625,000 | | | | 730,100 | |
Byron Center Michigan Public Schools, 4.00% due 5/1/2017 (Insured: AGM/Q-SBLF) | | | AA/NR | | | | 1,305,000 | | | | 1,308,484 | |
Byron Center Michigan Public Schools, 4.00% due 5/1/2018 (Insured: AGM/Q-SBLF) | | | AA/NR | | | | 1,935,000 | | | | 1,997,462 | |
Byron Center Michigan Public Schools, 4.00% due 5/1/2020 (Insured: AGM/Q-SBLF) | | | AA/NR | | | | 1,000,000 | | | | 1,076,410 | |
City of Battle Creek GO, 5.00% due 5/1/2020 (Downtown Development; Insured: AMBAC) | | | AA/NR | | | | 960,000 | | | | 998,784 | |
City of Battle Creek GO, 5.00% due 5/1/2020 pre-refunded 5/1/2018 (Downtown Development; Insured: AMBAC) | | | NR/NR | | | | 2,240,000 | | | | 2,338,022 | |
County of Genesee GO, 5.00% due 11/1/2022 (Water Supply System; Insured: BAM) | | | AA/A2 | | | | 600,000 | | | | 680,094 | |
County of Livingston GO, 4.00% due 5/1/2018 (Howell Public Schools; Insured: Q-SBLF) | | | AA-/NR | | | | 1,000,000 | | | | 1,031,620 | |
County of Livingston GO, 4.00% due 5/1/2020 (Howell Public Schools; Insured: Q-SBLF) | | | AA-/NR | | | | 1,000,000 | | | | 1,073,800 | |
County of Livingston GO, 4.00% due 5/1/2021 (Howell Public Schools; Insured: Q-SBLF) | | | AA-/NR | | | | 1,000,000 | | | | 1,090,080 | |
Kalamazoo Hospital Finance Authority, 4.50% due 5/15/2017 (Bronson Methodist Hospital; Insured: AGM) | | | NR/A2 | | | | 1,830,000 | | | | 1,837,851 | |
Kalamazoo Hospital Finance Authority, 5.00% due 5/15/2018 (Bronson Methodist Hospital; Insured: AGM) | | | AA/A2 | | | | 2,500,000 | | | | 2,603,500 | |
Kalamazoo Hospital Finance Authority, 5.00% due 5/15/2018 (Bronson Methodist Hospital; Insured: AGM) | | | AA/A2 | | | | 1,520,000 | | | | 1,582,928 | |
Kalamazoo Hospital Finance Authority, 5.00% due 5/15/2020 (Bronson Methodist Hospital; Insured: AGM) | | | NR/A2 | | | | 1,735,000 | | | | 1,914,382 | |
Kalamazoo Hospital Finance Authority, 5.00% due 5/15/2021 pre-refunded 5/15/2020 (Bronson Methodist Hospital; Insured: AGM) | | | NR/A2 | | | | 1,300,000 | | | | 1,443,221 | |
Kalamazoo Hospital Finance Authority, 5.00% due 5/15/2021 (Bronson Methodist Hospital; Insured: AGM) | | | NR/A2 | | | | 1,050,000 | | | | 1,155,189 | |
Livonia Public Schools School District GO, 4.00% due 5/1/2020 (School Building & Site) | | | A/A3 | | | | 800,000 | | | | 846,624 | |
Livonia Public Schools School District GO, 5.00% due 5/1/2021 (School Building & Site) | | | A/A3 | | | | 900,000 | | | | 1,002,861 | |
22 Semi-Annual Report
| | |
| Schedule of Investments, Continued | | |
| |
Thornburg Limited Term Municipal Fund | | March 31, 2017 (Unaudited) |
| | | | | | | | | | |
ISSUER-DESCRIPTION | | CREDIT RATING†
S&P/ MOODY’S | | PRINCIPAL
AMOUNT | | | VALUE | |
Michigan Finance Authority, 4.00% due 8/1/2018 (Beaumont Health Credit Group) | | A/A1 | | $ | 500,000 | | | $ | 518,265 | |
Michigan Finance Authority, 5.00% due 8/1/2019 (Ypsilanti Community Schools) | | A+/NR | | | 1,150,000 | | | | 1,237,101 | |
Michigan Finance Authority, 5.00% due 8/1/2020 (Ypsilanti Community Schools) | | A+/NR | | | 1,220,000 | | | | 1,338,450 | |
Michigan Finance Authority, 5.00% due 8/1/2021 (Ypsilanti Community Schools) | | A+/NR | | | 1,295,000 | | | | 1,447,072 | |
Michigan Finance Authority, 5.00% due 8/1/2022 (Ypsilanti Community Schools) | | A+/NR | | | 1,375,000 | | | | 1,556,184 | |
Michigan Finance Authority, 5.00% due 12/1/2022 (Trinity Health Credit Group) | | AA-/Aa3 | | | 1,000,000 | | | | 1,159,490 | |
Michigan Finance Authority, 5.00% due 8/1/2023 (Beaumont Health Credit Group) | | A/A1 | | | 3,800,000 | | | | 4,369,582 | |
Michigan Finance Authority, 5.00% due 12/1/2023 (Trinity Health Credit Group) | | AA-/Aa3 | | | 2,500,000 | | | | 2,933,450 | |
Michigan Finance Authority, 5.00% due 8/1/2024 (Beaumont Health Credit Group) | | A/A1 | | | 7,000,000 | | | | 8,099,630 | |
Michigan Finance Authority, 5.00% due 12/1/2024 (Trinity Health Credit Group) | | AA-/Aa3 | | | 1,000,000 | | | | 1,183,340 | |
Michigan Finance Authority, 5.00% due 8/1/2025 (Beaumont Health Credit Group) | | A/A1 | | | 8,000,000 | | | | 9,228,960 | |
Michigan Finance Authority, 5.00% due 11/15/2027 (Henry Ford Health System) | | A/A3 | | | 1,000,000 | | | | 1,150,610 | |
Michigan Municipal Bond Authority, 5.00% due 10/1/2020 (Clean Water Fund) | | AAA/Aaa | | | 35,000 | | | | 36,310 | |
Michigan State Building Authority, 5.50% due 10/15/2017 (ETM) | | NR/NR | | | 525,000 | | | | 538,277 | |
Michigan State Building Authority, 5.50% due 10/15/2017 (Facilities Program) (ETM) | | NR/NR | | | 165,000 | | | | 169,183 | |
Michigan State Building Authority, 5.50% due 10/15/2017 (Facilities Program) | | A+/Aa2 | | | 3,460,000 | | | | 3,546,569 | |
Michigan State Building Authority, 5.00% due 4/15/2023 (Facilities Program) | | A+/Aa2 | | | 1,000,000 | | | | 1,166,750 | |
Michigan State Building Authority, 5.00% due 4/15/2024 (Facilities Program) | | A+/Aa2 | | | 1,000,000 | | | | 1,177,760 | |
Michigan State Building Authority, 5.00% due 4/15/2025 (Facilities Program) | | A+/Aa2 | | | 1,555,000 | | | | 1,845,396 | |
Michigan State Building Authority, 5.00% due 4/15/2026 (Facilities Program) | | A+/Aa2 | | | 750,000 | | | | 892,448 | |
Michigan State Hospital Finance Authority, 5.00% due 11/15/2017 (Sparrow Memorial Hospital) | | A+/A1 | | | 1,500,000 | | | | 1,536,915 | |
Michigan State Hospital Finance Authority, 5.50% due 11/15/2017 (Henry Ford Health System) (ETM) | | A/A3 | | | 1,530,000 | | | | 1,574,431 | |
Michigan State Hospital Finance Authority, 5.00% due 7/15/2018 pre-refunded 7/15/2017 (Oakwood Hospital) | | A/A1 | | | 1,000,000 | | | | 1,012,180 | |
Michigan State Hospital Finance Authority, 5.50% due 11/15/2018 (Henry Ford Health System) (ETM) | | A/A3 | | | 3,500,000 | | | | 3,749,830 | |
Michigan State Hospital Finance Authority, 6.00% due 12/1/2018 (Trinity Health) | | AA-/Aa3 | | | 2,000,000 | | | | 2,159,740 | |
Michigan State Hospital Finance Authority, 5.00% due 7/15/2019 pre-refunded 7/15/2017 (Oakwood Hospital) | | A/A1 | | | 2,000,000 | | | | 2,024,360 | |
Michigan State Hospital Finance Authority, 5.00% due 10/1/2026 put 6/1/2017 (Ascension Health) | | NR/Aa3 | | | 11,100,000 | | | | 11,176,146 | |
Michigan State Hospital Finance Authority, 1.90% due 11/15/2047 (Ascension Health) | | AA+/Aa2 | | | 2,900,000 | | | | 2,900,232 | |
Michigan Strategic Fund, 5.00% due 10/15/2017 (Michigan House of Representatives Facilities; Insured: AGM) | | AA/Aa2 | | | 2,000,000 | | | | 2,043,020 | |
Michigan Strategic Fund, 5.25% due 10/15/2019 pre-refunded 10/15/2018 (Michigan House of Representatives Facilities; Insured: AGM) | | AA/Aa2 | | | 2,550,000 | | | | 2,714,246 | |
Michigan Strategic Fund, 5.25% due 10/15/2020 pre-refunded 10/15/2018 (Michigan House of Representatives Facilities; Insured: AGM) | | AA/Aa2 | | | 4,025,000 | | | | 4,284,250 | |
Novi Community School District GO, 5.00% due 5/1/2018 (Michigan School Bond Qualification and Loan Program; Insured: Q-SBLF) | | NR/Aa1 | | | 1,000,000 | | | | 1,042,360 | |
Novi Community School District GO, 5.00% due 5/1/2019 (Michigan School Bond Qualification and Loan Program; Insured: Q-SBLF) | | NR/Aa1 | | | 800,000 | | | | 860,184 | |
Plymouth-Canton Community Schools GO, 4.00% due 5/1/2018 (Insured: Q-SBLF) | | NR/Aa1 | | | 1,500,000 | | | | 1,547,430 | |
Plymouth-Canton Community Schools GO, 4.00% due 5/1/2019 (Insured: Q-SBLF) | | NR/Aa1 | | | 1,000,000 | | | | 1,054,750 | |
Plymouth-Canton Community Schools GO, 5.00% due 5/1/2020 (Insured: Q-SBLF) | | NR/Aa1 | | | 1,000,000 | | | | 1,103,790 | |
Royal Oak Hospital Finance Authority, 5.25% due 8/1/2017 (William Beaumont Hospital) (ETM) | | NR/A1 | | | 5,855,000 | | | | 5,942,825 | |
Royal Oak Hospital Finance Authority, 5.00% due 9/1/2020 (William Beaumont Hospital) | | A/A1 | | | 1,200,000 | | | | 1,333,548 | |
Royal Oak Hospital Finance Authority, 5.00% due 9/1/2021 (William Beaumont Hospital) | | A/A1 | | | 2,500,000 | | | | 2,832,025 | |
Royal Oak Hospital Finance Authority, 5.00% due 9/1/2023 (William Beaumont Hospital) | | A/A1 | | | 1,240,000 | | | | 1,427,190 | |
Royal Oak Hospital Finance Authority, 5.00% due 9/1/2024 (William Beaumont Hospital) | | A/A1 | | | 2,000,000 | | | | 2,302,000 | |
School District of the City of Dearborn GO, 3.00% due 5/1/2019 (Insured: Q-SBLF) (State Aid Withholding) | | NR/Aa1 | | | 445,000 | | | | 460,250 | |
School District of the City of Dearborn GO, 4.00% due 5/1/2020 (Insured: Q-SBLF) (State Aid Withholding) | | NR/Aa1 | | | 350,000 | | | | 375,830 | |
School District of the City of Dearborn GO, 4.00% due 5/1/2021 (Insured: Q-SBLF) (State Aid Withholding) | | NR/Aa1 | | | 570,000 | | | | 621,346 | |
School District of the City of Dearborn GO, 4.00% due 5/1/2022 (Insured: Q-SBLF) (State Aid Withholding) | | NR/Aa1 | | | 535,000 | | | | 587,842 | |
School District of the City of Dearborn GO, 4.00% due 5/1/2023 (Insured: Q-SBLF) (State Aid Withholding) | | NR/Aa1 | | | 625,000 | | | | 690,988 | |
School District of the City of Detroit GO, 5.00% due 5/1/2020 (Wayne County School Building & Site; Insured: Q-SBLF) | | AA-/Aa1 | | | 2,200,000 | | | | 2,399,144 | |
School District of the City of Detroit GO, 5.00% due 5/1/2021 (Wayne County School Building & Site; Insured: Q-SBLF) | | AA-/Aa1 | | | 4,000,000 | | | | 4,437,280 | |
School District of the City of Detroit GO, 5.00% due 5/1/2022 (Wayne County School Building & Site; Insured: Q-SBLF) | | AA-/Aa1 | | | 3,000,000 | | | | 3,365,070 | |
Sparta Area Schools, Counties of Kent and Ottawa GO, 5.00% due 5/1/2017 (School Building & Site; Insured: Q-SBLF) | | AA-/NR | | | 1,085,000 | | | | 1,088,635 | |
Sparta Area Schools, Counties of Kent and Ottawa GO, 5.00% due 5/1/2018 (School Building & Site; Insured: Q-SBLF) | | AA-/NR | | | 1,285,000 | | | | 1,337,775 | |
Sparta Area Schools, Counties of Kent and Ottawa GO, 5.00% due 5/1/2020 (School Building & Site; Insured: Q-SBLF) | | AA-/NR | | | 1,335,000 | | | | 1,476,684 | |
St. Johns Public Schools GO, 5.00% due 5/1/2021 (Insured: Natl-Re/FGIC/Q-SBLF) | | AA-/Aa2 | | | 1,000,000 | | | | 1,129,360 | |
State Building Authority of the State of Michigan, 5.00% due 10/15/2020 (Higher Education Facilities Program) | | A+/Aa2 | | | 1,000,000 | | | | 1,123,260 | |
State Building Authority of the State of Michigan, 5.00% due 10/15/2021 (Higher Education Facilities Program) | | A+/Aa2 | | | 1,000,000 | | | | 1,146,210 | |
State Building Authority of the State of Michigan, 5.00% due 10/15/2022 (Higher Education Facilities Program) | | A+/Aa2 | | | 3,000,000 | | | | 3,483,960 | |
State Building Authority of the State of Michigan, 5.00% due 10/15/2023 (Higher Education Facilities Program) | | A+/Aa2 | | | 7,715,000 | | | | 9,064,739 | |
State of Michigan, 5.00% due 3/15/2025 (Jobs Today Highway Program & Governor’s Economic Stimulus Program) | | AA/A2 | | | 19,000,000 | | | | 22,482,510 | |
Utica Community Schools County of Macomb GO, 4.00% due 5/1/2018 (Technology Infrastructure Improvements; Insured: Q-SBLF) | | AA-/NR | | | 1,725,000 | | | | 1,778,906 | |
Utica Community Schools County of Macomb GO, 4.00% due 5/1/2019 (Technology Infrastructure Improvements; Insured: Q-SBLF) | | AA-/NR | | | 9,925,000 | | | | 10,461,347 | |
Semi-Annual Report 23
| | |
| Schedule of Investments, Continued | | |
| |
Thornburg Limited Term Municipal Fund | | March 31, 2017 (Unaudited) |
| | | | | | | | | | |
ISSUER-DESCRIPTION | | CREDIT RATING†
S&P/ MOODY’S | | PRINCIPAL
AMOUNT | | | VALUE | |
Warren Consolidated School District GO, 4.00% due 5/1/2017 (Insured: Q-SBLF) | | AA-/NR | | $ | 1,035,000 | | | $ | 1,037,670 | |
Warren Consolidated School District GO, 5.00% due 5/1/2018 (Insured: Q-SBLF) | | AA-/NR | | | 1,000,000 | | | | 1,041,990 | |
Warren Consolidated School District GO, 5.00% due 5/1/2020 (Insured: Q-SBLF) | | AA-/NR | | | 1,000,000 | | | | 1,102,840 | |
Warren Consolidated School District GO, 5.00% due 5/1/2021 (Insured: Q-SBLF) | | AA-/NR | | | 1,000,000 | | | | 1,126,830 | |
Wayne County Airport Authority, 5.00% due 12/1/2017 (Detroit Metropolitan Airport; Insured: Natl-Re) | | AA-/A2 | | | 1,000,000 | | | | 1,026,080 | |
Wayne County Airport Authority, 5.00% due 12/1/2017 (Detroit Metropolitan Airport) | | A/A2 | | | 2,420,000 | | | | 2,482,121 | |
Wayne County Airport Authority, 5.00% due 12/1/2019 (Detroit Metropolitan Airport) | | A/A2 | | | 12,645,000 | | | | 13,760,795 | |
Wayne County Airport Authority, 5.50% due 12/1/2019 (Detroit Metropolitan Airport) | | A/A2 | | | 2,600,000 | | | | 2,863,224 | |
Wayne County Airport Authority, 5.50% due 12/1/2020 (Detroit Metropolitan Airport) | | A/A2 | | | 4,395,000 | | | | 4,936,903 | |
Wayne County Airport Authority, 5.50% due 12/1/2020 (Detroit Metropolitan Airport) | | A/A2 | | | 3,115,000 | | | | 3,499,079 | |
Wayne State University, 5.00% due 11/15/2023 | | A+/Aa3 | | | 3,865,000 | | | | 4,481,313 | |
Wayne State University, 5.00% due 11/15/2024 | | A+/Aa3 | | | 4,840,000 | | | | 5,662,122 | |
Wayne State University, 5.00% due 11/15/2025 | | A+/Aa3 | | | 5,775,000 | | | | 6,791,111 | |
Wayne State University, 5.00% due 11/15/2026 | | A+/Aa3 | | | 3,000,000 | | | | 3,523,080 | |
Western Townships Utilities Authority GO, 5.00% due 1/1/2018 (Sewage Disposal System) | | AA/NR | | | 1,500,000 | | | | 1,543,665 | |
| | | |
MINNESOTA — 0.70% | | | | | | | | | | |
City of Rochester, 4.00% due 11/15/2030 (Mayo Clinic) | | AA/Aa2 | | | 1,400,000 | | | | 1,463,700 | |
City of St. Cloud, 5.00% due 5/1/2017 (CentraCare Health System) | | NR/A1 | | | 2,920,000 | | | | 2,930,570 | |
City of St. Cloud, 5.00% due 5/1/2017 (CentraCare Health System) | | NR/A1 | | | 1,000,000 | | | | 1,003,620 | |
City of St. Cloud, 5.00% due 5/1/2018 (CentraCare Health System) | | NR/A1 | | | 3,105,000 | | | | 3,236,528 | |
City of St. Cloud, 5.00% due 5/1/2019 (CentraCare Health System) | | NR/A1 | | | 3,495,000 | | | | 3,763,661 | |
City of St. Cloud, 5.00% due 5/1/2020 (CentraCare Health System) | | NR/A1 | | | 3,310,000 | | | | 3,664,468 | |
City of St. Paul Housing & Redevelopment Authority, 5.00% due 2/1/2018 (Gillette Children’s Specialty Healthcare Project) | | A/NR | | | 1,255,000 | | | | 1,289,475 | |
City of St. Paul Housing & Redevelopment Authority, 5.25% due 2/1/2020 (Gillette Children’s Specialty Healthcare Project) | | A/NR | | | 2,010,000 | | | | 2,132,127 | |
County of Clay GO, 3.00% due 4/1/2018 (State-Aid Road Improvements) | | AA/NR | | | 1,225,000 | | | | 1,250,860 | |
Le Sueur-Henderson ISD No. 2397 GO, 3.00% due 4/1/2021 (Minnesota School District Credit Enhancement Program) | | AA+/NR | | | 1,125,000 | | | | 1,185,356 | |
Northern Municipal Power Agency, 5.00% due 1/1/2019 (Electric System) | | A-/A3 | | | 5,000,000 | | | | 5,336,100 | |
Northern Municipal Power Agency, 5.00% due 1/1/2020 (Electric System) | | A-/A3 | | | 3,500,000 | | | | 3,843,665 | |
Port Authority of the City of St. Paul, 5.00% due 12/1/2017 (Minnesota Andersen Office Building) | | AA/Aa2 | | | 4,945,000 | | | | 5,076,636 | |
Port Authority of the City of St. Paul, 4.00% due 12/1/2018 (Minnesota Freeman Office Building) | | AA/Aa2 | | | 3,925,000 | | | | 4,108,062 | |
Port Authority of the City of St. Paul, 5.00% due 12/1/2019 (Minnesota Freeman Office Building) | | AA/Aa2 | | | 2,000,000 | | | | 2,190,700 | |
Port Authority of the City of St. Paul, 5.00% due 12/1/2020 (Minnesota Freeman Office Building) | | AA/Aa2 | | | 2,675,000 | | | | 3,001,270 | |
Port Authority of the City of St. Paul, 5.00% due 12/1/2021 (Minnesota Andersen Office Building) | | AA/Aa2 | | | 965,000 | | | | 1,105,301 | |
Port Authority of the City of St. Paul, 5.00% due 12/1/2022 (Minnesota Andersen Office Building) | | AA/Aa2 | | | 1,250,000 | | | | 1,455,800 | |
St. Paul Housing and Redevelopment Authority, 5.00% due 7/1/2023 (HealthPartners) | | A/A2 | | | 1,000,000 | | | | 1,160,760 | |
St. Paul Housing and Redevelopment Authority, 5.00% due 7/1/2024 (HealthPartners) | | A/A2 | | | 600,000 | | | | 703,662 | |
St. Paul Housing and Redevelopment Authority, 5.00% due 7/1/2025 (HealthPartners) | | A/A2 | | | 250,000 | | | | 294,695 | |
| | | |
MISSISSIPPI — 0.29% | | | | | | | | | | |
Lamar County School District GO, 3.50% due 6/1/2017 (Educational and Performing Arts Capital Projects) | | A/NR | | | 1,700,000 | | | | 1,707,191 | |
Mississippi Development Bank, 4.75% due 7/1/2017 (Canton GO Public Improvement Project) (ETM) | | NR/NR | | | 335,000 | | | | 338,089 | |
Mississippi Development Bank, 5.00% due 8/1/2018 (Department of Corrections) | | AA-/NR | | | 4,910,000 | | | | 5,166,351 | |
Mississippi Development Bank, 5.00% due 1/1/2020 (MDOT-Harrison County Highway) | | AA-/Aa3 | | | 1,500,000 | | | | 1,639,605 | |
Mississippi Development Bank, 5.00% due 1/1/2020 (MDOT-Madison County Highway) | | AA-/Aa3 | | | 1,000,000 | | | | 1,093,070 | |
Mississippi Development Bank, 5.00% due 1/1/2021 (MDOT-Harrison County Highway) | | AA-/Aa3 | | | 2,500,000 | | | | 2,802,300 | |
Mississippi Development Bank, 5.00% due 1/1/2021 (MDOT-Madison County Highway) | | AA-/Aa3 | | | 2,000,000 | | | | 2,241,840 | |
a Mississippi Development Bank, 5.00% due 1/1/2022 (MDOT-Harrison County Highway) | | AA-/Aa3 | | | 1,000,000 | | | | 1,136,240 | |
Mississippi Development Bank, 5.00% due 1/1/2022 (MDOT-Madison County Highway) | | AA-/Aa3 | | | 1,000,000 | | | | 1,136,240 | |
Mississippi Development Bank, 5.00% due 1/1/2023 (MDOT-Harrison County Highway) | | AA-/Aa3 | | | 1,500,000 | | | | 1,721,265 | |
Mississippi Development Bank, 5.00% due 1/1/2023 (MDOT-Madison County Highway) | | AA-/Aa3 | | | 1,250,000 | | | | 1,434,387 | |
| | | |
MISSOURI — 1.43% | | | | | | | | | | |
Cass County COP, 4.00% due 5/1/2018 | | A/NR | | | 2,255,000 | | | | 2,311,646 | |
Cass County COP, 4.50% due 5/1/2019 | | A/NR | | | 1,270,000 | | | | 1,337,666 | |
Cass County COP, 5.00% due 5/1/2020 | | A/NR | | | 2,255,000 | | | | 2,449,223 | |
Cass County COP, 5.00% due 5/1/2021 | | A/NR | | | 1,750,000 | | | | 1,891,662 | |
Jackson County, 4.00% due 12/1/2017 (Parking Facility Projects) | | NR/Aa3 | | | 500,000 | | | | 510,385 | |
Jackson County, 4.00% due 12/1/2019 (Parking Facility Projects) | | NR/Aa3 | | | 500,000 | | | | 534,150 | |
Jackson County, 4.00% due 12/1/2021 (Parking Facility Projects) | | NR/Aa3 | | | 1,000,000 | | | | 1,100,220 | |
Kansas City IDA, 5.00% due 9/1/2018 (Kansas City Redevelopment District) (ETM) | | NR/NR | | | 695,000 | | | | 734,170 | |
Kansas City IDA, 5.00% due 9/1/2018 (Kansas City Redevelopment District) | | AA-/A1 | | | 1,305,000 | | | | 1,377,088 | |
Kansas City Municipal Assistance Corp., 5.00% due 4/15/2018 (H. Roe Bartle Convention Center & Infrastructure Project; Insured: Natl-Re) | | AA/A1 | | | 1,000,000 | | | | 1,038,860 | |
Kansas City Municipal Assistance Corp., 0% due 4/15/2021 (H. Roe Bartle Convention Center & Infrastructure Project; Insured: AMBAC) | | AA-/A1 | | | 10,055,000 | | | | 9,072,124 | |
24 Semi-Annual Report
| | |
| Schedule of Investments, Continued | | |
| |
Thornburg Limited Term Municipal Fund | | March 31, 2017 (Unaudited) |
| | | | | | | | | | | | |
ISSUER-DESCRIPTION | | CREDIT RATING†
S&P/ MOODY’S | | | PRINCIPAL
AMOUNT | | | VALUE | |
Kansas City Municipal Assistance Corp., 0% due 4/15/2022 (H. Roe Bartle Convention Center & Infrastructure Project; Insured: AMBAC) | | | AA-/A1 | | | $ | 5,040,000 | | | $ | 4,398,206 | |
Missouri Development Finance Board, 5.00% due 6/1/2017 (City of Independence Electric System) | | | A/NR | | | | 1,525,000 | | | | 1,534,485 | |
Missouri Development Finance Board, 5.00% due 6/1/2018 (City of Independence Electric System) | | | A/NR | | | | 1,705,000 | | | | 1,772,910 | |
Missouri Development Finance Board, 4.00% due 6/1/2019 (City of Independence Electric System) | | | A/NR | | | | 1,000,000 | | | | 1,046,050 | |
Missouri Development Finance Board, 5.00% due 6/1/2019 (City of Independence Electric System) | | | A/NR | | | | 1,790,000 | | | | 1,910,288 | |
Missouri Development Finance Board, 4.00% due 6/1/2020 (City of Independence Electric System) | | | A/NR | | | | 1,265,000 | | | | 1,335,764 | |
Missouri Development Finance Board, 5.00% due 6/1/2020 (City of Independence Electric System) | | | A/NR | | | | 1,000,000 | | | | 1,086,390 | |
Missouri Development Finance Board, 4.00% due 6/1/2021 (City of Independence Electric System) | | | A/NR | | | | 2,465,000 | | | | 2,624,633 | |
Missouri Development Finance Board, 4.00% due 6/1/2022 (City of Independence Electric System) | | | A/NR | | | | 3,155,000 | | | | 3,371,938 | |
Missouri Development Finance Board, 0.95% due 12/1/2033 put 4/3/2017 (The Nelson Gallery Foundation; SPA: Northern Trust Co.) (daily demand notes) | | | AAA/Aaa | | | | 21,655,000 | | | | 21,655,000 | |
Missouri Health and Educational Facilities Authority, 5.00% due 5/15/2017 (Children’s Mercy Hospital) | | | A+/NR | | | | 1,000,000 | | | | 1,005,080 | |
Missouri Health and Educational Facilities Authority, 5.00% due 5/15/2019 (Children’s Mercy Hospital) | | | A+/NR | | | | 1,000,000 | | | | 1,077,090 | |
Missouri Health and Educational Facilities Authority, 5.00% due 5/15/2020 pre-refunded 5/15/2019 (Children’s Mercy Hospital) | | | NR/NR | | | | 830,000 | | | | 896,400 | |
Missouri Health and Educational Facilities Authority, 5.00% due 5/15/2020 (Children’s Mercy Hospital) | | | A+/NR | | | | 170,000 | | | | 183,935 | |
Missouri Health and Educational Facilities Authority, 5.00% due 11/15/2020 (Saint Luke’s Health System, Inc.) | | | A+/A1 | | | | 1,400,000 | | | | 1,558,480 | |
Missouri Health and Educational Facilities Authority, 5.00% due 11/15/2021 (Saint Luke’s Health System, Inc.) | | | A+/A1 | | | | 1,710,000 | | | | 1,934,985 | |
Missouri Health and Educational Facilities Authority, 5.00% due 11/15/2023 (Saint Luke’s Health System, Inc.) | | | A+/A1 | | | | 2,000,000 | | | | 2,312,300 | |
Missouri Health and Educational Facilities Authority, 5.00% due 11/15/2024 (Saint Luke’s Health System, Inc.) | | | A+/A1 | | | | 1,585,000 | | | | 1,848,253 | |
Missouri Health and Educational Facilities Authority, 5.00% due 11/15/2026 (Saint Luke’s Health System, Inc.) | | | NR/NR | | | | 2,000,000 | | | | 2,346,740 | |
Platte County, 4.00% due 4/1/2017 (Community & Resource Centers) | | | NR/A1 | | | | 1,500,000 | | | | 1,500,000 | |
Platte County, 4.00% due 4/1/2018 (Community & Resource Centers) | | | NR/A1 | | | | 2,110,000 | | | | 2,163,446 | |
Platte County, 5.00% due 4/1/2019 (Community & Resource Centers) | | | NR/A1 | | | | 2,000,000 | | | | 2,134,140 | |
Platte County, 5.00% due 4/1/2021 (Community & Resource Centers) | | | NR/A1 | | | | 2,440,000 | | | | 2,714,598 | |
Southeast Missouri State University, 5.00% due 4/1/2018 (City of Cape Girardeau Campus System Facilities) | | | A/NR | | | | 1,165,000 | | | | 1,210,249 | |
Southeast Missouri State University, 5.00% due 4/1/2020 (City of Cape Girardeau Campus System Facilities) | | | A/NR | | | | 2,825,000 | | | | 3,106,116 | |
Special Administrative Board of the Transitional School District of the City of St. Louis GO, 4.00% due 4/1/2019 (State Aid Withholding) | | | AA+/NR | | | | 1,615,000 | | | | 1,699,997 | |
Special Administrative Board of the Transitional School District of the City of St. Louis GO, 4.00% due 4/1/2020 (State Aid Withholding) | | | AA+/NR | | | | 1,600,000 | | | | 1,713,504 | |
Special Administrative Board of the Transitional School District of the City of St. Louis GO, 4.00% due 4/1/2021 (State Aid Withholding) | | | AA+/NR | | | | 2,055,000 | | | | 2,231,237 | |
Special Administrative Board of the Transitional School District of the City of St. Louis GO, 4.00% due 4/1/2022 (State Aid Withholding) | | | AA+/NR | | | | 3,300,000 | | | | 3,615,480 | |
St. Louis Municipal Finance Corp., 5.00% due 2/15/2018 (City Justice Center) | | | A/Baa1 | | | | 3,865,000 | | | | 3,992,352 | |
| | | |
MONTANA — 0.19% | | | | | | | | | | | | |
City of Forsyth, 0.90% due 1/1/2018 put 4/3/2017 (PacifiCorp; LOC: Bank of Nova Scotia) (daily demand notes) | | | A+/Aa2 | | | | 13,260,000 | | | | 13,260,000 | |
| | | |
NEBRASKA — 0.11% | | | | | | | | | | | | |
Douglas County Hospital Authority No. 3, 5.00% due 11/1/2022 (Nebraska Methodist Health System) | | | A-/NR | | | | 1,670,000 | | | | 1,902,581 | |
Douglas County Hospital Authority No. 3, 5.00% due 11/1/2023 (Nebraska Methodist Health System) | | | A-/NR | | | | 1,905,000 | | | | 2,191,531 | |
Douglas County Hospital Authority No. 3, 5.00% due 11/1/2024 (Nebraska Methodist Health System) | | | A-/NR | | | | 1,400,000 | | | | 1,619,408 | |
Douglas County Hospital Authority No. 3, 5.00% due 11/1/2025 (Nebraska Methodist Health System) | | | A-/NR | | | | 2,005,000 | | | | 2,327,244 | |
| | | |
NEVADA — 3.43% | | | | | | | | | | | | |
Carson City, 5.00% due 9/1/2019 (Carson Tahoe Regional Healthcare) | | | BBB+/NR | | | | 1,000,000 | | | | 1,075,810 | |
Carson City, 5.00% due 9/1/2020 (Carson Tahoe Regional Healthcare) | | | BBB+/NR | | | | 1,000,000 | | | | 1,098,680 | |
Carson City, 5.00% due 9/1/2022 (Carson Tahoe Regional Healthcare) | | | BBB+/NR | | | | 2,450,000 | | | | 2,773,008 | |
a City of Las Vegas COP, 5.00% due 9/1/2017 (City Hall) | | | AA-/Aa3 | | | | 2,690,000 | | | | 2,736,107 | |
City of Las Vegas COP, 5.00% due 9/1/2017 (City Hall) | | | NR/NR | | | | 1,610,000 | | | | 1,638,288 | |
City of Las Vegas COP, 5.00% due 9/1/2018 (City Hall) | | | AA-/Aa3 | | | | 3,280,000 | | | | 3,433,799 | |
City of Las Vegas COP, 5.00% due 9/1/2018 (City Hall) | | | NR/NR | | | | 720,000 | | | | 760,471 | |
City of Las Vegas GO, 7.00% due 4/1/2017 (Performing Arts Center) | | | AA/Aa2 | | | | 1,825,000 | | | | 1,825,000 | |
City of Las Vegas GO, 7.00% due 4/1/2018 (Performing Arts Center) | | | AA/Aa2 | | | | 2,095,000 | | | | 2,219,338 | |
City of Reno, 5.25% due 6/1/2018 (Washoe Medical Center; Insured: AGM) | | | AA/A2 | | | | 1,000,000 | | | | 1,045,470 | |
Clark County School District GO, 5.00% due 6/15/2021 (Acquisition of Transportation & Technology Equipment) | | | AA-/A1 | | | | 20,000,000 | | | | 22,681,400 | |
Clark County School District GO, 5.00% due 6/15/2021 (Acquisition of Transportation & Technology Equipment) | | | AA-/A1 | | | | 21,405,000 | | | | 24,274,768 | |
Clark County School District GO, 5.00% due 6/15/2022 (Acquisition of Transportation & Technology Equipment) | | | AA-/A1 | | | | 2,560,000 | | | | 2,944,435 | |
Clark County School District GO, 5.00% due 6/15/2022 (Acquisition of Transportation & Technology Equipment) | | | AA-/A1 | | | | 27,150,000 | | | | 31,227,115 | |
Clark County School District GO, 5.00% due 6/15/2026 (Acquisition of Transportation & Technology Equipment) | | | AA-/A1 | | | | 12,180,000 | | | | 14,514,175 | |
Las Vegas Clark County Library District GO, 5.00% due 1/1/2018 | | | AA/Aa2 | | | | 6,535,000 | | | | 6,732,749 | |
Las Vegas Clark County Library District GO, 5.00% due 1/1/2019 | | | AA/Aa2 | | | | 3,000,000 | | | | 3,199,470 | |
Las Vegas Convention and Visitors Authority, 5.00% due 7/1/2023 | | | A+/A1 | | | | 800,000 | | | | 930,128 | |
Las Vegas Convention and Visitors Authority, 5.00% due 7/1/2024 | | | A+/A1 | | | | 3,155,000 | | | | 3,701,225 | |
Semi-Annual Report 25
| | |
| Schedule of Investments, Continued | | |
| |
Thornburg Limited Term Municipal Fund | | March 31, 2017 (Unaudited) |
| | | | | | | | | | | | |
ISSUER-DESCRIPTION | | CREDIT RATING†
S&P/ MOODY’S | | | PRINCIPAL
AMOUNT | | | VALUE | |
Las Vegas Convention and Visitors Authority, 5.00% due 7/1/2025 | | | A+/A1 | | | $ | 1,250,000 | | | $ | 1,476,538 | |
Las Vegas Convention and Visitors Authority, 5.00% due 7/1/2026 | | | A+/A1 | | | | 1,000,000 | | | | 1,188,030 | |
Las Vegas Valley Water District GO, 5.00% due 6/1/2017 | | | AA/Aa1 | | | | 1,050,000 | | | | 1,057,455 | |
Las Vegas Valley Water District GO, 5.00% due 6/1/2019 | | | AA/Aa1 | | | | 1,000,000 | | | | 1,083,000 | |
Las Vegas Valley Water District GO, 5.00% due 6/1/2020 | | | AA/Aa1 | | | | 4,255,000 | | | | 4,740,836 | |
Las Vegas Valley Water District GO, 5.00% due 6/1/2020 | | | AA/Aa1 | | | | 5,080,000 | | | | 5,660,034 | |
Las Vegas Valley Water District GO, 5.00% due 6/1/2021 | | | AA/Aa1 | | | | 5,000,000 | | | | 5,708,550 | |
Las Vegas Valley Water District GO, 5.00% due 6/1/2023 | | | AA/Aa1 | | | | 15,995,000 | | | | 18,832,513 | |
Las Vegas Valley Water District GO, 5.00% due 6/1/2024 | | | AA/Aa1 | | | | 13,825,000 | | | | 16,414,423 | |
Las Vegas Valley Water District GO, 5.00% due 6/1/2025 | | | AA/Aa1 | | | | 7,505,000 | | | | 8,986,187 | |
Las Vegas Valley Water District GO, 5.00% due 12/1/2025 | | | AA/Aa1 | | | | 20,000,000 | | | | 23,979,800 | |
Las Vegas Valley Water District GO, 5.00% due 6/1/2026 | | | AA/Aa1 | | | | 18,630,000 | | | | 22,197,459 | |
Washoe County GO, 5.00% due 7/1/2021 (Reno-Sparks Convention & Visitors Authority) | | | AA/Aa2 | | | | 1,700,000 | | | | 1,944,817 | |
Washoe County GO, 5.00% due 7/1/2022 (Reno-Sparks Convention & Visitors Authority) | | | AA/Aa2 | | | | 2,500,000 | | | | 2,831,900 | |
| | | |
NEW HAMPSHIRE — 0.17% | | | | | | | | | | | | |
New Hampshire Health and Education Facilities Authority, 5.00% due 10/1/2017 (Southern New Hampshire Medical Center) | | | A-/NR | | | | 1,000,000 | | | | 1,018,730 | |
New Hampshire Municipal Bond Bank, 5.00% due 8/15/2017 (Insured: Natl-Re) | | | AA/Aa3 | | | | 3,130,000 | | | | 3,175,448 | |
New Hampshire Municipal Bond Bank, 5.25% due 8/15/2020 | | | AA+/Aa2 | | | | 1,000,000 | | | | 1,120,230 | |
New Hampshire Municipal Bond Bank, 5.25% due 8/15/2022 | | | AA+/Aa2 | | | | 2,770,000 | | | | 3,233,919 | |
New Hampshire Turnpike System, 5.00% due 2/1/2018 | | | A+/A1 | | | | 1,295,000 | | | | 1,338,357 | |
New Hampshire Turnpike System, 5.00% due 2/1/2020 | | | A+/A1 | | | | 1,000,000 | | | | 1,098,660 | |
New Hampshire Turnpike System, 5.00% due 2/1/2021 | | | A+/A1 | | | | 1,260,000 | | | | 1,417,046 | |
| | | |
NEW JERSEY — 2.73% | | | | | | | | | | | | |
Burlington County Bridge Commission, 5.00% due 12/1/2018 (County Governmental Loan Program) | | | AA/Aa2 | | | | 1,000,000 | | | | 1,065,500 | |
City of Jersey City GO, 4.00% due 8/1/2020 (Qualified General Improvement; Insured: BAM) (State Aid Withholding) | | | AA/Aa3 | | | | 2,650,000 | | | | 2,869,659 | |
City of Jersey City GO, 4.00% due 8/1/2021 (Qualified General Improvement; Insured: BAM) (State Aid Withholding) | | | AA/Aa3 | | | | 2,805,000 | | | | 3,077,225 | |
City of Jersey City GO, 5.00% due 8/1/2022 (Qualified General Improvement; Insured: BAM) (State Aid Withholding) | | | AA/Aa3 | | | | 2,530,000 | | | | 2,914,762 | |
City of Jersey City GO, 5.00% due 8/1/2023 (Qualified General Improvement; Insured: BAM) (State Aid Withholding) | | | AA/Aa3 | | | | 2,455,000 | | | | 2,854,281 | |
Essex County Improvement Authority, 5.50% due 10/1/2024 (County Correctional Facilities & Gibraltar Facilities; Insured: Natl-Re) | | | NR/Aa2 | | | | 5,000,000 | | | | 6,105,050 | |
Gloucester County Improvement Authority, 2.125% due 12/1/2029 put 12/1/2017 (Waste Management) | | | A-/NR | | | | 2,000,000 | | | | 2,010,640 | |
Hudson County Improvement Authority, 4.75% due 10/1/2017 (Hudson County Lease; Insured: AGM) | | | AA/Aa3 | | | | 4,065,000 | | | | 4,137,764 | |
Hudson County Improvement Authority, 4.75% due 10/1/2018 (Hudson County Lease; Insured: AGM) | | | AA/Aa3 | | | | 2,000,000 | | | | 2,100,620 | |
Hudson County Improvement Authority, 4.75% due 10/1/2019 (Hudson County Lease; Insured: AGM) | | | AA/Aa3 | | | | 4,390,000 | | | | 4,731,454 | |
Hudson County Improvement Authority, 5.375% due 10/1/2020 (Hudson County Lease; Insured: AGM) | | | AA/Aa3 | | | | 2,020,000 | | | | 2,262,057 | |
New Jersey EDA, 5.50% due 12/15/2019 (School Facilities Construction; Insured: AMBAC) | | | BBB+/Baa1 | | | | 5,525,000 | | | | 5,952,303 | |
New Jersey EDA, 5.00% due 9/1/2020 (School Facilities Construction) (ETM) | | | NR/NR | | | | 365,000 | | | | 408,636 | |
New Jersey EDA, 5.00% due 9/1/2020 (School Facilities Construction) | | | BBB+/Baa1 | | | | 135,000 | | | | 143,385 | |
New Jersey EDA, 5.00% due 6/15/2023 (School Facilities Construction) | | | BBB+/Baa1 | | | | 2,000,000 | | | | 2,120,840 | |
New Jersey EDA, 5.75% due 9/1/2023 pre-refunded 3/1/2021 (School Facilities Construction) | | | NR/Baa1 | | | | 4,955,000 | | | | 5,751,120 | |
New Jersey EDA, 5.75% due 9/1/2023 (School Facilities Construction) | | | BBB+/Baa1 | | | | 550,000 | | | | 595,348 | |
New Jersey EDA, 5.00% due 6/15/2024 (School Facilities Construction) | | | BBB+/Baa1 | | | | 4,250,000 | | | | 4,479,627 | |
New Jersey EDA, 5.00% due 11/1/2024 (New Jersey Transit Corporation) | | | BBB+/Baa1 | | | | 8,000,000 | | | | 8,427,440 | |
New Jersey EDA, 5.00% due 3/1/2025 (School Facilities Construction) | | | BBB+/Baa1 | | | | 4,575,000 | | | | 4,776,757 | |
New Jersey EDA, 5.00% due 3/1/2026 (School Facilities Construction) | | | BBB+/Baa1 | | | | 11,150,000 | | | | 11,553,630 | |
New Jersey EDA, 5.00% due 11/1/2026 (New Jersey Transit Corporation) | | | BBB+/Baa1 | | | | 8,000,000 | | | | 8,358,960 | |
New Jersey Health Care Facilities Financing Authority, 5.00% due 7/1/2023 (Virtua Health Issue) | | | AA-/NR | | | | 535,000 | | | | 623,040 | |
New Jersey Health Care Facilities Financing Authority, 5.00% due 7/1/2024 (Virtua Health Issue) | | | AA-/NR | | | | 1,000,000 | | | | 1,166,530 | |
New Jersey Higher Educational Assistance Authority, 5.00% due 12/1/2017 (Student Loans) | | | AA/Aa2 | | | | 1,910,000 | | | | 1,955,916 | |
New Jersey Higher Educational Assistance Authority, 5.00% due 12/1/2018 | | | AA/Aa2 | | | | 3,000,000 | | | | 3,160,740 | |
New Jersey Higher Educational Assistance Authority, 5.25% due 12/1/2019 | | | AA/Aa2 | | | | 5,650,000 | | | | 6,133,527 | |
New Jersey Transit Corp., 5.00% due 9/15/2021 (Urban Public Transportation Capital Improvement) | | | A/A3 | | | | 3,395,000 | | | | 3,645,144 | |
New Jersey Transportation Trust Fund Authority, 5.00% due 6/15/2019 (State Transportation System Improvements) | | | BBB+/Baa1 | | | | 1,000,000 | | | | 1,050,710 | |
New Jersey Transportation Trust Fund Authority, 5.00% due 6/15/2020 (State Transportation System Improvements) | | | A+/Baa1 | | | | 2,500,000 | | | | 2,663,625 | |
New Jersey Transportation Trust Fund Authority, 5.00% due 6/15/2020 (State Transportation System Improvements) | | | BBB+/Baa1 | | | | 1,000,000 | | | | 1,060,550 | |
New Jersey Transportation Trust Fund Authority, 5.00% due 6/15/2021 (State Transportation System Improvements) | | | BBB+/Baa1 | | | | 2,570,000 | | | | 2,738,104 | |
New Jersey Transportation Trust Fund Authority, 5.25% due 12/15/2022 (State Transportation System Improvements) | | | BBB+/Baa1 | | | | 2,000,000 | | | | 2,150,480 | |
New Jersey Transportation Trust Fund Authority, 5.00% due 6/15/2023 (State Transportation System Improvements) | | | A+/Baa1 | | | | 4,500,000 | | | | 4,653,855 | |
New Jersey Transportation Trust Fund Authority, 5.00% due 6/15/2023 (State Transportation System Improvements) | | | A+/Baa1 | | | | 3,000,000 | | | | 3,234,240 | |
New Jersey Transportation Trust Fund Authority, 5.25% due 12/15/2023 (State Transportation System Improvements; Insured: AMBAC) | | | BBB+/Baa1 | | | | 3,545,000 | | | | 3,860,824 | |
New Jersey Transportation Trust Fund Authority, 5.00% due 6/15/2024 (State Transportation System Improvements) | | | BBB+/Baa1 | | | | 1,660,000 | | | | 1,752,960 | |
New Jersey Transportation Trust Fund Authority, 5.00% due 6/15/2024 (State Transportation System Improvements) | | | A+/Baa1 | | | | 5,500,000 | | | | 5,668,080 | |
New Jersey Transportation Trust Fund Authority, 5.00% due 6/15/2024 (State Transportation System Improvements) | | | A+/Baa1 | | | | 3,000,000 | | | | 3,237,720 | |
26 Semi-Annual Report
| | |
| Schedule of Investments, Continued | | |
| |
Thornburg Limited Term Municipal Fund | | March 31, 2017 (Unaudited) |
| | | | | | | | | | | | |
ISSUER-DESCRIPTION | | CREDIT RATING†
S&P/ MOODY’S | | | PRINCIPAL
AMOUNT | | | VALUE | |
New Jersey Transportation Trust Fund Authority, 5.00% due 6/15/2025 (State Transportation System Improvements) | | | A+/Baa1 | | | $ | 500,000 | | | $ | 538,445 | |
New Jersey Transportation Trust Fund Authority, 5.00% due 6/15/2027 (State Transportation System Improvements) | | | A+/Baa1 | | | | 30,285,000 | | | | 32,434,326 | |
New Jersey Transportation Trust Fund Authority, 5.00% due 6/15/2028 (Federal Highway) | | | A+/Baa1 | | | | 7,330,000 | | | | 7,506,360 | |
New Jersey Transportation Trust Fund Authority, 1.99% due 6/15/2034 put 12/15/2021 (State Transportation System Improvements) | | | BBB+/Baa1 | | | | 4,000,000 | | | | 3,889,520 | |
Ocean Township Municipal Utility Authority, 6.00% due 8/1/2017 (Insured: Natl-Re) | | | AA-/A3 | | | | 780,000 | | | | 792,628 | |
Passaic Valley Sewer Commissioners GO, 5.625% due 12/1/2018 (Sewer System) | | | NR/A3 | | | | 1,210,000 | | | | 1,288,856 | |
Passaic Valley Sewer Commissioners GO, 5.75% due 12/1/2019 (Sewer System) | | | NR/A3 | | | | 2,000,000 | | | | 2,197,020 | |
Passaic Valley Sewer Commissioners GO, 5.75% due 12/1/2020 (Sewer System) | | | NR/A3 | | | | 4,250,000 | | | | 4,777,722 | |
Passaic Valley Sewer Commissioners GO, 5.75% due 12/1/2021 (Sewer System) | | | NR/A3 | | | | 4,500,000 | | | | 5,148,000 | |
Township of Wayne GO, 2.00% due 2/15/2018 (General Improvements and Water Utility System) | | | AA+/Aaa | | | | 1,295,000 | | | | 1,308,390 | |
| | | |
NEW MEXICO — 0.57% | | | | | | | | | | | | |
Albuquerque Municipal School District No. 12 GO, 5.00% due 8/1/2019 (Bernalillo and Sandoval Counties School Facilities) (State Aid Withholding) | | | AA/Aa1 | | | | 2,300,000 | | | | 2,505,298 | |
City of Farmington, 1.875% due 6/1/2032 put 9/1/2017 (El Paso Electric Co.-Four Corners Project) | | | NR/Baa1 | | | | 3,000,000 | | | | 3,001,410 | |
City of Santa Fe, 4.50% due 5/15/2022 (El Castillo Retirement Residences) | | | BBB-/NR | | | | 2,585,000 | | | | 2,693,467 | |
Incorporated County of Los Alamos, 5.50% due 6/1/2017 | | | AA+/A1 | | | | 2,365,000 | | | | 2,383,423 | |
Incorporated County of Los Alamos, 5.50% due 6/1/2018 | | | AA+/A1 | | | | 2,205,000 | | | | 2,319,373 | |
New Mexico Educational Assistance Foundation, 4.00% due 9/1/2017 (Student Loans) | | | NR/Aaa | | | | 6,000,000 | | | | 6,078,960 | |
New Mexico Educational Assistance Foundation, 5.00% due 12/1/2018 (Student Loans) | | | AAA/Aaa | | | | 5,000,000 | | | | 5,324,950 | |
New Mexico Educational Assistance Foundation, 5.00% due 12/1/2021 (Student Loans) | | | AAA/Aaa | | | | 3,000,000 | | | | 3,352,260 | |
New Mexico Hospital Equipment Loan Council, 5.00% due 8/1/2024 (Presbyterian Healthcare Services) | | | AA/Aa3 | | | | 1,030,000 | | | | 1,217,409 | |
New Mexico Hospital Equipment Loan Council, 5.00% due 8/1/2025 (Presbyterian Healthcare Services) | | | AA/Aa3 | | | | 750,000 | | | | 894,075 | |
Regents of New Mexico State University, 5.00% due 4/1/2020 (Corbett Center Student Union & NMSU Golf Course) | | | AA-/Aa3 | | | | 3,095,000 | | | | 3,430,869 | |
Regents of New Mexico State University, 5.00% due 4/1/2021 (Corbett Center Student Union & NMSU Golf Course) | | | AA-/Aa3 | | | | 1,845,000 | | | | 2,095,569 | |
Regents of New Mexico State University, 5.00% due 4/1/2022 (Corbett Center Student Union & NMSU Golf Course) | | | AA-/Aa3 | | | | 1,250,000 | | | | 1,446,788 | |
Rio Rancho Public School District No. 94 GO, 4.00% due 8/1/2018 (State Aid Withholding) | | | NR/Aa2 | | | | 3,940,000 | | | | 4,092,636 | |
| | | |
NEW YORK — 12.68% | | | | | | | | | | | | |
City of Long Beach School District GO, 3.50% due 5/1/2022 (Insured: AGM) (State Aid Withholding) | | | AA/Aa2 | | | | 1,600,000 | | | | 1,683,696 | |
City of New York GO, 5.00% due 8/1/2021 (City Budget Financial Management) | | | AA/Aa2 | | | | 7,350,000 | | | | 8,402,961 | |
City of New York GO, 5.00% due 8/1/2021 (City Budget Financial Management) | | | AA/Aa2 | | | | 7,775,000 | | | | 8,888,846 | |
City of New York GO, 5.00% due 8/1/2021 (City Budget Financial Management) | | | AA/Aa2 | | | | 3,000,000 | | | | 3,429,780 | |
City of New York GO, 5.00% due 8/1/2021 (City Budget Financial Management) | | | AA/Aa2 | | | | 9,000,000 | | | | 10,289,340 | |
City of New York GO, 5.00% due 8/1/2022 (City Budget Financial Management) | | | AA/Aa2 | | | | 20,000,000 | | | | 23,243,200 | |
City of New York GO, 5.00% due 8/1/2022 (City Budget Financial Management) | | | AA/Aa2 | | | | 13,075,000 | | | | 15,195,242 | |
City of New York GO, 5.00% due 8/1/2022 (City Budget Financial Management) | | | AA/Aa2 | | | | 3,000,000 | | | | 3,486,480 | |
City of New York GO, 5.00% due 8/1/2022 (City Budget Financial Management) | | | AA/Aa2 | | | | 6,625,000 | | | | 7,699,310 | |
a City of New York GO, 5.00% due 8/1/2023 (City Budget Financial Management) | | | AA/Aa2 | | | | 12,985,000 | | | | 15,281,397 | |
City of New York GO, 5.00% due 8/1/2023 (City Budget Financial Management) | | | AA/Aa2 | | | | 9,520,000 | | | | 11,203,612 | |
City of New York GO, 5.00% due 8/1/2024 (City Budget Financial Management) | | | AA/Aa2 | | | | 40,145,000 | | | | 47,777,769 | |
City of New York GO, 0.91% due 8/1/2035 put 4/3/2017 (Capital Projects) (daily demand notes) | | | AA/Aa2 | | | | 9,590,000 | | | | 9,590,000 | |
City of New York GO, 0.95% due 8/1/2038 put 4/3/2017 (City Budget Financial Management; SPA: JPMorgan Chase Bank, N.A.) (daily demand notes) | | | AA/Aa2 | | | | 5,800,000 | | | | 5,800,000 | |
City of New York GO, 0.95% due 3/1/2040 put 4/3/2017 (Capital Projects) (daily demand notes) | | | AA/Aa2 | | | | 11,100,000 | | | | 11,100,000 | |
Erie County Individual Development Agency, 5.00% due 5/1/2017 (Buffalo School District) | | | AA/Aa2 | | | | 7,265,000 | | | | 7,291,154 | |
Erie County Individual Development Agency, 5.00% due 5/1/2018 (Buffalo School District) | | | AA/Aa2 | | | | 5,000,000 | | | | 5,221,800 | |
Metropolitan Transportation Authority, 5.00% due 11/15/2020 | | | AA-/A1 | | | | 12,955,000 | | | | 14,591,605 | |
Metropolitan Transportation Authority, 5.00% due 11/15/2020 | | | AA/NR | | | | 2,000,000 | | | | 2,257,200 | |
Metropolitan Transportation Authority, 5.00% due 11/15/2021 | | | AA-/A1 | | | | 24,325,000 | | | | 27,942,857 | |
Metropolitan Transportation Authority, 5.00% due 11/15/2025 | | | AA-/A1 | | | | 10,480,000 | | | | 12,520,875 | |
Metropolitan Transportation Authority, 5.00% due 11/15/2026 | | | AA-/A1 | | | | 21,400,000 | | | | 25,709,318 | |
Metropolitan Transportation Authority, 5.00% due 11/15/2027 | | | AA-/A1 | | | | 12,640,000 | | | | 15,173,309 | |
Metropolitan Transportation Authority, 5.00% due 11/15/2034 | | | AA-/A1 | | | | 550,000 | | | | 601,513 | |
Monroe County Industrial Development Corp., 5.00% due 6/1/2018 (St. John Fisher College) | | | A-/NR | | | | 1,425,000 | | | | 1,483,112 | |
Monroe County Industrial Development Corp., 5.00% due 6/1/2019 (St. John Fisher College) | | | A-/NR | | | | 1,030,000 | | | | 1,101,863 | |
Monroe County Industrial Development Corp., 5.00% due 6/1/2022 (St. John Fisher College) | | | A-/NR | | | | 2,000,000 | | | | 2,246,480 | |
Nassau County IDA, 5.25% due 3/1/2018 (New York Institute of Technology) (ETM) | | | BBB+/Baa2 | | | | 1,260,000 | | | | 1,309,846 | |
Nassau County IDA, 5.25% due 3/1/2020 (New York Institute of Technology) (ETM) | | | BBB+/Baa2 | | | | 1,715,000 | | | | 1,909,481 | |
New York City Health and Hospital Corp. GO, 5.00% due 2/15/2019 (Healthcare Facilities Improvements) | | | A+/Aa3 | | | | 2,700,000 | | | | 2,889,621 | |
New York City Health and Hospital Corp. GO, 5.00% due 2/15/2020 (Healthcare Facilities Improvements) | | | A+/Aa3 | | | | 10,000,000 | | | | 11,049,400 | |
New York City Health and Hospital Corp. GO, 5.00% due 2/15/2021 (Healthcare Facilities Improvements) | | | A+/Aa3 | | | | 2,615,000 | | | | 2,885,496 | |
New York City Municipal Water Finance Authority, 0.90% due 6/15/2035 put 4/3/2017 (Water & Sewer System; LOC: Citibank, N.A.) (daily demand notes) | | | AAA/Aa1 | | | | 53,605,000 | | | | 53,605,000 | |
New York City Municipal Water Finance Authority, 0.95% due 6/15/2043 put 4/3/2017 (Water and Sewer System; SPA: JPMorgan Chase Bank, N.A.) (daily demand notes) | | | AA+/Aa1 | | | | 24,500,000 | | | | 24,500,000 | |
Semi-Annual Report 27
| | |
| Schedule of Investments, Continued | | |
| |
Thornburg Limited Term Municipal Fund | | March 31, 2017 (Unaudited) |
| | | | | | | | | | |
ISSUER-DESCRIPTION | | CREDIT RATING†
S&P/ MOODY’S | | PRINCIPAL
AMOUNT | | | VALUE | |
New York City Municipal Water Finance Authority, 0.91% due 6/15/2044 put 4/3/2017 (Water & Sewer System; SPA: Mizuho Bank, Ltd.) (daily demand notes) | | AAA/Aa1 | | $ | 19,795,000 | | | $ | 19,795,000 | |
New York City Municipal Water Finance Authority, 0.96% due 6/15/2048 put 4/3/2017 (Water & Sewer System; SPA: Mizuho Bank, Ltd.) (daily demand notes) | | AA+/Aa1 | | | 12,975,000 | | | | 12,975,000 | |
New York City Municipal Water Finance Authority, 0.95% due 6/15/2050 put 4/3/2017 (Water & Sewer System; SPA: JPMorgan Chase Bank, N.A.) (daily demand notes) | | AA+/Aa1 | | | 12,900,000 | | | | 12,900,000 | |
New York City Municipal Water Finance Authority, 0.95% due 6/15/2050 put 3/1/2017 (Water and Sewer System; SPA: JPMorgan Chase Bank, N.A.) (daily demand notes) | | AA+/Aa1 | | | 76,550,000 | | | | 76,550,000 | |
New York City Transitional Finance Authority, 5.00% due 1/15/2018 (School Financing Act) (State Aid Withholding) | | AA/Aa2 | | | 4,865,000 | | | | 5,021,556 | |
New York City Transitional Finance Authority, 5.00% due 11/1/2018 (City Capital Projects & WTC Recovery Costs) | | AAA/Aa1 | | | 1,500,000 | | | | 1,594,410 | |
New York City Transitional Finance Authority, 5.00% due 11/1/2018 (City Capital Projects & WTC Recovery Costs) | | AAA/Aa1 | | | 11,730,000 | | | | 12,468,286 | |
New York City Transitional Finance Authority, 5.00% due 11/1/2018 (City Capital Projects & WTC Recovery Costs) | | AAA/Aa1 | | | 3,075,000 | | | | 3,268,541 | |
New York City Transitional Finance Authority, 5.00% due 11/1/2018 (City Capital Projects & WTC Recovery Costs) | | AAA/Aa1 | | | 1,645,000 | | | | 1,748,536 | |
New York City Transitional Finance Authority, 5.00% due 11/1/2018 (City Capital Projects & WTC Recovery Costs) | | AAA/Aa1 | | | 12,725,000 | | | | 13,525,911 | |
New York City Transitional Finance Authority, 5.00% due 11/1/2018 (City Capital Projects & WTC Recovery Costs) | | AAA/Aa1 | | | 2,000,000 | | | | 2,125,880 | |
New York City Transitional Finance Authority, 0.96% due 11/1/2022 put 4/3/2017 (WTC Recovery; SPA: Landesbank Hessen-Thuringen) (daily demand notes) | | AAA/Aa1 | | | 525,000 | | | | 525,000 | |
New York City Transitional Finance Authority, 0.96% due 8/1/2031 put 4/3/2017 (City Capital Projects; SPA: Landesbank Hessen-Thuringen) (daily demand notes) | | AAA/Aaa | | | 3,000,000 | | | | 3,000,000 | |
New York City Transitional Finance Authority, 0.95% due 11/1/2036 put 4/3/2017 (City Capital Projects; SPA: JPMorgan Chase Bank, N.A.) (daily demand notes) | | AAA/Aa1 | | | 7,450,000 | | | | 7,450,000 | |
New York City Transitional Finance Authority, 0.90% due 8/1/2039 put 4/3/2017 (City Capital Projects; SPA: State Street Bank & Trust Co.) (daily demand notes) | | AAA/Aa1 | | | 40,320,000 | | | | 40,320,000 | |
New York City Transitional Finance Authority, 0.91% due 11/1/2042 put 4/3/2017 (City Capital Projects; SPA: Barclays Bank plc) (daily demand notes) | | AAA/Aa1 | | | 16,800,000 | | | | 16,800,000 | |
New York City Transitional Finance Authority, 0.95% due 2/1/2045 put 4/3/2017 (City Capital Projects; SPA: JPMorgan Chase Bank, N.A.) (daily demand notes) | | AAA/Aa1 | | | 39,510,000 | | | | 39,510,000 | |
New York City Trust for Cultural Resources, 5.00% due 12/1/2026 (Lincoln Center for the Performing Arts, Inc.) | | A+/A2 | | | 2,500,000 | | | | 2,976,075 | |
New York State Dormitory Authority, 5.25% due 5/15/2017 (Court Facilities Lease; Insured: AMBAC) | | AA-/Aa2 | | | 4,945,000 | | | | 4,972,099 | |
New York State Dormitory Authority, 5.50% due 2/15/2018 (Mental Health Services Facilities) | | AA/NR | | | 5,280,000 | | | | 5,491,886 | |
New York State Dormitory Authority, 2.25% due 4/1/2018 (School Districts Financing Program) (State Aid Withholding) | | AA+/NR | | | 4,800,000 | | | | 4,862,688 | |
New York State Dormitory Authority, 5.00% due 4/1/2018 (School Districts Financing Program) (State Aid Withholding) | | AA+/NR | | | 325,000 | | | | 338,221 | |
New York State Dormitory Authority, 5.00% due 10/1/2018 (School Districts Financing Program) (State Aid Withholding) | | NR/Aa3 | | | 1,395,000 | | | | 1,478,184 | |
New York State Dormitory Authority, 5.00% due 10/1/2018 (School Districts Financing Program) (State Aid Withholding) | | AA-/NR | | | 2,520,000 | | | | 2,670,671 | |
New York State Dormitory Authority, 5.00% due 10/1/2018 (School Districts Financing Program; Insured: AGM) (State Aid Withholding) | | AA/A2 | | | 2,500,000 | | | | 2,649,475 | |
New York State Dormitory Authority, 5.00% due 4/1/2019 (School Districts Financing Program) (State Aid Withholding) | | AA+/NR | | | 610,000 | | | | 656,811 | |
New York State Dormitory Authority, 5.00% due 10/1/2019 (School Districts Financing Program) (State Aid Withholding) | | NR/Aa3 | | | 1,585,000 | | | | 1,732,484 | |
New York State Dormitory Authority, 5.00% due 10/1/2019 (School Districts Financing Program) (State Aid Withholding) | | AA-/NR | | | 2,645,000 | | | | 2,891,117 | |
New York State Dormitory Authority, 5.00% due 10/1/2019 (School Districts Financing Program; Insured: AGM) (State Aid Withholding) | | AA/A2 | | | 2,100,000 | | | | 2,295,405 | |
New York State Dormitory Authority, 5.00% due 12/15/2019 (Metropolitan Transportation Authority Service Contract) | | AAA/Aa1 | | | 60,000,000 | | | | 66,081,000 | |
New York State Dormitory Authority, 5.00% due 4/1/2020 (School Districts Financing Program) (State Aid Withholding) | | AA+/NR | | | 1,000,000 | | | | 1,107,740 | |
New York State Dormitory Authority, 5.00% due 7/1/2020 (NYSARC, Inc. Developmental Disability Programs) | | NR/Aa2 | | | 1,000,000 | | | | 1,110,260 | |
New York State Dormitory Authority, 5.00% due 10/1/2020 (School Districts Financing Program; Insured: AGM) | | AA/NR | | | 1,250,000 | | | | 1,403,175 | |
New York State Dormitory Authority, 5.00% due 10/1/2020 (School Districts Financing Program) (State Aid Withholding) | | NR/Aa3 | | | 1,000,000 | | | | 1,122,540 | |
New York State Dormitory Authority, 5.00% due 10/1/2020 (School Districts Financing Program) (State Aid Withholding) | | AA-/NR | | | 2,775,000 | | | | 3,113,023 | |
New York State Dormitory Authority, 5.00% due 10/1/2020 (School Districts Financing Program; Insured: AGM) (State Aid Withholding) | | AA/A2 | | | 2,100,000 | | | | 2,357,334 | |
New York State Dormitory Authority, 5.00% due 4/1/2021 (School Districts Financing Program) (State Aid Withholding) | | AA+/NR | | | 450,000 | | | | 510,462 | |
New York State Dormitory Authority, 5.00% due 10/1/2021 (School Districts Financing Program; Insured: AGM) | | AA/NR | | | 1,100,000 | | | | 1,263,031 | |
New York State Dormitory Authority, 5.00% due 10/1/2021 (School Districts Financing Program) (State Aid Withholding) | | NR/Aa3 | | | 750,000 | | | | 857,475 | |
New York State Dormitory Authority, 5.00% due 10/1/2021 (School Districts Financing Program; Insured: AGM) (State Aid Withholding) | | AA/A2 | | | 1,250,000 | | | | 1,435,263 | |
New York State Dormitory Authority, 5.00% due 10/1/2022 (School Districts Financing Program; Insured: AGM) | | AA/NR | | | 1,800,000 | | | | 2,099,574 | |
New York State Dormitory Authority, 5.00% due 10/1/2022 (School Districts Financing Program) (State Aid Withholding) | | AA+/NR | | | 300,000 | | | | 349,374 | |
New York State Dormitory Authority, 5.00% due 10/1/2023 (School Districts Financing Program; Insured: AGM) | | AA/NR | | | 2,500,000 | | | | 2,957,525 | |
New York State Dormitory Authority, 5.25% due 10/1/2023 (School Districts Financing Program; Insured: AGM) (State Aid Withholding) | | AA/A1 | | | 2,000,000 | | | | 2,307,960 | |
New York State Dormitory Authority, 5.00% due 10/1/2024 (School Districts Financing Program; Insured: AGM) | | AA/NR | | | 2,000,000 | | | | 2,392,860 | |
New York State Dormitory Authority, 0.95% due 7/1/2033 put 4/3/2017 (University of Rochester; LOC: HSBC Bank USA, N.A.) (daily demand notes) | | AAA/Aa1 | | | 5,565,000 | | | | 5,565,000 | |
New York State Housing Finance Agency, 0.96% due 11/1/2046 put 4/3/2017 (160 Madison Avenue Housing Development; LOC: PNC Bank, N.A.) (daily demand notes) | | NR/A1 | | | 5,995,000 | | | | 5,995,000 | |
New York State Housing Finance Agency, 0.96% due 11/1/2046 put 4/3/2017 (160 Madison Avenue Housing Development; LOC: PNC Bank, N.A.) (daily demand notes) | | NR/A1 | | | 25,630,000 | | | | 25,630,000 | |
28 Semi-Annual Report
| | |
| Schedule of Investments, Continued | | |
| |
Thornburg Limited Term Municipal Fund | | March 31, 2017 (Unaudited) |
| | | | | | | | | | | | |
ISSUER-DESCRIPTION | | CREDIT RATING†
S&P/ MOODY’S | | | PRINCIPAL
AMOUNT | | | VALUE | |
New York State Thruway Authority, 5.00% due 5/1/2019 (New NY Bridge) | | | A-/A3 | | | $ | 5,000,000 | | | $ | 5,390,800 | |
New York State Thruway Authority, 5.00% due 1/1/2020 (Governor Thomas E. Dewey Thruway) | | | A/A2 | | | | 2,000,000 | | | | 2,194,660 | |
New York State Thruway Authority, 5.00% due 1/1/2021 (Governor Thomas E. Dewey Thruway) | | | A/A2 | | | | 2,500,000 | | | | 2,807,150 | |
New York State Thruway Authority, 5.00% due 1/1/2022 (Governor Thomas E. Dewey Thruway) | | | A/A2 | | | | 3,000,000 | | | | 3,429,210 | |
New York State Thruway Authority, 5.00% due 1/1/2024 (Governor Thomas E. Dewey Thruway) | | | A/A2 | | | | 1,000,000 | | | | 1,176,080 | |
New York State Thruway Authority, 5.00% due 3/15/2024 (Highway, Bridge, Multi-Modal and MTA Projects) | | | AAA/Aa1 | | | | 18,300,000 | | | | 20,761,167 | |
New York State Thruway Authority, 5.00% due 1/1/2025 (Governor Thomas E. Dewey Thruway) | | | A/A2 | | | | 2,000,000 | | | | 2,376,560 | |
Suffolk County Economic Development Corp., 5.00% due 7/1/2020 (Catholic Health Services) | | | A-/Baa1 | | | | 5,000,000 | | | | 5,512,750 | |
Suffolk County Economic Development Corp., 5.00% due 7/1/2021 (Catholic Health Services) | | | A-/Baa1 | | | | 5,000,000 | | | | 5,614,600 | |
Suffolk County Economic Development Corp., 5.00% due 7/1/2022 (Catholic Health Services) | | | A-/Baa1 | | | | 5,000,000 | | | | 5,557,450 | |
The Port Authority of New York and New Jersey GO, 5.00% due 8/15/2017 (Insured: AGM) | | | AA/Aa3 | | | | 4,725,000 | | | | 4,799,371 | |
Tobacco Settlement Financing Corp., 5.00% due 6/1/2018 | | | AA/NR | | | | 3,725,000 | | | | 3,899,255 | |
Triborough Bridge & Tunnel Authority, 4.00% due 11/15/2017 (MTA Bridges & Tunnels) | | | AA-/Aa3 | | | | 750,000 | | | | 765,098 | |
Triborough Bridge & Tunnel Authority, 5.00% due 11/15/2021 (MTA Bridges & Tunnels) | | | AA-/Aa3 | | | | 5,140,000 | | | | 5,951,606 | |
United Nations Development Corp., 5.00% due 7/1/2017 (One, Two and Three U.N. Plaza) | | | NR/A1 | | | | 3,000,000 | | | | 3,031,140 | |
United Nations Development Corp., 5.00% due 7/1/2019 (One, Two and Three U.N. Plaza) | | | NR/A1 | | | | 4,000,000 | | | | 4,330,760 | |
West Seneca Central School District GO, 5.00% due 11/15/2022 (Insured: BAM) (State Aid Withholding) | | | AA/A2 | | | | 1,000,000 | | | | 1,163,320 | |
| | | |
NORTH CAROLINA — 1.97% | | | | | | | | | | | | |
Charlotte-Mecklenburg Hospital Authority, 4.00% due 1/15/2019 (Carolinas HealthCare System) | | | AA-/Aa3 | | | | 600,000 | | | | 630,132 | |
Charlotte-Mecklenburg Hospital Authority, 3.00% due 1/15/2021 (Carolinas HealthCare System) | | | AA-/Aa3 | | | | 1,595,000 | | | | 1,678,833 | |
Charlotte-Mecklenburg Hospital Authority, 4.00% due 1/15/2022 (Carolinas HealthCare System) | | | AA-/Aa3 | | | | 845,000 | | | | 929,272 | |
Charlotte-Mecklenburg Hospital Authority, 5.00% due 1/15/2023 (Carolinas HealthCare System) | | | AA-/Aa3 | | | | 1,400,000 | | | | 1,622,278 | |
Charlotte-Mecklenburg Hospital Authority, 5.00% due 1/15/2024 (Carolinas HealthCare System) | | | AA-/Aa3 | | | | 2,855,000 | | | | 3,323,591 | |
City of Charlotte COP, 5.00% due 12/1/2020 (Equipment Acquisition & Public Facilities) | | | AA+/Aa1 | | | | 1,000,000 | | | | 1,126,550 | |
City of Charlotte COP, 5.00% due 12/1/2021 (Equipment Acquisition & Public Facilities) | | | AA+/Aa1 | | | | 1,100,000 | | | | 1,266,331 | |
City of Charlotte COP, 5.00% due 12/1/2022 (Equipment Acquisition & Public Facilities) | | | AA+/Aa1 | | | | 2,405,000 | | | | 2,817,890 | |
City of Charlotte COP, 5.00% due 12/1/2023 (Equipment Acquisition & Public Facilities) | | | AA+/Aa1 | | | | 2,145,000 | | | | 2,544,807 | |
City of Charlotte COP, 5.00% due 12/1/2025 (Equipment Acquisition & Public Facilities) | | | AA+/Aa1 | | | | 2,290,000 | | | | 2,766,893 | |
County of Buncombe, 5.00% due 6/1/2022 (Primary, Middle School & Community College Facilities) | | | AA+/Aa1 | | | | 1,000,000 | | | | 1,160,720 | |
County of Buncombe, 5.00% due 6/1/2023 (Primary, Middle School & Community College Facilities) | | | AA+/Aa1 | | | | 750,000 | | | | 883,050 | |
County of Buncombe, 5.00% due 6/1/2024 (Primary, Middle School & Community College Facilities) | | | AA+/Aa1 | | | | 600,000 | | | | 713,256 | |
County of Catawba, 4.00% due 10/1/2017 | | | AA-/Aa2 | | | | 1,000,000 | | | | 1,015,580 | |
County of Dare, 4.00% due 6/1/2017 (Educational Facility Capital Projects) | | | AA/Aa3 | | | | 400,000 | | | | 402,120 | |
a County of Dare, 4.00% due 6/1/2018 (Educational Facility Capital Projects) | | | AA/Aa3 | | | | 425,000 | | | | 439,671 | |
County of Dare, 4.00% due 6/1/2019 (Educational Facility Capital Projects) | | | AA/Aa3 | | | | 500,000 | | | | 529,495 | |
County of Dare, 4.00% due 6/1/2020 (Educational Facility Capital Projects) | | | AA/Aa3 | | | | 765,000 | | | | 824,242 | |
County of Dare, 5.00% due 6/1/2021 (Educational Facility Capital Projects) | | | AA/Aa3 | | | | 1,225,000 | | | | 1,389,113 | |
County of Dare, 4.00% due 6/1/2022 (Educational Facility Capital Projects) | | | AA/Aa3 | | | | 490,000 | | | | 539,627 | |
a County of Dare, 5.00% due 6/1/2024 (Educational Facility Capital Projects) | | | AA/Aa3 | | | | 700,000 | | | | 809,368 | |
County of Mecklenburg GO, 5.00% due 12/1/2018 (County Debt Restructuring) | | | AAA/Aaa | | | | 3,015,000 | | | | 3,215,075 | |
County of Randolph, 5.00% due 10/1/2020 | | | A+/Aa3 | | | | 500,000 | | | | 556,735 | |
County of Randolph, 5.00% due 10/1/2021 | | | A+/Aa3 | | | | 1,065,000 | | | | 1,210,181 | |
County of Randolph, 5.00% due 10/1/2021 | | | A+/Aa3 | | | | 500,000 | | | | 568,160 | |
County of Randolph, 5.00% due 10/1/2022 | | | A+/Aa3 | | | | 1,945,000 | | | | 2,239,259 | |
County of Randolph, 5.00% due 10/1/2023 | | | A+/Aa3 | | | | 550,000 | | | | 640,805 | |
County of Randolph, 5.00% due 10/1/2023 | | | A+/Aa3 | | | | 400,000 | | | | 466,040 | |
North Carolina Eastern Municipal Power Agency, 6.00% due 1/1/2018 (Insured: AMBAC) (ETM) | | | NR/NR | | | | 7,500,000 | | | | 7,788,600 | |
North Carolina Eastern Municipal Power Agency, 6.00% due 1/1/2018 (Insured: BHAC/AMBAC) (ETM) | | | AA+/Aa1 | | | | 5,965,000 | | | | 6,189,463 | |
North Carolina Eastern Municipal Power Agency, 5.25% due 1/1/2019 pre-refunded 1/1/2018 (Insured: AGM) | | | AA/A3 | | | | 3,105,000 | | | | 3,206,627 | |
North Carolina Eastern Municipal Power Agency, 5.00% due 1/1/2021 (ETM) | | | NR/NR | | | | 5,000,000 | | | | 5,647,400 | |
North Carolina Eastern Municipal Power Agency, 5.00% due 1/1/2022 (ETM) | | | NR/NR | | | | 4,715,000 | | | | 5,440,638 | |
North Carolina Medical Care Commission, 5.00% due 6/1/2020 (Duke University Health System) | | | AA/Aa2 | | | | 2,000,000 | | | | 2,225,720 | |
North Carolina Medical Care Commission, 5.00% due 6/1/2021 (Duke University Health System) | | | AA/Aa2 | | | | 2,000,000 | | | | 2,280,080 | |
North Carolina Medical Care Commission, 5.00% due 6/1/2022 (Duke University Health System) | | | AA/Aa2 | | | | 1,800,000 | | | | 2,086,560 | |
North Carolina Medical Care Commission, 5.00% due 6/1/2023 (Duke University Health System) | | | AA/Aa2 | | | | 1,425,000 | | | | 1,671,995 | |
North Carolina Medical Care Commission, 5.00% due 6/1/2024 (Duke University Health System) | | | AA/Aa2 | | | | 2,300,000 | | | | 2,727,432 | |
North Carolina Medical Care Commission, 5.00% due 6/1/2025 (Duke University Health System) | | | AA/Aa2 | | | | 4,000,000 | | | | 4,792,760 | |
North Carolina Medical Care Commission, 5.00% due 6/1/2026 (Duke University Health System) | | | AA/Aa2 | | | | 1,600,000 | | | | 1,935,568 | |
North Carolina Municipal Power Agency, 4.00% due 1/1/2018 (Catawba Electric) (ETM) | | | NR/NR | | | | 3,250,000 | | | | 3,325,855 | |
North Carolina Municipal Power Agency, 4.00% due 1/1/2018 (Catawba Electric) | | | A/A2 | | | | 11,750,000 | | | | 12,014,375 | |
North Carolina Municipal Power Agency, 5.00% due 1/1/2019 (Catawba Electric) (ETM) | | | NR/NR | | | | 1,220,000 | | | | 1,303,765 | |
North Carolina Municipal Power Agency, 5.00% due 1/1/2019 (Catawba Electric) | | | A/A2 | | | | 3,280,000 | | | | 3,496,906 | |
North Carolina Municipal Power Agency, 4.00% due 1/1/2020 (Catawba Electric) (ETM) | | | NR/NR | | | | 945,000 | | | | 1,013,957 | |
North Carolina Municipal Power Agency, 4.00% due 1/1/2020 (Catawba Electric) | | | A/A2 | | | | 605,000 | | | | 646,939 | |
North Carolina Municipal Power Agency, 5.00% due 1/1/2020 (Catawba Electric) (ETM) | | | NR/NR | | | | 280,000 | | | | 308,454 | |
North Carolina Municipal Power Agency, 5.00% due 1/1/2020 (Catawba Electric) | | | A/A2 | | | | 720,000 | | | | 789,264 | |
Semi-Annual Report 29
| | |
| Schedule of Investments, Continued | | |
| |
Thornburg Limited Term Municipal Fund | | March 31, 2017 (Unaudited) |
| | | | | | | | | | | | |
ISSUER-DESCRIPTION | | CREDIT RATING†
S&P/ MOODY’S | | | PRINCIPAL
AMOUNT | | | VALUE | |
North Carolina Municipal Power Agency, 4.00% due 1/1/2022 (Catawba Electric) | | | A/A2 | | | $ | 1,000,000 | | | $ | 1,096,840 | |
State of North Carolina, 5.00% due 11/1/2019 (State Capital Projects and Correctional Facilities) | | | AA+/Aa1 | | | | 23,635,000 | | | | 25,948,394 | |
State of North Carolina GO, 5.00% due 6/1/2017 (Various Capital Improvements) | | | AAA/Aaa | | | | 6,070,000 | | | | 6,113,583 | |
Winston-Salem State University, 4.00% due 4/1/2017 (Student Housing and Student Services Facilities) | | | A-/A3 | | | | 645,000 | | | | 645,000 | |
Winston-Salem State University, 5.00% due 4/1/2019 (Student Housing and Student Services Facilities) | | | A-/A3 | | | | 815,000 | | | | 869,662 | |
Winston-Salem State University, 5.00% due 4/1/2022 (Student Housing and Student Services Facilities) | | | A-/A3 | | | | 945,000 | | | | 1,065,714 | |
| | | |
NORTH DAKOTA — 0.06% | | | | | | | | | | | | |
County of Ward, 4.00% due 4/1/2020 (Insured: AGM) | | | AA/A2 | | | | 2,445,000 | | | | 2,613,998 | |
North Dakota Public Finance Authority, 4.00% due 6/1/2017 (City of Fargo Flood Mitigation Projects) | | | A+/NR | | | | 1,460,000 | | | | 1,467,738 | |
| | | |
OHIO — 3.50% | | | | | | | | | | | | |
Akron, Bath & Copley Joint Township Hospital District, 5.00% due 11/15/2021 (Children’s Hospital Medical Center) | | | NR/A1 | | | | 1,000,000 | | | | 1,138,680 | |
American Municipal Power, Inc., 5.25% due 2/15/2018 (AMP Combined Hydroelectric Projects) | | | A/A2 | | | | 5,500,000 | | | | 5,702,290 | |
American Municipal Power, Inc., 5.25% due 2/15/2019 (AMP Combined Hydroelectric Projects) | | | A/A2 | | | | 5,595,000 | | | | 6,013,450 | |
American Municipal Power, Inc., 5.00% due 2/15/2020 (AMP Fremont Energy Center) | | | A/A1 | | | | 1,865,000 | | | | 2,051,127 | |
American Municipal Power, Inc., 5.00% due 2/15/2021 (AMP Fremont Energy Center) | | | A/A1 | | | | 1,300,000 | | | | 1,464,385 | |
American Municipal Power, Inc., 5.00% due 2/15/2022 (AMP Fremont Energy Center) | | | A/A1 | | | | 2,750,000 | | | | 3,150,400 | |
Cincinnati City School District Board of Education GO, 5.25% due 12/1/2023 (Educational Facilities; Insured: Natl-Re) | | | AA-/Aa2 | | | | 2,690,000 | | | | 3,212,936 | |
City of Akron, 5.00% due 12/1/2021 (Community Learning Centers) | | | AA+/NR | | | | 4,120,000 | | | | 4,721,026 | |
City of Akron GO, 5.00% due 12/1/2019 (Various Municipal Capital Projects) | | | AA-/NR | | | | 1,685,000 | | | | 1,847,838 | |
City of Cleveland, 4.00% due 10/1/2018 (Parks & Recreation Facilities) | | | AA/A1 | | | | 500,000 | | | | 521,700 | |
City of Cleveland, 5.00% due 5/15/2019 (Police & Fire Pension Payment) | | | AA/A1 | | | | 1,750,000 | | | | 1,881,758 | |
City of Cleveland, 4.00% due 10/1/2019 (Public Facilities) | | | AA/A1 | | | | 600,000 | | | | 637,200 | |
City of Cleveland, 4.00% due 10/1/2019 (Parks & Recreation Facilities) | | | AA/A1 | | | | 520,000 | | | | 552,240 | |
City of Cleveland, 5.00% due 5/15/2020 (Police & Fire Pension Payment) | | | AA/A1 | | | | 1,605,000 | | | | 1,768,999 | |
City of Cleveland, 5.00% due 10/1/2020 (Public Facilities) | | | AA/A1 | | | | 510,000 | | | | 567,130 | |
City of Cleveland, 5.00% due 10/1/2020 (Parks & Recreation Facilities) | | | AA/A1 | | | | 545,000 | | | | 606,051 | |
City of Cleveland, 5.00% due 5/15/2021 (Police & Fire Pension Payment) | | | AA/A1 | | | | 750,000 | | | | 845,670 | |
City of Cleveland, 5.00% due 10/1/2021 (Parks & Recreation Facilities) | | | AA/A1 | | | | 570,000 | | | | 647,178 | |
City of Cleveland, 5.00% due 10/1/2022 (Public Facilities) | | | AA/A1 | | | | 905,000 | | | | 1,038,370 | |
City of Cleveland, 5.00% due 10/1/2022 (Parks & Recreation Facilities) | | | AA/A1 | | | | 600,000 | | | | 688,422 | |
City of Cleveland, 5.00% due 11/15/2022 (Parks & Recreation Facilities) | | | AA/A1 | | | | 1,030,000 | | | | 1,183,635 | |
City of Cleveland, 5.00% due 10/1/2023 (Public Facilities) | | | AA/A1 | | | | 1,155,000 | | | | 1,338,125 | |
City of Cleveland, 5.00% due 10/1/2023 (Parks & Recreation Facilities) | | | AA/A1 | | | | 630,000 | | | | 729,887 | |
City of Cleveland COP, 4.75% due 11/15/2020 (Cleveland Stadium) | | | A/A3 | | | | 2,000,000 | | | | 2,178,960 | |
City of Cleveland GO, 2.00% due 12/1/2018 (City Capital Projects) | | | AA/A1 | | | | 700,000 | | | | 711,011 | |
City of Cleveland GO, 5.50% due 10/1/2019 (City Capital Projects; Insured: AMBAC) | | | AA/A1 | | | | 1,260,000 | | | | 1,392,048 | |
City of Cleveland GO, 3.00% due 12/1/2020 (Municipal Street System Improvements) | | | AA/A1 | | | | 675,000 | | | | 711,389 | |
City of Cleveland GO, 3.00% due 12/1/2021 (Municipal Street System Improvements) | | | AA/A1 | | | | 2,305,000 | | | | 2,432,282 | |
City of Cleveland GO, 4.00% due 12/1/2022 (Municipal Street System Improvements) | | | AA/A1 | | | | 3,330,000 | | | | 3,709,753 | |
City of Cleveland GO, 4.00% due 12/1/2023 (Municipal Street System Improvements) | | | AA/A1 | | | | 3,395,000 | | | | 3,805,659 | |
City of Cleveland GO, 5.00% due 12/1/2024 (Municipal Street System Improvements) | | | AA/A1 | | | | 3,730,000 | | | | 4,442,915 | |
City of Cleveland GO, 5.00% due 12/1/2025 (Municipal Street System Improvements) | | | AA/A1 | | | | 3,555,000 | | | | 4,246,056 | |
City of Cleveland GO, 5.00% due 12/1/2026 (Municipal Street System Improvements) | | | AA/A1 | | | | 3,610,000 | | | | 4,271,099 | |
City of Toledo, 5.00% due 11/15/2018 (Water System Improvements) | | | AA-/Aa3 | | | | 1,175,000 | | | | 1,250,682 | |
City of Toledo, 5.00% due 11/15/2019 (Water System Improvements) | | | AA-/Aa3 | | | | 2,260,000 | | | | 2,483,469 | |
City of Toledo, 5.00% due 11/15/2020 (Water System Improvements) | | | AA-/Aa3 | | | | 2,000,000 | | | | 2,255,300 | |
City of Toledo, 5.00% due 11/15/2021 (Water System Improvements) | | | AA-/Aa3 | | | | 2,000,000 | | | | 2,306,360 | |
City of Toledo, 5.00% due 11/15/2022 (Water System Improvements) | | | AA-/Aa3 | | | | 3,255,000 | | | | 3,822,151 | |
City of Toledo, 5.00% due 11/15/2023 (Water System Improvements) | | | AA-/Aa3 | | | | 1,750,000 | | | | 2,056,180 | |
Cleveland Package Facilities, 5.25% due 9/15/2021 (Insured: AGM) (ETM) | | | AA/A2 | | | | 965,000 | | | | 1,120,249 | |
Cleveland Package Facilities, 5.25% due 9/15/2021 (Insured: AGM) | | | AA/A2 | | | | 2,035,000 | | | | 2,293,201 | |
Cleveland State University, 5.00% due 6/1/2019 (Campus Capital Projects) | | | A+/A1 | | | | 1,000,000 | | | | 1,079,630 | |
Cleveland State University, 5.00% due 6/1/2020 (Campus Capital Projects) | | | A+/A1 | | | | 700,000 | | | | 775,782 | |
Cleveland State University, 5.00% due 6/1/2021 (Campus Capital Projects) | | | A+/A1 | | | | 1,000,000 | | | | 1,133,110 | |
Cleveland State University, 5.00% due 6/1/2022 (Campus Capital Projects) | | | A+/A1 | | | | 2,000,000 | | | | 2,291,340 | |
Cleveland-Cuyahoga County Port Authority, 5.00% due 10/1/2019 (Cleveland Museum of Art) | | | AA+/NR | | | | 2,000,000 | | | | 2,177,560 | |
County of Clermont, 4.00% due 8/1/2019 (Sanitary Sewer System) | | | NR/Aa3 | | | | 1,420,000 | | | | 1,471,489 | |
County of Cuyahoga COP, 5.00% due 12/1/2019 (Convention Hotel Project) | | | AA-/Aa3 | | | | 2,585,000 | | | | 2,820,442 | |
County of Cuyahoga COP, 5.00% due 12/1/2022 (Convention Hotel Project) | | | AA-/Aa3 | | | | 9,725,000 | | | | 11,230,527 | |
County of Cuyahoga COP, 5.00% due 12/1/2023 (Convention Hotel Project) | | | AA-/Aa3 | | | | 5,645,000 | | | | 6,597,650 | |
County of Cuyahoga COP, 5.00% due 12/1/2024 (Convention Hotel Project) | | | AA-/Aa3 | | | | 11,515,000 | | | | 13,442,611 | |
County of Hamilton, 5.00% due 12/1/2018 | | | AA-/A1 | | | | 1,900,000 | | | | 2,024,184 | |
County of Hamilton, 5.00% due 12/1/2019 | | | AA-/A1 | | | | 3,000,000 | | | | 3,294,630 | |
County of Hamilton, 5.00% due 12/1/2020 | | | AA-/A1 | | | | 1,200,000 | | | | 1,350,336 | |
County of Hamilton, 5.00% due 12/1/2022 | | | AA-/A1 | | | | 2,250,000 | | | | 2,623,410 | |
30 Semi-Annual Report
| | |
| Schedule of Investments, Continued | | |
| |
Thornburg Limited Term Municipal Fund | | March 31, 2017 (Unaudited) |
| | | | | | | | | | | | |
ISSUER-DESCRIPTION | | CREDIT RATING†
S&P/ MOODY’S | | | PRINCIPAL
AMOUNT | | | VALUE | |
County of Hamilton, 5.00% due 12/1/2023 | | | AA-/A1 | | | $ | 2,200,000 | | | $ | 2,599,652 | |
County of Hamilton, 5.00% due 12/1/2024 | | | AA-/A1 | | | | 3,200,000 | | | | 3,819,072 | |
County of Hamilton, 5.00% due 12/1/2025 | | | AA-/A1 | | | | 3,400,000 | | | | 4,084,420 | |
County of Hamilton, 5.00% due 12/1/2026 | | | AA-/A1 | | | | 3,000,000 | | | | 3,619,650 | |
County of Montgomery, 0.90% due 11/15/2045 put 4/3/2017 (Premier Health Partners; LOC: Barclays Bank plc) (daily demand notes) | | | NR/Aa2 | | | | 21,625,000 | | | | 21,625,000 | |
County of Montgomery, 0.90% due 11/15/2045 put 4/3/2017 (Premier Health Partners; LOC: Barclays Bank plc) (daily demand notes) | | | NR/Aa2 | | | | 16,425,000 | | | | 16,425,000 | |
County of Scioto, 5.00% due 2/15/2022 | | | NR/A2 | | | | 1,110,000 | | | | 1,263,913 | |
County of Scioto, 5.00% due 2/15/2023 | | | NR/A2 | | | | 2,020,000 | | | | 2,326,636 | |
County of Scioto, 5.00% due 2/15/2024 | | | NR/A2 | | | | 1,640,000 | | | | 1,909,206 | |
County of Scioto, 5.00% due 2/15/2025 | | | NR/A2 | | | | 1,695,000 | | | | 1,983,862 | |
Deerfield Township, 5.00% due 12/1/2017 | | | NR/A1 | | | | 1,000,000 | | | | 1,022,120 | |
Franklin County Convention Facilities Authority, 5.00% due 12/1/2021 (Greater Columbus Convention Center) | | | AA/Aa1 | | | | 1,000,000 | | | | 1,145,390 | |
Franklin County Convention Facilities Authority, 5.00% due 12/1/2022 (Greater Columbus Convention Center) | | | AA/Aa1 | | | | 500,000 | | | | 581,735 | |
Franklin County Convention Facilities Authority, 5.00% due 12/1/2024 (Greater Columbus Convention Center) | | | AA/Aa1 | | | | 1,000,000 | | | | 1,181,100 | |
Kent State University, 5.00% due 5/1/2020 pre-refunded 5/1/2019 (Insured: AGC) | | | AA/Aa3 | | | | 915,000 | | | | 989,481 | |
Kent State University, 5.00% due 5/1/2020 (Insured: AGC) | | | AA/Aa3 | | | | 85,000 | | | | 91,571 | |
Ohio State Building Authority, 5.00% due 10/1/2020 | | | AA/Aa2 | | | | 1,700,000 | | | | 1,866,362 | |
Penta Career Center COP, 4.00% due 4/1/2017 (School District Facilities) | | | NR/Aa3 | | | | 1,550,000 | | | | 1,550,000 | |
RiverSouth Authority, 5.00% due 12/1/2019 (RiverSouth Area Redevelopment) | | | AA+/Aa2 | | | | 2,500,000 | | | | 2,730,450 | |
State of Ohio, 4.00% due 12/15/2018 (Major New Street Infrastructure Project) | | | AA/Aa2 | | | | 1,000,000 | | | | 1,050,560 | |
State of Ohio, 4.00% due 12/15/2019 (Major New Street Infrastructure Project) | | | AA/Aa2 | | | | 1,000,000 | | | | 1,075,050 | |
State of Ohio, 5.00% due 10/1/2020 (Cultural and Sports Capital Facilities) | | | AA/Aa2 | | | | 3,845,000 | | | | 4,283,368 | |
State of Ohio, 5.00% due 12/15/2020 (Major New Street Infrastructure Project) | | | AA/Aa2 | | | | 1,000,000 | | | | 1,127,560 | |
State of Ohio, 5.00% due 12/15/2020 (Major New Street Infrastructure Project) | | | AA/Aa2 | | | | 1,000,000 | | | | 1,127,560 | |
State of Ohio, 5.00% due 12/15/2021 (Major New Street Infrastructure Project) | | | AA/Aa2 | | | | 2,500,000 | | | | 2,880,025 | |
State of Ohio, 5.00% due 12/15/2024 (Major New Street Infrastructure Project) | | | AA/Aa2 | | | | 2,000,000 | | | | 2,389,500 | |
State of Ohio, 5.00% due 12/15/2025 (Major New Street Infrastructure Project) | | | AA/Aa2 | | | | 3,000,000 | | | | 3,618,390 | |
State of Ohio, 5.00% due 12/15/2026 (Major New Street Infrastructure Project) | | | AA/Aa2 | | | | 1,000,000 | | | | 1,205,640 | |
State of Ohio GO, 5.50% due 9/15/2019 (Common Schools Capital Facilities) | | | AA+/Aa1 | | | | 4,150,000 | | | | 4,588,697 | |
University of Akron Ohio, 5.00% due 1/1/2018 (Insured: AGM) | | | AA/A1 | | | | 3,415,000 | | | | 3,518,850 | |
Youngstown City School District GO, 4.00% due 12/1/2017 (Educational Facilities) (State Aid Withholding) | | | NR/Aa2 | | | | 1,480,000 | | | | 1,508,386 | |
Youngstown City School District GO, 4.00% due 12/1/2018 (Educational Facilities) (State Aid Withholding) | | | NR/Aa2 | | | | 1,545,000 | | | | 1,615,236 | |
Youngstown City School District GO, 4.00% due 12/1/2019 (Educational Facilities) (State Aid Withholding) | | | NR/Aa2 | | | | 1,605,000 | | | | 1,712,663 | |
Youngstown City School District GO, 4.00% due 12/1/2020 (Educational Facilities) (State Aid Withholding) | | | NR/Aa2 | | | | 1,670,000 | | | | 1,808,209 | |
Youngstown City School District GO, 4.00% due 12/1/2021 (Educational Facilities) (State Aid Withholding) | | | NR/Aa2 | | | | 1,735,000 | | | | 1,864,570 | |
Youngstown City School District GO, 4.00% due 12/1/2022 (Educational Facilities) (State Aid Withholding) | | | NR/Aa2 | | | | 1,805,000 | | | | 1,926,747 | |
Youngstown City School District GO, 4.00% due 12/1/2023 (Educational Facilities) (State Aid Withholding) | | | NR/Aa2 | | | | 1,700,000 | | | | 1,800,453 | |
| | | |
OKLAHOMA — 0.73% | | | | | | | | | | | | |
Canadian County Educational Facilities Authority, 4.00% due 9/1/2019 (Mustang Public Schools) | | | A+/NR | | | | 1,410,000 | | | | 1,491,822 | |
Canadian County Educational Facilities Authority, 4.50% due 9/1/2020 (Mustang Public Schools) | | | A+/NR | | | | 2,690,000 | | | | 2,927,688 | |
Canadian County Educational Facilities Authority, 4.50% due 9/1/2021 (Mustang Public Schools) | | | A+/NR | | | | 2,290,000 | | | | 2,527,358 | |
Cleveland County Educational Facilities Authority, 5.00% due 6/1/2023 (Moore Public Schools) | | | A+/NR | | | | 5,355,000 | | | | 6,219,083 | |
Oklahoma Capitol Improvement Authority, 5.00% due 7/1/2023 (State Highway Capital Improvement) | | | AA-/NR | | | | 325,000 | | | | 382,327 | |
a Oklahoma Capitol Improvement Authority, 5.00% due 7/1/2024 (State Highway Capital Improvement) | | | AA-/NR | | | | 800,000 | | | | 947,280 | |
Oklahoma County Finance Authority, 5.00% due 9/1/2017 (Western Heights Public Schools) | | | A+/NR | | | | 4,075,000 | | | | 4,139,181 | |
Oklahoma County Finance Authority, 4.00% due 9/1/2018 (Western Heights Public Schools) | | | A+/NR | | | | 250,000 | | | | 259,393 | |
Oklahoma County Finance Authority, 5.00% due 9/1/2018 (Western Heights Public Schools) | | | A+/NR | | | | 2,120,000 | | | | 2,228,290 | |
Oklahoma County Finance Authority, 5.00% due 9/1/2020 (Western Heights Public Schools) | | | A+/NR | | | | 2,000,000 | | | | 2,206,200 | |
Oklahoma DFA, 5.00% due 8/15/2017 (INTEGRIS Health) (ETM) | | | AA-/NR | | | | 4,375,000 | | | | 4,443,950 | |
Oklahoma DFA, 5.00% due 8/15/2018 (INTEGRIS Health) (ETM) | | | AA-/NR | | | | 500,000 | | | | 527,275 | |
Oklahoma DFA, 5.00% due 8/15/2022 (INTEGRIS Health) | | | AA-/Aa3 | | | | 1,000,000 | | | | 1,154,650 | |
Oklahoma DFA, 5.00% due 8/15/2023 (INTEGRIS Health) | | | AA-/Aa3 | | | | 1,500,000 | | | | 1,748,715 | |
Oklahoma DFA, 5.00% due 8/15/2024 (INTEGRIS Health) | | | AA-/Aa3 | | | | 1,225,000 | | | | 1,442,205 | |
Oklahoma DFA, 5.00% due 8/15/2025 (INTEGRIS Health) | | | AA-/Aa3 | | | | 1,000,000 | | | | 1,186,770 | |
Oklahoma State Industrial Authority, 5.25% due 7/1/2017 (Medical Research Foundation) (ETM) | | | NR/A2 | | | | 1,075,000 | | | | 1,087,040 | |
Tulsa County Industrial Authority, 5.50% due 9/1/2018 (Jenks Public Schools) | | | AA-/NR | | | | 4,210,000 | | | | 4,472,072 | |
Tulsa County Industrial Authority, 4.50% due 9/1/2020 (Broken Arrow Public Schools) | | | AA-/NR | | | | 1,585,000 | | | | 1,734,989 | |
Tulsa County Industrial Authority, 4.50% due 9/1/2021 (Broken Arrow Public Schools) | | | AA-/NR | | | | 8,775,000 | | | | 9,753,851 | |
Tulsa Parking Authority, 3.00% due 7/1/2017 | | | AA-/NR | | | | 1,470,000 | | | | 1,477,894 | |
| | | |
OREGON — 1.33% | | | | | | | | | | | | |
Oregon Facilities Authority, 4.50% due 3/15/2018 (Legacy Health System) | | | AA-/A1 | | | | 1,100,000 | | | | 1,134,892 | |
Polk County Dallas School District No. 2 GO, 0% due 6/15/2017 (Capital Improvements) | | | AA+/NR | | | | 2,270,000 | | | | 2,265,823 | |
Polk County Dallas School District No. 2 GO, 0% due 6/15/2019 (Capital Improvements) | | | AA+/NR | | | | 515,000 | | | | 499,715 | |
Semi-Annual Report 31
| | |
| Schedule of Investments, Continued | | |
| |
Thornburg Limited Term Municipal Fund | | March 31, 2017 (Unaudited) |
| | | | | | | | | | | | |
ISSUER-DESCRIPTION | | CREDIT RATING†
S&P/ MOODY’S | | | PRINCIPAL
AMOUNT | | | VALUE | |
Polk County Dallas School District No. 2 GO, 0% due 6/15/2021 (Capital Improvements) | | | AA+/NR | | | $ | 1,475,000 | | | $ | 1,374,567 | |
State of Oregon GO, 2.00% due 6/30/2017 (Cash Management) | | | SP-1+/Mig1 | | | | 89,625,000 | | | | 89,899,253 | |
| | | |
PENNSYLVANIA — 4.56% | | | | | | | | | | | | |
Adams County IDA, 5.00% due 8/15/2017 (Gettysburg College) | | | A/A2 | | | | 1,340,000 | | | | 1,360,864 | |
Adams County IDA, 5.00% due 8/15/2019 (Gettysburg College) | | | A/A2 | | | | 1,765,000 | | | | 1,917,161 | |
Allegheny County Higher Education Building Authority, 5.00% due 3/1/2020 (Duquesne University of the Holy Spirit) | | | A/A2 | | | | 250,000 | | | | 273,903 | |
Allegheny County Higher Education Building Authority, 5.00% due 3/1/2023 (Duquesne University of the Holy Spirit) | | | A/A2 | | | | 300,000 | | | | 344,901 | |
Allegheny County Higher Education Building Authority, 5.00% due 3/1/2024 (Duquesne University of the Holy Spirit) | | | A/A2 | | | | 500,000 | | | | 581,645 | |
Allegheny County Higher Education Building Authority, 5.00% due 3/1/2025 (Duquesne University of the Holy Spirit) | | | A/A2 | | | | 1,145,000 | | | | 1,342,581 | |
Allegheny County Hospital Development Authority, 5.00% due 6/15/2017 (University of Pittsburgh Medical Center) | | | A+/Aa3 | | | | 3,000,000 | | | | 3,025,590 | |
Allegheny County Hospital Development Authority, 5.00% due 9/1/2017 (University of Pittsburgh Medical Center) | | | A+/Aa3 | | | | 1,875,000 | | | | 1,906,500 | |
Allegheny County Hospital Development Authority, 5.00% due 5/15/2018 (University of Pittsburgh Medical Center) | | | A+/Aa3 | | | | 5,915,000 | | | | 6,178,158 | |
Allegheny County Hospital Development Authority, 5.00% due 6/15/2018 (University of Pittsburgh Medical Center) | | | A+/Aa3 | | | | 3,310,000 | | | | 3,467,655 | |
Allegheny County Hospital Development Authority, 5.00% due 9/1/2018 (University of Pittsburgh Medical Center) | | | A+/Aa3 | | | | 3,100,000 | | | | 3,269,136 | |
Allegheny County Sanitary Authority, 4.00% due 12/1/2018 (2015 Capital Project) | | | A/A1 | | | | 650,000 | | | | 680,979 | |
Allegheny County Sanitary Authority, 5.00% due 12/1/2023 (2015 Capital Project) | | | A/A1 | | | | 14,500,000 | | | | 16,927,590 | |
Allegheny County Sanitary Authority, 5.00% due 12/1/2024 (2015 Capital Project) | | | A/A1 | | | | 4,650,000 | | | | 5,484,675 | |
Allegheny County Sanitary Authority, 5.00% due 12/1/2025 (2015 Capital Project; Insured: BAM) | | | AA/A1 | | | | 1,000,000 | | | | 1,190,960 | |
Altoona Area School District GO, 3.00% due 12/1/2022 (Insured: AGM) (State Aid Withholding) | | | AA/NR | | | | 1,335,000 | | | | 1,383,207 | |
Athens Area School District GO, 3.00% due 4/15/2018 (Insured: AGM) (State Aid Withholding) | | | NR/A2 | | | | 2,600,000 | | | | 2,647,840 | |
Athens Area School District GO, 3.00% due 4/15/2019 (Insured: AGM) (State Aid Withholding) | | | NR/A2 | | | | 2,680,000 | | | | 2,723,657 | |
City of Philadelphia, 5.00% due 6/15/2017 (Water and Wastewater System; Insured: AGM) | | | AA/A1 | | | | 5,570,000 | | | | 5,617,902 | |
City of Philadelphia, 5.00% due 10/1/2017 (Pennsylvania Gas Works) | | | A/Baa1 | | | | 400,000 | | | | 407,696 | |
City of Philadelphia, 5.00% due 7/1/2018 (Pennsylvania Gas Works) | | | AA/A2 | | | | 1,395,000 | | | | 1,460,370 | |
City of Philadelphia, 5.00% due 10/1/2020 (Pennsylvania Gas Works) | | | A/Baa1 | | | | 1,500,000 | | | | 1,658,070 | |
City of Philadelphia, 5.00% due 8/1/2023 (Pennsylvania Gas Works) | | | A/Baa1 | | | | 3,750,000 | | | | 4,312,087 | |
City of Philadelphia, 5.00% due 8/1/2024 (Pennsylvania Gas Works) | | | A/Baa1 | | | | 4,000,000 | | | | 4,614,920 | |
City of Philadelphia, 5.00% due 10/1/2024 (Water and Wastewater System) | | | A+/A1 | | | | 3,385,000 | | | | 3,985,770 | |
City of Philadelphia, 5.00% due 10/1/2024 (Pennsylvania Gas Works) | | | A/Baa1 | | | | 1,000,000 | | | | 1,155,940 | |
City of Philadelphia, 5.00% due 8/1/2025 (Pennsylvania Gas Works) | | | A/Baa1 | | | | 1,900,000 | | | | 2,202,841 | |
City of Philadelphia, 5.00% due 10/1/2025 (Water and Wastewater System) | | | A+/A1 | | | | 4,430,000 | | | | 5,260,315 | |
City of Philadelphia, 5.00% due 10/1/2026 (Water and Wastewater System) | | | A+/A1 | | | | 2,070,000 | | | | 2,474,747 | |
City of Philadelphia GO, 5.00% due 8/1/2025 (Insured: AGM) | | | AA/A2 | | | | 7,965,000 | | | | 9,244,657 | |
City of Philadelphia GO, 5.00% due 8/1/2026 (Insured: AGM) | | | AA/A2 | | | | 14,715,000 | | | | 17,194,772 | |
City of Philadelphia GO, 5.00% due 8/1/2027 (Insured: AGM) | | | AA/A2 | | | | 6,005,000 | | | | 7,070,467 | |
City of Pittsburgh GO, 5.00% due 9/1/2022 (Insured: BAM) | | | AA/A1 | | | | 1,100,000 | | | | 1,265,935 | |
Commonwealth of Pennsylvania GO, 5.00% due 8/15/2023 (Capital Facilities) | | | AA-/Aa3 | | | | 19,125,000 | | | | 22,278,904 | |
Commonwealth of Pennsylvania GO, 5.00% due 8/15/2024 (Capital Facilities) | | | AA-/Aa3 | | | | 15,500,000 | | | | 18,161,040 | |
Commonwealth of Pennsylvania GO, 5.00% due 8/15/2025 (Capital Facilities) | | | AA-/Aa3 | | | | 14,825,000 | | | | 17,402,771 | |
Economy Borough Municipal Authority, 3.00% due 12/15/2018 (Beaver County Sewer System; Insured: BAM) | | | AA/NR | | | | 435,000 | | | | 446,884 | |
Economy Borough Municipal Authority, 4.00% due 12/15/2020 (Beaver County Sewer System; Insured: BAM) | | | AA/NR | | | | 605,000 | | | | 651,706 | |
Economy Borough Municipal Authority, 4.00% due 12/15/2022 (Beaver County Sewer System; Insured: BAM) | | | AA/NR | | | | 1,180,000 | | | | 1,287,144 | |
Hospitals & Higher Education Facilities Authority of Philadelphia, 0.95% due 7/1/2041 put 4/3/2017 (The Children’s Hospital of Philadelphia; SPA: Wells Fargo Bank, N.A.) (daily demand notes) | | | AA/Aa2 | | | | 8,100,000 | | | | 8,100,000 | |
Lancaster County Hospital Authority, 4.00% due 11/1/2017 (Masonic Villages Project) | | | A/NR | | | | 865,000 | | | | 878,805 | |
Lancaster County Hospital Authority, 5.00% due 11/1/2018 (Masonic Villages Project) | | | A/NR | | | | 1,105,000 | | | | 1,164,792 | |
Lancaster County Solid Waste Management Authority, 5.00% due 12/15/2023 (Harrisburg Resource Recovery Facility) | | | AA-/NR | | | | 2,680,000 | | | | 3,079,776 | |
Lancaster County Solid Waste Management Authority, 5.25% due 12/15/2024 (Harrisburg Resource Recovery Facility) | | | AA-/NR | | | | 4,770,000 | | | | 5,567,258 | |
Lehigh County IDA, 0.90% due 2/15/2027 put 8/15/2017 (PPL Electric Utilities Corp.) | | | A/A1 | | | | 6,360,000 | | | | 6,359,300 | |
Lehigh County IDA, 0.90% due 9/1/2029 put 9/1/2017 (PPL Electric Utilities Corp.) | | | A/A1 | | | | 17,250,000 | | | | 17,228,610 | |
Luzerne County GO, 5.00% due 11/15/2021 (Insured: AGM) | | | AA/NR | | | | 2,680,000 | | | | 2,981,232 | |
Luzerne County GO, 5.00% due 11/15/2022 (Insured: AGM) | | | AA/NR | | | | 2,560,000 | | | | 2,869,965 | |
Luzerne County GO, 5.00% due 11/15/2023 (Insured: AGM) | | | AA/NR | | | | 2,600,000 | | | | 2,931,370 | |
Luzerne County GO, 5.00% due 11/15/2024 (Insured: AGM) | | | AA/NR | | | | 4,000,000 | | | | 4,530,800 | |
Monroeville Finance Authority, 5.00% due 2/15/2021 (University of Pittsburgh Medical Center) | | | A+/Aa3 | | | | 2,400,000 | | | | 2,702,520 | |
Monroeville Finance Authority, 5.00% due 2/15/2022 (University of Pittsburgh Medical Center) | | | A+/Aa3 | | | | 1,250,000 | | | | 1,431,450 | |
Montgomery County Higher Education & Health Authority, 5.00% due 6/1/2022 (Abington Memorial Hospital) | | | A+/NR | | | | 3,000,000 | | | | 3,442,440 | |
Northampton Borough Municipal Authority, 4.00% due 5/15/2021 (Water System; Insured: AGM) | | | NR/A1 | | | | 500,000 | | | | 535,695 | |
Northampton Borough Municipal Authority, 4.00% due 5/15/2022 (Water System; Insured: AGM) | | | NR/A1 | | | | 1,185,000 | | | | 1,274,728 | |
Northampton Borough Municipal Authority, 3.00% due 5/15/2023 (Water System; Insured: AGM) | | | NR/A1 | | | | 1,255,000 | | | | 1,282,447 | |
Norwin School District GO, 4.00% due 4/1/2018 (Insured: AGM) (State Aid Withholding) | | | AA/A1 | | | | 1,835,000 | | | | 1,885,646 | |
Pennsylvania Higher Educational Facilities Authority, 5.00% due 5/15/2019 (University of Pittsburgh Medical Center) | | | A+/Aa3 | | | | 5,600,000 | | | | 6,041,504 | |
Pennsylvania Higher Educational Facilities Authority, 5.00% due 5/15/2020 (University of Pittsburgh Medical Center) | | | A+/Aa3 | | | | 5,100,000 | | | | 5,649,525 | |
Pennsylvania Higher Educational Facilities Authority, 4.00% due 10/1/2022 (Shippensburg University Student Services, Inc. Student Housing) | | | BBB-/Baa3 | | | | 1,825,000 | | | | 1,904,661 | |
Pennsylvania Higher Educational Facilities Authority, 5.00% due 11/1/2023 (Saint Joseph’s University) | | | A-/NR | | | | 1,075,000 | | | | 1,196,066 | |
32 Semi-Annual Report
| | |
| Schedule of Investments, Continued | | |
| |
Thornburg Limited Term Municipal Fund | | March 31, 2017 (Unaudited) |
| | | | | | | | | | | | |
ISSUER-DESCRIPTION | | CREDIT RATING†
S&P/ MOODY’S | | | PRINCIPAL
AMOUNT | | | VALUE | |
Philadelphia Authority for Industrial Development, 5.00% due 8/1/2020 (Mast Charter School) (ETM) | | | BBB/NR | | | $ | 420,000 | | | $ | 445,801 | |
Philadelphia Parking Authority, 5.00% due 9/1/2017 | | | A/A1 | | | | 1,020,000 | | | | 1,037,483 | |
Philadelphia School District GO, 4.50% due 9/1/2017 (State Aid Withholding) | | | NR/A2 | | | | 2,270,000 | | | | 2,296,173 | |
Philadelphia School District GO, 5.00% due 9/1/2019 (State Aid Withholding) | | | NR/A2 | | | | 18,410,000 | | | | 19,647,520 | |
Philadelphia School District GO, 5.00% due 9/1/2019 (State Aid Withholding) | | | NR/A2 | | | | 4,210,000 | | | | 4,498,174 | |
Philadelphia School District GO, 5.25% due 9/1/2021 (State Aid Withholding) | | | NR/A2 | | | | 2,265,000 | | | | 2,487,695 | |
Pittsburgh Water and Sewer Authority, 5.00% due 9/1/2023 | | | A/A2 | | | | 2,520,000 | | | | 2,932,927 | |
Pittsburgh Water and Sewer Authority, 5.00% due 9/1/2024 | | | A/A2 | | | | 7,365,000 | | | | 8,549,513 | |
Pittsburgh Water and Sewer Authority, 5.00% due 9/1/2024 | | | A/A2 | | | | 2,395,000 | | | | 2,780,188 | |
Plum Borough School District GO, 3.00% due 9/15/2017 (Insured: BAM) (State Aid Withholding) | | | AA/NR | | | | 240,000 | | | | 242,131 | |
Plum Borough School District GO, 4.00% due 9/15/2018 (Insured: BAM) (State Aid Withholding) | | | AA/NR | | | | 740,000 | | | | 769,267 | |
Plum Borough School District GO, 4.00% due 9/15/2019 (Insured: BAM) (State Aid Withholding) | | | AA/NR | | | | 390,000 | | | | 413,306 | |
Plum Borough School District GO, 4.00% due 9/15/2019 (Insured: BAM) (State Aid Withholding) | | | AA/NR | | | | 395,000 | | | | 418,605 | |
Plum Borough School District GO, 4.00% due 9/15/2019 (Insured: BAM) (State Aid Withholding) | | | AA/NR | | | | 1,205,000 | | | | 1,277,011 | |
Plum Borough School District GO, 4.00% due 9/15/2020 (Insured: BAM) (State Aid Withholding) | | | AA/NR | | | | 1,455,000 | | | | 1,567,690 | |
Plum Borough School District GO, 4.00% due 9/15/2021 (Insured: BAM) (State Aid Withholding) | | | AA/NR | | | | 1,610,000 | | | | 1,755,528 | |
Plum Borough School District GO, 5.00% due 9/15/2022 (Insured: BAM) (State Aid Withholding) | | | AA/NR | | | | 1,410,000 | | | | 1,609,557 | |
Plum Borough School District GO, 5.00% due 9/15/2023 (Insured: BAM) (State Aid Withholding) | | | AA/NR | | | | 1,495,000 | | | | 1,721,448 | |
Plum Borough School District GO, 5.00% due 9/15/2023 (Insured: BAM) (State Aid Withholding) | | | AA/NR | | | | 470,000 | | | | 541,191 | |
Plum Borough School District GO, 5.00% due 9/15/2024 (Insured: BAM) (State Aid Withholding) | | | AA/NR | | | | 1,885,000 | | | | 2,191,784 | |
Wayne County Hospital and HFA, 2.00% due 7/1/2017 (Wayne Memorial Hospital; Insured: AGM) | | | AA/NR | | | | 1,000,000 | | | | 1,002,710 | |
Wayne County Hospital and HFA, 2.00% due 7/1/2018 (Wayne Memorial Hospital; Insured: AGM) | | | AA/NR | | | | 625,000 | | | | 632,037 | |
Wayne County Hospital and HFA, 3.00% due 7/1/2019 (Wayne Memorial Hospital; Insured: AGM) | | | AA/NR | | | | 1,185,000 | | | | 1,210,774 | |
| | | |
RHODE ISLAND — 1.58% | | | | | | | | | | | | |
Rhode Island Clean Water Finance Agency, 5.00% due 10/1/2018 (Public Drinking Water Supply or Treatment Facilities) | | | AAA/NR | | | | 870,000 | | | | 921,078 | |
Rhode Island Clean Water Finance Agency, 5.00% due 10/1/2019 (Public Drinking Water Supply or Treatment Facilities) | | | AAA/NR | | | | 1,250,000 | | | | 1,366,475 | |
Rhode Island Clean Water Finance Agency, 5.00% due 10/1/2020 (Public Drinking Water Supply or Treatment Facilities) | | | AAA/NR | | | | 1,300,000 | | | | 1,459,770 | |
Rhode Island Clean Water Finance Agency, 5.00% due 10/1/2021 (Public Drinking Water Supply or Treatment Facilities) | | | AAA/NR | | | | 2,000,000 | | | | 2,296,900 | |
Rhode Island Clean Water Finance Agency, 5.00% due 10/1/2022 (Public Drinking Water Supply or Treatment Facilities) | | | AAA/NR | | | | 2,280,000 | | | | 2,663,998 | |
Rhode Island Clean Water Finance Agency, 5.00% due 10/1/2023 (Public Drinking Water Supply or Treatment Facilities) | | | AAA/NR | | | | 2,380,000 | | | | 2,818,753 | |
Rhode Island Convention Center Authority, 5.00% due 5/15/2018 (Convention Center and Parking Projects) | | | AA-/A1 | | | | 5,890,000 | | | | 6,150,397 | |
Rhode Island Convention Center Authority, 5.00% due 5/15/2019 (Convention Center and Parking Projects) | | | AA-/A1 | | | | 7,310,000 | | | | 7,852,402 | |
Rhode Island Convention Center Authority, 5.00% due 5/15/2020 (Convention Center and Parking Projects) | | | AA-/A1 | | | | 5,890,000 | | | | 6,474,818 | |
Rhode Island Health and Educational Building Corp., 5.00% due 9/15/2020 (University of Rhode Island) | | | A+/A1 | | | | 355,000 | | | | 394,288 | |
Rhode Island Health and Educational Building Corp., 5.00% due 9/15/2020 (University of Rhode Island Auxiliary Enterprise) | | | A+/A1 | | | | 750,000 | | | | 833,002 | |
Rhode Island Health and Educational Building Corp., 5.00% due 9/15/2022 (University of Rhode Island) | | | A+/A1 | | | | 465,000 | | | | 533,462 | |
Rhode Island Health and Educational Building Corp., 5.00% due 9/15/2023 (University of Rhode Island Auxiliary Enterprise) | | | A+/A1 | | | | 1,400,000 | | | | 1,625,652 | |
Rhode Island Health and Educational Building Corp., 5.00% due 9/15/2025 (University of Rhode Island) | | | A+/A1 | | | | 500,000 | | | | 591,905 | |
State of Rhode Island and Providence Plantations COP, 5.00% due 10/1/2019 (Kent County Courthouse) | | | AA-/Aa3 | | | | 600,000 | | | | 652,878 | |
State of Rhode Island and Providence Plantations COP, 5.00% due 10/1/2019 (Training School) | | | AA-/Aa3 | | | | 1,575,000 | | | | 1,713,805 | |
State of Rhode Island and Providence Plantations COP, 5.00% due 10/1/2020 (Kent County Courthouse) | | | AA-/Aa3 | | | | 1,375,000 | | | | 1,530,017 | |
State of Rhode Island and Providence Plantations COP, 5.00% due 10/1/2020 (Training School) | | | AA-/Aa3 | | | | 1,405,000 | | | | 1,563,400 | |
State of Rhode Island and Providence Plantations COP, 5.00% due 10/1/2021 (Kent County Courthouse) | | | AA-/Aa3 | | | | 2,000,000 | | | | 2,269,400 | |
State of Rhode Island and Providence Plantations COP, 5.00% due 10/1/2021 (Training School) | | | AA-/Aa3 | | | | 3,540,000 | | | | 4,016,838 | |
State of Rhode Island and Providence Plantations COP, 5.00% due 4/1/2022 (Energy Conservation) | | | AA-/Aa3 | | | | 2,020,000 | | | | 2,297,992 | |
State of Rhode Island and Providence Plantations COP, 5.00% due 10/1/2022 (Kent County Courthouse) | | | AA-/Aa3 | | | | 2,100,000 | | | | 2,409,771 | |
State of Rhode Island and Providence Plantations COP, 5.00% due 10/1/2022 (Training School) | | | AA-/Aa3 | | | | 3,620,000 | | | | 4,153,986 | |
State of Rhode Island and Providence Plantations COP, 5.00% due 10/1/2023 (Kent County Courthouse) | | | AA-/Aa3 | | | | 1,500,000 | | | | 1,740,525 | |
State of Rhode Island and Providence Plantations COP, 5.00% due 10/1/2023 (Training School) | | | AA-/Aa3 | | | | 1,705,000 | | | | 1,978,397 | |
State of Rhode Island and Providence Plantations COP, 5.00% due 11/1/2024 (Information Technology) | | | AA-/Aa3 | | | | 3,010,000 | | | | 3,515,800 | |
State of Rhode Island and Providence Plantations GO, 5.00% due 10/1/2019 (Consolidated Capital Development Loan) | | | AA/Aa2 | | | | 5,000,000 | | | | 5,483,450 | |
State of Rhode Island and Providence Plantations GO, 5.00% due 8/1/2020 (Consolidated Capital Development Loan) | | | AA/Aa2 | | | | 8,365,000 | | | | 9,360,519 | |
State of Rhode Island and Providence Plantations GO, 4.00% due 10/15/2020 (Consolidated Capital Development Loan) | | | AA/Aa2 | | | | 1,200,000 | | | | 1,312,224 | |
State of Rhode Island and Providence Plantations GO, 5.00% due 8/1/2021 (Consolidated Capital Development Loan) | | | AA/Aa2 | | | | 16,535,000 | | | | 18,917,528 | |
State of Rhode Island and Providence Plantations GO, 4.00% due 10/15/2021 (Consolidated Capital Development Loan) | | | AA/Aa2 | | | | 1,000,000 | | | | 1,110,980 | |
State of Rhode Island and Providence Plantations GO, 5.00% due 8/1/2022 (Consolidated Capital Development Loan) | | | AA/Aa2 | | | | 9,825,000 | | | | 11,381,182 | |
State of Rhode Island and Providence Plantations GO, 4.00% due 10/15/2022 (Consolidated Capital Development Loan) | | | AA/Aa2 | | | | 1,000,000 | | | | 1,118,700 | |
| | | |
SOUTH CAROLINA — 0.79% | | | | | | | | | | | | |
Beaufort-Jasper Water & Sewer Authority, 5.00% due 3/1/2019 (Waterworks & Sewer System) | | | AA/Aa1 | | | | 1,000,000 | | | | 1,074,430 | |
Beaufort-Jasper Water & Sewer Authority, 5.00% due 3/1/2021 (Waterworks & Sewer System) | | | AA/Aa1 | | | | 750,000 | | | | 851,640 | |
Beaufort-Jasper Water & Sewer Authority, 5.00% due 3/1/2022 (Waterworks & Sewer System) | | | AA/Aa1 | | | | 1,000,000 | | | | 1,158,020 | |
Beaufort-Jasper Water & Sewer Authority, 5.00% due 3/1/2023 (Waterworks & Sewer System) | | | AA/Aa1 | | | | 1,000,000 | | | | 1,176,910 | |
Beaufort-Jasper Water & Sewer Authority, 5.00% due 3/1/2024 (Waterworks & Sewer System) | | | AA/Aa1 | | | | 1,000,000 | | | | 1,189,930 | |
Beaufort-Jasper Water & Sewer Authority, 5.00% due 3/1/2025 (Waterworks & Sewer System) | | | AA/Aa1 | | | | 1,000,000 | | | | 1,202,710 | |
Berkeley County School District, 5.00% due 12/1/2020 (School Facility Equipment Acquisition) | | | AA-/NR | | | | 550,000 | | | | 610,335 | |
Semi-Annual Report 33
| | |
| Schedule of Investments, Continued | | |
| |
Thornburg Limited Term Municipal Fund | | March 31, 2017 (Unaudited) |
| | | | | | | | | | | | |
ISSUER-DESCRIPTION | | CREDIT RATING†
S&P/ MOODY’S | | | PRINCIPAL
AMOUNT | | | VALUE | |
Berkeley County School District, 5.00% due 12/1/2021 (School Facility Equipment Acquisition) | | | AA-/NR | | | $ | 1,000,000 | | | $ | 1,128,550 | |
Berkeley County School District, 5.00% due 12/1/2024 (School Facility Equipment Acquisition) | | | AA-/NR | | | | 2,000,000 | | | | 2,313,540 | |
Charleston County, 5.00% due 12/1/2022 (South Aviation Ave. Construction) | | | AA+/NR | | | | 1,810,000 | | | | 2,120,741 | |
Charleston County, 5.00% due 12/1/2023 (South Aviation Ave. Construction) | | | AA+/NR | | | | 2,460,000 | | | | 2,918,519 | |
City of Charleston Public Facilities Corp., 5.00% due 9/1/2019 (City of Charleston Project) | | | AA+/Aa1 | | | | 390,000 | | | | 424,928 | |
City of Charleston Public Facilities Corp., 5.00% due 9/1/2020 (City of Charleston Project) | | | AA+/Aa1 | | | | 700,000 | | | | 780,451 | |
City of Charleston Public Facilities Corp., 5.00% due 9/1/2021 (City of Charleston Project) | | | AA+/Aa1 | | | | 460,000 | | | | 523,535 | |
City of Charleston Public Facilities Corp., 5.00% due 9/1/2022 (City of Charleston Project) | | | AA+/Aa1 | | | | 425,000 | | | | 491,632 | |
City of Charleston Public Facilities Corp., 5.00% due 9/1/2023 (City of Charleston Project) | | | AA+/Aa1 | | | | 345,000 | | | | 404,157 | |
City of Charleston Public Facilities Corp., 5.00% due 9/1/2025 (City of Charleston Project) | | | AA+/Aa1 | | | | 930,000 | | | | 1,105,724 | |
City of North Charleston Public Facilities Corp. COP, 5.00% due 10/1/2017 (Convention Center Complex) | | | AA-/NR | | | | 710,000 | | | | 724,562 | |
Greenwood County, 5.00% due 10/1/2022 (Self Regional Healthcare) | | | A+/A1 | | | | 1,000,000 | | | | 1,142,970 | |
Piedmont Municipal Power Agency, 6.75% due 1/1/2019 (Insured: Natl-Re) | | | NR/A3 | | | | 3,800,000 | | | | 4,148,916 | |
SCAGO Educational Facilities Corp., 5.00% due 12/1/2021 (School District of Pickens County) | | | A/A1 | | | | 1,810,000 | | | | 2,061,101 | |
SCAGO Educational Facilities Corp., 5.00% due 12/1/2022 (School District of Pickens County) | | | A/A1 | | | | 500,000 | | | | 576,275 | |
SCAGO Educational Facilities Corp., 5.00% due 12/1/2023 (School District of Pickens County) | | | A/A1 | | | | 1,000,000 | | | | 1,163,330 | |
SCAGO Educational Facilities Corp., 5.00% due 12/1/2024 (School District of Pickens County) | | | A/A1 | | | | 1,010,000 | | | | 1,184,417 | |
SCAGO Educational Facilities Corp., 5.00% due 12/1/2025 (School District of Pickens County) | | | A/A1 | | | | 1,000,000 | | | | 1,170,580 | |
York County Rock Hill School District No. 3 GO, 3.00% due 9/29/2017 | | | SP-1+/Mig1 | | | | 24,465,000 | | | | 24,706,470 | |
| | | |
SOUTH DAKOTA — 0.31% | | | | | | | | | | | | |
South Dakota Building Authority, 5.00% due 6/1/2022 | | | AA+/Aa1 | | | | 500,000 | | | | 578,575 | |
South Dakota Building Authority, 5.00% due 6/1/2024 | | | AA+/Aa1 | | | | 1,000,000 | | | | 1,165,000 | |
South Dakota Health & Educational Facilities Authority, 5.00% due 4/1/2017 (Prairie Lakes Health) | | | A+/NR | | | | 2,215,000 | | | | 2,215,000 | |
South Dakota Health & Educational Facilities Authority, 5.00% due 9/1/2017 (Regional Health) | | | NR/A1 | | | | 1,100,000 | | | | 1,118,579 | |
South Dakota Health & Educational Facilities Authority, 3.00% due 11/1/2017 (Sanford Health) | | | A+/A1 | | | | 450,000 | | | | 455,422 | |
South Dakota Health & Educational Facilities Authority, 5.00% due 4/1/2018 (Prairie Lakes Health) | | | A+/NR | | | | 2,290,000 | | | | 2,358,975 | |
South Dakota Health & Educational Facilities Authority, 5.00% due 9/1/2018 (Regional Health) | | | NR/A1 | | | | 1,275,000 | | | | 1,343,633 | |
South Dakota Health & Educational Facilities Authority, 5.00% due 9/1/2018 (Regional Health) | | | NR/A1 | | | | 1,000,000 | | | | 1,053,250 | |
South Dakota Health & Educational Facilities Authority, 4.00% due 11/1/2018 (Sanford Health) | | | A+/A1 | | | | 800,000 | | | | 835,744 | |
South Dakota Health & Educational Facilities Authority, 5.00% due 4/1/2019 (Prairie Lakes Health) | | | A+/NR | | | | 2,440,000 | | | | 2,574,200 | |
South Dakota Health & Educational Facilities Authority, 5.00% due 9/1/2020 (Regional Health) | | | NR/A1 | | | | 1,000,000 | | | | 1,114,470 | |
South Dakota Health & Educational Facilities Authority, 5.00% due 7/1/2021 (Avera Health) | | | AA-/A1 | | | | 1,670,000 | | | | 1,896,469 | |
South Dakota Health & Educational Facilities Authority, 5.00% due 11/1/2021 (Sanford Health) | | | A+/A1 | | | | 350,000 | | | | 399,931 | |
South Dakota Health & Educational Facilities Authority, 5.00% due 11/1/2022 (Sanford Health) | | | A+/A1 | | | | 1,070,000 | | | | 1,242,120 | |
South Dakota Health & Educational Facilities Authority, 5.00% due 11/1/2024 (Sanford Health) | | | A+/A1 | | | | 400,000 | | | | 475,664 | |
South Dakota Health & Educational Facilities Authority, 5.00% due 11/1/2025 (Sanford Health) | | | A+/A1 | | | | 965,000 | | | | 1,158,270 | |
South Dakota Housing Development Authority, 4.00% due 11/1/2017 (Single Family Mtg) | | | NR/Aa2 | | | | 1,055,000 | | | | 1,074,022 | |
South Dakota Housing Development Authority, 4.00% due 11/1/2018 (Single Family Mtg) | | | NR/Aa2 | | | | 1,165,000 | | | | 1,218,054 | |
| | | |
TENNESSEE — 0.93% | | | | | | | | | | | | |
Clarksville Natural Gas Acquisition Corp., 5.00% due 12/15/2019 | | | NR/Baa1 | | | | 6,000,000 | | | | 6,446,940 | |
Metropolitan Government of Nashville and Davidson County GO, 5.00% due 1/1/2024 | | | AA/Aa2 | | | | 7,000,000 | | | | 8,324,470 | |
Metropolitan Government of Nashville and Davidson County GO, 5.00% due 1/1/2025 | | | AA/Aa2 | | | | 13,400,000 | | | | 16,112,428 | |
State of Tennessee GO, 4.00% due 8/1/2017 | | | AAA/Aaa | | | | 3,250,000 | | | | 3,285,555 | |
State of Tennessee GO, 4.00% due 8/1/2018 | | | AAA/Aaa | | | | 2,000,000 | | | | 2,081,820 | |
State of Tennessee GO, 5.00% due 8/1/2018 | | | AAA/Aaa | | | | 2,000,000 | | | | 2,110,460 | |
State of Tennessee GO, 5.00% due 8/1/2019 | | | AAA/Aaa | | | | 3,000,000 | | | | 3,277,110 | |
State of Tennessee GO, 5.00% due 8/1/2019 | | | AAA/Aaa | | | | 2,000,000 | | | | 2,184,740 | |
State of Tennessee GO, 5.00% due 8/1/2020 | | | AAA/Aaa | | | | 2,000,000 | | | | 2,249,420 | |
State of Tennessee GO, 5.00% due 8/1/2020 | | | AAA/Aaa | | | | 2,000,000 | | | | 2,249,420 | |
Tennessee Energy Acquisition Corp., 5.25% due 9/1/2017 | | | BBB+/A3 | | | | 11,000,000 | | | | 11,176,550 | |
Tennessee Energy Acquisition Corp., 5.25% due 9/1/2018 | | | BBB+/A3 | | | | 5,000,000 | | | | 5,261,050 | |
Tennessee Energy Acquisition Corp., 5.25% due 9/1/2020 | | | BBB+/A3 | | | | 1,190,000 | | | | 1,320,841 | |
| | | |
TEXAS — 10.72% | | | | | | | | | | | | |
Austin Community College Public Facilities Corp., 5.25% due 8/1/2017 (Round Rock Campus) (ETM) | | | AA/Aa2 | | | | 1,500,000 | | | | 1,522,395 | |
Bexar County Hospital District GO, 5.00% due 2/15/2022 (University Health System) | | | AA+/Aa1 | | | | 1,250,000 | | | | 1,428,163 | |
Bexar County Hospital District GO, 5.00% due 2/15/2023 (University Health System) | | | AA+/Aa1 | | | | 1,250,000 | | | | 1,446,462 | |
Bexar County Hospital District GO, 5.00% due 2/15/2024 (University Health System) | | | AA+/Aa1 | | | | 1,500,000 | | | | 1,752,435 | |
Bexar County Hospital District GO, 5.00% due 2/15/2025 (University Health System) | | | AA+/Aa1 | | | | 2,355,000 | | | | 2,771,011 | |
Bexar County Hospital District GO, 5.00% due 2/15/2026 (University Health System) | | | AA+/Aa1 | | | | 1,500,000 | | | | 1,776,885 | |
Bexar County Hospital District GO, 5.00% due 2/15/2027 (University Health System) | | | AA+/Aa1 | | | | 1,500,000 | | | | 1,769,400 | |
Capital Area Cultural Education Facilities Finance Corp., 5.00% due 4/1/2018 (Roman Catholic Diocese of Austin) | | | NR/Baa1 | | | | 1,370,000 | | | | 1,413,470 | |
Cities of Dallas and Fort Worth, 5.25% due 11/1/2023 (DFW International Airport Terminal Renewal & Improvement Program) | | | A+/A1 | | | | 3,000,000 | | | | 3,449,460 | |
City of Austin, 5.00% due 11/15/2022 (Water and Wastewater System) | | | AA/Aa2 | | | | 2,640,000 | | | | 3,015,250 | |
City of Austin, 5.00% due 11/15/2025 (Water and Wastewater System) | | | AA/Aa2 | | | | 2,485,000 | | | | 2,998,923 | |
34 Semi-Annual Report
| | |
| Schedule of Investments, Continued | | |
| |
Thornburg Limited Term Municipal Fund | | March 31, 2017 (Unaudited) |
| | | | | | | | | | |
ISSUER-DESCRIPTION | | CREDIT RATING†
S&P/ MOODY’S | | PRINCIPAL
AMOUNT | | | VALUE | |
City of Austin, 5.00% due 11/15/2026 (Water and Wastewater System) | | AA/Aa2 | | $ | 3,330,000 | | | $ | 4,044,385 | |
City of Beaumont, 5.00% due 9/1/2023 (Waterworks & Sewer System Improvements; Insured: AGM) | | AA/A2 | | | 5,000,000 | | | | 5,858,450 | |
City of Beaumont, 5.00% due 9/1/2024 (Waterworks & Sewer System Improvements; Insured: AGM) | | AA/A2 | | | 2,500,000 | | | | 2,905,325 | |
City of Beaumont GO, 5.00% due 3/1/2022 | | AA-/Aa2 | | | 1,000,000 | | | | 1,147,830 | |
City of Beaumont GO, 5.00% due 3/1/2023 | | AA-/Aa2 | | | 1,000,000 | | | | 1,164,710 | |
City of Beaumont GO, 5.00% due 3/1/2024 | | AA-/Aa2 | | | 1,500,000 | | | | 1,763,730 | |
City of Beaumont GO, 5.00% due 3/1/2025 | | AA-/Aa2 | | | 3,060,000 | | | | 3,631,394 | |
City of Beaumont GO, 5.00% due 3/1/2026 | | AA-/Aa2 | | | 1,930,000 | | | | 2,304,459 | |
City of Brownsville, 5.00% due 9/1/2020 (Water, Wastewater & Electric Utilities Systems) | | A+/A2 | | | 1,500,000 | | | | 1,670,475 | |
City of Brownsville, 5.00% due 9/1/2022 (Water, Wastewater & Electric Utilities Systems) | | A+/A2 | | | 1,300,000 | | | | 1,494,909 | |
City of Brownsville, 5.00% due 9/1/2022 (Water, Wastewater & Electric Utilities Systems) | | A+/A2 | | | 1,520,000 | | | | 1,747,894 | |
City of Brownsville, 5.00% due 9/1/2023 (Water, Wastewater & Electric Utilities Systems) | | A+/A2 | | | 2,380,000 | | | | 2,760,729 | |
City of Bryan, 5.00% due 7/1/2019 (Electric System Improvements) | | A+/A2 | | | 8,000,000 | | | | 8,074,480 | |
City of Bryan, 5.00% due 7/1/2026 (Electric System Improvements) | | A+/NR | | | 535,000 | | | | 634,392 | |
City of Dallas GO, 5.00% due 2/15/2021 (Trinity River Corridor Infrastructure) | | AA-/A1 | | | 1,965,000 | | | | 2,186,279 | |
City of Dallas GO, 5.00% due 2/15/2022 | | AA-/A1 | | | 13,955,000 | | | | 15,760,219 | |
City of Dallas GO, 5.00% due 2/15/2022 (Public Improvements) | | AA-/A1 | | | 2,500,000 | | | | 2,823,400 | |
City of Dallas GO, 5.00% due 2/15/2023 | | AA-/A1 | | | 5,000,000 | | | | 5,600,100 | |
City of Dallas GO, 5.00% due 2/15/2024 (Trinity River Corridor Infrastructure) | | AA-/A1 | | | 2,705,000 | | | | 3,113,644 | |
City of Dallas GO, 5.00% due 2/15/2024 (Trinity River Corridor Infrastructure) | | AA-/A1 | | | 10,235,000 | | | | 11,572,714 | |
City of Dallas GO, 5.00% due 2/15/2025 (Trinity River Corridor Infrastructure) | | AA-/A1 | | | 9,350,000 | | | | 10,651,146 | |
City of Dallas GO, 5.00% due 2/15/2025 (Public Improvements) | | AA-/NR | | | 3,000,000 | | | | 3,471,930 | |
City of Dallas GO, 5.00% due 2/15/2026 (Trinity River Corridor Infrastructure) | | AA-/A1 | | | 8,585,000 | | | | 9,695,040 | |
City of Denton GO, 5.00% due 2/15/2019 | | AA+/Aa2 | | | 3,990,000 | | | | 4,278,876 | |
City of Denton GO, 5.00% due 2/15/2020 | | AA+/Aa2 | | | 4,195,000 | | | | 4,485,965 | |
City of Houston, 5.00% due 7/1/2017 (Airport System) | | AA-/Aa3 | | | 1,600,000 | | | | 1,616,560 | |
City of Houston, 5.00% due 7/1/2018 (Airport System) | | AA-/Aa3 | | | 1,000,000 | | | | 1,049,170 | |
City of Houston, 0% due 9/1/2020 (Convention & Entertainment Facilities; Insured: AGM/AMBAC) | | AA/A2 | | | 3,650,000 | | | | 3,343,874 | |
City of Houston, 5.00% due 9/1/2020 (Convention & Entertainment Facilities) | | A-/A2 | | | 650,000 | | | | 722,261 | |
City of Houston, 5.00% due 9/1/2021 (Convention & Entertainment Facilities) | | A-/A2 | | | 1,500,000 | | | | 1,694,910 | |
City of Houston, 5.00% due 11/15/2021 (Combined Utility System) | | NR/Aa2 | | | 5,455,000 | | | | 6,266,977 | |
City of Houston, 5.00% due 5/15/2022 (Combined Utility System) | | AA/Aa2 | | | 3,000,000 | | | | 3,477,570 | |
City of Houston, 5.00% due 9/1/2022 (Convention & Entertainment Facilities) | | A-/A2 | | | 600,000 | | | | 683,904 | |
City of Houston, 5.00% due 11/15/2022 (Combined Utility System) | | AA/Aa2 | | | 7,535,000 | | | | 8,817,080 | |
City of Houston, 5.00% due 11/15/2022 (Combined Utility System) | | NR/Aa2 | | | 7,110,000 | | | | 8,307,324 | |
City of Houston, 5.00% due 5/15/2023 (Combined Utility System) | | AA/Aa2 | | | 4,445,000 | | | | 5,227,098 | |
City of Houston, 5.00% due 11/15/2023 (Combined Utility System) | | AA/Aa2 | | | 5,000,000 | | | | 5,924,700 | |
City of Houston, 5.00% due 11/15/2023 (Combined Utility System) | | NR/Aa2 | | | 7,400,000 | | | | 8,758,492 | |
City of Houston, 5.00% due 5/15/2024 (Combined Utility System) | | AA/Aa2 | | | 7,250,000 | | | | 8,608,577 | |
City of Houston, 5.00% due 9/1/2024 (Convention & Entertainment Facilities) | | A-/A2 | | | 1,215,000 | | | | 1,410,494 | |
City of Houston, 5.00% due 11/15/2024 (Combined Utility System) | | AA/Aa2 | | | 5,000,000 | | | | 5,972,100 | |
City of Houston, 5.00% due 11/15/2025 (Combined Utility System) | | NR/Aa2 | | | 16,000,000 | | | | 19,253,440 | |
City of Houston GO, 5.00% due 3/1/2020 (Public Improvements) | | AA/Aa3 | | | 4,000,000 | | | | 4,416,560 | |
City of Houston GO, 5.00% due 3/1/2025 (Public Improvements) | | AA/Aa3 | | | 23,570,000 | | | | 27,877,889 | |
City of Houston GO, 5.00% due 3/1/2026 (Public Improvements) | | AA/Aa3 | | | 10,455,000 | | | | 12,428,381 | |
City of Laredo, 5.00% due 3/15/2021 (Sports Venues; Insured: AGM) | | AA/A1 | | | 600,000 | | | | 674,298 | |
City of Laredo, 5.00% due 3/15/2022 (Sports Venues; Insured: AGM) | | AA/A1 | | | 2,000,000 | | | | 2,277,040 | |
City of Laredo, 5.00% due 3/15/2023 (Sports Venues; Insured: AGM) | | AA/A1 | | | 1,500,000 | | | | 1,725,270 | |
City of Laredo, 5.00% due 3/15/2024 (Sports Venues; Insured: AGM) | | AA/A1 | | | 300,000 | | | | 347,934 | |
City of Laredo GO, 4.00% due 2/15/2018 (Acquire & Purchase Personal Property) | | AA/Aa2 | | | 675,000 | | | | 693,029 | |
City of Laredo GO, 4.00% due 2/15/2018 (City Infrastructure Improvements) | | AA/Aa2 | | | 175,000 | | | | 179,674 | |
City of Laredo GO, 4.00% due 2/15/2019 (Acquire & Purchase Personal Property) | | AA/Aa2 | | | 305,000 | | | | 321,272 | |
City of Laredo GO, 4.00% due 2/15/2019 (City Infrastructure Improvements) | | AA/Aa2 | | | 65,000 | | | | 68,468 | |
City of Laredo GO, 4.00% due 2/15/2020 (City Infrastructure Improvements) | | AA/Aa2 | | | 110,000 | | | | 118,346 | |
City of Laredo GO, 5.00% due 2/15/2020 (Acquire & Purchase Personal Property) | | AA/Aa2 | | | 735,000 | | | | 811,418 | |
City of Laredo GO, 5.00% due 2/15/2021 (Acquire & Purchase Personal Property) | | AA/Aa2 | | | 775,000 | | | | 877,130 | |
City of Laredo GO, 5.00% due 2/15/2021 (City Infrastructure Improvements) | | AA/Aa2 | | | 125,000 | | | | 141,473 | |
City of Laredo GO, 5.00% due 2/15/2022 (Acquire & Purchase Personal Property) | | AA/Aa2 | | | 810,000 | | | | 934,627 | |
City of Laredo GO, 5.00% due 2/15/2022 (City Infrastructure Improvements) | | AA/Aa2 | | | 150,000 | | | | 173,079 | |
City of Laredo GO, 5.00% due 2/15/2023 (City Infrastructure Improvements) | | AA/Aa2 | | | 275,000 | | | | 322,218 | |
City of Laredo GO, 5.00% due 2/15/2023 (Acquire & Purchase Personal Property) | | AA/Aa2 | | | 855,000 | | | | 1,001,804 | |
City of Laredo GO, 5.00% due 2/15/2024 (City Infrastructure Improvements) | | AA/Aa2 | | | 445,000 | | | | 526,982 | |
City of Laredo GO, 5.00% due 2/15/2024 (Acquire & Purchase Personal Property) | | AA/Aa2 | | | 900,000 | | | | 1,065,807 | |
City of Laredo GO, 5.00% due 2/15/2025 (City Infrastructure Improvements) | | AA/Aa2 | | | 380,000 | | | | 454,621 | |
City of Laredo GO, 5.00% due 2/15/2025 (Acquire & Purchase Personal Property) | | AA/Aa2 | �� | | 945,000 | | | | 1,130,570 | |
City of Laredo GO, 5.00% due 2/15/2026 (City Infrastructure Improvements) | | AA/Aa2 | | | 1,000,000 | | | | 1,205,760 | |
Semi-Annual Report 35
| | |
| Schedule of Investments, Continued | | |
| |
Thornburg Limited Term Municipal Fund | | March 31, 2017 (Unaudited) |
| | | | | | | | | | |
ISSUER-DESCRIPTION | | CREDIT RATING†
S&P/ MOODY’S | | PRINCIPAL
AMOUNT | | | VALUE | |
City of Laredo GO, 5.00% due 2/15/2026 (Acquire & Purchase Personal Property) | | AA/Aa2 | | $ | 995,000 | | | $ | 1,199,731 | |
City of Laredo GO, 5.00% due 2/15/2027 (City Infrastructure Improvements) | | AA/Aa2 | | | 500,000 | | | | 597,640 | |
City of Lubbock GO, 5.00% due 2/15/2020 (Waterworks System) | | AA+/Aa2 | | | 2,000,000 | | | | 2,210,340 | |
City of Lubbock GO, 5.00% due 2/15/2020 (Waterworks System) | | AA+/Aa2 | | | 2,325,000 | | | | 2,569,520 | |
City of Lubbock GO, 5.00% due 2/15/2021 (Waterworks System) | | AA+/Aa2 | | | 7,490,000 | | | | 8,474,036 | |
City of Lubbock GO, 5.00% due 2/15/2022 (Waterworks System) | | AA+/Aa2 | | | 2,895,000 | | | | 3,338,948 | |
City of Lubbock GO, 5.00% due 2/15/2023 (Waterworks System) | | AA+/Aa2 | | | 4,180,000 | | | | 4,895,156 | |
City of Lubbock GO, 5.00% due 2/15/2023 (Waterworks System) | | AA+/Aa2 | | | 500,000 | | | | 585,545 | |
City of Lubbock GO, 5.00% due 2/15/2024 (Waterworks System) | | AA+/Aa2 | | | 4,460,000 | | | | 5,278,544 | |
City of Lubbock GO, 5.00% due 2/15/2024 (Waterworks System) | | AA+/Aa2 | | | 4,440,000 | | | | 5,254,873 | |
City of Lubbock GO, 5.00% due 2/15/2025 (Waterworks System) | | AA+/Aa2 | | | 7,735,000 | | | | 9,247,811 | |
City of Lubbock GO, 5.00% due 2/15/2025 (Waterworks System) | | AA+/Aa2 | | | 5,725,000 | | | | 6,844,695 | |
City of McAllen, 5.00% due 3/1/2024 (International Toll Bridge System; Insured: AGM) | | AA/NR | | | 1,000,000 | | | | 1,162,710 | |
City of McAllen, 5.00% due 3/1/2025 (International Toll Bridge System; Insured: AGM) | | AA/NR | | | 890,000 | | | | 1,041,603 | |
City of McAllen, 5.00% due 3/1/2027 (International Toll Bridge System; Insured: AGM) | | AA/NR | | | 1,125,000 | | | | 1,316,194 | |
City of Olmos Park Higher Education Facilities Corp., 5.00% due 12/1/2020 (University of the Incarnate Word) | | NR/A3 | | | 3,620,000 | | | | 4,025,042 | |
City of Olmos Park Higher Education Facilities Corp., 5.00% due 12/1/2021 (University of the Incarnate Word) | | NR/A3 | | | 1,000,000 | | | | 1,130,930 | |
City of San Antonio, 5.00% due 5/15/2023 (San Antonio Water System) | | AA/Aa2 | | | 1,500,000 | | | | 1,762,980 | |
City of San Antonio, 5.25% due 2/1/2024 (CPS Energy) | | AA/Aa1 | | | 7,000,000 | | | | 8,440,600 | |
City of San Antonio, 5.00% due 5/15/2024 (San Antonio Water System) | | AA/Aa2 | | | 1,500,000 | | | | 1,778,910 | |
City of San Antonio, 5.00% due 5/15/2025 (San Antonio Water System) | | AA/Aa2 | | | 1,000,000 | | | | 1,197,590 | |
City of San Antonio, 5.00% due 5/15/2026 (San Antonio Water System) | | AA/Aa2 | | | 1,200,000 | | | | 1,446,636 | |
City of San Antonio, 3.00% due 12/1/2045 put 12/1/2020 (CPS Energy) | | AA-/Aa2 | | | 36,000,000 | | | | 37,699,560 | |
City of San Antonio GO, 5.00% due 2/1/2023 (San Antonio Water System) | | AAA/Aaa | | | 13,880,000 | | | | 16,344,672 | |
City of San Antonio GO, 5.00% due 2/1/2024 (San Antonio Water System) | | AAA/Aaa | | | 14,595,000 | | | | 17,397,678 | |
City of San Antonio GO, 5.00% due 2/1/2025 (San Antonio Water System) | | AAA/Aaa | | | 15,340,000 | | | | 18,489,916 | |
City of San Antonio Public Facilities Corp., 5.00% due 9/15/2022 (Convention Center Refinancing & Expansion) | | AA+/Aa2 | | | 1,450,000 | | | | 1,674,808 | |
Clifton Higher Education Finance Corp., 5.00% due 8/15/2017 (IDEA Public Schools) | | BBB/NR | | | 315,000 | | | | 318,430 | |
Clifton Higher Education Finance Corp., 5.00% due 8/15/2018 (IDEA Public Schools) | | BBB/NR | | | 325,000 | | | | 337,272 | |
Clifton Higher Education Finance Corp., 5.00% due 8/15/2019 (IDEA Public Schools) | | BBB/NR | | | 445,000 | | | | 471,829 | |
Clifton Higher Education Finance Corp., 5.00% due 8/15/2023 (IDEA Public Schools) | | BBB/NR | | | 1,100,000 | | | | 1,203,983 | |
Corpus Christi Business and Job Development Corp., 5.00% due 3/1/2021 (Seawall Project) | | A+/A1 | | | 625,000 | | | | 698,138 | |
Dallas Area Rapid Transit, 5.00% due 12/1/2026 | | AA+/Aa2 | | | 2,245,000 | | | | 2,692,720 | |
Dallas Convention Center Hotel Development Corp., 0% due 1/1/2018 | | A-/Baa1 | | | 5,240,000 | | | | 5,177,749 | |
Dallas Convention Center Hotel Development Corp., 5.00% due 1/1/2019 | | A-/Baa1 | | | 5,200,000 | | | | 5,514,028 | |
Dallas County Utility & Reclamation District GO, 5.00% due 2/15/2019 | | A/A2 | | | 1,050,000 | | | | 1,120,907 | |
Dallas County Utility & Reclamation District GO, 5.00% due 2/15/2020 | | A/A2 | | | 1,050,000 | | | | 1,150,674 | |
Dallas County Utility & Reclamation District GO, 5.00% due 2/15/2021 | | A/A2 | | | 3,000,000 | | | | 3,357,780 | |
Dallas County Utility & Reclamation District GO, 5.00% due 2/15/2022 | | A/A2 | | | 2,430,000 | | | | 2,757,564 | |
Dallas County Utility & Reclamation District GO, 5.00% due 2/15/2023 | | A/A2 | | | 510,000 | | | | 586,852 | |
Dallas County Utility & Reclamation District GO, 5.00% due 2/15/2024 | | A/A2 | | | 950,000 | | | | 1,103,330 | |
Dallas County Utility & Reclamation District GO, 5.00% due 2/15/2025 | | A/A2 | | | 2,920,000 | | | | 3,408,574 | |
Dallas County Utility & Reclamation District GO, 5.00% due 2/15/2027 | | A/A2 | | | 5,625,000 | | | | 6,616,800 | |
Dallas ISD GO, 5.00% due 2/15/2036 put 2/15/2022 (Educational Facilities Improvements; Guaranty: PSF) | | AAA/Aaa | | | 3,975,000 | | | | 4,524,186 | |
Grayson County GO, 4.00% due 1/1/2020 (State Highway Toll System) | | AA/Aa2 | | | 2,000,000 | | | | 2,140,320 | |
Grayson County GO, 5.00% due 1/1/2022 (State Highway Toll System) | | AA/Aa2 | | | 3,000,000 | | | | 3,436,560 | |
Guadalupe-Blanco River Authority, 5.625% due 10/1/2017 (AEP Texas Central Co.) | | A-/Baa1 | | | 5,000,000 | | | | 5,109,700 | |
a Gulf Coast Waste Disposal Authority, 4.00% due 10/1/2017 (Bayport Area Wastewater Treatment System; Insured: AGM) | | AA/A2 | | | 800,000 | | | | 812,080 | |
Gulf Coast Waste Disposal Authority, 5.00% due 10/1/2019 (Bayport Area Wastewater Treatment System; Insured: AGM) | | AA/A2 | | | 1,000,000 | | | | 1,092,010 | |
Gulf Coast Waste Disposal Authority, 5.00% due 10/1/2020 (Bayport Area Wastewater Treatment System; Insured: AGM) | | AA/A2 | | | 2,000,000 | | | | 2,228,020 | |
Gulf Coast Waste Disposal Authority, 5.00% due 10/1/2022 (Bayport Area Wastewater Treatment System; Insured: AGM) | | AA/A2 | | | 1,635,000 | | | | 1,870,244 | |
Gulf Coast Waste Disposal Authority, 5.00% due 10/1/2023 (Bayport Area Wastewater Treatment System; Insured: AGM) | | AA/NR | | | 500,000 | | | | 577,970 | |
Gulf Coast Waste Disposal Authority, 5.00% due 10/1/2024 (Bayport Area Wastewater Treatment System; Insured: AGM) | | AA/NR | | | 350,000 | | | | 408,198 | |
Gulf Coast Waste Disposal Authority, 5.00% due 10/1/2025 (Bayport Area Wastewater Treatment System; Insured: AGM) | | AA/NR | | | 1,000,000 | | | | 1,177,180 | |
Harris County Cultural Education Facilities Finance Corp., 5.00% due 11/15/2018 (Texas Medical Center Central Heating & Cooling Services Corp.) | | AA/Aa3 | | | 2,365,000 | | | | 2,510,211 | |
Harris County Cultural Education Facilities Finance Corp., 5.00% due 11/15/2019 (Texas Medical Center Central Heating & Cooling Services Corp.) | | AA/Aa3 | | | 1,000,000 | | | | 1,094,260 | |
Harris County Cultural Education Facilities Finance Corp., 5.00% due 12/1/2022 (Memorial Hermann Health) | | A+/A1 | | | 200,000 | | | | 232,598 | |
Harris County Cultural Education Facilities Finance Corp., 5.00% due 12/1/2023 (Memorial Hermann Health) | | A+/A1 | | | 400,000 | | | | 469,668 | |
Harris County Cultural Education Facilities Finance Corp., 5.00% due 12/1/2024 (Memorial Hermann Health) | | A+/A1 | | | 3,000,000 | | | | 3,559,290 | |
Harris County Cultural Education Facilities Finance Corp., 5.00% due 12/1/2025 (Memorial Hermann Health) | | A+/A1 | | | 2,845,000 | | | | 3,335,791 | |
Harris County GO, 5.00% due 10/1/2017 (Texas Permanent Improvement) | | AAA/Aaa | | | 3,500,000 | | | | 3,573,815 | |
Harris County GO, 5.00% due 10/1/2018 (Texas Permanent Improvement) | | AAA/Aaa | | | 3,000,000 | | | | 3,180,300 | |
Harris County GO, 5.00% due 10/1/2019 (Texas Permanent Improvement) | | AAA/Aaa | | | 700,000 | | | | 766,955 | |
Harris County GO, 5.00% due 10/1/2020 (Texas Permanent Improvement) | | AAA/Aaa | | | 500,000 | | | | 562,360 | |
36 Semi-Annual Report
| | |
| Schedule of Investments, Continued | | |
| |
Thornburg Limited Term Municipal Fund | | March 31, 2017 (Unaudited) |
| | | | | | | | | | |
ISSUER-DESCRIPTION | | CREDIT RATING†
S&P/ MOODY’S | | PRINCIPAL
AMOUNT | | | VALUE | |
Harris County Health Facilities Development Corp., 7.00% due 12/1/2027 pre-refunded 12/1/2018 (Memorial Hermann Health; LOC: JPMorgan Chase Bank, N.A.) | | NR/NR | | $ | 1,245,000 | | | $ | 1,367,520 | |
Harris County-Houston Sports Authority, 5.00% due 11/15/2022 (Insured: AGM) | | AA/A2 | | | 5,410,000 | | | | 6,243,248 | |
Harris County-Houston Sports Authority, 5.00% due 11/15/2023 (Insured: AGM) | | AA/A2 | | | 9,975,000 | | | | 11,652,196 | |
Harris County-Houston Sports Authority, 5.00% due 11/15/2024 (Insured: AGM) | | AA/A2 | | | 7,930,000 | | | | 9,337,892 | |
Hays County GO, 5.00% due 2/15/2022 | | AA/NR | | | 750,000 | | | | 862,740 | |
a Hays County GO, 5.00% due 2/15/2023 | | AA/NR | | | 1,500,000 | | | | 1,745,760 | |
Hays County GO, 5.00% due 2/15/2024 | | AA/NR | | | 1,300,000 | | | | 1,527,682 | |
Hays County GO, 5.00% due 2/15/2025 | | AA/NR | | | 500,000 | | | | 593,035 | |
Houston Higher Education Finance Corp., 5.00% due 8/15/2017 (KIPP, Inc.; Guaranty: PSF) | | AAA/NR | | | 925,000 | | | | 939,273 | |
Houston Higher Education Finance Corp., 5.00% due 8/15/2019 (KIPP, Inc.; Guaranty: PSF) | | AAA/NR | | | 1,020,000 | | | | 1,109,933 | |
Houston Higher Education Finance Corp., 5.875% due 5/15/2021 (Cosmos Foundation, Inc.) | | BBB/NR | | | 1,410,000 | | | | 1,511,139 | |
Houston Higher Education Finance Corp., 5.00% due 8/15/2021 (KIPP, Inc.; Guaranty: PSF) | | AAA/NR | | | 300,000 | | | | 342,636 | |
Houston Higher Education Finance Corp., 5.00% due 8/15/2022 (KIPP, Inc.; Guaranty: PSF) | | AAA/NR | | | 1,185,000 | | | | 1,372,668 | |
Katy ISD GO, 5.00% due 2/15/2023 (Educational Facilities Improvements; Guaranty: PSF) | | AAA/Aaa | | | 1,500,000 | | | | 1,764,840 | |
Katy ISD GO, 5.00% due 2/15/2024 (Educational Facilities Improvements; Guaranty: PSF) | | AAA/Aaa | | | 2,385,000 | | | | 2,837,840 | |
Katy ISD GO, 5.00% due 2/15/2025 (Educational Facilities Improvements; Guaranty: PSF) | | AAA/Aaa | | | 2,830,000 | | | | 3,406,103 | |
Katy ISD GO, 5.00% due 2/15/2026 (Educational Facilities Improvements; Guaranty: PSF) | | AAA/Aaa | | | 2,955,000 | | | | 3,586,365 | |
Keller ISD GO, 5.00% due 8/15/2023 | | AAA/Aaa | | | 1,715,000 | | | | 2,029,857 | |
Keller ISD GO, 5.00% due 8/15/2024 | | AAA/Aaa | | | 3,250,000 | | | | 3,892,785 | |
Keller ISD GO, 5.00% due 8/15/2025 | | AAA/Aaa | | | 7,140,000 | | | | 8,647,468 | |
Keller ISD GO, 5.00% due 8/15/2026 | | AAA/Aaa | | | 8,425,000 | | | | 10,154,063 | |
Laredo Community College District GO, 5.00% due 8/1/2019 (School Facilities Improvements) | | AA-/Aa3 | | | 880,000 | | | | 952,908 | |
Laredo Community College District GO, 5.00% due 8/1/2020 (School Facilities Improvements) | | AA-/Aa3 | | | 1,360,000 | | | | 1,508,621 | |
Laredo Community College District GO, 5.00% due 8/1/2022 (School Facilities Improvements) | | AA-/Aa3 | | | 655,000 | | | | 751,599 | |
Laredo Community College District GO, 5.00% due 8/1/2023 (School Facilities Improvements) | | AA-/Aa3 | | | 610,000 | | | | 707,252 | |
Laredo Community College District GO, 5.00% due 8/1/2024 (School Facilities Improvements) | | AA-/Aa3 | | | 715,000 | | | | 835,635 | |
Lower Colorado River Authority, 5.00% due 5/15/2025 pre-refunded 5/15/2022 | | NR/NR | | | 55,000 | | | | 63,880 | |
Lower Colorado River Authority, 5.00% due 5/15/2025 | | A/A2 | | | 8,020,000 | | | | 9,135,582 | |
Metropolitan Transit Authority of Harris County, 5.00% due 11/1/2019 | | AA+/Aa2 | | | 2,960,000 | | | | 3,246,528 | |
Metropolitan Transit Authority of Harris County, 5.00% due 11/1/2020 | | AA+/Aa2 | | | 1,565,000 | | | | 1,760,797 | |
Metropolitan Transit Authority of Harris County, 5.00% due 11/1/2021 | | AA+/Aa2 | | | 1,000,000 | | | | 1,149,480 | |
Metropolitan Transit Authority of Harris County, 5.00% due 11/1/2022 | | AA+/Aa2 | | | 1,750,000 | | | | 2,045,312 | |
Metropolitan Transit Authority of Harris County, 5.00% due 11/1/2023 | | AA+/Aa2 | | | 1,125,000 | | | | 1,332,304 | |
Metropolitan Transit Authority of Harris County, 5.00% due 11/1/2024 | | AA+/Aa2 | | | 1,140,000 | | | | 1,360,168 | |
Metropolitan Transit Authority of Harris County, 5.00% due 11/1/2025 | | AA+/Aa2 | | | 1,220,000 | | | | 1,469,588 | |
Metropolitan Transit Authority of Harris County, 5.00% due 11/1/2026 | | AA+/Aa2 | | | 1,000,000 | | | | 1,213,110 | |
Metropolitan Transit Authority of Harris County, 5.00% due 11/1/2027 | | AA+/Aa2 | | | 1,120,000 | | | | 1,344,750 | |
New Caney ISD GO, 5.00% due 2/15/2024 (Guaranty: PSF) | | AAA/Aaa | | | 865,000 | | | | 1,002,942 | |
North East ISD GO, 2.00% due 8/1/2044 put 8/1/2019 (Educational Facilities; Guaranty: PSF) | | AAA/Aaa | | | 10,445,000 | | | | 10,598,228 | |
North Harris County Regional Water Authority, 5.00% due 12/15/2020 (Regional Water Production Design, Acquisition and Construction) | | AA-/NR | | | 1,000,000 | | | | 1,123,640 | |
North Harris County Regional Water Authority, 5.00% due 12/15/2021 (Regional Water Production Design, Acquisition and Construction) | | AA-/NR | | | 1,000,000 | | | | 1,145,620 | |
North Harris County Regional Water Authority, 5.00% due 12/15/2023 (Regional Water Production Design, Acquisition and Construction) | | AA-/NR | | | 1,000,000 | | | | 1,169,990 | |
North Harris County Regional Water Authority, 5.00% due 12/15/2025 (Regional Water Production Design, Acquisition and Construction) | | AA-/NR | | | 2,000,000 | | | | 2,375,980 | |
North Harris County Regional Water Authority, 5.00% due 12/15/2026 (Regional Water Production Design, Acquisition and Construction) | | AA-/NR | | | 1,490,000 | | | | 1,785,601 | |
North Texas Tollway Authority, 5.00% due 1/1/2024 | | A/A1 | | | 12,000,000 | | | | 14,047,320 | |
Northside ISD GO, 2.00% due 6/1/2039 put 6/1/2019 (Educational Facilities; Guaranty: PSF) | | NR/Aaa | | | 2,135,000 | | | | 2,158,485 | |
Pasadena ISD GO, 3.00% due 2/15/2044 put 8/15/2019 (Educational Facilities; Guaranty: PSF) | | AAA/Aaa | | | 8,775,000 | | | | 9,133,371 | |
Round Rock ISD GO, 5.00% due 8/1/2017 (Educational Facilities Improvements; Guaranty: PSF) | | NR/Aaa | | | 1,290,000 | | | | 1,308,473 | |
Round Rock ISD GO, 5.00% due 8/1/2018 (Educational Facilities Improvements; Guaranty: PSF) | | NR/Aaa | | | 1,075,000 | | | | 1,133,340 | |
Round Rock ISD GO, 5.00% due 8/1/2019 (Educational Facilities Improvements; Guaranty: PSF) | | NR/Aaa | | | 1,500,000 | | | | 1,633,515 | |
Round Rock ISD GO, 5.00% due 8/1/2020 (Educational Facilities Improvements; Guaranty: PSF) | | NR/Aaa | | | 1,000,000 | | | | 1,119,190 | |
Round Rock ISD GO, 5.00% due 8/1/2021 (Educational Facilities Improvements; Guaranty: PSF) | | NR/Aaa | | | 2,000,000 | | | | 2,293,620 | |
Round Rock ISD GO, 5.00% due 8/1/2022 (Educational Facilities Improvements; Guaranty: PSF) | | NR/Aaa | | | 670,000 | | | | 782,419 | |
Round Rock ISD GO, 5.00% due 8/1/2024 (Educational Facilities Improvements; Guaranty: PSF) | | NR/Aaa | | | 2,305,000 | | | | 2,759,500 | |
Round Rock ISD GO, 5.00% due 8/1/2025 (Educational Facilities Improvements; Guaranty: PSF) | | NR/Aaa | | | 1,000,000 | | | | 1,210,560 | |
Round Rock ISD GO, 5.00% due 8/1/2026 (Educational Facilities Improvements; Guaranty: PSF) | | NR/Aaa | | | 1,575,000 | | | | 1,893,008 | |
Sam Rayburn Municipal Power Agency, 5.00% due 10/1/2017 | | BBB+/NR | | | 1,000,000 | | | | 1,019,720 | |
Sam Rayburn Municipal Power Agency, 5.00% due 10/1/2019 | | BBB+/NR | | | 2,565,000 | | | | 2,780,486 | |
Sam Rayburn Municipal Power Agency, 5.00% due 10/1/2020 | | BBB+/NR | | | 1,620,000 | | | | 1,790,132 | |
San Antonio Public Facilities Corp., 5.00% due 9/15/2020 (Convention Center Refinancing & Expansion) | | AA+/Aa2 | | | 915,000 | | | | 1,021,360 | |
Semi-Annual Report 37
| | |
| Schedule of Investments, Continued | | |
| |
Thornburg Limited Term Municipal Fund | | March 31, 2017 (Unaudited) |
| | | | | | | | | | | | |
ISSUER-DESCRIPTION | | CREDIT RATING†
S&P/ MOODY’S | | | PRINCIPAL
AMOUNT | | | VALUE | |
San Juan Higher Education Finance Authority, 5.125% due 8/15/2020 (IDEA Public Schools) | | | BBB/NR | | | $ | 1,115,000 | | | $ | 1,172,846 | |
Tarrant County Cultural Education Facilities Finance Corp., 5.00% due 8/15/2017 (Scott & White Memorial Hospital) (ETM) | | | AA-/Aa3 | | | | 2,000,000 | | | | 2,031,460 | |
Tarrant Regional Water District, 2.00% due 3/1/2020 | | | AAA/NR | | | | 800,000 | | | | 816,288 | |
Tarrant Regional Water District, 5.00% due 3/1/2021 | | | AAA/NR | | | | 1,000,000 | | | | 1,135,520 | |
Tarrant Regional Water District, 5.00% due 3/1/2022 | | | AAA/NR | | | | 650,000 | | | | 752,382 | |
Tarrant Regional Water District, 5.00% due 3/1/2023 | | | AAA/NR | | | | 700,000 | | | | 822,983 | |
Tarrant Regional Water District, 5.00% due 3/1/2024 | | | AAA/NR | | | | 1,000,000 | | | | 1,187,090 | |
Tarrant Regional Water District, 5.00% due 3/1/2025 | | | AAA/NR | | | | 1,500,000 | | | | 1,795,620 | |
Tarrant Regional Water District, 5.00% due 3/1/2026 | | | AAA/NR | | | | 2,000,000 | | | | 2,409,260 | |
Tarrant Regional Water District, 5.00% due 3/1/2027 | | | AAA/NR | | | | 2,000,000 | | | | 2,390,080 | |
Texas Municipal Power Agency, 5.00% due 9/1/2017 (Insured: AGM) | | | AA/A2 | | | | 10,000,000 | | | | 10,168,000 | |
Texas Transportation Commission, 5.00% due 8/15/2022 (Central Texas Turnpike System) | | | BBB+/Baa1 | | | | 400,000 | | | | 450,004 | |
Texas Transportation Commission, 5.00% due 8/15/2023 (Central Texas Turnpike System) | | | BBB+/Baa1 | | | | 730,000 | | | | 829,922 | |
Texas Transportation Commission, 5.00% due 8/15/2024 (Central Texas Turnpike System) | | | BBB+/Baa1 | | | | 1,000,000 | | | | 1,145,440 | |
Texas Transportation Commission GO, 5.00% due 4/1/2022 (Highway Improvements) | | | AAA/Aaa | | | | 2,880,000 | | | | 3,343,910 | |
Texas Transportation Commission GO, 5.00% due 4/1/2023 (Highway Improvements) | | | AAA/Aaa | | | | 3,500,000 | | | | 4,129,440 | |
Texas Transportation Commission GO, 5.00% due 4/1/2024 (Highway Improvements) | | | AAA/Aaa | | | | 4,000,000 | | | | 4,770,880 | |
University of Texas System, 5.00% due 8/15/2025 (Campus Improvements) | | | AAA/Aaa | | | | 7,000,000 | | | | 8,477,910 | |
University of Texas System, 5.00% due 8/15/2026 (Campus Improvements) | | | AAA/Aaa | | | | 3,750,000 | | | | 4,588,650 | |
Uptown Development Authority, 5.00% due 9/1/2017 (Infrastructure Improvements) | | | BBB/NR | | | | 1,580,000 | | | | 1,604,016 | |
Uptown Development Authority, 5.00% due 9/1/2018 (Infrastructure Improvements) | | | BBB/NR | | | | 1,870,000 | | | | 1,959,648 | |
Uptown Development Authority, 5.00% due 9/1/2019 (Infrastructure Improvements) | | | BBB/NR | | | | 1,945,000 | | | | 2,091,964 | |
Walnut Creek Special Utility District, 4.00% due 1/10/2020 (Water System Improvements; Insured: BAM) | | | AA/NR | | | | 520,000 | | | | 552,079 | |
Walnut Creek Special Utility District, 4.00% due 1/10/2021 (Water System Improvements; Insured: BAM) | | | AA/NR | | | | 445,000 | | | | 478,464 | |
Walnut Creek Special Utility District, 5.00% due 1/10/2022 (Water System Improvements; Insured: BAM) | | | AA/NR | | | | 525,000 | | | | 591,675 | |
Walnut Creek Special Utility District, 5.00% due 1/10/2024 (Water System Improvements; Insured: BAM) | | | AA/NR | | | | 750,000 | | | | 862,485 | |
West Harris County Regional Water Authority, 5.00% due 12/15/2020 (Insured: Natl-Re) | | | AA-/A1 | | | | 2,140,000 | | | | 2,196,881 | |
Ysleta ISD, 5.00% due 8/15/2017 (Public School Finance System; Guaranty: PSF) | | | AAA/Aaa | | | | 2,190,000 | | | | 2,224,952 | |
| | | |
U.S. VIRGIN ISLANDS — 0.06% | | | | | | | | | | | | |
Virgin Islands Public Finance Authority, 6.75% due 10/1/2019 (Diageo Project) | | | NR/Caa2 | | | | 4,920,000 | | | | 4,308,296 | |
| | | |
UTAH — 0.06% | | | | | | | | | | | | |
Utah Transit Authority, 5.00% due 6/15/2022 (Integrated Mass Transit System) | | | A+/A1 | | | | 710,000 | | | | 816,997 | |
Utah Transit Authority, 5.00% due 6/15/2023 (Integrated Mass Transit System) | | | A+/A1 | | | | 775,000 | | | | 901,015 | |
Utah Transit Authority, 5.00% due 6/15/2024 (Integrated Mass Transit System) | | | A+/A1 | | | | 825,000 | | | | 970,035 | |
Utah Transit Authority, 5.00% due 6/15/2025 (Integrated Mass Transit System) | | | A+/A1 | | | | 1,235,000 | | | | 1,462,191 | |
| | | |
VERMONT — 0.25% | | | | | | | | | | | | |
Vermont Colleges GO, 4.00% due 7/1/2017 | | | A-/NR | | | | 1,865,000 | | | | 1,878,857 | |
Vermont EDA, 5.00% due 12/15/2020 (Vermont Public Service Corp.) | | | NR/NR | | | | 14,250,000 | | | | 15,883,335 | |
| | | |
VIRGINIA — 0.17% | | | | | | | | | | | | |
Fairfax County IDA, 4.00% due 5/15/2022 (Inova Health System) | | | AA+/Aa2 | | | | 5,500,000 | | | | 6,079,480 | |
Fairfax County IDA, 5.00% due 5/15/2022 (Inova Health System) | | | AA+/Aa2 | | | | 5,000,000 | | | | 5,788,700 | |
| | | |
WASHINGTON — 2.15% | | | | | | | | | | | | |
Energy Northwest, 5.00% due 7/1/2017 (Bonneville Power Administration Project 3) | | | AA-/Aa1 | | | | 5,470,000 | | | | 5,528,310 | |
Energy Northwest, 5.00% due 7/1/2017 (Bonneville Power Administration Project 1) | | | AA-/Aa1 | | | | 5,000,000 | | | | 5,053,300 | |
Energy Northwest, 5.00% due 7/1/2018 (Nine Canyon Wind Project
Phase I-III) | | | NR/A2 | | | | 1,000,000 | | | | 1,046,730 | |
Energy Northwest, 5.00% due 7/1/2018 pre-refunded 7/1/2017 (Bonneville Power Administration Project 3) | | | NR/NR | | | | 185,000 | | | | 186,954 | |
Energy Northwest, 5.00% due 7/1/2018 (Bonneville Power Administration Project 3) | | | AA-/Aa1 | | | | 290,000 | | | | 292,897 | |
Energy Northwest, 5.00% due 7/1/2019 (Nine Canyon Wind Project
Phase I-III) | | | NR/A2 | | | | 2,000,000 | | | | 2,158,420 | |
Energy Northwest, 5.00% due 7/1/2020 (Nine Canyon Wind Project
Phase I-III) | | | NR/A2 | | | | 2,000,000 | | | | 2,203,100 | |
Energy Northwest, 5.00% due 7/1/2021 (Nine Canyon Wind Project
Phase I-III) | | | NR/A2 | | | | 2,000,000 | | | | 2,247,580 | |
Energy Northwest, 5.00% due 7/1/2022 (Nine Canyon Wind Project
Phase I-III) | | | NR/A2 | | | | 1,000,000 | | | | 1,140,490 | |
Energy Northwest, 5.00% due 7/1/2023 (Nine Canyon Wind Project
Phase I-III) | | | NR/A2 | | | | 1,000,000 | | | | 1,150,990 | |
Energy Northwest, 5.00% due 7/1/2025 (Nine Canyon Wind Project
Phase I-III) | | | NR/A2 | | | | 850,000 | | | | 995,767 | |
King County Federal Way School District No. 210 GO, 4.125% due 12/1/2019 pre-refunded 12/1/2017 (Insured: Natl-Re) | | | AA+/Aa1 | | | | 2,000,000 | | | | 2,043,480 | |
Marysville School District No. 25 GO, 4.00% due 12/1/2017 (Snohomish County Educational Facilities) (State Aid Withholding) | | | NR/Aa1 | | | | 1,000,000 | | | | 1,019,990 | |
Marysville School District No. 25 GO, 4.00% due 12/1/2018 (Snohomish County Educational Facilities) (State Aid Withholding) | | | NR/Aa1 | | | | 1,100,000 | | | | 1,153,922 | |
Marysville School District No. 25 GO, 5.00% due 12/1/2019 (Snohomish County Educational Facilities) (State Aid Withholding) | | | NR/Aa1 | | | | 1,390,000 | | | | 1,528,319 | |
Marysville School District No. 25 GO, 5.00% due 12/1/2020 (Snohomish County Educational Facilities) (State Aid Withholding) | | | NR/Aa1 | | | | 1,625,000 | | | | 1,831,261 | |
38 Semi-Annual Report
| | |
| Schedule of Investments, Continued | | |
| |
Thornburg Limited Term Municipal Fund | | March 31, 2017 (Unaudited) |
| | | | | | | | | | | | |
ISSUER-DESCRIPTION | | CREDIT RATING†
S&P/ MOODY’S | | | PRINCIPAL
AMOUNT | | | VALUE | |
Marysville School District No. 25 GO, 5.00% due 12/1/2021 (Snohomish County Educational Facilities) (State Aid Withholding) | | | NR/Aa1 | | | $ | 1,750,000 | | | $ | 2,014,617 | |
Marysville School District No. 25 GO, 5.00% due 12/1/2022 (Snohomish County Educational Facilities) (State Aid Withholding) | | | NR/Aa1 | | | | 2,620,000 | | | | 3,063,645 | |
Marysville School District No. 25 GO, 5.00% due 12/1/2023 (Snohomish County Educational Facilities) (State Aid Withholding) | | | NR/Aa1 | | | | 1,700,000 | | | | 2,002,090 | |
Port of Seattle, 5.50% due 9/1/2018 (Insured: Natl-Re) | | | AA-/A2 | | | | 5,000,000 | | | | 5,309,800 | |
Skagit County Public Hospital District No. 1, 5.00% due 12/1/2018 (Skagit Regional Health) | | | NR/Baa2 | | | | 800,000 | | | | 837,960 | |
Skagit County Public Hospital District No. 1, 5.00% due 12/1/2019 (Skagit Regional Health) | | | NR/Baa2 | | | | 835,000 | | | | 893,074 | |
Skagit County Public Hospital District No. 1, 5.00% due 12/1/2021 (Skagit Regional Health) | | | NR/Baa2 | | | | 1,160,000 | | | | 1,275,478 | |
Skagit County Public Hospital District No. 1, 5.00% due 12/1/2022 (Skagit Regional Health) | | | NR/Baa2 | | | | 500,000 | | | | 553,725 | |
Skagit County Public Hospital District No. 1, 5.00% due 12/1/2023 (Skagit Regional Health) | | | NR/Baa2 | | | | 750,000 | | | | 835,275 | |
Skagit County Public Hospital District No. 1 GO, 4.00% due 12/1/2017 (Skagit Regional Health) | | | NR/A1 | | | | 1,000,000 | | | | 1,019,960 | |
Skagit County Public Hospital District No. 1 GO, 4.00% due 12/1/2018 (Skagit Regional Health) | | | NR/A1 | | | | 1,270,000 | | | | 1,328,229 | |
Skagit County Public Hospital District No. 1 GO, 5.00% due 12/1/2019 (Skagit Regional Health) | | | NR/A1 | | | | 1,695,000 | | | | 1,856,703 | |
Skagit County Public Hospital District No. 1 GO, 5.00% due 12/1/2020 (Skagit Regional Health) | | | NR/A1 | | | | 1,570,000 | | | | 1,763,691 | |
Skagit County Public Hospital District No. 1 GO, 5.00% due 12/1/2021 (Skagit Regional Health) | | | NR/A1 | | | | 3,135,000 | | | | 3,596,629 | |
Skagit County Public Hospital District No. 1 GO, 5.00% due 12/1/2022 (Skagit Regional Health) | | | NR/A1 | | | | 3,635,000 | | | | 4,238,083 | |
Skagit County Public Hospital District No. 2 GO, 4.00% due 12/1/2018 (Island Hospital) | | | NR/A1 | | | | 1,000,000 | | | | 1,043,650 | |
Skagit County Public Hospital District No. 2 GO, 4.00% due 12/1/2019 (Island Hospital) | | | NR/A1 | | | | 1,000,000 | | | | 1,063,870 | |
Skagit County Public Hospital District No. 2 GO, 4.00% due 12/1/2020 (Island Hospital) | | | NR/A1 | | | | 1,000,000 | | | | 1,078,930 | |
Skagit County Public Hospital District No. 2 GO, 4.00% due 12/1/2021 (Island Hospital) | | | NR/A1 | | | | 1,000,000 | | | | 1,090,360 | |
Skagit County Public Hospital District No. 2 GO, 5.00% due 12/1/2022 (Island Hospital) | | | NR/A1 | | | | 1,700,000 | | | | 1,955,408 | |
State of Washington COP, 5.00% due 7/1/2017 (State Agency Real Property Projects) (State Aid Withholding) | | | NR/Aa2 | | | | 2,555,000 | | | | 2,582,109 | |
State of Washington COP, 5.00% due 7/1/2018 (State Agency Real Property Projects) (State Aid Withholding) | | | NR/Aa2 | | | | 2,670,000 | | | | 2,803,340 | |
State of Washington COP, 5.00% due 7/1/2019 (State and Local Agency Real and Personal Property Projects) (State Aid Withholding) | | | NR/Aa2 | | | | 1,000,000 | | | | 1,083,390 | |
State of Washington COP, 5.00% due 7/1/2020 (State and Local Agency Real and Personal Property Projects) (State Aid Withholding) | | | NR/Aa2 | | | | 3,290,000 | | | | 3,659,401 | |
State of Washington COP, 5.00% due 7/1/2021 (State and Local Agency Real and Personal Property Projects) (State Aid Withholding) | | | NR/Aa2 | | | | 3,125,000 | | | | 3,555,656 | |
State of Washington COP, 5.00% due 7/1/2022 (State and Local Agency Real and Personal Property Projects) (State Aid Withholding) | | | NR/Aa2 | | | | 3,000,000 | | | | 3,464,220 | |
State of Washington COP, 5.00% due 7/1/2024 (State and Local Agency Real and Personal Property Projects) | | | NR/Aa2 | | | | 4,410,000 | | | | 5,216,986 | |
State of Washington COP, 5.00% due 7/1/2025 (State and Local Agency Real and Personal Property Projects) | | | NR/Aa2 | | | | 3,650,000 | | | | 4,351,895 | |
State of Washington COP, 5.00% due 7/1/2026 (State and Local Agency Real and Personal Property Projects) | | | NR/Aa2 | | | | 4,745,000 | | | | 5,699,647 | |
State of Washington COP, 5.00% due 7/1/2027 (State and Local Agency Real and Personal Property Projects) | | | NR/Aa2 | | | | 4,970,000 | | | | 5,994,864 | |
State of Washington GO, 0% due 1/1/2018 (Stadium and Exhibition Center; Insured: Natl-Re) | | | AA+/Aa1 | | | | 4,000,000 | | | | 3,970,480 | |
State of Washington GO, 0% due 1/1/2019 (Stadium and Exhibition Center; Insured: Natl-Re) | | | AA+/Aa1 | | | | 3,000,000 | | | | 2,934,270 | |
State of Washington GO, 0% due 12/1/2019 (Public Highway, Bridge, Ferry Capital and Operating Costs; Insured: Natl-Re) | | | AA+/Aa1 | | | | 3,030,000 | | | | 2,918,950 | |
State of Washington GO, 5.00% due 7/1/2025 (Capital Projects) | | | AA+/Aa1 | | | | 10,475,000 | | | | 12,546,012 | |
Tacoma School District No.10 GO, 5.00% due 12/1/2017 (Pierce County Capital Projects) | | | AA+/Aa1 | | | | 2,280,000 | | | | 2,343,338 | |
Tacoma School District No.10 GO, 5.00% due 12/1/2018 (Pierce County Capital Projects) | | | AA+/Aa1 | | | | 4,000,000 | | | | 4,264,080 | |
Tacoma School District No.10 GO, 5.00% due 12/1/2019 (Pierce County Capital Projects) | | | AA+/Aa1 | | | | 2,000,000 | | | | 2,200,680 | |
Tacoma School District No.10 GO, 5.00% due 12/1/2020 (Pierce County Capital Projects) | | | AA+/Aa1 | | | | 2,500,000 | | | | 2,822,100 | |
a Washington Health Care Facilities Authority, 5.00% due 7/1/2017 (Overlake Hospital Medical Center) | | | A/A2 | | | | 1,245,000 | | | | 1,257,724 | |
Washington Health Care Facilities Authority, 5.00% due 8/15/2017 (MultiCare Health Systems) | | | AA-/Aa3 | | | | 1,000,000 | | | | 1,015,190 | |
Washington Health Care Facilities Authority, 5.25% due 8/1/2018 (Highline Medical Center; Insured: FHA 242) (ETM) | | | NR/NR | | | | 7,935,000 | | | | 8,192,253 | |
Washington Health Care Facilities Authority, 5.00% due 8/15/2018 (MultiCare Health Systems) | | | AA-/Aa3 | | | | 2,000,000 | | | | 2,108,180 | |
Washington Health Care Facilities Authority, 5.00% due 7/1/2019 (Overlake Hospital Medical Center) | | | A/A2 | | | | 1,050,000 | | | | 1,135,365 | |
Washington Health Care Facilities Authority, 4.75% due 7/1/2020 (Overlake Hospital Medical Center) | | | A/A2 | | | | 1,000,000 | | | | 1,082,800 | |
| | | |
WEST VIRGINIA — 0.10% | | | | | | | | | | | | |
Mason County, 1.625% due 10/1/2022 put 10/1/2018 (Appalachian Power Company) | | | A-/Baa1 | | | | 3,300,000 | | | | 3,299,736 | |
West Virginia Higher Education Policy Commission, 5.00% due 4/1/2020 (Higher Education Facilities) | | | A+/Aa3 | | | | 1,000,000 | | | | 1,100,750 | |
West Virginia Higher Education Policy Commission, 5.00% due 4/1/2021 (Higher Education Facilities) | | | A+/Aa3 | | | | 1,000,000 | | | | 1,127,310 | |
West Virginia Higher Education Policy Commission, 5.00% due 4/1/2022 (Higher Education Facilities) | | | A+/Aa3 | | | | 1,500,000 | | | | 1,714,290 | |
| | | |
WISCONSIN — 0.62% | | | | | | | | | | | | |
Wisconsin Health & Educational Facilities Authority, 5.00% due 4/15/2017 (Aurora Health Care, Inc.) | | | NR/A2 | | | | 1,295,000 | | | | 1,297,072 | |
Wisconsin Health & Educational Facilities Authority, 5.00% due 7/1/2017 (Agnesian Healthcare, Inc.) | | | A/A2 | | | | 1,000,000 | | | | 1,009,610 | |
Wisconsin Health & Educational Facilities Authority, 5.00% due 7/15/2017 (Aurora Health Care, Inc.) | | | NR/A2 | | | | 5,025,000 | | | | 5,079,823 | |
Wisconsin Health & Educational Facilities Authority, 5.00% due 7/1/2018 (Agnesian Healthcare, Inc.) | | | A/A2 | | | | 1,855,000 | | | | 1,937,418 | |
Wisconsin Health & Educational Facilities Authority, 5.00% due 7/1/2019 (Agnesian Healthcare, Inc.) | | | A/A2 | | | | 1,000,000 | | | | 1,074,360 | |
Wisconsin Health & Educational Facilities Authority, 5.00% due 7/1/2020 (Agnesian Healthcare, Inc.) | | | A/A2 | | | | 2,110,000 | | | | 2,320,050 | |
Wisconsin Health & Educational Facilities Authority, 5.00% due 8/15/2020 (ProHealth Care, Inc.) | | | A+/A1 | | | | 1,075,000 | | | | 1,194,895 | |
Wisconsin Health & Educational Facilities Authority, 5.00% due 8/15/2021 (ProHealth Care, Inc.) | | | A+/A1 | | | | 2,575,000 | | | | 2,925,200 | |
Semi-Annual Report 39
| | |
| Schedule of Investments, Continued | | |
| |
Thornburg Limited Term Municipal Fund | | March 31, 2017 (Unaudited) |
| | | | | | | | | | | | |
ISSUER-DESCRIPTION | | CREDIT RATING†
S&P/ MOODY’S | | | PRINCIPAL
AMOUNT | | | VALUE | |
Wisconsin Health & Educational Facilities Authority, 5.00% due 8/15/2022 (ProHealth Care, Inc.) | | | A+/A1 | | | $ | 1,600,000 | | | $ | 1,802,592 | |
Wisconsin Health & Educational Facilities Authority, 5.00% due 12/1/2022 (UnityPoint Health) | | | NR/Aa3 | | | | 1,000,000 | | | | 1,162,400 | |
Wisconsin Health & Educational Facilities Authority, 5.00% due 11/15/2024 (Ascension Health Alliance System) | | | AA+/Aa2 | | | | 625,000 | | | | 744,100 | |
Wisconsin Health & Educational Facilities Authority, 1.25% due 8/15/2025 put 8/15/2017 (Aurora Health Care, Inc.) | | | NR/A2 | | | | 3,800,000 | | | | 3,799,544 | |
Wisconsin Health & Educational Facilities Authority, 5.00% due 11/15/2025 (Ascension Health Alliance System) | | | AA+/Aa2 | | | | 1,215,000 | | | | 1,461,013 | |
Wisconsin Health & Educational Facilities Authority, 5.00% due 11/15/2026 (Ascension Health Alliance System) | | | AA+/Aa2 | | | | 2,000,000 | | | | 2,383,960 | |
Wisconsin Health & Educational Facilities Authority, 5.00% due 11/15/2043 put 6/1/2021 (Ascension Health Alliance System) | | | AA+/Aa2 | | | | 10,000,000 | | | | 11,313,900 | |
WPPI Energy, 5.00% due 7/1/2021 (Power Supply System) | | | A/A1 | | | | 4,100,000 | | | | 4,654,197 | |
| | | | | | | | | | | | |
TOTAL INVESTMENTS — 99.03% (Cost $6,965,714,900) | | | | | | | | | | $ | 7,076,869,342 | |
OTHER ASSETS LESS LIABILITIES — 0.97% | | | | | | | | | | | 69,209,749 | |
| | | | | | | | | | | | |
NET ASSETS — 100.00% | | | | | | | | | | $ | 7,146,079,091 | |
| | | | | | | | | | | | |
Footnote Legend
| † | Credit ratings are unaudited. Rating changes may have occurred subsequent to the reporting period end. Bonds issued with a maturity of one year or less are assigned Moody’s ratings from MIG-1 to MIG-4 and Standard and Poor’s ratings from SP-1+ to SP-3 with MIG-1 and SP-1+ being the strongest ratings. |
| a | Segregated as collateral for a when-issued security. |
Portfolio Abbreviations
To simplify the listings of securities, abbreviations are used per the table below:
| | |
| AGC | | Insured by Associated General Contractors |
| AGM | | Insured by Assured Guaranty Municipal Corp. |
| AMBAC | | Insured by American Municipal Bond Assurance Corp. |
| BAM | | Insured by Build America Mutual Insurance Co. |
| BHAC | | Insured by Berkshire Hathaway Assurance Corp. |
| COP | | Certificates of Participation |
| DFA | | Development Finance Authority |
| EDA | | Economic Development Authority |
| ETM | | Escrowed to Maturity |
| FGIC | | Insured by Financial Guaranty Insurance Co. |
| FHA | | Insured by Federal Housing Administration |
| FSA | | Insured by Financial Security Assurance Co. |
| GNMA | | Collateralized by Government National Mortgage Association |
| | |
| GO | | General Obligation |
| HFA | | Health Facilities Authority |
| HFFA | | Health Facilities Financing Authority |
| IDA | | Industrial Development Authority |
| ISD | | Independent School District |
| JEA | | Jacksonville Electric Authority |
| Mtg | | Mortgage |
| Natl-Re | | Insured by National Public Finance Guarantee Corp. |
| PSF | | Guaranteed by Permanent School Fund |
| Q-SBLF | | Insured by Qualified School Bond Loan Fund |
| Syncora | | Insured by Syncora Guarantee Inc. |
| USD | | Unified School District |
See notes to financial statements.
40 Semi-Annual Report
| | |
| Statement of Assets and Liabilities | | |
| |
Thornburg Limited Term Municipal Fund | | March 31, 2017 (Unaudited) |
| | | | |
ASSETS | | | | |
Investments at value (cost $6,965,714,900) (Note 3) | | $ | 7,076,869,342 | |
Cash | | | 14,056,514 | |
Receivable for investments sold | | | 4,445,803 | |
Receivable for fund shares sold | | | 13,489,814 | |
Interest receivable | | | 79,219,244 | |
Prepaid expenses and other assets | | | 140,863 | |
| | | | |
Total Assets | | | 7,188,221,580 | |
| | | | |
| |
LIABILITIES | | | | |
Payable for investments purchased | | | 22,652,534 | |
Payable for fund shares redeemed | | | 15,213,492 | |
Payable to investment advisor and other affiliates (Note 4) | | | 2,611,510 | |
Accounts payable and accrued expenses | | | 757,746 | |
Dividends payable | | | 907,207 | |
| | | | |
Total Liabilities | | | 42,142,489 | |
| | | | |
| |
NET ASSETS | | $ | 7,146,079,091 | |
| | | | |
NET ASSETS CONSIST OF | | | | |
Distribution in excess of net investment income | | $ | (947,051 | ) |
Net unrealized appreciation on investments | | | 111,154,442 | |
Accumulated net realized gain (loss) | | | (22,240,692 | ) |
Net capital paid in on shares of beneficial interest | | | 7,058,112,392 | |
| | | | |
| | $ | 7,146,079,091 | |
| | | | |
NET ASSET VALUE | | | | |
| |
Class A Shares: | | | | |
Net asset value and redemption price per share ($1,388,226,944 applicable to 97,001,981 shares of beneficial interest outstanding - Note 5) | | $ | 14.31 | |
Maximum sales charge, 1.50% of offering price | | | 0.22 | |
| | | | |
Maximum offering price per share | | $ | 14.53 | |
| | | | |
| |
Class C Shares: | | | | |
Net asset value and offering price per share* ($647,995,232 applicable to 45,195,334 shares of beneficial interest outstanding - Note 5) | | $ | 14.34 | |
| | | | |
| |
Class I Shares: | | | | |
Net asset value, offering and redemption price per share ($5,109,856,915 applicable to 357,001,441 shares of beneficial interest outstanding - Note 5) | | $ | 14.31 | |
| | | | |
| * | Redemption price per share is equal to net asset value less any applicable contingent deferred sales charge. |
See notes to financial statements.
Semi-Annual Report 41
| | |
| Statement of Operations | | |
| |
Thornburg Limited Term Municipal Fund | | Six Months Ended March 31, 2017 (Unaudited) |
| | | | |
INVESTMENT INCOME | | | | |
Interest income (net of premium amortized of $55,611,347) | | $ | 87,170,715 | |
| | | | |
| |
EXPENSES | | | | |
Investment advisory fees (Note 4) | | | 9,740,462 | |
Administration fees (Note 4) | | | | |
Class A Shares | | | 970,203 | |
Class C Shares | | | 430,812 | |
Class I Shares | | | 1,299,423 | |
Distribution and service fees (Note 4) | | | | |
Class A Shares | | | 1,940,405 | |
Class C Shares | | | 1,719,152 | |
Transfer agent fees | | | | |
Class A Shares | | | 504,265 | |
Class C Shares | | | 167,062 | |
Class I Shares | | | 1,992,032 | |
Registration and filing fees | | | | |
Class A Shares | | | 20,974 | |
Class C Shares | | | 12,984 | |
Class I Shares | | | 61,399 | |
Custodian fees (Note 2) | | | 353,400 | |
Professional fees | | | 74,185 | |
Accounting fees (Note 4) | | | 127,690 | |
Trustee fees | | | 173,320 | |
Other expenses | | | 297,579 | |
| | | | |
Total Expenses | | | 19,885,347 | |
| | | | |
Net Investment Income | | | 67,285,368 | |
| | | | |
REALIZED AND UNREALIZED GAIN (LOSS) | | | | |
Net realized gain (loss) on investments | | | (20,073,455 | ) |
Net change in unrealized appreciation (depreciation) on investments | | | (159,558,946 | ) |
| | | | |
Net Realized and Unrealized Loss | | | (179,632,401 | ) |
| | | | |
Net Decrease in Net Assets Resulting from Operations | | $ | (112,347,033 | ) |
| | | | |
See notes to financial statements.
42 Semi-Annual Report
| | |
| Statements of Changes in Net Assets | | |
| |
Thornburg Limited Term Municipal Fund | | |
| | | | | | | | |
| | | SIX MONTHS ENDED
MARCH 31, 2017* | | | YEAR ENDED
SEPTEMBER 30, 2016 | |
INCREASE (DECREASE) IN NET ASSETS FROM | | | | | | | | |
| | |
OPERATIONS | | | | | | | | |
Net investment income | | $ | 67,285,368 | | | $ | 130,961,632 | |
Net realized gain (loss) on investments | | | (20,073,455 | ) | | | (1,591,144 | ) |
Net unrealized appreciation (depreciation) on investments | | | (159,558,946 | ) | | | 56,431,868 | |
| | | | | | | | |
Net Increase (Decrease) in Net Assets Resulting from Operations | | | (112,347,033 | ) | | | 185,802,356 | |
| | |
DIVIDENDS TO SHAREHOLDERS | | | | | | | | |
From net investment income | | | | | | | | |
Class A Shares | | | (12,495,991 | ) | | | (26,222,114 | ) |
Class C Shares | | | (4,747,668 | ) | | | (9,606,259 | ) |
Class I Shares | | | (50,041,709 | ) | | | (95,133,259 | ) |
| | |
FUND SHARE TRANSACTIONS (NOTE 5) | | | | | | | | |
Class A Shares | | | (270,371,168 | ) | | | (15,604,952 | ) |
Class C Shares | | | (77,048,628 | ) | | | 5,714,401 | |
Class I Shares | | | (272,000,278 | ) | | | 637,192,599 | |
| | | | | | | | |
Net Increase (Decrease) in Net Assets | | | (799,052,475 | ) | | | 682,142,772 | |
| | |
NET ASSETS | | | | | | | | |
Beginning of Period | | | 7,945,131,566 | | | | 7,262,988,794 | |
| | | | | | | | |
| | |
End of Period | | $ | 7,146,079,091 | | | $ | 7,945,131,566 | |
| | | | | | | | |
| | |
Distribution in excess of net investment income | | $ | (947,051 | ) | | $ | (947,051 | ) |
See notes to financial statements.
Semi-Annual Report 43
| | |
| Notes to Financial Statements | | |
| |
Thornburg Limited Term Municipal Fund | | March 31, 2017 (Unaudited) |
NOTE 1 – ORGANIZATION
Thornburg Limited Term Municipal Fund (the “Fund”) is a diversified series of Thornburg Investment Trust (the “Trust”). The Trust is organized as a Massachusetts business trust under a Declaration of Trust dated June 3, 1987 and is registered as a diversified, open-end management investment company under the Investment Company Act of 1940, as amended. The Fund is currently one of twenty-one separate series of the Trust. Each series is considered to be a separate entity for financial reporting and tax purposes and bears expenses directly attributable to it. The Fund’s primary investment objective is to obtain as high a level of current income exempt from federal individual income taxes as is consistent, in the view of Thornburg Investment Management, Inc., the Trust’s investment advisor (the “Advisor”), with the preservation of capital. The Fund’s secondary objective is to reduce expected changes in its share price compared to longer intermediate and long-term bond portfolios.
The Fund currently offers three classes of shares of beneficial interest: Class A, Class C, and Institutional Class (“Class I”). Each class of shares of the Fund represents an interest in the same portfolio of investments, except that (i) Class A shares are sold subject to a front-end sales charge collected at the time the shares are purchased and bear a service fee, (ii) Class C shares are sold at net asset value without a sales charge at the time of purchase, but are subject to a contingent deferred sales charge upon redemption within one year of purchase, and bear both a service fee and a distribution fee, (iii) Class I shares are sold at net asset value without a sales charge at the time of purchase and may be subject to a service fee, and (iv) the respective classes may have different reinvestment privileges and conversion rights. Additionally, the Fund may allocate among its classes certain expenses, to the extent allocable to specific classes, including transfer agent fees, government registration fees, certain printing and postage costs, and administrative and legal expenses. Currently, class specific expenses of the Fund are limited to service and distribution fees, administration fees, and certain registration and transfer agent expenses.
The following is a summary of significant accounting policies followed by the Fund in the preparation of its financial statements. The Fund prepares its financial statements in conformity with United States generally accepted accounting principles (“GAAP”), including investment company accounting and reporting guidance in the Financial Accounting Standards Board (the “FASB”) Accounting Standard Codification Topic 946.
NOTE 2 – SIGNIFICANT ACCOUNTING POLICIES
Security Valuation: All investments in securities held by the Fund are valued as described in Note 3.
Allocation of Income, Gains, Losses and Expenses: Net investment income (other than class specific expenses) and realized and unrealized gains and losses are allocated daily to each class of shares based upon the relative net asset value of outstanding shares (or the value of the dividend-eligible shares, as appropriate) of each class of shares at the beginning of the day (after adjusting for the current capital shares activity of the respective class). Expenses common to all Funds are allocated among the Funds comprising the Trust based upon their relative net asset values or other appropriate allocation methods. Operating expenses directly attributable to a specific class are charged against the operating income of that class.
Dividends and Distributions to Shareholders: Dividends and distributions to shareholders, which are determined in accordance with federal income tax regulations and may differ from GAAP, are recorded on the ex-dividend date. Ordinary income distributions, if any, are declared daily and paid monthly. Capital gain distributions, if any, are declared and paid annually and more often if deemed necessary by the Advisor. Dividends are paid and are reinvested in additional shares of the Fund at net asset value per share at the close of business on the ex-dividend date, or at the shareholder’s option, paid in cash.
Investment Income: Interest income is accrued as earned. Premiums and discounts are amortized and accreted, respectively, to call dates or maturity dates using the effective yield method of the respective investments. These amounts are included in Interest income on the Statement of Operations.
Custodian Fees: Custodian fees disclosed in the Statement of Operations may include interest expenses incurred by the Fund on any cash overdrafts of its custodian account during the period. Such cash overdrafts may result from the effects of failed trades in portfolio securities and from cash outflows resulting from unanticipated shareholder redemption activity. The Fund pays interest to its custodian on any such cash overdraft at a rate equal to 2.50% of the overdraft amount in excess of $50,000.
Investment Transactions: Investment transactions are accounted for on a trade date basis. Realized gains and losses from the sale of investments are recorded on an identified cost basis.
When-Issued and Delayed Delivery Transactions: The Fund may engage in when-issued or delayed delivery transactions. To the extent the Fund engages in such transactions, it will do so for the purpose of acquiring portfolio investments consistent with the Fund’s investment objectives and not for the purpose of investment leverage or to speculate on interest rate or market changes. At the time the Fund makes a commitment to purchase an investment on a when-issued or delayed delivery basis, the Fund will record the transaction and reflect the value in determining its net asset value. When effecting such transactions, assets of an amount sufficient to make payment
44 Semi-Annual Report
| | |
| Notes to Financial Statements, Continued | | |
| |
Thornburg Limited Term Municipal Fund | | March 31, 2017 (Unaudited) |
for the portfolio investments to be purchased will be segregated on the Fund’s records on the trade date. Investments purchased on a when-issued or delayed delivery basis do not earn interest until the settlement date.
Guarantees and Indemnifications: Under the Trust’s organizational documents (and under separate agreements with the independent Trustees), its officers and Trustees are provided with an indemnification against certain liabilities arising out of the performance of their duties to the Fund. In the normal course of business the Trust may also enter into contracts with service providers that contain general indemnifications. The Trust’s maximum exposure under these arrangements is unknown. However, based on experience, the Trust expects the risk of loss to be remote.
Use of Estimates: The preparation of financial statements in conformity with GAAP requires management to make estimates and assumptions that affect the reported amounts of assets and liabilities and disclosure of contingent assets and liabilities at the date of the financial statements and the reported amounts of increases (decreases) in net assets from operations during the reporting period. Actual results could differ from those estimates.
Federal Income Taxes: It is the policy of the Trust to comply with the provisions of the Internal Revenue Code applicable to regulated investment companies and to distribute to shareholders substantially all investment company taxable income including net realized gains on investments (if any), and tax exempt income of the Fund. Therefore, no provision for federal income or excise tax is required.
The Fund files income tax returns in United States federal and applicable state jurisdictions. The statute of limitations on the Fund’s tax return filings generally remains open for the three years following a return’s filing date. The Fund has analyzed its tax positions taken on Federal income tax returns for all open tax years and has concluded that no provision for income tax is required in the financial statements.
At March 31, 2017, information on the tax components of capital was as follows:
| | | | |
Cost of investments for tax purposes | | $ | 6,965,714,900 | |
| | | | |
Gross unrealized appreciation on a tax basis | | $ | 141,863,402 | |
Gross unrealized depreciation on a tax basis | | | (30,708,960 | ) |
| | | | |
Net unrealized appreciation (depreciation) on investments (tax basis) | | $ | 111,154,442 | |
| | | | |
At March 31, 2017, the Fund had deferred tax basis capital losses occurring subsequent to October 31, 2015 through September 30, 2016 of $1,594,821. For tax purposes, such losses will be recognized in the year ending September 30, 2017.
At March 31, 2017, the Fund had cumulative tax basis capital losses of $572,416, (of which $233,596 are short-term and $338,820 are long-term) generated after September 30, 2011, which may be carried forward to offset future capital gains. To the extent such carryfor-wards are used, capital gain distributions may be reduced to the extent provided by regulations. Such capital loss carryforwards do not expire.
NOTE 3 – SECURITY VALUATION
Valuation of the Fund’s portfolio investment securities is performed in accordance with policies and procedures adopted by and under the oversight of the Trustees.
The Trustees of the Trust have appointed Thornburg Investment Management, Inc., the Trust’s investment advisor (the “Advisor”) to assist the Trustees in obtaining market values for portfolio investments, evaluate and monitor professional pricing service providers appointed by the Trustees’ Audit Committee (the “Audit Committee”) to assist in determining fair values for portfolio investments, assist in calculating fair values for portfolio investments in certain circumstances, and to perform other functions in connection with the valuation of investments. The Advisor acts through its Valuation and Pricing Committee (the “Committee”) and other employees of the Advisor. The Committee regularly reviews its own valuation calculations, as well as the valuations, valuation techniques and services furnished by pricing service providers, considers circumstances which may require valuation calculations by the Committee, and reviews previous valuation calculations. The Committee reports to the Audit Committee on the Committee’s activities, the performance of pricing service providers, and other matters relating to valuation of portfolio investments.
In those instances when the Committee assists in calculating a fair value for a portfolio investment, the Committee seeks to determine the price that the Fund would reasonably expect to receive upon a sale of the investment in an orderly transaction between market participants on the valuation date. The Committee customarily utilizes quotations from securities broker dealers in calculating valuations, but also may utilize prices obtained from pricing service providers or other methods approved by the Audit Committee. Because fair values calculated by the Committee are estimates, the calculation of a value for an investment may differ from the price that would be realized by the Fund upon a sale of the investment, and the difference could be material to the Fund’s financial statements. The
Semi-Annual Report 45
| | |
| Notes to Financial Statements, Continued | | |
| |
Thornburg Limited Term Municipal Fund | | March 31, 2017 (Unaudited) |
Committee’s calculation of a fair value for an investment may also differ from the prices obtained by other persons (including other mutual funds) for the investment.
Valuation of Securities: Debt obligations held by the Fund which are not listed or traded on exchanges or for which no reported market exists are ordinarily valued at the valuation obtained from a pricing service provider approved by the Audit Committee.
In any case when a pricing service provider fails to provide a valuation for a debt obligation held by the Fund, the Committee calculates a fair value for the obligation using alternative methods under procedures approved by the Audit Committee. Additionally, in cases when management believes that a valuation obtained from a pricing service provider merits review for significant reasons, the Committee decides whether or not to use the valuation calculated by the pricing service provider or to use an alternative method approved by the Audit Committee to calculate a fair value for the obligation.
Valuation Hierarchy: The Fund categorizes its investments based upon the inputs used in valuing those investments, according to a three-level hierarchy established in guidance from FASB. Categorization of investments using this hierarchy is intended by the FASB to maximize the use of observable inputs in valuing investments and minimize the use of unobservable inputs by requiring that the most observable inputs be used when available. Observable inputs are those that market participants would use in valuing an investment based on available market information. Unobservable inputs are those that reflect assumptions about the information market participants would use in valuing an investment. An investment’s level within the hierarchy is based on the lowest level input that is deemed significant to the valuation. The methodologies and inputs used to value investments are not necessarily indications of the risk or liquidity associated with those investments.
Various inputs are used in calculating valuations for the Fund’s investments. These inputs are generally summarized according to the three-level hierarchy below:
Level 1: Quoted prices in active markets for identical investments.
Level 2: Other direct or indirect significant observable inputs (including quoted prices for similar investments in active markets and other observable inputs, such as interest rates, prepayment rates, credit risk, etc.).
Level 3: Significant unobservable inputs (including the Committee’s own assumptions in calculating the fair values of investments).
Valuations for debt obligations held by the Fund are typically calculated by pricing service providers approved by the Audit Committee and are characterized as Level 2 within the valuation hierarchy.
In a limited number of cases the Committee calculates a fair value for investments using broker quotations or other methods approved by the Audit Committee. When the Committee uses a single broker quotation to calculate a fair value for an investment without other significant observable inputs, or if a fair value is calculated using other significant inputs that are considered unobservable, the investment is characterized as Level 3 within the hierarchy. Other significant unobservable inputs used to calculate a fair value in these instances might include an income-based valuation approach which considers discounted anticipated future cash flows from the investment, and application of discounts due to the nature or duration of any restrictions on the disposition of the investment.
Valuations based upon the use of inputs from Levels 1, 2 or 3 may not represent the actual price received upon the disposition of an investment, and the Fund may receive a price that is lower than the valuation based upon these inputs when it sells the investment.
The following table displays a summary of the fair value hierarchy measurements of the Fund’s investments as of March 31, 2017. In any instance when valuation inputs from more than one level are used to determine the fair value of a specific investment, the investment is placed in the level of the table based upon the lowest level input that is significant in determining the fair value of the investment:
| | | | | | | | | | | | | | | | |
| | | FAIR VALUE MEASUREMENTS AT MARCH 31, 2017 | |
| | | TOTAL | | | LEVEL 1 | | | LEVEL 2 | | | LEVEL 3 | |
Assets | | | | | | | | | | | | | | | | |
Investments in Securities | | | | | | | | | | | | | | | | |
Municipal Bonds | | $ | 7,076,869,342 | | | $ | — | | | $ | 7,076,869,342 | | | $ | — | |
| | | | | | | | | | | | | | | | |
Total Investments in Securities | | $ | 7,076,869,342 | | | $ | — | | | $ | 7,076,869,342 | | | $ | — | |
In accordance with the guidance prescribed in Accounting Standards Update No. 2011-04, it is the policy of the Fund to recognize transfers between levels and the underlying events which caused the movement. The Fund recognized no transfers between levels for the six months ended March 31, 2017.
46 Semi-Annual Report
| | |
| Notes to Financial Statements, Continued | | |
| |
Thornburg Limited Term Municipal Fund | | March 31, 2017 (Unaudited) |
NOTE 4 – INVESTMENT ADVISORY FEE AND OTHER TRANSACTIONS WITH AFFILIATES
Pursuant to an investment advisory agreement, the Advisor serves as the investment advisor and performs services for the Fund for which the fees are payable at the end of each month. Under the investment advisory agreement, the Fund pays the Advisor a management fee based on the daily net assets of the Fund at an annual rate as shown in the following table:
Management Fee Schedule
| | | | |
DAILY NET ASSETS | | FEE RATE | |
Up to $ 500 million | | | 0.500 | % |
Next $ 500 million | | | 0.400 | |
Next $ 500 million | | | 0.300 | |
Next $ 500 million | | | 0.250 | |
Over $ 2 billion | | | 0.225 | |
The Fund’s effective management fee for the six months ended March 31, 2017, was 0.262% of the Fund’s average net assets.
The Fund pays to the Advisor the costs of personnel who perform certain accounting services for the Fund. For the six months ended March 31, 2017 the Fund paid $127,690 to the Advisor for these accounting services. The Trust has also entered into administrative service agreements with the Advisor, whereby the Advisor will perform certain administrative services related to each class of the Fund’s shares, and for which fees will be payable at an annual rate of up to .125 of 1% per annum of the average daily net assets attributable to each class of shares. Total administrative service fees incurred by each class of shares of the Fund for the six months ended March 31, 2017, are set forth in the Statement of Operations.
The Trust has an underwriting agreement with Thornburg Securities Corporation (the “Distributor”), an affiliate of the Advisor, which acts as the distributor of the Fund’s shares. For the six months ended March 31, 2017, the Distributor has advised the Fund that it earned no net commissions from the sale of Class A shares, and collected contingent deferred sales charges aggregating $29,975 from redemptions of Class C shares of the Fund.
Pursuant to a service plan under Rule 12b-1 of the Investment Company Act of 1940, the Fund may pay to the Distributor or securities dealers and other financial institutions at the Distributor’s direction an amount not to exceed .25 of 1% per annum of the average daily net assets attributable to Class A and Class C shares of the Fund to obtain various shareholder and distribution related services. For the six months ended March 31, 2017, there were no 12b-1 service plan fees charged for Class I shares. The Advisor and the Distributor each may pay out of its own resources additional expenses for distribution of the Fund’s shares and shareholder services.
The Trust has also adopted a distribution plan pursuant to Rule 12b-1, applicable only to the Fund’s Class C shares, under which the Fund compensates the Distributor for services in promoting the sale of Class C shares of the Fund at an annual rate of up to .25 of 1% per annum of the average daily net assets attributable to Class C shares.
Total fees incurred by each class of shares of the Fund under their respective service and distribution plans for the six months ended March 31, 2017, are set forth in the Statement of Operations.
Certain officers and Trustees of the Trust are also officers or directors of the Advisor and Distributor. The compensation of independent Trustees is borne by the Trust.
The percentage of direct investments in the Fund held by the Trustees and Officers of the Trust and the Advisor is approximately 0.75%.
The Fund may purchase or sell securities from, or to an affiliated fund, provided the affiliation is due solely to having a common investment advisor, common officers, or common trustees, and provided that all such transactions will comply with Rule 17a-7 under the 1940 Act. For the six months ended March 31, 2017, the Fund had transactions with affiliated funds of $2,588,274 in purchases and $2,586,402 in sales.
Semi-Annual Report 47
| | |
| Notes to Financial Statements, Continued | | |
| |
Thornburg Limited Term Municipal Fund | | March 31, 2017 (Unaudited) |
NOTE 5 – SHARES OF BENEFICIAL INTEREST
At March 31, 2017, there were an unlimited number of shares with no par value of beneficial interest authorized. Transactions in shares of beneficial interest were as follows:
| | | | | | | | | | | | | | | | |
| | | SIX MONTHS ENDED
MARCH 31, 2017 (UNAUDITED) | | | YEAR ENDED
SEPTEMBER 30, 2016 (AUDITED) | |
| | | SHARES | | | AMOUNT | | | SHARES | | | AMOUNT | |
Class A Shares | | | | | | | | | | | | | | | | |
Shares sold | | | 10,376,714 | | | $ | 148,602,395 | | | | 24,409,105 | | | $ | 356,976,557 | |
Shares issued to shareholders in reinvestment of dividends | | | 788,282 | | | | 11,274,303 | | | | 1,617,427 | | | | 23,656,616 | |
Shares repurchased | | | (30,149,369 | ) | | | (430,247,866 | ) | | | (27,099,577 | ) | | | (396,238,125 | ) |
| | | | | | | | | | | | | | | | |
| | | | |
Net increase (decrease) | | | (18,984,373 | ) | | $ | (270,371,168 | ) | | | (1,073,045 | ) | | $ | (15,604,952 | ) |
| | | | | | | | | | | | | | | | |
Class C Shares | | | | | | | | | | | | | | | | |
Shares sold | | | 2,047,066 | | | $ | 29,399,903 | | | | 7,967,832 | | | $ | 116,744,198 | |
Shares issued to shareholders in reinvestment of dividends | | | 288,074 | | | | 4,128,118 | | | | 565,864 | | | | 8,292,917 | |
Shares repurchased | | | (7,726,503 | ) | | | (110,576,649 | ) | | | (8,145,288 | ) | | | (119,322,714 | ) |
| | | | | | | | | | | | | | | | |
| | | | |
Net increase (decrease) | | | (5,391,363 | ) | | $ | (77,048,628 | ) | | | 388,408 | | | $ | 5,714,401 | |
| | | | | | | | | | | | | | | | |
Class I Shares | | | | | | | | | | | | | | | | |
Shares sold | | | 60,667,675 | | | $ | 867,936,929 | | | | 114,131,595 | | | $ | 1,669,936,548 | |
Shares issued to shareholders in reinvestment of dividends | | | 3,207,848 | | | | 45,880,553 | | | | 5,957,028 | | | | 87,156,964 | |
Shares repurchased | | | (83,083,398 | ) | | | (1,185,817,760 | ) | | | (76,565,919 | ) | | | (1,119,900,913 | ) |
| | | | | | | | | | | | | | | | |
| | | | |
Net increase (decrease) | | | (19,207,875 | ) | | $ | (272,000,278 | ) | | | 43,522,704 | | | $ | 637,192,599 | |
| | | | | | | | | | | | | | | | |
NOTE 6 – INVESTMENT TRANSACTIONS
For the six months ended March 31, 2017, the Fund had purchase and sale transactions of investments (excluding short-term invest- ments) of $641,237,139 and $768,266,753, respectively.
OTHER NOTES
Risks: The Fund’s investments subject it to risks including, but not limited to, credit risk, interest rate risk, management risk, market and economic risk, and liquidity risk. Please see the Fund’s prospectus for a discussion of the risks associated with an investment in the Fund.
Subsequent Events: Fund management believes no events have occurred between March 31, 2017 and the date of issuance of the financial statements that require adjustment to or disclosure in the accompanying financial statements.
48 Semi-Annual Report
This page intentionally left blank.
Semi-Annual Report 49
Financial Highlights
Thornburg Limited Term Municipal Fund
| | | | | | | | | | | | | | | | | | | | | | | | | | | | | | | | | | | | | | | | | | | | | | | | | | | | | | |
| | | PER SHARE PERFORMANCE (FOR A SHARE OUTSTANDING THROUGHOUT THE PERIOD) | | RATIOS TO AVERAGE NET ASSETS | | | SUPPLEMENTAL DATA | |
UNLESS
OTHERWISE
NOTED,
PERIODS
ARE
FISCAL
YEARS
ENDED
SEPT. 30, | | NET ASSET
VALUE
BEGINNING
OF PERIOD | | | NET
INVESTMENT
INCOME
(LOSS)+ | | NET
REALIZED
&
UNREALIZED
GAIN (LOSS)
ON
INVESTMENTS | | | TOTAL FROM
INVESTMENT
OPERATIONS | | | DIVIDENDS
FROM NET
INVESTMENT
INCOME | | | DIVIDENDS
FROM NET
REALIZED
GAINS | | | TOTAL
DIVIDENDS | | | NET
ASSET
VALUE
END OF
PERIOD | | NET
INVESTMENT
INCOME
(LOSS)
(%) | | | EXPENSES,
AFTER
EXPENSE
REDUCTIONS
(%) | | | EXPENSES,
AFTER
EXPENSE
REDUCTIONS
AND
NET OF
CUSTODY
CREDITS
(%) | | | EXPENSES,
BEFORE
EXPENSE
REDUCTIONS
(%) | | | TOTAL
RETURN
(%)(a) | | | PORTFOLIO
TURNOVER
RATE (%)(a) | | NET
ASSETS
AT END
OF
PERIOD
(THOUSANDS) | |
CLASS A SHARES | | | | | | | | | | | | | | | | | | | | | | | | | | | | | | | | | | | | | | | | | | | | | | | | |
2017(b)(c) | | $ | 14.63 | | | 0.12 | | | (0.32 | ) | | | (0.20 | ) | | | (0.12 | ) | | | — | | | | (0.12 | ) | | $14.31 | | | 1.61 | (d) | | | 0.73 | (d) | | | 0.73 | (d) | | | 0.73 | (d) | | | (1.40 | ) | | 9.71 | | $ | 1,388,227 | |
2016(c) | | $ | 14.52 | | | 0.22 | | | 0.11 | | | | 0.33 | | | | (0.22 | ) | | | — | | | | (0.22 | ) | | $14.63 | | | 1.54 | | | | 0.72 | | | | 0.72 | | | | 0.72 | | | | 2.32 | | | 14.53 | | $ | 1,697,329 | |
2015(c) | | $ | 14.58 | | | 0.23 | | | (0.06 | ) | | | 0.17 | | | | (0.23 | ) | | | — | | | | (0.23 | ) | | $14.52 | | | 1.56 | | | | 0.73 | | | | 0.73 | | | | 0.73 | | | | 1.15 | | | 18.56 | | $ | 1,700,127 | |
2014(c) | | $ | 14.38 | | | 0.26 | | | 0.20 | | | | 0.46 | | | | (0.26 | ) | | | — | | | | (0.26 | ) | | $14.58 | | | 1.78 | | | | 0.72 | | | | 0.71 | | | | 0.72 | | | | 3.20 | | | 14.46 | | $ | 1,865,213 | |
2013(c) | | $ | 14.70 | | | 0.26 | | | (0.32 | ) | | | (0.06 | ) | | | (0.26 | ) | | | — | | | | (0.26 | ) | | $14.38 | | | 1.81 | | | | 0.71 | | | | 0.71 | | | | 0.71 | | | | (0.39 | ) | | 17.47 | | $ | 2,178,317 | |
2012(c) | | $ | 14.39 | | | 0.31 | | | 0.31 | | | | 0.62 | | | | (0.31 | ) | | | — | | | | (0.31 | ) | | $14.70 | | | 2.13 | | | | 0.72 | | | | 0.72 | | | | 0.72 | | | | 4.36 | | | 12.72 | | $ | 2,131,540 | |
CLASS C SHARES | | | | | | | | | | | | | | | | | | | | | | | | | | | | | | | | | | | | | | | | | | | | | | | | |
2017(b) | | $ | 14.66 | | | 0.10 | | | (0.32 | ) | | | (0.22 | ) | | | (0.10 | ) | | | — | | | | (0.10 | ) | | $14.34 | | | 1.38 | (d) | | | 0.97 | (d) | | | 0.97 | (d) | | | 0.97 | (d) | | | (1.51 | ) | | 9.71 | | $ | 647,995 | |
2016 | | $ | 14.55 | | | 0.19 | | | 0.11 | | | | 0.30 | | | | (0.19 | ) | | | — | | | | (0.19 | ) | | $14.66 | | | 1.30 | | | | 0.96 | | | | 0.96 | �� | | | 0.96 | | | | 2.07 | | | 14.53 | | $ | 741,637 | |
2015 | | $ | 14.60 | | | 0.19 | | | (0.05 | ) | | | 0.14 | | | | (0.19 | ) | | | — | | | | (0.19 | ) | | $14.55 | | | 1.32 | | | | 0.96 | | | | 0.96 | | | | 0.96 | | | | 0.98 | | | 18.56 | | $ | 730,395 | |
2014 | | $ | 14.41 | | | 0.22 | | | 0.19 | | | | 0.41 | | | | (0.22 | ) | | | — | | | | (0.22 | ) | | $14.60 | | | 1.52 | | | | 0.97 | | | | 0.96 | | | | 0.97 | | | | 2.87 | | | 14.46 | | $ | 749,648 | |
2013 | | $ | 14.72 | | | 0.23 | | | (0.31 | ) | | | (0.08 | ) | | | (0.23 | ) | | | — | | | | (0.23 | ) | | $14.41 | | | 1.55 | | | | 0.97 | | | | 0.97 | | | | 0.97 | | | | (0.58 | ) | | 17.47 | | $ | 795,052 | |
2012 | | $ | 14.41 | | | 0.27 | | | 0.31 | | | | 0.58 | | | | (0.27 | ) | | | — | | | | (0.27 | ) | | $14.72 | | | 1.85 | | | | 0.99 | | | | 0.99 | | | | 0.99 | | | | 4.08 | | | 12.72 | | $ | 777,026 | |
CLASS I SHARES | | | | | | | | | | | | | | | | | | | | | | | | | | | | | | | | | | | | | | | | | | | | | | | | |
2017(b) | | $ | 14.64 | | | 0.14 | | | (0.33 | ) | | | (0.19 | ) | | | (0.14 | ) | | | — | | | | (0.14 | ) | | $14.31 | | | 1.93 | (d) | | | 0.42 | (d) | | | 0.42 | (d) | | | 0.42 | (d) | | | (1.31 | ) | | 9.71 | | $ | 5,109,857 | |
2016 | | $ | 14.53 | | | 0.27 | | | 0.11 | | | | 0.38 | | | | (0.27 | ) | | | — | | | | (0.27 | ) | | $14.64 | | | 1.85 | | | | 0.41 | | | | 0.41 | | | | 0.41 | | | | 2.64 | | | 14.53 | | $ | 5,506,165 | |
2015 | | $ | 14.58 | | | 0.27 | | | (0.05 | ) | | | 0.22 | | | | (0.27 | ) | | | — | | | | (0.27 | ) | | $14.53 | | | 1.88 | | | | 0.41 | | | | 0.41 | | | | 0.41 | | | | 1.54 | | | 18.56 | | $ | 4,832,467 | |
2014 | | $ | 14.38 | | | 0.30 | | | 0.20 | | | | 0.50 | | | | (0.30 | ) | | | — | | | | (0.30 | ) | | $14.58 | | | 2.09 | | | | 0.40 | | | | 0.40 | | | | 0.40 | | | | 3.53 | | | 14.46 | | $ | 4,417,547 | |
2013 | | $ | 14.70 | | | 0.31 | | | (0.32 | ) | | | (0.01 | ) | | | (0.31 | ) | | | — | | | | (0.31 | ) | | $14.38 | | | 2.15 | | | | 0.37 | | | | 0.37 | | | | 0.37 | | | | (0.05 | ) | | 17.47 | | $ | 3,502,580 | |
2012 | | $ | 14.39 | | | 0.36 | | | 0.31 | | | | 0.67 | | | | (0.36 | ) | | | — | | | | (0.36 | ) | | $14.70 | | | 2.46 | | | | 0.39 | | | | 0.39 | | | | 0.39 | | | | 4.71 | | | 12.72 | | $ | 3,084,872 | |
| (a) | Not annualized for periods less than one year. |
| (b) | Unaudited Six Month Period Ended March 31. |
| (c) | Sales loads are not reflected in computing total return. |
| + | Based on weighted average shares outstanding. |
See notes to financial statements.
| | | | |
| 50 Semi-Annual Report | | | | Semi-Annual Report 51 |
| | |
| Expense Example | | |
| |
Thornburg Limited Term Municipal Fund | | March 31, 2017 (Unaudited) |
As a shareholder of the Fund, you incur two types of costs:
| | (1) | transaction costs, including |
(a) sales charges (loads) on purchase payments, for Class A shares;
(b) a deferred sales charge on redemptions of any part or all of a purchase of $1 million of Class A shares within 12 months of purchase;
(c) a deferred sales charge on redemptions of Class C shares within 12 months of purchase;
| | (2) | ongoing costs, including management fees; distribution and/or service (12b-1) fees; and other Fund expenses. |
This example is intended to help you understand your ongoing costs (in dollars) of investing in the Fund and to compare these costs with the ongoing costs of investing in other mutual funds.
The example is based on a $1,000 investment beginning on October 1, 2016, and held until March 31, 2017.
| | | | | | | | | | | | |
| | | BEGINNING
ACCOUNT VALUE
10/1/16 | | | ENDING
ACCOUNT VALUE
3/31/17 | | | EXPENSES PAID
DURING PERIOD†
10/1/16–3/31/17 | |
Class A Shares | | | | | | | | | | | | |
Actual | | $ | 1,000.00 | | | $ | 986.04 | | | $ | 3.62 | |
Hypothetical* | | $ | 1,000.00 | | | $ | 1,021.28 | | | $ | 3.69 | |
Class C Shares | | | | | | | | | | | | |
Actual | | $ | 1,000.00 | | | $ | 984.94 | | | $ | 4.78 | |
Hypothetical* | | $ | 1,000.00 | | | $ | 1,020.12 | | | $ | 4.86 | |
Class I Shares | | | | | | | | | | | | |
Actual | | $ | 1,000.00 | | | $ | 986.91 | | | $ | 2.07 | |
Hypothetical* | | $ | 1,000.00 | | | $ | 1,022.84 | | | $ | 2.11 | |
| † | Expenses are equal to the annualized expense ratio for each class (A: 0.73%; C: 0.97%; I: 0.42%) multiplied by the average account value over the period, multiplied by 182/365 to reflect the one-half year period. |
| * | Hypothetical assumes a rate of return of 5% per year before expenses. |
ACTUAL EXPENSES
For each class of shares, the first line of the accompanying table provides information about actual account values and actual expenses. You may use the information in this line, together with the amount you invested, to estimate the expenses that you paid over the period. Simply divide your account value by $1,000 (for example, an $8,600 account value divided by $1,000 = 8.6), then multiply the result by the number in the first line for your class of shares under the heading entitled “Expenses Paid During Period” to estimate the expenses you paid on your account during this period.
HYPOTHETICAL EXAMPLE FOR COMPARISON PURPOSES
For each class of shares, the second line of the accompanying table provides information about hypothetical account values and hypothetical expenses based on the Fund’s actual expense ratio and an assumed rate of return of 5% per year before expenses, which is not the Fund’s actual return. The hypothetical account values and expenses may not be used to estimate the actual ending account balance or expenses you paid for the period. You may use this information to compare the ongoing costs of investing in the Fund and other funds. To do so, compare this 5% hypothetical example with the 5% hypothetical examples that appear in the shareholder reports of the other funds.
Please note that the expenses shown in the table are meant to highlight your ongoing costs only and do not reflect any transactional costs, such as sales charges (loads), redemption fees, or exchange fees. Therefore, the second line of the table for each class of shares is useful in comparing ongoing costs only, and will not help you determine the relative total costs of owning different funds. In addition, if these transactional costs were included, your costs would have been higher.
52 Semi-Annual Report
| | |
| Other Information | | |
| |
Thornburg Limited Term Municipal Fund | | March 31, 2017 (Unaudited) |
PORTFOLIO PROXY VOTING
Policies and Procedures:
The Trust has delegated to Thornburg Investment Management, Inc. (the “Advisor”) voting decisions respecting proxies for the Fund’s voting securities. The Advisor makes voting decisions in accordance with its Proxy Voting Policy. A description of the Policy is available (i) without charge, upon request, by calling the Advisor toll-free at 1-800-847-0200, (ii) on the Thornburg website at www.thornburg. com, and (iii) on the Securities and Exchange Commission’s website at www.sec.gov.
Information regarding how proxies were voted is available on or before August 31 of each year for the twelve months ending the preceding June 30. This information is available (i) without charge, upon request by calling the Advisor toll-free at 1-800-847-0200, (ii) on the Thornburg website at www.thornburg.com, and (iii) on the Securities and Exchange Commission’s website at www.sec.gov.
AVAILABILITY OF QUARTERLY PORTFOLIO SCHEDULE
The Fund files with the Securities and Exchange Commission schedules of its portfolio holdings on Form N-Q for the first and third quarters of each fiscal year. The Fund’s Forms N-Q are available on the Commission’s website at www.sec.gov, or may be reviewed and copied at the Commission’s Public Reference Room in Washington, D.C. Information on the operation of the Public Reference Room may be obtained by calling 1-800-SEC-0330. The Fund also makes this information available on its website at www.thornburg. com/download or upon request by calling 1-800-847-0200.
Semi-Annual Report 53
Trustees’ Statement to Shareholders
Readopted September 12, 2016
The Trustees believe current and prospective shareholders should know how we discharge our responsibilities in supervising the Funds’ investment advisor and in reviewing the advisor’s contract for renewal. Since 2005, we have issued a statement which sets out clearly the three principal guidelines that we follow in supervising the Trust’s investment advisor on your behalf. In accordance with our customary practice, in September of this year we again reviewed our statement and concluded we should reissue this statement outlining the principal features of our supervision of the advisor’s performance of investment management services for the Funds.
We begin with the premise that each shareholder selected his or her Fund because its investments are managed by the investment advisor identified in the prospectus and in accordance with the objective and policies described in the prospectus. We realize, as each of you do, that if you believe that your Fund’s stated objective and policies no longer serve your personal investment goals, you can sell your shares and leave the Fund.
Therefore, we believe that our primary supervisory task – our principal obligation to you – is to assess the nature and quality of the advisor’s services, and to confirm that the advisor actively and competently pursues the Fund’s objective, in accordance with the policies set out in the prospectus. To do this, we meet regularly with management to review your Fund’s portfolio and to discuss the advisor’s specific actions and judgments in pursuing the Fund’s objective. We do not substitute our own judgment for the advisor’s decisions in selecting investments; the advisor is paid to exercise its informed judgment on investment decisions, and we seek to confirm, in reviewing the advisor’s performance, that the advisor is doing just that.
Second, we are conscious of costs and the effect that costs have on shareholders’ returns. We try to make sure that your Fund’s fees and costs are reasonable in relationship to the services rendered and that they are generally in line with those charged by other expert investment advisors, consistent with our belief that the Fund’s investors searched for and expect that expertise and attention and have decided to pay a reasonable price for it. We do not put the management contract “out to bid” as a matter of course, and we would not do so unless we had concluded that the advisor materially had failed to pursue the Fund’s objectives in accordance with its policies, or for other equally important reasons. We believe that any other approach would be inconsistent with your interests and contrary to your expectations when you bought shares of the Fund in the first place.
Finally, because we believe that most Thornburg Fund shareholders have invested with a long-term perspective, we try not to focus too much on the fashions of the moment and on short-term performance. The market will not favor any specific investment objective or set of policies at all times and under all economic circumstances. A fund will experience periods of both high and low returns relative to other funds and other investments. Even if one of our Funds is not favored by the market at a particular time, we believe that the advisor is nonetheless obliged to remain true to the Fund’s objective and policies, and we watch to see that it does so.
Trustees of Thornburg Investment Trust
54 Semi-Annual Report
Thornburg Funds
Thornburg Investment Management is a privately-owned global investment firm that offers a range of solutions for retail and institutional investors. Founded in 1982 and headquartered in Santa Fe, New Mexico, we manage approximately $49 billion (as of March 31, 2017) across U.S. mutual funds, separate accounts for high-net-worth investors and institutional accounts, and UCITS funds for non-U.S. investors.
The fund outlined in this report is one of many equity and fixed-income products available from Thornburg Investment Management.
EQUITY FUNDS
| | • | | Thornburg Investment Income Builder Fund |
| | • | | Thornburg Global Opportunities Fund |
| | • | | Thornburg International Value Fund |
| | • | | Thornburg Better World International Fund |
| | • | | Thornburg International Growth Fund |
| | • | | Thornburg Developing World Fund |
| | • | | Thornburg Core Growth Fund |
FIXED INCOME FUNDS
| | • | | Thornburg Low Duration Income Fund |
| | • | | Thornburg Limited Term U.S. Government Fund |
| | • | | Thornburg Limited Term Income Fund |
| | • | | Thornburg Strategic Income Fund |
| | • | | Thornburg Low Duration Municipal Fund |
| | • | | Thornburg Limited Term Municipal Fund |
| | • | | Thornburg Intermediate Municipal Fund |
| | • | | Thornburg California Limited Term Municipal Fund |
| | • | | Thornburg New Mexico Intermediate Municipal Fund |
| | • | | Thornburg New York Intermediate Municipal Fund |
| | • | | Thornburg Strategic Municipal Income Fund |
ALTERNATIVE FUNDS
| | • | | Thornburg Long/Short Equity Fund |
Before investing, carefully consider the Fund’s investment goals, risks, charges, and expenses. For a prospectus or summary prospectus containing this and other information, contact your financial advisor or visit thornburg.com. Read it carefully before investing.
For additional information, please visit thornburg.com
Thornburg Investment Management, Inc. 2300 North Ridgetop Road, Santa Fe, NM 87506
Semi-Annual Report 55
| | | | |
| Investment Advisor: | | Distributor: | | |
| Thornburg Investment Management® | | Thornburg Securities Corporation® | | |
| 800.847.0200 | | 800.847.0200 | | TH1072 |
2 Semi-Annual Report
Semi-Annual Report
Thornburg Intermediate Municipal Fund
March 31, 2017
| | | | |
SHARE CLASS | | NASDAQ SYMBOL | | CUSIP |
Class A | | THIMX | | 885-215-202 |
Class C | | THMCX | | 885-215-780 |
Class I | | THMIX | | 885-215-673 |
Minimum investments for Class I shares may be higher than those for other classes. Class I shares may not be available to all investors.
Investments carry risks, including possible loss of principal. Portfolios investing in bonds have the same interest rate, inflation, and credit risks that are associated with the underlying bonds. The value of bonds will fluctuate relative to changes in interest rates, decreasing when interest rates rise. Unlike bonds, bond funds have ongoing fees and expenses. Please see the Fund’s prospectus for a discussion of the risks associated with an investment in the Fund. Investments in the Fund are not FDIC insured, nor are they bank deposits or guaranteed by a bank or any other entity.
Semi-Annual Report 3
Letter to Shareholders
| | |
| |
Thornburg Intermediate Municipal Fund | | March 31, 2017 (Unaudited) |
April 28, 2017
Dear Fellow Shareholder:
We are pleased to present the semi-annual report for Thornburg Intermediate Municipal Fund. The net asset value (NAV) of the Class A shares decreased by 50 cents to $13.97 per share during the six-month period ended March 31, 2017. If you were with us the entire period, you received dividends of 14.85 cents per share. If you reinvested your dividends, you received 14.91 cents per share. Dividends were lower for Class C shares and higher for Class I shares to account for varying class-specific expenses. The Class A shares of your Fund underperformed the index with a negative 2.43% total return (without sales charge) for the six months ended March 31, 2017, compared to the negative 1.94% return for the BofA Merrill Lynch 3-15 Year U.S. Municipal Securities Index.
The Fund’s duration and curve positioning added 0.41% to relative performance. Credit factors detracted 0.30% from relative performance and were largely driven by a single, troubled, legacy issue. Other risk factors detracted 0.14% from relative performance. Fund expenses accounted for any remaining differences.
The Municipal Bond Market
After a few years of relative quiet in the municipal bond market, things heated up following the election of Donald Trump in 2016. Stocks were rallying, bond prices, particularly municipal bond prices, came under pressure. Bond yields initially rose after the election based on expectations for greater infrastructure spending, stronger growth and higher inflation. The uptick in rates led mutual fund investors to sell their shares, which caused municipal bond mutual funds to sell their bonds to meet those redemptions. After significant inflows in January to September of 2016, investors pulled $26 billion from municipal bond funds in November and December, some of which was related to tax-loss selling.
When the calendar turned in 2017, these outflows slowed and the municipal bond market produced positive returns. A contributing factor to positive returns was a decline in municipal bond issuance, as during the first quarter of 2017, the supply of new municipal bonds declined by 12% from the same time last year.
The value metrics we use at Thornburg suggest that the municipal bond market continues to price in the rosiest of scenarios moving forward, as investors have been pushed out of the risk spectrum. That is why we have Thornburg Intermediate Municipal Fund positioned in the lower end of its respective risk spectrum. In this environment, we continue to keep duration shorter, credit quality higher and we maintain higher levels of reserves.
Inside the Risk Metrics
Real yields, which indicate how much yield over inflation investors are being paid to own municipal bonds, increased over the six-month period. As of September 30, 2016, 10-year AAA general obligation (GO) bonds were yielding 1.64% and the Core Personal Consumption Expenditures Index (PCE) was running at 1.70%, so investors were earning less than inflation. By the end of February 2017, the yield on 10-year AAA GO bonds had increased to 2.30%, while Core PCE was running at 1.80%. While certainly more interesting at the end of the period, the 0.5% real yield was significantly less than the average of 2% investors have earned over the past 20 years.
The second thing to consider is credit spreads, which reflect the incremental yield an investor earns from owning a lower-rated credit versus a higher-rated credit, and which today remain narrow. As of March 31, 2017, an investor earned about 1.28% more for owning a 10-year BBB revenue bond versus a 10-year AAA GO bond. That is slightly higher than the average 0.75% an investor earned between 1994 and 2007. However, in 2007, approximately 50% of the new-issue municipal bond market was insured by AAA/AAA municipal bond insurers. Today, there are no AAA/AAA municipal bond insurers, and insurance coverage generally accounts for only 6% to 8% of the new-issue municipal bond market.
Finally, the slope of the yield curve, which tracks how much incremental yield an investor earns by owning securities with longer maturities, is slightly flatter than historical averages. Currently, investors are earning about 1.4% more for owning a 10-year AAA GO municipal bond, versus a one-year AAA GO municipal bond. Since 1994, an investor earned on average almost 1.6% to extend maturities from one to 10 years.
The Economy and Tax Reform
The U.S. economy continued its slow recovery in 2016, growing at a rate of 1.6% for 2016 in aggregate.
Unemployment continued to tick down. During the six-month period ended March 31, 2017, the U.S. economy added 976,000 jobs and by the end of the period the unemployment rate had fallen to 4.5%. Inflation remained stable, with the Core PCE Index reading 1.75% through March, below the Fed’s 2% target range.
Taken in aggregate, the economy continues to grow, jobs are being added and inflation has remained contained to date. In an effort to keep the economy in check, the U.S. Federal Reserve raised the Fed funds rate in December of 2016, and again in March of 2017.
The economic health of the municipal bond market appears steady with a couple of notable exceptions. The drama in
4 Semi-Annual Report
| | |
Letter to Shareholders, Continued | | |
| |
Thornburg Intermediate Municipal Fund | | March 31, 2017 (Unaudited) |
Puerto Rico is still playing out; the only winners are the consultants and lawyers hired by all sides.
Elsewhere, Bloomberg provides a heat map of the economic health of U.S. states, covering the period from the fourth quarter of 2015 through the fourth quarter of 2016 (the most recent data available). The majority of the states appear healthy except those with heavy dependence on oil, gas, and coal. The energy-dependent states should improve if oil can maintain prices above $50/barrel.
Tax reform is the second highest priority of President Trump’s and the Republican-led House agenda—second only to health care reform. The most important items in the tax proposals for the owners of municipal bonds (individuals as well as corporations) are those relevant to investment income. By lowering the effective tax rate on competing sources of income, prices of municipal bonds would most likely fall (yields would increase) to become more competitive with these alternative sources of income. There are a number of proposals that have been brought forth, and we believe that if tax reform is enacted, it will be something different than any one of these specific proposals.
President Trump’s tax reform proposal (released Thursday, April 27, 2017) called for the elimination of the deduction for state and local taxes on an individual’s federal tax return. This would, if adopted, have significant impacts for residents of high-tax states. The near-term effects on the economy would be minimal, but long term, residents would have less money in their pockets to spend, the cost of residing in high tax-states would increase and might cause out-migration and lower growth.
Conclusion
We continue to run this portfolio as an actively managed laddered portfolio. Laddering a portfolio is a simple way to diversify its investment along its entire investment universe. While past performance does not guarantee future results, our study showed that this structure outperformed other structures around 60% of the time and added 0.15% to 0.25% of total return annually from 1997 through 2016.* Our view is that the current investment environment is not compensating investors enough to take on extra risk, so we have positioned our portfolios at the lower end of their risk spectrums.
Thank you for your continued trust in us, and please know that the co-managers of this Fund are invested alongside you.
Sincerely,
| | | | |
| | |
 | |  | | |
| Christopher Ryon,CFA | | Nicholos Venditti,CFA | | |
| Portfolio Manager | | Portfolio Manager | | |
| Managing Director | | Managing Director | | |
| * | We examined three hypothetical portfolios of bonds from December 1997 to December 2016. One using a laddering strategy, one using a barbell strategy, and a third using a bullet strategy. For the laddering strategy, the BofA Merrill Lynch 1–12 Year Municipal Index was used as a proxy, since, similar to a ladder, it contains bonds relatively evenly spread across all maturities within the index. The barbell strategy is a duration management technique wherein bonds are clustered at the two extremes of a maturity range. For the barbell strategy, the BofA Merrill Lynch 1–3 Year Municipal Index and BofA Merrill Lynch 8–12 Year Municipal Index were combined. The two indices were weighted in such a way as to give them the same duration as the broader 1–12 Year Index, and each year the portfolio was re-weighted back to the original index weights. This was done to make the two portfolios duration-neutral so that the impact of the strategy chosen could be isolated. The bullet strategy invests at the duration midpoint of the portfolio, therefore the BofA Merrill Lynch 6–8 Year Index was used to represent the bullet strategy. For additional information, see www.thornburg.com/whyladder. Past performance does not guarantee future results. |
The laddering strategy does not assure or guarantee better performance and cannot eliminate the risk of investment losses.
The matters discussed in this report may constitute forward-looking statements made pursuant to the safe harbor provisions of the Securities Litigation Reform Act of 1995. These include any advisor or portfolio manager prediction, assessment, analysis or outlook for individual securities, industries, investment styles, market sectors and/or markets. These statements involve risks and uncertainties. In addition to the general risks described for each fund in its current prospectus, other factors bearing on these reports include the accuracy of the advisor’s or portfolio manager’s forecasts and predictions, the appropriateness of the investment strategies designed by the advisor or portfolio manager and the ability of the advisor or portfolio manager to implement their strategies efficiently and successfully. Any one or more of these factors, as well as other risks affecting the securities markets generally, could cause the actual results of any fund to differ materially as compared to its benchmarks.
The views expressed are subject to change and do not necessarily reflect the views of Thornburg Investment Management, Inc. This information should not be relied upon as a recommendation or investment advice and is not intended to predict the performance of any investment or market.
Semi-Annual Report 5
| | |
| Performance Summary | | |
| |
Thornburg Intermediate Municipal Fund | | March 31, 2017 (Unaudited) |
AVERAGE ANNUAL TOTAL RETURNS
| | | | | | | | | | | | | | | | | | | | |
| | | 1-YR | | | 3-YR | | | 5-YR | | | 10-YR | | | SINCE
INCEP. | |
A Shares (Incep: 7/22/91) | | | | | | | | | | | | | | | | | | | | |
Without sales charge | | | -0.85 | % | | | 2.18 | % | | | 2.37 | % | | | 3.63 | % | | | 4.73 | % |
With sales charge | | | -2.81 | % | | | 1.50 | % | | | 1.96 | % | | | 3.42 | % | | | 4.65 | % |
C Shares (Incep: 9/1/94) | | | | | | | | | | | | | | | | | | | | |
Without sales charge | | | -1.16 | % | | | 1.85 | % | | | 2.04 | % | | | 3.32 | % | | | 3.90 | % |
With sales charge | | | -1.75 | % | | | 1.85 | % | | | 2.04 | % | | | 3.32 | % | | | 3.90 | % |
I Shares (Incep: 7/5/96) | | | -0.62 | % | | | 2.48 | % | | | 2.68 | % | | | 3.96 | % | | | 4.43 | % |
30-DAY YIELDS, A SHARES
(with sales charge)
| | | | |
Annualized Distribution Yield | | | 2.04 | % |
| |
SEC Yield | | | 1.43 | % |
GROWTH OF A HYPOTHETICAL $10,000 INVESTMENT
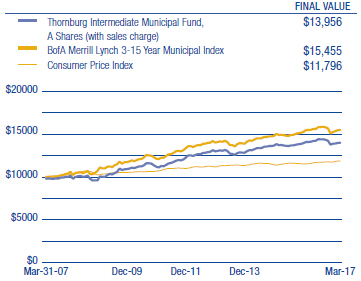
Performance data shown represents past performance and is no guarantee of future results. Investment return and principal value will fluctuate so shares, when redeemed, may be worth more or less than their original cost. Current performance may be lower or higher than quoted. For performance current to the most recent month end, visit thornburg.com or call 800-847-0200. The performance information does not reflect the deduction of taxes that a shareholder would pay on distributions or the redemption of Fund shares. Returns reflect the reinvestment of dividends and capital gains. Class A shares are sold with a maximum sales charge of 2.00%. Class C shares include a 0.60% CDSC for the first year only. There is no sales charge for Class I shares. As disclosed in the most recent prospectus, the total annual fund operating expenses are as follows: A shares, 0.92%; C shares, 1.27%; I shares, 0.61%. Thornburg Investment Management and/or Thornburg Securities Corporation have contractually agreed to waive fees and reimburse expenses through at least April 10, 2018, for some of the share classes, resulting in net expense ratios of the following: C shares, 1.24%. For more detailed information on fund expenses and waivers/reimbursements please see the Fund’s prospectus.
Glossary
The BofA Merrill Lynch 3-15 Year U.S. Municipal Securities Index is a subset of the BofA Merrill Lynch U.S. Municipal Securities Index including all securities with a remaining term to final maturity greater than or equal to 3 years and less than 15 years.
The BofA Merrill Lynch indices used in the Ladder vs Barbell & Bullet study are model portfolios of municipal obligations throughout the United States, with maturities ranging either from one to three years, six to eight years, eight to twelve years, or one to twelve years. These indices are subsets of the BofA Merrill Lynch U.S. Municipal Securities Index, which is comprised of U.S. dollar denominated investment grade tax-exempt debt publicly issued by U.S. states and territories, and their political subdivisions, in the U.S. domestic market. Qualifying securities must have at least a one-year remaining term to final maturity, a fixed coupon schedule and an investment grade rating.
The performance of any index is not indicative of the performance of any particular investment. Unless otherwise noted, index returns reflect the reinvestment of income dividends and capital gains, if any, but do not reflect fees, brokerage commissions or other expenses of investing. Investors may not make direct investments into any index.
Annualized Distribution Yield – The distribution yield reflects actual distributions made to shareholders. The annualized distribution yield is calculated by summing the last 30 days of income at a given month end and annualizing to a 360-day year. The result is divided by the ending maximum offering price or net asset value.
Bond Credit Ratings (Credit Quality) – A bond credit rating assesses the financial ability of a debt issuer to make timely payments of principal and interest. Ratings of AAA (the highest), AA, A, and BBB are investment-grade quality. Ratings of BB, B, CCC, CC, C and D (the lowest) are considered below investment grade, speculative grade, or junk bonds.
Insured Bonds – Individual bonds are sometimes insured by private companies. The insurance guarantees the payment of principal and interest on a bond issue if the issuer defaults. Mutual funds are not insured, even if the underlying bonds are insured.
Core Personal Consumption Expenditure Index (Core PCE) – Core Personal Consumption Expenditure Index is a measure of the Personal Consumption Expenditure Index that excludes the more volatile and seasonal food and energy prices.
Credit Spread/Quality Spread – The difference between the yields of securities with different credit qualities.
Effective Duration – A bond’s sensitivity to interest rates, incorporating the embedded option features, such as call provisions. Bonds with longer durations experience greater price volatility than bonds with shorter durations.
Fed Funds Rate – The interest rate at which a depository institution lends immediately available funds (balances at the Federal Reserve) to another depository institution overnight.
General Obligation Bond (GO) – A municipal bond backed by the credit and “taxing power” of the issuing jurisdiction rather than the revenue from a given project.
Laddering – Laddering involves building a portfolio of bonds with staggered maturities so that a portion matures each year. Money that comes in from maturing bonds is typically invested in bonds with longer maturities at the far end of the portfolio.
Revenue Bond – A bond on which the debt service is payable solely from the revenue generated from the operation of the project being financed or a category of facilities, or from other non-tax sources.
Yield Curve – A line that plots the interest rates, at a set point in time, of bonds having equal credit quality, but differing maturity dates.
6 Semi-Annual Report
| | |
| Fund Summary | | |
| |
Thornburg Intermediate Municipal Fund | | March 31, 2017 (Unaudited) |
OBJECTIVES AND STRATEGIES
The Fund’s primary investment goal is to obtain as high a level of current income exempt from federal individual income tax as is consistent, in the view of the Fund’s investment advisor, with preservation of capital (may be subject to Alternative Minimum Tax).
The secondary goal of the Fund is to reduce expected changes in its share price compared to long-term bond portfolios.
This Fund invests principally in a laddered portfolio of municipal bonds with a dollar-weighted average maturity of normally three to 10 years. Laddering involves building a portfolio of bonds with staggered maturities so that a portion of the portfolio matures each year. Cash from maturing bonds, if not needed for other purposes, is typically invested in bonds with longer maturities at the far end of the ladder. We regard the strategy as a good compromise for managing different types of risk.
LONG-TERM STABILITY OF PRINCIPAL
Net Asset Value History of A Shares
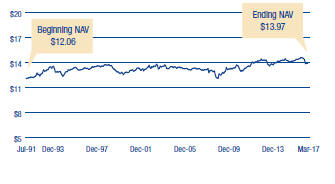
SECURITY CREDIT RATINGS
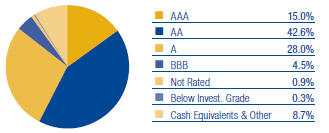
A bond credit rating assesses the financial ability of a debt issuer to make timely payments of principal and interest. Ratings of AAA (the highest), AA, A, and BBB are investment-grade quality. Ratings of BB, B, CCC, CC, C and D (the lowest) are considered below investment grade, speculative grade, or junk bonds. Credit quality ratings for Thornburg’s municipal portfolios used the highest rating available from either Standard & Poor’s or Moody’s Investors Service.
| | | | |
| KEY PORTFOLIO ATTRIBUTES | | | | |
Number of Bonds | | | 548 | |
| |
Effective Duration | | | 5.2 Yrs | |
| |
Average Maturity | | | 8.1 Yrs | |
PORTFOLIO LADDER
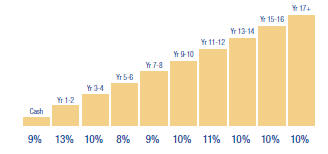
Percent of portfolio maturing in each year. Cash includes cash equivalents and other.
There is no guarantee that the Fund will meet its investment objectives.
All data is subject to change. Charts may not add up to 100% due to rounding.
Semi-Annual Report 7
| | |
| Schedule of Investments | | |
| |
Thornburg Intermediate Municipal Fund | | March 31, 2017 (Unaudited) |
| | | | | | | | | | |
ISSUER-DESCRIPTION | | CREDIT RATING†
S&P/ MOODY’S | | PRINCIPAL
AMOUNT | | | VALUE | |
ALABAMA — 2.02% | | | | | | | | | | |
Alabama Capital Region Solid Waste Disposal Authority, 4.00% due 6/15/2017 (Montgomery Materials Recovery Facility) (AMT) | | AA/NR | | $ | 750,000 | | | $ | 752,408 | |
Alabama Capital Region Solid Waste Disposal Authority, 4.00% due 6/15/2019 (Montgomery Materials Recovery Facility) (AMT) | | AA/NR | | | 815,000 | | | | 838,203 | |
Alabama Capital Region Solid Waste Disposal Authority, 5.00% due 6/15/2020 (Montgomery Materials Recovery Facility) (AMT) | | AA/NR | | | 845,000 | | | | 900,246 | |
Alabama Capital Region Solid Waste Disposal Authority, 5.00% due 6/15/2021 (Montgomery Materials Recovery Facility) (AMT) | | AA/NR | | | 890,000 | | | | 954,338 | |
Alabama Capital Region Solid Waste Disposal Authority, 5.00% due 6/15/2022 (Montgomery Materials Recovery Facility) (AMT) | | AA/NR | | | 930,000 | | | | 1,007,320 | |
Alabama Capital Region Solid Waste Disposal Authority, 5.00% due 6/15/2023 (Montgomery Materials Recovery Facility) (AMT) | | AA/NR | | | 980,000 | | | | 1,055,921 | |
Alabama Public School & College Authority, 5.00% due 6/1/2021 (Educational Facilities) | | AA/Aa1 | | | 775,000 | | | | 883,477 | |
Alabama Public School & College Authority, 5.00% due 6/1/2026 (Educational Facilities) | | AA/Aa1 | | | 4,380,000 | | | | 5,097,488 | |
Board of Trustees of the University of Alabama, 5.25% due 9/1/2025 pre-refunded 9/1/2018 (Birmingham Hospital) | | NR/A1 | | | 2,000,000 | | | | 2,119,140 | |
City of Mobile Industrial Development Board, 1.85% due 6/1/2034 put 3/20/2017 (Alabama Power Company Barry Plant) | | A-/A1 | | | 5,500,000 | | | | 5,514,300 | |
East Alabama Health Care Authority GO, 5.00% due 9/1/2027 (Health Care Facilities Capital Improvements) | | A/NR | | | 1,250,000 | | | | 1,358,887 | |
Montgomery Water Works & Sanitary Sewer Board, 5.00% due 9/1/2017 | | AAA/Aa1 | | | 2,185,000 | | | | 2,223,172 | |
UAB Medicine Finance Authority, 5.00% due 9/1/2032 (University Hospital) | | AA-/A1 | | | 6,000,000 | | | | 6,798,900 | |
| | | |
ALASKA — 0.19% | | | | | | | | | | |
Alaska Housing Finance Corp. GO, 5.00% due 12/1/2021 (State Capital Project) | | AA+/Aa2 | | | 500,000 | | | | 562,255 | |
City of Valdez, 5.00% due 1/1/2021 (BP Pipelines (Alaska), Inc. Project) | | A-/A2 | | | 2,000,000 | | | | 2,211,860 | |
| | | |
ARIZONA — 1.59% | | | | | | | | | | |
Arizona Board of Regents, 5.00% due 8/1/2024 (University of Arizona SPEED) | | A+/Aa3 | | | 1,635,000 | | | | 1,845,065 | |
Arizona Board of Regents, 5.00% due 8/1/2029 (University of Arizona SPEED) | | A+/Aa3 | | | 1,000,000 | | | | 1,148,120 | |
Arizona HFA, 5.00% due 7/1/2017 (Dignity Health) | | A/A3 | | | 1,450,000 | | | | 1,464,601 | |
Arizona HFA, 5.00% due 12/1/2031 (Scottsdale Lincoln Hospitals) | | NR/A2 | | | 2,500,000 | | | | 2,809,100 | |
Arizona State University Energy Management LLC, 5.00% due 7/1/2017 (Tempe Campus Project) | | AA-/A1 | | | 465,000 | | | | 469,813 | |
City of Flagstaff GO, 3.00% due 7/1/2020 (Urban Trail, Street and Utilities Improvements) | | AA/Aa2 | | | 700,000 | | | | 734,769 | |
City of Flagstaff GO, 4.00% due 7/1/2022 (Urban Trail, Street and Utilities Improvements) | | AA/Aa2 | | | 420,000 | | | | 467,762 | |
City of Flagstaff GO, 4.00% due 7/1/2023 (Urban Trail, Street and Utilities Improvements) | | AA/Aa2 | | | 200,000 | | | | 224,452 | |
City of Phoenix, 5.00% due 7/1/2017 (Civic Improvement Corp.; Insured: Natl-Re) | | AA+/Aa3 | | | 1,000,000 | | | | 1,010,450 | |
County of Pima IDA, 5.00% due 12/1/2030 (Providence Day School Project) | | BBB+/NR | | | 2,000,000 | | | | 2,105,240 | |
Salt Verde Financial Corp., 5.25% due 12/1/2022 (Salt River Project Agricultural Improvement and Power District) | | BBB+/Baa1 | | | 2,000,000 | | | | 2,256,160 | |
Salt Verde Financial Corp., 5.25% due 12/1/2028 (Salt River Project Agricultural Improvement and Power District) | | BBB+/Baa1 | | | 770,000 | | | | 902,155 | |
State of Arizona, 5.00% due 7/1/2019 (Insured: AGM) | | AA/A1 | | | 7,280,000 | | | | 7,875,213 | |
| | | |
ARKANSAS — 0.28% | | | | | | | | | | |
Board of Trustees of the University of Arkansas, 5.00% due 11/1/2031 (Fayetteville Campus) | | NR/Aa2 | | | 1,000,000 | | | | 1,142,010 | |
Board of Trustees of the University of Arkansas, 5.00% due 11/1/2032 (Fayetteville Campus) | | NR/Aa2 | | | 655,000 | | | | 744,676 | |
Board of Trustees of the University of Arkansas, 5.00% due 11/1/2033 (Fayetteville Campus) | | NR/Aa2 | | | 1,000,000 | | | | 1,129,660 | |
Board of Trustees of the University of Arkansas, 5.00% due 11/1/2034 (Fayetteville Campus) | | NR/Aa2 | | | 1,000,000 | | | | 1,125,340 | |
| | | |
CALIFORNIA — 7.57% | | | | | | | | | | |
Alameda County Joint Powers Authority, 5.25% due 12/1/2027 (Alameda County Medical Center Highland Hospital) | | AA/Aa1 | | | 1,000,000 | | | | 1,181,730 | |
Alameda County Joint Powers Authority, 5.25% due 12/1/2028 (Alameda County Medical Center Highland Hospital) | | AA/Aa1 | | | 1,150,000 | | | | 1,353,412 | |
Alameda County Joint Powers Authority, 5.25% due 12/1/2029 (Alameda County Medical Center Highland Hospital) | | AA/Aa1 | | | 1,500,000 | | | | 1,755,405 | |
Brentwood Infrastructure Financing Authority, 5.00% due 11/1/2026 (Insured: AGM) | | AA/NR | | | 2,000,000 | | | | 2,197,300 | |
California Educational Facilities Authority, 5.50% due 4/1/2029 (Pitzer College) | | NR/A2 | | | 3,000,000 | | | | 3,302,880 | |
California HFFA, 5.00% due 11/15/2022 (Children’s Hospital Los Angeles) | | BBB+/Baa2 | | | 1,000,000 | | | | 1,150,660 | |
California HFFA, 5.00% due 3/1/2026 (Adventist Health System/West) | | A/NR | | | 3,020,000 | | | | 3,444,733 | |
California HFFA, 5.25% due 3/1/2027 (Dignity Health) | | A/A3 | | | 5,250,000 | | | | 5,880,577 | |
California Infrastructure & Economic Development Bank, 5.75% due 8/15/2029 (King City Joint Union High School District) | | AA-/NR | | | 1,500,000 | | | | 1,681,800 | |
California Pollution Control Financing Authority, 5.25% due 6/1/2023 put 12/1/2017 (Solid Waste Disposal-Republic Services, Inc.) (AMT) | | BBB+/Baa3 | | | 2,000,000 | | | | 2,043,380 | |
California State Public Works Board, 5.00% due 6/1/2017 (University of California Multiple Campus Capital Projects; Insured: Natl-Re) (ETM) | | AA+/Aaa | | | 2,000,000 | | | | 2,014,100 | |
California State Public Works Board, 5.00% due 4/1/2028 (Corrections, Rehabilitation and Judicial Council) | | A+/A1 | | | 2,500,000 | | | | 2,836,700 | |
California Statewide Community Development Authority, 6.25% due 8/15/2028 pre-refunded 8/15/2018 (Enloe Medical Center; Insured: California Mtg Insurance) | | AA-/NR | | | 1,050,000 | | | | 1,125,684 | |
California Statewide Community Development Authority, 6.00% due 7/1/2030 pre-refunded 1/1/2019 (Aspire Public Schools) | | NR/NR | | | 7,015,000 | | | | 7,602,647 | |
Carson Redevelopment Agency, 6.25% due 10/1/2022 pre-refunded 10/1/2019 (Redevelopment Project Area No. 1) | | A-/NR | | | 1,620,000 | | | | 1,823,666 | |
Carson Redevelopment Agency, 6.375% due 10/1/2024 pre-refunded 10/1/2019 (Redevelopment Project Area No. 1) | | A-/NR | | | 1,300,000 | | | | 1,467,427 | |
Chico Redevelopment Agency, 5.00% due 4/1/2030 (Chico Amended & Merged Redevelopment; Insured: AMBAC) | | A+/NR | | | 5,500,000 | | | | 5,513,420 | |
City of Los Angeles GO, 3.00% due 6/29/2017 (Cash Flow Management) | | SP-1+/Mig1 | | | 9,750,000 | | | | 9,797,775 | |
Corona-Norco USD COP, 5.00% due 4/15/2018 (Insured: AGM) | | AA/A1 | | | 1,245,000 | | | | 1,296,842 | |
Corona-Norco USD COP, 5.00% due 4/15/2021 (Insured: AGM) | | AA/A1 | | | 1,000,000 | | | | 1,101,700 | |
8 Semi-Annual Report
| | |
| Schedule of Investments, Continued | | |
| |
Thornburg Intermediate Municipal Fund | | March 31, 2017 (Unaudited) |
| | | | | | | | | | |
ISSUER-DESCRIPTION | | CREDIT RATING†
S&P/ MOODY’S | | PRINCIPAL
AMOUNT | | | VALUE | |
County of Los Angeles GO, 3.00% due 6/30/2017 (Cash Management Program) | | SP-1+/Mig1 | | $ | 4,500,000 | | | $ | 4,526,055 | |
Delano Financing Authority, 5.00% due 12/1/2025 (City of Delano Police Station and Woollomes Avenue Bridge) | | A-/NR | | | 2,555,000 | | | | 2,811,139 | |
El Camino Hospital District, 6.25% due 8/15/2017 (Insured: AMBAC) (ETM) | | NR/NR | | | 155,000 | | | | 158,176 | |
Franklin-McKinley School District GO, 5.25% due 8/1/2027 (Insured: Natl-Re) | | NR/Aa3 | | | 1,000,000 | | | | 1,202,470 | |
Fresno USD GO, 6.00% due 8/1/2026 (Educational Facilities and Improvements; Insured: Natl-Re) | | AA-/A3 | | | 1,165,000 | | | | 1,429,140 | |
Jurupa Public Financing Authority, 5.50% due 9/1/2025 (Eastvale Community Services; Insured: AGM) | | AA/NR | | | 1,195,000 | | | | 1,407,316 | |
Jurupa Public Financing Authority, 5.50% due 9/1/2027 (Eastvale Community Services; Insured: AGM) | | AA/NR | | | 1,335,000 | | | | 1,554,407 | |
M-S-R Energy Authority, 6.125% due 11/1/2029 | | BBB+/NR | | | 2,500,000 | | | | 3,125,500 | |
North City West School Facilities Financing Authority, 5.00% due 9/1/2024 (Carmel Valley Schools; Insured: AGM) | | AA/NR | | | 1,080,000 | | | | 1,250,521 | |
Oakland USD GO, 5.00% due 8/1/2032 (County of Alameda Educational Facilities) | | AA-/Aa3 | | | 1,000,000 | | | | 1,155,230 | |
Oakland USD GO, 5.00% due 8/1/2033 (County of Alameda Educational Facilities) | | AA-/Aa3 | | | 1,000,000 | | | | 1,148,050 | |
Oakland USD GO, 5.00% due 8/1/2034 (County of Alameda Educational Facilities) | | AA-/Aa3 | | | 1,000,000 | | | | 1,143,290 | |
Redwood City Redevelopment Agency, 0% due 7/15/2023 (Redevelopment Area A-2; Insured: AMBAC) | | A-/NR | | | 2,065,000 | | | | 1,687,270 | |
San Jose Redevelopment Agency, 5.25% due 8/1/2027 (Merged Area Redevelopment Project) | | A/A2 | | | 2,400,000 | | | | 2,668,008 | |
San Jose Redevelopment Agency, 5.375% due 8/1/2028 (Merged Area Redevelopment Project) | | A/A2 | | | 1,175,000 | | | | 1,309,326 | |
San Mateo Union High School District GO, 0.01% due 9/1/2019 (Educational Facilities; Insured: Natl-Re) | | AA+/Aaa | | | 3,000,000 | | | | 2,900,520 | |
Saratoga Union School District GO, 0.01% due 9/1/2023 (Insured: Natl-Re) | | AA+/Aa1 | | | 900,000 | | | | 773,064 | |
State of California GO, 5.25% due 9/1/2026 (Kindergarten-University Facilities) | | AA-/Aa3 | | | 5,000,000 | | | | 5,754,400 | |
State of California GO, 5.00% due 8/1/2034 (Kindergarten-University Facilities) | | AA-/Aa3 | | | 5,000,000 | | | | 5,734,050 | |
State of California GO, 5.00% due 8/1/2035 (Kindergarten-University Facilities) | | AA-/Aa3 | | | 4,000,000 | | | | 4,569,880 | |
Tuolumne Wind Project Authority, 5.875% due 1/1/2029 pre-refunded 1/1/2019 | | AA-/A2 | | | 3,000,000 | | | | 3,251,400 | |
Turlock Irrigation District, 5.00% due 1/1/2021 pre-refunded 1/1/2020 | | NR/NR | | | 745,000 | | | | 821,340 | |
Turlock Irrigation District, 5.00% due 1/1/2021 | | AA-/A2 | | | 1,005,000 | | | | 1,105,400 | |
William S. Hart Union High School District GO, 0% due 9/1/2021 (Educational Facilities) | | AA/A2 | | | 800,000 | | | | 733,520 | |
| | | |
COLORADO — 1.34% | | | | | | | | | | |
City & County of Denver COP, 0.95% due 12/1/2029 put 4/3/2017 (Wellington E. Webb Municipal Office Building; SPA: | | | | | | | | | | |
JPMorgan Chase Bank, N.A.) (daily demand notes) | | AA+/Aa1 | | | 7,990,000 | | | | 7,990,000 | |
City & County of Denver COP, 0.95% due 12/1/2031 put 4/3/2017 (Wellington E. Webb Municipal Office Building; SPA: | | | | | | | | | | |
JPMorgan Chase Bank, N.A.) (daily demand notes) | | AA+/Aa1 | | | 2,610,000 | | | | 2,610,000 | |
Housing Authority of the City and County of Denver, 5.20% due 11/1/2027 pre-refunded 11/1/2017 (Three Towers | | | | | | | | | | |
Rehabilitation; Insured: AGM) (AMT) | | NR/Aaa | | | 1,220,000 | | | | 1,250,341 | |
Housing Authority of the City and County of Denver, 5.20% due 11/1/2027 (Three Towers Rehabilitation; Insured: AGM) (AMT) | | NR/A2 | | | 1,335,000 | | | | 1,362,688 | |
Park Creek Metropolitan District, 5.25% due 12/1/2020 pre-refunded 12/1/2019 (Insured: AGM) | | AA/NR | | | 1,120,000 | | | | 1,236,648 | |
Regional Transportation District COP, 5.50% due 6/1/2022 (FasTracks Transportation System) | | A/Aa3 | | | 3,000,000 | | | | 3,376,800 | |
Regional Transportation District COP, 5.00% due 6/1/2028 (North Metro Rail Line) | | A/Aa3 | | | 1,550,000 | | | | 1,767,744 | |
| | | |
CONNECTICUT — 1.23% | | | | | | | | | | |
City of Hartford GO, 5.00% due 7/1/2031 (Various Public Improvements; Insured: AGM) | | AA/A2 | | | 1,700,000 | | | | 1,827,007 | |
Connecticut Health & Educational Facilities Authority, 5.75% due 7/1/2029 pre-refunded 7/1/2019 (Ethel Walker School) | | NR/NR | | | 1,350,000 | | | | 1,488,146 | |
State of Connecticut GO, 5.00% due 5/15/2027 (Various Capital Projects) | | AA-/Aa3 | | | 5,000,000 | | | | 5,781,600 | |
State of Connecticut GO Floating Rate Note, 1.31% due 9/15/2017 (Various Capital Projects) | | AA-/Aa3 | | | 2,000,000 | | | | 1,999,980 | |
State of Connecticut GO Floating Rate Note, 1.54% due 6/15/2018 (Various Capital Projects) | | AA-/Aa3 | | | 6,820,000 | | | | 6,842,915 | |
| | | |
DISTRICT OF COLUMBIA — 0.54% | | | | | | | | | | |
Metropolitan Airports Authority, 0% due 10/1/2023 (Dulles Toll Road; Insured: AGM) | | AA/A3 | | | 4,890,000 | | | | 4,017,917 | |
Metropolitan Airports Authority, 0% due 10/1/2024 (Dulles Toll Road; Insured: AGM) | | AA/A3 | | | 5,000,000 | | | | 3,921,000 | |
| | | |
FLORIDA — 6.22% | | | | | | | | | | |
Broward County School Board COP, 5.00% due 7/1/2030 (Educational Facilities) | | A+/Aa3 | | | 1,250,000 | | | | 1,431,463 | |
Broward County School Board COP, 5.00% due 7/1/2032 (Educational Facilities) | | A+/Aa3 | | | 2,000,000 | | | | 2,268,440 | |
City of Jacksonville, 5.00% due 10/1/2026 (Better Jacksonville Plan) | | A+/A1 | | | 2,075,000 | | | | 2,348,568 | |
City of Lakeland, 5.00% due 10/1/2018 (Electric Power System Smart Grid Project; Insured: AGM) | | AA/Aa3 | | | 2,000,000 | | | | 2,118,040 | |
City of Lakeland, 5.25% due 10/1/2027 (Electric Power System Smart Grid Project; Insured: AGM) | | AA/Aa3 | | | 3,680,000 | | | | 4,551,976 | |
City of Lakeland, 5.00% due 11/15/2028 (Lakeland Regional Health Systems) | | NR/A2 | | | 2,775,000 | | | | 3,172,824 | |
City of Lakeland, 5.25% due 10/1/2036 (Electric Power System Smart Grid Project; Insured: AGM) | | AA/Aa3 | | | 2,770,000 | | | | 3,455,436 | |
Escambia County HFA, 5.95% due 7/1/2020 (Florida Health Care Facility Loan Program; Insured: AMBAC) (ETM) | | NR/NR | | | 260,000 | | | | 297,898 | |
Florida Department of Management Services, 5.00% due 9/1/2018 (Financing or Acquisition of State-Owned Office Buildings; Insured: AMBAC) | | AA+/Aa2 | | | 500,000 | | | | 501,740 | |
Florida State Department of Children & Families COP, 5.00% due 10/1/2018 (South Florida Evaluation Treatment Center) | | AA+/NR | | | 2,090,000 | | | | 2,096,939 | |
Florida State Department of Children & Families COP, 5.00% due 10/1/2019 (South Florida Evaluation Treatment Center) | | AA+/NR | | | 2,255,000 | | | | 2,262,487 | |
Florida State Municipal Loan Council, 5.00% due 10/1/2020 pre-refunded 10/1/2017 (Insured: Natl-Re) | | AA-/A3 | | | 580,000 | | | | 592,134 | |
Florida State Municipal Loan Council, 5.00% due 10/1/2020 pre-refunded 10/1/2017 (Insured: Natl-Re) | | AA-/A3 | | | 420,000 | | | | 428,807 | |
Florida State Municipal Loan Council, 5.00% due 10/1/2024 pre-refunded 10/1/2017 (Insured: Natl-Re) | | AA-/A3 | | | 1,285,000 | | | | 1,311,882 | |
Florida State Municipal Loan Council, 5.00% due 10/1/2024 pre-refunded 10/1/2017 (Insured: Natl-Re) | | AA-/A3 | | | 950,000 | | | | 969,922 | |
JEA, 0.90% due 10/1/2038 put 4/3/2017 (Water and Sewer System; SPA: U.S. Bank, N.A.) (daily demand notes) | | AA+/Aa2 | | | 650,000 | | | | 650,000 | |
Semi-Annual Report 9
| | |
| Schedule of Investments, Continued | | |
| |
Thornburg Intermediate Municipal Fund | | March 31, 2017 (Unaudited) |
| | | | | | | | | | |
ISSUER-DESCRIPTION | | CREDIT RATING†
S&P/ MOODY’S | | PRINCIPAL
AMOUNT | | | VALUE | |
Lake County School Board COP, 5.00% due 6/1/2026 (School District Facility Projects) | | A/NR | | $ | 1,210,000 | | | $ | 1,363,343 | |
Manatee County, 5.00% due 10/1/2026 (Public Utilities System Improvements) | | NR/Aa2 | | | 370,000 | | | | 434,643 | |
Manatee County, 5.00% due 10/1/2027 (Public Utilities System Improvements) | | NR/Aa2 | | | 470,000 | | | | 547,588 | |
Manatee County, 5.00% due 10/1/2028 (Public Utilities System Improvements) | | NR/Aa2 | | | 1,030,000 | | | | 1,190,999 | |
Manatee County, 5.00% due 10/1/2031 (Public Utilities System Improvements) | | NR/Aa2 | | | 2,675,000 | | | | 3,042,812 | |
Manatee County, 5.00% due 10/1/2033 (Public Utilities System Improvements) | | NR/Aa2 | | | 1,535,000 | | | | 1,728,656 | |
Miami-Dade County, 5.00% due 10/1/2028 (Miami International Airport) | | A/A2 | | | 1,000,000 | | | | 1,151,360 | |
Miami-Dade County, 5.00% due 10/1/2029 (Miami International Airport) | | A/A2 | | | 1,335,000 | | | | 1,527,347 | |
Miami-Dade County, 5.00% due 10/1/2030 (Miami International Airport) | | A/A2 | | | 1,000,000 | | | | 1,138,110 | |
Miami-Dade County, 5.00% due 10/1/2031 (Miami International Airport) | | A/A2 | | | 2,000,000 | | | | 2,266,860 | |
Miami-Dade County Educational Facilities Authority, 5.25% due 4/1/2024 (University of Miami; Insured: AMBAC) | | A-/A3 | | | 1,000,000 | | | | 1,172,270 | |
Miami-Dade County GO, 5.00% due 10/1/2023 (Seaport Properties) | | AA/Aa2 | | | 1,040,000 | | | | 1,177,706 | |
Miami-Dade County GO, 6.25% due 7/1/2026 pre-refunded 7/1/2018 (Building Better Communities) | | AA/Aa2 | | | 2,130,000 | | | | 2,269,089 | |
Miami-Dade County School Board COP, 5.00% due 10/1/2021 (Insured: AMBAC) | | A/A1 | | | 3,035,000 | | | | 3,459,323 | |
Miami-Dade County School Board COP, 5.25% due 5/1/2022 pre-refunded 5/1/2018 (Insured: AGM) | | AA/A1 | | | 2,600,000 | | | | 2,720,484 | |
Miami-Dade County School Board COP, 5.00% due 5/1/2030 | | A/A1 | | | 3,250,000 | | | | 3,669,477 | |
Orange County, 5.00% due 10/1/2031 (Tourist Development) | | AA-/Aa3 | | | 2,000,000 | | | | 2,317,760 | |
Orange County HFA, 5.125% due 10/1/2026 (Orlando Health, Inc.) | | A/A2 | | | 2,000,000 | | | | 2,171,080 | |
Palm Beach County HFA, 5.00% due 12/1/2025 (Boca Raton Regional Hospital) | | BBB+/NR | | | 500,000 | | | | 566,485 | |
Reedy Creek Improvement District GO, 5.00% due 6/1/2032 (District-Wide Transportation, additional Buena Vista Corridor Improvements and District Facilities) | | AA-/Aa3 | | | 3,965,000 | | | | 4,548,331 | |
Reedy Creek Improvement District GO, 5.00% due 6/1/2033 (District-Wide Transportation, additional Buena Vista Corridor Improvements and District Facilities) | | AA-/Aa3 | | | 7,300,000 | | | | 8,330,249 | |
Sarasota County Public Hospital Board, 4.343% due 10/1/2021 (Sarasota Memorial Hospital; Insured: Natl-Re) | | AA-/A1 | | | 2,000,000 | | | | 2,073,100 | |
School Board of Broward County COP, 5.00% due 7/1/2026 (Educational Facilities and Equipment) | | A+/Aa3 | | | 3,000,000 | | | | 3,348,780 | |
School Board of Broward County COP, 5.00% due 7/1/2027 (Educational Facilities and Equipment) | | A+/Aa3 | | | 2,000,000 | | | | 2,223,180 | |
School District of Manatee County, 5.00% due 10/1/2032 (School Facilities Improvement; Insured: AGM) | | AA/NR | | | 2,250,000 | | | | 2,563,267 | |
South Miami HFA, 5.00% due 8/15/2022 (Baptist Health Group) | | AA-/Aa3 | | | 1,500,000 | | | | 1,521,450 | |
Sunshine State Governmental Finance Commission, 5.00% due 9/1/2028 (Miami-Dade County Program) | | AA-/Aa3 | | | 3,500,000 | | | | 4,015,690 | |
| | | |
GEORGIA — 1.86% | | | | | | | | | | |
Athens-Clarke County Unified Government Development Authority, 5.00% due 6/15/2024 (UGAREF Bolton Commons, LLC) | | NR/Aa2 | | | 485,000 | | | | 562,605 | |
Athens-Clarke County Unified Government Development Authority, 5.00% due 6/15/2025 (UGAREF Bolton Commons, LLC) | | NR/Aa2 | | | 510,000 | | | | 587,112 | |
Athens-Clarke County Unified Government Development Authority, 5.00% due 6/15/2027 (UGAREF Bolton Commons, LLC) | | NR/Aa2 | | | 735,000 | | | | 834,688 | |
Athens-Clarke County Unified Government Development Authority, 5.00% due 6/15/2028 (UGAREF Bolton Commons, LLC) | | NR/Aa2 | | | 590,000 | | | | 667,131 | |
City of Atlanta, 5.50% due 11/1/2022 (Water & Wastewater System; Insured: Natl-Re) | | AA-/Aa2 | | | 530,000 | | | | 610,581 | |
City of Atlanta, 5.50% due 11/1/2024 (Water & Wastewater System; Insured: AGM) | | AA/Aa2 | | | 5,000,000 | | | | 5,526,300 | |
Clarke County Hospital Authority, 5.00% due 1/1/2023 pre-refunded 1/1/2022 (Athens Regional Medical Center) | | AA/Aa1 | | | 2,060,000 | | | | 2,379,094 | |
Clarke County Hospital Authority, 5.00% due 1/1/2024 pre-refunded 1/1/2022 (Athens Regional Medical Center) | | AA/Aa1 | | | 2,310,000 | | | | 2,667,819 | |
Clarke County Hospital Authority, 5.00% due 1/1/2025 pre-refunded 1/1/2022 (Athens Regional Medical Center) | | AA/Aa1 | | | 525,000 | | | | 606,323 | |
Clarke County Hospital Authority, 5.00% due 1/1/2026 pre-refunded 1/1/2022 (Athens Regional Medical Center) | | AA/Aa1 | | | 725,000 | | | | 837,302 | |
Development Authority of Fulton County, 5.00% due 10/1/2019 (Georgia Tech Athletic Assoc.) | | NR/A2 | | | 3,000,000 | | | | 3,267,120 | |
Gwinnett County School District GO, 4.50% due 10/1/2017 (Capital Projects) | | AAA/Aaa | | | 7,000,000 | | | | 7,131,250 | |
Municipal Electric Authority of Georgia, 6.60% due 1/1/2018 (Insured: Natl-Re) | | AA-/A1 | | | 125,000 | | | | 129,359 | |
Valdosta and Lowndes County Hospital Authority, 5.00% due 10/1/2024 (South Medical Center) | | AA-/Aa2 | | | 1,200,000 | | | | 1,358,472 | |
| | | |
GUAM — 2.60% | | | | | | | | | | |
Government of Guam, 5.00% due 11/15/2031 (Various Capital Projects) | | A/NR | | | 5,500,000 | | | | 5,831,595 | |
Government of Guam, 5.00% due 11/15/2032 (Various Capital Projects) | | A/NR | | | 12,000,000 | | | | 12,661,200 | |
Government of Guam, 5.00% due 11/15/2033 (Various Capital Projects) | | A/NR | | | 10,500,000 | | | | 11,032,035 | |
Guam Power Authority, 5.00% due 10/1/2023 (Electric Power System; Insured: AGM) | | AA/A2 | | | 2,000,000 | | | | 2,276,940 | |
Guam Power Authority, 5.00% due 10/1/2024 (Electric Power System; Insured: AGM) | | AA/A2 | | | 2,000,000 | | | | 2,268,080 | |
Guam Power Authority, 5.00% due 10/1/2025 (Electric Power System; Insured: AGM) | | AA/A2 | | | 2,500,000 | | | | 2,829,600 | |
Guam Waterworks Authority, 5.25% due 7/1/2024 (Water and Wastewater System) | | A-/Baa2 | | | 1,000,000 | | | | 1,132,190 | |
| | | |
HAWAII — 0.88% | | | | | | | | | | |
County of Hawaii GO, 5.00% due 9/1/2033 | | AA-/Aa2 | | | 1,250,000 | | | | 1,443,237 | |
State of Hawaii GO, 5.00% due 12/1/2027 pre-refunded 12/1/2021 | | NR/NR | | | 3,635,000 | | | | 4,199,734 | |
State of Hawaii GO, 5.00% due 12/1/2027 pre-refunded 12/1/2021 | | NR/NR | | | 2,550,000 | | | | 2,946,168 | |
State of Hawaii GO, 5.00% due 12/1/2027 | | AA+/Aa1 | | | 3,815,000 | | | | 4,334,527 | |
| | | |
IDAHO — 0.34% | | | | | | | | | | |
State of Idaho GO, 2.00% due 6/30/2017 | | SP-1+/Mig1 | | | 5,000,000 | | | | 5,013,300 | |
10 Semi-Annual Report
| | |
| Schedule of Investments, Continued |
| |
Thornburg Intermediate Municipal Fund | | March 31, 2017 (Unaudited) |
| | | | | | | | | | |
ISSUER-DESCRIPTION | | CREDIT RATING†
S&P/MOODY’S | | PRINCIPAL
AMOUNT | | | VALUE | |
ILLINOIS — 6.50% | | | | | | | | | | |
Board of Trustees of Southern Illinois University, 5.25% due 4/1/2019 (Housing & Auxiliary Facilities; Insured: Natl-Re) | | AA-/A3 | | $ | 1,000,000 | | | $ | 1,067,180 | |
Chicago O’Hare International Airport, 5.00% due 1/1/2019 (2015 Airport Projects) | | A/NR | | | 1,000,000 | | | | 1,066,130 | |
Chicago O’Hare International Airport, 5.00% due 1/1/2020 (2015 Airport Projects) | | A/NR | | | 1,000,000 | | | | 1,096,200 | |
Chicago O’Hare International Airport, 5.00% due 1/1/2021 (2015 Airport Projects) | | A/NR | | | 1,000,000 | | | | 1,120,140 | |
Chicago O’Hare International Airport, 5.00% due 1/1/2029 (2016 Airport Projects) | | A/NR | | | 1,000,000 | | | | 1,147,070 | |
Chicago O’Hare International Airport, 5.00% due 1/1/2030 (2016 Airport Projects) | | A/NR | | | 765,000 | | | | 871,205 | |
Chicago Park District GO, 5.00% due 1/1/2025 (Capital Improvement Plan) | | AA+/NR | | | 1,000,000 | | | | 1,120,690 | |
Chicago Park District GO, 5.00% due 1/1/2027 (Capital Improvement Plan) | | AA+/NR | | | 1,945,000 | | | | 2,150,956 | |
Chicago Park District GO, 5.00% due 1/1/2028 (Capital Improvement Plan) | | AA+/NR | | | 3,450,000 | | | | 3,795,552 | |
Chicago Park District GO, 5.00% due 1/1/2029 (Capital Improvement Plan) | | AA+/NR | | | 1,995,000 | | | | 2,183,468 | |
Chicago Park District GO, 5.00% due 1/1/2030 (Capital Improvement Plan) | | AA+/NR | | | 3,500,000 | | | | 3,806,425 | |
Chicago Transit Authority, 5.00% due 12/1/2018 (Bombardier Transit Rail System) | | AA/A1 | | | 1,500,000 | | | | 1,580,880 | |
City of Chicago, 5.00% due 1/1/2028 (Wastewater Transmission System) | | A/NR | | | 5,365,000 | | | | 5,937,553 | |
City of Chicago, 5.00% due 1/1/2029 (Wastewater Transmission System) | | A/NR | | | 2,500,000 | | | | 2,750,700 | |
City of Chicago, 5.75% due 11/1/2030 (Water System; Insured: AMBAC) | | AA+/Aa1 | | | 1,270,000 | | | | 1,537,551 | |
a City of Chicago, 5.00% due 1/1/2032 (Midway Airport) | | A/A3 | | | 4,805,000 | | | | 5,301,549 | |
City of Chicago, 5.00% due 1/1/2033 (Midway Airport) | | A/A3 | | | 5,000,000 | | | | 5,504,000 | |
City of Chicago, 5.25% due 1/1/2034 (Midway Airport) | | A/A3 | | | 4,700,000 | | | | 5,181,374 | |
City of Chicago GO, 5.00% due 1/1/2020 (Municipal Facilities Projects; Insured: AMBAC) | | BBB+/Ba1 | | | 75,000 | | | | 75,165 | |
City of Chicago GO, 5.00% due 12/1/2022 (Modern Schools Across Chicago Program; Insured: AMBAC) | | BBB+/Ba1 | | | 415,000 | | | | 416,166 | |
City of Chicago GO, 5.00% due 12/1/2024 (Modern Schools Across Chicago Program; Insured: AMBAC) | | BBB+/Ba1 | | | 500,000 | | | | 501,395 | |
City of Mount Vernon GO, 4.00% due 12/15/2025 (Various Municipal Capital Improvements; Insured: AGM) | | AA/A2 | | | 1,900,000 | | | | 1,971,136 | |
City of Waukegan GO, 5.00% due 12/30/2017 (Insured: AGM) | | NR/A2 | | | 1,680,000 | | | | 1,724,671 | |
City of Waukegan GO, 5.00% due 12/30/2018 (Insured: AGM) | | NR/A2 | | | 2,000,000 | | | | 2,112,580 | |
Community College District No. 525 GO, 6.25% due 6/1/2024 (Joliet Junior College) | | AA/NR | | | 500,000 | | | | 528,515 | |
Cook County Community College District No. 508 GO, 5.25% due 12/1/2026 (City Colleges of Chicago) | | A+/NR | | | 1,000,000 | | | | 1,107,850 | |
Cook County GO, 5.25% due 11/15/2024 | | AA-/A2 | | | 3,000,000 | | | | 3,258,960 | |
Cook County School District No. 104 GO, 0% due 12/1/2022 (Argo Summit Elementary School Facilities; Insured: AGM) (ETM) | | NR/NR | | | 2,000,000 | | | | 1,788,960 | |
Forest Preserve District of DuPage County GO, 4.00% due 11/1/2022 (Land Acquisition and Development) | | AAA/NR | | | 750,000 | | | | 835,215 | |
Illinois Educational Facilities Authority, 5.75% due 11/1/2028 pre-refunded 11/1/2018 (Rush University Medical Center) | | AA-/Aaa | | | 1,000,000 | | | | 1,073,980 | |
Illinois Finance Authority, 5.00% due 11/1/2017 (Central DuPage Health) | | AA+/Aa2 | | | 2,000,000 | | | | 2,043,820 | |
Illinois Finance Authority, 5.00% due 8/1/2022 (Bradley University; Insured: Syncora) | | A/NR | | | 1,000,000 | | | | 1,012,680 | |
Illinois Finance Authority, 6.125% due 11/1/2023 pre-refunded 11/1/2018 (Advocate Health Care Network) | | AA+/Aa2 | | | 5,175,000 | | | | 5,588,224 | |
Illinois Finance Authority, 5.00% due 8/15/2024 (Silver Cross Hospital and Medical Centers) | | NR/Baa1 | | | 1,000,000 | | | | 1,138,840 | |
Illinois Finance Authority, 5.00% due 11/15/2033 (Rush University Medical Center) | | A+/A1 | | | 1,000,000 | | | | 1,095,590 | |
Illinois HFA, 5.70% due 2/20/2021 (Midwest Care Center I, Inc.; Collateralized: GNMA) | | NR/Aa1 | | | 355,000 | | | | 356,409 | |
Illinois Toll Highway Authority, 5.00% due 1/1/2037 (Move Illinois Program) | | AA-/Aa3 | | | 5,550,000 | | | | 6,129,253 | |
Metropolitan Pier & Exposition Authority, 5.00% due 12/15/2022 (McCormick Place Expansion Project) | | BBB-/NR | | | 1,000,000 | | | | 1,092,320 | |
Monroe and St. Clair Counties GO, 5.00% due 4/15/2027 (Community Unit School District No. 5; Insured: BAM) | | AA/Aa3 | | | 325,000 | | | | 379,002 | |
Monroe and St. Clair Counties GO, 5.00% due 4/15/2028 (Community Unit School District No. 5; Insured: BAM) | | AA/Aa3 | | | 1,415,000 | | | | 1,635,839 | |
Monroe and St. Clair Counties GO, 5.00% due 4/15/2029 (Community Unit School District No. 5; Insured: BAM) | | AA/Aa3 | | | 1,630,000 | | | | 1,872,495 | |
Monroe and St. Clair Counties GO, 5.00% due 4/15/2030 (Community Unit School District No. 5; Insured: BAM) | | AA/Aa3 | | | 1,800,000 | | | | 2,053,188 | |
Monroe and St. Clair Counties GO, 5.00% due 4/15/2031 (Community Unit School District No. 5; Insured: BAM) | | AA/Aa3 | | | 1,115,000 | | | | 1,262,091 | |
Niles Park District GO, 3.00% due 12/1/2017 (Parks and Recreation Projects) | | NR/Aa2 | | | 340,000 | | | | 343,964 | |
Niles Park District GO, 3.00% due 12/1/2018 (Parks and Recreation Projects) | | NR/Aa2 | | | 350,000 | | | | 358,915 | |
Niles Park District GO, 3.00% due 12/1/2019 (Parks and Recreation Projects) | | NR/Aa2 | | | 360,000 | | | | 372,668 | |
Niles Park District GO, 3.00% due 12/1/2020 (Parks and Recreation Projects) | | NR/Aa2 | | | 370,000 | | | | 385,052 | |
State of Illinois, 5.00% due 6/15/2018 | | AAA/NR | | | 2,000,000 | | | | 2,093,080 | |
Tazewell County School District GO, 9.00% due 12/1/2024 (Insured: Natl-Re) | | NR/Aa3 | | | 1,205,000 | | | | 1,716,137 | |
Village of Tinley Park GO, 4.00% due 12/1/2021 | | AA+/NR | | | 585,000 | | | | 639,545 | |
Village of Tinley Park GO, 5.00% due 12/1/2024 | | AA+/NR | | | 870,000 | | | | 1,005,703 | |
| | | |
INDIANA — 2.81% | | | | | | | | | | |
Board of Trustees for the Vincennes University, 5.375% due 6/1/2022 | | NR/Aa3 | | | 895,000 | | | | 1,008,128 | |
City of Carmel Redevelopment Authority, 0% due 2/1/2021 (Performing Arts Center) | | AA+/Aa3 | | | 2,000,000 | | | | 1,850,280 | |
City of Carmel Redevelopment District COP, 6.50% due 7/15/2035 pre-refunded 1/15/2021 (Performing Arts Center) | | NR/NR | | | 2,730,000 | | | | 3,217,086 | |
City of Petersburg, 5.40% due 8/1/2017 (Indianapolis Power and Light Company; Insured: Natl-Re/IBC) | | AA-/A2 | | | 1,325,000 | | | | 1,344,305 | |
Clay Multi-School Building Corp., 5.00% due 1/15/2018 (State Aid Withholding) | | AA+/NR | | | 1,735,000 | | | | 1,787,883 | |
Franklin Township Multi-School Building Corp., 5.00% due 7/10/2017 (Franklin Central High School) (State Aid Withholding) | | AA+/NR | | | 630,000 | | | | 637,201 | |
Hobart Building Corp., 6.50% due 7/15/2019 (Insured: Natl-Re) (State Aid Withholding) (ETM) | | AA+/A3 | | | 1,000,000 | | | | 1,100,400 | |
Indiana Bond Bank, 5.25% due 10/15/2020 (Natural Gas Utility Improvements) | | NR/A3 | | | 5,340,000 | | | | 5,963,018 | |
Indiana Bond Bank, 5.25% due 4/1/2023 (Hendricks Regional Health Financing Program; Insured: AMBAC) | | AA/NR | | | 2,000,000 | | | | 2,319,820 | |
Indiana Finance Authority, 5.00% due 3/1/2019 (Indiana University Health) | | AA-/Aa3 | | | 5,000,000 | | | | 5,366,550 | |
Indiana Finance Authority, 5.00% due 11/1/2021 (Sisters of St. Francis Health Services, Inc.) | | NR/Aa3 | | | 605,000 | | | | 641,106 | |
Indiana Finance Authority, 5.25% due 9/15/2022 (Marian University) | | BBB-/NR | | | 2,480,000 | | | | 2,663,917 | |
Semi-Annual Report 11
| | |
| Schedule of Investments, Continued | | |
| |
Thornburg Intermediate Municipal Fund | | March 31, 2017 (Unaudited) |
| | | | | | | | | | |
ISSUER-DESCRIPTION | | CREDIT RATING†
S&P/ MOODY’S | | PRINCIPAL
AMOUNT | | | VALUE | |
Indiana Finance Authority, 5.25% due 9/15/2023 (Marian University) | | BBB-/NR | | $ | 2,605,000 | | | $ | 2,790,398 | |
Indiana Finance Authority, 0.93% due 2/1/2037 put 4/3/2017 (Stadium Project; SPA: JPMorgan Chase Bank, N.A.) (daily demand notes) | | AA+/Aa2 | | | 1,070,000 | | | | 1,070,000 | |
Indiana HFFA, 5.00% due 11/15/2034 (Ascension Health Credit Group) | | NR/Aa2 | | | 1,325,000 | | | | 1,487,498 | |
Indiana HFFA, 5.00% due 11/15/2035 (Ascension Health Credit Group) | | NR/Aa2 | | | 5,000,000 | | | | 5,593,350 | |
Indiana HFFA, 5.00% due 11/15/2036 (Ascension Health Credit Group) | | NR/Aa2 | | | 2,000,000 | | | | 2,232,580 | |
| | | |
IOWA — 0.31% | | | | | | | | | | |
Iowa Finance Authority, 5.00% due 2/15/2030 (UnityPoint Health) | | NR/Aa3 | | | 2,250,000 | | | | 2,513,813 | |
Iowa Finance Authority, 5.00% due 2/15/2032 (UnityPoint Health) | | NR/Aa3 | | | 1,850,000 | | | | 2,043,103 | |
| | | |
KANSAS — 0.04% | | | | | | | | | | |
Kansas DFA, 5.00% due 6/1/2020 (Wichita State University) | | NR/Aa3 | | | 575,000 | | | | 636,117 | |
| | | |
KENTUCKY — 2.00% | | | | | | | | | | |
Commonwealth of Kentucky State Property and Buildings Commission, 5.00% due 11/1/2020 (Project No. 112) | | A/Aa3 | | | 4,385,000 | | | | 4,904,798 | |
Commonwealth of Kentucky State Property and Buildings Commission, 5.00% due 11/1/2021 (Project No. 112) | | A/Aa3 | | | 5,990,000 | | | | 6,828,420 | |
Commonwealth of Kentucky State Property and Buildings Commission, 5.00% due 11/1/2022 (Project No. 112) | | A/Aa3 | | | 6,960,000 | | | | 8,041,027 | |
Commonwealth of Kentucky State Property and Buildings Commission, 5.00% due 11/1/2023 (Project No. 112) | | A/Aa3 | | | 2,440,000 | | | | 2,850,530 | |
Louisville/Jefferson County Metro Government, 5.25% due 10/1/2026 (Norton Suburban Hospital and Kosair Children’s Hospital) | | A-/NR | | | 2,320,000 | | | | 2,664,567 | |
b Louisville/Jefferson County Metropolitan Government, 1.50% due 10/1/2033 (Louisville Gas and Electric Company) | | NR/NR | | | 4,000,000 | | | | 4,001,960 | |
| | | |
LOUISIANA — 2.39% | | | | | | | | | | |
City of New Orleans, 6.00% due 6/1/2024 pre-refunded 6/1/2019 (Sewerage System; Insured: AGM) | | AA/A3 | | | 750,000 | | | | 828,142 | |
East Baton Rouge Sewerage Commission, 5.00% due 2/1/2030 | | AA-/Aa3 | | | 1,170,000 | | | | 1,334,713 | |
East Baton Rouge Sewerage Commission, 5.00% due 2/1/2031 | | AA-/Aa3 | | | 2,655,000 | | | | 3,011,248 | |
East Baton Rouge Sewerage Commission, 5.00% due 2/1/2032 | | AA-/Aa3 | | | 3,000,000 | | | | 3,384,720 | |
Law Enforcement District of the Parish of Plaquemines, 5.00% due 9/1/2023 pre-refunded 9/1/2019 | | A+/NR | | | 1,230,000 | | | | 1,342,520 | |
Law Enforcement District of the Parish of Plaquemines, 5.00% due 9/1/2025 pre-refunded 9/1/2019 | | A+/NR | | | 1,350,000 | | | | 1,473,498 | |
Law Enforcement District of the Parish of Plaquemines, 5.15% due 9/1/2027 pre-refunded 9/1/2019 | | A+/NR | | | 1,490,000 | | | | 1,631,610 | |
Law Enforcement District of the Parish of Plaquemines, 5.30% due 9/1/2029 pre-refunded 9/1/2019 | | A+/NR | | | 1,650,000 | | | | 1,812,706 | |
Louisiana Energy and Power Authority, 5.25% due 6/1/2029 (LEPA Unit No. 1; Insured: AGM) | | AA/A2 | | | 1,000,000 | | | | 1,137,290 | |
Louisiana Energy and Power Authority, 5.25% due 6/1/2030 (LEPA Unit No. 1; Insured: AGM) | | AA/A2 | | | 2,955,000 | | | | 3,346,508 | |
Louisiana Energy and Power Authority, 5.25% due 6/1/2031 (LEPA Unit No. 1; Insured: AGM) | | AA/A2 | | | 2,145,000 | | | | 2,422,520 | |
Louisiana Public Facilities Authority, 5.00% due 7/1/2022 pre-refunded 7/1/2017 (Black & Gold Facilities; Insured: CIFG) | | AA/A3 | | | 1,590,000 | | | | 1,606,790 | |
New Orleans Aviation Board, 5.25% due 1/1/2018 (Insured: AGM) (AMT) | | AA/A2 | | | 1,000,000 | | | | 1,030,210 | |
New Orleans Aviation Board, 5.25% due 1/1/2020 (Insured: AGM) | | AA/A2 | | | 2,000,000 | | | | 2,058,280 | |
New Orleans Regional Transit Authority, 5.00% due 12/1/2023 (Insured: AGM) | | AA/Aa3 | | | 1,000,000 | | | | 1,109,390 | |
New Orleans Regional Transit Authority, 5.00% due 12/1/2024 (Insured: AGM) | | AA/Aa3 | | | 1,000,000 | | | | 1,098,080 | |
Office Facilities Corp., 5.00% due 3/1/2019 (Louisiana State Capitol Complex Program) | | A+/A1 | | | 390,000 | | | | 417,074 | |
Parish of Lafourche, 5.00% due 1/1/2024 (Roads, Highways and Bridges) | | AA-/NR | | | 1,065,000 | | | | 1,230,107 | |
Parish of Lafourche, 5.00% due 1/1/2025 (Roads, Highways and Bridges) | | AA-/NR | | | 2,620,000 | | | | 3,042,711 | |
Terrebonne Parish Hospital Service District 1, 5.00% due 4/1/2028 (General Medical Center) | | A/A3 | | | 1,500,000 | | | | 1,607,850 | |
| | | |
MARYLAND — 0.03% | | | | | | | | | | |
County of Montgomery GO, 0.93% due 6/1/2026 put 4/3/2017 (Consolidated Public Improvements; SPA: Wells Fargo Bank, N.A.) (daily demand notes) | | AAA/Aaa | | | 500,000 | | | | 500,000 | |
| | | |
MASSACHUSETTS — 2.00% | | | | | | | | | | |
Massachusetts Bay Transportation Authority, 5.25% due 7/1/2030 (Transportation Capital Program) | | AAA/Aa1 | | | 1,000,000 | | | | 1,250,700 | |
Massachusetts Development Finance Agency, 5.00% due 7/1/2019 (CareGroup Healthcare System) | | A-/A3 | | | 2,800,000 | | | | 3,017,896 | |
Massachusetts Development Finance Agency, 5.00% due 7/1/2020 (CareGroup Healthcare System) | | A-/A3 | | | 5,000,000 | | | | 5,519,450 | |
Massachusetts Development Finance Agency, 5.00% due 7/1/2021 (CareGroup Healthcare System) | | A-/A3 | | | 2,330,000 | | | | 2,625,537 | |
Massachusetts Development Finance Agency, 5.50% due 10/1/2025 (Simmons College) | | BBB+/Baa1 | | | 460,000 | | | | 531,714 | |
Massachusetts Development Finance Agency, 5.50% due 10/1/2028 (Simmons College) | | BBB+/Baa1 | | | 1,330,000 | | | | 1,522,917 | |
Massachusetts Development Finance Agency, 5.00% due 7/1/2033 (CareGroup Healthcare System) | | A-/A3 | | | 5,000,000 | | | | 5,634,350 | |
Massachusetts Development Finance Agency, 5.00% due 7/1/2034 (CareGroup Healthcare System) | | A-/A3 | | | 2,320,000 | | | | 2,604,548 | |
Massachusetts Development Finance Agency, 5.00% due 7/1/2036 (CareGroup Healthcare System) | | A-/A3 | | | 1,750,000 | | | | 1,952,877 | |
Massachusetts Educational Financing Authority, 5.50% due 1/1/2022 (Higher Education Student Loans) | | AA/NR | | | 1,130,000 | | | | 1,225,474 | |
Massachusetts Health & Educational Facilities Authority, 0.95% due 7/1/2044 put 4/3/2017 (Baystate Medical Center; LOC: JPMorgan Chase Bank, N.A.) (daily demand notes) | | AA+/Aa1 | | | 3,300,000 | | | | 3,300,000 | |
| | | |
MICHIGAN — 4.42% | | | | | | | | | | |
Board of Governors of Wayne State University, 5.00% due 11/15/2031 (Educational Facilities and Equipment) | | A+/Aa3 | | | 1,010,000 | | | | 1,144,481 | |
12 Semi-Annual Report
| | |
| Schedule of Investments, Continued | | |
| |
Thornburg Intermediate Municipal Fund | | March 31, 2017 (Unaudited) |
| | | | | | | | | | | | |
ISSUER-DESCRIPTION | | CREDIT RATING†
S&P/ MOODY’S | | | PRINCIPAL
AMOUNT | | | VALUE | |
City of Troy GO, 5.00% due 11/1/2025 (Downtown Development Authority-Community Center Facilities) | | | AAA/NR | | | $ | 300,000 | | | $ | 341,946 | |
County of Genesee, 5.00% due 11/1/2024 (Water Supply System; Insured: BAM) | | | AA/A2 | | | | 610,000 | | | | 688,446 | |
County of Genesee, 5.00% due 11/1/2025 (Water Supply System; Insured: BAM) | | | AA/A2 | | | | 345,000 | | | | 389,781 | |
County of Genesee, 5.25% due 11/1/2026 (Water Supply System; Insured: BAM) | | | AA/A2 | | | | 900,000 | | | | 1,022,607 | |
County of Genesee, 5.25% due 11/1/2027 (Water Supply System; Insured: BAM) | | | AA/A2 | | | | 1,375,000 | | | | 1,555,744 | |
County of Genesee, 5.25% due 11/1/2028 (Water Supply System; Insured: BAM) | | | AA/A2 | | | | 645,000 | | | | 726,722 | |
County of Genesee, 5.00% due 11/1/2029 (Water Supply System; Insured: BAM) | | | AA/A2 | | | | 1,210,000 | | | | 1,338,768 | |
County of Genesee, 5.00% due 11/1/2030 (Water Supply System; Insured: BAM) | | | AA/A2 | | | | 1,195,000 | | | | 1,319,507 | |
County of Genesee, 5.125% due 11/1/2032 (Water Supply System; Insured: BAM) | | | AA/A2 | | | | 750,000 | | | | 828,562 | |
Detroit City School District GO, 5.25% due 5/1/2026 (School Building & Site Improvement; Insured: AGM/Q-SBLF) | | | AA/Aa1 | | | | 3,150,000 | | | | 3,669,876 | |
Detroit City School District GO, 5.25% due 5/1/2027 (School Building & Site Improvement; Insured: AGM/Q-SBLF) | | | AA/Aa1 | | | | 1,100,000 | | | | 1,290,619 | |
Kalamazoo Hospital Finance Authority, 5.00% due 5/15/2019 (Bronson Healthcare; Insured: AGM) | | | AA/A2 | | | | 2,000,000 | | | | 2,088,980 | |
Kalamazoo Hospital Finance Authority, 5.00% due 5/15/2022 pre-refunded 5/15/2020 (Bronson Healthcare; Insured: AGM) | | | NR/A2 | | | | 1,365,000 | | | | 1,515,382 | |
Kalamazoo Hospital Finance Authority, 5.00% due 5/15/2022 (Bronson Healthcare; Insured: AGM) | | | NR/A2 | | | | 1,105,000 | | | | 1,209,920 | |
Kalamazoo Hospital Finance Authority, 5.25% due 5/15/2026 pre-refunded 5/15/2021 (Bronson Healthcare) | | | NR/NR | | | | 1,110,000 | | | | 1,272,682 | |
Kalamazoo Hospital Finance Authority, 5.25% due 5/15/2026 (Bronson Healthcare) | | | NR/A2 | | | | 175,000 | | | | 194,509 | |
Kalamazoo Hospital Finance Authority, 5.00% due 5/15/2029 (Bronson Healthcare) | | | NR/A2 | | | | 2,150,000 | | | | 2,404,882 | |
Kalamazoo Hospital Finance Authority, 5.00% due 5/15/2030 (Bronson Healthcare) | | | NR/A2 | | | | 3,810,000 | | | | 4,231,691 | |
Michigan Finance Authority, 5.00% due 4/1/2026 (Government Loan Program) | | | A+/NR | | | | 1,580,000 | | | | 1,719,561 | |
Michigan Finance Authority, 5.00% due 8/1/2031 (Beaumont Health Credit Group) | | | A/A1 | | | | 19,080,000 | | | | 21,189,676 | |
Michigan Public School Academy, 8.00% due 8/1/2035 (Will Carleton Charter School) | | | NR/NR | | | | 910,000 | | | | 941,941 | |
Michigan State Hospital Finance Authority, 5.00% due 11/15/2024 pre-refunded 11/15/2017 (Edward W. Sparrow Hospital Association) | | | NR/NR | | | | 1,520,000 | | | | 1,559,338 | |
Michigan State Hospital Finance Authority, 5.00% due 11/15/2024 (Edward W. Sparrow Hospital Association) | | | A+/A1 | | | | 620,000 | | | | 632,381 | |
Michigan State Hospital Finance Authority, 5.00% due 7/15/2025 pre-refunded 7/15/2017 (Oakwood Health System) | | | A/A1 | | | | 3,000,000 | | | | 3,036,540 | |
Michigan State Hospital Finance Authority, 5.625% due 11/15/2029 pre-refunded 11/15/2019 (Henry Ford Health System) | | | A/A3 | | | | 2,500,000 | | | | 2,780,050 | |
Michigan Strategic Fund, 5.25% due 10/15/2023 pre-refunded 10/15/2018 (Michigan House of Representatives Facilities; Insured: AGM) | | | AA/Aa2 | | | | 1,000,000 | | | | 1,064,410 | |
Royal Oak Hospital Finance Authority, 8.00% due 9/1/2029 pre-refunded 9/1/2018 (William Beaumont Hospital) | | | NR/Aaa | | | | 2,540,000 | | | | 2,786,761 | |
State of Michigan, 5.50% due 11/1/2020 (Trunk Line Fund; Insured: AGM) | | | AA+/Aa2 | | | | 1,500,000 | | | | 1,712,850 | |
| | | |
MINNESOTA — 0.19% | | | | | | | | | | | | |
Minnesota Agriculture & Economic Development Board, 5.50% due 2/15/2025 (Essentia Health; Insured: AGM) | | | AA/NR | | | | 2,500,000 | | | | 2,740,625 | |
| | | |
MISSISSIPPI — 0.62% | | | | | | | | | | | | |
Mississippi Development Bank, 5.00% due 7/1/2022 pre-refunded 7/1/2017 (City of Canton Parking Facilities) | | | NR/NR | | | | 1,935,000 | | | | 1,955,182 | |
Mississippi Development Bank, 5.25% due 8/1/2027 pre-refunded 8/1/2020 (Department of Corrections) | | | AA-/NR | | | | 3,415,000 | | | | 3,848,603 | |
Mississippi Development Bank GO, 5.00% due 3/1/2025 (Capital City Convention Center) | | | A+/Baa2 | | | | 2,850,000 | | | | 3,267,069 | |
| | | |
MISSOURI — 1.62% | | | | | | | | | | | | |
Missouri Development Finance Board, 5.00% due 4/1/2019 (Eastland Center) | | | A-/NR | | | | 1,000,000 | | | | 1,003,290 | |
Missouri Development Finance Board, 5.00% due 4/1/2021 (Eastland Center) | | | A-/NR | | | | 2,000,000 | | | | 2,006,580 | |
Missouri Development Finance Board, 5.125% due 4/1/2022 (Eastland Center) | | | A-/NR | | | | 2,000,000 | | | | 2,067,740 | |
Missouri Development Finance Board, 0.95% due 12/1/2033 put 4/3/2017 (The Nelson Gallery Foundation; SPA: Northern Trust Co.) (daily demand notes) | | | AAA/Aaa | | | | 1,200,000 | | | | 1,200,000 | |
Missouri Health and Educational Facilities Authority, 5.00% due 4/1/2019 (Webster University) | | | NR/A2 | | | | 2,235,000 | | | | 2,392,232 | |
Missouri Health and Educational Facilities Authority, 5.00% due 4/1/2021 (Webster University) | | | NR/A2 | | | | 2,520,000 | | | | 2,807,709 | |
Missouri Health and Educational Facilities Authority, 0.90% due 9/1/2030 put 4/3/2017 (Washington University; SPA: JPMorgan Chase Bank, N.A.) (daily demand notes) | | | AAA/Aaa | | | | 4,600,000 | | | | 4,600,000 | |
Missouri Health and Educational Facilities Authority, 5.00% due 11/15/2034 (Saint Luke’s Health System) | | | A+/A1 | | | | 3,300,000 | | | | 3,675,408 | |
Missouri Health and Educational Facilities Authority, 5.00% due 11/15/2035 (Saint Luke’s Health System) | | | A+/A1 | | | | 1,000,000 | | | | 1,109,640 | |
Tax Increment Financing Commission of Kansas City, 5.25% due 3/1/2018 (Maincor Public Improvements) (ETM) | | | NR/NR | | | | 335,000 | | | | 346,172 | |
Tax Increment Financing Commission of Kansas City, 5.00% due 5/1/2022 (Union Hill Redevelopment Project) | | | NR/NR | | | | 2,495,000 | | | | 2,560,718 | |
| | | |
NEVADA — 0.87% | | | | | | | | | | | | |
Carson City, 5.00% due 9/1/2027 (Carson Tahoe Regional Medical Center) | | | BBB+/NR | | | | 2,450,000 | | | | 2,678,266 | |
Washoe County GO, 5.00% due 7/1/2026 (Reno Sparks Convention & Visitors Authority) | | | AA/Aa2 | | | | 5,000,000 | | | | 5,649,500 | |
Washoe County GO, 5.00% due 7/1/2029 (Reno Sparks Convention & Visitors Authority) | | | AA/Aa2 | | | | 2,000,000 | | | | 2,253,680 | |
Washoe County GO, 5.00% due 7/1/2032 (Reno Sparks Convention & Visitors Authority) | | | AA/Aa2 | | | | 2,000,000 | | | | 2,213,560 | |
| | | |
NEW HAMPSHIRE — 0.53% | | | | | | | | | | | | |
New Hampshire Health and Education Facilities Authority, 5.25% due 10/1/2023 pre-refunded 10/1/2017 (Southern New Hampshire Medical Center) | | | NR/NR | | | | 770,000 | | | | 787,417 | |
New Hampshire Health and Education Facilities Authority, 5.25% due 10/1/2023 (Southern New Hampshire Medical Center) | | | A-/NR | | | | 230,000 | | | | 234,474 | |
New Hampshire Municipal Bond Bank, 5.00% due 8/15/2026 | | | AA+/Aa2 | | | | 1,860,000 | | | | 2,173,633 | |
Semi-Annual Report 13
| | |
| Schedule of Investments, Continued | | |
| |
Thornburg Intermediate Municipal Fund | | March 31, 2017 (Unaudited) |
| | | | | | | | | | |
ISSUER-DESCRIPTION | | CREDIT RATING†
S&P/ MOODY’S | | PRINCIPAL
AMOUNT | | | VALUE | |
State of New Hampshire, 5.00% due 2/1/2022 (Turnpike System) | | A+/A1 | | $ | 2,250,000 | | | $ | 2,573,347 | |
State of New Hampshire, 5.00% due 2/1/2024 (Turnpike System) | | A+/A1 | | | 1,755,000 | | | | 1,990,293 | |
| | | |
NEW JERSEY — 3.60% | | | | | | | | | | |
Burlington County Bridge Commission, 4.00% due 12/1/2017 (County Governmental Loan Program) | | AA/Aa2 | | | 850,000 | | | | 867,442 | |
Cape May County Industrial Pollution Control Financing Authority, 6.80% due 3/1/2021 (Atlantic City Electric Company; Insured: Natl-Re) | | AA-/A3 | | | 560,000 | | | | 647,646 | |
Essex County Improvement Authority, 5.50% due 10/1/2024 (County Correctional Facilities & Gibraltar Facilities; Insured: Natl-Re) | | NR/Aa2 | | | 2,500,000 | | | | 3,052,525 | |
New Jersey EDA, 5.00% due 3/1/2026 (School Facilities Construction) | | BBB+/Baa1 | | | 2,000,000 | | | | 2,072,400 | |
New Jersey EDA, 5.50% due 9/1/2026 (School Facilities Construction; Insured: AMBAC) | | BBB+/Baa1 | | | 3,000,000 | | | | 3,350,100 | |
New Jersey EDA, 5.50% due 9/1/2027 (School Facilities Construction; Insured: Natl-Re) | | AA-/A3 | | | 1,700,000 | | | | 1,972,561 | |
New Jersey EDA, 5.00% due 6/15/2029 (School Facilities Construction) | | BBB+/Baa1 | | | 12,890,000 | | | | 13,151,925 | |
New Jersey State Health Care Facilities Financing Authority, 5.00% due 7/1/2027 (Virtua Health) | | AA-/NR | | | 2,000,000 | | | | 2,279,400 | |
New Jersey State Health Care Facilities Financing Authority, 5.00% due 7/1/2028 (Virtua Health) | | AA-/NR | | | 1,000,000 | | | | 1,129,820 | |
New Jersey Transportation Trust Fund Authority, 5.50% due 12/15/2020 (State Transportation System Improvements; Insured: Natl-Re) | | AA-/A3 | | | 3,185,000 | | | | 3,520,763 | |
New Jersey Transportation Trust Fund Authority, 5.00% due 6/15/2023 (State Transportation System Improvements) | | A+/Baa1 | | | 1,000,000 | | | | 1,034,190 | |
New Jersey Transportation Trust Fund Authority, 5.00% due 6/15/2023 (State Transportation System Improvements) | | A+/Baa1 | | | 1,500,000 | | | | 1,617,120 | |
New Jersey Transportation Trust Fund Authority, 5.00% due 6/15/2024 (State Transportation System Improvements) | | A+/Baa1 | | | 1,000,000 | | | | 1,030,560 | |
New Jersey Transportation Trust Fund Authority, 5.00% due 6/15/2024 (State Transportation System Improvements) | | A+/Baa1 | | | 1,000,000 | | | | 1,079,240 | |
New Jersey Transportation Trust Fund Authority, 5.00% due 6/15/2027 (State Transportation System Improvements) | | A+/Baa1 | | | 9,750,000 | | | | 10,441,957 | |
New Jersey Transportation Trust Fund Authority, 1.99% due 6/15/2034 (State Transportation System Improvements) | | BBB+/Baa1 | | | 2,000,000 | | | | 1,944,760 | |
Passaic Valley Sewage Commissioners GO, 5.75% due 12/1/2022 | | NR/A3 | | | 3,000,000 | | | | 3,489,510 | |
| | | |
NEW MEXICO — 0.53% | | | | | | | | | | |
City of Farmington, 4.70% due 9/1/2024 (Arizona Public Service Co.-Four Corners Project) | | A-/A2 | | | 3,000,000 | | | | 3,218,760 | |
City of Las Cruces, 5.00% due 6/1/2030 (NMFA Loan) | | NR/Aa3 | | | 2,040,000 | | | | 2,237,697 | |
New Mexico Hospital Equipment Loan Council, 5.00% due 7/1/2032 (Haverland Carter Lifestyle Group) | | NR/NR | | | 2,130,000 | | | | 2,218,565 | |
| | | |
NEW YORK — 9.68% | | | | | | | | | | |
City of New York GO, 5.00% due 8/1/2027 (City Budget Financial Management) | | AA/Aa2 | | | 4,530,000 | | | | 5,260,372 | |
City of New York GO, 5.00% due 8/1/2030 (City Budget Financial Management) | | AA/Aa2 | | | 5,000,000 | | | | 5,792,100 | |
City of New York GO, 5.00% due 8/1/2031 (City Budget Financial Management) | | AA/Aa2 | | | 4,000,000 | | | | 4,602,480 | |
City of New York GO, 0.91% due 8/1/2035 put 4/3/2017 (Capital Projects) (daily demand notes) | | AA/Aa2 | | | 2,210,000 | | | | 2,210,000 | |
City of New York GO, 0.95% due 1/1/2036 put 4/3/2017 (Gowanus Canal Site; SPA: JPMorgan Chase Bank, N.A.) (daily demand notes) | | AA/Aa2 | | | 13,400,000 | | | | 13,400,000 | |
County of Nassau GO, 5.00% due 4/1/2026 (Insured: BAM) | | AA/NR | | | 1,300,000 | | | | 1,487,850 | |
Erie County Industrial Development Agency, 5.00% due 5/1/2019 (City of Buffalo School District) (State Aid Withholding) (ETM) | | NR/NR | | | 1,190,000 | | | | 1,285,664 | |
Erie County Industrial Development Agency, 5.00% due 5/1/2019 (City of Buffalo School District) (State Aid Withholding) | | AA/Aa2 | | | 1,810,000 | | | | 1,956,157 | |
Erie County Industrial Development Agency, 5.00% due 5/1/2027 (City of Buffalo School District) (State Aid Withholding) | | AA/Aa2 | | | 5,000,000 | | | | 5,801,300 | |
Lake Placid Central School District GO, 5.00% due 6/15/2017 (Educational Facilities; Insured: Natl-Re) (State Aid Withholding) | | NR/Aa3 | | | 305,000 | | | | 307,541 | |
Metropolitan Transportation Authority, 5.00% due 11/15/2024 (Transit and Commuter System) | | AA-/A1 | | | 5,435,000 | | | | 6,453,410 | |
Metropolitan Transportation Authority, 5.00% due 11/15/2025 | | AA-/A1 | | | 10,000,000 | | | | 11,947,400 | |
New York City Municipal Water Finance Authority, 0.90% due 6/15/2035 put 4/3/2017 (Water & Sewer System; LOC: Citibank, N.A.) (daily demand notes) | | AAA/Aa1 | | | 1,800,000 | | | | 1,800,000 | |
New York City Municipal Water Finance Authority, 0.95% due 6/15/2043 put 4/3/2017 (Water and Sewer System; SPA: JPMorgan Chase Bank, N.A.) (daily demand notes) | | AA+/Aa1 | | | 8,100,000 | | | | 8,100,000 | |
New York City Municipal Water Finance Authority, 0.91% due 6/15/2044 put 4/3/2017 (Water & Sewer System; SPA: Mizuho Bank, Ltd.) (daily demand notes) | | AAA/Aa1 | | | 3,000,000 | | | | 3,000,000 | |
New York City Municipal Water Finance Authority, 0.93% due 6/15/2048 put 4/3/2017 (Water & Sewer System; SPA: Mizuho Bank, Ltd.) (daily demand notes) | | AA+/Aa1 | | | 1,600,000 | | | | 1,600,000 | |
New York City Municipal Water Finance Authority, 0.95% due 6/15/2050 put 4/3/2017 (Water & Sewer System; SPA: JPMorgan Chase Bank, N.A.) (daily demand notes) | | AA+/Aa1 | | | 19,000,000 | | | | 19,000,000 | |
New York City Transitional Finance Authority, 0.96% due 8/1/2031 put 4/3/2017 (City Capital Projects; SPA: Landesbank Hessen-Thuringen) (daily demand notes) | | AAA/Aaa | | | 26,250,000 | | | | 26,250,000 | |
New York City Transitional Finance Authority, 0.90% due 8/1/2039 put 4/3/2017 (City Capital Projects; SPA: U.S. Bank, N.A.) (daily demand notes) | | AAA/Aa1 | | | 3,200,000 | | | | 3,200,000 | |
New York City Transitional Finance Authority, 0.91% due 11/1/2042 put 4/3/2017 (City Capital Projects; SPA: Barclays Bank plc) (daily demand notes) | | AAA/Aa1 | | | 1,200,000 | | | | 1,200,000 | |
New York State Dormitory Authority, 5.00% due 7/1/2017 (Bishop Henry B. Hucles Nursing Home; Insured: SONYMA) | | NR/Aa1 | | | 850,000 | | | | 852,941 | |
New York State Dormitory Authority, 5.25% due 5/15/2021 (State University Educational Facilities) | | AA/Aa2 | | | 500,000 | | | | 563,790 | |
New York State Dormitory Authority, 5.00% due 7/1/2023 (Miriam Osborn Memorial Home Assoc.) | | NR/NR | | | 2,180,000 | | | | 2,300,423 | |
New York State Dormitory Authority, 5.00% due 12/15/2027 (Metropolitan Transportation Authority & State Urban Development Corp.) | | AAA/Aa1 | | | 2,500,000 | | | | 2,888,725 | |
14 Semi-Annual Report
| | |
| Schedule of Investments, Continued | | |
| |
Thornburg Intermediate Municipal Fund | | March 31, 2017 (Unaudited) |
| | | | | | | | | | |
ISSUER-DESCRIPTION | | CREDIT RATING†
S&P/ MOODY’S | | PRINCIPAL
AMOUNT | | | VALUE | |
New York State Thruway Authority, 5.00% due 1/1/2030 (Multi-Year Highway and Bridge Capital Program) | | A/A2 | | $ | 7,480,000 | | | $ | 8,574,100 | |
United Nations Development Corp., 5.00% due 7/1/2025 (One, Two and Three U.N. Plaza) | | NR/A1 | | | 1,700,000 | | | | 1,835,048 | |
| | | |
NORTH CAROLINA — 0.44% | | | | | | | | | | |
Charlotte-Mecklenburg Hospital Authority, 3.00% due 1/15/2018 (Carolinas HealthCare System) | | AA-/Aa3 | | | 600,000 | | | | 609,516 | |
Charlotte-Mecklenburg Hospital Authority, 5.00% due 1/15/2028 (Carolinas HealthCare System) | | AA-/Aa3 | | | 2,190,000 | | | | 2,502,185 | |
North Carolina Medical Care Commission, 5.00% due 6/1/2030 (Vidant Health) | | A+/A1 | | | 3,000,000 | | | | 3,381,060 | |
| | | |
NORTH DAKOTA — 0.07% | | | | | | | | | | |
County of Ward, 5.125% due 7/1/2021 (Trinity Health System) | | BBB-/NR | | | 1,000,000 | | | | 1,003,200 | |
| | | |
OHIO — 4.97% | | | | | | | | | | |
Akron, Bath and Copley Joint Township Hospital District, 5.00% due 11/15/2024 (Children’s Hospital Medical Center of Akron) | | NR/A1 | | | 1,000,000 | | | | 1,128,450 | |
American Municipal Power, Inc., 5.25% due 2/15/2028 (AMP Fremont Energy Center) | | A/A1 | | | 4,000,000 | | | | 4,523,840 | |
Cincinnati City School District COP, 5.00% due 12/15/2031 (School Improvement Project) | | A+/Aa3 | | | 3,075,000 | | | | 3,436,835 | |
City of Cleveland, 3.00% due 10/1/2017 (Parks and Recreation Facilities) | | AA/A1 | | | 490,000 | | | | 495,170 | |
City of Cleveland, 5.00% due 11/15/2027 (Public Facilities Improvements) | | AA/A1 | | | 1,285,000 | | | | 1,500,289 | |
City of Cleveland, 5.00% due 10/1/2028 (Bridges and Roadways) | | AA/A1 | | | 2,420,000 | | | | 2,811,604 | |
City of Cleveland, 5.00% due 11/15/2028 (Public Facilities Improvements) | | AA/A1 | | | 1,000,000 | | | | 1,164,120 | |
City of Cleveland, 5.00% due 10/1/2029 (Bridges and Roadways) | | AA/A1 | | | 100,000 | | | | 115,725 | |
City of Cleveland, 5.00% due 11/15/2029 (Public Facilities Improvements) | | AA/A1 | | | 1,415,000 | | | | 1,640,636 | |
City of Cleveland, 5.00% due 11/15/2030 (Public Facilities Improvements) | | AA/A1 | | | 1,485,000 | | | | 1,712,205 | |
City of Cleveland GO, 5.00% due 12/1/2024 (Various Municipal Capital Improvements) | | AA/A1 | | | 1,000,000 | | | | 1,172,020 | |
City of Cleveland GO, 5.00% due 12/1/2026 (Various Municipal Capital Improvements) | | AA/A1 | | | 1,230,000 | | | | 1,442,077 | |
Cleveland-Cuyahoga County Port Authority, 5.00% due 10/1/2021 (Cleveland Museum of Art) | | AA+/NR | | | 2,040,000 | | | | 2,280,332 | |
Cleveland-Cuyahoga County Port Authority, 5.00% due 7/1/2025 (County Administration Offices) | | AA-/Aa2 | | | 1,780,000 | | | | 2,092,443 | |
County of Allen, 5.00% due 5/1/2025 (Catholic Health Partners-Mercy Health West Facility) | | A+/A2 | | | 4,470,000 | | | | 5,017,754 | |
County of Allen, 5.00% due 5/1/2026 (Catholic Health Partners-Mercy Health West Facility) | | A+/A2 | | | 3,855,000 | | | | 4,307,153 | |
County of Cuyahoga COP, 5.00% due 12/1/2026 (Convention Center Hotel) | | AA-/Aa3 | | | 2,910,000 | | | | 3,340,273 | |
County of Hamilton, 5.00% due 12/1/2018 | | AA-/A1 | | | 1,000,000 | | | | 1,065,360 | |
County of Hamilton, 5.00% due 12/1/2021 | | AA-/A1 | | | 1,100,000 | | | | 1,264,197 | |
County of Hamilton, 5.00% due 12/1/2023 | | AA-/A1 | | | 1,000,000 | | | | 1,181,660 | |
County of Hamilton, 5.00% due 5/15/2028 (Cincinnati Children’s Hospital Medical Center) | | AA/Aa2 | | | 2,665,000 | | | | 3,100,701 | |
County of Hamilton, 5.00% due 5/15/2029 (Cincinnati Children’s Hospital Medical Center) | | AA/Aa2 | | | 1,000,000 | | | | 1,158,920 | |
County of Hamilton, 5.00% due 5/15/2031 (Cincinnati Children’s Hospital Medical Center) | | AA/Aa2 | | | 4,420,000 | | | | 5,074,558 | |
County of Montgomery, 0.90% due 11/15/2045 put 4/3/2017 (Premier Health Partners; LOC: Barclays Bank plc) (daily demand notes) | | NR/Aa2 | | | 14,000,000 | | | | 14,000,000 | |
County of Scioto, 5.00% due 2/15/2030 (Southern Ohio Medical Center) | | NR/A2 | | | 1,690,000 | | | | 1,932,768 | |
County of Scioto, 5.00% due 2/15/2032 (Southern Ohio Medical Center) | | NR/A2 | | | 925,000 | | | | 1,045,065 | |
County of Scioto, 5.00% due 2/15/2033 (Southern Ohio Medical Center) | | NR/A2 | | | 1,000,000 | | | | 1,124,880 | |
Deerfield Township, 5.00% due 12/1/2025 (Public Street Improvements-Wilkens Blvd.) | | NR/A1 | | | 1,000,000 | | | | 1,022,710 | |
Lucas County Health Care Facility, 5.00% due 8/15/2021 (Sunset Retirement Community) | | NR/NR | | | 1,190,000 | | | | 1,242,967 | |
Lucas County Health Care Facility, 5.125% due 8/15/2025 (Sunset Retirement Community) | | NR/NR | | | 1,250,000 | | | | 1,375,150 | |
| | | |
OKLAHOMA — 0.50% | | | | | | | | | | |
Oklahoma DFA, 5.00% due 8/15/2026 (INTEGRIS Health) | | AA-/Aa3 | | | 1,000,000 | | | | 1,176,230 | |
Oklahoma DFA, 5.00% due 8/15/2027 (INTEGRIS Health) | | AA-/Aa3 | | | 1,000,000 | | | | 1,166,620 | |
Oklahoma Industries Authority, 5.50% due 7/1/2023 pre-refunded 7/1/2018 (Oklahoma Medical Research Foundation) | | NR/A2 | | | 3,730,000 | | | | 3,937,910 | |
Oklahoma Municipal Power Authority, 5.00% due 1/1/2018 (Power Supply System Capital Projects; Insured: AGM) | | AA/A2 | | | 1,000,000 | | | | 1,030,030 | |
| | | |
OREGON — 1.37% | | | | | | | | | | |
State of Oregon GO, 2.00% due 6/30/2017 (Cash Management) | | SP-1+/Mig1 | | | 20,000,000 | | | | 20,061,200 | |
| | | |
PENNSYLVANIA — 6.67% | | | | | | | | | | |
Allegheny County Hospital Development Authority, 5.00% due 5/15/2019 (University of Pittsburgh Medical Center) | | A+/Aa3 | | | 2,500,000 | | | | 2,699,300 | |
Allegheny County IDA, 5.90% due 8/15/2026 (Propel Charter School-McKeesport) | | BBB-/NR | | | 905,000 | | | | 949,255 | |
Allegheny County IDA, 6.375% due 8/15/2035 (Propel Charter School-McKeesport) | | BBB-/NR | | | 1,130,000 | | | | 1,195,721 | |
Bethlehem Area School District GO, 5.00% due 10/15/2020 pre-refunded 04/15/2019 (Northampton and Lehigh Counties District; Insured: AGM) (State Aid Withholding) | | AA/NR | | | 95,000 | | | | 102,429 | |
Bethlehem Area School District GO, 5.00% due 10/15/2020 (Northampton and Lehigh Counties District; Insured: AGM) (State Aid Withholding) | | AA/NR | | | 380,000 | | | | 403,678 | |
City of Philadelphia, 5.00% due 10/1/2029 (Water and Wastewater System) | | A+/A1 | | | 1,100,000 | | | | 1,270,599 | |
City of Philadelphia, 5.00% due 10/1/2030 (Water and Wastewater System) | | A+/A1 | | | 2,410,000 | | | | 2,766,150 | |
City of Philadelphia, 5.00% due 8/1/2032 (Pennsylvania Gas Works) | | A/Baa1 | | | 1,000,000 | | | | 1,100,730 | |
Semi-Annual Report 15
| | |
| Schedule of Investments, Continued | | |
| |
Thornburg Intermediate Municipal Fund | | March 31, 2017 (Unaudited) |
| | | | | | | | | | |
ISSUER-DESCRIPTION | | CREDIT RATING†
S&P/ MOODY’S | | PRINCIPAL
AMOUNT | | | VALUE | |
City of Philadelphia, 5.00% due 8/1/2033 (Pennsylvania Gas Works) | | A/Baa1 | | $ | 800,000 | | | $ | 876,360 | |
City of Philadelphia, 5.00% due 8/1/2034 (Pennsylvania Gas Works) | | A/Baa1 | | | 500,000 | | | | 545,475 | |
Commonwealth of Pennsylvania GO, 5.00% due 3/15/2022 (Capital Facilities Projects) | | AA-/Aa3 | | | 12,485,000 | | | | 14,265,111 | |
County of Luzerne GO, 5.00% due 11/15/2029 (Insured: AGM) | | AA/NR | | | 3,000,000 | | | | 3,301,560 | |
Dallastown Area School District GO, 4.00% due 5/1/2021 (State Aid Withholding) | | AA/NR | | | 460,000 | | | | 504,427 | |
Hospitals & Higher Education Facilities Authority of Philadelphia, 0.95% due 7/1/2041 put 4/3/2017 (The Children’s Hospital of Philadelphia; SPA: Wells Fargo Bank, N.A.) (daily demand notes) | | AA/Aa2 | | | 6,485,000 | | | | 6,485,000 | |
Hospitals & Higher Education Facilities Authority of Philadelphia, 0.95% due 7/1/2041 put 4/3/2017 (The Children’s Hospital of Philadelphia; SPA: JPMorgan Chase Bank, N.A.) (daily demand notes) | | AA/Aa2 | | | 5,610,000 | | | | 5,610,000 | |
Lancaster County Solid Waste Management Authority, 5.25% due 12/15/2030 (Acquisition of Susquehanna Resource Management Facility) | | AA-/NR | | | 3,000,000 | | | | 3,389,790 | |
Lehigh County IDA, 0.90% due 2/15/2027 put 8/15/2017 (PPL Electric Utilities Corp.) | | A/A1 | | | 3,250,000 | | | | 3,249,643 | |
Monroeville Financing Authority, 5.00% due 2/15/2026 (University of Pittsburgh Medical Center) | | A+/Aa3 | | | 3,490,000 | | | | 4,152,821 | |
Pennsylvania Economic DFA, 4.625% due 12/1/2018 (Colver Project; Insured: AMBAC) (AMT) | | BBB-/Ba1 | | | 4,755,000 | | | | 4,789,236 | |
Pennsylvania Higher Education Facilities Authority, 0% due 7/1/2020 (Insured: AMBAC) | | NR/NR | | | 2,032,839 | | | | 1,605,516 | |
Pennsylvania State Public School Building Authority GO, 5.00% due 6/1/2027 (Philadelphia School District; Insured: AGM) (State Aid Withholding) | | AA/A2 | | | 5,000,000 | | | | 5,582,750 | |
Pennsylvania Turnpike Commission, 5.35% due 12/1/2030 pre-refunded 12/1/2020 (Highway Improvements) | | NR/NR | | | 1,390,000 | | | | 1,587,769 | |
Pennsylvania Turnpike Commission, 5.35% due 12/1/2030 (Highway Improvements) | | A-/A3 | | | 2,610,000 | | | | 2,880,057 | |
Philadelphia Authority for Industrial Development, 5.00% due 9/1/2032 (Thomas Jefferson University) | | A+/A2 | | | 3,685,000 | | | | 4,121,709 | |
Philadelphia Authority for Industrial Development, 5.00% due 9/1/2034 (Thomas Jefferson University) | | A+/A2 | | | 2,000,000 | | | | 2,215,880 | |
Pittsburgh Water & Sewer Authority, 5.00% due 9/1/2030 (Water and Sewer System; Insured: AGM) | | A/A2 | | | 5,000,000 | | | | 5,625,150 | |
Pittsburgh Water & Sewer Authority, 5.00% due 9/1/2031 (Water and Sewer System; Insured: AGM) | | A/A2 | | | 3,740,000 | | | | 4,189,772 | |
Pittsburgh Water & Sewer Authority, 5.00% due 9/1/2031 (Water and Sewer System; Insured: AGM) | | A/A2 | | | 3,665,000 | | | | 4,105,753 | |
Plum Borough School District GO, 4.00% due 9/15/2017 (Insured: BAM) (State Aid Withholding) | | AA/NR | | | 365,000 | | | | 369,873 | |
Plum Borough School District GO, 4.00% due 9/15/2018 (Insured: BAM) (State Aid Withholding) | | AA/NR | | | 355,000 | | | | 369,040 | |
Plum Borough School District GO, 4.00% due 9/15/2020 (Insured: BAM) (State Aid Withholding) | | AA/NR | | | 405,000 | | | | 436,367 | |
Plum Borough School District GO, 4.00% due 9/15/2020 (Insured: BAM) (State Aid Withholding) | | AA/NR | | | 385,000 | | | | 414,818 | |
Plum Borough School District GO, 4.00% due 9/15/2021 (Insured: BAM) (State Aid Withholding) | | AA/NR | | | 425,000 | | | | 463,416 | |
Plum Borough School District GO, 5.00% due 9/15/2021 (Insured: BAM) (State Aid Withholding) | | AA/NR | | | 430,000 | | | | 487,164 | |
School District of Philadelphia GO, 5.00% due 9/1/2018 (School Reform Commission) (State Aid Withholding) | | NR/A2 | | | 5,250,000 | | | | 5,466,037 | |
| | | |
RHODE ISLAND — 0.34% | | | | | | | | | | |
State of Rhode Island and Providence Plantations COP, 5.00% due 10/1/2024 (Training School Project) | | AA-/Aa3 | | | 3,595,000 | | | | 4,159,703 | |
State of Rhode Island and Providence Plantations GO, 4.00% due 10/15/2023 (Consolidated Capital Development Loan) | | AA/Aa2 | | | 800,000 | | | | 875,904 | |
| | | |
SOUTH CAROLINA — 0.52% | | | | | | | | | | |
City of Myrtle Beach, 5.00% due 6/1/2028 (Municipal Sports Complex) | | AA-/A1 | | | 1,000,000 | | | | 1,130,200 | |
City of Myrtle Beach, 5.00% due 6/1/2030 (Municipal Sports Complex) | | AA-/A1 | | | 1,000,000 | | | | 1,117,250 | |
Greenwood Fifty School Facilities, Inc., 5.00% due 12/1/2025 pre-refunded 12/1/2017 (School District No. 50; Insured: AGM) | | AA/A1 | | | 2,400,000 | | | | 2,466,264 | |
Sumter Two School Facilities, Inc., 5.00% due 12/1/2021 pre-refunded 12/1/2017 (School District No. 2; Insured: AGM) | | AA/A3 | | | 2,855,000 | | | | 2,934,597 | |
| | | |
SOUTH DAKOTA — 0.39% | | | | | | | | | | |
South Dakota Health and Educational Facilities Authority, 5.00% due 7/1/2023 (Avera Health) | | AA-/A1 | | | 1,575,000 | | | | 1,772,741 | |
South Dakota Health and Educational Facilities Authority, 5.00% due 11/1/2024 (Sanford Health) | | A+/A1 | | | 1,700,000 | | | | 1,831,750 | |
South Dakota Health and Educational Facilities Authority, 5.00% due 11/1/2028 (Sanford Health) | | A+/A1 | | | 800,000 | | | | 920,256 | |
South Dakota Health and Educational Facilities Authority, 5.00% due 11/1/2029 (Sanford Health) | | A+/A1 | | | 1,000,000 | | | | 1,139,090 | |
| | | |
TENNESSEE — 0.74% | | | | | | | | | | |
Tennessee Energy Acquisition Corp., 5.00% due 2/1/2023 (The Gas Project) | | BBB+/A3 | | | 2,500,000 | | | | 2,795,450 | |
Tennessee Energy Acquisition Corp., 5.25% due 9/1/2023 (The Gas Project) | | BBB+/A3 | | | 7,000,000 | | | | 8,005,130 | |
| | | |
TEXAS — 11.97% | | | | | | | | | | |
Austin Community College District, 5.50% due 8/1/2023 pre-refunded 8/1/2018 (Round Rock Campus) | | AA/Aa2 | | | 2,180,000 | | | | 2,310,713 | |
Bexar County Health Facilities Development Corp., 5.00% due 7/1/2027 pre-refunded 7/1/2017 (Army Retirement Residence) | | NR/NR | | | 260,000 | | | | 262,746 | |
Bexar County Health Facilities Development Corp., 5.00% due 7/1/2027 (Army Retirement Residence) | | BBB/NR | | | 1,270,000 | | | | 1,276,236 | |
City of Austin (Travis, Williamson and Hays Counties), 5.00% due 11/15/2033 (Water and Wastewater System) | | AA/Aa2 | | | 4,000,000 | | | | 4,642,440 | |
City of Austin (Travis, Williamson and Hays Counties), 5.00% due 11/15/2035 (Water and Wastewater System) | | AA/Aa2 | | | 8,185,000 | | | | 9,418,561 | |
City of Austin (Travis, Williamson and Hays Counties), 5.00% due 11/15/2036 (Water and Wastewater System) | | AA/Aa2 | | | 6,985,000 | | | | 8,018,990 | |
City of Brownsville, 5.00% due 9/1/2017 (Water, Wastewater & Electric Utilities Systems) | | A+/A2 | | | 500,000 | | | | 508,570 | |
City of Brownsville, 5.00% due 9/1/2020 (Water, Wastewater & Electric Utilities Systems) | | A+/A2 | | | 1,000,000 | | | | 1,113,650 | |
City of Dallas GO, 5.00% due 2/15/2025 (Public Improvements) | | AA-/NR | | | 1,000,000 | | | | 1,157,310 | |
City of Dallas GO, 5.00% due 2/15/2028 (Trinity River Corridor Infrastructure) | | AA-/A1 | | | 1,000,000 | | | | 1,111,040 | |
City of Dallas GO, 5.00% due 2/15/2028 (Public Improvements) | | AA-/NR | | | 3,635,000 | | | | 4,090,393 | |
City of Dallas GO, 5.00% due 2/15/2030 (Public Improvements) | | AA-/NR | | | 3,585,000 | | | | 3,975,514 | |
16 Semi-Annual Report
| | |
| Schedule of Investments, Continued | | |
| |
Thornburg Intermediate Municipal Fund | | March 31, 2017 (Unaudited) |
| | | | | | | | | | |
ISSUER-DESCRIPTION | | CREDIT RATING†
S&P/ MOODY’S | | PRINCIPAL
AMOUNT | | | VALUE | |
City of Dallas GO, 5.00% due 2/15/2034 (Public Improvements) | | AA-/NR | | $ | 1,500,000 | | | $ | 1,628,850 | |
City of Galveston, 5.00% due 9/1/2021 (Galveston Island Convention Center; Insured: AGM) | | NR/A2 | | | 545,000 | | | | 609,277 | |
City of Galveston, 5.00% due 9/1/2024 (Galveston Island Convention Center; Insured: AGM) | | NR/A2 | | | 1,115,000 | | | | 1,276,017 | |
City of Houston, 5.00% due 9/1/2032 (Convention & Entertainment Facilities) | | A-/A2 | | | 3,560,000 | | | | 3,989,977 | |
City of Houston GO, 5.00% due 3/1/2020 (Public Improvements) | | AA/Aa3 | | | 5,000,000 | | | | 5,520,700 | |
City of Houston GO, 5.00% due 3/1/2021 (Public Improvements) | | AA/Aa3 | | | 5,000,000 | | | | 5,657,150 | |
City of Houston GO, 5.00% due 3/1/2023 (Public Improvements) | | AA/Aa3 | | | 5,000,000 | | | | 5,829,650 | |
City of Houston GO, 5.00% due 3/1/2027 (Public Improvements) | | AA/Aa3 | | | 1,175,000 | | | | 1,383,656 | |
City of McAllen, 5.00% due 3/1/2028 (International Toll Bridge; Insured: AGM) | | AA/NR | | | 1,390,000 | | | | 1,615,708 | |
City of McAllen, 5.00% due 3/1/2029 (International Toll Bridge; Insured: AGM) | | AA/NR | | | 590,000 | | | | 681,639 | |
City of McAllen, 5.00% due 3/1/2030 (International Toll Bridge; Insured: AGM) | | AA/NR | | | 1,530,000 | | | | 1,754,497 | |
City of McAllen, 5.00% due 3/1/2031 (International Toll Bridge; Insured: AGM) | | AA/NR | | | 1,610,000 | | | | 1,833,226 | |
City of McAllen, 5.00% due 3/1/2032 (International Toll Bridge; Insured: AGM) | | AA/NR | | | 1,000,000 | | | | 1,132,020 | |
City of Pharr Higher Education Finance Authority, 5.75% due 8/15/2024 (IDEA Public Schools) | | BBB/NR | | | 5,050,000 | | | | 5,364,312 | |
City of San Antonio, 5.00% due 7/1/2024 (Airport System Capital Improvements) (AMT) | | A/A2 | | | 2,065,000 | | | | 2,288,495 | |
City of San Antonio, 5.00% due 7/1/2025 (Airport System Capital Improvements) (AMT) | | A/A2 | | | 1,160,000 | | | | 1,276,615 | |
City of San Antonio, 2.25% due 2/1/2033 (Electric and Gas Systems) | | AA-/NR | | | 4,655,000 | | | | 4,749,310 | |
City of San Antonio, 5.00% due 5/15/2033 (Water System) | | AA/Aa2 | | | 1,500,000 | | | | 1,730,055 | |
City of San Antonio, 5.00% due 5/15/2034 (Water System) | | AA/Aa2 | | | 1,575,000 | | | | 1,808,446 | |
City of San Antonio, 3.00% due 12/1/2045 put 12/1/2019 (Electric and Gas Systems) | | AA-/Aa2 | | | 5,200,000 | | | | 5,382,156 | |
City of Texas City Industrial Development Corp., 7.375% due 10/1/2020 (ARCO Pipe Line Co. Project) | | A-/A2 | | | 2,705,000 | | | | 3,187,058 | |
Dallas Area Rapid Transit, 5.00% due 12/1/2034 | | AA+/Aa2 | | | 5,475,000 | | | | 6,273,529 | |
Dallas Area Rapid Transit, 5.00% due 12/1/2035 | | AA+/Aa2 | | | 4,000,000 | | | | 4,567,040 | |
Dallas Area Rapid Transit, 5.00% due 12/1/2036 | | AA+/Aa2 | | | 3,000,000 | | | | 3,417,960 | |
Dallas County Utility & Reclamation District GO, 5.00% due 2/15/2027 | | A/A2 | | | 1,905,000 | | | | 2,240,890 | |
Harris County Cultural Education Facilities Finance Corp., 5.00% due 12/1/2028 (Memorial Hermann Health System) | | A+/A1 | | | 3,000,000 | | | | 3,449,070 | |
Harris County Cultural Education Facilities Finance Corp., 0.95% due 9/1/2031 put 4/3/2017 (Texas Medical Center; LOC: JPMorgan Chase Bank, N.A.) (daily demand notes) | | AA+/Aa1 | | | 2,850,000 | | | | 2,850,000 | |
Houston Higher Education Finance Corp., 6.50% due 5/15/2031 pre-refunded 5/15/2021 (Cosmos Foundation, Inc.) | | NR/NR | | | 415,000 | | | | 497,556 | |
Houston Higher Education Finance Corp., 6.50% due 5/15/2031 (Cosmos Foundation, Inc.) | | BBB/NR | | | 360,000 | | | | 411,203 | |
Katy ISD GO, 5.00% due 2/15/2034 (Educational Facilities Improvements; Guaranty: PSF) | | AAA/Aaa | | | 7,560,000 | | | | 8,697,326 | |
Kimble County Hospital District GO, 5.00% due 8/15/2017 (Medical Facilities Improvements) (ETM) | | NR/NR | | | 510,000 | | | | 518,063 | |
Kimble County Hospital District GO, 5.00% due 8/15/2018 (Medical Facilities Improvements) (ETM) | | NR/NR | | | 525,000 | | | | 553,786 | |
La Vernia Higher Education Finance Corp., 5.75% due 8/15/2024 pre-refunded 8/15/2019 (Kipp, Inc.) | | BBB/NR | | | 3,000,000 | | | | 3,312,870 | |
Lower Colorado River Authority, 5.00% due 5/15/2026 pre-refunded 5/15/2022 | | NR/NR | | | 55,000 | | | | 63,880 | |
Lower Colorado River Authority, 5.00% due 5/15/2026 | | A/A2 | | | 9,415,000 | | | | 10,672,562 | |
North Central Texas Health Facilities Development Corp., 5.00% due 8/15/2019 (Children’s Medical Center of Dallas) | | NR/Aa2 | | | 270,000 | | | | 292,353 | |
North Texas Tollway Authority, 5.00% due 9/1/2017 (Special Projects System) | | AA+/NR | | | 450,000 | | | | 457,830 | |
North Texas Tollway Authority, 5.00% due 1/1/2020 (NTTA System) | | A/A1 | | | 2,000,000 | | | | 2,194,660 | |
Round Rock ISD GO, 5.00% due 8/1/2028 (Educational Facilities Improvements; Guaranty: PSF) | | NR/Aaa | | | 2,840,000 | | | | 3,360,458 | |
Round Rock ISD GO, 5.00% due 8/1/2029 (Educational Facilities Improvements; Guaranty: PSF) | | NR/Aaa | | | 2,980,000 | | | | 3,501,679 | |
San Juan Higher Education Finance Authority, 5.75% due 8/15/2024 (IDEA Public Schools) | | BBB/NR | | | 1,590,000 | | | | 1,725,993 | |
Tarrant Regional Water District, 5.00% due 3/1/2028 (Water Control and Improvement) | | AAA/NR | | | 2,000,000 | | | | 2,378,040 | |
Tarrant Regional Water District, 5.00% due 3/1/2029 (Water Control and Improvement) | | AAA/NR | | | 1,650,000 | | | | 1,947,528 | |
Texas Public Finance Authority Charter School Finance Corp., 5.00% due 8/15/2023 pre-refunded 8/15/2017 (IDEA Public Schools; Insured: ACA) | | BBB/NR | | | 3,000,000 | | | | 3,047,070 | |
Texas Public Finance Authority Charter School Finance Corp., 6.00% due 2/15/2030 pre-refunded 2/15/2020 (Cosmos Foundation, Inc.) | | BBB/NR | | | 1,750,000 | | | | 1,973,842 | |
Texas Public Finance Authority Charter School Finance Corp., 5.00% due 8/15/2030 pre-refunded 8/15/2017 (IDEA Public Schools; Insured: ACA) | | BBB/NR | | | 2,000,000 | | | | 2,031,380 | |
Texas Transportation Commission, 5.00% due 8/15/2024 (Central Texas Turnpike System) | | BBB+/Baa1 | | | 1,500,000 | | | | 1,718,160 | |
Texas Transportation Commission, 5.00% due 8/15/2025 (Central Texas Turnpike System) | | BBB+/Baa1 | | | 750,000 | | | | 852,128 | |
Texas Transportation Commission GO, 5.00% due 4/1/2022 (Highway Improvements) | | AAA/Aaa | | | 1,000,000 | | | | 1,161,080 | |
Texas Transportation Commission GO, 5.00% due 4/1/2023 (Highway Improvements) | | AAA/Aaa | | | 1,000,000 | | | | 1,179,840 | |
Texas Transportation Commission GO, 5.00% due 4/1/2024 (Highway Improvements) | | AAA/Aaa | | | 1,000,000 | | | | 1,192,720 | |
Trinity River Authority, 5.00% due 2/1/2025 (Red Oak Creek System) | | AA-/NR | | | 625,000 | | | | 741,450 | |
Uptown Development Authority, 5.50% due 9/1/2029 pre-refunded 9/1/2019 (Infrastructure Improvements) | | BBB/NR | | | 1,250,000 | | | | 1,377,312 | |
| | | |
U.S. VIRGIN ISLANDS — 0.28% | | | | | | | | | | |
Virgin Islands Public Finance Authority, 6.625% due 10/1/2029 | | NR/Caa2 | | | 5,000,000 | | | | 4,137,500 | |
| | | |
UTAH — 0.09% | | | | | | | | | | |
Local Building Authority of Salt Lake Valley Fire Service Area, 5.25% due 4/1/2020 pre-refunded 4/1/2018 | | NR/Aa2 | | | 1,250,000 | | | | 1,303,950 | |
Semi-Annual Report 17
| | |
| Schedule of Investments, Continued | | |
| |
Thornburg Intermediate Municipal Fund | | March 31, 2017 (Unaudited) |
| | | | | | | | | | | | |
ISSUER-DESCRIPTION | | CREDIT RATING†
S&P/ MOODY’S | | | PRINCIPAL
AMOUNT | | | VALUE | |
VIRGINIA — 0.47% | | | | | | | | | | | | |
County of Hanover IDA, 6.00% due 10/1/2021 (FirstHealth Richmond Memorial Hospital) (ETM) | | | AA-/NR | | | $ | 590,000 | | | $ | 630,610 | |
Virginia Housing Development Authority GO, 4.85% due 4/1/2019 (Multi-Family Housing Development) (AMT) | | | AAA/Aaa | | | | 3,100,000 | | | | 3,124,738 | |
Virginia Housing Development Authority GO, 4.85% due 10/1/2019 (Multi-Family Housing Development) (AMT) | | | AAA/Aaa | | | | 3,100,000 | | | | 3,119,995 | |
| | | |
WASHINGTON — 2.94% | | | | | | | | | | | | |
City of Seattle, 5.00% due 2/1/2019 (Light and Power Improvements) | | | AA/Aa2 | | | | 3,000,000 | | | | 3,214,650 | |
King County Public Hospital District No. 2 GO, 5.00% due 12/1/2028 (EvergreenHealth Medical Center) | | | NR/Aa3 | | | | 1,015,000 | | | | 1,168,448 | |
King County Public Hospital District No. 2 GO, 5.00% due 12/1/2029 (EvergreenHealth Medical Center) | | | NR/Aa3 | | | | 2,930,000 | | | | 3,347,056 | |
King County Public Hospital District No. 2 GO, 5.00% due 12/1/2030 (EvergreenHealth Medical Center) | | | NR/Aa3 | | | | 600,000 | | | | 682,134 | |
King County Public Hospital District No. 2 GO, 5.00% due 12/1/2031 (EvergreenHealth Medical Center) | | | NR/Aa3 | | | | 2,040,000 | | | | 2,305,567 | |
Skagit County Public Hospital District No. 1 GO, 5.00% due 12/1/2025 (Skagit Regional Health) | | | NR/A1 | | | | 4,860,000 | | | | 5,594,638 | |
Skagit County Public Hospital District No. 1 GO, 5.00% due 12/1/2028 (Skagit Regional Health) | | | NR/A1 | | | | 3,000,000 | | | | 3,425,370 | |
Skagit County Public Hospital District No. 2 GO, 5.00% due 12/1/2027 (Island Hospital) | | | NR/A1 | | | | 2,445,000 | | | | 2,720,331 | |
Skagit County Public Hospital District No. 2 GO, 5.00% due 12/1/2028 (Island Hospital) | | | NR/A1 | | | | 2,195,000 | | | | 2,432,367 | |
State of Washington COP, 5.00% due 7/1/2030 (Acquisition and Improvements of Real and Personal Property) | | | NR/Aa2 | | | | 4,415,000 | | | | 5,197,559 | |
State of Washington COP, 5.00% due 7/1/2031 (Acquisition and Improvements of Real and Personal Property) | | | NR/Aa2 | | | | 4,635,000 | | | | 5,420,818 | |
Tacoma School District No.10 GO, 5.00% due 12/1/2019 (Pierce County Capital Projects) | | | AA+/Aa1 | | | | 1,000,000 | | | | 1,100,340 | |
Tacoma School District No.10 GO, 5.00% due 12/1/2020 (Pierce County Capital Projects) | | | AA+/Aa1 | | | | 1,000,000 | | | | 1,128,840 | |
Washington Health Care Facilities Authority, 5.25% due 8/15/2024 pre-refunded 8/15/2018 (MultiCare Systems; Insured: AGM) | | | AA/Aa3 | | | | 1,000,000 | | | | 1,056,850 | |
Washington Health Care Facilities Authority, 6.25% due 8/1/2028 pre-refunded 8/1/2018 (Highline Medical Centers; Insured: FHA 242) | | | NR/NR | | | | 3,985,000 | | | | 4,258,212 | |
| | | |
WISCONSIN — 2.37% | | | | | | | | | | | | |
Wisconsin Health & Educational Facilities Authority, 5.00% due 7/1/2021 (Agnesian Healthcare, Inc.) | | | A/A2 | | | | 2,170,000 | | | | 2,373,069 | |
Wisconsin Health & Educational Facilities Authority, 5.00% due 8/15/2023 (ProHealth Care, Inc.) | | | A+/A1 | | | | 1,980,000 | | | | 2,220,669 | |
Wisconsin Health & Educational Facilities Authority, 5.00% due 8/15/2024 (ProHealth Care, Inc.) | | | A+/A1 | | | | 2,460,000 | | | | 2,747,254 | |
Wisconsin Health & Educational Facilities Authority, 5.50% due 7/1/2025 (Agnesian Healthcare, Inc.) | | | A/A2 | | | | 5,000,000 | | | | 5,503,100 | |
Wisconsin Health & Educational Facilities Authority, 5.00% due 8/15/2025 (ProHealth Care, Inc.) | | | A+/A1 | | | | 3,180,000 | | | | 3,549,389 | |
Wisconsin Health & Educational Facilities Authority, 5.00% due 8/15/2026 (ProHealth Care, Inc.) | | | A+/A1 | | | | 3,305,000 | | | | 3,666,864 | |
Wisconsin Health & Educational Facilities Authority, 5.00% due 11/15/2035 (Ascension Health) | | | AA+/Aa2 | | | | 10,000,000 | | | | 11,228,800 | |
Wisconsin Health & Educational Facilities Authority, 5.00% due 11/15/2036 (Ascension Health) | | | AA+/Aa2 | | | | 3,000,000 | | | | 3,361,170 | |
| | | | | | | | | | | | |
TOTAL INVESTMENTS — 98.93% (Cost $1,409,529,095) | | | | | | | | | | $ | 1,447,934,689 | |
OTHER ASSETS LESS LIABILITIES — 1.07% | | | | | | | | | | | 15,608,239 | |
| | | | | | | | | | | | |
NET ASSETS — 100.00% | | | | | | | | | | $ | 1,463,542,928 | |
| | | | | | | | | | | | |
Footnote Legend
| † | Credit ratings are unaudited. Rating changes may have occurred subsequent to the reporting period end. Bonds issued with a maturity of one year or less are assigned Moody’s ratings from MIG-1 to MIG-4 and Standard and Poor’s ratings from SP-1+ to SP-3 with MIG-1 and SP-1+ being the strongest ratings. |
| a | Segregated as collateral for a when-issued security. |
Portfolio Abbreviations
To simplify the listings of securities, abbreviations are used per the table below:
| | |
| ACA | | Insured by American Capital Access |
| AGM | | Insured by Assured Guaranty Municipal Corp. |
| AMBAC | | Insured by American Municipal Bond Assurance Corp. |
| AMT | | Alternative Minimum Tax |
| BAM | | Insured by Build America Mutual Insurance Co. |
| CIFG | | Insured by CIFG Assurance North America Inc. |
| COP | | Certificates of Participation |
| DFA | | Development Finance Authority |
| EDA | | Economic Development Authority |
| ETM | | Escrowed to Maturity |
| FHA | | Insured by Federal Housing Administration |
| GNMA | | Collateralized by Government National Mortgage Association |
| GO | | General Obligation |
| | |
| HFA | | Health Facilities Authority |
| HFFA | | Health Facilities Financing Authority |
| IBC | | Insured Bond Certificate |
| IDA | | Industrial Development Authority |
| ISD | | Independent School District |
| JEA | | Jacksonville Electric Authority |
| Mtg | | Mortgage |
| Natl-Re | | Insured by National Public Finance Guarantee Corp. |
| PSF | | Guaranteed by Permanent School Fund |
| Q-SBLF | | Insured by Qualified School Bond Loan Fund |
| SONYMA | | State of New York Mortgage Authority |
| Syncora | | Insured by Syncora Guarantee Inc. |
| USD | | Unified School District |
See notes to financial statements.
18 Semi-Annual Report
| | |
| Statement of Assets and Liabilities | | |
| |
Thornburg Intermediate Municipal Fund | | March 31, 2017 (Unaudited) |
| | | | |
ASSETS | | | | |
Investments at value (cost $1,409,529,095) (Note 3) | | $ | 1,447,934,689 | |
Cash | | | 827,331 | |
Receivable for investments sold | | | 4,020,000 | |
Receivable for fund shares sold | | | 2,959,329 | |
Interest receivable | | | 16,529,622 | |
Prepaid expenses and other assets | | | 45,859 | |
| | | | |
Total Assets | | | 1,472,316,830 | |
| | | | |
| |
LIABILITIES | | | | |
Payable for investments purchased | | | 4,000,000 | |
Payable for fund shares redeemed | | | 3,520,571 | |
Payable to investment advisor and other affiliates (Note 4) | | | 818,771 | |
Accounts payable and accrued expenses | | | 165,133 | |
Dividends payable | | | 269,427 | |
| | | | |
Total Liabilities | | | 8,773,902 | |
| | | | |
| |
NET ASSETS | | $ | 1,463,542,928 | |
| | | | |
NET ASSETS CONSIST OF | | | | |
Distribution in excess of net investment income | | $ | (3,781 | ) |
Net unrealized appreciation on investments | | | 38,405,594 | |
Accumulated net realized gain (loss) | | | (6,546,243 | ) |
Net capital paid in on shares of beneficial interest | | | 1,431,687,358 | |
| | | | |
| | $ | 1,463,542,928 | |
| | | | |
| |
NET ASSET VALUE | | | | |
Class A Shares: | | | | |
Net asset value and redemption price per share ($407,004,300 applicable to 29,131,439 shares of beneficial interest outstanding - Note 5) | | $ | 13.97 | |
Maximum sales charge, 2.00% of offering price | | | 0.29 | |
| | | | |
Maximum offering price per share | | $ | 14.26 | |
| | | | |
| |
Class C Shares: | | | | |
Net asset value and offering price per share* ($152,840,426 applicable to 10,925,414 shares of beneficial interest outstanding - Note 5) | | $ | 13.99 | |
| | | | |
| |
Class I Shares: | | | | |
Net asset value, offering and redemption price per share ($903,698,202 applicable to 64,763,744 shares of beneficial interest outstanding - Note 5) | | $ | 13.95 | |
| | | | |
| * | Redemption price per share is equal to net asset value less any applicable contingent deferred sales charge. |
See notes to financial statements.
Semi-Annual Report 19
| | |
| Statement of Operations | | |
| |
Thornburg Intermediate Municipal Fund | | Six Months Ended March 31, 2017 (Unaudited) |
| | | | |
INVESTMENT INCOME | | | | |
Interest income (net of premium amortized of $7,336,530) | | $ | 22,774,512 | |
| | | | |
| |
EXPENSES | | | | |
Investment advisory fees (Note 4) | | | 3,370,067 | |
Administration fees (Note 4) | | | | |
Class A Shares | | | 272,204 | |
Class C Shares | | | 100,158 | |
Class I Shares | | | 226,345 | |
Distribution and service fees (Note 4) | | | | |
Class A Shares | | | 544,407 | |
Class C Shares | | | 479,761 | |
Transfer agent fees | | | | |
Class A Shares | | | 114,151 | |
Class C Shares | | | 39,946 | |
Class I Shares | | | 376,400 | |
Registration and filing fees | | | | |
Class A Shares | | | 12,651 | |
Class C Shares | | | 9,584 | |
Class I Shares | | | 30,247 | |
Custodian fees (Note 2) | | | 90,580 | |
Professional fees | | | 31,562 | |
Accounting fees (Note 4) | | | 25,983 | |
Trustee fees | | | 34,880 | |
Other expenses | | | 61,283 | |
| | | | |
Total Expenses | | | 5,820,209 | |
Less: | | | | |
Expenses reimbursed by investment advisor (Note 4) | | | (22,333 | ) |
| | | | |
Net Expenses | | | 5,797,876 | |
| | | | |
Net Investment Income | | | 16,976,636 | |
| | | | |
| |
REALIZED AND UNREALIZED GAIN (LOSS) | | | | |
Net realized gain (loss) on investments | | | (6,454,832 | ) |
Net change in unrealized appreciation (depreciation) on investments | | | (49,758,993 | ) |
| | | | |
Net Realized and Unrealized Loss | | | (56,213,825 | ) |
| | | | |
Net Decrease in Net Assets Resulting from Operations | | $ | (39,237,189 | ) |
| | | | |
See notes to financial statements.
20 Semi-Annual Report
| | |
| Statements of Changes in Net Assets | | |
| |
Thornburg Intermediate Municipal Fund | | |
| | | | | | | | |
| | | SIX MONTHS ENDED
MARCH 31, 2017* | | | YEAR ENDED
SEPTEMBER 30, 2016 | |
INCREASE (DECREASE) IN NET ASSETS FROM | | | | | | | | |
| | |
OPERATIONS | | | | | | | | |
Net investment income | | $ | 16,976,636 | | | $ | 31,582,883 | |
Net realized gain (loss) on investments | | | (6,454,832 | ) | | | 87,293 | |
Net unrealized appreciation (depreciation) on investments | | | (49,758,993 | ) | | | 29,544,061 | |
| | | | | | | | |
Net Increase (Decrease) in Net Assets Resulting from Operations | | | (39,237,189 | ) | | | 61,214,237 | |
| | |
DIVIDENDS TO SHAREHOLDERS | | | | | | | | |
From net investment income | | | | | | | | |
Class A Shares | | | (4,613,158 | ) | | | (8,992,508 | ) |
Class C Shares | | | (1,438,127 | ) | | | (2,806,252 | ) |
Class I Shares | | | (10,925,351 | ) | | | (19,784,123 | ) |
| | |
FUND SHARE TRANSACTIONS (NOTE 5) | | | | | | | | |
Class A Shares | | | (43,844,022 | ) | | | 35,033,185 | |
Class C Shares | | | (11,377,257 | ) | | | 6,640,373 | |
Class I Shares | | | (21,179,553 | ) | | | 190,211,712 | |
| | | | | | | | |
Net Increase (Decrease) in Net Assets | | | (132,614,657 | ) | | | 261,516,624 | |
| | |
NET ASSETS | | | | | | | | |
Beginning of Period | | | 1,596,157,585 | | | | 1,334,640,961 | |
| | | | | | | | |
| | |
End of Period | | $ | 1,463,542,928 | | | $ | 1,596,157,585 | |
| | | | | | | | |
Distribution in excess of net investment income | | $ | (3,781 | ) | | $ | (3,781 | ) |
See notes to financial statements.
Semi-Annual Report 21
| | |
| Notes to Financial Statements | | |
| |
Thornburg Intermediate Municipal Fund | | March 31, 2017 (Unaudited) |
NOTE 1 – ORGANIZATION
Thornburg Intermediate Municipal Fund (the “Fund”) is a diversified series of Thornburg Investment Trust (the “Trust”). The Trust is organized as a Massachusetts business trust under a Declaration of Trust dated June 3, 1987 and is registered as a diversified, open-end management investment company under the Investment Company Act of 1940, as amended. The Fund is currently one of twenty-one separate series of the Trust. Each series is considered to be a separate entity for financial reporting and tax purposes and bears expenses directly attributable to it. The Fund’s primary investment objective is to obtain as high a level of current income exempt from federal individual income taxes as is consistent, in the view of Thornburg Investment Management, Inc., the Trust’s investment advisor (the “Advisor”), with the preservation of capital. The Fund’s secondary objective is to reduce expected changes in its share price compared to long-term bond portfolios.
The Fund currently offers three classes of shares of beneficial interest: Class A, Class C, and Institutional Class (“Class I”). Each class of shares of the Fund represents an interest in the same portfolio of investments, except that (i) Class A shares are sold subject to a front-end sales charge collected at the time the shares are purchased and bear a service fee, (ii) Class C shares are sold at net asset value without a sales charge at the time of purchase, but are subject to a contingent deferred sales charge upon redemption within one year of purchase, and bear both a service fee and a distribution fee, (iii) Class I shares are sold at net asset value without a sales charge at the time of purchase and may be subject to a service fee, and (iv) the respective classes may have different reinvestment privileges and conversion rights. Additionally, the Fund may allocate among its classes certain expenses, to the extent allocable to specific classes, including transfer agent fees, government registration fees, certain printing and postage costs, and administrative and legal expenses. Currently, class specific expenses of the Fund are limited to service and distribution fees, administration fees, and certain registration and transfer agent expenses.
The following is a summary of significant accounting policies followed by the Fund in the preparation of its financial statements. The Fund prepares its financial statements in conformity with United States generally accepted accounting principles (“GAAP”), including investment company accounting and reporting guidance in the Financial Accounting Standards Board (the “FASB”) Accounting Standard Codification Topic 946.
NOTE 2 – SIGNIFICANT ACCOUNTING POLICIES
Security Valuation: All investments in securities held by the Fund are valued as described in Note 3.
Allocation of Income, Gains, Losses and Expenses: Net investment income (other than class specific expenses) and realized and unrealized gains and losses are allocated daily to each class of shares based upon the relative net asset value of outstanding shares (or the value of the dividend-eligible shares, as appropriate) of each class of shares at the beginning of the day (after adjusting for the current capital shares activity of the respective class). Expenses common to all Funds are allocated among the Funds comprising the Trust based upon their relative net asset values or other appropriate allocation methods. Operating expenses directly attributable to a specific class are charged against the operating income of that class.
Dividends and Distributions to Shareholders: Dividends and distributions to shareholders, which are determined in accordance with federal income tax regulations and may differ from GAAP, are recorded on the ex-dividend date. Ordinary income distributions, if any, are declared daily and paid monthly. Capital gain distributions, if any, are declared and paid annually and more often if deemed necessary by the Advisor. Dividends are paid and are reinvested in additional shares of the Fund at net asset value per share at the close of business on the ex-dividend date, or at the shareholder’s option, paid in cash.
Investment Income: Interest income is accrued as earned. Premiums and discounts are amortized and accreted, respectively, to call dates or maturity dates using the effective yield method of the respective investments. These amounts are included in Interest income on the Statement of Operations.
Custodian Fees: Custodian fees disclosed in the Statement of Operations may include interest expenses incurred by the Fund on any cash overdrafts of its custodian account during the period. Such cash overdrafts may result from the effects of failed trades in portfolio securities and from cash outflows resulting from unanticipated shareholder redemption activity. The Fund pays interest to its custodian on any such cash overdraft at a rate equal to 2.50% of the overdraft amount in excess of $50,000.
Investment Transactions: Investment transactions are accounted for on a trade date basis. Realized gains and losses from the sale of investments are recorded on an identified cost basis.
When-Issued and Delayed Delivery Transactions: The Fund may engage in when-issued or delayed delivery transactions. To the extent the Fund engages in such transactions, it will do so for the purpose of acquiring portfolio investments consistent with the Fund’s investment objectives and not for the purpose of investment leverage or to speculate on interest rate or market changes. At the time the Fund makes a commitment to purchase an investment on a when-issued or delayed delivery basis, the Fund will record the transaction and reflect the value in determining its net asset value. When effecting such transactions, assets of an amount sufficient to make payment
22 Semi-Annual Report
| | |
| Notes to Financial Statements, Continued | | |
| |
Thornburg Intermediate Municipal Fund | | March 31, 2017 (Unaudited) |
for the portfolio investments to be purchased will be segregated on the Fund’s records on the trade date. Investments purchased on a when-issued or delayed delivery basis do not earn interest until the settlement date.
Guarantees and Indemnifications: Under the Trust’s organizational documents (and under separate agreements with the independent Trustees), its officers and Trustees are provided with an indemnification against certain liabilities arising out of the performance of their duties to the Fund. In the normal course of business the Trust may also enter into contracts with service providers that contain general indemnifications. The Trust’s maximum exposure under these arrangements is unknown. However, based on experience, the Trust expects the risk of loss to be remote.
Use of Estimates: The preparation of financial statements in conformity with GAAP requires management to make estimates and assumptions that affect the reported amounts of assets and liabilities and disclosure of contingent assets and liabilities at the date of the financial statements and the reported amounts of increases (decreases) in net assets from operations during the reporting period. Actual results could differ from those estimates.
Federal Income Taxes: It is the policy of the Trust to comply with the provisions of the Internal Revenue Code applicable to regulated investment companies and to distribute to shareholders substantially all investment company taxable income including net realized gains on investments (if any), and tax exempt income of the Fund. Therefore, no provision for federal income or excise tax is required.
The Fund files income tax returns in United States federal and applicable state jurisdictions. The statute of limitations on the Fund’s tax return filings generally remains open for the three years following a return’s filing date. The Fund has analyzed its tax positions taken on Federal income tax returns for all open tax years and has concluded that no provision for income tax is required in the financial statements.
At March 31, 2017, information on the tax components of capital was as follows:
| | | | |
Cost of investments for tax purposes | | $ | 1,409,529,095 | |
| | | | |
| |
Gross unrealized appreciation on a tax basis | | $ | 49,538,549 | |
Gross unrealized depreciation on a tax basis | | | (11,132,955 | ) |
| | | | |
| |
Net unrealized appreciation (depreciation) on investments (tax basis) | | $ | 38,405,594 | |
| | | | |
At March 31, 2017, the Fund had deferred tax basis capital losses occurring subsequent to October 31, 2015 through September 30, 2016 of $110. For tax purposes, such losses will be recognized in the year ending September 30, 2017.
At March 31, 2017, the Fund had cumulative tax basis capital losses of $91,303, (of which $0 are short-term and $91,303 are long-term) generated after September 30, 2011, which may be carried forward to offset future capital gains. To the extent such carryforwards are used, capital gain distributions may be reduced to the extent provided by regulations. Such capital loss carryforwards do not expire.
NOTE 3 – SECURITY VALUATION
Valuation of the Fund’s portfolio investment securities is performed in accordance with policies and procedures adopted by and under the oversight of the Trustees.
The Trustees of the Trust have appointed Thornburg Investment Management, Inc., the Trust’s investment advisor (the “Advisor”) to assist the Trustees in obtaining market values for portfolio investments, evaluate and monitor professional pricing service providers appointed by the Trustees’ Audit Committee (the “Audit Committee”) to assist in determining fair values for portfolio investments, assist in calculating fair values for portfolio investments in certain circumstances, and to perform other functions in connection with the valuation of investments. The Advisor acts through its Valuation and Pricing Committee (the “Committee”) and other employees of the Advisor. The Committee regularly reviews its own valuation calculations, as well as the valuations, valuation techniques and services furnished by pricing service providers, considers circumstances which may require valuation calculations by the Committee, and reviews previous valuation calculations. The Committee reports to the Audit Committee on the Committee’s activities, the performance of pricing service providers, and other matters relating to valuation of portfolio investments.
In those instances when the Committee assists in calculating a fair value for a portfolio investment, the Committee seeks to determine the price that the Fund would reasonably expect to receive upon a sale of the investment in an orderly transaction between market participants on the valuation date. The Committee customarily utilizes quotations from securities broker dealers in calculating valuations, but also may utilize prices obtained from pricing service providers or other methods approved by the Audit Committee. Because fair values calculated by the Committee are estimates, the calculation of a value for an investment may differ from the price that would be realized by the Fund upon a sale of the investment, and the difference could be material to the Fund’s financial statements. The
Semi-Annual Report 23
| | |
| Notes to Financial Statements, Continued | | |
| |
Thornburg Intermediate Municipal Fund | | March 31, 2017 (Unaudited) |
Committee’s calculation of a fair value for an investment may also differ from the prices obtained by other persons (including other mutual funds) for the investment.
Valuation of Securities: Debt obligations held by the Fund which are not listed or traded on exchanges or for which no reported market exists are ordinarily valued at the valuation obtained from a pricing service provider approved by the Audit Committee.
In any case when a pricing service provider fails to provide a valuation for a debt obligation held by the Fund, the Committee calculates a fair value for the obligation using alternative methods under procedures approved by the Audit Committee. Additionally, in cases when management believes that a valuation obtained from a pricing service provider merits review for significant reasons, the Committee decides whether or not to use the valuation calculated by the pricing service provider or to use an alternative method approved by the Audit Committee to calculate a fair value for the obligation.
Valuation Hierarchy: The Fund categorizes its investments based upon the inputs used in valuing those investments, according to a three-level hierarchy established in guidance from FASB. Categorization of investments using this hierarchy is intended by the FASB to maximize the use of observable inputs in valuing investments and minimize the use of unobservable inputs by requiring that the most observable inputs be used when available. Observable inputs are those that market participants would use in valuing an investment based on available market information. Unobservable inputs are those that reflect assumptions about the information market participants would use in valuing an investment. An investment’s level within the hierarchy is based on the lowest level input that is deemed significant to the valuation. The methodologies and inputs used to value investments are not necessarily indications of the risk or liquidity associated with those investments.
Various inputs are used in calculating valuations for the Fund’s investments. These inputs are generally summarized according to the three-level hierarchy below:
Level 1: Quoted prices in active markets for identical investments.
Level 2: Other direct or indirect significant observable inputs (including quoted prices for similar investments in active markets and other observable inputs, such as interest rates, prepayment rates, credit risk, etc.).
Level 3: Significant unobservable inputs (including the Committee’s own assumptions in calculating the fair values of investments).
Valuations for debt obligations held by the Fund are typically calculated by pricing service providers approved by the Audit Committee and are characterized as Level 2 within the valuation hierarchy.
In a limited number of cases the Committee calculates a fair value for investments using broker quotations or other methods approved by the Audit Committee. When the Committee uses a single broker quotation to calculate a fair value for an investment without other significant observable inputs, or if a fair value is calculated using other significant inputs that are considered unobservable, the investment is characterized as Level 3 within the hierarchy. Other significant unobservable inputs used to calculate a fair value in these instances might include an income-based valuation approach which considers discounted anticipated future cash flows from the investment, and application of discounts due to the nature or duration of any restrictions on the disposition of the investment.
Valuations based upon the use of inputs from Levels 1, 2 or 3 may not represent the actual price received upon the disposition of an investment, and the Fund may receive a price that is lower than the valuation based upon these inputs when it sells the investment.
The following table displays a summary of the fair value hierarchy measurements of the Fund’s investments as of March 31, 2017. In any instance when valuation inputs from more than one level are used to determine the fair value of a specific investment, the investment is placed in the level of the table based upon the lowest level input that is significant in determining the fair value of the investment:
| | | | | | | | | | | | | | | | |
| | | FAIR VALUE MEASUREMENTS AT MARCH 31, 2017 | |
| | | TOTAL | | | LEVEL 1 | | | LEVEL 2 | | | LEVEL 3 | |
Assets | | | | | | | | | | | | | | | | |
Investments in Securities | | | | | | | | | | | | | | | | |
Municipal Bonds | | $ | 1,447,934,689 | | | $ | — | | | $ | 1,447,934,689 | | | $ | — | |
| | | | | | | | | | | | | | | | |
Total Investments in Securities | | $ | 1,447,934,689 | | | $ | — | | | $ | 1,447,934,689 | | | $ | — | |
In accordance with the guidance prescribed in Accounting Standards Update No. 2011-04, it is the policy of the Fund to recognize transfers between levels and the underlying events which caused the movement. The Fund recognized no transfers between levels for the six months ended March 31, 2017.
24 Semi-Annual Report
| | |
| Notes to Financial Statements, Continued | | |
| |
Thornburg Intermediate Municipal Fund | | March 31, 2017 (Unaudited) |
NOTE 4 – INVESTMENT ADVISORY FEE AND OTHER TRANSACTIONS WITH AFFILIATES
Pursuant to an investment advisory agreement, the Advisor serves as the investment advisor and performs services for the Fund for which the fees are payable at the end of each month. Under the investment advisory agreement, the Fund pays the Advisor a management fee based on the daily net assets of the Fund at an annual rate as shown in the following table:
Management Fee Schedule
| | | | |
DAILY NET ASSETS | | FEE RATE | |
Up to $500 million | | | 0.500 | % |
Next $500 million | | | 0.450 | |
Next $500 million | | | 0.400 | |
Next $500 million | | | 0.350 | |
Over $2 billion | | | 0.275 | |
The Fund’s effective management fee for the six months ended March 31, 2017 was 0.45% of the Fund’s average net assets.
The Fund pays to the Advisor the costs of personnel who perform certain accounting services for the Fund. For the six months ended March 31, 2017 the Fund paid $25,983 to the Advisor for these accounting services. The Trust has also entered into administrative service agreements with the Advisor, whereby the Advisor will perform certain administrative services related to each class of the Fund’s shares, and for which fees will be payable at an annual rate of up to .125 of 1% per annum of the average daily net assets attributable to each class of shares. Total administrative service fees incurred by each class of shares of the Fund for the six months ended March 31, 2017, are set forth in the Statement of Operations.
The Trust has an underwriting agreement with Thornburg Securities Corporation (the “Distributor”), an affiliate of the Advisor, which acts as the distributor of the Fund’s shares. For the six months ended March 31, 2017, the Distributor has advised the Fund that it earned net commissions aggregating $604 from the sale of Class A shares, and collected contingent deferred sales charges aggregating $3,352 from redemptions of Class C shares of the Fund.
Pursuant to a service plan under Rule 12b-1 of the Investment Company Act of 1940, the Fund may reimburse to the Distributor an amount not to exceed .25 of 1% per annum of the average daily net assets attributable to Class A and Class C shares of the Fund for payments made by the Distributor to securities dealers and other financial institutions to obtain various shareholder and distribution related services. For the six months ended March 31, 2017, there were no 12b-1 service plan fees charged for Class I shares. The Advisor and the Distributor each may pay out of its own resources additional expenses for distribution of the Fund’s shares and shareholder services.
The Trust has also adopted a distribution plan pursuant to Rule 12b-1, applicable only to the Fund’s Class C shares, under which the Fund compensates the Distributor for services in promoting the sale of Class C shares of the Fund at an annual rate of up to .25 of 1% per annum of the average daily net assets attributable to Class C shares.
Total fees incurred by each class of shares of the Fund under their respective service and distribution plans for the six months ended March 31, 2017, are set forth in the Statement of Operations.
The Advisor and Distributor have contractually agreed to waive fees and reimburse expenses incurred by the Fund so that actual expenses of certain share classes do not exceed levels as specified in the Fund’s most recent prospectus. The agreement may be terminated by the Fund at any time, but may not be terminated by the Advisor or Distributor before April 10, 2018, unless the Advisor ceases to be the investment advisor to the Fund or the Distributor ceases to be the distributor of the Fund prior to that date. The Advisor and Distributor may recoup amounts waived or reimbursed during the fiscal year if actual expenses fall below the contractual limit during that year.
For the six months ended March 31, 2017 the Advisor contractually reimbursed certain class specific expenses, administrative fees, and distribution fees of $22,333 for Class C shares.
Certain officers and Trustees of the Trust are also officers or directors of the Advisor and Distributor. The compensation of independent Trustees is borne by the Trust.
The percentage of direct investments in the Fund held by Trustees and Officers of the Trust and the Advisor is 0.27%.
The Fund may purchase or sell securities from, or to an affiliated fund, provided the affiliation is due solely to having a common investment advisor, common officers, or common trustees, and provided that all such transactions will comply with Rule 17a-7 under the 1940 Act. For the six months ended March 31, 2017, the Fund had no transactions with affiliated funds.
Semi-Annual Report 25
| | |
| Notes to Financial Statements, Continued | | |
| |
Thornburg Intermediate Municipal Fund | | March 31, 2017 (Unaudited) |
NOTE 5 – SHARES OF BENEFICIAL INTEREST
At March 31, 2017, there were an unlimited number of shares with no par value of beneficial interest authorized. Transactions in shares of beneficial interest were as follows:
| | | | | | | | | | | | | | | | |
| | | SIX MONTHS ENDED
MARCH 31, 2017 (UNAUDITED) | | | YEAR ENDED
SEPTEMBER 30, 2016 (AUDITED) | |
| | | SHARES | | | AMOUNT | | | SHARES | | | AMOUNT | |
Class A Shares | | | | | | | | | | | | | | | | |
Shares sold | | | 2,739,952 | | | $ | 38,315,853 | | | | 9,279,089 | | | $ | 133,413,786 | |
Shares issued to shareholders in reinvestment of dividends | | | 303,907 | | | | 4,252,862 | | | | 574,357 | | | | 8,275,394 | |
Shares repurchased | | | (6,198,333 | ) | | | (86,412,737 | ) | | | (7,420,820 | ) | | | (106,655,995 | ) |
| | | | | | | | | | | | | | | | |
| | | | |
Net increase (decrease) | | | (3,154,474 | ) | | $ | (43,844,022 | ) | | | 2,432,626 | | | $ | 35,033,185 | |
| | | | | | | | | | | | | | | | |
Class C Shares | | | | | | | | | | | | | | | | |
Shares sold | | | 517,295 | | | $ | 7,270,574 | | | | 1,913,796 | | | $ | 27,572,239 | |
Shares issued to shareholders in reinvestment of dividends | | | 87,125 | | | | 1,220,676 | | | | 165,842 | | | | 2,392,143 | |
Shares repurchased | | | (1,418,438 | ) | | | (19,868,507 | ) | | | (1,617,751 | ) | | | (23,324,009 | ) |
| | | | | | | | | | | | | | | | |
| | | | |
Net increase (decrease) | | | (814,018 | ) | | $ | (11,377,257 | ) | | | 461,887 | | | $ | 6,640,373 | |
| | | | | | | | | | | | | | | | |
Class I Shares | | | | | | | | | | | | | | | | |
Shares sold | | | 15,980,993 | | | $ | 222,907,727 | | | | 25,331,370 | | | $ | 364,312,426 | |
Shares issued to shareholders in reinvestment of dividends | | | 692,771 | | | | 9,683,346 | | | | 1,211,588 | | | | 17,444,423 | |
Shares repurchased | | | (18,224,200 | ) | | | (253,770,626 | ) | | | (13,320,008 | ) | | | (191,545,137 | ) |
| | | | | | | | | | | | | | | | |
| | | | |
Net increase (decrease) | | | (1,550,436 | ) | | $ | (21,179,553 | ) | | | 13,222,950 | | | $ | 190,211,712 | |
| | | | | | | | | | | | | | | | |
NOTE 6 – INVESTMENT TRANSACTIONS
For the six months ended March 31, 2017, the Fund had purchase and sale transactions of investments (excluding short-term investments) of $159,405,661 and $179,999,063 respectively.
OTHER NOTES
Risks: The Fund’s investments subject it to risks including, but not limited to, credit risk, interest rate risk, management risk, market and economic risk, and liquidity risk. Please see the Fund’s prospectus for a discussion of the risks associated with an investment in the Fund.
Subsequent Events: Fund management believes no events have occurred between March 31, 2017 and the date of issuance of the financial statements that require adjustment to or disclosure in the accompanying financial statements.
26 Semi-Annual Report
This page intentionally left blank.
Semi-Annual Report 27
Financial Highlights
Thornburg Intermediate Municipal Fund
| | | | | | | | | | | | | | | | | | | | | | | | | | | | | | | | | | | | | | | | | | | | | | | | | | | | | | |
| | | PER SHARE PERFORMANCE (FOR A SHARE OUTSTANDING THROUGHOUT THE PERIOD) | | | RATIOS TO AVERAGE NET ASSETS | | | SUPPLEMENTAL DATA | |
UNLESS
OTHERWISE
NOTED,
PERIODS
ARE
FISCAL
YEARS
ENDED
SEPT. 30, | | NET ASSET
VALUE
BEGINNING
OF PERIOD | | | NET
INVESTMENT
INCOME
(LOSS)+ | | NET
REALIZED
&
UNREALIZED
GAIN (LOSS)
ON
INVESTMENTS | | | TOTAL FROM
INVESTMENT
OPERATIONS | | | DIVIDENDS
FROM NET
INVESTMENT
INCOME | | | DIVIDENDS FROM NET REALIZED GAINS | | TOTAL
DIVIDENDS | | | NET
ASSET
VALUE
END
OF
PERIOD | | | NET
INVESTMENT
INCOME
(LOSS)
(%) | | | EXPENSES,
AFTER
EXPENSE
REDUCTIONS
(%) | | | EXPENSES,
AFTER
EXPENSE
REDUCTIONS
AND
NET OF
CUSTODY
CREDITS
(%) | | | EXPENSES,
BEFORE
EXPENSE
REDUCTIONS
(%) | | | TOTAL
RETURN
(%)(a) | | | PORTFOLIO TURNOVER RATE (%)(a) | | NET
ASSETS
AT END
OF
PERIOD
(THOUSANDS) | |
CLASS A SHARES | | | | | | | | | | | | | | | | | | | | | | | | | | | | | | | | | | | | | | | | | |
2017(b)(c) | | $ | 14.47 | | | 0.15 | | | (0.50 | ) | | | (0.35 | ) | | | (0.15 | ) | | — | | | (0.15 | ) | | | $13.97 | | | | 2.12 | (d) | | | 0.91 | (d) | | | 0.91 | (d) | | | 0.91 | (d) | | | (2.43 | ) | | 11.99 | | $ | 407,005 | |
2016(c) | | $ | 14.17 | | | 0.29 | | | 0.30 | | | | 0.59 | | | | (0.29 | ) | | — | | | (0.29 | ) | | | $14.47 | | | | 2.00 | | | | 0.92 | | | | 0.92 | | | | 0.92 | | | | 4.17 | | | 10.80 | | $ | 467,335 | |
2015(c) | | $ | 14.23 | | | 0.30 | | | (0.06 | ) | | | 0.24 | | | | (0.30 | ) | | — | | | (0.30 | ) | | | $14.17 | | | | 2.09 | | | | 0.92 | | | | 0.92 | | | | 0.92 | | | | 1.68 | | | 13.49 | | $ | 423,113 | |
2014(c) | | $ | 13.76 | | | 0.34 | | | 0.47 | | | | 0.81 | | | | (0.34 | ) | | — | | | (0.34 | ) | | | $14.23 | | | | 2.43 | | | | 0.92 | | | | 0.92 | | | | 0.92 | | | | 5.95 | | | 14.85 | | $ | 417,369 | |
2013(c) | | $ | 14.22 | | | 0.33 | | | (0.46 | ) | | | (0.13 | ) | | | (0.33 | ) | | — | | | (0.33 | ) | | | $13.76 | | | | 2.37 | | | | 0.92 | | | | 0.92 | | | | 0.92 | | | | (0.91 | ) | | 29.18 | | $ | 429,941 | |
CLASS C SHARES | | | | | | | | | | | | | | | | | | | | | | | | | | | | | | | | | | | | | | | | | |
2017(b) | | $ | 14.49 | | | 0.13 | | | (0.50 | ) | | | (0.37 | ) | | | (0.13 | ) | | — | | | (0.13 | ) | | | $13.99 | | | | 1.79 | (d) | | | 1.24 | (d) | | | 1.24 | (d) | | | 1.27 | (d) | | | (2.58 | ) | | 11.99 | | $ | 152,840 | |
2016 | | $ | 14.19 | | | 0.24 | | | 0.30 | | | | 0.54 | | | | (0.24 | ) | | — | | | (0.24 | ) | | | $14.49 | | | | 1.68 | | | | 1.24 | | | | 1.24 | | | | 1.27 | | | | 3.84 | | | 10.80 | | $ | 170,149 | |
2015 | | $ | 14.25 | | | 0.25 | | | (0.06 | ) | | | 0.19 | | | | (0.25 | ) | | — | | | (0.25 | ) | | | $14.19 | | | | 1.77 | | | | 1.24 | | | | 1.24 | | | | 1.28 | | | | 1.35 | | | 13.49 | | $ | 160,042 | |
2014 | | $ | 13.78 | | | 0.30 | | | 0.47 | | | | 0.77 | | | | (0.30 | ) | | — | | | (0.30 | ) | | | $14.25 | | | | 2.11 | | | | 1.24 | | | | 1.24 | | | | 1.29 | | | | 5.61 | | | 14.85 | | $ | 157,126 | |
2013 | | $ | 14.24 | | | 0.29 | | | (0.46 | ) | | | (0.17 | ) | | | (0.29 | ) | | — | | | (0.29 | ) | | | $13.78 | | | | 2.05 | | | | 1.24 | | | | 1.24 | | | | 1.30 | | | | (1.22 | ) | | 29.18 | | $ | 159,727 | |
CLASS I SHARES | | | | | | | | | | | | | | | | | | | | | | | | | | | | | | | | | | | | | | | | | |
2017(b) | | $ | 14.46 | | | 0.17 | | | (0.51 | ) | | | (0.34 | ) | | | (0.17 | ) | | — | | | (0.17 | ) | | | $13.95 | | | | 2.41 | (d) | | | 0.62 | (d) | | | 0.62 | (d) | | | 0.62 | (d) | | | (2.36 | ) | | 11.99 | | $ | 903,698 | |
2016 | | $ | 14.15 | | | 0.33 | | | 0.31 | | | | 0.64 | | | | (0.33 | ) | | — | | | (0.33 | ) | | | $14.46 | | | | 2.30 | | | | 0.61 | | | | 0.61 | | | | 0.61 | | | | 4.57 | | | 10.80 | | $ | 958,674 | |
2015 | | $ | 14.22 | | | 0.34 | | | (0.07 | ) | | | 0.27 | | | | (0.34 | ) | | — | | | (0.34 | ) | | | $14.15 | | | | 2.39 | | | | 0.62 | | | | 0.62 | | | | 0.62 | | | | 1.91 | | | 13.49 | | $ | 751,486 | |
2014 | | $ | 13.75 | | | 0.38 | | | 0.47 | | | | 0.85 | | | | (0.38 | ) | | — | | | (0.38 | ) | | | $14.22 | | | | 2.73 | | | | 0.62 | | | | 0.61 | | | | 0.62 | | | | 6.28 | | | 14.85 | | $ | 618,280 | |
2013 | | $ | 14.20 | | | 0.38 | | | (0.45 | ) | | | (0.07 | ) | | | (0.38 | ) | | — | | | (0.38 | ) | | | $13.75 | | | | 2.68 | | | | 0.61 | | | | 0.61 | | | | 0.61 | | | | (0.53 | ) | | 29.18 | | $ | 449,501 | |
| (a) | Not annualized for periods less than one year. |
| (b) | Unaudited Six Month Period Ended March 31. |
| (c) | Sales loads are not reflected in computing total return. |
| + | Based on weighted average shares outstanding. |
See notes to financial statements.
| | | | |
| 28 Semi-Annual Report | | | | Semi-Annual Report 29 |
| | |
| Expense Example | | |
| |
Thornburg Intermediate Municipal Fund | | March 31, 2017 (Unaudited) |
As a shareholder of the Fund, you incur two types of costs:
| | (1) | transaction costs, including |
(a) sales charges (loads) on purchase payments, for Class A shares;
(b) a deferred sales charge on redemptions of any part or all of a purchase of $1 million of Class A shares within 12 months of purchase;
(c) a deferred sales charge on redemptions of Class C shares within 12 months of purchase;
| | (2) | ongoing costs, including management fees; distribution and/or service (12b-1) fees; and other Fund expenses. |
This example is intended to help you understand your ongoing costs (in dollars) of investing in the Fund and to compare these costs with the ongoing costs of investing in other mutual funds.
The example is based on a $1,000 investment beginning on October 1, 2016, and held until March 31, 2017.
| | | | | | | | | | | | |
| | | BEGINNING
ACCOUNT VALUE
10/1/16 | | | ENDING
ACCOUNT VALUE
3/31/17 | | | EXPENSES PAID
DURING PERIOD†
10/1/16–3/31/17 | |
Class A Shares | | | | | | | | | | | | |
Actual | | $ | 1,000.00 | | | $ | 975.73 | | | $ | 4.51 | |
Hypothetical* | | $ | 1,000.00 | | | $ | 1,020.37 | | | $ | 4.61 | |
Class C Shares | | | | | | | | | | | | |
Actual | | $ | 1,000.00 | | | $ | 974.20 | | | $ | 6.10 | |
Hypothetical* | | $ | 1,000.00 | | | $ | 1,018.75 | | | $ | 6.24 | |
Class I Shares | | | | | | | | | | | | |
Actual | | $ | 1,000.00 | | | $ | 976.44 | | | $ | 3.06 | |
Hypothetical* | | $ | 1,000.00 | | | $ | 1,021.83 | | | $ | 3.13 | |
| † | Expenses are equal to the annualized expense ratio for each class (A: 0.91%; C: 1.24%; I: 0.62%) multiplied by the average account value over the period, multiplied by 182/365 to reflect the one-half year period. |
| * | Hypothetical assumes a rate of return of 5% per year before expenses. |
ACTUAL EXPENSES
For each class of shares, the first line of the accompanying table provides information about actual account values and actual expenses. You may use the information in this line, together with the amount you invested, to estimate the expenses that you paid over the period. Simply divide your account value by $1,000 (for example, an $8,600 account value divided by $1,000 = 8.6), then multiply the result by the number in the first line for your class of shares under the heading entitled “Expenses Paid During Period” to estimate the expenses you paid on your account during this period.
HYPOTHETICAL EXAMPLE FOR COMPARISON PURPOSES
For each class of shares, the second line of the accompanying table provides information about hypothetical account values and hypothetical expenses based on the Fund’s actual expense ratio and an assumed rate of return of 5% per year before expenses, which is not the Fund’s actual return. The hypothetical account values and expenses may not be used to estimate the actual ending account balance or expenses you paid for the period. You may use this information to compare the ongoing costs of investing in the Fund and other funds. To do so, compare this 5% hypothetical example with the 5% hypothetical examples that appear in the shareholder reports of the other funds.
Please note that the expenses shown in the table are meant to highlight your ongoing costs only and do not reflect any transactional costs, such as sales charges (loads), redemption fees, or exchange fees. Therefore, the second line of the table for each class of shares is useful in comparing ongoing costs only, and will not help you determine the relative total costs of owning different funds. In addition, if these transactional costs were included, your costs would have been higher.
30 Semi-Annual Report
| | |
| Other Information | | |
| |
Thornburg Intermediate Municipal Fund | | March 31, 2017, 2015 (Unaudited) |
PORTFOLIO PROXY VOTING
Policies and Procedures:
The Trust has delegated to Thornburg Investment Management, Inc. (the “Advisor”) voting decisions respecting proxies for the Fund’s voting securities. The Advisor makes voting decisions in accordance with its Proxy Voting Policy. A description of the Policy is available (i) without charge, upon request, by calling the Advisor toll-free at 1-800-847-0200, (ii) on the Thornburg website at www.thornburg. com, and (iii) on the Securities and Exchange Commission’s website at www.sec.gov.
Information regarding how proxies were voted is available on or before August 31 of each year for the twelve months ending the preceding June 30. This information is available (i) without charge, upon request by calling the Advisor toll-free at 1-800-847-0200, (ii) on the Thornburg website at www.thornburg.com, and (iii) on the Securities and Exchange Commission’s website at www.sec.gov.
AVAILABILITY OF QUARTERLY PORTFOLIO SCHEDULE
The Fund files with the Securities and Exchange Commission schedules of its portfolio holdings on Form N-Q for the first and third quarters of each fiscal year. The Fund’s Forms N-Q are available on the Commission’s website at www.sec.gov, or may be reviewed and copied at the Commission’s Public Reference Room in Washington, D.C. Information on the operation of the Public Reference Room may be obtained by calling 1-800-SEC-0330. The Fund also makes this information available on its website at www.thornburg. com/download or upon request by calling 1-800-847-0200.
Semi-Annual Report 31
Trustees’ Statement to Shareholders
Readopted September 12, 2016
The Trustees believe current and prospective shareholders should know how we discharge our responsibilities in supervising the Funds’ investment advisor and in reviewing the advisor’s contract for renewal. Since 2005, we have issued a statement which sets out clearly the three principal guidelines that we follow in supervising the Trust’s investment advisor on your behalf. In accordance with our customary practice, in September of this year we again reviewed our statement and concluded we should reissue this statement outlining the principal features of our supervision of the advisor’s performance of investment management services for the Funds.
We begin with the premise that each shareholder selected his or her Fund because its investments are managed by the investment advisor identified in the prospectus and in accordance with the objective and policies described in the prospectus. We realize, as each of you do, that if you believe that your Fund’s stated objective and policies no longer serve your personal investment goals, you can sell your shares and leave the Fund.
Therefore, we believe that our primary supervisory task - our principal obligation to you - is to assess the nature and quality of the advisor’s services, and to confirm that the advisor actively and competently pursues the Fund’s objective, in accordance with the policies set out in the prospectus. To do this, we meet regularly with management to review your Fund’s portfolio and to discuss the advisor’s specific actions and judgments in pursuing the Fund’s objective. We do not substitute our own judgment for the advisor’s decisions in selecting investments; the advisor is paid to exercise its informed judgment on investment decisions, and we seek to confirm, in reviewing the advisor’s performance, that the advisor is doing just that.
Second, we are conscious of costs and the effect that costs have on shareholders’ returns. We try to make sure that your Fund’s fees and costs are reasonable in relationship to the services rendered and that they are generally in line with those charged by other expert investment advisors, consistent with our belief that the Fund’s investors searched for and expect that expertise and attention and have decided to pay a reasonable price for it. We do not put the management contract “out to bid” as a matter of course, and we would not do so unless we had concluded that the advisor materially had failed to pursue the Fund’s objectives in accordance with its policies, or for other equally important reasons. We believe that any other approach would be inconsistent with your interests and contrary to your expectations when you bought shares of the Fund in the first place.
Finally, because we believe that most Thornburg Fund shareholders have invested with a long-term perspective, we try not to focus too much on the fashions of the moment and on short-term performance. The market will not favor any specific investment objective or set of policies at all times and under all economic circumstances. A fund will experience periods of both high and low returns relative to other funds and other investments. Even if one of our Funds is not favored by the market at a particular time, we believe that the advisor is nonetheless obliged to remain true to the Fund’s objective and policies, and we watch to see that it does so.
Trustees of Thornburg Investment Trust
32 Semi-Annual Report
Thornburg Funds
Thornburg Investment Management is a privately-owned global investment firm that offers a range of solutions for retail and institutional investors. Founded in 1982 and headquartered in Santa Fe, New Mexico, we manage approximately $49 billion (as of March 31, 2017) across U.S. mutual funds, separate accounts for high-net-worth investors and institutional accounts, and UCITS funds for non-U.S. investors.
The fund outlined in this report is one of many equity and fixed-income products available from Thornburg Investment Management.
EQUITY FUNDS
| | • | | Thornburg Investment Income Builder Fund |
| | • | | Thornburg Global Opportunities Fund |
| | • | | Thornburg International Value Fund |
| | • | | Thornburg Better World International Fund |
| | • | | Thornburg International Growth Fund |
| | • | | Thornburg Developing World Fund |
| | • | | Thornburg Core Growth Fund |
FIXED INCOME FUNDS
| | • | | Thornburg Low Duration Income Fund |
| | • | | Thornburg Limited Term U.S. Government Fund |
| | • | | Thornburg Limited Term Income Fund |
| | • | | Thornburg Strategic Income Fund |
| | • | | Thornburg Low Duration Municipal Fund |
| | • | | Thornburg Limited Term Municipal Fund |
| | • | | Thornburg Intermediate Municipal Fund |
| | • | | Thornburg California Limited Term Municipal Fund |
| | • | | Thornburg New Mexico Intermediate Municipal Fund |
| | • | | Thornburg New York Intermediate Municipal Fund |
| | • | | Thornburg Strategic Municipal Income Fund |
ALTERNATIVE FUNDS
| | • | | Thornburg Long/Short Equity Fund |
Before investing, carefully consider the Fund’s investment goals, risks, charges, and expenses. For a prospectus or summary prospectus containing this and other information, contact your financial advisor or visit thornburg.com. Read it carefully before investing.
For additional information, please visit thornburg.com
Thornburg Investment Management, Inc. 2300 North Ridgetop Road, Santa Fe, NM 87506
Semi-Annual Report 33
This page intentionally left blank.
34 Semi-Annual Report
This page intentionally left blank.
Semi-Annual Report 35

| | |
|
| This Semi-Annual Report is submitted for the general information of shareholders of the Fund. It is not authorized for distribution to prospective investors in the Fund unless preceded or accompanied by an effective prospectus. |
| | | | |
| Investment Advisor: | | Distributor: | | |
| Thornburg Investment Management® | | Thornburg Securities Corporation® | | |
| 800.847.0200 | | 800.847.0200 | | TH172 |
2 Semi-Annual Report
Semi-Annual Report
Thornburg Strategic Municipal Income Fund
March 31, 2017
| | | | |
SHARE CLASS | | NASDAQ SYMBOL | | CUSIP |
Class A | | TSSAX | | 885-216-101 |
Class C | | TSSCX | | 885-216-200 |
Class I | | TSSIX | | 885-216-309 |
Minimum investments for Class I shares may be higher than those for other classes. Class I shares may not be available to all investors.
Investments carry risks, including possible loss of principal. Portfolios investing in bonds have the same interest rate, inflation, and credit risks that are associated with the underlying bonds. The value of bonds will fluctuate relative to changes in interest rates, decreasing when interest rates rise. This effect is more pronounced for longer-term bonds. Unlike bonds, bond funds have ongoing fees and expenses. Investments in lower rated and unrated bonds may be more sensitive to default, downgrades, and market volatility; these investments may also be less liquid than higher rated bonds. Investments in derivatives are subject to the risks associated with the securities or other assets underlying the pool of securities, including illiquidity and difficulty in valuation. Please see the Fund’s prospectus for a discussion of the risks associated with an investment in the Fund. Investments in the Fund are not FDIC insured, nor are they bank deposits or guaranteed by a bank or any other entity.
Semi-Annual Report 3
| | |
| Letter to Shareholders | | |
| |
Thornburg Strategic Municipal Income Fund | | March 31, 2017 (Unaudited) |
April 28, 2017
Dear Fellow Shareholder:
We are pleased to present the semi-annual report for Thornburg Strategic Municipal Income Fund. The net asset value (NAV) of the Class A shares decreased by 60 cents to $14.93 per share during the six-month period ended March 31, 2017. If you were with us the entire period, you received dividends of 16.32 cents per share. If you reinvested your dividends, you received 16.39 cents per share. Dividends were lower for Class C shares and higher for Class I shares to account for varying class-specific expenses. The Class A shares of your Fund underperformed the index with a negative 2.81% total return (without sales charge) for the six months ended March 31, 2017, compared to the negative 2.16% return for the BofA Merrill Lynch Municipal Master Index.
The Fund’s duration exposure contributed 0.73% to relative performance. Performance attributed to credit factors detracted 0.40% from performance, and was largely driven by a single, troubled, legacy issue. Other risk factors detracted 0.48% from performance. Fund expenses accounted for the other differences.
The Municipal Bond Market
After a few years of relative quiet in the municipal bond market, things heated up following the election of Donald Trump in 2016. While stocks were rallying, bond prices, particularly municipal bond prices, came under pressure. Bond yields initially rose after the election based on expectations for greater infrastructure spending, stronger growth and higher inflation. The uptick in rates led mutual fund investors to sell their shares, which caused municipal bond mutual funds to sell their bonds to meet those redemptions. After significant inflows in January to September of 2016, investors pulled $26 billion from municipal bond funds in November and December, some of which was related to tax-loss selling.
When the calendar turned in 2017, these outflows slowed and the municipal bond market produced positive returns. A contributing factor to positive returns was a decline in municipal bond issuance, as during the first quarter of 2017, the supply of new municipal bonds declined by 12% from the same time last year.
The value metrics we use at Thornburg suggest that the municipal bond market continues to price in the rosiest of scenarios moving forward, as investors have been pushed out of the risk spectrum. That is why we have Thornburg Strategic Municipal Income Fund positioned in the lower end of its respective risk spectrum. In this environment, we continue to keep duration shorter, credit quality higher and we maintain higher levels of reserves.
Inside the Risk Metrics
Real yields, which indicate how much yield over inflation investors are being paid to own municipal bonds, increased over the six-month period. As of September 30, 2016, 10-year AAA general obligation (GO) bonds were yielding 1.64% and the Core Personal Consumption Expenditures Index (PCE) was running at 1.70%, so investors were earning less than inflation. By the end of February 2017, the yield on 10-year AAA GO bonds had increased to 2.30%, while Core PCE was running at 1.80%. While certainly more interesting at the end of the period, the 0.5% real yield was significantly less than the average of 2% investors have earned over the past 20 years.
The second thing to consider is credit spreads, which reflect the incremental yield an investor earns from owning a lower-rated credit versus a higher-rated credit, and which today remain narrow. As of March 31, 2017, an investor earned about 1.28% more for owning a 10-year BBB revenue bond versus a 10-year AAA GO bond. That is slightly higher than the average 0.75% an investor earned between 1994 and 2007. However, in 2007, approximately 50% of the new-issue municipal bond market was insured by AAA/AAA municipal bond insurers. Today, there are no AAA/AAA municipal bond insurers, and insurance coverage generally accounts for only 6% to 8% of the new-issue municipal bond market.
Finally, the slope of the yield curve, which tracks how much incremental yield an investor earns by owning securities with longer maturities, is slightly flatter than historical averages. Currently, investors are earning about 1.4% more for owning a 10-year AAA GO municipal bond, versus a one-year AAA GO municipal bond. Since 1994, an investor earned on average almost 1.6% to extend maturities from one to 10 years.
The Economy and Tax Reform
The U.S. economy continued its slow recovery in 2016, growing at a rate of 1.6% for 2016 in aggregate.
Unemployment continued to tick down. During the six-month period ended March 31, 2017, the U.S. economy added 976,000 jobs and by the end of the period the unemployment rate had fallen to 4.5%. Inflation remained stable, with the Core PCE Index reading 1.75% through March, below the Fed’s 2% target range.
Taken in aggregate, the economy continues to grow, jobs are being added and inflation has remained contained to date. In an effort to keep the economy in check, the U.S. Federal Reserve raised the Fed funds rate in December of 2016, and again in March of 2017.
The economic health of the municipal bond market appears steady with a couple of notable exceptions. The drama in
4 Semi-Annual Report
| | |
| Letter to Shareholders, | | |
| |
Continued | | |
| |
Thornburg Strategic Municipal Income Fund | | March 31, 2017 (Unaudited) |
Puerto Rico is still playing out; the only winners are the consultants and lawyers hired by all sides.
Elsewhere, Bloomberg provides a heat map of the economic health of U.S. states, covering the period from the fourth quarter of 2015 through the fourth quarter of 2016 (the most recent data available). The majority of the states appear healthy except those with heavy dependence on oil, gas, and coal. The energy-dependent states should improve if oil can maintain prices above $50/barrel.
Tax reform is the second highest priority of President Trump’s and the Republican-led House agenda—second only to health care reform. The most important items in the tax proposals for the owners of municipal bonds (individuals as well as corporations) are those relevant to investment income. By lowering the effective tax rate on competing sources of income, prices of municipal bonds would most likely fall (yields would increase) to become more competitive with these alternative sources of income. There are a number of proposals that have been brought forth, and we believe that if tax reform is enacted, it will be something different than any one of these specific proposals.
President Trump’s tax reform proposal (released Thursday, April 27, 2017) called for the elimination of the deduction for state and local taxes on an individual’s federal tax return. This would, if adopted, have significant impacts for residents of high-tax states. The near-term effects on the economy would be minimal, but long term, residents would have less money in their pockets to spend, the cost of residing in high-tax states would increase and might cause out-migration and lower growth.
Conclusion
We continue to run this portfolio in an opportunistic fashion, taking higher degrees of risk when our shareholders are getting paid to take those risks. We go where the value is! Unfortunately, in this environment we see very little reason to position the portfolio any place other than the low end of its relative risk spectrum.
Thank you for your continued trust in us, and please know that the co-managers of this Fund are invested alongside you.
Sincerely,
| | |
 | |  |
Christopher Ryon,CFA Portfolio Manager Managing Director | | Nicholos Venditti,CFA Portfolio Manager Managing Director |
The matters discussed in this report may constitute forward-looking statements made pursuant to the safe harbor provisions of the Securities Litigation Reform Act of 1995. These include any advisor or portfolio manager prediction, assessment, analysis or outlook for individual securities, industries, investment styles, market sectors and/or markets. These statements involve risks and uncertainties. In addition to the general risks described for each fund in its current prospectus, other factors bearing on these reports include the accuracy of the advisor’s or portfolio manager’s forecasts and predictions, the appropriateness of the investment strategies designed by the advisor or portfolio manager and the ability of the advisor or portfolio manager to implement their strategies efficiently and successfully. Any one or more of these factors, as well as other risks affecting the securities markets generally, could cause the actual results of any fund to differ materially as compared to its benchmarks.
The views expressed are subject to change and do not necessarily reflect the views of Thornburg Investment Management, Inc. This information should not be relied upon as a recommendation or investment advice and is not intended to predict the performance of any investment or market.
Semi-Annual Report 5
| | |
| Performance Summary | | |
| |
Thornburg Strategic Municipal Income Fund | | March 31, 2017 (Unaudited) |
AVERAGE ANNUAL TOTAL RETURNS
| | | | | | | | | | | | | | | | |
| | | 1-YR | | | 3-YR | | | 5-YR | | | SINCE
INCEP. | |
A Shares (Incep: 4/1/09) | | | | | | | | | | | | | | | | |
Without sales charge | | | -0.90 | % | | | 2.81 | % | | | 3.07 | % | | | 6.40 | % |
With sales charge | | | -2.86 | % | | | 2.12 | % | | | 2.65 | % | | | 6.14 | % |
C Shares (Incep: 4/1/09) | | | | | | | | | | | | | | | | |
Without sales charge | | | -1.29 | % | | | 2.47 | % | | | 2.74 | % | | | 6.09 | % |
With sales charge | | | -1.87 | % | | | 2.47 | % | | | 2.74 | % | | | 6.09 | % |
I Shares (Incep: 4/1/09) | | | -0.67 | % | | | 3.11 | % | | | 3.39 | % | | | 6.72 | % |
30-DAY YIELDS, A SHARES
(with sales charge)
| | | | |
Annualized Distribution Yield | | | 2.29 | % |
SEC Yield | | | 1.60 | % |
GROWTH OF A HYPOTHETICAL $10,000 INVESTMENT
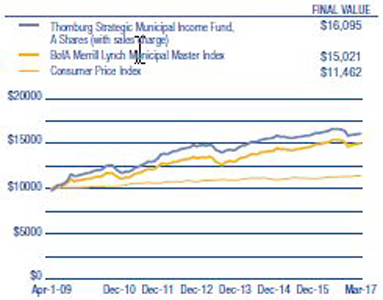
Performance data shown represents past performance and is no guarantee of Apr-1-09 Dec-10 Dec-11 Dec-12 Dec-13 Dec-14 Dec-15 Mar-17 future results. Investment return and principal value will fluctuate so shares, when redeemed, may be worth more or less than their original cost. Current performance may be lower or higher than quoted. For performance current to the most recent month end, visit thornburg.com or call 800-847-0200. The performance information does not reflect the deduction of taxes that a shareholder would pay on distributions or the redemption of Fund shares. Returns reflect the reinvestment of dividends and capital gains. Class A shares are sold with a maximum sales charge of 2.00%. Class C shares include a 0.60% CDSC for the first year only. There is no sales charge for Class I shares. As disclosed in the most recent prospectus, the total annual fund operating expenses are as follows: A shares, 1.29%; C shares, 1.66%; I shares, 0.93%. Thornburg Investment Management and/or Thornburg Securities Corporation have contractually agreed to waive fees and reimburse expenses through at least April 10, 2018, for some of the share classes, resulting in net expense ratios of the following: A shares, 1.00%; C shares, 1.51%; I shares, 0.78%. For more detailed information on fund expenses and waivers/reimbursements please see the Fund’s prospectus. Without the fee waivers and expense reimbursements, the Annualized Distribution yield would have been 2.17%, and the SEC yield would have been 1.46%.
Glossary
The BofA Merrill Lynch Municipal Master Index tracks the performance of the investment-grade U.S. tax-exempt bond market. Qualifying bonds must have at least one year remaining term to maturity, a fixed coupon schedule, and an investment grade rating (based on average of Moody’s, S&P, and Fitch).
The performance of any index is not indicative of the performance of any particular investment. Unless otherwise noted, index returns reflect the reinvestment of income dividends and capital gains, if any, but do not reflect fees, brokerage commissions or other expenses of investing. Investors may not make direct investments into any index.
Annualized Distribution Yield – The distribution yield reflects actual distributions made to shareholders. The annualized distribution yield is calculated by summing the last 30 days of income at a given month end and annualizing to a 360-day year. The result is divided by the ending maximum offering price or net asset value.
Bond Credit Ratings (Credit Quality) – A bond credit rating assesses the financial ability of a debt issuer to make timely payments of principal and interest. Ratings of AAA (the highest), AA, A, and BBB are investment-grade quality. Ratings of BB, B, CCC, CC, C and D (the lowest) are considered below investment grade, speculative grade, or junk bonds.
Insured Bonds – Individual bonds are sometimes insured by private companies. The insurance guarantees the payment of principal and interest on a bond issue if the issuer defaults. Mutual funds are not insured, even if the underlying bonds are insured.
Core Personal Consumption Expenditure Index (Core PCE) – Core Personal Consumption Expenditure Index is a measure of the Personal Consumption Expenditure Index that excludes the more volatile and seasonal food and energy prices.
Credit Spread/Quality Spread – The difference between the yields of securities with different credit qualities.
Effective Duration – A bond’s sensitivity to interest rates, incorporating the embedded option features, such as call provisions. Bonds with longer durations experience greater price volatility than bonds with shorter durations.
Fed Funds Rate – The interest rate at which a depository institution lends immediately available funds (balances at the Federal Reserve) to another depository institution overnight.
General Obligation Bond (GO) – A municipal bond backed by the credit and “taxing power” of the issuing jurisdiction rather than the revenue from a given project.
Revenue Bond – A bond on which the debt service is payable solely from the revenue generated from the operation of the project being financed or a category of facilities, or from other non-tax sources.
Yield Curve – A line that plots the interest rates, at a set point in time, of bonds having equal credit quality, but differing maturity dates.
6 Semi-Annual Report
| | |
| Fund Summary | | |
| |
Thornburg Strategic Municipal Income Fund | | March 31, 2017 (Unaudited) |
OBJECTIVES AND STRATEGIES
The Fund seeks a high level of current income exempt from federal individual income tax (may be subject to Alternative Minimum Tax).
The Fund invests principally in a portfolio of municipal bonds issued by states and state agencies, local governments and their agencies, and by U.S. territories and possessions.
Not more than 50% of the portfolio is invested in bonds rated below investment grade (or of equivalent quality as determined in accordance with the prospectus) at the time of purchase. Also, the portfolio is typically diversified among sectors, issuers, credit qualities, geographic regions, and segments of the yield curve. The flexible nature of the Fund allows the team to adapt the portfolio’s duration and credit quality to our perception of future market conditions.
KEY PORTFOLIO ATTRIBUTES
| | | | |
Number of Bonds | | | 222 | |
| |
Effective Duration | | | 5.2 Yrs | |
| |
Average Maturity | | | 9.7 Yrs | |
SECURITY CREDIT RATINGS
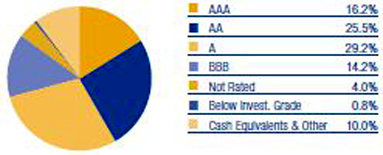
A bond credit rating assesses the financial ability of a debt issuer to make timely payments of principal and interest. Ratings of AAA (the highest), AA, A, and BBB are investment-grade quality. Ratings of BB, B, CCC, CC, C and D (the lowest) are considered below investment grade, speculative grade, or junk bonds. Credit quality ratings for Thornburg’s municipal portfolios used the highest rating available from either Standard & Poor’s or Moody’s Investors Service.
There is no guarantee that the Fund will meet its investment objectives.
All data is subject to change. Charts may not add up to 100% due to rounding.
Semi-Annual Report 7
| | |
| Schedule of Investments | | |
| |
Thornburg Strategic Municipal Income Fund | | March 31, 2017 (Unaudited) |
| | | | | | | | | | |
ISSUER-DESCRIPTION | | CREDIT RATING†
S&P/ MOODY’S | | PRINCIPAL
AMOUNT | | | VALUE | |
ARIZONA — 1.26% | | | | | | | | | | |
Arizona HFA, 5.00% due 12/1/2031 (Scottsdale Lincoln Hospitals) | | NR/A2 | | $ | 2,500,000 | | | $ | 2,809,100 | |
Pima County IDA, 5.125% due 12/1/2040 (Providence Day School) | | BBB+/NR | | | 710,000 | | | | 739,408 | |
ARKANSAS — 0.40% | | | | | | | | | | |
University of Arkansas Board of Trustees, 5.00% due 11/1/2036 (Fayetteville Campus) | | NR/Aa2 | | | 1,000,000 | | | | 1,121,750 | |
CALIFORNIA — 16.81% | | | | | | | | | | |
ABAG Finance Authority for Nonprofit Corporations, 5.00% due 7/1/2047 (Episcopal Senior Communities) | | NR/NR | | | 1,635,000 | | | | 1,717,044 | |
Benicia USD GO, 0% due 8/1/2026 (Benicia High School; Insured: AGM) | | AA/A2 | | | 830,000 | | | | 637,540 | |
California HFFA, 6.25% due 2/1/2026 (Community Program Developmental Disabilities; Insured: California Mtg Insurance) | | AA-/NR | | | 1,500,000 | | | | 1,729,455 | |
California HFFA, 5.00% due 11/15/2034 (Children’s Hospital Los Angeles) | | BBB+/Baa2 | | | 420,000 | | | | 453,440 | |
California Municipal Finance Authority, 8.50% due 11/1/2039 pre-refunded 11/1/2019 (Harbor Regional Center) | | NR/A3 | | | 1,000,000 | | | | 1,184,270 | |
California Pollution Control Financing Authority, 5.00% due 11/21/2045 (Poseidon Resources (Channelside) LP Desalination Project) (AMT) | | NR/Baa3 | | | 3,000,000 | | | | 3,106,830 | |
California School Cash Reserve Program Authority, 2.00% due 6/30/2017 | | SP-1+/NR | | | 1,000,000 | | | | 1,002,710 | |
California State Public Works Board, 5.00% due 4/1/2028 (Corrections, Rehabilitation and Judicial Council) | | A+/A1 | | | 1,000,000 | | | | 1,134,680 | |
California State Public Works Board, 6.25% due 4/1/2034 pre-refunded 4/1/2019 (Department of General Services-Office Buildings 8 and 9 Renovation) | | A+/Aaa | | | 100,000 | | | | 110,150 | |
California Statewide Communities Development Authority, 5.00% due 7/1/2020 pre-refunded 1/1/2019 (Aspire Public Schools; LOC: PCSD Guaranty Pool I, LLC) | | NR/NR | | | 125,000 | | | | 129,983 | |
California Statewide Communities Development Authority, 5.00% due 5/15/2035 (Irvine East Campus Apartments) | | NR/Baa1 | | | 2,975,000 | | | | 3,243,137 | |
California Statewide Communities Development Authority, 6.125% due 7/1/2046 pre-refunded 1/1/2019 (Aspire Public Schools) | | NR/NR | | | 995,000 | | | | 1,080,500 | |
Calipatria USD GO, 0% due 8/1/2025 (Educational Facilities; Insured: ACA) | | NR/NR | | | 2,210,000 | | | | 1,522,160 | |
Carson Redevelopment Agency, 7.00% due 10/1/2036 pre-refunded 10/1/2019 (Project Area 1) | | A-/NR | | | 500,000 | | | | 571,810 | |
Chico Redevelopment Agency, 5.00% due 4/1/2030 (Chico Amended & Merged Redevelopment; Insured: AMBAC) | | A+/NR | | | 1,500,000 | | | | 1,503,660 | |
City of Los Angeles GO, 3.00% due 6/29/2017 (Cash Flow Management) | | SP-1+/Mig1 | | | 2,000,000 | | | | 2,009,800 | |
City of Moorpark Mobile Home Park, 6.15% due 5/15/2031 (Villa Del Arroyo) | | A+/NR | | | 1,000,000 | | | | 1,113,850 | |
City of Palm Springs Financing Authority, 5.25% due 6/1/2027 (Downtown Revitalization Project) | | AA/NR | | | 1,620,000 | | | | 1,846,573 | |
Corona-Norco USD COP, 5.00% due 4/15/2031 (Insured: AGM) | | AA/A1 | | | 1,750,000 | | | | 1,912,050 | |
County of El Dorado, 5.00% due 9/1/2026 (El Dorado Hills Development-Community Facilities) | | A/NR | | | 630,000 | | | | 703,105 | |
County of Los Angeles GO, 3.00% due 6/30/2017 (Cash Management Program) | | SP-1+/Mig1 | | | 3,000,000 | | | | 3,017,370 | |
Daly County Housing Development Finance Agency, 5.25% due 12/15/2023 (Franciscan Country Club Mobile Home Park Acquisition) | | A+/NR | | | 650,000 | | | | 665,028 | |
M-S-R Energy Authority, 6.50% due 11/1/2039 | | BBB+/NR | | | 1,000,000 | | | | 1,358,470 | |
Metropolitan Water District of Southern California Floating Rate Note, 1.07% due 7/1/2030 | | AAA/Aa1 | | | 4,000,000 | | | | 4,000,000 | |
Oakland USD GO, 5.00% due 8/1/2035 (County of Alameda Educational Facilities) | | AA-/Aa3 | | | 1,000,000 | | | | 1,138,550 | |
Redwood City Redevelopment Agency, 0% due 7/15/2021 (Redevelopment Project Area 2; Insured: AMBAC) | | A-/NR | | | 1,285,000 | | | | 1,137,867 | |
Riverside County Asset Leasing Corp., 0% due 6/1/2021 (Riverside County Hospital; Insured: Natl-Re) | | AA-/A1 | | | 535,000 | | | | 489,589 | |
San Francisco City & County Redevelopment Financing Authority, 0% due 8/1/2023 (Redevelopment Project; Insured: Natl-Re) | | AA-/A2 | | | 1,025,000 | | | | 856,593 | |
San Francisco City & County Redevelopment Financing Authority, 6.50% due 8/1/2039 pre-refunded 8/1/2019 (Mission Bay North Redevelopment) | | A-/NR | | | 250,000 | | | | 280,915 | |
San Francisco City & County Redevelopment Financing Authority, 6.75% due 8/1/2041 pre-refunded 2/1/2021 (Mission Bay North Redevelopment) | | A-/NR | | | 500,000 | | | | 599,965 | |
San Jose Redevelopment Agency, 5.50% due 8/1/2035 (Merged Area Redevelopment) | | A/A2 | | | 1,000,000 | | | | 1,096,770 | |
State of California GO, 5.00% due 8/1/2032 (Kindergarten-University Facilities) | | AA-/Aa3 | | | 4,600,000 | | | | 5,331,722 | |
Union Elementary School District, 0% due 9/1/2027 (Santa Clara County District Schools; Insured: Natl-Re) | | AA+/NR | | | 905,000 | | | | 654,406 | |
COLORADO — 1.30% | | | | | | | | | | |
Denver Convention Center Hotel Authority, 5.00% due 12/1/2028 | | BBB-/Baa2 | | | 1,000,000 | | | | 1,139,160 | |
Eagle River Fire District, 6.625% due 12/1/2024 pre-refunded 12/1/2019 | | NR/NR | | | 225,000 | | | | 256,552 | |
Eagle River Fire District, 6.875% due 12/1/2030 pre-refunded 12/1/2019 | | NR/NR | | | 400,000 | | | | 458,592 | |
Public Authority for Colorado Energy, 5.75% due 11/15/2018 (Natural Gas Purchase) | | BBB+/Baa1 | | | 285,000 | | | | 295,576 | |
Public Authority for Colorado Energy, 6.50% due 11/15/2038 (Natural Gas Purchase) | | BBB+/Baa1 | | | 260,000 | | | | 349,349 | |
Regional Transportation District COP, 5.375% due 6/1/2031 (FasTracks Transportation System) | | A/Aa3 | | | 500,000 | | | | 550,950 | |
Regional Transportation District COP, 5.00% due 6/1/2044 (FasTracks Transportation System) | | A/Aa3 | | | 565,000 | | | | 622,478 | |
CONNECTICUT — 1.82% | | | | | | | | | | |
Connecticut Health & Educational Facilities Authority, 6.00% due 7/1/2039 pre-refunded 7/1/2019 (Ethel Walker School) | | NR/NR | | | 1,000,000 | | | | 1,107,870 | |
State of Connecticut GO Floating Rate Note, 1.31% due 9/15/2017 (Various Capital Projects) | | AA-/Aa3 | | | 1,000,000 | | | | 999,990 | |
State of Connecticut GO Floating Rate Note, 1.54% due 6/15/2018 (Various Capital Projects) | | AA-/Aa3 | | | 3,000,000 | | | | 3,010,080 | |
8 Semi-Annual Report
| | |
| Schedule of Investments, Continued | | |
| |
Thornburg Strategic Municipal Income Fund | | March 31, 2017 (Unaudited) |
| | | | | | | | | | | | |
ISSUER-DESCRIPTION | | CREDIT RATING†
S&P/ MOODY’S | | | PRINCIPAL
AMOUNT | | | VALUE | |
DELAWARE — 0.38% | | | | | | | | | | | | |
Delaware HFA, 5.00% due 7/1/2021 (Nanticoke Memorial Hospital) | | | BBB/NR | | | $ | 1,000,000 | | | $ | 1,084,610 | |
DISTRICT OF COLUMBIA — 0.36% | | | | | | | | | | | | |
Metropolitan Washington Airports Authority, 0% due 10/1/2027 (Dulles Toll Road; Insured: AGM) | | | AA/A3 | | | | 1,500,000 | | | | 1,023,885 | |
FLORIDA — 4.33% | | | | | | | | | | | | |
City of Miami GO, 5.00% due 1/1/2018 (Homeland Defense/Neighborhood Capital Improvements) | | | AA-/A1 | | | | 1,790,000 | | | | 1,837,328 | |
Florida Higher Educational Facilities Financing Authority, 5.00% due 4/1/2027 (Nova Southeastern University) | | | A-/Baa1 | | | | 1,000,000 | | | | 1,095,150 | |
Florida Higher Educational Facilities Financing Authority, 5.00% due 4/1/2028 (Nova Southeastern University) | | | A-/Baa1 | | | | 1,250,000 | | | | 1,417,175 | |
Miami-Dade County Expressway Authority, 5.00% due 7/1/2022 (Toll System Five-Year Work Program) | | | A/A2 | | | | 625,000 | | | | 716,994 | |
Miami-Dade County Expressway Authority, 5.00% due 7/1/2024 (Toll System Five-Year Work Program) | | | A/A2 | | | | 625,000 | | | | 733,206 | |
Miami-Dade County School Board COP, 5.00% due 8/1/2027 (District School Facilities and Infrastructure) | | | A/A1 | | | | 1,100,000 | | | | 1,221,913 | |
Orange County, 5.00% due 10/1/2031 (Tourist Development) | | | AA-/Aa3 | | | | 1,000,000 | | | | 1,158,880 | |
Pinellas County Educational Facilities Authority, 5.25% due 10/1/2030 (Barry University) | | | BBB/NR | | | | 500,000 | | | | 538,380 | |
Sarasota County Public Hospital Board, 4.343% due 10/1/2021 (Sarasota Memorial Hospital; Insured: Natl-Re) | | | AA-/A1 | | | | 1,000,000 | | | | 1,036,550 | |
Tampa Sports Authority, 5.75% due 10/1/2020 (Tampa Bay Arena; Insured: Natl-Re) | | | AA-/NR | | | | 725,000 | | | | 780,397 | |
Volusia County Educational Facilities Authority, 5.00% due 10/15/2030 (Embry-Riddle Aeronautical University, Inc.) | | | NR/Baa1 | | | | 1,500,000 | | | | 1,654,710 | |
GEORGIA — 0.92% | | | | | | | | | | | | |
City of Atlanta, 6.25% due 11/1/2034 pre-refunded 11/1/2019 (Water and Wastewater Capital Improvement Program) | | | AA-/Aa2 | | | | 500,000 | | | | 564,165 | |
Development Authority of Fulton County, 5.00% due 10/1/2019 (Georgia Tech Athletic Assoc.) | | | NR/A2 | | | | 1,000,000 | | | | 1,089,040 | |
Main Street Natural Gas, Inc., 5.00% due 3/15/2018 (Georgia Gas) | | | A-/A3 | | | | 515,000 | | | | 532,433 | |
Main Street Natural Gas, Inc., 5.50% due 9/15/2023 (Georgia Gas) | | | BBB+/NR | | | | 350,000 | | | | 403,441 | |
GUAM — 3.46% | | | | | | | | | | | | |
Government of Guam, 5.00% due 11/15/2031 (Economic Development) | | | A/NR | | | | 2,000,000 | | | | 2,120,580 | |
Government of Guam, 5.00% due 11/15/2032 (Various Capital Projects) | | | A/NR | | | | 3,000,000 | | | | 3,165,300 | |
Government of Guam, 5.75% due 12/1/2034 pre-refunded 12/1/2019 (Layon Solid Waste Disposal Facility) | | | BBB+/NR | | | | 500,000 | | | | 558,140 | |
Government of Guam Department of Education COP, 6.875% due 12/1/2040 (John F. Kennedy High School) | | | B+/NR | | | | 1,000,000 | | | | 1,056,710 | |
Government of Guam GO, 7.00% due 11/15/2039 pre-refunded 11/15/2019 (Economic Development) | | | NR/NR | | | | 520,000 | | | | 596,705 | |
Guam Power Authority, 5.00% due 10/1/2027 (Electric Power System; Insured: AGM) | | | AA/A2 | | | | 1,000,000 | | | | 1,130,190 | |
Guam Waterworks Authority, 5.25% due 7/1/2024 (Water and Wastewater System) | | | A-/Baa2 | | | | 500,000 | | | | 566,095 | |
Guam Waterworks Authority, 5.00% due 7/1/2028 (Water and Wastewater System) | | | A-/Baa2 | | | | 500,000 | | | | 548,070 | |
IDAHO — 0.36% | | | | | | | | | | | | |
State of Idaho GO, 2.00% due 6/30/2017 | | | SP-1+/Mig1 | | | | 1,000,000 | | | | 1,002,660 | |
ILLINOIS — 8.81% | | | | | | | | | | | | |
Board of Education of the City of Chicago GO, 5.00% due 12/1/2020 (Education Capital Improvement Program; Insured: AGM) | | | AA/A2 | | | | 365,000 | | | | 373,063 | |
Chicago Park District, 5.00% due 1/1/2027 (Various Capital Improvements) | | | AA+/NR | | | | 825,000 | | | | 934,816 | |
Chicago Park District GO, 5.00% due 1/1/2035 (Various Capital Improvements) | | | AA+/NR | | | | 2,000,000 | | | | 2,131,780 | |
City of Chicago, 5.00% due 1/1/2018 | | | BBB-/Ba1 | | | | 500,000 | | | | 508,650 | |
City of Chicago, 0% due 11/1/2018 (Water System Improvements; Insured: AMBAC) | | | A+/Baa1 | | | | 305,000 | | | | 297,225 | |
City of Chicago, 5.00% due 1/1/2022 | | | BBB-/Ba1 | | | | 1,195,000 | | | | 1,272,759 | |
City of Chicago, 5.00% due 11/1/2029 (Water System Improvements) | | | A/Baa2 | | | | 200,000 | | | | 216,476 | |
City of Chicago, 5.00% due 1/1/2030 (Wastewater Transmission System) | | | A/NR | | | | 1,500,000 | | | | 1,637,655 | |
City of Chicago, 5.00% due 1/1/2031 (Riverwalk Expansion Project; Insured: AGM) | | | AA/A2 | | | | 500,000 | | | | 533,560 | |
City of Chicago, 5.00% due 1/1/2031 (Chicago O’Hare International Airport) | | | A/NR | | | | 500,000 | | | | 565,335 | |
City of Chicago GO, 5.00% due 1/1/2020 (Capital Projects; Insured: AGM) | | | AA/A2 | | | | 475,000 | | | | 476,563 | |
City of Chicago GO, 5.00% due 1/1/2026 (Debt Restructuring) | | | BBB+/NR | | | | 500,000 | | | | 498,560 | |
City of Chicago GO, 5.25% due 1/1/2035 (Various Infrastructure Projects) | | | BBB+/Ba1 | | | | 500,000 | | | | 482,065 | |
Cook County GO, 5.25% due 11/15/2033 | | | AA-/A2 | | | | 1,000,000 | | | | 1,057,610 | |
Illinois Finance Authority, 5.00% due 8/1/2029 (Advocate Health Care Network) | | | AA+/Aa2 | | | | 2,195,000 | | | | 2,484,937 | |
Illinois Finance Authority, 5.00% due 8/15/2035 (Silver Cross Hospital & Medical Centers) | | | NR/Baa1 | | | | 2,355,000 | | | | 2,521,051 | |
Illinois Finance Authority, 5.75% due 11/15/2037 pre-refunded 11/15/2017 (OSF Healthcare System) | | | A/A2 | | | | 330,000 | | | | 339,864 | |
Illinois Finance Authority, 6.00% due 5/15/2039 pre-refunded 5/15/2020 (OSF Healthcare System) | | | NR/NR | | | | 990,000 | | | | 1,127,917 | |
Illinois Finance Authority, 6.00% due 5/15/2039 (OSF Healthcare System) | | | A/A2 | | | | 555,000 | | | | 610,344 | |
Illinois Toll Highway Authority, 5.00% due 1/1/2037 (Move Illinois Program) | | | AA-/Aa3 | | | | 1,000,000 | | | | 1,104,370 | |
Kane, Cook, & DuPage Counties School District No. 46 GO, 5.00% due 1/1/2028 | | | AA-/NR | | | | 1,000,000 | | | | 1,123,940 | |
Kane, Cook, & DuPage Counties School District No. 46 GO, 5.00% due 1/1/2031 | | | AA-/NR | | | | 2,255,000 | | | | 2,499,555 | |
Metropolitan Pier & Exposition Authority, 5.00% due 6/15/2050 (McCormick Place) | | | BBB-/Baa3 | | | | 1,500,000 | | | | 1,511,370 | |
Semi-Annual Report 9
| | |
| Schedule of Investments, Continued | | |
| |
Thornburg Strategic Municipal Income Fund | | March 31, 2017 (Unaudited) |
| | | | | | | | | | |
ISSUER-DESCRIPTION | | CREDIT RATING†
S&P/ MOODY’S | | PRINCIPAL
AMOUNT | | | VALUE | |
Metropolitan Water Reclamation District of Greater Chicago GO, 5.25% due 12/1/2032 (Various Capital Improvement Projects) | | AA+/Aa2 | | $ | 40,000 | | | $ | 47,478 | |
Will County School District No. 114 GO, 0% due 12/1/2023 (Educational Facilities; Insured: Natl-Re) | | NR/A3 | | | 570,000 | | | | 469,212 | |
INDIANA — 1.81% | | | | | | | | | | |
City of Carmel Redevelopment District COP, 6.50% due 7/15/2035 pre-refunded 1/15/2021 (Performing Arts Center) | | NR/NR | | | 1,000,000 | | | | 1,178,420 | |
City of Whiting Environmental Facilities, 5.00% due 3/1/2046 (BP Products North America Inc. Project) (AMT) | | A-/A2 | | | 2,500,000 | | | | 2,827,025 | |
Indiana Finance Authority, 6.375% due 9/15/2041 (Marian University) | | BBB-/NR | | | 1,000,000 | | | | 1,096,030 | |
KANSAS — 1.10% | | | | | | | | | | |
City of Wichita, 5.85% due 12/1/2025 (Brentwood Apartments) | | B/NR | | | 895,000 | | | | 842,141 | |
Unified Government of Wyandotte County/Kansas City, 5.00% due 9/1/2031 (Utility System Improvement) | | A+/A3 | | | 1,000,000 | | | | 1,129,240 | |
Unified Government of Wyandotte County/Kansas City, 5.00% due 9/1/2032 (Utility System Improvement) | | A+/A3 | | | 1,000,000 | | | | 1,123,590 | |
KENTUCKY — 2.18% | | | | | | | | | | |
Commonwealth of Kentucky State Property and Buildings Commission, 5.00% due 11/1/2020 pre-refunded 11/1/2018 (Project No. 89; Insured: AGM) | | AA/Aa3 | | | 2,500,000 | | | | 2,655,575 | |
County of Owen, 6.25% due 6/1/2039 (Kentucky-American Water Co. Project) | | A/A3 | | | 540,000 | | | | 583,421 | |
Kentucky Economic DFA, 0% due 10/1/2021 (Norton Healthcare, Inc.; Insured: Natl-Re) | | AA-/A3 | | | 715,000 | | | | 634,620 | |
Kentucky Economic DFA, 0% due 10/1/2022 (Norton Healthcare, Inc.; Insured: Natl-Re) | | AA-/A3 | | | 2,650,000 | | | | 2,268,029 | |
LOUISIANA — 2.01% | | | | | | | | | | |
City of New Orleans, 5.00% due 12/1/2034 (Water System Facilities Improvement) | | A-/NR | | | 400,000 | | | | 446,288 | |
Louisiana Energy and Power Authority, 5.25% due 6/1/2038 (LEPA Unit No. 1; Insured: AGM) | | AA/A2 | | | 2,000,000 | | | | 2,221,800 | |
Louisiana Public Facilities Authority, 5.00% due 7/1/2032 pre-refunded 7/1/2017 (Black & Gold Facilities; Insured: CIFG) | | AA/A3 | | | 120,000 | | | | 121,267 | |
Louisiana Public Facilities Authority, 5.375% due 5/15/2043 pre-refunded 5/15/2017 (Ochsner Clinic Foundation) | | NR/NR | | | 140,000 | | | | 140,792 | |
Louisiana Public Facilities Authority, 5.375% due 5/15/2043 (Ochsner Clinic Foundation) | | NR/Baa1 | | | 360,000 | | | | 361,253 | |
Parish of St. Charles, 4.00% due 12/1/2040 put 6/1/2022 (Valero Energy Corp. Refinery) | | BBB/Baa2 | | | 2,250,000 | | | | 2,360,498 | |
MASSACHUSETTS — 0.29% | | | | | | | | | | |
Massachusetts Development Finance Agency, 5.00% due 7/1/2032 (Jordan Hospital and Milton Hospital) | | A-/A3 | | | 355,000 | | | | 395,275 | |
Massachusetts Development Finance Agency, 5.00% due 7/1/2033 (Jordan Hospital and Milton Hospital) | | A-/A3 | | | 200,000 | | | | 221,174 | |
Massachusetts Educational Financing Authority, 6.00% due 1/1/2028 | | AA/NR | | | 195,000 | | | | 205,699 | |
MICHIGAN — 5.49% | | | | | | | | | | |
Board of Governors of Wayne State University, 5.00% due 11/15/2033 (Educational Facilities and Equipment) | | A+/Aa3 | | | 1,250,000 | | | | 1,402,875 | |
City of Troy GO, 5.25% due 11/1/2032 (Downtown Development Authority-Community Center Facilities) | | AAA/NR | | | 1,025,000 | | | | 1,163,672 | |
County of Genesee GO, 5.375% due 11/1/2038 (Water Supply System; Insured: BAM) | | AA/A2 | | | 1,000,000 | | | | 1,111,160 | |
Detroit City School District, 5.00% due 5/1/2025 (School Building & Site; Insured: Q-SBLF) | | AA-/Aa1 | | | 1,000,000 | | | | 1,098,920 | |
Detroit City School District GO, 5.25% due 5/1/2027 (School Building & Site; Insured: AGM) | | AA/Aa1 | | | 1,000,000 | | | | 1,173,290 | |
Kalamazoo Hospital Finance Authority, 5.00% due 5/15/2036 pre-refunded 5/15/2020 (Bronson Methodist Hospital) | | NR/NR | | | 550,000 | | | | 610,594 | |
Kalamazoo Hospital Finance Authority, 5.00% due 5/15/2036 (Bronson Methodist Hospital) | | NR/A2 | | | 450,000 | | | | 483,296 | |
Kalamazoo Hospital Finance Authority, 5.25% due 5/15/2041 pre-refunded 5/15/2021 (Bronson Methodist Hospital) | | NR/NR | | | 860,000 | | | | 986,042 | |
Kalamazoo Hospital Finance Authority, 5.25% due 5/15/2041 (Bronson Methodist Hospital) | | NR/A2 | | | 140,000 | | | | 151,502 | |
Livonia Public School District GO, 5.00% due 5/1/2036 (School Building & Site) | | AA/A2 | | | 225,000 | | | | 245,662 | |
Michigan Finance Authority, 5.00% due 4/1/2031 (State Dept. of Human Services Office Buildings) | | A+/NR | | | 1,000,000 | | | | 1,074,880 | |
Michigan Public School Academy, 8.00% due 8/1/2035 (Will Carleton Charter School) | | NR/NR | | | 995,000 | | | | 1,029,924 | |
Michigan State Hospital Finance Authority, 5.00% due 7/15/2025 pre-refunded 7/15/2017 (Oakwood Southshore Medical Center) | | A/A1 | | | 650,000 | | | | 657,917 | |
Michigan State Hospital Finance Authority, 5.75% due 11/15/2039 pre-refunded 11/15/2019 (Henry Ford Health System) | | A/A3 | | | 1,000,000 | | | | 1,115,240 | |
Michigan Strategic Fund, 7.00% due 5/1/2021 (Detroit Edison Company; Insured: Natl-Re/AMBAC) | | NR/NR | | | 250,000 | | | | 300,118 | |
Wayne County Airport Authority, 5.00% due 12/1/2031 (Detroit Metropolitan Wayne County Airport) | | A/A2 | | | 650,000 | | | | 716,410 | |
Wayne County Airport Authority, 5.00% due 12/1/2033 (Detroit Metropolitan Wayne County Airport) | | A/A2 | | | 825,000 | | | | 901,741 | |
Wayne County Airport Authority, 5.00% due 12/1/2034 (Detroit Metropolitan Wayne County Airport) | | A/A2 | | | 1,140,000 | | | | 1,241,266 | |
MINNESOTA — 0.15% | | | | | | | | | | |
Washington County Housing Redevelopment Authority, 5.625% due 6/1/2037 pre-refunded 6/1/2017 (Birchwood and Woodbury Healthcare Facility Projects) | | NR/NR | | | 415,000 | | | | 418,362 | |
MISSOURI — 1.07% | | | | | | | | | | |
Tax Increment Financing Commission of Kansas City, 5.25% due 3/1/2018 (Maincor Public Improvements) (ETM) | | NR/NR | | | 420,000 | | | | 434,007 | |
Tax Increment Financing Commission of Kansas City, 6.00% due 5/1/2030 (Union Hill Redevelopment Project) | | NR/NR | | | 2,505,000 | | | | 2,569,003 | |
10 Semi-Annual Report
| | |
| Schedule of Investments, Continued | | |
| |
Thornburg Strategic Municipal Income Fund | | March 31, 2017 (Unaudited) |
| | | | | | | | | | |
ISSUER-DESCRIPTION | | CREDIT RATING†
S&P/ MOODY’S | | PRINCIPAL
AMOUNT | | | VALUE | |
NEBRASKA — 0.70% | | | | | | | | | | |
Douglas County Health Facilities, 5.00% due 11/1/2029 (Nebraska Methodist Health System) | | A-/NR | | $ | 950,000 | | | $ | 1,069,196 | |
Douglas County Health Facilities, 5.00% due 11/1/2030 (Nebraska Methodist Health System) | | A-/NR | | | 800,000 | | | | 892,888 | |
NEW JERSEY — 4.03% | | | | | | | | | | |
Higher Education Student Assistance Authority, 5.75% due 12/1/2039 (NJCLASS Student Loan Program) (AMT) | | A/A2 | | | 750,000 | | | | 801,795 | |
New Jersey Economic Development Authority, 5.50% due 6/15/2030 (School Facilities Construction) | | BBB+/Baa1 | | | 1,000,000 | | | | 1,064,180 | |
New Jersey EDA, 5.00% due 3/1/2026 (School Facilities Construction) | | BBB+/Baa1 | | | 1,000,000 | | | | 1,036,200 | |
New Jersey EDA, 5.50% due 9/1/2027 (School Facilities Construction; Insured: Natl-Re) | | AA-/A3 | | | 1,000,000 | | | | 1,160,330 | |
New Jersey EDA, 5.00% due 6/15/2029 (School Facilities Construction) | | BBB+/Baa1 | | | 2,000,000 | | | | 2,040,640 | |
New Jersey Transit Corp., 5.00% due 9/15/2020 (Federal Transit Administration Section 5307 Urbanized Area Formula Funds) | | A/A3 | | | 1,000,000 | | | | 1,068,510 | |
New Jersey Transportation Trust Fund Authority, 5.00% due 6/15/2027 (State Transportation System Improvements) | | A+/Baa1 | | | 3,000,000 | | | | 3,212,910 | |
New Jersey Transportation Trust Fund Authority, 1.99% due 6/15/2034 put 4/7/2017 (State Transportation System Improvements) (weekly demand notes) | | BBB+/Baa1 | | | 1,000,000 | | | | 972,380 | |
NEW MEXICO — 1.31% | | | | | | | | | | |
City of Farmington, 4.70% due 9/1/2024 (Arizona Public Service Co.-Four Corners Project) | | A-/A2 | | | 1,000,000 | | | | 1,072,920 | |
New Mexico Hospital Equipment Loan Council, 5.00% due 7/1/2032 (Haverland Carter Lifestyle Group) | | NR/NR | | | 2,500,000 | | | | 2,603,950 | |
NEW YORK — 11.75% | | | | | | | | | | |
City of New York GO, 5.00% due 8/1/2023 (City Budget Financial Management) | | AA/Aa2 | | | 3,000,000 | | | | 3,530,550 | |
City of New York GO, 5.00% due 8/1/2031 (City Budget Financial Management) | | AA/Aa2 | | | 2,000,000 | | | | 2,301,240 | |
City of New York GO, 0.91% due 8/1/2035 put 4/3/2017 (Capital Projects) (daily demand notes) | | AA/Aa2 | | | 1,000,000 | | | | 1,000,000 | |
City of Syracuse, 5.00% due 8/1/2017 (City Public and School Building Capital Projects; Insured: AGM) (State Aid Withholding) | | AA/Aa3 | | | 400,000 | | | | 401,360 | |
New York City Municipal Water Finance Authority, 0.90% due 6/15/2045 put 4/3/2017 (Water & Sewer System; SPA: U.S. Bank, N.A.) (daily demand notes) | | AAA/Aa1 | | | 3,200,000 | | | | 3,200,000 | |
New York City Municipal Water Finance Authority, 0.93% due 6/15/2048 put 4/3/2017 (Water & Sewer System; SPA: Mizuho Bank, Ltd.) (daily demand notes) | | AA+/Aa1 | | | 1,000,000 | | | | 1,000,000 | |
New York City Municipal Water Finance Authority, 0.96% due 6/15/2048 put 4/3/2017 (Water & Sewer System; SPA: Mizuho Bank, Ltd.) (daily demand notes) | | AA+/Aa1 | | | 4,100,000 | | | | 4,100,000 | |
New York City Transitional Finance Authority, 0.96% due 11/1/2022 put 4/3/2017 (World Trade Center Recovery; SPA: Landesbank Hessen-Thuringen) (daily demand notes) | | AAA/Aa1 | | | 2,225,000 | | | | 2,225,000 | |
New York City Transitional Finance Authority, 0.96% due 8/1/2031 put 4/3/2017 (City Capital Projects; SPA: Landesbank Hessen-Thuringen) (daily demand notes) | | AAA/Aaa | | | 2,250,000 | | | | 2,250,000 | |
New York City Transitional Finance Authority, 0.95% due 11/1/2036 put 4/3/2017 (City Capital Projects; SPA: JPMorgan Chase Bank, N.A.) (daily demand notes) | | AAA/Aa1 | | | 3,775,000 | | | | 3,775,000 | |
New York City Transitional Finance Authority, 0.91% due 11/1/2042 put 4/3/2017 (City Capital Projects; SPA: Barclays Bank plc) (daily demand notes) | | AAA/Aa1 | | | 2,200,000 | | | | 2,200,000 | |
New York State Housing Finance Agency, 0.96% due 11/1/2046 put 4/3/2017 (160 Madison Avenue Housing; LOC: PNC Bank, N.A.) (daily demand notes) | | NR/A1 | | | 4,955,000 | | | | 4,955,000 | |
Tobacco Settlement Asset Securitization Corp., 5.00% due 6/1/2022 | | A/NR | | | 1,000,000 | | | | 1,133,140 | |
Town of Oyster Bay GO, 3.50% due 2/2/2018 | | NR/NR | | | 1,000,000 | | | | 1,008,690 | |
NORTH CAROLINA — 0.60% | | | | | | | | | | |
North Carolina Medical Care Commission, 5.00% due 6/1/2029 (Vidant Health) | | A+/A1 | | | 1,500,000 | | | | 1,701,975 | |
OHIO — 1.78% | | | | | | | | | | |
Akron, Bath and Copley Joint Hospital District, 5.25% due 11/15/2030 (Summa Health) | | NR/Baa1 | | | 1,420,000 | | | | 1,597,074 | |
American Municipal Power, Inc., 5.25% due 2/15/2018 (AMP Combined Hydroelectric Projects) | | A/A2 | | | 500,000 | | | | 518,390 | |
City of Akron, 5.00% due 12/1/2031 (Community Learning Centers) | | AA+/NR | | | 625,000 | | | | 711,319 | |
Cleveland-Cuyahoga County Port Authority, 7.00% due 5/15/2040 (Flats East Development Project; LOC: Fifth Third Bank) | | BBB+/NR | | | 945,000 | | | | 1,034,085 | |
County of Scioto, 5.00% due 2/15/2034 (Southern Ohio Medical Center) | | NR/A2 | | | 1,025,000 | | | | 1,148,830 | |
OREGON’ — 1.78% | | | | | | | | | | |
State of Oregon GO, 2.00% due 6/30/2017 (Cash Management) | | SP-1+/Mig1 | | | 5,000,000 | | | | 5,015,300 | |
PENNSYLVANIA — 9.15% | | | | | | | | | | |
Allegheny County IDA, 6.75% due 8/15/2035 (Propel Charter School) | | BBB-/NR | | | 920,000 | | | | 987,786 | |
City of Philadelphia Gas Works, 5.00% due 10/1/2029 | | A/Baa1 | | | 1,000,000 | | | | 1,132,220 | |
City of Philadelphia Gas Works, 5.00% due 10/1/2030 | | A/Baa1 | | | 1,000,000 | | | | 1,125,940 | |
City of Philadelphia Gas Works, 5.00% due 10/1/2031 | | A/Baa1 | | | 1,000,000 | | | | 1,119,490 | |
Semi-Annual Report 11
| | |
| Schedule of Investments, Continued | | |
| |
Thornburg Strategic Municipal Income Fund | | March 31, 2017 (Unaudited) |
| | | | | | | | | | |
ISSUER-DESCRIPTION | | CREDIT RATING†
S&P/ MOODY’S | | PRINCIPAL
AMOUNT | | | VALUE | |
Coatesville Area School District GO, 5.00% due 8/1/2024 (Insured: AGM) (State Aid Withholding) | | AA/A2 | | $ | 975,000 | | | $ | 1,130,990 | |
Coatesville Area School District GO, 5.00% due 8/1/2025 (Insured: AGM) (State Aid Withholding) | | AA/A2 | | | 500,000 | | | | 583,735 | |
County of Luzerne GO, 5.00% due 11/15/2029 (Insured: AGM) | | AA/NR | | | 1,000,000 | | | | 1,100,520 | |
Cumberland County Municipal Authority, 5.00% due 1/1/2018 (Diakon Lutheran Social Ministries) | | NR/NR | | | 425,000 | | | | 436,139 | |
Hospitals & Higher Education Facilities Authority of Philadelphia, 0.95% due 2/15/2021 put 4/3/2017 (The Children’s Hospital of Philadelphia; SPA: Wells Fargo Bank, N.A.) (daily demand notes) | | AA/Aa2 | | | 2,500,000 | | | | 2,500,000 | |
Hospitals & Higher Education Facilities Authority of Philadelphia, 0.95% due 7/1/2025 put 4/3/2017 (The Children’s Hospital of Philadelphia; SPA: Wells Fargo Bank, N.A.) (daily demand notes) | | AA/Aa2 | | | 800,000 | | | | 800,000 | |
Lancaster County Hospital Authority, 5.00% due 11/1/2019 (Masonic Villages Project) | | A/NR | | | 2,675,000 | | | | 2,895,688 | |
Lehigh County IDA, 0.90% due 2/15/2027 put 8/15/2017 (PPL Electric Utilities Corp.) | | A/A1 | | | 5,500,000 | | | | 5,499,395 | |
Pennsylvania Economic DFA, 4.625% due 12/1/2018 (Colver Project; Insured: AMBAC) (AMT) | | BBB-/Ba1 | | | 1,145,000 | | | | 1,153,244 | |
Pennsylvania Turnpike Commission, 5.35% due 12/1/2030 pre-refunded 12/1/2020 (Highway Improvements) | | NR/NR | | | 695,000 | | | | 793,885 | |
Pennsylvania Turnpike Commission, 5.35% due 12/1/2030 (Highway Improvements) | | A-/A3 | | | 1,305,000 | | | | 1,440,028 | |
Philadelphia Authority for Industrial Development, 5.00% due 9/1/2035 (Thomas Jefferson University) | | A+/A2 | | | 1,500,000 | | | | 1,655,355 | |
Philadelphia IDA, 6.00% due 8/1/2035 pre-refunded 8/1/2020 (Mast Charter School) | | BBB/NR | | | 1,000,000 | | | | 1,150,620 | |
Philadelphia School District GO, 4.50% due 9/1/2017 (Capital Improvements; Insured: BHAC) (State Aid Withholding) | | AA+/Aa1 | | | 250,000 | | | | 253,460 | |
RHODE ISLAND — 0.27% | | | | | | | | | | |
Pawtucket Housing Authority, 5.50% due 9/1/2022 | | A+/NR | | | 225,000 | | | | 256,671 | |
Pawtucket Housing Authority, 5.50% due 9/1/2022 pre-refunded 9/1/2020 | | NR/NR | | | 90,000 | | | | 105,029 | |
Pawtucket Housing Authority, 5.50% due 9/1/2024 pre-refunded 9/1/2020 | | NR/NR | | | 100,000 | | | | 116,699 | |
Pawtucket Housing Authority, 5.50% due 9/1/2024 | | A+/NR | | | 250,000 | | | | 284,143 | |
SOUTH DAKOTA — 0.44% | | | | | | | | | | |
South Dakota Health & Educational Facilities Authority, 5.00% due 7/1/2027 (Avera Health) | | AA-/A1 | | | 400,000 | | | | 440,576 | |
South Dakota Health & Educational Facilities Authority, 5.50% due 11/1/2040 (Sanford Health) | | A+/A1 | | | 750,000 | | | | 804,375 | |
TENNESSEE — 0.20% | | | | | | | | | | |
Tennessee Energy Acquisition Corp., 5.25% due 9/1/2024 | | BBB+/A3 | | | 500,000 | | | | 575,015 | |
TEXAS — 9.63% | | | | | | | | | | |
Austin Convention Enterprises, Inc., 5.25% due 1/1/2024 (Austin Convention Center; Insured: Syncora) | | BBB-/Ba1 | | | 720,000 | | | | 720,842 | |
Austin Convention Enterprises, Inc., 5.00% due 1/1/2034 (Austin Convention Center; Insured: Syncora) | | BBB-/Ba1 | | | 795,000 | | | | 796,121 | |
City of Dallas GO, 5.00% due 2/15/2031 (Public Improvements) | | AA-/NR | | | 1,930,000 | | | | 2,126,223 | |
City of Houston, 5.00% due 9/1/2025 (Convention & Entertainment Facilities Department) | | A-/A2 | | | 1,000,000 | | | | 1,166,290 | |
City of Houston, 5.00% due 9/1/2028 (Convention & Entertainment Facilities Department) | | A-/A2 | | | 325,000 | | | | 371,641 | |
City of Houston, 5.00% due 11/15/2028 (Combined Utility System) | | AA/Aa2 | | | 2,500,000 | | | | 2,917,550 | |
City of Houston, 5.00% due 9/1/2034 (Convention & Entertainment Facilities Department) | | A-/A2 | | | 1,550,000 | | | | 1,719,911 | |
City of Houston GO, 5.00% due 3/1/2032 (Public Improvements) | | AA/Aa3 | | | 3,000,000 | | | | 3,401,010 | |
City of Texas City Industrial Development Corp., 7.375% due 10/1/2020 (ARCO Pipe Line Co. Project) | | A-/A2 | | | 1,165,000 | | | | 1,372,615 | |
Harris County-Houston Sports Authority, 5.00% due 11/15/2030 | | A-/A2 | | | 2,000,000 | | | | 2,269,580 | |
Kimble County Hospital District, 6.25% due 8/15/2033 pre-refunded 8/15/2019 | | NR/NR | | | 500,000 | | | | 558,470 | |
La Vernia Higher Education Finance Corp., 6.25% due 8/15/2039 pre-refunded 8/15/2019 (Kipp, Inc.) | | BBB/NR | | | 1,000,000 | | | | 1,115,940 | |
Lower Colorado River Authority, 5.00% due 5/15/2026 pre-refunded 5/15/2022 | | NR/NR | | | 20,000 | | | | 23,229 | |
Lower Colorado River Authority, 5.00% due 5/15/2026 | | A/A2 | | | 2,980,000 | | | | 3,378,039 | |
San Antonio Energy Acquisition Public Facilities Corp., 5.50% due 8/1/2021 (Natural Gas Supply Agreement) | | BBB+/A3 | | | 40,000 | | | | 44,950 | |
San Juan Higher Education Finance Authority, 6.70% due 8/15/2040 pre-refunded 8/15/2020 (IDEA Public Schools) | | BBB/NR | | | 1,000,000 | | | | 1,174,860 | |
Texas Public Finance Authority Charter School Finance Corp., 5.00% due 8/15/2023 pre-refunded 8/15/2017 (IDEA Public Schools; Insured: ACA) | | BBB/NR | | | 155,000 | | | | 157,432 | |
Texas Public Finance Authority Charter School Finance Corp., 5.00% due 8/15/2030 pre-refunded 8/15/2017 (IDEA Public Schools; Insured: ACA) | | BBB/NR | | | 1,550,000 | | | | 1,574,319 | |
Texas Public Finance Authority Charter School Finance Corp., 6.20% due 2/15/2040 pre-refunded 2/15/2020 (Cosmos Foundation, Inc.) | | BBB/NR | | | 1,000,000 | | | | 1,133,520 | |
Texas Transportation Commission, 5.00% due 8/15/2034 (Central Texas Turnpike System) | | BBB+/Baa1 | | | 1,000,000 | | | | 1,088,550 | |
U.S. VIRGIN ISLANDS — 0.14% | | | | | | | | | | |
Virgin Islands Public Finance Authority, 6.75% due 10/1/2037 | | NR/Caa2 | | | 500,000 | | | | 401,260 | |
UTAH — 0.79% | | | | | | | | | | |
Herriman City, 4.75% due 11/1/2022 pre-refunded 5/1/2020 (Towne Center Access and Utility Improvements) | | AA-/NR | | | 1,000,000 | | | | 1,104,040 | |
Utah Transit Authority, 5.00% due 6/15/2033 (Integrated Mass Transit System) | | A+/A1 | | | 1,000,000 | | | | 1,128,950 | |
WASHINGTON — 1.71% | | | | | | | | | | |
Skagit County Public Hospital District No. 1, 5.75% due 12/1/2028 pre-refunded 12/1/2017 (Skagit Valley Hospital) | | NR/Baa2 | | | 1,510,000 | | | | 1,559,709 | |
12 Semi-Annual Report
| | |
| Schedule of Investments, Continued | | |
| |
Thornburg Strategic Municipal Income Fund | | March 31, 2017 (Unaudited) |
| | | | | | | | | | | | |
ISSUER-DESCRIPTION | | CREDIT RATING†
S&P/ MOODY’S | | | PRINCIPAL
AMOUNT | | | VALUE | |
Washington Health Care Facilities Authority, 5.70% due 7/1/2038 (Overlake Hospital Medical Center) | | | A/A2 | | | $ | 1,000,000 | | | $ | 1,097,800 | |
Washington Health Care Facilities Authority, 5.75% due 1/1/2045 (Catholic Health Initiatives) | | | BBB+/Baa1 | | | | 2,000,000 | | | | 2,149,360 | |
WISCONSIN — 0.35% | | | | | | | | | | | | |
Wisconsin Health & Educational Facilities Authority, 1.25% due 8/15/2025 put 8/15/2017 (Aurora Health Care, Inc.) | | | NR/A2 | | | | 1,000,000 | | | | 999,880 | |
| | | | | | | | | | | | |
TOTAL INVESTMENTS — 98.94% (Cost $267,073,055) | | | | | | | | | | $ | 278,653,674 | |
OTHER ASSETS LESS LIABILITIES — 1.06% | | | | | | | | | | | 2,982,728 | |
| | | | | | | | | | | | |
NET ASSETS — 100.00% | | | | | | | | | | $ | 281,636,402 | |
| | | | | | | | | | | | |
Footnote Legend
| † | Credit ratings are unaudited. Rating changes may have occurred subsequent to the reporting period end. Bonds issued with a maturity of one year or less are assigned Moody’s ratings from MIG-1 to MIG-4 and Standard and Poor’s ratings from SP-1+ to SP-3 with MIG-1 and SP-1+ being the strongest ratings. |
Portfolio Abbreviations
To simplify the listings of securities, abbreviations are used per the table below:
| | |
| ABAG | | Association of Bay Area Governments |
| ACA | | Insured by American Capital Access |
| AGM | | Insured by Assured Guaranty Municipal Corp. |
| AMBAC | | Insured by American Municipal Bond Assurance Corp. |
| AMT | | Alternative Minimum Tax |
| BAM | | Insured by Build America Mutual Insurance Co. |
| BHAC | | Insured by Berkshire Hathaway Assurance Corp. |
| CIFG | | Insured by CIFG Assurance North America Inc. |
| COP | | Certificates of Participation |
| DFA | | Development Finance Authority |
| EDA | | Economic Development Authority |
| | |
| ETM | | Escrowed to Maturity |
| GO | | General Obligation |
| HFA | | Health Facilities Authority |
| HFFA | | Health Facilities Financing Authority |
| IDA | | Industrial Development Authority |
| Mtg | | Mortgage |
| Natl-Re | | Insured by National Public Finance Guarantee Corp. |
| Q-SBLF | | Insured by Qualified School Bond Loan Fund |
| Syncora | | Insured by Syncora Guarantee Inc. |
| USD | | Unified School District |
See notes to financial statements.
Semi-Annual Report 13
| | |
| Statement of Assets and Liabilities | | |
| |
Thornburg Strategic Municipal Income Fund | | March 31, 2017 (Unaudited) |
| | | | |
ASSETS | | | | |
Investments at value (cost $267,073,055) (Note 3) | | $ | 278,653,674 | |
Cash | | | 177,391 | |
Receivable for investments sold | | | 100,000 | |
Receivable for fund shares sold | | | 654,322 | |
Interest receivable | | | 3,167,237 | |
Prepaid expenses and other assets | | | 54,151 | |
| | | | |
Total Assets | | | 282,806,775 | |
| | | | |
| |
LIABILITIES | | | | |
Payable for fund shares redeemed | | | 906,686 | |
Payable to investment advisor and other affiliates (Note 4) | | | 154,051 | |
Accounts payable and accrued expenses | | | 58,337 | |
Dividends payable | | | 51,299 | |
| | | | |
Total Liabilities | | | 1,170,373 | |
| | | | |
| |
NET ASSETS | | $ | 281,636,402 | |
| | | | |
NET ASSETS CONSIST OF | | | | |
Undistributed net investment income | | $ | 3,595 | |
Net unrealized appreciation on investments | | | 11,580,619 | |
Accumulated net realized gain (loss) | | | (2,303,965 | ) |
Net capital paid in on shares of beneficial interest | | | 272,356,153 | |
| | | | |
| |
| | $ | 281,636,402 | |
| | | | |
| |
NET ASSET VALUE | | | | |
Class A Shares: | | | | |
Net asset value and redemption price per share ($64,797,279 applicable to 4,341,197 shares of beneficial interest outstanding - Note 5) | | $ | 14.93 | |
Maximum sales charge, 2.00% of offering price | | | 0.30 | |
| | | | |
Maximum offering price per share | | $ | 15.23 | |
| | | | |
| |
Class C Shares: | | | | |
Net asset value and offering price per share* ($35,621,314 applicable to 2,384,055 shares of beneficial interest outstanding - Note 5) | | $ | 14.94 | |
| | | | |
| |
Class I Shares: | | | | |
Net asset value, offering and redemption price per share ($181,217,809 applicable to 12,129,494 shares of beneficial interest outstanding - Note 5) | | $ | 14.94 | |
| | | | |
| * | Redemption price per share is equal to net asset value less any applicable contingent deferred sales charge. See notes to financial statements. |
See notes to financial statements.
14 Semi-Annual Report
| | |
| Statement of Operations | | |
| |
| Thornburg Strategic Municipal Income Fund | | Six Months Ended March 31, 2017 (Unaudited) |
| | | | |
INVESTMENT INCOME | | | | |
Interest income (net of premium amortized of $1,067,245) | | $ | 4,900,950 | |
| | | | |
| |
EXPENSES | | | | |
Investment advisory fees (Note 4) | | | 1,098,147 | |
Administration fees (Note 4) | | | | |
Class A Shares | | | 45,383 | |
Class C Shares | | | 23,259 | |
Class I Shares | | | 45,753 | |
Distribution and service fees (Note 4) | | | | |
Class A Shares | | | 90,766 | |
Class C Shares | | | 110,806 | |
Transfer agent fees | | | | |
Class A Shares | | | 29,057 | |
Class C Shares | | | 12,405 | |
Class I Shares | | | 61,775 | |
Registration and filing fees | | | | |
Class A Shares | | | 8,379 | |
Class C Shares | | | 8,385 | |
Class I Shares | | | 8,305 | |
Custodian fees (Note 2) | | | 32,440 | |
Professional fees | | | 24,557 | |
Accounting fees (Note 4) | | | 4,789 | |
Trustee fees | | | 7,280 | |
Other expenses | | | 18,623 | |
| | | | |
Total Expenses | | | 1,630,109 | |
Less: | | | | |
Expenses reimbursed by investment advisor (Note 4) | | | (39,834 | ) |
Investment advisory fees waived by investment advisor (Note 4) | | | (69,151 | ) |
| | | | |
Net Expenses | | | 1,521,124 | |
| | | | |
Net Investment Income | | | 3,379,826 | |
| | | | |
| |
REALIZED AND UNREALIZED GAIN (LOSS) | | | | |
Net realized gain (loss) on investments | | | (2,224,774 | ) |
Net change in unrealized appreciation (depreciation) on investments | | | (9,709,086 | ) |
| | | | |
Net Realized and Unrealized Loss | | | (11,933,860 | ) |
| | | | |
Net Decrease in Net Assets Resulting from Operations | | $ | (8,554,034 | ) |
| | | | |
See notes to financial statements.
Semi-Annual Report 15
| | |
| Statement of Changes in Net Assets | | |
| |
Thornburg Strategic Municipal Income Fund | | |
| | | | | | | | |
| | | SIX MONTHS ENDED
MARCH 31, 2017* | | | YEAR ENDED
SEPTEMBER 30, 2016 | |
INCREASE (DECREASE) IN NET ASSETS FROM | | | | | | | | |
| | |
OPERATIONS | | | | | | | | |
Net investment income | | $ | 3,379,826 | | | $ | 6,298,959 | |
Net realized gain (loss) on investments | | | (2,224,774 | ) | | | (14,740 | ) |
Net unrealized appreciation (depreciation) on investments | | | (9,709,086 | ) | | | 6,349,988 | |
| | | | | | | | |
Net Increase (Decrease) in Net Assets Resulting from Operations | | | (8,554,034 | ) | | | 12,634,207 | |
| | |
DIVIDENDS TO SHAREHOLDERS | | | | | | | | |
From net investment income | | | | | | | | |
Class A Shares | | | (788,369 | ) | | | (1,518,969 | ) |
Class C Shares | | | (338,966 | ) | | | (621,799 | ) |
Class I Shares | | | (2,252,249 | ) | | | (4,158,191 | ) |
| | |
FUND SHARE TRANSACTIONS (NOTE 5) | | | | | | | | |
Class A Shares | | | (11,120,351 | ) | | | 10,728,657 | |
Class C Shares | | | (1,643,332 | ) | | | 8,907,855 | |
Class I Shares | | | (2,155,328 | ) | | | 34,729,848 | |
| | | | | | | | |
Net Increase (Decrease) in Net Assets | | | (26,852,629 | ) | | | 60,701,608 | |
| | |
NET ASSETS | | | | | | | | |
Beginning of Period | | | 308,489,031 | | | | 247,787,423 | |
| | | | | | | | |
| | |
End of Period | | $ | 281,636,402 | | | $ | 308,489,031 | |
| | | | | | | | |
Undistributed net investment income | | $ | 3,595 | | | $ | 3,353 | |
See notes to financial statements.
16 Semi-Annual Report
| | |
| Notes to Financial Statements | | |
| |
Thornburg Strategic Municipal Income Fund | | March 31, 2017 (Unaudited) |
NOTE 1 – ORGANIZATION
Thornburg Strategic Municipal Income Fund (the “Fund”) is a diversified series of Thornburg Investment Trust (the “Trust”). The Trust is organized as a Massachusetts business trust under a Declaration of Trust dated June 3, 1987 and is registered as a diversified, open-end management investment company under the Investment Company Act of 1940, as amended. The Fund is currently one of twenty-one separate series of the Trust. Each series is considered to be a separate entity for financial reporting and tax purposes and bears expenses directly attributable to it. The Fund’s primary investment objective is to seek a high level of current income exempt from federal individual income tax.
The Fund currently offers three classes of shares of beneficial interest outstanding: Class A, Class C, and Institutional Class (“Class I”). Each class of shares of the Fund represents an interest in the same portfolio of investments, except that (i) Class A shares are sold subject to a front-end sales charge collected at the time the shares are purchased and bear a service fee, (ii) Class C shares are sold at net asset value without a sales charge at the time of purchase, but are subject to a contingent deferred sales charge upon redemption within one year of purchase, and bear both a service fee and a distribution fee, (iii) Class I shares are sold at net asset value without a sales charge at the time of purchase and may be subject to a service fee, and (iv) the respective classes may have different reinvestment privileges and conversion rights. Additionally, the Fund may allocate among its classes certain expenses, to the extent allocable to specific classes, including transfer agent fees, government registration fees, certain printing and postage costs, and administrative and legal expenses. Currently, class specific expenses of the Fund are limited to service and distribution fees, administration fees, and certain registration and transfer agent expenses.
The following is a summary of significant accounting policies followed by the Fund in the preparation of its financial statements. The Fund prepares its financial statements in conformity with United States generally accepted accounting principles (“GAAP”), including investment company accounting and reporting guidance in the Financial Accounting Standards Board (the “FASB”) Accounting Standard Codification Topic 946.
NOTE 2 – SIGNIFICANT ACCOUNTING POLICIES
Security Valuation: All investments in securities held by the Fund are valued as described in Note 3.
Allocation of Income, Gains, Losses and Expenses: Net investment income (other than class specific expenses) and realized and unre-alized gains and losses are allocated daily to each class of shares based upon the relative net asset value of outstanding shares (or the value of the dividend-eligible shares, as appropriate) of each class of shares at the beginning of the day (after adjusting for the current capital shares activity of the respective class). Expenses common to all Funds are allocated among the Funds comprising the Trust based upon their relative net asset values or other appropriate allocation methods. Operating expenses directly attributable to a specific class are charged against the operating income of that class.
Dividends and Distributions to Shareholders: Dividends and distributions to shareholders, which are determined in accordance with federal income tax regulations and may differ from GAAP, are recorded on the ex-dividend date. Ordinary income distributions, if any, are declared daily and paid monthly. Capital gain distributions, if any, are declared and paid annually and more often if deemed neces-sary by the Advisor. Dividends are paid and are reinvested in additional shares of the Fund at net asset value per share at the close of business on the ex-dividend date, or at the shareholder’s option, paid in cash.
Investment Income: Interest income is accrued as earned. Premiums and discounts are amortized and accreted, respectively, to call dates or maturity dates using the effective yield method of the respective investments. These amounts are included in Interest income on the Statement of Operations.
Custodian Fees: Custodian fees disclosed in the Statement of Operations may include interest expenses incurred by the Fund on any cash overdrafts of its custodian account during the period. Such cash overdrafts may result from the effects of failed trades in portfolio securities and from cash outflows resulting from unanticipated shareholder redemption activity. The Fund pays interest to its custodian on any such cash overdraft at a rate equal to 2.50% of the overdraft amount in excess of $50,000.
Investment Transactions: Investment transactions are accounted for on a trade date basis. Realized gains and losses from the sale of investments are recorded on an identified cost basis.
When-Issued and Delayed Delivery Transactions: The Fund may engage in when-issued or delayed delivery transactions. To the extent the Fund engages in such transactions, it will do so for the purpose of acquiring portfolio investments consistent with the Fund’s invest-ment objectives and not for the purpose of investment leverage or to speculate on interest rate or market changes. At the time the Fund makes a commitment to purchase an investment on a when-issued or delayed delivery basis, the Fund will record the transaction and reflect the value in determining its net asset value. When effecting such transactions, assets of an amount sufficient to make payment for the portfolio investments to be purchased will be segregated on the Fund’s records on the trade date. Investments purchased on a when-issued or delayed delivery basis do not earn interest until the settlement date.
Semi-Annual Report 17
| | |
| Notes to Financial Statements, Continued | | |
| |
Thornburg Strategic Municipal Income Fund | | March 31, 2017 (Unaudited) |
Guarantees and Indemnifications: Under the Trust’s organizational documents (and under separate agreements with the independent Trustees), its officers and Trustees are provided with an indemnification against certain liabilities arising out of the performance of their duties to the Fund. In the normal course of business the Trust may also enter into contracts with service providers that contain general indemnifications. The Trust’s maximum exposure under these arrangements is unknown. However, based on experience, the Trust expects the risk of loss to be remote.
Use of Estimates: The preparation of financial statements in conformity with GAAP requires management to make estimates and assumptions that affect the reported amounts of assets and liabilities and disclosure of contingent assets and liabilities at the date of the financial statements and the reported amounts of increases (decreases) in net assets from operations during the reporting period. Actual results could differ from those estimates.
Federal Income Taxes: It is the policy of the Trust to comply with the provisions of the Internal Revenue Code applicable to regulated investment companies and to distribute to shareholders substantially all investment company taxable income including net realized gains on investments (if any), and tax exempt income of the Fund. Therefore, no provision for federal income or excise tax is required.
The Fund files income tax returns in United States federal and applicable state jurisdictions. The statute of limitations on the Fund’s tax return filings generally remains open for the three years following a return’s filing date. The Fund has analyzed its tax positions taken on Federal income tax returns for all open tax years and has concluded that no provision for income tax is required in the financial statements.
At March 31, 2017, information on the tax components of capital was as follows:
| | | | |
Cost of investments for tax purposes | | $ | 267,073,055 | |
| | | | |
| |
Gross unrealized appreciation on a tax basis | | $ | 12,782,732 | |
Gross unrealized depreciation on a tax basis | | | (1,202,113 | ) |
| | | | |
| |
Net unrealized appreciation (depreciation) on investments (tax basis) | | $ | 11,580,619 | |
| | | | |
At March 31, 2017, the Fund had deferred tax basis capital losses occurring subsequent to October 31, 2015 through September 30, 2016 of $50,792. For tax purposes, such losses will be recognized in the year ending September 30, 2017.
At March 31, 2017, the Fund had cumulative tax basis capital losses of $28,398, (of which $10,848 are short-term and $17,550 are long-term) generated after September 30, 2011, which may be carried forward to offset future capital gains. To the extent such carry-forwards are used, capital gain distributions may be reduced to the extent provided by regulations. Such capital loss carryforwards do not expire.
NOTE 3 – SECURITY VALUATION
Valuation of the Fund’s portfolio investment securities is performed in accordance with policies and procedures adopted by and under the oversight of the Trustees.
The Trustees of the Trust have appointed Thornburg Investment Management, Inc., the Trust’s investment advisor (the “Advisor”), to assist the Trustees in obtaining market values for portfolio investments, evaluate and monitor professional pricing service providers appointed by the Trustees’ Audit Committee (the “Audit Committee”) to assist in determining fair values for portfolio investments, assist in calculating fair values for portfolio investments in certain circumstances, and to perform other functions in connection with the valuation of investments. The Advisor acts through its Valuation and Pricing Committee (the “Committee”) and other employees of the Advisor. The Committee regularly reviews its own valuation calculations, as well as the valuations, valuation techniques and services furnished by pricing service providers, considers circumstances which may require valuation calculations by the Committee, and reviews previous valuation calculations. The Committee reports to the Audit Committee on the Committee’s activities, the performance of pricing service providers, and other matters relating to valuation of portfolio investments.
In those instances when the Committee assists in calculating a fair value for a portfolio investment, the Committee seeks to determine the price that the Fund would reasonably expect to receive upon a sale of the investment in an orderly transaction between market participants on the valuation date. The Committee customarily utilizes quotations from securities broker dealers in calculating valua-tions, but also may utilize prices obtained from pricing service providers or other methods approved by the Audit Committee. Because fair values calculated by the Committee are estimates, the calculation of a value for an investment may differ from the price that would be realized by the Fund upon a sale of the investment, and the difference could be material to the Fund’s financial statements. The Committee’s calculation of a fair value for an investment may also differ from the prices obtained by other persons (including other mutual funds) for the investment.
18 Semi-Annual Report
| | |
| Notes to Financial Statements, Continued | | |
| |
Thornburg Strategic Municipal Income Fund | | March 31, 2017 (Unaudited) |
Valuation of Securities: Debt obligations held by the Fund which are not listed or traded on exchanges or for which no reported market exists are ordinarily valued at the valuation obtained from a pricing service provider approved by the Audit Committee.
In any case when a pricing service provider fails to provide a valuation for a debt obligation held by the Fund, the Committee calculates a fair value for the obligation using alternative methods under procedures approved by the Audit Committee. Additionally, in cases when management believes that a valuation obtained from a pricing service provider merits review for significant reasons, the Committee decides whether or not to use the valuation calculated by the pricing service provider or to use an alternative method approved by the Audit Committee to calculate a fair value for the obligation.
Valuation Hierarchy: The Fund categorizes its investments based upon the inputs used in valuing those investments, according to a three-level hierarchy established in guidance from FASB. Categorization of investments using this hierarchy is intended by the FASB to maximize the use of observable inputs in valuing investments and minimize the use of unobservable inputs by requiring that the most observable inputs be used when available. Observable inputs are those that market participants would use in valuing an investment based on available market information. Unobservable inputs are those that reflect assumptions about the information market partici-pants would use in valuing an investment. An investment’s level within the hierarchy is based on the lowest level input that is deemed significant to the valuation. The methodologies and inputs used to value investments are not necessarily indications of the risk or liquid-ity associated with those investments.
Various inputs are used in calculating valuations for the Fund’s investments. These inputs are generally summarized according to the three-level hierarchy below:
Level 1: Quoted prices in active markets for identical investments.
Level 2: Other direct or indirect significant observable inputs (including quoted prices for similar investments in active markets and other observable inputs, such as interest rates, prepayment rates, credit risk, etc.).
Level 3: Significant unobservable inputs (including the Committee’s own assumptions in calculating the fair values of investments).
Valuations for debt obligations held by the Fund are typically calculated by pricing service providers approved by the Audit Committee and are characterized as Level 2 within the valuation hierarchy.
In a limited number of cases the Committee calculates a fair value for investments using broker quotations or other methods approved by the Audit Committee. When the Committee uses a single broker quotation to calculate a fair value for an investment without other significant observable inputs, or if a fair value is calculated using other significant inputs that are considered unobservable, the investment is characterized as Level 3 within the hierarchy. Other significant unobservable inputs used to calculate a fair value in these instances might include an income-based valuation approach which considers discounted anticipated future cash flows from the investment, and application of discounts due to the nature or duration of any restrictions on the disposition of the investment.
Valuations based upon the use of inputs from Levels 1, 2 or 3 may not represent the actual price received upon the disposition of an investment, and the Fund may receive a price that is lower than the valuation based upon these inputs when it sells the investment.
The following table displays a summary of the fair value hierarchy measurements of the Fund’s investments as of March 31, 2017. In any instance when valuation inputs from more than one level are used to determine the fair value of a specific investment, the investment is placed in the level of the table based upon the lowest level input that is significant in determining the fair value of the investment:
| | | | | | | | | | | | | | | | |
| | | FAIR VALUE MEASUREMENTS AT MARCH 31, 2017 | |
| | | TOTAL | | | LEVEL 1 | | | LEVEL 2 | | | LEVEL 3 | |
Assets | | | | | | | | | | | | | | | | |
Investments in Securities | | | | | | | | | | | | | | | | |
Municipal Bonds | | $ | 278,653,674 | | | $ | — | | | $ | 278,653,674 | | | $ | — | |
| | | | | | | | | | | | | | | | |
Total Investments in Securities | | $ | 278,653,674 | | | $ | — | | | $ | 278,653,674 | | | $ | — | |
In accordance with the guidance prescribed in Accounting Standards Update No. 2011-04, it is the policy of the Fund to recognize transfers between levels and the underlying events which caused the movement. The Fund recognized no transfers between levels for the six months ended March 31, 2017.
Semi-Annual Report 19
| | |
| Notes to Financial Statements, Continued | | |
| |
Thornburg Strategic Municipal Income Fund | | March 31, 2017 (Unaudited) |
NOTE 4 – INVESTMENT ADVISORY FEE AND OTHER TRANSACTIONS WITH AFFILIATES
Pursuant to an investment advisory agreement, the Advisor serves as the investment advisor and performs services for the Fund for which the fees are payable at the end of each month. Under the investment advisory agreement, the Fund pays the Advisor a manage-ment fee based on the daily net assets of the Fund at an annual rate as shown in the following table:
Management Fee Schedule
| | | | |
DAILY NET ASSETS | | FEE RATE | |
Up to $500 million | | | 0.750 | % |
Next $500 million | | | 0.675 | |
Next $500 million | | | 0.625 | |
Next $500 million | | | 0.575 | |
Over $2 billion | | | 0.500 | |
The Fund’s effective management fee for the six months ended March 31, 2017 was 0.75% of the Fund’s average net assets.
The Fund pays to the Advisor the costs of personnel who perform certain accounting services for the Fund. For the six months ended March 31, 2017 the Fund paid $4,789 to the Advisor for these accounting services. The Trust has also entered into administrative ser-vice agreements with the Advisor, whereby the Advisor will perform certain administrative services related to each class of the Fund’s shares, and for which fees will be payable at an annual rate of up to .125 of 1% per annum of the average daily net assets attributable to each class of shares. Total administrative service fees incurred by each class of shares of the Fund for the six months ended March 31, 2017, are set forth in the Statement of Operations.
The Trust has an underwriting agreement with Thornburg Securities Corporation (the “Distributor”), an affiliate of the Advisor, which acts as the distributor of the Fund’s shares. For the six months ended March 31, 2017, the Distributor has advised the Fund that it earned net commissions aggregating $755 from the sale of Class A shares, and collected contingent deferred sales charges aggregating $1,730 from redemptions of Class C shares of the Fund.
Pursuant to a service plan under Rule 12b-1 of the Investment Company Act of 1940, the Fund may reimburse to the Distributor an amount not to exceed .25 of 1% per annum of the average daily net assets attributable to Class A and Class C shares of the Fund for payments made by the Distributor to securities dealers and other financial institutions to obtain various shareholder and distribution related services. For the six months ended March 31, 2017, there were no 12b-1 service plan fees charged for Class I shares. The Advisor and the Distributor each may pay out of its own resources additional expenses for distribution of the Fund’s shares and share-holder services.
The Trust has also adopted a distribution plan pursuant to Rule 12b-1, applicable only to the Fund’s Class C shares, under which the Fund compensates the Distributor for services in promoting the sale of Class C shares of the Fund at an annual rate of up to .25 of 1% per annum of the average daily net assets attributable to Class C shares.
Total fees incurred by each class of shares of the Fund under their respective service and distribution plans for the six months ended March 31, 2017, are set forth in the Statement of Operations.
The Advisor and Distributor have contractually agreed to waive fees and reimburse expenses incurred by the Fund so that actual expenses of certain share classes do not exceed levels as specified in the Fund’s most recent prospectus. The agreement may be terminated by the Fund at any time, but may not be terminated by the Advisor or Distributor before April 10, 2018, unless the Advisor ceases to be the investment advisor to the Fund or the Distributor ceases to be the distributor of the Fund prior to that date. The Advisor and Distributor may recoup amounts waived or reimbursed during the fiscal year if actual expenses fall below the contractual limit during that year in which the waivers or reimbursements occurred.
For the six months ended March 31, 2017, the Advisor contractually waived Fund level investment advisory fees of $69,151. The Advisor contractually reimbursed certain class specific expenses, administrative fees, and distribution fees of $24,888 for Class A shares, $12,707 for Class C shares, and $2,239 for Class I.
Certain officers and Trustees of the Trust are also officers or directors of the Advisor and Distributor. The compensation of independent Trustees is borne by the Trust.
The percentage of direct investments in the Fund held by appointed Trustees and Officers of the Trust and the Advisor is approximately 7.91%.
20 Semi-Annual Report
| | |
| Notes To Financial Statements, Continued | | |
| |
Thornburg Strategic Municipal Income Fund | | March 31, 2017 (Unaudited) |
The Fund may purchase or sell securities from or to an affiliated fund, provided the affiliation is due solely to having a common investment advisor, common officers, or common trustees, and provided that all such transactions will comply with Rule 17a-7 under the 1940 Act. For the six months ended March 31, 2017, the Fund had no transactions with affiliated funds.
NOTE 5 – SHARES OF BENEFICIAL INTEREST
At March 31, 2017, there were an unlimited number of shares with no par value of beneficial interest authorized. Transactions in shares of beneficial interest were as follows:
| | | | | | | | | | | | | | | | |
| | | SIX MONTHS ENDED | | | YEAR ENDED | |
| | | MARCH 31, 2017 (UNAUDITED) | | | SEPTEMBER 30, 2016 (AUDITED) | |
| | | SHARES | | | AMOUNT | | | SHARES | | | AMOUNT | |
Class A Shares | | | | | | | | | | | | | | | | |
Shares sold | | | 885,229 | | | $ | 13,294,108 | | | | 1,882,295 | | | $ | 29,048,882 | |
Shares issued to shareholders in reinvestment of dividends | | | 50,344 | | | | 753,739 | | | | 91,530 | | | | 1,411,031 | |
Shares repurchased | | | (1,686,405 | ) | | | (25,168,198 | ) | | | (1,283,224 | ) | | | (19,731,256 | ) |
| | | | | | | | | | | | | | | | |
| | | | |
Net increase (decrease) | | | (750,832 | ) | | $ | (11,120,351 | ) | | | 690,601 | | | $ | 10,728,657 | |
| | | | | | | | | | | | | | | | |
Class C Shares | | | | | | | | | | | | | | | | |
Shares sold | | | 381,764 | | | $ | 5,724,949 | | | | 1,073,899 | | | $ | 16,569,930 | |
Shares issued to shareholders in reinvestment of dividends | | | 20,809 | | | | 311,829 | | | | 36,232 | | | | 559,203 | |
Shares repurchased | | | (513,269 | ) | | | (7,680,110 | ) | | | (531,309 | ) | | | (8,221,278 | ) |
| | | | | | | | | | | | | | | | |
| | | | |
Net increase (decrease) | | | (110,696 | ) | | $ | (1,643,332 | ) | | | 578,822 | | | $ | 8,907,855 | |
| | | | | | | | | | | | | | | | |
Class I Shares | | | | | | | | | | | | | | | | |
Shares sold | | | 3,698,402 | | | $ | 55,227,905 | | | | 5,173,837 | | | $ | 79,887,572 | |
Shares issued to shareholders in reinvestment of dividends | | | 136,617 | | | | 2,047,664 | | | | 235,073 | | | | 3,628,305 | |
Shares repurchased | | | (3,973,590 | ) | | | (59,430,897 | ) | | | (3,157,683 | ) | | | (48,786,029 | ) |
| | | | | | | | | | | | | | | | |
| | | | |
Net increase (decrease) | | | (138,571 | ) | | $ | (2,155,328 | ) | | | 2,251,227 | | | $ | 34,729,848 | |
| | | | | | | | | | | | | | | | |
NOTE 6 – INVESTMENT TRANSACTIONS
For the six months ended March 31, 2017, the Fund had purchase and sale transactions of investments (excluding short-term investments) of $34,330,295 and $45,800,388, respectively.
OTHER NOTES
Risks: The Fund’s investments subject it to risks including, but not limited to, credit risk, interest rate risk, management risk, high yield risk, derivatives risk, market and economic risk, and liquidity risk. Please see the Fund’s prospectus for a discussion of the risks asso-ciated with an investment in the Fund.
Subsequent Events: Fund management believes no events have occurred between March 31, 2017 and the date of issuance of the financial statements that require adjustment to or disclosure in the accompanying financial statements.
Semi-Annual Report 21
Financial Highlights
Thornburg Strategic Municipal Income Fund
| | | | | | | | | | | | | | | | | | | | | | | | | | | | | | | | | | | | | | | | | | | | | | | | | | | | | | | | | | | | |
| | | PER SHARE PERFORMANCE (FOR A SHARE OUTSTANDING THROUGHOUT THE PERIOD) | | | RATIOS TO AVERAGE NET ASSETS | | | SUPPLEMENTAL DATA | |
UNLESS OTHERWISE NOTED, PERIODS ARE FISCAL YEARS ENDED SEPT.
30, | | NET ASSET
VALUE
BEGINNING
OF PERIOD | | | NET
INVESTMENT
INCOME
(LOSS)+ | | | NET
REALIZED
&
UNREALIZED
GAIN (LOSS)
ON
INVESTMENTS | | | TOTAL FROM
INVESTMENT
OPERATIONS | | | DIVIDENDS
FROM NET
INVESTMENT
INCOME | | | DIVIDENDS
FROM NET
REALIZED
GAINS | | | TOTAL
DIVIDENDS | | | NET
ASSET
VALUE END
OF PERIOD | | | NET
INVESTMENT
INCOME
(LOSS)
(%) | | | EXPENSES,
AFTER
EXPENSE
REDUCTIONS
(%) | | | EXPENSES,
AFTER
EXPENSE
REDUCTIONS
AND
NET OF
CUSTODY
CREDITS
(%) | | | EXPENSES,
BEFORE
EXPENSE
REDUCTIONS
(%) | | | TOTAL
RETURN
(%)(a) | | | PORTFOLIO
TURNOVER
RATE
(%)(a) | | | NET
ASSETS AT
END OF
PERIOD
(THOUSANDS) | |
CLASS A SHARES | | | | | | | | | | | | | | | | | | | | | | | | | | | | | | | | | | | | | | | | | | | | | | | | | | | | | |
2017(b)(c) | | | $15.53 | | | | 0.16 | | | | (0.60) | | | | (0.44) | | | | (0.16) | | | | – | | | | (0.16) | | | | $14.93 | | | | 2.17 | (d) | | | 1.22 | (d) | | | 1.22 | (d) | | | 1.29 | (d) | | | (2.81) | | | | 13.12 | | | | $64,797 | |
2016(c) | | | $15.16 | | | | 0.33 | | | | 0.37 | | | | 0.70 | | | | (0.33) | | | | – | | | | (0.33) | | | | $15.53 | | | | 2.11 | | | | 1.25 | | | | 1.25 | | | | 1.29 | | | | 4.63 | | | | 11.24 | | | | $79,058 | |
2015(c) | | | $15.19 | | | | 0.35 | | | | (0.02) | | | | 0.33 | | | | (0.35) | | | | (0.01) | | | | (0.36) | | | | $15.16 | | | | 2.28 | | | | 1.25 | | | | 1.25 | | | | 1.31 | | | | 2.18 | | | | 12.13 | | | | $66,722 | |
2014(c) | | | $14.40 | | | | 0.41 | | | | 0.85 | | | | 1.26 | | | | (0.42) | | | | (0.05) | | | | (0.47) | | | | $15.19 | | | | 2.82 | | | | 1.25 | | | | 1.25 | | | | 1.31 | | | | 8.93 | | | | 21.89 | | | | $61,424 | |
2013(c) | | | $15.17 | | | | 0.41 | | | | (0.74) | | | | (0.33) | | | | (0.41) | | | | (0.03) | | | | (0.44) | | | | $14.40 | | | | 2.74 | | | | 1.25 | | | | 1.25 | | | | 1.31 | | | | (2.21) | | | | 37.42 | | | | $52,278 | |
2012(c) | | | $14.06 | | | | 0.49 | | | | 1.13 | | | | 1.62 | | | | (0.50) | | | | (0.01) | | | | (0.51) | | | | $15.17 | | | | 3.34 | | | | 1.25 | | | | 1.25 | | | | 1.31 | | | | 11.71 | | | | 12.52 | | | | $65,446 | |
CLASS C SHARES | | | | | | | | | | | | | | | | | | | | | | | | | | | | | | | | | | | | | | | | | | | | | | | | | | | | | |
2017(b) | | | $15.54 | | | | 0.14 | | | | (0.60) | | | | (0.46) | | | | (0.14) | | | | – | | | | (0.14) | | | | $14.94 | | | | 1.82 | (d) | | | 1.57 | (d) | | | 1.57 | (d) | | | 1.64 | (d) | | | (2.98) | | | | 13.12 | | | | $35,621 | |
2016 | | | $15.17 | | | | 0.28 | | | | 0.37 | | | | 0.65 | | | | (0.28) | | | | – | | | | (0.28) | | | | $15.54 | | | | 1.80 | | | | 1.55 | | | | 1.55 | | | | 1.66 | | | | 4.32 | | | | 11.24 | | | | $38,773 | |
2015 | | | $15.20 | | | | 0.30 | | | | (0.02) | | | | 0.28 | | | | (0.30) | | | | (0.01) | | | | (0.31) | | | | $15.17 | | | | 1.98 | | | | 1.55 | | | | 1.55 | | | | 1.70 | | | | 1.87 | | | | 12.13 | | | | $29,073 | |
2014 | | | $14.41 | | | | 0.37 | | | | 0.84 | | | | 1.21 | | | | (0.37) | | | | (0.05) | | | | (0.42) | | | | $15.20 | | | | 2.53 | | | | 1.55 | | | | 1.55 | | | | 1.72 | | | | 8.60 | | | | 21.89 | | | | $26,168 | |
2013 | | | $15.18 | | | | 0.37 | | | | (0.74) | | | | (0.37) | | | | (0.37) | | | | (0.03) | | | | (0.40) | | | | $14.41 | | | | 2.44 | | | | 1.55 | | | | 1.55 | | | | 1.73 | | | | (2.50) | | | | 37.42 | | | | $21,344 | |
2012 | | | $14.07 | | | | 0.45 | | | | 1.12 | | | | 1.57 | | | | (0.45) | | | | (0.01) | | | | (0.46) | | | | $15.18 | | | | 3.04 | | | | 1.55 | | | | 1.55 | | | | 1.78 | | | | 11.38 | | | | 12.52 | | | | $23,521 | |
CLASS I SHARES | | | | | | | | | | | | | | | | | | | | | | | | | | | | | | | | | | | | | | | | | | | | | | | | | | | | | |
2017(b) | | | $15.54 | | | | 0.18 | | | | (0.60) | | | | (0.42) | | | | (0.18) | | | | – | | | | (0.18) | | | | $14.94 | | | | 2.46 | (d) | | | 0.93 | (d) | | | 0.93 | (d) | | | 0.94 | (d) | | | (2.67) | | | | 13.12 | | | | $181,218 | |
2016 | | | $15.17 | | | | 0.38 | | | | 0.37 | | | | 0.75 | | | | (0.38) | | | | – | | | | (0.38) | | | | $15.54 | | | | 2.42 | | | | 0.93 | | | | 0.93 | | | | 0.93 | | | | 4.96 | | | | 11.24 | | | | $190,658 | |
2015 | | | $15.20 | | | | 0.39 | | | | (0.01) | | | | 0.38 | | | | (0.40) | | | | (0.01) | | | | (0.41) | | | | $15.17 | | | | 2.60 | | | | 0.93 | | | | 0.93 | | | | 0.93 | | | | 2.50 | | | | 12.13 | | | | $151,992 | |
2014 | | | $14.41 | | | | 0.46 | | | | 0.85 | | | | 1.31 | | | | (0.47) | | | | (0.05) | | | | (0.52) | | | | $15.20 | | | | 3.12 | | | | 0.94 | | | | 0.93 | | | | 0.94 | | | | 9.27 | | | | 21.89 | | | | $137,109 | |
2013 | | | $15.18 | | | | 0.45 | | | | (0.73) | | | | (0.28) | | | | (0.46) | | | | (0.03) | | | | (0.49) | | | | $14.41 | | | | 3.04 | | | | 0.95 | | | | 0.95 | | | | 0.96 | | | | (1.92) | | | | 37.42 | | | | $89,262 | |
2012 | | | $14.07 | | | | 0.53 | | | | 1.13 | | | | 1.66 | | | | (0.54) | | | | (0.01) | | | | (0.55) | | | | $15.18 | | | | 3.62 | | | | 0.95 | | | | 0.95 | | | | 0.95 | | | | 12.03 | | | | 12.52 | | | | $92,386 | |
| (a) | Not annualized for periods less than one year. |
| (b) | Unaudited Six Month Period Ended March 31. |
| (c) | Sales loads are not reflected in computing total return. |
| + | Based on weighted average shares outstanding. |
See notes to financial statements.
| | | | |
| 22 Semi-Annual Report | | | | Semi-Annual Report 23 |
| | |
Expense Example | | |
| |
| Thornburg Strategic Municipal Income Fund | | March 31, 2017 (Unaudited) |
As a shareholder of the Fund, you incur two types of costs:
| | (1) | transaction costs, including |
(a) sales charges (loads) on purchase payments, for Class A shares;
(b) a deferred sales charge on redemptions of any part or all of a purchase of $1 million of Class A shares within 12 months of purchase;
(c) a deferred sales charge on redemptions of Class C shares within 12 months of purchase;
| | (2) | ongoing costs, including management fees; distribution and/or service (12b-1) fees; and other Fund expenses. |
This example is intended to help you understand your ongoing costs (in dollars) of investing in the Fund and to compare these costs with the ongoing costs of investing in other mutual funds.
The example is based on a $1,000 investment beginning on October 1, 2016, and held until March 31, 2017.
| | | | | | | | | | | | |
| | | BEGINNING
ACCOUNT VALUE
10/1/16 | | | ENDING
ACCOUNT VALUE
3/31/17 | | | EXPENSES PAID
DURING PERIOD†
10/1/16–3/31/17 | |
CLASS A SHARES | | | | | | | | | | | | |
Actual | | $ | 1,000.00 | | | $ | 971.90 | | | $ | 6.00 | |
Hypothetical* | | $ | 1,000.00 | | | $ | 1,018.85 | | | $ | 6.14 | |
CLASS C SHARES | | | | | | | | | | | | |
Actual | | $ | 1,000.00 | | | $ | 970.19 | | | $ | 7.73 | |
Hypothetical* | | $ | 1,000.00 | | | $ | 1,017.08 | | | $ | 7.91 | |
CLASS I SHARES | | | | | | | | | | | | |
Actual | | $ | 1,000.00 | | | $ | 973.30 | | | $ | 4.60 | |
Hypothetical* | | $ | 1,000.00 | | | $ | 1,020.27 | | | $ | 4.70 | |
| † | Expenses are equal to the annualized expense ratio for each class (A: 1.22%; C: 1.57%; I: 0.93%) multiplied by the average account value over the period, multiplied by 182/365 to reflect the one-half year period. |
| * | Hypothetical assumes a rate of return of 5% per year before expenses. |
ACTUAL EXPENSES
For each class of shares, the first line of the accompanying table provides information about actual account values and actual expenses. You may use the information in this line, together with the amount you invested, to estimate the expenses that you paid over the period. Simply divide your account value by $1,000 (for example, an $8,600 account value divided by $1,000 = 8.6), then multiply the result by the number in the first line for your class of shares under the heading entitled “Expenses Paid During Period” to estimate the expenses you paid on your account during this period.
HYPOTHETICAL EXAMPLE FOR COMPARISON PURPOSES
For each class of shares, the second line of the accompanying table provides information about hypothetical account values and hypothetical expenses based on the Fund’s actual expense ratio and an assumed rate of return of 5% per year before expenses, which is not the Fund’s actual return. The hypothetical account values and expenses may not be used to estimate the actual ending account balance or expenses you paid for the period. You may use this information to compare the ongoing costs of investing in the Fund and other funds. To do so, compare this 5% hypothetical example with the 5% hypothetical examples that appear in the shareholder reports of the other funds.
Please note that the expenses shown in the table are meant to highlight your ongoing costs only and do not reflect any transactional costs, such as sales charges (loads), redemption fees, or exchange fees. Therefore, the second line of the table for each class of shares is useful in comparing ongoing costs only, and will not help you determine the relative total costs of owning different funds. In addition, if these transactional costs were included, your costs would have been higher.
24 Semi-Annual Report
| | |
| Other Information | | |
| |
Thornburg Strategic Municipal Income Fund | | March 31, 2017 (Unaudited) |
PORTFOLIO PROXY VOTING
Policies and Procedures:
The Trust has delegated to Thornburg Investment Management, Inc. (the “Advisor”) voting decisions respecting proxies for the Fund’s voting securities. The Advisor makes voting decisions in accordance with its Proxy Voting Policy. A description of the Policy is available (i) without charge, upon request, by calling the Advisor toll-free at 1-800-847-0200, (ii) on the Thornburg website at www.thornburg. com, and (iii) on the Securities and Exchange Commission’s website at www.sec.gov.
Information regarding how proxies were voted is available on or before August 31 of each year for the twelve months ending the pre-ceding June 30. This information is available (i) without charge, upon request by calling the Advisor toll-free at 1-800-847-0200, (ii) on the Thornburg website at www.thornburg.com, and (iii) on the Securities and Exchange Commission’s website at www.sec.gov.
AVAILABILITY OF QUARTERLY PORTFOLIO SCHEDULE
The Fund files with the Securities and Exchange Commission schedules of its portfolio holdings on Form N-Q for the first and third quarters of each fiscal year. The Fund’s Forms N-Q are available on the Commission’s website at www.sec.gov, or may be reviewed and copied at the Commission’s Public Reference Room in Washington, D.C. Information on the operation of the Public Reference Room may be obtained by calling 1-800-SEC-0330. The Fund also makes this information available on its website at www.thornburg. com/download or upon request by calling 1-800-847-0200.
Semi-Annual Report 25
Trustees’ Statement to Shareholders
Readopted September 12, 2016
The Trustees believe current and prospective shareholders should know how we discharge our responsibilities in supervising the Funds’ investment advisor and in reviewing the advisor’s contract for renewal. Since 2005, we have issued a statement which sets out clearly the three principal guidelines that we follow in supervising the Trust’s investment advisor on your behalf. In accordance with our customary practice, in September of this year we again reviewed our statement and concluded we should reissue this statement outlining the principal features of our supervision of the advisor’s performance of investment management services for the Funds.
We begin with the premise that each shareholder selected his or her Fund because its investments are managed by the investment advisor identified in the prospectus and in accordance with the objective and policies described in the prospectus. We realize, as each of you do, that if you believe that your Fund’s stated objective and policies no longer serve your personal investment goals, you can sell your shares and leave the Fund.
Therefore, we believe that our primary supervisory task—our principal obligation to you—is to assess the nature and quality of the advisor’s services, and to confirm that the advisor actively and competently pursues the Fund’s objective, in accordance with the policies set out in the prospectus. To do this, we meet regularly with management to review your Fund’s portfolio and to discuss the advisor’s specific actions and judgments in pursuing the Fund’s objective. We do not substitute our own judgment for the advisor’s decisions in selecting investments; the advisor is paid to exercise its informed judgment on investment decisions, and we seek to confirm, in reviewing the advisor’s performance, that the advisor is doing just that.
Second, we are conscious of costs and the effect that costs have on shareholders’ returns. We try to make sure that your Fund’s fees and costs are reasonable in relationship to the services rendered and that they are generally in line with those charged by other expert investment advisors, consistent with our belief that the Fund’s investors searched for and expect that expertise and attention and have decided to pay a reasonable price for it. We do not put the management contract “out to bid” as a matter of course, and we would not do so unless we had concluded that the advisor materially had failed to pursue the Fund’s objectives in accordance with its policies, or for other equally important reasons. We believe that any other approach would be inconsistent with your inter-ests and contrary to your expectations when you bought shares of the Fund in the first place.
Finally, because we believe that most Thornburg Fund shareholders have invested with a long-term perspective, we try not to focus too much on the fashions of the moment and on short-term performance. The market will not favor any specific investment objective or set of policies at all times and under all economic circumstances. A fund will experience periods of both high and low returns relative to other funds and other investments. Even if one of our Funds is not favored by the market at a particular time, we believe that the advisor is nonetheless obliged to remain true to the Fund’s objective and policies, and we watch to see that it does so.
Trustees of Thornburg Investment Trust
26 Semi-Annual Report
Thornburg Funds
Thornburg Investment Management is a privately-owned global investment firm that offers a range of solutions for retail and institutional investors. Founded in 1982 and headquartered in Santa Fe, New Mexico, we manage approximately $49 billion (as of March 31, 2017) across U.S. mutual funds, separate accounts for high-net-worth investors and institutional accounts, and UCITS funds for non-U.S. investors.
The fund outlined in this report is one of many equity and fixed-income products available from Thornburg Investment Management.
EQUITY FUNDS
| | • | | Thornburg Investment Income Builder Fund |
| | • | | Thornburg Global Opportunities Fund |
| | • | | Thornburg International Value Fund |
| | • | | Thornburg Better World International Fund |
| | • | | Thornburg International Growth Fund |
| | • | | Thornburg Developing World Fund |
| | • | | Thornburg Core Growth Fund |
FIXED INCOME FUNDS
| | • | | Thornburg Low Duration Income Fund |
| | • | | Thornburg Limited Term U .S . Government Fund |
| | • | | Thornburg Limited Term Income Fund |
| | • | | Thornburg Strategic Income Fund |
| | • | | Thornburg Low Duration Municipal Fund |
| | • | | Thornburg Limited Term Municipal Fund |
| | • | | Thornburg Intermediate Municipal Fund |
| | • | | Thornburg California Limited Term Municipal Fund |
| | • | | Thornburg New Mexico Intermediate Municipal Fund |
| | • | | Thornburg New York Intermediate Municipal Fund |
| | • | | Thornburg Strategic Municipal Income Fund |
ALTERNATIVE FUNDS
| | • | | Thornburg Long/Short Equity Fund |
Before investing, carefully consider the Fund’s investment goals, risks, charges, and expenses. For a prospectus or summary prospectus containing this and other information, contact your financial advisor or visit thornburg.com. Read it carefully before investing.
For additional information, please visit thornburg ..com
Thornburg Investment Management, Inc . 2300 North Ridgetop Road, Santa Fe, NM 87506
Semi-Annual Report 27
This Semi-Annual Report is submitted for the general information of shareholders of the Fund. It is not authorized for distribution to prospective investors in the Fund unless preceded or accompanied by an effective prospectus.
| | | | |
| Investment Advisor: | | Distributor: | | |
| Thornburg Investment Management® | | Thornburg Securities Corporation® | | |
| 800.847.0200 | | 800.847.0200 | | TH1979 |

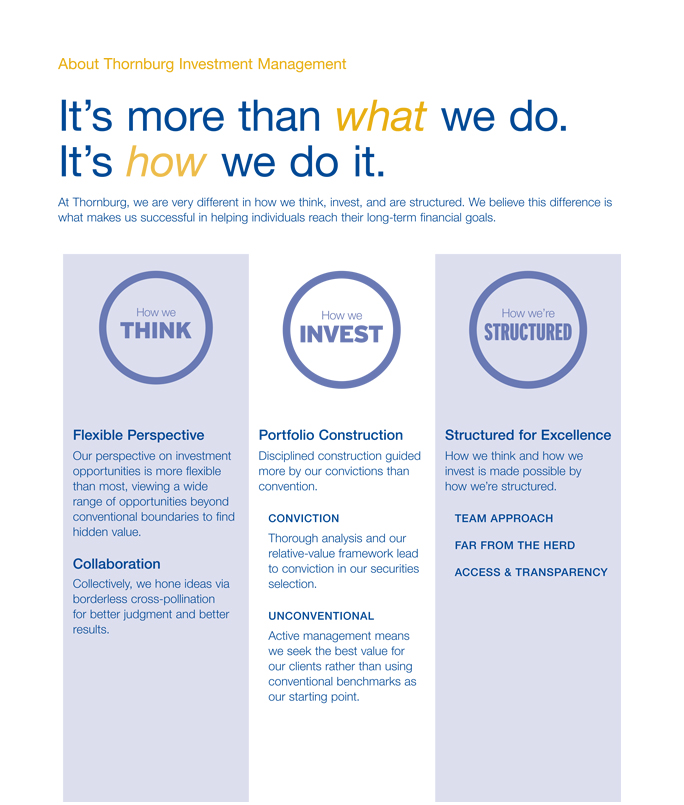
About Thornburg Investment Management It’s more than what we do. It’s how we do it. At Thornburg, we are very different in how we think, invest, and are structured. We believe this difference is what makes us successful in helping individuals reach their long-term financial goals. How we Flexible Perspective Our perspective on investment opportunities is more flexible than most, viewing a wide range of opportunities beyond conventional boundaries to find hidden value. Collaboration Collectively, we hone ideas via borderless cross-pollination for better judgment and better results. Portfolio Construction Disciplined construction guided more by our convictions than convention. CONVICTION Thorough analysis and our relative-value framework lead to conviction in our securities selection. UNCONVENTIONAL Active management means we seek the best value for our clients rather than using conventional benchmarks as our starting point. Structured for Excellence How we think and how we invest is made possible by how we’re structured. TEAM APPROACH FAR FROM THE HERD ACCESS & TRANSPARENCY
2 Semi-Annual Report
Semi-Annual Report
Thornburg California Limited Term Municipal Fund
March 31, 2017
| | | | |
SHARE CLASS | | NASDAQ SYMBOL | | CUSIP |
Class A | | LTCAX | | 885-215-426 |
Class C | | LTCCX | | 885-215-418 |
Class I | | LTCIX | | 885-215-392 |
Minimum investments for Class I shares may be higher than those for other classes. Class I shares may not be available to all investors.
Investments carry risks, including possible loss of principal. Portfolios investing in bonds have the same interest rate, inflation, and credit risks that are associated with the underlying bonds. The value of bonds will fluctuate relative to changes in interest rates, decreasing when interest rates rise. Unlike bonds, bond funds have ongoing fees and expenses. Please see the Fund’s prospectus for a discussion of the risks associated with an investment in the Fund. Investments in the Funds are not FDIC insured, nor are they bank deposits or guaranteed by a bank or any other entity.
The laddering strategy does not assure or guarantee better performance and cannot eliminate the risk of investment losses.
Diversification does not assure or guarantee better performance and cannot eliminate the risk of investment losses.
Semi-Annual Report 3
Letter to Shareholders
Thornburg California Limited Term Municipal Fund | March 31, 2017 (Unaudited) |
April 28, 2017
Dear Fellow Shareholder:
We are pleased to present the semi-annual report for Thornburg California Limited Term Municipal Fund. The net asset value (NAV) of the Class A shares decreased by 33 cents to $13.65 per share during the six-month period ended March 31, 2017. If you were with us the entire period, you received dividends of 8.89 cents per share. If you reinvested your dividends, you received 8.92 cents per share. Dividends were lower for Class C shares and higher for Class I shares to account for varying class-specific expenses. The Class A shares of your Fund underperformed the index with a negative 1.72% total return (without sales charge) for the six months ended March 31, 2017, compared to the negative 0.90% return for the BofA Merrill Lynch 1-10 Year U.S. Municipal Securities Index.
The Fund’s duration and curve positioning detracted 0.03% from performance. Credit allocations detracted 0.06%, and other risk factors detracted 0.26%. Fund expenses accounted for the remaining differences.
The Municipal Bond Market
After a few years of relative quiet in the municipal bond market, things heated up following the election of Donald Trump in 2016. While stocks were rallying, bond prices, even municipal bond prices, came under pressure. Bond yields initially rose after the election based on expectations for greater infrastructure spending, stronger growth and higher inflation. The uptick in rates led mutual fund investors to sell their shares, which caused municipal bond mutual funds to sell their bonds to meet those redemptions. After significant inflows in January to September of 2016, investors pulled $26 billion from municipal bond funds in November and December, some of which was related to tax-loss selling.
When the calendar turned in 2017, these outflows slowed and the municipal bond market produced positive returns. A contributing factor to positive returns was a decline in municipal bond issuance, as during the first quarter of 2017, the supply of new municipal bonds declined by 12% from the same time last year.
The value metrics we use at Thornburg suggest that the municipal bond market continues to price in the rosiest of scenarios moving forward, as investors have been pushed out of the risk spectrum. That is why we have Thornburg California Limited Term Municipal Fund positioned in the lower end of its respective risk spectrum. In this environment, we continue to keep duration shorter, credit quality higher and we maintain higher levels of reserves.
Inside the Risk Metrics
Real yields, which indicate how much yield over inflation investors are being paid to own municipal bonds, increased over the six-month period. As of September 30, 2016, 10-year AAA general obligation (GO) bonds were yielding 1.64% and the Core Personal Consumption Expenditures Index (PCE) was running at 1.70%, so investors were earning less than inflation. By the end of February 2017, the yield on 10-year AAA GO bonds had increased to 2.30%, while Core PCE was running at 1.80%. While certainly more interesting at the end of the period, the 0.5% real yield was significantly less than the average of 2% investors have earned over the past 20 years.
The second thing to consider is credit spreads, which reflect the incremental yield an investor earns from owning a lower-rated credit versus a higher-rated credit, and which today remain narrow. As of March 31, 2017, an investor earned about 1.28% more for owning a 10-year BBB revenue bond versus a 10-year AAA GO bond. That is slightly higher than the average 0.75% an investor earned between 1994 and 2007. However, in 2007, approximately 50% of the new-issue municipal bond market was insured by AAA/AAA municipal bond insurers. Today, there are no AAA/AAA municipal bond insurers, and insurance coverage generally accounts for only 6% to 8% of the new-issue municipal bond market.
Finally, the slope of the yield curve, which tracks how much incremental yield an investor earns by owning securities with longer maturities, is slightly flatter than historical averages. Currently, investors are earning about 1.4% more for owning a 10-year AAA GO municipal bond, versus a one-year AAA GO municipal bond. Since 1994, an investor earned on average almost 1.6% to extend maturities from one to 10 years.
The Economy and Tax Reform
The U.S. economy continued its slow recovery in 2016, growing at a rate of 1.6% for 2016 in aggregate.
Unemployment continued to tick down. During the six-month period ended March 31, 2017, the U.S. economy added 976,000 jobs and by the end of the period the unemployment rate had fallen to 4.5%. Inflation remained stable, with the Core PCE Index reading 1.75% through March, below the Fed’s 2% target range.
Taken in aggregate, the economy continues to grow, jobs are being added and inflation has remained contained to date. In an effort to keep the economy in check, the U.S. Federal Reserve raised the Fed funds rate in December of 2016, and again in March of 2017.
4 Semi-Annual Report
| | |
| Letter to Shareholders, | | |
| |
Continued | | |
| |
Thornburg California Limited Term Municipal Fund | | March 31, 2017 (Unaudited) |
The economic health of the municipal bond market appears steady with a couple of notable exceptions. The drama in Puerto Rico is still playing out; the only winners are the consultants and lawyers hired by all sides.
California’s economic health is still quite good. For the period from Q4 2015 to Q4 2016 (latest data available) personal income is up 4.6%, employment is up 2.19% and home prices are up 6.58%. Alas, all is not sunny there. Tax revenues are down 0.44%. All in all, California seems on firm footing, but there is a risk that the legislature might want to spend these monies (as they usually do) versus continuing with Governor Brown’s program of conservative fiscal stewardship. Imagine the irony of calling “Governor Moonbeam” a fiscal conservative.
Tax reform is the second highest priority of President Trump’s and the Republican-led House second only to health care reform. The most important items in the tax proposals for the owners of municipal bonds (individuals as well as corporations) are those relevant to investment income. By lowering the effective tax rate on competing sources of income, prices of municipal bonds would most likely fall (yields would increase) to become more competitive with these alternative sources of income.
President Trump’s tax reform proposal (released Thursday, April 27, 2017) called for the elimination of the deduction for state and local taxes on an individual’s federal tax return. This would, if adopted, have significant impacts for residents of high-tax states. California is one of those states with a top marginal income tax rate of 13.3%. The near-term effects on the economy would be minimal, but long term, residents would have less money in their pockets to spend, the cost of residing in the state would increase and might cause out-migration and lower growth.
Conclusion
We continue to run this portfolio as an actively managed laddered portfolio. Laddering a portfolio is a simple way to diversify its investment along its entire investment universe. While past performance does not guarantee future results, our study showed that this structure outperformed other structures around 60% of the time and added 0.15% to 0.25% of total return annually from 1997 through 2016.* Our view is that the current investment environment is not compensating investors enough to take on extra risk, so we have positioned our portfolios at the lower end of their risk spectrums.
Thank you for your continued trust in us.
Sincerely,
| | |
 | |  |
| Christopher Ryon,CFA | | Nicholos Venditti,CFA |
| Portfolio Manager | | Portfolio Manager |
| Managing Director | | Managing Director |
* We examined three hypothetical portfolios of bonds from December 1997 to December 2016. One using a laddering strategy, one using a barbell strategy, and a third using a bullet strategy. For the laddering strategy, the BofA Merrill Lynch 1–12 Year Municipal Index was used as a proxy, since, similar to a ladder, it contains bonds relatively evenly spread across all maturities within the index. The barbell strategy is a duration management technique wherein bonds are clustered at the two extremes of a maturity range. For the barbell strategy, the BofA Merrill Lynch 1–3 Year Municipal Index and BofA Merrill Lynch 8–12 Year Municipal Index were combined. The two indices were weighted in such a way as to give them the same duration as the broader 1–12 Year Index, and each year the portfolio was re-weighted back to the original index weights. This was done to make the two portfolios duration-neutral so that the impact of the strategy chosen could be isolated. The bullet strategy invests at the duration midpoint of the portfolio, therefore the BofA Merrill Lynch 6–8 Year Index was used to represent the bullet strategy. For additional information, see www.thornburg.com/whyladder. Past performance does not guarantee future results.
The matters discussed in this report may constitute forward-looking statements made pursuant to the safe harbor provisions of the Securities Litigation Reform Act of 1995. These include any advisor or portfolio manager prediction, assessment, analysis or outlook for individual securities, industries, investment styles, market sectors and/or markets. These statements involve risks and uncertainties. In addition to the general risks described for each fund in its current prospectus, other factors bearing on these reports include the accuracy of the advisor’s or portfolio manager’s forecasts and predictions, the appropriateness of the investment strategies designed by the advisor or portfolio manager and the ability of the advisor or portfolio manager to implement their strategies efficiently and successfully. Any one or more of these factors, as well as other risks affecting the securities markets generally, could cause the actual results of any fund to differ materially as compared to its benchmarks.
The views expressed are subject to change and do not necessarily reflect the views of Thornburg Investment Management, Inc. This information should not be relied upon as a recommendation or investment advice and is not intended to predict the performance of any investment or market.
Semi-Annual Report 5
| | |
| Performance Summary | | |
| |
| Thornburg California Limited Term Municipal Fund | | |
| |
| | March 31, 2017 (Unaudited) |
AVERAGE ANNUAL TOTAL RETURNS
| | | | | | | | | | | | | | | | | | | | |
| | | | | |
| | | 1-YR | | | 3-YR | | | 5-YR | | | 10-YR | | | SINCE
INCEP. | |
A Shares (Incep: 2/19/87) | | | | | | | | | | | | | | | | | | | | |
Without sales charge | | | -0.82 | % | | | 1.39 | % | | | 1.64 | % | | | 3.07 | % | | | 4.26 | % |
With sales charge | | | -2.29 | % | | | 0.87 | % | | | 1.33 | % | | | 2.92 | % | | | 4.20 | % |
C Shares (Incep: 9/1/94) | | | | | | | | | | | | | | | | | | | | |
Without sales charge | | | -1.06 | % | | | 1.14 | % | | | 1.39 | % | | | 2.81 | % | | | 3.22 | % |
With sales charge | | | -1.55 | % | | | 1.14 | % | | | 1.39 | % | | | 2.81 | % | | | 3.22 | % |
I Shares (Incep: 4/1/97) | | | -0.59 | % | | | 1.70 | % | | | 1.95 | % | | | 3.40 | % | | | 3.71 | % |
30-DAY YIELDS, A SHARES
(with sales charge)
| | | | | | | | | | | | | | | | | | | | |
Annualized Distribution Yield | | | | | | | | | | | | | | | | | | | 1.24 | % |
SEC Yield | | | | | | | | | | | | | | | | | | | 0.70 | % |
GROWTH OF A HYPOTHETICAL $10,000 INVESTMENT
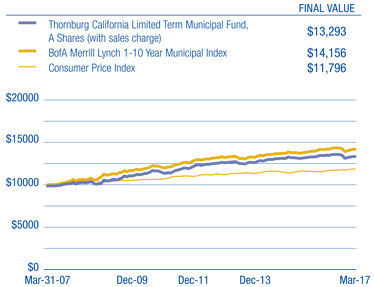
Performance data shown represents past performance and is no guarantee of future results. Investment return and principal value will fluctuate so shares, when redeemed, may be worth more or less than their original cost. Current performance may be lower or higher than quoted. For performance current to the most recent month end, visit thornburg.com or call 800-847-0200. The performance information does not reflect the deduction of taxes that a shareholder would pay on distributions or the redemption of Fund shares. Returns reflect the reinvestment of dividends and capital gains. Class A shares are sold with a maximum sales charge of 1.50%. Class C shares include a 0.50% CDSC for the first year only. There is no sales charge for Class I shares. As disclosed in the most recent prospectus, the total annual fund operating expenses are as follows: A shares, 0.93%; C shares, 1.18%; I shares, 0.62%.
Glossary
The BofA Merrill Lynch 1-10 Year Municipal Securities Index is a subset of the BofA Merrill Lynch U.S. Municipal Securities Index including all securities with a remaining term to final maturity less than 10 years.
The BofA Merrill Lynch indices used in the Ladder vs Barbell & Bullet study are model portfolios of municipal obligations throughout the United States, with maturities ranging either from one to three years, six to eight years, eight to twelve years, or one to twelve years. These indices are subsets of the BofA Merrill Lynch U.S. Municipal Securities Index, which is comprised of U.S. dollar denominated investment grade tax-exempt debt publicly issued by U.S. states and territories, and their political subdivisions, in the U.S. domestic market. Qualifying securities must have at least a one-year remaining term to final maturity, a fixed coupon schedule and an investment grade rating.
The performance of any index is not indicative of the performance of any particular investment. Unless otherwise noted, index returns reflect the reinvestment of income dividends and capital gains, if any, but do not reflect fees, brokerage commissions or other expenses of investing. Investors may not make direct investments into any index.
Annualized Distribution Yield – The distribution yield reflects actual distributions made to shareholders. The annualized distribution yield is calculated by summing the last 30 days of income at a given month end and annualizing to a 360-day year. The result is divided by the ending maximum offering price or net asset value.
Bond Credit Ratings (Credit Quality) – A bond credit rating assesses the financial ability of a debt issuer to make timely payments of principal and interest. Ratings of AAA (the highest), AA, A, and BBB are investment-grade quality. Ratings of BB, B, CCC, CC, C and D (the lowest) are considered below investment grade, speculative grade, or junk bonds.
Insured Bonds – Individual bonds are sometimes insured by private companies. The insurance guarantees the payment of principal and interest on a bond issue if the issuer defaults. Mutual funds are not insured, even if the underlying bonds are insured.
Core Personal Consumption Expenditure Index (Core PCE) – Core Personal Consumption Expenditure Index is a measure of the Personal Consumption Expenditure Index that excludes the more volatile and seasonal food and energy prices.
Credit Spread/Quality Spread – The difference between the yields of securities with different credit qualities.
Effective Duration – A bond’s sensitivity to interest rates, incorporating the embedded option features, such as call provisions. Bonds with longer durations experience greater price volatility than bonds with shorter durations.
Fed Funds Rate – The interest rate at which a depository institution lends immediately available funds (balances at the Federal Reserve) to another depository institution overnight.
General Obligation Bond (GO) – A municipal bond backed by the credit and “taxing power” of the issuing jurisdiction rather than the revenue from a given project.
Laddering – Laddering involves building a portfolio of bonds with staggered maturities so that a portion matures each year. Money that comes in from maturing bonds is typically invested in bonds with longer maturities at the far end of the portfolio.
Revenue Bond – A bond on which the debt service is payable solely from the revenue generated from the operation of the project being financed or a category of facilities, or from other non-tax sources.
Yield Curve – A line that plots the interest rates, at a set point in time, of bonds having equal credit quality, but differing maturity dates.
6 Semi-Annual Report
| | |
| Fund Summary | | |
| |
Thornburg California Limited Term Municipal Fund | | March 31, 2013 (Unaudited) |
OBJECTIVES AND STRATEGIES
The Fund’s primary investment objective is to obtain as high a level of current income exempt from federal and California state individual income taxes as is consistent, in the view of the Fund’s investment advisor, with preservation of capital.
The secondary goal of the Fund is to reduce expected changes in its share price compared to longer intermediate and long-term bond portfolios.
As described in the Fund’s prospectus, the Fund offers California investors double tax-free yields (may be subject to Alternative Minimum Tax) in a laddered municipal bond portfolio with a dollar-weighted average maturity of normally less than five years. Laddering involves building a portfolio of bonds with staggered maturities so that a portion of the portfolio matures each year. Cash from maturing bonds, if not needed for other purposes, is typically invested in bonds with longer maturities at the far end of the ladder. We regard this strategy as a good compromise for managing different types of risk.
LONG-TERM STABILITY OF PRINCIPAL
Net Asset Value History of A Shares
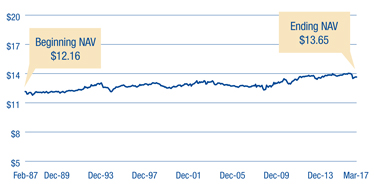
KEY PORTFOLIO ATTRIBUTES
| | | | |
Number of Bonds | | | 390 | |
| |
Effective Duration | | | 3.2 Yrs | |
| |
Average Maturity | | | 4.5 Yrs | |
SECURITY CREDIT RATINGS
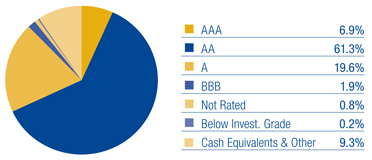
A bond credit rating assesses the financial ability of a debt issuer to make timely payments of principal and interest. Ratings of AAA (the highest), AA, A, and BBB are investment-grade quality. Ratings of BB, B, CCC, CC, C and D (the lowest) are considered below investment grade, speculative grade, or junk bonds. Credit quality ratings for Thornburg’s municipal portfolios used the highest rating available from either Standard & Poor’s or Moody’s Investors Service.
PORTFOLIO LADDER
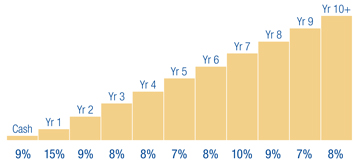
Percent of portfolio maturing in each year. Cash includes cash equivalents and other.
There is no guarantee that the Fund will meet its investment objectives.
All data is subject to change. Charts may not add up to 100% due to rounding.
Semi-Annual Report 7
| | |
| Schedule of Investments | | |
| |
Thornburg California Limited Term Municipal Fund | | March 31, 2017 (Unaudited) |
| | | | | | | | | | |
ISSUER-DESCRIPTION | | CREDIT RATING†
S&P/ MOODY’S | | PRINCIPAL
AMOUNT | | | VALUE | |
ABAG Finance Authority for Nonprofit Corporations, 0.87% due 8/1/2024 put 4/7/2017 (Sharp HealthCare; LOC: Bank of America, N.A.) (weekly demand notes) | | AA+/Aa1 | | $ | 20,700,000 | | | $ | 20,700,000 | |
Alameda County Joint Powers Authority, 5.00% due 12/1/2018 (Alameda County Medical Center Highland Hospital) | | AA/Aa1 | | | 400,000 | | | | 426,616 | |
Alameda County Joint Powers Authority, 5.00% due 12/1/2019 (Alameda County Medical Center Highland Hospital) | | AA/Aa1 | | | 750,000 | | | | 824,557 | |
Alameda County Joint Powers Authority, 5.00% due 12/1/2019 (Juvenile Justice) | | AA/Aa1 | | | 3,010,000 | | | | 3,309,224 | |
Alameda County Joint Powers Authority, 5.00% due 12/1/2020 (Alameda County Medical Center Highland Hospital) | | AA/Aa1 | | | 725,000 | | | | 818,597 | |
Alameda County Joint Powers Authority, 5.00% due 12/1/2020 (Juvenile Justice) | | AA/Aa1 | | | 3,200,000 | | | | 3,613,120 | |
Alameda County Joint Powers Authority, 5.00% due 12/1/2021 (Juvenile Justice) | | AA/Aa1 | | | 500,000 | | | | 577,065 | |
Alameda County Joint Powers Authority, 5.00% due 12/1/2021 (Public Facilities Capital Projects) | | AA/Aa1 | | | 1,000,000 | | | | 1,154,130 | |
Alameda County Joint Powers Authority, 5.00% due 12/1/2024 (Alameda County Medical Center Highland Hospital) | | AA/Aa1 | | | 2,500,000 | | | | 2,936,850 | |
Anaheim Public Financing Authority, 0.01% due 9/1/2022 (Public Improvements; Insured: AGM) | | AA/A2 | | | 3,000,000 | | | | 2,596,650 | |
Bay Area Toll Authority, 1.49% due 4/1/2047 put 10/1/2019 (San Francisco Bay Area Toll Bridge) (weekly demand notes) | | AA/Aa3 | | | 5,000,000 | | | | 4,999,650 | |
Bay Area Toll Authority, 1.50% due 4/1/2047 put 4/2/2018 (San Francisco Bay Area Toll Bridge) | | AA/Aa3 | | | 1,200,000 | | | | 1,202,532 | |
Bay Area Toll Authority, 2.95% due 4/1/2047 (San Francisco Bay Area Toll Bridge) | | AA/Aa3 | | | 4,775,000 | | | | 4,892,560 | |
Bonita USD GO, 5.00% due 8/1/2024 (Educational Facilities) | | AA-/NR | | | 1,000,000 | | | | 1,158,790 | |
Brea Redevelopment Agency, 5.00% due 8/1/2019 (Redevelopment Project AB) | | AA-/NR | | | 2,000,000 | | | | 2,167,160 | |
Brentwood Infrastructure Financing Authority, 4.00% due 9/2/2017 (Residential Single Family Development; Insured: AGM) | | AA/NR | | | 920,000 | | | | 932,043 | |
Brentwood Infrastructure Financing Authority, 5.00% due 9/2/2020 (Residential Single Family Development; Insured: AGM) | | AA/NR | | | 1,760,000 | | | | 1,966,395 | |
Brentwood Infrastructure Financing Authority, 5.00% due 9/2/2021 (Residential Single Family Development; Insured: AGM) | | AA/NR | | | 925,000 | | | | 1,057,626 | |
Brentwood Infrastructure Financing Authority, 5.00% due 9/2/2022 (Residential Single Family Development; Insured: AGM) | | AA/NR | | | 850,000 | | | | 984,410 | |
Brentwood Infrastructure Financing Authority, 5.00% due 9/2/2023 (Residential Single Family Development; Insured: AGM) | | AA/NR | | | 2,690,000 | | | | 3,159,001 | |
Calexico USD COP, 6.75% due 9/1/2017 | | A-/NR | | | 840,000 | | | | 858,959 | |
California Educational Facilities Authority, 5.00% due 4/1/2018 (Pitzer College) | | NR/A2 | | | 1,540,000 | | | | 1,601,230 | |
California Educational Facilities Authority, 0.01% due 10/1/2019 (Loyola Marymount University; Insured: Natl-Re) | | NR/A2 | | | 2,025,000 | | | | 1,951,938 | |
California Educational Facilities Authority, 5.00% due 4/1/2020 (Pitzer College) | | NR/A2 | | | 1,445,000 | | | | 1,592,376 | |
California Educational Facilities Authority, 5.00% due 4/1/2022 (Chapman University) | | NR/A2 | | | 2,000,000 | | | | 2,249,660 | |
California HFFA, 5.50% due 10/1/2017 (Providence Health and Services) | | AA-/Aa3 | | | 1,100,000 | | | | 1,125,190 | |
California HFFA, 5.50% due 2/1/2018 (Community Program Developmental Disabilities; Insured: California Mtg Insurance) | | AA-/NR | | | 2,715,000 | | | | 2,816,514 | |
California HFFA, 6.00% due 10/1/2018 (Providence Health and Services) | | AA-/Aa3 | | | 1,000,000 | | | | 1,072,850 | |
California HFFA, 5.00% due 11/15/2018 (Children’s Hospital Los Angeles) | | BBB+/Baa2 | | | 1,235,000 | | | | 1,307,643 | |
California HFFA, 5.10% due 2/1/2019 (Episcopal Home; Insured: California Mtg Insurance) (ETM) | | AA-/NR | | | 530,000 | | | | 557,094 | |
California HFFA, 5.00% due 11/15/2020 (Children’s Hospital Los Angeles) | | BBB+/Baa2 | | | 1,190,000 | | | | 1,326,041 | |
California HFFA, 5.25% due 3/1/2022 (Dignity Health) | | A/A3 | | | 1,000,000 | | | | 1,128,160 | |
California HFFA, 5.00% due 11/15/2023 (Children’s Hospital Los Angeles) | | BBB+/Baa2 | | | 1,000,000 | | | | 1,138,080 | |
California HFFA, 5.00% due 7/1/2024 (St. Joseph Health System) | | AA-/Aa3 | | | 1,000,000 | | | | 1,173,810 | |
California HFFA, 0.80% due 9/1/2028 put 4/3/2017 (Adventist Health System/West; LOC: U.S. Bank, N.A.) (daily demand notes) | | AA-/Aa2 | | | 8,300,000 | | | | 8,300,000 | |
California HFFA, 5.00% due 7/1/2034 put 10/18/2022 (St. Joseph Health System) | | AA-/Aa3 | | | 2,000,000 | | | | 2,286,480 | |
California HFFA, 5.00% due 7/1/2043 put 10/17/2017 (St. Joseph Health System) | | AA-/Aa3 | | | 3,000,000 | | | | 3,064,380 | |
California HFFA, 5.00% due 7/1/2043 put 10/15/2020 (St. Joseph Health System) | | AA-/Aa3 | | | 5,000,000 | | | | 5,576,700 | |
California Infrastructure and Economic Development Bank, 5.00% due 7/1/2018 (The Scripps Research Institute) | | NR/A1 | | | 200,000 | | | | 210,064 | |
California Infrastructure and Economic Development Bank, 5.00% due 7/1/2019 (The Scripps Research Institute) | | NR/A1 | | | 200,000 | | | | 216,632 | |
California Infrastructure and Economic Development Bank, 5.00% due 7/1/2020 (The Scripps Research Institute) | | NR/A1 | | | 200,000 | | | | 222,320 | |
California Infrastructure and Economic Development Bank, 5.00% due 7/1/2021 (The Scripps Research Institute) | | NR/A1 | | | 200,000 | | | | 227,738 | |
California Infrastructure and Economic Development Bank, 5.00% due 7/1/2022 (The Scripps Research Institute) | | NR/A1 | | | 200,000 | | | | 231,110 | |
California Infrastructure and Economic Development Bank, 5.00% due 7/1/2023 (The Scripps Research Institute) | | NR/A1 | | | 175,000 | | | | 204,691 | |
California Infrastructure and Economic Development Bank, 5.00% due 7/1/2024 (The Scripps Research Institute) | | NR/A1 | | | 200,000 | | | | 236,746 | |
California Infrastructure and Economic Development Bank, 5.00% due 7/1/2025 (The Scripps Research Institute) | | NR/A1 | | | 200,000 | | | | 238,542 | |
California Infrastructure and Economic Development Bank, 5.00% due 7/1/2026 (The Scripps Research Institute) | | NR/A1 | | | 200,000 | | | | 240,420 | |
California Infrastructure and Economic Development Bank, 5.00% due 7/1/2027 (The Scripps Research Institute) | | NR/A1 | | | 250,000 | | | | 296,895 | |
California Municipal Finance Authority, 5.00% due 10/1/2021 (Biola University Residential Hall and Parking Structure) | | NR/Baa1 | | | 150,000 | | | | 166,169 | |
California Municipal Finance Authority, 5.00% due 10/1/2022 (Biola University Residential Hall and Parking Structure) | | NR/Baa1 | | | 160,000 | | | | 179,235 | |
California Municipal Finance Authority, 5.00% due 10/1/2023 (Biola University Residential Hall and Parking Structure) | | NR/Baa1 | | | 125,000 | | | | 141,200 | |
California Pollution Control Financing Authority, 5.25% due 6/1/2023 put 12/1/2017 (Solid Waste Disposal-Republic Services, Inc.) (AMT) | | BBB+/Baa3 | | | 2,820,000 | | | | 2,881,166 | |
California State Housing Finance Agency, 3.05% due 12/1/2019 (Multi-Family Housing; Insured: FHA) | | NR/Aa1 | | | 735,000 | | | | 735,926 | |
California State Infrastructure & Economic Development Bank, 5.25% due 8/15/2020 (King City High School) | | AA-/NR | | | 1,000,000 | | | | 1,104,350 | |
California State Public Works Board, 5.00% due 6/1/2020 (University of California; Insured: Natl-Re) (ETM) | | AA+/Aaa | | | 1,185,000 | | | | 1,321,808 | |
California State Public Works Board, 5.125% due 3/1/2021 (Various State Participating Agency Capital Projects) | | A+/A1 | | | 1,635,000 | | | | 1,804,680 | |
California State Public Works Board, 5.00% due 12/1/2021 (Judicial Council Projects) | | A+/A1 | | | 3,100,000 | | | | 3,567,480 | |
California State Public Works Board, 5.00% due 4/1/2022 (California School for the Deaf Riverside Campus) | | A+/A1 | | | 565,000 | | | | 652,631 | |
California State Public Works Board, 5.00% due 6/1/2022 (Yuba City Courthouse) | | A+/A1 | | | 1,950,000 | | | | 2,259,406 | |
California State Public Works Board, 5.00% due 9/1/2022 (Correctional and Rehabilitation Facilities) | | A+/A1 | | | 3,250,000 | | | | 3,782,545 | |
California State Public Works Board, 5.00% due 11/1/2022 (Correctional and Rehabilitation Facilities) | | A+/A1 | | | 1,500,000 | | | | 1,750,800 | |
California State Public Works Board, 5.00% due 12/1/2022 (Judicial Council Projects) | | A+/A1 | | | 1,200,000 | | | | 1,368,360 | |
California State Public Works Board, 5.00% due 3/1/2023 (Judicial Council Projects) | | A+/A1 | | | 1,400,000 | | | | 1,636,824 | |
8 Semi-Annual Report
| | |
| Schedule of Investments, Continued | | |
| |
Thornburg California Limited Term Municipal Fund | | March 31, 2017 (Unaudited) |
| | | | | | | | | | |
ISSUER-DESCRIPTION | | CREDIT RATING†
S&P/ MOODY’S | | PRINCIPAL
AMOUNT | | | VALUE | |
California State Public Works Board, 5.00% due 6/1/2023 (Coalinga State Hospital) | | A+/A1 | | $ | 7,200,000 | | | $ | 8,453,664 | |
California State Public Works Board, 5.00% due 9/1/2023 (Correctional and Rehabilitation Facilities) | | A+/A1 | | | 3,600,000 | | | | 4,244,112 | |
California State Public Works Board, 5.00% due 11/1/2023 (Laboratory Facility and San Diego Courthouse) | | A+/A1 | | | 3,000,000 | | | | 3,546,060 | |
California State Public Works Board, 5.00% due 3/1/2024 (Judicial Council Projects) | | A+/A1 | | | 1,000,000 | | | | 1,160,970 | |
California State Public Works Board, 5.00% due 4/1/2024 (Correctional and Rehabilitation Facilities) | | A+/A1 | | | 3,350,000 | | | | 3,838,832 | |
California State Public Works Board, 5.00% due 9/1/2024 (Correctional and Rehabilitation Facilities) | | A+/A1 | | | 3,580,000 | | | | 4,272,300 | |
California State Public Works Board, 5.00% due 11/1/2024 (Laboratory Facility and San Diego Courthouse) | | A+/A1 | | | 4,000,000 | | | | 4,702,440 | |
California Statewide Communities Development Authority, 4.00% due 5/15/2017 (Irvine East Campus Apartments) | | NR/Baa1 | | | 2,000,000 | | | | 2,006,620 | |
California Statewide Communities Development Authority, 5.00% due 4/1/2019 (Kaiser Foundation Hospitals) | | AA-/NR | | | 3,715,000 | | | | 4,000,089 | |
California Statewide Communities Development Authority, 5.00% due 7/1/2020 pre-refunded 1/1/2019 (Aspire Public Schools; LOC: PCSD Guaranty Pool I, LLC) | | NR/NR | | | 890,000 | | | | 925,475 | |
California Statewide Communities Development Authority, 5.00% due 11/1/2020 (Cottage Health System) | | A+/NR | | | 100,000 | | | | 111,965 | |
California Statewide Communities Development Authority, 5.00% due 5/15/2021 (Irvine East Campus Apartments) | | NR/Baa1 | | | 760,000 | | | | 843,980 | |
California Statewide Communities Development Authority, 4.00% due 11/1/2021 (Cottage Health System) | | A+/NR | | | 150,000 | | | | 164,960 | |
California Statewide Communities Development Authority, 5.00% due 11/1/2022 (Cottage Health System) | | A+/NR | | | 125,000 | | | | 145,684 | |
California Statewide Communities Development Authority, 5.00% due 11/1/2023 (Cottage Health System) | | A+/NR | | | 150,000 | | | | 177,251 | |
California Statewide Communities Development Authority, 5.00% due 5/15/2024 (Irvine East Campus Apartments) | | NR/Baa1 | | | 1,000,000 | | | | 1,148,300 | |
California Statewide Communities Development Authority, 5.00% due 11/1/2024 (Cottage Health System) | | A+/NR | | | 200,000 | | | | 237,374 | |
California Statewide Communities Development Authority, 5.00% due 11/1/2025 (Cottage Health System) | | A+/NR | | | 135,000 | | | | 158,857 | |
California Statewide Communities Development Authority, 5.00% due 5/15/2027 (Irvine East Campus Apartments) | | NR/Baa1 | | | 500,000 | | | | 574,035 | |
California Statewide Communities Development Authority, 2.625% due 11/1/2033 (Southern California Edison Company) | | A/Aa3 | | | 4,195,000 | | | | 4,250,584 | |
Calipatria USD GO, 0% due 8/1/2025 (Educational Facilities; Insured: ACA) | | NR/NR | | | 4,555,000 | | | | 3,137,302 | |
Carson Redevelopment Agency, 6.00% due 10/1/2019 (Project Area 1) (ETM) | | A-/NR | | | 1,050,000 | | | | 1,151,514 | |
Castaic USD GO, 0% due 5/1/2018 (Insured: Natl-Re) | | AA-/NR | | | 615,000 | | | | 590,025 | |
CDC Successor Agency of the City of Santee, 5.00% due 8/1/2023 (Redevelopment and Low and Moderate Income Housing; Insured: BAM) | | AA/NR | | | 500,000 | | | | 578,625 | |
CDC Successor Agency of the City of Santee, 5.00% due 8/1/2025 (Redevelopment and Low and Moderate Income Housing; Insured: BAM) | | AA/NR | | | 550,000 | | | | 645,238 | |
CDC Successor Agency of the City of Santee, 5.00% due 8/1/2027 (Redevelopment and Low and Moderate Income Housing; Insured: BAM) | | AA/NR | | | 1,000,000 | | | | 1,174,480 | |
Central Valley Financing Authority, 5.25% due 7/1/2020 (Carson Ice) | | AA-/Aa3 | | | 500,000 | | | | 559,415 | |
Chabot-Las Positas Community College District GO, 4.00% due 8/1/2019 (Educational Facilities) | | AA-/Aa2 | | | 360,000 | | | | 383,418 | |
Chabot-Las Positas Community College District GO, 5.00% due 8/1/2020 (Educational Facilities) | | AA-/Aa2 | | | 485,000 | | | | 543,593 | |
Chabot-Las Positas Community College District GO, 5.00% due 8/1/2021 (Educational Facilities) | | AA-/Aa2 | | | 400,000 | | | | 459,176 | |
City and County of San Francisco COP, 5.00% due 9/1/2018 (City Office Buildings-Multiple Properties Project; Insured: Natl- Re) | | AA/Aa2 | | | 5,000 | | | | 5,017 | |
City and County of San Francisco COP, 5.00% due 11/1/2022 (525 Golden Gate Avenue-Public Utilities Commission Office Project) | | AA/Aa2 | | | 700,000 | | | | 761,649 | |
City of Antioch Public Financing Authority, 5.00% due 5/1/2022 (Municipal Facilities Project) | | AA-/NR | | | 500,000 | | | | 575,125 | |
City of Antioch Public Financing Authority, 5.00% due 5/1/2024 (Municipal Facilities Project) | | AA-/NR | | | 900,000 | | | | 1,062,945 | |
City of Burbank, 5.00% due 6/1/2017 (Burbank Water and Power System) | | AA-/A1 | | | 1,000,000 | | | | 1,007,020 | |
City of Burbank, 5.00% due 6/1/2018 (Burbank Water and Power System) | | AA-/A1 | | | 360,000 | | | | 376,744 | |
City of Burbank, 5.00% due 6/1/2020 (Burbank Water and Power System) | | AA-/A1 | | | 625,000 | | | | 695,712 | |
City of Chula Vista, 1.65% due 7/1/2018 (San Diego Gas & Electric Co.) | | A+/Aa2 | | | 3,500,000 | | | | 3,502,065 | |
City of Chula Vista COP, 5.25% due 3/1/2020 (Capital Facilities Project) (ETM) | | AA-/NR | | | 1,300,000 | | | | 1,448,746 | |
City of Chula Vista COP, 5.00% due 10/1/2024 (Police Facility Project) | | AA-/Aa3 | | | 1,700,000 | | | | 1,999,489 | |
City of Clovis, 5.00% due 3/1/2021 (Water System Facilities; Insured: BAM) | | AA/A1 | | | 550,000 | | | | 617,974 | |
City of Clovis, 5.00% due 3/1/2022 (Water System Facilities; Insured: BAM) | | AA/A1 | | | 720,000 | | | | 822,672 | |
City of Clovis, 5.00% due 3/1/2023 (Water System Facilities; Insured: BAM) | | AA/A1 | | | 1,000,000 | | | | 1,156,260 | |
City of Folsom, 5.00% due 12/1/2018 (Community Facilities District No. 2) | | A+/NR | | | 965,000 | | | | 1,024,705 | |
City of Los Angeles Community Facilities District No. 4, 4.00% due 9/1/2017 (Playa Vista — Phase 1) | | BBB+/NR | | | 500,000 | | | | 505,425 | |
City of Los Angeles COP, 3.00% due 11/1/2030 put 2/1/2018 (American Academy of Dramatic Arts; LOC: TD Bank, N.A.) | | NR/Aa2 | | | 2,370,000 | | | | 2,394,814 | |
City of Los Angeles GO, 3.00% due 6/29/2017 (Cash Flow Management) | | SP-1+/Mig1 | | | 4,000,000 | | | | 4,019,600 | |
City of Manteca, 4.00% due 7/1/2018 (Water Supply System) | | AA-/A1 | | | 550,000 | | | | 570,861 | |
City of Manteca, 4.00% due 12/1/2018 (Wastewater Quality Control Facility) | | AA/Aa3 | | | 375,000 | | | | 393,446 | |
City of Manteca, 5.00% due 7/1/2019 (Water Supply System) | | AA-/A1 | | | 400,000 | | | | 433,544 | |
City of Manteca, 5.00% due 7/1/2021 (Water Supply System) | | AA-/A1 | | | 1,000,000 | | | | 1,139,580 | |
City of Manteca, 5.00% due 7/1/2023 (Water Supply System) | | AA-/A1 | | | 650,000 | | | | 750,223 | |
City of Moorpark Mobile Home Park, 4.90% due 5/15/2017 (Villa Del Arroyo) | | A+/NR | | | 215,000 | | | | 215,849 | |
City of Porterville COP, 6.30% due 10/1/2018 (Public Service Capital Projects; Insured: AMBAC) (ETM) | | NR/NR | | | 470,000 | | | | 493,265 | |
City of Redding COP, 5.00% due 6/1/2020 pre-refunded 6/1/2018 (City Electric System; Insured: AGM) | | NR/A2 | | | 1,445,000 | | | | 1,513,377 | |
City of Redding COP, 5.00% due 6/1/2020 (City Electric System; Insured: AGM) | | NR/A2 | | | 1,055,000 | | | | 1,103,836 | |
City of San Jose Financing Authority, 5.00% due 6/1/2019 (Civic Center Project) | | AA/Aa2 | | | 650,000 | | | | 703,774 | |
City of San Jose Financing Authority, 5.00% due 6/1/2020 (Civic Center Project) | | AA/Aa2 | | | 600,000 | | | | 666,924 | |
City of San Jose Financing Authority, 4.00% due 6/1/2021 (Civic Center Project) | | AA/Aa2 | | | 1,000,000 | | | | 1,097,270 | |
City of San Jose Financing Authority, 5.00% due 6/1/2022 (Civic Center Project) | | AA/Aa2 | | | 745,000 | | | | 860,721 | |
Semi-Annual Report 9
| | |
| Schedule of Investments, Continued | | |
| |
Thornburg California Limited Term Municipal Fund | | March 31, 2017 (Unaudited) |
| | | | | | | | | | |
ISSUER-DESCRIPTION | | CREDIT RATING†
S&P/ MOODY’S | | PRINCIPAL
AMOUNT | | | VALUE | |
City of San Jose Financing Authority, 5.00% due 6/1/2023 (Civic Center Project) | | AA/Aa2 | | $ | 1,000,000 | | | $ | 1,172,060 | |
City of San Jose Financing Authority, 5.00% due 6/1/2024 (Civic Center Project) | | AA/Aa2 | | | 750,000 | | | | 880,860 | |
City of Torrance, 5.00% due 9/1/2020 (Torrance Memorial Medical Center) | | BBB+/A3 | | | 1,155,000 | | | | 1,281,103 | |
City of Vallejo, 5.00% due 5/1/2017 (Water Improvement Project; Insured: Natl-Re) | | AA-/A3 | | | 1,240,000 | | | | 1,244,253 | |
Community Development Commission of the City of Santa Fe Springs, 5.00% due 9/1/2018 (Redevelopment Project; Insured: Natl-Re) | | AA-/A3 | | | 1,235,000 | | | | 1,254,451 | |
Corona-Norco USD GO, 0.01% due 9/1/2017 (Insured: AGM) | | AA/Aa2 | | | 1,595,000 | | | | 1,589,067 | |
County of El Dorado Community Facilities District, 5.00% due 9/1/2019 (El Dorado Hills Development) | | A/NR | | | 1,700,000 | | | | 1,844,874 | |
County of Los Angeles GO, 3.00% due 6/30/2017 (Cash Management Program) | | SP-1+/Mig1 | | | 12,000,000 | | | | 12,069,480 | |
County of Los Angeles Redevelopment Refunding Authority, 5.00% due 6/1/2020 (Bunker Hill Project) | | AA/NR | | | 1,000,000 | | | | 1,107,280 | |
County of Los Angeles Redevelopment Refunding Authority, 5.00% due 6/1/2021 (Bunker Hill Project) | | AA/NR | | | 2,500,000 | | | | 2,832,050 | |
County of Los Angeles Redevelopment Refunding Authority, 5.00% due 6/1/2022 (Bunker Hill Project) | | AA/NR | | | 1,000,000 | | | | 1,147,350 | |
County of Los Angeles Redevelopment Refunding Authority, 5.00% due 6/1/2023 (Bunker Hill Project) | | AA/NR | | | 1,000,000 | | | | 1,162,610 | |
County of Los Angeles Redevelopment Refunding Authority, 5.00% due 6/1/2024 (Bunker Hill Project) | | AA/NR | | | 500,000 | | | | 585,830 | |
County of Monterey COP, 5.25% due 8/1/2021 (Natividad Medical Center; Insured: AGM) | | AA/Aa3 | | | 3,700,000 | | | | 4,079,398 | |
County of Riverside, 3.00% due 10/11/2017 | | NR/Mig1 | | | 15,000,000 | | | | 15,168,900 | |
Delano Financing Authority, 5.00% due 12/1/2017 (Police Station and Capital Improvements) | | A-/NR | | | 1,085,000 | | | | 1,111,713 | |
Delano Financing Authority, 5.00% due 12/1/2018 (Police Station and Capital Improvements) | | A-/NR | | | 1,135,000 | | | | 1,199,411 | |
Delano Financing Authority, 5.00% due 12/1/2019 (Police Station and Capital Improvements) | | A-/NR | | | 1,195,000 | | | | 1,295,559 | |
Desert Sands USD COP, 4.00% due 3/1/2019 (Educational Facilities; Insured: BAM) | | AA/A1 | | | 1,000,000 | | | | 1,054,400 | |
Desert Sands USD COP, 5.00% due 3/1/2020 (Educational Facilities; Insured: BAM) | | AA/A1 | | | 700,000 | | | | 772,548 | |
Desert Sands USD COP, 5.00% due 3/1/2021 (Educational Facilities; Insured: BAM) | | AA/A1 | | | 1,080,000 | | | | 1,221,804 | |
Eastern Municipal Water District COP, 0.88% due 7/1/2046 put 4/7/2017 (Water and Wastewater; SPA: U.S. Bank, N.A.) (weekly demand notes) | | AA+/Aa2 | | | 2,500,000 | | | | 2,500,000 | |
El Dorado Irrigation District COP, 5.00% due 3/1/2025 (Water System Capital Improvements) | | AA-/Aa3 | | | 1,200,000 | | | | 1,445,184 | |
El Dorado Irrigation District COP, 5.00% due 3/1/2026 (Water System Capital Improvements) | | AA-/Aa3 | | | 1,500,000 | | | | 1,821,690 | |
Elk Grove Finance Authority, 4.00% due 9/1/2020 (Poppy Ridge CFD No. 2003-1 and East Franklin CFD No. 2002-1) | | A-/NR | | | 575,000 | | | | 619,764 | |
Elk Grove Finance Authority, 5.00% due 9/1/2021 (Poppy Ridge CFD No. 2003-1 and East Franklin CFD No. 2002-1) | | A-/NR | | | 450,000 | | | | 510,791 | |
Elk Grove Finance Authority, 5.00% due 9/1/2025 (Poppy Ridge CFD No. 2003-1 and East Franklin CFD No. 2002-1) | | A-/NR | | | 750,000 | | | | 887,955 | |
Emeryville Redevelopment Agency, 5.00% due 9/1/2022 (Emeryville and Shellmound Park Projects; Insured: AGM) | | AA/NR | | | 2,775,000 | | | | 3,219,860 | |
Emeryville Redevelopment Agency, 5.00% due 9/1/2023 (Emeryville and Shellmound Park Projects; Insured: AGM) | | AA/NR | | | 2,420,000 | | | | 2,845,000 | |
Emeryville Redevelopment Agency, 5.00% due 9/1/2024 (Emeryville and Shellmound Park Projects; Insured: AGM) | | AA/NR | | | 3,900,000 | | | | 4,640,454 | |
Folsom Cordova USD COP, 5.00% due 4/1/2021 (Educational Facilities; Insured: AGM) | | AA/NR | | | 1,000,000 | | | | 1,133,110 | |
Fresno County USD GO, 5.90% due 8/1/2017 (Educational Facilities; Insured: Natl-Re) | | AA-/A3 | | | 590,000 | | | | 599,458 | |
Fresno County USD GO, 5.90% due 8/1/2018 (Educational Facilities; Insured: Natl-Re) | | AA-/A3 | | | 630,000 | | | | 668,487 | |
Fresno County USD GO, 5.90% due 8/1/2019 (Educational Facilities; Insured: Natl-Re) | | AA-/A3 | | | 675,000 | | | | 743,404 | |
Fresno County USD GO, 5.00% due 2/1/2020 (Educational Facilities; Insured: Natl-Re) | | AA-/A3 | | | 2,510,000 | | | | 2,748,199 | |
Fresno County USD GO, 5.90% due 8/1/2020 (Educational Facilities; Insured: Natl-Re) | | AA-/A3 | | | 720,000 | | | | 819,245 | |
Golden Empire Schools Financing Authority Floating Rate Note, 1.41% due 5/1/2017 (Kern High School District) | | SP-1/Mig1 | | | 4,000,000 | | | | 4,000,000 | |
Government of Guam, 3.00% due 11/15/2017 (Various Capital Projects) | | A/NR | | | 300,000 | | | | 302,214 | |
Government of Guam, 5.00% due 11/15/2017 (Educational Facilities Improvements) | | A/NR | | | 1,720,000 | | | | 1,753,867 | |
Government of Guam, 5.00% due 11/15/2023 (Various Capital Projects) | | A/NR | | | 1,250,000 | | | | 1,373,700 | |
Government of Guam, 5.00% due 11/15/2025 (Various Capital Projects) | | A/NR | | | 4,175,000 | | | | 4,582,939 | |
Guam Power Authority, 5.00% due 10/1/2021 (Electric Power System; Insured: AGM) | | AA/A2 | | | 1,275,000 | | | | 1,425,985 | |
Hacienda La Puente USD COP, 3.00% due 6/1/2017 (Educational Facilities; Insured: AGM) | | AA/A1 | | | 160,000 | | | | 160,598 | |
Hacienda La Puente USD COP, 4.00% due 6/1/2018 (Educational Facilities; Insured: AGM) | | AA/A1 | | | 705,000 | | | | 729,753 | |
Hacienda La Puente USD COP, 5.00% due 6/1/2019 (Educational Facilities; Insured: AGM) | | AA/A1 | | | 875,000 | | | | 946,409 | |
Hacienda La Puente USD COP, 5.00% due 6/1/2020 (Educational Facilities; Insured: AGM) | | AA/A1 | | | 740,000 | | | | 822,258 | |
Hacienda La Puente USD COP, 5.00% due 6/1/2022 (Educational Facilities; Insured: AGM) | | AA/A1 | | | 575,000 | | | | 664,441 | |
Hacienda La Puente USD COP, 5.00% due 6/1/2023 (Educational Facilities; Insured: AGM) | | AA/A1 | | | 1,535,000 | | | | 1,798,145 | |
Hacienda La Puente USD COP, 5.00% due 6/1/2024 (Educational Facilities; Insured: AGM) | | AA/A1 | | | 880,000 | | | | 1,043,803 | |
Hacienda La Puente USD COP, 5.00% due 6/1/2025 (Educational Facilities; Insured: AGM) | | AA/A1 | | | 1,300,000 | | | | 1,552,304 | |
Hemet USD GO, 4.00% due 8/1/2018 (Insured: AGM) | | AA/NR | | | 1,335,000 | | | | 1,387,626 | |
Irvine USD, 0.80% due 9/1/2053 put 4/3/2017 (Community Facilities District No. 09-1; LOC: U.S. Bank, N.A.) (daily demand notes) | | AA-/Aa2 | | | 26,300,000 | | | | 26,300,000 | |
Irvine USD Community Facilities District No. 86-1, 5.25% due 9/1/2017 (Acquisition of Public Facilities; Insured: AGM) | | AA/NR | | | 250,000 | | | | 254,408 | |
Jurupa Public Financing Authority, 4.50% due 9/1/2018 (Community Services District-Eastvale Area; Insured: AGM) | | AA/NR | | | 870,000 | | | | 910,237 | |
Jurupa Public Financing Authority, 4.50% due 9/1/2019 (Community Services District-Eastvale Area; Insured: AGM) | | AA/NR | | | 905,000 | | | | 971,409 | |
Jurupa Public Financing Authority, 4.50% due 9/1/2020 (Community Services District-Eastvale Area; Insured: AGM) | | AA/NR | | | 945,000 | | | | 1,034,199 | |
Kern High School District GO, 4.00% due 8/1/2017 (Insured: AGM) | | A+/Aa2 | | | 500,000 | | | | 505,365 | |
Kern High School District GO, 4.00% due 8/1/2018 (Insured: AGM) | | A+/Aa2 | | | 500,000 | | | | 520,255 | |
La Quinta Redevelopment Agency, 5.00% due 9/1/2021 (Redevelopment Project Areas No. 1 and 2) | | AA-/NR | | | 1,000,000 | | | | 1,135,090 | |
La Quinta Redevelopment Agency, 5.00% due 9/1/2022 (Redevelopment Project Areas No. 1 and 2) | | AA-/NR | | | 2,000,000 | | | | 2,304,300 | |
La Quinta Redevelopment Agency, 5.00% due 9/1/2023 (Redevelopment Project Areas No. 1 and 2) | | AA-/NR | | | 1,500,000 | | | | 1,746,450 | |
Lodi Public Financing Authority, 5.00% due 10/1/2020 (City Police Building and Jail) | | A+/NR | | | 965,000 | | | | 1,074,151 | |
Lodi Public Financing Authority, 5.00% due 10/1/2021 (City Police Building and Jail) | | A+/NR | | | 1,020,000 | | | | 1,159,526 | |
10 Semi-Annual Report
| | |
| Schedule of Investments, Continued | | |
| |
Thornburg California Limited Term Municipal Fund | | March 31, 2017 (Unaudited) |
| | | | | | | | | | |
ISSUER-DESCRIPTION | | CREDIT RATING†
S&P/ MOODY’S | | PRINCIPAL
AMOUNT | | | VALUE | |
Lodi Public Financing Authority, 5.00% due 10/1/2022 (City Police Building and Jail) | | A+/NR | | $ | 1,040,000 | | | $ | 1,183,634 | |
Lodi Public Financing Authority, 5.00% due 10/1/2023 (City Police Building and Jail) | | A+/NR | | | 1,120,000 | | | | 1,270,270 | |
Los Angeles Convention & Exhibition Center Authority, 5.00% due 8/15/2017 (ETM) | | A+/NR | | | 1,660,000 | | | | 1,686,510 | |
Los Angeles County Public Works Financing Authority, 5.00% due 8/1/2018 (Multiple Capital Projects) | | AA/Aa3 | | | 2,060,000 | | | | 2,171,240 | |
Los Angeles County Schools Pooled Financing Program COP, 5.00% due 6/1/2022 (Compton USD; Insured: AGM) | | AA/A2 | | | 1,500,000 | | | | 1,721,220 | |
Los Angeles County Schools Regionalized Business Services Corp. COP, 0% due 8/1/2021 (Insured: AMBAC) | | NR/NR | | | 2,135,000 | | | | 1,929,677 | |
Los Angeles Department of Airports, 5.50% due 5/15/2018 (Los Angeles International Airport) (AMT) | | AA/Aa3 | | | 2,000,000 | | | | 2,099,480 | |
Los Angeles Department of Water and Power, 5.00% due 7/1/2024 (Power System Capital Improvements) | | AA-/Aa2 | | | 1,000,000 | | | | 1,208,640 | |
Los Angeles Department of Water and Power, 5.00% due 7/1/2025 (Power System Capital Improvements) | | AA-/Aa2 | | | 500,000 | | | | 611,425 | |
Los Angeles Department of Water and Power, 5.00% due 7/1/2026 (Power System Capital Improvements) | | AA-/Aa2 | | | 300,000 | | | | 364,128 | |
Los Angeles USD COP, 5.50% due 12/1/2018 (Educational Facilities and Information Technology Infrastructure) | | A+/A1 | | | 2,000,000 | | | | 2,146,100 | |
Los Angeles USD GO, 5.00% due 7/1/2022 (Educational Facilities and Information Technology Infrastructure) | | AA-/Aa2 | | | 2,750,000 | | | | 3,216,757 | |
Los Angeles USD GO, 5.00% due 7/1/2023 (Educational Facilities and Information Technology Infrastructure) | | AA-/Aa2 | | | 3,000,000 | | | | 3,569,970 | |
Los Angeles USD GO, 5.00% due 7/1/2024 (Educational Facilities and Information Technology Infrastructure) | | AA-/Aa2 | | | 3,000,000 | | | | 3,618,030 | |
Lynwood USD GO, 5.00% due 8/1/2023 (Insured: AGM) | | AA/A2 | | | 1,000,000 | | | | 1,174,250 | |
Manteca USD Community Facilities District No. 1989-2, 4.00% due 9/1/2018 (Educational Facilities; Insured: AGM) | | AA/A2 | | | 500,000 | | | | 519,790 | |
Manteca USD Community Facilities District No. 1989-2, 4.00% due 9/1/2019 (Educational Facilities; Insured: AGM) | | AA/A2 | | | 870,000 | | | | 924,044 | |
Manteca USD Community Facilities District No. 1989-2, 5.00% due 9/1/2020 (Educational Facilities; Insured: AGM) | | AA/A2 | | | 1,425,000 | | | | 1,586,609 | |
Manteca USD Community Facilities District No. 1989-2, 5.00% due 9/1/2021 (Educational Facilities; Insured: AGM) | | AA/A2 | | | 750,000 | | | | 849,270 | |
Manteca USD Community Facilities District No. 1989-2, 5.00% due 9/1/2023 (Educational Facilities; Insured: AGM) | | AA/A2 | | | 500,000 | | | | 578,695 | |
Mark West Union School District GO, 4.125% due 8/1/2020 (Educational Facilities; Insured: Natl-Re) | | AA/A3 | | | 1,275,000 | | | | 1,278,277 | |
Metropolitan Water District of Southern California Floating Rate Note, 0.91% due 7/1/2030 | | A-1+/Aa1 | | | 9,500,000 | | | | 9,500,000 | |
Metropolitan Water District of Southern California, 1.07% due 7/1/2030 | | AAA/Aa1 | | | 5,000,000 | | | | 5,000,000 | |
Metropolitan Water District of Southern California Floating Rate Note, 0.95% due 7/1/2036 | | A-1+/Aa1 | | | 10,000,000 | | | | 9,999,700 | |
Milpitas Redevelopment Agency, 4.00% due 9/1/2017 (Redevelopment Project Area No. 1) | | AA-/NR | | | 1,000,000 | | | | 1,013,080 | |
Milpitas Redevelopment Agency, 5.00% due 9/1/2025 (Redevelopment Project Area No. 1) | | AA-/NR | | | 2,300,000 | | | | 2,736,494 | |
Modesto Irrigation District, 5.00% due 7/1/2022 (San Joaquin Valley Electric System) | | A+/A2 | | | 1,000,000 | | | | 1,156,910 | |
Moreno Valley Public Financing Authority, 5.00% due 11/1/2024 (Public Improvements) | | A+/NR | | | 1,455,000 | | | | 1,712,666 | |
Municipal Improvement Corp. of Los Angeles, 5.00% due 11/1/2017 (Capital Equipment) | | A+/Aa3 | | | 3,235,000 | | | | 3,312,737 | |
Municipal Improvement Corp. of Los Angeles, 5.00% due 3/1/2018 (Capital Equipment) | | A+/Aa3 | | | 4,765,000 | | | | 4,941,448 | |
Murrieta Valley USD Public Financing Authority GO, 5.00% due 9/1/2023 (Educational Facilities; Insured: BAM) | | AA/NR | | | 1,080,000 | | | | 1,271,808 | |
Natomas USD GO, 5.00% due 8/1/2024 (Insured: BAM) | | AA/A1 | | | 2,425,000 | | | | 2,847,799 | |
North City West School Facilities Financing Authority, 5.00% due 9/1/2021 (Carmel Valley; Insured: AGM) | | AA/NR | | | 2,155,000 | | | | 2,440,236 | |
North City West School Facilities Financing Authority, 5.00% due 9/1/2022 (Carmel Valley; Insured: AGM) | | AA/NR | | | 2,260,000 | | | | 2,588,446 | |
Northern California Power Agency, 5.00% due 7/1/2017 (Hydroelectric Project) | | A+/A1 | | | 100,000 | | | | 101,058 | |
Northern California Power Agency, 5.00% due 7/1/2018 (Hydroelectric Project) | | A+/A1 | | | 1,250,000 | | | | 1,312,900 | |
Northern California Power Agency, 5.00% due 6/1/2019 (Lodi Energy Center) | | A-/A2 | | | 2,340,000 | | | | 2,531,506 | |
Oakland USD GO, 5.00% due 8/1/2022 (County of Alameda Educational Facilities) | | AA-/Aa3 | | | 745,000 | | | | 872,008 | |
Oakland USD GO, 5.00% due 8/1/2023 (County of Alameda Educational Facilities) | | AA-/Aa3 | | | 700,000 | | | | 832,692 | |
Oakland USD GO, 5.00% due 8/1/2025 (County of Alameda Educational Facilities) | | AA-/Aa3 | | | 1,300,000 | | | | 1,583,660 | |
Palomar Pomerado Health GO, 0% due 8/1/2019 (Insured: AGM) | | AA/A2 | | | 2,000,000 | | | | 1,918,320 | |
Palomar Pomerado Health GO, 0.01% due 8/1/2021 (Insured: Natl-Re) | | AA-/A2 | | | 2,850,000 | | | | 2,579,136 | |
Pasadena USD GO, 5.00% due 8/1/2024 (Educational Facilities Improvements) | | A+/Aa2 | | | 250,000 | | | | 300,913 | |
Pasadena USD GO, 5.00% due 8/1/2024 (2019 Crossover) | | A+/Aa2 | | | 800,000 | | | | 962,920 | |
Pasadena USD GO, 5.00% due 8/1/2025 (Educational Facilities Improvements) | | A+/Aa2 | | | 365,000 | | | | 444,643 | |
Pasadena USD GO, 5.00% due 8/1/2025 (2019 Crossover) | | A+/Aa2 | | | 1,000,000 | | | | 1,218,200 | |
Pasadena USD GO, 5.00% due 8/1/2026 (Educational Facilities Improvements) | | A+/Aa2 | | | 500,000 | | | | 615,320 | |
Pasadena USD GO, 5.00% due 8/1/2026 (2019 Crossover) | | A+/Aa2 | | | 1,000,000 | | | | 1,230,640 | |
Pomona Public Financing Authority, 2.00% due 6/1/2018 (Facilities Improvements) | | A+/NR | | | 500,000 | | | | 504,870 | |
Pomona Public Financing Authority, 3.00% due 6/1/2020 (Facilities Improvements) | | A+/NR | | | 250,000 | | | | 260,723 | |
Pomona Public Financing Authority, 4.00% due 6/1/2024 (Facilities Improvements; Insured: AGM) | | AA/NR | | | 450,000 | | | | 502,475 | |
Pomona Public Financing Authority, 4.00% due 6/1/2026 (Facilities Improvements; Insured: AGM) | | AA/NR | | | 275,000 | | | | 307,467 | |
Pomona USD GO, 6.10% due 2/1/2020 (Educational Facilities Improvements; Insured: Natl-Re) | | AA-/A3 | | | 465,000 | | | | 523,251 | |
Rancho Santa Fe Community Services District Financing Authority, 3.00% due 9/1/2018 | | A-/NR | | | 1,055,000 | | | | 1,081,628 | |
Rancho Santa Fe Community Services District Financing Authority, 3.00% due 9/1/2019 | | A-/NR | | | 750,000 | | | | 778,395 | |
Rancho Santa Fe Community Services District Financing Authority, 4.00% due 9/1/2020 | | A-/NR | | | 1,000,000 | | | | 1,077,850 | |
Rancho Santa Fe Community Services District Financing Authority, 4.00% due 9/1/2021 | | A-/NR | | | 550,000 | | | | 601,051 | |
Rancho Santa Fe Community Services District Financing Authority, 4.00% due 9/1/2022 | | A-/NR | | | 475,000 | | | | 521,056 | |
Rancho Santa Fe Community Services District Financing Authority, 4.00% due 9/1/2023 | | A-/NR | | | 650,000 | | | | 716,917 | |
Rancho Santa Fe Community Services District Financing Authority, 5.00% due 9/1/2024 | | A-/NR | | | 750,000 | | | | 880,620 | |
Rancho Santa Fe Community Services District Financing Authority, 5.00% due 9/1/2025 | | A-/NR | | | 900,000 | | | | 1,065,546 | |
Rancho Santa Fe Community Services District Financing Authority, 5.00% due 9/1/2026 | | A-/NR | | | 915,000 | | | | 1,066,304 | |
Redevelopment Agency of the City and County of San Francisco, 5.00% due 6/1/2020 (Yerba Buena Center Redevelopment Project Area; Insured: AGM) | | AA/A1 | | | 1,730,000 | | | | 1,910,595 | |
Redevelopment Agency of the City of Rialto, 5.00% due 9/1/2023 (Merged Project Area; Insured: BAM) | | AA/NR | | | 550,000 | | | | 640,365 | |
Redevelopment Agency of the City of Rialto, 5.00% due 9/1/2024 (Merged Project Area; Insured: BAM) | | AA/NR | | | 500,000 | | | | 587,575 | |
Semi-Annual Report 11
| | |
| Schedule of Investments, Continued | | |
| |
Thornburg California Limited Term Municipal Fund | | March 31, 2017 (Unaudited) |
| | | | | | | | | | |
ISSUER-DESCRIPTION | | CREDIT RATING†
S&P/ MOODY’S | | PRINCIPAL
AMOUNT | | | VALUE | |
Regents of the University of California, 4.00% due 5/15/2017 (Campus Housing and Facilities) | | AA-/Aa3 | | $ | 1,250,000 | | | $ | 1,255,087 | |
Ridgecrest Redevelopment Agency, 5.00% due 6/30/2017 (Redevelopment Project) | | A-/NR | | | 1,055,000 | | | | 1,065,603 | |
Ridgecrest Redevelopment Agency, 5.25% due 6/30/2018 (Redevelopment Project) | | A-/NR | | | 1,050,000 | | | | 1,102,993 | |
Ridgecrest Redevelopment Agency, 5.50% due 6/30/2019 (Redevelopment Project) | | A-/NR | | | 1,050,000 | | | | 1,146,232 | |
Ridgecrest Redevelopment Agency, 5.50% due 6/30/2020 (Redevelopment Project) | | A-/NR | | | 1,040,000 | | | | 1,167,234 | |
Riverside County Infrastructure Financing Authority, 3.00% due 11/1/2017 (Capital Improvement Projects) | | AA-/NR | | | 1,000,000 | | | | 1,012,930 | |
Riverside County Infrastructure Financing Authority, 4.00% due 11/1/2018 (Capital Improvement Projects) | | AA-/NR | | | 1,000,000 | | | | 1,046,990 | |
Riverside County Infrastructure Financing Authority, 4.00% due 11/1/2019 (Capital Improvement Projects) | | AA-/NR | | | 1,700,000 | | | | 1,816,484 | |
Riverside County Infrastructure Financing Authority, 5.00% due 11/1/2020 (Capital Improvement Projects) | | AA-/NR | | | 605,000 | | | | 678,362 | |
Riverside County Infrastructure Financing Authority, 5.00% due 11/1/2021 (Capital Improvement Projects) | | AA-/NR | | | 500,000 | | | | 572,995 | |
Riverside County Palm Desert Financing Authority, 6.00% due 5/1/2022 pre-refunded 5/1/2018 (Palm Desert Sheriff’s Station Facilities) | | AA-/A1 | | | 2,600,000 | | | | 2,742,818 | |
Riverside County Public Financing Authority, 4.00% due 11/1/2017 (Capital Facilities Project) | | AA-/NR | | | 550,000 | | | | 559,460 | |
Riverside County Public Financing Authority, 5.00% due 11/1/2019 (Capital Facilities Project) | | AA-/NR | | | 2,000,000 | | | | 2,179,320 | |
Riverside County Public Financing Authority, 4.00% due 11/1/2020 (Capital Facilities Project) | | AA-/NR | | | 465,000 | | | | 502,465 | |
Riverside County Public Financing Authority, 5.00% due 11/1/2021 (Capital Facilities Project) | | AA-/NR | | | 1,000,000 | | | | 1,138,400 | |
Riverside County Public Financing Authority, 5.00% due 11/1/2025 (Capital Facilities Project) | | AA-/NR | | | 1,000,000 | | | | 1,186,630 | |
Riverside USD Financing Authority, 4.00% due 9/1/2017 (Educational Facilities; Insured: BAM) | | AA/NR | | | 285,000 | | | | 288,708 | |
Riverside USD Financing Authority, 5.00% due 9/1/2019 (Educational Facilities; Insured: BAM) | | AA/NR | | | 950,000 | | | | 1,032,460 | |
Riverside USD Financing Authority, 5.00% due 9/1/2022 (Educational Facilities; Insured: BAM) | | AA/NR | | | 215,000 | | | | 246,246 | |
Riverside USD Financing Authority, 5.00% due 9/1/2024 (Educational Facilities; Insured: BAM) | | AA/NR | | | 680,000 | | | | 793,907 | |
Riverside USD Financing Authority, 5.00% due 9/1/2025 (Educational Facilities; Insured: BAM) | | AA/NR | | | 350,000 | | | | 415,338 | |
Sacramento City Schools Joint Power Financing Authority, 5.00% due 3/1/2021 (Sacramento City USD Educational Facility Sublease; Insured: BAM) | | AA/NR | | | 830,000 | | | | 930,571 | |
Sacramento City Schools Joint Power Financing Authority, 5.00% due 3/1/2022 (Sacramento City USD Educational Facility Sublease; Insured: BAM) | | AA/NR | | | 775,000 | | | | 883,298 | |
Sacramento City Schools Joint Power Financing Authority, 5.00% due 3/1/2023 (Sacramento City USD Educational Facility Sublease; Insured: BAM) | | AA/NR | | | 815,000 | | | | 942,352 | |
Sacramento City Schools Joint Power Financing Authority, 5.00% due 3/1/2024 (Sacramento City USD Educational Facility Sublease; Insured: BAM) | | AA/NR | | | 765,000 | | | | 894,163 | |
Sacramento City Schools Joint Power Financing Authority, 5.00% due 3/1/2025 (Sacramento City USD Educational Facility Sublease; Insured: BAM) | | AA/NR | | | 2,175,000 | | | | 2,518,933 | |
Sacramento City USD GO, 5.00% due 7/1/2018 (Educational Facilities Improvements; Insured: AGM) | | AA/NR | | | 360,000 | | | | 377,932 | |
Sacramento City USD GO, 4.00% due 7/1/2019 (Educational Facilities Improvements) | | A+/Aa3 | | | 5,455,000 | | | | 5,782,955 | |
Sacramento City USD GO, 5.00% due 7/1/2019 (Educational Facilities Improvements; Insured: AGM) | | AA/NR | | | 635,000 | | | | 688,543 | |
Sacramento City USD GO, 5.00% due 7/1/2020 (Educational Facilities Improvements; Insured: AGM) | | AA/NR | | | 500,000 | | | | 556,815 | |
Sacramento City USD GO, 5.00% due 7/1/2021 (Educational Facilities Improvements; Insured: AGM) | | AA/NR | | | 400,000 | | | | 456,008 | |
Sacramento City USD GO, 5.00% due 7/1/2021 (Educational Facilities Improvements) | | A+/Aa3 | | | 3,600,000 | | | | 4,088,196 | |
Sacramento City USD GO, 5.00% due 7/1/2022 (Educational Facilities Improvements; Insured: AGM) | | AA/NR | | | 700,000 | | | | 810,026 | |
Sacramento Cogeneration Authority, 5.00% due 7/1/2019 (Procter & Gamble Project) | | AA-/Aa3 | | | 625,000 | | | | 678,281 | |
Salinas Valley Solid Waste Authority, 5.00% due 8/1/2023 (Insured: AGM) (AMT) | | AA/A2 | | | 1,530,000 | | | | 1,742,792 | |
San Diego Redevelopment Agency, 0.01% due 9/1/2019 (Centre City Redevelopment; Insured: AGM) | | AA/A2 | | | 1,910,000 | | | | 1,828,596 | |
San Diego USD GO, 3.00% due 7/1/2017 (Educational System Capital Projects) | | NR/Aa2 | | | 5,000,000 | | | | 5,028,650 | |
San Diego USD GO, 5.50% due 7/1/2020 (Educational System Capital Projects; Insured: Natl-Re) | | AA-/Aa2 | | | 1,390,000 | | | | 1,578,025 | |
San Diego USD GO, 5.00% due 7/1/2023 (Educational System Capital Projects) | | AA-/Aa2 | | | 5,000,000 | | | | 5,949,950 | |
San Diego USD GO, 5.00% due 7/1/2024 (Educational System Capital Projects) | | AA-/Aa2 | | | 3,000,000 | | | | 3,573,930 | |
San Francisco City and County Airports Commission, 5.00% due 5/1/2026 (San Francisco International Airport) | | A+/A1 | | | 5,000,000 | | | | 6,111,700 | |
San Joaquin Delta Community College District GO, 0% due 8/1/2019 (Insured: AGM) | | AA/Aa2 | | | 5,000,000 | | | | 4,670,800 | |
San Mateo County Joint Powers Financing Authority, 5.00% due 6/15/2017 (Maple Street Correctional Center) | | AA+/Aa1 | | | 750,000 | | | | 756,607 | |
San Mateo County Joint Powers Financing Authority, 5.00% due 7/15/2018 (County Capital Projects) | | AA+/Aa1 | | | 800,000 | | | | 841,432 | |
San Mateo County Joint Powers Financing Authority, 5.00% due 6/15/2021 (Maple Street Correctional Center) | | AA+/Aa1 | | | 410,000 | | | | 468,556 | |
San Mateo County Joint Powers Financing Authority, 5.00% due 6/15/2022 (Maple Street Correctional Center) | | AA+/Aa1 | | | 1,000,000 | | | | 1,162,490 | |
San Mateo County Joint Powers Financing Authority, 5.00% due 6/15/2023 (Maple Street Correctional Center) | | AA+/Aa1 | | | 585,000 | | | | 690,160 | |
San Mateo Union High School District GO, 0.01% due 9/1/2019 (Educational Facilities; Insured: Natl-Re) | | AA+/Aaa | | | 2,000,000 | | | | 1,933,680 | |
Santa Ana Financing Authority, 6.25% due 7/1/2018 (Police Administration & Holding Facility; Insured: Natl-Re) (ETM) | | AA-/A3 | | | 1,000,000 | | | | 1,065,810 | |
Santa Ana Financing Authority, 6.25% due 7/1/2018 (Police Administration & Holding Facility; Insured: Natl-Re) | | AA-/A3 | | | 1,000,000 | | | | 1,061,280 | |
Santa Ana USD GO, 0.01% due 8/1/2020 (Insured: Natl-Re) | | AA-/A3 | | | 2,035,000 | | | | 1,920,592 | |
Santa Clara County Financing Authority, 4.00% due 5/15/2017 (Multiple Facilities Projects) (ETM) | | AA+/Aa3 | | | 1,000,000 | | | | 1,003,960 | |
Santa Clara County Financing Authority, 5.00% due 5/15/2025 (Multiple Facilities Projects) | | AA+/NR | | | 6,755,000 | | | | 8,206,785 | |
Semitropic Water Storage Improvement District, 5.00% due 12/1/2022 (Irrigation Water System; Insured: AGM) | | AA/A2 | | | 400,000 | | | | 465,932 | |
Semitropic Water Storage Improvement District, 5.00% due 12/1/2023 (Irrigation Water System; Insured: AGM) | | AA/A2 | | | 500,000 | | | | 589,805 | |
Semitropic Water Storage Improvement District, 5.00% due 12/1/2024 (Irrigation Water System; Insured: AGM) | | AA/A2 | | | 500,000 | | | | 596,695 | |
Semitropic Water Storage Improvement District, 5.00% due 12/1/2025 (Irrigation Water System; Insured: AGM) | | AA/A2 | | | 1,110,000 | | | | 1,332,477 | |
Sequoia Union High School District, 2.00% due 6/30/2017 (Capital Expenditures) | | NR/Mig1 | | | 9,225,000 | | | | 9,251,107 | |
South San Francisco USD GO, 4.00% due 6/15/2018 (Educational Facilities) (ETM) | | SP-1+/NR | | | 5,000,000 | | | | 5,181,700 | |
Southeast Resource Recovery Facilities Authority, 5.25% due 12/1/2017 (Insured: AMBAC) | | AA-/Aa3 | | | 1,000,000 | | | | 1,000,000 | |
12 Semi-Annual Report
| | |
| Schedule of Investments, Continued | | |
| |
Thornburg California Limited Term Municipal Fund | | March 31, 2017 (Unaudited) |
| | | | | | | | | | |
ISSUER-DESCRIPTION | | CREDIT RATING†
S&P/ MOODY’S | | PRINCIPAL
AMOUNT | | | VALUE | |
Southeast Resource Recovery Facilities Authority, 5.375% due 12/1/2018 (Insured: AMBAC) (AMT) | | AA-/Aa3 | | $ | 2,000,000 | | | $ | 2,007,360 | |
Southwestern Community College District GO, 4.00% due 8/1/2022 | | AA-/Aa2 | | | 265,000 | | | | 296,991 | |
Southwestern Community College District GO, 4.00% due 8/1/2023 | | AA-/Aa2 | | | 280,000 | | | | 316,938 | |
Southwestern Community College District GO, 4.00% due 8/1/2024 | | AA-/Aa2 | | | 390,000 | | | | 444,374 | |
Southwestern Community College District GO, 4.00% due 8/1/2025 | | AA-/Aa2 | | | 325,000 | | | | 372,557 | |
Southwestern Community College District GO, 4.00% due 8/1/2026 | | AA-/Aa2 | | | 410,000 | | | | 471,705 | |
State of California Economic Recovery GO, 5.00% due 7/1/2018 (ETM) | | AA+/Aaa | | | 2,330,000 | | | | 2,447,851 | |
State of California Economic Recovery GO, 5.00% due 7/1/2018 (ETM) | | AA+/Aaa | | | 670,000 | | | | 703,889 | |
State of California GO, 4.75% due 9/1/2018 (Various Capital Projects; Insured: AGM) | | AA/Aa3 | | | 145,000 | | | | 147,358 | |
State of California GO, 5.00% due 9/1/2020 (Various Capital Projects) | | AA-/Aa3 | | | 2,000,000 | | | | 2,244,080 | |
State of California GO, 0.63% due 5/1/2034 put 4/3/2017 (Kindergarten-University Facilities; LOC: Citibank N.A.) (daily demand notes) | | AA+/Aa1 | | | 2,000,000 | | | | 2,000,000 | |
Successor Agency to the City Colton Redevelopment Agency, 5.00% due 8/1/2021 (Multiple Redevelopment Project Areas; Insured: BAM) | | AA/NR | | | 940,000 | | | | 1,065,377 | |
Successor Agency to the City Colton Redevelopment Agency, 5.00% due 8/1/2023 (Multiple Redevelopment Project Areas; Insured: BAM) | | AA/NR | | | 925,000 | | | | 1,075,784 | |
Successor Agency to the City Colton Redevelopment Agency, 5.00% due 8/1/2025 (Multiple Redevelopment Project Areas; Insured: BAM) | | AA/NR | | | 950,000 | | | | 1,123,850 | |
Successor Agency to the City of Riverside Redevelopment Agency, 5.00% due 9/1/2023 (Multiple Redevelopment Project Areas) | | AA-/NR | | | 1,735,000 | | | | 2,051,152 | |
Successor Agency to the City of Riverside Redevelopment Agency, 5.00% due 9/1/2024 (Multiple Redevelopment Project Areas) | | AA-/NR | | | 1,250,000 | | | | 1,490,150 | |
Successor Agency to the City of Sacramento Redevelopment Agency, 3.00% due 12/1/2017 (Multiple Redevelopment Project Areas) | | A/NR | | | 1,315,000 | | | | 1,332,266 | |
Successor Agency to the City of San Diego Redevelopment Agency, 5.00% due 9/1/2025 (Multiple Redevelopment Project Areas) | | AA/NR | | | 2,745,000 | | | | 3,340,390 | |
Successor Agency to the City of San Diego Redevelopment Agency, 5.00% due 9/1/2026 (Multiple Redevelopment Project Areas) | | AA/NR | | | 1,500,000 | | | | 1,819,770 | |
Successor Agency to the Commerce Community Development Commission, 5.00% due 8/1/2027 (Multiple Redevelopment Project Areas; Insured: AGM) | | AA/NR | | | 1,760,000 | | | | 2,096,618 | |
Successor Agency to the Community Development Agency of the City of Menlo Park, 3.00% due 10/1/2017 (Las Pulgas Community Development Project) | | A+/NR | | | 655,000 | | | | 662,212 | |
Successor Agency to the Community Development Agency of the City of Menlo Park, 5.00% due 10/1/2019 (Las Pulgas Community Development Project) | | A+/NR | | | 400,000 | | | | 435,820 | |
Successor Agency to the Community Development Agency of the City of Menlo Park, 5.00% due 10/1/2020 (Las Pulgas Community Development Project) | | A+/NR | | | 325,000 | | | | 363,054 | |
Successor Agency to the Community Development Agency of the City of Menlo Park, 5.00% due 10/1/2021 (Las Pulgas Community Development Project; Insured: AGM) | | AA/NR | | | 1,250,000 | | | | 1,432,050 | |
Successor Agency to the Community Development Agency of the City of Menlo Park, 5.00% due 10/1/2022 (Las Pulgas Community Development Project; Insured: AGM) | | AA/NR | | | 900,000 | | | | 1,044,162 | |
Successor Agency to the Community Development Agency of the City of Menlo Park, 5.00% due 10/1/2025 (Las Pulgas Community Development Project; Insured: AGM) | | AA/NR | | | 500,000 | | | | 599,210 | |
Successor Agency to the Community Redevelopment Agency of the City of Palmdale, 5.00% due 9/1/2024 (Merged Redevelopment Project Areas) | | A+/NR | | | 600,000 | | | | 708,966 | |
Successor Agency to the Community Redevelopment Agency of the City of Palmdale, 5.00% due 9/1/2025 (Merged Redevelopment Project Areas) | | A+/NR | | | 450,000 | | | | 534,650 | |
Successor Agency to the Community Redevelopment Agency of the City of Palmdale, 5.00% due 9/1/2026 (Merged Redevelopment Project Areas) | | A+/NR | | | 550,000 | | | | 660,627 | |
Successor Agency to the Poway Redevelopment Agency, 5.00% due 6/15/2025 (Paguay Redevelopment Project) | | AA-/NR | | | 4,665,000 | | | | 5,521,074 | |
Successor Agency to the Rancho Cucamonga Redevelopment Project, 5.00% due 9/1/2023 (Rancho Redevelopment Project Area; Insured: AGM) | | AA/NR | | | 1,000,000 | | | | 1,175,620 | |
Successor Agency to the Rancho Cucamonga Redevelopment Project, 5.00% due 9/1/2024 (Rancho Redevelopment Project Area: Insured: AGM) | | AA/NR | | | 2,000,000 | | | | 2,379,720 | |
Successor Agency to the Redevelopment Agency of the City and County of San Francisco, 5.00% due 8/1/2019 (San Francisco Redevelopment Projects) | | A+/NR | | | 2,050,000 | | | | 2,224,291 | |
Successor Agency to the Redevelopment Agency of the City and County of San Francisco, 5.00% due 8/1/2020 (San Francisco Redevelopment Projects) | | A+/NR | | | 1,685,000 | | | | 1,875,422 | |
Successor Agency to the Redevelopment Agency of the City and County of San Francisco, 5.00% due 8/1/2021 (San Francisco Redevelopment Projects) | | A+/NR | | | 1,000,000 | | | | 1,138,760 | |
Successor Agency to the Redevelopment Agency of the City of Stockton, 5.00% due 9/1/2025 (Redevelopment of Midtown, North and South Stockton and Waterfront Areas; Insured: AGM) | | AA/NR | | | 1,900,000 | | | | 2,202,689 | |
Successor Agency to the Redevelopment Agency of the City of Stockton, 5.00% due 9/1/2026 (Redevelopment of Midtown, North and South Stockton and Waterfront Areas; Insured: AGM) | | AA/NR | | | 1,000,000 | | | | 1,165,360 | |
Successor Agency to the Redevelopment Agency of the City of Stockton, 5.00% due 9/1/2027 (Redevelopment of Midtown, North and South Stockton and Waterfront Areas; Insured: AGM) | | AA/NR | | | 1,000,000 | | | | 1,153,810 | |
Semi-Annual Report 13
| | |
| Schedule of Investments, Continued | | |
| |
Thornburg California Limited Term Municipal Fund | | March 31, 2017 (Unaudited) |
| | | | | | | | | | |
ISSUER-DESCRIPTION | | CREDIT RATING†
S&P/ MOODY’S | | PRINCIPAL
AMOUNT | | | VALUE | |
Successor Agency to the Richmond County Redevelopment Agency, 5.00% due 9/1/2022 (Joint Powers Financing Authority & Harbour Redevelopment Project; Insured: BAM) | | AA/NR | | $ | 400,000 | | | $ | 460,860 | |
Successor Agency to the Richmond County Redevelopment Agency, 5.00% due 9/1/2023 (Joint Powers Financing Authority & Harbour Redevelopment Project; Insured: BAM) | | AA/NR | | | 400,000 | | | | 465,720 | |
Successor Agency to the Richmond County Redevelopment Agency, 5.00% due 9/1/2024 (Joint Powers Financing Authority & Harbour Redevelopment Project; Insured: BAM) | | AA/NR | | | 450,000 | | | | 528,818 | |
Successor Agency to the Rosemead Community Development Commission, 5.00% due 10/1/2020 (Rosemead Merged Project Area; Insured: BAM) | | AA/NR | | | 745,000 | | | | 827,248 | |
Successor Agency to the Rosemead Community Development Commission, 5.00% due 10/1/2021 (Rosemead Merged Project Area; Insured: BAM) | | AA/NR | | | 680,000 | | | | 769,869 | |
Successor Agency to the Rosemead Community Development Commission, 5.00% due 10/1/2022 (Rosemead Merged Project Area; Insured: BAM) | | AA/NR | | | 1,190,000 | | | | 1,361,884 | |
Successor Agency to the Rosemead Community Development Commission, 5.00% due 10/1/2023 (Rosemead Merged Project Area; Insured: BAM) | | AA/NR | | | 450,000 | | | | 520,763 | |
Successor Agency to the Rosemead Community Development Commission, 5.00% due 10/1/2024 (Rosemead Merged Project Area; Insured: BAM) | | AA/NR | | | 620,000 | | | | 724,365 | |
Successor Agency to the Rosemead Community Development Commission, 5.00% due 10/1/2025 (Rosemead Merged Project Area; Insured: BAM) | | AA/NR | | | 405,000 | | | | 477,179 | |
Successor Agency to the Rosemead Community Development Commission, 5.00% due 10/1/2026 (Rosemead Merged Project Area; Insured: BAM) | | AA/NR | | | 745,000 | | | | 883,793 | |
Temecula Valley USD Financing Authority, 4.00% due 9/1/2017 (Educational Facilities; Insured: BAM) | | AA/NR | | | 400,000 | | | | 404,912 | |
Temecula Valley USD Financing Authority, 5.00% due 9/1/2018 (Educational Facilities; Insured: BAM) | | AA/NR | | | 325,000 | | | | 341,884 | |
Temecula Valley USD Financing Authority, 5.00% due 9/1/2019 (Educational Facilities; Insured: BAM) | | AA/NR | | | 375,000 | | | | 406,275 | |
Temecula Valley USD Financing Authority, 5.00% due 9/1/2020 (Educational Facilities; Insured: BAM) | | AA/NR | | | 400,000 | | | | 443,624 | |
Temecula Valley USD Financing Authority, 5.00% due 9/1/2021 (Educational Facilities; Insured: BAM) | | AA/NR | | | 515,000 | | | | 582,465 | |
Temecula Valley USD Financing Authority, 5.00% due 9/1/2022 (Educational Facilities; Insured: BAM) | | AA/NR | | | 275,000 | | | | 314,966 | |
Temecula Valley USD Financing Authority, 5.00% due 9/1/2023 (Educational Facilities; Insured: BAM) | | AA/NR | | | 300,000 | | | | 346,443 | |
Temecula Valley USD Financing Authority, 5.00% due 9/1/2024 (Educational Facilities; Insured: BAM) | | AA/NR | | | 300,000 | | | | 348,492 | |
Temecula Valley USD Financing Authority, 5.00% due 9/1/2025 (Educational Facilities; Insured: BAM) | | AA/NR | | | 300,000 | | | | 348,954 | |
Town of Hillsborough COP, 0.97% due 6/1/2030 put 4/7/2017 (Water and Sewer Systems; SPA: Bank of the West) (weekly demand notes) | | NR/NR | | | 500,000 | | | | 500,000 | |
Trustees of the California State University, 5.00% due 11/1/2026 (Educational Facilities Improvements) | | AA-/Aa2 | | | 1,000,000 | | | | 1,215,890 | |
Tuolumne Wind Project Authority, 5.00% due 1/1/2018 | | AA-/A2 | | | 1,690,000 | | | | 1,742,948 | |
Turlock Irrigation District, 5.00% due 1/1/2019 | | AA-/A2 | | | 1,000,000 | | | | 1,068,660 | |
Turlock Irrigation District, 5.00% due 1/1/2025 | | A+/NR | | | 1,000,000 | | | | 1,187,500 | |
Turlock Irrigation District, 5.00% due 1/1/2026 | | A+/NR | | | 1,000,000 | | | | 1,197,960 | |
Ukiah USD GO, 0% due 8/1/2019 (Insured: Natl-Re) | | AA-/A1 | | | 2,000,000 | | | | 1,938,840 | |
Upper Lake Union High School District GO, 0% due 8/1/2020 (Insured: Natl-Re) | | NR/A3 | | | 1,050,000 | | | | 933,943 | |
Ventura County Public Financing Authority, 5.00% due 11/1/2023 (Office Building Purchase and Improvements) | | AA+/Aa1 | | | 500,000 | | | | 597,925 | |
Ventura County Public Financing Authority, 5.00% due 11/1/2024 (Office Building Purchase and Improvements) | | AA+/Aa1 | | | 1,060,000 | | | | 1,259,640 | |
Virgin Islands Public Finance Authority, 5.00% due 10/1/2017 | | B/Caa1 | | | 1,440,000 | | | | 1,378,310 | |
Vista Redevelopment Agency, 5.00% due 9/1/2019 (Vista Redevelopment Project; Insured: AGM) | | AA/NR | | | 300,000 | | | | 325,566 | |
Vista Redevelopment Agency, 5.00% due 9/1/2020 (Vista Redevelopment Project; Insured: AGM) | | AA/NR | | | 275,000 | | | | 305,509 | |
Vista Redevelopment Agency, 5.00% due 9/1/2021 (Vista Redevelopment Project; Insured: AGM) | | AA/NR | | | 265,000 | | | | 300,799 | |
Vista Redevelopment Agency, 5.00% due 9/1/2022 (Vista Redevelopment Project; Insured: AGM) | | AA/NR | | | 335,000 | | | | 385,970 | |
Vista Redevelopment Agency, 5.00% due 9/1/2023 (Vista Redevelopment Project; Insured: AGM) | | AA/NR | | | 400,000 | | | | 466,848 | |
Walnut Improvement Agency, 4.00% due 3/1/2018 (City of Walnut Improvement Plan; Insured: BAM) | | AA/NR | | | 1,000,000 | | | | 1,026,220 | |
Walnut Improvement Agency, 5.00% due 3/1/2019 (City of Walnut Improvement Plan; Insured: BAM) | | AA/NR | | | 400,000 | | | | 427,900 | |
Washington USD Yolo County COP, 5.00% due 8/1/2017 (West Sacramento High School; Insured: AMBAC) | | A/NR | | | 725,000 | | | | 734,889 | |
Washington USD Yolo County COP, 5.00% due 8/1/2021 (West Sacramento High School; Insured: AMBAC) | | A/NR | | | 910,000 | | | | 921,521 | |
Washington USD Yolo County COP, 5.00% due 8/1/2022 (West Sacramento High School; Insured: AMBAC) | | A/NR | | | 2,010,000 | | | | 2,035,447 | |
Westminster Redevelopment Agency, 5.00% due 8/1/2024 (Commercial Redevelopment Project No. 1; Insured: AGM) | | AA/A2 | | | 1,205,000 | | | | 1,259,731 | |
| | | | | | | | | | |
TOTAL INVESTMENTS — 98.77% (Cost $641,873,873) | | | | | | | | $ | 655,352,500 | |
OTHER ASSETS LESS LIABILITIES — 1.23% | | | | | | | | | 8,178,468 | |
| | | | | | | | | | |
NET ASSETS — 100.00% | | | | | | | | $ | 663,530,968 | |
| | | | | | | | | | |
14 Semi-Annual Report
| | |
| Schedule of Investments, Continued | | |
| |
Thornburg California Limited Term Municipal Fund | | March 31, 2017 (Unaudited) |
Footnote Legend
| † | Credit ratings are unaudited. Rating changes may have occurred subsequent to the reporting period end. Bonds issued with a maturity of one year or less are assigned Moody’s ratings from MIG-1 to MIG-4 and Standard and Poor’s ratings from SP-1+ to SP-3 with MIG-1 and SP-1+ being the strongest ratings. |
Portfolio Abbreviations
To simplify the listings of securities, abbreviations are used per the table below:
| | |
| ABAG | | Association of Bay Area Governments |
| ACA | | Insured by American Capital Access |
| AGM | | Insured by Assured Guaranty Municipal Corp. |
| AMBAC | | Insured by American Municipal Bond Assurance Corp. |
| AMT | | Alternative Minimum Tax |
| BAM | | Insured by Build America Mutual Insurance Co. |
| COP | | Certificates of Participation |
See notes to financial statements.
| | |
| ETM | | Escrowed to Maturity |
| FHA | | Insured by Federal Housing Administration |
| GO | | General Obligation |
| HFFA | | Health Facilities Financing Authority |
| Mtg | | Mortgage |
| Natl-Re | | Insured by National Public Finance Guarantee Corp. |
| USD | | Unified School District |
Semi-Annual Report 15
| | |
| Statement of Assets and Liabilities | | |
| |
Thornburg California Limited Term Municipal Fund | | March 31, 2017 (Unaudited) |
| | | | |
ASSETS | | | | |
Investments at value (cost $641,873,873) (Note 3) | | $ | 655,352,500 | |
Cash | | | 1,654,698 | |
Receivable for investments sold | | | 1,052,497 | |
Receivable for fund shares sold | | | 2,029,790 | |
Interest receivable | | | 6,082,419 | |
Prepaid expenses and other assets | | | 2,298 | |
| | | | |
Total Assets | | | 666,174,202 | |
| | | | |
| |
LIABILITIES | | | | |
Payable for investments purchased | | | 583,857 | |
Payable for fund shares redeemed | | | 1,442,550 | |
Payable to investment advisor and other affiliates (Note 4) | | | 370,127 | |
Accounts payable and accrued expenses | | | 93,560 | |
Dividends payable | | | 153,140 | |
| | | | |
Total Liabilities | | | 2,643,234 | |
| | | | |
| |
NET ASSETS | | $ | 663,530,968 | |
| | | | |
NET ASSETS CONSIST OF | | | | |
Undistributed net investment income | | $ | 2,150 | |
Net unrealized appreciation on investments | | | 13,478,627 | |
Accumulated net realized gain (loss) | | | (2,234,855 | ) |
Net capital paid in on shares of beneficial interest | | | 652,285,046 | |
| | | | |
| |
| | $ | 663,530,968 | |
| | | | |
NET ASSET VALUE | | | | |
| |
Class A Shares: | | | | |
Net asset value and redemption price per share ($153,869,372 applicable to 11,273,940 shares of beneficial interest outstanding - Note 5) | | $ | 13.65 | |
Maximum sales charge, 1.50% of offering price | | | 0.21 | |
| | | | |
Maximum offering price per share | | $ | 13.86 | |
| | | | |
| |
Class C Shares: | | | | |
Net asset value and offering price per share* ($60,124,492 applicable to 4,401,765 shares of beneficial interest outstanding - Note 5) | | $ | 13.66 | |
| | | | |
| |
Class I Shares: | | | | |
Net asset value, offering and redemption price per share ($449,537,104 applicable to 32,905,757 shares of beneficial interest outstanding - Note 5) | | $ | 13.66 | |
| | | | |
| * | Redemption price per share is equal to net asset value less any applicable contingent deferred sales charge. |
See notes to financial statements.
16 Semi-Annual Report
| | |
| Statement of Operations | | |
| |
Thornburg California Limited Term Municipal Fund | | Six Months Ended March 31, 2017 (Unaudited) |
| | | | |
INVESTMENT INCOME | | | | |
Interest income (net of premium amortized of $5,003,387) | | $ | 7,829,244 | |
| | | | |
| |
EXPENSES | | | | |
Investment advisory fees (Note 4) | | | 1,647,256 | |
Administration fees (Note 4) | | | | |
Class A Shares | | | 109,132 | |
Class C Shares | | | 39,712 | |
Class I Shares | | | 115,205 | |
Distribution and service fees (Note 4) | | | | |
Class A Shares | | | 218,264 | |
Class C Shares | | | 158,542 | |
Transfer agent fees | | | | |
Class A Shares | | | 47,052 | |
Class C Shares | | | 14,815 | |
Class I Shares | | | 178,839 | |
Registration and filing fees | | | | |
Class A Shares | | | 18 | |
Class C Shares | | | 17 | |
Class I Shares | | | 18 | |
Custodian fees (Note 2) | | | 55,965 | |
Professional fees | | | 25,435 | |
Accounting fees (Note 4) | | | 11,767 | |
Trustee fees | | | 16,258 | |
Other expenses | | | 24,385 | |
| | | | |
Total Expenses | | | 2,662,680 | |
| | | | |
Net Investment Income | | | 5,166,564 | |
| | | | |
REALIZED AND UNREALIZED GAIN (LOSS) | | | | |
Net realized gain (loss) on investments | | | (2,219,065 | ) |
Net change in unrealized appreciation (depreciation) on investments | | | (15,799,407 | ) |
| | | | |
Net Realized and Unrealized Loss | | | (18,018,472 | ) |
| | | | |
Net Decrease in Net Assets Resulting from Operations | | $ | (12,851,908 | ) |
| | | | |
See notes to financial statements.
Semi-Annual Report 17
| | |
| Statements of Changes in Net Assets | | |
| |
Thornburg California Limited Term Municipal Fund | | |
| | | | | | | | |
| | | SIX MONTHS ENDED
MARCH 31, 2017* | | | YEAR ENDED
SEPTEMBER 30, 2016 | |
INCREASE (DECREASE) IN NET ASSETS FROM | | | | | | | | |
| | |
OPERATIONS | | | | | | | | |
Net investment income | | $ | 5,166,564 | | | $ | 10,039,681 | |
Net realized gain (loss) on investments | | | (2,219,065 | ) | | | 190,349 | |
Net unrealized appreciation (depreciation) on investments | | | (15,799,407 | ) | | | 6,449,717 | |
| | | | | | | | |
Net Increase (Decrease) in Net Assets Resulting from Operations | | | (12,851,908 | ) | | | 16,679,747 | |
| | |
DIVIDENDS TO SHAREHOLDERS | | | | | | | | |
From net investment income | | | | | | | | |
Class A Shares | | | (1,134,916 | ) | | | (2,354,052 | ) |
Class C Shares | | | (336,805 | ) | | | (694,054 | ) |
Class I Shares | | | (3,695,097 | ) | | | (6,991,575 | ) |
| | |
FUND SHARE TRANSACTIONS (NOTE 5) | | | | | | | | |
Class A Shares | | | (34,674,052 | ) | | | 20,188,735 | |
Class C Shares | | | (6,486,912 | ) | | | 3,358,067 | |
Class I Shares | | | (15,203,495 | ) | | | 64,610,015 | |
| | | | | | | | |
Net Increase (Decrease) in Net Assets | | | (74,383,185 | ) | | | 94,796,883 | |
| | |
NET ASSETS | | | | | | | | |
Beginning of Period | | | 737,914,153 | | | | 643,117,270 | |
| | | | | | | | |
| | |
End of Period | | $ | 663,530,968 | | | $ | 737,914,153 | |
| | | | | | | | |
Undistributed net investment income | | $ | 2,150 | | | $ | 2,404 | |
See notes to financial statements.
18 Semi-Annual Report
| | |
| Notes to Financial Statements | | |
| |
Thornburg California Limited Term Municipal Fund | | March 31, 2017 (Unaudited) |
NOTE 1 – ORGANIZATION
Thornburg California Limited Term Municipal Fund (the “Fund”) is a diversified series of Thornburg Investment Trust (the “Trust”). The Trust is organized as a Massachusetts business trust under a Declaration of Trust dated June 3, 1987 and is registered as a diversified, open-end management investment company under the Investment Company Act of 1940, as amended. The Fund is currently one of twenty-one separate series of the Trust. Each series is considered to be a separate entity for financial reporting and tax purposes and bears expenses directly attributable to it. The Fund’s primary investment objective is to obtain as high a level of current income exempt from federal and California state individual income tax as is consistent, in the view of Thornburg Investment Management, Inc., the Trust’s investment advisor (the “Advisor”), with the preservation of capital. The Fund’s secondary objective is to reduce expected changes in its share price compared to longer intermediate and long-term bond portfolios.
The Fund currently offers three classes of shares of beneficial interest: Class A, Class C, and Institutional Class (“Class I”). Each class of shares of the Fund represents an interest in the same portfolio of investments, except that (i) Class A shares are sold subject to a front-end sales charge collected at the time the shares are purchased and bear a service fee, (ii) Class C shares are sold at net asset value without a sales charge at the time of purchase, but are subject to a contingent deferred sales charge upon redemption within one year of purchase, and bear both a service fee and a distribution fee, (iii) Class I shares are sold at net asset value without a sales charge at the time of purchase and may be subject to a service fee, and (iv) the respective classes may have different reinvestment privileges and conversion rights. Additionally, the Fund may allocate among its classes certain expenses, to the extent allocable to specific classes, including transfer agent fees, government registration fees, certain printing and postage costs, and administrative and legal expenses. Currently, class specific expenses of the Fund are limited to service and distribution fees, administration fees, and certain registration and transfer agent expenses.
The following is a summary of significant accounting policies followed by the Fund in the preparation of its financial statements. The Fund prepares its financial statements in conformity with United States generally accepted accounting principles (“GAAP”), including investment company accounting and reporting guidance in the Financial Accounting Standards Board (the “FASB”) Accounting Standard Codification Topic 946.
NOTE 2 – SIGNIFICANT ACCOUNTING POLICIES
Security Valuation: All investments in securities held by the Fund are valued as described in Note 3.
Allocation of Income, Gains, Losses and Expenses: Net investment income (other than class specific expenses) and realized and unrealized gains and losses are allocated daily to each class of shares based upon the relative net asset value of outstanding shares (or the value of the dividend-eligible shares, as appropriate) of each class of shares at the beginning of the day (after adjusting for the current capital shares activity of the respective class). Expenses common to all Funds are allocated among the Funds comprising the Trust based upon their relative net asset values or other appropriate allocation methods. Operating expenses directly attributable to a specific class are charged against the operating income of that class.
Dividends and Distributions to Shareholders: Dividends and distributions to shareholders, which are determined in accordance with federal income tax regulations and may differ from GAAP, are recorded on the ex-dividend date. Ordinary income distributions, if any, are declared daily and paid monthly. Capital gain distributions, if any, are declared and paid annually and more often if deemed necessary by the Advisor. Dividends are paid and are reinvested in additional shares of the Fund at net asset value per share at the close of business on the ex-dividend date, or at the shareholder’s option, paid in cash.
Investment Income: Interest income is accrued as earned. Premiums and discounts are amortized and accreted, respectively, to call dates or maturity dates using the effective yield method of the respective investments. These amounts are included in Interest income on the Statement of Operations.
Custodian Fees: Custodian fees disclosed in the Statement of Operations may include interest expenses incurred by the Fund on any cash overdrafts of its custodian account during the period. Such cash overdrafts may result from the effects of failed trades in portfolio securities and from cash outflows resulting from unanticipated shareholder redemption activity. The Fund pays interest to its custodian on any such cash overdraft at a rate equal to 2.50% of the overdraft amount in excess of $50,000.
Investment Transactions: Investment transactions are accounted for on a trade date basis. Realized gains and losses from the sale of investments are recorded on an identified cost basis.
When-Issued and Delayed Delivery Transactions: The Fund may engage in when-issued or delayed delivery transactions. To the extent the Fund engages in such transactions, it will do so for the purpose of acquiring portfolio investments consistent with the Fund’s investment objectives and not for the purpose of investment leverage or to speculate on interest rate or market changes. At the time the Fund makes a commitment to purchase an investment on a when-issued or delayed delivery basis, the Fund will record the transaction and reflect the value in determining its net asset value. When effecting such transactions, assets of an amount sufficient to make payment
Semi-Annual Report 19
| | |
| Notes to Financial Statements, Continued | | |
| |
Thornburg California Limited Term Municipal Fund | | March 31, 2017 (Unaudited) |
for the portfolio investments to be purchased will be segregated on the Fund’s records on the trade date. Investments purchased on a when-issued or delayed delivery basis do not earn interest until the settlement date.
Guarantees and Indemnifications: Under the Trust’s organizational documents (and under separate agreements with the independent Trustees), its officers and Trustees are provided with an indemnification against certain liabilities arising out of the performance of their duties to the Fund. In the normal course of business the Trust may also enter into contracts with service providers that contain general indemnifications. The Trust’s maximum exposure under these arrangements is unknown. However, based on experience, the Trust expects the risk of loss to be remote.
Use of Estimates: The preparation of financial statements in conformity with GAAP requires management to make estimates and assumptions that affect the reported amounts of assets and liabilities and disclosure of contingent assets and liabilities at the date of the financial statements and the reported amounts of increases (decreases) in net assets from operations during the reporting period. Actual results could differ from those estimates.
Federal Income Taxes: It is the policy of the Trust to comply with the provisions of the Internal Revenue Code applicable to regulated investment companies and to distribute to shareholders substantially all investment company taxable income including net realized gains on investments (if any), and tax exempt income of the Fund . Therefore, no provision for federal income or excise tax is required.
The Fund files income tax returns in United States federal and applicable state jurisdictions. The statute of limitations on the Fund’s tax return filings generally remains open for the three years following a return’s filing date. The Fund has analyzed its tax positions taken on Federal income tax returns for all open tax years and has concluded that no provision for income tax is required in the financial statements.
At March 31, 2017, information on the tax components of capital was as follows:
| | | | |
Cost of investments for tax purposes | | $ | 641,873,873 | |
| | | | |
Gross unrealized appreciation on a tax basis | | $ | 15,813,758 | |
Gross unrealized depreciation on a tax basis | | | (2,335,131 | ) |
| | | | |
Net unrealized appreciation (depreciation) on investments (tax basis) | | $ | 13,478,627 | |
| | | | |
At March 31, 2017, the Fund had cumulative tax basis capital losses of $15,789, (of which $15,789 are short-term and $0 are long-term) generated after September 30, 2011, which may be carried forward to offset future capital gains. To the extent such carryforwards are used, capital gain distributions may be reduced to the extent provided by regulations. Such capital loss carryforwards do not expire.
NOTE 3 – SECURITY VALUATION
Valuation of the Fund’s portfolio investment securities is performed in accordance with policies and procedures adopted by and under the oversight of the Trustees.
The Trustees of the Trust have appointed Thornburg Investment Management, Inc., the Trust’s investment advisor (the “Advisor”), to assist the Trustees in obtaining market values for portfolio investments, evaluate and monitor professional pricing service providers appointed by the Trustees’ Audit Committee (the “Audit Committee”) to assist in determining fair values for portfolio investments, assist in calculating fair values for portfolio investments in certain circumstances, and to perform other functions in connection with the valuation of investments. The Advisor acts through its Valuation and Pricing Committee (the “Committee”) and other employees of the Advisor. The Committee regularly reviews its own valuation calculations, as well as the valuations, valuation techniques and services furnished by pricing service providers, considers circumstances which may require valuation calculations by the Committee, and reviews previous valuation calculations. The Committee reports to the Audit Committee on the Committee’s activities, the performance of pricing service providers, and other matters relating to valuation of portfolio investments.
In those instances when the Committee assists in calculating a fair value for a portfolio investment, the Committee seeks to determine the price that the Fund would reasonably expect to receive upon a sale of the investment in an orderly transaction between market participants on the valuation date. The Committee customarily utilizes quotations from securities broker dealers in calculating valuations, but also may utilize prices obtained from pricing service providers or other methods approved by the Audit Committee. Because fair values calculated by the Committee are estimates, the calculation of a value for an investment may differ from the price that would be realized by the Fund upon a sale of the investment, and the difference could be material to the Fund’s financial statements. The Committee’s calculation of a fair value for an investment may also differ from the prices obtained by other persons (including other mutual funds) for the investment.
Valuation of Securities: Debt obligations held by the Fund which are not listed or traded on exchanges or for which no reported market exists are ordinarily valued at the valuation obtained from a pricing service provider approved by the Audit Committee.
20 Semi-Annual Report
| | |
| Notes to Financial Statements, Continued | | |
| |
Thornburg California Limited Term Municipal Fund | | March 31, 2017 (Unaudited) |
In any case when a pricing service provider fails to provide a valuation for a debt obligation held by the Fund, the Committee calculates a fair value for the obligation using alternative methods under procedures approved by the Audit Committee. Additionally, in cases when management believes that a valuation obtained from a pricing service provider merits review for significant reasons, the Committee decides whether or not to use the valuation calculated by the pricing service provider or to use an alternative method approved by the Audit Committee to calculate a fair value for the obligation.
Valuation Hierarchy: The Fund categorizes its investments based upon the inputs used in valuing those investments, according to a three-level hierarchy established in guidance from FASB. Categorization of investments using this hierarchy is intended by the FASB to maximize the use of observable inputs in valuing investments and minimize the use of unobservable inputs by requiring that the most observable inputs be used when available. Observable inputs are those that market participants would use in valuing an investment based on available market information. Unobservable inputs are those that reflect assumptions about the information market participants would use in valuing an investment. An investment’s level within the hierarchy is based on the lowest level input that is deemed significant to the valuation. The methodologies and inputs used to value investments are not necessarily indications of the risk or liquidity associated with those investments.
Various inputs are used in calculating valuations for the Fund’s investments. These inputs are generally summarized according to the three-level hierarchy below:
Level 1: Quoted prices in active markets for identical investments.
Level 2: Other direct or indirect significant observable inputs (including quoted prices for similar investments in active markets and other observable inputs, such as interest rates, prepayment rates, credit risk, etc.).
Level 3: Significant unobservable inputs (including the Committee’s own assumptions in calculating the fair values of investments).
Valuations for debt obligations held by the Fund are typically calculated by pricing service providers approved by the Audit Committee and are characterized as Level 2 within the valuation hierarchy.
In a limited number of cases the Committee calculates a fair value for investments using broker quotations or other methods approved by the Audit Committee. When the Committee uses a single broker quotation to calculate a fair value for an investment without other significant observable inputs, or if a fair value is calculated using other significant inputs that are considered unobservable, the investment is characterized as Level 3 within the hierarchy. Other significant unobservable inputs used to calculate a fair value in these instances might include an income-based valuation approach which considers discounted anticipated future cash flows from the investment, and application of discounts due to the nature or duration of any restrictions on the disposition of the investment.
Valuations based upon the use of inputs from Levels 1, 2 or 3 may not represent the actual price received upon the disposition of an investment, and the Fund may receive a price that is lower than the valuation based upon these inputs when it sells the investment.
The following table displays a summary of the fair value hierarchy measurements of the Fund’s investments as of March 31, 2017. In any instance when valuation inputs from more than one level are used to determine the fair value of a specific investment, the investment is placed in the level of the table based upon the lowest level input that is significant in determining the fair value of the investment:
| | | | | | | | | | | | | | | | |
| | | FAIR VALUE MEASUREMENTS AT MARCH 31, 2017 | |
| | | TOTAL | | | LEVEL 1 | | | LEVEL 2 | | | LEVEL 3 | |
Assets | | | | | | | | | | | | | | | | |
Investments in Securities | | | | | | | | | | | | | | | | |
Municipal Bonds | | $ | 655,352,500 | | | $ | — | | | $ | 655,352,500 | | | $ | — | |
| | | | | | | | | | | | | | | | |
Total Investments in Securities | | $ | 655,352,500 | | | $ | — | | | $ | 655,352,500 | | | $ | — | |
In accordance with the guidance prescribed in Accounting Standards Update No. 2011-04, it is the policy of the Fund to recognize transfers between levels and the underlying events which caused the movement. The Fund recognized no transfers between levels for the six months ended March 31, 2017.
Semi-Annual Report 21
| | |
| Notes to Financial Statements, Continued | | |
| |
Thornburg California Limited Term Municipal Fund | | March 31, 2017 (Unaudited) |
NOTE 4 – INVESTMENT ADVISORY FEE AND OTHER TRANSACTIONS WITH AFFILIATES
Pursuant to an investment advisory agreement, the Advisor serves as the investment advisor and performs services for the Fund for which the fees are payable at the end of each month. Under the investment advisory agreement, the Fund pays the Advisor a management fee based on the daily net assets of the Fund at an annual rate as shown in the following table:
Management Fee Schedule
| | | | |
DAILY NET ASSETS | | FEE RATE | |
Up to $500 million | | | 0.500 | % |
Next $500 million | | | 0.400 | |
Next $500 million | | | 0.300 | |
Next $500 million | | | 0.250 | |
Over $2 billion | | | 0.225 | |
The Fund’s effective management fee for the six months ended March 31, 2017 was 0 .471% of the Fund’s average net assets.
The Fund pays to the Advisor the costs of personnel who perform certain accounting services for the Fund. For the six months ended March 31, 2017 the Fund paid $11,767 to the Advisor for these accounting services. The Trust has also entered into administrative service agreements with the Advisor, whereby the Advisor will perform certain administrative services related to each class of the Fund’s shares, and for which fees will be payable at an annual rate of up to .125 of 1% per annum of the average daily net assets attributable to each class of shares. Total administrative service fees incurred by each class of shares of the Fund for the six months ended March 31, 2017, are set forth in the Statement of Operations.
The Trust has an underwriting agreement with Thornburg Securities Corporation (the “Distributor”), an affiliate of the Advisor, which acts as the distributor of the Fund’s shares. For the six months ended March 31, 2017, the Distributor has advised the Fund that it earned net commissions aggregating $2,507 from the sale of Class A shares, and collected contingent deferred sales charges aggregating $2,449 from redemptions of Class C shares of the Fund.
Pursuant to a service plan under Rule 12b-1 of the Investment Company Act of 1940, the Fund may pay to the Distributor or securities dealers and other financial institutions at the Distributor’s direction and amount not to exceed .25 of 1% per annum of the average daily net assets attributable to Class A and Class C shares of the Fund to obtain various shareholder and distribution related services. For the six months ended March 31, 2017, there were no 12b-1 service plan fees charged for Class I shares. The Advisor and the Distributor each may pay out of its own resources additional expenses for distribution of the Funds shares and shareholder services.
The Trust has also adopted a distribution plan pursuant to Rule 12b-1, applicable only to the Fund’s Class C shares, under which the Fund compensates the Distributor for services in promoting the sale of Class C shares of the Fund at an annual rate of up to .25 of 1% per annum of the average daily net assets attributable to Class C shares.
Total fees incurred by each class of shares of the Fund under their respective service and distribution plans for the six months ended March 31, 2017, are set forth in the Statement of Operations.
Certain officers and Trustees of the Trust are also officers or directors of the Advisor and Distributor. The compensation of independent Trustees is borne by the Trust.
The Fund may purchase or sell securities from, or to an affiliated fund, provided the affiliation is due solely to having a common investment advisor, common officers, or common trustees, and provided that all such transactions will comply with Rule 17a-7 under the 1940 Act. For the six months ended March 31, 2017, the Fund had transactions with affiliated funds of $1,312,169 in sales.
22 Semi-Annual Report
| | |
| Notes to Financial Statements, Continued | | |
| |
Thornburg California Limited Term Municipal Fund | | March 31, 2017 (Unaudited) |
NOTE 5 – SHARES OF BENEFICIAL INTEREST
At March 31, 2017, there were an unlimited number of shares with no par value of beneficial interest authorized. Transactions in shares of beneficial interest were as follows:
| | | | | | | | | | | | | | | | |
| | | SIX MONTHS ENDED | | | YEAR ENDED | |
| | | MARCH 31, 2017 (UNAUDITED) | | | SEPTEMBER 30, 2016 (AUDITED) | |
| | | SHARES | | | AMOUNT | | | SHARES | | | AMOUNT | |
Class A Shares | | | | | | | | | | | | | | | | |
Shares sold | | | 1,742,291 | | | $ | 23,841,996 | | | | 3,545,788 | | | $ | 49,447,106 | |
Shares issued to shareholders in reinvestment of dividends | | | 70,907 | | | | 967,425 | | | | 142,013 | | | | 1,981,364 | |
Shares repurchased | | | (4,370,315 | ) | | | (59,483,473 | ) | | | (2,238,533 | ) | | | (31,239,735 | ) |
| | | | | | | | | | | | | | | | |
| | | | |
Net increase (decrease) | | | (2,557,117 | ) | | $ | (34,674,052 | ) | | | 1,449,268 | | | $ | 20,188,735 | |
| | | | | | | | | | | | | | | | |
Class C Shares | | | | | | | | | | | | | | | | |
Shares sold | | | 210,690 | | | $ | 2,879,190 | | | | 1,011,365 | | | $ | 14,117,934 | |
Shares issued to shareholders in reinvestment of dividends | | | 19,493 | | | | 266,139 | | | | 38,417 | | | | 536,374 | |
Shares repurchased | | | (705,863 | ) | | | (9,632,241 | ) | | | (808,902 | ) | | | (11,296,241 | ) |
| | | | | | | | | | | | | | | | |
| | | | |
Net increase (decrease) | | | (475,680 | ) | | $ | (6,486,912 | ) | | | 240,880 | | | $ | 3,358,067 | |
| | | | | | | | | | | | | | | | |
Class I Shares | | | | | | | | | | | | | | | | |
Shares sold | | | 11,100,855 | | | $ | 151,454,964 | | | | 12,762,501 | | | $ | 178,298,927 | |
Shares issued to shareholders in reinvestment of dividends | | | 218,043 | | | | 2,977,143 | | | | 381,818 | | | | 5,333,769 | |
Shares repurchased | | | (12,461,493 | ) | | | (169,635,602 | ) | | | (8,518,649 | ) | | | (119,022,681 | ) |
| | | | | | | | | | | | | | | | |
| | | | |
Net increase (decrease) | | | (1,142,595 | ) | | $ | (15,203,495 | ) | | | 4,625,670 | | | $ | 64,610,015 | |
| | | | | | | | | | | | | | | | |
NOTE 6 – INVESTMENT TRANSACTIONS
For the six months ended March 31, 2017, the Fund had purchase and sale transactions of investments (excluding short-term investments) of $56,870,414 and $99,861,694, respectively.
OTHER NOTES
Risks: The Fund’s investments subject it to risks including, but not limited to, management risk, interest rate risk, credit risk, market and economic risk, liquidity risk, and the risk of investing mainly in the obligations primarily originating in a single state. Please see the Fund’s prospectus for a discussion of the risks associated with an investment in the Fund.
Subsequent Events: Fund management believes no events have occurred between March 31, 2017 and the date of issuance of the financial statements that require adjustment to or disclosure in the accompanying financial statements.
Semi-Annual Report 23
| | |
| Financial Highlights | | |
| |
Thornburg California Limited Term Municipal Fund | | |
| | | | | | | | | | | | | | | | | | | | | | | | | | | | | | | | | | | | | | | | | | | | | | | | | | | | | | | | | | | | |
| | | PER SHARE PERFORMANCE (FOR A SHARE OUTSTANDING THROUGHOUT THE PERIOD) | | | RATIOS TO AVERAGE NET ASSETS | | | SUPPLEMENTAL DATA | |
UNLESS
OTHERWISE
NOTED,
PERIODS
ARE
FISCAL
YEARS
ENDED
SEPT. 30, | | NET ASSET
VALUE
BEGINNING
OF PERIOD | | | NET
INVESTMENT
INCOME
(LOSS)+ | | | NET
REALIZED
&
UNREALIZED
GAIN (LOSS)
ON
INVESTMENTS | | | TOTAL
FROM
INVESTMENT
OPERATIONS | | | DIVIDENDS
FROM NET
INVESTMENT
INCOME | | | DIVIDENDS
FROM NET
REALIZED
GAINS | | | TOTAL
DIVIDENDS | | | NET
ASSET
VALUE
END
OF
PERIOD | | | NET
INVESTMENT
INCOME
(LOSS)
(%) | | | EXPENSES,
AFTER
EXPENSE
REDUCTIONS
(%) | | | EXPENSES,
AFTER
EXPENSE
REDUCTIONS
AND
NET OF
CUSTODY
CREDITS
(%) | | | EXPENSES,
BEFORE
EXPENSE
REDUCTIONS
(%) | | | TOTAL
RETURN
(%)(a) | | | PORTFOLIO
TURNOVER
RATE
(%)(a) | | | NET
ASSETS
AT END
OF PERIOD
(THOUSANDS) | |
CLASS A SHARES | | | | | | | | | | | | | | | | | | | | | | | | | | | | | |
2017(b)(c) | | $ | 13.98 | | | | 0.09 | | | | (0.33 | ) | | | (0.24 | ) | | | (0.09 | ) | | | — | | | | (0.09 | ) | | $ | 13.65 | | | | 1.30 | (e) | | | 0.94 | (e) | | | 0.94 | (e) | | | 0.94 | (e) | | | (1.72 | ) | | | 9.10 | | | $ | 153,869 | |
2016(c) | | $ | 13.84 | | | | 0.18 | | | | 0.14 | | | | 0.32 | | | | (0.18 | ) | | | — | | | | (0.18 | ) | | $ | 13.98 | | | | 1.28 | | | | 0.93 | | | | 0.93 | | | | 0.93 | | | | 2.32 | | | | 16.47 | | | $ | 193,321 | |
2015(c) | | $ | 13.84 | | | | 0.19 | | | | — | (d) | | | 0.19 | | | | (0.19 | ) | | | — | | | | (0.19 | ) | | $ | 13.84 | | | | 1.39 | | | | 0.94 | | | | 0.94 | | | | 0.94 | | | | 1.40 | | | | 14.43 | | | $ | 171,344 | |
2014(c) | | $ | 13.54 | | | | 0.23 | | | | 0.30 | | | | 0.53 | | | | (0.23 | ) | | | — | | | | (0.23 | ) | | $ | 13.84 | | | | 1.67 | | | | 0.95 | | | | 0.94 | | | | 0.95 | | | | 3.93 | | | | 16.85 | | | $ | 160,151 | |
2013(c) | | $ | 13.75 | | | | 0.24 | | | | (0.20 | ) | | | 0.04 | | | | (0.24 | ) | | | (0.01 | ) | | | (0.25 | ) | | $ | 13.54 | | | | 1.75 | | | | 0.94 | | | | 0.94 | | | | 0.94 | | | | 0.28 | | | | 17.57 | | | $ | 159,058 | |
CLASS C SHARES | | | | | | | | | | | | | | | | | | | | | | | | | | | | | |
2017(b) | | $ | 13.99 | | | | 0.07 | | | | (0.33 | ) | | | (0.26 | ) | | | (0.07 | ) | | | — | | | | (0.07 | ) | | $ | 13.66 | | | | 1.06 | (e) | | | 1.18 | (e) | | | 1.18 | (e) | | | 1.18 | (e) | | | (1.84 | ) | | | 9.10 | | | $ | 60,125 | |
2016 | | $ | 13.85 | | | | 0.14 | | | | 0.14 | | | | 0.28 | | | | (0.14 | ) | | | — | | | | (0.14 | ) | | $ | 13.99 | | | | 1.04 | | | | 1.18 | | | | 1.18 | | | | 1.18 | | | | 2.06 | | | | 16.47 | | | $ | 68,229 | |
2015 | | $ | 13.85 | | | | 0.16 | | | | — | (d) | | | 0.16 | | | | (0.16 | ) | | | — | | | | (0.16 | ) | | $ | 13.85 | | | | 1.15 | | | | 1.18 | | | | 1.18 | | | | 1.18 | | | | 1.15 | | | | 14.43 | | | $ | 64,216 | |
2014 | | $ | 13.55 | | | | 0.19 | | | | 0.30 | | | | 0.49 | | | | (0.19 | ) | | | — | | | | (0.19 | ) | | $ | 13.85 | | | | 1.41 | | | | 1.21 | | | | 1.20 | | | | 1.21 | | | | 3.66 | | | | 16.85 | | | $ | 62,858 | |
2013 | | $ | 13.76 | | | | 0.20 | | | | (0.20 | ) | | | — | | | | (0.20 | ) | | | (0.01 | ) | | | (0.21 | ) | | $ | 13.55 | | | | 1.48 | | | | 1.21 | | | | 1.21 | | | | 1.21 | | | | 0.02 | | | | 17.57 | | | $ | 59,585 | |
CLASS I SHARES | | | | | | | | | | | | | | | | | | | | | | | | | | | | | |
2017(b) | | $ | 13.99 | | | | 0.11 | | | | (0.33 | ) | | | (0.22 | ) | | | (0.11 | ) | | | — | | | | (0.11 | ) | | $ | 13.66 | | | | 1.60 | (e) | | | 0.64 | (e) | | | 0.64 | (e) | | | 0.64 | (e) | | | (1.57 | ) | | | 9.10 | | | $ | 449,537 | |
2016 | | $ | 13.85 | | | | 0.22 | | | | 0.14 | | | | 0.36 | | | | (0.22 | ) | | | — | | | | (0.22 | ) | | $ | 13.99 | | | | 1.60 | | | | 0.62 | | | | 0.62 | | | | 0.62 | | | | 2.64 | | | | 16.47 | | | $ | 476,364 | |
2015 | | $ | 13.85 | | | | 0.24 | | | | — | (d) | | | 0.24 | | | | (0.24 | ) | | | — | | | | (0.24 | ) | | $ | 13.85 | | | | 1.70 | | | | 0.63 | | | | 0.63 | | | | 0.63 | | | | 1.72 | | | | 14.43 | | | $ | 407,557 | |
2014 | | $ | 13.55 | | | | 0.27 | | | | 0.30 | | | | 0.57 | | | | (0.27 | ) | | | — | | | | (0.27 | ) | | $ | 13.85 | | | | 1.99 | | | | 0.62 | | | | 0.62 | | | | 0.62 | | | | 4.27 | | | | 16.85 | | | $ | 361,015 | |
2013 | | $ | 13.76 | | | | 0.28 | | | | (0.19 | ) | | | 0.09 | | | | (0.29 | ) | | | (0.01 | ) | | | (0.30 | ) | | $ | 13.55 | | | | 2.08 | | | | 0.61 | | | | 0.61 | | | | 0.61 | | | | 0.62 | | | | 17.57 | | | $ | 254,869 | |
| (a) | Not annualized for periods less than one year. |
| (b) | Unaudited six month period ended March 31. |
| (c) | Sales loads are not reflected in computing total return. |
| (d) | Net realized and unrealized gain (loss) on investments was less than $0.01 per share. |
| + | Based on weighted average shares outstanding. |
See notes to financial statements.
| | | | |
| 24 Semi-Annual Report | | | | Semi-Annual Report 25 |
| | |
| Expense Example | | |
| |
Thornburg California Limited Term Municipal Fund | | March 31, 2017 (Unaudited) |
As a shareholder of the Fund, you incur two types of costs:
| | (1) | transaction costs, including |
(a) sales charges (loads) on purchase payments, for Class A shares;
(b) a deferred sales charge on redemptions of any part or all of a purchase of $1 million of Class A shares within 12 months of purchase;
(c) a deferred sales charge on redemptions of Class C shares within 12 months of purchase;
| | (2) | ongoing costs, including management fees; distribution and/or service (12b-1) fees; and other Fund expenses. |
This example is intended to help you understand your ongoing costs (in dollars) of investing in the Fund and to compare these costs with the ongoing costs of investing in other mutual funds.
The example is based on a $1,000 investment beginning on October 1, 2016, and held until March 31, 2017.
| | | | | | | | | | | | |
| | | BEGINNING
ACCOUNT VALUE
10/1/16 | | | ENDING
ACCOUNT VALUE
3/31/17 | | | EXPENSES PAID
DURING PERIOD†
10/1/16–3/31/17 | |
Class A Shares | | | | | | | | | | | | |
Actual | | $ | 1,000.00 | | | $ | 982.80 | | | $ | 4.64 | |
Hypothetical* | | $ | 1,000.00 | | | $ | 1,020.25 | | | $ | 4.73 | |
Class C Shares | | | | | | | | | | | | |
Actual | | $ | 1,000.00 | | | $ | 981.60 | | | $ | 5.83 | |
Hypothetical* | | $ | 1,000.00 | | | $ | 1,019.05 | | | $ | 5.94 | |
Class I Shares | | | | | | | | | | | | |
Actual | | $ | 1,000.00 | | | $ | 984.30 | | | $ | 3.15 | |
Hypothetical* | | $ | 1,000.00 | | | $ | 1,021.75 | | | $ | 3.21 | |
| † | Expenses are equal to the annualized expense ratio for each class (A: 0.94%; C: 1.18%; I:0.64%) multiplied by the average account value over the period, multiplied by 182/365 to reflect the one-half year period. |
| * | Hypothetical assumes a rate of return of 5% per year before expenses. |
ACTUAL EXPENSES
For each class of shares, the first line of the accompanying table provides information about actual account values and actual expenses. You may use the information in this line, together with the amount you invested, to estimate the expenses that you paid over the period. Simply divide your account value by $1,000 (for example, an $8,600 account value divided by $1,000 = 8.6), then multiply the result by the number in the first line for your class of shares under the heading entitled “Expenses Paid During Period” to estimate the expenses you paid on your account during this period.
HYPOTHETICAL EXAMPLE FOR COMPARISON PURPOSES
For each class of shares, the second line of the accompanying table provides information about hypothetical account values and hypothetical expenses based on the Fund’s actual expense ratio and an assumed rate of return of 5% per year before expenses, which is not the Fund’s actual return. The hypothetical account values and expenses may not be used to estimate the actual ending account balance or expenses you paid for the period. You may use this information to compare the ongoing costs of investing in the Fund and other funds. To do so, compare this 5% hypothetical example with the 5% hypothetical examples that appear in the shareholder reports of the other funds.
Please note that the expenses shown in the table are meant to highlight your ongoing costs only and do not reflect any transactional costs, such as sales charges (loads), redemption fees, or exchange fees. Therefore, the second line of the table for each class of shares is useful in comparing ongoing costs only, and will not help you determine the relative total costs of owning different funds. In addition, if these transactional costs were included, your costs would have been higher.
26 Semi-Annual Report
| | |
| Other Information | | |
| |
Thornburg California Limited Term Municipal Fund | | March 31, 2017 (Unaudited) |
PORTFOLIO PROXY VOTING
Policies and Procedures:
The Trust has delegated to Thornburg Investment Management, Inc. (the “Advisor”) voting decisions respecting proxies for the Fund’s voting securities. The Advisor makes voting decisions in accordance with its Proxy Voting Policy. A description of the Policy is available (i) without charge, upon request, by calling the Advisor toll-free at 1-800-847-0200, (ii) on the Thornburg website at www.thornburg.com, and (iii) on the Securities and Exchange Commission’s website at www.sec.gov.
Information regarding how proxies were voted is available on or before August 31 of each year for the twelve months ending the preceding June 30. This information is available (i) without charge, upon request by calling the Advisor toll-free at 1-800-847-0200, (ii) on the Thornburg website at www.thornburg.com, and (iii) on the Securities and Exchange Commission’s website at www.sec.gov.
AVAILABILITY OF QUARTERLY PORTFOLIO SCHEDULE
The Fund files with the Securities and Exchange Commission schedules of its portfolio holdings on Form N-Q for the first and third quarters of each fiscal year. The Fund’s Forms N-Q are available on the Commission’s website at www.sec.gov, or may be reviewed and copied at the Commission’s Public Reference Room in Washington, D.C. Information on the operation of the Public Reference Room may be obtained by calling 1-800-SEC-0330. The Fund also makes this information available on its website at www.thornburg.com/download or upon request by calling 1-800-847-0200.
Semi-Annual Report 27
Trustees’ Statement to Shareholders
Readopted September 12, 2016
The Trustees believe current and prospective shareholders should know how we discharge our responsibilities in supervising the Funds’ investment advisor and in reviewing the advisor’s contract for renewal. Since 2005, we have issued a statement which sets out clearly the three principal guidelines that we follow in supervising the Trust’s investment advisor on your behalf. In accordance with our customary practice, in September of this year we again reviewed our statement and concluded we should reissue this statement outlining the principal features of our supervision of the advisor’s performance of investment management services for the Funds.
We begin with the premise that each shareholder selected his or her Fund because its investments are managed by the investment advisor identified in the prospectus and in accordance with the objective and policies described in the prospectus. We realize, as each of you do, that if you believe that your Fund’s stated objective and policies no longer serve your personal investment goals, you can sell your shares and leave the Fund.
Therefore, we believe that our primary supervisory task – our principal obligation to you – is to assess the nature and quality of the advisor’s services, and to confirm that the advisor actively and competently pursues the Fund’s objective, in accordance with the policies set out in the prospectus. To do this, we meet regularly with management to review your Fund’s portfolio and to discuss the advisor’s specific actions and judgments in pursuing the Fund’s objective. We do not substitute our own judgment for the advisor’s decisions in selecting investments; the advisor is paid to exercise its informed judgment on investment decisions, and we seek to confirm, in reviewing the advisor’s performance, that the advisor is doing just that.
Second, we are conscious of costs and the effect that costs have on shareholders’ returns. We try to make sure that your Fund’s fees and costs are reasonable in relationship to the services rendered and that they are generally in line with those charged by other expert investment advisors, consistent with our belief that the Fund’s investors searched for and expect that expertise and attention and have decided to pay a reasonable price for it. We do not put the management contract “out to bid” as a matter of course, and we would not do so unless we had concluded that the advisor materially had failed to pursue the Fund’s objectives in accordance with its policies, or for other equally important reasons. We believe that any other approach would be inconsistent with your interests and contrary to your expectations when you bought shares of the Fund in the first place.
Finally, because we believe that most Thornburg Fund shareholders have invested with a long-term perspective, we try not to focus too much on the fashions of the moment and on short-term performance. The market will not favor any specific investment objective or set of policies at all times and under all economic circumstances. A fund will experience periods of both high and low returns relative to other funds and other investments. Even if one of our Funds is not favored by the market at a particular time, we believe that the advisor is nonetheless obliged to remain true to the Fund’s objective and policies, and we watch to see that it does so.
Trustees of Thornburg Investment Trust
28 Semi-Annual Report
Thornburg Funds
Thornburg Investment Management is a privately-owned global investment firm that offers a range of solutions for retail and institutional investors. Founded in 1982 and headquartered in Santa Fe, New Mexico, we manage approximately $49 billion (as of March 31, 2017) across U.S. mutual funds, separate accounts for high-net-worth investors and institutional accounts, and UCITS funds for non-U.S. investors.
The fund outlined in this report is one of many equity and fixed-income products available from Thornburg Investment Management.
EQUITY FUNDS
| | • | | Thornburg Investment Income Builder Fund |
| | • | | Thornburg Global Opportunities Fund |
| | • | | Thornburg International Value Fund |
| | • | | Thornburg Better World International Fund |
| | • | | Thornburg International Growth Fund |
| | • | | Thornburg Developing World Fund |
| | • | | Thornburg Core Growth Fund |
FIXED INCOME FUNDS
| | • | | Thornburg Low Duration Income Fund |
| | • | | Thornburg Limited Term U .S . Government Fund |
| | • | | Thornburg Limited Term Income Fund |
| | • | | Thornburg Strategic Income Fund |
| | • | | Thornburg Low Duration Municipal Fund |
| | • | | Thornburg Limited Term Municipal Fund |
| | • | | Thornburg Intermediate Municipal Fund |
| | • | | Thornburg California Limited Term Municipal Fund |
| | • | | Thornburg New Mexico Intermediate Municipal Fund |
| | • | | Thornburg New York Intermediate Municipal Fund |
| | • | | Thornburg Strategic Municipal Income Fund |
ALTERNATIVE FUNDS
| | • | | Thornburg Long/Short Equity Fund |
Before investing, carefully consider the Fund’s investment goals, risks, charges, and expenses. For a prospectus or summary prospectus containing this and other information, contact your financial advisor or visit thornburg.com. Read it carefully before investing.
For additional information, please visit thornburg.com
Thornburg Investment Management, Inc. 2300 North Ridgetop Road, Santa Fe, NM 87506
Semi-Annual Report 29
This page intentionally left blank.
30 Semi-Annual Report
This page intentionally left blank.
Semi-Annual Report 31
This Semi-Annual Report is submitted for the general information of shareholders of the Fund. It is not authorized for distribution to prospective investors in the Fund unless preceded or accompanied by an effective prospectus.
| | | | |
| Investment Advisor: | | Distributor: | | |
| Thornburg Investment Management® | | Thornburg Securities Corporation® | | |
| 800.847.0200 | | 800.847.0200 | | TH1070 |
Semi-Annual Report March 31, 2017 THORNBURG NEW MEXICO INTERMEDIATE MUNICIPAL FUND
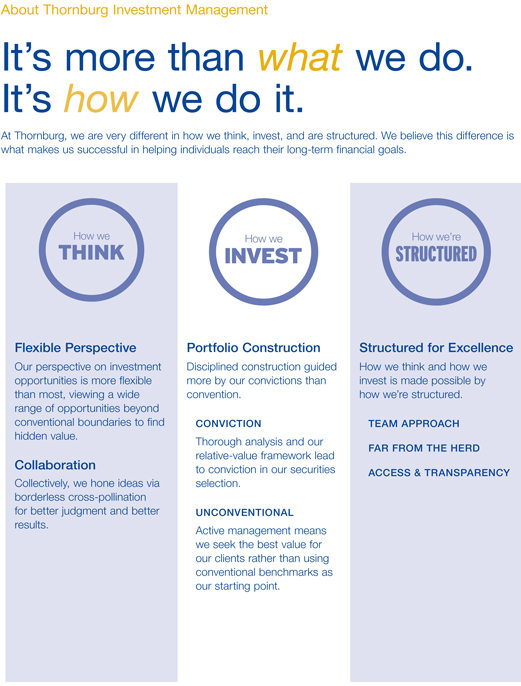
About Thornburg Investment Management It’s more than what we do. It’s how we do it. At Thornburg, we are very different in how we think, invest, and are structured. We believe this difference is what makes us successful in helping individuals reach their long-term financial goals. Flexible Perspective Our perspective on investment opportunities is more flexible than most, viewing a wide range of opportunities beyond conventional boundaries to find hidden value. Collaboration Collectively, we hone ideas via borderless cross-pollination for better judgment and better results. Portfolio Construction Disciplined construction guided more by our convictions than convention. CONVICTION Thorough analysis and our relative-value framework lead to conviction in our securities selection. UNCONVENTIONAL Active management means we seek the best value for our clients rather than using conventional benchmarks as our starting point. Structured for Excellence How we think and how we invest is made possible by how we’re structured. TEAM APPROACH FAR FROM THE HERD ACCESS & TRANSPARENCY
2 Semi-Annual Report
Semi-Annual Report
Thornburg New Mexico
Intermediate Municipal Fund
March 31, 2017
| | | | |
SHARE CLASS | | NASDAQ SYMBOL | | CUSIP |
Class A | | THNMX | | 885-215-301 |
Class D | | THNDX | | 885-215-624 |
Class I | | THNIX | | 885-215-285 |
Minimum investments for Class I shares may be higher than those for other classes. Class I shares may not be available to all investors.
Investments carry risks, including possible loss of principal. Portfolios investing in bonds have the same interest rate, inflation, and credit risks that are associated with the underlying bonds. The value of bonds will fluctuate relative to changes in interest rates, decreasing when interest rates rise. Unlike bonds, bond funds have ongoing fees and expenses. Please see the Fund’s prospectus for a discussion of the risks associated with an investment in the Fund. Investments in the Funds are not FDIC insured, nor are they bank deposits or guaranteed by a bank or any other entity.
Semi-Annual Report 3
Letter to Shareholders
| | |
Thornburg New Mexico Intermediate Municipal Fund | | March 31, 2017 (Unaudited) |
April 28, 2017
Dear Fellow Shareholder:
We are pleased to present the semi-annual report for Thornburg New Mexico Intermediate Municipal Fund. The net asset value (NAV) of the Class A shares decreased by 41 cents to $13.26 per share during the six-month period ended March 31, 2017. If you were with us the entire period, you received dividends of 15.70 cents per share. If you reinvested your dividends, you received 15.77 cents per share. Dividends were lower for Class D shares and higher for Class I shares to account for varying class-specific expenses. The Class A shares of your Fund outperformed the index with a negative 1.85% total return (without sales charge) for the six months ended March 31, 2017, compared to the negative 1.94% return for the BofA Merrill Lynch 3-15 Year U.S. Municipal Securities Index.
The Fund’s duration as well as curve positioning added 0.88% to relative performance. The Fund’s credit allocations detracted 0.21%, while other risk factors detracted 0.09%. Fund expenses accounted for any remaining differences.
The Municipal Bond Market
After a few years of relative quiet in the municipal bond market, things heated up following the election of Donald Trump in 2016. While stocks were rallying, bond prices, even municipal bond prices, came under pressure. Bond yields initially rose after the election based on expectations for greater infrastructure spending, stronger growth and higher inflation. The uptick in rates led mutual fund investors to sell their shares, which caused municipal bond mutual funds to sell their bonds to meet those redemptions. After significant inflows in January to September of 2016, investors pulled $26 billion from municipal bond funds in November and December, some of which was related to tax-loss selling.
When the calendar turned in 2017, these outflows slowed and the municipal bond market produced positive returns. A contributing factor to positive returns was a decline in municipal bond issuance, as during the first quarter of 2017, the supply of new municipal bonds declined by 12% from the same time last year.
The value metrics we use at Thornburg suggest that the municipal bond market continues to price in the rosiest of scenarios moving forward, as investors have been pushed out of the risk spectrum. That is why we have Thornburg New Mexico Intermediate Municipal Fund positioned in the lower end of its respective risk spectrum. In this environment, we continue to keep duration shorter, credit quality higher and we maintain higher levels of reserves.
Inside the Risk Metrics
Real yields, which indicate how much yield over inflation investors are being paid to own municipal bonds, increased over the six-month period. As of September 30, 2016, 10-year AAA general obligation (GO) bonds were yielding 1.64% and the Core Personal Consumption Expenditures Index (PCE) was running at 1.70%, so investors were earning less than inflation. By the end of February 2017, the yield on 10-year AAA GO bonds had increased to 2.30%, while Core PCE was running at 1.80%. While certainly more interesting at the end of the period, the 0.5% real yield was significantly less than the average of 2% investors have earned over the past 20 years.
The second thing to consider is credit spreads, which reflect the incremental yield an investor earns from owning a lower-rated credit versus a higher-rated credit, and which today remain narrow. As of March 31, 2017, an investor earned about 1.28% more for owning a 10-year BBB revenue bond versus a 10-year AAA GO bond. That is slightly higher than the average 0.75% an investor earned between 1994 and 2007. However, in 2007, approximately 50% of the new-issue municipal bond market was insured by AAA/AAA municipal bond insurers. Today, there are no AAA/AAA municipal bond insurers, and insurance coverage generally accounts for only 6% to 8% of the new-issue municipal bond market.
Finally, the slope of the yield curve, which tracks how much incremental yield an investor earns by owning securities with longer maturities, is slightly flatter than historical averages. Currently, investors are earning about 1.4% more for owning a 10-year AAA GO municipal bond, versus a one-year AAA GO municipal bond. Since 1994, an investor earned on average almost 1.6% to extend maturities from one to 10 years.
The Economy and Tax Reform
The U.S. economy continued its slow recovery in 2016, growing at a rate of 1.6% for 2016 in aggregate.
Unemployment continued to tick down. During the six-month period ended March 31, 2017, the U.S. economy added 976,000 jobs and by the end of the period the unemployment rate had fallen to 4.5%. Inflation remained stable, with the Core PCE Index reading 1.75% through March, below the Fed’s 2% target range.
Taken in aggregate, the economy continues to grow, jobs are being added and inflation has remained contained to date. In an effort to keep the economy in check, the U.S. Federal Reserve raised the Fed funds rate in December of 2016, and again in March of 2017.
The economic health of the municipal bond market appears steady with a couple of notable exceptions. The drama in
4 Semi-Annual Report
| | |
| Letter to Shareholders, | | |
| |
Continued | | |
| |
Thornburg New Mexico Intermediate Municipal Fund | | March 31, 2017 (Unaudited) |
Puerto Rico is still playing out; the only winners are the consultants and lawyers hired by all sides.
New Mexico’s economic health is still quite good. For the period from Q4 2015 to Q4 2016 (latest data available) personal income is up 2.34%, employment is up 1.08%, and home prices are up 4.66%. As far as state tax revenues go, the “land of enchantment” is a little less enchanting as state tax revenues have declined 3.58%—no doubt the effects of volatile energy prices.
Tax reform is the second highest priority of President Trump’s and the Republican-led House agenda—second only to health care reform. The most important items in the tax proposals for the owners of municipal bonds (individuals as well as corporations) are those relevant to investment income. By lowering the effective tax rate on competing sources of income, prices of municipal bonds would most likely fall (yields would increase) to become more competitive with these alternative sources of income.
President Trump’s tax reform proposal (released Thursday, April 27, 2017) called for the elimination of the deduction for state and local taxes on an individual’s federal tax return. This would, if adopted, have significant impacts for residents of high-tax states. New Mexico is not one of those states with a top marginal income tax rate of 4.9%. The near-term effects on the economy would be minimal, but long term, residents would have less money in their pockets to spend on goods and services.
Conclusion
We continue to run this portfolio as an actively managed laddered portfolio. Laddering a portfolio is a simple way to diversify its investment along its entire investment universe. While past performance does not guarantee future results, our study showed that this structure outperformed other structures around 60% of the time and added 0.15% to 0.25% of total return annually from 1997 through 2016.* Our view is that the current investment environment is not compensating investors enough to take on extra risk, so we have positioned our portfolios at the lower end of their risk spectrums.
Thank you for your continued trust in us.
Sincerely
| | | | |
 | |  | | |
| Christopher Ryon, CFA | | Nicholos Venditti, CFA | | |
| Portfolio Manager | | Portfolio Manager | | |
| Managing Director | | Managing Director | | |
| * | We examined three hypothetical portfolios of bonds from December 1997 to December 2016. One using a laddering strategy, one using a barbell strategy, and a third using a bullet strategy. For the laddering strategy, the BofA Merrill Lynch 1–12 Year Municipal Index was used as a proxy, since, similar to a ladder, it contains bonds relatively evenly spread across all maturities within the index. The barbell strategy is a duration management technique wherein bonds are clustered at the two extremes of a maturity range. For the barbell strategy, the BofA Merrill Lynch 1–3 Year Municipal Index and BofA Merrill Lynch 8–12 Year Municipal Index were combined. The two indices were weighted in such a way as to give them the same duration as the broader 1–12 Year Index, and each year the portfolio was re-weighted back to the original index weights. This was done to make the two portfolios duration-neutral so that the impact of the strategy chosen could be isolated. The bullet strategy invests at the duration midpoint of the portfolio, therefore the BofA Merrill Lynch 6–8 Year Index was used to represent the bullet strategy. For additional information, see www.thornburg.com/whyladder. Past performance does not guarantee future results. |
The laddering strategy does not assure or guarantee better performance and cannot eliminate the risk of investment losses.
The matters discussed in this report may constitute forward-looking statements made pursuant to the safe harbor provisions of the Securities Litigation Reform Act of 1995. These include any advisor or portfolio manager prediction, assessment, analysis or outlook for individual securities, industries, investment styles, market sectors and/or markets. These statements involve risks and uncertainties. In addition to the general risks described for each fund in its current prospectus, other factors bearing on these reports include the accuracy of the advisor’s or portfolio manager’s forecasts and predictions, the appropriateness of the investment strategies designed by the advisor or portfolio manager and the ability of the advisor or portfolio manager to implement their strategies efficiently and successfully. Any one or more of these factors, as well as other risks affecting the securities markets generally, could cause the actual results of any fund to differ materially as compared to its benchmarks.
The views expressed are subject to change and do not necessarily reflect the views of Thornburg Investment Management, Inc. This information should not be relied upon as a recommendation or investment advice and is not intended to predict the performance of any investment or market.
Semi-Annual Report 5
| | |
| Performance Summary | | |
| |
Thornburg New Mexico Intermediate Municipal Fund | | March 31, 2017 (Unaudited) |
Average Annual Total Returns
| | | | | | | | | | | | | | | | | | | | |
| | | 1-YR | | | 3-YR | | | 5-YR | | | 10-YR | | | SINCE
INCEP. | |
A Shares (Incep: 6/18/91) | | | | | | | | | | | | | | | | | | | | |
Without sales charge | | | -0.78 | % | | | 2.02 | % | | | 1.85 | % | | | 3.14 | % | | | 4.32 | % |
With sales charge | | | -2.77 | % | | | 1.34 | % | | | 1.44 | % | | | 2.93 | % | | | 4.24 | % |
D Shares (Incep: 6/1/99) | | | -1.00 | % | | | 1.80 | % | | | 1.60 | % | | | 2.88 | % | | | 3.20 | % |
I Shares (Incep: 2/1/07) | | | -0.45 | % | | | 2.38 | % | | | 2.21 | % | | | 3.48 | % | | | 3.53 | % |
30-DAY YIELDS, A SHARES
(with sales charge)
| | | | |
Annualized Distribution Yield | | | 2.28 | % |
SEC Yield | | | 1.22 | % |
GROWTH OF A HYPOTHETICAL $10,000 INVESTMENT
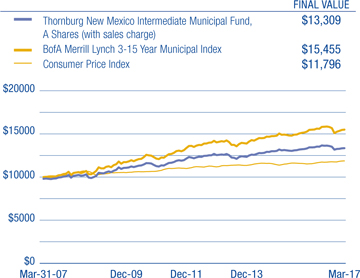
Performance data shown represents past performance and is no guarantee of future results. Investment return and principal value will fluctuate so shares, when redeemed, may be worth more or less than their original cost. Current performance may be lower or higher than quoted. For performance current to the most recent month end, visit thornburg.com or call 800-847-0200. The performance information does not reflect the deduction of taxes that a shareholder would pay on distributions or the redemption of Fund shares. Returns reflect the reinvestment of dividends and capital gains. Class A shares are sold with a maximum sales charge of 2.00%. There is no sales charge for Class D and Class I shares. As disclosed in the most recent prospectus, the total annual fund operating expenses are as follows: A shares, 0.97%; D shares, 1.21%; I shares, 0.63%.
Glossary
The BofA Merrill Lynch 3-15 Year U.S. Municipal Securities Index is a subset of the BofA Merrill Lynch U.S. Municipal Securities Index including all securities with a remaining term to final maturity greater than or equal to 3 years and less than 15 years.
The BofA Merrill Lynch indices used in the Ladder vs Barbell & Bullet study are model portfolios of municipal obligations throughout the United States, with maturities ranging either from one to three years, six to eight years, eight to twelve years, or one to twelve years. These indices are subsets of the BofA Merrill Lynch U.S. Municipal Securities Index, which is comprised of U.S. dollar denominated investment grade tax-exempt debt publicly issued by U.S. states and territories, and their political subdivisions, in the U.S. domestic market. Qualifying securities must have at least a one-year remaining term to final maturity, a fixed coupon schedule and an investment grade rating.
The performance of any index is not indicative of the performance of any particular investment. Unless otherwise noted, index returns reflect the reinvestment of income dividends and capital gains, if any, but do not reflect fees, brokerage commissions or other expenses of investing. Investors may not make direct investments into any index.
Annualized Distribution Yield – The distribution yield reflects actual distributions made to shareholders. The annualized distribution yield is calculated by summing the last 30 days of income at a given month end and annualizing to a 360-day year. The result is divided by the ending maximum offering price or net asset value.
Bond Credit Ratings (Credit Quality) – A bond credit rating assesses the financial ability of a debt issuer to make timely payments of principal and interest. Ratings of AAA (the highest), AA, A, and BBB are investment-grade quality. Ratings of BB, B, CCC, CC, C and D (the lowest) are considered below investment grade, speculative grade, or junk bonds.
Insured Bonds – Individual bonds are sometimes insured by private companies. The insurance guarantees the payment of principal and interest on a bond issue if the issuer defaults. Mutual funds are not insured, even if the underlying bonds are insured.
Core Personal Consumption Expenditure Index (Core PCE) – Core Personal Consumption Expenditure Index is a measure of the Personal Consumption Expenditure Index that excludes the more volatile and seasonal food and energy prices.
Credit Spread/Quality Spread – The difference between the yields of securities with different credit qualities.
Effective Duration – A bond’s sensitivity to interest rates, incorporating the embedded option features, such as call provisions. Bonds with longer durations experience greater price volatility than bonds with shorter durations.
Fed Funds Rate – The interest rate at which a depository institution lends immediately available funds (balances at the Federal Reserve) to another depository institution overnight.
General Obligation Bond (GO) – A municipal bond backed by the credit and “taxing power” of the issuing jurisdiction rather than the revenue from a given project.
Laddering – Laddering involves building a portfolio of bonds with staggered maturities so that a portion matures each year. Money that comes in from maturing bonds is typically invested in bonds with longer maturities at the far end of the portfolio.
Revenue Bond – A bond on which the debt service is payable solely from the revenue generated from the operation of the project being financed or a category of facilities, or from other non-tax sources.
Yield Curve – A line that plots the interest rates, at a set point in time, of bonds having equal credit quality, but differing maturity dates.
6 Semi-Annual Report
| | |
| Fund Summary | | |
| |
Thornburg New Mexico Intermediate Municipal Fund | | March 31, 2017 (Unaudited) |
OBJECTIVES AND STRATEGIES
The Fund’s primary investment objective is to obtain as high a level of current income exempt from federal and New Mexico state individual income taxes as is consistent, in the view of the investment advisor, with preservation of capital.
The secondary goal of the Fund is to reduce expected changes in its share price compared to long-term bond portfolios.
This Fund offers New Mexico investors double tax-free yields (may be subject to Alternative Minimum Tax) in a laddered municipal bond portfolio with a dollar-weighted average maturity of normally three to 10 years. Laddering involves building a portfolio of bonds with staggered maturities so that a portion of the portfolio matures each year. Cash from maturing bonds, if not needed for other purposes, is typically invested in bonds with longer maturities at the far end of the ladder. We regard the strategy as a good compromise for managing different types of risk.
KEY PORTFOLIO ATTRIBUTES
| | | | |
Number of Bonds | | | 130 | |
| |
Effective Duration | | | 4.3 Yrs | |
| |
Average Maturity | | | 7.7 Yrs | |
LONG-TERM STABILITY OF PRINCIPAL
Net Asset Value History of A Shares
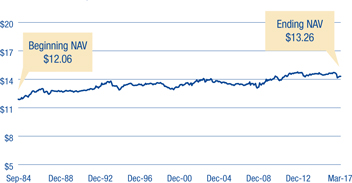
SECURITY CREDIT RATINGS
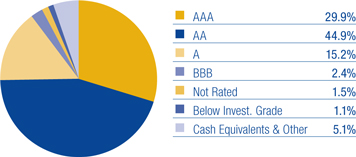
A bond credit rating assesses the financial ability of a debt issuer to make timely payments of principal and interest. Ratings of AAA (the highest), AA, A, and BBB are investment-grade quality. Ratings of BB, B, CCC, CC, C and D (the lowest) are considered below investment grade, speculative grade, or junk bonds. Credit quality ratings for Thornburg’s municipal portfolios used the highest rating available from either Standard & Poor’s or Moody’s Investors Service.
PORTFOLIO LADDER
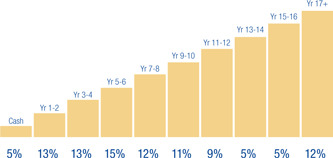
Percent of portfolio maturing in each year. Cash includes cash equivalents and other.
There is no guarantee that the Fund will meet its investment objectives.
All data is subject to change. Charts may not add up to 100% due to rounding.
Semi-Annual Report 7
| | |
| Schedule of Investments | | |
| |
Thornburg New Mexico Intermediate Municipal Fund | | March 31, 2017 (Unaudited) |
| | | | | | | | | | |
ISSUER-DESCRIPTION | | CREDIT RATING†
S&P/ MOODY’S | | PRINCIPAL
AMOUNT | | | VALUE | |
MUNICIPAL BONDS — 96.16% | | | | | | | | | | |
Albuquerque Bernalillo County Water Utility Authority, 5.00% due 7/1/2021 pre-refunded 7/1/2019 (New Mexico Utilities, Inc. Water System) | | AA+/Aa2 | | $ | 1,760,000 | | | $ | 1,910,867 | |
Albuquerque Bernalillo County Water Utility Authority, 5.50% due 7/1/2025 pre-refunded 7/1/2019 (New Mexico Utilities, Inc. Water System) | | AA+/Aa2 | | | 1,000,000 | | | | 1,096,800 | |
Albuquerque Bernalillo County Water Utility Authority, 5.00% due 7/1/2026 (2005 NMFA Loan and Joint Water and Sewer System Improvements) | | AA+/Aa2 | | | 2,000,000 | | | | 2,361,600 | |
Albuquerque Bernalillo County Water Utility Authority, 5.00% due 7/1/2026 pre-refunded 7/1/2018 (San Juan-Chama Drinking Water Project) | | AA+/Aa2 | | | 1,420,000 | | | | 1,491,270 | |
Albuquerque Bernalillo County Water Utility Authority, 5.00% due 7/1/2031 (2007 NMFA Loan and Joint Water and Sewer System Improvements) | | AA+/Aa2 | | | 500,000 | | | | 578,115 | |
Albuquerque Bernalillo County Water Utility Authority, 5.00% due 7/1/2032 (2007 NMFA Loan and Joint Water and Sewer System Improvements) | | AA+/Aa2 | | | 1,000,000 | | | | 1,149,890 | |
a Albuquerque Metropolitan Arroyo Flood Control Authority GO, 4.00% due 8/1/2017 | | AAA/Aaa | | | 500,000 | | | | 503,985 | |
Albuquerque Municipal School District No. 12 GO, 5.00% due 8/1/2019 (Bernalillo and Sandoval Counties School Facilities) (State Aid Withholding) | | AA/Aa1 | | | 3,585,000 | | | | 3,904,997 | |
Albuquerque Municipal School District No. 12 GO, 4.00% due 8/1/2029 (Bernalillo and Sandoval Counties School Facilities) (State Aid Withholding) | | AA/Aa1 | | | 1,300,000 | | | | 1,387,204 | |
Albuquerque Municipal School District No. 12 GO, 5.00% due 8/1/2031 (Bernalillo and Sandoval Counties School Facilities) (State Aid Withholding) | | AA/Aa1 | | | 1,000,000 | | | | 1,171,490 | |
Bernalillo County, 5.00% due 4/1/2021 (Government Services; Insured: Natl-Re) | | AAA/Aa2 | | | 3,000,000 | | | | 3,214,560 | |
Bernalillo County, 5.25% due 10/1/2022 (Government Services; Insured: AMBAC) | | AAA/Aa2 | | | 3,170,000 | | | | 3,755,309 | |
Bernalillo County, 5.25% due 10/1/2023 (Government Services; Insured: AMBAC) | | AAA/Aa2 | | | 1,275,000 | | | | 1,530,051 | |
Bernalillo County, 5.25% due 10/1/2025 (Government Services; Insured: AMBAC) | | AAA/Aa2 | | | 3,850,000 | | | | 4,661,156 | |
Bernalillo County, 5.25% due 4/1/2027 (Government Services) | | AAA/Aa2 | | | 300,000 | | | | 358,698 | |
Bernalillo County, 5.70% due 4/1/2027 (Government Services) | | AAA/Aa2 | | | 3,000,000 | | | | 3,676,950 | |
Bernalillo County, 5.70% due 4/1/2027 (Government Services; Insured: Natl-Re) | | AAA/Aa2 | | | 815,000 | | | | 994,390 | |
Carlsbad Municipal School District GO, 5.00% due 8/1/2018 (Educational Facilities) (State Aid Withholding) | | NR/Aa2 | | | 1,000,000 | | | | 1,054,410 | |
Carlsbad Municipal School District GO, 5.00% due 8/1/2023 (Educational Facilities) (State Aid Withholding) | | NR/Aa2 | | | 1,650,000 | | | | 1,955,365 | |
Central New Mexico Community College GO, 5.00% due 8/15/2020 (Campus Buildings Acquisition & Improvements) | | AA+/Aa1 | | | 1,375,000 | | | | 1,541,595 | |
Central New Mexico Community College GO, 5.00% due 8/15/2021 (Campus Buildings Acquisition & Improvements) | | AA+/Aa1 | | | 1,435,000 | | | | 1,646,949 | |
Central New Mexico Community College GO, 5.00% due 8/15/2022 (Campus Buildings Acquisition & Improvements) | | AA+/Aa1 | | | 1,100,000 | | | | 1,285,548 | |
Central New Mexico Community College GO, 4.00% due 8/15/2023 (Campus Buildings Acquisition & Improvements) | | AA+/Aa1 | | | 1,920,000 | | | | 2,096,736 | |
Cibola County, 5.00% due 6/1/2025 (County Building Improvements) | | NR/A2 | | | 360,000 | | | | 416,876 | |
Cibola County, 5.00% due 6/1/2025 (County Building Improvements) | | NR/NR | | | 355,000 | | | | 411,086 | |
City of Albuquerque, 5.00% due 7/1/2021 (Lodgers’ Tax Obligation Reserve Fund) | | AAA/Aa2 | | | 1,340,000 | | | | 1,448,312 | |
City of Albuquerque, 5.00% due 7/1/2021 (Lodgers’ Tax Obligation Reserve Fund) | | AAA/Aa2 | | | 3,000,000 | | | | 3,242,490 | |
b City of Albuquerque, 5.00% due 7/1/2025 (I-25/Paseo del Norte Interchange) | | AAA/Aa2 | | | 540,000 | | | | 633,339 | |
City of Albuquerque, 5.00% due 7/1/2027 (I-25/Paseo del Norte Interchange) | | AAA/Aa2 | | | 555,000 | | | | 643,689 | |
City of Albuquerque, 5.00% due 7/1/2033 (City Infrastructure Improvements) | | AAA/Aa2 | | | 1,100,000 | | | | 1,256,222 | |
City of Albuquerque, 5.00% due 7/1/2034 (City Infrastructure Improvements) | | AAA/Aa2 | | | 1,200,000 | | | | 1,364,796 | |
a City of Albuquerque GO, 5.00% due 7/1/2023 (City Infrastructure Improvements) | | AAA/Aa1 | | | 1,360,000 | | | | 1,612,008 | |
a City of Albuquerque GO, 5.00% due 7/1/2026 (City Infrastructure Improvements) | | AAA/Aa1 | | | 870,000 | | | | 1,068,238 | |
City of Farmington, 5.00% due 6/1/2017 (San Juan Regional Medical Center) | | NR/A3 | | | 530,000 | | | | 533,551 | |
City of Farmington, 5.125% due 6/1/2018 (San Juan Regional Medical Center) | | NR/A3 | | | 570,000 | | | | 572,058 | |
City of Farmington, 5.125% due 6/1/2019 (San Juan Regional Medical Center) | | NR/A3 | | | 645,000 | | | | 647,264 | |
City of Farmington, 5.00% due 6/1/2022 (San Juan Regional Medical Center) | | NR/A3 | | | 2,825,000 | | | | 2,841,554 | |
City of Farmington, 4.70% due 5/1/2024 (Arizona Public Service Co.-Four Corners Project) | | A-/A2 | | | 965,000 | | | | 1,035,377 | |
City of Farmington, 4.70% due 9/1/2024 (Arizona Public Service Co.-Four Corners Project) | | A-/A2 | | | 4,000,000 | | | | 4,291,680 | |
City of Farmington, 1.875% due 4/1/2029 put 4/1/2020 (Southern California Edison Co.-Four Corners Project) | | A/Aa3 | | | 3,000,000 | | | | 3,000,450 | |
City of Gallup, 5.125% due 6/1/2017 (City Infrastructure Improvements) | | NR/NR | | | 140,000 | | | | 140,851 | |
City of Gallup, 5.125% due 6/1/2019 (City Infrastructure Improvements) | | NR/NR | | | 310,000 | | | | 328,541 | |
City of Las Cruces, 4.00% due 6/1/2021 (Joint Utility System) | | NR/Aa2 | | | 100,000 | | | | 110,230 | |
City of Las Cruces, 5.00% due 6/1/2021 (NMFA Loan) | | NR/Aa3 | | | 730,000 | | | | 804,183 | |
City of Las Cruces, 4.00% due 6/1/2022 (Joint Utility System) | | NR/Aa2 | | | 670,000 | | | | 746,467 | |
City of Las Cruces, 5.00% due 6/1/2022 (NMFA Loan) | | NR/Aa3 | | | 765,000 | | | | 846,021 | |
City of Las Cruces, 4.00% due 6/1/2023 (Joint Utility System) | | NR/Aa2 | | | 695,000 | | | | 779,797 | |
City of Las Cruces, 5.00% due 6/1/2023 (NMFA Loan) | | NR/Aa3 | | | 800,000 | | | | 883,688 | |
City of Las Cruces, 5.00% due 6/1/2024 (NMFA Loan) | | NR/Aa3 | | | 840,000 | | | | 926,772 | |
City of Las Cruces, 4.00% due 6/1/2025 (Joint Utility System) | | NR/Aa2 | | | 750,000 | | | | 846,713 | |
City of Las Cruces, 5.00% due 6/1/2030 (NMFA Loan) | | NR/Aa3 | | | 2,000,000 | | | | 2,193,820 | |
City of Las Cruces, 5.00% due 6/1/2037 (NMFA Loan) | | NR/Aa3 | | | 5,000,000 | | | | 5,457,100 | |
City of Rio Rancho, 2.00% due 5/15/2017 (Water and Wastewater System) | | AA-/Aa3 | | | 100,000 | | | | 100,134 | |
City of Roswell, 5.00% due 6/1/2026 (Joint Water and Sewer Improvement; Insured: BAM) | | AA/A1 | | | 830,000 | | | | 988,289 | |
City of Roswell, 5.00% due 6/1/2035 (Joint Water and Sewer Improvement; lnsured: BAM) | | AA/A1 | | | 580,000 | | | | 652,535 | |
City of Roswell, 5.00% due 6/1/2036 (Joint Water and Sewer Improvement; Insured: BAM) | | AA/A1 | | | 640,000 | | | | 718,432 | |
8 Semi-Annual Report
| | |
| Schedule of Investments, Continued | | |
| |
Thornburg New Mexico Intermediate Municipal Fund | | March 31, 2017 (Unaudited) |
| | | | | | | | | | |
ISSUER-DESCRIPTION | | CREDIT RATING†
S&P/ MOODY’S | | PRINCIPAL
AMOUNT | | | VALUE | |
City of Santa Fe, 4.00% due 6/1/2017 (Public Facility Capital Projects) | | AA+/NR | | $ | 100,000 | | | $ | 100,547 | |
City of Santa Fe, 4.50% due 5/15/2027 (El Castillo Retirement Residences) | | BBB-/NR | | | 3,275,000 | | | | 3,368,043 | |
City of Santa Fe, 5.00% due 5/15/2034 (El Castillo Retirement Residences) | | BBB-/NR | | | 1,465,000 | | | | 1,500,790 | |
City of Santa Fe GRT, 5.00% due 6/1/2028 (Public Facilities) | | AA+/NR | | | 930,000 | | | | 1,081,990 | |
City of Santa Fe GRT, 5.00% due 6/1/2029 (Public Facilities) | | AA+/NR | | | 950,000 | | | | 1,098,514 | |
Colfax County, 5.00% due 9/1/2019 (Government Center Facility) (ETM) | | A-/NR | | | 355,000 | | | | 373,361 | |
Colfax County, 5.50% due 9/1/2029 pre-refunded 9/1/2019 (Government Center Facility) | | A-/NR | | | 2,510,000 | | | | 2,766,898 | |
County of Los Alamos, 4.875% due 6/1/2018 (Public Facilities) | | AA+/A1 | | | 500,000 | | | | 522,320 | |
County of Los Alamos, 5.625% due 6/1/2023 pre-refunded 6/1/2018 (Public Facilities) | | AA+/A1 | | | 1,000,000 | | | | 1,054,160 | |
County of Los Alamos, 5.75% due 6/1/2024 pre-refunded 6/1/2018 (Public Facilities) | | AA+/A1 | | | 3,000,000 | | | | 3,166,800 | |
County of Los Alamos, 5.75% due 6/1/2025 pre-refunded 6/1/2018 (Public Facilities) | | AA+/A1 | | | 1,000,000 | | | | 1,055,600 | |
Farmington Municipal School District No. 5 GO, 5.00% due 9/1/2019 (Educational Facilities) (State Aid Withholding) | | NR/Aa2 | | | 600,000 | | | | 655,692 | |
Government of Guam, 5.375% due 12/1/2024 pre-refunded 12/1/2019 (Layon Solid Waste Disposal Facility) | | BBB+/NR | | | 2,000,000 | | | | 2,212,980 | |
Government of Guam, 5.00% due 11/15/2031 (Various Capital Projects) | | A/NR | | | 2,500,000 | | | | 2,650,725 | |
Government of Guam, 5.00% due 11/15/2033 (Various Capital Projects) | | A/NR | | | 2,500,000 | | | | 2,626,675 | |
Grant County, 5.50% due 7/1/2020 (State Dept. of Health-Ft. Bayard Project) | | AA-/Aa2 | | | 1,565,000 | | | | 1,647,209 | |
b Grant County, 5.50% due 7/1/2021 (State Dept. of Health-Ft. Bayard Project) | | AA-/Aa2 | | | 1,655,000 | | | | 1,741,937 | |
Grant County, 5.50% due 7/1/2022 (State Dept. of Health-Ft. Bayard Project) | | AA-/Aa2 | | | 1,745,000 | | | | 1,836,665 | |
Guam Power Authority, 5.00% due 10/1/2026 (Electric Power System; Insured: AGM) | | AA/A2 | | | 2,000,000 | | | | 2,260,380 | |
Las Cruces School District No. 2 GO, 2.00% due 8/1/2018 (New Mexico SD Credit Enhancement Program) (State Aid Withholding) | | NR/Aa2 | | | 630,000 | | | | 638,694 | |
b New Mexico Educational Assistance Foundation, 4.00% due 9/1/2017 (Student Loans) | | NR/Aaa | | | 1,150,000 | | | | 1,165,134 | |
New Mexico Educational Assistance Foundation, 5.00% due 12/1/2019 (Student Loans) | | AAA/Aaa | | | 1,000,000 | | | | 1,096,600 | |
New Mexico Educational Assistance Foundation, 5.00% due 12/1/2022 (Student Loans) | | AAA/Aaa | | | 3,000,000 | | | | 3,338,310 | |
New Mexico Finance Authority, 5.00% due 12/15/2017 (State Highway Infrastructure) | | AA/Aa2 | | | 250,000 | | | | 257,383 | |
New Mexico Finance Authority, 5.00% due 6/15/2022 (The Public Project Revolving Fund Program; Insured: Natl-Re) | | AA+/Aa2 | | | 1,300,000 | | | | 1,310,582 | |
New Mexico Finance Authority, 5.00% due 6/15/2024 (The Public Project Revolving Fund Program; Insured: Natl-Re) | | AA+/Aa2 | | | 7,000,000 | | | | 7,061,530 | |
New Mexico Finance Authority, 5.00% due 6/15/2026 (State Highway Infrastructure) | | AA/Aa2 | | | 1,220,000 | | | | 1,436,099 | |
New Mexico Finance Authority, 0.90% due 12/15/2026 put 4/7/2017 (The Public Project Revolving Fund Program; LOC: State Street Bank & Trust) (weekly demand notes) | | AA-/Aa1 | | | 200,000 | | | | 200,000 | |
New Mexico Finance Authority, 5.00% due 6/15/2027 (State Highway Infrastructure) | | AA/Aa2 | | | 1,195,000 | | | | 1,396,692 | |
New Mexico Finance Authority, 5.00% due 6/15/2031 (The Public Project Revolving Fund Program) | | AA+/Aa2 | | | 1,000,000 | | | | 1,153,120 | |
New Mexico Hospital Equipment Loan Council, 6.00% due 8/1/2023 pre-refunded 8/1/2018 (Presbyterian Healthcare Services) | | AA/Aa3 | | | 6,000,000 | | | | 6,391,560 | |
New Mexico Hospital Equipment Loan Council, 5.00% due 8/1/2031 (Presbyterian Healthcare Services) | | AA/Aa3 | | | 600,000 | | | | 682,662 | |
New Mexico Hospital Equipment Loan Council, 5.00% due 7/1/2032 (Haverland Carter Lifestyle Group) | | NR/NR | | | 2,000,000 | | | | 2,083,160 | |
New Mexico Hospital Equipment Loan Council, 5.00% due 8/1/2039 (Presbyterian Healthcare Services) | | AA/Aa3 | | | 3,000,000 | | | | 3,174,480 | |
New Mexico Housing Authority, 5.30% due 12/1/2022 (El Paseo Apartments; Insured: AMBAC) (AMT) | | NR/NR | | | 525,000 | | | | 525,347 | |
New Mexico Institute of Mining and Technology, 5.00% due 7/1/2020 (Campus Buildings Acquisition & Improvements) | | A+/A1 | | | 590,000 | | | | 652,280 | |
New Mexico Institute of Mining and Technology, 5.00% due 7/1/2023 (Campus Buildings Acquisition & Improvements) | | A+/A1 | | | 685,000 | | | | 770,700 | |
New Mexico Institute of Mining and Technology, 5.00% due 7/1/2024 (Campus Buildings Acquisition & Improvements) | | A+/A1 | | | 525,000 | | | | 584,315 | |
New Mexico Institute of Mining and Technology, 5.00% due 7/1/2025 (Campus Buildings Acquisition & Improvements) | | A+/A1 | | | 505,000 | | | | 560,752 | |
New Mexico Institute of Mining and Technology, 5.00% due 7/1/2028 (Campus Buildings Acquisition & Improvements) | | A+/A1 | | | 1,500,000 | | | | 1,661,115 | |
New Mexico Mortgage Finance Authority, 5.25% due 7/1/2023 (HERO SFM Loan Program; Collateralized: GNMA/FNMA/ FHLMC) (AMT) | | AA+/NR | | | 410,000 | | | | 417,310 | |
New Mexico Mortgage Finance Authority, 5.375% due 7/1/2023 (Saver SFM Loan Program; Collateralized: GNMA/FNMA/ FHLMC) (AMT) | | AA+/NR | | | 175,000 | | | | 175,672 | |
New Mexico Mortgage Finance Authority, 4.625% due 3/1/2028 (NIBP SFM Loan Program; Collateralized: GNMA/FNMA/ FHLMC) | | AA+/NR | | | 925,000 | | | | 974,978 | |
New Mexico Mortgage Finance Authority, 5.50% due 7/1/2028 (HERO SFM Loan Program; Collateralized: GNMA/FNMA/ FHLMC) (AMT) | | AA+/NR | | | 900,000 | | | | 912,618 | |
New Mexico Mortgage Finance Authority, 5.60% due 7/1/2028 (Saver SFM Loan Program; Collateralized: GNMA/FNMA/ FHLMC) (AMT) | | AA+/NR | | | 160,000 | | | | 162,466 | |
New Mexico Mortgage Finance Authority, 5.40% due 9/1/2029 (Saver SFM Loan Program; Collateralized: GNMA/FNMA/ FHLMC) | | AA+/NR | | | 465,000 | | | | 482,252 | |
Regents of the University of New Mexico, 6.00% due 6/1/2021 (Campus Buildings Acquisition & Improvements) | | AA/Aa2 | | | 370,000 | | | | 402,460 | |
Regents of the University of New Mexico, 0.92% due 6/1/2026 put 4/7/2017 (Campus Buildings Acquisition & Improvements; SPA: U.S. Bank, N.A.) (weekly demand notes) | | AA/Aa2 | | | 4,500,000 | | | | 4,500,000 | |
Regents of the University of New Mexico, 4.50% due 6/1/2034 (Campus Buildings Acquisition & Improvements) | | AA/Aa2 | | | 1,500,000 | | | | 1,652,550 | |
Regents of the University of New Mexico, 4.50% due 6/1/2035 (Campus Buildings Acquisition & Improvements) | | AA/Aa2 | | | 1,500,000 | | | | 1,646,295 | |
Regents of the University of New Mexico, 4.50% due 6/1/2036 (Campus Buildings Acquisition & Improvements) | | AA/Aa2 | | | 1,500,000 | | | | 1,642,560 | |
Rio Rancho Public School District No. 94 GO, 3.00% due 8/1/2017 (State Aid Withholding) | | NR/Aa2 | | | 2,530,000 | | | | 2,547,685 | |
San Juan County, 4.00% due 6/15/2017 (County Capital Improvements) | | A+/A2 | | | 500,000 | | | | 503,250 | |
San Juan County, 5.00% due 6/15/2028 (County Capital Improvements) | | A+/A1 | | | 1,280,000 | | | | 1,461,888 | |
San Juan County, 5.00% due 6/15/2030 (County Capital Improvements) | | A+/A1 | | | 1,365,000 | | | | 1,543,583 | |
Santa Fe County, 5.00% due 2/1/2018 (County Correctional System; Insured: AGM) | | AA/A2 | | | 205,000 | | | | 210,256 | |
Semi-Annual Report 9
| | |
| Schedule of Investments, Continued | | |
| |
Thornburg New Mexico Intermediate Municipal Fund | | March 31, 2017 (Unaudited) |
| | | | | | | | | | | | |
ISSUER-DESCRIPTION | | CREDIT RATING†
S&P/ MOODY’S | | | PRINCIPAL
AMOUNT | | | VALUE | |
Santa Fe County, 5.00% due 6/1/2025 pre-refunded 6/1/2018 (County Courthouse and Other Public Facilities) | | | AA+/Aa2 | | | $ | 1,400,000 | | | $ | 1,465,520 | |
Santa Fe County, 5.00% due 6/1/2026 pre-refunded 6/1/2018 (County Courthouse and Other Public Facilities) | | | AA+/Aa2 | | | | 1,535,000 | | | | 1,606,838 | |
Santa Fe County, 6.00% due 2/1/2027 (County Correctional System; Insured: AGM) | | | AA/A2 | | | | 1,520,000 | | | | 1,829,913 | |
Santa Fe County GRT, 5.00% due 6/1/2025 (County Buildings & Facilities) | | | AA+/NR | | | | 1,250,000 | | | | 1,505,987 | |
Santa Fe County GRT, 5.00% due 6/1/2026 (County Buildings & Facilities) | | | AA+/NR | | | | 640,000 | | | | 763,597 | |
Santa Fe County GRT, 5.00% due 6/1/2027 (County Buildings & Facilities) | | | AA+/NR | | | | 275,000 | | | | 323,513 | |
Santa Fe Public School District GO, 3.00% due 8/1/2017 (Santa Fe County School Facilities) (State Aid Withholding) | | | AA/Aa1 | | | | 400,000 | | | | 403,076 | |
State of New Mexico, 5.00% due 7/1/2020 (Educational Facilities) | | | AA-/Aa2 | | | | 4,000,000 | | | | 4,468,040 | |
State of New Mexico, 5.00% due 7/1/2022 pre-refunded 7/1/2019 (Capital Improvements) | | | AA-/Aa2 | | | | 350,000 | | | | 380,002 | |
State of New Mexico, 5.00% due 7/1/2025 (Educational Facilities) | | | AA-/Aa2 | | | | 2,000,000 | | | | 2,410,320 | |
Taos Municipal School District No. 1 GO, 5.00% due 9/1/2021 (Educational Facilities) (State Aid Withholding) | | | NR/Aa2 | | | | 520,000 | | | | 597,319 | |
Town of Silver City, 2.00% due 12/1/2018 (Joint Utility System Improvement; Insured: BAM) | | | AA/NR | | | | 260,000 | | | | 263,435 | |
Town of Silver City, 2.00% due 12/1/2019 (Joint Utility System Improvement; Insured: BAM) | | | AA/NR | | | | 265,000 | | | | 270,228 | |
Town of Silver City, 4.00% due 6/1/2029 (Public Facility Capital Projects) | | | A+/NR | | | | 1,000,000 | | | | 1,034,240 | |
Town of Silver City, 4.25% due 6/1/2032 (Public Facility Capital Projects) | | | A+/NR | | | | 1,050,000 | | | | 1,083,537 | |
Village of Los Ranchos de Albuquerque, 4.50% due 9/1/2040 (Albuquerque Academy) | | | A/NR | | | | 3,000,000 | | | | 3,111,420 | |
Virgin Islands Public Finance Authority, 6.625% due 10/1/2029 (Diageo Project) | | | NR/Caa2 | | | | 2,500,000 | | | | 2,068,750 | |
Zuni Public School District, 5.00% due 8/1/2028 (Teacher Housing Projects) | | | A/NR | | | | 1,600,000 | | | | 1,774,464 | |
| | | | | | | | | | | | |
TOTAL INVESTMENTS — 96.16% (Cost $191,002,386) | | | | | | | | | | $ | 197,328,321 | |
OTHER ASSETS LESS LIABILITIES — 3.84% | | | | | | | | | | | 7,882,084 | |
| | | | | | | | | | | | |
NET ASSETS — 100.00% | | | | | | | | | | $ | 205,210,405 | |
| | | | | | | | | | | | |
Footnote Legend
| † | Credit ratings are unaudited. Rating changes may have occurred subsequent to the reporting period end. Bonds issued with a maturity of one year or less are assigned Moody’s ratings from MIG-1 to MIG-4 and Standard and Poor’s ratings from SP-1+ to SP-3 with MIG-1 and SP-1+ being the strongest ratings. |
| b | Segregated as collateral for a when-issued security. |
Portfolio Abbreviations
To simplify the listings of securities, abbreviations are used per the table below:
| | |
| AGM | | Insured by Assured Guaranty Municipal Corp. |
| AMBAC | | Insured by American Municipal Bond Assurance Corp. |
| AMT | | Alternative Minimum Tax |
| BAM | | Insured by Build America Mutual Insurance Co. |
| ETM | | Escrowed to Maturity |
| | |
| FHLMC | | Insured by Federal Home Loan Mortgage Corp. |
| FNMA | | Collateralized by Federal National Mortgage Association |
| GNMA | | Collateralized by Government National Mortgage Association |
| GO | | General Obligation |
| GRT | | Gross Receipts Tax |
| Natl-Re | | Insured by National Public Finance Guarantee Corp. |
See notes to financial statements.
10 Semi-Annual Report
| | |
| Statement of Assets and Liabilities | | |
| |
Thornburg New Mexico Intermediate Municipal Fund | | March 31, 2017 (Unaudited) |
| | | | |
ASSETS | | | | |
Investments at value (cost $191,002,386) (Note 3) | | $ | 197,328,321 | |
Cash | | | 8,879,594 | |
Receivable for fund shares sold | | | 91,509 | |
Interest receivable | | | 2,560,202 | |
Prepaid expenses and other assets | | | 622 | |
| | | | |
Total Assets | | | 208,860,248 | |
| | | | |
| |
LIABILITIES | | | | |
Payable for investments purchased | | | 3,157,868 | |
Payable for fund shares redeemed | | | 260,428 | |
Payable to investment advisor and other affiliates (Note 4) | | | 141,004 | |
Accounts payable and accrued expenses | | | 52,818 | |
Dividends payable | | | 37,725 | |
| | | | |
Total Liabilities | | | 3,649,843 | |
| | | | |
| |
NET ASSETS | | $ | 205,210,405 | |
| | | | |
NET ASSETS CONSIST OF | | | | |
Distribution in excess of net investment income | | $ | (25,896 | ) |
Net unrealized appreciation on investments | | | 6,325,935 | |
Accumulated net realized gain (loss) | | | (1,250,641 | ) |
Net capital paid in on shares of beneficial interest | | | 200,161,007 | |
| | | | |
| | $ | 205,210,405 | |
| | | | |
NET ASSET VALUE | | | | |
| |
Class A Shares: | | | | |
Net asset value and redemption price per share ($123,411,401 applicable to 9,304,084 shares of beneficial interest outstanding - Note 5) | | $ | 13.26 | |
Maximum sales charge, 2.00% of offering price | | | 0.27 | |
| | | | |
Maximum offering price per share | | $ | 13.53 | |
| | | | |
| |
Class D Shares: | | | | |
Net asset value, offering and redemption price per share ($24,257,877 applicable to 1,827,900 shares of beneficial interest outstanding - Note 5) | | $ | 13.27 | |
| | | | |
| |
Class I Shares: | | | | |
Net asset value, offering and redemption price per share ($57,541,127 applicable to 4,339,943 shares of beneficial interest outstanding - Note 5) | | $ | 13.26 | |
| | | | |
See notes to financial statements.
Semi-Annual Report 11
| | |
| Statement of Operations | | |
| |
Thornburg New Mexico Intermediate Municipal Fund | | Six Months Ended March 31, 2017 (Unaudited) |
| | | | |
INVESTMENT INCOME | | | | |
Interest income (net of premium amortized of $976,559) | | $ | 3,561,201 | |
| | | | |
| |
EXPENSES | | | | |
Investment advisory fees (Note 4) | | | 532,261 | |
Administration fees (Note 4) | | | | |
Class A Shares | | | 79,759 | |
Class D Shares | | | 15,855 | |
Class I Shares | | | 14,980 | |
Distribution and service fees (Note 4) | | | | |
Class A Shares | | | 159,518 | |
Class D Shares | | | 60,127 | |
Transfer agent fees | | | | |
Class A Shares | | | 29,701 | |
Class D Shares | | | 5,352 | |
Class I Shares | | | 13,044 | |
Registration and filing fees | | | | |
Class A Shares | | | 600 | |
Class D Shares | | | 315 | |
Class I Shares | | | 215 | |
Custodian fees (Note 2) | | | 25,810 | |
Professional fees | | | 23,246 | |
Accounting fees (Note 4) | | | 3,608 | |
Trustee fees | | | 5,221 | |
Other expenses | | | 14,239 | |
| | | | |
Total Expenses | | | 983,851 | |
Less: | | | | |
Expenses reimbursed by investment advisor (Note 4) | | | (1,356 | ) |
| | | | |
Net Expenses | | | 982,495 | |
| | | | |
Net Investment Income | | | 2,578,706 | |
| | | | |
REALIZED AND UNREALIZED GAIN (LOSS) | | | | |
Net realized gain (loss) on investments | | | (96,257 | ) |
Net change in unrealized appreciation (depreciation) on investments | | | (6,844,847 | ) |
| | | | |
Net Realized and Unrealized Loss | | | (6,941,104 | ) |
| | | | |
Net Decrease in Net Assets Resulting from Operations | | $ | (4,362,398 | ) |
| | | | |
See notes to financial statements.
12 Semi-Annual Report
| | |
| Statements of Changes in Net Assets | | |
| |
Thornburg New Mexico Intermediate Municipal Fund | | |
| | | | | | | | |
| | | SIX MONTHS ENDED
MARCH 31, 2017* | | | YEAR ENDED
SEPTEMBER 30, 2016 | |
INCREASE (DECREASE) IN NET ASSETS FROM | | | | | | | | |
| | |
OPERATIONS | | | | | | | | |
Net investment income | | $ | 2,578,706 | | | $ | 5,145,164 | |
Net realized gain (loss) on investments | | | (96,257 | ) | | | (8,510 | ) |
Net unrealized appreciation (depreciation) on investments | | | (6,844,847 | ) | | | 2,102,714 | |
| | | | | | | | |
Net Increase (Decrease) in Net Assets Resulting from Operations | | | (4,362,398 | ) | | | 7,239,368 | |
| | |
DIVIDENDS TO SHAREHOLDERS | | | | | | | | |
From net investment income | | | | | | | | |
Class A Shares | | | (1,504,624 | ) | | | (3,030,645 | ) |
Class D Shares | | | (270,641 | ) | | | (560,708 | ) |
Class I Shares | | | (803,441 | ) | | | (1,553,811 | ) |
| | |
FUND SHARE TRANSACTIONS (NOTE 5) | | | | | | | | |
Class A Shares | | | (9,238,640 | ) | | | (4,494,643 | ) |
Class D Shares | | | (3,368,169 | ) | | | (727,598 | ) |
Class I Shares | | | (6,316,883 | ) | | | 7,352,843 | |
| | | | | | | | |
Net Increase (Decrease) in Net Assets | | | (25,864,796 | ) | | | 4,224,806 | |
| | |
NET ASSETS | | | | | | | | |
Beginning of Period | | | 231,075,201 | | | | 226,850,395 | |
| | | | | | | | |
| | |
End of Period | | $ | 205,210,405 | | | $ | 231,075,201 | |
| | | | | | | | |
Distribution in excess of net investment income | | $ | (25,896 | ) | | $ | (25,896 | ) |
See notes to financial statements.
Semi-Annual Report 13
| | |
| Notes to Financial Statements | | |
| |
Thornburg New Mexico Intermediate Municipal Fund | | March 31, 2017 (Unaudited) |
NOTE 1 – ORGANIZATION
Thornburg New Mexico Intermediate Municipal Fund (the “Fund”) is a non-diversified series of Thornburg Investment Trust (the “Trust”). The Trust is organized as a Massachusetts business trust under a Declaration of Trust dated June 3, 1987 and is registered as a diversified, open-end management investment company under the Investment Company Act of 1940, as amended. The Fund is currently one of twenty-one separate series of the Trust. Each series is considered to be a separate entity for financial reporting and tax purposes and bears expenses directly attributable to it. The Fund’s primary investment objective is to obtain as high a level of current income exempt from federal and New Mexico state individual income tax as is consistent, in the view of Thornburg Investment Management, Inc., the Trust’s investment advisor (the “Advisor”), with the preservation of capital. The Fund’s secondary objective is to reduce expected changes in its share price compared to long-term bond portfolios.
The Fund currently offers three classes of shares of beneficial interest: Class A, Class D, and Institutional Class (“Class I”). Each class of shares of the Fund represents an interest in the same portfolio of investments, except that (i) Class A shares are sold subject to a front-end sales charge collected at the time the shares are purchased and bear a service fee, (ii) Class D shares are sold at net asset value without a sales charge at the time of purchase or redemption, and bear both a service fee and a distribution fee, (iii) Class I shares are sold at net asset value without a sales charge at the time of purchase and may be subject to a service fee, and (iv) the respective classes may have different reinvestment privileges and conversion rights. Additionally, the Fund may allocate among its classes certain expenses, to the extent allocable to specific classes, including transfer agent fees, government registration fees, certain printing and postage costs, and administrative and legal expenses. Currently, class specific expenses of the Fund are limited to service and distribution fees, administration fees, and certain registration and transfer agent expenses.
The following is a summary of significant accounting policies followed by the Fund in the preparation of its financial statements. The Fund prepares its financial statements in conformity with United States generally accepted accounting principles (“GAAP”), including investment company accounting and reporting guidance in the Financial Accounting Standards Board (the “FASB”) Accounting Standard Codification Topic 946.
NOTE 2 – SIGNIFICANT ACCOUNTING POLICIES
Security Valuation: All investments in securities held by the Fund are valued as described in Note 3.
Allocation of Income, Gains, Losses and Expenses: Net investment income (other than class specific expenses) and realized and unrealized gains and losses are allocated daily to each class of shares based upon the relative net asset value of outstanding shares (or the value of the dividend-eligible shares, as appropriate) of each class of shares at the beginning of the day (after adjusting for the current capital shares activity of the respective class). Expenses common to all Funds are allocated among the Funds comprising the Trust based upon their relative net asset values or other appropriate allocation methods. Operating expenses directly attributable to a specific class are charged against the operating income of that class.
Dividends and Distributions to Shareholders: Dividends and distributions to shareholders, which are determined in accordance with federal income tax regulations and may differ from GAAP, are recorded on the ex-dividend date. Ordinary income distributions, if any, are declared daily and paid monthly. Capital gain distributions, if any, are declared and paid annually and more often if deemed necessary by the Advisor. Dividends are paid and are reinvested in additional shares of the Fund at net asset value per share at the close of business on the ex-dividend date, or at the shareholder’s option, paid in cash.
Investment Income: Interest income is accrued as earned. Premiums and discounts are amortized and accreted, respectively, to call dates or maturity dates using the effective yield method of the respective investments. These amounts are included in Interest income on the Statement of Operations.
Custodian Fees: Custodian fees disclosed in the Statement of Operations may include interest expenses incurred by the Fund on any cash overdrafts of its custodian account during the period. Such cash overdrafts may result from the effects of failed trades in portfolio securities and from cash outflows resulting from unanticipated shareholder redemption activity. The Fund pays interest to its custodian on any such cash overdraft at a rate equal to 2.50% of the overdraft amount in excess of $50,000.
Investment Transactions: Investment transactions are accounted for on a trade date basis. Realized gains and losses from the sale of investments are recorded on an identified cost basis.
When-Issued and Delayed Delivery Transactions: The Fund may engage in when-issued or delayed delivery transactions. To the extent the Fund engages in such transactions, it will do so for the purpose of acquiring portfolio investments consistent with the Fund’s investment objectives and not for the purpose of investment leverage or to speculate on interest rate or market changes. At the time the Fund makes a commitment to purchase an investment on a when-issued or delayed delivery basis, the Fund will record the transaction and reflect the value in determining its net asset value. When effecting such transactions, assets of an amount sufficient to make payment for the portfolio investments to be purchased will be segregated on the Fund’s records on the trade date. Investments purchased on a when-issued or delayed delivery basis do not earn interest until the settlement date.
14 Semi-Annual Report
| | |
| Notes to Financial Statements, Continued | | |
| |
Thornburg New Mexico Intermediate Municipal Fund | | March 31, 2017 (Unaudited) |
Guarantees and Indemnifications: Under the Trust’s organizational documents (and under separate agreements with the independent Trustees), its officers and Trustees are provided with an indemnification against certain liabilities arising out of the performance of their duties to the Fund. In the normal course of business the Trust may also enter into contracts with service providers that contain general indemnifications. The Trust’s maximum exposure under these arrangements is unknown. However, based on experience, the Trust expects the risk of loss to be remote.
Use of Estimates: The preparation of financial statements in conformity with GAAP requires management to make estimates and assumptions that affect the reported amounts of assets and liabilities and disclosure of contingent assets and liabilities at the date of the financial statements and the reported amounts of increases (decreases) in net assets from operations during the reporting period. Actual results could differ from those estimates.
Federal Income Taxes: It is the policy of the Trust to comply with the provisions of the Internal Revenue Code applicable to regulated investment companies and to distribute to shareholders substantially all investment company taxable income including net realized gains on investments (if any), and tax exempt income of the Fund. Therefore, no provision for federal income or excise tax is required.
The Fund files income tax returns in United States federal and applicable state jurisdictions. The statute of limitations on the Fund’s tax return filings generally remains open for the three years following a return’s filing date. The Fund has analyzed its tax positions taken on Federal income tax returns for all open tax years and has concluded that no provision for income tax is required in the financial statements.
At March 31, 2017, information on the tax components of capital was as follows:
| | | | |
Cost of investments for tax purposes | | $ | 191,002,386 | |
| | | | |
Gross unrealized appreciation on a tax basis | | $ | 7,434,781 | |
Gross unrealized depreciation on a tax basis | | | (1,108,846 | ) |
| | | | |
Net unrealized appreciation (depreciation) on investments (tax basis) | | $ | 6,325,935 | |
| | | | |
At March 31, 2017, the Fund had deferred tax basis capital losses occurring subsequent to October 31, 2015 through September 30, 2016 of $6,818. For tax purposes, such losses will be recognized in the year ending September 30, 2017.
At March 31, 2017, the Fund had cumulative tax basis capital losses of $1,147,566, (of which $87,413 are short-term and $1,060,153 are long-term) generated after September 30, 2011, which may be carried forward to offset future capital gains. To the extent such carry-forwards are used, capital gain distributions may be reduced to the extent provided by regulations. Such capital loss carryforwards do not expire.
NOTE 3 – SECURITY VALUATION
Valuation of the Fund’s portfolio investment securities is performed in accordance with policies and procedures adopted by and under the oversight of the Trustees.
The Trustees of the Trust have appointed Thornburg Investment Management, Inc., the Trust’s investment advisor (the “Advisor”) to assist the Trustees in obtaining market values for portfolio investments, evaluate and monitor professional pricing service providers appointed by the Trustees’ Audit Committee (the “Audit Committee”) to assist in determining fair values for portfolio investments, assist in calculating fair values for portfolio investments in certain circumstances, and to perform other functions in connection with the valuation of investments. The Advisor acts through its Valuation and Pricing Committee (the “Committee”) and other employees of the Advisor. The Committee regularly reviews its own valuation calculations, as well as the valuations, valuation techniques and services furnished by pricing service providers, considers circumstances which may require valuation calculations by the Committee, and reviews previous valuation calculations. The Committee reports to the Audit Committee on the Committee’s activities, the performance of pricing service providers, and other matters relating to valuation of portfolio investments.
In those instances when the Committee assists in calculating a fair value for a portfolio investment, the Committee seeks to determine the price that the Fund would reasonably expect to receive upon a sale of the investment in an orderly transaction between market participants on the valuation date. The Committee customarily utilizes quotations from securities broker dealers in calculating valuations, but also may utilize prices obtained from pricing service providers or other methods approved by the Audit Committee. Because fair values calculated by the Committee are estimates, the calculation of a value for an investment may differ from the price that would be realized by the Fund upon a sale of the investment, and the difference could be material to the Fund’s financial statements. The Committee’s calculation of a fair value for an investment may also differ from the prices obtained by other persons (including other mutual funds) for the investment.
Semi-Annual Report 15
| | |
| Notes to Financial Statements, Continued | | |
| |
Thornburg New Mexico Intermediate Municipal Fund | | March 31, 2017 (Unaudited) |
Valuation of Securities: Debt obligations held by the Fund which are not listed or traded on exchanges or for which no reported market exists are ordinarily valued at the valuation obtained from a pricing service provider approved by the Audit Committee.
In any case when a pricing service provider fails to provide a valuation for a debt obligation held by the Fund, the Committee calculates a fair value for the obligation using alternative methods under procedures approved by the Audit Committee. Additionally, in cases when management believes that a valuation obtained from a pricing service provider merits review for significant reasons, the Committee decides whether or not to use the valuation calculated by the pricing service provider or to use an alternative method approved by the Audit Committee to calculate a fair value for the obligation.
Valuation Hierarchy: The Fund categorizes its investments based upon the inputs used in valuing those investments, according to a three-level hierarchy established in guidance from FASB. Categorization of investments using this hierarchy is intended by the FASB to maximize the use of observable inputs in valuing investments and minimize the use of unobservable inputs by requiring that the most observable inputs be used when available. Observable inputs are those that market participants would use in valuing an investment based on available market information. Unobservable inputs are those that reflect assumptions about the information market participants would use in valuing an investment. An investment’s level within the hierarchy is based on the lowest level input that is deemed significant to the valuation. The methodologies and inputs used to value investments are not necessarily indications of the risk or liquidity associated with those investments.
Various inputs are used in calculating valuations for the Fund’s investments. These inputs are generally summarized according to the three-level hierarchy below:
Level 1: Quoted prices in active markets for identical investments.
Level 2: Other direct or indirect significant observable inputs (including quoted prices for similar investments in active markets and other observable inputs, such as interest rates, prepayment rates, credit risk, etc.).
Level 3: Significant unobservable inputs (including the Committee’s own assumptions in calculating the fair values of investments).
Valuations for debt obligations held by the Fund are typically calculated by pricing service providers approved by the Audit Committee and are characterized as Level 2 within the valuation hierarchy.
In a limited number of cases the Committee calculates a fair value for investments using broker quotations or other methods approved by the Audit Committee. When the Committee uses a single broker quotation to calculate a fair value for an investment without other significant observable inputs, or if a fair value is calculated using other significant inputs that are considered unobservable, the investment is characterized as Level 3 within the hierarchy. Other significant unobservable inputs used to calculate a fair value in these instances might include an income-based valuation approach which considers discounted anticipated future cash flows from the investment, and application of discounts due to the nature or duration of any restrictions on the disposition of the investment.
Valuations based upon the use of inputs from Levels 1, 2 or 3 may not represent the actual price received upon the disposition of an investment, and the Fund may receive a price that is lower than the valuation based upon these inputs when it sells the investment.
The following table displays a summary of the fair value hierarchy measurements of the Fund’s investments as of March 31, 2017. In any instance when valuation inputs from more than one level are used to determine the fair value of a specific investment, the investment is placed in the level of the table based upon the lowest level input that is significant in determining the fair value of the investment:
| | | | | | | | | | | | | | | | |
| | | FAIR VALUE MEASUREMENTS AT MARCH 31, 2017 | |
| | | TOTAL | | | LEVEL 1 | | | LEVEL 2 | | | LEVEL 3 | |
Assets | | | | | | | | | | | | | | | | |
Investments in Securities Municipal Bonds | | $ | 197,328,321 | | | $ | — | | | $ | 197,328,321 | | | $ | — | |
| | | | | | | | | | | | | | | | |
Total Investments in Securities | | $ | 197,328,321 | | | $ | — | | | $ | 197,328,321 | | | $ | — | |
In accordance with the guidance prescribed in Accounting Standards Update No. 2011-04, it is the policy of the Fund to recognize transfers between levels and the underlying events which caused the movement. The Fund recognized no transfers between levels for the six months ended March 31, 2017.
16 Semi-Annual Report
| | |
| Notes to Financial Statements, Continued | | |
| |
Thornburg New Mexico Intermediate Municipal Fund | | March 31, 2017 (Unaudited) |
NOTE 4 – INVESTMENT ADVISORY FEE AND OTHER TRANSACTIONS WITH AFFILIATES
Pursuant to an investment advisory agreement, the Advisor serves as the investment advisor and performs services for the Fund for which the fees are payable at the end of each month. Under the investment advisory agreement, the Fund pays the Advisor a management fee based on the daily net assets of the Fund at an annual rate as shown in the following table:
Management Fee Schedule
| | | | |
DAILY NET ASSETS | | FEE RATE | |
Up to $500 million | | | 0.500 | % |
Next $500 million | | | 0.450 | |
Next $500 million | | | 0.400 | |
Next $500 million | | | 0.350 | |
Over $2 billion | | | 0.275 | |
The Fund’s effective management fee for the six months ended March 31, 2017 was 0.50% of the Fund’s average net assets.
The Fund pays to the Advisor the costs of personnel who perform certain accounting services for the Fund. For the six months ended March 31, 2017 the Fund paid $3,608 to the Advisor for these accounting services. The Trust has also entered into administrative service agreements with the Advisor, whereby the Advisor will perform certain administrative services related to each class of the Fund’s shares, and for which fees will be payable at an annual rate of up to .125 of 1% per annum of the average daily net assets attributable to each class of shares. Total administrative service fees incurred by each class of shares of the Fund for the six months ended March 31, 2017, are set forth in the Statement of Operations.
The Trust has an underwriting agreement with Thornburg Securities Corporation (the “Distributor”), an affiliate of the Advisor, which acts as the distributor of the Fund’s shares. For the six months ended March 31, 2017, the Distributor has advised the Fund that it earned net commissions aggregating $297 from the sale of Class A shares.
Pursuant to a service plan under Rule 12b-1 of the Investment Company Act of 1940, the Fund may pay to the Distributor or securities dealers and other financial institutions at the Distributor’s direction an amount not to exceed .25 or 1% per annum of the average daily net assets attributable to Class A and Class D shares of the Fund to obtain various shareholder and distribution related services. For the six months ended March 31, 2017, there were no 12b-1 service plan fees charged for Class I shares. The Advisor and the Distributor each may pay out of its own resources additional expenses for distribution of the Fund’s shares and shareholder services.
The Trust has also adopted a distribution plan pursuant to Rule 12b-1, applicable only to the Fund’s Class D shares, under which the Fund compensates the Distributor for services in promoting the sale of Class D shares of the Fund at an annual rate of up to .25 of 1% per annum of the average daily net assets attributable to Class D shares.
Total fees incurred by each class of shares of the Fund under their respective service and distribution plans for the six months ended March 31, 2017, are set forth in the Statement of Operations.
The Advisor and Distributor have contractually agreed to waive fees and reimburse expenses incurred by the Fund so that actual expenses of certain share classes do not exceed levels as specified in the Fund’s most recent prospectus. The agreement may be terminated by the Fund at any time, but may not be terminated by the Advisor or Distributor before February 1, 2018, unless the Advisor ceases to be the investment advisor to the Fund or the Distributor ceases to be the distributor of the Fund prior to that date. The Advisor and Distributor may recoup amounts waived or reimbursed during the fiscal year if actual expenses fall below the contractual limit during that year.
For the six months ended March 31, 2017, the Advisor contractually reimbursed certain class specific expenses, administrative fees, and distribution fees of $966 for Class A shares, $381 for Class D shares, and $9 for Class I shares.
Certain officers and Trustees of the Trust are also officers or directors of the Advisor and Distributor. The compensation of independent Trustees is borne by the Trust.
The percentage of direct investments in the Fund held by the Trustees and Officers of the Trust and the Advisors is approximately 8.41%.
The Fund may purchase or sell securities from, or to an affiliated fund, provided the affiliation is due solely to having a common investment advisor, common officers, or common trustees, and provided that all such transactions will comply with Rule 17a-7 under the 1940 Act. For the six months ended March 31, 2017, the Fund had transactions with affiliated funds of $2,586,402 in purchases and $3,608,794 in sales.
Semi-Annual Report 17
| | |
| Notes to Financial Statements, Continued | | |
| |
Thornburg New Mexico Intermediate Municipal Fund | | March 31, 2017 (Unaudited) |
NOTE 5 – SHARES OF BENEFICIAL INTEREST
At March 31, 2017, there were an unlimited number of shares with no par value of beneficial interest authorized. Transactions in shares of beneficial interest were as follows:
| | | | | | | | | | | | | | | | |
| | | SIX MONTHS ENDED | | | YEAR ENDED | |
| | | MARCH 31, 2017 (UNAUDITED) | | | SEPTEMBER 30, 2016 (AUDITED) | |
| | | SHARES | | | AMOUNT | | | SHARES | | | AMOUNT | |
Class A Shares | | | | | | | | | | | | | | | | |
Shares sold | | | 403,185 | | | $ | 5,382,784 | | | | 915,431 | | | $ | 12,528,291 | |
Shares issued to shareholders in reinvestment of dividends | | | 98,285 | | | | 1,306,585 | | | | 188,232 | | | | 2,574,787 | |
Shares repurchased | | | (1,198,986 | ) | | | (15,928,009 | ) | | | (1,432,981 | ) | | | (19,597,721 | ) |
| | | | | | | | | | | | | | | | |
Net increase (decrease) | | | (697,516 | ) | | $ | (9,238,640 | ) | | | (329,318 | ) | | $ | (4,494,643 | ) |
| | | | | | | | | | | | | | | | |
Class D Shares | | | | | | | | | | | | | | | | |
Shares sold | | | 229,652 | | | $ | 3,055,016 | | | | 309,896 | | | $ | 4,243,840 | |
Shares issued to shareholders in reinvestment of dividends | | | 18,624 | | | | 247,758 | | | | 38,634 | | | | 528,742 | |
Shares repurchased | | | (503,069 | ) | | | (6,670,943 | ) | | | (402,304 | ) | | | (5,500,180 | ) |
| | | | | | | | | | | | | | | | |
Net increase (decrease) | | | (254,793 | ) | | $ | (3,368,169 | ) | | | (53,774 | ) | | $ | (727,598 | ) |
| | | | | | | | | | | | | | | | |
Class I Shares | | | | | | | | | | | | | | | | |
Shares sold | | | 619,401 | | | $ | 8,220,823 | | | | 673,041 | | | $ | 9,199,727 | |
Shares issued to shareholders in reinvestment of dividends | | | 55,944 | | | | 743,576 | | | | 105,479 | | | | 1,442,583 | |
Shares repurchased | | | (1,153,691 | ) | | | (15,281,282 | ) | | | (241,095 | ) | | | (3,289,467 | ) |
| | | | | | | | | | | | | | | | |
Net increase (decrease) | | | (478,346 | ) | | $ | (6,316,883 | ) | | | 537,425 | | | $ | 7,352,843 | |
| | | | | | | | | | | | | | | | |
NOTE 6 – INVESTMENT TRANSACTIONS
For the six months ended March 31, 2017, the Fund had purchase and sale transactions of investments (excluding short-term investments) of $9,204,707 and $22,432,375, respectively.
OTHER NOTES
Risks: The Fund’s investments subject it to risks including, but not limited to, management risk, interest rate risk, credit risk, market and economic risk, liquidity risk, diversification risk, and the risk of investing mainly in the obligations primarily originating in a single state. Please see the Fund’s prospectus for a discussion of the risks associated with an investment in the Fund.
Subsequent Events: Fund management believes no events have occurred between March 31, 2017 and the date of issuance of the financial statements that require adjustment to or disclosure in the accompanying financial statements.
18 Semi-Annual Report
This page intentionally left blank.
Semi-Annual Report 19
Financial Highlights
Thornburg New Mexico Intermediate Municipal Fund
| | | | | | | | | | | | | | | | | | | | | | | | | | | | | | | | | | | | | | | | | | | | | | | | | | | | | | |
| | | PER SHARE PERFORMANCE (FOR A SHARE OUTSTANDING THROUGHOUT THE PERIOD) | | RATIOS TO AVERAGE NET ASSETS | | | SUPPLEMENTAL DATA | |
UNLESS
OTHERWISE
NOTED,
PERIODS
ARE
FISCAL
YEARS
ENDED
SEPT. 30, | | NET ASSET
VALUE
BEGINNING
OF PERIOD | | | NET
INVESTMENT
INCOME
(LOSS)+ | | | NET
REALIZED &
UNREALIZED
GAIN (LOSS)
ON
INVESTMENTS | | | TOTAL FROM
INVESTMENT
OPERATIONS | | | DIVIDENDS
FROM NET
INVESTMENT
INCOME | | | DIVIDENDS
FROM NET
REALIZED
GAINS | | TOTAL
DIVIDENDS | | | NET
ASSET
VALUE
END OF
PERIOD | | NET
INVESTMENT
INCOME
(LOSS)
(%) | | | EXPENSES,
AFTER
EXPENSE
REDUCTIONS
(%) | | | EXPENSES,
AFTER
EXPENSE
REDUCTIONS
AND
NET OF
CUSTODY
CREDITS
(%) | | | EXPENSES,
BEFORE
EXPENSE
REDUCTIONS
(%) | | | TOTAL
RETURN
(%)(a) | | | PORTFOLIO
TURNOVER
RATE (%)(a) | | NET
ASSETS
AT END
OF
PERIOD
(THOUSANDS) | |
CLASS A SHARES | | | | | | | | | | | | | | | | | | | | | | | | | | | | | | | | | | | | | | | | | | | | | | | |
2017(b)(c) | | $ | 13.67 | | | | 0.16 | | | | (0.41 | ) | | | (0.25 | ) | | | (0.16 | ) | | — | | | (0.16 | ) | | $13.26 | | | 2.36 | (d) | | | 0.99 | (d) | | | 0.99 | (d) | | | 0.99 | (d) | | | (1.85 | ) | | 4.62 | | $ | 123,411 | |
2016(c) | | $ | 13.55 | | | | 0.30 | | | | 0.12 | | | | 0.42 | | | | (0.30 | ) | | — | | | (0.30 | ) | | $13.67 | | | 2.18 | | | | 0.97 | | | | 0.97 | | | | 0.97 | | | | 3.11 | | | 6.80 | | $ | 136,743 | |
2015(c) | | $ | 13.60 | | | | 0.34 | | | | (0.05 | ) | | | 0.29 | | | | (0.34 | ) | | — | | | (0.34 | ) | | $13.55 | | | 2.50 | | | | 0.98 | | | | 0.98 | | | | 0.98 | | | | 2.15 | | | 19.01 | | $ | 139,939 | |
2014(c) | | $ | 13.35 | | | | 0.39 | | | | 0.25 | | | | 0.64 | | | | (0.39 | ) | | — | | | (0.39 | ) | | $13.60 | | | 2.87 | | | | 0.97 | | | | 0.97 | | | | 0.97 | | | | 4.83 | | | 10.79 | | $ | 143,994 | |
2013(c) | | $ | 13.95 | | | | 0.38 | | | | (0.60 | ) | | | (0.22 | ) | | | (0.38 | ) | | — | | | (0.38 | ) | | $13.35 | | | 2.76 | | | | 0.96 | | | | 0.95 | | | | 0.96 | | | | (1.61 | ) | | 11.78 | | $ | 148,499 | |
2012(c) | | $ | 13.72 | | | | 0.41 | | | | 0.24 | | | | 0.65 | | | | (0.41 | ) | | (0.01) | | | (0.42 | ) | | $13.95 | | | 2.95 | | | | 0.95 | | | | 0.95 | | | | 0.95 | | | | 4.80 | | | 11.66 | | $ | 187,578 | |
CLASS D SHARES | | | | | | | | | | | | | | | | | | | | | | | | | | | | | | | | | | | | | | | | | | | | | | | |
2017(b) | | $ | 13.68 | | | | 0.14 | | | | (0.41 | ) | | | (0.27 | ) | | | (0.14 | ) | | — | | | (0.14 | ) | | $13.27 | | | 2.13 | (d) | | | 1.21 | (d) | | | 1.21 | (d) | | | 1.21 | (d) | | | (1.95 | ) | | 4.62 | | $ | 24,258 | |
2016 | | $ | 13.55 | | | | 0.28 | | | | 0.12 | | | | 0.40 | | | | (0.27 | ) | | — | | | (0.27 | ) | | $13.68 | | | 1.94 | | | | 1.21 | | | | 1.21 | | | | 1.21 | | | | 2.94 | | | 6.80 | | $ | 28,489 | |
2015 | | $ | 13.61 | | | | 0.31 | | | | (0.06 | ) | | | 0.25 | | | | (0.31 | ) | | — | | | (0.31 | ) | | $13.55 | | | 2.27 | | | | 1.20 | | | | 1.20 | | | | 1.20 | | | | 1.84 | | | 19.01 | | $ | 28,953 | |
2014 | | $ | 13.36 | | | | 0.35 | | | | 0.25 | | | | 0.60 | | | | (0.35 | ) | | — | | | (0.35 | ) | | $13.61 | | | 2.60 | | | | 1.23 | | | | 1.23 | | | | 1.23 | | | | 4.55 | | | 10.79 | | $ | 28,438 | |
2013 | | $ | 13.96 | | | | 0.34 | | | | (0.59 | ) | | | (0.25 | ) | | | (0.35 | ) | | — | | | (0.35 | ) | | $13.36 | | | 2.51 | | | | 1.21 | | | | 1.21 | | | | 1.22 | | | | (1.85 | ) | | 11.78 | | $ | 28,858 | |
2012 | | $ | 13.72 | | | | 0.37 | | | | 0.26 | | | | 0.63 | | | | (0.38 | ) | | (0.01) | | | (0.39 | ) | | $13.96 | | | 2.71 | | | | 1.18 | | | | 1.18 | | | | 1.22 | | | | 4.62 | | | 11.66 | | $ | 31,984 | |
CLASS I SHARES | | | | | | | | | | | | | | | | | | | | | | | | | | | | | | | | | | | | | | | | | | | | | | | |
2017(b) | | $ | 13.67 | | | | 0.18 | | | | (0.41 | ) | | | (0.23 | ) | | | (0.18 | ) | | — | | | (0.18 | ) | | $13.26 | | | 2.68 | (d) | | | 0.66 | (d) | | | 0.66 | (d) | | | 0.66 | (d) | | | (1.69 | ) | | 4.62 | | $ | 57,541 | |
2016 | | $ | 13.54 | | | | 0.35 | | | | 0.12 | | | | 0.47 | | | | (0.34 | ) | | — | | | (0.34 | ) | | $13.67 | | | 2.52 | | | | 0.63 | | | | 0.63 | | | | 0.63 | | | | 3.53 | | | 6.80 | | $ | 65,843 | |
2015 | | $ | 13.59 | | | | 0.38 | | | | (0.05 | ) | | | 0.33 | | | | (0.38 | ) | | — | | | (0.38 | ) | | $13.54 | | | 2.80 | | | | 0.65 | | | | 0.65 | | | | 0.65 | | | | 2.48 | | | 19.01 | | $ | 57,958 | |
2014 | | $ | 13.35 | | | | 0.43 | | | | 0.24 | | | | 0.67 | | | | (0.43 | ) | | — | | | (0.43 | ) | | $13.59 | | | 3.19 | | | | 0.65 | | | | 0.64 | | | | 0.65 | | | | 5.09 | | | 10.79 | | $ | 37,380 | |
2013 | | $ | 13.95 | | | | 0.43 | | | | (0.61 | ) | | | (0.18 | ) | | | (0.42 | ) | | — | | | (0.42 | ) | | $13.35 | | | 3.09 | | | | 0.61 | | | | 0.61 | | | | 0.61 | | | | (1.29 | ) | | 11.78 | | $ | 25,590 | |
2012 | | $ | 13.71 | | | | 0.46 | | | | 0.25 | | | | 0.71 | | | | (0.46 | ) | | (0.01) | | | (0.47 | ) | | $13.95 | | | 3.30 | | | | 0.61 | | | | 0.61 | | | | 0.61 | | | | 5.24 | | | 11.66 | | $ | 38,099 | |
| (a) | Not annualized for periods less than one year. |
| (b) | Unaudited Six Month Period Ended March 31. |
| (c) | Sales loads are not reflected in computing total return. |
| + | Based on weighted average shares outstanding. |
See notes to financial statements.
| | | | |
| 20 Semi-Annual Report | | | | Semi-Annual Report 21 |
| | |
| Expense Example | | |
| |
Thornburg New Mexico Intermediate Municipal Fund | | March 31, 2017 (Unaudited) |
As a shareholder of the Fund, you incur two types of costs:
| | (1) | transaction costs, including |
(a) sales charges (loads) on purchase payments, for Class A shares;
(b) a deferred sales charge on redemptions of any part or all of a purchase of $1 million of Class A shares within 12 months of purchase;
| | (2) | ongoing costs, including management fees; distribution and/or service (12b-1) fees; and other Fund expenses. |
This example is intended to help you understand your ongoing costs (in dollars) of investing in the Fund and to compare these costs with the ongoing costs of investing in other mutual funds.
The example is based on a $1,000 investment beginning on October 1, 2016, and held until March 31, 2017.
| | | | | | | | | | | | |
| | | BEGINNING
ACCOUNT VALUE
10/1/16 | | | ENDING
ACCOUNT VALUE
3/31/17 | | | EXPENSES PAID
DURING PERIOD†
10/1/16–3/31/17 | |
CLASS A SHARES | | | | | | | | | | | | |
Actual | | $ | 1,000.00 | | | $ | 981.52 | | | $ | 4.88 | |
Hypothetical* | | $ | 1,000.00 | | | $ | 1,020.00 | | | $ | 4.98 | |
CLASS D SHARES | | | | | | | | | | | | |
Actual | | $ | 1,000.00 | | | $ | 980.47 | | | $ | 5.97 | |
Hypothetical* | | $ | 1,000.00 | | | $ | 1,018.91 | | | $ | 6.08 | |
CLASS I SHARES | | | | | | | | | | | | |
Actual | | $ | 1,000.00 | | | $ | 983.12 | | | $ | 3.27 | |
Hypothetical* | | $ | 1,000.00 | | | $ | 1,021.63 | | | $ | 3.34 | |
| † | Expenses are equal to the annualized expense ratio for each class (A: 0.99%; D: 1.21%; I: 0.66%) multiplied by the average account value over the period, multiplied by 182/365 to reflect the one-half year period. |
| * | Hypothetical assumes a rate of return of 5% per year before expenses. |
ACTUAL EXPENSES
For each class of shares, the first line of the accompanying table provides information about actual account values and actual expenses. You may use the information in this line, together with the amount you invested, to estimate the expenses that you paid over the period. Simply divide your account value by $1,000 (for example, an $8,600 account value divided by $1,000 = 8.6), then multiply the result by the number in the first line for your class of shares under the heading entitled “Expenses Paid During Period” to estimate the expenses you paid on your account during this period.
HYPOTHETICAL EXAMPLE FOR COMPARISON PURPOSES
For each class of shares, the second line of the accompanying table provides information about hypothetical account values and hypothetical expenses based on the Fund’s actual expense ratio and an assumed rate of return of 5% per year before expenses, which is not the Fund’s actual return. The hypothetical account values and expenses may not be used to estimate the actual ending account balance or expenses you paid for the period. You may use this information to compare the ongoing costs of investing in the Fund and other funds. To do so, compare this 5% hypothetical example with the 5% hypothetical examples that appear in the shareholder reports of the other funds.
Please note that the expenses shown in the table are meant to highlight your ongoing costs only and do not reflect any transactional costs, such as sales charges (loads), redemption fees, or exchange fees. Therefore, the second line of the table for each class of shares is useful in comparing ongoing costs only, and will not help you determine the relative total costs of owning different funds. In addition, if these transactional costs were included, your costs would have been higher.
22 Semi-Annual Report
| | |
| Other Information | | |
| |
Thornburg New Mexico Intermediate Municipal Fund | | March 31, 2017 (Unaudited) |
PORTFOLIO PROXY VOTING
Policies and Procedures:
The Trust has delegated to Thornburg Investment Management, Inc. (the “Advisor”) voting decisions respecting proxies for the Fund’s voting securities. The Advisor makes voting decisions in accordance with its Proxy Voting Policy. A description of the Policy is available (i) without charge, upon request, by calling the Advisor toll-free at 1-800-847-0200, (ii) on the Thornburg website at www.thornburg. com, and (iii) on the Securities and Exchange Commission’s website at www.sec.gov.
Information regarding how proxies were voted is available on or before August 31 of each year for the twelve months ending the preceding June 30. This information is available (i) without charge, upon request by calling the Advisor toll-free at 1-800-847-0200, (ii) on the Thornburg website at www.thornburg.com, and (iii) on the Securities and Exchange Commission’s website at www.sec.gov.
AVAILABILITY OF QUARTERLY PORTFOLIO SCHEDULE
The Fund files with the Securities and Exchange Commission schedules of its portfolio holdings on Form N-Q for the first and third quarters of each fiscal year. The Fund’s Forms N-Q are available on the Commission’s website at www.sec.gov, or may be reviewed and copied at the Commission’s Public Reference Room in Washington, D.C. Information on the operation of the Public Reference Room may be obtained by calling 1-800-SEC-0330. The Fund also makes this information available on its website at www.thornburg. com/download or upon request by calling 1-800-847-0200.
Semi-Annual Report 23
Trustees’ Statement to Shareholders
Readopted September 12, 2016
The Trustees believe current and prospective shareholders should know how we discharge our responsibilities in supervising the Funds’ investment advisor and in reviewing the advisor’s contract for renewal. Since 2005, we have issued a statement which sets out clearly the three principal guidelines that we follow in supervising the Trust’s investment advisor on your behalf. In accordance with our customary practice, in September of this year we again reviewed our statement and concluded we should reissue this statement outlining the principal features of our supervision of the advisor’s performance of investment management services for the Funds.
We begin with the premise that each shareholder selected his or her Fund because its investments are managed by the investment advisor identified in the prospectus and in accordance with the objective and policies described in the prospectus. We realize, as each of you do, that if you believe that your Fund’s stated objective and policies no longer serve your personal investment goals, you can sell your shares and leave the Fund.
Therefore, we believe that our primary supervisory task—our principal obligation to you—is to assess the nature and quality of the advisor’s services, and to confirm that the advisor actively and competently pursues the Fund’s objective, in accordance with the policies set out in the prospectus. To do this, we meet regularly with management to review your Fund’s portfolio and to discuss the advisor’s specific actions and judgments in pursuing the Fund’s objective. We do not substitute our own judgment for the advisor’s decisions in selecting investments; the advisor is paid to exercise its informed judgment on investment decisions, and we seek to confirm, in reviewing the advisor’s performance, that the advisor is doing just that.
Second, we are conscious of costs and the effect that costs have on shareholders’ returns. We try to make sure that your Fund’s fees and costs are reasonable in relationship to the services rendered and that they are generally in line with those charged by other expert investment advisors, consistent with our belief that the Fund’s investors searched for and expect that expertise and attention and have decided to pay a reasonable price for it. We do not put the management contract “out to bid” as a matter of course, and we would not do so unless we had concluded that the advisor materially had failed to pursue the Fund’s objectives in accordance with its policies, or for other equally important reasons. We believe that any other approach would be inconsistent with your interests and contrary to your expectations when you bought shares of the Fund in the first place.
Finally, because we believe that most Thornburg Fund shareholders have invested with a long-term perspective, we try not to focus too much on the fashions of the moment and on short-term performance. The market will not favor any specific investment objective or set of policies at all times and under all economic circumstances. A fund will experience periods of both high and low returns relative to other funds and other investments. Even if one of our Funds is not favored by the market at a particular time, we believe that the advisor is nonetheless obliged to remain true to the Fund’s objective and policies, and we watch to see that it does so.
Trustees of Thornburg Investment Trust
24 Semi-Annual Report
Thornburg Funds
Thornburg Investment Management is a privately-owned global investment firm that offers a range of solutions for retail and institutional investors. Founded in 1982 and headquartered in Santa Fe, New Mexico, we manage approximately $49 billion (as of March 31, 2017) across U.S. mutual funds, separate accounts for high-net-worth investors and institutional accounts, and UCITS funds for non-U.S. investors.
The fund outlined in this report is one of many equity and fixed-income products available from Thornburg Investment Management.
EQUITY FUNDS
| | • | | Thornburg Investment Income Builder Fund |
| | • | | Thornburg Global Opportunities Fund |
| | • | | Thornburg International Value Fund |
| | • | | Thornburg Better World International Fund |
| | • | | Thornburg International Growth Fund |
| | • | | Thornburg Developing World Fund |
| | • | | Thornburg Core Growth Fund |
FIXED INCOME FUNDS
| | • | | Thornburg Low Duration Income Fund |
| | • | | Thornburg Limited Term U.S. Government Fund |
| | • | | Thornburg Limited Term Income Fund |
| | • | | Thornburg Strategic Income Fund |
| | • | | Thornburg Low Duration Municipal Fund |
| | • | | Thornburg Limited Term Municipal Fund |
| | • | | Thornburg Intermediate Municipal Fund |
| | • | | Thornburg California Limited Term Municipal Fund |
| | • | | Thornburg New Mexico Intermediate Municipal Fund |
| | • | | Thornburg New York Intermediate Municipal Fund |
| | • | | Thornburg Strategic Municipal Income Fund |
ALTERNATIVE FUNDS
| | • | | Thornburg Long/Short Equity Fund |
Before investing, carefully consider the Fund’s investment goals, risks, charges, and expenses. For a prospectus or summary prospectus containing this and other information, contact your financial advisor or visit thornburg.com. Read it carefully before investing.
For additional information, please visit thornburg.com
Thornburg Investment Management, Inc. 2300 North Ridgetop Road, Santa Fe, NM 87506
Semi-Annual Report 25
This page intentionally left blank.
26 Semi-Annual Report
This page intentionally left blank.
Semi-Annual Report 27

| | |
To receive shareholder reports, prospectuses, and proxy statements electronically, go to www.thornburg.com/edelivery. This Semi-Annual Report is submitted for the general information of shareholders of the Fund. It is not authorized for distribution to prospective investors in the Fund unless preceded or accompanied by an effective prospectus. | |  |
| |
| | | | |
| Investment Advisor: | | Distributor: | | |
| Thornburg Investment Management® | | Thornburg Securities Corporation® | | |
| 800.847.0200 | | 800.847.0200 | | TH178 |
Semi-Annual Report March 31, 2017 THORNBURG NEW YORK INTERMEDIATE MUNICIPAL FUND
About Thornburg Investment Management It’s more than what we do. It’s how we do it. At Thornburg, we are very different in how we think, invest, and are structured . We believe this difference is what makes us successful in helping individuals reach their long-term financial goals . Flexible Perspective Our perspective on investment opportunities is more flexible than most, viewing a wide range of opportunities beyond conventional boundaries to find hidden value . Collaboration Collectively, we hone ideas via borderless cross-pollination for better judgment and better results . Portfolio Construction Disciplined construction guided more by our convictions than convention . CONVICTION Thorough analysis and our relative-value framework lead to conviction in our securities selection . UNCONVENTIONAL Active management means we seek the best value for our clients rather than using conventional benchmarks as our starting point . Structured for Excellence How we think and how we invest is made possible by how we’re structured . TEAM APPROACH FAR FROM THE HERD ACCESS & TRANSPARENCY
2 Semi-Annual Report
Semi-Annual Report
Thornburg New York
Intermediate Municipal Fund
March 31, 2017
| | | | |
SHARE CLASS | | NASDAQ SYMBOL | | CUSIP |
Class A | | THNYX | | 885-215-665 |
Class I | | TNYIX | | 885-216-705 |
Minimum investments for Class I shares may be higher than those for Class A. Class I shares may not be available to all investors.
Investments carry risks, including possible loss of principal. Portfolios investing in bonds have the same interest rate, inflation, and credit risks that are associated with the underlying bonds. The value of bonds will fluctuate relative to changes in interest rates, decreasing when interest rates rise. Unlike bonds, bond funds have ongoing fees and expenses. Please see the Fund’s prospectus for a discussion of the risks associated with an investment in the Fund. Investments in the Funds are not FDIC insured, nor are they bank deposits or guaranteed by a bank or any other entity.
The laddering strategy does not assure or guarantee better performance and cannot eliminate the risk of investment losses.
Semi-Annual Report 3
Letter to Shareholders
| | |
Thornburg New York Intermediate Municipal Fund | | March 31, 2017 (Unaudited) |
April 28, 2017
Dear Fellow Shareholder:
We are pleased to present the semi-annual report for Thornburg New York Intermediate Municipal Fund. The net asset value (NAV) of the Class A shares decreased by 46 cents to $12.94 per share during the six-month period ended March 31, 2017. If you were with us the entire period, you received dividends of 16.12 cents per share. If you reinvested your dividends, you received 16.21 cents per share. Dividends were higher for Class I shares to account for varying class-specific expenses. The Class A shares of your Fund underperformed the index with a negative 2.23% total return (without sales charge) for the six months ended March 31, 2017, compared to the negative 1.94% return for the BofA Merrill Lynch 3-15 Year U.S. Municipal Securities Index.
The Fund’s duration as well as curve positioning added 0.61% to relative performance. The Fund’s credit allocations detracted 0.09%, while other risk factors detracted 0.33%. Fund expenses accounted for the remaining differences.
The Municipal Bond Market
After a few years of relative quiet in the municipal bond market, things heated up following the election of Donald Trump in 2016. While stocks were rallying, bond prices, even municipal bond prices, came under pressure. Bond yields initially rose after the election based on expectations for greater infrastructure spending, stronger growth and higher inflation. The uptick in rates led mutual fund investors to sell their shares, which caused municipal bond mutual funds to sell their bonds to meet those redemptions. After significant inflows in January to September of 2016, investors pulled $26 billion from municipal bond funds in November and December, some of which was related to tax-loss selling.
When the calendar turned in 2017, these outflows slowed and the municipal bond market produced positive returns. A contributing factor to positive returns was a decline in municipal bond issuance, as during the first quarter of 2017, the supply of new municipal bonds declined by 12% from the same time last year.
The value metrics we use at Thornburg suggest that the municipal bond market continues to price in the rosiest of scenarios moving forward, as investors have been pushed out of the risk spectrum. That is why we have Thornburg New York Intermediate Municipal Fund positioned in the lower end of its respective risk spectrum. In this environment, we continue to keep duration shorter, credit quality higher and we maintain higher levels of reserves.
Inside the Risk Metrics
Real yields, which indicate how much yield over inflation investors are being paid to own municipal bonds, increased over the six-month period. As of September 30, 2016, 10-year AAA general obligation (GO) bonds were yielding 1.64% and the Core Personal Consumption Expenditures Index (PCE) was running at 1.70%, so investors were earning less than inflation. By the end of February 2017, the yield on 10-year AAA GO bonds had increased to 2.30%, while Core PCE was running at 1.80%. While certainly more interesting at the end of the period, the 0.5% real yield was significantly less than the average of 2% investors have earned over the past 20 years.
The second thing to consider is credit spreads, which reflect the incremental yield an investor earns from owning a lower-rated credit versus a higher-rated credit, and which today remain narrow. As of March 31, 2017, an investor earned about 1.28% more for owning a 10-year BBB revenue bond versus a 10-year AAA GO bond. That is slightly higher than the average 0.75% an investor earned between 1994 and 2007. However, in 2007, approximately 50% of the new-issue municipal bond market was insured by AAA/AAA municipal bond insurers. Today, there are no AAA/AAA municipal bond insurers, and insurance coverage generally accounts for only 6% to 8% of the new-issue municipal bond market.
Finally, the slope of the yield curve, which tracks how much incremental yield an investor earns by owning securities with longer maturities, is slightly flatter than historical averages. Currently, investors are earning about 1.4% more for owning a 10-year AAA GO municipal bond, versus a one-year AAA GO municipal bond. Since 1994, an investor earned on average almost 1.6% to extend maturities from one to 10 years.
The Economy and Tax Reform
The U.S. economy continued its slow recovery in 2016, growing at a rate of 1.6% for 2016 in aggregate.
Unemployment continued to tick down. During the six-month period ended March 31, 2017, the U.S. economy added 976,000 jobs and by the end of the period the unemployment rate had fallen to 4.5%. Inflation remained stable, with the Core PCE Index reading 1.75% through March, below the Fed’s 2% target range.
Taken in aggregate, the economy continues to grow, jobs are being added and inflation has remained contained to date. In an effort to keep the economy in check, the U.S. Federal Reserve raised the Fed funds rate in December of 2016, and again in March of 2017.
4 Semi-Annual Report
| | |
| Letter to Shareholders, | | |
| |
Continued | | |
| |
Thornburg New York Intermediate Municipal Fund | | March 31, 2017 (Unaudited) |
| |
| | |
The economic health of the municipal bond market appears steady with a couple of notable exceptions. The drama in Puerto Rico is still playing out; the only winners are the consultants and lawyers hired by all sides.
New York’s economic health is still quite good. For the period from Q4 2015 to Q4 2016 (latest data available) personal income is up 2.98%, employment is up 1.34%, home prices are up 4.46% and state tax revenues are up 121%. All in all the empire state seems on firm footing, excelsior!
Tax reform is the second highest priority of President Trump’s and the Republican-led House agenda—second only to health care reform. The most important items in the tax proposals for the owners of municipal bonds (individuals as well as corporations) are those relevant to investment income. By lowering the effective tax rate on competing sources of income, prices of municipal bonds would most likely fall (yields would increase) to become more competitive with these alternative sources of income.
President Trump’s tax reform proposal (released Thursday, April 27, 2017) called for the elimination of the deduction for state and local taxes on an individual’s federal tax return. This would, if adopted, have significant impacts for residents of high-tax states. New York is one of those states with a top marginal income tax rate of 8.82%. The near-term effects on the economy would be minimal, but long term, residents would have less money in their pockets to spend, the cost of residing in the state would increase and might cause out-migration and lower growth.
Conclusion
We continue to run this portfolio as an actively managed laddered portfolio. Laddering a portfolio is a simple way to diversify its investment along its entire investment universe. While past performance does not guarantee future results, our study showed that this structure outperformed other structures around 60% of the time and added 0.15% to 0.25% of total return annually from 1997 through 2016.* Our view is that the current investment environment is not compensating investors enough to take on extra risk, so we have positioned our portfolios at the lower end of their risk spectrums.
Thank you for your continued trust in us.
Sincerely,
| | |
 | |  |
| Christopher Ryon,CFA | | Nicholos Venditti,CFA |
| Portfolio Manager | | Portfolio Manager |
| Managing Director | | Managing Director |
| * | We examined three hypothetical portfolios of bonds from December 1997 to December 2016. One using a laddering strategy, one using a barbell strategy, and a third using a bullet strategy. For the laddering strategy, the BofA Merrill Lynch 1–12 Year Municipal Index was used as a proxy, since, similar to a ladder, it contains bonds relatively evenly spread across all maturities within the index. The barbell strategy is a duration management technique wherein bonds are clustered at the two extremes of a maturity range. For the barbell strategy, the BofA Merrill Lynch 1–3 Year Municipal Index and BofA Merrill Lynch 8–12 Year Municipal Index were combined. The two indices were weighted in such a way as to give them the same duration as the broader 1–12 Year Index, and each year the portfolio was re-weighted back to the original index weights. This was done to make the two portfolios duration-neutral so that the impact of the strategy chosen could be isolated. The bullet strategy invests at the duration midpoint of the portfolio, therefore the BofA Merrill Lynch 6–8 Year Index was used to represent the bullet strategy. For additional information, see www.thornburg.com/whyladder. Past performance does not guarantee future results. |
The matters discussed in this report may constitute forward-looking statements made pursuant to the safe harbor provisions of the Securities Litigation Reform Act of 1995. These include any advisor or portfolio manager prediction, assessment, analysis or outlook for individual securities, industries, investment styles, market sectors and/or markets. These statements involve risks and uncertainties. In addition to the general risks described for each fund in its current prospectus, other factors bearing on these reports include the accuracy of the advisor’s or portfolio manager’s forecasts and predictions, the appropriateness of the investment strategies designed by the advisor or portfolio manager and the ability of the advisor or portfolio manager to implement their strategies efficiently and successfully. Any one or more of these factors, as well as other risks affecting the securities markets generally, could cause the actual results of any fund to differ materially as compared to its benchmarks.
The views expressed are subject to change and do not necessarily reflect the views of Thornburg Investment Management, Inc. This information should not be relied upon as a recommendation or investment advice and is not intended to predict the performance of any investment or market.
Semi-Annual Report 5
| | |
| Performance Summary | | |
| |
Thornburg New York Intermediate Municipal Fund | | March 31, 2017 (Unaudited) |
AVERAGE ANNUAL TOTAL RETURNS
| | | | | | | | | | | | | | | | | | | | |
| | | 1-YR | | | 3-YR | | | 5-YR | | | 10-YR | | | SINCE
INCEP. | |
A Shares (Incep: 9/5/97) | | | | | | | | | | | | | | | | | | | | |
Without sales charge | | | -0.83 | % | | | 2.14 | % | | | 2.10 | % | | | 3.45 | % | | | 3.83 | % |
With sales charge | | | -2.79 | % | | | 1.47 | % | | | 1.69 | % | | | 3.24 | % | | | 3.72 | % |
I Shares (Incep: 2/1/10) | | | -0.51 | % | | | 2.47 | % | | | 2.43 | % | | | — | | | | 3.49 | % |
30-DAY YIELDS, A SHARES
(with sales charge)
| | | | |
Annualized Distribution Yield | | | 2.44 | % |
| |
SEC Yield | | | 1.00 | % |
Performance data shown represents past performance and is no guarantee of future results. Investment return and principal value will fluctuate so shares, when redeemed, may be worth more or less than their original cost. Current performance may be lower or higher than quoted. For performance current to the most recent month end, visit thornburg.com or call 800-847-0200. The performance information does not reflect the deduction of taxes that a shareholder would pay on distributions or the redemption of Fund shares. Returns reflect the reinvestment of dividends and capital gains. Class A shares are sold with a maximum sales charge of 2.00%. There is no sales charge for Class I shares. As disclosed in the most recent prospectus, the total annual fund operating expenses are as follows: A shares, 1.03%; I shares, 0.72%. Thornburg Investment Management and/or Thornburg Securities Corporation have contractually agreed to waive fees and reimburse expenses through at least April 10, 2018, for some of the share classes, resulting in net expense ratios of the following: A shares, 0.99%; I shares, 0.67%. For more detailed information on fund expenses and waivers/reimbursements please see the Fund’s prospectus. Without the fee waivers and expense reimbursements, the Annualized Distribution yield would have been 2.35%, and the SEC yield would have been 0.91%.
GROWTH OF A HYPOTHETICAL $10,000 INVESTMENT
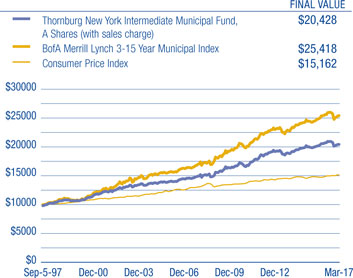
Glossary
The BofA Merrill Lynch 3-15 Year U.S. Municipal Securities Index is a subset of the BofA Merrill Lynch U.S. Municipal Securities Index including all securities with a remaining term to final maturity greater than or equal to 3 years and less than 15 years.
The BofA Merrill Lynch indices used in the Ladder vs Barbell & Bullet study are model portfolios of municipal obligations throughout the United States, with maturities ranging either from one to three years, six to eight years, eight to twelve years, or one to twelve years. These indices are subsets of the BofA Merrill Lynch U.S. Municipal Securities Index, which is comprised of U.S. dollar denominated investment grade tax-exempt debt publicly issued by U.S. states and territories, and their political subdivisions, in the U.S. domestic market. Qualifying securities must have at least a one-year remaining term to final maturity, a fixed coupon schedule and an investment grade rating.
The performance of any index is not indicative of the performance of any particular investment. Unless otherwise noted, index returns reflect the reinvestment of income dividends and capital gains, if any, but do not reflect fees, brokerage commissions or other expenses of investing. Investors may not make direct investments into any index.
Annualized Distribution Yield – The distribution yield reflects actual distributions made to shareholders. The annualized distribution yield is calculated by summing the last 30 days of income at a given month end and annualizing to a 360-day year. The result is divided by the ending maximum offering price or net asset value.
Bond Credit Ratings (Credit Quality) – A bond credit rating assesses the financial ability of a debt issuer to make timely payments of principal and interest. Ratings of AAA (the highest), AA, A, and BBB are investment-grade quality. Ratings of BB, B, CCC, CC, C and D (the lowest) are considered below investment grade, speculative grade, or junk bonds.
Insured Bonds – Individual bonds are sometimes insured by private companies. The insurance guarantees the payment of principal and interest on a bond issue if the issuer defaults. Mutual funds are not insured, even if the underlying bonds are insured.
Core Personal Consumption Expenditure Index (Core PCE) – Core Personal Consumption Expenditure Index is a measure of the Personal Consumption Expenditure Index that excludes the more volatile and seasonal food and energy prices.
Credit Spread/Quality Spread – The difference between the yields of securities with different credit qualities.
Effective Duration – A bond’s sensitivity to interest rates, incorporating the embedded option features, such as call provisions. Bonds with longer durations experience greater price volatility than bonds with shorter durations.
Fed Funds Rate – The interest rate at which a depository institution lends immediately available funds (balances at the Federal Reserve) to another depository institution overnight.
General Obligation Bond (GO) – A municipal bond backed by the credit and “taxing power” of the issuing jurisdiction rather than the revenue from a given project.
Laddering – Laddering involves building a portfolio of bonds with staggered maturities so that a portion matures each year. Money that comes in from maturing bonds is typically invested in bonds with longer maturities at the far end of the portfolio.
Revenue Bond – A bond on which the debt service is payable solely from the revenue generated from the operation of the project being financed or a category of facilities, or from other non-tax sources.
Yield Curve – A line that plots the interest rates, at a set point in time, of bonds having equal credit quality, but differing maturity dates.
6 Semi-Annual Report
| | |
| Fund Summary | | |
| |
Thornburg New York Intermediate Municipal Fund | | March 31, 2017 (Unaudited) |
OBJECTIVES AND STRATEGIES
The Fund’s primary investment objective is to obtain as high a level of current income exempt from federal, New York State and New York City individual income taxes as is consistent, in the view of the Fund’s investment advisor, with preservation of capital.
The secondary goal of the Fund is to reduce expected changes in its share price compared to long-term bond portfolios.
The Fund offers New York investors double (or for New York City residents triple) tax-free yields in a laddered municipal bond portfolio with a dollar-weighted average maturity of normally three to 10 years (may be subject to Alternative Minimum Tax). Laddering involves building a portfolio of bonds with staggered maturities so that a portion of the portfolio matures each year. Cash from maturing bonds, if not needed for other purposes, is typically invested in bonds with longer maturities at the far end of the ladder. We regard the strategy as a good compromise for managing different types of risk.
KEY PORTFOLIO ATTRIBUTES
| | | | |
Number of Bonds | | | 62 | |
| |
Effective Duration | | | 4.3 Yrs | |
| |
Average Maturity | | | 7.3 Yrs | |
LONG-TERM STABILITY OF PRINCIPAL
Net Asset Value History of A Shares
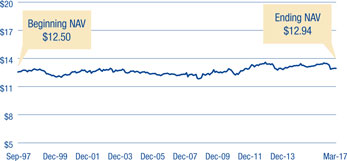
SECURITY CREDIT RATINGS
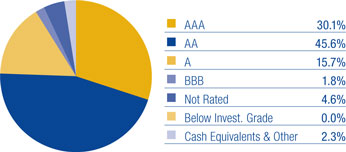
A bond credit rating assesses the financial ability of a debt issuer to make timely payments of principal and interest. Ratings of AAA (the highest), AA, A, and BBB are investment-grade quality. Ratings of BB, B, CCC, CC, C and D (the lowest) are considered below investment grade, speculative grade, or junk bonds. Credit quality ratings for Thornburg’s municipal portfolios used the highest rating available from either Standard & Poor’s or Moody’s Investors Service.
PORTFOLIO LADDER

Percent of portfolio maturing in each year. Cash includes cash equivalents and other.
There is no guarantee that the Fund will meet its investment objectives.
All data is subject to change. Charts may not add up to 100% due to rounding.
Semi-Annual Report 7
| | |
| Schedule of Investments | | |
| |
Thornburg New York Intermediate Municipal Fund | | March 31, 2017 (Unaudited) |
| | | | | | | | | | |
ISSUER-DESCRIPTION | | CREDIT RATING†
S&P/ MOODY’S | | PRINCIPAL
AMOUNT | | | VALUE | |
City of New York GO, 5.00% due 8/1/2025 (City Budget Financial Management) | | AA/Aa2 | | $ | 400,000 | | | $ | 405,368 | |
City of New York GO, 5.00% due 8/1/2030 (City Budget Financial Management) | | AA/Aa2 | | | 1,000,000 | | | | 1,148,550 | |
City of New York GO, 0.95% due 4/1/2042 put 4/3/2017 (City Budget Financial Management; LOC: Mizuho Bank, Ltd.) (daily demand notes) | | AA+/Aa1 | | | 1,200,000 | | | | 1,200,000 | |
County of Nassau GO, 5.00% due 4/1/2026 (Insured: BAM) | | AA/NR | | | 1,000,000 | | | | 1,144,500 | |
Dutchess County Local Development Corp., 5.00% due 7/1/2021 (Health Quest Systems, Inc.; Insured: AGM) | | AA/A2 | | | 535,000 | | | | 590,758 | |
Dutchess County Local Development Corp., 5.00% due 7/1/2022 (Health Quest Systems, Inc.; Insured: AGM) | | AA/A2 | | | 510,000 | | | | 560,526 | |
Erie County Industrial Development Agency, 5.25% due 5/1/2025 pre-refunded 5/1/2019 (Buffalo City School District) | | AA/Aa2 | | | 1,000,000 | | | | 1,085,310 | |
Government of Guam, 5.375% due 12/1/2024 pre-refunded 12/1/2019 (Layon Solid Waste Disposal Facility) | | BBB+/NR | | | 1,000,000 | | | | 1,106,490 | |
Government of Guam, 5.00% due 11/15/2033 (Various Capital Projects) | | A/NR | | | 2,000,000 | | | | 2,101,340 | |
Guam Waterworks Authority, 5.00% due 7/1/2028 (Water and Wastewater System) | | A-/Baa2 | | | 500,000 | | | | 548,070 | |
Hempstead Town Local Development Corp., 5.00% due 7/1/2028 (Hofstra University) | | A/A2 | | | 500,000 | | | | 554,450 | |
Long Island Power Authority, 5.25% due 9/1/2029 (Electric System Capital Improvements) | | AA/A3 | | | 645,000 | | | | 773,232 | |
Metropolitan Transportation Authority, 6.25% due 11/15/2023 pre-refunded 11/15/2018 | | NR/NR | | | 800,000 | | | | 867,576 | |
Metropolitan Transportation Authority, 6.25% due 11/15/2023 pre-refunded 11/15/2018 | | NR/NR | | | 10,000 | | | | 10,845 | |
Metropolitan Transportation Authority, 6.25% due 11/15/2023 | | AA-/A1 | | | 190,000 | | | | 206,042 | |
Monroe County Industrial Development Corp., 5.00% due 1/15/2028 (Monroe Community College Association, Inc.; Insured: AGM) | | AA/A2 | | | 250,000 | | | | 283,570 | |
Monroe County Industrial Development Corp., 5.00% due 1/15/2029 (Monroe Community College Association, Inc.; Insured: AGM) | | AA/A2 | | | 300,000 | | | | 338,505 | |
Nassau County IDA, 4.75% due 3/1/2026 pre-refunded 3/1/2020 (New York Institute of Technology) | | BBB+/Baa2 | | | 1,000,000 | | | | 1,099,130 | |
Nassau County Sewer & Storm Water Finance Authority, 5.00% due 10/1/2021 (Sewerage and Storm Water Resource Facilities) | | AAA/Aa3 | | | 275,000 | | | | 317,831 | |
Nassau County Sewer & Storm Water Finance Authority, 5.00% due 10/1/2028 (Sewerage and Storm Water Resource Facilities) | | AAA/Aa3 | | | 400,000 | | | | 472,048 | |
Nassau County Sewer & Storm Water Finance Authority, 5.00% due 10/1/2031 (Sewerage and Storm Water Resource Facilities) | | AAA/Aa3 | | | 1,000,000 | | | | 1,162,580 | |
New York City Health and Hospital Corp. GO, 5.00% due 2/15/2020 (Healthcare Facilities Improvements) | | A+/Aa3 | | | 770,000 | | | | 850,804 | |
New York City Health and Hospitals Corp. GO, 5.00% due 2/15/2025 (Healthcare Facilities Improvements) | | A+/Aa3 | | | 1,000,000 | | | | 1,085,250 | |
New York City Transitional Finance Authority, 5.00% due 1/15/2020 (Educational Facilities) (State Aid Withholding) | | AA/Aa2 | | | 1,000,000 | | | | 1,067,870 | |
New York City Trust for Cultural Resources, 5.25% due 12/1/2018 (Lincoln Center for the Performing Arts) (ETM) | | A+/A2 | | | 175,000 | | | | 187,275 | |
New York Municipal Bond Bank Agency, 5.00% due 4/15/2018 (Insured: AGM) | | AA/A2 | | | 1,000,000 | | | | 1,040,350 | |
New York State Dormitory Authority, 5.00% due 10/1/2018 (School District Financing Program; Insured: AGM) | | AA/Aa3 | | | 475,000 | | | | 487,816 | |
New York State Dormitory Authority, 5.25% due 10/1/2018 (School District Financing Program; Insured: AGM) | | AA/Aa3 | | | 775,000 | | | | 824,212 | |
New York State Dormitory Authority, 5.00% due 7/1/2020 (NYSARC, Inc. Developmental Disability Programs) | | NR/Aa2 | | | 1,175,000 | | | | 1,304,555 | |
New York State Dormitory Authority, 5.25% due 7/1/2022 (St. John’s University; Insured: Natl-Re) | | AA-/A3 | | | 1,000,000 | | | | 1,174,010 | |
New York State Dormitory Authority, 5.00% due 1/15/2023 (Municipal Health Facilities) | | AA-/Aa3 | | | 1,000,000 | | | | 1,031,700 | |
New York State Dormitory Authority, 5.00% due 10/1/2023 (School District Financing Program) (State Aid Withholding) | | AA-/NR | | | 575,000 | | | | 679,845 | |
New York State Dormitory Authority, 5.00% due 10/1/2023 pre-refunded 10/1/2017 (School District Financing Program; Insured: AGM) (State Aid Withholding) | | AA/A2 | | | 400,000 | | | | 408,548 | |
New York State Dormitory Authority, 5.00% due 7/1/2024 (Bishop Henry B. Hucles Nursing Home; Insured: SONYMA) | | NR/Aa1 | | | 1,000,000 | | | | 1,002,270 | |
New York State Dormitory Authority, 5.00% due 7/1/2024 (Miriam Osborn Memorial Home Assoc.) | | NR/NR | | | 1,540,000 | | | | 1,625,408 | |
New York State Dormitory Authority, 5.00% due 10/1/2024 (School District Financing Program; Insured: AGM) (State Aid Withholding) | | AA/Aa3 | | | 1,000,000 | | | | 1,146,930 | |
New York State Dormitory Authority, 5.00% due 7/1/2025 (Miriam Osborn Memorial Home Assoc.) | | NR/NR | | | 1,105,000 | | | | 1,160,327 | |
New York State Dormitory Authority, 5.00% due 7/1/2027 (Columbia University Teachers College) | | A+/A1 | | | 750,000 | | | | 843,270 | |
New York State Dormitory Authority, 5.25% due 7/1/2027 (Health Quest Systems; Insured: AGM) | | AA/A3 | | | 500,000 | | | | 505,210 | |
New York State Dormitory Authority, 5.00% due 12/15/2027 (Metropolitan Transportation Authority & State Urban | | | | | | | | | | |
Development Corp.) | | AAA/Aa1 | | | 2,500,000 | | | | 2,888,725 | |
New York State Dormitory Authority, 5.00% due 10/1/2028 (School District Financing Program; Insured: AGM) | | AA/NR | | | 200,000 | | | | 233,926 | |
New York State Dormitory Authority, 5.25% due 5/1/2030 pre-refunded 5/1/2019 (North Shore Long Island Jewish Medical) | | A-/A3 | | | 1,000,000 | | | | 1,085,310 | |
New York State Thruway Authority, 5.00% due 5/1/2019 (New NY Bridge) | | A-/A3 | | | 2,000,000 | | | | 2,156,320 | |
New York State Thruway Authority, 5.00% due 4/1/2022 pre-refunded 10/01/17 (Multi-Year Highway and Bridge Capital Program) | | AA/NR | | | 1,000,000 | | | | 1,021,170 | |
New York State Urban Development Corp., 5.25% due 1/1/2021 | | AA/NR | | | 1,000,000 | | | | 1,076,070 | |
Onondaga Civic Development Corp., 5.00% due 7/1/2021 (Le Moyne College) | | NR/Baa2 | | | 1,000,000 | | | | 1,083,720 | |
Onondaga Civic Development Corp., 5.50% due 12/1/2031 (State University of New York Upstate Medical University) | | A+/NR | | | 1,000,000 | | | | 1,144,490 | |
Port Authority New York & New Jersey, 5.00% due 8/15/2022 (Insured: AGM) | | AA/Aa3 | | | 1,000,000 | | | | 1,015,820 | |
Sales Tax Asset Receivable Corp., 5.00% due 10/15/2029 (New York Local Government Assistance Corp.) | | AAA/Aa1 | | | 250,000 | | | | 294,858 | |
Sales Tax Asset Receivable Corp., 5.00% due 10/15/2030 (New York Local Government Assistance Corp.) | | AAA/Aa1 | | | 1,000,000 | | | | 1,176,370 | |
Sales Tax Asset Receivable Corp., 5.00% due 10/15/2031 (New York Local Government Assistance Corp.) | | AAA/Aa1 | | | 1,000,000 | | | | 1,171,550 | |
Syracuse Industrial Development Agency, 5.25% due 5/1/2026 (Syracuse City School District) | | AA/Aa2 | | | 2,150,000 | | | | 2,440,443 | |
Tobacco Settlement Asset Securitization Corp., 5.00% due 6/1/2022 | | A/NR | | | 1,000,000 | | | | 1,133,140 | |
Town of Amherst Development Corp., 5.00% due 10/1/2020 (University at Buffalo Foundation Facility-Student Housing; Insured: AGM) | | AA/A2 | | | 1,000,000 | | | | 1,107,530 | |
8 Semi-Annual Report
| | |
| Schedule of Investments, Continued | | |
| |
Thornburg New York Intermediate Municipal Fund | | March 31, 2017 (Unaudited) |
| | | | | | | | | | | | |
ISSUER-DESCRIPTION | | CREDIT RATING†
S&P/ MOODY’S | | | PRINCIPAL
AMOUNT | | | VALUE | |
Triborough Bridge & Tunnel Authority GO, 5.00% due 11/15/2025 pre-refunded 11/15/2017 (MTA Bridges and Tunnels) | | | AA-/Aa3 | | | $ | 1,410,000 | | | $ | 1,446,900 | |
Triborough Bridge & Tunnel Authority GO, 5.00% due 11/15/2028 (MTA Bridges and Tunnels) | | | AA-/Aa3 | | | | 1,000,000 | | | | 1,161,980 | |
Triborough Bridge & Tunnel Authority GO, 5.00% due 11/15/2029 (MTA Bridges and Tunnels) | | | AA-/Aa3 | | | | 1,000,000 | | | | 1,152,200 | |
United Nations Development Corp., 5.00% due 7/1/2019 (One, Two and Three U.N. Plaza) | | | NR/A1 | | | | 230,000 | | | | 249,019 | |
United Nations Development Corp., 5.00% due 7/1/2025 (One, Two and Three U.N. Plaza) | | | NR/A1 | | | | 710,000 | | | | 766,402 | |
Utility Debt Securitization Authority, 5.00% due 12/15/2029 (Long Island Power Authority-Electric Service) | | | AAA/Aaa | | | | 1,000,000 | | | | 1,168,420 | |
Utility Debt Securitization Authority, 5.00% due 12/15/2030 (Long Island Power Authority-Electric Service) | | | AAA/Aaa | | | | 1,000,000 | | | | 1,164,220 | |
West Seneca Central School District GO, 5.00% due 11/15/2023 (Facilities Improvements; Insured: BAM) (State Aid Withholding) | | | AA/A2 | | | | 1,300,000 | | | | 1,533,467 | |
| | | | | | | | | | | | |
TOTAL INVESTMENTS — 98.20% (Cost $56,949,523) | | | | | | | | | | $ | 60,074,421 | |
OTHER ASSETS LESS LIABILITIES — 1.80% | | | | | | | | | | | 1,101,783 | |
| | | | | | | | | | | | |
NET ASSETS — 100.00% | | | | | | | | | | $ | 61,176,204 | |
| | | | | | | | | | | | |
Footnote Legend
| † | Credit ratings are unaudited. Rating changes may have occurred subsequent to the reporting period end. Bonds issued with a maturity of one year or less are assigned Moody’s ratings from MIG-1 to MIG-4 and Standard and Poor’s ratings from SP-1+ to SP-3 with MIG-1 and SP-1+ being the strongest ratings. |
Portfolio Abbreviations
To simplify the listings of securities, abbreviations are used per the table below:
| | |
| AGM | | Insured by Assured Guaranty Municipal Corp. |
| BAM | | Insured by Build America Mutual Insurance Co. |
| ETM | | Escrowed to Maturity |
| GO | | General Obligation |
| IDA | | Industrial Development Authority |
| Natl-Re | | Insured by National Public Finance Guarantee Corp. |
| SONYMA | | State of New York Mortgage Authority |
See notes to financial statements.
Semi-Annual Report 9
| | |
| Statement of Assets and Liabilities | | |
| |
Thornburg New York Intermediate Municipal Fund | | March 31, 2017 (Unaudited) |
| | | | |
ASSETS | | | | |
Investments at value (cost $56,949,523) (Note 3) | | $ | 60,074,421 | |
Cash | | | 208,328 | |
Receivable for investments sold | | | 205,000 | |
Receivable for fund shares sold | | | 205,822 | |
Interest receivable | | | 881,195 | |
Prepaid expenses and other assets | | | 215 | |
| | | | |
Total Assets | | | 61,574,981 | |
| | | | |
| |
LIABILITIES | | | | |
Payable for fund shares redeemed | | | 301,972 | |
Payable to investment advisor and other affiliates (Note 4) | | | 33,526 | |
Accounts payable and accrued expenses | | | 43,335 | |
Dividends payable | | | 19,944 | |
| | | | |
Total Liabilities | | | 398,777 | |
| | | | |
| |
NET ASSETS | | $ | 61,176,204 | |
| | | | |
NET ASSETS CONSIST OF | | | | |
Distribution in excess of net investment income | | $ | (16,847 | ) |
Net unrealized appreciation on investments | | | 3,124,898 | |
Accumulated net realized gain (loss) | | | (660,190 | ) |
Net capital paid in on shares of beneficial interest | | | 58,728,343 | |
| | | | |
| |
| | $ | 61,176,204 | |
| | | | |
NET ASSET VALUE | | | | |
| |
Class A Shares: | | | | |
Net asset value and redemption price per share ($38,055,744 applicable to 2,940,422 shares of beneficial interest outstanding - Note 5) | | $ | 12.94 | |
Maximum sales charge, 2.00% of offering price | | | 0.26 | |
| | | | |
Maximum offering price per share | | $ | 13.20 | |
| | | | |
| |
Class I Shares: | | | | |
Net asset value, offering and redemption price per share ($23,120,460 applicable to 1,786,461 shares of beneficial interest outstanding - Note 5) | | $ | 12.94 | |
| | | | |
See notes to financial statements.
10 Semi-Annual Report
| | |
| Statement of Operations | | |
| |
Thornburg New York Intermediate Municipal Fund | | Six Months Ended March 31, 2017 (Unaudited) |
| | | | |
INVESTMENT INCOME | | | | |
Interest income (net of premium amortized of $303,551) | | $ | 1,163,190 | |
| | | | |
| |
EXPENSES | | | | |
Investment advisory fees (Note 4) | | | 168,037 | |
Administration fees (Note 4) | | | | |
Class A Shares | | | 25,921 | |
Class I Shares | | | 6,435 | |
Distribution and service fees (Note 4) | | | | |
Class A Shares | | | 51,842 | |
Transfer agent fees | | | | |
Class A Shares | | | 14,511 | |
Class I Shares | | | 13,066 | |
Registration and filing fees | | | | |
Class A Shares | | | 83 | |
Class I Shares | | | 83 | |
Custodian fees (Note 2) | | | 14,745 | |
Professional fees | | | 21,099 | |
Accounting fees (Note 4) | | | 1,213 | |
Trustee fees | | | 1,546 | |
Other expenses | | | 9,402 | |
| | | | |
Total Expenses | | | 327,983 | |
Less: | | | | |
Expenses reimbursed by investment advisor (Note 4) | | | (36,585 | ) |
| | | | |
Net Expenses | | | 291,398 | |
| | | | |
Net Investment Income | | | 871,792 | |
| | | | |
REALIZED AND UNREALIZED GAIN (LOSS) | | | | |
Net realized gain (loss) on investments | | | (167,322 | ) |
Net change in unrealized appreciation (depreciation) on investments | | | (2,506,644 | ) |
| | | | |
Net Realized and Unrealized Loss | | | (2,673,966 | ) |
| | | | |
Net Decrease in Net Assets Resulting from Operations | | $ | (1,802,174 | ) |
| | | | |
See notes to financial statements.
Semi-Annual Report 11
| | |
| Statements of Changes in Net Assets | | |
| |
Thornburg New York Intermediate Municipal Fund | | |
| | | | | | | | |
| | | SIX MONTHS ENDED
MARCH 31, 2017* | | | YEAR ENDED
SEPTEMBER 30, 2016 | |
INCREASE (DECREASE) IN NET ASSETS FROM | | | | | | | | |
| | |
OPERATIONS | | | | | | | | |
Net investment income | | $ | 871,792 | | | $ | 1,815,241 | |
Net realized gain (loss) on investments | | | (167,322 | ) | | | (13,529 | ) |
Net unrealized appreciation (depreciation) on investments | | | (2,506,644 | ) | | | 1,336,245 | |
| | | | | | | | |
Net Increase (Decrease) in Net Assets Resulting from Operations | | | (1,802,174 | ) | | | 3,137,957 | |
| | |
DIVIDENDS TO SHAREHOLDERS | | | | | | | | |
From net investment income | | | | | | | | |
Class A Shares | | | (514,030 | ) | | | (1,033,774 | ) |
Class I Shares | | | (357,762 | ) | | | (781,467 | ) |
| | |
FUND SHARE TRANSACTIONS (NOTE 5) | | | | | | | | |
Class A Shares | | | (5,402,332 | ) | | | (5,647,817 | ) |
Class I Shares | | | (7,254,761 | ) | | | 745,159 | |
| | | | | | | | |
Net Decrease in Net Assets | | | (15,331,059 | ) | | | (3,579,942 | ) |
| | |
NET ASSETS | | | | | | | | |
Beginning of Period | | | 76,507,263 | | | | 80,087,205 | |
| | | | | | | | |
| | |
End of Period | | $ | 61,176,204 | | | $ | 76,507,263 | |
| | | | | | | | |
Distribution in excess of net investment income | | $ | (16,847 | ) | | $ | (16,847 | ) |
See notes to financial statements.
12 Semi-Annual Report
| | |
| Notes to Financial Statements | | |
| |
Thornburg New York Intermediate Municipal Fund | | March 31, 2017 (Unaudited) |
NOTE 1 – ORGANIZATION
Thornburg New York Intermediate Municipal Fund (the “Fund”) is a non-diversified series of Thornburg Investment Trust (the “Trust”). The Trust is organized as a Massachusetts business trust under a Declaration of Trust dated June 3, 1987 and is registered as a diversified, open-end management investment company under the Investment Company Act of 1940, as amended. The Fund is currently one of twenty-one separate series of the Trust. Each series is considered to be a separate entity for financial reporting and tax purposes and bears expenses directly attributable to it. The Fund’s primary investment objective is to obtain as high a level of current income exempt from federal, New York State, and New York City individual income tax as is consistent, in the view of Thornburg Investment Management, Inc., the Trust’s investment advisor (the “Advisor”), with the preservation of capital. The Fund’s secondary objective is to reduce expected changes in its share price compared to long-term bond portfolios. The Fund will invest primarily in municipal obligations within the state of New York.
The Fund currently offers two classes of shares of beneficial interest: Class A and Institutional Class (“Class I”) shares. Each class of shares of the Fund represents an interest in the same portfolio of investments, except that (i) Class A shares are sold subject to a front-end sales charge collected at the time the shares are purchased and bear a service fee and (ii) Class I shares are sold at net asset value without a sales charge at the time of purchase and may be subject to a service fee, and (iii) the respective classes may have different reinvestment privileges and conversion rights. Additionally, the Fund may allocate among its classes certain expenses, to the extent allocable to specific classes, including transfer agent fees, government registration fees, certain printing and postage costs, and administrative and legal expenses. Currently, class specific expenses of the Fund are limited to service and distribution fees, administration fees, and certain registration and transfer agent expenses.
The following is a summary of significant accounting policies followed by the Fund in the preparation of its financial statements. The Fund prepares its financial statements in conformity with United States generally accepted accounting principles (“GAAP”), including investment company accounting and reporting guidance in the Financial Accounting Standards Board (the “FASB”) Accounting Standard Codification Topic 946.
NOTE 2 – SIGNIFICANT ACCOUNTING POLICIES
Security Valuation: All investments in securities held by the Fund are valued as described in Note 3.
Allocation of Income, Gains, Losses and Expenses: Net investment income (other than class specific expenses) and realized and unrealized gains and losses are allocated daily to each class of shares based upon the relative net asset value of outstanding shares (or the value of the dividend-eligible shares, as appropriate) of each class of shares at the beginning of the day (after adjusting for the current capital shares activity of the respective class). Expenses common to all Funds are allocated among the Funds comprising the Trust based upon their relative net asset values or other appropriate allocation methods. Operating expenses directly attributable to a specific class are charged against the operating income of that class.
Dividends and Distributions to Shareholders: Dividends and distributions to shareholders, which are determined in accordance with federal income tax regulations and may differ from GAAP, are recorded on the ex-dividend date. Ordinary income distributions, if any, are declared daily and paid monthly. Capital gain distributions, if any, are declared and paid annually and more often if deemed necessary by the Advisor. Dividends are paid and are reinvested in additional shares of the Fund at net asset value per share at the close of business on the ex-dividend date, or at the shareholder’s option, paid in cash.
Investment Income: Interest income is accrued as earned. Premiums and discounts are amortized and accreted, respectively, to call dates or maturity dates using the effective yield method of the respective investments. These amounts are included in Interest income on the Statement of Operations.
Custodian Fees: Custodian fees disclosed in the Statement of Operations may include interest expenses incurred by the Fund on any cash overdrafts of its custodian account during the period. Such cash overdrafts may result from the effects of failed trades in portfolio securities and from cash outflows resulting from unanticipated shareholder redemption activity. The Fund pays interest to its custodian on any such cash overdraft at a rate equal to 2.50% of the overdraft amount in excess of $50,000.
Investment Transactions: Investment transactions are accounted for on a trade date basis. Realized gains and losses from the sale of investments are recorded on an identified cost basis.
When-Issued and Delayed Delivery Transactions: The Fund may engage in when-issued or delayed delivery transactions. To the extent the Fund engages in such transactions, it will do so for the purpose of acquiring portfolio investments consistent with the Fund’s investment objectives and not for the purpose of investment leverage or to speculate on interest rate or market changes. At the time the Fund makes a commitment to purchase an investment on a when-issued or delayed delivery basis, the Fund will record the transaction and reflect the value in determining its net asset value. When effecting such transactions, assets of an amount sufficient to make payment
Semi-Annual Report 13
| | |
| Notes to Financial Statements, Continued | | |
| |
Thornburg New York Intermediate Municipal Fund | | March 31, 2017 (Unaudited) |
for the portfolio investments to be purchased will be segregated on the Fund’s records on the trade date. Investments purchased on a when-issued or delayed delivery basis do not earn interest until the settlement date.
Guarantees and Indemnifications: Under the Trust’s organizational documents (and under separate agreements with the independent Trustees), its officers and Trustees are provided with an indemnification against certain liabilities arising out of the performance of their duties to the Fund. In the normal course of business the Trust may also enter into contracts with service providers that contain general indemnifications. The Trust’s maximum exposure under these arrangements is unknown. However, based on experience, the Trust expects the risk of loss to be remote.
Use of Estimates: The preparation of financial statements in conformity with GAAP requires management to make estimates and assumptions that affect the reported amounts of assets and liabilities and disclosure of contingent assets and liabilities at the date of the financial statements and the reported amounts of increases (decreases) in net assets from operations during the reporting period. Actual results could differ from those estimates.
Federal Income Taxes: It is the policy of the Trust to comply with the provisions of the Internal Revenue Code applicable to regulated investment companies and to distribute to shareholders substantially all investment company taxable income including net realized gains on investments (if any), and tax exempt income of the Fund. Therefore, no provision for federal income or excise tax is required.
The Fund files income tax returns in United States federal and applicable state jurisdictions. The statute of limitations on the Fund’s tax return filings generally remains open for the three years following a return’s filing date. The Fund has analyzed its tax positions taken on Federal income tax returns for all open tax years and has concluded that no provision for income tax is required in the financial statements.
At March 31, 2017, information on the tax components of capital was as follows:
| | | | |
Cost of investments for tax purposes | | $ | 56,949,523 | |
| | | | |
| |
Gross unrealized appreciation on a tax basis | | $ | 3,200,025 | |
Gross unrealized depreciation on a tax basis | | | (75,127 | ) |
| | | | |
| |
Net unrealized appreciation (depreciation) on investments (tax basis) | | $ | 3,124,898 | |
| | | | |
At March 31, 2017, the Fund had deferred tax basis capital losses occurring subsequent to October 31, 2015 through September 30, 2016 of $13,529. For tax purposes, such losses will be recognized in the year ending September 30, 2017.
At March 31, 2017, the Fund had cumulative tax basis capital losses of $479,338, (of which $127,505 are short-term and $351,833 are long-term) generated after September 30, 2011, which may be carried forward to offset future capital gains. To the extent such carry-forwards are used, capital gain distributions may be reduced to the extent provided by regulations. Such capital loss carryforwards do not expire.
NOTE 3 – SECURITY VALUATION
Valuation of the Fund’s portfolio investment securities is performed in accordance with policies and procedures adopted by and under the oversight of the Trustees.
The Trustees of the Trust have appointed Thornburg Investment Management, Inc., the Trust’s investment advisor (the “Advisor”), to assist the Trustees in obtaining market values for portfolio investments, evaluate and monitor professional pricing service providers appointed by the Trustees’ Audit Committee (the “Audit Committee”) to assist in determining fair values for portfolio investments, assist in calculating fair values for portfolio investments in certain circumstances, and to perform other functions in connection with the valuation of investments. The Advisor acts through its Valuation and Pricing Committee (the “Committee”) and other employees of the Advisor. The Committee regularly reviews its own valuation calculations, as well as the valuations, valuation techniques and services furnished by pricing service providers, considers circumstances which may require valuation calculations by the Committee, and reviews previous valuation calculations. The Committee reports to the Audit Committee on the Committee’s activities, the performance of pricing service providers, and other matters relating to valuation of portfolio investments.
In those instances when the Committee assists in calculating a fair value for a portfolio investment, the Committee seeks to determine the price that the Fund would reasonably expect to receive upon a sale of the investment in an orderly transaction between market participants on the valuation date. The Committee customarily utilizes quotations from securities broker dealers in calculating valuations, but also may utilize prices obtained from pricing service providers or other methods approved by the Audit Committee. Because fair values calculated by the Committee are estimates, the calculation of a value for an investment may differ from the price that would be realized by the Fund upon a sale of the investment, and the difference could be material to the Fund’s financial statements. The
14 Semi-Annual Report
| | |
| Notes to Financial Statements, Continued | | |
| |
Thornburg New York Intermediate Municipal Fund | | March 31, 2017 (Unaudited) |
Committee’s calculation of a fair value for an investment may also differ from the prices obtained by other persons (including other mutual funds) for the investment.
Valuation of Securities: Debt obligations held by the Fund which are not listed or traded on exchanges or for which no reported market exists are ordinarily valued at the valuation obtained from a pricing service provider approved by the Audit Committee.
In any case when a pricing service provider fails to provide a valuation for a debt obligation held by the Fund, the Committee calculates a fair value for the obligation using alternative methods under procedures approved by the Audit Committee. Additionally, in cases when management believes that a valuation obtained from a pricing service provider merits review for significant reasons, the Committee decides whether or not to use the valuation calculated by the pricing service provider or to use an alternative method approved by the Audit Committee to calculate a fair value for the obligation.
Valuation Hierarchy: The Fund categorizes its investments based upon the inputs used in valuing those investments, according to a three-level hierarchy established in guidance from FASB. Categorization of investments using this hierarchy is intended by the FASB to maximize the use of observable inputs in valuing investments and minimize the use of unobservable inputs by requiring that the most observable inputs be used when available. Observable inputs are those that market participants would use in valuing an investment based on available market information. Unobservable inputs are those that reflect assumptions about the information market participants would use in valuing an investment. An investment’s level within the hierarchy is based on the lowest level input that is deemed significant to the valuation. The methodologies and inputs used to value investments are not necessarily indications of the risk or liquidity associated with those investments.
Various inputs are used in calculating valuations for the Fund’s investments. These inputs are generally summarized according to the three-level hierarchy below:
Level 1: Quoted prices in active markets for identical investments.
Level 2: Other direct or indirect significant observable inputs (including quoted prices for similar investments in active markets and other observable inputs, such as interest rates, prepayment rates, credit risk, etc.).
Level 3: Significant unobservable inputs (including the Committee’s own assumptions in calculating the fair values of investments).
Valuations for debt obligations held by the Fund are typically calculated by pricing service providers approved by the Audit Committee and are characterized as Level 2 within the valuation hierarchy.
In a limited number of cases the Committee calculates a fair value for investments using broker quotations or other methods approved by the Audit Committee. When the Committee uses a single broker quotation to calculate a fair value for an investment without other significant observable inputs, or if a fair value is calculated using other significant inputs that are considered unobservable, the investment is characterized as Level 3 within the hierarchy. Other significant unobservable inputs used to calculate a fair value in these instances might include an income-based valuation approach which considers discounted anticipated future cash flows from the investment, and application of discounts due to the nature or duration of any restrictions on the disposition of the investment.
Valuations based upon the use of inputs from Levels 1, 2 or 3 may not represent the actual price received upon the disposition of an investment, and the Fund may receive a price that is lower than the valuation based upon these inputs when it sells the investment.
The following table displays a summary of the fair value hierarchy measurements of the Fund’s investments as of March 31, 2017. In any instance when valuation inputs from more than one level are used to determine the fair value of a specific investment, the investment is placed in the level of the table based upon the lowest level input that is significant in determining the fair value of the investment:
| | | | | | | | | | | | | | | | |
| | | FAIR VALUE MEASUREMENTS AT MARCH 31, 2017 | |
| | | TOTAL | | | LEVEL 1 | | | LEVEL 2 | | | LEVEL 3 | |
Assets | | | | | | | | | | | | | | | | |
Investments in Securities | | | | | | | | | | | | | | | | |
Municipal Bonds | | $ | 60,074,421 | | | $ | — | | | $ | 60,074,421 | | | $ | — | |
| | | | | | | | | | | | | | | | |
Total Investments in Securities | | $ | 60,074,421 | | | $ | — | | | $ | 60,074,421 | | | $ | — | |
In accordance with the guidance prescribed in Accounting Standards Update No. 2011-04, it is the policy of the Fund to recognize transfers between levels and the underlying events which caused the movement. The Fund recognized no transfers between levels for the six months ended March 31, 2017.
Semi-Annual Report 15
| | |
| Notes to Financial Statements, Continued | | |
| |
Thornburg New York Intermediate Municipal Fund | | March 31, 2017 (Unaudited) |
NOTE 4 – INVESTMENT ADVISORY FEE AND OTHER TRANSACTIONS WITH AFFILIATES
Pursuant to an investment advisory agreement, the Advisor serves as the investment advisor and performs services for the Fund for which the fees are payable at the end of each month. Under the investment advisory agreement, the Fund pays the Advisor a management fee based on the daily net assets of the Fund at an annual rate as shown in the following table:
Management Fee Schedule
| | | | |
DAILY NET ASSETS | | FEE RATE | |
Up to $500 million | | | 0.500 | % |
Next $500 million | | | 0.450 | |
Next $500 million | | | 0.400 | |
Next $500 million | | | 0.350 | |
Over $2 billion | | | 0.275 | |
The Fund’s effective management fee for the six months ended March 31, 2017 was 0.50% of the Fund’s average net assets.
The Fund pays to the Advisor the costs of personnel who perform certain accounting services for the Fund. For the six months ended March 31, 2017 the Fund paid $1,213 to the Advisor for these accounting services. The Trust has also entered into administrative service agreements with the Advisor, whereby the Advisor will perform certain administrative services related to each class of the Fund’s shares, and for which fees will be payable at an annual rate of up to .125 of 1% per annum of the average daily net assets attributable to each class of shares. Total administrative service fees incurred by each class of shares of the Fund for the six months ended March 31, 2017, are set forth in the Statement of Operations.
The Trust has an underwriting agreement with Thornburg Securities Corporation (the “Distributor”), an affiliate of the Advisor, which acts as the distributor of the Fund’s shares. For the six months ended March 31, 2017, the Distributor has advised the Fund that it earned net commissions aggregating $15 from the sale of Class A shares.
Pursuant to a service plan under Rule 12b-1 of the Investment Company Act of 1940, the Fund may pay to the Distributor or securities dealers and other financial institutions at the Distributor’s direction an amount not to exceed .25 of 1% per annum of the average daily net assets attributable to Class A shares of the Fund to obtain various shareholder and distribution related services. For the six months ended March 31, 2017, there were no 12b-1 service plan fees charged for Class I shares. The Advisor and the Distributor each may pay out of its own resources additional expenses for distribution of the Fund’s shares and shareholder services.
The Advisor and Distributor have contractually agreed to waive fees and reimburse expenses incurred by the Fund so that actual expenses of certain share classes do not exceed levels as specified in the Fund’s most recent prospectus. The agreement may be terminated by the Fund at any time, but may not be terminated by the Advisor or Distributor before April 10, 2018, unless the Advisor ceases to be the investment advisor to the Fund or the Distributor ceases to be the distributor of the Fund prior to that date. The Advisor and Distributor may recoup amounts waived or reimbursed during the fiscal year if actual expenses fall below the contractual limit during that year.
For the six months ended March 31, 2017, the Advisor contractually reimbursed certain class specific expenses, administrative fees, and distribution fees of $20,401 for Class A shares and $16,184 for Class I shares.
Certain officers and Trustees of the Trust are also officers or directors of the Advisor and Distributor. The compensation of independent Trustees is borne by the Trust.
The Fund may purchase or sell securities from, or to an affiliated fund, provided the affiliation is due solely to having a common investment advisor, common officers, or common trustees, and provided that all such transactions will comply with Rule 17a-7 under the 1940 Act. For the six months ended March 31, 2017, the Fund had transactions with affiliated funds of $1,026,217 in sales.
16 Semi-Annual Report
| | |
| Notes to Financial Statements, Continued | | |
| |
Thornburg New York Intermediate Municipal Fund | | March 31, 2017 (Unaudited) |
NOTE 5 – SHARES OF BENEFICIAL INTEREST
At March 31, 2017, there were an unlimited number of shares with no par value of beneficial interest authorized. Transactions in shares of beneficial interest were as follows:
| | | | | | | | | | | | | | | | |
| | | SIX MONTHS ENDED | | | YEAR ENDED | |
| | | MARCH 31, 2017 (UNAUDITED) | | | SEPTEMBER 30, 2016 (AUDITED) | |
| | | SHARES | | | AMOUNT | | | SHARES | | | AMOUNT | |
Class A Shares | | | | | | | | | | | | | | | | |
Shares sold | | | 159,293 | | | $ | 2,061,617 | | | | 249,737 | | | $ | 3,332,694 | |
Shares issued to shareholders in reinvestment of dividends | | | 30,622 | | | | 397,347 | | | | 60,467 | | | | 808,135 | |
Shares repurchased | | | (607,787 | ) | | | (7,861,296 | ) | | | (733,326 | ) | | | (9,788,646 | ) |
| | | | | | | | | | | | | | | | |
| | | | |
Net increase (decrease) | | | (417,872 | ) | | $ | (5,402,332 | ) | | | (423,122 | ) | | $ | (5,647,817 | ) |
| | | | | | | | | | | | | | | | |
Class I Shares | | | | | | | | | | | | | | | | |
Shares sold | | | 283,544 | | | $ | 3,673,274 | | | | 602,854 | | | $ | 8,053,470 | |
Shares issued to shareholders in reinvestment of dividends | | | 27,270 | | | | 353,999 | | | | 58,096 | | | | 776,695 | |
Shares repurchased | | | (874,543 | ) | | | (11,282,034 | ) | | | (605,034 | ) | | | (8,085,006 | ) |
| | | | | | | | | | | | | | | | |
| | | | |
Net increase (decrease) | | | (563,729 | ) | | $ | (7,254,761 | ) | | | 55,916 | | | $ | 745,159 | |
| | | | | | | | | | | | | | | | |
NOTE 6 – INVESTMENT TRANSACTIONS
For the six months ended March 31, 2017, the Fund had purchase and sale transactions of investments (excluding short-term investments) of $1,317,732 and $11,275,426, respectively.
OTHER NOTES
Risks: The Fund’s investments subject it to risks including, but not limited to, management risk, interest rate risk, credit risk, market and economic risk, liquidity risk, diversification risk, and the risk of investing mainly in the obligations primarily originating in a single state. Please see the Fund’s prospectus for a discussion of the risks associated with an investment in the Fund.
Subsequent Events: Fund management believes no events have occurred between March 31, 2017 and the date of issuance of the financial statements that require adjustment to or disclosure in the accompanying financial statements.
Semi-Annual Report 17
Financial Highlights
Thornburg New York Intermediate Municipal Fund
| | | | | | | | | | | | | | | | | | | | | | | | | | | | | | | | | | | | | | | | | | | | | | | | | | |
| | | PER SHARE PERFORMANCE (FOR A SHARE OUTSTANDING THROUGHOUT THE PERIOD) | | RATIOS TO AVERAGE NET ASSETS | | | SUPPLEMENTAL DATA | |
UNLESS
OTHERWISE
NOTED,
PERIODS
ARE
FISCAL
YEARS
ENDED
SEPT. 30, | | NET ASSET
VALUE
BEGINNING
OF PERIOD | | | NET
INVESTMENT
INCOME
(LOSS)+ | | NET
REALIZED &
UNREALIZED
GAIN (LOSS)
ON
INVESTMENTS | | | TOTAL FROM
INVESTMENT
OPERATIONS | | DIVIDENDS
FROM NET
INVESTMENT
INCOME | | | DIVIDENDS
FROM NET
REALIZED GAINS | | TOTAL
DIVIDENDS | | | NET
ASSET
VALUE
END
OF
PERIOD | | NET
INVESTMENT
INCOME
(LOSS)
(%) | | | EXPENSES,
AFTER
EXPENSE
REDUCTIONS
(%) | | | EXPENSES,
AFTER
EXPENSE
REDUCTIONS
AND
NET OF
CUSTODY
CREDITS
(%) | | | EXPENSES,
BEFORE
EXPENSE
REDUCTIONS
(%) | | | TOTAL
RETURN
(%)(a) | | PORTFOLIO
TURNOVER
RATE
(%)(a) | | | NET
ASSETS
AT END OF
PERIOD
(THOUSANDS) | |
CLASS A SHARES | | | | | | | | | | | | | | | | | | | | | | | | | | | | | | | | | | | | | | | | | | | | |
2017(b)(c) | | $ | 13.40 | | | 0.16 | | | (0.46 | ) | | (0.30) | | | (0.16 | ) | | — | | | (0.16 | ) | | $12.94 | | | 2.48 | (d) | | | 0.99 | (d) | | | 0.99 | (d) | | | 1.09 | (d) | | (2.23) | | | 2.05 | | | $ | 38,056 | |
2016(c) | | $ | 13.18 | | | 0.29 | | | 0.22 | | | 0.51 | | | (0.29 | ) | | — | | | (0.29 | ) | | $13.40 | | | 2.18 | | | | 0.96 | | | | 0.96 | | | | 1.03 | | | 3.91 | | | 7.02 | | | $ | 45,009 | |
2015(c) | | $ | 13.22 | | | 0.29 | | | (0.04 | ) | | 0.25 | | | (0.29 | ) | | — | | | (0.29 | ) | | $13.18 | | | 2.16 | | | | 0.98 | | | | 0.98 | | | | 1.05 | | | 1.87 | | | 7.72 | | | $ | 49,845 | |
2014(c) | | $ | 12.93 | | | 0.30 | | | 0.29 | | | 0.59 | | | (0.30 | ) | | — | | | (0.30 | ) | | $13.22 | | | 2.27 | | | | 0.99 | | | | 0.99 | | | | 1.05 | | | 4.59 | | | 14.12 | | | $ | 54,301 | |
2013(c) | | $ | 13.44 | | | 0.34 | | | (0.51 | ) | | (0.17) | | | (0.34 | ) | | — | | | (0.34 | ) | | $12.93 | | | 2.54 | | | | 0.99 | | | | 0.99 | | | | 1.05 | | | (1.32) | | | 11.31 | | | $ | 54,061 | |
2012(c) | | $ | 12.93 | | | 0.37 | | | 0.51 | | | 0.88 | | | (0.37 | ) | | — | | | (0.37 | ) | | $13.44 | | | 2.80 | | | | 0.99 | | | | 0.99 | | | | 1.05 | | | 6.90 | | | 13.37 | | | $ | 55,862 | |
CLASS I SHARES | | | | | | | | | | | | | | | | | | | | | | | | | | | | | | | | | | | | | | | | | | | | |
2017(b) | | $ | 13.40 | | | 0.18 | | | (0.46 | ) | | (0.28) | | | (0.18 | ) | | — | | | (0.18 | ) | | $12.94 | | | 2.78 | (d) | | | 0.67 | (d) | | | 0.67 | (d) | | | 0.79 | (d) | | (2.07) | | | 2.05 | | | $ | 23,120 | |
2016 | | $ | 13.18 | | | 0.33 | | | 0.22 | | | 0.55 | | | (0.33 | ) | | — | | | (0.33 | ) | | $13.40 | | | 2.51 | | | | 0.63 | | | | 0.63 | | | | 0.72 | | | 4.25 | | | 7.02 | | | $ | 31,498 | |
2015 | | $ | 13.22 | | | 0.33 | | | (0.04 | ) | | 0.29 | | | (0.33 | ) | | — | | | (0.33 | ) | | $13.18 | | | 2.47 | | | | 0.67 | | | | 0.67 | | | | 0.76 | | | 2.19 | | | 7.72 | | | $ | 30,242 | |
2014 | | $ | 12.93 | | | 0.33 | | | 0.30 | | | 0.63 | | | (0.34 | ) | | — | | | (0.34 | ) | | $13.22 | | | 2.57 | | | | 0.67 | | | | 0.67 | | | | 0.73 | | | 4.93 | | | 14.12 | | | $ | 23,922 | |
2013 | | $ | 13.44 | | | 0.38 | | | (0.51 | ) | | (0.13) | | | (0.38 | ) | | — | | | (0.38 | ) | | $12.93 | | | 2.86 | | | | 0.67 | | | | 0.67 | | | | 0.74 | | | (1.00) | | | 11.31 | | | $ | 7,060 | |
2012 | | $ | 12.92 | | | 0.41 | | | 0.52 | | | 0.93 | | | (0.41 | ) | | — | | | (0.41 | ) | | $13.44 | | | 3.12 | | | | 0.67 | | | | 0.67 | | | | 0.77 | | | 7.33 | | | 13.37 | | | $ | 4,707 | |
| (a) | Not annualized for periods less than one year. |
| (b) | Unaudited Six Month Period Ended March 31. |
| (c) | Sales loads are not reflected in computing total return. |
| + | Based on weighted average shares outstanding. |
See notes to financial statements.
| | | | |
| 18 Semi-Annual Report | | | | Semi-Annual Report 19 |
| | |
| Expense Example | | |
| |
Thornburg New York Intermediate Municipal Fund | | March 31, 2017 (Unaudited) |
As a shareholder of the Fund, you incur two types of costs:
| | (1) | transaction costs, including |
(a) sales charges (loads) on purchase payments, for Class A shares;
(b) a deferred sales charge on redemptions of any part or all of a purchase of $1 million of Class A shares within 12 months of purchase;
| | (2) | ongoing costs, including management fees; distribution and/or service (12b-1) fees; and other Fund expenses. |
This example is intended to help you understand your ongoing costs (in dollars) of investing in the Fund and to compare these costs with the ongoing costs of investing in other mutual funds.
The example is based on a $1,000 investment beginning on October 31, 2016, and held until March 31, 2017.
| | | | | | | | | | | | |
| | | BEGINNING
ACCOUNT VALUE
10/1/16 | | | ENDING
ACCOUNT VALUE
3/31/17 | | | EXPENSES PAID
DURING PERIOD†
10/1/16–3/31/17 | |
Class A Shares | | | | | | | | | | | | |
Actual | | $ | 1,000.00 | | | $ | 977.74 | | | $ | 4.88 | |
Hypothetical* | | $ | 1,000.00 | | | $ | 1,020.00 | | | $ | 4.99 | |
Class I Shares | | | | | | | | | | | | |
Actual | | $ | 1,000.00 | | | $ | 979.30 | | | $ | 3.30 | |
Hypothetical* | | $ | 1,000.00 | | | $ | 1,021.60 | | | $ | 3.37 | |
| † | Expenses are equal to the annualized expense ratio for each class (A: 0.99%; I: 0.67%) multiplied by the average account value over the period, multiplied by 182/365 to reflect the one-half year period. |
| * | Hypothetical assumes a rate of return of 5% per year before expenses. |
ACTUAL EXPENSES
For each class of shares, the first line of the accompanying table provides information about actual account values and actual expenses. You may use the information in this line, together with the amount you invested, to estimate the expenses that you paid over the period. Simply divide your account value by $1,000 (for example, an $8,600 account value divided by $1,000 = 8.6), then multiply the result by the number in the first line for your class of shares under the heading entitled “Expenses Paid During Period” to estimate the expenses you paid on your account during this period.
HYPOTHETICAL EXAMPLE FOR COMPARISON PURPOSES
For each class of shares, the second line of the accompanying table provides information about hypothetical account values and hypothetical expenses based on the Fund’s actual expense ratio and an assumed rate of return of 5% per year before expenses, which is not the Fund’s actual return. The hypothetical account values and expenses may not be used to estimate the actual ending account balance or expenses you paid for the period. You may use this information to compare the ongoing costs of investing in the Fund and other funds. To do so, compare this 5% hypothetical example with the 5% hypothetical examples that appear in the shareholder reports of the other funds.
Please note that the expenses shown in the table are meant to highlight your ongoing costs only and do not reflect any transactional costs, such as sales charges (loads), redemption fees, or exchange fees. Therefore, the second line of the table for each class of shares is useful in comparing ongoing costs only, and will not help you determine the relative total costs of owning different funds. In addition, if these transactional costs were included, your costs would have been higher.
20 Semi-Annual Report
| | |
| Other Information | | |
| |
Thornburg New York Intermediate Municipal Fund | | March 31, 2017 (Unaudited) |
PORTFOLIO PROXY VOTING
Policies and Procedures:
The Trust has delegated to Thornburg Investment Management, Inc. (the “Advisor”) voting decisions respecting proxies for the Fund’s voting securities. The Advisor makes voting decisions in accordance with its Proxy Voting Policy. A description of the Policy is available (i) without charge, upon request, by calling the Advisor toll-free at 1-800-847-0200, (ii) on the Thornburg website at www.thornburg. com, and (iii) on the Securities and Exchange Commission’s website at www.sec.gov.
Information regarding how proxies were voted is available on or before August 31 of each year for the twelve months ending the preceding June 30. This information is available (i) without charge, upon request by calling the Advisor toll-free at 1-800-847-0200, (ii) on the Thornburg website at www.thornburg.com, and (iii) on the Securities and Exchange Commission’s website at www.sec.gov.
AVAILABILITY OF QUARTERLY PORTFOLIO SCHEDULE
The Fund files with the Securities and Exchange Commission schedules of its portfolio holdings on Form N-Q for the first and third quarters of each fiscal year. The Fund’s Forms N-Q are available on the Commission’s website at www.sec.gov, or may be reviewed and copied at the Commission’s Public Reference Room in Washington, D.C. Information on the operation of the Public Reference Room may be obtained by calling 1-800-SEC-0330. The Fund also makes this information available on its website at www.thornburg.com/download or upon request by calling 1-800-847-0200.
Semi-Annual Report 21
Trustees’ Statement to Shareholders
Readopted September 12, 2016
The Trustees believe current and prospective shareholders should know how we discharge our responsibilities in supervising the Funds’ investment advisor and in reviewing the advisor’s contract for renewal. Since 2005, we have issued a statement which sets out clearly the three principal guidelines that we follow in supervising the Trust’s investment advisor on your behalf. In accordance with our customary practice, in September of this year we again reviewed our statement and concluded we should reissue this statement outlining the principal features of our supervision of the advisor’s performance of investment management services for the Funds.
We begin with the premise that each shareholder selected his or her Fund because its investments are managed by the investment advisor identified in the prospectus and in accordance with the objective and policies described in the prospectus. We realize, as each of you do, that if you believe that your Fund’s stated objective and policies no longer serve your personal investment goals, you can sell your shares and leave the Fund.
Therefore, we believe that our primary supervisory task—our principal obligation to you—is to assess the nature and quality of the advisor’s services, and to confirm that the advisor actively and competently pursues the Fund’s objective, in accordance with the policies set out in the prospectus. To do this, we meet regularly with management to review your Fund’s portfolio and to discuss the advisor’s specific actions and judgments in pursuing the Fund’s objective. We do not substitute our own judgment for the advisor’s decisions in selecting investments; the advisor is paid to exercise its informed judgment on investment decisions, and we seek to confirm, in reviewing the advisor’s performance, that the advisor is doing just that.
Second, we are conscious of costs and the effect that costs have on shareholders’ returns. We try to make sure that your Fund’s fees and costs are reasonable in relationship to the services rendered and that they are generally in line with those charged by other expert investment advisors, consistent with our belief that the Fund’s investors searched for and expect that expertise and attention and have decided to pay a reasonable price for it. We do not put the management contract “out to bid” as a matter of course, and we would not do so unless we had concluded that the advisor materially had failed to pursue the Fund’s objectives in accordance with its policies, or for other equally important reasons. We believe that any other approach would be inconsistent with your interests and contrary to your expectations when you bought shares of the Fund in the first place.
Finally, because we believe that most Thornburg Fund shareholders have invested with a long-term perspective, we try not to focus too much on the fashions of the moment and on short-term performance. The market will not favor any specific investment objective or set of policies at all times and under all economic circumstances. A fund will experience periods of both high and low returns relative to other funds and other investments. Even if one of our Funds is not favored by the market at a particular time, we believe that the advisor is nonetheless obliged to remain true to the Fund’s objective and policies, and we watch to see that it does so.
Trustees of Thornburg Investment Trust
22 Semi-Annual Report
Thornburg Funds
Thornburg Investment Management is a privately-owned global investment firm that offers a range of solutions for retail and institutional investors. Founded in 1982 and headquartered in Santa Fe, New Mexico, we manage approximately $49 billion (as of March 31, 2017) across U.S. mutual funds, separate accounts for high-net-worth investors and institutional accounts, and UCITS funds for non-U.S. investors.
The fund outlined in this report is one of many equity and fixed-income products available from Thornburg Investment Management.
EQUITY FUNDS
| | • | | Thornburg Investment Income Builder Fund |
| | • | | Thornburg Global Opportunities Fund |
| | • | | Thornburg International Value Fund |
| | • | | Thornburg Better World International Fund |
| | • | | Thornburg International Growth Fund |
| | • | | Thornburg Developing World Fund |
| | • | | Thornburg Core Growth Fund |
FIXED INCOME FUNDS
| | • | | Thornburg Low Duration Income Fund |
| | • | | Thornburg Limited Term U.S. Government Fund |
| | • | | Thornburg Limited Term Income Fund |
| | • | | Thornburg Strategic Income Fund |
| | • | | Thornburg Low Duration Municipal Fund |
| | • | | Thornburg Limited Term Municipal Fund |
| | • | | Thornburg Intermediate Municipal Fund |
| | • | | Thornburg California Limited Term Municipal Fund |
| | • | | Thornburg New Mexico Intermediate Municipal Fund |
| | • | | Thornburg New York Intermediate Municipal Fund |
| | • | | Thornburg Strategic Municipal Income Fund |
ALTERNATIVE FUNDS
| | • | | Thornburg Long/Short Equity Fund |
Before investing, carefully consider the Fund’s investment goals, risks, charges, and expenses. For a prospectus or summary prospectus containing this and other information, contact your financial advisor or visit thornburg.com. Read it carefully before investing.
For additional information, please visit thornburg.com
Thornburg Investment Management, Inc. 2300 North Ridgetop Road, Santa Fe, NM 87506
Semi-Annual Report 23
| | |
To receive shareholder reports, prospectuses, and proxy statements electronically, go to www.thornburg.com/edelivery. This Semi-Annual Report is submitted for the general information of shareholders of the Fund. It is not authorized for distribution to prospective investors in the Fund unless preceded or accompanied by an effective prospectus. | | 
|
| |
| | | | |
| Investment Advisor: | | Distributor: | | |
| Thornburg Investment Management® 800.847.0200 | | Thornburg Securities Corporation® 800.847.0200 | | TH1069 |
About Thornburg Investment Management
It’s more than what we do. It’s how we do it.
At Thornburg, we are very different in how we think, invest, and are structured We believe this difference is what makes us successful in helping individuals reach their long-term financial goals.
Flexible Perspective
Our perspective on investment opportunities is more flexible than most, viewing a wide range of opportunities beyond conventional boundaries to find hidden value.
Collaboration
Collectively, we hone ideas via borderless cross-pollination for better judgment and better results.
Portfolio Construction
Disciplined construction guided more by our convictions than convention.
CONVICTION
Thorough analysis and our relative-value framework lead to conviction in our securities selection.
UNCONVENTIONAL
Active management means we seek the best value for our clients rather than using conventional benchmarks as our starting point.
Structured for Excellence
How we think and how we invest is made possible by how we’re structured.
TEAM APPROACH
FAR FROM THE HERD
ACCESS & TRANSPARENCY
2 | Semi-Annual Reports
2 Semi-Annual Reports
Semi-Annual Reports
Thornburg Limited Term U.S. Government Fund
Thornburg Limited Term Income Fund
Thornburg Low Duration Income Fund
March 31, 2017
| | | | |
LIMITED TERM U.S. GOVERNMENT FUND | | NASDAQ SYMBOLS | | CUSIPS |
Class A | | LTUSX | | 885-215-103 |
Class C | | LTUCX | | 885-215-830 |
Class I | | LTUIX | | 885-215-699 |
Class R3 | | LTURX | | 885-215-491 |
Class R4 | | LTUGX | | 885-216-747 |
Class R5 | | LTGRX | | 885-216-861 |
| |
LIMITED TERM INCOME FUND | | |
Class A | | THIFX | | 885-215-509 |
Class C | | THICX | | 885-215-764 |
Class I | | THIIX | | 885-215-681 |
Class R3 | | THIRX | | 885-215-483 |
Class R4 | | THRIX | | 885-216-762 |
Class R5 | | THRRX | | 885-216-853 |
| | |
LOW DURATION INCOME FUND | | | | |
Class A | | TLDAX | | 885-216-812 |
Class I | | TLDIX | | 885-216-796 |
Class I, R3, R4, and R5 shares may not be available to all investors. Minimum investments for Class I shares may be higher than those for other classes.
Investments carry risks, including possible loss of principal. Portfolios investing in bonds have the same interest rate, inflation, and credit risks that are associated with the underlying bonds. The value of bonds will fluctuate relative to changes in interest rates, decreasing when interest rates rise. Unlike bonds, bond funds have ongoing fees and expenses. Investments in mortgage-backed securities (MBS) may bear additional risk. Please see the Fund’s prospectus for a discussion of the risks associated with an investment in the Fund. Investments in the Funds are not FDIC insured, nor are they bank deposits or guaranteed by a bank or any other entity.
The laddering strategy does not assure or guarantee better performance and cannot eliminate the risk of investment losses.
Semi-Annual Reports 3
Letter to Shareholders
March 31, 2017 (Unaudited)
April 18, 2017
Dear Fellow Shareholder:
We are pleased to present the semi-annual report for Thornburg Limited Term U.S. Government Fund, Thornburg Limited Term Income Fund, and Thornburg Low Duration Income Fund for the six months ended March 31, 2017. The net asset value (NAV) of a Class A share of Thornburg Limited Term U.S. Government Fund decreased by twenty-three cents in the period to $13.02, and if you were invested for the entire period, you received dividends of 9.17 cents per share. If you reinvested your dividends, you received 9.19 cents per share. The NAV of a Class A share of Thornburg Limited Term Income Fund decreased thirteen cents in the period to $13.38. If you were invested for the entire period, you received dividends of 11.89 cents per share. If you reinvested your dividends, you received 11.93 cents per share. The NAV of a Class A share of Thornburg Low Duration Income Fund decreased four cents to $12.42 per share. If you were invested for the entire period, you received dividends of 7.87 cents per share. If you reinvested your dividends, you received 7.89 cents per share. Dividends per share varied for other share classes to account for varying class-specific expenses.
Combining income and change in price, Class A shares of Thornburg Limited Term U.S. Government Fund produced a total return of negative 1.04% (without sales charge) over the six-month period. The Bloomberg Barclays Intermediate Government Bond Index produced a total return of negative 1.65% over the same period. Class A shares of Thornburg Limited Term Income Fund produced a total return of negative 0.08% (without sales charge) over the six months ended March 31, 2017. The Bloomberg Barclays Intermediate U.S. Government/Credit Bond Index produced a negative 1.30% total return over the same time period. Class A shares of Thornburg Low Duration Income Fund produced a total return of 0.31% (without sales charge) over the six months ended March 31, 2017. The Bloomberg Barclays U.S. Aggregate Bond 1-3 Year Index produced a 0.03% total return over the same time period.
Over the last six months, markets have continued to remind investors that low-probability events sometimes occur, and that the general consensus can be quite wrong. However, even if investors had foreseen a Trump victory, could anyone have effectively repositioned their portfolios to address the equally surprising reaction to it across domestic and global markets? Market gloom lasted only hours before President-elect Trump gave a conciliatory speech on election night, igniting market enthusiasm. Stocks rallied and bonds sold off as investors became confident Trump’s pro-growth policies would be implemented by the Republican-dominated legislative branch.
Despite yields having bottomed in July 2016, many investors’ portfolios were caught off guard as yields rose faster than most expected. The Funds, while not immune to the rise in rates during this time, ultimately outperformed their respective benchmarks. Why? We do not make large bets on singular events. We take a balanced risk approach; regardless of election outcome, we didn’t believe Treasury curve pricing compensated appropriately for risk (low real return, low/negative term premium in the U.S. 10-year Treasury, etc.).
After yields backed up post-election, we added a bit of duration to the portfolios via U.S. Treasuries and Treasury Inflation Protected Securities as the risk-reward tradeoff became more favorable. As can be expected, we remain consistent in our philosophy of taking on incremental risk only when we believe that risk offers proper compensation. Given the move in U.S. Treasuries, one might have expected that corporate spreads widened as well, leading to a broader opportunity set in which to deploy capital. This has not happened broadly and credit spreads continue to remain quite tight. Currently, we believe that current spread compensation per unit of risk has yet to become attractive en masse.
The market however, continues to appear yield hungry although skittish around rates, as the Federal Reserve (the Fed) hiked short-term rates in March 2017, bringing the current count to three hikes during this cycle with more expected during the second half of 2017. Most investors will agree that quantitative easing (QE) from central banks around the world has both depressed risk-free yields and compressed risk-asset spreads. What then, will be the ultimate result of the inevitable unwinding? The truth is no one knows, and while we believe it can be completed in an orderly fashion—that is to say, we are unlikely to repeat taper tantrums—we ultimately sit at low overall yields today. Said another way, if QE was a tailwind over the last few years, then negative QE should be a headwind going forward.
Risk markets have benefited from what some call the “Trump trade” (i.e., potential better business conditions due to lower and simpler taxes, reduced regulation, and more productive government spending). While we viewed markets’ reactions as a bit optimistic, there are reasons to be hopeful, especially with Republicans controlling the White House, Senate, and the House of Representatives. It’s too early, of course, to say that the market’s hope in policy-driven growth was misplaced, but the political environment remains notoriously difficult to navigate as evidenced by the failed repeal of the Affordable Care Act. And while sentiment and hard data had been strong to start the year, hard economic data appears to be weakening as of late. It is too early to tell if this weakness is just another bout of first quarter malaise, which seems to be an annual occurrence for the U.S. economy as of late, or a sign of deeper trouble to come. How the Fed responds and whether we
4 Semi-Annual Reports
| | |
| Letter to Shareholders, | | |
| |
Continued | | March 31, 2017 (Unaudited) |
get positive and clear movement on the political front may ultimately determine the economy’s course in the short run. For now, uncertainty remains the order of the day, though markets certainly aren’t priced that way.
Remember, however, in deciding where to deploy capital, we attempt to discern how likely it is something will happen, what will happen, over what time period, and what the market is currently pricing in. While we clearly follow day-to-day developments when positioning the portfolios to meet their goals over time, we step back and consider the longer term and ultimately try to position the portfolio to perform well across market cycles.
In general, we remain disciplined and defensive regarding interest-rate and credit risk. Depending upon the mandate, we added modest exposure to relatively short-term investment grade floating-rate bonds. Where appropriate, given each portfolio’s guidelines, these additions came by way of various structures, including asset-backed securities and corporates—the common link being that, regardless of structure, they were backed by high-quality assets. But while neither interest rate nor credit risk is well compensated in the market today, we still are finding select opportunities to add interesting securities to the portfolios. For example, across the portfolios we added modest mortgage-backed securities exposure. In all instances these were high-quality short-term bonds. Additionally, they were structured to limit the potential range of pre-payment or extension risk outcomes, giving us confidence in their likely weighted average life. We also continue to take advantage of market pullbacks to add attractively priced risk assets to the market, though as suggested, these pullbacks have been fewer in number in recent months. Lastly, in keeping with the theme of defensive positioning, we ended the period with cash balances towards the higher end of their historical ranges, which we stand ready to deploy should opportunities present themselves.
We are pleased that Thornburg Limited Term U.S. Government Fund, I shares, was recognized by Lipper as the Best Short-Intermediate U.S. Government Fund for the three-year period as of 11/30/2016, among 25 funds. Lipper Fund Awards are granted annually to funds with the strongest risk-adjusted performance in their category (see page eight for additional information).
Thank you for your continued trust in us. We look forward to working hard to add value to your holdings.
Sincerely,
| | | | |
 | |  | |  |
| Jason Brady, CFA | | Lon R. Erickson, CFA | | Jeff Klingelhofer, CFA |
| Portfolio Manager | | Portfolio Manager | | Portfolio Manager |
| President, CEO, and Managing Director | | Managing Director | | Managing Director |
The matters discussed in this report may constitute forward-looking statements made pursuant to the safe harbor provisions of the Securities Litigation Reform Act of 1995. These include any advisor or portfolio manager prediction, assessment, analysis or outlook for individual securities, industries, investment styles, market sectors and/or markets. These statements involve risks and uncertainties. In addition to the general risks described for each fund in its current prospectus, other factors bearing on these reports include the accuracy of the advisor’s or portfolio manager’s forecasts and predictions, the appropriateness of the investment strategies designed by the advisor or portfolio manager and the ability of the advisor or portfolio manager to implement their strategies efficiently and successfully. Any one or more of these factors, as well as other risks affecting the securities markets generally, could cause the actual results of any fund to differ materially as compared to its benchmarks.
The views expressed are subject to change and do not necessarily reflect the views of Thornburg Investment Management, Inc. This information should not be relied upon as a recommendation or investment advice and is not intended to predict the performance of any investment or market.
Semi-Annual Reports 5
Performance Summary
March 31, 2017 (Unaudited)
AVERAGE ANNUAL RETURNS
| | | | | | | | | | | | | | | | | | | | |
LIMITED TERM U.S. GOVERNMENT FUND | | 1-YR | | | 3-YR | | | 5-YR | | | 10-YR | | | SINCE
INCEP. | |
A Shares (Incep: 11/16/87) | | | | | | | | | | | | | | | | | | | | |
Without sales charge | | | -0.46 | % | | | 0.96 | % | | | 0.70 | % | | | 2.70 | % | | | 4.87 | % |
With sales charge | | | -1.94 | % | | | 0.46 | % | | | 0.39 | % | | | 2.54 | % | | | 4.82 | % |
C Shares (Incep: 9/1/94) | | | | | | | | | | | | | | | | | | | | |
Without sales charge | | | -0.73 | % | | | 0.68 | % | | | 0.41 | % | | | 2.42 | % | | | 3.77 | % |
With sales charge | | | -1.22 | % | | | 0.68 | % | | | 0.41 | % | | | 2.42 | % | | | 3.77 | % |
I Shares (Incep: 7/5/96) | | | -0.13 | % | | | 1.28 | % | | | 1.02 | % | | | 3.03 | % | | | 4.25 | % |
R3 Shares (Incep: 7/1/03) | | | -0.52 | % | | | 0.89 | % | | | 0.62 | % | | | 2.64 | % | | | 2.43 | % |
R4 Shares (Incep: 2/1/14) | | | -0.53 | % | | | 0.92 | % | | | — | | | | — | | | | 0.82 | % |
R5 Shares (Incep: 5/1/12) | | | -0.14 | % | | | 1.26 | % | | | — | | | | — | | | | 0.90 | % |
| | | | | |
LIMITED TERM INCOME FUND | | | | | | | | | | | | | | | |
A Shares (Incep: 10/1/92) | | | | | | | | | | | | | | | | | | | | |
Without sales charge | | | 2.08 | % | | | 2.04 | % | | | 2.52 | % | | | 4.30 | % | | | 5.02 | % |
With sales charge | | | 0.57 | % | | | 1.54 | % | | | 2.22 | % | | | 4.14 | % | | | 4.96 | % |
C Shares (Incep: 9/1/94) | | | | | | | | | | | | | | | | | | | | |
Without sales charge | | | 1.87 | % | | | 1.82 | % | | | 2.29 | % | | | 4.06 | % | | | 4.71 | % |
With sales charge | | | 1.37 | % | | | 1.82 | % | | | 2.29 | % | | | 4.06 | % | | | 4.71 | % |
I Shares (Incep: 7/5/96) | | | 2.45 | % | | | 2.41 | % | | | 2.89 | % | | | 4.66 | % | | | 5.23 | % |
R3 Shares (Incep: 7/1/03) | | | 1.96 | % | | | 1.93 | % | | | 2.42 | % | | | 4.24 | % | | | 3.75 | % |
R4 Shares (Incep: 2/1/14) | | | 1.95 | % | | | 1.93 | % | | | — | | | | — | | | | 1.93 | % |
R5 Shares (Incep: 5/1/12) | | | 2.29 | % | | | 2.28 | % | | | — | | | | — | | | | 2.66 | % |
| | | | | |
LOW DURATION INCOME FUND | | | | | | | | | | | | | | | |
A Shares (Incep: 12/30/13) | | | | | | | | | | | | | | | | | | | | |
Without sales charge | | | 1.33 | % | | | 1.07 | % | | | — | | | | — | | | | 1.20 | % |
With sales charge | | | -0.20 | % | | | 0.56 | % | | | — | | | | — | | | | 0.73 | % |
I Shares (Incep: 12/30/13) | | | 1.41 | % | | | 1.23 | % | | | — | | | | — | | | | 1.37 | % |
30-DAY YIELDS
(with sales charge)
| | | | |
Thornburg Limited Term U.S. Government Fund, A Shares | | | | |
Annualized Distribution Yield | | | 1.75 | % |
SEC Yield | | | 1.58 | % |
| |
Thornburg Limited Term Income Fund, A Shares | | | | |
Annualized Distribution Yield | | | 1.75 | % |
SEC Yield | | | 1.65 | % |
| |
Thornburg Low Duration Income Fund, A Shares | | | | |
Annualized Distribution Yield | | | 1.43 | % |
SEC Yield | | | 1.37 | % |
GROWTH OF A HYPOTHETICAL $10,000 INVESTMENT
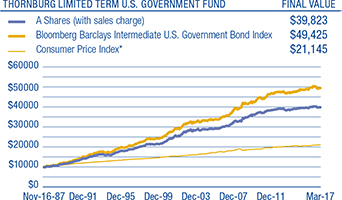
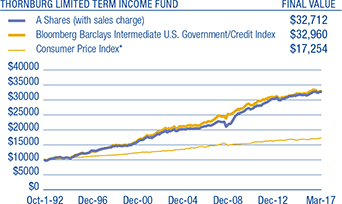
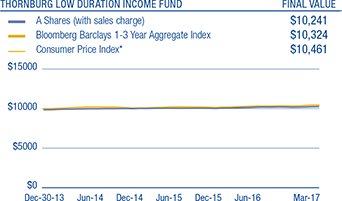
* CPI data is as of 3/31/17.
Performance data shown represents past performance and is no guarantee of future results. Investment return and principal value will fluctuate so shares, when redeemed, may be worth more or less than their original cost. Current performance may be lower or higher than quoted. For performance current to the most recent month end, visit thornburg.com or call 800-847-0200. The performance information does not reflect the deduction of taxes that a shareholder would pay on distributions or the redemption of Fund shares. Returns reflect the reinvestment of dividends and capital gains. Class A shares are sold with a maximum sales charge of 1.50%. Class C shares include a 0.50% CDSC for the first year only. There is no sales charge for Class I, Class R3, Class R4, and Class R5 shares. As disclosed in the most recent prospectus, the total annual fund operating expenses are as follows: Limited Term U.S. Government Fund A shares, 0.91%; C shares, 1.20%; I shares, 0.57%; R3 shares, 1.30%; R4 shares, 2.71%; R5 shares, 2.05%; Limited Term Income Fund A shares, 0.86%; C shares, 1.08%; I shares, 0.50%; R3 shares, 1.10%; R4 shares, 1.97%; R5 shares, 0.72%; and Low Duration Income Fund A shares, 1.74%; I shares, 1.18%. Thornburg Investment Management and/or Thornburg Securities Corporation have contractually agreed to waive fees and reimburse expenses through at least April 10, 2018, for some of the share classes, resulting in net expense ratios of the following: For Limited Term U.S. Government Fund R3 shares, 0.99%; R4 shares, 0.99%; R5 shares, 0.67%. Limited Term Income Fund R3 shares, 0.99%; R4 shares, 0.99%; R5 shares, 0.67%. Low Duration Income Fund A shares, 0.70%; I shares, 0.50%. For more detailed information on fund expenses and waivers/reimbursements please see the Fund’s prospectus. Without the fee waivers and expense reimbursements, the Annualized Distribution yield for Low Duration Income Fund A shares would have been 0.27%, and the SEC yield would have been 0.22%.
6 Semi-Annual Reports
Glossary
March 31, 2017 (Unaudited)
The Bloomberg Barclays Intermediate Government Bond Index is an unmanaged, market-weighted index generally representative of all public obligations of the U.S. Government, its agencies and instrumentalities having maturities from one up to ten years.
The Bloomberg Barclays Intermediate Government/Credit Bond Index is an unmanaged, market-weighted index generally representative of intermediate government and investment-grade corporate debt securities having maturities from one up to ten years.
The Bloomberg Barclays U.S. 1-3 Yr Aggregate Bond Index measures the investment grade, U.S. dollar-denominated, fixed-rate taxable bond market with maturities between 1 and 3 years, including Treasuries, government-related and corporate securities, MBS (agency fixed-rate and hybrid ARM passthroughs), ABS, and CMBS.
The performance of any index is not indicative of the performance of any particular investment. Unless otherwise noted, index returns reflect the reinvestment of income dividends and capital gains, if any, but do not reflect fees, brokerage commissions or other expenses of investing. Investors may not make direct investments into any index.
Asset-backed Security (ABS) – A security whose value and income payments are derived from and collateralized (or “backed”) by a specified pool of underlying assets. The pool of assets is typically a group of small and illiquid assets that are unable to be sold individually. Pooling the assets into financial instruments allows them to be sold to general investors, a process called securitization, and allows the risk of investing in the underlying assets to be diversified because each security will represent a fraction of the total value of the diverse pool of underlying assets.
Basis Point (bp) – A unit equal to 1/100th of 1%. 1% = 100 basis points (bps).
Bond Credit Ratings (Credit Quality) – A bond credit rating assesses the financial ability of a debt issuer to make timely payments of principal and interest. Ratings of AAA (the highest), AA, A, and BBB are investment-grade quality. Ratings of BB, B, CCC, CC, C and D (the lowest) are considered below investment grade, speculative grade, or junk bonds.
Credit Spread/Quality Spread – The difference between the yields of securities with different credit qualities.
Duration – A bond’s sensitivity to interest rates. Bonds with longer durations experience greater price volatility than bonds with shorter durations.
Floating-Rate Securities (Floater) – Debt instrument whose coupon rate adjusts with short-term interest rate changes.
Laddering – Laddering involves building a portfolio of bonds with staggered maturities so that a portion matures each year. Money that comes in from maturing bonds is typically invested in bonds with longer maturities at the far end of the portfolio.
Mortgage-backed Security – A type of asset-backed security that is secured by a mortgage or collection of mortgages. These securities must be grouped in one of the top two ratings as determined by a accredited credit rating agency and usually pay periodic payments that are similar to coupon payments. The mortgage must have originated from a regulated and authorized financial institution.
Quantitative Easing (QE) – An unconventional monetary policy in which a central bank purchases financial assets from the market in order to lower interest rates and increase the money supply.
Riskless (or risk-free) Interest Rate – The theoretical rate of return of an investment with zero risk. The risk-free rate represents the interest that an investor would expect from an absolutely risk-free investment over a given period of time. Though a truly risk-free asset exists only in theory, in practice most professionals and academics use short-dated government bonds, such as a three-month U.S. Treasury bill.
Term Premium – The excess yield that investors require to commit to holding a long-term bond instead of a series of shorter-term bonds.
TIPS (Treasury Inflation Protected Securities) – A U.S. Treasury note or bond that offers protection from the effects of inflation. Using the Consumer Price Index as a guide, the value of the principal is adjusted to reflect the effects of inflation. A fixed interest rate is paid semi-annually on the adjusted amount. At maturity, if inflation has increased the value of the principal, the investor receives the higher value. If deflation has decreased the value, the investor receives the original face amount of the security.
Treasuries – U.S. Treasury securities, such as bills, notes and bonds, are negotiable debt obligations of the U.S. government. These debt obligations are backed by the “full faith and credit” of the government and issued at various schedules and maturities. Income from Treasury securities is exempt from state and local, but not federal, taxes.
Yield Curve – A line that plots the interest rates, at a set point in time, of bonds having equal credit quality, but differing maturity dates.
Semi-Annual Reports 7
| | |
| Fund Summary | | |
| |
Thornburg Limited Term U.S. Government Fund | | March 31, 2017 (Unaudited) |
OBJECTIVES AND STRATEGIES
The Fund’s primary objective is to provide as high a level of current income as is consistent, in the view of the Fund’s investment advisor, with the safety of capital. As a secondary goal, the Fund seeks to reduce changes in its share price compared to longer term portfolios.
This Fund is a laddered portfolio primarily composed of short/ intermediate debt obligations at least 80% of which are issued by the U.S. Government, its agencies, or its instrumentalities, with a dollar-weighted average maturity of normally less than five years.
LONG-TERM STABILITY OF PRINCIPAL
Net Asset Value History of A Shares
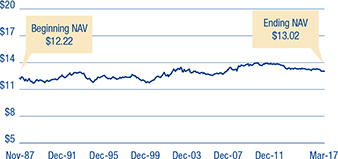
KEY PORTFOLIO ATTRIBUTES
| | | | |
Number of Bonds | | | 157 | |
| |
Effective Duration | | | 2.7 Yrs | |
| |
Average Maturity | | | 3.7 Yrs | |

Lipper Best Short-Intermediate U.S. Government Fund (Class I Shares) 3-year period ended 11/30/16, among 25 funds.
Lipper Fund Awards are granted annually to the fund in each Lipper classification that consistently delivered the strongest risk-adjusted performance (calculated with dividends reinvested and without sales charge). Fund Classification Awards are given for three-year, five-year, and ten-year periods. Thornburg did not win the award for any other time period. Past performance does not guarantee future results. From Thomson Reuters Lipper Awards, © 2017 Thomson Reuters. All rights reserved. Used by permission and protected by the Copyright Laws of the United States. The printing, copying, redistribution or retransmission of this Content without express permission is prohibited.
TYPES OF HOLDINGS
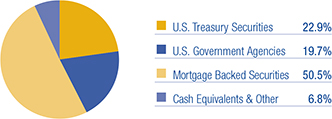
PORTFOLIO LADDER
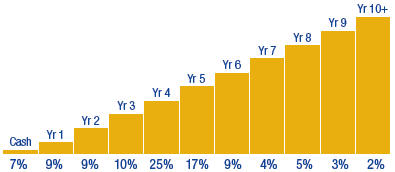
Percent of portfolio maturing in each year. Cash includes cash equivalents.
There is no guarantee that the Fund will meet its investment objectives.
All data is subject to change. Charts may not add up to 100% due to rounding.
8 Semi-Annual Reports
| | |
| Schedule of Investments | | |
| |
Thornburg Limited Term U.S. Government Fund | | March 31, 2017 (Unaudited) |
| | | | | | | | |
ISSUER-DESCRIPTION | | PRINCIPAL
AMOUNT | | | VALUE | |
U.S. TREASURY SECURITIES — 22.93% | | | | | | | | |
United States Treasury Notes, 2.25%, 11/30/2017 | | $ | 7,500,000 | | | $ | 7,561,202 | |
United States Treasury Notes, 2.625%, 1/31/2018 | | | 6,700,000 | | | | 6,786,838 | |
United States Treasury Notes, 0.75%, 4/30/2018 | | | 4,750,000 | | | | 4,731,631 | |
United States Treasury Notes, 1.125%, 6/15/2018 | | | 4,000,000 | | | | 3,999,672 | |
United States Treasury Notes, 3.625%, 2/15/2020 | | | 1,000,000 | | | | 1,060,430 | |
United States Treasury Notes, 1.375%, 2/29/2020 | | | 2,500,000 | | | | 2,490,586 | |
United States Treasury Notes, 1.625%, 6/30/2020 | | | 4,000,000 | | | | 4,003,406 | |
United States Treasury Notes, 0.125%, 4/15/2021 | | | 2,970,818 | | | | 3,002,579 | |
United States Treasury Notes, 2.25%, 4/30/2021 | | | 6,000,000 | | | | 6,105,328 | |
United States Treasury Notes, 2.25%, 11/15/2024 | | | 1,500,000 | | | | 1,496,250 | |
United States Treasury Notes, 1.50%, 8/15/2026 | | | 1,500,000 | | | | 1,388,121 | |
United States Treasury Notes Inflationary Index, 0.125%, 4/15/2020 | | | 3,099,972 | | | | 3,146,318 | |
United States Treasury Notes Inflationary Index, 0.625%, 7/15/2021 | | | 2,693,125 | | | | 2,793,597 | |
United States Treasury Notes Inflationary Index, 0.125%, 7/15/2022 | | | 5,278,950 | | | | 5,321,129 | |
United States Treasury Notes Inflationary Index, 0.125%, 1/15/2023 | | | 2,629,650 | | | | 2,628,799 | |
United States Treasury Notes Inflationary Index, 0.375%, 7/15/2025 | | | 5,887,023 | | | | 5,901,334 | |
United States Treasury Notes Inflationary Index, 0.625%, 1/15/2026 | | | 3,218,702 | | | | 3,276,955 | |
United States Treasury Notes Inflationary Index, 0.125%, 7/15/2026 | | | 1,519,350 | | | | 1,482,469 | |
| | | | | | | | |
TOTAL U.S. TREASURY SECURITIES (Cost $66,946,031) | | | | | | | 67,176,644 | |
| | | | | | | | |
| | |
U.S. GOVERNMENT AGENCIES — 19.71% | | | | | | | | |
Federal Home Loan Bank, 5.00%, 12/8/2017 | | | 3,000,000 | | | | 3,079,471 | |
Federal Home Loan Mtg Corp., 4.875%, 6/13/2018 | | | 3,000,000 | | | | 3,134,046 | |
Federal National Mtg Assoc., 1.875%, 12/28/2020 | | | 2,000,000 | | | | 2,010,443 | |
HNA Group 2015 LLC, (Guaranty: Export-Import Bank of the United States), 2.291%, 6/30/2027 | | | 2,659,689 | | | | 2,620,591 | |
Mortgage-Linked Amortizing Notes, Series 2012-1 Class A10, 2.06%, 1/15/2022 | | | 426,402 | | | | 428,556 | |
New Valley Generation I, Tennessee Valley Authority, 7.299%, 3/15/2019 | | | 845,228 | | | | 887,840 | |
a Petroleos Mexicanos Floating Rate Note, (Guaranty: Export-Import Bank of the United States), 1.373%, 4/15/2025 | | | 2,887,500 | | | | 2,849,700 | |
a Petroleos Mexicanos, (Guaranty: Export-Import Bank of the United States), 1.70%, 12/20/2022 | | | 3,135,000 | | | | 3,087,533 | |
a Petroleos Mexicanos, (Guaranty: Export-Import Bank of the United States), 2.46%, 12/15/2025 | | | 2,250,000 | | | | 2,249,924 | |
Private Export Funding Corp., (Guaranty: Export-Import Bank of the United States), 5.45%, 9/15/2017 | | | 3,000,000 | | | | 3,058,962 | |
a Reliance Industries Ltd., (Guaranty: Export-Import Bank of the United States), 2.512%, 1/15/2026 | | | 3,150,000 | | | | 3,155,828 | |
a Reliance Industries Ltd., (Guaranty: Export-Import Bank of the United States), 2.06%, 1/15/2026 | | | 3,150,000 | | | | 3,095,187 | |
a Reliance Industries Ltd., (Guaranty: Export-Import Bank of the United States), 1.87%, 1/15/2026 | | | 2,131,579 | | | | 2,077,239 | |
Small Business Administration Participation Certificates, Series 2001-20D Class 1, 6.35%, 4/1/2021 | | | 549,812 | | | | 582,807 | |
Small Business Administration Participation Certificates, Series 2001-20F Class 1, 6.44%, 6/1/2021 | | | 408,453 | | | | 434,006 | |
Small Business Administration Participation Certificates, Series 2002-20A Class 1, 6.14%, 1/1/2022 | | | 280,063 | | | | 299,787 | |
Small Business Administration Participation Certificates, Series 2002-20K Class 1, 5.08%, 11/1/2022 | | | 275,809 | | | | 291,480 | |
Small Business Administration Participation Certificates, Series 2005-20H Class 1, 5.11%, 8/1/2025 | | | 219,052 | | | | 232,605 | |
Small Business Administration Participation Certificates, Series 2007-20D Class 1, 5.32%, 4/1/2027 | | | 642,750 | | | | 693,076 | |
Small Business Administration Participation Certificates, Series 2007-20F Class 1, 5.71%, 6/1/2027 | | | 367,976 | | | | 399,386 | |
Small Business Administration Participation Certificates, Series 2007-20I Class 1, 5.56%, 9/1/2027 | | | 1,137,517 | | | | 1,228,006 | |
Small Business Administration Participation Certificates, Series 2007-20K Class 1, 5.51%, 11/1/2027 | | | 783,808 | | | | 846,045 | |
Small Business Administration Participation Certificates, Series 2008-20G Class 1, 5.87%, 7/1/2028 | | | 1,876,554 | | | | 2,075,136 | |
Small Business Administration Participation Certificates, Series 2011-20G Class 1, 3.74%, 7/1/2031 | | | 2,041,873 | | | | 2,135,673 | |
Small Business Administration Participation Certificates, Series 2011-20K Class 1, 2.87%, 11/1/2031 | | | 2,470,201 | | | | 2,502,229 | |
Small Business Administration Participation Certificates, Series 2015-20G Class 1, 2.88%, 7/1/2035 | | | 2,287,052 | | | | 2,307,989 | |
Small Business Administration Participation Certificates, Series 2015-20I Class 1, 2.82%, 9/1/2035 | | | 2,537,553 | | | | 2,550,869 | |
Ulani MSN 35940 LLC, (Guaranty: Export-Import Bank of the United States), 2.227%, 5/16/2025 | | | 3,437,500 | | | | 3,410,117 | |
Union 13 Leasing LLC, (Guaranty: Export-Import Bank of the United States), 1.87%, 6/28/2024 | | | 1,896,653 | | | | 1,861,156 | |
a Washington Aircraft 2 Co. Ltd. Floating Rate Note, (Guaranty: Export-Import Bank of the United States), 1.583%, 6/26/2024 | | | 4,195,897 | | | | 4,134,498 | |
| | | | | | | | |
TOTAL U.S. GOVERNMENT AGENCIES (Cost $57,588,954) | | | | | | | 57,720,185 | |
| | | | | | | | |
| | |
MORTGAGE BACKED — 50.54% | | | | | | | | |
Federal Home Loan Mtg Corp. Multi-Family Structured Pass Through, Series KLH3 Class A Floating Rate Note, 1.489%, 11/25/2022 | | | 3,141,615 | | | | 3,143,231 | |
Federal Home Loan Mtg Corp. Whole Loan Securities, Series 2016-SC01 Class 2A, 3.50%, 7/25/2046 | | | 2,319,253 | | | | 2,241,952 | |
Federal Home Loan Mtg Corp. Whole Loan Securities, Series 2016-SC02 Class 2A, 3.50%, 10/25/2046 | | | 1,884,555 | | | | 1,911,151 | |
Federal Home Loan Mtg Corp., CMO Series 1321 Class TE, 7.00%, 8/15/2022 | | | 122,174 | | | | 130,389 | |
Federal Home Loan Mtg Corp., CMO Series 2527 Class BP, 5.00%, 11/15/2017 | | | 35,647 | | | | 35,938 | |
Federal Home Loan Mtg Corp., CMO Series 2529 Class MB, 5.00%, 11/15/2017 | | | 34,839 | | | | 35,160 | |
Federal Home Loan Mtg Corp., CMO Series 2553 Class GB, 5.00%, 1/15/2018 | | | 32,099 | | | | 32,401 | |
Federal Home Loan Mtg Corp., CMO Series 2558 Class BD, 5.00%, 1/15/2018 | | | 156,735 | | | | 158,284 | |
Federal Home Loan Mtg Corp., CMO Series 2622 Class PE, 4.50%, 5/15/2018 | | | 100,560 | | | | 101,747 | |
Federal Home Loan Mtg Corp., CMO Series 2641 Class WE, 4.50%, 1/15/2033 | | | 29,572 | | | | 29,962 | |
Semi-Annual Reports 9
| | |
| Schedule of Investments, Continued | | |
| |
Thornburg Limited Term U.S. Government Fund | | March 31, 2017 (Unaudited) |
| | | | | | | | |
ISSUER-DESCRIPTION | | PRINCIPAL
AMOUNT | | | VALUE | |
Federal Home Loan Mtg Corp., CMO Series 2649 Class QH, 4.50%, 7/15/2018 | | $ | 56,123 | | | $ | 56,979 | |
Federal Home Loan Mtg Corp., CMO Series 2814 Class GB, 5.00%, 6/15/2019 | | | 18,221 | | | | 18,610 | |
Federal Home Loan Mtg Corp., CMO Series 2827 Class BU, 3.50%, 7/15/2019 | | | 219,385 | | | | 221,534 | |
Federal Home Loan Mtg Corp., CMO Series 3291 Class BY, 4.50%, 3/15/2022 | | | 616,236 | | | | 635,319 | |
Federal Home Loan Mtg Corp., CMO Series 3640 Class EL, 4.00%, 3/15/2020 | | | 410,022 | | | | 419,068 | |
Federal Home Loan Mtg Corp., CMO Series 3704 Class DC, 4.00%, 11/15/2036 | | | 503,299 | | | | 529,303 | |
Federal Home Loan Mtg Corp., CMO Series 3867 Class VA, 4.50%, 3/15/2024 | | | 1,758,053 | | | | 1,882,030 | |
Federal Home Loan Mtg Corp., CMO Series 3922 Class PQ, 2.00%, 4/15/2041 | | | 945,995 | | | | 940,052 | |
Federal Home Loan Mtg Corp., CMO Series 4050 Class MV, 3.50%, 8/15/2023 | | | 2,162,891 | | | | 2,244,022 | |
Federal Home Loan Mtg Corp., CMO Series 4097 Class TE, 1.75%, 5/15/2039 | | | 2,046,919 | | | | 1,977,645 | |
Federal Home Loan Mtg Corp., CMO Series 4105 Class FG, 1.312%, 9/15/2042 | | | 2,055,251 | | | | 2,059,674 | |
Federal Home Loan Mtg Corp., CMO Series 4120 Class TC, 1.50%, 10/15/2027 | | | 2,485,512 | | | | 2,407,725 | |
Federal Home Loan Mtg Corp., CMO Series 4120 Class UE, 2.00%, 10/15/2027 | | | 2,558,324 | | | | 2,515,872 | |
Federal Home Loan Mtg Corp., CMO Series K018 Class A1, 1.781%, 10/25/2020 | | | 1,184,070 | | | | 1,183,844 | |
Federal Home Loan Mtg Corp., CMO Series K035 Class A1, 2.615%, 3/25/2023 | | | 2,861,997 | | | | 2,900,229 | |
Federal Home Loan Mtg Corp., CMO Series K037 Class A1, 2.592%, 4/25/2023 | | | 1,600,802 | | | | 1,620,711 | |
Federal Home Loan Mtg Corp., CMO Series K038 Class A1, 2.604%, 10/25/2023 | | | 4,955,141 | | | | 5,018,006 | |
Federal Home Loan Mtg Corp., CMO Series K042 Class A1, 2.267%, 6/25/2024 | | | 2,173,499 | | | | 2,169,235 | |
Federal Home Loan Mtg Corp., CMO Series K709 Class A2, 2.086%, 3/25/2019 | | | 3,000,000 | | | | 3,017,437 | |
Federal Home Loan Mtg Corp., CMO Series K716 Class A1, 2.413%, 8/25/2047 | | | 1,445,442 | | | | 1,462,982 | |
Federal Home Loan Mtg Corp., CMO Series KF15 Class A, 1.449%, 2/25/2023 | | | 2,675,446 | | | | 2,677,588 | |
Federal Home Loan Mtg Corp., CMO Series KLH1 Class A, 1.489%, 11/25/2022 | | | 2,000,000 | | | | 2,001,166 | |
Federal Home Loan Mtg Corp., CMO Series KP02 Class A2, 2.355%, 4/25/2021 | | | 3,000,000 | | | | 3,010,916 | |
Federal Home Loan Mtg Corp., CMO Series KS03 Class A2, 2.79%, 6/25/2022 | | | 2,500,000 | | | | 2,513,290 | |
Federal Home Loan Mtg Corp., CMO Series SC02 Class 2A, 3.50%, 9/25/2045 | | | 1,902,107 | | | | 1,904,686 | |
Federal Home Loan Mtg Corp., Pool AK6768, 3.00%, 3/1/2027 | | | 1,917,551 | | | | 1,977,025 | |
Federal Home Loan Mtg Corp., Pool B14155, 3.50%, 5/1/2019 | | | 108,595 | | | | 113,164 | |
Federal Home Loan Mtg Corp., Pool D98887, 3.50%, 1/1/2032 | | | 1,082,591 | | | | 1,130,673 | |
Federal Home Loan Mtg Corp., Pool E96575, 4.50%, 6/1/2018 | | | 97,483 | | | | 99,558 | |
Federal Home Loan Mtg Corp., Pool G12079, 4.50%, 4/1/2019 | | | 158,441 | | | | 162,128 | |
Federal Home Loan Mtg Corp., Pool G12140, 4.00%, 2/1/2020 | | | 45,685 | | | | 47,225 | |
Federal Home Loan Mtg Corp., Pool G13804, 5.00%, 3/1/2025 | | | 457,187 | | | | 488,297 | |
Federal Home Loan Mtg Corp., Pool G18435, 2.50%, 5/1/2027 | | | 2,416,232 | | | | 2,453,892 | |
Federal Home Loan Mtg Corp., Pool J11371, 4.50%, 12/1/2024 | | | 456,555 | | | | 484,700 | |
Federal Home Loan Mtg Corp., Pool J13583, 3.50%, 11/1/2025 | | | 797,242 | | | | 832,277 | |
Federal Home Loan Mtg Corp., Pool J14888, 3.50%, 4/1/2026 | | | 857,979 | | | | 895,951 | |
Federal Home Loan Mtg Corp., Pool T61943, 3.50%, 8/1/2045 | | | 907,892 | | | | 922,255 | |
Federal Home Loan Mtg Corp., REMIC Series 4072 Class VA, 3.50%, 10/15/2023 | | | 1,895,535 | | | | 1,967,318 | |
Federal National Mtg Assoc., CMO Series 1993-32 Class H, 6.00%, 3/25/2023 | | | 14,963 | | | | 15,957 | |
Federal National Mtg Assoc., CMO Series 2003-15 Class CY, 5.00%, 3/25/2018 | | | 25,748 | | | | 25,989 | |
Federal National Mtg Assoc., CMO Series 2003-4 Class PE, 5.00%, 2/25/2018 | | | 66,307 | | | | 67,006 | |
Federal National Mtg Assoc., CMO Series 2003-9 Class DB, 5.00%, 2/25/2018 | | | 30,786 | | | | 31,083 | |
Federal National Mtg Assoc., CMO Series 2009-17 Class AH, 0.876%, 3/25/2039 | | | 433,694 | | | | 373,905 | |
Federal National Mtg Assoc., CMO Series 2009-52 Class AJ, 4.00%, 7/25/2024 | | | 145,323 | | | | 148,142 | |
Federal National Mtg Assoc., CMO Series 2009-70 Class NK, 4.50%, 8/25/2019 | | | 50,112 | | | | 50,773 | |
Federal National Mtg Assoc., CMO Series 2009-78 Class A, 4.50%, 8/25/2019 | | | 79,994 | | | | 81,210 | |
Federal National Mtg Assoc., CMO Series 2011-103 Class VA, 4.00%, 12/25/2022 | | | 226,433 | | | | 226,361 | |
Federal National Mtg Assoc., CMO Series 2011-110 Class JV, 4.00%, 1/25/2023 | | | 500,948 | | | | 502,008 | |
Federal National Mtg Assoc., CMO Series 2011-124 Class QA, 2.00%, 12/25/2041 | | | 474,711 | | | | 473,747 | |
Federal National Mtg Assoc., CMO Series 2011-45 Class VA, 4.00%, 3/25/2024 | | | 2,406,713 | | | | 2,491,791 | |
Federal National Mtg Assoc., CMO Series 2011-63 Class MV, 3.50%, 7/25/2024 | | | 2,444,696 | | | | 2,508,301 | |
Federal National Mtg Assoc., CMO Series 2011-70 Class CA, 3.00%, 8/25/2026 | | | 4,401,251 | | | | 4,373,029 | |
Federal National Mtg Assoc., CMO Series 2011-72 Class KV, 3.50%, 11/25/2022 | | | 1,298,088 | | | | 1,322,823 | |
Federal National Mtg Assoc., CMO Series 2012-20 Class VT, 3.50%, 3/25/2025 | | | 3,301,882 | | | | 3,438,208 | |
Federal National Mtg Assoc., CMO Series 2012-36 Class CV, 4.00%, 6/25/2023 | | | 2,416,360 | | | | 2,508,462 | |
Federal National Mtg Assoc., CMO Series 2013-81 Class FW Floating Rate Note, 1.282%, 1/25/2043 | | | 3,268,298 | | | | 3,249,196 | |
Federal National Mtg Assoc., CMO Series 2013-92 Class FA, 1.532%, 9/25/2043 | | | 2,299,582 | | | | 2,305,254 | |
Federal National Mtg Assoc., CMO Series 2015-AB5 Class A10, 3.15%, 9/25/2035 | | | 2,453,969 | | | | 2,453,233 | |
Federal National Mtg Assoc., Pool 044003, 8.00%, 6/1/2017 | | | 6 | | | | 6 | |
Federal National Mtg Assoc., Pool 252648, 6.50%, 5/1/2022 | | | 22,807 | | | | 24,641 | |
Federal National Mtg Assoc., Pool 342947, 7.25%, 4/1/2024 | | | 54,451 | | | | 60,381 | |
Federal National Mtg Assoc., Pool 443909, 6.50%, 9/1/2018 | | | 5,533 | | | | 5,685 | |
Federal National Mtg Assoc., Pool 555207, 7.00%, 11/1/2017 | | | 385 | | | | 389 | |
Federal National Mtg Assoc., Pool 726308, 4.00%, 7/1/2018 | | | 68,535 | | | | 70,845 | |
Federal National Mtg Assoc., Pool 889906, 4.00%, 7/1/2023 | | | 169,980 | | | | 178,112 | |
Federal National Mtg Assoc., Pool 895572, 3.07%, 6/1/2036 | | | 265,969 | | | | 282,035 | |
Federal National Mtg Assoc., Pool 930986, 4.50%, 4/1/2019 | | | 167,723 | | | | 171,491 | |
10 Semi-Annual Reports
| | |
| Schedule of Investments, Continued | | |
| |
Thornburg Limited Term U.S. Government Fund | | March 31, 2017 (Unaudited) |
| | | | | | | | |
ISSUER-DESCRIPTION | | PRINCIPAL
AMOUNT | | | VALUE | |
Federal National Mtg Assoc., Pool AA2870, 4.00%, 3/1/2024 | | $ | 447,598 | | | $ | 470,372 | |
Federal National Mtg Assoc., Pool AB7997, 2.50%, 2/1/2023 | | | 832,379 | | | | 842,361 | |
Federal National Mtg Assoc., Pool AB8447, 2.50%, 2/1/2028 | | | 2,027,714 | | | | 2,052,031 | |
Federal National Mtg Assoc., Pool AD8191, 4.00%, 9/1/2025 | | | 737,453 | | | | 777,178 | |
Federal National Mtg Assoc., Pool AE0704, 4.00%, 1/1/2026 | | | 2,860,103 | | | | 3,016,850 | |
Federal National Mtg Assoc., Pool AH3487, 3.50%, 2/1/2026 | | | 3,180,600 | | | | 3,318,633 | |
Federal National Mtg Assoc., Pool AJ1752, 3.50%, 9/1/2026 | | | 2,102,420 | | | | 2,193,662 | |
Federal National Mtg Assoc., Pool AK6518, 3.00%, 3/1/2027 | | | 1,881,430 | | | | 1,939,196 | |
Federal National Mtg Assoc., Pool AU2669, 2.50%, 10/1/2028 | | | 2,044,865 | | | | 2,071,624 | |
Federal National Mtg Assoc., Pool MA0045, 4.00%, 4/1/2019 | | | 108,080 | | | | 111,723 | |
Federal National Mtg Assoc., Pool MA0071, 4.50%, 5/1/2019 | | | 86,038 | | | | 87,971 | |
Federal National Mtg Assoc., Pool MA0125, 4.50%, 7/1/2019 | | | 71,846 | | | | 73,466 | |
Federal National Mtg Assoc., Pool MA0380, 4.00%, 4/1/2020 | | | 202,442 | | | | 209,266 | |
Federal National Mtg Assoc., Pool MA1582, 3.50%, 9/1/2043 | | | 4,745,586 | | | | 4,856,996 | |
Federal National Mtg Assoc., Pool MA1585, 2.00%, 9/1/2023 | | | 2,027,094 | | | | 2,038,734 | |
Federal National Mtg Assoc., Pool MA1625, 3.00%, 10/1/2023 | | | 2,193,914 | | | | 2,261,960 | |
Federal National Mtg Assoc., Pool MA2322, 2.50%, 7/1/2025 | | | 1,767,901 | | | | 1,791,312 | |
Federal National Mtg Assoc., Pool MA2353, 3.00%, 8/1/2035 | | | 2,673,088 | | | | 2,718,301 | |
Federal National Mtg Assoc., Pool MA2480, 4.00%, 12/1/2035 | | | 2,879,646 | | | | 3,055,349 | |
Federal National Mtg Assoc., Pool MA2499, 2.50%, 1/1/2026 | | | 2,853,200 | | | | 2,892,766 | |
Federal National Mtg Assoc., Pool MA2612, 2.50%, 5/1/2026 | | | 1,979,917 | | | | 2,007,373 | |
Government National Mtg Assoc., CMO Series 2010-160 Class VY, 4.50%, 1/20/2022 | | | 495,040 | | | | 522,837 | |
Government National Mtg Assoc., Pool 003550, 5.00%, 5/20/2019 | | | 85,154 | | | | 87,515 | |
Government National Mtg Assoc., Pool 714631, 5.722%, 10/20/2059 | | | 306,892 | | | | 311,842 | |
Government National Mtg Assoc., Pool 721652, 5.057%, 5/20/2061 | | | 2,263,906 | | | | 2,350,296 | |
Government National Mtg Assoc., Pool 751388, 5.305%, 1/20/2061 | | | 2,022,719 | | | | 2,141,375 | |
Government National Mtg Assoc., Pool 751392, 5.00%, 2/20/2061 | | | 4,505,099 | | | | 4,859,017 | |
Government National Mtg Assoc., Pool 757313, 4.30%, 12/20/2060 | | | 2,347,713 | | | | 2,387,995 | |
Government National Mtg Assoc., Pool 894205, 2.125%, 8/20/2039 | | | 359,725 | | | | 370,201 | |
Government National Mtg Assoc., Pool MA0100, 2.50%, 5/20/2042 | | | 1,165,052 | | | | 1,193,241 | |
Government National Mtg Assoc., Pool MA0907, 2.00%, 4/20/2028 | | | 2,855,002 | | | | 2,787,865 | |
| | | | | | | | |
TOTAL MORTGAGE BACKED (Cost $148,960,696) | | | | | | | 148,021,972 | |
| | | | | | | | |
| | |
SHORT TERM INVESTMENTS — 6.52% | | | | | | | | |
Bank of New York Tri-Party Repurchase Agreement 1.03% dated 3/31/2017 due 4/3/2017, repurchase price $14,001,202 collateralized by 18 U.S. Government debt securities, having an average coupon of 2.71%, a minimum credit rating of BBB-, maturity dates from 3/25/2019 to 2/20/2047, and having an aggregate market value of $14,253,827 at 3/31/2017 | | | 14,000,000 | | | | 14,000,000 | |
Federal Home Loan Discount Note, 0.30%, 4/3/2017 | | | 5,100,000 | | | | 5,099,915 | |
| | | | | | | | |
TOTAL SHORT TERM INVESTMENTS (Cost $19,099,915) | | | | | | | 19,099,915 | |
| | | | | | | | |
TOTAL INVESTMENTS — 99.70% (Cost $292,595,596) | | | | | | $ | 292,018,716 | |
OTHER ASSETS LESS LIABILITIES — 0.30% | | | | | | | 870,078 | |
| | | | | | | | |
NET ASSETS — 100.00% | | | | | | $ | 292,888,794 | |
| | | | | | | | |
Footnote Legend
| a | Yankee bond denominated in U.S. dollars and is issued in the U.S. by foreign banks and corporations. |
Portfolio Abbreviations
To simplify the listings of securities, abbreviations are used per the table below:
| | |
| CMO | | Collateralized Mortgage Obligation |
| Mtg | | Mortgage |
| REMIC | | Real Estate Mortgage Investment Conduit |
| VA | | Veterans Affairs |
See notes to financial statements.
Semi-Annual Reports 11
| | |
| Fund Summary | | |
| |
Thornburg Limited Term Income Fund | | March 31, 2017 (Unaudited) |
OBJECTIVES AND STRATEGIES
The Fund’s primary objective is to provide as high a level of current income as is consistent, in the view of the Fund’s investment advisor, with the preservation of capital. As a secondary goal, the Fund seeks to reduce changes in its share price compared to longer term portfolios.
This Fund is a laddered portfolio primarily composed of short/intermediate debt obligations which are investment grade or judged by the advisor to be of equivalent quality, with a dollar-weighted average maturity of normally less than five years.
LONG-TERM STABILITY OF PRINCIPAL
Net Asset Value History of A Shares
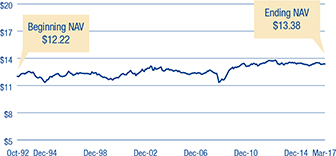
KEY PORTFOLIO ATTRIBUTES
| | | | |
Number of Bonds | | | 596 | |
| |
Effective Duration | | | 2.6 Yrs | |
| |
Average Maturity | | | 3.6 Yrs | |
SECURITY CREDIT RATINGS
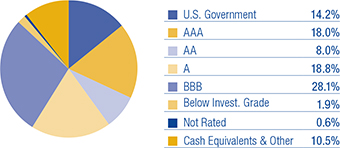
Credit quality ratings for Thornburg’s global fixed income portfolios used ratings from Moody’s Investors Service. Where Moody’s ratings are not available, we have used Standard & Poor’s ratings. Where neither rating is available, we have used ratings from other nationally recognized statistical rating organizations (NRSROs).
PORTFOLIO LADDER
Percent of portfolio maturing in each year. Cash includes cash equivalents.
There is no guarantee that the Fund will meet its investment objectives.
All data is subject to change. Charts may not add up to 100% due to rounding.
12 Semi-Annual Reports
| | |
| Schedule of Investments | | |
| |
Thornburg Limited Term Income Fund | | March 31, 2017 (Unaudited) |
| | | | | | | | | | | | |
ISSUER-DESCRIPTION | | CREDIT RATING†
S&P/ MOODY’S | | | PRINCIPAL
AMOUNT | | | VALUE | |
U.S. TREASURY SECURITIES — 6.50% | | | | | | | | | | | | |
United States Treasury Notes, 0.875% due 6/15/2017 | | | NR/Aaa | | | $ | 14,900,000 | | | $ | 14,902,445 | |
United States Treasury Notes, 0.875% due 7/15/2017 | | | NR/Aaa | | | | 36,500,000 | | | | 36,505,417 | |
United States Treasury Notes, 0.75% due 4/30/2018 | | | NR/Aaa | | | | 6,875,000 | | | | 6,848,413 | |
United States Treasury Notes, 1.625% due 3/31/2019 | | | NR/Aaa | | | | 15,000,000 | | | | 15,106,171 | |
United States Treasury Notes, 1.50% due 5/31/2019 | | | NR/Aaa | | | | 10,000,000 | | | | 10,042,969 | |
United States Treasury Notes, 2.75% due 11/15/2023 | | | NR/Aaa | | | | 5,500,000 | | | | 5,694,778 | |
United States Treasury Notes, 2.25% due 11/15/2024 | | | NR/Aaa | | | | 41,780,000 | | | | 41,675,550 | |
United States Treasury Notes, 2.00% due 8/15/2025 | | | NR/Aaa | | | | 17,500,000 | | | | 17,040,898 | |
United States Treasury Notes, 1.625% due 2/15/2026 | | | NR/Aaa | | | | 25,200,000 | | | | 23,695,285 | |
United States Treasury Notes, 1.50% due 8/15/2026 | | | NR/Aaa | | | | 58,000,000 | | | | 53,674,018 | |
United States Treasury Notes, 2.00% due 11/15/2026 | | | NR/Aaa | | | | 22,633,000 | | | | 21,864,363 | |
United States Treasury Notes Inflationary Index, 0.125% due 4/15/2020 | | | NR/Aaa | | | | 17,167,003 | | | | 17,423,657 | |
United States Treasury Notes Inflationary Index, 0.25% due 1/15/2025 | | | NR/Aaa | | | | 5,637,940 | | | | 5,589,821 | |
United States Treasury Notes Inflationary Index, 0.125% due 7/15/2026 | | | NR/Aaa | | | | 45,492,378 | | | | 44,388,091 | |
| | | | | | | | | | | | |
TOTAL U.S. TREASURY SECURITIES (Cost $318,199,309) | | | | | | | | | | | 314,451,876 | |
| | | | | | | | | | | | |
| | | |
U.S. GOVERNMENT AGENCIES — 4.80% | | | | | | | | | | | | |
Alex Alpha, LLC, (Guaranty: Export-Import Bank of the United States), 1.617% due 8/15/2024 | | | NR/NR | | | | 3,260,869 | | | | 3,173,129 | |
Altitude Investments 12, LLC, (Guaranty: Export-Import Bank of the United States), 2.454% due 12/9/2025 | | | NR/NR | | | | 5,301,473 | | | | 5,297,365 | |
a CoBank, ACB Floating Rate Note, (Federal Farm Credit Banks), 1.731% due 6/15/2022 | | | A-/NR | | | | 27,800,000 | | | | 26,837,342 | |
b Durrah MSN 35603, (Guaranty: Export-Import Bank of the United States), 1.684% due 1/22/2025 | | | NR/NR | | | | 10,296,274 | | | | 10,007,762 | |
DY8 Leasing, LLC, (Guaranty: Export-Import Bank of the United States), 2.627% due 4/29/2026 | | | NR/NR | | | | 3,950,521 | | | | 3,976,871 | |
Export Leasing (2009), LLC, (Guaranty: Export-Import Bank of the United States), 1.859% due 8/28/2021 | | | NR/NR | | | | 4,083,811 | | | | 4,059,986 | |
b Gate Capital Cayman One Ltd., (Guaranty: Export-Import Bank of the United States), 1.839% due 3/27/2021 | | | NR/NR | | | | 6,615,423 | | | | 6,579,085 | |
Helios Leasing I, LLC, (Guaranty: Export-Import Bank of the United States), 1.562% due 9/28/2024 | | | NR/NR | | | | 3,887,684 | | | | 3,758,057 | |
b Micron Semiconductor Ltd., (Guaranty: Export-Import Bank of the United States), 1.258% due 1/15/2019 | | | NR/NR | | | | 1,720,000 | | | | 1,708,349 | |
Mortgage-Linked Amortizing Notes, Series 2012-1 Class A10, 2.06% due 1/15/2022 | | | AA+/NR | | | | 586,303 | | | | 589,264 | |
b MSN 41079 and 41084 Ltd., (Guaranty: Export-Import Bank of the United States), 1.717% due 7/13/2024 | | | NR/NR | | | | 7,808,299 | | | | 7,620,111 | |
b Petroleos Mexicanos Floating Rate Note, (Guaranty: Export-Import Bank of the United States), 1.373% due 4/15/2025 | | | NR/NR | | | | 8,547,000 | | | | 8,435,111 | |
b Petroleos Mexicanos, (Guaranty: Export-Import Bank of the United States), 1.70% due 12/20/2022 | | | NR/NR | | | | 6,240,000 | | | | 6,145,520 | |
b Petroleos Mexicanos, (Guaranty: Export-Import Bank of the United States), 2.46% due 12/15/2025 | | | NR/NR | | | | 6,750,000 | | | | 6,749,770 | |
Private Export Funding Corp., (Guaranty: Export-Import Bank of the United States), 5.45% due 9/15/2017 | | | NR/Aaa | | | | 3,000,000 | | | | 3,058,962 | |
Private Export Funding Corp., (Guaranty: Export-Import Bank of the United States), 3.55% due 1/15/2024 | | | NR/Aaa | | | | 10,000,000 | | | | 10,651,170 | |
b Reliance Industries Ltd., (Guaranty: Export-Import Bank of the United States), 2.512% due 1/15/2026 | | | NR/NR | | | | 5,850,000 | | | | 5,860,822 | |
b Reliance Industries Ltd., (Guaranty: Export-Import Bank of the United States), 2.06% due 1/15/2026 | | | NR/NR | | | | 1,350,000 | | | | 1,326,509 | |
b Reliance Industries Ltd., (Guaranty: Export-Import Bank of the United States), 1.87% due 1/15/2026 | | | NR/NR | | | | 6,461,053 | | | | 6,296,341 | |
Sandalwood 2013, LLC, (Guaranty: Export-Import Bank of the United States), 2.821% due 2/12/2026 | | | NR/NR | | | | 5,443,357 | | | | 5,524,594 | |
Santa Rosa Leasing, LLC, (Guaranty: Export-Import Bank of the United States), 1.693% due 8/15/2024 | | | NR/NR | | | | 3,866,697 | | | | 3,773,259 | |
Santa Rosa Leasing, LLC, (Guaranty: Export-Import Bank of the United States), 1.472% due 11/3/2024 | | | NR/NR | | | | 10,683,427 | | | | 10,311,591 | |
Small Business Administration Participation Certificates, Series 2001-20J Class 1, 5.76% due 10/1/2021 | | | NR/NR | | | | 201,599 | | | | 212,693 | |
Small Business Administration Participation Certificates, Series 2008-20D Class 1, 5.37% due 4/1/2028 | | | NR/NR | | | | 1,118,558 | | | | 1,211,096 | |
Small Business Administration Participation Certificates, Series 2009-20E Class 1, 4.43% due 5/1/2029 | | | NR/NR | | | | 1,041,196 | | | | 1,104,026 | |
Small Business Administration Participation Certificates, Series 2009-20K Class 1, 4.09% due 11/1/2029 | | | NR/NR | | | | 6,060,771 | | | | 6,410,491 | |
Small Business Administration Participation Certificates, Series 2011-20E Class 1, 3.79% due 5/1/2031 | | | NR/NR | | | | 7,772,340 | | | | 8,135,509 | |
Small Business Administration Participation Certificates, Series 2011-20F Class 1, 3.67% due 6/1/2031 | | | NR/NR | | | | 1,222,166 | | | | 1,274,603 | |
Small Business Administration Participation Certificates, Series 2011-20G Class 1, 3.74% due 7/1/2031 | | | NR/NR | | | | 8,167,491 | | | | 8,542,693 | |
Small Business Administration Participation Certificates, Series 2011-20I Class 1, 2.85% due 9/1/2031 | | | NR/NR | | | | 11,425,343 | | | | 11,568,142 | |
Small Business Administration Participation Certificates, Series 2011-20K Class 1, 2.87% due 11/1/2031 | | | NR/NR | | | | 9,615,257 | | | | 9,739,928 | |
Small Business Administration Participation Certificates, Series 2012-20D Class 1, 2.67% due 4/1/2032 | | | NR/NR | | | | 9,736,131 | | | | 9,736,329 | |
Small Business Administration Participation Certificates, Series 2012-20J Class 1, 2.18% due 10/1/2032 | | | NR/NR | | | | 7,510,460 | | | | 7,370,288 | |
Small Business Administration Participation Certificates, Series 2012-20K Class 1, 2.09% due 11/1/2032 | | | NR/NR | | | | 4,736,344 | | | | 4,614,168 | |
a,c U.S. Department of Transportation, 6.001% due 12/7/2021 | | | NR/NR | | | | 3,000,000 | | | | 3,360,000 | |
Union 13 Leasing, LLC, (Guaranty: Export-Import Bank of the United States), 1.682% due 12/19/2024 | | | NR/NR | | | | 10,015,338 | | | | 9,730,302 | |
b Washington Aircraft 2 Co. Ltd. Floating Rate Note, (Guaranty: Export-Import Bank of the United States), 1.583% due 6/26/2024 | | | NR/NR | | | | 7,418,601 | | | | 7,310,045 | |
| | | | | | | | | | | | |
TOTAL U.S. GOVERNMENT AGENCIES (Cost $234,470,494) | | | | | | | | | | | 232,061,283 | |
| | | | | | | | | | | | |
| | | |
OTHER GOVERNMENT — 1.30% | | | | | | | | | | | | |
a,b Carpintero Finance Ltd., (Guaranty: Export Credits Guarantee Department of the United Kingdom), 2.004% due 9/18/2024 | | | NR/NR | | | | 7,491,146 | | | | 7,377,184 | |
a,b Carpintero Finance Ltd., (Guaranty: Export Credits Guarantee Department of the United Kingdom), 2.581% due 11/11/2024 | | | NR/NR | | | | 10,616,111 | | | | 10,681,612 | |
a,b Government of Bermuda, 5.603% due 7/20/2020 | | | A+/A2 | | | | 3,000,000 | | | | 3,273,750 | |
a,b Government of Bermuda, 4.138% due 1/3/2023 | | | A+/A2 | | | | 4,000,000 | | | | 4,106,540 | |
Semi-Annual Reports 13
| | |
| Schedule of Investments, Continued | | |
| |
Thornburg Limited Term Income Fund | | March 31, 2017 (Unaudited) |
| | | | | | | | | | | | |
ISSUER-DESCRIPTION | | CREDIT RATING†
S&P/ MOODY’S | | | PRINCIPAL
AMOUNT | | | VALUE | |
a,b Khadrawy Ltd., (Guaranty: Export Credit Guarantee Department of the United Kingdom), 2.471% due 3/31/2025 | | | NR/NR | | | $ | 5,089,076 | | | $ | 5,043,275 | |
a,b Korea National Oil Corp., 2.75% due 1/23/2019 | | | AA/Aa2 | | | | 5,000,000 | | | | 5,047,135 | |
b North American Development Bank, 4.375% due 2/11/2020 | | | NR/Aa1 | | | | 15,500,000 | | | | 16,447,794 | |
a,b Seven and Seven Ltd. Floating Rate Note, (Guaranty: Export-Import Bank of Korea), 2.43% due 9/11/2019 | | | NR/NR | | | | 11,150,000 | | | | 11,077,179 | |
| | | | | | | | | | | | |
TOTAL OTHER GOVERNMENT (Cost $62,752,771) | | | | | | | | | | | 63,054,469 | |
| | | | | | | | | | | | |
| | | |
MORTGAGE BACKED — 4.80% | | | | | | | | | | | | |
Federal Home Loan Mtg Corp. Multi-Family Structured Pass Through, Series KLH3 Class A Floating Rate Note, 1.489% due 11/25/2022 | | | NR/NR | | | | 18,456,989 | | | | 18,466,482 | |
Federal Home Loan Mtg Corp. Whole Loan Securities, Series 2016-SC01 Class 2A, 3.50% due 7/25/2046 | | | NR/NR | | | | 8,890,470 | | | | 8,594,151 | |
Federal Home Loan Mtg Corp., CMO Interest Only Series K008 Class X1, 1.618% due 6/25/2020 | | | NR/NR | | | | 35,424,408 | | | | 1,364,662 | |
Federal Home Loan Mtg Corp., CMO Interest Only Series K710 Class X1, 1.757% due 5/25/2019 | | | NR/NR | | | | 46,209,825 | | | | 1,345,884 | |
Federal Home Loan Mtg Corp., CMO Series 2528 Class HN, 5.00% due 11/15/2017 | | | NR/NR | | | | 20,720 | | | | 20,928 | |
Federal Home Loan Mtg Corp., CMO Series 2627 Class GY, 4.50% due 6/15/2018 | | | NR/NR | | | | 205,273 | | | | 207,826 | |
Federal Home Loan Mtg Corp., CMO Series 2628 Class AB, 4.50% due 6/15/2018 | | | NR/NR | | | | 50,453 | | | | 51,155 | |
Federal Home Loan Mtg Corp., CMO Series 2682 Class JG, 4.50% due 10/15/2023 | | | NR/NR | | | | 616,256 | | | | 640,670 | |
Federal Home Loan Mtg Corp., CMO Series 2814 Class GB, 5.00% due 6/15/2019 | | | NR/NR | | | | 18,221 | | | | 18,610 | |
Federal Home Loan Mtg Corp., CMO Series 2827 Class BU, 3.50% due 7/15/2019 | | | NR/NR | | | | 263,262 | | | | 265,840 | |
Federal Home Loan Mtg Corp., CMO Series 3195 Class PD, 6.50% due 7/15/2036 | | | NR/NR | | | | 935,366 | | | | 1,023,404 | |
Federal Home Loan Mtg Corp., CMO Series 3291 Class BY, 4.50% due 3/15/2022 | | | NR/NR | | | | 821,648 | | | | 847,092 | |
Federal Home Loan Mtg Corp., CMO Series 3504 Class PC, 4.00% due 1/15/2039 | | | NR/NR | | | | 75,430 | | | | 77,284 | |
Federal Home Loan Mtg Corp., CMO Series 3919 Class VB, 4.00% due 8/15/2024 | | | NR/NR | | | | 3,808,862 | | | | 4,035,983 | |
Federal Home Loan Mtg Corp., CMO Series 3922 Class PQ, 2.00% due 4/15/2041 | | | NR/NR | | | | 1,418,993 | | | | 1,410,077 | |
Federal Home Loan Mtg Corp., CMO Series 4050 Class MV, 3.50% due 8/15/2023 | | | NR/NR | | | | 2,471,169 | | | | 2,563,864 | |
Federal Home Loan Mtg Corp., CMO Series 4079 Class WV, 3.50% due 3/15/2027 | | | NR/NR | | | | 2,787,887 | | | | 2,873,779 | |
Federal Home Loan Mtg Corp., CMO Series 4097 Class TE, 1.75% due 5/15/2039 | | | NR/NR | | | | 6,140,757 | | | | 5,932,934 | |
Federal Home Loan Mtg Corp., CMO Series 4120 Class TC, 1.50% due 10/15/2027 | | | NR/NR | | | | 3,227,458 | | | | 3,126,451 | |
Federal Home Loan Mtg Corp., CMO Series K038 Class A1, 2.604% due 10/25/2023 | | | NR/NR | | | | 11,561,996 | | | | 11,708,680 | |
Federal Home Loan Mtg Corp., CMO Series K039 Class A1, 2.683% due 12/25/2023 | | | NR/NR | | | | 5,852,695 | | | | 5,942,114 | |
Federal Home Loan Mtg Corp., CMO Series K716 Class A1, 2.413% due 8/25/2047 | | | NR/Aaa | | | | 4,444,733 | | | | 4,498,670 | |
Federal Home Loan Mtg Corp., Multi-Family Structured Pass Through, Series K710 Class A2, 1.883% due 5/25/2019 | | | NR/NR | | | | 7,605,000 | | | | 7,617,735 | |
Federal Home Loan Mtg Corp., Pool D98887, 3.50% due 1/1/2032 | | | NR/NR | | | | 3,623,968 | | | | 3,784,923 | |
Federal Home Loan Mtg Corp., Pool G15523, 2.50% due 8/1/2025 | | | NR/NR | | | | 3,564,037 | | | | 3,619,586 | |
Federal Home Loan Mtg Corp., Pool J17504, 3.00% due 12/1/2026 | | | NR/NR | | | | 1,961,197 | | | | 2,021,412 | |
Federal Home Loan Mtg Corp., REMIC Series 3838 Class GV, 4.00% due 3/15/2024 | | | NR/NR | | | | 7,362,095 | | | | 7,751,368 | |
Federal Home Loan Mtg Corp., REMIC Series 4072 Class VA, 3.50% due 10/15/2023 | | | NR/NR | | | | 1,907,428 | | | | 1,979,662 | |
c Federal Home Loan Mtg Corp., Series 2017-SCO1 Class 1A, 3.00% due 12/25/2046 | | | NR/NR | | | | 27,000,000 | | | | 26,067,658 | |
Federal National Mtg Assoc., CMO Series 2003-4 Class PE, 5.00% due 2/25/2018 | | | NR/NR | | | | 66,820 | | | | 67,523 | |
Federal National Mtg Assoc., CMO Series 2003-74 Class KN, 4.50% due 8/25/2018 | | | NR/NR | | | | 36,486 | | | | 36,884 | |
Federal National Mtg Assoc., CMO Series 2005-48 Class AR, 5.50% due 2/25/2035 | | | NR/NR | | | | 197,667 | | | | 204,972 | |
Federal National Mtg Assoc., CMO Series 2007-42 Class PA, 5.50% due 4/25/2037 | | | NR/NR | | | | 332,361 | | | | 351,135 | |
Federal National Mtg Assoc., CMO Series 2009-17 Class AH, 0.876% due 3/25/2039 | | | NR/NR | | | | 722,824 | | | | 623,175 | |
Federal National Mtg Assoc., CMO Series 2009-5 Class A, 4.50% due 12/25/2023 | | | NR/NR | | | | 266,131 | | | | 269,450 | |
Federal National Mtg Assoc., CMO Series 2009-52 Class AJ, 4.00% due 7/25/2024 | | | NR/NR | | | | 242,205 | | | | 246,904 | |
Federal National Mtg Assoc., CMO Series 2009-70 Class NK, 4.50% due 8/25/2019 | | | NR/NR | | | | 125,280 | | | | 126,931 | |
Federal National Mtg Assoc., CMO Series 2011-103 Class VA, 4.00% due 12/25/2022 | | | NR/NR | | | | 224,319 | | | | 224,248 | |
Federal National Mtg Assoc., CMO Series 2011-15 Class VA, 4.00% due 4/25/2022 | | | NR/NR | | | | 1,010,800 | | | | 1,034,915 | |
Federal National Mtg Assoc., CMO Series 2012-129 Class LA, 3.50% due 12/25/2042 | | | NR/NR | | | | 8,483,192 | | | | 8,634,634 | |
Federal National Mtg Assoc., CMO Series 2012-36 Class CV, 4.00% due 6/25/2023 | | | NR/NR | | | | 2,204,324 | | | | 2,288,345 | |
Federal National Mtg Assoc., CMO Series 2013-81 Class FW Floating Rate Note, 1.282% due 1/25/2043 | | | NR/NR | | | | 11,875,258 | | | | 11,805,853 | |
Federal National Mtg Assoc., Pool 357384, 4.50% due 5/1/2018 | | | NR/NR | | | | 24,617 | | | | 24,944 | |
Federal National Mtg Assoc., Pool 897936, 5.50% due 8/1/2021 | | | NR/NR | | | | 393,230 | | | | 415,780 | |
Federal National Mtg Assoc., Pool AB7997, 2.50% due 2/1/2023 | | | NR/NR | | | | 4,531,647 | | | | 4,585,991 | |
Federal National Mtg Assoc., Pool AE0704, 4.00% due 1/1/2026 | | | NR/NR | | | | 7,439,063 | | | | 7,846,758 | |
Federal National Mtg Assoc., Pool AK6518, 3.00% due 3/1/2027 | | | NR/NR | | | | 2,624,355 | | | | 2,704,931 | |
d Federal National Mtg Assoc., Pool AL9612, 3.50% due 11/1/2043 | | | NR/NR | | | | 9,620,324 | | | | 9,900,291 | |
Federal National Mtg Assoc., Pool MA1278, 2.50% due 12/1/2022 | | | NR/NR | | | | 5,991,367 | | | | 6,065,580 | |
Federal National Mtg Assoc., Pool MA1585, 2.00% due 9/1/2023 | | | NR/NR | | | | 7,677,618 | | | | 7,721,704 | |
Federal National Mtg Assoc., Pool MA1691, 3.00% due 12/1/2023 | | | NR/NR | | | | 6,675,575 | | | | 6,882,622 | |
Federal National Mtg Assoc., Pool MA2612, 2.50% due 5/1/2026 | | | NR/NR | | | | 19,245,109 | | | | 19,511,985 | |
Government National Mtg Assoc., CMO Series 2009-68 Class DP, 4.50% due 11/16/2038 | | | NR/NR | | | | 346,640 | | | | 363,098 | |
Government National Mtg Assoc., Pool 714631, 5.722% due 10/20/2059 | | | NR/NR | | | | 828,610 | | | | 841,972 | |
Government National Mtg Assoc., Pool 721652, 5.057% due 5/20/2061 | | | NR/NR | | | | 3,300,672 | | | | 3,426,625 | |
Government National Mtg Assoc., Pool 731491, 5.158% due 12/20/2060 | | | NR/NR | | | | 2,601,855 | | | | 2,741,840 | |
Government National Mtg Assoc., Pool 751388, 5.305% due 1/20/2061 | | | NR/NR | | | | 3,178,559 | | | | 3,365,018 | |
Government National Mtg Assoc., Pool 783299, 4.50% due 2/15/2022 | | | NR/NR | | | | 774,775 | | | | 792,804 | |
14 Semi-Annual Reports
| | |
| Schedule of Investments, Continued | | |
| |
Thornburg Limited Term Income Fund | | March 31, 2017 (Unaudited) |
| | | | | | | | | | | | |
ISSUER-DESCRIPTION | | CREDIT RATING†
S&P/ MOODY’S | | | PRINCIPAL
AMOUNT | | | VALUE | |
Government National Mtg Assoc., Pool 827148, 2.00% due 2/20/2024 | | | NR/NR | | | $ | 17,484 | | | $ | 17,770 | |
Government National Mtg Assoc., Pool MA0100, 2.50% due 5/20/2042 | | | NR/NR | | | | 1,176,820 | | | | 1,205,294 | |
| | | | | | | | | | | | |
TOTAL MORTGAGE BACKED (Cost $233,670,678) | | | | | | | | | | | 232,188,860 | |
| | | | | | | | | | | | |
| | | |
ASSET BACKED SECURITIES — 22.24% | | | | | | | | | | | | |
ADVANCE RECEIVABLES — 1.00% | | | | | | | | | | | | |
a New Residential Advance Receivables Trust, Series 2016-T2 Class AT2, 2.575% due 10/15/2049 | | | AAA/NR | | | | 22,700,000 | | | | 22,458,813 | |
a SPS Servicer Advance Receivables Trust, Series 2015-T3 Class AT3, 2.92% due 7/15/2047 | | | NR/NR | | | | 13,875,000 | | | | 13,896,281 | |
a SPS Servicer Advance Receivables Trust, Series 2016-T1 Class AT1, 2.53% due 11/16/2048 | | | AAA/NR | | | | 12,000,000 | | | | 11,960,762 | |
| | | | | | | | | | | | |
| | | | | | | | | | | 48,315,856 | |
| | | | | | | | | | | | |
AUTO RECEIVABLES — 3.47% | | | | | | | | | | | | |
a Avis Budget Rental Car Funding AESOP, LLC, Series 2012-3A Class A, 2.10% due 3/20/2019 | | | NR/Aaa | | | | 10,200,000 | | | | 10,227,485 | |
a Avis Budget Rental Car Funding AESOP, LLC, Series 2015-2A Class A, 2.63% due 12/20/2021 | | | NR/Aaa | | | | 6,000,000 | | | | 6,005,135 | |
Capital Auto Receivables Asset Trust, Series 2016-3 Class A2A, 1.36% due 4/22/2019 | | | AAA/Aaa | | | | 3,123,670 | | | | 3,123,262 | |
a Chesapeake Funding II, LLC, Series 2016-1A Class A1, 2.11% due 3/15/2028 | | | NR/Aaa | | | | 13,256,791 | | | | 13,265,930 | |
a Chrysler Capital Auto Receivables Trust, Series 2013-BA Class A4, 1.27% due 3/15/2019 | | | AAA/Aaa | | | | 3,657,644 | | | | 3,657,523 | |
a Drive Auto Receivables Trust, Series 2017-AA Class B, 2.51% due 1/15/2021 | | | AA/Aa1 | | | | 8,875,000 | | | | 8,891,246 | |
a Enterprise Fleet Financing, LLC, Series 2017-1 Class A2, 2.13% due 7/20/2022 | | | AAA/NR | | | | 6,000,000 | | | | 6,006,739 | |
a Exeter Automobile Receivables Trust, Series 2015-1A Class B, 2.84% due 3/16/2020 | | | AA-/NR | | | | 14,250,000 | | | | 14,317,133 | |
Ford Credit Auto Owner Trust, Series 2013-C Class A4, 1.25% due 10/15/2018 | | | AAA/NR | | | | 311,755 | | | | 311,748 | |
a Ford Credit Auto Owner Trust, Series 2014-2 Class A, 2.31% due 4/15/2026 | | | NR/Aaa | | | | 18,000,000 | | | | 18,157,075 | |
a Ford Credit Auto Owner Trust, Series 2015-1 Class A, 2.12% due 7/15/2026 | | | AAA/NR | | | | 9,900,000 | | | | 9,925,195 | |
a Foursight Capital Automobile Receivables Trust, Series 2016-1 Class A2, 2.87% due 10/15/2021 | | | A/NR | | | | 12,978,681 | | | | 13,028,440 | |
a GM Financial Automobile Leasing Trust, Series 2014-2A Class A4, 1.62% due 2/20/2018 | | | NR/Aaa | | | | 13,400,000 | | | | 13,405,523 | |
a Hertz Vehicle Financing, LLC, Series 2013-1A Class A2, 1.83% due 8/25/2019 | | | NR/Aaa | | | | 10,400,000 | | | | 10,367,179 | |
a Hertz Vehicle Financing, LLC, Series 2015-2A Class A, 2.02% due 9/25/2019 | | | NR/Aaa | | | | 15,000,000 | | | | 14,915,610 | |
Nissan Auto Receivables Owner Trust, Series 2016-B Class A2B Floating Rate Note, 1.212% due 4/15/2019 | | | NR/Aaa | | | | 9,545,526 | | | | 9,556,926 | |
a OSCAR US Funding Trust, Series 2014-1A Class A3, 1.72% due 4/15/2019 | | | AAA/Aaa | | | | 5,055,930 | | | | 5,027,551 | |
a,c OSCAR US Funding Trust, Series 2016-2A Class A3, 2.73% due 12/15/2020 | | | AAA/Aaa | | | | 7,430,000 | | | | 7,407,710 | |
| | | | | | | | | | | | |
| | | | | | | | | | | 167,597,410 | |
| | | | | | | | | | | | |
COMMERCIAL MTG TRUST — 2.91% | | | | | | | | | | | | |
a Barclays Commercial Mortgage Securities, LLC, Series 2015-STP Class A, 3.323% due 9/10/2028 | | | AAA/NR | | | | 5,880,924 | | | | 6,032,270 | |
a Bayview Commercial Asset Trust, Series 2004-3 Class A2 Floating Rate Note, 1.402% due 1/25/2035 | | | NR/Aa2 | | | | 2,690,855 | | | | 2,582,210 | |
a BHMS Mtg Trust, Series 2014-ATLS Class AFL Floating Rate Note, 2.33% due 7/5/2033 | | | NR/NR | | | | 10,000,000 | | | | 10,012,259 | |
a CFCRE Commercial Mtg Trust, Series 2011-C1 Class A4, 4.961% due 4/15/2044 | | | NR/Aaa | | | | 11,877,000 | | | | 12,719,389 | |
Citigroup Commercial Mortgage Trust, Series 2004-HYB2 Class B1, 3.317% due 3/25/2034 | | | CCC/Caa2 | | | | 176,580 | | | | 144,548 | |
COMM Mortgage Trust, Series 2016-DC2 Class A1, 1.82% due 2/10/2049 | | | NR/Aaa | | | | 21,442,207 | | | | 21,428,977 | |
a DBUBS Mortgage Trust CMO, Series 2011-LC2A Class A1FL, 2.208% due 7/12/2044 | | | NR/Aaa | | | | 4,012,091 | | | | 4,036,703 | |
a FREMF Mortgage Trust, Series 2013-KF02 Class B Floating Rate Note, 3.778% due 12/25/2045 | | | NR/Baa3 | | | | 1,146,838 | | | | 1,159,587 | |
a GAHR Commercial Mortgage Trust, Series 2015-NRF Class BFX, 3.382% due 12/15/2034 | | | AA-/NR | | | | 24,980,000 | | | | 25,461,212 | |
a Hilton USA Trust, Series 2016-HHV Class A, 3.719% due 11/5/2038 | | | NR/Aaa | | | | 7,000,000 | | | | 7,153,689 | |
a JPMorgan Chase Commercial Mortgage, Series 2014-BXH Class A Floating Rate Note, 1.812% due 4/15/2027 | | | AAA/NR | | | | 18,322,891 | | | | 18,333,629 | |
a Madison Avenue Trust, Series 2015-11MD Class A, 3.555% due 9/10/2035 | | | AAA/NR | | | | 12,000,000 | | | | 12,333,953 | |
a Morgan Stanley Re-REMIC Trust, Series 2009-GG10 Class A4A, 5.949% due 8/12/2045 | | | NR/Aaa | | | | 451,291 | | | | 451,334 | |
a Wells Fargo Commercial Mtg Trust, Series 2013-120B Class A, 2.71% due 3/18/2028 | | | AAA/NR | | | | 15,000,000 | | | | 15,171,830 | |
WFRBS Commercial Mortgage Trust, Series 2014-C22 Class A1, 1.479% due 9/15/2057 | | | NR/Aaa | | | | 3,586,411 | | | | 3,572,096 | |
| | | | | | | | | | | | |
| | | | | | | | | | | 140,593,686 | |
| | | | | | | | | | | | |
CREDIT CARD — 2.58% | | | | | | | | | | | | |
Barclays Dryrock Issuance Trust, Series 2015-4 Class A, 1.72% due 8/16/2021 | | | AAA/NR | | | | 13,630,000 | | | | 13,633,973 | |
Barclays Dryrock Issuance Trust, Series 2016-1 Class A, 1.52% due 5/16/2022 | | | AAA/NR | | | | 10,365,000 | | | | 10,280,242 | |
Cabela’s Master Credit Card Trust, Series 2015-1A Class A2 Floating Rate Note, 1.452% due 3/15/2023 | | | AAA/NR | | | | 15,665,000 | | | | 15,752,621 | |
Cabela’s Master Credit Card Trust, Series 2016-1 Class A2 Floating Rate Note, 1.762% due 6/15/2022 | | | AAA/NR | | | | 15,000,000 | | | | 15,184,967 | |
Capital One Multi-Asset Execution Trust, Series 2016-A1 Class A1 Floating Rate Note, 1.362% due 2/15/2022 | | | AAA/NR | | | | 29,280,000 | | | | 29,449,440 | |
Synchrony Credit Card Master Note Trust, Series 2014-1 Class A, 1.61% due 11/15/2020 | | | AAA/Aaa | | | | 14,613,000 | | | | 14,634,258 | |
Synchrony Credit Card Master Note Trust, Series 2015-2 Class A, 1.60% due 4/15/2021 | | | AAA/NR | | | | 7,400,000 | | | | 7,403,571 | |
Synchrony Credit Card Master Note Trust, Series 2016-1 Class A, 2.04% due 3/15/2022 | | | NR/Aaa | | | | 8,500,000 | | | | 8,533,449 | |
a,b Turquoise Card Backed Securities plc, Series 2012-1A Class A Floating Rate Note, 1.712% due 6/17/2019 | | | NR/Aaa | | | | 10,000,000 | | | | 10,007,360 | |
| | | | | | | | | | | | |
| | | | | | | | | | | 124,879,881 | |
| | | | | | | | | | | | |
OTHER ASSET BACKED — 8.39% | | | | | | | | | | | | |
a 321 Henderson Receivables, LLC, Series 2014-1A Class A, 3.96% due 3/15/2063 | | | NR/Aaa | | | | 16,586,900 | | | | 16,153,941 | |
a Alterna Funding I, LLC, Series 2014-1A, 1.639% due 2/15/2021 | | | NR/NR | | | | 1,629,966 | | | | 1,597,367 | |
a AMSR Trust, Series 2016-SFR1 Class A Floating Rate Note, 2.343% due 11/17/2033 | | | NR/Aaa | | | | 15,900,000 | | | | 15,969,361 | |
Appalachian Consumer Rate Relief Funding, LLC, Series 2013-1 Class A1, 2.008% due 2/1/2024 | | | AAA/Aaa | | | | 10,291,895 | | | | 10,242,981 | |
Semi-Annual Reports 15
| | |
| Schedule of Investments, Continued | | |
| |
Thornburg Limited Term Income Fund | | March 31, 2017 (Unaudited) |
| | | | | | | | | | | | |
ISSUER-DESCRIPTION | | CREDIT RATING†
S&P/ MOODY’S | | | PRINCIPAL
AMOUNT | | | VALUE | |
a Ascentium Equipment Receivables, LLC, Series 2015-1A Class B, 2.26% due 6/10/2021 | | | NR/Aaa | | | $ | 5,970,000 | | | $ | 5,987,820 | |
a BCC Funding Corp., Series 2016-1 Class A1, 1.10% due 9/20/2017 | | | NR/NR | | | | 7,122,790 | | | | 7,116,757 | |
a CLI Funding V, LLC, Series 2014-2A Class A, 3.38% due 10/18/2029 | | | A/NR | | | | 7,536,351 | | | | 7,363,166 | |
a,b Cronos Containers Program Ltd., Series 2013-1A Class A, 3.08% due 4/18/2028 | | | A+/NR | | | | 6,083,333 | | | | 5,860,925 | |
a,b Cronos Containers Program Ltd., Series 2014-2A Class A, 3.27% due 11/18/2029 | | | A+/NR | | | | 1,896,296 | | | | 1,852,100 | |
a Dell Equipment Finance Trust, Series 2015-2 Class A3, 1.72% due 9/22/2020 | | | AAA/Aaa | | | | 9,875,000 | | | | 9,893,988 | |
a Dell Equipment Finance Trust, Series 2016-1 Class A3, 1.65% due 7/22/2021 | | | AAA/Aaa | | | | 7,000,000 | | | | 6,980,557 | |
a Diamond Resorts Owner Trust, Series 2014-1 Class A, 2.54% due 5/20/2027 | | | A+/NR | | | | 15,826,592 | | | | 15,825,205 | |
a Dominos Pizza Master Issuer, LLC, Series 2012-1A Class A2, 5.216% due 1/25/2042 | | | BBB+/Baa1 | | | | 17,657,724 | | | | 17,989,727 | |
a,b ECAF Ltd., Series 2015-1A Class A2, 4.947% due 6/15/2040 | | | A/NR | | | | 4,870,312 | | | | 4,675,499 | |
a Engs Commercial Finance Trust, Series 2016-1A Class A1, 1.25% due 11/22/2017 | | | NR/NR | | | | 7,975,486 | | | | 7,976,542 | |
Entergy New Orleans Storm Recovery Funding I, LLC, Series 2015-1 Class A, 2.67% due 6/1/2027 | | | AAA/Aa1 | | | | 13,264,526 | | | | 13,346,136 | |
a Fairway Outdoor Funding, LLC, Series 2012-1A Class A2, 4.212% due 10/15/2042 | | | NR/NR | | | | 6,122,891 | | | | 6,158,384 | |
GE Dealer Floorplan Master Note Trust, Series 2012-2 Class A Floating Rate Note, 1.728% due 4/22/2019 | | | NR/Aaa | | | | 14,900,000 | | | | 14,903,743 | |
a GTP Acquisition Partners I, LLC, Series 2015-1 Class A, 2.35% due 6/15/2045 | | | NR/Aaa | | | | 9,900,000 | | | | 9,773,082 | |
Harley-Davidson Motorcycle Trust, Series 2015-2 Class A4, 1.66% due 12/15/2022 | | | AAA/Aaa | | | | 22,544,000 | | | | 22,507,819 | |
a HERO Funding Trust, Series 2015-1A Class A, 3.84% due 9/21/2040 | | | NR/NR | | | | 14,051,429 | | | | 14,332,457 | |
a Hertz Fleet Lease Funding LP, Series 2016-1 Class A1 Floating Rate Note, 1.958% due 4/10/2030 | | | NR/Aaa | | | | 19,800,000 | | | | 19,888,850 | |
a Navistar Financial Dealer Note Master Owner Trust II, Series 2015-1 Class A Floating Rate Note, 2.382% due 6/25/2020 | | | NR/Aaa | | | | 15,330,000 | | | | 15,356,220 | |
a Navitas Equipment Receivables, LLC, Series 2015-1 Class A2, 2.12% due 11/15/2018 | | | NR/A1 | | | | 3,823,610 | | | | 3,820,818 | |
Northwest Airlines, Inc., 7.027% due 5/1/2021 | | | A/A2 | | | | 3,794,813 | | | | 4,193,268 | |
a,c Northwind Holdings, LLC, Series 2007-1A Class A1 Floating Rate Note, 1.622% due 12/1/2037 | | | A/Baa1 | | | | 2,143,750 | | | | 1,995,831 | |
a OnDeck Asset Securitization Trust II, LLC, Series 2016-1A Class A, 4.21% due 5/17/2020 | | | BBB+/NR | | | | 6,700,000 | | | | 6,660,838 | |
a OneMain Financial Issuance Trust, Series 2016-2A Class A, 4.10% due 3/20/2028 | | | A+/NR | | | | 12,900,000 | | | | 13,214,265 | |
a PFS Financing Corp., Series 2014-BA Class A Floating Rate Note, 1.512% due 10/15/2019 | | | AAA/Aaa | | | | 6,000,000 | | | | 5,990,467 | |
a PFS Financing Corp., Series 2015-AA Class A Floating Rate Note, 1.532% due 4/15/2020 | | | AAA/Aaa | | | | 7,400,000 | | | | 7,397,631 | |
a PFS Financing Corp., Series 2016-BA Class A, 1.87% due 10/15/2021 | | | AAA/Aaa | | | | 5,500,000 | | | | 5,456,510 | |
a PFS Tax Lien Trust, Series 2014-1, 1.44% due 5/15/2029 | | | AAA/NR | | | | 1,100,280 | | | | 1,093,226 | |
a SBA Tower Trust, Series 2012-1 Class C, 2.933% due 12/9/2042 | | | NR/A2 | | | | 11,198,000 | | | | 11,203,522 | |
a SBA Tower Trust, Series 2014-1A Class C, 2.898% due 10/15/2044 | | | NR/A2 | | | | 17,900,000 | | | | 17,955,619 | |
a SBA Tower Trust, Series 2015-1 Class C, 3.156% due 10/15/2045 | | | NR/A2 | | | | 5,000,000 | | | | 5,025,500 | |
a SBA Tower Trust, Series 2016-1 Class C, 2.877% due 7/15/2021 | | | NR/A2 | | | | 9,500,000 | | | | 9,444,045 | |
a Sierra Receivables Funding Co., LLC, Series 2012-2A Class A, 2.05% due 6/20/2031 | | | A/NR | | | | 1,675,877 | | | | 1,671,661 | |
a Sierra Receivables Funding Co., LLC, Series 2014-1A Class A, 2.07% due 3/20/2030 | | | A/NR | | | | 3,445,740 | | | | 3,411,099 | |
a Sierra Receivables Funding Co., LLC, Series 2015-1A Class A, 2.40% due 3/22/2032 | | | A/NR | | | | 3,584,303 | | | | 3,568,145 | |
a Sierra Receivables Funding Co., LLC, Series 2015-2A Class A, 2.43% due 6/20/2032 | | | A/NR | | | | 2,612,299 | | | | 2,606,985 | |
a Sierra Receivables Funding Co., LLC, Series 2015-3A Class A, 2.58% due 9/20/2032 | | | A/NR | | | | 7,120,938 | | | | 7,147,974 | |
a Sonic Capital, LLC, Series 2016-1A Class A2, 4.472% due 5/20/2046 | | | BBB/NR | | | | 9,345,167 | | | | 9,210,340 | |
a Springfield Funding Trust, Series 2015-AA Class A, 3.16% due 11/15/2024 | | | A+/NR | | | | 13,000,000 | | | | 13,103,345 | |
a Tax Ease Funding, LLC, Series 2016-1A Class A, 3.131% due 6/15/2028 | | | NR/NR | | | | 10,341,621 | | | | 10,348,284 | |
a Westgate Resorts, Series 2016-1A Class A, 3.50% due 12/20/2028 | | | NR/NR | | | | 9,380,656 | | | | 9,325,925 | |
| | | | | | | | | | | | |
| | | | | | | | | | | 405,597,925 | |
| | | | | | | | | | | | |
RESIDENTIAL MTG TRUST — 1.23% | | | | | | | | | | | | |
a Angel Oak Mortgage Trust LLC, Series 2017-1 Class A2, 3.085% due 1/25/2047 | | | NR/NR | | | | 7,160,871 | | | | 7,160,770 | |
a B2R Mortgage Trust, Series 2015-2 Class A, 3.336% due 11/15/2048 | | | NR/NR | | | | 9,557,289 | | | | 9,518,576 | |
a Citigroup Mortgage Loan Trust, Inc., Series 2014-A Class A, 4.00% due 1/25/2035 | | | AAA/NR | | | | 3,246,367 | | | | 3,341,210 | |
Countrywide Home Loan, Series 2004-HYB2 Class 1A, 3.374% due 7/20/2034 | | | A/B1 | | | | 196,602 | | | | 203,474 | |
a FDIC Trust, Series 2013-R1 Class A, 1.15% due 3/25/2033 | | | NR/NR | | | | 2,603,850 | | | | 2,575,819 | |
Merrill Lynch Mortgage Investors Trust, Series 2003-E Class B3, 3.232% due 10/25/2028 | | | D/Ca | | | | 261,772 | | | | 8,425 | |
Merrill Lynch Mortgage Investors Trust, Series 2004-A4 Class M1, 2.855% due 8/25/2034 | | | CCC/NR | | | | 634,396 | | | | 580,305 | |
a Nationstar HECM Loan Trust, Series 16-1A Class A, 2.981% due 2/25/2026 | | | NR/Aaa | | | | 4,111,443 | | | | 4,111,443 | |
Option One Mortgage Loan Trust, Series 2005-5 Class A3 Floating Rate Note, 1.192% due 12/25/2035 | | | AA+/Aa2 | | | | 366,899 | | | | 367,079 | |
Popular ABS Mortgage Pass-Through Trust, Series 2005-4 Class AF5, 5.537% due 9/25/2035 | | | A+/A1 | | | | 435,740 | | | | 437,873 | |
Residential Asset Mortgage Products, Inc., Series 2003-SL1 Class A31, 7.125% due 4/25/2031 | | | AA+/NR | | | | 1,229,366 | | | | 1,269,511 | |
a Shellpoint Asset Funding Trust, Series 2013-1 Class A1, 3.75% due 7/25/2043 | | | NR/NR | | | | 6,314,164 | | | | 6,361,341 | |
Structured Asset Securities Corp., Series 2003-9A Class 2A2, 2.975% due 3/25/2033 | | | AA+/NR | | | | 1,368,142 | | | | 1,387,492 | |
a Towd Point Mortgage Trust, Series 2016-5 Class A1, 2.50% due 10/25/2056 | | | NR/NR | | | | 14,243,417 | | | | 14,154,378 | |
a Towd Point Mortgage Trust, Series 2017-1 Class A1, 2.75% due 10/25/2056 | | | NR/Aaa | | | | 7,883,247 | | | | 7,885,956 | |
Washington Mutual Mortgage, Series 2003-S13 Class 21A1, 4.50% due 12/25/2018 | | | AA+/NR | | | | 124,537 | | | | 124,491 | |
| | | | | | | | | | | | |
| | | | | | | | | | | 59,488,143 | |
| | | | | | | | | | | | |
STUDENT LOAN — 2.66% | | | | | | | | | | | | |
Navient Student Loan Trust, Series 2014-1 Class A3 Floating Rate Note, 1.492% due 6/25/2031 | | | NR/A1 | | | | 10,750,000 | | | | 10,482,593 | |
a Navient Student Loan Trust, Series 2015-AA Class A2B Floating Rate Note, 2.112% due 12/15/2028 | | | NR/Aaa | | | | 7,000,000 | | | | 7,099,895 | |
a Navient Student Loan Trust, Series 2016-6A Class A2 Floating Rate Note, 1.732% due 3/25/2066 | | | AAA/Aaa | | | | 13,900,000 | | | | 13,982,694 | |
a Nelnet Student Loan Trust, Series 2013-1A Class A Floating Rate Note, 1.582% due 6/25/2041 | | | NR/Aaa | | | | 8,414,271 | | | | 8,312,377 | |
16 Semi-Annual Reports
| | |
| Schedule of Investments, Continued | | |
| |
Thornburg Limited Term Income Fund | | March 31, 2017 (Unaudited) |
| | | | | | | | | | | | |
ISSUER-DESCRIPTION | | CREDIT RATING†
S&P/ MOODY’S | | | PRINCIPAL
AMOUNT | | | VALUE | |
a Nelnet Student Loan Trust, Series 2016-A Class A1A, 2.528% due 12/26/2040 | | | NR/NR | | | $ | 16,339,669 | | | $ | 16,339,652 | |
a Pennsylvania Higher Education Assistance Agency, Series 2012-1A Class A1 Floating Rate Note, 1.532% due 5/25/2057 | | | AA+/NR | | | | 2,754,819 | | | | 2,722,037 | |
SLM Student Loan Trust, Series 2003-C Class A2 Floating Rate Note, 1.521% due 9/15/2020 | | | AAA/Aaa | | | | 515,778 | | | | 509,708 | |
a SLM Student Loan Trust, Series 2011-A Class A3 Floating Rate Note, 3.412% due 1/15/2043 | | | AAA/Aaa | | | | 13,650,000 | | | | 14,265,382 | |
a SLM Student Loan Trust, Series 2011-B Class A2, 3.74% due 2/15/2029 | | | AAA/Aaa | | | | 3,907,305 | | | | 3,983,829 | |
SLM Student Loan Trust, Series 2013-6 Class A2 Floating Rate Note, 1.482% due 2/25/2021 | | | NR/Aaa | | | | 1,400,432 | | | | 1,401,000 | |
SLM Student Loan Trust, Series 2013-6 Class A3 Floating Rate Note, 1.632% due 6/25/2055 | | | NR/Aaa | | | | 24,700,000 | | | | 24,616,171 | |
a SMB Private Education Loan Trust, Series 2015-A Class A3 Floating Rate Note, 2.412% due 2/17/2032 | | | AAA/Aaa | | | | 10,000,000 | | | | 10,206,014 | |
a Social Professional Loan Program, LLC, Series 2014-A Class A1 Floating Rate Note, 2.356% due 6/25/2025 | | | AAA/NR | | | | 1,864,132 | | | | 1,903,667 | |
a Social Professional Loan Program, LLC, Series 2014-A Class A2, 3.02% due 10/25/2027 | | | AAA/NR | | | | 9,299,897 | | | | 9,402,914 | |
a Social Professional Loan Program, LLC, Series 2014-B Class A1 Floating Rate Note, 2.028% due 8/25/2032 | | | AAA/Aa3 | | | | 2,676,024 | | | | 2,713,040 | |
a Social Professional Loan Program, LLC, Series 2014-B Class A2, 2.55% due 8/27/2029 | | | AAA/Aa1 | | | | 859,703 | | | | 862,520 | |
| | | | | | | | | | | | |
| | | | | | | | | | | 128,803,493 | |
| | | | | | | | | | | | |
TOTAL ASSET BACKED SECURITIES (Cost $1,075,244,284) | | | | | | | | | | | 1,075,276,394 | |
| | | | | | | | | | | | |
| | | |
CORPORATE BONDS — 47.70% | | | | | | | | | | | | |
AUTOMOBILES & COMPONENTS — 1.20% | | | | | | | | | | | | |
Automobiles — 1.20% | | | | | | | | | | | | |
a Daimler Finance North America, LLC, 2.45% due 5/18/2020 | | | A/A2 | | | | 9,850,000 | | | | 9,862,411 | |
a Daimler Finance North America, LLC, 1.60% due 8/3/2017 | | | A/A2 | | | | 3,000,000 | | | | 2,999,622 | |
a Daimler Finance North America, LLC, 3.875% due 9/15/2021 | | | A/A2 | | | | 5,000,000 | | | | 5,235,325 | |
a Hyundai Capital America, 2.00% due 3/19/2018 | | | A-/Baa1 | | | | 4,950,000 | | | | 4,954,460 | |
a Hyundai Capital America, 2.40% due 10/30/2018 | | | A-/Baa1 | | | | 9,950,000 | | | | 9,981,293 | |
a Nissan Motor Acceptance Corp., 1.95% due 9/12/2017 | | | A-/A2 | | | | 14,900,000 | | | | 14,914,408 | |
a Volkswagen Group of America, Inc., 1.65% due 5/22/2018 | | | BBB+/A3 | | | | 10,000,000 | | | | 9,970,990 | |
| | | | | | | | | | | | |
| | | | | | | | | | | 57,918,509 | |
| | | | | | | | | | | | |
BANKS — 3.68% | | | | | | | | | | | | |
Banks — 3.68% | | | | | | | | | | | | |
a,b Banco BTG Pactual SA/Cayman Islands N.A., 4.00% due 1/16/2020 | | | NR/Ba3 | | | | 7,000,000 | | | | 6,754,720 | |
a,b Banco Latinoamericano de Comercio Exterior, S.A., 3.75% due 4/4/2017 | | | BBB/NR | | | | 4,000,000 | | | | 4,000,000 | |
Bank of America Corp. Floating Rate Note, 2.063% due 1/15/2019 | | | BBB+/Baa1 | | | | 4,225,000 | | | | 4,276,207 | |
Bank of America Corp. Floating Rate Note, 1.868% due 4/1/2019 | | | BBB+/Baa1 | | | | 8,000,000 | | | | 8,069,976 | |
Bank of America Corp. Floating Rate Note, 1.55% due 6/5/2017 | | | A+/A1 | | | | 7,000,000 | | | | 7,005,012 | |
b Barclays plc, 3.684% due 1/10/2023 | | | BBB/Baa2 | | | | 10,000,000 | | | | 10,047,390 | |
b Barclays plc Floating Rate Note, 2.635% due 1/10/2023 | | | BBB/Baa2 | | | | 9,000,000 | | | | 9,095,976 | |
Citigroup, Inc., 2.50% due 7/29/2019 | | | BBB+/Baa1 | | | | 2,925,000 | | | | 2,951,398 | |
Citigroup, Inc. Floating Rate Note, 2.485% due 9/1/2023 | | | BBB+/Baa1 | | | | 14,000,000 | | | | 14,396,200 | |
Citizens Bank N.A., 2.25% due 3/2/2020 | | | A-/Baa1 | | | | 5,000,000 | | | | 4,992,820 | |
a,b DNB Bank ASA, 3.20% due 4/3/2017 | | | A+/NR | | | | 10,000,000 | | | | 10,000,000 | |
Fifth Third Bank, 2.30% due 3/15/2019 | | | A-/A3 | | | | 3,800,000 | | | | 3,825,696 | |
First Tennessee Bank, 2.95% due 12/1/2019 | | | BBB/Baa3 | | | | 7,000,000 | | | | 7,081,921 | |
JPMorgan Chase & Co. Floating Rate Note, 2.535% due 3/1/2021 | | | A-/A3 | | | | 7,000,000 | | | | 7,217,385 | |
Manufacturers and Traders Trust Co., 2.30% due 1/30/2019 | | | A/A3 | | | | 10,000,000 | | | | 10,085,400 | |
b Mitsubishi UFJ Financial Group, Inc. Floating Rate Note, 2.935% due 3/1/2021 | | | A/A1 | | | | 9,500,000 | | | | 9,823,722 | |
a,b Mizuho Bank Ltd., 2.45% due 4/16/2019 | | | A/A1 | | | | 7,000,000 | | | | 7,035,462 | |
a,b Mizuho Bank Ltd. Floating Rate Note, 2.22% due 10/20/2018 | | | A/A1 | | | | 5,000,000 | | | | 5,049,590 | |
National City Bank Floating Rate Note, 1.472% due 6/7/2017 | | | A-/A3 | | | | 5,000,000 | | | | 5,000,085 | |
b Santander UK plc Floating Rate Note, 2.601% due 3/14/2019 | | | A/Aa3 | | | | 9,900,000 | | | | 10,068,221 | |
a,b Sberbank of Russia, 5.50% due 2/26/2024 | | | NR/NR | | | | 1,030,000 | | | | 1,059,417 | |
a Sovereign Bank, 12.18% due 6/30/2020 | | | BBB+/A3 | | | | 2,945,211 | | | | 3,664,049 | |
b Sumitomo Mitsui Banking Corp. Floating Rate Note, 1.781% due 7/23/2018 | | | A/A1 | | | | 14,700,000 | | | | 14,756,580 | |
b Sumitomo Mitsui Banking Corp. Floating Rate Note, 1.695% due 10/19/2018 | | | A/A1 | | | | 7,000,000 | | | | 7,019,068 | |
Wells Fargo & Co. Floating Rate Note, 2.112% due 12/7/2020 | | | A/A2 | | | | 4,400,000 | | | | 4,462,911 | |
| | | | | | | | | | | | |
| | | | | | | | | | | 177,739,206 | |
| | | | | | | | | | | | |
CAPITAL GOODS — 1.56% | | | | | | | | | | | | |
Construction & Engineering — 0.19% | | | | | | | | | | | | |
URS Corp., 3.85% due 4/1/2017 | | | BB-/NR | | | | 8,895,000 | | | | 8,895,000 | |
Electrical Equipment — 0.14% | | | | | | | | | | | | |
Hubbell, Inc., 3.35% due 3/1/2026 | | | A/A3 | | | | 7,000,000 | | | | 6,958,812 | |
Semi-Annual Reports 17
| | |
| Schedule of Investments, Continued | | |
| |
Thornburg Limited Term Income Fund | | March 31, 2017 (Unaudited) |
| | | | | | | | | | | | |
ISSUER-DESCRIPTION | | CREDIT RATING†
S&P/ MOODY’S | | | PRINCIPAL
AMOUNT | | | VALUE | |
Industrial Conglomerates — 0.65% | | | | | | | | | | | | |
Roper Technologies, Inc., 3.125% due 11/15/2022 | | | BBB/Baa3 | | | $ | 6,000,000 | | | $ | 6,052,704 | |
Roper Technologies, Inc., 3.00% due 12/15/2020 | | | BBB/Baa3 | | | | 4,870,000 | | | | 4,961,527 | |
a,b Siemens Financieringsmaatschappij N.V., 1.747% due 3/16/2022 | | | A+/A1 | | | | 5,000,000 | | | | 5,015,125 | |
a,b Siemens Financieringsmaatschappij N.V., 2.90% due 5/27/2022 | | | A+/A1 | | | | 12,000,000 | | | | 12,092,196 | |
a,b Smiths Group plc, 7.20% due 5/15/2019 | | | BBB+/Baa2 | | | | 3,000,000 | | | | 3,270,270 | |
Machinery — 0.58% | | | | | | | | | | | | |
Aeroquip Vickers, Inc., 6.875% due 4/9/2018 | | | A-/NR | | | | 1,500,000 | | | | 1,552,005 | |
Ingersoll Rand Co., 6.391% due 11/15/2027 | | | BBB/Baa2 | | | | 3,000,000 | | | | 3,502,956 | |
Stanley Black & Decker, Inc., 2.451% due 11/17/2018 | | | A-/Baa2 | | | | 6,900,000 | | | | 6,971,891 | |
Wabtec Corp., 4.375% due 8/15/2023 | | | BBB/Baa3 | | | | 10,590,000 | | | | 11,042,542 | |
a Wabtec Corp., 3.45% due 11/15/2026 | | | BBB/Baa3 | | | | 5,000,000 | | | | 4,862,210 | |
| | | | | | | | | | | | |
| | | | | | | | | | | 75,177,238 | |
| | | | | | | | | | | | |
COMMERCIAL & PROFESSIONAL SERVICES — 0.36% | | | | | | | | | | | | |
Commercial Services & Supplies — 0.06% | | | | | | | | | | | | |
Cintas Corp. No. 2, 2.90% due 4/1/2022 | | | BBB+/A3 | | | | 2,622,000 | | | | 2,652,581 | |
Professional Services — 0.30% | | | | | | | | | | | | |
Dun & Bradstreet, Inc., 4.25% due 6/15/2020 | | | BB+/NR | | | | 7,175,000 | | | | 7,452,507 | |
Verisk Analytics, Inc., 4.00% due 6/15/2025 | | | BBB-/Baa3 | | | | 6,930,000 | | | | 7,043,666 | |
| | | | | | | | | | | | |
| | | | | | | | | | | 17,148,754 | |
| | | | | | | | | | | | |
CONSUMER DURABLES & APPAREL — 0.22% | | | | | | | | | | | | |
Household Durables — 0.22% | | | | | | | | | | | | |
Tupperware Brands Corp., 4.75% due 6/1/2021 | | | BBB-/Baa3 | | | | 10,000,000 | | | | 10,657,760 | |
| | | | | | | | | | | | |
| | | | | | | | | | | 10,657,760 | |
| | | | | | | | | | | | |
CONSUMER SERVICES — 0.31% | | | | | | | | | | | | |
Diversified Consumer Services — 0.31% | | | | | | | | | | | | |
George Washington University, 4.411% due 9/15/2017 | | | A+/A1 | | | | 1,650,000 | | | | 1,668,495 | |
Rensselaer Polytechnic I, 5.60% due 9/1/2020 | | | BBB+/A3 | | | | 10,925,000 | | | | 11,905,092 | |
University of Chicago, 3.065% due 10/1/2024 | | | AA-/Aa2 | | | | 1,325,000 | | | | 1,300,028 | |
| | | | | | | | | | | | |
| | | | | | | | | | | 14,873,615 | |
| | | | | | | | | | | | |
DIVERSIFIED FINANCIALS — 7.65% | | | | | | | | | | | | |
Capital Markets — 5.76% | | | | | | | | | | | | |
Ares Capital Corp., 4.875% due 11/30/2018 | | | BBB/NR | | | | 18,000,000 | | | | 18,675,702 | |
a Ares Finance Co., LLC, 4.00% due 10/8/2024 | | | BBB+/NR | | | | 5,000,000 | | | | 4,682,425 | |
a,b BTG Investments LP, 4.50% due 4/17/2018 | | | NR/NR | | | | 18,500,000 | | | | 18,077,830 | |
CBOE Holdings, Inc., 3.65% due 1/12/2027 | | | BBB+/Baa1 | | | | 6,824,000 | | | | 6,860,508 | |
b Credit Suisse Group AG - New York, 1.70% due 4/27/2018 | | | A/A1 | | | | 9,325,000 | | | | 9,312,672 | |
b Credit Suisse Group Funding (Guernsey) Ltd., 3.80% due 9/15/2022 | | | BBB+/Baa2 | | | | 7,000,000 | | | | 7,095,256 | |
b Credit Suisse Group Funding (Guernsey) Ltd., 3.125% due 12/10/2020 | | | BBB+/Baa2 | | | | 10,000,000 | | | | 10,055,470 | |
b Credit Suisse Group Funding (Guernsey) Ltd., 4.55% due 4/17/2026 | | | BBB+/Baa2 | | | | 7,000,000 | | | | 7,234,878 | |
a,b Deutsche Bank AG, 4.25% due 10/14/2021 | | | BBB-/Baa2 | | | | 8,675,000 | | | | 8,890,773 | |
FS Investment Corp., 4.00% due 7/15/2019 | | | BBB/NR | | | | 12,000,000 | | | | 12,104,748 | |
Goldman Sachs Group, Inc. Floating Rate Note, 2.061% due 10/23/2019 | | | BBB+/A3 | | | | 14,772,000 | | | | 14,929,425 | |
Goldman Sachs Group, Inc. Floating Rate Note, 2.331% due 9/15/2020 | | | BBB+/A3 | | | | 17,900,000 | | | | 18,159,228 | |
a,b IPIC GMTN Ltd., 5.00% due 11/15/2020 | | | AA/Aa2 | | | | 1,000,000 | | | | 1,081,000 | |
a,b IPIC GMTN Ltd., 5.50% due 3/1/2022 | | | AA/Aa2 | | | | 3,500,000 | | | | 3,893,169 | |
Legg Mason, Inc., 2.70% due 7/15/2019 | | | BBB/Baa1 | | | | 1,660,000 | | | | 1,676,190 | |
Legg Mason, Inc., 4.75% due 3/15/2026 | | | BBB/Baa1 | | | | 5,000,000 | | | | 5,245,665 | |
a,b Macquarie Bank Ltd., 1.60% due 10/27/2017 | | | A/A2 | | | | 5,000,000 | | | | 5,000,070 | |
Merrill Lynch & Co., 1.585% due 5/2/2017 | | | BBB/Baa3 | | | | 5,000,000 | | | | 5,000,655 | |
Moody’s Corp., 2.75% due 7/15/2019 | | | BBB+/NR | | | | 4,875,000 | | | | 4,938,516 | |
Moody’s Corp., 4.875% due 2/15/2024 | | | BBB+/NR | | | | 17,000,000 | | | | 18,551,590 | |
Moody’s Corp. Floating Rate Note, 1.414% due 9/4/2018 | | | BBB+/NR | | | | 6,950,000 | | | | 6,962,044 | |
Morgan Stanley, 2.80% due 6/16/2020 | | | BBB+/A3 | | | | 1,350,000 | | | | 1,366,376 | |
Morgan Stanley Floating Rate Note, 2.177% due 1/27/2020 | | | BBB+/A3 | | | | 925,000 | | | | 940,977 | |
Morgan Stanley Floating Rate Note, 2.443% due 10/24/2023 | | | BBB+/A3 | | | | 19,900,000 | | | | 20,322,298 | |
State Street Corp. Floating Rate Note, 1.952% due 8/18/2020 | | | A/A1 | | | | 9,475,000 | | | | 9,655,158 | |
a,b SumitG Guaranteed Secured Obligation Issuer D.A.C, 2.251% due 11/2/2020 | | | NR/Aa2 | | | | 15,000,000 | | | | 14,842,560 | |
TD Ameritrade Holding Corp., 2.95% due 4/1/2022 | | | A/A3 | | | | 2,550,000 | | | | 2,581,475 | |
The Bank of New York Mellon Corp. Floating Rate Note, 1.912% due 8/17/2020 | | | A/A1 | | | | 4,525,000 | | | | 4,606,477 | |
e The Bank of New York Mellon Corp. Floating Rate Note, 2.089% due 10/30/2023 | | | A/A1 | | | | 11,835,000 | | | | 12,105,761 | |
18 Semi-Annual Reports
| | |
| Schedule of Investments, Continued | | |
| |
Thornburg Limited Term Income Fund | | March 31, 2017 (Unaudited) |
| | | | | | | | | | | | |
ISSUER-DESCRIPTION | | CREDIT RATING†
S&P/ MOODY’S | | | PRINCIPAL
AMOUNT | | | VALUE | |
a,b UBS AG Jersey Floating Rate Note, 2.597% due 9/24/2020 | | | A-/Baa1 | | | $ | 10,800,000 | | | $ | 11,008,969 | |
b UBS AG Stamford, 2.375% due 8/14/2019 | | | A+/A1 | | | | 9,500,000 | | | | 9,563,764 | |
b UBS AG Stamford, 1.80% due 3/26/2018 | | | A+/A1 | | | | 3,000,000 | | | | 3,002,130 | |
Consumer Finance — 0.39% | | | | | | | | | | | | |
Capital One Bank (USA), N.A., 2.30% due 6/5/2019 | | | BBB+/Baa1 | | | | 3,000,000 | | | | 3,006,339 | |
Synchrony Financial, 3.00% due 8/15/2019 | | | BBB-/NR | | | | 1,950,000 | | | | 1,980,418 | |
Western Union Co., 3.65% due 8/22/2018 | | | BBB/Baa2 | | | | 2,000,000 | | | | 2,046,986 | |
Western Union Co., 3.35% due 5/22/2019 | | | BBB/Baa2 | | | | 11,350,000 | | | | 11,594,638 | |
Diversified Financial Services — 1.50% | | | | | | | | | | | | |
a Athene Global Funding, 2.875% due 10/23/2018 | | | A-/NR | | | | 13,925,000 | | | | 14,006,503 | |
General Electric Capital Corp. Floating Rate Note, 1.302% due 12/28/2018 | | | AA-/A1 | | | | 4,850,000 | | | | 4,829,320 | |
General Electric Capital Corp. Floating Rate Note, 2.131% due 3/15/2023 | | | AA-/A1 | | | | 7,725,000 | | | | 7,921,725 | |
Intercontinental Exchange, Inc., 4.00% due 10/15/2023 | | | A/A2 | | | | 11,257,000 | | | | 11,901,705 | |
a Jackson National Life Global Funding, 3.25% due 1/30/2024 | | | AA/A1 | | | | 10,000,000 | | | | 10,055,030 | |
a Jackson National Life Global Funding, 2.20% due 1/30/2020 | | | AA/A1 | | | | 8,000,000 | | | | 7,989,296 | |
National Rural Utilities Cooperative Finance Corp., 10.375% due 11/1/2018 | | | A/A1 | | | | 2,000,000 | | | | 2,264,922 | |
S&P Global, Inc., 4.00% due 6/15/2025 | | | NR/Baa1 | | | | 8,000,000 | | | | 8,222,440 | |
S&P Global, Inc., 2.50% due 8/15/2018 | | | NR/Baa1 | | | | 2,950,000 | | | | 2,973,287 | |
S&P Global, Inc., 3.30% due 8/14/2020 | | | NR/Baa1 | | | | 2,450,000 | | | | 2,502,967 | |
| | | | | | | | | | | | |
| | | | | | | | | | | 369,719,335 | |
| | | | | | | | | | | | |
ENERGY — 5.58% | | | | | | | | | | | | |
Energy Equipment & Services — 0.27% | | | | | | | | | | | | |
b Ensco plc, 8.00% due 1/31/2024 | | | BB/B1e | | | | 2,425,000 | | | | 2,455,313 | |
Oceaneering International, Inc., 4.65% due 11/15/2024 | | | BBB/Baa3 | | | | 10,000,000 | | | | 10,066,980 | |
a,b,f Schahin II Finance Co. (SPV) Ltd., 5.875% due 9/25/2023 | | | NR/NR | | | | 4,082,733 | | | | 469,514 | |
Oil, Gas & Consumable Fuels — 5.31% | | | | | | | | | | | | |
b BP Capital Markets plc Floating Rate Note, 1.386% due 8/14/2018 | | | A-/A2 | | | | 11,380,000 | | | | 11,407,824 | |
Buckeye Partners LP, 4.15% due 7/1/2023 | | | BBB-/Baa3 | | | | 7,000,000 | | | | 7,153,335 | |
a Chevron Phillips Chemical Co., LLC, Floating Rate Note, 1.784% due 5/1/2020 | | | A-/A2 | | | | 24,900,000 | | | | 24,677,170 | |
a,b CNPC General Capital Ltd., 2.75% due 4/19/2017 | | | A+/A1 | | | | 5,000,000 | | | | 5,001,814 | |
a,b CNPC General Capital Ltd., 2.75% due 5/14/2019 | | | A+/A1 | | | | 5,000,000 | | | | 5,043,911 | |
a,b CNPC General Capital Ltd. Floating Rate Note, 1.936% due 5/14/2017 | | | A+/A1 | | | | 5,000,000 | | | | 5,001,540 | |
a Colorado Interstate Gas Co., LLC/Colorado Interstate Issuing Corp., 4.15% due 8/15/2026 | | | BBB-/Baa3 | | | | 26,000,000 | | | | 25,410,970 | |
Energen Corp., 4.625% due 9/1/2021 | | | BB/B2 | | | | 10,000,000 | | | | 9,947,000 | |
Exxon Mobil Corp., 2.222% due 3/1/2021 | | | AA+/Aaa | | | | 4,925,000 | | | | 4,934,525 | |
Exxon Mobil Corp. Floating Rate Note, 1.835% due 3/1/2019 | | | AA+/Aaa | | | | 6,625,000 | | | | 6,718,545 | |
Exxon Mobil Corp. Floating Rate Note, 1.654% due 2/28/2018 | | | AA+/Aaa | | | | 6,950,000 | | | | 6,991,276 | |
a Florida Gas Transmission Co., LLC, 3.875% due 7/15/2022 | | | BBB/Baa2 | | | | 9,000,000 | | | | 9,229,104 | |
a Florida Gas Transmission Co., LLC, 4.35% due 7/15/2025 | | | BBB/Baa2 | | | | 4,200,000 | | | | 4,347,996 | |
Gulf South Pipeline Co., LP, 4.00% due 6/15/2022 | | | BBB-/Baa2 | | | | 13,690,000 | | | | 13,953,026 | |
a Gulfstream Natural Gas System, LLC, 4.60% due 9/15/2025 | | | BBB/Baa2 | | | | 9,000,000 | | | | 9,470,700 | |
a,b Harvest Operations Corp., 2.125% due 5/14/2018 | | | AA/Aa2 | | | | 7,000,000 | | | | 7,008,727 | |
HollyFrontier Corp., 5.875% due 4/1/2026 | | | BBB-/Baa3 | | | | 25,000,000 | | | | 26,542,950 | |
Marathon Petroleum Corp., 2.70% due 12/14/2018 | | | BBB/Baa2 | | | | 8,000,000 | | | | 8,068,720 | |
a Northern Natural Gas Co., 5.75% due 7/15/2018 | | | A/A2 | | | | 50,000 | | | | 52,396 | |
a Northwest Pipeline, LLC, 4.00% due 4/1/2027 | | | BBB/NR | | | | 10,000,000 | | | | 9,996,650 | |
NuStar Logistics LP, 4.75% due 2/1/2022 | | | BB+/Ba1 | | | | 5,000,000 | | | | 4,912,500 | |
b Petroleos Mexicanos Floating Rate Note, 3.044% due 7/18/2018 | | | BBB+/Baa3 | | | | 10,000,000 | | | | 10,150,000 | |
b Sasol Financing International plc, 4.50% due 11/14/2022 | | | BBB/Baa2 | | | | 4,000,000 | | | | 4,042,000 | |
a Semco Energy, Inc., 5.15% due 4/21/2020 | | | A-/A2 | | | | 3,000,000 | | | | 3,211,107 | |
a,b Sinopec Group Overseas Development Ltd., 2.75% due 5/17/2017 | | | A+/Aa3 | | | | 6,000,000 | | | | 6,008,226 | |
a Texas Gas Transmission, LLC, 4.50% due 2/1/2021 | | | BBB-/Baa2 | | | | 11,015,000 | | | | 11,493,227 | |
Transcontinental Gas Pipe Line Co., LLC, 7.85% due 2/1/2026 | | | BBB/Baa2 | | | | 11,000,000 | | | | 14,124,473 | |
Williams Partners LP, 3.60% due 3/15/2022 | | | BBB/Baa3 | | | | 1,800,000 | | | | 1,825,880 | |
| | | | | | | | | | | | |
| | | | | | | | | | | 269,717,399 | |
| | | | | | | | | | | | |
FOOD & STAPLES RETAILING — 0.40% | | | | | | | | | | | | |
Food & Staples Retailing — 0.40% | | | | | | | | | | | | |
Whole Foods Market, Inc., 5.20% due 12/3/2025 | | | BBB-/Baa3 | | | | 18,175,000 | | | | 19,315,681 | |
| | | | | | | | | | | | |
| | | | | | | | | | | 19,315,681 | |
| | | | | | | | | | | | |
Semi-Annual Reports 19
| | |
| Schedule of Investments, Continued | | |
| |
Thornburg Limited Term Income Fund | | March 31, 2017 (Unaudited) |
| | | | | | | | | | |
ISSUER-DESCRIPTION | | CREDIT RATING†
S&P/ MOODY’S | | PRINCIPAL
AMOUNT | | | VALUE | |
FOOD, BEVERAGE & TOBACCO — 2.33% | | | | | | | | | | |
Beverages — 1.43% | | | | | | | | | | |
Anheuser-Busch InBev Finance Inc., 3.30% due 2/1/2023 | | A-/A3 | | $ | 9,650,000 | | | $ | 9,821,876 | |
Anheuser-Busch InBev Finance Inc. Floating Rate Note, 2.294% due 2/1/2021 | | A-/A3 | | | 7,550,000 | | | | 7,777,187 | |
Coca Cola Enterprises, Inc., 5.71% due 3/18/2037 | | AA-/NR | | | 3,380,000 | | | | 3,855,117 | |
a,b Coca Cola Icecek Uretim A.S., 4.75% due 10/1/2018 | | NR/Baa3 | | | 5,000,000 | | | | 5,121,000 | |
a,b JB y Compania, S.A. de C.V., 3.75% due 5/13/2025 | | BBB/NR | | | 13,750,000 | | | | 13,452,131 | |
PepsiCo, Inc., 3.10% due 7/17/2022 | | A/A1 | | | 9,250,000 | | | | 9,502,923 | |
PepsiCo, Inc. Floating Rate Note, 1.535% due 10/6/2021 | | A/A1 | | | 19,230,000 | | | | 19,349,072 | |
Food Products — 0.45% | | | | | | | | | | |
General Mills, Inc., 1.40% due 10/20/2017 | | BBB+/A3 | | | 4,600,000 | | | | 4,602,185 | |
Ingredion, Inc., 1.80% due 9/25/2017 | | BBB/Baa2 | | | 12,150,000 | | | | 12,155,686 | |
Mead Johnson Nutrition Co., 4.125% due 11/15/2025 | | BBB/Baa1 | | | 3,000,000 | | | | 3,143,178 | |
Mead Johnson Nutrition Co., 3.00% due 11/15/2020 | | BBB/Baa1 | | | 1,900,000 | | | | 1,936,731 | |
Tobacco — 0.45% | | | | | | | | | | |
Altria Group, Inc., 2.625% due 1/14/2020 | | A-/A3 | | | 4,900,000 | | | | 4,962,450 | |
a,b B.A.T. International Finance plc, 2.125% due 6/7/2017 | | BBB+/Baa2 | | | 8,000,000 | | | | 8,006,224 | |
a,b B.A.T. International Finance plc, 3.95% due 6/15/2025 | | BBB+/Baa2 | | | 3,000,000 | | | | 3,066,954 | |
Reynolds American, Inc., 6.875% due 5/1/2020 | | BBB/Baa3 | | | 5,000,000 | | | | 5,635,275 | |
| | | | | | | | | | |
| | | | | | | | | 112,387,989 | |
| | | | | | | | | | |
HEALTH CARE EQUIPMENT & SERVICES — 1.05% | | | | | | | | | | |
Health Care Equipment & Supplies — 0.45% | | | | | | | | | | |
Abbott Laboratories, 2.35% due 11/22/2019 | | BBB/Baa3 | | | 14,825,000 | | | | 14,886,450 | |
Abbott Laboratories, 3.40% due 11/30/2023 | | BBB/Baa3 | | | 6,860,000 | | | | 6,930,891 | |
Health Care Providers & Services — 0.60% | | | | | | | | | | |
Catholic Health Initiatives, 1.60% due 11/1/2017 | | BBB+/Baa1 | | | 1,900,000 | | | | 1,898,013 | |
Catholic Health Initiatives, 2.95% due 11/1/2022 | | BBB+/Baa1 | | | 7,000,000 | | | | 6,768,923 | |
UnitedHealth Group, Inc., 3.35% due 7/15/2022 | | A+/A3 | | | 5,000,000 | | | | 5,173,165 | |
UnitedHealth Group, Inc., 3.75% due 7/15/2025 | | A+/A3 | | | 5,000,000 | | | | 5,221,580 | |
Wellpoint, Inc., 2.25% due 8/15/2019 | | A/Baa2 | | | 10,000,000 | | | | 10,036,290 | |
| | | | | | | | | | |
| | | | | | | | | 50,915,312 | |
| | | | | | | | | | |
HOUSEHOLD & PERSONAL PRODUCTS — 0.10% | | | | | | | | | | |
Household Products — 0.10% | | | | | | | | | | |
Edgewell Personal Care, 4.70% due 5/24/2022 | | BB+/Ba2 | | | 2,000,000 | | | | 2,080,000 | |
a,b Kimberly-Clark de Mexico, 3.80% due 4/8/2024 | | A-/NR | | | 3,000,000 | | | | 2,982,719 | |
| | | | | | | | | | |
| | | | | | | | | 5,062,719 | |
| | | | | | | | | | |
INSURANCE — 3.62% | | | | | | | | | | |
Insurance — 3.62% | | | | | | | | | | |
CNA Financial Corp., 4.50% due 3/1/2026 | | BBB/Baa2 | | | 20,000,000 | | | | 21,137,660 | |
a,b DaVinciRe Holdings Ltd., 4.75% due 5/1/2025 | | A/Baa2 | | | 10,260,000 | | | | 9,922,682 | |
b Enstar Group Ltd., 4.50% due 3/10/2022 | | BBB-/NR | | | 1,950,000 | | | | 1,974,539 | |
a Forethought Financial Group, Inc., 8.625% due 4/15/2021 | | BBB-/Baa3 | | | 2,270,000 | | | | 2,579,803 | |
Hanover Insurance Group, Inc., 4.50% due 4/15/2026 | | BBB/Baa3 | | | 10,000,000 | | | | 10,382,790 | |
Horace Mann Educators Corp., 4.50% due 12/1/2025 | | BBB/Baa3 | | | 4,800,000 | | | | 4,890,173 | |
Infinity Property & Casualty Corp., 5.00% due 9/19/2022 | | BBB/Baa2 | | | 3,000,000 | | | | 3,168,405 | |
Kemper Corp., 4.35% due 2/15/2025 | | BBB-/Baa3 | | | 7,540,000 | | | | 7,551,280 | |
a,b Lancashire Holdings Ltd., 5.70% due 10/1/2022 | | BBB/Baa2 | | | 11,000,000 | | | | 11,730,422 | |
Marsh & McLennan Companies, Inc., 3.30% due 3/14/2023 | | A-/Baa1 | | | 3,000,000 | | | | 3,055,779 | |
a MassMutual Global Funding, LLC, 2.00% due 4/5/2017 | | AA+/Aa2 | | | 8,000,000 | | | | 8,000,000 | |
Mercury General Corp., 4.40% due 3/15/2027 | | NR/Baa2 | | | 16,000,000 | | | | 15,984,352 | |
b Montpelier Re Holdings Ltd., 4.70% due 10/15/2022 | | BBB+/NR | | | 5,000,000 | | | | 5,359,660 | |
a Pricoa Global Funding I, 1.35% due 8/18/2017 | | AA-/A1 | | | 10,000,000 | | | | 9,985,490 | |
a Principal Life Global Funding II, 1.50% due 9/11/2017 | | A+/A1 | | | 6,950,000 | | | | 6,949,326 | |
a Principal Life Global Funding II, 2.375% due 9/11/2019 | | A+/A1 | | | 2,450,000 | | | | 2,465,332 | |
a Principal Life Global Funding II, 2.20% due 4/8/2020 | | A+/A1 | | | 7,000,000 | | | | 6,989,640 | |
Reinsurance Group of America, Inc., 3.95% due 9/15/2026 | | A-/Baa1 | | | 3,765,000 | | | | 3,796,972 | |
a Reliance Standard Life Insurance Co., 2.50% due 4/24/2019 | | A/A2 | | | 9,900,000 | | | | 9,965,548 | |
a Reliance Standard Life Insurance Co., 2.50% due 1/15/2020 | | A/A2 | | | 15,000,000 | | | | 14,991,780 | |
a Reliance Standard Life Insurance Co., 3.05% due 1/20/2021 | | A/A2 | | | 3,975,000 | | | | 4,008,060 | |
b Trinity Acquisition plc, 4.40% due 3/15/2026 | | BBB/Baa3 | | | 9,815,000 | | | | 10,060,571 | |
| | | | | | | | | | |
| | | | | | | | | 174,950,264 | |
| | | | | | | | | | |
20 Semi-Annual Reports
| | |
| Schedule of Investments, Continued | | |
| |
Thornburg Limited Term Income Fund | | March 31, 2017 (Unaudited) |
| | | | | | | | | | | | | | | |
ISSUER-DESCRIPTION | | CREDIT RATING†
S&P/ MOODY’S | | PRINCIPAL
AMOUNT | | VALUE |
MATERIALS — 1.27% | | | | | | | | | | | | |
Chemicals — 0.50% | | | | | | | | | | | | |
Airgas, Inc., 3.05% due 8/1/2020 | | A-/A3 | | | $ | 4,950,000 | | | | $ | 5,085,254 | |
a Incitec Pivot Finance, LLC, 6.00% due 12/10/2019 | | BBB/Baa3 | | | | 4,538,000 | | | | | 4,880,179 | |
a,b Office Cherifien des Phosphates, 5.625% due 4/25/2024 | | BBB-/NR | | | | 8,555,000 | | | | | 9,108,508 | |
a,b Yara International ASA, 3.80% due 6/6/2026 | | BBB/Baa2 | | | | 5,000,000 | | | | | 4,923,540 | |
Construction Materials — 0.01% | | | | | | | | | | | | |
CRH America, Inc., 8.125% due 7/15/2018 | | BBB+/Baa2 | | | | 650,000 | | | | | 701,034 | |
Metals & Mining — 0.76% | | | | | | | | | | | | |
a,b Anglo American Capital plc, 2.625% due 9/27/2017 | | BB+/Ba1 | | | | 9,700,000 | | | | | 9,700,000 | |
b Anglogold Holdings plc, 5.375% due 4/15/2020 | | BB+/Baa3 | | | | 9,100,000 | | | | | 9,577,750 | |
b Anglogold Holdings plc, 5.125% due 8/1/2022 | | BB+/Baa3 | | | | 6,500,000 | | | | | 6,693,050 | |
a,b Newcrest Finance Property Ltd., 4.20% due 10/1/2022 | | BBB-/Baa3 | | | | 10,459,000 | | | | | 10,743,506 | |
| | | | | | | | | | | | | |
| | | | | | | | | | | 61,412,821 | |
| | | | | | | | | | | | | |
MEDIA — 0.11% | | | | | | | | | | | | |
Media — 0.11% | | | | | | | | | | | | |
The Washington Post Co., 7.25% due 2/1/2019 | | BB+/Ba1 | | | | 5,000,000 | | | | | 5,412,500 | |
| | | | | | | | | | | | | |
| | | | | | | | | | | 5,412,500 | |
| | | | | | | | | | | | | |
PHARMACEUTICALS, BIOTECHNOLOGY & LIFE
SCIENCES — 1.00% | | | | | | | | | | | | |
Biotechnology — 0.40% | | | | | | | | | | | | |
Biogen, Inc., 3.625% due 9/15/2022 | | A-/Baa1 | | | | 5,000,000 | | | | | 5,156,960 | |
Gilead Sciences, Inc., 2.55% due 9/1/2020 | | A/A3 | | | | 4,820,000 | | | | | 4,871,902 | |
Gilead Sciences, Inc., 3.25% due 9/1/2022 | | A/A3 | | | | 4,650,000 | | | | | 4,750,035 | |
Gilead Sciences, Inc., 2.50% due 9/1/2023 | | A/A3 | | | | 4,695,000 | | | | | 4,542,436 | |
Pharmaceuticals — 0.60% | | | | | | | | | | | | |
b Actavis Funding SCS, 2.35% due 3/12/2018 | | BBB/Baa3 | | | | 1,720,000 | | | | | 1,727,499 | |
b Actavis Funding SCS, 3.45% due 3/15/2022 | | BBB/Baa3 | | | | 5,000,000 | | | | | 5,105,390 | |
b Actavis Funding SCS, 3.80% due 3/15/2025 | | BBB/Baa3 | | | | 5,000,000 | | | | | 5,045,615 | |
b Actavis Funding SCS Floating Rate Note, 2.375% due 3/12/2020 | | BBB/Baa3 | | | | 5,000,000 | | | | | 5,110,965 | |
a Bayer U.S. Finance, LLC, 1.50% due 10/6/2017 | | A-/A3 | | | | 1,975,000 | | | | | 1,973,363 | |
b Mylan N.V., 3.00% due 12/15/2018 | | BBB-/Baa3 | | | | 4,900,000 | | | | | 4,956,870 | |
Zoetis, Inc., 3.45% due 11/13/2020 | | BBB/Baa2 | | | | 2,000,000 | | | | | 2,048,480 | |
Zoetis, Inc., 4.50% due 11/13/2025 | | BBB/Baa2 | | | | 3,000,000 | | | | | 3,231,444 | |
| | | | | | | | | | | | | |
| | | | | | | | | | | 48,520,959 | |
| | | | | | | | | | | | | |
REAL ESTATE — 1.15% | | | | | | | | | | | | |
Equity Real Estate Investment Trusts — 0.88% | | | | | | | | | | | | |
Alexandria Real Estate Equities, Inc., 3.95% due 1/15/2027 | | BBB/Baa2 | | | | 3,975,000 | | | | | 3,973,621 | |
Alexandria Real Estate Equities, Inc., 3.90% due 6/15/2023 | | BBB/Baa2 | | | | 11,700,000 | | | | | 11,973,803 | |
EPR Properties, 5.25% due 7/15/2023 | | BBB-/Baa2 | | | | 4,041,000 | | | | | 4,238,294 | |
Hospitality Properties Trust, 4.95% due 2/15/2027 | | BBB-/Baa2 | | | | 2,000,000 | | | | | 2,053,628 | |
Washington REIT, 4.95% due 10/1/2020 | | BBB/Baa2 | | | | 19,100,000 | | | | | 20,231,236 | |
Real Estate Management & Development — 0.27% | | | | | | | | | | | | |
Jones Lang LaSalle, Inc., 4.40% due 11/15/2022 | | BBB+/Baa2 | | | | 3,000,000 | | | | | 3,128,727 | |
a,b Vonovia Finance B.V., 3.20% due 10/2/2017 | | BBB+/NR | | | | 10,000,000 | | | | | 10,056,870 | |
| | | | | | | | | | | | | |
| | | | | | | | | | | 55,656,179 | |
| | | | | | | | | | | | | |
RETAILING — 0.41% | | | | | | | | | | | | |
Multiline Retail — 0.41% | | | | | | | | | | | | |
Family Dollar Stores, Inc., 5.00% due 2/1/2021 | | BBB-/Baa3 | | | | 18,475,000 | | | | | 19,694,350 | |
| | | | | | | | | | | | | |
| | | | | | | | | | | 19,694,350 | |
| | | | | | | | | | | | | |
SEMICONDUCTORS & SEMICONDUCTOR EQUIPMENT — 0.66% | |
Semiconductors & Semiconductor Equipment — 0.66% | | | | | | | | | | | | |
a Broadcom Corp./Broadcom Cayman Finance Ltd., 2.375% due 1/15/2020 | | BBB-/Baa2 | | | | 8,875,000 | | | | | 8,873,926 | |
a Broadcom Corp./Broadcom Cayman Finance Ltd., 3.00% due 1/15/2022 | | BBB-/Baa2 | | | | 9,000,000 | | | | | 8,988,534 | |
a Broadcom Corp./Broadcom Cayman Finance Ltd., 3.625% due 1/15/2024 | | BBB-/Baa2 | | | | 9,000,000 | | | | | 9,066,330 | |
Intel Corp., 3.10% due 7/29/2022 | | A+/A1 | �� | | | 5,000,000 | | | | | 5,138,860 | |
| | | | | | | | | | | | | |
| | | | | | | | | | | 32,067,650 | |
| | | | | | | | | | | | | |
Semi-Annual Reports 21
| | |
| Schedule of Investments, Continued | | |
| |
Thornburg Limited Term Income Fund | | March 31, 2017 (Unaudited) |
| | | | | | | | | | | | | | | |
ISSUER-DESCRIPTION | | CREDIT RATING†
S&P/ MOODY’S | | PRINCIPAL
AMOUNT | | VALUE |
SOFTWARE & SERVICES — 2.82% | | | | | | | | | | | | |
Information Technology Services — 1.07% | | | | | | | | | | | | |
Broadridge Financial Solutions, Inc., 3.95% due 9/1/2020 | | BBB+/Baa1 | | | $ | 8,000,000 | | | | $ | 8,376,336 | |
Fidelity National Information Services, Inc., 2.85% due 10/15/2018 | | BBB/Baa3 | | | | 4,850,000 | | | | | 4,916,964 | |
Fiserv, Inc., 2.70% due 6/1/2020 | | BBB/Baa2 | | | | 6,900,000 | | | | | 6,978,074 | |
SAIC, Inc., 4.45% due 12/1/2020 | | BBB-/Ba1 | | | | 2,000,000 | | | | | 2,080,000 | |
Total System Services, Inc., 3.75% due 6/1/2023 | | BBB-/Baa3 | | | | 5,000,000 | | | | | 5,017,915 | |
Total System Services, Inc., 3.80% due 4/1/2021 | | BBB-/Baa3 | | | | 3,000,000 | | | | | 3,103,590 | |
Total System Services, Inc., 2.375% due 6/1/2018 | | BBB-/Baa3 | | | | 20,915,000 | | | | | 21,002,090 | |
Internet Software & Services — 0.38% | | | | | | | | | | | | |
eBay, Inc., 2.50% due 3/9/2018 | | BBB+/Baa1 | | | | 4,885,000 | | | | | 4,922,136 | |
Lender Processing Services, Inc./Black Knight Lending Solutions, Inc., 5.75% due 4/15/2023 | | BBB/Baa3 | | | | 8,175,000 | | | | | 8,563,157 | |
a,b Tencent Holdings Ltd., 2.00% due 5/2/2017 | | A/A2 | | | | 5,000,000 | | | | | 5,000,741 | |
Software — 1.37% | | | | | | | | | | | | |
Autodesk, Inc., 3.125% due 6/15/2020 | | BBB/Baa2 | | | | 1,945,000 | | | | | 1,982,535 | |
Autodesk, Inc., 4.375% due 6/15/2025 | | BBB/Baa2 | | | | 1,000,000 | | | | | 1,030,473 | |
CA Technologies, Inc., 3.60% due 8/1/2020 | | BBB+/Baa2 | | | | 13,905,000 | | | | | 14,332,078 | |
CA Technologies, Inc., 2.875% due 8/15/2018 | | BBB+/Baa2 | | | | 4,082,000 | | | | | 4,135,907 | |
CA, Inc., 3.60% due 8/15/2022 | | BBB+/Baa2e | | | | 3,000,000 | | | | | 3,044,109 | |
CDK Global, Inc., 3.80% due 10/15/2019 | | BB+/Ba1 | | | | 5,000,000 | | | | | 5,097,000 | |
Microsoft Corp., 2.875% due 2/6/2024 | | AAA/Aaa | | | | 9,216,000 | | | | | 9,275,213 | |
Oracle Corp., 2.50% due 5/15/2022 | | AA-/A1 | | | | 4,400,000 | | | | | 4,387,807 | |
Oracle Corp., 1.90% due 9/15/2021 | | AA-/A1 | | | | 11,825,000 | | | | | 11,619,481 | |
Oracle Corp., 2.40% due 9/15/2023 | | AA-/A1 | | | | 11,650,000 | | | | | 11,340,215 | |
| | | | | | | | | | | | | |
| | | | | | | | | | | 136,205,821 | |
| | | | | | | | | | | | | |
TECHNOLOGY HARDWARE &
EQUIPMENT — 2.33% | | | | | | | | | | | | |
Communications Equipment — 0.97% | | | | | | | | | | | | |
Cisco Systems, Inc. Floating Rate Note, 1.652% due 2/21/2018 | | AA-/A1 | | | | 9,850,000 | | | | | 9,903,751 | |
Juniper Networks, Inc., 3.30% due 6/15/2020 | | BBB/Baa2 | | | | 4,825,000 | | | | | 4,935,102 | |
Juniper Networks, Inc., 3.125% due 2/26/2019 | | BBB/Baa2 | | | | 10,000,000 | | | | | 10,187,870 | |
b LM Ericsson, 4.125% due 5/15/2022 | | BBB-/Baa3 | | | | 21,215,000 | | | | | 21,648,847 | |
Computers & Peripherals — 0.11% | | | | | | | | | | | | |
Lexmark International, Inc., 6.125% due 3/15/2020 | | BB/Ba2 | | | | 5,375,000 | | | | | 5,571,773 | |
Electronic Equipment, Instruments & Components — 0.60% | |
Ingram Micro, Inc., 5.45% due 12/15/2024 | | NR/Ba1 | | | | 5,596,000 | | | | | 5,506,296 | |
Tech Data Corp., 4.95% due 2/15/2027 | | BBB-/Baa3 | | | | 6,000,000 | | | | | 6,056,724 | |
Trimble Navigation, Ltd., 4.75% due 12/1/2024 | | BBB-/Baa2 | | | | 17,000,000 | | | | | 17,594,133 | |
Technology, Hardware, Storage &
Peripherals — 0.65% | | | | | | | | | | | | |
Apple, Inc. Floating Rate Note, 1.873% due 2/22/2019 | | AA+/Aa1 | | | | 4,950,000 | | | | | 5,024,993 | |
Apple, Inc. Floating Rate Note, 2.183% due 2/23/2021 | | AA+/Aa1 | | | | 9,050,000 | | | | | 9,339,917 | |
Apple, Inc. Floating Rate Note, 1.538% due 2/9/2022 | | AA+/Aa1 | | | | 11,975,000 | | | | | 12,071,602 | |
Hewlett Packard Enterprise Co. Floating Rate Note, 2.929% due 10/5/2018 | | BBB/Baa2 | | | | 4,900,000 | | | | | 5,000,063 | |
| | | | | | | | | | | | | |
| | | | | | | | | | | 112,841,071 | |
| | | | | | | | | | | | | |
TELECOMMUNICATION SERVICES — 2.58% | | | | | | | | | | | | |
Diversified Telecommunication Services — 1.75% | | | | | | | | | | | | |
AT&T, Inc., 1.962% due 11/27/2018 | | BBB+/Baa1 | | | | 11,350,000 | | | | | 11,453,694 | |
AT&T, Inc., 2.082% due 6/30/2020 | | BBB+/Baa1 | | | | 4,950,000 | | | | | 5,007,841 | |
AT&T, Inc., 3.60% due 2/17/2023 | | BBB+/Baa1 | | | | 8,000,000 | | | | | 8,102,408 | |
AT&T, Inc., 4.45% due 4/1/2024 | | BBB+/Baa1 | | | | 10,000,000 | | | | | 10,480,140 | |
AT&T, Inc., 3.00% due 6/30/2022 | | BBB+/Baa1 | | | | 4,500,000 | | | | | 4,476,577 | |
Michigan Bell Telephone Co., 7.85% due 1/15/2022 | | BBB+/NR | | | | 3,000,000 | | | | | 3,596,679 | |
Qwest Corp., 6.75% due 12/1/2021 | | BBB-/Ba1 | | | | 3,000,000 | | | | | 3,288,744 | |
Verizon Communications, Inc., 4.125% due 3/16/2027 | | BBB+/Baa1 | | | | 7,000,000 | | | | | 7,118,587 | |
Verizon Communications, Inc., 3.45% due 3/15/2021 | | BBB+/Baa1 | | | | 9,600,000 | | | | | 9,860,294 | |
Verizon Communications, Inc., 3.50% due 11/1/2024 | | BBB+/Baa1 | | | | 4,683,000 | | | | | 4,643,644 | |
Verizon Communications, Inc. Floating Rate Note, 2.137% due 3/16/2022 | | NR/NR | | | | 7,500,000 | | | | | 7,568,220 | |
Verizon Communications, Inc. Floating Rate Note, 2.871% due 9/14/2018 | | BBB+/Baa1 | | | | 1,825,000 | | | | | 1,863,635 | |
Verizon Communications, Inc. Floating Rate Note, 1.918% due 6/17/2019 | | BBB+/Baa1 | | | | 6,970,000 | | | | | 7,019,766 | |
22 Semi-Annual Reports
| | |
| Schedule of Investments, Continued | | |
| |
Thornburg Limited Term Income Fund | | March 31, 2017 (Unaudited) |
| | | | | | | | | | | | | | | |
ISSUER-DESCRIPTION | | CREDIT RATING†
S&P/ MOODY’S | | PRINCIPAL
AMOUNT | | VALUE |
Wireless Telecommunication Services — 0.83% | | | | | | | | | | | | |
a Crown Castle Towers, LLC, 6.113% due 1/15/2040 | | NR/A2 | | | $ | 6,970,000 | | | | $ | 7,546,860 | |
b Telefonica Emisiones S.A.U., 4.103% due 3/8/2027 | | BBB/Baa3 | | | | 8,500,000 | | | | | 8,559,985 | |
b Vodafone Group plc, 1.25% due 9/26/2017 | | BBB+/Baa1 | | | | 24,245,000 | | | | | 24,224,125 | |
| | | | | | | | | | | | | |
| | | | | | | | | | | 124,811,199 | |
| | | | | | | | | | | | | |
TRANSPORTATION — 1.47% | | | | | | | | | | | | |
Air Freight & Logistics — 0.01% | | | | | | | | | | | | |
a FedEx Corp. 2012 Pass-Through Trust, 2.625% due 1/15/2018 | | BBB/Baa1 | | | | 286,478 | | | | | 286,180 | |
Airlines — 0.43% | | | | | | | | | | | | |
American Airlines Group, Inc., 4.95% due 7/15/2024 | | A/NR | | | | 5,695,123 | | | | | 6,057,503 | |
American Airlines Group, Inc., 3.60% due 3/22/2029 | | AA/Aa3 | | | | 9,526,629 | | | | | 9,579,026 | |
US Airways, 6.25% due 10/22/2024 | | A+/A3 | | | | 4,845,326 | | | | | 5,281,405 | |
Road & Rail — 0.95% | | | | | | | | | | | | |
a,b Asciano Finance Ltd., 5.00% due 4/7/2018 | | BBB-/Baa3 | | | | 2,000,000 | | | | | 2,047,688 | |
a BNSF Railway Co., 3.442% due 6/16/2028 | | AA/Aa2 | | | | 14,153,711 | | | | | 14,173,617 | |
a,b LeasePlan Corp. NV, 2.50% due 5/16/2018 | | BBB-/Baa1 | | | | 10,000,000 | | | | | 10,024,850 | |
a Penske Truck Leasing Co., LP/PTL Finance Corp., 4.25% due 1/17/2023 | | BBB/Baa2 | | | | 5,000,000 | | | | | 5,209,070 | |
a TTX Co., 4.15% due 1/15/2024 | | A/Baa1 | | | | 6,000,000 | | | | | 6,290,154 | |
a TTX Co., 5.453% due 1/2/2022 | | NR/NR | | | | 3,271,821 | | | | | 3,396,118 | |
a TTX Co., 2.25% due 2/1/2019 | | A/Baa1 | | | | 5,000,000 | | | | | 5,002,295 | |
Transportation Infrastructure — 0.08% | | | | | | | | | | | | |
a,b Mexico City Airport Trust, 4.25% due 10/31/2026 | | BBB+/Baa1 | | | | 3,750,000 | | | | | 3,801,563 | |
| | | | | | | | | | | | | |
| | | | | | | | | | | 71,149,469 | |
| | | | | | | | | | | | | |
UTILITIES — 5.84% | | | | | | | | | | | | |
Electric Utilities — 4.77% | | | | | | | | | | | | |
Appalachian Power Co., 3.40% due 6/1/2025 | | A-/Baa1 | | | | 7,000,000 | | | | | 7,077,035 | |
Cleveland Electric Illuminating Co., 7.88% due 11/1/2017 | | BBB+/Baa1 | | | | 15,359,000 | | | | | 15,894,123 | |
Duke Energy Corp. Floating Rate Note, 1.378% due 4/3/2017 | | BBB+/NR | | | | 39,371,000 | | | | | 39,371,000 | |
Duke Energy Florida Project Finance, LLC, 1.196% due 3/1/2022 | | AAA/Aaa | | | | 17,910,000 | | | | | 17,800,695 | |
a,b Electricite de France S.A., 2.15% due 1/22/2019 | | A-/A3 | | | | 4,900,000 | | | | | 4,905,635 | |
a,b Enel Finance International S.A., 6.25% due 9/15/2017 | | BBB/Baa2 | | | | 15,889,000 | | | | | 16,207,384 | |
Entergy Louisiana, LLC, 4.80% due 5/1/2021 | | A/A2 | | | | 4,300,000 | | | | | 4,606,642 | |
Entergy Texas, Inc., 7.125% due 2/1/2019 | | A/Baa1 | | | | 2,000,000 | | | | | 2,173,620 | |
Exelon Corp., 1.55% due 6/9/2017 | | BBB-/Baa2 | | | | 2,950,000 | | | | | 2,950,089 | |
Exelon Corp., 2.85% due 6/15/2020 | | BBB-/Baa2 | | | | 2,950,000 | | | | | 2,988,675 | |
a Jersey Central Power & Light Co., 4.30% due 1/15/2026 | | BBB-/Baa2 | | | | 15,000,000 | | | | | 15,604,785 | |
a,b Korea Western Power Co., Ltd., 2.875% due 10/10/2018 | | NR/Aa2 | | | | 10,000,000 | | | | | 10,113,096 | |
a Monongahela Power Co., 4.10% due 4/15/2024 | | BBB+/A3 | | | | 8,000,000 | | | | | 8,389,256 | |
NextEra Energy Capital Holdings, Inc., 1.586% due 6/1/2017 | | BBB+/Baa1 | | | | 6,715,000 | | | | | 6,716,786 | |
Northern States Power Company-Wisconsin, 3.30% due 6/15/2024 | | A/Aa3 | | | | 10,000,000 | | | | | 10,132,370 | |
Public Service Co. of New Mexico, 5.35% due 10/1/2021 | | BBB+/Baa2 | | | | 3,000,000 | | | | | 3,246,990 | |
a Rochester Gas & Electric, 5.90% due 7/15/2019 | | A/A2 | | | | 11,732,000 | | | | | 12,658,159 | |
Southern Power Co., 2.375% due 6/1/2020 | | BBB+/Baa1 | | | | 9,793,000 | | | | | 9,792,128 | |
Southern Power Co., 1.85% due 12/1/2017 | | BBB+/Baa1 | | | | 5,000,000 | | | | | 5,004,920 | |
a,b State Grid Overseas Investment (2014) Ltd., 2.75% due 5/7/2019 | | AA-/Aa3 | | | | 9,000,000 | | | | | 9,107,809 | |
a Steelriver Transmission Co., LLC, 4.71% due 6/30/2017 | | NR/Baa1 | | | | 2,823,230 | | | | | 2,823,207 | |
The Southern Co., 2.45% due 9/1/2018 | | BBB+/Baa2 | | | | 4,825,000 | | | | | 4,865,491 | |
Toledo Edison Co., 7.25% due 5/1/2020 | | BBB+/Baa1 | | | | 167,000 | | | | | 181,985 | |
a,b Transelec S.A., 4.25% due 1/14/2025 | | BBB/Baa1 | | | | 6,000,000 | | | | | 6,128,613 | |
UIL Holdings Corp., 4.625% due 10/1/2020 | | BBB/Baa1 | | | | 11,660,000 | | | | | 12,030,158 | |
Gas Utilities — 0.26% | | | | | | | | | | | | |
AGL Capital Corp., 3.50% due 9/15/2021 | | A-/Baa1 | | | | 9,925,000 | | | | | 10,232,804 | |
Spire, Inc., 2.55% due 8/15/2019 | | BBB+/Baa2 | | | | 2,350,000 | | | | | 2,364,365 | |
Independent Power & Renewable Electricity Producers — 0.13% | |
a Midland Cogeneration Venture, 6.00% due 3/15/2025 | | BBB-/NR | | | | 5,987,152 | | | | | 6,357,793 | |
Multi-Utilities — 0.68% | | | | | | | | | | | | |
Dominion Gas Holdings, LLC, 2.50% due 12/15/2019 | | BBB+/A2 | | | | 3,900,000 | | | | | 3,943,688 | |
Dominion Gas Holdings, LLC, 2.80% due 11/15/2020 | | BBB+/A2 | | | | 5,000,000 | | | | | 5,061,795 | |
a Enable Oklahoma Intrastate Transmission, LLC, 6.25% due 3/15/2020 | | BB+/Baa3 | | | | 3,640,000 | | | | | 3,891,276 | |
Semi-Annual Reports 23
| | |
| Schedule of Investments, Continued | | |
| |
Thornburg Limited Term Income Fund | | March 31, 2017 (Unaudited) |
| | | | | | | | | | | | |
ISSUER-DESCRIPTION | | CREDIT RATING†
S&P/ MOODY’S | | | PRINCIPAL
AMOUNT | | | VALUE | |
a,b Korea Hydro & Nuclear Power Co. Ltd., 2.875% due 10/2/2018 | | | AA/Aa2 | | | $ | 7,000,000 | | | $ | 7,075,968 | |
a Niagara Mohawk Power Corp., 4.881% due 8/15/2019 | | | A-/A2 | | | | 10,000,000 | | | | 10,668,680 | |
SCANA Corp., 4.125% due 2/1/2022 | | | BBB/Baa3 | | | | 2,000,000 | | | | 2,026,960 | |
| | | | | | | | | | | | |
| | | | | | | | | | | 282,393,980 | |
| | | | | | | | | | | | |
TOTAL CORPORATE BONDS (Cost $2,269,749,436) | | | | | | | | | | | 2,305,749,780 | |
| | | | | | | | | | | | |
| | | |
CONVERTIBLE BONDS — 0.42% | | | | | | | | | | | | |
REAL ESTATE — 0.42% | | | | | | | | | | | | |
Equity Real Estate Investment Trusts — 0.42% | | | | | | | | | | | | |
a IAS Operating Partnership LP, 5.00% due 3/15/2018 | | | NR/NR | | | | 19,950,000 | | | | 20,124,562 | |
| | | | | | | | | | | | |
TOTAL CONVERTIBLE BONDS (Cost $19,950,000) | | | | | | | | | | | 20,124,562 | |
| | | | | | | | | | | | |
| | | |
MUNICIPAL BONDS — 2.39% | | | | | | | | | | | | |
American Municipal Power Ohio, Inc., 5.072% due 2/15/2018 (Meldahl Hydroelectric) | | | A/A3 | | | | 5,000,000 | | | | 5,125,000 | |
Anaheim California Public Financing Authority, 5.316% due 9/1/2017 (Anaheim Public Improvements; Insured: Natl-Re/FGIC) | | | AA-/A1 | | | | 520,000 | | | | 526,947 | |
Anaheim California Public Financing Authority, 5.486% due 9/1/2020 (Anaheim Public Improvements; Insured: Natl-Re) | | | AA-/A1 | | | | 3,270,000 | | | | 3,422,349 | |
Brentwood California Infrastructure Financing Authority, 6.16% due 10/1/2019 (Civic Center) | | | AA/NR | | | | 2,110,000 | | | | 2,222,547 | |
California HFFA, 6.76% due 2/1/2019 (Community Program for Persons with Developmental Disabilities) | | | AA-/NR | | | | 3,905,000 | | | | 4,112,551 | |
California School Finance Authority, 5.041% due 7/1/2020 (LOC: City National Bank) | | | AA+/NR | | | | 4,000,000 | | | | 4,313,280 | |
Camden County Improvement Authority, 5.47% due 7/1/2018 (Cooper Medical School of Rowan University) | | | A/A2 | | | | 2,140,000 | | | | 2,226,007 | |
Camden County Improvement Authority, 5.62% due 7/1/2019 (Cooper Medical School of Rowan University) | | | A/A2 | | | | 3,025,000 | | | | 3,223,259 | |
City and County of San Francisco Redevelopment Financing Authority, 8.00% due 8/1/2019 (San Francisco Redevelopment Projects) | | | AA-/A2 | | | | 6,500,000 | | | | 7,047,040 | |
City of Fort Collins Colorado Electric Utility Enterprise, 4.92% due 12/1/2020 (Fort Collins Smart Grid) | | | AA-/NR | | | | 2,250,000 | | | | 2,351,205 | |
City of Riverside California, 5.61% due 8/1/2017 (City Sewer System) | | | A+/A1 | | | | 2,000,000 | | | | 2,027,560 | |
Connecticut Housing Finance Authority, 5.071% due 11/15/2019 (Housing Mtg Finance Program) | | | AAA/Aaa | | | | 1,585,000 | | | | 1,620,932 | |
Denver Public Schools COP, 2.018% due 12/15/2019 (School District No. 1 Educational Facilities) | | | NR/Aa3 | | | | 3,000,000 | | | | 3,007,500 | |
JobsOhio Beverage System, 2.217% due 1/1/2019 (State Liquor Enterprise) | | | AA/Aa3 | | | | 11,245,000 | | | | 11,393,434 | |
Kentucky Asset/Liability Commission, 2.099% due 4/1/2019 (Commonwealth of Kentucky and Teachers’ Retirement System Funding Obligations) | | | A/Aa3 | | | | 3,000,000 | | | | 3,018,750 | |
Los Angeles County Public Works Financing Authority, 5.591% due 8/1/2020 (Los Angeles County & USC Medical Center Projects) | | | AA/Aa3 | | | | 3,000,000 | | | | 3,312,060 | |
Louisiana Local Government Environmental Facilities and Community Development Authority, 1.66% due 2/1/2022 (Louisiana Utilities Restoration) | | | AAA/Aaa | | | | 4,590,287 | | | | 4,578,077 | |
Municipal Improvement Corp. of Los Angeles, 6.165% due 11/1/2020 (Recovery Zone Economic Development) | | | A+/Aa3 | | | | 11,885,000 | | | | 13,060,545 | |
New York City Transitional Finance Authority, 4.075% due 11/1/2020 (World Trade Center Recovery) | | | AAA/Aa1 | | | | 2,500,000 | | | | 2,682,300 | |
Oklahoma Development Finance Authority, 8.00% due 5/1/2020 (Cleveland County Industrial Authority (CCIA) - Hitachi Norman, Oklahoma Project) | | | NR/NR | | | | 3,355,000 | | | | 3,382,175 | |
Orleans Parish School Board GO, 4.40% due 2/1/2021 (Educational Facilities Improvements; Insured: AGM) | | | AA/A2 | | | | 10,000,000 | | | | 10,718,400 | |
Redevelopment Agency of the City of Redlands, 5.818% due 8/1/2022 (Redlands Redevelopment; Insured: AMBAC) (ETM) | | | NR/NR | | | | 1,495,000 | | | | 1,621,492 | |
Redevelopment Agency of the County of San Bernardino, 7.135% due 9/1/2020 (San Sevaine Redevelopment Project) | | | BBB/NR | | | | 1,045,000 | | | | 1,098,264 | |
Rutgers State University GO, 2.342% due 5/1/2019 (New Brunswick, Newark and Camden Campus Facilities) | | | A+/Aa3 | | | | 3,485,000 | | | | 3,506,363 | |
Rutgers State University GO, 3.028% due 5/1/2021 (New Brunswick, Newark and Camden Campus Facilities) | | | A+/Aa3 | | | | 1,500,000 | | | | 1,510,305 | |
Sandoval County, New Mexico, 1.452% due 6/1/2017 | | | A+/NR | | | | 1,000,000 | | | | 1,000,370 | |
Tampa-Hillsborough County Florida Expressway Authority, 2.22% due 7/1/2018 (Electronic Tolling Program) | | | A/A2 | | | | 2,000,000 | | | | 2,002,680 | |
Tampa-Hillsborough County Florida Expressway Authority, 2.49% due 7/1/2019 (Electronic Tolling Program) | | | A/A2 | | | | 2,500,000 | | | | 2,503,775 | |
Tampa-Hillsborough County Florida Expressway Authority, 2.84% due 7/1/2020 (Electronic Tolling Program) | | | A/A2 | | | | 1,750,000 | | | | 1,754,830 | |
Wallenpaupack Area School District GO, 3.80% due 9/1/2019 (Pike and Wayne Counties Educational Facilities) (State Aid Withholding) | | | AA/NR | | | | 3,000,000 | | | | 3,108,690 | |
Wallenpaupack Area School District GO, 4.00% due 9/1/2020 (Pike and Wayne Counties Educational Facilities) (State Aid Withholding) | | | AA/NR | | | | 2,750,000 | | | | 2,879,003 | |
Yuba Levee Financing Authority, 6.375% due 9/1/2021 (pre-refunded 9/1/2017) (Yuba County Levee Financing Project) | | | AA/NR | | | | 1,000,000 | | | | 1,021,900 | |
| | | | | | | | | | | | |
TOTAL MUNICIPAL BONDS (Cost $110,623,516) | | | | | | | | | | | 115,379,590 | |
| | | | | | | | | | | | |
| | | |
SHORT TERM INVESTMENTS — 9.62% | | | | | | | | | | | | |
Bank of New York Tri-Party Repurchase Agreement 1.11% dated 3/31/2017 due 4/3/2017, repurchase price $125,011,563 collateralized by 71 corporate debt securities, having an average coupon of 3.98%, a minimum credit rating of BBB-, maturity dates from 6/24/2018 to 8/8/2056, and having an aggregate market value of $133,780,848 at 3/31/2017 | | | NR/NR | | | | 125,000,000 | | | | 125,000,000 | |
a Canadian National Railway, 0.85% due 4/12/2017 | | | NR/NR | | | | 5,000,000 | | | | 4,998,701 | |
a Cintas Executive, 1.15% due 4/6/2017 | | | NR/NR | | | | 22,000,000 | | | | 21,996,486 | |
Farmer Mac Discount Note, 0.50% due 4/3/2017 | | | NR/NR | | | | 20,000,000 | | | | 19,999,445 | |
Federal Home Loan Discount Note, 0.65% due 4/10/2017 | | | NR/NR | | | | 3,000,000 | | | | 2,999,513 | |
Federal Home Loan Discount Note, 0.30% due 4/3/2017 | | | NR/NR | | | | 57,000,000 | | | | 56,998,675 | |
24 Semi-Annual Reports
| | |
| Schedule of Investments, Continued | | |
| |
Thornburg Limited Term Income Fund | | March 31, 2017 (Unaudited) |
| | | | | | | | | | | | |
ISSUER-DESCRIPTION | | CREDIT RATING†
S&P/ MOODY’S | | | PRINCIPAL
AMOUNT | | | VALUE | |
Florida Power & Light Co., 1.00% due 4/4/2017 | | | NR/NR | | | $ | 4,000,000 | | | $ | 3,999,667 | |
a Intercontinental Exchange, 0.86% due 4/3/2017 | | | NR/NR | | | | 11,000,000 | | | | 10,999,474 | |
a KCP&L Greater Missouri Operations Co., 1.15% due 4/7/2017 | | | NR/NR | | | | 22,000,000 | | | | 21,995,783 | |
a Kentucky Utilities Co., 1.13% due 4/5/2017 | | | NR/NR | | | | 15,000,000 | | | | 14,998,117 | |
a Kentucky Utilities Co., 1.13% due 4/6/2017 | | | NR/NR | | | | 5,000,000 | | | | 4,999,215 | |
a Louisville Gas & Electric Co., 1.13% due 4/6/2017 | | | NR/NR | | | | 15,000,000 | | | | 14,997,688 | |
a Louisville Gas & Electric Co., 1.13% due 4/10/2017 | | | NR/NR | | | | 8,000,000 | | | | 7,997,740 | |
a McCormick & Company Inc., 0.95% due 4/3/2017 | | | NR/NR | | | | 22,000,000 | | | | 21,998,839 | |
a Reckitt Benckiser Co., 0.95% due 4/3/2017 | | | NR/NR | | | | 5,090,000 | | | | 5,089,731 | |
a Rockwell Automation, Inc., 0.97% due 4/7/2017 | | | NR/NR | | | | 22,000,000 | | | | 21,996,443 | |
a The Home Depot Inc., 0.77% due 4/7/2017 | | | NR/NR | | | | 22,000,000 | | | | 21,997,177 | |
a United Parcel Service, Inc., 0.73% due 4/6/2017 | | | NR/NR | | | | 22,000,000 | | | | 21,997,769 | |
United States Treasury Bill, 0.431% due 4/6/2017 | | | NR/NR | | | | 23,000,000 | | | | 22,998,623 | |
United States Treasury Bill, 0.69% due 4/13/2017 | | | NR/NR | | | | 36,800,000 | | | | 36,791,536 | |
| | | | | | | | | | | | |
TOTAL SHORT TERM INVESTMENTS (Cost $464,850,622) | | | | | | | | | | | 464,850,622 | |
| | | | | | | | | | | | |
TOTAL INVESTMENTS — 99.77% (Cost $4,789,511,110) | | | | | | | | | | $ | 4,823,137,436 | |
OTHER ASSETS LESS LIABILITIES — 0.23% | | | | | | | | | | | 10,934,902 | |
| | | | | | | | | | | | |
NET ASSETS — 100.00% | | | | | | | | | | $ | 4,834,072,338 | |
| | | | | | | | | | | | |
Footnote Legend
| † | Credit ratings are unaudited. Rating changes may have occurred subsequent to the reporting period end. Bonds issued with a maturity of one year or less are assigned Moody’s ratings from MIG-1 to MIG-4 and Standard and Poor’s ratings from SP-1+ to SP-3 with MIG-1 and SP-1+ being the strongest ratings. |
| a | Securities exempt from registration under Rule 144A of the Securities Act of 1933, as amended. These securities may only be resold in the ordinary course of business in transactions exempt from registration, normally to qualified institutional buyers. As of March 31, 2017, the aggregate value of these securities in the Fund’s portfolio was $1,830,590,878, representing 37.87% of the Fund’s net assets. |
| b | Yankee bond denominated in U.S. dollars and is issued in the U.S. by foreign banks and corporations. |
| c | Security currently fair valued by the Valuation and Pricing Committee using procedures approved by the Trustees’ Audit Committee. |
| e | Segregated as collateral for a when-issued security. |
Portfolio Abbreviations
To simplify the listings of securities, abbreviations are used per the table below:
| | |
| AGM | | Insured by Assured Guaranty Municipal Corp. |
| AMBAC | | Insured by American Municipal Bond Assurance Corp. |
| CMO | | Collateralized Mortgage Obligation |
| COP | | Certificates of Participation |
| ETM | | Escrowed to Maturity |
| FGIC | | Insured by Financial Guaranty Insurance Co. |
| GO | | General Obligation |
| HFFA | | Health Facilities Financing Authority |
| | |
| Mtg | | Mortgage |
| Natl-Re | | Insured by National Public Finance Guarantee Corp. |
| REIT | | Real Estate Investment Trust |
| REMIC | | Real Estate Mortgage Investment Conduit |
| SBA | | Small Business Administration |
| SPV | | Special Purpose Vehicle |
| VA | | Veterans Affairs |
See notes to financial statements.
Semi-Annual Reports 25
| | |
| Fund Summary | | |
| |
Thornburg Low Duration Income Fund | | March 31, 2017 (Unaudited) |
OBJECTIVES AND STRATEGIES
The Fund’s objective is to seek current income, consistent with preservation of capital.
The Fund invests in debt obligations issued by the U.S. Government, its agencies, or its instrumentalities, and in debt obligations rated at the time of purchase in one of the four highest credit ratings categories or, if no credit rating is available, judged to be of comparable quality by the Fund’s advisor. The Fund aims to reduce changes in its share value compared to longer duration fixed income portfolios by maintaining a laddered portfolio of investments with a dollar-weighted average duration of normally no more than three years.
LONG-TERM STABILITY OF PRINCIPAL
Net Asset Value History of A Shares
KEY PORTFOLIO ATTRIBUTES
| | | | |
Number of Bonds | | | 182 | |
| |
Effective Duration | | | 1.2 Yrs | |
| |
Average Maturity | | | 2.0 Yrs | |
SECURITY CREDIT RATINGS
Credit quality ratings for Thornburg’s global fixed income portfolios used ratings from Moody’s Investors Service. Where Moody’s ratings are not available, we have used Standard & Poor’s ratings. Where neither rating is available, we have used ratings from other nationally recognized statistical rating organizations (NRSROs).
PORTFOLIO LADDER
Percent of portfolio maturing in each year. Cash includes cash equivalents.
There is no guarantee that the Fund will meet its investment objective.
All data is subject to change. Charts may not add up to 100% due to rounding.
26 Semi-Annual Reports
| | |
| Schedule of Investments | | |
| |
Thornburg Low Duration Income Fund | | March 31, 2017 (Unaudited) |
| | | | | | | | | | | | |
ISSUER-DESCRIPTION | | CREDIT RATING†
S&P/MOODY’S | | | PRINCIPAL
AMOUNT | | | VALUE | |
U.S. TREASURY SECURITIES — 8.75% | | | | | | | | | | | | |
United States Treasury Notes, 0.875% due 6/15/2017 | | | NR/Aaa | | | $ | 100,000 | | | $ | 100,017 | |
United States Treasury Notes, 0.625% due 8/31/2017 | | | NR/Aaa | | | | 200,000 | | | | 199,806 | |
United States Treasury Notes, 0.75% due 12/31/2017 | | | NR/Aaa | | | | 400,000 | | | | 399,203 | |
United States Treasury Notes, 0.125% due 4/15/2019 | | | NR/Aaa | | | | 233,136 | | | | 236,503 | |
United States Treasury Notes, 0.125% due 4/15/2021 | | | NR/Aaa | | | | 358,547 | | | | 362,380 | |
United States Treasury Notes Inflationary Index, 0.125% due 4/15/2020 | | | NR/Aaa | | | | 388,793 | | | | 394,605 | |
| | | | | | | | | | | | |
TOTAL U.S. TREASURY SECURITIES (Cost $1,682,944) | | | | | | | | | | | 1,692,514 | |
| | | | | | | | | | | | |
| | | |
U.S. GOVERNMENT AGENCIES — 3.64% | | | | | | | | | | | | |
Export Leasing (2009), LLC, (Guaranty: Export-Import Bank of the United States), 1.859% due 8/28/2021 | | | NR/NR | | | | 59,186 | | | | 58,841 | |
a Micron Semiconductor Ltd., (Guaranty: Export-Import Bank of the United States), 1.258% due 1/15/2019 | | | NR/NR | | | | 200,000 | | | | 198,645 | |
a Petroleos Mexicanos Floating Rate Note, (Guaranty: Export-Import Bank of the United States), 1.373% due 4/15/2025 | | | NR/NR | | | | 82,500 | | | | 81,420 | |
a Petroleos Mexicanos, (Guaranty: Export-Import Bank of the United States), 1.70% due 12/20/2022 | | | NR/NR | | | | 60,000 | | | | 59,092 | |
a Reliance Industries Ltd., (Guaranty: Export-Import Bank of the United States), 1.87% due 1/15/2026 | | | NR/NR | | | | 118,421 | | | | 115,402 | |
Small Business Administration Participation Certificates, Series 2005-20K Class 1, 5.36% due 11/1/2025 | | | NR/NR | | | | 32,077 | | | | 34,199 | |
a Washington Aircraft 2 Co. Ltd. Floating Rate Note, (Guaranty: Export-Import Bank of the United States), 1.583% due 6/26/2024 | | | NR/NR | | | | 159,540 | | | | 157,205 | |
| | | | | | | | | | | | |
TOTAL U.S. GOVERNMENT AGENCIES (Cost $711,434) | | | | | | | | | | | 704,804 | |
| | | | | | | | | | | | |
| | | |
MORTGAGE BACKED — 3.73% | | | | | | | | | | | | |
Federal Home Loan Mtg Corp., CMO Series K716 Class A1, 2.413% due 8/25/2047 | | | NR/Aaa | | | | 72,272 | | | | 73,149 | |
Federal Home Loan Mtg Corp., Multi-Family Structured Pass Through, Series K710 Class A2, 1.883% due 5/25/2019 | | | NR/NR | | | | 275,000 | | | | 275,461 | |
Federal Home Loan Mtg Corp., Pool G15523, 2.50% due 8/1/2025 | | | NR/NR | | | | 148,502 | | | | 150,816 | |
Federal Home Loan Mtg Corp., Series 2586 Class AF, 5.00% due 3/15/2018 | | | NR/NR | | | | 124,246 | | | | 125,663 | |
Federal National Mtg Assoc. Pool AS3705, 2.50% due 11/1/2024 | | | NR/NR | | | | 93,957 | | | | 95,201 | |
| | | | | | | | | | | | |
TOTAL MORTGAGE BACKED (Cost $724,466) | | | | | | | | | | | 720,290 | |
| | | | | | | | | | | | |
| | | |
ASSET BACKED SECURITIES — 29.80% | | | | | | | | | | | | |
ADVANCE RECEIVABLES — 1.16% | | | | | | | | | | | | |
b New Residential Advance Receivables Trust, Series 2016-T2 Class AT2, 2.575% due 10/15/2049 | | | AAA/NR | | | | 100,000 | | | | 98,937 | |
b SPS Servicer Advance Receivables Trust, Series 2015-T3 Class AT3, 2.92% due 7/15/2047 | | | NR/NR | | | | 125,000 | | | | 125,192 | |
| | | | | | | | | | | | |
| | | | | | | | | | | 224,129 | |
| | | | | | | | | | | | |
AUTO RECEIVABLES — 6.32% | | | | | | | | | | | | |
Ally Auto Receivables Trust, Series 15-1 Class A3, 1.39% due 9/16/2019 | | | AAA/Aaa | | | | 133,765 | | | | 133,761 | |
Ally Auto Receivables Trust, Series 15-2 Class A3, 1.49% due 11/15/2019 | | | AAA/Aaa | | | | 95,521 | | | | 95,543 | |
b Avis Budget Rental Car Funding AESOP, LLC, Series 2012-3A Class A, 2.10% due 3/20/2019 | | | NR/Aaa | | | | 100,000 | | | | 100,269 | |
Capital Auto Receivables Asset Trust, Series 2016-3 Class A2A, 1.36% due 4/22/2019 | | | AAA/Aaa | | | | 86,170 | | | | 86,159 | |
b Chesapeake Funding II, LLC, Series 2016-1A Class A1, 2.11% due 3/15/2028 | | | NR/Aaa | | | | 192,127 | | | | 192,260 | |
b Drive Auto Receivables Trust, Series 2017-AA Class B, 2.51% due 1/15/2021 | | | AA/Aa1 | | | | 125,000 | | | | 125,229 | |
b Ford Credit Auto Owner Trust, Series 2015-1 Class A, 2.12% due 7/15/2026 | | | AAA/NR | | | | 100,000 | | | | 100,255 | |
b Foursight Capital Automobile Receivables Trust, Series 2016-1 Class A2, 2.87% due 10/15/2021 | | | A/NR | | | | 87,105 | | | | 87,439 | |
b GM Financial Automobile Leasing Trust, Series 2014-2A Class A4, 1.62% due 2/20/2018 | | | NR/Aaa | | | | 100,000 | | | | 100,041 | |
Nissan Auto Receivables Owner Trust, Series 2016-B Class A2B Floating Rate Note, 1.212% due 4/15/2019 | | | NR/Aaa | | | | 80,215 | | | | 80,310 | |
b OSCAR US Funding Trust, Series 2014-1A Class A3, 1.72% due 4/15/2019 | | | AAA/Aaa | | | | 51,070 | | | | 50,783 | |
b,c OSCAR US Funding Trust, Series 2016-2A Class A3, 2.73% due 12/15/2020 | | | AAA/Aaa | | | | 70,000 | | | | 69,790 | |
| | | | | | | | | | | | |
| | | | | | | | | | | 1,221,839 | |
| | | | | | | | | | | | |
COMMERCIAL MTG TRUST — 2.84% | | | | | | | | | | | | |
b Barclays Commercial Mortgage Securities, LLC, Series 2015-STP Class A, 3.323% due 9/10/2028 | | | AAA/NR | | | | 99,677 | | | | 102,242 | |
COMM Mortgage Trust, Series 2016-DC2 Class A1, 1.82% due 2/10/2049 | | | NR/Aaa | | | | 113,243 | | | | 113,173 | |
b DBUBS Mortgage Trust CMO, Series 2011-LC2A Class A1FL, 2.208% due 7/12/2044 | | | NR/Aaa | | | | 40,836 | | | | 41,086 | |
b FREMF Mortgage Trust, Series 2013-KF02 Class B Floating Rate Note, 3.778% due 12/25/2045 | | | NR/Baa3 | | | | 19,945 | | | | 20,167 | |
b JPMorgan Chase Commercial Mortgage, Series 2014-BXH Class A Floating Rate Note, 1.812% due 4/15/2027 | | | AAA/NR | | | | 92,075 | | | | 92,129 | |
Morgan Stanley BAML Trust, Series 2012-C6 Class A2, 1.868% due 11/15/2045 | | | NR/Aaa | | | | 74,142 | | | | 74,198 | |
b Morgan Stanley Re-REMIC Trust, Series 2009-GG10 Class A4A, 5.949% due 8/12/2045 | | | NR/Aaa | | | | 11,026 | | | | 11,026 | |
WFRBS Commercial Mortgage Trust, Series 2014-C22 Class A1, 1.479% due 9/15/2057 | | | NR/Aaa | | | | 96,377 | | | | 95,993 | |
| | | | | | | | | | | | |
| | | | | | | | | | | 550,014 | |
| | | | | | | | | | | | |
CREDIT CARD — 2.90% | | | | | | | | | | | | |
Barclays Dryrock Issuance Trust, Series 2015-4 Class A, 1.72% due 8/16/2021 | | | AAA/NR | | | | 100,000 | | | | 100,029 | |
Barclays Dryrock Issuance Trust, Series 2016-1 Class A, 1.52% due 5/16/2022 | | | AAA/NR | | | | 135,000 | | | | 133,896 | |
b Cabela’s Master Credit Card Trust, Series 2013-2A Class A1, 2.17% due 8/16/2021 | | | AAA/NR | | | | 150,000 | | | | 150,819 | |
Semi-Annual Reports 27
| | |
| Schedule of Investments, Continued | | |
| |
Thornburg Low Duration Income Fund | | March 31, 2017 (Unaudited) |
| | | | | | | | | | |
ISSUER-DESCRIPTION | | CREDIT RATING†
S&P/MOODY’S | | PRINCIPAL
AMOUNT | | | VALUE | |
Cabela’s Master Credit Card Trust, Series 2015-1A Class A2 Floating Rate Note, 1.452% due 3/15/2023 | | AAA/NR | | $ | 75,000 | | | $ | 75,420 | |
Synchrony Credit Card Master Note Trust, Series 2014-1 Class A, 1.61% due 11/15/2020 | | AAA/Aaa | | | 100,000 | | | | 100,145 | |
| | | | | | | | | | |
| | | | | | | | | 560,309 | |
| | | | | | | | | | |
OTHER ASSET BACKED — 10.50% | | | | | | | | | | |
b Alterna Funding I, LLC, Series 2014-1A, 1.639% due 2/15/2021 | | NR/NR | | | 23,623 | | | | 23,150 | |
b AMSR Trust, Series 2016-SFR1 Class A Floating Rate Note, 2.343% due 11/17/2033 | | NR/Aaa | | | 100,000 | | | | 100,436 | |
b BCC Funding Corp., Series 2016-1 Class A1, 1.10% due 9/20/2017 | | NR/NR | | | 40,121 | | | | 40,087 | |
b CLI Funding, LLC, Series 2014-1A Class A, 3.29% due 6/18/2029 | | A/NR | | | 72,534 | | | | 69,580 | |
b Dell Equipment Finance Trust, Series 2015-2 Class A3, 1.72% due 9/22/2020 | | AAA/Aaa | | | 125,000 | | | | 125,240 | |
b Diamond Resorts Owner Trust, Series 2014-1 Class A, 2.54% due 5/20/2027 | | A+/NR | | | 110,543 | | | | 110,533 | |
b Dominos Pizza Master Issuer, LLC, Series 2012-1A Class A2, 5.216% due 1/25/2042 | | BBB+/Baa1 | | | 144,484 | | | | 147,201 | |
b Engs Commercial Finance Trust, Series 2016-1A Class A1, 1.25% due 11/22/2017 | | NR/NR | | | 39,483 | | | | 39,488 | |
b Enterprise Fleet Financing LLC, Series 2016-2 Class A1, 0.85% due 7/20/2017 | | A-1+/NR | | | 29,598 | | | | 29,592 | |
GE Dealer Floorplan Master Note Trust, Series 2012-2 Class A Floating Rate Note, 1.728% due 4/22/2019 | | NR/Aaa | | | 100,000 | | | | 100,025 | |
b GTP Acquisition Partners I, LLC, Series 2015-1 Class A, 2.35% due 6/15/2045 | | NR/Aaa | | | 100,000 | | | | 98,718 | |
Harley-Davidson Motorcycle Trust, Series 2015-2 Class A4, 1.66% due 12/15/2022 | | AAA/Aaa | | | 100,000 | | | | 99,840 | |
b Hertz Fleet Lease Funding LP, Series 2016-1 Class A1 Floating Rate Note, 1.958% due 4/10/2030 | | NR/Aaa | | | 200,000 | | | | 200,897 | |
MVW Owner Trust, Series 2013-1X Class A, 2.15% due 4/22/2030 | | A+/NR | | | 32,036 | | | | 31,921 | |
b OnDeck Asset Securitization Trust II, LLC, Series 2016-1A Class A, 4.21% due 5/17/2020 | | BBB+/NR | | | 100,000 | | | | 99,416 | |
b OneMain Financial Issuance Trust, Series 2016-2A Class A, 4.10% due 3/20/2028 | | A+/NR | | | 100,000 | | | | 102,436 | |
b PFS Financing Corp., Series 2015-AA Class A Floating Rate Note, 1.532% due 4/15/2020 | | AAA/Aaa | | | 100,000 | | | | 99,968 | |
b PFS Tax Lien Trust, Series 2014-1, 1.44% due 5/15/2029 | | AAA/NR | | | 22,455 | | | | 22,311 | |
b SBA Tower Trust, Series 2012-1 Class C, 2.933% due 12/9/2042 | | NR/A2 | | | 100,000 | | | | 100,049 | |
b SBA Tower Trust, Series 2014-1A Class C, 2.898% due 10/15/2044 | | NR/A2 | | | 100,000 | | | | 100,311 | |
b Sierra Receivables Funding Co., LLC, Series 2014-1A Class A, 2.07% due 3/20/2030 | | A/NR | | | 20,269 | | | | 20,065 | |
b Sierra Receivables Funding Co., LLC, Series 2015-1A Class A, 2.40% due 3/22/2032 | | A/NR | | | 104,271 | | | | 103,801 | |
b Sierra Receivables Funding Co., LLC, Series 2015-3A Class A, 2.58% due 9/20/2032 | | A/NR | | | 44,786 | | | | 44,956 | |
b Tax Ease Funding, LLC, Series 2016-1A Class A, 3.131% due 6/15/2028 | | NR/NR | | | 120,719 | | | | 120,797 | |
| | | | | | | | | | |
| | | | | | | | | 2,030,818 | |
| | | | | | | | | | |
RESIDENTIAL MTG TRUST — 1.72% | | | | | | | | | | |
b Angel Oak Mortgage Trust LLC, Series 2017-1 Class A2, 3.085% due 1/25/2047 | | NR/NR | | | 95,657 | | | | 95,656 | |
b B2R Mortgage Trust, Series 2015-2 Class A, 3.336% due 11/15/2048 | | NR/NR | | | 96,538 | | | | 96,147 | |
b Nationstar HECM Loan Trust, Series 16-1A Class A, 2.981% due 2/25/2026 | | NR/Aaa | | | 45,938 | | | | 45,938 | |
b Towd Point Mortgage Trust, Series 2016-5 Class A1, 2.50% due 10/25/2056 | | NR/NR | | | 95,593 | | | | 94,996 | |
| | | | | | | | | | |
| | | | | | | | | 332,737 | |
| | | | | | | | | | |
STUDENT LOAN — 4.36% | | | | | | | | | | |
b Navient Student Loan Trust, Series 2015-AA Class A1, 1.412% due 12/15/2021 | | NR/Aaa | | | 6,016 | | | | 6,015 | |
b Navient Student Loan Trust, Series 2016-6A Class A2 Floating Rate Note, 1.732% due 3/25/2066 | | AAA/Aaa | | | 100,000 | | | | 100,595 | |
b Nelnet Student Loan Trust, Series 2016-A Class A1A, 2.528% due 12/26/2040 | | NR/NR | | | 136,680 | | | | 136,680 | |
b Pennsylvania Higher Education Assistance Agency, Series 2012-1A Class A1 Floating Rate Note, 1.532% due 5/25/2057 | | AA+/NR | | | 50,088 | | | | 49,492 | |
b SLM Student Loan Trust, Series 2011-A Class A3 Floating Rate Note, 3.412% due 1/15/2043 | | AAA/Aaa | | | 100,000 | | | | 104,508 | |
SLM Student Loan Trust, Series 2013-4 Class A Floating Rate Note, 1.532% due 6/25/2043 | | NR/Baa3 | | | 57,207 | | | | 56,037 | |
SLM Student Loan Trust, Series 2013-6 Class A2 Floating Rate Note, 1.482% due 2/25/2021 | | NR/Aaa | | | 60,832 | | | | 60,857 | |
b SLM Student Loan Trust, Series 2013-B Class A2B Floating Rate Note, 2.012% due 6/17/2030 | | AAA/NR | | | 200,000 | | | | 201,921 | |
b Social Professional Loan Program, LLC, Series 2014-A Class A1 Floating Rate Note, 2.356% due 6/25/2025 | | AAA/NR | | | 90,015 | | | | 91,924 | |
b Social Professional Loan Program, LLC, Series 2014-B Class A2, 2.55% due 8/27/2029 | | AAA/Aa1 | | | 35,821 | | | | 35,939 | |
| | | | | | | | | | |
| | | | | | | | | 843,968 | |
| | | | | | | | | | |
TOTAL ASSET BACKED SECURITIES (Cost $5,763,673) | | | | | | | | | 5,763,814 | |
| | | | | | | | | | |
| | | |
CORPORATE BONDS — 50.30% | | | | | | | | | | |
AUTOMOBILES & COMPONENTS — 1.81% | | | | | | | | | | |
Automobiles — 1.81% | | | | | | | | | | |
b Daimler Finance North America, LLC, 2.45% due 5/18/2020 | | A/A2 | | | 150,000 | | | | 150,189 | |
b Hyundai Capital America, 2.00% due 3/19/2018 | | A-/Baa1 | | | 50,000 | | | | 50,045 | |
b Hyundai Capital America, 2.40% due 10/30/2018 | | A-/Baa1 | | | 50,000 | | | | 50,157 | |
b Nissan Motor Acceptance Corp., 1.95% due 9/12/2017 | | A-/A2 | | | 100,000 | | | | 100,097 | |
| | | | | | | | | | |
| | | | | | | | | 350,488 | |
| | | | | | | | | | |
BANKS — 5.12% | | | | | | | | | | |
Banks — 5.12% | | | | | | | | | | |
Bank of America Corp. Floating Rate Note, 2.063% due 1/15/2019 | | BBB+/Baa1 | | | 100,000 | | | | 101,212 | |
Citigroup, Inc., 1.70% due 4/27/2018 | | BBB+/Baa1 | | | 75,000 | | | | 75,032 | |
Citigroup, Inc., 2.50% due 7/29/2019 | | BBB+/Baa1 | | | 75,000 | | | | 75,677 | |
28 Semi-Annual Reports
| | |
| Schedule of Investments, Continued | | |
| |
Thornburg Low Duration Income Fund | | March 31, 2017 (Unaudited) |
| | | | | | | | | | |
ISSUER-DESCRIPTION | | CREDIT RATING†
S&P/MOODY’S | | PRINCIPAL
AMOUNT | | | VALUE | |
Fifth Third Bank, 2.30% due 3/15/2019 | | A-/A3 | | $ | 200,000 | | | $ | 201,353 | |
JPMorgan Chase & Co., 2.244% due 10/29/2020 | | A-/A3 | | | 125,000 | | | | 127,705 | |
a Mitsubishi UFJ Financial Group, Inc. Floating Rate Note, 2.935% due 3/1/2021 | | A/A1 | | | 200,000 | | | | 206,815 | |
a Santander UK plc Floating Rate Note, 2.601% due 3/14/2019 | | A/Aa3 | | | 100,000 | | | | 101,699 | |
Wells Fargo & Co. Floating Rate Note, 2.112% due 12/7/2020 | | A/A2 | | | 100,000 | | | | 101,430 | |
| | | | | | | | | | |
| | | | | | | | | 990,923 | |
| | | | | | | | | | |
CAPITAL GOODS — 1.04% | | | | | | | | | | |
Construction & Engineering — 0.52% | | | | | | | | | | |
URS Corp., 3.85% due 4/1/2017 | | BB-/NR | | | 100,000 | | | | 100,000 | |
Machinery — 0.52% | | | | | | | | | | |
Stanley Black & Decker, Inc., 2.451% due 11/17/2018 | | A-/Baa2 | | | 100,000 | | | | 101,042 | |
| | | | | | | | | | |
| | | | | | | | | 201,042 | |
| | | | | | | | | | |
COMMERCIAL & PROFESSIONAL SERVICES — 0.93% | | | | | | | | | | |
Commercial Services & Supplies — 0.53% | | | | | | | | | | |
Cintas Corp. No. 2, 2.90% due 4/1/2022 | | BBB+/A3 | | | 100,000 | | | | 101,166 | |
Professional Services — 0.40% | | | | | | | | | | |
Dun & Bradstreet, Inc., 4.25% due 6/15/2020 | | BB+/NR | | | 75,000 | | | | 77,901 | |
| | | | | | | | | | |
| | | | | | | | | 179,067 | |
| | | | | | | | | | |
CONSUMER DURABLES & APPAREL — 1.28% | | | | | | | | | | |
Leisure Products — 1.28% | | | | | | | | | | |
Mattel, Inc., 2.35% due 8/15/2021 | | BBB/Baa2 | | | 125,000 | | | | 122,159 | |
Mattel, Inc., 1.70% due 3/15/2018 | | BBB/Baa2 | | | 125,000 | | | | 124,788 | |
| | | | | | | | | | |
| | | | | | | | | 246,947 | |
| | | | | | | | | | |
CONSUMER SERVICES — 0.52% | | | | | | | | | | |
Diversified Consumer Services — 0.52% | | | | | | | | | | |
George Washington University, 4.411% due 9/15/2017 | | A+/A1 | | | 100,000 | | | | 101,121 | |
| | | | | | | | | | |
| | | | | | | | | 101,121 | |
| | | | | | | | | | |
DIVERSIFIED FINANCIALS — 5.51% | | | | | | | | | | |
Capital Markets — 3.81% | | | | | | | | | | |
Goldman Sachs Group, Inc. Floating Rate Note, 2.331% due 9/15/2020 | | BBB+/A3 | | | 100,000 | | | | 101,448 | |
Legg Mason, Inc., 2.70% due 7/15/2019 | | BBB/Baa1 | | | 100,000 | | | | 100,975 | |
Moody’s Corp., 2.75% due 7/15/2019 | | BBB+/NR | | | 50,000 | | | | 50,652 | |
Moody’s Corp. Floating Rate Note, 1.414% due 9/4/2018 | | BBB+/NR | | | 50,000 | | | | 50,087 | |
Morgan Stanley, 2.80% due 6/16/2020 | | BBB+/A3 | | | 50,000 | | | | 50,607 | |
Morgan Stanley Floating Rate Note, 2.177% due 1/27/2020 | | BBB+/A3 | | | 75,000 | | | | 76,295 | |
State Street Corp. Floating Rate Note, 1.952% due 8/18/2020 | | A/A1 | | | 100,000 | | | | 101,901 | |
a,b UBS AG Jersey Floating Rate Note, 2.597% due 9/24/2020 | | A-/Baa1 | | | 200,000 | | | | 203,870 | |
Consumer Finance — 0.26% | | | | | | | | | | |
Synchrony Financial, 3.00% due 8/15/2019 | | BBB-/NR | | | 50,000 | | | | 50,780 | |
Diversified Financial Services — 1.44% | | | | | | | | | | |
b Athene Global Funding, 2.875% due 10/23/2018 | | A-/NR | | | 75,000 | | | | 75,439 | |
Intercontinental Exchange, Inc., 2.75% due 12/1/2020 | | A/A2 | | | 100,000 | | | | 101,534 | |
S&P Global, Inc., 2.50% due 8/15/2018 | | NR/Baa1 | | | 50,000 | | | | 50,395 | |
S&P Global, Inc., 3.30% due 8/14/2020 | | NR/Baa1 | | | 50,000 | | | | 51,081 | |
| | | | | | | | | | |
| | | | | | | | | 1,065,064 | |
| | | | | | | | | | |
ENERGY — 3.72% | | | | | | | | | | |
Oil, Gas & Consumable Fuels — 3.72% | | | | | | | | | | |
a BP Capital Markets plc Floating Rate Note, 1.386% due 8/14/2018 | | A-/A2 | | | 150,000 | | | | 150,367 | |
b Chevron Phillips Chemical Co., LLC, Floating Rate Note, 1.784% due 5/1/2020 | | A-/A2 | | | 100,000 | | | | 99,105 | |
Exxon Mobil Corp., 2.222% due 3/1/2021 | | AA+/Aaa | | | 75,000 | | | | 75,145 | |
Exxon Mobil Corp. Floating Rate Note, 1.835% due 3/1/2019 | | AA+/Aaa | | | 75,000 | | | | 76,059 | |
Exxon Mobil Corp. Floating Rate Note, 1.654% due 2/28/2018 | | AA+/Aaa | | | 50,000 | | | | 50,297 | |
b Kern River Funding Corp., 4.893% due 4/30/2018 | | A/A2 | | | 64,850 | | | | 66,840 | |
a Statoil ASA, 3.125% due 8/17/2017 | | A+/Aa3 | | | 200,000 | | | | 201,275 | |
| | | | | | | | | | |
| | | | | | | | | 719,088 | |
| | | | | | | | | | |
Semi-Annual Reports 29
| | |
| Schedule of Investments, Continued | | |
| |
Thornburg Low Duration Income Fund | | March 31, 2017 (Unaudited) |
| | | | | | | | | | |
ISSUER-DESCRIPTION | | CREDIT RATING†
S&P/MOODY’S | | PRINCIPAL
AMOUNT | | | VALUE | |
FOOD & STAPLES RETAILING — 0.16% | | | | | | | | | | |
Food & Staples Retailing — 0.16% | | | | | | | | | | |
Smith’s 1994-A3 Pass Through Trust, 9.20% due 7/2/2018 | | BBB/A2 | | $ | 28,555 | | | $ | 30,240 | |
| | | | | | | | | | |
| | | | | | | | | 30,240 | |
| | | | | | | | | | |
FOOD, BEVERAGE & TOBACCO — 5.72% | | | | | | | | | | |
Beverages — 2.60% | | | | | | | | | | |
Anheuser-Busch InBev Finance Inc. Floating Rate Note, 2.294% due 2/1/2021 | | A-/A3 | | | 150,000 | | | | 154,514 | |
Molson Coors Brewing Co., 2.10% due 7/15/2021 | | BBB-/Baa3 | | | 150,000 | | | | 146,475 | |
PepsiCo, Inc. Floating Rate Note, 1.535% due 10/6/2021 | | A/A1 | | | 200,000 | | | | 201,238 | |
Food Products — 2.60% | | | | | | | | | | |
General Mills, Inc., 1.40% due 10/20/2017 | | BBB+/A3 | | | 50,000 | | | | 50,024 | |
Ingredion, Inc., 1.80% due 9/25/2017 | | BBB/Baa2 | | | 100,000 | | | | 100,047 | |
Kraft Heinz Foods Co., 1.60% due 6/30/2017 | | BBB-/Baa3 | | | 250,000 | | | | 250,076 | |
Mead Johnson Nutrition Co., 3.00% due 11/15/2020 | | BBB/Baa1 | | | 100,000 | | | | 101,933 | |
Tobacco — 0.52% | | | | | | | | | | |
Altria Group, Inc., 2.625% due 1/14/2020 | | A-/A3 | | | 100,000 | | | | 101,274 | |
| | | | | | | | | | |
| | | | | | | | | 1,105,581 | |
| | | | | | | | | | |
HEALTH CARE EQUIPMENT & SERVICES — 2.33% | | | | | | | | | | |
Health Care Equipment & Supplies — 0.78% | | | | | | | | | | |
Abbott Laboratories, 2.35% due 11/22/2019 | | BBB/Baa3 | | | 150,000 | | | | 150,622 | |
Health Care Providers & Services — 1.55% | | | | | | | | | | |
Catholic Health Initiatives, 1.60% due 11/1/2017 | | BBB+/Baa1 | | | 100,000 | | | | 99,895 | |
b Roche Holding, Inc. Floating Rate Note, 1.492% due 9/30/2019 | | AA/A1 | | | 200,000 | | | | 200,883 | |
| | | | | | | | | | |
| | | | | | | | | 451,400 | |
| | | | | | | | | | |
INSURANCE — 1.43% | | | | | | | | | | |
Insurance — 1.43% | | | | | | | | | | |
a Enstar Group Ltd., 4.50% due 3/10/2022 | | BBB-/NR | | | 50,000 | | | | 50,629 | |
b Principal Life Global Funding II, 1.50% due 9/11/2017 | | A+/A1 | | | 50,000 | | | | 49,995 | |
b Principal Life Global Funding II, 2.375% due 9/11/2019 | | A+/A1 | | | 50,000 | | | | 50,313 | |
b Reliance Standard Life Insurance Co., 3.05% due 1/20/2021 | | A/A2 | | | 25,000 | | | | 25,208 | |
b Reliance Standard Life Insurance Co., 2.50% due 4/24/2019 | | A/A2 | | | 100,000 | | | | 100,662 | |
| | | | | | | | | | |
| | | | | | | | | 276,807 | |
| | | | | | | | | | |
MATERIALS — 0.26% | | | | | | | | | | |
Chemicals — 0.26% | | | | | | | | | | |
Airgas, Inc., 3.05% due 8/1/2020 | | A-/A3 | | | 50,000 | | | | 51,366 | |
| | | | | | | | | | |
| | | | | | | | | 51,366 | |
| | | | | | | | | | |
PHARMACEUTICALS, BIOTECHNOLOGY & LIFE SCIENCES — 1.36% | | | | | |
Biotechnology — 0.52% | | | | | | | | | | |
Gilead Sciences, Inc., 2.55% due 9/1/2020 | | A/A3 | | | 100,000 | | | | 101,077 | |
Pharmaceuticals — 0.84% | | | | | | | | | | |
a Actavis Funding SCS, 2.35% due 3/12/2018 | | BBB/Baa3 | | | 60,000 | | | | 60,262 | |
a Mylan N.V., 3.00% due 12/15/2018 | | BBB-/Baa3 | | | 100,000 | | | | 101,160 | |
| | | | | | | | | | |
| | | | | | | | | 262,499 | |
| | | | | | | | | | |
REAL ESTATE — 0.52% | | | | | | | | | | |
Equity Real Estate Investment Trusts — 0.52% | | | | | | | | | | |
Select Income REIT, 2.85% due 2/1/2018 | | BBB-/Baa2 | | | 100,000 | | | | 100,637 | |
| | | | | | | | | | |
| | | | | | | | | 100,637 | |
| | | | | | | | | | |
SEMICONDUCTORS & SEMICONDUCTOR EQUIPMENT — 0.65% | | | | | |
Semiconductors & Semiconductor Equipment — 0.65% | | | | | | | | | | |
b Broadcom Corp./Broadcom Cayman Finance Ltd., 2.375% due 1/15/2020 | | BBB-/Baa2 | | | 125,000 | | | | 124,985 | |
| | | | | | | | | | |
| | | | | | | | | 124,985 | |
| | | | | | | | | | |
SOFTWARE & SERVICES — 4.50% | | | | | | | | | | |
Information Technology Services — 1.83% | | | | | | | | | | |
Fidelity National Information Services, Inc., 2.85% due 10/15/2018 | | BBB/Baa3 | | | 150,000 | | | | 152,071 | |
30 Semi-Annual Reports
| | |
| Schedule of Investments, Continued | | |
| |
Thornburg Low Duration Income Fund | | March 31, 2017 (Unaudited) |
| | | | | | | | | | |
ISSUER-DESCRIPTION | | CREDIT RATING†
S&P/MOODY’S | | PRINCIPAL
AMOUNT | | | VALUE | |
Fiserv, Inc., 2.70% due 6/1/2020 | | BBB/Baa2 | | $ | 100,000 | | | $ | 101,132 | |
Total System Services, Inc., 2.375% due 6/1/2018 | | BBB-/Baa3 | | | 100,000 | | | | 100,416 | |
Internet Software & Services — 0.60% | | | | | | | | | | |
eBay, Inc., 2.50% due 3/9/2018 | | BBB+/Baa1 | | | 115,000 | | | | 115,874 | |
Software — 2.07% | | | | | | | | | | |
Autodesk, Inc., 3.125% due 6/15/2020 | | BBB/Baa2 | | | 100,000 | | | | 101,930 | |
CA Technologies, Inc., 2.875% due 8/15/2018 | | BBB+/Baa2 | | | 125,000 | | | | 126,651 | |
Oracle Corp., 1.90% due 9/15/2021 | | AA-/A1 | | | 175,000 | | | | 171,958 | |
| | | | | | | | | | |
| | | | | | | | | 870,032 | |
| | | | | | | | | | |
TECHNOLOGY HARDWARE & EQUIPMENT — 2.50% | | | | | | | | | | |
Communications Equipment — 1.31% | | | | | | | | | | |
Cisco Systems, Inc. Floating Rate Note, 1.652% due 2/21/2018 | | AA-/A1 | | | 150,000 | | | | 150,818 | |
Juniper Networks, Inc., 3.30% due 6/15/2020 | | BBB/Baa2 | | | 100,000 | | | | 102,282 | |
Technology, Hardware, Storage & Peripherals — 1.19% | | | | | | | | | | |
Apple, Inc. Floating Rate Note, 1.873% due 2/22/2019 | | AA+/Aa1 | | | 50,000 | | | | 50,757 | |
Apple, Inc. Floating Rate Note, 2.183% due 2/23/2021 | | AA+/Aa1 | | | 50,000 | | | | 51,602 | |
Apple, Inc. Floating Rate Note, 1.538% due 2/9/2022 | | AA+/Aa1 | | | 25,000 | | | | 25,202 | |
Hewlett Packard Enterprise Co. Floating Rate Note, 2.929% due 10/5/2018 | | BBB/Baa2 | | | 100,000 | | | | 102,042 | |
| | | | | | | | | | |
| | | | | | | | | 482,703 | |
| | | | | | | | | | |
TELECOMMUNICATION SERVICES — 3.33% | | | | | | | | | | |
Diversified Telecommunication Services — 2.30% | | | | | | | | | | |
AT&T, Inc., 2.45% due 6/30/2020 | | BBB+/Baa1 | | | 100,000 | | | | 99,993 | |
AT&T, Inc., 2.082% due 6/30/2020 | | BBB+/Baa1 | | | 50,000 | | | | 50,584 | |
AT&T, Inc., 1.962% due 11/27/2018 | | BBB+/Baa1 | | | 50,000 | | | | 50,457 | |
Verizon Communications, Inc. Floating Rate Note, 2.871% due 9/14/2018 | | BBB+/Baa1 | | | 140,000 | | | | 142,963 | |
Verizon Communications, Inc. Floating Rate Note, 1.918% due 6/17/2019 | | BBB+/Baa1 | | | 100,000 | | | | 100,714 | |
Wireless Telecommunication Services — 1.03% | | | | | | | | | | |
a Vodafone Group plc, 1.25% due 9/26/2017 | | BBB+/Baa1 | | | 200,000 | | | | 199,828 | |
| | | | | | | | | | |
| | | | | | | | | 644,539 | |
| | | | | | | | | | |
TRANSPORTATION — 0.56% | | | | | | | | | | |
Air Freight & Logistics — 0.04% | | | | | | | | | | |
b FedEx Corp. 2012 Pass-Through Trust, 2.625% due 1/15/2018 | | BBB/Baa1 | | | 7,346 | | | | 7,338 | |
Road & Rail — 0.52% | | | | | | | | | | |
b Penske Truck Leasing Co. LP/PTL Finance Corp., 3.20% due 7/15/2020 | | BBB/Baa2 | | | 100,000 | | | | 101,767 | |
| | | | | | | | | | |
| | | | | | | | | 109,105 | |
| | | | | | | | | | |
UTILITIES — 7.05% | | | | | | | | | | |
Electric Utilities — 6.53% | | | | | | | | | | |
Cleveland Electric Illuminating Co., 7.88% due 11/1/2017 | | BBB+/Baa1 | | | 185,000 | | | | 191,446 | |
Commonwealth Edison Co., 6.15% due 9/15/2017 | | A-/A2 | | | 165,000 | | | | 168,383 | |
Duke Energy Corp. Floating Rate Note, 1.378% due 4/3/2017 | | BBB+/NR | | | 200,000 | | | | 200,000 | |
Duke Energy Florida Project Finance, LLC, 1.196% due 3/1/2022 | | AAA/Aaa | | | 201,000 | | | | 199,773 | |
a,b Electricite de France S.A., 2.15% due 1/22/2019 | | A-/A3 | | | 100,000 | | | | 100,115 | |
a,b Enel Finance International S.A., 6.25% due 9/15/2017 | | BBB/Baa2 | | | 100,000 | | | | 102,004 | |
Exelon Corp., 1.55% due 6/9/2017 | | BBB-/Baa2 | | | 50,000 | | | | 50,002 | |
Exelon Corp., 2.85% due 6/15/2020 | | BBB-/Baa2 | | | 50,000 | | | | 50,655 | |
NextEra Energy Capital Holdings, Inc., 1.586% due 6/1/2017 | | BBB+/Baa1 | | | 100,000 | | | | 100,027 | |
The Southern Co., 2.45% due 9/1/2018 | | BBB+/Baa2 | | | 100,000 | | | | 100,839 | |
Multi-Utilities — 0.52% | | | | | | | | | | |
Dominion Gas Holdings, LLC, 2.50% due 12/15/2019 | | BBB+/A2 | | | 100,000 | | | | 101,120 | |
| | | | | | | | | | |
| | | | | | | | | 1,364,364 | |
| | | | | | | | | | |
TOTAL CORPORATE BONDS (Cost $9,659,777) | | | | | | | | | 9,727,998 | |
| | | | | | | | | | |
| | | |
CONVERTIBLE BONDS — 0.26% | | | | | | | | | | |
REAL ESTATE — 0.26% | | | | | | | | | | |
Equity Real Estate Investment Trusts — 0.26% | | | | | | | | | | |
b IAS Operating Partnership LP, 5.00% due 3/15/2018 | | NR/NR | | | 50,000 | | | | 50,437 | |
| | | | | | | | | | |
TOTAL CONVERTIBLE BONDS (Cost $48,962) | �� | | | | | | | | 50,437 | |
| | | | | | | | | | |
Semi-Annual Reports 31
| | |
| Schedule of Investments, Continued | | |
| |
Thornburg Low Duration Income Fund | | March 31, 2017 (Unaudited) |
| | | | | | | | | | | | |
ISSUER-DESCRIPTION | | CREDIT RATING†
S&P/MOODY’S | | | PRINCIPAL
AMOUNT | | | VALUE | |
MUNICIPAL BONDS — 1.33% | | | | | | | | | | | | |
JobsOhio Beverage System, 2.217% due 1/1/2019 (State Liquor Enterprise) | | | AA/Aa3 | | | $ | 100,000 | | | $ | 101,320 | |
Louisiana Local Government Environmental Facilities and Community Development Authority, 1.66% due 2/1/2022 (Louisiana Utilities Restoration) | | | AAA/Aaa | | | | 54,974 | | | | 54,827 | |
Sandoval County, New Mexico, 1.452% due 6/1/2017 | | | A+/NR | | | | 100,000 | | | | 100,037 | |
| | | | | | | | | | | | |
TOTAL MUNICIPAL BONDS (Cost $253,353) | | | | | | | | | | | 256,184 | |
| | | | | | | | | | | | |
SHORT TERM INVESTMENTS — 4.35% | | | | | | | 84,193 | | | | 841,926 | |
d Thornburg Capital Management Fund | | | | | | | | | | | | |
| | | | | | | | | | | | |
TOTAL SHORT TERM INVESTMENTS (Cost $841,926) | | | | | | | | | | | 841,926 | |
| | | | | | | | | | | | |
TOTAL INVESTMENTS — 102.16% (Cost $19,686,535) | | | | | | | | | | $ | 19,757,967 | |
LIABILITIES NET OF OTHER ASSETS — (2.16)% | | | | | | | | | | | (417,866 | ) |
| | | | | | | | | | | | |
NET ASSETS — 100.00% | | | | | | | | | | $ | 19,340,101 | |
| | | | | | | | | | | | |
Footnote Legend
| † | Credit ratings are unaudited. Rating changes may have occurred subsequent to the reporting period end. Bonds issued with a maturity of one year or less are assigned Moody’s ratings from MIG-1 to MIG-4 and Standard and Poor’s ratings from SP-1+ to SP-3 with MIG-1 and SP-1+ being the strongest ratings. |
| a | Yankee bond denominated in U.S. dollars and is issued in the U.S. by foreign banks and corporations. |
| b | Securities exempt from registration under Rule 144A of the Securities Act of 1933, as amended. These securities may only be resold in the ordinary course of business in transactions exempt from registration, normally to qualified institutional buyers. As of March 31, 2017, the aggregate value of these securities in the Fund’s portfolio was $6,035,956, representing 31.21% of the Fund’s net assets. |
| c | Security currently fair valued by the Valuation and Pricing Committee using procedures approved by the Trustees’ Audit Committee. |
| d | Investment in Affiliates - Shown below are holdings of voting securities of each portfolio company which is considered “affiliated” to the Fund under the Investment Company Act of 1940, including companies for which the Fund’s holding represented 5% or more of the company’s voting securities, and a series of the Thornburg Investment Trust in which the Fund invested for cash management purposes during the period: |
| | | | | | | | | | | | | | | | | | | | | | | | | | | | |
ISSUER | | SHARES/
PRINCIPAL
SEPTEMBER 30,
2016 | | | GROSS
ADDITIONS | | | GROSS
REDUCTIONS | | | SHARES/
PRINCIPAL
MARCH 31,
2017 | | | MARKET
VALUE
MARCH 31,
2017 | | | INVESTMENT
INCOME | | | REALIZED
GAIN (LOSS) | |
Thornburg Capital Management Fund | | | 136,327 | | | | 739,439 | | | | 791,573 | | | | 84,193 | | | $ | 841,926 | | | $ | 3,779 | | | $ | — | |
| | | | | | | | | | | | | | | | | | | | | | | | | | | | |
Total non-controlled affiliated issuers - 4.35% of net assets | | | $ | 841,926 | | | $ | 3,779 | | | $ | — | |
| | | | | | | | | | | | | | | | | | | | | | | | | | | | |
Portfolio Abbreviations
To simplify the listings of securities, abbreviations are used per the table below:
| | |
| CMO | | Collateralized Mortgage Obligation |
| Mtg | | Mortgage |
| REIT | | Real Estate Investment Trust |
| SBA | | Small Business Administration |
See notes to financial statements.
32 Semi-Annual Reports
| | |
| Statements of Assets and Liabilities | | |
| |
| | March 31, 2017 (Unaudited) |
| | | | | | | | | | | | |
| | | THORNBURG
LIMITED TERM U.S.
GOVERNMENT FUND | | | THORNBURG
LIMITED TERM
INCOME FUND | | | THORNBURG
LOW DURATION
INCOME FUND | |
ASSETS | | | | | | | | | | | | |
Investments at value (Note 3) | | | | | | | | | | | | |
Non-affiliated issuers (cost $292,595,596, $4,789,511,110,and 18,844,609, respectively) | | $ | 292,018,716 | | | $ | 4,823,137,436 | | | $ | 18,916,041 | |
Non-controlled affiliated issuer (cost $0, $0, and $841,926,respectively) | | | — | | | | — | | | | 841,926 | |
Cash | | | 77,010 | | | | 3,747,597 | | | | — | |
Receivable for investments sold | | | — | | | | 1,205,000 | | | | — | |
Receivable for fund shares sold | | | 948,376 | | | | 16,900,940 | | | | 47,416 | |
Receivable from investment advisor | | | — | | | | — | | | | 7,673 | |
Dividends receivable | | | — | | | | — | | | | 761 | |
Interest receivable | | | 970,172 | | | | 25,646,124 | | | | 60,307 | |
Prepaid expenses and other assets | | | 173,987 | | | | 128,822 | | | | 34,674 | |
| | | | | | | | | | | | |
Total Assets | | | 294,188,261 | | | | 4,870,765,919 | | | | 19,908,798 | |
| | | | | | | | | | | | |
| | | |
LIABILITIES | | | | | | | | | | | | |
Payable for investments purchased | | | — | | | | 19,855,514 | | | | 761 | |
Payable for fund shares redeemed | | | 1,055,870 | | | | 13,024,555 | | | | 523,753 | |
Payable to investment advisor and other affiliates (Note 4) | | | 139,647 | | | | 2,178,194 | | | | — | |
Accounts payable and accrued expenses | | | — | | | | 765,539 | | | | 42,866 | |
Dividends payable | | | 103,950 | | | | 869,779 | | | | 1,317 | |
| | | | | | | | | | | | |
Total Liabilities | | | 1,299,467 | | | | 36,693,581 | | | | 568,697 | |
| | | | | | | | | | | | |
| | | |
NET ASSETS | | $ | 292,888,794 | | | $ | 4,834,072,338 | | | $ | 19,340,101 | |
| | | | | | | | | | | | |
NET ASSETS CONSIST OF | | | | | | | | | | | | |
Undistributed (distribution in excess of) net investment income | | $ | (578,541 | ) | | $ | (1,650,835 | ) | | $ | 1,205 | |
Net unrealized appreciation (depreciation) on investments | | | (576,880 | ) | | | 33,626,326 | | | | 71,432 | |
Accumulated net realized gain (loss) | | | (9,587,606 | ) | | | (2,342,268 | ) | | | 3,211 | |
Net capital paid in on shares of beneficial interest | | | 303,631,821 | | | | 4,804,439,115 | | | | 19,264,253 | |
| | | | | | | | | | | | |
| | | |
| | $ | 292,888,794 | | | $ | 4,834,072,338 | | | $ | 19,340,101 | |
| | | | | | | | | | | | |
Semi-Annual Reports 33
| | |
| Statements of Assets and Liabilities, Continued |
| |
| | March 31, 2017 (Unaudited) |
| | | | | | | | | | | | |
| | | THORNBURG
LIMITED TERM U.S.
GOVERNMENT FUND | | | THORNBURG
LIMITED TERM
INCOME FUND | | | THORNBURG
LOW DURATION
INCOME FUND | |
NET ASSET VALUE | | | | | | | | | | | | |
| | | |
Class A Shares: | | | | | | | | | | | | |
Net asset value and redemption price per share ($99,631,317, $949,142,731, and $6,651,391 applicable to 7,651,074, 70,934,537, and 535,723 shares of beneficial interest outstanding - Note 5) | | $ | 13.02 | | | $ | 13.38 | | | $ | 12.42 | |
Maximum sales charge, 1.50% of offering price | | | 0.20 | | | | 0.20 | | | | 0.19 | |
| | | | | | | | | | | | |
Maximum offering price per share | | $ | 13.22 | | | $ | 13.58 | | | $ | 12.61 | |
| | | | | | | | | | | | |
| | | |
Class C Shares: | | | | | | | | | | | | |
Net asset value and offering price per share* ($41,673,093 and $617,261,103 applicable to 3,181,202 and 46,205,448 shares of beneficial interest outstanding - Note 5) | | $ | 13.10 | | | $ | 13.36 | | | $ | — | |
| | | | | | | | | | | | |
| | | |
Class I Shares: | | | | | | | | | | | | |
Net asset value, offering and redemption price per share ($130,863,916, $3,062,450,995, and $12,688,710 applicable to 10,049,034, 228,833,679, and 1,022,405 shares of beneficial interest outstanding - Note 5) | | $ | 13.02 | | | $ | 13.38 | | | $ | 12.41 | |
| | | | | | | | | | | | |
| | | |
Class R3 Shares: | | | | | | | | | | | | |
Net asset value, offering and redemption price per share ($13,833,898 and $106,020,215 applicable to 1,061,696 and 7,917,879 shares of beneficial interest outstanding - Note 5) | | $ | 13.03 | | | $ | 13.39 | | | $ | — | |
| | | | | | | | | | | | |
| | | |
Class R4 Shares: | | | | | | | | | | | | |
Net asset value, offering and redemption price per share ($2,501,025 and $7,431,623 applicable to 192,094 and 555,698 shares of beneficial interest outstanding - Note 5) | | $ | 13.02 | | | $ | 13.37 | | | $ | — | |
| | | | | | | | | | | | |
| | | |
Class R5 Shares: | | | | | | | | | | | | |
Net asset value, offering and redemption price per share ($4,385,545 and $91,765,671 applicable to 336,371 and 6,859,137 shares of beneficial interest outstanding - Note 5) | | $ | 13.04 | | | $ | 13.38 | | | $ | — | |
| | | | | | | | | | | | |
| * | Redemption price per share is equal to net asset value less any applicable contingent deferred sales charge. |
See notes to financial statements.
34 Semi-Annual Reports
| | |
| Statements of Operations | | |
| |
| | Six Months Ended March 31, 2017 (Unaudited) |
| | | | | | | | | | | | |
| | | THORNBURG
LIMITED TERM U.S.
GOVERNMENT FUND | | | THORNBURG
LIMITED TERM
INCOME FUND | | | THORNBURG
LOW DURATION
INCOME FUND | |
INVESTMENT INCOME | | | | | | | | | | | | |
Dividend income non-controlled affiliated issuer | | $ | — | | | $ | — | | | $ | 3,779 | |
Interest income (net of premium amortized of $431,578, $3,916,830, and $26,639 and net of paydown losses of $529,985, $1,664,926, and $8,560, respectively) | | | 3,131,703 | | | | 61,535,659 | | | | 226,889 | |
| | | | | | | | | | | | |
Total Income | | | 3,131,703 | | | | 61,535,659 | | | | 230,668 | |
| | | |
EXPENSES | | | | | | | | | | | | |
Investment advisory fees (Note 4) | | | 583,737 | | | | 8,000,375 | | | | 49,202 | |
Administration fees (Note 4) | | | | | | | | | | | | |
Class A Shares | | | 66,914 | | | | 667,289 | | | | 5,393 | |
Class C Shares | | | 27,991 | | | | 402,315 | | | | — | |
Class I Shares | | | 33,251 | | | | 710,002 | | | | 3,993 | |
Class R3 Shares | | | 13,074 | | | | 61,295 | | | | — | |
Class R4 Shares | | | 1,287 | | | | 4,343 | | | | — | |
Class R5 Shares | | | 875 | | | | 18,535 | | | | — | |
Distribution and service fees (Note 4) | | | | | | | | | | | | |
Class A Shares | | | 133,829 | | | | 1,334,578 | | | | 8,626 | |
Class C Shares | | | 111,568 | | | | 1,607,546 | | | | — | |
Class R3 Shares | | | 52,004 | | | | 244,652 | | | | — | |
Class R4 Shares | | | 2,571 | | | | 8,734 | | | | — | |
Transfer agent fees | | | | | | | | | | | | |
Class A Shares | | | 46,101 | | | | 653,495 | | | | 13,644 | |
Class C Shares | | | 25,707 | | | | 253,461 | | | | — | |
Class I Shares | | | 53,305 | | | | 1,068,891 | | | | 4,999 | |
Class R3 Shares | | | 23,362 | | | | 51,004 | | | | — | |
Class R4 Shares | | | 3,528 | | | | 16,954 | | | | — | |
Class R5 Shares | | | 2,372 | | | | 82,194 | | | | — | |
Registration and filing fees | | | | | | | | | | | | |
Class A Shares | | | 14,194 | | | | 18,585 | | | | 11,476 | |
Class C Shares | | | 8,416 | | | | 15,128 | | | | — | |
Class I Shares | | | 10,118 | | | | 57,589 | | | | 11,547 | |
Class R3 Shares | | | 7,757 | | | | 9,511 | | | | — | |
Class R4 Shares | | | 9,924 | | | | 9,765 | | | | — | |
Class R5 Shares | | | 10,052 | | | | 10,522 | | | | — | |
Custodian fees (Note 2) | | | 58,995 | | | | 219,890 | | | | 19,230 | |
Professional fees | | | 22,720 | | | | 43,366 | | | | 12,812 | |
Accounting fees (Note 4) | | | 5,457 | | | | 76,545 | | | | 454 | |
Trustee fees | | | 7,582 | | | | 108,080 | | | | 820 | |
Other expenses | | | 32,726 | | | | 244,923 | | | | 6,729 | |
| | | | | | | | | | | | |
Total Expenses | | | 1,369,417 | | | | 15,999,567 | | | | 148,925 | |
Less: | | | | | | | | | | | | |
Expenses reimbursed by investment advisor (Note 4) | | | (73,913 | ) | | | (85,170 | ) | | | (55,053 | ) |
Investment advisory fees waived by investment advisor (Note 4) | | | — | | | | — | | | | (27,764 | ) |
| | | | | | | | | | | | |
Net Expenses | | | 1,295,504 | | | | 15,914,397 | | | | 66,108 | |
| | | | | | | | | | | | |
Net Investment Income | | $ | 1,836,199 | | | $ | 45,621,262 | | | $ | 164,560 | |
| | | | | | | | | | | | |
Semi-Annual Reports 35
| | |
| Statements of Operations, Continued | | |
| |
| | Six Months Ended March 31, 2017 (Unaudited) |
| | | | | | | | | | | | |
| | | THORNBURG
LIMITED TERM U.S.
GOVERNMENT FUND | | | THORNBURG
LIMITED TERM
INCOME FUND | | | THORNBURG
LOW DURATION
INCOME FUND | |
REALIZED AND UNREALIZED GAIN (LOSS) | | | | | | | | | | | | |
Net realized gain (loss) on non-affiliated issuer investments | | $ | (143,276 | ) | | $ | 229,243 | | | $ | 10,732 | |
Net change in unrealized appreciation (depreciation) on non-affiliated issuer investments | | | (5,204,708 | ) | | | (46,092,987 | ) | | | (106,323 | ) |
| | | | | | | | | | | | |
Net Realized and Unrealized Gain (Loss) | | | (5,347,984 | ) | | | (45,863,744 | ) | | | (95,591 | ) |
| | | | | | | | | | | | |
Net Increase (Decrease) in Net Assets Resulting from Operations | | $ | (3,511,785 | ) | | $ | (242,482 | ) | | $ | 68,969 | |
| | | | | | | | | | | | |
See notes to financial statements.
36 Semi-Annual Reports
| | |
| Statements of Changes in Net Assets | | |
| |
Thornburg Limited Term U.S. Government Fund | | |
| | | | | | | | |
| | | SIX MONTHS ENDED
MARCH 31, 2017* | | | YEAR ENDED
SEPTEMBER 30, 2016 | |
INCREASE (DECREASE) IN NET ASSETS FROM | | | | | | | | |
| | |
OPERATIONS | | | | | | | | |
Net investment income | | $ | 1,836,199 | | | $ | 3,717,056 | |
Net realized gain (loss) on investments | | | (143,276 | ) | | | 431,056 | |
Net unrealized appreciation (depreciation) on investments | | | (5,204,708 | ) | | | 624,568 | |
| | | | | | | | |
Net Increase (Decrease) in Net Assets Resulting from Operations | | | (3,511,785 | ) | | | 4,772,680 | |
| | |
DIVIDENDS TO SHAREHOLDERS | | | | | | | | |
From net investment income | | | | | | | | |
Class A Shares | | | (749,794 | ) | | | (1,621,961 | ) |
Class B Shares | | | — | | | | (213 | ) |
Class C Shares | | | (249,053 | ) | | | (599,665 | ) |
Class I Shares | | | (1,160,061 | ) | | | (2,370,502 | ) |
Class R3 Shares | | | (139,147 | ) | | | (314,773 | ) |
Class R4 Shares | | | (13,848 | ) | | | (20,171 | ) |
Class R5 Shares | | | (30,293 | ) | | | (31,611 | ) |
| | |
FUND SHARE TRANSACTIONS (NOTE 5) | | | | | | | | |
Class A Shares | | | (10,286,243 | ) | | | 6,979,231 | |
Class B Shares** | | | — | | | | (146,065 | ) |
Class C Shares | | | (5,869,481 | ) | | | 1,598,490 | |
Class I Shares | | | (11,146,399 | ) | | | 31,721,059 | |
Class R3 Shares | | | (13,658,174 | ) | | | 11,722,796 | |
Class R4 Shares | | | 440,432 | | | | 1,392,817 | |
Class R5 Shares | | | 3,879,331 | | | | (1,602,542 | ) |
| | | | | | | | |
Net Increase (Decrease) in Net Assets | | | (42,494,515 | ) | | | 51,479,570 | |
| | |
NET ASSETS | | | | | | | | |
Beginning of Period | | | 335,383,309 | | | | 283,903,739 | |
| | | | | | | | |
| | |
End of Period | | $ | 292,888,794 | | | $ | 335,383,309 | |
| | | | | | | | |
Distribution in excess of net investment income | | $ | (578,541 | ) | | $ | (72,544 | ) |
| ** | Class B shares converted to Class A shares on August 29, 2016. |
See notes to financial statements.
Semi-Annual Reports 37
| | |
| Statements of Changes in Net Assets | | |
| |
Thornburg Limited Term Income Fund | | |
| | | | | | | | |
| | | SIX MONTHS ENDED
MARCH 31, 2017* | | | YEAR ENDED
SEPTEMBER 30, 2016 | |
INCREASE (DECREASE) IN NET ASSETS FROM | | | | | | | | |
| | |
OPERATIONS | | | | | | | | |
Net investment income | | $ | 45,621,262 | | | $ | 83,440,137 | |
Net realized gain (loss) on investments | | | 229,243 | | | | 368,703 | |
Net unrealized appreciation (depreciation) on investments | | | (46,092,987 | ) | | | 67,630,273 | |
| | | | | | | | |
Net Increase (Decrease) in Net Assets Resulting from Operations | | | (242,482 | ) | | | 151,439,113 | |
| | |
DIVIDENDS TO SHAREHOLDERS | | | | | | | | |
From net investment income | | | | | | | | |
Class A Shares | | | (9,504,482 | ) | | | (20,118,725 | ) |
Class C Shares | | | (5,063,369 | ) | | | (10,624,842 | ) |
Class I Shares | | | (30,589,730 | ) | | | (52,073,916 | ) |
Class R3 Shares | | | (813,017 | ) | | | (2,231,397 | ) |
Class R4 Shares | | | (57,743 | ) | | | (92,837 | ) |
Class R5 Shares | | | (741,281 | ) | | | (1,551,920 | ) |
| | |
FUND SHARE TRANSACTIONS (NOTE 5) | | | | | | | | |
Class A Shares | | | (151,107,809 | ) | | | 117,352,214 | |
Class C Shares | | | (43,720,685 | ) | | | 46,797,603 | |
Class I Shares | | | 297,528,205 | | | | 773,360,293 | |
Class R3 Shares | | | 2,738,158 | | | | (70,153,200 | ) |
Class R4 Shares | | | 1,167,890 | | | | 2,318,125 | |
Class R5 Shares | | | 20,607,826 | | | | (25,337,098 | ) |
| | | | | | | | |
Net Increase in Net Assets | | | 80,201,481 | | | | 909,083,413 | |
| | |
NET ASSETS | | | | | | | | |
Beginning of Period | | | 4,753,870,857 | | | | 3,844,787,444 | |
| | | | | | | | |
| | |
End of Period | | $ | 4,834,072,338 | | | $ | 4,753,870,857 | |
| | | | | | | | |
Distribution in excess of net investment income | | $ | (1,650,835 | ) | | $ | (502,475 | ) |
See notes to financial statements.
38 Semi-Annual Reports
| | |
| Statements of Changes in Net Assets | | |
| |
Thornburg Low Duration Income Fund | | |
| | | | | | | | |
| | | SIX MONTHS ENDED
MARCH 31, 2017* | | | YEAR ENDED
SEPTEMBER 30, 2016 | |
INCREASE (DECREASE) IN NET ASSETS FROM | | | | | | | | |
| | |
OPERATIONS | | | | | | | | |
Net investment income | | $ | 164,560 | | | $ | 235,375 | |
Net realized gain (loss) on investments | | | 10,732 | | | | 3,535 | |
Net unrealized appreciation (depreciation) on investments | | | (106,323 | ) | | | 163,252 | |
| | | | | | | | |
Net Increase (Decrease) in Net Assets Resulting from Operations | | | 68,969 | | | | 402,162 | |
| | |
DIVIDENDS TO SHAREHOLDERS | | | | | | | | |
From net investment income | | | | | | | | |
Class A Shares | | | (54,466 | ) | | | (98,936 | ) |
Class I Shares | | | (110,584 | ) | | | (145,144 | ) |
| | |
FUND SHARE TRANSACTIONS (NOTE 5) | | | | | | | | |
Class A Shares | | | (3,550,627 | ) | | | 230,729 | |
Class I Shares | | | (4,354,103 | ) | | | 8,956,507 | |
| | | | | | | | |
Net Increase (Decrease) in Net Assets | | | (8,000,811 | ) | | | 9,345,318 | |
| | |
NET ASSETS | | | | | | | | |
Beginning of Period | | | 27,340,912 | | | | 17,995,594 | |
| | | | | | | | |
| | |
End of Period | | $ | 19,340,101 | | | $ | 27,340,912 | |
| | | | | | | | |
Undistributed net investment income | | $ | 1,205 | | | $ | 1,695 | |
See notes to financial statements.
Semi-Annual Reports 39
| | |
| Notes to Financial Statements | | |
| |
| | March 31, 2017 (Unaudited) |
NOTE 1 – ORGANIZATION
Thornburg Limited Term U.S. Government Fund (the “Government Fund”), Thornburg Limited Term Income Fund (the “Income Fund”) and Thornburg Low Duration Income Fund (the “Low Duration Fund”), collectively the (“Funds”), are diversified series of Thornburg Investment Trust (the “Trust”). The Trust is organized as a Massachusetts business trust under a Declaration of Trust dated June 3, 1987 and is registered as a diversified, open-end management investment company under the Investment Company Act of 1940, as amended. The Funds are currently three of twenty-one separate series of the Trust. Each series is considered to be a separate entity for financial reporting and tax purposes and bears expenses directly attributable to it. The Funds’ primary objectives are to provide as high a level of current income as is consistent, in the view of Thornburg Investment Management, Inc., the Trust’s investment advisor (the “Advisor”), with the preservation of capital. As a secondary objective, the Government Fund and the Income Fund seek to reduce changes in their share prices compared to longer term portfolios.
The Government Fund currently offers six classes of shares of beneficial interest: Class A, Class C, Institutional Class (“Class I”), and Retirement Classes (“Class R3,” “Class R4,” and “Class R5”).
The Income Fund currently offers six classes of shares of beneficial interest outstanding, Class A, Class C, Institutional Class (“Class I”), and Retirement Classes (“Class R3,” “Class R4,” and “Class R5”).
The Low Duration Fund currently offers two classes of shares of beneficial interest outstanding, Class A and Institutional Class (“Class I”).
Each class of shares of the Funds represents an interest in the same portfolio of investments, except that (i) Class A shares are sold subject to a front-end sales charge collected at the time the shares are purchased and bear a service fee, (ii) Class C shares are sold at net asset value without a sales charge at the time of purchase, but are subject to a contingent deferred sales charge upon redemption within one year of purchase, and bear both a service fee and a distribution fee, (iii) Class I shares are sold at net asset value without a sales charge at the time of purchase and may be subject to a service fee, (iv) Class R3 shares are sold at net asset value without a sales charge, but bear both a service fee and a distribution fee, (v) Class R4 shares are sold at net asset value without a sales charge at the time of purchase but bear a service fee, (vi) Class R5 shares are sold at net asset value without a sales charge at the time of purchase and may be subject to a service fee, and (vii) the respective classes may have different reinvestment privileges and conversion rights. Additionally, each Fund may allocate among its classes certain expenses, to the extent allocable to specific classes, including transfer agent fees, government registration fees, certain printing and postage costs, and administrative and legal expenses. Currently, class specific expenses of the Funds are limited to distribution and service fees, administration fees, and certain registration and transfer agent expenses.
The following is a summary of significant accounting policies followed by the Funds in the preparation of its financial statements. Each Fund prepares its financial statements in conformity with United States generally accepted accounting principles (“GAAP”), including investment company accounting and reporting guidance in the Financial Accounting Standards Board (the “FASB”) Accounting Standard Codification Topic 946.
NOTE 2 – SIGNIFICANT ACCOUNTING POLICIES
Security Valuation: All investments in securities held by the Fund are valued as described in Note 3.
Allocation of Income, Gains, Losses and Expenses: Net investment income (other than class specific expenses) and realized and unrealized gains and losses are allocated daily to each class of shares based upon the relative net asset value of outstanding shares (or the value of the dividend-eligible shares, as appropriate) of each class of shares at the beginning of the day (after adjusting for the current capital shares activity of the respective class). Expenses common to all Funds are allocated among the Funds comprising the Trust based upon their relative net asset values or other appropriate allocation methods. Operating expenses directly attributable to a specific class are charged against the operating income of that class.
Dividends and Distributions to Shareholders: Dividends and distributions to shareholders, which are determined in accordance with federal income tax regulations and may differ from GAAP, are recorded on the ex-dividend date. Ordinary income distributions, if any, are declared daily and paid monthly. Capital gain distributions, if any, are declared and paid annually and more often if deemed necessary by the Advisor. Dividends are paid and are reinvested in additional shares of the Fund at net asset value per share at the close of business on the ex-dividend date, or at the shareholder’s option, paid in cash.
Investment Income: Interest income is accrued as earned. Premiums and discounts are amortized and accreted, respectively, to call dates or maturity dates using the effective yield method of the respective investments. These amounts are included in Interest income on the Statement of Operations. Dividend income is recorded on the ex-dividend date.
Custodian Fees: Custodian fees disclosed in the Statement of Operations may include interest expenses incurred by the Fund on any cash overdrafts of its custodian account during the period. Such cash overdrafts may result from the effects of failed trades in portfolio
40 Semi-Annual Reports
| | |
| Notes to Financial Statements, Continued | | |
| |
| | March 31, 2017 (Unaudited) |
securities and from cash outflows resulting from unanticipated shareholder redemption activity. The Fund pays interest to its custodian on any such cash overdraft at a rate equal to 2.50% of the overdraft amount in excess of $50,000.
Investment Transactions: Investment transactions are accounted for on a trade date basis. Realized gains and losses from the sale of investments are recorded on an identified cost basis.
Repurchase Agreements: The Funds may invest excess cash in repurchase agreements whereby the Funds purchase investments, which serve as collateral, with an agreement to resell such collateral to the seller at an agreed upon price at the maturity date of the repurchase agreement. Investments pledged as collateral for repurchase agreements are held in custody until maturity of the repurchase agreement. Provisions in the agreements require that the market value of the collateral is at least equal to the repurchase value in the event of default. In the event of default, the Funds have the right to liquidate the collateral and apply the proceeds in satisfaction of the obligation. Under certain circumstances, in the event of default or bankruptcy by the other party to the agreement, realization and/or retention of the collateral may be subject to legal proceedings.
When-Issued and Delayed Delivery Transactions: The Fund may engage in when-issued or delayed delivery transactions. To the extent the Fund engages in such transactions, it will do so for the purpose of acquiring portfolio investments consistent with the Fund’s investment objectives and not for the purpose of investment leverage or to speculate on interest rate or market changes. At the time the Fund makes a commitment to purchase an investment on a when-issued or delayed delivery basis, the Fund will record the transaction and reflect the value in determining its net asset value. When effecting such transactions, assets of an amount sufficient to make payment for the portfolio investments to be purchased will be segregated on the Fund’s records on the trade date. Investments purchased on a when-issued or delayed delivery basis do not earn interest until the settlement date.
Guarantees and Indemnifications: Under the Trust’s organizational documents (and under separate agreements with the independent Trustees), its officers and Trustees are provided with an indemnification against certain liabilities arising out of the performance of their duties to the Fund. In the normal course of business the Trust may also enter into contracts with service providers that contain general indemnifications. The Trust’s maximum exposure under these arrangements is unknown. However, based on experience, the Trust expects the risk of loss to be remote.
Use of Estimates: The preparation of financial statements in conformity with GAAP requires management to make estimates and assumptions that affect the reported amounts of assets and liabilities and disclosure of contingent assets and liabilities at the date of the financial statements and the reported amounts of increases (decreases) in net assets from operations during the reporting period. Actual results could differ from those estimates.
Federal Income Taxes: It is the policy of the Trust to comply with the provisions of the Internal Revenue Code applicable to regulated investment companies and to distribute to shareholders substantially all investment company taxable income including net realized gains on investments (if any), and tax exempt income of the Fund. Therefore, no provision for federal income or excise tax is required.
The Fund files income tax returns in United States federal and applicable state jurisdictions. The statute of limitations on the Fund’s tax return filings generally remains open for the three years following a return’s filing date. The Fund has analyzed its tax positions taken on Federal income tax returns for all open tax years and has concluded that no provision for income tax is required in the financial statements.
At March 31, 2017, information on the tax components of capital was as follows:
| | | | | | | | | | | | |
| | | GOVERNMENT FUND | | | INCOME FUND | | | LOW DURATION FUND | |
Cost of investments for tax purposes | | $ | 292,595,596 | | | $ | 4,789,511,110 | | | $ | 19,686,535 | |
| | | | | | | | | | | | |
| | | |
Gross unrealized appreciation on a tax basis | | $ | 1,725,266 | | | $ | 55,952,327 | | | $ | 111,659 | |
Gross unrealized depreciation on a tax basis | | | (2,302,146 | ) | | | (22,326,001 | ) | | | (40,227 | ) |
| | | | | | | | | | | | |
| | | |
Net unrealized appreciation (depreciation) on investments (tax basis) | | $ | (576,880 | ) | | $ | 33,626,326 | | | $ | 71,432 | |
| | | | | | | | | | | | |
At March 31, 2017, the Funds had deferred tax basis capital losses occurring subsequent to October 31, 2015 through September 30, 2016 as follows. For tax purposes, such losses will be recognized in the year ending September 30, 2017:
| | | | | | | | | | | | |
| | | GOVERNMENT FUND | | | INCOME FUND | | | LOW DURATION FUND | |
Deferred tax basis capital losses | | $ | 562,103 | | | $ | – | | | $ | 4,028 | |
| | | | | | | | | | | | |
Semi-Annual Reports 41
| | |
| Notes to Financial Statements, Continued | | |
| |
| | March 31, 2017 (Unaudited) |
At March 31, 2017, the Government Fund had cumulative tax basis capital losses of $8,758,031, (of which $2,091,263 are short-term and $6,666,768 are long-term) generated after September 30, 2011, which may be carried forward to offset future capital gains. To the extent such carryforwards are used, capital gain distributions may be reduced to the extent provided by regulations. Such capital loss carryforwards do not expire, but are required to be utilized to offset future gains prior to the utilization of losses generated prior to October 1, 2011.
At March 31, 2017, the Government Fund had cumulative tax basis capital losses generated prior to October 1, 2011 which may expire prior to utilization.
Capital loss carryforwards generated prior to October 31, 2011 expire as follows:
| | | | |
2018 | | $ | 17,316 | |
2019 | | | 106,151 | |
| | | | |
| | $ | 123,467 | |
| | | | |
At March 31, 2017, the Income Fund had cumulative tax basis capital losses of $2,252,409, (of which $0 are short-term and $2,252,409 are long-term) generated after September 30, 2011, which may be carried forward to offset future capital gains. To the extent such carryforwards are used, capital gain distributions may be reduced to the extent provided by regulations. Such capital loss carryforwards do not expire.
At March 31, 2017, the Low Duration Fund had cumulative tax basis capital losses of $3,471, (of which $0 are short-term and $3,471 are long-term) generated after September 30, 2011, which may be carried forward to offset future capital gains. To the extent such carryforwards are used, capital gain distributions may be reduced to the extent provided by regulations. Such capital loss carryforwards do not expire.
NOTE 3 – SECURITY VALUATION
Valuation of the Fund’s portfolio investment securities is performed in accordance with policies and procedures adopted by and under the oversight of the Trustees.
The Trustees of the Trust have appointed Thornburg Investment Management, Inc., the Trust’s investment advisor (the “Advisor”), to assist the Trustees in obtaining market values for portfolio investments, evaluate and monitor professional pricing service providers appointed by the Trustees’ Audit Committee (the “Audit Committee”) to assist in determining fair values for portfolio investments, assist in calculating fair values for portfolio investments in certain circumstances, and to perform other functions in connection with the valuation of investments. The Advisor acts through its Valuation and Pricing Committee (the “Committee”) and other employees of the Advisor. The Committee regularly reviews its own valuation calculations, as well as the valuations, valuation techniques and services furnished by pricing service providers, considers circumstances which may require valuation calculations by the Committee, and reviews previous valuation calculations. The Committee reports to the Audit Committee on the Committee’s activities, the performance of pricing service providers, and other matters relating to valuation of portfolio investments.
In those instances when the Committee assists in calculating a fair value for a portfolio investment, the Committee seeks to determine the price that the Fund would reasonably expect to receive upon a sale of the investment in an orderly transaction between market participants on the valuation date. The Committee customarily utilizes quotations from securities broker dealers in calculating valuations, but also may utilize prices obtained from pricing service providers or other methods approved by the Audit Committee. Because fair values calculated by the Committee are estimates, the calculation of a value for an investment may differ from the price that would be realized by the Fund upon a sale of the investment, and the difference could be material to the Fund’s financial statements. The Committee’s calculation of a fair value for an investment may also differ from the prices obtained by other persons (including other mutual funds) for the investment.
Valuation of Securities: Debt obligations held by the Funds which are not listed or traded on exchanges or for which no reported market exists are ordinarily valued at the valuation obtained from a pricing service provider approved by the Audit Committee.
In any case when a pricing service provider fails to provide a valuation for a debt obligation held by the Funds, the Committee calculates a fair value for the obligation using alternative methods under procedures approved by the Audit Committee. Additionally, in cases when management believes that a valuation obtained from a pricing service provider merits review for significant reasons, the Committee decides whether or not to use the valuation calculated by the pricing service provider or to use an alternative method approved by the Audit Committee to calculate a fair value for the obligation.
Valuation Hierarchy: The Funds categorize investments based upon the inputs used in valuing those investments, according to a three-level hierarchy established in guidance from FASB. Categorization of investments using this hierarchy is intended by the FASB to maximize the use of observable inputs in valuing investments and minimize the use of unobservable inputs by requiring that the most
42 Semi-Annual Reports
| | |
| Notes to Financial Statements, Continued | | |
| |
| | March 31, 2017 (Unaudited) |
observable inputs be used when available. Observable inputs are those that market participants would use in valuing an investment based on available market information. Unobservable inputs are those that reflect assumptions about the information market participants would use in valuing an investment. An investment’s level within the hierarchy is based on the lowest level input that is deemed significant to the valuation. The methodologies and inputs used to value investments are not necessarily indications of the risk or liquidity associated with those investments.
Various inputs are used in calculating valuations for a Fund’s investments. These inputs are generally summarized according to the three-level hierarchy below:
Level 1: Quoted prices in active markets for identical investments.
Level 2: Other direct or indirect significant observable inputs (including quoted prices for similar investments in active markets and other observable inputs, such as interest rates, prepayment rates, credit risk, etc.).
Level 3: Significant unobservable inputs (including the Committee’s own assumptions in calculating the fair values of investments).
Valuations for debt obligations held by a Fund are typically calculated by pricing service providers approved by the Audit Committee and are characterized as Level 2 within the valuation hierarchy.
In a limited number of cases the Committee calculates a fair value for investments using broker quotations or other methods approved by the Audit Committee. When the Committee uses a single broker quotation to calculate a fair value for an investment without other significant observable inputs, or if a fair value is calculated using other significant inputs that are considered unobservable, the investment is characterized as Level 3 within the hierarchy. Other significant unobservable inputs used to calculate a fair value in these instances might include an income-based valuation approach which considers discounted anticipated future cash flows from the investment and application of discounts due to the nature or duration of any restrictions on the disposition of the investment.
Valuations based upon the use of inputs from Levels 1, 2 or 3 may not represent the actual price received upon the disposition of an investment, and a Fund may receive a price that is lower than the valuation based upon these inputs when it sells the investment.
GOVERNMENT FUND
The following table displays a summary of the fair value hierarchy measurements of the Government Fund’s investments as of March 31, 2017. In any instance when valuation inputs from more than one level are used to determine the fair value of a specific investment, the investment is placed in the level of the table based upon the lowest level input that is significant in determining the fair value of the investment:
| | | | | | | | | | | | | | | | |
| | | FAIR VALUE MEASUREMENTS AT MARCH 31, 2017 | |
| | | TOTAL | | | LEVEL 1 | | | LEVEL 2 | | | LEVEL 3 | |
Assets | | | | | | | | | | | | | | | | |
Investments in Securities | | | | | | | | | | | | | | | | |
U.S. Treasury Securities | | $ | 67,176,644 | | | $ | 67,176,644 | | | $ | — | | | $ | — | |
U.S. Government Agencies | | | 57,720,185 | | | | 2,010,443 | | | | 55,709,742 | | | | — | |
Mortgage Backed | | | 148,021,972 | | | | — | | | | 148,021,972 | | | | — | |
Short Term Investments | | | 19,099,915 | | | | — | | | | 19,099,915 | | | | — | |
| | | | | | | | | | | | | | | | |
Total Investments in Securities | | $ | 292,018,716 | | | $ | 69,187,087 | | | $ | 222,831,629 | | | $ | — | |
In accordance with the guidance prescribed in ASU No. 2011-04, it is the policy of the Fund to recognize transfers between levels and those underlying events which caused the movement. The Fund recognized no transfers between Levels 1 and 2 for the six months ended March 31, 2017.
Semi-Annual Reports 43
| | |
| Notes to Financial Statements, Continued | | |
| |
| | March 31, 2017 (Unaudited) |
A rollforward of fair value measurements using significant unobservable inputs (Level 3) for the six months ended March 31, 2017 is as follows:
| | | | | | | | |
| | | U.S. GOVERNMENT AGENCIES | | | TOTAL | |
Beginning Balance 9/30/2016 | | $ | 2,863,421 | | | $ | 2,863,421 | |
Accrued Discounts (Premiums) | | | — | | | | — | |
Net Realized Gain (Loss) | | | — | | | | — | |
Gross Purchases | | | — | | | | — | |
Gross Sales | | | — | | | | — | |
Net Change in Unrealized | | | | | | | | |
Appreciation (Depreciation) | | | — | | | | — | |
Transfers into Level 3(a) | | | — | | | | — | |
Transfers out of Level 3(a) | | | (2,863,421) | | | | (2,863,421) | |
Ending Balance 3/31/2017 | | $ | — | | | $ | — | |
| (a) | Transfers into or out of Level 3 were out of or into Level 2, and were due to changes in other significant observable inputs available during the six months ended March 31, 2017. Transfers into or out of Level 3 are based on the beginning market value of the period in which they occurred. |
INCOME FUND
The following table displays a summary of the fair value hierarchy measurements of the Income Fund’s investments as of March 31, 2017. In any instance when valuation inputs from more than one level are used to determine the fair value of a specific investment, the investment is placed in the level of the table based upon the lowest level input that is significant in determining the fair value of the investment:
| | | | | | | | | | | | | | | | |
| | | FAIR VALUE MEASUREMENTS AT MARCH 31, 2017 | |
| | | TOTAL | | | LEVEL 1 | | | LEVEL 2 | | | LEVEL 3(a) | |
Assets | | | | | | | | | | | | | | | | |
Investments in Securities | | | | | | | | | | | | | | | | |
U.S. Treasury Securities | | $ | 314,451,876 | | | $ | 314,451,876 | | | $ | — | | | $ | — | |
U.S. Government Agencies | | | 232,061,283 | | | | — | | | | 228,701,283 | | | | 3,360,000 | |
Other Government | | | 63,054,469 | | | | 5,047,135 | | | | 58,007,334 | | | | — | |
Mortgage Backed | | | 232,188,860 | | | | — | | | | 206,121,202 | | | | 26,067,658 | |
Asset Backed Securities | | | 1,075,276,394 | | | | — | | | | 1,065,872,853 | | | | 9,403,541 | |
Corporate Bonds | | | 2,305,749,780 | | | | 17,189,064 | | | | 2,288,560,716 | | | | — | |
Convertible Bonds | | | 20,124,562 | | | | — | | | | 20,124,562 | | | | — | |
Municipal Bonds | | | 115,379,590 | | | | — | | | | 115,379,590 | | | | — | |
Short Term Investments | | | 464,850,622 | | | | — | | | | 464,850,622 | | | | — | |
| | | | | | | | | | | | | | | | |
Total Investments in Securities | | $ | 4,823,137,436 | | | $ | 336,688,075 | | | $ | 4,447,618,162 | | | $ | 38,831,199 | |
| (a) | In accordance with the guidance prescribed in Accounting Standards Update (“ASU”) No. 2011-04, no unadjusted broker quotes were applied to portfolio securities characterized as Level 3 investments at March 31, 2017. The following table displays a summary of the valuation techniques and unobservable inputs used to value portfolio securities characterized as Level 3 investments, where no unadjusted broker quotes were available at March 31, 2017: |
| | | | | | | | | | | | | | | | |
| | | FAIR VALUE AT
MARCH 31, 2017 | | | VALUATION
TECHNIQUE(S) | | | UNOBSERVABLE
INPUT | | | RANGE
(WEIGHTED AVERAGE) | |
Mortgage Backed | | $ | 26,067,658 | | | | Cost basis | | | | Cost basis | | | $ | 96.55 (N/A | ) |
U.S. Government Agencies | | | 3,360,000 | | |
| Market comparable securities
yield method |
| | | Yields of comparable securities | | | | 3.25% (N/A | ) |
Asset-Backed Securities | | | 9,403,541 | | | | Discounted cash flows | | |
| Third party vendor projection of
discounted cash flows |
| | | 2.80% – 5.40% (2.18% | ) |
| | | | | | | | | | | | | | | | |
Total | | $ | 38,831,199 | | | | | | | | | | | | | |
In accordance with the guidance prescribed in ASU No. 2011-04, it is the policy of the Fund to recognize transfers between levels and those underlying events which caused the movement. The Fund recognized no transfers between Levels 1 and 2 for the six months ended March 31, 2017.
44 Semi-Annual Reports
| | |
| Notes To Financial Statements, Continued | | |
| |
| | March 31, 2017 (Unaudited) |
A rollforward of fair value measurements using significant unobservable inputs (Level 3) for the six months ended March 31, 2017 is as follows:
| | | | | | | | | | | | | | | | |
| | | ASSET BACKED
SECURITIES | | | MORTGAGE
BACKED | | | U.S. GOVERNMENT
AGENCIES | | | TOTAL(d) | |
Beginning Balance 9/30/2016 | | $ | 9,667,174 | | | $ | — | | | $ | 3,540,000 | | | $ | 13,207,174 | |
Accrued Discounts (Premiums) | | | 7,170 | | | | 925 | | | | (20,458 | ) | | | (12,363 | ) |
Net Realized Gain (Loss)(a) | | | 33,980 | | | | — | | | | — | | | | 33,980 | |
Gross Purchases | | | — | | | | 26,067,658 | | | | — | | | | 26,067,658 | |
Gross Sales | | | (262,500 | ) | | | — | | | | — | | | | (262,500 | ) |
Net Change in Unrealized | | | | | | | | | | | | | | | | |
Appreciation (Depreciation)(b)(c) | | | (42,283 | ) | | | (925 | ) | | | (159,542 | ) | | | (202,750 | ) |
Transfers into Level 3 | | | — | | | | — | | | | — | | | | — | |
Transfers out of Level 3 | | | — | | | | — | | | | — | | | | — | |
| | | | | | | | | | | | | | | | |
Ending Balance 3/31/2017 | | $ | 9,403,541 | | | $ | 26,067,658 | | | $ | 3,360,000 | | | $ | 38,831,199 | |
| (a) | Amount of net realized gain (loss) from investments recognized in income is included in the Fund’s Statement of Operations for the six months ended March 31, 2017. |
| (b) | Amount of net change in unrealized appreciation (depreciation) on investments recognized in income is included in the Fund’s Statement of Operations for the six months ended March 31, 2017. |
| (c) | The net change in unrealized appreciation (depreciation) attributable to securities owned at March 31, 2017, which were valued using significant unobservable inputs, was $(202,750). This is included within net change in unrealized appreciation (depreciation) on investments in the Fund’s the Statement of Operations for the six months ended March 31, 2017. |
| (d) | Level 3 investments represent 0.80% of total net assets at the six months ended March 31, 2017. Significant fluctuations of the unobservable inputs applied to portfolio securities characterized as Level 3 investments could be expected to increase or decrease the fair value of these portfolio securities. |
LOW DURATION FUND
The following table displays a summary of the fair value hierarchy measurements of the Low Duration Fund’s investments as of March 31, 2017. In any instance when valuation inputs from more than one level are used to determine the fair value of a specific investment, the investment is placed in the level of the table based upon the lowest level input that is significant in determining the fair value of the investment:
| | | | | | | | | | | | | | | | |
| | | FAIR VALUE MEASUREMENTS AT MARCH 31, 2017 | |
| | | TOTAL | | | LEVEL 1 | | | LEVEL 2 | | | LEVEL 3(a) | |
Assets | | | | | | | | | | | | | | | | |
Investments in Securities | | | | | | | | | | | | | | | | |
U.S. Treasury Securities | | $ | 1,692,514 | | | $ | 1,692,514 | | | $ | — | | | $ | — | |
U.S. Government Agencies | | | 704,804 | | | | — | | | | 704,804 | | | | — | |
Mortgage Backed | | | 720,290 | | | | — | | | | 720,290 | | | | — | |
Asset Backed Securities | | | 5,763,814 | | | | — | | | | 5,694,024 | | | | 69,790 | |
Corporate Bonds | | | 9,727,998 | | | | — | | | | 9,727,998 | | | | — | |
Convertible Bonds | | | 50,437 | | | | — | | | | 50,437 | | | | — | |
Municipal Bonds | | | 256,184 | | | | — | | | | 256,184 | | | | — | |
Short Term Investments | | | 841,926 | | | | 841,926 | | | | — | | | | — | |
| | | | | | | | | | | | | | | | |
Total Investments in Securities | | $ | 19,757,967 | | | $ | 2,534,440 | | | $ | 17,153,737 | | | $ | 69,790 | |
| (a) | In accordance with the guidance prescribed in Accounting Standards Update (“ASU”) No. 2011-04, a portfolio security characterized as a Level 3 investment was fair valued by the Committee using a yield of 2.90% based upon a third party projection of discounted cash flows. |
In accordance with the guidance prescribed in ASU No. 2011-04, it is the policy of the Fund to recognize transfers between levels and those underlying events which caused the movement. The Fund recognized no transfers between Levels 1 and 2 for the six months ended March 31, 2017.
Semi-Annual Reports 45
| | |
| Notes to Financial Statements, Continued | | |
| |
| | March 31, 2017 (Unaudited) |
A rollforward of fair value measurements using significant unobservable inputs (Level 3) for the six months ended March 31, 2017 is as follows:
| | | | | | | | |
| | | ASSET BACKED SECURITIES | | | TOTAL(c) | |
Beginning Balance 9/30/2016 | | $ | 69,994 | | | $ | 69,994 | |
Accrued Discounts (Premiums) | | | — | | | | — | |
Net Realized Gain (Loss) | | | — | | | | — | |
Gross Purchases | | | — | | | | — | |
Gross Sales | | | — | | | | — | |
Net Change in Unrealized | | | | | | | | |
Appreciation (Depreciation)(a)(b) | | | (204 | ) | | | (204 | ) |
Transfers into Level 3 | | | — | | | | — | |
Transfers out of Level 3 | | | — | | | | — | |
| | | | | | | | |
Ending Balance 3/31/2017 | | $ | 69,790 | | | $ | 69,790 | |
| (a) | Amount of net change in unrealized appreciation (depreciation) on investments recognized in income is included in the Fund’s Statement of Operations for the six months ended March 31, 2017. |
| (b) | The net change in unrealized appreciation (depreciation) attributable to securities owned at March 31, 2017, which were valued using significant unobservable inputs, was $(204). This is included within net change in unrealized appreciation (depreciation) on investments in the Fund’s the Statement of Operations for the six months ended March 31, 2017. |
| (c) | Level 3 investments represent 0.36% of total net assets at the year ended March 31, 2017. Significant fluctuations of the unobservable inputs to portfolio securities characterized as Level 3 investments could be expected to increase or decrease the fair value of these portfolio securities. |
NOTE 4 – INVESTMENT ADVISORY FEE AND OTHER TRANSACTIONS WITH AFFILIATES
Pursuant to an investment advisory agreement, the Advisor serves as the investment advisor and performs services for the Funds for which the fees are payable at the end of each month. Under the investment advisory agreement, a Fund pays the Advisor a management fee based on the daily net assets of a Fund at an annual rate as shown in the following table:
| | | | | | | | | | | | | | | | | | |
| Management Fee Schedule | |
| GOVERNMENT FUND | | | INCOME FUND | | | LOW DURATION FUND | |
DAILY NET ASSETS | | FEE RATE | | | DAILY NET ASSETS | | FEE RATE | | | DAILY NET ASSETS | | | FEE RATE | |
Up to $1 billion | | | 0.375 | % | | Up to $500 million | | | 0.500 | % | | | Up to $1 Billion | | | | 0.400 | % |
Next $1 billion | | | 0.325 | | | Next $500 million | | | 0.450 | | | | Next $500 million | | | | 0.300 | |
Over $2 billion | | | 0.275 | | | Next $500 million | | | 0.400 | | | | Next $500 million | | | | 0.250 | |
| | | | | | Next $500 million | | | 0.350 | | | | Over $2 billion | | | | 0.225 | |
| | | | | | Over $2 billion | | | 0.275 | | | | | | | | | |
The Government Fund’s effective management fee for the period ended March 31, 2017 was 0.375% of the Fund’s average net assets.
The Income Fund’s effective management fee for the period ended March 31, 2017 was 0.338% of the Fund’s average net assets.
The Low Duration Fund’s effective management fee for the period ended March 31, 2017 was 0.40% of the Fund’s average net assets (before applicable management fee waiver of $27,764).
The Funds pay the Advisor the costs of personnel who perform certain accounting services for the Funds. For the six months ended March 31, 2017 the Government Fund, Income Fund, and Low Duration Fund paid $5,457, $76,545, and $454 to the Advisor for these accounting services, respectively. The Trust has also entered into administrative service agreements with the Advisor, whereby the Advisor will perform certain administrative services for the shareholders of each class of the Funds’ shares, and for which fees will be payable at an annual rate of up to .125 of 1% per annum of the average daily net assets attributable to Class A, Class C, Class R3, and Class R4 shares, and up to .05 of 1% per annum of the average daily net assets attributable to Class I and Class R5 shares. Total administrative service fees incurred by each class of shares of the Funds for the six months ended March 31, 2017, are set forth in the Statement of Operations.
46 Semi-Annual Reports
| | |
| Notes To Financial Statements, Continued | | |
| |
| | March 31, 2017 (Unaudited) |
The Trust has an underwriting agreement with Thornburg Securities Corporation (the “Distributor”), an affiliate of the Advisor, which acts as the distributor of the Funds’ shares. For the six months ended March 31, 2017, the Distributor has advised the Funds that they earned net commissions from the sale of Class A shares and collected contingent deferred sales charges (CDSC fees) from redemptions of Class C shares as follows:
| | | | | | | | | | | | |
| | | GOVERNMENT FUND | | | INCOME FUND | | | LOW DURATION FUND | |
Commissions | | $ | 244 | | | $ | 84 | | | $ | 1,267 | |
CDSC fees | | $ | 1,019 | | | $ | 23,932 | | | $ | — | |
Pursuant to a service plan under Rule 12b-1 of the Investment Company Act of 1940, the Funds may reimburse to the Distributor an amount not to exceed .25 of 1% per annum of the average daily net assets attributable to the applicable Class A, Class C, Class R3, and Class R4 shares of the Funds for payments made by the Distributor to securities dealers and other financial institutions to obtain various shareholder and distribution related services. For the six months ended March 31, 2017, there were no 12b-1 service plan fees charged for Class I or Class R5 shares. The Advisor and the Distributor each may pay out of its own resources additional expenses for distribution of each Fund’s shares and shareholder services.
The Trust has also adopted distribution plans pursuant to Rule 12b-1, applicable to each Fund’s Class C and Class R3 shares under which the Funds compensate the Distributor for services in promoting the sale of Class C and R3 shares of the Funds at an annual rate of up to .25 of 1% per annum of the average daily net assets attributable to Class C and Class R3 shares.
Total fees incurred by each class of shares of the Funds under their respective service and distribution plans for the six months ended March 31, 2017, are set forth in the Statements of Operations.
The Advisor and Distributor have contractually agreed to waive fees and reimburse expenses incurred by the Funds so that actual expenses of certain share classes do not exceed levels as specified in each Fund’s most recent prospectus. The agreement may be terminated by the Funds at any time, but may not be terminated by the Advisor or Distributor before April 10, 2018, unless the Advisor ceases to be the investment advisor to the Fund or the Distributor ceases to be the distributor of the Funds prior to that date. The Advisor and Distributor retain the right to be repaid by the Funds for fee waivers and expense reimbursements if expenses fall below the contractual limit prior to the end of the fiscal year.
| | | | | | | | | | | | |
| | | GOVERNMENT FUND | | | INCOME FUND | | | LOW DURATION FUND | |
Contractual: | | | | | | | | | | | | |
Class A | | $ | 4,395 | | | $ | — | | | $ | 34,514 | |
Class C | | $ | 1,962 | | | $ | — | | | $ | — | |
Class I | | $ | 5,330 | | | $ | — | | | $ | 20,539 | |
Class R3 | | $ | 40,810 | | | $ | 61,249 | | | $ | — | |
Class R4 | | $ | 11,820 | | | $ | 18,168 | | | $ | — | |
Class R5 | | $ | 9,596 | | | $ | 5,753 | | | $ | — | |
| | | |
| | | GOVERNMENT FUND | | | INCOME FUND | | | LOW DURATION FUND | |
Voluntary: | | | | | | | | | | | | |
Class A | | $ | — | | | $ | — | | | $ | 9,738 | |
Class C | | $ | — | | | $ | — | | | $ | — | |
Class I | | $ | — | | | $ | — | | | $ | 18,026 | |
Class R3 | | $ | — | | | $ | — | | | $ | — | |
Class R4 | | $ | — | | | $ | — | | | $ | — | |
Class R5 | | $ | — | | | $ | — | | | $ | — | |
Certain officers and Trustees of the Trust are also officers or directors of the Advisor and Distributor. The compensation of independent Trustees is borne by the Trust.
The percentage of direct investments in the Funds held by Trustees and Officers of the Trust and the Advisor is approximately .03%, .50%, and 33.04% for the Government Fund, Income Fund, and Low Duration Fund, respectively.
The Funds may purchase or sell securities from, or to an affiliated fund, provided the affiliation is due solely to having a common investment advisor, common officers, or common trustees, and provided that all such transactions will comply with Rule 17a-7 under the 1940 Act. For the six months ended March 31, 2017, the Government Fund had no affiliated fund transactions. The Income Fund had transactions of $1,921,393 in purchases. The Low Duration Fund had transactions of $1,921,393 in sales.
Semi-Annual Reports 47
| | |
| Notes to Financial Statements, Continued | | |
| |
| | March 31, 2017 (Unaudited) |
NOTE 5 – SHARES OF BENEFICIAL INTEREST
At March 31, 2017, there were an unlimited number of shares with no par value of beneficial interest authorized. Transactions in shares of beneficial interest were as follows:
GOVERNMENT FUND
| | | | | | | | | | | | | | | | |
| | | SIX MONTHS ENDED | | | YEAR ENDED | |
| | | MARCH 31, 2017 (UNAUDITED) | | | SEPTEMBER 30, 2016 (AUDITED) | |
| | | SHARES | | | AMOUNT | | | SHARES | | | AMOUNT | |
Class A Shares | | | | | | | | | | | | | | | | |
Shares sold | | | 619,669 | | | $ | 8,115,787 | | | | 3,244,060 | | | $ | 42,920,650 | |
Shares converted from Class B Shares | | | — | | | | — | | | | 3,192 | | | | 42,268 | |
Shares issued to shareholders in reinvestment of dividends | | | 52,095 | | | | 680,733 | | | | 107,867 | | | | 1,428,746 | |
Shares repurchased | | | (1,460,901 | ) | | | (19,082,763 | ) | | | (2,825,799 | ) | | | (37,412,433 | ) |
| | | | | | | | | | | | | | | | |
| | | | |
Net increase (decrease) | | | (789,137 | ) | | | (10,286,243 | ) | | | 529,320 | | | | 6,979,231 | |
| | | | | | | | | | | | | | | | |
Class B Shares* | | | | | | | | | | | | | | | | |
Shares sold | | | — | | | | — | | | | 13,171 | | | $ | 173,000 | |
Shares issued to shareholders in reinvestment of dividends | | | — | | | | — | | | | 15 | | | | 201 | |
Shares converted to Class A shares | | | — | | | | — | | | | (3,201 | ) | | | (42,268 | ) |
Shares repurchased | | | — | | | | — | | | | (20,937 | ) | | | (276,998 | ) |
| | | | | | | | | | | | | | | | |
| | | | |
Net increase (decrease) | | | — | | | | — | | | | (10,952 | ) | | | (146,065 | ) |
| | | | | | | | | | | | | | | | |
Class C Shares | | | | | | | | | | | | | | | | |
Shares sold | | | 252,883 | | | $ | 3,333,164 | | | | 1,382,885 | | | $ | 18,381,110 | |
Shares issued to shareholders in reinvestment of dividends | | | 16,808 | | | | 220,953 | | | | 39,396 | | | | 524,936 | |
Shares repurchased | | | (715,921 | ) | | | (9,423,598 | ) | | | (1,300,183 | ) | | | (17,307,556 | ) |
| | | | | | | | | | | | | | | | |
| | | | |
Net increase (decrease) | | | (446,230 | ) | | | (5,869,481 | ) | | | 122,098 | | | | 1,598,490 | |
| | | | | | | | | | | | | | | | |
Class I Shares | | | | | | | | | | | | | | | | |
Shares sold | | | 1,779,449 | | | $ | 23,241,852 | | | | 6,846,168 | | | $ | 90,628,309 | |
Shares issued to shareholders in reinvestment of dividends | | | 58,943 | | | | 770,313 | | | | 109,182 | | | | 1,446,413 | |
Shares repurchased | | | (2,685,920 | ) | | | (35,158,564 | ) | | | (4,567,281 | ) | | | (60,353,663 | ) |
| | | | | | | | | | | | | | | | |
| | | | |
Net increase (decrease) | | | (847,528 | ) | | | (11,146,399 | ) | | | 2,388,069 | | | | 31,721,059 | |
| | | | | | | | | | | | | | | | |
Class R3 Shares | | | | | | | | | | | | | | | | |
Shares sold | | | 339,001 | | | $ | 4,455,470 | | | | 1,457,239 | | | $ | 19,307,025 | |
Shares issued to shareholders in reinvestment of dividends | | | 8,642 | | | | 113,098 | | | | 21,503 | | | | 284,976 | |
Shares repurchased | | | (1,399,913 | ) | | | (18,226,742 | ) | | | (594,414 | ) | | | (7,869,205 | ) |
| | | | | | | | | | | | | | | | |
| | | | |
Net increase (decrease) | | | (1,052,270 | ) | | | (13,658,174 | ) | | | 884,328 | | | | 11,722,796 | |
| | | | | | | | | | | | | | | | |
Class R4 Shares | | | | | | | | | | | | | | | | |
Shares sold | | | 78,107 | | | $ | 1,017,904 | | | | 120,688 | | | $ | 1,601,055 | |
Shares issued to shareholders in reinvestment of dividends | | | 981 | | | | 12,807 | | | | 1,452 | | | | 19,238 | |
Shares repurchased | | | (45,217 | ) | | | (590,279 | ) | | | (17,154 | ) | | | (227,476 | ) |
| | | | | | | | | | | | | | | | |
| | | | |
Net increase (decrease) | | | 33,871 | | | | 440,432 | | | | 104,986 | | | | 1,392,817 | |
| | | | | | | | | | | | | | | | |
48 Semi-Annual Reports
| | |
| Notes to Financial Statements, Continued | | |
| |
| | March 31, 2017 (Unaudited) |
GOVERNMENT FUND (continued)
| | | | | | | | | | | | | | | | |
| | | SIX MONTHS ENDED | | | YEAR ENDED | |
| | | MARCH 31, 2017 (UNAUDITED) | | | SEPTEMBER 30, 2016 (AUDITED) | |
| | | SHARES | | | AMOUNT | | | SHARES | | | AMOUNT | |
Class R5 Shares | | | | | | | | | | | | | | | | |
Shares sold | | | 309,654 | | | $ | 4,091,636 | | | | 64,811 | | | $ | 858,427 | |
Shares issued to shareholders in reinvestment of dividends | | | 2,296 | | | | 29,987 | | | | 535 | | | | 7,096 | |
Shares repurchased | | | (18,514 | ) | | | (242,292 | ) | | | (185,977 | ) | | | (2,468,065 | ) |
| | | | | | | | | | | | | | | | |
| | | | |
Net increase (decrease) | | | 293,436 | | | | 3,879,331 | | | | (120,631 | ) | | | (1,602,542 | ) |
| | | | | | | | | | | | | | | | |
| * | Class B shares converted to Class A shares on August 29, 2016. |
INCOME FUND
| | | | | | | | | | | | | | | | |
| | | SIX MONTHS ENDED | | | YEAR ENDED | |
| | | MARCH 31, 2017 (UNAUDITED) | | | SEPTEMBER 30, 2016 (AUDITED) | |
| | | SHARES | | | AMOUNT | | | SHARES | | | AMOUNT | |
Class A Shares | | | | | | | | | | | | | | | | |
Shares sold | | | 9,942,505 | | | $ | 132,974,167 | | | | 32,795,693 | | | $ | 437,429,823 | |
Shares issued to shareholders in reinvestment of dividends | | | 631,331 | | | | 8,448,455 | | | | 1,328,847 | | | | 17,770,838 | |
Shares repurchased | | | (21,878,181 | ) | | | (292,530,431 | ) | | | (25,246,243 | ) | | | (337,848,447 | ) |
| | | | | | | | | | | | | | | | |
| | | | |
Net increase (decrease) | | | (11,304,345 | ) | | | (151,107,809 | ) | | | 8,878,297 | | | | 117,352,214 | |
| | | | | | | | | | | | | | | | |
Class C Shares | | | | | | | | | | | | | | | | |
Shares sold | | | 3,783,467 | | | $ | 50,566,268 | | | �� | 12,728,067 | | | $ | 169,641,470 | |
Shares issued to shareholders in reinvestment of dividends | | | 339,818 | | | | 4,540,063 | | | | 711,677 | | | | 9,500,564 | |
Shares repurchased | | | (7,401,573 | ) | | | (98,827,016 | ) | | | (9,928,440 | ) | | | (132,344,431 | ) |
| | | | | | | | | | | | | | | | |
| | | | |
Net increase (decrease) | | | (3,278,288 | ) | | | (43,720,685 | ) | | | 3,511,304 | | | | 46,797,603 | |
| | | | | | | | | | | | | | | | |
Class I Shares | | | | | | | | | | | | | | | | |
Shares sold | | | 59,990,556 | | | $ | 802,226,174 | | | | 104,313,980 | | | $ | 1,394,443,302 | |
Shares issued to shareholders in reinvestment of dividends | | | 2,038,787 | | | | 27,286,082 | | | | 3,427,302 | | | | 45,859,108 | |
Shares repurchased | | | (39,768,912 | ) | | | (531,984,051 | ) | | | (49,935,769 | ) | | | (666,942,117 | ) |
| | | | | | | | | | | | | | | | |
| | | | |
Net increase (decrease) | | | 22,260,431 | | | | 297,528,205 | | | | 57,805,513 | | | | 773,360,293 | |
| | | | | | | | | | | | | | | | |
Class R3 Shares | | | | | | | | | | | | | | | | |
Shares sold | | | 2,146,523 | | | $ | 28,734,957 | | | | 5,362,451 | | | $ | 71,387,699 | |
Shares issued to shareholders in reinvestment of dividends | | | 54,254 | | | | 726,626 | | | | 156,543 | | | | 2,091,489 | |
Shares repurchased | | | (1,995,435 | ) | | | (26,723,425 | ) | | | (10,779,842 | ) | | | (143,632,388 | ) |
| | | | | | | | | | | | | | | | |
| | | | |
Net increase (decrease) | | | 205,342 | | | | 2,738,158 | | | | (5,260,848 | ) | | | (70,153,200 | ) |
| | | | | | | | | | | | | | | | |
Class R4 Shares | | | | | | | | | | | | | | | | |
Shares sold | | | 176,656 | | | $ | 2,362,796 | | | | 363,454 | | | $ | 4,853,487 | |
Shares issued to shareholders in reinvestment of dividends | | | 1,813 | | | | 24,245 | | | | 1,985 | | | | 26,613 | |
Shares repurchased | | | (91,233 | ) | | | (1,219,151 | ) | | | (190,459 | ) | | | (2,561,975 | ) |
| | | | | | | | | | | | | | | | |
| | | | |
Net increase (decrease) | | | 87,236 | | | | 1,167,890 | | | | 174,980 | | | | 2,318,125 | |
| | | | | | | | | | | | | | | | |
Semi-Annual Reports 49
| | |
| Notes to Financial Statements, Continued | | |
| |
| | March 31, 2017 (Unaudited) |
INCOME FUND (continued)
| | | | | | | | | | | | | | | | |
| | | SIX MONTHS ENDED
MARCH 31, 2017 (UNAUDITED) | | | YEAR ENDED
SEPTEMBER 30, 2016 (AUDITED) | |
| | | SHARES | | | AMOUNT | | | SHARES | | | AMOUNT | |
Class R5 Shares | | | | | | | | | | | | | | | | |
Shares sold | | | 3,186,249 | | | $ | 42,614,303 | | | | 4,605,721 | | | $ | 61,328,527 | |
Shares issued to shareholders in reinvestment of dividends | | | 54,044 | | | | 723,148 | | | | 115,762 | | | | 1,545,596 | |
Shares repurchased | | | (1,699,205 | ) | | | (22,729,625 | ) | | | (6,632,663 | ) | | | (88,211,221 | ) |
| | | | | | | | | | | | | | | | |
| | | | |
Net increase (decrease) | | | 1,541,088 | | | | 20,607,826 | | | | (1,911,180 | ) | | | (25,337,098 | ) |
| | | | | | | | | | | | | | | | |
LOW DURATION INCOME FUND
| | | | | | | | | | | | | | | | |
| | | SIX MONTHS ENDED
MARCH 31, 2017 (UNAUDITED) | | | YEAR ENDED
SEPTEMBER 30, 2016 (AUDITED) | |
| | | SHARES | | | AMOUNT | | | SHARES | | | AMOUNT | |
Class A Shares | | | | | | | | | | | | | | | | |
Shares sold | | | 160,103 | | | $ | 1,984,603 | | | | 418,546 | | | $ | 5,189,601 | |
Shares issued to shareholders in reinvestment of dividends | | | 4,335 | | | | 53,794 | | | | 7,788 | | | | 96,596 | |
Shares repurchased | | | (450,431 | ) | | | (5,589,024 | ) | | | (407,683 | ) | | | (5,055,468 | ) |
| | | | | | | | | | | | | | | | |
| | | | |
Net increase (decrease) | | | (285,993 | ) | | | (3,550,627 | ) | | | 18,651 | | | | 230,729 | |
| | | | | | | | | | | | | | | | |
Class I Shares | | | | | | | | | | | | | | | | |
Shares sold | | | 141,657 | | | $ | 1,757,915 | | | | 968,154 | | | $ | 12,006,139 | |
Shares issued to shareholders in reinvestment of dividends | | | 8,459 | | | | 104,951 | | | | 11,204 | | | | 139,078 | |
Shares repurchased | | | (501,306 | ) | | | (6,216,969 | ) | | | (256,766 | ) | | | (3,188,710 | ) |
| | | | | | | | | | | | | | | | |
| | | | |
Net increase (decrease) | | | (351,190 | ) | | | (4,354,103 | ) | | | 722,592 | | | | 8,956,507 | |
| | | | | | | | | | | | | | | | |
NOTE 6 – INVESTMENT TRANSACTIONS
For the six months ended March 31, 2017, the Government Fund had purchase and sale transactions of investments (excluding short-term investments) of $23,335,133 and $22,148,984, respectively.
For the six months ended March 31, 2017, the Income Fund had purchase and sale transactions of investments (excluding short-term investments and U.S. Government obligations) of $615,090,881 and $437,479,606, respectively.
For the six months ended March 31, 2017, the Low Duration Fund had purchase and sale transactions of investments (excluding short-term investments and U.S. Government obligations) of $2,833,654 and $4,224,431, respectively.
OTHER NOTES
Risks: Each Fund’s investments subject it to risks including, but not limited to, management risk, interest rate risk, prepayment risk, credit risk, market and economic risk, liquidity risk, structured products risk and, in the case of the Income Fund and Low Duration Fund, the risks associated with investments in non-U.S. issuers. Please see each Fund’s prospectus for a discussion of the risks associated with an investment in the Funds.
Subsequent Events: Fund management believes no events have occurred between March 31, 2017 and the date of issuance of the financial statements that require adjustment to or disclosure in the accompanying financial statements.
50 Semi-Annual Reports
This page intentionally left blank.
Semi-Annual Reports 51
Financial Highlights
Thornburg Limited Term U.S. Government Fund
| | | | | | | | | | | | | | | | | | | | | | | | | | | | | | | | | | | | | | | | | | | | | | | | | | | | | | |
| | | PER SHARE PERFORMANCE (FOR A SHARE OUTSTANDING THROUGHOUT THE PERIOD) | | RATIOS TO AVERAGE NET ASSETS | | | SUPPLEMENTAL DATA | |
UNLESS OTHERWISE NOTED, PERIODS ARE FISCAL YEARS ENDED SEPT. 30, | | NET ASSET
VALUE
BEGINNING
OF PERIOD | | | NET
INVESTMENT
INCOME
(LOSS)+ | | | NET
REALIZED
&
UNREALIZED
GAIN (LOSS)
ON
INVESTMENTS | | | TOTAL FROM
INVESTMENT
OPERATIONS | | | DIVIDENDS
FROM NET
INVESTMENT
INCOME | | | DIVIDENDS
FROM NET
REALIZED
GAINS | | TOTAL
DIVIDENDS | | | NET
ASSET
VALUE
END
OF
PERIOD | | NET
INVESTMENT
INCOME
(LOSS)
(%) | | | EXPENSES,
AFTER
EXPENSE
REDUCTIONS
(%) | | | EXPENSES,
AFTER
EXPENSE
REDUCTIONS
AND
NET OF
CUSTODY
CREDITS
(%) | | | EXPENSES,
BEFORE
EXPENSE
REDUCTIONS
(%) | | | TOTAL
RETURN
(%)(a) | | | PORTFOLIO
TURNOVER
RATE (%)(a) | | NET
ASSETS
AT END
OF
PERIOD
(THOUSANDS) | |
CLASS A SHARES | | | | | | | | | | | | | | | | | | | | | | | | | | | | | | | | | | | | | | | | | | | | | | | |
2017(b)(c) | | $ | 13.25 | | | | 0.07 | | | | (0.21 | ) | | | (0.14 | ) | | | (0.09 | ) | | — | | | (0.09 | ) | | $13.02 | | | 1.07 | (g) | | | 0.94 | (g) | | | 0.94 | (g) | | | 0.94 | (g) | | | (1.04 | ) | | 7.68 | | $ | 99,631 | |
2016(c)(d) | | $ | 13.26 | | | | 0.14 | | | | 0.05 | | | | 0.19 | | | | (0.20 | ) | | — | | | (0.20 | ) | | $13.25 | | | 1.08 | | | | 0.91 | | | | 0.91 | | | | 0.91 | | | | 1.41 | | | 9.78 | | $ | 111,874 | |
2015(c) | | $ | 13.27 | | | | 0.15 | | | | 0.06 | | | | 0.21 | | | | (0.22 | ) | | — | | | (0.22 | ) | | $13.26 | | | 1.15 | | | | 0.92 | | | | 0.92 | | | | 0.92 | | | | 1.62 | | | 14.15 | | $ | 104,933 | |
2014(c) | | $ | 13.36 | | | | 0.19 | | | | (0.02 | ) | | | 0.17 | | | | (0.26 | ) | | — | | | (0.26 | ) | | $13.27 | | | 1.41 | | | | 0.93 | | | | 0.93 | | | | 0.94 | | | | 1.30 | | | 8.14 | | $ | 132,916 | |
2013(c) | | $ | 13.86 | | | | 0.20 | | | | (0.39 | ) | | | (0.19 | ) | | | (0.31 | ) | | — | | | (0.31 | ) | | $13.36 | | | 1.45 | | | | 0.89 | | | | 0.89 | | | | 0.89 | | | | (1.38 | ) | | 12.18 | | $ | 159,225 | |
2012(c) | | $ | 13.90 | | | | 0.25 | | | | 0.06 | | | | 0.31 | | | | (0.35 | ) | | — | | | (0.35 | ) | | $13.86 | | | 1.79 | | | | 0.89 | | | | 0.89 | | | | 0.89 | | | | 2.29 | | | 9.89 | | $ | 214,749 | |
CLASS C SHARES | | | | | | | | | | | | | | | | | | | | | | | | | | | | | | | | | | | | | | | | | | | | | | | |
2017(b) | | $ | 13.33 | | | | 0.05 | | | | (0.21 | ) | | | (0.16 | ) | | | (0.07 | ) | | — | | | (0.07 | ) | | $13.10 | | | 0.79 | (g) | | | 1.22 | (g) | | | 1.22 | (g) | | | 1.23 | (g) | | | (1.18 | ) | | 7.68 | | $ | 41,673 | |
2016 | | $ | 13.34 | | | | 0.11 | | | | 0.04 | | | | 0.15 | | | | (0.16 | ) | | — | | | (0.16 | ) | | $13.33 | | | 0.81 | | | | 1.19 | | | | 1.19 | | | | 1.20 | | | | 1.13 | | | 9.78 | | $ | 48,369 | |
2015 | | $ | 13.35 | | | | 0.12 | | | | 0.06 | | | | 0.18 | | | | (0.19 | ) | | — | | | (0.19 | ) | | $13.34 | | | 0.88 | | | | 1.20 | | | | 1.20 | | | | 1.21 | | | | 1.34 | | | 14.15 | | $ | 46,777 | |
2014 | | $ | 13.45 | | | | 0.15 | | | | (0.02 | ) | | | 0.13 | | | | (0.23 | ) | | — | | | (0.23 | ) | | $13.35 | | | 1.14 | | | | 1.19 | | | | 1.19 | | | | 1.20 | | | | 0.96 | | | 8.14 | | $ | 51,001 | |
2013 | | $ | 13.94 | | | | 0.16 | | | | (0.37 | ) | | | (0.21 | ) | | | (0.28 | ) | | — | | | (0.28 | ) | | $13.45 | | | 1.17 | | | | 1.17 | | | | 1.17 | | | | 1.17 | | | | (1.56 | ) | | 12.18 | | $ | 73,877 | |
2012 | | $ | 13.98 | | | | 0.21 | | | | 0.07 | | | | 0.28 | | | | (0.32 | ) | | — | | | (0.32 | ) | | $13.94 | | | 1.51 | | | | 1.17 | | | | 1.17 | | | | 1.17 | | | | 2.01 | | | 9.89 | | $ | 102,790 | |
CLASS I SHARES | | | | | | | | | | | | | | | | | | | | | | | | | | | | | | | | | | | | | | | | | | | | | | | |
2017(b) | | $ | 13.26 | | | | 0.09 | | | | (0.22 | ) | | | (0.13 | ) | | | (0.11 | ) | | — | | | (0.11 | ) | | $13.02 | | | 1.42 | (g) | | | 0.59 | (g) | | | 0.59 | (g) | | | 0.60 | (g) | | | (0.95 | ) | | 7.68 | | $ | 130,864 | |
2016 | | $ | 13.26 | | | | 0.19 | | | | 0.05 | | | | 0.24 | | | | (0.24 | ) | | — | | | (0.24 | ) | | $13.26 | | | 1.43 | | | | 0.57 | | | | 0.57 | | | | 0.57 | | | | 1.83 | | | 9.78 | | $ | 144,437 | |
2015 | | $ | 13.27 | | | | 0.19 | | | | 0.06 | | | | 0.25 | | | | (0.26 | ) | | — | | | (0.26 | ) | | $13.26 | | | 1.45 | | | | 0.62 | | | | 0.62 | | | | 0.62 | | | | 1.93 | | | 14.15 | | $ | 112,853 | |
2014 | | $ | 13.36 | | | | 0.23 | | | | (0.02 | ) | | | 0.21 | | | | (0.30 | ) | | — | | | (0.30 | ) | | $13.27 | | | 1.73 | | | | 0.61 | | | | 0.61 | | | | 0.61 | | | | 1.62 | | | 8.14 | | $ | 69,309 | |
2013 | | $ | 13.86 | | | | 0.24 | | | | (0.38 | ) | | | (0.14 | ) | | | (0.36 | ) | | — | | | (0.36 | ) | | $13.36 | | | 1.78 | | | | 0.56 | | | | 0.56 | | | | 0.56 | | | | (1.05 | ) | | 12.18 | | $ | 73,645 | |
2012 | | $ | 13.90 | | | | 0.29 | | | | 0.07 | | | | 0.36 | | | | (0.40 | ) | | — | | | (0.40 | ) | | $13.86 | | | 2.12 | | | | 0.56 | | | | 0.55 | | | | 0.56 | | | | 2.63 | | | 9.89 | | $ | 98,112 | |
CLASS R3 SHARES | | | | | | | | | | | | | | | | | | | | | | | | | | | | | | | | | | | | | | | | | | | | | | | |
2017(b) | | $ | 13.26 | | | | 0.07 | | | | (0.21 | ) | | | (0.14 | ) | | | (0.09 | ) | | — | | | (0.09 | ) | | $13.03 | | | 1.02 | (g) | | | 0.99 | (g) | | | 0.99 | (g) | | | 1.38 | (g) | | | (1.07 | ) | | 7.68 | | $ | 13,834 | |
2016 | | $ | 13.27 | | | | 0.14 | | | | 0.04 | | | | 0.18 | | | | (0.19 | ) | | — | | | (0.19 | ) | | $13.26 | | | 1.03 | | | | 0.98 | | | | 0.98 | | | | 1.30 | | | | 1.34 | | | 9.78 | | $ | 28,036 | |
2015 | | $ | 13.28 | | | | 0.14 | | | | 0.06 | | | | 0.20 | | | | (0.21 | ) | | — | | | (0.21 | ) | | $13.27 | | | 1.09 | | | | 0.99 | | | | 0.99 | | | | 1.35 | | | | 1.55 | | | 14.15 | | $ | 16,320 | |
2014 | | $ | 13.37 | | | | 0.18 | | | | (0.02 | ) | | | 0.16 | | | | (0.25 | ) | | — | | | (0.25 | ) | | $13.28 | | | 1.35 | | | | 0.99 | | | | 0.99 | | | | 1.31 | | | | 1.23 | | | 8.14 | | $ | 13,748 | |
2013 | | $ | 13.87 | | | | 0.18 | | | | (0.38 | ) | | | (0.20 | ) | | | (0.30 | ) | | — | | | (0.30 | ) | | $13.37 | | | 1.35 | | | | 0.99 | | | | 0.99 | | | | 1.27 | | | | (1.47 | ) | | 12.18 | | $ | 15,350 | |
2012 | | $ | 13.91 | | | | 0.23 | | | | 0.07 | | | | 0.30 | | | | (0.34 | ) | | — | | | (0.34 | ) | | $13.87 | | | 1.69 | | | | 1.00 | | | | 0.99 | | | | 1.29 | | | | 2.19 | | | 9.89 | | $ | 15,486 | |
CLASS R4 SHARES | | | | | | | | | | | | | | | | | | | | | | | | | | | | | | | | | | | | | | | | | | | | | | | |
2017(b) | | $ | 13.25 | | | | 0.07 | | | | (0.21 | ) | | | (0.14 | ) | | | (0.09 | ) | | — | | | (0.09 | ) | | $13.02 | | | 1.02 | (g) | | | 0.99 | (g) | | | 0.99 | (g) | | | 2.14 | (g) | | | (1.07 | ) | | 7.68 | | $ | 2,501 | |
2016 | | $ | 13.26 | | | | 0.14 | | | | 0.04 | | | | 0.18 | | | | (0.19 | ) | | — | | | (0.19 | ) | | $13.25 | | | 1.04 | | | | 0.99 | | | | 0.99 | | | | 2.71 | | | | 1.33 | | | 9.78 | | $ | 2,097 | |
2015 | | $ | 13.27 | | | | 0.13 | | | | 0.08 | | | | 0.21 | | | | (0.22 | ) | | — | | | (0.22 | ) | | $13.26 | | | 1.00 | | | | 0.99 | | | | 0.99 | | | | 17.30 | (e) | | | 1.55 | | | 14.15 | | $ | 706 | |
2014(f) | | $ | 13.36 | | | | 0.14 | | | | (0.03 | ) | | | 0.11 | | | | (0.20 | ) | | — | | | (0.20 | ) | | $13.27 | | | 1.57 | (g) | | | 0.99 | (g) | | | 0.99 | (g) | | | 64.66 | (e)(g) | | | 0.78 | | | 8.14 | | $ | 15 | |
CLASS R5 SHARES | | | | | | | | | | | | | | | | | | | | | | | | | | | | | | | | | | | | | | | | | | | | | | | |
2017(b) | | $ | 13.28 | | | | 0.09 | | | | (0.22 | ) | | | (0.13 | ) | | | (0.11 | ) | | — | | | (0.11 | ) | | $13.04 | | | 1.38 | (g) | | | 0.67 | (g) | | | 0.67 | (g) | | | 1.22 | (g) | | | (0.98 | ) | | 7.68 | | $ | 4,386 | |
2016 | | $ | 13.27 | | | | 0.17 | | | | 0.07 | | | | 0.24 | | | | (0.23 | ) | | — | | | (0.23 | ) | | $13.28 | | | 1.30 | | | | 0.67 | | | | 0.67 | | | | 2.05 | | | | 1.80 | | | 9.78 | | $ | 570 | |
2015 | | $ | 13.27 | | | | 0.19 | | | | 0.07 | | | | 0.26 | | | | (0.26 | ) | | — | | | (0.26 | ) | | $13.27 | | | 1.40 | | | | 0.67 | | | | 0.67 | | | | 2.02 | | | | 1.95 | | | 14.15 | | $ | 2,170 | |
2014 | | $ | 13.36 | | | | 0.21 | | | | — | (h) | | | 0.21 | | | | (0.30 | ) | | — | | | (0.30 | ) | | $13.27 | | | 1.59 | | | | 0.67 | | | | 0.67 | | | | 2.87 | | | | 1.56 | | | 8.14 | | $ | 1,859 | |
2013 | | $ | 13.85 | | | | 0.24 | | | | (0.39 | ) | | | (0.15 | ) | | | (0.34 | ) | | — | | | (0.34 | ) | | $13.36 | | | 1.83 | | | | 0.67 | | | | 0.67 | | | | 7.28 | (e) | | | (1.09 | ) | | 12.18 | | $ | 881 | |
2012(i) | | $ | 13.84 | | | | 0.10 | | | | 0.07 | | | | 0.17 | | | | (0.16 | ) | | — | | | (0.16 | ) | | $13.85 | | | 1.87 | (g) | | | 0.68 | (g) | | | 0.67 | (g) | | | 44.86 | (e)(g) | | | 1.20 | | | 9.89 | | $ | 299 | |
| (a) | Not annualized for periods less than one year. |
| (b) | Unaudited Six Month Period Ended March 31. |
| (c) | Sales loads are not reflected in computing total return. |
| (d) | Class B shares were converted to Class A shares on August 29, 2016. |
| (e) | Due to the size of net assets and fixed expenses, ratios may appear disproportionate. |
| (f) | Effective date of this class of shares was February 1, 2014. |
| (h) | Net realized and unrealized gain (loss) on investments was less than $0.01 per share. |
| (i) | Effective date of this class of shares was May 1, 2012. |
| + | Based on weighted average shares outstanding. |
See notes to financial statements.
| | | | |
| 52 Semi-Annual Reports | | | | Semi-Annual Reports 53 |
Financial Highlights
Thornburg Limited Term Income Fund
| | | | | | | | | | | | | | | | | | | | | | | | | | | | | | | | | | | | | | | | | | | | | | | | | | | | | | |
| | | PER SHARE PERFORMANCE (FOR A SHARE OUTSTANDING THROUGHOUT THE PERIOD) | | RATIOS TO AVERAGE NET ASSETS | | | SUPPLEMENTAL DATA | |
UNLESS OTHERWISE NOTED, PERIODS ARE FISCAL YEARS ENDED SEPT. 30, | | NET ASSET
VALUE
BEGINNING
OF PERIOD | | | NET
INVESTMENT
INCOME
(LOSS)+ | | NET
REALIZED
&
UNREALIZED
GAIN (LOSS)
ON
INVESTMENTS | | | TOTAL FROM
INVESTMENT
OPERATIONS | | | DIVIDENDS
FROM NET
INVESTMENT
INCOME | | | DIVIDENDS
FROM NET
REALIZED
GAINS | | | TOTAL
DIVIDENDS | | | NET
ASSET
VALUE
END
OF
PERIOD | | NET
INVESTMENT
INCOME
(LOSS)
(%) | | | EXPENSES,
AFTER
EXPENSE
REDUCTIONS
(%) | | | EXPENSES,
AFTER
EXPENSE
REDUCTIONS
AND
NET OF
CUSTODY
CREDITS
(%) | | | EXPENSES,
BEFORE
EXPENSE
REDUCTIONS
(%) | | | TOTAL
RETURN
(%)(a) | | | PORTFOLIO
TURNOVER
RATE (%)(a) | | NET
ASSETS
AT END
OF
PERIOD
(THOUSANDS) | |
CLASS A SHARES | | | | | | | | | | | | | | | | | | | | | | | | | | | | | | | | | | | | | | | | | | | | | | | | |
2017(b)(c) | | $ | 13.51 | | | 0.12 | | | (0.13 | ) | | | (0.01 | ) | | | (0.12 | ) | | | — | | | | (0.12 | ) | | $13.38 | | | 1.73 | (e) | | | 0.87 | (e) | | | 0.87 | (e) | | | 0.87 | (e) | | | (0.08 | ) | | 10.24 | | $ | 949,143 | |
2016(c) | | $ | 13.32 | | | 0.24 | | | 0.20 | | | | 0.44 | | | | (0.25 | ) | | | — | | | | (0.25 | ) | | $13.51 | | | 1.82 | | | | 0.86 | | | | 0.86 | | | | 0.86 | | | | 3.36 | | | 20.56 | | $ | 1,111,441 | |
2015(c) | | $ | 13.49 | | | 0.26 | | | (0.09 | ) | | | 0.17 | | | | (0.27 | ) | | | (0.07 | ) | | | (0.34 | ) | | $13.32 | | | 1.94 | | | | 0.87 | | | | 0.87 | | | | 0.87 | | | | 1.27 | | | 18.71 | | $ | 977,470 | |
2014(c) | | $ | 13.42 | | | 0.29 | | | 0.19 | | | | 0.48 | | | | (0.30 | ) | | | (0.11 | ) | | | (0.41 | ) | | $13.49 | | | 2.15 | | | | 0.89 | | | | 0.89 | | | | 0.89 | | | | 3.61 | | | 29.41 | | $ | 906,708 | |
2013(c) | | $ | 13.72 | | | 0.32 | | | (0.22 | ) | | | 0.10 | | | | (0.34 | ) | | | (0.06 | ) | | | (0.40 | ) | | $13.42 | | | 2.33 | | | | 0.88 | | | | 0.88 | | | | 0.88 | | | | 0.69 | | | 36.66 | | $ | 1,029,692 | |
2012(c) | | $ | 13.32 | | | 0.39 | | | 0.52 | | | | 0.91 | | | | (0.42 | ) | | | (0.09 | ) | | | (0.51 | ) | | $13.72 | | | 2.94 | | | | 0.93 | | | | 0.93 | | | | 0.93 | | | | 7.04 | | | 23.72 | | $ | 1,049,044 | |
CLASS C SHARES | | | | | | | | | | | | | | | | | | | | | | | | | | | | | | | | | | | | | | | | | | | | | | | | |
2017(b) | | $ | 13.49 | | | 0.10 | | | (0.13 | ) | | | (0.03 | ) | | | (0.10 | ) | | | — | | | | (0.10 | ) | | $13.36 | | | 1.52 | (e) | | | 1.08 | (e) | | | 1.08 | (e) | | | 1.08 | (e) | | | (0.18 | ) | | 10.24 | | $ | 617,261 | |
2016 | | $ | 13.30 | | | 0.21 | | | 0.20 | | | | 0.41 | | | | (0.22 | ) | | | — | | | | (0.22 | ) | | $13.49 | | | 1.59 | | | | 1.08 | | | | 1.08 | | | | 1.08 | | | | 3.13 | | | 20.56 | | $ | 667,680 | |
2015 | | $ | 13.47 | | | 0.23 | | | (0.09 | ) | | | 0.14 | | | | (0.24 | ) | | | (0.07 | ) | | | (0.31 | ) | | $13.30 | | | 1.71 | | | | 1.10 | | | | 1.10 | | | | 1.10 | | | | 1.04 | | | 18.71 | | $ | 611,555 | |
2014 | | $ | 13.39 | | | 0.26 | | | 0.20 | | | | 0.46 | | | | (0.27 | ) | | | (0.11 | ) | | | (0.38 | ) | | $13.47 | | | 1.92 | | | | 1.11 | | | | 1.11 | | | | 1.11 | | | | 3.46 | | | 29.41 | | $ | 593,658 | |
2013 | | $ | 13.70 | | | 0.28 | | | (0.23 | ) | | | 0.05 | | | | (0.30 | ) | | | (0.06 | ) | | | (0.36 | ) | | $13.39 | | | 2.09 | | | | 1.12 | | | | 1.12 | | | | 1.12 | | | | 0.38 | | | 36.66 | | $ | 632,918 | |
2012 | | $ | 13.30 | | | 0.36 | | | 0.52 | | | | 0.88 | | | | (0.39 | ) | | | (0.09 | ) | | | (0.48 | ) | | $13.70 | | | 2.70 | | | | 1.18 | | | | 1.18 | | | | 1.18 | | | | 6.78 | | | 23.72 | | $ | 604,314 | |
CLASS I SHARES | | | | | | | | | | | | | | | | | | | | | | | | | | | | | | | | | | | | | | | | | | | | | | | | |
2017(b) | | $ | 13.52 | | | 0.14 | | | (0.14 | ) | | | — | | | | (0.14 | ) | | | — | | | | (0.14 | ) | | $13.38 | | | 2.11 | (e) | | | 0.50 | (e) | | | 0.50 | (e) | | | 0.50 | (e) | | | 0.03 | | | 10.24 | | $ | 3,062,451 | |
2016 | | $ | 13.33 | | | 0.29 | | | 0.20 | | | | 0.49 | | | | (0.30 | ) | | | — | | | | (0.30 | ) | | $13.52 | | | 2.17 | | | | 0.50 | | | | 0.50 | | | | 0.50 | | | | 3.73 | | | 20.56 | | $ | 2,792,249 | |
2015 | | $ | 13.49 | | | 0.31 | | | (0.08 | ) | | | 0.23 | | | | (0.32 | ) | | | (0.07 | ) | | | (0.39 | ) | | $13.33 | | | 2.29 | | | | 0.52 | | | | 0.52 | | | | 0.52 | | | | 1.71 | | | 18.71 | | $ | 1,982,536 | |
2014 | | $ | 13.42 | | | 0.33 | | | 0.20 | | | | 0.53 | | | | (0.35 | ) | | | (0.11 | ) | | | (0.46 | ) | | $13.49 | | | 2.49 | | | | 0.54 | | | | 0.54 | | | | 0.54 | | | | 3.98 | | | 29.41 | | $ | 1,578,168 | |
2013 | | $ | 13.73 | | | 0.36 | | | (0.23 | ) | | | 0.13 | �� | | | (0.38 | ) | | | (0.06 | ) | | | (0.44 | ) | | $13.42 | | | 2.68 | | | | 0.53 | | | | 0.53 | | | | 0.53 | | | | 0.98 | | | 36.66 | | $ | 1,260,449 | |
2012 | | $ | 13.32 | | | 0.44 | | | 0.53 | | | | 0.97 | | | | (0.47 | ) | | | (0.09 | ) | | | (0.56 | ) | | $13.73 | | | 3.27 | | | | 0.58 | | | | 0.58 | | | | 0.58 | | | | 7.49 | | | 23.72 | | $ | 1,012,430 | |
CLASS R3 SHARES | | | | | | | | | | | | | | | | | | | | | | | | | | | | | | | | | | | | | | | | | | | | | | | | |
2017(b) | | $ | 13.52 | | | 0.11 | | | (0.13 | ) | | | (0.02 | ) | | | (0.11 | ) | | | — | | | | (0.11 | ) | | $13.39 | | | 1.61 | (e) | | | 0.99 | (e) | | | 0.99 | (e) | | | 1.11 | (e) | | | (0.14 | ) | | 10.24 | | $ | 106,020 | |
2016 | | $ | 13.33 | | | 0.23 | | | 0.20 | | | | 0.43 | | | | (0.24 | ) | | | — | | | | (0.24 | ) | | $13.52 | | | 1.69 | | | | 0.98 | | | | 0.98 | | | | 1.10 | | | | 3.23 | | | 20.56 | | $ | 104,309 | |
2015 | | $ | 13.50 | | | 0.24 | | | (0.09 | ) | | | 0.15 | | | | (0.25 | ) | | | (0.07 | ) | | | (0.32 | ) | | $13.33 | | | 1.82 | | | | 0.99 | | | | 0.99 | | | | 1.11 | | | | 1.16 | | | 18.71 | | $ | 172,992 | |
2014 | | $ | 13.43 | | | 0.27 | | | 0.19 | | | | 0.46 | | | | (0.28 | ) | | | (0.11 | ) | | | (0.39 | ) | | $13.50 | | | 2.04 | | | | 0.99 | | | | 0.99 | | | | 1.12 | | | | 3.51 | | | 29.41 | | $ | 120,013 | |
2013 | | $ | 13.73 | | | 0.30 | | | (0.22 | ) | | | 0.08 | | | | (0.32 | ) | | | (0.06 | ) | | | (0.38 | ) | | $13.43 | | | 2.22 | | | | 0.99 | | | | 0.99 | | | | 1.14 | | | | 0.59 | | | 36.66 | | $ | 81,585 | |
2012 | | $ | 13.33 | | | 0.39 | | | 0.52 | | | | 0.91 | | | | (0.42 | ) | | | (0.09 | ) | | | (0.51 | ) | | $13.73 | | | 2.88 | | | | 0.99 | | | | 0.99 | | | | 1.19 | | | | 6.97 | | | 23.72 | | $ | 73,373 | |
CLASS R4 SHARES | | | | | | | | | | | | | | | | | | | | | | | | | | | | | | | | | | | | | | | | | | | | | | | | |
2017(b) | | $ | 13.51 | | | 0.11 | | | (0.14 | ) | | | (0.03 | ) | | | (0.11 | ) | | | — | | | | (0.11 | ) | | $13.37 | | | 1.62 | (e) | | | 0.99 | (e) | | | 0.99 | (e) | | | 1.51 | (e) | | | (0.22 | ) | | 10.24 | | $ | 7,432 | |
2016 | | $ | 13.32 | | | 0.23 | | | 0.20 | | | | 0.43 | | | | (0.24 | ) | | | — | | | | (0.24 | ) | | $13.51 | | | 1.70 | | | | 0.99 | | | | 0.99 | | | | 1.97 | | | | 3.23 | | | 20.56 | | $ | 6,328 | |
2015 | | $ | 13.48 | | | 0.24 | | | (0.08 | ) | | | 0.16 | | | | (0.25 | ) | | | (0.07 | ) | | | (0.32 | ) | | $13.32 | | | 1.82 | | | | 0.98 | | | | 0.98 | | | | 1.66 | | | | 1.24 | | | 18.71 | | $ | 3,908 | |
2014(d) | | $ | 13.42 | | | 0.18 | | | 0.07 | | | | 0.25 | | | | (0.19 | ) | | | — | | | | (0.19 | ) | | $13.48 | | | 1.99 | (e) | | | 0.99 | (e) | | | 0.99 | (e) | | | 61.75 | (e)(g) | | | 1.84 | | | 29.41 | | $ | 47 | |
CLASS R5 SHARES | | | | | | | | | | | | | | | | | | | | | | | | | | | | | | | | | | | | | | | | | | | | | | | | |
2017(b) | | $ | 13.51 | | | 0.13 | | | (0.13 | ) | | | — | | | | (0.13 | ) | | | — | | | | (0.13 | ) | | $13.38 | | | 1.95 | (e) | | | 0.65 | (e) | | | 0.65 | (e) | | | 0.67 | (e) | | | 0.03 | | | 10.24 | | $ | 91,765 | |
2016 | | $ | 13.32 | | | 0.27 | | | 0.20 | | | | 0.47 | | | | (0.28 | ) | | | — | | | | (0.28 | ) | | $13.51 | | | 2.05 | | | | 0.62 | | | | 0.62 | | | | 0.72 | | | | 3.60 | | | 20.56 | | $ | 71,864 | |
2015 | | $ | 13.49 | | | 0.29 | | | (0.09 | ) | | | 0.20 | | | | (0.30 | ) | | | (0.07 | ) | | | (0.37 | ) | | $13.32 | | | 2.17 | | | | 0.64 | | | | 0.64 | | | | 0.67 | | | | 1.50 | | | 18.71 | | $ | 96,326 | |
2014 | | $ | 13.42 | | | 0.32 | | | 0.19 | | | | 0.51 | | | | (0.33 | ) | | | (0.11 | ) | | | (0.44 | ) | | $13.49 | | | 2.38 | | | | 0.64 | | | | 0.64 | | | | 0.72 | | | | 3.86 | | | 29.41 | | $ | 16,825 | |
2013 | | $ | 13.72 | | | 0.34 | | | (0.21 | ) | | | 0.13 | | | | (0.37 | ) | | | (0.06 | ) | | | (0.43 | ) | | $13.42 | | | 2.52 | | | | 0.65 | | | | 0.65 | | | | 1.01 | | | | 0.92 | | | 36.66 | | $ | 8,164 | |
2012(f) | | $ | 13.47 | | | 0.16 | | | 0.27 | | | | 0.43 | | | | (0.18 | ) | | | — | | | | (0.18 | ) | | $13.72 | | | 2.96 | (e) | | | 0.67 | (e) | | | 0.67 | (e) | | | 25.61 | (e)(g) | | | 3.19 | | | 23.72 | | $ | 1,322 | |
| (a) | Not annualized for periods less than one year. |
| (b) | Unaudited Six Month Period Ended March 31. |
| (c) | Sales loads are not reflected in computing total return. |
| (d) | Effective date of this Class of shares was February 1, 2014. |
| (f) | Effective date of this Class of shares was May 1, 2012. |
| (g) | Due to the size of net assets and fixed expenses, ratios may appear disproportionate. |
| + | Based on weighted average shares outstanding. |
See notes to financial statements.
| | | | |
| 54 Semi-Annual Reports | | | | Semi-Annual Reports 55 |
Financial Highlights
Thornburg Low Duration Income Fund
| | | | | | | | | | | | | | | | | | | | | | | | | | | | | | | | | | | | | | | | | | | | | | | | | | |
| | | PER SHARE PERFORMANCE (FOR A SHARE OUTSTANDING THROUGHOUT THE PERIOD) | | RATIOS TO AVERAGE NET ASSETS | | | SUPPLEMENTAL DATA | |
UNLESS OTHERWISE NOTED, PERIODS ARE FISCAL YEARS ENDED SEPT. 30, | | NET ASSET
VALUE
BEGINNING
OF PERIOD | | | NET
INVESTMENT
INCOME
(LOSS)+ | | | NET
REALIZED
&
UNREALIZED
GAIN (LOSS)
ON
INVESTMENTS | | | TOTAL FROM
INVESTMENT
OPERATIONS | | DIVIDENDS
FROM NET
INVESTMENT
INCOME | | | DIVIDENDS
FROM NET
REALIZED
GAINS | | TOTAL
DIVIDENDS | | | NET
ASSET
VALUE
END
OF
PERIOD | | NET
INVESTMENT
INCOME
(LOSS)
(%) | | | EXPENSES,
AFTER
EXPENSE
REDUCTIONS
(%) | | | EXPENSES,
AFTER
EXPENSE
REDUCTIONS
AND
NET OF
CUSTODY
CREDITS (%) | | | EXPENSES,
BEFORE
EXPENSE
REDUCTIONS
(%) | | | TOTAL
RETURN
(%)(a) | | PORTFOLIO
TURNOVER
RATE (%)(a) | | NET
ASSETS
AT END
OF
PERIOD
(THOUSANDS) | |
CLASS A SHARES | | | | | | | | | | | | | | | | | | | | | | | | | | | | | | | | | | | | | | | | | | | |
2017(b)(c) | | $ | 12.46 | | | | 0.08 | | | | (0.04 | ) | | 0.04 | | | (0.08 | ) | | — | | | (0.08 | ) | | $12.42 | | | 1.26 | (f) | | | 0.61 | (f) | | | 0.61 | (f) | | | 1.63 | (f) | | 0.31 | | 14.20 | | $ | 6,651 | |
2016(c) | | $ | 12.38 | | | | 0.11 | | | | 0.09 | | | 0.20 | | | (0.12 | ) | | — | | | (0.12 | ) | | $12.46 | | | 0.89 | | | | 0.69 | | | | 0.69 | | | | 1.74 | | | 1.60 | | 42.99 | | $ | 10,235 | |
2015(c) | | $ | 12.38 | | | | 0.08 | | | | — | (d) | | 0.08 | | | (0.08 | ) | | — | | | (0.08 | ) | | $12.38 | | | 0.67 | | | | 0.70 | | | | 0.70 | | | | 2.10 | | | 0.68 | | 29.22 | | $ | 9,940 | |
2014(c)(e) | | $ | 12.31 | | | | 0.08 | | | | 0.08 | | | 0.16 | | | (0.09 | ) | | — | | | (0.09 | ) | | $12.38 | | | 0.92 | (f) | | | 0.62 | (f) | | | 0.61 | (f) | | | 3.14 | (f) | | 1.33 | | 23.70 | | $ | 6,678 | |
CLASS I SHARES | | | | | | | | | | | | | | | | | | | | | | | | | | | | | | | | | | | | | | | | | | | |
2017(b) | | $ | 12.45 | | | | 0.09 | | | | (0.04 | ) | | 0.05 | | | (0.09 | ) | | — | | | (0.09 | ) | | $12.41 | | | 1.38 | (f) | | | 0.50 | (f) | | | 0.50 | (f) | | | 0.98 | (f) | | 0.37 | | 14.20 | | $ | 12,689 | |
2016 | | $ | 12.37 | | | | 0.14 | | | | 0.08 | | | 0.22 | | | (0.14 | ) | | — | | | (0.14 | ) | | $12.45 | | | 1.15 | | | | 0.48 | | | | 0.48 | | | | 1.18 | | | 1.81 | | 42.99 | | $ | 17,106 | |
2015 | | $ | 12.38 | | | | 0.11 | | | | (0.01 | ) | | 0.10 | | | (0.11 | ) | | — | | | (0.11 | ) | | $12.37 | | | 0.87 | | | | 0.50 | | | | 0.50 | | | | 1.89 | | | 0.80 | | 29.22 | | $ | 8,056 | |
2014(e) | | $ | 12.31 | | | | 0.11 | | | | 0.07 | | | 0.18 | | | (0.11 | ) | | — | | | (0.11 | ) | | $12.38 | | | 1.19 | (f) | | | 0.41 | (f) | | | 0.41 | (f) | | | 3.19 | (f) | | 1.48 | | 23.70 | | $ | 3,698 | |
| (a) | Not annualized for periods less than one year. |
| (b) | Unaudited Six Month Period Ended March 31. |
| (c) | Sales loads are not reflected in computing total return. |
| (d) | Net realized and unrealized gain (loss) on investments was less than $0.01 per share. |
| (e) | Fund commenced operations on December 30, 2013. |
| + | Based on weighted average shares outstanding. |
See notes to financial statements.
| | | | |
| 56 Semi-Annual Reports | | | | Semi-Annual Reports 57 |
| | |
| Expense Examples | | |
| |
| | March 31, 2017 (Unaudited) |
As a shareholder of a Fund, you incur two types of costs:
| | (1) | transaction costs, including |
(a) sales charges (loads) on purchase payments, for Class A shares;
(b) a deferred sales charge on redemptions of any part or all of a purchase of $1 million of Class A shares within 12 months of purchase;
(c) a deferred sales charge on redemptions of Class C shares within 12 months of purchase;
| | (2) | ongoing costs, including management fees; distribution and/or service (12b-1) fees; and other Fund expenses. |
This example is intended to help you understand your ongoing costs (in dollars) of investing in a Fund and to compare these costs with the ongoing costs of investing in other mutual funds.
The example is based on a $1,000 investment beginning on October 1, 2016, and held until March 31, 2017.
| | | | | | | | | | | | |
| | | Beginning
Account Value
10/1/16 | | | Ending
Account Value
3/31/17 | | | Expenses Paid
During Period†
10/1/16–3/31/17 | |
LIMITED TERM U.S. GOVERNMENT FUND | |
Class A Shares | | | | | | | | | | | | |
Actual | | $ | 1,000.00 | | | $ | 989.56 | | | $ | 4.64 | |
Hypothetical* | | $ | 1,000.00 | | | $ | 1,020.26 | | | $ | 4.71 | |
Class C Shares | | | | | | | | | | | | |
Actual | | $ | 1,000.00 | | | $ | 988.24 | | | $ | 6.07 | |
Hypothetical* | | $ | 1,000.00 | | | $ | 1,018.83 | | | $ | 6.16 | |
Class I Shares | | | | | | | | | | | | |
Actual | | $ | 1,000.00 | | | $ | 990.49 | | | $ | 2.95 | |
Hypothetical* | | $ | 1,000.00 | | | $ | 1,021.97 | | | $ | 2.99 | |
Class R3 Shares | | | | | | | | | | | | |
Actual | | $ | 1,000.00 | | | $ | 989.31 | | | $ | 4.91 | |
Hypothetical* | | $ | 1,000.00 | | | $ | 1,020.00 | | | $ | 4.98 | |
Class R4 Shares | | | | | | | | | | | | |
Actual | | $ | 1,000.00 | | | $ | 989.28 | | | $ | 4.92 | |
Hypothetical* | | $ | 1,000.00 | | | $ | 1,019.99 | | | $ | 4.99 | |
Class R5 Shares | | | | | | | | | | | | |
Actual | | $ | 1,000.00 | | | $ | 990.15 | | | $ | 3.32 | |
Hypothetical* | | $ | 1,000.00 | | | $ | 1,021.60 | | | $ | 3.37 | |
LIMITED TERM INCOME FUND | |
Class A Shares | | | | | | | | | | | | |
Actual | | $ | 1,000.00 | | | $ | 999.21 | | | $ | 4.33 | |
Hypothetical* | | $ | 1,000.00 | | | $ | 1,020.60 | | | $ | 4.37 | |
Class C Shares | | | | | | | | | | | | |
Actual | | $ | 1,000.00 | | | $ | 998.16 | | | $ | 5.36 | |
Hypothetical* | | $ | 1,000.00 | | | $ | 1,019.57 | | | $ | 5.41 | |
Class I Shares | | | | | | | | | | | | |
Actual | | $ | 1,000.00 | | | $ | 1,000.32 | | | $ | 2.48 | |
Hypothetical* | | $ | 1,000.00 | | | $ | 1,022.45 | | | $ | 2.50 | |
Class R3 Shares | | | | | | | | | | | | |
Actual | | $ | 1,000.00 | | | $ | 998.61 | | | $ | 4.93 | |
Hypothetical* | | $ | 1,000.00 | | | $ | 1,020.00 | | | $ | 4.98 | |
Class R4 Shares | | | | | | | | | | | | |
Actual | | $ | 1,000.00 | | | $ | 997.85 | | | $ | 4.94 | |
Hypothetical* | | $ | 1,000.00 | | | $ | 1,019.99 | | | $ | 4.99 | |
Class R5 Shares | | | | | | | | | | | | |
Actual | | $ | 1,000.00 | | | $ | 1,000.28 | | | $ | 3.25 | |
Hypothetical* | | $ | 1,000.00 | | | $ | 1,021.68 | | | $ | 3.29 | |
LOW DURATION INCOME FUND | |
Class A Shares | | | | | | | | | | | | |
Actual | | $ | 1,000.00 | | | $ | 1,003.13 | | | $ | 3.03 | |
Hypothetical* | | $ | 1,000.00 | | | $ | 1,021.91 | | | $ | 3.06 | |
Class I Shares | | | | | | | | | | | | |
Actual | | $ | 1,000.00 | | | $ | 1,003.71 | | | $ | 2.50 | |
Hypothetical* | | $ | 1,000.00 | | | $ | 1,022.44 | | | $ | 2.52 | |
| † | Thornburg Limited Term U.S. Government Fund expenses are equal to the annualized expense ratio for each class (A: 0.94%; C: 1.22%; I: 0.59%; R3: 0.99%; R4: 0.99%; R5: 0.67%) multiplied by the average account value over the period, multiplied by 182/365 to reflect the one-half year period. |
| † | Thornburg Limited Term Income Fund expenses are equal to the annualized expense ratio for each class (A: 0.87%; C: 1.08%; I: 0.50%; R3: 0.99%; R4: 0.99%; R5: 0.65%) multiplied by the average account value over the period, multiplied by 182/365 to reflect the one-half year period. |
| † | Thornburg Low Duration Income Fund expenses are equal to the the annualized expense ratio for each class (A: 0.61%; I: 0.50%) multiplied by the average account value over the period, multiplied by 182/365 to reflect the one-half year period. |
| * | Hypothetical assumes a rate of return of 5% per year before expenses. |
ACTUAL EXPENSES
For each class of shares, the first line of the accompanying table provides information about actual account values and actual expenses. You may use the information in this line, together with the amount you invested, to estimate the expenses that you paid over the period. Simply divide your account value by $1,000 (for example, an $8,600 account value divided by $1,000 = 8.6), then multiply the result by the number in the first line for your class of shares under the heading entitled “Expenses Paid During Period” to estimate the expenses you paid on your account during this period.
HYPOTHETICAL EXAMPLE FOR COMPARISON PURPOSES
For each class of shares, the second line of the accompanying table provides information about hypothetical account values and hypothetical expenses based on the Fund’s actual expense ratio and an assumed rate of return of 5% per year before expenses, which is not the Fund’s actual return. The hypothetical account values and expenses may not be used to estimate the actual ending account balance or expenses you paid for the period. You may use this information to compare the ongoing costs of investing in the Fund and other funds. To do so, compare this 5% hypothetical example with the 5% hypothetical examples that appear in the shareholder reports of the other funds.
Please note that the expenses shown in the table are meant to highlight your ongoing costs only and do not reflect any transactional costs, such as sales charges (loads), redemption fees, or exchange fees. Therefore, the second line of the table for each class of shares is useful in comparing ongoing costs only, and will not help you determine the relative total costs of owning different funds. In addition, if these transactional costs were included, your costs would have been higher.
58 Semi-Annual Reports
| | |
| Other Information | | |
| |
| | March 31, 2017 (Unaudited) |
PORTFOLIO PROXY VOTING
Policies and Procedures:
The Trust has delegated to Thornburg Investment Management, Inc. (the “Advisor”) voting decisions respecting proxies for each of the Funds’ voting securities. The Advisor makes voting decisions in accordance with its Proxy Voting Policy. A description of the Policy is available (i) without charge, upon request, by calling the Advisor toll-free at 1-800-847-0200, (ii) on the Thornburg website at www. thornburg.com, and (iii) on the Securities and Exchange Commission’s website at www.sec.gov.
Information regarding how proxies were voted is available on or before August 31 of each year for the twelve months ending the preceding June 30. This information is available (i) without charge, upon request by calling the Advisor toll-free at 1-800-847-0200, (ii) on the Thornburg website at www.thornburg.com, and (iii) on the Securities and Exchange Commission’s website at www.sec.gov.
AVAILABILITY OF QUARTERLY PORTFOLIO SCHEDULE
The Funds file with the Securities and Exchange Commission schedules of their portfolio holdings on Form N-Q for the first and third quarters of each fiscal year. The Funds’ Forms N-Q are available on the Commission’s website at www.sec.gov, or may be reviewed and copied at the Commission’s Public Reference Room in Washington, D.C. Information on the operation of the Public Reference Room may be obtained by calling 1-800-SEC-0330. The Funds also make this information available on their website at www.thornburg. com/download or upon request by calling 1-800-847-0200.
Semi-Annual Reports 59
Trustees’ Statement to Shareholders
Readopted September 12, 2016
The Trustees believe current and prospective shareholders should know how we discharge our responsibilities in supervising the Funds’ investment advisor and in reviewing the advisor’s contract for renewal. Since 2005, we have issued a statement which sets out clearly the three principal guidelines that we follow in supervising the Trust’s investment advisor on your behalf. In accordance with our customary practice, in September of this year we again reviewed our statement and concluded we should reissue this statement outlining the principal features of our supervision of the advisor’s performance of investment management services for the Funds.
We begin with the premise that each shareholder selected his or her Fund because its investments are managed by the investment advisor identified in the prospectus and in accordance with the objective and policies described in the prospectus. We realize, as each of you do, that if you believe that your Fund’s stated objective and policies no longer serve your personal investment goals, you can sell your shares and leave the Fund.
Therefore, we believe that our primary supervisory task – our principal obligation to you – is to assess the nature and quality of the advisor’s services, and to confirm that the advisor actively and competently pursues the Fund’s objective, in accordance with the policies set out in the prospectus. To do this, we meet regularly with management to review your Fund’s portfolio and to discuss the advisor’s specific actions and judgments in pursuing the Fund’s objective. We do not substitute our own judgment for the advisor’s decisions in selecting investments; the advisor is paid to exercise its informed judgment on investment decisions, and we seek to confirm, in reviewing the advisor’s performance, that the advisor is doing just that.
Second, we are conscious of costs and the effect that costs have on shareholders’ returns. We try to make sure that your Fund’s fees and costs are reasonable in relationship to the services rendered and that they are generally in line with those charged by other expert investment advisors, consistent with our belief that the Fund’s investors searched for and expect that expertise and attention and have decided to pay a reasonable price for it. We do not put the management contract “out to bid” as a matter of course, and we would not do so unless we had concluded that the advisor materially had failed to pursue the Fund’s objectives in accordance with its policies, or for other equally important reasons. We believe that any other approach would be inconsistent with your interests and contrary to your expectations when you bought shares of the Fund in the first place.
Finally, because we believe that most Thornburg Fund shareholders have invested with a long-term perspective, we try not to focus too much on the fashions of the moment and on short-term performance. The market will not favor any specific investment objective or set of policies at all times and under all economic circumstances. A fund will experience periods of both high and low returns relative to other funds and other investments. Even if one of our Funds is not favored by the market at a particular time, we believe that the advisor is nonetheless obliged to remain true to the Fund’s objective and policies, and we watch to see that it does so.
Trustees of Thornburg Investment Trust
60 Semi-Annual Reports
Thornburg Funds
Thornburg Investment Management is a privately-owned global investment firm that offers a range of solutions for retail and institutional investors. Founded in 1982 and headquartered in Santa Fe, New Mexico, we manage approximately $49 billion (as of March 31, 2017) across U.S. mutual funds, separate accounts for high-net-worth investors and institutional accounts, and UCITS funds for non-U.S. investors.
The fund outlined in this report is one of many equity and fixed-income products available from Thornburg Investment Management.
EQUITY FUNDS
| | • | | Thornburg Investment Income Builder Fund |
| | • | | Thornburg Global Opportunities Fund |
| | • | | Thornburg International Value Fund |
| | • | | Thornburg Better World International Fund |
| | • | | Thornburg International Growth Fund |
| | • | | Thornburg Developing World Fund |
| | • | | Thornburg Core Growth Fund |
FIXED INCOME FUNDS
| | • | | Thornburg Low Duration Income Fund |
| | • | | Thornburg Limited Term U.S. Government Fund |
| | • | | Thornburg Limited Term Income Fund |
| | • | | Thornburg Strategic Income Fund |
| | • | | Thornburg Low Duration Municipal Fund |
| | • | | Thornburg Limited Term Municipal Fund |
| | • | | Thornburg Intermediate Municipal Fund |
| | • | | Thornburg California Limited Term Municipal Fund |
| | • | | Thornburg New Mexico Intermediate Municipal Fund |
| | • | | Thornburg New York Intermediate Municipal Fund |
| | • | | Thornburg Strategic Municipal Income Fund |
ALTERNATIVE FUNDS
| | • | | Thornburg Long/Short Equity Fund |
Before investing, carefully consider the Fund’s investment goals, risks, charges, and expenses. For a prospectus or summary prospectus containing this and other information, contact your financial advisor or visit thornburg.com. Read it carefully before investing.
For additional information, please visit thornburg.com
Thornburg Investment Management, Inc. 2300 North Ridgetop Road, Santa Fe, NM 87506
Semi-Annual Reports 61
This page intentionally left blank.
62 Semi-Annual Reports
This page intentionally left blank.
Semi-Annual Reports 63

| | | | |
| Investment Advisor: | | Distributor: | | |
| Thornburg Investment Management® | | Thornburg Securities Corporation® | | |
| 800.847.0200 | | 800.847.0200 | | TH174 |
Semi-Annual Report March 31, 2017 THORNBURG STRATEGIC INCOME FUND
About Thornburg Investment Management
It’s more than what we do. It’s how we do it.
At Thornburg, we are very different in how we think, invest, and are structured. We believe this difference is what makes us successful in helping individuals reach their long-term financial goals.
How we
Flexible Perspective
Our perspective on investment opportunities is more flexible than most, viewing a wide range of opportunities beyond conventional boundaries to find hidden value.
Collaboration
Collectively, we hone ideas via borderless cross-pollination for better judgment and better results.
How we
Portfolio Construction
Disciplined construction guided more by our convictions than convention.
CONVICTION
Thorough analysis and our relative-value framework lead to conviction in our securities selection.
UNCONVENTIONAL
Active management means we seek the best value for our clients rather than using conventional benchmarks as our starting point.
How we’re
Structured for Excellence
How we think and how we invest is made possible by how we’re structured.
TEAM APPROACH FAR FROM THE HERD ACCESS & TRANSPARENCY
2 Semi-Annual Report
Semi-Annual Report
Thornburg Strategic Income Fund
March 31, 2017
| | | | |
SHARE CLASS | | NASDAQ SYMBOL | | CUSIP |
Class A | | TSIAX | | 885-215-228 |
Class C | | TSICX | | 885-215-210 |
Class I | | TSIIX | | 885-215-194 |
Class R3 | | TSIRX | | 885-216-887 |
Class R4 | | TSRIX | | 885-216-754 |
Class R5 | | TSRRX | | 885-216-879 |
Class I, R3, R4, and R5 shares may not be available to all investors. Minimum investments for Class I shares may be higher than those for other classes.
Investments carry risks, including possible loss of principal. Portfolios investing in bonds have the same interest rate, inflation, and credit risks that are associated with the underlying bonds. The value of bonds will fluctuate relative to changes in interest rates, decreasing when interest rates rise. This effect is more pronounced for longer-term bonds. Unlike bonds, bond funds have ongoing fees and expenses. Investments in lower rated and unrated bonds may be more sensitive to default, downgrades, and market volatility; these investments may also be less liquid than higher rated bonds. Investments in derivatives are subject to the risks associated with the securities or other assets underlying the pool of securities, including illiquidity and difficulty in valuation. Investments in equity securities are subject to additional risks, such as greater market fluctuations. Additional risks may be associated with investments outside the United States, especially in emerging markets, including currency fluctuations, illiquidity, volatility, and political and economic risks. Please see the Fund’s prospectus for a discussion of the risks associated with an investment in the Fund. Investments in the Fund are not FDIC insured, nor are they bank deposits or guaranteed by a bank or any other entity.
Semi-Annual Report 3
| | |
| Letter to Shareholders | | |
| |
Thornburg Strategic Income Fund | | March 31, 2017 (Unaudited) |
April 20, 2017
Dear Fellow Shareholder:
We are pleased to present the semi-annual report for Thornburg Strategic Income Fund for the six months ended March 31, 2017. The net asset value (NAV) of a Class A share of Thornburg Strategic Income Fund increased 9 cents in the period to $11.65. If you were invested for the entire period, you received dividends of 16.1 cents per share. If you reinvested your dividends, you received 16.2 cents per share. Dividends per share varied for other share classes to account for class-specific expenses. Combining income and change in price, Class A shares of Thornburg Strategic Income Fund produced a total return of 2.19% (without sales charge) over the six-month period. The Bloomberg Barclays U.S. Universal Bond Index produced a return of negative 1.54%, and a blended index of 80% Bloomberg Barclays U.S. Aggregate Bond Index and 20% MSCI World Index produced a negative 0.14% total return over the same time period.
Despite yields having bottomed in July 2016, many investors’ portfolios were caught off guard as yields rose faster than most expected, following the surprise election of Donald Trump. While not immune to the rise in rates during the first half of the period, Thornburg Strategic Income Fund ultimately outperformed its benchmarks, delivering positive returns in a tumultuous period for fixed income investors. While yields moved up dramatically during the fourth quarter of 2016, both investment-grade and high-yield corporate spreads tightened. Risk market optimism heading into 2017 carried through most of the first quarter. Fixed income markets ebbed and flowed in January and February; that is, until the last hour of trading on the last day of the month. A duo of U.S. Federal Reserve (the Fed) presidents gave a hawkish message two weeks before the March meeting, sending the implied probability of a Fed rate hike from around 50% to 75% in a matter of an hour. Ultimately, the Fed would raise rates in March for the third time in nearly a decade.
Corporate investment-grade issuance set a record during the first quarter, yet, as evidenced by the declining spreads, the market remained strong despite increased supply. Both investment-grade and bank-loan funds experienced significant inflows, supporting the broader market. With respect to high yield, equity market hesitation during the first weeks of March proved a headwind leading to outflows, while gradually higher trending equity markets helped keep returns in solidly positive territory.
In our view, the market continues to feel awash in complacency, given both known risks and unknown risks lurking beneath the surface. Currently, the U.S. Treasury market suggests, at a minimum, the potential for risk on the horizon given the fall in longer-dated yields. Yet, credit spreads and asset prices generally remain at very lofty levels. We have seen a very minor sell off, but this “correction” should be taken with a grain of salt. The option-adjusted spread on the high-yield index has reverted back to near beginning-of-year levels, despite a rally to start the year; however, this still represents spreads at about 280 basis points tighter than where we began 2016.
Geopolitical risks continue to represent significant potential concern for investors. The upcoming final round of the French presidential election, Korea and Russia tensions, and a challenging political backdrop should represent immediate challenges to confidence. Further, Brexit negotiations beginning in earnest, fiscal and tax reform, inflationary pressures on the employment side, the very real possibility of corporate interest tax deductibility being used to create revenue for other tax cuts, difficulties thus far with Affordable Care Act and Border Adjustment Tax legislation, are all areas that remain unresolved. The aforementioned challenges should test the willingness of corporations and consumers to move forward with longer-dated purchases or expansions. In fact, despite strong initial leading indicators of growth, we have yet to experience a follow-through in terms of actual realized strong economic data. On top of actual growth concerns/questions, technical pressures from the potential unwinding of quantitative easing and higher U.S. Treasury rates don’t appear to be broadly considered by the market.
While there are challenges to strong growth, we believe that the consumer remains relatively strong, and the economy is likely to hum along at around a 2% rate (despite a likely bad 1Q Gross Domestic Product print) for some time. Corporate balance sheets are no doubt stretched, but manageable. And while we wouldn’t call it secular stagnation, we are clearly in a lower growth environment globally. Debt expansion appears to have run its course supporting growth, and this may be as good as it is going to get in terms of growth this cycle. All of this points to a high likelihood that we find ourselves in the later stages of the expansion, and as such investments need to reflect a balance of risks.
Broadly speaking, we believe that credit is overvalued. However, there remains no clear catalyst for the downside. Ultimately, we prefer to focus a little higher in quality, hold more liquidity (cash), and focus on defensive income. The defensive portion being paramount to our thinking. Considering a lack of an immediate catalyst to the downside and the all-in extremely low yields on very high-quality instruments, we remain significantly invested in credit. However, we do so with a keen eye toward defensive balance sheets and counter, or less cyclical cash flows than the market in general. One inarguable truth in the market today is that investors simply are not paid to take significant risk. Spread differentials by rating, leverage, cyclicality, etc. are all extremely low. While there are times to stretch, now is not one of them.
4 Semi-Annual Report
| | |
| Letter To Shareholders, | | |
| |
Continued | | March 31, 2017 (Unaudited) |
| |
Thornburg Strategic Income Fund | | |
Throughout the period, we expressed a defensive posture in multiple ways. Given our guiding philosophy of managing a diversified portfolio to be robust across many macro environments, we continued to build balanced risk exposures to avoid overdependence upon any singular outcome.
We remained cautious around interest rate risk and, as a result, the portfolio ended the period with an effective duration statistic towards the lower end of its historical range. During the period, we added floating-rate bond exposure, as well as high-quality investment-grade exposure on the front end of the curve.
Additionally, within our high-yield holdings, we continued to upgrade quality and reduce potential volatility. All high-yield bonds are not created equal. Focusing on shorter maturities, less cyclical cash flows, and companies focused on the stronger segments of the economy will generally lower volatility at the portfolio level in times of stress. To this end, we have added interesting opportunities at the front end of the curve and focused on more defensive names over time, continuing this trend during the quarter. Furthermore, we continued to upgrade the overall quality of this portion of the portfolio by taking advantage of the narrowing spread differentials between the higher- and lower-quality ends of the high-yield spectrum, thus swapping into higher-rated issues where appropriate.
While portfolio objectives can range from managing yield within price volatility constraints to maximizing total returns, all investors must consider the risk/reward trade-offs inherent in various investments. Higher yields tend to come with higher price volatility, whether driven by credit, duration, or both. On the other hand, defensive products offer limited volatility but produce low-yield returns. The key to a successful portfolio is balancing these competing variables into an optimal combination that meets overall objectives. The problem is most organizations aren’t structured to find relative value across the available spectrum of investment opportunities. The “risk bucket” methodologies utilized by the majority of players within the space, may be using a sub-optimal structure for the fixed income environment we are moving into. We believe our unique approach and structure offers our investors an edge in this strange and tumultuous environment.
Thank you for investing alongside us.
Sincerely,
| | | | |
 | |  | |  |
| Jason H. Brady,CFA | | Lon R. Erickson,CFA | | Jeff Klingelhofer,CFA |
| Portfolio Manager | | Portfolio Manager | | Portfolio Manager |
| CEO, President, and Managing Director | | Managing Director | | Managing Director |
The matters discussed in this report may constitute forward-looking statements made pursuant to the safe harbor provisions of the Securities Litigation Reform Act of 1995. These include any advisor or portfolio manager prediction, assessment, analysis or outlook for individual securities, industries, investment styles, market sectors and/or markets. These statements involve risks and uncertainties. In addition to the general risks described for each fund in its current prospectus, other factors bearing on these reports include the accuracy of the advisor’s or portfolio manager’s forecasts and predictions, the appropriateness of the investment strategies designed by the advisor or portfolio manager and the ability of the advisor or portfolio manager to implement their strategies efficiently and successfully. Any one or more of these factors, as well as other risks affecting the securities markets generally, could cause the actual results of any fund to differ materially as compared to its benchmarks.
The views expressed are subject to change and do not necessarily reflect the views of Thornburg Investment Management, Inc. This information should not be relied upon as a recommendation or investment advice and is not intended to predict the performance of any investment or market.
Semi-Annual Report 5
| | |
| Performance Summary | | |
| |
Thornburg Strategic Income Fund | | March 31, 2017 (Unaudited) |
AVERAGE ANNUAL TOTAL RETURNS
| | | | | | | | | | | | | | | | |
| | | 1-YR | | | 3-YR | | | 5-YR | | | SINCE
INCEP. | |
Class A Share (Incep: 12/19/07) | | | | | | | | | | | | | | | | |
Without sales charge | | | 7.99 | % | | | 2.64 | % | | | 4.73 | % | | | 6.37 | % |
With sales charge | | | 3.15 | % | | | 1.09 | % | | | 3.76 | % | | | 5.85 | % |
Class C Shares (Incep: 12/19/07) | | | | | | | | | | | | | | | | |
Without sales charge | | | 7.29 | % | | | 2.04 | % | | | 4.15 | % | | | 5.77 | % |
With sales charge | | | 6.29 | % | | | 2.04 | % | | | 4.15 | % | | | 5.77 | % |
Class I Shares (Incep: 12/19/07) | | | 8.29 | % | | | 2.97 | % | | | 5.08 | % | | | 6.70 | % |
Class R3 Shares (Incep: 5/1/12) | | | 7.89 | % | | | 2.54 | % | | | — | | | | 4.60 | % |
Class R4 Shares (Incep: 2/1/14) | | | 7.88 | % | | | 2.60 | % | | | — | | | | 3.13 | % |
Class R5 Shares (Incep: 5/1/12) | | | 8.22 | % | | | 2.91 | % | | | — | | | | 4.93 | % |
Bloomberg Barclays U.S. Universal Index (Since 12/19/07) | | | 1.92 | % | | | 2.99 | % | | | 2.83 | % | | | 4.38 | % |
Blended Index (Since 12/19/07) | | | 3.20 | % | | | 3.34 | % | | | 3.82 | % | | | 4.32 | % |
GROWTH OF HYPOTHETICAL $10,000 INVESTMENT
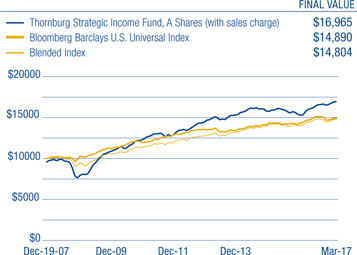
30-DAY YIELDS, A SHARES
(with sales charge)
| | | | |
SEC Yield | | | 3.23 | % |
Annualized Distribution Yield | | | 3.33 | % |
Performance data shown represents past performance and is no guarantee of future results. Investment return and principal value will fluctuate so shares, when redeemed, may be worth more or less than their original cost. Current performance may be lower or higher than quoted. For performance current to the most recent month end, visit thornburg.com or call 800-847-0200. The performance information does not reflect the deduction of taxes that a shareholder would pay on distributions or the redemption of Fund shares. Returns reflect the reinvestment of dividends and capital gains. Class A shares are sold with a maximum sales charge of 4.50%. Class C shares are subject to a 1% CDSC for the first year only. There is no sales charge for Class I, R3, R4, and R5 shares.
As disclosed in the most recent prospectus, the total annual fund operating expenses are as follows: A shares, 1.24%; C shares, 1.99%; I shares, 0.91%; R3 shares, 3.09%; R4 shares, 2.50%; R5 shares, 1.37%. Thornburg Investment Management and/or Thornburg Securities Corporation have contractually agreed to waive fees and reimburse expenses through at least April 10, 2018, for some of the share classes, resulting in net expense ratios of the following: A shares, 1.13%; C shares, 1.80%; I shares, 0.69%; R3 shares, 1.25%; R4 shares, 1.25%; R5 shares, 0.69%. For more detailed information on fund expenses and waivers/reimbursements please see the Fund’s prospectus. Unsubsidized SEC Yield: 3.17%. Unsubsidized Annualized Distribution Yield: 3.29%
Glossary
The Bloomberg Barclays U.S. Aggregate Bond Index is composed of approximately 8,000 publicly traded bonds including U.S. government, mortgage-backed, corporate and Yankee bonds. The index is weighted by the market value of the bonds included in the index.
The Bloomberg Barclays US Universal Bond Index represents the union of the U.S. Aggregate Index, U.S. Corporate High-Yield, Investment Grade 144A Index, Eurodollar Index, U.S. Emerging Markets Index, and the non-ERISA eligible portion of the CMBS Index. The index covers USD denominated, taxable bonds that are rated either investment-grade or below investment-grade.
Thornburg Strategic Income Fund’s Blended Index is composed of 80% Bloomberg Barclays U.S. Aggregate Bond Index and 20% MSCI World Index, rebalanced monthly. The MSCI World Index is an unmanaged market-weighted index that consists of securities traded in 23 of the world’s most developed countries. Securities are listed on exchanges in the U.S., Europe, Canada, Australia, New Zealand, and the Far East. The index is calculated with net dividends reinvested in U.S. dollars.
The performance of any index is not indicative of the performance of any particular investment. Unless otherwise noted, index returns reflect the reinvestment of income dividends and capital gains, if any, but do not reflect fees, brokerage commissions or other expenses of investing. Investors may not make direct investments into any index.
Annualized Distribution Yield – The distribution yield reflects actual distributions made to shareholders. The Annualized distribution yield is calculated by summing the last 30 days of income at a given month end and annualizing to a 360-day year. The result is divided by the ending maximum offering price or net asset value.
Basis Point (bp) – A unit equal to 1/100th of 1%. 1% = 100 basis points (bps).
Credit Spread/Quality Spread – The difference between the yields of securities with different credit qualities.
Effective Duration – A bond’s sensitivity to interest rates, incorporating the embedded option features, such as call provisions. Bonds with longer durations experience greater price volatility than bonds with shorter durations.
Floating-Rate Securities (Floater) – Debt instrument whose coupon rate adjusts with short-term interest rate changes.
OAS (Option Adjusted Spread) – The flat spread over the treasury yield curve required to discount a security payment to match its market price.
Quantitative Easing (QE) – An unconventional monetary policy in which a central bank purchases financial assets from the market in order to lower interest rates and increase the money supply.
SEC Yield – A yield computed in accordance with SEC standards measuring the net investment income per share over a specified 30-day period expressed as a percentage of the maximum offering price of the Fund’s shares at the end of the period.
Yield Curve – A line that plots the interest rates, at a set point in time, of bonds having equal credit quality, but differing maturity dates.
6 Semi-Annual Report
| | |
| Fund Summary | | |
| |
Thornburg Strategic Income Fund | | March 31, 2017 (Unaudited) |
OBJECTIVES AND STRATEGIES
The Fund’s primary investment goal is to seek a high level of current income. The Fund’s secondary investment goal is some long-term capital appreciation.
The Fund pursues its investment goals by investing in a broad range of income-producing investments from throughout the world, primarily including debt obligations and income-producing stocks. The Fund expects, under normal conditions, to invest a majority of its assets in debt obligations, but the relative proportions of the Fund’s investments in debt obligations and in income-producing stocks can be expected to vary over time.
PORTFOLIO COMPOSITION
| | | | |
Corporate Bonds | | | 63.8 | % |
| |
Asset-backed Securities | | | 14.5 | % |
| |
Bank Loans | | | 5.0 | % |
| |
Preferred Stock | | | 1.9 | % |
| |
Commercial Mortgage-backed Securities | | | 1.5 | % |
| |
Foreign Treasury | | | 1.0 | % |
| |
Municipal Bonds | | | 1.0 | % |
| |
Collateralized Mortgage Obligation | | | 0.4 | % |
| |
Common Stock | | | 0.4 | % |
| |
Government Agency | | | 0.3 | % |
| |
Cash & Cash Equivalents | | | 10.1 | % |
FIXED INCOME CREDIT QUALITY*
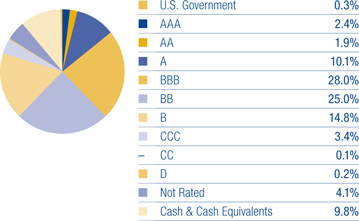
| * | Excludes equity securities. |
A bond credit rating assesses the financial ability of a debt issuer to make timely payments of principal and interest. Ratings of AAA (the highest), AA, A, and BBB are investment-grade quality. Ratings of BB, B, CCC, CC, C and D (the lowest) are considered below investment grade, speculative grade, or junk bonds.
Credit quality ratings for Thornburg’s global fixed income portfolios used ratings from Moody’s Investors Service. Where Moody’s ratings are not available, we have used Standard & Poor’s ratings. Where neither rating is available, we have used ratings from other nationally recognized statistical rating organizations (NRSROs). “NR” = not rated.
TOP TEN INDUSTRY GROUPS
| | | | |
Energy | | | 8.6 | % |
| |
Diversified Financials | | | 8.5 | % |
| |
Telecommunication Services | | | 5.7 | % |
| |
Media | | | 5.0 | % |
| |
Capital Goods | | | 3.8 | % |
| |
Materials | | | 3.8 | % |
| |
Technology Hardware & Equipment | | | 3.5 | % |
| |
Commercial & Professional Services | | | 3.5 | % |
| |
Software & Services | | | 3.1 | % |
| |
Transportation | | | 3.1 | % |
COUNTRY EXPOSURE**
| | | | |
United States | | | 70.5 | % |
| |
Canada | | | 3.9 | % |
| |
Mexico | | | 2.1 | % |
| |
Brazil | | | 1.8 | % |
| |
Sweden | | | 1.3 | % |
| |
United Kingdom | | | 1.2 | % |
| |
Luxembourg | | | 0.9 | % |
| |
Australia | | | 0.7 | % |
| |
Cayman Islands | | | 0.6 | % |
| |
Jamaica | | | 0.6 | % |
| |
Netherlands | | | 0.6 | % |
| |
France | | | 0.6 | % |
| |
Guatemala | | | 0.5 | % |
| |
Morocco | | | 0.5 | % |
| |
Chile | | | 0.4 | % |
| |
Belgium | | | 0.4 | % |
| |
Ireland | | | 0.4 | % |
| |
Mauritius | | | 0.4 | % |
| |
Romania | | | 0.4 | % |
| |
South Africa | | | 0.3 | % |
| |
Barbados | | | 0.3 | % |
| |
Singapore | | | 0.3 | % |
| |
South Korea | | | 0.3 | % |
| |
Russia | | | 0.3 | % |
| |
Hong Kong | | | 0.2 | % |
| |
Bermuda | | | 0.2 | % |
| |
Switzerland | | | 0.2 | % |
| |
Panama | | | 0.1 | % |
| |
Cash & Cash Equivalents | | | 10.1 | % |
| ** | The country assignment of each holding is determined by the Fund’s Advisor based on various factors, including the location of the issuer’s head office, the issuer’s jurisdiction of incorporation and the country from which a majority of the issuer’s revenue is derived. |
There is no guarantee that the Fund will meet its investment objectives.
All portfolio information is subject to change. Charts may not add up to 100% due to rounding.
Semi-Annual Report 7
| | |
| Schedule of Investments | | |
| |
Thornburg Strategic Income Fund | | March 31, 2017 (Unaudited) |
| | | | | | | | |
| | | SHARES/
PRINCIPAL AMOUNT | | | VALUE | |
COMMON STOCK — 0.35% | | | | | | | | |
ENERGY — 0.35% | | | | | | | | |
Oil, Gas & Consumable Fuels — 0.35% | | | | | | | | |
a,e Malamute Energy, Inc. | | | 847 | | | $ | 8,893 | |
b ROMGAZ SA-GDR | | | 531,954 | | | | 3,728,998 | |
| | | | | | | | |
| | | | | | | 3,737,891 | |
| | | | | | | | |
TOTAL COMMON STOCK (Cost $5,258,023) | | | | | | | 3,737,891 | |
| | | | | | | | |
| | |
PREFERRED STOCK — 1.85% | | | | | | | | |
BANKS — 0.28% | | | | | | | | |
Banks — 0.28% | | | | | | | | |
GMAC Capital Trust I Pfd, 8.125% | | | 115,244 | | | | 2,930,655 | |
| | | | | | | | |
| | | | | | | 2,930,655 | |
| | | | | | | | |
ENERGY — 0.23% | | | | | | | | |
Oil, Gas & Consumable Fuels — 0.23% | | | | | | | | |
a,e Crestwood Equity Partners | | | 256,000 | | | | 2,500,147 | |
| | | | | | | | |
| | | | | | | 2,500,147 | |
| | | | | | | | |
MISCELLANEOUS — 1.02% | | | | | | | | |
U.S. Government Agencies — 1.02% | | | | | | | | |
Farm Credit Bank of Texas Pfd, 10.00% | | | 1,000 | | | | 1,227,500 | |
b Cobank, ACB Pfd, 6.25% | | | 50,000 | | | | 5,262,500 | |
b AgriBank, FCB Pfd, 6.875% | | | 40,000 | | | | 4,282,500 | |
| | | | | | | | |
| | | | | | | 10,772,500 | |
| | | | | | | | |
REAL ESTATE — 0.06% | | | | | | | | |
Equity Real Estate Investment Trusts — 0.06% | | | | | | | | |
VEREIT, Inc. Pfd, 6.70% | | | 25,857 | | | | 664,525 | |
| | | | | | | | |
| | | | | | | 664,525 | |
| | | | | | | | |
TELECOMMUNICATION SERVICES — 0.26% | | | | | | | | |
Wireless Telecommunication Services — 0.26% | | | | | | | | |
b,c Centaur Funding Corp. Pfd, 9.08% | | | 2,380 | | | | 2,772,700 | |
| | | | | | | | |
| | | | | | | 2,772,700 | |
| | | | | | | | |
TOTAL PREFERRED STOCK (Cost $18,742,533) | | | | | | | 19,640,527 | |
| | | | | | | | |
| | |
ASSET BACKED SECURITIES — 12.57% | | | | | | | | |
ADVANCE RECEIVABLES — 0.54% | | | | | | | | |
b New Residential Advance Receivables Trust, Series 2016-T2 Class AT2, 2.575%, 10/15/2049 | | | $5,000,000 | | | | 4,946,875 | |
| | | | | | | | |
b SPS Servicer Advance Receivables Trust, Series 2016-T1 Class AT1, 2.53%, 11/16/2048 | | | 800,000 | | | | 797,384 | |
| | | | | | | | |
| | | | | | | 5,744,259 | |
| | | | | | | | |
AUTO RECEIVABLES — 1.17% | | | | | | | | |
b Drive Auto Receivables Trust, 2.59%, 12/16/2019 | | | 4,969,112 | | | | 4,979,762 | |
b DT Auto Owner Trust, Series 2016-4A Class A, 1.44%, 11/15/2019 | | | 1,335,939 | | | | 1,333,550 | |
b Foursight Capital Automobile Receivables Trust, Series 2016-1 Class A2, 2.87%, 10/15/2021 | | | 3,962,417 | | | | 3,977,609 | |
a,b OSCAR US Funding Trust, Series 2016-2A Class A2A, 2.31%, 11/15/2019 | | | 2,100,000 | | | | 2,100,000 | |
| | | | | | | | |
| | | | | | | 12,390,921 | |
| | | | | | | | |
COMMERCIAL MTG TRUST — 1.42% | | | | | | | | |
b Capital Automotive REIT, Series 2012-1A Class A, 4.70%, 7/15/2042 | | | 2,782,174 | | | | 2,786,950 | |
b CFCRE Commercial Mortgage Trust, Series 2011-C1 Class C, 6.127%, 4/15/2044 | | | 6,200,000 | | | | 6,379,649 | |
Citigroup Commercial Mortgage Trust, Series 2004-HYB2 Class B1, 3.336%, 3/25/2034 | | | 79,540 | | | | 65,112 | |
b Credit Suisse Mortgage Trust, Series 2016-BDWN Class E, 12.412%, 2/15/2029 | | | 3,000,000 | | | | 3,014,986 | |
b FREMF Mortgage Trust, Series 2013-KF02 Class B Floating Rate Note, 3.779%, 12/25/2045 | | | 598,350 | | | | 605,002 | |
b FREMF Mortgage Trust, Series 2016-KF24 Class B Floating Rate Note, 5.779%, 10/25/2026 | | | 2,089,870 | | | | 2,183,538 | |
| | | | | | | | |
| | | | | | | 15,035,237 | |
| | | | | | | | |
OTHER ASSET BACKED — 6.82% | | | | | | | | |
b 321 Henderson Receivables, LLC, Series 2006-3A Class A1, 0.968%, 9/15/2041 | | | 2,996,825 | | | | 2,822,932 | |
b 321 Henderson Receivables, LLC, Series 2014-1A Class A, 3.96%, 3/15/2063 | | | 5,445,194 | | | | 5,303,061 | |
b Aircraft Certificate Owner Trust, Series 2003-1A Class E, 7.001%, 9/20/2022 | | | 1,915,954 | | | | 2,062,045 | |
b BCC Funding Corp., Series 2016-1 Class A1, 1.10%, 9/20/2017 | | | 593,789 | | | | 593,286 | |
b Diamond Resorts Owner Trust, Series 2014-1 Class A, 2.54%, 5/20/2027 | | | 1,105,429 | | | | 1,105,333 | |
b Dominos Pizza Master Issuer, LLC, Series 2012-1A Class A2, 5.216%, 1/25/2042 | | | 5,808,272 | | | | 5,917,480 | |
b,c ECAF Ltd., Series 2015-1A Class B1, 5.802%, 6/15/2040 | | | 6,818,710 | | | | 6,545,962 | |
b Engs Commercial Finance Trust, Series 2016-1A Class A1, 1.25%, 11/22/2017 | | | 1,233,831 | | | | 1,233,995 | |
b Fairway Outdoor Funding, LLC, Series 2012-1 Class B, 8.835%, 10/15/2042 | | | 3,000,000 | | | | 3,055,286 | |
b,c Global SC Finance SRL, Series 2014-1A Class A1, 3.19%, 7/17/2029 | | | 3,483,333 | | | | 3,365,813 | |
8 Semi-Annual Report
| | |
| Schedule of Investments, Continued | | |
| |
Thornburg Strategic Income Fund | | March 31, 2017 (Unaudited) |
| | | | | | | | |
| | | SHARES/
PRINCIPAL AMOUNT | | | VALUE | |
b JPR Royalty, LLC, 10.50%, 9/1/2020 | | $ | 2,000,000 | | | $ | 1,000,000 | |
b Motel 6 Trust, Series 2015-MTL6 Class B, 3.298%, 2/5/2030 | | | 3,470,000 | | | | 3,468,476 | |
a,b Northwind Holdings, LLC, Series 2007-1A Class A1 Floating Rate Note, 1.622%, 12/1/2037 | | | 612,500 | | | | 570,238 | |
b OnDeck Asset Securitization Trust II, LLC, Series 2016-1A Class A, 4.21%, 5/17/2020 | | | 4,470,000 | | | | 4,443,872 | |
b SBA Tower Trust, 3.598%, 4/15/2043 | | | 1,080,000 | | | | 1,080,252 | |
b SBA Tower Trust, Series 2012-1 Class C, 2.933%, 12/9/2042 | | | 625,000 | | | | 625,308 | |
b SBA Tower Trust, Series 2015-1 Class C, 3.156%, 10/15/2045 | | | 3,750,000 | | | | 3,769,125 | |
b SBA Tower Trust, Series 2016-1 Class C, 2.877%, 7/15/2021 | | | 2,275,000 | | | | 2,261,600 | |
a,b Scala Funding Co., Series 2016-1 Class B, 5.21%, 2/15/2021 | | | 4,000,000 | | | | 4,016,000 | |
b Sierra Receivables Funding Co., LLC, Series 2015-2A Class A, 2.43%, 6/20/2032 | | | 4,851,412 | | | | 4,841,544 | |
b SolarCity LMC, LLC, Series 2013-1 Class A, 4.80%, 11/20/2038 | | | 2,864,419 | | | | 2,828,633 | |
b SolarCity LMC, LLC, Series 2014-1 Class A, 4.59%, 4/20/2044 | | | 3,016,744 | | | | 2,983,904 | |
b Sonic Capital, LLC, Series 2016-1A Class A2, 4.472%, 5/20/2046 | | | 3,081,917 | | | | 3,037,453 | |
b VB-S1 Issuer LLC, Series 16-1A Class C, 3.065%, 6/15/2046 | | | 3,100,000 | | | | 3,053,291 | |
b Westgate Resorts, Series 2016-1A Class A, 3.50%, 12/20/2028 | | | 2,243,026 | | | | 2,229,939 | |
| | | | | | | | |
| | | | | | | 72,214,828 | |
| | | | | | | | |
RESIDENTIAL MTG TRUST — 1.15% | | | | | | | | |
Bear Stearns ARM Mortgage, Series 2003-6 Class 2B-1, 2.905%, 8/25/2033 | | | 141,839 | | | | 108,811 | |
b Citigroup Mortgage Loan Trust, Inc., Series 2014-A Class A, 4.00%, 1/25/2035 | | | 2,499,702 | | | | 2,572,732 | |
Countrywide, Series 2005-11 Class AF3, 4.676%, 2/25/2036 | | | 191,816 | | | | 192,877 | |
b CS First Boston Mortgage Securities Co., Series 2005-CF1 Class M1, 1.682%, 3/25/2045 | | | 741,021 | | | | 727,659 | |
Merrill Lynch Mortgage Investors Trust, Series 2004-A4 Class M1, 2.855%, 8/25/2034 | | | 253,758 | | | | 232,122 | |
Morgan Stanley Capital, Inc., Series 2005-HE7 Class A2C, 1.302%, 11/25/2035 | | | 472,873 | | | | 473,210 | |
a,b Senior Homeowner Assistance Program, Series 2013-RM1 Class A, 4.00%, 5/26/2053 | | | 1,626,203 | | | | 1,616,445 | |
Structured Asset Securities Corp., Series 2004-20 Class 7A1, 5.25%, 11/25/2034 | | | 472,224 | | | | 485,960 | |
b TAL Advantage V, LLC, Series 2014-1A Class A, 3.51%, 2/22/2039 | | | 6,052,083 | | | | 5,809,969 | |
| | | | | | | | |
| | | | | | | 12,219,785 | |
| | | | | | | | |
STUDENT LOAN — 1.47% | | | | | | | | |
Access Group, Inc., Series 2005-A Class A3, 1.438%, 7/25/2034 | | | 3,688,494 | | | | 3,460,043 | |
b Earnest Student Loan Program, LLC, Series 2016-C Class A2, 2.68%, 7/25/2035 | | | 3,085,649 | | | | 2,987,910 | |
b Nelnet Student Loan Trust, Series 2016-A Class A1A, 2.528%, 12/26/2040 | | | 4,100,408 | | | | 4,100,404 | |
SLM Student Loan Trust, Series 2008-2 Class A3 Floating Rate Note, 1.788%, 4/25/2023 | | | 1,416,316 | | | | 1,395,732 | |
b Social Professional Loan Program, LLC, Series 2014-A Class A2, 3.02%, 10/25/2027 | | | 1,840,510 | | | | 1,860,897 | |
b Social Professional Loan Program, LLC, Series 2014-B Class A1 Floating Rate Note, 2.028%, 8/25/2032 | | | 1,781,668 | | | | 1,806,314 | |
| | | | | | | | |
| | | | | | | 15,611,300 | |
| | | | | | | | |
TOTAL ASSET BACKED SECURITIES (Cost $135,243,092) | | | | | | | 133,216,330 | |
| | | | | | | | |
| | |
CORPORATE BONDS — 63.30% | | | | | | | | |
AUTOMOBILES & COMPONENTS — 0.20% | | | | | | | | |
Auto Components — 0.20% | | | | | | | | |
b,c Nexteer Automotive Group Ltd., 5.875%, 11/15/2021 | | | 2,000,000 | | | | 2,075,000 | |
| | | | | | | | |
| | | | | | | 2,075,000 | |
| | | | | | | | |
BANKS — 1.35% | | | | | | | | |
Banks — 1.35% | | | | | | | | |
Bank of America Corp., 4.20%, 8/26/2024 | | | 3,200,000 | | | | 3,258,614 | |
c Barclays plc Floating Rate Note, 2.635%, 1/10/2023 | | | 6,000,000 | | | | 6,063,984 | |
c Royal Bank of Scotland Group plc, 6.125%, 12/15/2022 | | | 2,000,000 | | | | 2,117,846 | |
b,c Sberbank of Russia, 5.50%, 2/26/2024 | | | 2,750,000 | | | | 2,828,540 | |
| | | | | | | | |
| | | | | | | 14,268,984 | |
| | | | | | | | |
CAPITAL GOODS — 3.85% | | | | | | | | |
Aerospace & Defense — 0.28% | | | | | | | | |
b CBC Ammo, LLC, 7.25%, 11/15/2021 | | | 2,970,000 | | | | 2,955,150 | |
Building Products — 0.29% | | | | | | | | |
b,c Ardagh Packaging Group Ltd., 4.289%, 5/15/2021 | | | 3,000,000 | | | | 3,071,250 | |
Construction & Engineering — 1.30% | | | | | | | | |
URS Corp., 3.85%, 4/1/2017 | | | 7,310,000 | | | | 7,310,000 | |
b Zachry Holdings, Inc., 7.50%, 2/1/2020 | | | 6,310,000 | | | | 6,499,300 | |
Electrical Equipment — 0.36% | | | | | | | | |
b,c Sensata Technologies UK Finance Co., 6.25%, 2/15/2026 | | | 3,550,000 | | | | 3,763,000 | |
Machinery — 0.51% | | | | | | | | |
b,c Automation Tooling Systems, 6.50%, 6/15/2023 | | | 3,125,000 | | | | 3,265,625 | |
Mueller Industries, Inc., 6.00%, 3/1/2027 | | | 2,132,000 | | | | 2,116,010 | |
Semi-Annual Report 9
| | |
| Schedule of Investments, Continued | | |
| |
Thornburg Strategic Income Fund | | March 31, 2017 (Unaudited) |
| | | | | | | | |
| | | SHARES/
PRINCIPAL AMOUNT | | | VALUE | |
Trading Companies & Distributors — 1.11% | | | | | | | | |
b International Lease Finance Corp., 7.125%, 9/1/2018 | | $ | 8,000,000 | | | $ | 8,549,984 | |
b Wajax Corp. (CAD), 6.125%, 10/23/2020 | | | 4,210,000 | | | | 3,245,548 | |
| | | | | | | | |
| | | | | | | 40,775,867 | |
| | | | | | | | |
COMMERCIAL & PROFESSIONAL SERVICES — 2.86% | | | | | | | | |
Commercial Services & Supplies — 1.04% | | | | | | | | |
b ACCO Brands Corp., 5.25%, 12/15/2024 | | | 2,000,000 | | | | 2,010,000 | |
RR Donnelley & Sons Co., 7.875%, 3/15/2021 | | | 4,000,000 | | | | 4,300,000 | |
RR Donnelley & Sons Co., 8.875%, 4/15/2021 | | | 4,300,000 | | | | 4,676,250 | |
Professional Services — 1.82% | | | | | | | | |
Dun & Bradstreet, Inc., 4.25%, 6/15/2020 | | | 4,185,000 | | | | 4,346,863 | |
b Nielsen Finance, LLC, 5.00%, 4/15/2022 | | | 7,420,000 | | | | 7,586,950 | |
b ServiceMaster Co., LLC, 5.125%, 11/15/2024 | | | 3,330,000 | | | | 3,413,250 | |
Verisk Analytics, Inc., 4.00%, 6/15/2025 | | | 3,920,000 | | | | 3,984,296 | |
| | | | | | | | |
| | | | | | | 30,317,609 | |
| | | | | | | | |
COMMERCIAL SERVICES & SUPPLIES — 0.38% | | | | | | | | |
Diversified Support Services — 0.38% | | | | | | | | |
Lavare Holding AB (SEK), 4.402%, 4/4/2019 | | | 35,000,000 | | | | 4,007,522 | |
| | | | | | | | |
| | | | | | | 4,007,522 | |
| | | | | | | | |
CONSUMER DURABLES & APPAREL — 1.36% | | | | | | | | |
Leisure Products — 0.82% | | | | | | | | |
Mattel, Inc., 1.70%, 3/15/2018 | | | 6,235,000 | | | | 6,224,432 | |
Vista Outdoor, Inc., 5.875%, 10/1/2023 | | | 2,530,000 | | | | 2,460,425 | |
Textiles, Apparel & Luxury Goods — 0.54% | | | | | | | | |
b Hanesbrands, Inc., 4.625%, 5/15/2024 | | | 3,980,000 | | | | 3,925,275 | |
Under Armour, Inc., 3.25%, 6/15/2026 | | | 2,000,000 | | | | 1,826,366 | |
| | | | | | | | |
| | | | | | | 14,436,498 | |
| | | | | | | | |
CONSUMER SERVICES — 1.61% | | | | | | | | |
Diversified Consumer Services — 1.27% | | | | | | | | |
a,b Laureate Education, Inc., 10.00%, 9/1/2019 | | | 8,864,000 | | | | 9,218,560 | |
b Nord Anglia Education Finance, LLC (CHF), 5.75%, 7/15/2022 | | | 3,985,000 | | | | 4,197,249 | |
Hotels, Restaurants & Leisure — 0.34% | | | | | | | | |
b Aramark International Finance (EUR), 3.125%, 4/1/2025 | | | 500,000 | | | | 539,454 | |
b Aramark Services, Inc., 5.00%, 4/1/2025 | | | 3,000,000 | | | | 3,090,000 | |
| | | | | | | | |
| | | | | | | 17,045,263 | |
| | | | | | | | |
DIVERSIFIED FINANCIALS — 7.59% | | | | | | | | |
Capital Markets — 2.92% | | | | | | | | |
Ares Capital Corp., 4.875%, 11/30/2018 | | | 7,000,000 | | | | 7,262,773 | |
b Ares Finance Co., LLC, 4.00%, 10/8/2024 | | | 4,025,000 | | | | 3,769,352 | |
b,c BTG Investments LP, 4.50%, 4/17/2018 | | | 4,750,000 | | | | 4,641,605 | |
c Credit Suisse Group Funding (Guernsey) Ltd., 3.80%, 9/15/2022 | | | 2,450,000 | | | | 2,483,340 | |
FS Investment Corp., 4.00%, 7/15/2019 | | | 6,286,000 | | | | 6,340,870 | |
Goldman Sachs Group, Inc. Floating Rate Note, 2.061%, 10/23/2019 | | | 5,895,000 | | | | 5,957,823 | |
b MSCI, Inc., 4.75%, 8/1/2026 | | | 400,000 | | | | 404,000 | |
Consumer Finance — 1.37% | | | | | | | | |
Ally Financial, Inc., 4.75%, 9/10/2018 | | | 4,000,000 | | | | 4,110,000 | |
First Cash Financial Services, Inc., 6.75%, 4/1/2021 | | | 10,000,000 | | | | 10,425,000 | |
Diversified Financial Services — 3.30% | | | | | | | | |
b Athene Global Funding, 2.875%, 10/23/2018 | | | 4,725,000 | | | | 4,752,655 | |
b,c CFG Holdings Ltd./CFG Finance, LLC, 11.50%, 11/15/2019 | | | 4,000,000 | | | | 4,060,000 | |
b Citicorp, 8.04%, 12/15/2019 | | | 186,087 | | | | 212,344 | |
c Credit Suisse Group Ltd., 3.80%, 6/9/2023 | | | 400,000 | | | | 401,638 | |
General Electric Capital Corp. (SEK), 2.625%, 1/16/2018 | | | 24,000,000 | | | | 2,732,186 | |
b,c Genpact Luxembourg S.a.r.l., 3.70%, 4/1/2022 | | | 3,000,000 | | | | 3,017,388 | |
Morgan Stanley, 2.441%, 4/21/2021 | | | 6,660,000 | | | | 6,830,909 | |
b MSCI, Inc., 5.75%, 8/15/2025 | | | 2,640,000 | | | | 2,805,000 | |
b MSCI, Inc., 5.25%, 11/15/2024 | | | 1,625,000 | | | | 1,710,312 | |
S&P Global, Inc., 4.00%, 6/15/2025 | | | 1,590,000 | | | | 1,634,210 | |
S&P Global, Inc., 3.30%, 8/14/2020 | | | 1,975,000 | | | | 2,017,698 | |
b TMX Finance, LLC/Titlemax Finance, 8.50%, 9/15/2018 | | | 5,235,000 | | | | 4,816,200 | |
| | | | | | | | |
| | | | | | | 80,385,303 | |
| | | | | | | | |
10 Semi-Annual Report
| | |
| Schedule of Investments, Continued | | |
| |
Thornburg Strategic Income Fund | | March 31, 2017 (Unaudited) |
| | | | | | | | |
| | | SHARES/
PRINCIPAL AMOUNT | | | VALUE | |
ENERGY — 7.65% | | | | | | | | |
Energy Equipment & Services — 1.12% | | | | | | | | |
Compressco Partners, L.P., 7.25%, 8/15/2022 | | $ | 4,800,000 | | | $ | 4,560,000 | |
b Enviva Partners, LP, 8.50%, 11/1/2021 | | | 1,900,000 | | | | 2,014,000 | |
Oceaneering International, Inc., 4.65%, 11/15/2024 | | | 4,075,000 | | | | 4,102,294 | |
b,c,d,e Schahin II Finance Co. (SPV) Ltd., 5.875%, 9/25/2023 | | | 10,684,600 | | | | 1,228,729 | |
Oil, Gas & Consumable Fuels — 6.53% | | | | | | | | |
b Citgo Holding, Inc., 10.75%, 2/15/2020 | | | 980,000 | | | | 1,053,500 | |
b Citgo Petroleum Corp., 6.25%, 8/15/2022 | | | 450,000 | | | | 455,625 | |
b Colorado Interstate Gas Co., LLC/Colorado Interstate Issuing Corp., 4.15%, 8/15/2026 | | | 4,500,000 | | | | 4,398,053 | |
Energy Transfer Partners LP, 4.052%, 11/1/2066 | | | 1,200,000 | | | | 1,014,000 | |
Enterprise Products Operating LP, 7.034%, 1/15/2068 | | | 1,400,000 | | | | 1,450,260 | |
b Florida Gas Transmission Co., LLC, 3.875%, 7/15/2022 | | | 4,765,000 | | | | 4,886,298 | |
b Florida Gas Transmission Co., LLC, 4.35%, 7/15/2025 | | | 2,224,000 | | | | 2,302,367 | |
Global Partners LP/GLP Finance Corp., 6.25%, 7/15/2022 | | | 4,975,000 | | | | 4,875,500 | |
Gulf South Pipeline Co., LP, 4.00%, 6/15/2022 | | | 4,860,000 | | | | 4,953,375 | |
b Gulfstream Natural Gas System, LLC, 4.60%, 9/15/2025 | | | 5,515,000 | | | | 5,803,434 | |
HollyFrontier Corp., 5.875%, 4/1/2026 | | | 3,500,000 | | | | 3,716,013 | |
a,b,d,e Linc Energy, 12.50%, 10/31/2017 | | | 6,617,950 | | | | 66 | |
a,b,d,e Linc Energy, 9.625%, 10/31/2017 | | | 1,100,236 | | | | 45,660 | |
NGL Energy Partners LP, 6.875%, 10/15/2021 | | | 3,000,000 | | | | 3,052,500 | |
Northern Tier Energy, LLC, 7.125%, 11/15/2020 | | | 6,450,000 | | | | 6,708,000 | |
b Northwest Pipeline, LLC, 4.00%, 4/1/2027 | | | 2,000,000 | | | | 1,999,330 | |
b,c Odebrecht Offshore Drilling Finance Ltd., 6.75%, 10/1/2023 | | | 2,497,238 | | | | 923,978 | |
Plains All American Pipeline LP, 8.75%, 5/1/2019 | | | 1,000,000 | | | | 1,127,874 | |
b,c QGOG Atlantic/Alaskan Rigs Ltd., 5.25%, 7/30/2019 | | | 557,550 | | | | 543,611 | |
d,e RAAM Global Energy Co., 12.50%, 10/1/2015 | | | 2,000,000 | | | | 30,000 | |
b Rockies Express Pipeline, LLC, 6.85%, 7/15/2018 | | | 2,000,000 | | | | 2,090,000 | |
Summit Midstream Holdings, LLC, 5.50%, 8/15/2022 | | | 7,010,000 | | | | 7,010,000 | |
Tennessee Gas Pipeline Co., L.L.C., 7.00%, 3/15/2027 | | | 1,352,000 | | | | 1,603,118 | |
Tesoro Logistics LP, 6.125%, 10/15/2021 | | | 3,375,000 | | | | 3,531,094 | |
b Texas Gas Transmission, LLC, 4.50%, 2/1/2021 | | | 940,000 | | | | 980,811 | |
Transcontinental Gas Pipe Line Co., LLC, 7.85%, 2/1/2026 | | | 3,600,000 | | | | 4,622,555 | |
| | | | | | | | |
| | | | | | | 81,082,045 | |
| | | | | | | | |
FOOD & STAPLES RETAILING — 0.85% | | | | | | | | |
Food & Staples Retailing — 0.85% | | | | | | | | |
b C&S Group Enterprises, LLC, 5.375%, 7/15/2022 | | | 3,935,000 | | | | 3,885,812 | |
Whole Foods Market, Inc., 5.20%, 12/3/2025 | | | 4,830,000 | | | | 5,133,136 | |
| | | | | | | | |
| | | | | | | 9,018,948 | |
| | | | | | | | |
FOOD, BEVERAGE & TOBACCO — 1.86% | | | | | | | | |
Beverages — 0.55% | | | | | | | | |
Ambev International Finance Co., Ltd. (BRL), 9.50%, 7/24/2017 | | | 2,000,000 | | | | 627,995 | |
b,c Central America Bottling Corp., 5.75%, 1/31/2027 | | | 5,000,000 | | | | 5,182,300 | |
Food Products — 0.92% | | | | | | | | |
B&G Foods, Inc., 5.25%, 4/1/2025 | | | 1,000,000 | | | | 1,008,750 | |
b,c Barry Callebaut Services NV, 5.50%, 6/15/2023 | | | 4,000,000 | | | | 4,291,632 | |
b,c BRF S.A., 4.75%, 5/22/2024 | | | 4,650,000 | | | | 4,482,600 | |
Tobacco — 0.39% | | | | | | | | |
b Vector Group Ltd., 6.125%, 2/1/2025 | | | 4,000,000 | | | | 4,085,000 | |
| | | | | | | | |
| | | | | | | 19,678,277 | |
| | | | | | | | |
HEALTH CARE EQUIPMENT & SERVICES — 2.11% | | | | | | | | |
Health Care Providers & Services — 2.11% | | | | | | | | |
b Covenant Surgical Partners, Inc., 8.75%, 8/1/2019 | | | 6,125,000 | | | | 5,818,750 | |
DaVita Healthcare Partners, Inc., 5.00%, 5/1/2025 | | | 3,450,000 | | | | 3,458,625 | |
HCA, Inc., 5.25%, 4/15/2025 | | | 1,520,000 | | | | 1,615,000 | |
HCA, Inc., 4.75%, 5/1/2023 | | | 1,735,000 | | | | 1,808,737 | |
HCA, Inc., 4.50%, 2/15/2027 | | | 1,475,000 | | | | 1,475,000 | |
b LifePoint Health, Inc., 5.375%, 5/1/2024 | | | 3,000,000 | | | | 3,051,000 | |
WellCare Health Plans, Inc., 5.25%, 4/1/2025 | | | 5,000,000 | | | | 5,116,500 | |
| | | | | | | | |
| | | | | | | 22,343,612 | |
| | | | | | | | |
HOUSEHOLD & PERSONAL PRODUCTS — 0.99% | | | | | | | | |
Household Products — 0.86% | | | | | | | | |
Edgewell Personal Care, 4.70%, 5/24/2022 | | | 5,990,000 | | | | 6,229,600 | |
b Energizer Holdings, Inc., 5.50%, 6/15/2025 | | | 2,850,000 | | | | 2,907,000 | |
Semi-Annual Report 11
| | |
| Schedule of Investments, Continued | | |
| |
Thornburg Strategic Income Fund | | March 31, 2017 (Unaudited) |
| | | | | | | | |
| | | SHARES/
PRINCIPAL AMOUNT | | | VALUE | |
Personal Products — 0.13% | | | | | | | | |
b Avon International Operations, Inc., 7.875%, 8/15/2022 | | $ | 1,340,000 | | | $ | 1,413,700 | |
| | | | | | | | |
| | | | | | | 10,550,300 | |
| | | | | | | | |
INSURANCE — 2.99% | | | | | | | | |
Insurance — 2.99% | | | | | | | | |
CNA Financial Corp., 4.50%, 3/1/2026 | | | 3,460,000 | | | | 3,656,815 | |
b,c DaVinciRe Holdings Ltd., 4.75%, 5/1/2025 | | | 4,790,000 | | | | 4,632,519 | |
ELM B.V. (AUD), 7.635%, 12/29/2049 | | | 1,000,000 | | | | 766,671 | |
ELM B.V. (AUD), 3.185%, 4/29/2049 | | | 1,000,000 | | | | 761,830 | |
c Enstar Group Ltd., 4.50%, 3/10/2022 | | | 2,000,000 | | | | 2,025,168 | |
b Forethought Financial Group, Inc., 8.625%, 4/15/2021 | | | 1,160,000 | | | | 1,318,313 | |
Genworth Holdings, Inc., 4.90%, 8/15/2023 | | | 6,000,000 | | | | 4,995,000 | |
Kemper Corp., 4.35%, 2/15/2025 | | | 1,810,000 | | | | 1,812,708 | |
b,c Lancashire Holdings Ltd., 5.70%, 10/1/2022 | | | 4,900,000 | | | | 5,225,370 | |
Mercury General Corp., 4.40%, 3/15/2027 | | | 4,000,000 | | | | 3,996,088 | |
b National Life Insurance of Vermont, 10.50%, 9/15/2039 | | | 1,000,000 | | | | 1,529,354 | |
Reinsurance Group of America, Inc., 3.95%, 9/15/2026 | | | 990,000 | | | | 998,407 | |
| | | | | | | | |
| | | | | | | 31,718,243 | |
| | | | | | | | |
MATERIALS — 3.84% | | | | | | | | |
Chemicals — 1.46% | | | | | | | | |
CF Industries Holdings, Inc., 6.875%, 5/1/2018 | | | 2,975,000 | | | | 3,101,438 | |
b,c Consolidated Energy Finance S.A., 6.75%, 10/15/2019 | | | 3,030,000 | | | | 3,052,725 | |
b,c Kissner Group Holdings, 8.375%, 12/1/2022 | | | 4,170,000 | | | | 4,295,100 | |
b,c Office Cherifien des Phosphates, 5.625%, 4/25/2024 | | | 4,710,000 | | | | 5,014,737 | |
Construction Materials — 0.33% | | | | | | | | |
b,c Cimpor Financial Operations B.V., 5.75%, 7/17/2024 | | | 4,000,000 | | | | 3,530,000 | |
Containers & Packaging — 0.40% | | | | | | | | |
b,c Ardagh Finance Holdings S.A., 4.25%, 9/15/2022 | | | 1,000,000 | | | | 1,010,000 | |
Graphic Packaging International, Inc., 4.125%, 8/15/2024 | | | 3,225,000 | | | | 3,196,781 | |
Metals & Mining — 0.97% | | | | | | | | |
b International Wire Group, Inc., 10.75%, 8/1/2021 | | | 3,200,000 | | | | 3,112,000 | |
b,c Newcrest Finance Property Ltd., 4.20%, 10/1/2022 | | | 7,000,000 | | | | 7,190,414 | |
Paper & Forest Products — 0.68% | | | | | | | | |
b Neenah Paper, Inc., 5.25%, 5/15/2021 | | | 7,075,000 | | | | 7,216,500 | |
| | | | | | | | |
| | | | | | | 40,719,695 | |
| | | | | | | | |
MEDIA — 2.79% | | | | | | | | |
Media — 2.79% | | | | | | | | |
b Cable One, Inc., 5.75%, 6/15/2022 | | | 7,031,000 | | | | 7,312,240 | |
b CSC Holdings, LLC, 5.50%, 4/15/2027 | | | 1,825,000 | | | | 1,854,656 | |
b DHX Media Ltd. (CAD), 5.875%, 12/2/2021 | | | 1,340,000 | | | | 1,007,633 | |
b EMI Music Publishing Ltd., 7.625%, 6/15/2024 | | | 1,520,000 | | | | 1,656,800 | |
b,c SFR Group SA, 6.00%, 5/15/2022 | | | 3,475,000 | | | | 3,600,969 | |
b,c SFR Group SA, 7.375%, 5/1/2026 | | | 2,365,000 | | | | 2,435,950 | |
b Sirius XM Canada Holdings, Inc. (CAD), 5.625%, 4/23/2021 | | | 7,441,000 | | | | 5,609,356 | |
The Washington Post Co., 7.25%, 2/1/2019 | | | 2,100,000 | | | | 2,273,250 | |
b,c Virgin Media, Inc., 5.50%, 8/15/2026 | | | 3,790,000 | | | | 3,846,850 | |
| | | | | | | | |
| | | | | | | 29,597,704 | |
| | | | | | | | |
PHARMACEUTICALS, BIOTECHNOLOGY & LIFE SCIENCES — 0.00% | | | | | | | | |
Pharmaceuticals — 0.00% | | | | | | | | |
a,d,e Atlas U.S. Royalty, LLC Participation Rights, 0%, 3/15/2027 | | | 5,450,000 | | | | 0 | |
| | | | | | | | |
| | | | | | | 0 | |
| | | | | | | | |
REAL ESTATE — 1.68% | | | | | | | | |
Equity Real Estate Investment Trusts — 1.40% | | | | | | | | |
EPR Properties, 5.25%, 7/15/2023 | | | 5,000,000 | | | | 5,244,115 | |
Hospitality Properties Trust, 4.95%, 2/15/2027 | | | 2,850,000 | | | | 2,926,420 | |
Retail Opportunity Investments Corp., 5.00%, 12/15/2023 | | | 1,500,000 | | | | 1,549,818 | |
Select Income REIT, 2.85%, 2/1/2018 | | | 5,100,000 | | | | 5,132,472 | |
Real Estate Management & Development — 0.28% | | | | | | | | |
b,c Avison Young (Canada), Inc., 9.50%, 12/15/2021 | | | 3,000,000 | | | | 2,955,000 | |
| | | | | | | | |
| | | | | | | 17,807,825 | |
| | | | | | | | |
RETAILING — 1.74% | | | | | | | | |
Distributors — 0.57% | | | | | | | | |
LKQ Corp., Inc., 4.75%, 5/15/2023 | | | 6,045,000 | | | | 6,014,775 | |
12 Semi-Annual Report
| | |
| Schedule of Investments, Continued | | |
| |
Thornburg Strategic Income Fund | | March 31, 2017 (Unaudited) |
| | | | | | | | |
| | | SHARES/
PRINCIPAL AMOUNT | | | VALUE | |
Internet & Direct Marketing Retail — 0.75% | | | | | | | | |
QVC, Inc., 4.45%, 2/15/2025 | | $ | 8,147,000 | | | $ | 7,911,894 | |
Multiline Retail — 0.42% | | | | | | | | |
b,c Grupo Famsa S.A.B. de C.V., 7.25%, 6/1/2020 | | | 5,550,000 | | | | 4,495,500 | |
| | | | | | | | |
| | | | | | | 18,422,169 | |
| | | | | | | | |
SEMICONDUCTORS & SEMICONDUCTOR EQUIPMENT — 0.52% | | | | | | | | |
Semiconductors & Semiconductor Equipment — 0.52% | | | | | | | | |
b Broadcom Corp./Broadcom Cayman Finance Ltd., 2.375%, 1/15/2020 | | | 1,000,000 | | | | 999,879 | |
b Broadcom Corp./Broadcom Cayman Finance Ltd., 3.00%, 1/15/2022 | | | 1,000,000 | | | | 998,726 | |
b Broadcom Corp./Broadcom Cayman Finance Ltd., 3.625%, 1/15/2024 | | | 1,000,000 | | | | 1,007,370 | |
b,c Sensata Technologies B.V., 5.00%, 10/1/2025 | | | 2,530,000 | | | | 2,548,975 | |
| | | | | | | | |
| | | | | | | 5,554,950 | |
| | | | | | | | |
SOFTWARE & SERVICES — 2.78% | | | | | | | | |
Information Technology Services — 1.25% | | | | | | | | |
b Alliance Data Systems Corp., 5.375%, 8/1/2022 | | | 4,190,000 | | | | 4,221,425 | |
Neustar, Inc., 4.50%, 1/15/2023 | | | 8,770,000 | | | | 9,000,212 | |
Internet Software & Services — 0.54% | | | | | | | | |
Lender Processing Services, Inc./Black Knight Lending Solutions, Inc., 5.75%, 4/15/2023 | | | 5,417,000 | | | | 5,674,205 | |
Software — 0.99% | | | | | | | | |
Autodesk, Inc., 3.125%, 6/15/2020 | | | 2,350,000 | | | | 2,395,350 | |
Autodesk, Inc., 4.375%, 6/15/2025 | | | 1,600,000 | | | | 1,648,757 | |
b,c Open Text Corp., 5.875%, 6/1/2026 | | | 3,320,000 | | | | 3,477,700 | |
b Solera Capital, LLC, 10.50%, 3/1/2024 | | | 2,630,000 | | | | 3,004,775 | |
| | | | | | | | |
| | | | | | | 29,422,424 | |
| | | | | | | | |
TECHNOLOGY HARDWARE & EQUIPMENT — 3.19% | | | | | | | | |
Communications Equipment — 0.34% | | | | | | | | |
c LM Ericsson, 4.125%, 5/15/2022 | | | 3,490,000 | | | | 3,561,371 | |
Computers & Peripherals — 0.10% | | | | | | | | |
Lexmark International, Inc., 6.125%, 3/15/2020 | | | 1,038,000 | | | | 1,076,000 | |
Electronic Equipment, Instruments & Components — 2.17% | | | | | | | | |
Anixter, Inc., 5.125%, 10/1/2021 | | | 8,395,000 | | | | 8,751,788 | |
b Harland Clarke Holdings, 8.375%, 8/15/2022 | | | 1,500,000 | | | | 1,537,500 | |
Ingram Micro, Inc., 5.45%, 12/15/2024 | | | 1,951,000 | | | | 1,919,725 | |
Tech Data Corp., 4.95%, 2/15/2027 | | | 4,000,000 | | | | 4,037,816 | |
Trimble Navigation, Ltd., 4.75%, 12/1/2024 | | | 6,525,000 | | | | 6,753,042 | |
Technology, Hardware, Storage & Peripherals — 0.58% | | | | | | | | |
CDW LLC/CDW Finance Corp., 5.00%, 9/1/2025 | | | 2,000,000 | | | | 2,040,000 | |
b Western Digital Corp., 7.375%, 4/1/2023 | | | 3,725,000 | | | | 4,083,531 | |
| | | | | | | | |
| | | | | | | 33,760,773 | |
| | | | | | | | |
TELECOMMUNICATION SERVICES — 5.19% | | | | | | | | |
Diversified Telecommunication Services — 1.84% | | | | | | | | |
AT&T, Inc., 3.00%, 6/30/2022 | | | 2,395,000 | | | | 2,382,534 | |
b,c Inmarsat Finance plc, 4.875%, 5/15/2022 | | | 400,000 | | | | 396,000 | |
Qwest Corp., 6.75%, 12/1/2021 | | | 3,700,000 | | | | 4,056,118 | |
b Unison Ground Lease Funding, 5.78%, 3/15/2043 | | | 1,920,000 | | | | 1,794,225 | |
Verizon Communications, Inc. Floating Rate Note, 2.137%, 3/16/2022 | | | 2,500,000 | | | | 2,522,740 | |
b,c Videotron Ltd., Co., 5.375%, 6/15/2024 | | | 8,050,000 | | | | 8,361,937 | |
Wireless Telecommunication Services — 3.35% | | | | | | | | |
America Movil SAB de CV (MXN), 6.45%, 12/5/2022 | | | 120,000,000 | | | | 5,973,641 | |
b,c Digicel Ltd., 6.00%, 4/15/2021 | | | 7,450,000 | | | | 6,770,187 | |
b,c Inmarsat Finance plc, 6.50%, 10/1/2024 | | | 600,000 | | | | 621,750 | |
b,c Millicom International Cellular S.A., 6.00%, 3/15/2025 | | | 5,578,000 | | | | 5,717,450 | |
b,c MTN (Mauritius) Investments Ltd., 5.373%, 2/13/2022 | | | 3,450,000 | | | | 3,503,510 | |
b,c MTN International (Mauritius) Ltd., 4.755%, 11/11/2024 | | | 4,125,000 | | | | 3,891,937 | |
T-Mobile USA, Inc., 4.00%, 4/15/2022 | | | 2,000,000 | | | | 2,032,500 | |
b WCP Issuer, LLC, 6.657%, 8/15/2043 | | | 386,000 | | | | 419,293 | |
b WCP Issuer, LLC, 7.143%, 8/15/2043 | | | 6,000,000 | | | | 6,592,500 | |
| | | | | | | | |
| | | | | | | 55,036,322 | |
| | | | | | | | |
TRANSPORTATION — 3.01% | | | | | | | | |
Airlines — 2.81% | | | | | | | | |
American Airlines Group, Inc., 4.00%, 8/15/2030 | | | 2,000,000 | | | | 2,025,000 | |
b American Airlines Group, Inc., 5.60%, 1/15/2022 | | | 11,293,608 | | | | 11,674,767 | |
American Airlines Group, Inc., 4.95%, 7/15/2024 | | | 2,283,530 | | | | 2,428,830 | |
Continental Airlines, 9.798%, 10/1/2022 | | | 4,324,388 | | | | 4,756,827 | |
Semi-Annual Report 13
| | |
| Schedule of Investments, Continued | | |
| |
Thornburg Strategic Income Fund | | March 31, 2017 (Unaudited) |
| | | | | | | | |
| | | SHARES/
PRINCIPAL AMOUNT | | | VALUE | |
b,c Guanay Finance Ltd., 6.00%, 12/15/2020 | | $ | 4,625,576 | | | $ | 4,746,998 | |
US Airways, 7.076%, 9/20/2022 | | | 958,003 | | | | 1,022,668 | |
US Airways, 6.25%, 10/22/2024 | | | 1,289,851 | | | | 1,405,938 | |
US Airways, 5.90%, 4/1/2026 | | | 1,547,564 | | | | 1,724,048 | |
Marine — 0.12% | | | | | | | | |
b,c Stena International SA, 5.75%, 3/1/2024 | | | 1,400,000 | | | | 1,260,000 | |
Transportation Infrastructure — 0.08% | | | | | | | | |
b,c Mexico City Airport Trust, 4.25%, 10/31/2026 | | | 842,000 | | | | 853,578 | |
| | | | | | | | |
| | | | | | | 31,898,654 | |
| | | | | | | | |
UTILITIES — 2.91% | | | | | | | | |
Electric Utilities — 2.16% | | | | | | | | |
b Duquesne Light Holdings, Inc., 6.40%, 9/15/2020 | | | 2,000,000 | | | | 2,233,046 | |
Great Plains Energy, Inc., 2.50%, 3/9/2020 | | | 4,500,000 | | | | 4,518,945 | |
b Jersey Central Power & Light Co., 4.30%, 1/15/2026 | | | 3,965,000 | | | | 4,124,865 | |
Puget Energy, Inc., 6.50%, 12/15/2020 | | | 2,000,000 | | | | 2,239,896 | |
Puget Energy, Inc., 5.625%, 7/15/2022 | | | 2,500,000 | | | | 2,766,145 | |
Southern Power Co., 1.85%, 12/1/2017 | | | 7,000,000 | | | | 7,006,888 | |
Independent Power & Renewable Electricity Producers — 0.54% | | | | | | | | |
Ipalco Enterprises, Inc., 5.00%, 5/1/2018 | | | 2,500,000 | | | | 2,568,750 | |
b Midland Cogeneration Venture, 6.00%, 3/15/2025 | | | 1,496,788 | | | | 1,589,448 | |
b Pattern Energy Group, Inc., 5.875%, 2/1/2024 | | | 1,500,000 | | | | 1,518,750 | |
Multi-Utilities — 0.21% | | | | | | | | |
CMS Energy Corp., 8.75%, 6/15/2019 | | | 2,000,000 | | | | 2,283,692 | |
| | | | | | | | |
| | | | | | | 30,850,425 | |
| | | | | | | | |
TOTAL CORPORATE BONDS (Cost $678,732,536) | | | | | | | 670,774,412 | |
| | | | | | | | |
| | |
CONVERTIBLE BONDS — 2.42% | | | | | | | | |
DIVERSIFIED FINANCIALS — 0.50% | | | | | | | | |
Consumer Finance — 0.50% | | | | | | | | |
EZCORP, Inc., 2.125%, 6/15/2019 | | | 5,719,000 | | | | 5,297,224 | |
| | | | | | | | |
| | | | | | | 5,297,224 | |
| | | | | | | | |
FOOD, BEVERAGE & TOBACCO — 0.24% | | | | | | | | |
Tobacco — 0.24% | | | | | | | | |
Vector Group Ltd., 1.75%, 4/15/2020 | | | 2,260,000 | | | | 2,552,388 | |
| | | | | | | | |
| | | | | | | 2,552,388 | |
| | | | | | | | |
MEDIA — 0.74% | | | | | | | | |
Media — 0.74% | | | | | | | | |
Comcast Holdings Corp., 2.00%, 10/15/2029 | | | 15,500,000 | | | | 7,827,500 | |
| | | | | | | | |
| | | | | | | 7,827,500 | |
| | | | | | | | |
REAL ESTATE — 0.85% | | | | | | | | |
Equity Real Estate Investment Trusts — 0.85% | | | | | | | | |
b IAS Operating Partnership LP, 5.00%, 3/15/2018 | | | 5,040,000 | | | | 5,084,100 | |
VEREIT, Inc., 3.00%, 8/1/2018 | | | 3,890,000 | | | | 3,892,431 | |
| | | | | | | | |
| | | | | | | 8,976,531 | |
| | | | | | | | |
SOFTWARE & SERVICES — 0.09% | | | | | | | | |
Internet Software & Services — 0.09% | | | | | | | | |
b Zillow, Inc., 2.00%, 12/1/2021 | | | 1,000,000 | | | | 991,875 | |
| | | | | | | | |
| | | | | | | 991,875 | |
| | | | | | | | |
TOTAL CONVERTIBLE BONDS (Cost $24,715,653) | | | | | | | 25,645,518 | |
| | | | | | | | |
| | |
MUNICIPAL BONDS — 0.97% | | | | | | | | |
California Health Facilities Financing Authority (Developmental Disabilities), 7.875%, 2/1/2026 | | | 1,940,000 | | | | 2,182,539 | |
City of Chicago GO, 7.045%, 1/1/2029 | | | 5,000,000 | | | | 5,094,850 | |
Oklahoma Development Finance Authority, 8.00%, 5/1/2020 | | | 590,000 | | | | 594,779 | |
San Bernardino County California Redevelopment Agency (San Sevaine), 8.45%, 9/1/2030 | | | 1,000,000 | | | | 1,141,430 | |
Town of Oyster Bay GO, 3.25%, 2/1/2018 | | | 1,220,000 | | | | 1,221,427 | |
| | | | | | | | |
TOTAL MUNICIPAL BONDS (Cost $9,717,776) | | | | | | | 10,235,025 | |
| | | | | | | | |
| | |
U.S. GOVERNMENT AGENCIES — 1.16% | | | | | | | | |
b CoBank, ACB Floating Rate Note, (Federal Farm Credit Banks), 1.731%, 6/15/2022 | | | 12,700,000 | | | | 12,260,224 | |
| | | | | | | | |
TOTAL U.S. GOVERNMENT AGENCIES (Cost $12,266,305) | | | | | | | 12,260,224 | |
| | | | | | | | |
14 Semi-Annual Report
| | |
| Schedule of Investments, Continued | | |
| |
Thornburg Strategic Income Fund | | March 31, 2017 (Unaudited) |
| | | | | | | | |
| | | SHARES/
PRINCIPAL AMOUNT | | | VALUE | |
OTHER GOVERNMENT— 1.32% | | | | | | | | |
Mexican Bonos de Desarrollo (MXN), 5.00%, 6/15/2017 | | $ | 130,000,000 | | | $ | 6,926,598 | |
Mexican Bonos de Desarrollo (MXN), 4.75%, 6/14/2018 | | | 77,700,000 | | | | 4,063,238 | |
b,c Seven and Seven Ltd. Floating Rate Note, (Guaranty: Export-Import Bank of Korea), 2.43%, 9/11/2019 | | | 3,000,000 | | | | 2,980,407 | |
| | | | | | | | |
TOTAL OTHER GOVERNMENT (Cost $18,396,532) | | | | | | | 13,970,243 | |
| | | | | | | | |
| | |
MORTGAGE BACKED — 0.29% | | | | | | | | |
Federal Home Loan Mtg Corp., CMO Series KIR1 Class X, 1.093%, 3/25/2026 | | | 37,684,564 | | | | 2,830,243 | |
Federal National Mtg Assoc., CMO Series 1994-37 Class L, 6.50%, 3/25/2024 | | | 2,340 | | | | 2,547 | |
a Reilly FHA 1997-A Mtg, 6.896%, 7/1/2020 | | | 254,595 | | | | 254,595 | |
| | | | | | | | |
TOTAL MORTGAGE BACKED (Cost $3,026,810) | | | | | | | 3,087,385 | |
| | | | | | | | |
| | |
LOAN PARTICIPATIONS — 5.62% | | | | | | | | |
COMMERCIAL & PROFESSIONAL SERVICES — 0.60% | | | | | | | | |
Professional Services — 0.60% | | | | | | | | |
RGIS Services, LLC, 7.50%, 3/24/2023 | | | 2,462,500 | | | | 2,450,187 | |
Affinion Group, Inc., 6.75%, 4/30/2018 | | | 3,899,497 | | | | 3,880,741 | |
| | | | | | | | |
| | | | | | | 6,330,928 | |
| | | | | | | | |
CONSUMER SERVICES — 0.10% | | | | | | | | |
Hotels, Restaurants & Leisure — 0.10% | | | | | | | | |
Cheddar’s Scratch Kitchen, 10.75%, 12/20/2022 | | | 1,000,000 | | | | 1,005,000 | |
| | | | | | | | |
| | | | | | | 1,005,000 | |
| | | | | | | | |
DIVERSIFIED FINANCIALS — 0.46% | | | | | | | | |
Diversified Financial Services — 0.46% | | | | | | | | |
c Stena International S.A., 4.15%, 3/3/2021 | | | 5,208,900 | | | | 4,820,108 | |
| | | | | | | | |
| | | | | | | 4,820,108 | |
| | | | | | | | |
ENERGY — 0.33% | | | | | | | | |
Oil, Gas & Consumable Fuels — 0.33% | | | | | | | | |
a Malamute Energy, Inc., 1.15%, 11/22/2022 | | | 14,316 | | | | 14,316 | |
Citgo Holding, Inc., 9.65%, 5/12/2018 | | | 3,458,695 | | | | 3,507,705 | |
| | | | | | | | |
| | | | | | | 3,522,021 | |
| | | | | | | | |
FOOD, BEVERAGE & TOBACCO — 0.28% | | | | | | | | |
Tobacco — 0.28% | | | | | | | | |
a North Atlantic Holding Co., Inc., 7.15%, 5/9/2022 | | | 3,000,000 | | | | 2,970,000 | |
| | | | | | | | |
| | | | | | | 2,970,000 | |
| | | | | | | | |
HEALTH CARE EQUIPMENT & SERVICES — 0.35% | | | | | | | | |
Health Care Providers & Services — 0.35% | | | | | | | | |
Prospect Medical Holdings, Inc., 7.13%, 06/30/2022 | | | 3,672,250 | | | | 3,722,743 | |
| | | | | | | | |
| | | | | | | 3,722,743 | |
| | | | | | | | |
HOUSEHOLD & PERSONAL PRODUCTS — 0.24% | | | | | | | | |
Household Products — 0.24% | | | | | | | | |
Energizer Holdings, Inc., 2.81%, 6/30/2022 | | | 2,500,000 | | | | 2,508,325 | |
| | | | | | | | |
| | | | | | | 2,508,325 | |
| | | | | | | | |
INDUSTRIALS — 0.51% | | | | | | | | |
Construction & Engineering — 0.51% | | | | | | | | |
ABG Intermediate Holdings (2), LLC, 9.65%, 5/27/2022 | | | 5,359,598 | | | | 5,399,795 | |
| | | | | | | | |
| | | | | | | 5,399,795 | |
| | | | | | | | |
MEDIA — 1.43% | | | | | | | | |
Media — 1.43% | | | | | | | | |
c Mood Media Corp., 7.15%, 5/1/2019 | | | 9,636,291 | | | | 9,536,940 | |
New Media Holdings II, LLC, 7.40%, 6/4/2020 | | | 5,679,128 | | | | 5,622,337 | |
| | | | | | | | |
| | | | | | | 15,159,277 | |
| | | | | | | | |
REAL ESTATE — 0.03% | | | | | | | | |
Real Estate Management & Development — 0.03% | | | | | | | | |
DTZ U.S. Borrower, LLC, 9.29%, 11/4/2022 | | | 318,298 | | | | 317,238 | |
| | | | | | | | |
| | | | | | | 317,238 | |
| | | | | | | | |
RETAILING — 0.31% | | | | | | | | |
Specialty Retail — 0.31% | | | | | | | | |
Redbox Automated Retail, LLC, 8.50%, 9/27/2021 | | | 3,325,000 | | | | 3,320,844 | |
| | | | | | | | |
| | | | | | | 3,320,844 | |
| | | | | | | | |
Semi-Annual Report 15
| | |
| Schedule of Investments, Continued | | |
| |
Thornburg Strategic Income Fund | | March 31, 2017 (Unaudited) |
| | | | | | | | |
| | | SHARES/
PRINCIPAL AMOUNT | | | VALUE | |
SOFTWARE & SERVICES — 0.27% | | | | | | | | |
Information Technology Services — 0.27% | | | | | | | | |
CCC Information Services, Inc., 7.75%, 3/29/2025 | | $ | 1,000,000 | | | $ | 1,010,000 | |
Neustar, Inc., 3.25%, 8/28/2019 | | | 1,000,000 | | | | 1,012,080 | |
Neustar, Inc., 4.03%, 1/22/2019 | | | 863,300 | | | | 858,984 | |
| | | | | | | | |
| | | | | | | 2,881,064 | |
| | | | | | | | |
TECHNOLOGY HARDWARE & EQUIPMENT — 0.33% | | | | | | | | |
Technology, Hardware, Storage & Peripherals — 0.33% | | | | | | | | |
Harland Clarke Holdings Corp., 7.15%, 12/31/2021 | | | 3,477,858 | | | | 3,505,681 | |
| | | | | | | | |
| | | | | | | 3,505,681 | |
| | | | | | | | |
TELECOMMUNICATION SERVICES — 0.28% | | | | | | | | |
Diversified Telecommunication Services — 0.28% | | | | | | | | |
Cyxtera Technologies, Inc., 7.75%, 3/28/2025 | | | 3,000,000 | | | | 3,011,250 | |
| | | | | | | | |
| | | | | | | 3,011,250 | |
| | | | | | | | |
TRANSPORTATION — 0.10% | | | | | | | | |
Airlines — 0.05% | | | | | | | | |
a,b,c,d,e OS Two, LLC, 12.00%, 12/15/2020 | | | 710,495 | | | | 546,371 | |
Road & Rail — 0.05% | | | | | | | | |
Avolon Holdings Ltd., 3.73%, 3/20/2022 | | | 500,000 | | | | 506,460 | |
| | | | | | | | |
| | | | | | | 1,052,831 | |
| | | | | | | | |
TOTAL LOAN PARTICIPATIONS (Cost $59,368,927) | | | | | | | 59,527,105 | |
| | | | | | | | |
| | |
SHORT TERM INVESTMENTS — 9.62% | | | | | | | | |
f Thornburg Capital Management Fund | | | 10,194,681 | | | | 101,946,814 | |
| | | | | | | | |
TOTAL SHORT TERM INVESTMENTS (Cost $101,946,814) | | | | | | | 101,946,814 | |
| | | | | | | | |
TOTAL INVESTMENTS — 99.47% (Cost $1,067,415,001) | | | | | | $ | 1,054,041,474 | |
OTHER ASSETS LESS LIABILITIES — 0.53% | | | | | | | 5,595,754 | |
| | | | | | | | |
NET ASSETS — 100.00% | | | | | | $ | 1,059,637,228 | |
| | | | | | | | |
Footnote Legend
| a | Security currently fair valued by the Valuation and Pricing Committee using procedures approved by the Trustees’ Audit Committee. |
| b | Securities exempt from registration under Rule 144A of the Securities Act of 1933, as amended. These securities may only be resold in the ordinary course of business in transactions exempt from registration, normally to qualified institutional buyers. As of March 31, 2017, the aggregate value of these securities in the Fund’s portfolio was $498,830,493, representing 47.08% of the Fund’s net assets. |
| c | Yankee bond denominated in U.S. dollars and is issued in the U.S. by foreign banks and corporations. |
| f | Investment in Affiliates - Shown below are holdings of voting securities of each portfolio company which is considered “affiliated” to the Fund under the Investment Company Act of 1940, including companies for which the Fund’s holding represented 5% or more of the company’s voting securities, and a series of the Thornburg Investment Trust in which the Fund invested for cash management purposes during the period: |
| | | | | | | | | | | | | | | | | | | | | | | | | | | | |
ISSUER | | SHARES/PRINCIPAL
SEPTEMBER 30,
2016 | | | GROSS
ADDITIONS | | | GROSS
REDUCTIONS | | | SHARES/PRINCIPAL
MARCH 31,
2017 | | | MARKET
VALUE
MARCH 31,
2017 | | | INVESTMENT
INCOME | | | REALIZED
GAIN (LOSS) | |
Thornburg Capital Management Fund | | | 11,484,943 | | | | 14,171,283 | | | | 15,461,545 | | | | 10,194,681 | | | $ | 101,946,814 | | | $ | 355,440 | | | $ | — | |
| | | | | | | | | | | | | | | | | | | | | | | | | | | | |
Total non-controlled affiliated issuers - 9.62% of net assets | | | | | | | | | | | $ | 101,946,814 | | | $ | 355,440 | | | $ | — | |
| | | | | | | | | | | | | | | | | | | | | | | | | | | | |
Portfolio Abbreviations
To simplify the listings of securities, abbreviations are used per the table below:
| | |
| ARM | | Adjustable Rate Mortgage |
| AUD | | Denominated in Australian Dollars |
| BRL | | Denominated in Brazilian Real |
| CAD | | Denominated in Canadian Dollars |
| CHL | | Denominated in Chilean Peso |
| CMO | | Collateralized Mortgage Obligation |
| EUR | | Denominated in Euros |
| FCB | | Farm Credit Bank |
| FHA | | Insured by Federal Housing Administration |
| | |
| GO | | General Obligation |
| Mtg | | Mortgage |
| MTN | | Medium-Term Note |
| MXN | | Denominated in Mexican Pesos |
| Pfd | | Preferred Stock |
| REIT | | Real Estate Investment Trust |
| SBA | | Small Business Administration |
| SEK | | Denominated in Swedish Kronor |
| SPV | | Special Purpose Vehicle |
See notes to financial statements.
16 Semi-Annual Report
This page intentionally left blank.
Semi-Annual Report 17
| | |
| Statement of Assets and Liabilities | | |
| |
Thornburg Strategic Income Fund | | March 31, 2017 (Unaudited) |
| | | | |
ASSETS | | | | |
Investments at value (Note 3) | | | | |
Non-affiliated issuers (cost $965,468,187) | | $ | 952,094,660 | |
Non-controlled affiliated issuer (cost $101,946,814) | | | 101,946,814 | |
Cash | | | 738,913 | |
Receivable for investments sold | | | 2,697,884 | |
Receivable for fund shares sold | | | 8,658,969 | |
Unrealized appreciation on forward currency contracts (Note 7) | | | 137,184 | |
Dividends receivable | | | 207,587 | |
Dividend and interest reclaim receivable | | | 50,888 | |
Interest receivable | | | 10,979,252 | |
Prepaid expenses and other assets | | | 76,268 | |
| | | | |
Total Assets | | | 1,077,588,419 | |
| | | | |
| |
LIABILITIES | | | | |
Payable for investments purchased | | | 12,224,480 | |
Payable for fund shares redeemed | | | 4,302,422 | |
Unrealized depreciation on forward currency contracts (Note 7) | | | 72,991 | |
Payable to investment advisor and other affiliates (Note 4) | | | 685,928 | |
Accounts payable and accrued expenses | | | 264,263 | |
Dividends payable | | | 401,107 | |
| | | | |
Total Liabilities | | | 17,951,191 | |
| | | | |
| |
NET ASSETS | | $ | 1,059,637,228 | |
| | | | |
NET ASSETS CONSIST OF | | | | |
Distribution in excess of net investment income | | $ | (673,286 | ) |
Net unrealized depreciation on investments | | | (13,297,999 | ) |
Accumulated net realized gain (loss) | | | (34,807,397 | ) |
Net capital paid in on shares of beneficial interest | | | 1,108,415,910 | |
| | | | |
| |
| | $ | 1,059,637,228 | |
| | | | |
18 Semi-Annual Report
| | |
| Statement of Assets and Liabilities, Continued | | |
| |
Thornburg Strategic Income Fund | | March 31, 2017 (Unaudited) |
| | | | |
NET ASSET VALUE | | | | |
| |
Class A Shares: | | | | |
Net asset value and redemption price per share ($241,563,697 applicable to 20,743,914 shares of beneficial interest outstanding - Note 5) | | $ | 11.65 | |
Maximum sales charge, 4.50% of offering price | | | 0.55 | |
| | | | |
Maximum offering price per share | | $ | 12.20 | |
| | | | |
| |
Class C Shares: | | | | |
Net asset value and offering price per share* ($235,079,441 applicable to 20,219,710 shares of beneficial interest outstanding - Note 5) | | $ | 11.63 | |
| | | | |
| |
Class I Shares: | | | | |
Net asset value, offering and redemption price per share ($571,676,587 applicable to 49,207,772 shares of beneficial interest outstanding - Note 5) | | $ | 11.62 | |
| | | | |
| |
Class R3 Shares: | | | | |
Net asset value, offering and redemption price per share ($2,683,197 applicable to 230,693 shares of beneficial interest outstanding - Note 5) | | $ | 11.63 | |
| | | | |
| |
Class R4 Shares: | | | | |
Net asset value, offering and redemption price per share ($2,759,348 applicable to 237,114 shares of beneficial interest outstanding - Note 5) | | $ | 11.64 | |
| | | | |
| |
Class R5 Shares: | | | | |
Net asset value, offering and redemption price per share ($5,874,958 applicable to 505,789 shares of beneficial interest outstanding - Note 5) | | $ | 11.62 | |
| | | | |
| * | Redemption price per share is equal to net asset value less any applicable contingent deferred sales charge. |
See notes to financial statements.
Semi-Annual Report 19
| | |
| Statement of Operations | | |
| |
Thornburg Strategic Income Fund | | Six Months Ended March 31, 2017 |
| | | | |
INVESTMENT INCOME | | | | |
Dividend income | | | | |
Non-affiliated issuers | | $ | 611,474 | |
Non-controlled affiliated issuer | | | 355,440 | |
Interest income (net of premium amortized of $1,010,789) | | | 23,969,121 | |
| | | | |
Total Income | | | 24,936,035 | |
| | | | |
| |
EXPENSES | | | | |
Investment advisory fees (Note 4) | | | 3,676,905 | |
Administration fees (Note 4) | | | | |
Class A Shares | | | 168,569 | |
Class C Shares | | | 157,155 | |
Class I Shares | | | 125,961 | |
Class R3 Shares | | | 1,801 | |
Class R4 Shares | | | 1,832 | |
Class R5 Shares | | | 1,544 | |
Distribution and service fees (Note 4) | | | | |
Class A Shares | | | 336,337 | |
Class C Shares | | | 1,253,192 | |
Class R3 Shares | | | 7,258 | |
Class R4 Shares | | | 3,668 | |
Transfer agent fees | | | | |
Class A Shares | | | 129,754 | |
Class C Shares | | | 114,658 | |
Class I Shares | | | 219,868 | |
Class R3 Shares | | | 6,704 | |
Class R4 Shares | | | 6,255 | |
Class R5 Shares | | | 8,504 | |
Registration and filing fees | | | | |
Class A Shares | | | 15,431 | |
Class C Shares | | | 10,836 | |
Class I Shares | | | 36,910 | |
Class R3 Shares | | | 10,376 | |
Class R4 Shares | | | 10,247 | |
Class R5 Shares | | | 10,376 | |
Custodian fees (Note 2) | | | 140,950 | |
Professional fees | | | 49,127 | |
Accounting fees (Note 4) | | | 16,070 | |
Trustee fees | | | 22,637 | |
Other expenses | | | 76,932 | |
| | | | |
Total Expenses | | | 6,619,857 | |
Less: | | | | |
Expenses reimbursed by investment advisor (Note 4) | | | (370,430 | ) |
Investment advisory fees waived by investment advisor (Note 4) | | | (191,452 | ) |
| | | | |
Net Expenses | | | 6,057,975 | |
| | | | |
Net Investment Income | | $ | 18,878,060 | |
| | | | |
20 Semi-Annual Report
| | |
| Statement of Operations, Continued | | |
| |
Thornburg Strategic Income Fund | | Six Months Ended March 31, 2017 |
| | | | |
REALIZED AND UNREALIZED GAIN (LOSS) | | | | |
Net realized gain (loss) on: | | | | |
Non-affiliated issuer investments | | $ | (2,367,649 | ) |
Forward currency contracts (Note 7) | | | 386,142 | |
Foreign currency transactions | | | (62,423 | ) |
| | | | |
| | | (2,043,930 | ) |
| | | | |
Net change in unrealized appreciation (depreciation) on: | | | | |
Non-affiliated issuer investments | | | 5,265,162 | |
Forward currency contracts (Note 7) | | | (62,151 | ) |
Foreign currency translations | | | 49,950 | |
| | | | |
| | | 5,252,961 | |
| | | | |
Net Realized and Unrealized Gain | | | 3,209,031 | |
| | | | |
Net Increase in Net Assets Resulting from Operations | | $ | 22,087,091 | |
| | | | |
See notes to financial statements.
Semi-Annual Report 21
| | |
| Statements of Changes in Net Assets | | |
| |
Thornburg Strategic Income Fund | | March 31, 2017 (Unaudited) |
| | | | | | | | |
| | | SIX MONTHS ENDED
MARCH 31, 2017* | | | YEAR ENDED
SEPTEMBER 30, 2016 | |
INCREASE (DECREASE) IN NET ASSETS FROM | | | | | | | | |
| | |
OPERATIONS | | | | | | | | |
Net investment income | | $ | 18,878,060 | | | $ | 44,371,576 | |
Net realized gain (loss) on investments, forward currency contracts, and foreign currency transactions | | | (2,043,930 | ) | | | (38,813,306 | ) |
Net unrealized appreciation (depreciation) on investments, forward currency contracts, and foreign currency translations | | | 5,252,961 | | | | 61,853,369 | |
| | | | | | | | |
Net Increase (Decrease) in Net Assets Resulting from Operations | | | 22,087,091 | | | | 67,411,639 | |
| | |
DIVIDENDS TO SHAREHOLDERS | | | | | | | | |
From net investment income | | | | | | | | |
Class A Shares | | | (3,748,361 | ) | | | (9,880,040 | ) |
Class C Shares | | | (2,778,022 | ) | | | (7,668,653 | ) |
Class I Shares | | | (8,125,111 | ) | | | (17,002,116 | ) |
Class R3 Shares | | | (40,242 | ) | | | (59,729 | ) |
Class R4 Shares | | | (40,546 | ) | | | (84,997 | ) |
Class R5 Shares | | | (95,823 | ) | | | (239,592 | ) |
From realized gains | | | | | | | | |
Class A Shares | | | — | | | | (816,703 | ) |
Class C Shares | | | — | | | | (732,196 | ) |
Class I Shares | | | — | | | | (1,265,868 | ) |
Class R3 Shares | | | — | | | | (3,811 | ) |
Class R4 Shares | | | — | | | | (5,676 | ) |
Class R5 Shares | | | — | | | | (14,864 | ) |
| | |
FUND SHARE TRANSACTIONS (NOTE 5) | | | | | | | | |
Class A Shares | | | (43,682,256 | ) | | | (63,035,022 | ) |
Class C Shares | | | (39,147,077 | ) | | | (41,609,027 | ) |
Class I Shares | | | 87,727,345 | | | | (64,637,440 | ) |
Class R3 Shares | | | (155,719 | ) | | | 1,314,552 | |
Class R4 Shares | | | (474,414 | ) | | | 1,018,779 | |
Class R5 Shares | | | (1,349,371 | ) | | | 514,084 | |
| | | | | | | | |
Net Increase (Decrease) in Net Assets | | | 10,177,494 | | | | (136,796,680 | ) |
| | |
NET ASSETS | | | | | | | | |
Beginning of Period | | | 1,049,459,734 | | | | 1,186,256,414 | |
| | | | | | | | |
| | |
End of Period | | $ | 1,059,637,228 | | | $ | 1,049,459,734 | |
| | | | | | | | |
Distribution in excess of net investment income | | $ | (673,286 | ) | | $ | (4,723,241 | ) |
See notes to financial statements.
22 Semi-Annual Report
| | |
| Notes to Financial Statements | | |
| |
Thornburg Strategic Income Fund | | March 31, 2017 |
NOTE 1 – ORGANIZATION
Thornburg Strategic Income Fund (the “Fund”) is a diversified series of Thornburg Investment Trust (the “Trust”). The Fund commenced operations on December 19, 2007. The Trust was organized as a Massachusetts business trust under a Declaration of Trust dated June 3, 1987 and is registered as a diversified, open-end management investment company under the Investment Company Act of 1940, as amended. The Fund is currently one of twenty-one separate series of the Trust. Each series is considered to be a separate entity for financial reporting and tax purposes and bears expenses directly attributable to it. The Fund’s primary investment goal is to seek a high level of current income. The Fund’s secondary investment goal is some long-term capital appreciation.
The Fund currently offers six classes of shares of beneficial interest: Class A, Class C, Institutional Class (“Class I”) and Retirement Classes (“Class R3”, “Class R4”, and “Class R5”). Each class of shares of the Fund represents an interest in the same portfolio of investments, except that (i) Class A shares are sold subject to a front-end sales charge collected at the time the shares are purchased and bear a service fee, (ii) Class C shares are sold at net asset value without a sales charge at the time of purchase, but are subject to a contingent deferred sales charge upon redemption within one year of purchase, and bear both a service fee and a distribution fee, (iii) Class I shares are sold at net asset value without a sales charge at the time of purchase and may be subject to a service fee, (iv) Class R3 shares are sold at net asset value without a sales charge at the time of purchase, but bear both a service fee and distribution fee, (v) Class R4 shares are sold at net asset value without a sales charge at the time of purchase, but bear a service fee, (vi) Class R5 shares are sold at net asset value without a sales charge at the time of purchase and may be subject to a service fee, and (vii) the respective classes may have different reinvestment privileges and conversion rights. Additionally, the Fund may allocate among its classes certain expenses, to the extent allocable to specific classes, including transfer agent fees, government registration fees, certain printing and postage costs, and administrative and legal expenses. Currently, class specific expenses of the Fund are limited to service and distribution fees, administration fees, and certain registration and transfer agent expenses.
The following is a summary of significant accounting policies followed by the Fund in the preparation of its financial statements. The Fund prepares its financial statements in conformity with United States generally accepted accounting principles (“GAAP”), including investment company accounting and reporting guidance in the Financial Accounting Standards Board (the “FASB”) Accounting Standard Codification Topic 946.
NOTE 2 – SIGNIFICANT ACCOUNTING POLICIES
Security Valuation: All investments in securities held by the Fund are valued as described in Note 3.
Allocation of Income, Gains, Losses and Expenses: Net investment income (other than class specific expenses) and realized and unrealized gains and losses are allocated daily to each class of shares based upon the relative net asset value of outstanding shares (or the value of the dividend-eligible shares, as appropriate) of each class of shares at the beginning of the day (after adjusting for the current capital shares activity of the respective class). Expenses common to all Funds are allocated among the Funds comprising the Trust based upon their relative net asset values or other appropriate allocation methods. Operating expenses directly attributable to a specific class are charged against the operating income of that class.
Dividends and Distributions to Shareholders: Dividends and distributions to shareholders, which are determined in accordance with federal income tax regulations and may differ from GAAP, are recorded on the ex-dividend date. Ordinary income distributions, if any, are declared and paid quarterly. Capital gain distributions, if any, are declared and paid annually and more often if deemed necessary by the Advisor. Dividends are paid and are reinvested in additional shares of the Fund at net asset value per share at the close of business on the ex-dividend date, or at the shareholder’s option, paid in cash.
Investment Income: Dividend income is recorded on the ex-dividend date. Certain income from foreign investments is recognized as soon as information is available to the Fund. Interest income is accrued as earned. Premiums and discounts are amortized and accreted, respectively, to call dates or maturity dates of the respective investments. These amounts are included in Interest Income on the Statement of Operations.
Custodian Fees: Custodian fees disclosed in the Statement of Operations may include interest expenses incurred by the Fund on any cash overdrafts of its custodian account during the period. Such cash overdrafts may result from the effects of failed trades in portfolio securities and from cash outflows resulting from unanticipated shareholder redemption activity. The Fund pays interest to its custodian on any such cash overdraft at a rate equal to 2.50% of the overdraft amount in excess of $50,000.
Investment Transactions: Investment transactions are accounted for on a trade date basis. Realized gains and losses from the sale of investments are recorded on an identified cost basis.
Repurchase Agreements: The Fund may invest excess cash in repurchase agreements whereby the Fund purchases investments, which serve as collateral, with an agreement to resell such collateral to the seller at an agreed upon price at the maturity date of the repurchase agreement. Investments pledged as collateral for repurchase agreements are held in custody until maturity of the repurchase agreement. Provisions in the agreements require that the market value of the collateral is at least equal to the repurchase value
Semi-Annual Report 23
| | |
| Notes to Financial Statements, Continued | | |
| |
Thornburg Strategic Income Fund | | March 31, 2017 (Unaudited) |
in the event of default. In the event of default, the Fund has the right to liquidate the collateral and apply the proceeds in satisfaction of the obligation. Under certain circumstances, in the event of default or bankruptcy by the other party to the agreement, realization and/or retention of the collateral may be subject to legal proceedings.
Unfunded Loan Commitments: The Fund has entered into a loan commitment with Malamute Energy, Inc., of which at March 31, 2017, $14,316 of the $42,350 par commitment had been funded. The maturity date is November 22, 2022.
When-Issued and Delayed Delivery Transactions: The Fund may engage in when-issued or delayed delivery transactions. To the extent the Fund engages in such transactions, it will do so for the purpose of acquiring portfolio investments consistent with the Fund’s investment objectives and not for the purpose of investment leverage or to speculate on interest rate or market changes. At the time the Fund makes a commitment to purchase an investment on a when-issued or delayed delivery basis, the Fund will record the transaction and reflect the value in determining its net asset value. When effecting such transactions, assets of an amount sufficient to make payment for the portfolio investments to be purchased will be segregated on the Fund’s records on the trade date. Investments purchased on a when-issued or delayed delivery basis do not earn interest until the settlement date.
Foreign Currency Translation: Portfolio investments and other assets and liabilities denominated in foreign currencies are translated into U.S. dollars based on the exchange rate of such currencies against the U.S. dollar on the date of valuation. Purchases and sales of investments and income items denominated in foreign currencies are translated into U.S. dollars at the exchange rate in effect on the transaction date. When the Fund purchases or sells foreign investments, it will customarily enter into a foreign exchange contract to minimize foreign exchange risk from the trade date to the settlement date of such transactions. The values of such spot contracts are included in receivable for investments sold and payable for investments purchased on the Statement of Assets and Liabilities.
The Fund does not separately report the effect of changes in foreign exchange rates from changes in market prices on investments held. Such changes are included in net unrealized appreciation (depreciation) from investments.
Reported net realized gains and losses from foreign currency transactions arise due to purchases and sales of foreign currencies, currency gains and losses realized between the trade and settlement dates on investment transactions and the difference between the amounts of dividends, interest, and foreign withholding taxes recorded on the Fund’s books, and the U.S. dollar equivalent of the amounts actually received or paid.
Net change in unrealized appreciation (depreciation) on foreign currency translations arise from changes in the fair value of assets and liabilities, other than investments at period end, resulting from changes in exchange rates.
Guarantees and Indemnifications: Under the Trust’s organizational documents (and under separate agreements with the independent Trustees), its officers and Trustees are provided with an indemnification against certain liabilities arising out of the performance of their duties to the Fund. In the normal course of business the Trust may also enter into contracts with service providers that contain general indemnifications. The Trust’s maximum exposure under these arrangements is unknown. However, based on experience, the Trust expects the risk of loss to be remote.
Use of Estimates: The preparation of financial statements in conformity with GAAP requires management to make estimates and assumptions that affect the reported amounts of assets and liabilities and disclosure of contingent assets and liabilities at the date of the financial statements and the reported amounts of increases (decreases) in net assets from operations during the reporting period. Actual results could differ from those estimates.
Federal Income Taxes: It is the policy of the Trust to comply with the provisions of the Internal Revenue Code applicable to regulated investment companies and to distribute to shareholders substantially all investment company taxable income including net realized gains on investments (if any), and tax exempt income of the Fund. Therefore, no provision for federal income or excise tax is required.
The Fund files income tax returns in United States federal and applicable state jurisdictions. The statute of limitations on the Fund’s tax return filings generally remains open for the three years following a return’s filing date. The Fund has analyzed its tax positions taken on Federal income tax returns for all open tax years and has concluded that no provision for income tax is required in the financial statements.
At March 31, 2017, information on the tax components of capital was as follows:
| | | | |
| | |
Cost of investments for tax purposes | | $ | 1,067,415,001 | |
| | | | |
Gross unrealized appreciation on a tax basis | | $ | 26,209,659 | |
Gross unrealized depreciation on a tax basis | | | (39,583,186 | ) |
| | | | |
Net unrealized appreciation (depreciation) on investments (tax basis) | | $ | (13,373,527 | ) |
| | | | |
24 Semi-Annual Report
| | |
| Notes to Financial Statements, Continued | | |
| |
Thornburg Strategic Income Fund | | March 31, 2017 (Unaudited) |
At March 31, 2017, the Fund had deferred tax basis late year specified ordinary losses occurring subsequent to October 31, 2015 through September 30, 2016 of $9,305,389. For tax purposes, such losses will be recognized in the year ending September 30, 2017.
At March 31, 2017, the Fund had deferred tax basis capital losses occurring subsequent to October 31, 2015 through September 30, 2016 of $30,691,256. For tax purposes, such capital losses will be recognized in the year ending September 30, 2017.
At March 31, 2017, the Fund had cumulative tax basis capital losses of $1,894,006, (of which $0 are short-term and $1,894,006 are long-term) generated after September 30, 2011, which may be carried forward to offset future capital gains. To the extent such carryfor-wards are used, capital gain distributions may be reduced to the extent provided by regulations. Such capital loss carryforwards do not expire.
Foreign Withholding Taxes: The Fund is subject to foreign tax withholding imposed by certain foreign countries in which the Fund may invest. Withholding taxes are incurred on certain foreign dividends and are accrued at the time the dividend is recognized based on applicable foreign tax laws. The Fund may file withholding tax reclaims in certain jurisdictions to recover a portion of amounts previously withheld, in view of various considerations, including recent decisions rendered by the courts in those and other jurisdictions. The Fund would expect to record a receivable for such a reclaim based on a variety of factors, including assessment of a jurisdiction’s legal obligation to pay reclaims, the jurisdiction’s administrative practices and payment history, and industry convention. To date the Fund has recorded no such receivable because there is limited precedent for collecting such prior year reclaims and the likelihood of collection remains uncertain.
Deferred Foreign Capital Gain Taxes: The Fund is subject to a tax imposed on net realized gains of securities of certain foreign countries. The Fund records an estimated deferred tax liability for net unrealized gains on these investments as reflected in the accompanying financial statements.
NOTE 3 – SECURITY VALUATION
Valuation of the Fund’s portfolio investment securities is performed in accordance with policies and procedures adopted by and under the oversight of the Trustees.
The Trustees of the Trust have appointed Thornburg Investment Management, Inc., the Trust’s advisor (the “Advisor”) to assist the Trustees in obtaining market values for portfolio investments, evaluate and monitor professional pricing service providers appointed by the Trustees’ Audit Committee (the “Audit Committee”) to assist in determining fair values for portfolio investments, assist in calculating fair values for portfolio investments in certain circumstances, and to perform other functions in connection with the valuation of investments. The Advisor acts through its Valuation and Pricing Committee (the “Committee”) and other employees of the Advisor. The Committee regularly reviews its own valuation calculations, as well as the valuations, valuation techniques and services furnished by pricing service providers, considers circumstances which may require valuation calculations by the Committee, and reviews previous valuation calculations. The Committee reports to the Audit Committee on the Committee’s activities, the performance of pricing service providers, and other matters relating to valuation of portfolio investments.
In those instances when the Committee assists in calculating a fair value for a portfolio investment, the Committee seeks to determine the price that the Fund would reasonably expect to receive upon a sale of the investment in an orderly transaction between market participants on the valuation date. The Committee customarily utilizes quotations from securities broker dealers in calculating valuations, but also may utilize prices obtained from pricing service providers or other methods approved by the Audit Committee. Because fair values calculated by the Committee are estimates, the calculation of a value for an investment may differ from the price that would be realized by the Fund upon a sale of the investment, and the difference could be material to the Fund’s financial statements. The Committee’s calculation of a fair value for an investment may also differ from the prices obtained by other persons (including other mutual funds) for the investment.
Valuation of Securities: Securities and other portfolio investments which are listed or traded on a United States securities exchange are valued at the last reported sale price on the valuation date. Investments listed or traded on an exchange for which there has been no sale that day are valued at the mean between the last reported bid and asked prices on that valuation date. Portfolio investments reported by NASDAQ are valued at the official closing price on the valuation date. If an investment is traded on more than one exchange, the investment is considered traded on the exchange that is normally the primary market for that investment. Securities and other portfolio investments which are listed or traded on exchanges outside the United States are valued at the last price or the closing price of the investment on the exchange that is normally the primary market for the investment, as of the close of the exchange preceding the Fund’s valuation date. Foreign investments listed or traded on an exchange for which there has been no sale that day are valued at the mean between the last reported bid and asked prices on that valuation date.
In any case when a market quotation is not readily available for a portfolio investment ordinarily valued by market quotation, the Committee calculates a fair value for the investment using alternative methods approved by the Audit Committee. A market quotation is not readily available when the primary market or exchange for the investment is not open for the entire scheduled day of trading.
Semi-Annual Report 25
| | |
| Notes to Financial Statements, Continued | | |
| |
Thornburg Strategic Income Fund | | March 31, 2017 (Unaudited) |
Market quotations for an investment also may not be readily available if developments after the most recent close of the investment’s primary exchange or market, but prior to the close of business on any Fund business day, or an unusual event or significant period of time occurring since the availability of a market quotation, create a serious question concerning the reliability of the most recent market quotation available for the investment. In particular, on days when market volatility thresholds established by the Audit Committee are exceeded, foreign equity investments held by the Fund may be valued using alternative methods. The Committee customarily obtains valuations in these instances from pricing service providers approved by the Audit Committee. Pricing service providers ordinarily calculate valuations using multi-factor models to adjust market prices based upon various inputs, including exchange data, depository receipt prices, futures, index data and other data.
Debt obligations held by the Fund which are not listed or traded on exchanges or for which no reported market exists are ordinarily valued at the valuation obtained from a pricing service provider approved by the Audit Committee.
In any case when a pricing service provider fails to provide a valuation for a debt obligation held by the Fund, the Committee calculates a fair value for the obligation using alternative methods under procedures approved by the Audit Committee. Additionally, in cases when management believes that a valuation obtained from a pricing service provider merits review for significant reasons, the Committee decides whether or not to use the valuation calculated by the pricing service provider or to use an alternative method approved by the Audit Committee to calculate a fair value for the obligation.
Quotations for foreign investments expressed in foreign currency amounts are converted to U.S. dollar equivalents using a foreign exchange quotation from a third party service provider at the time of valuation. Foreign investments held by the Fund may be traded on days and at times when the Fund is not open for business. Consequently, the value of Fund investments may be significantly affected on days when shareholders cannot purchase or sell Fund shares. Futures contracts and other financial and derivative instruments traded on an exchange are valued at the latest published price for the instrument on its primary exchange. Listed options are valued at the last bid price.
Valuation Hierarchy: The Fund categorizes its investments based upon the inputs used in valuing those investments, according to a three-level hierarchy established in guidance from FASB. Categorization of investments using this hierarchy is intended by the FASB to maximize the use of observable inputs in valuing investments and minimize the use of unobservable inputs by requiring that the most observable inputs be used when available. Observable inputs are those that market participants would use in valuing an investment based on available market information. Unobservable inputs are those that reflect assumptions about the information market participants would use in valuing an investment. An investment’s level within the hierarchy is based on the lowest level input that is deemed significant to the valuation. The methodologies and inputs used to value investments are not necessarily indications of the risk or liquidity associated with those investments.
Various inputs are used in calculating valuations for the Fund’s investments. These inputs are generally summarized according to the three-level hierarchy below:
Level 1: Quoted prices in active markets for identical investments.
Level 2: Other direct or indirect significant observable inputs (including quoted prices for similar investments in active markets and other observable inputs, such as interest rates, prepayment rates, credit risk, etc.).
Level 3: Significant unobservable inputs (including the Committee’s own assumptions in calculating the fair values of investments).
Valuations for debt obligations held by the Fund are typically calculated by pricing service providers approved by the Audit Committee and are characterized as Level 2 within the valuation hierarchy.
On days when market volatility thresholds established by the Audit Committee are exceeded, foreign securities for which valuations are obtained from pricing service providers are fair valued. On these days, the foreign securities are characterized as Level 2 within the valuation hierarchy and revert to Level 1 after the threshold is no longer exceeded.
In a limited number of cases the Committee calculates a fair value for investments using broker quotations or other methods approved by the Audit Committee. When the Committee uses a single broker quotation to calculate a fair value for an investment without other significant observable inputs, or if a fair value is calculated using other significant inputs that are considered unobservable, the investment is characterized as Level 3 within the hierarchy. Other significant unobservable inputs used to calculate a fair value in these instances might include an income-based valuation approach which considers discounted anticipated future cash flows from the investment, and application of discounts due to the nature or duration of any restrictions on the disposition of the investment.
Valuations based upon the use of inputs from Levels 1, 2 or 3 may not represent the actual price received upon the disposition of an investment, and the Fund may receive a price that is lower than the valuation based upon these inputs when it sells the investment.
26 Semi-Annual Report
| | |
| Notes to Financial Statements, Continued | | |
| |
Thornburg Strategic Income Fund | | March 31, 2017 (Unaudited) |
The following table displays a summary of the fair value hierarchy measurements of the Fund’s investments as of March 31, 2017. In any instance when valuation inputs from more than one level are used to determine the fair value of a specific investment, the investment is placed in the level of the table based upon the lowest level input that is significant in determining the fair value of the investment:
| | | | | | | | | | | | | | | | |
| | | FAIR VALUE MEASUREMENTS AT MARCH 31, 2017 | |
| | | TOTAL | | | LEVEL 1 | | | LEVEL 2 | | | LEVEL 3(b) | |
Assets | | | | | | | | | | | | | | | | |
Investments in Securities* | | | | | | | | | | | | | | | | |
Common Stock(a) | | $ | 3,737,891 | | | $ | — | | | $ | 3,728,998 | | | $ | 8,893 | |
Preferred Stock(a) | | | 19,640,527 | | | | 3,595,180 | | | | 13,545,200 | | | | 2,500,147 | |
Asset Backed Securities | | | 133,216,330 | | | | — | | | | 124,913,647 | | | | 8,302,683 | |
Corporate Bonds | | | 670,774,412 | | | | — | | | | 661,510,126 | | | | 9,264,286 | |
Convertible Bonds | | | 25,645,518 | | | | — | | | | 25,645,518 | | | | — | |
Municipal Bonds | | | 10,235,025 | | | | — | | | | 10,235,025 | | | | — | |
U.S. Government Agencies | | | 12,260,224 | | | | — | | | | 12,260,224 | | | | — | |
Other Government | | | 13,970,243 | | | | — | | | | 13,970,243 | | | | — | |
Mortgage Backed | | | 3,087,385 | | | | — | | | | 2,832,790 | | | | 254,595 | |
Loan Participations | | | 59,527,105 | | | | — | | | | 55,996,418 | | | | 3,530,687 | |
Short Term Investments | | | 101,946,814 | | | | 101,946,814 | | | | — | | | | — | |
| | | | | | | | | | | | | | | | |
Total Investments in Securities | | $ | 1,054,041,474 | | | $ | 105,541,994 | | | $ | 924,638,189 | | | $ | 23,861,291 | |
Other Financial Instruments** | | | | | | | | | | | | | | | | |
Forward Currency Contracts | | $ | 137,184 | | | $ | — | | | $ | 137,184 | | | $ | — | |
Liabilities | | | | | | | | | | | | | | | | |
Other Financial Instruments** | | | | | | | | | | | | | | | | |
Forward Currency Contracts | | $ | (72,991 | ) | | $ | — | | | $ | (72,991 | ) | | $ | — | |
| * | See Schedule of Investments for a summary of the industry exposure as grouped according to the Global Industry Classification Standard (GICS), which is an industry taxonomy developed by MSCI, Inc. and Standard & Poor’s (S&P). |
| ** | Other Financial Instruments include investments not reflected in the Schedule of Investments, which may include futures, forwards and swap contracts, which are valued at the unrealized appreciation (depreciation) on the investment. |
| (a) | At March 31, 2017, industry classifications for Common Stock and Preferred Stock in Level 2 and Level 3 consist of $6,238,038 in Energy, $10,772,500 in Miscellaneous, and $2,772,700 in Telecommunication Services. |
| (b) | In accordance with the guidance prescribed in Accounting Standards Update (“ASU”) No. 2011-04, unadjusted broker quotes were applied to $9,473,155 of portfolio securities characterized as Level 3 investments at March 31, 2017. The following table displays a summary of the valuation techniques and unobservable inputs used to value portfolio securities characterized as Level 3 investments, where no unadjusted broker quotes were available at March 31, 2017: |
| | | | | | | | | | | | | | |
| | | FAIR VALUE AT
MARCH 31, 2017 | | | VALUATION
TECHNIQUE(S) | | | UNOBSERVABLE INPUT | | RANGE
(WEIGHTED AVERAGE) | |
Common Stock | | $ | 8,893 | | | | Discount to valuation | | | Fair valued by the Committee due to halt in trading and lack of information and liquidity | | | $10.50 (N/A) | |
Preferred Stock | | | 2,500,147 | | | | Cost basis | | | Cost basis | | | $9.77 (N/A) | |
Asset-Backed Securities | | | 8,302,683 | | | | Discounted cash flows | | | Third party vendor projection of discounted cash flows | | | 2.30% - 5.40% (3.29%) | |
Corporate Bonds | | | 45,726 | | | | Discount to valuation | | | Fair valued by the Committee due to halt in trading and lack of information and liquidity | | $ | 0.001-$4.15 (11.07%) | |
Loan Participations | | | 2,970,000 | | | | Cost basis | | | Cost basis | | | $99.00 (N/A) | |
| | | 546,371 | | | | Discounted cash flows | | | Third party vendor projection of discounted cash flows | | | 22.50%-27.50% (12.00%) | |
| | | 14,316 | | | | Discount to valuation | | | Fair valued by the Committee due to halt in trading and lack of information and liquidity | | | $100.00 (N/A) | |
| | | | | | | | | | | | | | |
Total | | $ | 14,388,136 | | | | | | | | | | | |
Semi-Annual Report 27
| | |
| Notes to Financial Statements, Continued | | |
| |
Thornburg Strategic Income Fund | | March 31, 2017 (Unaudited) |
In accordance with the guidance prescribed in ASU No. 2011-04, it is the policy of the Fund to recognize transfers between levels and those underlying events which caused the movement. The Fund recognized no transfers between Levels 1 and 2 for the six months ended March 31, 2017, other than when the Fund exceeded market volatility thresholds for foreign equity investments during the period.
A rollforward of fair value measurements using significant unobservable inputs (Level 3) for the six months ended March 31, 2017 is as follows:
| | | | | | | | | | | | | | | | | | | | | | | | | | | | |
| | | PREFERRED
STOCK | | | ASSET BACKED
SECURITIES | | | COMMON
STOCK | | | CORPORATE
BONDS | | | MORTGAGE
BACKED | | | OTHER
SECURITIES | | | TOTAL(e) | |
Beginning Balance 9/30/2016 | | $ | — | | | $ | 10,975,294 | | | $ | — | | | $ | 1,785,600 | | | $ | 331,595 | | | $ | 6,692,250 | | | $ | 19,784,739 | |
Accrued Discounts (Premiums) | | | — | | | | 4,849 | | | | — | | | | 13,840 | | | | (631 | ) | | | 5,083 | | | | 23,141 | |
Net Realized Gain (Loss)(a) | | | — | | | | 17,233 | | | | — | | | | — | | | | (1,288 | ) | | | (134,865 | ) | | | (118,920 | ) |
Gross Purchases | | | 2,500,147 | | | | 4,000,000 | | | | 8,894 | | | | 7,113,500 | | | | — | | | | 3,146,396 | | | | 16,768,937 | |
Gross Sales | | | — | | | | (4,577,082 | ) | | | — | | | | (223,764 | ) | | | (77,000 | ) | | | (6,360,246 | ) | | | (11,238,092 | ) |
Net Change in Unrealized Appreciation (Depreciation)(b)(c) | | | — | | | | (17,717 | ) | | | — | | | | 129,884 | | | | 1,919 | | | | 182,069 | | | | 296,155 | |
Transfers into Level 3(d) | | | — | | | | — | | | | — | | | | 2,230,826 | | | | — | | | | — | | | | 2,230,826 | |
Transfers out of Level 3(d) | | | — | | | | (2,099,895 | ) | | | — | | | | (1,785,600 | ) | | | — | | | | — | | | | (3,885,495 | ) |
| | | | | | | | | | | | | | | | | | | | | | | | | | | | |
Ending Balance 3/31/2017 | | $ | 2,500,147 | | | $ | 8,302,682 | | | $ | 8,894 | | | $ | 9,264,286 | | | $ | 254,595 | | | $ | 3,530,687 | | | $ | 23,861,291 | |
| (a) | Amount of net realized gain (loss) from investments recognized in income is included in the Fund’s Statement of Operations for the six months ended March 31, 2017. |
| (b) | Amount of net change in unrealized appreciation (depreciation) on investments recognized in income is included in the Fund’s Statement of Operations for the six months ended March 31, 2017. |
| (c) | The net change in unrealized appreciation (depreciation) attributable to securities owned at March 31, 2017, which were valued using significant unobservable inputs, was $112,017. This is included within net change in unrealized appreciation (depreciation) on investments in the Fund’s the Statement of Operations for the six months ended March 31, 2017. |
| (d) | Transfers into or out of Level 3 were out of or into Level 2, and were due to changes in other significant observable inputs available during the six months ended March 31, 2017. Transfers into or out of Level 3 are based on the beginning market value of the period in which they occurred. |
| (e) | Level 3 investments represent 2.25% of total net assets at the six months ended March 31, 2017. Significant fluctuations of the unobservable inputs applied to portfolio investments characterized as Level 3 could be expected to increase or decrease the fair value of these portfolio investments. |
NOTE 4 – INVESTMENT ADVISORY FEE AND OTHER TRANSACTIONS WITH AFFILIATES
Pursuant to an investment advisory agreement, the Advisor serves as the investment advisor and performs services for the Fund for which the fees are payable at the end of each month. Under the investment advisory agreement, the Fund pays the Advisor a management fee based on the daily net assets of the Fund at an annual rate as shown in the following table:
Management Fee Schedule
| | | | |
DAILY NET ASSETS | | FEE RATE | |
Up to $500 million | | | 0.750 | % |
Next $500 million | | | 0.675 | |
Next $500 million | | | 0.625 | |
Next $500 million | | | 0.575 | |
Over $2 billion | | | 0.500 | |
The Fund’s effective management fee for the year ended September 30, 2016 was 0.709% of the Fund’s average net assets, (before applicable management fee waiver of $191,452).
The Fund pays to the Advisor the costs of personnel who perform certain accounting services for the Fund. For the six months ended March 31, 2017 the Fund paid $16,070 to the Advisor for these accounting services. The Trust has also entered into administrative service agreements with the Advisor, whereby the Advisor will perform certain administrative services related to each class of the Fund’s shares, and for which fees will be payable at an annual rate of up to .125 of 1% per annum of the average daily net assets attributable to each class of shares. Total administrative service fees incurred by each class of shares of the Fund for the six months ended March 31, 2017, are set forth in the Statement of Operations.
The Trust has an underwriting agreement with Thornburg Securities Corporation (the “Distributor”), an affiliate of the Advisor, which acts as the distributor of the Fund’s shares. For the six months ended March 31, 2017, the Distributor has advised the Fund that it earned net commissions aggregating $20,133 from the sale of Class A shares, and collected contingent deferred sales charges aggregating $4,192 from redemptions of Class C shares of the Fund.
28 Semi-Annual Report
| | |
| Notes to Financial Statements, Continued | | |
| |
Thornburg Strategic Income Fund | | March 31, 2017 (Unaudited) |
Pursuant to a service plan under Rule 12b-1 of the Investment Company Act of 1940, the Fund may pay to the Distributor or securities dealers and other financial institutions at the Distributor’s direction an amount not to exceed .25 of 1% per annum of the average daily net assets attributable to Class A, Class C, Class R3, and Class R4 shares of the Fund to obtain various shareholder and distribution related services. For the six months ended March 31, 2017, there were no 12b-1 service plan fees charged for Class I and Class R5 shares. The Advisor and Distributor each may pay out of its own resources additional expenses for distribution of the Fund’s shares and shareholder services.
The Trust has also adopted a distribution plan pursuant to Rule 12b-1, applicable only to the Fund’s Class C and Class R3 shares, under which the Fund compensates the Distributor for services in promoting the sale of Class C and Class R3 shares of the Fund at an annual rate of up to .75 of 1% per annum of the average daily net assets attributable to Class C shares and an annual rate of .25 of 1% of the average daily net assets attributable to Class R3 shares. Total fees incurred by each class of shares of the Fund under their respective service and distribution plans for the six months ended March 31, 2017, are set forth in the Statement of Operations.
The Advisor and Distributor have contractually agreed to waive fees and reimburse expenses incurred by the Fund so that actual expenses of certain share classes do not exceed levels as specified in the Fund’s most recent prospectus. The agreement may be terminated by the Fund at any time, but may not be terminated by the Advisor or Distributor before April 10, 2018, unless the Advisor ceases to be the investment advisor to the Fund or the Distributor ceases to be the distributor of the Fund prior to that date. The Advisor and Distributor may recoup amounts waived or reimbursed during the fiscal year if actual expenses fall below the contractual limit during that year.
For the six months ended March 31, 2017, the Advisor contractually waived Fund level investment advisory fees of $191,452. The Advisor contractually reimbursed certain class specific expenses, administrative fees, and distribution fees of $9,286 for Class A shares, $195,824 for Class C shares, $116,906 for Class I shares, $18,665 for Class R3 shares, $14,434 for Class R4 shares, and $15,315 for Class R5 shares.
Certain officers and Trustees of the Trust are also officers or directors of the Advisor and Distributor. The compensation of independent Trustees is borne by the Trust.
The percentage of direct investments in the Fund held by the Trustees and Officers of the Trust and the Advisor is approximately 1.50%.
The Fund may purchase or sell securities from, or to an affiliated fund, provided the affiliation is due solely to having a common investment advisor, common officers, or common trustees, and provided that all such transactions will comply with Rule 17a-7 under the 1940 Act. For the six months ended March 31, 2017, the Fund had transactions with affiliated funds of $3,125,667 in sales.
NOTE 5 – SHARES OF BENEFICIAL INTEREST
At March 31, 2017, there were an unlimited number of shares with no par value of beneficial interest authorized. Transactions in shares of beneficial interest were as follows:
| | | | | | | | | | | | | | | | |
| | | SIX MONTHS ENDED | | | YEAR ENDED | |
| | | MARCH 31, 2017 (UNAUDITED) | | | SEPTEMBER 30, 2016 (AUDITED) | |
| | | SHARES | | | AMOUNT | | | SHARES | | | AMOUNT | |
Class A Shares | | | | | | | | | | | | | | | | |
Shares sold | | | 2,524,188 | | | $ | 29,138,580 | | | | 4,582,152 | | | $ | 51,291,779 | |
Shares issued to shareholders in reinvestment of dividends | | | 297,011 | | | | 3,439,741 | | | | 871,540 | | | | 9,760,425 | |
Shares repurchased | | | (6,584,960 | ) | | | (76,260,577 | ) | | | (11,109,168 | ) | | | (124,087,226 | ) |
| | | | | | | | | | | | | | | | |
| | | | |
Net increase (decrease) | | | (3,763,761 | ) | | $ | (43,682,256 | ) | | | (5,655,476 | ) | | $ | (63,035,022 | ) |
| | | | | | | | | | | | | | | | |
Class C Shares | | | | | | | | | | | | | | | | |
Shares sold | | | 941,251 | | | $ | 10,847,245 | | | | 2,946,495 | | | $ | 32,860,557 | |
Shares issued to shareholders in reinvestment of dividends | | | 210,524 | | | | 2,434,735 | | | | 654,821 | | | | 7,317,489 | |
Shares repurchased | | | (4,548,979 | ) | | | (52,429,057 | ) | | | (7,309,089 | ) | | | (81,787,073 | ) |
| | | | | | | | | | | | | | | | |
| | | | |
Net increase (decrease) | | | (3,397,204 | ) | | $ | (39,147,077 | ) | | | (3,707,773 | ) | | $ | (41,609,027 | ) |
| | | | | | | | | | | | | | | | |
Semi-Annual Report 29
| | |
| Notes To Financial Statements, Continued | | |
| |
Thornburg Strategic Income Fund | | March 31, 2017 (Unaudited) |
| | | | | | | | | | | | | | | | |
| | | SIX MONTHS ENDED | | | YEAR ENDED | |
| | | MARCH 31, 2017 (UNAUDITED) | | | SEPTEMBER 30, 2016 (AUDITED) | |
| | | SHARES | | | AMOUNT | | | SHARES | | | AMOUNT | |
Class I Shares | | | | | | | | | | | | | | | | |
Shares sold | | | 13,849,072 | | | $ | 159,754,364 | | | | 13,499,402 | | | $ | 151,142,252 | |
Shares issued to shareholders in reinvestment of dividends | | | 602,054 | | | | 6,956,978 | | | | 1,377,570 | | | | 15,401,708 | |
Shares repurchased | | | (6,857,206 | ) | | | (78,983,997 | ) | | | (20,779,133 | ) | | | (231,181,400 | ) |
| | | | | | | | | | | | | | | | |
| | | | |
Net increase (decrease) | | | 7,593,920 | | | $ | 87,727,345 | | | | (5,902,161 | ) | | $ | (64,637,440 | ) |
| | | | | | | | | | | | | | | | |
Class R3 Shares | | | | | | | | | | | | | | | | |
Shares sold | | | 43,980 | | | $ | 506,895 | | | | 185,212 | | | $ | 2,084,448 | |
Shares issued to shareholders in reinvestment of dividends | | | 1,455 | | | | 16,831 | | | | 3,115 | | | | 34,849 | |
Shares repurchased | | | (58,783 | ) | | | (679,445 | ) | | | (71,853 | ) | | | (804,745 | ) |
| | | | | | | | | | | | | | | | |
| | | | |
Net increase (decrease) | | | (13,348 | ) | | $ | (155,719 | ) | | | 116,474 | | | $ | 1,314,552 | |
| | | | | | | | | | | | | | | | |
Class R4 Shares | | | | | | | | | | | | | | | | |
Shares sold | | | 61,988 | | | $ | 713,584 | | | | 98,418 | | | $ | 1,108,245 | |
Shares issued to shareholders in reinvestment of dividends | | | 2,291 | | | | 26,528 | | | | 5,291 | | | | 59,279 | |
Shares repurchased | | | (105,547 | ) | | | (1,214,526 | ) | | | (13,157 | ) | | | (148,745 | ) |
| | | | | | | | | | | | | | | | |
| | | | |
Net increase (decrease) | | | (41,268 | ) | | $ | (474,414 | ) | | | 90,552 | | | $ | 1,018,779 | |
| | | | | | | | | | | | | | | | |
Class R5 Shares | | | | | | | | | | | | | | | | |
Shares sold | | | 121,893 | | | $ | 1,405,467 | | | | 537,061 | | | $ | 5,962,916 | |
Shares issued to shareholders in reinvestment of dividends | | | 6,819 | | | | 78,778 | | | | 14,404 | | | | 161,108 | |
Shares repurchased | | | (246,273 | ) | | | (2,833,616 | ) | | | (499,950 | ) | | | (5,609,940 | ) |
| | | | | | | | | | | | | | | | |
| | | | |
Net increase (decrease) | | | (117,561 | ) | | $ | (1,349,371 | ) | | | 51,515 | | | $ | 514,084 | |
| | | | | | | | | | | | | | | | |
NOTE 6 – INVESTMENT TRANSACTIONS
For the six months ended March 31, 2017, the Fund had purchase and sale transactions of investments (excluding short-term investments and U.S. Government obligations) of $204,523,892 and $163,432,371, respectively.
NOTE 7 – DERIVATIVE FINANCIAL INSTRUMENTS WITH OFF-BALANCE SHEET RISK AND FOREIGN INVESTMENT RISK
The Fund may use a variety of derivative financial instruments to hedge or adjust the risks affecting its investment portfolio or to enhance investment returns. Provisions of the FASB Accounting Standards Codification 815-10-50 (“ASC 815”) require certain disclosures. The disclosures are intended to provide users of financial statements with an understanding of the use of derivative instruments by the Fund and how these derivatives affect the financial position, financial performance and cash flows of the Fund. The Fund does not designate any derivative instruments as hedging instruments under ASC 815. During the six months ended March 31, 2017, the Fund’s principal exposure to derivative financial instruments of the type addressed by ASC 815 was investment in foreign exchange contracts. A foreign exchange contract is an agreement between two parties to exchange different currencies at a specified rate of exchange at an agreed upon future date. Foreign exchange contracts involve risks to the Fund, including the risk that a contract’s counterparty will not meet its obligations to the Fund, the risk that a change in a contract’s value may not correlate perfectly with the currency the contract was intended to track, and the risk that the Fund’s Advisor is unable to correctly implement its strategy in using a contract. In any such instance, the Fund may not achieve the intended benefit of entering into a contract, and may experience a loss.
The Fund entered into forward currency contracts during the six months ended March 31, 2017 in the normal course of pursuing its investment objectives, with the objective of purchasing foreign investments or with the intent of reducing the risk to the value of the
30 Semi-Annual Report
| | |
| Notes to Financial Statements, Continued | | |
| |
Thornburg Strategic Income Fund | | March 31, 2017 (Unaudited) |
Fund’s foreign investments from adverse changes in the relationship between the U.S. dollar and foreign currencies. In each case these contracts have been initiated in conjunction with foreign investment transactions.
These contracts are accounted for by the Fund under ASC 815. Unrealized appreciation and depreciation on outstanding contracts are reported in the Fund’s Statement of Assets and Liabilities, as measured by the difference between the forward exchange rates at the reporting date and the forward exchange rates at each contract’s inception date. Net realized gain (loss) on contracts closed during the period, and changes in net unrealized appreciation (depreciation) on outstanding contracts are recognized in the Fund’s Statement of Operations.
The quarterly average value of open sell currency contracts for the six months ended March 31, 2017 was $14,906,617. Open buy currency contracts are entered into for the purpose of closing open sell currency contracts and the values are dependent upon the values of the open sell currency contracts to which they relate.
The following table displays the outstanding forward currency contracts at March 31, 2017:
| | | | | | | | | | | | | | | | | | | | | | | | |
| OUTSTANDING FORWARD CURRENCY CONTRACTS TO BUY OR SELL AT MARCH 31, 2017 | |
| |
| | | | |
| CONTRACT DESCRIPTION | | BUY/
SELL | | | CONTRACT
AMOUNT | | | CONTRACT
VALUE DATE | | | VALUE
USD | | | UNREALIZED
APPRECIATION | | | UNREALIZED
DEPRECIATION | |
Canadian Dollar | | | Sell | | | | 12,854,000 | | | | 09/06/2017 | | | | 9,687,642 | | | $ | — | | | $ | (72,991 | ) |
Euro | | | Sell | | | | 475,000 | | | | 09/25/2017 | | | | 511,154 | | | | 6,498 | | | | — | |
Swiss Franc | | | Sell | | | | 3,974,100 | | | | 09/21/2017 | | | | 4,010,296 | | | | 130,686 | | | | — | |
| | | | | | | | | | | | | | | | | | | | | | | | |
Total | | | | | | | | | | | | | | | | | | $ | 137,184 | | | $ | (72,991 | ) |
| | | | | | | | | | | | | | | | | | | | | | | | |
Net unrealized appreciation (depreciation) | | | | | | | | | | | $ | 64,193 | | | | | |
| | | | | | | | | | | | | | | | | |
The outstanding forward currency contracts in the foregoing table were entered into with State Street Bank and Trust Company (“SSB”), pursuant to an International Swaps and Derivatives Association (“ISDA”) Master Agreement. In the event of a default or termination under the ISDA Master Agreement with SSB, the non-defaulting party has the right to close out all outstanding forward currency contracts between the parties and to net any payment amounts under those contracts, resulting in a single net amount payable by one party to the other.
Because the ISDA Master Agreement with SSB does not result in an offset of reported amounts of financial assets and liabilities in the Fund’s Statement of Assets and Liabilities unless there has been an event of default or termination event under that agreement, the Fund does not net its outstanding forward currency contracts for purposes of the disclosure in the Fund’s Statement of Assets and Liabilities. Instead the Fund recognizes the unrealized appreciation or depreciation on those forward currency contracts on a gross basis in the Fund’s Statement of Assets and Liabilities.
The unrealized appreciation (depreciation) of the outstanding forward currency contracts recognized in the Fund’s Statement of Assets and Liabilities at March 31, 2017 is disclosed in the following table:
| | | | |
| FAIR VALUES OF DERIVATIVE FINANCIAL INSTRUMENTS AT MARCH 31, 2017 |
| | |
| ASSET DERIVATIVES | | BALANCE SHEET LOCATION | | FAIR VALUE |
| | |
Foreign exchange contracts | | Assets - Unrealized appreciation on forward currency contracts | | $137,184 |
| | |
| LIABILITY DERIVATIVES | | BALANCE SHEET LOCATION | | FAIR VALUE |
| | |
Foreign exchange contracts | | Liabilities - Unrealized depreciation on forward currency contracts | | $(72,991) |
Because the Fund does not currently receive or post cash collateral in connection with its currency forward contracts, and because all of the Fund’s outstanding currency forward contracts are with SSB, the net amounts of the Fund’s assets and liabilities which are attributable to those contracts at March 31, 2017 can be determined by offsetting the dollar amounts shown in the preceding table. Based on those amounts, the net amount of the Fund’s assets which is attributable to its outstanding forward currency contracts at March
Semi-Annual Report 31
| | |
| Notes To Financial Statements, Continued | | |
| |
Thornburg Strategic Income Fund | | March 31, 2017 (Unaudited) |
31, 2017 is $64,193, and the net amount of the Fund’s liabilities which is attributable to those contracts at that date is $0. The Fund’s forward currency contracts are valued each day, and the net amounts of the Fund’s assets and liabilities which are attributable to those contracts are expected to vary over time.
The net realized gain (loss) from forward currency contracts and the net change in unrealized appreciation (depreciation) on outstanding forward currency contracts recognized in the Fund’s Statement of Operations for the six months ended March 31, 2017 are disclosed in the following tables:
| | | | |
NET REALIZED GAIN (LOSS) ON DERIVATIVE FINANCIAL INSTRUMENTS RECOGNIZED IN INCOME FOR THE SIX MONTHS ENDED MARCH 31, 2017 |
| | |
| | | TOTAL | | FORWARD CURRENCY CONTRACTS |
| | |
Foreign exchange contracts | | $ 386,142 | | $ 386,142 |
| | | | |
NET CHANGE IN UNREALIZED APPRECIATION (DEPRECIATION) OF DERIVATIVE FINANCIAL INSTRUMENTS RECOGNIZED IN INCOME FOR THE SIX MONTHS ENDED MARCH 31, 2017 |
| | |
| | | TOTAL | | FORWARD CURRENCY CONTRACTS |
| | |
Foreign exchange contracts | | $ (62,151) | | $ (62,151) |
OTHER NOTES
Risks: The Fund’s investments subject it to risks including, but not limited to, credit risk, interest rate risk, prepayment risk, management risk, market and economic risk, liquidity risk, risks affecting specific issuers, and the risks associated with investments in derivative instruments, small- and mid-cap companies, non-U.S. issuers, real estate investment trusts, below investment grade debt obligations, and structured finance arrangements. Please see the Fund’s prospectus for a discussion of the risks associated with an investment in the Fund.
Subsequent Events: Fund management believes no events have occurred between March 31, 2017 and the date of issuance of the financial statements that require adjustment to or disclosure in the accompanying financial statements.
32 Semi-Annual Report
This page intentionally left blank.
Semi-Annual Report 33
Financial Highlights
Thornburg Strategic Income Fund
| | | | | | | | | | | | | | | | | | | | | | | | | | | | | | | | | | | | | | | | | | | | | | | | | | | | |
| | | PER SHARE PERFORMANCE (FOR A SHARE OUTSTANDING THROUGHOUT THE PERIOD) | | RATIOS TO AVERAGE NET ASSETS | | | SUPPLEMENTAL DATA | |
UNLESS
OTHERWISE
NOTED,
PERIODS
ARE
FISCAL
YEARS
ENDED
SEPT. 30, | | NET ASSET
VALUE
BEGINNING
OF PERIOD | | | NET
INVESTMENT
INCOME
(LOSS)+ | | NET
REALIZED &
UNREALIZED
GAIN (LOSS)
ON
INVESTMENTS | | | TOTAL FROM
INVESTMENT
OPERATIONS | | | DIVIDENDS
FROM NET
INVESTMENT
INCOME | | | DIVIDENDS
FROM NET
REALIZED
GAINS | | TOTAL
DIVIDENDS | | | NET
ASSET
VALUE
END OF
PERIOD | | NET
INVESTMENT
INCOME
(LOSS) (%) | | | EXPENSES,
AFTER
EXPENSE
REDUCTIONS
(%) | | | EXPENSES,
AFTER
EXPENSE
REDUCTIONS
AND
NET OF
CUSTODY
CREDITS (%) | | | EXPENSES,
BEFORE
EXPENSE
REDUCTIONS
(%) | | | TOTAL
RETURN
(%)(a) | | | PORTFOLIO
TURNOVER
RATE (%)(a) | | NET
ASSETS
AT END
OF
PERIOD
(THOUSANDS) | |
CLASS A SHARES | | | | | | | | | | | | | | | | | | | | | | | | | | | | | | | | | | | | | | | | | | | | | | |
2017(b)(c) | | $ | 11.56 | | | 0.21 | | | 0.04 | | | | 0.25 | | | | (0.16 | ) | | — | | | (0.16 | ) | | $11.65 | | | 3.60 | (f) | | | 1.21 | (f) | | | 1.21 | (f) | | | 1.25 | (f) | | | 2.19 | | | 17.70 | | $ | 241,564 | |
2016(c) | | $ | 11.22 | | | 0.46 | | | 0.28 | | | | 0.74 | | | | (0.37 | ) | | (0.03) | | | (0.40 | ) | | $11.56 | | | 4.12 | | | | 1.24 | | | | 1.24 | | | | 1.24 | | | | 6.70 | | | 29.48 | | $ | 283,398 | |
2015(c) | | $ | 12.18 | | | 0.47 | | | (0.82 | ) | | | (0.35 | ) | | | (0.46 | ) | | (0.15) | | | (0.61 | ) | | $11.22 | | | 4.04 | | | | 1.23 | | | | 1.23 | | | | 1.23 | | | | (2.97 | ) | | 38.40 | | $ | 338,387 | |
2014(c) | | $ | 12.19 | | | 0.52 | | | 0.28 | | | | 0.80 | | | | (0.54 | ) | | (0.27) | | | (0.81 | ) | | $12.18 | | | 4.30 | | | | 1.22 | | | | 1.22 | | | | 1.24 | | | | 6.79 | | | 51.20 | | $ | 392,604 | |
2013(c) | | $ | 12.28 | | | 0.67 | | | 0.03 | | | | 0.70 | | | | (0.65 | ) | | (0.14) | | | (0.79 | ) | | $12.19 | | | 5.44 | | | | 1.25 | | | | 1.25 | | | | 1.27 | | | | 5.79 | | | 76.47 | | $ | 251,106 | |
2012(c) | | $ | 11.86 | | | 0.71 | | | 0.73 | | | | 1.44 | | | | (0.74 | ) | | (0.28) | | | (1.02 | ) | | $12.28 | | | 5.97 | | | | 1.25 | | | | 1.25 | | | | 1.31 | | | | 12.73 | | | 34.54 | | $ | 199,770 | |
CLASS C SHARES | | | | | | | | | | | | | | | | | | | | | | | | | | | | | | | | | | | | | | | | | | | | | | |
2017(b) | | $ | 11.55 | | | 0.17 | | | 0.04 | | | | 0.21 | | | | (0.13 | ) | | — | | | (0.13 | ) | | $11.63 | | | 3.01 | (f) | | | 1.80 | (f) | | | 1.80 | (f) | | | 1.99 | (f) | | | 1.82 | | | 17.70 | | $ | 235,079 | |
2016 | | $ | 11.20 | | | 0.40 | | | 0.28 | | | | 0.68 | | | | (0.30 | ) | | (0.03) | | | (0.33 | ) | | $11.55 | | | 3.56 | | | | 1.80 | | | | 1.80 | | | | 1.99 | | | | 6.20 | | | 29.48 | | $ | 272,691 | |
2015 | | $ | 12.17 | | | 0.41 | | | (0.83 | ) | | | (0.42 | ) | | | (0.40 | ) | | (0.15) | | | (0.55 | ) | | $11.20 | | | 3.47 | | | | 1.80 | | | | 1.80 | | | | 1.97 | | | | (3.61 | ) | | 38.40 | | $ | 306,085 | |
2014 | | $ | 12.17 | | | 0.45 | | | 0.29 | | | | 0.74 | | | | (0.47 | ) | | (0.27) | | | (0.74 | ) | | $12.17 | | | 3.73 | | | | 1.80 | | | | 1.80 | | | | 1.98 | | | | 6.27 | | | 51.20 | | $ | 348,334 | |
2013 | | $ | 12.26 | | | 0.60 | | | 0.03 | | | | 0.63 | | | | (0.58 | ) | | (0.14) | | | (0.72 | ) | | $12.17 | | | 4.88 | | | | 1.80 | | | | 1.80 | | | | 2.02 | | | | 5.21 | | | 76.47 | | $ | 237,177 | |
2012 | | $ | 11.84 | | | 0.64 | | | 0.73 | | | | 1.37 | | | | (0.67 | ) | | (0.28) | | | (0.95 | ) | | $12.26 | | | 5.42 | | | | 1.79 | | | | 1.79 | | | | 2.05 | | | | 12.15 | | | 34.54 | | $ | 188,782 | |
CLASS I SHARES | | | | | | | | | | | | | | | | | | | | | | | | | | | | | | | | | | | | | | | | | | | | | | |
2017(b) | | $ | 11.54 | | | 0.23 | | | 0.03 | | | | 0.26 | | | | (0.18 | ) | | — | | | (0.18 | ) | | $11.62 | | | 3.98 | (f) | | | 0.83 | (f) | | | 0.83 | (f) | | | 0.92 | (f) | | | 2.30 | | | 17.70 | | $ | 571,677 | |
2016 | | $ | 11.19 | | | 0.50 | | | 0.28 | | | | 0.78 | | | | (0.40 | ) | | (0.03) | | | (0.43 | ) | | $11.54 | | | 4.45 | | | | 0.91 | | | | 0.91 | | | | 0.91 | | | | 7.15 | | | 29.48 | | $ | 480,143 | |
2015 | | $ | 12.16 | | | 0.51 | | | (0.83 | ) | | | (0.32 | ) | | | (0.50 | ) | | (0.15) | | | (0.65 | ) | | $11.19 | | | 4.38 | | | | 0.89 | | | | 0.89 | | | | 0.89 | | | | (2.73 | ) | | 38.40 | | $ | 531,849 | |
2014 | | $ | 12.17 | | | 0.56 | | | 0.28 | | | | 0.84 | | | | (0.58 | ) | | (0.27) | | | (0.85 | ) | | $12.16 | | | 4.60 | | | | 0.90 | | | | 0.90 | | | | 0.90 | | | | 7.15 | | | 51.20 | | $ | 552,182 | |
2013 | | $ | 12.25 | | | 0.70 | | | 0.04 | | | | 0.74 | | | | (0.68 | ) | | (0.14) | | | (0.82 | ) | | $12.17 | | | 5.75 | | | | 0.94 | | | | 0.94 | | | | 0.94 | | | | 6.21 | | | 76.47 | | $ | 246,332 | |
2012 | | $ | 11.83 | | | 0.74 | | | 0.73 | | | | 1.47 | | | | (0.77 | ) | | (0.28) | | | (1.05 | ) | | $12.25 | | | 6.27 | | | | 0.96 | | | | 0.96 | | | | 0.97 | | | | 13.06 | | | 34.54 | | $ | 191,090 | |
CLASS R3 SHARES | | | | | | | | | | | | | | | | | | | | | | | | | | | | | | | | | | | | | | | | | | | | | | |
2017(b) | | $ | 11.55 | | | 0.20 | | | 0.04 | | | | 0.24 | | | | (0.16 | ) | | — | | | (0.16 | ) | | $11.63 | | | 3.56 | (f) | | | 1.25 | (f) | | | 1.25 | (f) | | | 2.58 | (f) | | | 2.10 | | | 17.70 | | $ | 2,683 | |
2016 | | $ | 11.21 | | | 0.46 | | | 0.27 | | | | 0.73 | | | | (0.36 | ) | | (0.03) | | | (0.39 | ) | | $11.55 | | | 4.07 | | | | 1.25 | | | | 1.25 | | | | 3.09 | | | | 6.69 | | | 29.48 | | $ | 2,819 | |
2015 | | $ | 12.18 | | | 0.47 | | | (0.83 | ) | | | (0.36 | ) | | | (0.46 | ) | | (0.15) | | | (0.61 | ) | | $11.21 | | | 3.98 | | | | 1.25 | | | | 1.25 | | | | 2.70 | | | | (3.07 | ) | | 38.40 | | $ | 1,430 | |
2014 | | $ | 12.19 | | | 0.49 | | | 0.31 | | | | 0.80 | | | | (0.54 | ) | | (0.27) | | | (0.81 | ) | | $12.18 | | | 4.10 | | | | 1.25 | | | | 1.25 | | | | 3.10 | | | | 6.76 | | | 51.20 | | $ | 3,049 | |
2013 | | $ | 12.28 | | | 0.63 | | | 0.06 | | | | 0.69 | | | | (0.64 | ) | | (0.14) | | | (0.78 | ) | | $12.19 | | | 5.19 | | | | 1.25 | | | | 1.25 | | | | 32.64 | (d) | | | 5.78 | | | 76.47 | | $ | 171 | |
2012(e) | | $ | 12.03 | | | 0.30 | | | 0.25 | | | | 0.55 | | | | (0.30 | ) | | — | | | (0.30 | ) | | $12.28 | | | 5.93 | (f) | | | 1.22 | (f) | | | 1.22 | (f) | | | 373.07 | (d)(f) | | | 4.63 | | | 34.54 | | $ | 11 | |
CLASS R4 SHARES | | | | | | | | | | | | | | | | | | | | | | | | | | | | | | | | | | | | | | | | | | | | | | |
2017(b) | | $ | 11.56 | | | 0.20 | | | 0.04 | | | | 0.24 | | | | (0.16 | ) | | — | | | (0.16 | ) | | $11.64 | | | 3.56 | (f) | | | 1.25 | (f) | | | 1.25 | (f) | | | 2.27 | (f) | | | 2.10 | | | 17.70 | | $ | 2,759 | |
2016 | | $ | 11.21 | | | 0.46 | | | 0.28 | | | | 0.74 | | | | (0.36 | ) | | (0.03) | | | (0.39 | ) | | $11.56 | | | 4.10 | | | | 1.25 | | | | 1.25 | | | | 2.50 | | | | 6.79 | | | 29.48 | | $ | 3,218 | |
2015 | | $ | 12.18 | | | 0.48 | | | (0.84 | ) | | | (0.36 | ) | | | (0.46 | ) | | (0.15) | | | (0.61 | ) | | $11.21 | | | 4.15 | | | | 1.25 | | | | 1.25 | | | | 2.64 | | | | (3.07 | ) | | 38.40 | | $ | 2,106 | |
2014(g) | | $ | 12.00 | | | 0.35 | | | 0.17 | | | | 0.52 | | | | (0.34 | ) | | — | | | (0.34 | ) | | $12.18 | | | 4.25 | (f) | | | 1.25 | (f) | | | 1.25 | (f) | | | 60.66 | (d)(f) | | | 4.29 | | | 51.20 | | $ | 16 | |
CLASS R5 SHARES | | | | | | | | | | | | | | | | | | | | | | | | | | | | | | | | | | | | | | | | | | | | | | |
2017(b) | | $ | 11.54 | | | 0.22 | | | 0.04 | | | | 0.26 | | | | (0.18 | ) | | — | | | (0.18 | ) | | $11.62 | | | 3.91 | (f) | | | 0.90 | (f) | | | 0.90 | (f) | | | 1.43 | (f) | | | 2.28 | | | 17.70 | | $ | 5,875 | |
2016 | | $ | 11.19 | | | 0.49 | | | 0.28 | | | | 0.77 | | | | (0.39 | ) | | (0.03) | | | (0.42 | ) | | $11.54 | | | 4.34 | | | | 0.99 | | | | 0.99 | | | | 1.37 | | | | 7.07 | | | 29.48 | | $ | 7,191 | |
2015 | | $ | 12.15 | | | 0.50 | | | (0.82 | ) | | | (0.32 | ) | | | (0.49 | ) | | (0.15) | | | (0.64 | ) | | $11.19 | | | 4.33 | | | | 0.99 | | | | 0.99 | | | | 1.55 | | | | (2.75 | ) | | 38.40 | | $ | 6,399 | |
2014 | | $ | 12.16 | | | 0.55 | | | 0.28 | | | | 0.83 | | | | (0.57 | ) | | (0.27) | | | (0.84 | ) | | $12.15 | | | 4.51 | | | | 0.99 | | | | 0.99 | | | | 2.11 | | | | 7.05 | | | 51.20 | | $ | 2,565 | |
2013 | | $ | 12.25 | | | 0.70 | | | 0.03 | | | | 0.73 | | | | (0.68 | ) | | (0.14) | | | (0.82 | ) | | $12.16 | | | 5.68 | | | | 0.99 | | | | 0.99 | | | | 227.33 | (d) | | | 6.07 | | | 76.47 | | $ | 11 | |
2012(e) | | $ | 12.00 | | | 0.31 | | | 0.25 | | | | 0.56 | | | | (0.31 | ) | | — | | | (0.31 | ) | | $12.25 | | | 6.22 | (f) | | | 0.97 | (f) | | | 0.97 | (f) | | | 372.35 | (d)(f) | | | 4.75 | | | 34.54 | | $ | 11 | |
| (a) | Not annualized for periods less than one year. |
| (b) | Unaudited Six Month Period Ended March 31. |
| (c) | Sales loads are not reflected in computing total return. |
| (d) | Due to the size of net assets and fixed expenses, ratios may appear disproportionate. |
| (e) | Effective date of this class of shares was May 1, 2012. |
| (g) | Effective date of this class of shares was February 1, 2014. |
| + | Based on weighted average shares outstanding. |
See notes to financial statements.
| | | | |
| 34 Semi-Annual Report | | | | Semi-Annual Report 35 |
| | |
| Expense Example | | |
| |
Thornburg Strategic Income Fund | | March 31, 2017 (Unaudited) |
As a shareholder of the Fund, you incur two types of costs:
| | (1) | transaction costs, including |
(a) sales charges (loads) on purchase payments, for Class A shares;
(b) a deferred sales charge on redemptions of any part or all of a purchase of $1 million of Class A shares within 12 months of purchase;
(c) a deferred sales charge on redemptions of Class C shares within 12 months of purchase;
| | (2) | ongoing costs, including management fees; distribution and/or service (12b-1) fees; and other Fund expenses. |
This example is intended to help you understand your ongoing costs (in dollars) of investing in the Fund and to compare these costs with the ongoing costs of investing in other mutual funds.
The example is based on a $1,000 investment beginning on October 1, 2016, and held until March 31, 2017.
ACTUAL EXPENSES
For each class of shares, the first line of the accompanying table provides information about actual account values and actual expenses. You may use the information in this line, together with the amount you invested, to estimate the expenses that you paid over the period. Simply divide your account value by $1,000 (for example, an $8,600 account value divided by $1,000 = 8.6), then multiply the result by the number in the first line for your class of shares under the heading entitled “Expenses Paid During Period” to estimate the expenses you paid on your account during this period.
| | | | | | | | | | | | |
| | | BEGINNING
ACCOUNT VALUE
10/1/16 | | | ENDING
ACCOUNT VALUE
3/31/17 | | | EXPENSES PAID
DURING PERIOD†
10/1/16–3/31/17 | |
CLASS A SHARES | | | | | | | | | | | | |
Actual | | $ | 1,000.00 | | | $ | 1,021.89 | | | $ | 6.27 | |
Hypothetical | | $ | 1,000.00 | | | $ | 1,018.73 | | | $ | 6.26 | |
CLASS C SHARES | | | | | | | | | | | | |
Actual | | $ | 1,000.00 | | | $ | 1,018.17 | | | $ | 9.23 | |
Hypothetical | | $ | 1,000.00 | | | $ | 1,015.78 | | | $ | 9.22 | |
CLASS I SHARES | | | | | | | | | | | | |
Actual | | $ | 1,000.00 | | | $ | 1,023.05 | | | $ | 4.41 | |
Hypothetical | | $ | 1,000.00 | | | $ | 1,020.58 | | | $ | 4.40 | |
CLASS R3 SHARES | | | | | | | | | | | | |
Actual | | $ | 1,000.00 | | | $ | 1,021.01 | | | $ | 6.49 | |
Hypothetical | | $ | 1,000.00 | | | $ | 1,018.51 | | | $ | 6.48 | |
CLASS R4 SHARES | | | | | | | | | | | | |
Actual | | $ | 1,000.00 | | | $ | 1,021.01 | | | $ | 6.48 | |
Hypothetical | | $ | 1,000.00 | | | $ | 1,018.52 | | | $ | 6.47 | |
CLASS R5 SHARES | | | | | | | | | | | | |
Actual | | $ | 1,000.00 | | | $ | 1,022.77 | | | $ | 4.71 | |
Hypothetical | | $ | 1,000.00 | | | $ | 1,020.28 | | | $ | 4.70 | |
| † | Expenses are equal to the annualized expense ratio for each class (A: 1.24%; C: 1.83%; I: 0.87%; R3: 1.29%; R4: 1.29%; R5: 0.93%) multiplied by the average account value over the period, multiplied by 182/365 to reflect the one-half year period. |
Hypothetical assumes a rate of return of 5% per year before expenses.
HYPOTHETICAL EXAMPLE FOR COMPARISON PURPOSES
For each class of shares, the second line of the accompanying table provides information about hypothetical account values and hypothetical expenses based on the Fund’s actual expense ratio and an assumed rate of return of 5% per year before expenses, which is not the Fund’s actual return. The hypothetical account values and expenses may not be used to estimate the actual ending account balance or expenses you paid for the period. You may use this information to compare the ongoing costs of investing in the Fund and other funds. To do so, compare this 5% hypothetical example with the 5% hypothetical examples that appear in the shareholder reports of the other funds.
Please note that the expenses shown in the table are meant to highlight your ongoing costs only and do not reflect any transactional costs, such as sales charges (loads), redemption fees, or exchange fees. Therefore, the second line of the table for each class of shares is useful in comparing ongoing costs only, and will not help you determine the relative total costs of owning different funds. In addition, if these transactional costs were included, your costs would have been higher.
36 Semi-Annual Report
| | |
| Other Information | | |
| |
Thornburg Strategic Income Fund | | March 31, 2017 (Unaudited) |
PORTFOLIO PROXY VOTING
Policies and Procedures:
The Trust has delegated to Thornburg Investment Management, Inc. (the “Advisor”) voting decisions respecting proxies for the Fund’s voting securities. The Advisor makes voting decisions in accordance with its Proxy Voting Policy and Procedures. A description of the Policy and Procedures is available (i) without charge, upon request, by calling the Advisor toll-free at 1-800-847-0200, (ii) on the Thornburg website at www.thornburg.com, and (iii) on the Securities and Exchange Commission’s website at www.sec.gov.
Information regarding how proxies were voted is available on or before August 31 of each year for the twelve months ending the preceding June 30. This information is available (i) without charge, upon request by calling the Advisor toll-free at 1-800-847-0200, (ii) on the Thornburg website at www.thornburg.com, and (iii) on the Securities and Exchange Commission’s website at www.sec.gov.
AVAILABILITY OF QUARTERLY PORTFOLIO SCHEDULE
The Fund files with the Securities and Exchange Commission schedules of its portfolio holdings on Form N-Q for the first and third quarters of each fiscal year. The Fund’s Forms N-Q are available on the Commission’s website at www.sec.gov, or may be reviewed and copied at the Commission’s Public Reference Room in Washington, D.C. Information on the operation of the Public Reference Room may be obtained by calling 1-800-SEC-0330. The Fund also makes this information available on its website at www.thornburg. com/download or upon request by calling 1-800-847-0200.
Semi-Annual Report 37
Trustees’ Statement to Shareholders
Readopted September 12, 2016
The Trustees believe current and prospective shareholders should know how we discharge our responsibilities in supervising the Funds’ investment advisor and in reviewing the advisor’s contract for renewal. Since 2005, we have issued a statement which sets out clearly the three principal guidelines that we follow in supervising the Trust’s investment advisor on your behalf. In accordance with our customary practice, in September of this year we again reviewed our statement and concluded we should reissue this statement outlining the principal features of our supervision of the advisor’s performance of investment management services for the Funds.
We begin with the premise that each shareholder selected his or her Fund because its investments are managed by the investment advisor identified in the prospectus and in accordance with the objective and policies described in the prospectus. We realize, as each of you do, that if you believe that your Fund’s stated objective and policies no longer serve your personal investment goals, you can sell your shares and leave the Fund.
Therefore, we believe that our primary supervisory task—our principal obligation to you—is to assess the nature and quality of the advisor’s services, and to confirm that the advisor actively and competently pursues the Fund’s objective, in accordance with the policies set out in the prospectus. To do this, we meet regularly with management to review your Fund’s portfolio and to discuss the advisor’s specific actions and judgments in pursuing the Fund’s objective. We do not substitute our own judgment for the advisor’s decisions in selecting investments; the advisor is paid to exercise its informed judgment on investment decisions, and we seek to confirm, in reviewing the advisor’s performance, that the advisor is doing just that.
Second, we are conscious of costs and the effect that costs have on shareholders’ returns. We try to make sure that your Fund’s fees and costs are reasonable in relationship to the services rendered and that they are generally in line with those charged by other expert investment advisors, consistent with our belief that the Fund’s investors searched for and expect that expertise and attention and have decided to pay a reasonable price for it. We do not put the management contract “out to bid” as a matter of course, and we would not do so unless we had concluded that the advisor materially had failed to pursue the Fund’s objectives in accordance with its policies, or for other equally important reasons. We believe that any other approach would be inconsistent with your interests and contrary to your expectations when you bought shares of the Fund in the first place.
Finally, because we believe that most Thornburg Fund shareholders have invested with a long-term perspective, we try not to focus too much on the fashions of the moment and on short-term performance. The market will not favor any specific investment objective or set of policies at all times and under all economic circumstances. A fund will experience periods of both high and low returns relative to other funds and other investments. Even if one of our Funds is not favored by the market at a particular time, we believe that the advisor is nonetheless obliged to remain true to the Fund’s objective and policies, and we watch to see that it does so.
Trustees of Thornburg Investment Trust
38 Semi-Annual Report
Thornburg Funds
Thornburg Investment Management is a privately-owned global investment firm that offers a range of solutions for retail and institutional investors. Founded in 1982 and headquartered in Santa Fe, New Mexico, we manage approximately $49 billion (as of March 31, 2017) across U.S. mutual funds, separate accounts for high-net-worth investors and institutional accounts, and UCITS funds for non-U.S. investors.
The fund outlined in this report is one of many equity and fixed-income products available from Thornburg Investment Management.
EQUITY FUNDS
| | • | | Thornburg Investment Income Builder Fund |
| | • | | Thornburg Global Opportunities Fund |
| | • | | Thornburg International Value Fund |
| | • | | Thornburg Better World International Fund |
| | • | | Thornburg International Growth Fund |
| | • | | Thornburg Developing World Fund |
| | • | | Thornburg Core Growth Fund |
FIXED INCOME FUNDS
| | • | | Thornburg Low Duration Income Fund |
| | • | | Thornburg Limited Term U.S. Government Fund |
| | • | | Thornburg Limited Term Income Fund |
| | • | | Thornburg Strategic Income Fund |
| | • | | Thornburg Low Duration Municipal Fund |
| | • | | Thornburg Limited Term Municipal Fund |
| | • | | Thornburg Intermediate Municipal Fund |
| | • | | Thornburg California Limited Term Municipal Fund |
| | • | | Thornburg New Mexico Intermediate Municipal Fund |
| | • | | Thornburg New York Intermediate Municipal Fund |
| | • | | Thornburg Strategic Municipal Income Fund |
ALTERNATIVE FUNDS
| | • | | Thornburg Long/Short Equity Fund |
Before investing, carefully consider the Fund’s investment goals, risks, charges, and expenses. For a prospectus or summary prospectus containing this and other information, contact your financial advisor or visit thornburg.com. Read it carefully before investing.
For additional information, please visit thornburg.com
Thornburg Investment Management, Inc. 2300 North Ridgetop Road, Santa Fe, NM 87506
Semi-Annual Report 39

| | |
To receive shareholder reports, prospectuses, and proxy statements electronically, go to www.thornburg.com/edelivery. This Semi-Annual Report is submitted for the general information of shareholders of the Fund. It is not authorized for distribution to prospective investors in the Fund unless preceded or accompanied by an effective prospectus. | | 
|
| |
| | | | |
| Investment Advisor: | | Distributor: | | |
| Thornburg Investment Management® | | Thornburg Securities Corporation® | | |
| 800.847.0200 | | 800.847.0200 | | TH1663 |
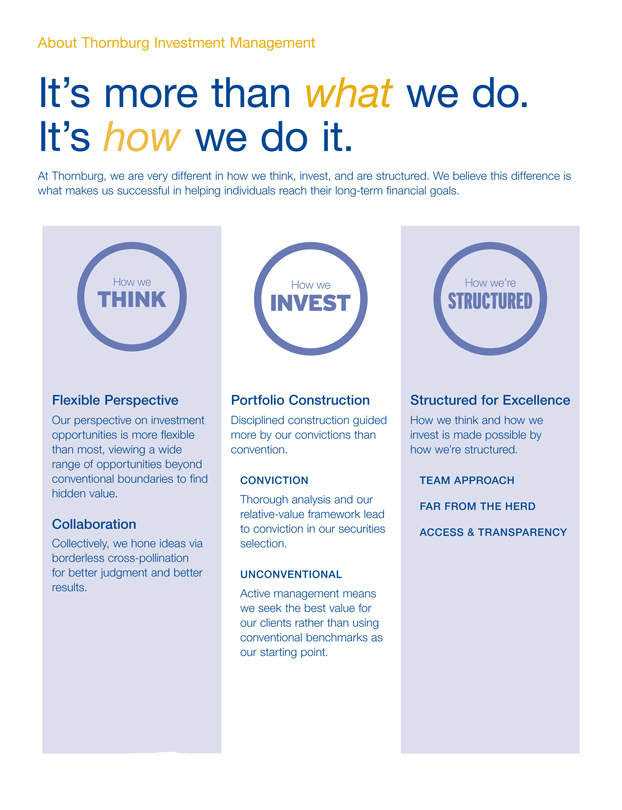
About Thornburg Investment Management
It’s more than what we do.
It’s how we do it.
At Thornburg, we are very different in how we think, invest, and are structured. We believe this difference is what makes us successful in helping individuals reach their long-term financial goals.
How we THINK
Flexible Perspective
Our perspective on investment opportunities is more flexible than most, viewing a wide range of opportunities beyond conventional boundaries to find hidden value.
Collaboration
Collectively, we hone ideas via borderless cross-pollination for better judgment and better results.
How we INVEST
Portfolio Construction
Disciplined construction guided more by our convictions than convention.
CONVICTION
Thorough analysis and our relative-value framework lead to conviction in our securities selection.
UNCONVENTIONAL
Active management means we seek the best value for our clients rather than using conventional benchmarks as our starting point.
How we’re STRUCTURED
Structured for Excellence
How we think and how we invest is made possible by how we’re structured.
TEAM APPROACH
FAR FROM THE HERD
ACCESS & TRANSPARENCY
2 Semi-Annual Report
Semi-Annual Report
Thornburg Value Fund
March 31, 2017
| | | | |
SHARE CLASS | | NASDAQ SYMBOL | | CUSIP |
Class A | | TVAFX | | 885-215-731 |
Class C | | TVCFX | | 885-215-715 |
Class I | | TVIFX | | 885-215-632 |
Class R3 | | TVRFX | | 885-215-533 |
Class R4 | | TVIRX | | 885-215-277 |
Class R5 | | TVRRX | | 885-215-376 |
Class I, R3, R4, and R5 shares may not be available to all investors. Minimum investments for Class I shares may be higher than those for other classes.
Investments carry risks, including possible loss of principal. Additional risks may be associated with investments outside the United States, especially in emerging markets, including currency fluctuations, illiquidity, volatility, and political and economic risks. Investments in small- and mid-capitalization companies may increase the risk of greater price fluctuations. Please see the Fund’s prospectus for a discussion of the risks associated with an investment in the Fund. Investments in the Fund are not FDIC insured, nor are they bank deposits or guaranteed by a bank or any other entity.
Semi-Annual Report 3
Letter to Shareholders
| | |
Thornburg Value Fund | | March 31, 2017 (Unaudited) |
April 25, 2017
Dear Fellow Shareholders:
The first half of Thornburg Value Fund’s 2017 fiscal year showed a positive result, and was just below our benchmark, the S&P 500 Index. During the period, the Fund (A shares without sales charge) slightly underperformed the S&P 500 Index, returning 9.80%, versus the index’s 10.12%.
Both long-term performance (since inception) and returns since we bolstered the consistent earners basket characteristics (in mid-2012) remain constructive. To illustrate the recovery with hard data, the updated Table 1, which was introduced in last year’s semi-annual letter, further highlights the Fund’s strengthening performance and improved beta characteristic since our mid-2012 consistent earner bolstering. We’re excited that, since then, we have provided a significant return for shareholders (in absolute terms) while also outpacing many pertinent investment alternatives.
Table I Historical Performance Statistics
| | | | | | | | | | | | |
| | | 10/2/95–
12/31/10 | | | 12/31/10–
6/30/12 | | | 6/30/12–
3/31/17 | |
Value Fund Beta | | | 0.94 | | | | 1.22 | | | | 0.96 | |
Value Fund Total Return, Annualized (A shares without sales charge) | | | 9.9 | % | | | -8.9 | % | | | 16.1 | % |
S&P 500 Total Return, Annualized | | | 7.1 | % | | | 7.7 | % | | | 14.7 | % |
Value Fund Total Return, Cumulative | | | 320.3 | % | | | -12.9 | % | | | 103.3 | % |
S&P 500 Total Return, Cumulative | | | 184.3 | % | | | 11.8 | % | | | 92.0 | % |
Source: Bloomberg and Confluence.
Performance data shown represents past performance and is no guarantee of future results. Investment return and principal value will fluctuate so shares, when redeemed, may be worth more or less than their original cost. Current performance may be lower or higher than quoted. For performance current to the most recent month end, visit thornburg.com or call 800.847.0200.
The maximum sales charge for Class A shares is 4.50%. If the sales charge had been deducted, returns would be lower. The total annual fund operating expense of Class A shares is 1.39%, as disclosed in the most recent prospectus.
We recently read Philip Tetlock and Dan Gardner’s book Superforecasting, the Art and Science of Prediction, which focuses on measuring and improving our ability to forecast the future. Tetlock’s work helped lead the U.S. Director of National Intelligence to form IARPA, or the Intelligence Advanced Research Project Activity. In IARPA’s first forecasting competition, Tetlock’s crowdsourced team significantly out-forecasted U.S. government intelligence officers who had access to classified information. (It so happens that one of our team members, Greg Mazares, participated in the competition and forecasted accurately enough to qualify as a “Superforecaster.”)
We were particularly interested in Tetlock’s point about how hard the simple idea of probabilistic thinking can be to understand. This is the idea that if a weatherman projects just a 10% chance of rain, but then it rains, it doesn’t mean the weatherman was wrong. Imagine a weatherman predicts a 10% chance of rain on 100 different days. If it rains 10 of those days, then he is a perfect forecaster. That’s little solace when you’re soaked on one of those 10 days without an umbrella!
Probabilistic thinking plays a role in our investment approach. Like the weather on a given day, individual world events are hard to predict and have big near-term impact on the stock market. So how do you add value when big drivers of market performance are impossible to predict? We do this through portfolio construction.
Using our three-basket approach (consisting of basic value stocks, consistent earners, and emerging franchises), we attempt to construct a portfolio that has the ability to outperform over time regardless of outcomes of global events. The flexibility inherent in our basket approach ensures we always have a focused, yet diversified portfolio. Our hope is to construct a portfolio that has the opportunity to outperform no matter what low probability events come to pass in the future. If we consistently make good investment decisions investment by investment, with good probabilistic thinking around potential outcomes for the businesses we research, we believe can be successful in pursuing the Fund’s objectives over time.
Probabilistic thinking also plays a role in how we judge our own historic investment results. When we review individual stock performance within the portfolio, whether we made money or not isn’t the only important question to ask. Did we win for the right reasons? Did we correctly estimate the probability and size of the downside scenario? Sometimes investments with good risk/rewards lead to bad outcomes—sometimes it rains when there is a 90% chance of sun.
Similarly, probabilistic thinking is important when analyzing portfolio level performance. Over short periods of time, it may rain more or less than you predict. Over longer periods of time, short-term factors tend to cancel each other out and longer-term trends begin to emerge. This is why we like to think about performance on a three- to five-year basis, instead of just the past quarter or six-month period.
Sometimes even over longer periods of time, factors can sometimes still distort results. In an attempt to appropriately evaluate underlying performance, we offer several ways to look at portfolio performance since our bolstering of the consistent-earners basket characteristics in mid-2012. We learned a lot in the year and a half of weak performance before then, and we believe we have successfully put those lessons to work in the almost five years since.
Specifically, here are three examples of how we control our overall good results for different “macro” influences. When we run simple alpha/beta (i.e., controlling for market risk, the main driver of equity returns) our beta shows 0.96, leaving annualized alpha of 1.80% over this period. If we run a sector
4 Semi-Annual Report
| | |
| Letter to Shareholders, | | |
| |
Continued | | |
| |
Thornburg Value Fund | | March 31, 2017 (Unaudited) |
attribution report, individual stock selection contribution to returns (i.e., Fund performance not explained by our allocation to different sectors) is 2.27% annualized. Since “risk factors” are all the rage, let’s see how we’ve done when controlling for a few of these. Running a traditional “five factor model,” remaining, unexplained alpha is 4.1% annualized over this period and statistically significant. Slicing the data a few different ways points to strong contribution from individual stock picking, just as we would hope, given our approach.
To really know whether this period of success has been based on luck or skill, you’ll have to stick around for the next five years. We like our chances.
A Quick Update on Smart Beta and ETFs
Since our initial discussion of smart beta strategies last year, we’ve found interesting research work generally supporting our hypothesis that “smart” beta is anything but. Further, we find mounting evidence that extensive use of ETFs (exchange traded funds) are leading to bad outcomes in real world portfolios. We believe passive flows are exacerbating market inefficiencies. This has created a challenging environment for intrinsic-value-based active managers over the last few years (especially those that compare themselves to the S&P 500 Index, the hardest index in the world to beat over that time period). We believe, however, that passive flows are creating exciting opportunities for managers brave enough to look different than the index. If this is true, we might expect to see a period in the future where intrinsic-value-based active managers have a much easier time outperforming passive indexes. We recently released a new white paper on this topic, now available in the Firm Insights section at www.thornburg.com.
Our summary: $480 billion today is invested in smart beta ETFs, fully 30% of ETF investments in the U.S. Smart beta flows show all the classic signs of performance chasing.
We’re off to an ok start for the first half of the fiscal year. Early in the period, the Fund did not keep pace with the broad market in the post-election rally. This seemed, in part, due to less exposure in the Fund to companies that benefited from the “Trump Trade,” i.e., companies that would benefit from lower corporate tax rates or infrastructure spending. The Fund also has significant exposure to Silicon Valley-based technology companies. After the election, many of these companies underperformed traditional network operators (Cable and Telecom) as Trump and his FCC are viewed to be a better friend to the network operators than to the software and service companies that operate on the networks (e.g. GOOGL, FB). Since the end of December, relative performance improved markedly, in part due to a reversal of many of the “Trump Trade” stocks.
Stock selection in the financials and consumer discretionary sectors aided Fund performance during the first half of the fiscal year and helped to offset weak stock selection effect in the health care and materials sectors.
We are certain that 2017 will continue to be an exciting year, especially if you “follow” or “feed” the social media juggernaut that will surround the Trump administration. We believe the market will latch on to different parts of the Trump agenda, and oscillate between optimism and pessimism toward prospects for the global economy.
While we can’t help but glance at the noise, our sights are trained on finding promising companies at a discount for the portfolio. Our focus will be on what we believe we do well—fundamental, bottom-up security selection. We like the portfolio’s current holdings, and will continue looking for other overlooked gems.
Thank you for investing alongside us in Thornburg Value Fund.
Sincerely,
| | |
 | |  |
| Connor Browne, CFA | | Robert MacDonald, CFA |
| Portfolio Manager | | Portfolio Manager |
| Managing Director | | Managing Director |
The matters discussed in this report may constitute forward-looking statements made pursuant to the safe harbor provisions of the Securities Litigation Reform Act of 1995. These include any advisor or portfolio manager prediction, assessment, analysis or outlook for individual securities, industries, investment styles, market sectors and/or markets. These statements involve risks and uncertainties. In addition to the general risks described for each fund in its current prospectus, other factors bearing on these reports include the accuracy of the advisor’s or portfolio manager’s forecasts and predictions, the appropriateness of the investment strategies designed by the advisor or portfolio manager and the ability of the advisor or portfolio manager to implement their strategies efficiently and successfully. Any one or more of these factors, as well as other risks affecting the securities markets generally, could cause the actual results of any fund to differ materially as compared to its benchmarks.
The views expressed are subject to change and do not necessarily reflect the views of Thornburg Investment Management, Inc. This information should not be relied upon as a recommendation or investment advice and is not intended to predict the performance of any investment or market.
Semi-Annual Report 5
| | |
| Performance Summary | | |
| |
Thornburg Value Fund | | March 31, 2017 (Unaudited) |
AVERAGE ANNUAL TOTAL RETURNS
| | | | | | | | | | | | | | | | | | | | |
| | | 1-YR | | | 3-YR | | | 5-YR | | | 10-YR | | | SINCE
INCEP. | |
Class A Share (Incep: 10/2/95) | | | | | | | | | | | | | | | | | | | | |
Without sales charge | | | 17.84 | % | | | 8.92 | % | | | 11.99 | % | | | 5.40 | % | | | 9.79 | % |
With sales charge | | | 12.54 | % | | | 7.27 | % | | | 10.96 | % | | | 4.92 | % | | | 9.55 | % |
Class C Shares (Incep: 10/2/95) | | | | | | | | | | | | | | | | | | | | |
Without sales charge | | | 16.99 | % | | | 8.12 | % | | | 11.14 | % | | | 4.61 | % | | | 8.95 | % |
With sales charge | | | 15.99 | % | | | 8.12 | % | | | 11.14 | % | | | 4.61 | % | | | 8.95 | % |
Class I Shares (Incep: 11/2/98) | | | 18.32 | % | | | 9.35 | % | | | 12.43 | % | | | 5.81 | % | | | 7.57 | % |
Class R3 Shares (Incep: 7/1/03) | | | 17.90 | % | | | 8.96 | % | | | 12.03 | % | | | 5.40 | % | | | 7.78 | % |
Class R4 Shares (Incep: 2/1/07) | | | 18.03 | % | | | 9.07 | % | | | 12.14 | % | | | 5.51 | % | | | 5.25 | % |
Class R5 Shares (Incep: 2/1/05) | | | 18.35 | % | | | 9.36 | % | | | 12.43 | % | | | 5.79 | % | | | 7.73 | % |
S&P 500 Index (Since 10/2/95) | | | 17.17 | % | | | 10.37 | % | | | 13.30 | % | | | 7.51 | % | | | 8.78 | % |
GROWTH OF A HYPOTHETICAL $10,000 INVESTMENT
Performance data shown represents past performance and is no guarantee of future results. Investment return and principal value will fluctuate so shares, when redeemed, may be worth more or less than their original cost. Current performance may be lower or higher than quoted. For performance current to the most recent month end, visit thornburg.com or call 800-847-0200. The performance information does not reflect the deduction of taxes that a shareholder would pay on distributions or the redemption of Fund shares. Returns reflect the reinvestment of dividends and capital gains. Class A shares are sold with a maximum sales charge of 4.50%. Class C shares are subject to a 1% CDSC for the first year only. There is no sales charge for Class I, R3, R4, and R5 shares.
As disclosed in the most recent prospectus, the total annual fund operating expenses are as follows: A shares, 1.39%; C shares, 2.14%; I shares, 1.07%; R3 shares, 1.81%; R4 shares, 1.75%; R5 shares, 1.46%. Thornburg Investment Management and/or Thornburg Securities Corporation have contractually agreed to waive fees and reimburse expenses through at least April 10, 2018, for some of the share classes, resulting in net expense ratios of the following: I shares, 0.99%; R3 shares, 1.35%; R4 shares, 1.25%; R5 shares, 0.99%. For more detailed information on fund expenses and waivers/reimbursements please see the Fund’s prospectus.
Glossary
The S&P 500 Index is an unmanaged broad measure of the U.S. stock market.
The performance of any index is not indicative of the performance of any particular investment. Unless otherwise noted, index returns reflect the reinvestment of income dividends and capital gains, if any, but do not reflect fees, brokerage commissions or other expenses of investing. Investors may not make direct investments into any index.
Alpha – A measure of the difference between a portfolio’s actual returns and its expected performance, given its level of risk as measured by beta. A positive alpha figure indicates the portfolio performed better than its beta would predict. In contrast, a negative alpha indicates under-performance, given the expectations established by the beta.
Beta – A measure of market-related risk. Less than one means the portfolio is less volatile than the index, while greater than one indicates more volatility than the index.
Exchange Traded Fund (ETF) – A security that tracks an index, a commodity or a basket of assets like an index fund, but trades like a stock on an exchange. ETFs experience price changes throughout the day as they are bought and sold.
Upside/Downside Capture Ratio – A ratio that shows whether a given fund has outperformed—gained more or lost less than—a broad market benchmark during periods of market strength and weakness, and if so, by how much.
6 Semi-Annual Report
| | |
| Fund Summary | | |
| |
Thornburg Value Fund | | March 31, 2017 (Unaudited) |
OBJECTIVES AND STRATEGIES
The Fund seeks long-term capital appreciation by investing in equity and debt securities of all types. As a secondary consideration, the Fund also seeks some current income.
The Fund expects to invest primarily in domestic equity securities (primarily common stocks) selected on a value basis. However, the Fund may own a variety of securities, including foreign equity securities, partnership interests, and foreign and domestic debt obligations which, in the opinion of the Fund’s investment advisor, offer prospects for meeting the Fund’s investment goals.
MARKET CAPITALIZATION EXPOSURE
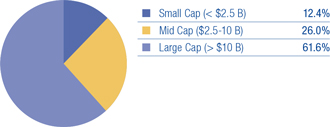
BASKET STRUCTURE
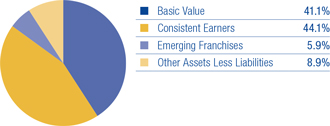
TOP TEN EQUITY HOLDINGS
| | | | |
JPMorgan Chase & Co. | | | 4.1 | % |
Wal-Mart Stores, Inc. | | | 3.9 | % |
Thermo Fisher Scientific, Inc. | | | 3.9 | % |
Facebook, Inc. | | | 3.8 | % |
Gilead Sciences, Inc. | | | 3.5 | % |
Grand Canyon Education, Inc. | | | 3.4 | % |
Activision Blizzard, Inc. | | | 3.3 | % |
Medtronic plc | | | 3.2 | % |
International Flavors & Fragrances, Inc. | | | 3.1 | % |
Alphabet, Inc. Class C | | | 3.1 | % |
There is no guarantee that the Fund will meet its investment objectives.
All portfolio information is subject to change.
SECTOR EXPOSURE
| | | | |
Information Technology | | | 18.6 | % |
Financials | | | 17.6 | % |
Health Care | | | 15.6 | % |
Consumer Discretionary | | | 14.8 | % |
Consumer Staples | | | 9.0 | % |
Energy | | | 4.4 | % |
Materials | | | 3.1 | % |
Industrials | | | 3.1 | % |
Telecommunication Services | | | 2.8 | % |
Utilities | | | 1.5 | % |
Real Estate | | | 0.6 | % |
Other Assets Less Liabilities | | | 8.9 | % |
TOP TEN INDUSTRY GROUPS
| | | | |
Pharmaceuticals, Biotechnology & Life Sciences | | | 11.2 | % |
Software & Services | | | 11.2 | % |
Banks | | | 7.9 | % |
Technology Hardware & Equipment | | | 7.4 | % |
Diversified Financials | | | 7.3 | % |
Consumer Services | | | 5.9 | % |
Food, Beverage & Tobacco | | | 5.1 | % |
Retailing | | | 4.5 | % |
Health Care Equipment & Services | | | 4.4 | % |
Energy | | | 4.4 | % |
Semi-Annual Report 7
| | |
| Schedule of Investments | | |
| |
Thornburg Value Fund | | March 31, 2017 (Unaudited) |
| | | | | | | | |
| | | SHARES/
PRINCIPAL
AMOUNT | | | VALUE | |
COMMON STOCK — 91.12% | | | | | | | | |
BANKS — 7.94% | | | | | | | | |
Banks — 7.94% | | | | | | | | |
Citigroup, Inc. | | | 459,400 | | | $ | 27,481,308 | |
Citizens Financial Group, Inc. | | | 225,620 | | | | 7,795,171 | |
JPMorgan Chase & Co. | | | 419,409 | | | | 36,840,887 | |
| | | | | | | | |
| | | | | | | 72,117,366 | |
| | | | | | | | |
CAPITAL GOODS — 0.82% | | | | | | | | |
Machinery — 0.82% | | | | | | | | |
Allison Transmission Holdings, Inc. | | | 207,603 | | | | 7,486,164 | |
| | | | | | | | |
| | | | | | | 7,486,164 | |
| | | | | | | | |
COMMERCIAL & PROFESSIONAL SERVICES — 0.98% | | | | | | | | |
Commercial Services & Supplies — 0.98% | | | | | | | | |
Covanta Holding Corp. | | | 568,774 | | | | 8,929,752 | |
| | | | | | | | |
| | | | | | | 8,929,752 | |
| | | | | | | | |
CONSUMER DURABLES & APPAREL — 4.39% | | | | | | | | |
Household Durables — 1.84% | | | | | | | | |
a TRI Pointe Homes, Inc. | | | 1,333,678 | | | | 16,724,322 | |
Leisure Products — 2.55% | | | | | | | | |
a Acushnet Holdings Corp. | | | 911,800 | | | | 15,755,904 | |
Callaway Golf Co. | | | 669,908 | | | | 7,415,882 | |
| | | | | | | | |
| | | | | | | 39,896,108 | |
| | | | | | | | |
CONSUMER SERVICES — 5.87% | | | | | | | | |
Diversified Consumer Services — 3.39% | | | | | | | | |
a Grand Canyon Education, Inc. | | | 430,608 | | | | 30,835,839 | |
Hotels, Restaurants & Leisure — 2.48% | | | | | | | | |
Aramark Holdings Corp. | | | 610,976 | | | | 22,526,685 | |
| | | | | | | | |
| | | | | | | 53,362,524 | |
| | | | | | | | |
DIVERSIFIED FINANCIALS — 7.34% | | | | | | | | |
Capital Markets — 4.98% | | | | | | | | |
Apollo Global Management, LLC | | | 1,036,419 | | | | 25,205,710 | |
Oaktree Capital Group, LLC | | | 441,634 | | | | 20,006,020 | |
Mortgage Real Estate Investment Trusts — 2.36% | | | | | | | | |
PennyMac Mortgage Investment Trust | | | 1,207,530 | | | | 21,433,658 | |
| | | | | | | | |
| | | | | | | 66,645,388 | |
| | | | | | | | |
ENERGY — 4.40% | | | | | | | | |
Oil, Gas & Consumable Fuels — 4.40% | | | | | | | | |
Devon Energy Corp. | | | 306,112 | | | | 12,770,993 | |
Enterprise Products Partners L.P. | | | 985,004 | | | | 27,195,960 | |
| | | | | | | | |
| | | | | | | 39,966,953 | |
| | | | | | | | |
FOOD & STAPLES RETAILING — 3.95% | | | | | | | | |
Food & Staples Retailing — 3.95% | | | | | | | | |
Wal-Mart Stores, Inc. | | | 497,651 | | | | 35,870,684 | |
| | | | | | | | |
| | | | | | | 35,870,684 | |
| | | | | | | | |
FOOD, BEVERAGE & TOBACCO — 5.06% | | | | | | | | |
Food Products — 5.06% | | | | | | | | |
Mead Johnson Nutrition Co. | | | 161,839 | | | | 14,416,618 | |
Mondelez International, Inc. | | | 231,738 | | | | 9,983,273 | |
a Nomad Foods Ltd. | | | 1,123,935 | | | | 12,869,056 | |
The Kraft Heinz Co. | | | 95,800 | | | | 8,699,598 | |
| | | | | | | | |
| | | | | | | 45,968,545 | |
| | | | | | | | |
HEALTH CARE EQUIPMENT & SERVICES — 4.43% | | | | | | | | |
Health Care Equipment & Supplies — 3.40% | | | | | | | | |
a Avinger, Inc. | | | 760,168 | | | | 1,444,319 | |
Medtronic plc | | | 365,335 | | | | 29,431,388 | |
8 Semi-Annual Report
| | |
| Schedule of Investments, Continued | | |
| |
Thornburg Value Fund | | March 31, 2017 (Unaudited) |
| | | | | | | | |
| | | SHARES/
PRINCIPAL
AMOUNT | | | VALUE | |
Health Care Providers & Services — 1.03% | | | | | | | | |
a Envision Healthcare Corp. | | | 152,706 | | | $ | 9,363,932 | |
| | | | | | | | |
| | | | | | | 40,239,639 | |
| | | | | | | | |
INSURANCE — 2.32% | | | | | | | | |
Insurance — 2.32% | | | | | | | | |
Assured Guaranty Ltd. | | | 568,300 | | | | 21,089,613 | |
| | | | | | | | |
| | | | | | | 21,089,613 | |
| | | | | | | | |
MATERIALS — 3.13% | | | | | | | | |
Chemicals — 3.13% | | | | | | | | |
International Flavors & Fragrances, Inc. | | | 214,596 | | | | 28,440,408 | |
| | | | | | | | |
| | | | | | | 28,440,408 | |
| | | | | | | | |
PHARMACEUTICALS, BIOTECHNOLOGY & LIFE SCIENCES — 11.20% | | | | | | | | |
Biotechnology — 4.42% | | | | | | | | |
Gilead Sciences, Inc. | | | 462,370 | | | | 31,404,171 | |
a Seattle Genetics, Inc. | | | 139,020 | | | | 8,738,797 | |
Life Sciences Tools & Services — 3.94% | | | | | | | | |
Thermo Fisher Scientific, Inc. | | | 232,786 | | | | 35,755,930 | |
Pharmaceuticals — 2.84% | | | | | | | | |
a Akorn, Inc. | | | 530,900 | | | | 12,784,072 | |
Phibro Animal Health Corp. | | | 463,763 | | | | 13,031,740 | |
| | | | | | | | |
| | | | | | | 101,714,710 | |
| | | | | | | | |
REAL ESTATE — 0.59% | | | | | | | | |
Real Estate Management & Development — 0.59% | | | | | | | | |
a CBRE Group, Inc. | | | 153,398 | | | | 5,336,716 | |
| | | | | | | | |
| | | | | | | 5,336,716 | |
| | | | | | | | |
RETAILING — 4.54% | | | | | | | | |
Internet & Direct Marketing Retail — 2.46% | | | | | | | | |
Expedia, Inc. | | | 100,894 | | | | 12,729,796 | |
a Netflix, Inc. | | | 64,967 | | | | 9,602,772 | |
Specialty Retail — 2.08% | | | | | | | | |
a AutoZone, Inc. | | | 11,178 | | | | 8,082,253 | |
Office Depot, Inc. | | | 1,084,757 | | | | 5,060,391 | |
Staples, Inc. | | | 655,979 | | | | 5,752,936 | |
| | | | | | | | |
| | | | | | | 41,228,148 | |
| | | | | | | | |
SOFTWARE & SERVICES — 11.19% | | | | | | | | |
Information Technology Services — 1.01% | | | | | | | | |
a Cognizant Tech Solutions Corp. | | | 153,844 | | | | 9,156,795 | |
Internet Software & Services — 6.90% | | | | | | | | |
a Alphabet, Inc. Class C | | | 33,858 | | | | 28,087,243 | |
a Facebook, Inc. | | | 243,800 | | | | 34,631,790 | |
Software — 3.28% | | | | | | | | |
Activision Blizzard, Inc. | | | 597,977 | | | | 29,815,133 | |
| | | | | | | | |
| | | | | | | 101,690,961 | |
| | | | | | | | |
TECHNOLOGY HARDWARE & EQUIPMENT — 7.39% | | | | | | | | |
Communications Equipment — 3.05% | | | | | | | | |
a ARRIS International plc | | | 352,600 | | | | 9,326,270 | |
Nokia Oyj | | | 1,819,095 | | | | 9,761,269 | |
a Palo Alto Networks, Inc. | | | 76,474 | | | | 8,617,090 | |
Technology, Hardware, Storage & Peripherals — 4.34% | | | | | | | | |
Apple, Inc. | | | 166,700 | | | | 23,948,122 | |
HP, Inc. | | | 867,177 | | | | 15,505,125 | |
| | | | | | | | |
| | | | | | | 67,157,876 | |
| | | | | | | | |
TELECOMMUNICATION SERVICES — 2.82% | | | | | | | | |
Diversified Telecommunication Services — 1.39% | | | | | | | | |
a Level 3 Communications, Inc. | | | 221,619 | | | | 12,681,039 | |
Semi-Annual Report 9
| | |
| Schedule of Investments, Continued | | |
| |
Thornburg Value Fund | | March 31, 2017 (Unaudited) |
| | | | | | | | |
| | | SHARES/
PRINCIPAL
AMOUNT | | | VALUE | |
Wireless Telecommunication Services — 1.43% | | | | | | | | |
China Mobile Ltd. | | | 1,185,700 | | | | 12,976,103 | |
| | | | | | | | |
| | | | | | | 25,657,142 | |
| | | | | | | | |
TRANSPORTATION — 1.27% | | | | | | | | |
Air Freight & Logistics — 1.27% | | | | | | | | |
United Parcel Service, Inc. | | | 107,667 | | | $ | 11,552,669 | |
| | | | | | | | |
| | | | | | | 11,552,669 | |
| | | | | | | | |
UTILITIES — 1.49% | | | | | | | | |
Electric Utilities — 1.49% | | | | | | | | |
Fortis, Inc. | | | 408,853 | | | | 13,557,565 | |
| | | | | | | | |
| | | | | | | 13,557,565 | |
| | | | | | | | |
TOTAL COMMON STOCK (Cost $637,710,210) | | | | | | | 827,908,931 | |
| | | | | | | | |
SHORT TERM INVESTMENTS — 8.95% | | | | | | | | |
b Thornburg Capital Management Fund | | | 8,132,319 | | | | 81,323,190 | |
| | | | | | | | |
TOTAL SHORT TERM INVESTMENTS (Cost $81,323,190) | | | | | | | 81,323,190 | |
| | | | | | | | |
TOTAL INVESTMENTS — 100.07% (Cost $719,033,400) | | | | | | $ | 909,232,121 | |
LIABILITIES NET OF OTHER ASSETS — (0.07)% | | | | | | | (669,293 | ) |
| | | | | | | | |
NET ASSETS — 100.00% | | | | | | $ | 908,562,828 | |
| | | | | | | | |
Footnote Legend
| b | Investment in Affiliates – Shown below are holdings of voting securities of each portfolio company which is considered “affiliated” to the Fund under the Investment Company Act of 1940, including companies for which the Fund’s holding represented 5% or more of the company’s voting securities, and a series of the Thornburg Investment Trust in which the Fund invested for cash management purposes during the period: |
| | | | | | | | | | | | | | | | | | | | | | | | | | | | |
ISSUER | | SHARES/PRINCIPAL
SEPTEMBER 30,
2016 | | | GROSS
ADDITIONS | | | GROSS
REDUCTIONS | | | SHARES/PRINCIPAL
MARCH 31,
2017 | | | MARKET VALUE
MARCH 31,
2017 | | | INVESTMENT
INCOME | | | REALIZED
GAIN (LOSS) | |
Avinger, Inc.* | | | 1,466,902 | | | | — | | | | 706,734 | | | | | | | $ | | | | $ | — | | | $ | 95,207 | |
Thornburg Capital Management Fund | | | 7,337,220 | | | | 14,363,136 | | | | 13,568,037 | | | | 8,132,319 | | | | 81,323,190 | | | | 239,861 | | | | — | |
| | | | | | | | | | | | | | | | | | | | | | | | | | | | |
Total non-controlled affiliated issuers - 8.95% of net assets | | | | | | | $ | 81,323,190 | | | $ | 239,861 | | | $ | — | |
| | | | | | | | | | | | | | | | | | | | | | | | | | | | |
| * | Issuer not affiliated at March 31, 2017. |
See notes to financial statements.
10 Semi-Annual Report
This page intentionally left blank.
Semi-Annual Report 11
| | |
| Statement of Assets and Liabilities | | |
| |
Thornburg Value Fund | | March 31, 2017 (Unaudited) |
| | | | |
ASSETS | | | | |
Investments at value (Note 3) | | | | |
Non-affiliated issuers (cost $637,710,210) | | $ | 827,908,931 | |
Non-controlled affiliated issuer (cost $81,323,190) | | | 81,323,190 | |
Receivable for fund shares sold | | | 601,676 | |
Dividends receivable | | | 1,262,093 | |
Prepaid expenses and other assets | | | 69,662 | |
| | | | |
Total Assets | | | 911,165,552 | |
| | | | |
| |
LIABILITIES | | | | |
Payable for investments purchased | | | 52,770 | |
Payable for fund shares redeemed | | | 1,290,720 | |
Unrealized depreciation on forward currency contracts (Note 7) | | | 66,068 | |
Payable to investment advisor and other affiliates (Note 4) | | | 925,126 | |
Accounts payable and accrued expenses | | | 268,040 | |
| | | | |
Total Liabilities | | | 2,602,724 | |
| | | | |
| |
NET ASSETS | | $ | 908,562,828 | |
| | | | |
NET ASSETS CONSIST OF | | | | |
Distribution in excess of net investment income | | $ | (480,945 | ) |
Net unrealized appreciation on investments | | | 191,540,144 | |
Accumulated net realized gain (loss) | | | (347,317,287 | ) |
Net capital paid in on shares of beneficial interest | | | 1,064,820,916 | |
| | | | |
| |
| | $ | 908,562,828 | |
| | | | |
12 Semi-Annual Report
| | |
| Statement of Assets and Liabilities, Continued |
| |
Thornburg Value Fund | | March 31, 2017 (Unaudited) |
| | | | |
NET ASSET VALUE | | | | |
| |
Class A Shares: | | | | |
Net asset value and redemption price per share ($355,211,532 applicable to 5,983,577 shares of beneficial interest outstanding - Note 5) | | $ | 59.36 | |
Maximum sales charge, 4.50% of offering price | | | 2.80 | |
| | | | |
Maximum offering price per share | | $ | 62.16 | |
| | | | |
| |
Class C Shares: | | | | |
Net asset value and offering price per share* ($165,883,726 applicable to 3,034,236 shares of beneficial interest outstanding - Note 5) | | $ | 54.67 | |
| | | | |
| |
Class I Shares: | | | | |
Net asset value, offering and redemption price per share ($315,464,215 applicable to 5,165,331 shares of beneficial interest outstanding - Note 5) | | $ | 61.07 | |
| | | | |
| |
Class R3 Shares: | | | | |
Net asset value, offering and redemption price per share ($46,943,933 applicable to 795,500 shares of beneficial interest outstanding - Note 5) | | $ | 59.01 | |
| | | | |
| |
Class R4 Shares: | | | | |
Net asset value, offering and redemption price per share ($9,400,588 applicable to 157,641 shares of beneficial interest outstanding - Note 5) | | $ | 59.63 | |
| | | | |
| |
Class R5 Shares: | | | | |
Net asset value, offering and redemption price per share ($15,658,834 applicable to 256,758 shares of beneficial interest outstanding - Note 5) | | $ | 60.99 | |
| | | | |
| * | Redemption price per share is equal to net asset value less any applicable contingent deferred sales charge. |
See notes to financial statements.
Semi-Annual Report 13
| | |
| Statement of Operations | | |
| |
Thornburg Value Fund | | Six Months Ended March 31, 2017 |
| | | | |
INVESTMENT INCOME | | | | |
Dividend income | | | | |
Non-affiliated issuers (net of foreign taxes withheld of $36,256) | | $ | 6,584,230 | |
Non-controlled affiliated issuer | | | 239,861 | |
| | | | |
Total Income | | | 6,824,091 | |
| | | | |
| |
EXPENSES | | | | |
Investment advisory fees (Note 4) | | | 3,789,505 | |
Administration fees (Note 4) | | | | |
Class A Shares | | | 223,160 | |
Class C Shares | | | 102,675 | |
Class I Shares | | | 73,756 | |
Class R3 Shares | | | 29,774 | |
Class R4 Shares | | | 5,853 | |
Class R5 Shares | | | 3,771 | |
Distribution and service fees (Note 4) | | | | |
Class A Shares | | | 445,609 | |
Class C Shares | | | 820,305 | |
Class R3 Shares | | | 118,943 | |
Class R4 Shares | | | 11,021 | |
Transfer agent fees | | | | |
Class A Shares | | | 205,705 | |
Class C Shares | | | 88,032 | |
Class I Shares | | | 152,852 | |
Class R3 Shares | | | 61,885 | |
Class R4 Shares | | | 14,819 | |
Class R5 Shares | | | 25,198 | |
Registration and filing fees | | | | |
Class A Shares | | | 17,461 | |
Class C Shares | | | 8,613 | |
Class I Shares | | | 13,594 | |
Class R3 Shares | | | 8,237 | |
Class R4 Shares | | | 9,239 | |
Class R5 Shares | | | 7,895 | |
Custodian fees (Note 2) | | | 62,350 | |
Professional fees | | | 60,172 | |
Accounting fees (Note 4) | | | 13,802 | |
Trustee fees | | | 19,397 | |
Other expenses | | | 65,747 | |
| | | | |
Total Expenses | | | 6,459,370 | |
Less: | | | | |
Expenses reimbursed by investment advisor (Note 4) | | | (279,186 | ) |
| | | | |
Net Expenses | | | 6,180,184 | |
| | | | |
Net Investment Income | | $ | 643,907 | |
| | | | |
14 Semi-Annual Report
| | |
| Statement of Operations, Continued | | |
| |
Thornburg Value Fund | | Six Months Ended March 31, 2017 |
| | | | |
REALIZED AND UNREALIZED GAIN (LOSS) | | | | |
Net realized gain (loss) on: | | | | |
Investments | | | | |
Non-affiliated issuers | | $ | 46,650,440 | |
Non-controlled affiliated issuers | | | 95,207 | |
Forward currency contracts (Note 7) | | | 794,730 | |
Foreign currency transactions | | | 55,072 | |
| | | | |
| | | 47,595,449 | |
| | | | |
Net change in unrealized appreciation (depreciation) on: | | | | |
Non-affiliated issuer investments | | | 35,312,430 | |
Forward currency contracts (Note 7) | | | 3,336 | |
Foreign currency translations | | | 74 | |
| | | | |
| | | 35,315,840 | |
| | | | |
Net Realized and Unrealized Gain | | | 82,911,289 | |
| | | | |
Net Increase in Net Assets Resulting from Operations | | $ | 83,555,196 | |
| | | | |
See notes to financial statements.
Semi-Annual Report 15
| | |
| Statements of Changes in Net Assets | | |
| |
Thornburg Value Fund | | |
| | | | | | | | |
| | | SIX MONTHS ENDED
MARCH 31, 2017* | | | YEAR ENDED
SEPTEMBER 30, 2016 | |
INCREASE (DECREASE) IN NET ASSETS FROM | | | | | | | | |
| | |
OPERATIONS | | | | | | | | |
Net investment income | | $ | 643,907 | | | $ | 5,651,412 | |
Net realized gain (loss) on investments, forward currency contracts, and foreign currency transactions | | | 47,595,449 | | | | (9,665,095 | ) |
Net unrealized appreciation (depreciation) on investments, forward currency contracts, and foreign currency translations | | | 35,315,840 | | | | 93,060,311 | |
| | | | | | | | |
Net Increase (Decrease) in Net Assets Resulting from Operations | | | 83,555,196 | | | | 89,046,628 | |
| | |
DIVIDENDS TO SHAREHOLDERS | | | | | | | | |
From net investment income | | | | | | | | |
Class A Shares | | | (133,853 | ) | | | (1,158,420 | ) |
Class I Shares | | | (425,629 | ) | | | (1,940,838 | ) |
Class R3 Shares | | | (26,173 | ) | | | (169,459 | ) |
Class R4 Shares | | | (7,537 | ) | | | (40,361 | ) |
Class R5 Shares | | | (21,323 | ) | | | (101,418 | ) |
| | |
FUND SHARE TRANSACTIONS (NOTE 5) | | | | | | | | |
Class A Shares | | | (52,205,969 | ) | | | (38,733,979 | ) |
Class B Shares** | | | — | | | | (1,613,193 | ) |
Class C Shares | | | (15,739,929 | ) | | | (16,405,080 | ) |
Class I Shares | | | 6,668,528 | | | | (35,363,785 | ) |
Class R3 Shares | | | (7,550,573 | ) | | | (14,298,695 | ) |
Class R4 Shares | | | (1,018,290 | ) | | | (1,514,713 | ) |
Class R5 Shares | | | (525,720 | ) | | | (6,121,309 | ) |
| | | | | | | | |
Net Increase (Decrease) in Net Assets | | | 12,568,728 | | | | (28,414,622 | ) |
| | |
NET ASSETS | | | | | | | | |
Beginning of Period | | | 895,994,100 | | | | 924,408,722 | |
| | | | | | | | |
| | |
End of Period | | $ | 908,562,828 | | | $ | 895,994,100 | |
| | | | | | | | |
Distribution in excess of net investment income | | $ | (480,945 | ) | | $ | (510,337 | ) |
| ** | Class B shares converted to Class A shares on August 29, 2016. |
See notes to financial statements.
16 Semi-Annual Report
| | |
| Notes to Financial Statements | | |
| |
Thornburg Value Fund | | March 31, 2017 |
NOTE 1 – ORGANIZATION
Thornburg Value Fund (the “Fund”) is a diversified series of Thornburg Investment Trust (the “Trust”). The Trust is organized as a Massachusetts business trust under a Declaration of Trust dated June 3, 1987 and is registered as a diversified, open-end management investment company under the Investment Company Act of 1940, as amended. The Fund is currently one of twenty-one separate series of the Trust. Each series is considered to be a separate entity for financial reporting and tax purposes and bears expenses directly attributable to it. The Fund seeks long-term capital appreciation by investing in equity and debt securities of all types. As a secondary objective, the Fund also seeks some current income.
The Fund currently has six classes of shares of beneficial interest: Class A, Class C, Institutional Class (“Class I”), and Retirement Classes (“Class R3,” “Class R4,” and “Class R5”). Each class of shares of the Fund represents an interest in the same portfolio of investments, except that (i) Class A shares are sold subject to a front-end sales charge collected at the time the shares are purchased and bear a service fee, (ii) Class C shares are sold at net asset value without a sales charge at the time of purchase, but are subject to a contingent deferred sales charge upon redemption within one year of purchase, and bear both a service fee and a distribution fee, (iii) Class I shares are sold at net asset value without a sales charge at the time of purchase and may be subject to a service fee, (iv) Class R3 shares are sold at net asset value without a sales charge at the time of purchase, but bear both a service fee and distribution fee, (v) Class R4 shares are sold at net asset value without a sales charge at the time of purchase, but bear a service fee, (vi) Class R5 shares are sold at net asset value without a sales charge at the time of purchase and may be subject to a service fee, and (vii) the respective classes may have different reinvestment privileges and conversion rights. Additionally, the Fund may allocate among its classes certain expenses, to the extent allocable to specific classes, including transfer agent fees, government registration fees, certain printing and postage costs, and administrative and legal expenses. Currently, class specific expenses of the Fund are limited to service and distribution fees, administration fees, and certain registration and transfer agent expenses.
The following is a summary of significant accounting policies followed by the Fund in the preparation of its financial statements. The Fund prepares its financial statements in conformity with United States generally accepted accounting principles (“GAAP”), including investment company accounting and reporting guidance in the Financial Accounting Standards Board (the “FASB”) Accounting Standard Codification Topic 946.
NOTE 2 – SIGNIFICANT ACCOUNTING POLICIES
Security Valuation: All investments in securities held by the Fund are valued as described in Note 3.
Allocation of Income, Gains, Losses and Expenses: Net investment income (other than class specific expenses) and realized and unrealized gains and losses are allocated daily to each class of shares based upon the relative net asset value of outstanding shares (or the value of the dividend-eligible shares, as appropriate) of each class of shares at the beginning of the day (after adjusting for the current capital shares activity of the respective class). Expenses common to all Funds are allocated among the Funds comprising the Trust based upon their relative net asset values or other appropriate allocation methods. Operating expenses directly attributable to a specific class are charged against the operating income of that class.
Dividends and Distributions to Shareholders: Dividends and distributions to shareholders, which are determined in accordance with federal income tax regulations and may differ from GAAP, are recorded on the ex-dividend date. Ordinary income distributions, if any, are declared and paid quarterly. Capital gain distributions, if any, are declared and paid annually and more often if deemed necessary by the Advisor. Dividends are paid and are reinvested in additional shares of the Fund at net asset value per share at the close of business on the ex-dividend date, or at the shareholder’s option, paid in cash.
Investment Income: Dividend income is recorded on the ex-dividend date. Certain income from foreign investments is recognized as soon as information is available to the Fund. Interest income is accrued as earned. Premiums and discounts are amortized and accreted, respectively, to call dates or maturity dates using the effective yield method of the respective investments. These amounts are included in Interest income on the Statement of Operations.
Custodian Fees: Custodian fees disclosed in the Statement of Operations may include interest expenses incurred by the Fund on any cash overdrafts of its custodian account during the period. Such cash overdrafts may result from the effects of failed trades in portfolio securities and from cash outflows resulting from unanticipated shareholder redemption activity. The Fund pays interest to its custodian on any such cash overdraft at a rate equal to 2.50% of the overdraft amount in excess of $50,000.
Investment Transactions: Investment transactions are accounted for on a trade date basis. Realized gains and losses from the sale of investments are recorded on an identified cost basis.
Repurchase Agreements: The Fund may invest excess cash in repurchase agreements whereby the Fund purchases investments, which serve as collateral, with an agreement to resell such collateral to the seller at an agreed upon price at the maturity date of the repurchase agreement. Investments pledged as collateral for repurchase agreements are held in custody until maturity of the repurchase agreement. Provisions in the agreements require that the market value of the collateral is at least equal to the repurchase value
Semi-Annual Report 17
| | |
| Notes to Financial Statements, Continued | | |
| |
Thornburg Value Fund | | March 31, 2017 (Unaudited) |
in the event of default. In the event of default, the Fund has the right to liquidate the collateral and apply the proceeds in satisfaction of the obligation. Under certain circumstances, in the event of default or bankruptcy by the other party to the agreement, realization and/or retention of the collateral may be subject to legal proceedings.
When-Issued and Delayed Delivery Transactions: The Fund may engage in when-issued or delayed delivery transactions. To the extent the Fund engages in such transactions, it will do so for the purpose of acquiring portfolio investments consistent with the Fund’s investment objectives and not for the purpose of investment leverage or to speculate on interest rate or market changes. At the time the Fund makes a commitment to purchase an investment on a when-issued or delayed delivery basis, the Fund will record the transaction and reflect the value in determining its net asset value. When effecting such transactions, assets of an amount sufficient to make payment for the portfolio investments to be purchased will be segregated on the Fund’s records on the trade date. Investments purchased on a when-issued or delayed delivery basis do not earn interest until the settlement date.
Foreign Currency Translation: Portfolio investments and other assets and liabilities denominated in foreign currencies are translated into U.S. dollars based on the exchange rate of such currencies against the U.S. dollar on the date of valuation. Purchases and sales of investments and income items denominated in foreign currencies are translated into U.S. dollars at the exchange rate in effect on the transaction date. When the Fund purchases or sells foreign investments, it will customarily enter into a foreign exchange contract to minimize foreign exchange risk from the trade date to the settlement date of such transactions. The values of such spot contracts are included in receivable for investments sold and payable for investments purchased on the Statement of Assets and Liabilities.
The Fund does not separately report the effect of changes in foreign exchange rates from changes in market prices on investments held. Such changes are included in net unrealized appreciation (depreciation) from investments.
Reported net realized gains and losses from foreign currency transactions arise due to purchases and sales of foreign currencies, currency gains and losses realized between the trade and settlement dates on investment transactions and the difference between the amounts of dividends, interest, and foreign withholding taxes recorded on the Fund’s books, and the U.S. dollar equivalent of the amounts actually received or paid.
Net change in unrealized appreciation (depreciation) on foreign currency translations arise from changes in the fair value of assets and liabilities, other than investments at period end, resulting from changes in exchange rates.
Guarantees and Indemnifications: Under the Trust’s organizational documents (and under separate agreements with the independent Trustees), its officers and Trustees are provided with an indemnification against certain liabilities arising out of the performance of their duties to the Fund. In the normal course of business the Trust may also enter into contracts with service providers that contain general indemnifications. The Trust’s maximum exposure under these arrangements is unknown. However, based on experience, the Trust expects the risk of loss to be remote.
Use of Estimates: The preparation of financial statements in conformity with GAAP requires management to make estimates and assumptions that affect the reported amounts of assets and liabilities and disclosure of contingent assets and liabilities at the date of the financial statements and the reported amounts of increases (decreases) in net assets from operations during the reporting period. Actual results could differ from those estimates.
Federal Income Taxes: It is the policy of the Trust to comply with the provisions of the Internal Revenue Code applicable to regulated investment companies and to distribute to shareholders substantially all investment company taxable income including net realized gains on investments (if any), and tax exempt income of the Fund. Therefore, no provision for federal income or excise tax is required.
The Fund files income tax returns in United States federal and applicable state jurisdictions. The statute of limitations on the Fund’s tax return filings generally remains open for the three years following a return’s filing date. The Fund has analyzed its tax positions taken on Federal income tax returns for all open tax years and has concluded that no provision for income tax is required in the financial statements.
At March 31, 2017, information on the tax components of capital was as follows:
| | | | |
Cost of investments for tax purposes | | $ | 720,431,690 | |
| | | | |
| |
Gross unrealized appreciation on a tax basis | | $ | 210,154,213 | |
Gross unrealized depreciation on a tax basis | | | (21,353,782 | ) |
| | | | |
| |
Net unrealized appreciation (depreciation) on investments (tax basis) | | $ | 188,800,431 | |
| | | | |
At March 31, 2017, the Fund had deferred tax basis late year specified ordinary losses occurring subsequent to December 31, 2015 through September 30, 2016 of $34,093. For tax purposes, such losses will be recognized in the year ending September 30, 2017.
At March 31, 2017, the Fund had deferred tax basis capital losses occurring subsequent to October 31, 2015 through September 30, 2016 of $17,189,381. For tax purposes, such capital losses will be recognized in the year ending September 30, 2017.
18 Semi-Annual Report
| | |
| Notes to Financial Statements, Continued | | |
| |
Thornburg Value Fund | | March 31, 2017 (Unaudited) |
At March 31, 2017, the Fund had cumulative tax basis capital losses generated prior to October 1, 2011 which may expire prior to utilization. To the extent such carryforwards are utilized, capital gain distributions may be reduced to the extent provided by regulations.
Capital loss carryforwards generated prior to October 31, 2011 expire as follows:
| | | | |
2017 | | $ | 136,966,580 | |
2018 | | | 242,353,997 | |
| | | | |
| |
| | $ | 379,320,577 | |
| | | | |
Foreign Withholding Taxes: The Fund is subject to foreign tax withholding imposed by certain foreign countries in which the Fund may invest. Withholding taxes are incurred on certain foreign dividends and are accrued at the time the dividend is recognized based on applicable foreign tax laws. The Fund may file withholding tax reclaims in certain jurisdictions to recover a portion of amounts previously withheld, in view of various considerations, including recent decisions rendered by the courts in those and other jurisdictions. The Fund would expect to record a receivable for such a reclaim based on a variety of factors, including assessment of a jurisdiction’s legal obligation to pay reclaims, the jurisdiction’s administrative practices and payment history, and industry convention. To date the Fund has recorded no such receivable because there is limited precedent for collecting such prior year reclaims and the likelihood of collection remains uncertain.
Deferred Foreign Capital Gain Taxes: The Fund is subject to a tax imposed on net realized gains of securities of certain foreign countries. The Fund records an estimated deferred tax liability for net unrealized gains on these investments as reflected in the accompanying financial statements.
NOTE 3 – SECURITY VALUATION
Valuation of the Fund’s portfolio investment securities is performed in accordance with policies and procedures adopted by and under the oversight of the Trustees.
The Trustees of the Trust have appointed Thornburg Investment Management, Inc., the Trust’s investment advisor (“the Advisor”) to assist the Trustees in obtaining market values for portfolio investments, evaluate and monitor professional pricing service providers appointed by the Trustees’ Audit Committee (the “Audit Committee”) to assist in determining fair values for portfolio investments, assist in calculating fair values for portfolio investments in certain circumstances, and to perform other functions in connection with the valuation of investments. The Advisor acts through its Valuation and Pricing Committee (the “Committee”) and other employees of the Advisor. The Committee regularly reviews its own valuation calculations, as well as the valuations, valuation techniques and services furnished by pricing service providers, considers circumstances which may require valuation calculations by the Committee, and reviews previous valuation calculations. The Committee reports to the Audit Committee on the Committee’s activities, the performance of pricing service providers, and other matters relating to valuation of portfolio investments.
In those instances when the Committee assists in calculating a fair value for a portfolio investment, the Committee seeks to determine the price that the Fund would reasonably expect to receive upon a sale of the investment in an orderly transaction between market participants on the valuation date. The Committee customarily utilizes quotations from securities broker dealers in calculating valuations, but also may utilize prices obtained from pricing service providers or other methods approved by the Audit Committee. Because fair values calculated by the Committee are estimates, the calculation of a value for an investment may differ from the price that would be realized by the Fund upon a sale of the investment, and the difference could be material to the Fund’s financial statements. The Committee’s calculation of a fair value for an investment may also differ from the prices obtained by other persons (including other mutual funds) for the investment.
Valuation of Securities: Securities and other portfolio investments which are listed or traded on a United States securities exchange are valued at the last reported sale price on the valuation date. Investments listed or traded on an exchange for which there has been no sale that day are valued at the mean between the last reported bid and asked prices on that valuation date. Portfolio investments reported by NASDAQ are valued at the official closing price on the valuation date. If an investment is traded on more than one exchange, the investment is considered traded on the exchange that is normally the primary market for that investment. Securities and other portfolio investments which are listed or traded on exchanges outside the United States are valued at the last price or the closing price of the investment on the exchange that is normally the primary market for the investment, as of the close of the exchange preceding the Fund’s valuation date. Foreign investments listed or traded on an exchange for which there has been no sale that day are valued at the mean between the last reported bid and asked prices on that valuation date.
In any case when a market quotation is not readily available for a portfolio investment ordinarily valued by market quotation, the Committee calculates a fair value for the investment using alternative methods approved by the Audit Committee. A market quotation is not readily available when the primary market or exchange for the investment is not open for the entire scheduled day of trading. Market quotations for an investment also may not be readily available if developments after the most recent close of the investment’s primary exchange or market, but prior to the close of business on any Fund business day, or an unusual event or significant period of
Semi-Annual Report 19
| | |
| Notes to Financial Statements, Continued | | |
| |
Thornburg Value Fund | | March 31, 2017 (Unaudited) |
time occurring since the availability of a market quotation, create a serious question concerning the reliability of the most recent market quotation available for the investment. In particular, on days when market volatility thresholds established by the Audit Committee are exceeded, foreign equity investments held by the Fund may be valued using alternative methods. The Committee customarily obtains valuations in these instances from pricing service providers approved by the Audit Committee. Pricing service providers ordinarily calculate valuations using multi-factor models to adjust market prices based upon various inputs, including exchange data, depository receipt prices, futures, index data and other data.
Debt obligations held by the Fund which are not listed or traded on exchanges or for which no reported market exists are ordinarily valued at the valuation obtained from a pricing service provider approved by the Audit Committee.
In any case when a pricing service provider fails to provide a valuation for a debt obligation held by the Fund, the Committee calculates a fair value for the obligation using alternative methods under procedures approved by the Audit Committee. Additionally, in cases when management believes that a valuation obtained from a pricing service provider merits review for significant reasons, the Committee decides whether or not to use the valuation calculated by the pricing service provider or to use an alternative method approved by the Audit Committee to calculate a fair value for the obligation.
Quotations for foreign investments expressed in foreign currency amounts are converted to U.S. dollar equivalents using a foreign exchange quotation from a third party service provider at the time of valuation. Foreign investments held by the Fund may be traded on days and at times when the Fund is not open for business. Consequently, the value of Fund investments may be significantly affected on days when shareholders cannot purchase or sell Fund shares. Futures contracts and other financial and derivative instruments traded on an exchange are valued at the latest published price for the instrument on its primary exchange. Listed options are valued at the last bid price.
Valuation Hierarchy: The Fund categorizes its investments based upon the inputs used in valuing those investments, according to a three-level hierarchy established in guidance from FASB. Categorization of investments using this hierarchy is intended by the FASB to maximize the use of observable inputs in valuing investments and minimize the use of unobservable inputs by requiring that the most observable inputs be used when available. Observable inputs are those that market participants would use in valuing an investment based on available market information. Unobservable inputs are those that reflect assumptions about the information market participants would use in valuing an investment. An investment’s level within the hierarchy is based on the lowest level input that is deemed significant to the valuation. The methodologies and inputs used to value investments are not necessarily indications of the risk or liquidity associated with those investments.
Various inputs are used in calculating valuations for the Fund’s investments. These inputs are generally summarized according to the three-level hierarchy below:
Level 1: Quoted prices in active markets for identical investments.
Level 2: Other direct or indirect significant observable inputs (including quoted prices for similar investments in active markets and other observable inputs, such as interest rates, prepayment rates, credit risk, etc.).
Level 3: Significant unobservable inputs (including the Committee’s own assumptions in calculating the fair values of investments).
Valuations for debt obligations held by the Fund are typically calculated by pricing service providers approved by the Audit Committee and are characterized as Level 2 within the valuation hierarchy.
On days when market volatility thresholds established by the Audit Committee are exceeded, foreign securities for which valuations are obtained from pricing service providers are fair valued. On these days, the foreign securities are characterized as Level 2 within the valuation hierarchy and revert to Level 1 after the threshold is no longer exceeded.
In a limited number of cases the Committee calculates a fair value for investments using broker quotations or other methods approved by the Audit Committee. When the Committee uses a single broker quotation to calculate a fair value for an investment without other significant observable inputs, or if a fair value is calculated using other significant inputs that are considered unobservable, the investment is characterized as Level 3 within the hierarchy. Other significant unobservable inputs used to calculate a fair value in these instances might include an income-based valuation approach which considers discounted anticipated future cash flows from the investment, and application of discounts due to the nature or duration of any restrictions on the disposition of the investment.
Valuations based upon the use of inputs from Levels 1, 2 or 3 may not represent the actual price received upon the disposition of an investment, and the Fund may receive a price that is lower than the valuation based upon these inputs when it sells the investment.
The following table displays a summary of the fair value hierarchy measurements of the Fund’s investments as of March 31, 2017. In any instance when valuation inputs from more than one level are used to determine the fair value of a specific investment, the investment is placed in the level of the table based upon the lowest level input that is significant in determining the fair value of the investment:
20 Semi-Annual Report
| | |
| Notes to Financial Statements, Continued | | |
| |
Thornburg Value Fund | | March 31, 2017 (Unaudited) |
| | | | | | | | | | | | | | | | |
| | | FAIR VALUE MEASUREMENTS AT MARCH 31, 2017 | |
| | | TOTAL | | | LEVEL 1 | | | LEVEL 2 | | | LEVEL 3 | |
Assets | | | | | | | | | | | | | | | | |
Investments in Securities* | | | | | | | | | | | | | | | | |
Common Stock | | $ | 827,908,931 | | | $ | 827,908,931 | | | $ | — | | | $ | — | |
Short Term Investments | | | 81,323,190 | | | | 81,323,190 | | | | — | | | | — | |
| | | | | | | | | | | | | | | | |
Total Investments in Securities | | $ | 909,232,121 | | | $ | 909,232,121 | | | $ | — | | | $ | — | |
| | | | |
Liabilities | | | | | | | | | | | | | | | | |
Other Financial Instruments** | | | | | | | | | | | | | | | | |
Forward Currency Contracts | | $ | (66,068 | ) | | $ | — | | | $ | (66,068 | ) | | $ | — | |
| * | See Schedule of Investments for a summary of the industry exposure as grouped according to the Global Industry Classification Standard (GICS), which is an industry taxonomy developed by MSCI, Inc. and Standard & Poor’s (S&P). |
| ** | Other Financial Instruments include investments not reflected in the Schedule of Investments, which may include futures, forwards and swap contracts, which are valued at the unrealized appreciation (depreciation) on the investment. |
In accordance with the guidance prescribed in ASU No. 2011-04, it is the policy of the Fund to recognize transfers between levels and those underlying events which caused the movement. The Fund recognized no transfers between Levels 1 and 2 for the six months ended March 31, 2017, other than when the Fund exceeded market volatility thresholds for foreign equity investments during the period.
NOTE 4 – INVESTMENT ADVISORY FEE AND OTHER TRANSACTIONS WITH AFFILIATES
Pursuant to an investment advisory agreement, the Advisor serves as the investment advisor and performs services for the Fund for which the fees are payable at the end of each month. Under the investment advisory agreement, the Fund pays the Advisor a management fee based on the daily net assets of the Fund at an annual rate as shown in the following table:
Management Fee Schedule
| | | | |
DAILY NET ASSETS | | FEE RATE | |
Up to $500 million | | | 0.875 | % |
Next $500 million | | | 0.825 | |
Next $500 million | | | 0.775 | |
Next $500 million | | | 0.725 | |
Over $2 billion | | | 0.675 | |
The Fund’s effective management fee for the period ended March 31, 2017 was 0.853% of the Fund’s average net assets.
The Fund pays to the Advisor the costs of personnel who perform certain accounting services for the Fund. For the six months ended March 31, 2017 the Fund paid $13,802 to the Advisor for these accounting services. The Trust has also entered into administrative service agreements with the Advisor, whereby the Advisor will perform certain administrative services related to each class of the Fund’s shares, and for which fees will be payable at an annual rate of up to .125 of 1% per annum of the average daily net assets attributable to each class of shares. Total administrative service fees incurred by each class of shares of the Fund for the six months ended March 31, 2017, are set forth in the Statement of Operations.
The Trust has an underwriting agreement with Thornburg Securities Corporation (the “Distributor”), an affiliate of the Advisor, which acts as the distributor of the Fund’s shares. For the six months ended March 31, 2017, the Distributor has advised the Fund that it earned net commissions aggregating $7,576 from the sale of Class A shares, and collected contingent deferred sales charges aggregating $1,118 from redemptions of Class C shares of the Fund.
Pursuant to a service plan under Rule 12b-1 of the Investment Company Act of 1940, the Fund may pay to the Distributor or securities dealers and other financial institutions at the Distributor’s direction an amount not to exceed .25 of 1% per annum of the average daily net assets attributable to Class A, Class C, Class R3, and Class R4 shares of the Fund to obtain various shareholder and distribution related services. For the six months ended March 31, 2017, there were no 12b-1 service plan fees charged for Class I and Class R5 shares. The Advisor and Distributor each may pay out of its own resources additional expenses for distribution of the Fund’s shares and shareholder services.
The Trust has also adopted distribution plans pursuant to Rule 12b-1, applicable only to the Fund’s Class C and Class R3 shares, under which the Fund compensates the Distributor for services in promoting the sale of Class C and Class R3 shares of the Fund at an
Semi-Annual Report 21
| | |
| Notes to Financial Statements, Continued | | |
| |
Thornburg Value Fund | | March 31, 2017 (Unaudited) |
annual rate of up to .75 of 1% per annum of the average daily net assets attributable to Class C shares and an annual rate of up to .25 of 1% per annum of the average daily net assets attributable to Class R3 shares.
Total fees incurred by each class of shares of the Fund under their respective service and distribution plans for the six months ended March 31, 2017, are set forth in the Statement of Operations.
The Advisor and Distributor have contractually agreed to waive fees and reimburse expenses incurred by the Fund so that actual expenses of certain share classes do not exceed levels as specified in the Fund’s most recent prospectus. The agreement may be terminated by the Fund at any time, but may not be terminated by the Advisor or Distributor before April 10, 2018, unless the Advisor ceases to be the investment advisor to the Fund or the Distributor ceases to be the distributor of the Fund prior to that date. The Advisor and Distributor may recoup amounts waived or reimbursed during the fiscal year if actual expenses fall below the contractual limit during that year.
For the six months ended March 31, 2017, the Advisor contractually reimbursed certain class specific expenses, administrative fees, and distribution fees of $111,524 for Class I shares, $112,382 for Class R3 shares, $24,990 for Class R4 shares, and $30,290 for Class R5 shares.
Certain officers and Trustees of the Trust are also officers or directors of the Advisor and Distributor. The compensation of independent Trustees is borne by the Trust.
The percentage of direct investments in the Fund held by the Trustees and Officers of the Trust and the Advisor is approximately 5.32%.
The Fund may purchase or sell securities from, or to an affiliated fund, provided the affiliation is due solely to having a common investment advisor, common officers, or common trustees, and provided that all such transactions will comply with Rule 17a-7 under the 1940 Act. For the six months ended March 31, 2017, the Fund had no affiliated fund transactions.
NOTE 5 – SHARES OF BENEFICIAL INTEREST
At March 31, 2017, there were an unlimited number of shares with no par value of beneficial interest authorized. Transactions in shares of beneficial interest were as follows:
| | | | | | | | | | | | | | | | |
| | | SIX MONTHS ENDED | | | YEAR ENDED | |
| | | MARCH 31, 2017 (UNAUDITED) | | | SEPTEMBER 30, 2016 (AUDITED) | |
| | | SHARES | | | AMOUNT | | | SHARES | | | AMOUNT | |
Class A Shares | | | | | | | | | | | | | | | | |
Shares sold | | | 137,710 | | | $ | 7,721,111 | | | | 536,840 | | | $ | 27,382,909 | |
Shares converted from Class B Shares | | | | | | | | | | | 6,588 | | | | 352,743 | |
Shares issued to shareholders in reinvestment of dividends | | | 2,296 | | | | 127,693 | | | | 20,753 | | | | 1,108,861 | |
Shares repurchased | | | (1,076,300 | ) | | | (60,054,773 | ) | | | (1,318,359 | ) | | | (67,578,492 | ) |
| | | | | | | | | | | | | | | | |
| | | | |
Net increase (decrease) | | | (936,294 | ) | | $ | (52,205,969 | ) | | | (754,178 | ) | | $ | (38,733,979 | ) |
| | | | | | | | | | | | | | | | |
Class B Shares* | | | | | | | | | | | | | | | | |
Shares sold | | | — | | | | — | | | | 1,210 | | | $ | 56,199 | |
Shares issued to shareholders in reinvestment of dividends | | | — | | | | — | | | | — | | | | — | |
Shares converted to Class A shares | | | — | | | | — | | | | (7,328 | ) | | | (352,743 | ) |
Shares repurchased | | | — | | | | — | | | | (28,859 | ) | | | (1,316,649 | ) |
| | | | | | | | | | | | | | | | |
| | | | |
Net increase (decrease) | | | — | | | | — | | | | (34,977 | ) | | $ | (1,613,193 | ) |
| | | | | | | | | | | | | | | | |
Class C Shares | | | | | | | | | | | | | | | | |
Shares sold | | | 92,118 | | | $ | 4,730,525 | | | | 292,210 | | | $ | 13,905,964 | |
Shares issued to shareholders in reinvestment of dividends | | | — | | | | — | | | | — | | | | — | |
Shares repurchased | | | (396,237 | ) | | | (20,470,454 | ) | | | (642,811 | ) | | | (30,311,044 | ) |
| | | | | | | | | | | | | | | | |
| | | | |
Net increase (decrease) | | | (304,119 | ) | | $ | (15,739,929 | ) | | | (350,601 | ) | | $ | (16,405,080 | ) |
| | | | | | | | | | | | | | | | |
22 Semi-Annual Report
| | |
| Notes to Financial Statements, Continued | | |
| |
Thornburg Value Fund | | March 31, 2017 (Unaudited) |
| | | | | | | | | | | | | | | | |
| | | SIX MONTHS ENDED | | | YEAR ENDED | |
| | | MARCH 31, 2017 (UNAUDITED) | | | SEPTEMBER 30, 2016 (AUDITED) | |
| | | SHARES | | | AMOUNT | | | SHARES | | | AMOUNT | |
Class I Shares | | | | | | | | | | | | | | | | |
Shares sold | | | 752,590 | | | $ | 43,210,035 | | | | 716,301 | | | $ | 37,689,763 | |
Shares issued to shareholders in reinvestment of dividends | | | 7,089 | | | | 405,173 | | | | 33,666 | | | | 1,848,626 | |
Shares repurchased | | | (642,189 | ) | | | (36,946,680 | ) | | | (1,414,916 | ) | | | (74,902,174 | ) |
| | | | | | | | | | | | | | | | |
| | | | |
Net increase (decrease) | | | 117,490 | | | $ | 6,668,528 | | | | (664,949 | ) | | $ | (35,363,785 | ) |
| | | | | | | | | | | | | | | | |
Class R3 Shares | | | | | | | | | | | | | | | | |
Shares sold | | | 49,918 | | | $ | 2,766,502 | | | | 141,034 | | | $ | 7,131,504 | |
Shares issued to shareholders in reinvestment of dividends | | | 457 | | | | 25,275 | | | | 3,090 | | | | 164,106 | |
Shares repurchased | | | (186,664 | ) | | | (10,342,350 | ) | | | (422,847 | ) | | | (21,594,305 | ) |
| | | | | | | | | | | | | | | | |
| | | | |
Net increase (decrease) | | | (136,289 | ) | | $ | (7,550,573 | ) | | | (278,723 | ) | | $ | (14,298,695 | ) |
| | | | | | | | | | | | | | | | |
Class R4 Shares | | | | | | | | | | | | | | | | |
Shares sold | | | 14,742 | | | $ | 841,913 | | | | 52,912 | | | $ | 2,743,429 | |
Shares issued to shareholders in reinvestment of dividends | | | 97 | | | | 5,414 | | | | 556 | | | | 29,835 | |
Shares repurchased | | | (32,854 | ) | | | (1,865,617 | ) | | | (83,787 | ) | | | (4,287,977 | ) |
| | | | | | | | | | | | | | | | |
| | | | |
Net increase (decrease) | | | (18,015 | ) | | $ | (1,018,290 | ) | | | (30,319 | ) | | $ | (1,514,713 | ) |
| | | | | | | | | | | | | | | | |
Class R5 Shares | | | | | | | | | | | | | | | | |
Shares sold | | | 28,508 | | | $ | 1,620,149 | | | | 41,585 | | | $ | 2,160,843 | |
Shares issued to shareholders in reinvestment of dividends | | | 371 | | | | 21,155 | | | | 1,838 | | | | 100,759 | |
Shares repurchased | | | (37,661 | ) | | | (2,167,024 | ) | | | (159,826 | ) | | | (8,382,911 | ) |
| | | | | | | | | | | | | | | | |
| | | | |
Net increase (decrease) | | | (8,782 | ) | | $ | (525,720 | ) | | | (116,403 | ) | | $ | (6,121,309 | ) |
| | | | | | | | | | | | | | | | |
| * | Class B shares converted to Class A shares on August 29, 2016. |
NOTE 6 – INVESTMENT TRANSACTIONS
For the six months ended March 31, 2017, the Fund had purchase and sale transactions of investments (excluding short-term investments) of $180,921,003 and $256,568,832, respectively.
NOTE 7 – DERIVATIVE FINANCIAL INSTRUMENTS WITH OFF-BALANCE SHEET RISK AND FOREIGN INVESTMENT RISK
The Fund may use a variety of derivative financial instruments to hedge or adjust the risks affecting its investment portfolio or to enhance investment returns. Provisions of the FASB Accounting Standards Codification 815-10-50 (“ASC 815”) require certain disclosures. The disclosures are intended to provide users of financial statements with an understanding of the use of derivative instruments by the Fund and how these derivatives affect the financial position, financial performance and cash flows of the Fund. The Fund does not designate any derivative instruments as hedging instruments under ASC 815. During the six months ended March 31, 2017, the Fund’s principal exposure to derivative financial instruments of the type addressed by ASC 815 was investment in foreign exchange contracts. A foreign exchange contract is an agreement between two parties to exchange different currencies at a specified rate of exchange at an agreed upon future date. Foreign exchange contracts involve risks to the Fund, including the risk that a contract’s counterparty will not meet its obligations to the Fund, the risk that a change in a contract’s value may not correlate perfectly with the currency the contract was intended to track, and the risk that the Fund’s Advisor is unable to correctly implement its strategy in using a contract. In any such instance, the Fund may not achieve the intended benefit of entering into a contract, and may experience a loss.
The Fund entered into forward currency contracts during the six months ended March 31, 2017 in the normal course of pursuing its investment objectives, with the objective of purchasing foreign investments or with the intent of reducing the risk to the value of the Fund’s foreign investments from adverse changes in the relationship between the U.S. dollar and foreign currencies. In each case these contracts have been initiated in conjunction with foreign investment transactions.
Semi-Annual Report 23
| | |
| Notes to Financial Statements, Continued | | |
| |
Thornburg Value Fund | | March 31, 2017 (Unaudited) |
These contracts are accounted for by the Fund under ASC 815. Unrealized appreciation and depreciation on outstanding contracts are reported in the Fund’s Statement of Assets and Liabilities, as measured by the difference between the forward exchange rates at the reporting date and the forward exchange rates at each contract’s inception date. Net realized gain (loss) on contracts closed during the period, and changes in net unrealized appreciation (depreciation) on outstanding contracts are recognized in the Fund’s Statement of Operations.
The quarterly average value of open sell currency contracts for the six months ended March 31, 2017 was $11,880,331. Open buy currency contracts are entered into for the purpose of closing open sell currency contracts and the values are dependent upon the values of the open sell currency contracts to which they relate.
The following table displays the outstanding forward currency contracts at March 31, 2017:
| | | | | | | | | | | | | | | | | | | | | | | | |
OUTSTANDING FORWARD CURRENCY CONTRACTS TO BUY OR SELL AT MARCH 31, 2017 | |
| | | | | | |
| CONTRACT DESCRIPTION | | BUY/SELL | | | CONTRACT
AMOUNT | | | CONTRACT
VALUE DATE | | | VALUE
USD | | | UNREALIZED
APPRECIATION | | | UNREALIZED
DEPRECIATION | |
| | | | | | |
Euro | | | Sell | | | | 8,257,100 | | | | 05/30/2017 | | | | 8,831,227 | | | $ | — | | | $ | (66,068 | ) |
| | | | | | | | | | | | | | | | | | | | | | | | |
| | | | | | |
Total | | | | | | | | | | | | | | | | | | $ | — | | | $ | (66,068 | ) |
| | | | | | | | | | | | | | | | | | | | | | | | |
| | | | | | |
Net unrealized appreciation (depreciation) | | | | | | | | | | | | | | | | | | | | | | $ | (66,068 | ) |
| | | | | | | | | | | | | | | | | | | | | | | | |
The outstanding forward currency contracts in the foregoing table were entered into with State Street Bank and Trust Company (“SSB”), pursuant to an International Swaps and Derivatives Association (“ISDA”) Master Agreement. In the event of a default or termination under the ISDA Master Agreement with SSB, the non-defaulting party has the right to close out all outstanding forward currency contracts between the parties and to net any payment amounts under those contracts, resulting in a single net amount payable by one party to the other.
Because the ISDA Master Agreement with SSB does not result in an offset of reported amounts of financial assets and liabilities in the Fund’s Statement of Assets and Liabilities unless there has been an event of default or termination event under that agreement, the Fund does not net its outstanding forward currency contracts for purposes of the disclosure in the Fund’s Statement of Assets and Liabilities. Instead the Fund recognizes the unrealized appreciation or depreciation on those forward currency contracts on a gross basis in the Fund’s Statement of Assets and Liabilities.
The unrealized appreciation (depreciation) of the outstanding forward currency contracts recognized in the Fund’s Statement of Assets and Liabilities at March 31, 2017 is disclosed in the following table:
| | | | |
FAIR VALUES OF DERIVATIVE FINANCIAL INSTRUMENTS AT MARCH 31, 2017 |
| LIABILITY DERIVATIVES | | BALANCE SHEET LOCATION | | FAIR VALUE |
| | |
Foreign exchange contracts | | Liabilities - Unrealized depreciation
on forward currency contracts | | $ (66,068) |
Because the Fund does not currently receive or post cash collateral in connection with its currency forward contracts, and because all of the Fund’s outstanding currency forward contracts are with SSB, the net amounts of the Fund’s assets and liabilities which are attributable to those contracts at March 31, 2017 can be determined by offsetting the dollar amounts shown in the preceding table. Based on those amounts, the net amount of the Fund’s assets which is attributable to its outstanding forward currency contracts at March 31, 2017 is $0, and the net amount of the Fund’s liabilities which is attributable to those contracts at that date is $66,068. The Fund’s forward currency contracts are valued each day, and the net amounts of the Fund’s assets and liabilities which are attributable to those contracts are expected to vary over time.
The net realized gain (loss) from forward currency contracts and the net change in unrealized appreciation (depreciation) on outstanding forward currency contracts recognized in the Fund’s Statement of Operations for the six months ended March 31, 2017 are disclosed in the following tables:
| | | | |
NET REALIZED GAIN (LOSS) ON DERIVATIVE FINANCIAL INSTRUMENTS RECOGNIZED IN INCOME FOR THE SIX MONTHS ENDED MARCH 31, 2017 |
| | | TOTAL | | FORWARD CURRENCY CONTRACTS |
| | |
Foreign exchange contracts | | $ 794,730 | | $ 794,730 |
24 Semi-Annual Report
| | |
| Notes to Financial Statements, Continued | | |
| |
Thornburg Value Fund | | March 31, 2017 (Unaudited) |
| | | | |
NET CHANGE IN UNREALIZED APPRECIATION (DEPRECIATION) OF DERIVATIVE FINANCIAL INSTRUMENTS RECOGNIZED IN INCOME FOR THE SIX MONTHS ENDED MARCH 31, 2017 |
| | | TOTAL | | FORWARD CURRENCY CONTRACTS |
| | |
Foreign exchange contracts | | $ 3,336 | | $ 3,336 |
OTHER NOTES
Risks: The Fund’s investments subject it to risks including, but not limited to, management risk, market and economic risk, risks affecting specific issuers, liquidity risk, the risks associated with investments in small- and mid-cap companies and non-U.S. issuers (including developing country issuers), credit risk, and interest rate risk. Please see the Fund’s prospectus for a discussion of the risks associated with an investment in the Fund.
Subsequent Events: Fund management believes no events have occurred between March 31, 2017 and the date of issuance of the financial statements that require adjustment to or disclosure in the accompanying financial statements.
Semi-Annual Report 25
Financial Highlights
Thornburg Value Fund
| | | | | | | | | | | | | | | | | | | | | | | | | | | | | | | | | | | | | | | | | | | | | | | | | | | | | | | | | | | | |
| | | PER SHARE PERFORMANCE (FOR A SHARE OUTSTANDING THROUGHOUT THE PERIOD) | | | RATIOS TO AVERAGE NET ASSETS | | | SUPPLEMENTAL DATA | |
UNLESS
OTHERWISE
NOTED,
PERIODS
ARE
FISCAL
YEARS
ENDED
SEPT. 30, | | NET ASSET
VALUE
BEGINNING
OF PERIOD | | | NET
INVESTMENT
INCOME
(LOSS)+ | | | NET
REALIZED
&
UNREALIZED
GAIN (LOSS)
ON
INVESTMENTS | | | TOTAL FROM
INVESTMENT
OPERATIONS | | | DIVIDENDS
FROM NET
INVESTMENT
INCOME | | | DIVIDENDS
FROM NET
REALIZED
GAINS | | | TOTAL
DIVIDENDS | | | NET
ASSET
VALUE
END
OF
PERIOD | | | NET
INVESTMENT
INCOME
(LOSS)
(%) | | | EXPENSES,
AFTER
EXPENSE
REDUCTIONS
(%) | | | EXPENSES,
AFTER
EXPENSE
REDUCTIONS
AND
NET OF
CUSTODY
CREDITS
(%) | | | EXPENSES,
BEFORE
EXPENSE
REDUCTIONS
(%) | | | TOTAL
RETURN
(%)(a) | | | PORTFOLIO
TURNOVER
RATE
(%)(a) | | | NET
ASSETS
AT END
OF
PERIOD
(THOUSANDS) | |
CLASS A SHARES | | | | | | | | | | | | | | | | | | | | | | | | | | | | | | | | | | | | | | | | | | | | | |
2017(b)(c) | | $ | 54.08 | | | | 0.04 | | | | 5.26 | | | | 5.30 | | | | (0.02 | ) | | | — | | | | (0.02 | ) | | $ | 59.36 | | | | 0.14 | (g) | | | 1.40 | (g) | | | 1.40 | (g) | | | 1.40 | (g) | | | 9.80 | | | | 22.16 | | | $ | 355,211 | |
2016(c)(d) | | $ | 49.17 | | | | 0.32 | | | | 4.76 | | | | 5.08 | | | | (0.17 | ) | | | — | | | | (0.17 | ) | | $ | 54.08 | | | | 0.63 | | | | 1.39 | | | | 1.39 | | | | 1.39 | | | | 10.33 | | | | 31.10 | | | $ | 374,237 | |
2015(c) | | $ | 48.09 | | | | 0.07 | | | | 1.03 | | | | 1.10 | | | | (0.02 | ) | | | — | | | | (0.02 | ) | | $ | 49.17 | | | | 0.14 | | | | 1.37 | | | | 1.37 | | | | 1.37 | | | | 2.28 | | | | 59.70 | | | $ | 377,299 | |
2014(c) | | $ | 40.84 | | | | 0.10 | | | | 7.41 | | | | 7.51 | | | | (0.26 | ) | | | — | | | | (0.26 | ) | | $ | 48.09 | | | | 0.22 | | | | 1.37 | | | | 1.37 | | | | 1.37 | | | | 18.40 | | | | 72.43 | | | $ | 395,216 | |
2013(c) | | $ | 31.51 | | | | 0.08 | | | | 9.25 | | | | 9.33 | | | | — | | | | — | | | | — | | | $ | 40.84 | | | | 0.23 | | | | 1.40 | | | | 1.40 | | | | 1.40 | | | | 29.61 | | | | 61.50 | | | $ | 400,275 | |
2012(c) | | $ | 27.71 | | | | (0.10 | ) | | | 3.90 | | | | 3.80 | | | | — | | | | — | | | | — | | | $ | 31.51 | | | | (0.32 | ) | | | 1.32 | | | | 1.32 | | | | 1.32 | | | | 13.71 | | | | 54.16 | | | $ | 470,120 | |
CLASS C SHARES | | | | | | | | | | | | | | | | | | | | | | | | | | | | | | | | | | | | | | | | | | | | | |
2017(b) | | $ | 49.97 | | | | (0.16 | ) | | | 4.86 | | | | 4.70 | | | | — | | | | — | | | | — | | | $ | 54.67 | | | | (0.60 | )(g) | | | 2.14 | (g) | | | 2.14 | (g) | | | 2.14 | (g) | | | 9.41 | | | | 22.16 | | | $ | 165,884 | |
2016 | | $ | 45.63 | | | | (0.06 | ) | | | 4.40 | | | | 4.34 | | | | — | | | | — | | | | — | | | $ | 49.97 | | | | (0.12 | ) | | | 2.14 | | | | 2.14 | | | | 2.14 | | | | 9.51 | | | | 31.10 | | | $ | 166,821 | |
2015 | | $ | 44.95 | | | | (0.29 | ) | | | 0.97 | | | | 0.68 | | | | — | | | | — | | | | — | | | $ | 45.63 | | | | (0.61 | ) | | | 2.12 | | | | 2.12 | | | | 2.12 | | | | 1.51 | | | | 59.70 | | | $ | 168,321 | |
2014 | | $ | 38.26 | | | | (0.24 | ) | | | 6.93 | | | | 6.69 | | | | — | | | | — | | | | — | | | $ | 44.95 | | | | (0.55 | ) | | | 2.14 | | | | 2.14 | | | | 2.14 | | | | 17.49 | | | | 72.43 | | | $ | 175,495 | |
2013 | | $ | 29.75 | | | | (0.18 | ) | | | 8.69 | | | | 8.51 | | | | — | | | | — | | | | — | | | $ | 38.26 | | | | (0.55 | ) | | | 2.18 | | | | 2.18 | | | | 2.18 | | | | 28.60 | | | | 61.50 | | | $ | 166,971 | |
2012 | | $ | 26.36 | | | | (0.32 | ) | | | 3.71 | | | | 3.39 | | | | — | | | | — | | | | — | | | $ | 29.75 | | | | (1.09 | ) | | | 2.09 | | | | 2.09 | | | | 2.09 | | | | 12.86 | | | | 54.16 | | | $ | 185,286 | |
CLASS I SHARES | | | | | | | | | | | | | | | | | | | | | | | | | | | | | | | | | | | | | | | | | | | | | |
2017(b) | | $ | 55.58 | | | | 0.15 | | | | 5.42 | | | | 5.57 | | | | (0.08 | ) | | | — | | | | (0.08 | ) | | $ | 61.07 | | | | 0.53 | (g) | | | 0.99 | (g) | | | 0.99 | (g) | | | 1.07 | (g) | | | 10.03 | | | | 22.16 | | | $ | 315,464 | |
2016 | | $ | 50.53 | | | | 0.54 | | | | 4.90 | | | | 5.44 | | | | (0.39 | ) | | | — | | | | (0.39 | ) | | $ | 55.58 | | | | 1.02 | | | | 0.99 | | | | 0.99 | | | | 1.07 | | | | 10.77 | | | | 31.10 | | | $ | 280,570 | |
2015 | | $ | 49.28 | | | | 0.28 | | | | 1.04 | | | | 1.32 | | | | (0.07 | ) | | | — | | | | (0.07 | ) | | $ | 50.53 | | | | 0.53 | | | | 0.99 | | | | 0.99 | | | | 1.06 | | | | 2.68 | | | | 59.70 | | | $ | 288,642 | |
2014 | | $ | 41.96 | | | | 0.28 | | | | 7.62 | | | | 7.90 | | | | (0.58 | ) | | | — | | | | (0.58 | ) | | $ | 49.28 | | | | 0.60 | | | | 0.99 | | | | 0.99 | | | | 1.06 | | | | 18.86 | | | | 72.43 | | | $ | 299,568 | |
2013 | | $ | 32.24 | | | | 0.20 | | | | 9.52 | | | | 9.72 | | | | — | | | | — | | | | — | | | $ | 41.96 | | | | 0.59 | | | | 0.98 | | | | 0.98 | | | | 1.01 | | | | 30.15 | | | | 61.50 | | | $ | 272,468 | |
2012 | | $ | 28.26 | | | | 0.02 | | | | 3.99 | | | | 4.01 | | | | (0.03 | ) | | | — | | | | (0.03 | ) | | $ | 32.24 | | | | 0.07 | | | | 0.93 | | | | 0.93 | | | | 0.93 | | | | 14.18 | | | | 54.16 | | | $ | 1,104,163 | |
CLASS R3 SHARES | | | | | | | | | | | | | | | | | | | | | | | | | | | | | | | | | | | | | | | | | | | | | |
2017(b) | | $ | 53.76 | | | | 0.06 | | | | 5.22 | | | | 5.28 | | | | (0.03 | ) | | | — | | | | (0.03 | ) | | $ | 59.01 | | | | 0.20 | (g) | | | 1.35 | (g) | | | 1.35 | (g) | | | 1.82 | (g) | | | 9.83 | | | | 22.16 | | | $ | 46,944 | |
2016 | | $ | 48.86 | | | | 0.34 | | | | 4.74 | | | | 5.08 | | | | (0.18 | ) | | | — | | | | (0.18 | ) | | $ | 53.76 | | | | 0.67 | | | | 1.35 | | | | 1.35 | | | | 1.81 | | | | 10.40 | | | | 31.10 | | | $ | 50,089 | |
2015 | | $ | 47.79 | | | | 0.08 | | | | 1.01 | | | | 1.09 | | | | (0.02 | ) | | | — | | | | (0.02 | ) | | $ | 48.86 | | | | 0.16 | | | | 1.35 | | | | 1.35 | | | | 1.77 | | | | 2.28 | | | | 59.70 | | | $ | 59,150 | |
2014 | | $ | 40.56 | | | | 0.11 | | | | 7.37 | | | | 7.48 | | | | (0.25 | ) | | | — | | | | (0.25 | ) | | $ | 47.79 | | | | 0.23 | | | | 1.35 | | | | 1.35 | | | | 1.77 | | | | 18.45 | | | | 72.43 | | | $ | 74,579 | |
2013 | | $ | 31.28 | | | | 0.10 | | | | 9.18 | | | | 9.28 | | | | — | | | | — | | | | — | | | $ | 40.56 | | | | 0.29 | | | | 1.34 | | | | 1.34 | | | | 1.78 | | | | 29.67 | | | | 61.50 | | | $ | 80,671 | |
2012 | | $ | 27.51 | | | | (0.10 | ) | | | 3.87 | | | | 3.77 | | | | — | | | | — | | | | — | | | $ | 31.28 | | | | (0.34 | ) | | | 1.35 | | | | 1.35 | | | | 1.66 | | | | 13.70 | | | | 54.16 | | | $ | 131,013 | |
CLASS R4 SHARES | | | | | | | | | | | | | | | | | | | | | | | | | | | | | | | | | | | | | | | | | | | | | |
2017(b) | | $ | 54.31 | | | | 0.08 | | | | 5.69 | | | | 5.77 | | | | (0.04 | ) | | | — | | | | (0.04 | ) | | $ | 59.63 | | | | 0.30 | (g) | | | 1.24 | (g) | | | 1.24 | (g) | | | 1.78 | (g) | | | 9.88 | | | | 22.16 | | | $ | 9,401 | |
2016 | | $ | 49.36 | | | | 0.40 | | | | 4.78 | | | | 5.18 | | | | (0.23 | ) | | | — | | | | (0.23 | ) | | $ | 54.31 | | | | 0.78 | | | | 1.25 | | | | 1.25 | | | | 1.75 | | | | 10.50 | | | | 31.10 | | | $ | 9,539 | |
2015 | | $ | 48.24 | | | | 0.14 | | | | 1.01 | | | | 1.15 | | | | (0.03 | ) | | | — | | | | (0.03 | ) | | $ | 49.36 | | | | 0.26 | | | | 1.25 | | | | 1.25 | | | | 1.67 | | | | 2.39 | | | | 59.70 | | | $ | 10,167 | |
2014 | | $ | 40.89 | | | | 0.16 | | | | 7.43 | | | | 7.59 | | | | (0.24 | ) | | | — | | | | (0.24 | ) | | $ | 48.24 | | | | 0.36 | | | | 1.24 | | | | 1.24 | | | | 1.69 | | | | 18.56 | | | | 72.43 | | | $ | 11,330 | |
2013 | | $ | 31.50 | | | | 0.13 | | | | 9.26 | | | | 9.39 | | | | — | | | | — | | | | — | | | $ | 40.89 | | | | 0.39 | | | | 1.25 | | | | 1.25 | | | | 1.67 | | | | 29.81 | | | | 61.50 | | | $ | 13,340 | |
2012 | | $ | 27.68 | | | | (0.07 | ) | | | 3.89 | | | | 3.82 | | | | — | | | | — | | | | — | | | $ | 31.50 | | | | (0.24 | ) | | | 1.25 | | | | 1.25 | | | | 1.50 | | | | 13.80 | | | | 54.16 | | | $ | 45,989 | |
CLASS R5 SHARES | | | | | | | | | | | | | | | | | | | | | | | | | | | | | | | | | | | | | | | | | | | | | |
2017(b) | | $ | 55.50 | | | | 0.15 | | | | 5.42 | | | | 5.57 | | | | (0.08 | ) | | | — | | | | (0.08 | ) | | $ | 60.99 | | | | 0.54 | (g) | | | 0.99 | (g) | | | 0.99 | (g) | | | 1.39 | (g) | | | 10.05 | | | | 22.16 | | | $ | 15,659 | |
2016 | | $ | 50.45 | | | | 0.53 | | | | 4.90 | | | | 5.43 | | | | (0.38 | ) | | | — | | | | (0.38 | ) | | $ | 55.50 | | | | 1.00 | | | | 0.99 | | | | 0.99 | | | | 1.46 | | | | 10.78 | | | | 31.10 | | | $ | 14,738 | |
2015 | | $ | 49.21 | | | | 0.27 | | | | 1.04 | | | | 1.31 | | | | (0.07 | ) | | | — | | | | (0.07 | ) | | $ | 50.45 | | | | 0.51 | | | | 0.99 | | | | 0.99 | | | | 1.20 | | | | 2.65 | | | | 59.70 | | | $ | 19,270 | |
2014 | | $ | 41.89 | | | | 0.28 | | | | 7.61 | | | | 7.89 | | | | (0.57 | ) | | | — | | | | (0.57 | ) | | $ | 49.21 | | | | 0.59 | | | | 0.98 | | | | 0.98 | | | | 1.42 | | | | 18.88 | | | | 72.43 | | | $ | 30,676 | |
2013 | | $ | 32.19 | | | | 0.22 | | | | 9.48 | | | | 9.70 | | | | — | | | | — | | | | — | | | $ | 41.89 | | | | 0.63 | | | | 0.99 | | | | 0.99 | | | | 1.37 | | | | 30.13 | | | | 61.50 | | | $ | 47,076 | |
2012 | | $ | 28.22 | | | | — | (e) | | | 3.98 | | | | 3.98 | | | | (0.01 | ) | | | — | | | | (0.01 | ) | | $ | 32.19 | | | | — | (f) | | | 0.99 | | | | 0.99 | | | | 1.17 | | | | 14.10 | | | | 54.16 | | | $ | 129,995 | |
| (a) | Not annualized for periods less than one year. |
| (b) | Unaudited Six Month Period Ended March 31. |
| (c) | Sales loads are not reflected in computing total return. |
| (d) | Class B shares were converted to Class A shares on August 29, 2016. |
| (e) | Net investment income (loss) was less than $0.01 per share. |
| (f) | Net investment income (loss) is less than 0.01%. |
| + | Based on weighted average shares outstanding. |
See notes to financial statements.
| | | | |
| 26 Semi-Annual Report | | | | Semi-Annual Report 27 |
| | |
| Expense Example | | |
| |
Thornburg Value Fund | | March 31, 2017 (Unaudited) |
As a shareholder of the Fund, you incur two types of costs:
| | (1) | transaction costs, including |
(a) sales charges (loads) on purchase payments for Class A shares;
(b) a deferred sales charge on redemptions of any part or all of a purchase of $1 million of Class A shares within 12 months of purchase;
(c) a deferred sales charge on redemptions of Class C shares within 12 months of purchase;
| | (2) | ongoing costs, including management fees; distribution and/or service (12b-1) fees; and other Fund expenses. |
This example is intended to help you understand your ongoing costs (in dollars) of investing in the Fund and to compare these costs with the ongoing costs of investing in other mutual funds.
The example is based on a $1,000 investment beginning on October 1, 2016, and held until March 31, 2017.
| | | | | | | | | | | | |
| | | BEGINNING
ACCOUNT VALUE
10/1/16 | | | ENDING
ACCOUNT VALUE
3/31/17 | | | EXPENSES PAID
DURING PERIOD†
10/1/16–3/31/17 | |
CLASS A SHARES | | | | | | | | | | | | |
Actual | | $ | 1,000.00 | | | $ | 1,098.05 | | | $ | 7.34 | |
Hypothetical* | | $ | 1,000.00 | | | $ | 1,017.94 | | | $ | 7.06 | |
CLASS C SHARES | | | | | | | | | | | | |
Actual | | $ | 1,000.00 | | | $ | 1,094.06 | | | $ | 11.19 | |
Hypothetical* | | $ | 1,000.00 | | | $ | 1,014.24 | | | $ | 10.77 | |
CLASS I SHARES | | | | | | | | | | | | |
Actual | | $ | 1,000.00 | | | $ | 1,100.34 | | | $ | 5.18 | |
Hypothetical* | | $ | 1,000.00 | | | $ | 1,019.99 | | | $ | 4.99 | |
CLASS R3 SHARES | | | | | | | | | | | | |
Actual | | $ | 1,000.00 | | | $ | 1,098.26 | | | $ | 7.07 | |
Hypothetical* | | $ | 1,000.00 | | | $ | 1,018.19 | | | $ | 6.80 | |
CLASS R4 SHARES | | | | | | | | | | | | |
Actual | | $ | 1,000.00 | | | $ | 1,098.84 | | | $ | 6.51 | |
Hypothetical* | | $ | 1,000.00 | | | $ | 1,018.73 | | | $ | 6.26 | |
CLASS R5 SHARES | | | | | | | | | | | | |
Actual | | $ | 1,000.00 | | | $ | 1,100.48 | | | $ | 5.18 | |
Hypothetical* | | $ | 1,000.00 | | | $ | 1,020.00 | | | $ | 4.99 | |
| † | Expenses are equal to the annualized expense ratio for each class (A: 1.40%; C: 2.14%; I: 0.99%; R3: 1.35%; R4: 1.24%; R5: 0.99%) multiplied by the average account value over the period, multiplied by 182/365 to reflect the one-half year period. |
| * | Hypothetical assumes a rate of return of 5% per year before expenses. |
ACTUAL EXPENSES
For each class of shares, the first line of the accompanying table provides information about actual account values and actual expenses. You may use the information in this line, together with the amount you invested, to estimate the expenses that you paid over the period. Simply divide your account value by $1,000 (for example, an $8,600 account value divided by $1,000 = 8.6), then multiply the result by the number in the first line for your class of shares under the heading entitled “Expenses Paid During Period” to estimate the expenses you paid on your account during this period.
HYPOTHETICAL EXAMPLE FOR COMPARISON PURPOSES
For each class of shares, the second line of the accompanying table provides information about hypothetical account values and hypothetical expenses based on the Fund’s actual expense ratio and an assumed rate of return of 5% per year before expenses, which is not the Fund’s actual return. The hypothetical account values and expenses may not be used to estimate the actual ending account balance or expenses you paid for the period. You may use this information to compare the ongoing costs of investing in the Fund and other funds. To do so, compare this 5% hypothetical example with the 5% hypothetical examples that appear in the shareholder reports of the other funds.
Please note that the expenses shown in the table are meant to highlight your ongoing costs only and do not reflect any transactional costs, such as sales charges (loads), redemption fees, or exchange fees. Therefore, the second line of the table for each class of shares is useful in comparing ongoing costs only, and will not help you determine the relative total costs of owning different funds. In addition, if these transactional costs were included, your costs would have been higher.
28 Semi-Annual Report
| | |
| Other Information | | |
| |
Thornburg Value Fund | | March 31, 2017 (Unaudited) |
PORTFOLIO PROXY VOTING
Policies and Procedures:
The Trust has delegated to Thornburg Investment Management, Inc. (the “Advisor”) voting decisions respecting proxies for the Fund’s voting securities. The Advisor makes voting decisions in accordance with its Proxy Voting Policy and Procedures. A description of the Policy and Procedures is available (i) without charge, upon request, by calling the Advisor toll-free at 1-800-847-0200, (ii) on the Thornburg website at www.thornburg.com, and (iii) on the Securities and Exchange Commission’s website at www.sec.gov.
Information regarding how proxies were voted is available on or before August 31 of each year for the twelve months ending the preceding June 30. This information is available (i) without charge, upon request by calling the Advisor toll-free at 1-800-847-0200, (ii) on the Thornburg website at www.thornburg.com, and (iii) on the Securities and Exchange Commission’s website at www.sec.gov.
AVAILABILITY OF QUARTERLY PORTFOLIO SCHEDULE
The Fund files with the Securities and Exchange Commission schedules of its portfolio holdings on Form N-Q for the first and third quarters of each fiscal year. The Fund’s Forms N-Q are available on the Commission’s website at www.sec.gov, or may be reviewed and copied at the Commission’s Public Reference Room in Washington, D.C. Information on the operation of the Public Reference Room may be obtained by calling 1-800-SEC-0330. The Fund also makes this information available on its website at www.thornburg. com/download or upon request by calling 1-800-847-0200.
Semi-Annual Report 29
Trustees’ Statement to Shareholders
Readopted September 12, 2016
The Trustees believe current and prospective shareholders should know how we discharge our responsibilities in supervising the Funds’ investment advisor and in reviewing the advisor’s contract for renewal. Since 2005, we have issued a statement which sets out clearly the three principal guidelines that we follow in supervising the Trust’s investment advisor on your behalf. In accordance with our customary practice, in September of this year we again reviewed our statement and concluded we should reissue this statement outlining the principal features of our supervision of the advisor’s performance of investment management services for the Funds.
We begin with the premise that each shareholder selected his or her Fund because its investments are managed by the investment advisor identified in the prospectus and in accordance with the objective and policies described in the prospectus. We realize, as each of you do, that if you believe that your Fund’s stated objective and policies no longer serve your personal investment goals, you can sell your shares and leave the Fund.
Therefore, we believe that our primary supervisory task – our principal obligation to you – is to assess the nature and quality of the advisor’s services, and to confirm that the advisor actively and competently pursues the Fund’s objective, in accordance with the policies set out in the prospectus. To do this, we meet regularly with management to review your Fund’s portfolio and to discuss the advisor’s specific actions and judgments in pursuing the Fund’s objective. We do not substitute our own judgment for the advisor’s decisions in selecting investments; the advisor is paid to exercise its informed judgment on investment decisions, and we seek to confirm, in reviewing the advisor’s performance, that the advisor is doing just that.
Second, we are conscious of costs and the effect that costs have on shareholders’ returns. We try to make sure that your Fund’s fees and costs are reasonable in relationship to the services rendered and that they are generally in line with those charged by other expert investment advisors, consistent with our belief that the Fund’s investors searched for and expect that expertise and attention and have decided to pay a reasonable price for it. We do not put the management contract “out to bid” as a matter of course, and we would not do so unless we had concluded that the advisor materially had failed to pursue the Fund’s objectives in accordance with its policies, or for other equally important reasons. We believe that any other approach would be inconsistent with your interests and contrary to your expectations when you bought shares of the Fund in the first place.
Finally, because we believe that most Thornburg Fund shareholders have invested with a long-term perspective, we try not to focus too much on the fashions of the moment and on short-term performance. The market will not favor any specific investment objective or set of policies at all times and under all economic circumstances. A fund will experience periods of both high and low returns relative to other funds and other investments. Even if one of our Funds is not favored by the market at a particular time, we believe that the advisor is nonetheless obliged to remain true to the Fund’s objective and policies, and we watch to see that it does so.
Trustees of Thornburg Investment Trust
30 Semi-Annual Report
Thornburg Funds
Thornburg Investment Management is a privately-owned global investment firm that offers a range of solutions for retail and institutional investors. Founded in 1982 and headquartered in Santa Fe, New Mexico, we manage approximately $49 billion (as of March 31, 2017) across U.S. mutual funds, separate accounts for high-net-worth investors and institutional accounts, and UCITS funds for non-U.S. investors.
The fund outlined in this report is one of many equity and fixed-income products available from Thornburg Investment Management.
EQUITY FUNDS
| | • | | Thornburg Investment Income Builder Fund |
| | • | | Thornburg Global Opportunities Fund |
| | • | | Thornburg International Value Fund |
| | • | | Thornburg Better World International Fund |
| | • | | Thornburg International Growth Fund |
| | • | | Thornburg Developing World Fund |
| | • | | Thornburg Core Growth Fund |
FIXED INCOME FUNDS
| | • | | Thornburg Low Duration Income Fund |
| | • | | Thornburg Limited Term U.S. Government Fund |
| | • | | Thornburg Limited Term Income Fund |
| | • | | Thornburg Strategic Income Fund |
| | • | | Thornburg Low Duration Municipal Fund |
| | • | | Thornburg Limited Term Municipal Fund |
| | • | | Thornburg Intermediate Municipal Fund |
| | • | | Thornburg California Limited Term Municipal Fund |
| | • | | Thornburg New Mexico Intermediate Municipal Fund |
| | • | | Thornburg New York Intermediate Municipal Fund |
| | • | | Thornburg Strategic Municipal Income Fund |
ALTERNATIVE FUNDS
| | • | | Thornburg Long/Short Equity Fund |
Before investing, carefully consider the Fund’s investment goals, risks, charges, and expenses. For a prospectus or summary prospectus containing this and other information, contact your financial advisor or visit thornburg.com. Read it carefully before investing.
For additional information, please visit thornburg.com
Thornburg Investment Management, Inc. 2300 North Ridgetop Road, Santa Fe, NM 87506
Semi-Annual Report 31
This Semi-Annual Report is submitted for the general information of shareholders of the Fund. It is not authorized for distribution to prospective investors in the Fund unless preceded or accompanied by an effective prospectus.
| | | | |
| Investment Advisor: | | Distributor: | | |
| Thornburg Investment Management® | | Thornburg Securities Corporation® | | |
| 800.847.0200 | | 800.847.0200 | | TH170 |
About Thornburg Investment Management It’s more than what we do. It’s how we do it. At Thornburg, we are very different in how we think, invest, and are structured. We believe this difference is what makes us successful in helping individuals reach their long-term financial goals. Flexible Perspective Our perspective on investment opportunities is more flexible than most, viewing a wide range of opportunities beyond conventional boundaries to find hidden value. Collaboration Collectively, we hone ideas via borderless cross-pollination for better judgment and better results. Portfolio Construction Disciplined construction guided more by our convictions than convention. CONVICTION Thorough analysis and our relative-value framework lead to conviction in our securities selection. UNCONVENTIONAL Active management means we seek the best value for our clients rather than using conventional benchmarks as our starting point. Structured for Excellence How we think and how we invest is made possible by how we’re structured. TEAM APPROACH FAR FROM THE HERD ACCESS & TRANSPARENCY
2 Semi-Annual Report
Semi-Annual Report
Thornburg International Value Fund
March 31, 2017
| | | | |
SHARE CLASS | | NASDAQ SYMBOL | | CUSIP |
Class A | | TGVAX | | 885-215-657 |
Class C | | THGCX | | 885-215-640 |
Class I | | TGVIX | | 885-215-566 |
Class R3 | | TGVRX | | 885-215-525 |
Class R4 | | THVRX | | 885-215-269 |
Class R5 | | TIVRX | | 885-215-368 |
Class R6 | | TGIRX | | 885-216-804 |
Class I, R3, R4, R5, and R6 shares may not be available to all investors. Minimum investments for Class I shares may be higher than those for other classes.
Investments carry risks, including possible loss of principal. Additional risks may be associated with investments outside the United States, especially in emerging markets, including currency fluctuations, illiquidity, volatility, and political and economic risks. Investments in small- and mid-capitalization companies may increase the risk of greater price fluctuations. Please see the Fund’s prospectus for a discussion of the risks associated with an investment in the Fund. Investments in the Fund are not FDIC insured, nor are they bank deposits or guaranteed by a bank or any other entity.
Funds invested in a smaller number of holdings may expose an investor to greater volatility.
Semi-Annual Report 3
| | |
| Letter to Shareholders | | |
| |
Thornburg International Value Fund | | March 31, 2017 (Unaudited) |
April 25, 2017
Dear Fellow Shareholder:
The last six months saw the end to a volatile and headline-filled 2016, serving as a reminder that political events can, in fact, prove difficult to predict. We have generally seen strong market returns, starting in late November, as markets rallied alongside improvements in key economic indicators. That was particularly true in Europe, while in the U.S. an “unpredicted” electoral outcome resulted in a potentially pro-growth U.S. president whose party also controls the legislature.
Purchasing Managers’ Indices (PMI), a surveyed indicator of economic health, have picked up globally. In Europe, Composite PMIs in Germany, France, and the Eurozone all reached their highest levels in the last three years, showing strength in both manufacturing PMI and service PMI. If geopolitical risk remains benign and the positive economic trend continues, we could see a faster earnings recovery in the Eurozone, driven by higher regional and global nominal economic growth and improving pricing power across Europe. Simultaneously, Eurozone equity market valuations remain reasonable and discounted relative to the U.S. equity market. In Japan, the economy is levered to a global cyclical recovery and corporate earnings should improve as the global manufacturing cycle regains momentum.
For the six months ended March 31, 2017, the Thornburg International Value Fund returned 5.12% (Class A shares without sales charge). The comparable benchmarks, the MSCI EAFE Index and the MSCI ACWI ex-U.S., returned 6.48% and 6.51%, respectively.
Contributors
BNP Paribas
BNP Paribas is a France-based depository commercial bank that has a well-diversified business across Europe, coupled with a U.S. subsidiary, Bank of the West. We believe BNP is adequately capitalized, with the potential for increasing shareholder payouts, leaving the bank relatively undervalued. During the period, BNP produced an earnings beat with profits above analyst expectations. As with all banks, firming interest rates are positive for net interest margins and thus accretive to earnings.
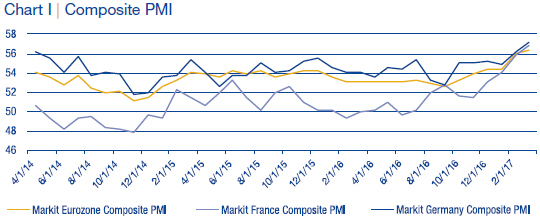
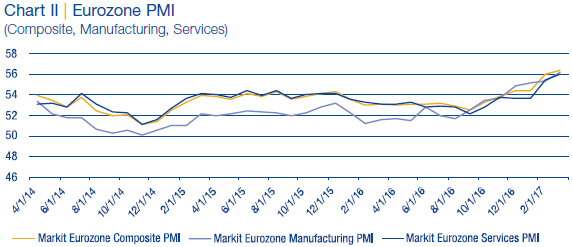
Source: Bloomberg
Intesa Sanpaolo
Intesa Sanpaolo is Italy’s premier bank with a healthy Tier 1 capital ratio and, unlike our view on some of the non-performing loans of its Italian peers, we do not view Intesa’s non-performing loans as a concern. We purchased Intesa during the third quarter, as it had a favorable risk-reward profile, with a price/book valuation of 0.60. Its share price has since rallied, raising its P/B ratio to 0.84. This rally is largely driven by a decreasing
4 Semi-Annual Report
| | |
| Letter to Shareholders, | | |
| |
Continued | | |
| |
Thornburg International Value Fund | | March 31, 2017 (Unaudited) |
“Italian discount,” even as the Italian government, regulators, and investors continue to determine what to do with troubled banks. Another potential catalyst for Intesa is the potential to take share from its more troubled competitors.
Mitsubishi UFJ Financial Group
Mitsubishi UFJ Financial Group is the largest banking group in Japan, providing banking, financial and asset management services. It benefited from a number of developments: the Bank of Japan’s yield curve targeting program, which brings less of a focus on negative rates; a depreciating yen; and an improving economic outlook in Japan, thanks largely to the benefit that a weaker yen brings to the export-oriented Japanese economy. Mitsubishi UFJ owns 23% of Morgan Stanley and 100% of California-based Union Bank.
Anhui Conch Cement Company
Anhui Conch, one of the largest cement manufacturers in China by capacity, as well as the lowest cost producer, benefits from high-capacity utilization rates, given its primary geographic exposures to Eastern and South Central China. China has seen a few turbulent years for basic materials, but demand for cement has rebounded recently, driven by better-than-expected property demand and fixed-asset investments. Over the near term, Anhui Conch should benefit from a supply side capacity reduction effort in China and gain market share. Over the medium term, its overseas expansion is margin accretive and contributes to future earnings growth. We had been adding to the position at depressed levels, and the stock has benefited during the first quarter from higher demand and firmer cement prices.
UniCredit
UniCredit is an Italy-based, pan-European commercial bank with EUR 900 billion in assets. It is under going a credible strategic business plan aimed at improving profitability and dealing with non-performing loans. We purchased UniCredit following the December constitutional referendum, which led to the resignation of then-Prime Minister Matteo Renzi, and before UniCredit announced its long-term strategic plan. Shares have done well on the back of its rights offering, as the stock was materially undervalued. UniCredit represents a classic example of our basic value basket.
Detractors
Rakuten
Rakuten, Japanese e-commerce leader, benefits from the global secular growth trend of e-commerce companies displacing typical brick-and-mortar storefronts. Following a strong third quarter, it has since seen increasing competitive pressures causing the stock to sell off. We exited Rakuten during the period in favor of more compelling opportunities.
Seven & I Holdings
Seven & I, a Japanese convenience, supermarket, and department store retail operator, is undergoing corporate governance reform and focusing on its more profitable business lines. We believe the company to be directionally on the right track, which is why we owned the stock, but management has been slow to execute. We have put capital behind more compelling stocks in Japan.
ZTO Express
ZTO Express, a Chinese express delivery company, should benefit from growth in e-commerce, especially on volume increases as value-per-shipment declines. While the stock detracted following disappointing price performance in the wake of its initial public offering, the secular growth drivers stand to support rapid top-line and bottom-line growth. We still like the stock but chose to favor alternative e-commerce growth drivers in China.
Électricité de France
Électricité de France (EDF) is one of the world’s largest utility companies. It is expanding into global deregulated markets and is highly active in nuclear power. During the period, EDF raised capital to fund its new U.K. nuclear plant, Hinkley Point, and to strengthen its credit rating. The capital raising coupled with outages in some reactors brought EDF shares under pressure. The importance of EDF’s fleet to power price stability in Europe was exemplified last year, when EDF’s nuclear output declined, causing power price spikes across Europe and the U.K. We believe the company to be well-discounted now and well-positioned to monetize the value of its assets, paying an 11% dividend yield while we wait on share price recovery.
Nippon Telegraph & Telephone
Japanese telecommunication services provider Nippon Telegraph & Telephone (NTT) has shifted its fiber optic footprint to wholesale distribution (from retail), increasing company profitability, as it owned approximately 70% of the fiber footprint in Japan. This distribution strategy can reach more customers at lower cost to NTT. We have owned the stock for years since the business model shift announcement, and it has consistently performed well. The period saw a natural pull back for the stock, as the market favored more of an export-driven business model in Japan, as the dollar began to strengthen.
Semi-Annual Report 5
| | |
| Letter to Shareholders, | | |
| |
Continued | | |
| |
Thornburg International Value Fund | | March 31, 2017 (Unaudited) |
While economic data have improved and stock valuations are compelling outside the U.S., political risk is present. The result of the Dutch general election in mid-March was in line with expectations as Prime Minister Mark Rutte and the center-right People’s Party for Freedom and Democracy overcame the populist candidate from the Party for Freedom, Geert Wilders. Near the end of the period, Theresa May triggered Article 50, beginning the two-year process for the United Kingdom to exit the European Union. As the second round of the French presidential election approaches, we continue to evaluate the impact of geopolitical risk on our portfolio with an eye on buying promising companies with sound business fundamentals at a discount to their intrinsic value.
Thank you for investing alongside us in Thornburg International Value Fund.
Sincerely,
| | |
 | |  |
| Lei Wang,CFA | | Di Zhou,CFA |
| Portfolio Manager | | Portfolio Manager |
| Managing Director | | Managing Director |
The matters discussed in this report may constitute forward-looking statements made pursuant to the safe harbor provisions of the Securities Litigation Reform Act of 1995. These include any advisor or portfolio manager prediction, assessment, analysis or outlook for individual securities, industries, investment styles, market sectors and/or markets. These statements involve risks and uncertainties. In addition to the general risks described for each fund in its current prospectus, other factors bearing on these reports include the accuracy of the advisor’s or portfolio manager’s forecasts and predictions, the appropriateness of the investment strategies designed by the advisor or portfolio manager and the ability of the advisor or portfolio manager to implement their strategies efficiently and successfully. Any one or more of these factors, as well as other risks affecting the securities markets generally, could cause the actual results of any fund to differ materially as compared to its benchmarks.
The views expressed are subject to change and do not necessarily reflect the views of Thornburg Investment Management, Inc. This information should not be relied upon as a recommendation or investment advice and is not intended to predict the performance of any investment or market.
6 Semi-Annual Report
| | |
| Performance Summary | | |
| |
Thornburg International Value Fund | | March 31, 2017 (Unaudited) |
AVERAGE ANNUAL TOTAL RETURNS
| | | | | | | | | | | | | | | | | | | | |
| | | | | | | | | | | | | | | SINCE | |
| | | 1-YR | | | 3-YR | | | 5-YR | | | 10-YR | | | INCEP. | |
Class A Share (Incep: 5/28/98) | | | | | | | | | | | | | | | | | | | | |
Without sales charge | | | 8.61 | % | | | 2.94 | % | | | 4.47 | % | | | 2.58 | % | | | 7.32 | % |
With sales charge | | | 3.71 | % | | | 1.38 | % | | | 3.51 | % | | | 2.11 | % | | | 7.06 | % |
Class C Shares (Incep: 5/28/98) | | | | | | | | | | | | | | | | | | | | |
Without sales charge | | | 7.81 | % | | | 2.19 | % | | | 3.71 | % | | | 1.84 | % | | | 6.49 | % |
With sales charge | | | 6.81 | % | | | 2.19 | % | | | 3.71 | % | | | 1.84 | % | | | 6.49 | % |
Class I Shares (Incep: 3/30/01) | | | 9.03 | % | | | 3.31 | % | | | 4.87 | % | | | 2.98 | % | | | 7.03 | % |
Class R3 Shares (Incep: 7/1/03) | | | 8.45 | % | | | 2.77 | % | | | 4.29 | % | | | 2.42 | % | | | 8.12 | % |
Class R4 Shares (Incep: 2/1/07) | | | 8.67 | % | | | 2.96 | % | | | 4.49 | % | | | 2.62 | % | | | 2.75 | % |
Class R5 Shares (Incep: 2/1/05) | | | 9.01 | % | | | 3.25 | % | | | 4.78 | % | | | 2.90 | % | | | 6.21 | % |
Class R6 Shares (Incep: 5/1/12) | | | 9.22 | % | | | 3.50 | % | | | — | | | | — | | | | 5.19 | % |
MSCI EAFE Index (Since 5/28/98) | | | 11.67 | % | | | 0.50 | % | | | 5.83 | % | | | 1.05 | % | | | 3.92 | % |
MSCI AC World ex-U.S. Index (Net) (Since 5/28/98) | | | 13.13 | % | | | 0.56 | % | | | 4.36 | % | | | 1.35 | % | | | 4.43 | % |
GROWTH OF A HYPOTHETICAL $10,000 INVESTMENT
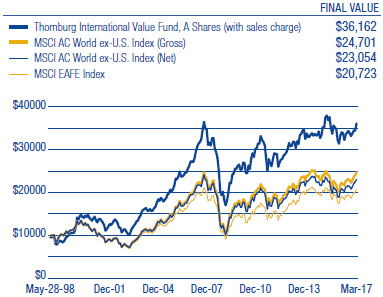
Performance data shown represents past performance and is no guarantee of future results. Investment return and principal value will fluctuate so shares, when redeemed, may be worth more or less than their original cost. Current performance may be lower or higher than quoted. For performance current to the most recent month end, visit thornburg.com or call 800-847-0200. The performance information does not reflect the deduction of taxes that a shareholder would pay on distributions or the redemption of Fund shares. Returns reflect the reinvestment of dividends and capital gains. Class A shares are sold with a maximum sales charge of 4.50%. Class C shares are subject to a 1% CDSC for the first year only. There is no sales charge for Class I, R3, R4, R5 and R6 shares
As disclosed in the most recent prospectus, the total annual fund operating expenses are as follows: A shares, 1.28%; C shares, 2.02%; I shares, 0.90%; R3 shares, 1.62%; R4 shares, 1.39%; R5 shares, 0.95%; R6 shares, 0.79%. Thornburg Investment Management and/or Thornburg Securities Corporation have contractually agreed to waive fees and reimburse expenses through at least April 10, 2018, for some of the share classes, resulting in net expense ratios of the following: R3 shares, 1.45%; R4 shares, 1.25%. For more detailed information on fund expenses and waivers/reimbursements please see the Fund’s prospectus.
Effective February 1, 2017, the Fund changed one of its benchmarks from the MSCI AC World ex-U.S. Index (gross) to the MSCI AC World ex-U.S. Index (net). While those two indices include the same securities, the calculation of returns for the “net” version of the index reflects the reinvestment of dividends after deduction of withholding taxes that apply to individuals who are not resident in the issuer’s country, while the calculation of returns for the “gross” version of the index reflects the reinvestment of dividends without any withholding tax deduction. Thornburg believes that the “net” version of the index better reflects how dividends paid to the Fund in respect of its foreign investments will be reinvested, since those dividends are generally subject to withholding tax when paid to the Fund.
Glossary
The MSCI All Country (AC) World ex-US Index is a market capitalization weighted index representative of the market structure of 45 developed and emerging market countries in North and South America, Europe, Africa, and the Pacific Rim, excluding securities of United States’ issuers. Beginning in January 2001, the index is calculated with net dividends reinvested in U.S. dollars. Prior data is calculated with gross dividends.
The MSCI EAFE (Europe, Australasia, Far East) Index is an unmanaged index. It is a generally accepted benchmark for major overseas markets. Index weightings represent the relative capitalizations of the major overseas developed markets on a U.S. dollar adjusted basis. The index is calculated with net dividends reinvested in U.S. dollars.
The performance of any index is not indicative of the performance of any particular investment. Unless otherwise noted, index returns reflect the reinvestment of income dividends and capital gains, if any, but do not reflect fees, brokerage commissions or other expenses of investing. Investors may not make direct investments into any index.
Markit Composite PMI – Each country PMI for the manufacturing or service sector is based on questionnaire responses from panels of senior purchasing executives (or similar) at over 400 companies. Respondents are asked to state whether business conditions for a number of variables have improved, deteriorated or stayed the same compared with the previous month, as well as to provide reasons for any changes. The questionnaire covers the following economic variables: manufacturing, services, construction, and whole economy.
PMI (Purchasing Managers Index) – An indicator of the economic health of the manufacturing sector and for the economy as a whole. The PMI index is based on five major indicators: new orders, inventory levels, production, supplier deliveries, and the employment environment. A PMI of 50 or higher generally indicates that the industry is expanding.
Price/Book ratio (P/B ratio) – A ratio used to compare a stock’s market value to its book value. It is calculated by dividing the current closing price of the stock by the latest quarter’s book value per share.
Tier 1 Capital – The core measure of a bank’s financial strength. It is composed of core capital, which consists primarily of common stock and disclosed reserves (or retained earnings), but may also include non-redeemable non-cumulative preferred stock.
Yield Curve – A line that plots the interest rates, at a set point in time, of bonds having equal credit quality, but differing maturity dates.
Semi-Annual Report 7
| | |
| Fund Summary | | |
| |
Thornburg International Value Fund | | March 31, 2017 (Unaudited) |
OBJECTIVES AND STRATEGIES
The Fund seeks long-term capital appreciation by investing in equity and debt securities of all types. As a secondary consideration, the Fund also seeks some current income. The Fund invests primarily in foreign securities or depositary receipts of foreign securities. The Fund may invest in developing countries.
MARKET CAPITALIZATION EXPOSURE
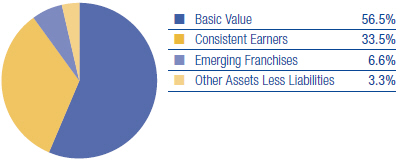
BASKET STRUCTURE
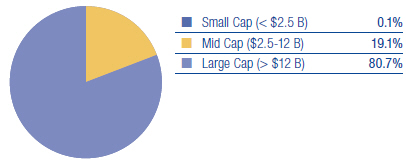
TOP TEN EQUITY HOLDINGS
| | | | |
UniCredit S.p.A. | | | 4.0 | % |
BNP Paribas SA | | | 3.6 | % |
Intesa Sanpaolo S.p.A. | | | 3.5 | % |
Mitsubishi UFJ Financial Group, Inc. | | | 3.2 | % |
Shin-Etsu Chemical Co., Ltd. | | | 3.1 | % |
China Petroleum & Chemical Corp. | | | 3.0 | % |
UBS Group AG | | | 3.0 | % |
Anhui Conch Cement Co., Ltd. | | | 2.9 | % |
Daimler AG | | | 2.8 | % |
LafargeHolcim Ltd. | | | 2.8 | % |
There is no guarantee that the Fund will meet its investment objectives.
All portfolio information is subject to change. Charts may not add up to 100% due to rounding.
SECTOR EXPOSURE
| | | | |
Financials | | | 24.3 | % |
Industrials | | | 12.3 | % |
Information Technology | | | 11.5 | % |
Materials | | | 10.5 | % |
Health Care | | | 9.5 | % |
Consumer Staples | | | 7.6 | % |
Consumer Discretionary | | | 7.2 | % |
Utilities | | | 7.2 | % |
Energy | | | 4.2 | % |
Telecommunication Services | | | 2.3 | % |
Other Assets Less Liabilities | | | 3.3 | % |
TOP TEN INDUSTRY GROUPS
| | | | |
Banks | | | 16.4 | % |
Materials | | | 10.5 | % |
Capital Goods | | | 9.6 | % |
Utilities | | | 7.2 | % |
Software & Services | | | 5.7 | % |
Health Care Equipment & Services | | | 5.4 | % |
Diversified Financials | | | 4.6 | % |
Food, Beverage & Tobacco | | | 4.3 | % |
Energy | | | 4.2 | % |
Pharmaceuticals, Biotechnology & Life Sciences | | | 4.1 | % |
COUNTRY EXPOSURE*
(percent of equity holdings)
| | | | |
Japan | | | 16.0 | % |
Germany | | | 14.7 | % |
China | | | 14.3 | % |
France | | | 12.6 | % |
Switzerland | | | 8.3 | % |
United Kingdom | | | 8.0 | % |
Italy | | | 7.8 | % |
Spain | | | 4.6 | % |
Canada | | | 4.5 | % |
Netherlands | | | 4.5 | % |
United States | | | 1.6 | % |
Russia | | | 1.6 | % |
India | | | 1.2 | % |
South Korea | | | 0.3 | % |
| * | The country assignment of each equity holding is determined by the Fund’s Advisor based on various factors, including the location of the issuer’s head office, the issuer’s jurisdiction of incorporation and the country from which a majority of the issuer’s revenue is derived. |
8 Semi-Annual Report
| | |
| Schedule of Investments | | |
| |
Thornburg International Value Fund | | March 31, 2017 (Unaudited) |
| | | | | | | | |
| | | SHARES/ | | | | |
| | | PRINCIPAL
AMOUNT | | | VALUE | |
COMMON STOCK — 96.54% | | | | | | | | |
AUTOMOBILES & COMPONENTS — 2.85% | | | | | | | | |
Automobiles — 2.85% | | | | | | | | |
Daimler AG | | | 2,271,615 | | | $ | 167,696,404 | |
| | | | | | | | |
| | | | | | | 167,696,404 | |
| | | | | | | | |
BANKS — 16.44% | | | | | | | | |
Banks — 16.44% | | | | | | | | |
BNP Paribas SA | | | 3,146,864 | | | | 209,582,123 | |
Commerzbank AG | | | 14,235,033 | | | | 128,746,318 | |
Intesa Sanpaolo S.p.A. | | | 75,117,757 | | | | 204,025,259 | |
Mitsubishi UFJ Financial Group, Inc. | | | 29,824,505 | | | | 187,444,590 | |
UniCredit S.p.A. | | | 15,435,552 | | | | 237,943,003 | |
| | | | | | | | |
| | | | | | | 967,741,293 | |
| | | | | | | | |
CAPITAL GOODS — 9.57% | | | | | | | | |
Building Products — 2.47% | | | | | | | | |
Daikin Industries, Ltd. | | | 1,448,078 | | | | 145,484,168 | |
Construction & Engineering — 4.67% | | | | | | | | |
Ferrovial SA | | | 7,670,366 | | | | 153,508,295 | |
Vinci S.A. | | | 1,528,001 | | | | 121,114,288 | |
Machinery — 2.43% | | | | | | | | |
Komatsu Ltd. | | | 5,496,854 | | | | 143,259,875 | |
| | | | | | | | |
| | | | | | | 563,366,626 | |
| | | | | | | | |
CONSUMER SERVICES — 1.77% | | | | | | | | |
Hotels, Restaurants & Leisure — 1.77% | | | | | | | | |
a Yum China Holdings, Inc. | | | 3,828,808 | | | | 104,143,577 | |
| | | | | | | | |
| | | | | | | 104,143,577 | |
| | | | | | | | |
DIVERSIFIED FINANCIALS — 4.48% | | | | | | | | |
Capital Markets — 4.48% | | | | | | | | |
a Deutsche Bank AG | | | 5,188,203 | | | | 89,386,599 | |
UBS Group AG | | | 10,913,194 | | | | 174,650,327 | |
| | | | | | | | |
| | | | | | | 264,036,926 | |
| | | | | | | | |
ENERGY — 4.17% | | | | | | | | |
Oil, Gas & Consumable Fuels — 4.17% | | | | | | | | |
China Petroleum & Chemical Corp. | | | 220,530,576 | | | | 178,774,063 | |
a Reliance Industries Ltd. | | | 3,295,602 | | | | 67,023,516 | |
| | | | | | | | |
| | | | | | | 245,797,579 | |
| | | | | | | | |
FOOD & STAPLES RETAILING — 1.02% | | | | | | | | |
Food & Staples Retailing — 1.02% | | | | | | | | |
Carrefour SA | | | 2,554,449 | | | | 60,224,394 | |
| | | | | | | | |
| | | | | | | 60,224,394 | |
| | | | | | | | |
FOOD, BEVERAGE & TOBACCO — 4.31% | | | | | | | | |
Beverages — 1.52% | | | | | | | | |
Heineken NV | | | 1,047,475 | | | | 89,172,201 | |
Food Products — 2.79% | | | | | | | | |
Danone SA | | | 478,860 | | | | 32,571,653 | |
Nestle SA | | | 1,719,832 | | | | 131,951,369 | |
| | | | | | | | |
| | | | | | | 253,695,223 | |
| | | | | | | | |
HEALTH CARE EQUIPMENT & SERVICES — 5.43% | | | | | | | | |
Health Care Equipment & Supplies — 3.23% | | | | | | | | |
a ConvaTec Ltd. | | | 23,717,108 | | | | 82,905,340 | |
Olympus Corp. | | | 2,791,134 | | | | 107,303,095 | |
Health Care Providers & Services — 2.20% | | | | | | | | |
Fresenius SE & Co. KGaA | | | 1,608,474 | | | | 129,260,234 | |
| | | | | | | | |
| | | | | | | 319,468,669 | |
| | | | | | | | |
HOUSEHOLD & PERSONAL PRODUCTS — 2.26% | | | | | | | | |
Household Products — 2.26% | | | | | | | | |
Reckitt Benckiser plc | | | 1,460,241 | | | | 133,300,039 | |
| | | | | | | | |
| | | | | | | 133,300,039 | |
| | | | | | | | |
Semi-Annual Report 9
| | |
| Schedule of Investments, Continued | | |
| |
Thornburg International Value Fund | | March 31, 2017 (Unaudited) |
| | | | | | | | |
| | | SHARES/ | | | | |
| | | PRINCIPAL
AMOUNT | | | VALUE | |
INSURANCE — 3.24% | | | | | | | | |
Insurance — 3.24% | | | | | | | | |
AXA S.A. | | | 3,561,118 | | | $ | 92,144,744 | |
NN Group NV | | | 3,024,183 | | | | 98,350,641 | |
| | | | | | | | |
| | | | | | | 190,495,385 | |
| | | | | | | | |
MATERIALS — 10.54% | | | | | | | | |
Chemicals — 4.76% | | | | | | | | |
Potash Corporation of Saskatchewan, Inc. | | | 5,797,618 | | | | 99,023,315 | |
Shin-Etsu Chemical Co., Ltd. | | | 2,095,767 | | | | 181,546,546 | |
Construction Materials — 5.78% | | | | | | | | |
Anhui Conch Cement Co., Ltd. | | | 57,351,384 | | | | 172,674,950 | |
LafargeHolcim Ltd. | | | 2,832,941 | | | | 167,433,841 | |
| | | | | | | | |
| | | | | | | 620,678,652 | |
| | | | | | | | |
PHARMACEUTICALS, BIOTECHNOLOGY & LIFE SCIENCES — 4.11% | | | | | | | | |
Biotechnology — 2.41% | | | | | | | | |
Shire plc | | | 2,432,307 | | | | 142,041,112 | |
Pharmaceuticals — 1.70% | | | | | | | | |
Dong-E-E-Jiao Co., Ltd. | | | 4,198,910 | | | | 39,967,570 | |
Yunnan Baiyao Group Co., Ltd. | | | 4,852,123 | | | | 59,928,133 | |
| | | | | | | | |
| | | | | | | 241,936,815 | |
| | | | | | | | |
RETAILING — 2.62% | | | | | | | | |
Internet & Direct Marketing Retail — 2.62% | | | | | | | | |
a Ctrip.com International, Ltd. ADR | | | 3,144,070 | | | | 154,531,040 | |
| | | | | | | | |
| | | | | | | 154,531,040 | |
| | | | | | | | |
SEMICONDUCTORS & SEMICONDUCTOR EQUIPMENT — 3.41% | | | | | | | | |
Semiconductors & Semiconductor Equipment — 3.41% | | | | | | | | |
Infineon Technologies AG | | | 6,395,887 | | | | 130,628,843 | |
a NXP Semiconductors N.V. | | | 675,365 | | | | 69,900,277 | |
| | | | | | | | |
| | | | | | | 200,529,120 | |
| | | | | | | | |
SOFTWARE & SERVICES — 5.66% | | | | | | | | |
Information Technology Services — 0.75% | | | | | | | | |
Wirecard AG | | | 795,941 | | | | 44,068,794 | |
Internet Software & Services — 3.34% | | | | | | | | |
a Alibaba Group Holding Ltd. ADR | | | 989,994 | | | | 106,751,053 | |
a Yandex NV | | | 4,109,571 | | | | 90,122,892 | |
Software — 1.57% | | | | | | | | |
a PTC, Inc. | | | 1,760,806 | | | | 92,530,355 | |
| | | | | | | | |
| | | | | | | 333,473,094 | |
| | | | | | | | |
TECHNOLOGY HARDWARE & EQUIPMENT — 2.43% | | | | | | | | |
Electronic Equipment, Instruments & Components — 2.43% | | | | | | | | |
OMRON Corporation | | | 3,259,569 | | | | 143,025,191 | |
| | | | | | | | |
| | | | | | | 143,025,191 | |
| | | | | | | | |
TELECOMMUNICATION SERVICES — 2.34% | | | | | | | | |
Diversified Telecommunication Services — 2.34% | | | | | | | | |
Deutsche Telekom AG | | | 7,878,112 | | | | 138,041,750 | |
| | | | | | | | |
| | | | | | | 138,041,750 | |
| | | | | | | | |
TRANSPORTATION — 2.71% | | | | | | | | |
Road & Rail — 2.71% | | | | | | | | |
Canadian Pacific Railway Ltd. | | | 1,084,042 | | | | 159,267,451 | |
| | | | | | | | |
| | | | | | | 159,267,451 | |
| | | | | | | | |
UTILITIES — 7.18% | | | | | | | | |
Electric Utilities — 3.96% | | | | | | | | |
Electricite de France SA | | | 12,801,510 | | | | 107,778,269 | |
Iberdrola S.A. | | | 15,067,418 | | | | 107,775,624 | |
Korea Electric Power Corp. | | | 430,780 | | | | 17,892,990 | |
Multi-Utilities — 3.22% | | | | | | | | |
National Grid plc | | | 7,701,207 | | | | 97,791,053 | |
Veolia Environnement SA | | | 4,894,284 | | | | 91,684,644 | |
| | | | | | | | |
| | | | | | | 422,922,580 | |
| | | | | | | | |
TOTAL COMMON STOCK (Cost $5,097,153,907) | | | | | | | 5,684,371,808 | |
| | | | | | | | |
10 Semi-Annual Report
| | |
| Schedule of Investments, Continued | | |
| |
Thornburg International Value Fund | | March 31, 2017 (Unaudited) |
| | | | | | | | |
| | | SHARES/ | | | | |
| | | PRINCIPAL
AMOUNT | | | VALUE | |
RIGHTS — 0.13% | | | | | | | | |
DIVERSIFIED FINANCIALS — 0.13% | | | | | | | | |
Capital Markets — 0.13% | | | | | | | | |
a Deutsche Bank AG Subscription Rights | | | 3,251,300 | | | $ | 7,769,409 | |
| | | | | | | | |
TOTAL RIGHTS (Cost $0) | | | | | | | 7,769,409 | |
| | | | | | | | |
| | |
SHORT TERM INVESTMENTS — 3.67% | | | | | | | | |
b Thornburg Capital Management Fund | | | 21,590,731 | | | | 215,907,309 | |
| | | | | | | | |
TOTAL SHORT TERM INVESTMENTS (Cost $215,907,309) | | | | | | | 215,907,309 | |
| | | | | | | | |
TOTAL INVESTMENTS — 100.34% (Cost $5,313,061,216) | | | | | | $ | 5,908,048,526 | |
LIABILITIES NET OF OTHER ASSETS — (0.34)% | | | | | | | (19,850,967 | ) |
| | | | | | | | |
NET ASSETS — 100.00% | | | | | | $ | 5,888,197,559 | |
| | | | | | | | |
Footnote Legend
| b | Investment in Affiliates – Holdings of voting securities of each portfolio company which is considered “affiliated” to the Fund under the Investment Company Act of 1940 because the Fund’s holding represented 5% or more of the company’s voting securities during the period, are shown below: |
| | | | | | | | | | | | | | | | | | | | | | | | | | | | |
| | | SHARES/PRINCIPAL | | | | | | | | | SHARES/PRINCIPAL | | | MARKET VALUE | | | | | | | |
| | | SEPTEMBER 30, | | | GROSS | | | GROSS | | | MARCH 31, | | | MARCH 31, | | | INVESTMENT | | | REALIZED | |
ISSUER | | 2016 | | | ADDITIONS | | | REDUCTIONS | | | 2017 | | | 2017 | | | INCOME | | | GAIN (LOSS) | |
Thornburg Capital Management Fund | | | 60,637,324 | | | | 147,532,083 | | | | 186,578,676 | | | | 21,590,731 | | | $ | 215,907,309 | | | $ | 894,619 | | | $ | — | |
| | | | | | | | | | | | | | | | | | | | | | | | | | | | |
Total non-controlled affiliated issuers - 3.67% of net assets | | | | | | | $ | 215,907,309 | | | $ | 894,619 | | | $ | — | |
| | | | | | | | | | | | | | | | | | | | | | | | | | | | |
Portfolio Abbreviations
To simplify the listings of securities, abbreviations are used per the table below:
| ADR | American Depositary Receipt |
See notes to financial statements.
Semi-Annual Report 11
| | |
| Statement of Assets and Liabilities | | |
| |
Thornburg International Value Fund | | March 31, 2017 (Unaudited) |
| | | | |
ASSETS | | | | |
Investments at value (Note 3) | | | | |
Non-affiliated issuers (cost $5,097,153,907) | | $ | 5,692,141,217 | |
Non-controlled affiliated issuer (cost $215,907,309) | | | 215,907,309 | |
Cash denominated in foreign currency (cost $11) | | | 11 | |
Receivable for investments sold | | | 29,608,990 | |
Receivable for fund shares sold | | | 9,549,708 | |
Unrealized appreciation on forward currency contracts (Note 7) | | | 15,130,368 | |
Dividends receivable | | | 15,978,960 | |
Dividend reclaim receivable | | | 11,417,903 | |
Prepaid expenses and other assets | | | 140,810 | |
| | | | |
Total Assets | | | 5,989,875,276 | |
| | | | |
| |
LIABILITIES | | | | |
Payable for investments purchased | | | 20,905,374 | |
Payable for fund shares redeemed | | | 68,810,108 | |
Unrealized depreciation on forward currency contracts (Note 7) | | | 2,207,187 | |
Payable to investment advisor and other affiliates (Note 4) | | | 4,615,360 | |
Deferred taxes payable (Note 2) | | | 502,246 | |
Accounts payable and accrued expenses | | | 4,637,442 | |
| | | | |
Total Liabilities | | | 101,677,717 | |
| | | | |
| |
NET ASSETS | | $ | 5,888,197,559 | |
| | | | |
NET ASSETS CONSIST OF | | | | |
Distribution in excess of net investment income | | $ | (2,404,244 | ) |
Net unrealized appreciation on investments | | | 607,190,098 | |
Accumulated net realized gain (loss) | | | 410,257,911 | |
Net capital paid in on shares of beneficial interest | | | 4,873,153,794 | |
| | | | |
| |
| | $ | 5,888,197,559 | |
| | | | |
12 Semi-Annual Report
| | |
| Statement of Assets and Liabilities, Continued | | |
| |
Thornburg International Value Fund | | March 31, 2017 (Unaudited) |
| | | | |
NET ASSET VALUE | | | | |
| |
Class A Shares: | | | | |
Net asset value and redemption price per share ($804,480,756 applicable to 32,661,084 shares of beneficial interest outstanding - Note 5) | | $ | 24.63 | |
Maximum sales charge, 4.50% of offering price | | | 1.16 | |
| | | | |
Maximum offering price per share | | $ | 25.79 | |
| | | | |
| |
Class C Shares: | | | | |
Net asset value and offering price per share* ($444,460,894 applicable to 19,931,887 shares of beneficial interest outstanding - Note 5) | | $ | 22.30 | |
| | | | |
| |
Class I Shares: | | | | |
Net asset value, offering and redemption price per share ($3,244,291,482 applicable to 128,337,673 shares of beneficial interest outstanding - Note 5) | | $ | 25.28 | |
| | | | |
| |
Class R3 Shares: | | | | |
Net asset value, offering and redemption price per share ($294,140,994 applicable to 11,944,457 shares of beneficial interest outstanding - Note 5) | | $ | 24.63 | |
| | | | |
| |
Class R4 Shares: | | | | |
Net asset value, offering and redemption price per share ($222,570,000 applicable to 9,097,750 shares of beneficial interest outstanding - Note 5) | | $ | 24.46 | |
| | | | |
| |
Class R5 Shares: | | | | |
Net asset value, offering and redemption price per share ($439,777,403 applicable to 17,409,898 shares of beneficial interest outstanding - Note 5) | | $ | 25.26 | |
| | | | |
| |
Class R6 Shares: | | | | |
Net asset value, offering and redemption price per share ($438,476,030 applicable to 17,403,192 shares of beneficial interest outstanding - Note 5) | | $ | 25.20 | |
| | | | |
| * | Redemption price per share is equal to net asset value less any applicable contingent deferred sales charge. |
See notes to financial statements.
Semi-Annual Report 13
| | |
| Statement of Operations | | |
| |
Thornburg International Value Fund | | Six Months Ended March 31, 2017 (Unaudited) |
| | | | |
INVESTMENT INCOME | | | | |
Dividend income | | | | |
Non-affiliated issuers (net of foreign taxes withheld of $3,918,746) | | $ | 35,244,070 | |
Non-controlled affiliated issuer | | | 894,619 | |
| | | | |
Total Income | | | 36,138,689 | |
| | | | |
| |
EXPENSES | | | | |
Investment advisory fees (Note 4) | | | 23,779,452 | |
Administration fees (Note 4) | | | | |
Class A Shares | | | 562,137 | |
Class C Shares | | | 296,073 | |
Class I Shares | | | 959,669 | |
Class R3 Shares | | | 188,018 | |
Class R4 Shares | | | 147,792 | |
Class R5 Shares | | | 119,368 | |
Distribution and service fees (Note 4) | | | | |
Class A Shares | | | 1,120,919 | |
Class C Shares | | | 2,361,532 | |
Class R3 Shares | | | 751,049 | |
Class R4 Shares | | | 294,605 | |
Transfer agent fees | | | | |
Class A Shares | | | 799,860 | |
Class C Shares | | | 360,665 | |
Class I Shares | | | 2,403,960 | |
Class R3 Shares | | | 364,381 | |
Class R4 Shares | | | 369,455 | |
Class R5 Shares | | | 756,214 | |
Class R6 Shares | | | 4,463 | |
Registration and filing fees | | | | |
Class A Shares | | | 20,161 | |
Class C Shares | | | 11,496 | |
Class I Shares | | | 37,520 | |
Class R3 Shares | | | 9,006 | |
Class R4 Shares | | | 13,239 | |
Class R5 Shares | | | 11,247 | |
Class R6 Shares | | | 15,035 | |
Custodian fees (Note 2) | | | 883,850 | |
Professional fees | | | 124,755 | |
Accounting fees (Note 4) | | | 121,030 | |
Trustee fees | | | 149,355 | |
Other expenses | | | 561,373 | |
| | | | |
Total Expenses | | | 37,597,679 | |
Less: | | | | |
Expenses reimbursed by investment advisor (Note 4) | | | (900,216 | ) |
| | | | |
Net Expenses | | | 36,697,463 | |
| | | | |
Net Investment Loss | | $ | (558,774 | ) |
| | | | |
14 Semi-Annual Report
| | |
| Statement of Operations, Continued | | |
| |
Thornburg International Value Fund | | Six Months Ended March 31, 2017 (Unaudited) |
| | | | |
REALIZED AND UNREALIZED GAIN (LOSS) | | | | |
Net realized gain (loss) on: | | | | |
Non-affiliated issuer investments | | $ | 378,211,754 | |
Forward currency contracts (Note 7) | | | 73,123,237 | |
Foreign currency transactions | | | (1,413,058 | ) |
| | | | |
| | | 449,921,933 | |
| | | | |
Net change in unrealized appreciation (depreciation) on: | | | | |
Non-affiliated issuer investments (net of change in deferred taxes payable of $ 502,246) | | | (158,466,741 | ) |
Forward currency contracts (Note 7) | | | 12,298,969 | |
Foreign currency translations | | | (106,604 | ) |
| | | | |
| | | (146,274,376 | ) |
| | | | |
Net Realized and Unrealized Gain | | | 303,647,557 | |
| | | | |
Net Increase in Net Assets Resulting from Operations | | $ | 303,088,783 | |
| | | | |
See notes to financial statements.
Semi-Annual Report 15
| | |
| Statements of Changes in Net Assets | | |
| |
Thornburg International Value Fund | | |
| | | | | | | | |
| | | SIX MONTHS ENDED | | | YEAR ENDED | |
| | | MARCH 31, 2017* | | | SEPTEMBER 30, 2016 | |
INCREASE (DECREASE) IN NET ASSETS FROM | | | | | | | | |
| | |
OPERATIONS | | | | | | | | |
Net investment income (loss) | | $ | (558,774 | ) | | $ | 150,733,271 | |
Net realized gain (loss) on investments, forward currency contracts, and foreign currency transactions | | | 449,921,933 | | | | (43,733,165 | ) |
Net unrealized appreciation (depreciation) on investments, deferred taxes payable, forward currency contracts, and foreign currency translations | | | (146,274,376 | ) | | | 67,937,358 | |
| | | | | | | | |
Net Increase (Decrease) in Net Assets Resulting from Operations | | | 303,088,783 | | | | 174,937,464 | |
| | |
DIVIDENDS TO SHAREHOLDERS | | | | | | | | |
From net investment income | | | | | | | | |
Class A Shares | | | — | | | | (17,373,490 | ) |
Class B Shares | | | — | | | | (2,771 | ) |
Class C Shares | | | — | | | | (7,105,228 | ) |
Class I Shares | | | (3,323,751 | ) | | | (89,286,035 | ) |
Class R3 Shares | | | — | | | | (4,928,035 | ) |
Class R4 Shares | | | — | | | | (4,718,359 | ) |
Class R5 Shares | | | (377,744 | ) | | | (10,876,039 | ) |
Class R6 Shares | | | (884,968 | ) | | | (10,748,034 | ) |
From realized gains | | | | | | | | |
Class A Shares | | | — | | | | (206,189,949 | ) |
Class B Shares | | | — | | | | (1,033,957 | ) |
Class C Shares | | | — | | | | (114,820,498 | ) |
Class I Shares | | | — | | | | (855,268,178 | ) |
Class R3 Shares | | | — | | | | (72,397,527 | ) |
Class R4 Shares | | | — | | | | (50,071,447 | ) |
Class R5 Shares | | | — | | | | (102,430,055 | ) |
Class R6 Shares | | | — | | | | (63,967,908 | ) |
| | |
FUND SHARE TRANSACTIONS (NOTE 5) | | | | | | | | |
Class A Shares | | | (227,801,910 | ) | | | (164,111,525 | ) |
Class B Shares** | | | — | | | | (6,445,128 | ) |
Class C Shares | | | (110,081,960 | ) | | | (54,628,381 | ) |
Class I Shares | | | (1,300,219,542 | ) | | | (696,459,252 | ) |
Class R3 Shares | | | (44,999,420 | ) | | | (80,286,274 | ) |
Class R4 Shares | | | (55,736,134 | ) | | | (15,765,354 | ) |
Class R5 Shares | | | (111,649,892 | ) | | | (53,965,690 | ) |
Class R6 Shares | | | (57,162,562 | ) | | | 114,956,797 | |
| | | | | | | | |
Net Decrease in Net Assets | | | (1,609,149,100 | ) | | | (2,392,984,853 | ) |
| | |
NET ASSETS | | | | | | | | |
Beginning of Period | | | 7,497,346,659 | | | | 9,890,331,512 | |
| | | | | | | | |
| | |
End of Period | | $ | 5,888,197,559 | | | $ | 7,497,346,659 | |
| | | | | | | | |
Undistributed (distribution in excess of) net investment income | | $ | (2,404,244 | ) | | $ | 2,740,993 | |
| ** | Class B shares converted to Class A shares on August 29, 2016. |
See notes to financial statements.
16 Semi-Annual Report
| | |
| Notes to Financial Statements | | |
| |
Thornburg International Value Fund | | March 31, 2017 |
NOTE 1 – ORGANIZATION
Thornburg International Value Fund (the “Fund”) is a diversified series of Thornburg Investment Trust (the “Trust”). The Trust was organized as a Massachusetts business trust under a Declaration of Trust dated June 3, 1987 and is registered as a diversified, open-end management investment company under the Investment Company Act of 1940, as amended. The Fund is currently one of twenty-one separate series of the Trust. Each series is considered to be a separate entity for financial reporting and tax purposes and bears expenses directly attributable to it. The Fund seeks long-term capital appreciation by investing in equity and debt securities of all types. As a secondary objective, the Fund also seeks some current income.
The Fund currently has seven classes of shares of beneficial interest: Class A, Class C, Institutional Class (“Class I”), and Retirement Classes (“Class R3,” “Class R4,” “Class R5,” and “Class R6”). Each class of shares of the Fund represents an interest in the same portfolio of investments, except that (i) Class A shares are sold subject to a front-end sales charge collected at the time the shares are purchased and bear a service fee, (ii) Class C shares are sold at net asset value without a sales charge at the time of purchase, but are subject to a contingent deferred sales charge upon redemption within one year of purchase, and bear both a service fee and a distribution fee, (iii) Class I and Class R5 shares are sold at net asset value without a sales charge at the time of purchase and may be subject to a service fee, (iv) Class R3 shares are sold at net asset value without a sales charge at the time of purchase, but bear both a service fee and distribution fee, (v) Class R4 shares are sold at net asset value without a sales charge at the time of purchase, but bear a service fee, (vi) Class R6 shares are sold at net asset value without a sales charge at the time of purchase, and (vii) the respective classes may have different reinvestment privileges and conversion rights. Additionally, the Fund may allocate among its classes certain expenses, to the extent allocable to specific classes, including transfer agent fees, government registration fees, certain printing and postage costs, and administrative and legal expenses. Currently, class specific expenses of the Fund are limited to service and distribution fees, administration fees, and certain registration and transfer agent expenses.
The following is a summary of significant accounting policies followed by the Fund in the preparation of its financial statements. The Fund prepares its financial statements in conformity with United States generally accepted accounting principles (“GAAP”), including investment company accounting and reporting guidance in the Financial Accounting Standards Board (the “FASB”) Accounting Standard Codification Topic 946.
NOTE 2 – SIGNIFICANT ACCOUNTING POLICIES
Security Valuation: All investments in securities held by the Fund are valued as described in Note 3.
Allocation of Income, Gains, Losses and Expenses: Net investment income (other than class specific expenses) and realized and unrealized gains and losses are allocated daily to each class of shares based upon the relative net asset value of outstanding shares (or the value of the dividend-eligible shares, as appropriate) of each class of shares at the beginning of the day (after adjusting for the current capital shares activity of the respective class). Expenses common to all Funds are allocated among the Funds comprising the Trust based upon their relative net asset values or other appropriate allocation methods. Operating expenses directly attributable to a specific class are charged against the operating income of that class.
Dividends and Distributions to Shareholders: Dividends and distributions to shareholders, which are determined in accordance with federal income tax regulations and may differ from GAAP, are recorded on the ex-dividend date. Ordinary income distributions, if any, are declared and paid quarterly. Capital gain distributions, if any, are declared and paid annually and more often if deemed necessary by the Advisor. Dividends are paid and are reinvested in additional shares of the Fund at net asset value per share at the close of business on the ex-dividend date, or at the shareholder’s option, paid in cash.
Investment Income: Dividend income is recorded on the ex-dividend date. Certain income from foreign investments is recognized as soon as information is available to the Fund. Interest income is accrued as earned. Premiums and discounts are amortized and accreted, respectively, to call dates or maturity dates using the effective yield method of the respective investments. These amounts are included in Interest income on the Statement of Operations.
Custodian Fees: Custodian fees disclosed in the Statement of Operations may include interest expenses incurred by the Fund on any cash overdrafts of its custodian account during the period. Such cash overdrafts may result from the effects of failed trades in portfolio securities and from cash outflows resulting from unanticipated shareholder redemption activity. The Fund pays interest to its custodian on any such cash overdraft at a rate equal to 2.50% of the overdraft amount in excess of $50,000.
Investment Transactions: Investment transactions are accounted for on a trade date basis. Realized gains and losses from the sale of investments are recorded on an identified cost basis.
Repurchase Agreements: The Fund may invest excess cash in repurchase agreements whereby the Fund purchases investments, which serve as collateral, with an agreement to resell such collateral to the seller at an agreed upon price at the maturity date of the repurchase agreement. Investments pledged as collateral for repurchase agreements are held in custody until maturity of the repurchase
Semi-Annual Report 17
| | |
| Notes to Financial Statements, Continued | | |
| |
Thornburg International Value Fund | | March 31, 2017 (Unaudited) |
agreement. Provisions in the agreements require that the market value of the collateral is at least equal to the repurchase value in the event of default. In the event of default, the Fund has the right to liquidate the collateral and apply the proceeds in satisfaction of the obligation. Under certain circumstances, in the event of default or bankruptcy by the other party to the agreement, realization and/ or retention of the collateral may be subject to legal proceedings.
When-Issued and Delayed Delivery Transactions: The Fund may engage in when-issued or delayed delivery transactions. To the extent the Fund engages in such transactions, it will do so for the purpose of acquiring portfolio investments consistent with the Fund’s investment objectives and not for the purpose of investment leverage or to speculate on interest rate or market changes. At the time the Fund makes a commitment to purchase an investment on a when-issued or delayed delivery basis, the Fund will record the transaction and reflect the value in determining its net asset value. When effecting such transactions, assets of an amount sufficient to make payment for the portfolio investments to be purchased will be segregated on the Fund’s records on the trade date. Investments purchased on a when-issued or delayed delivery basis do not earn interest until the settlement date.
Foreign Currency Translation: Portfolio investments and other assets and liabilities denominated in foreign currencies are translated into U.S. dollars based on the exchange rate of such currencies against the U.S. dollar on the date of valuation. Purchases and sales of investments and income items denominated in foreign currencies are translated into U.S. dollars at the exchange rate in effect on the transaction date. When the Fund purchases or sells foreign investments, it will customarily enter into a foreign exchange contract to minimize foreign exchange risk from the trade date to the settlement date of such transactions. The values of such spot contracts are included in receivable for investments sold and payable for investments purchased on the Statement of Assets and Liabilities.
The Fund does not separately report the effect of changes in foreign exchange rates from changes in market prices on investments held. Such changes are included in net unrealized appreciation (depreciation) from investments.
Reported net realized gains and losses from foreign currency transactions arise due to purchases and sales of foreign currencies, currency gains and losses realized between the trade and settlement dates on investment transactions and the difference between the amounts of dividends, interest, and foreign withholding taxes recorded on the Fund’s books, and the U.S. dollar equivalent of the amounts actually received or paid.
Net change in unrealized appreciation (depreciation) on foreign currency translations arise from changes in the fair value of assets and liabilities, other than investments at period end, resulting from changes in exchange rates.
Guarantees and Indemnifications: Under the Trust’s organizational documents (and under separate agreements with the independent Trustees), its officers and Trustees are provided with an indemnification against certain liabilities arising out of the performance of their duties to the Fund. In the normal course of business the Trust may also enter into contracts with service providers that contain general indemnifications. The Trust’s maximum exposure under these arrangements is unknown. However, based on experience, the Trust expects the risk of loss to be remote.
Use of Estimates: The preparation of financial statements in conformity with GAAP requires management to make estimates and assumptions that affect the reported amounts of assets and liabilities and disclosure of contingent assets and liabilities at the date of the financial statements and the reported amounts of increases (decreases) in net assets from operations during the reporting period. Actual results could differ from those estimates.
Federal Income Taxes: It is the policy of the Trust to comply with the provisions of the Internal Revenue Code applicable to regulated investment companies and to distribute to shareholders substantially all investment company taxable income including net realized gains on investments (if any), and tax exempt income of the Fund. Therefore, no provision for federal income or excise tax is required.
The Fund files income tax returns in United States federal and applicable state jurisdictions. The statute of limitations on the Fund’s tax return filings generally remains open for the three years following a return’s filing date. The Fund has analyzed its tax positions taken on Federal income tax returns for all open tax years and has concluded that no provision for income tax is required in the financial statements.
At March 31, 2017, information on the tax components of capital was as follows:
| | | | |
Cost of investments for tax purposes | | $ | 5,313,061,216 | |
| | | | |
Gross unrealized appreciation on a tax basis | | $ | 634,475,753 | |
Gross unrealized depreciation on a tax basis | | | (39,488,443 | ) |
| | | | |
Net unrealized appreciation (depreciation) on investments (tax basis) | | $ | 594,987,310 | |
| | | | |
At March 31, 2017, the Fund had deferred tax basis late year specified ordinary losses occurring subsequent to December 31, 2015 through September 30, 2016 of $1,834,099. For tax purposes, such losses will be recognized in the year ending September 30, 2017.
18 Semi-Annual Report
| | |
| Notes to Financial Statements, Continued | | |
| |
Thornburg International Value Fund | | March 31, 2017 (Unaudited) |
At March 31, 2017, the Fund had deferred tax basis capital losses occurring subsequent to October 31, 2015 through September 30, 2016 of $37,870,759. For tax purposes, such losses will be recognized in the year ending September 30, 2017.
Foreign Withholding Taxes: The Fund is subject to foreign tax withholding imposed by certain foreign countries in which the Fund may invest. Withholding taxes are incurred on certain foreign dividends and are accrued at the time the dividend is recognized based on applicable foreign tax laws. The Fund may file withholding tax reclaims in certain jurisdictions to recover a portion of amounts previously withheld, in view of various considerations, including recent decisions rendered by the courts in those and other jurisdictions. The Fund would expect to record a receivable for such a reclaim based on a variety of factors, including assessment of a jurisdiction’s legal obligation to pay reclaims, the jurisdiction’s administrative practices and payment history, and industry convention. To date the Fund has recorded no such receivable because there is limited precedent for collecting such prior year reclaims and the likelihood of collection remains uncertain.
Deferred Foreign Capital Gain Taxes: The Fund is subject to a tax imposed on net realized gains of securities of certain foreign countries. The Fund records an estimated deferred tax liability for net unrealized gains on these investments as reflected in the accompanying financial statements.
NOTE 3 – SECURITY VALUATION
Valuation of the Fund’s portfolio investment securities is performed in accordance with policies and procedures adopted by and under the oversight of the Trustees.
The Trustees of the Trust have appointed Thornburg Investment Management, Inc., the Trust’s investment advisor (the “Advisor”) to assist the Trustees in obtaining market values for portfolio investments, evaluate and monitor professional pricing service providers appointed by the Trustees’ Audit Committee (the “Audit Committee”) to assist in determining fair values for portfolio investments, assist in calculating fair values for portfolio investments in certain circumstances, and to perform other functions in connection with the valuation of investments. The Advisor acts through its Valuation and Pricing Committee (the “Committee”) and other employees of the Advisor. The Committee regularly reviews its own valuation calculations, as well as the valuations, valuation techniques and services furnished by pricing service providers, considers circumstances which may require valuation calculations by the Committee, and reviews previous valuation calculations. The Committee reports to the Audit Committee on the Committee’s activities, the performance of pricing service providers, and other matters relating to valuation of portfolio investments.
In those instances when the Committee assists in calculating a fair value for a portfolio investment, the Committee seeks to determine the price that the Fund would reasonably expect to receive upon a sale of the investment in an orderly transaction between market participants on the valuation date. The Committee customarily utilizes quotations from securities broker dealers in calculating valuations, but also may utilize prices obtained from pricing service providers or other methods approved by the Audit Committee. Because fair values calculated by the Committee are estimates, the calculation of a value for an investment may differ from the price that would be realized by the Fund upon a sale of the investment, and the difference could be material to the Fund’s financial statements. The Committee’s calculation of a fair value for an investment may also differ from the prices obtained by other persons (including other mutual funds) for the investment.
Valuation of Securities: Securities and other portfolio investments which are listed or traded on a United States securities exchange are valued at the last reported sale price on the valuation date. Investments listed or traded on an exchange for which there has been no sale that day are valued at the mean between the last reported bid and asked prices on that valuation date. Portfolio investments reported by NASDAQ are valued at the official closing price on the valuation date. If an investment is traded on more than one exchange, the investment is considered traded on the exchange that is normally the primary market for that investment. Securities and other portfolio investments which are listed or traded on exchanges outside the United States are valued at the last price or the closing price of the investment on the exchange that is normally the primary market for the investment, as of the close of the exchange preceding the Fund’s valuation date. Foreign investments listed or traded on an exchange for which there has been no sale that day are valued at the mean between the last reported bid and asked prices on that valuation date.
In any case when a market quotation is not readily available for a portfolio investment ordinarily valued by market quotation, the Committee calculates a fair value for the investment using alternative methods approved by the Audit Committee. A market quotation is not readily available when the primary market or exchange for the investment is not open for the entire scheduled day of trading. Market quotations for an investment also may not be readily available if developments after the most recent close of the investment’s primary exchange or market, but prior to the close of business on any Fund business day, or an unusual event or significant period of time occurring since the availability of a market quotation, create a serious question concerning the reliability of the most recent market quotation available for the investment. In particular, on days when market volatility thresholds established by the Audit Committee are exceeded, foreign equity investments held by the Fund may be valued using alternative methods. The Committee customarily obtains valuations in these instances from pricing service providers approved by the Audit Committee. Pricing service providers ordinarily calculate valuations using multi-factor models to adjust market prices based upon various inputs, including exchange data, depository receipt prices, futures, index data and other data.
Semi-Annual Report 19
| | |
| Notes to Financial Statements, Continued | | |
| |
Thornburg International Value Fund | | March 31, 2017 (Unaudited) |
Debt obligations held by the Fund which are not listed or traded on exchanges or for which no reported market exists are ordinarily valued at the valuation obtained from a pricing service provider approved by the Audit Committee.
In any case when a pricing service provider fails to provide a valuation for a debt obligation held by the Fund, the Committee calculates a fair value for the obligation using alternative methods under procedures approved by the Audit Committee. Additionally, in cases when management believes that a valuation obtained from a pricing service provider merits review for significant reasons, the Committee decides whether or not to use the valuation calculated by the pricing service provider or to use an alternative method approved by the Audit Committee to calculate a fair value for the obligation.
Quotations for foreign investments expressed in foreign currency amounts are converted to U.S. dollar equivalents using a foreign exchange quotation from a third party service provider at the time of valuation. Foreign investments held by the Fund may be traded on days and at times when the Fund is not open for business. Consequently, the value of Fund investments may be significantly affected on days when shareholders cannot purchase or sell Fund shares. Futures contracts and other financial and derivative instruments traded on an exchange are valued at the latest published price for the instrument on its primary exchange. Listed options are valued at the last bid price.
Valuation Hierarchy: The Fund categorizes its investments based upon the inputs used in valuing those investments, according to a three-level hierarchy established in guidance from FASB. Categorization of investments using this hierarchy is intended by the FASB to maximize the use of observable inputs in valuing investments and minimize the use of unobservable inputs by requiring that the most observable inputs be used when available. Observable inputs are those that market participants would use in valuing an investment based on available market information. Unobservable inputs are those that reflect assumptions about the information market participants would use in valuing an investment. An investment’s level within the hierarchy is based on the lowest level input that is deemed significant to the valuation. The methodologies and inputs used to value investments are not necessarily indications of the risk or liquidity associated with those investments.
Various inputs are used in calculating valuations for the Fund’s investments. These inputs are generally summarized according to the three-level hierarchy below:
Level 1: Quoted prices in active markets for identical investments.
Level 2: Other direct or indirect significant observable inputs (including quoted prices for similar investments in active markets and other observable inputs, such as interest rates, prepayment rates, credit risk, etc.).
Level 3: Significant unobservable inputs (including the Committee’s own assumptions in calculating the fair values of investments).
Valuations for debt obligations held by the Fund are typically calculated by pricing service providers approved by the Audit Committee and are characterized as Level 2 within the valuation hierarchy.
On days when market volatility thresholds established by the Audit Committee are exceeded, foreign securities for which valuations are obtained from pricing service providers are fair valued. On these days, the foreign securities are characterized as Level 2 within the valuation hierarchy and revert to Level 1 after the threshold is no longer exceeded.
In a limited number of cases the Committee calculates a fair value for investments using broker quotations or other methods approved by the Audit Committee. When the Committee uses a single broker quotation to calculate a fair value for an investment without other significant observable inputs, or if a fair value is calculated using other significant inputs that are considered unobservable, the investment is characterized as Level 3 within the hierarchy. Other significant unobservable inputs used to calculate a fair value in these instances might include an income-based valuation approach which considers discounted anticipated future cash flows from the investment, and application of discounts due to the nature or duration of any restrictions on the disposition of the investment.
Valuations based upon the use of inputs from Levels 1, 2 or 3 may not represent the actual price received upon the disposition of an investment, and the Fund may receive a price that is lower than the valuation based upon these inputs when it sells the investment.
The following table displays a summary of the fair value hierarchy measurements of the Fund’s investments as of March 31, 2017. In any instance when valuation inputs from more than one level are used to determine the fair value of a specific investment, the investment is placed in the level of the table based upon the lowest level input that is significant in determining the fair value of the investment:
20 Semi-Annual Report
| | |
| Notes to Financial Statements, Continued | | |
| |
Thornburg International Value Fund | | March 31, 2017 (Unaudited) |
| | | | | | | | | | | | | | | | |
| | | FAIR VALUE MEASUREMENTS AT MARCH 31, 2017 | |
| | | TOTAL | | | LEVEL 1 | | | LEVEL 2 | | | LEVEL 3 | |
Assets | | | | | | | | | | | | | | | | |
Investments in Securities* | | | | | | | | | | | | | | | | |
Common Stock | | $ | 5,692,141,217 | | | $ | 5,692,141,217 | | | $ | — | | | $ | — | |
Short Term Investments | | | 215,907,309 | | | | 215,907,309 | | | | — | | | | — | |
| | | | | | | | | | | | | | | | |
Total Investments in Securities | | $ | 5,908,048,526 | | | $ | 5,908,048,526 | | | $ | — | | | $ | — | |
| | | | |
Other Financial Instruments** | | | | | | | | | | | | | | | | |
Forward Currency Contracts | | $ | 15,130,368 | | | $ | — | | | $ | 15,130,368 | | | $ | — | |
Spot Currency | | $ | 125,775 | | | $ | 125,775 | | | $ | — | | | $ | — | |
| | | | |
Liabilities | | | | | | | | | | | | | | | | |
Other Financial Instruments** | | | | | | | | | | | | | | | | |
Forward Currency Contracts | | $ | (2,207,187 | ) | | $ | — | | | $ | (2,207,187 | ) | | $ | — | |
Spot Currency | | $ | (647 | ) | | $ | (647 | ) | | $ | — | | | $ | — | |
| * | See Schedule of Investments for a summary of the industry exposure as grouped according to the Global Industry Classification Standard (GICS), which is an industry taxonomy developed by MSCI, Inc. and Standard & Poor’s (S&P). |
| ** | Other Financial Instruments include investments not reflected in the Schedule of Investments, which may include futures, forwards and swap contracts, which are valued at the unrealized appreciation (depreciation) on the investment. |
In accordance with the guidance prescribed in Accounting Standards Update No. 2011-04, it is the policy of the Fund to recognize transfers between levels and the underlying events which caused the movement. The Fund recognized no transfers between levels for the six months ended March 31, 2017, other than when the Fund exceeded market volatility thresholds for foreign equity investments during the period.
NOTE 4 – INVESTMENT ADVISORY FEE AND OTHER TRANSACTIONS WITH AFFILIATES
Pursuant to an investment advisory agreement, the Advisor serves as the investment advisor and performs services for the Fund for which the fees are payable at the end of each month. Under the investment advisory agreement, the Fund pays the Advisor a management fee based on the daily net assets of the Fund at an annual rate as shown in the following table:
Management Fee Schedule
| | | | |
DAILY NET ASSETS | | FEE RATE | |
Up to $500 million | | | 0.875 | % |
Next $500 million | | | 0.825 | |
Next $500 million | | | 0.775 | |
Next $500 million | | | 0.725 | |
Over $2 billion | | | 0.675 | |
The Fund’s effective management fee for the period ended March 31, 2017 was 0.712% of the Fund’s average net assets.
The Fund pays to the Advisor the costs of personnel who perform certain accounting services for the Fund. For the six months ended March 31, 2017, the Fund paid $121,030 to the Advisor for these accounting services. The Trust has also entered into administrative service agreements with the Advisor, whereby the Advisor will perform certain administrative services related to each class of the Fund’s shares and for which fees will be payable at an annual rate of up to .125 of 1% per annum of the average daily net assets attributable to each class of shares. Total administrative service fees incurred by each class of shares of the Fund for the six months ended March 31, 2017, are set forth in the Statement of Operations.
The Trust has an underwriting agreement with Thornburg Securities Corporation (the “Distributor”), an affiliate of the Advisor, which acts as the distributor of the Fund’s shares. For the six months ended March 31, 2017, the Distributor has advised the Fund that it earned net commissions aggregating $7,722 from the sale of Class A shares, and collected contingent deferred sales charges aggregating $6,776 from redemptions of Class C shares of the Fund.
Semi-Annual Report 21
| | |
| Notes to Financial Statements, Continued | | |
| |
Thornburg International Value Fund | | March 31, 2017 (Unaudited) |
Pursuant to a service plan under Rule 12b-1 of the Investment Company Act of 1940, the Fund may pay to the Distributor or securities dealers and other financial institutions at the Distributor’s direction an amount not to exceed .25 of 1% per annum of the average daily net assets attributable to Class A, Class C, Class R3 and Class R4 shares of the Fund to obtain various shareholder and distribution related services. For the six months ended March 31, 2017, there were no 12b-1 service plan fees charged for Class I, Class R5 and Class R6 shares. The Advisor and Distributor each may pay out of its own resources additional expenses for distribution of the Fund’s shares and shareholder services.
The Trust has also adopted distribution plans pursuant to Rule 12b-1, applicable only to the Fund’s Class C and Class R3 shares, under which the Fund compensates the Distributor for services in promoting the sale of Class C and Class R3 shares of the Fund at an annual rate of up to .75 of 1% per annum of the average daily net assets attributable to Class C shares and an annual rate of up to .25 of 1% per annum of the average daily net assets attributable to Class R3 shares. Total fees incurred by each class of shares of the Fund under their respective service and distribution plans for the six months ended March 31, 2017, are set forth in the Statement of Operations.
The Advisor and Distributor have contractually agreed to waive fees and reimburse expenses incurred by the Fund so that actual expenses of certain share classes do not exceed levels as specified in the Fund’s most recent prospectus. The agreement may be terminated by the Fund at any time, but may not be terminated by the Advisor or Distributor before April 10, 2018, unless the Advisor ceases to be the investment advisor to the Fund or the Distributor ceases to be the distributor of the Fund prior to that date. The Advisor and Distributor may recoup amounts waived or reimbursed during the fiscal year if actual expenses fall below the contractual limit during that year.
For the six months ended March 31, 2017, the Advisor contractually reimbursed certain class specific expenses, administrative fees, and distribution fees of $287,094 for Class R3 shares, $255,546 for Class R4 shares, and $357,576 for Class R5 shares.
Certain officers and Trustees of the Trust are also officers or directors of the Advisor and Distributor. The compensation of independent Trustees is borne by the Trust.
The percentage of direct investments in the Fund held by the Trustees and Officers of the Trust and the Advisor is approximately 0.68%.
The Fund may purchase or sell securities from, or to an affiliated fund, provided the affiliation is due solely to having a common investment advisor, common officers, or common trustees, and provided that all such transactions will comply with Rule 17a-7 under the 1940 Act. For the six months ended March 31, 2017, the Fund had no transactions with affiliated funds.
NOTE 5 – SHARES OF BENEFICIAL INTEREST
At March 31, 2017, there were an unlimited number of shares with no par value of beneficial interest authorized. Transactions in shares of beneficial interest were as follows:
| | | | | | | | | | | | | | | | |
| | | SIX MONTHS ENDED
MARCH 31, 2017 (UNAUDITED) | | | YEAR ENDED
SEPTEMBER 30, 2016 (AUDITED) | |
| | | SHARES | | | AMOUNT | | | SHARES | | | AMOUNT | |
Class A Shares | | | | | | | | | | | | | | | | |
Shares sold | | | 2,530,861 | | | $ | 58,539,453 | | | | 6,663,995 | | | $ | 159,603,304 | |
Shares converted from Class B Shares | | | — | | | | — | | | | 75,049 | | | | 1,748,646 | |
Shares issued to shareholders in reinvestment of dividends | | | — | | | | — | | | | 8,432,658 | | | | 205,155,554 | |
Shares repurchased | | | (12,134,268 | ) | | | (286,341,363 | ) | | | (22,493,529 | ) | | | (530,619,029 | ) |
| | | | | | | | | | | | | | | | |
| | | | |
Net increase (decrease) | | | (9,603,407 | ) | | $ | (227,801,910 | ) | | | (7,321,827 | ) | | $ | (164,111,525 | ) |
| | | | | | | | | | | | | | | | |
| | | | |
Class B Shares* | | | | | | | | | | | | | | | | |
Shares sold | | | — | | | | — | | | | 10,346 | | | $ | 225,076 | |
Shares issued to shareholders in reinvestment of dividends | | | — | | | | — | | | | 36,621 | | | | 810,856 | |
Shares converted to Class A shares | | | — | | | | — | | | | (83,044 | ) | | | (1,748,646 | ) |
Shares repurchased | | | — | | | | — | | | | (262,313 | ) | | | (5,732,414 | ) |
| | | | | | | | | | | | | | | | |
| | | | |
Net increase (decrease) | | | — | | | | — | | | | (298,390 | ) | | $ | (6,445,128 | ) |
| | | | | | | | | | | | | | | | |
22 Semi-Annual Report
| | |
| Notes to Financial Statements, Continued | | |
| |
Thornburg International Value Fund | | March 31, 2017 (Unaudited) |
| | | | | | | | | | | | | | | | |
| | | SIX MONTHS ENDED
MARCH 31, 2017 (UNAUDITED) | | | YEAR ENDED
SEPTEMBER 30, 2016 (AUDITED) | |
| | | SHARES | | | AMOUNT | | | SHARES | | | AMOUNT | |
Class C Shares | | | | | | | | | | | | | | | | |
Shares sold | | | 282,948 | | | $ | 6,007,268 | | | | 2,344,411 | | | $ | 51,715,435 | |
Shares issued to shareholders in reinvestment of dividends | | | — | | | | — | | | | 4,231,136 | | | | 93,936,821 | |
Shares repurchased | | | (5,491,837 | ) | | | (116,089,228 | ) | | | (9,254,631 | ) | | | (200,280,637 | ) |
| | | | | | | | | | | | | | | | |
| | | | |
Net increase (decrease) | | | (5,208,889 | ) | | $ | (110,081,960 | ) | | | (2,679,084 | ) | | $ | (54,628,381 | ) |
| | | | | | | | | | | | | | | | |
| | | | |
Class I Shares | | | | | | | | | | | | | | | | |
Shares sold | | | 12,668,408 | | | $ | 304,438,242 | | | | 53,906,880 | | | $ | 1,294,025,547 | |
Shares issued to shareholders in reinvestment of dividends | | | 113,651 | | | | 2,862,880 | | | | 33,325,928 | | | | 830,190,740 | |
Shares repurchased | | | (66,594,251 | ) | | | (1,607,520,664 | ) | | | (115,362,911 | ) | | | (2,820,675,539 | ) |
| | | | | | | | | | | | | | | | |
| | | | |
Net increase (decrease) | | | (53,812,192 | ) | | $ | (1,300,219,542 | ) | | | (28,130,103 | ) | | $ | (696,459,252 | ) |
| | | | | | | | | | | | | | | | |
| | | | |
Class R3 Shares | | | | | | | | | | | | | | | | |
Shares sold | | | 964,013 | | | $ | 22,536,345 | | | | 3,233,955 | | | $ | 76,543,365 | |
Shares issued to shareholders in reinvestment of dividends | | | — | | | | — | | | | 2,938,343 | | | | 71,615,592 | |
Shares repurchased | | | (2,891,574 | ) | | | (67,535,765 | ) | | | (9,747,898 | ) | | | (228,445,231 | ) |
| | | | | | | | | | | | | | | | |
| | | | |
Net increase (decrease) | | | (1,927,561 | ) | | $ | (44,999,420 | ) | | | (3,575,600 | ) | | $ | (80,286,274 | ) |
| | | | | | | | | | | | | | | | |
| | | | |
Class R4 Shares | | | | | | | | | | | | | | | | |
Shares sold | | | 877,236 | | | $ | 20,420,528 | | | | 2,976,526 | | | $ | 70,234,604 | |
Shares issued to shareholders in reinvestment of dividends | | | 1 | | | | 21 | | | | 1,632,286 | | | | 39,409,828 | |
Shares repurchased | | | (3,284,594 | ) | | | (76,156,683 | ) | | | (5,312,446 | ) | | | (125,409,786 | ) |
| | | | | | | | | | | | | | | | |
| | | | |
Net increase (decrease) | | | (2,407,357 | ) | | $ | (55,736,134 | ) | | | (703,634 | ) | | $ | (15,765,354 | ) |
| | | | | | | | | | | | | | | | |
| | | | |
Class R5 Shares | | | | | | | | | | | | | | | | |
Shares sold | | | 1,639,915 | | | $ | 39,436,396 | | | | 5,121,121 | | | $ | 125,836,118 | |
Shares issued to shareholders in reinvestment of dividends | | | 14,395 | | | | 362,333 | | | | 4,346,336 | | | | 108,199,722 | |
Shares repurchased | | | (6,293,056 | ) | | | (151,448,621 | ) | | | (11,882,677 | ) | | | (288,001,530 | ) |
| | | | | | | | | | | | | | | | |
| | | | |
Net increase (decrease) | | | (4,638,746 | ) | | $ | (111,649,892 | ) | | | (2,415,220 | ) | | $ | (53,965,690 | ) |
| | | | | | | | | | | | | | | | |
| | | | |
Class R6 Shares | | | | | | | | | | | | | | | | |
Shares sold | | | 1,450,273 | | | $ | 34,713,277 | | | | 8,733,531 | | | $ | 205,874,135 | |
Shares issued to shareholders in reinvestment of dividends | | | 35,112 | | | | 881,677 | | | | 3,013,284 | | | | 74,472,093 | |
Shares repurchased | | | (3,872,498 | ) | | | (92,757,516 | ) | | | (7,004,088 | ) | | | (165,389,431 | ) |
| | | | | | | | | | | | | | | | |
| | | | |
Net increase (decrease) | | | (2,387,113 | ) | | $ | (57,162,562 | ) | | | 4,742,727 | | | $ | 114,956,797 | |
| | | | | | | | | | | | | | | | |
| * | Class B shares converted to Class A shares on August 29, 2016. |
NOTE 6 – INVESTMENT TRANSACTIONS
For the six months ended March 31, 2017, the Fund had purchase and sale transactions of investments (excluding short-term investments) of $2,838,151,744 and $4,446,116,514, respectively.
Semi-Annual Report 23
| | |
| Notes to Financial Statements, Continued | | |
| |
Thornburg International Value Fund | | March 31, 2017 (Unaudited) |
NOTE 7 — DERIVATIVE FINANCIAL INSTRUMENTS WITH OFF-BALANCE SHEET RISK AND FOREIGN INVESTMENT RISK
The Fund may use a variety of derivative financial instruments to hedge or adjust the risks affecting its investment portfolio or to enhance investment returns. Provisions of the FASB Accounting Standards Codification 815-10-50 (“ASC 815”) require certain disclosures. The disclosures are intended to provide users of financial statements with an understanding of the use of derivative instruments by the Fund and how these derivatives affect the financial position, financial performance and cash flows of the Fund. The Fund does not designate any derivative instruments as hedging instruments under ASC 815. During the six months ended March 31, 2017, the Fund’s principal exposure to derivative financial instruments of the type addressed by ASC 815 was investment in foreign exchange contracts. A foreign exchange contract is an agreement between two parties to exchange different currencies at a specified rate of exchange at an agreed upon future date. Foreign exchange contracts involve risks to the Fund, including the risk that a contract’s counterparty will not meet its obligations to the Fund, the risk that a change in a contract’s value may not correlate perfectly with the currency the contract was intended to track, and the risk that the Fund’s Advisor is unable to correctly implement its strategy in using a contract. In any such instance, the Fund may not achieve the intended benefit of entering into a contract, and may experience a loss.
The Fund entered into forward currency contracts during the six months ended March 31, 2017 in the normal course of pursuing its investment objectives, with the objective of purchasing foreign investments or with the intent of reducing the risk to the value of the Fund’s foreign investments from adverse changes in the relationship between the U.S. dollar and foreign currencies. In each case these contracts have been initiated in conjunction with foreign investment transactions.
These contracts are accounted for by the Fund under ASC 815. Unrealized appreciation and depreciation on outstanding contracts are reported in the Fund’s Statement of Assets and Liabilities, as measured by the difference between the forward exchange rates at the reporting date and the forward exchange rates at each contract’s inception date. Net realized gain (loss) on contracts closed during the period, and changes in net unrealized appreciation (depreciation) on outstanding contracts are recognized in the Fund’s Statement of Operations.
The quarterly average value of open sell currency contracts for the six months ended March 31, 2017 was $1,012,012,352. Open buy currency contracts are entered into for the purpose of closing open sell currency contracts and the values are dependent upon the values of the open sell currency contracts to which they relate.
The following table displays the outstanding forward currency contracts at March 31, 2017:
| | | | | | | | | | | | | | | | | | | | | | | | |
OUTSTANDING FORWARD CURRENCY CONTRACTS TO BUY OR SELL AT MARCH 31, 2017 | |
| CONTRACT DESCRIPTION | | BUY/SELL | | | CONTRACT AMOUNT | | | CONTRACT VALUE DATE | | | VALUE USD | | | UNREALIZED APPRECIATION | | | UNREALIZED DEPRECIATION | |
Japanese Yen | | | Buy | | | | 38,604,772,100 | | | | 05/10/2017 | | | | 347,208,261 | | | $ | 9,062,297 | | | $ | — | |
Japanese Yen | | | Buy | | | | 30,149,436,200 | | | | 05/10/2017 | | | | 271,161,640 | | | | 6,068,071 | | | | — | |
Japanese Yen | | | Sell | | | | 68,754,208,300 | | | | 05/10/2017 | | | | 618,369,901 | | | | — | | | | (2,207,187 | ) |
| | | | | | | | | | | | | | | | | | | | | | | | |
| | | | | | |
Total | | | | | | | | | | | | | | | | | | $ | 15,130,368 | | | $ | (2,207,187 | ) |
| | | | | | | | | | | | | | | | | | | | | | | | |
| | | |
Net unrealized appreciation (depreciation) | | | | | | | $ | 12,923,181 | | | | — | |
| | | | | | | | | | | | | | | | | | | | | | | | |
The outstanding forward currency contracts in the foregoing table were entered into with State Street Bank and Trust Company (“SSB”), pursuant to an International Swaps and Derivatives Association (“ISDA”) Master Agreement. In the event of a default or termination under the ISDA Master Agreement with SSB, the non-defaulting party has the right to close out all outstanding forward currency contracts between the parties and to net any payment amounts under those contracts, resulting in a single net amount payable by one party to the other.
Because the ISDA Master Agreement with SSB does not result in an offset of reported amounts of financial assets and liabilities in the Fund’s Statement of Assets and Liabilities unless there has been an event of default or termination event under that agreement, the Fund does not net its outstanding forward currency contracts for purposes of the disclosure in the Fund’s Statement of Assets and Liabilities. Instead the Fund recognizes the unrealized appreciation or depreciation on those forward currency contracts on a gross basis in the Fund’s Statement of Assets and Liabilities.
24 Semi-Annual Report
| | |
| Notes to Financial Statements, Continued | | |
| |
Thornburg International Value Fund | | March 31, 2017 (Unaudited) |
The unrealized appreciation (depreciation) of the outstanding forward currency contracts recognized in the Fund’s Statement of Assets and Liabilities at March 31, 2017 is disclosed in the following table:
| | | | |
| FAIR VALUES OF DERIVATIVE FINANCIAL INSTRUMENTS AT MARCH 31, 2017 |
| | |
| ASSET DERIVATIVES | | BALANCE SHEET LOCATION | | FAIR VALUE |
| | |
Foreign exchange contracts | | Assets - Unrealized appreciation on forward currency contracts | | $15,130,368 |
| | |
| LIABILITY DERIVATIVES | | BALANCE SHEET LOCATION | | FAIR VALUE |
| | |
Foreign exchange contracts | | Liabilities - Unrealized depreciation on forward currency contracts | | $(2,207,187) |
Because the Fund does not currently receive or post cash collateral in connection with its currency forward contracts, and because all of the Fund’s outstanding currency forward contracts are with SSB, the net amounts of the Fund’s assets and liabilities which are attributable to those contracts at March 31, 2017 can be determined by offsetting the dollar amounts shown in the preceding table. Based on those amounts, the net amount of the Fund’s assets which is attributable to its outstanding forward currency contracts at March 31, 2017 is $12,923,181, and the net amount of the Fund’s liabilities which is attributable to those contracts at that date is $0. The Fund’s forward currency contracts are valued each day, and the net amounts of the Fund’s assets and liabilities which are attributable to those contracts are expected to vary over time.
The net realized gain (loss) from forward currency contracts and the net change in unrealized appreciation (depreciation) on outstanding forward currency contracts recognized in the Fund’s Statement of Operations for the six months ended March 31, 2017 are disclosed in the following tables:
| | | | |
NET REALIZED GAIN (LOSS) ON DERIVATIVE FINANCIAL INSTRUMENTS RECOGNIZED IN INCOME FOR THE SIX MONTHS ENDED MARCH 31, 2017 |
| | |
| | | TOTAL | | FORWARD CURRENCY CONTRACTS |
| | |
Foreign exchange contracts | | $ 73,123,237 | | $ 73,123,237 |
| | | | |
NET CHANGE IN UNREALIZED APPRECIATION (DEPRECIATION) OF DERIVATIVE FINANCIAL INSTRUMENTS RECOGNIZED IN INCOME FOR THE SIX MONTHS ENDED MARCH 31, 2017 |
| | |
| | | TOTAL | | FORWARD CURRENCY CONTRACTS |
| | |
Foreign exchange contracts | | $ 12,298,969 | | $ 12,298,969 |
OTHER NOTES
Risks: The Fund’s investments subject it to risks including, but not limited to, management risk, market and economic risk, risks affecting specific issuers, liquidity risk, the risks associated with investments in small- and mid-cap companies and non-U.S. issuers (including developing country issuers), credit risk, and interest rate risk. Please see the Fund’s prospectus for a discussion of the risks associated with an investment in the Fund.
Subsequent Events: Fund management believes no events have occurred between March 31, 2017 and the date of issuance of the financial statements that require adjustment to or disclosure in the accompanying financial statements.
Semi-Annual Report 25
Financial Highlights
Thornburg International Value Fund
| | | | | | | | | | | | | | | | | | | | | | | | | | | | | | | | | | | | | | | | | | | | | | | | | | | | | | | | | | | | |
| | | PER SHARE PERFORMANCE (FOR A SHARE OUTSTANDING THROUGHOUT THE PERIOD) | | | RATIOS TO AVERAGE NET ASSETS | | | SUPPLEMENTAL DATA | |
UNLESS OTHERWISE NOTED, PERIODS ARE FISCAL YEARS ENDED SEPT. 30, | | NET ASSET
VALUE
BEGINNING
OF PERIOD | | | NET
INVESTMENT
INCOME
(LOSS)+ | | | NET
REALIZED
&
UNREALIZED
GAIN (LOSS)
ON
INVESTMENTS | | | TOTAL FROM
INVESTMENT
OPERATIONS | | | DIVIDENDS
FROM NET
INVESTMENT
INCOME | | | DIVIDENDS
FROM NET
REALIZED
GAINS | | | TOTAL
DIVIDENDS | | | NET
ASSET
VALUE
END
OF
PERIOD | | | NET
INVESTMENT
INCOME
(LOSS)
(%) | | | EXPENSES,
AFTER
EXPENSE
REDUCTIONS
(%) | | | EXPENSES,
AFTER
EXPENSE
REDUCTIONS
AND
NET OF
CUSTODY
CREDITS
(%) | | | EXPENSES,
BEFORE
EXPENSE
REDUCTIONS
(%) | | | TOTAL
RETURN
(%)(a) | | | PORTFOLIO
TURNOVER
RATE
(%)(a) | | | NET
ASSETS
AT END
OF
PERIOD
(THOUSANDS) | |
CLASS A SHARES | | | | | | | | | | | | | | | | | | | | | | | | | | | | | | | | | | | | | | | | | | | | | |
2017(b)(c) | | $ | 23.43 | | | | (0.03 | ) | | | 1.23 | | | | 1.20 | | | | — | | | | — | | | | — | | | $ | 24.63 | | | | (0.22 | )(h) | | | 1.32 | (h) | | | 1.32 | (h) | | | 1.32 | (h) | | | 5.12 | | | | 44.69 | | | $ | 804,481 | |
2016(c)(d) | | $ | 27.46 | | | | 0.36 | | | | 0.25 | | | | 0.61 | | | | (0.39 | ) | | | (4.25 | ) | | | (4.64 | ) | | $ | 23.43 | | | | 1.51 | | | | 1.28 | | | | 1.28 | | | | 1.28 | | | | 1.90 | | | | 103.90 | | | $ | 990,194 | |
2015(c) | | $ | 29.84 | | | | 0.24 | | | | 0.16 | | | | 0.40 | | | | (0.26 | ) | | | (2.52 | ) | | | (2.78 | ) | | $ | 27.46 | | | | 0.82 | | | | 1.27 | | | | 1.27 | | | | 1.27 | | | | 1.25 | | | | 70.88 | | | $ | 1,361,529 | |
2014(c) | | $ | 30.12 | | | | 0.19 | | | | (0.23 | ) | | | (0.04 | ) | | | (0.24 | ) | | | — | | | | (0.24 | ) | | $ | 29.84 | | | | 0.63 | | | | 1.26 | | | | 1.26 | | | | 1.26 | | | | (0.14 | ) | | | 37.25 | | | $ | 2,601,689 | |
2013(c) | | $ | 26.08 | | | | 0.26 | | | | 4.02 | | | | 4.28 | | | | (0.24 | ) | | | — | | | | (0.24 | ) | | $ | 30.12 | | | | 0.92 | | | | 1.25 | | | | 1.25 | | | | 1.25 | | | | 16.49 | | | | 34.67 | | | $ | 5,212,813 | |
2012(c) | | $ | 23.14 | | | | 0.28 | | | | 2.95 | | | | 3.23 | | | | (0.29 | ) | | | — | | | | (0.29 | ) | | $ | 26.08 | | | | 1.09 | | | | 1.29 | | | | 1.29 | | | | 1.29 | | | | 14.02 | | | | 17.86 | | | $ | 5,429,316 | |
CLASS C SHARES | | | | | | | | | | | | | | | | | | | | | | | | | | | | | | | | | | | | | | | | | | | | | |
2017(b) | | $ | 21.29 | | | | (0.10 | ) | | | 1.11 | | | | 1.01 | | | | — | | | | — | | | | — | | | $ | 22.30 | | | | (0.94 | )(h) | | | 2.05 | (h) | | | 2.05 | (h) | | | 2.05 | (h) | | | 4.74 | | | | 44.69 | | | $ | 444,461 | |
2016 | | $ | 25.40 | | | | 0.17 | | | | 0.24 | | | | 0.41 | | | | (0.27 | ) | | | (4.25 | ) | | | (4.52 | ) | | $ | 21.29 | | | | 0.77 | | | | 2.02 | | | | 2.02 | | | | 2.02 | | | | 1.12 | | | | 103.90 | | | $ | 535,169 | |
2015 | | $ | 27.86 | | | | 0.05 | | | | 0.11 | | | | 0.16 | | | | (0.10 | ) | | | (2.52 | ) | | | (2.62 | ) | | $ | 25.40 | | | | 0.19 | | | | 1.99 | | | | 1.99 | | | | 1.99 | | | | 0.52 | | | | 70.88 | | | $ | 706,606 | |
2014 | | $ | 28.17 | | | | — | (e) | | | (0.23 | ) | | | (0.23 | ) | | | (0.08 | ) | | | — | | | | (0.08 | ) | | $ | 27.86 | | | | — | (f) | | | 1.99 | | | | 1.99 | | | | 1.99 | | | | (0.83 | ) | | | 37.25 | | | $ | 874,358 | |
2013 | | $ | 24.48 | | | | 0.04 | | | | 3.77 | | | �� | 3.81 | | | | (0.12 | ) | | | — | | | | (0.12 | ) | | $ | 28.17 | | | | 0.15 | | | | 2.01 | | | | 2.01 | | | | 2.01 | | | | 15.62 | | | | 34.67 | | | $ | 1,181,438 | |
2012 | | $ | 21.77 | | | | 0.08 | | | | 2.77 | | | | 2.85 | | | | (0.14 | ) | | | — | | | | (0.14 | ) | | $ | 24.48 | | | | 0.35 | | | | 2.03 | | | | 2.03 | | | | 2.03 | | | | 13.14 | | | | 17.86 | | | $ | 1,254,732 | |
CLASS I SHARES | | | | | | | | | | | | | | | | | | | | | | | | | | | | | | | | | | | | | | | | | | | | | |
2017(b) | | $ | 24.02 | | | | 0.01 | | | | 1.28 | | | | 1.29 | | | | (0.03 | ) | | | — | | | | (0.03 | ) | | $ | 25.28 | | | | 0.12 | (h) | | | 0.94 | (h) | | | 0.94 | (h) | | | 0.94 | (h) | | | 5.35 | | | | 44.69 | | | $ | 3,244,292 | |
2016 | | $ | 28.04 | | | | 0.47 | | | | 0.23 | | | | 0.70 | | | | (0.47 | ) | | | (4.25 | ) | | | (4.72 | ) | | $ | 24.02 | | | | 1.91 | | | | 0.90 | | | | 0.90 | | | | 0.90 | | | | 2.21 | | | | 103.90 | | | $ | 4,375,955 | |
2015 | | $ | 30.43 | | | | 0.38 | | | | 0.13 | | | | 0.51 | | | | (0.38 | ) | | | (2.52 | ) | | | (2.90 | ) | | $ | 28.04 | | | | 1.27 | | | | 0.90 | | | | 0.90 | | | | 0.90 | | | | 1.65 | | | | 70.88 | | | $ | 5,895,731 | |
2014 | | $ | 30.76 | | | | 0.33 | | | | (0.25 | ) | | | 0.08 | | | | (0.41 | ) | | | — | | | | (0.41 | ) | | $ | 30.43 | | | | 1.05 | | | | 0.88 | | | | 0.88 | | | | 0.88 | | | | 0.23 | | | | 37.25 | | | $ | 7,748,950 | |
2013 | | $ | 26.66 | | | | 0.38 | | | | 4.10 | | | | 4.48 | | | | (0.38 | ) | | | — | | | | (0.38 | ) | | $ | 30.76 | | | | 1.34 | | | | 0.86 | | | | 0.86 | | | | 0.86 | | | | 16.94 | | | | 34.67 | | | $ | 14,601,876 | |
2012 | | $ | 23.65 | | | | 0.40 | | | | 3.00 | | | | 3.40 | | | | (0.39 | ) | | | — | | | | (0.39 | ) | | $ | 26.66 | | | | 1.53 | | | | 0.88 | | | | 0.88 | | | | 0.88 | | | | 14.47 | | | | 17.86 | | | $ | 12,505,553 | |
CLASS R3 SHARES | | | | | | | | | | | | | | | | | | | | | | | | | | | | | | | | | | | | | | | | | | | | | |
2017(b) | | $ | 23.44 | | | | (0.04 | ) | | | 1.23 | | | | 1.19 | | | | — | | | | — | | | | — | | | $ | 24.63 | | | | (0.33 | )(h) | | | 1.45 | (h) | | | 1.45 | (h) | | | 1.64 | (h) | | | 5.08 | | | | 44.69 | | | $ | 294,141 | |
2016 | | $ | 27.47 | | | | 0.31 | | | | 0.25 | | | | 0.56 | | | | (0.34 | ) | | | (4.25 | ) | | | (4.59 | ) | | $ | 23.44 | | | | 1.31 | | | | 1.45 | | | | 1.45 | | | | 1.62 | | | | 1.67 | | | | 103.90 | | | $ | 325,135 | |
2015 | | $ | 29.86 | | | | 0.21 | | | | 0.13 | | | | 0.34 | | | | (0.21 | ) | | | (2.52 | ) | | | (2.73 | ) | | $ | 27.47 | | | | 0.71 | | | | 1.45 | | | | 1.45 | | | | 1.58 | | | | 1.09 | | | | 70.88 | | | $ | 479,223 | |
2014 | | $ | 30.14 | | | | 0.15 | | | | (0.24 | ) | | | (0.09 | ) | | | (0.19 | ) | | | — | | | | (0.19 | ) | | $ | 29.86 | | | | 0.51 | | | | 1.45 | | | | 1.45 | | | | 1.61 | | | | (0.30 | ) | | | 37.25 | | | $ | 754,139 | |
2013 | | $ | 26.11 | | | | 0.20 | | | | 4.02 | | | | 4.22 | | | | (0.19 | ) | | | — | | | | (0.19 | ) | | $ | 30.14 | | | | 0.71 | | | | 1.45 | | | | 1.45 | | | | 1.57 | | | | 16.23 | | | | 34.67 | | | $ | 1,152,795 | |
2012 | | $ | 23.17 | | | | 0.24 | | | | 2.95 | | | | 3.19 | | | | (0.25 | ) | | | — | | | | (0.25 | ) | | $ | 26.11 | | | | 0.95 | | | | 1.45 | | | | 1.45 | | | | 1.60 | | | | 13.82 | | | | 17.86 | | | $ | 1,323,765 | |
CLASS R4 SHARES | | | | | | | | | | | | | | | | | | | | | | | | | | | | | | | | | | | | | | | | | | | | | |
2017(b) | | $ | 23.26 | | | | (0.02 | ) | | | 1.22 | | | | 1.20 | | | | — | | | | — | | | | — | | | $ | 24.46 | | | | (0.14 | )(h) | | | 1.25 | (h) | | | 1.25 | (h) | | | 1.47 | (h) | | | 5.16 | | | | 44.69 | | | $ | 222,570 | |
2016 | | $ | 27.30 | | | | 0.37 | | | | 0.23 | | | | 0.60 | | | | (0.39 | ) | | | (4.25 | ) | | | (4.64 | ) | | $ | 23.26 | | | | 1.55 | | | | 1.25 | | | | 1.25 | | | | 1.39 | | | | 1.87 | | | | 103.90 | | | $ | 267,623 | |
2015 | | $ | 29.69 | | | | 0.25 | | | | 0.15 | | | | 0.40 | | | | (0.27 | ) | | | (2.52 | ) | | | (2.79 | ) | | $ | 27.30 | | | | 0.86 | | | | 1.24 | | | | 1.24 | | | | 1.37 | | | | 1.30 | | | | 70.88 | | | $ | 333,247 | |
2014 | | $ | 29.98 | | | | 0.21 | | | | (0.24 | ) | | | (0.03 | ) | | | (0.26 | ) | | | — | | | | (0.26 | ) | | $ | 29.69 | | | | 0.70 | | | | 1.25 | | | | 1.25 | | | | 1.49 | | | | (0.12 | ) | | | 37.25 | | | $ | 722,349 | |
2013 | | $ | 25.96 | | | | 0.25 | | | | 4.01 | | | | 4.26 | | | | (0.24 | ) | | | — | | | | (0.24 | ) | | $ | 29.98 | | | | 0.91 | | | | 1.25 | | | | 1.25 | | | | 1.38 | | | | 16.49 | | | | 34.67 | | | $ | 1,342,883 | |
2012 | | $ | 23.04 | | | | 0.29 | | | | 2.93 | | | | 3.22 | | | | (0.30 | ) | | | — | | | | (0.30 | ) | | $ | 25.96 | | | | 1.16 | | | | 1.25 | | | | 1.25 | | | | 1.45 | | | | 14.05 | | | | 17.86 | | | $ | 1,495,958 | |
CLASS R5 SHARES | | | | | | | | | | | | | | | | | | | | | | | | | | | | | | | | | | | | | | | | | | | | | |
2017(b) | | $ | 24.01 | | | | 0.01 | | | | 1.26 | | | | 1.27 | | | | (0.02 | ) | | | — | | | | (0.02 | ) | | $ | 25.26 | | | | 0.10 | (h) | | | 0.99 | (h) | | | 0.99 | (h) | | | 1.14 | (h) | | | 5.30 | | | | 44.69 | | | $ | 439,777 | |
2016 | | $ | 28.03 | | | | 0.46 | | | | 0.23 | | | | 0.69 | | | | (0.46 | ) | | | (4.25 | ) | | | (4.71 | ) | | $ | 24.01 | | | | 1.88 | | | | 0.95 | | | | 0.95 | | | | 0.95 | | | | 2.19 | | | | 103.90 | | | $ | 529,330 | |
2015 | | $ | 30.41 | | | | 0.30 | | | | 0.19 | | | | 0.49 | | | | (0.35 | ) | | | (2.52 | ) | | | (2.87 | ) | | $ | 28.03 | | | | 1.01 | | | | 0.98 | | | | 0.98 | | | | 1.11 | | | | 1.57 | | | | 70.88 | | | $ | 685,617 | |
2014 | | $ | 30.71 | | | | 0.30 | | | | (0.24 | ) | | | 0.06 | | | | (0.36 | ) | | | — | | | | (0.36 | ) | | $ | 30.41 | | | | 0.97 | | | | 0.99 | | | | 0.99 | | | | 1.12 | | | | 0.17 | | | | 37.25 | | | $ | 2,171,673 | |
2013 | | $ | 26.61 | | | | 0.34 | | | | 4.10 | | | | 4.44 | | | | (0.34 | ) | | | — | | | | (0.34 | ) | | $ | 30.71 | | | | 1.20 | | | | 0.96 | | | | 0.96 | | | | 1.00 | | | | 16.80 | | | | 34.67 | | | $ | 4,376,567 | |
2012 | | $ | 23.61 | | | | 0.37 | | | | 3.00 | | | | 3.37 | | | | (0.37 | ) | | | — | | | | (0.37 | ) | | $ | 26.61 | | | | 1.44 | | | | 0.99 | | | | 0.99 | | | | 1.06 | | | | 14.33 | | | | 17.86 | | | $ | 4,512,144 | |
CLASS R6 SHARES | | | | | | | | | | | | | | | | | | | | | | | | | | | | | | | | | | | | | | | | | | | | | |
2017(b) | | $ | 23.95 | | | | 0.04 | | | | 1.26 | | | | 1.30 | | | | (0.05 | ) | | | — | | | | (0.05 | ) | | $ | 25.20 | | | | 0.33 | (h) | | | 0.78 | (h) | | | 0.78 | (h) | | | 0.78 | (h) | | | 5.43 | | | | 44.69 | | | $ | 438,476 | |
2016 | | $ | 27.97 | | | | 0.53 | | | | 0.21 | | | | 0.74 | | | | (0.51 | ) | | | (4.25 | ) | | | (4.76 | ) | | $ | 23.95 | | | | 2.19 | | | | 0.74 | | | | 0.74 | | | | 0.74 | | | | 2.40 | | | | 103.90 | | | $ | 473,941 | |
2015 | | $ | 30.36 | | | | 0.39 | | | | 0.17 | | | | 0.56 | | | | (0.43 | ) | | | (2.52 | ) | | | (2.95 | ) | | $ | 27.97 | | | | 1.33 | | | | 0.74 | | | | 0.74 | | | | 0.74 | | | | 1.81 | | | | 70.88 | | | $ | 420,849 | |
2014 | | $ | 30.70 | | | | 0.40 | | | | (0.26 | ) | | | 0.14 | | | | (0.48 | ) | | | — | | | | (0.48 | ) | | $ | 30.36 | | | | 1.28 | | | | 0.73 | | | | 0.73 | | | | 0.73 | | | | 0.42 | | | | 37.25 | | | $ | 872,512 | |
2013 | | $ | 26.62 | | | | 0.46 | | | | 4.05 | | | | 4.51 | | | | (0.43 | ) | | | — | | | | (0.43 | ) | | $ | 30.70 | | | | 1.59 | | | | 0.74 | | | | 0.74 | | | | 0.74 | | | | 17.07 | | | | 34.67 | | | $ | 1,345,680 | |
2012(g) | | $ | 27.14 | | | | 0.15 | | | | (0.38 | ) | | | (0.23 | ) | | | (0.29 | ) | | | — | | | | (0.29 | ) | | $ | 26.62 | | | | 1.35 | (h) | | | 0.76 | (h) | | | 0.76 | (h) | | | 0.76 | (h) | | | (0.77 | ) | | | 17.86 | | | $ | 478,078 | |
| (a) | Not annualized for periods less than one year. |
| (b) | Unaudited Six Month Period Ended March 31. |
| (c) | Sales loads are not reflected in computing total return. |
| (d) | Class B shares were converted to Class A shares on August 29, 2016. |
| (e) | Net investment income (loss) was less than $0.01 per share. |
| (f) | Net investment income (Loss) is less than 0.01%. |
| (g) | Effective date of this class of shares was May 1, 2012. |
| + | Based on weighted average shares outstanding. |
See notes to financial statements.
| | | | |
| 26 Semi-Annual Report | | | | Semi-Annual Report 27 |
| | |
| Expense Example | | |
| |
Thornburg International Value Fund | | March 31, 2017 (Unaudited) |
As a shareholder of the Fund, you incur two types of costs:
| | (1) | transaction costs, including |
(a) sales charges (loads) on purchase payments for Class A shares;
(b) a deferred sales charge on redemptions of any part or all of a purchase of $1 million of Class A shares within 12 months of purchase;
(c) a deferred sales charge on redemptions of Class C shares within 12 months of purchase;
| | (2) | ongoing costs, including management fees; distribution and/or service (12b-1) fees; and other Fund expenses. |
This example is intended to help you understand your ongoing costs (in dollars) of investing in the Fund and to compare these costs with the ongoing costs of investing in other mutual funds.
The example is based on a $1,000 investment beginning on October 1, 2016, and held until March 31, 2017.
| | | | | | | | | | | | |
| | | BEGINNING
ACCOUNT VALUE
10/1/16 | | | ENDING
ACCOUNT VALUE
3/31/17 | | | EXPENSES PAID
DURING PERIOD†
10/1/16–3/31/17 | |
CLASS A SHARES | | | | | | | | | | | | |
Actual | | $ | 1,000.00 | | | $ | 1,051.22 | | | $ | 6.78 | |
Hypothetical* | | $ | 1,000.00 | | | $ | 1,018.33 | | | $ | 6.67 | |
CLASS C SHARES | | | | | | | | | | | | |
Actual | | $ | 1,000.00 | | | $ | 1,047.44 | | | $ | 10.45 | |
Hypothetical* | | $ | 1,000.00 | | | $ | 1,014.72 | | | $ | 10.28 | |
CLASS I SHARES | | | | | | | | | | | | |
Actual | | $ | 1,000.00 | | | $ | 1,053.53 | | | $ | 4.84 | |
Hypothetical* | | $ | 1,000.00 | | | $ | 1,020.22 | | | $ | 4.76 | |
CLASS R3 SHARES | | | | | | | | | | | | |
Actual | | $ | 1,000.00 | | | $ | 1,050.77 | | | $ | 7.41 | |
Hypothetical* | | $ | 1,000.00 | | | $ | 1,017.70 | | | $ | 7.29 | |
CLASS R4 SHARES | | | | | | | | | | | | |
Actual | | $ | 1,000.00 | | | $ | 1,051.59 | | | $ | 6.39 | |
Hypothetical* | | $ | 1,000.00 | | | $ | 1,018.70 | | | $ | 6.29 | |
CLASS R5 SHARES | | | | | | | | | | | | |
Actual | | $ | 1,000.00 | | | $ | 1,052.97 | | | $ | 5.07 | |
Hypothetical* | | $ | 1,000.00 | | | $ | 1,020.00 | | | $ | 4.99 | |
CLASS R6 SHARES | | | | | | | | | | | | |
Actual | | $ | 1,000.00 | | | $ | 1,054.33 | | | $ | 3.98 | |
Hypothetical* | | $ | 1,000.00 | | | $ | 1,021.06 | | | $ | 3.92 | |
| † | Expenses are equal to the annualized expense ratio for each class (A: 1.32%; C: 2.05%; I: 0.95%; R3: 1.45%; R4: 1.25%; R5: 0.99%; R6: 0.78%) multiplied by the average account value over the period, multiplied by 182/365 to reflect the one-half year period. |
| * | Hypothetical assumes a rate of return of 5% per year before expenses. |
ACTUAL EXPENSES
For each class of shares, the first line of the accompanying table provides information about actual account values and actual expenses. You may use the information in this line, together with the amount you invested, to estimate the expenses that you paid over the period. Simply divide your account value by $1,000 (for example, an $8,600 account value divided by $1,000 = 8.6), then multiply the result by the number in the first line for your class of shares under the heading entitled “Expenses Paid During Period” to estimate the expenses you paid on your account during this period.
HYPOTHETICAL EXAMPLE FOR COMPARISON PURPOSES
For each class of shares, the second line of the accompanying table provides information about hypothetical account values and hypothetical expenses based on the Fund’s actual expense ratio and an assumed rate of return of 5% per year before expenses, which is not the Fund’s actual return. The hypothetical account values and expenses may not be used to estimate the actual ending account balance or expenses you paid for the period. You may use this information to compare the ongoing costs of investing in the Fund and other funds. To do so, compare this 5% hypothetical example with the 5% hypothetical examples that appear in the shareholder reports of the other funds.
Please note that the expenses shown in the table are meant to highlight your ongoing costs only and do not reflect any transactional costs, such as sales charges (loads), redemption fees, or exchange fees. Therefore, the second line of the table for each class of shares is useful in comparing ongoing costs only, and will not help you determine the relative total costs of owning different funds. In addition, if these transactional costs were included, your costs would have been higher.
28 Semi-Annual Report
| | |
| Other Information | | |
| |
Thornburg International Value Fund | | March 31, 2017 (Unaudited) |
PORTFOLIO PROXY VOTING
Policies and Procedures:
The Trust has delegated to Thornburg Investment Management, Inc. (the “Advisor”) voting decisions respecting proxies for the Fund’s voting securities. The Advisor makes voting decisions in accordance with its Proxy Voting Policy and Procedures. A description of the Policy and Procedures is available (i) without charge, upon request, by calling the Advisor toll-free at 1-800-847-0200, (ii) on the Thornburg website at www.thornburg.com, and (iii) on the Securities and Exchange Commission’s website at www.sec.gov.
Information regarding how proxies were voted is available on or before August 31 of each year for the twelve months ending the preceding June 30. This information is available (i) without charge, upon request by calling the Advisor toll-free at 1-800-847-0200, (ii) on the Thornburg website at www.thornburg.com, and (iii) on the Securities and Exchange Commission’s website at www.sec.gov.
AVAILABILITY OF QUARTERLY PORTFOLIO SCHEDULE
The Fund files with the Securities and Exchange Commission schedules of its portfolio holdings on Form N-Q for the first and third quarters of each fiscal year. The Fund’s Forms N-Q are available on the Commission’s website at www.sec.gov, or may be reviewed and copied at the Commission’s Public Reference Room in Washington, D.C. Information on the operation of the Public Reference Room may be obtained by calling 1-800-SEC-0330. The Fund also makes this information available on its website at www.thornburg. com/download or upon request by calling 1-800-847-0200.
Semi-Annual Report 29
Trustees’ Statement to Shareholders
Readopted September 12, 2016
The Trustees believe current and prospective shareholders should know how we discharge our responsibilities in supervising the Funds’ investment advisor and in reviewing the advisor’s contract for renewal. Since 2005, we have issued a statement which sets out clearly the three principal guidelines that we follow in supervising the Trust’s investment advisor on your behalf. In accordance with our customary practice, in September of this year we again reviewed our statement and concluded we should reissue this statement outlining the principal features of our supervision of the advisor’s performance of investment management services for the Funds.
We begin with the premise that each shareholder selected his or her Fund because its investments are managed by the investment advisor identified in the prospectus and in accordance with the objective and policies described in the prospectus. We realize, as each of you do, that if you believe that your Fund’s stated objective and policies no longer serve your personal investment goals, you can sell your shares and leave the Fund.
Therefore, we believe that our primary supervisory task – our principal obligation to you – is to assess the nature and quality of the advisor’s services, and to confirm that the advisor actively and competently pursues the Fund’s objective, in accordance with the policies set out in the prospectus. To do this, we meet regularly with management to review your Fund’s portfolio and to discuss the advisor’s specific actions and judgments in pursuing the Fund’s objective. We do not substitute our own judgment for the advisor’s decisions in selecting investments; the advisor is paid to exercise its informed judgment on investment decisions, and we seek to confirm, in reviewing the advisor’s performance, that the advisor is doing just that.
Second, we are conscious of costs and the effect that costs have on shareholders’ returns. We try to make sure that your Fund’s fees and costs are reasonable in relationship to the services rendered and that they are generally in line with those charged by other expert investment advisors, consistent with our belief that the Fund’s investors searched for and expect that expertise and attention and have decided to pay a reasonable price for it. We do not put the management contract “out to bid” as a matter of course, and we would not do so unless we had concluded that the advisor materially had failed to pursue the Fund’s objectives in accordance with its policies, or for other equally important reasons. We believe that any other approach would be inconsistent with your interests and contrary to your expectations when you bought shares of the Fund in the first place.
Finally, because we believe that most Thornburg Fund shareholders have invested with a long-term perspective, we try not to focus too much on the fashions of the moment and on short-term performance. The market will not favor any specific investment objective or set of policies at all times and under all economic circumstances. A fund will experience periods of both high and low returns relative to other funds and other investments. Even if one of our Funds is not favored by the market at a particular time, we believe that the advisor is nonetheless obliged to remain true to the Fund’s objective and policies, and we watch to see that it does so.
Trustees of Thornburg Investment Trust
30 Semi-Annual Reports
Thornburg Funds
Thornburg Investment Management is a privately-owned global investment firm that offers a range of solutions for retail and institutional investors. Founded in 1982 and headquartered in Santa Fe, New Mexico, we manage approximately $49 billion (as of March 31, 2017) across U.S. mutual funds, separate accounts for high-net-worth investors and institutional accounts, and UCITS funds for non-U.S. investors.
The fund outlined in this report is one of many equity and fixed-income products available from Thornburg Investment Management.
EQUITY FUNDS
| | • | | Thornburg Investment Income Builder Fund |
| | • | | Thornburg Global Opportunities Fund |
| | • | | Thornburg International Value Fund |
| | • | | Thornburg Better World International Fund |
| | • | | Thornburg International Growth Fund |
| | • | | Thornburg Developing World Fund |
| | • | | Thornburg Core Growth Fund |
FIXED INCOME FUNDS
| | • | | Thornburg Low Duration Income Fund |
| | • | | Thornburg Limited Term U.S. Government Fund |
| | • | | Thornburg Limited Term Income Fund |
| | • | | Thornburg Strategic Income Fund |
| | • | | Thornburg Low Duration Municipal Fund |
| | • | | Thornburg Limited Term Municipal Fund |
| | • | | Thornburg Intermediate Municipal Fund |
| | • | | Thornburg California Limited Term Municipal Fund |
| | • | | Thornburg New Mexico Intermediate Municipal Fund |
| | • | | Thornburg New York Intermediate Municipal Fund |
| | • | | Thornburg Strategic Municipal Income Fund |
ALTERNATIVE FUNDS
| | • | | Thornburg Long/Short Equity Fund |
Before investing, carefully consider the Fund’s investment goals, risks, charges, and expenses. For a prospectus or summary prospectus containing this and other information, contact your financial advisor or visit thornburg.com. Read it carefully before investing.
For additional information, please visit thornburg.com
Thornburg Investment Management, Inc. 2300 North Ridgetop Road, Santa Fe, NM 87506
Semi-Annual Report 31

This Semi-Annual Report is submitted for the general information of shareholders of the Fund. It is not authorized for distribution to prospective investors in the Fund unless preceded or accompanied by an effective prospectus.
| | | | |
| Investment Advisor: | | Distributor: | | |
| Thornburg Investment Management® | | Thornburg Securities Corporation® | | |
| 800.847.0200 | | 800.847.0200 | | TH176 |
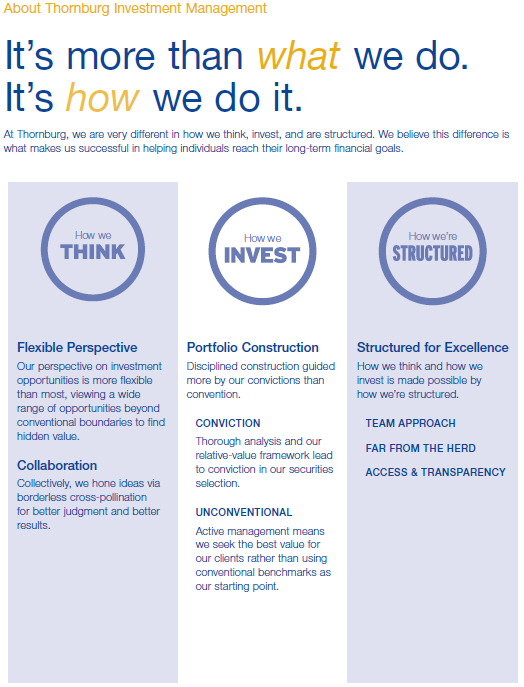
2 Semi-Annual Report
Semi-Annual Report
Thornburg Core Growth Fund
March 31, 2017
| | | | |
SHARE CLASS | | NASDAQ SYMBOL | | CUSIP |
Class A | | THCGX | | 885-215-582 |
Class C | | TCGCX | | 885-215-574 |
Class I | | THIGX | | 885-215-475 |
Class R3 | | THCRX | | 885-215-517 |
Class R4 | | TCGRX | | 885-215-251 |
Class R5 | | THGRX | | 885-215-350 |
Class I, R3, R4, and R5 shares may not be available to all investors. Minimum investments for Class I shares may be higher than those for other classes.
Investments carry risks, including possible loss of principal. Additional risks may be associated with investments outside the United States, especially in emerging markets, including currency fluctuations, illiquidity, volatility, and political and economic risks. Investments in small- and mid-capitalization companies may increase the risk of greater price fluctuations. Please see the Fund’s prospectus for a discussion of the risks associated with an investment in the Fund. Investments in the Fund are not FDIC insured, nor are they bank deposits or guaranteed by a bank or any other entity.
Funds invested in a limited number of holdings may expose an investor to greater volatility.
Semi-Annual Report 3
Letter to Shareholders
| | |
| |
Thornburg Core Growth Fund | | March 31, 2017 (Unaudited) |
April 24, 2017
Dear Fellow Shareholder:
For the six months ended March 31, 2017, Thornburg Core Growth Fund returned 6.10% for Class A shares, without sales charge, underperforming its benchmark, the Russell 3000 Growth Index, which returned 9.94%. On March 31, 2017, the net asset value per Class A share was $29.94.
For the first half of our fiscal year domestic equity markets were strong, with the period heavily influenced by the outcome of the U.S. presidential election. Donald J. Trump’s surprising victory led to a sudden expectation for tax breaks, fiscal stimulus, and protectionist trade policies. Since the election financials, consumer discretionary, and technology stocks have been the best performers in the benchmark, while consumer staples and energy companies have lagged. This has proved a tailwind to the Fund on a sector allocation basis, due to both our current preference for higher-growth companies in the technology and financials spaces, as well as our underweight to lower-growth consumer staples and more volatile energy stocks. As I write this in April, the Trump administration has not yet passed any notable legislation, so perhaps the market’s optimism is misplaced. Or perhaps policy isn’t driving stocks as much as a resilient economy and strong company fundamentals. Price-to-earnings multiples have expanded, but at only roughly half the rate of stock prices, as earnings have been better than expected and driven positive revisions.
For Core Growth Fund our strongest performance came from our financials companies. We don’t own traditional banks or insurance companies, but do have interest-rate-sensitive growth companies like SVB Financial Group, Charles Schwab Corp., and asset manager Affiliated Managers Group. These are companies that we favor for their strong fundamentals and growth prospects. As interest rates climbed on optimism over increased economic growth following the U.S. presidential election, these names each experienced significant tailwinds to performance. Our biggest headwind from a sector perspective was information technology. Large-cap technology stocks were especially strong this period, and although we own several of the best performers like Alphabet, Facebook, Apple and Netflix, these also constitute significant weights in the benchmark. Additionally, we held too many negative performers to keep up with the market. These included Palo Alto Networks, discussed below in the period’s detractors.
Top contributors to performance included:
SVB Financial Group – SVB Financial (formerly Silicon Valley Bank) specializes in providing banking services to startup, technology, and life science companies. Currently the stock is considered an interest rate play given the fee waivers in their third-party money market business and the net interest margin compression in their banking business. Recently, rate expectations have shifted higher, benefiting sentiment around SVB.
Apple – Apple’s stock performance was driven by better-than-expected earnings. The outlook for personal computers has improved. Additionally, the market continues to look forward to the latest iPhone introduction. Initial data points suggest that the current iPhone cycle could trend better than last year’s model, which should drive a return to earnings growth for Apple in fiscal 2017. Increasing earnings expectations have driven a re-rating in the shares.
Netflix – Netflix stock pulled back following weak subscriber growth trends when they revealed their second quarter 2016 earnings results. This gave the Fund the opportunity to re-initiate a position in the leading global subscription video on-demand provider at a significant discount to our calculation of intrinsic value. Third quarter reported results showed subscriber additions back on track and the stock price responded positively.
Charles Schwab Corp. – Charles Schwab is a leading discount brokerage firm offering a wide selection of investment products. Over time Schwab has been a very consistent asset gatherer, collecting net inflows of approximately $10 billion per month. Schwab is also fairly innovative, quick to launch their own in-house, Schwab-branded ETFs as well as a robo-advisor product. Currently the stock is considered an interest rate play given the fee waivers in their money market business and the net interest margin compression in their banking business.
Affiliated Managers Group – AMG is a global asset manager with approximately $628bn in assets under management. We increased our position during the period as global market volatility pushed the stock towards attractive valuation levels. As markets rebounded in February and March, AMG was a strong performer as it tracked the recovery.
Top Detractors to performance included:
Under Armour – Under Armour is one of the largest performance apparel and footwear makers globally. In the period, management announced a consecutive reduction in profitability and also took down revenue growth expectations. The departure of the CFO after less than a year in the role was a further point of concern. We sold the position as the deteriorating fundamentals were no longer justified by its current valuation.
Palo Alto Networks – Palo Alto is the fastest growing company in the firewall space, but had another tough quarter. Slowing hardware sales have raised doubts about their long-term growth trajectory. We are confident that the combination of a product cycle and a shift to the cloud (firewall without hardware) are temporarily depressing growth. We don’t think
4 Semi-Annual Report
| | |
Letter to Shareholders, Continued | | |
| |
Thornburg Core Growth Fund | | March 31, 2017 (Unaudited) |
Palo Alto’s competitive position and long-term opportunity have changed.
Acuity Brands – Acuity is the leader in lighting solutions for the commercial construction market in North America. During the reported period, Acuity saw a slowdown in small projects with short lead times due to concerns around the U.S. presidential election. The long-term thesis remains compelling as the small project weakness is likely to be temporary.
Allergan – Allergan is a global pharmaceutical manufacturing and distribution company. During the period volume erosion of mature/legacy products weighed on the business. We view this as an issue that will persist and we exited our position.
Patterson Companies – Patterson is a distributor of dental products and veterinary supplies. We sold our position as fundamentals deteriorated due to a weakening dental market and execution issues with the sales force also impairing growth.
Conclusion
Over the life of Core Growth Fund we have held true to our philosophy and process, which tends to favor quality growth stocks, smaller capitalization ranges than the benchmark, long-term secular themes, and idiosyncratic opportunities at attractive valuations. While we recognize there will be periods when our style is out of favor, over time it has served our investors well. We remain bullish about the prospects of the individual companies we have identified through our bottom up process.
Thank you for investing alongside us in Thornburg Core Growth Fund.
Sincerely,

Greg Dunn
Managing Director
Portfolio Manager
The matters discussed in this report may constitute forward-looking statements made pursuant to the safe harbor provisions of the Securities Litigation Reform Act of 1995. These include any advisor or portfolio manager prediction, assessment, analysis or outlook for individual securities, industries, investment styles, market sectors and/or markets. These statements involve risks and uncertainties. In addition to the general risks described for each fund in its current prospectus, other factors bearing on these reports include the accuracy of the advisor’s or portfolio manager’s forecasts and predictions, the appropriateness of the investment strategies designed by the advisor or portfolio manager and the ability of the advisor or portfolio manager to implement their strategies efficiently and successfully. Any one or more of these factors, as well as other risks affecting the securities markets generally, could cause the actual results of any fund to differ materially as compared to its benchmarks.
The views expressed are subject to change and do not necessarily reflect the views of Thornburg Investment Management, Inc. This information should not be relied upon as a recommendation or investment advice and is not intended to predict the performance of any investment or market.
Semi-Annual Report 5
| | |
| Performance Summary | | |
| |
Thornburg Core Growth Fund | | March 31, 2017 (Unaudited) |
AVERAGE ANNUAL TOTAL RETURNS
| | | | | | | | | | | | | | | | | | | | |
| | | 1-YR | | | 3-YR | | | 5-YR | | | 10-YR | | | SINCE
INCEP. | |
Class A Shares (Incep: 12/27/00) | | | | | | | | | | | | | | | | | | | | |
Without sales charge | | | 14.80 | % | | | 3.94 | % | | | 9.87 | % | | | 4.83 | % | | | 5.93 | % |
With sales charge | | | 9.63 | % | | | 2.36 | % | | | 8.86 | % | | | 4.34 | % | | | 5.63 | % |
Class C Shares (Incep: 12/27/00) | | | | | | | | | | | | | | | | | | | | |
Without sales charge | | | 13.94 | % | | | 3.15 | % | | | 9.05 | % | | | 4.04 | % | | | 5.10 | % |
With sales charge | | | 12.94 | % | | | 3.15 | % | | | 9.05 | % | | | 4.04 | % | | | 5.10 | % |
Class I Shares (Incep: 11/3/03) | | | 15.28 | % | | | 4.37 | % | | | 10.34 | % | | | 5.30 | % | | | 8.50 | % |
Class R3 Shares (Incep: 7/1/03) | | | 14.66 | % | | | 3.83 | % | | | 9.77 | % | | | 4.75 | % | | | 8.73 | % |
Class R4 Shares (Incep: 2/1/07) | | | 14.78 | % | | | 3.93 | % | | | 9.88 | % | | | 4.86 | % | | | 4.68 | % |
Class R5 Shares (Incep: 10/3/05) | | | 15.30 | % | | | 4.37 | % | | | 10.34 | % | | | 5.30 | % | | | 7.30 | % |
Russell 3000 Growth Index (Since: 12/27/00) | | | 16.27 | % | | | 10.90 | % | | | 13.22 | % | | | 9.04 | % | | | 5.00 | % |
GROWTH OF A HYPOTHETICAL $10,000 INVESTMENT
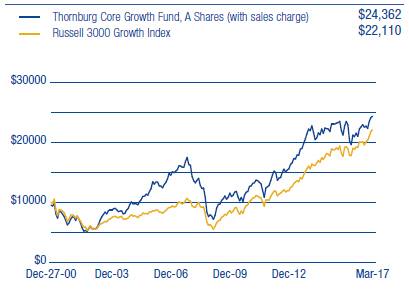
Performance data shown represents past performance and is no guarantee of future results. Investment return and principal value will fluctuate so shares, when redeemed, may be worth more or less than their original cost. Current performance may be lower or higher than quoted. For performance current to the most recent month end, visit thornburg.com or call 800-847-0200. The performance information does not reflect the deduction of taxes that a shareholder would pay on distributions or the redemption of Fund shares. Returns reflect the reinvestment of dividends and capital gains. Class A shares are sold with a maximum sales charge of 4.50%. Class C shares are subject to a 1% CDSC for the first year only. There is no sales charge for Class I, R3, R4, and R5 shares.
As disclosed in the most recent prospectus, the total annual fund operating expenses are as follows: A shares, 1.40%; C shares, 2.16%; I shares, 1.05%; R3 shares, 1.81%; R4 shares, 1.86%; R5 shares, 1.30%. Thornburg Investment Management and/or Thornburg Securities Corporation have contractually agreed to waive fees and reimburse expenses through at least April 10, 2018, for some of the share classes, resulting in net expense ratios of the following: I shares, 0.99%, R3 shares, 1.50%; R4 shares, 1.40%; R5 shares, 0.99%. For more detailed information on fund expenses and waivers/reimbursements please see the Fund’s prospectus.
Glossary
The Russell 3000 Growth Index is an unmanaged index comprised of those Russell 3000 companies with higher price-to-book ratios and higher forecasted growth values. The stocks in this index are also members of either the Russell 1000 Growth or the Russell 2000 Growth indices. Source: Frank Russell Company.
The performance of any index is not indicative of the performance of any particular investment. Unless otherwise noted, index returns reflect the reinvestment of income dividends and capital gains, if any, but do not reflect fees, brokerage commissions or other expenses of investing. Investors may not make direct investments into any index.
Exchange Traded Fund (ETF) – A security that tracks an index, a commodity or a basket of assets like an index fund, but trades like a stock on an exchange. ETFs experience price changes throughout the day as they are bought and sold.
P/E – Price/Earnings ratio (P/E ratio) is a valuation ratio of a company’s current share price compared to its per-share earnings. P/E equals a company’s market value per share divided by earnings per share. Forecasted P/E is not intended to be a forecast of the fund’s future performance.
6 Semi-Annual Report
| | |
| Fund Summary | | |
| |
Thornburg Core Growth Fund | | March 31, 2017 (Unaudited) |
OBJECTIVES AND STRATEGIES
The Fund seeks long-term growth of capital by investing in equity securities selected for their growth potential.
The Fund expects to invest primarily in domestic equity securities (primarily common stocks) selected for their growth potential. However, the Fund may own a variety of securities, including foreign equity securities and partnership interests. The Fund may also invest in developing countries.
MARKET CAPITALIZATION EXPOSURE
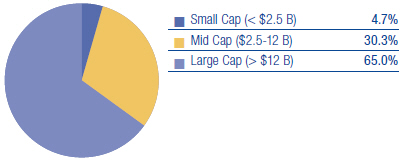
BASKET STRUCTURE
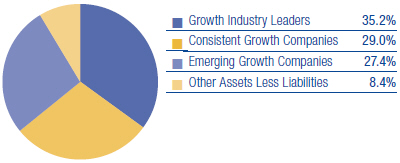
TOP TEN EQUITY HOLDINGS
| | | | |
Visa, Inc. | | | 4.1 | % |
Apple, Inc. | | | 4.1 | % |
Facebook, Inc. | | | 3.7 | % |
Alphabet, Inc. Class C | | | 3.5 | % |
PayPal Holdings, Inc. | | | 2.9 | % |
FleetCor Technologies, Inc. | | | 2.8 | % |
Las Vegas Sands Corp. | | | 2.7 | % |
Affiliated Managers Group, Inc. | | | 2.7 | % |
SVB Financial Group | | | 2.7 | % |
Amazon.com, Inc. | | | 2.7 | % |
There is no guarantee that the Fund will meet its investment objective.
All portfolio information is subject to change. Charts may not add up to 100% due to rounding.
SECTOR EXPOSURE
| | | | |
Information Technology | | | 41.6 | % |
Consumer Discretionary | | | 20.5 | % |
Health Care | | | 9.5 | % |
Consumer Staples | | | 7.1 | % |
Financials | | | 6.2 | % |
Industrials | | | 3.5 | % |
Energy | | | 1.6 | % |
Materials | | | 1.6 | % |
Other Assets Less Liabilities | | | 8.4 | % |
| |
TOP TEN INDUSTRY GROUPS | | | | |
Software & Services | | | 33.2 | % |
Retailing | | | 11.7 | % |
Technology Hardware & Equipment | | | 6.6 | % |
Pharmaceuticals, Biotechnology & Life Sciences | | | 5.0 | % |
Food & Staples Retailing | | | 5.0 | % |
Consumer Services | | | 4.6 | % |
Health Care Equipment & Services | | | 4.4 | % |
Diversified Financials | | | 3.6 | % |
Banks | | | 2.7 | % |
Consumer Durables & Apparel | | | 2.4 | % |
| |
COUNTRY EXPOSURE* | | | | |
(percent of equity holdings) | | | | |
United States | | | 95.2 | % |
Argentina | | | 1.9 | % |
France | | | 1.9 | % |
Australia | | | 1.0 | % |
| * | The country assignment of each equity holding is determined by the Fund’s Advisor based on various factors, including the location of the issuer’s head office, the issuer’s jurisdiction of incorporation and the country from which a majority of the issuer’s revenue is derived. |
Semi Annual Report 7
Schedule of Investments
| | |
| |
Thornburg Core Growth Fund | | March 31, 2017 (Unaudited) |
| | | | | | | | |
| | | SHARES/
PRINCIPAL AMOUNT | | | VALUE | |
COMMON STOCK — 91.56% | | | | | | | | |
BANKS — 2.66% | | | | | | | | |
Banks — 2.66% | | | | | | | | |
a SVB Financial Group | | | 88,871 | | | $ | 16,538,004 | |
| | | | | | | | |
| | | | | | | 16,538,004 | |
| | | | | | | | |
| | |
CAPITAL GOODS — 2.00% | | | | | | | | |
Electrical Equipment — 2.00% | | | | | | | | |
Acuity Brands, Inc. | | | 60,951 | | | | 12,434,004 | |
| | | | | | | | |
| | | | | | | 12,434,004 | |
| | | | | | | | |
COMMERCIAL & PROFESSIONAL SERVICES — 1.46% | | | | | | | | |
Professional Services — 1.46% | | | | | | | | |
a Verisk Analytics, Inc. | | | 112,025 | | | | 9,089,709 | |
| | | | | | | | |
| | | | | | | 9,089,709 | |
| | | | | | | | |
CONSUMER DURABLES & APPAREL — 2.44% | | | | | | | | |
Household Durables — 2.44% | | | | | | | | |
Newell Brands, Inc. | | | 321,500 | | | | 15,165,155 | |
| | | | | | | | |
| | | | | | | 15,165,155 | |
| | | | | | | | |
CONSUMER SERVICES — 4.58% | | | | | | | | |
Hotels, Restaurants & Leisure — 4.58% | | | | | | | | |
a Chipotle Mexican Grill, Inc. | | | 25,910 | | | | 11,543,423 | |
.Las Vegas Sands Corp. | | | 296,200 | | | | 16,904,134 | |
| | | | | | | | |
| | | | | | | 28,447,557 | |
| | | | | | | | |
DIVERSIFIED FINANCIALS — 3.58% | | | | | | | | |
Capital Markets — 3.58% | | | | | | | | |
Affiliated Managers Group, Inc. | | | 102,453 | | | | 16,796,145 | |
WisdomTree Investments, Inc. | | | 600,481 | | | | 5,452,367 | |
| | | | | | | | |
| | | | | | | 22,248,512 | |
| | | | | | | | |
ENERGY — 1.60% | | | | | | | | |
Oil, Gas & Consumable Fuels — 1.60% | | | | | | | | |
a Concho Resources, Inc. | | | 77,309 | | | | 9,921,837 | |
| | | | | | | | |
| | | | | | | 9,921,837 | |
| | | | | | | | |
| | |
FOOD & STAPLES RETAILING — 5.01% | | | | | | | | |
Food & Staples Retailing — 5.01% | | | | | | | | |
a Sprouts Farmers Market, Inc. | | | 655,616 | | | | 15,157,842 | |
Wal-Mart Stores, Inc. | | | 220,917 | | | | 15,923,697 | |
| | | | | | | | |
| | | | | | | 31,081,539 | |
| | | | | | | | |
| | |
FOOD, BEVERAGE & TOBACCO — 2.10% | | | | | | | | |
Beverages — 2.10% | | | | | | | | |
a Monster Beverage Corp. | | | 282,313 | | | | 13,034,391 | |
| | | | | | | | |
| | | | | | | 13,034,391 | |
| | | | | | | | |
HEALTH CARE EQUIPMENT & SERVICES — 4.42% | | | | | | | | |
Health Care Equipment & Supplies — 2.56% | | | | | | | | |
a DexCom, Inc. | | | 139,034 | | | | 11,780,351 | |
a Inogen, Inc. | | | 52,994 | | | | 4,110,215 | |
Health Care Providers & Services — 1.86% | | | | | | | | |
a DaVita, Inc. | | | 169,800 | | | | 11,541,306 | |
| | | | | | | | |
| | | | | | | 27,431,872 | |
| | | | | | | | |
MATERIALS — 1.57% | | | | | | | | |
Chemicals — 1.57% | | | | | | | | |
Monsanto Co. | | | 86,300 | | | | 9,769,160 | |
| | | | | | | | |
| | | | | | | 9,769,160 | |
| | | | | | | | |
MEDIA — 1.80% | | | | | | | | |
Media — 1.80% | | | | | | | | |
Comcast Corp. | | | 297,118 | | | | 11,168,666 | |
| | | | | | | | |
| | | | | | | 11,168,666 | |
| | | | | | | | |
PHARMACEUTICALS, BIOTECHNOLOGY & LIFE SCIENCES — 5.04% | | | | | | | | |
Biotechnology — 3.44% | | | | | | | | |
a Alexion Pharmaceuticals, Inc. | | | 99,946 | | | | 12,117,453 | |
Gilead Sciences, Inc. | | | 136,300 | | | | 9,257,496 | |
Life Sciences Tools & Services — 1.60% | | | | | | | | |
a Illumina, Inc. | | | 58,090 | | | | 9,912,478 | |
| | | | | | | | |
| | | | | | | 31,287,427 | |
| | | | | | | | |
RETAILING — 11.66% | | | | | | | | |
Internet & Direct Marketing Retail — 7.79% | | | | | | | | |
a Amazon.com, Inc. | | | 18,653 | | | | 16,536,630 | |
Expedia, Inc. | | | 101,728 | | | | 12,835,022 | |
a Netflix, Inc. | | | 43,274 | | | | 6,396,330 | |
a priceline.com, Inc. | | | 7,102 | | | | 12,641,347 | |
8 Semi-Annual Report
| | |
| Schedule of Investments, Continued | | |
| |
Thornburg Core Growth Fund | | March 31, 2017 (Unaudited) |
| | | | | | | | |
| | | SHARES/
PRINCIPAL AMOUNT | | | VALUE | |
Multiline Retail — 3.87% | | | | | | | | |
Dollar General Corp. | | | 133,220 | | | $ | 9,289,431 | |
a Dollar Tree, Inc. | | | 187,800 | | | | 14,734,788 | |
| | | | | | | | |
| | | | | | | 72,433,548 | |
| | | | | | | | |
SEMICONDUCTORS & SEMICONDUCTOR EQUIPMENT — 1.83% | | | | | | | | |
Semiconductors & Semiconductor Equipment — 1.83% | | | | | | | | |
a Cavium, Inc. | | | 158,403 | | | | 11,351,159 | |
| | | | | | | | |
| | | | | | | 11,351,159 | |
| | | | | | | | |
SOFTWARE & SERVICES — 33.17% | | | | | | | | |
Information Technology Services — 9.85% | | | | | | | | |
a FleetCor Technologies, Inc. | | | 115,844 | | | | 17,542,257 | |
a PayPal Holdings, Inc. | | | 417,799 | | | | 17,973,713 | |
Visa, Inc. | | | 288,529 | | | | 25,641,572 | |
Internet Software & Services — 12.54% | | | | | | | | |
a Alphabet, Inc. Class C | | | 25,895 | | | | 21,481,456 | |
a CoStar Group, Inc. | | | 52,789 | | | | 10,938,937 | |
a Criteo SA ADR | | | 214,205 | | | | 10,708,108 | |
a Facebook, Inc. | | | 159,762 | | | | 22,694,192 | |
a Zillow Group, Inc. Class C | | | 357,854 | | | | 12,048,944 | |
Software — 10.78% | | | | | | | | |
a Atlassian Corp. plc | | | 193,159 | | | | 5,785,112 | |
a Globant S.A. | | | 298,500 | | | | 10,865,400 | |
a Proofpoint, Inc. | | | 151,355 | | | | 11,254,758 | |
a Rapid7, Inc. | | | 422,254 | | | | 6,325,365 | |
a ServiceNow, Inc. | | | 125,165 | | | | 10,948,182 | |
a Splunk, Inc. | | | 183,651 | | | | 11,439,621 | |
a Workday, Inc. | | | 123,867 | | | | 10,315,644 | |
| | | | | | | | |
| | | | | | | 205,963,261 | |
| | | | | | | | |
TECHNOLOGY HARDWARE & EQUIPMENT — 6.64% | | | | | | | | |
Communications Equipment — 2.55% | | | | | | | | |
a Palo Alto Networks, Inc. | | | 140,231 | | | | 15,801,229 | |
Technology, Hardware, Storage & Peripherals — 4.09% | | | | | | | | |
Apple, Inc. | | | 176,905 | | | | 25,414,172 | |
| | | | | | | | |
| | | | | | | 41,215,401 | |
| | | | | | | | |
TOTAL COMMON STOCK (Cost $422,179,868) | | | | | | | 568,581,202 | |
| | | | | | | | |
SHORT TERM INVESTMENTS — 9.23% | | | | | | | | |
b Thornburg Capital Management Fund | | | 5,733,667 | | | | 57,336,670 | |
| | | | | | | | |
TOTAL SHORT TERM INVESTMENTS (Cost $57,336,670) | | | | | | | 57,336,670 | |
| | | | | | | | |
TOTAL INVESTMENTS — 100.79% (Cost $479,516,538) | | | | | | $ | 625,917,872 | |
LIABILITIES NET OF OTHER ASSETS — (0.79)% | | | | | | | (4,922,853 | ) |
| | | | | | | | |
NET ASSETS — 100.00% | | | | | | $ | 620,995,019 | |
| | | | | | | | |
Footnote Legend
| b | Investment in Affiliates—Shown below are holdings of voting securities of each portfolio company which is considered “affiliated” to the Fund under the Investment Company Act of 1940, including companies for which the Fund’s holding represented 5% or more of the company’s voting securities, and a series of the Thornburg Investment Trust in which the Fund invested for cash management purposes during the period: |
| | | | | | | | | | | | | | | | | | | | | | | | | | | | |
ISSUER | | SHARES/
PRINCIPAL
SEPTEMBER
30, 2016 | | | GROSS
ADDITIONS | | | GROSS
REDUCTIONS | | | SHARES/
PRINCIPAL
MARCH 31,
2017 | | | MARKET
VALUE
MARCH 31,
2017 | | | INVESTMENT
INCOME | | | REALIZED
GAIN (LOSS) | |
Thornburg Capital Management Fund | | | 4,908,697 | | | | 17,081,853 | | | | 16,256,883 | | | | 5,733,667 | | | $ | 57,336,670 | | | $ | 180,255 | | | $ | — | |
| | | | | | | | | | | | | | | | | | | | | | | | | | | | |
Total non-controlled affiliated issuers - 9.23% of net assets | | | | | | | | | | | $ | 57,336,670 | | | $ | 180,255 | | | $ | — | |
| | | | | | | | | | | | | | | | | | | | | | | | | | | | |
Portfolio Abbreviations
To simplify the listings of securities, abbreviations are used per the table below:
ADR American Depositary Receipt
See notes to financial statements.
Semi-Annual Report 9
| | |
| Statement of Assets and Liabilities | | |
| |
Thornburg Core Growth Fund | | March 31, 2017 (Unaudited) |
| | | | |
ASSETS | | | | |
Investments at value (Note 3) | | | | |
Non-affiliated issuers (cost $422,179,868) | | $ | 568,581,202 | |
Non-controlled affiliated issuer (cost $57,336,670) | | | 57,336,670 | |
Receivable for investments sold | | | 7,844,393 | |
Receivable for fund shares sold | | | 1,295,800 | |
Dividends receivable | | | 44,688 | |
Prepaid expenses and other assets | | | 67,897 | |
| | | | |
Total Assets | | | 635,170,650 | |
| | | | |
| |
LIABILITIES | | | | |
Payable for investments purchased | | | 10,999,249 | |
Payable for fund shares redeemed | | | 2,316,790 | |
Payable to investment advisor and other affiliates (Note 4) | | | 652,014 | |
Accounts payable and accrued expenses | | | 207,578 | |
| | | | |
Total Liabilities | | | 14,175,631 | |
| | | | |
| |
NET ASSETS | | $ | 620,995,019 | |
| | | | |
NET ASSETS CONSIST OF | | | | |
Accumulated net investment loss | | $ | (8,829,097 | ) |
Net unrealized appreciation on investments | | | 146,401,334 | |
Accumulated net realized gain (loss) | | | (215,098,542 | ) |
Net capital paid in on shares of beneficial interest | | | 698,521,324 | |
| | | | |
| |
| | $ | 620,995,019 | |
| | | | |
10 Semi-Annual Report
| | |
| Statement of Assets and Liabilities, Continued | | |
| |
Thornburg Core Growth Fund | | March 31, 2017 (Unaudited) |
| | | | |
| |
NET ASSET VALUE | | | | |
| |
Class A Shares: | | | | |
Net asset value and redemption price per share ($184,270,040 applicable to 6,155,610 shares of beneficial interest outstanding - Note 5) | | $ | 29.94 | |
Maximum sales charge, 4.50% of offering price | | | 1.41 | |
| | | | |
Maximum offering price per share | | $ | 31.35 | |
| | | | |
| |
Class C Shares: | | | | |
Net asset value and offering price per share* ($141,179,210 applicable to 5,364,637 shares of beneficial interest outstanding - Note 5) | | $ | 26.32 | |
| | | | |
| |
Class I Shares: | | | | |
Net asset value, offering and redemption price per share ($206,494,426 applicable to 6,471,185 shares of beneficial interest outstanding - Note 5) | | $ | 31.91 | |
| | | | |
| |
Class R3 Shares: | | | | |
Net asset value, offering and redemption price per share ($50,084,893 applicable to 1,680,531 shares of beneficial interest outstanding - Note 5) | | $ | 29.80 | |
| | | | |
| |
Class R4 Shares: | | | | |
Net asset value, offering and redemption price per share ($5,416,069 applicable to 180,214 shares of beneficial interest outstanding - Note 5) | | $ | 30.05 | |
| | | | |
| |
Class R5 Shares: | | | | |
Net asset value, offering and redemption price per share ($33,550,381 applicable to 1,052,521 shares of beneficial interest outstanding - Note 5) | | $ | 31.88 | |
| | | | |
| * | Redemption price per share is equal to net asset value less any applicable contingent deferred sales charge. |
See notes to financial statements.
Semi-Annual Report 11
Statement of Operations
| | |
| |
Thornburg Core Growth Fund | | Six Months Ended March 31, 2017 (Unaudited) |
| | | | |
INVESTMENT INCOME | | | | |
Dividend income | | | | |
Non-affiliated issuers | | $ | 1,200,942 | |
Non-controlled affiliated issuer | | | 180,255 | |
| | | | |
Total Income | | | 1,381,197 | |
| | | | |
| |
EXPENSES | | | | |
Investment advisory fees (Note 4) | | | 2,699,900 | |
Administration fees (Note 4) | | | | |
Class A Shares | | | 117,816 | |
Class C Shares | | | 90,846 | |
Class I Shares | | | 49,664 | |
Class R3 Shares | | | 32,268 | |
Class R4 Shares | | | 3,731 | |
Class R5 Shares | | | 8,547 | |
Distribution and service fees (Note 4) | | | | |
Class A Shares | | | 235,120 | |
Class C Shares | | | 725,460 | |
Class R3 Shares | | | 128,780 | |
Class R4 Shares | | | 7,391 | |
Transfer agent fees | | | | |
Class A Shares | | | 102,246 | |
Class C Shares | | | 88,856 | |
Class I Shares | | | 82,706 | |
Class R3 Shares | | | 64,261 | |
Class R4 Shares | | | 11,472 | |
Class R5 Shares | | | 59,323 | |
Registration and filing fees | | | | |
Class A Shares | | | 8,997 | |
Class C Shares | | | 8,647 | |
Class I Shares | | | 9,120 | |
Class R3 Shares | | | 8,437 | |
Class R4 Shares | | | 9,013 | |
Class R5 Shares | | | 8,058 | |
Custodian fees (Note 2) | | | 41,725 | |
Professional fees | | | 24,378 | |
Accounting fees (Note 4) | | | 9,385 | |
Trustee fees | | | 13,162 | |
Other expenses | | | 55,093 | |
| | | | |
Total Expenses | | | 4,704,402 | |
Less: | | | | |
Expenses reimbursed by investment advisor (Note 4) | | | (224,071 | ) |
| | | | |
Net Expenses | | | 4,480,331 | |
| | | | |
Net Investment Loss | | $ | (3,099,134 | ) |
| | | | |
12 Semi-Annual Report
| | |
| Statement of Operations, Continued | | |
| |
Thornburg Core Growth Fund | | Six Months Ended March 31, 2017 (Unaudited) |
| | | | |
REALIZED AND UNREALIZED GAIN (LOSS) | | | | |
Net realized gain (loss) on non-affiliated issuer investments | | $ | 38,200,348 | |
Net change in unrealized appreciation (depreciation) on non-affiliated issuer investments | | | 1,307,870 | |
| | | | |
Net Realized and Unrealized Gain | | | 39,508,218 | |
Net Increase in Net Assets Resulting from Operations | | $ | 36,409,084 | |
| | | | |
See notes to financial statements.
Semi-Annual Report 13
| | |
| Statements of Changes in Net Assets | | |
| |
Thornburg Core Growth Fund | | |
| | | | | | | | |
| | | SIX MONTHS ENDED
MARCH 31, 2017* | | | YEAR ENDED
SEPTEMBER 30, 2016 | |
INCREASE (DECREASE) IN NET ASSETS FROM | | | | | | | | |
| | |
OPERATIONS | | | | | | | | |
Net investment income (loss) | | $ | (3,099,134 | ) | | $ | (7,401,668 | ) |
Net realized gain (loss) on investments | | | 38,200,348 | | | | 9,780,002 | |
Net unrealized appreciation (depreciation) on investments | | | 1,307,870 | | | | 43,558,418 | |
| | | | | | | | |
Net Increase (Decrease) in Net Assets Resulting from Operations | | | 36,409,084 | | | | 45,936,752 | |
| | |
FUND SHARE TRANSACTIONS (NOTE 5) | | | | | | | | |
Class A Shares | | | (25,897,724 | ) | | | (50,041,105 | ) |
Class C Shares | | | (22,719,319 | ) | | | (30,801,495 | ) |
Class I Shares | | | (4,474,835 | ) | | | (58,233,894 | ) |
Class R3 Shares | | | (8,658,213 | ) | | | (18,964,601 | ) |
Class R4 Shares | | | (1,752,762 | ) | | | (3,465,547 | ) |
Class R5 Shares | | | (7,121,185 | ) | | | (9,684,705 | ) |
| | | | | | | | |
Net Decrease in Net Assets | | | (34,214,954 | ) | | | (125,254,595 | ) |
| | |
NET ASSETS | | | | | | | | |
Beginning of Period | | | 655,209,973 | | | | 780,464,568 | |
| | | | | | | | |
| | |
End of Period | | $ | 620,995,019 | | | $ | 655,209,973 | |
| | | | | | | | |
Accumulated net investment loss | | $ | (8,829,097 | ) | | $ | (5,729,963 | ) |
See notes to financial statements.
14 Semi-Annual Report
| | |
| Notes to Financial Statements | | |
| |
Thornburg Core Growth Fund | | March 31, 2017 |
NOTE 1 – ORGANIZATION
Thornburg Core Growth Fund (the “Fund”) is a diversified series of Thornburg Investment Trust (the “Trust”). The Trust was organized as a Massachusetts business trust under a Declaration of Trust dated June 3, 1987 and is registered as a diversified, open-end management investment company under the Investment Company Act of 1940, as amended. The Fund is currently one of twenty-one separate series of the Trust. Each series is considered to be a separate entity for financial reporting and tax purposes and bears expenses directly attributable to it. The Fund seeks long-term capital appreciation by investing in equity securities selected for their growth potential.
The Fund currently offers six classes of shares of beneficial interest: Class A, Class C, Institutional Class (“Class I”), and Retirement Classes (“Class R3,” “Class R4,” and “Class R5”). Each class of shares of the Fund represents an interest in the same portfolio of investments, except that (i) Class A shares are sold subject to a front-end sales charge collected at the time the shares are purchased and bear a service fee, (ii) Class C shares are sold at net asset value without a sales charge at the time of purchase, but are subject to a contingent deferred sales charge upon redemption within one year of purchase, and bear both a service fee and a distribution fee, (iii) Class I shares are sold at net asset value without a sales charge at the time of purchase and may be subject to a service fee, (iv) Class R3 shares are sold at net asset value without a sales charge at the time of purchase, but bear both a service fee and distribution fee, (v) Class R4 shares are sold at net asset value without sales charge at the time of purchase, but bear a service fee, (vi) Class R5 shares are sold at net asset value without a sales charge at the time of purchase and may bear a service fee, and (vii) the respective classes may have different reinvestment privileges and conversion rights. Additionally, the Fund may allocate among its classes certain expenses, to the extent allocable to specific classes, including transfer agent fees, government registration fees, certain printing and postage costs, and administrative and legal expenses. Currently, class specific expenses of the Fund are limited to service and distribution fees, administration fees, and certain registration and transfer agent expenses.
The following is a summary of significant accounting policies followed by the Fund in the preparation of its financial statements. The Fund prepares its financial statements in conformity with United States generally accepted accounting principles (“GAAP”), including investment company accounting and reporting guidance in the Financial Accounting Standards Board (the “FASB”) Accounting Standard Codification Topic 946.
NOTE 2 – SIGNIFICANT ACCOUNTING POLICIES
Security Valuation: All investments in securities held by the Fund are valued as described in Note 3.
Allocation of Income, Gains, Losses and Expenses: Net investment income (other than class specific expenses) and realized and unrealized gains and losses are allocated daily to each class of shares based upon the relative net asset value of outstanding shares (or the value of the dividend-eligible shares, as appropriate) of each class of shares at the beginning of the day (after adjusting for the current capital shares activity of the respective class). Expenses common to all Funds are allocated among the Funds comprising the Trust based upon their relative net asset values or other appropriate allocation methods. Operating expenses directly attributable to a specific class are charged against the operating income of that class.
Dividends and Distributions to Shareholders: Dividends and distributions to shareholders, which are determined in accordance with federal income tax regulations and may differ from GAAP, are recorded on the ex-dividend date. Ordinary income distributions, if any, are declared and paid quarterly. Capital gain distributions, if any, are declared and paid annually and more often if deemed necessary by the Advisor. Dividends are paid and are reinvested in additional shares of the Fund at net asset value per share at the close of business on the ex-dividend date, or at the shareholder’s option, paid in cash.
Investment Income: Dividend income is recorded on the ex-dividend date. Certain income from foreign investments is recognized as soon as information is available to the Fund. Interest income is accrued as earned. Premiums and discounts are amortized and accreted, respectively, to call dates or maturity dates using the effective yield method of the respective investments. These amounts are included in Interest income on the Statement of Operations.
Custodian Fees: Custodian fees disclosed in the Statement of Operations may include interest expenses incurred by the Fund on any cash overdrafts of its custodian account during the period. Such cash overdrafts may result from the effects of failed trades in portfolio securities and from cash outflows resulting from unanticipated shareholder redemption activity. The Fund pays interest to its custodian on any such cash overdraft at a rate equal to 2.50% of the overdraft amount in excess of $50,000.
Investment Transactions: Investment transactions are accounted for on a trade date basis. Realized gains and losses from the sale of investments are recorded on an identified cost basis.
Repurchase Agreements: The Fund may invest excess cash in repurchase agreements whereby the Fund purchases investments, which serve as collateral, with an agreement to resell such collateral to the seller at an agreed upon price at the maturity date of the repurchase agreement. Investments pledged as collateral for repurchase agreements are held in custody until maturity of the repurchase
Semi-Annual Report 15
| | |
| Notes to Financial Statements, Continued | | |
| |
Thornburg Core Growth Fund | | March 31, 2017 (Unaudited) |
agreement. Provisions in the agreements require that the market value of the collateral is at least equal to the repurchase value in the event of default. In the event of default, the Fund has the right to liquidate the collateral and apply the proceeds in satisfaction of the obligation. Under certain circumstances, in the event of default or bankruptcy by the other party to the agreement, realization and/or retention of the collateral may be subject to legal proceedings.
When-Issued and Delayed Delivery Transactions: The Fund may engage in when-issued or delayed delivery transactions. To the extent the Fund engages in such transactions, it will do so for the purpose of acquiring portfolio investments consistent with the Fund’s investment objectives and not for the purpose of investment leverage or to speculate on interest rate or market changes. At the time the Fund makes a commitment to purchase an investment on a when-issued or delayed delivery basis, the Fund will record the transaction and reflect the value in determining its net asset value. When effecting such transactions, assets of an amount sufficient to make payment for the portfolio investments to be purchased will be segregated on the Fund’s records on the trade date. Investments purchased on a when-issued or delayed delivery basis do not earn interest until the settlement date.
Foreign Currency Translation: Portfolio investments and other assets and liabilities denominated in foreign currencies are translated into U.S. dollars based on the exchange rate of such currencies against the U.S. dollar on the date of valuation. Purchases and sales of investments and income items denominated in foreign currencies are translated into U.S. dollars at the exchange rate in effect on the transaction date. When the Fund purchases or sells foreign investments, it will customarily enter into a foreign exchange contract to minimize foreign exchange risk from the trade date to the settlement date of such transactions. The values of such spot contracts are included in receivable for investments sold and payable for investments purchased on the Statement of Assets and Liabilities.
The Fund does not separately report the effect of changes in foreign exchange rates from changes in market prices on investments held. Such changes are included in net unrealized appreciation (depreciation) from investments.
Reported net realized gains and losses from foreign currency transactions arise due to purchases and sales of foreign currencies, currency gains and losses realized between the trade and settlement dates on investment transactions and the difference between the amounts of dividends, interest, and foreign withholding taxes recorded on the Fund’s books, and the U.S. dollar equivalent of the amounts actually received or paid.
Net change in unrealized appreciation (depreciation) on foreign currency translations arise from changes in the fair value of assets and liabilities, other than investments at period end, resulting from changes in exchange rates.
Guarantees and Indemnifications: Under the Trust’s organizational documents (and under separate agreements with the independent Trustees), its officers and Trustees are provided with an indemnification against certain liabilities arising out of the performance of their duties to the Fund. In the normal course of business the Trust may also enter into contracts with service providers that contain general indemnifications. The Trust’s maximum exposure under these arrangements is unknown. However, based on experience, the Trust expects the risk of loss to be remote.
Use of Estimates: The preparation of financial statements in conformity with GAAP requires management to make estimates and assumptions that affect the reported amounts of assets and liabilities and disclosure of contingent assets and liabilities at the date of the financial statements and the reported amounts of increases (decreases) in net assets from operations during the reporting period. Actual results could differ from those estimates.
Federal Income Taxes: It is the policy of the Trust to comply with the provisions of the Internal Revenue Code applicable to regulated investment companies and to distribute to shareholders substantially all investment company taxable income including net realized gains on investments (if any), and tax exempt income of the Fund. Therefore, no provision for federal income or excise tax is required.
The Fund files income tax returns in United States federal and applicable state jurisdictions. The statute of limitations on the Fund’s tax return filings generally remains open for the three years following a return’s filing date. The Fund has analyzed its tax positions taken on Federal income tax returns for all open tax years and has concluded that no provision for income tax is required in the financial statements.
At March 31, 2017, information on the tax components of capital was as follows:
| | | | |
Cost of investments for tax purposes | | $ | 479,516,538 | |
| | | | |
| |
Gross unrealized appreciation on a tax basis | | $ | 152,951,697 | |
Gross unrealized depreciation on a tax basis | | | (6,550,363 | ) |
| | | | |
| |
Net unrealized appreciation (depreciation) on investments (tax basis) | | $ | 146,401,334 | |
| | | | |
16 Semi-Annual Report
| | |
| Notes to Financial Statements, Continued | | |
| |
Thornburg Core Growth Fund | | March 31, 2017 (Unaudited) |
At March 31, 2017, the Fund had deferred tax basis late-year ordinary investment losses occurring subsequent to December 31, 2015 through September 30, 2016 of $5,729,963. For tax purposes, such ordinary losses will be recognized in the year ending September 30, 2017.
At March 31, 2017, the Fund had deferred tax basis capital losses occurring subsequent to October 31, 2015 through September 30, 2016 of $24,900,607. For tax purposes, such capital losses will be recognized in the year ending September 30, 2017.
At March 31, 2017, the Fund had cumulative tax basis capital losses of $226,993,175 generated prior to October 1, 2011 which may be carried forward to offset future capital gains. To the extent such carryforwards are utilized, capital gain distributions may be reduced to the extent provided by regulations. Such capital loss carryforwards expire September 30, 2018.
Foreign Withholding Taxes: The Fund is subject to foreign tax withholding imposed by certain foreign countries in which the Fund may invest. Withholding taxes are incurred on certain foreign dividends and are accrued at the time the dividend is recognized based on applicable foreign tax laws. The Fund may file withholding tax reclaims in certain jurisdictions to recover a portion of amounts previously withheld, in view of various considerations, including recent decisions rendered by the courts in those and other jurisdictions. The Fund would expect to record a receivable for such a reclaim based on a variety of factors, including assessment of a jurisdiction’s legal obligation to pay reclaims, the jurisdiction’s administrative practices and payment history, and industry convention. To date the Fund has recorded no such receivable because there is limited precedent for collecting such prior year reclaims and the likelihood of collection remains uncertain.
Deferred Foreign Capital Gain Taxes: The Fund is subject to a tax imposed on net realized gains of securities of certain foreign countries. The Fund records an estimated deferred tax liability for net unrealized gains on these investments as reflected in the accompanying financial statements.
NOTE 3 – SECURITY VALUATION
Valuation of the Fund’s portfolio investment securities is performed in accordance with policies and procedures adopted by and under the oversight of the Trustees.
The Trustees of the Trust have appointed Thornburg Investment Management, Inc., the Trust’s investment advisor (the “Advisor”) to assist the Trustees in obtaining market values for portfolio investments, evaluate and monitor professional pricing service providers appointed by the Trustees’ Audit Committee (the “Audit Committee”) to assist in determining fair values for portfolio investments, assist in calculating fair values for portfolio investments in certain circumstances, and to perform other functions in connection with the valuation of investments. The Advisor acts through its Valuation and Pricing Committee (the “Committee”) and other employees of the Advisor. The Committee regularly reviews its own valuation calculations, as well as the valuations, valuation techniques and services furnished by pricing service providers, considers circumstances which may require valuation calculations by the Committee, and reviews previous valuation calculations. The Committee reports to the Audit Committee on the Committee’s activities, the performance of pricing service providers, and other matters relating to valuation of portfolio investments.
In those instances when the Committee assists in calculating a fair value for a portfolio investment, the Committee seeks to determine the price that the Fund would reasonably expect to receive upon a sale of the investment in an orderly transaction between market participants on the valuation date. The Committee customarily utilizes quotations from securities broker dealers in calculating valuations, but also may utilize prices obtained from pricing service providers or other methods approved by the Audit Committee. Because fair values calculated by the Committee are estimates, the calculation of a value for an investment may differ from the price that would be realized by the Fund upon a sale of the investment, and the difference could be material to the Fund’s financial statements. The Committee’s calculation of a fair value for an investment may also differ from the prices obtained by other persons (including other mutual funds) for the investment.
Valuation of Securities: Securities and other portfolio investments which are listed or traded on a United States securities exchange are valued at the last reported sale price on the valuation date. Investments listed or traded on an exchange for which there has been no sale that day are valued at the mean between the last reported bid and asked prices on that valuation date. Portfolio investments reported by NASDAQ are valued at the official closing price on the valuation date. If an investment is traded on more than one exchange, the investment is considered traded on the exchange that is normally the primary market for that investment. Securities and other portfolio investments which are listed or traded on exchanges outside the United States are valued at the last price or the closing price of the investment on the exchange that is normally the primary market for the investment, as of the close of the exchange preceding the Fund’s valuation date. Foreign investments listed or traded on an exchange for which there has been no sale that day are valued at the mean between the last reported bid and asked prices on that valuation date.
In any case when a market quotation is not readily available for a portfolio investment ordinarily valued by market quotation, the Committee calculates a fair value for the investment using alternative methods approved by the Audit Committee. A market quotation is not readily available when the primary market or exchange for the investment is not open for the entire scheduled day of trading. Market quotations for an investment also may not be readily available if developments after the most recent close of the investment’s
Semi-Annual Report 17
| | |
| Notes to Financial Statements, Continued | | |
| |
Thornburg Core Growth Fund | | March 31, 2017 (Unaudited) |
primary exchange or market, but prior to the close of business on any Fund business day, or an unusual event or significant period of time occurring since the availability of a market quotation, create a serious question concerning the reliability of the most recent market quotation available for the investment. In particular, on days when market volatility thresholds established by the Audit Committee are exceeded, foreign equity investments held by the Fund may be valued using alternative methods. The Committee customarily obtains valuations in these instances from pricing service providers approved by the Audit Committee. Pricing service providers ordinarily calculate valuations using multi-factor models to adjust market prices based upon various inputs, including exchange data, depository receipt prices, futures, index data and other data.
Debt obligations held by the Fund which are not listed or traded on exchanges or for which no reported market exists are ordinarily valued at the valuation obtained from a pricing service provider approved by the Audit Committee.
In any case when a pricing service provider fails to provide a valuation for a debt obligation held by the Fund, the Committee calculates a fair value for the obligation using alternative methods under procedures approved by the Audit Committee. Additionally, in cases when management believes that a valuation obtained from a pricing service provider merits review for significant reasons, the Committee decides whether or not to use the valuation calculated by the pricing service provider or to use an alternative method approved by the Audit Committee to calculate a fair value for the obligation.
Quotations for foreign investments expressed in foreign currency amounts are converted to U.S. dollar equivalents using a foreign exchange quotation from a third party service provider at the time of valuation. Foreign investments held by the Fund may be traded on days and at times when the Fund is not open for business. Consequently, the value of Fund investments may be significantly affected on days when shareholders cannot purchase or sell Fund shares. Futures contracts and other financial and derivative instruments traded on an exchange are valued at the latest published price for the instrument on its primary exchange. Listed options are valued at the last bid price.
Valuation Hierarchy: The Fund categorizes its investments based upon the inputs used in valuing those investments, according to a three-level hierarchy established in guidance from FASB. Categorization of investments using this hierarchy is intended by the FASB to maximize the use of observable inputs in valuing investments and minimize the use of unobservable inputs by requiring that the most observable inputs be used when available. Observable inputs are those that market participants would use in valuing an investment based on available market information. Unobservable inputs are those that reflect assumptions about the information market participants would use in valuing an investment. An investment’s level within the hierarchy is based on the lowest level input that is deemed significant to the valuation. The methodologies and inputs used to value investments are not necessarily indications of the risk or liquidity associated with those investments.
Various inputs are used in calculating valuations for the Fund’s investments. These inputs are generally summarized according to the three-level hierarchy below:
Level 1: Quoted prices in active markets for identical investments.
Level 2: Other direct or indirect significant observable inputs (including quoted prices for similar investments in active markets and other observable inputs, such as interest rates, prepayment rates, credit risk, etc.).
Level 3: Significant unobservable inputs (including the Committee’s own assumptions in calculating the fair values of investments).
Valuations for debt obligations held by the Fund are typically calculated by pricing service providers approved by the Audit Committee and are characterized as Level 2 within the valuation hierarchy.
On days when market volatility thresholds established by the Audit Committee are exceeded, foreign securities for which valuations are obtained from pricing service providers are fair valued. On these days, the foreign securities are characterized as Level 2 within the valuation hierarchy and revert to Level 1 after the threshold is no longer exceeded.
In a limited number of cases the Committee calculates a fair value for investments using broker quotations or other methods approved by the Audit Committee. When the Committee uses a single broker quotation to calculate a fair value for an investment without other significant observable inputs, or if a fair value is calculated using other significant inputs that are considered unobservable, the investment is characterized as Level 3 within the hierarchy. Other significant unobservable inputs used to calculate a fair value in these instances might include an income-based valuation approach which considers discounted anticipated future cash flows from the investment, and application of discounts due to the nature or duration of any restrictions on the disposition of the investment.
Valuations based upon the use of inputs from Levels 1, 2 or 3 may not represent the actual price received upon the disposition of an investment, and the Fund may receive a price that is lower than the valuation based upon these inputs when it sells the investment.
The following table displays a summary of the fair value hierarchy measurements of the Fund’s investments as of March 31, 2017. In any instance when valuation inputs from more than one level are used to determine the fair value of a specific investment, the investment is placed in the level of the table based upon the lowest level input that is significant in determining the fair value of the investment:
18 Semi-Annual Report
| | |
| Notes to Financial Statements, Continued | | |
| |
Thornburg Core Growth Fund | | March 31, 2017 (Unaudited) |
| | | | | | | | | | | | | | | | |
| | | FAIR VALUE MEASUREMENTS AT MARCH 31, 2017 | |
| | | TOTAL | | | LEVEL 1 | | | LEVEL 2 | | | LEVEL 3 | |
Assets | | | | | | | | | | | | | | | | |
Investments in Securities* | | | | | | | | | | | | | | | | |
Common Stock | | $ | 568,581,202 | | | $ | 568,581,202 | | | $ | — | | | $ | — | |
Short Term Investments | | | 57,336,670 | | | | 57,336,670 | | | | — | | | | — | |
| | | | | | | | | | | | | | | | |
Total Investments in Securities | | $ | 625,917,872 | | | $ | 625,917,872 | | | $ | — | | | $ | — | |
| * | See Schedule of Investments for a summary of the industry exposure as grouped according to the Global Industry Classification Standard (GICS), which is an industry taxonomy developed by MSCI, Inc. and Standard & Poor’s (S&P). |
In accordance with the guidance prescribed in Accounting Standards Update No. 2011-04, it is the policy of the Fund to recognize transfers between levels and the underlying events which caused the movement. The Fund recognized no transfers between levels for the six months ended March 31, 2017, other than when the Fund exceeded market volatility thresholds for foreign equity investments during the period.
NOTE 4 – INVESTMENT ADVISORY FEE AND OTHER TRANSACTIONS WITH AFFILIATES
Pursuant to an investment advisory agreement, the Advisor serves as the investment advisor and performs services for the Fund for which the fees are payable at the end of each month. Under the investment advisory agreement, the Fund pays the Advisor a management fee based on the daily net assets of the Fund at an annual rate as shown in the following table:
Management Fee Schedule
| | | | |
DAILY NET ASSETS | | FEE RATE | |
| Up to $500 million | | | 0.875 | % |
| Next $500 million | | | 0.825 | |
| Next $500 million | | | 0.775 | |
| Next $500 million | | | 0.725 | |
| Over $2 billion | | | 0.675 | |
The Fund’s effective management fee for the period ended March 31, 2017 was 0.865% of the Fund’s average net assets.
The Fund pays to the Advisor the costs of personnel who perform certain accounting services for the Fund. For the six months ended March 31, 2017, the Fund paid $9,385 to the Advisor for these accounting services. The Trust has also entered into administrative service agreements with the Advisor, whereby the Advisor will perform certain administrative services for the shareholders of each class of the Fund’s shares, and for which fees will be payable at an annual rate of up to .125 of 1% per annum of the average daily net assets attributable to each class of shares. Total administrative service fees incurred by each class of shares of the Fund for the six months ended March 31, 2017, are set forth in the Statement of Operations.
The Trust has an underwriting agreement with Thornburg Securities Corporation (the “Distributor”), an affiliate of the Advisor, which acts as the distributor of the Fund’s shares. For the six months ended March 31, 2017, the Distributor has advised the Fund that it earned net commissions aggregating $5,853 from the sale of Class A shares, and collected contingent deferred sales charges aggregating $1,590 from redemptions of Class C shares of the Fund.
Pursuant to a service plan under Rule 12b-1 of the Investment Company Act of 1940, the Fund may pay to the Advisor or securities dealers and other financial institutions at the Advisor’s request an amount not to exceed .25 of 1% per annum of the average daily net assets attributable to Class A, Class C, Class R3, and Class R4 shares of the Fund to obtain various shareholder and distribution related services. For the six months ended March 31, 2017, there were no 12b-1 service plan fees charged for Class I or Class R5 shares. The Advisor may pay out of its own resources additional expenses for distribution of the Fund’s shares and shareholder services.
The Trust has also adopted distribution plans pursuant to Rule 12b-1, applicable only to the Fund’s Class C and Class R3 shares, under which the Fund compensates the Distributor for services in promoting the sale of Class C and Class R3 shares of the Fund at an annual rate of up to .75 of 1% per annum of the average daily net assets attributable to Class C shares, and an annual rate of up to .25 of 1% per annum of the average daily net assets attributable to Class R3 shares. Total fees incurred by each class of shares of the Fund under their respective service and distribution plans for the six months ended March 31, 2017, are set forth in the Statement of Operations.
Semi-Annual Report 19
| | |
| Notes to Financial Statements, Continued | | |
| |
Thornburg Core Growth Fund | | March 31, 2017 (Unaudited) |
The Advisor and Distributor have contractually agreed to waive fees and reimburse expenses incurred by the Fund so that actual expenses of certain share classes do not exceed levels as specified in the Fund’s most recent prospectus. The agreement may be terminated by the Fund at any time, but may not be terminated by the Advisor or Distributor before April 10, 2018, unless the Advisor ceases to be the investment advisor to the Fund or the Distributor ceases to be the distributor of the Fund prior to that date. The Advisor and Distributor may recoup amounts waived or reimbursed during the fiscal year if actual expenses fall below the contractual limit during that year.
For the six months ended March 31, 2017, The Advisor contractually reimbursed certain class specific expenses, administrative fees, and distribution fees of $62,939 for Class I shares, $81,704 for Class R3 shares, $17,011 for Class R4 shares, and $62,417 for Class R5 shares.
Certain officers and Trustees of the Trust are also officers or directors of the Advisor and Distributor. The compensation of independent Trustees is borne by the Trust.
The percentage of direct investments in the Fund held by Trustees and Officers of the Trust and the Advisor is approximately 7.23%.
The Fund may purchase or sell securities from, or to an affiliated fund, provided the affiliation is due solely to having a common investment advisor, common officers, or common trustees, and provided that all such transactions will comply with Rule 17a-7 under the 1940 Act. For the six months ended March 31, 2017, the Fund had no transactions with affiliated funds.
NOTE 5 – SHARES OF BENEFICIAL INTEREST
At March 31, 2017, there were an unlimited number of shares with no par value of beneficial interest authorized. Transactions in shares of beneficial interest were as follows:
| | | | | | | | | | | | | | | | |
| | | SIX MONTHS ENDED
MARCH 31, 2017 (UNAUDITED) | | | YEAR ENDED
SEPTEMBER 30, 2016 (AUDITED) | |
| | | SHARES | | | AMOUNT | | | SHARES | | | AMOUNT | |
Class A Shares | | | | | | | | | | | | | | | | |
Shares sold | | | 171,433 | | | $ | 4,898,411 | | | | 492,618 | | | $ | 13,190,882 | |
Shares issued to shareholders in reinvestment of dividends | | | — | | | | — | | | | — | | | | — | |
Shares repurchased | | | (1,075,044 | ) | | | (30,796,135 | ) | | | (2,413,586 | ) | | | (63,231,987 | ) |
| | | | | | | | | | | | | | | | |
| | | | |
Net increase (decrease) | | | (903,611 | ) | | $ | (25,897,724 | ) | | | (1,920,968 | ) | | $ | (50,041,105 | ) |
| | | | | | | | | | | | | | | | |
Class C Shares | | | | | | | | | | | | | | | | |
Shares sold | | | 104,082 | | | $ | 2,606,885 | | | | 406,148 | | | $ | 9,771,822 | |
Shares issued to shareholders in reinvestment of dividends | | | — | | | | — | | | | — | | | | — | |
Shares repurchased | | | (1,009,302 | ) | | | (25,326,204 | ) | | | (1,741,483 | ) | | | (40,573,317 | ) |
| | | | | | | | | | | | | | | | |
| | | | |
Net increase (decrease) | | | (905,220 | ) | | $ | (22,719,319 | ) | | | (1,335,335 | ) | | $ | (30,801,495 | ) |
| | | | | | | | | | | | | | | | |
Class I Shares | | | | | | | | | | | | | | | | |
Shares sold | | | 711,080 | | | $ | 21,661,367 | | | | 927,799 | | | $ | 26,349,638 | |
Shares issued to shareholders in reinvestment of dividends | | | — | | | | — | | | | — | | | | — | |
Shares repurchased | | | (858,619 | ) | | | (26,136,202 | ) | | | (3,162,309 | ) | | | (84,583,532 | ) |
| | | | | | | | | | | | | | | | |
| | | | |
Net increase (decrease) | | | (147,539 | ) | | $ | (4,474,835 | ) | | | (2,234,510 | ) | | $ | (58,233,894 | ) |
| | | | | | | | | | | | | | | | |
Class R3 Shares | | | | | | | | | | | | | | | | |
Shares sold | | | 133,709 | | | $ | 3,835,946 | | | | 286,391 | | | $ | 7,559,165 | |
Shares issued to shareholders in reinvestment of dividends | | | — | | | | — | | | | — | | | | — | |
Shares repurchased | | | (438,992 | ) | | | (12,494,159 | ) | | | (1,003,594 | ) | | | (26,523,766 | ) |
| | | | | | | | | | | | | | | | |
| | | | |
Net increase (decrease) | | | (305,283 | ) | | $ | (8,658,213 | ) | | | (717,203 | ) | | $ | (18,964,601 | ) |
| | | | | | | | | | | | | | | | |
20 Semi-Annual Report
| | |
| Notes to Financial Statements, Continued | | |
| |
Thornburg Core Growth Fund | | March 31, 2017 (Unaudited) |
| | | | | | | | | | | | | | | | |
| | | SIX MONTHS ENDED
MARCH 31, 2017 (UNAUDITED) | | | YEAR ENDED
SEPTEMBER 30, 2016 (AUDITED) | |
| | | SHARES | | | AMOUNT | | | SHARES | | | AMOUNT | |
Class R4 Shares | | | | | | | | | | | | | | | | |
Shares sold | | | 49,060 | | | $ | 1,424,444 | | | | 203,623 | | | $ | 5,252,801 | |
Shares issued to shareholders in reinvestment of dividends | | | — | | | | — | | | | — | | | | — | |
Shares repurchased | | | (109,629 | ) | | | (3,177,206 | ) | | | (330,597 | ) | | | (8,718,348 | ) |
| | | | | | | | | | | | | | | | |
| | | | |
Net increase (decrease) | | | (60,569 | ) | | $ | (1,752,762 | ) | | | (126,974 | ) | | $ | (3,465,547 | ) |
| | | | | | | | | | | | | | | | |
Class R5 Shares | | | | | | | | | | | | | | | | |
Shares sold | | | 85,159 | | | $ | 2,609,111 | | | | 173,654 | | | $ | 4,899,966 | |
Shares issued to shareholders in reinvestment of dividends | | | — | | | | — | | | | — | | | | — | |
Shares repurchased | | | (321,008 | ) | | | (9,730,296 | ) | | | (519,703 | ) | | | (14,584,671 | ) |
| | | | | | | | | | | | | | | | |
| | | | |
Net increase (decrease) | | | (235,849 | ) | | $ | (7,121,185 | ) | | | (346,049 | ) | | $ | (9,684,705 | ) |
| | | | | | | | | | | | | | | | |
NOTE 6 – INVESTMENT TRANSACTIONS
For the six months ended March 31, 2017, the Fund had purchase and sale transactions of investments (excluding short-term investments) of $251,135,464 and $326,054,988, respectively.
NOTE 7 – DERIVATIVE FINANCIAL INSTRUMENTS WITH OFF-BALANCE SHEET RISK AND FOREIGN INVESTMENT RISK
The Fund may use a variety of derivative financial instruments to hedge or adjust the risks affecting its investment portfolio or to enhance investment returns. Provisions of FASB Accounting Standards Codification ASC 815-10-50 (“ASC 815”) require certain disclosures. The disclosures are intended to provide users of financial statements with an understanding of the use of derivative instruments by the Fund and how these derivatives affect the financial position, financial performance and cash flows of the Fund. The Fund does not designate any derivative instruments as hedging instruments under ASC 815. Additionally, the Fund’s risk of loss may exceed the amounts recognized on the Statement of Assets and Liabilities.
During the six months ended March 31, 2017, the Fund did not invest in any derivative financial instruments of the type addressed by ASC 815.
OTHER NOTES
Risks: The Fund’s investments subject it to risks including, but not limited to, management risk, market and economic risk, risks affecting specific issuers, liquidity risk, the risks associated with investments in small- and mid-cap companies and non-U.S. issuers, credit risk, and interest rate risk. Please see the Fund’s prospectus for a discussion of the risks associated with an investment in the Fund.
Subsequent Events: Fund management believes no events have occurred between March 31, 2017 and the date of issuance of the financial statements that require adjustment to or disclosure in the accompanying financial statements.
Semi-Annual Report 21
| | |
| Financial Highlights | | |
| |
Thornburg Core Growth Fund | | |
| | | | | | | | | | | | | | | | | | | | | | | | | | | | | | | | | | | | | | | | | | | | | | | | | | | | | | | | | | | | |
| | | PER SHARE PERFORMANCE (FOR A SHARE OUTSTANDING THROUGHOUT THE PERIOD) | | | RATIOS TO AVERAGE NET ASSETS | | | SUPPLEMENTAL DATA | |
UNLESS
OTHERWISE
NOTED,
PERIODS
ARE
FISCAL
YEARS
ENDED
SEPT. 30, | | NET ASSET
VALUE
BEGINNING
OF PERIOD | | | NET
INVESTMENT
INCOME
(LOSS)+ | | | NET
REALIZED
&
UNREALIZED
GAIN (LOSS)
ON
INVESTMENTS | | | TOTAL FROM
INVESTMENT
OPERATIONS | | | DIVIDENDS
FROM NET
INVESTMENT
INCOME | | | DIVIDENDS
FROM NET
REALIZED
GAINS | | | TOTAL
DIVIDENDS | | | NET
ASSET
VALUE
END
OF
PERIOD | | | NET
INVESTMENT
INCOME
(LOSS)
(%) | | | EXPENSES,
AFTER
EXPENSE
REDUCTIONS
(%) | | | EXPENSES,
AFTER
EXPENSE
REDUCTIONS
AND
NET OF
CUSTODY
CREDITS
(%) | | | EXPENSES,
BEFORE
EXPENSE
REDUCTIONS
(%) | | | TOTAL
RETURN
(%)(a) | | | PORTFOLIO
TURNOVER
RATE
(%)(a) | | | NET
ASSETS
AT END
OF
PERIOD
(THOUSANDS) | |
CLASS A SHARES | | | | | | | | | | | | | | | | | | | | | | | | | | | | | | | | | | | | | | | | | | | | | | | | | | | | | |
2017(b)(c) | | $ | 28.22 | | | | (0.14 | ) | | | 1.86 | | | | 1.72 | | | | — | | | | — | | | | — | | | $ | 29.94 | | | | (0.96 | )(d) | | | 1.40 | (d) | | | 1.40 | (d) | | | 1.40 | (d) | | | 6.10 | | | | 44.01 | | | $ | 184,270 | |
2016(c) | | $ | 26.09 | | | | (0.27 | ) | | | 2.40 | | | | 2.13 | | | | — | | | | — | | | | — | | | $ | 28.22 | | | | (1.00 | ) | | | 1.40 | | | | 1.40 | | | | 1.40 | | | | 8.16 | | | | 86.24 | | | $ | 199,178 | |
2015(c) | | $ | 26.44 | | | | (0.26 | ) | | | (0.09 | ) | | | (0.35 | ) | | | — | | | | — | | | | — | | | $ | 26.09 | | | | (0.93 | ) | | | 1.39 | | | | 1.39 | | | | 1.39 | | | | (1.32 | ) | | | 96.02 | | | $ | 234,284 | |
2014(c) | | $ | 24.35 | | | | (0.28 | ) | | | 2.37 | | | | 2.09 | | | | — | | | | — | | | | — | | | $ | 26.44 | | | | (1.06 | ) | | | 1.40 | | | | 1.40 | | | | 1.40 | | | | 8.58 | | | | 100.62 | | | $ | 277,099 | |
2013(c) | | $ | 19.11 | | | | (0.21 | ) | | | 5.45 | | | | 5.24 | | | | — | | | | — | | | | — | | | $ | 24.35 | | | | (1.01 | ) | | | 1.45 | | | | 1.45 | | | | 1.45 | | | | 27.42 | | | | 91.92 | | | $ | 279,483 | |
2012(c) | | $ | 13.33 | | | | (0.17 | ) | | | 5.95 | | | | 5.78 | | | | — | | | | — | | | | — | | | $ | 19.11 | | | | (1.02 | ) | | | 1.48 | | | | 1.49 | | | | 1.48 | | | | 43.36 | | | | 122.93 | | | $ | 225,945 | |
CLASS C SHARES | | | | | | | | | | | | | | | | | | | | | | | | | | | | | | | | | | | | | | | | | | | | | | | | | | | | | |
2017(b) | | $ | 24.90 | | | | (0.22 | ) | | | 1.64 | | | | 1.42 | | | | — | | | | — | | | | — | | | $ | 26.32 | | | | (1.73 | )(d) | | | 2.17 | (d) | | | 2.17 | (d) | | | 2.17 | (d) | | | 5.70 | | | | 44.01 | | | $ | 141,179 | |
2016 | | $ | 23.20 | | | | (0.41 | ) | | | 2.11 | | | | 1.70 | | | | — | | | | — | | | | — | | | $ | 24.90 | | | | (1.76 | ) | | | 2.16 | | | | 2.16 | | | | 2.16 | | | | 7.33 | | | | 86.24 | | | $ | 156,115 | |
2015 | | $ | 23.69 | | | | (0.42 | ) | | | (0.07 | ) | | | (0.49 | ) | | | — | | | | — | | | | — | | | $ | 23.20 | | | | (1.69 | ) | | | 2.15 | | | | 2.15 | | | | 2.15 | | | | (2.07 | ) | | | 96.02 | | | $ | 176,422 | |
2014 | | $ | 21.98 | | | | (0.43 | ) | | | 2.14 | | | | 1.71 | | | | — | | | | — | | | | — | | | $ | 23.69 | | | | (1.81 | ) | | | 2.14 | | | | 2.14 | | | | 2.14 | | | | 7.78 | | | | 100.62 | | | $ | 200,664 | |
2013 | | $ | 17.38 | | | | (0.34 | ) | | | 4.94 | | | | 4.60 | | | | — | | | | — | | | | — | | | $ | 21.98 | | | | (1.76 | ) | | | 2.20 | | | | 2.20 | | | | 2.20 | | | | 26.47 | | | | 91.92 | | | $ | 182,999 | |
2012 | | $ | 12.22 | | | | (0.28 | ) | | | 5.44 | | | | 5.16 | | | | — | | | | — | | | | — | | | $ | 17.38 | | | | (1.79 | ) | | | 2.25 | | | | 2.25 | | | | 2.25 | | | | 42.23 | | | | 122.93 | | | $ | 156,597 | |
CLASS I SHARES | | | | | | | | | | | | | | | | | | | | | | | | | | | | | | | | | | | | | | | | | | | | | | | | | | | | | |
2017(b) | | $ | 30.01 | | | | (0.08 | ) | | | 1.98 | | | | 1.90 | | | | — | | | | — | | | | — | | | $ | 31.91 | | | | (0.55 | )(d) | | | 0.99 | (d) | | | 0.99 | (d) | | | 1.05 | (d) | | | 6.33 | | | | 44.01 | | | $ | 206,494 | |
2016 | | $ | 27.64 | | | | (0.17 | ) | | | 2.54 | | | | 2.37 | | | | — | | | | — | | | | — | | | $ | 30.01 | | | | (0.59 | ) | | | 0.99 | | | | 0.99 | | | | 1.05 | | | | 8.57 | | | | 86.24 | | | $ | 198,658 | |
2015 | | $ | 27.90 | | | | (0.16 | ) | | | (0.10 | ) | | | (0.26 | ) | | | — | | | | — | | | | — | | | $ | 27.64 | | | | (0.53 | ) | | | 0.99 | | | | 0.99 | | | | 1.05 | | | | (0.93 | ) | | | 96.02 | | | $ | 244,691 | |
2014 | | $ | 25.59 | | | | (0.18 | ) | | | 2.49 | | | | 2.31 | | | | — | | | | — | | | | — | | | $ | 27.90 | | | | (0.65 | ) | | | 0.99 | | | | 0.99 | | | | 1.03 | | | | 9.03 | | | | 100.62 | | | $ | 251,122 | |
2013 | | $ | 19.99 | | | | (0.12 | ) | | | 5.72 | | | | 5.60 | | | | — | | | | — | | | | — | | | $ | 25.59 | | | | (0.55 | ) | | | 0.99 | | | | 0.99 | | | | 1.02 | | | | 28.01 | | | | 91.92 | | | $ | 191,358 | |
2012 | | $ | 13.88 | | | | (0.09 | ) | | | 6.20 | | | | 6.11 | | | | — | | | | — | | | | — | | | $ | 19.99 | | | | (0.52 | ) | | | 0.99 | | | | 0.99 | | | | 1.08 | | | | 44.02 | | | | 122.93 | | | $ | 116,567 | |
CLASS R3 SHARES | | | | | | | | | | | | | | | | | | | | | | | | | | | | | | | | | | | | | | | | | | | | | | | | | | | | | |
2017(b) | | $ | 28.10 | | | | (0.15 | ) | | | 1.85 | | | | 1.70 | | | | — | | | | — | | | | — | | | $ | 29.80 | | | | (1.06 | )(d) | | | 1.50 | (d) | | | 1.50 | (d) | | | 1.82 | (d) | | | 6.05 | | | | 44.01 | | | $ | 50,085 | |
2016 | | $ | 26.01 | | | | (0.29 | ) | | | 2.38 | | | | 2.09 | | | | — | | | | — | | | | — | | | $ | 28.10 | | | | (1.10 | ) | | | 1.50 | | | | 1.50 | | | | 1.81 | | | | 8.04 | | | | 86.24 | | | $ | 55,809 | |
2015 | | $ | 26.39 | | | | (0.29 | ) | | | (0.09 | ) | | | (0.38 | ) | | | — | | | | — | | | | — | | | $ | 26.01 | | | | (1.05 | ) | | | 1.50 | | | | 1.50 | | | | 1.79 | | | | (1.44 | ) | | | 96.02 | | | $ | 70,310 | |
2014 | | $ | 24.33 | | | | (0.31 | ) | | | 2.37 | | | | 2.06 | | | | — | | | | — | | | | — | | | $ | 26.39 | | | | (1.16 | ) | | | 1.50 | | | | 1.50 | | | | 1.80 | | | | 8.47 | | | | 100.62 | | | $ | 90,788 | |
2013 | | $ | 19.11 | | | | (0.22 | ) | | | 5.44 | | | | 5.22 | | | | — | | | | — | | | | — | | | $ | 24.33 | | | | (1.06 | ) | | | 1.50 | | | | 1.50 | | | | 1.79 | | | | 27.32 | | | | 91.92 | | | $ | 95,545 | |
2012 | | $ | 13.33 | | | | (0.18 | ) | | | 5.96 | | | | 5.78 | | | | — | | | | — | | | | — | | | $ | 19.11 | | | | (1.04 | ) | | | 1.50 | | | | 1.50 | | | | 1.80 | | | | 43.36 | | | | 122.93 | | | $ | 106,353 | |
CLASS R4 SHARES | | | | | | | | | | | | | | | | | | | | | | | | | | | | | | | | | | | | | | | | | | | | | | | | | | | | | |
2017(b) | | $ | 28.33 | | | | (0.14 | ) | | | 1.86 | | | | 1.72 | | | | — | | | | — | | | | — | | | $ | 30.05 | | | | (0.96 | )(d) | | | 1.40 | (d) | | | 1.40 | (d) | | | 1.97 | (d) | | | 6.07 | | | | 44.01 | | | $ | 5,416 | |
2016 | | $ | 26.19 | | | | (0.27 | ) | | | 2.41 | | | | 2.14 | | | | — | | | | — | | | | — | | | $ | 28.33 | | | | (1.00 | ) | | | 1.40 | | | | 1.40 | | | | 1.86 | | | | 8.17 | | | | 86.24 | | | $ | 6,821 | |
2015 | | $ | 26.54 | | | | (0.26 | ) | | | (0.09 | ) | | | (0.35 | ) | | | — | | | | — | | | | — | | | $ | 26.19 | | | | (0.94 | ) | | | 1.40 | | | | 1.40 | | | | 1.82 | | | | (1.32 | ) | | | 96.02 | | | $ | 9,632 | |
2014 | | $ | 24.44 | | | | (0.28 | ) | | | 2.38 | | | | 2.10 | | | | — | | | | — | | | | — | | | $ | 26.54 | | | | (1.06 | ) | | | 1.40 | | | | 1.40 | | | | 1.77 | | | | 8.59 | | | | 100.62 | | | $ | 11,306 | |
2013 | | $ | 19.18 | | | | (0.20 | ) | | | 5.46 | | | | 5.26 | | | | — | | | | — | | | | — | | | $ | 24.44 | | | | (0.96 | ) | | | 1.40 | | | | 1.40 | | | | 1.79 | | | | 27.42 | | | | 91.92 | | | $ | 10,277 | |
2012 | | $ | 13.37 | | | | (0.16 | ) | | | 5.97 | | | | 5.81 | | | | — | | | | — | | | | — | | | $ | 19.18 | | | | (0.93 | ) | | | 1.40 | | | | 1.40 | | | | 1.78 | | | | 43.46 | | | | 122.93 | | | $ | 9,344 | |
CLASS R5 SHARES | | | | | | | | | | | | | | | | | | | | | | | | | | | | | | | | | | | | | | | | | | | | | | | | | | | | | |
2017(b) | | $ | 29.98 | | | | (0.08 | ) | | | 1.98 | | | | 1.90 | | | | — | | | | — | | | | — | | | $ | 31.88 | | | | (0.55 | )(d) | | | 0.99 | (d) | | | 0.99 | (d) | | | 1.36 | (d) | | | 6.34 | | | | 44.01 | | | $ | 33,550 | |
2016 | | $ | 27.61 | | | | (0.17 | ) | | | 2.54 | | | | 2.37 | | | | — | | | | — | | | | — | | | $ | 29.98 | | | | (0.59 | ) | | | 0.99 | | | | 0.99 | | | | 1.30 | | | | 8.58 | | | | 86.24 | | | $ | 38,629 | |
2015 | | $ | 27.87 | | | | (0.16 | ) | | | (0.10 | ) | | | (0.26 | ) | | | — | | | | — | | | | — | | | $ | 27.61 | | | | (0.54 | ) | | | 0.99 | | | | 0.99 | | | | 1.24 | | | | (0.93 | ) | | | 96.02 | | | $ | 45,126 | |
2014 | | $ | 25.56 | | | | (0.18 | ) | | | 2.49 | | | | 2.31 | | | | — | | | | — | | | | — | | | $ | 27.87 | | | | (0.65 | ) | | | 0.99 | | | | 0.99 | | | | 1.28 | | | | 9.04 | | | | 100.62 | | | $ | 61,818 | |
2013 | | $ | 19.97 | | | | (0.12 | ) | | | 5.71 | | | | 5.59 | | | | — | | | | — | | | | — | | | $ | 25.56 | | | | (0.55 | ) | | | 0.99 | | | | 0.99 | | | | 1.12 | | | | 27.99 | | | | 91.92 | | | $ | 62,146 | |
2012 | | $ | 13.86 | | | | (0.09 | ) | | | 6.20 | | | | 6.11 | | | | — | | | | — | | | | — | | | $ | 19.97 | | | | (0.52 | ) | | | 0.98 | | | | 0.99 | | | | 1.32 | | | | 44.08 | | | | 122.93 | | | $ | 61,411 | |
| (a) | Not annualized for periods less than one year. |
| (b) | Unaudited Six Month Period Ended March 31. |
| (c) | Sales loads are not reflected in computing total return. |
| + | Based on weighted average shares outstanding. |
See notes to financial statements.
| | |
| 22 Semi-Annual Report | | Semi-Annual Report 23 |
| | |
| Expense Example | | |
| |
Thornburg Core Growth Fund | | March 31, 2017 (Unaudited) |
As a shareholder of the Fund, you incur two types of costs:
| | (1) | transaction costs, including |
(a) sales charges (loads) on purchase payments, for Class A shares;
(b) a deferred sales charge on redemptions of any part or all of a purchase of $1 million of Class A shares within 12 months of purchase;
(c) a deferred sales charge on redemptions of Class C shares within 12 months of purchase;
| | (2) | ongoing costs, including management fees; distribution and/or service (12b-1) fees; and other Fund expenses. |
This example is intended to help you understand your ongoing costs (in dollars) of investing in the Fund and to compare these costs with the ongoing costs of investing in other mutual funds.
The example is based on a $1,000 investment beginning on October 1, 2016, and held until March 31, 2017.
| | | | | | | | | | | | |
| | | BEGINNING
ACCOUNT VALUE
10/1/16 | | | ENDING
ACCOUNT VALUE
3/31/17 | | | EXPENSES PAID
DURING PERIOD†
10/1/16–3/31/17 | |
CLASS A SHARES | | | | | | | | | | | | |
Actual | | $ | 1,000.00 | | | $ | 1,060.95 | | | $ | 7.21 | |
Hypothetical* | | $ | 1,000.00 | | | $ | 1,017.93 | | | $ | 7.06 | |
CLASS C SHARES | | | | | | | | | | | | |
Actual | | $ | 1,000.00 | | | $ | 1,057.03 | | | $ | 11.12 | |
Hypothetical* | | $ | 1,000.00 | | | $ | 1,014.12 | | | $ | 10.89 | |
CLASS I SHARES | | | | | | | | | | | | |
Actual | | $ | 1,000.00 | | | $ | 1,063.31 | | | $ | 5.09 | |
Hypothetical* | | $ | 1,000.00 | | | $ | 1,020.00 | | | $ | 4.99 | |
CLASS R3 SHARES | | | | | | | | | | | | |
Actual | | $ | 1,000.00 | | | $ | 1,060.50 | | | $ | 7.71 | |
Hypothetical* | | $ | 1,000.00 | | | $ | 1,017.45 | | | $ | 7.55 | |
CLASS R4 SHARES | | | | | | | | | | | | |
Actual | | $ | 1,000.00 | | | $ | 1,060.71 | | | $ | 7.19 | |
Hypothetical* | | $ | 1,000.00 | | | $ | 1,017.95 | | | $ | 7.04 | |
CLASS R5 SHARES | | | | | | | | | | | | |
Actual | | $ | 1,000.00 | | | $ | 1,063.38 | | | $ | 5.09 | |
Hypothetical* | | $ | 1,000.00 | | | $ | 1,020.00 | | | $ | 4.99 | |
| † | Expenses are equal to the annualized expense ratio for each class (A: 1.40%; C: 2.17%; I: 0.99%; R3: 1.50%; R4: 1.40%; R5: 0.99%) multiplied by the average account value over the period, multiplied by 182/365 to reflect the one-half year period. |
| * | Hypothetical assumes a rate of return of 5% per year before expenses. |
ACTUAL EXPENSES
For each class of shares, the first line of the accompanying table provides information about actual account values and actual expenses. You may use the information in this line, together with the amount you invested, to estimate the expenses that you paid over the period. Simply divide your account value by $1,000 (for example, an $8,600 account value divided by $1,000 = 8.6), then multiply the result by the number in the first line for your class of shares under the heading entitled “Expenses Paid During Period” to estimate the expenses you paid on your account during this period.
HYPOTHETICAL EXAMPLE FOR COMPARISON PURPOSES
For each class of shares, the second line of the accompanying table provides information about hypothetical account values and hypothetical expenses based on the Fund’s actual expense ratio and an assumed rate of return of 5% per year before expenses, which is not the Fund’s actual return. The hypothetical account values and expenses may not be used to estimate the actual ending account balance or expenses you paid for the period. You may use this information to compare the ongoing costs of investing in the Fund and other funds. To do so, compare this 5% hypothetical example with the 5% hypothetical examples that appear in the shareholder reports of the other funds.
Please note that the expenses shown in the table are meant to highlight your ongoing costs only and do not reflect any transactional costs, such as sales charges (loads), redemption fees, or exchange fees. Therefore, the second line of the table for each class of shares is useful in comparing ongoing costs only, and will not help you determine the relative total costs of owning different funds. In addition, if these transactional costs were included, your costs would have been higher.
24 Semi-Annual Report
| | |
| Other Information | | |
| |
Thornburg Core Growth Fund | | March 31, 2017 (Unaudited) |
PORTFOLIO PROXY VOTING
Policies and Procedures:
The Trust has delegated to Thornburg Investment Management, Inc. (the “Advisor”) voting decisions respecting proxies for the Fund’s voting securities. The Advisor makes voting decisions in accordance with its Proxy Voting Policy and Procedures. A description of the Policy and Procedures is available (i) without charge, upon request, by calling the Advisor toll-free at 1-800-847-0200, (ii) on the Thornburg website at www.thornburg.com, and (iii) on the Securities and Exchange Commission’s website at www.sec.gov.
Information regarding how proxies were voted is available on or before August 31 of each year for the twelve months ending the preceding June 30. This information is available (i) without charge, upon request by calling the Advisor toll-free at 1-800-847-0200, (ii) on the Thornburg website at www.thornburg.com, and (iii) on the Securities and Exchange Commission’s website at www.sec.gov.
AVAILABILITY OF QUARTERLY PORTFOLIO SCHEDULE
The Fund files with the Securities and Exchange Commission schedules of its portfolio holdings on Form N-Q for the first and third quarters of each fiscal year. The Fund’s Forms N-Q are available on the Commission’s website at www.sec.gov, or may be reviewed and copied at the Commission’s Public Reference Room in Washington, D.C. Information on the operation of the Public Reference Room may be obtained by calling 1-800-SEC-0330. The Fund also makes this information available on its website at www. thornburg. com/download or upon request by calling 1-800-847-0200.
Semi-Annual Report 25
Trustees’ Statement to Shareholders
Readopted September 12, 2016
The Trustees believe current and prospective shareholders should know how we discharge our responsibilities in supervising the Funds’ investment advisor and in reviewing the advisor’s contract for renewal. Since 2005, we have issued a statement which sets out clearly the three principal guidelines that we follow in supervising the Trust’s investment advisor on your behalf. In accordance with our customary practice, in September of this year we again reviewed our statement and concluded we should reissue this statement outlining the principal features of our supervision of the advisor’s performance of investment management services for the Funds.
We begin with the premise that each shareholder selected his or her Fund because its investments are managed by the investment advisor identified in the prospectus and in accordance with the objective and policies described in the prospectus. We realize, as each of you do, that if you believe that your Fund’s stated objective and policies no longer serve your personal investment goals, you can sell your shares and leave the Fund.
Therefore, we believe that our primary supervisory task – our principal obligation to you – is to assess the nature and quality of the advisor’s services, and to confirm that the advisor actively and competently pursues the Fund’s objective, in accordance with the policies set out in the prospectus. To do this, we meet regularly with management to review your Fund’s portfolio and to discuss the advisor’s specific actions and judgments in pursuing the Fund’s objective. We do not substitute our own judgment for the advisor’s decisions in selecting investments; the advisor is paid to exercise its informed judgment on investment decisions, and we seek to confirm, in reviewing the advisor’s performance, that the advisor is doing just that.
Second, we are conscious of costs and the effect that costs have on shareholders’ returns. We try to make sure that your Fund’s fees and costs are reasonable in relationship to the services rendered and that they are generally in line with those charged by other expert investment advisors, consistent with our belief that the Fund’s investors searched for and expect that expertise and attention and have decided to pay a reasonable price for it. We do not put the management contract “out to bid” as a matter of course, and we would not do so unless we had concluded that the advisor materially had failed to pursue the Fund’s objectives in accordance with its policies, or for other equally important reasons. We believe that any other approach would be inconsistent with your interests and contrary to your expectations when you bought shares of the Fund in the first place.
Finally, because we believe that most Thornburg Fund shareholders have invested with a long-term perspective, we try not to focus too much on the fashions of the moment and on short-term performance. The market will not favor any specific investment objective or set of policies at all times and under all economic circumstances. A fund will experience periods of both high and low returns relative to other funds and other investments. Even if one of our Funds is not favored by the market at a particular time, we believe that the advisor is nonetheless obliged to remain true to the Fund’s objective and policies, and we watch to see that it does so.
Trustees of Thornburg Investment Trust
26 Semi-Annual Report.
Thornburg Funds
Thornburg Investment Management is a privately-owned global investment firm that offers a range of solutions for retail and institutional investors . Founded in 1982 and headquartered in Santa Fe, New Mexico, we manage approximately $49 billion (as of March 31, 2017) across U.S. mutual funds, separate accounts for high-net-worth investors and institutional accounts, and UCITS funds for non-U.S. investors.
The fund outlined in this report is one of many equity and fixed-income products available from Thornburg Investment Management .
EQUITY FUNDS
| | • | | Thornburg Investment Income Builder Fund |
| | • | | Thornburg Global Opportunities Fund |
| | • | | Thornburg International Value Fund |
| | • | | Thornburg Better World International Fund |
| | • | | Thornburg International Growth Fund |
| | • | | Thornburg Developing World Fund |
| | • | | Thornburg Core Growth Fund |
FIXED INCOME FUNDS
| | • | | Thornburg Low Duration Income Fund |
| | • | | Thornburg Limited Term U.S. Government Fund |
| | • | | Thornburg Limited Term Income Fund |
| | • | | Thornburg Strategic Income Fund |
| | • | | Thornburg Low Duration Municipal Fund |
| | • | | Thornburg Limited Term Municipal Fund |
| | • | | Thornburg Intermediate Municipal Fund |
| | • | | Thornburg California Limited Term Municipal Fund |
| | • | | Thornburg New Mexico Intermediate Municipal Fund |
| | • | | Thornburg New York Intermediate Municipal Fund |
| | • | | Thornburg Strategic Municipal Income Fund |
ALTERNATIVE FUNDS
| | • | | Thornburg Long/Short Equity Fund |
Before investing, carefully consider the Fund’s investment goals, risks, charges, and expenses. For a prospectus or summary prospectus containing this and other information, contact your financial advisor or visit thornburg.com. Read it carefully before investing.
For additional information, please visit thornburg ..com
Thornburg Investment Management, Inc. 2300 North Ridgetop Road, Santa Fe, NM 87506
Semi-Annual Report. 27

This Semi-Annual Report is submitted for the general information of shareholders of the Fund. It is not authorized for distribution to prospective investors in the Fund unless preceded or accompanied by an effective prospectus.
| | | | |
| Investment Advisor: | | Distributor: | | |
| Thornburg Investment Management® | | Thornburg Securities Corporation® | | |
| 800.847.0200 | | 800.847.0200 | | TH180 |
About Thornburg Investment Management
It’s more than what we do. It’s how we do it.
At Thornburg, we are very different in how we think, invest, and are structured . We believe this difference is what makes us successful in helping individuals reach their long-term financial goals.
How we THINK
Flexible Perspective
Our perspective on investment opportunities is more flexible than most, viewing a wide range of opportunities beyond conventional boundaries to find hidden value.
Collaboration
Collectively, we hone ideas via borderless cross-pollination for better judgment and better results.
How we INVEST
Portfolio Construction
Disciplined construction guided more by our convictions than convention.
CONVICTION
Thorough analysis and our relative-value framework lead to conviction in our securities selection.
UNCONVENTIONAL
Active management means we seek the best value for our clients rather than using conventional benchmarks as our starting point.
How we’re STRUCTURED
Structured for Excellence
How we think and how we invest is made possible by how we’re structured.
TEAM APPROACH FAR FROM THE HERD ACCESS & TRANSPARENCY
2 Semi-Annual Report
Semi-Annual Report
Thornburg International Growth Fund
March 31, 2017
| | | | |
SHARE CLASS | | NASDAQ SYMBOL | | CUSIP |
Class A | | TIGAX | | 885-215-319 |
Class C | | TIGCX | | 885-215-293 |
Class I | | TINGX | | 885-215-244 |
Class R3 | | TIGVX | | 885-215-178 |
Class R4 | | TINVX | | 885-215-160 |
Class R5 | | TINFX | | 885-215-152 |
Class R6 | | THGIX | | 885-216-820 |
Class I, R3, R4, R5, and R6 shares may not be available to all investors. Minimum investments for Class I shares may be higher than those for other classes.
Investments carry risks, including possible loss of principal. Additional risks may be associated with investments outside the United States, especially in emerging markets, including currency fluctuations, illiquidity, volatility, and political and economic risks. Investments in small- and mid-capitalization companies may increase the risk of greater price fluctuations. Please see the Fund’s prospectus for a discussion of the risks associated with an investment in the Fund. Investments in the Fund are not FDIC insured, nor are they bank deposits or guaranteed by a bank or any other entity.
Semi-Annual Report 3
Letter to Shareholders
| | |
Thornburg International Growth Fund | | March 31, 2017 (Unaudited) |
April 17, 2017
Dear Fellow Shareholder:
For the six months ended March 31, 2017, Thornburg International Growth Fund returned 4.73% for the Class A shares (without sales charge), outperforming the benchmark MSCI All Country (AC) World ex-U.S. Growth Index, which returned 2.88%. On March 31, 2017, the net asset value (NAV) of the Class A shares was $20.13.
At the start of this semi-annual period, global markets were generally weak and investor risk taking was at a minimum leading into the U.S. general election. Although Trump’s victory was a surprise to consensus expectations, and investors initially reacted negatively, as markets digested the ramifications of a Trump presidency, coupled with a Republican-controlled Congress, we witnessed initial skepticism turn into enthusiasm. Investors are optimistic that the pro-business and pro-growth agenda of the new administration will be positive for the U.S. economy and corporate earnings.
We’ve seen a rally that began initially with U.S. equities extend globally, with non-U.S. equities also performing well in this period. International markets have benefited as global growth expectations have risen.
As largely expected, the U.S. Federal Reserve raised benchmark interest rates twice in this period, each time by a quarter of a percentage point. With the second hike, the tone around the pace of further Fed tightening was interpreted as unexpectedly dovish. This took currency markets by surprise and led to a reversal of trades that resulted in the U.S. dollar weakening in the back part of the period. As a result, already solid returns for international stocks in local terms this period saw further improvement in dollar-denominated terms.
Another major event was the U.K. triggering Article 50 to initiate the “Brexit” process from the European Union. By triggering Article 50, the U.K. now has two years to negotiate an exit deal. Markets absorbed the event without missing a beat and for now investors are optimistic that the departure will proceed without serious economic disruption, as evidenced by the British pound strengthening in the days post Article 50. It remains to be seen what the actual terms of the Brexit agreement will be and the associated long-run implications. We will keep a watchful eye and remain cognizant of the potential risks to economic growth and currency fluctuations.
In the eurozone, we are seeing healthy economic activity and the pace of recovery gathering strength. Manufacturing output, as measured by the Purchasing Managers’ Index (PMI), is well into expansionary territory and reached its highest level in six years. Unemployment rates have fallen to their lowest levels since 2009, with more than one million people having found employment over the past year. This improvement in growth has been coupled with low core inflation readings, thus giving the European Central Bank leeway to maintain accommodative monetary policy, supporting further economic expansion.
Performance Discussion
During this period, large-capitalization stocks outperformed vis-à-vis mid- and small-capitalization stocks. Although this was a headwind for the Fund, because we favor smaller capitalization ranges, our portfolio still delivered positive results relative to the benchmark thanks to effective individual stock selection, particularly in the technology, health care, and consumer staples sectors.
Information technology was the best performing sector in the benchmark for this period, and our considerable overweight here was a tailwind to returns. We also saw good gains in consumer staples and health care, with most of the performance attribution coming from stock selection as opposed to allocation effects. The worst performing sectors in the benchmark were energy, real estate, and telecommunication services. These are all sectors in which we have limited to no exposure.
Geographically, the eurozone and Asia ex-Japan were leaders within the benchmark, while Japan and the U.K. were laggards. The portfolio benefited from being modestly overweight the eurozone as well as solid performance from our underlying holdings. Despite being underweight Asia ex-Japan, the Fund delivered positive returns here as our individual stock picks, particularly in China and Macau, outperformed strongly. Although being underweight Japan should have helped our performance more we saw a few individual holdings sell off due to worsening fundamentals.
Top contributors to performance for the period included U.K. payments processor Paysafe Group, Macau-based casino operator Galaxy Entertainment, French digital advertising firm Criteo, U.K. medical products producer Convatec Group, and German health care and agricultural products company Bayer AG.
Paysafe late last year was targeted by a short-seller report, which made a number of erroneous allegations against the company. We took advantage of the volatility to add to our existing position. The outsized move in the stock price during the period was largely the share price retracing to prior levels. Long-term fundamentals remain solid and Paysafe continues to be a top holding.
Galaxy Entertainment has benefitted from a recovery in Macau’s gaming industry and investor optimism over new properties slated to open soon. Criteo logged good growth as a leader in the field of search advertising, with strong technology and product offerings. Convatec is making good progress in turning around their ostomy (wound care) business and the stock has closed some of its valuation discount relative to peers. Bayer shares have moved higher as the market is beginning to factor in a greater probability of the proposed
4 Semi-Annual Report
| | |
| Letter to Shareholders, | | |
| |
Continued | | |
| |
Thornburg International Growth Fund | | March 31, 2017 (Unaudited) |
acquisition of Monsanto being completed. This union would create the world’s largest agricultural products company and provide significant long-term synergies.
Primary detractors to performance this quarter were Japanese internet services company Rakuten, Italian online luxury fashion retailer YOOX Net-A-Porter, Japanese smartphone messaging company LINE Corp., Korean cosmetics maker AmorePacific, and Ireland-domiciled global pharmaceutical firm Allergan plc.
Rakuten fell as it reported weaker-than-expected margins in its domestic e-commerce business. Although it is the market leader in Japan, increased promotional pressure from Yahoo and Amazon also weighed on the stock. YOOX declined as growth has slowed and the competitive landscape has intensified with LVMH’s (Louis Vuitton Moët Hennessy) planned development of its own e-commerce platform. LINE, although it has a large user base, has delivered monetization of that user base at a pace slower than investor expectations. AmorePacific declined as political tensions between China and Korea have negatively impacted Chinese tourism into Korea and subsequent spending on cosmetics. Allergan reported a disappointing quarter as we saw an erosion of growth in some of its legacy products.
We have since sold out of each of these detractors, with the exception of YOOX Net-A-Porter. We believe YOOX remains well positioned to maintain a leading position and benefit from the secular trend of luxury fashion moving online.
Outlook
Over the course of many business cycles, international equities have come in and out of favor relative to domestic equities. The U.S. economy is poised to continue its expansion, given the pro-growth agenda of the new administration, as well as positive readings in various economic gauges such as business confidence, wage growth, and corporate profits. However, the economic expansion in the U.S. appears to be mid to later cycle, with equity markets reaching fresh highs and valuation metrics above their long-term averages.
With global economic indicators picking up, this makes the case for international equities all the more compelling on a relative basis. Eurozone industrial activity continues to be robust and the unemployment rate fell to the lowest in eight years. Fears of a disruptive slowdown or “hard landing” in China have diminished considerably, with pockets of healthy growth evident, such as in technology and services. And in emerging markets, fundamentals continue to improve, with economic growth set to accelerate in 2017 as better performing countries, such as India, continue to build upon existing momentum and weaker countries pull out of recessions or see data points trend less negatively. Broadly, valuations for international equities remain attractive, with relative valuations below current U.S. levels and historical valuations below prior peaks.
Over the life of the Fund, we have managed through various market cycles and have consistently adhered to a repeatable process and philosophy that employs rigorous, bottom-up fundamental analysis and seeks to invest in great businesses with attractive growth prospects. As a result, we tend to favor quality growth stocks, smaller capitalization ranges, and long-term secular themes while remaining disciplined around valuation. This approach has resulted in a less correlated, high active share portfolio that we believe can deliver compelling risk-adjusted returns over the long term.
Thank you for investing alongside us in Thornburg International Growth Fund.
| | | | |
| Sincerely, | | | | |
| | |
 | | | |  |
| Greg Dunn | | | | Sean Koung Sun,CFA |
| Managing Director | | | | Managing Director |
| Portfolio Manager | | | | Portfolio Manager |
The matters discussed in this report may constitute forward-looking statements made pursuant to the safe harbor provisions of the Securities Litigation Reform Act of 1995. These include any advisor or portfolio manager prediction, assessment, analysis or outlook for individual securities, industries, investment styles, market sectors and/or markets. These statements involve risks and uncertainties. In addition to the general risks described for each fund in its current prospectus, other factors bearing on these reports include the accuracy of the advisor’s or portfolio manager’s forecasts and predictions, the appropriateness of the investment strategies designed by the advisor or portfolio manager and the ability of the advisor or portfolio manager to implement their strategies efficiently and successfully. Any one or more of these factors, as well as other risks affecting the securities markets generally, could cause the actual results of any fund to differ materially as compared to its benchmarks.
The views expressed are subject to change and do not necessarily reflect the views of Thornburg Investment Management, Inc. This information should not be relied upon as a recommendation or investment advice and is not intended to predict the performance of any investment or market.
Semi-Annual Report 5
| | |
| Performance Summary | | |
| |
Thornburg International Growth Fund | | March 31, 2017 (Unaudited) |
AVERAGE ANNUAL TOTAL RETURNS
| | | | | | | | | | | | | | | | | | | | |
| | | 1-YR | | | 3-YR | | | 5-YR | | | 10-YR | | | SINCE
INCEP. | |
Class A Shares (Incep: 2/1/07) | | | | | | | | | | | | | | | | | | | | |
Without sales charge | | | 8.77 | % | | | 1.08 | % | | | 7.00 | % | | | 6.14 | % | | | 6.61 | % |
With sales charge | | | 3.89 | % | | | -0.46 | % | | | 6.02 | % | | | 5.66 | % | | | 6.14 | % |
Class C Shares (Incep: 2/1/07) | | | | | | | | | | | | | | | | | | | | |
Without sales charge | | | 7.99 | % | | | 0.34 | % | | | 6.20 | % | | | 5.40 | % | | | 5.87 | % |
With sales charge | | | 6.99 | % | | | 0.34 | % | | | 6.20 | % | | | 5.40 | % | | | 5.87 | % |
Class I Shares (Incep: 2/1/07) | | | 9.24 | % | | | 1.52 | % | | | 7.45 | % | | | 6.68 | % | | | 7.16 | % |
Class R3 Shares (Incep: 2/1/08) | | | 8.70 | % | | | 1.00 | % | | | 6.90 | % | | | — | | | | 5.28 | % |
Class R4 Shares (Incep: 2/1/08) | | | 8.77 | % | | | 1.09 | % | | | 7.02 | % | | | — | | | | 5.39 | % |
Class R5 Shares (Incep: 2/1/08) | | | 9.23 | % | | | 1.51 | % | | | 7.44 | % | | | — | | | | 5.81 | % |
Class R6 Shares (Incep: 2/1/13) | | | 9.35 | % | | | 1.61 | % | | | — | | | | — | | | | 6.43 | % |
MSCI AC World ex-U.S. Growth Index (Since 2/1/07) | | | 9.63 | % | | | 1.55 | % | | | 4.84 | % | | | 1.97 | % | | | 2.19 | % |
GROWTH OF A HYPOTHETICAL $10,000 INVESTMENT
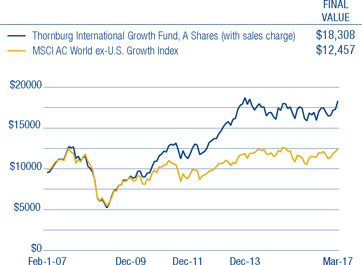
Performance data shown represents past performance and is no guarantee of future results. Investment return and principal value will fluctuate so shares, when redeemed, may be worth more or less than their original cost. Current performance may be lower or higher than quoted. For performance current to the most recent month end, visit thornburg.com or call 800-847-0200. The performance information does not reflect the deduction of taxes that a shareholder would pay on distributions or the redemption of Fund shares. Returns reflect the reinvestment of dividends and capital gains. Class A shares are sold with a maximum sales charge of 4.50%. Class C shares are subject to a 1% CDSC for the first year only. There is no sales charge for Class I, R3, R4, R5, and R6 shares.
As disclosed in the most recent prospectus, the total annual fund operating expenses are as follows: A shares, 1.39%; C shares, 2.15%; I shares, 1.00%; R3 shares, 2.04%; R4 shares, 1.68%; R5 shares, 1.21%; R6 shares, 1.39%. Thornburg Investment Management and/or Thornburg Securities Corporation have contractually agreed to waive fees and reimburse expenses through at least April 10, 2018, for some of the share classes, resulting in net expense ratios of the following: I shares, 0.99%; R3 shares, 1.50%; R4 shares, 1.40%; R5 shares, 0.99%; R6 shares, 0.89%. For more detailed information on fund expenses and waivers/reimbursements please see the Fund’s prospectus.
Glossary
The MSCI All Country (AC) World ex-U.S. Growth Index is a market capitalization weighted index that includes growth companies in developed and emerging markets throughout the world, excluding the United States.
The performance of any index is not indicative of the performance of any particular investment. Unless otherwise noted, index returns reflect the reinvestment of income dividends and capital gains, if any, but do not reflect fees, brokerage commissions or other expenses of investing. Investors may not make direct investments into any index.
Active Share – A measure of the percentage of stock holdings in a manager’s portfolio that differ from the benchmark index.
PMI (Purchasing Managers’ Index) – An indicator of the economic health of the manufacturing sector and for the economy as a whole. The PMI index is based on five major indicators: new orders, inventory levels, production, supplier deliveries, and the employment environment. A PMI of 50 or higher generally indicates that the industry is expanding.
6 Semi-Annual Report
| | |
| Fund Summary | | |
| |
Thornburg International Growth Fund | | March 31, 2017 (Unaudited) |
OBJECTIVES AND STRATEGIES
The Fund seeks long-term growth of capital by investing in equity securities selected for their growth potential.
The Fund normally invests at least 75% of its assets in foreign securities or depositary receipts of foreign securities. However, the Fund may own a variety of securities, including domestic equity securities, partnership interests, and debt obligations. The Fund may also invest in developing countries and in smaller companies with market capitalizations of less than $500 million.
MARKET CAPITALIZATION EXPOSURE
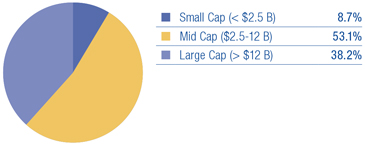
BASKET STRUCTURE
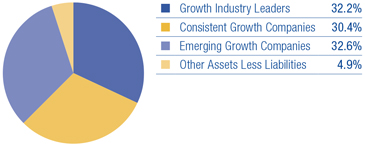
TOP TEN EQUITY HOLDINGS
| | | | |
Paysafe Group plc | | | 4.8 | % |
Wirecard AG | | | 4.7 | % |
Worldpay Group plc | | | 3.2 | % |
Bayer AG | | | 3.2 | % |
Fomento Economico Mexicano SAB de CV ADR | | | 3.0 | % |
Edenred | | | 2.8 | % |
MasterCard, Inc. | | | 2.6 | % |
Fresenius Medical Care AG & Co. | | | 2.4 | % |
Sands China Ltd. | | | 2.4 | % |
Tencent Holdings Ltd. | | | 2.3 | % |
There is no guarantee that the Fund will meet its investment objectives.
All portfolio information is subject to change. Charts may not add up to 100% due to rounding.
SECTOR EXPOSURE
| | | | |
Information Technology | | | 34.1 | % |
Consumer Discretionary | | | 20.8 | % |
Health Care | | | 12.4 | % |
Consumer Staples | | | 9.5 | % |
Financials | | | 9.1 | % |
Industrials | | | 6.4 | % |
Materials | | | 1.9 | % |
Real Estate | | | 0.9 | % |
Other Assets Less Liabilities | | | 4.9 | % |
TOP TEN INDUSTRY GROUPS
| | | | |
Software & Services | | | 32.2 | % |
Consumer Services | | | 10.9 | % |
Retailing | | | 8.7 | % |
Health Care Equipment & Services | | | 7.4 | % |
Food, Beverage & Tobacco | | | 7.0 | % |
Commercial & Professional Services | | | 6.4 | % |
Diversified Financials | | | 5.1 | % |
Pharmaceuticals, Biotechnology & Life Sciences | | | 5.1 | % |
Banks | | | 2.1 | % |
Insurance | | | 1.9 | % |
COUNTRY EXPOSURE*
(percent of equity holdings)
| | | | |
United Kingdom | | | 23.4 | % |
France | | | 13.2 | % |
Germany | | | 13.1 | % |
China | | | 12.3 | % |
United States | | | 5.1 | % |
Australia | | | 4.7 | % |
Mexico | | | 4.3 | % |
Denmark | | | 3.3 | % |
Japan | | | 3.2 | % |
India | | | 3.2 | % |
Italy | | | 2.1 | % |
Spain | | | 2.0 | % |
Ireland | | | 1.7 | % |
Brazil | | | 1.7 | % |
Russia | | | 1.6 | % |
Sweden | | | 1.6 | % |
Switzerland | | | 1.5 | % |
Netherlands | | | 1.2 | % |
Costa Rica | | | 0.9 | % |
| * | The country assignment of each equity holding is determined by the Fund’s Advisor based on various factors, including the location of the issuer’s head office, the issuer’s jurisdiction of incorporation and the country from which a majority of the issuer’s revenue is derived. |
Semi-Annual Report 7
| | |
| Schedule of Investments | | |
| |
Thornburg International Growth Fund | | March 31, 2017 (Unaudited) |
| | | | | | | | |
| | | SHARES/
PRINCIPAL
AMOUNT | | | VALUE | |
COMMON STOCK — 95.15% | | | | | | | | |
BANKS — 2.10% | | | | | | | | |
Banks — 1.11% | | | | | | | | |
ING Groep N.V. | | | 880,530 | | | $ | 13,310,578 | |
Thrifts & Mortgage Finance — 0.99% | | | | | | | | |
Housing Development Finance Corp. Ltd. | | | 516,469 | | | | 11,929,253 | |
| | | | | | | | |
| | | | | | | 25,239,831 | |
| | | | | | | | |
COMMERCIAL & PROFESSIONAL SERVICES — 6.36% | | | | | | | | |
Commercial Services & Supplies — 2.76% | | | | | | | | |
Edenred | | | 1,403,318 | | | | 33,159,865 | |
Professional Services — 3.60% | | | | | | | | |
Bureau Veritas SA | | | 1,236,547 | | | | 26,086,154 | |
SGS S.A. | | | 7,986 | | | | 17,037,969 | |
| | | | | | | | |
| | | | | | | 76,283,988 | |
| | | | | | | | |
CONSUMER SERVICES — 10.87% | | | | | | | | |
Hotels, Restaurants & Leisure — 10.87% | | | | | | | | |
Alsea S.A.B. de C.V. | | | 4,008,077 | | | | 13,390,763 | |
Domino’s Pizza Enterprises Ltd. | | | 376,549 | | | | 16,720,155 | |
Evolution Gaming Group AB | | | 224,580 | | | | 8,195,573 | |
Galaxy Entertainment Group Ltd. | | | 4,658,834 | | | | 25,507,738 | |
Merlin Entertainments plc | | | 3,064,462 | | | | 18,414,079 | |
Paddy Power Betfair plc | | | 181,700 | | | | 19,578,073 | |
Sands China Ltd. | | | 6,155,800 | | | | 28,515,576 | |
| | | | | | | | |
| | | | | | | 130,321,957 | |
| | | | | | | | |
DIVERSIFIED FINANCIALS — 5.09% | | | | | | | | |
Capital Markets — 5.09% | | | | | | | | |
Hargreaves Lansdown plc | | | 709,167 | | | | 11,559,589 | |
Japan Exchange Group, Inc. | | | 1,160,213 | | | | 16,517,898 | |
Schroders plc | | | 573,808 | | | | 21,783,406 | |
WisdomTree Investments, Inc. | | | 1,226,236 | | | | 11,134,223 | |
| | | | | | | | |
| | | | | | | 60,995,116 | |
| | | | | | | | |
FOOD & STAPLES RETAILING — 0.81% | | | | | | | | |
Food & Staples Retailing — 0.81% | | | | | | | | |
PriceSmart, Inc. | | | 105,586 | | | | 9,735,029 | |
| | | | | | | | |
| | | | | | | 9,735,029 | |
| | | | | | | | |
FOOD, BEVERAGE & TOBACCO — 7.01% | | | | | | | | |
Beverages — 2.97% | | | | | | | | |
Fomento Economico Mexicano SAB de CV ADR | | | 401,653 | | | | 35,554,324 | |
Food Products — 2.03% | | | | | | | | |
Danone SA | | | 357,972 | | | | 24,348,953 | |
Tobacco — 2.01% | | | | | | | | |
ITC Ltd. | | | 5,582,152 | | | | 24,134,737 | |
| | | | | | | | |
| | | | | | | 84,038,014 | |
| | | | | | | | |
HEALTH CARE EQUIPMENT & SERVICES — 7.35% | | | | | | | | |
Health Care Equipment & Supplies — 4.94% | | | | | | | | |
Coloplast A/S | | | 189,968 | | | | 14,832,737 | |
a ConvaTec Ltd. | | | 6,483,906 | | | | 22,665,092 | |
Essilor International SA | | | 179,000 | | | | 21,750,021 | |
Health Care Providers & Services — 2.41% | | | | | | | | |
Fresenius Medical Care AG & Co. | | | 343,373 | | | | 28,956,825 | |
| | | | | | | | |
| | | | | | | 88,204,675 | |
| | | | | | | | |
HOUSEHOLD & PERSONAL PRODUCTS — 1.67% | | | | | | | | |
Personal Products — 1.67% | | | | | | | | |
KOSE Corp. | | | 221,700 | | | | 20,053,166 | |
| | | | | | | | |
| | | | | | | 20,053,166 | |
| | | | | | | | |
INSURANCE — 1.93% | | | | | | | | |
Insurance — 1.93% | | | | | | | | |
St. James’s Place plc | | | 1,740,264 | | | | 23,155,610 | |
| | | | | | | | |
| | | | | | | 23,155,610 | |
| | | | | | | | |
MATERIALS — 1.90% | | | | | | | | |
Chemicals — 1.90% | | | | | | | | |
Novozymes AS | | | 576,446 | | | | 22,847,550 | |
| | | | | | | | |
| | | | | | | 22,847,550 | |
| | | | | | | | |
8 Semi-Annual Report
| | |
| Schedule of Investments, Continued | | |
| |
Thornburg International Growth Fund | | March 31, 2017 (Unaudited) |
| | | | | | | | |
| | | SHARES/
PRINCIPAL
AMOUNT | | | VALUE | |
MEDIA — 1.25% | | | | | | | | |
Media — 1.25% | | | | | | | | |
REA Group Ltd. | | | 330,476 | | | $ | 14,979,850 | |
| | | | | | | | |
| | | | | | | 14,979,850 | |
| | | | | | | | |
PHARMACEUTICALS, BIOTECHNOLOGY & LIFE SCIENCES — 5.08% | | | | | | | | |
Biotechnology — 1.93% | | | | | | | | |
Grifols S.A. | | | 942,310 | | | | 23,110,838 | |
Pharmaceuticals — 3.15% | | | | | | | | |
Bayer AG | | | 328,200 | | | | 37,830,866 | |
| | | | | | | | |
| | | | | | | 60,941,704 | |
| | | | | | | | |
REAL ESTATE — 0.88% | | | | | | | | |
Real Estate Management & Development — 0.88% | | | | | | | | |
Foxtons Group plc | | | 8,788,639 | | | | 10,598,367 | |
| | | | | | | | |
| | | | | | | 10,598,367 | |
| | | | | | | | |
RETAILING — 8.74% | | | | | | | | |
Internet & Direct Marketing Retail — 6.81% | | | | | | | | |
a Ctrip.com International, Ltd. ADR | | | 436,460 | | | | 21,452,009 | |
a priceline.com, Inc. | | | 8,364 | | | | 14,887,669 | |
a YOOX S.p.A | | | 987,899 | | | | 23,522,835 | |
a Zalando SE | | | 538,639 | | | | 21,792,463 | |
Multiline Retail — 1.93% | | | | | | | | |
B&M European Value Retail S.A. | | | 6,163,821 | | | | 23,121,627 | |
| | | | | | | | |
| | | | | | | 104,776,603 | |
| | | | | | | | |
SOFTWARE & SERVICES — 32.22% | | | | | | | | |
Information Technology Services — 16.98% | | | | | | | | |
Cielo S.A. | | | 2,154,089 | | | | 19,479,416 | |
MasterCard, Inc. | | | 282,534 | | | | 31,776,599 | |
a Paysafe Group plc | | | 9,775,161 | | | | 57,268,392 | |
Wirecard AG | | | 1,020,034 | | | | 56,476,131 | |
Worldpay Group plc | | | 10,450,768 | | | | 38,679,003 | |
Internet Software & Services — 15.24% | | | | | | | | |
a Alibaba Group Holding Ltd. ADR | | | 153,514 | | | | 16,553,415 | |
Auto Trader Group plc | | | 4,045,064 | | | | 19,882,009 | |
a Baidu, Inc. ADR | | | 119,590 | | | | 20,631,667 | |
carsales.com Ltd. | | | 2,572,600 | | | | 21,934,597 | |
a Criteo SA ADR | | | 451,157 | | | | 22,553,338 | |
a Just Eat plc | | | 2,829,360 | | | | 20,064,171 | |
NetEnt AB | | | 1,306,122 | | | | 10,494,862 | |
a Rocket Internet SE | | | 266,275 | | | | 4,553,516 | |
Tencent Holdings Ltd. | | | 956,100 | | | | 27,410,291 | |
a Yandex NV | | | 852,551 | | | | 18,696,443 | |
| | | | | | | | |
| | | | | | | 386,453,850 | |
| | | | | | | | |
TECHNOLOGY HARDWARE & EQUIPMENT — 1.89% | | | | | | | | |
Electronic Equipment, Instruments & Components — 1.89% | | | | | | | | |
Ingenico S.A. | | | 239,868 | | | | 22,636,130 | |
| | | | | | | | |
| | | | | | | 22,636,130 | |
| | | | | | | | |
TOTAL COMMON STOCK (Cost $1,002,339,850) | | | | | | | 1,141,261,440 | |
| | | | | | | | |
SHORT TERM INVESTMENTS — 3.60% | | | | | | | | |
b Thornburg Capital Management Fund | | | 4,322,485 | | | | 43,224,846 | |
| | | | | | | | |
TOTAL SHORT TERM INVESTMENTS (Cost $43,224,846) | | | | | | | 43,224,846 | |
| | | | | | | | |
TOTAL INVESTMENTS — 98.75% (Cost $1,045,564,696) | | | | | | $ | 1,184,486,286 | |
OTHER ASSETS LESS LIABILITIES — 1.25% | | | | | | | 14,997,875 | |
| | | | | | | | |
NET ASSETS — 100.00% | | | | | | $ | 1,199,484,161 | |
| | | | | | | | |
Semi-Annual Report 9
| | |
| Schedule of Investments, Continued | | |
| |
Thornburg International Growth Fund | | March 31, 2017 (Unaudited) |
Footnote Legend
| b | Investment in Affiliates - Shown below are holdings of voting securities of each portfolio company which is considered “affiliated” to the Fund under the Investment Company Act of 1940, including companies for which the Fund’s holding represented 5% or more of the company’s voting securities, and a series of the Thornburg Investment Trust in which the Fund invested for cash management purposes during the period: |
| | | | | | | | | | | | | | | | | | | | | | | | | | | | |
ISSUER | | SHARES/PRINCIPAL
SEPTEMBER 30,
2016 | | | GROSS
ADDITIONS | | | GROSS
REDUCTIONS | | | SHARES/PRINCIPAL
MARCH 31,
2017 | | | MARKET VALUE
MARCH 31,
2017 | | | INVESTMENT
INCOME | | | REALIZED
GAIN (LOSS) | |
Thornburg Capital Management Fund | | | 14,196,332 | | | | 29,515,000 | | | | 39,388,847 | | | | 4,322,485 | | | $ | 43,224,846 | | | $ | 182,463 | | | $ | — | |
| | | | | | | | | | | | | | | | | | | | | | | | | | | | |
Total non-controlled affiliated issuers - 3.60% of net assets | | | $ | 43,224,846 | | | $ | 182,463 | | | $ | — | |
| | | | | | | | | | | | | | | | | | | | | | | | | | | | |
Portfolio Abbreviations
To simplify the listings of securities, abbreviations are used per the table below:
| | |
| ADR | | American Depositary Receipt |
See notes to financial statements.
10 Semi-Annual Report
This page intentionally left blank.
Semi-Annual Report 11
| | |
| Statement of Assets and Liabilities | | |
| |
Thornburg International Growth Fund | | March 31, 2017 (Unaudited) |
| | | | |
ASSETS | | | | |
Investments at value (Note 3) | | | | |
Non-affiliated issuers (cost $1,002,339,850) | | $ | 1,141,261,440 | |
Non-controlled affiliated issuer (cost $43,224,846) | | | 43,224,846 | |
Cash denominated in foreign currency (cost $114,264) | | | 114,749 | |
Receivable for investments sold | | | 26,281,218 | |
Receivable for fund shares sold | | | 2,370,335 | |
Unrealized appreciation on forward currency contracts (Note 7) | | | 8,923 | |
Dividends receivable | | | 1,353,483 | |
Dividend reclaim receivable | | | 711,010 | |
Prepaid expenses and other assets | | | 116,636 | |
| | | | |
Total Assets | | | 1,215,442,640 | |
| | | | |
| |
LIABILITIES | | | | |
Payable for investments purchased | | | 3,024,611 | |
Payable for fund shares redeemed | | | 9,275,470 | |
Unrealized depreciation on forward currency contracts (Note 7) | | | 311,175 | |
Payable to investment advisor and other affiliates (Note 4) | | | 909,794 | |
Deferred taxes payable (Note 2) | | | 1,991,134 | |
Accounts payable and accrued expenses | | | 446,295 | |
| | | | |
Total Liabilities | | | 15,958,479 | |
| | | | |
| |
NET ASSETS | | $ | 1,199,484,161 | |
| | | | |
NET ASSETS CONSIST OF | | | | |
Distribution in excess of net investment income | | $ | (2,085,749 | ) |
Net unrealized appreciation on investments | | | 136,613,143 | |
Accumulated net realized gain (loss) | | | 25,604,063 | |
Net capital paid in on shares of beneficial interest | | | 1,039,352,704 | |
| | | | |
| |
| | $ | 1,199,484,161 | |
| | | | |
12 Semi-Annual Report
| | |
| Statement of Assets and Liabilities, Continued |
| |
Thornburg International Growth Fund | | March 31, 2017 (Unaudited) |
| | | | |
NET ASSET VALUE | | | | |
| |
Class A Shares: | | | | |
Net asset value and redemption price per share ($104,496,613 applicable to 5,190,670 shares of beneficial interest outstanding - Note 5) | | $ | 20.13 | |
Maximum sales charge, 4.50% of offering price | | | 0.95 | |
| | | | |
Maximum offering price per share | | $ | 21.08 | |
| | | | |
| |
Class C Shares: | | | | |
Net asset value and offering price per share* ($80,948,432 applicable to 4,247,955 shares of beneficial interest outstanding - Note 5) | | $ | 19.06 | |
| | | | |
| |
Class I Shares: | | | | |
Net asset value, offering and redemption price per share ($893,299,536 applicable to 43,217,632 shares of beneficial interest outstanding - Note 5) | | $ | 20.67 | |
| | | | |
| |
Class R3 Shares: | | | | |
Net asset value, offering and redemption price per share ($10,259,702 applicable to 513,703 shares of beneficial interest outstanding - Note 5) | | $ | 19.97 | |
| | | | |
| |
Class R4 Shares: | | | | |
Net asset value, offering and redemption price per share ($37,629,415 applicable to 1,879,509 shares of beneficial interest outstanding - Note 5) | | $ | 20.02 | |
| | | | |
| |
Class R5 Shares: | | | | |
Net asset value, offering and redemption price per share ($43,606,497 applicable to 2,104,701 shares of beneficial interest outstanding - Note 5) | | $ | 20.72 | |
| | | | |
| |
Class R6 Shares: | | | | |
Net asset value, offering and redemption price per share ($29,243,966 applicable to 1,407,948 shares of beneficial interest outstanding - Note 5) | | $ | 20.77 | |
| | | | |
| * | Redemption price per share is equal to net asset value less any applicable contingent deferred sales charge. |
See notes to financial statements.
Semi-Annual Report 13
| | |
| Statement of Operations | | |
| |
Thornburg International Growth Fund | | Six Months Ended March 31, 2017 (Unaudited) |
| | | | |
INVESTMENT INCOME | | | | |
Dividend income | | | | |
Non-affiliated issuers (net of foreign taxes withheld of $57,495) | | $ | 5,207,622 | |
Non-controlled affiliated issuer | | | 182,463 | |
| | | | |
Total Income | | | 5,390,085 | |
| | | | |
| |
EXPENSES | | | | |
Investment advisory fees (Note 4) | | | 5,231,759 | |
Administration fees (Note 4) | | | | |
Class A Shares | | | 83,536 | |
Class C Shares | | | 53,449 | |
Class I Shares | | | 227,658 | |
Class R3 Shares | | | 6,574 | |
Class R4 Shares | | | 23,401 | |
Class R5 Shares | | | 13,377 | |
Distribution and service fees (Note 4) | | | | |
Class A Shares | | | 166,099 | |
Class C Shares | | | 425,866 | |
Class R3 Shares | | | 26,316 | |
Class R4 Shares | | | 46,779 | |
Transfer agent fees | | | | |
Class A Shares | | | 114,835 | |
Class C Shares | | | 60,373 | |
Class I Shares | | | 423,978 | |
Class R3 Shares | | | 25,579 | |
Class R4 Shares | | | 78,732 | |
Class R5 Shares | | | 92,487 | |
Class R6 Shares | | | 1,274 | |
Registration and filing fees | | | | |
Class A Shares | | | 12,019 | |
Class C Shares | | | 10,973 | |
Class I Shares | | | 20,909 | |
Class R3 Shares | | | 7,685 | |
Class R4 Shares | | | 7,685 | |
Class R5 Shares | | | 8,291 | |
Class R6 Shares | | | 9,688 | |
Custodian fees (Note 2) | | | 181,225 | |
Professional fees | | | 52,049 | |
Accounting fees (Note 4) | | | 22,510 | |
Trustee fees | | | 28,660 | |
Other expenses | | | 128,105 | |
| | | | |
Total Expenses | | | 7,591,871 | |
Less: | | | | |
Expenses reimbursed by investment advisor (Note 4) | | | (408,873 | ) |
Investment advisory fees waived by investment advisor (Note 4) | | | (72,979 | ) |
| | | | |
Net Expenses | | | 7,110,019 | |
| | | | |
Net Investment Loss | | $ | (1,719,934 | ) |
| | | | |
14 Semi-Annual Report
| | |
| Statement of Operations, Continued | | |
| |
Thornburg International Growth Fund | | Six Months Ended March 31, 2017 (Unaudited) |
| | | | |
REALIZED AND UNREALIZED GAIN (LOSS) | | | | |
Net realized gain (loss) on: | | | | |
Non-affiliated issuer investments (net of realized capital gain taxes paid of $51,236) | | $ | 33,116,243 | |
Forward currency contracts (Note 7) | | | 4,722,770 | |
Foreign currency transactions | | | (847,764 | ) |
| | | | |
| | | 36,991,249 | |
| | | | |
Net change in unrealized appreciation (depreciation) on: | | | | |
Non-affiliated issuer investments (net of change in deferred taxes payable of $1,991,134) | | | 12,031,852 | |
Forward currency contracts (Note 7) | | | 457,837 | |
Foreign currency translations | | | 72 | |
| | | | |
| | | 12,489,761 | |
| | | | |
Net Realized and Unrealized Gain | | | 49,481,010 | |
| | | | |
Net Increase in Net Assets Resulting from Operations | | $ | 47,761,076 | |
| | | | |
See notes to financial statements.
Semi-Annual Report 15
| | |
| Statement of Changes in Net Assets | | |
| |
Thornburg International Growth Fund | | |
| | | | | | | | |
| | | SIX MONTHS ENDED
MARCH 31, 2017* | | | YEAR ENDED
SEPTEMBER 30, 2016 | |
INCREASE (DECREASE) IN NET ASSETS FROM | | | | | | | | |
| | |
OPERATIONS | | | | | | | | |
Net investment income (loss) | | $ | (1,719,934 | ) | | $ | 4,511,895 | |
Net realized gain (loss) from investments, capital gain taxes, forward currency contracts, and foreign currency transactions | | | 36,991,249 | | | | 24,307,955 | |
Net unrealized appreciation (depreciation) on investments, deferred taxes payable, forward currency contracts, and foreign currency translations | | | 12,489,761 | | | | 86,211,614 | |
| | | | | | | | |
Net Increase (Decrease) in Net Assets Resulting from Operations | | | 47,761,076 | | | | 115,031,464 | |
| | |
DIVIDENDS TO SHAREHOLDERS | | | | | | | | |
From net investment income | | | | | | | | |
Class A Shares | | | — | | | | (112,705 | ) |
Class I Shares | | | — | | | | (4,259,877 | ) |
Class R3 Shares | | | — | | | | (5,726 | ) |
Class R4 Shares | | | — | | | | (31,291 | ) |
Class R5 Shares | | | — | | | | (283,521 | ) |
Class R6 Shares | | | — | | | | (28,260 | ) |
| | |
FUND SHARE TRANSACTIONS (NOTE 5) | | | | | | | | |
Class A Shares | | | (67,512,979 | ) | | | (65,549,535 | ) |
Class C Shares | | | (20,402,201 | ) | | | (16,163,708 | ) |
Class I Shares | | | (174,160,296 | ) | | | (128,357,590 | ) |
Class R3 Shares | | | (3,223,198 | ) | | | (3,755,415 | ) |
Class R4 Shares | | | (4,879,973 | ) | | | (146,856 | ) |
Class R5 Shares | | | (24,217,493 | ) | | | (6,042,851 | ) |
Class R6 Shares | | | 21,107,628 | | | | 1,241,489 | |
| | | | | | | | |
Net Decrease in Net Assets | | | (225,527,436 | ) | | | (108,464,382 | ) |
| | |
NET ASSETS | | | | | | | | |
Beginning of Period | | | 1,425,011,597 | | | | 1,533,475,979 | |
| | | | | | | | |
| | |
End of Period | | $ | 1,199,484,161 | | | $ | 1,425,011,597 | |
| | | | | | | | |
Distribution in excess of net investment income | | $ | (2,085,749 | ) | | $ | (365,815 | ) |
See notes to financial statements.
16 Semi-Annual Report
| | |
| Notes to Financial Statements | | |
| |
Thornburg International Growth Fund | | March 31, 2017 |
NOTE 1 – ORGANIZATION
Thornburg International Growth Fund (the “Fund”) is a diversified series of Thornburg Investment Trust (the “Trust”). The Fund commenced operations on February 1, 2007. The Trust was organized as a Massachusetts business trust under a Declaration of Trust dated June 3, 1987 and is registered as a diversified, open-end management investment company under the Investment Company Act of 1940, as amended. The Fund is currently one of twenty-one separate series of the Trust. Each series is considered to be a separate entity for financial reporting and tax purposes and bears expenses directly attributable to it. The Fund seeks long-term capital appreciation by investing in equity securities selected for their growth potential.
The Fund currently offers seven classes of shares of beneficial interest: Class A, Class C, Institutional Class (“Class I”), and Retirement Classes (“Class R3,” “Class R4,” “Class R5,” and “Class R6”). Each class of shares of the Fund represents an interest in the same portfolio of investments, except that (i) Class A shares are sold subject to a front-end sales charge collected at the time the shares are purchased and bear a service fee, (ii) Class C shares are sold at net asset value without a sales charge at the time of purchase, but are subject to a contingent deferred sales charge upon redemption within one year of purchase, and bear both a service fee and a distribution fee, (iii) Class I and Class R5 shares are sold at net asset value without a sales charge at the time of purchase and may be subject to a service fee, (iv) Class R3 shares are sold at net asset value without a sales charge at the time of purchase, but bear both a service fee and distribution fee, (v) Class R4 shares are sold at net asset value without a sales charge at the time of purchase, but bear a service fee, (vi) Class R6 shares are sold at net asset value without a sales charge at the time of purchase, and (vii) the respective classes may have different reinvestment privileges and conversion rights. Additionally, the Fund may allocate among its classes certain expenses, to the extent allocable to specific classes, including transfer agent fees, government registration fees, certain printing and postage costs, and administrative and legal expenses. Currently, class specific expenses of the Fund are limited to service and distribution fees, administration fees, and certain registration and transfer agent expenses.
The following is a summary of significant accounting policies followed by the Fund in the preparation of its financial statements. The Fund prepares its financial statements in conformity with United States generally accepted accounting principles (“GAAP”), including investment company accounting and reporting guidance in the Financial Accounting Standards Board (the “FASB”) Accounting Standard Codification Topic 946.
NOTE 2 – SIGNIFICANT ACCOUNTING POLICIES
Security Valuation: All investments in securities held by the Fund are valued as described in Note 3.
Allocation of Income, Gains, Losses and Expenses: Net investment income (other than class specific expenses) and realized and unrealized gains and losses are allocated daily to each class of shares based upon the relative net asset value of outstanding shares (or the value of the dividend-eligible shares, as appropriate) of each class of shares at the beginning of the day (after adjusting for the current capital shares activity of the respective class). Expenses common to all Funds are allocated among the Funds comprising the Trust based upon their relative net asset values or other appropriate allocation methods. Operating expenses directly attributable to a specific class are charged against the operating income of that class.
Dividends and Distributions to Shareholders: Dividends and distributions to shareholders, which are determined in accordance with federal income tax regulations and may differ from GAAP, are recorded on the ex-dividend date. Ordinary income distributions, if any, are declared and paid quarterly. Capital gain distributions, if any, are declared and paid annually and more often if deemed necessary by the Advisor. Dividends are paid and are reinvested in additional shares of the Fund at net asset value per share at the close of business on the ex-dividend date, or at the shareholder’s option, paid in cash.
Investment Income: Dividend income is recorded on the ex-dividend date. Certain income from foreign investments is recognized as soon as information is available to the Fund. Interest income is accrued as earned. Premiums and discounts are amortized and accreted, respectively, to call dates or maturity dates using the effective yield method of the respective investments. These amounts are included in Interest income on the Statement of Operations.
Custodian Fees: Custodian fees disclosed in the Statement of Operations may include interest expenses incurred by the Fund on any cash overdrafts of its custodian account during the period. Such cash overdrafts may result from the effects of failed trades in portfolio securities and from cash outflows resulting from unanticipated shareholder redemption activity. The Fund pays interest to its custodian on any such cash overdraft at a rate equal to 2.50% of the overdraft amount in excess of $50,000.
Investment Transactions: Investment transactions are accounted for on a trade date basis. Realized gains and losses from the sale of investments are recorded on an identified cost basis.
Repurchase Agreements: The Fund may invest excess cash in repurchase agreements whereby the Fund purchases investments, which serve as collateral, with an agreement to resell such collateral to the seller at an agreed upon price at the maturity date of the repurchase agreement. Investments pledged as collateral for repurchase agreements are held in custody until maturity of the repurchase
Semi-Annual Report 17
| | |
| Notes to Financial Statements, Continued | | |
| |
Thornburg International Growth Fund | | March 31, 2017 (Unaudited) |
agreement. Provisions in the agreements require that the market value of the collateral is at least equal to the repurchase value in the event of default. In the event of default, the Fund has the right to liquidate the collateral and apply the proceeds in satisfaction of the obligation. Under certain circumstances, in the event of default or bankruptcy by the other party to the agreement, realization and/or retention of the collateral may be subject to legal proceedings.
When-Issued and Delayed Delivery Transactions: The Fund may engage in when-issued or delayed delivery transactions. To the extent the Fund engages in such transactions, it will do so for the purpose of acquiring portfolio investments consistent with the Fund’s investment objectives and not for the purpose of investment leverage or to speculate on interest rate or market changes. At the time the Fund makes a commitment to purchase an investment on a when-issued or delayed delivery basis, the Fund will record the transaction and reflect the value in determining its net asset value. When effecting such transactions, assets of an amount sufficient to make payment for the portfolio investments to be purchased will be segregated on the Fund’s records on the trade date. Investments purchased on a when-issued or delayed delivery basis do not earn interest until the settlement date.
Foreign Currency Translation: Portfolio investments and other assets and liabilities denominated in foreign currencies are translated into U.S. dollars based on the exchange rate of such currencies against the U.S. dollar on the date of valuation. Purchases and sales of investments and income items denominated in foreign currencies are translated into U.S. dollars at the exchange rate in effect on the transaction date. When the Fund purchases or sells foreign investments, it will customarily enter into a foreign exchange contract to minimize foreign exchange risk from the trade date to the settlement date of such transactions. The values of such spot contracts are included in receivable for investments sold and payable for investments purchased on the Statement of Assets and Liabilities.
The Fund does not separately report the effect of changes in foreign exchange rates from changes in market prices on investments held. Such changes are included in net unrealized appreciation (depreciation) from investments.
Reported net realized gains and losses from foreign currency transactions arise due to purchases and sales of foreign currencies, currency gains and losses realized between the trade and settlement dates on investment transactions and the difference between the amounts of dividends, interest, and foreign withholding taxes recorded on the Fund’s books, and the U.S. dollar equivalent of the amounts actually received or paid.
Net change in unrealized appreciation (depreciation) on foreign currency translations arise from changes in the fair value of assets and liabilities, other than investments at period end, resulting from changes in exchange rates.
Guarantees and Indemnifications: Under the Trust’s organizational documents (and under separate agreements with the independent Trustees), its officers and Trustees are provided with an indemnification against certain liabilities arising out of the performance of their duties to the Fund. In the normal course of business the Trust may also enter into contracts with service providers that contain general indemnifications. The Trust’s maximum exposure under these arrangements is unknown. However, based on experience, the Trust expects the risk of loss to be remote.
Use of Estimates: The preparation of financial statements in conformity with GAAP requires management to make estimates and assumptions that affect the reported amounts of assets and liabilities and disclosure of contingent assets and liabilities at the date of the financial statements and the reported amounts of increases (decreases) in net assets from operations during the reporting period. Actual results could differ from those estimates.
Federal Income Taxes: It is the policy of the Trust to comply with the provisions of the Internal Revenue Code applicable to regulated investment companies and to distribute to shareholders substantially all investment company taxable income including net realized gains on investments (if any), and tax exempt income of the Fund. Therefore, no provision for federal income or excise tax is required.
The Fund files income tax returns in United States federal and applicable state jurisdictions. The statute of limitations on the Fund’s tax return filings generally remains open for the three years following a returns filing date. The Fund has analyzed its tax positions taken on Federal income tax returns for all open tax years and has concluded that no provision for income tax is required in the financial statements.
At March 31, 2017, information on the tax components of capital was as follows:
| | | | |
Cost of investments for tax purposes | | $ | 1,045,564,696 | |
| | | | |
| |
Gross unrealized appreciation on a tax basis | | $ | 166,852,617 | |
Gross unrealized depreciation on a tax basis | | | (27,931,027 | ) |
| | | | |
| |
Net unrealized appreciation (depreciation) on investments (tax basis) | | $ | 138,921,590 | |
| | | | |
18 Semi-Annual Report
| | |
| Notes to Financial Statements, Continued | | |
| |
Thornburg International Growth Fund | | March 31, 2017 (Unaudited) |
At March 31, 2017, the Fund had deferred tax basis late year specified ordinary losses occurring subsequent to December 31, 2015 through September 30, 2016 of $356,994. For tax purposes, such losses will be recognized in the year ending September 30, 2017.
At March 31, 2017, the Fund had cumulative tax basis capital losses of $8,924,572, (of which $8,924,572 are short-term and $0 are long-term) generated after September 30, 2011, which may be carried forward to offset future capital gains. To the extent such carryforwards are used, capital gain distributions may be reduced to the extent provided by regulations. Such capital loss carryforwards do not expire.
Foreign Withholding Taxes: The Fund is subject to foreign tax withholding imposed by certain foreign countries in which the Fund may invest. Withholding taxes are incurred on certain foreign dividends and are accrued at the time the dividend is recognized based on applicable foreign tax laws. The Fund may file withholding tax reclaims in certain jurisdictions to recover a portion of amounts previously withheld, in view of various considerations, including recent decisions rendered by the courts in those and other jurisdictions. The Fund would expect to record a receivable for such a reclaim based on a variety of factors, including assessment of a jurisdiction’s legal obligation to pay reclaims, the jurisdiction’s administrative practices and payment history, and industry convention. To date the Fund has recorded no such receivable because there is limited precedent for collecting such prior year reclaims and the likelihood of collection remains uncertain.
Deferred Foreign Capital Gain Taxes: The Fund is subject to a tax imposed on net realized gains of securities of certain foreign countries. The Fund records an estimated deferred tax liability for net unrealized gains on these investments as reflected in the accompanying financial statements.
NOTE 3 – SECURITY VALUATION
Valuation of the Fund’s portfolio investment securities is performed in accordance with policies and procedures adopted by and under the oversight of the Trustees.
The Trustees of the Trust have appointed Thornburg Investment Management, Inc., the Trust’s investment advisor (“the Advisor”) to assist the Trustees in obtaining market values for portfolio investments, evaluate and monitor professional pricing service providers appointed by the Trustees’ Audit Committee (the “Audit Committee”) to assist in determining fair values for portfolio investments, assist in calculating fair values for portfolio investments in certain circumstances, and to perform other functions in connection with the valuation of investments. The Advisor acts through its Valuation and Pricing Committee (the “Committee”) and other employees of the Advisor. The Committee regularly reviews its own valuation calculations, as well as the valuations, valuation techniques and services furnished by pricing service providers, considers circumstances which may require valuation calculations by the Committee, and reviews previous valuation calculations. The Committee reports to the Audit Committee on the Committee’s activities, the performance of pricing service providers, and other matters relating to valuation of portfolio investments.
In those instances when the Committee assists in calculating a fair value for a portfolio investment, the Committee seeks to determine the price that the Fund would reasonably expect to receive upon a sale of the investment in an orderly transaction between market participants on the valuation date. The Committee customarily utilizes quotations from securities broker dealers in calculating valuations, but also may utilize prices obtained from pricing service providers or other methods approved by the Audit Committee. Because fair values calculated by the Committee are estimates, the calculation of a value for an investment may differ from the price that would be realized by the Fund upon a sale of the investment, and the difference could be material to the Fund’s financial statements. The Committee’s calculation of a fair value for an investment may also differ from the prices obtained by other persons (including other mutual funds) for the investment.
Valuation of Securities: Securities and other portfolio investments which are listed or traded on a United States securities exchange are valued at the last reported sale price on the valuation date. Investments listed or traded on an exchange for which there has been no sale that day are valued at the mean between the last reported bid and asked prices on that valuation date. Portfolio investments reported by NASDAQ are valued at the official closing price on the valuation date. If an investment is traded on more than one exchange, the investment is considered traded on the exchange that is normally the primary market for that investment. Securities and other portfolio investments which are listed or traded on exchanges outside the United States are valued at the last price or the closing price of the investment on the exchange that is normally the primary market for the investment, as of the close of the exchange preceding the Fund’s valuation date. Foreign investments listed or traded on an exchange for which there has been no sale that day are valued at the mean between the last reported bid and asked prices on that valuation date.
In any case when a market quotation is not readily available for a portfolio investment ordinarily valued by market quotation, the Committee calculates a fair value for the investment using alternative methods approved by the Audit Committee. A market quotation is not readily available when the primary market or exchange for the investment is not open for the entire scheduled day of trading. Market quotations for an investment also may not be readily available if developments after the most recent close of the investment’s primary exchange or market, but prior to the close of business on any Fund business day, or an unusual event or significant period of time occurring since the availability of a market quotation, create a serious question concerning the reliability of the most recent market
Semi-Annual Report 19
| | |
| Notes to Financial Statements, Continued | | |
| |
Thornburg International Growth Fund | | March 31, 2017 (Unaudited) |
quotation available for the investment. In particular, on days when market volatility thresholds established by the Audit Committee are exceeded, foreign equity investments held by the Fund may be valued using alternative methods. The Committee customarily obtains valuations in these instances from pricing service providers approved by the Audit Committee. Pricing service providers ordinarily calculate valuations using multi-factor models to adjust market prices based upon various inputs, including exchange data, depository receipt prices, futures, index data and other data.
Debt obligations held by the Fund which are not listed or traded on exchanges or for which no reported market exists are ordinarily valued at the valuation obtained from a pricing service provider approved by the Audit Committee.
In any case when a pricing service provider fails to provide a valuation for a debt obligation held by the Fund, the Committee calculates a fair value for the obligation using alternative methods under procedures approved by the Audit Committee. Additionally, in cases when management believes that a valuation obtained from a pricing service provider merits review for significant reasons, the Committee decides whether or not to use the valuation calculated by the pricing service provider or to use an alternative method approved by the Audit Committee to calculate a fair value for the obligation.
Quotations for foreign investments expressed in foreign currency amounts are converted to U.S. dollar equivalents using a foreign exchange quotation from a third party service provider at the time of valuation. Foreign investments held by the Fund may be traded on days and at times when the Fund is not open for business. Consequently, the value of Fund investments may be significantly affected on days when shareholders cannot purchase or sell Fund shares. Futures contracts and other financial and derivative instruments traded on an exchange are valued at the latest published price for the instrument on its primary exchange. Listed options are valued at the last bid price.
Valuation Hierarchy: The Fund categorizes its investments based upon the inputs used in valuing those investments, according to a three-level hierarchy established in guidance from the FASB. Categorization of investments using this hierarchy is intended by the FASB to maximize the use of observable inputs in valuing investments and minimize the use of unobservable inputs by requiring that the most observable inputs be used when available. Observable inputs are those that market participants would use in valuing an investment based on available market information. Unobservable inputs are those that reflect assumptions about the information market participants would use in valuing an investment. An investment’s level within the hierarchy is based on the lowest level input that is deemed significant to the valuation. The methodologies and inputs used to value investments are not necessarily indications of the risk or liquidity associated with those investments.
Various inputs are used in calculating valuations for the Fund’s investments. These inputs are generally summarized according to the three-level hierarchy below:
Level 1: Quoted prices in active markets for identical investments.
Level 2: Other direct or indirect significant observable inputs (including quoted prices for similar investments in active markets and other observable inputs, such as interest rates, prepayment rates, credit risk, etc.).
Level 3: Significant unobservable inputs (including the Committee’s own assumptions in calculating the fair values of investments).
Valuations for debt obligations held by the Fund are typically calculated by pricing service providers approved by the Audit Committee and are characterized as Level 2 within the valuation hierarchy.
On days when market volatility thresholds established by the Audit Committee are exceeded, foreign securities for which valuations are obtained from pricing service providers are fair valued. On these days, the foreign securities are characterized as Level 2 within the valuation hierarchy and revert to Level 1 after the threshold is no longer exceeded.
In a limited number of cases the Committee calculates a fair value for investments using broker quotations or other methods approved by the Audit Committee. When the Committee uses a single broker quotation to calculate a fair value for an investment without other significant observable inputs, or if a fair value is calculated using other significant inputs that are considered unobservable, the investment is characterized as Level 3 within the hierarchy. Other significant unobservable inputs used to calculate a fair value in these instances might include an income-based valuation approach which considers discounted anticipated future cash flows from the investment, and application of discounts due to the nature or duration of any restrictions on the disposition of the investment.
Valuations based upon the use of inputs from Levels 1, 2 or 3 may not represent the actual price received upon the disposition of an investment, and the Fund may receive a price that is lower than the valuation based upon these inputs when it sells the investment.
The following table displays a summary of the fair value hierarchy measurements of the Fund’s investments as of March 31, 2017. In any instance when valuation inputs from more than one level are used to determine the fair value of a specific investment, the investment is placed in the level of the table based upon the lowest level input that is significant in determining the fair value of the investment:
20 Semi-Annual Report
| | |
| Notes to Financial Statements, Continued | | |
| |
Thornburg International Growth Fund | | March 31, 2017 (Unaudited) |
| | | | | | | | | | | | | | | | |
| | | FAIR VALUE MEASUREMENTS AT MARCH 31, 2017 | |
| | | TOTAL | | | LEVEL 1 | | | LEVEL 2 | | | LEVEL 3 | |
Assets | | | | | | | | | | | | | | | | |
Investments in Securities* | | | | | | | | | | | | | | | | |
Common Stock | | $ | 1,141,261,440 | | | $ | 1,141,261,440 | | | $ | — | | | $ | — | |
Short Term Investments | | | 43,224,846 | | | | 43,224,846 | | | | — | | | | — | |
| | | | | | | | | | | | | | | | |
Total Investments in Securities | | $ | 1,184,486,286 | | | $ | 1,184,486,286 | | | $ | — | | | $ | — | |
| | | | |
Other Financial Instruments** | | | | | | | | | | | | | | | | |
Forward Currency Contracts | | $ | 8,923 | | | $ | — | | | $ | 8,923 | | | $ | — | |
Spot Currency | | $ | 19,132 | | | $ | 19,132 | | | $ | — | | | $ | — | |
| | | | |
Liabilities | | | | | | | | | | | | | | | | |
Other Financial Instruments** | | | | | | | | | | | | | | | | |
Forward Currency Contracts | | $ | (311,175 | ) | | $ | — | | | $ | (311,175 | ) | | $ | — | |
| * | See Schedule of Investments for a summary of the industry exposure as grouped according to the Global Industry Classification Standard (GICS), which is an industry taxonomy developed by MSCI, Inc. and Standard & Poor’s (S&P). |
| ** | Other Financial Instruments include investments not reflected in the Schedule of Investments, which may include futures, forwards and swap contracts, which are valued at the unrealized appreciation (depreciation) on the investment. |
In accordance with the guidance prescribed in Accounting Standards Update No. 2011-04, it is the policy of the Fund to recognize transfers between levels and the underlying events which caused the movement. The Fund recognized no transfers between levels for the six months ended March 31, 2017, other than when the Fund exceeded market volatility thresholds for foreign equity investments during the period.
NOTE 4 – INVESTMENT ADVISORY FEE AND OTHER TRANSACTIONS WITH AFFILIATES
Pursuant to an investment advisory agreement, the Advisor serves as the investment advisor and performs services for the Fund for which the fees are payable at the end of each month. Under the investment advisory agreement, the Fund pays the Advisor a management fee based on the daily net assets of the Fund at an annual rate as shown in the following table:
Management Fee Schedule
| | | | |
DAILY NET ASSETS | | FEE RATE | |
Up to $ 500 million | | | 0.875 | % |
Next $ 500 million | | | 0.825 | |
Next $ 500 million | | | 0.775 | |
Next $ 500 million | | | 0.725 | |
Over $ 2 billion | | | 0.675 | |
The Fund’s effective management fee for the period ended March 31, 2017 was 0.835% of the Fund’s average net assets (before applicable management fee waiver of $72,979).
The Fund pays to the Advisor the costs of personnel who perform certain accounting services for the Fund. For the six months ended March 31, 2017 the Fund paid $22,510 to the Advisor for these accounting services. The Trust has also entered into administrative service agreements with the Advisor, whereby the Advisor will perform certain administrative services for the shareholders of each class of the Fund’s shares and for which fees will be payable at an annual rate of up to .125 of 1% per annum of the average daily net assets attributable to each class of shares. Total administrative service fees incurred by each class of shares of the Fund for the six months ended March 31, 2017, are set forth in the Statement of Operations.
The Trust has an underwriting agreement with Thornburg Securities Corporation (the “Distributor”), an affiliate of the Advisor, which acts as the distributor of the Fund’s shares. For the six months ended March 31, 2017, the Distributor has advised the Fund that it earned net commissions aggregating $3,011 from the sale of Class A shares, and collected contingent deferred sales charges aggregating $3,453 from redemptions of Class C shares of the Fund.
Pursuant to a service plan under Rule 12b-1 of the Investment Company Act of 1940, the Fund may pay to the Advisor or securities dealers and other financial institutions at the Advisor’s request an amount not to exceed .25 of 1% per annum of the average daily net assets attributable to Class A, Class C, Class R3, and Class R4 shares of the Fund to obtain various shareholder and distribution
Semi-Annual Report 21
| | |
| Notes to Financial Statements, Continued | | |
| |
Thornburg International Growth Fund | | March 31, 2017 (Unaudited) |
related services. For the six months ended March 31, 2017, there were no 12b-1 service plan fees charged for Class I, Class R5 and Class R6 shares. The Advisor may pay out of its own resources additional expenses for distribution of the Fund’s shares and shareholder services.
The Trust has also adopted distribution plans pursuant to Rule 12b-1, applicable only to the Fund’s Class C and Class R3 shares, under which the Fund compensates the Distributor for services in promoting the sale of Class C and Class R3 shares of the Fund at an annual rate of up to .75 of 1% per annum of the average daily net assets attributable to Class C shares, and an annual rate of up to .25 of 1% per annum of the average daily net assets attributable to Class R3 shares. Total fees incurred by each class of shares of the Fund under their respective service and distribution plans for the six months ended March 31, 2017, are set forth in the Statement of Operations.
The Advisor and Distributor have contractually agreed to waive fees and reimburse expenses incurred by the Fund so that actual expenses of certain share classes do not exceed levels as specified in the Fund’s most recent prospectus. The agreement may be terminated by the Fund at any time, but may not be terminated by the Advisor or Distributor before April 10, 2018, unless the Advisor ceases to be the investment advisor to the Fund or the Distributor ceases to be the distributor of the Fund prior to that date. The Advisor and Distributor may recoup amounts waived or reimbursed during the fiscal year if actual expenses fall below the contractual limit during that year.
For the six months ended March 31, 2017, the Advisor voluntarily waived Fund level investment advisory fees of $72,979. The Advisor contractually reimbursed certain class specific expenses, administrative fees, and distribution fees of $16,572 for Class A shares, $200,691 for Class I shares, $33,885 for Class R3 shares, $60,467 for Class R4 shares, $86,297 for Class R5 shares, and $10,961 for Class R6 shares.
Certain officers and Trustees of the Trust are also officers or directors of the Advisor and Distributor. The compensation of independent Trustees is borne by the Trust.
The percentage of direct investments in the Fund held by Trustees and Officers of the Trust and the Advisor is approximately 2.71%.
The Fund may purchase or sell securities from, or to an affiliated fund, provided the affiliation is due solely to having a common investment advisor, common officers, or common trustees, and provided that all such transactions will comply with Rule 17a-7 under the 1940 Act. For the six months ended March 31, 2017, the Fund had transactions no transactions with affiliated funds.
NOTE 5 – SHARES OF BENEFICIAL INTEREST
At March 31, 2017, there were an unlimited number of shares with no par value of beneficial interest authorized. Transactions in shares of beneficial interest were as follows:
| | | | | | | | | | | | | | | | |
| | | SIX MONTHS ENDED
MARCH 31, 2017 (UNAUDITED) | | | YEAR ENDED
SEPTEMBER 30, 2016 (AUDITED) | |
| | | SHARES | | | AMOUNT | | | SHARES | | | AMOUNT | |
Class A Shares | | | | | | | | | | | | | | | | |
Shares sold | | | 462,312 | | | $ | 8,627,183 | | | | 2,522,328 | | | $ | 47,142,292 | |
Shares issued to shareholders in reinvestment of dividends | | | — | | | | — | | | | 5,384 | | | | 103,750 | |
Shares repurchased | | | (4,079,609 | ) | | | (76,140,162 | ) | | | (6,144,717 | ) | | | (112,795,577 | ) |
| | | | | | | | | | | | | | | | |
| | | | |
Net increase (decrease) | | | (3,617,297 | ) | | $ | (67,512,979 | ) | | | (3,617,005 | ) | | $ | (65,549,535 | ) |
| | | | | | | | | | | | | | | | |
Class C Shares | | | | | | | | | | | | | | | | |
Shares sold | | | 112,061 | | | $ | 1,973,750 | | | | 870,906 | | | $ | 15,660,814 | |
Shares issued to shareholders in reinvestment of dividends | | | — | | | | — | | | | — | | | | — | |
Shares repurchased | | | (1,266,711 | ) | | | (22,375,951 | ) | | | (1,821,172 | ) | | | (31,824,522 | ) |
| | | | | | | | | | | | | | | | |
| | | | |
Net increase (decrease) | | | (1,154,650 | ) | | $ | (20,402,201 | ) | | | (950,266 | ) | | $ | (16,163,708 | ) |
| | | | | | | | | | | | | | | | |
Class I Shares | | | | | | | | | | | | | | | | |
Shares sold | | | 6,406,492 | | | $ | 122,925,869 | | | | 18,510,440 | | | $ | 347,208,152 | |
Shares issued to shareholders in reinvestment of dividends | | | — | | | | — | | | | 213,288 | | | | 3,990,511 | |
Shares repurchased | | | (15,557,525 | ) | | | (297,086,165 | ) | | | (25,673,584 | ) | | | (479,556,253 | ) |
| | | | | | | | | | | | | | | | |
| | | | |
Net increase (decrease) | | | (9,151,033 | ) | | $ | (174,160,296 | ) | | | (6,949,856 | ) | | $ | (128,357,590 | ) |
| | | | | | | | | | | | | | | | |
22 Semi-Annual Report
| | |
| Notes to Financial Statements, Continued | | |
| |
Thornburg International Growth Fund | | March 31, 2017 (Unaudited) |
| | | | | | | | | | | | | | | | |
| | | SIX MONTHS ENDED
MARCH 31, 2017 (UNAUDITED) | | | YEAR ENDED
SEPTEMBER 30, 2016 (AUDITED) | |
| | | SHARES | | | AMOUNT | | | SHARES | | | AMOUNT | |
Class R3 Shares | | | | | | | | | | | | | | | | |
Shares sold | | | 58,999 | | | $ | 1,103,621 | | | | 301,326 | | | $ | 5,450,951 | |
Shares issued to shareholders in reinvestment of dividends | | | — | | | | — | | | | 239 | | | | 4,567 | |
Shares repurchased | | | (231,486 | ) | | | (4,326,819 | ) | | | (512,912 | ) | | | (9,210,933 | ) |
| | | | | | | | | | | | | | | | |
| | | | |
Net increase (decrease) | | | (172,487 | ) | | $ | (3,223,198 | ) | | | (211,347 | ) | | $ | (3,755,415 | ) |
| | | | | | | | | | | | | | | | |
Class R4 Shares | | | | | | | | | | | | | | | | |
Shares sold | | | 262,434 | | | $ | 4,888,626 | | | | 603,840 | | | $ | 10,997,045 | |
Shares issued to shareholders in reinvestment of dividends | | | — | | | | — | | | | 1,168 | | | | 22,375 | |
Shares repurchased | | | (528,664 | ) | | | (9,768,599 | ) | | | (610,484 | ) | | | (11,166,276 | ) |
| | | | | | | | | | | | | | | | |
| | | | |
Net increase (decrease) | | | (266,230 | ) | | $ | (4,879,973 | ) | | | (5,476 | ) | | $ | (146,856 | ) |
| | | | | | | | | | | | | | | | |
Class R5 Shares | | | | | | | | | | | | | | | | |
Shares sold | | | 306,629 | | | $ | 5,879,936 | | | | 1,019,836 | | | $ | 19,060,679 | |
Shares issued to shareholders in reinvestment of dividends | | | — | | | | — | | | | 14,800 | | | | 277,832 | |
Shares repurchased | | | (1,560,181 | ) | | | (30,097,429 | ) | | | (1,328,309 | ) | | | (25,381,362 | ) |
| | | | | | | | | | | | | | | | |
| | | | |
Net increase (decrease) | | | (1,253,552 | ) | | $ | (24,217,493 | ) | | | (293,673 | ) | | $ | (6,042,851 | ) |
| | | | | | | | | | | | | | | | |
Class R6 Shares | | | | | | | | | | | | | | | | |
Shares sold | | | 1,213,482 | | | $ | 23,065,285 | | | | 136,593 | | | $ | 2,564,302 | |
Shares issued to shareholders in reinvestment of dividends | | | — | | | | — | | | | 1,501 | | | | 28,260 | |
Shares repurchased | | | (101,593 | ) | | | (1,957,657 | ) | | | (71,190 | ) | | | (1,351,073 | ) |
| | | | | | | | | | | | | | | | |
| | | | |
Net increase (decrease) | | | 1,111,889 | | | $ | 21,107,628 | | | | 66,904 | | | $ | 1,241,489 | |
| | | | | | | | | | | | | | | | |
NOTE 6 – INVESTMENT TRANSACTIONS
For the six months ended March 31, 2017, the Fund had purchase and sale transactions of investments (excluding short-term investments) of $459,748,883 and $643,121,919, respectively.
NOTE 7 – DERIVATIVE FINANCIAL INSTRUMENTS WITH OFF-BALANCE SHEET RISK AND FOREIGN INVESTMENT RISK
The Fund may use a variety of derivative financial instruments to hedge or adjust the risks affecting its investment portfolio or to enhance investment returns. Provisions of the FASB Accounting Standards Codification 815-10-50 (“ASC 815”) require certain disclosures. The disclosures are intended to provide users of financial statements with an understanding of the use of derivative instruments by the Fund and how these derivatives affect the financial position, financial performance and cash flows of the Fund. The Fund does not designate any derivative instruments as hedging instruments under ASC 815. During the six months ended March 31, 2017, the Fund’s principal exposure to derivative financial instruments of the type addressed by ASC 815 was investment in foreign exchange contracts. A foreign exchange contract is an agreement between two parties to exchange different currencies at a specified rate of exchange at an agreed upon future date. Foreign exchange contracts involve risks to the Fund, including the risk that a contract’s counterparty will not meet its obligations to the Fund, the risk that a change in a contract’s value may not correlate perfectly with the currency the contract was intended to track, and the risk that the Fund’s Advisor is unable to correctly implement its strategy in using a contract. In any such instance, the Fund may not achieve the intended benefit of entering into a contract, and may experience a loss.
The Fund entered into forward currency contracts during the six months ended March 31, 2017 in the normal course of pursuing its investment objectives, with the objective of purchasing foreign investments or with the intent of reducing the risk to the value of the Fund’s foreign investments from adverse changes in the relationship between the U.S. dollar and foreign currencies. In each case these contracts have been initiated in conjunction with foreign investment transactions.
Semi-Annual Report 23
| | |
| Notes to Financial Statements, Continued | | |
| |
Thornburg International Growth Fund | | March 31, 2017 (Unaudited) |
These contracts are accounted for by the Fund under ASC 815. Unrealized appreciation and depreciation on outstanding contracts are reported in the Fund’s Statement of Assets and Liabilities, as measured by the difference between the forward exchange rates at the reporting date and the forward exchange rates at each contract’s inception date. Net realized gain (loss) on contracts closed during the period, and changes in net unrealized appreciation (depreciation) on outstanding contracts are recognized in the Fund’s Statement of Operations.
The quarterly average value of open sell currency contracts for the six months ended March 31, 2017 was $65,946,718. Open buy currency contracts are entered into for the purpose of closing open sell currency contracts and the values are dependent upon the values of the open sell currency contracts to which they relate.
The following table displays the outstanding forward currency contracts at March 31, 2017:
| | | | | | | | | | | | | | | | | | | | | | | | |
OUTSTANDING FORWARD CURRENCY CONTRACTS TO BUY OR SELL AT MARCH 31, 2017 | |
| | | | | | |
| CONTRACT DESCRIPTION | | BUY/SELL | | | CONTRACT
AMOUNT | | | CONTRACT
VALUE DATE | | | VALUE
USD | | | UNREALIZED
APPRECIATION | | | UNREALIZED
DEPRECIATION | |
| | | | | | |
Japanese Yen | | | Buy | | | | 957,591,900 | | | | 06/01/2017 | | | | 8,619,571 | | | $ | 8,923 | | | $ | — | |
Japanese Yen | | | Sell | | | | 4,915,014,800 | | | | 06/01/2017 | | | | 44,241,520 | | | | — | | | | (311,175 | ) |
| | | | | | | | | | | | | | | | | | | | | | | | |
| | | | | | |
Total | | | | | | | | | | | | | | | | | | $ | 8,923 | | | $ | (311,175 | ) |
| | | | | | | | | | | | | | | | | | | | | | | | |
| | | | |
Net unrealized appreciation (depreciation) | | | | | | | | | | | | | | | $ | (302,252 | ) |
| | | | | | | | | | | | | | | | | | | | | | | | |
The outstanding forward currency contracts in the foregoing table were entered into with State Street Bank and Trust Company (“SSB”), pursuant to an International Swaps and Derivatives Association (“ISDA”) Master Agreement. In the event of a default or termination under the ISDA Master Agreement with SSB, the non-defaulting party has the right to close out all outstanding forward currency contracts between the parties and to net any payment amounts under those contracts, resulting in a single net amount payable by one party to the other.
Because the ISDA Master Agreement with SSB does not result in an offset of reported amounts of financial assets and liabilities in the Fund’s Statement of Assets and Liabilities unless there has been an event of default or termination event under that agreement, the Fund does not net its outstanding forward currency contracts for purposes of the disclosure in the Fund’s Statement of Assets and Liabilities. Instead the Fund recognizes the unrealized appreciation or depreciation on those forward currency contracts on a gross basis in the Fund’s Statement of Assets and Liabilities.
The unrealized appreciation (depreciation) of the outstanding forward currency contracts recognized in the Fund’s Statement of Assets and Liabilities at March 31, 2017 is disclosed in the following table:
| | | | |
FAIR VALUES OF DERIVATIVE FINANCIAL INSTRUMENTS AT MARCH 31, 2017 |
| | |
| ASSET DERIVATIVES | | BALANCE SHEET LOCATION | | FAIR VALUE |
| | |
Foreign exchange contracts | | Assets - Unrealized appreciation
on forward currency contracts | | $ 8,923 |
| | |
| LIABILITY DERIVATIVES | | BALANCE SHEET LOCATION | | FAIR VALUE |
| | |
Foreign exchange contracts | | Liabilities - Unrealized depreciation
on forward currency contracts | | $ (311,175) |
Because the Fund does not currently receive or post cash collateral in connection with its currency forward contracts, and because all of the Fund’s outstanding currency forward contracts are with SSB, the net amounts of the Fund’s assets and liabilities which are attributable to those contracts at March 31, 2017 can be determined by offsetting the dollar amounts shown in the preceding table. Based on those amounts, the net amount of the Fund’s assets which is attributable to its outstanding forward currency contracts at March 31, 2017 is $0, and the net amount of the Fund’s liabilities which is attributable to those contracts at that date is $302,252. The Fund’s forward currency contracts are valued each day, and the net amounts of the Fund’s assets and liabilities which are attributable to those contracts are expected to vary over time.
24 Semi-Annual Report
| | |
| Notes to Financial Statements, Continued | | |
| |
Thornburg International Growth Fund | | March 31, 2017 (Unaudited) |
The net realized gain (loss) from forward currency contracts and the net change in unrealized appreciation (depreciation) on outstanding forward currency contracts recognized in the Fund’s Statement of Operations for the six months ended March 31, 2017 are disclosed in the following tables:
| | | | |
NET REALIZED GAIN (LOSS) ON DERIVATIVE FINANCIAL INSTRUMENTS RECOGNIZED IN INCOME FOR THE SIX MONTHS ENDED MARCH 31, 2017 |
| | |
| | | TOTAL | | FORWARD CURRENCY CONTRACTS |
| | |
Foreign exchange contracts | | $ 4,722,770 | | $ 4,722,770 |
|
NET CHANGE IN UNREALIZED APPRECIATION (DEPRECIATION) OF DERIVATIVE FINANCIAL INSTRUMENTS RECOGNIZED IN INCOME FOR THE SIX MONTHS ENDED MARCH 31, 2017 |
| | |
| | | TOTAL | | FORWARD CURRENCY CONTRACTS |
| | |
Foreign exchange contracts | | $ 457,837 | | $ 457,837 |
OTHER NOTES
Risks: The Fund’s investments subject it to risks including, but not limited to, management risk, market and economic risk, risks affecting specific issuers, liquidity risk, the risks associated with investments in small-and mid-cap companies and non-U.S. issuers (including developing country issuers), credit risk, and interest rate risk. Please see the Fund’s prospectus for a discussion of the risks associated with an investment in the Fund.
Subsequent Events: Fund management believes no events have occurred between March 31, 2017 and the date of issuance of the financial statements that require adjustment to or disclosure in the accompanying financial statements.
Semi-Annual Report 25
Financial Highlights
Thornburg International Growth Fund
| | | | | | | | | | | | | | | | | | | | | | | | | | | | | | | | | | | | | | | | | | | | | | | | | | | | | | | | | | | | |
| | | PER SHARE PERFORMANCE (FOR A SHARE OUTSTANDING THROUGHOUT THE PERIOD) | | | RATIOS TO AVERAGE NET ASSETS | | | SUPPLEMENTAL DATA | |
UNLESS
OTHERWISE
NOTED,
PERIODS
ARE
FISCAL
YEARS
ENDED
SEPT. 30, | | NET ASSET
VALUE
BEGINNING
OF PERIOD | | | NET
INVESTMENT
INCOME
(LOSS)+ | | | NET
REALIZED
&
UNREALIZED
GAIN (LOSS)
ON
INVESTMENTS | | | TOTAL FROM
INVESTMENT
OPERATIONS | | | DIVIDENDS
FROM NET
INVESTMENT
INCOME | | | DIVIDENDS
FROM NET
REALIZED
GAINS | | | TOTAL
DIVIDENDS | | | NET
ASSET
VALUE
END
OF
PERIOD | | | NET
INVESTMENT
INCOME
(LOSS)
(%) | | | EXPENSES,
AFTER
EXPENSE
REDUCTIONS
(%) | | | EXPENSES,
AFTER
EXPENSE
REDUCTIONS
AND
NET OF
CUSTODY
CREDITS
(%) | | | EXPENSES,
BEFORE
EXPENSE
REDUCTIONS
(%) | | | TOTAL
RETURN
(%)(a) | | | PORTFOLIO
TURNOVER
RATE
(%)(a) | | | NET
ASSETS
AT END
OF
PERIOD
(THOUSANDS) | |
CLASS A SHARES | | | | | | | | | | | | | | | | | | | | | | | | | | | | | | | | | | | | | | | | | | | | | |
2017(b)(c) | | $ | 19.22 | | | | (0.06 | ) | | | 0.97 | | | | 0.91 | | | | — | | | | — | | | | — | | | $ | 20.13 | | | | (0.62 | )(h) | | | 1.42 | (h) | | | 1.42 | (h) | | | 1.46 | (h) | | | 4.73 | | | | 38.51 | | | $ | 104,497 | |
2016(c) | | $ | 17.78 | | | | — | (d) | | | 1.45 | | | | 1.45 | | | | (0.01 | ) | | | — | | | | (0.01 | ) | | $ | 19.22 | | | | 0.03 | | | | 1.39 | | | | 1.39 | | | | 1.39 | | | | 8.23 | | | | 104.60 | | | $ | 169,248 | |
2015(c) | | $ | 19.10 | | | | (0.01 | ) | | | (0.33 | ) | | | (0.34 | ) | | | — | | | | (0.98 | ) | | | (0.98 | ) | | $ | 17.78 | | | | (0.06 | ) | | | 1.42 | | | | 1.42 | | | | 1.42 | | | | (2.01 | ) | | | 92.01 | | | $ | 220,897 | |
2014(c) | | $ | 20.54 | | | | 0.02 | | | | (0.89 | ) | | | (0.87 | ) | | | — | | | | (0.57 | ) | | | (0.57 | ) | | $ | 19.10 | | | | 0.07 | | | | 1.33 | | | | 1.33 | | | | 1.33 | | | | (4.46 | ) | | | 106.18 | | | $ | 508,044 | |
2013(c) | | $ | 15.78 | | | | (0.01 | ) | | | 4.77 | | | | 4.76 | | | | — | | | | — | | | | — | | | $ | 20.54 | | | | (0.06 | ) | | | 1.41 | | | | 1.41 | | | | 1.42 | | | | 30.16 | | | | 89.17 | | | $ | 580,194 | |
2012(c) | | $ | 13.37 | | | | (0.06 | ) | | | 2.47 | | | | 2.41 | | | | — | (e) | | | — | | | | — | | | $ | 15.78 | | | | (0.41 | ) | | | 1.51 | | | | 1.51 | | | | 1.52 | | | | 18.03 | | | | 95.17 | | | $ | 255,725 | |
CLASS C SHARES | | | | | | | | | | | | | | | | | | | | | | | | | | | | | | | | | | | | | | | | | | | | | |
2017(b) | | $ | 18.26 | | | | (0.12 | ) | | | 0.92 | | | | 0.80 | | | | — | | | | — | | | | — | | | $ | 19.06 | | | | (1.32 | )(h) | | | 2.18 | (h) | | | 2.18 | (h) | | | 2.19 | (h) | | | 4.38 | | | | 38.51 | | | $ | 80,948 | |
2016 | | $ | 17.01 | | | | (0.13 | ) | | | 1.38 | | | | 1.25 | | | | — | | | | — | | | | — | | | $ | 18.26 | | | | (0.73 | ) | | | 2.15 | | | | 2.15 | | | | 2.15 | | | | 7.35 | | | | 104.60 | | | $ | 98,633 | |
2015 | | $ | 18.45 | | | | (0.14 | ) | | | (0.32 | ) | | | (0.46 | ) | | | — | | | | (0.98 | ) | | | (0.98 | ) | | $ | 17.01 | | | | (0.77 | ) | | | 2.20 | | | | 2.20 | | | | 2.20 | | | | (2.72 | ) | | | 92.01 | | | $ | 108,062 | |
2014 | | $ | 20.01 | | | | (0.13 | ) | | | (0.86 | ) | | | (0.99 | ) | | | — | | | | (0.57 | ) | | | (0.57 | ) | | $ | 18.45 | | | | (0.65 | ) | | | 2.09 | | | | 2.09 | | | | 2.09 | | | | (5.19 | ) | | | 106.18 | | | $ | 146,399 | |
2013 | | $ | 15.49 | | | | (0.14 | ) | | | 4.66 | | | | 4.52 | | | | — | | | | — | | | | — | | | $ | 20.01 | | | | (0.81 | ) | | | 2.15 | | | | 2.15 | | | | 2.17 | | | | 29.18 | | | | 89.17 | | | $ | 116,453 | |
2012 | | $ | 13.23 | | | | (0.17 | ) | | | 2.43 | | | | 2.26 | | | | — | | | | — | | | | — | | | $ | 15.49 | | | | (1.19 | ) | | | 2.27 | | | | 2.27 | | | | 2.28 | | | | 17.08 | | | | 95.17 | | | $ | 55,656 | |
CLASS I SHARES | | | | | | | | | | | | | | | | | | | | | | | | | | | | | | | | | | | | | | | | | | | | | |
2017(b) | | $ | 19.69 | | | | (0.01 | ) | | | 0.99 | | | | 0.98 | | | | — | | | | — | | | | — | | | $ | 20.67 | | | | (0.12 | )(h) | | | 0.99 | (h) | | | 0.99 | (h) | | | 1.05 | (h) | | | 4.98 | | | | 38.51 | | | $ | 893,300 | |
2016 | | $ | 18.20 | | | | 0.08 | | | | 1.49 | | | | 1.57 | | | | (0.08 | ) | | | — | | | | (0.08 | ) | | $ | 19.69 | | | | 0.45 | | | | 0.99 | | | | 0.99 | | | | 1.00 | | | | 8.63 | | | | 104.60 | | | $ | 1,030,921 | |
2015 | | $ | 19.51 | | | | 0.09 | | | | (0.37 | ) | | | (0.28 | ) | | | (0.05 | ) | | | (0.98 | ) | | | (1.03 | ) | | $ | 18.20 | | | | 0.47 | | | | 0.99 | | | | 0.99 | | | | 1.01 | | | | (1.58 | ) | | | 92.01 | | | $ | 1,079,791 | |
2014 | | $ | 20.96 | | | | 0.10 | | | | (0.91 | ) | | | (0.81 | ) | | | (0.07 | ) | | | (0.57 | ) | | | (0.64 | ) | | $ | 19.51 | | | | 0.47 | | | | 0.98 | | | | 0.98 | | | | 0.98 | | | | (4.09 | ) | | | 106.18 | | | $ | 1,171,032 | |
2013 | | $ | 16.04 | | | | 0.07 | | | | 4.85 | | | | 4.92 | | | | — | | | | — | | | | — | | | $ | 20.96 | | | | 0.38 | | | | 0.99 | | | | 0.99 | | | | 1.04 | | | | 30.67 | | | | 89.17 | | | $ | 737,536 | |
2012 | | $ | 13.55 | | | | 0.02 | | | | 2.50 | | | | 2.52 | | | | (0.03 | ) | | | — | | | | (0.03 | ) | | $ | 16.04 | | | | 0.10 | | | | 0.99 | | | | 0.99 | | | | 1.14 | | | | 18.60 | | | | 95.17 | | | $ | 198,938 | |
CLASS R3 SHARES | | | | | | | | | | | | | | | | | | | | | | | | | | | | | | | | | | | | | | | | | | | | | |
2017(b) | | $ | 19.07 | | | | (0.06 | ) | | | 0.96 | | | | 0.90 | | | | — | | | | — | | | | — | | | $ | 19.97 | | | | (0.64 | )(h) | | | 1.50 | (h) | | | 1.50 | (h) | | | 2.16 | (h) | | | 4.72 | | | | 38.51 | | | $ | 10,260 | |
2016 | | $ | 17.66 | | | | — | (d) | | | 1.42 | | | | 1.42 | | | | (0.01 | ) | | | — | | | | (0.01 | ) | | $ | 19.07 | | | | (0.02 | ) | | | 1.50 | | | | 1.50 | | | | 2.04 | | | | 8.03 | | | | 104.60 | | | $ | 13,086 | |
2015 | | $ | 18.99 | | | | (0.02 | ) | | | (0.33 | ) | | | (0.35 | ) | | | — | | | | (0.98 | ) | | | (0.98 | ) | | $ | 17.66 | | | | (0.13 | ) | | | 1.50 | | | | 1.50 | | | | 1.98 | | | | (2.03 | ) | | | 92.01 | | | $ | 15,851 | |
2014 | | $ | 20.46 | | | | — | (d) | | | (0.90 | ) | | | (0.90 | ) | | | — | | | | (0.57 | ) | | | (0.57 | ) | | $ | 18.99 | | | | — | (f) | | | 1.50 | | | | 1.50 | | | | 1.86 | | | | (4.63 | ) | | | 106.18 | | | $ | 22,739 | |
2013 | | $ | 15.73 | | | | (0.03 | ) | | | 4.76 | | | | 4.73 | | | | — | | | | — | | | | — | | | $ | 20.46 | | | | (0.15 | ) | | | 1.50 | | | | 1.50 | | | | 2.01 | | | | 30.07 | | | | 89.17 | | | $ | 13,982 | |
2012 | | $ | 13.34 | | | | (0.06 | ) | | | 2.45 | | | | 2.39 | | | | — | (e) | | | — | | | | — | | | $ | 15.73 | | | | (0.40 | ) | | | 1.50 | | | | 1.50 | | | | 2.49 | | | | 17.94 | | | | 95.17 | | | $ | 5,709 | |
CLASS R4 SHARES | | | | | | | | | | | | | | | | | | | | | | | | | | | | | | | | | | | | | | | | | | | | | |
2017(b) | | $ | 19.11 | | | | (0.05 | ) | | | 0.96 | | | | 0.91 | | | | — | | | | — | | | | — | | | $ | 20.02 | | | | (0.53 | )(h) | | | 1.40 | (h) | | | 1.40 | (h) | | | 1.73 | (h) | | | 4.76 | | | | 38.51 | | | $ | 37,629 | |
2016 | | $ | 17.68 | | | | 0.01 | | | | 1.43 | | | | 1.44 | | | | (0.01 | ) | | | — | | | | (0.01 | ) | | $ | 19.11 | | | | 0.04 | | | | 1.40 | | | | 1.40 | | | | 1.68 | | | | 8.17 | | | | 104.60 | | | $ | 40,999 | |
2015 | | $ | 19.00 | | | | 0.02 | | | | (0.36 | ) | | | (0.34 | ) | | | — | | | | (0.98 | ) | | | (0.98 | ) | | $ | 17.68 | | | | 0.10 | | | | 1.40 | | | | 1.40 | | | | 1.65 | | | | (1.97 | ) | | | 92.01 | | | $ | 38,038 | |
2014 | | $ | 20.45 | | | | 0.01 | | | | (0.89 | ) | | | (0.88 | ) | | | — | | | | (0.57 | ) | | | (0.57 | ) | | $ | 19.00 | | | | 0.04 | | | | 1.39 | | | | 1.39 | | | | 1.63 | | | | (4.53 | ) | | | 106.18 | | | $ | 38,575 | |
2013 | | $ | 15.70 | | | | (0.01 | ) | | | 4.76 | | | | 4.75 | | | | — | | | | — | | | | — | | | $ | 20.45 | | | | (0.04 | ) | | | 1.38 | | | | 1.38 | | | | 1.68 | | | | 30.25 | | | | 89.17 | | | $ | 26,441 | |
2012 | | $ | 13.31 | | | | (0.04 | ) | | | 2.46 | | | | 2.42 | | | | (0.03 | ) | | | — | | | | (0.03 | ) | | $ | 15.70 | | | | (0.29 | ) | | | 1.40 | | | | 1.40 | | | | 2.23 | | | | 18.17 | | | | 95.17 | | | $ | 9,326 | |
CLASS R5 SHARES | | | | | | | | | | | | | | | | | | | | | | | | | | | | | | | | | | | | | | | | | | | | | |
2017(b) | | $ | 19.73 | | | | (0.02 | ) | | | 1.01 | | | | 0.99 | | | | — | | | | — | | | | — | | | $ | 20.72 | | | | (0.19 | )(h) | | | 0.99 | (h) | | | 0.99 | (h) | | | 1.32 | (h) | | | 5.02 | | | | 38.51 | | | $ | 43,606 | |
2016 | | $ | 18.25 | | | | 0.09 | | | | 1.47 | | | | 1.56 | | | | (0.08 | ) | | | — | | | | (0.08 | ) | | $ | 19.73 | | | | 0.45 | | | | 0.99 | | | | 0.99 | | | | 1.21 | | | | 8.56 | | | | 104.60 | | | $ | 66,271 | |
2015 | | $ | 19.55 | | | | 0.09 | | | | (0.36 | ) | | | (0.27 | ) | | | (0.05 | ) | | | (0.98 | ) | | | (1.03 | ) | | $ | 18.25 | | | | 0.46 | | | | 0.99 | | | | 0.99 | | | | 1.20 | | | | (1.53 | ) | | | 92.01 | | | $ | 66,646 | |
2014 | | $ | 21.01 | | | | 0.10 | | | | (0.93 | ) | | | (0.83 | ) | | | (0.06 | ) | | | (0.57 | ) | | | (0.63 | ) | | $ | 19.55 | | | | 0.46 | | | | 0.99 | | | | 0.99 | | | | 1.18 | | | | (4.15 | ) | | | 106.18 | | | $ | 69,217 | |
2013 | | $ | 16.07 | | | | 0.07 | | | | 4.87 | | | | 4.94 | | | | — | | | | — | | | | — | | | $ | 21.01 | | | | 0.35 | | | | 0.99 | | | | 0.99 | | | | 1.22 | | | | 30.74 | | | | 89.17 | | | $ | 43,209 | |
2012 | | $ | 13.58 | | | | 0.02 | | | | 2.50 | | | | 2.52 | | | | (0.03 | ) | | | — | | | | (0.03 | ) | | $ | 16.07 | | | | 0.13 | | | | 0.99 | | | | 0.99 | | | | 1.29 | | | | 18.56 | | | | 95.17 | | | $ | 19,251 | |
CLASS R6 SHARES | | | | | | | | | | | | | | | | | | | | | | | | | | | | | | | | | | | | | | | | | | | | | |
2017(b) | | $ | 19.77 | | | | 0.01 | | | | 0.99 | | | | 1.00 | | | | — | | | | — | | | | — | | | $ | 20.77 | | | | 0.11 | (h) | | | 0.89 | (h) | | | 0.89 | (h) | | | 1.00 | (h) | | | 5.06 | | | | 38.51 | | | $ | 29,244 | |
2016 | | $ | 18.29 | | | | 0.11 | | | | 1.47 | | | | 1.58 | | | | (0.10 | ) | | | — | | | | (0.10 | ) | | $ | 19.77 | | | | 0.60 | | | | 0.89 | | | | 0.89 | | | | 1.34 | | | | 8.65 | | | | 104.60 | | | $ | 5,854 | |
2015 | | $ | 19.59 | | | | 0.13 | | | | (0.38 | ) | | | (0.25 | ) | | | (0.07 | ) | | | (0.98 | ) | | | (1.05 | ) | | $ | 18.29 | | | | 0.66 | | | | 0.89 | | | | 0.89 | | | | 1.43 | | | | (1.43 | ) | | | 92.01 | | | $ | 4,191 | |
2014 | | $ | 21.05 | | | | 0.12 | | | | (0.93 | ) | | | (0.81 | ) | | | (0.08 | ) | | | (0.57 | ) | | | (0.65 | ) | | $ | 19.59 | | | | 0.58 | | | | 0.89 | | | | 0.89 | | | | 1.34 | | | | (4.05 | ) | | | 106.18 | | | $ | 3,950 | |
2013(g) | | $ | 17.54 | | | | 0.46 | | | | 3.05 | | | | 3.51 | | | | — | | | | — | | | | — | | | $ | 21.05 | | | | 2.21 | (h) | | | 0.89 | (h) | | | 0.89 | (h) | | | 11.83 | (h)(i) | | | 20.01 | | | | 89.17 | | | $ | 2,553 | |
| (a) | Not annualized for periods less than one year. |
| (b) | Unaudited Six Month Period Ended March 31. |
| (c) | Sales loads are not reflected in computing total return. |
| (d) | Net investment income (loss) was less than $0.01 per share. |
| (e) | Dividends from net investment income per share were less than $(0.01). |
| (f) | Net investment income (Loss) is less than 0.01%. |
| (g) | Effective date of this class of shares was February 1, 2013. |
| (i) | Due to the size of net assets and fixed expenses, ratios may appear disproportionate. |
| + | Based on weighted average shares outstanding. |
See notes to financial statements.
| | | | |
| 26 Semi-Annual Report | | | | Semi-Annual Report 27 |
| | |
| Expense Example | | |
| |
Thornburg International Growth Fund | | March 31, 2017 (Unaudited) |
As a shareholder of the Fund, you incur two types of costs:
| | (1) | transaction costs, including |
(a) sales charges (loads) on purchase payments, for Class A shares;
(b) a deferred sales charge on redemptions of any part or all of a purchase of $1 million of Class A shares within 12 months of purchase;
(c) a deferred sales charge on redemptions of Class C shares within 12 months of purchase;
| | (2) | ongoing costs, including management fees; distribution and/or service (12b-1) fees; and other Fund expenses. |
This example is intended to help you understand your ongoing costs (in dollars) of investing in the Fund and to compare these costs with the ongoing costs of investing in other mutual funds.
The example is based on a $1,000 investment beginning on October 1, 2016, and held until March 31, 2017.
| | | | | | | | | | | | |
| | | BEGINNING
ACCOUNT VALUE
10/1/16 | | | ENDING
ACCOUNT VALUE
3/31/17 | | | EXPENSES PAID
DURING PERIOD†
10/1/16–3/31/17 | |
CLASS A SHARES | | | | | | | | | | | | |
Actual | | $ | 1,000.00 | | | $ | 1,047.35 | | | $ | 7.27 | |
Hypothetical* | | $ | 1,000.00 | | | $ | 1,017.83 | | | $ | 7.16 | |
CLASS C SHARES | | | | | | | | | | | | |
Actual | | $ | 1,000.00 | | | $ | 1,043.81 | | | $ | 11.08 | |
Hypothetical* | | $ | 1,000.00 | | | $ | 1,014.09 | | | $ | 10.92 | |
CLASS I SHARES | | | | | | | | | | | | |
Actual | | $ | 1,000.00 | | | $ | 1,049.77 | | | $ | 5.06 | |
Hypothetical* | | $ | 1,000.00 | | | $ | 1,020.00 | | | $ | 4.98 | |
CLASS R3 SHARES | | | | | | | | | | | | |
Actual | | $ | 1,000.00 | | | $ | 1,047.19 | | | $ | 7.66 | |
Hypothetical* | | $ | 1,000.00 | | | $ | 1,017.45 | | | $ | 7.55 | |
CLASS R4 SHARES | | | | | | | | | | | | |
Actual | | $ | 1,000.00 | | | $ | 1,047.62 | | | $ | 7.14 | |
Hypothetical* | | $ | 1,000.00 | | | $ | 1,017.95 | | | $ | 7.04 | |
CLASS R5 SHARES | | | | | | | | | | | | |
Actual | | $ | 1,000.00 | | | $ | 1,050.18 | | | $ | 5.06 | |
Hypothetical* | | $ | 1,000.00 | | | $ | 1,020.00 | | | $ | 4.98 | |
CLASS R6 SHARES | | | | | | | | | | | | |
Actual | | $ | 1,000.00 | | | $ | 1,050.58 | | | $ | 4.55 | |
Hypothetical* | | $ | 1,000.00 | | | $ | 1,020.50 | | | $ | 4.48 | |
| † | Expenses are equal to the annualized expense ratio for each class (A: 1.42%; C: 2.18%; I: 0.99%; R3: 1.50%; R4: 1.40%; R5: 0.99%; R6: 0.89%) multiplied by the average account value over the period, multiplied by 182/365 to reflect the one-half year period. |
| * | Hypothetical assumes a rate of return of 5% per year before expenses. |
ACTUAL EXPENSES
For each class of shares, the first line of the accompanying table provides information about actual account values and actual expenses. You may use the information in this line, together with the amount you invested, to estimate the expenses that you paid over the period. Simply divide your account value by $1,000 (for example, an $8,600 account value divided by $1,000 = 8 .6), then multiply the result by the number in the first line for your class of shares under the heading entitled “Expenses Paid During Period” to estimate the expenses you paid on your account during this period.
HYPOTHETICAL EXAMPLE FOR COMPARISON PURPOSES
For each class of shares, the second line of the accompanying table provides information about hypothetical account values and hypothetical expenses based on the Fund’s actual expense ratio and an assumed rate of return of 5% per year before expenses, which is not the Fund’s actual return. The hypothetical account values and expenses may not be used to estimate the actual ending account balance or expenses you paid for the period. You may use this information to compare the ongoing costs of investing in the Fund and other funds. To do so, compare this 5% hypothetical example with the 5% hypothetical examples that appear in the shareholder reports of the other funds.
Please note that the expenses shown in the table are meant to highlight your ongoing costs only and do not reflect any transactional costs, such as sales charges (loads), redemption fees, or exchange fees. Therefore, the second line of the table for each class of shares is useful in comparing ongoing costs only, and will not help you determine the relative total costs of owning different funds. In addition, if these transactional costs were included, your costs would have been higher.
28 Semi Annual Report
| | |
| Other Information | | |
| |
Thornburg International Growth Fund | | March 31, 2017 (Unaudited) |
PORTFOLIO PROXY VOTING
Policies and Procedures:
The Trust has delegated to Thornburg Investment Management, Inc. (the “Advisor”) voting decisions respecting proxies for the Fund’s voting securities. The Advisor makes voting decisions in accordance with its Proxy Voting Policy and Procedures. A description of the Policy and Procedures is available (i) without charge, upon request, by calling the Advisor toll-free at 1-800-847-0200, (ii) on the Thornburg website at www.thornburg.com, and (iii) on the Securities and Exchange Commission’s website at www.sec.gov.
Information regarding how proxies were voted is available on or before August 31 of each year for the twelve months ending the preceding June 30. This information is available (i) without charge, upon request by calling the Advisor toll-free at 1-800-847-0200, (ii) on the Thornburg website at www.thornburg.com, and (iii) on the Securities and Exchange Commission’s website at www.sec.gov.
AVAILABILITY OF QUARTERLY PORTFOLIO SCHEDULE
The Fund files with the Securities and Exchange Commission schedules of its portfolio holdings on Form N-Q for the first and third quarters of each fiscal year. The Fund’s Forms N-Q are available on the Commission’s website at www.sec.gov, or may be reviewed and copied at the Commission’s Public Reference Room in Washington, D.C. Information on the operation of the Public Reference Room may be obtained by calling 1-800-SEC-0330. The Fund also makes this information available on its website at www.thornburg. com/download or upon request by calling 1-800-847-0200.
Semi-Annual Report 29
Trustees’ Statement to Shareholders
Readopted September 12, 2016
The Trustees believe current and prospective shareholders should know how we discharge our responsibilities in supervising the Funds’ investment advisor and in reviewing the advisor’s contract for renewal. Since 2005, we have issued a statement which sets out clearly the three principal guidelines that we follow in supervising the Trust’s investment advisor on your behalf. In accordance with our customary practice, in September of this year we again reviewed our statement and concluded we should reissue this statement outlining the principal features of our supervision of the advisor’s performance of investment management services for the Funds.
We begin with the premise that each shareholder selected his or her Fund because its investments are managed by the investment advisor identified in the prospectus and in accordance with the objective and policies described in the prospectus. We realize, as each of you do, that if you believe that your Fund’s stated objective and policies no longer serve your personal investment goals, you can sell your shares and leave the Fund.
Therefore, we believe that our primary supervisory task – our principal obligation to you – is to assess the nature and quality of the advisor’s services, and to confirm that the advisor actively and competently pursues the Fund’s objective, in accordance with the policies set out in the prospectus. To do this, we meet regularly with management to review your Fund’s portfolio and to discuss the advisor’s specific actions and judgments in pursuing the Fund’s objective. We do not substitute our own judgment for the advisor’s decisions in selecting investments; the advisor is paid to exercise its informed judgment on investment decisions, and we seek to confirm, in reviewing the advisor’s performance, that the advisor is doing just that.
Second, we are conscious of costs and the effect that costs have on shareholders’ returns. We try to make sure that your Fund’s fees and costs are reasonable in relationship to the services rendered and that they are generally in line with those charged by other expert investment advisors, consistent with our belief that the Fund’s investors searched for and expect that expertise and attention and have decided to pay a reasonable price for it. We do not put the management contract “out to bid” as a matter of course, and we would not do so unless we had concluded that the advisor materially had failed to pursue the Fund’s objectives in accordance with its policies, or for other equally important reasons. We believe that any other approach would be inconsistent with your interests and contrary to your expectations when you bought shares of the Fund in the first place.
Finally, because we believe that most Thornburg Fund shareholders have invested with a long-term perspective, we try not to focus too much on the fashions of the moment and on short-term performance. The market will not favor any specific investment objective or set of policies at all times and under all economic circumstances. A fund will experience periods of both high and low returns relative to other funds and other investments. Even if one of our Funds is not favored by the market at a particular time, we believe that the advisor is nonetheless obliged to remain true to the Fund’s objective and policies, and we watch to see that it does so.
Trustees of Thornburg Investment Trust
30 Semi-Annual Report
Thornburg Funds
Thornburg Investment Management is a privately-owned global investment firm that offers a range of solutions for retail and institutional investors. Founded in 1982 and headquartered in Santa Fe, New Mexico, we manage approximately $49 billion (as of March 31, 2017) across U.S. mutual funds, separate accounts for high-net-worth investors and institutional accounts, and UCITS funds for non-U.S. investors.
The fund outlined in this report is one of many equity and fixed-income products available from Thornburg Investment Management.
EQUITY FUNDS
| | • | | Thornburg Investment Income Builder Fund |
| | • | | Thornburg Global Opportunities Fund |
| | • | | Thornburg International Value Fund |
| | • | | Thornburg Better World International Fund |
| | • | | Thornburg International Growth Fund |
| | • | | Thornburg Developing World Fund |
| | • | | Thornburg Core Growth Fund |
FIXED INCOME FUNDS
| | • | | Thornburg Low Duration Income Fund |
| | • | | Thornburg Limited Term U.S. Government Fund |
| | • | | Thornburg Limited Term Income Fund |
| | • | | Thornburg Strategic Income Fund |
| | • | | Thornburg Low Duration Municipal Fund |
| | • | | Thornburg Limited Term Municipal Fund |
| | • | | Thornburg Intermediate Municipal Fund |
| | • | | Thornburg California Limited Term Municipal Fund |
| | • | | Thornburg New Mexico Intermediate Municipal Fund |
| | • | | Thornburg New York Intermediate Municipal Fund |
| | • | | Thornburg Strategic Municipal Income Fund |
ALTERNATIVE FUNDS
| | • | | Thornburg Long/Short Equity Fund |
Before investing, carefully consider the Fund’s investment goals, risks, charges, and expenses. For a prospectus or summary prospectus containing this and other information, contact your financial advisor or visit thornburg.com. Read it carefully before investing.
For additional information, please visit thornburg.com
Thornburg Investment Management, Inc. 2300 North Ridgetop Road, Santa Fe, NM 87506
Semi-Annual Report 31
This Semi-Annual Report is submitted for the general information of shareholders of the Fund. It is not authorized for distribution to prospective investors in the Fund unless preceded or accompanied by an effective prospectus.
| | | | |
| Investment Advisor: | | Distributor: | | |
| Thornburg Investment Management® | | Thornburg Securities Corporation® | | |
| 800.847.0200 | | 800.847.0200 | | TH1409 |

2 Semi-Annual Report
Semi-Annual Report
Thornburg Investment Income Builder Fund
March 31, 2017
| | | | |
SHARE CLASS | | NASDAQ SYMBOL | | CUSIP |
Class A | | TIBAX | | 885-215-558 |
Class C | | TIBCX | | 885-215-541 |
Class I | | TIBIX | | 885-215-467 |
Class R3 | | TIBRX | | 885-215-384 |
Class R4 | | TIBGX | | 885-215-186 |
Class R5 | | TIBMX | | 885-215-236 |
Class I, R3, R4, and R5 shares may not be available to all investors. Minimum investments for Class I shares may be higher than those for other classes.
Investments carry risks, including possible loss of principal. Additional risks may be associated with investments outside the United States, especially in emerging markets, including currency fluctuations, illiquidity, volatility, and political and economic risks. Investments in small- and mid-capitalization companies may increase the risk of greater price fluctuations. Portfolios investing in bonds have the same interest rate, inflation, and credit risks that are associated with the underlying bonds. The value of bonds will fluctuate relative to changes in interest rates, decreasing when interest rates rise. Please see the Fund’s prospectus for a discussion of the risks associated with an investment in the Fund. Investments in the Fund are not FDIC insured, nor are they deposits of or guaranteed by a bank or any other entity.
Semi-Annual Report 3
| | |
| Letter to Shareholders | | |
| |
Thornburg Investment Income Builder Fund | | March 31, 2017 (Unaudited) |
April 28, 2017
Dear Fellow Shareholder:
This letter will highlight the basic results of your Fund’s investment activities for the six-month period ended March 31, 2017. Your Fund’s fiscal year ends on September 30. In addition, we will comment on the overall investment landscape, which continues to evolve.
Thornburg Investment Income Builder Fund paid dividends of $0.385 per Class A share in the six months ended March 31, 2017, down from the $0.423 per share paid in the comparable prior-year period. The dividends per share were higher for Class I and Class R5 shares, and lower on the Class C, R3, and R4 shares, to account for varying class-specific expenses. The net asset value per Class A share increased by $0.70 per share during the six-month period, from $19.82 to $20.52, giving a total return including dividends of 5.52% without sales charge.
For the six-month period ended March 31, 2017, Thornburg Investment Income Builder Fund (total return of 5.52%) slightly trailed the 5.65% return of blended index of 75% MSCI World Index/25% Bloomberg Barclays U.S. Aggregate Bond Index. The Fund’s total return for the 12-month period ended March 31, 2017, 11.85%, exceeded the blended index return of 11.06%. Performance relative to indices for all share classes over various periods is set forth on page 10.
The quarter ended March 31, 2017 was the 57th full calendar quarter since the inception of Thornburg Investment Income Builder in December 2002. In 42 of these quarters, including each of the last six quarters, the Fund delivered a positive total return. The Fund has delivered positive total returns in 12 of its 14 calendar years of existence. As of March 31, 2017, Thornburg Investment Income Builder has delivered tax-efficient average annual total returns in excess of 9.5% since its inception.
We do not expect to pay any capital gain dividend for 2017. At March 31, 2017 the Fund had realized capital losses of more than $600 million, which may be carried forward to offset future capital gains to the extent permitted by regulations.
In assessing the overall performance of Thornburg Investment Income Builder for the period under review, it is instructive to consider the performance in U.S. dollars of the sector components of the MSCI World Index over the six-months ended March 31, 2017. The MSCI World Index comprises 75%, and the entire equity portion, of the Fund’s global performance benchmark (75% MSCI World Index and 25% Bloomberg Barclays U.S. Aggregate Bond Index):
| | 1. | The MSCI World Index showed a return of 8.35% for the six-months ended March 31, 2017. Nine of eleven index sectors showed positive total returns, with individual sector returns ranging from 20% (financials) to negative 2% (real estate). Stocks of firms in the information technology, materials, consumer discretionary, and industrials sectors joined financial sector stocks in outperforming the index. Stocks in the energy, utilities, health care, consumer staples, and telecommunications sectors joined real estate stocks in underperforming the index. |
Performance data shown represents past performance and is no guarantee of future results. Investment return and principal value will fluctuate so shares, when redeemed, may be worth more or less than their original cost. Current performance may be lower or higher than quoted. For performance current to the most recent month end, visit thornburg.com or call 800.847.0200.
The maximum sales charge for Class A shares is 4.50%. The total annual fund operating expense of Class A shares is 1.39%, as disclosed in the most recent prospectus.
| | 2. | Income Builder Fund investments in firms in the financials (27% average equity weighting), telecommunications (20% average equity weighting), industrials (9% average equity weighting), energy (9% average equity weighting), health care (7% average equity weighting), consumer discretionary (7% average equity weighting), and consumer staples (7% average equity weighting) sectors comprised the largest sector weightings in the Fund’s equity portfolio during the period under review. The Fund’s performance relative to the MSCI World Index was hurt by comparative underperformance from our holdings in the telecommunications and information technology sectors, and was helped by our overweight in the financials sector. |
| | 3. | In the Income Builder portfolio, 39 equity investments contributed positive returns of at least 0.05% (five basis points) to the portfolio during the six-month period, considering both portfolio weights and individual security returns. Eleven of the Fund’s equity investments contributed negative returns of 0.05% or worse for the period. |
Investment Income Builder’s bond holdings delivered modestly positive returns during the semi-annual period, with accrued interest overcoming mixed returns from bond price changes.
Your Fund’s average return of 19% from its investments in the financial sector was largely in line with the performance of the equities in the financial sector of the MSCI World Index for the period. Fund investments in JPMorgan Chase, CME Group, DBS Group (Singapore), ING Groep, Ares Capital, UBS Group, MFA Financial, Two Harbors Investment, Blackstone Group, and Chimera Investment Corporation were among the strongest performers in the portfolio. There were no significant detractors from portfolio performance among our financial sector holdings in the semi-annual period.
Your Fund’s significant holdings in the telecommunications sector delivered disappointing returns, and were the largest detractors from relative performance vis-á-vis the MSCI World Index.
4 Semi-Annual Report
| | |
| Letter to Shareholders, | | |
| |
Continued | | |
| |
Thornburg Investment Income Builder Fund | | March 31, 2017 (Unaudited) |
England’s BT Group, China Mobile, Vodafone, Netherlands’ Royal KPN, and Singapore Telecommunications each delivered negative returns. Competitive conditions are intensifying around the world as usage of telecommunications networks becomes ever more woven into everyday life. Communications network operators compete for market share with varying degrees of governmental oversight influencing the competitive landscapes. While each of these firms has its own business outlook, most of our telecommunications holdings delivered reasonable (if unexciting) commercial performance during the period under review. Investors generally sold telecommunications stocks to fund investments in more cyclical sectors during the December 2016 quarter. Each of these firms pays interesting dividends to shareholders.
Your Fund’s investments in the industrials sector delivered positive performance, with Italian toll road and airport operator Atlantia and Chinese conglomerates Hopewell Holdings, China Merchants Port Holdings, and NWS Holdings leading the way. There were no significant detractors from portfolio performance among our industrial sector holdings in the semi-annual period.
Among Income Builder’s investments in the energy sector, Royal Dutch Shell, Canadian producer Suncor, Italian producer ENI and pipeline operator ONEOK each made significant contributions to portfolio performance during the semi-annual period. Energy stocks were very strong performers in the December quarter, and relatively weak performers in the March quarter. The price of oil mostly fluctuated in a narrow range just above $50/ barrel, while natural gas prices traded around $3.20/MMbtu. Global demand for oil and gas continues to increase. The near-term direction for oil and gas prices, and for the energy investments in your Fund’s portfolio, will depend upon the outlook for suppliers to meet growing global demand for hydrocarbons at today’s prices. For now, the energy industry appears to be capable of obtaining sufficient capital to sustain production in line with growing global consumption at today’s prices.
The performance of Investment Income Builder’s holdings in the health care sector was modestly positive during the semi-annual period, thanks to price recoveries in the March quarter that offset price declines during the December quarter. Roche Holding was the strongest performer among these, followed by Merck & Co. Each of these is establishing leading positions in “immuno-therapies” that channel the body’s own defenses to fight disease, especially cancers. Political rhetoric turned strongly against for-profit health care firms two years ago, acting as a governor on pricing flexibility by these firms. From here, it appears that solid scientific advancement will be the most important contributor to share price performance. Your Fund’s portfolio holdings generate sufficient cash flow to fund both world-class research programs and interesting dividends, and we are monitoring their scientific progress.
Among Fund investments in the consumer staples sector, Walgreens Boots Alliance and CVS Health were positive contributors during the semi-annual period, while Netherlands-based grocer Royal Ahold Delhaize and Korea’s KT&G Corporation were negative contributors. Investors sold consumer staples stocks during the period under review in order to fund purchases of stocks in more cyclical sectors. KT&G Corporation faced company specific concerns in late 2016 regarding the future competitive landscape for smokeless tobacco products in Korea, though it has continued to deliver satisfactory commercial performance in Korea and abroad.
Your Fund’s investments in the consumer discretionary sector, though positive contributors, trailed the performance of this sector in the index portfolio for the semi-annual period. Home Depot and vehicle manufacturer Daimler AG were positive contributors to portfolio performance, while department store operator Target was a detractor.
Among other portfolio holdings, notable positive contributors to performance included chemicals manufacturer LyondellBasell Industries, Taiwan Semiconductor Manufacturing, Lamar Advertising, and French construction/telecom conglomerate Bouygues. Negative contributors included European utilities Electricite de France and National Grid, and U.S. semiconductor maker Qualcomm.
Most foreign currencies depreciated slightly vis-à-vis the U.S. dollar during the semi-annual period, declining sharply in November and December of 2016 before recovering much of the declines in the early months of 2017. We hedged a majority of the currency exposure to Chinese yuan, the euro and other European currencies tied to the euro. We are more focused on risk management than on reaping possible currency gains from exposure to assets denominated in these currencies. Currency hedges modestly contributed to our performance relative to the MSCI World Index during the period.
Within its bond portfolio, Investment Income Builder owned significantly fewer U.S. government and agency bonds than the Bloomberg Barclays U.S. Aggregate Bond Index. U.S. government bond yields increased between 0.4% and 0.8% in the Fund’s semi-annual period, depending upon maturity. Yield spreads of corporate credits over government bond yields tightened from September 30, 2016 to March 31, 2017, causing prices of these bonds to significantly outperform government bonds. The FINRA-Bloomberg Index of Active High Yield U.S. Corporate Bond Yields dropped by 0.2% to 6.11% during the period. The FINRA-Bloomberg Index of Active Investment Grade Corporate Bond Yields rose by 0.29%, to 3.76%. The Fund’s bond portfolio had an effective duration of approximately 4.0 years as of March 31, 2017.
Readers of this commentary who are long-time shareholders of Income Builder will recall that the cash and interest bearing debt portion of the Fund’s portfolio (see Chart I on the next page) has varied over time, ranging from around 12% currently to 45% at June 30, 2009.
Investors have been debating the future direction of the economies of China, Europe, various emerging markets, and the U.S. Macroeconomic vital signs to date have been stronger than
Semi-Annual Report 5
| | |
| Letter to Shareholders, | | |
| |
Continued | | |
| |
Thornburg Investment Income Builder Fund | | March 31, 2017 (Unaudited) |
Chart I | Interest-Bearing Investments as a Percentage of
Total Portfolio as of March 31, 2017
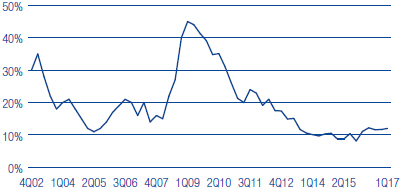
As of March 31st, the Fund portfolio included more than 100 bonds and hybrid securities.
earlier expected, particularly outside the United States. Investors try to evaluate potential policy actions by the U.S. Federal Reserve, Congress, the Trump administration, and the evolving governance of Europe and other key countries. For the most part, the political and macroeconomic issues remain open, but “globalization” as we have come to know it is being questioned in many corners of the world with uncertain consequences. Importantly, overall global consumer spending is growing, and most macro-economic indicators around the world have positively surprised in the early months of 2017. Corporate earnings reported for the March quarter are also generally surprising, positively.
The improvement in global economic growth expectations is supporting a rotation of investor preferences from more defensive debt and equity assets to more economically sensitive assets. The U.S. election in November initially added momentum to improving growth expectations, though it now appears that political gridlock will persist in Washington DC. The U.S. Federal Reserve has given signals that a faster pace of Federal funds target rate hikes is probable in 2017 and 2018, but most major central banks around the world continue to pursue very easy monetary conditions with the stated goal of creating more inflation. Offshore demand for U.S. dollar bonds remains strong. Yields available to investors in the U.S. bond market today are below the already low January 1, 2017 levels.
While low interest rates are good news for borrowers, they have negative consequences for conservative savers and income-seeking investors. Total reported taxable interest income of all U.S. households fell from $168 billion in 2009 to less than $94 billion in 2014, a five-year drop of $74 billion (negative 44%), according to Statistics of Income published by the Internal Revenue Service.
Investors must consider other options. Banks have aggressively reduced yields on deposits, and money market fund yields remain around ½ of 1%. A very large pool of investor dollars is looking for better returns elsewhere, but in sensible investments. We are optimistic that the types of income-producing investments owned by Thornburg Investment Income Builder Fund will experience sustainable popularity among investors as their intrinsic values for income production are recognized. A high percentage of investor funds belong to people over the age of 55, for whom income is an increasingly necessary and desirable attribute.
Thank you for being a shareholder of Thornburg Investment Income Builder Fund. Remember that you can review descriptions of many of the stocks in your portfolio at your leisure by going to our website, www.thornburg.com/iib. Best wishes for a wonderful summer!
Sincerely,
| | | | |
 | |  | |  |
| Brian McMahon | | Jason Brady,CFA | | Ben Kirby,CFA |
| Portfolio Manager | | Portfolio Manager | | Portfolio Manager |
| Chief Investment Officer and Managing Director | | CEO, President, and Managing Director | | Managing Director |
The matters discussed in this report may constitute forward-looking statements made pursuant to the safe harbor provisions of the Securities Litigation Reform Act of 1995. These include any advisor or portfolio manager prediction, assessment, analysis or outlook for individual securities, industries, investment styles, market sectors and/or markets. These statements involve risks and uncertainties. In addition to the general risks described for each fund in its current prospectus, other factors bearing on these reports include the accuracy of the advisor’s or portfolio manager’s forecasts and predictions, the appropriateness of the investment strategies designed by the advisor or portfolio manager and the ability of the advisor or portfolio manager to implement their strategies efficiently and successfully. Any one or more of these factors, as well as other risks affecting the securities markets generally, could cause the actual results of any fund to differ materially as compared to its benchmarks.
The views expressed are subject to change and do not necessarily reflect the views of Thornburg Investment Management, Inc. This information should not be relied upon as a recommendation or investment advice and is not intended to predict the performance of any investment or market.
6 Semi-Annual Report
This page intentionally left blank.
Semi-Annual Report 7
| | |
| The Dividend Landscape | | |
| |
Thornburg Investment Income Builder Fund | | March 31, 2017 (Unaudited) |
To appreciate the investment environment in which Thornburg Investment Income Builder Fund operates, you may wish to review these highlights of the “dividend landscape.”
The S&P 500 Index Payout Ratio — A Historical Perspective
The dividend payout ratio is a fraction that expresses dividend payments as a percentage of per-share earnings. As the economy slowed in the wake of the financial crisis, earnings-per-share on average declined, causing the payout ratio to spike, even as dividends paid by the S&P 500 portfolio declined. Earnings have since materially improved, bringing the payout ratio back in line with the overall trend in recent times.
Corporate Willingness to Pay Dividends is Key to the Fund’s Investment Process
The Russell 1000 Index includes approximately 1,000 public companies that are supposed to be generally representative of corporate America. Between 1980 and 1993, at least 75% of these firms paid some dividend. Between 1994 and 2001, the percentage of Russell 1000 companies paying dividends sank to just over 50%, indicating a preference towards reinvesting retained earnings in growth initiatives. Dividends returned to fashion between 2002 and 2008. A reduction in the number of Russell 1000 firms paying dividends followed the 2008 recession. However, from early 2010, the number steadily climbed back to around 70%.
Rising Dividend Payments Despite Decreasing Dividend Yields
Over time, the dollar dividend per unit of the S&P 500 Index has generally increased. Because the price of the index itself has increased even more, the yield on the S&P 500 Index, as a percentage of the current index price, has generally decreased in recent decades. You should note, however, that the dollar yield on an original investment made at a fixed point in time (say, 1970 or 1989) has increased, even without reinvestment of dividends.
S&P 500 Index Payout Ratio
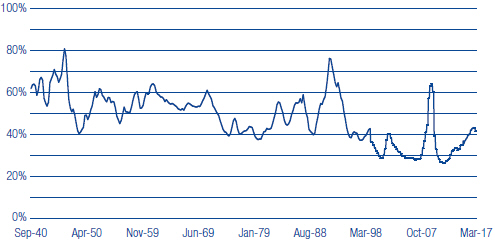
Source: Bloomberg, beginning in 1999 (uses operating earnings); “Irrational Exuberance” by Robert J. Shiller, through 1998 (uses reported earnings).
Percentage of Companies Paying Dividends in Russell 1000 Index
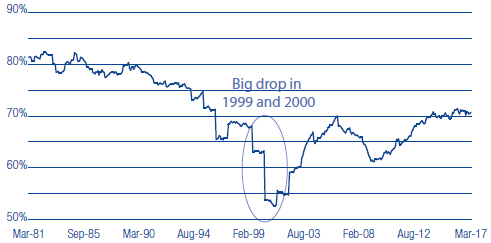
Source: CSFB Quantitative and Equity Derivatives Strategy, Baseline, and FactSet.
S&P 500 Index Average Yield vs. Annual Dividends from a Hypothetical $100,000 Investment (Dividends not Reinvested)
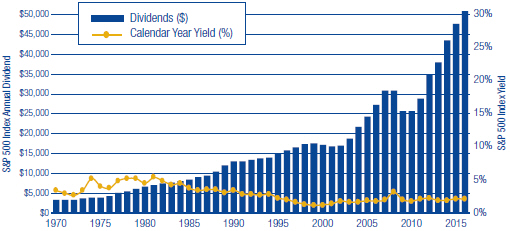
Source: Bloomberg and FactSet as of 12/31/16
Past performance does not guarantee future results.
8 Semi-Annual Report
| | |
| The Dividend Landscape, Continued | | |
| |
Thornburg Investment Income Builder Fund | | March 31, 2017 (Unaudited) |
The Top 100 Dividend Yields
| | | | | | | | |
| | | RUSSELL 1000
INDEX | | | RUSSELL 2000
INDEX | |
Real Estate | | | 39 | % | | | 32 | % |
Consumer Discretionary | | | 17 | % | | | 15 | % |
Financials | | | 11 | % | | | 29 | % |
Energy | | | 11 | % | | | 10 | % |
Utilities | | | 8 | % | | | 3 | % |
Industrials | | | 4 | % | | | 3 | % |
Materials | | | 4 | % | | | 0 | % |
Telecommunication Services | | | 4 | % | | | 3 | % |
Information Technology | | | 1 | % | | | 1 | % |
Consumer Staples | | | 1 | % | | | 2 | % |
Health Care | | | 0 | % | | | 2 | % |
Source: FactSet as of March 31, 2017.
Estimated Average Dividend Yields (MSCI Indices) of Markets Around the Globe
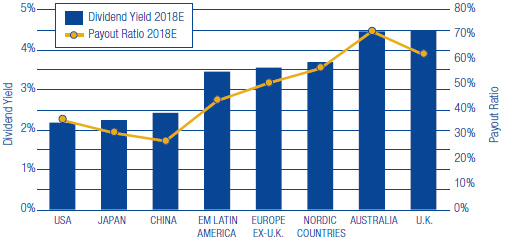
Source: Bloomberg as of March 31, 2017.
A Truly Diversified Dividend-Paying Portfolio Must Look Beyond the Obvious High-Yield Stocks!
In the (large cap) Russell 1000 Index, 50% of the top 100 dividend payers are in the real estate and financials sectors. In the (small cap) Russell 2000 Index, 61% of the top 100 dividend-yielding stocks are real estate or financials companies. To construct a diversified portfolio of attractive yielding stocks, one must look beyond these sectors. We certainly do.
Dividend yield is a ratio that shows how much a company pays out in dividends each year relative to its share price.
Global Diversification Can Improve the Portfolio Yield
Since firms outside the U.S. tend to pay higher dividends than U.S. firms, particularly outside the financial and utility sectors, we maintain the ability to diversify the Thornburg Investment Income Builder Fund into foreign dividend-paying stocks to try to take advantage of these opportunities.
Diversification does not assure or guarantee better performance and cannot eliminate the risk of investment losses.
Dividends are not guaranteed.
Semi-Annual Report 9
| | |
| Performance Summary | | |
| |
Thornburg Investment Income Builder Fund | | March 31, 2017 (Unaudited) |
AVERAGE ANNUAL TOTAL RETURNS
| | | | | | | | | | | | | | | | | | | | |
| | | 1-YR | | | 3-YR | | | 5-YR | | | 10-YR | | | SINCE
INCEP. | |
Class A Share (Incep: 12/24/02) | | | | | | | | | | | | | | | | | | | | |
Without sales charge | | | 11.85 | % | | | 2.89 | % | | | 6.74 | % | | | 5.40 | % | | | 9.51 | % |
With sales charge | | | 6.81 | % | | | 1.33 | % | | | 5.76 | % | | | 4.91 | % | | | 9.16 | % |
Class C Shares (Incep: 12/24/02) | | | | | | | | | | | | | | | | | | | | |
Without sales charge | | | 11.03 | % | | | 2.15 | % | | | 5.98 | % | | | 4.69 | % | | | 8.84 | % |
With sales charge | | | 10.03 | % | | | 2.15 | % | | | 5.98 | % | | | 4.69 | % | | | 8.84 | % |
Class I Shares (Incep: 11/3/03) | | | 12.20 | % | | | 3.21 | % | | | 7.07 | % | | | 5.74 | % | | | 8.75 | % |
Class R3 Shares (Incep: 2/1/05) | | | 11.51 | % | | | 2.57 | % | | | 6.41 | % | | | 5.11 | % | | | 7.11 | % |
Class R4 Shares (Incep: 2/1/08) | | | 11.56 | % | | | 2.66 | % | | | 6.53 | % | | | — | | | | 4.93 | % |
Class R5 Shares (Incep: 2/1/07) | | | 12.07 | % | | | 3.08 | % | | | 6.94 | % | | | 5.64 | % | | | 5.78 | % |
Blended Index (Since 12/24/02) | | | 11.06 | % | | | 4.92 | % | | | 7.70 | % | | | 4.50 | % | | | 7.44 | % |
GROWTH OF A HYPOTHETICAL $10,000 INVESTMENT
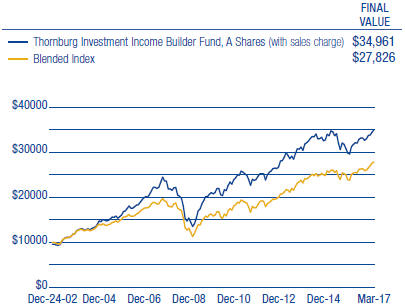
Performance data shown represents past performance and is no guarantee of future results. Investment return and principal value will fluctuate so shares, when redeemed, may be worth more or less than their original cost. Current performance may be lower or higher than quoted. For performance current to the most recent month end, visit thornburg.com or call 800-847-0200. The performance information does not reflect the deduction of taxes that a shareholder would pay on distributions or the redemption of Fund shares. Returns reflect the reinvestment of dividends and capital gains. Class A shares are sold with a maximum sales charge of 4.50%. Class C shares are subject to a 1% CDSC for the first year only. There is no sales charge for Class I, R3, R4, and R5 shares.
As disclosed in the most recent prospectus, the total annual fund operating expenses are as follows: A shares, 1.39%; C shares, 2.14%; I shares, 1.07%; R3 shares, 1.80%; R4 shares, 1.69%; R5 shares, 1.28%. Thornburg Investment Management and/or Thornburg Securities Corporation have contractually agreed to waive fees and reimburse expenses through at least April 10, 2018, for some of the share classes, resulting in net expense ratios of the following: C shares, 2.11%; R3 shares, 1.71%; R4 shares, 1.61%; R5 shares, 1.20%. For more detailed information on fund expenses and waivers/reimbursements please see the Fund’s prospectus.
30-day SEC Yield as of 3/31/17 (A Shares): 2.89%
Glossary
The Bloomberg Barclays U.S. Aggregate Bond Index is composed of approximately 8,000 publicly traded bonds including U.S. government, mortgage-backed, corporate and Yankee bonds. The index is weighted by the market value of the bonds included in the index.
The Blended index is composed of 25% Bloomberg Barclays U.S. Aggregate Bond Index and 75% MSCI World Index.
The FlNRA-Bloomberg Active High Yield U.S. Corporate Bond Index is comprised of the “active” (most frequently traded) fixed-coupon, high-yield bonds represented by FINRA TRACE, FINRA’s transaction reporting facility that disseminates all over-the-counter secondary market transactions in these public bonds.
The FlNRA-Bloomberg Active Investment Grade U.S. Corporate Bond Index is comprised of the “active” (most frequently traded) fixed-coupon, investment-grade bonds represented by FINRA TRACE, FINRA’s transaction reporting facility that disseminates all over-the-counter secondary market transactions in these public bonds.
The MSCI country indices are free float-adjusted market capitalization indices that are designed to measure equity market performance in that specific country in U.S. dollars.
The MSCI World Index is an unmanaged market-weighted index that consists of securities traded in 23 of the world’s most developed countries. Securities are listed on exchanges in the U.S., Europe, Canada, Australia, New Zealand, and the Far East. The index is calculated with net dividends reinvested in U.S. dollars.
The Russell 1000 Index measures the performance of the large-cap segment of the U.S. equity universe. It is a subset of the Russell 3000 Index and includes approximately 1,000 of the largest securities based on a combination of their market cap and current index membership. Source: Frank Russell Company.
The Russell 2000 Index measures the performance of the small-cap segment of the U.S. equity universe. The Russell 2000 Index is a subset of the Russell 3000 Index including approximately 2,000 of the smallest securities based on a combination of their market cap and current index membership. Source: Frank Russell Company.
The S&P 500 Index is an unmanaged broad measure of the U.S. stock market.
The performance of any index is not indicative of the performance of any particular investment. Unless otherwise noted, index returns reflect the reinvestment of income dividends and capital gains, if any, but do not reflect fees, brokerage commissions or other expenses of investing. Investors may not make direct investments into any index.
Effective Duration – A bond’s sensitivity to interest rates, incorporating the embedded option features, such as call provisions. Bonds with longer durations experience greater price volatility than bonds with shorter durations.
Yield Spread – The difference between yields on differing debt instruments, calculated by deducting the yield of one instrument from another.
10 Semi-Annual Report
| | |
| Fund Summary | | |
| |
Thornburg Investment Income Builder Fund | | March 31, 2017 (Unaudited) |
OBJECTIVES AND STRATEGIES
The Fund seeks to provide a level of current income which exceeds the average yield on U.S. stocks generally, and which will generally grow, subject to periodic fluctuations, over the years on a per share basis. The Fund’s secondary investment objective is long-term capital appreciation.
The Fund may invest in any domestic or foreign equity or debt security which Thornburg Investment Management believes may assist the Fund in pursuing its investment goals, although the Fund expects that equity securities in its portfolio will normally be weighted in favor of companies that pay dividends or other current income.
PORTFOLIO COMPOSITION
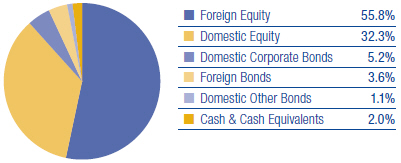
TOP TEN EQUITY HOLDINGS
| | | | |
China Mobile Ltd. | | | 4.3 | % |
Atlantia S.p.A. | | | 3.1 | % |
JPMorgan Chase & Co. | | | 2.9 | % |
CME Group, Inc. | | | 2.8 | % |
Royal Dutch Shell plc ADR | | | 2.7 | % |
Orange SA | | | 2.7 | % |
Roche Holding AG | | | 2.6 | % |
Taiwan Semiconductor Manufacturing Co., Ltd. | | | 2.1 | % |
BT Group plc | | | 2.0 | % |
Novartis AG | | | 2.0 | % |
SECTOR EXPOSURE
(percent of equity holdings)
| | | | |
Financials | | | 26.3 | % |
Telecommunication Services | | | 20.7 | % |
Industrials | | | 9.3 | % |
Consumer Staples | | | 8.7 | % |
Energy | | | 8.3 | % |
Health Care | | | 7.9 | % |
Consumer Discretionary | | | 7.1 | % |
Information Technology | | | 4.2 | % |
Real Estate | | | 3.2 | % |
Utilities | | | 2.6 | % |
Materials | | | 1.7 | % |
Other | | | 0.1 | % |
COUNTRY EXPOSURE*
(percent of Fund)
| | | | |
United States | | | 38.6 | % |
Switzerland | | | 11.0 | % |
Netherlands | | | 8.7 | % |
France | | | 8.0 | % |
Italy | | | 5.2 | % |
United Kingdom | | | 5.0 | % |
China | | | 4.5 | % |
Taiwan | | | 2.6 | % |
Germany | | | 2.3 | % |
Singapore | | | 2.1 | % |
Norway | | | 1.5 | % |
Canada | | | 1.3 | % |
South Korea | | | 1.2 | % |
Hong Kong | | | 1.2 | % |
Spain | | | 1.1 | % |
Australia | | | 0.6 | % |
South Africa | | | 0.6 | % |
Russia | | | 0.6 | % |
Thailand | | | 0.4 | % |
Jamaica | | | 0.4 | % |
Brazil | | | 0.4 | % |
Cayman Islands | | | 0.3 | % |
Luxembourg | | | 0.3 | % |
Ireland | | | 0.1 | % |
Chile | | | 0.1 | % |
Japan | | | 0.1 | % |
Trinidad and Tobago** | | | 0.0 | % |
Panama** | | | 0.0 | % |
Other Assets Less Liabilities | | | 2.0 | % |
| * | The country assignment of each holding is determined by the Fund’s Advisor based on various factors, including the location of the issuer’s head office, the issuer’s jurisdiction of incorporation and the country from which a majority of the issuer’s revenue is derived. |
| ** | Country percentage was less than 0.1%. |
There is no guarantee that the Fund will meet its investment objectives.
All portfolio information is subject to change. Charts may not add up to 100% due to rounding.
Semi-Annual Report 11
| | |
| Fund Summary, Continued | | |
| |
Thornburg Investment Income Builder Fund | | March 31, 2017 (Unaudited) |
QUARTERLY DIVIDEND HISTORY, CLASS A
| | | | | | | | | | | | | | | | | | | | |
YEAR | | Q1 | | | Q2 | | | Q3 | | | Q4 | | | TOTAL | |
2003 | | | 9.2 | ¢ | | | 11.2 | ¢ | | | 12.4 | ¢ | | | 17.5 | ¢ | | | 50.3 | ¢ |
2004 | | | 10.2 | ¢ | | | 12.5 | ¢ | | | 15.0 | ¢ | | | 21.8 | ¢ | | | 59.5 | ¢ |
2005 | | | 11.0 | ¢ | | | 13.6 | ¢ | | | 17.4 | ¢ | | | 29.0 | ¢ | | | 71.0 | ¢ |
2006 | | | 12.5 | ¢ | | | 16.0 | ¢ | | | 19.2 | ¢ | | | 33.0 | ¢ | | | 80.7 | ¢ |
2007 | | | 14.2 | ¢ | | | 18.5 | ¢ | | | 21.5 | ¢ | | | 36.8 | ¢ | | | 91.0 | ¢ |
2008 | | | 17.9 | ¢ | | | 21.8 | ¢ | | | 26.0 | ¢ | | | 36.8 | ¢ | | | 102.4 | ¢ |
2009 | | | 18.0 | ¢ | | | 24.2 | ¢ | | | 28.0 | ¢ | | | 34.5 | ¢ | | | 104.7 | ¢ |
2010 | | | 19.8 | ¢ | | | 25.0 | ¢ | | | 32.0 | ¢ | | | 36.0 | ¢ | | | 112.8 | ¢ |
2011 | | | 21.0 | ¢ | | | 26.0 | ¢ | | | 32.0 | ¢ | | | 37.5 | ¢ | | | 116.5 | ¢ |
2012 | | | 21.5 | ¢ | | | 26.0 | ¢ | | | 28.5 | ¢ | | | 36.0 | ¢ | | | 112.0 | ¢ |
2013 | | | 21.5 | ¢ | | | 25.3 | ¢ | | | 25.0 | ¢ | | | 24.5 | ¢ | | | 96.3 | ¢ |
2014 | | | 22.5 | ¢ | | | 24.0 | ¢ | | | 27.0 | ¢ | | | 26.0 | ¢ | | | 99.5 | ¢ |
2015 | | | 16.5 | ¢ | | | 20.0 | ¢ | | | 20.0 | ¢ | | | 25.3 | ¢ | | | 81.8 | ¢ |
2016 | | | 17.0 | ¢ | | | 18.5 | ¢ | | | 19.5 | ¢ | | | 21.5 | ¢ | | | 76.5 | ¢ |
2017 | | | 17.0 | ¢ | | | | | | | | | | | | | | | | |
We do not expect each sequential quarter’s dividend to increase over that of the prior quarter, since dividend payments outside the United States tend to be seasonal. Rather, the Fund aspires to increase the dividend paid on an annual basis.
EVOLUTION OF INDUSTRY GROUP EXPOSURE
Top 10 industry groups quarter by quarter (percent of equity holdings)
As of 3/31/17
| | | | |
Telecommunication Services | | | 20.7 | % |
Diversified Financials | | | 13.7 | % |
Energy | | | 8.3 | % |
Pharma, Biotech & Life Sciences | | | 7.9 | % |
Banks | | | 7.5 | % |
Insurance | | | 5.0 | % |
Food & Staples Retailing | | | 4.7 | % |
Capital Goods | | | 4.5 | % |
Transportation | | | 4.2 | % |
Semiconductors & Equipment | | | 4.2 | % |
As of 9/30/16
| | | | |
Telecommunication Services | | | 22.7 | % |
Diversified Financials | | | 15.9 | % |
Energy | | | 8.6 | % |
Banks | | | 7.8 | % |
Pharma, Biotech & Life Sciences | | | 7.4 | % |
Transportation | | | 4.5 | % |
Capital Goods | | | 4.5 | % |
Retailing | | | 4.4 | % |
Semiconductors & Equipment | | | 4.1 | % |
Real Estate | | | 3.1 | % |
As of 12/31/16
| | | | |
Telecommunication Services | | | 21.0 | % |
Diversified Financials | | | 16.9 | % |
Energy | | | 9.1 | % |
Banks | | | 8.1 | % |
Pharma, Biotech & Life Sciences | | | 7.1 | % |
Transportation | | | 4.4 | % |
Capital Goods | | | 4.2 | % |
Food & Staples Retailing | | | 4.1 | % |
Semiconductors & Equipment | | | 4.0 | % |
Retailing | | | 3.9 | % |
As of 6/30/16
| | | | |
Telecommunication Services | | | 23.0 | % |
Diversified Financials | | | 9.5 | % |
Pharma, Biotech & Life Sciences | | | 9.0 | % |
Real Estate | | | 8.7 | % |
Banks | | | 8.2 | % |
Energy | | | 6.9 | % |
Retailing | | | 4.8 | % |
Transportation | | | 4.3 | % |
Semiconductors & Equipment | | | 3.9 | % |
Utilities | | | 3.8 | % |
12 Semi-Annual Report
| | |
| Schedule of Investments | | |
| |
Thornburg Investment Income Builder Fund | | March 31, 2017 (Unaudited) |
| | | | | | | | |
| | | SHARES/
PRINCIPAL AMOUNT | | | VALUE | |
COMMON STOCK — 87.70% | | | | | | | | |
| | |
AUTOMOBILES & COMPONENTS — 1.32% | | | | | | | | |
Automobiles — 1.32% | | | | | | | | |
Daimler AG | | | 2,846,100 | | | $ | 210,106,349 | |
| | | | | | | | |
| | | | | | | 210,106,349 | |
| | | | | | | | |
BANKS — 6.51% | | | | | | | | |
Banks — 6.51% | | | | | | | | |
DBS Group Holdings Ltd. | | | 16,421,200 | | | | 227,737,985 | |
ING Groep N.V. | | | 17,617,500 | | | | 266,315,876 | |
Intesa Sanpaolo S.p.A. | | | 12,079,000 | | | | 32,807,437 | |
JPMorgan Chase & Co. | | | 5,323,200 | | | | 467,589,888 | |
Liechtensteinische Landesbank AG | | | 852,411 | | | | 42,209,939 | |
| | | | | | | | |
| | | | | | | 1,036,661,125 | |
| | | | | | | | |
CAPITAL GOODS — 3.96% | | | | | | | | |
Aerospace & Defense — 0.68% | | | | | | | | |
BAE Systems plc | | | 13,559,800 | | | | 109,154,837 | |
Construction & Engineering — 2.12% | | | | | | | | |
Bouygues SA | | | 1,793,900 | | | | 73,018,451 | |
Ferrovial SA | | | 3,178,900 | | | | 63,619,848 | |
Vinci S.A. | | | 2,537,795 | | | | 201,153,817 | |
Industrial Conglomerates — 1.16% | | | | | | | | |
Hopewell Holdings Ltd. | | | 32,379,840 | | | | 122,078,017 | |
NWS Holdings Ltd. | | | 34,000,000 | | | | 62,036,930 | |
| | | | | | | | |
| | | | | | | 631,061,900 | |
| | | | | | | | |
COMMERCIAL & PROFESSIONAL SERVICES — 0.49% | | | | | | | | |
Professional Services — 0.49% | | | | | | | | |
Wolters Kluwer N.V. | | | 1,880,374 | | | | 78,163,113 | |
| | | | | | | | |
| | | | | | | 78,163,113 | |
| | | | | | | | |
CONSUMER SERVICES — 1.60% | | | | | | | | |
Hotels, Restaurants & Leisure — 1.60% | | | | | | | | |
Las Vegas Sands Corp. | | | 3,885,000 | | | | 221,716,950 | |
TUI AG | | | 2,333,000 | | | | 32,267,862 | |
| | | | | | | | |
| | | | | | | 253,984,812 | |
| | | | | | | | |
DIVERSIFIED FINANCIALS — 12.05% | | | | | | | | |
Capital Markets — 7.93% | | | | | | | | |
a Apollo Investment Corp. | | | 24,800,000 | | | | 162,688,000 | |
Ares Capital Corp. | | | 15,285,900 | | | | 265,668,942 | |
CME Group, Inc. | | | 3,800,000 | | | | 451,440,000 | |
GAM Holding AG | | | 3,688,882 | | | | 45,482,646 | |
a Solar Capital Ltd. | | | 4,607,900 | | | | 104,184,619 | |
UBS Group AG | | | 14,605,325 | | | | 233,737,693 | |
Mortgage Real Estate Investment Trusts — 4.12% | | | | | | | | |
Chimera Investment Corp. | | | 5,265,000 | | | | 106,247,700 | |
a Invesco Mortgage Capital, Inc. | | | 7,670,600 | | | | 118,280,652 | |
a MFA Financial, Inc. | | | 33,520,151 | | | | 270,842,820 | |
Two Harbors Investment Corp. | | | 16,698,600 | | | | 160,139,574 | |
| | | | | | | | |
| | | | | | | 1,918,712,646 | |
| | | | | | | | |
ENERGY — 7.20% | | | | | | | | |
Oil, Gas & Consumable Fuels — 7.20% | | | | | | | | |
Eni S.p.A. | | | 10,288,800 | | | | 168,482,979 | |
b,c Malamute Energy, Inc. | | | 12,439 | | | | 130,609 | |
ONEOK, Inc. | | | 3,489,700 | | | | 193,468,968 | |
Royal Dutch Shell plc A Shares | | | 1,189,380 | | | | 31,234,063 | |
Royal Dutch Shell plc ADR | | | 7,450,000 | | | | 392,838,500 | |
Suncor Energy, Inc. | | | 3,900,000 | | | | 119,740,572 | |
Semi-Annual Report 13
| | |
| Schedule of Investments, Continued | | |
| |
Thornburg Investment Income Builder Fund | | March 31, 2017 (Unaudited) |
| | | | | | | | |
| | | SHARES/
PRINCIPAL AMOUNT | | | VALUE | |
The Williams Companies, Inc. | | | 2,657,000 | | | $ | 78,620,630 | |
Total SA | | | 3,193,100 | | | | 161,514,383 | |
| | | | | | | | |
| | | | | | | 1,146,030,704 | |
| | | | | | | | |
FOOD & STAPLES RETAILING — 4.13% | | | | | | | | |
Food & Staples Retailing — 4.13% | | | | | | | | |
CVS Health Corp. | | | 2,710,000 | | | | 212,735,000 | |
Koninklijke Ahold Delhaize N.V. | | | 5,474,247 | | | | 117,148,908 | |
Walgreens Boots Alliance, Inc. | | | 3,595,906 | | | | 298,639,993 | |
Woolworths Ltd. | | | 1,444,900 | | | | 29,253,435 | |
| | | | | | | | |
| | | | | | | 657,777,336 | |
| | | | | | | | |
FOOD, BEVERAGE & TOBACCO — 3.12% | | | | | | | | |
Food Products — 1.92% | | | | | | | | |
Nestle SA | | | 3,972,300 | | | | 304,768,387 | |
Tobacco — 1.20% | | | | | | | | |
KT&G Corp. | | | 2,195,817 | | | | 191,444,297 | |
| | | | | | | | |
| | | | | | | 496,212,684 | |
| | | | | | | | |
HOUSEHOLD & PERSONAL PRODUCTS — 0.41% | | | | | | | | |
Household Products — 0.41% | | | | | | | | |
Reckitt Benckiser plc | | | 719,900 | | | | 65,717,027 | |
| | | | | | | | |
| | | | | | | 65,717,027 | |
| | | | | | | | |
INSURANCE — 4.42% | | | | | | | | |
Insurance — 4.42% | | | | | | | | |
AXA S.A. | | | 3,128,400 | | | | 80,948,067 | |
Gjensidige Forsikring ASA | | | 1,810,476 | | | | 27,580,334 | |
Legal and General Group plc | | | 23,968,500 | | | | 74,264,548 | |
Munich Re | | | 300,000 | | | | 58,695,325 | |
NN Group NV | | | 7,533,300 | | | | 244,993,403 | |
Swiss Re AG | | | 600,000 | | | | 53,881,096 | |
Zurich Financial Services AG | | | 610,000 | | | | 162,845,305 | |
| | | | | | | | |
| | | | | | | 703,208,078 | |
| | | | | | | | |
MATERIALS — 1.49% | | | | | | | | |
Chemicals — 0.99% | | | | | | | | |
LyondellBasell Industries NV | | | 1,727,000 | | | | 157,485,130 | |
Metals & Mining — 0.50% | | | | | | | | |
Mining and Metallurgical Co. Norilsk Nickel PJSC ADR | | | 4,119,000 | | | | 64,627,110 | |
Mining and Metallurgical Co. Norilsk Nickel PJSC ADR | | | 990,000 | | | | 15,562,800 | |
| | | | | | | | |
| | | | | | | 237,675,040 | |
| | | | | | | | |
MEDIA — 0.51% | | | | | | | | |
Media — 0.51% | | | | | | | | |
Vivendi S.A. | | | 4,143,968 | | | | 80,568,793 | |
| | | | | | | | |
| | | | | | | 80,568,793 | |
| | | | | | | | |
PHARMACEUTICALS, BIOTECHNOLOGY & LIFE SCIENCES — 6.99% | | | | | |
Pharmaceuticals — 6.99% | | | | | | | | |
Merck & Co., Inc. | | | 4,687,687 | | | | 297,855,632 | |
Novartis AG | | | 4,278,400 | | | | 317,575,041 | |
Pfizer, Inc. | | | 2,292,200 | | | | 78,416,162 | |
Roche Holding AG | | | 1,640,300 | | | | 418,897,559 | |
| | | | | | | | |
| | | | | | | 1,112,744,394 | |
| | | | | | | | |
REAL ESTATE — 2.83% | | | | | | | | |
Equity Real Estate Investment Trusts — 2.83% | | | | | | | | |
Crown Castle International Corp. | | | 2,020,000 | | | | 190,789,000 | |
Lamar Advertising Co. | | | 1,658,220 | | | | 123,935,363 | |
a Washington REIT | | | 4,325,000 | | | | 135,286,000 | |
| | | | | | | | |
| | | | | | | 450,010,363 | |
| | | | | | | | |
14 Semi-Annual Report
| | |
| Schedule of Investments, Continued | | |
| |
Thornburg Investment Income Builder Fund | | March 31, 2017 (Unaudited) |
| | | | | | | | |
| | | SHARES/
PRINCIPAL AMOUNT | | | VALUE | |
RETAILING — 2.84% | | | | | | | | |
Multiline Retail — 0.90% | | | | | | | | |
Target Corp. | | | 2,603,734 | | | $ | 143,700,079 | |
Specialty Retail — 1.94% | | | | | | | | |
The Home Depot, Inc. | | | 2,104,800 | | | | 309,047,784 | |
| | | | | | | | |
| | | | | | | 452,747,863 | |
| | | | | | | | |
SEMICONDUCTORS & SEMICONDUCTOR EQUIPMENT — 3.69% | | | | | |
Semiconductors & Semiconductor Equipment — 3.69% | | | | | | | | |
Advanced Semiconductor Engineering, Inc. | | | 62,862,954 | | | | 80,281,436 | |
Qualcomm, Inc. | | | 2,929,200 | | | | 167,960,328 | |
Taiwan Semiconductor Manufacturing Co., Ltd. | | | 54,341,000 | | | | 338,483,942 | |
| | | | | | | | |
| | | | | | | 586,725,706 | |
| | | | | | | | |
TELECOMMUNICATION SERVICES — 18.13% | | | | | | | | |
Diversified Telecommunication Services — 12.03% | | | | | | | | |
AT&T, Inc. | | | 5,503,100 | | | | 228,653,805 | |
BT Group plc | | | 80,279,884 | | | | 320,054,164 | |
CenturyLink, Inc. | | | 6,370,000 | | | | 150,140,900 | |
Jasmine Broadband Internet Infrastructure Fund | | | 183,724,000 | | | | 62,021,052 | |
Koninklijke KPN N.V. | | | 86,168,500 | | | | 259,502,973 | |
Orange SA | | | 27,211,900 | | | | 422,816,846 | |
Singapore Telecommunications Ltd. | | | 37,641,215 | | | | 105,212,961 | |
Swisscom AG | | | 344,600 | | | | 158,977,348 | |
Telenor ASA | | | 12,500,200 | | | | 208,040,644 | |
Wireless Telecommunication Services — 6.10% | | | | | | | | |
China Mobile Ltd. | | | 62,038,574 | | | | 678,939,808 | |
MTN Group Ltd. | | | 10,663,810 | | | | 96,970,824 | |
Vodafone Group plc | | | 75,109,324 | | | | 195,831,479 | |
| | | | | | | | |
| | | | | | | 2,887,162,804 | |
| | | | | | | | |
TRANSPORTATION — 3.74% | | | | | | | | |
Transportation Infrastructure — 3.74% | | | | | | | | |
Atlantia S.p.A. | | | 19,236,102 | | | | 496,609,890 | |
China Merchants Holdings International Co. Ltd. | | | 10,464,830 | | | | 30,634,354 | |
Sydney Airport | | | 13,247,554 | | | | 68,520,034 | |
| | | | | | | | |
| | | | | | | 595,764,278 | |
| | | | | | | | |
UTILITIES — 2.27% | | | | | | | | |
Electric Utilities — 1.93% | | | | | | | | |
Electricite de France SA | | | 25,287,083 | | | | 212,896,606 | |
Enel S.p.A. | | | 8,700,200 | | | | 40,967,974 | |
Terna Rete Elettrica Nazionale S.p.A. | | | 10,874,721 | | | | 53,945,349 | |
Multi-Utilities — 0.34% | | | | | | | | |
c Innogy SE | | | 757,713 | | | | 28,602,689 | |
National Grid plc | | | 2,012,000 | | | | 25,548,670 | |
| | | | | | | | |
| | | | | | | 361,961,288 | |
| | | | | | | | |
TOTAL COMMON STOCK (Cost $12,546,634,890) | | | | | | | 13,962,996,303 | |
| | | | | | | | |
PREFERRED STOCK — 0.42% | | | | | | | | |
BANKS — 0.14% | | | | | | | | |
Banks — 0.14% | | | | | | | | |
d First Tennessee Bank Pfd, 3.75% | | | 12,000 | | | | 8,520,000 | |
GMAC Capital Trust I Pfd, 8.125% | | | 517,056 | | | | 13,148,734 | |
| | | | | | | | |
| | | | | | | 21,668,734 | |
| | | | | | | | |
DIVERSIFIED FINANCIALS — 0.02% | | | | | | | | |
Capital Markets — 0.02% | | | | | | | | |
Morgan Stanley Pfd, 4.00% | | | 120,000 | | | | 2,833,200 | |
| | | | | | | | |
| | | | | | | 2,833,200 | |
| | | | | | | | |
Semi-Annual Report 15
| | |
| Schedule of Investments, Continued | | |
| |
Thornburg Investment Income Builder Fund | | March 31, 2017 (Unaudited) |
| | | | | | | | |
| | | SHARES/
PRINCIPAL AMOUNT | | | VALUE | |
ENERGY — 0.08% | | | | | | | | |
Oil, Gas & Consumable Fuels — 0.08% | | | | | | | | |
b,c Crestwood Equity Partners LP | | | 1,387,421 | | | $ | 13,549,831 | |
| | | | | | | | |
| | | | | | | 13,549,831 | |
| | | | | | | | |
MISCELLANEOUS — 0.07% | | | | | | | | |
U.S. Government Agencies — 0.07% | | | | | | | | |
Farm Credit Bank of Texas Pfd, 10.00% | | | 9,000 | | | | 11,047,500 | |
| | | | | | | | |
| | | | | | | 11,047,500 | |
| | | | | | | | |
TELECOMMUNICATION SERVICES — 0.11% | | | | | | | | |
Wireless Telecommunication Services — 0.11% | | | | | | | | |
d Centaur Funding Corp. Pfd, 9.08% | | | 15,000 | | | | 17,475,000 | |
| | | | | | | | |
| | | | | | | 17,475,000 | |
| | | | | | | | |
TOTAL PREFERRED STOCK (Cost $65,860,932) | | | | | | | 66,574,265 | |
| | | | | | | | |
ASSET BACKED SECURITIES — 0.19% | | | | | | | | |
COMMERCIAL MTG TRUST — 0.02% | | | | | | | | |
Citigroup Commercial Mortgage Trust, Series 2004-HYB2 Class B1, 3.336%, 3/25/2034 | | $ | 636,324 | | | | 520,895 | |
d Credit Suisse Mortgage Trust, Series 2016-BDWN Class E, 12.412%, 2/15/2029 | | | 2,000,000 | | | | 2,009,991 | |
| | | | | | | | |
| | | | | | | 2,530,886 | |
| | | | | | | | |
OTHER ASSET BACKED — 0.07% | | | | | | | | |
d Fairway Outdoor Funding, LLC, Series 2012-1 Class B, 8.835%, 10/15/2042 | | | 7,000,000 | | | | 7,129,002 | |
d JPR Royalty, LLC, 10.50%, 9/1/2020 | | | 5,000,000 | | | | 2,500,000 | |
b,d Northwind Holdings, LLC, Series 2007-1A Class A1 Floating Rate Note, 1.622%, 12/1/2037 | | | 2,143,750 | | | | 1,995,831 | |
| | | | | | | | |
| | | | | | | 11,624,833 | |
| | | | | | | | |
RESIDENTIAL MTG TRUST — 0.10% | | | | | | | | |
Bear Stearns ARM Mortgage, Series 2003-6 Class 2B-1, 2.905%, 8/25/2033 | | | 141,839 | | | | 108,811 | |
FBR Securitization Trust, Series 2005-2 Class M1, 1.702%, 9/25/2035 | | | 8,771,267 | | | | 8,771,148 | |
Merrill Lynch Mortgage Investors Trust, Series 2004-A4 Class M1, 2.855%, 8/25/2034 | | | 4,669,156 | | | | 4,271,046 | |
Morgan Stanley Capital, Inc., Series 2005-HE7 Class A2C, 1.302%, 11/25/2035 | | | 2,517,964 | | | | 2,519,757 | |
| | | | | | | | |
| | | | | | | 15,670,762 | |
| | | | | | | | |
TOTAL ASSET BACKED SECURITIES (Cost $30,841,627) | | | | | | | 29,826,481 | |
| | | | | | | | |
CORPORATE BONDS — 8.48% | | | | | | | | |
AUTOMOBILES & COMPONENTS — 0.03% | | | | | | | | |
Auto Components — 0.03% | | | | | | | | |
d,e Nexteer Automotive Group Ltd., 5.875%, 11/15/2021 | | | 4,300,000 | | | | 4,461,250 | |
| | | | | | | | |
| | | | | | | 4,461,250 | |
| | | | | | | | |
BANKS — 0.08% | | | | | | | | |
Banks — 0.08% | | | | | | | | |
d,e Groupe BPCE, 12.50%, 8/29/2049 | | | 10,211,000 | | | | 12,329,782 | |
| | | | | | | | |
| | | | | | | 12,329,782 | |
| | | | | | | | |
CAPITAL GOODS — 0.21% | | | | | | | | |
Aerospace & Defense — 0.06% | | | | | | | | |
d CBC Ammo, LLC, 7.25%, 11/15/2021 | | | 9,265,000 | | | | 9,218,675 | |
Construction & Engineering — 0.10% | | | | | | | | |
d Zachry Holdings, Inc., 7.50%, 2/1/2020 | | | 15,420,000 | | | | 15,882,600 | |
Machinery — 0.05% | | | | | | | | |
Mueller Industries, Inc., 6.00%, 3/1/2027 | | | 7,679,000 | | | | 7,621,407 | |
| | | | | | | | |
| | | | | | | 32,722,682 | |
| | | | | | | | |
COMMERCIAL & PROFESSIONAL SERVICES — 0.01% | | | | | | | | |
Commercial Services & Supplies — 0.01% | | | | | | | | |
RR Donnelley, 7.625%, 6/15/2020 | | | 1,697,000 | | | | 1,820,033 | |
| | | | | | | | |
| | | | | | | 1,820,033 | |
| | | | | | | | |
16 Semi-Annual Report
| | |
| Schedule of Investments, Continued | | |
| |
Thornburg Investment Income Builder Fund | | March 31, 2017 (Unaudited) |
| | | | | | | | |
| | | SHARES/
PRINCIPAL AMOUNT | | | VALUE | |
CONSUMER SERVICES — 0.28% | | | | | | | | |
Diversified Consumer Services — 0.28% | | | | | | | | |
b,d Laureate Education, Inc., 9.25%, 9/1/2019 | | $ | 43,176,000 | | | $ | 44,039,520 | |
| | | | | | | | |
| | | | | | | 44,039,520 | |
| | | | | | | | |
DIVERSIFIED FINANCIALS — 0.52% | | | | | | | | |
Capital Markets — 0.01% | | | | | | | | |
d Morgan Stanley (BRL), 10.09%, 5/3/2017 | | | 4,560,000 | | | | 1,453,677 | |
Consumer Finance — 0.07% | | | | | | | | |
First Cash Financial Services, Inc., 6.75%, 4/1/2021 | | | 10,395,000 | | | | 10,836,787 | |
Diversified Financial Services — 0.44% | | | | | | | | |
Bank of America Corp. (BRL), 10.75%, 8/20/2018 | | | 5,000,000 | | | | 1,639,686 | |
d,e CFG Holdings Ltd./CFG Finance, LLC, 11.50%, 11/15/2019 | | | 30,634,000 | | | | 31,093,510 | |
d,e Genpact Luxembourg S.a.r.l., 3.70%, 4/1/2022 | | | 12,000,000 | | | | 12,069,552 | |
JPMorgan Chase & Co., 7.90%, 12/29/2049 | | | 15,000,000 | | | | 15,543,750 | |
National Rural Utilities Cooperative Finance Corp., 10.375%, 11/1/2018 | | | 5,000,000 | | | | 5,662,305 | |
d TMX Finance, LLC/Titlemax Finance, 8.50%, 9/15/2018 | | | 5,385,000 | | | | 4,954,200 | |
| | | | | | | | |
| | | | | | | 83,253,467 | |
| | | | | | | | |
ENERGY — 2.36% | | | | | | | | |
Energy Equipment & Services — 0.06% | | | | | | | | |
d Enviva Partners, LP, 8.50%, 11/1/2021 | | | 7,500,000 | | | | 7,950,000 | |
c,d,e,f Schahin II Finance Co. (SPV) Ltd., 5.875%, 9/25/2023 | | | 11,640,133 | | | | 1,338,616 | |
Oil, Gas & Consumable Fuels — 2.30% | | | | | | | | |
d Citgo Petroleum Corp., 6.25%, 8/15/2022 | | | 27,000,000 | | | | 27,337,500 | |
d DCP Midstream, LLC, 9.75%, 3/15/2019 | | | 5,000,000 | | | | 5,612,500 | |
Enbridge Energy Partners LP, 9.875%, 3/1/2019 | | | 9,750,000 | | | | 11,090,245 | |
Energy Transfer Partners LP, 4.052%, 11/1/2066 | | | 13,820,000 | | | | 11,677,900 | |
Enterprise Products Operating LP, 7.034%, 1/15/2068 | | | 14,480,000 | | | | 14,999,832 | |
d,e Gaz Capital SA, 8.146%, 4/11/2018 | | | 2,000,000 | | | | 2,116,192 | |
HollyFrontier Corp., 5.875%, 4/1/2026 | | | 25,000,000 | | | | 26,542,950 | |
Kinder Morgan Energy Partners LP, 9.00%, 2/1/2019 | | | 8,000,000 | | | | 8,948,920 | |
Kinder Morgan Energy Partners LP, 5.00%, 3/1/2043 | | | 10,000,000 | | | | 9,491,980 | |
Kinder Morgan Energy Partners LP, 5.80%, 3/15/2035 | | | 10,000,000 | | | | 10,472,080 | |
Kinder Morgan, Inc., 5.30%, 12/1/2034 | | | 23,630,000 | | | | 23,714,430 | |
Kinder Morgan, Inc., 5.55%, 6/1/2045 | | | 5,000,000 | | | | 5,108,740 | |
b,c,d,f Linc Energy, 12.50%, 10/31/2017 | | | 22,791,000 | | | | 228 | |
b,c,d,f Linc Energy, 9.625%, 10/31/2017 | | | 16,148,704 | | | | 670,171 | |
NuStar Logistics LP, 8.15%, 4/15/2018 | | | 18,000,000 | | | | 18,990,000 | |
d,e Odebrecht Offshore Drilling Finance Ltd., 6.75%, 10/1/2023 | | | 19,146,870 | | | | 7,084,342 | |
ONEOK Partners LP, 8.625%, 3/1/2019 | | | 8,000,000 | | | | 8,910,960 | |
d,e Petro Co., Trinidad Tobago Ltd., 9.75%, 8/14/2019 | | | 4,000,000 | | | | 4,224,000 | |
c,f RAAM Global Energy Co., 12.50%, 10/1/2015 | | | 15,000,000 | | | | 225,000 | |
Summit Midstream Holdings, LLC, 5.50%, 8/15/2022 | | | 8,172,000 | | | | 8,172,000 | |
Teppco Partners LP, 7.00%, 6/1/2067 | | | 7,000,000 | | | | 6,475,000 | |
The Williams Companies, Inc., 3.70%, 1/15/2023 | | | 29,129,000 | | | | 28,619,242 | |
The Williams Companies, Inc., 4.55%, 6/24/2024 | | | 69,318,000 | | | | 69,837,885 | |
The Williams Companies, Inc., 5.75%, 6/24/2044 | | | 14,198,000 | | | | 14,268,990 | |
Transcontinental Gas Pipe Line Co., LLC, 7.85%, 2/1/2026 | | | 32,700,000 | | | | 41,988,206 | |
| | | | | | | | |
| | | | | | | 375,867,909 | |
| | | | | | | | |
FOOD & STAPLES RETAILING — 0.05% | | | | | | | | |
Food & Staples Retailing — 0.05% | | | | | | | | |
d C&S Group Enterprises, LLC, 5.375%, 7/15/2022 | | | 7,860,000 | | | | 7,761,750 | |
| | | | | | | | |
| | | | | | | 7,761,750 | |
| | | | | | | | |
FOOD, BEVERAGE & TOBACCO — 0.18% | | | | | | | | |
Beverages — 0.04% | | | | | | | | |
Ambev International Finance Co., Ltd. (BRL), 9.50%, 7/24/2017 | | | 21,669,000 | | | | 6,804,008 | |
Food Products — 0.04% | | | | | | | | |
d,e BRF S.A., 4.75%, 5/22/2024 | | | 6,000,000 | | | | 5,784,000 | |
Semi-Annual Report 17
| | |
| Schedule of Investments, Continued | | |
| |
Thornburg Investment Income Builder Fund | | March 31, 2017 (Unaudited) |
| | | | | | | | |
| | | SHARES/
PRINCIPAL AMOUNT | | | VALUE | |
Tobacco — 0.10% | | | | | | | | |
d Vector Group Ltd., 6.125%, 2/1/2025 | | $ | 16,000,000 | | | $ | 16,340,000 | |
| | | | | | | | |
| | | | | | | 28,928,008 | |
| | | | | | | | |
HOUSEHOLD & PERSONAL PRODUCTS — 0.05% | | | | | | | | |
Household Products — 0.05% | | | | | | | | |
d Energizer Holdings, Inc., 5.50%, 6/15/2025 | | | 7,500,000 | | | | 7,650,000 | |
| | | | | | | | |
| | | | | | | 7,650,000 | |
| | | | | | | | |
INSURANCE — 0.97% | | | | | | | | |
Insurance — 0.97% | | | | | | | | |
d,e Dai Ichi Mutual Life Insurance Co., Ltd., 7.25%, 12/29/2049 | | | 9,000,000 | | | | 10,300,500 | |
ELM B.V. (AUD), 7.635%, 12/29/2049 | | | 10,500,000 | | | | 8,050,042 | |
ELM B.V. (AUD), 3.185%, 4/29/2049 | | | 8,000,000 | | | | 6,094,640 | |
Genworth Holdings, Inc., 4.90%, 8/15/2023 | | | 24,020,000 | | | | 19,996,650 | |
Hartford Financial Services Group, 8.125%, 6/15/2068 | | | 9,650,000 | | | | 10,277,250 | |
d MetLife, Inc., 9.25%, 4/8/2038 | | | 12,000,000 | | | | 16,575,000 | |
MetLife, Inc., 6.817%, 8/15/2018 | | | 4,000,000 | | | | 4,264,384 | |
d National Life Insurance of Vermont, 10.50%, 9/15/2039 | | | 2,000,000 | | | | 3,058,708 | |
d,e QBE Insurance Group Ltd., 7.50%, 11/24/2043 | | | 40,000,000 | | | | 45,400,000 | |
d,e Sirius International Group, 7.506%, 5/29/2049 | | | 28,590,000 | | | | 29,161,800 | |
d ZFS Finance USA Trust V, 6.50%, 5/9/2067 | | | 1,260,000 | | | | 1,258,425 | |
| | | | | | | | |
| | | | | | | 154,437,399 | |
| | | | | | | | |
MATERIALS — 0.44% | | | | | | | | |
Chemicals — 0.16% | | | | | | | | |
d,e Consolidated Energy Finance S.A., 6.75%, 10/15/2019 | | | 11,000,000 | | | | 11,082,500 | |
d,e Kissner Group Holdings, 8.375%, 12/1/2022 | | | 14,520,000 | | | | 14,955,600 | |
Construction Materials — 0.18% | | | | | | | | |
d,e Cimpor Financial Operations B.V., 5.75%, 7/17/2024 | | | 17,985,000 | | | | 15,871,762 | |
CRH America, Inc., 8.125%, 7/15/2018 | | | 12,000,000 | | | | 12,942,168 | |
Metals & Mining — 0.10% | | | | | | | | |
d International Wire Group, Inc., 10.75%, 8/1/2021 | | | 15,780,000 | | | | 15,346,050 | |
| | | | | | | | |
| | | | | | | 70,198,080 | |
| | | | | | | | |
MEDIA — 0.39% | | | | | | | | |
Media — 0.39% | | | | | | | | |
Comcast Cable Communications, LLC, 8.875%, 5/1/2017 | | | 5,000,000 | | | | 5,027,245 | |
d EMI Music Publishing Ltd., 7.625%, 6/15/2024 | | | 5,000,000 | | | | 5,450,000 | |
d,e Mood Media Corp., 9.25%, 10/15/2020 | | | 18,445,000 | | | | 12,634,825 | |
d,e SFR Group SA, 7.375%, 5/1/2026 | | | 23,480,000 | | | | 24,184,400 | |
Time Warner Cable, Inc., 8.75%, 2/14/2019 | | | 14,000,000 | | | | 15,649,396 | |
| | | | | | | | |
| | | | | | | 62,945,866 | |
| | | | | | | | |
REAL ESTATE — 0.14% | | | | | | | | |
Real Estate Management & Development — 0.14% | | | | | | | | |
d,e Avison Young (Canada), Inc., 9.50%, 12/15/2021 | | | 22,000,000 | | | | 21,670,000 | |
| | | | | | | | |
| | | | | | | 21,670,000 | |
| | | | | | | | |
SOFTWARE & SERVICES — 0.39% | | | | | | | | |
Information Technology Services — 0.13% | | | | | | | | |
d Alliance Data Systems Corp., 5.375%, 8/1/2022 | | | 10,000,000 | | | | 10,075,000 | |
Neustar, Inc., 4.50%, 1/15/2023 | | | 11,185,000 | | | | 11,478,606 | |
Internet Software & Services — 0.05% | | | | | | | | |
b,d Yahoo!, Inc., 6.65%, 8/10/2026 | | | 6,694,596 | | | | 7,303,805 | |
Software — 0.21% | | | | | | | | |
d Solera Capital, LLC, 10.50%, 3/1/2024 | | | 29,200,000 | | | | 33,361,000 | |
| | | | | | | | |
| | | | | | | 62,218,411 | |
| | | | | | | | |
18 Semi-Annual Report
| | |
| Schedule of Investments, Continued | | |
| |
Thornburg Investment Income Builder Fund | | March 31, 2017 (Unaudited) |
| | | | | | | | |
| | | SHARES/
PRINCIPAL AMOUNT | | | VALUE | |
TECHNOLOGY HARDWARE & EQUIPMENT — 0.04% | | | | | | | | |
Electronic Equipment, Instruments & Components — 0.04% | | | | | | | | |
d Harland Clarke Holdings, 8.375%, 8/15/2022 | | $ | 6,500,000 | | | $ | 6,662,500 | |
| | | | | | | | |
| | | | | | | 6,662,500 | |
| | | | | | | | |
TELECOMMUNICATION SERVICES — 1.63% | | | | | | | | |
Diversified Telecommunication Services — 1.00% | | | | | | | | |
e Deutsche Telekom International Finance BV, 8.75%, 6/15/2030 | | | 26,150,000 | | | | 38,117,547 | |
Qwest Corp., 6.75%, 12/1/2021 | | | 9,000,000 | | | | 9,866,232 | |
e Telefonica Emisiones SAU, 6.221%, 7/3/2017 | | | 2,770,000 | | | | 2,800,470 | |
e Telefonica Emisiones SAU, 7.045%, 6/20/2036 | | | 85,390,000 | | | | 105,596,946 | |
c,d,e,f Telemar Norte Leste SA, 0%, 10/23/2020 | | | 9,065,000 | | | | 2,753,494 | |
Wireless Telecommunication Services — 0.63% | | | | | | | | |
d,e Digicel Ltd., 6.00%, 4/15/2021 | | | 67,037,000 | | | | 60,919,874 | |
d,e Millicom International Cellular S.A., 6.00%, 3/15/2025 | | | 28,423,000 | | | | 29,133,575 | |
d,e VimpelCom Holdings B.V., 7.504%, 3/1/2022 | | | 8,735,000 | | | | 9,892,387 | |
| | | | | | | | |
| | | | | | | 259,080,525 | |
| | | | | | | | |
TRANSPORTATION — 0.12% | | | | | | | | |
Airlines — 0.12% | | | | | | | | |
American Airlines Group, Inc., 4.95%, 7/15/2024 | | | 4,053,265 | | | | 4,311,174 | |
d,e Guanay Finance Ltd., 6.00%, 12/15/2020 | | | 11,983,742 | | | | 12,298,315 | |
US Airways, 6.25%, 10/22/2024 | | | 1,934,777 | | | | 2,108,907 | |
| | | | | | | | |
| | | | | | | 18,718,396 | |
| | | | | | | | |
UTILITIES — 0.59% | | | | | | | | |
Electric Utilities — 0.35% | | | | | | | | |
Arizona Public Service Co., 8.75%, 3/1/2019 | | | 6,500,000 | | | | 7,324,167 | |
d,e Enel Finance International S.A., 6.25%, 9/15/2017 | | | 40,000,000 | | | | 40,801,520 | |
Entergy Gulf States Louisiana, LLC, 6.00%, 5/1/2018 | | | 8,000,000 | | | | 8,359,872 | |
d Great River Energy, 5.829%, 7/1/2017 | | | 249,461 | | | | 250,791 | |
Multi-Utilities — 0.24% | | | | | | | | |
Ameren Illinois Co., 9.75%, 11/15/2018 | | | 5,000,000 | | | | 5,617,510 | |
d Enable Oklahoma Intrastate Transmission, LLC, 6.25%, 3/15/2020 | | | 2,500,000 | | | | 2,672,580 | |
NiSource Finance Corp., 6.40%, 3/15/2018 | | | 20,000,000 | | | | 20,860,000 | |
Sempra Energy, 9.80%, 2/15/2019 | | | 7,750,000 | | | | 8,839,596 | |
| | | | | | | | |
| | | | | | | 94,726,036 | |
| | | | | | | | |
TOTAL CORPORATE BONDS (Cost $1,257,842,364) | | | | | | | 1,349,491,614 | |
| | | | | | | | |
MUNICIPAL BONDS — 0.02% | | | | | | | | |
San Bernardino County California Redevelopment Agency (San Sevaine), 8.45%, 9/1/2030 | | | 2,555,000 | | | | 2,916,354 | |
| | | | | | | | |
TOTAL MUNICIPAL BONDS (Cost $2,508,464) | | | | | | | 2,916,354 | |
| | | | | | | | |
OTHER GOVERNMENT — 0.04% | | | | | | | | |
Federative Republic of Brazil (BRL), 12.50%, 1/5/2022 | | | 20,000,000 | | | | 7,027,407 | |
| | | | | | | | |
TOTAL OTHER GOVERNMENT (Cost $12,765,645) | | | | | | | 7,027,407 | |
| | | | | | | | |
LOAN PARTICIPATIONS — 1.15% | | | | | | | | |
COMMERCIAL & PROFESSIONAL SERVICES — 0.05% | | | | | | | | |
Professional Services — 0.05% | | | | | | | | |
RGIS Services, LLC, 7.50%, 3/24/2023 | | | 7,387,750 | | | | 7,350,811 | |
CONSUMER SERVICES — 0.18% | | | | | | | | |
Hotels, Restaurants & Leisure — 0.04% | | | | | | | | |
Cheddar’s Scratch Kitchen, 10.75%, 12/20/2022 | | | 6,000,000 | | | | 6,030,000 | |
Diversified Consumer Services — 0.14% | | | | | | | | |
Laureate Education, Inc., 8.51%, 3/17/2021 | | | 23,055,200 | | | | 23,228,114 | |
ENERGY — 0.00% | | | | | | | | |
Oil, Gas & Consumable Fuels — 0.00% | | | | | | | | |
b Malamute Energy, Inc., 1.15%, 11/22/2022 | | | 210,241 | | | | 210,241 | |
Semi-Annual Report 19
| | |
| Schedule of Investments, Continued | | |
| |
Thornburg Investment Income Builder Fund | | March 31, 2017 (Unaudited) |
| | | | | | | | |
| | | SHARES/
PRINCIPAL AMOUNT | | | VALUE | |
FOOD, BEVERAGE & TOBACCO — 0.04% | | | | | | | | |
Tobacco — 0.04% | | | | | | | | |
b North Atlantic Holding Co., Inc., 7.15%, 5/9/2022 | | $ | 7,000,000 | | | $ | 6,930,000 | |
INDUSTRIALS — 0.10% | | | | | | | | |
Construction & Engineering — 0.10% | | | | | | | | |
ABG Intermediate Holdings (2), LLC, 9.65%, 5/27/2022 | | | 15,710,047 | | | | 15,827,872 | |
MEDIA — 0.05% | | | | | | | | |
Media — 0.05% | | | | | | | | |
e Mood Media Corp., 7.15%, 5/1/2019 | | | 8,340,758 | | | | 8,254,765 | |
PHARMACEUTICALS, BIOTECHNOLOGY & LIFE SCIENCES — 0.14% | | | | | |
Pharmaceuticals — 0.14% | | | | | | | | |
b,e Concordia Healthcare Corp., 9.50%, 10/21/2017 | | | 33,610,960 | | | | 21,847,124 | |
RETAILING — 0.19% | | | | | | | | |
Specialty Retail — 0.19% | | | | | | | | |
Redbox Automated Retail, LLC, 8.50%, 9/27/2021 | | | 30,625,000 | | | | 30,586,719 | |
SOFTWARE & SERVICES — 0.17% | | | | | | | | |
Information Technology Services — 0.17% | | | | | | | | |
Neustar, Inc., 4.03%, 1/22/2019 | | | 26,726,700 | | | | 26,593,067 | |
TECHNOLOGY HARDWARE & EQUIPMENT — 0.12% | | | | | | | | |
Technology, Hardware, Storage & Peripherals — 0.12% | | | | | | | | |
Harland Clarke Holdings Corp., 7.15%, 12/31/2021 | | | 18,304,516 | | | | 18,450,952 | |
TRANSPORTATION — 0.11% | | | | | | | | |
Airlines — 0.11% | | | | | | | | |
b,c,d,e,f OS Two, LLC, 12.00%, 12/15/2020 | | | 4,617,946 | | | | 3,551,200 | |
b,d WU Finance I, LLC, 7.20%, 08/17/2025 | | | 14,325,217 | | | | 14,038,713 | |
| | | | | | | | |
TOTAL LOAN PARTICIPATIONS (Cost $192,730,729) | | | | | | | 182,899,578 | |
| | | | | | | | |
SHORT TERM INVESTMENTS — 1.24% | | | | | | | | |
a Thornburg Capital Management Fund | | | 19,720,259 | | | | 197,202,593 | |
| | | | | | | | |
TOTAL SHORT TERM INVESTMENTS (Cost $197,202,593) | | | | | | | 197,202,593 | |
| | | | | | | | |
TOTAL INVESTMENTS — 99.24% (Cost $14,306,387,244) | | | | | | $ | 15,798,934,595 | |
OTHER ASSETS LESS LIABILITIES — 0.76% | | | | | | | 121,638,150 | |
| | | | | | | | |
NET ASSETS — 100.00% | | | | | | $ | 15,920,572,745 | |
| | | | | | | | |
Footnote Legend
| a | Investment in Affiliates – Shown below are holdings of voting securities of each portfolio company which is considered “affiliated” to the Fund under the Investment Company Act of 1940, including companies for which the Fund’s holding represented 5% or more of the company’s voting securities, and a series of the Thornburg Investment Trust in which the Fund invested for cash management purposes during the period: |
| | | | | | | | | | | | | | | | | | | | | | | | | | | | |
ISSUER | | SHARES/PRINCIPAL
SEPTEMBER 30,
2016 | | | GROSS
ADDITIONS | | | GROSS
REDUCTIONS | | | SHARES/PRINCIPAL
MARCH 31,
2017 | | | MARKET VALUE
MARCH 31,
2017 | | | INVESTMENT
INCOME | | | REALIZED
GAIN (LOSS) | |
Apollo Investment Corp. | | | 24,800,000 | | | | — | | | | — | | | | 24,800,000 | | | $ | 162,688,000 | | | $ | 5,208,000 | | | $ | — | |
Dynex Capital, Inc.* | | | 3,562,668 | | | | — | | | | 3,562,668 | | | | | | | | | | | | 1,178,460 | | | | (8,519,533 | ) |
Invesco Mortgage Capital, Inc. | | | 13,839,800 | | | | — | | | | 6,169,200 | | | | 7,670,600 | | | | 118,280,652 | | | | 8,498,533 | | | | (9,947,559 | ) |
MFA Financial, Inc. | | | 33,520,151 | | | | — | | | | — | | | | 33,520,151 | | | | 270,842,820 | | | | 13,408,060 | | | | — | |
Solar Capital Ltd. | | | 4,607,900 | | | | — | | | | — | | | | 4,607,900 | | | | 104,184,619 | | | | 3,686,320 | | | | — | |
Thornburg Capital Management Fund | | | 23,399,287 | | | | 146,491,870 | | | | 150,170,898 | | | | 19,720,259 | | | | 197,202,593 | | | | 695,909 | | | | — | |
Two Harbors Investment Corp* | | | 23,875,000 | | | | — | | | | 7,176,400 | | | | | | | | | | | | 9,577,092 | | | | (14,023,907 | ) |
Washington REIT | | | 5,300,000 | | | | — | | | | 975,000 | | | | 4,325,000 | | | | 135,286,000 | | | | 2,021,250 | | | | 2,895,079 | |
| | | | | | | | | | | | | | | | | | | | | | | | | | | | |
Total non-controlled affiliated issuers - 6.21% of net assets | | | | | | | $ | 988,484,684 | | | $ | 44,273,624 | | | $ | (29,595,920 | ) |
| | | | | | | | | | | | | | | | | | | | | | | | | | | | |
| * | Issuers not affiliated at March 31, 2017. |
20 Semi-Annual Report
| | |
| Schedule of Investments, Continued | | |
| |
Thornburg Investment Income Builder Fund | | March 31, 2017 (Unaudited) |
| b | Security currently fair valued by the Valuation and Pricing Committee using procedures approved by the Trustees’ Audit Committee. |
| d | Securities exempt from registration under Rule 144A of the Securities Act of 1933, as amended. These securities may only be resold in the ordinary course of business in transactions exempt from registration, normally to qualified institutional buyers. As of March 31, 2017, the aggregate value of these securities in the Fund’s portfolio was $729,666,213, representing 4.58% of the Fund’s net assets. |
| e | Yankee bond denominated in U.S. dollars and is issued in the U.S. by foreign banks and corporations. |
Portfolio Abbreviations
To simplify the listings of securities, abbreviations are used per the table below:
| | |
| ADR | | American Depositary Receipt |
| ARM | | Adjustable Rate Mortgage |
| AUD | | Denominated in Australian Dollars |
| BRL | | Denominated in Brazilian Real |
CHL | | Denominated in Chilean Peso |
| MFA | | Mortgage Finance Authority |
MTN | | Medium-Term Note |
| Pfd | | Preferred Stock |
| REIT | | Real Estate Investment Trust |
| SPV | | Special Purpose Vehicle |
See notes to financial statements.
Semi-Annual Report 21
| | |
| Statement of Assets and Liabilities | | |
| |
Thornburg Investment Income Builder Fund | | March 31, 2017 (Unaudited) |
| | | | |
ASSETS | | | | |
Investments at value (Note 3) | | | | |
Non-affiliated issuers (cost $13,216,356,478) | | $ | 14,810,449,911 | |
Non-controlled affiliated issuers (cost $1,090,030,766) | | | 988,484,684 | |
Cash | | | 2,522,076 | |
Receivable for investments sold | | | 92,771,664 | |
Receivable for fund shares sold | | | 33,772,835 | |
Unrealized appreciation on forward currency contracts (Note 7) | | | 3,461,272 | |
Dividends receivable | | | 56,105,335 | |
Dividend and interest reclaim receivable | | | 32,554,084 | |
Interest receivable | | | 26,234,137 | |
Prepaid expenses and other assets | | | 139,853 | |
| | | | |
Total Assets | | | 16,046,495,851 | |
| | | | |
| |
LIABILITIES | | | | |
Payable for investments purchased | | | 26,963,518 | |
Payable for fund shares redeemed | | | 29,598,379 | |
Unrealized depreciation on forward currency contracts (Note 7) | | | 38,388,248 | |
Payable to investment advisor and other affiliates (Note 4) | | | 15,342,239 | |
Deferred taxes payable (Note 2) | | | 1,283,194 | |
Accounts payable and accrued expenses | | | 7,319,625 | |
Dividends payable | | | 7,027,903 | |
| | | | |
Total Liabilities | | | 125,923,106 | |
| | | | |
| |
NET ASSETS | | $ | 15,920,572,745 | |
| | | | |
NET ASSETS CONSIST OF | | | | |
Distribution in excess of net investment income | | $ | (13,842,534 | ) |
Net unrealized appreciation on investments | | | 1,455,857,828 | |
Accumulated net realized gain (loss) | | | (788,628,217 | ) |
Net capital paid in on shares of beneficial interest | | | 15,267,185,668 | |
| | | | |
| |
| | $ | 15,920,572,745 | |
| | | | |
22 Semi-Annual Report
| | |
| Statement of Assets and Liabilities, Continued | | |
| |
Thornburg Investment Income Builder Fund | | March 31, 2017 (Unaudited) |
| | | | |
NET ASSET VALUE | | | | |
| |
Class A Shares: | | | | |
Net asset value and redemption price per share ($3,465,919,414 applicable to 168,945,662 shares of beneficial interest outstanding - Note 5) | | $ | 20.52 | |
Maximum sales charge, 4.50% of offering price | | | 0.97 | |
| | | | |
Maximum offering price per share | | $ | 21.49 | |
| | | | |
| |
Class C Shares: | | | | |
Net asset value and offering price per share* ($4,936,947,992 applicable to 240,832,279 shares of beneficial interest outstanding - Note 5) | | $ | 20.50 | |
| | | | |
| |
Class I Shares: | | | | |
Net asset value, offering and redemption price per share ($7,313,736,848 applicable to 353,961,229 shares of beneficial interest outstanding - Note 5) | | $ | 20.66 | |
| | | | |
| |
Class R3 Shares: | | | | |
Net asset value, offering and redemption price per share ($75,252,883 applicable to 3,669,525 shares of beneficial interest outstanding - Note 5) | | $ | 20.51 | |
| | | | |
| |
Class R4 Shares: | | | | |
Net asset value, offering and redemption price per share ($44,906,795 applicable to 2,186,160 shares of beneficial interest outstanding - Note 5) | | $ | 20.54 | |
| | | | |
| |
Class R5 Shares: | | | | |
Net asset value, offering and redemption price per share ($83,808,813 applicable to 4,058,569 shares of beneficial interest outstanding - Note 5) | | $ | 20.65 | |
| | | | |
| * | Redemption price per share is equal to net asset value less any applicable contingent deferred sales charge. |
See notes to financial statements.
Semi-Annual Report 23
| | |
| Statement of Operations | | |
| |
Thornburg Investment Income Builder Fund | | Six Months Ended March 31, 2017 |
| | | | |
INVESTMENT INCOME | | | | |
Dividend income | | | | |
Non-affiliated issuers (net of foreign taxes withheld of $20,815,383) | | $ | 254,538,387 | |
Non-controlled affiliated issuers | | | 44,273,624 | |
Interest income (net of premium amortized of $548,492) | | | 60,648,308 | |
| | | | |
Total Income | | | 359,460,319 | |
| | | | |
| |
EXPENSES | | | | |
Investment advisory fees (Note 4) | | | 54,724,896 | |
Administration fees (Note 4) | | | | |
Class A Shares | | | 2,247,440 | |
Class C Shares | | | 3,170,344 | |
Class I Shares | | | 1,743,045 | |
Class R3 Shares | | | 47,218 | |
Class R4 Shares | | | 28,128 | |
Class R5 Shares | | | 21,060 | |
Distribution and service fees (Note 4) | | | | |
Class A Shares | | | 4,482,447 | |
Class C Shares | | | 25,287,645 | |
Class R3 Shares | | | 188,294 | |
Class R4 Shares | | | 55,593 | |
Transfer agent fees | | | | |
Class A Shares | | | 1,401,720 | |
Class C Shares | | | 1,945,860 | |
Class I Shares | | | 2,842,260 | |
Class R3 Shares | | | 83,627 | |
Class R4 Shares | | | 75,249 | |
Class R5 Shares | | | 108,461 | |
Registration and filing fees | | | | |
Class A Shares | | | 27,909 | |
Class C Shares | | | 14,572 | |
Class I Shares | | | 49,618 | |
Class R3 Shares | | | 1,820 | |
Class R4 Shares | | | 8,033 | |
Class R5 Shares | | | 10,090 | |
Custodian fees (Note 2) | | | 1,619,950 | |
Professional fees | | | 255,650 | |
Accounting fees (Note 4) | | | 251,540 | |
Trustee fees | | | 353,925 | |
Other expenses | | | 1,083,832 | |
| | | | |
Total Expenses | | | 102,130,226 | |
Less: | | | | |
Expenses reimbursed by investment advisor (Note 4) | | | (997,378 | ) |
| | | | |
Net Expenses | | | 101,132,848 | |
| | | | |
Net Investment Income | | $ | 258,327,471 | |
| | | | |
24 Semi-Annual Report
| | |
| Statement of Operations, Continued | | |
| |
Thornburg Investment Income Builder Fund | | Six Months Ended March 31, 2017 |
| | | | |
REALIZED AND UNREALIZED GAIN (LOSS) | | | | |
Net realized gain (loss) on: | | | | |
Investments | | | | |
Non-affiliated issuers (net of realized capital gain taxes paid of $153,169) | | $ | 43,814,953 | |
Non-controlled affiliated issuers | | | (29,595,920 | ) |
Forward currency contracts (Note 7) | | | 255,719,049 | |
Foreign currency transactions | | | 906,071 | |
| | | | |
| | | 270,844,153 | |
| | | | |
Net change in unrealized appreciation (depreciation) on: | | | | |
Investments | | | | |
Non-affiliated issuers (net of change in deferred taxes payable of $230,792) | | | 369,470,886 | |
Non-controlled affiliated issuers | | | (154,417 | ) |
Forward currency contracts (Note 7) | | | (58,848,044 | ) |
Foreign currency translations | | | (370,271 | ) |
| | | | |
| | | 310,098,154 | |
| | | | |
Net Realized and Unrealized Gain | | | 580,942,307 | |
| | | | |
Net Increase in Net Assets Resulting from Operations | | $ | 839,269,778 | |
| | | | |
See notes to financial statements.
Semi-Annual Report 25
| | |
| Statements of Changes in Net Assets | | |
| |
Thornburg Investment Income Builder Fund | | |
| | | | | | | | |
| | | SIX MONTHS ENDED
MARCH 31, 2017* | | | YEAR ENDED
SEPTEMBER 30, 2016 | |
INCREASE (DECREASE) IN NET ASSETS FROM | | | | | | | | |
| | |
OPERATIONS | | | | | | | | |
Net investment income | | $ | 258,327,471 | | | $ | 797,779,249 | |
Net realized gain (loss) on investments, capital gain taxes, forward currency contracts, and foreign currency transactions | | | 270,844,153 | | | | (918,976,358 | ) |
Net unrealized appreciation (depreciation) on investments, deferred taxes payable, forward currency contracts, and foreign currency translations | | | 310,098,154 | | | | 1,416,784,014 | |
| | | | | | | | |
Net Increase (Decrease) in Net Assets Resulting from Operations | | | 839,269,778 | | | | 1,295,586,905 | |
| | |
DIVIDENDS TO SHAREHOLDERS | | | | | | | | |
From net investment income | | | | | | | | |
Class A Shares | | | (69,856,606 | ) | | | (165,152,557 | ) |
Class C Shares | | | (81,135,655 | ) | | | (194,621,516 | ) |
Class I Shares | | | (146,064,409 | ) | | | (318,850,073 | ) |
Class R3 Shares | | | (1,352,879 | ) | | | (3,068,837 | ) |
Class R4 Shares | | | (829,982 | ) | | | (1,745,250 | ) |
Class R5 Shares | | | (1,716,715 | ) | | | (3,692,411 | ) |
| | |
FUND SHARE TRANSACTIONS (NOTE 5) | | | | | | | | |
Class A Shares | | | (433,875,116 | ) | | | (621,247,635 | ) |
Class C Shares | | | (587,571,601 | ) | | | (754,505,642 | ) |
Class I Shares | | | 142,866,343 | | | | (797,345,150 | ) |
Class R3 Shares | | | (5,476,028 | ) | | | (4,651,940 | ) |
Class R4 Shares | | | (2,590,455 | ) | | | 1,865,239 | |
Class R5 Shares | | | (5,583,798 | ) | | | 4,254,268 | |
| | | | | | | | |
Net Decrease in Net Assets | | | (353,917,123 | ) | | | (1,563,174,599 | ) |
| | |
NET ASSETS | | | | | | | | |
Beginning of Period | | | 16,274,489,868 | | | | 17,837,664,467 | |
| | | | | | | | |
| | |
End of Period | | $ | 15,920,572,745 | | | $ | 16,274,489,868 | |
| | | | | | | | |
Undistributed (distribution in excess of) net investment income | | $ | (13,842,534 | ) | | $ | 28,786,241 | |
See notes to financial statements.
26 Semi-Annual Report
| | |
| Notes to Financial Statements | | |
| |
Thornburg Investment Income Builder Fund | | March 31, 2017 (Unaudited) |
NOTE 1 – ORGANIZATION
Thornburg Investment Income Builder Fund (the “Fund”) is a diversified series of Thornburg Investment Trust (the “Trust”). The Trust is organized as a Massachusetts business trust under a Declaration of Trust dated June 3, 1987 and is registered as a diversified, open-end management investment company under the Investment Company Act of 1940, as amended. The Fund is currently one of twenty-one separate series of the Trust. Each series is considered to be a separate entity for financial reporting and tax purposes and bears expenses directly attributable to it. The Fund’s primary investment goal is to provide a level of current income which exceeds the average yield on U.S. stocks generally, and which will generally grow, subject to periodic fluctuations, over the years on a per share basis. The Fund’s secondary investment goal is long-term capital appreciation.
The Fund currently offers six classes of shares of beneficial interest: Class A, Class C, Institutional Class (“Class I”), and Retirement Classes (“Class R3,” “Class R4,” and “Class R5”). Each class of shares of the Fund represents an interest in the same portfolio of investments, except that (i) Class A shares are sold subject to a front-end sales charge collected at the time the shares are purchased and bear a service fee, (ii) Class C shares are sold at net asset value without a sales charge at the time of purchase, but are subject to a contingent deferred sales charge upon redemption within one year of purchase, and bear both a service fee and a distribution fee, (iii) Class I shares are sold at net asset value without a sales charge at the time of purchase and may be subject to a service fee, (iv) Class R3 shares are sold at net asset value without a sales charge at the time of purchase, but bear both a service fee and distribution fee, (v) Class R4 shares are sold at net asset value without sales charge at the time of purchase, but bear a service fee, (vi) Class R5 shares are sold at net asset value without a sales charge at the time of purchase and may be subject to a service fee, and (vii) the respective classes may have different reinvestment privileges and conversion rights. Additionally, the Fund may allocate among its classes certain expenses, to the extent allocable to specific classes, including transfer agent fees, government registration fees, certain printing and postage costs, and administrative and legal expenses. Currently, class specific expenses of the Fund are limited to service and distribution fees, administration fees, and certain registration and transfer agent expenses.
The following is a summary of significant accounting policies followed by the Fund in the preparation of its financial statements. The Fund prepares its financial statements in conformity with United States generally accepted accounting principles (“GAAP”), including investment company accounting and reporting guidance in the Financial Accounting Standards Board (the “FASB”) Accounting Standard Codification Topic 946.
NOTE 2 – SIGNIFICANT ACCOUNTING POLICIES
Security Valuation: All investments in securities held by the Fund are valued as described in Note 3.
Allocation of Income, Gains, Losses and Expenses: Net investment income (other than class specific expenses) and realized and unrealized gains and losses are allocated daily to each class of shares based upon the relative net asset value of outstanding shares (or the value of the dividend-eligible shares, as appropriate) of each class of shares at the beginning of the day (after adjusting for the current capital shares activity of the respective class). Expenses common to all Funds are allocated among the Funds comprising the Trust based upon their relative net asset values or other appropriate allocation methods. Operating expenses directly attributable to a specific class are charged against the operating income of that class.
Dividends and Distributions to Shareholders: Dividends and distributions to shareholders, which are determined in accordance with federal income tax regulations and may differ from GAAP, are recorded on the ex-dividend date. Ordinary income distributions, if any, are declared and paid quarterly. Capital gain distributions, if any, are declared and paid annually and more often if deemed necessary by the Advisor. Dividends are paid and are reinvested in additional shares of the Fund at net asset value per share at the close of business on the ex-dividend date, or at the shareholder’s option, paid in cash.
Investment Income: Dividend income is recorded on the ex-dividend date. Certain income from foreign investments is recognized as soon as information is available to the Fund. Interest income is accrued as earned. Premiums and discounts are amortized and accreted, respectively, to call dates or maturity dates using the effective yield method of the respective investments. These amounts are included in Interest Income on the Statement of Operations.
Custodian Fees: Custodian fees disclosed in the Statement of Operations may include interest expenses incurred by the Fund on any cash overdrafts of its custodian account during the period. Such cash overdrafts may result from the effects of failed trades in portfolio securities and from cash outflows resulting from unanticipated shareholder redemption activity. The Fund pays interest to its custodian on any such cash overdraft at a rate equal to 2.50% of the overdraft amount in excess of $50,000.
Investment Transactions: Investment transactions are accounted for on a trade date basis. Realized gains and losses from the sale of investments are recorded on an identified cost basis.
Repurchase Agreements: The Fund may invest excess cash in repurchase agreements whereby the Fund purchases investments, which serve as collateral, with an agreement to resell such collateral to the seller at an agreed upon price at the maturity date of the repurchase agreement. Investments pledged as collateral for repurchase agreements are held in custody until maturity of the repur-
Semi-Annual Report 27
| | |
| Notes to Financial Statements, Continued | | |
| |
Thornburg Investment Income Builder Fund | | March 31, 2017 (Unaudited) |
chase agreement. Provisions in the agreements require that the market value of the collateral is at least equal to the repurchase value in the event of default. In the event of default, the Fund has the right to liquidate the collateral and apply the proceeds in satisfaction of the obligation. Under certain circumstances, in the event of default or bankruptcy by the other party to the agreement, realization and/or retention of the collateral may be subject to legal proceedings.
Unfunded Loan Commitments: The Fund has entered into a loan commitment with Malamute Energy, Inc., of which at March 31, 2017, $210,241 of the $621,950 par commitment had been funded. The maturity date is November 22, 2022.
When-Issued and Delayed Delivery Transactions: The Fund may engage in when-issued or delayed delivery transactions. To the extent the Fund engages in such transactions, it will do so for the purpose of acquiring portfolio investments consistent with the Fund’s investment objectives and not for the purpose of investment leverage or to speculate on interest rate or market changes. At the time the Fund makes a commitment to purchase an investment on a when-issued or delayed delivery basis, the Fund will record the transaction and reflect the value in determining its net asset value. When effecting such transactions, assets of an amount sufficient to make payment for the portfolio investments to be purchased will be segregated on the Fund’s records on the trade date. Investments purchased on a when-issued or delayed delivery basis do not earn interest until the settlement date.
Foreign Currency Translation: Portfolio investments and other assets and liabilities denominated in foreign currencies are translated into U.S. dollars based on the exchange rate of such currencies against the U.S. dollar on the date of valuation. Purchases and sales of investments and income items denominated in foreign currencies are translated into U.S. dollars at the exchange rate in effect on the transaction date. When the Fund purchases or sells foreign investments, it will customarily enter into a foreign exchange contract to minimize foreign exchange risk from the trade date to the settlement date of such transactions. The values of such spot contracts are included in receivable for investments sold and payable for investments purchased on the Statement of Assets and Liabilities.
The Fund does not separately report the effect of changes in foreign exchange rates from changes in market prices on investments held. Such changes are included in net unrealized appreciation (depreciation) from investments.
Reported net realized gains and losses from foreign currency transactions arise due to purchases and sales of foreign currencies, currency gains and losses realized between the trade and settlement dates on investment transactions and the difference between the amounts of dividends, interest, and foreign withholding taxes recorded on the Fund’s books, and the U.S. dollar equivalent of the amounts actually received or paid.
Net change in unrealized appreciation (depreciation) on foreign currency translations arise from changes in the fair value of assets and liabilities, other than investments at period end, resulting from changes in exchange rates.
Guarantees and Indemnifications: Under the Trust’s organizational documents (and under separate agreements with the independent Trustees), its officers and Trustees are provided with an indemnification against certain liabilities arising out of the performance of their duties to the Fund. In the normal course of business the Trust may also enter into contracts with service providers that contain general indemnifications. The Trust’s maximum exposure under these arrangements is unknown. However, based on experience, the Trust expects the risk of loss to be remote.
Use of Estimates: The preparation of financial statements in conformity with GAAP requires management to make estimates and assumptions that affect the reported amounts of assets and liabilities and disclosure of contingent assets and liabilities at the date of the financial statements and the reported amounts of increases (decreases) in net assets from operations during the reporting period. Actual results could differ from those estimates.
Federal Income Taxes: It is the policy of the Trust to comply with the provisions of the Internal Revenue Code applicable to regulated investment companies and to distribute to shareholders substantially all investment company taxable income including net realized gains on investments (if any), and tax exempt income of the Fund. Therefore, no provision for federal income or excise tax is required.
The Fund files income tax returns in United States federal and applicable state jurisdictions. The statute of limitations on the Fund’s tax return filings generally remains open for the three years following a return’s filing date. The Fund has analyzed its tax positions taken on Federal income tax returns for all open tax years and has concluded that no provision for income tax is required in the financial statements.
At March 31, 2017, information on the tax components of capital was as follows:
| | | | |
Cost of investments for tax purposes | | $ | 14,329,652,920 | |
| | | | |
Gross unrealized appreciation on a tax basis | | $ | 413,011,656 | |
Gross unrealized depreciation on a tax basis | | | (322,634,827 | ) |
| | | | |
Net unrealized appreciation (depreciation) on investments (tax basis) | | $ | 90,376,829 | |
| | | | |
28 Semi-Annual Report
| | |
| Notes to Financial Statements, Continued | | |
| |
Thornburg Investment Income Builder Fund | | March 31, 2017 (Unaudited) |
At March 31, 2017, the Fund had deferred tax basis late year specified ordinary losses occurring subsequent to October 31, 2015 through September 30, 2016 of $68,712,311. For tax purposes, such losses will be recognized in the year ending September 30, 2017.
At March 31, 2017, the Fund had deferred tax basis capital losses occurring subsequent to October 31, 2015 through September 30, 2016 of $662,713,179. For tax purposes, such capital losses will be recognized in the year ending September 30, 2017.
At March 31, 2017, the Fund had cumulative tax basis capital losses of $226,181,345, (of which $219,602,120 are short-term and $6,579,225 are long-term) generated after September 30, 2011, which may be carried forward to offset future capital gains. To the extent such carryforwards are used, capital gain distributions may be reduced to the extent provided by regulations. Such capital loss carryforwards do not expire.
Foreign Withholding Taxes: The Fund is subject to foreign tax withholding imposed by certain foreign countries in which the Fund may invest. Withholding taxes are incurred on certain foreign dividends and are accrued at the time the dividend is recognized based on applicable foreign tax laws. The Fund may file withholding tax reclaims in certain jurisdictions to recover a portion of amounts previously withheld, in view of various considerations, including recent decisions rendered by the courts in those and other jurisdictions. The Fund would expect to record a receivable for such a reclaim based on a variety of factors, including assessment of a jurisdiction’s legal obligation to pay reclaims, the jurisdiction’s administrative practices and payment history, and industry convention. To date the Fund has recorded no such receivable because there is limited precedent for collecting such prior year reclaims and the likelihood of collection remains uncertain.
Deferred Foreign Capital Gain Taxes: The Fund is subject to a tax imposed on net realized gains of securities of certain foreign countries. The Fund records an estimated deferred tax liability for net unrealized gains on these investments as reflected in the accompanying financial statements.
NOTE 3 – SECURITY VALUATION
Valuation of the Fund’s portfolio investment securities is performed in accordance with policies and procedures adopted by and under the oversight of the Trustees.
The Trustees of the Trust have appointed Thornburg Investment Management, Inc., the Trust’s investment advisor ( the “Advisor”) to assist the Trustees in obtaining market values for portfolio investments, evaluate and monitor professional pricing service providers appointed by the Trustees’ Audit Committee (the “Audit Committee”) to assist in determining fair values for portfolio investments, assist in calculating fair values for portfolio investments in certain circumstances, and to perform other functions in connection with the valuation of investments. The Advisor acts through its Valuation and Pricing Committee (the “Committee”) and other employees of the Advisor. The Committee regularly reviews its own valuation calculations, as well as the valuations, valuation techniques and services furnished by pricing service providers, considers circumstances which may require valuation calculations by the Committee, and reviews previous valuation calculations. The Committee reports to the Audit Committee on the Committee’s activities, the performance of pricing service providers, and other matters relating to valuation of portfolio investments.
In those instances when the Committee assists in calculating a fair value for a portfolio investment, the Committee seeks to determine the price that the Fund would reasonably expect to receive upon a sale of the investment in an orderly transaction between market participants on the valuation date. The Committee customarily utilizes quotations from securities broker dealers in calculating valuations, but also may utilize prices obtained from pricing service providers or other methods approved by the Audit Committee. Because fair values calculated by the Committee are estimates, the calculation of a value for an investment may differ from the price that would be realized by the Fund upon a sale of the investment, and the difference could be material to the Fund’s financial statements. The Committee’s calculation of a fair value for an investment may also differ from the prices obtained by other persons (including other mutual funds) for the investment.
Valuation of Securities: Securities and other portfolio investments which are listed or traded on a United States securities exchange are valued at the last reported sale price on the valuation date. Investments listed or traded on an exchange for which there has been no sale that day are valued at the mean between the last reported bid and asked prices on that valuation date. Portfolio investments reported by NASDAQ are valued at the official closing price on the valuation date. If an investment is traded on more than one exchange, the investment is considered traded on the exchange that is normally the primary market for that investment. Securities and other portfolio investments which are listed or traded on exchanges outside the United States are valued at the last price or the closing price of the investment on the exchange that is normally the primary market for the investment, as of the close of the exchange preceding the Fund’s valuation date. Foreign investments listed or traded on an exchange for which there has been no sale that day are valued at the mean between the last reported bid and asked prices on that valuation date.
In any case when a market quotation is not readily available for a portfolio investment ordinarily valued by market quotation, the Committee calculates a fair value for the investment using alternative methods approved by the Audit Committee. A market quotation is not readily available when the primary market or exchange for the investment is not open for the entire scheduled day of trading. Market quotations for an investment also may not be readily available if developments after the most recent close of the investment’s
Semi-Annual Report 29
| | |
| Notes to Financial Statements, Continued | | |
| |
Thornburg Investment Income Builder Fund | | March 31, 2017 (Unaudited) |
primary exchange or market, but prior to the close of business on any Fund business day, or an unusual event or significant period of time occurring since the availability of a market quotation, create a serious question concerning the reliability of the most recent market quotation available for the investment. In particular, on days when market volatility thresholds established by the Audit Committee are exceeded, foreign equity investments held by the Fund may be valued using alternative methods. The Committee customarily obtains valuations in these instances from pricing service providers approved by the Audit Committee. Pricing service providers ordinarily calculate valuations using multi-factor models to adjust market prices based upon various inputs, including exchange data, depository receipt prices, futures, index data and other data.
Debt obligations held by the Fund which are not listed or traded on exchanges or for which no reported market exists are ordinarily valued at the valuation obtained from a pricing service provider approved by the Audit Committee.
In any case when a pricing service provider fails to provide a valuation for a debt obligation held by the Fund, the Committee calculates a fair value for the obligation using alternative methods under procedures approved by the Audit Committee. Additionally, in cases when management believes that a valuation obtained from a pricing service provider merits review for significant reasons, the Committee decides whether or not to use the valuation calculated by the pricing service provider or to use an alternative method approved by the Audit Committee to calculate a fair value for the obligation.
Quotations for foreign investments expressed in foreign currency amounts are converted to U.S. dollar equivalents using a foreign exchange quotation from a third party service provider at the time of valuation. Foreign investments held by the Fund may be traded on days and at times when the Fund is not open for business. Consequently, the value of Fund investments may be significantly affected on days when shareholders cannot purchase or sell Fund shares. Futures contracts and other financial and derivative instruments traded on an exchange are valued at the latest published price for the instrument on its primary exchange. Listed options are valued at the last bid price.
Valuation Hierarchy: The Fund categorizes its investments based upon the inputs used in valuing those investments, according to a three-level hierarchy established in guidance from FASB. Categorization of investments using this hierarchy is intended by the FASB to maximize the use of observable inputs in valuing investments and minimize the use of unobservable inputs by requiring that the most observable inputs be used when available. Observable inputs are those that market participants would use in valuing an investment based on available market information. Unobservable inputs are those that reflect assumptions about the information market participants would use in valuing an investment. An investment’s level within the hierarchy is based on the lowest level input that is deemed significant to the valuation. The methodologies and inputs used to value investments are not necessarily indications of the risk or liquidity associated with those investments.
Various inputs are used in calculating valuations for the Fund’s investments. These inputs are generally summarized according to the three-level hierarchy below:
Level 1: Quoted prices in active markets for identical investments.
Level 2: Other direct or indirect significant observable inputs (including quoted prices for similar investments in active markets and other observable inputs, such as interest rates, prepayment rates, credit risk, etc.).
Level 3: Significant unobservable inputs (including the Committee’s own assumptions in calculating the fair values of investments).
Valuations for debt obligations held by the Fund are typically calculated by pricing service providers approved by the Audit Committee and are characterized as Level 2 within the valuation hierarchy.
On days when market volatility thresholds established by the Audit Committee are exceeded, foreign securities for which valuations are obtained from pricing service providers are fair valued. On these days, the foreign securities are characterized as Level 2 within the valuation hierarchy and revert to Level 1 after the threshold is no longer exceeded.
In a limited number of cases the Committee calculates a fair value for investments using broker quotations or other methods approved by the Audit Committee. When the Committee uses a single broker quotation to calculate a fair value for an investment without other significant observable inputs, or if a fair value is calculated using other significant inputs that are considered unobservable, the investment is characterized as Level 3 within the hierarchy. Other significant unobservable inputs used to calculate a fair value in these instances might include an income-based valuation approach which considers discounted anticipated future cash flows from the investment, and application of discounts due to the nature or duration of any restrictions on the disposition of the investment.
Valuations based upon the use of inputs from Levels 1, 2 or 3 may not represent the actual price received upon the disposition of an investment, and the Fund may receive a price that is lower than the valuation based upon these inputs when it sells the investment.
The following table displays a summary of the fair value hierarchy measurements of the Fund’s investments as of March 31, 2017. In any instance when valuation inputs from more than one level are used to determine the fair value of a specific investment, the investment is placed in the level of the table based upon the lowest level input that is significant in determining the fair value of the investment:
30 Semi-Annual Report
| | |
| Notes to Financial Statements, Continued | | |
| |
Thornburg Investment Income Builder Fund | | March 31, 2017 (Unaudited) |
| | | | | | | | | | | | | | | | |
| | | FAIR VALUE MEASUREMENTS AT MARCH 31, 2017 | |
| | | TOTAL | | | LEVEL 1 | | | LEVEL 2 | | | LEVEL 3(b) | |
Assets | | | | | | | | | | | | | | | | |
Investments in Securities* | | | | | | | | | | | | | | | | |
Common Stock(a) | | $ | 13,962,996,303 | | | $ | 13,900,844,642 | | | $ | 62,021,052 | | | $ | 130,609 | |
Preferred Stock(a) | | | 66,574,265 | | | | 15,981,934 | | | | 37,042,500 | | | | 13,549,831 | |
Asset Backed Securities | | | 29,826,481 | | | | — | | | | 27,830,650 | | | | 1,995,831 | |
Corporate Bonds | | | 1,349,491,614 | | | | — | | | | 1,297,477,890 | | | | 52,013,724 | |
Municipal Bonds | | | 2,916,354 | | | | — | | | | 2,916,354 | | | | — | |
Other Government | | | 7,027,407 | | | | — | | | | 7,027,407 | | | | — | |
Loan Participations | | | 182,899,578 | | | | — | | | | 136,322,300 | | | | 46,577,278 | |
Short Term Investments | | | 197,202,593 | | | | 197,202,593 | | | | — | | | | — | |
| | | | | | | | | | | | | | | | |
Total Investments in Securities | | $ | 15,798,934,595 | | | $ | 14,114,029,169 | | | $ | 1,570,638,153 | | | $ | 114,267,273 | |
Other Financial Instruments** | | | | | | | | | | | | | | | | |
Forward Currency Contracts | | $ | 3,461,272 | | | $ | — | | | $ | 3,461,272 | | | $ | — | |
Liabilities | | | | | | | | | | | | | | | | |
Other Financial Instruments** | | | | | | | | | | | | | | | | |
Forward Currency Contracts | | $ | 38,388,248 | | | $ | — | | | $ | 38,388,248 | | | $ | — | |
Spot Currency | | $ | 103,535 | | | $ | 103,535 | | | $ | — | | | $ | — | |
| * | See Schedule of Investments for a summary of the industry exposure as grouped according to the Global Industry Classification Standard (GICS), which is an industry taxonomy developed by MSCI, Inc. and Standard & Poor’s (S&P). |
| ** | Other Financial Instruments include investments not reflected in the Schedule of Investments, which may include futures, forwards and swap contracts, which are valued at the unrealized appreciation (depreciation) on the investment. |
| (a) | At March 31, 2017, industry classifications for Common Stock and Preferred Stock in Level 2 and Level 3 consist of $8,520,000 in Banks, $13,680,440 in Energy, $11,047,500 in Miscellaneous, and $79,496,052 in Telecommunication Services. |
| (b) | In accordance with the guidance prescribed in Accounting Standards Update (“ASU”) No. 2011-04, unadjusted broker quotes were applied to $65,886,644 portfolio securities characterized as Level 3 investments at March 31, 2017. The following table displays a summary of the valuation techniques and unobservable inputs used to value portfolio securities characterized as Level 3 investments, where no unadjusted broker quotes were available at March 31, 2017: |
| | | | | | | | | | |
| | | FAIR VALUE
AT MARCH 31, 2017 | | | VALUATION
TECHNIQUE(S) | | UNOBSERVABLE INPUT | | RANGE
(WEIGHTED AVERAGE) |
Common Stock | | $ | 130,609 | | | Discount to valuation | | Fair valued by the Committee due to halt in trading and lack of information and liquidity | | $10.50 (N/A) |
Preferred Stock | | | 13,549,831 | | | Cost basis | | Cost basis | | $9.77 (N/A) |
Asset-Backed Securities | | | 1,995,831 | | | Discounted cash flows | | Third party vendor projection of discounted cash flows | | 4.40% - 5.40% (1.62%) |
Corporate Bond | |
| 670,399
|
| | Discount to valuation
| | Fair valued by the Committee due to halt in trading and lack of information and liquidity | | $0.001-$4.15 (11.07%) |
| | | 7,303,805 | | | Discounted cash flows | | Discounted rate of cash flows | | 4.30%-5.30% (6.65%) |
Loan Participations | | | 6,930,000 | | | Cost basis | | Cost basis | | $99.00 (N/A) |
| |
| 17,589,913
|
| | Discounted cash flows
| | Third party vendor projection of discounted cash flows | | 9.00%-27.50% (10.25%) |
| |
| 210,241
|
| | Discount to valuation
| | Fair valued by the Committee due to halt in trading and lack of information and liquidity | | $100.00 (N/A) |
| | | | | | | | | | |
Total | | $ | 48,380,629 | | | | | | | |
In accordance with the guidance prescribed in ASU No. 2011-04, it is the policy of the Fund to recognize transfers between levels and those underlying events which caused the movement. The Fund recognized no transfers between Levels 1 and 2 for the six months ended March 31, 2017, other than when the Fund exceeded market volatility thresholds for foreign equity investments during the period.
A rollforward of fair value measurements using significant unobservable inputs (Level 3) for the six months ended March 31, 2017 is as follows:
Semi-Annual Report 31
| | |
| Notes to Financial Statements, Continued | | |
| |
Thornburg Investment Income Builder Fund | | March 31, 2017 (Unaudited) |
| | | | | | | | | | | | | | | | | | | | | | | | |
| | | PREFERRED
STOCK | | | COMMON
STOCK | | | ASSET BACKED
SECURITIES | | | CORPORATE
BONDS | | | LOAN
PARTICIPATIONS | | | TOTAL(e) | |
Beginning Balance 9/30/2016 | | $ | — | | | $ | — | | | $ | 2,237,813 | | | $ | 7,605,592 | | | $ | 18,137,761 | | | $ | 27,981,166 | |
Accrued Discounts (Premiums) | | | — | | | | — | | | | 7,096 | | | | 616,998 | | | | 70,465 | | | | 694,559 | |
Net Realized Gain (Loss)(a) | | | — | | | | — | | | | 33,980 | | | | 24,053 | | | | (972,700 | ) | | | (914,667 | ) |
Gross Purchases | | | 13,549,831 | | | | 130,609 | | | | — | | | | 3,001,320 | | | | 10,802,589 | | | | 27,484,349 | |
Gross Sales | | | — | | | | — | | | | (262,500 | ) | | | (3,472,588 | ) | | | (3,918,848 | ) | | | (7,653,936 | ) |
Net Change in Unrealized Appreciation (Depreciation)(b)(c) | | | — | | | | — | | | | (20,558 | ) | | | 2,251,521 | | | | (11,447,045 | ) | | | (9,216,082 | ) |
Transfers into Level 3(d) | | | — | | | | — | | | | — | | | | 41,986,828 | | | | 33,905,056 | | | | 75,891,884 | |
Transfers out of Level 3(d) | | | — | | | | — | | | | — | | | | — | | | | — | | | | — | |
| | | | | | | | | | | | | | | | | | | | | | | | |
Ending Balance 3/31/2017 | | $ | 13,549,831 | | | $ | 130,609 | | | $ | 1,995,831 | | | $ | 52,013,724 | | | $ | 46,577,278 | | | $ | 114,267,273 | |
| (a) | Amount of net realized gain (loss) from investments recognized in income is included in the Fund’s Statement of Operations for the six months ended March 31, 2017. |
| (b) | Amount of net change in unrealized appreciation (depreciation) on investments recognized in income is included in the Fund’s Statement of Operations for the six months ended March 31, 2017. |
| (c) | The net change in unrealized appreciation (depreciation) attributable to securities owned at March 31, 2017, which were valued using significant unobservable inputs, was $(10,105,331). This is included within net change in unrealized appreciation (depreciation) on investments in the Fund’s the Statement of Operations for the six months ended March 31, 2017. |
| (d) | Transfers into or out of Level 3 were out of or into Level 2, and were due to changes in other significant observable inputs available during the six months ended March 31, 2017. Transfers into or out of Level 3 are based on the beginning market value of the period in which they occurred. |
| (e) | Level 3 investments represent 0.72% of total net assets at the six months ended March 31, 2017. Significant fluctuations of the unobservable inputs applied to portfolio investments characterized as Level 3 could be expected to increase or decrease the fair value of these portfolio investments. |
NOTE 4 — INVESTMENT ADVISORY FEE AND OTHER TRANSACTIONS WITH AFFILIATES
Pursuant to an investment advisory agreement, the Advisor serves as the investment advisor and performs services for the Fund for which the fees are payable at the end of each month. Under the investment advisory agreement, the Fund pays the Advisor a management fee based on the daily net assets of the Fund at an annual rate as shown in the following table:
Management Fee Schedule
| | | | |
DAILY NET ASSETS | | FEE RATE | |
Up to $ 500 million | | | 0.875 | % |
Next $ 500 million | | | 0.825 | |
Next $ 500 million | | | 0.775 | |
Next $ 500 million | | | 0.725 | |
Over $ 2 billion | | | 0.670 | |
The Fund’s effective management fee for the period ended March 31, 2017 was 0.691% of the Fund’s average net assets.
The Fund pays to the Advisor the costs of personnel who perform certain accounting services for the Fund. For the six months ended March 31, 2017 the Fund paid $251,540 to the Advisor for these accounting services. The Trust has also entered into administrative service agreements with the Advisor, whereby the Advisor will perform certain administrative services related to each class of the Fund’s shares, and for which fees will be payable at an annual rate of up to .125 of 1% per annum of the average daily net assets attributable to each class of shares. Total administrative service fees incurred by each class of shares of the Fund for the six months ended March 31, 2017, are set forth in the Statement of Operations.
The Trust has an underwriting agreement with Thornburg Securities Corporation (the “Distributor”), an affiliate of the Advisor, which acts as the distributor of the Fund’s shares. For the six months ended March 31, 2017, the Distributor has advised the Fund that it earned net commissions aggregating $157,693 from the sale of Class A shares, and collected contingent deferred sales charges aggregating $58,738 from redemptions of Class C shares of the Fund.
Pursuant to a service plan under Rule 12b-1 of the Investment Company Act of 1940, the Fund may pay to the Distributor or securities dealers and other financial institutions at the Distributor’s direction an amount not to exceed .25 of 1% per annum of the average daily net assets attributable to Class A, Class C, Class R3, and Class R4 shares of the Fund for payments made by the Advisor to securities dealers and other financial institutions to obtain various shareholder and distribution related services. For the six months ended March 31, 2017, there were no 12b-1 service plan fees charged for Class I and R5 shares. The Advisor and Distributor each may pay out of its own resources additional expenses for distribution of the Fund’s shares and shareholder services.
32 Semi-Annual Report
| | |
| Notes to Financial Statements, Continued | | |
| |
Thornburg Investment Income Builder Fund | | March 31, 2017 (Unaudited) |
The Trust has also adopted distribution plans pursuant to Rule 12b-1, applicable only to the Fund’s Class C and Class R3 shares, under which the Fund compensates the Distributor for services in promoting the sale of Class C and Class R3 shares of the Fund at an annual rate of up to .75 of 1% per annum of the average daily net assets attributable to Class C shares, and an annual rate of up to .25 of 1% per annum of the average daily net assets attributable to Class R3 shares. Total fees incurred by each class of shares of the Fund under their respective service and distribution plans for the six months ended March 31, 2017, are set forth in the Statement of Operations.
The Advisor and Distributor have contractually agreed to waive fees and reimburse expenses incurred by the Fund so that actual expenses of certain share classes do not exceed levels as specified in the Fund’s most recent prospectus. The agreement may be terminated by the Fund at any time, but may not be terminated by the Advisor or Distributor before April 10, 2018, unless the Advisor ceases to be the investment advisor to the Fund or the Distributor ceases to be the distributor of the Fund prior to that date. The Advisor and Distributor may recoup amounts waived or reimbursed during the fiscal year if actual expenses fall below the contractual limit during that year.
For the six months ended March 31, 2017, the Advisor contractually reimbursed certain class specific expenses, administrative fees, and distribution fees of $916,120 for Class C shares, $31,849 for Class R3 shares, $31,935 for Class R4 shares, and $17,474 for Class R5 shares.
Certain officers and Trustees of the Trust are also officers or directors of the Advisor and Distributor. The compensation of independent Trustees is borne by the Trust.
The percentage of direct investments in the Fund held by the Trustees and Officers of the Trust and the Advisor is approximately 0.96%.
The Fund may purchase or sell securities from, or to an affiliated fund, provided the affiliation is due solely to having a common investment advisor, common officers, or common trustees, and provided that all such transactions will comply with Rule 17a-7 under the 1940 Act. For the six months ended March 31, 2017, the Fund had transactions with affiliated funds of $3,125,667 in purchases.
NOTE 5 – SHARES OF BENEFICIAL INTEREST
At March 31, 2017, there were an unlimited number of shares with no par value of beneficial interest authorized. Transactions in shares of beneficial interest were as follows:
| | | | | | | | | | | | | | | | |
| | | SIX MONTHS ENDED | | | YEAR ENDED | |
| | | MARCH 31, 2017 (UNAUDITED) | | | SEPTEMBER 30, 2016 (AUDITED) | |
| | | SHARES | | | AMOUNT | | | SHARES | | | AMOUNT | |
Class A Shares | | | | | | | | | | | | | | | | |
Shares sold | | | 7,044,248 | | | $ | 140,642,710 | | | | 19,832,477 | | | $ | 379,977,526 | |
Shares issued to shareholders in reinvestment of dividends | | | 3,207,291 | | | | 64,705,855 | | | | 8,070,888 | | | | 153,998,830 | |
Shares repurchased | | | (31,924,028 | ) | | | (639,223,681 | ) | | | (60,535,763 | ) | | | (1,155,223,991 | ) |
| | | | | | | | | | | | | | | | |
| | | | |
Net increase (decrease) | | | (21,672,489 | ) | | $ | (433,875,116 | ) | | | (32,632,398 | ) | | $ | (621,247,635 | ) |
| | | | | | | | | | | | | | | | |
Class C Shares | | | | | | | | | | | | | | | | |
Shares sold | | | 5,237,225 | | | $ | 104,685,460 | | | | 18,917,018 | | | $ | 362,084,120 | |
Shares issued to shareholders in reinvestment of dividends | | | 3,523,003 | | | | 70,988,434 | | | | 8,898,237 | | | | 169,695,424 | |
Shares repurchased | | | (38,283,240 | ) | | | (763,245,495 | ) | | | (67,268,251 | ) | | | (1,286,288,186 | ) |
| | | | | | | | | | | | | | | | |
| | | | |
Net increase (decrease) | | | (29,523,012 | ) | | $ | (587,571,601 | ) | | | (39,452,996 | ) | | $ | (754,508,642 | ) |
| | | | | | | | | | | | | | | | |
Class I Shares | | | | | | | | | | | | | | | | |
Shares sold | | | 46,590,454 | | | $ | 939,469,546 | | | | 72,402,003 | | | $ | 1,398,940,681 | |
Shares issued to shareholders in reinvestment of dividends | | | 6,258,988 | | | | 127,197,802 | | | | 14,573,749 | | | | 280,115,894 | |
Shares repurchased | | | (45,907,810 | ) | | | (923,801,005 | ) | | | (128,987,422 | ) | | | (2,476,401,725 | ) |
| | | | | | | | | | | | | | | | |
| | | | |
Net increase (decrease) | | | 6,941,632 | | | $ | 142,866,343 | | | | (42,011,670 | ) | | $ | (797,345,150 | ) |
| | | | | | | | | | | | | | | | |
Semi-Annual Report 33
| | |
| Notes to Financial Statements, Continued | | |
| |
Thornburg Investment Income Builder Fund | | March 31, 2017 (Unaudited) |
| | | | | | | | | | | | | | | | |
| | | SIX MONTHS ENDED | | | YEAR ENDED | |
| | | MARCH 31, 2017 (UNAUDITED) | | | SEPTEMBER 30, 2016 (AUDITED) | |
| | | SHARES | | | AMOUNT | | | SHARES | | | AMOUNT | |
Class R3 Shares | | | | | | | | | | | | | | | | |
Shares sold | | | 327,264 | | | $ | 6,541,464 | | | | 861,058 | | | $ | 16,544,230 | |
Shares issued to shareholders in reinvestment of dividends | | | 59,100 | | | | 1,191,747 | | | | 142,700 | | | | 2,722,374 | |
Shares repurchased | | | (662,149 | ) | | | (13,209,239 | ) | | | (1,245,253 | ) | | | (23,918,544 | ) |
| | | | | | | | | | | | | | | | |
| | | | |
Net increase (decrease) | | | (275,785 | ) | | $ | (5,476,028 | ) | | | (241,495 | ) | | $ | (4,651,940 | ) |
| | | | | | | | | | | | | | | | |
Class R4 Shares | | | | | | | | | | | | | | | | |
Shares sold | | | 256,959 | | | $ | 5,159,842 | | | | 727,487 | | | $ | 14,065,623 | |
Shares issued to shareholders in reinvestment of dividends | | | 26,774 | | | | 540,678 | | | | 61,508 | | | | 1,175,805 | |
Shares repurchased | | | (413,080 | ) | | | (8,290,975 | ) | | | (692,777 | ) | | | (13,376,189 | ) |
| | | | | | | | | | | | | | | | |
| | | | |
Net increase (decrease) | | | (129,347 | ) | | $ | (2,590,455 | ) | | | 96,218 | | | $ | 1,865,239 | |
| | | | | | | | | | | | | | | | |
Class R5 Shares | | | | | | | | | | | | | | | | |
Shares sold | | | 555,055 | | | $ | 11,173,686 | | | | 1,447,762 | | | $ | 27,879,490 | |
Shares issued to shareholders in reinvestment of dividends | | | 77,974 | | | | 1,583,532 | | | | 170,327 | | | | 3,272,878 | |
Shares repurchased | | | (911,171 | ) | | | (18,341,016 | ) | | | (1,393,727 | ) | | | (26,898,100 | ) |
| | | | | | | | | | | | | | | | |
| | | | |
Net increase (decrease) | | | (278,142 | ) | | $ | (5,583,798 | ) | | | 224,362 | | | $ | 4,254,268 | |
| | | | | | | | | | | | | | | | |
NOTE 6 – INVESTMENT TRANSACTIONS
For the six months ended March 31, 2017, the Fund had purchase and sale transactions of investments (excluding short-term investments and U.S. Government obligations) of $2,620,751,368 and $3,451,550,098, respectively.
NOTE 7 – DERIVATIVE FINANCIAL INSTRUMENTS WITH OFF-BALANCE SHEET RISK AND FOREIGN INVESTMENT RISK
The Fund may use a variety of derivative financial instruments to hedge or adjust the risks affecting its investment portfolio or to enhance investment returns. Provisions of the FASB Accounting Standards Codification 815-10-50 (“ASC 815”) require certain disclosures. The disclosures are intended to provide users of financial statements with an understanding of the use of derivative instruments by the Fund and how these derivatives affect the financial position, financial performance and cash flows of the Fund. The Fund does not designate any derivative instruments as hedging instruments under ASC 815. During the six months ended March 31, 2017, the Fund’s principal exposure to derivative financial instruments of the type addressed by ASC 815 was investment in foreign exchange contracts. A foreign exchange contract is an agreement between two parties to exchange different currencies at a specified rate of exchange at an agreed upon future date. Foreign exchange contracts involve risks to the Fund, including the risk that a contract’s counterparty will not meet its obligations to the Fund, the risk that a change in a contract’s value may not correlate perfectly with the currency the contract was intended to track, and the risk that the Fund’s Advisor is unable to correctly implement its strategy in using a contract. In any such instance, the Fund may not achieve the intended benefit of entering into a contract, and may experience a loss.
The Fund entered into forward currency contracts during the six months ended March 31, 2017 in the normal course of pursuing its investment objectives, with the objective of purchasing foreign investments or with the intent of reducing the risk to the value of the Fund’s foreign investments from adverse changes in the relationship between the U.S. dollar and foreign currencies. In each case these contracts have been initiated in conjunction with foreign investment transactions.
These contracts are accounted for by the Fund under ASC 815. Unrealized appreciation and depreciation on outstanding contracts are reported in the Fund’s Statement of Assets and Liabilities, as measured by the difference between the forward exchange rates at the reporting date and the forward exchange rates at each contract’s inception date. Net realized gain (loss) on contracts closed during the period, and changes in net unrealized appreciation (depreciation) on outstanding contracts are recognized in the Fund’s Statement of Operations.
The quarterly average value of open sell currency contracts for the six months ended March 31, 2017 was $5,271,874,559. Open buy currency contracts are entered into for the purpose of closing open sell currency contracts and the values are dependent upon the values of the open sell currency contracts to which they relate.
34 Semi-Annual Report
| | |
| Notes to Financial Statements, Continued | | |
| |
Thornburg Investment Income Builder Fund | | March 31, 2017 (Unaudited) |
The following table displays the outstanding forward currency contracts at March 31, 2017:
| | | | | | | | | | | | | | | | | | | | | | | | | | | | |
| OUTSTANDING FORWARD CURRENCY CONTRACTS TO BUY OR SELL AT MARCH 31, 2017 | |
CONTRACT DESCRIPTION | | BUY/SELL | | | CONTRACT
PARTY* | | | CONTRACT
AMOUNT | | | CONTRACT
VALUE DATE | | | VALUE USD | | | UNREALIZED
APPRECIATION | | | UNREALIZED
DEPRECIATION | |
South Korean Won | | | Buy | | | | SSB | | | | 12,013,526,100 | | | | 05/16/2017 | | | | 10,748,255 | | | $ | 259,756 | | | $ | — | |
South Korean Won | | | Buy | | | | SSB | | | | 9,387,117,600 | | | | 05/16/2017 | | | | 8,398,461 | | | | 84,288 | | | | — | |
South Korean Won | | | Buy | | | | SSB | | | | 11,823,526,200 | | | | 05/16/2017 | | | | 10,578,266 | | | | 77,799 | | | | — | |
South Korean Won | | | Sell | | | | SSB | | | | 235,568,706,500 | | | | 05/16/2017 | | | | 210,758,482 | | | | — | | | | (3,983,229 | ) |
Thai Baht | | | Sell | | | | BBH | | | | 1,543,281,600 | | | | 05/16/2017 | | | | 44,895,383 | | | | — | | | | (801,623 | ) |
Chinese Yuan Renminbi | | | Sell | | | | SSB | | | | 5,542,696,600 | | | | 04/28/2017 | | | | 804,957,862 | | | | — | | | | (2,665,087 | ) |
Euro | | | Sell | | | | SSB | | | | 111,700,000 | | | | 05/15/2017 | | | | 119,383,377 | | | | — | | | | (1,701,842 | ) |
Euro | | | Sell | | | | SSB | | | | 2,350,441,200 | | | | 05/15/2017 | | | | 2,512,118,254 | | | | — | | | | (8,169,740 | ) |
Great Britain Pound | | | Buy | | | | SSB | | | | 107,366,700 | | | | 04/10/2017 | | | | 134,538,194 | | | | — | | | | (774,985 | ) |
Great Britain Pound | | | Sell | | | | SSB | | | | 709,091,000 | | | | 04/10/2017 | | | | 888,542,000 | | | | — | | | | (12,098,433 | ) |
Swiss Franc | | | Sell | | | | SSB | | | | 473,571,500 | | | | 06/30/2017 | | | | 475,266,892 | | | | 2,781,532 | | | | — | |
Swiss Franc | | | Buy | | | | SSB | | | | 445,871,900 | | | | 04/03/2017 | | | | 445,137,423 | | | | — | | | | (2,682,493 | ) |
Swiss Franc | | | Sell | | | | SSB | | | | 54,794,700 | | | | 04/03/2017 | | | | 54,704,438 | | | | 257,897 | | | | — | |
Swiss Franc | | | Sell | | | | SSB | | | | 47,930,100 | | | | 04/03/2017 | | | | 47,851,146 | | | | — | | | | (246,140 | ) |
Swiss Franc | | | Sell | | | | SSB | | | | 41,248,100 | | | | 04/03/2017 | | | | 41,180,153 | | | | — | | | | (351,081 | ) |
Swiss Franc | | | Sell | | | | SSB | | | | 301,899,000 | | | | 04/03/2017 | | | | 301,401,687 | | | | — | | | | (4,913,595 | ) |
| | | | | | | | | | | | | | | | | | | | | | | | | | | | |
| | | | | | | |
Total | | | | | | | | | | | | | | | | | | | | | | $ | 3,461,272 | | | $ | (38,388,248 | ) |
| | | | | | | | | | | | | | | | | | | | | | | | | | | | |
| | | | | |
Net unrealized appreciation (depreciation) | | | | | | | | | | | | | | | | | | | $ | (34,926,976 | ) |
| | | | | | | | | | | | | | | | | | | | | | | | | | | | |
| * | Counterparties include State Street Bank and Trust Company (“SSB”) and Brown Brothers Harriman & Co. (“BBH”). |
The outstanding forward currency contracts in the foregoing table which were entered into with State Street Bank and Trust Company (“SSB”), were entered into pursuant to an International Swaps and Derivatives Association (“ISDA”) Master Agreement. Outstanding forward currency contracts which were entered into with Brown Brothers Harriman & Co. (“BBH”) were entered into pursuant to a written agreement with BBH. In the event of a default or termination under the ISDA Master Agreement with SSB or the agreement with BBH, the non-defaulting party has the right to close out all outstanding forward currency contracts between the parties and to net any payment amounts under those contracts, resulting in a single net amount payable by one party to the other.
Because the ISDA Master Agreement with SSB and the agreement with BBH does not result in an offset of reported amounts of financial assets and liabilities in the Fund’s Statement of Assets and Liabilities unless there has been an event of default or termination event under such agreements, the Fund does not net its outstanding forward currency contracts for the purpose of disclosure in the Fund’s Statement of Assets and Liabilities. Instead the Fund recognizes the unrealized appreciation (depreciation) on those forward currency contracts on a gross basis in the Fund’s Statement of Assets and Liabilities.
The unrealized appreciation (depreciation) of the outstanding forward currency contracts recognized in the Fund’s Statement of Assets and Liabilities at March 31, 2017 is disclosed in the following table:
| | | | | | |
| FAIR VALUES OF DERIVATIVE FINANCIAL INSTRUMENTS AT MARCH 31, 2017 | |
| ASSET DERIVATIVES | | BALANCE SHEET LOCATION | | FAIR VALUE | |
Foreign exchange contracts | | Assets - Unrealized appreciation on forward currency contracts | | $ | 3,461,272 | |
| | |
| LIABILITY DERIVATIVES | | BALANCE SHEET LOCATION | | FAIR VALUE | |
Foreign exchange contracts | | Liabilities - Unrealized depreciation on forward currency contracts | | $ | (38,388,248 | ) |
Because the Fund does not currently receive or post cash collateral in connection with its currency forward contracts, the net amounts of the Fund’s assets and liabilities which are attributable to those contracts at March 31, 2017 can be determined by offsetting the dollar amounts shown in the preceding table. Based on those amounts, the net amount of the Fund’s liabilities which is attributable to its outstanding forward currency contracts at March 31, 2017 is $34,125,353 attributable to the Fund’s contracts with SSB, and the net amount of the Fund’s liabilities which is attributable to those contracts at that date is $801,623 attributable to the Fund’s contracts with
Semi-Annual Report 35
| | |
| Notes to Financial Statements, Continued | | |
| |
Thornburg Investment Income Builder Fund | | March 31, 2017 (Unaudited) |
BBH. The Fund’s forward currency contracts are valued each day, and the net amounts of the Fund’s assets and liabilities which are attributable to those contracts are expected to vary over time.
The net realized gain (loss) from forward currency contracts and the net change in unrealized appreciation (depreciation) on outstanding forward currency contracts recognized in the Fund’s Statement of Operations for the six months ended March 31, 2017 are disclosed in the following tables:
| | | | |
NET REALIZED GAIN (LOSS) ON DERIVATIVE FINANCIAL INSTRUMENTS RECOGNIZED IN INCOME FOR THE SIX MONTHS ENDED MARCH 31, 2017 |
| | | TOTAL | | FORWARD CURRENCY CONTRACTS |
Foreign exchange contracts | | $ 255,719,049 | | $ 255,719,049 |
NET CHANGE IN UNREALIZED APPRECIATION (DEPRECIATION) OF DERIVATIVE FINANCIAL INSTRUMENTS RECOGNIZED IN INCOME FOR THE SIX MONTHS ENDED MARCH 31, 2017 |
| | | TOTAL | | FORWARD CURRENCY CONTRACTS |
Foreign exchange contracts | | $ (58,848,044) | | $ (58,848,044) |
OTHER NOTES
Risks: The Fund’s investments subject it to risks including, but not limited to, management risk, market and economic risk, risks affecting specific issuers, the risks associated with investments in small- and mid-cap companies and non-U.S. issuers (including developing country issuers), credit risk, high-yield risk, interest rate risk, prepayment risk, liquidity risk and real estate investment trust risk. Please see the Fund’s prospectus for a discussion of the risks associated with an investment in the Fund.
Subsequent Events: Fund management believes no events have occurred between March 31, 2017 and the date of issuance of the financial statements that require adjustment to or disclosure in the accompanying financial statements.
36 Semi-Annual Report
This page intentionally left blank.
Semi-Annual Report 37
Financial Highlights
Thornburg Investment Income Builder Fund
| | | | | | | | | | | | | | | | | | | | | | | | | | | | | | | | | | | | | | | | | | | | | | | | | | | | | | | | | | | | |
| | | PER SHARE PERFORMANCE (FOR A SHARE OUTSTANDING THROUGHOUT THE PERIOD) | | | RATIOS TO AVERAGE NET ASSETS | | | SUPPLEMENTAL DATA | |
UNLESS OTHERWISE NOTED, PERIODS ARE FISCAL YEARS ENDED SEPT. 30, | | NET ASSET
VALUE
BEGINNING
OF PERIOD | | | NET
INVESTMENT
INCOME
(LOSS)+ | | | NET
REALIZED
&
UNREALIZED
GAIN (LOSS)
ON
INVESTMENTS | | | TOTAL FROM
INVESTMENT
OPERATIONS | | | DIVIDENDS
FROM NET
INVESTMENT
INCOME | | | DIVIDENDS
FROM NET
REALIZED
GAINS | | | TOTAL
DIVIDENDS | | | NET
ASSET
VALUE
END
OF
PERIOD | | | NET
INVESTMENT
INCOME
(LOSS)
(%) | | | EXPENSES,
AFTER
EXPENSE
REDUCTIONS
(%) | | | EXPENSES,
AFTER
EXPENSE
REDUCTIONS
AND
NET OF
CUSTODY
CREDITS
(%) | | | EXPENSES,
BEFORE
EXPENSE
REDUCTIONS
(%) | | | TOTAL
RETURN
(%)(a) | | | PORTFOLIO
TURNOVER
RATE
(%)(a) | | | NET
ASSETS
AT END
OF
PERIOD
(THOUSANDS) | |
CLASS A SHARES | | | | | | | | | | | | | | | | | | | | | | | | | | | | | | | | | | | | | | | | | | | | | | | | | | | | | |
2017(b)(c) | | $ | 19.82 | | | | 0.33 | | | | 0.76 | | | | 1.09 | | | | (0.39 | ) | | | — | | | | (0.39 | ) | | $ | 20.52 | | | | 3.33 | (d) | | | 1.19 | (d) | | | 1.19 | (d) | | | 1.19 | (d) | | | 5.52 | | | | 16.78 | | | $ | 3,465,919 | |
2016(c) | | $ | 19.07 | | | | 0.93 | | | | 0.62 | | | | 1.55 | | | | (0.80 | ) | | | — | | | | (0.80 | ) | | $ | 19.82 | | | | 4.82 | | | | 1.18 | | | | 1.18 | | | | 1.18 | | | | 8.35 | | | | 42.81 | | | $ | 3,778,863 | |
2015(c) | | $ | 21.38 | | | | 0.85 | | | | (2.34 | ) | | | (1.49 | ) | | | (0.82 | ) | | | — | | | | (0.82 | ) | | $ | 19.07 | | | | 4.02 | | | | 1.17 | | | | 1.17 | | | | 1.17 | | | | (7.27 | ) | | | 51.27 | | | $ | 4,257,943 | |
2014(c) | | $ | 20.13 | | | | 1.10 | | | | 1.13 | | | | 2.23 | | | | (0.98 | ) | | | — | | | | (0.98 | ) | | $ | 21.38 | | | | 5.21 | | | | 1.18 | | | | 1.18 | | | | 1.18 | | | | 11.19 | | | | 38.81 | | | $ | 4,588,033 | |
2013(c) | | $ | 18.90 | | | | 1.03 | | | | 1.27 | | | | 2.30 | | | | (1.07 | ) | | | — | | | | (1.07 | ) | | $ | 20.13 | | | | 5.26 | | | | 1.18 | | | | 1.18 | | | | 1.18 | | | | 12.51 | | | | 46.14 | | | $ | 4,281,060 | |
2012(c) | | $ | 17.29 | | | | 1.15 | | | | 1.60 | | | | 2.75 | | | | (1.14 | ) | | | — | | | | (1.14 | ) | | $ | 18.90 | | | | 6.32 | | | | 1.20 | | | | 1.20 | | | | 1.20 | | | | 16.26 | | | | 40.96 | | | $ | 3,420,877 | |
CLASS C SHARES | | | | | | | | | | | | | | | | | | | | | | | | | | | | | | | | | | | | | | | | | | | | | | | | | | | | | |
2017(b) | | $ | 19.81 | | | | 0.26 | | | | 0.75 | | | | 1.01 | | | | (0.32 | ) | | | — | | | | (0.32 | ) | | $ | 20.50 | | | | 2.63 | (d) | | | 1.90 | (d) | | | 1.90 | (d) | | | 1.94 | (d) | | | 5.12 | | | | 16.78 | | | $ | 4,936,948 | |
2016 | | $ | 19.06 | | | | 0.79 | | | | 0.62 | | | | 1.41 | | | | (0.66 | ) | | | — | | | | (0.66 | ) | | $ | 19.81 | | | | 4.11 | | | | 1.90 | | | | 1.90 | | | | 1.93 | | | | 7.59 | | | | 42.81 | | | $ | 5,356,153 | |
2015 | | $ | 21.37 | | | | 0.70 | | | | (2.34 | ) | | | (1.64 | ) | | | (0.67 | ) | | | — | | | | (0.67 | ) | | $ | 19.06 | | | | 3.30 | | | | 1.90 | | | | 1.90 | | | | 1.92 | | | | (7.93 | ) | | | 51.27 | | | $ | 5,906,206 | |
2014 | | $ | 20.13 | | | | 0.94 | | | | 1.13 | | | | 2.07 | | | | (0.83 | ) | | | — | | | | (0.83 | ) | | $ | 21.37 | | | | 4.44 | | | | 1.90 | | | | 1.90 | | | | 1.93 | | | | 10.36 | | | | 38.81 | | | $ | 6,266,270 | |
2013 | | $ | 18.89 | | | | 0.89 | | | | 1.28 | | | | 2.17 | | | | (0.93 | ) | | | — | | | | (0.93 | ) | | $ | 20.13 | | | | 4.55 | | | | 1.90 | | | | 1.90 | | | | 1.94 | | | | 11.78 | | | | 46.14 | | | $ | 5,160,706 | |
2012 | | $ | 17.29 | | | | 1.02 | | | | 1.59 | | | | 2.61 | | | | (1.01 | ) | | | — | | | | (1.01 | ) | | $ | 18.89 | | | | 5.63 | | | | 1.90 | | | | 1.90 | | | | 1.97 | | | | 15.43 | | | | 40.96 | | | $ | 4,051,242 | |
CLASS I SHARES | | | | | | | | | | | | | | | | | | | | | | | | | | | | | | | | | | | | | | | | | | | | | | | | | | | | | |
2017(b) | | $ | 19.97 | | | | 0.37 | | | | 0.74 | | | | 1.11 | | | | (0.42 | ) | | | — | | | | (0.42 | ) | | $ | 20.66 | | | | 3.69 | (d) | | | 0.87 | (d) | | | 0.87 | (d) | | | 0.87 | (d) | | | 5.60 | | | | 16.78 | | | $ | 7,313,737 | |
2016 | | $ | 19.21 | | | | 1.00 | | | | 0.62 | | | | 1.62 | | | | (0.86 | ) | | | — | | | | (0.86 | ) | | $ | 19.97 | | | | 5.15 | | | | 0.86 | | | | 0.86 | | | | 0.86 | | | | 8.71 | | | | 42.81 | | | $ | 6,928,783 | |
2015 | | $ | 21.53 | | | | 0.93 | | | | (2.35 | ) | | | (1.42 | ) | | | (0.90 | ) | | | — | | | | (0.90 | ) | | $ | 19.21 | | | | 4.35 | | | | 0.85 | | | | 0.85 | | | | 0.85 | | | | (6.94 | ) | | | 51.27 | | | $ | 7,472,344 | |
2014 | | $ | 20.27 | | | | 1.16 | | | | 1.15 | | | | 2.31 | | | | (1.05 | ) | | | — | | | | (1.05 | ) | | $ | 21.53 | | | | 5.45 | | | | 0.86 | | | | 0.86 | | | | 0.86 | | | | 11.54 | | | | 38.81 | | | $ | 7,454,275 | |
2013 | | $ | 19.03 | | | | 1.10 | | | | 1.28 | | | | 2.38 | | | | (1.14 | ) | | | — | | | | (1.14 | ) | | $ | 20.27 | | | | 5.58 | | | | 0.85 | | | | 0.85 | | | | 0.85 | | | | 12.94 | | | | 46.14 | | | $ | 5,567,617 | |
2012 | | $ | 17.40 | | | | 1.22 | | | | 1.61 | | | | 2.83 | | | | (1.20 | ) | | | — | | | | (1.20 | ) | | $ | 19.03 | | | | 6.67 | | | | 0.89 | | | | 0.89 | | | | 0.89 | | | | 16.61 | | | | 40.96 | | | $ | 3,981,955 | |
CLASS R3 SHARES | | | | | | | | | | | | | | | | | | | | | | | | | | | | | | | | | | | | | | | | | | | | | | | | | | | | | |
2017(b) | | $ | 19.82 | | | | 0.30 | | | | 0.75 | | | | 1.05 | | | | (0.36 | ) | | | — | | | | (0.36 | ) | | $ | 20.51 | | | | 3.03 | (d) | | | 1.50 | (d) | | | 1.50 | (d) | | | 1.59 | (d) | | | 5.31 | | | | 16.78 | | | $ | 75,253 | |
2016 | | $ | 19.07 | | | | 0.87 | | | | 0.62 | | | | 1.49 | | | | (0.74 | ) | | | — | | | | (0.74 | ) | | $ | 19.82 | | | | 4.53 | | | | 1.50 | | | | 1.50 | | | | 1.59 | | | | 8.01 | | | | 42.81 | | | $ | 78,188 | |
2015 | | $ | 21.37 | | | | 0.78 | | | | (2.32 | ) | | | (1.54 | ) | | | (0.76 | ) | | | — | | | | (0.76 | ) | | $ | 19.07 | | | | 3.70 | | | | 1.50 | | | | 1.50 | | | | 1.55 | | | | (7.52 | ) | | | 51.27 | | | $ | 79,834 | |
2014 | | $ | 20.13 | | | | 1.03 | | | | 1.12 | | | | 2.15 | | | | (0.91 | ) | | | — | | | | (0.91 | ) | | $ | 21.37 | | | | 4.84 | | | | 1.49 | | | | 1.49 | | | | 1.55 | | | | 10.80 | | | | 38.81 | | | $ | 83,670 | |
2013 | | $ | 18.89 | | | | 0.97 | | | | 1.28 | | | | 2.25 | | | | (1.01 | ) | | | — | | | | (1.01 | ) | | $ | 20.13 | | | | 4.96 | | | | 1.49 | | | | 1.49 | | | | 1.70 | | | | 12.23 | | | | 46.14 | | | $ | 61,334 | |
2012 | | $ | 17.28 | | | | 1.10 | | | | 1.60 | | | | 2.70 | | | | (1.09 | ) | | | — | | | | (1.09 | ) | | $ | 18.89 | | | | 6.05 | | | | 1.50 | | | | 1.50 | | | | 1.59 | | | | 15.94 | | | | 40.96 | | | $ | 47,023 | |
CLASS R4 SHARES | | | | | | | | | | | | | | | | | | | | | | | | | | | | | | | | | | | | | | | | | | | | | | | | | | | | | |
2017(b) | | $ | 19.85 | | | | 0.31 | | | | 0.75 | | | | 1.06 | | | | (0.37 | ) | | | — | | | | (0.37 | ) | | $ | 20.54 | | | | 3.14 | (d) | | | 1.40 | (d) | | | 1.40 | (d) | | | 1.48 | (d) | | | 5.36 | | | | 16.78 | | | $ | 44,907 | |
2016 | | $ | 19.10 | | | | 0.89 | | | | 0.62 | | | | 1.51 | | | | (0.76 | ) | | | — | | | | (0.76 | ) | | $ | 19.85 | | | | 4.63 | | | | 1.40 | | | | 1.40 | | | | 1.48 | | | | 8.12 | | | | 42.81 | | | $ | 45,968 | |
2015 | | $ | 21.42 | | | | 0.81 | | | | (2.35 | ) | | | (1.54 | ) | | | (0.78 | ) | | | — | | | | (0.78 | ) | | $ | 19.10 | | | | 3.81 | | | | 1.40 | | | | 1.40 | | | | 1.46 | | | | (7.48 | ) | | | 51.27 | | | $ | 42,392 | |
2014 | | $ | 20.17 | | | | 1.04 | | | | 1.16 | | | | 2.20 | | | | (0.95 | ) | | | — | | | | (0.95 | ) | | $ | 21.42 | | | | 4.88 | | | | 1.35 | | | | 1.35 | | | | 1.40 | | | | 11.00 | | | | 38.81 | | | $ | 39,890 | |
2013 | | $ | 18.93 | | | | 0.99 | | | | 1.29 | | | | 2.28 | | | | (1.04 | ) | | | — | | | | (1.04 | ) | | $ | 20.17 | | | | 5.05 | | | | 1.37 | | | | 1.37 | | | | 1.41 | | | | 12.35 | | | | 46.14 | | | $ | 24,906 | |
2012 | | $ | 17.31 | | | | 1.12 | | | | 1.61 | | | | 2.73 | | | | (1.11 | ) | | | — | | | | (1.11 | ) | | $ | 18.93 | | | | 6.14 | | | | 1.39 | | | | 1.39 | | | | 1.53 | | | | 16.10 | | | | 40.96 | | | $ | 19,471 | |
CLASS R5 SHARES | | | | | | | | | | | | | | | | | | | | | | | | | | | | | | | | | | | | | | | | | | | | | | | | | | | | | |
2017(b) | | $ | 19.95 | | | | 0.35 | | | | 0.76 | | | | 1.11 | | | | (0.41 | ) | | | — | | | | (0.41 | ) | | $ | 20.65 | | | | 3.54 | (d) | | | 0.99 | (d) | | | 0.99 | (d) | | | 1.07 | (d) | | | 5.60 | | | | 16.78 | | | $ | 83,809 | |
2016 | | $ | 19.20 | | | | 0.98 | | | | 0.62 | | | | 1.60 | | | | (0.85 | ) | | | — | | | | (0.85 | ) | | $ | 19.95 | | | | 5.08 | | | | 0.99 | | | | 0.99 | | | | 1.07 | | | | 8.52 | | | | 42.81 | | | $ | 86,535 | |
2015 | | $ | 21.52 | | | | 0.90 | | | | (2.35 | ) | | | (1.45 | ) | | | (0.87 | ) | | | — | | | | (0.87 | ) | | $ | 19.20 | | | | 4.23 | | | | 0.98 | | | | 0.98 | | | | 1.07 | | | | (7.06 | ) | | | 51.27 | | | $ | 78,945 | |
2014 | | $ | 20.26 | | | | 1.10 | | | | 1.19 | | | | 2.29 | | | | (1.03 | ) | | | — | | | | (1.03 | ) | | $ | 21.52 | | | | 5.15 | | | | 0.99 | | | | 0.99 | | | | 1.10 | | | | 11.40 | | | | 38.81 | | | $ | 64,748 | |
2013 | | $ | 19.01 | | | | 1.07 | | | | 1.30 | | | | 2.37 | | | | (1.12 | ) | | | — | | | | (1.12 | ) | | $ | 20.26 | | | | 5.37 | | | | 0.99 | | | | 0.98 | | | | 1.05 | | | | 12.80 | | | | 46.14 | | | $ | 39,985 | |
2012 | | $ | 17.40 | | | | 1.21 | | | | 1.58 | | | | 2.79 | | | | (1.18 | ) | | | — | | | | (1.18 | ) | | $ | 19.01 | | | | 6.61 | | | | 0.99 | | | | 0.99 | | | | 1.29 | | | | 16.44 | | | | 40.96 | | | $ | 14,914 | |
| (a) | Not annualized for periods less than one year. |
| (b) | Unaudited Six Month Period Ended March 31. |
| (c) | Sales loads are not reflected in computing total return. |
| + | Based on weighted average shares outstanding. |
See notes to financial statements.
| | |
| 38 Semi-Annual Report | | Semi-Annual Report 39 |
| | |
| Expense Example | | |
| |
Thornburg Investment Income Builder Fund | | March 31, 2017 (Unaudited) |
As a shareholder of the Fund, you incur two types of costs:
| | (1) | transaction costs, including |
(a) sales charges (loads) on purchase payments, for Class A shares;
(b) a deferred sales charge on redemptions of any part or all of a purchase of $1 million of Class A shares within 12 months of purchase;
(c) a deferred sales charge on redemptions of Class C shares within 12 months of purchase;
| | (2) | ongoing costs, including management fees; distribution and/or service (12b-1) fees; and other Fund expenses. |
This example is intended to help you understand your ongoing costs (in dollars) of investing in the Fund and to compare these costs with the ongoing costs of investing in other mutual funds.
The example is based on a $1,000 investment beginning on October 1, 2016, and held until March 31, 2017.
| | | | | | | | | | | | |
| | | BEGINNING
ACCOUNT VALUE
10/1/16 | | | ENDING
ACCOUNT VALUE
3/31/17 | | | EXPENSES PAID
DURING PERIOD†
10/1/16–3/31/17 | |
CLASS A SHARES | | | | | | | | | | | | |
Actual | | $ | 1,000.00 | | | $ | 1,055.18 | | | $ | 6.09 | |
Hypothetical* | | $ | 1,000.00 | | | $ | 1,019.01 | | | $ | 5.98 | |
CLASS C SHARES | | | | | | | | | | | | |
Actual | | $ | 1,000.00 | | | $ | 1,051.17 | | | $ | 9.71 | |
Hypothetical* | | $ | 1,000.00 | | | $ | 1,015.47 | | | $ | 9.54 | |
CLASS I SHARES | | | | | | | | | | | | |
Actual | | $ | 1,000.00 | | | $ | 1,056.03 | | | $ | 4.45 | |
Hypothetical* | | $ | 1,000.00 | | | $ | 1,020.61 | | | $ | 4.37 | |
CLASS R3 SHARES | | | | | | | | | | | | |
Actual | | $ | 1,000.00 | | | $ | 1,053.13 | | | $ | 7.68 | |
Hypothetical* | | $ | 1,000.00 | | | $ | 1,017.45 | | | $ | 7.55 | |
CLASS R4 SHARES | | | | | | | | | | | | |
Actual | | $ | 1,000.00 | | | $ | 1,053.65 | | | $ | 7.16 | |
Hypothetical* | | $ | 1,000.00 | | | $ | 1,017.96 | | | $ | 7.04 | |
CLASS R5 SHARES | | | | | | | | | | | | |
Actual | | $ | 1,000.00 | | | $ | 1,055.96 | | | $ | 5.07 | |
Hypothetical* | | $ | 1,000.00 | | | $ | 1,020.00 | | | $ | 4.99 | |
| † | Expenses are equal to the annualized expense ratio for each class (A: 1.19%; C: 1.90%; I: 0.87%; R3: 1.50%; R4: 1.40%; R5: 0.99%) multiplied by the average account value over the period, multiplied by 182/365 to reflect the one-half year period. |
| * | Hypothetical assumes a rate of return of 5% per year before expenses. |
ACTUAL EXPENSES
For each class of shares, the first line of the accompanying table provides information about actual account values and actual expenses. You may use the information in this line, together with the amount you invested, to estimate the expenses that you paid over the period. Simply divide your account value by $1,000 (for example, an $8,600 account value divided by $1,000 = 8.6), then multiply the result by the number in the first line for your class of shares under the heading entitled “Expenses Paid During Period” to estimate the expenses you paid on your account during this period.
HYPOTHETICAL EXAMPLE FOR COMPARISON PURPOSES
For each class of shares, the second line of the accompanying table provides information about hypothetical account values and hypothetical expenses based on the Fund’s actual expense ratio and an assumed rate of return of 5% per year before expenses, which is not the Fund’s actual return. The hypothetical account values and expenses may not be used to estimate the actual ending account balance or expenses you paid for the period. You may use this information to compare the ongoing costs of investing in the Fund and other funds. To do so, compare this 5% hypothetical example with the 5% hypothetical examples that appear in the shareholder reports of the other funds.
Please note that the expenses shown in the table are meant to highlight your ongoing costs only and do not reflect any transactional costs, such as sales charges (loads), redemption fees, or exchange fees. Therefore, the second line of the table for each class of shares is useful in comparing ongoing costs only, and will not help you determine the relative total costs of owning different funds. In addition, if these transactional costs were included, your costs would have been higher.
40 Semi-Annual Report
| | |
| Other Information | | |
| |
Thornburg Investment Income Builder Fund | | March 31, 2017 (Unaudited) |
PORTFOLIO PROXY VOTING
Policies and Procedures:
The Trust has delegated to Thornburg Investment Management, Inc. (the “Advisor”) voting decisions respecting proxies for the Fund’s voting securities. The Advisor makes voting decisions in accordance with its Proxy Voting Policy and Procedures. A description of the Policy and Procedures is available (i) without charge, upon request, by calling the Advisor toll-free at 1-800-847-0200, (ii) on the Thornburg website at www.thornburg.com, and (iii) on the Securities and Exchange Commission’s website at www.sec.gov.
Information regarding how proxies were voted is available on or before August 31 of each year for the twelve months ending the preceding June 30. This information is available (i) without charge, upon request by calling the Advisor toll-free at 1-800-847-0200, (ii) on the Thornburg website at www.thornburg.com, and (iii) on the Securities and Exchange Commission’s website at www.sec.gov.
AVAILABILITY OF QUARTERLY PORTFOLIO SCHEDULE
The Fund files with the Securities and Exchange Commission schedules of its portfolio holdings on Form N-Q for the first and third quarters of each fiscal year. The Fund’s Forms N-Q are available on the Commission’s website at www.sec.gov, or may be reviewed and copied at the Commission’s Public Reference Room in Washington, D.C. Information on the operation of the Public Reference Room may be obtained by calling 1-800-SEC-0330. The Fund also makes this information available on its website at www.thornburg. com/download or upon request by calling 1-800-847-0200.
Semi-Annual Report 41
Trustees’ Statement to Shareholders
Readopted September 12, 2016
The Trustees believe current and prospective shareholders should know how we discharge our responsibilities in supervising the Funds’ investment advisor and in reviewing the advisor’s contract for renewal. Since 2005, we have issued a statement which sets out clearly the three principal guidelines that we follow in supervising the Trust’s investment advisor on your behalf. In accordance with our customary practice, in September of this year we again reviewed our statement and concluded we should reissue this statement outlining the principal features of our supervision of the advisor’s performance of investment management services for the Funds.
We begin with the premise that each shareholder selected his or her Fund because its investments are managed by the investment advisor identified in the prospectus and in accordance with the objective and policies described in the prospectus. We realize, as each of you do, that if you believe that your Fund’s stated objective and policies no longer serve your personal investment goals, you can sell your shares and leave the Fund.
Therefore, we believe that our primary supervisory task—our principal obligation to you—is to assess the nature and quality of the advisor’s services, and to confirm that the advisor actively and competently pursues the Fund’s objective, in accordance with the policies set out in the prospectus. To do this, we meet regularly with management to review your Fund’s portfolio and to discuss the advisor’s specific actions and judgments in pursuing the Fund’s objective. We do not substitute our own judgment for the advisor’s decisions in selecting investments; the advisor is paid to exercise its informed judgment on investment decisions, and we seek to confirm, in reviewing the advisor’s performance, that the advisor is doing just that.
Second, we are conscious of costs and the effect that costs have on shareholders’ returns. We try to make sure that your Fund’s fees and costs are reasonable in relationship to the services rendered and that they are generally in line with those charged by other expert investment advisors, consistent with our belief that the Fund’s investors searched for and expect that expertise and attention and have decided to pay a reasonable price for it. We do not put the management contract “out to bid” as a matter of course, and we would not do so unless we had concluded that the advisor materially had failed to pursue the Fund’s objectives in accordance with its policies, or for other equally important reasons. We believe that any other approach would be inconsistent with your interests and contrary to your expectations when you bought shares of the Fund in the first place.
Finally, because we believe that most Thornburg Fund shareholders have invested with a long-term perspective, we try not to focus too much on the fashions of the moment and on short-term performance. The market will not favor any specific investment objective or set of policies at all times and under all economic circumstances. A fund will experience periods of both high and low returns relative to other funds and other investments. Even if one of our Funds is not favored by the market at a particular time, we believe that the advisor is nonetheless obliged to remain true to the Fund’s objective and policies, and we watch to see that it does so.
Trustees of Thornburg Investment Trust
42 Semi-Annual Report
Thornburg Funds
Thornburg Investment Management is a privately-owned global investment firm that offers a range of solutions for retail and institutional investors. Founded in 1982 and headquartered in Santa Fe, New Mexico, we manage approximately $49 billion (as of March 31, 2017) across U.S. mutual funds, separate accounts for high-net-worth investors and institutional accounts, and UCITS funds for non-U.S. investors.
The fund outlined in this report is one of many equity and fixed-income products available from Thornburg Investment Management.
EQUITY FUNDS
| | • | | Thornburg Investment Income Builder Fund |
| | • | | Thornburg Global Opportunities Fund |
| | • | | Thornburg International Value Fund |
| | • | | Thornburg Better World International Fund |
| | • | | Thornburg International Growth Fund |
| | • | | Thornburg Developing World Fund |
| | • | | Thornburg Core Growth Fund |
FIXED INCOME FUNDS
| | • | | Thornburg Low Duration Income Fund |
| | • | | Thornburg Limited Term U.S. Government Fund |
| | • | | Thornburg Limited Term Income Fund |
| | • | | Thornburg Strategic Income Fund |
| | • | | Thornburg Low Duration Municipal Fund |
| | • | | Thornburg Limited Term Municipal Fund |
| | • | | Thornburg Intermediate Municipal Fund |
| | • | | Thornburg California Limited Term Municipal Fund |
| | • | | Thornburg New Mexico Intermediate Municipal Fund |
| | • | | Thornburg New York Intermediate Municipal Fund |
| | • | | Thornburg Strategic Municipal Income Fund |
ALTERNATIVE FUNDS
| | • | | Thornburg Long/Short Equity Fund |
Before investing, carefully consider the Fund’s investment goals, risks, charges, and expenses. For a prospectus or summary prospectus containing this and other information, contact your financial advisor or visit thornburg.com. Read it carefully before investing.
For additional information, please visit thornburg.com
Thornburg Investment Management, Inc. 2300 North Ridgetop Road, Santa Fe, NM 87506
Semi-Annual Report 43

This Semi-Annual Report is submitted for the general information of shareholders of the Fund. It is not authorized for distribution to prospective investors in the Fund unless preceded or accompanied by an effective prospectus.
| | | | |
| Investment Advisor: | | Distributor: | | |
| Thornburg Investment Management® | | Thornburg Securities Corporation® | | |
| 800.847.0200 | | 800.847.0200 | | TH1075 |
Semi-Annual Report March 31, 2017 THORNBURG GLOBAL OPPORTUNITIES FUND
About Thornburg Investment Management
It’s more than what we do. It’s how we do it.
At Thornburg, we are very different in how we think, invest, and are structured. We believe this difference is what makes us successful in helping individuals reach their long-term financial goals. How we think
Flexible Perspective
Our perspective on investment opportunities is more flexible than most, viewing a wide range of opportunities beyond conventional boundaries to find hidden value.
Collaboration
Collectively, we hone ideas via borderless cross-pollination for better judgment and better results. How we invest
Portfolio Construction
Disciplined construction guided more by our convictions than convention.
CONVICTION
Thorough analysis and our relative-value framework lead to conviction in our securities selection.
UNCONVENTIONAL
Active management means we seek the best value for our clients rather than using conventional benchmarks as our starting point. How we’re structured
Structured for Excellence
How we think and how we invest is made possible by how we’re structured.
TEAM APPROACH
FAR FROM THE HERD
ACCESS & TRANSPARENCY
2 Semi-Annual Report
Semi-Annual Report
Thornburg Global Opportunities Fund
March 31, 2017
| | | | |
SHARE CLASS | | NASDAQ SYMBOL | | CUSIP |
Class A | | THOAX | | 885-215-343 |
Class C | | THOCX | | 885-215-335 |
Class I | | THOIX | | 885-215-327 |
Class R3 | | THORX | | 885-215-145 |
Class R4 | | THOVX | | 885-215-137 |
Class R5 | | THOFX | | 885-215-129 |
Class I, R3, R4, and R5 shares may not be available to all investors. Minimum investments for Class I shares may be higher than those for other classes.
Investments carry risks, including possible loss of principal. Additional risks may be associated with investments outside the United States, especially in emerging markets, including currency fluctuations, illiquidity, volatility, and political and economic risks. Investments in small- and mid-capitalization companies may increase the risk of greater price fluctuations. Please see the Fund’s prospectus for a discussion of the risks associated with an investment in the Fund. Investments in the Fund are not FDIC insured, nor are they bank deposits or guaranteed by a bank or any other entity.
Funds invested in a smaller number of holdings may expose an investor to greater volatility.
Semi-Annual Report 3
Letter to Shareholders
| | |
| |
Thornburg Global Opportunities Fund | | March 31, 2017 (Unaudited) |
April 20, 2017
Dear Fellow Shareholder:
This letter will highlight the results of Thornburg Global Opportunities Fund for the six-month period ended March 31, 2017. In addition, we will comment on the overall investment landscape. Recall that Thornburg Global Opportunities Fund seeks capital appreciation from a portfolio of typically 30–40 equity investments from around the world. We believe the structure of the Fund—built on our core investment principles of flexibility, focus, and value—gives us a durable framework for value-added investing.
The Fund’s total return for the six-month period ended March 31, 2017, was 13.10% (Class A shares without sales charge), outperforming the 8.18% return of the benchmark MSCI All Country World Index by almost five percentage points. The net asset value (NAV) per A share increased from $24.90 to $28.10. The Class A shares also paid dividend distributions amounting to 5.85 cents per share. The dividends per share for other share classes varied due to class-specific expenses.
Although six months is a very short measurement period, recent results extend the favorable performance that your Fund has seen over the long term. From its inception on July 28, 2006, through March 31, 2017, Thornburg Global Opportunities Fund has outperformed the MSCI All-Country World Index on average over 480 basis points (or 4.8%) per year, resulting in a total cumulative return since inception of 177% (for the A shares without sales charge) versus 72% for the index. As of March 2017, the Fund’s Class A and I shares are both rated five stars by Morningstar and rank in the top 1% of world stock funds for the time period starting August 2006. Additionally, we were pleased to be recognized last month by Investor’s Business Daily, which awarded Thornburg Global Opportunities Fund the No. 1 ranking among international funds based on its long-term record.1 Performance data for various measurement periods is included on page 7 of this report.
Markets rallied worldwide over the past six months, with all major bourses extending their gains from the second half of last year into early 2017. Underpinning this were a host of factors including favorable macroeconomic developments in many regions and accommodative monetary policy from major central banks. JPMorgan’s Chairman Jamie Dimon recently commented that the U.S. economic agenda has awoken the “animal spirits” of the markets and boosted confidence.2 From an industry perspective, nine of the eleven sectors of the MSCI All Country World Index delivered positive returns for the period ranging from 0.7% (consumer staples) to 18.3% (financials). The two sectors producing negative returns were real estate (-1.9%), and telecommunication services (-0.3%).
Performance data shown represents past performance and is no guarantee of future results. Investment return and principal value will fluctuate so shares, when redeemed, may be worth more or less than their original cost. Current performance may be lower or higher than quoted. For performance current to the most recent month end, visit thornburg.com or call 800.847.0200.
The maximum sales charge for Class A shares is 4.50%. If the sales charge had been deducted, returns would be lower. The total annual fund operating expense of Class A shares is 1.35%, as disclosed in the most recent prospectus.
Table I Morningstar World Stock Ratings and Rankings
as of March 31, 2017
| | | | | | | | | | | | | | | | | | | | |
| | | | | | RATINGS | |
| | | | | | OVERALL | | | 3-YR | | | 5-YR | | | 10-YR | |
A Shares | | | | | | | 5 | | | | 5 | | | | 5 | | | | 4 | |
I Shares | | | | | | | 5 | | | | 5 | | | | 5 | | | | 5 | |
# of Funds | | | | | | | 839 | | | | 839 | | | | 673 | | | | 382 | |
| |
| | | RANKINGS | |
| | | 1-YR | | | 3-YR | | | 5-YR | | | 10-YR | | | SINCE INCEP. | |
A Shares | | | 48 | % | | | 5 | % | | | 3 | % | | | 3 | % | | | 1 | % |
I Shares | | | 42 | % | | | 4 | % | | | 2 | % | | | 2 | % | | | 1 | % |
# of Funds | | | 1023 | | | | 839 | | | | 673 | | | | 382 | | | | 528 | |
Percentile rankings are based on total returns, before sales charge. Source: Morningstar.
To determine a fund’s Morningstar Rating™, funds and other managed products with at least a three-year history are ranked in their categories by their Morningstar Risk-Adjusted Return scores. The top 10% receive 5 stars; the next 22.5%, 4 stars; the middle 35%, 3 stars; the next 22.5%, 2 stars; and the bottom 10% receive 1 star. The Risk-Adjusted Return accounts for variation in a managed product’s monthly excess performance (excluding sales charges), placing more emphasis on downward variations and rewarding consistent performance. Other share classes may have different performance characteristics. © 2017 Morningstar, Inc. All Rights Reserved. The information contained herein: (1) is proprietary to Morningstar and/or its content providers; (2) may not be copied or distributed; and (3) is not warranted to be accurate, complete or timely. Neither Morningstar nor its content providers are responsible for any damages or losses arising from any use of this information. Past performance is no guarantee of future results.
Table II | Total Return for Global Indices
| | | | |
IN U.S. DOLLAR TERMS | | SIX-MONTHS ENDED
MARCH 31, 2017 | |
S&P 500 Index | | | 10.12 | % |
Nikkei 225 Index | | | 5.65 | % |
Euro Stoxx Index | | | 12.14 | % |
| |
Source: Bloomberg. | | | | |
| 1. | http://www.investors.com/best-mutual-fund-awards/best-mutual-funds-awards-by-category-international-stock/ |
| 2. | Animal spirits is the term economist John Maynard Keynes used in the 1930s to describe the emotions that guide human behavior. |
4 Semi-Annual Report
| | |
| Letter to Shareholders, | | |
| |
Continued | | |
| |
Thornburg Global Opportunities Fund | | March 31, 2017 (Unaudited) |
During the semi-annual period, 17 stocks contributed at least 25 basis points (0.25%) to overall Fund results, while four subtracted at least 25 basis points. Contribution to overall Fund performance incorporates both position size and return. Significant positive contributors during the period included multi-national telecommunications provider Altice SA; Citigroup; Macau casino operator Galaxy Entertainment; fiber network operator Level 3 Communications; and T-Mobile U.S.
T-Mobile U.S. has been in the news recently regarding mergers and acquisitions (M&A) speculation. Thornburg Global Opportunities has benefitted periodically in the past from merger activity. For example, in October 2016, Level 3 Communications announced a tie-up with another U.S. telecom operator, CenturyLink, which boosted the Fund’s performance at that time. M&A activity has flourished over the past few years, which is attributable to a variety of factors including strong balance sheets, low financing costs, and benign credit market conditions. Investment bank Jeffries reports that the U.S. high yield market just recorded its largest weekly transaction volume of all time, totaling over $17 billion of issuance and spanning the spectrum of credit quality. Chinese bidders for large Western companies have also become a major factor in recent M&A.
We attempt to be diligent in considering both the risks and benefits of M&A activity. We try to align ourselves with management teams that have shown effective judgment in the past. Sometimes M&A deals or merely rumors can catalyze other transactions. In any case, other companies in our current portfolio (e.g. Altice and InterXion) have been covered by the media in conjunction with M&A possibilities.3 The M&A landscape could remain lively in 2017.
Chart I Largest M&A Transactions, Last 12 Months
(Acquiror / Target, $ billions)
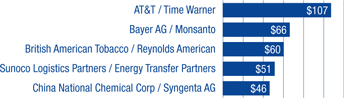
Source: Bloomberg.
Detractors during the period under review were a diverse group including global drug maker Allergan PLC, Chinese internet leader Baidu, Brazilian food giant BRF SA, Spanish infrastructure operator Ferrovial SA, and U.S. real estate lessor VEREIT, Inc. None of these had a large impact on the overall Fund result.
Portfolio turnover this year has been light. Top sector weightings as of March 31, 2017, were consumer discretionary (20.1% portfolio weighting), information technology (15.6%), telecommunication services (14.3%), financials (13.5%), and industrials (13.4%). As of March 31, 2017, the one-year forward price-to-earnings multiples for the Fund’s holdings stand at 17.8x, vs. 16.4x for the MSCI All Country World Index. Relative to the index, the Fund is overweight firms based in China and Europe, and has no direct exposure to firms based in Japan. Firms based in emerging markets constitute about 13.4% of the Fund portfolio. Table III shows the Fund’s largest geographic weightings.
Table III Largest Geographic Weightings
| | | | |
COUNTRY | | WEIGHTING AS OF
MARCH 31, 2017 | |
United States | | | 44.2 | % |
Netherlands | | | 13.3 | % |
United Kingdom | | | 10.8 | % |
China | | | 8.0 | % |
Spain | | | 7.9 | % |
As a percent of the equity holdings. Holdings are classified by country of risk, determined at the Fund advisor’s discretion.
Market Environment
On the macroeconomic front, global growth expectations have risen, supporting a rotation of investor preferences from more defensive assets toward more economically sensitive ones. Earnings estimates for the MSCI All Country World Index portfolio for 2017 were reduced throughout the first half of 2016; however, earnings expectations have recovered in most world markets in recent months. The U.S. election in November initially added fuel to budding growth expectations, though it now appears that political gridlock could persist in Washington DC. The U.S. Federal Reserve has signaled that a faster pace of Federal funds target interest rate hikes is probable in 2017 and 2018, although most major central banks continue to pursue easy monetary conditions. We are also following political elections and other developments in Europe this year with great interest.
Asset prices have been appreciating, and the opportunity set seems narrower today for value-oriented investors. We continue to urge fellow shareholders of the Fund to maintain a long-term investment perspective. Competing macroeconomic forces of fiscal restraint and monetary stimulus from governments
| 3. | See for example Bloomberg,” T-Mobile Rises on Report SoftBank Open to Sprint Combination.” https://www.bloomberg.com/news/articles/2017-02-17/t-mobile-rises-on-report-softbank-wants-to-discuss-sprint-deal |
Semi-Annual Report 5
| | |
| Letter to Shareholders, Continued | | |
| |
Thornburg Global Opportunities Fund | | March 31, 2017 (Unaudited) |
will affect business conditions and investor sentiment, likely producing periods of volatility in the markets. The strategy of Thornburg Global Opportunities Fund is based on fundamental analysis of individual businesses, not macroeconomic forecasts. This approach has served us well over the years.
Thank you for your support of Thornburg Global Opportunities Fund. Remember that you can review additional information about your portfolio at www.thornburg.com/global.
Best wishes for a great summer.
Sincerely,
| | |
 | |  |
| Brian McMahon | | W. Vinson Walden,CFA |
| Portfolio Manager | | Portfolio Manager |
| Chief Investment Officer | | Managing Director |
The matters discussed in this report may constitute forward-looking statements made pursuant to the safe harbor provisions of the Securities Litigation Reform Act of 1995. These include any advisor or portfolio manager prediction, assessment, analysis or outlook for individual securities, industries, investment styles, market sectors and/or markets. These statements involve risks and uncertainties. In addition to the general risks described for each fund in its current prospectus, other factors bearing on these reports include the accuracy of the advisor’s or portfolio manager’s forecasts and predictions, the appropriateness of the investment strategies designed by the advisor or portfolio manager and the ability of the advisor or portfolio manager to implement their strategies efficiently and successfully. Any one or more of these factors, as well as other risks affecting the securities markets generally, could cause the actual results of any fund to differ materially as compared to its benchmarks.
The views expressed are subject to change and do not necessarily reflect the views of Thornburg Investment Management, Inc. This information should not be relied upon as a recommendation or investment advice and is not intended to predict the performance of any investment or market.
6 Semi-Annual Report
| | |
| Performance Summary | | |
| |
Thornburg Global Opportunities Fund | | March 31, 2017 (Unaudited) |
AVERAGE ANNUAL TOTAL RETURNS
| | | | | | | | | | | | | | | | | | | | |
| | | 1-YR | | | 3-YR | | | 5-YR | | | 10-YR | | | SINCE
INCEP. | |
Class A Shares (Incep: 7/28/06) | | | | | | | | | | | | | | | | | | | | |
Without sales charge | | | 13.63 | % | | | 8.58 | % | | | 12.89 | % | | | 7.38 | % | | | 10.00 | % |
With sales charge | | | 8.52 | % | | | 6.93 | % | | | 11.85 | % | | | 6.89 | % | | | 9.53 | % |
Class C Shares (Incep: 7/28/06) | | | | | | | | | | | | | | | | | | | | |
Without sales charge | | | 12.83 | % | | | 7.76 | % | | | 12.03 | % | | | 6.57 | % | | | 9.16 | % |
With sales charge | | | 11.83 | % | | | 7.76 | % | | | 12.03 | % | | | 6.57 | % | | | 9.16 | % |
Class I Shares (Incep: 7/28/06) | | | 14.05 | % | | | 8.98 | % | | | 13.35 | % | | | 7.88 | % | | | 10.51 | % |
Class R3 Shares (Incep: 2/1/08) | | | 13.48 | % | | | 8.41 | % | | | 12.76 | % | | | — | | | | 6.38 | % |
Class R4 Shares (Incep: 2/1/08) | | | 13.60 | % | | | 8.51 | % | | | 12.88 | % | | | — | | | | 6.47 | % |
Class R5 Shares (Incep: 2/1/08) | | | 14.06 | % | | | 8.97 | % | | | 13.34 | % | | | — | | | | 6.93 | % |
MSCI All Country World Index (Since 7/28/06) | | | 15.04 | % | | | 5.08 | % | | | 8.37 | % | | | 4.00 | % | | | 5.19 | % |
GROWTH OF A HYPOTHETICAL $10,000 INVESTMENT
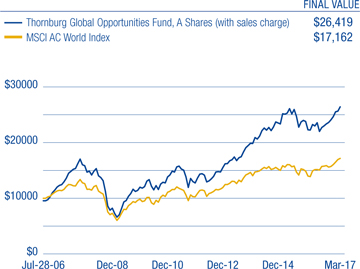
Performance data shown represents past performance and is no guarantee of future results. Investment return and principal value will fluctuate so shares, when redeemed, may be worth more or less than their original cost. Current performance may be lower or higher than quoted. For performance current to the most recent month end, visit thornburg.com or call 800.847.0200. The performance information does not reflect the deduction of taxes that a shareholder would pay on distributions or the redemption of Fund shares. Returns reflect the reinvestment of dividends and capital gains as well as applicable sales charges. Class A shares are sold with a maximum sales charge of 4.50%. Class C shares are subject to a 1% CDSC for the first year only. There is no sales charge for Class I, R3, R4, and R5 shares.
As disclosed in the most recent prospectus, the total annual fund operating expenses are as follows: A shares, 1.35%; C shares, 2.09%; I shares, 0.99%; R3 shares, 2.01%; R4 shares, 1.66%; and R5 shares, 1.07%. Thornburg Investment Management and/or Thornburg Securities Corporation have contractually agreed to waive fees and reimburse expenses through at least April 10, 2018, for some of the share classes, resulting in net expense ratios of the following: R3 shares, 1.50%; R4 shares, 1.40%; and R5 shares, 0.99%. For more detailed information on fund expenses and waivers/reimbursements please see the Fund’s prospectus.
Thornburg Global Opportunities Fund’s I shares earned the Investor’s Business Daily Best Mutual Funds 2017 Award, ranking first among 438 International Stock funds for 10-year average annual total returns. The awards recognize top-notch funds that beat benchmark indices (MSCI EAFE Index for Thornburg Global Opportunities Fund) in each of the one-, three-, five-, and 10-year periods, through December 31, 2016.
Glossary
The MSCI All Country (AC) World Index is a market capitalization weighted index that is representative of the market structure of 46 developed and emerging market countries in North and South America, Europe, Africa, and the Pacific Rim. The index is calculated with net dividends reinvested in U.S. dollars.
The MSCI EAFE (Europe, Australasia, Far East) Index is an unmanaged index. It is a generally accepted benchmark for major overseas markets. Index weightings represent the relative capitalizations of the major overseas developed markets on a U.S. dollar adjusted basis. The index is calculated with net dividends reinvested in U.S. dollars.
The S&P 500 Index is an unmanaged broad measure of the U.S. stock market.
Japan’s Nikkei 225 Stock Average is the leading index of Japanese stocks. It is a price-weighted index comprised of Japan’s top 225 blue-chip companies on the Tokyo Stock Exchange.
The EURO STOXX 50 Index provides a blue-chip representation of supersector leaders in the Eurozone. The index covers 50 stocks from 11 countries: Austria, Belgium, Finland, France, Germany, Ireland, Italy, Luxembourg, the Netherlands, Portugal and Spain.
The performance of any index is not indicative of the performance of any particular investment. Unless otherwise noted, index returns reflect the reinvestment of income dividends and capital gains, if any, but do not reflect fees, brokerage commissions or other expenses of investing. Investors may not make direct investments into any index.
Basis Point (bp) – A unit equal to 1/100th of 1%. 1% = 100 basis points (bps).
P/E – Price/Earnings ratio (P/E ratio) is a valuation ratio of a company’s current share price compared to its per-share earnings. P/E equals a company’s market value per share divided by earnings per share. Forecasted P/E is not intended to be a forecast of the fund’s future performance.
Semi-Annual Report 7
| | |
| Fund Summary | | |
| |
Thornburg Global Opportunities Fund | | March 31, 2017 (Unaudited) |
OBJECTIVES AND STRATEGIES
The Fund seeks long-term capital appreciation by investing in equity and debt securities of all types from issuers around the world.
The Fund pursues its investment goals by investing primarily in a broad range of equity securities, including common stocks, preferred stocks, real estate investment trusts, other equity trusts, and partnership interests. The Fund may invest in any stock or other equity security which the investment advisor believes may assist the Fund in pursuing its goals, including smaller companies with market capitalizations of less than $500 million. The Fund may also invest in debt obligations of any kind.
MARKET CAPITALIZATION EXPOSURE
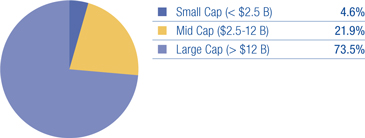
ASSET STRUCTURE
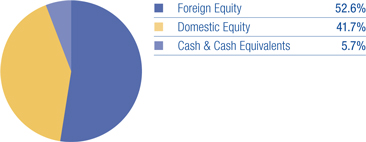
TOP TEN EQUITY HOLDINGS
| | | | |
| |
Level 3 Communications, Inc. | | | 6.3 | % |
| |
Aena S.A. | | | 5.4 | % |
| |
T-Mobile US, Inc. | | | 5.3 | % |
| |
Altice N.V. | | | 5.2 | % |
| |
Alphabet, Inc. Class A | | | 4.6 | % |
| |
Barratt Developments plc | | | 4.2 | % |
| |
Baidu, Inc. ADR | | | 4.1 | % |
| |
Citigroup, Inc. | | | 4.1 | % |
| |
Wynn Resorts, Ltd. | | | 3.8 | % |
| |
Galaxy Entertainment Group Ltd. | | | 3.5 | % |
There is no guarantee that the Fund will meet its investment objective.
All portfolio information is subject to change. Charts may not add up to 100% due to rounding.
SECTOR EXPOSURE
| | | | |
Consumer Discretionary | | | 20.1 | % |
| |
Information Technology | | | 15.6 | % |
| |
Telecommunication Services | | | 14.3 | % |
| |
Financials | | | 13.5 | % |
| |
Industrials | | | 13.4 | % |
| |
Consumer Staples | | | 6.3 | % |
| |
Materials | | | 4.5 | % |
| |
Energy | | | 3.0 | % |
| |
Health Care | | | 1.9 | % |
| |
Real Estate | | | 1.7 | % |
| |
Other Assets Less Liabilities | | | 5.7 | % |
TOP TEN INDUSTRY GROUPS
| | | | |
Telecommunication Services | | | 14.3 | % |
| |
Transportation | | | 11.3 | % |
| |
Software & Services | | | 10.5 | % |
| |
Consumer Services | | | 7.3 | % |
| |
Banks | | | 6.5 | % |
| |
Food, Beverage & Tobacco | | | 6.3 | % |
| |
Media | | | 5.2 | % |
| |
Technology Hardware & Equipment | | | 5.1 | % |
| |
Materials | | | 4.5 | % |
| |
Consumer Durables & Apparel | |
| 4.2
| %
|
COUNTRY EXPOSURE*
(percent of equity holdings)
| | | | |
United States | | | 44.2 | % |
| |
Netherlands | | | 13.3 | % |
| |
United Kingdom | | | 10.8 | % |
| |
China | | | 8.0 | % |
| |
Spain | | | 7.9 | % |
| |
Ireland | | | 5.3 | % |
| |
India | | | 2.9 | % |
| |
France | | | 2.8 | % |
| |
South Korea | | | 2.4 | % |
| |
Australia | | | 1.5 | % |
| |
Switzerland | | | 0.7 | % |
| |
Brazil | | | 0.1 | % |
| * | The country assignment of each equity holding is determined by the Fund’s Advisor based on various factors, including the location of the issuer’s head office, the issuer’s jurisdiction of incorporation and the country from which a majority of the issuer’s revenue is derived. |
8 Semi-Annual Report
| | |
| Schedule of Investments | | |
| |
Thornburg Global Opportunities Fund | | March 31, 2017 (Unaudited) |
| | | | | | | | |
| | | SHARES/
PRINCIPAL AMOUNT | | | VALUE | |
| | |
COMMON STOCK — 94.30% | | | | | | | | |
AUTOMOBILES & COMPONENTS — 3.43% | | | | | | | | |
Auto Components — 3.43% | | | | | | | | |
Delphi Automotive plc | | | 874,608 | | | $ | 70,397,198 | |
| | | | | | | | |
| | | | | | | 70,397,198 | |
| | | | | | | | |
BANKS — 6.47% | | | | | | | | |
Banks — 6.47% | | | | | | | | |
Citigroup, Inc. | | | 1,396,099 | | | | 83,514,642 | |
ING Groep N.V. | | | 3,257,752 | | | | 49,245,982 | |
| | | | | | | | |
| | | | | | | 132,760,624 | |
| | | | | | | | |
CAPITAL GOODS — 2.04% | | | | | | | | |
Construction & Engineering — 2.04% | | | | | | | | |
Ferrovial SA | | | 2,094,140 | | | | 41,910,368 | |
| | | | | | | | |
| | | | | | | 41,910,368 | |
| | | | | | | | |
CONSUMER DURABLES & APPAREL — 4.17% | | | | | | | | |
Household Durables — 4.17% | | | | | | | | |
Barratt Developments plc | | | 12,495,145 | | | | 85,555,520 | |
| | | | | | | | |
| | | | | | | 85,555,520 | |
| | | | | | | | |
CONSUMER SERVICES — 7.34% | | | | | | | | |
Hotels, Restaurants & Leisure — 7.34% | | | | | | | | |
Galaxy Entertainment Group Ltd. | | | 13,131,814 | | | | 71,898,435 | |
Wynn Resorts, Ltd. | | | 687,295 | | | | 78,770,880 | |
| | | | | | | | |
| | | | | | | 150,669,315 | |
| | | | | | | | |
DIVERSIFIED FINANCIALS — 3.86% | | | | | | | | |
Capital Markets — 0.68% | | | | | | | | |
UBS Group AG | | | 875,012 | | | | 14,003,337 | |
Consumer Finance — 3.18% | | | | | | | | |
Capital One Financial Corp. | | | 752,959 | | | | 65,251,427 | |
| | | | | | | | |
| | | | | | | 79,254,764 | |
| | | | | | | | |
ENERGY — 3.04% | | | | | | | | |
Energy Equipment & Services — 0.29% | | | | | | | | |
Helmerich & Payne, Inc. | | | 88,323 | | | | 5,879,662 | |
Oil, Gas & Consumable Fuels — 2.75% | | | 2,780,872 | | | | 56,555,318 | |
| | | | | | | | |
a Reliance Industries Ltd. | | | | | | | 62,434,980 | |
| | | | | | | | |
| | | | | | | | |
FOOD, BEVERAGE & TOBACCO — 6.32% | | | | | | | | |
Food Products — 6.32% | | | | | | | | |
BRF SA | | | 179,116 | | | | 2,209,055 | |
Mondelez International, Inc. | | | 1,633,895 | | | | 70,388,197 | |
The Kraft Heinz Co. | | | 628,676 | | | | 57,090,067 | |
| | | | | | | | |
| | | | | | | 129,687,319 | |
| | | | | | | | |
HEALTH CARE EQUIPMENT & SERVICES — 0.31% | | | | | | | | |
Health Care Providers & Services — 0.31% | | | 95,880 | | | | 6,319,451 | |
| | | | | | | | |
a Express Scripts Holding Company | | | | | | | 6,319,451 | |
| | | | | | | | |
| | | | | | | | |
INSURANCE — 3.21% | | | | | | | | |
Insurance — 3.21% | | | | | | | | |
NN Group NV | | | 2,023,563 | | | | 65,809,086 | |
| | | | | | | | |
| | | | | | | 65,809,086 | |
| | | | | | | | |
MATERIALS — 4.48% | | | | | | | | |
Chemicals — 3.05% | | | | | | | | |
CF Industries Holdings, Inc. | | | 2,132,086 | | | | 62,576,724 | |
Metals & Mining — 1.43% | | | | | | | | |
Mineral Resources Ltd. | | | 3,581,222 | | | | 29,412,566 | |
| | | | | | | | |
| | | | | | | 91,989,290 | |
| | | | | | | | |
MEDIA — 5.16% | | | | | | | | |
Media — 5.16% | | | | | | | | |
a Altice N.V. | | | 4,684,193 | | | | 105,963,424 | |
| | | | | | | | |
| | | | | | | 105,963,424 | |
| | | | | | | | |
PHARMACEUTICALS, BIOTECHNOLOGY & LIFE SCIENCES — 1.63% | | | | | |
Pharmaceuticals — 1.63% | | | | | | | | |
Allergan plc | | | 140,340 | | | | 33,530,033 | |
| | | | | | | | |
| | | | | | | 33,530,033 | |
| | | | | | | | |
Semi-Annual Report 9
| | |
| Schedule of Investments, Continued | | |
| |
Thornburg Global Opportunities Fund | | March 31, 2017 (Unaudited) |
| | | | | | | | |
| | | SHARES/
PRINCIPAL AMOUNT | | | VALUE | |
REAL ESTATE — 1.68% | | | | | | | | |
Equity Real Estate Investment Trusts — 1.68% | | | | | | | | |
Colony Northstar, Inc. | | | 2,669,495 | | | $ | 34,463,180 | |
| | | | | | | | |
| | | | | | | 34,463,180 | |
| | | | | | | | |
SOFTWARE & SERVICES — 10.47% | | | | | | | | |
Information Technology Services — 1.77% | | | | | | | | |
a InterXion Holding NV | | | 918,302 | | | | 36,328,027 | |
Internet Software & Services — 8.70% | | | | | | | | |
a Alphabet, Inc. Class A | | | 111,727 | | | | 94,722,151 | |
a Baidu, Inc. ADR | | | 486,264 | | | | 83,890,265 | |
| | | | | | | | |
| | | | | | | 214,940,443 | |
| | | | | | | | |
TECHNOLOGY HARDWARE & EQUIPMENT — 5.11% | | | | | | | | |
Communications Equipment — 2.89% | | | | | | | | |
a EchoStar Corp. | | | 1,042,709 | | | | 59,382,278 | |
Technology, Hardware, Storage & Peripherals — 2.22% | | | | | | | | |
Samsung Electronics Co. Ltd. | | | 24,720 | | | | 45,536,260 | |
| | | | | | | | |
| | | | | | | 104,918,538 | |
| | | | | | | | |
TELECOMMUNICATION SERVICES — 14.26% | | | | | | | | |
Diversified Telecommunication Services — 8.95% | | | | | | | | |
a Level 3 Communications, Inc. | | | 2,252,087 | | | | 128,864,418 | |
a SFR Group SA | | | 1,742,121 | | | | 54,806,998 | |
Wireless Telecommunication Services — 5.31% | | | | | | | | |
a T-Mobile US, Inc. | | | 1,686,958 | | | | 108,960,617 | |
| | | | | | | | |
| | | | | | | 292,632,033 | |
| | | | | | | | |
TRANSPORTATION — 11.32% | | | | | | | | |
Airlines — 5.90% | | | 4,095,758 | | | | 52,649,981 | |
easyJet plc | | | | | | | | |
a Ryanair Holdings plc ADR | | | 826,432 | | | | 68,577,327 | |
Transportation Infrastructure — 5.42% | | | | | | | | |
Aena S.A. | | | 702,724 | | | | 111,175,442 | |
| | | | | | | | |
| | | | | | | 232,402,750 | |
| | | | | | | | |
TOTAL COMMON STOCK (Cost $1,537,812,017) | | | | | | | 1,935,638,316 | |
| | | | | | | | |
| | |
SHORT TERM INVESTMENTS — 5.73% | | | | | | | | |
b Thornburg Capital Management Fund | | | 11,763,679 | | | | 117,636,793 | |
| | | | | | | | |
TOTAL SHORT TERM INVESTMENTS (Cost $117,636,793) | | | | | | | 117,636,793 | |
| | | | | | | | |
TOTAL INVESTMENTS — 100.03% (Cost $1,655,448,810) | | | | | | $ | 2,053,275,109 | |
LIABILITIES NET OF OTHER ASSETS — (0.03)% | | | | | | | (629,524 | ) |
| | | | | | | | |
NET ASSETS — 100.00% | | | | | | $ | 2,052,645,583 | |
| | | | | | | | |
Footnote Legend
| b | Investment in Affiliates - Shown below are holdings of voting securities of each portfolio company which is considered “affiliated” to the Fund under the Investment Company Act of 1940, including companies for which the Fund’s holding represented 5% or more of the company’s voting securities, and a series of the Thornburg Investment Trust in which the Fund invested for cash management purposes during the period: |
| | | | | | | | | | | | | | | | | | | | | | | | | | | | |
ISSUER | | SHARES/
PRINCIPAL
SEPTEMBER 30,
2016 | | | GROSS
ADDITIONS | | | GROSS
REDUCTIONS | | | SHARES/
PRINCIPAL
MARCH 31,
2017 | | | MARKET
VALUE
MARCH 31,
2017 | | | INVESTMENT
INCOME | | | REALIZED
GAIN
(LOSS) | |
Thornburg Capital Management Fund | | | 8,109,038 | | | | 25,815,534 | | | | 22,160,893 | | | | 11,763,679 | | | $ | 117,636,793 | | | $ | 397,201 | | | $ | — | |
| | | | | | | | | | | | | | | | | | | | | | | | | | | | |
Total non-controlled affiliated
issuers - 5.73% of net assets | | | | | | | | | | | $ | 117,636,793 | | | $ | 397,201 | | | $ | — | |
| | | | | | | | | | | | | | | | | | | | | |
Portfolio Abbreviations
To simplify the listings of securities, abbreviations are used per the table below:
| | |
| ADR | | American Depositary Receipt |
See notes to financial statements.
10 Semi-Annual Report
This page intentionally left blank.
Semi-Annual Report 11
| | |
| Statement of Assets and Liabilities | | |
| |
Thornburg Global Opportunities Fund | | March 31, 2017, (Unaudited) |
| | | | |
ASSETS | | | | |
Investments at value (Note 3) | | | | |
Non-affiliated issuers (cost $1,537,812,017) | | $ | 1,935,638,316 | |
Non-controlled affiliated issuer (cost $117,636,793) | | | 117,636,793 | |
Cash denominated in foreign currency (cost $5) | | | 5 | |
Receivable for fund shares sold | | | 9,350,343 | |
Unrealized appreciation on forward currency contracts (Note 7) | | | 1,993,418 | |
Dividends receivable | | | 2,097,462 | |
Prepaid expenses and other assets | | | 80,983 | |
| | | | |
Total Assets | | | 2,066,797,320 | |
| | | | |
| |
LIABILITIES | | | | |
Payable for investments purchased | | | 87,424 | |
Payable for fund shares redeemed | | | 7,726,680 | |
Unrealized depreciation on forward currency contracts (Note 7) | | | 2,082,877 | |
Payable to investment advisor and other affiliates (Note 4) | | | 1,886,710 | |
Deferred taxes payable (Note 2) | | | 1,683,300 | |
Accounts payable and accrued expenses | | | 684,746 | |
| | | | |
Total Liabilities | | | 14,151,737 | |
| | | | |
| |
NET ASSETS | | $ | 2,052,645,583 | |
| | | | |
NET ASSETS CONSIST OF | | | | |
Undistributed net investment income | | $ | 502,048 | |
Net unrealized appreciation on investments | | | 396,085,899 | |
Accumulated net realized gain (loss) | | | (208,340,815 | ) |
Net capital paid in on shares of beneficial interest | | | 1,864,398,451 | |
| | | | |
| | $ | 2,052,645,583 | |
| | | | |
12 Semi-Annual Report
| | |
| Statement of Assets and Liabilities, Continued | | |
| |
Thornburg Global Opportunities Fund | | March 31, 2017, (Unaudited) |
| | | | |
NET ASSET VALUE | | | | |
| |
Class A Shares: | | | | |
Net asset value and redemption price per share
($394,301,468 applicable to 14,030,948 shares of beneficial interest outstanding - Note 5) | | $ | 28.10 | |
Maximum sales charge, 4.50% of offering price | | | 1.32 | |
| | | | |
Maximum offering price per share | | $ | 29.42 | |
| | | | |
| |
Class C Shares: | | | | |
Net asset value and offering price per share*
($359,554,883 applicable to 13,230,403 shares of beneficial interest outstanding - Note 5) | | $ | 27.18 | |
| | | | |
| |
Class I Shares: | | | | |
Net asset value, offering and redemption price per share
($1,197,920,056 applicable to 42,524,185 shares of beneficial interest outstanding - Note 5) | | $ | 28.17 | |
| | | | |
| |
Class R3 Shares: | | | | |
Net asset value, offering and redemption price per share
($10,896,518 applicable to 391,631 shares of beneficial interest outstanding - Note 5) | | $ | 27.82 | |
| | | | |
| |
Class R4 Shares: | | | | |
Net asset value, offering and redemption price per share
($23,451,565 applicable to 842,241 shares of beneficial interest outstanding - Note 5) | | $ | 27.84 | |
| | | | |
| |
Class R5 Shares: | | | | |
Net asset value, offering and redemption price per share
($66,521,093 applicable to 2,358,961 shares of beneficial interest outstanding - Note 5) | | $ | 28.20 | |
| | | | |
| * | Redemption price per share is equal to net asset value less any applicable contingent deferred sales charge. |
See notes to financial statements.
Semi-Annual Report 13
| | |
| Statement of Operations | | |
| |
Thornburg Global Opportunities Fund | | Six Months Ended March 31, 2017 (Unaudited) |
| | | | |
INVESTMENT INCOME | | | | |
Dividend income | | | | |
Non-affiliated issuers (net of foreign taxes withheld of $111,519) | | $ | 17,320,763 | |
Non-controlled affiliated issuer | | | 397,201 | |
| | | | |
Total Income | | | 17,717,964 | |
| | | | |
| |
EXPENSES | | | | |
Investment advisory fees (Note 4) | | | 7,733,776 | |
Administration fees (Note 4) | | | | |
Class A Shares | | | 259,951 | |
Class C Shares | | | 221,244 | |
Class I Shares | | | 265,259 | |
Class R3 Shares | | | 6,580 | |
Class R4 Shares | | | 14,008 | |
Class R5 Shares | | | 15,885 | |
Distribution and service fees (Note 4) | | | | |
Class A Shares | | | 519,158 | |
Class C Shares | | | 1,766,993 | |
Class R3 Shares | | | 26,411 | |
Class R4 Shares | | | 28,017 | |
Transfer agent fees | | | | |
Class A Shares | | | 283,525 | |
Class C Shares | | | 225,687 | |
Class I Shares | | | 567,998 | |
Class R3 Shares | | | 19,509 | |
Class R4 Shares | | | 38,605 | |
Class R5 Shares | | | 87,518 | |
Registration and filing fees | | | | |
Class A Shares | | | 18,769 | |
Class C Shares | | | 13,354 | |
Class I Shares | | | 48,270 | |
Class R3 Shares | | | 7,783 | |
Class R4 Shares | | | 8,212 | |
Class R5 Shares | | | 8,798 | |
Custodian fees (Note 2) | | | 139,260 | |
Professional fees | | | 45,932 | |
Accounting fees (Note 4) | | | 34,010 | |
Trustee fees | | | 41,308 | |
Other expenses | | | 212,676 | |
| | | | |
Total Expenses | | | 12,658,496 | |
Less: | | | | |
Expenses reimbursed by investment advisor (Note 4) | | | (271,030 | ) |
| | | | |
Net Expenses | | | 12,387,466 | |
| | | | |
Net Investment Income | | $ | 5,330,498 | |
| | | | |
14 Semi-Annual Report
| | |
| Statement of Operations, Continued | | |
| |
Thornburg Global Opportunities Fund | | Six Months Ended March 31, 2017 (Unaudited) |
| | | | |
REALIZED AND UNREALIZED GAIN (LOSS) | | | | |
Net realized gain (loss) on: | | | | |
Non-affiliated issuer investments | | $ | (14,320,414 | ) |
Forward currency contracts (Note 7) | | | 27,382,999 | |
Foreign currency transactions | | | (121,604 | ) |
| | | | |
| | | 12,940,981 | |
| | | | |
Net change in unrealized appreciation (depreciation) on: | | | | |
Non-affiliated issuer investments (net of change in deferred taxes payable of $ 1,683,300) | | | 218,908,147 | |
Forward currency contracts (Note 7) | | | 1,023,665 | |
Foreign currency translations | | | 31,370 | |
| | | | |
| | | 219,963,182 | |
| | | | |
Net Realized and Unrealized Gain | | | 232,904,163 | |
| | | | |
Net Increase in Net Assets Resulting from Operations | | $ | 238,234,661 | |
| | | | |
See notes to financial statements.
Semi-Annual Report 15
| | |
| Statements of Changes in Net Assets | | |
| |
Thornburg Global Opportunities Fund | | |
| | | | | | | | |
| | | SIX MONTHS ENDED
MARCH 31, 2017* | | | YEAR ENDED
SEPTEMBER 30, 2016 | |
INCREASE (DECREASE) IN NET ASSETS FROM | | | | | | | | |
| | |
OPERATIONS | | | | | | | | |
Net investment income | | $ | 5,330,498 | | | $ | 24,603,881 | |
Net realized gain (loss) on investments, forward currency contracts, and foreign currency transactions | | | 12,940,981 | | | | (152,227,669 | ) |
Net unrealized appreciation (depreciation) on investments, deferred taxes payable, forward currency contracts, and foreign currency translations | | | 219,963,182 | | | | 156,517,976 | |
| | | | | | | | |
Net Increase (Decrease) in Net Assets Resulting from Operations | | | 238,234,661 | | | | 28,894,188 | |
| | |
DIVIDENDS TO SHAREHOLDERS | | | | | | | | |
From net investment income | | | | | | | | |
Class A Shares | | | (918,004 | ) | | | (3,010,113 | ) |
Class C Shares | | | (156,914 | ) | | | — | |
Class I Shares | | | (4,598,694 | ) | | | (13,341,341 | ) |
Class R3 Shares | | | (19,940 | ) | | | (36,643 | ) |
Class R4 Shares | | | (50,699 | ) | | | (110,179 | ) |
Class R5 Shares | | | (270,665 | ) | | | (1,174,656 | ) |
FUND SHARE TRANSACTIONS (NOTE 5) | | | | | | | | |
Class A Shares | | | (98,393,088 | ) | | | (110,083,884 | ) |
Class C Shares | | | (42,048,088 | ) | | | (7,662,535 | ) |
Class I Shares | | | 72,240,630 | | | | (293,034,015 | ) |
Class R3 Shares | | | (1,019,955 | ) | | | 1,433,669 | |
Class R4 Shares | | | (687,633 | ) | | | 8,050,573 | |
Class R5 Shares | | | (1,445,967 | ) | | | (48,461,226 | ) |
| | | | | | | | |
Net Increase (Decrease) in Net Assets | | | 160,865,644 | | | | (438,536,162 | ) |
| | |
NET ASSETS | | | | | | | | |
Beginning of Period | | | 1,891,779,939 | | | | 2,330,316,101 | |
| | | | | | | | |
End of Period | | $ | 2,052,645,583 | | | $ | 1,891,779,939 | |
| | | | | | | | |
Undistributed net investment income | | $ | 502,048 | | | $ | 1,186,466 | |
See notes to financial statements.
16 Semi-Annual Report
| | |
| Notes to Financial Statements | | |
| |
Thornburg Global Opportunities Fund | | March 31, 2017 (Unaudited) |
NOTE 1 – ORGANIZATION
Thornburg Global Opportunities Fund (the “Fund”) is a diversified series of Thornburg Investment Trust (the “Trust”). The Trust was organized as a Massachusetts business trust under a Declaration of Trust dated June 3, 1987 and is registered as a diversified, open-end management investment company under the Investment Company Act of 1940, as amended. The Fund is currently one of twenty-one separate series of the Trust. Each series is considered to be a separate entity for financial reporting and tax purposes and bears expenses directly attributable to it. The Fund seeks long-term capital appreciation by investing in equity and debt securities of all types from issuers around the world.
The Fund currently offers six classes of shares of beneficial interest: Class A, Class C, Institutional Class (“Class I”), and Retirement Classes (“Class R3,” “Class R4,” and “Class R5”). Each class of shares of the Fund represents an interest in the same portfolio of investments, except that (i) Class A shares are sold subject to a front-end sales charge collected at the time the shares are purchased and bear a service fee, (ii) Class C shares are sold at net asset value without a sales charge at the time of purchase, but are subject to a contingent deferred sales charge upon redemption within one year of purchase, and bear both a service fee and a distribution fee, (iii) Class I and Class R5 shares are sold at net asset value without a sales charge at the time of purchase and may be subject to a service fee, (iv) Class R3 shares are sold at net asset value without a sales charge at the time of purchase, but bear both a service fee and distribution fee, (v) Class R4 shares are sold at net asset value without a sales charge at the time of purchase, but bear a service fee, and (vi) the respective classes may have different reinvestment privileges and conversion rights. Additionally, the Fund may allocate among its classes certain expenses, to the extent allocable to specific classes, including transfer agent fees, government registration fees, certain printing and postage costs, and administrative and legal expenses. Currently, class specific expenses of the Fund are limited to service and distribution fees, administration fees, and certain registration and transfer agent expenses.
The following is a summary of significant accounting policies followed by the Fund in the preparation of its financial statements. The Fund prepares its financial statements in conformity with United States generally accepted accounting principles (“GAAP”), including investment company accounting and reporting guidance in the Financial Accounting Standards Board (the “FASB”) Accounting Standard Codification Topic 946.
NOTE 2 – SIGNIFICANT ACCOUNTING POLICIES
Security Valuation: All investments in securities held by the Fund are valued as described in Note 3.
Allocation of Income, Gains, Losses and Expenses: Net investment income (other than class specific expenses) and realized and unrealized gains and losses are allocated daily to each class of shares based upon the relative net asset value of outstanding shares (or the value of the dividend-eligible shares, as appropriate) of each class of shares at the beginning of the day (after adjusting for the current capital shares activity of the respective class). Expenses common to all Funds are allocated among the Funds comprising the Trust based upon their relative net asset values or other appropriate allocation methods. Operating expenses directly attributable to a specific class are charged against the operating income of that class.
Dividends and Distributions to Shareholders: Dividends and distributions to shareholders, which are determined in accordance with federal income tax regulations and may differ from GAAP, are recorded on the ex-dividend date. Ordinary income distributions, if any, are declared and paid quarterly. Capital gain distributions, if any, are declared and paid annually and more often if deemed necessary by the Advisor. Dividends are paid and are reinvested in additional shares of the Fund at net asset value per share at the close of business on the ex-dividend date, or at the shareholder’s option, paid in cash.
Investment Income: Dividend income is recorded on the ex-dividend date. Certain income from foreign investments is recognized as soon as information is available to the Fund. Interest income is accrued as earned. Premiums and discounts are amortized and accreted, respectively, to call dates or maturity dates using the effective yield method of the respective investments. These amounts are included in Interest income on the Statement of Operations.
Custodian Fees: Custodian fees disclosed in the Statement of Operations may include interest expenses incurred by the Fund on any cash overdrafts of its custodian account during the period. Such cash overdrafts may result from the effects of failed trades in portfolio securities and from cash outflows resulting from unanticipated shareholder redemption activity. The Fund pays interest to its custodian on any such cash overdraft at a rate equal to 2.50% of the overdraft amount in excess of $50,000.
Investment Transactions: Investment transactions are accounted for on a trade date basis. Realized gains and losses from the sale of investments are recorded on an identified cost basis.
Repurchase Agreements: The Fund may invest excess cash in repurchase agreements whereby the Fund purchases investments, which serve as collateral, with an agreement to resell such collateral to the seller at an agreed upon price at the maturity date of the repurchase agreement. Investments pledged as collateral for repurchase agreements are held in custody until maturity of the repurchase agreement. Provisions in the agreements require that the market value of the collateral is at least equal to the repurchase value in the event of default. In the event of default, the Fund has the right to liquidate the collateral and apply the proceeds in satisfaction of
Semi-Annual Report 17
| | |
| Notes to Financial Statements, Continued | | |
| |
Thornburg Global Opportunities Fund | | March 31, 2017 (Unaudited) |
the obligation. Under certain circumstances, in the event of default or bankruptcy by the other party to the agreement, realization and/or retention of the collateral may be subject to legal proceedings.
When-Issued and Delayed Delivery Transactions: The Fund may engage in when-issued or delayed delivery transactions. To the extent the Fund engages in such transactions, it will do so for the purpose of acquiring portfolio investments consistent with the Fund’s investment objectives and not for the purpose of investment leverage or to speculate on interest rate or market changes. At the time the Fund makes a commitment to purchase an investment on a when-issued or delayed delivery basis, the Fund will record the transaction and reflect the value in determining its net asset value. When effecting such transactions, assets of an amount sufficient to make payment for the portfolio investments to be purchased will be segregated on the Fund’s records on the trade date. Investments purchased on a when-issued or delayed delivery basis do not earn interest until the settlement date.
Foreign Currency Translation: Portfolio investments and other assets and liabilities denominated in foreign currencies are translated into U.S. dollars based on the exchange rate of such currencies against the U.S. dollar on the date of valuation. Purchases and sales of investments and income items denominated in foreign currencies are translated into U.S. dollars at the exchange rate in effect on the transaction date. When the Fund purchases or sells foreign investments, it will customarily enter into a foreign exchange contract to minimize foreign exchange risk from the trade date to the settlement date of such transactions. The values of such spot contracts are included in receivable for investments sold and payable for investments purchased on the Statement of Assets and Liabilities.
The Fund does not separately report the effect of changes in foreign exchange rates from changes in market prices on investments held. Such changes are included in net unrealized appreciation (depreciation) from investments.
Reported net realized gains and losses from foreign currency transactions arise due to purchases and sales of foreign currencies, currency gains and losses realized between the trade and settlement dates on investment transactions and the difference between the amounts of dividends, interest, and foreign withholding taxes recorded on the Fund’s books, and the U.S. dollar equivalent of the amounts actually received or paid.
Net change in unrealized appreciation (depreciation) on foreign currency translations arise from changes in the fair value of assets and liabilities, other than investments at period end, resulting from changes in exchange rates.
Guarantees and Indemnifications: Under the Trust’s organizational documents (and under separate agreements with the independent Trustees), its officers and Trustees are provided with an indemnification against certain liabilities arising out of the performance of their duties to the Fund. In the normal course of business the Trust may also enter into contracts with service providers that contain general indemnifications. The Trust’s maximum exposure under these arrangements is unknown. However, based on experience, the Trust expects the risk of loss to be remote.
Use of Estimates: The preparation of financial statements in conformity with GAAP requires management to make estimates and assumptions that affect the reported amounts of assets and liabilities and disclosure of contingent assets and liabilities at the date of the financial statements and the reported amounts of increases (decreases) in net assets from operations during the reporting period. Actual results could differ from those estimates.
Federal Income Taxes: It is the policy of the Trust to comply with the provisions of the Internal Revenue Code applicable to regulated investment companies and to distribute to shareholders substantially all investment company taxable income including net realized gains on investments (if any), and tax exempt income of the Fund. Therefore, no provision for federal income or excise tax is required.
The Fund files income tax returns in United States federal and applicable state jurisdictions. The statute of limitations on the Fund’s tax return filings generally remains open for the three years following a return’s filing date. The Fund has analyzed its tax positions taken on Federal income tax returns for all open tax years and has concluded that no provision for income tax is required in the financial statements.
At March 31, 2017, information on the tax components of capital was as follows:
| | | | |
Cost of investments for tax purposes | | $ | 1,655,781,963 | |
| | | | |
Gross unrealized appreciation on a tax basis | | $ | 410,509,713 | |
Gross unrealized depreciation on a tax basis | | | (13,016,568 | ) |
| | | | |
Net unrealized appreciation (depreciation) on investments (tax basis) | | $ | 397,493,145 | |
| | | | |
At March 31, 2017, the Fund had deferred tax basis late year specified ordinary losses occurring subsequent to December 31, 2015 through September 30, 2016 of $301,466. For tax purposes, such losses will be recognized in the year ending September 30, 2017.
At March 31, 2017, the Fund had deferred tax basis capital losses occurring subsequent to October 31, 2015 through September 30, 2016 of $133,084,576. For tax purposes, such capital losses will be recognized in the year ending September 30, 2017.
18 Semi-Annual Report
| | |
| Notes to Financial Statements, Continued | | |
| |
Thornburg Global Opportunities Fund | | March 31, 2017 (Unaudited) |
At March 31, 2017, the Fund had cumulative tax basis capital losses of $18,965,104, (of which $18,965,104 are short-term and $0 are long-term) generated after September 30, 2011, which may be carried forward to offset future capital gains. To the extent such carryforwards are used, capital gain distributions may be reduced to the extent provided by regulations. Such capital loss carryforwards do not expire, but are required to be utilized to offset future gains prior to the utilization of losses generated prior to October 1, 2011.
At March 31, 2017, the Fund had tax basis capital losses of $65,016,060 generated prior to October 1, 2011, which may be carried forward to offset future capital gains. To the extent such carryforwards are used, capital gain distributions may be reduced to the extent provided by regulations. Such capital loss carryforwards expire September 30, 2018.
Foreign Withholding Taxes: The Fund is subject to foreign tax withholding imposed by certain foreign countries in which the Fund may invest. Withholding taxes are incurred on certain foreign dividends and are accrued at the time the dividend is recognized based on applicable foreign tax laws. The Fund may file withholding tax reclaims in certain jurisdictions to recover a portion of amounts previously withheld, in view of various considerations, including recent decisions rendered by the courts in those and other jurisdictions. The Fund would expect to record a receivable for such a reclaim based on a variety of factors, including assessment of a jurisdiction’s legal obligation to pay reclaims, the jurisdiction’s administrative practices and payment history, and industry convention. To date the Fund has recorded no such receivable because there is limited precedent for collecting such prior year reclaims and the likelihood of collection remains uncertain.
Deferred Foreign Capital Gain Taxes: The Fund is subject to a tax imposed on net realized gains of securities of certain foreign countries. The Fund records an estimated deferred tax liability for net unrealized gains on these investments as reflected in the accompanying financial statements.
NOTE 3 – SECURITY VALUATION
Valuation of the Fund’s portfolio investment securities is performed in accordance with policies and procedures adopted by and under the oversight of the Trustees.
The Trustees of the Trust have appointed Thornburg Investment Management, Inc., the Trust’s investment advisor (the “Advisor”) to assist the Trustees in obtaining market values for portfolio investments, evaluate and monitor professional pricing service providers appointed by the Trustees’ Audit Committee (the “Audit Committee”) to assist in determining fair values for portfolio investments, assist in calculating fair values for portfolio investments in certain circumstances, and to perform other functions in connection with the valuation of investments. The Advisor acts through its Valuation and Pricing Committee (the “Committee”) and other employees of the Advisor. The Committee regularly reviews its own valuation calculations, as well as the valuations, valuation techniques and services furnished by pricing service providers, considers circumstances which may require valuation calculations by the Committee, and reviews previous valuation calculations. The Committee reports to the Audit Committee on the Committee’s activities, the performance of pricing service providers, and other matters relating to valuation of portfolio investments.
In those instances when the Committee assists in calculating a fair value for a portfolio investment, the Committee seeks to determine the price that the Fund would reasonably expect to receive upon a sale of the investment in an orderly transaction between market participants on the valuation date. The Committee customarily utilizes quotations from securities broker dealers in calculating valuations, but also may utilize prices obtained from pricing service providers or other methods approved by the Audit Committee. Because fair values calculated by the Committee are estimates, the calculation of a value for an investment may differ from the price that would be realized by the Fund upon a sale of the investment, and the difference could be material to the Fund’s financial statements. The Committee’s calculation of a fair value for an investment may also differ from the prices obtained by other persons (including other mutual funds) for the investment.
Valuation of Securities: Securities and other portfolio investments which are listed or traded on a United States securities exchange are valued at the last reported sale price on the valuation date. Investments listed or traded on an exchange for which there has been no sale that day are valued at the mean between the last reported bid and asked prices on that valuation date. Portfolio investments reported by NASDAQ are valued at the official closing price on the valuation date. If an investment is traded on more than one exchange, the investment is considered traded on the exchange that is normally the primary market for that investment. Securities and other portfolio investments which are listed or traded on exchanges outside the United States are valued at the last price or the closing
price of the investment on the exchange that is normally the primary market for the investment, as of the close of the exchange preceding the Fund’s valuation date. Foreign investments listed or traded on an exchange for which there has been no sale that day are valued at the mean between the last reported bid and asked prices on that valuation date.
In any case when a market quotation is not readily available for a portfolio investment ordinarily valued by market quotation, the Committee calculates a fair value for the investment using alternative methods approved by the Audit Committee. A market quotation is not readily available when the primary market or exchange for the investment is not open for the entire scheduled day of trading. Market quotations for an investment also may not be readily available if developments after the most recent close of the investment’s primary exchange or market, but prior to the close of business on any Fund business day, or an unusual event or significant period of
Semi-Annual Report 19
| | |
| Notes to Financial Statements, Continued | | |
| |
Thornburg Global Opportunities Fund | | March 31, 2017 (Unaudited) |
time occurring since the availability of a market quotation, create a serious question concerning the reliability of the most recent market quotation available for the investment. In particular, on days when market volatility thresholds established by the Audit Committee are exceeded, foreign equity investments held by the Fund may be valued using alternative methods. The Committee customarily obtains valuations in these instances from pricing service providers approved by the Audit Committee. Pricing service providers ordinarily calculate valuations using multi-factor models to adjust market prices based upon various inputs, including exchange data, depository receipt prices, futures, index data and other data.
Debt obligations held by the Fund which are not listed or traded on exchanges or for which no reported market exists are ordinarily valued at the valuation obtained from a pricing service provider approved by the Audit Committee.
In any case when a pricing service provider fails to provide a valuation for a debt obligation held by the Fund, the Committee calculates a fair value for the obligation using alternative methods under procedures approved by the Audit Committee. Additionally, in cases when management believes that a valuation obtained from a pricing service provider merits review for significant reasons, the Committee decides whether or not to use the valuation calculated by the pricing service provider or to use an alternative method approved by the Audit Committee to calculate a fair value for the obligation.
Quotations for foreign investments expressed in foreign currency amounts are converted to U.S. dollar equivalents using a foreign exchange quotation from a third party service provider at the time of valuation. Foreign investments held by the Fund may be traded on days and at times when the Fund is not open for business. Consequently, the value of Fund investments may be significantly affected on days when shareholders cannot purchase or sell Fund shares. Futures contracts and other financial and derivative instruments traded on an exchange are valued at the latest published price for the instrument on its primary exchange. Listed options are valued at the last bid price.
Valuation Hierarchy: The Fund categorizes its investments based upon the inputs used in valuing those investments, according to a three-level hierarchy established in guidance from FASB. Categorization of investments using this hierarchy is intended by the FASB to maximize the use of observable inputs in valuing investments and minimize the use of unobservable inputs by requiring that the most observable inputs be used when available. Observable inputs are those that market participants would use in valuing an investment based on available market information. Unobservable inputs are those that reflect assumptions about the information market participants would use in valuing an investment. An investment’s level within the hierarchy is based on the lowest level input that is deemed significant to the valuation. The methodologies and inputs used to value investments are not necessarily indications of the risk or liquidity associated with those investments.
Various inputs are used in calculating valuations for the Fund’s investments. These inputs are generally summarized according to the three-level hierarchy below:
Level 1: Quoted prices in active markets for identical investments.
Level 2: Other direct or indirect significant observable inputs (including quoted prices for similar investments in active markets and other observable inputs, such as interest rates, prepayment rates, credit risk, etc.).
Level 3: Significant unobservable inputs (including the Committee’s own assumptions in calculating the fair values of investments).
Valuations for debt obligations held by the Fund are typically calculated by pricing service providers approved by the Audit Committee and are characterized as Level 2 within the valuation hierarchy.
On days when market volatility thresholds established by the Audit Committee are exceeded, foreign securities for which valuations are obtained from pricing service providers are fair valued. On these days, the foreign securities are characterized as Level 2 within the valuation hierarchy and revert to Level 1 after the threshold is no longer exceeded.
In a limited number of cases the Committee calculates a fair value for investments using broker quotations or other methods approved by the Audit Committee. When the Committee uses a single broker quotation to calculate a fair value for an investment without other significant observable inputs, or if a fair value is calculated using other significant inputs that are considered unobservable, the investment is characterized as Level 3 within the hierarchy. Other significant unobservable inputs used to calculate a fair value in these instances might include an income-based valuation approach which considers discounted anticipated future cash flows from the investment, and application of discounts due to the nature or duration of any restrictions on the disposition of the investment.
Valuations based upon the use of inputs from Levels 1, 2 or 3 may not represent the actual price received upon the disposition of an investment, and the Fund may receive a price that is lower than the valuation based upon these inputs when it sells the investment.
The following table displays a summary of the fair value hierarchy measurements of the Fund’s investments as of March 31, 2017. In any instance when valuation inputs from more than one level are used to determine the fair value of a specific investment, the investment is placed in the level of the table based upon the lowest level input that is significant in determining the fair value of the investment:
20 Semi-Annual Report
| | |
| Notes to Financial Statements, Continued | | |
| |
Thornburg Global Opportunities Fund | | March 31, 2017 (Unaudited) |
| | | | | | | | | | | | | | | | |
| | | FAIR VALUE MEASUREMENTS AT MARCH 31, 2017 | |
| | | TOTAL | | | LEVEL 1 | | | LEVEL 2 | | | LEVEL 3 | |
Assets | | | | | | | | | | | | | | | | |
Investments in Securities* | | | | | | | | | | | | | | | | |
Common Stock | | $ | 1,935,638,316 | | | $ | 1,935,638,316 | | | $ | — | | | $ | — | |
Short Term Investments | | | 117,636,793 | | | | 117,636,793 | | | | — | | | | — | |
| | | | | | | | | | | | | | | | |
Total Investments in Securities | | $ | 2,053,275,109 | | | $ | 2,053,275,109 | | | $ | — | | | $ | — | |
Other Financial Instruments** | | | | | | | | | | | | | | | | |
Forward Currency Contracts | | $ | 1,993,418 | | | $ | — | | | $ | 1,993,418 | | | $ | — | |
Liabilities | | | | | | | | | | | | | | | | |
Other Financial Instruments** | | | | | | | | | | | | | | | | |
Forward Currency Contracts | | $ | (2,082,877 | ) | | $ | — | | | $ | (2,082,877 | ) | | $ | — | |
| * | See Schedule of Investments for a summary of the industry exposure as grouped according to the Global Industry Classification Standard (GICS), which is an industry taxonomy developed by MSCI, Inc. and Standard & Poor’s (S&P). |
| ** | Other Financial Instruments include investments not reflected in the Schedule of Investments, which may include futures, forwards and swap contracts, which are valued at the unrealized appreciation (depreciation) on the investment. |
In accordance with the guidance prescribed in Accounting Standards Update No. 2011-04, it is the policy of the Fund to recognize transfers between levels and the underlying events which caused the movement. The Fund recognized no transfers between levels for the six months ended March 31, 2017, other than when the Fund exceeded market volatility thresholds for foreign equity investments during the period.
NOTE 4 – INVESTMENT ADVISORY FEE AND OTHER TRANSACTIONS WITH AFFILIATES
Pursuant to an investment advisory agreement, the Advisor serves as the investment advisor and performs services for the Fund for which the fees are payable at the end of each month. Under the investment advisory agreement, the Fund pays the Advisor a management fee based on the daily net assets of the Fund at an annual rate as shown in the following table:
Management Fee Schedule
| | | | |
DAILY NET ASSETS | | FEE RATE | |
Up to $500 million | | | 0.875 | % |
Next $500 million | | | 0.825 | |
Next $500 million | | | 0.775 | |
Next $500 million | | | 0.725 | |
Over $2 billion | | | 0.675 | |
The Fund’s effective management fee for the period ended March 31, 2017 was 0.802% of the Fund’s average net assets.
The Fund pays to the Advisor the costs of personnel who perform certain accounting services for the Fund. For the six months ended March 31, 2017 the Fund paid $34,010 to the Advisor for these accounting services. The Trust has also entered into administrative service agreements with the Advisor, whereby the Advisor will perform certain administrative services related to each class of the Fund’s shares, and for which fees will be payable at an annual rate of up to .125 of 1% per annum of the average daily net assets attributable to each class of shares. Total administrative service fees incurred by each class of shares of the Fund for the six months ended March 31, 2017, are set forth in the Statement of Operations.
The Trust has an underwriting agreement with Thornburg Securities Corporation (the “Distributor”), an affiliate of the Advisor, which acts as the distributor of the Fund’s shares. For the six months ended March 31, 2017, the Distributor has advised the Fund that it earned net commissions aggregating $20,752 from the sale of Class A shares, and collected contingent deferred sales charges aggregating $15,426 from redemptions of Class C shares of the Fund.
Pursuant to a service plan under Rule 12b-1 of the Investment Company Act of 1940, the Fund may reimburse to the Advisor an amount not to exceed .25 of 1% per annum of the average daily net assets attributable to Class A, Class C, Class R3, and Class R4 shares of the Fund for payments made by the Advisor to securities dealers and other financial institutions to obtain various shareholder and distribution related services. For the six months ended March 31, 2017, there were no 12b-1 service plan fees charged for Class I
Semi-Annual Report 21
| | |
| Notes to Financial Statements, Continued | | |
| |
Thornburg Global Opportunities Fund | | March 31, 2017 (Unaudited) |
and R5 shares. The Advisor may pay out of its own resources additional expenses for distribution of the Fund’s shares and shareholder services.
The Trust has also adopted distribution plans pursuant to Rule 12b-1, applicable only to the Fund’s Class C and Class R3 shares, under which the Fund compensates the Distributor for services in promoting the sale of Class C and Class R3 shares of the Fund at an annual rate of up to .75 of 1% per annum of the average daily net assets attributable to Class C shares, and an annual rate of up to .25 of 1% per annum of the average daily net assets attributable to Class R3 shares. Total fees incurred by each class of shares of the Fund under their respective service and distribution plans for the six months ended March 31, 2017, are set forth in the Statement of Operations.
The Advisor and Distributor have contractually agreed to waive fees and reimburse expenses incurred by the Fund so that actual expenses of certain share classes do not exceed levels as specified in the Fund’s most recent prospectus. The agreement may be terminated by the Fund at any time, but may not be terminated by the Advisor or Distributor before April 10, 2018, unless the Advisor ceases to be the investment advisor to the Fund or the Distributor ceases to be the distributor of the Fund prior to that date. The Advisor and Distributor may recoup amounts waived or reimbursed during the fiscal year if actual expenses fall below the contractual limit during that year.
For the six months ended March 31, 2017, the Advisor contractually reimbursed certain class specific expenses, administrative fees, and distribution fees of $149,259 for Class I shares, $26,163 for Class R3 shares, $27,384 for Class R4 shares, and $68,224 for Class R5 shares.
Certain officers and Trustees of the Trust are also officers or directors of the Advisor and Distributor. The compensation of independent Trustees is borne by the Trust.
The percentage of direct investments in the Fund held by the Trustees and Officers of the Trust and the Advisor is approximately 2.23%.
The Fund may purchase or sell securities from, or to an affiliated fund, provided the affiliation is due solely to having a common investment advisor, common officers, or common trustees, and provided that all such transactions will comply with Rule 17a-7 under the 1940 Act. For the six months ended March 31, 2017, the Fund had no transactions with affiliated funds.
NOTE 5 – SHARES OF BENEFICIAL INTEREST
At March 31, 2017, there were an unlimited number of shares with no par value of beneficial interest authorized. Transactions in shares of beneficial interest were as follows:
| | | | | | | | | | | | | | | | |
| | | SIX MONTHS ENDED | | | YEAR ENDED | |
| | | MARCH 31, 2017 (UNAUDITED) | | | SEPTEMBER 30, 2016 (AUDITED) | |
| | | SHARES | | | AMOUNT | | | SHARES | | | AMOUNT | |
Class A Shares | | | | | | | | | | | | | | | | |
Shares sold | | | 1,548,219 | | | $ | 40,847,954 | | | | 8,325,065 | | | $ | 206,319,481 | |
Shares issued to shareholders in reinvestment of dividends | | | 32,274 | | | | 851,742 | | | | 110,072 | | | | 2,763,766 | |
Shares repurchased | | | (5,343,689 | ) | | | (140,092,784 | ) | | | (13,183,729 | ) | | | (319,167,131 | ) |
| | | | | | | | | | | | | | | | |
| | | | |
Net increase (decrease) | | | (3,763,196 | ) | | $ | (98,393,088 | ) | | | (4,748,592 | ) | | $ | (110,083,884 | ) |
| | | | | | | | | | | | | | | | |
Class C Shares | | | | | | | | | | | | | | | | |
Shares sold | | | 912,049 | | | $ | 23,422,105 | | | | 4,803,724 | | | $ | 115,763,249 | |
Shares issued to shareholders in reinvestment of dividends | | | 5,507 | | | | 140,551 | | | | — | | | | — | |
Shares repurchased | | | (2,585,098 | ) | | | (65,610,744 | ) | | | (5,248,474 | ) | | | (123,425,784 | ) |
| | | | | | | | | | | | | | | | |
| | | | |
Net increase (decrease) | | | (1,667,542 | ) | | $ | (42,048,088 | ) | | | (444,750 | ) | | $ | (7,662,535 | ) |
| | | | | | | | | | | | | | | | |
Class I Shares | | | | | | | | | | | | | | | | |
Shares sold | | | 9,821,601 | | | $ | 263,013,467 | | | | 18,934,040 | | | $ | 468,189,151 | |
Shares issued to shareholders in reinvestment of dividends | | | 147,035 | | | | 3,934,986 | | | | 471,633 | | | | 11,765,280 | |
Shares repurchased | | | (7,381,612 | ) | | | (194,707,823 | ) | | | (31,876,944 | ) | | | (772,988,446 | ) |
| | | | | | | | | | | | | | | | |
| | | | |
Net increase (decrease) | | | 2,587,024 | | | $ | 72,240,630 | | | | (12,471,271 | ) | | $ | (293,034,015 | ) |
| | | | | | | | | | | | | | | | |
22 Semi-Annual Report
| | |
| Notes to Financial Statements, Continued | | |
| |
Thornburg Global Opportunities Fund | | March 31, 2017 (Unaudited) |
| | | | | | | | | | | | | | | | |
| | | SIX MONTHS ENDED | | | YEAR ENDED | |
| | | MARCH 31, 2017 (UNAUDITED) | | | SEPTEMBER 30, 2016 (AUDITED) | |
| | | SHARES | | | AMOUNT | | | SHARES | | | AMOUNT | |
Class R3 Shares | | | | | | | | | | | | | | | | |
Shares sold | | | 54,445 | | | $ | 1,418,619 | | | | 305,984 | | | $ | 7,356,605 | |
Shares issued to shareholders in reinvestment of dividends | | | 409 | | | | 10,680 | | | | 773 | | | | 19,074 | |
Shares repurchased | | | (94,886 | ) | | | (2,449,254 | ) | | | (244,734 | ) | | | (5,942,010 | ) |
| | | | | | | | | | | | | | | | |
| | | | |
Net increase (decrease) | | | (40,032 | ) | | $ | (1,019,955 | ) | | | 62,023 | | | $ | 1,433,669 | |
| | | | | | | | | | | | | | | | |
Class R4 Shares | | | | | | | | | | | | | | | | |
Shares sold | | | 282,889 | | | $ | 7,613,447 | | | | 659,749 | | | $ | 16,156,222 | |
Shares issued to shareholders in reinvestment of dividends | | | 1,419 | | | | 37,062 | | | | 3,301 | | | | 81,175 | |
Shares repurchased | | | (309,973 | ) | | | (8,338,142 | ) | | | (339,232 | ) | | | (8,186,824 | ) |
| | | | | | | | | | | | | | | | |
| | | | |
Net increase (decrease) | | | (25,665 | ) | | $ | (687,633 | ) | | | 323,818 | | | $ | 8,050,573 | |
| | | | | | | | | | | | | | | | |
Class R5 Shares | | | | | | | | | | | | | | | | |
Shares sold | | | 328,072 | | | $ | 8,684,096 | | | | 1,385,031 | | | $ | 34,352,393 | |
Shares issued to shareholders in reinvestment of dividends | | | 9,865 | | | | 264,006 | | | | 46,737 | | | | 1,162,738 | |
Shares repurchased | | | (390,135 | ) | | | (10,394,069 | ) | | | (3,446,732 | ) | | | (83,976,357 | ) |
| | | | | | | | | | | | | | | | |
| | | | |
Net increase (decrease) | | | (52,198 | ) | | $ | (1,445,967 | ) | | | (2,014,964 | ) | | $ | (48,461,226 | ) |
| | | | | | | | | | | | | | | | |
NOTE 6 – INVESTMENT TRANSACTIONS
For the six months ended March 31, 2017, the Fund had purchase and sale transactions of investments (excluding short-term investments) of $276,445,205 and $358,949,853, respectively.
NOTE 7 – DERIVATIVE FINANCIAL INSTRUMENTS WITH OFF-BALANCE SHEET RISK AND FOREIGN INVESTMENT RISK
The Fund may use a variety of derivative financial instruments to hedge or adjust the risks affecting its investment portfolio or to enhance investment returns. Provisions of the FASB Accounting Standards Codification 815-10-50 (“ASC 815”) require certain disclosures. The disclosures are intended to provide users of financial statements with an understanding of the use of derivative instruments by the Fund and how these derivatives affect the financial position, financial performance and cash flows of the Fund. The Fund does not designate any derivative instruments as hedging instruments under ASC 815. During the six months ended March 31, 2017, the Fund’s principal exposure to derivative financial instruments of the type addressed by ASC 815 was investment in foreign exchange contracts. A foreign exchange contract is an agreement between two parties to exchange different currencies at a specified rate of exchange at an agreed upon future date. Foreign exchange contracts involve risks to the Fund, including the risk that a contract’s counterparty will not meet its obligations to the Fund, the risk that a change in a contract’s value may not correlate perfectly with the currency the contract was intended to track, and the risk that the Fund’s Advisor is unable to correctly implement its strategy in using a contract. In any such instance, the Fund may not achieve the intended benefit of entering into a contract, and may experience a loss.
The Fund entered into forward currency contracts during the six months ended March 31, 2017 in the normal course of pursuing its investment objectives, with the objective of purchasing foreign investments or with the intent of reducing the risk to the value of the Fund’s foreign investments from adverse changes in the relationship between the U.S. dollar and foreign currencies. In each case these contracts have been initiated in conjunction with foreign investment transactions.
These contracts are accounted for by the Fund under ASC 815. Unrealized appreciation and depreciation on outstanding contracts are reported in the Fund’s Statement of Assets and Liabilities, as measured by the difference between the forward exchange rates at the reporting date and the forward exchange rates at each contract’s inception date. Net realized gain (loss) on contracts closed during the period, and changes in net unrealized appreciation (depreciation) on outstanding contracts are recognized in the Fund’s Statement of Operations.
The quarterly average value of open sell currency contracts for the six months ended March 31, 2017 was $569,860,908. Open buy currency contracts are entered into for the purpose of closing open sell currency contracts and the values are dependent upon the values of the open sell currency contracts to which they relate.
Semi-Annual Report 23
| | |
| Notes to Financial Statements, Continued | | |
| |
Thornburg Global Opportunities Fund | | March 31, 2017 (Unaudited) |
The following table displays the outstanding forward currency contracts at March 31, 2017:
| | | | | | | | | | | | | | | | | | | | | | |
OUTSTANDING FORWARD CURRENCY CONTRACTS TO BUY OR SELL AT MARCH 31, 2017 | |
| CONTRACT DESCRIPTION | | BUY/SELL | | CONTRACT
AMOUNT | | | CONTRACT
VALUE DATE | | | VALUE
USD | | | UNREALIZED
APPRECIATION | | | UNREALIZED
DEPRECIATION | |
Australian Dollar | | Buy | | | 2,143,400 | | | | 05/01/2017 | | | | 1,636,765 | | | $ | 21,844 | | | $ | — | |
Australian Dollar | | Buy | | | 2,211,400 | | | | 05/01/2017 | | | | 1,688,692 | | | | 16,343 | | | | — | |
Australian Dollar | | Buy | | | 3,606,300 | | | | 05/01/2017 | | | | 2,753,879 | | | | — | | | | (11,287 | ) |
Australian Dollar | | Buy | | | 3,758,500 | | | | 05/01/2017 | | | | 2,870,104 | | | | — | | | | (29,508 | ) |
Australian Dollar | | Sell | | | 42,016,700 | | | | 05/01/2017 | | | | 32,085,219 | | | | — | | | | (417,904 | ) |
Euro | | Sell | | | 377,156,500 | | | | 05/15/2017 | | | | 403,099,524 | | | | 1,685,199 | | | | — | |
Great Britain Pound | | Sell | | | 11,918,000 | | | | 04/10/2017 | | | | 14,934,111 | | | | 80,841 | | | | — | |
Great Britain Pound | | Buy | | | 22,065,900 | | | | 04/10/2017 | | | | 27,650,159 | | | | 80,582 | | | | — | |
Great Britain Pound | | Buy | | | 8,199,500 | | | | 04/10/2017 | | | | 10,274,563 | | | | 68,522 | | | | — | |
Great Britain Pound | | Sell | | | 14,123,500 | | | | 04/10/2017 | | | | 17,697,761 | | | | — | | | | (66,690 | ) |
Great Britain Pound | | Sell | | | 18,971,500 | | | | 04/10/2017 | | | | 23,772,653 | | | | — | | | | (245,717 | ) |
Great Britain Pound | | Sell | | | 67,645,800 | | | | 04/10/2017 | | | | 84,765,050 | | | | — | | | | (1,154,165 | ) |
Swiss Franc | | Sell | | | 6,825,100 | | | | 06/30/2017 | | | | 6,849,534 | | | | 40,087 | | | | — | |
Swiss Franc | | Buy | | | 7,070,100 | | | | 04/03/2017 | | | | 7,058,454 | | | | — | | | | (42,536 | ) |
Swiss Franc | | Sell | | | 7,070,100 | | | | 04/03/2017 | | | | 7,058,454 | | | | — | | | | (115,070 | ) |
| | | | | | | | | | | | | | | | | | | | | | |
Total | | | | | | | | | | | | | | | | $ | 1,993,418 | | | $ | (2,082,877 | ) |
| | | | | | | | | | | | | | | | | | | | | | |
| | | | |
Net unrealized appreciation (depreciation) | | | | | | | | | | | | | | | $ | (89,459 | ) |
| | | | | | | | | | | | | | | | | | | | | | |
The outstanding forward currency contracts in the foregoing table were entered into with State Street Bank and Trust Company (“SSB”), pursuant to an International Swaps and Derivatives Association (“ISDA”) Master Agreement. In the event of a default or termination under the ISDA Master Agreement with SSB, the non-defaulting party has the right to close out all outstanding forward currency contracts between the parties and to net any payment amounts under those contracts, resulting in a single net amount payable by one party to the other.
Because the ISDA Master Agreement with SSB does not result in an offset of reported amounts of financial assets and liabilities in the Fund’s Statement of Assets and Liabilities unless there has been an event of default or termination event under that agreement, the Fund does not net its outstanding forward currency contracts for purposes of the disclosure in the Fund’s Statement of Assets and Liabilities. Instead the Fund recognizes the unrealized appreciation or depreciation on those forward currency contracts on a gross basis in the Fund’s Statement of Assets and Liabilities.
The unrealized appreciation (depreciation) of the outstanding forward currency contracts recognized in the Fund’s Statement of Assets and Liabilities at March 31, 2017 is disclosed in the following table:
| | | | |
| FAIR VALUES OF DERIVATIVE FINANCIAL INSTRUMENTS AT MARCH 31, 2017 |
| | |
| ASSET DERIVATIVES | | BALANCE SHEET LOCATION | | FAIR VALUE |
| | |
Foreign exchange contracts | | Assets - Unrealized appreciation on forward currency contracts | | $ 1,993,418 |
| | |
| LIABILITY DERIVATIVES | | BALANCE SHEET LOCATION | | FAIR VALUE |
| | |
Foreign exchange contracts | | Liabilities - Unrealized depreciation on forward currency contracts | | $(2,082,877) |
| | |
| | | | |
Because the Fund does not currently receive or post cash collateral in connection with its currency forward contracts, and because all of the Fund’s outstanding currency forward contracts are with SSB, the net amounts of the Fund’s assets and liabilities which are attributable to those contracts at March 31, 2017 can be determined by offsetting the dollar amounts shown in the preceding table. Based on those amounts, the net amount of the Fund’s assets which is attributable to its outstanding forward currency contracts at March 31, 2017 is $0, and the net amount of the Fund’s liabilities which is attributable to those contracts at that date is $89,459. The Fund’s forward currency contracts are valued each day, and the net amounts of the Fund’s assets and liabilities which are attributable to those contracts are expected to vary over time.
24 Semi-Annual Report
| | |
| Notes to Financial Statements, Continued | | |
| |
Thornburg Global Opportunities Fund | | March 31, 2017 (Unaudited) |
The net realized gain (loss) from forward currency contracts and the net change in unrealized appreciation (depreciation) on outstanding forward currency contracts recognized in the Fund’s Statement of Operations for the six months ended March 31, 2017 are disclosed in the following tables:
| | | | |
NET REALIZED GAIN (LOSS) ON DERIVATIVE FINANCIAL INSTRUMENTS
RECOGNIZED IN INCOME FOR THE SIX MONTHS ENDED MARCH 31, 2017 |
| | |
| | | TOTAL | | FORWARD CURRENCY CONTRACTS |
| | |
Foreign exchange contracts | | $ 27,382,999 | | $ 27,382,999 |
|
NET CHANGE IN UNREALIZED APPRECIATION (DEPRECIATION) OF DERIVATIVE FINANCIAL INSTRUMENTS
RECOGNIZED IN INCOME FOR THE SIX MONTHS ENDED MARCH 31, 2017 |
| | |
| | | TOTAL | | FORWARD CURRENCY CONTRACTS |
| | |
Foreign exchange contracts | | $ 1,023,665 | | $ 1,023,665 |
OTHER NOTES
Risks: The Fund’s investments subject it to risks including, but not limited to, management risk, market and economic risk, risks affecting specific issuers, liquidity risk, the risks associated with investments in small- and mid-cap companies and non-U.S. issuers (including developing country issuers), credit risk, real estate investment trusts, and interest rate risk. Please see the Fund’s prospectus for a discussion of the risks associated with an investment in the Fund.
Subsequent Events: Fund management believes no events have occurred between March 31, 2017 and the date of issuance of the financial statements that require adjustment to or disclosure in the accompanying financial statements.
Semi-Annual Report 25
Financial Highlights
Thornburg Global Opportunities Fund
| | | | | | | | | | | | | | | | | | | | | | | | | | | | | | | | | | | | | | | | | | | | | | | | | | | | |
| | | PER SHARE PERFORMANCE (FOR A SHARE OUTSTANDING THROUGHOUT THE PERIOD) | | RATIOS TO AVERAGE NET ASSETS | | | SUPPLEMENTAL DATA | |
UNLESS OTHERWISE
NOTED, PERIODS ARE
FISCAL YEARS ENDED
SEPT. 30, | | NET ASSET
VALUE
BEGINNING
OF PERIOD | | | NET
INVESTMENT
INCOME
(LOSS)+ | | | NET
REALIZED &
UNREALIZED
GAIN (LOSS)
ON
INVESTMENTS | | | TOTAL FROM
INVESTMENT
OPERATIONS | | DIVIDENDS
FROM NET
INVESTMENT
INCOME | | | DIVIDENDS
FROM NET
REALIZED
GAINS | | TOTAL
DIVIDENDS | | | NET
ASSET
VALUE
END OF
PERIOD | | NET
INVESTMENT
INCOME
(LOSS)
(%) | | | EXPENSES,
AFTER
EXPENSE
REDUCTIONS
(%) | | | EXPENSES,
AFTER
EXPENSE
REDUCTIONS
AND NET OF
CUSTODY
CREDITS
(%) | | | EXPENSES,
BEFORE
EXPENSE
REDUCTIONS
(%) | | | TOTAL
RETURN
(%)(a) | | PORTFOLIO
TURNOVER
RATE (%)(a) | | | NET ASSETS
AT END OF
PERIOD
(THOUSANDS) | |
CLASS A SHARES | | | | | | | | | | | | | | | | | | | | | | | | | | | | | | | | | | | | | | | | | | | | | |
2017(b)(c) | | $ | 24.90 | | | | 0.06 | | | | 3.20 | | | 3.26 | | | (0.06 | ) | | — | | | (0.06 | ) | | $28.10 | | | 0.48 | (e) | | | 1.37 | (e) | | | 1.37 | (e) | | | 1.37 | (e) | | 13.10 | | | 15.32 | | | $ | 394,301 | |
2016(c) | | $ | 24.41 | | | | 0.25 | | | | 0.38 | | | 0.63 | | | (0.14 | ) | | — | | | (0.14 | ) | | $24.90 | | | 1.02 | | | | 1.35 | | | | 1.35 | | | | 1.35 | | | 2.57 | | | 37.11 | | | $ | 443,072 | |
2015(c) | | $ | 23.74 | | | | (0.11 | ) | | | 0.78 | | | 0.67 | | | — | | | — | | | — | | | $24.41 | | | (0.42 | ) | | | 1.32 | | | | 1.32 | | | | 1.32 | | | 2.82 | | | 45.41 | | | $ | 550,327 | |
2014(c) | | $ | 19.72 | | | | (0.03 | ) | | | 4.13 | | | 4.10 | | | (0.08 | ) | | — | | | (0.08 | ) | | $23.74 | | | (0.15 | ) | | | 1.41 | | | | 1.41 | | | | 1.41 | | | 20.85 | | | 60.29 | | | $ | 207,227 | |
2013(c) | | $ | 15.97 | | | | 0.11 | | | | 3.79 | | | 3.90 | | | (0.15 | ) | | — | | | (0.15 | ) | | $19.72 | | | 0.60 | | | | 1.46 | | | | 1.46 | | | | 1.46 | | | 24.50 | | | 66.12 | | | $ | 96,855 | |
2012(c) | | $ | 13.15 | | | | 0.14 | | | | 2.89 | | | 3.03 | | | (0.21 | ) | | — | | | (0.21 | ) | | $15.97 | | | 0.94 | | | | 1.49 | | | | 1.49 | | | | 1.49 | | | 23.22 | | | 66.07 | | | $ | 77,103 | |
CLASS C SHARES | | | | | | | | | | | | | | | | | | | | | | | | | | | | | | | | | | | | | | | | | | | | | |
2017(b) | | $ | 24.13 | | | | (0.03 | ) | | | 3.09 | | | 3.06 | | | (0.01 | ) | | — | | | (0.01 | ) | | $27.18 | | | (0.27 | )(e) | | | 2.11 | (e) | | | 2.11 | (e) | | | 2.11 | (e) | | 12.69 | | | 15.32 | | | $ | 359,555 | |
2016 | | $ | 23.70 | | | | 0.07 | | | | 0.36 | | | 0.43 | | | — | | | — | | | — | | | $24.13 | | | 0.29 | | | | 2.09 | | | | 2.09 | | | | 2.09 | | | 1.81 | | | 37.11 | | | $ | 359,426 | |
2015 | | $ | 23.23 | | | | (0.31 | ) | | | 0.78 | | | 0.47 | | | — | | | — | | | — | | | $23.70 | | | (1.20 | ) | | | 2.10 | | | | 2.10 | | | | 2.10 | | | 2.02 | | | 45.41 | | | $ | 363,615 | |
2014 | | $ | 19.38 | | | | (0.20 | ) | | | 4.07 | | | 3.87 | | | (0.02 | ) | | — | | | (0.02 | ) | | $23.23 | | | (0.92 | ) | | | 2.17 | | | | 2.17 | | | | 2.17 | | | 19.96 | | | 60.29 | | | $ | 143,506 | |
2013 | | $ | 15.69 | | | | (0.03 | ) | | | 3.72 | | | 3.69 | | | — | | | — | | | — | | | $19.38 | | | (0.18 | ) | | | 2.22 | | | | 2.22 | | | | 2.22 | | | 23.52 | | | 66.12 | | | $ | 87,808 | |
2012 | | $ | 12.98 | | | | 0.02 | | | | 2.84 | | | 2.86 | | | (0.15 | ) | | — | | | (0.15 | ) | | $15.69 | | | 0.17 | | | | 2.27 | | | | 2.27 | | | | 2.27 | | | 22.21 | | | 66.07 | | | $ | 76,738 | |
CLASS I SHARES | | | | | | | | | | | | | | | | | | | | | | | | | | | | | | | | | | | | | | | | | | | | | |
2017(b) | | $ | 24.96 | | | | 0.11 | | | | 3.21 | | | 3.32 | | | (0.11 | ) | | — | | | (0.11 | ) | | $28.17 | | | 0.84 | (e) | | | 0.99 | (e) | | | 0.99 | (e) | | | 1.02 | (e) | | 13.34 | | | 15.32 | | | $ | 1,197,920 | |
2016 | | $ | 24.53 | | | | 0.34 | | | | 0.37 | | | 0.71 | | | (0.28 | ) | | — | | | (0.28 | ) | | $24.96 | | | 1.39 | | | | 0.99 | | | | 0.99 | | | | 0.99 | | | 2.91 | | | 37.11 | | | $ | 996,970 | |
2015 | | $ | 23.79 | | | | (0.02 | ) | | | 0.77 | | | 0.75 | | | (0.01 | ) | | — | | | (0.01 | ) | | $24.53 | | | (0.08 | ) | | | 0.97 | | | | 0.97 | | | | 0.98 | | | 3.17 | | | 45.41 | | | $ | 1,285,609 | |
2014 | | $ | 19.74 | | | | 0. 06 | | | | 4.15 | | | 4.21 | | | (0.16 | ) | | — | | | (0.16 | ) | | $23.79 | | | 0.26 | | | | 0.99 | | | | 0.99 | | | | 1.08 | | | 21.39 | | | 60.29 | | | $ | 453,511 | |
2013 | | $ | 16.06 | | | | 0.19 | | | | 3.80 | | | 3.99 | | | (0.31 | ) | | — | | | (0.31 | ) | | $19.74 | | | 1.07 | | | | 0.99 | | | | 0.99 | | | | 1.11 | | | 25.08 | | | 66.12 | | | $ | 249,283 | |
2012 | | $ | 13.20 | | | | 0.21 | | | | 2.90 | | | 3.11 | | | (0.25 | ) | | — | | | (0.25 | ) | | $16.06 | | | 1.44 | | | | 0.99 | | | | 0.99 | | | | 1.21 | | | 23.82 | | | 66.07 | | | $ | 169,384 | |
CLASS R3 SHARES | | | | | | | | | | | | | | | | | | | | | | | | | | | | | | | | | | | | | | | | | | | | | |
2017(b) | | $ | 24.66 | | | | 0.04 | | | | 3.17 | | | 3.21 | | | (0.05 | ) | | — | | | (0.05 | ) | | $27.82 | | | 0.34 | (e) | | | 1.50 | (e) | | | 1.50 | (e) | | | 2.00 | (e) | | 13.03 | | | 15.32 | | | $ | 10,897 | |
2016 | | $ | 24.18 | | | | 0.20 | | | | 0.38 | | | 0.58 | | | (0.10 | ) | | — | | | (0.10 | ) | | $24.66 | | | 0.84 | | | | 1.50 | | | | 1.50 | | | | 2.01 | | | 2.38 | | | 37.11 | | | $ | 10,645 | |
2015 | | $ | 23.55 | | | | (0.15 | ) | | | 0.78 | | | 0.63 | | | — | | | — | | | — | | | $24.18 | | | (0.58 | ) | | | 1.50 | | | | 1.50 | | | | 2.15 | | | 2.68 | | | 45.41 | | | $ | 8,936 | |
2014 | | $ | 19.55 | | | | (0.06 | ) | | | 4.11 | | | 4.05 | | | (0.05 | ) | | — | | | (0.05 | ) | | $23.55 | | | (0.26 | ) | | | 1.50 | | | | 1.50 | | | | 2.59 | | | 20.75 | | | 60.29 | | | $ | 2,182 | |
2013 | | $ | 15.91 | | | | 0.11 | | | | 3.74 | | | 3.85 | | | (0.21 | ) | | — | | | (0.21 | ) | | $19.55 | | | 0.60 | | | | 1.49 | | | | 1.49 | | | | 3.41 | | | 24.37 | | | 66.12 | | | $ | 1,653 | |
2012 | | $ | 13.11 | | | | 0.11 | | | | 2.90 | | | 3.01 | | | (0.21 | ) | | — | | | (0.21 | ) | | $15.91 | | | 0.75 | | | | 1.50 | | | | 1.50 | | | | 9.01 | (d) | | 23.22 | | | 66.07 | | | $ | 894 | |
CLASS R4 SHARES | | | | | | | | | | | | | | | | | | | | | | | | | | | | | | | | | | | | | | | | | | | | | |
2017(b) | | $ | 24.67 | | | | 0.06 | | | | 3.17 | | | 3.23 | | | (0.06 | ) | | — | | | (0.06 | ) | | $27.84 | | | 0.43 | (e) | | | 1.40 | (e) | | | 1.40 | (e) | | | 1.64 | (e) | | 13.10 | | | 15.32 | | | $ | 23,452 | |
2016 | | $ | 24.22 | | | | 0.24 | | | | 0.35 | | | 0.59 | | | (0.14 | ) | | — | | | (0.14 | ) | | $24.67 | | | 0.98 | | | | 1.40 | | | | 1.40 | | | | 1.66 | | | 2.45 | | | 37.11 | | | $ | 21,415 | |
2015 | | $ | 23.57 | | | | (0.13 | ) | | | 0.78 | | | 0.65 | | | — | | | — | | | — | | | $24.22 | | | (0.51 | ) | | | 1.40 | | | | 1.40 | | | | 1.76 | | | 2.76 | | | 45.41 | | | $ | 13,175 | |
2014 | | $ | 19.59 | | | | (0.03 | ) | | | 4.10 | | | 4.07 | | | (0.09 | ) | | — | | | (0.09 | ) | | $23.57 | | | (0.14 | ) | | | 1.40 | | | | 1.40 | | | | 2.23 | | | 20.82 | | | 60.29 | | | $ | 4,462 | |
2013 | | $ | 15.90 | | | | 0.12 | | | | 3.76 | | | 3.88 | | | (0.19 | ) | | — | | | (0.19 | ) | | $19.59 | | | 0.68 | | | | 1.40 | | | | 1.40 | | | | 2.76 | | | 24.57 | | | 66.12 | | | $ | 2,161 | |
2012 | | $ | 13.09 | | | | 0.15 | | | | 2.88 | | | 3.03 | | | (0.22 | ) | | — | | | (0.22 | ) | | $15.90 | | | 1.05 | | | | 1.40 | | | | 1.40 | | | | 3.72 | | | 23.36 | | | 66.07 | | | $ | 1,329 | |
CLASS R5 SHARES | | | | | | | | | | | | | | | | | | | | | | | | | | | | | | | | | | | | | | | | | | | | | |
2017(b) | | $ | 24.99 | | | | 0.11 | | | | 3.21 | | | 3.32 | | | (0.11 | ) | | — | | | (0.11 | ) | | $28.20 | | | 0.85 | (e) | | | 0.99 | (e) | | | 0.99 | (e) | | | 1.20 | (e) | | 13.32 | | | 15.32 | | | $ | 66,521 | |
2016 | | $ | 24.55 | | | | 0.34 | | | | 0.37 | | | 0.71 | | | (0.27 | ) | | — | | | (0.27 | ) | | $24.99 | | | 1.38 | | | | 0.99 | | | | 0.99 | | | | 1.07 | | | 2.91 | | | 37.11 | | | $ | 60,252 | |
2015 | | $ | 23.81 | | | | (0.03 | ) | | | 0.78 | | | 0.75 | | | (0.01 | ) | | — | | | (0.01 | ) | | $24.55 | | | (0.11 | ) | | | 0.98 | | | | 0.98 | | | | 1.02 | | | 3.17 | | | 45.41 | | | $ | 108,654 | |
2014 | | $ | 19.76 | | | | 0.06 | | | | 4.15 | | | 4.21 | | | (0.16 | ) | | — | | | (0.16 | ) | | $23.81 | | | 0.26 | | | | 0.99 | | | | 0.99 | | | | 1.10 | | | 21.36 | | | 60.29 | | | $ | 74,212 | |
2013 | | $ | 16.07 | | | | 0.18 | | | | 3.82 | | | 4.00 | | | (0.31 | ) | | — | | | (0.31 | ) | | $19.76 | | | 1.03 | | | | 0.99 | | | | 0.99 | | | | 1.15 | | | 25.13 | | | 66.12 | | | $ | 49,023 | |
2012 | | $ | 13.21 | | | | 0.21 | | | | 2.90 | | | 3.11 | | | (0.25 | ) | | — | | | (0.25 | ) | | $16.07 | | | 1.44 | | | | 0.99 | | | | 0.99 | | | | 1.15 | | | 23.80 | | | 66.07 | | | $ | 50,327 | |
| (a) | Not annualized for periods less than one year. |
| (b) | Unaudited Six Month Period Ended March 31. |
| (c) | Sales loads are not reflected in computing total return. |
| (d) | Due to the size of net assets and fixed expenses, ratios may appear disproportionate. |
| + | Based on weighted average shares outstanding. |
See notes to financial statements.
| | | | |
| 26 Semi-Annual Report | | | | Semi-Annual Report 27 |
| | |
| Expense Example | | |
| |
Thornburg Global Opportunities Fund | | March 31, 2017 (Unaudited) |
As a shareholder of the Fund, you incur two types of costs:
| | (1) | transaction costs, including |
(a) sales charges (loads) on purchase payments, for Class A shares;
(b) a deferred sales charge on redemptions of any part or all of a purchase of $1 million of Class A shares within 12 months of purchase;
(c) a deferred sales charge on redemptions of Class C shares within 12 months of purchase;
| | (2) | ongoing costs, including management fees; distribution and/or service (12b-1) fees; and other Fund expenses. |
This example is intended to help you understand your ongoing costs (in dollars) of investing in the Fund and to compare these costs with the ongoing costs of investing in other mutual funds.
The example is based on a $1,000 investment beginning on October 1, 2016, and held until March 31, 2017.
| | | | | | | | | | | | |
| | | BEGINNING
ACCOUNT VALUE
10/1/16 | | | ENDING
ACCOUNT VALUE
3/31/17 | | | EXPENSES PAID
DURING PERIOD†
10/1/16–3/31/17 | |
CLASS A SHARES | | | | | | | | | | | | |
Actual | | $ | 1,000.00 | | | $ | 1,131.01 | | | $ | 7.29 | |
Hypothetical* | | $ | 1,000.00 | | | $ | 1,018.09 | | | $ | 6.90 | |
CLASS C SHARES | | | | | | | | | | | | |
Actual | | $ | 1,000.00 | | | $ | 1,126.90 | | | $ | 11.19 | |
Hypothetical* | | $ | 1,000.00 | | | $ | 1,014.41 | | | $ | 10.60 | |
CLASS I SHARES | | | | | | | | | | | | |
Actual | | $ | 1,000.00 | | | $ | 1,133.39 | | | $ | 5.26 | |
Hypothetical* | | $ | 1,000.00 | | | $ | 1,020.00 | | | $ | 4.98 | |
CLASS R3 SHARES | | | | | | | | | | | | |
Actual | | $ | 1,000.00 | | | $ | 1,130.29 | | | $ | 7.97 | |
Hypothetical* | | $ | 1,000.00 | | | $ | 1,017.44 | | | $ | 7.55 | |
CLASS R4 SHARES | | | | | | | | | | | | |
Actual | | $ | 1,000.00 | | | $ | 1,131.04 | | | $ | 7.44 | |
Hypothetical* | | $ | 1,000.00 | | | $ | 1,017.95 | | | $ | 7.04 | |
CLASS R5 SHARES | | | | | | | | | | | | |
Actual | | $ | 1,000.00 | | | $ | 1,133.21 | | | $ | 5.27 | |
Hypothetical* | | $ | 1,000.00 | | | $ | 1,020.00 | | | $ | 4.99 | |
| † | Expenses are equal to the annualized expense ratio for each class (A: 1.37%; C: 2.11%; I: 0.99%; R3: 1.50%; R4: 1.40%; R5: 0.99%) multiplied by the average account value over the period, multiplied by 182/365 to reflect the one-half year period. |
| * | Hypothetical assumes a rate of return of 5% per year before expenses. |
ACTUAL EXPENSES
For each class of shares, the first line of the accompanying table provides information about actual account values and actual expenses. You may use the information in this line, together with the amount you invested, to estimate the expenses that you paid over the period. Simply divide your account value by $1,000 (for example, an $8,600 account value divided by $1,000 = 8.6), then multiply the result by the number in the first line for your class of shares under the heading entitled “Expenses Paid During Period” to estimate the expenses you paid on your account during this period.
HYPOTHETICAL EXAMPLE FOR COMPARISON PURPOSES
For each class of shares, the second line of the accompanying table provides information about hypothetical account values and hypothetical expenses based on the Fund’s actual expense ratio and an assumed rate of return of 5% per year before expenses, which is not the Fund’s actual return. The hypothetical account values and expenses may not be used to estimate the actual ending account balance or expenses you paid for the period. You may use this information to compare the ongoing costs of investing in the Fund and other funds. To do so, compare this 5% hypothetical example with the 5% hypothetical examples that appear in the shareholder reports of the other funds.
Please note that the expenses shown in the table are meant to highlight your ongoing costs only and do not reflect any transactional costs, such as sales charges (loads), redemption fees, or exchange fees. Therefore, the second line of the table for each class of shares is useful in comparing ongoing costs only, and will not help you determine the relative total costs of owning different funds. In addition, if these transactional costs were included, your costs would have been higher.
28 Semi-Annual Report
| | |
| Other Information | | |
| |
Thornburg Global Opportunities Fund | | March 31, 2017 |
PORTFOLIO PROXY VOTING
Policies and Procedures:
The Trust has delegated to Thornburg Investment Management, Inc. (the “Advisor”) voting decisions respecting proxies for the Fund’s voting securities. The Advisor makes voting decisions in accordance with its Proxy Voting Policy and Procedures. A description of the Policy and Procedures is available (i) without charge, upon request, by calling the Advisor toll-free at 1-800-847-0200, (ii) on the Thornburg website at www.thornburg.com, and (iii) on the Securities and Exchange Commission’s website at www.sec.gov.
Information regarding how proxies were voted is available on or before August 31 of each year for the twelve months ending the preceding June 30. This information is available (i) without charge, upon request by calling the Advisor toll-free at 1-800-847-0200, (ii) on the Thornburg website at www.thornburg.com, and (iii) on the Securities and Exchange Commission’s website at www.sec.gov.
AVAILABILITY OF QUARTERLY PORTFOLIO SCHEDULE
The Fund files with the Securities and Exchange Commission schedules of its portfolio holdings on Form N-Q for the first and third quarters of each fiscal year. The Fund’s Forms N-Q are available on the Commission’s website at www.sec.gov, or may be reviewed and copied at the Commission’s Public Reference Room in Washington, D.C. Information on the operation of the Public Reference Room may be obtained by calling 1-800-SEC-0330. The Fund also makes this information available on its website at www.thornburg.com/download or upon request by calling 1-800-847-0200.
Semi-Annual Report 29
Trustees’ Statement to Shareholders
Readopted September 12, 2016
The Trustees believe current and prospective shareholders should know how we discharge our responsibilities in supervising the Funds’ investment advisor and in reviewing the advisor’s contract for renewal. Since 2005, we have issued a statement which sets out clearly the three principal guidelines that we follow in supervising the Trust’s investment advisor on your behalf. In accordance with our customary practice, in September of this year we again reviewed our statement and concluded we should reissue this statement outlining the principal features of our supervision of the advisor’s performance of investment management services for the Funds.
We begin with the premise that each shareholder selected his or her Fund because its investments are managed by the investment advisor identified in the prospectus and in accordance with the objective and policies described in the prospectus. We realize, as each of you do, that if you believe that your Fund’s stated objective and policies no longer serve your personal investment goals, you can sell your shares and leave the Fund.
Therefore, we believe that our primary supervisory task — our principal obligation to you—is to assess the nature and quality of the advisor’s services, and to confirm that the advisor actively and competently pursues the Fund’s objective, in accordance with the policies set out in the prospectus. To do this, we meet regularly with management to review your Fund’s portfolio and to discuss the advisor’s specific actions and judgments in pursuing the Fund’s objective. We do not substitute our own judgment for the advisor’s decisions in selecting investments; the advisor is paid to exercise its informed judgment on investment decisions, and we seek to confirm, in reviewing the advisor’s performance, that the advisor is doing just that.
Second, we are conscious of costs and the effect that costs have on shareholders’ returns. We try to make sure that your Fund’s fees and costs are reasonable in relationship to the services rendered and that they are generally in line with those charged by other expert investment advisors, consistent with our belief that the Fund’s investors searched for and expect that expertise and attention and have decided to pay a reasonable price for it. We do not put the management contract “out to bid” as a matter of course, and we would not do so unless we had concluded that the advisor materially had failed to pursue the Fund’s objectives in accordance with its policies, or for other equally important reasons. We believe that any other approach would be inconsistent with your interests and contrary to your expectations when you bought shares of the Fund in the first place.
Finally, because we believe that most Thornburg Fund shareholders have invested with a long-term perspective, we try not to focus too much on the fashions of the moment and on short-term performance. The market will not favor any specific investment objective or set of policies at all times and under all economic circumstances. A fund will experience periods of both high and low returns relative to other funds and other investments. Even if one of our Funds is not favored by the market at a particular time, we believe that the advisor is nonetheless obliged to remain true to the Fund’s objective and policies, and we watch to see that it does so.
Trustees of Thornburg Investment Trust
30 Semi-Annual Report
Thornburg Funds
Thornburg Investment Management is a privately-owned global investment firm that offers a range of solutions for retail and institutional investors. Founded in 1982 and headquartered in Santa Fe, New Mexico, we manage approximately $49 billion (as of March 31, 2017) across U.S. mutual funds, separate accounts for high-net-worth investors and institutional accounts, and UCITS funds for non-U.S. investors.
The fund outlined in this report is one of many equity and fixed-income products available from Thornburg Investment Management.
EQUITY FUNDS
| | • | | Thornburg Investment Income Builder Fund |
| | • | | Thornburg Global Opportunities Fund |
| | • | | Thornburg International Value Fund |
| | • | | Thornburg Better World International Fund |
| | • | | Thornburg International Growth Fund |
| | • | | Thornburg Developing World Fund |
| | • | | Thornburg Core Growth Fund |
FIXED INCOME FUNDS
| | • | | Thornburg Low Duration Income Fund |
| | • | | Thornburg Limited Term U.S. Government Fund |
| | • | | Thornburg Limited Term Income Fund |
| | • | | Thornburg Strategic Income Fund |
| | • | | Thornburg Low Duration Municipal Fund |
| | • | | Thornburg Limited Term Municipal Fund |
| | • | | Thornburg Intermediate Municipal Fund |
| | • | | Thornburg California Limited Term Municipal Fund |
| | • | | Thornburg New Mexico Intermediate Municipal Fund |
| | • | | Thornburg New York Intermediate Municipal Fund |
| | • | | Thornburg Strategic Municipal Income Fund |
ALTERNATIVE FUNDS
| | • | | Thornburg Long/Short Equity Fund |
Before investing, carefully consider the Fund’s investment goals, risks, charges, and expenses. For a prospectus or summary prospectus containing this and other information, contact your financial advisor or visit thornburg.com. Read it carefully before investing.
For additional information, please visit thornburg.com
Thornburg Investment Management, Inc. 2300 North Ridgetop Road, Santa Fe, NM 87506
Semi-Annual Report 31

| | |
To receive shareholder reports, prospectuses, and proxy statements electronically, go to www.thornburg.com/edelivery. This Semi-Annual Report is submitted for the general information of shareholders of the Fund. It is not authorized for distribution to prospective investors in the Fund unless preceded or accompanied by an effective prospectus. | | 
|
| |
| | | | |
| Investment Advisor: | | Distributor: | | |
| Thornburg Investment Management® | | Thornburg Securities Corporation® | | |
| 800.847.0200 | | 800.847.0200 | | TH1411 |


2 Semi-Annual Reports
Semi-Annual Report
Thornburg Developing World Fund
March 31, 2017
| | | | |
SHARE CLASS | | NASDAQ SYMBOL | | CUSIP |
Class A | | THDAX | | 885-216-408 |
Class C | | THDCX | | 885-216-507 |
Class I | | THDIX | | 885-216-606 |
Class R5 | | THDRX | | 885-216-846 |
Class R6 | | TDWRX | | 885-216-838 |
Class I, R5, and R6 shares may not be available to all investors. Minimum investments for Class I shares may be higher than those for other classes.
Investments carry risks, including possible loss of principal. Additional risks may be associated with investments outside the United States, especially in emerging markets, including currency fluctuations, illiquidity, volatility, and political and economic risks. Investments in small- and mid-capitalization companies may increase the risk of greater price fluctuations. Please see the Fund’s prospectus for a discussion of the risks associated with an investment in the Fund. Investments in the Fund are not FDIC insured, nor are they bank deposits or guaranteed by a bank or any other entity.
Funds invested in a smaller number of holdings may expose an investor to greater volatility.
Semi-Annual Report 3
| | |
| Letter to Shareholders | | |
| |
Thornburg Developing World Fund | | March 31, 2017 (Unaudited) |
April 17, 2017
Dear Fellow Shareholder,
At the start of this semi-annual period last October 1, global markets were still generally weak and risk appetite tepid. But a bullish shift was just starting to take shape as developed world economic data, particularly in Europe, began to diverge from the then-prevailing “secular stagnation” meme. China’s contribution to market anxiety over deflationary pressures also began to abate after its producer price data turned positive in September for the first time in five years. That, in turn, helped soothe concerns about its slowing economy amid a transition to more consumer-driven from investment-led growth. Fears about the impact of the U.S. general election in November and an expected Federal Reserve interest rate hike in December still undercut emerging market performance in the last leg of 2016, but it nonetheless turned out to be a banner year for emerging market equities.
Although the Fed did indeed hike its key interest rate a quarter-point in December, and raised it again in March this year, worries that capital would fly from emerging markets for dollar-based assets have so far proven unfounded. Investors have focused more on the global reflation trade, with the rebound in world economic growth led by emerging markets. Meanwhile, developing country stocks continued to race higher, with the MSCI Emerging Markets Index gaining 11.5% in the first quarter of 2017, more than matching the 11.2% advance for all of calendar 2016.
Much of last year’s emerging market gains were driven narrowly by commodities and energy prices, primarily in Brazil and Russia. Moreover, developing world corporate earnings were generally lagging the rebound in emerging market share prices and valuation multiples. More defensive sectors even declined as investors shifted toward cyclically focused sectors, including technology and financials. Given our preference for free cash flow generative, less leveraged stocks, we typically lag in strong cyclical upswings. For the six months ended March 31, 2017, the Thornburg Developing World Fund returned 0.29% for the Class A shares (without sales charge), under-performing the benchmark MSCI Emerging Markets Index, which returned 6.80% in the period.
As we have pointed out, we aim to outperform over full market cycles, and with lower volatility, by compounding off a higher base of downside protection following inevitable downturns.
In the six months through March 31, 2017, our top contributors included Samsung Electronics; Galaxy Entertainment; Itau Unibanco; Novatek; and Reliance Industries. Samsung rose thanks to better-than-expected end-market fundamentals and increased pressure to restructure into a more transparent organization, while increasing cash return to shareholders. Galaxy Entertainment rebounded on a recovery in gross gaming revenue, amid a greater focus on Macau’s mass market segment and optimism in its property development pipeline. Itau Unibanco, Brazil’s premier private sector bank, climbed as growth expectations improved and it signaled that a peak in non-performing loans may be at hand. Russian oil and gas producer Novatek rebounded with improved sentiment and energy prices. Lastly, India’s Reliance Industries Limited gained as its significant investments in what is now the country’s largest 4G network is showing signs of monetization, with many millions of new clients joining the network. Reliance also benefited from the rise in energy prices late last year.
The main detractors in the six-month period were Amorepacific; Liberty Global; CT Environmental Group; PT Matahari Department Store; and GT Capital. South Korean cosmetics maker Amorepacific declined as geopolitical tensions between China and South Korea rose, prompting a reduction in Chinese leisure travel to South Korea and investor concerns about a retrenchment in Chinese spending on Amorepacific products. Liberty Global plc LiLAK is a Latin America-focused telecom and cable operator that is part of the Liberty Global group. It declined after reporting much-lower-than expected earnings before interest, taxes, depreciation and amortization (EBITDA) following the closure of a recent acquisition, sparking concerns the company had overpaid for an asset with limited growth. We sold the stock. Chinese wastewater utility CT Environmental Group was the target of a short-seller attack launched the night before Thanksgiving. Although we believe the allegations weren’t well established and the shares have begun to slowly recover, its troubles may not be over, so we sold the shares. Indonesia’s PT Matahari Department Store fell on concerns about increasing competition in its apparel segment and weaker-than-expected 2017 guidance. GT Capital, an investment holding company based in the Philippines, declined with the Philippine peso due to concerns around margin pressure in its Toyota Motors subsidiary, which imports some parts from other markets.
We remain optimistic about the accelerating economic recovery in emerging markets and the growing breadth of the rebound in earnings across sectors in developing countries. Earnings revisions are for the most part positive, and not just in the most cyclically sensitive sectors. Although commodities and energy prices bounced back in 2016 and contributed to a recovery in global inflation later in the year, price pressures are hardly threatening, keeping the specter of aggressive central
4 Semi-Annual Report
| | |
| Letter to Shareholders, | | |
| |
Continued Thornburg Developing World Fund | | March 31, 2017 (Unaudited) |
bank monetary tightening at bay, certainly in the near term. We believe this is a favorable environment for our disciplined, bottom-up investment process, as country and sector stock correlations ebb.
Thank you for investing alongside us in Thornburg Developing World Fund.
Sincerely,
| | | | |
 | |  | | |
| Ben Kirby, CFA | | Charlie Wilson, PhD | | |
| Portfolio Manager | | Portfolio Manager | | |
| Managing Director | | Managing Director | | |
The matters discussed in this report may constitute forward-looking statements made pursuant to the safe harbor provisions of the Securities Litigation Reform Act of 1995. These include any advisor or portfolio manager prediction, assessment, analysis or outlook for individual securities, industries, investment styles, market sectors and/or markets. These statements involve risks and uncertainties. In addition to the general risks described for each fund in its current prospectus, other factors bearing on these reports include the accuracy of the advisor’s or portfolio manager’s forecasts and predictions, the appropriateness of the investment strategies designed by the advisor or portfolio manager and the ability of the advisor or portfolio manager to implement their strategies efficiently and successfully. Any one or more of these factors, as well as other risks affecting the securities markets generally, could cause the actual results of any fund to differ materially as compared to its benchmarks.
The views expressed are subject to change and do not necessarily reflect the views of Thornburg Investment Management, Inc. This information should not be relied upon as a recommendation or investment advice and is not intended to predict the performance of any investment or market.
Semi-Annual Report 5
| | |
| Performance Summary | | |
| |
Thornburg Developing World Fund | | March 31, 2017 (Unaudited) |
AVERAGE ANNUAL TOTAL RETURNS
| | | | | | | | | | | | | | | | |
| | | 1-YR | | | 3-YR | | | 5-YR | | | SINCE
INCEP. | |
Class A Shares (Incep: 12/16/09) | | | | | | | | | | | | | | | | |
Without sales charge | | | 7.53 | % | | | -2.91 | % | | | 1.95 | % | | | 5.07 | % |
With sales charge | | | 2.68 | % | | | -4.38 | % | | | 1.01 | % | | | 4.41 | % |
Class C Shares (Incep: 12/16/09) | | | | | | | | | | | | | | | | |
Without sales charge | | | 6.63 | % | | | -3.64 | % | | | 1.17 | % | | | 4.32 | % |
With sales charge | | | 5.63 | % | | | -3.64 | % | | | 1.17 | % | | | 4.32 | % |
Class I Shares (Incep: 12/16/09) | | | 7.94 | % | | | -2.49 | % | | | 2.42 | % | | | 5.60 | % |
Class R5 Shares (Incep: 2/1/13) | | | 7.89 | % | | | -2.48 | % | | | — | | | | 0.17 | % |
Class R6 Shares (Incep: 2/1/13) | | | 8.03 | % | | | -2.38 | % | | | — | | | | 0.27 | % |
MSCI Emerging Markets Index (Since 12/16/09) | | | 17.22 | % | | | 1.18 | % | | | 0.81 | % | | | 2.19 | % |
GROWTH OF A HYPOTHETICAL $10,000 INVESTMENT
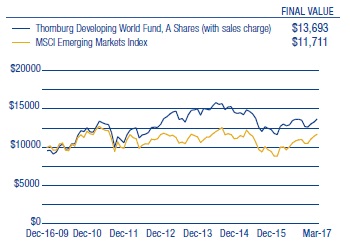
Performance data shown represents past performance and is no guarantee of future results. Investment return and principal value will fluctuate so shares, when redeemed, may be worth more or less than their original cost. Current performance may be lower or higher than quoted. For performance current to the most recent month end, visit thornburg.com or call 800.847.0200. The performance information does not reflect the deduction of taxes that a shareholder would pay on distributions or the redemption of Fund shares. Returns reflect the reinvestment of dividends and capital gains as well as applicable sales charges. Class A shares are sold with a maximum sales charge of 4.50%. Class C shares are subject to a 1% CDSC for the first year only. There is no sales charge for Class I, R5, and R6 shares.
As disclosed in the most recent prospectus, the total annual fund operating expenses are as follows: A shares, 1.57%; C shares, 2.34%; I shares, 1.16%; R5 shares, 1.75%; R6 shares, 1.17%. Thornburg Investment Management and/or Thornburg Securities Corporation have contractually agreed to waive fees and reimburse expenses through at least April 10, 2018, for some of the share classes, resulting in net expense ratios of the following: I shares, 1.09%; R5 shares, 1.09%; R6 shares, 0.99%. For more detailed information on fund expenses and waivers/reimbursements please see the Fund’s prospectus.
The MSCI Emerging Markets Index is a free float-adjusted market capitalization index that is designed to measure equity market performance of emerging markets. The MSCI Emerging Markets Index consists of the following 23 emerging market country indexes: Brazil, Chile, China, Colombia, Czech Republic, Egypt, Greece, Hungary, India, Indonesia, Korea, Malaysia, Mexico, Peru, Philippines, Poland, Qatar, Russia, South Africa, Taiwan, Thailand, Turkey and United Arab Emirates.
The performance of any index is not indicative of the performance of any particular investment. Unless otherwise noted, index returns reflect the reinvestment of income dividends and capital gains, if any, but do not reflect fees, brokerage commissions or other expenses of investing. Investors may not make direct investments into any index.
EBITDA – Earnings Before Interest, Taxes, Depreciation and Amortization. An approximate measure of a company’s operating cash flow based on data from the company’s income statement.
Multiple – A valuation multiple reflects an investment’s market value relative to some key metric. Price to earnings ratio (P/E) is a commonly used multiple. It’s calculated by dividing a stock’s price by the company’s earnings per share.
Producer Price Index (PPI) – Measures the average change over time in selling price received by domestic producers for their goods and services. The prices included in the PPI are from the first commercial transaction for many products and some services.
6 Semi-Annual Report
| | |
| Fund Summary | | |
| |
Thornburg Developing World Fund | | March 31, 2017 (Unaudited) |
OBJECTIVES AND STRATEGIES
The Fund seeks long-term capital appreciation. Under normal market conditions the Fund invests at least 80% of its assets in equity securities and debt obligations of developing country issuers. A developing country issuer is a company or sovereign entity that is domiciled or otherwise tied economically to one or more developing countries. The Fund expects that investments in the Fund’s portfolio normally will be weighted in favor of equity securities.
MARKET CAPITALIZATION EXPOSURE
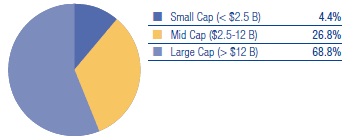
BASKET STRUCTURE
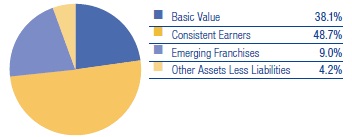
TOP TEN EQUITY HOLDINGS
| | | | |
Tencent Holdings Ltd. | | | 4.6 | % |
Alibaba Group Holding Ltd. ADR | | | 4.3 | % |
HDFC Bank Ltd. ADR | | | 4.0 | % |
AIA Group Ltd. | | | 4.0 | % |
Samsung Electronics Co. Ltd. | | | 3.5 | % |
Baidu, Inc. ADR | | | 2.9 | % |
Sanlam Ltd. | | | 2.6 | % |
Facebook, Inc. | | | 2.5 | % |
ICICI Bank Ltd. ADR | | | 2.5 | % |
ITC Ltd. | | | 2.3 | % |
SECTOR EXPOSURE
| | | | |
Financials | | | 26.0 | % |
Information Technology | | | 24.0 | % |
Consumer Staples | | | 11.9 | % |
Consumer Discretionary | | | 8.7 | % |
Energy | | | 5.4 | % |
Real Estate | | | 5.1 | % |
Health Care | | | 4.8 | % |
Industrials | | | 4.8 | % |
Telecommunication Services | | | 3.4 | % |
Materials | | | 0.9 | % |
Utilities | | | 0.8 | % |
Other Assets Less Liabilities | | | 4.2 | % |
TOP TEN INDUSTRY GROUPS
| | | | |
Software & Services | | | 16.8 | % |
Banks | | | 15.8 | % |
Insurance | | | 6.6 | % |
Technology Hardware & Equipment | | | 5.8 | % |
Energy | | | 5.4 | % |
Food, Beverage & Tobacco | | | 5.3 | % |
Real Estate | | | 5.1 | % |
Food & Staples Retailing | | | 3.9 | % |
Diversified Financials | | | 3.5 | % |
Telecommunication Services | | | 3.4 | % |
There is no guarantee that the Fund will meet its investment objective.
All portfolio information is subject to change. Charts may not add up to 100% due to rounding.
Semi-Annual Report 7
| | |
Fund Summary, Continued | | |
| |
Thornburg Developing World Fund | | March 31, 2017 (Unaudited) |
COUNTRY EXPOSURE*
(percent of equity holdings)
| | | | |
China | | | 22.3 | % |
India | | | 15.0 | % |
Brazil | | | 9.6 | % |
Hong Kong | | | 8.5 | % |
South Korea | | | 8.5 | % |
Mexico | | | 4.9 | % |
United States | | | 4.9 | % |
Indonesia | | | 3.8 | % |
Russia | | | 3.5 | % |
South Africa | | | 3.2 | % |
Taiwan | | | 2.6 | % |
Netherlands | | | 2.3 | % |
Turkey | | | 2.0 | % |
United Arab Emirates | | | 2.0 | % |
Philippines | | | 1.9 | % |
Thailand | | | 1.9 | % |
United Kingdom | | | 1.8 | % |
Switzerland | | | 1.3 | % |
| * | The country assignment of each equity holding is determined by the Fund’s Advisor based on various factors, including the location of the issuer’s head office, the issuer’s jurisdiction of incorporation and the country from which a majority of the issuer’s revenue is derived. The Advisor may deem certain issuers to be developing country issuers, as defined in the Fund’s prospectus, even if those issuers have country exposure in a developed country. |
8 Semi-Annual Report
| | |
| Schedule of Investments | | |
| |
Thornburg Developing World Fund | | March 31, 2017 (Unaudited) |
| | | | | | | | |
| | | SHARES/
PRINCIPAL
AMOUNT | | | VALUE | |
COMMON STOCK — 95.84% | | | | | | | | |
BANKS — 15.80% | | | | | | | | |
Banks — 15.80% | | | | | | | | |
Citigroup, Inc. | | | 380,009 | | | $ | 22,732,139 | |
Grupo Financiero Banorte, S.A.B. de C.V. | | | 2,601,082 | | | | 14,968,317 | |
HDFC Bank Ltd. | | | 461,970 | | | | 10,507,532 | |
HDFC Bank Ltd. ADR | | | 411,368 | | | | 30,943,101 | |
ICICI Bank Ltd. ADR | | | 2,928,400 | | | | 25,184,240 | |
Itau Unibanco Holding SA ADR | | | 1,235,128 | | | | 14,907,995 | |
PT Bank Central Asia | | | 19,176,294 | | | | 23,816,567 | |
Siam Commercial Bank plc | | | 3,981,229 | | | | 18,885,131 | |
| | | | | | | | |
| | | | | | | 161,945,022 | |
| | | | | | | | |
CAPITAL GOODS — 0.59% | | | | | | | | |
Industrial Conglomerates — 0.59% | | | | | | | | |
CJ Corp. | | | 39,110 | | | | 6,085,255 | |
| | | | | | | | |
| | | | | | | 6,085,255 | |
| | | | | | | | |
COMMERCIAL & PROFESSIONAL SERVICES — 1.00% | | | | | | | | |
Commercial Services & Supplies — 1.00% | | | | | | | | |
Valid Solucoes e Servicos SA | | | 1,414,458 | | | | 10,211,062 | |
| | | | | | | | |
| | | | | | | 10,211,062 | |
| | | | | | | | |
CONSUMER DURABLES & APPAREL — 1.92% | | | | | | | | |
Household Durables — 1.92% | | | | | | | | |
Coway Co., Ltd. | | | 229,331 | | | | 19,727,839 | |
| | | | | | | | |
| | | | | | | 19,727,839 | |
| | | | | | | | |
CONSUMER SERVICES — 2.74% | | | | | | | | |
Diversified Consumer Services — 1.58% | | | | | | | | |
Kroton Educacional S.A. | | | 3,818,550 | | | | 16,198,283 | |
Hotels, Restaurants & Leisure — 1.16% | | | | | | | | |
Galaxy Entertainment Group Ltd. | | | 2,174,839 | | | | 11,907,534 | |
| | | | | | | | |
| | | | | | | 28,105,817 | |
| | | | | | | | |
DIVERSIFIED FINANCIALS — 3.53% | | | | | | | | |
Capital Markets — 1.73% | | | | | | | | |
Hong Kong Exchanges & Clearing Ltd. | | | 704,831 | | | | 17,739,811 | |
Diversified Financial Services — 1.80% | | | | | | | | |
GT Capital Holdings, Inc. | | | 809,233 | | | | 18,466,802 | |
| | | | | | | | |
| | | | | | | 36,206,613 | |
| | | | | | | | |
ENERGY — 5.44% | | | | | | | | |
Energy Equipment & Services — 2.23% | | | | | | | | |
Schlumberger Ltd. | | | 292,182 | | | | 22,819,414 | |
Oil, Gas & Consumable Fuels — 3.21% | | | | | | | | |
NovaTek OAO-GDR Reg S | | | 116,653 | | | | 14,523,298 | |
a Reliance Industries Ltd. | | | 906,097 | | | | 18,427,531 | |
| | | | | | | | |
| | | | | | | 55,770,243 | |
| | | | | | | | |
FOOD & STAPLES RETAILING — 3.88% | | | | | | | | |
Food & Staples Retailing — 3.88% | | | | | | | | |
BIM Birlesik Magazalar A.S. | | | 1,303,631 | | | | 20,050,619 | |
Magnit PJSC GDR | | | 516,348 | | | | 19,724,494 | |
| | | | | | | | |
| | | | | | | 39,775,113 | |
| | | | | | | | |
FOOD, BEVERAGE & TOBACCO — 5.27% | | | | | | | | |
Beverages — 0.90% | | | | | | | | |
Kweichow Moutai Co., Ltd. | | | 164,666 | | | | 9,232,267 | |
Food Products — 1.02% | | | | | | | | |
Grupo Lala, S.A.B. de C.V. | | | 5,776,187 | | | | 10,483,507 | |
Tobacco — 3.35% | | | | | | | | |
ITC Ltd. | | | 5,516,046 | | | | 23,848,925 | |
KT&G Corp. | | | 120,471 | | | | 10,503,373 | |
| | | | | | | | |
| | | | | | | 54,068,072 | |
| | | | | | | | |
Semi-Annual Report 9
| | |
| Schedule of Investments, Continued | | |
| |
Thornburg Developing World Fund | | March 31, 2017 (Unaudited) |
| | | | | | | | |
| | | SHARES/
PRINCIPAL
AMOUNT | | | VALUE | |
HEALTH CARE EQUIPMENT & SERVICES — 1.75% | | | | | | | | |
Health Care Providers & Services — 1.75% | | | | | | | | |
Life Healthcare Group Holdings Ltd. | | | 2,114,393 | | | $ | 4,568,807 | |
Sinopharm Group Co., Ltd. | | | 2,875,932 | | | | 13,340,712 | |
| | | | | | | | |
| | | | | | | 17,909,519 | |
| | | | | | | | |
HOUSEHOLD & PERSONAL PRODUCTS — 2.77% | | | | | | | | |
Personal Products — 2.77% | | | | | | | | |
AmorePacific Corp. | | | 42,715 | | | | 10,714,081 | |
Unilever N.V. | | | 354,829 | | | | 17,627,905 | |
| | | | | | | | |
| | | | | | | 28,341,986 | |
| | | | | | | | |
INSURANCE — 6.64% | | | | | | | | |
Insurance — 6.64% | | | | | | | | |
AIA Group Ltd. | | | 6,493,387 | | | | 40,941,384 | |
Sanlam Ltd. | | | 5,395,144 | | | | 27,091,836 | |
| | | | | | | | |
| | | | | | | 68,033,220 | |
| | | | | | | | |
MATERIALS — 0.87% | | | | | | | | |
Metals & Mining — 0.87% | | | | | | | | |
Vedanta Ltd. | | | 2,107,584 | | | | 8,948,347 | |
| | | | | | | | |
| | | | | | | 8,948,347 | |
| | | | | | | | |
MEDIA — 2.66% | | | | | | | | |
Media — 2.66% | | | | | | | | |
a IMAX China Holding, Inc. | | | 2,827,760 | | | | 14,554,513 | |
Zee Entertainment Enterprises Ltd. | | | 1,546,333 | | | | 12,752,157 | |
| | | | | | | | |
| | | | | | | 27,306,670 | |
| | | | | | | | |
PHARMACEUTICALS, BIOTECHNOLOGY & LIFE SCIENCES — 3.09% | | | | | |
Pharmaceuticals — 1.87% | | | | | | | | |
a,b China Animal Healthcare Ltd. | | | 35,787,582 | | | | 920,996 | |
Hypermarcas SA | | | 1,967,958 | | | | 18,229,982 | |
Novartis AG ADR | | | 168,242 | | | | 12,495,333 | |
| | | | | | | | |
| | | | | | | 31,646,311 | |
| | | | | | | | |
REAL ESTATE — 5.09% | | | | | | | | |
Equity Real Estate Investment Trusts — 2.19% | | | | | | | | |
Fibra Uno Administracion S.A. de C.V. | | | 13,103,603 | | | | 22,403,628 | |
Real Estate Management & Development — 2.90% | | | | | | | | |
China Resources Land Ltd. | | | 3,697,015 | | | | 9,990,004 | |
Emaar Properties PJSC | | | 9,949,310 | | | | 19,774,555 | |
| | | | | | | | |
| | | | | | | 52,168,187 | |
| | | | | | | | |
RETAILING — 1.33% | | | | | | | | |
Multiline Retail — 1.33% | | | | | | | | |
Matahari Department Store Tbk | | | 13,832,886 | | | | 13,676,656 | |
| | | | | | | | |
| | | | | | | 13,676,656 | |
| | | | | | | | |
SEMICONDUCTORS & SEMICONDUCTOR EQUIPMENT — 1.38% | | | | | | | | |
Semiconductors & Semiconductor Equipment — 1.38% | | | | | | | | |
Taiwan Semiconductor Manufacturing Co., Ltd. | | | 2,277,820 | | | | 14,188,283 | |
| | | | | | | | |
| | | | | | | 14,188,283 | |
| | | | | | | | |
SOFTWARE & SERVICES — 16.85% | | | | | | | | |
Information Technology Services — 1.74% | | | | | | | | |
Cielo S.A. | | | 1,970,556 | | | | 17,819,728 | |
Internet Software & Services — 14.23% | | | | | | | | |
a Alibaba Group Holding Ltd. ADR | | | 406,934 | | | | 43,879,693 | |
a Baidu, Inc. ADR | | | 170,589 | | | | 29,430,014 | |
a Facebook, Inc. | | | 180,180 | | | | 25,594,569 | |
Tencent Holdings Ltd. | | | 1,637,663 | | | | 46,949,922 | |
Software — 0.88% | | | | | | | | |
Linx S.A. | | | 1,705,915 | | | | 9,045,611 | |
| | | | | | | | |
| | | | | | | 172,719,537 | |
| | | | | | | | |
TECHNOLOGY HARDWARE & EQUIPMENT — 5.81% | | | | | | | | |
Electronic Equipment, Instruments & Components — 2.28% | | | | | | | | |
Hangzhou Hikvision Digital Technology Co., Ltd. | | | 2,655,313 | | | | 12,290,618 | |
Largan Precision Co., Ltd. | | | 70,241 | | | | 11,065,403 | |
10 Semi-Annual Report
| | |
| Schedule of Investments, Continued | | |
| |
Thornburg Developing World Fund | | March 31, 2017 (Unaudited) |
| | | | | | | | |
| | | SHARES/
PRINCIPAL
AMOUNT | | | VALUE | |
Technology, Hardware, Storage & Peripherals — 3.53% | | | | | | | | |
Samsung Electronics Co. Ltd. | | | 19,658 | | | $ | 36,211,643 | |
| | | | | | | | |
| | | | | | | 59,567,664 | |
| | | | | | | | |
TELECOMMUNICATION SERVICES — 3.41% | | | | | | | | |
Diversified Telecommunication Services — 1.63% | | | | | | | | |
Bharti Infratel Ltd. | | | 3,341,168 | | | | 16,712,272 | |
Wireless Telecommunication Services — 1.78% | | | | | | | | |
China Mobile Ltd. | | | 1,663,279 | | | | 18,202,648 | |
| | | | | | | | |
| | | | | | | 34,914,920 | |
| | | | | | | | |
TRANSPORTATION — 3.21% | | | | | | | | |
Air Freight & Logistics — 1.32% | | | | | | | | |
a ZTO Express (Cayman), Inc. ADR | | | 1,030,136 | | | | 13,484,480 | |
Transportation Infrastructure — 1.89% | | | | | | | | |
Shanghai International Air Co., Ltd. | | | 4,466,426 | | | | 19,429,388 | |
| | | | | | | | |
| | | | | | | 32,913,868 | |
| | | | | | | | |
UTILITIES — 0.81% | | | | | | | | |
Water Utilities — 0.81% | | | | | | | | |
Cia Saneamento do Parana | | | 2,375,196 | | | | 8,345,734 | |
| | | | | | | | |
| | | | | | | 8,345,734 | |
| | | | | | | | |
TOTAL COMMON STOCK (Cost $867,037,655) | | | | | | | 982,575,938 | |
| | | | | | | | |
| | |
RIGHTS — 0.00% | | | | | | | | |
HEALTH CARE EQUIPMENT & SERVICES 0.00% | | | | | | | | |
Health Care Providers & Services — 0.00% | | | | | | | | |
Life Healthcare Group Holdings Rights | | | 6 | | | | 2 | |
| | | | | | | | |
TOTAL RIGHTS (Cost $0) | | | | | | | 2 | |
| | | | | | | | |
SHORT TERM INVESTMENTS — 4.84% | | | | | | | | |
c Thornburg Capital Management Fund | | | 4,959,991 | | | | 49,599,909 | |
| | | | | | | | |
TOTAL SHORT TERM INVESTMENTS (Cost $49,599,909) | | | | | | | 49,599,909 | |
| | | | | | | | |
TOTAL INVESTMENTS — 100.68% (Cost $916,637,564) | | | | | | $ | 1,032,175,849 | |
LIABILITIES NET OF OTHER ASSETS — (0.68)% | | | | | | | (7,005,227 | ) |
| | | | | �� | | | |
NET ASSETS — 100.00% | | | | | | $ | 1,025,170,622 | |
| | | | | | | | |
Footnote Legend
| b | Security currently fair valued by the Valuation and Pricing Committee using procedures approved by the Trustees’ Audit Committee. |
| c | Investment in Affiliates - Shown below are holdings of voting securities of each portfolio company which is considered “affiliated” to the Fund under the Investment Company Act of 1940, including companies for which the Fund’s holding represented 5% or more of the company’s voting securities, and a series of the Thornburg Investment Trust in which the Fund invested for cash management purposes during the period: |
| | | | | | | | | | | | | | | | | | | | | | | | | | | | |
ISSUER | | SHARES/PRINCIPAL
SEPTEMBER 30,
2016 | | | GROSS
ADDITIONS | | | GROSS
REDUCTIONS | | | SHARES/PRINCIPAL
MARCH 31,
2017 | | | MARKET VALUE
MARCH 31,
2017 | | | INVESTMENT
INCOME | | | REALIZED
GAIN (LOSS) | |
Thornburg Capital Management Fund | | | 8,651,050 | | | | 20,793,298 | | | | 24,484,357 | | | | 4,959,991 | | | $ | 49,599,909 | | | $ | 150,793 | | | $ | — | |
| | | | | | | | | | | | | | | | | | | | | | | | | | | | |
Total non-controlled affiliated issuers - 4.84% of net assets | | | | | | | | | | | | | | | $ | 49,599,909 | | | $ | 150,793 | | | $ | — | |
| | | | | | | | | | | | | | | | | | | | | | | | | | | | |
Portfolio Abbreviations
To simplify the listings of securities, abbreviations are used per the table below:
| | |
| ADR | | American Depositary Receipt |
| GDR | | Global Depository Receipt |
See notes to financial statements.
Semi-Annual Report 11
| | |
| Statement of Assets and Liabilities | | |
| |
Thornburg Developing World Fund | | March 31, 2017 (Unaudited) |
| | | | |
ASSETS | | | | |
Investments at value (Note 3) | | | | |
Non-affiliated issuers (cost $867,037,655) | | $ | 982,575,940 | |
Non-controlled affiliated issuer (cost $49,599,909) | | | 49,599,909 | |
Cash denominated in foreign currency (cost $157,364) | | | 158,032 | |
Receivable for investments sold | | | 15,584,329 | |
Receivable for fund shares sold | | | 1,565,358 | |
Dividends receivable | | | 2,829,939 | |
Dividend reclaim receivable | | | 316,378 | |
Prepaid expenses and other assets | | | 75,627 | |
| | | | |
Total Assets | | | 1,052,705,512 | |
| | | | |
| |
LIABILITIES | | | | |
Payable for investments purchased | | | 10,948,512 | |
Payable for fund shares redeemed | | | 13,165,174 | |
Unrealized depreciation on forward currency contracts (Note 7) | | | 130,664 | |
Payable to investment advisor and other affiliates (Note 4) | | | 794,762 | |
Deferred taxes payable (Note 2) | | | 1,685,767 | |
Accounts payable and accrued expenses | | | 810,011 | |
| | | | |
Total Liabilities | | | 27,534,890 | |
| | | | |
| |
NET ASSETS | | $ | 1,025,170,622 | |
| | | | |
NET ASSETS CONSIST OF | | | | |
Distribution in excess of net investment income | | $ | (1,731,358 | ) |
Net unrealized appreciation on investments | | | 113,783,428 | |
Accumulated net realized gain (loss) | | | (292,717,246 | ) |
Net capital paid in on shares of beneficial interest | | | 1,205,835,798 | |
| | | | |
| | $ | 1,025,170,622 | |
| | | | |
12 Semi-Annual Report
| | |
| Statement of Assets and Liabilities, Continued |
| |
Thornburg Developing World Fund | | March 31, 2017 (Unaudited) |
| | | | |
NET ASSET VALUE | | | | |
| |
Class A Shares: | | | | |
Net asset value and redemption price per share ($124,253,581 applicable to 7,296,050 shares of beneficial interest outstanding - Note 5) | | $ | 17.03 | |
Maximum sales charge, 4.50% of offering price | | | 0.80 | |
| | | | |
Maximum offering price per share | | $ | 17.83 | |
| | | | |
| |
Class C Shares: | | | | |
Net asset value and offering price per share* ($109,315,034 applicable to 6,730,175 shares of beneficial interest outstanding - Note 5) | | $ | 16.24 | |
| | | | |
| |
Class I Shares: | | | | |
Net asset value, offering and redemption price per share ($737,738,843 applicable to 42,569,916 shares of beneficial interest outstanding - Note 5) | | $ | 17.33 | |
| | | | |
| |
Class R5 Shares: | | | | |
Net asset value, offering and redemption price per share ($5,272,714 applicable to 305,262 shares of beneficial interest outstanding - Note 5) | | $ | 17.27 | |
| | | | |
| |
Class R6 Shares: | | | | |
Net asset value, offering and redemption price per share ($48,590,450 applicable to 2,803,418 shares of beneficial interest outstanding - Note 5) | | $ | 17.33 | |
| | | | |
| * | Redemption price per share is equal to net asset value less any applicable contingent deferred sales charge. |
See notes to financial statements.
Semi-Annual Report 13
| | |
| Statement of Operations | | |
| |
Thornburg Developing World Fund | | Six Months Ended March 31, 2017 (Unaudited) |
| | | | |
INVESTMENT INCOME | | | | |
Dividend income | | | | |
Non-affiliated issuers (net of foreign taxes withheld of $878,749) | | $ | 6,268,213 | |
Non-controlled affiliated issuer | | | 150,793 | |
Interest income (net of foreign taxes withheld of $21) | | | 996,975 | |
| | | | |
Total Income | | | 7,415,981 | |
| | | | |
| |
EXPENSES | | | | |
Investment advisory fees (Note 4) | | | 5,130,917 | |
Administration fees (Note 4) | | | | |
Class A Shares | | | 90,666 | |
Class C Shares | | | 73,122 | |
Class I Shares | | | 193,265 | |
Class R5 Shares | | | 1,446 | |
Distribution and service fees (Note 4) | | | | |
Class A Shares | | | 180,636 | |
Class C Shares | | | 582,774 | |
Transfer agent fees | | | | |
Class A Shares | | | 112,413 | |
Class C Shares | | | 95,754 | |
Class I Shares | | | 353,309 | |
Class R5 Shares | | | 7,792 | |
Class R6 Shares | | | 3,335 | |
Registration and filing fees | | | | |
Class A Shares | | | 10,667 | |
Class C Shares | | | 9,156 | |
Class I Shares | | | 25,583 | |
Class R5 Shares | | | 10,036 | |
Class R6 Shares | | | 10,027 | |
Custodian fees (Note 2) | | | 449,075 | |
Professional fees | | | 42,128 | |
Accounting fees (Note 4) | | | 8,608 | |
Trustee fees | | | 24,560 | |
Other expenses | | | 126,812 | |
| | | | |
Total Expenses | | | 7,542,081 | |
Less: | | | | |
Expenses reimbursed by investment advisor (Note 4) | | | (254,775 | ) |
Investment advisory fees waived by investment advisor (Note 4) | | | (563,034 | ) |
| | | | |
Net Expenses | | | 6,724,272 | |
| | | | |
Net Investment Income | | $ | 691,709 | |
| | | | |
14 Semi-Annual Report
| | |
| Statement of Operations, Continued | | |
| |
Thornburg Developing World Fund | | Six Months Ended March 31, 2017 (Unaudited) |
| | | | |
REALIZED AND UNREALIZED GAIN (LOSS) | | | | |
Net realized gain (loss) on: | | | | |
Non-affiliated issuer investments (net of realized capital gain taxes paid of $752,433) | | $ | (33,584,325 | ) |
Forward currency contracts (Note 7) | | | 804,783 | |
Foreign currency transactions | | | (459,422 | ) |
| | | | |
| | | (33,238,964 | ) |
| | | | |
Net change in unrealized appreciation (depreciation) on: | | | | |
Non-affiliated issuer investments (net of change in deferred taxes payable of $1,018,144) | | | 28,651,072 | |
Forward currency contracts (Note 7) | | | 943,248 | |
Foreign currency translations | | | (1,741 | ) |
| | | | |
| | | 29,592,579 | |
| | | | |
Net Realized and Unrealized Loss | | | (3,646,385 | ) |
| | | | |
Net Decrease in Net Assets Resulting from Operations | | $ | (2,954,676 | ) |
| | | | |
See notes to financial statements.
Semi-Annual Report 15
| | |
| Statement of Changes in Net Assets | | |
| |
Thornburg Developing World Fund | | |
| | | | | | | | |
| | | SIX MONTHS ENDED
MARCH 31, 2017* | | | YEAR ENDED
SEPTEMBER 30, 2016 | |
INCREASE (DECREASE) IN NET ASSETS FROM | | | | | | | | |
| | |
OPERATIONS | | | | | | | | |
Net investment income | | $ | 691,709 | | | $ | 5,848,787 | |
Net realized gain (loss) on investments, capital gain taxes, forward currency contracts, and foreign currency transactions | | | (33,238,964 | ) | | | (9,043,921 | ) |
Net unrealized appreciation (depreciation) on investments, deferred taxes payable, forward currency contracts, and foreign currency translations | | | 29,592,579 | | | | 154,540,479 | |
| | | | | | | | |
Net Increase (Decrease) in Net Assets Resulting from Operations | | | (2,954,676 | ) | | | 151,345,345 | |
| | |
DIVIDENDS TO SHAREHOLDERS | | | | | | | | |
From net investment income | | | | | | | | |
Class A Shares | | | — | | | | (343,296 | ) |
Class I Shares | | | (627,123 | ) | | | (4,899,868 | ) |
Class R5 Shares | | | (4,503 | ) | | | (35,207 | ) |
Class R6 Shares | | | (40,364 | ) | | | (276,797 | ) |
| | |
FUND SHARE TRANSACTIONS (NOTE 5) | | | | | | | | |
Class A Shares | | | (40,966,143 | ) | | | (61,310,070 | ) |
Class C Shares | | | (23,601,274 | ) | | | (36,759,558 | ) |
Class I Shares | | | (114,871,599 | ) | | | (267,526,805 | ) |
Class R5 Shares | | | (944,376 | ) | | | 200,879 | |
Class R6 Shares | | | (275,296 | ) | | | 23,520,145 | |
| | | | | | | | |
Net Decrease in Net Assets | | | (184,285,354 | ) | | | (196,085,232 | ) |
| | |
NET ASSETS | | | | | | | | |
Beginning of Period | | | 1,209,455,976 | | | | 1,405,541,208 | |
| | | | | | | | |
| | |
End of Period | | $ | 1,025,170,622 | | | $ | 1,209,455,976 | |
| | | | | | | | |
Distribution in excess of net investment income | | $ | (1,731,358 | ) | | $ | (1,751,077 | ) |
See notes to financial statements.
16 Semi-Annual Report
| | |
| Notes to Financial Statements | | |
| |
Thornburg Developing World Fund | | March 31, 2017 |
NOTE 1 – ORGANIZATION
Thornburg Developing World Fund (the “Fund”) is a diversified series of Thornburg Investment Trust (the “Trust”). The Fund commenced operations on December 16, 2009. The Trust was organized as a Massachusetts business trust under a Declaration of Trust dated June 3, 1987 and is registered as a diversified, open-end management investment company under the Investment Company Act of 1940, as amended. The Fund is currently one of twenty-one separate series of the Trust. Each series is considered to be a separate entity for financial reporting and tax purposes and bears expenses directly attributable to it. The Fund seeks long-term capital appreciation.
The Fund currently offers five classes of shares of beneficial interest: Class A, Class C, Institutional Class (“Class I”) and Retirement Classes (“Class R5” and “Class R6”). Each class of shares of the Fund represents an interest in the same portfolio of investments, except that (i) Class A shares are sold subject to a front-end sales charge collected at the time the shares are purchased and bear a service fee, (ii) Class C shares are sold at net asset value without a sales charge at the time of purchase, but are subject to a contingent deferred sales charge upon redemption within one year of purchase, and bear both a service fee and a distribution fee, (iii) Class I and Class R5 shares are sold at net asset value without a sales charge at the time of purchase and may be subject to a service fee, (iv) Class R6 shares are sold at net asset value without a sales charge at the time of purchase, and (v) the respective classes may have different reinvestment privileges and conversion rights. Additionally, the Fund may allocate among its classes certain expenses, to the extent allocable to specific classes, including transfer agent fees, government registration fees, certain printing and postage costs, and administrative and legal expenses. Currently, class specific expenses of the Fund are limited to service and distribution fees, administration fees, and certain registration and transfer agent expenses.
The following is a summary of significant accounting policies followed by the Fund in the preparation of its financial statements. The Fund prepares its financial statements in conformity with United States generally accepted accounting principles (“GAAP”), including investment company accounting and reporting guidance in the Financial Accounting Standards Board (the “FASB”) Accounting Standard Codification Topic 946.
NOTE 2 – SIGNIFICANT ACCOUNTING POLICIES
Security Valuation: All investments in securities held by the Fund are valued as described in Note 3.
Allocation of Income, Gains, Losses and Expenses: Net investment income (other than class specific expenses) and realized and unrealized gains and losses are allocated daily to each class of shares based upon the relative net asset value of outstanding shares (or the value of the dividend-eligible shares, as appropriate) of each class of shares at the beginning of the day (after adjusting for the current capital shares activity of the respective class). Expenses common to all Funds are allocated among the Funds comprising the Trust based upon their relative net asset values or other appropriate allocation methods. Operating expenses directly attributable to a specific class are charged against the operating income of that class.
Dividends and Distributions to Shareholders: Dividends and distributions to shareholders, which are determined in accordance with federal income tax regulations and may differ from GAAP, are recorded on the ex-dividend date. Ordinary income distributions, if any, are declared and paid quarterly. Capital gain distributions, if any, are declared and paid annually and more often if deemed necessary by the Advisor. Dividends are paid and are reinvested in additional shares of the Fund at net asset value per share at the close of business on the ex-dividend date, or at the shareholder’s option, paid in cash.
Investment Income: Dividend income is recorded on the ex-dividend date. Certain income from foreign investments is recognized as soon as information is available to the Fund. Interest income is accrued as earned. Premiums and discounts are amortized and accreted, respectively, to call dates or maturity dates using the effective yield method of the respective investments. These amounts are included in Interest income on the Statement of Operations.
Custodian Fees: Custodian fees disclosed in the Statement of Operations may include interest expenses incurred by the Fund on any cash overdrafts of its custodian account during the period. Such cash overdrafts may result from the effects of failed trades in portfolio securities and from cash outflows resulting from unanticipated shareholder redemption activity. The Fund pays interest to its custodian on any such cash overdraft at a rate equal to 2.50% of the overdraft amount in excess of $50,000.
Investment Transactions: Investment transactions are accounted for on a trade date basis. Realized gains and losses from the sale of investments are recorded on an identified cost basis.
Repurchase Agreements: The Fund may invest excess cash in repurchase agreements whereby the Fund purchases investments, which serve as collateral, with an agreement to resell such collateral to the seller at an agreed upon price at the maturity date of the repurchase agreement. Investments pledged as collateral for repurchase agreements are held in custody until maturity of the repurchase agreement. Provisions in the agreements require that the market value of the collateral is at least equal to the repurchase value in the event of default. In the event of default, the Fund has the right to liquidate the collateral and apply the proceeds in satisfaction of the obligation. Under certain circumstances, in the event of default or bankruptcy by the other party to the agreement, realization and/or retention of the collateral may be subject to legal proceedings.
Semi-Annual Report 17
| | |
| Notes to Financial Statements, Continued | | |
| |
Thornburg Developing World Fund | | March 31, 2017 (Unaudited) |
When-Issued and Delayed Delivery Transactions: The Fund may engage in when-issued or delayed delivery transactions. To the extent the Fund engages in such transactions, it will do so for the purpose of acquiring portfolio investments consistent with the Fund’s investment objectives and not for the purpose of investment leverage or to speculate on interest rate or market changes. At the time the Fund makes a commitment to purchase an investment on a when-issued or delayed delivery basis, the Fund will record the transaction and reflect the value in determining its net asset value. When effecting such transactions, assets of an amount sufficient to make payment for the portfolio investments to be purchased will be segregated on the Fund’s records on the trade date. Investments purchased on a when-issued or delayed delivery basis do not earn interest until the settlement date.
Foreign Currency Translation: Portfolio investments and other assets and liabilities denominated in foreign currencies are translated into U.S. dollars based on the exchange rate of such currencies against the U.S. dollar on the date of valuation. Purchases and sales of investments and income items denominated in foreign currencies are translated into U.S. dollars at the exchange rate in effect on the transaction date. When the Fund purchases or sells foreign investments, it will customarily enter into a foreign exchange contract to minimize foreign exchange risk from the trade date to the settlement date of such transactions. The values of such spot contracts are included in receivable for investments sold and payable for investments purchased on the Statement of Assets and Liabilities.
The Fund does not separately report the effect of changes in foreign exchange rates from changes in market prices on investments held. Such changes are included in net unrealized appreciation (depreciation) from investments.
Reported net realized gains and losses from foreign currency transactions arise due to purchases and sales of foreign currencies, currency gains and losses realized between the trade and settlement dates on investment transactions and the difference between the amounts of dividends, interest, and foreign withholding taxes recorded on the Fund’s books, and the U.S. dollar equivalent of the amounts actually received or paid.
Net change in unrealized appreciation (depreciation) on foreign currency translations arise from changes in the fair value of assets and liabilities, other than investments at period end, resulting from changes in exchange rates.
Guarantees and Indemnifications: Under the Trust’s organizational documents (and under separate agreements with the independent Trustees), its officers and Trustees are provided with an indemnification against certain liabilities arising out of the performance of their duties to the Fund. In the normal course of business the Trust may also enter into contracts with service providers that contain general indemnifications. The Trust’s maximum exposure under these arrangements is unknown. However, based on experience, the Trust expects the risk of loss to be remote.
Use of Estimates: The preparation of financial statements in conformity with GAAP requires management to make estimates and assumptions that affect the reported amounts of assets and liabilities and disclosure of contingent assets and liabilities at the date of the financial statements and the reported amounts of increases (decreases) in net assets from operations during the reporting period. Actual results could differ from those estimates.
Federal Income Taxes: It is the policy of the Trust to comply with the provisions of the Internal Revenue Code applicable to regulated investment companies and to distribute to shareholders substantially all investment company taxable income including net realized gains on investments (if any), and tax exempt income of the Fund. Therefore, no provision for federal income or excise tax is required.
The Fund files income tax returns in United States federal and applicable state jurisdictions. The statute of limitations on the Fund’s tax return filings generally remains open for the three years following a return’s filing date. The Fund has analyzed its tax positions taken on Federal income tax returns for all open tax years and has concluded that no provision for income tax is required in the financial statements.
At March 31, 2017, information on the tax components of capital was as follows:
| | | | |
Cost of investments for tax purposes | | $ | 916,637,564 | |
| | | | |
Gross unrealized appreciation on a tax basis | | $ | 168,081,096 | |
Gross unrealized depreciation on a tax basis | | | (52,542,811 | ) |
| | | | |
Net unrealized appreciation (depreciation) on investments (tax basis) | | $ | 115,538,285 | |
| | | | |
At March 31, 2017, the Fund had deferred tax basis late year specified ordinary losses occurring subsequent to December 31, 2015 through September 30, 2016 of $2,393,848. For tax purposes, such losses will be recognized in the year ending September 30, 2017.
At March 31, 2017, the Fund had deferred tax basis capital losses occurring subsequent to October 31, 2015 through September 30, 2016 of $55,539,592. For tax purposes, such capital losses will be recognized in the year ending September 30, 2017.
At March 31, 2017, the Fund had cumulative tax basis capital losses of $200,029,811, (of which $200,029,811 are short-term and $0 are long-term) generated after September 30, 2011, which may be carried forward to offset future capital gains. To the extent such carryforwards
18 Semi-Annual Report
| | |
| Notes to Financial Statements, Continued | | |
| |
Thornburg Developing World Fund | | March 31, 2017 (Unaudited) |
are used, capital gain distributions may be reduced to the extent provided by regulations. Such capital loss carryforwards do not expire.
Foreign Withholding Taxes: The Fund is subject to foreign tax withholding imposed by certain foreign countries in which the Fund may invest. Withholding taxes are incurred on certain foreign dividends and are accrued at the time the dividend is recognized based on applicable foreign tax laws. The Fund may file withholding tax reclaims in certain jurisdictions to recover a portion of amounts previously withheld, in view of various considerations, including recent decisions rendered by the courts in those and other jurisdictions. The Fund would expect to record a receivable for such a reclaim based on a variety of factors, including assessment of a jurisdiction’s legal obligation to pay reclaims, the jurisdiction’s administrative practices and payment history, and industry convention. To date the Fund has recorded no such receivable because there is limited precedent for collecting such prior year reclaims and the likelihood of collection remains uncertain.
Deferred Foreign Capital Gain Taxes: The Fund is subject to a tax imposed on net realized gains of securities of certain foreign countries. The Fund records an estimated deferred tax liability for net unrealized gains on these investments as reflected in the accompanying financial statements.
NOTE 3 – SECURITY VALUATION
Valuation of the Fund’s portfolio investment securities is performed in accordance with policies and procedures adopted by and under the oversight of the Trustees.
The Trustees of the Trust have appointed Thornburg Investment Management, Inc., the Trust’s investment advisor (the “Advisor”) to assist the Trustees in obtaining market values for portfolio investments, evaluate and monitor professional pricing service providers appointed by the Trustees’ Audit Committee (the “Audit Committee”) to assist in determining fair values for portfolio investments, assist in calculating fair values for portfolio investments in certain circumstances, and to perform other functions in connection with the valuation of investments. The Advisor acts through its Valuation and Pricing Committee (the “Committee”) and other employees of the Advisor. The Committee regularly reviews its own valuation calculations, as well as the valuations, valuation techniques and services furnished by pricing service providers, considers circumstances which may require valuation calculations by the Committee, and reviews previous valuation calculations. The Committee reports to the Audit Committee on the Committee’s activities, the performance of pricing service providers, and other matters relating to valuation of portfolio investments.
In those instances when the Committee assists in calculating a fair value for a portfolio investment, the Committee seeks to determine the price that the Fund would reasonably expect to receive upon a sale of the investment in an orderly transaction between market participants on the valuation date. The Committee customarily utilizes quotations from securities broker dealers in calculating valuations, but also may utilize prices obtained from pricing service providers or other methods approved by the Audit Committee. Because fair values calculated by the Committee are estimates, the calculation of a value for an investment may differ from the price that would be realized by the Fund upon a sale of the investment, and the difference could be material to the Fund’s financial statements. The Committee’s calculation of a fair value for an investment may also differ from the prices obtained by other persons (including other mutual funds) for the investment.
Valuation of Securities: Securities and other portfolio investments which are listed or traded on a United States securities exchange are valued at the last reported sale price on the valuation date. Investments listed or traded on an exchange for which there has been no sale that day are valued at the mean between the last reported bid and asked prices on that valuation date. Portfolio investments reported by NASDAQ are valued at the official closing price on the valuation date. If an investment is traded on more than one exchange, the investment is considered traded on the exchange that is normally the primary market for that investment. Securities and other portfolio investments which are listed or traded on exchanges outside the United States are valued at the last price or the closing price of the investment on the exchange that is normally the primary market for the investment, as of the close of the exchange preceding the Fund’s valuation date. Foreign investments listed or traded on an exchange for which there has been no sale that day are valued at the mean between the last reported bid and asked prices on that valuation date.
In any case when a market quotation is not readily available for a portfolio investment ordinarily valued by market quotation, the Committee calculates a fair value for the investment using alternative methods approved by the Audit Committee. A market quotation is not readily available when the primary market or exchange for the investment is not open for the entire scheduled day of trading. Market quotations for an investment also may not be readily available if developments after the most recent close of the investment’s primary exchange or market, but prior to the close of business on any Fund business day, or an unusual event or significant period of time occurring since the availability of a market quotation, create a serious question concerning the reliability of the most recent market quotation available for the investment. In particular, on days when market volatility thresholds established by the Audit Committee are exceeded, foreign equity investments held by the Fund may be valued using alternative methods. The Committee customarily obtains valuations in these instances from pricing service providers approved by the Audit Committee. Pricing service providers ordinarily calculate valuations using multi-factor models to adjust market prices based upon various inputs, including exchange data, depository receipt prices, futures, index data and other data.
Semi-Annual Report 19
| | |
| Notes to Financial Statements, Continued | | |
| |
Thornburg Developing World Fund | | March 31, 2017 (Unaudited) |
Debt obligations held by the Fund which are not listed or traded on exchanges or for which no reported market exists are ordinarily valued at the valuation obtained from a pricing service provider approved by the Audit Committee.
In any case when a pricing service provider fails to provide a valuation for a debt obligation held by the Fund, the Committee calculates a fair value for the obligation using alternative methods under procedures approved by the Audit Committee. Additionally, in cases when management believes that a valuation obtained from a pricing service provider merits review for significant reasons, the Committee decides whether or not to use the valuation calculated by the pricing service provider or to use an alternative method approved by the Audit Committee to calculate a fair value for the obligation.
Quotations for foreign investments expressed in foreign currency amounts are converted to U.S. dollar equivalents using a foreign exchange quotation from a third party service provider at the time of valuation. Foreign investments held by the Fund may be traded on days and at times when the Fund is not open for business. Consequently, the value of Fund investments may be significantly affected on days when shareholders cannot purchase or sell Fund shares. Futures contracts and other financial and derivative instruments traded on an exchange are valued at the latest published price for the instrument on its primary exchange. Listed options are valued at the last bid price.
Valuation Hierarchy: The Fund categorizes its investments based upon the inputs used in valuing those investments, according to a three-level hierarchy established in guidance from FASB. Categorization of investments using this hierarchy is intended by the FASB to maximize the use of observable inputs in valuing investments and minimize the use of unobservable inputs by requiring that the most observable inputs be used when available. Observable inputs are those that market participants would use in valuing an investment based on available market information. Unobservable inputs are those that reflect assumptions about the information market participants would use in valuing an investment. An investment’s level within the hierarchy is based on the lowest level input that is deemed significant to the valuation. The methodologies and inputs used to value investments are not necessarily indications of the risk or liquidity associated with those investments.
Various inputs are used in calculating valuations for the Fund’s investments. These inputs are generally summarized according to the three-level hierarchy below:
Level 1: Quoted prices in active markets for identical investments.
Level 2: Other direct or indirect significant observable inputs (including quoted prices for similar investments in active markets and other observable inputs, such as interest rates, prepayment rates, credit risk, etc.).
Level 3: Significant unobservable inputs (including the Committee’s own assumptions in calculating the fair values of investments).
Valuations for debt obligations held by the Fund are typically calculated by pricing service providers approved by the Audit Committee and are characterized as Level 2 within the valuation hierarchy.
On days when market volatility thresholds established by the Audit Committee are exceeded, foreign securities for which valuations are obtained from pricing service providers are fair valued. On these days, the foreign securities are characterized as Level 2 within the valuation hierarchy and revert to Level 1 after the threshold is no longer exceeded.
In a limited number of cases the Committee calculates a fair value for investments using broker quotations or other methods approved by the Audit Committee. When the Committee uses a single broker quotation to calculate a fair value for an investment without other significant observable inputs, or if a fair value is calculated using other significant inputs that are considered unobservable, the investment is characterized as Level 3 within the hierarchy. Other significant unobservable inputs used to calculate a fair value in these instances might include an income-based valuation approach which considers discounted anticipated future cash flows from the investment, and application of discounts due to the nature or duration of any restrictions on the disposition of the investment.
Valuations based upon the use of inputs from Levels 1, 2 or 3 may not represent the actual price received upon the disposition of an investment, and the Fund may receive a price that is lower than the valuation based upon these inputs when it sells the investment.
The following table displays a summary of the fair value hierarchy measurements of the Fund’s investments as of March 31, 2017. In any instance when valuation inputs from more than one level are used to determine the fair value of a specific investment, the investment is placed in the level of the table based upon the lowest level input that is significant in determining the fair value of the investment:
20 Semi-Annual Report
| | |
| Notes to Financial Statements, Continued | | |
| |
Thornburg Developing World Fund | | March 31, 2017 (Unaudited) |
| | | | | | | | | | | | | | | | |
| | | FAIR VALUE MEASUREMENTS AT MARCH 31, 2017 | |
| | | TOTAL | | | LEVEL 1 | | | LEVEL 2 | | | LEVEL 3(a) | |
Assets | | | | | | | | | | | | | | | | |
Investments in Securities* | | | | | | | | | | | | | | | | |
Common Stock(b) | | $ | 982,575,940 | | | $ | 962,769,813 | | | $ | 18,885,131 | | | $ | 920,996 | |
Short Term Investments | | | 49,599,909 | | | | 49,599,909 | | | | — | | | | — | |
| | | | | | | | | | | | | | | | |
Total Investments in Securities | | $ | 1,032,175,849 | | | $ | 1,012,369,722 | | | $ | 18,885,131 | | | $ | 920,996 | |
Other Financial Instruments** | | | | | | | | | | | | | | | | |
Spot Currency | | $ | 61,060 | | | $ | 61,060 | | | $ | — | | | $ | — | |
Liabilities | | | | | | | | | | | | | | | | |
Other Financial Instruments** | | | | | | | | | | | | | | | | |
Forward Currency Contracts | | $ | (130,664 | ) | | $ | — | | | $ | (130,664 | ) | | $ | — | |
Spot Currency | | $ | (4,208 | ) | | $ | (4,208 | ) | | $ | — | | | $ | — | |
| * | See Schedule of Investments for a summary of the industry exposure as grouped according to the Global Industry Classification Standard (GICS), which is an industry taxonomy developed by MSCI, Inc. and Standard & Poor’s (S&P). |
| ** | Other Financial Instruments include investments not reflected in the Schedule of Investments, which may include futures, forwards and swap contracts, which are valued at the unrealized appreciation (depreciation) on the investment. |
| (a) | In accordance with the guidance prescribed in Accounting Standards Update (“ASU”) No. 2011-04, a fair value determination was applied to a portfolio security characterized as a Level 3 investment at March 31, 2017. The valuation technique and unobservable input applied to value this portfolio security was a discount to the valuation determined by the Valuation and Pricing Committee due to a halt in trading of the security and lack of information and liquidity. |
| (b) | At March 31, 2017, industry classifications for Common Stock in Levels 2 and 3 consist of $920,996 in Pharmaceuticals and $18,885,131 in Banks. |
In accordance with the guidance prescribed in Accounting Standards Update No. 2011-04, it is the policy of the Fund to recognize transfers between levels and the underlying events which caused the movement. The Fund recognized no transfers between levels for the six months ended March 31, 2017, other than when the Fund exceeded market volatility thresholds for foreign equity investments during the period.
A rollforward of fair value measurements using significant unobservable inputs (Level 3) for the six months ended March 31, 2017 is as follows:
| | | | | | | | |
| | | COMMON STOCK | | | TOTAL(b) | |
Beginning Balance 9/30/2016 | | $ | 2,306,972 | | | $ | 2,306,972 | |
Accrued Discounts (Premiums) | | | — | | | | — | |
Net Realized Gain (Loss) | | | — | | | | — | |
Gross Purchases | | | — | | | | — | |
Gross Sales | | | — | | | | — | |
Net Change in Unrealized Appreciation (Depreciation)(a) | | | (1,385,976 | ) | | | (1,385,976 | ) |
Transfers into Level 3 | | | — | | | | — | |
Transfers out of Level 3 | | | — | | | | — | |
| | | | | | | | |
Ending Balance 3/31/2017 | | $ | 920,996 | | | $ | 920,996 | |
| (a) | Amount of net change in unrealized appreciation (depreciation) on investments recognized in income is included in the Fund’s Statement of Operations for the six months ended March 31, 2017. The net change in unrealized appreciation (depreciation) attributable to securities owned at March 31, 2017, which were valued using significant unobservable inputs, was ($1,385,976). |
| (b) | Level 3 investments represent 0.09% of total net assets at the six months ended March 31, 2017. Significant fluctuations of the unobservable inputs applied to portfolio investments characterized as Level 3 could be expected to increase or decrease the fair value of these portfolio investments. |
Semi-Annual Report 21
| | |
| Notes to Financial Statements, Continued | | |
| |
Thornburg Developing World Fund | | March 31, 2017 (Unaudited) |
NOTE 4 – INVESTMENT ADVISORY FEE AND OTHER TRANSACTIONS WITH AFFILIATES
Pursuant to an investment advisory agreement, the Advisor serves as the investment advisor and performs services for the Fund for which the fees are payable at the end of each month. Under the investment advisory agreement, the Fund pays the Advisor a management fee based on the daily net assets of the Fund at an annual rate as shown in the following table:
Management Fee Schedule
| | | | |
DAILY NET ASSETS | | FEE RATE | |
Up to $500 million | | | 0.975 | % |
Next $500 million | | | 0.925 | |
Next $500 million | | | 0.875 | |
Next $500 million | | | 0.825 | |
Over $2 billion | | | 0.775 | |
The Fund’s effective management fee for the period ended March 31, 2017 was 0.944% of the Fund’s average net assets (before applicable management fee waiver of $563,034).
The Fund pays to the Advisor the costs of personnel who perform certain accounting services for the Fund. For the six months ended March 31, 2017 the Fund paid $8,608 to the Advisor for these accounting services. The Trust has also entered into administrative service agreements with the Advisor, whereby the Advisor will perform certain administrative services for the shareholders of each class of the Fund’s shares and for which fees will be payable at an annual rate of up to .125 of 1% per annum of the average daily net assets attributable to each class of shares. Total administrative service fees incurred by each class of shares of the Fund for the six months ended March 31, 2017, are set forth in the Statement of Operations.
The Trust has an underwriting agreement with Thornburg Securities Corporation (the “Distributor”), an affiliate of the Advisor, which acts as the distributor of the Fund’s shares. For the six months ended March 31, 2017, the Distributor has advised the Fund that it earned net commissions aggregating $5,356 from the sale of Class A shares, and collected contingent deferred sales charges aggregating $3,085 from redemptions of Class C shares of the Fund.
Pursuant to a service plan under Rule 12b-1 of the Investment Company Act of 1940, the Fund may pay to the Advisor or securities dealers and other financial institutions at the Advisor’s request an amount not to exceed .25 of 1% per annum of the average daily net assets attributable to Class A and Class C shares of the Fund to obtain various shareholder and distribution related services. For the six months ended March 31, 2017, there were no 12b-1 service plan fees charged for Class I, Class R5, and Class R6 shares. The Advisor may pay out of its own resources additional expenses for distribution of the Fund’s shares and shareholder services.
The Trust has also adopted a distribution plan pursuant to Rule 12b-1, applicable only to the Fund’s Class C shares under which the Fund compensates the Distributor for services in promoting the sale of Class C shares of the Fund at an annual rate of up to .75 of 1% per annum of the average daily net assets attributable to Class C shares. Total fees incurred by each class of shares of the Fund under their respective service and distribution plans for the six months ended March 31, 2017, are set forth in the Statement of Operations.
The Advisor and Distributor have contractually agreed to waive fees and reimburse expenses incurred by the Fund so that actual expenses of certain share classes do not exceed levels as specified in the Fund’s most recent prospectus. The agreement may be terminated by the Fund at any time, but may not be terminated by the Advisor or Distributor before April 10, 2018, unless the Advisor ceases to be the investment advisor to the Fund or the Distributor ceases to be the distributor of the Fund prior to that date. The Advisor and Distributor may recoup amounts waived or reimbursed during the fiscal year if actual expenses fall below the contractual limit during that year.
For the six months ended March 31, 2017, the Advisor voluntarily waived Fund level investment advisory fees of $563,034. The Advisor contractually reimbursed certain class specific expenses, administrative fees, and distribution fees of $4,474 for Class A shares, $2,360 for Class C shares, $218,479 for Class I shares, $16,100 for Class R4 shares, and $13,362 for Class R6 shares.
Certain officers and Trustees of the Trust are also officers or directors of the Advisor and Distributor. The compensation of independent Trustees is borne by the Trust.
The percentage of direct investments in the Fund held by Trustees and Officers of the Trust and the Advisor is approximately 2.95%.
The Fund may purchase or sell securities from, or to an affiliated fund, provided the affiliation is due solely to having a common investment advisor, common officers, or common trustees, and provided that all such transactions will comply with Rule 17a-7 under the 1940 Act. For the six months ended March 31, 2017, the Fund had no transactions with affiliated funds.
22 Semi-Annual Report
| | |
| Notes to Financial Statements, Continued | | |
| |
Thornburg Developing World Fund | | March 31, 2017 (Unaudited) |
NOTE 5 – SHARES OF BENEFICIAL INTEREST
At March 31, 2017, there were an unlimited number of shares with no par value of beneficial interest authorized. Transactions in shares of beneficial interest were as follows:
| | | | | | | | | | | | | | | | |
| | | SIX MONTHS ENDED | | | YEAR ENDED | |
| | | MARCH 31, 2017 (UNAUDITED) | | | SEPTEMBER 30, 2016 (AUDITED) | |
| | | SHARES | | | AMOUNT | | | SHARES | | | AMOUNT | |
Class A Shares | | | | | | | | | | | | | | | | |
Shares sold | | | 781,150 | | | $ | 12,731,767 | | | | 3,308,344 | | | $ | 52,192,505 | |
Shares issued to shareholders in reinvestment of dividends | | | — | | | | — | | | | 18,515 | | | | 317,350 | |
Shares repurchased | | | (3,300,082 | ) | | | (53,697,910 | ) | | | (7,300,644 | ) | | | (113,819,995 | ) |
| | | | | | | | | | | | | | | | |
| | | | |
Net increase (decrease) | | | (2,518,932 | ) | | $ | (40,966,143 | ) | | | (3,973,785 | ) | | $ | (61,310,140 | ) |
| | | | | | | | | | | | | | | | |
Class C Shares | | | | | | | | | | | | | | | | |
Shares sold | | | 297,909 | | | $ | 4,610,302 | | | | 1,054,538 | | | $ | 15,948,557 | |
Shares issued to shareholders in reinvestment of dividends | | | — | | | | — | | | | — | | | | — | |
Shares repurchased | | | (1,818,546 | ) | | | (28,211,576 | ) | | | (3,507,682 | ) | | | (52,708,115 | ) |
| | | | | | | | | | | | | | | | |
| | | | |
Net increase (decrease) | | | (1,520,637 | ) | | $ | (23,601,274 | ) | | | (2,453,144 | ) | | $ | (36,759,558 | ) |
| | | | | | | | | | | | | | | | |
Class I Shares | | | | | | | | | | | | | | | | |
Shares sold | | | 7,814,391 | | | $ | 129,741,879 | | | | 23,659,769 | | | $ | 375,895,310 | |
Shares issued to shareholders in reinvestment of dividends | | | 32,864 | | | | 571,178 | | | | 262,131 | | | | 4,510,533 | |
Shares repurchased | | | (14,761,395 | ) | | | (245,184,656 | ) | | | (41,050,094 | ) | | | (647,932,648 | ) |
| | | | | | | | | | | | | | | | |
| | | | |
Net increase (decrease) | | | (6,914,140 | ) | | $ | (114,871,599 | ) | | | (17,128,194 | ) | | $ | (267,526,805 | ) |
| | | | | | | | | | | | | | | | |
Class R5 Shares | | | | | | | | | | | | | | | | |
Shares sold | | | 71,344 | | | $ | 1,176,414 | | | | 154,398 | | | $ | 2,473,042 | |
Shares issued to shareholders in reinvestment of dividends | | | 260 | | | | 4,503 | | | | 2,053 | | | | 35,206 | |
Shares repurchased | | | (127,289 | ) | | | (2,125,293 | ) | | | (147,926 | ) | | | (2,307,369 | ) |
| | | | | | | | | | | | | | | | |
| | | | |
Net increase (decrease) | | | (55,685 | ) | | $ | (944,376 | ) | | | 8,525 | | | $ | 200,879 | |
| | | | | | | | | | | | | | | | |
Class R6 Shares | | | | | | | | | | | | | | | | |
Shares sold | | | 370,140 | | | $ | 6,119,400 | | | | 2,141,556 | | | $ | 34,838,084 | |
Shares issued to shareholders in reinvestment of dividends | | | 2,310 | | | | 40,153 | | | | 15,902 | | | | 275,102 | |
Shares repurchased | | | (386,288 | ) | | | (6,434,849 | ) | | | (720,421 | ) | | | (11,593,041 | ) |
| | | | | | | | | | | | | | | | |
| | | | |
Net increase (decrease) | | | (13,838 | ) | | $ | (275,296 | ) | | | 1,437,037 | | | $ | 23,520,145 | |
| | | | | | | | | | | | | | | | |
NOTE 6 – INVESTMENT TRANSACTIONS
For the six months ended March 31, 2017, the Fund had purchase and sale transactions of investments (excluding short-term investments) of $423,825,923 and $583,760,365, respectively.
NOTE 7 – DERIVATIVE FINANCIAL INSTRUMENTS WITH OFF-BALANCE SHEET RISK AND FOREIGN INVESTMENT RISK
The Fund may use a variety of derivative financial instruments to hedge or adjust the risks affecting its investment portfolio or to enhance investment returns. Provisions of the FASB Accounting Standards Codification 815-10-50 (“ASC 815”) require certain disclosures. The disclosures are intended to provide users of financial statements with an understanding of the use of derivative instruments by the Fund and how these derivatives affect the financial position, financial performance and cash flows of the Fund. The Fund does
Semi-Annual Report 23
| | |
| Notes to Financial Statements, Continued | | |
| |
Thornburg Developing World Fund | | March 31, 2017 (Unaudited) |
not designate any derivative instruments as hedging instruments under ASC 815. During the six months ended March 31, 2017, the Fund’s principal exposure to derivative financial instruments of the type addressed by ASC 815 was investment in foreign exchange contracts. A foreign exchange contract is an agreement between two parties to exchange different currencies at a specified rate of exchange at an agreed upon future date. Foreign exchange contracts involve risks to the Fund, including the risk that a contract’s counterparty will not meet its obligations to the Fund, the risk that a change in a contract’s value may not correlate perfectly with the currency the contract was intended to track, and the risk that the Fund’s Advisor is unable to correctly implement its strategy in using a contract. In any such instance, the Fund may not achieve the intended benefit of entering into a contract, and may experience a loss.
The Fund entered into forward currency contracts during the six months ended March 31, 2017 in the normal course of pursuing its investment objectives, with the objective of purchasing foreign investments or with the intent of reducing the risk to the value of the Fund’s foreign investments from adverse changes in the relationship between the U.S. dollar and foreign currencies. In each case these contracts have been initiated in conjunction with foreign investment transactions.
These contracts are accounted for by the Fund under ASC 815. Unrealized appreciation and depreciation on outstanding contracts are reported in the Fund’s Statement of Assets and Liabilities, as measured by the difference between the forward exchange rates at the reporting date and the forward exchange rates at each contract’s inception date. Net realized gain (loss) on contracts closed during the period, and changes in net unrealized appreciation (depreciation) on outstanding contracts are recognized in the Fund’s Statement of Operations.
The quarterly average value of open sell currency contracts for the six months ended March 31, 2017 was $95,959,909. Open buy currency contracts are entered into for the purpose of closing open sell currency contracts and the values are dependent upon the values of the open sell currency contracts to which they relate.
The following table displays the outstanding forward currency contracts at March 31, 2017:
| | | | | | | | | | | | | | | | | | | | | | |
OUTSTANDING FORWARD CURRENCY CONTRACTS TO BUY OR SELL AT MARCH 31, 2017 | |
| CONTRACT DESCRIPTION | | BUY/SELL | | CONTRACT
AMOUNT | | | CONTRACT
VALUE DATE | | | VALUE
USD | | | UNREALIZED
APPRECIATION | | | UNREALIZED
DEPRECIATION | |
Chinese Yuan Renminbi | | Sell | | | 632,381,300 | | | | 05/16/2017 | | | | 91,713,763 | | | $ | — | | | $ | (130,664 | ) |
| | | | | | | | | | | | | | | | | | | | | | |
Total | | | | | | | | | | | | | | | | $ | — | | | $ | (130,664 | ) |
| | | | | | | | | | | | | | | | | | | | | | |
Net unrealized appreciation (depreciation) | | | | | | | | | | | | | | | | | | $ | (130,664 | ) |
| | | | | | | | | | | | | | | | | | | | | | |
The outstanding forward currency contracts in the foregoing table were entered into with State Street Bank and Trust Company (“SSB”), pursuant to an International Swaps and Derivatives Association (“ISDA”) Master Agreement. In the event of a default or termination under the ISDA Master Agreement with SSB, the non-defaulting party has the right to close out all outstanding forward currency contracts between the parties and to net any payment amounts under those contracts, resulting in a single net amount payable by one party to the other.
Because the ISDA Master Agreement with SSB does not result in an offset of reported amounts of financial assets and liabilities in the Fund’s Statement of Assets and Liabilities unless there has been an event of default or termination event under that agreement, the Fund does not net its outstanding forward currency contracts for purposes of the disclosure in the Fund’s Statement of Assets and Liabilities. Instead the Fund recognizes the unrealized appreciation or depreciation on those forward currency contracts on a gross basis in the Fund’s Statement of Assets and Liabilities.
The unrealized appreciation (depreciation) of the outstanding forward currency contracts recognized in the Fund’s Statement of Assets and Liabilities at March 31, 2017 is disclosed in the following table:
| | | | |
FAIR VALUES OF DERIVATIVE FINANCIAL INSTRUMENTS AT MARCH 31, 2017 |
| LIABILITY DERIVATIVES | | BALANCE SHEET LOCATION | | FAIR VALUE |
Foreign exchange contracts | | Liabilities - Unrealized depreciation on forward currency contracts | | $(130,664) |
24 Semi-Annual Report
| | |
| Notes to Financial Statements, Continued | | |
| |
Thornburg Developing World Fund | | March 31, 2017 (Unaudited) |
Because the Fund does not currently receive or post cash collateral in connection with its currency forward contracts, and because all of the Fund’s outstanding currency forward contracts are with SSB, the net amounts of the Fund’s assets and liabilities which are attributable to those contracts at March 31, 2017 can be determined by offsetting the dollar amounts shown in the preceding table. Based on those amounts, the net amount of the Fund’s assets which is attributable to its outstanding forward currency contracts at March 31, 2017 is $0, and the net amount of the Fund’s liabilities which is attributable to those contracts at that date is $130,664. The Fund’s forward currency contracts are valued each day, and the net amounts of the Fund’s assets and liabilities which are attributable to those contracts are expected to vary over time.
The net realized gain (loss) from forward currency contracts and the net change in unrealized appreciation (depreciation) on outstanding forward currency contracts recognized in the Fund’s Statement of Operations for the six months ended March 31, 2017 are disclosed in the following tables:
| | | | | | | | |
NET REALIZED GAIN (LOSS) ON DERIVATIVE FINANCIAL INSTRUMENTS RECOGNIZED IN INCOME FOR THE SIX MONTHS ENDED MARCH 31, 2017 | |
| | | TOTAL | | | FORWARD CURRENCY CONTRACTS | |
Foreign exchange contracts | | $ | 804,783 | | | | $ 804,783 | |
|
NET CHANGE IN UNREALIZED APPRECIATION (DEPRECIATION) OF DERIVATIVE FINANCIAL INSTRUMENTS RECOGNIZED IN INCOME FOR THE SIX MONTHS ENDED MARCH 31, 2017 | |
| | | TOTAL | | | FORWARD CURRENCY CONTRACTS | |
Foreign exchange contracts | | $ | 943,248 | | | | $ 943,248 | |
OTHER NOTES
Risks: The Fund’s investments subject it to risks including, but not limited to, management risk, market and economic risk, risks affecting specific issuers, liquidity risk, the risks associated with investments in small- and mid-cap companies and non-U.S. issuers (including developing country issuers), credit risk, and interest rate risk. Please see the Fund’s prospectus for a discussion of the risks associated with an investment in the Fund.
Subsequent Events: Fund management believes no events have occurred between March 31, 2017 and the date of issuance of the financial statements that require adjustment to or disclosure in the accompanying financial statements.
Semi-Annual Report 25
Financial Highlights
Thornburg Developing World Fund
| | | | | | | | | | | | | | | | | | | | | | | | | | | | | | | | | | | | | | | | | | | | | | | | | | | | | | | | | | | | |
| | | PER SHARE PERFORMANCE (FOR A SHARE OUTSTANDING THROUGHOUT THE PERIOD) | | | RATIOS TO AVERAGE NET ASSETS | | | SUPPLEMENTAL DATA | |
UNLESS OTHERWISE NOTED, PERIODS ARE
FISCAL
YEARS
ENDED
SEPT. 30, | | NET ASSET
VALUE
BEGINNING OF
PERIOD | | | NET
INVESTMENT
INCOME
(LOSS)+ | | | NET
REALIZED
&
UNREALIZED
GAIN (LOSS)
ON
INVESTMENTS | | | TOTAL FROM
INVESTMENT
OPERATIONS | | | DIVIDENDS
FROM NET
INVESTMENT
INCOME | | | DIVIDENDS
FROM NET
REALIZED
GAINS | | | TOTAL
DIVIDENDS | | | NET
ASSET
VALUE
END
OF
PERIOD | | | NET
INVESTMENT
INCOME
(LOSS)
(%) | | | EXPENSES,
AFTER
EXPENSE
REDUCTIONS
(%) | | | EXPENSES,
AFTER
EXPENSE
REDUCTIONS
AND
NET OF
CUSTODY
CREDITS
(%) | | | EXPENSES,
BEFORE
EXPENSE
REDUCTIONS
(%) | | | TOTAL
RETURN
(%)(a) | | | PORTFOLIO
TURNOVER
RATE
(%)(a) | | | NET
ASSETS
AT END
OF
PERIOD
(THOUSANDS) | |
CLASS A SHARES | | | | | | | | | | | | | | | | | | | | | | | | | | | | | | | | | | | | | | | | | | | | | | | | | | | | | |
2017(b)(c) | | $ | 16.98 | | | | (0.01 | ) | | | 0.06 | | | | 0.05 | | | | — | | | | — | | | | — | | | $ | 17.03 | | | | (0.14 | )(e) | | | 1.50 | (e) | | | 1.50 | (e) | | | 1.61 | (e) | | | 0.29 | | | | 40.56 | | | $ | 124,254 | |
2016(c) | | $ | 15.03 | | | | 0.04 | | | | 1.94 | | | | 1.98 | | | | (0.03 | ) | | | — | | | | (0.03 | ) | | $ | 16.98 | | | | 0.25 | | | | 1.52 | | | | 1.52 | | | | 1.57 | | | | 13.20 | | | | 94.68 | | | $ | 166,655 | |
2015(c) | | $ | 18.61 | | | | 0.02 | | | | (3.58 | ) | | | (3.56 | ) | | | (0.02 | ) | | | — | | | | (0.02 | ) | | $ | 15.03 | | | | 0.14 | | | | 1.53 | | | | 1.53 | | | | 1.53 | | | | (19.12 | ) | | | 96.74 | | | $ | 207,282 | |
2014(c) | | $ | 17.77 | | | | 0.03 | | | | 0.81 | | | | 0.84 | | | | — | | | | — | | | | — | | | $ | 18.61 | | | | 0.15 | | | | 1.45 | | | | 1.45 | | | | 1.45 | | | | 4.73 | | | | 61.46 | | | $ | 459,121 | |
2013(c) | | $ | 15.71 | | | | 0.01 | | | | 2.06 | | | | 2.07 | | | | (0.01 | ) | | | — | | | | (0.01 | ) | | $ | 17.77 | | | | 0.05 | | | | 1.48 | | | | 1.48 | | | | 1.59 | | | | 13.19 | | | | 61.67 | | | $ | 347,073 | |
2012(c) | | $ | 12.50 | | | | (0.01 | ) | | | 3.22 | | | | 3.21 | | | | — | | | | — | | | | — | | | $ | 15.71 | | | | (0.05 | ) | | | 1.69 | | | | 1.69 | | | | 1.85 | | | | 25.68 | | | | 129.49 | | | $ | 39,390 | |
CLASS C SHARES | | | | | | | | | | | | | | | | | | | | | | | | | | | | | | | | | | | | | | | | | | | | | | | | | | | | | |
2017(b) | | $ | 16.26 | | | | (0.07 | ) | | | 0.05 | | | | (0.02 | ) | | | — | | | | — | | | | — | | | $ | 16.24 | | | | (0.90 | )(e) | | | 2.26 | (e) | | | 2.26 | (e) | | | 2.36 | (e) | | | (0.12 | ) | | | 40.56 | | | $ | 109,315 | |
2016 | | $ | 14.48 | | | | (0.08 | ) | | | 1.86 | | | | 1.78 | | | | — | | | | — | | | | — | | | $ | 16.26 | | | | (0.51 | ) | | | 2.29 | | | | 2.29 | | | | 2.34 | | | | 12.29 | | | | 94.68 | | | $ | 134,129 | |
2015 | | $ | 18.03 | | | | (0.09 | ) | | | (3.46 | ) | | | (3.55 | ) | | | — | | | | — | | | | — | | | $ | 14.48 | | | | (0.55 | ) | | | 2.27 | | | | 2.27 | | | | 2.27 | | | | (19.69 | ) | | | 96.74 | | | $ | 154,943 | |
2014 | | $ | 17.34 | | | | (0.11 | ) | | | 0.80 | | | | 0.69 | | | | — | | | | — | | | | — | | | $ | 18.03 | | | | (0.62 | ) | | | 2.23 | | | | 2.23 | | | | 2.23 | | | | 3.98 | | | | 61.46 | | | $ | 232,493 | |
2013 | | $ | 15.44 | | | | (0.12 | ) | | | 2.02 | | | | 1.90 | | | | — | | | | — | | | | — | | | $ | 17.34 | | | | (0.71 | ) | | | 2.26 | | | | 2.26 | | | | 2.40 | | | | 12.31 | | | | 61.67 | | | $ | 106,168 | |
2012 | | $ | 12.37 | | | | (0.11 | ) | | | 3.18 | | | | 3.07 | | | | — | | | | — | | | | — | | | $ | 15.44 | | | | (0.76 | ) | | | 2.38 | | | | 2.38 | | | | 2.86 | | | | 24.82 | | | | 129.49 | | | $ | 10,006 | |
CLASS I SHARES | | | | | | | | | | | | | | | | | | | | | | | | | | | | | | | | | | | | | | | | | | | | | | | | | | | | | |
2017(b) | | $ | 17.26 | | | | 0.03 | | | | 0.05 | | | | 0.08 | | | | (0.01 | ) | | | — | | | | (0.01 | ) | | $ | 17.33 | | | | 0.31 | (e) | | | 1.05 | (e) | | | 1.05 | (e) | | | 1.21 | (e) | | | 0.49 | | | | 40.56 | | | $ | 737,739 | |
2016 | | $ | 15.27 | | | | 0.11 | | | | 1.97 | | | | 2.08 | | | | (0.09 | ) | | | — | | | | (0.09 | ) | | $ | 17.26 | | | | 0.70 | | | | 1.07 | | | | 1.07 | | | | 1.16 | | | | 13.68 | | | | 94.68 | | | $ | 853,866 | |
2015 | | $ | 18.92 | | | | 0.10 | | | | (3.65 | ) | | | (3.55 | ) | | | (0.10 | ) | | | — | | | | (0.10 | ) | | $ | 15.27 | | | | 0.52 | | | | 1.09 | | | | 1.09 | | | | 1.14 | | | | (18.75 | ) | | | 96.74 | | | $ | 1,016,898 | |
2014 | | $ | 18.05 | | | | 0.10 | | | | 0.84 | | | | 0.94 | | | | (0.07 | ) | | | — | | | | (0.07 | ) | | $ | 18.92 | | | | 0.54 | | | | 1.09 | | | | 1.09 | | | | 1.09 | | | | 5.20 | | | | 61.46 | | | $ | 2,376,420 | |
2013 | | $ | 15.96 | | | | 0.09 | | | | 2.09 | | | | 2.18 | | | | (0.09 | ) | | | — | | | | (0.09 | ) | | $ | 18.05 | | | | 0.52 | | | | 1.04 | | | | 1.04 | | | | 1.22 | | | | 13.74 | | | | 61.67 | | | $ | 828,147 | |
2012 | | $ | 12.62 | | | | 0.08 | | | | 3.26 | | | | 3.34 | | | | — | | | | — | | | | — | | | $ | 15.96 | | | | 0.57 | | | | 1.09 | | | | 1.09 | | | | 1.45 | | | | 26.47 | | | | 129.49 | | | $ | 53,103 | |
CLASS R5 SHARES | | | | | | | | | | | | | | | | | | | | | | | | | | | | | | | | | | | | | | | | | | | | | | | | | | | | | |
2017(b) | | $ | 17.20 | | | | 0.03 | | | | 0.05 | | | | 0.08 | | | | (0.01 | ) | | | — | | | | (0.01 | ) | | $ | 17.27 | | | | 0.31 | (e) | | | 1.07 | (e) | | | 1.07 | (e) | | | 1.73 | (e) | | | 0.49 | | | | 40.56 | | | $ | 5,273 | |
2016 | | $ | 15.22 | | | | 0.12 | | | | 1.96 | | | | 2.08 | | | | (0.10 | ) | | | — | | | | (0.10 | ) | | $ | 17.20 | | | | 0.74 | | | | 1.08 | | | | 1.08 | | | | 1.75 | | | | 13.65 | | | | 94.68 | | | $ | 6,208 | |
2015 | | $ | 18.86 | | | | 0.12 | | | | (3.65 | ) | | | (3.53 | ) | | | (0.11 | ) | | | — | | | | (0.11 | ) | | $ | 15.22 | | | | 0.66 | | | | 1.09 | | | | 1.09 | | | | 1.67 | | | | (18.72 | ) | | | 96.74 | | | $ | 5,363 | |
2014 | | $ | 18.04 | | | | 0.13 | | | | 0.80 | | | | 0.93 | | | | (0.11 | ) | | | — | | | | (0.11 | ) | | $ | 18.86 | | | | 0.67 | | | | 1.09 | | | | 1.09 | | | | 1.90 | | | | 5.17 | | | | 61.46 | | | $ | 7,433 | |
2013(d) | | $ | 17.49 | | | | 0.08 | | | | 0.47 | | | | 0.55 | | | | — | | | | — | | | | — | | | $ | 18.04 | | | | 0.47 | (e) | | | 1.07 | (e) | | | 1.07 | (e) | | | 17.45 | (e)(f) | | | 3.14 | | | | 61.67 | | | $ | 697 | |
CLASS R6 SHARES | | | | | | | | | | | | | | | | | | | | | | | | | | | | | | | | | | | | | | | | | | | | | | | | | | | | | |
2017(b) | | $ | 17.25 | | | | 0.04 | | | | 0.05 | | | | 0.09 | | | | (0.01 | ) | | | — | | | | (0.01 | ) | | $ | 17.33 | | | | 0.43 | (e) | | | 0.96 | (e) | | | 0.96 | (e) | | | 1.12 | (e) | | | 0.55 | | | | 40.56 | | | $ | 48,590 | |
2016 | | $ | 15.25 | | | | 0.13 | | | | 1.98 | | | | 2.11 | | | | (0.17 | ) | | | — | | | | (0.17 | ) | | $ | 17.25 | | | | 0.80 | | | | 0.97 | | | | 0.97 | | | | 1.12 | | | | 13.81 | | | | 94.68 | | | $ | 48,598 | |
2015 | | $ | 18.91 | | | | 0.15 | | | | (3.68 | ) | | | (3.53 | ) | | | (0.13 | ) | | | — | | | | (0.13 | ) | | $ | 15.25 | | | | 0.84 | | | | 0.99 | | | | 0.99 | | | | 1.10 | | | | (18.68 | ) | | | 96.74 | | | $ | 21,055 | |
2014 | | $ | 18.08 | | | | 0.11 | | | | 0.84 | | | | 0.95 | | | | (0.12 | ) | | | — | | | | (0.12 | ) | | $ | 18.91 | | | | 0.57 | | | | 0.99 | | | | 0.99 | | | | 1.10 | | | | 5.26 | | | | 61.46 | | | $ | 22,727 | |
2013(d) | | $ | 17.51 | | | | 0.04 | | | | 0.53 | | | | 0.57 | | | | — | | | | — | | | | — | | | $ | 18.08 | | | | 0.20 | (e) | | | 0.98 | (e) | | | 0.98 | (e) | | | 1.99 | (e) | | | 3.26 | | | | 61.67 | | | $ | 14,422 | |
| (a) | Not annualized for periods less than one year. |
| (b) | Unaudited Six Month Period Ended March 31. |
| (c) | Sales loads are not reflected in computing total return. |
| (d) | Effective date of this class of shares was February 1, 2013. |
| (f) | Due to the size of net assets and fixed expenses, ratios may appear disproportionate. |
| + | Based on weighted average shares outstanding. |
See notes to financial statements.
| | | | |
| 26 Semi-Annual Report | | | | Semi-Annual Report 27 |
| | |
| Expense Examples | | |
| |
Thornburg Developing World Fund | | March 31, 2017 (Unaudited) |
As a shareholder of the Fund, you incur two types of costs:
| | (1) | transaction costs, including |
(a) sales charges (loads) on purchase payments, for Class A shares;
(b) a deferred sales charge on redemptions of any part or all of a purchase of $1 million of Class A shares within 12 months of purchase;
(c) a deferred sales charge on redemptions of Class C shares within 12 months of purchase;
| | (2) | ongoing costs, including management fees; distribution and/or service (12b-1) fees; and other Fund expenses. |
This example is intended to help you understand your ongoing costs (in dollars) of investing in the Fund and to compare these costs with the ongoing costs of investing in other mutual funds.
The example is based on a $1,000 investment beginning on October 1, 2016, and held until March 31, 2017.
| | | | | | | | | | | | |
| | | BEGINNING
ACCOUNT VALUE
10/1/16 | | | ENDING
ACCOUNT VALUE
3/31/17 | | | EXPENSES PAID
DURING PERIOD†
10/1/16–3/31/17 | |
CLASS A SHARES | | | | | | | | | | | | |
Actual | | $ | 1,000.00 | | | $ | 1,002.94 | | | $ | 7.48 | |
Hypothetical* | | $ | 1,000.00 | | | $ | 1,017.46 | | | $ | 7.53 | |
CLASS C SHARES | | | | | | | | | | | | |
Actual | | $ | 1,000.00 | | | $ | 998.77 | | | $ | 11.24 | |
Hypothetical* | | $ | 1,000.00 | | | $ | 1,013.68 | | | $ | 11.33 | |
CLASS I SHARES | | | | | | | | | | | | |
Actual | | $ | 1,000.00 | | | $ | 1,004.89 | | | $ | 5.26 | |
Hypothetical* | | $ | 1,000.00 | | | $ | 1,019.69 | | | $ | 5.29 | |
CLASS R5 SHARES | | | | | | | | | | | | |
Actual | | $ | 1,000.00 | | | $ | 1,004.87 | | | $ | 5.35 | |
Hypothetical* | | $ | 1,000.00 | | | $ | 1,019.60 | | | $ | 5.39 | |
CLASS R6 SHARES | | | | | | | | | | | | |
Actual | | $ | 1,000.00 | | | $ | 1,005.47 | | | $ | 4.80 | |
Hypothetical* | | $ | 1,000.00 | | | $ | 1,020.14 | | | $ | 4.84 | |
| † | Expenses are equal to the annualized expense ratio for each class (A: 1.50%; C: 2.26%; I: 1.05%; R5: 1.07%; R6: 0.96%) multiplied by the average account value over the period, multiplied by 182/365 to reflect the one-half year period. |
| * | Hypothetical assumes a rate of return of 5% per year before expenses. |
ACTUAL EXPENSES
For each class of shares, the first line of the accompanying table provides information about actual account values and actual expenses. You may use the information in this line, together with the amount you invested, to estimate the expenses that you paid over the period. Simply divide your account value by $1,000 (for example, an $8,600 account value divided by $1,000 = 8.6), then multiply the result by the number in the first line for your class of shares under the heading entitled “Expenses Paid During Period” to estimate the expenses you paid on your account during this period.
HYPOTHETICAL EXAMPLE FOR COMPARISON PURPOSES
For each class of shares, the second line of the accompanying table provides information about hypothetical account values and hypothetical expenses based on the Fund’s actual expense ratio and an assumed rate of return of 5% per year before expenses, which is not the Fund’s actual return. The hypothetical account values and expenses may not be used to estimate the actual ending account balance or expenses you paid for the period. You may use this information to compare the ongoing costs of investing in the Fund and other funds. To do so, compare this 5% hypothetical example with the 5% hypothetical examples that appear in the shareholder reports of the other funds.
Please note that the expenses shown in the table are meant to highlight your ongoing costs only and do not reflect any transactional costs, such as sales charges (loads), redemption fees, or exchange fees. Therefore, the second line of the table for each class of shares is useful in comparing ongoing costs only, and will not help you determine the relative total costs of owning different funds. In addition, if these transactional costs were included, your costs would have been higher.
28 Semi-Annual Report
| | |
| Other Information | | |
| |
Thornburg Developing World Fund | | March 31, 2017 (Unaudited) |
PORTFOLIO PROXY VOTING
Policies and Procedures:
The Trust has delegated to Thornburg Investment Management, Inc. (the “Advisor”) voting decisions respecting proxies for the Fund’s voting securities. The Advisor makes voting decisions in accordance with its Proxy Voting Policy and Procedures. A description of the Policy and Procedures is available (i) without charge, upon request, by calling the Advisor toll-free at 1-800-847-0200, (ii) on the Thornburg website at www.thornburg.com, and (iii) on the Securities and Exchange Commission’s website at www.sec.gov.
Information regarding how proxies were voted is available on or before August 31 of each year for the twelve months ending the preceding June 30. This information is available (i) without charge, upon request by calling the Advisor toll-free at 1-800-847-0200, (ii) on the Thornburg website at www.thornburg.com, and (iii) on the Securities and Exchange Commission’s website at www.sec.gov.
AVAILABILITY OF QUARTERLY PORTFOLIO SCHEDULE
The Fund files with the Securities and Exchange Commission schedules of its portfolio holdings on Form N-Q for the first and third quarters of each fiscal year. The Fund’s Forms N-Q are available on the Commission’s website at www.sec.gov, or may be reviewed and copied at the Commission’s Public Reference Room in Washington, D.C. Information on the operation of the Public Reference Room may be obtained by calling 1-800-SEC-0330. The Fund also makes this information available on its website at www.thornburg. com/download or upon request by calling 1-800-847-0200.
Semi-Annual Report 29
Trustees’ Statement to Shareholders
Readopted September 12, 2016
The Trustees believe current and prospective shareholders should know how we discharge our responsibilities in supervising the Funds’ investment advisor and in reviewing the advisor’s contract for renewal. Since 2005, we have issued a statement which sets out clearly the three principal guidelines that we follow in supervising the Trust’s investment advisor on your behalf. In accordance with our customary practice, in September of this year we again reviewed our statement and concluded we should reissue this statement outlining the principal features of our supervision of the advisor’s performance of investment management services for the Funds.
We begin with the premise that each shareholder selected his or her Fund because its investments are managed by the investment advisor identified in the prospectus and in accordance with the objective and policies described in the prospectus. We realize, as each of you do, that if you believe that your Fund’s stated objective and policies no longer serve your personal investment goals, you can sell your shares and leave the Fund.
Therefore, we believe that our primary supervisory task—our principal obligation to you—is to assess the nature and quality of the advisor’s services, and to confirm that the advisor actively and competently pursues the Fund’s objective, in accordance with the policies set out in the prospectus. To do this, we meet regularly with management to review your Fund’s portfolio and to discuss the advisor’s specific actions and judgments in pursuing the Fund’s objective. We do not substitute our own judgment for the advisor’s decisions in selecting investments; the advisor is paid to exercise its informed judgment on investment decisions, and we seek to confirm, in reviewing the advisor’s performance, that the advisor is doing just that.
Second, we are conscious of costs and the effect that costs have on shareholders’ returns. We try to make sure that your Fund’s fees and costs are reasonable in relationship to the services rendered and that they are generally in line with those charged by other expert investment advisors, consistent with our belief that the Fund’s investors searched for and expect that expertise and attention and have decided to pay a reasonable price for it. We do not put the management contract “out to bid” as a matter of course, and we would not do so unless we had concluded that the advisor materially had failed to pursue the Fund’s objectives in accordance with its policies, or for other equally important reasons. We believe that any other approach would be inconsistent with your interests and contrary to your expectations when you bought shares of the Fund in the first place.
Finally, because we believe that most Thornburg Fund shareholders have invested with a long-term perspective, we try not to focus too much on the fashions of the moment and on short-term performance. The market will not favor any specific investment objective or set of policies at all times and under all economic circumstances. A fund will experience periods of both high and low returns relative to other funds and other investments. Even if one of our Funds is not favored by the market at a particular time, we believe that the advisor is nonetheless obliged to remain true to the Fund’s objective and policies, and we watch to see that it does so.
Trustees of Thornburg Investment Trust
30 Semi-Annual Report
Thornburg Funds
Thornburg Investment Management is a privately-owned global investment firm that offers a range of solutions for retail and institutional investors. Founded in 1982 and headquartered in Santa Fe, New Mexico, we manage approximately $49 billion (as of March 31, 2017) across U.S. mutual funds, separate accounts for high-net-worth investors and institutional accounts, and UCITS funds for non-U.S. investors.
The fund outlined in this report is one of many equity and fixed-income products available from Thornburg Investment Management.
EQUITY FUNDS
| | • | | Thornburg Investment Income Builder Fund |
| | • | | Thornburg Global Opportunities Fund |
| | • | | Thornburg International Value Fund |
| | • | | Thornburg Better World International Fund |
| | • | | Thornburg International Growth Fund |
| | • | | Thornburg Developing World Fund |
| | • | | Thornburg Core Growth Fund |
FIXED INCOME FUNDS
| | • | | Thornburg Low Duration Income Fund |
| | • | | Thornburg Limited Term U.S. Government Fund |
| | • | | Thornburg Limited Term Income Fund |
| | • | | Thornburg Strategic Income Fund |
| | • | | Thornburg Low Duration Municipal Fund |
| | • | | Thornburg Limited Term Municipal Fund |
| | • | | Thornburg Intermediate Municipal Fund |
| | • | | Thornburg California Limited Term Municipal Fund |
| | • | | Thornburg New Mexico Intermediate Municipal Fund |
| | • | | Thornburg New York Intermediate Municipal Fund |
| | • | | Thornburg Strategic Municipal Income Fund |
ALTERNATIVE FUNDS
| | • | | Thornburg Long/Short Equity Fund |
Before investing, carefully consider the Fund’s investment goals, risks, charges, and expenses. For a prospectus or summary prospectus containing this and other information, contact your financial advisor or visit thornburg.com. Read it carefully before investing.
For additional information, please visit thornburg.com
Thornburg Investment Management, Inc. 2300 North Ridgetop Road, Santa Fe, NM 87506
Semi-Annual Report. 31

This Semi-Annual Report is submitted for the general information of shareholders of the Fund. It is not authorized for distribution to prospective investors in the Fund unless preceded or accompanied by an effective prospectus.
| | | | |
| Investment Advisor: | | Distributor: | | |
| Thornburg Investment Management® | | Thornburg Securities Corporation® | | |
| 800.847.0200 | | 800.847.0200 | | TH2148 |
About Thornburg Investment Management
It’s more than what we do.
It’s how we do it.
At Thornburg, we are very different in how we think, invest, and are structured. We believe this difference is what makes us successful in helping individuals reach their long-term financial goals.
How we THINK
Flexible Perspective
Our perspective on investment opportunities is more flexible than most, viewing a wide range of opportunities beyond conventional boundaries to find hidden value.
Collaboration
Collectively, we hone ideas via borderless cross-pollination for better judgment and better results.
How we INVEST
Portfolio Construction
Disciplined construction guided more by our convictions than convention.
CONVICTION
Thorough analysis and our relative-value framework lead to conviction in our securities selection.
UNCONVENTIONAL
Active management means we seek the best value for our clients rather than using conventional benchmarks as our starting point.
How we’re STRUCTURED
Structured for Excellence
How we think and how we invest is made possible by how we’re structured.
TEAM APPROACH FAR FROM THE HERD ACCESS & TRANSPARENCY
2 Semi-Annual Report
Semi-Annual Report
Thornburg Better World International Fund
March 31, 2017
| | | | |
SHARE CLASS | | NASDAQ SYMBOL | | CUSIP |
Class A | | TBWAX | | 885-216-721 |
Class C | | TBWCX | | 885-216-713 |
Class I | | TBWIX | | 885-216-697 |
Class I shares may not be available to all investors. Minimum investments for Class I shares may be higher than those for other classes.
Investments carry risks, including possible loss of principal. Additional risks may be associated with investments outside the United States, especially in emerging markets, including currency fluctuations, illiquidity, volatility, and political and economic risks. Investments in small- and mid-capitalization companies may increase the risk of greater price fluctuations. Investments in the Fund are not FDIC insured, nor are they bank deposits or guaranteed by a bank or any other entity.
Funds invested in a smaller number of holdings may expose an investor to greater volatility.
Semi-Annual Report 3
Letter to Shareholders
| | |
Thornburg Better World International Fund | | March 31, 2017 (Unaudited) |
April 20, 2017
Dear Fellow Shareholder:
We are pleased to present the semi-annual report for Thornburg Better World International Fund for the six months ended March 31, 2017. In the October-through-March period, Better World International Fund gained 0.15% (A shares without sales charge), underperforming the MSCI AC World ex-U.S. Index’s 6.51% return. That brought the since inception return to 10.89% (A shares without sales charge), versus 10.62% for the benchmark. The Fund’s investments in initial public offerings (IPOs) contributed 1.76% to performance for the six-month period. We don’t expect to consistently outperform in shorter timespans. But, we do aim to provide investors with superior returns over the long run, and believe that our investment philosophy and process provide a sound framework to add value.
Thornburg Better World International Fund seeks what we view as attractively priced stocks of quality companies that we believe have sustainable business models, compelling growth prospects and, critically, exhibit high “ESG” standards of environmental sensitivity, social responsibility and corporate governance. In our research and experience running socially responsible separate accounts for several years prior to launching our own ESG fund, we have found that companies with durable business models incorporating these values can outperform over time. The intersection of ESG and financial advantages is found in lower regulatory and legal risks, enhanced marketplace reputations, reduced operating costs and more effective capital allocation. These advantages create a positive self-reinforcing cycle to the benefit of clients, employees, and shareholders.
The first half of the period proved challenging for international equity investors amid a series of sharp market and geopolitical shifts. During the fourth quarter, the U.S. presidential election dominated headlines across the globe. Donald Trump’s surprise win quickly reverberated throughout markets, altering the landscape for both equity and fixed income investors. Although the market’s knee-jerk reaction to Trump’s triumph was decidedly negative, the skepticism was quickly replaced with enthusiasm as investors assessed the possibility of a pro-business, pro-growth agenda being implemented by a Republican-controlled U.S. government. However, geopolitical risks should continue to represent significant potential concern for investors going forward.
The Fund remained conservatively positioned during the period. We believe slow and unstable global growth combined with elevated valuations merit increased attention to protection against downside risk exposure. However, global markets generally appreciated during the period. Gains were led by financials (anticipating higher rates and less regulation), and commodity producers (inflation beneficiaries), both sectors in which Thornburg Better World International Fund has been underweight.
Performance data shown represents past performance and is no guarantee of future results. Investment return and principal value will fluctuate so shares, when redeemed, may be worth more or less than their original cost. Current performance may be lower or higher than quoted. For performance current to the most recent month end, visit thornburg.com or call 800.847.0200.
The maximum sales charge for Class A shares is 4.50%. If the sales charge had been deducted, returns would be lower. The total annual fund operating expense of Class A shares is 7.27%, as disclosed in the most recent prospectus. Thornburg Investment Management and/or Thornburg Securities Corporation have contractually agreed to waive fees and reimburse expenses through at least April 10, 2018, resulting in a net expense ratio of 1.83% for Class A shares.
The first quarter of 2017 kicked off with global growth expectations having risen, albeit from a low base, and earnings expectations followed. Our conservative positioning weighed on performance during the period. The most significant detractors were our underweight in emerging market cyclicals and high cash position. During the quarter, we deployed incremental capital into some new promising sustainable businesses, particularly in industrial and materials areas. However, valuations remain elevated and hence, we remain disciplined to our long-term focused process of value creation, with less emphasis on quarterly variance.
Thornburg Better World International Fund is designed to be conservative and fare well during periods of volatility and has a downside capture ratio of 64.5% as of March 31, 2017. This is achieved through our approach to investing in companies exhibiting attractive cash flow-based valuations, strong moats, and runways for growth, as well as synergistic financial and ESG characteristics.
Commodity exposure is one particular area where our approach to the integration of ESG and financial considerations differs with many of our peers. Regulatory risk and transforming energy economics should directly affect sustainable returns on capital. Commodity producers generally have less ability to create and maintain competitive advantages. Moreover, regulation headwinds are coalescing with advancements in clean energy technology to shift asset valuations and cash-generation abilities.
While Better World International Fund is not designed specifically as a low-carbon portfolio, our ESG integration process
4 Semi-Annual Report
| | |
| Letter to Shareholders, | | |
| |
Continued | | |
| |
Thornburg Better World International Fund | | March 31, 2017 (Unaudited) |
naturally results in a much lower carbon footprint than that of many of our peers. In fact, according to MSCI Fund Metrics data, our portfolio’s weighted average carbon intensity was 27% lower than the peer average as of December 31, 2016. On a portfolio level, we seek to reduce carbon cost exposure and instead focus on superior business models that have exposure to commodity prices.
Two examples illustrate this strategy of reducing factor risk with a focus on the connection between ESG and financial sustainability. Norwegian salmon producer Marine Harvest is a leader in a growing food sector niche with a strong environmental track record. As a Norwegian company, it is exposed to the oil-sensitive krone. Another example, Bureau Veritas, stands to benefit from increased environmental regulation of commodity sectors, as its leadership in testing, inspection, and certification becomes more critical for those commodity producers.
Ultimately, we believe the proactive incorporation of ESG metrics is an important lens to measure management quality, effective capital allocation, and sustainable returns. We will continue to experience bouts of market volatility and rallies and, at times, our positioning may be temporarily out of step with market sentiment. However, over the long run, we firmly believe that investing in companies with attractive valuations, synergistic financial and ESG characteristics provides a superior opportunity in which to add value for our clients.
Thank you for investing alongside us in Thornburg Better World International Fund.
Sincerely,
| | |

| | |
| Rolf Kelly, CFA | | |
| Portfolio Manager | | |
| Managing Director | | |
The matters discussed in this report may constitute forward-looking statements made pursuant to the safe harbor provisions of the Securities Litigation Reform Act of 1995. These include any advisor or portfolio manager prediction, assessment, analysis or outlook for individual securities, industries, investment styles, market sectors and/or markets. These statements involve risks and uncertainties. In addition to the general risks described for each fund in its current prospectus, other factors bearing on these reports include the accuracy of the advisor’s or portfolio manager’s forecasts and predictions, the appropriateness of the investment strategies designed by the advisor or portfolio manager and the ability of the advisor or portfolio manager to implement their strategies efficiently and successfully. Any one or more of these factors, as well as other risks affecting the securities markets generally, could cause the actual results of any fund to differ materially as compared to its benchmarks.
The views expressed are subject to change and do not necessarily reflect the views of Thornburg Investment Management, Inc. This information should not be relied upon as a recommendation or investment advice and is not intended to predict the performance of any investment or market.
Semi-Annual Report 5
Performance Summary
| | |
Thornburg Better World International Fund | | March 31, 2017 (Unaudited) |
AVERAGE ANNUAL TOTAL RETURNS
| | | | | | | | |
| | | 1-YR | | | SINCE
INCEP. | |
Class A Shares (Incep: 9/30/15) | | | | | | | | |
Without sales charge | | | 11.91 | % | | | 10.89 | % |
With sales charge | | | 6.85 | % | | | 7.55 | % |
Class C Shares (Incep: 9/30/15) | | | | | | | | |
Without sales charge | | | 11.34 | % | | | 10.27 | % |
With sales charge | | | 10.34 | % | | | 10.27 | % |
Class I Shares (Incep: 9/30/15) | | | 12.78 | % | | | 11.76 | % |
MSCI AC World ex-U.S. Index (Since: 9/30/15) | | | 13.13 | % | | | 10.62 | % |
GROWTH OF A HYPOTHETICAL $10,000 INVESTMENT
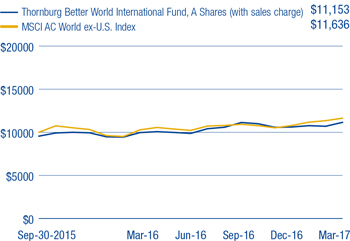
Performance data shown represents past performance and is no guarantee of future results. Investment return and principal value will fluctuate so shares, when redeemed, may be worth more or less than their original cost. Due to the Fund’s relatively small asset base in initial stages, performance was positively impacted by IPOs to a greater degree than it may be in the future. IPO investments are not an integral component of the Fund’s investment process and may not be utilized to the same extent in the future. Current performance may be lower or higher than quoted. For performance current to the most recent month end, visit thornburg.com or call 800-847-0200. The performance information does not reflect the deduction of taxes that a shareholder would pay on distributions or the redemption of Fund shares. Returns reflect the reinvestment of dividends and capital gains. The maximum sales charge for the Fund’s A shares is 4.50%. C shares are subject to a 1% contingent deferred sales charge (CDSC) for the first year only. There is no sales charge for Class I shares.
As disclosed in the most recent prospectus, the total annual fund operating expenses are as follows: A shares, 7.27%; C shares, 13.13%; I shares, 2.28%. Thornburg Investment Management and/or Thornburg Securities Corporation have contractually agreed to waive fees and reimburse expenses through at least April 10, 2018, for these share classes, resulting in net expense ratios of the following: A shares, 1.83%; C shares, 2.38%; I shares, 1.09%. For more detailed information on fund expenses and waivers/reimbursements please see the Fund’s prospectus.
Glossary
The MSCI All Country (AC) World ex-US Index is a market capitalization weighted index representative of the market structure of 45 developed and emerging market countries in North and South America, Europe, Africa, and the Pacific Rim, excluding securities of United States issuers. The index is calculated with net dividends reinvested in U.S. dollars.
The performance of any index is not indicative of the performance of any particular investment. Unless otherwise noted, index returns reflect the reinvestment of income dividends and capital gains, if any, but do not reflect fees, brokerage commissions or other expenses of investing. Investors may not make direct investments into any index.
Upside/Downside Capture Ratio – A ratio that shows whether a given fund has outperformed—gained more or lost less than—a broad market benchmark during periods of market strength and weakness, and if so, by how much.
6 Semi-Annual Report
Fund Summary
| | |
Thornburg Better World International Fund | | March 31, 2017 (Unaudited) |
OBJECTIVES AND STRATEGIES
The Fund seeks long-term capital appreciation.
The Fund invests primarily in a broad range of foreign companies that demonstrate one or more positive environmental, social, and governance (ESG) characteristics that the investment manager identifies as significant. The Fund targets companies of any size or country of origin, and which we believe are high-quality and attractively valued.
MARKET CAPITALIZATION EXPOSURE
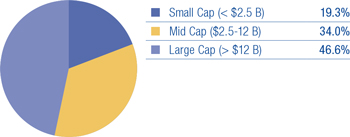
BASKET STRUCTURE
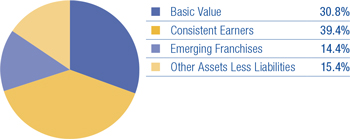
TOP TEN EQUITY HOLDINGS
| | | | |
ING Groep N.V. | | | 3.1 | % |
UBS Group AG | | | 3.1 | % |
Tsuruha Holdings, Inc. | | | 2.8 | % |
Korea Zinc Co., Ltd. | | | 2.6 | % |
Cairn Homes plc | | | 2.5 | % |
Taiwan Semiconductor Manufacturing Co., Ltd. ADR | | | 2.3 | % |
Megacable Holdings S.A.B. de C.V. | | | 2.3 | % |
Intact Financial Corp. | | | 2.3 | % |
Thermo Fisher Scientific, Inc. | | | 2.3 | % |
Olympus Corp. | | | 2.2 | % |
There is no guarantee that the Fund will meet its investment objective.
All portfolio information is subject to change. Charts may not add up to 100% due to rounding.
| * | The country assignment of each equity holding is determined by the Fund’s Advisor based on various factors, including the location of the issuer’s head office, the issuer’s jurisdiction of incorporation and the country from which a majority of the issuer’s revenue is derived. |
SECTOR EXPOSURE
| | | | |
Financials | | | 17.9 | % |
Consumer Staples | | | 13.6 | % |
Consumer Discretionary | | | 12.2 | % |
Health Care | | | 8.6 | % |
Industrials | | | 8.4 | % |
Information Technology | | | 7.4 | % |
Materials | | | 5.7 | % |
Telecommunication Services | | | 4.7 | % |
Real Estate | | | 3.6 | % |
Utilities | | | 2.5 | % |
Other Assets Less Liabilities | | | 15.4 | % |
TOP TEN INDUSTRY GROUPS
| | | | |
Food, Beverage & Tobacco | | | 8.3 | % |
Diversified Financials | | | 7.7 | % |
Pharmaceuticals, Biotechnology & Life Sciences | | | 6.4 | % |
Materials | | | 5.7 | % |
Banks | | | 5.7 | % |
Software & Services | | | 5.1 | % |
Consumer Durables & Apparel | | | 5.0 | % |
Telecommunication Services | | | 4.7 | % |
Insurance | | | 4.5 | % |
Commercial & Professional Services | | | 4.4 | % |
COUNTRY EXPOSURE*
(percent of equity holdings)
| | | | |
Japan | | | 12.6 | % |
United States | | | 8.2 | % |
United Kingdom | | | 8.0 | % |
Switzerland | | | 6.9 | % |
Canada | | | 5.4 | % |
Ireland | | | 5.3 | % |
Netherlands | | | 5.1 | % |
Norway | | | 4.7 | % |
Mexico | | | 4.4 | % |
France | | | 4.3 | % |
India | | | 3.8 | % |
China | | | 3.3 | % |
Germany | | | 3.2 | % |
South Korea | | | 3.0 | % |
Taiwan | | | 2.7 | % |
Spain | | | 2.7 | % |
Hong Kong | | | 2.6 | % |
Italy | | | 2.1 | % |
Philippines | | | 1.8 | % |
Vietnam | | | 1.8 | % |
Russia | | | 1.8 | % |
Australia | | | 1.6 | % |
Peru | | | 1.4 | % |
Singapore | | | 1.3 | % |
Brazil | | | 1.2 | % |
New Zealand | | | 0.8 | % |
Semi-Annual Report 7
| | |
| Schedule of Investments | | |
| |
Thornburg Better World International Fund | | March 31, 2017 (Unaudited) |
| | | | | | | | |
| | | SHARES/
PRINCIPAL
AMOUNT | | | VALUE | |
COMMON STOCK — 84.57% | | | | | | | | |
BANKS — 5.69% | | | | | | | | |
Banks — 5.69% | | | | | | | | |
ICICI Bank Ltd. | | | 159,607 | | | $ | 679,254 | |
ING Groep N.V. | | | 96,804 | | | | 1,463,343 | |
United Overseas Bank Ltd. | | | 34,005 | | | | 537,478 | |
| | | | | | | | |
| | | | | | | 2,680,075 | |
| | | | | | | | |
CAPITAL GOODS — 1.21% | | | | | | | | |
Trading Companies & Distributors — 1.21% | | | | | | | | |
Brenntag AG | | | 10,166 | | | | 569,909 | |
| | | | | | | | |
| | | | | | | 569,909 | |
| | | | | | | | |
COMMERCIAL & PROFESSIONAL SERVICES — 4.44% | | | | | | | | |
Professional Services — 4.44% | | | | | | | | |
Bureau Veritas SA | | | 33,900 | | | | 715,153 | |
Nielsen Holdings plc | | | 19,982 | | | | 825,456 | |
RELX plc | | | 28,169 | | | | 551,982 | |
| | | | | | | | |
| | | | | | | 2,092,591 | |
| | | | | | | | |
CONSUMER DURABLES & APPAREL — 4.98% | | | | | | | | |
Household Durables — 4.15% | | | | | | | | |
a Cairn Homes plc | | | 753,428 | | | | 1,181,522 | |
Sony Corp. | | | 22,835 | | | | 772,448 | |
Leisure Products — 0.83% | | | | | | | | |
Shimano, Inc. | | | 2,675 | | | | 390,450 | |
| | | | | | | | |
| | | | | | | 2,344,420 | |
| | | | | | | | |
CONSUMER SERVICES — 1.11% | | | | | | | | |
Hotels, Restaurants & Leisure — 1.11% | | | | | | | | |
Compass Group plc | | | 27,797 | | | | 524,493 | |
| | | | | | | | |
| | | | | | | 524,493 | |
| | | | | | | | |
DIVERSIFIED FINANCIALS — 7.74% | | | | | | | | |
Capital Markets — 4.44% | | | | | | | | |
Japan Exchange Group, Inc. | | | 44,838 | | | | 638,357 | |
UBS Group AG | | | 90,729 | | | | 1,451,990 | |
Diversified Financial Services — 3.30% | | | | | | | | |
Cerved Information Solutions S.p.A. | | | 85,126 | | | | 823,214 | |
GT Capital Holdings, Inc. | | | 31,980 | | | | 729,788 | |
| | | | | | | | |
| | | | | | | 3,643,349 | |
| | | | | | | | |
FOOD & STAPLES RETAILING — 4.31% | | | | | | | | |
Food & Staples Retailing — 4.31% | | | | | | | | |
a Lenta Ltd. | | | 105,020 | | | | 714,136 | |
Tsuruha Holdings, Inc. | | | 14,222 | | | | 1,315,787 | |
| | | | | | | | |
| | | | | | | 2,029,923 | |
| | | | | | | | |
FOOD, BEVERAGE & TOBACCO — 8.26% | | | | | | | | |
Food Products — 8.26% | | | | | | | | |
BRF SA | | | 38,283 | | | | 472,148 | |
Marine Harvest ASA | | | 32,419 | | | | 494,240 | |
Orkla ASA | | | 62,361 | | | | 558,520 | |
Premium Brands Holdings Corp. | | | 8,216 | | | | 526,069 | |
a SunOpta, Inc. | | | 81,146 | | | | 563,965 | |
Vietnam Dairy Products JSC | | | 113,500 | | | | 714,768 | |
Wessanen NV | | | 41,459 | | | | 559,932 | |
| | | | | | | | |
| | | | | | | 3,889,642 | |
| | | | | | | | |
HEALTH CARE EQUIPMENT & SERVICES — 2.21% | | | | | | | | |
Health Care Equipment & Supplies — 2.21% | | | | | | | | |
Olympus Corp. | | | 27,074 | | | | 1,040,840 | |
| | | | | | | | |
| | | | | | | 1,040,840 | |
| | | | | | | | |
HOUSEHOLD & PERSONAL PRODUCTS — 0.98% | | | | | | | | |
Household Products — 0.98% | | | | | | | | |
Lion Corp. | | | 25,754 | | | | 463,123 | |
| | | | | | | | |
| | | | | | | 463,123 | |
| | | | | | | | |
INSURANCE — 4.46% | | | | | | | | |
Insurance — 4.46% | | | | | | | | |
AIA Group Ltd. | | | 163,302 | | | | 1,029,634 | |
Intact Financial Corp. | | | 15,024 | | | | 1,068,519 | |
| | | | | | | | |
| | | | | | | 2,098,153 | |
| | | | | | | | |
8 Semi-Annual Report
| | |
| Schedule of Investments, Continued | | |
| |
Thornburg Better World International Fund | | March 31, 2017 (Unaudited) |
| | | | | | | | |
| | | SHARES/
PRINCIPAL
AMOUNT | | | VALUE | |
MATERIALS — 5.70% | | | | | | | | |
Construction Materials — 3.12% | | | | | | | | |
Cementos Pacasmayo S.A.A. | | | 241,497 | | | $ | 542,690 | |
CRH plc | | | 26,319 | | | | 926,600 | |
Metals & Mining — 2.58% | | | | | | | | |
Korea Zinc Co., Ltd. | | | 3,142 | | | | 1,213,756 | |
| | | | | | | | |
| | | | | | | 2,683,046 | |
| | | | | | | | |
MEDIA — 3.69% | | | | | | | | |
Media — 3.69% | | | | | | | | |
China South Publishing & Media Group Co., Ltd. | | | 249,714 | | | | 650,754 | |
Megacable Holdings S.A.B. de C.V. | | | 279,376 | | | | 1,089,316 | |
| | | | | | | | |
| | | | | | | 1,740,070 | |
| | | | | | | | |
PHARMACEUTICALS, BIOTECHNOLOGY & LIFE SCIENCES — 6.41% | | | | | | | | |
Biotechnology — 1.38% | | | | | | | | |
Gilead Sciences, Inc. | | | 9,577 | | | | 650,470 | |
Life Sciences Tools & Services — 2.26% | | | | | | | | |
Thermo Fisher Scientific, Inc. | | | 6,932 | | | | 1,064,755 | |
Pharmaceuticals — 2.77% | | | | | | | | |
Novartis AG | | | 8,166 | | | | 606,142 | |
Roche Holding AG | | | 2,728 | | | | 696,673 | |
| | | | | | | | |
| | | | | | | 3,018,040 | |
| | | | | | | | |
REAL ESTATE — 3.65% | | | | | | | | |
Equity Real Estate Investment Trusts — 3.65% | | | | | | | | |
Empiric Student Property plc | | | 469,084 | | | | 636,202 | |
Fibra Uno Administracion S.A. de C.V. | | | 389,113 | | | | 665,279 | |
Merlin Properties Socimi S.A. | | | 37,305 | | | | 417,072 | |
| | | | | | | | |
| | | | | | | 1,718,553 | |
| | | | | | | | |
RETAILING — 2.37% | | | | | | | | |
Internet & Direct Marketing Retail — 0.66% | | | | | | | | |
Trade Me Ltd. | | | 87,046 | | | | 309,905 | |
Multiline Retail — 1.71% | | | | | | | | |
Europris ASA | | | 186,363 | | | | 805,253 | |
| | | | | | | | |
| | | | | | | 1,115,158 | |
| | | | | | | | |
SEMICONDUCTORS & SEMICONDUCTOR EQUIPMENT — 2.32% | | | | | | | | |
Semiconductors & Semiconductor Equipment — 2.32% | | | | | | | | |
Taiwan Semiconductor Manufacturing Co., Ltd. ADR | | | 33,309 | | | | 1,093,868 | |
| | | | | | | | |
| | | | | | | 1,093,868 | |
| | | | | | | | |
SOFTWARE & SERVICES — 5.08% | | | | | | | | |
Information Technology Services — 3.69% | | | | | | | | |
MasterCard, Inc. | | | 2,069 | | | | 232,700 | |
a PayPal Holdings, Inc. | | | 18,982 | | | | 816,606 | |
Wirecard AG | | | 12,432 | | | | 688,321 | |
Internet Software & Services — 1.39% | | | | | | | | |
carsales.com Ltd. | | | 76,802 | | | | 654,832 | |
| | | | | | | | |
| | | | | | | 2,392,459 | |
| | | | | | | | |
TELECOMMUNICATION SERVICES — 4.75% | | | | | | | | |
Diversified Telecommunication Services — 4.75% | | | | | | | | |
Bharti Infratel Ltd. | | | 164,586 | | | | 823,247 | |
Nippon Telegraph & Telephone Corp. | | | 9,625 | | | | 410,833 | |
Orange SA | | | 64,394 | | | | 1,000,550 | |
| | | | | | | | |
| | | | | | | 2,234,630 | |
| | | | | | | | |
TRANSPORTATION — 2.74% | | | | | | | | |
Transportation Infrastructure — 2.74% | | | | | | | | |
Aena S.A. | | | 4,090 | | | | 647,064 | |
Shanghai International Air Co., Ltd. | | | 148,175 | | | | 644,576 | |
| | | | | | | | |
| | | | | | | 1,291,640 | |
| | | | | | | | |
UTILITIES — 2.47% | | | | | | | | |
Electric Utilities — 1.08% | | | | | | | | |
Nextera Energy, Inc. | | | 3,950 | | | | 507,061 | |
Multi-Utilities — 1.39% | | | | | | | | |
National Grid plc | | | 51,526 | | | | 654,285 | |
| | | | | | | | |
| | | | | | | 1,161,346 | |
| | | | | | | | |
TOTAL COMMON STOCK (Cost $37,345,670) | | | | | | | 39,825,328 | |
| | | | | | | | |
Semi-Annual Report 9
| | |
| Schedule of Investments, Continued | | |
| |
Thornburg Better World International Fund | | March 31, 2017 (Unaudited) |
| | | | | | | | |
| | | SHARES/
PRINCIPAL
AMOUNT | | | VALUE | |
SHORT TERM INVESTMENTS — 14.60% | | | | | | | | |
b Thornburg Capital Management Fund | | | 687,682 | | | $ | 6,876,815 | |
| | | | | | | | |
TOTAL SHORT TERM INVESTMENTS (Cost $6,876,815) | | | | | | | 6,876,815 | |
| | | | | | | | |
TOTAL INVESTMENTS — 99.17% (Cost $44,222,485) | | | | | | $ | 46,702,143 | |
OTHER ASSETS LESS LIABILITIES — 0.83% | | | | | | | 389,335 | |
| | | | | | | | |
NET ASSETS — 100.00% | | | | | | $ | 47,091,478 | |
| | | | | | | | |
Footnote Legend
| b | Investment in Affiliates – Shown below are holdings of voting securities of each portfolio company which is considered “affiliated” to the Fund under the Investment Company Act of 1940, including companies for which the Fund’s holding represented 5% or more of the company’s voting securities, and a series of the Thornburg Investment Trust in which the Fund invested for cash management purposes during the period: |
| | | | | | | | | | | | | | | | | | | | | | | | | | | | |
ISSUER | | SHARES/PRINCIPAL
SEPTEMBER 30,
2016 | | | GROSS
ADDITIONS | | | GROSS
REDUCTIONS | | | SHARES/PRINCIPAL
MARCH 31,
2017 | | | MARKET VALUE
MARCH 31,
2017 | | | INVESTMENT
INCOME | | | REALIZED
GAIN (LOSS) | |
Thornburg Capital Management Fund | | | 493,408 | | | | 1,360,078 | | | | 1,165,804 | | | | 687,682 | | | $ | 6,876,815 | | | $ | 18,885 | | | $ | — | |
| | | | | | | | | | | | | | | | | | | | | | | | | | | | |
Total non-controlled affiliated issuers - 14.60% of net assets | | | $ | 6,876,815 | | | $ | 18,885 | | | $ | — | |
| | | | | | | | | | | | | | | | | | | | | | | | | | | | |
Portfolio Abbreviations
To simplify the listings of securities, abbreviations are used per the table below:
| | |
| ADR | | American Depositary Receipt |
See notes to financial statements.
10 Semi-Annual Report
This page intentionally left blank.
Semi-Annual Report 11
| | |
| Statement of Assets and Liabilities | | |
| |
Thornburg Better World International Fund | | March 31, 2017 (Unaudited) |
| | | | |
ASSETS | | | | |
Investments at value (Note 3) | | | | |
Non-affiliated issuers (cost $37,345,670) | | $ | 39,825,328 | |
Non-controlled affiliated issuer (cost $6,876,815) | | | 6,876,815 | |
Cash | | | 3,044 | |
Cash denominated in foreign currency (cost $4,939) | | | 4,953 | |
Receivable for investments sold | | | 573,826 | |
Receivable for fund shares sold | | | 1,059,656 | |
Dividends receivable | | | 103,820 | |
Dividend reclaim receivable | | | 14,767 | |
Prepaid expenses and other assets | | | 32,818 | |
| | | | |
Total Assets | | | 48,495,027 | |
| | | | |
| |
LIABILITIES | | | | |
Payable for investments purchased | | | 1,330,412 | |
Payable for fund shares redeemed | | | 13,097 | |
Payable to investment advisor and other affiliates (Note 4) | | | 9,988 | |
Deferred taxes payable (Note 2) | | | 4,221 | |
Accounts payable and accrued expenses | | | 45,831 | |
| | | | |
Total Liabilities | | | 1,403,549 | |
| | | | |
| |
NET ASSETS | | $ | 47,091,478 | |
| | | | |
NET ASSETS CONSIST OF | | | | |
Undistributed net investment income | | $ | 28,002 | |
Net unrealized appreciation on investments | | | 2,474,608 | |
Accumulated net realized gain (loss) | | | (84,370 | ) |
Net capital paid in on shares of beneficial interest | | | 44,673,238 | |
| | | | |
| |
| | $ | 47,091,478 | |
| | | | |
12 Semi-Annual Report
| | |
| Statement of Assets and Liabilities, Continued | | |
| |
Thornburg Better World International Fund | | March 31, 2017 (Unaudited) |
| | | | |
NET ASSET VALUE | | | | |
| |
Class A Shares: | | | | |
Net asset value and redemption price per share ($ 5,115,166 applicable to 389,694 shares of beneficial interest outstanding - Note 5) | | $ | 13.13 | |
Maximum sales charge, 4.50% of offering price | | | 0.62 | |
| | | | |
Maximum offering price per share | | $ | 13.75 | |
| | | | |
| |
Class C Shares: | | | | |
Net asset value and offering price per share* ($ 1,498,870 applicable to 114,985 shares of beneficial interest outstanding - Note 5) | | $ | 13.04 | |
| | | | |
| |
Class I Shares: | | | | |
Net asset value, offering and redemption price per share ($ 40,477,442 applicable to 3,048,929 shares of beneficial interest outstanding - Note 5) | | $ | 13.28 | |
| | | | |
| * | Redemption price per share is equal to net asset value less any applicable contingent deferred sales charge. |
See notes to financial statements.
Semi-Annual Report 13
| | |
| Statement of Operations | | |
| |
Thornburg Better World International Fund | | Six Months Ended March 31, 2017 |
| | | | |
INVESTMENT INCOME | | | | |
Dividend income | | | | |
Non-affiliated issuers (net of foreign taxes withheld of $19,712) | | $ | 286,544 | |
Non-controlled affiliated issuer | | | 18,885 | |
| | | | |
Total Income | | | 305,429 | |
| | | | |
| |
EXPENSES | | | | |
Investment advisory fees (Note 4) | | | 179,533 | |
Administration fees (Note 4) | | | | |
Class A Shares | | | 2,467 | |
Class C Shares | | | 679 | |
Class I Shares | | | 7,948 | |
Distribution and service fees (Note 4) | | | | |
Class A Shares | | | 4,957 | |
Class C Shares | | | 5,454 | |
Transfer agent fees | | | | |
Class A Shares | | | 13,823 | |
Class C Shares | | | 1,182 | |
Class I Shares | | | 5,269 | |
Registration and filing fees | | | | |
Class A Shares | | | 12,691 | |
Class C Shares | | | 12,691 | |
Class I Shares | | | 12,823 | |
Custodian fees (Note 2) | | | 47,310 | |
Professional fees | | | 17,907 | |
Accounting fees (Note 4) | | | 393 | |
Trustee fees | | | 454 | |
Other expenses | | | 31,044 | |
| | | | |
Total Expenses | | | 356,625 | |
Less: | | | | |
Expenses reimbursed by investment advisor (Note 4) | | | (53,609 | ) |
Investment advisory fees waived by investment advisor (Note 4) | | | (129,312 | ) |
| | | | |
Net Expenses | | | 173,704 | |
| | | | |
Net Investment Income | | | 131,725 | |
| | | | |
| |
REALIZED AND UNREALIZED GAIN (LOSS) | | | | |
Net realized gain (loss) on: | | | | |
Non-affiliated issuer investments (net of realized capital gain taxes paid of $6,647) | | | 49,156 | |
Foreign currency transactions | | | (8,077 | ) |
| | | | |
| | | 41,079 | |
| | | | |
Net change in unrealized appreciation (depreciation) on: | | | | |
Non-affiliated issuer investments (net of change in deferred taxes payable of $1,742) | | | 490,076 | |
Foreign currency translations | | | (631 | ) |
| | | | |
| | | 489,445 | |
| | | | |
Net Realized and Unrealized Gain | | | 530,524 | |
| | | | |
Net Increase in Net Assets Resulting from Operations | | $ | 662,249 | |
| | | | |
See notes to financial statements.
14 Semi-Annual Report
| | |
| Statements of Changes in Net Assets | | |
| |
Thornburg Better World International Fund | | |
| | | | | | | | |
| | | SIX MONTHS ENDED
MARCH 31, 2017* | | | YEAR ENDED
SEPTEMBER 30, 2016** | |
INCREASE (DECREASE) IN NET ASSETS FROM | | | | | | | | |
| | |
OPERATIONS | | | | | | | | |
Net investment income | | $ | 131,725 | | | $ | 137,184 | |
Net realized gain (loss) on investments, capital gain taxes, and foreign currency transactions | | | 41,079 | | | | 1,582,461 | |
Net unrealized appreciation (depreciation) on investments, deferred taxes payable, and foreign currency translations | | | 489,445 | | | | 1,985,163 | |
| | | | | | | | |
Net Increase (Decrease) in Net Assets Resulting from Operations | | | 662,249 | | | | 3,704,808 | |
| | |
DIVIDENDS TO SHAREHOLDERS | | | | | | | | |
From net investment income | | | | | | | | |
Class A Shares | | | (5,961 | ) | | | (7,285 | ) |
Class C Shares | | | — | | | | (3,171 | ) |
Class I Shares | | | (83,128 | ) | | | (123,062 | ) |
From realized gains | | | | | | | | |
Class A Shares | | | (177,797 | ) | | | — | |
Class C Shares | | | (45,820 | ) | | | — | |
Class I Shares | | | (1,502,645 | ) | | | — | |
| | |
FUND SHARE TRANSACTIONS (NOTE 5) | | | | | | | | |
Class A Shares | | | 3,537,592 | | | | 1,518,080 | |
Class C Shares | | | 701,215 | | | | 753,057 | |
Class I Shares | | | 13,736,982 | | | | 24,426,364 | |
| | | | | | | | |
Net Increase in Net Assets | | | 16,822,687 | | | | 30,268,791 | |
| | |
NET ASSETS | | | | | | | | |
Beginning of Period | | | 30,268,791 | | | | — | |
| | | | | | | | |
| | |
End of Period | | $ | 47,091,478 | | | $ | 30,268,791 | |
| | | | | | | | |
Undistributed (distribution in excess of) net investment income | | $ | 28,002 | | | $ | (14,634 | ) |
| ** | The Fund commenced operations on October 1, 2015. |
See notes to financial statements.
Semi-Annual Report 15
| | |
| Notes to Financial Statements | | |
| |
Thornburg Better World International Fund | | March 31, 2017 (Unaudited) |
NOTE 1 – ORGANIZATION
Thornburg Better World International Fund (the “Fund”) is a diversified series of Thornburg Investment Trust (the “Trust”). The Fund commenced operations on October 1, 2015. The Trust was organized as a Massachusetts business trust under a Declaration of Trust dated June 3, 1987 and is registered as a diversified, open-end management investment company under the Investment Company Act of 1940, as amended. The Fund is currently one of twenty-one separate series of the Trust. Each series is considered to be a separate entity for financial reporting and tax purposes and bears expenses directly attributable to it. The Fund seeks long-term capital appreciation.
The Fund currently offers three classes of shares of beneficial interest: Class A, Class C, and Institutional Class (“Class I”). Each class of shares of the Fund represents an interest in the same portfolio of investments, except that (i) Class A shares are sold subject to a front-end sales charge collected at the time the shares are purchased and bear a service fee, (ii) Class C shares are sold at net asset value without a sales charge at the time of purchase, but are subject to a contingent deferred sales charge upon redemption within one year of purchase, and bear both a service fee and a distribution fee, (iii) Class I shares are sold at net asset value without a sales charge at the time of purchase and may be subject to a service fee, and (iv) the respective classes may have different reinvestment privileges and conversion rights. Additionally, the Fund may allocate among its classes certain expenses, to the extent allocable to specific classes, including transfer agent fees, government registration fees, certain printing and postage costs, and administrative and legal expenses. Currently, class specific expenses of the Fund are limited to service and distribution fees, administration fees, and certain registration and transfer agent expenses.
The following is a summary of significant accounting policies followed by the Fund in the preparation of its financial statements. The Fund prepares its financial statements in conformity with United States generally accepted accounting principles (“GAAP”), including investment company accounting and reporting guidance in the Financial Accounting Standards Board (the “FASB”) Accounting Standard Codification Topic 946.
NOTE 2 – SIGNIFICANT ACCOUNTING POLICIES
Security Valuation: All investments in securities held by the Fund are valued as described in Note 3.
Allocation of Income, Gains, Losses and Expenses: Net investment income (other than class specific expenses) and realized and unrealized gains and losses are allocated daily to each class of shares based upon the relative net asset value of outstanding shares (or the value of the dividend-eligible shares, as appropriate) of each class of shares at the beginning of the day (after adjusting for the current capital shares activity of the respective class). Expenses common to all Funds are allocated among the Funds comprising the Trust based upon their relative net asset values or other appropriate allocation methods. Operating expenses directly attributable to a specific class are charged against the operating income of that class.
Dividends and Distributions to Shareholders: Dividends and distributions to shareholders, which are determined in accordance with federal income tax regulations and may differ from GAAP, are recorded on the ex-dividend date. Ordinary income distributions, if any, are declared and paid quarterly. Capital gain distributions, if any, are declared and paid annually and more often if deemed necessary by the Advisor. Dividends are paid and are reinvested in additional shares of the Fund at net asset value per share at the close of business on the ex-dividend date, or at the shareholder’s option, paid in cash.
Investment Income: Dividend income is recorded on the ex-dividend date. Certain income from foreign investments is recognized as soon as information is available to the Fund. Interest income is accrued as earned. Premiums and discounts are amortized and accreted, respectively, to call dates or maturity dates using the effective yield method of the respective investments. These amounts are included in Interest income on the Statement of Operations.
Custodian Fees: Custodian fees disclosed in the Statement of Operations may include interest expenses incurred by the Fund on any cash overdrafts of its custodian account during the period. Such cash overdrafts may result from the effects of failed trades in portfolio securities and from cash outflows resulting from unanticipated shareholder redemption activity. The Fund pays interest to its custodian on any such cash overdraft at a rate equal to 2.50% of the overdraft amount in excess of $50,000.
Investment Transactions: Investment transactions are accounted for on a trade date basis. Realized gains and losses from the sale of investments are recorded on an identified cost basis.
Repurchase Agreements: The Fund may invest excess cash in repurchase agreements whereby the Fund purchases investments, which serve as collateral, with an agreement to resell such collateral to the seller at an agreed upon price at the maturity date of the repurchase agreement. Investments pledged as collateral for repurchase agreements are held in custody until maturity of the repurchase agreement. Provisions in the agreements require that the market value of the collateral is at least equal to the repurchase value in the event of default. In the event of default, the Fund has the right to liquidate the collateral and apply the proceeds in satisfaction of the obligation. Under certain circumstances, in the event of default or bankruptcy by the other party to the agreement, realization and/or retention of the collateral may be subject to legal proceedings.
16 Semi-Annual Report
| | |
| Notes to Financial Statements, Continued | | |
| |
Thornburg Better World International Fund | | March 31, 2017 (Unaudited) |
When-Issued and Delayed Delivery Transactions: The Fund may engage in when-issued or delayed delivery transactions. To the extent the Fund engages in such transactions, it will do so for the purpose of acquiring portfolio investments consistent with the Fund’s investment objectives and not for the purpose of investment leverage or to speculate on interest rate or market changes. At the time the Fund makes a commitment to purchase an investment on a when-issued or delayed delivery basis, the Fund will record the transaction and reflect the value in determining its net asset value. When effecting such transactions, assets of an amount sufficient to make payment for the portfolio investments to be purchased will be segregated on the Fund’s records on the trade date. Investments purchased on a when-issued or delayed delivery basis do not earn interest until the settlement date.
Foreign Currency Translation: Portfolio investments and other assets and liabilities denominated in foreign currencies are translated into U.S. dollars based on the exchange rate of such currencies against the U.S. dollar on the date of valuation. Purchases and sales of investments and income items denominated in foreign currencies are translated into U.S. dollars at the exchange rate in effect on the transaction date. When the Fund purchases or sells foreign investments, it will customarily enter into a foreign exchange contract to minimize foreign exchange risk from the trade date to the settlement date of such transactions. The values of such spot contracts are included in receivable for investments sold and payable for investments purchased on the Statement of Assets and Liabilities.
The Fund does not separately report the effect of changes in foreign exchange rates from changes in market prices on investments held. Such changes are included in net unrealized appreciation (depreciation) from investments.
Reported net realized gains and losses from foreign currency transactions arise due to purchases and sales of foreign currencies, currency gains and losses realized between the trade and settlement dates on investment transactions and the difference between the amounts of dividends, interest, and foreign withholding taxes recorded on the Fund’s books, and the U.S. dollar equivalent of the amounts actually received or paid.
Net change in unrealized appreciation (depreciation) on foreign currency translations arise from changes in the fair value of assets and liabilities, other than investments at period end, resulting from changes in exchange rates.
Guarantees and Indemnifications: Under the Trust’s organizational documents (and under separate agreements with the independent Trustees), its officers and Trustees are provided with an indemnification against certain liabilities arising out of the performance of their duties to the Fund. In the normal course of business the Trust may also enter into contracts with service providers that contain general indemnifications. The Trust’s maximum exposure under these arrangements is unknown. However, based on experience, the Trust expects the risk of loss to be remote.
Use of Estimates: The preparation of financial statements in conformity with GAAP requires management to make estimates and assumptions that affect the reported amounts of assets and liabilities and disclosure of contingent assets and liabilities at the date of the financial statements and the reported amounts of increases (decreases) in net assets from operations during the reporting period. Actual results could differ from those estimates.
Federal Income Taxes: It is the policy of the Trust to comply with the provisions of the Internal Revenue Code applicable to regulated investment companies and to distribute to shareholders substantially all investment company taxable income including net realized gains on investments (if any), and tax exempt income of the Fund. Therefore, no provision for federal income or excise tax is required.
The Fund files income tax returns in United States federal and applicable state jurisdictions. The statute of limitations on the Fund’s tax return filings generally remains open for the three years following a return’s filing date. The Fund has analyzed its tax positions taken on Federal income tax returns for all open tax years and has concluded that no provision for income tax is required in the financial statements.
At March 31, 2017, information on the tax components of capital was as follows:
| | | | |
Cost of investments for tax purposes | | $ | 44,222,485 | |
| | | | |
| |
Gross unrealized appreciation on a tax basis | | $ | 3,089,157 | |
Gross unrealized depreciation on a tax basis | | | (609,499 | ) |
| | | | |
| |
Net unrealized appreciation (depreciation) on investments (tax basis) | | $ | 2,479,658 | |
| | | | |
At March 31, 2017, the Fund had deferred tax basis capital losses occurring subsequent to October 31, 2015 through September 30, 2016 of $17,380. For tax purposes, such capital losses will be recognized in the year ending September 30, 2017.
Foreign Withholding Taxes: The Fund is subject to foreign tax withholding imposed by certain foreign countries in which the Fund may invest. Withholding taxes are incurred on certain foreign dividends and are accrued at the time the dividend is recognized based on applicable foreign tax laws. The Fund may file withholding tax reclaims in certain jurisdictions to recover a portion of amounts previously withheld, in view of various considerations, including recent decisions rendered by the courts in those and other jurisdictions. The Fund would expect to record a receivable for such a reclaim based on a variety of factors, including assessment of a jurisdiction’s legal obligation to pay reclaims, the jurisdiction’s administrative practices and payment history, and industry convention. To date the Fund has
Semi-Annual Report 17
| | |
| Notes to Financial Statements, Continued | | |
| |
Thornburg Better World International Fund | | March 31, 2017 (Unaudited) |
recorded no such receivable because there is limited precedent for collecting such prior year reclaims and the likelihood of collection remains uncertain.
Deferred Foreign Capital Gain Taxes: The Fund is subject to a tax imposed on net realized gains of securities of certain foreign countries. The Fund records an estimated deferred tax liability for net unrealized gains on these investments as reflected in the accompanying financial statements.
NOTE 3 – SECURITY VALUATION
Valuation of the Fund’s portfolio investment securities is performed in accordance with policies and procedures adopted by and under the oversight of the Trustees.
The Trustees of the Trust have appointed Thornburg Investment Management, Inc., the Trust’s investment advisor (the “Advisor”) to assist the Trustees in obtaining market values for portfolio investments, evaluate and monitor professional pricing service providers appointed by the Trustees’ Audit Committee (the “Audit Committee”) to assist in determining fair values for portfolio investments, assist in calculating fair values for portfolio investments in certain circumstances, and to perform other functions in connection with the valuation of investments. The Advisor acts through its Valuation and Pricing Committee (the “Committee”) and other employees of the Advisor. The Committee regularly reviews its own valuation calculations, as well as the valuations, valuation techniques and services furnished by pricing service providers, considers circumstances which may require valuation calculations by the Committee, and reviews previous valuation calculations. The Committee reports to the Audit Committee on the Committee’s activities, the performance of pricing service providers, and other matters relating to valuation of portfolio investments.
In those instances when the Committee assists in calculating a fair value for a portfolio investment, the Committee seeks to determine the price that the Fund would reasonably expect to receive upon a sale of the investment in an orderly transaction between market participants on the valuation date. The Committee customarily utilizes quotations from securities broker dealers in calculating valuations, but also may utilize prices obtained from pricing service providers or other methods approved by the Audit Committee. Because fair values calculated by the Committee are estimates, the calculation of a value for an investment may differ from the price that would be realized by the Fund upon a sale of the investment, and the difference could be material to the Fund’s financial statements. The Committee’s calculation of a fair value for an investment may also differ from the prices obtained by other persons (including other mutual funds) for the investment.
Valuation of Securities: Securities and other portfolio investments which are listed or traded on a United States securities exchange are valued at the last reported sale price on the valuation date. Investments listed or traded on an exchange for which there has been no sale that day are valued at the mean between the last reported bid and asked prices on that valuation date. Portfolio investments reported by NASDAQ are valued at the official closing price on the valuation date. If an investment is traded on more than one exchange, the investment is considered traded on the exchange that is normally the primary market for that investment. Securities and other portfolio investments which are listed or traded on exchanges outside the United States are valued at the last price or the closing price of the investment on the exchange that is normally the primary market for the investment, as of the close of the exchange preceding the Fund’s valuation date. Foreign investments listed or traded on an exchange for which there has been no sale that day are valued at the mean between the last reported bid and asked prices on that valuation date.
In any case when a market quotation is not readily available for a portfolio investment ordinarily valued by market quotation, the Committee calculates a fair value for the investment using alternative methods approved by the Audit Committee. A market quotation is not readily available when the primary market or exchange for the investment is not open for the entire scheduled day of trading. Market quotations for an investment also may not be readily available if developments after the most recent close of the investment’s primary exchange or market, but prior to the close of business on any Fund business day, or an unusual event or significant period of time occurring since the availability of a market quotation, create a serious question concerning the reliability of the most recent market quotation available for the investment. In particular, on days when market volatility thresholds established by the Audit Committee are exceeded, foreign equity investments held by the Fund may be valued using alternative methods. The Committee customarily obtains valuations in these instances from pricing service providers approved by the Audit Committee. Pricing service providers ordinarily calculate valuations using multi-factor models to adjust market prices based upon various inputs, including exchange data, depository receipt prices, futures, index data and other data.
Debt obligations held by the Fund which are not listed or traded on exchanges or for which no reported market exists are ordinarily valued at the valuation obtained from a pricing service provider approved by the Audit Committee.
In any case when a pricing service provider fails to provide a valuation for a debt obligation held by the Fund, the Committee calculates a fair value for the obligation using alternative methods under procedures approved by the Audit Committee. Additionally, in cases when management believes that a valuation obtained from a pricing service provider merits review for significant reasons, the Committee decides whether or not to use the valuation calculated by the pricing service provider or to use an alternative method approved by the Audit Committee to calculate a fair value for the obligation.
18 Semi-Annual Report
| | |
| Notes to Financial Statements, Continued | | |
| |
Thornburg Better World International Fund | | March 31, 2017 (Unaudited) |
Quotations for foreign investments expressed in foreign currency amounts are converted to U.S. dollar equivalents using a foreign exchange quotation from a third party service provider at the time of valuation. Foreign investments held by the Fund may be traded on days and at times when the Fund is not open for business. Consequently, the value of Fund investments may be significantly affected on days when shareholders cannot purchase or sell Fund shares. Futures contracts and other financial and derivative instruments traded on an exchange are valued at the latest published price for the instrument on its primary exchange. Listed options are valued at the last bid price.
Valuation Hierarchy: The Fund categorizes its investments based upon the inputs used in valuing those investments, according to a three-level hierarchy established in guidance from FASB. Categorization of investments using this hierarchy is intended by the FASB to maximize the use of observable inputs in valuing investments and minimize the use of unobservable inputs by requiring that the most observable inputs be used when available. Observable inputs are those that market participants would use in valuing an investment based on available market information. Unobservable inputs are those that reflect assumptions about the information market participants would use in valuing an investment. An investment’s level within the hierarchy is based on the lowest level input that is deemed significant to the valuation. The methodologies and inputs used to value investments are not necessarily indications of the risk or liquidity associated with those investments.
Various inputs are used in calculating valuations for the Fund’s investments. These inputs are generally summarized according to the three-level hierarchy below:
Level 1: Quoted prices in active markets for identical investments.
Level 2: Other direct or indirect significant observable inputs (including quoted prices for similar investments in active markets and other observable inputs, such as interest rates, prepayment rates, credit risk, etc.).
Level 3: Significant unobservable inputs (including the Committee’s own assumptions in calculating the fair values of investments).
Valuations for debt obligations held by the Fund are typically calculated by pricing service providers approved by the Audit Committee and are characterized as Level 2 within the valuation hierarchy.
On days when market volatility thresholds established by the Audit Committee are exceeded, foreign securities for which valuations are obtained from pricing service providers are fair valued. On these days, the foreign securities are characterized as Level 2 within the valuation hierarchy and revert to Level 1 after the threshold is no longer exceeded.
In a limited number of cases the Committee calculates a fair value for investments using broker quotations or other methods approved by the Audit Committee. When the Committee uses a single broker quotation to calculate a fair value for an investment without other significant observable inputs, or if a fair value is calculated using other significant inputs that are considered unobservable, the investment is characterized as Level 3 within the hierarchy. Other significant unobservable inputs used to calculate a fair value in these instances might include an income-based valuation approach which considers discounted anticipated future cash flows from the investment, and application of discounts due to the nature or duration of any restrictions on the disposition of the investment.
Valuations based upon the use of inputs from Levels 1, 2 or 3 may not represent the actual price received upon the disposition of an investment, and the Fund may receive a price that is lower than the valuation based upon these inputs when it sells the investment.
The following table displays a summary of the fair value hierarchy measurements of the Fund’s investments as of March 31, 2017. In any instance when valuation inputs from more than one level are used to determine the fair value of a specific investment, the investment is placed in the level of the table based upon the lowest level input that is significant in determining the fair value of the investment:
| | | | | | | | | | | | | | | | |
| | | FAIR VALUE MEASUREMENTS AT MARCH 31, 2017 | |
| | | TOTAL | | | LEVEL 1 | | | LEVEL 2 | | | LEVEL 3 | |
Assets | | | | | | | | | | | | | | | | |
Investments in Securities* | | | | | | | | | | | | | | | | |
Common Stock | | $ | 39,825,328 | | | $ | 39,825,328 | | | $ | — | | | $ | — | |
Short Term Investments | | | 6,876,815 | | | | 6,876,815 | | | | — | | | | — | |
| | | | | | | | | | | | | | | | |
Total Investments in Securities | | $ | 46,702,143 | | | $ | 46,702,143 | | | $ | — | | | $ | — | |
| | | | |
Liabilities | | | | | | | | | | | | | | | | |
Other Financial Instruments** | | | | | | | | | | | | | | | | |
Spot Currency | | $ | 1,943 | | | $ | 1,943 | | | $ | — | | | $ | — | |
| * | See Schedule of Investments for a summary of the industry exposure as grouped according to the Global Industry Classification Standard (GICS), which is an industry taxonomy developed by MSCI, Inc. and Standard & Poor’s (S&P). |
| ** | Other Financial Instruments include investments not reflected in the Schedule of Investments, which may include futures, forwards and swap contracts, which are valued at the unrealized appreciation (depreciation) on the investment. |
Semi-Annual Report 19
| | |
| Notes to Financial Statements, Continued | | |
| |
Thornburg Better World International Fund | | March 31, 2017 (Unaudited) |
In accordance with the guidance prescribed in Accounting Standards Update No. 2011-04, it is the policy of the Fund to recognize transfers between levels and the underlying events which caused the movement. The Fund recognized no transfers between levels for the six months ended March 31, 2017, other than when the Fund exceeded market volatility thresholds for foreign equity investments during the period.
NOTE 4 – INVESTMENT ADVISORY FEE AND OTHER TRANSACTIONS WITH AFFILIATES
Pursuant to an investment advisory agreement, the Advisor serves as the investment advisor and performs services for the Fund for which the fees are payable at the end of each month. Under the investment advisory agreement, the Fund pays the Advisor a management fee based on the daily net assets of the Fund at an annual rate as shown in the following table:
Management Fee Schedule
| | | | |
DAILY NET ASSETS | | FEE RATE | |
Up to $500 million | | | 0.975 | % |
Next $500 million | | | 0.925 | |
Next $500 million | | | 0.875 | |
Next $500 million | | | 0.825 | |
Over $2 billion | | | 0.775 | |
The Fund’s effective management fee for the period ended March 31, 2017 was 0.975% of the Fund’s average net assets (before applicable management fee waiver of $129,312).
The Fund pays to the Advisor the costs of personnel who perform certain accounting services for the Fund. For the six months ended March 31, 2017 the Fund paid $393 to the Advisor for these accounting services. The Trust has also entered into administrative service agreements with the Advisor, whereby the Advisor will perform certain administrative services related to each class of the Fund’s shares, and for which fees will be payable at an annual rate of up to .125 of 1% per annum of the average daily net assets attributable to each class of shares. Total administrative service fees incurred by each class of shares of the Fund for the six months ended March 31, 2017, are set forth in the Statement of Operations.
The Trust has an underwriting agreement with Thornburg Securities Corporation (the “Distributor”), an affiliate of the Advisor, which acts as the distributor of the Fund’s shares. For the six months ended March 31, 2017, the Distributor has advised the Fund that it earned net commissions aggregating $3,730 from the sale of Class A shares of the Fund, and collected deferred sales charges aggregating $46 from redemptions of Class C shares of the Fund.
Pursuant to a service plan under Rule 12b-1 of the Investment Company Act of 1940, the Fund may pay to the Distributor or securities dealers and other financial institutions at the Distributor’s direction an amount not to exceed .25 of 1% per annum of the average daily net assets attributable to Class A and Class C shares of the Fund to obtain various shareholder and distribution related services. For the six months ended March 31, 2017, there were no 12b-1 service plan fees charged for Class I shares. The Advisor and Distributor each may pay out of its own resources additional expenses for distribution of the Fund’s shares and shareholder services.
The Trust has also adopted distribution plans pursuant to Rule 12b-1, applicable only to the Fund’s Class C shares, under which the Fund compensates the Distributor for services in promoting the sale of Class C shares of the Fund at an annual rate of up to 75 of 1% per annum of the average daily net assets attributable to Class C shares. Total fees incurred by each class of shares of the Fund under their respective service and distribution plans for the six months ended March 31, 2017, are set forth in the Statement of Operations
The Advisor and Distributor have contractually agreed to waive fees and reimburse expenses incurred by the Fund so that actual expenses of certain share classes do not exceed levels as specified in the Fund’s most recent prospectus. The agreement may be terminated by the Fund at any time, but may not be terminated by the Advisor or Distributor before April 10, 2018, unless the Advisor ceases to be the investment advisor to the Fund or the Distributor ceases to be the distributor of the Fund prior to that date. The Advisor and Distributor may recoup amounts waived or reimbursed during the fiscal year if actual expenses fall below the contractual limit during that year.
For the six months ended March 31, 2017, the Advisor voluntarily waived Fund level investment advisory fees of $129,312. The Advisor contractually reimbursed certain class specific expenses, administrative fees, and distribution fees of $15,279 for Class A shares, $12,291 for Class C shares, and $26,039 for Class I shares.
Certain officers and Trustees of the Trust are also officers or directors of the Advisor and Distributor. The compensation of independent Trustees is borne by the Trust.
20 Semi-Annual Report
| | |
| Notes to Financial Statements, Continued | | |
| |
Thornburg Better World International Fund | | March 31, 2017 (Unaudited) |
The percentage of direct investments in the Fund held by the Trustees and Officers of the Trust and the Advisor is approximately 39.25%.
The Fund may purchase or sell securities from, or to an affiliated fund, provided the affiliation is due solely to having a common investment advisor, common officers, or common trustees, and provided that all such transactions will comply with Rule 17a-7 under the 1940 Act. For the six months ended March 31, 2017, the Fund had no transactions with affiliated funds.
NOTE 5 – SHARES OF BENEFICIAL INTEREST
At March 31, 2017, there were an unlimited number of shares with no par value of beneficial interest authorized. Transactions in shares of beneficial interest were as follows:
| | | | | | | | | | | | | | | | |
| | | SIX MONTHS ENDED | | | YEAR ENDED | |
| | | MARCH 31, 2017 (UNAUDITED) | | | SEPTEMBER 30, 2016 (AUDITED)* | |
| | | SHARES | | | AMOUNT | | | SHARES | | | AMOUNT | |
Class A Shares | | | | | | | | | | | | | | | | |
Shares sold | | | 275,892 | | | $ | 3,627,966 | | | | 132,207 | | | $ | 1,665,516 | |
Shares issued to shareholders in reinvestment of dividends | | | 14,253 | | | | 177,164 | | | | 515 | | | | 7,141 | |
Shares repurchased | | | (20,645 | ) | | | (267,538 | ) | | | (12,528 | ) | | | (154,577 | ) |
| | | | | | | | | | | | | | | | |
| | | | |
Net increase (decrease) | | | 269,500 | | | $ | 3,537,592 | | | | 120,194 | | | $ | 1,518,080 | |
| | | | | | | | | | | | | | | | |
Class C Shares | | | | | | | | | | | | | | | | |
Shares sold | | | 53,499 | | | $ | 678,262 | | | | 59,567 | | | $ | 752,758 | |
Shares issued to shareholders in reinvestment of dividends | | | 3,716 | | | | 45,820 | | | | 230 | | | | 3,171 | |
Shares repurchased | | | (1,812 | ) | | | (22,867 | ) | | | (215 | ) | | | (2,872 | ) |
| | | | | | | | | | | | | | | | |
| | | | |
Net increase (decrease) | | | 55,403 | | | $ | 701,215 | | | | 59,582 | | | $ | 753,057 | |
| | | | | | | | | | | | | | | | |
Class I Shares | | | | | | | | | | | | | | | | |
Shares sold | | | 1,013,433 | | | $ | 13,170,618 | | | | 1,992,451 | | | $ | 24,462,178 | |
Shares issued to shareholders in reinvestment of dividends | | | 114,721 | | | | 1,439,781 | | | | 6,180 | | | | 86,279 | |
Shares repurchased | | | (68,601 | ) | | | (873,417 | ) | | | (9,255 | ) | | | (122,093 | ) |
| | | | | | | | | | | | | | | | |
| | | | |
Net increase (decrease) | | | 1,059,553 | | | $ | 13,736,982 | | | | 1,989,376 | | | $ | 24,426,364 | |
| | | | | | | | | | | | | | | | |
| * | The Fund commenced operations on October 1, 2015. |
NOTE 6 – INVESTMENT TRANSACTIONS
For the six months ended March 31, 2017, the Fund had purchase and sale transactions of investments (excluding short-term investments) of $30,079,148 and $15,851,934, respectively.
NOTE 7 – DERIVATIVE FINANCIAL INSTRUMENTS WITH OFF-BALANCE SHEET RISK AND FOREIGN INVESTMENT RISK
The Fund may use a variety of derivative financial instruments to hedge or adjust the risks affecting its investment portfolio or to enhance investment returns. Provisions of FASB Accounting Standards Codification ASC 815-10-50 (“ASC 815”) require certain disclosures. The disclosures are intended to provide users of financial statements with an understanding of the use of derivative instruments by the Fund and how these derivatives affect the financial position, financial performance and cash flows of the Fund. The Fund does not designate any derivative instruments as hedging instruments under ASC 815. Additionally, the Fund’s risk of loss may exceed the amounts recognized on the Statement of Assets and Liabilities.
During the six months ended March 31, 2017, the Fund did not invest in any derivative financial instruments of the type addressed by ASC 815.
Semi-Annual Report 21
| | |
| Notes to Financial Statements, Continued | | |
| |
Thornburg Better World International Fund | | March 31, 2017 (Unaudited) |
OTHER NOTES
Risks: The Fund’s investments subject it to risks including, but not limited to, management risk, market and economic risk, risks affecting specific issuers, liquidity risk, the risks associated with investments in small- and mid-cap companies and non-U.S. issuers (including developing country issuers), credit risk, social investing risk, real estate investment trusts, and interest rate risk. Please see the Fund’s prospectus for a discussion of the risks associated with an investment in the Fund.
Subsequent Events: Fund management believes no events have occurred between March 31, 2017 and the date of issuance of the financial statements that require adjustment to or disclosure in the accompanying financial statements.
22 Semi-Annual Report
This page intentionally left blank.
Semi-Annual Report 23
Financial Highlights
Thornburg Better World International Fund
| | | | | | | | | | | | | | | | | | | | | | | | | | | | | | | | | | | | | | | | | | | | | | | | | | |
| | | PER SHARE PERFORMANCE (FOR A SHARE OUTSTANDING THROUGHOUT THE PERIOD) | | RATIOS TO AVERAGE NET ASSETS | | | SUPPLEMENTAL DATA | |
UNLESS
OTHERWISE NOTED,
PERIODS
ARE FISCAL
YEARS
ENDED SEPT. 30, | | NET ASSET
VALUE
BEGINNING
OF PERIOD | | | NET
INVESTMENT
INCOME
(LOSS)+ | | | NET
REALIZED
&
UNREALIZED
GAIN (LOSS)
ON
INVESTMENTS | | | TOTAL FROM INVESTMENT OPERATIONS | | DIVIDENDS
FROM NET
INVESTMENT
INCOME | | | DIVIDENDS FROM NET REALIZED GAINS | | TOTAL
DIVIDENDS | | | NET
ASSET VALUE END
OF
PERIOD | | NET
INVESTMENT
INCOME
(LOSS)
(%) | | | EXPENSES,
AFTER
EXPENSE
REDUCTIONS
(%) | | | EXPENSES,
AFTER
EXPENSE
REDUCTIONS
AND
NET OF
CUSTODY
CREDITS
(%) | | | EXPENSES,
BEFORE
EXPENSE
REDUCTIONS
(%) | | | TOTAL RETURN
(%)(a) | | PORTFOLIO TURNOVER RATE (%)(a) | | NET
ASSETS
AT END
OF
PERIOD
(THOUSANDS) | |
CLASS A SHARES | | | | | | | | | | | | | | | | | | | | | | | | | | | | | | | | | | | | | | | | | | | |
2017(b)(c) | | $ | 13.86 | | | | — | (d) | | | (0.03 | ) | | (0.03) | | | (0.02 | ) | | (0.69) | | | (0.71 | ) | | $13.13 | | | (0.03 | )(g) | | | 1.74 | (g) | | | 1.74 | (g) | | | 3.21 | (g) | | 0.15 | | 50.72 | | $ | 5,115 | |
2016(c)(e) | | $ | 11.94 | | | | 0.03 | | | | 2.04 | | | 2.07 | | | (0.15 | ) | | — | | | (0.15 | ) | | $13.86 | | | 0.21 | | | | 1.83 | | | | 1.83 | | | | 7.27 | (f) | | 16.60 | | 180.60 | | $ | 1,666 | |
CLASS C SHARES | | | | | | | | | | | | | | | | | | | | | | | | | | | | | | | | | | | | | | | | | | | |
2017(b) | | $ | 13.79 | | | | (0.03 | ) | | | (0.03 | ) | | (0.06) | | | — | | | (0.69) | | | (0.69 | ) | | $13.04 | | | (0.44 | )(g) | | | 2.22 | (g) | | | 2.22 | (g) | | | 5.18 | (f)(g) | | (0.11) | | 50.72 | | $ | 1,499 | |
2016(e) | | $ | 11.94 | | | | (0.05 | ) | | | 2.04 | | | 1.99 | | | (0.14 | ) | | — | | | (0.14 | ) | | $13.79 | | | (0.40 | ) | | | 2.38 | | | | 2.38 | | | | 13.13 | (f) | | 15.94 | | 180.60 | | $ | 822 | |
CLASS I SHARES | | | | | | | | | | | | | | | | | | | | | | | | | | | | | | | | | | | | | | | | | | | |
2017(b) | | $ | 13.96 | | | | 0.06 | | | | (0.02 | ) | | 0.04 | | | (0.03 | ) | | (0.69) | | | (0.72 | ) | | $13.28 | | | 0.85 | (g) | | | 0.80 | (g) | | | 0.80 | (g) | | | 1.67 | (g) | | 0.62 | | 50.72 | | $ | 40,477 | |
2016(e) | | $ | 11.94 | | | | 0.10 | | | | 2.01 | | | 2.11 | | | (0.09 | ) | | — | | | (0.09 | ) | | $13.96 | | | 0.76 | | | | 1.09 | | | | 1.09 | | | | 2.28 | | | 17.44 | | 180.60 | | $ | 27,781 | |
| (a) | Not annualized for periods less than one year. |
| (b) | Unaudited Six Month Period Ended March 31. |
| (c) | Sales loads are not reflected in computing total return. |
| (d) | Net investment income (loss) is less than 0.01%. (e) Fund commenced operations on October 1, 2015. |
| (f) | Due to the size of net assets and fixed expenses, ratios may appear disproportionate. |
| + | Based on weighted average shares outstanding. |
See notes to financial statements.
| | | | |
| 24 Semi-Annual Report | | | | Semi-Annual Report 25 |
| | |
| Expense Example | | |
| |
Thornburg Better World International Fund | | March 31, 2017 (Unaudited) |
As a shareholder of the Fund, you incur two types of costs:
| | (1) | transaction costs, including |
(a) sales charges (loads) on purchase payments, for Class A shares;
(b) a deferred sales charge on redemptions of any part or all of a purchase of $1 million of Class A shares within 12 months of purchase;
(c) a deferred sales charge on redemptions of Class C shares within 12 months of purchase;
| | (2) | ongoing costs, including management fees; distribution and/or service (12b-1) fees; and other Fund expenses. |
This example is intended to help you understand your ongoing costs (in dollars) of investing in the Fund and to compare these costs with the ongoing costs of investing in other mutual funds.
The example is based on a $1,000 investment beginning on October 1, 2016, and held until March 31, 2017.
| | | | | | | | | | | | |
| | | BEGINNING
ACCOUNT VALUE
10/1/16 | | | ENDING
ACCOUNT VALUE
3/31/17 | | | EXPENSES PAID
DURING PERIOD†
10/1/16–3/31/17 | |
CLASS A SHARES | | | | | | | | | | | | |
Actual | | $ | 1,000.00 | | | $ | 1,001.54 | | | $ | 8.67 | |
Hypothetical* | | $ | 1,000.00 | | | $ | 1,016.26 | | | $ | 8.74 | |
CLASS C SHARES | | | | | | | | | | | | |
Actual | | $ | 1,000.00 | | | $ | 998.88 | | | $ | 11.05 | |
Hypothetical* | | $ | 1,000.00 | | | $ | 1,013.87 | | | $ | 11.14 | |
CLASS I SHARES | | | | | | | | | | | | |
Actual | | $ | 1,000.00 | | | $ | 1,006.20 | | | $ | 4.01 | |
Hypothetical* | | $ | 1,000.00 | | | $ | 1,020.94 | | | $ | 4.03 | |
| † | Expenses are equal to the annualized expense ratio for each class (A: 1.74%; C: 2.22%; I: 0.80%) multiplied by the average account value over the period, multiplied by 182/365 to reflect the one-half year period. |
| * | Hypothetical assumes a rate of return of 5% per year before expenses. |
ACTUAL EXPENSES
For each class of shares, the first line of the accompanying table provides information about actual account values and actual expenses. You may use the information in this line, together with the amount you invested, to estimate the expenses that you paid over the period. Simply divide your account value by $1,000 (for example, an $8,600 account value divided by $1,000 = 8.6), then multiply the result by the number in the first line for your class of shares under the heading entitled “Expenses Paid During Period” to estimate the expenses you paid on your account during this period.
HYPOTHETICAL EXAMPLE FOR COMPARISON PURPOSES
For each class of shares, the second line of the accompanying table provides information about hypothetical account values and hypothetical expenses based on the Fund’s actual expense ratio and an assumed rate of return of 5% per year before expenses, which is not the Fund’s actual return. The hypothetical account values and expenses may not be used to estimate the actual ending account balance or expenses you paid for the period. You may use this information to compare the ongoing costs of investing in the Fund and other funds. To do so, compare this 5% hypothetical example with the 5% hypothetical examples that appear in the shareholder reports of the other funds.
Please note that the expenses shown in the table are meant to highlight your ongoing costs only and do not reflect any transactional costs, such as sales charges (loads), redemption fees, or exchange fees. Therefore, the second line of the table for each class of shares is useful in comparing ongoing costs only, and will not help you determine the relative total costs of owning different funds. In addition, if these transactional costs were included, your costs would have been higher.
26 Semi-Annual Report
| | |
| Other Information | | |
| |
Thornburg Better World International Fund | | March 31, 2017 (Unaudited) |
PORTFOLIO PROXY VOTING
Policies and Procedures:
The Trust has delegated to Thornburg Investment Management, Inc. (the “Advisor”) voting decisions respecting proxies for the Fund’s voting securities. The Advisor makes voting decisions in accordance with its Proxy Voting Policy. A description of the Policy is available (i) without charge, upon request, by calling the Advisor toll-free at 1-800-847-0200, (ii) on the Thornburg website at www.thornburg. com, and (iii) on the Securities and Exchange Commission’s website at www.sec.gov.
No proxy voting information is currently available because the Fund commenced operations on October 1, 2015. The Fund expects to begin making annual proxy voting information available in accordance with applicable regulations commencing on or before August 31, 2016. This information is available (i) without charge, upon request by calling the Advisor toll-free at 1-800-847-0200, (ii) on the Thornburg website at www.thornburg.com, and (iii) on the Securities and Exchange Commission’s website at www.sec.gov.
AVAILABILITY OF QUARTERLY PORTFOLIO SCHEDULE
The Fund files with the Securities and Exchange Commission schedules of its portfolio holdings on Form N-Q for the first and third quarters of each fiscal year. The Fund’s Forms N-Q are available on the Commission’s website at www.sec.gov, or may be reviewed and copied at the Commission’s Public Reference Room in Washington, D.C. Information on the operation of the Public Reference Room may be obtained by calling 1-800-SEC-0330. The Fund also makes this information available on its website at www.thornburg.com/download or upon request by calling 1-800-847-0200.
Semi-Annual Report 27
Trustees’ Statement to Shareholders
Readopted September 12, 2016
The Trustees believe current and prospective shareholders should know how we discharge our responsibilities in supervising the Funds’ investment advisor and in reviewing the advisor’s contract for renewal. Since 2005, we have issued a statement which sets out clearly the three principal guidelines that we follow in supervising the Trust’s investment advisor on your behalf. In accordance with our customary practice, in September of this year we again reviewed our statement and concluded we should reissue this statement outlining the principal features of our supervision of the advisor’s performance of investment management services for the Funds.
We begin with the premise that each shareholder selected his or her Fund because its investments are managed by the investment advisor identified in the prospectus and in accordance with the objective and policies described in the prospectus. We realize, as each of you do, that if you believe that your Fund’s stated objective and policies no longer serve your personal investment goals, you can sell your shares and leave the Fund.
Therefore, we believe that our primary supervisory task – our principal obligation to you – is to assess the nature and quality of the advisor’s services, and to confirm that the advisor actively and competently pursues the Fund’s objective, in accordance with the policies set out in the prospectus. To do this, we meet regularly with management to review your Fund’s portfolio and to discuss the advisor’s specific actions and judgments in pursuing the Fund’s objective. We do not substitute our own judgment for the advisor’s decisions in selecting investments; the advisor is paid to exercise its informed judgment on investment decisions, and we seek to confirm, in reviewing the advisor’s performance, that the advisor is doing just that.
Second, we are conscious of costs and the effect that costs have on shareholders’ returns. We try to make sure that your Fund’s fees and costs are reasonable in relationship to the services rendered and that they are generally in line with those charged by other expert investment advisors, consistent with our belief that the Fund’s investors searched for and expect that expertise and attention and have decided to pay a reasonable price for it. We do not put the management contract “out to bid” as a matter of course, and we would not do so unless we had concluded that the advisor materially had failed to pursue the Fund’s objectives in accordance with its policies, or for other equally important reasons. We believe that any other approach would be inconsistent with your interests and contrary to your expectations when you bought shares of the Fund in the first place.
Finally, because we believe that most Thornburg Fund shareholders have invested with a long-term perspective, we try not to focus too much on the fashions of the moment and on short-term performance. The market will not favor any specific investment objective or set of policies at all times and under all economic circumstances. A fund will experience periods of both high and low returns relative to other funds and other investments. Even if one of our Funds is not favored by the market at a particular time, we believe that the advisor is nonetheless obliged to remain true to the Fund’s objective and policies, and we watch to see that it does so.
Trustees of Thornburg Investment Trust
28 Semi-Annual Report
Thornburg Funds
Thornburg Investment Management is a privately-owned global investment firm that offers a range of solutions for retail and institutional investors. Founded in 1982 and headquartered in Santa Fe, New Mexico, we manage approximately $49 billion (as of March 31, 2017) across U.S. mutual funds, separate accounts for high-net-worth investors and institutional accounts, and UCITS funds for non-U.S. investors.
The fund outlined in this report is one of many equity and fixed-income products available from Thornburg Investment Management.
EQUITY FUNDS
| | • | | Thornburg Investment Income Builder Fund |
| | • | | Thornburg Global Opportunities Fund |
| | • | | Thornburg International Value Fund |
| | • | | Thornburg Better World International Fund |
| | • | | Thornburg International Growth Fund |
| | • | | Thornburg Developing World Fund |
| | • | | Thornburg Core Growth Fund |
FIXED INCOME FUNDS
| | • | | Thornburg Low Duration Income Fund |
| | • | | Thornburg Limited Term U.S. Government Fund |
| | • | | Thornburg Limited Term Income Fund |
| | • | | Thornburg Strategic Income Fund |
| | • | | Thornburg Low Duration Municipal Fund |
| | • | | Thornburg Limited Term Municipal Fund |
| | • | | Thornburg Intermediate Municipal Fund |
| | • | | Thornburg California Limited Term Municipal Fund |
| | • | | Thornburg New Mexico Intermediate Municipal Fund |
| | • | | Thornburg New York Intermediate Municipal Fund |
| | • | | Thornburg Strategic Municipal Income Fund |
ALTERNATIVE FUNDS
| | • | | Thornburg Long/Short Equity Fund |
Before investing, carefully consider the Fund’s investment goals, risks, charges, and expenses. For a prospectus or summary prospectus containing this and other information, contact your financial advisor or visit thornburg.com. Read it carefully before investing.
For additional information, please visit thornburg.com
Thornburg Investment Management, Inc. 2300 North Ridgetop Road, Santa Fe, NM 87506
Semi-Annual Report 29
This page intentionally left blank.
30 Semi-Annual Report
This page intentionally left blank.
Semi-Annual Report 31
This Semi-Annual Report is submitted for the general information of shareholders of the Fund. It is not authorized for distribution to prospective investors in the Fund unless preceded or accompanied by an effective prospectus.
| | | | |
| Investment Advisor: | | Distributor: | | |
| Thornburg Investment Management® | | Thornburg Securities Corporation® | | |
| 800.847.0200 | | 800.847.0200 | | TH3645 |
This page intentionally left blank.
2 Semi-Annual Report
Semi-Annual Report
Thornburg Capital Management Fund
March 31, 2017
| | | | | | |
SHARE CLASS | | NASDAQ SYMBOL | | CUSIP | |
Class I | | N/A | | | 885-216-739 | |
Semi-Annual Report 3
Letter to Shareholders
| | |
Thornburg Capital Management Fund | | March 31, 2017 (Unaudited) |
April 12, 2017
Dear Shareholder:
Thornburg Capital Management Fund (TCMF) was started on July 31, 2015, with the goal of providing superior risk exposures for cash management across the Thornburg family of funds with higher returns and lower costs. Through March 31, 2017, we have generally invested approximately $891 million of Thornburg Investment Trust cash in what we view as high-quality, short-term instruments. With the custodian of the Thornburg Investment Trust funds charging 20 basis points (0.20%) for large cash balances, the annualized distribution yield from the portfolio of 81 basis points (0.81%) represents a significant pick-up in return.
As a reminder to all shareholders, by combining the cash balances of all eligible Thornburg Investment Trust portfolios into a single pool, we seek to reduce the costs of investing and significantly diversify and reduce risk exposures in any given portfolio. While individual transaction costs appear low (ticketing costs are $6.00 and an additional $6.00 for every maturity), these costs would add up quickly for any Thornburg Fund that maintained its own portfolio of overnight securities. Duplicate trades in different portfolios incur separate charges, and with 11 different eligible portfolios, the multiplier effect on costs would be significant. The creation and the continued management of the Thornburg Capital Management Fund helps illustrate our long-standing culture of efficient capital stewardship, benefiting all eligible portfolios through reduced transaction costs and more efficient management.
All of the Fund’s investments are rated A-1+, A-1, or A-2 by Standard & Poor’s. As of March 31, 2017, 47.9% of the portfolio was invested in instruments with maturities of three days or less. The weighted average maturity of the portfolio, ex-cash was 8.4 days. Microsoft Corp. currently represents our largest single exposure outside of supranationals or U.S. government entities. At the end of the period, this exposure represented 1.80% of the portfolio. Keep in mind that at the investing fund level, this is 1.80% of the cash equivalent position. As an example, if cash equivalents in the investing fund sat at 10%, the investing fund’s Microsoft position would be 0.18%. As we generally expect to have a large pool of assets, we have the ability to purchase a large number of different issues and still expect to have a vast cost advantage versus splitting investments amongst portfolios.
The above figures should give investors a picture of what we believe is a very high-quality, very short-term, very liquid portfolio that is intended to avoid undue fees and provides a notable return over the custodian’s negative 20 basis point (0.20%) penalty rate. We continue to believe that this structure is a significant improvement over a fragmented, costly, less-diversified outcome of investing the cash of each fund separately, and should be a benefit to all of the participating portfolios of Thornburg Investment Trust.
Sincerely,
| | | | |

| | 
| | 
|
Jason Brady, CFA | | Lon R. Erickson, CFA | | Jeff Klingelhofer, CFA |
Portfolio Manager | | Portfolio Manager | | Portfolio Manager |
CEO, President, and Managing Director | | Managing Director | | Managing Director |
The matters discussed in this report may constitute forward-looking statements made pursuant to the safe harbor provisions of the Securities Litigation Reform Act of 1995. These include any advisor or portfolio manager prediction, assessment, analysis or outlook for individual securities, industries, investment styles, market sectors and/or markets. These statements involve risks and uncertainties. In addition to the general risks described for each fund in its current prospectus, other factors bearing on these reports include the accuracy of the advisor’s or portfolio manager’s forecasts and predictions, the appropriateness of the investment strategies designed by the advisor or portfolio manager and the ability of the advisor or portfolio manager to implement their strategies efficiently and successfully. Any one or more of these factors, as well as other risks affecting the securities markets generally, could cause the actual results of any fund to differ materially as compared to its benchmarks.
The views expressed are subject to change and do not necessarily reflect the views of Thornburg Investment Management, Inc. This information should not be relied upon as a recommendation or investment advice and is not intended to predict the performance of any investment or market.
4 Semi-Annual Report
Performance Summary
| | |
Thornburg Capital Management Fund | | March 31, 2017 |
AVERAGE ANNUAL TOTAL RETURNS
| | | | | | | | |
| | | 1-YR | | | SINCE
INCEP. | |
I Shares (Incep: 7/31/15) | | | 0.56 | % | | | 0.48 | % |
Citigroup One-Month Treasury Bill Index (Since: 7/31/15) | | | 0.27 | % | | | 0.20 | % |
30-DAY YIELDS
| | | | |
SEC Yield | | | 0.82 | % |
Annualized Distribution Yield | | | 0.81 | % |
Performance data shown represents past performance and is no guarantee of future results. Investment return and principal value will fluctuate so shares, when redeemed, may be worth more or less than their original cost. Current performance may be lower or higher than quoted. For performance current to the most recent month end, call 800-847-0200. There is no sales charge for class I shares.
GROWTH OF A HYPOTHETICAL $10,000 INVESTMENT
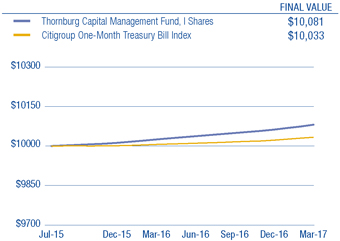
Fund Summary
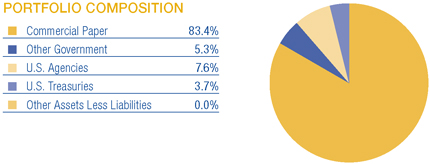
Glossary
Citigroup One-Month Treasury Bill Index – Measures monthly return equivalents of yield averages that are not marked to market. The One-Month Treasury Bill Index consists of the last one-month Treasury bill issue.
The performance of any index is not indicative of the performance of any particular investment. Unless otherwise noted, index returns reflect the reinvestment of income dividends and capital gains, if any, but do not reflect fees, brokerage commissions or other expenses of investing. Investors may not make direct investments into any index.
Annualized Distribution Yield – The distribution yield reflects actual distributions made to shareholders. The annualized distribution yield is calculated by summing the last 30 days of income at a given month end and annualizing to a 360-day year. The result is divided by the ending maximum offering price.
Basis Point (bp) – A unit equal to 1/100th of 1%. 1% = 100 basis points (bps).
SEC Yield – SEC Yield is computed in accordance with SEC standards measuring the net investment income per share over a specified 30-day period expressed as a percentage of the maximum offering price of the Fund’s shares at the end of the period.
Short-Term Credit Ratings – A bond credit rating assesses the financial ability of a debt issuer to make timely payments of principal and interest. Short-term obligation ratings of A-1 (the highest), A-2 and A-3 are investment-grade quality. Ratings of B, C and D (the lowest) are considered below investment grade, speculative grade, or junk bonds.
Semi-Annual Report 5
| | |
| Schedule of Investments | | |
| |
Thornburg Capital Management Fund | | March 31, 2017 (Unaudited) |
| | | | | | | | |
| | | SHARES/
PRINCIPAL
AMOUNT | | | VALUE | |
SHORT TERM INVESTMENTS — 99.98% | | | | | | | | |
Ameren Corp., 1.08%, 4/3/2017 | | $ | 12,000,000 | | | $ | 11,999,280 | |
a Anthem, Inc., 1.22%, 4/17/2017 | | | 14,000,000 | | | | 13,992,409 | |
Arizona Public Service Co., 1.02%, 4/3/2017 | | | 12,000,000 | | | | 11,999,320 | |
a Autozone, Inc., 1.10%, 4/3/2017 | | | 13,000,000 | | | | 12,999,206 | |
a B. A. T. International Finance, 1.17%, 4/4/2017 | | | 4,900,000 | | | | 4,899,522 | |
a B. A. T. International Finance, 1.21%, 4/11/2017 | | | 5,500,000 | | | | 5,498,151 | |
a B. A. T. International Finance, 1.25%, 4/19/2017 | | | 1,600,000 | | | | 1,599,000 | |
Bank of New York Tri-Party Repurchase Agreement 1.11% dated 3/31/2017 due 4/3/2017, repurchase price $35,003,238 collateralized by 29 corporate debt securities, having an average coupon of 3.83%, a minimum credit rating of BBB-, maturity dates from 4/3/2017 to 8/8/2056, and having an aggregate market value of $37,301,704 at 3/31/2017 | | | 35,000,000 | | | | 35,000,000 | |
a Basf Aktiengesellsch, 0.76%, 4/3/2017 | | | 13,000,000 | | | | 12,999,451 | |
a Brown-Forman Corp., 0.95%, 4/17/2017 | | | 10,000,000 | | | | 9,995,778 | |
a Campbell Soup Co., 0.98%, 4/3/2017 | | | 7,200,000 | | | | 7,199,608 | |
a Campbell Soup Co., 1.09%, 4/27/2017 | | | 4,800,000 | | | | 4,796,221 | |
a Canadian National Railway, 0.92%, 4/18/2017 | | | 5,000,000 | | | | 4,997,828 | |
a Canadian National Railway, 0.92%, 4/27/2017 | | | 7,000,000 | | | | 6,995,349 | |
a CBS Corp., 1.15%, 4/27/2017 | | | 14,000,000 | | | | 13,988,372 | |
a CenterPoint Energy, Inc., 1.11%, 4/3/2017 | | | 12,000,000 | | | | 11,999,260 | |
a Church & Dwight Co., Inc., 1.07%, 4/3/2017 | | | 13,000,000 | | | | 12,999,227 | |
a Cintas Corp., 1.07%, 4/3/2017 | | | 5,000,000 | | | | 4,999,703 | |
a Cintas Corp., 1.12%, 4/12/2017 | | | 7,000,000 | | | | 6,997,604 | |
a Colgate-Palmolive Co., 0.79%, 4/10/2017 | | | 13,000,000 | | | | 12,997,432 | |
a Consolidated Edison, Inc., 1.06%, 4/6/2017 | | | 12,000,000 | | | | 11,998,233 | |
a CVS Corp., 1.12%, 4/11/2017 | | | 12,000,000 | | | | 11,996,267 | |
a Dollar General Corp., 1.13%, 4/11/2017 | | | 13,000,000 | | | | 12,995,808 | |
a Edison International, 1.05%, 4/3/2017 | | | 12,000,000 | | | | 11,999,300 | |
a Equifax, Inc., 1.12%, 4/10/2017 | | | 6,200,000 | | | | 6,198,264 | |
a Experian Finance plc, 1.12%, 4/24/2017 | | | 10,000,000 | | | | 9,992,844 | |
Farmer Mac Discount Note, 0.50%, 4/3/2017 | | | 30,000,000 | | | | 29,999,167 | |
Farmer Mac Discount Note, 0.72%, 4/18/2017 | | | 4,900,000 | | | | 4,898,334 | |
Federal Home Loan Discount Note, 0.535%, 4/3/2017 | | | 21,000,000 | | | | 20,999,376 | |
Federal Home Loan Discount Note, 0.65%, 4/5/2017 | | | 1,200,000 | | | | 1,199,913 | |
Federal Home Loan Discount Note, 0.715%, 4/17/2017 | | | 11,000,000 | | | | 10,996,504 | |
a Hasbro, Inc., 1.10%, 4/3/2017 | | | 6,090,000 | | | | 6,089,628 | |
a Illinois Tool Works, Inc., 0.82%, 4/3/2017 | | | 12,000,000 | | | | 11,999,453 | |
a Intercontinental Exchange, Inc., 0.87%, 4/7/2017 | | | 7,000,000 | | | | 6,998,985 | |
b International Bank for Reconstruction & Development Discount Note, 0.55%, 4/3/2017 | | | 28,100,000 | | | | 28,099,141 | |
b International Bank for Reconstruction & Development Discount Note, 0.76%, 4/17/2017 | | | 15,000,000 | | | | 14,994,933 | |
b International Bank for Reconstruction & Development Discount Note, 0.76%, 4/18/2017 | | | 4,000,000 | | | | 3,998,564 | |
a Kansas City Power & Light Co., 1.10%, 4/3/2017 | | | 13,000,000 | | | | 12,999,206 | |
a KCP&L Greater Missouri Operations Co., 1.15%, 4/13/2017 | | | 1,000,000 | | | | 999,617 | |
a Kentucky Utilities Co., 1.13%, 4/3/2017 | | | 10,000,000 | | | | 9,999,372 | |
a Kentucky Utilities Co., 1.13%, 4/7/2017 | | | 3,000,000 | | | | 2,999,435 | |
a Kroger Co., 1.10%, 4/3/2017 | | | 12,000,000 | | | | 11,999,267 | |
a L’oreal USA, Inc., 0.77%, 4/10/2017 | | | 7,835,000 | | | | 7,833,492 | |
a L’oreal USA, Inc., 0.83%, 4/12/2017 | | | 6,165,000 | | | | 6,163,436 | |
a Louisville Gas & Electric Co., 1.13%, 4/3/2017 | | | 5,000,000 | | | | 4,999,686 | |
a Marriott International, Inc., 1.10%, 4/3/2017 | | | 14,000,000 | | | | 13,999,144 | |
Mattel, Inc., 1.12%, 4/19/2017 | | | 13,000,000 | | | | 12,992,720 | |
a McCormick & Co., 1.04%, 4/6/2017 | | | 12,000,000 | | | | 11,998,267 | |
a Merck & Co., Inc., 0.81%, 4/12/2017 | | | 14,000,000 | | | | 13,996,535 | |
a Microsoft Corp., 0.75%, 4/12/2017 | | | 16,000,000 | | | | 15,996,333 | |
a NextEra Energy, Inc., 1.17%, 4/19/2017 | | | 10,000,000 | | | | 9,994,150 | |
Northern Illinois Gas Co., 1.00%, 4/3/2017 | | | 13,000,000 | | | | 12,999,278 | |
a Novartis Finance Corp., 0.74%, 4/10/2017 | | | 5,500,000 | | | | 5,498,982 | |
a Novartis Finance Corp., 0.84%, 4/24/2017 | | | 7,500,000 | | | | 7,495,975 | |
a Oglethorpe Power Corp., 0.95%, 4/17/2017 | | | 11,149,000 | | | | 11,144,293 | |
a PepsiCo, Inc., 0.80%, 4/10/2017 | | | 5,000,000 | | | | 4,999,000 | |
a PG&E Corp., 0.96%, 4/3/2017 | | | 13,000,000 | | | | 12,999,307 | |
a Pinnacle West Capital Corp., 1.10%, 4/3/2017 | | | 13,000,000 | | | | 12,999,206 | |
Potomac Electric Power Co., 1.09%, 4/3/2017 | | | 13,000,000 | | | | 12,999,213 | |
a PPL Corp., 1.22%, 4/5/2017 | | | 4,000,000 | | | | 3,999,458 | |
a PPL Corp., 1.20%, 4/10/2017 | | | 6,600,000 | | | | 6,598,020 | |
a PPL Corp., 1.18%, 4/11/2017 | | | 1,400,000 | | | | 1,399,541 | |
Praxair, Inc., 0.79%, 4/17/2017 | | | 13,000,000 | | | | 12,995,436 | |
6 Semi-Annual Report
| | |
| Schedule of Investments, Continued | | |
| |
Thornburg Capital Management Fund | | March 31, 2017 (Unaudited) |
| | | | | | | | |
| | | SHARES/
PRINCIPAL
AMOUNT | | | VALUE | |
a Reckitt Benckiser Co., 0.95%, 4/3/2017 | | $ | 12,000,000 | | | $ | 11,999,367 | |
a Roche Holding, Inc., 0.72%, 4/5/2017 | | | 10,200,000 | | | | 10,199,184 | |
a Rockwell Automation, Inc., 1.00%, 4/13/2017 | | | 13,000,000 | | | | 12,995,667 | |
a San Diego Gas & Electric Co., 0.87%, 4/3/2017 | | | 12,000,000 | | | | 11,999,420 | |
a Siemens Capital Co. LLC, 0.88%, 4/27/2017 | | | 12,000,000 | | | | 11,992,373 | |
Sonoco Products Co., 1.05%, 4/3/2017 | | | 13,000,000 | | | | 12,999,242 | |
South Carolina Electric & Gas, 1.00%, 4/4/2017 | | | 4,000,000 | | | | 3,999,667 | |
a Southern Co. Gas, 1.13%, 4/3/2017 | | | 13,000,000 | | | | 12,999,184 | |
a Southwestern Public Service Co., 1.08%, 4/3/2017 | | | 13,000,000 | | | | 12,999,220 | |
a Spectra Energy Corp., 1.17%, 4/4/2017 | | | 12,000,000 | | | | 11,998,830 | |
a Sysco Corp., 1.13%, 4/3/2017 | | | 13,000,000 | | | | 12,999,184 | |
a The Home Depot, 0.78%, 4/5/2017 | | | 12,000,000 | | | | 11,998,960 | |
a The Stanley Works Co., 1.05%, 4/17/2017 | | | 5,600,000 | | | | 5,597,387 | |
a The Western Union Co., 1.10%, 4/4/2017 | | | 13,000,000 | | | | 12,998,808 | |
a Tyco Electronics Group S.A., 1.13%, 4/4/2017 | | | 12,000,000 | | | | 11,998,870 | |
a Tyson Foods, Inc., 1.25%, 4/27/2017 | | | 5,500,000 | | | | 5,495,035 | |
Union Electric Co., 1.10%, 4/3/2017 | | | 13,000,000 | | | | 12,999,206 | |
United States Treasury Bill, 0.66%, 4/6/2017 | | | 22,000,000 | | | | 21,997,983 | |
United States Treasury Bill, 0.716%, 4/20/2017 | | | 11,000,000 | | | | 10,995,846 | |
a Wal-Mart Stores, Inc., 0.76%, 4/10/2017 | | | 12,000,000 | | | | 11,997,720 | |
| | | | | | | | |
TOTAL SHORT TERM INVESTMENTS (Cost $890,766,957) | | | | | | | 890,766,957 | |
| | | | | | | | |
TOTAL INVESTMENTS — 99.98% (Cost $890,766,957) | | | | | | $ | 890,766,957 | |
OTHER ASSETS LESS LIABILITIES — 0.02% | | | | | | | 148,643 | |
| | | | | | | | |
NET ASSETS — 100.00% | | | | | | $ | 890,915,600 | |
| | | | | | | | |
Footnote Legend
| a | Securities exempt from registration under Rule 144A of the Securities Act of 1933, as amended. These securities may only be resold in the ordinary course of business in transactions exempt from registration, normally to qualified institutional buyers. As of March 31, 2017, the aggregate value of these securities in the Fund’s portfolio was $601,603,834, representing 67.53% of the Fund’s net assets. |
| b | Yankee bond denominated in U.S. dollars and is issued in the U.S. by foreign banks and corporations. |
See notes to financial statements.
Semi-Annual Report 7
| | |
| Statement of Assets and Liabilities | | |
| |
Thornburg Capital Management Fund | | March 31, 2017 (Unaudited) |
| | | | |
ASSETS | | | | |
Investments at value (cost $890,766,957) (Note 3) | | $ | 890,766,957 | |
Cash | | | 189,511 | |
Interest receivable | | | 1,079 | |
Prepaid expenses and other assets | | | 3,471 | |
| | | | |
Total Assets | | | 890,961,018 | |
| | | | |
| |
LIABILITIES | | | | |
Accounts payable and accrued expenses | | | 45,336 | |
Dividends payable | | | 82 | |
| | | | |
Total Liabilities | | | 45,418 | |
| | | | |
| |
NET ASSETS | | $ | 890,915,600 | |
| | | | |
NET ASSETS CONSIST OF | | | | |
Undistributed net investment income | | $ | 23,695 | |
Net capital paid in on shares of beneficial interest | | | 890,891,905 | |
| | | | |
| | $ | 890,915,600 | |
| | | | |
| |
NET ASSET VALUE | | | | |
Class I Shares: | | | | |
Net asset value and redemption price per share ($890,915,600 applicable to 89,091,560 shares of beneficial interest outstanding - Note 5) | | $ | 10.00 | |
| | | | |
See notes to financial statements.
8 Semi-Annual Report
| | |
| Statement of Operations | | |
| |
Thornburg Capital Management Fund | | Six Months Ended March 31, 2017 (Unaudited) |
| | | | |
INVESTMENT INCOME | | | | |
Interest income | | $ | 3,340,275 | |
| | | | |
| |
EXPENSES | | | | |
Transfer agent fees | | | 1,456 | |
Custodian fees (Note 2) | | | 91,435 | |
Professional fees | | | 26,440 | |
Accounting fees (Note 4) | | | 22,910 | |
Trustee fees | | | 14,100 | |
Other expenses | | | 19,684 | |
| | | | |
Total Expenses | | | 176,025 | |
| | | | |
Net Investment Income | | $ | 3,164,250 | |
| | | | |
See notes to financial statements.
Semi-Annual Report 9
| | |
| Statements of Changes in Net Assets | | |
| |
Thornburg Capital Management Fund | | |
| | | | | | | | |
| | | SIX MONTHS ENDED
MARCH 31, 2017* | | | YEAR ENDED
SEPTEMBER 30, 2016 | |
INCREASE (DECREASE) IN NET ASSETS FROM | | | | | | | | |
| | |
OPERATIONS | | | | | | | | |
Net investment income | | $ | 3,164,250 | | | $ | 7,036,117 | |
| | | | | | | | |
Net Increase (Decrease) in Net Assets Resulting from Operations | | | 3,164,250 | | | | 7,036,117 | |
| | |
DIVIDENDS TO SHAREHOLDERS | | | | | | | | |
From net investment income | | | | | | | | |
Class I Shares | | | (3,164,250 | ) | | | (7,036,117 | ) |
| | |
FUND SHARE TRANSACTIONS (NOTE 5) | | | | | | | | |
Class I Shares | | | (502,620,654 | ) | | | (379,323,866 | ) |
| | | | | | | | |
Net Decrease in Net Assets | | | (502,620,654 | ) | | | (379,323,866 | ) |
| | |
NET ASSETS | | | | | | | | |
Beginning of Period | | | 1,393,536,254 | | | | 1,772,860,120 | |
| | | | | | | | |
| | |
End of Period | | $ | 890,915,600 | | | $ | 1,393,536,254 | |
| | | | | | | | |
Undistributed net investment income | | $ | 23,695 | | | $ | 23,695 | |
See notes to financial statements.
10 Semi-Annual Report
| | |
| Notes to Financial Statements | | |
| |
Thornburg Capital Management Fund | | March 31, 2017 (Unaudited) |
NOTE 1 – ORGANIZATION
Thornburg Capital Management Fund (the “Fund”) is a non-diversified series of Thornburg Investment Trust (the “Trust”). The Trust is organized as a Massachusetts business trust under a Declaration of Trust dated June 3, 1987 and is registered as a diversified, open-end management investment company under the Investment Company Act of 1940, as amended. The Fund is currently one of twenty-one separate series of the Trust. Each series is considered to be a separate entity for financial reporting and tax purposes and bears expenses directly attributable to it. The Fund’s investment objective is to seek current income consistent with liquidity management and safety of capital.
The Fund currently offers one class of shares of beneficial interest: Institutional Class (“Class I”). This class of shares of the Fund represents all interest in the portfolio of investments. Class I shares are sold at net asset value without a sales charge at the time of purchase. All expenses are allocated to the class including transfer agent fees, government registration fees, printing and postage costs, and legal expenses.
Shares of the Fund are issued solely in private placement transactions that do not involve any “public offering” within the meaning of Section (4)2 of the 1933 Act. Investments in the Fund may only be made by investment companies, or other persons that are “accredited investors” within the meaning of Regulation D under the 1933 Act. Currently, the Fund’s shares are only sold to certain other series of the Trust.
The following is a summary of significant accounting policies followed by the Fund in the preparation of its financial statements. The Fund prepares its financial statements in conformity with United States generally accepted accounting principles (“GAAP”), including investment company accounting and reporting guidance in the Financial Accounting Standards Board (the “FASB”) Accounting Standard Codification Topic 946.
NOTE 2 – SIGNIFICANT ACCOUNTING POLICIES
Security Valuation: All investments in securities held by the Fund are valued as described in Note 3.
Allocation of Income, Gains, Losses and Expenses: Net investment income and any realized and unrealized gains and losses are allocated daily to each outstanding share of the Fund at the beginning of the day (after adjusting for the current capital shares activity of the Fund). Expenses common to all Funds are allocated among the Funds comprising the Trust based upon their relative net asset values or other appropriate allocation methods.
Dividends and Distributions to Shareholders: Dividends and distributions to shareholders, which are determined in accordance with federal income tax regulations and may differ from GAAP, are recorded on the ex-dividend date. Ordinary income distributions, if any, are declared daily and paid monthly. Capital gain distributions, if any, are declared and paid annually and more often if deemed necessary by the Advisor. Dividends are paid and are reinvested in additional shares of the Fund at net asset value per share at the close of business on the ex-dividend date, or at the shareholder’s option, paid in cash.
Investment Income: Interest income is accrued as earned. Premiums and discounts are amortized and accreted, respectively, to call dates or maturity dates using the effective yield method of the respective investments. These amounts are included in Interest income on the Statement of Operations.
Custodian Fees: Custodian fees disclosed in the Statement of Operations may include interest expenses incurred by the Fund on any cash overdrafts of its custodian account during the period. Such cash overdrafts may result from the effects of failed trades in portfolio securities and from cash outflows resulting from unanticipated shareholder redemption activity. The Fund pays interest to its custodian on any such cash overdraft at a rate equal to 2.50% of the overdraft amount in excess of $50,000.
Investment Transactions: Investment transactions are accounted for on a trade date basis. Realized gains and losses from the sale of investments are recorded on an identified cost basis.
Repurchase Agreements: The Fund may invest excess cash in repurchase agreements whereby the Fund purchases investments, which serve as collateral, with an agreement to resell such collateral to the seller at an agreed upon price at the maturity date of the repurchase agreement. Investments pledged as collateral for repurchase agreements are held in custody until maturity of the repurchase agreement. Provisions in the agreements require that the market value of the collateral is at least equal to the repurchase value in the event of default. In the event of default, the Fund has the right to liquidate the collateral and apply the proceeds in satisfaction of the obligation. Under certain circumstances, in the event of default or bankruptcy by the other party to the agreement, realization and/or retention of the collateral may be subject to legal proceedings.
When-Issued and Delayed Delivery Transactions: The Fund may engage in when-issued or delayed delivery transactions. To the extent the Fund engages in such transactions, it will do so for the purpose of acquiring portfolio investments consistent with the Fund’s investment objectives and not for the purpose of investment leverage or to speculate on interest rate or market changes. At the time the Fund
Semi-Annual Report 11
| | |
| Notes to Financial Statements, Continued | | |
| |
Thornburg Capital Management Fund | | March 31, 2017 (Unaudited) |
makes a commitment to purchase an investment on a when-issued or delayed delivery basis, the Fund will record the transaction and reflect the value in determining its net asset value. When effecting such transactions, assets of an amount sufficient to make payment for the portfolio investments to be purchased will be segregated on the Fund’s records on the trade date. Investments purchased on a when-issued or delayed delivery basis do not earn interest until the settlement date.
Guarantees and Indemnifications: Under the Trust’s organizational documents (and under separate agreements with the independent Trustees), its officers and Trustees are provided with an indemnification against certain liabilities arising out of the performance of their duties to the Fund. In the normal course of business the Trust may also enter into contracts with service providers that contain general indemnifications. The Trust’s maximum exposure under these arrangements is unknown. However, based on experience, the Trust expects the risk of loss to be remote.
Use of Estimates: The preparation of financial statements in conformity with GAAP requires management to make estimates and assumptions that affect the reported amounts of assets and liabilities and disclosure of contingent assets and liabilities at the date of the financial statements and the reported amounts of increases (decreases) in net assets from operations during the reporting period. Actual results could differ from those estimates.
Federal Income Taxes: It is the policy of the Trust to comply with the provisions of the Internal Revenue Code applicable to regulated investment companies and to distribute to shareholders substantially all investment company taxable income including net realized gains on investments (if any), and tax exempt income of the Fund. Therefore, no provision for federal income or excise tax is required.
The Fund files income tax returns in United States federal and applicable state jurisdictions. The statute of limitations on the Fund’s tax return filings generally remains open for the three years following a return’s filing date. The Fund has analyzed its tax positions taken on Federal income tax returns for all open tax years and has concluded that no provision for income tax is required in the financial statements.
At March 31, 2017, information on the tax components of capital was as follows:
| | | | |
Cost of investments for tax purposes | | $ | 890,766,957 | |
| | | | |
| |
Net unrealized appreciation (depreciation) on investments (tax basis) | | $ | 0 | |
| | | | |
There is no unrealized gain (loss) in the Fund at March 31, 2017 due to all securities with less than 60 days to maturity being valued by the amortized cost method.
NOTE 3 – SECURITY VALUATION
Valuation of the Fund’s portfolio investment securities is performed in accordance with policies and procedures adopted by and under the oversight of the Trustees.
The Trustees of the Trust have appointed Thornburg Investment Management, Inc., the Trust’s investment advisor (the “Advisor”) to assist the Trustees in obtaining market values for portfolio investments, evaluate and monitor professional pricing service providers appointed by the Trustees’ Audit Committee (the “Audit Committee”) to assist in determining fair values for portfolio investments, assist in calculating fair values for portfolio investments in certain circumstances, and to perform other functions in connection with the valuation of investments. The Advisor acts through its Valuation and Pricing Committee (the “Committee”) and other employees of the Advisor. The Committee regularly reviews its own valuation calculations, as well as the valuations, valuation techniques and services furnished by pricing service providers, considers circumstances which may require valuation calculations by the Committee, and reviews previous valuation calculations. The Committee reports to the Audit Committee on the Committee’s activities, the performance of pricing service providers, and other matters relating to valuation of portfolio investments.
In those instances when the Committee assists in calculating a fair value for a portfolio investment, the Committee seeks to determine the price that the Fund would reasonably expect to receive upon a sale of the investment in an orderly transaction between market participants on the valuation date. The Committee customarily utilizes quotations from securities broker dealers in calculating valuations, but also may utilize prices obtained from pricing service providers or other methods approved by the Audit Committee. Because fair values calculated by the Committee are estimates, the calculation of a value for an investment may differ from the price that would be realized by the Fund upon a sale of the investment, and the difference could be material to the Fund’s financial statements. The Committee’s calculation of a fair value for an investment may also differ from the prices obtained by other persons (including other mutual funds) for the investment.
Valuation of Securities: Debt obligations held by the Fund which are not listed or traded on exchanges or for which no reported market exists are ordinarily valued at the valuation obtained from a pricing service provider approved by the Audit Committee. The Committee is authorized by the Audit Committee to calculate values of commercial paper having a remaining maturity of 60 days or less using amortized cost, subject to regular confirmation of those calculated values using procedures approved by the Audit Committee.
12 Semi-Annual Report
| | |
| Notes to Financial Statements, Continued | | |
| |
Thornburg Capital Management Fund | | March 31, 2017 (Unaudited) |
In any case when a pricing service provider fails to provide a valuation for a debt obligation held by the Fund, the Committee calculates a fair value for the obligation using alternative methods under procedures approved by the Audit Committee. Additionally, in cases when management believes that a valuation obtained from a pricing service provider merits review for significant reasons, the Committee decides whether or not to use the valuation calculated by the pricing service provider or to use an alternative method approved by the Audit Committee to calculate a fair value for the obligation.
Valuation Hierarchy: The Fund categorizes its investments based upon the inputs used in valuing those investments, according to a three-level hierarchy established in guidance from FASB. Categorization of investments using this hierarchy is intended by the FASB to maximize the use of observable inputs in valuing investments and minimize the use of unobservable inputs by requiring that the most observable inputs be used when available. Observable inputs are those that market participants would use in valuing an investment based on available market information. Unobservable inputs are those that reflect assumptions about the information market participants would use in valuing an investment. An investment’s level within the hierarchy is based on the lowest level input that is deemed significant to the valuation. The methodologies and inputs used to value investments are not necessarily indications of the risk or liquidity associated with those investments.
Various inputs are used in calculating valuations for the Fund’s investments. These inputs are generally summarized according to the three-level hierarchy below:
Level 1: Quoted prices in active markets for identical investments.
Level 2: Other direct or indirect significant observable inputs (including quoted prices for similar investments in active markets and other observable inputs, such as interest rates, prepayment rates, credit risk, etc.).
Level 3: Significant unobservable inputs (including the Committee’s own assumptions in calculating the fair values of investments).
Valuations for debt obligations held by the Fund are typically calculated by pricing service providers approved by the Audit Committee and are characterized as Level 2 within the valuation hierarchy.
On days when market volatility thresholds established by the Audit Committee are exceeded, foreign securities for which valuations are obtained from pricing service providers are fair valued. On these days, the foreign securities are characterized as Level 2 within the valuation hierarchy and revert to Level 1 after the threshold is no longer exceeded.
In a limited number of cases the Committee calculates a fair value for investments using broker quotations or other methods approved by the Audit Committee. When the Committee uses a single broker quotation to calculate a fair value for an investment without other significant observable inputs, or if a fair value is calculated using other significant inputs that are considered unobservable, the investment is characterized as Level 3 within the hierarchy. Other significant unobservable inputs used to calculate a fair value in these instances might include an income-based valuation approach which considers discounted anticipated future cash flows from the investment, and application of discounts due to the nature or duration of any restrictions on the disposition of the investment.
Valuations based upon the use of inputs from Levels 1, 2 or 3 may not represent the actual price received upon the disposition of an investment, and the Fund may receive a price that is lower than the valuation based upon these inputs when it sells the investment.
The following table displays a summary of the fair value hierarchy measurements of the Fund’s investments as of March 31, 2017. In any instance when valuation inputs from more than one level are used to determine the fair value of a specific investment, the investment is placed in the level of the table based upon the lowest level input that is significant in determining the fair value of the investment:
| | | | | | | | | | | | | | | | |
| | | FAIR VALUE MEASUREMENTS AT MARCH 31, 2017 | |
| | | TOTAL | | | LEVEL 1 | | | LEVEL 2 | | | LEVEL 3 | |
Assets | | | | | | | | | | | | | | | | |
Investments in Securities | | | | | | | | | | | | | | | | |
Short Term Investments | | $ | 890,766,957 | | | $ | — | | | $ | 890,766,957 | | | $ | — | |
| | | | | | | | | | | | | | | | |
Total Investments in Securities | | $ | 890,766,957 | | | $ | — | | | $ | 890,766,957 | | | $ | — | |
In accordance with the guidance prescribed in Accounting Standards Update No. 2011-04, it is the policy of the Fund to recognize transfers between levels and the underlying events which caused the movement. The Fund recognized no transfers between levels for the six months ended March 31, 2017.
Semi-Annual Report 13
| | |
| Notes to Financial Statements, Continued | | |
| |
Thornburg Capital Management Fund | | March 31, 2017 (Unaudited) |
NOTE 4 – INVESTMENT ADVISORY FEE AND OTHER TRANSACTIONS WITH AFFILIATES
Pursuant to an investment advisory agreement, the Advisor serves as the investment advisor and performs services for the Fund. The Fund does not pay an advisory fee to the Advisor under this agreement.
The Fund pays to the Advisor the costs of personnel who perform certain accounting services for the Fund. For the six months ended March 31, 2017, the Fund paid $22,910 to the Advisor for these accounting services. The Advisor provides certain administrative services to the Fund. No fees are charged for those services.
The Fund may sell securities to an affiliated fund or the Fund may purchase securities held by an affiliated fund, provided the affiliation is due solely to having a common investment advisor, common officers, or common trustees, and provided that all such transactions will comply with Rule 17a-7 under the 1940 Act. For the six months ended March 31, 2017, the Fund had no transactions with affiliated funds.
NOTE 5 – SHARES OF BENEFICIAL INTEREST
At March 31, 2017, there were an unlimited number of shares with no par value of beneficial interest authorized. Transactions in shares of beneficial interest were as follows:
| | | | | | | | | | | | | | | | |
| | | SIX MONTHS ENDED | | | YEAR ENDED | |
| | | MARCH 31, 2017 (UNAUDITED) | | | SEPTEMBER 30, 2016 (AUDITED) | |
| | | SHARES | | | AMOUNT | | | SHARES | | | AMOUNT | |
Class I Shares | | | | | | | | | | | | | | | | |
Shares sold | | | 421,239,646 | | | $ | 4,212,396,457 | | | | 1,098,287,670 | | | $ | 10,982,876,709 | |
Shares issued to shareholders in reinvestment of dividends | | | 316,425 | | | | 3,164,250 | | | | 703,612 | | | | 7,036,117 | |
Shares repurchased | | | (471,818,136 | ) | | | (4,718,181,361 | ) | | | (1,136,923,669 | ) | | | (11,369,236,692 | ) |
| | | | | | | | | | | | | | | | |
| | | | |
Net increase (decrease) | | | (50,262,065 | ) | | $ | (502,620,654 | ) | | | (37,932,387 | ) | | $ | (379,323,866 | ) |
| | | | | | | | | | | | | | | | |
NOTE 6 – INVESTMENT TRANSACTIONS
For the six months ended March 31, 2017, the Fund had no purchase and sale transactions of investments other than short-term investments.
OTHER NOTES
Risks: The Fund’s investments subject it to risks including, but not limited to, credit risk, interest rate risk, management risk, market and economic risk, foreign investment risk, diversification risk, and liquidity risk. Please see the Fund’s prospectus for a discussion of the risks associated with an investment in the Fund.
Subsequent Events: Fund management believes no events have occurred between March 31, 2017 and the date of issuance of the financial statements that require adjustment to or disclosure in the accompanying financial statements.
14 Semi-Annual Report
This page intentionally left blank.
Semi-Annual Report 15
Financial Highlights
Thornburg Capital Management Fund
| | | | | | | | | | | | | | | | | | | | | | | | | | | | | | | | | | | | | | | | | | | | | | | | | | | | | | | | | | | | |
| | | PER SHARE PERFORMANCE (FOR A SHARE OUTSTANDING THROUGHOUT THE PERIOD) | | | RATIOS TO AVERAGE NET ASSETS | | | SUPPLEMENTAL DATA | |
UNLESS
OTHERWISE
NOTED,
PERIODS
ARE
FISCAL
YEARS
ENDED
SEPT. 30, | | NET ASSET
VALUE
BEGINNING
OF PERIOD | | | NET
INVESTMENT
INCOME
(LOSS)+ | | | NET
REALIZED
&
UNREALIZED
GAIN(LOSS)
ON
INVESTMENTS | | | TOTAL FROM
INVESTMENT
OPERATIONS | | | DIVIDENDS
FROM NET
INVESTMENT
INCOME | | | DIVIDENDS
FROM NET
REALIZED
GAINS | | | TOTAL
DIVIDENDS | | | NET
ASSET
VALUE
END
OF
PERIOD | | | NET
INVESTMENT
INCOME
(LOSS)
(%) | | | EXPENSES,
AFTER
EXPENSE
REDUCTIONS
(%) | | | EXPENSES,
AFTER
EXPENSE
REDUCTIONS
AND
NET OF
CUSTODY
CREDITS
(%) | | | EXPENSES,
BEFORE
EXPENSE
REDUCTIONS
(%) | | | TOTAL
RETURN
(%)(a) | | | PORTFOLIO
TURNOVER
RATE
(%)(a) | | | NET
ASSETS
AT END
OF
PERIOD
(THOUSANDS) | |
CLASS I SHARES | | | | | | | | | | | | | | | | | | | | | | | | | | | | | | | | | | | | | | | | | | | | | | | | | | | | | |
2017(b) | | $ | 10.00 | | | | 0.03 | | | | — | | | | 0.03 | | | | (0.03 | ) | | | — | | | | (0.03 | ) | | $ | 10.00 | | | | 0.62 | (i) | | | 0.03 | (i) | | | 0.03 | (i) | | | 0.03 | (i) | | | 0.31 | | | | — | (c) | | $ | 890,916 | |
2016 | | $ | 10.00 | | | | 0.05 | | | | — | | | | 0.05 | | | | (0.05 | ) | | | — | | | | (0.05 | ) | | $ | 10.00 | | | | 0.45 | | | | 0.03 | | | | 0.03 | | | | 0.03 | | | | 0.45 | | | | — | (c) | | $ | 1,393,536 | |
2015(d) | | $ | 10.00 | | | | — | (e) | | | — | (f) | | | — | (g) | | | — | (h) | | | — | | | | — | | | $ | 10.00 | | | | 0.26 | (i) | | | 0.03 | (i) | | | 0.03 | (i) | | | 0.03 | (i) | | | 0.04 | | | | — | (c) | | $ | 1,772,860 | |
| (a) | Not annualized for periods less than one year. |
| (b) | Unaudited Six Month Period Ended March 31. |
| (c) | Portfolio turnover rate equals zero due to no long term investment transactions in the period. |
| (d) | Fund commenced operations on July 31, 2015. |
| (e) | Net investment income (loss) was less than $0.01 per share. |
| (f) | Net realized and unrealized gain (loss) on investments was less than $0.01 per share. |
| (g) | Net investment income (loss) was less than $0.01 per share. |
| (h) | Dividends from net investment income per share were less than $(0.01). |
| + | Based on weighted average shares outstanding. |
See notes to financial statements.
| | | | |
| 16 Semi-Annual Report | | | | Semi-Annual Report 17 |
| | |
| Expense Example | | |
| |
Thornburg Capital Management Fund | | March 31, 2017 (Unaudited) |
As a shareholder of the Fund, you incur ongoing costs of investing in the Fund. Because the Fund does not pay any management fee or distribution and/or service (12b-1) fee, the Fund’s ongoing costs are comprised of other Fund expenses. Shareholders of the Fund do not incur any transaction costs.
This example is intended to help you understand your ongoing costs (in dollars) of investing in the Fund and to compare these costs with the ongoing costs of investing in other mutual funds.
The example is based on a $1,000 investment beginning on October 1, 2016, and held until March 31, 2017.
| | | | | | | | | | | | |
| | | BEGINNING
ACCOUNT VALUE
10/1/16 | | | ENDING
ACCOUNT VALUE
3/31/17 | | | EXPENSES PAID
DURING PERIOD†
10/1/16–3/31/17 | |
Actual | | $ | 1,000.00 | | | $ | 1,003.14 | | | $ | 0.17 | |
Hypothetical* | | $ | 1,000.00 | | | $ | 1,024.76 | | | $ | 0.17 | |
| † | Expenses are equal to the annualized expense ratio of the Fund (I: 0.03%) multiplied by the average account value over the period, multiplied by 182/365 to reflect the one-half year period. |
| * | Hypothetical assumes a rate of return of 5% per year before expenses. |
ACTUAL EXPENSES
The first line of the accompanying table provides information about actual account values and actual expenses. You may use the information in this line, together with the amount you invested, to estimate the expenses that you paid over the period. Simply divide your account value by $1,000 (for example, an $8,600 account value divided by $1,000 = 8.6), then multiply the result by the number in the first line for your class of shares under the heading entitled “Expenses Paid During Period” to estimate the expenses you paid on your account during this period.
HYPOTHETICAL EXAMPLE FOR COMPARISON PURPOSES
The second line of the accompanying table provides information about hypothetical account values and hypothetical expenses based on the Fund’s actual expense ratio and an assumed rate of return of 5% per year before expenses, which is not the Fund’s actual return. The hypothetical account values and expenses may not be used to estimate the actual ending account balance or expenses you paid for the period. You may use this information to compare the ongoing costs of investing in the Fund and other funds. To do so, compare this 5% hypothetical example with the 5% hypothetical examples that appear in the shareholder reports of the other funds.
Please note that the expenses shown in the table are meant to highlight your ongoing costs and therefore, the second line of the table is useful in comparing ongoing costs only, and will not help you determine the relative total costs of owning different funds which may impose transactional costs. Shareholders of the Fund do not incur transactional costs such as sales charges (loads), redemption fees, or exchange fees.
18 Semi-Annual Report
| | |
| Other Information | | |
| |
Thornburg Capital Management Fund | | March 31, 2017 (Unaudited) |
PORTFOLIO PROXY VOTING
Policies and Procedures:
The Trust has delegated to Thornburg Investment Management, Inc. (the “Advisor”) voting decisions respecting proxies for the Fund’s voting securities. The Advisor makes voting decisions in accordance with its Proxy Voting Policy. A description of the Policy is available (i) without charge, upon request, by calling the Advisor toll-free at 1-800-847-0200, (ii) on the Thornburg website at www.thornburg. com, and (iii) on the Securities and Exchange Commission’s website at www.sec.gov.
Information regarding how proxies were voted is available on or before August 31 of each year for the twelve months ending the preceding June 30. This information is available (i) without charge, upon request by calling the Advisor toll-free at 1-800-847-0200, (ii) on the Thornburg website at www.thornburg.com, and (iii) on the Securities and Exchange Commission’s website at www.sec.gov.
AVAILABILITY OF QUARTERLY PORTFOLIO SCHEDULE
The Fund files with the Securities and Exchange Commission schedules of its portfolio holdings on Form N-Q for the first and third quarters of each fiscal year. The Fund’s Forms N-Q are available on the Commission’s website at www.sec.gov, or may be reviewed and copied at the Commission’s Public Reference Room in Washington, D.C. Information on the operation of the Public Reference Room may be obtained by calling 1-800-SEC-0330. The Fund also makes this information available on its website at www.thornburg. com/download or upon request by calling 1-800-847-0200.
Semi-Annual Report 19
Trustees’ Statement to Shareholders
Readopted September 12, 2016
The Trustees believe current and prospective shareholders should know how we discharge our responsibilities in supervising the Funds’ investment advisor and in reviewing the advisor’s contract for renewal. Since 2005, we have issued a statement which sets out clearly the three principal guidelines that we follow in supervising the Trust’s investment advisor on your behalf. In accordance with our customary practice, in September of this year we again reviewed our statement and concluded we should reissue this statement outlining the principal features of our supervision of the advisor’s performance of investment management services for the Funds.
We begin with the premise that each shareholder selected his or her Fund because its investments are managed by the investment advisor identified in the prospectus and in accordance with the objective and policies described in the prospectus. We realize, as each of you do, that if you believe that your Fund’s stated objective and policies no longer serve your personal investment goals, you can sell your shares and leave the Fund.
Therefore, we believe that our primary supervisory task – our principal obligation to you – is to assess the nature and quality of the advisor’s services, and to confirm that the advisor actively and competently pursues the Fund’s objective, in accordance with the policies set out in the prospectus. To do this, we meet regularly with management to review your Fund’s portfolio and to discuss the advisor’s specific actions and judgments in pursuing the Fund’s objective. We do not substitute our own judgment for the advisor’s decisions in selecting investments; the advisor is paid to exercise its informed judgment on investment decisions, and we seek to confirm, in reviewing the advisor’s performance, that the advisor is doing just that.
Second, we are conscious of costs and the effect that costs have on shareholders’ returns. We try to make sure that your Fund’s fees and costs are reasonable in relationship to the services rendered and that they are generally in line with those charged by other expert investment advisors, consistent with our belief that the Fund’s investors searched for and expect that expertise and attention and have decided to pay a reasonable price for it. We do not put the management contract “out to bid” as a matter of course, and we would not do so unless we had concluded that the advisor materially had failed to pursue the Fund’s objectives in accordance with its policies, or for other equally important reasons. We believe that any other approach would be inconsistent with your interests and contrary to your expectations when you bought shares of the Fund in the first place.
Finally, because we believe that most Thornburg Fund shareholders have invested with a long-term perspective, we try not to focus too much on the fashions of the moment and on short-term performance. The market will not favor any specific investment objective or set of policies at all times and under all economic circumstances. A fund will experience periods of both high and low returns relative to other funds and other investments. Even if one of our Funds is not favored by the market at a particular time, we believe that the advisor is nonetheless obliged to remain true to the Fund’s objective and policies, and we watch to see that it does so.
Trustees of Thornburg Investment Trust
20 Semi-Annual Report
This Semi-Annual Report is submitted for the general information of shareholders of the Fund. It is not authorized for distribution to prospective investors in the Fund unless preceded or accompanied by an effective prospectus.
| | | | |
| Investment Advisor: | | Distributor: | | |
| Thornburg Investment Management® | | Thornburg Securities Corporation® | | |
| 800.847.0200 | | 800.847.0200 | | TH3478 |
About Thornburg Investment Management
It’s more than what we do. It’s how we do it.
At Thornburg, we are very different in how we think, invest, and are structured. We believe this difference is what makes us successful in helping individuals reach their long-term financial goals.
How we THINK
Flexible Perspective
Our perspective on investment opportunities is more flexible than most, viewing a wide range of opportunities beyond conventional boundaries to find hidden value.
Collaboration
Collectively, we hone ideas via borderless cross-pollination for better judgment and better results.
How we INVEST
Portfolio Construction
Disciplined construction guided more by our convictions than convention.
CONVICTION
Thorough analysis and our relative-value framework lead to conviction in our securities selection.
UNCONVENTIONAL
Active management means we seek the best value for our clients rather than using conventional benchmarks as our starting point.
How we’re STRUCTURED
Structured for Excellence
How we think and how we invest is made possible by how we’re structured.
TEAM APPROACH FAR FROM THE HERD ACCESS & TRANSPARENCY
2 Semi-Annual Report
Semi-Annual Report
Thornburg Long/Short Equity Fund
March 31, 2017
| | | | |
SHARE CLASS | | NASDAQ SYMBOL | | CUSIP |
Class I | | THLSX | | 885-216-689 |
Investments carry risks, including possible loss of principal. Additional risks may be associated with investments outside the United States, especially in emerging markets, including currency fluctuations, illiquidity, volatility, and political and economic risks.
Investments in small- and mid-capitalization companies may increase the risk of greater price fluctuations. A short position will lose value as the security’s price increases. Theoretically, the loss on a short sale can be unlimited. Investments in derivatives are subject to the risks associated with the securities or other assets underlying the pool of securities, including illiquidity and difficulty in valuation. Non-diversified funds can be more volatile than diversified funds. Investments in the Fund are not FDIC insured, nor are they bank deposits or guaranteed by a bank or any other entity.
Semi-Annual Report 3
Letter to Shareholders
| | |
Thornburg Long/Short Equity Fund | | March 31, 2017 (Unaudited) |
April 25, 2017
Dear Fellow Shareholder:
The newest addition to our fund family, Thornburg Long/ Short Equity Fund, was launched on December 30, 2016. The Fund is a conversion of a private hedge fund Thornburg has successfully managed since 2008.
This new Fund applies the same active, focused strategy used in the former hedge fund and leverages the entire Thornburg investment team in the search for long and short investment ideas.
As we mark the new Fund’s first full quarter of performance, we’d like to take this opportunity to both report on portfolio returns while offering more context on the distinct approach we take to pursue our goals in this liquid alternative strategy. References below to the Fund’s performance or portfolio exposures for periods prior to December 30, 2016, are to the performance or exposures of the predecessor hedge fund.
The Fund returned 4.61% (Class I) for the first quarter, compared to a 6.07% increase for the S&P 500 Index. The Morningstar Long/Short Category, returned just 2.91%.
Long and Short Exposure
During the semi-annual period, the Fund averaged gross long exposure of 106% and gross short exposure of 75%, resulting in 31% net long exposure across the portfolio. In our view, a reasonable benchmark for the Fund’s performance is an adjusted S&P 500 Index, which takes the Fund’s average net exposure and multiplies it by the S&P 500 Index return, resulting in a 1.94% return for the benchmark for the quarter. While the S&P 500 Index is the Fund’s benchmark, we would consider our return relative to the adjusted index as a more reasonable measure of our value added each period. For this quarter, our contribution is significant, as our 4.61% return well outpaced the 1.94% return of the adjusted index.
Per Morningstar, our competitors (in their Long/Short Equity category) on average maintain 88% gross long and 33% gross short exposures, with an average net long exposure of 59%. During the period, we maintained a higher total gross exposure (gross long + gross short) but much lower net exposure (31%) compared to category peers. Our relatively lower net exposure, we believe, has provided better downside protection in volatile and downward trending markets. While higher net exposures can boost performance in up markets, it can also contribute to higher beta and greater correlation, which would undercut some of the primary reasons investors use long/short strategies.
With the benefit of good stock selection both on the long and short sides of the portfolio, Fund returns have remained competitive with broad equity indices, despite eight consecutive years of rising equity markets. Our goal is to keep pace with broad equity indices over a full market cycle with significantly lower volatility. We generally seek to maintain a net long exposure of 30%-50% to aid in managing the Fund’s share price volatility. We aim to use active stock selection to bridge the gap between returns generated by our beta (we expect 0.3–0.5x the equity index return) and the overall market return over the long term. Should we see a significant pull back in the broad markets, we believe our low net exposure should significantly aid our returns relative to both the benchmark and our Morningstar peers.
During the most recent quarter, the Fund’s long book contributed to absolute return, while the short book detracted. On a relative basis, our long book well outperformed the S&P 500 Index, while our short book marginally underperformed (i.e., the total return of our short book was slightly higher than the index return for the quarter). This is a reversal of our results over the last three years where our long equities have lagged but our shorts have generated significant alpha. When we short securities, we are first focused on generating alpha, and second on providing a hedge (i.e., to mitigate factor risks that can arise from our bottom-up fundamental stock selection).
A Word about Our Baskets
To construct our portfolio, we employ a six-basket approach (three baskets on the long side and three baskets on the short side), which we believe diversifies both the long and short books among select and distinctly different companies.
On the long side, the Fund seeks positions in investments that we believe will grow over time, and which we believe are trading below their long-term value. We categorize long equity positions in three baskets:
| • | | Growth Industry Leaders: Firms with top positions in growing markets. |
| • | | Consistent Growers: Companies that generally exhibit steady earnings or revenue growth, or both. |
| • | | Emerging Growth Companies: Names that are addressing a new market or carving out a niche in an existing one. |
In considering short book opportunities, we look for companies we believe are overvalued (or to hedge against the Fund’s long exposures). Here too, we apply a three-basket portfolio construct:
| • | | Cycle Victims: Cyclical companies that could be facing deteriorating industry dynamics or risks specific to the company or industry. |
| • | | Stumbling Stalwarts: Firms that once exhibited steady earnings or revenue growth, but we expect to decline due to technological changes, weakening business economics, or other factors. |
| • | | Falling Stars: Fast-growing businesses with premium valuations that we expect to decline because of approaching market saturation, increasing competition, or other factors. |
4 Semi-Annual Report
| | |
| Letter to Shareholders, | | |
| |
Continued | | |
| |
Thornburg Long/Short Equity Fund | | March 31, 2017 (Unaudited) |
Top Contributors
Long Book
Grand Canyon Education, Inc.
Grand Canyon Education, Inc. provides brick and mortar and online education services, offering graduate and undergraduate degree programs. We continue to view Grand Canyon as an underappreciated quality holding with a differentiated model within the troubled for-profit education space. Recent results suggested an acceleration in online new enrollments driven in part by investment in brand advertising. We have trimmed our position in Grand Canyon somewhat since quarter end, as the stock began to approach our target price.
Activision Blizzard, Inc.
Activision Blizzard, Inc. is a videogame studio. As game console capabilities improve, fewer companies can make the upfront investments required to fund new game development. Activision’s entertainment network has nearly 500 million monthly active users in 196 countries. As more game players are connected to each other and the company during game play, revenue monetization opportunities are proliferating.
Facebook, Inc.
Facebook, Inc. is the leading global social network. “Old” and new Facebook applications remain relevant with their customers as users and engagement increase on the Facebook platform, while “newer” Facebook-owned platforms, such as Instagram, Messenger and WhatsApp, grow users at a faster pace. As advertising dollars move online from traditional forms of media, Facebook stands to gain greater share of global advertising spend.
Ardagh Group S.A.
Ardagh Group S.A. is a packaging company focused on metal and glass packaging for the food and beverage industry. The company made its equity market debut during the quarter with a successful initial public offering.
Netflix, Inc.
Netflix, Inc. is the leading subscription video-on-demand streaming company in the world. After selling shares as we approached a price target in late 2015/early 2016, value investing patriarch Ben Graham’s iconic “Mr. Market” gave us the chance to repurchase the stock in August of 2016 at a lower price following a mixed earnings report. While the share price of Netflix moves around a lot, our calculation of the intrinsic value of the business isn’t nearly as volatile. We have taken advantage of the volatility of the share price to add value for Fund investors since our initial purchase in early 2014.
Short Book
None of our top five contributors were short positions during the quarter.
Top Detractors
Long Book
Marin Software, Inc.
Marin Software, Inc. was a long-time holding of the Fund. Marin is an independent provider of software to help customers measure and manage their online advertising spend. Marin has struggled over the years to consolidate internally developed and acquired software platforms to help clients manage spend on search, display, and social. We had long believed that an independent (NOT Google or Facebook), reasonably priced tool would be of value to advertisers and that the $8 billion of annualized advertising spend flowing through their platform each year was worth much more than Marin’s market implied Enterprise Value. A CEO shakeup, very weak revenue guidance and fundamental deterioration for 2017 led us to sell this investment—in the end, a disappointing long-term holding for the Fund.
Short Book
Oriflame Holdings AG
Oriflame Holdings AG is a Swedish company that sells cosmetics directly to consumers in Europe, Asia, Latin America and Africa. Recently, the company has been able to grow sales in new regions despite continued declines in its sales force across its core Eastern European markets. The stock appreciated on this potential new growth driver compensating for declines in traditional business areas.
Advanced Micro Devices
Advanced Micro Devices shares increased during the quarter on anticipation that AMD will successfully gain market share from Intel and Nvidia through new product launches. While we trimmed our short position during the quarter for risk management purposes, we continue to believe that AMD has under-invested in research and development (R&D) compared to rivals and that current valuation levels factor in a sharp improvement in AMD’s market share, which we believe will prove elusive.
Mixi Inc.
Mixi’s key mobile game franchise, Monster Strike, showed signs of stability in the quarter after slowing in 2016. The stock appreciated on the potential extension of revenues from this game.
Arista Networks
Arista Networks is a software-driven cloud networking company. Shares increased during the quarter due to a better-than-expected earnings report. Our short thesis on Arista has been predicated on a slowdown in revenue growth driven by white-box cannibalization, increased competition, and legal disruptions. We trimmed this position during the quarter for risk management purposes.
Semi-Annual Report 5
| | |
| Letter to Shareholders, | | |
| |
Continued | | |
| |
Thornburg Long/Short Equity Fund | | March 31, 2017 (Unaudited) |
Select Long Positions Added this Quarter
Palo Alto Networks
Palo Alto Networks is a leading network-security company. We believe network security is increasingly important to companies all over the world and that Palo Alto has a strong competitive advantage in supplying these services. The stock traded lower as sales growth and forecasts have missed expectations recently. We believe this is in part due to the transition of their revenue model from up-front license fees to subscriptions. Stock weakness gave us an opportunity to add this fast-growing company to the Emerging Growth basket of our long portfolio during the quarter.
Kose Corp.
Kose Corp. is a leading Japanese cosmetics company. We are excited about their consistent market share gains in their home market. We also believe their fast-growing U.S. cosmetics brand, Tarte, is underappreciated.
Akorn, Inc.
Akorn, Inc. is a niche pharmaceutical company with specialized manufacturing and R&D capabilities in alternative dosage forms including injectables and opthalmics. Akorn is less levered than peers and competes in less competitive, hard-to-manufacture spaces, which results in higher margins. Shortly after purchase, AKRX received FDA clearance on their injectable manufacturing facility in Lake Charles, IL, removing a significant overhang by providing the company a long runway to grow revenues from their development pipeline.
Conclusion
We are pleased with the results of our new fund’s inaugural quarter, yet the portfolio is designed to truly shine over a longer, full market cycle. And for the eight-plus years history of its predecessor fund, we saw this happen. Now available to the general public, the Fund has an exciting opportunity to offer our distinct fundamental, bottom-up approach to the long/short space to a wider range of investors—ideally adding alpha to a diversified portfolio while seeking less volatility than the overall market.
Thank you for your trust and confidence.
Sincerely,

Connor Browne, CFA
Portfolio Manager
Managing Director
The matters discussed in this report may constitute forward-looking statements made pursuant to the safe harbor provisions of the Securities Litigation Reform Act of 1995. These include any advisor or portfolio manager prediction, assessment, analysis or outlook for individual securities, industries, investment styles, market sectors and/or markets. These statements involve risks and uncertainties. In addition to the general risks described for each fund in its current prospectus, other factors bearing on these reports include the accuracy of the advisor’s or portfolio manager’s forecasts and predictions, the appropriateness of the investment strategies designed by the advisor or portfolio manager and the ability of the advisor or portfolio manager to implement their strategies efficiently and successfully. Any one or more of these factors, as well as other risks affecting the securities markets generally, could cause the actual results of any fund to differ materially as compared to its benchmarks.
The views expressed are subject to change and do not necessarily reflect the views of Thornburg Investment Management, Inc. This information should not be relied upon as a recommendation or investment advice and is not intended to predict the performance of any investment or market.
6 Semi-Annual Report
| | |
| Performance Summary | | |
| |
Thornburg Long/Short Equity Fund | | March 31, 2017 (Unaudited) |
AVERAGE ANNUAL TOTAL RETURNS
| | | | | | | | | | | | | | | | |
| | | 1-YR | | | 3-YR | | | 5-YR | | | SINCE
INCEP.
(2/1/08) | |
Class I Shares | | | 12.18 | % | | | 4.51 | % | | | 8.49 | % | | | 6.77 | % |
S&P 500 Index | | | 17.17 | % | | | 10.37 | % | | | 13.30 | % | | | 8.40 | % |
Performance data shown represents past performance and is no guarantee of future results. Investment return and principal value will fluctuate so shares, when redeemed, may be worth more or less than their original cost. Due to the Fund’s relatively small asset base in initial stages, performance was positively impacted by IPOs to a greater degree than it may be in the future. IPO investments are not an integral component of the Fund’s investment process and may not be utilized to the same extent in the future. Current performance may be lower or higher than quoted. For performance current to the most recent month end, visit thornburg.com or call 800-847-0200. The performance information does not reflect the deduction of taxes that a shareholder would pay on distributions or the redemption of Fund shares. Returns reflect the reinvestment of dividends and capital gains. There is no sales charge for Class I shares.
As disclosed in the most recent prospectus, the total annual fund operating expenses are as follows: I shares, 3.01%. Thornburg Investment Management and/or Thornburg Securities Corporation have contractually agreed to waive fees and reimburse expenses through at least February 1, 2018, for some of the share classes, resulting in net expense ratios of the following: I shares, 2.74%. For more detailed information on fund expenses and waivers/reimbursements please see the Fund’s prospectus.
Performance prior to 12/30/2016 is from the predecessor fund, which was managed in a materially equivalent manner to the Thornburg Long/Short Equity Fund. The predecessor fund was not a registered mutual fund and was not subject to the same investment restrictions as the Long/Short Equity Fund. If the predecessor fund had been registered under the 1940 Act, the performance may have been different.
Glossary
The S&P 500 Index is an unmanaged broad measure of the U.S. stock market.
The performance of any index is not indicative of the performance of any particular investment. Unless otherwise noted, index returns reflect the reinvestment of income dividends and capital gains, if any, but do not reflect fees, brokerage commissions or other expenses of investing. Investors may not make direct investments into any index.
Alpha – A measure of the difference between a portfolio’s actual returns and its expected performance, given its level of risk as measured by beta. A positive alpha figure indicates the portfolio performed better than its beta would predict. In contrast, a negative alpha indicates under-performance, given the expectations established by the beta.
Beta – A measure of market-related risk. Less than one means the portfolio is less volatile than the index, while greater than one indicates more volatility than the index.
Morningstar Long/Short Equity Category – Long/short portfolios hold sizeable stakes in both long and short positions in equities, exchange traded funds, and related derivatives. At least 75% of the assets are in equity securities or derivatives, and funds in the category will typically have beta values to relevant benchmarks of between 0.3 and 0.8 over a three-year period.
Semi-Annual Report 7
| | |
| Fund Summary | | |
| |
Thornburg Long/Short Equity Fund | | March 31, 2017 (Unaudited) |
OBJECTIVES AND STRATEGIES
The Fund seeks long-term capital appreciation. There is no guarantee that the Fund will meet its objective.
The Fund pursues its investment goal by investing a significant amount of its assets in long and short positions in a broad range of equity securities. While the Fund normally expects to invest a larger portion of its portfolio in long positions than short positions, the Fund expects to invest a significant portion of its assets in short positions.
SECTOR ALLOCATION
| | | | |
Health Care | | | 9.1 | % |
Consumer Discretionary | | | 8.5 | % |
Consumer Staples | | | 5.1 | % |
Information Technology | | | 4.3 | % |
Financials | | | 4.1 | % |
Energy | | | 3.4 | % |
Utilities | | | 0.1 | % |
Real Estate | | | -0.3 | % |
Telecommunication Services | | | -0.4 | % |
Industrials | | | -1.2 | % |
Materials | | | -2.2 | % |
Miscellaneous | | | 0.0 | % |
PORTFOLIO EXPOSURE
| | | | | | | | |
| | | 1Q17 | | | 4Q16 | |
Gross Long | | | 106.3 | % | | | 110.9 | % |
Gross Short | | | -75.6 | % | | | -79.5 | % |
Net Equity | | | 30.7 | % | | | 30.7 | % |
ASSETS BY GEOGRAPHY
| | | | | | | | |
| | | LONG | | | SHORT | |
United States | | | 96.7 | % | | | -61.9 | % |
Ex-U.S. | | | 9.6 | % | | | -13.7 | % |
There is no guarantee that the Fund will meet its investment objectives.
All portfolio information is subject to change.
Thornburg adjusts the characteristics of certain derivatives to, in our investment team’s opinion, more accurately reflect their market exposure.
TOP TEN LONG HOLDINGS
| | | | |
Grand Canyon Education, Inc. | | | 9.2 | % |
Gilead Sciences, Inc. | | | 5.4 | % |
Facebook, Inc. | | | 5.1 | % |
Wal-Mart Stores, Inc. | | | 4.9 | % |
Activision Blizzard, Inc. | | | 4.7 | % |
Alphabet, Inc. | | | 4.3 | % |
Netflix, Inc. | | | 4.3 | % |
Medtronic plc | | | 4.1 | % |
Amazon.com, Inc. | | | 4.0 | % |
Assured Guaranty Ltd. | | | 3.9 | % |
8 Semi-Annual Report
| | |
| Schedule of Investments | | |
| |
Thornburg Long/Short Equity Fund | | March 31, 2017 (Unaudited) |
| | | | | | | | |
| | | SHARES/
PRINCIPAL
AMOUNT | | | VALUE | |
COMMON STOCK — 102.74% | | | | | | | | |
CAPITAL GOODS — 1.95% | | | | | | | | |
Machinery — 1.95% | | | | | | | | |
c Allison Transmission Holdings, Inc. | | | 26,123 | | | $ | 941,995 | |
| | | | | | | | |
| | | | | | | 941,995 | |
| | | | | | | | |
COMMERCIAL & PROFESSIONAL SERVICES — 1.74% | | | | | | | | |
Commercial Services & Supplies — 1.74% | | | | | | | | |
Covanta Holding Corp. | | | 53,583 | | | | 841,253 | |
| | | | | | | | |
| | | | | | | 841,253 | |
| | | | | | | | |
CONSUMER DURABLES & APPAREL — 4.80% | | | | | | | | |
Household Durables — 2.83% | | | | | | | | |
a,c TRI Pointe Homes, Inc. | | | 109,235 | | | | 1,369,807 | |
Leisure Products — 1.97% | | | | | | | | |
c Callaway Golf Co. | | | 85,927 | | | | 951,212 | |
| | | | | | | | |
| | | | | | | 2,321,019 | |
| | | | | | | | |
CONSUMER SERVICES — 10.80% | | | | | | | | |
Diversified Consumer Services — 10.80% | | | | | | | | |
a,c Grand Canyon Education, Inc. | | | 62,187 | | | | 4,453,211 | |
a Nord Anglia Education, Inc. | | | 30,449 | | | | 771,578 | |
| | | | | | | | |
| | | | | | | 5,224,789 | |
| | | | | | | | |
DIVERSIFIED FINANCIALS — 8.94% | | | | | | | | |
Capital Markets — 5.65% | | | | | | | | |
Apollo Global Management, LLC | | | 48,300 | | | | 1,174,656 | |
Oaktree Capital Group, LLC | | | 34,400 | | | | 1,558,320 | |
Mortgage Real Estate Investment Trusts — 3.29% | | | | | | | | |
c PennyMac Mortgage Investment Trust | | | 89,701 | | | | 1,592,193 | |
| | | | | | | | |
| | | | | | | 4,325,169 | |
| | | | | | | | |
ENERGY — 3.16% | | | | | | | | |
Oil, Gas & Consumable Fuels — 3.16% | | | | | | | | |
Devon Energy Corp. | | | 15,600 | | | | 650,832 | |
Teekay LNG Partners LP | | | 50,100 | | | | 879,255 | |
| | | | | | | | |
| | | | | | | 1,530,087 | |
| | | | | | | | |
FOOD & STAPLES RETAILING — 4.86% | | | | | | | | |
Food & Staples Retailing — 4.86% | | | | | | | | |
c Wal-Mart Stores, Inc. | | | 32,602 | | | | 2,349,952 | |
| | | | | | | | |
| | | | | | | 2,349,952 | |
| | | | | | | | |
FOOD, BEVERAGE & TOBACCO — 2.02% | | | | | | | | |
Food Products — 2.02% | | | | | | | | |
c The Kraft Heinz Co. | | | 10,790 | | | | 979,840 | |
| | | | | | | | |
| | | | | | | 979,840 | |
| | | | | | | | |
HEALTH CARE EQUIPMENT & SERVICES — 6.43% | | | | | | | | |
Health Care Equipment & Supplies — 4.58% | | | | | | | | |
a Avinger, Inc. | | | 112,831 | | | | 214,379 | |
Medtronic plc | | | 24,848 | | | | 2,001,755 | |
Health Care Providers & Services — 1.85% | | | | | | | | |
a Envision Healthcare Corp. | | | 14,586 | | | | 894,413 | |
| | | | | | | | |
| | | | | | | 3,110,547 | |
| | | | | | | | |
HOUSEHOLD & PERSONAL PRODUCTS — 2.19% | | | | | | | | |
Personal Products — 2.19% | | | | | | | | |
KOSE Corp. | | | 11,700 | | | | 1,058,286 | |
| | | | | | | | |
| | | | | | | 1,058,286 | |
| | | | | | | | |
INSURANCE — 3.86% | | | | | | | | |
Insurance — 3.86% | | | | | | | | |
c Assured Guaranty Ltd. | | | 50,370 | | | | 1,869,231 | |
| | | | | | | | |
| | | | | | | 1,869,231 | |
| | | | | | | | |
PHARMACEUTICALS, BIOTECHNOLOGY & LIFE SCIENCES — 13.29% | | | | | | | | |
Biotechnology — 7.38% | | | | | | | | |
c Gilead Sciences, Inc. | | | 38,687 | | | | 2,627,621 | |
a,c Seattle Genetics, Inc. | | | 15,007 | | | | 943,340 | |
Semi-Annual Report 9
| | |
| Schedule of Investments, Continued | | |
| |
Thornburg Long/Short Equity Fund | | March 31, 2017 (Unaudited) |
| | | | | | | | |
| | | SHARES/
PRINCIPAL
AMOUNT | | | VALUE | |
Pharmaceuticals — 5.91% | | | | | | | | |
a,c Akorn, Inc. | | | 57,300 | | | $ | 1,379,784 | |
c Phibro Animal Health Corp. | | | 52,807 | | | | 1,483,877 | |
| | | | | | | | |
| | | | | | | 6,434,622 | |
| | | | | | | | |
REAL ESTATE — 1.73% | | | | | | | | |
Equity Real Estate Investment Trusts — 1.73% | | | | | | | | |
Fibra Uno Administracion S.A. de C.V. | | | 490,800 | | | | 839,136 | |
| | | | | | | | |
| | | | | | | 839,136 | |
| | | | | | | | |
RETAILING — 12.61% | | | | | | | | |
Internet & Direct Marketing Retail — 11.62% | | | | | | | | |
a,c Amazon.com, Inc. | | | 2,206 | | | | 1,955,707 | |
c Expedia, Inc. | | | 12,452 | | | | 1,571,069 | |
a,c Netflix, Inc. | | | 14,190 | | | | 2,097,424 | |
Specialty Retail — 0.99% | | | | | | | | |
Office Depot, Inc. | | | 102,300 | | | | 477,230 | |
| | | | | | | | |
| | | | | | | 6,101,430 | |
| | | | | | | | |
SOFTWARE & SERVICES — 15.48% | | | | | | | | |
Information Technology Services — 1.30% | | | | | | | | |
a Cognizant Tech Solutions Corp. | | | 10,551 | | | | 627,995 | |
Internet Software & Services — 9.44% | | | | | | | | |
a,c Alphabet, Inc. Class C | | | 2,531 | | | | 2,099,616 | |
a,c Facebook, Inc. | | | 17,400 | | | | 2,471,670 | |
Software — 4.74% | | | | | | | | |
c Activision Blizzard, Inc. | | | 45,989 | | | | 2,293,012 | |
| | | | | | | | |
| | | | | | | 7,492,293 | |
| | | | | | | | |
TECHNOLOGY HARDWARE & EQUIPMENT — 7.12% | | | | | | | | |
Communications Equipment — 7.12% | | | | | | | | |
a ARRIS International plc | | | 28,824 | | | | 762,395 | |
Nokia Oyj | | | 152,640 | | | | 819,067 | |
a Palo Alto Networks, Inc. | | | 8,187 | | | | 922,511 | |
a,c ViaSat, Inc. | | | 14,800 | | | | 944,536 | |
| | | | | | | | |
| | | | | | | 3,448,509 | |
| | | | | | | | |
TELECOMMUNICATION SERVICES — 1.77% | | | | | | | | |
Diversified Telecommunication Services — 1.77% | | | | | | | | |
a Level 3 Communications, Inc. | | | 14,934 | | | | 854,523 | |
| | | | | | | | |
| | | | | | | 854,523 | |
| | | | | | | | |
TOTAL COMMON STOCK (Cost $39,280,109) | | | | | | | 49,722,681 | |
| | | | | | | | |
COMMON STOCK SOLD SHORT — (75.69)% | | | | | | | | |
AUTOMOBILES & COMPONENTS — (2.48)% | | | | | | | | |
Auto Components — (2.48)% | | | | | | | | |
The Goodyear Tire & Rubber Co. | | | (33,341 | ) | | | (1,200,276 | ) |
| | | | | | | | |
| | | | | | | (1,200,276 | ) |
| | | | | | | | |
BANKS — (4.05)% | | | | | | | | |
Banks — (2.03)% | | | | | | | | |
Westamerica Bancorporation | | | (17,600 | ) | | | (982,608 | ) |
Thrifts & Mortgage Finance — (2.02)% | | | | | | | | |
a Bofi Holding, Inc. | | | (37,502 | ) | | | (979,927 | ) |
| | | | | | | | |
| | | | | | | (1,962,535 | ) |
| | | | | | | | |
CAPITAL GOODS — (5.02)% | | | | | | | | |
Construction & Engineering — (1.00)% | | | | | | | | |
EMCOR Group, Inc. | | | (7,725 | ) | | | (486,289 | ) |
Machinery — (1.97)% | | | | | | | | |
KONE Oyj | | | (21,731 | ) | | | (954,197 | ) |
Trading Companies & Distributors — (2.05)% | | | | | | | | |
W.W. Grainger, Inc. | | | (4,256 | ) | | | (990,626 | ) |
| | | | | | | | |
| | | | | | | (2,431,112 | ) |
| | | | | | | | |
CONSUMER DURABLES & APPAREL — (4.10)% | | | | | | | | |
Household Durables — (4.10)% | | | | | | | | |
Tupperware Brands Corp. | | | (18,484 | ) | | | (1,159,316 | ) |
10 Semi-Annual Report
| | |
| Schedule of Investments, Continued | | |
| |
Thornburg Long/Short Equity Fund | | March 31, 2017 (Unaudited) |
| | | | | | | | |
| | | SHARES/
PRINCIPAL
AMOUNT | | | VALUE | |
Garmin Ltd. | | | (16,100 | ) | | $ | (822,871 | ) |
| | | | | | | | |
| | | | | | | (1,982,187 | ) |
| | | | | | | | |
CONSUMER SERVICES — (4.03)% | | | | | | | | |
Hotels, Restaurants & Leisure — (4.03)% | | | | | | | | |
Sonic Corp. | | | (38,366 | ) | | | (972,962 | ) |
Darden Restaurants, Inc. | | | (11,700 | ) | | | (978,939 | ) |
| | | | | | | | |
| | | | | | | (1,951,901 | ) |
| | | | | | | | |
DIVERSIFIED FINANCIALS — (6.60)% | | | | | | | | |
Capital Markets — (4.34)% | | | | | | | | |
FactSet Research Systems, Inc. | | | (6,099 | ) | | | (1,005,786 | ) |
Financial Engines, Inc. | | | (25,150 | ) | | | (1,095,283 | ) |
Consumer Finance — (2.26)% | | | | | | | | |
a Credit Acceptance Corp. | | | (5,471 | ) | | | (1,090,972 | ) |
| | | | | | | | |
| | | | | | | (3,192,041 | ) |
| | | | | | | | |
FOOD & STAPLES RETAILING — (1.95)% | | | | | | | | |
Food & Staples Retailing — (1.95)% | | | | | | | | |
Colruyt SA | | | (19,202 | ) | | | (942,705 | ) |
| | | | | | | | |
| | | | | | | (942,705 | ) |
| | | | | | | | |
HEALTH CARE EQUIPMENT & SERVICES — (6.61)% | | | | | | | | |
Health Care Equipment & Supplies — (4.64)% | | | | | | | | |
ResMed, Inc. | | | (16,314 | ) | | | (1,174,118 | ) |
a Haemonetics Corp. | | | (26,375 | ) | | | (1,070,034 | ) |
Health Care Providers & Services — (1.97)% | | | | | | | | |
a Select Medical Holdings Corp. | | | (71,400 | ) | | | (953,190 | ) |
| | | | | | | | |
| | | | | | | (3,197,342 | ) |
| | | | | | | | |
HOUSEHOLD & PERSONAL PRODUCTS — (2.10)% | | | | | | | | |
Personal Products — (2.10)% | | | | | | | | |
Oriflame Holding AG | | | (25,443 | ) | | | (1,018,214 | ) |
| | | | | | | | |
| | | | | | | (1,018,214 | ) |
| | | | | | | | |
MATERIALS — (2.25)% | | | | | | | | |
Chemicals — (2.25)% | | | | | | | | |
Orica Ltd. | | | (80,955 | ) | | | (1,088,553 | ) |
| | | | | | | | |
| | | | | | | (1,088,553 | ) |
| | | | | | | | |
MEDIA — (2.30)% | | | | | | | | |
Media — (2.30)% | | | | | | | | |
a E.W. Scripps Co. | | | (47,500 | ) | | | (1,113,400 | ) |
| | | | | | | | |
| | | | | | | (1,113,400 | ) |
| | | | | | | | |
PHARMACEUTICALS, BIOTECHNOLOGY & LIFE SCIENCES — (4.18)% | | | | | | | | |
Biotechnology — (2.25)% | | | | | | | | |
a Myriad Genetics, Inc. | | | (56,615 | ) | | | (1,087,008 | ) |
Life Sciences Tools & Services — (1.93)% | | | | | | | | |
a PAREXEL International Corp. | | | (14,812 | ) | | | (934,785 | ) |
| | | | | | | | |
| | | | | | | (2,021,793 | ) |
| | | | | | | | |
REAL ESTATE — (2.12)% | | | | | | | | |
Equity Real Estate Investment Trusts — (2.12)% | | | | | | | | |
Extra Space Storage, Inc. | | | (13,794 | ) | | | (1,026,136 | ) |
| | | | | | | | |
| | | | | | | (1,026,136 | ) |
| | | | | | | | |
RETAILING — (6.95)% | | | | | | | | |
Internet & Direct Marketing Retail — (1.96)% | | | | | | | | |
PetMed Express, Inc. | | | (47,100 | ) | | | (948,594 | ) |
Specialty Retail — (4.99)% | | | | | | | | |
The Children’s Place, Inc. | | | (10,013 | ) | | | (1,202,061 | ) |
a Dufry AG | | | (7,949 | ) | | | (1,211,019 | ) |
| | | | | | | | |
| | | | | | | (3,361,674 | ) |
| | | | | | | | |
SEMICONDUCTORS & SEMICONDUCTOR EQUIPMENT — (2.63)% | | | | | | | | |
Semiconductors & Semiconductor Equipment — (2.63)% | | | | | | | | |
a Advanced Micro Devices, Inc. | | | (87,390 | ) | | | (1,271,525 | ) |
| | | | | | | | |
| | | | | | | (1,271,525 | ) |
| | | | | | | | |
Semi-Annual Report 11
| | |
| Schedule of Investments, Continued | | |
| |
Thornburg Long/Short Equity Fund | | March 31, 2017 (Unaudited) |
| | | | | | | | |
| | | SHARES/
PRINCIPAL
AMOUNT | | | VALUE | |
SOFTWARE & SERVICES — (11.77)% | | | | | | | | |
Information Technology Services — (2.05)% | | | | | | | | |
Paychex, Inc. | | | (16,820 | ) | | $ | (990,698 | ) |
Internet Software & Services — (2.90)% | | | | | | | | |
mixi, Inc. | | | (29,200 | ) | | | (1,405,838 | ) |
Software — (6.82)% | | | | | | | | |
a Ellie Mae, Inc. | | | (11,921 | ) | | | (1,195,319 | ) |
Fair Isaac Corp. | | | (8,620 | ) | | | (1,111,549 | ) |
Microsoft Corp. | | | (15,100 | ) | | | (994,486 | ) |
| | | | | | | | |
| | | | | | | (5,697,890 | ) |
| | | | | | | | |
TECHNOLOGY HARDWARE & EQUIPMENT — (4.34)% | | | | | | | | |
Communications Equipment — (4.34)% | | | | | | | | |
ADTRAN, Inc. | | | (45,400 | ) | | | (942,050 | ) |
a Arista Networks, Inc. | | | (8,765 | ) | | | (1,159,347 | ) |
| | | | | | | | |
| | | | | | | (2,101,397 | ) |
| | | | | | | | |
TELECOMMUNICATION SERVICES — (2.21)% | | | | | | | | |
Diversified Telecommunication Services — (2.21)% | | | | | | | | |
Cogent Communications Holdings, Inc. | | | (24,839 | ) | | | (1,069,319 | ) |
| | | | | | | | |
| | | | | | | (1,069,319 | ) |
| | | | | | | | |
TOTAL COMMON STOCK SOLD SHORT (Proceeds $32,908,249) | | | | | | | (36,630,000 | ) |
| | | | | | | | |
PREFERRED STOCK — 1.38% | | | | | | | | |
BANKS — 1.38% | | | | | | | | |
Banks — 1.38% | | | | | | | | |
GMAC Capital Trust I Pfd, 8.125% | | | 26,238 | | | | 667,232 | |
| | | | | | | | |
TOTAL PREFERRED STOCK (Cost $623,152) | | | | | | | 667,232 | |
| | | | | | | | |
EXCHANGE-TRADED FUNDS SOLD SHORT — (0.77)% | | | | | | | | |
a Direxion Daily Developed Markets Bear 3X | | | (550 | ) | | | (10,648 | ) |
a Direxion Daily Emerging Markets Bear 3X | | | (4,595 | ) | | | (79,723 | ) |
a Direxion Daily Energy Bear 3X | | | (2,677 | ) | | | (30,438 | ) |
a Direxion Daily Financial Bear 3X | | | (3,601 | ) | | | (69,679 | ) |
a Direxion Daily S&P 500 Bear 3X | | | (1,330 | ) | | | (12,050 | ) |
a Direxion Daily Semiconductors Bear 3X | | | (332 | ) | | | (2,477 | ) |
a Direxion Daily Small Cap Bear 3X | | | (255 | ) | | | (4,600 | ) |
a iPath S&P 500 VIX Short-Term Futures ETN | | | (7,340 | ) | | | (115,899 | ) |
a ProShares UltraPro Short MidCap400 | | | (2,550 | ) | | | (37,714 | ) |
a ProShares UltraPro Short QQQ | | | (221 | ) | | | (8,188 | ) |
| | | | | | | | |
TOTAL EXCHANGE-TRADED FUNDS SOLD SHORT (Proceeds $5,530,028) | | | | | | | (371,416 | ) |
| | | | | | | | |
SHORT TERM INVESTMENTS — 39.30% | | | | | | | | |
b Thornburg Capital Management Fund | | | 1,901,874 | | | | 19,018,736 | |
| | | | | | | | |
TOTAL SHORT TERM INVESTMENTS (Cost $19,018,736) | | | | | | | 19,018,736 | |
| | | | | | | | |
TOTAL INVESTMENTS — 66.96% (Cost $20,483,720) | | | | | | $ | 32,407,233 | |
OTHER ASSETS LESS LIABILITIES — 33.04% | | | | | | | 15,988,924 | |
| | | | | | | | |
NET ASSETS — 100.00% | | | | | | $ | 48,396,157 | |
| | | | | | | | |
12 Semi-Annual Report
| | |
| Schedule of Investments, Continued | | |
| |
Thornburg Long/Short Equity Fund | | March 31, 2017 (Unaudited) |
Footnote Legend
| b | Investment in Affiliates – Shown below are holdings of voting securities of each portfolio company which is considered “affiliated” to the Fund under the Investment Company Act of 1940, including companies for which the Fund’s holding represented 5% or more of the company’s voting securities, and a series of the Thornburg Investment Trust in which the Fund invested for cash management purposes during the period: |
| | | | | | | | | | | | | | | | | | | | | | | | | | | | |
ISSUER | | SHARES/PRINCIPAL
SEPTEMBER 30,
2016 | | | GROSS
ADDITIONS | | | GROSS
REDUCTIONS | | | SHARES/PRINCIPAL
MARCH 31,
2017 | | | MARKET VALUE
MARCH 31,
2017 | | | INVESTMENT
INCOME | | | REALIZED
GAIN (LOSS) | |
Thornburg Capital Management Fund | | | — | * | | | 3,692,496 | | | | 1,790,622 | | | | 1,901,874 | | | $ | 19,018,736 | | | $ | 45,171 | | | $ | — | |
| | | | | | | | | | | | | | | | | | | | | | | | | | | | |
Total non-controlled affiliated issuers - 39.30% of net assets | | | | | | | $ | 19,018,736 | | | $ | 45,171 | | | $ | — | |
| | | | | | | | | | | | | | | | | | | | | | | | | | | | |
| * | The Fund commenced operations on December 30, 2016. |
| c | All or a portion of the security is pledged as collateral for securities sold short. At March 31, 2017, the value of securities pledged was $27,109,848. An additional $15,946,811 in cash has been segregated for collateral on securities sold short. |
Portfolio Abbreviations
To simplify the listings of securities, abbreviations are used per the table below:
See notes to financial statements.
Semi-Annual Report 13
| | |
| Statement of Assets and Liabilities | | |
| |
Thornburg Long/Short Equity Fund | | March 31, 2017 (Unaudited) |
| | | | |
ASSETS | | | | |
Investments at value (Note 3) | | | | |
Non-affiliated issuers (cost $39,903,261) | | $ | 50,389,913 | |
Non-controlled affiliated issuer (cost $19,018,736) | | | 19,018,736 | |
Cash segregated as collateral on securities sold short | | | 15,946,811 | |
Receivable for investments sold | | | 183,058 | |
Dividends receivable | | | 73,666 | |
Dividend and interest reclaim receivable | | | 263 | |
Prepaid expenses and other assets | | | 32,644 | |
| | | | |
Total Assets | | | 85,645,091 | |
| | | | |
| |
LIABILITIES | | | | |
Securities sold short (proceeds $38,438,277) | | | 37,001,416 | |
Payable for investments purchased | | | 137,776 | |
Payable to investment advisor and other affiliates (Note 4) | | | 20,261 | |
Payable for short sale financing | | | 32,313 | |
Dividends payable for short sales | | | 57,168 | |
| | | | |
Total Liabilities | | | 37,248,934 | |
| | | | |
| |
NET ASSETS | | $ | 48,396,157 | |
| | | | |
NET ASSETS CONSIST OF | | | | |
Undistributed net investment income | | $ | 10,469,312 | |
Net unrealized appreciation on investments | | | 11,923,565 | |
Accumulated net realized gain (loss) | | | 198,697 | |
Net capital paid in on shares of beneficial interest | | | 25,804,583 | |
| | | | |
| |
| | $ | 48,396,157 | |
| | | | |
NET ASSET VALUE | | | | |
| |
Class I Shares: | | | | |
Net asset value, offering and redemption price per share ($48,396,157 applicable to 4,635,217 shares of beneficial interest outstanding - Note 5) | | $ | 10.44 | |
| | | | |
See notes to financial statements.
14 Semi-Annual Report
| | |
| Statement of Operations | | |
| |
Thornburg Long/Short Equity Fund | | Period Ended March 31, 2017* |
| | | | |
INVESTMENT INCOME | | | | |
Dividend income | | | | |
Non-affiliated issuers (net of foreign taxes withheld of $ 495) | | $ | 180,611 | |
Non-controlled affiliated issuer | | | 45,171 | |
| | | | |
Total | | | 225,782 | |
| | | | |
| |
EXPENSES | | | | |
Investment advisory fees (Note 4) | | | 152,282 | |
Administration fees (Note 4) | | | | |
Class I Shares | | | 6,091 | |
Transfer agent fees | | | | |
Class I Shares | | | 2,760 | |
Registration and filing fees | | | | |
Class I Shares | | | 8,850 | |
Dividend expense on securities sold short | | | 164,542 | |
Short sale financing fees | | | 116,792 | |
Custodian fees (Note 2) | | | 14,720 | |
Professional fees | | | 75,150 | |
Accounting fees (Note 4) | | | 184 | |
Trustee fees | | | 460 | |
Other expenses | | | 7,719 | |
| | | | |
Total Expenses | | | 549,550 | |
Less: | | | | |
Expenses reimbursed by investment advisor (Note 4) | | | (82,914 | ) |
| | | | |
Net Expenses | | | 466,636 | |
| | | | |
Net Investment Loss | | | (240,854 | ) |
| | | | |
REALIZED AND UNREALIZED GAIN (LOSS) | | | | |
Net realized gain (loss) on: | | | | |
Non-affiliated issuer investments | | | (990,020 | ) |
Foreign currency transactions | | | 22,156 | |
| | | | |
| | | (967,864 | ) |
| | | | |
Net change in unrealized appreciation (depreciation) on: | | | | |
Non-affiliated issuer investments | | | 3,242,394 | |
Foreign currency translations | | | 52 | |
| | | | |
| | | 3,242,446 | |
| | | | |
Net Realized and Unrealized Gain | | | 2,274,582 | |
| | | | |
Net Increase in Net Assets Resulting from Operations | | $ | 2,033,728 | |
| | | | |
| * | For the unaudited period from commencement of operations on December 30, 2016 through March 31, 2017. |
See notes to financial statements.
Semi-Annual Report 15
| | |
Statement of Changes in Net Assets | | |
| |
Thornburg Long/Short Equity Fund | | |
| | | | |
| | | PERIOD ENDED
MARCH 31, 2017* | |
INCREASE (DECREASE) IN NET ASSETS FROM | | | | |
| |
OPERATIONS | | | | |
Net investment income (loss) | | $ | (240,854 | ) |
Net realized gain (loss) on investments and foreign currency transactions | | | (967,864 | ) |
Net unrealized appreciation (depreciation) on investments and foreign currency translations | | | 3,242,446 | |
| | | | |
Net Increase (Decrease) in Net Assets Resulting from Operations | | | 2,033,728 | |
| |
FUND SHARE TRANSACTIONS (NOTE 5) | | | | |
Class I Shares | | | (263,309 | ) |
| | | | |
Net Increase in Net Assets | | | 1,770,419 | |
| |
NET ASSETS | | | | |
Beginning of Period | | | 46,625,738 | |
| | | | |
| |
End of Period | | $ | 48,396,157 | |
| | | | |
Undistributed net investment income | | $ | 10,469,312 | |
| * | For the unaudited period from commencement of operations on December 30, 2016 through March 31, 2017. |
See notes to financial statements.
16 Semi-Annual Report
| | |
Notes to Financial Statements | | |
| |
Thornburg Long/Short Equity Fund | | March 31, 2017 |
NOTE 1 – ORGANIZATION
Thornburg Long/Short Equity Fund (the “Fund”) is a diversified series of Thornburg Investment Trust (the “Trust”). The Fund commenced operations on December 30, 2016. The Trust was organized as a Massachusetts business trust under a Declaration of Trust dated June 3, 1987 and is registered as a diversified, open-end management investment company under the Investment Company Act of 1940, as amended. The Fund is currently one of twenty-one separate series of the Trust. Each series is considered to be a separate entity for financial reporting and tax purposes and bears expenses directly attributable to it. The Fund seeks long-term capital appreciation.
Effective December 30, 2016, the assets of Thornburg Partners Fund, L.P., a private investment vehicle for which Thornburg Investment Management, Inc. served as general partner and investment advisor (the “Partnership”), were transferred to the Fund, in exchange for which the Fund delivered to the Partnership Class I shares of beneficial interest of the Fund, and assumed certain liabilities of the Partnership. The net assets that the Fund received from the Partnership in the transaction had a value of $46,625,738 at the time of the transaction. The Partnership received 4,662,559 Class I shares of the Fund, each with a NAV per share of $10.00. Those Class I shares were distributed in pro rata amounts to the partners of the Partnership, and the Partnership was subsequently dissolved. The investment policies and restrictions of the Fund are in all material respects equivalent to those of the Partnership, except that the Partnership was not registered as an investment company under the Investment Company Act of 1940 and was not, therefore, subject to certain investment restrictions, diversification requirements, and other restrictions imposed on registered investment companies by the 1940 Act or the Internal Revenue Code of 1986. The Fund’s portfolio management team is the same as the Partnership’s portfolio management team.
The Fund currently offers one class of shares of beneficial interest: Class I. This class of shares of the Fund represents all interest in the portfolio of investments. Class I shares are sold at net asset value without a sales charge at the time of purchase and may be subject to a service fee. All expenses are allocated to the class including transfer agent fees, government registration fees, certain printing and postage costs, and administrative and legal expenses.
The following is a summary of significant accounting policies followed by the Fund in the preparation of its financial statements. The Fund prepares its financial statements in conformity with United States generally accepted accounting principles (“GAAP”), including investment company accounting and reporting guidance in the Financial Accounting Standards Board (the “FASB”) Accounting Standard Codification Topic 946.
NOTE 2 – SIGNIFICANT ACCOUNTING POLICIES
Security Valuation: All investments in securities held by the Fund are valued as described in Note 3.
Allocation of Income, Gains, Losses and Expenses: Net investment income (other than class specific expenses) and realized and unrealized gains and losses are allocated daily to each class of shares based upon the relative net asset value of outstanding shares (or the value of the dividend-eligible shares, as appropriate) of each class of shares at the beginning of the day (after adjusting for the current capital shares activity of the respective class). Expenses common to all Funds are allocated among the Funds comprising the Trust based upon their relative net asset values or other appropriate allocation methods. Operating expenses directly attributable to a specific class are charged against the operating income of that class.
Dividends and Distributions to Shareholders: Dividends and distributions to shareholders, which are determined in accordance with federal income tax regulations and may differ from GAAP, are recorded on the ex-dividend date. Ordinary income distributions, if any, are declared and paid quarterly. Capital gain distributions, if any, are declared and paid annually and more often if deemed necessary by the Advisor. Dividends are paid and are reinvested in additional shares of the Fund at net asset value per share at the close of business on the ex-dividend date, or at the shareholder’s option, paid in cash.
Investment Income: Dividend income is recorded on the ex-dividend date. Certain income from foreign investments is recognized as soon as information is available to the Fund. Interest income is accrued as earned. Premiums and discounts are amortized and accreted, respectively, to call dates or maturity dates using the effective yield method of the respective investments. These amounts are included in Interest Income on the Statement of Operations.
Custodian Fees: Custodian fees disclosed in the Statement of Operations may include interest expenses incurred by the Fund on any cash overdrafts of its custodian account during the period. Such cash overdrafts may result from the effects of failed trades in portfolio securities and from cash outflows resulting from unanticipated shareholder redemption activity. The Fund pays interest to its custodian on any such cash overdraft at a rate equal to 2.50% of the overdraft amount in excess of $50,000.
Investment Transactions: Investment transactions are accounted for on a trade date basis. Realized gains and losses from the sale of investments are recorded on an identified cost basis.
Semi-Annual Report 17
| | |
| Notes to Financial Statements, Continued | | |
| |
Thornburg Long/Short Equity Fund | | March 31, 2017 (Unaudited) |
Short Sales: A short sale involves the sale by the Fund of a security that the Fund does not own. The Fund borrows the security that it intends to sell from a broker or other institution, and at a later date the Fund completes the short sale by purchasing that same security on the open market and delivering it to the lending institution. The Fund is generally required to pay the lender amounts equal to any dividend or interest which accrues on the borrowed security during the period of the loan. The Fund may also be required to pay a premium, fee, or other amount to the lender in exchange for borrowing the security. When it enters into a short sale, the Fund seeks to profit on a decline in the price of the security between the date the Fund borrows the security and the date the Fund purchases the security to deliver it to the lender. If, however, the price of the security increases between those dates, or if the price of the security declines by an amount which is not sufficient to cover the expenses of borrowing the security, the Fund will experience a loss.
Repurchase Agreements: The Fund may invest excess cash in repurchase agreements whereby the Fund purchases investments, which serve as collateral, with an agreement to resell such collateral to the seller at an agreed upon price at the maturity date of the repurchase agreement. Investments pledged as collateral for repurchase agreements are held in custody until maturity of the repurchase agreement. Provisions in the agreements require that the market value of the collateral is at least equal to the repurchase value in the event of default. In the event of default, the Fund has the right to liquidate the collateral and apply the proceeds in satisfaction of the obligation. Under certain circumstances, in the event of default or bankruptcy by the other party to the agreement, realization and/ or retention of the collateral may be subject to legal proceedings.
When-Issued and Delayed Delivery Transactions: The Fund may engage in when-issued or delayed delivery transactions. To the extent the Fund engages in such transactions, it will do so for the purpose of acquiring portfolio investments consistent with the Fund’s investment objectives and not for the purpose of investment leverage or to speculate on interest rate or market changes. At the time the Fund makes a commitment to purchase an investment on a when-issued or delayed delivery basis, the Fund will record the transaction and reflect the value in determining its net asset value. When effecting such transactions, assets of an amount sufficient to make payment for the portfolio investments to be purchased will be segregated on the Fund’s records on the trade date. Investments purchased on a when-issued or delayed delivery basis do not earn interest until the settlement date.
Foreign Currency Translation: Portfolio investments and other assets and liabilities denominated in foreign currencies are translated into U.S. dollars based on the exchange rate of such currencies against the U.S. dollar on the date of valuation. Purchases and sales of investments and income items denominated in foreign currencies are translated into U.S. dollars at the exchange rate in effect on the transaction date. When the Fund purchases or sells foreign investments, it will customarily enter into a foreign exchange contract to minimize foreign exchange risk from the trade date to the settlement date of such transactions. The values of such spot contracts are included in receivable for investments sold and payable for investments purchased on the Statement of Assets and Liabilities.
The Fund does not separately report the effect of changes in foreign exchange rates from changes in market prices on investments held. Such changes are included in net unrealized appreciation (depreciation) from investments.
Reported net realized gains and losses from foreign currency transactions arise due to purchases and sales of foreign currencies, currency gains and losses realized between the trade and settlement dates on investment transactions and the difference between the amounts of dividends, interest, and foreign withholding taxes recorded on the Fund’s books, and the U.S. dollar equivalent of the amounts actually received or paid.
Net change in unrealized appreciation (depreciation) on foreign currency translations arise from changes in the fair value of assets and liabilities, other than investments at period end, resulting from changes in exchange rates.
Guarantees and Indemnifications: Under the Trust’s organizational documents (and under separate agreements with the independent Trustees), its officers and Trustees are provided with an indemnification against certain liabilities arising out of the performance of their duties to the Fund. In the normal course of business the Trust may also enter into contracts with service providers that contain general indemnifications. The Trust’s maximum exposure under these arrangements is unknown. However, based on experience, the Trust expects the risk of loss to be remote.
Use of Estimates: The preparation of financial statements in conformity with GAAP requires management to make estimates and assumptions that affect the reported amounts of assets and liabilities and disclosure of contingent assets and liabilities at the date of the financial statements and the reported amounts of increases (decreases) in net assets from operations during the reporting period. Actual results could differ from those estimates.
Federal Income Taxes: It is the policy of the Trust to comply with the provisions of the Internal Revenue Code applicable to regulated investment companies and to distribute to shareholders substantially all investment company taxable income including net realized gains on investments (if any), and tax exempt income of the Fund. Therefore, no provision for federal income or excise tax is required.
The Fund files income tax returns in United States federal and applicable state jurisdictions. The statute of limitations on the Fund’s tax return filings generally remains open for the three years following a return’s filing date. The Fund has analyzed its tax positions taken on Federal income tax returns for all open tax years and has concluded that no provision for income tax is required in the financial statements.
18 Semi-Annual Report
| | |
| Notes to Financial Statements, Continued | | |
| |
Thornburg Long/Short Equity Fund | | March 31, 2017 (Unaudited) |
At March 31, 2017, information on the tax components of capital was as follows:
| | | | |
Cost of investments for tax purposes | | $ | 20,483,720 | |
| | | | |
| |
Gross unrealized appreciation on a tax basis | | $ | 17,980,204 | |
Gross unrealized depreciation on a tax basis | | | (6,056,691 | ) |
| | | | |
| |
Net unrealized appreciation (depreciation) on investments (tax basis) | | $ | 11,923,513 | |
| | | | |
Foreign Withholding Taxes: The Fund is subject to foreign tax withholding imposed by certain foreign countries in which the Fund may invest. Withholding taxes are incurred on certain foreign dividends and are accrued at the time the dividend is recognized based on applicable foreign tax laws. The Fund may file withholding tax reclaims in certain jurisdictions to recover a portion of amounts previously withheld, in view of various considerations, including recent decisions rendered by the courts in those and other jurisdictions. The Fund would expect to record a receivable for such a reclaim based on a variety of factors, including assessment of a jurisdiction’s legal obligation to pay reclaims, the jurisdiction’s administrative practices and payment history, and industry convention. To date the Fund has recorded no such receivable because there is limited precedent for collecting such prior year reclaims and the likelihood of collection remains uncertain.
Deferred Foreign Capital Gain Taxes: The Fund is subject to a tax imposed on net realized gains of securities of certain foreign countries. The Fund records an estimated deferred tax liability for net unrealized gains on these investments as reflected in the accompanying financial statements.
NOTE 3 – SECURITY VALUATION
Valuation of the Fund’s portfolio investment securities is performed in accordance with policies and procedures adopted by and under the oversight of the Trustees.
The Trustees of the Trust have appointed Thornburg Investment Management, Inc., the Trust’s investment advisor ( the “Advisor”) to assist the Trustees in obtaining market values for portfolio investments, evaluate and monitor professional pricing service providers appointed by the Trustees’ Audit Committee (the “Audit Committee”) to assist in determining fair values for portfolio investments, assist in calculating fair values for portfolio investments in certain circumstances, and to perform other functions in connection with the valuation of investments. The Advisor acts through its Valuation and Pricing Committee (the “Committee”) and other employees of the Advisor. The Committee regularly reviews its own valuation calculations, as well as the valuations, valuation techniques and services furnished by pricing service providers, considers circumstances which may require valuation calculations by the Committee, and reviews previous valuation calculations. The Committee reports to the Audit Committee on the Committee’s activities, the performance of pricing service providers, and other matters relating to valuation of portfolio investments.
In those instances when the Committee assists in calculating a fair value for a portfolio investment, the Committee seeks to determine the price that the Fund would reasonably expect to receive upon a sale of the investment in an orderly transaction between market participants on the valuation date. The Committee customarily utilizes quotations from securities broker dealers in calculating valuations, but also may utilize prices obtained from pricing service providers or other methods approved by the Audit Committee. Because fair values calculated by the Committee are estimates, the calculation of a value for an investment may differ from the price that would be realized by the Fund upon a sale of the investment, and the difference could be material to the Fund’s financial statements. The Committee’s calculation of a fair value for an investment may also differ from the prices obtained by other persons (including other mutual funds) for the investment.
Valuation of Securities: Securities and other portfolio investments which are listed or traded on a United States securities exchange are valued at the last reported sale price on the valuation date. Investments listed or traded on an exchange for which there has been no sale that day are valued at the mean between the last reported bid and asked prices on that valuation date. Portfolio investments reported by NASDAQ are valued at the official closing price on the valuation date. If an investment is traded on more than one exchange, the investment is considered traded on the exchange that is normally the primary market for that investment. Securities and other portfolio investments which are listed or traded on exchanges outside the United States are valued at the last price or the closing price of the investment on the exchange that is normally the primary market for the investment, as of the close of the exchange preceding the Fund’s valuation date. Foreign investments listed or traded on an exchange for which there has been no sale that day are valued at the mean between the last reported bid and asked prices on that valuation date.
In any case when a market quotation is not readily available for a portfolio investment ordinarily valued by market quotation, the Committee calculates a fair value for the investment using alternative methods approved by the Audit Committee. A market quotation is not readily available when the primary market or exchange for the investment is not open for the entire scheduled day of trading. Market quotations for an investment also may not be readily available if developments after the most recent close of the investment’s primary exchange or market, but prior to the close of business on any Fund business day, or an unusual event or significant period of time occurring since the availability of a market quotation, create a serious question concerning the reliability of the most recent market
Semi-Annual Report 19
| | |
| Notes to Financial Statements, Continued | | |
| |
Thornburg Long/Short Equity Fund | | March 31, 2017 (Unaudited) |
quotation available for the investment. In particular, on days when market volatility thresholds established by the Audit Committee are exceeded, foreign equity investments held by the Fund may be valued using alternative methods. The Committee customarily obtains valuations in these instances from pricing service providers approved by the Audit Committee. Pricing service providers ordinarily calculate valuations using multi-factor models to adjust market prices based upon various inputs, including exchange data, depository receipt prices, futures, index data and other data.
Debt obligations held by the Fund which are not listed or traded on exchanges or for which no reported market exists are ordinarily valued at the valuation obtained from a pricing service provider approved by the Audit Committee.
In any case when a pricing service provider fails to provide a valuation for a debt obligation held by the Fund, the Committee calculates a fair value for the obligation using alternative methods under procedures approved by the Audit Committee. Additionally, in cases when management believes that a valuation obtained from a pricing service provider merits review for significant reasons, the Committee decides whether or not to use the valuation calculated by the pricing service provider or to use an alternative method approved by the Audit Committee to calculate a fair value for the obligation.
Quotations for foreign investments expressed in foreign currency amounts are converted to U.S. dollar equivalents using a foreign exchange quotation from a third party service provider at the time of valuation. Foreign investments held by the Fund may be traded on days and at times when the Fund is not open for business. Consequently, the value of Fund investments may be significantly affected on days when shareholders cannot purchase or sell Fund shares. Futures contracts and other financial and derivative instruments traded on an exchange are valued at the latest published price for the instrument on its primary exchange. Listed options are valued at the last bid price.
Valuation Hierarchy: The Fund categorizes its investments based upon the inputs used in valuing those investments, according to a three-level hierarchy established in guidance from FASB. Categorization of investments using this hierarchy is intended by the FASB to maximize the use of observable inputs in valuing investments and minimize the use of unobservable inputs by requiring that the most observable inputs be used when available. Observable inputs are those that market participants would use in valuing an investment based on available market information. Unobservable inputs are those that reflect assumptions about the information market participants would use in valuing an investment. An investment’s level within the hierarchy is based on the lowest level input that is deemed significant to the valuation. The methodologies and inputs used to value investments are not necessarily indications of the risk or liquidity associated with those investments.
Various inputs are used in calculating valuations for the Fund’s investments. These inputs are generally summarized according to the three-level hierarchy below:
Level 1: Quoted prices in active markets for identical investments.
Level 2: Other direct or indirect significant observable inputs (including quoted prices for similar investments in active markets and other observable inputs, such as interest rates, prepayment rates, credit risk, etc.).
Level 3: Significant unobservable inputs (including the Committee’s own assumptions in calculating the fair values of investments).
Valuations for debt obligations held by the Fund are typically calculated by pricing service providers approved by the Audit Committee and are characterized as Level 2 within the valuation hierarchy.
On days when market volatility thresholds established by the Audit Committee are exceeded, foreign securities for which valuations are obtained from pricing service providers are fair valued. On these days, the foreign securities are characterized as Level 2 within the valuation hierarchy and revert to Level 1 after the threshold is no longer exceeded.
In a limited number of cases the Committee calculates a fair value for investments using broker quotations or other methods approved by the Audit Committee. When the Committee uses a single broker quotation to calculate a fair value for an investment without other significant observable inputs, or if a fair value is calculated using other significant inputs that are considered unobservable, the investment is characterized as Level 3 within the hierarchy. Other significant unobservable inputs used to calculate a fair value in these instances might include an income-based valuation approach which considers discounted anticipated future cash flows from the investment, and application of discounts due to the nature or duration of any restrictions on the disposition of the investment.
Valuations based upon the use of inputs from Levels 1, 2 or 3 may not represent the actual price received upon the disposition of an investment, and the Fund may receive a price that is lower than the valuation based upon these inputs when it sells the investment.
The following table displays a summary of the fair value hierarchy measurements of the Fund’s investments as of March 31, 2017. In any instance when valuation inputs from more than one level are used to determine the fair value of a specific investment, the investment is placed in the level of the table based upon the lowest level input that is significant in determining the fair value of the investment:
20 Semi-Annual Report
| | |
| Notes to Financial Statements, Continued | | |
| |
Thornburg Long/Short Equity Fund | | March 31, 2017 (Unaudited) |
| | | | | | | | | | | | | | | | |
| | | FAIR VALUE MEASUREMENTS AT MARCH 31, 2017 | |
| | | TOTAL | | | LEVEL 1 | | | LEVEL 2 | | | LEVEL 3 | |
Assets | | | | | | | | | | | | | | | | |
Investments in Securities* | | | | | | | | | | | | | | | | |
Common Stock | | $ | 49,722,681 | | | $ | 49,722,681 | | | $ | — | | | $ | — | |
Preferred Stock | | | 667,232 | | | | 667,232 | | | | | | | | | |
Short Term Investments | | | 19,018,736 | | | | 19,018,736 | | | | — | | | | — | |
| | | | | | | | | | | | | | | | |
Total Investments in Securities | | $ | 69,408,649 | | | $ | 69,408,649 | | | $ | — | | | $ | — | |
| | | | |
Liabilities | | | | | | | | | | | | | | | | |
Investments in Securities Sold Short* | | | | | | | | | | | | | | | | |
Common Stock | | $ | (36,630,000 | ) | | $ | (36,630,000 | ) | | $ | — | | | $ | — | |
Exchange–Traded Funds | | | (371,416 | ) | | | (371,416 | ) | | | | | | | | |
| | | | | | | | | | | | | | | | |
Total Investments in Securities | | $ | (37,001,416 | ) | | $ | (37,001,416 | ) | | $ | — | | | $ | — | |
| * | See Schedule of Investments for a summary of the industry exposure as grouped according to the Global Industry Classification Standard (GICS), which is an industry taxonomy developed by MSCI, Inc. and Standard & Poor’s (S&P). |
In accordance with the guidance prescribed in ASU No. 2011-04, it is the policy of the Fund to recognize transfers between levels and those underlying events which caused the movement. The Fund recognized no transfers between Levels 1 and 2 for the period ended March 31, 2017, other than when the Fund exceeded market volatility thresholds for foreign equity investments during the period.
NOTE 4 – INVESTMENT ADVISORY FEE AND OTHER TRANSACTIONS WITH AFFILIATES
Pursuant to an investment advisory agreement, the Advisor serves as the investment advisor and performs services for the Fund for which the fees are payable at the end of each month. Under the investment advisory agreement, the Fund pays the Advisor a management fee based on the daily net assets of the Fund at an annual rate as shown in the following table:
Management Fee Schedule
| | | | |
DAILY NET ASSETS | | FEE RATE | |
Up to $500 million | | | 1.250 | % |
Next $500 million | | | 1.200 | |
Next $1 billion | | | 1.150 | |
Over $2 billion | | | 1.100 | |
The Fund’s effective management fee for the period ended March 31, 2017 was 1.25% of the Fund’s average net assets.
The Fund pays to the Advisor the costs of personnel who perform certain accounting services for the Fund. For the period ended March 31, 2017, the Fund paid $184 to the Advisor for these accounting services. The Trust has also entered into administrative service agreements with the Advisor, whereby the Advisor will perform certain administrative services related to each class of the Fund’s shares, and for which fees will be payable at an annual rate of up to .125 of 1% per annum of the average daily net assets attributable to each class of shares. Total administrative service fees incurred by each class of shares of the Fund for the period ended March 31, 2017, are set forth in the Statement of Operations.
The Trust has an underwriting agreement with Thornburg Securities Corporation (the “Distributor”), an affiliate of the Advisor, which acts as the distributor of the Fund’s shares.
The Advisor and Distributor have contractually agreed to waive fees and reimburse expenses incurred by the Fund so that actual expenses of certain share classes do not exceed levels as specified in the Fund’s most recent prospectus. The agreement may be terminated by the Fund at any time, but may not be terminated by the Advisor or Distributor before February 1, 2018, unless the Advisor ceases to be the investment advisor to the Fund or the Distributor ceases to be the distributor of the Fund prior to that date. The Advisor and Distributor may recoup amounts waived or reimbursed during the fiscal year if actual expenses fall below the contractual limit during that year.
For the period ended March 31, 2017, the Advisor contractually reimbursed certain class specific expenses, administrative fees, and distribution fees of $82,914 for Class I shares.
Certain officers and Trustees of the Trust are also officers or directors of the Advisor and Distributor. The compensation of independent Trustees is borne by the Trust.
Semi-Annual Report 21
| | |
| Notes to Financial Statements, Continued | | |
| |
Thornburg Long/Short Equity Fund | | March 31, 2017 (Unaudited) |
The percentage of direct investments in the Fund held by the Trustees and Officers of the Trust and the Advisor is approximately 69.03%.
The Fund may purchase or sell securities from, or to an affiliated fund, provided the affiliation is due solely to having a common investment advisor, common officers, or common trustees, and provided that all such transactions will comply with Rule 17a-7 under the 1940 Act. For the period ended March 31, 2017, the Fund had no transactions with affiliated funds.
NOTE 5 – SHARES OF BENEFICIAL INTEREST
At March 31, 2017, there were an unlimited number of shares with no par value of beneficial interest authorized. Transactions in shares of beneficial interest were as follows:
| | | | | | | | |
| | | PERIOD ENDED
MARCH 31, 2017 (UNAUDITED)* | |
| | | SHARES | | | AMOUNT | |
Class I Shares | | | | | | | | |
Shares sold | | | 137,371 | | | $ | 1,403,735 | |
Shares issued to shareholders in reinvestment of dividends | | | — | | | | — | |
Shares repurchased | | | (164,728 | ) | | | (1,667,044 | ) |
| | | | | | | | |
| | |
Net increase (decrease) | | | (27,357 | ) | | $ | (263,309 | ) |
| | | | | | | | |
| * | The Fund commenced operations on December 30, 2016. |
NOTE 6 – INVESTMENT TRANSACTIONS
For the period ended March 31, 2017, the Fund had purchase and sale transactions of investments (excluding short-term investments and securities transferred from the Partnership) of $18,208,987 and $20,772,624, respectively.
NOTE 7 – DERIVATIVE FINANCIAL INSTRUMENTS WITH OFF-BALANCE SHEET RISK AND FOREIGN INVESTMENT RISK
The Fund may use a variety of derivative financial instruments to hedge or adjust the risks affecting its investment portfolio or to enhance investment returns. Provisions of FASB Accounting Standards Codification ASC 815-10-50 (“ASC 815”) require certain disclosures. The disclosures are intended to provide users of financial statements with an understanding of the use of derivative instruments by the Fund and how these derivatives affect the financial position, financial performance and cash flows of the Fund. The Fund does not designate any derivative instruments as hedging instruments under ASC 815. Additionally, the Fund’s risk of loss may exceed the amounts recognized on the Statement of Assets and Liabilities.
During the period ended March 31, 2017, the Fund did not invest in any derivative financial instruments of the type addressed by ASC 815.
OTHER NOTES
Risks: The Fund’s investments subject it to risks including, but not limited to, management risk, market and economic risk, risks affecting specific issuers, liquidity risk, the risks associated with investments in small- and mid-cap companies and non-U.S. issuers (including developing country issuers), short sale risk, diversification risk, derivatives risk, credit risk, and interest rate risk. Please see the Fund’s prospectus for a discussion of the risks associated with an investment in the Fund.
Subsequent Events: Fund management believes no events have occurred between March 31, 2017 and the date of issuance of the financial statements that require adjustment to or disclosure in the accompanying financial statements.
22 Semi-Annual Report
This page intentionally left blank.
Semi-Annual Report 23
Financial Highlights
Thornburg Long/Short Equity Fund
| | | | | | | | | | | | | | | | | | | | | | | | | | | | | | | | | | | | | | | | | | | | | | | | | | | | | | | | | | | | |
| | | PER SHARE PERFORMANCE (FOR A SHARE OUTSTANDING THROUGHOUT THE PERIOD) | | | RATIOS TO AVERAGE NET ASSETS | | | SUPPLEMENTAL DATA | |
UNLESS
OTHERWISE
NOTED,
PERIODS
ARE
FISCAL
YEARS
ENDED
SEPT. 30, | | NET ASSET
VALUE
BEGINNING
OF PERIOD | | | NET
INVESTMENT
INCOME
(LOSS)+ | | | NET
REALIZED
&
UNREALIZED
GAIN (LOSS)
ON
INVESTMENTS | | | TOTAL FROM
INVESTMENT
OPERATIONS | | | DIVIDENDS
FROM NET
INVESTMENT
INCOME | | | DIVIDENDS
FROM NET
REALIZED
GAINS | | | TOTAL
DIVIDENDS | | | NET
ASSET
VALUE
END
OF
PERIOD | | | NET
INVESTMENT
INCOME
(LOSS)
(%) | | | EXPENSES,
AFTER
EXPENSE
REDUCTIONS
(%) | | | EXPENSES,
AFTER
EXPENSE
REDUCTIONS
AND
NET OF
CUSTODY
CREDITS
(%) | | | EXPENSES,
BEFORE
EXPENSE
REDUCTIONS
(%) | | | TOTAL
RETURN
(%)(a) | | | PORTFOLIO
TURNOVER
RATE
(%)(a) | | | NET
ASSETS
AT END
OF
PERIOD
(THOUSANDS) | |
| CLASS I SHARES | | | | | | | | | | | | | | | | | | | | | | | | | | | | | | | | | | | | | | | | | | | | | | | | | | | | | |
2017(b)(c) | | $ | 10.00 | | | | (0.05 | ) | | | 0.49 | | | | 0.44 | | | | — | | | | — | | | | — | | | $ | 10.44 | | | | (1.98 | )(d) | | | 1.50 | (d) | | | 1.50 | (d) | | | 4.49 | (d)(e) | | | 4.40 | | | | 20.13 | | | $ | 48,396 | |
| (a) | Not annualized for periods less than one year. |
| (b) | Unaudited Six Month Period Ended March 31. |
| (c) | Fund commenced operations on December 30, 2016. |
| (e) | The Fund incurs certain expenses and fees in connection with investments in short positions. If such expenses and fees had not occurred, the Expenses Before Expense Reductions ratio would have been 2.18%. |
| + | Based on weighted average shares outstanding. |
See notes to financial statements.
| | | | |
| 24 Semi-Annual Report | | | | Semi-Annual Report 25 |
| | |
| Expense Example | | |
| |
Thornburg Long/Short Equity Fund | | March 31, 2017 (Unaudited) |
This example is intended to help you understand your ongoing costs (in dollars) of investing in the Fund and to compare these costs with the ongoing costs of investing in other mutual funds.
The example is based on a $1,000 investment beginning on October 1, 2016, and held until March 31, 2017.
| | | | | | | | | | | | |
| | | BEGINNING
ACCOUNT VALUE
10/1/16 | | | ENDING
ACCOUNT VALUE
3/31/17 | | | EXPENSES PAID
DURING PERIOD†
10/1/16–3/31/17 | |
CLASS I SHARES | | | | | | | | | | | | |
Actual | | $ | 1,000.00 | | | $ | 1,044.00 | | | $ | 7.64 | |
Hypothetical* | | $ | 1,000.00 | | | $ | 1,017.45 | | | $ | 7.54 | |
| † | Expenses are equal to the annualized expense ratio for Class I (1.50%) multiplied by the average account value over the period, multiplied by 182/365 to reflect the one-half year period. |
| * | Hypothetical assumes a rate of return of 5% per year before expenses. |
ACTUAL EXPENSES
For each class of shares, the first line of the accompanying table provides information about actual account values and actual expenses. You may use the information in this line, together with the amount you invested, to estimate the expenses that you paid over the period. Simply divide your account value by $1,000 (for example, an $8,600 account value divided by $1,000 = 8.6), then multiply the result by the number in the first line for your class of shares under the heading entitled “Expenses Paid During Period” to estimate the expenses you paid on your account during this period.
HYPOTHETICAL EXAMPLE FOR COMPARISON PURPOSES
For each class of shares, the second line of the accompanying table provides information about hypothetical account values and hypothetical expenses based on the Fund’s actual expense ratio and an assumed rate of return of 5% per year before expenses, which is not the Fund’s actual return. The hypothetical account values and expenses may not be used to estimate the actual ending account balance or expenses you paid for the period. You may use this information to compare the ongoing costs of investing in the Fund and other funds. To do so, compare this 5% hypothetical example with the 5% hypothetical examples that appear in the shareholder reports of the other funds.
Please note that the expenses shown in the table are meant to highlight your ongoing costs only and do not reflect any transactional costs, such as sales charges (loads), redemption fees, or exchange fees. Therefore, the second line of the table for each class of shares is useful in comparing ongoing costs only, and will not help you determine the relative total costs of owning different funds. In addition, if these transactional costs were included, your costs would have been higher.
26 Semi-Annual Report
| | |
| Other Information | | |
| |
Thornburg Long/Short Equity Fund | | March 31, 2017 (Unaudited) |
PORTFOLIO PROXY VOTING
Policies and Procedures:
The Trust has delegated to Thornburg Investment Management, Inc. (the “Advisor”) voting decisions respecting proxies for the Fund’s voting securities. The Advisor makes voting decisions in accordance with its Proxy Voting Policy and Procedures. A description of the Policy and Procedures is available (i) without charge, upon request, by calling the Advisor toll-free at 1-800-847-0200, (ii) on the Thornburg website at www.thornburg.com, and (iii) on the Securities and Exchange Commission’s website at www.sec.gov.
Information regarding how proxies were voted is available on or before August 31 of each year for the twelve months ending the preceding June 30. This information is available (i) without charge, upon request by calling the Advisor toll-free at 1-800-847-0200, (ii) on the Thornburg website at www.thornburg.com, and (iii) on the Securities and Exchange Commission’s website at www.sec.gov.
AVAILABILITY OF QUARTERLY PORTFOLIO SCHEDULE
The Fund files with the Securities and Exchange Commission schedules of its portfolio holdings on Form N-Q for the first and third quarters of each fiscal year. The Fund’s Forms N-Q are available on the Commission’s website at www.sec.gov, or may be reviewed and copied at the Commission’s Public Reference Room in Washington, D.C. Information on the operation of the Public Reference Room may be obtained by calling 1-800-SEC-0330. The Fund also makes this information available on its website at www.thornburg. com/download or upon request by calling 1-800-847-0200.
Semi-Annual Report 27
Trustees’ Statement to Shareholders
Readopted September 12, 2016
The Trustees believe current and prospective shareholders should know how we discharge our responsibilities in supervising the Funds’ investment advisor and in reviewing the advisor’s contract for renewal. Since 2005, we have issued a statement which sets out clearly the three principal guidelines that we follow in supervising the Trust’s investment advisor on your behalf. In accordance with our customary practice, in September of this year we again reviewed our statement and concluded we should reissue this statement outlining the principal features of our supervision of the advisor’s performance of investment management services for the Funds.
We begin with the premise that each shareholder selected his or her Fund because its investments are managed by the investment advisor identified in the prospectus and in accordance with the objective and policies described in the prospectus. We realize, as each of you do, that if you believe that your Fund’s stated objective and policies no longer serve your personal investment goals, you can sell your shares and leave the Fund.
Therefore, we believe that our primary supervisory task – our principal obligation to you – is to assess the nature and quality of the advisor’s services, and to confirm that the advisor actively and competently pursues the Fund’s objective, in accordance with the policies set out in the prospectus. To do this, we meet regularly with management to review your Fund’s portfolio and to discuss the advisor’s specific actions and judgments in pursuing the Fund’s objective. We do not substitute our own judgment for the advisor’s decisions in selecting investments; the advisor is paid to exercise its informed judgment on investment decisions, and we seek to confirm, in reviewing the advisor’s performance, that the advisor is doing just that.
Second, we are conscious of costs and the effect that costs have on shareholders’ returns. We try to make sure that your Fund’s fees and costs are reasonable in relationship to the services rendered and that they are generally in line with those charged by other expert investment advisors, consistent with our belief that the Fund’s investors searched for and expect that expertise and attention and have decided to pay a reasonable price for it. We do not put the management contract “out to bid” as a matter of course, and we would not do so unless we had concluded that the advisor materially had failed to pursue the Fund’s objectives in accordance with its policies, or for other equally important reasons. We believe that any other approach would be inconsistent with your interests and contrary to your expectations when you bought shares of the Fund in the first place.
Finally, because we believe that most Thornburg Fund shareholders have invested with a long-term perspective, we try not to focus too much on the fashions of the moment and on short-term performance. The market will not favor any specific investment objective or set of policies at all times and under all economic circumstances. A fund will experience periods of both high and low returns relative to other funds and other investments. Even if one of our Funds is not favored by the market at a particular time, we believe that the advisor is nonetheless obliged to remain true to the Fund’s objective and policies, and we watch to see that it does so.
Trustees of Thornburg Investment Trust
28 Semi-Annual Report
Thornburg Funds
Thornburg Investment Management is a privately-owned global investment firm that offers a range of solutions for retail and institutional investors. Founded in 1982 and headquartered in Santa Fe, New Mexico, we manage approximately $49 billion (as of March 31, 2017) across U.S. mutual funds, separate accounts for high-net-worth investors and institutional accounts, and UCITS funds for non-U.S. investors.
The fund outlined in this report is one of many equity and fixed-income products available from Thornburg Investment Management.
EQUITY FUNDS
| | • | | Thornburg Investment Income Builder Fund |
| | • | | Thornburg Global Opportunities Fund |
| | • | | Thornburg International Value Fund |
| | • | | Thornburg Better World International Fund |
| | • | | Thornburg International Growth Fund |
| | • | | Thornburg Developing World Fund |
| | • | | Thornburg Core Growth Fund |
FIXED INCOME FUNDS
| | • | | Thornburg Low Duration Income Fund |
| | • | | Thornburg Limited Term U.S. Government Fund |
| | • | | Thornburg Limited Term Income Fund |
| | • | | Thornburg Strategic Income Fund |
| | • | | Thornburg Low Duration Municipal Fund |
| | • | | Thornburg Limited Term Municipal Fund |
| | • | | Thornburg Intermediate Municipal Fund |
| | • | | Thornburg California Limited Term Municipal Fund |
| | • | | Thornburg New Mexico Intermediate Municipal Fund |
| | • | | Thornburg New York Intermediate Municipal Fund |
| | • | | Thornburg Strategic Municipal Income Fund |
ALTERNATIVE FUNDS
| | • | | Thornburg Long/Short Equity Fund |
Before investing, carefully consider the Fund’s investment goals, risks, charges, and expenses. For a prospectus or summary prospectus containing this and other information, contact your financial advisor or visit thornburg.com. Read it carefully before investing.
For additional information, please visit thornburg.com
Thornburg Investment Management, Inc. 2300 North Ridgetop Road, Santa Fe, NM 87506
Semi-Annual Report 29
This page intentionally left blank.
30 Semi-Annual Report
This page intentionally left blank.
Semi-Annual Report 31
This Semi-Annual Report is submitted for the general information of shareholders of the Fund. It is not authorized for distribution to prospective investors in the Fund unless preceded or accompanied by an effective prospectus.
| | | | |
| Investment Advisor: | | Distributor: | | |
| Thornburg Investment Management® | | Thornburg Securities Corporation® | | |
| 800.847.0200 | | 800.847.0200 | | TH3932 |
Item 2. Code of Ethics
Not applicable.
Item 3. Audit Committee Financial Expert
Not applicable.
Item 4. Principal Accountant Fees and Services
Not applicable.
Item 5. Audit Committee of Listed Registrants
Not applicable.
Item 6. Schedule of Investments
Filed as part of the reports to shareholders filed under item 1 of this Form.
Item 7. Disclosure of Proxy Voting Policies and Procedures for Closed-End Management Investment Companies
Not applicable.
Item 8. Portfolio Managers of Closed-End Management Investment Companies
Not applicable.
Item 9. Purchases of Equity Securities by Closed-End Management Investment Companies and Affiliated Purchasers.
Not applicable.
Item 10. Submission of Matters to a Vote of Security Holders
The authority to consider candidates recommended by the shareholders in accordance with the Trust’s Procedures for Shareholder Communications is committed to the Governance and Nominating Committee.
Item 11. Controls and Procedures
(a) The principal executive officer and the principal financial officer have concluded that Thornburg Investment Trust’s disclosure controls and procedures provide reasonable assurance that material information relating to Thornburg Investment Trust is made known to them by the appropriate persons, based on their evaluation of these controls and procedures as of a date within 90 days prior to the filing date of this report.
(b) There was no change in Thornburg Investment Trust’s internal control over financial reporting that occurred during the registrant’s second fiscal quarter of the period covered by this report (that is, the registrant’s second fiscal quarter) that has materially affected, or is reasonably likely to materially affect, the registrant’s internal control over financial reporting.
Item 12. Exhibits
| (a) (2) | Certifications pursuant to Rule 30a-2(a) under the Investment Company Act of 1940 (17 CFR 70.30a-2(a)) attached hereto as Exhibit 99.CERT. |
| (b) | Certification pursuant to Section 906 of the Sarbanes-Oxley Act of 2002 and Rule 30a-2(b) under the Investment Company Act of 1940 (17 CFR 70.30a-2(b)) attached hereto as Exhibit 99.906CERT. |
SIGNATURES
Pursuant to the requirements of the Securities Exchange Act of 1934 and the Investment Company Act of 1940, the registrant has duly caused this report to be signed on its behalf by the undersigned, thereunto duly authorized.
Thornburg Investment Trust, in respect of the following Thornburg Funds: Low Duration Municipal Fund, Limited Term Municipal Fund, Intermediate Municipal Fund, Strategic Municipal Income Fund, California Limited Term Municipal Fund, New Mexico Intermediate Municipal Fund, New York Intermediate Municipal Fund, Limited Term U.S. Government Fund, Limited Term Income Fund, Low Duration Income Fund, Strategic Income Fund, Value Fund, International Value Fund, Core Growth Fund, International Growth Fund, Investment Income Builder Fund, Global Opportunities Fund, Developing World Fund, Better World International Fund, Capital Management Fund, and Long/Short Equity Fund.
| | |
| |
| By: | | /s/ Jason H. Brady |
| |
| | Jason H. Brady |
| |
| | President and principal executive officer |
| |
| Date: | | May 25, 2017 |
Pursuant to the requirements of the Securities Exchange Act of 1934 and the Investment Company Act of 1940, this report has been signed below by the following persons on behalf of the registrant and in the capacities and on the dates indicated.
| | |
| |
| By: | | /s/ Jason H. Brady |
| |
| | Jason H. Brady |
| |
| | President and principal executive officer |
| |
| Date: | | May 25, 2017 |
| |
| By: | | /s/ Nimish Bhatt |
| |
| | Nimish Bhatt |
| |
| | Treasurer and principal financial officer |
| |
| Date: | | May 25, 2017 |