UNITED STATES
SECURITIES AND EXCHANGE COMMISSION
Washington, D.C. 20549
FORM N-CSR
CERTIFIED SHAREHOLDER REPORT OF REGISTERED MANAGEMENT INVESTMENT
COMPANIES
Investment Company Act file number 811-05201
Thornburg Investment Trust
(Exact name of registrant as specified in charter)
c/o Thornburg Investment Management, Inc.
2300 North Ridgetop Road, Santa Fe, New Mexico 87506
(Address of principal executive offices) (Zip code)
Garrett Thornburg, 2300 North Ridgetop Road, Santa Fe, New Mexico 87506
(Name and address of agent for service)
Registrant’s telephone number, including area code: 505-984-0200
Date of fiscal year end: September 30
Date of reporting period: March 31, 2020
Item 1.Reports to Stockholders
The following Semi-annual reports are attached hereto, in order:
Thornburg Short Duration Municipal Fund
Thornburg Limited Term Municipal Fund
Thornburg Intermediate Municipal Fund
Thornburg Strategic Municipal Income Fund
Thornburg California Limited Term Municipal Fund
Thornburg New Mexico Intermediate Municipal Fund
Thornburg New York Intermediate Municipal Fund
Thornburg Limited Term U.S. Government Fund
Thornburg Limited Term Income Fund
Thornburg Low Duration Income Fund
Thornburg Strategic Income Fund
Thornburg Value Fund
Thornburg International Value Fund
Thornburg Core Growth Fund
Thornburg International Growth Fund
Thornburg Investment Income Builder Fund
Thornburg Global Opportunities Fund
Thornburg Developing World Fund
Thornburg Better World International Fund
Thornburg Capital Management Fund
Thornburg Long/Short Equity Fund
Thornburg Summit Fund
Semi-Annual Report
March 31, 2020
Beginning on January 1, 2021, as permitted by regulations adopted by the Securities and Exchange Commission, paper copies of the Fund’s shareholder reports will no longer be sent by mail, unless you specifically request paper copies of the reports from the Fund or from your financial intermediary, such as a broker-dealer or bank. Instead, the reports will be made available on a website, and you will be notified by mail each time a report is posted and provided with a website link to access the report.
If you already elected to receive shareholder reports electronically, you will not be affected by this change and you need not take any action. You may elect to receive shareholder reports and other communications from the Fund or your financial intermediary electronically by going to thornburg.com/edelivery.
You may elect to receive all future reports in paper free of charge. You can inform the Fund or your financial intermediary that you wish to continue receiving paper copies of your shareholder reports by calling 800.847.0200 or your financial intermediary directly. Your election to receive reports in paper will apply to all funds held with the fund complex/your financial intermediary.
| THORNBURG EQUITY FUNDS |
| Multi Asset |
| Thornburg Investment Income Builder Fund |
| Thornburg Summit Fund |
| Global Equity |
| Thornburg Global Opportunities Fund |
| International Equity |
| Thornburg International Value Fund |
| Thornburg Better World International Fund |
| Thornburg International Growth Fund |
| Thornburg Developing World Fund |
| Domestic Equity |
| Thornburg Value Fund |
| Thornburg Core Growth Fund |
| Alternatives |
| Thornburg Long/Short Equity Fund |
At Thornburg, we believe unconstrained investing leads to better outcomes for our clients. Our investment solutions are highly active, high conviction, and benchmark agnostic. When it comes to finding economic opportunity for clients, it’s more than what we do.
It’s how we do it. Active Asbottom-up, fundamental, active managers, we look beyond conventional benchmarks. Long Term We take a long-term view in how we manage our firm and our portfolios. Benchmark Agnostic Investment strategies should have the flexibility to pursue solutions for clients, not stay within the conventional confines of benchmarks. Flexible Perspective Our approach to portfolio construction is guided by our convictions rather than convention. High Conviction We focus our attention and capital on thoroughly researched, well-understood positions. The best form of risk management is to know what you own, and why. Repeatable & Robust Our long-term outperformance of benchmarks verifies that our process works and outperforms conventional thinking. Independent We are independently owned and far from the herd of other investment managers. Investment Driven All members of the investment team are resources for all of our strategies. Collaborative Our team collaborates on opportunities across geography, sector, or asset class.
Thornburg Equity Funds
Semi-Annual Reports | March 31, 2020
Table of Contents
Investments carry risks, including possible loss of principal. Additional risks may be associated with investments outside the United States, especially in emerging markets, including currency fluctuations, illiquidity, volatility, and political and economic risks. Investments in small- and mid-capitalization companies may increase the risk of greater price fluctuations. Portfolios investing in bonds have the same interest rate, inflation, and credit risks that are associated with the underlying bonds. The value of bonds will fluctuate relative to changes in interest rates, decreasing when interest rates rise. A short position will lose value as the security’s price increases. Theoretically, the loss on a short sale can be unlimited. Investments in derivatives are subject to the risks associated with the securities or other assets underlying the pool of securities, including illiquidity and difficulty in valuation. Please see the Funds’ prospectus for a discussion of the risks associated with an investment in the Funds. Investments in the Funds are not FDIC insured, nor are they deposits of or guaranteed by a bank or any other entity.
Thornburg Equity Funds Semi-Annual Report | 3
Letter to Shareholders
March 31, 2020 (Unaudited)
Dear Shareholder:
I hope this letter finds you safe and healthy. Amid the COVID-19 pandemic, we’re all adjusting to the challenges of working and living new ways while trying to see into a cloudy future. In these uncertain times, all of us at Thornburg Investment Management are squarely focused on providing you with the best investment outcomes that we can.
Many of our portfolios were well positioned for higher volatility. While we did not predict the cause of this downturn, it’s clear that high prices make for more vulnerable markets. Given our solid liquidity and preparation, we’ve been able to take advantage of price swings as many assets were on sale after the market’s decline. Longer term, it appears even the extraordinary fiscal and monetary support will merely cushion the blow. After all, the reason policy makers’ actions have been so extreme is in large part because they view them as necessary.
Looking forward, our nimble, collaborative investment team is well suited to deliver. The reason that we have a benchmark agnostic, flexible approach is so that we can go where we find value, within the mandate and objectives of the portfolio. While many investment firms have good products and processes, Thornburg is designed to see the world differently, and our perspective from Santa Fe, NM, is especially valuable in challenging times. While many other professionals are siloed into narrow areas of expertise, without the ability to evaluate the bigger picture, we work across sectors and asset classes to find great investments and put them into balanced portfolios. The last few months have demonstrated the strength of our approach, given its adaptability and capacity to place new information in the context of broad portfolios quickly. Being nimble is part of Thornburg’s culture, and people across the organization are finding new ways to pitch in for the sake of our clients.
No one can predict with certainty what the market has in store for us, especially in the context of the current health crisis. What does seem certain, however, is that the events of the last few months are accelerating change that was already occurring, as well as underlining the vulnerability of many of the systems that many of us take for granted. That is true in our daily lives, as well as in financial markets. We believe our understanding of and participation in the interconnectedness of these markets is our core competency: We’re built for this.
Thank you so much for your time and your business.

| |
Jason Brady,cfa
Portfolio Manager
CEO, President, and
Managing Director | |
The matters discussed in this report may constitute forward-looking statements made pursuant to the safe harbor provisions of the Securities Litigation Reform Act of 1995. These include any advisor or portfolio manager prediction, assessment, analysis or outlook for individual securities, industries, investment styles, market sectors and/or markets. These statements involve risks and uncertainties. In addition to the general risks described for each fund in its current prospectus, other factors bearing on these reports include the accuracy of the advisor’s or portfolio manager’s forecasts and predictions, the appropriateness of the investment strategies designed by the advisor or portfolio manager and the ability of the advisor or portfolio manager to implement their strategies efficiently and successfully. Any one or more of these factors, as well as other risks affecting the securities markets generally, could cause the actual results of any fund to differ materially as compared to its benchmarks.
The views expressed are subject to change and do not necessarily reflect the views of Thornburg Investment Management, Inc. This information should not be relied upon as a recommendation or investment advice and is not intended to predict the performance of any investment or market.
Performance results of individual share classes will vary based on the fees and expenses associated with each share class, and may be higher or lower than other share classes within the same Fund. Please see Performance Summary for performance results of each share class.
4 | Thornburg Equity Funds Semi-Annual Report
Letter to Shareholders, Continued
March 31, 2020 (Unaudited)
Thornburg Investment Income Builder Fund
Dear Fellow Shareholder:
This letter highlights the basic results of your Fund’s investment portfolio for the six-month period ended March 31, 2020. Your Fund’s fiscal year ends on September 30. In addition, we comment on the overall investment landscape, which has been evolving rapidly amidst the extraordinary developments associated with the global spread of COVID-19.
Thornburg Investment Income Builder Fund paid an ordinary dividend of $0.52 per Class I share in the six-month period ending March 31, 2020. This was approximately 4% above the dividend of $0.50 for the comparable period of fiscal 2019. The Fund paid $1.014 per Class I share for the trailing four quarters, up 4.4% from $0.970 in the prior year comparable period. The dividend per share were higher for Class R6 shares and lower for Class A, Class C, R3, R4 and R5 shares, to account for varying class-specific expenses.
The net asset value of the Class I shares decreased by $5.27 per share ($21.88 to $16.61) during the period under review. Importantly, the net asset value decreased by $6.53 per share in the 41 days from February 19 to March 31 as the COVID-19 pandemic gained momentum globally and set off a chain reaction of selling across a range of financial assets. As of the close of business on February 19, the net asset value of the Class I shares was $23.14 per share and the total return for the then partial semiannual period was 7.69%. The ensuing global chain reaction of selling financial assets was unprecedented in speed, depth and breadth, though the selling wave was significantly reversed in the final week of March with respect to government bonds, government agency bonds and high-grade corporate bonds as a result of U.S. Federal Reserve (and other central bank) buying of these instruments with newly printed money.
The next several paragraphs focus on the first three months of 2020. We provide brief descriptions of the largest individual equity holdings in your Fund portfolio and how these individual assets repriced during the March quarter. The final six weeks of the quarter dominated outcomes for the semiannual period under review. In general, we believe the rapid price declines for these businesses represent significant buying opportunities rather than warnings of impending competitive irrelevance or significant financial distress. Most have strong positions providing products and services that will prove to be more resilient than the overall global economy.
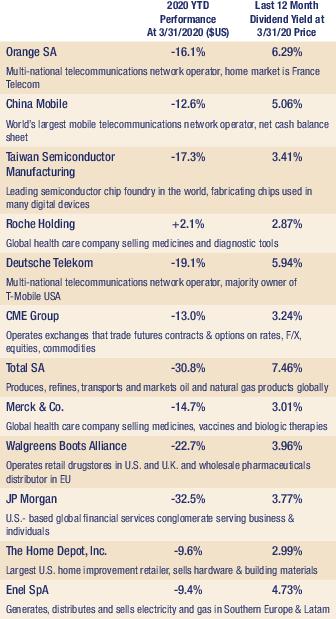
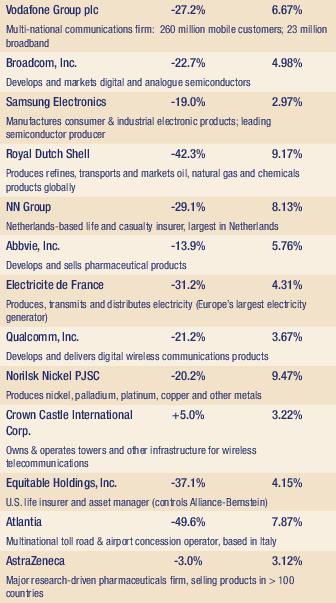
Most dividend-paying equities in the Thornburg Investment Income Builder Fund were down more than 15% in the first three months of calendar 2020. Listed below in descending order are the 25 largest equity holdings in the Fund as of March 31, 2020, along with year-to-date share price performance and trailing-year dividend yields at closing March 31, 2020, stock prices. Twenty-three of these holdings have delivered share price declines in 2020 to date. Together,
these 25 firms comprise approximately 66% of the Fund’s total assets. Interest-bearing debt comprises almost 12% of assets and 39 other equities comprise a total of approximately 22% of portfolio assets. Individual position sizes range from more than 5% (telecom operator Orange SA) to approximately 1.5% for those holdings shown near the bottom of this list.
Thornburg Investment Income Builder Fund – Top 25 Equity Holdings as of March 31, 2020
Thornburg Equity Funds Semi-Annual Report | 5
Letter to Shareholders, Continued
March 31, 2020 (Unaudited)
These are not trivial companies. Over time they generally tend to be well capitalized, and we epxect most should be good dividend payors in the years to come.
The global economy has been significantly dented by the COVID-19 outbreak, and by government actions taken to control this outbreak: travel restrictions, mandatory business closings, school closings, event cancellations, stay home orders, etc. We cannot predict how these companies’ 2020 dividends will be impacted by the COVID-19 outbreak, particularly any possible political pressures to reduce dividends. That noted, we believe these are strong businesses with important positions in their respective markets. The reader will notice a significant number of telecommunications, communications infrastructure and health care firms among these top 25 holdings, as well as other providers of various ingredients important to modern life. Aside from the fact that they have paid attractive dividends
previously, in our view, the current crisis reinforces the essential nature of the products and services they provide.
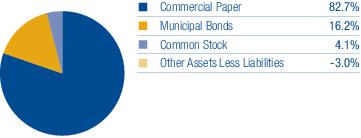
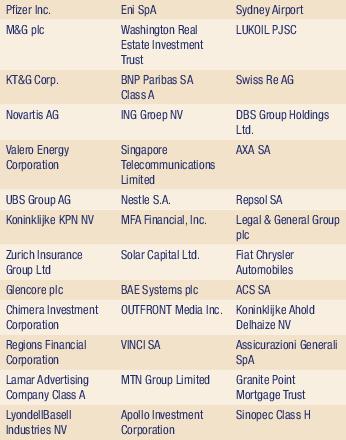
The 39 equity investments shown below comprised approximately 22% of your Fund’s total net assets as of March 31, 2020. Some of these are not cyclical businesses (pharmaceuticals firms Pfizer and Novartis, or telecommunications network operators KPN and Singapore Telecommunications). Others are cyclical businesses that have paid attractive dividends in recent years (investment managers M&G and UBS), non-bank financials (Chimera Investment, MFA Financial, Solar Capital) or industrial materials producers (Glencore and LyondellBasell). In general, share prices of the cyclical businesses in the Thornburg Investment Income Builder Fund’s portfolio declined more than the entire portfolio for the period under review. The five insurance companies among these 39 have varying degrees of cyclicality, but their stock prices declined mostly due to concerns about the market values of their bond portfolios, which have likely recovered significantly as global central banks buy bonds (Zurich Insurance Group, Swiss Reinsurance, Axa, Legal & General and Generali).
Thornburg Investment Income Builder Fund’s bond holdings overall delivered negative returns during the period under review. U.S. government bond prices increased significantly as 10-year U.S. Treasury yields dropped from 1.92% to 0.67%. Corporate bond prices were generally lower, as much of March saw heavy selling of corporate credit.
6 | Thornburg Equity Funds Semi-Annual Report
Letter to Shareholders, Continued
March 31, 2020 (Unaudited)
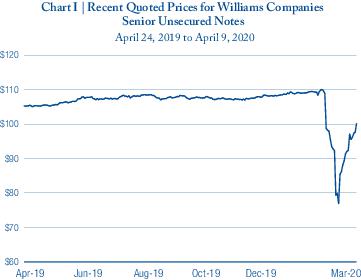
For example, the following graph shows the precipitous drop of the quoted price of a 4.55% bond due June 24, 2024, issued by U.S. energy infrastructure firm Williams Companies. This bond, issued at par in 2014, was quoted by Bloomberg at a dollar price of 110% of par to yield below 2% as recently as March 5, 2020. Over the next 18 days to March 23, the market price of this bond declined by some 33%, to yield 11.57%. We observed that bond mutual funds in the U.S. saw high redemptions over this period, so many sellers of corporate bond funds at that time were selling good assets at low prices. On the afternoon of March 23, the Federal Reserve Bank announced it would fund a bond purchase program for investment grade corporate bonds with final maturities below five years. The Williams Companies 4.55% bond qualifies for the Fed’s bond purchase program. As you can see in the accompanying graph of recent market prices for this bond, it has increased in value by more than 26% since March 23, and now yields 3.62% at a price of 103.36% of par. This bond is the second largest individual bond holding in Thornburg Investment Income Builder Fund’s portfolio. It is illustrative of the volatile ride many of the portfolio’s other bonds took during the month of March.
Thornburg Investment Income Builder Fund’s Class I share return of negative 21.96% for the semiannual period trailed its blended benchmark (75% MSCI World Net Total Return USD Index and 25% Bloomberg Barclays US Aggregate Bond Total Return Index Value USD), which returned negative 9.9% for the period. We have described many of the individual ingredients of your Fund’s six-month performance in the preceding paragraphs. The comparison benchmark benefited significantly from (i) a larger bond weighting than Investment Income Builder Fund and central bank support for the bond component of the blended index in the last week of March, and (ii) the fact that six of the seven largest holdings of the equity portion of the benchmark are technology giants whose share prices have performed relatively well, but pay low dividends or no dividends (Microsoft, Apple, Amazon, Facebook, Alphabet/Google and
Alibaba). Performance comparisons of Investment Income Builder to its blended benchmark over various periods are shown elsewhere in this report.
Although no central banks have been bidding up prices of most of the assets in your Investment Income Builder Fund portfolio, we are optimistic about the future return potential of these assets. Why? Virtually all of the businesses in your fund retain their market positions, providing important products and services that generate cash flows to pay attractive dividends. As high-quality bond yields, bank deposit yields and money market yields decline, we believe investors will direct capital into dividend-paying stocks and certain bonds, supporting prices of these.
Readers of this commentary who are long-time shareholders of Thornburg Investment Income Builder Fund will recall that the interest-bearing debt portion of the Fund’s portfolio has varied over time, ranging from less than 9% in 2015 to 45% at June 30, 2009. We tend to allocate more portfolio assets to interest-bearing debt when yields are more attractive. In the September 2019 fiscal year, more than 85% of Investment Income Builder Fund’s income was derived from stock dividends, the remainder coming from interest. In the coming quarters, this mix may likely include a higher proportion of interest income. We have already modestly increased your Fund’s weighting in interest-bearing debt. From today’s vantage point, we would expect to add assets from the more dislocated segments of the bond market that are less subject to price support from central bank buying.
The quarter ending March 31, 2020, was the 69th full calendar quarter since the inception of Thornburg Investment Income Builder Fund in December 2002. In 51 of these quarters the Fund delivered a positive total return. The Fund has delivered positive total returns in 14 of its 17 calendar years of existence.
We believe the extreme dislocation caused by the COVID-19 pandemic will be temporary. As we write these words, more than half of the global population, from countries comprising a significant majority of global GDP, are under “shelter in place” orders that sharply reduce normal economic activity. Government bodies around the world have taken unusual steps to control the disease and mitigate the consequences of related economic disruption in order to keep the basic structure of the global economy in place to resume normal economic activity when the pandemic passes.
When the COVID-19 pandemic passes, we believe people around the world will continue to buy goods and services and trade with each other. We expect the global economy will gradually repair, albeit with some significant changes, and, in the meantime, most governments will make reasonable attempts to bridge the material dislocations we currently witness. In the United States, for example, the combination of payments from the Paycheck Protection Program, enhanced weekly unemployment benefits, and CARES Act stimulus payments to
Thornburg Equity Funds Semi-Annual Report | 7
Letter to Shareholders, Continued
March 31, 2020 (Unaudited)
qualifying households will surpass the median weekly income ($933/week as of Q4 2019) of many workers prior to the COVID-19 outbreak. More broadly, governments around the developed world have enacted fiscal stimulus programs amounting to approximately 10% of their combined GDPs, amounts approximately sufficient to offset -33% drops in GDP for a three-month period.
Thank you for being a shareholder of Thornburg Investment Income Builder Fund. Remember that you can review additional information about your portfolio by going to our website, www.thornburg.com.
Sincerely,

|
|
Brian McMahon
Portfolio Manager
Chief Investment Strategist
and Managing Director | Jason Brady,cfa
Portfolio Manager
CEO, President, and
Managing Director |

| 
|
Ben Kirby,cfa
Portfolio Manager
Head of Investments
and Managing Director | Matt Burdett
Portfolio Manager and
Managing Director |
The performance data quoted represents past performance; it does not guarantee future results.
Neither the payment of, or increase in, dividends is guaranteed.
The matters discussed in this report may constitute forward-looking statements made pursuant to the safe harbor provisions of the Securities Litigation Reform Act of 1995. These include any advisor or portfolio manager prediction, assessment, analysis or outlook for individual securities, industries, investment styles, market sectors and/or markets. These statements involve risks and uncertainties. In addition to the general risks described for each fund in its current prospectus, other factors bearing on these reports include the accuracy of the advisor’s or portfolio manager’s forecasts and predictions, the appropriateness of the investment strategies designed by the advisor or portfolio manager and the ability of the advisor or portfolio manager to implement their strategies efficiently and successfully. Any one or more of these factors, as well as other risks affecting the securities markets generally, could cause the actual results of any fund to differ materially as compared to its benchmarks.
The views expressed are subject to change and do not necessarily reflect the views of Thornburg Investment Management, Inc. This information should not be relied upon as a recommendation or investment advice and is not intended to predict the performance of any investment or market.
Performance results of individual share classes will vary based on the fees and expenses associated with each share class and may be higher or lower than other share classes within the same Fund. Please see Performance Summary for performance results of each share class.
8 | Thornburg Equity Funds Semi-Annual Report
Letter to Shareholders, Continued
March 31, 2020 (Unaudited)
Thornburg Global Opportunities Fund
Dear Fellow Shareholders:
This letter highlights the results of the Thornburg Global Opportunities Fund investment portfolio for the six-month period ended March 31, 2020. Your Fund’s fiscal year ends on September 30. In addition, we comment on the overall investment landscape, which has been evolving rapidly amidst the extraordinary developments associated with the global spread of COVID-19 (coronavirus).
The net asset value of the Class I shares decreased by $4.23 per share ($27.67 to $23.44) during the semiannual period under review. The net asset value decreased by $8.69 per share in the 41 days from February 19 to March 31 as the COVID-19 pandemic gained momentum globally and set off a chain reaction of selling across a range of financial assets as lockdown orders spread. As of the close of business on February 19, the net asset value of Thornburg Global Opportunities Fund’s Class I shares was $32.13 per share and the total return for the then partial semiannual period was +18.09%. The ensuing global chain reaction of selling financial assets was unprecedented in speed, depth and breadth. The selling wave was partially reversed in the final week of March with respect to government bonds, government agency bonds and high-grade corporate bonds as a result of Federal Reserve (and other central bank) buying of these instruments with newly printed money.
The next several paragraphs focus on your Fund’s largest portfolio holdings during the first three months of 2020. The final six weeks of the quarter dominated outcomes for these months and for the semiannual period under review. In general, we believe the rapid share price declines for these businesses over these weeks represent significant buying opportunities rather than warnings of impending competitive irrelevance or significant financial distress. Most have strong positions providing products and services that we believe will be resilient in the years ahead.
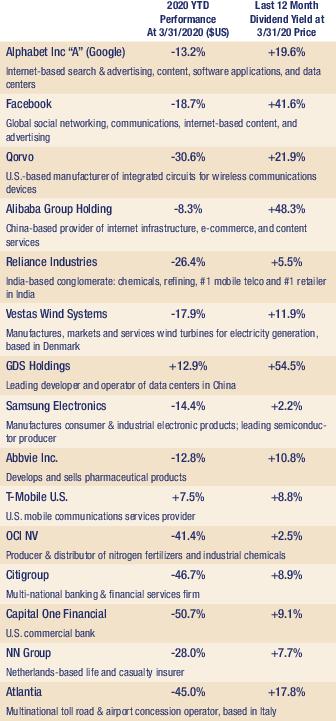
Most equities in the Thornburg Global Opportunities Fund were down more than 15% in the first three months of 2020 in a widespread global equity selloff. Listed below in descending order are the 20 largest equity holdings in the Fund as of March 31, 2020, along with 2020 year-to-date share price changes and trailing five-year average annual revenue growth rates for these businesses. Together, these firms comprised approximately 78% of the Fund’s total assets. Near-cash debt comprised 7% of assets, and 12 other equities comprised a total of approximately 15% of Fund assets as of March 31, 2020. Fifteen of these 20 largest equity investments delivered share price declines in 2020 through March 31, the exceptions being health care and digital communications–centric businesses. Individual position sizes varied from more than 5% (Alphabet, Facebook, Qorvo, Alibaba, Reliance Industries) to just over 2.25% for those shown near the bottom of this list.
Thornburg Global Opportunities Fund – Top 20 Equity Holdings as of March 31, 2020
Thornburg Equity Funds Semi-Annual Report | 9
Letter to Shareholders, Continued
March 31, 2020 (Unaudited)
Notice that a high incidence of these investments are in firms tied to the digital economy, and to tools that facilitate digital communications.
These are not trivial businesses. Over time they generally tend to be well capitalized. We believe most of these will emerge from the present economic valley with their competitive positions either intact or improved. Most have been growing faster than the global economy, and some of the slower growers over recent years appear to be advantaged in their industries at this time. Most of their share prices have increased significantly between March 31 and the date of this letter.
The Thornburg Global Opportunities Fund’s Class I share return of negative 13.85% for the semiannual period slightly beat its benchmark (MSCI All Country World Net Total Return USD Index "ACWI"), which returned negative 14.33% for the period. Most of your Fund’s net asset value decline occurred during the extraordinary month of March as governments around the world ordered significant portions of private economies to shut down. We expect these economies to gradually reopen in the current quarter.
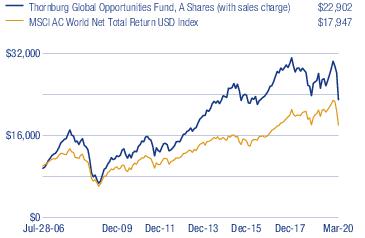
In July of 2020 we will mark the 14th anniversary of the Fund’s inception. From its inception on July 28, 2006, through March 31, 2020, the Thornburg Global Opportunities Fund has outpaced the ACWI by an average margin of over 2.6% per year, resulting in a total cumulative return since inception of 154% (I shares) versus 79% for the ACWI.
The following table summarizes major sector weightings within the Global Opportunities Fund portfolio as of March 31, as well as general directional changes over the course of the semiannual period:
We believe the extreme dislocation caused by the COVID-19 pandemic will be temporary. As we write these words more than half of the global population, from countries comprising a significant majority of global GDP, are under “shelter in place” orders that sharply reduce normal economic activity. Government bodies around the world have taken unusual steps to control the disease and mitigate the consequences of related economic disruption in order to keep the basic structure of the global economy in place to resume normal economic activity when the pandemic passes.
When the COVID-19 pandemic passes, we believe people around the world will continue to buy goods and services and trade with each other. We expect the global economy will gradually repair, albeit with some significant changes, and, in the meantime, most governments will make reasonable attempts to bridge the material dislocations we currently witness. In the United States, for example, the combination of payments from the Payroll Protection Program, enhanced weekly unemployment benefits, and CARES Act stimulus payments to qualifying households will surpass the median weekly income ($933/week as of Q4 2019) of many workers prior to the COVID-19 outbreak. More broadly, governments around the developed world have enacted fiscal stimulus programs amounting to approximately 10% of their combined GDPs, amounts approximately sufficient to offset -33% drops in GDP for a three-month period.
Our Investment Framework
The Thornburg Global Opportunities Fund seeks capital appreciation from a focused portfolio of global equity investments. We believe the structure of the Fund—built on our core investment principles of flexibility, focus and value—provides a durable framework for value-added investing.
We urge shareholders of the Fund to maintain a long-term investment perspective rather than placing too much emphasis on return figures that are available daily, weekly, monthly and quarterly. We continue to follow our core investment principles of flexibility, focus and value, as we have since the Fund’s inception back in 2006.
Thank you for being a shareholder of the Thornburg Global Opportunities Fund. Remember that you can monitor portfolio
10 | Thornburg Equity Funds Semi-Annual Report
Letter to Shareholders, Continued
March 31, 2020 (Unaudited)
holdings and other Fund information on our website, www.thornburg.com.
Sincerely,

| 
|
Brian McMahon
Portfolio Manager
Chief Investment Strategist
and Managing Director | Miguel Oleaga
Portfolio Manager
and Managing Director |
The performance data quoted represents past performance; it does not guarantee future results.
The matters discussed in this report may constitute forward-looking statements made pursuant to the safe harbor provisions of the Securities Litigation Reform Act of 1995. These include any advisor or portfolio manager prediction, assessment, analysis or outlook for individual securities, industries, investment styles, market sectors and/or markets. These statements involve risks and uncertainties. In addition to the general risks described for each fund in its current prospectus, other factors bearing on these reports include the accuracy of the advisor’s or portfolio manager’s forecasts and predictions, the appropriateness of the investment strategies designed by the advisor or portfolio manager and the ability of the advisor or portfolio manager to implement their strategies efficiently and successfully. Any one or more of these factors, as well as other risks affecting the securities markets generally, could cause the actual results of any fund to differ materially as compared to its benchmarks.
The views expressed are subject to change and do not necessarily reflect the views of Thornburg Investment Management, Inc. This information should not be relied upon as a recommendation or investment advice and is not intended to predict the performance of any investment or market.
Performance results of individual share classes will vary based on the fees and expenses associated with each share class, and may be higher or lower than other share classes within the same Fund. Please see Performance Summary for performance results of each share class.
Thornburg Equity Funds Semi-Annual Report | 11
Performance Summary
March 31, 2020 (Unaudited)
AVERAGE ANNUAL TOTAL RETURNS
| THORNBURG INVESTMENT INCOME BUILDER FUND | 1-YR | 3-YR | 5-YR | 10-YR | SINCE
INCEPTION |
| Class A Shares(Incep: 12/24/02) | | | | | |
| Without sales charge | -18.64% | -2.76% | -0.91% | 3.90% | 7.27% |
| With sales charge | -22.30% | -4.25% | -1.82% | 3.42% | 6.98% |
| Class C Shares(Incep: 12/24/02) | | | | | |
| Without sales charge | -19.29% | -3.49% | -1.64% | 3.16% | 6.59% |
| With sales charge | -20.07% | -3.49% | -1.64% | 3.16% | 6.59% |
| Class I Shares(Incep: 11/3/03) | -18.46% | -2.48% | -0.62% | 4.23% | 6.60% |
| Class R3 Shares(Incep: 2/1/05) | -18.93% | -3.07% | -1.23% | 3.58% | 5.01% |
| Class R4 Shares(Incep: 2/1/08) | -18.86% | -3.01% | -1.16% | 3.69% | 2.91% |
| Class R5 Shares(Incep: 2/1/07) | -18.51% | -2.60% | -0.74% | 4.10% | 3.81% |
| Class R6 Shares(Incep: 4/10/17) | -18.37% | - | - | - | -2.33% |
| MSCI World Net Total Return USD Index(Since 12/24/02) | -10.39% | 1.92% | 3.25% | 6.57% | 7.10% |
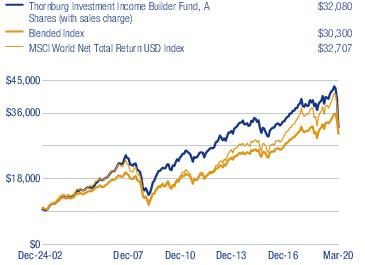
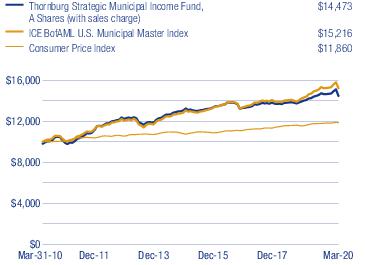
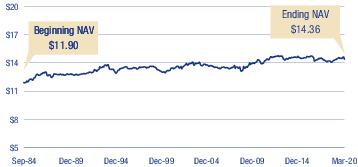
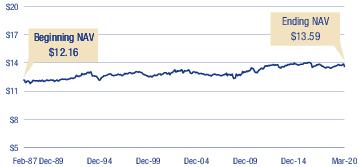
GROWTH OF A HYPOTHETICAL $10,000 INVESTMENT
| THORNBURG INVESTMENT INCOME BUILDER FUND | FINAL VALUE |
AVERAGE ANNUAL TOTAL RETURNS
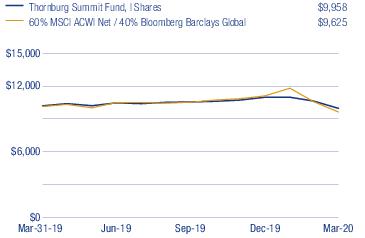
| THORNBURG SUMMIT FUND | 1-YR | 3-YR | 5-YR | 10-YR | SINCE
INCEPTION |
| Class I Shares(Incep: 3/1/19) | -2.28% | - | - | - | -0.39% |
| 60% MSCI ACWI Net / 40% Bloomberg Barclays Global(Since 3/1/19) | -4.94% | - | - | - | -3.62% |
GROWTH OF A HYPOTHETICAL $10,000 INVESTMENT
| THORNBURG SUMMIT FUND | FINAL VALUE |
Performance data shown represents past performance and is no guarantee of future results. Investment return and principal value will fluctuate so shares, when redeemed, may be worth more or less than their original cost. Current performance may be lower or higher than quoted. For performance current to the Funds’ most recent month end, visit thornburg.com or call 800-847-0200. The performance information does not reflect the deduction of taxes that a shareholder would pay on distributions or the redemption of Fund shares. Returns reflect the reinvestment of dividends and capital gains. Thornburg Investment Income Builder Fund; Class A shares are sold with a maximum sales charge of 4.50%. Class C shares are subject to a 1% CDSC for the first year only. There is no sales charge for Class I, R3, R4, R5 and R6 shares. Thornburg Summit Fund; Class A shares are sold with a maximum sales charge of 4.50%. There is no sales charge for Class I shares. As disclosed in the Funds’ most recent prospectus, the total annual fund operating expenses before fee waivers or expense reimbursements are as follows: Thornburg Investment Income Builder Fund; A shares, 1.27%; C shares, 2.01%; I shares, 1.02%; R3 shares, 1.72%; R4 shares, 1.64%; R5 shares, 1.22%; R6 shares, 0.96%. Thornburg Summit Fund;A shares, 2.72%; I shares, 2.47%. Thornburg Investment Management has contractually agreed to waive fees and reimburse expenses until at least February 1, 2021, for some of the share classes, resulting in net expense ratios of the following: Thornburg Investment Income Builder Fund;R3 shares, 1.64%; R4 shares, 1.54%; R5 shares, 1.13%; R6 shares, 0.94%. Thornburg Summit Fund; A shares, 2.00%; I shares, 1.75%. For more detailed information on fund expenses and waivers/reimbursements please see the Funds’ prospectus.
30-day SEC Yield as of 3/31/20 for Thornburg Investment Income Builder Fund (A Shares) : 4.21%
12 | Thornburg Equity Funds Semi-Annual Report
Performance Summary, Continued
March 31, 2020 (Unaudited)
AVERAGE ANNUAL TOTAL RETURNS
| THORNBURG GLOBAL OPPORTUNITIES FUND | 1-YR | 3-YR | 5-YR | 10-YR | SINCE
INCEPTION |
| Class A Shares(Incep: 7/28/06) | | | | | |
| Without sales charge | -14.10% | -4.66% | -1.82% | 5.76% | 6.60% |
| With sales charge | -17.97% | -6.11% | -2.72% | 5.28% | 6.25% |
| Class C Shares(Incep: 7/28/06) | | | | | |
| Without sales charge | -14.75% | -5.39% | -2.55% | 4.96% | 5.79% |
| With sales charge | -15.59% | -5.39% | -2.55% | 4.96% | 5.79% |
| Class I Shares(Incep: 7/28/06) | -13.88% | -4.37% | -1.50% | 6.18% | 7.06% |
| Class R3 Shares(Incep: 2/1/08) | -14.33% | -4.86% | -2.00% | 5.64% | 3.49% |
| Class R4 Shares(Incep: 2/1/08) | -14.23% | -4.77% | -1.91% | 5.74% | 3.58% |
| Class R5 Shares(Incep: 2/1/08) | -13.91% | -4.39% | -1.51% | 6.17% | 4.02% |
| Class R6 Shares(Incep: 4/10/17) | -13.76% | - | - | - | -4.46% |
| MSCI AC World Net Total Return USD Index(Since 7/28/06) | -11.26% | 1.50% | 2.85% | 5.88% | 4.37% |
GROWTH OF A HYPOTHETICAL $10,000 INVESTMENT
| THORNBURG GLOBAL OPPORTUNITIES FUND | FINAL VALUE |
AVERAGE ANNUAL TOTAL RETURNS
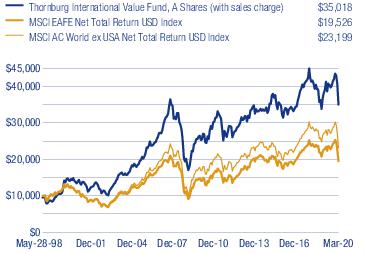
| THORNBURG INTERNATIONAL VALUE FUND | 1-YR | 3-YR | 5-YR | 10-YR | SINCE
INCEPTION |
| Class A Shares(Incep: 5/28/98) | | | | | |
| Without sales charge | -10.39% | -1.07% | -0.10% | 2.63% | 6.13% |
| With sales charge | -14.42% | -2.58% | -1.02% | 2.16% | 5.91% |
| Class C Shares(Incep: 5/28/98) | | | | | |
| Without sales charge | -11.03% | -1.81% | -0.83% | 1.87% | 5.31% |
| With sales charge | -11.87% | -1.81% | -0.83% | 1.87% | 5.31% |
| Class I Shares(Incep: 3/30/01) | -10.13% | -0.75% | 0.25% | 3.01% | 5.76% |
| Class R3 Shares(Incep: 7/1/03) | -10.60% | -1.26% | -0.27% | 2.45% | 6.38% |
| Class R4 Shares(Incep: 2/1/07) | -10.42% | -1.05% | -0.08% | 2.65% | 1.87% |
| Class R5 Shares(Incep: 2/1/05) | -10.19% | -0.80% | 0.19% | 2.93% | 4.79% |
| Class R6 Shares(Incep: 5/1/12) | -10.04% | -0.62% | 0.40% | - | 2.95% |
| MSCI EAFE Net Total Return USD Index(Since 5/28/98) | -14.38% | -1.82% | -0.62% | 2.72% | 3.11% |
| MSCI AC World ex USA Net Total Return USD Index(Since 5/28/98) | -15.57% | -1.96% | -0.64% | 2.05% | 3.53% |
GROWTH OF A HYPOTHETICAL $10,000 INVESTMENT
| THORNBURG INTERNATIONAL VALUE FUND | FINAL VALUE |
Performance data shown represents past performance and is no guarantee of future results. Investment return and principal value will fluctuate so shares, when redeemed, may be worth more or less than their original cost. Current performance may be lower or higher than quoted. For performance current to the most recent month end, visit thornburg.com or call 800-847-0200. The performance information does not reflect the deduction of taxes that a shareholder would pay on distributions or the redemption of Fund shares. Returns reflect the reinvestment of dividends and capital gains. Thornburg Global Opportunities Fund; Class A shares are sold with a maximum sales charge of 4.50%. Class C shares are subject to a 1% CDSC for the first year only. There is no sales charge for Class I, R3, R4, R5 and R6 shares. Thornburg International Value Fund; Class A shares are sold with a maximum sales charge of 4.50%. Class C shares are subject to a 1% CDSC for the first year only. There is no sales charge for Class I, R3, R4, R5 and R6 shares. As disclosed in the Funds’ most recent prospectus, the total annual fund operating expenses before fee waivers or expense reimbursements are as follows: Thornburg Global Opportunities Fund;A shares, 1.33%; C shares, 2.09%; I shares, 1.06%; R3 shares, 2.20%; R4 shares, 1.86%; R5 shares, 1.27%; R6 shares, 1.00%. Thornburg International Value Fund; A shares, 1.26%; C shares, 2.09%; I shares, 0.97%; R3 shares, 1.65%; R4 shares, 1.44%; R5 shares, 1.12%; R6 shares, 0.88%. Thornburg Investment Management has contractually agreed to waive fees and reimburse expenses until at least February 1, 2021, for some of the share classes, resulting in net expense ratios of the following: Thornburg Global Opportunities Fund; R3 shares, 1.50%; R4 shares, 1.40%; R5 shares, 0.99%; R6 shares, 0.85%. Thornburg International Value Fund;R3 shares, 1.45%; R4 shares, 1.25%; R5 shares, 0.99%. For more detailed information on fund expenses and waivers/reimbursements please see the Funds’ prospectus.
Thornburg Equity Funds Semi-Annual Report | 13
Performance Summary, Continued
March 31, 2020 (Unaudited)
AVERAGE ANNUAL TOTAL RETURNS
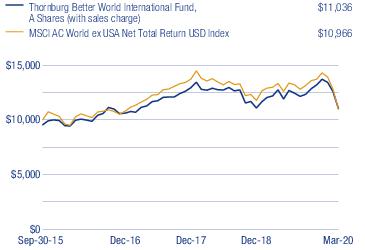
THORNBURG BETTER WORLD
INTERNATIONAL FUND | 1-YR | 3-YR | SINCE
INCEPTION |
| Class A Shares(Incep: 10/1/15) | | | |
| Without sales charge | -9.50% | -0.36% | 3.26% |
| With sales charge | -13.59% | -1.88% | 2.21% |
| Class C Shares(Incep: 10/1/15) | | | |
| Without sales charge | -10.01% | -0.91% | 2.69% |
| With sales charge | -10.91% | -0.91% | 2.69% |
| Class I Shares(Incep: 10/1/15) | -8.86% | 0.37% | 4.03% |
| MSCI AC World ex USA Net Total Return USD Index(Since 10/1/15) | -15.57% | -1.96% | 2.07% |
GROWTH OF A HYPOTHETICAL $10,000 INVESTMENT
| THORNBURG BETTER WORLD INTERNATIONAL FUND | FINAL VALUE |
AVERAGE ANNUAL TOTAL RETURNS
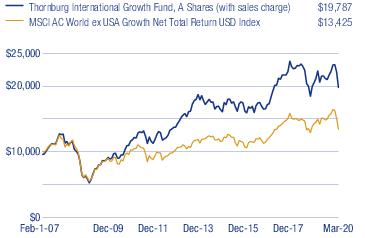
| THORNBURG INTERNATIONAL GROWTH FUND | 1-YR | 3-YR | 5-YR | 10-YR | SINCE
INCEPTION |
| Class A Shares(Incep: 2/1/07) | | | | | |
| Without sales charge | -6.63% | 2.62% | 2.89% | 7.41% | 5.69% |
| With sales charge | -10.83% | 1.05% | 1.94% | 6.92% | 5.32% |
| Class C Shares(Incep: 2/1/07) | | | | | |
| Without sales charge | -7.34% | 1.84% | 2.10% | 6.59% | 4.94% |
| With sales charge | -8.26% | 1.84% | 2.10% | 6.59% | 4.94% |
| Class I Shares(Incep: 2/1/07) | -6.35% | 2.97% | 3.27% | 7.86% | 6.19% |
| Class R3 Shares(Incep: 2/1/08) | -6.80% | 2.45% | 2.75% | 7.31% | 4.58% |
| Class R4 Shares(Incep: 2/1/08) | -6.72% | 2.55% | 2.84% | 7.42% | 4.68% |
| Class R5 Shares(Incep: 2/1/08) | -6.33% | 2.97% | 3.27% | 7.85% | 5.10% |
| Class R6 Shares(Incep: 2/1/13) | -6.23% | 3.07% | 3.38% | - | 5.01% |
| MSCI AC World ex USA Growth Net Total Return USD Index(Since 2/1/07) | -7.31% | 2.53% | 2.10% | 3.91% | 2.26% |
GROWTH OF A HYPOTHETICAL $10,000 INVESTMENT
| THORNBURG INTERNATIONAL GROWTH FUND | FINAL VALUE |
Performance data shown represents past performance and is no guarantee of future results. Investment return and principal value will fluctuate so shares, when redeemed, may be worth more or less than their original cost. Current performance may be lower or higher than quoted. For performance current to the most recent month end, visit thornburg.com or call 800-847-0200. The performance information does not reflect the deduction of taxes that a shareholder would pay on distributions or the redemption of Fund shares. Returns reflect the reinvestment of dividends and capital gains. Thornburg Better World International Fund; Class A shares are sold with a maximum sales charge of 4.50%. Class C shares are subject to a 1% CDSC for the first year only. There is no sales charge for Class I shares. Thornburg International Growth Fund; Class A shares are sold with a maximum sales charge of 4.50%. Class C shares are subject to a 1% CDSC for the first year only. There is no sales charge for Class I, R3, R4, R5 and R6 shares. As disclosed in the Funds’ most recent prospectus, the total annual fund operating expenses before fee waivers or expense reimbursements are as follows: Thornburg Better World International Fund;A shares, 2.10%; C shares, 3.48%; I shares, 1.44%. Thornburg International Growth Fund; A shares, 1.32%; C shares, 2.08%; I shares, 1.03%; R3 shares, 2.02%; R4 shares, 1.91%; R5 shares, 1.29%; R6 shares, 0.99%. Thornburg Investment Management has contractually agreed to waive fees and reimburse expenses until at least February 1, 2021, for some of the share classes, resulting in net expense ratios of the following: Thornburg Better World International Fund; A shares, 1.83%; C shares, 2.38%; I shares, 1.09%. Thornburg International Growth Fund;R3 shares, 1.50%; R4 shares, 1.40%; R5 shares, 0.99%; R6 shares, 0.89%. For more detailed information on fund expenses and waivers/reimbursements please see the Funds’ prospectus.
14 | Thornburg Equity Funds Semi-Annual Report
Performance Summary, Continued
March 31, 2020 (Unaudited)
AVERAGE ANNUAL TOTAL RETURNS
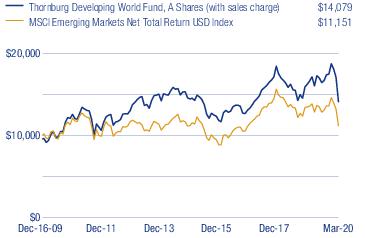
| THORNBURG DEVELOPING WORLD FUND | 1-YR | 3-YR | 5-YR | 10-YR | SINCE
INCEPTION |
| Class A Shares(Incep: 12/16/09) | | | | | |
| Without sales charge | -15.30% | 0.92% | -0.24% | 3.36% | 3.84% |
| With sales charge | -19.11% | -0.61% | -0.16% | 2.89% | 3.38% |
| Class C Shares(Incep: 12/16/09) | | | | | |
| Without sales charge | -15.90% | 0.17% | -1.00% | 2.61% | 3.09% |
| With sales charge | -16.74% | 0.17% | -1.00% | 2.61% | 3.09% |
| Class I Shares(Incep: 12/16/09) | -14.96% | 1.32% | 0.17% | 3.84% | 4.34% |
| Class R5 Shares(Incep: 2/1/13) | -15.00% | 1.32% | 0.18% | - | 0.65% |
| Class R6 Shares(Incep: 2/1/13) | -14.92% | 1.41% | 0.27% | - | 0.75% |
| MSCI Emerging Markets Net Total Return USD Index(Since 12/16/09) | -17.69% | -1.62% | -0.37% | 0.68% | 1.06% |
GROWTH OF A HYPOTHETICAL $10,000 INVESTMENT
| THORNBURG DEVELOPING WORLD FUND | FINAL VALUE |
AVERAGE ANNUAL TOTAL RETURNS
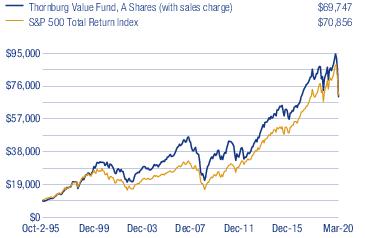
| THORNBURG VALUE FUND | 1-YR | 3-YR | 5-YR | 10-YR | SINCE
INCEPTION |
| Class A Shares(Incep: 10/2/95) | | | | | |
| Without sales charge | -16.62% | -0.62% | 2.42% | 6.11% | 8.45% |
| With sales charge | -20.38% | -2.14% | 1.48% | 5.62% | 8.25% |
| Class C Shares(Incep: 10/2/95) | | | | | |
| Without sales charge | -17.27% | -1.43% | 1.62% | 5.29% | 7.62% |
| With sales charge | -18.10% | -1.43% | 1.62% | 5.29% | 7.62% |
| Class I Shares(Incep: 11/2/98) | -16.35% | -0.28% | 2.80% | 6.51% | 6.43% |
| Class R3 Shares(Incep: 7/1/03) | -16.64% | -0.64% | 2.43% | 6.11% | 6.22% |
| Class R4 Shares(Incep: 2/1/07) | -16.57% | -0.54% | 2.53% | 6.22% | 3.90% |
| Class R5 Shares(Incep: 2/1/05) | -16.36% | -0.28% | 2.80% | 6.49% | 6.10% |
S&P 500 Total Return Index
(Since 10/2/95) | -6.98% | 5.10% | 6.73% | 10.53% | 8.32% |
GROWTH OF A HYPOTHETICAL $10,000 INVESTMENT
| THORNBURG VALUE FUND | FINAL VALUE |
Performance data shown represents past performance and is no guarantee of future results. Investment return and principal value will fluctuate so shares, when redeemed, may be worth more or less than their original cost. Current performance may be lower or higher than quoted. For performance current to the most recent month end, visit thornburg.com or call 800-847-0200. The performance information does not reflect the deduction of taxes that a shareholder would pay on distributions or the redemption of Fund shares. Returns reflect the reinvestment of dividends and capital gains. Thornburg Developing World Fund; Class A shares are sold with a maximum sales charge of 4.50%. Class C shares are subject to a 1% CDSC for the first year only. There is no sales charge for Class I, R5 and R6 shares. Thornburg Value Fund; Class A shares are sold with a maximum sales charge of 4.50%. Class C shares are subject to a 1% CDSC for the first year only. There is no sales charge for Class I, R3, R4 and R5 shares. As disclosed in the Funds’ most recent prospectus, the total annual fund operating expenses before fee waivers or expense reimbursements are as follows: Thornburg Developing World Fund; A shares, 1.50%; C shares, 2.26%; I shares, 1.19%; R5 shares, 2.07%; R6 shares, 1.14%. Thornburg Value Fund; A shares, 1.33%; C shares, 2.19%; I shares, 1.07%; R3 shares, 1.79%; R4 shares, 1.75%; R5 shares, 1.43%. Thornburg Investment Management has contractually agreed to waive fees and reimburse expenses until at least February 1, 2021, for some of the share classes, resulting in net expense ratios of the following: Thornburg Developing World Fund; I shares, 1.09%; R5 shares, 1.09%; R6 shares, 0.99%. Thornburg Value Fund; I shares, 0.99%; R3 shares, 1.35%; R4 shares, 1.25%; R5 shares, 0.99%. For more detailed information on fund expenses and waivers/reimbursements please see the Funds’ prospectus.
Thornburg Equity Funds Semi-Annual Report | 15
Performance Summary, Continued
March 31, 2020 (Unaudited)
AVERAGE ANNUAL TOTAL RETURNS
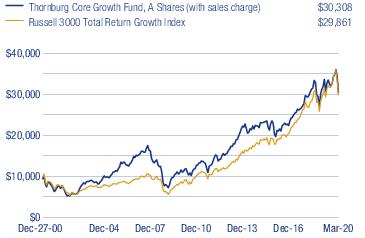
THORNBURG CORE
GROWTH FUND | 1-YR | 3-YR | 5-YR | 10-YR | SINCE
INCEPTION |
| Class A Shares(Incep: 12/27/00) | | | | | |
| Without sales charge | -4.71% | 7.54% | 5.63% | 9.97% | 6.18% |
| With sales charge | -8.99% | 5.91% | 4.66% | 9.46% | 5.93% |
| Class C Shares(Incep: 12/27/00) | | | | | |
| Without sales charge | -5.45% | 6.67% | 4.79% | 9.13% | 5.34% |
| With sales charge | -6.29% | 6.67% | 4.79% | 9.13% | 5.34% |
| Class I Shares(Incep: 11/3/03) | -4.38% | 7.93% | 6.03% | 10.43% | 8.40% |
| Class R3 Shares(Incep: 7/1/03) | -4.85% | 7.39% | 5.49% | 9.87% | 8.49% |
| Class R4 Shares(Incep: 2/1/07) | -4.75% | 7.51% | 5.60% | 9.98% | 5.32% |
| Class R5 Shares(Incep: 10/3/05) | -4.38% | 7.93% | 6.03% | 10.43% | 7.43% |
| Russell 3000 Total Return Growth Index(Since 12/27/00) | -0.44% | 10.54% | 9.74% | 12.68% | 5.85% |
GROWTH OF A HYPOTHETICAL $10,000 INVESTMENT
| THORNBURG CORE GROWTH FUND | FINAL VALUE |
AVERAGE ANNUAL TOTAL RETURNS
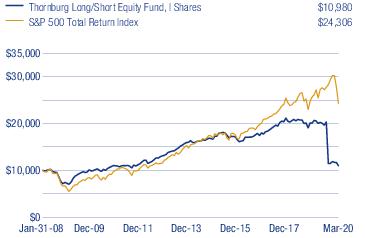
| THORNBURG LONG/SHORT EQUITY FUND* | 1-YR | 3-YR | 5-YR | 10-YR | SINCE
INCEPTION |
| Class I Shares(Incep: 12/30/16) | -7.40% | 1.63% | 2.06% | 6.57% | 5.48% |
| S&P 500 Total Return Index | -6.98% | 5.10% | 6.73% | 7.57% | 7.57% |
GROWTH OF A HYPOTHETICAL $10,000 INVESTMENT
| THORNBURG LONG/SHORT EQUITY FUND | FINAL VALUE |
Performance data shown represents past performance and is no guarantee of future results. Investment return and principal value will fluctuate so shares, when redeemed, may be worth more or less than their original cost. Current performance may be lower or higher than quoted. For performance current to the most recent month end, visit thornburg.com or call 800-847-0200. The performance information does not reflect the deduction of taxes that a shareholder would pay on distributions or the redemption of Fund shares. Returns reflect the reinvestment of dividends and capital gains. Thornburg Core Growth Fund; Class A shares are sold with a maximum sales charge of 4.50%. Class C shares are subject to a 1% CDSC for the first year only. There is no sales charge for Class I, R3, R4 and R5 shares. Thornburg Long/Short Equity Fund; there is no sales charge for Class I shares. As disclosed in the Funds’ most recent prospectus, the total annual fund operating expenses before fee waivers or expense reimbursements are as follows: Thornburg Core Growth Fund; A shares, 1.35%; C shares, 2.18%; I shares, 1.05%; R3 shares, 1.80%; R4 shares, 1.91%; R5 shares, 1.39%. Thornburg Long/Short Equity Fund; I shares, 3.47%. Thornburg Investment Management has contractually agreed to waive fees and reimburse expenses until at least February 1, 2021, for some of the share classes, resulting in net expense ratios of the following: Thornburg Core Growth Fund; I shares, 0.99%; R3 shares, 1.50%; R4 shares, 1.40%; R5 shares, 0.99%. For more detailed information on fund expenses and waivers/reimbursements please see the Funds’ prospectus.
*Performance prior to 12/30/2016 is from the predecessor fund, which was managed in a materially equivalent manner to the Thornburg Long/Short Equity Fund. The predecessor fund was not a registered mutual fund and was not subject to the same investment restrictions as the Long/Short Equity Fund. If the predecessor fund had been registered under the 1940 Act, the performance may have been different.
16 | Thornburg Equity Funds Semi-Annual Report
Glossary
March 31, 2020 (Unaudited)
The Bloomberg Barclays US Aggregate Bond Total Return Index Value USD is composed of approximately 8,000 publicly traded bonds including U.S. government, mortgage-backed, corporate and Yankee bonds. The index is weighted by the market value of the bonds included in the index.
The Bloomberg Barclays Global Aggregate Bond Index provides a broad-based measure of the global investment-grade fixed-rate debt markets. It is comprised of the U.S. Aggregate, Pan European Aggregate, and the Asian-Pacific Aggregate indices. It also includes a wide range of standard and customized sub-indices by liquidity constraint, sector, quality, and maturity.
Thornburg Investment Income Builder Fund’s Blended Index is composed of 25% Bloomberg Barclays US Aggregate Bond Total Return Index Value USD and 75% MSCI World Net Total Return USD Index, rebalanced monthly.
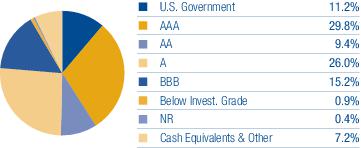
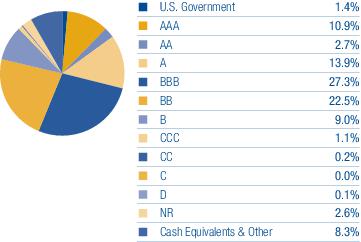
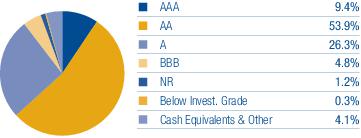
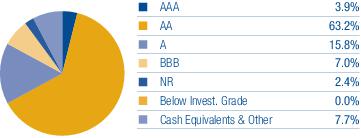
Bond Credit Ratings (Credit Quality) – A bond credit rating assesses the financial ability of a debt issuer to make timely payments of principal and interest. Ratings of AAA (the highest), AA, A, and BBB are investment-grade quality. Ratings of BB, B, CCC, CC, C and D (the lowest) are considered below investment grade, speculative grade, or junk bonds.
The MSCI World Net Total Return USD Index is an unmanaged market-weighted index that consists of securities traded in 23 of the world’s most developed countries. Securities are listed on exchanges in the U.S., Europe, Canada, Australia, New Zealand, and the Far East. The index is calculated with net dividends reinvested in U.S. dollars.
The MSCI All Country (AC) World Net Total Return USD Index is a market capitalization weighted index that is representative of the market structure of 47 developed and emerging market countries in North and South America, Europe, Africa, the Middle East, and the Pacific Rim. The index is calculated with net dividends reinvested in U.S. dollars.
The MSCI All Country (AC) World ex USA Net Total Return USD Index is a market capitalization weighted index representative of the market structure of 45 developed and emerging market countries in North and South America, Europe, Africa, and the Pacific Rim, excluding securities of United States issuers. Beginning in January 2001, the index is calculated with net dividends reinvested in U.S. dollars. Prior data is calculated with gross dividends.
The MSCI EAFE (Europe, Australasia, Far East) Net Total Return USD Index is an unmanaged index. It is a generally accepted benchmark for major overseas markets. Index weightings represent the relative capitalizations of the major overseas developed markets on a U.S. dollar adjusted basis. The index is calculated with net dividends reinvested in U.S. dollars.
The MSCI All Country (AC) World ex USA Growth Net Total Return USD Index is a market capitalization weighted index that includes growth companies in developed and emerging markets throughout the world, excluding the United States.
The MSCI Emerging Markets Net Total Return USD Index is a free float-adjusted market capitalization index that is designed to measure equity market performance of emerging markets. The MSCI Emerging Markets Index consists of the following 23 emerging market country indexes: Brazil, Chile, China, Colombia, Czech Republic, Egypt, Greece, Hungary, India, Indonesia, Korea, Malaysia, Mexico, Peru, Philippines, Poland, Qatar, Russia, South Africa, Taiwan, Thailand, Turkey and United Arab Emirates.
The S&P 500 Total Return Index is an unmanaged broad measure of the U.S. stock market.
The Russell 3000 Total Return Growth Index is an unmanaged index comprised of those Russell 3000 companies with higher price-to-book ratios and higher forecasted growth values. The stocks in this index are also members of either the Russell 1000 Growth or the Russell 2000 Growth indices. Source: Frank Russell Company.
P/E - Price/Earnings ratio (P/E ratio) is a valuation ratio of a company’s current share price compared to its per-share earnings. P/E equals a company’s market value per share divided by earnings per share. Forecasted P/E is not intended to be a forecast of the Fund’s future performance.
Price/Book ratio (P/B ratio) – A ratio used to compare a stock’s market value to its book value. It is calculated by dividing the current closing price of the stock by the latest quarter’s book value per share.
Yield to Worst (YTW) – The lowest potential yield that can be received on a bond without the issuer actually defaulting.
The performance of any index is not indicative of the performance of any particular investment. Unless otherwise noted, index returns reflect the reinvestment of income dividends and capital gains, if any, but do not reflect fees, brokerage commissions or other expenses of investing. Investors may not make direct investments into any index.
Any securities, sectors, or countries mentioned are for illustration purposes only. Holdings are subject to change. Under no circumstances does the information contained within represent a recommendation to buy or sell any security.
The information given should not be considered tax advice. Please consult your tax advisor for personal tax questions and concerns.
Thornburg Equity Funds Semi-Annual Report | 17
The Dividend Landscape
Thornburg Investment Income Builder Fund | March 31, 2020 (Unaudited)
To appreciate the investment environment in which Thornburg Investment Income Builder Fund operates, you may wish to review these highlights of the “dividend landscape.”
The S&P 500 Index Payout Ratio — A Historical Perspective
The dividend payout ratio is a fraction that expresses dividend payments as a percentage of per-share earnings. As the economy slowed in the wake of the financial crisis, earnings-per-share on average declined, causing the payout ratio to spike, even as dividends paid by the S&P 500 portfolio declined. Earnings have since materially improved, bringing the payout ratio back in line with the overall trend in recent times.
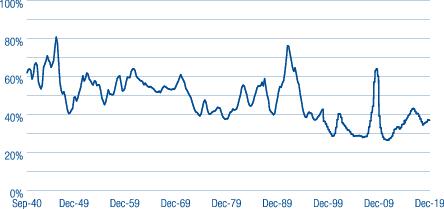
Corporate Willingness to Pay Dividends is Key to the Fund’s Investment Process
The Russell 1000 Index includes approximately 1,000 public companies that are supposed to be generally representative of corporate America. Between 1980 and 1993, at least 75% of these firms paid some dividend. Between 1994 and 2001, the percentage of Russell 1000 companies paying dividends sank to just over 50%, indicating a preference towards reinvesting retained earnings in growth initiatives. Dividends returned to fashion between 2002 and 2008. A reduction in the number of Russell 1000 firms paying dividends followed the 2008 recession. However, from early 2010, the number steadily climbed back to around 70%.
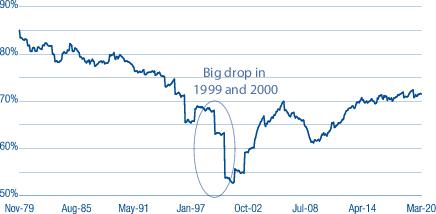
Rising Dividend Payments Despite Decreasing Dividend Yields
Over time, the dollar dividend per unit of the S&P 500 Index has generally increased. Because the price of the index itself has increased even more, the yield on the S&P 500 Index, as a percentage of the current index price, has generally decreased in recent decades. You should note, however, that the dollar yield on an original investment made at a fixed point in time (say, 1970 or 1989) has increased, even without reinvestment of dividends.
S&P 500 Index Payout Ratio
Source: Bloomberg, beginning in 1999 (uses operating earnings); “Irrational Exuberance”
by Robert J. Shiller, through 1998 (uses reported earnings).
Source: CSFB Quantitative and Equity Derivatives Strategy, Baseline, and FactSet.
Source: Bloomberg and FactSet as of 12/31/19
Past performance does not guarantee future results.
18 | Thornburg Equity Funds Semi-Annual Report
The Dividend Landscape, Continued
Thornburg Investment Income Builder Fund | March 31, 2020 (Unaudited)
The Top 100 Dividend Yields
| | RUSSELL 1000
INDEX | RUSSELL 2000
INDEX |
| Real Estate | 27% | 31% |
| Financials | 21% | 27% |
| Consumer Discretionary | 19% | 10% |
| Energy | 18% | 15% |
| Industrials | 4% | 6% |
| Materials | 4% | 2% |
| Consumer Staples | 2% | 1% |
| Information Technology | 2% | 1% |
| Communication Services | 2% | 6% |
| Utilities | 1% | 1% |
| Health Care | 0% | 0% |
A Truly Diversified Dividend-Paying Portfolio Must Look Beyond the Obvious High-Yield Stocks!
In the (large cap) Russell 1000 Index, 49% of the top 100 dividend payers are in the real estate and financials sectors. In the (small cap) Russell 2000 Index, 60% of the top 100 dividend-yielding stocks are real estate or financials companies. To construct a diversified portfolio of attractive yielding stocks, one must look beyond these sectors. We certainly do.
Dividend yield is a ratio that shows how much a company pays out in dividends each year relative to its share price.
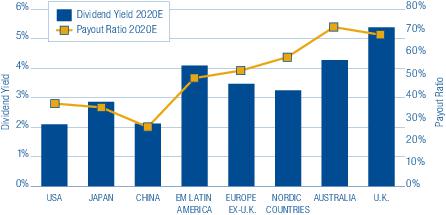
Global Diversification Can Improve the Portfolio Yield
Since firms outside the U.S. tend to pay higher dividends than U.S. firms, particularly outside the financial and utility sectors, we maintain the ability to diversify the Thornburg Investment Income Builder Fund into foreign dividend-paying stocks to try to take advantage of these opportunities.
Diversification does not assure or guarantee better performance and cannot eliminate the risk of investment losses.
Dividends are not guaranteed.
Thornburg Equity Funds Semi-Annual Report | 19
Fund Summary
Thornburg Investment Income Builder Fund | March 31, 2020 (Unaudited)
OBJECTIVES AND STRATEGIES
The Fund seeks to provide a level of current income which exceeds the average yield on U.S. stocks generally, and which will generally grow, subject to periodic fluctuations, over the years on a per share basis. The Fund’s secondary investment objective is long-term capital appreciation.
The Fund may invest in any domestic or foreign equity or debt security which Thornburg Investment Management believes may assist the Fund in pursuing its investment goals, although the Fund expects that equity securities in its portfolio will normally be weighted in favor of companies that pay dividends or other current income.
PORTFOLIO COMPOSITION
| TOP TEN EQUITY HOLDINGS |
| Orange SA | 5.4% |
| China Mobile Ltd. | 4.3% |
| Taiwan Semiconductor Manufacturing Co. Ltd. | 3.9% |
| Roche Holding AG | 3.4% |
| Deutsche Telekom AG | 3.3% |
| CME Group, Inc. | 2.9% |
| TOTAL S.A. | 2.8% |
| Merck & Co., Inc. | 2.8% |
| Walgreens Boots Alliance, Inc. | 2.7% |
| JPMorgan Chase & Co. | 2.7% |
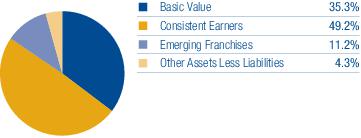
SECTOR EXPOSURE
(percent of equity holdings) |
| Financials | 20.7% |
| Communication Services | 20.0% |
| Health Care | 14.1% |
| Information Technology | 11.7% |
| Energy | 8.6% |
| Consumer Staples | 5.2% |
| Utilities | 5.2% |
| Real Estate | 4.1% |
| Materials | 4.0% |
| Industrials | 3.2% |
| Consumer Discretionary | 3.2% |
COUNTRY EXPOSURE *
(percent of Fund) |
| United States | 38.1% |
| France | 11.5% |
| Switzerland | 8.7% |
| Netherlands | 6.0% |
| United Kingdom | 5.9% |
| Italy | 5.0% |
| China | 4.4% |
| Taiwan | 3.9% |
| Germany | 3.7% |
| South Korea | 3.5% |
| Russian Federation | 2.2% |
| Spain | 1.4% |
| Singapore | 0.9% |
| Australia | 0.7% |
| South Africa | 0.4% |
| Ireland | 0.3% |
| Jamaica | 0.3% |
| Colombia | 0.3% |
| Canada | 0.2% |
| Brazil | 0.1% |
| Cayman Islands | 0.1% |
| Japan | 0.1% |
| Belgium | 0.1% |
| Mexico | 0.0%** |
| Saint Lucia | 0.0%** |
| Other Assets Less Liabilities | 2.2% |
| * | Holdings are classified by country of risk as determined by MSCI and Bloomberg. |
| ** | Country percentage was less than 0.1%. |
20 | Thornburg Equity Funds Semi-Annual Report
Fund Summary, Continued
Thornburg Investment Income Builder Fund | March 31, 2020 (Unaudited)
| QUARTERLY DIVIDEND HISTORY, CLASS A |
| YEAR | Q1 | Q2 | Q3 | Q4 | TOTAL |
| 2003 | 9.2¢ | 11.2¢ | 12.4¢ | 17.5¢ | 50.3¢ |
| 2004 | 10.2¢ | 12.5¢ | 15.0¢ | 21.8¢ | 59.5¢ |
| 2005 | 11.0¢ | 13.6¢ | 17.4¢ | 29.0¢ | 71.0¢ |
| 2006 | 12.5¢ | 16.0¢ | 19.2¢ | 33.0¢ | 80.7¢ |
| 2007 | 14.2¢ | 18.5¢ | 21.5¢ | 36.8¢ | 91.0¢ |
| 2008 | 17.9¢ | 21.8¢ | 26.0¢ | 36.8¢ | 102.5¢ |
| 2009 | 18.0¢ | 24.2¢ | 28.0¢ | 34.5¢ | 104.7¢ |
| 2010 | 19.8¢ | 25.0¢ | 32.0¢ | 36.0¢ | 112.8¢ |
| 2011 | 21.0¢ | 26.0¢ | 32.0¢ | 37.5¢ | 116.5¢ |
| 2012 | 21.5¢ | 26.0¢ | 28.5¢ | 36.0¢ | 112.0¢ |
| 2013 | 21.5¢ | 25.3¢ | 25.0¢ | 24.5¢ | 96.3¢ |
| 2014 | 22.5¢ | 24.0¢ | 27.0¢ | 26.0¢ | 99.5¢ |
| 2015 | 16.5¢ | 20.0¢ | 20.0¢ | 25.3¢ | 81.8¢ |
| 2016 | 17.0¢ | 18.5¢ | 19.5¢ | 21.5¢ | 76.5¢ |
| 2017 | 17.0¢ | 20.0¢ | 26.0¢ | 29.5¢ | 92.5¢ |
| 2018 | 18.0¢ | 20.0¢ | 24.0¢ | 28.0¢ | 90.0¢ |
| 2019 | 19.0¢ | 21.5¢ | 25.0¢ | 30.0¢ | 95.5¢ |
| 2020 | 19.0¢ | | | | |
We do not expect each sequential quarter’s dividend to increase over that of the prior quarter, since dividend payments outside the United States tend to be seasonal. Rather, the Fund aspires to increase the dividend paid on an annual basis.
Thornburg Equity Funds Semi-Annual Report | 21
Fund Summary, Continued
Thornburg Investment Income Builder Fund | March 31, 2020 (Unaudited)
EVOLUTION OF INDUSTRY GROUP EXPOSURE
Top 10 industry groups quarter by quarter (percent of equity holdings)
| As of 3/31/2020 | |
| Telecommunication Services | 20.0% |
| Pharmaceuticals, Biotechnology & Life Sciences | 14.1% |
| Diversified Financials | 10.3% |
| Semiconductors & Semiconductor Equipment | 9.2% |
| Energy | 8.6% |
| Banks | 5.6% |
| Utilities | 5.2% |
| Insurance | 4.6% |
| Real Estate | 4.1% |
| Materials | 4.0% |
| As of 12/31/2019 | |
| Telecommunication Services | 15.5% |
| Diversified Financials | 13.6% |
| Energy | 12.9% |
| Pharmaceuticals, Biotechnology & Life Sciences | 9.6% |
| Semiconductors & Semiconductor Equipment | 9.5% |
| Banks | 6.0% |
| Materials | 5.4% |
| Utilities | 4.7% |
| Real Estate | 3.9% |
| Insurance | 3.0% |
| As of 9/30/2019 | |
| Telecommunication Services | 15.8% |
| Diversified Financials | 15.7% |
| Energy | 12.7% |
| Pharmaceuticals, Biotechnology & Life Sciences | 9.1% |
| Semiconductors & Semiconductor Equipment | 8.5% |
| Banks | 5.5% |
| Materials | 5.3% |
| Utilities | 4.7% |
| Real Estate | 4.1% |
| Insurance | 3.0% |
| As of 6/30/2019 | |
| Telecommunication Services | 17.3% |
| Diversified Financials | 15.1% |
| Energy | 13.1% |
| Pharmaceuticals, Biotechnology & Life Sciences | 7.9% |
| Semiconductors & Semiconductor Equipment | 7.8% |
| Banks | 5.9% |
| Materials | 5.1% |
| Utilities | 4.7% |
| Real Estate | 3.9% |
| Transportation | 3.9% |
THORNBURG INVESTMENT INCOME
BUILDER FUND | NASDAQ SYMBOLS | CUSIPS |
| Class A | TIBAX | 885-215-558 |
| Class C | TIBCX | 885-215-541 |
| Class I | TIBIX | 885-215-467 |
| Class R3 | TIBRX | 885-215-384 |
| Class R4 | TIBGX | 885-215-186 |
| Class R5 | TIBMX | 885-215-236 |
| Class R6 | TIBOX | 885-216-663 |
Class I, R3, R4, R5, and R6 shares may not be available to all investors. Minimum investments for Class I shares may be higher than those for other classes.
There is no guarantee that the Fund will meet its investment objectives.
All data is subject to change. Charts may not add up to 100% due to rounding.
22 | Thornburg Equity Funds Semi-Annual Report
Fund Summary
Thornburg Summit Fund | March 31, 2020 (Unaudited)
OBJECTIVES AND STRATEGIES
The Fund seeks to grow real wealth over time. “Real wealth” for this purpose is a mix of capital appreciation and current income that is intended to exceed the rate of inflation. While the Fund seeks to achieve its goal over a variety of different market environments by selecting investments from a range of asset classes, the value of an investment in the Fund will fluctuate and the Fund may not achieve its goal in every environment or in all environments. Under normal conditions the Fund’s investments are expected to emphasize long positions in equity securities and fixed income obligations, though the Fund may also invest a significant amount of its assets in short positions in equity securities and fixed income obligations, in commodities-related investments, in derivative instruments, in currencies, and in cash or cash equivalents. There are no specific percentage limitations on the amount of the Fund’s portfolio that may be invested in a particular asset class, and the proportions of the Fund’s assets that are invested in the respective asset classes are expected to vary over time and from time to time depending upon Thornburg’s perceptions of which types of investments represent better values and opportunities to achieve the Fund’s investment goal.
With respect to its equity investments, the Fund may invest in any stock or equity security, including common stocks, preferred stocks, convertible securities, warrants, depositary receipts, partnership interests, publicly traded real estate investment trusts, and shares in exchange traded funds. The Fund may invest in companies of any size. The Fund’s portfolio may include investments in United States issuers and the securities of issuers domiciled outside the
United States, including developing countries. The relative proportions of the Fund’s U.S. and foreign investments will vary over time depending upon Thornburg’s view of specific investment opportunities and macroeconomic factors.
PORTFOLIO COMPOSITION
SECTOR EXPOSURE
(percent of equity holdings) |
| Information Technology | 26.2% |
| Consumer Discretionary | 19.4% |
| Financials | 17.2% |
| Communication Services | 10.9% |
| Health Care | 7.6% |
| Energy | 6.7% |
| Consumer Staples | 5.4% |
| Industrials | 2.8% |
| Utilities | 2.4% |
| Materials | 1.4% |
Thornburg Equity Funds Semi-Annual Report | 23
Fund Summary, Continued
Thornburg Summit Fund | March 31, 2020 (Unaudited)
COUNTRY EXPOSURE *
(percent of Fund) |
| United States | 64.2% |
| Netherlands | 4.6% |
| France | 3.3% |
| Japan | 3.0% |
| India | 2.4% |
| China | 2.4% |
| Taiwan | 2.1% |
| Switzerland | 1.6% |
| Germany | 1.5% |
| Hong Kong | 1.2% |
| United Kingdom | 1.2% |
| Australia | 1.0% |
| Argentina | 1.0% |
| United Arab Emirates | 0.6% |
| Canada | 0.5% |
| Ireland | 0.5% |
| Brazil | 0.5% |
| Mexico | 0.1% |
| Other Assets Less Liabilities | 8.3% |
| * | Holdings are classified by country of risk as determined by MSCI and Bloomberg. |
| TOP TEN LONG HOLDINGS |
| Visa, Inc. Class A | 3.1% |
| Microsoft Corp. | 3.1% |
| JPMorgan Chase & Co. | 2.5% |
| CME Group, Inc. | 2.4% |
| Facebook, Inc. Class A | 2.1% |
| Amazon.com, Inc. | 2.0% |
| Royal Dutch Shell plc Class A | 1.9% |
| HDFC Bank Ltd. ADR | 1.8% |
| Estee Lauder Cos, Inc. | 1.8% |
| Alphabet, Inc. Class A | 1.7% |
| THORNBURG SUMMIT FUND | NASDAQ SYMBOLS | CUSIPS |
| Class I | TSUMX | 885-216-580 |
Class I shares may not be available to all investors. Minimum investments for Class I shares may be higher than those for other classes. Class A shares are not currently available for purchase.
There is no guarantee that the Fund will meet its investment objectives.
All data is subject to change. Charts may not add up to 100% due to rounding.
24 | Thornburg Equity Funds Semi-Annual Report
Fund Summary
Thornburg Global Opportunities Fund | March 31, 2020 (Unaudited)
OBJECTIVES AND STRATEGIES
The Fund seeks long-term capital appreciation by investing in equity and debt securities of all types from issuers around the world.
The Fund pursues its investment goals by investing primarily in a broad range of equity securities, including common stocks, preferred stocks, real estate investment trusts, other equity trusts, and partnership interests. The Fund may invest in any stock or other equity security which the investment advisor believes may assist the Fund in pursuing its goals, including smaller companies with market capitalizations of less than $500 million. The Fund may also invest in debt obligations of any kind.
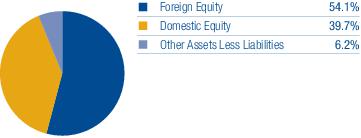
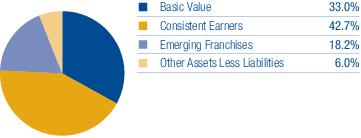
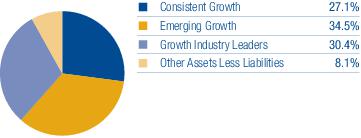
ASSET STRUCTURE
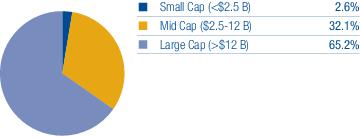
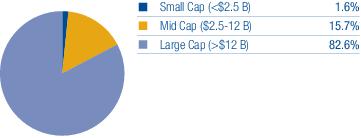
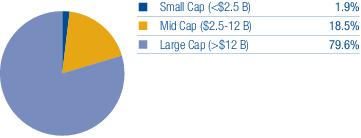
MARKET CAPITALIZATION EXPOSURE
| TOP TEN EQUITY HOLDINGS |
| Alphabet, Inc. Class A | 5.6% |
| Facebook, Inc. Class A | 5.4% |
| Qorvo, Inc. | 5.2% |
| Alibaba Group Holding Ltd. | 5.1% |
| Reliance Industries Ltd. | 5.0% |
| Vestas Wind Systems A/S | 4.7% |
| GDS Holdings Ltd. ADR | 4.6% |
| Samsung Electronics Co. Ltd. | 4.2% |
| OCI N.V. | 4.0% |
| AbbVie, Inc. | 3.9% |
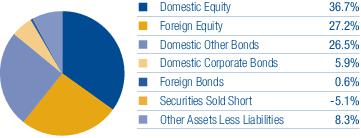
| SECTOR EXPOSURE |
| Communication Services | 20.1% |
| Information Technology | 15.8% |
| Financials | 13.0% |
| Industrials | 12.4% |
| Health Care | 9.2% |
| Materials | 8.6% |
| Consumer Discretionary | 7.1% |
| Energy | 5.0% |
| Consumer Staples | 2.5% |
| Utilities | 0.1% |
| Other Assets Less Liabilities | 6.2% |
Thornburg Equity Funds Semi-Annual Report | 25
Fund Summary, Continued
Thornburg Global Opportunities Fund | March 31, 2020 (Unaudited)
| TOP TEN INDUSTRY GROUPS |
| Media & Entertainment | 13.3% |
| Materials | 8.6% |
| Semiconductors & Semiconductor Equipment | 6.9% |
| Pharmaceuticals, Biotechnology & Life Sciences | 6.8% |
| Telecommunication Services | 6.8% |
| Transportation | 6.8% |
| Capital Goods | 5.6% |
| Diversified Financials | 5.7% |
| Retailing | 5.1% |
| Energy | 5.0% |
COUNTRY EXPOSURE *
(percent of equity holdings) |
| United States | 42.4% |
| China | 13.5% |
| Netherlands | 8.0% |
| India | 5.3% |
| Denmark | 5.0% |
| South Korea | 4.5% |
| Taiwan | 4.2% |
| United Kingdom | 4.2% |
| Italy | 3.7% |
| Switzerland | 2.9% |
| Australia | 2.6% |
| Ireland | 2.1% |
| Macao | 1.5% |
| France | 0.1% |
| * | Holdings are classified by country of risk as determined by MSCI and Bloomberg. |
| THORNBURG GLOBAL OPPORTUNITIES FUND | NASDAQ SYMBOLS | CUSIPS |
| Class A | THOAX | 885-215-343 |
| Class C | THOCX | 885-215-335 |
| Class I | THOIX | 885-215-327 |
| Class R3 | THORX | 885-215-145 |
| Class R4 | THOVX | 885-215-137 |
| Class R5 | THOFX | 885-215-129 |
| Class R6 | THOGX | 885-216-655 |
Class I, R3, R4, R5, and R6 shares may not be available to all investors. Minimum investments for Class I shares may be higher than those for other classes.
There is no guarantee that the Fund will meet its investment objectives.
All data is subject to change. Charts may not add up to 100% due to rounding.
26 | Thornburg Equity Funds Semi-Annual Report
Fund Summary
Thornburg International Value Fund | March 31, 2020 (Unaudited)
OBJECTIVES AND STRATEGIES
The Fund seeks long-term capital appreciation by investing in equity and debt securities of all types. As a secondary goal, the Fund also seeks some current income.
The Fund invests primarily in foreign securities or depositary receipts of foreign securities. The Fund may invest in developing countries.
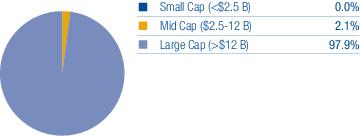
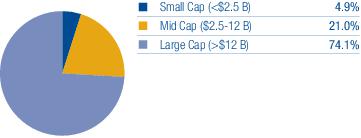
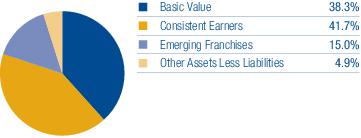
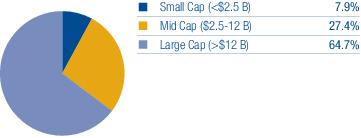
MARKET CAPITALIZATION EXPOSURE
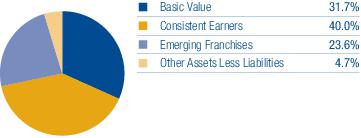
BASKET STRUCTURE
| TOP TEN EQUITY HOLDINGS |
| Telefonaktiebolaget LM Ericsson Class B | 3.2% |
| Alibaba Group Holding Ltd. | 3.0% |
| Lonza Group AG | 2.9% |
| Tencent Holdings Ltd. | 2.8% |
| Ferrovial S.A. | 2.8% |
| Nintendo Co. Ltd. | 2.7% |
| Vinci S.A. | 2.7% |
| BAE Systems plc | 2.7% |
| adidas AG | 2.7% |
| Meituan Dianping Class B | 2.6% |
| SECTOR EXPOSURE |
| Industrials | 19.5% |
| Information Technology | 12.5% |
| Consumer Staples | 12.1% |
| Communication Services | 12.0% |
| Financials | 11.2% |
| Consumer Discretionary | 9.3% |
| Utilities | 6.1% |
| Health Care | 5.0% |
| Materials | 3.4% |
| Energy | 2.8% |
| Other Assets Less Liabilities | 6.1% |
Thornburg Equity Funds Semi-Annual Report | 27
Fund Summary, Continued
Thornburg International Value Fund | March 31, 2020 (Unaudited)
| TOP TEN INDUSTRY GROUPS |
| Capital Goods | 14.5% |
| Food, Beverage & Tobacco | 8.7% |
| Media & Entertainment | 8.1% |
| Utilities | 6.1% |
| Retailing | 5.6% |
| Banks | 5.0% |
| Semiconductors & Semiconductor Equipment | 4.5% |
| Technology Hardware & Equipment | 4.4% |
| Insurance | 4.0% |
| Pharmaceuticals, Biotechnology & Life Sciences | 4.0% |
COUNTRY EXPOSURE *
(percent of equity holdings) |
| China | 20.8% |
| Switzerland | 14.7% |
| France | 14.2% |
| Japan | 9.3% |
| Germany | 8.2% |
| Spain | 7.3% |
| United Kingdom | 6.9% |
| Netherlands | 5.6% |
| Sweden | 3.4% |
| Canada | 2.6% |
| Italy | 2.0% |
| South Korea | 1.9% |
| India | 1.0% |
| Taiwan | 0.9% |
| United States | 0.7% |
| Hong Kong | 0.5% |
| * | Holdings are classified by country of risk as determined by MSCI and Bloomberg. |
| THORNBURG INTERNATIONAL VALUE FUND | NASDAQ SYMBOLS | CUSIPS |
| Class A | TGVAX | 885-215-657 |
| Class C | THGCX | 885-215-640 |
| Class I | TGVIX | 885-215-566 |
| Class R3 | TGVRX | 885-215-525 |
| Class R4 | THVRX | 885-215-269 |
| Class R5 | TIVRX | 885-215-368 |
| Class R6 | TGIRX | 885-216-804 |
Class I, R3, R4, R5, and R6 shares may not be available to all investors. Minimum investments for Class I shares may be higher than those for other classes.
There is no guarantee that the Fund will meet its investment objectives.
All data is subject to change. Charts may not add up to 100% due to rounding.
28 | Thornburg Equity Funds Semi-Annual Report
Fund Summary
Thornburg Better World International Fund | March 31, 2020 (Unaudited)
OBJECTIVES AND STRATEGIES
The Fund seeks long-term capital appreciation.
The Fund invests primarily in a broad range of foreign companies that demonstrate one or more positive environmental, social, and governance (ESG) characteristics that the investment manager identifies as significant. The Fund targets companies of any size or country of origin, and which we believe are high-quality and attractively valued.
MARKET CAPITALIZATION EXPOSURE
BASKET STRUCTURE
| TOP TEN EQUITY HOLDINGS |
| Alibaba Group Holding Ltd. | 4.6% |
| Tencent Holdings Ltd. | 4.5% |
| Sony Corp. | 3.5% |
| AIA Group Ltd. | 3.3% |
| Enel S.p.A. | 3.0% |
| Nomad Foods Ltd. | 2.7% |
| Fresenius Medical Care AG & Co. KGaA | 2.7% |
| Takeda Pharmaceutical Co. Ltd. | 2.2% |
| Kao Corp. | 2.1% |
| Reckitt Benckiser Group plc | 2.1% |
| SECTOR EXPOSURE |
| Consumer Discretionary | 17.3% |
| Health Care | 14.3% |
| Information Technology | 12.3% |
| Financials | 11.0% |
| Communication Services | 10.7% |
| Consumer Staples | 9.8% |
| Industrials | 9.6% |
| Materials | 5.9% |
| Utilities | 3.5% |
| Real Estate | 0.9% |
| Other Assets Less Liabilities | 4.7% |
Thornburg Equity Funds Semi-Annual Report | 29
Fund Summary, Continued
Thornburg Better World International Fund | March 31, 2020 (Unaudited)
| TOP TEN INDUSTRY GROUPS |
| Retailing | 8.9% |
| Consumer Durables & Apparel | 8.4% |
| Capital Goods | 8.1% |
| Health Care Equipment & Services | 7.5% |
| Media & Entertainment | 7.4% |
| Insurance | 7.0% |
| Pharmaceuticals, Biotechnology & Life Sciences | 6.8% |
| Materials | 5.9% |
| Household & Personal Products | 5.6% |
| Semiconductors & Semiconductor Equipment | 5.3% |
COUNTRY EXPOSURE *
(percent of equity holdings) |
| China | 14.6% |
| Japan | 14.1% |
| Germany | 13.3% |
| France | 11.7% |
| United Kingdom | 9.6% |
| United States | 6.7% |
| Italy | 5.6% |
| Switzerland | 5.2% |
| Netherlands | 5.1% |
| Hong Kong | 3.4% |
| Denmark | 2.6% |
| Ireland | 2.2% |
| Taiwan | 2.0% |
| Norway | 1.3% |
| Sweden | 1.2% |
| Spain | 0.7% |
| Brazil | 0.7% |
| * | Holdings are classified by country of risk as determined by MSCI and Bloomberg. |
| BETTER WORLD INTERNATIONAL FUND | NASDAQ SYMBOLS | CUSIPS |
| Class A | TBWAX | 885-216-721 |
| Class C | TBWCX | 885-216-713 |
| Class I | TBWIX | 885-216-697 |
Class I shares may not be available to all investors. Minimum investments for Class I shares may be higher than those for other classes.
There is no guarantee that the Fund will meet its investment objectives.
All data is subject to change. Charts may not add up to 100% due to rounding.
30 | Thornburg Equity Funds Semi-Annual Report
Fund Summary
Thornburg International Growth Fund | March 31, 2020 (Unaudited)
OBJECTIVES AND STRATEGIES
The Fund seeks long-term growth of capital by investing in equity securities selected for their growth potential.
The Fund normally invests at least 75% of its assets in foreign securities or depositary receipts of foreign securities. However, the Fund may own a variety of securities, including domestic equity securities, partnership interests, and debt obligations. The Fund may also invest in developing countries.
MARKET CAPITALIZATION EXPOSURE
BASKET STRUCTURE
| TOP TEN EQUITY HOLDINGS |
| Alibaba Group Holding Ltd. | 6.0% |
| Tencent Holdings Ltd. | 4.9% |
| AstraZeneca plc | 4.1% |
| Wirecard AG | 3.3% |
| Lonza Group AG | 3.2% |
| Activision Blizzard, Inc. | 3.0% |
| Adyen N.V. | 2.9% |
| Kerry Group plc Class A | 2.7% |
| adidas AG | 2.7% |
| SK Hynix, Inc. | 2.5% |
| SECTOR EXPOSURE |
| Information Technology | 25.4% |
| Consumer Discretionary | 19.4% |
| Communication Services | 16.9% |
| Health Care | 13.0% |
| Consumer Staples | 7.6% |
| Financials | 3.9% |
| Industrials | 3.8% |
| Energy | 1.9% |
| Other Assets Less Liabilities | 8.1% |
Thornburg Equity Funds Semi-Annual Report | 31
Fund Summary, Continued
Thornburg International Growth Fund | March 31, 2020 (Unaudited)
| TOP TEN INDUSTRY GROUPS |
| Software & Services | 18.7% |
| Media & Entertainment | 16.9% |
| Retailing | 11.0% |
| Pharmaceuticals, Biotechnology & Life Sciences | 9.1% |
| Food, Beverage & Tobacco | 6.8% |
| Semiconductors & Semiconductor Equipment | 6.7% |
| Consumer Durables & Apparel | 4.3% |
| Consumer Services | 4.1% |
| Diversified Financials | 3.9% |
| Health Care Equipment & Services | 3.9% |
COUNTRY EXPOSURE *
(percent of equity holdings) |
| China | 16.9% |
| United States | 11.4% |
| France | 10.8% |
| Germany | 10.8% |
| United Kingdom | 8.8% |
| Netherlands | 7.0% |
| Japan | 6.9% |
| Australia | 3.6% |
| Switzerland | 3.5% |
| Ireland | 2.9% |
| South Korea | 2.8% |
| Taiwan | 2.7% |
| Mexico | 2.0% |
| Russian Federation | 1.9% |
| Israel | 1.9% |
| United Arab Emirates | 1.7% |
| Sweden | 1.7% |
| Argentina | 1.6% |
| Macao | 1.0% |
| Brazil | 0.1% |
��
| * | Holdings are classified by country of risk as determined by MSCI and Bloomberg. |
| THORNBURG INTERNATIONAL GROWTH FUND | NASDAQ SYMBOLS | CUSIPS |
| Class A | TIGAX | 885-215-319 |
| Class C | TIGCX | 885-215-293 |
| Class I | TINGX | 885-215-244 |
| Class R3 | TIGVX | 885-215-178 |
| Class R4 | TINVX | 885-215-160 |
| Class R5 | TINFX | 885-215-152 |
| Class R6 | THGIX | 885-216-820 |
Class I, R3, R4, R5, and R6 shares may not be available to all investors. Minimum investments for Class I shares may be higher than those for other classes.
There is no guarantee that the Fund will meet its investment objectives.
All data is subject to change. Charts may not add up to 100% due to rounding.
32 | Thornburg Equity Funds Semi-Annual Report
Fund Summary
Thornburg Developing World Fund | March 31, 2020 (Unaudited)
OBJECTIVES AND STRATEGIES
The Fund seeks long-term capital appreciation. Under normal market conditions the Fund invests at least 80% of its assets in equity securities of developing country issuers. A developing country issuer is a company or sovereign entity that is domiciled or otherwise tied economically to one or more developing countries. The Fund may invest in issuers of any size of capitalization, including small companies.
MARKET CAPITALIZATION EXPOSURE
BASKET STRUCTURE
| TOP TEN EQUITY HOLDINGS |
| Alibaba Group Holding Ltd. | 9.3% |
| Tencent Holdings Ltd. | 7.6% |
| Samsung Electronics Co. Ltd. | 6.0% |
| Taiwan Semiconductor Manufacturing Co. Ltd. | 4.9% |
| AIA Group Ltd. | 4.4% |
| HDFC Bank Ltd. | 3.3% |
| Ping An Insurance Group Co. of China Ltd. Class H | 3.2% |
| Unilever N.V. | 3.0% |
| Reliance Industries Ltd. | 2.6% |
| Shenzhou International Group Holdings Ltd. | 2.5% |
| SECTOR EXPOSURE |
| Financials | 25.7% |
| Consumer Discretionary | 18.7% |
| Information Technology | 17.1% |
| Communication Services | 11.5% |
| Consumer Staples | 6.9% |
| Energy | 4.7% |
| Industrials | 3.3% |
| Materials | 3.3% |
| Utilities | 2.4% |
| Health Care | 1.5% |
| Other Assets Less Liabilities | 4.9% |
Thornburg Equity Funds Semi-Annual Report | 33
Fund Summary, Continued
Thornburg Developing World Fund | March 31, 2020 (Unaudited)
| TOP TEN INDUSTRY GROUPS |
| Banks | 12.9% |
| Retailing | 10.6% |
| Media & Entertainment | 9.5% |
| Semiconductors & Semiconductor Equipment | 7.8% |
| Insurance | 7.6% |
| Technology Hardware & Equipment | 7.7% |
| Diversified Financials | 5.2% |
| Energy | 4.7% |
| Consumer Services | 4.3% |
| Consumer Durables & Apparel | 3.8% |
COUNTRY EXPOSURE *
(percent of equity holdings) |
| China | 36.6% |
| India | 10.2% |
| Taiwan | 6.9% |
| South Korea | 6.3% |
| Russian Federation | 6.0% |
| Hong Kong | 5.8% |
| Brazil | 4.3% |
| United States | 4.1% |
| United Kingdom | 3.2% |
| Indonesia | 2.8% |
| Mexico | 2.5% |
| Peru | 2.3% |
| Chile | 2.3% |
| Macao | 2.1% |
| United Arab Emirates | 1.9% |
| France | 1.4% |
| Philippines | 1.3% |
| Vietnam | 0.0%** |
| * | Holdings are classified by country of risk as determined by MSCI and Bloomberg. |
| ** | Country percentage was less than 0.1%. |
| THORNBURG DEVELOPING WORLD FUND | NASDAQ SYMBOLS | CUSIPS |
| Class A | THDAX | 885-216-408 |
| Class C | THDCX | 885-216-507 |
| Class I | THDIX | 885-216-606 |
| Class R5 | THDRX | 885-216-846 |
| Class R6 | TDWRX | 885-216-838 |
Class I, R5, and R6 shares may not be available to all investors. Minimum investments for Class I shares may be higher than those for other classes.
There is no guarantee that the Fund will meet its investment objectives.
All data is subject to change. Charts may not add up to 100% due to rounding.
34 | Thornburg Equity Funds Semi-Annual Report
Fund Summary
Thornburg Value Fund | March 31, 2020 (Unaudited)
OBJECTIVES AND STRATEGIES
The Fund seeks long-term capital appreciation by investing in equity and debt securities of all types. As a secondary, non-fundamental goal, the Fund also seeks some current income.
The Fund expects to invest primarily in domestic equity securities (primarily common stocks) selected on a value basis. However, the Fund may own a variety of securities, including foreign equity securities, partnership interests, and foreign and domestic debt obligations which, in the opinion of the Fund’s investment advisor, offer prospects for meeting the Fund’s investment goals.
MARKET CAPITALIZATION EXPOSURE
BASKET STRUCTURE
| TOP TEN EQUITY HOLDINGS |
| Thermo Fisher Scientific, Inc. | 6.1% |
| Alphabet, Inc. Class C | 5.5% |
| Nomad Foods Ltd. | 4.8% |
| Crown Holdings, Inc. | 4.6% |
| JPMorgan Chase & Co. | 4.5% |
| China Mobile Ltd. | 4.0% |
| Comcast Corp. Class A | 3.8% |
| Facebook, Inc. Class A | 3.7% |
| Activision Blizzard, Inc. | 3.6% |
| Alibaba Group Holding Ltd. | 3.4% |
| SECTOR EXPOSURE |
| Communication Services | 23.7% |
| Financials | 15.8% |
| Health Care | 14.8% |
| Consumer Discretionary | 11.0% |
| Consumer Staples | 9.3% |
| Information Technology | 7.3% |
| Materials | 6.6% |
| Energy | 4.3% |
| Utilities | 1.8% |
| Industrials | 1.1% |
| Other Assets Less Liabilities | 4.3% |
| TOP TEN INDUSTRY GROUPS |
| Media & Entertainment | 19.7% |
| Pharmaceuticals, Biotechnology & Life Sciences | 10.2% |
| Retailing | 7.3% |
| Banks | 6.8% |
| Materials | 6.6% |
| Diversified Financials | 6.3% |
| Food, Beverage & Tobacco | 6.3% |
| Technology Hardware & Equipment | 6.3% |
| Health Care Equipment & Services | 4.6% |
| Energy | 4.3% |
| THORNBURG VALUE FUND | NASDAQ SYMBOLS | CUSIPS |
| Class A | TVAFX | 885-215-731 |
| Class C | TVCFX | 885-215-715 |
| Class I | TVIFX | 885-215-632 |
| Class R3 | TVRFX | 885-215-533 |
| Class R4 | TVIRX | 885-215-277 |
| Class R5 | TVRRX | 885-215-376 |
Class I, R3, R4, and R5 shares may not be available to all investors. Minimum investments for Class I shares may be higher than those for other classes.
There is no guarantee that the Fund will meet its investment objectives.
All data is subject to change. Charts may not add up to 100% due to rounding.
Thornburg Equity Funds Semi-Annual Report | 35
Fund Summary
Thornburg Core Growth Fund | March 31, 2020 (Unaudited)
OBJECTIVES AND STRATEGIES
The Fund seeks long-term growth of capital by investing in equity securities selected for their growth potential.
The Fund expects to invest primarily in domestic equity securities (primarily common stocks) selected for their growth potential. However, the Fund may own a variety of securities, including foreign equity securities and partnership interests. The Fund may invest in developing countries.
MARKET CAPITALIZATION EXPOSURE
BASKET STRUCTURE
| TOP TEN EQUITY HOLDINGS |
| Amazon.com, Inc. | 6.7% |
| Microsoft Corp. | 6.1% |
| Apple, Inc. | 5.2% |
| Alphabet, Inc. Class C | 4.9% |
| Activision Blizzard, Inc. | 4.4% |
| DaVita, Inc. | 3.5% |
| salesforce.com, Inc. | 3.4% |
| Netflix, Inc. | 3.2% |
| Visa, Inc. Class A | 3.1% |
| Comcast Corp. Class A | 3.0% |
| SECTOR EXPOSURE |
| Information Technology | 46.9% |
| Communication Services | 17.4% |
| Consumer Discretionary | 11.2% |
| Health Care | 8.7% |
| Financials | 4.7% |
| Consumer Staples | 4.3% |
| Industrials | 1.6% |
| Other Assets Less Liabilities | 5.2% |
| TOP TEN INDUSTRY GROUPS |
| Software & Services | 38.0% |
| Media & Entertainment | 17.4% |
| Retailing | 11.2% |
| Health Care Equipment & Services | 7.0% |
| Technology Hardware & Equipment | 5.2% |
| Diversified Financials | 4.7% |
| Food, Beverage & Tobacco | 4.3% |
| Semiconductors & Semiconductor Equipment | 3.7% |
| Pharmaceuticals, Biotechnology & Life Sciences | 1.7% |
| Capital Goods | 1.1% |
COUNTRY EXPOSURE *
(percent of equity holdings) |
| United States | 91.0% |
| Ireland | 2.7% |
| Israel | 2.2% |
| Mexico | 1.9% |
| China | 1.2% |
| Argentina | 1.0% |
| * | Holdings are classified by country of risk as determined by MSCI and Bloomberg. |
| THORNBURG CORE GROWTH FUND | NASDAQ SYMBOLS | CUSIPS |
| Class A | THCGX | 885-215-582 |
| Class C | TCGCX | 885-215-574 |
| Class I | THIGX | 885-215-475 |
| Class R3 | THCRX | 885-215-517 |
| Class R4 | TCGRX | 885-215-251 |
| Class R5 | THGRX | 885-215-350 |
Class I, R3, R4, and R5 shares may not be available to all investors. Minimum investments for Class I shares may be higher than those for other classes.
There is no guarantee that the Fund will meet its investment objectives.
All data is subject to change. Charts may not add up to 100% due to rounding.
36 | Thornburg Equity Funds Semi-Annual Report
Fund Summary
Thornburg Long/Short Equity Fund | March 31, 2020 (Unaudited)
OBJECTIVES AND STRATEGIES
The Fund seeks long-term capital appreciation.
The Fund pursues its investment goal by investing a significant amount of its assets in long and short positions in a broad range of equity securities. While the Fund normally expects to invest a larger portion of its portfolio in long positions than short positions, the Fund expects to invest a significant portion of its assets in short positions.
| SECTOR EXPOSURE |
| Health Care | 18.7% |
| Communication Services | 14.8% |
| Materials | 5.3% |
| Financials | 5.0% |
| Consumer Staples | 6.7% |
| Energy | 1.1% |
| Consumer Discretionary | -1.6% |
| Real Estate | -3.2% |
| Information Technology | -3.5% |
| Industrials | -7.3% |
| Other Assets Less Liabilities | 64.1% |
| PORTFOLIO EXPOSURE | | |
| | 1Q20 | 4Q19 |
| Gross Long | 109.1% | 111.7% |
| Gross Short | -73.3% | -79.3% |
| Net Equity | 35.9% | 32.3% |
| ASSETS BY GEOGRAPHY | | |
| | Long | Short |
| United States | 56.1% | 43.9% |
| Ex-U.S | 71.9% | 28.1% |
| TOP TEN LONG HOLDINGS |
| Thermo Fisher Scientific, Inc. | 5.9% |
| China Mobile Ltd. | 5.2% |
| Alphabet, Inc. Class C | 5.0% |
| Cooper Companies, Inc. | 4.6% |
| Netflix, Inc. | 4.5% |
| Comcast Corp. Class A | 4.4% |
| Starbucks Corp. | 4.3% |
| Nomad Foods Ltd. | 4.2% |
| Amazon.com, Inc. | 4.0% |
| Medtronic plc | 4.0% |
| THORNBURG LONG/SHORT EQUITY FUND | NASDAQ SYMBOLS | CUSIPS |
| Class I | THLSX | 885-216-689 |
There is no guarantee that the Fund will meet its investment objectives.
All data is subject to change. Charts may not add up to 100% due to rounding.
Thornburg Equity Funds Semi-Annual Report | 37
Schedule of Investments
Thornburg Investment Income Builder Fund | March 31, 2020 (Unaudited)
| | Issuer-Description | SHARES/
PRINCIPAL AMOUNT | VALUE |
| | Common Stock — 88.1% | | |
| | Automobiles & Components — 0.1% | | |
| | Automobiles — 0.1% | | |
| | Fiat Chrysler Automobiles N.V. | 1,817,794 | $ 12,976,759 |
| | | | 12,976,759 |
| | Banks — 4.9% | | |
| | Banks — 4.9% | | |
| | BNP Paribas S.A. | 2,069,472 | 60,418,683 |
| | DBS Group Holdings Ltd. | 2,266,000 | 29,567,108 |
| | ING Groep N.V. | 10,446,600 | 53,529,347 |
| | JPMorgan Chase & Co. | 3,027,000 | 272,520,810 |
| | Regions Financial Corp. | 9,100,000 | 81,627,000 |
| | | | 497,662,948 |
| | Capital Goods — 1.0% | | |
| | Aerospace & Defense — 0.5% | | |
| | BAE Systems plc | 7,389,500 | 47,477,690 |
| | Construction & Engineering — 0.5% | | |
| | ACS Actividades de Construccion y Servicios S.A. | 795,049 | 15,789,157 |
| | Vinci S.A. | 474,819 | 38,797,101 |
| | | | 102,063,948 |
| | Diversified Financials — 9.1% | | |
| | Capital Markets — 4.8% | | |
| a | Apollo Investment Corp. | 4,902,600 | 33,092,550 |
| | CME Group, Inc. | 1,718,000 | 297,059,380 |
| a | Solar Capital Ltd. | 4,607,900 | 53,635,956 |
| | UBS Group AG | 11,662,172 | 106,896,765 |
| | Diversified Financial Services — 3.0% | | |
| | Equitable Holdings, Inc. | 11,740,292 | 169,647,219 |
| b | M&G plc | 93,224,000 | 129,675,232 |
| | Mortgage Real Estate Investment Trusts — 1.3% | | |
| | Chimera Investment Corp. | 8,623,507 | 78,473,914 |
| | Granite Point Mortgage Trust, Inc. | 1,417,500 | 7,186,725 |
| a | MFA Financial, Inc. | 32,720,000 | 50,716,000 |
| | | | 926,383,741 |
| | Energy — 7.5% | | |
| | Oil, Gas & Consumable Fuels — 7.5% | | |
| | China Petroleum & Chemical Corp. Class H | 11,705,000 | 5,719,141 |
| | Eni SpA | 8,220,252 | 81,688,462 |
| | LUKOIL PJSC Sponsored ADR | 603,100 | 35,541,708 |
| b,c | Malamute Energy, Inc. | 12,439 | 130,610 |
| | Repsol S.A. | 2,508,054 | 22,374,973 |
| | Royal Dutch Shell plc Sponsored ADR Class A | 6,339,000 | 221,167,710 |
| | TOTAL S.A. | 7,645,800 | 288,084,370 |
| | Valero Energy Corp. | 2,435,000 | 110,451,600 |
| | | | 765,158,574 |
| | Food & Staples Retailing — 2.8% | | |
| | Food & Staples Retailing — 2.8% | | |
| | Koninklijke Ahold Delhaize N.V. | 444,000 | 10,343,665 |
| | Walgreens Boots Alliance, Inc. | 6,023,000 | 275,552,250 |
| | | | 285,895,915 |
| | Food, Beverage & Tobacco — 1.8% | | |
| | Food Products — 0.5% | | |
| | Nestle S.A. | 493,100 | 50,477,555 |
| | Tobacco — 1.3% | | |
| | KT&G Corp. | 2,192,054 | 134,213,429 |
38 | Thornburg Equity Funds Semi-Annual Report
| See notes to financial statements. |
Schedule of Investments, Continued
Thornburg Investment Income Builder Fund | March 31, 2020 (Unaudited)
| | Issuer-Description | SHARES/
PRINCIPAL AMOUNT | VALUE |
| | | | 184,690,984 |
| | Insurance — 4.1% | | |
| | Insurance — 4.1% | | |
| | Assicurazioni Generali SpA | 725,047 | $ 9,820,607 |
| | AXA S.A. | 1,567,000 | 26,532,343 |
| | Legal & General Group plc | 7,920,800 | 18,714,460 |
| | NN Group N.V. | 8,095,300 | 219,995,762 |
| | Swiss Re AG | 609,000 | 46,892,334 |
| | Zurich Insurance Group AG | 264,200 | 92,815,200 |
| | | | 414,770,706 |
| | Materials — 3.5% | | |
| | Chemicals — 0.8% | | |
| | LyondellBasell Industries N.V. Class A | 1,593,700 | 79,095,331 |
| | Metals & Mining — 2.7% | | |
| | Glencore plc | 60,788,800 | 92,006,742 |
| | MMC Norilsk Nickel PJSC ADR | 7,491,100 | 185,557,019 |
| | | | 356,659,092 |
| | Pharmaceuticals, Biotechnology & Life Sciences — 12.5% | | |
| | Biotechnology — 2.1% | | |
| | AbbVie, Inc. | 2,812,994 | 214,322,013 |
| | Pharmaceuticals — 10.4% | | |
| | AstraZeneca plc | 1,630,300 | 145,257,930 |
| | Merck & Co., Inc. | 3,697,000 | 284,447,180 |
| | Novartis AG | 1,612,500 | 133,029,282 |
| | Pfizer, Inc. | 4,303,000 | 140,449,920 |
| | Roche Holding AG | 1,085,300 | 349,186,439 |
| | | | 1,266,692,764 |
| | Real Estate — 3.7% | | |
| | Equity Real Estate Investment Trusts — 3.7% | | |
| | Crown Castle International Corp. | 1,253,881 | 181,060,417 |
| | Lamar Advertising Co. Class A | 1,621,351 | 83,142,879 |
| | Outfront Media, Inc. | 3,016,100 | 40,657,028 |
| | Washington Real Estate Investment Trust | 2,726,000 | 65,069,620 |
| | | | 369,929,944 |
| | Retailing — 2.7% | | |
| | Specialty Retail — 2.7% | | |
| | Home Depot, Inc. | 1,457,100 | 272,055,141 |
| | | | 272,055,141 |
| | Semiconductors & Semiconductor Equipment — 8.2% | | |
| | Semiconductors & Semiconductor Equipment — 8.2% | | |
| | Broadcom, Inc. | 987,900 | 234,231,090 |
| | QUALCOMM, Inc. | 2,950,000 | 199,567,500 |
| | Taiwan Semiconductor Manufacturing Co. Ltd. | 43,972,000 | 395,849,616 |
| | | | 829,648,206 |
| | Technology Hardware & Equipment — 2.2% | | |
| | Technology Hardware, Storage & Peripherals — 2.2% | | |
| | Samsung Electronics Co. Ltd. | 5,764,300 | 224,124,557 |
| | | | 224,124,557 |
| | Telecommunication Services — 17.6% | | |
| | Diversified Telecommunication Services — 10.4% | | |
| b | Deutsche Telekom AG | 26,262,600 | 339,192,560 |
| | Koninklijke KPN N.V. | 42,170,400 | 100,846,631 |
| | Orange S.A. | 45,652,780 | 552,738,901 |
| | Singapore Telecommunications Ltd. | 33,698,000 | 60,074,192 |
| | Wireless Telecommunication Services — 7.2% | | |
See notes to financial statements.
| Thornburg Equity Funds Semi-Annual Report | 39 |
Schedule of Investments, Continued
Thornburg Investment Income Builder Fund | March 31, 2020 (Unaudited)
| | Issuer-Description | SHARES/
PRINCIPAL AMOUNT | VALUE |
| | China Mobile Ltd. | 58,587,774 | $ 439,073,219 |
| | MTN Group Ltd. | 16,320,361 | 43,760,698 |
| | Vodafone Group plc | 177,755,924 | 245,915,330 |
| | | | 1,781,601,531 |
| | Transportation — 1.8% | | |
| | Transportation Infrastructure — 1.8% | | |
| | Atlantia SpA | 12,104,678 | 150,369,826 |
| | Sydney Airport | 9,548,656 | 32,991,545 |
| | | | 183,361,371 |
| | Utilities — 4.6% | | |
| | Electric Utilities — 4.6% | | |
| | Electricite de France S.A. | 26,360,784 | 206,128,224 |
| | Enel SpA | 37,943,171 | 261,725,947 |
| | | | 467,854,171 |
| | Total Common Stock(Cost $9,862,028,191) | | 8,941,530,352 |
| | Preferred Stock — 0.4% | | |
| | Banks — 0.1% | | |
| | Banks — 0.1% | | |
| d,e,f | First Horizon Bank, 3.75% (LIBOR 3 Month + 0.85%) | $ 12,000 | 7,920,000 |
| | | | 7,920,000 |
| | Diversified Financials — 0.0% | | |
| | Capital Markets — 0.0% | | |
| e,f | Morgan Stanley, Series A, 4.00% (LIBOR 3 Month + 0.70%) | 120,000 | 2,298,000 |
| | | | 2,298,000 |
| | Energy — 0.1% | | |
| | Oil, Gas & Consumable Fuels — 0.1% | | |
| e | Crestwood Equity Partners L.P., 9.25% | 2,166,596 | 8,233,065 |
| | | | 8,233,065 |
| | Miscellaneous — 0.1% | | |
| | U.S. Government Agencies — 0.1% | | |
| e | Farm Credit Bank of Texas, Series 1, 10.00% | 9,000 | 9,085,500 |
| | | | 9,085,500 |
| | Telecommunication Services — 0.1% | | |
| | Diversified Telecommunication Services — 0.1% | | |
| d,g | Centaur Funding Corp., 9.08%, 4/21/2020 | 15,000 | 14,932,500 |
| | | | 14,932,500 |
| | Total Preferred Stock(Cost $59,796,152) | | 42,469,065 |
| | Asset Backed Securities — 0.1% | | |
| | Other Asset Backed — 0.1% | | |
| d | CFG Investments Ltd., Series 2019-1 Class A, 5.56%, 8/15/2029 | 13,500,000 | 9,580,364 |
| c,d,f | Northwind Holdings, LLC, Series 2007-1A Class A1, 2.36% (LIBOR 3 Month + 0.78%), 12/1/2037 | 568,750 | 553,394 |
| | | | 10,133,758 |
| | Total Asset Backed Securities(Cost $14,006,379) | | 10,133,758 |
| | Corporate Bonds — 8.3% | | |
| | Automobiles & Components — 0.0% | | |
| | Auto Components — 0.0% | | |
| d,g | Nexteer Automotive Group Ltd., 5.875%, 11/15/2021 | 4,300,000 | 4,304,538 |
| | | | 4,304,538 |
| | Capital Goods — 0.1% | | |
40 | Thornburg Equity Funds Semi-Annual Report
| See notes to financial statements. |
Schedule of Investments, Continued
Thornburg Investment Income Builder Fund | March 31, 2020 (Unaudited)
| | Issuer-Description | SHARES/
PRINCIPAL AMOUNT | VALUE |
| | Machinery — 0.1% | | |
| | Mueller Industries, Inc., 6.00%, 3/1/2027 | $ 7,679,000 | $ 6,930,298 |
| | | | 6,930,298 |
| | Commercial & Professional Services — 0.5% | | |
| | Commercial Services & Supplies — 0.5% | | |
| d,g | Cimpress plc, 7.00%, 6/15/2026 | 33,804,000 | 29,747,520 |
| d | Nielsen Finance, LLC / Nielsen Finance Co., 5.00%, 4/15/2022 | 18,018,000 | 16,609,353 |
| d | ServiceMaster Co., LLC, 5.125%, 11/15/2024 | 2,480,000 | 2,449,000 |
| | | | 48,805,873 |
| | Consumer Durables & Apparel — 0.2% | | |
| | Leisure Products — 0.2% | | |
| | Vista Outdoor, Inc., 5.875%, 10/1/2023 | 18,815,000 | 15,565,838 |
| | | | 15,565,838 |
| | Consumer Services — 0.1% | | |
| | Hotels, Restaurants & Leisure — 0.1% | | |
| d | Nathan’s Famous, Inc., 6.625%, 11/1/2025 | 6,188,000 | 5,754,840 |
| | | | 5,754,840 |
| | Diversified Financials — 0.5% | | |
| | Capital Markets — 0.2% | | |
| d | Compass Group Diversified Holdings, LLC, 8.00%, 5/1/2026 | 16,141,000 | 15,495,360 |
| c,d | JPR Royalty Sub, LLC, 14.00%, 9/1/2020 | 5,000,000 | 500,000 |
| | Consumer Finance — 0.1% | | |
| d | FirstCash, Inc., 5.375%, 6/1/2024 | 7,500,000 | 7,181,250 |
| | Diversified Financial Services — 0.2% | | |
| d | Antares Holdings L.P., 6.00%, 8/15/2023 | 18,000,000 | 18,540,045 |
| e,f | JPMorgan Chase & Co., Series I, 5.24% (LIBOR 3 Month + 3.47%), 4/30/2020 | 7,334,000 | 6,547,502 |
| | | | 48,264,157 |
| | Energy — 2.4% | | |
| | Energy Equipment & Services — 0.1% | | |
| | Odebrecht Offshore Drilling Finance Ltd., | | |
| d,g | 6.72%, 12/1/2022 | 3,424,639 | 2,739,711 |
| d,g,h | 7.72%, 12/1/2026 PIK | 16,901,555 | 1,690,156 |
| d,e,g | Odebrecht Oil & Gas Finance Ltd. (Guaranty: Odebrecht Oleo e Gas S.A.), Zero Coupon, 12/31/2099 | 2,337,727 | 19,871 |
| b,d,g,i | Schahin II Finance Co. SPV Ltd., 5.875%, 9/25/2023 | 11,640,134 | 727,508 |
| | Oil, Gas & Consumable Fuels — 2.3% | | |
| d | Citgo Holding, Inc., 9.25%, 8/1/2024 | 22,226,000 | 18,114,190 |
| f | Energy Transfer Operating L.P., 4.781% (LIBOR 3 Month + 3.02%), 11/1/2066 | 13,820,000 | 6,184,450 |
| f | Enterprise TE Partners L.P., Series 1, 4.358% (LIBOR 3 Month + 2.78%), 6/1/2067 | 7,000,000 | 3,780,000 |
| | Kinder Morgan Energy Partners L.P., | | |
| | 5.00%, 3/1/2043 | 10,000,000 | 9,479,973 |
| | 5.80%, 3/15/2035 | 10,000,000 | 10,625,154 |
| | Kinder Morgan, Inc., | | |
| | 5.30%, 12/1/2034 | 23,630,000 | 22,746,779 |
| | 5.55%, 6/1/2045 | 5,000,000 | 5,096,147 |
| b,c,d,i | Linc USA GP / Linc Energy Finance USA, Inc., 9.625%, 10/31/2017 | 14,991,164 | 299,823 |
| | ONEOK Partners L.P., 4.90%, 3/15/2025 | 9,544,000 | 8,343,803 |
| d | Par Petroleum, LLC / Par Petroleum Finance Corp., 7.75%, 12/15/2025 | 1,672,000 | 1,049,180 |
| d,g | Petroleos Mexicanos, 5.95%, 1/28/2031 | 7,820,000 | 5,423,326 |
| b,i | RAAM Global Energy Co., 12.50%, 10/1/2015 | 15,000,000 | 72,000 |
| c,d,g,h | Schahin II Finance Co. SPV Ltd., 8.00%, 5/25/2020 PIK | 707,365 | 837,520 |
| | Summit Midstream Holdings, LLC / Summit Midstream Finance Corp., 5.50%, 8/15/2022 | 7,497,000 | 1,349,460 |
| e,f | Summit Midstream Partners L.P., Series A, 9.50% (LIBOR 3 Month + 7.43%), 12/15/2022 | 27,036,000 | 388,507 |
| | Transcontinental Gas Pipe Line Co., LLC, 7.85%, 2/1/2026 | 32,700,000 | 37,230,144 |
| | Williams Companies, Inc., | | |
| | 3.70%, 1/15/2023 | 29,129,000 | 26,931,512 |
| | 4.55%, 6/24/2024 | 69,318,000 | 63,375,095 |
| | 5.75%, 6/24/2044 | 14,198,000 | 14,800,236 |
| | | | 241,304,545 |
See notes to financial statements.
| Thornburg Equity Funds Semi-Annual Report | 41 |
Schedule of Investments, Continued
Thornburg Investment Income Builder Fund | March 31, 2020 (Unaudited)
| | Issuer-Description | SHARES/
PRINCIPAL AMOUNT | VALUE |
| | Food & Staples Retailing — 0.1% | | |
| | Food & Staples Retailing — 0.1% | | |
| d | KeHE Distributors, LLC / KeHE Finance Corp, 8.625%, 10/15/2026 | $ 5,852,000 | $ 5,881,260 |
| | | | 5,881,260 |
| | Food, Beverage & Tobacco — 0.5% | | |
| | Food Products — 0.1% | | |
| | B&G Foods, Inc., 5.25%, 9/15/2027 | 5,000,000 | 4,875,000 |
| | Tobacco — 0.4% | | |
| | Vector Group Ltd., | | |
| d | 6.125%, 2/1/2025 | 8,826,000 | 8,031,660 |
| d | 10.50%, 11/1/2026 | 43,420,000 | 36,255,700 |
| | | | 49,162,360 |
| | Health Care Equipment & Services — 0.2% | | |
| | Health Care Providers & Services — 0.2% | | |
| d | Tenet Healthcare Corp., 6.25%, 2/1/2027 | 23,500,000 | 22,912,500 |
| | | | 22,912,500 |
| | Insurance — 0.6% | | |
| | Insurance — 0.6% | | |
| d,e,f,g | Dai-ichi Life Insurance Co. Ltd., 7.25% (LIBOR 3 Month + 4.56%), 7/25/2021 | 9,000,000 | 9,360,000 |
| d | MetLife, Inc., 9.25%, 4/8/2038 | 12,000,000 | 15,000,000 |
| d,f,g | QBE Insurance Group Ltd., 7.50% (USSW10 + 6.03%), 11/24/2043 | 40,000,000 | 37,200,000 |
| | | | 61,560,000 |
| | Materials — 0.4% | | |
| | Chemicals — 0.1% | | |
| d,g | Consolidated Energy Finance S.A., 6.875%, 6/15/2025 | 13,000,000 | 11,245,000 |
| | Construction Materials — 0.1% | | |
| d,g | InterCement Financial Operations B.V., 5.75%, 7/17/2024 | 8,000,000 | 4,580,080 |
| | Containers & Packaging — 0.1% | | |
| d | Matthews International Corp., 5.25%, 12/1/2025 | 13,975,000 | 12,368,154 |
| | Metals & Mining — 0.0% | | |
| d | Cleveland-Cliffs, Inc., 6.75%, 3/15/2026 | 5,000,000 | 4,450,000 |
| | Paper & Forest Products — 0.1% | | |
| d | Neenah, Inc., 5.25%, 5/15/2021 | 7,470,000 | 7,283,250 |
| | | | 39,926,484 |
| | Media & Entertainment — 0.2% | | |
| | Media — 0.2% | | |
| d | CCO Holdings, LLC / CCO Holdings Capital Corp., 5.375%, 6/1/2029 | 4,390,000 | 4,511,164 |
| d | CSC Holdings LLC, 6.50%, 2/1/2029 | 4,000,000 | 4,313,960 |
| d | Salem Media Group, Inc., 6.75%, 6/1/2024 | 7,920,000 | 6,573,600 |
| d,g | Telenet Finance Luxembourg Notes Sarl, 5.50%, 3/1/2028 | 10,000,000 | 9,300,000 |
| | | | 24,698,724 |
| | Real Estate — 0.3% | | |
| | Equity Real Estate Investment Trusts — 0.3% | | |
| | CoreCivic, Inc., | | |
| | 4.625%, 5/1/2023 | 11,364,000 | 10,341,240 |
| | 4.75%, 10/15/2027 | 23,901,000 | 17,925,750 |
| | | | 28,266,990 |
| | Retailing — 0.1% | | |
| | Specialty Retail — 0.1% | | |
| d | Michaels Stores, Inc., 8.00%, 7/15/2027 | 20,055,000 | 14,840,700 |
| | | | 14,840,700 |
| | Software & Services — 0.0% | | |
| | Information Technology Services — 0.0% | | |
| d | Vericast Corp., 8.375%, 8/15/2022 | 6,500,000 | 5,013,125 |
42 | Thornburg Equity Funds Semi-Annual Report
| See notes to financial statements. |
Schedule of Investments, Continued
Thornburg Investment Income Builder Fund | March 31, 2020 (Unaudited)
| | Issuer-Description | SHARES/
PRINCIPAL AMOUNT | VALUE |
| | | | 5,013,125 |
| | Technology Hardware & Equipment — 0.1% | | |
| | Communications Equipment — 0.1% | | |
| | Anixter, Inc. (Guaranty: Anixter International, Inc.), 6.00%, 12/1/2025 | $ 8,000,000 | $ 7,830,000 |
| | | | 7,830,000 |
| | Telecommunication Services — 2.0% | | |
| | Diversified Telecommunication Services — 1.7% | | |
| g | Deutsche Telekom International Finance B.V. (Guaranty: Deutsche Telekom AG), 8.75%, 6/15/2030 | 26,150,000 | 35,301,559 |
| d,g | Digicel Ltd., 6.00%, 4/15/2021 | 51,737,000 | 27,873,826 |
| | Qwest Corp., 6.75%, 12/1/2021 | 9,000,000 | 9,326,700 |
| g | Telefonica Emisiones SAU (Guaranty: Telefonica S.A.), 7.045%, 6/20/2036 | 85,390,000 | 101,745,880 |
| | Wireless Telecommunication Services — 0.3% | | |
| d,g | Digicel International Finance Ltd., 8.75%, 5/25/2024 | 4,300,000 | 3,848,500 |
| d,g | Millicom International Cellular S.A., 6.00%, 3/15/2025 | 28,423,000 | 27,464,008 |
| | | | 205,560,473 |
| | Transportation — 0.0% | | |
| | Airlines — 0.0% | | |
| | American Airlines Pass Through Trust, Series 2013-2 Class A, 4.95%, 7/15/2024 | 2,512,418 | 2,553,296 |
| | US Airways Pass Through Trust, Series 2010-1 Class A, 6.25%, 10/22/2024 | 1,353,742 | 1,393,090 |
| | | | 3,946,386 |
| | Total Corporate Bonds(Cost $920,748,527) | | 840,529,091 |
| | Municipal Bonds — 0.0% | | |
| | San Bernardino County Redevelopment Agency Successor Agency, Series A, 8.45%, 9/1/2030 | 2,555,000 | 2,604,822 |
| | Total Municipal Bonds(Cost $2,514,818) | | 2,604,822 |
| | Other Government — 0.0% | | |
| | Brazilian Government International Bond (BRL), 12.50%, 1/5/2022 | 20,000,000 | 4,202,729 |
| | Total Other Government(Cost $12,446,979) | | 4,202,729 |
| | Mortgage Backed — 0.0% | | |
| f | Bear Stearns ARM Trust, Whole Loan Securities Trust CMO, Series 2003-6 Class 2B1, 4.774%, 8/25/2033 | 51,147 | 44,637 |
| f | Citigroup Mortgage Loan Trust, Inc., Whole Loan Securities Trust CMO, Series 2004-HYB2 Class B1, 4.05%, 3/25/2034 | 329,133 | 260,188 |
| f | Merrill Lynch Mortgage Investors Trust, Whole Loan Securities Trust CMO, Series 2004-A4 Class M1, 4.322%, 8/25/2034 | 1,951,197 | 1,533,217 |
| | Total Mortgage Backed(Cost $2,403,572) | | 1,838,042 |
| | Loan Participations — 0.9% | | |
| | Commercial & Professional Services — 0.4% | | |
| | Professional Services — 0.4% | | |
| j | Par Pacific Holdings, Inc., 8.60% (LIBOR 3 Month + 6.75%), 1/12/2026 | 14,052,598 | 9,555,766 |
| j | R.R. Donnelley & Sons Company, 5.989% (LIBOR 1 Month + 5.00%), 1/15/2024 | 16,787,500 | 14,521,188 |
| | RGIS Services, LLC, | | |
| j | 8.95% (LIBOR 3 Month + 7.50%), 3/31/2023 | 7,908,804 | 5,377,987 |
| j | 9.119% (LIBOR 3 Month + 7.50%), 3/31/2023 | 3,918,296 | 2,664,441 |
| j | 9.277% (LIBOR 3 Month + 7.50%), 3/31/2023 | 3,438,610 | 2,338,255 |
| j | Vericast Corp., 6.463% (LIBOR 3 Month + 4.75%), 11/3/2023 | 12,672,230 | 7,631,090 |
| | | | 42,088,727 |
| | Energy — 0.0% | | |
| | Energy Equipment & Services — 0.0% | | |
| | McDermott Technology Americas, Inc., | | |
| j | 10.647% (LIBOR 3 Month + 9.00%), 10/22/2020 | 3,201,241 | 2,890,721 |
| j | 10.806% (LIBOR 3 Month + 9.00%), 10/21/2020 | 606,597 | 547,757 |
| j | 10.647% (LIBOR 3 Month + 9.00%), 10/21/2020 | 716,887 | 647,349 |
| | Oil, Gas & Consumable Fuels — 0.0% | | |
| c,h,j | Malamute Energy, Inc., 2.95% (LIBOR 3 Month + 1.50% PIK), 11/22/2022 | 316,081 | 316,081 |
| | | | 4,401,908 |
See notes to financial statements.
| Thornburg Equity Funds Semi-Annual Report | 43 |
Schedule of Investments, Continued
Thornburg Investment Income Builder Fund | March 31, 2020 (Unaudited)
| | Issuer-Description | SHARES/
PRINCIPAL AMOUNT | VALUE |
| | Real Estate — 0.2% | | |
| | Equity Real Estate Investment Trusts — 0.2% | | |
| j | CoreCivic, Inc., 5.50% (LIBOR 1 Month + 4.50%), 12/12/2024 | $ 13,923,750 | $ 12,113,662 |
| j | GEO Group, Inc., 2.99% (LIBOR 1 Month + 2.00%), 3/22/2024 | 7,917,593 | 6,448,563 |
| | | | 18,562,225 |
| | Retailing — 0.0% | | |
| | Specialty Retail — 0.0% | | |
| j | Office Depot, Inc., 6.25% (LIBOR 1 Month + 5.25%), 11/8/2022 | 2,325,589 | 2,209,310 |
| | | | 2,209,310 |
| | Software & Services — 0.2% | | |
| | Internet Software & Services — 0.2% | | |
| j | Dun & Bradstreet Corporation (The), 4.959% (LIBOR 1 Month + 4.00%), 2/6/2026 | 16,910,000 | 15,155,587 |
| | | | 15,155,587 |
| | Transportation — 0.1% | | |
| | Airlines — 0.1% | | |
| c,j | Wheels Up Partners, LLC, 8.08% (LIBOR 3 Month + 6.50%), 8/17/2025 | 10,676,522 | 8,850,837 |
| | | | 8,850,837 |
| | Total Loan Participations(Cost $112,500,281) | | 91,268,594 |
| | Short-Term Investments — 1.3% | | |
| a | Thornburg Capital Management Fund | 13,013,685 | 130,136,853 |
| | Total Short-Term Investments(Cost $130,136,853) | | 130,136,853 |
| | Total Investments — 99.1%(Cost $11,116,581,752) | | $10,064,713,306 |
| | Other Assets Less Liabilities — 0.9% | | 88,103,084 |
| | Net Assets — 100.0% | | $10,152,816,390 |
| Outstanding Forward Currency Contracts To Buy Or Sell At March 31, 2020 |
Contract
Description | Contract
Party* | Buy/Sell | Contract
Amount | Contract
Value Date | Value
USD | Unrealized
Appreciation | Unrealized
Depreciation |
| Great Britain Pound | SSB | Sell | 442,246,700 | 4/14/2020 | 549,430,569 | $ 31,040,337 | $ — |
| Swiss Franc | SSB | Sell | 42,771,000 | 4/23/2020 | 44,483,731 | — | (30,856) |
| Chinese Yuan Renminbi | SSB | Sell | 1,464,706,400 | 4/29/2020 | 206,456,898 | 4,970,617 | — |
| Korean Won | SSB | Sell | 185,829,326,300 | 4/29/2020 | 152,777,452 | 4,999,187 | — |
| Euro | SSB | Sell | 1,445,177,000 | 5/18/2020 | 1,596,714,915 | — | (20,821,655) |
| |
| Total | | | | | | $41,010,141 | $(20,852,511) |
| |
| Net unrealized appreciation (depreciation) | | | | | | $20,157,630 | |
| * | Counterparty includes State Street Bank and Trust Company ("SSB"). |
44 | Thornburg Equity Funds Semi-Annual Report
| See notes to financial statements. |
Schedule of Investments, Continued
Thornburg Investment Income Builder Fund | March 31, 2020 (Unaudited)
| Footnote Legend |
| a | Investment in Affiliates. |
| b | Non-income producing. |
| c | Security currently fair valued by the Valuation and Pricing Committee using procedures approved by the Trustees’ Audit Committee. |
| d | Securities exempt from registration under Rule 144A of the Securities Act of 1933, as amended. These securities are restricted but liquid and may only be resold in the ordinary course of business in transactions exempt from registration, normally to qualified institutional buyers. As of March 31, 2020, the aggregate value of these securities in the Fund’s portfolio was $442,775,936, representing 4.36% of the Fund’s net assets. |
| e | Securities are perpetual and, thus, do not have a predetermined maturity date. The date shown, if applicable, reflects the next call date. |
| f | Variable, floating, step, or fixed to floating rate securities are securities for which interest rate changes are based on changes in a designated base rate or on a predetermined schedule. The rates shown are those in effect on March 31, 2020. |
| g | Yankee bond denominated in U.S. dollars and is issued in the U.S. by foreign banks and corporations. |
| h | Pay-In-Kind Payments (PIK). The issuer may pay cash interest and/or interest in additional debt securities. Rates shown are the rates in effect at March 31, 2020. |
| i | Bond in default. |
| j | The stated coupon rate represents the greater of the LIBOR or the LIBOR floor rate plus a spread at March 31, 2020. |
Portfolio Abbreviations
To simplify the listings of securities, abbreviations are used per the table below:
| ADR | American Depositary Receipt |
| ARM | Adjustable Rate Mortgage |
| BRL | Denominated in Brazilian Real |
| CMO | Collateralized Mortgage Obligation |
| LIBOR | London Interbank Offered Rates |
| MFA | Mortgage Finance Authority |
| SPV | Special Purpose Vehicle |
See notes to financial statements.
| Thornburg Equity Funds Semi-Annual Report | 45 |
Schedule of Investments
Thornburg Summit Fund | March 31, 2020 (Unaudited)
| | Issuer-Description | SHARES/
PRINCIPAL AMOUNT | VALUE |
| | Common Stock — 60.4% | | |
| | Banks — 4.3% | | |
| | Banks — 4.3% | | |
| | HDFC Bank Ltd. ADR | 15,844 | $ 609,360 |
| a | JPMorgan Chase & Co. | 9,190 | 827,376 |
| | | | 1,436,736 |
| | Capital Goods — 2.3% | | |
| | Aerospace & Defense — 2.0% | | |
| | Northrop Grumman Corp. | 1,498 | 453,220 |
| | Safran S.A. | 2,510 | 222,379 |
| | Trading Companies & Distributors — 0.3% | | |
| | MonotaRO Co. Ltd. | 4,200 | 110,970 |
| | | | 786,569 |
| | Consumer Durables & Apparel — 3.3% | | |
| | Household Durables — 0.7% | | |
| | Sony Corp. | 3,879 | 229,767 |
| | Textiles, Apparel & Luxury Goods — 2.6% | | |
| | adidas AG | 1,025 | 227,578 |
| | Hermes International | 281 | 191,195 |
| b | Lululemon Athletica, Inc. | 551 | 104,442 |
| | LVMH Moet Hennessy Louis Vuitton SE | 1,013 | 371,519 |
| | | | 1,124,501 |
| | Consumer Services — 2.0% | | |
| | Diversified Consumer Services — 0.9% | | |
| | Service Corp. International/US | 8,156 | 318,981 |
| | Hotels, Restaurants & Leisure — 1.1% | | |
| a | Starbucks Corp. | 5,429 | 356,903 |
| | | | 675,884 |
| | Diversified Financials — 4.1% | | |
| | Capital Markets — 2.9% | | |
| | B3 S.A. - Brasil Bolsa Balcao | 22,771 | 157,325 |
| a | CME Group, Inc. | 4,691 | 811,121 |
| | Consumer Finance — 1.2% | | |
| a | Capital One Financial Corp. | 8,276 | 417,276 |
| | | | 1,385,722 |
| | Energy — 3.7% | | |
| | Oil, Gas & Consumable Fuels — 3.7% | | |
| a | Enterprise Products Partners L.P. | 13,287 | 190,004 |
| | Reliance Industries Ltd. | 13,816 | 198,981 |
| | Royal Dutch Shell plc Class A | 37,807 | 656,847 |
| | Valero Energy Corp. | 4,614 | 209,291 |
| | | | 1,255,123 |
| | Health Care Equipment & Services — 1.6% | | |
| | Health Care Equipment & Supplies — 1.5% | | |
| b | Boston Scientific Corp. | 15,636 | 510,202 |
| | Health Care Providers & Services — 0.1% | | |
| | NMC Health plc | 13,900 | 18,070 |
| | | | 528,272 |
| | Household & Personal Products — 3.0% | | |
| | Personal Products — 3.0% | | |
| | Estee Lauder Cos, Inc. Class A | 3,807 | 606,607 |
| | Unilever N.V. | 7,991 | 392,768 |
| | | | 999,375 |
| | Insurance — 1.2% | | |
46 | Thornburg Equity Funds Semi-Annual Report
| See notes to financial statements. |
Schedule of Investments, Continued
Thornburg Summit Fund | March 31, 2020 (Unaudited)
| | Issuer-Description | SHARES/
PRINCIPAL AMOUNT | VALUE |
| | Insurance — 1.2% | | |
| | AIA Group Ltd. | 44,100 | $ 394,899 |
| | | | 394,899 |
| | Materials — 0.8% | | |
| | Chemicals — 0.3% | | |
| | LyondellBasell Industries N.V. Class A | 2,113 | 104,868 |
| | Containers & Packaging — 0.5% | | |
| b | Crown Holdings, Inc. | 2,700 | 156,708 |
| | | | 261,576 |
| | Media & Entertainment — 6.4% | | |
| | Entertainment — 1.9% | | |
| | Nintendo Co. Ltd. | 677 | 263,118 |
| b | Sea Ltd. ADR | 8,473 | 375,439 |
| | Interactive Media & Services — 4.5% | | |
| a,b | Alphabet, Inc. Class A | 498 | 578,651 |
| b | Cargurus, Inc. | 13,082 | 247,773 |
| b | Facebook, Inc. Class A | 4,248 | 708,567 |
| | | | 2,173,548 |
| | Pharmaceuticals, Biotechnology & Life Sciences — 2.6% | | |
| | Biotechnology — 1.0% | | |
| | CSL Ltd. | 1,955 | 354,386 |
| | Pharmaceuticals — 1.6% | | |
| | Roche Holding AG | 1,656 | 532,805 |
| | | | 887,191 |
| | Retailing — 5.9% | | |
| | Internet & Direct Marketing Retail — 4.6% | | |
| a,b | Alibaba Group Holding Ltd. Sponsored ADR | 2,758 | 536,376 |
| a,b | Amazon.com, Inc. | 355 | 692,150 |
| b | MercadoLibre, Inc. | 670 | 327,349 |
| | Multiline Retail — 0.6% | | |
| | Dollarama, Inc. | 6,600 | 183,091 |
| | Specialty Retail — 0.7% | | |
| | Home Depot, Inc. | 1,272 | 237,495 |
| | | | 1,976,461 |
| | Semiconductors & Semiconductor Equipment — 2.3% | | |
| | Semiconductors & Semiconductor Equipment — 2.3% | | |
| | ASML Holding N.V. | 1,685 | 444,191 |
| a | Taiwan Semiconductor Manufacturing Co. Ltd. Sponsored ADR | 7,018 | 335,390 |
| | | | 779,581 |
| | Software & Services — 12.3% | | |
| | Information Technology Services — 5.5% | | |
| b,c | Adyen N.V. | 542 | 460,643 |
| b | FleetCor Technologies, Inc. | 726 | 135,428 |
| b,c | Network International Holdings plc | 41,191 | 200,288 |
| a | Visa, Inc. Class A | 6,528 | 1,051,791 |
| | Software — 6.8% | | |
| a | Microsoft Corp. | 6,609 | 1,042,305 |
| b | salesforce.com, Inc. | 3,894 | 560,658 |
| | SAP SE | 2,403 | 268,290 |
| a,b | ServiceNow, Inc. | 1,474 | 422,419 |
| | | | 4,141,822 |
| | Technology Hardware & Equipment — 1.2% | | |
| | Electronic Equipment, Instruments & Components — 1.2% | | |
| | Keyence Corp. | 1,246 | 400,604 |
| | | | 400,604 |
See notes to financial statements.
| Thornburg Equity Funds Semi-Annual Report | 47 |
Schedule of Investments, Continued
Thornburg Summit Fund | March 31, 2020 (Unaudited)
| | Issuer-Description | SHARES/
PRINCIPAL AMOUNT | VALUE |
| | Telecommunication Services — 2.1% | | |
| | Diversified Telecommunication Services — 1.0% | | |
| | Orange S.A. | 28,659 | $ 346,987 |
| | Wireless Telecommunication Services — 1.1% | | |
| | China Mobile Ltd. | 49,500 | 370,967 |
| | | | 717,954 |
| | Utilities — 1.3% | | |
| | Electric Utilities — 1.3% | | |
| a | NextEra Energy, Inc. | 1,832 | 440,816 |
| | | | 440,816 |
| | Total Common Stock(Cost $21,097,862) | | 20,366,634 |
| | Asset Backed Securities — 10.9% | | |
| | Asset-Backed - Finance & Insurance — 4.4% | | |
| c | Aqua Finance Trust, Series 2019-A Class A, 3.14%, 7/16/2040 | $ 84,716 | 86,397 |
| c | Conn’s Receivables Funding, LLC, Series 2018-A Class B, 4.65%, 1/15/2023 | 162,553 | 156,136 |
| | Freed ABS Trust, | | |
| c | Series 2019-1 Class B, 3.87%, 6/18/2026 | 275,000 | 224,233 |
| c | Series 2019-1 Class-A, 3.42%, 6/18/2026 | 33,807 | 33,668 |
| c | MelTel Land Funding, LLC, Series 2019-1A Class A, 3.768%, 4/15/2049 | 100,000 | 79,233 |
| c | New Residential Advance Receivables Trust Advance Receivables Backed, Series 2019-T3 Class DT3, 3.055%, 9/15/2052 | 100,000 | 100,303 |
| c | NRZ Advance Receivables Trust , Series 2019-T1 Class AT1, 2.59%, 7/15/2052 | 175,000 | 167,032 |
| c,d | SBA Tower Trust, Series 2014-2A Class C, 3.869%, 10/15/2049 | 30,000 | 30,361 |
| c | SCF Equipment Leasing, LLC, Series 2019-1A Class A1, 3.04%, 3/20/2023 | 98,799 | 96,430 |
| c | Sierra Timeshare Receivables Funding, LLC, Series 2019-1A Class A, 3.20%, 1/20/2036 | 57,477 | 56,919 |
| c | SoFi Consumer Loan Program Trust, Series 2019-2 Class A, 3.01%, 4/25/2028 | 210,418 | 204,159 |
| c,d | Towd Point Mortgage Trust, Series 2018-5 Class A1, 3.25%, 7/25/2058 | 122,501 | 118,250 |
| c | Upstart Securitization Trust, Series 2019-1 Class B, 4.19%, 4/20/2026 | 150,000 | 136,902 |
| | | | 1,490,023 |
| | Auto Receivables — 2.3% | | |
| c | Avid Automobile Receivables Trust, Series 2019-1 Class A, 2.62%, 2/15/2024 | 224,393 | 217,464 |
| c | CarNow Auto Receivables Trust, Series 2017-1A Class B, 4.35%, 9/15/2022 | 75,693 | 74,109 |
| c | CIG Auto Receivables Trust, Series 2017-1A Class A, 2.71%, 5/15/2023 | 23,655 | 23,088 |
| c | CPS Auto Receivables Trust, Series 2020-A Class A, 2.09%, 5/15/2023 | 250,086 | 243,738 |
| c | Flagship Credit Auto Trust, Series 2018-3 Class A, 3.07%, 2/15/2023 | 35,227 | 34,888 |
| c,d | Navistar Financial Dealer Note Master Owner Trust II, Series 2018-1 Class D, 2.497% (LIBOR 1 Month + 1.55%), 9/25/2023 | 175,000 | 171,808 |
| | | | 765,095 |
| | Other Asset Backed — 3.1% | | |
| c | Avant Loans Funding Trust, Series 2019-A Class A, 3.48%, 7/15/2022 | 39,593 | 38,944 |
| c | AXIS Equipment Finance Receivables VI, LLC, Series 2018-2A Class A2, 3.89%, 7/20/2022 | 0 | 0 |
| c | Consumer Loan Underlying Bond Credit Trust, Series 2019-A Class A, 3.52%, 4/15/2026 | 37,945 | 36,829 |
| c | Diamond Resorts Owner Trust, Series 2018-1 Class A, 3.70%, 1/21/2031 | 45,835 | 46,600 |
| c,e | ECAF I Ltd., Series 2015-1A Class A2, 4.947%, 6/15/2040 | 196,172 | 167,122 |
| c | Foundation Finance Trust, Series 2019-1A Class A, 3.86%, 11/15/2034 | 136,617 | 130,634 |
| c | Marlette Funding Trust, Series 2019-3A Class A, 2.69%, 9/17/2029 | 185,321 | 175,024 |
| c | Ocwen Master Advance Receivables Trust, Series 2019-T1 Class AT1, 2.514%, 8/15/2050 | 200,000 | 199,427 |
| c | Sofi Consumer Loan Program, LLC, Series 2016-3 Class A, 3.05%, 12/26/2025 | 132,940 | 130,468 |
| c | SPS Servicer Advance Receivables Trust Advance Receivables Backed Notes, Series 2019-T2 Class AT2, 2.32%, 10/15/2052 | 121,000 | 116,850 |
| | | | 1,041,898 |
| | Student Loan — 1.1% | | |
| c,d | Earnest Student Loan Program, LLC, Series 2016-B Class A1, 2.997% (LIBOR 1 Month + 2.05%), 2/26/2035 | 206,394 | 193,913 |
| c,d | Navient Private Education Refinance Loan Trust, Series 2019-D Class A2B, 1.755% (LIBOR 1 Month + 1.05%), 12/15/2059 | 100,000 | 81,035 |
| c | SMB Private Education Loan Trust, Series 2015-C Class A2A, 2.75%, 7/15/2027 | 74,226 | 71,322 |
| c | SoFi Professional Loan Program, LLC, Series 2015-B Class A2, 2.51%, 9/27/2032 | 35,961 | 35,300 |
| | | | 381,570 |
| | Total Asset Backed Securities(Cost $3,828,138) | | 3,678,586 |
| | Corporate Bonds — 5.9% | | |
48 | Thornburg Equity Funds Semi-Annual Report
| See notes to financial statements. |
Schedule of Investments, Continued
Thornburg Summit Fund | March 31, 2020 (Unaudited)
| | Issuer-Description | SHARES/
PRINCIPAL AMOUNT | VALUE |
| | Commercial & Professional Services — 0.5% | | |
| | Commercial Services & Supplies — 0.5% | | |
| c | Nielsen Finance, LLC / Nielsen Finance Co., 5.00%, 4/15/2022 | $ 168,000 | $ 154,866 |
| | | | 154,866 |
| | Diversified Financials — 1.1% | | |
| | Capital Markets — 0.7% | | |
| | Ares Capital Corp., 3.25%, 7/15/2025 | 120,000 | 95,239 |
| c | Ares Finance Co., LLC, 4.00%, 10/8/2024 | 140,000 | 138,318 |
| | Main Street Capital Corp., 5.20%, 5/1/2024 | 11,000 | 10,410 |
| | Diversified Financial Services — 0.4% | | |
| d | Morgan Stanley, 1.613% (SOFR + 0.70%), 1/20/2023 | 130,000 | 121,011 |
| | | | 364,978 |
| | Energy — 0.3% | | |
| | Oil, Gas & Consumable Fuels — 0.3% | | |
| | ONEOK Partners L.P., 4.90%, 3/15/2025 | 100,000 | 87,425 |
| | | | 87,425 |
| | Food, Beverage & Tobacco — 0.7% | | |
| | Tobacco — 0.7% | | |
| c | Vector Group Ltd., 10.50%, 11/1/2026 | 280,000 | 233,800 |
| | | | 233,800 |
| | Insurance — 0.4% | | |
| | Insurance — 0.4% | | |
| c,d | Metropolitan Life Global Funding, 0.58% (SOFR + 0.57%), 9/7/2020 | 150,000 | 148,393 |
| | | | 148,393 |
| | Materials — 0.3% | | |
| | Paper & Forest Products — 0.3% | | |
| c | Neenah, Inc., 5.25%, 5/15/2021 | 100,000 | 97,500 |
| | | | 97,500 |
| | Real Estate — 0.7% | | |
| | Equity Real Estate Investment Trusts — 0.7% | | |
| | CoreCivic, Inc., 4.75%, 10/15/2027 | 80,000 | 60,000 |
| | GEO Group, Inc., 6.00%, 4/15/2026 | 250,000 | 162,344 |
| | Service Properties Trust, 4.95%, 2/15/2027 | 40,000 | 30,311 |
| | | | 252,655 |
| | Technology Hardware & Equipment — 0.6% | | |
| | Office Electronics — 0.6% | | |
| | Xerox Corp., 4.50%, 5/15/2021 | 200,000 | 197,240 |
| | | | 197,240 |
| | Telecommunication Services — 1.1% | | |
| | Diversified Telecommunication Services — 0.1% | | |
| c | GTT Communications, Inc., 7.875%, 12/31/2024 | 60,000 | 38,700 |
| | Wireless Telecommunication Services — 1.0% | | |
| | Sprint Communications, Inc., 9.25%, 4/15/2022 | 310,000 | 331,700 |
| | | | 370,400 |
| | Transportation — 0.2% | | |
| | Airlines — 0.2% | | |
| c | American Airlines Pass Through Trust, Series 2013-2 Class B, 5.60%, 7/15/2022 | 71,390 | 70,854 |
| | | | 70,854 |
| | Total Corporate Bonds(Cost $2,164,388) | | 1,978,111 |
| | Convertible Bonds — 0.7% | | |
| | Diversified Financials — 0.5% | | |
| | Consumer Finance — 0.5% | | |
See notes to financial statements.
| Thornburg Equity Funds Semi-Annual Report | 49 |
Schedule of Investments, Continued
Thornburg Summit Fund | March 31, 2020 (Unaudited)
| | Issuer-Description | SHARES/
PRINCIPAL AMOUNT | VALUE |
| | EZCORP, Inc., 2.375%, 5/1/2025 | $ 230,000 | $ 170,257 |
| | | | 170,257 |
| | Food, Beverage & Tobacco — 0.2% | | |
| | Tobacco — 0.2% | | |
| d | Vector Group Ltd., 1.75%, 4/15/2020 | 80,000 | 79,840 |
| | | | 79,840 |
| | Total Convertible Bonds(Cost $253,731) | | 250,097 |
| | Other Government — 0.1% | | |
| | Mexican Bonos, 8.00%, 12/7/2023 | 750,000 | 33,152 |
| | Total Other Government(Cost $38,750) | | 33,152 |
| | U.S. Treasury Securities — 9.4% | | |
| | United States Treasury Notes Inflationary Index, | | |
| | 0.50%, 1/15/2028 | 1,171,184 | 1,218,097 |
| | 0.875%, 1/15/2029 | 1,302,451 | 1,413,013 |
| | 3.625%, 4/15/2028 | 424,209 | 545,186 |
| | Total U.S. Treasury Securities(Cost $3,007,512) | | 3,176,296 |
| | Mortgage Backed — 5.7% | | |
| c,d | Angel Oak Mortgage Trust I, LLC, Whole Loan Securities Trust CMO, Series 2019-2 Class A1, 3.628%, 3/25/2049 | 117,167 | 114,906 |
| | Arroyo Mortgage Trust, Whole Loan Securities Trust CMO, | | |
| c,d | Series 2019-1 Class A1, 3.805%, 1/25/2049 | 129,868 | 123,263 |
| c,d | Series 2019-3 Class A1, 2.962%, 10/25/2048 | 164,898 | 151,096 |
| c | Bravo Residential Funding Trust, Whole Loan Securities Trust CMO, Series 2019-1 Class A1C, 3.50%, 3/25/2058 | 233,646 | 230,147 |
| c,d | CSMLT Mortgage Trust, Whole Loan Securities Trust CMO, Series 2015-3 Class B1, 3.692%, 11/25/2045 | 233,227 | 231,394 |
| | Federal Home Loan Mtg Corp., Seasoned Credit Risk Transfer, Whole Loan Securities Trust CMO, Series 2019-1 Class MA, 3.50%, 7/25/2058 | 103,864 | 109,755 |
| | Federal Home Loan Mtg Corp., Whole Loan Securities Trust CMO, Series 2017-SC02 Class 1A, 3.00%, 5/25/2047 | 288,886 | 286,130 |
| c,d | FWD Securitization Trust, Whole Loan Securities Trust CMO, Series 2019-INV1 Class A1, 2.81%, 6/25/2049 | 169,349 | 158,673 |
| c,d | Homeward Opportunities Fund I Trust, Whole Loan Securities Trust CMO, Series 2019-1 Class A1, 3.454%, 1/25/2059 | 116,217 | 114,465 |
| | JPMorgan Mortgage Trust, Whole Loan Securities Trust CMO, | | |
| c,d | Series 2017-6 Class A5, 3.50%, 12/25/2048 | 50,163 | 50,778 |
| c,d | Series 2018-6 Class 1A4, 3.50%, 12/25/2048 | 9,970 | 9,722 |
| c,d | Metlife Securitization Trust, Whole Loan Securities Trust CMO, Series 2019-1A Class A1A, 3.75%, 4/25/2058 | 167,685 | 165,945 |
| | New Residential Mortgage Loan Trust, Whole Loan Securities Trust CMO, | | |
| c,d | Series 2017-4 Class A1, 3.60%, 4/25/2049 | 85,697 | 84,551 |
| c,d | Series 2017-4A Class A1, 4.00%, 5/25/2057 | 95,530 | 99,050 |
| | Total Mortgage Backed(Cost $1,949,369) | | 1,929,875 |
| | Loan Participations — 0.2% | | |
| | Real Estate — 0.2% | | |
| | Equity Real Estate Investment Trusts — 0.2% | | |
| f | CoreCivic, Inc., 5.50% (LIBOR 1 Month + 4.50%), 12/12/2024 | 79,000 | 68,730 |
| | | | 68,730 |
| | Total Loan Participations(Cost $75,113) | | 68,730 |
| | Exchange-Traded Funds — 3.0% | | |
| a | Invesco DB Agriculture Fund | 11,207 | 157,682 |
| a | Invesco DB Base Metals Fund | 40,003 | 494,037 |
| a,b | SPDR Gold Shares Fund | 2,516 | 372,494 |
| | Total Exchange-Traded Funds(Cost $1,108,872) | | 1,024,213 |
| | Investment Company — 0.5% | | |
| b | United States Oil Fund L.P. | 37,786 | 159,079 |
| | Total Investment Company(Cost $410,823) | | 159,079 |
| | Total Long-Term Investments — 96.8%(Cost $33,934,558) | | 32,664,773 |
50 | Thornburg Equity Funds Semi-Annual Report
| See notes to financial statements. |
Schedule of Investments, Continued
Thornburg Summit Fund | March 31, 2020 (Unaudited)
| | Issuer-Description | SHARES/
PRINCIPAL AMOUNT | VALUE |
| | Short-Term Investments — 7.6% | | |
| g | Thornburg Capital Management Fund | 255,332 | $ 2,553,322 |
| | Total Short-Term Investments(Cost $2,553,322) | | 2,553,322 |
| | Total Investments — 104.4%(Cost $36,487,880) | | $35,218,095 |
| | Liabilities Net of Other Assets — (4.4)% | | (1,470,209) |
| | Common Stock Sold Short — (5.1)% | | |
| | Commercial & Professional Services — (0.8)% | | |
| | Professional Services — (0.8)% | | |
| b | FTI Consulting, Inc. | (2,189) | (262,176) |
| | | | (262,176) |
| | Media & Entertainment — (1.6)% | | |
| | Entertainment — (0.7)% | | |
| b | Roku, Inc. | (1,656) | (144,867) |
| b | Tencent Music Entertainment Group ADR | (9,891) | (99,503) |
| | Media — (0.9)% | | |
| b | Discovery, Inc., Class A | (4,091) | (79,529) |
| | New York Times Co., Class A | (7,319) | (224,767) |
| | | | (548,666) |
| | Retailing — (0.5)% | | |
| | Specialty Retail — (0.5)% | | |
| | Rent-A-Center, Inc. | (7,887) | (111,522) |
| b | Sleep Number Corp. | (2,377) | (45,543) |
| | | | (157,065) |
| | Software & Services — (1.3)% | | |
| | Information Technology Services — (0.9)% | | |
| | Western Union Co. | (16,775) | (304,131) |
| | Software — (0.4)% | | |
| | Blackbaud, Inc. | (2,338) | (129,876) |
| | | | (434,007) |
| | Telecommunication Services — (0.9)% | | |
| | Diversified Telecommunication Services — (0.9)% | | |
| | Cogent Communications Holdings, Inc. | (3,772) | (309,191) |
| | | | (309,191) |
| | Total Common Stock Sold Short(Proceeds $2,006,098) | | (1,711,105) |
| | Net Assets — 100.0% | | $33,747,886 |
See notes to financial statements.
| Thornburg Equity Funds Semi-Annual Report | 51 |
Schedule of Investments, Continued
Thornburg Summit Fund | March 31, 2020 (Unaudited)
| Footnote Legend |
| a | All or a portion of the security is pledged as collateral for securities sold short. At March 31, 2020, the value of securities pledged was $2,076,475. |
| b | Non-income producing. |
| c | Securities exempt from registration under Rule 144A of the Securities Act of 1933, as amended. These securities are restricted but liquid and may only be resold in the ordinary course of business in transactions exempt from registration, normally to qualified institutional buyers. As of March 31, 2020, the aggregate value of these securities in the Fund’s portfolio was $6,755,938, representing 20.02% of the Fund’s net assets. |
| d | Variable, floating, step, or fixed to floating rate securities are securities for which interest rate changes are based on changes in a designated base rate or on a predetermined schedule. The rates shown are those in effect on March 31, 2020. |
| e | Yankee bond denominated in U.S. dollars and is issued in the U.S. by foreign banks and corporations. |
| f | The stated coupon rate represents the greater of the LIBOR or the LIBOR floor rate plus a spread at March 31, 2020. |
| g | Investment in Affiliates. |
Portfolio Abbreviations
To simplify the listings of securities, abbreviations are used per the table below:
| ADR | American Depositary Receipt |
| CMO | Collateralized Mortgage Obligation |
| LIBOR | London Interbank Offered Rates |
| Mtg | Mortgage |
| SOFR | Secured Overnight Financing Rate |
52 | Thornburg Equity Funds Semi-Annual Report
| See notes to financial statements. |
Schedule of Investments
Thornburg Global Opportunities Fund | March 31, 2020 (Unaudited)
| | Issuer-Description | SHARES | VALUE |
| | Common Stock — 93.8% | | |
| | Banks — 3.8% | | |
| | Banks — 3.8% | | |
| | Citigroup, Inc. | 766,552 | $ 32,287,170 |
| | | | 32,287,170 |
| | Capital Goods — 5.6% | | |
| | Electrical Equipment — 4.7% | | |
| | Vestas Wind Systems A/S | 487,622 | 39,675,665 |
| | Machinery — 0.9% | | |
| | CNH Industrial N.V. | 1,372,807 | 7,818,531 |
| | | | 47,494,196 |
| | Consumer Durables & Apparel — 0.6% | | |
| | Household Durables — 0.6% | | |
| | Barratt Developments plc | 908,113 | 4,908,634 |
| | | | 4,908,634 |
| | Consumer Services — 1.4% | | |
| | Hotels, Restaurants & Leisure — 1.4% | | |
| | Galaxy Entertainment Group Ltd. | 2,257,725 | 11,891,031 |
| | | | 11,891,031 |
| | Diversified Financials — 5.7% | | |
| | Capital Markets — 2.0% | | |
| | Charles Schwab Corp. | 508,125 | 17,083,163 |
| | Consumer Finance — 3.7% | | |
| | Capital One Financial Corp. | 614,636 | 30,989,947 |
| | | | 48,073,110 |
| | Energy — 5.0% | | |
| | Oil, Gas & Consumable Fuels — 5.0% | | |
| | Reliance Industries Ltd. | 2,909,506 | 41,903,290 |
| | | | 41,903,290 |
| | Food & Staples Retailing — 2.5% | | |
| | Food & Staples Retailing — 2.5% | | |
| | Tesco plc | 2,990,196 | 8,444,393 |
| | Walgreens Boots Alliance, Inc. | 282,045 | 12,903,559 |
| | | | 21,347,952 |
| | Health Care Equipment & Services — 2.4% | | |
| | Health Care Providers & Services — 2.4% | | |
| a | DaVita, Inc. | 269,119 | 20,469,191 |
| | | | 20,469,191 |
| | Insurance — 3.5% | | |
| | Insurance — 3.5% | | |
| | NN Group N.V. | 1,096,695 | 29,803,497 |
| | | | 29,803,497 |
| | Materials — 8.6% | | |
| | Chemicals — 6.1% | | |
| | CF Industries Holdings, Inc. | 660,799 | 17,973,733 |
| a | OCI N.V. | 2,795,826 | 33,410,324 |
| | Metals & Mining — 2.5% | | |
| | Mineral Resources Ltd. | 2,468,176 | 20,883,475 |
| | | | 72,267,532 |
| | Media & Entertainment — 13.3% | | |
| | Entertainment — 2.3% | | |
| a | Sea Ltd. ADR | 437,121 | 19,368,832 |
See notes to financial statements.
| Thornburg Equity Funds Semi-Annual Report | 53 |
Schedule of Investments, Continued
Thornburg Global Opportunities Fund | March 31, 2020 (Unaudited)
| | Issuer-Description | SHARES | VALUE |
| | Interactive Media & Services — 11.0% | | |
| a | Alphabet, Inc. Class A | 40,557 | $ 47,125,206 |
| a | Facebook, Inc. Class A | 275,650 | 45,978,420 |
| | | | 112,472,458 |
| | Pharmaceuticals, Biotechnology & Life Sciences — 6.8% | | |
| | Biotechnology — 3.9% | | |
| | AbbVie, Inc. | 428,809 | 32,670,958 |
| | Pharmaceuticals — 2.9% | | |
| | Allergan plc | 7,717 | 1,366,681 |
| | Roche Holding AG | 71,626 | 23,045,082 |
| | | | 57,082,721 |
| | Retailing — 5.1% | | |
| | Internet & Direct Marketing Retail — 5.1% | | |
| a | Alibaba Group Holding Ltd. Sponsored ADR | 222,627 | 43,296,499 |
| | | | 43,296,499 |
| | Semiconductors & Semiconductor Equipment — 6.9% | | |
| | Semiconductors & Semiconductor Equipment — 6.9% | | |
| a | Qorvo, Inc. | 543,206 | 43,798,700 |
| | Taiwan Semiconductor Manufacturing Co. Ltd. | 1,558,114 | 14,026,626 |
| | | | 57,825,326 |
| | Software & Services — 4.6% | | |
| | Information Technology Services — 4.6% | | |
| a | GDS Holdings Ltd. ADR | 667,789 | 38,711,728 |
| | | | 38,711,728 |
| | Technology Hardware & Equipment — 4.3% | | |
| | Technology Hardware, Storage & Peripherals — 4.3% | | |
| | Samsung Electronics Co. Ltd. | 923,096 | 35,891,345 |
| | | | 35,891,345 |
| | Telecommunication Services — 6.8% | | |
| | Wireless Telecommunication Services — 6.8% | | |
| | China Mobile Ltd. | 3,336,208 | 25,002,479 |
| a | T-Mobile US, Inc. | 387,969 | 32,550,599 |
| | | | 57,553,078 |
| | Transportation — 6.8% | | |
| | Airlines — 3.4% | | |
| | easyJet plc | 1,688,743 | 11,702,243 |
| a | Ryanair Holdings plc Sponsored ADR | 318,148 | 16,890,477 |
| | Transportation Infrastructure — 3.4% | | |
| | Atlantia SpA | 2,321,481 | 28,838,495 |
| | | | 57,431,215 |
| | Utilities — 0.1% | | |
| | Electric Utilities — 0.1% | | |
| | Electricite de France S.A. | 115,559 | 903,614 |
| | | | 903,614 |
| | Total Common Stock(Cost $780,086,573) | | 791,613,587 |
| | Short-Term Investments — 5.9% | | |
| b | Thornburg Capital Management Fund | 4,969,882 | 49,698,820 |
| | Total Short-Term Investments(Cost $49,698,820) | | 49,698,820 |
| | Total Investments — 99.7%(Cost $829,785,393) | | $841,312,407 |
| | Other Assets Less Liabilities — 0.3% | | 2,852,155 |
| | Net Assets — 100.0% | | $844,164,562 |
54 | Thornburg Equity Funds Semi-Annual Report
| See notes to financial statements. |
Schedule of Investments, Continued
Thornburg Global Opportunities Fund | March 31, 2020 (Unaudited)
| Outstanding Forward Currency Contracts To Buy Or Sell At March 31, 2020 |
Contract
Description | Contract
Party* | Buy/Sell | Contract
Amount | Contract
Value Date | Value
USD | Unrealized
Appreciation | Unrealized
Depreciation |
| Great Britain Pound | SSB | Sell | 15,634,200 | 4/14/2020 | 19,423,339 | $ 1,097,331 | $ — |
| Great Britain Pound | SSB | Sell | 1,342,000 | 4/14/2020 | 1,667,250 | 87,699 | — |
| Great Britain Pound | SSB | Buy | 4,535,000 | 4/14/2020 | 5,634,112 | — | (233,996) |
| Great Britain Pound | SSB | Buy | 591,900 | 4/14/2020 | 735,354 | 50,430 | — |
| Australian Dollar | BBH | Sell | 16,684,900 | 4/30/2020 | 10,264,476 | 1,005,172 | — |
| Euro | SSB | Sell | 94,238,700 | 5/18/2020 | 104,120,352 | — | (1,357,761) |
| Euro | SSB | Buy | 7,506,600 | 5/18/2020 | 8,293,725 | — | (115,814) |
| Euro | SSB | Buy | 6,558,100 | 5/18/2020 | 7,245,767 | — | (39,593) |
| |
| Total | | | | | | $2,240,632 | $(1,747,164) |
| |
| Net unrealized appreciation (depreciation) | | | | | | $493,468 | |
| * | Counterparties include State Street Bank and Trust Company (“SSB”) and Brown Brothers Harriman & Co. (“BBH”). |
| Footnote Legend |
| a | Non-income producing. |
| b | Investment in Affiliates. |
Portfolio Abbreviations
To simplify the listings of securities, abbreviations are used per the table below:
| ADR | American Depositary Receipt |
See notes to financial statements.
| Thornburg Equity Funds Semi-Annual Report | 55 |
Schedule of Investments
Thornburg International Value Fund | March 31, 2020 (Unaudited)
| | Issuer-Description | SHARES | VALUE |
| | Common Stock — 93.9% | | |
| | Banks — 5.0% | | |
| | Banks — 5.0% | | |
| | BNP Paribas S.A. | 728,812 | $ 21,277,824 |
| | ING Groep N.V. | 8,075,759 | 41,380,938 |
| | Ping An Bank Co. Ltd. Class A | 32,619,774 | 58,353,387 |
| | | | 121,012,149 |
| | Capital Goods — 14.5% | | |
| | Aerospace & Defense — 4.9% | | |
| | BAE Systems plc | 10,138,292 | 65,138,735 |
| | Safran S.A. | 603,602 | 53,477,370 |
| | Construction & Engineering — 5.5% | | |
| | Ferrovial S.A. | 2,851,365 | 67,682,069 |
| | Vinci S.A. | 806,531 | 65,901,038 |
| | Electrical Equipment — 2.3% | | |
| | ABB Ltd. | 2,729,379 | 47,439,431 |
| | Schneider Electric SE | 112,720 | 9,527,416 |
| | Machinery — 1.8% | | |
| | Knorr-Bremse AG | 516,345 | 45,394,923 |
| | | | 354,560,982 |
| | Commercial & Professional Services — 1.1% | | |
| | Professional Services — 1.1% | | |
| | Recruit Holdings Co. Ltd. | 1,072,062 | 27,692,722 |
| | | | 27,692,722 |
| | Consumer Durables & Apparel — 3.7% | | |
| | Textiles, Apparel & Luxury Goods — 3.7% | | |
| | adidas AG | 292,383 | 64,916,998 |
| | Kering S.A. | 50,162 | 26,155,094 |
| | | | 91,072,092 |
| | Diversified Financials — 2.2% | | |
| | Capital Markets — 2.2% | | |
| | CME Group, Inc. | 93,218 | 16,118,324 |
| | UBS Group AG | 4,127,175 | 37,830,145 |
| | | | 53,948,469 |
| | Energy — 2.8% | | |
| | Oil, Gas & Consumable Fuels — 2.8% | | |
| | Reliance Industries Ltd. | 1,548,761 | 22,305,567 |
| | Royal Dutch Shell plc Sponsored ADR Class A | 1,323,861 | 46,189,510 |
| | | | 68,495,077 |
| | Food, Beverage & Tobacco — 8.7% | | |
| | Beverages — 4.5% | | |
| | Kweichow Moutai Co. Ltd. Class A | 316,727 | 49,221,748 |
| | Wuliangye Yibin Co. Ltd. Class A | 3,763,520 | 60,539,862 |
| | Food Products — 4.2% | | |
| | Danone S.A. | 851,486 | 54,493,553 |
| | Nestle S.A. | 457,709 | 46,854,656 |
| | | | 211,109,819 |
| | Health Care Equipment & Services — 1.0% | | |
| | Health Care Equipment & Supplies — 1.0% | | |
| a | Alcon, Inc. | 480,700 | 24,626,612 |
| | | | 24,626,612 |
| | Household & Personal Products — 3.4% | | |
| | Personal Products — 3.4% | | |
| | Proya Cosmetics Co. Ltd. Class A | 1,278,762 | 20,633,709 |
| | Shiseido Co. Ltd. | 444,492 | 26,123,883 |
56 | Thornburg Equity Funds Semi-Annual Report
| See notes to financial statements. |
Schedule of Investments, Continued
Thornburg International Value Fund | March 31, 2020 (Unaudited)
| | Issuer-Description | SHARES | VALUE |
| | Unilever plc | 708,819 | $ 35,745,878 |
| | | | 82,503,470 |
| | Insurance — 4.0% | | |
| | Insurance — 4.0% | | |
| | AIA Group Ltd. | 1,351,202 | 12,099,519 |
| | NN Group N.V. | 856,561 | 23,277,678 |
| | Ping An Insurance Group Co. of China Ltd. Class H | 6,344,948 | 61,966,381 |
| | | | 97,343,578 |
| | Materials — 3.4% | | |
| | Chemicals — 2.9% | | |
| | Linde plc | 72,140 | 12,511,810 |
| | Sika AG | 359,264 | 58,995,722 |
| | Metals & Mining — 0.5% | | |
| | Franco-Nevada Corp. | 121,611 | 12,102,727 |
| | | | 83,610,259 |
| | Media & Entertainment — 8.1% | | |
| | Entertainment — 2.8% | | |
| | Nintendo Co. Ltd. | 171,529 | 66,665,339 |
| | Interactive Media & Services — 5.3% | | |
| | Tencent Holdings Ltd. | 1,395,366 | 68,969,584 |
| | Z Holdings Corp. | 19,130,258 | 60,990,242 |
| | | | 196,625,165 |
| | Pharmaceuticals, Biotechnology & Life Sciences — 4.0% | | |
| | Life Sciences Tools & Services — 2.9% | | |
| | Lonza Group AG | 174,109 | 71,615,171 |
| | Pharmaceuticals — 1.1% | | |
| | Roche Holding AG | 80,728 | 25,973,577 |
| | | | 97,588,748 |
| | Retailing — 5.6% | | |
| | Internet & Direct Marketing Retail — 5.6% | | |
| a | Alibaba Group Holding Ltd. Sponsored ADR | 374,131 | 72,760,997 |
| a | Meituan Dianping Class B | 5,359,384 | 63,890,531 |
| | | | 136,651,528 |
| | Semiconductors & Semiconductor Equipment — 4.5% | | |
| | Semiconductors & Semiconductor Equipment — 4.5% | | |
| | ASML Holding N.V. | 67,975 | 17,919,199 |
| | Infineon Technologies AG | 1,783,028 | 25,739,337 |
| | SK Hynix, Inc. | 657,433 | 44,445,103 |
| | Taiwan Semiconductor Manufacturing Co. Ltd. Sponsored ADR | 425,229 | 20,321,694 |
| | | | 108,425,333 |
| | Software & Services — 3.6% | | |
| | Information Technology Services — 1.5% | | |
| | Amadeus IT Group S.A. | 761,819 | 35,857,938 |
| | Software — 2.1% | | |
| | SAP SE | 468,930 | 52,355,055 |
| | | | 88,212,993 |
| | Technology Hardware & Equipment — 4.4% | | |
| | Communications Equipment — 3.1% | | |
| a | Telefonaktiebolaget LM Ericsson Class B | 9,453,950 | 76,529,372 |
| | Electronic Equipment, Instruments & Components — 1.3% | | |
| | Keyence Corp. | 98,761 | 31,752,886 |
| | | | 108,282,258 |
| | Telecommunication Services — 3.9% | | |
| | Diversified Telecommunication Services — 2.1% | | |
| | Orange S.A. | 4,304,988 | 52,122,441 |
See notes to financial statements.
| Thornburg Equity Funds Semi-Annual Report | 57 |
Schedule of Investments, Continued
Thornburg International Value Fund | March 31, 2020 (Unaudited)
| | Issuer-Description | SHARES | VALUE |
| | Wireless Telecommunication Services — 1.8% | | |
| | Vodafone Group plc | 31,461,760 | $ 43,525,577 |
| | | | 95,648,018 |
| | Transportation — 3.9% | | |
| | Marine — 1.0% | | |
| | Kuehne + Nagel International AG | 177,720 | 24,209,124 |
| | Road & Rail — 1.9% | | |
| | Canadian Pacific Railway Ltd. | 213,086 | 46,791,555 |
| | Transportation Infrastructure — 1.0% | | |
| | Atlantia SpA | 369,724 | 4,592,880 |
| | Shanghai International Airport Co. Ltd. Class A | 2,402,857 | 20,423,378 |
| | | | 96,016,937 |
| | Utilities — 6.1% | | |
| | Electric Utilities — 6.1% | | |
| | Electricite de France S.A. | 5,541,892 | 43,334,840 |
| | Enel SpA | 5,915,401 | 40,803,494 |
| | Iberdrola S.A. | 6,528,604 | 63,856,308 |
| | | | 147,994,642 |
| | Total Common Stock(Cost $2,401,514,437) | | 2,291,420,851 |
| | Short-Term Investments — 4.5% | | |
| b | Thornburg Capital Management Fund | 10,903,440 | 109,034,397 |
| | Total Short-Term Investments(Cost $109,034,397) | | 109,034,397 |
| | Total Investments — 98.4%(Cost $2,510,548,834) | | $2,400,455,248 |
| | Other Assets Less Liabilities — 1.6% | | 38,039,084 |
| | Net Assets — 100.0% | | $2,438,494,332 |
| Outstanding Forward Currency Contracts To Buy Or Sell At March 31, 2020 |
Contract
Description | Contract
Party* | Buy/Sell | Contract
Amount | Contract
Value Date | Value
USD | Unrealized
Appreciation | Unrealized
Depreciation |
| Euro | BBH | Sell | 207,764,800 | 6/12/2020 | 229,767,602 | $ 6,352,938 | $ — |
| Euro | BBH | Buy | 110,068,800 | 6/12/2020 | 121,725,356 | 2,111,389 | — |
| Euro | BBH | Sell | 52,905,500 | 6/12/2020 | 58,508,322 | 87,165 | — |
| |
| Total | | | | | | $8,551,492 | — |
| |
| Net unrealized appreciation (depreciation) | | | | | | $8,551,492 | |
| * | Counterparty includes Brown Brothers Harriman & Co. ("BBH"). |
| Footnote Legend |
| a | Non-income producing. |
| b | Investment in Affiliates. |
Portfolio Abbreviations
To simplify the listings of securities, abbreviations are used per the table below:
| ADR | American Depositary Receipt |
58 | Thornburg Equity Funds Semi-Annual Report
| See notes to financial statements. |
Schedule of Investments
Thornburg Better World International Fund | March 31, 2020 (Unaudited)
| | Issuer-Description | SHARES | VALUE |
| | Common Stock — 95.3% | | |
| | Banks — 2.3% | | |
| | Banks — 2.3% | | |
| | DNB ASA | 66,503 | $ 740,906 |
| | ING Groep N.V. | 136,576 | 699,828 |
| | | | 1,440,734 |
| | Capital Goods — 8.1% | | |
| | Construction & Engineering — 1.5% | | |
| | Vinci S.A. | 11,541 | 943,006 |
| | Electrical Equipment — 2.6% | | |
| | Prysmian SpA | 48,849 | 775,569 |
| | Vestas Wind Systems A/S | 10,038 | 816,748 |
| | Industrial Conglomerates — 1.8% | | |
| | Siemens AG | 13,084 | 1,095,589 |
| | Machinery — 2.2% | | |
| | Alstom S.A. | 20,933 | 864,368 |
| | Weir Group plc | 57,972 | 515,610 |
| | | | 5,010,890 |
| | Commercial & Professional Services — 0.7% | | |
| | Commercial Services & Supplies — 0.7% | | |
| | Park24 Co. Ltd. | 31,100 | 458,465 |
| | | | 458,465 |
| | Consumer Durables & Apparel — 8.4% | | |
| | Household Durables — 3.5% | | |
| | Sony Corp. | 36,462 | 2,159,773 |
| | Textiles, Apparel & Luxury Goods — 4.9% | | |
| | adidas AG | 3,059 | 679,182 |
| | Li Ning Co. Ltd. | 304,000 | 874,572 |
| | LVMH Moet Hennessy Louis Vuitton SE | 2,124 | 778,979 |
| | Moncler SpA Moncler SpA | 19,045 | 692,070 |
| | | | 5,184,576 |
| | Diversified Financials — 1.7% | | |
| | Capital Markets — 1.7% | | |
| | UBS Group AG | 71,837 | 658,466 |
| a | XP, Inc. Class A | 21,823 | 420,966 |
| | | | 1,079,432 |
| | Food, Beverage & Tobacco — 4.2% | | |
| | Food Products — 4.2% | | |
| | Danone S.A. | 13,727 | 878,503 |
| a | Nomad Foods Ltd. | 92,017 | 1,707,836 |
| | | | 2,586,339 |
| | Health Care Equipment & Services — 7.5% | | |
| | Health Care Equipment & Supplies — 3.7% | | |
| | Hoya Corp. | 10,617 | 902,779 |
| b | Siemens Healthineers AG | 17,300 | 668,758 |
| | Terumo Corp. | 20,845 | 714,178 |
| | Health Care Providers & Services — 2.7% | | |
| | Fresenius Medical Care AG & Co. KGaA | 25,799 | 1,684,054 |
| | Health Care Technology — 1.1% | | |
| | M3, Inc. | 24,082 | 710,350 |
| | | | 4,680,119 |
| | Household & Personal Products — 5.6% | | |
| | Household Products — 2.1% | | |
| | Reckitt Benckiser Group plc | 17,222 | 1,311,896 |
| | Personal Products — 3.5% | | |
See notes to financial statements.
| Thornburg Equity Funds Semi-Annual Report | 59 |
Schedule of Investments, Continued
Thornburg Better World International Fund | March 31, 2020 (Unaudited)
| | Issuer-Description | SHARES | VALUE |
| | Kao Corp. | 16,191 | $ 1,319,052 |
| | L’Oreal S.A. | 1,951 | 504,939 |
| | Unilever plc | 6,229 | 314,130 |
| | | | 3,450,017 |
| | Insurance — 7.0% | | |
| | Insurance — 7.0% | | |
| | AIA Group Ltd. | 225,805 | 2,022,001 |
| | AXA S.A. | 64,077 | 1,084,948 |
| | NN Group N.V. | 45,997 | 1,250,002 |
| | | | 4,356,951 |
| | Materials — 5.9% | | |
| | Chemicals — 2.5% | | |
| | Novozymes A/S Class B | 16,726 | 750,274 |
| | Sika AG | 4,799 | 788,057 |
| | Construction Materials — 2.1% | | |
| | CRH plc | 47,657 | 1,293,155 |
| | Paper & Forest Products — 1.3% | | |
| | Mondi plc | 49,875 | 841,672 |
| | | | 3,673,158 |
| | Media & Entertainment — 7.4% | | |
| | Entertainment — 2.9% | | |
| a | Netflix, Inc. | 2,447 | 918,848 |
| a | Ubisoft Entertainment S.A. | 12,472 | 911,591 |
| | Interactive Media & Services — 4.5% | | |
| | Tencent Holdings Ltd. | 56,338 | 2,784,652 |
| | | | 4,615,091 |
| | Pharmaceuticals, Biotechnology & Life Sciences — 6.8% | | |
| | Life Sciences Tools & Services — 2.8% | | |
| | Lonza Group AG | 1,312 | 539,657 |
| | Thermo Fisher Scientific, Inc. | 4,322 | 1,225,719 |
| | Pharmaceuticals — 4.0% | | |
| | Roche Holding AG | 3,430 | 1,103,574 |
| | Takeda Pharmaceutical Co. Ltd. | 45,100 | 1,373,209 |
| | | | 4,242,159 |
| | Real Estate — 0.9% | | |
| | Equity Real Estate Investment Trusts — 0.9% | | |
| | Equinix, Inc. | 925 | 577,727 |
| | | | 577,727 |
| | Retailing — 8.9% | | |
| | Internet & Direct Marketing Retail — 6.6% | | |
| a | Alibaba Group Holding Ltd. Sponsored ADR | 14,856 | 2,889,195 |
| a | Meituan Dianping Class B | 100,800 | 1,201,661 |
| | Multiline Retail — 1.6% | | |
| | B&M European Value Retail S.A. | 287,531 | 976,518 |
| | Specialty Retail — 0.7% | | |
| | Industria de Diseno Textil S.A. | 17,072 | 442,397 |
| | | | 5,509,771 |
| | Semiconductors & Semiconductor Equipment — 5.3% | | |
| | Semiconductors & Semiconductor Equipment — 5.3% | | |
| | ASML Holding N.V. | 3,941 | 1,038,905 |
| | Infineon Technologies AG | 74,656 | 1,077,715 |
| | Taiwan Semiconductor Manufacturing Co. Ltd. Sponsored ADR | 24,614 | 1,176,303 |
| | | | 3,292,923 |
| | Software & Services — 4.0% | | |
| | Information Technology Services — 2.0% | | |
| | Visa, Inc. Class A | 7,698 | 1,240,302 |
60 | Thornburg Equity Funds Semi-Annual Report
| See notes to financial statements. |
Schedule of Investments, Continued
Thornburg Better World International Fund | March 31, 2020 (Unaudited)
| | Issuer-Description | SHARES | VALUE |
| | Software — 2.0% | | |
| | SAP SE | 11,113 | $ 1,240,743 |
| | | | 2,481,045 |
| | Technology Hardware & Equipment — 3.0% | | |
| | Electronic Equipment, Instruments & Components — 3.0% | | |
| | Hexagon AB Class B | 17,380 | 734,916 |
| | Luxshare Precision Industry Co. Ltd. Class A | 80,800 | 428,455 |
| | Murata Manufacturing Co. Ltd. | 14,000 | 696,006 |
| | | | 1,859,377 |
| | Telecommunication Services — 3.3% | | |
| | Diversified Telecommunication Services — 3.3% | | |
| a | Deutsche Telekom AG | 82,517 | 1,065,742 |
| | Orange S.A. | 81,326 | 984,651 |
| | | | 2,050,393 |
| | Transportation — 0.8% | | |
| | Transportation Infrastructure — 0.8% | | |
| | Shanghai International Airport Co. Ltd. Class A | 55,077 | 468,134 |
| | | | 468,134 |
| | Utilities — 3.5% | | |
| | Electric Utilities — 3.0% | | |
| | Enel SpA | 267,133 | 1,842,641 |
| | Multi-Utilities — 0.5% | | |
| | E.ON SE | 32,715 | 335,580 |
| | | | 2,178,221 |
| | Total Common Stock(Cost $63,719,010) | | 59,195,522 |
| | Short-Term Investments — 3.8% | | |
| c | Thornburg Capital Management Fund | 234,635 | 2,346,351 |
| | Total Short-Term Investments(Cost $2,346,351) | | 2,346,351 |
| | Total Investments — 99.1%(Cost $66,065,361) | | $61,541,873 |
| | Other Assets Less Liabilities — 0.9% | | 565,856 |
| | Net Assets — 100.0% | | $62,107,729 |
| Footnote Legend |
| a | Non-income producing. |
| b | Securities exempt from registration under Rule 144A of the Securities Act of 1933, as amended. These securities are restricted but liquid and may only be resold in the ordinary course of business in transactions exempt from registration, normally to qualified institutional buyers. As of March 31, 2020, the aggregate value of these securities in the Fund’s portfolio was $668,758, representing 1.08% of the Fund’s net assets. |
| c | Investment in Affiliates. |
Portfolio Abbreviations
To simplify the listings of securities, abbreviations are used per the table below:
| ADR | American Depositary Receipt |
See notes to financial statements.
| Thornburg Equity Funds Semi-Annual Report | 61 |
Schedule of Investments
Thornburg International Growth Fund | March 31, 2020 (Unaudited)
| | Issuer-Description | SHARES | VALUE |
| | Common Stock — 91.9% | | |
| | Capital Goods — 1.9% | | |
| | Aerospace & Defense — 0.5% | | |
| | Safran S.A. | 77,200 | $ 6,839,694 |
| | Trading Companies & Distributors — 1.4% | | |
| | MonotaRO Co. Ltd. | 658,146 | 17,389,153 |
| | | | 24,228,847 |
| | Commercial & Professional Services — 1.9% | | |
| | Professional Services — 1.9% | | |
| | Nihon M&A Center, Inc. | 890,900 | 24,264,421 |
| | | | 24,264,421 |
| | Consumer Durables & Apparel — 4.3% | | |
| | Textiles, Apparel & Luxury Goods — 4.3% | | |
| | adidas AG | 148,776 | 33,032,328 |
| | LVMH Moet Hennessy Louis Vuitton SE | 54,836 | 20,111,161 |
| | | | 53,143,489 |
| | Consumer Services — 4.1% | | |
| | Diversified Consumer Services — 2.3% | | |
| a | TAL Education Group ADR | 556,852 | 29,657,938 |
| | Hotels, Restaurants & Leisure — 1.8% | | |
| b | Evolution Gaming Group AB | 308,948 | 10,474,838 |
| | Galaxy Entertainment Group Ltd. | 2,221,658 | 11,701,073 |
| | | | 51,833,849 |
| | Diversified Financials — 3.9% | | |
| | Capital Markets — 3.9% | | |
| | Japan Exchange Group, Inc. | 1,593,113 | 27,957,413 |
| | St James’s Place plc | 2,108,487 | 19,688,895 |
| a | XP, Inc. Class A | 84,884 | 1,637,412 |
| | | | 49,283,720 |
| | Energy — 1.9% | | |
| | Oil, Gas & Consumable Fuels — 1.9% | | |
| | Royal Dutch Shell plc Class A | 1,338,103 | 23,203,951 |
| | | | 23,203,951 |
| | Food, Beverage & Tobacco — 6.8% | | |
| | Beverages — 1.8% | | |
| | Fomento Economico Mexicano SAB de CV Sponsored ADR | 370,771 | 22,435,353 |
| | Food Products — 5.0% | | |
| | Danone S.A. | 450,342 | 28,821,067 |
| | Kerry Group plc Class A | 283,970 | 33,146,760 |
| | | | 84,403,180 |
| | Health Care Equipment & Services — 3.9% | | |
| | Health Care Equipment & Supplies — 1.4% | | |
| b | Siemens Healthineers AG | 464,054 | 17,938,712 |
| | Health Care Providers & Services — 2.5% | | |
| | Fresenius Medical Care AG & Co. KGaA | 478,836 | 31,256,465 |
| | | | 49,195,177 |
| | Household & Personal Products — 0.8% | | |
| | Personal Products — 0.8% | | |
| | Kose Corp. | 79,800 | 9,874,578 |
| | | | 9,874,578 |
| | Media & Entertainment — 16.9% | | |
| | Entertainment — 8.7% | | |
| a | Activision Blizzard, Inc. | 630,155 | 37,481,619 |
| a | HUYA, Inc. ADR | 802,271 | 13,598,493 |
62 | Thornburg Equity Funds Semi-Annual Report
| See notes to financial statements. |
Schedule of Investments, Continued
Thornburg International Growth Fund | March 31, 2020 (Unaudited)
| | Issuer-Description | SHARES | VALUE |
| a | Netflix, Inc. | 73,021 | $ 27,419,386 |
| a | Ubisoft Entertainment S.A. | 409,370 | 29,921,252 |
| | Interactive Media & Services — 8.2% | | |
| | carsales.com Ltd. | 2,603,380 | 18,706,318 |
| | Tencent Holdings Ltd. | 1,249,600 | 61,764,721 |
| a | Yandex N.V. Class A | 658,619 | 22,425,977 |
| | | | 211,317,766 |
| | Pharmaceuticals, Biotechnology & Life Sciences — 9.1% | | |
| | Biotechnology — 1.8% | | |
| | CSL Ltd. | 127,443 | 23,101,793 |
| | Life Sciences Tools & Services — 3.2% | | |
| | Lonza Group AG | 97,100 | 39,939,539 |
| | Pharmaceuticals — 4.1% | | |
| | AstraZeneca plc | 576,465 | 51,362,395 |
| | | | 114,403,727 |
| | Retailing — 11.0% | | |
| | Internet & Direct Marketing Retail — 9.3% | | |
| a | Alibaba Group Holding Ltd. Sponsored ADR | 387,046 | 75,272,706 |
| a,b | Boozt AB | 2,245,703 | 9,073,888 |
| a | MercadoLibre, Inc. | 37,987 | 18,559,689 |
| a | Prosus N.V. | 196,804 | 13,780,370 |
| | Multiline Retail — 1.7% | | |
| | B&M European Value Retail S.A. | 6,311,803 | 21,436,249 |
| | | | 138,122,902 |
| | Semiconductors & Semiconductor Equipment — 6.7% | | |
| | Semiconductors & Semiconductor Equipment — 6.7% | | |
| | ASML Holding N.V. | 78,629 | 20,727,748 |
| | SK Hynix, Inc. | 469,344 | 31,729,534 |
| | Taiwan Semiconductor Manufacturing Co. Ltd. | 3,422,000 | 30,805,908 |
| | | | 83,263,190 |
| | Software & Services — 18.7% | | |
| | Information Technology Services — 16.7% | | |
| a,b | Adyen N.V. | 42,960 | 36,511,459 |
| | Capgemini SE | 218,212 | 18,234,291 |
| | Edenred | 497,037 | 20,626,759 |
| | Mastercard, Inc. Class A | 100,697 | 24,324,367 |
| a,b | Network International Holdings plc | 4,035,999 | 19,624,687 |
| | Visa, Inc. Class A | 160,216 | 25,814,002 |
| | Wirecard AG | 369,387 | 41,618,863 |
| a | Wix.com Ltd. | 219,511 | 22,131,099 |
| | Software — 2.0% | | |
| a | Atlassian Corp. plc Class A | 116,557 | 15,998,614 |
| a | Blue Prism Group plc | 611,224 | 8,485,149 |
| | | | 233,369,290 |
| | Total Common Stock(Cost $1,055,283,608) | | 1,149,908,087 |
| | Short-Term Investments — 5.8% | | |
| c | Thornburg Capital Management Fund | 7,188,069 | 71,880,693 |
| | Total Short-Term Investments(Cost $71,880,693) | | 71,880,693 |
| | Total Investments — 97.7%(Cost $1,127,164,301) | | $1,221,788,780 |
| | Other Assets Less Liabilities — 2.3% | | 29,221,363 |
| | Net Assets — 100.0% | | $1,251,010,143 |
See notes to financial statements.
| Thornburg Equity Funds Semi-Annual Report | 63 |
Schedule of Investments, Continued
Thornburg International Growth Fund | March 31, 2020 (Unaudited)
| Footnote Legend |
| a | Non-income producing. |
| b | Securities exempt from registration under Rule 144A of the Securities Act of 1933, as amended. These securities are restricted but liquid and may only be resold in the ordinary course of business in transactions exempt from registration, normally to qualified institutional buyers. As of March 31, 2020, the aggregate value of these securities in the Fund’s portfolio was $93,623,584, representing 7.48% of the Fund’s net assets. |
| c | Investment in Affiliates. |
Portfolio Abbreviations
To simplify the listings of securities, abbreviations are used per the table below:
| ADR | American Depositary Receipt |
64 | Thornburg Equity Funds Semi-Annual Report
| See notes to financial statements. |
Schedule of Investments
Thornburg Developing World Fund | March 31, 2020 (Unaudited)
| | Issuer-Description | SHARES | VALUE |
| | Common Stock — 95.1% | | |
| | Banks — 12.9% | | |
| | Banks — 12.9% | | |
| | Bank Central Asia Tbk PT | 5,111,333 | $ 8,612,179 |
| | Bank Rakyat Indonesia Persero Tbk PT | 54,400,906 | 9,977,404 |
| | Credicorp Ltd. | 108,416 | 15,511,077 |
| | Grupo Financiero Banorte SAB de C.V. | 2,542,707 | 6,967,055 |
| | HDFC Bank Ltd. | 2,019,326 | 22,907,048 |
| | ICICI Bank Ltd. Sponsored ADR | 431,256 | 3,665,676 |
| | Industrial & Commercial Bank of China Ltd. Class H | 18,853,341 | 12,861,345 |
| | Sberbank of Russia PJSC Sponsored ADR | 1,018,542 | 9,594,485 |
| | | | 90,096,269 |
| | Capital Goods — 1.2% | | |
| | Industrial Conglomerates — 1.2% | | |
| | SM Investments Corp. | 544,224 | 8,706,020 |
| | | | 8,706,020 |
| | Consumer Durables & Apparel — 3.8% | | |
| | Textiles, Apparel & Luxury Goods — 3.8% | | |
| | LVMH Moet Hennessy Louis Vuitton SE | 24,891 | 9,128,801 |
| | Shenzhou International Group Holdings Ltd. | 1,646,868 | 17,275,746 |
| | | | 26,404,547 |
| | Consumer Services — 4.3% | | |
| | Diversified Consumer Services — 1.1% | | |
| a | TAL Education Group ADR | 147,348 | 7,847,754 |
| | Hotels, Restaurants & Leisure — 3.2% | | |
| | Galaxy Entertainment Group Ltd. | 2,646,133 | 13,936,706 |
| | Huazhu Group Ltd. ADR | 298,309 | 8,570,418 |
| | | | 30,354,878 |
| | Diversified Financials — 5.2% | | |
| | Capital Markets — 3.9% | | |
| | B3 S.A. - Brasil Bolsa Balcao | 1,833,255 | 12,666,010 |
| | Hong Kong Exchanges & Clearing Ltd. | 252,962 | 7,578,565 |
| a | XP, Inc. Class A | 366,616 | 7,072,022 |
| | Consumer Finance — 1.3% | | |
| a | SBI Cards & Payment Services Ltd. | 1,075,103 | 8,788,271 |
| | | | 36,104,868 |
| | Energy — 4.7% | | |
| | Oil, Gas & Consumable Fuels — 4.7% | | |
| | LUKOIL PJSC Sponsored ADR | 137,487 | 8,102,343 |
| | Novatek PJSC Sponsored GDR | 60,328 | 6,840,776 |
| | Reliance Industries Ltd. | 1,254,833 | 18,072,357 |
| | | | 33,015,476 |
| | Food, Beverage & Tobacco — 3.8% | | |
| | Beverages — 2.2% | | |
| | Jiangsu Yanghe Brewery Joint-Stock Co. Ltd. Class A | 623,085 | 7,310,813 |
| | Wuliangye Yibin Co. Ltd. Class A | 494,138 | 7,948,688 |
| | Food Products — 1.6% | | |
| a,b | China Feihe Ltd. | 6,469,569 | 11,500,310 |
| | Vietnam Dairy Products, JSC | 2 | 8 |
| | | | 26,759,819 |
| | Health Care Equipment & Services — 1.5% | | |
| | Health Care Providers & Services — 1.5% | | |
| b | Hapvida Participacoes e Investimentos S.A. | 1,115,707 | 9,104,131 |
| | NMC Health plc | 862,458 | 1,121,180 |
| | | | 10,225,311 |
See notes to financial statements.
| Thornburg Equity Funds Semi-Annual Report | 65 |
Schedule of Investments, Continued
Thornburg Developing World Fund | March 31, 2020 (Unaudited)
| | Issuer-Description | SHARES | VALUE |
| | Household & Personal Products — 3.1% | | |
| | Personal Products — 3.1% | | |
| | Unilever N.V. | 438,470 | $ 21,392,951 |
| | | | 21,392,951 |
| | Insurance — 7.6% | | |
| | Insurance — 7.6% | | |
| | AIA Group Ltd. | 3,490,883 | 31,259,578 |
| | Ping An Insurance Group Co. of China Ltd. Class H | 2,273,947 | 22,207,947 |
| | | | 53,467,525 |
| | Materials — 3.3% | | |
| | Chemicals — 2.2% | | |
| | Sociedad Quimica y Minera de Chile S.A. Sponsored ADR | 681,959 | 15,378,175 |
| | Metals & Mining — 1.1% | | |
| | Severstal PJSC GDR | 713,200 | 7,813,947 |
| | | | 23,192,122 |
| | Media & Entertainment — 9.5% | | |
| | Entertainment — 0.8% | | |
| a | Sea Ltd. ADR | 134,761 | 5,971,260 |
| | Interactive Media & Services — 8.7% | | |
| | Tencent Holdings Ltd. | 1,072,922 | 53,031,953 |
| a | Yandex N.V. Class A | 231,761 | 7,891,462 |
| | | | 66,894,675 |
| | Pharmaceuticals, Biotechnology & Life Sciences — 0.0% | | |
| | Pharmaceuticals — 0.0% | | |
| c | Animal Health Holdings, Inc. | 35,787,582 | 0 |
| | | | 0 |
| | Retailing — 10.6% | | |
| | Internet & Direct Marketing Retail — 10.6% | | |
| a | Alibaba Group Holding Ltd. Sponsored ADR | 336,471 | 65,436,880 |
| a | Prosus N.V. | 128,660 | 9,008,874 |
| | | | 74,445,754 |
| | Semiconductors & Semiconductor Equipment — 7.8% | | |
| | Semiconductors & Semiconductor Equipment — 7.8% | | |
| | MediaTek, Inc. | 472,550 | 5,071,986 |
| a | Micron Technology, Inc. | 357,589 | 15,040,193 |
| | Taiwan Semiconductor Manufacturing Co. Ltd. | 3,844,205 | 34,606,729 |
| | | | 54,718,908 |
| | Software & Services — 1.6% | | |
| | Information Technology Services — 1.6% | | |
| a,b | Network International Holdings plc | 2,323,427 | 11,297,458 |
| | | | 11,297,458 |
| | Technology Hardware & Equipment — 7.7% | | |
| | Electronic Equipment, Instruments & Components — 1.7% | | |
| a | IPG Photonics Corp. | 108,217 | 11,934,171 |
| | Technology Hardware, Storage & Peripherals — 6.0% | | |
| | Samsung Electronics Co. Ltd. | 1,075,851 | 41,830,687 |
| | | | 53,764,858 |
| | Telecommunication Services — 2.0% | | |
| | Wireless Telecommunication Services — 2.0% | | |
| | China Mobile Ltd. | 1,916,247 | 14,360,893 |
| | | | 14,360,893 |
| | Transportation — 2.1% | | |
| | Transportation Infrastructure — 2.1% | | |
| | Adani Ports & Special Economic Zone Ltd. | 4,474,461 | 14,819,696 |
66 | Thornburg Equity Funds Semi-Annual Report
| See notes to financial statements. |
Schedule of Investments, Continued
Thornburg Developing World Fund | March 31, 2020 (Unaudited)
| | Issuer-Description | SHARES | VALUE |
| | | | 14,819,696 |
| | Utilities — 2.4% | | |
| | Gas Utilities — 2.4% | | |
| | China Gas Holdings Ltd. | 1,966,860 | $ 6,801,263 |
| | Infraestructura Energetica Nova SAB de CV | 3,189,541 | 9,789,461 |
| | | | 16,590,724 |
| | Total Common Stock(Cost $647,457,513) | | 666,612,752 |
| | Short-Term Investments — 4.4% | | |
| d | Thornburg Capital Management Fund | 3,089,397 | 30,893,971 |
| | Total Short-Term Investments(Cost $30,893,971) | | 30,893,971 |
| | Total Investments — 99.5%(Cost $678,351,484) | | $697,506,723 |
| | Other Assets Less Liabilities — 0.5% | | 3,707,712 |
| | Net Assets — 100.0% | | $701,214,435 |
| Footnote Legend |
| a | Non-income producing. |
| b | Securities exempt from registration under Rule 144A of the Securities Act of 1933, as amended. These securities are restricted but liquid and may only be resold in the ordinary course of business in transactions exempt from registration, normally to qualified institutional buyers. As of March 31, 2020, the aggregate value of these securities in the Fund’s portfolio was $31,901,899, representing 4.55% of the Fund’s net assets. |
| c | Security currently fair valued by the Valuation and Pricing Committee using procedures approved by the Trustees’ Audit Committee. |
| d | Investment in Affiliates. |
Portfolio Abbreviations
To simplify the listings of securities, abbreviations are used per the table below:
| ADR | American Depositary Receipt |
| GDR | Global Depositary Receipt |
See notes to financial statements.
| Thornburg Equity Funds Semi-Annual Report | 67 |
Schedule of Investments
Thornburg Value Fund | March 31, 2020 (Unaudited)
| | Issuer-Description | SHARES | VALUE |
| | Common Stock — 95.7% | | |
| | Banks — 6.8% | | |
| | Banks — 6.8% | | |
| | Citigroup, Inc. | 347,156 | $ 14,622,211 |
| | JPMorgan Chase & Co. | 327,726 | 29,505,172 |
| | | | 44,127,383 |
| | Capital Goods — 1.1% | | |
| | Machinery — 1.1% | | |
| | ITT, Inc. | 163,890 | 7,434,050 |
| | | | 7,434,050 |
| | Consumer Durables & Apparel — 1.1% | | |
| | Household Durables — 0.7% | | |
| a | Mohawk Industries, Inc. | 61,289 | 4,672,673 |
| | Textiles, Apparel & Luxury Goods — 0.4% | | |
| a | Capri Holdings Ltd. | 216,801 | 2,339,283 |
| | | | 7,011,956 |
| | Consumer Services — 2.6% | | |
| | Hotels, Restaurants & Leisure — 2.6% | | |
| | Starbucks Corp. | 156,038 | 10,257,938 |
| | Wyndham Hotels & Resorts, Inc. | 207,789 | 6,547,432 |
| | | | 16,805,370 |
| | Diversified Financials — 6.3% | | |
| | Capital Markets — 2.0% | | |
| | Brookfield Asset Management, Inc. Class A | 287,453 | 12,719,795 |
| | Consumer Finance — 3.0% | | |
| | Capital One Financial Corp. | 278,206 | 14,027,147 |
| | Navient Corp. | 734,797 | 5,569,761 |
| | Mortgage Real Estate Investment Trusts — 1.3% | | |
| | PennyMac Mortgage Investment Trust | 811,762 | 8,620,912 |
| | | | 40,937,615 |
| | Energy — 4.3% | | |
| | Oil, Gas & Consumable Fuels — 4.3% | | |
| | Devon Energy Corp. | 554,000 | 3,828,140 |
| | Enterprise Products Partners L.P. | 1,072,386 | 15,335,120 |
| | Teekay LNG Partners L.P. | 914,908 | 8,956,949 |
| | | | 28,120,209 |
| | Food & Staples Retailing — 3.0% | | |
| | Food & Staples Retailing — 3.0% | | |
| a | US Foods Holding Corp. | 1,110,723 | 19,670,904 |
| | | | 19,670,904 |
| | Food, Beverage & Tobacco — 6.3% | | |
| | Food Products — 6.3% | | |
| a,b | China Feihe Ltd. | 5,431,346 | 9,654,765 |
| a | Nomad Foods Ltd. | 1,701,154 | 31,573,418 |
| | | | 41,228,183 |
| | Health Care Equipment & Services — 4.6% | | |
| | Health Care Equipment & Supplies — 4.6% | | |
| | Cooper Companies, Inc. | 29,200 | 8,049,564 |
| | Medtronic plc | 246,280 | 22,209,530 |
| | | | 30,259,094 |
| | Insurance — 2.7% | | |
| | Insurance — 2.7% | | |
| | Assured Guaranty Ltd. | 671,424 | 17,316,025 |
| | | | 17,316,025 |
68 | Thornburg Equity Funds Semi-Annual Report
| See notes to financial statements. |
Schedule of Investments, Continued
Thornburg Value Fund | March 31, 2020 (Unaudited)
| | Issuer-Description | SHARES | VALUE |
| | Materials — 6.6% | | |
| | Chemicals — 2.0% | | |
| | Huntsman Corp. | 908,504 | $ 13,109,713 |
| | Containers & Packaging — 4.6% | | |
| a | Crown Holdings, Inc. | 517,250 | 30,021,190 |
| | | | 43,130,903 |
| | Media & Entertainment — 19.7% | | |
| | Entertainment — 5.8% | | |
| a | Activision Blizzard, Inc. | 388,723 | 23,121,244 |
| a | Netflix, Inc. | 38,998 | 14,643,749 |
| | Interactive Media & Services — 10.1% | | |
| a | Alphabet, Inc. Class C | 30,996 | 36,042,459 |
| a | Facebook, Inc. Class A | 144,633 | 24,124,784 |
| a | Zillow Group, Inc. Class C | 161,058 | 5,801,309 |
| | Media — 3.8% | | |
| | Comcast Corp. Class A | 711,400 | 24,457,932 |
| | | | 128,191,477 |
| | Pharmaceuticals, Biotechnology & Life Sciences — 10.2% | | |
| | Biotechnology — 4.1% | | |
| a | Alkermes plc | 444,499 | 6,409,676 |
| | Gilead Sciences, Inc. | 270,732 | 20,239,924 |
| | Life Sciences Tools & Services — 6.1% | | |
| | Thermo Fisher Scientific, Inc. | 139,762 | 39,636,503 |
| | | | 66,286,103 |
| | Retailing — 7.3% | | |
| | Internet & Direct Marketing Retail — 3.5% | | |
| a | Alibaba Group Holding Ltd. Sponsored ADR | 115,172 | 22,398,650 |
| | Multiline Retail — 2.5% | | |
| | Dollarama, Inc. | 590,666 | 16,385,704 |
| | Specialty Retail — 1.3% | | |
| a | CarMax, Inc. | 160,566 | 8,643,268 |
| | | | 47,427,622 |
| | Software & Services — 1.0% | | |
| | Information Technology Services — 1.0% | | |
| | Mastercard, Inc. Class A | 26,109 | 6,306,890 |
| | | | 6,306,890 |
| | Technology Hardware & Equipment — 6.3% | | |
| | Electronic Equipment, Instruments & Components — 1.4% | | |
| a | Flex Ltd. | 1,090,901 | 9,136,296 |
| | Technology Hardware, Storage & Peripherals — 4.9% | | |
| | Apple, Inc. | 70,823 | 18,009,580 |
| a | Pure Storage, Inc. Class A | 1,151,129 | 14,158,887 |
| | | | 41,304,763 |
| | Telecommunication Services — 4.0% | | |
| | Wireless Telecommunication Services — 4.0% | | |
| | China Mobile Ltd. | 3,481,832 | 26,093,826 |
| | | | 26,093,826 |
| | Utilities — 1.8% | | |
| | Electric Utilities — 1.8% | | |
| | Fortis, Inc. | 302,670 | 11,667,929 |
| | | | 11,667,929 |
| | Total Common Stock(Cost $703,601,305) | | 623,320,302 |
| | Short-Term Investments — 4.5% | | |
| c | Thornburg Capital Management Fund | 2,965,373 | 29,653,735 |
See notes to financial statements.
| Thornburg Equity Funds Semi-Annual Report | 69 |
Schedule of Investments, Continued
Thornburg Value Fund | March 31, 2020 (Unaudited)
| | Issuer-Description | SHARES | VALUE |
| | Total Short-Term Investments(Cost $29,653,735) | | 29,653,735 |
| | Total Investments — 100.2%(Cost $733,255,040) | | $652,974,037 |
| | Liabilities Net of Other Assets — (0.2)% | | (1,471,034) |
| | Net Assets — 100.0% | | $651,503,003 |
| Outstanding Forward Currency Contracts To Buy Or Sell At March 31, 2020 |
Contract
Description | Contract
Party* | Buy/Sell | Contract
Amount | Contract
Value Date | Value
USD | Unrealized
Appreciation | Unrealized
Depreciation |
| Euro | SSB | Sell | 20,309,000 | 5/29/2020 | 22,448,111 | $ — | $ (259,614) |
| Euro | SSB | Buy | 3,706,600 | 5/29/2020 | 4,097,010 | — | (32,165) |
| |
| Total | | | | | | — | $(291,779) |
| |
| Net unrealized appreciation (depreciation) | | | | | | | $(291,779) |
| * | Counterparty includes State Street Bank and Trust Company ("SSB"). |
| Footnote Legend |
| a | Non-income producing. |
| b | Securities exempt from registration under Rule 144A of the Securities Act of 1933, as amended. These securities are restricted but liquid and may only be resold in the ordinary course of business in transactions exempt from registration, normally to qualified institutional buyers. As of March 31, 2020, the aggregate value of these securities in the Fund’s portfolio was $9,654,765, representing 1.48% of the Fund’s net assets. |
| c | Investment in Affiliates. |
Portfolio Abbreviations
To simplify the listings of securities, abbreviations are used per the table below:
| ADR | American Depositary Receipt |
70 | Thornburg Equity Funds Semi-Annual Report
| See notes to financial statements. |
Schedule of Investments
Thornburg Core Growth Fund | March 31, 2020
| | Issuer-Description | SHARES | VALUE |
| | Common Stock — 94.8% | | |
| | Capital Goods — 1.1% | | |
| | Aerospace & Defense — 1.1% | | |
| | HEICO Corp. | 78,985 | $ 5,893,071 |
| | | | 5,893,071 |
| | Commercial & Professional Services — 0.5% | | |
| | Professional Services — 0.5% | | |
| a | CoStar Group, Inc. | 4,420 | 2,595,468 |
| | | | 2,595,468 |
| | Diversified Financials — 4.7% | | |
| | Capital Markets — 4.7% | | |
| | Charles Schwab Corp. | 335,554 | 11,281,325 |
| | CME Group, Inc. | 73,546 | 12,716,839 |
| | | | 23,998,164 |
| | Food, Beverage & Tobacco — 4.3% | | |
| | Beverages — 1.8% | | |
| | Fomento Economico Mexicano SAB de CV Sponsored ADR | 152,042 | 9,200,061 |
| | Food Products — 2.5% | | |
| | Kerry Group plc Class A | 112,182 | 13,094,587 |
| | | | 22,294,648 |
| | Health Care Equipment & Services — 7.0% | | |
| | Health Care Equipment & Supplies — 3.5% | | |
| | Cooper Companies, Inc. | 42,469 | 11,707,429 |
| a | DexCom, Inc. | 22,930 | 6,174,361 |
| | Health Care Providers & Services — 3.5% | | |
| a | DaVita, Inc. | 234,283 | 17,819,565 |
| | | | 35,701,355 |
| | Media & Entertainment — 17.4% | | |
| | Entertainment — 7.6% | | |
| a | Activision Blizzard, Inc. | 381,158 | 22,671,278 |
| a | Netflix, Inc. | 43,366 | 16,283,933 |
| | Interactive Media & Services — 6.8% | | |
| a | Alphabet, Inc. Class C | 21,427 | 24,915,530 |
| a | Facebook, Inc. Class A | 60,797 | 10,140,939 |
| | Media — 3.0% | | |
| | Comcast Corp. Class A | 441,363 | 15,174,060 |
| | | | 89,185,740 |
| | Pharmaceuticals, Biotechnology & Life Sciences — 1.7% | | |
| | Biotechnology — 1.7% | | |
| a | Alexion Pharmaceuticals, Inc. | 94,925 | 8,523,316 |
| | | | 8,523,316 |
| | Retailing — 11.2% | | |
| | Internet & Direct Marketing Retail — 9.0% | | |
| a | Alibaba Group Holding Ltd. Sponsored ADR | 29,943 | 5,823,315 |
| a | Amazon.com, Inc. | 17,677 | 34,465,200 |
| a | Booking Holdings, Inc. | 4,028 | 5,418,949 |
| | Specialty Retail — 2.2% | | |
| a | Floor & Decor Holdings, Inc. Class A | 170,021 | 5,455,974 |
| | TJX Companies, Inc. | 124,600 | 5,957,126 |
| | | | 57,120,564 |
| | Semiconductors & Semiconductor Equipment — 3.7% | | |
| | Semiconductors & Semiconductor Equipment — 3.7% | | |
| a | Micron Technology, Inc. | 293,247 | 12,333,969 |
| | Texas Instruments, Inc. | 66,800 | 6,675,324 |
See notes to financial statements.
| Thornburg Equity Funds Semi-Annual Report | 71 |
Schedule of Investments, Continued
Thornburg Core Growth Fund | March 31, 2020
| | Issuer-Description | SHARES | VALUE |
| | | | 19,009,293 |
| | Software & Services — 38.0% | | |
| | Information Technology Services — 12.5% | | |
| a | FleetCor Technologies, Inc. | 48,842 | $ 9,110,987 |
| a | PayPal Holdings, Inc. | 157,778 | 15,105,666 |
| a | Square, Inc. Class A | 254,962 | 13,354,910 |
| | Visa, Inc. Class A | 100,012 | 16,113,933 |
| a | Wix.com Ltd. | 105,014 | 10,587,511 |
| | Software — 25.5% | | |
| a | Atlassian Corp. plc Class A | 58,536 | 8,034,651 |
| a | Avalara, Inc. | 148,762 | 11,097,645 |
| a | Globant S.A. | 57,715 | 5,071,994 |
| | Microsoft Corp. | 199,650 | 31,486,802 |
| a | Proofpoint, Inc. | 107,294 | 11,007,292 |
| a | salesforce.com, Inc. | 120,228 | 17,310,428 |
| a | ServiceNow, Inc. | 38,371 | 10,996,361 |
| a | Slack Technologies, Inc. Class A | 123,967 | 3,327,274 |
| a | Splunk, Inc. | 109,710 | 13,848,693 |
| a | Workday, Inc. Class A | 100,769 | 13,122,139 |
| a | Zoom Video Communications, Inc. Class A | 34,743 | 5,076,647 |
| | | | 194,652,933 |
| | Technology Hardware & Equipment — 5.2% | | |
| | Technology Hardware, Storage & Peripherals — 5.2% | | |
| | Apple, Inc. | 103,785 | 26,391,488 |
| | | | 26,391,488 |
| | Total Common Stock(Cost $450,061,201) | | 485,366,040 |
| | Short-Term Investments — 5.0% | | |
| b | Thornburg Capital Management Fund | 2,539,143 | 25,391,428 |
| | Total Short-Term Investments(Cost $25,391,428) | | 25,391,428 |
| | Total Investments — 99.8%(Cost $475,452,629) | | $510,757,468 |
| | Other Assets Less Liabilities — 0.2% | | 898,421 |
| | Net Assets — 100.0% | | $511,655,889 |
| Footnote Legend |
| a | Non-income producing. |
| b | Investment in Affiliates. |
Portfolio Abbreviations
To simplify the listings of securities, abbreviations are used per the table below:
| ADR | American Depositary Receipt |
72 | Thornburg Equity Funds Semi-Annual Report
| See notes to financial statements. |
Schedule of Investments
Thornburg Long/Short Equity Fund | March 31, 2020 (Unaudited)
| | Issuer-Description | SHARES/
PRINCIPAL AMOUNT | VALUE |
| | Common Stock — 109.8% | | |
| | Capital Goods — 3.6% | | |
| | Electrical Equipment — 3.6% | | |
| a | Vestas Wind Systems A/S | 54,493 | $ 4,433,856 |
| | | | 4,433,856 |
| | Consumer Durables & Apparel — 0.7% | | |
| | Household Durables — 0.7% | | |
| b | Mohawk Industries, Inc. | 11,461 | 873,787 |
| | | | 873,787 |
| | Consumer Services — 5.0% | | |
| | Hotels, Restaurants & Leisure — 5.0% | | |
| a | Starbucks Corp. | 79,815 | 5,247,038 |
| | Wyndham Hotels & Resorts, Inc. | 26,580 | 837,536 |
| | | | 6,084,574 |
| | Diversified Financials — 7.0% | | |
| | Capital Markets — 2.1% | | |
| a | Brookfield Asset Management, Inc. Class A | 57,733 | 2,554,685 |
| | Consumer Finance — 3.7% | | |
| a | Capital One Financial Corp. | 32,133 | 1,620,146 |
| | Navient Corp. | 229,966 | 1,743,142 |
| b | SBI Cards & Payment Services Ltd. | 138,714 | 1,133,897 |
| | Mortgage Real Estate Investment Trusts — 1.2% | | |
| | PennyMac Mortgage Investment Trust | 142,606 | 1,514,476 |
| | | | 8,566,346 |
| | Energy — 1.1% | | |
| | Oil, Gas & Consumable Fuels — 1.1% | | |
| | Teekay LNG Partners L.P. | 135,197 | 1,323,579 |
| | | | 1,323,579 |
| | Food & Staples Retailing — 2.3% | | |
| | Food & Staples Retailing — 2.3% | | |
| a,b | US Foods Holding Corp. | 160,470 | 2,841,924 |
| | | | 2,841,924 |
| | Food, Beverage & Tobacco — 10.3% | | |
| | Food Products — 10.3% | | |
| b,c | China Feihe Ltd. | 1,688,648 | 3,001,742 |
| a | Danone S.A. | 70,363 | 4,503,104 |
| b | Nomad Foods Ltd. | 275,316 | 5,109,865 |
| | | | 12,614,711 |
| | Health Care Equipment & Services — 8.8% | | |
| | Health Care Equipment & Supplies — 8.6% | | |
| a | Cooper Companies, Inc. | 20,531 | 5,659,781 |
| | Medtronic plc | 53,630 | 4,836,353 |
| | Health Care Providers & Services — 0.2% | | |
| | NMC Health plc | 177,802 | 231,139 |
| | | | 10,727,273 |
| | Insurance — 1.9% | | |
| | Insurance — 1.9% | | |
| a | Assured Guaranty Ltd. | 91,843 | 2,368,631 |
| | | | 2,368,631 |
| | Materials — 5.3% | | |
| | Chemicals — 1.4% | | |
| a | Huntsman Corp. | 113,984 | 1,644,789 |
See notes to financial statements.
| Thornburg Equity Funds Semi-Annual Report | 73 |
Schedule of Investments, Continued
Thornburg Long/Short Equity Fund | March 31, 2020 (Unaudited)
| | Issuer-Description | SHARES/
PRINCIPAL AMOUNT | VALUE |
| | Containers & Packaging — 3.9% | | |
| a,b | Crown Holdings, Inc. | 81,866 | $ 4,751,503 |
| | | | 6,396,292 |
| | Media & Entertainment — 23.9% | | |
| | Entertainment — 9.8% | | |
| a,b | Activision Blizzard, Inc. | 69,130 | 4,111,852 |
| a,b | Netflix, Inc. | 14,722 | 5,528,111 |
| b | Ubisoft Entertainment S.A. | 31,216 | 2,281,608 |
| | Interactive Media & Services — 9.7% | | |
| a,b | Alphabet, Inc. Class C | 5,249 | 6,103,590 |
| b | Facebook, Inc. Class A | 20,528 | 3,424,070 |
| a,b | Zillow Group, Inc. Class C | 63,985 | 2,304,740 |
| | Media — 4.4% | | |
| a | Comcast Corp. Class A | 156,524 | 5,381,295 |
| | | | 29,135,266 |
| | Pharmaceuticals, Biotechnology & Life Sciences — 15.2% | | |
| | Biotechnology — 6.1% | | |
| b | Alkermes plc | 229,744 | 3,312,908 |
| a | Gilead Sciences, Inc. | 54,285 | 4,058,347 |
| | Life Sciences Tools & Services — 5.9% | | |
| a | Thermo Fisher Scientific, Inc. | 25,505 | 7,233,218 |
| | Pharmaceuticals — 3.2% | | |
| a | Allergan plc | 22,147 | 3,922,234 |
| | | | 18,526,707 |
| | Retailing — 12.8% | | |
| | Internet & Direct Marketing Retail — 6.7% | | |
| b | Alibaba Group Holding Ltd. Sponsored ADR | 16,665 | 3,241,009 |
| a,b | Amazon.com, Inc. | 2,527 | 4,926,943 |
| | Multiline Retail — 3.4% | | |
| | Dollarama, Inc. | 149,056 | 4,134,972 |
| | Specialty Retail — 2.7% | | |
| a,b | CarMax, Inc. | 61,412 | 3,305,808 |
| | | | 15,608,732 |
| | Software & Services — 5.0% | | |
| | Information Technology Services — 2.4% | | |
| | Mastercard, Inc. Class A | 12,000 | 2,898,720 |
| | Software — 2.6% | | |
| a,b | PTC, Inc. | 52,101 | 3,189,102 |
| | | | 6,087,822 |
| | Technology Hardware & Equipment — 1.7% | | |
| | Technology Hardware, Storage & Peripherals — 1.7% | | |
| a,b | Pure Storage, Inc. Class A | 166,511 | 2,048,085 |
| | | | 2,048,085 |
| | Telecommunication Services — 5.2% | | |
| | Wireless Telecommunication Services — 5.2% | | |
| | China Mobile Ltd. | 844,811 | 6,331,251 |
| | | | 6,331,251 |
| | Total Common Stock(Cost $135,114,890) | | 133,968,836 |
| | Total Long-Term Investments — 109.8%(Cost $135,114,890) | | 133,968,836 |
| | Short-Term Investments — 11.7% | | |
| d | Thornburg Capital Management Fund | 1,423,614 | 14,236,138 |
| | Total Short-Term Investments(Cost $14,236,138) | | 14,236,138 |
74 | Thornburg Equity Funds Semi-Annual Report
| See notes to financial statements. |
Schedule of Investments, Continued
Thornburg Long/Short Equity Fund | March 31, 2020 (Unaudited)
| | Issuer-Description | SHARES/
PRINCIPAL AMOUNT | VALUE |
| | Total Investments — 121.5%(Cost $149,351,028) | | $148,204,974 |
| | Liabilities Net of Other Assets — (21.5)% | | (26,256,472) |
| | Common Stock Sold Short — (73.9)% | | |
| | Banks — (1.1)% | | |
| | Banks — (1.1)% | | |
| | Westamerica Bancorporation | (22,407) | $ (1,317,084) |
| | | | (1,317,084) |
| | Capital Goods — (8.0)% | | |
| | Electrical Equipment — (2.7)% | | |
| b | Generac Holdings, Inc. | (35,344) | (3,293,000) |
| | Machinery — (0.8)% | | |
| | Snap-on, Inc. | (8,735) | (950,543) |
| | Trading Companies & Distributors — (4.5)% | | |
| | GATX Corp. | (53,394) | (3,340,329) |
| b | SiteOne Landscape Supply, Inc. | (29,759) | (2,190,857) |
| | | | (9,774,729) |
| | Commercial & Professional Services — (2.9)% | | |
| | Professional Services — (2.9)% | | |
| b | FTI Consulting, Inc. | (29,467) | (3,529,263) |
| | | | (3,529,263) |
| | Consumer Durables & Apparel — (3.5)% | | |
| | Leisure Products — (3.5)% | | |
| b | Peloton Interactive, Inc., Class A | (129,192) | (3,430,048) |
| b | YETI Holdings, Inc. | (44,716) | (872,856) |
| | | | (4,302,904) |
| | Consumer Services — (4.0)% | | |
| | Diversified Consumer Services — (0.9)% | | |
| b | Perdoceo Education Corp. | (100,198) | (1,081,136) |
| | Hotels, Restaurants & Leisure — (3.1)% | | |
| | Cracker Barrel Old Country Store, Inc. | (11,338) | (943,548) |
| b | Luckin Coffee, Inc. ADR | (102,992) | (2,800,353) |
| | | | (4,825,037) |
| | Diversified Financials — (2.8)% | | |
| | Capital Markets — (2.8)% | | |
| | FactSet Research Systems, Inc. | (13,245) | (3,452,707) |
| | | | (3,452,707) |
| | Food, Beverage & Tobacco — (2.8)% | | |
| | Beverages — (2.8)% | | |
| b | Boston Beer Co., Inc., Class A | (9,209) | (3,384,860) |
| | | | (3,384,860) |
| | Health Care Equipment & Services — (2.9)% | | |
| | Health Care Equipment & Supplies — (2.9)% | | |
| | DiaSorin SpA | (26,426) | (3,483,318) |
| | | | (3,483,318) |
| | Household & Personal Products — (3.2)% | | |
| | Household Products — (3.2)% | | |
| | Church & Dwight Co., Inc. | (20,415) | (1,310,235) |
| | Clorox Co. | (14,953) | (2,590,607) |
| | | | (3,900,842) |
| | Media & Entertainment — (8.9)% | | |
See notes to financial statements.
| Thornburg Equity Funds Semi-Annual Report | 75 |
Schedule of Investments, Continued
Thornburg Long/Short Equity Fund | March 31, 2020 (Unaudited)
| | Issuer-Description | SHARES/
PRINCIPAL AMOUNT | VALUE |
| | Entertainment — (5.1)% | | |
| b | Roku, Inc. | (34,302) | $ (3,000,739) |
| b | Tencent Music Entertainment Group ADR | (320,683) | (3,226,071) |
| | Media — (3.8)% | | |
| b | Discovery, Inc., Class A | (86,065) | (1,673,104) |
| | New York Times Co., Class A | (95,917) | (2,945,611) |
| | | | (10,845,525) |
| | Pharmaceuticals, Biotechnology & Life Sciences — (2.4)% | | |
| | Pharmaceuticals — (2.4)% | | |
| | Shionogi & Co. Ltd. | (60,149) | (2,962,908) |
| | | | (2,962,908) |
| | Real Estate — (3.2)% | | |
| | Equity Real Estate Investment Trusts — (2.3)% | | |
| | Extra Space Storage, Inc. | (29,305) | (2,806,247) |
| | Real Estate Management & Development — (0.9)% | | |
| b | Redfin Corp. | (68,996) | (1,063,918) |
| | | | (3,870,165) |
| | Retailing — (12.6)% | | |
| | Internet & Direct Marketing Retail — (7.3)% | | |
| b | Chewy, Inc., Class A | (96,523) | (3,618,647) |
| b | HelloFresh SE | (75,705) | (2,472,169) |
| | PetMed Express, Inc. | (98,733) | (2,841,536) |
| | Specialty Retail — (5.3)% | | |
| b | Carvana Co., Class A | (34,101) | (1,878,624) |
| b | Murphy USA, Inc. | (19,765) | (1,667,375) |
| | Rent-A-Center, Inc. | (133,027) | (1,881,002) |
| b | Sleep Number Corp. | (52,012) | (996,550) |
| | | | (15,355,903) |
| | Software & Services — (8.3)% | | |
| | Information Technology Services — (3.9)% | | |
| | Paychex, Inc. | (31,138) | (1,959,203) |
| | Western Union Co. | (152,555) | (2,765,822) |
| | Software — (4.4)% | | |
| b | Alarm.com Holdings, Inc. | (71,802) | (2,793,816) |
| | Blackbaud, Inc. | (18,696) | (1,038,563) |
| b | Manhattan Associates, Inc. | (30,979) | (1,543,374) |
| | | | (10,100,778) |
| | Technology Hardware & Equipment — (1.9)% | | |
| | Electronic Equipment, Instruments & Components — (1.9)% | | |
| | Badger Meter, Inc. | (44,434) | (2,381,662) |
| | | | (2,381,662) |
| | Telecommunication Services — (5.4)% | | |
| | Diversified Telecommunication Services — (5.4)% | | |
| | AT&T, Inc. | (107,019) | (3,119,604) |
| | Cogent Communications Holdings, Inc. | (42,956) | (3,521,103) |
| | | | (6,640,707) |
| | Total Common Stock Sold Short(Proceeds $93,621,579) | | (90,128,392) |
| | Exchange-Traded Funds Sold Short — (0.1)% | | |
| e | Direxion Daily Developed Markets Bear 3X | (550) | (8,677) |
| | Direxion Daily Emerging Markets Bear 3X | (919) | (45,564) |
| | Direxion Daily Energy Bear 3X | (535) | (62,274) |
| | Direxion Daily Financial Bear 3X | (720) | (27,339) |
| | Direxion Daily S&P 500 Bear 3X | (266) | (4,240) |
| | Direxion Daily Semiconductors Bear 3x | (6) | (104) |
| | Direxion Daily Small Cap Bear 3X | (51) | (3,029) |
76 | Thornburg Equity Funds Semi-Annual Report
| See notes to financial statements. |
Schedule of Investments, Continued
Thornburg Long/Short Equity Fund | March 31, 2020 (Unaudited)
| | Issuer-Description | SHARES/
PRINCIPAL AMOUNT | VALUE |
| | ProShares UltraPro Short QQQ | (55) | $ (1,070) |
| | Total Exchange-Traded Funds Sold Short(Proceeds $4,118,541) | | (152,297) |
| | Total Securities Sold Short(Proceeds $97,740,120) | | $(90,280,689) |
| | Net Assets — 100.0% | | $121,948,502 |
| Footnote Legend |
| a | All or a portion of the security is pledged as collateral for securities sold short. At March 31, 2020, the value of securities pledged was $60,287,110. An additional $65,297,301 in cash has been segregated for collateral on securities sold short. |
| b | Non-income producing. |
| c | Securities exempt from registration under Rule 144A of the Securities Act of 1933, as amended. These securities are restricted but liquid and may only be resold in the ordinary course of business in transactions exempt from registration, normally to qualified institutional buyers. As of March 31, 2020, the aggregate value of these securities in the Fund’s portfolio was $3,001,742, representing 2.46% of the Fund’s net assets. |
| d | Investment in Affiliates. |
| e | Security currently fair valued by the Valuation and Pricing Committee using procedures approved by the Trustees’ Audit Committee. |
Portfolio Abbreviations
To simplify the listings of securities, abbreviations are used per the table below:
| ADR | American Depositary Receipt |
See notes to financial statements.
| Thornburg Equity Funds Semi-Annual Report | 77 |
Statements of Assets and Liabilities
March 31, 2020 (Unaudited)
| | THORNBURG
INVESTMENT
INCOME BUILDER
FUND | THORNBURG
SUMMIT
FUND | THORNBURG
GLOBAL
OPPORTUNITIES
FUND | Thornburg
International
Value
Fund | THORNBURG
BETTER WORLD
INTERNATIONAL
FUND |
| ASSETS | | | | | |
| Investments at cost | | | | | |
| Non-affiliated issuers | $ 10,561,887,528 | $ 33,934,558 | $ 780,086,573 | $ 2,401,514,437 | $ 63,719,010 |
| Non-controlled affiliated issuers | 554,694,224 | 2,553,322 | 49,698,820 | 109,034,397 | 2,346,351 |
| Investments at value | | | | | |
| Non-affiliated issuers | 9,797,131,947 | 32,664,773 | 791,613,587 | 2,291,420,851 | 59,195,522 |
| Non-controlled affiliated issuers | 267,581,359 | 2,553,322 | 49,698,820 | 109,034,397 | 2,346,351 |
| Cash | 4,259,190 | - | 34,215 | 115,051 | - |
| Foreign currency at value(a) | 1,584,012 | 6,795 | 1,696,414 | - | 29 |
| Unrealized appreciation on forward currency contracts | 41,010,141 | - | 2,240,632 | 8,551,492 | - |
| Receivable for investments sold | 60,974,313 | 165,607 | 14,084,741 | 27,595,201 | 597,132 |
| Receivable for fund shares sold | 14,263,497 | - | 847,602 | 3,684,993 | 12,080 |
| Dividends receivable | 36,688,481 | 18,361 | 760,355 | 5,989,256 | 163,479 |
| Tax reclaims receivable | 35,274,649 | 7,658 | 168,076 | 2,480,128 | 44,500 |
| Interest receivable | 19,904,218 | 75,230 | - | - | - |
| Prepaid expenses and other assets | 395,043 | �� 20,403 | 209,511 | 213,899 | 30,482 |
| Total Assets | 10,279,066,850 | 35,512,149 | 861,353,953 | 2,449,085,268 | 62,389,575 |
| Liabilities | | | | | |
| Securities sold short | - | 1,711,105(b) | - | - | - |
| Unrealized depreciation on forward currency contracts | 20,852,511 | - | 1,747,164 | - | - |
| Payable for investments purchased | 34,598,531 | 4,058 | 9,494,375 | 129,225 | 3,094 |
| Payable for fund shares redeemed | 39,458,751 | - | 3,963,141 | 6,273,892 | 104,847 |
| Payable to investment advisor and other affiliates | 9,917,878 | 18,695 | 809,478 | 2,065,171 | 46,456 |
| Payable for short sale financing | - | 1,438 | - | - | - |
| Deferred taxes payable | - | - | 672,127 | - | - |
| Accounts payable and accrued expenses | 5,801,472 | 25,193 | 503,106 | 2,122,648 | 127,449 |
| Dividends payable for short sales | - | 3,774 | - | - | - |
| Dividends payable | 15,621,317 | - | - | - | - |
| Total Liabilities | 126,250,460 | 1,764,263 | 17,189,391 | 10,590,936 | 281,846 |
| Net Assets | $ 10,152,816,390 | $ 33,747,886 | $ 844,164,562 | $ 2,438,494,332 | $ 62,107,729 |
| NET ASSETS CONSIST OF | | | | | |
| Net capital paid in on shares of beneficial interest | $ 11,974,752,725 | $ 35,126,935 | $ 800,410,542 | $ 2,474,685,674 | $ 69,269,202 |
| Distributable earnings (accumulated loss) | (1,821,936,335) | (1,379,049) | 43,754,020 | (36,191,342) | (7,161,473) |
| Net Assets | $ 10,152,816,390 | $ 33,747,886 | $ 844,164,562 | $ 2,438,494,332 | $ 62,107,729 |
78 | Thornburg Equity Funds Semi-Annual Report
Statements of Assets and Liabilities, Continued
March 31, 2020 (Unaudited)
| | THORNBURG
INVESTMENT
INCOME BUILDER
FUND | THORNBURG
SUMMIT
FUND | THORNBURG
GLOBAL
OPPORTUNITIES
FUND | Thornburg
International
Value
Fund | THORNBURG
BETTER WORLD
INTERNATIONAL
FUND |
| NET ASSET VALUE | | | | | |
| Class A Shares: | | | | | |
| Net assets applicable to shares outstanding | $ 2,569,984,398 | $ - | $ 178,424,100 | $ 517,464,239 | $ 7,914,413 |
| Shares outstanding | 155,822,270 | - | 7,628,693 | 27,626,980 | 693,094 |
| Net asset value and redemption price per share | $ 16.49 | $ - | $ 23.39 | $ 18.73 | $ 11.42 |
| Maximum offering price per share (net asset value, plus 4.50% of offering price) | $ 17.27 | $ - | $ 24.49 | $ 19.61 | $ 11.96 |
| Class C Shares: | | | | | |
| Net assets applicable to shares outstanding | 1,789,654,622 | - | 108,092,093 | 52,140,533 | 1,573,961 |
| Shares outstanding | 108,641,216 | - | 4,794,135 | 3,138,535 | 138,853 |
| Net asset value and redemption price per share* | 16.47 | - | 22.55 | 16.61 | 11.34 |
| Class I Shares: | | | | | |
| Net assets applicable to shares outstanding | 5,594,652,219 | 33,747,886 | 487,378,500 | 1,353,710,006 | 52,619,355 |
| Shares outstanding | 336,750,974 | 3,476,476 | 20,793,903 | 69,815,093 | 4,511,352 |
| Net asset value and redemption price per share | 16.61 | 9.71 | 23.44 | 19.39 | 11.66 |
| Class R3 Shares: | | | | | |
| Net assets applicable to shares outstanding | 25,052,313 | - | 2,905,893 | 130,680,646 | - |
| Shares outstanding | 1,519,480 | - | 125,362 | 6,973,762 | - |
| Net asset value and redemption price per share | 16.49 | - | 23.18 | 18.74 | - |
| Class R4 Shares: | | | | | |
| Net assets applicable to shares outstanding | 17,256,371 | - | 4,465,202 | 90,810,863 | - |
| Shares outstanding | 1,045,216 | - | 191,984 | 4,885,446 | - |
| Net asset value and redemption price per share | 16.51 | - | 23.26 | 18.59 | - |
| Class R5 Shares: | | | | | |
| Net assets applicable to shares outstanding | 42,489,058 | - | 27,267,988 | 107,541,694 | - |
| Shares outstanding | 2,559,294 | - | 1,162,303 | 5,551,439 | - |
| Net asset value and redemption price per share | 16.60 | - | 23.46 | 19.37 | - |
| Class R6 Shares: | | | | | |
| Net assets applicable to shares outstanding | 113,727,409 | - | 35,630,786 | 186,146,351 | - |
| Shares outstanding | 6,867,422 | - | 1,515,860 | 9,648,845 | - |
| Net asset value and redemption price per share | 16.56 | - | 23.51 | 19.29 | - |
| (a) | Cost of foreign currency is $1,591,435; $6,817; $1,696,414; $0; $29 respectively. |
| (b) | Proceeds $2,006,098. |
| * | Redemption price per share is equal to net asset value less any applicable contingent deferred sales charge. |
See notes to financial statements.
Thornburg Equity Funds Semi-Annual Report | 79
Statements of Assets and Liabilities, Continued
March 31, 2020 (Unaudited)
| | THORNBURG
INTERNATIONAL
GROWTH
FUND | THORNBURG
DEVELOPING
WORLD
FUND | Thornburg
Value
Fund | THORNBURG
CORE GROWTH
FUND | THORNBURG
LONG/SHORT
EQUITY
FUND |
| ASSETS | | | | | |
| Investments at cost | | | | | |
| Non-affiliated issuers | $ 1,055,283,608 | $ 647,457,513 | $ 703,601,305 | $ 450,061,201 | $ 135,114,890 |
| Non-controlled affiliated issuers | 71,880,693 | 30,893,971 | 29,653,735 | 25,391,428 | 14,236,138 |
| Investments at value | | | | | |
| Non-affiliated issuers | 1,149,908,087 | 666,612,752 | 623,320,302 | 485,366,040 | 133,968,836 |
| Non-controlled affiliated issuers | 71,880,693 | 30,893,971 | 29,653,735 | 25,391,428 | 14,236,138 |
| Cash | 6,209 | 11,922 | 17,852 | - | - |
| Foreign currency at value(a) | 1,048,315 | 56,481 | - | - | - |
| Cash segregated as collateral on securities sold short | - | - | - | - | 65,297,301 |
| Receivable for investments sold | 33,890,246 | 7,334,218 | - | 1,806,963 | 437,031 |
| Receivable for fund shares sold | 4,928,098 | 2,127,327 | 353,731 | 486,247 | 767,772 |
| Dividends receivable | 3,172,459 | 1,219,445 | 394,475 | 135,142 | 95,463 |
| Tax reclaims receivable | 463,335 | 458,012 | - | - | 9,105 |
| Prepaid expenses and other assets | 157,705 | 95,177 | 92,424 | 62,309 | 34,830 |
| Total Assets | 1,265,455,147 | 708,809,305 | 653,832,519 | 513,248,129 | 214,846,476 |
| Liabilities | | | | | |
| Securities sold short | - | - | - | - | 90,280,689(b) |
| Unrealized depreciation on forward currency contracts | - | - | 291,779 | - | - |
| Payable for investments purchased | 5,960,573 | 4,005,858 | 39,694 | 32,518 | 465,106 |
| Payable for fund shares redeemed | 6,835,447 | 2,505,847 | 1,127,778 | 906,752 | 1,825,401 |
| Payable to investment advisor and other affiliates | 1,015,036 | 696,083 | 646,351 | 501,514 | 166,204 |
| Payable for short sale financing | - | - | - | - | 28,373 |
| Accounts payable and accrued expenses | 633,948 | 387,082 | 223,914 | 151,456 | 71,061 |
| Dividends payable for short sales | - | - | - | - | 61,140 |
| Total Liabilities | 14,445,004 | 7,594,870 | 2,329,516 | 1,592,240 | 92,897,974 |
| Net Assets | $ 1,251,010,143 | $ 701,214,435 | $ 651,503,003 | $ 511,655,889 | $ 121,948,502 |
| NET ASSETS CONSIST OF | | | | | |
| Net capital paid in on shares of beneficial interest | $ 1,158,877,419 | $ 847,885,399 | $ 732,461,263 | $ 464,287,207 | $ 128,786,167 |
| Distributable earnings (accumulated loss) | 92,132,724 | (146,670,964) | (80,958,260) | 47,368,682 | (6,837,665) |
| Net Assets | $ 1,251,010,143 | $ 701,214,435 | $ 651,503,003 | $ 511,655,889 | $ 121,948,502 |
80 | Thornburg Equity Funds Semi-Annual Report
Statements of Assets and Liabilities, Continued
March 31, 2020 (Unaudited)
| | THORNBURG
INTERNATIONAL
GROWTH
FUND | THORNBURG
DEVELOPING
WORLD
FUND | Thornburg
Value
Fund | THORNBURG
CORE GROWTH
FUND | THORNBURG
LONG/SHORT
EQUITY
FUND |
| NET ASSET VALUE | | | | | |
| Class A Shares: | | | | | |
| Net assets applicable to shares outstanding | $ 94,743,158 | $ 80,480,778 | $ 319,892,545 | $ 226,080,420 | $ - |
| Shares outstanding | 4,707,618 | 4,709,364 | 5,559,147 | 6,667,526 | - |
| Net asset value and redemption price per share | $ 20.13 | $ 17.09 | $ 57.54 | $ 33.91 | $ - |
| Maximum offering price per share (net asset value, plus 4.50% of offering price) | $ 21.08 | $ 17.90 | $ 60.25 | $ 35.51 | $ - |
| Class C Shares: | | | | | |
| Net assets applicable to shares outstanding | 38,485,515 | 45,940,260 | 23,699,516 | 29,577,698 | - |
| Shares outstanding | 2,073,755 | 2,827,210 | 454,424 | 1,032,961 | - |
| Net asset value and redemption price per share* | 18.56 | 16.25 | 52.15 | 28.63 | - |
| Class I Shares: | | | | | |
| Net assets applicable to shares outstanding | 1,037,437,123 | 524,147,285 | 269,500,931 | 212,334,895 | 121,948,502 |
| Shares outstanding | 50,053,671 | 30,093,155 | 4,549,422 | 5,771,462 | 12,203,849 |
| Net asset value and redemption price per share | 20.73 | 17.42 | 59.24 | 36.79 | 9.99 |
| Class R3 Shares: | | | | | |
| Net assets applicable to shares outstanding | 4,685,213 | - | 21,327,168 | 24,223,573 | - |
| Shares outstanding | 235,605 | - | 372,433 | 721,413 | - |
| Net asset value and redemption price per share | 19.89 | - | 57.26 | 33.58 | - |
| Class R4 Shares: | | | | | |
| Net assets applicable to shares outstanding | 7,328,114 | - | 3,898,642 | 2,459,108 | - |
| Shares outstanding | 366,425 | - | 67,352 | 72,314 | - |
| Net asset value and redemption price per share | 20.00 | - | 57.88 | 34.01 | - |
| Class R5 Shares: | | | | | |
| Net assets applicable to shares outstanding | 25,897,848 | 2,039,008 | 13,184,201 | 16,980,195 | - |
| Shares outstanding | 1,245,934 | 117,456 | 222,884 | 462,080 | - |
| Net asset value and redemption price per share | 20.79 | 17.36 | 59.15 | 36.75 | - |
| Class R6 Shares: | | | | | |
| Net assets applicable to shares outstanding | 42,433,172 | 48,607,104 | - | - | - |
| Shares outstanding | 2,036,490 | 2,788,680 | - | - | - |
| Net asset value and redemption price per share | 20.84 | 17.43 | - | - | - |
| (a) | Cost of foreign currency is $1,051,732; $56,858; $0; $0; $0 respectively. |
| (b) | Proceeds $97,740,120. |
| * | Redemption price per share is equal to net asset value less any applicable contingent deferred sales charge. |
See notes to financial statements.
Thornburg Equity Funds Semi-Annual Report | 81
Statements of Operations
Six Months Ended March 31, 2020 (Unaudited)
| | THORNBURG
INVESTMENT
INCOME BUILDER
FUND | THORNBURG
SUMMIT
FUND | THORNBURG
GLOBAL
OPPORTUNITIES
FUND | Thornburg
International
Value
Fund | THORNBURG
BETTER WORLD
INTERNATIONAL
FUND |
| INVESTMENT INCOME | | | | | |
| Dividend income | | | | | |
| Non-affiliated issuers | $ 253,226,087 | $ 158,522 | $ 6,813,191 | $ 19,027,301 | $ 495,400 |
| Non-controlled affiliated issuers | 19,332,185 | 35,854 | 642,488 | 1,441,663 | 27,379 |
| Dividend taxes withheld | (19,478,158) | (8,361) | (235,645) | (1,910,028) | (53,115) |
| Interest income | 35,887,366 | 229,198 | 8,758 | 16,282 | - |
| Non-cash dividend | - | - | - | 1,465,745 | - |
| Total Income | 288,967,480 | 415,213 | 7,228,792 | 20,040,963 | 469,664 |
| EXPENSES | | | | | |
| Investment management fees | 48,322,524 | 135,203 | 5,132,138 | 11,528,785 | 360,076 |
| Administration fees | 6,139,464 | 15,880 | 540,791 | 1,340,833 | 32,522 |
| Distribution and service fees | | | | | |
| Class A Shares | 4,280,183 | - | 297,471 | 810,580 | 11,776 |
| Class C Shares | 12,548,670 | - | 745,934 | 363,108 | 8,755 |
| Class R3 Shares | 86,613 | - | 10,370 | 396,925 | - |
| Class R4 Shares | 29,742 | - | 9,197 | 145,603 | - |
| Transfer agent fees | | | | | |
| Class A Shares | 930,914 | - | 72,636 | 327,076 | 9,554 |
| Class C Shares | 569,241 | - | 41,934 | 13,282 | 2,015 |
| Class I Shares | 2,161,323 | 638 | 217,744 | 223,417 | 27,194 |
| Class R3 Shares | 11,710 | - | 1,849 | 115,731 | - |
| Class R4 Shares | 36,829 | - | 6,884 | 86,810 | - |
| Class R5 Shares | 35,189 | - | 38,288 | 38,974 | - |
| Class R6 Shares | 4,171 | - | 2,496 | 5,733 | - |
| Registration and filing fees | | ��� | | | |
| Class A Shares | 14,672 | - | 7,308 | 8,510 | 7,043 |
| Class C Shares | 10,854 | - | 6,243 | 6,274 | 7,043 |
| Class I Shares | 20,661 | 501 | 8,670 | 13,792 | 7,085 |
| Class R3 Shares | 6,284 | - | 6,200 | 6,280 | - |
| Class R4 Shares | 6,416 | - | 6,200 | 6,872 | - |
| Class R5 Shares | 6,763 | - | 6,415 | 6,113 | - |
| Class R6 Shares | 6,629 | - | 6,108 | 7,517 | - |
| Dividend expense on securities sold short | - | 18,654 | - | - | - |
| Short sale financing fees | - | (1,908)* | - | - | - |
| Custodian fees | 677,991 | 25,145 | 151,747 | 247,311 | 42,639 |
| Professional fees | 201,436 | 27,444 | 51,618 | 100,128 | 29,194 |
| Trustee and officer fees | 448,270 | 860 | 43,757 | 105,810 | 2,168 |
| Other expenses | 563,164 | 29,590 | 96,542 | 194,474 | 19,543 |
| Total Expenses | 77,119,713 | 252,007 | 7,508,540 | 16,099,938 | 566,607 |
| Less: | | | | | |
| Expenses reimbursed | (19,461) | (56,794) | (103,764) | (201,056) | (69,182) |
| Investment management fees waived | - | - | (258,368) | (152,334) | (51,051) |
| Net Expenses | 77,100,252 | 195,213 | 7,146,408 | 15,746,548 | 446,374 |
| Net Investment Income (Loss) | $ 211,867,228 | $ 220,000 | $ 82,384 | $ 4,294,415 | $ 23,290 |
82 | Thornburg Equity Funds Semi-Annual Report
Statements of Operations, Continued
Six Months Ended March 31, 2020 (Unaudited)
| | THORNBURG
INVESTMENT
INCOME BUILDER
FUND | THORNBURG
SUMMIT
FUND | THORNBURG
GLOBAL
OPPORTUNITIES
FUND | Thornburg
International
Value
Fund | THORNBURG
BETTER WORLD
INTERNATIONAL
FUND |
| REALIZED AND UNREALIZED GAIN (LOSS) | | | | | |
| Net realized gain (loss) on: | | | | | |
| Investments | | | | | |
| Non-affiliated issuer investments* | $ (8,452,552) | $ (552,027) | $ 43,997,965 | $ 66,121,262 | $ (1,694,706) |
| Non-controlled affiliated issuers | (26,150,938) | - | - | - | - |
| Securities sold short | - | 350,209 | - | - | - |
| Forward currency contracts | 47,779,339 | - | 4,824,797 | - | - |
| Foreign currency transactions | (1,351,111) | (1,053) | (283,865) | (318,434) | (2,711) |
| Net realized gain (loss) | 11,824,738 | (202,871) | 48,538,897 | 65,802,828 | (1,697,417) |
| Net change in unrealized appreciation (depreciation) on: | | | | | |
| Investments | | | | | |
| Non-affiliated issuers investments** | (2,972,368,723) | (2,241,334) | (168,920,336) | (429,638,850) | (5,773,870) |
| Non-controlled affiliated issuers | (248,523,817) | - | - | - | - |
| Securities sold short | - | 224,242 | - | - | - |
| Forward currency contracts | (46,616,205) | - | (4,033,955) | 8,551,492 | - |
| Foreign currency translations | 653,062 | (246) | 6,601 | 7,755 | 4,046 |
| Change in net unrealized appreciation (depreciation) | (3,266,855,683) | (2,017,338) | (172,947,690) | (421,079,603) | (5,769,824) |
| Net Realized and Unrealized Gain (Loss) | (3,255,030,945) | (2,220,209) | (124,408,793) | (355,276,775) | (7,467,241) |
| Change in Net Assets Resulting from Operations | $ (3,043,163,717) | $ (2,000,209) | $ (124,326,409) | $ (350,982,360) | $ (7,443,951) |
| * Net of foreign capital gain taxes | $152 | $- | $269,297 | $258,570 | $- |
| ** Net of change in deferred taxes | $- | $133 | $1,475,667 | $858,720 | $- |
| * | A reimbursement for prior period expenses has been applied against Short Sale Financing Fees resulting in a negative balance as of the period ending 3/31/2020. |
See notes to financial statements.
Thornburg Equity Funds Semi-Annual Report | 83
Statements of Operations, Continued
Six Months Ended March 31, 2020 (Unaudited)
| | THORNBURG
INTERNATIONAL
GROWTH
FUND | THORNBURG
DEVELOPING
WORLD
FUND | Thornburg
Value
Fund | THORNBURG
CORE GROWTH
FUND | THORNBURG
LONG/SHORT
EQUITY
FUND |
| INVESTMENT INCOME | | | | | |
| Dividend income | | | | | |
| Non-affiliated issuers | $ 7,489,961 | $ 5,820,514 | $ 6,531,727 | $ 2,059,052 | $ 1,173,172 |
| Non-controlled affiliated issuers | 861,739 | 333,162 | 283,296 | 307,382 | 180,934 |
| Dividend taxes withheld | (723,747) | (762,712) | (48,743) | (2,123) | (4,577) |
| Interest income | 11,591 | 4,288 | 6,419 | 3,997 | - |
| Total Income | 7,639,544 | 5,395,252 | 6,772,699 | 2,368,308 | 1,349,529 |
| EXPENSES | | | | | |
| Investment management fees | 6,129,040 | 4,112,606 | 3,692,123 | 2,632,996 | 1,222,137 |
| Administration fees | 654,733 | 379,620 | 380,656 | 267,743 | 86,071 |
| Distribution and service fees | | | | | |
| Class A Shares | 136,193 | 125,029 | 529,111 | 328,841 | - |
| Class C Shares | 234,148 | 311,012 | 167,971 | 180,227 | - |
| Class R3 Shares | 14,566 | - | 71,824 | 72,943 | - |
| Class R4 Shares | 10,558 | - | 7,484 | 4,015 | - |
| Transfer agent fees | | | | | |
| Class A Shares | 39,043 | 39,594 | 155,971 | 96,582 | - |
| Class C Shares | 18,014 | 18,055 | 13,938 | 10,775 | - |
| Class I Shares | 309,144 | 122,205 | 111,692 | 66,591 | 54,262 |
| Class R3 Shares | 6,982 | - | 19,742 | 23,305 | - |
| Class R4 Shares | 3,039 | - | 5,243 | 5,839 | - |
| Class R5 Shares | 34,098 | 1,864 | 24,063 | 13,451 | - |
| Class R6 Shares | 2,558 | 4,557 | - | - | - |
| Registration and filing fees | | | | | |
| Class A Shares | 6,797 | 6,622 | 7,060 | 7,514 | - |
| Class C Shares | 6,136 | 6,402 | 6,492 | 6,304 | - |
| Class I Shares | 10,291 | 9,074 | 6,952 | 6,767 | 12,206 |
| Class R3 Shares | 6,251 | - | 6,149 | 6,167 | - |
| Class R4 Shares | 6,252 | - | 6,165 | 6,189 | - |
| Class R5 Shares | 6,676 | 6,494 | 6,136 | 6,426 | - |
| Class R6 Shares | 6,178 | 6,494 | - | - | - |
| Dividend expense on securities sold short | - | - | - | - | 872,327 |
| Short sale financing fees | - | - | - | - | 624,210 |
| Custodian fees | 181,939 | 167,331 | 32,808 | 27,979 | 23,616 |
| Professional fees | 55,828 | 39,448 | 40,484 | 30,368 | 25,792 |
| Trustee and officer fees | 47,244 | 26,216 | 28,125 | 19,590 | 6,517 |
| Other expenses | 80,033 | 55,259 | 51,113 | 36,497 | 14,965 |
| Total Expenses | 8,005,741 | 5,437,882 | 5,371,302 | 3,857,109 | 2,942,103 |
| Less: | | | | | |
| Expenses reimbursed | (218,912) | (139,611) | (179,817) | (133,033) | - |
| Investment management fees waived | - | (132,804) | - | - | - |
| Net Expenses | 7,786,829 | 5,165,467 | 5,191,485 | 3,724,076 | 2,942,103 |
| Net Investment Income (Loss) | $ (147,285) | $ 229,785 | $ 1,581,214 | $ (1,355,768) | $ (1,592,574) |
84 | Thornburg Equity Funds Semi-Annual Report
Statements of Operations, Continued
Six Months Ended March 31, 2020 (Unaudited)
| | THORNBURG
INTERNATIONAL
GROWTH
FUND | THORNBURG
DEVELOPING
WORLD
FUND | Thornburg
Value
Fund | THORNBURG
CORE GROWTH
FUND | THORNBURG
LONG/SHORT
EQUITY
FUND |
| REALIZED AND UNREALIZED GAIN (LOSS) | | | | | |
| Net realized gain (loss) on: | | | | | |
| Non-affiliated issuer investments* | $ 350,391 | $ (11,714,326) | $ 9,197,472 | $ 16,690,484 | $ (121,862) |
| Securities sold short | - | - | - | - | (6,922,028) |
| Forward currency contracts | (1,452,058) | - | 439,137 | - | - |
| Foreign currency transactions | (86,947) | (514,417) | 7,956 | 4,066 | (117,238) |
| Net realized gain (loss) | (1,188,614) | (12,228,743) | 9,644,565 | 16,694,550 | (7,161,128) |
| Net change in unrealized appreciation (depreciation) on: | | | | | |
| Non-affiliated issuers investments** | (72,898,041) | (125,579,197) | (166,914,482) | (40,587,321) | (19,103,622) |
| Securities sold short | - | - | - | - | 18,380,356 |
| Forward currency contracts | (310,039) | - | (573,863) | - | - |
| Foreign currency translations | 62,491 | (37,437) | 239 | 216 | 1,095 |
| Change in net unrealized appreciation (depreciation) | (73,145,589) | (125,616,634) | (167,488,106) | (40,587,105) | (722,171) |
| Net Realized and Unrealized Gain (Loss) | (74,334,203) | (137,845,377) | (157,843,541) | (23,892,555) | (7,883,299) |
| Change in Net Assets Resulting from Operations | $ (74,481,488) | $ (137,615,592) | $ (156,262,327) | $ (25,248,323) | $ (9,475,873) |
| * Net of foreign capital gain taxes | $59,546 | $89,189 | $- | $- | $- |
| ** Net of change in deferred taxes | $- | $754,348 | $- | $- | $- |
See notes to financial statements.
Thornburg Equity Funds Semi-Annual Report | 85
Statements of Changes in Net Assets
| | THORNBURG INVESTMENT INCOME BUILDER FUND | THORNBURG SUMMIT FUND |
| | Six Months Ended
March 31, 2020* | Year Ended
September 30, 2019 | Six Months Ended
March 31, 2020* | Period Ended
September 30, 2019** |
| INCREASE (DECREASE) IN NET ASSETS FROM | | | | |
| OPERATIONS | | | | |
| Net investment income | $ 211,867,228 | $ 622,449,712 | $ 220,000 | $ 318,669 |
| Net realized gain (loss) | 11,824,738 | 93,973,879 | (202,871) | 133,329 |
| Net change in unrealized appreciation (depreciation) | (3,266,855,683) | (169,703,765) | (2,017,338) | 1,042,165 |
Net Increase (Decrease) in Net Assets
Resulting from Operations | (3,043,163,717) | 546,719,826 | (2,000,209) | 1,494,163 |
| DIVIDENDS TO SHAREHOLDERS | | | | |
| From distributable earnings | | | | |
| Class A Shares | (78,634,574) | (145,285,706) | - | - |
| Class C Shares | (48,378,466) | (115,848,620) | - | - |
| Class I Shares | (187,416,269) | (353,388,550) | (621,180) | (251,823) |
| Class R3 Shares | (745,691) | (1,660,148) | - | - |
| Class R4 Shares | (511,780) | (1,133,088) | - | - |
| Class R5 Shares | (1,339,517) | (2,557,558) | - | - |
| Class R6 Shares | (3,621,482) | (7,383,222) | - | - |
| FUND SHARE TRANSACTIONS | | | | |
| Class A Shares | (57,851,449) | 83,585,956 | - | - |
| Class C Shares | (290,116,383) | (888,620,255) | - | - |
| Class I Shares | (322,497,392) | 35,004,150 | 879,858 | 34,247,077 |
| Class R3 Shares | (3,238,668) | (10,267,472) | - | - |
| Class R4 Shares | (2,565,658) | (5,668,174) | - | - |
| Class R5 Shares | (4,341,551) | 422,399 | - | - |
| Class R6 Shares | (8,984,048) | 1,725,253 | - | - |
| Net Increase (Decrease) in Net Assets | (4,053,406,645) | (864,355,209) | (1,741,531) | 35,489,417 |
| NET ASSETS | | | | |
| Beginning of Period | 14,206,223,035 | 15,070,578,244 | 35,489,417 | 0 |
| End of Period | $ 10,152,816,390 | $ 14,206,223,035 | $ 33,747,886 | $ 35,489,417 |
| * | Unaudited. |
| ** | For the period from commencement of operations on March 01, 2019 through September 30, 2019. |
See notes to financial statements.
86 | Thornburg Equity Funds Semi-Annual Report
Statements of Changes in Net Assets, Continued
| | THORNBURG GLOBAL OPPORTUNITIES FUND | THORNBURG INTERNATIONAL VALUE FUND |
| | Six Months Ended
March 31, 2020* | Year Ended
September 30, 2019 | Six Months Ended
March 31, 2020* | Year Ended
September 30, 2019 |
| INCREASE (DECREASE) IN NET ASSETS FROM | | | | |
| OPERATIONS | | | | |
| Net investment income | $ 82,384 | $ 12,674,753 | $ 4,294,415 | $ 36,498,482 |
| Net realized gain (loss) | 48,538,897 | 20,393,776 | 65,802,828 | 254,258,240 |
| Net change in unrealized appreciation (depreciation) | (172,947,690) | (164,532,027) | (421,079,603) | (275,033,639) |
Net Increase (Decrease) in Net Assets
Resulting from Operations | (124,326,409) | (131,463,498) | (350,982,360) | 15,723,083 |
| DIVIDENDS TO SHAREHOLDERS | | | | |
| From distributable earnings | | ��� | | |
| Class A Shares | (3,426,643) | (6,084,601) | (42,355,548) | (8,986,188) |
| Class C Shares | (1,537,469) | (1,977,267) | (4,756,124) | - |
| Class I Shares | (13,354,554) | (23,054,670) | (110,539,987) | (30,860,690) |
| Class R3 Shares | (49,078) | (108,092) | (10,029,696) | (1,984,958) |
| Class R4 Shares | (78,407) | (288,231) | (7,549,189) | (1,906,286) |
| Class R5 Shares | (717,913) | (1,405,780) | (10,042,628) | (3,078,981) |
| Class R6 Shares | (912,732) | (1,209,350) | (15,441,134) | (7,281,194) |
| FUND SHARE TRANSACTIONS | | | | |
| Class A Shares | (26,201,721) | (101,269,120) | (19,967,902) | (126,975,885) |
| Class C Shares | (25,141,005) | (82,379,964) | (17,294,287) | (76,657,213) |
| Class I Shares | (192,386,083) | (333,371,480) | (37,700,766) | (731,547,651) |
| Class R3 Shares | (975,413) | (2,626,610) | (4,281,528) | (48,954,078) |
| Class R4 Shares | (4,275,316) | (9,917,215) | (14,306,137) | (40,117,767) |
| Class R5 Shares | (10,783,126) | (22,285,902) | (20,945,669) | (75,022,223) |
| Class R6 Shares | (4,020,023) | (2,114,070) | 10,092,477 | (236,639,711) |
| Net Decrease in Net Assets | (408,185,892) | (719,555,850) | (656,100,478) | (1,374,289,742) |
| NET ASSETS | | | | |
| Beginning of Period | 1,252,350,454 | 1,971,906,304 | 3,094,594,810 | 4,468,884,552 |
| End of Period | $ 844,164,562 | $ 1,252,350,454 | $ 2,438,494,332 | $ 3,094,594,810 |
See notes to financial statements.
Thornburg Equity Funds Semi-Annual Report | 87
Statements of Changes in Net Assets, Continued
| | THORNBURG BETTER WORLD INTERNATIONAL FUND | THORNBURG INTERNATIONAL GROWTH FUND |
| | Six Months Ended
March 31, 2020* | Year Ended
September 30, 2019 | Six Months Ended
March 31, 2020* | Year Ended
September 30, 2019 |
| INCREASE (DECREASE) IN NET ASSETS FROM | | | | |
| OPERATIONS | | | | |
| Net investment income (loss) | $ 23,290 | $ 912,777 | $ (147,285) | $ 4,125,865 |
| Net realized gain (loss) | (1,697,417) | (764,557) | (1,188,614) | 12,262,873 |
| Net change in unrealized appreciation (depreciation) | (5,769,824) | (2,220,228) | (73,145,589) | (131,871,425) |
Net Decrease in Net Assets
Resulting from Operations | (7,443,951) | (2,072,008) | (74,481,488) | (115,482,687) |
| DIVIDENDS TO SHAREHOLDERS | | | | |
| From distributable earnings | | | | |
| Class A Shares | (63,296) | (794,041) | (553,089) | (3,914,434) |
| Class C Shares | (1,257) | (158,603) | (259,350) | (2,516,390) |
| Class I Shares | (847,463) | (4,524,294) | (9,871,216) | (50,306,025) |
| Class R3 Shares | - | - | (31,060) | (267,010) |
| Class R4 Shares | - | - | (43,446) | (355,180) |
| Class R5 Shares | - | - | (238,867) | (1,314,036) |
| Class R6 Shares | - | - | (427,726) | (1,827,702) |
| FUND SHARE TRANSACTIONS | | | | |
| Class A Shares | (503,311) | 1,776,230 | (6,078,671) | (8,526,596) |
| Class C Shares | 71,976 | (343,821) | (6,962,738) | (21,012,442) |
| Class I Shares | (3,342) | 10,196,900 | (94,373,962) | (121,377,075) |
| Class R3 Shares | - | - | (1,344,982) | (1,339,119) |
| Class R4 Shares | - | - | 289,855 | (3,982,891) |
| Class R5 Shares | - | - | (1,116,165) | (5,662,040) |
| Class R6 Shares | - | - | 348,086 | (1,509,937) |
| Net Increase (Decrease) in Net Assets | (8,790,644) | 4,080,363 | (195,144,819) | (339,393,564) |
| NET ASSETS | | | | |
| Beginning of Period | 70,898,373 | 66,818,010 | 1,446,154,962 | 1,785,548,526 |
| End of Period | $ 62,107,729 | $ 70,898,373 | $ 1,251,010,143 | $ 1,446,154,962 |
See notes to financial statements.
88 | Thornburg Equity Funds Semi-Annual Report
Statements of Changes in Net Assets, Continued
| | THORNBURG DEVELOPING WORLD FUND | THORNBURG VALUE FUND |
| | Six Months Ended
March 31, 2020* | Year Ended
September 30, 2019 | Six Months Ended
March 31, 2020* | Year Ended
September 30, 2019 |
| INCREASE (DECREASE) IN NET ASSETS FROM | | | | |
| OPERATIONS | | | | |
| Net investment income | $ 229,785 | $ 11,439,642 | $ 1,581,214 | $ 4,158,599 |
| Net realized gain (loss) | (12,228,743) | 15,188,453 | 9,644,565 | (11,319,398) |
| Net change in unrealized appreciation (depreciation) | (125,616,634) | 33,833,871 | (167,488,106) | (3,595,618) |
Net Increase (Decrease) in Net Assets
Resulting from Operations | (137,615,592) | 60,461,966 | (156,262,327) | (10,756,417) |
| DIVIDENDS TO SHAREHOLDERS | | | | |
| From distributable earnings | | | | |
| Class A Shares | (1,058,043) | (832,625) | (1,021,543) | (1,836,449) |
| Class C Shares | (162,600) | - | - | - |
| Class I Shares | (8,943,418) | (7,328,575) | (2,037,070) | (2,694,843) |
| Class R3 Shares | - | - | (56,105) | (114,235) |
| Class R4 Shares | - | - | (16,670) | (29,384) |
| Class R5 Shares | (37,097) | (35,726) | (99,060) | (128,320) |
| Class R6 Shares | (910,491) | (703,702) | - | - |
| FUND SHARE TRANSACTIONS | | | | |
| Class A Shares | (413,812) | (21,799,926) | (25,604,195) | (42,236,468) |
| Class C Shares | (8,487,746) | (22,061,241) | (6,370,381) | (14,837,174) |
| Class I Shares | 47,575,563 | (80,785,547) | (26,258,979) | (55,270,314) |
| Class R3 Shares | - | - | (3,070,199) | (8,888,072) |
| Class R4 Shares | - | - | (1,354,411) | (1,294,640) |
| Class R5 Shares | 29,794 | (1,089,073) | (1,721,795) | (767,164) |
| Class R6 Shares | 1,815,582 | (3,312,730) | - | - |
| Net Decrease in Net Assets | (108,207,860) | (77,487,179) | (223,872,735) | (138,853,480) |
| NET ASSETS | | | | |
| Beginning of Period | 809,422,295 | 886,909,474 | 875,375,738 | 1,014,229,218 |
| End of Period | $ 701,214,435 | $ 809,422,295 | $ 651,503,003 | $ 875,375,738 |
See notes to financial statements.
Thornburg Equity Funds Semi-Annual Report | 89
Statements of Changes in Net Assets, Continued
| | THORNBURG CORE GROWTH FUND | THORNBURG LONG/SHORT EQUITY FUND |
| | Six Months Ended
March 31, 2020* | Year Ended
September 30, 2019 | Six Months Ended
March 31, 2020* | Year Ended
September 30, 2019 |
| INCREASE (DECREASE) IN NET ASSETS FROM | | | | |
| OPERATIONS | | | | |
| Net investment loss | $ (1,355,768) | $ (2,206,363) | $ (1,592,574) | $ (3,143,968) |
| Net realized gain (loss) | 16,694,550 | 54,097,373 | (7,161,128) | 4,168,021 |
| Net change in unrealized appreciation (depreciation) | (40,587,105) | (71,349,791) | (722,171) | (4,863,694) |
Net Decrease in Net Assets
Resulting from Operations | (25,248,323) | (19,458,781) | (9,475,873) | (3,839,641) |
| DIVIDENDS TO SHAREHOLDERS | | | | |
| From distributable earnings | | | | |
| Class A Shares | (23,521,075) | - | - | - |
| Class C Shares | (3,795,871) | - | - | - |
| Class I Shares | (21,867,930) | - | (3,953,280) | (8,099,318) |
| Class R3 Shares | (2,684,133) | - | - | - |
| Class R4 Shares | (332,371) | - | - | - |
| Class R5 Shares | (1,703,398) | - | - | - |
| FUND SHARE TRANSACTIONS | | | | |
| Class A Shares | 1,890,438 | (28,138,946) | - | - |
| Class C Shares | (1,957,825) | (15,122,046) | - | - |
| Class I Shares | (10,975,876) | (24,897,376) | (84,997,836) | 28,510,781 |
| Class R3 Shares | (2,024,164) | (9,425,792) | - | - |
| Class R4 Shares | (1,202,251) | (293,149) | - | - |
| Class R5 Shares | (532,909) | (10,416,662) | - | - |
| Net Increase (Decrease) in Net Assets | (93,955,688) | (107,752,752) | (98,426,989) | 16,571,822 |
| NET ASSETS | | | | |
| Beginning of Period | 605,611,577 | 713,364,329 | 220,375,491 | 203,803,669 |
| End of Period | $ 511,655,889 | $ 605,611,577 | $ 121,948,502 | $ 220,375,491 |
See notes to financial statements.
90 | Thornburg Equity Funds Semi-Annual Report
Statement of Cash Flows
Thornburg Long/Short Equity Fund | Six Months Ended March 31, 2020 (Unaudited)
| Cash Flows from Operating Activities: | |
| Net change in net assets resulting from operations | $ (9,475,873) |
| Adjustments to reconcile net increase in net assets resulting from operations to net cash provided by (used for) operating activities: | |
| Purchases of investments in securities | (63,315,377) |
| Payments to cover securities sold short | (84,631,881) |
| Proceeds from disposition of investments in securities | 125,825,144 |
| Proceeds from securities sold short | 35,797,360 |
| Purchases of short term investments, net | 34,935,356 |
| Net realized (gain) loss: | |
| Investment transactions | 121,862 |
| Securities sold short | 6,922,028 |
| Net unrealized (gain) loss: | |
| Investments | 19,103,622 |
| Securities sold short | (18,380,356) |
| Changes in assets and liabilities: | |
| (Increase) decrease in assets: | |
| Cash segregated as collateral on securities sold short | 35,981,004 |
| Dividend and interest reclaim receivable | 19,467 |
| Prepaid expenses and other assets | (15,372) |
| Increase (decrease) in liabilities: | |
| Payable for short sale financing | (290,841) |
| Payable for dividends on securities sold short | (50,103) |
| Payable to investment adviser | (39,491) |
| Accrued expenses and other payables | (55,927) |
| Net cash used in operating activities | $ 82,450,622 |
| Cash Flows from Financing Activities: | |
| Fund shares sold | $ 19,379,042 |
| Fund shares redeemed | (105,101,290) |
| Fund distributions paid and not reinvested | (147,121) |
| Net cash received from financing activities | $ (85,869,369) |
| Net increase in cash during the period | $ (3,418,747) |
| Cash and foreign currency, beginning of period: | $ 3,418,747 |
| Cash and foreign currency, end of period: | $ - |
| Non-cash Activities: | |
| Reinvestment of Fund distributions | 3,806,159 |
See notes to financial statements.
Thornburg Equity Funds Semi-Annual Report | 91
Notes to Financial Statements
March 31, 2020 (Unaudited)
NOTE 1 – ORGANIZATION
Thornburg Investment Income Builder Fund ("Income Builder Fund"), Thornburg Summit Fund ("Summit Fund"), Thornburg Global Opportunities Fund ("Global Opportunities Fund"), Thornburg International Value Fund ("International Value Fund"), Thornburg Better World International Fund ("Better World International Fund"), Thornburg International Growth Fund ("International Growth Fund"), Thornburg Developing World Fund ("Developing World Fund"), Thornburg Value Fund ("Value Fund"), Thornburg Core Growth Fund ("Growth Fund"), and Thornburg Long/Short Equity Fund ("Long/Short Equity Fund"), collectively the ("Funds"), are diversified series of Thornburg Investment Trust (the “Trust”). The Trust is organized as a Massachusetts business trust under a Declaration of Trust dated June 3, 1987 and is registered as a diversified, open-end management investment company under the Investment Company Act of 1940, as amended (the "1940 Act"). The Funds are currently ten of twenty-two separate series of the Trust. Each series is considered to be a separate entity for financial reporting and tax purposes and bears expenses directly attributable to it.
Income Builder Fund:The Fund’s primary investment goal is to provide a level of current income which exceeds the average yield on U.S. stocks generally, and which will generally grow, subject to periodic fluctuations, over the years on a per share basis. The Fund’s secondary investment goal is long-term capital appreciation. The Fund’s investments subject it to risks including, but not limited to, management risk, market and economic risk, risks affecting specific issuers, small and mid-cap company risk, credit risk, high-yield risk, interest rate risk, prepayment and extension risk, foreign investment risk,developing country risk, risks affecting specific countries or regions, liquidity risk, and real estate risk. Please see the Fund’s prospectus for a discussion of the risks associated with an investment in the Fund.
Summit Fund:The Fund’s investment goal is to seek to grow real wealth over time. The Fund’s investments subject it to risks including, but not limited to, management risk, market and economic risk, risks affecting specific issuers, foreign investment risk, developing country risk, small and mid-cap company risk, short sale risk, credit risk, high yield risk, interest rate risk, prepayment and extension risk, liquidity risk, inflation risk, structured products risk, commodities-related investment risk, real estate risk and derivatives risk. Please see the Fund’s prospectus for a discussion of the risks associated with an investment in the Fund.
Global Opportunities Fund:The Fund seeks long-term capital appreciation by investing in equity and debt securities of all types from issuers around the world. The Fund’s investments subject it to risks including, but not limited to, management risk, market and economic risk, risks affecting specific issuers, foreign investment risk, developing country risk, risks affecting specific countries or regions, small and mid-cap company risk, credit risk, interest rate risk, liquidity risk, and real estate risk. Please see the Fund’s prospectus for a discussion of the risks associated with an investment in the Fund.
International Value Fund:The Fund seeks long-term capital appreciation by investing in equity and debt securities of all types. As a secondary objective, the Fund also seeks some current income. The Fund’s investments subject it to risks including, but not limited to, management risk, market and economic risk, risks affecting specific issuers, foreign investment risk, developing country risk, risks affecting specific countries or regions, risks affecting investments in China, small and mid-cap company risk, credit risk, interest rate risk, and liquidity risk. Please see the Fund’s prospectus for a discussion of the risks associated with an investment in the Fund.
Better World International Fund:The Fund seeks long-term capital appreciation. The Fund’s investments subject it to risks including, but not limited to, management risk, market and economic risk, risks affecting specific issuers, foreign investment risk, developing country risk, risks affecting specific countries or regions, small and mid-cap company risk, credit risk, interest rate risk, liquidity risk, social investing risk, and real estate risk. Please see the Fund’s prospectus for a discussion of the risks associated with an investment in the Fund.
International Growth Fund:The Fund seeks long-term capital appreciation by investing in equity securities selected for their growth potential. The Fund’s investments subject it to risks including, but not limited to, management risk, market and economic risk, risks affecting specific issuers, foreign investment risk, developing country risk, risks affecting specific countries or regions, small and mid-cap company risk, credit risk, interest rate risk, and liquidity risk. Please see the Fund’s prospectus for a discussion of the risks associated with an investment in the Fund.
Developing World Fund:The Fund seeks long-term capital appreciation. The Fund’s investments subject it to risks including, but not limited to, management risk, market and economic risk, risks affecting specific issuers, foreign investment risk, developing country risk, risks affecting specific countries or regions, risks affecting investments in China, small and mid-cap company risk, and liquidity risk. Please see the Fund’s prospectus for a discussion of the risks associated with an investment in the Fund.
Value Fund:The Fund seeks long-term capital appreciation by investing in equity and debt securities of all types. As a secondary objective, the Fund also seeks some current income. The Fund’s investments subject it to risks including, but not limited to, management risk, market and economic risk, risks affecting specific issuers, small and mid-cap company risk, foreign investment risk, credit risk, interest rate risk, and liquidity risk. Please see the Fund’s prospectus for a discussion of the risks associated with an investment in the Fund.
Core Growth Fund:The Fund seeks long-term capital appreciation by investing in equity securities selected for their growth potential. The Fund’s investments subject it to risks including, but not limited to, management risk, market and economic risk, risks affecting specific
92 | Thornburg Equity Funds Semi-Annual Report
Notes to Financial Statements, Continued
March 31, 2020 (Unaudited)
issuers, small and mid-cap company risk, foreign investment risk, credit risk, interest rate risk, and liquidity risk. Please see the Fund’s prospectus for a discussion of the risks associated with an investment in the Fund.
Long/Short Equity Fund:The Fund seeks long-term capital appreciation. The Fund’s investments subject it to risks including, but not limited to, management risk, market and economic risk, risks affecting specific issuers, foreign investment risk, developing country risk, small and mid-cap company risk, short sale risk, non-diversification risk, derivatives risk, credit risk, interest rate risk, and liquidity risk. Please see the Fund’s prospectus for a discussion of the risks associated with an investment in the Fund.
The Funds currently offer from one to seven classes of shares of beneficial interest:
Each class of shares of the Funds represents an interest in the same portfolio of investments, except that (i) Class A shares are sold subject to a front-end sales charge collected at the time the shares are purchased and bear a service fee, (ii) Class C shares are sold at net asset value without a sales charge at the time of purchase, but are subject to a contingent deferred sales charge upon redemption within one year of purchase, and bear both a service fee and a distribution fee, (iii) Class I and Class R5 shares are sold at net asset value without a sales charge at the time of purchase and may be subject to a service fee, (iv) Class R3 shares are sold at net asset value without a sales charge, but bear both a service fee and a distribution fee, (v) Class R4 shares are sold at net asset value without a sales charge at the time of purchase but bear a service fee, (vi) Class R6 shares are sold at net asset value without a sales charge at the time of purchase, and (vii) the respective classes may have different reinvestment privileges and conversion rights. Additionally, each Fund may allocate among its classes certain expenses, to the extent allocable to specific classes, including administration fees, transfer agent fees, government registration fees, certain printing and postage costs and legal expenses. Currently, class specific expenses of the Funds are limited to distribution and service fees, transfer agent fees, and certain registration and filing fees.
At March 31, 2020, the following class of shares are offered in each respective Fund:
| | Class A | Class C | Class I | Class R3 | Class R4 | Class R5 | Class R6 |
| Income Builder Fund | X | X | X | X | X | X | X |
| Summit Fund | | | X | | | | |
| Global Opportunities Fund | X | X | X | X | X | X | X |
| International Value Fund | X | X | X | X | X | X | X |
| Better World International Fund | X | X | X | | | | |
| International Growth Fund | X | X | X | X | X | X | X |
| Developing World Fund | X | X | X | | | X | X |
| Value Fund | X | X | X | X | X | X | |
| Growth Fund | X | X | X | X | X | X | |
| Long/Short Equity Fund | | | X | | | | |
NOTE 2 – SIGNIFICANT ACCOUNTING POLICIES
The following is a summary of significant accounting policies followed by each of the Funds in the preparation of its financial statements. Each Fund prepares its financial statements in conformity with United States generally accepted accounting principles (“GAAP”), including investment company accounting and reporting guidance in the Financial Accounting Standards Board (the “FASB”) Accounting Standard Codification Topic 946.
Allocation of Income, Gains, Losses and Expenses: Net investment income (other than class specific expenses) and realized and unrealized gains and losses are allocated daily to each class of shares based upon the relative net asset value of outstanding shares (or the value of the dividend-eligible shares, as appropriate) of each class of shares at the beginning of the day (after adjusting for the current capital shares activity of the respective class). Expenses common to all Funds are allocated among the Funds comprising the Trust based upon their relative net asset values or other appropriate allocation methods. Operating expenses directly attributable to a specific class are charged against the operating income of that class.
Dividends and Distributions to Shareholders: Dividends and distributions to shareholders, which are determined in accordance with federal income tax regulations and may differ from GAAP, are recorded on the ex-dividend date. Ordinary income dividends, if any, are declared daily and paid quarterly or annually. Capital gain distributions, if any, are declared and paid annually and more often if deemed necessary by Thornburg Investment Management, Inc., the Trust’s investment advisor (the "Advisor"). Dividends and distributions are paid and are reinvested in additional shares of the Funds at net asset value per share at the close of business on the ex-dividend date, or at the shareholder’s option, paid in cash.
Foreign Currency Translation: Portfolio investments and other assets and liabilities denominated in foreign currencies are translated into U.S. dollars based on the exchange rate of such currencies against the U.S. dollar on the date of valuation. Purchases and sales of investments and income items denominated in foreign currencies are translated into U.S. dollars at the exchange rate in effect on the
Thornburg Equity Funds Semi-Annual Report | 93
Notes to Financial Statements, Continued
March 31, 2020 (Unaudited)
transaction date. When the Funds purchase or sell foreign investments, they will customarily enter into a foreign exchange contract to minimize foreign exchange risk from the trade date to the settlement date of such transactions. The values of such spot contracts are included in receivable for investments sold and payable for investments purchased on the Statement of Assets and Liabilities.
The Funds do not separately report the effect of changes in foreign exchange rates from changes in market prices on investments held. Such changes are included in net unrealized appreciation (depreciation) from investments in the Statement of Operations.
Reported net realized gains and losses from foreign currency transactions arise due to purchases and sales of foreign currencies, currency gains and losses realized between the trade and settlement dates on investment transactions and the difference between the amounts of dividends, interest, and foreign withholding taxes recorded on the Funds’ books, and the U.S. dollar equivalent of the amounts actually received or paid. These amounts are included in foreign currency transactions in the Statement of Operations.
Net change in unrealized appreciation (depreciation) on foreign currency translations arise from changes in the fair value of assets and liabilities, other than investments at period end, resulting from changes in exchange rates.
Guarantees and Indemnifications: Under the Trust’s organizational documents (and under separate agreements with the independent Trustees), its officers and Trustees are provided with an indemnification against certain liabilities arising out of the performance of their duties to the Funds. In the normal course of business the Trust may also enter into contracts with service providers that contain general indemnifications. The Trust’s maximum exposure under these arrangements is unknown. However, based on experience, the Trust expects the risk of loss to be remote.
Investment Income: Dividend income is recorded on the ex-dividend date. Interest income is accrued as earned. Premiums and discounts are amortized and accreted, respectively, to first call dates or maturity dates using the effective yield method of the respective investments. These amounts are included in Investment Income in the Statement of Operations.
Investment Transactions: Investment transactions are accounted for on a trade date basis. Realized gains and losses from the sale of investments are recorded on an identified cost basis.
Repurchase Agreements: The Funds may invest excess cash in repurchase agreements whereby the Funds purchase investments, which serve as collateral, with an agreement to resell such collateral to the seller at an agreed upon price at the maturity date of the repurchase agreement. Investments pledged as collateral for repurchase agreements are held in custody until maturity of the repurchase agreement. Provisions in the agreements require that the market value of the collateral is at least equal to the repurchase value in the event of default. In the event of default, the Funds have the right to liquidate the collateral and apply the proceeds in satisfaction of the obligation. Under certain circumstances, in the event of default or bankruptcy by the other party to the agreement, realization and/or retention of the collateral may be subject to legal proceedings.
Security Valuation: All investments in securities held by the Funds are valued as described in Note 3.
Short Sales: A short sale involves the sale by the Funds of a security that the Funds do not own. The Funds borrow the security that they intend to sell from a broker or other institution, and at a later date the Funds complete the short sale by purchasing that same security on the open market and delivering it to the lending institution. The Funds may be required to pay a premium, fee, or other amount to the lender in exchange for borrowing the security. These amounts are included in Short sale financing fees on the Statement of Operations. When it enters into a short sale, the Funds seek to profit on a decline in the price of the security between the date the Funds borrow the security and the date the Funds purchase the security to deliver it to the lender. If, however, the price of the security increases between those dates, or if the price of the security declines by an amount which is not sufficient to cover the expenses of borrowing the security, the Funds will experience a loss. Although the potential for gain as a result of a short sale is limited to the price at which the Funds sold the security short less the cost of borrowing the security, the potential for loss is theoretically unlimited because there is no limit to the cost of replacing the borrowed security. Short sales held by the Funds during the six month period were fully collateralized by segregated cash or other securities, which are denoted on the Schedule of Investments.
Unfunded Loan Commitments: The Income Builder Fund has entered into a loan commitment with Malamute Energy, Inc., of which at March 31, 2020, $316,081 of the $634,830 par commitment had been funded. The maturity date is June 30, 2020.
Use of Estimates: The preparation of financial statements in conformity with GAAP requires management to make estimates and assumptions that affect the reported amounts of assets and liabilities and disclosure of contingent assets and liabilities at the date of the financial statements and the reported amounts of increases (decreases) in net assets from operations during the reporting period. Actual results could differ from those estimates.
When-Issued and Delayed Delivery Transactions: The Funds may engage in when-issued or delayed delivery transactions. To the extent the Funds engage in such transactions, they will do so for the purpose of acquiring portfolio investments consistent with the Funds’ investment objectives and not for the purpose of investment leverage or to speculate on interest rate or market changes. At the time the Funds make a
94 | Thornburg Equity Funds Semi-Annual Report
Notes to Financial Statements, Continued
March 31, 2020 (Unaudited)
commitment to purchase an investment on a when-issued or delayed delivery basis, the Funds will record the transaction and reflect the value in determining its net asset value. When effecting such transactions, assets of an amount sufficient to make payment for the portfolio investments to be purchased will be segregated on the Funds’ records on the trade date. Investments purchased on a when-issued or delayed delivery basis do not earn interest until the settlement date. The values of these securities held at March 31, 2020 are detailed in the Schedule of Investments.
NOTE 3 – SECURITY VALUATION
Valuation of the Funds’ portfolio investment securities is performed in accordance with policies and procedures adopted by and under the oversight of the Trustees.
The Trustees of the Trust have appointed the Advisor to assist the Trustees with obtaining fair market values for portfolio investments, evaluating and monitoring professional pricing service providers appointed by the Trustees’ Audit Committee (the “Audit Committee”) to assist in determining fair values for portfolio investments, assisting in calculating fair values for portfolio investments in certain circumstances, and performing other functions in connection with the valuation of investments. The Advisor acts through its Valuation and Pricing Committee (the “Committee”) and other employees of the Advisor. The Committee regularly reviews its own valuation calculations, reviews the valuations, valuation techniques and services furnished by pricing service providers, considers circumstances which may require valuation calculations by the Committee, and reviews previous valuation calculations. The Committee reports to the Audit Committee on the Committee’s activities, the performance of pricing service providers, and other matters relating to valuation of portfolio investments.
In those instances when the Committee assists in calculating a fair value for a portfolio investment, the Committee seeks to determine the price that the Funds would reasonably expect to receive upon a sale of the investment in an orderly transaction between market participants on the valuation date. The Committee customarily utilizes quotations from securities broker dealers in calculating valuations, but also may utilize prices obtained from pricing service providers or other methods approved by the Audit Committee. Because fair values calculated by the Committee are estimates, the calculation of a value for an investment may differ from the price that would be realized by the Funds upon a sale of the investment, and the difference could be material to the Funds’ financial statements. The Committee’s calculation of a fair value for an investment may also differ from the prices obtained by other persons (including other mutual funds) for the investment.
Valuation of Securities: Securities and other portfolio investments which are listed or traded on a United States securities exchange are valued at the last reported sale price on the valuation date. Investments listed or traded on an exchange for which there has been no sale that day are valued at the mean between the last reported bid and asked prices on that valuation date. Portfolio investments reported by NASDAQ are valued at the official closing price on the valuation date. If an investment is traded on more than one exchange, the investment is considered traded on the exchange that is normally the primary market for that investment. Securities and other portfolio investments which are listed or traded on exchanges outside the United States are valued at the last price or the closing price of the investment on the exchange that is normally the primary market for the investment, as of the close of the exchange preceding the Funds’ valuation date. Foreign investments listed or traded on an exchange for which there has been no sale that day are valued at the mean between the last reported bid and asked prices on that valuation date.
In any case when a market quotation is not readily available for a portfolio investment ordinarily valued by market quotation, the Committee calculates a fair value for the investment using alternative methods approved by the Audit Committee. A market quotation is not readily available when the primary market or exchange for the investment is not open for the entire scheduled day of trading. Market quotations for an investment also may not be readily available if developments after the most recent close of the investment’s primary exchange or market, but prior to the close of business on any Funds’ business day, or an unusual event or significant period of time occurring since the availability of a market quotation, create a serious question concerning the reliability of the most recent market quotation available for the investment. In particular, on days when market volatility thresholds established by the Audit Committee are exceeded, foreign equity investments held by the Funds may be valued using alternative methods. The Committee customarily obtains valuations in these instances from pricing service providers approved by the Audit Committee. Pricing service providers ordinarily calculate valuations using multi-factor models to adjust market prices based upon various inputs, including exchange data, depository receipt prices, futures, index data and other data.
Debt obligations held by the Funds which are not listed or traded on exchanges or for which no reported market exists are ordinarily valued at the valuation obtained from a pricing service provider approved by the Audit Committee.
In any case when a pricing service provider fails to provide a valuation for a debt obligation held by the Funds, the Committee calculates a fair value for the obligation using alternative methods under procedures approved by the Audit Committee. Additionally, in cases when management believes that a valuation obtained from a pricing service provider is stale, does not reflect material factors affecting the valuation of the investment, is significantly different than the value the Funds are likely to obtain if it sought a bid for the investment, or is otherwise unreliable, the Committee calculates a fair value for the obligation using an alternative method approved by the Audit Committee.
Thornburg Equity Funds Semi-Annual Report | 95
Notes to Financial Statements, Continued
March 31, 2020 (Unaudited)
Quotations for foreign investments expressed in foreign currency amounts are converted to U.S. dollar equivalents using a foreign exchange quotation from a third party service provider at the time of valuation. Foreign investments held by the Funds may be traded on days and at times when the Funds are not open for business. Consequently, the value of Funds’ investments may be significantly affected on days when shareholders cannot purchase or sell Funds’ shares.
Valuation Hierarchy: The Funds categorize their investments based upon the inputs used in valuing those investments, according to a three-level hierarchy established in guidance from the FASB. Categorization of investments using this hierarchy is intended by the FASB to maximize the use of observable inputs in valuing investments and minimize the use of unobservable inputs by requiring that the most observable inputs be used when available. Observable inputs are those that market participants would use in valuing an investment based on available market information. Unobservable inputs are those that reflect assumptions about the information market participants would use in valuing an investment. An investment’s level within the hierarchy is based on the lowest level input that is deemed significant to the valuation. The methodologies and inputs used to value investments are not necessarily indications of the risk or liquidity associated with those investments.
Various inputs are used in calculating valuations for the Fund’s investments. These inputs are generally summarized according to the three-level hierarchy below:
Level 1: Quoted prices in active markets for identical investments.
Level 2: Other direct or indirect significant observable inputs (including quoted prices for similar investments in active markets and other observable inputs, such as interest rates, prepayment rates, credit ratings, etc.).
Level 3: Significant unobservable inputs (including the Committee’s own assumptions in calculating the fair values of investments).
Valuations for debt obligations held by the Funds are typically calculated by pricing service providers approved by the Audit Committee and are generally characterized as Level 2 within the valuation hierarchy.
On days when market volatility thresholds established by the Audit Committee are exceeded, foreign securities for which valuations are obtained from pricing service providers are fair valued. On these days, the foreign securities are characterized as Level 2 within the valuation hierarchy and revert to Level 1 after the threshold is no longer exceeded.
In any case when a pricing service provider fails to provide a valuation for a debt obligation held by the Funds, the Committee calculates a fair value for the obligation using alternative methods under procedures approved by the Audit Committee. Additionally, in cases when management believes that a valuation obtained from a pricing service provider is stale, does not reflect material factors affecting the valuation of the investment, is significantly different than the value the Funds are likely to obtain if they sought a bid for the investment, or is otherwise unreliable, the Committee calculates a fair value for the obligation using an alternative method approved by the Audit Committee.
In a limited number of cases the Committee calculates a fair value for investments using broker quotations or other methods approved by the Audit Committee. When the Committee uses a single broker quotation to calculate a fair value for an investment without other significant observable inputs, or if a fair value is calculated using other significant inputs that are considered unobservable, the investment is characterized as Level 3 within the hierarchy. Other significant unobservable inputs used to calculate a fair value in these instances might include an income-based valuation approach which considers discounted anticipated future cash flows from the investment and application of discounts due to the nature or duration of any restrictions on the disposition of the investment.
Valuations based upon the use of inputs from Levels 1, 2 or 3 may not represent the actual price received upon the disposition of an investment, and a fund may receive a price that is lower than the valuation based upon these inputs when it sells the investment.
96 | Thornburg Equity Funds Semi-Annual Report
Notes to Financial Statements, Continued
March 31, 2020 (Unaudited)
The following tables display a summary of the fair value hierarchy measurements of each Fund’s investments as of March 31, 2020:
| INCOME BUILDER FUND | TOTAL | LEVEL 1 | LEVEL 2 | LEVEL 3 |
| Assets | | | | |
| Investments in Securities | | | | |
| Common Stock | $ 8,941,530,352 | $ 3,445,229,233 | $ 5,496,170,509 | $ 130,610 |
| Preferred Stock | 42,469,065 | 10,531,065 | 31,938,000 | — |
| Asset Backed Securities | 10,133,758 | — | 9,580,364 | 553,394 |
| Corporate Bonds | 840,529,091 | — | 838,891,748 | 1,637,343 |
| Municipal Bonds | 2,604,822 | — | 2,604,822 | — |
| Other Government | 4,202,729 | — | 4,202,729 | — |
| Mortgage Backed | 1,838,042 | — | 1,838,042 | — |
| Loan Participations | 91,268,594 | — | 82,101,676 | 9,166,918 |
| Short-Term Investments | 130,136,853 | 130,136,853 | — | — |
| Total Investments in Securities | $10,064,713,306 | $3,585,897,151 | $6,467,327,890 | $11,488,265(a)(b) |
| Other Financial Instruments | | | | |
| Forward Currency Contracts | $ 41,010,141 | $ — | $ 41,010,141 | $ — |
| Total Assets | $10,105,723,447 | $3,585,897,151 | $6,508,338,031 | $11,488,265 |
| Liabilities | | | | |
| Other Financial Instruments | | | | |
| Forward Currency Contracts | $ (20,852,511) | $ — | $ (20,852,511) | $ — |
| Total Liabilities | $(20,852,511) | $— | $(20,852,511) | $— |
| (a) | Level 3 investments at the beginning and/or end of the period in relation to net assets were not significant and accordingly, a reconciliation of Level 3 assets for the period ended March 31, 2020 is not presented. |
| (b) | During the six months ended March 31, 2020, there were no significant transfers into or out of Level 3 of the fair value hierarchy. |
| SUMMIT FUND | TOTAL | LEVEL 1 | LEVEL 2 | LEVEL 3 |
| Assets | | | | |
| Investments in Securities | | | | |
| Common Stock | $ 20,366,634 | $ 14,188,095 | $ 6,178,539 | $ — |
| Asset Backed Securities | 3,678,586 | — | 3,678,586 | — |
| Corporate Bonds | 1,978,111 | — | 1,978,111 | — |
| Convertible Bonds | 250,097 | — | 250,097 | — |
| Other Government | 33,152 | — | 33,152 | — |
| U.S. Treasury Securities | 3,176,296 | 3,176,296 | — | — |
| Mortgage Backed | 1,929,875 | — | 1,929,875 | — |
| Loan Participations | 68,730 | — | 68,730 | — |
| Exchange-Traded Funds | 1,024,213 | 1,024,213 | — | — |
| Investment Company | 159,079 | 159,079 | — | — |
| Short-Term Investments | 2,553,322 | 2,553,322 | — | — |
| Total Investments in Securities | $35,218,095 | $21,101,005 | $14,117,090 | $— |
| Total Assets | $35,218,095 | $21,101,005 | $14,117,090 | $— |
| Liabilities | | | | |
| Investment in Securities Sold Short | | | | |
| Common Stock | $ (1,711,105) | $ (1,711,105) | $ — | $ — |
| Total Liabilities | $(1,711,105) | $(1,711,105) | $— | $— |
| GLOBAL OPPORTUNITIES FUND | TOTAL | LEVEL 1 | LEVEL 2 | LEVEL 3 |
| Assets | | | | |
| Investments in Securities | | | | |
| Common Stock | $ 791,613,587 | $ 453,464,863 | $ 338,148,724 | $ — |
| Short-Term Investments | 49,698,820 | 49,698,820 | — | — |
| Total Investments in Securities | $841,312,407 | $503,163,683 | $338,148,724 | $— |
Thornburg Equity Funds Semi-Annual Report | 97
Notes to Financial Statements, Continued
March 31, 2020 (Unaudited)
| GLOBAL OPPORTUNITIES FUND | TOTAL | LEVEL 1 | LEVEL 2 | LEVEL 3 |
| Other Financial Instruments | | | | |
| Forward Currency Contracts | $ 2,240,632 | $ — | $ 2,240,632 | $ — |
| Total Assets | $843,553,039 | $503,163,683 | $340,389,356 | $— |
| Liabilities | | | | |
| Other Financial Instruments | | | | |
| Forward Currency Contracts | $ (1,747,164) | $ — | $ (1,747,164) | $ — |
| Total Liabilities | $(1,747,164) | $— | $(1,747,164) | $— |
| INTERNATIONAL VALUE FUND | TOTAL | LEVEL 1 | LEVEL 2 | LEVEL 3 |
| Assets | | | | |
| Investments in Securities | | | | |
| Common Stock | $ 2,291,420,851 | $ 214,284,807 | $ 2,077,136,044 | $ — |
| Short-Term Investments | 109,034,397 | 109,034,397 | — | — |
| Total Investments in Securities | $2,400,455,248 | $323,319,204 | $2,077,136,044 | $— |
| Other Financial Instruments | | | | |
| Forward Currency Contracts | $ 8,551,492 | $ — | $ 8,551,492 | $ — |
| Total Assets | $2,409,006,740 | $323,319,204 | $2,085,687,536 | $— |
| BETTER WORLD INTERNATIONAL FUND | TOTAL | LEVEL 1 | LEVEL 2 | LEVEL 3 |
| Assets | | | | |
| Investments in Securities | | | | |
| Common Stock | $ 59,195,522 | $ 10,156,896 | $ 49,038,626 | $ — |
| Short-Term Investments | 2,346,351 | 2,346,351 | — | — |
| Total Investments in Securities | $61,541,873 | $12,503,247 | $49,038,626 | $— |
| Total Assets | $61,541,873 | $12,503,247 | $49,038,626 | $— |
| INTERNATIONAL GROWTH FUND | TOTAL | LEVEL 1 | LEVEL 2 | LEVEL 3 |
| Assets | | | | |
| Investments in Securities | | | | |
| Common Stock | $ 1,149,908,087 | $ 373,268,114 | $ 776,639,973 | $ — |
| Short-Term Investments | 71,880,693 | 71,880,693 | — | — |
| Total Investments in Securities | $1,221,788,780 | $445,148,807 | $776,639,973 | $— |
| Total Assets | $1,221,788,780 | $445,148,807 | $776,639,973 | $— |
| DEVELOPING WORLD FUND | TOTAL | LEVEL 1 | LEVEL 2 | LEVEL 3 |
| Assets | | | | |
| Investments in Securities | | | | |
| Common Stock | $ 666,612,752 | $ 234,148,147 | $ 432,464,605 | $ — |
| Short-Term Investments | 30,893,971 | 30,893,971 | — | — |
| Total Investments in Securities | $697,506,723 | $265,042,118 | $432,464,605 | $—(a)(b) |
| Total Assets | $697,506,723 | $265,042,118 | $432,464,605 | $— |
| (a) | Level 3 investments at the beginning and/or end of the period in relation to net assets were not significant and accordingly, a reconciliation of Level 3 assets for the period ended March 31, 2020 is not presented. |
| (b) | During the six months ended March 31, 2020, there were no significant transfers into or out of Level 3 of the fair value hierarchy. |
| VALUE FUND | TOTAL | LEVEL 1 | LEVEL 2 | LEVEL 3 |
| Assets | | | | |
| Investments in Securities | | | | |
| Common Stock | $ 623,320,302 | $ 587,571,711 | $ 35,748,591 | $ — |
| Short-Term Investments | 29,653,735 | 29,653,735 | — | — |
| Total Investments in Securities | $652,974,037 | $617,225,446 | $35,748,591 | $— |
| Total Assets | $652,974,037 | $617,225,446 | $35,748,591 | $— |
98 | Thornburg Equity Funds Semi-Annual Report
Notes to Financial Statements, Continued
March 31, 2020 (Unaudited)
| VALUE FUND | TOTAL | LEVEL 1 | LEVEL 2 | LEVEL 3 |
| Liabilities | | | | |
| Other Financial Instruments | | | | |
| Forward Currency Contracts | $ (291,779) | $ — | $ (291,779) | $ — |
| Total Liabilities | $(291,779) | $— | $(291,779) | $— |
| GROWTH FUND | TOTAL | LEVEL 1 | LEVEL 2 | LEVEL 3 |
| Assets | | | | |
| Investments in Securities | | | | |
| Common Stock | $ 485,366,040 | $ 472,271,453 | $ 13,094,587 | $ — |
| Short-Term Investments | 25,391,428 | 25,391,428 | — | — |
| Total Investments in Securities | $510,757,468 | $497,662,881 | $13,094,587 | $— |
| Total Assets | $510,757,468 | $497,662,881 | $13,094,587 | $— |
| LONG/SHORT EQUITY FUND | TOTAL | LEVEL 1 | LEVEL 2 | LEVEL 3 |
| Assets | | | | |
| Investments in Securities | | | | |
| Common Stock | $ 133,968,836 | $ 113,417,275 | $ 20,551,561 | $ — |
| Short-Term Investments | 14,236,138 | 14,236,138 | — | — |
| Total Investments in Securities | $148,204,974 | $127,653,413 | $20,551,561 | $— |
| Total Assets | $148,204,974 | $127,653,413 | $20,551,561 | $— |
| Liabilities | | | | |
| Investment in Securities Sold Short | | | | |
| Common Stock | $ (90,128,392) | $ (81,209,997) | $ (8,918,395) | $ — |
| Exchange-Traded Funds | (152,297) | (143,620) | — | (8,677) |
| Total Investment in Securities Sold Short | $(90,280,689) | $(81,353,617) | $(8,918,395) | $(8,677) |
| Total Liabilities | $(90,280,689) | $(81,353,617) | $(8,918,395) | $(8,677) |
NOTE 4 – INVESTMENT MANAGEMENT FEE AND OTHER TRANSACTIONS WITH AFFILIATES
Pursuant to an investment management agreement, the Advisor serves as the investment advisor and performs services for the Funds for which the fees are payable at the end of each month. Under the investment advisory agreement, Funds pay the Advisor a management fee based on the average daily net assets of the Funds at an annual rate as shown in the following table:
INCOME BUILDER FUND,
GLOBAL OPPORTUNITIES FUND,
INTERNATIONAL VALUE FUND,
INTERNATIONAL GROWTH FUND,
VALUE FUND,
GROWTH FUND | SUMMIT FUND | BETTER WORLD INTERNATIONAL FUND,
DEVELOPING WORLD FUND | LONG/SHORT EQUITY FUND |
| DAILY NET ASSETS | FEE RATE | DAILY NET ASSETS | FEE RATE | DAILY NET ASSETS | FEE RATE | DAILY NET ASSETS | FEE RATE |
| Up to $500 million | 0.875% | Up to $500 million | 0.750% | Up to $500 million | 0.975% | Up to $500 million | 1.250% |
| Next $500 million | 0.825 | Next $500 million | 0.700 | Next $500 million | 0.925 | Next $500 million | 1.200 |
| Next $500 million | 0.775 | Next $500 million | 0.650 | Next $500 million | 0.875 | Next $1 billion | 1.150 |
| Next $500 million | 0.725 | Next $500 million | 0.625 | Next $500 million | 0.825 | Over $2 billion | 1.100 |
| Over $2 billion | 0.675 | Over $2 billion | 0.600 | Over $2 billion | 0.775 | | |
The Funds’ effective management fee of the Funds’ average daily net assets (before applicable management fee waivers) for the six months ended March 31, 2020 were as shown in the following table. Total management fees incurred by the Funds for the six months ended March 31, 2020 are set forth in the Statement of Operations.
Thornburg Equity Funds Semi-Annual Report | 99
Notes to Financial Statements, Continued
March 31, 2020 (Unaudited)
| | Effective
Management
Fee |
| Income Builder Fund | 0.693% |
| Summit Fund | 0.750 |
| Global Opportunities Fund | 0.835 |
| International Value Fund | 0.757 |
| Better World International Fund | 0.975 |
| International Growth Fund | 0.824 |
| Developing World Fund | 0.954 |
| Value Fund | 0.853 |
| Growth Fund | 0.866 |
| Long/Short Equity Fund | 1.250 |
The Trust has entered into an administrative services agreement with the Advisor, whereby the Advisor will perform certain administrative services related to each class of the Funds’ shares. The fees are computed as an annual percentage of the aggregate average daily net assets of all shares classes of all Funds in the Trust as follows:
| Administration Fee Schedule |
| Daily Net Assets | Fee Rate |
| Up to $20 billion | 0.100% |
| $20 billion to $40 billion | 0.075 |
| $40 billion to $60 billion | 0.040 |
| Over $60 billion | 0.030 |
The aggregate fee amount is allocated on a daily basis to each Fund based on net assets and subsequently allocated to each class of shares of the Funds. Total administrative service fees incurred by each class of shares of the Funds for the six months ended March 31, 2020, are set forth in the Statement of Operations.
The Trust has an underwriting agreement with Thornburg Securities Corporation (the “Distributor”), an affiliate of the Advisor, which acts as the distributor of the Funds’ shares. For the six months ended March 31, 2020, the Distributor has advised the Funds that they earned net commissions from the sale of Class A shares and collected contingent deferred sales charges ("CDSC Fees") from redemptions of Class C shares as follows:
| | Commissions | CDSC fees |
| Income Builder Fund | $ 163,373 | $ 35,282 |
| Global Opportunities Fund | 4,788 | 5,199 |
| International Value Fund | 4,426 | 4,445 |
| Better World International Fund | 650 | 66 |
| International Growth Fund | 6,025 | 1,638 |
| Developing World Fund | 4,358 | 574 |
| Value Fund | 6,341 | 1,247 |
| Growth Fund | 4,664 | 1,303 |
Pursuant to a service plan under Rule 12b-1 of the 1940 Act, the Funds may reimburse to the Distributor an amount not to exceed .25 of 1% per annum of the average daily net assets attributable to the applicable Class A, Class C, Class I, Class R3, Class R4, and Class R5 shares of the Income Builder Fund, Global Opportunities Fund, International Value Fund, International Growth Fund, Value Fund and Growth Fund, Class A, Class C, Class I shares of the Better World International Fund and Class I shares of the Summit Fund and Long/Short Equity Fund. For the six months ended March 31, 2020, there were no 12b-1 service plan fees charged for Class I or Class R5 shares. Class R6 shares are not subject to a service plan. The Advisor and Distributor each may pay out of its own resources additional expenses for distribution of each Funds’ shares and shareholder services.
The Trust has also adopted a distribution plan pursuant to Rule 12b-1, applicable only to the Funds’ Class C and Class R3 shares, under which the Funds compensate the Distributor for services in promoting the sale of Class C and Class R3 shares of the Funds at an annual rate of up to .75 of 1% per annum of the average daily net assets attributable to Class C shares, and an annual rate of up to .25 of 1% per
100 | Thornburg Equity Funds Semi-Annual Report
Notes to Financial Statements, Continued
March 31, 2020 (Unaudited)
annum of the average daily net assets attributable to Class R3 shares. Total fees incurred by each class of shares of the Funds under their respective service and distribution plans for the six months ended March 31, 2020, are set forth in the Statements of Operations.
The Advisor has contractually agreed to waive fees and reimburse expenses incurred by the Funds. The agreement may be terminated by the Funds at any time, but may not be terminated by the Advisor before February 1, 2021, unless the Advisor ceases to be the investment advisor to the Funds prior to that date. The Advisor may recoup amounts waived or reimbursed during the six months ended March 31, 2020 if, during the fiscal year, expenses fall below the contractual limit that was in place at the time these fees and expenses were waived or reimbursed. The Advisor will not recoup fees or expenses as described in the preceding sentence if that recoupment would cause the Fund’s total annual operating expenses (after the recoupment is taken into account) to exceed the lesser of: (a) the expense cap that was in place at the time the waiver or reimbursement occurred; or (b) the expense cap that is in place at the time of the recoupment.
Actual expenses of certain share classes do not exceed levels as specified in each Fund’s most recent prospectus as shown in the following table:
| | Class A | Class C | Class I | Class R3 | Class R4 | Class R5 | Class R6 |
| Income Builder Fund | —% | —% | —% | 1.50% | 1.50% | 0.99% | 0.80% |
| Summit Fund | — | — | 0.99 | — | — | — | — |
| Global Opportunities Fund | — | — | — | 1.50 | 1.40 | 0.99 | 0.85 |
| International Value Fund | — | — | — | 1.45 | 1.25 | 0.99 | — |
| Better World International Fund | 1.83 | 2.38 | 1.09 | — | — | — | — |
| International Growth Fund | — | — | — | 1.50 | 0.40 | 0.99 | 0.85 |
| Developing World Fund | — | — | 1.09 | — | — | 1.09 | 0.99 |
| Value Fund | — | — | 0.99 | 1.35 | 1.25 | 0.99 | — |
| Growth Fund | — | — | 0.99 | 1.50 | 1.40 | 0.99 | — |
For the six months ended March 31, 2020, the Advisor contractually reimbursed certain class specific expenses and distribution fees and voluntarily waived Fund level investment advisory fees as follows:
| Contractual: | Class C | Class I | Class R3 | Class R4 | Class R5 | Class R6 |
| Income Builder Fund | $ — | $ — | $ — | $ 2,470 | $ — | $ 16,991 |
| Summit Fund | — | 56,794 | — | — | — | — |
| Global Opportunities Fund | — | — | 6,743 | 5,157 | 34,017 | 29,413 |
| International Value Fund | — | — | 64,705 | 21,951 | — | — |
| Better World International Fund | 7,300 | 61,882 | — | — | — | — |
| International Growth Fund | — | — | 12,044 | 1,368 | 36,543 | 25,995 |
| Developing World Fund | — | 94,011 | — | — | 8,196 | 37,404 |
| Value Fund | — | 95,916 | 44,141 | 10,693 | 29,067 | — |
| Growth Fund | — | 75,119 | 28,236 | 9,622 | 20,056 | — |
| Voluntary: | Class A | Class C | Class I | Class R3 | Class R4 | Class R5 | Class R6 |
| Global Opportunities Fund | $ 50,082 | $ 31,392 | $ 184,542 | $ 872 | $ 1,545 | $ 8,431 | $ 9,938 |
| International Value Fund | 32,441 | 3,630 | 83,528 | 7,942 | 5,822 | 7,482 | 125,889 |
| Better World International Fund | 6,511 | 1,212 | 43,328 | — | — | — | — |
| International Growth Fund | — | — | 142,962 | — | — | — | — |
| Developing World Fund | 15,403 | 9,570 | 98,210 | — | — | 402 | 9,219 |
Certain officers and Trustees of the Trust are also officers or directors of the Advisor and Distributor. The compensation of the independent Trustees is borne by the Trust. The Trust also pays a portion of the Chief Compliance Officer’s compensation. These amounts are reflected as Trustee and officer fees in the Statement of Operations.
The percentage of direct investments in the Funds held by the Trustees, officers of the Trust, and the Advisor is approximately 1.22% for Investment Income Builder Fund, 3.92% for Global Opportunities Fund, 1.44% for International Value Fund, 45.32% for Better World International Fund, 2.68% for International Growth Fund, 4.90% for Developing World Fund, 5.21% for Value Fund, 7.02% for Core Growth Fund, 34.79% for Long/Short Equity Fund and 99.46% for Summit Fund.
The Funds may purchase or sell securities from or to an affiliated fund, provided the affiliation is due solely to having a common investment advisor, common officers, or common trustees, and provided that all such transactions will comply with Rule 17a-7 under the 1940 Act. For the six months ended March 31, 2020, the Summit Fund had transactions with affiliated funds of $1,336,354 in purchases and $2,375,455 in sales generating realized gains of $22,328.
Thornburg Equity Funds Semi-Annual Report | 101
Notes to Financial Statements, Continued
March 31, 2020 (Unaudited)
Shown below are holdings of voting securities of each portfolio company which is considered "affiliated" to the Funds under the 1940 Act, including companies for which the Funds’ holding represented 5% or more of the company’s voting securities, and a series of the Thornburg Investment Trust in which the Funds’ invested for cash management purposes during the period:
| INCOME BUILDER FUND | Market Value
9/30/19 | Purchases
at Cost | Sales
Proceeds | Realized
Gain
(Loss) | Change in
Unrealized
Appr./(Depr.) | Market Value
3/31/20 | Dividend
Income |
| Apollo Investment Corp. | $131,408,333 | $- | $(55,220,494) | $(25,711,054) | $(17,384,235) | $33,092,550 | $4,873,741 |
| MFA Financial, Inc. | 244,867,200 | - | (4,088,913) | (439,884) | (189,622,403) | 50,716,000 | 6,544,000 |
| Solar Capital Ltd. | 95,153,135 | - | - | - | (41,517,179) | 53,635,956 | 3,778,478 |
| Thornburg Capital Mgmt. Fund | 614,430,438 | 1,330,626,435 | (1,814,920,020) | - | - | 130,136,853 | 4,135,966 |
| Total | $1,085,859,106 | $1,330,626,435 | $(1,874,229,427) | $(26,150,938) | $(248,523,817) | $267,581,359 | $19,332,185 |
| SUMMIT FUND | | | | | | | |
| Thornburg Capital Mgmt. Fund | $3,204,470 | $14,260,433 | $(14,911,581) | $- | $- | $2,553,322 | $35,854 |
| GLOBAL OPPORTUNITIES FUND | | | | | | | |
| Thornburg Capital Mgmt. Fund | $87,050,413 | $247,400,000 | $(284,751,593) | $- | $- | $49,698,820 | $642,488 |
| INTERNATIONAL VALUE FUND | | | | | | | |
| Thornburg Capital Mgmt. Fund | $326,788,112 | $496,954,241 | $(714,707,956) | $- | $- | $109,034,397 | $1,441,663 |
| BETTER WORLD INTERNATIONAL FUND | | | | | | | |
| Thornburg Capital Mgmt. Fund | $4,609,937 | $15,554,526 | $(17,818,112) | $- | $- | $2,346,351 | $27,379 |
| INTERNATIONAL GROWTH FUND | | | | | | | |
| Thornburg Capital Mgmt. Fund | $146,116,782 | $188,523,118 | $(262,759,207) | $- | $- | $71,880,693 | $861,739 |
| DEVELOPING WORLD FUND | | | | | | | |
| Thornburg Capital Mgmt. Fund | $30,350,997 | $139,667,538 | $(139,124,564) | $- | $- | $30,893,971 | $333,162 |
| VALUE FUND | | | | | | | |
| Thornburg Capital Mgmt. Fund | $26,639,766 | $112,928,384 | $(109,914,415) | $- | $- | $29,653,735 | $283,296 |
| GROWTH FUND | | | | | | | |
| Thornburg Capital Mgmt. Fund | $54,791,964 | $124,573,298 | $(153,973,834) | $- | $- | $25,391,428 | $307,382 |
| LONG/SHORT EQUITY FUND | | | | | | | |
| Thornburg Capital Mgmt. Fund | $49,171,496 | $122,943,976 | $(157,879,334) | $- | $- | $14,236,138 | $180,934 |
NOTE 5 – TAXES
Federal Income Taxes: It is the policy of the Trust to comply with the provisions of the Internal Revenue Code applicable to regulated investment companies and to distribute to shareholders substantially all investment company taxable income including net realized gains on investments (if any), and tax exempt income of the Funds. Therefore, no provision for federal income or excise tax is required.
The Funds file income tax returns in United States federal and applicable state jurisdictions. The statute of limitations on the Funds’ tax return filings generally remains open for the three years following a return’s filing date. The Funds have analyzed each uncertain tax position believed to be material in the preparation of the Funds’ financial statements for the six month period ended March 31, 2020, including open tax years, to assess whether it is more likely than not that the position would be sustained upon examination, based on the technical merits of the position. The Funds have not identified any such position for which an asset or liability must be reflected in the Statement of Assets and Liabilities.
102 | Thornburg Equity Funds Semi-Annual Report
Notes to Financial Statements, Continued
March 31, 2020 (Unaudited)
At March 31, 2020, information on the tax components of capital was as follows:
| | Cost | Unrealized
Appreciation | Unrealized
Depreciation | Net Unrealized
Appreciation
(Depreciation) |
| Income Builder Fund | $ 11,116,581,752 | $ 1,506,820,905 | $ (2,558,689,351) | $ (1,051,868,446) |
| Summit Fund | 34,481,782 | 1,780,358 | (2,755,150) | (974,792) |
| Global Opportunities Fund | 829,785,393 | 122,432,958 | (110,905,944) | 11,527,014 |
| International Value Fund | 2,510,548,834 | 190,634,676 | (300,728,262) | (110,093,586) |
| Better World International Fund | 66,065,361 | 5,170,685 | (9,694,173) | (4,523,488) |
| International Growth Fund | 1,127,164,301 | 198,639,262 | (104,014,783) | 94,624,479 |
| Developing World Fund | 678,351,484 | 130,529,986 | (111,374,747) | 19,155,239 |
| Value Fund | 733,255,040 | 67,586,075 | (147,867,078) | (80,281,003) |
| Growth Fund | 475,452,629 | 58,294,557 | (22,989,718) | 35,304,839 |
| Long/Short Equity Fund | 51,610,908 | 32,792,110 | (26,478,732) | 6,313,378 |
At March 31, 2020, the Growth and Long/Short Equity Funds had deferred tax basis late-year ordinary losses losses occurring subsequent to October 31, 2018 through September 30, 2019 of $1,720,335 and $3,460,244, respectively. For tax purposes, such losses will be recognized in the year ending September 30, 2020.
At March 31, 2020, the Funds had deferred tax basis capital losses occurring subsequent to October 31, 2018 through September 30, 2019 per the following table. For tax purposes, such losses will be recognized in the year ending September 30, 2020.
| | Capital Losses |
| Income Builder Fund | $ 74,824,138 |
| Better World International Fund | 300,012 |
| Developing World Fund | 7,235,226 |
| Value Fund | 11,133,633 |
| Long/Short Equity Fund | 234,573 |
At March 31, 2020, the Funds had cumulative tax basis capital losses from prior fiscal years as shown on the following table, which may be carried forward to offset future capital gains. To the extent such carryforwards are used, capital gain distributions may be reduced to the extent provided by regulations. Such capital loss carryforwards do not expire.
| | Cumulative Capital Losses |
| | Short-Term | Long-Term |
| Income Builder Fund | $ 480,015,129 | $ — |
| Better World International Fund | 356,445 | 27,286 |
| Developing World Fund | 145,451,455 | — |
| Value Fund | 761,266 | 3,892,019 |
Foreign Withholding Taxes: The Funds are subject to foreign tax withholding imposed by certain foreign countries in which the Funds may invest. Withholding taxes are incurred on certain foreign dividends and are accrued at the time the dividend is recognized based on applicable foreign tax laws. The Funds may file withholding tax reclaims in certain jurisdictions to recover a portion of amounts previously withheld, in view of various considerations, including recent decisions rendered by the courts in those and other jurisdictions. The Funds would expect to record a receivable for such a reclaim based on a variety of factors, including assessment of a jurisdiction’s legal obligation to pay reclaims, the jurisdiction’s administrative practices and payment history, and industry convention. To date the Funds have recorded no such receivable because there is limited precedent for collecting such prior year reclaims and the likelihood of collection remains uncertain.
Deferred Foreign Capital Gain Taxes: The Funds are subject to a tax imposed on net realized gains of securities of certain foreign countries. The Funds record an estimated deferred tax liability for net unrealized gains on these investments as reflected in the accompanying financial statements. Such changes are included in net unrealized appreciation (depreciation) from investments in the Statement of Operations.
NOTE 6 – SHARES OF BENEFICIAL INTEREST
At March 31, 2020, there were an unlimited number of shares with no par value of beneficial interest authorized. Transactions in shares of beneficial interest were as follows:
Thornburg Equity Funds Semi-Annual Report | 103
Notes to Financial Statements, Continued
March 31, 2020 (Unaudited)
| | SIX MONTHS ENDED
March 31, 2020 | YEAR ENDED
September 30, 2019 (AUDITED) |
| INCOME BUILDER FUND | SHARES | AMOUNT | SHARES | AMOUNT |
| Class A Shares | | | | |
| Shares sold | 11,787,261 | $ 252,218,219 | 33,705,434 | $ 707,103,365 |
Shares issued to shareholders in
reinvestment of dividends | 3,856,151 | 73,490,726 | 6,463,698 | 135,920,991 |
| Shares repurchased | (19,057,243) | (383,560,394) | (35,866,394) | (759,438,400) |
| Net increase (decrease) | (3,413,831) | $ (57,851,449) | 4,302,738 | $ 83,585,956 |
| Class C Shares | | | | |
| Shares sold | 3,397,353 | $ 72,797,472 | 7,061,223 | $ 148,341,647 |
Shares issued to shareholders in
reinvestment of dividends | 2,252,429 | 43,221,283 | 5,004,929 | 104,768,735 |
| Shares repurchased | (19,566,834) | (406,135,138) | (54,396,665) | (1,141,730,637) |
| Net increase (decrease) | (13,917,052) | $ (290,116,383) | (42,330,513) | $ (888,620,255) |
| Class I Shares | | | | |
| Shares sold | 31,994,933 | $ 679,388,699 | 73,615,316 | $ 1,562,786,242 |
Shares issued to shareholders in
reinvestment of dividends | 8,663,085 | 166,016,578 | 14,703,460 | 311,369,187 |
| Shares repurchased | (60,905,046) | (1,167,902,669) | (86,778,222) | (1,839,151,279) |
| Net increase (decrease) | (20,247,028) | $ (322,497,392) | 1,540,554 | $ 35,004,150 |
| Class R3 Shares | | | | |
| Shares sold | 96,792 | $ 2,015,218 | 209,743 | $ 4,403,248 |
Shares issued to shareholders in
reinvestment of dividends | 36,121 | 692,576 | 71,195 | 1,492,405 |
| Shares repurchased | (278,705) | (5,946,462) | (767,138) | (16,163,125) |
| Net increase (decrease) | (145,792) | $ (3,238,668) | (486,200) | $ (10,267,472) |
| Class R4 Shares | | | | |
| Shares sold | 158,670 | $ 3,328,254 | 326,458 | $ 6,855,745 |
Shares issued to shareholders in
reinvestment of dividends | 17,158 | 328,798 | 34,362 | 721,871 |
| Shares repurchased | (290,744) | (6,222,710) | (626,921) | (13,245,790) |
| Net increase (decrease) | (114,916) | $ (2,565,658) | (266,101) | $ (5,668,174) |
| Class R5 Shares | | | | |
| Shares sold | 295,702 | $ 6,097,458 | 623,849 | $ 13,230,266 |
Shares issued to shareholders in
reinvestment of dividends | 60,501 | 1,167,594 | 114,673 | 2,425,762 |
| Shares repurchased | (536,322) | (11,606,603) | (712,201) | (15,233,629) |
| Net increase (decrease) | (180,119) | $ (4,341,551) | 26,321 | $ 422,399 |
| Class R6 Shares | | | | |
| Shares sold | 443,293 | $ 9,500,259 | 638,809 | $ 13,481,559 |
Shares issued to shareholders in
reinvestment of dividends | 169,853 | 3,250,081 | 315,339 | 6,657,506 |
| Shares repurchased | (987,962) | (21,734,388) | (873,000) | (18,413,812) |
| Net increase (decrease) | (374,816) | $ (8,984,048) | 81,148 | $ 1,725,253 |
104 | Thornburg Equity Funds Semi-Annual Report
Notes to Financial Statements, Continued
March 31, 2020 (Unaudited)
| | SIX MONTHS ENDED
March 31, 2020 | PERIOD ENDED
September 30, 2019* (AUDITED) |
| SUMMIT FUND | SHARES | AMOUNT | SHARES | AMOUNT |
| Class I Shares | | | | |
| Shares sold | 41,791 | $ 440,447 | 3,370,232 | $ 34,036,328 |
Shares issued to shareholders in
reinvestment of dividends | 54,495 | 546,992 | 20,145 | 210,749 |
| Shares repurchased | (10,187) | (107,581) | - | - |
| Net increase (decrease) | 86,099 | $ 879,858 | 3,390,377 | $ 34,247,077 |
| * The Fund commenced operations on March 01, 2019. |
| | SIX MONTHS ENDED
March 31, 2020 | YEAR ENDED
September 30, 2019 (AUDITED) |
| GLOBAL OPPORTUNITIES FUND | SHARES | AMOUNT | SHARES | AMOUNT |
| Class A Shares | | | | |
| Shares sold | 313,892 | $ 9,085,180 | 781,038 | $ 20,906,242 |
Shares issued to shareholders in
reinvestment of dividends | 108,824 | 3,274,818 | 242,411 | 5,769,379 |
| Shares repurchased | (1,376,391) | (38,561,719) | (4,718,077) | (127,944,741) |
| Net increase (decrease) | (953,675) | $ (26,201,721) | (3,694,628) | $ (101,269,120) |
| Class C Shares | | | | |
| Shares sold | 103,818 | $ 2,859,658 | 321,134 | $ 8,203,210 |
Shares issued to shareholders in
reinvestment of dividends | 50,480 | 1,438,784 | 79,218 | 1,826,769 |
| Shares repurchased | (1,064,403) | (29,439,447) | (3,542,700) | (92,409,943) |
| Net increase (decrease) | (910,105) | $ (25,141,005) | (3,142,348) | $ (82,379,964) |
| Class I Shares | | | | |
| Shares sold | 1,698,041 | $ 48,792,482 | 6,403,173 | $ 173,821,046 |
Shares issued to shareholders in
reinvestment of dividends | 401,346 | 12,189,849 | 865,374 | 20,630,523 |
| Shares repurchased | (8,868,205) | (253,368,414) | (19,616,732) | (527,823,049) |
| Net increase (decrease) | (6,768,818) | $ (192,386,083) | (12,348,185) | $ (333,371,480) |
| Class R3 Shares | | | | |
| Shares sold | 13,133 | $ 380,557 | 30,849 | $ 826,958 |
Shares issued to shareholders in
reinvestment of dividends | 1,382 | 40,806 | 2,888 | 68,136 |
| Shares repurchased | (47,422) | (1,396,776) | (131,740) | (3,521,704) |
| Net increase (decrease) | (32,907) | $ (975,413) | (98,003) | $ (2,626,610) |
| Class R4 Shares | | | | |
| Shares sold | 89,181 | $ 2,618,700 | 152,774 | $ 3,989,913 |
Shares issued to shareholders in
reinvestment of dividends | 1,969 | 57,789 | 8,800 | 207,684 |
| Shares repurchased | (237,954) | (6,951,805) | (524,575) | (14,114,812) |
| Net increase (decrease) | (146,804) | $ (4,275,316) | (363,001) | $ (9,917,215) |
| Class R5 Shares | | | | |
| Shares sold | 196,900 | $ 5,853,198 | 296,661 | $ 8,089,436 |
Shares issued to shareholders in
reinvestment of dividends | 22,000 | 668,594 | 56,561 | 1,349,546 |
| Shares repurchased | (585,829) | (17,304,918) | (1,152,006) | (31,724,884) |
| Net increase (decrease) | (366,929) | $ (10,783,126) | (798,784) | $ (22,285,902) |
Thornburg Equity Funds Semi-Annual Report | 105
Notes to Financial Statements, Continued
March 31, 2020 (Unaudited)
| | SIX MONTHS ENDED
March 31, 2020 | YEAR ENDED
September 30, 2019 (AUDITED) |
| GLOBAL OPPORTUNITIES FUND | SHARES | AMOUNT | SHARES | AMOUNT |
| Class R6 Shares | | | | |
| Shares sold | 48,696 | $ 1,356,748 | 301,553 | $ 8,281,671 |
Shares issued to shareholders in
reinvestment of dividends | 28,664 | 874,386 | 43,624 | 1,042,604 |
| Shares repurchased | (207,173) | (6,251,157) | (416,053) | (11,438,345) |
| Net increase (decrease) | (129,813) | $ (4,020,023) | (70,876) | $ (2,114,070) |
| | SIX MONTHS ENDED
March 31, 2020 | YEAR ENDED
September 30, 2019 (AUDITED) |
| INTERNATIONAL VALUE FUND | SHARES | AMOUNT | SHARES | AMOUNT |
| Class A Shares | | | | |
| Shares sold | 1,403,787 | $ 31,618,127 | 4,193,267 | $ 91,176,594 |
Shares issued to shareholders in
reinvestment of dividends | 1,690,807 | 38,525,641 | 432,321 | 8,153,571 |
| Shares repurchased | (4,091,976) | (90,111,670) | (10,476,530) | (226,306,050) |
| Net increase (decrease) | (997,382) | $ (19,967,902) | (5,850,942) | $ (126,975,885) |
| Class C Shares | | | | |
| Shares sold | 145,952 | $ 2,795,130 | 259,750 | $ 4,848,426 |
Shares issued to shareholders in
reinvestment of dividends | 191,682 | 3,835,544 | - | - |
| Shares repurchased | (1,202,403) | (23,924,961) | (4,241,881) | (81,505,639) |
| Net increase (decrease) | (864,769) | $ (17,294,287) | (3,982,131) | $ (76,657,213) |
| Class I Shares | | | | |
| Shares sold | 5,581,449 | $ 123,648,438 | 11,926,611 | $ 261,023,247 |
Shares issued to shareholders in
reinvestment of dividends | 4,341,838 | 102,568,694 | 1,426,129 | 27,752,471 |
| Shares repurchased | (11,637,981) | (263,917,898) | (46,729,970) | (1,020,323,369) |
| Net increase (decrease) | (1,714,694) | $ (37,700,766) | (33,377,230) | $ (731,547,651) |
| Class R3 Shares | | | | |
| Shares sold | 1,090,750 | $ 24,039,055 | 959,317 | $ 20,864,279 |
Shares issued to shareholders in
reinvestment of dividends | 413,170 | 9,398,883 | 94,905 | 1,790,857 |
| Shares repurchased | (1,714,260) | (37,719,466) | (3,275,976) | (71,609,214) |
| Net increase (decrease) | (210,340) | $ (4,281,528) | (2,221,754) | $ (48,954,078) |
| Class R4 Shares | | | | |
| Shares sold | 663,987 | $ 14,650,089 | 1,477,039 | $ 31,561,225 |
Shares issued to shareholders in
reinvestment of dividends | 260,515 | 5,889,205 | 66,011 | 1,235,734 |
| Shares repurchased | (1,552,179) | (34,845,431) | (3,343,042) | (72,914,726) |
| Net increase (decrease) | (627,677) | $ (14,306,137) | (1,799,992) | $ (40,117,767) |
| Class R5 Shares | | | | |
| Shares sold | 510,587 | $ 11,941,605 | 1,157,927 | $ 25,895,089 |
Shares issued to shareholders in
reinvestment of dividends | 419,984 | 9,913,022 | 154,892 | 3,012,644 |
| Shares repurchased | (1,857,925) | (42,800,296) | (4,623,294) | (103,929,956) |
| Net increase (decrease) | (927,354) | $ (20,945,669) | (3,310,475) | $ (75,022,223) |
106 | Thornburg Equity Funds Semi-Annual Report
Notes to Financial Statements, Continued
March 31, 2020 (Unaudited)
| | SIX MONTHS ENDED
March 31, 2020 | YEAR ENDED
September 30, 2019 (AUDITED) |
| INTERNATIONAL VALUE FUND | SHARES | AMOUNT | SHARES | AMOUNT |
| Class R6 Shares | | | | |
| Shares sold | 1,852,415 | $ 41,887,136 | 3,823,624 | $ 86,514,020 |
Shares issued to shareholders in
reinvestment of dividends | 595,018 | 14,007,969 | 358,774 | 6,949,445 |
| Shares repurchased | (2,092,284) | (45,802,628) | (14,415,098) | (330,103,176) |
| Net increase (decrease) | 355,149 | $ 10,092,477 | (10,232,700) | $ (236,639,711) |
| | SIX MONTHS ENDED
March 31, 2020 | YEAR ENDED
September 30, 2019 (AUDITED) |
| BETTER WORLD INTERNATIONAL FUND | SHARES | AMOUNT | SHARES | AMOUNT |
| Class A Shares | | | | |
| Shares sold | 25,123 | $ 329,984 | 285,435 | $��� 3,639,837 |
Shares issued to shareholders in
reinvestment of dividends | 4,491 | 63,452 | 65,598 | 793,951 |
| Shares repurchased | (66,477) | (896,747) | (209,272) | (2,657,558) |
| Net increase (decrease) | (36,863) | $ (503,311) | 141,761 | $ 1,776,230 |
| Class C Shares | | | | |
| Shares sold | 20,300 | $ 265,106 | 19,928 | $ 242,846 |
Shares issued to shareholders in
reinvestment of dividends | 98 | 1,371 | 13,178 | 158,604 |
| Shares repurchased | (14,231) | (194,501) | (60,397) | (745,271) |
| Net increase (decrease) | 6,167 | $ 71,976 | (27,291) | $ (343,821) |
| Class I Shares | | | | |
| Shares sold | 280,777 | $ 3,859,834 | 1,565,202 | $ 20,168,241 |
Shares issued to shareholders in
reinvestment of dividends | 52,598 | 757,411 | 333,731 | 4,122,477 |
| Shares repurchased | (368,065) | (4,620,587) | (1,128,238) | (14,093,818) |
| Net increase (decrease) | (34,690) | $ (3,342) | 770,695 | $ 10,196,900 |
| | SIX MONTHS ENDED
March 31, 2020 | YEAR ENDED
September 30, 2019 (AUDITED) |
| INTERNATIONAL GROWTH FUND | SHARES | AMOUNT | SHARES | AMOUNT |
| Class A Shares | | | | |
| Shares sold | 531,529 | $ 12,089,951 | 1,359,532 | $ 28,489,373 |
Shares issued to shareholders in
reinvestment of dividends | 23,326 | 515,953 | 177,269 | 3,634,307 |
| Shares repurchased | (841,698) | (18,684,575) | (1,919,924) | (40,650,276) |
| Net increase (decrease) | (286,843) | $ (6,078,671) | (383,123) | $ (8,526,596) |
| Class C Shares | | | | |
| Shares sold | 84,028 | $ 1,726,346 | 227,972 | $ 4,288,260 |
Shares issued to shareholders in
reinvestment of dividends | 11,609 | 237,306 | 120,517 | 2,309,109 |
| Shares repurchased | (436,250) | (8,926,390) | (1,412,167) | (27,609,811) |
| Net increase (decrease) | (340,613) | $ (6,962,738) | (1,063,678) | $ (21,012,442) |
| Class I Shares | | | | |
| Shares sold | 5,460,498 | $ 124,297,891 | 19,144,670 | $ 410,939,079 |
Shares issued to shareholders in
reinvestment of dividends | 391,788 | 9,122,885 | 2,184,161 | 45,702,448 |
| Shares repurchased | (10,181,173) | (227,794,738) | (26,924,382) | (578,018,602) |
| Net increase (decrease) | (4,328,887) | $ (94,373,962) | (5,595,551) | $ (121,377,075) |
Thornburg Equity Funds Semi-Annual Report | 107
Notes to Financial Statements, Continued
March 31, 2020 (Unaudited)
| | SIX MONTHS ENDED
March 31, 2020 | YEAR ENDED
September 30, 2019 (AUDITED) |
| INTERNATIONAL GROWTH FUND | SHARES | AMOUNT | SHARES | AMOUNT |
| Class R3 Shares | | | | |
| Shares sold | 16,846 | $ 373,943 | 78,781 | $ 1,662,558 |
Shares issued to shareholders in
reinvestment of dividends | 1,287 | 28,171 | 10,759 | 219,052 |
| Shares repurchased | (78,136) | (1,747,096) | (151,941) | (3,220,729) |
| Net increase (decrease) | (60,003) | $ (1,344,982) | (62,401) | $ (1,339,119) |
| Class R4 Shares | | | | |
| Shares sold | 74,915 | $ 1,636,730 | 96,637 | $ 2,047,446 |
Shares issued to shareholders in
reinvestment of dividends | 1,042 | 22,891 | 8,904 | 182,073 |
| Shares repurchased | (61,722) | (1,369,766) | (288,377) | (6,212,410) |
| Net increase (decrease) | 14,235 | $ 289,855 | (182,836) | $ (3,982,891) |
| Class R5 Shares | | | | |
| Shares sold | 117,616 | $ 2,764,981 | 262,504 | $ 5,796,872 |
Shares issued to shareholders in
reinvestment of dividends | 9,969 | 232,842 | 61,537 | 1,291,266 |
| Shares repurchased | (176,106) | (4,113,988) | (577,968) | (12,750,178) |
| Net increase (decrease) | (48,521) | $ (1,116,165) | (253,927) | $ (5,662,040) |
| Class R6 Shares | | | | |
| Shares sold | 158,695 | $ 3,681,546 | 407,174 | $ 8,774,427 |
Shares issued to shareholders in
reinvestment of dividends | 17,211 | 404,097 | 84,527 | 1,777,102 |
| Shares repurchased | (157,761) | (3,737,557) | (545,823) | (12,061,466) |
| Net increase (decrease) | 18,145 | $ 348,086 | (54,122) | $ (1,509,937) |
| | SIX MONTHS ENDED
March 31, 2020 | YEAR ENDED
September 30, 2019 (AUDITED) |
| DEVELOPING WORLD FUND | SHARES | AMOUNT | SHARES | AMOUNT |
| Class A Shares | | | | |
| Shares sold | 593,871 | $ 12,584,035 | 1,085,323 | $ 21,275,188 |
Shares issued to shareholders in
reinvestment of dividends | 43,975 | 993,822 | 45,605 | 787,592 |
| Shares repurchased | (673,111) | (13,991,669) | (2,244,922) | (43,862,706) |
| Net increase (decrease) | (35,265) | $ (413,812) | (1,113,994) | $ (21,799,926) |
| Class C Shares | | | | |
| Shares sold | 72,695 | $ 1,523,668 | 165,190 | $ 3,021,325 |
Shares issued to shareholders in
reinvestment of dividends | 7,220 | 155,419 | - | - |
| Shares repurchased | (518,782) | (10,166,833) | (1,359,589) | (25,082,566) |
| Net increase (decrease) | (438,867) | $ (8,487,746) | (1,194,399) | $ (22,061,241) |
| Class I Shares | | | | |
| Shares sold | 7,072,855 | $ 151,555,665 | 6,414,296 | $ 128,136,137 |
Shares issued to shareholders in
reinvestment of dividends | 375,751 | 8,646,014 | 401,425 | 7,057,046 |
| Shares repurchased | (5,652,313) | (112,626,116) | (10,980,973) | (215,978,730) |
| Net increase (decrease) | 1,796,293 | $ 47,575,563 | (4,165,252) | $ (80,785,547) |
108 | Thornburg Equity Funds Semi-Annual Report
Notes to Financial Statements, Continued
March 31, 2020 (Unaudited)
| | SIX MONTHS ENDED
March 31, 2020 | YEAR ENDED
September 30, 2019 (AUDITED) |
| DEVELOPING WORLD FUND | SHARES | AMOUNT | SHARES | AMOUNT |
| Class R5 Shares | | | | |
| Shares sold | 19,225 | $ 424,953 | 77,485 | $ 1,515,534 |
Shares issued to shareholders in
reinvestment of dividends | 1,618 | 37,096 | 2,039 | 35,726 |
| Shares repurchased | (20,271) | (432,255) | (134,103) | (2,640,333) |
| Net increase (decrease) | 572 | $ 29,794 | (54,579) | $ (1,089,073) |
| Class R6 Shares | | | | |
| Shares sold | 243,519 | $ 5,284,640 | 412,093 | $ 8,203,299 |
Shares issued to shareholders in
reinvestment of dividends | 35,373 | 814,301 | 36,173 | 636,287 |
| Shares repurchased | (203,609) | (4,283,359) | (609,784) | (12,152,316) |
| Net increase (decrease) | 75,283 | $ 1,815,582 | (161,518) | $ (3,312,730) |
| | SIX MONTHS ENDED
March 31, 2020 | YEAR ENDED
September 30, 2019 (AUDITED) |
| VALUE FUND | SHARES | AMOUNT | SHARES | AMOUNT |
| Class A Shares | | | | |
| Shares sold | 146,537 | $ 10,324,590 | 291,297 | $ 19,819,489 |
Shares issued to shareholders in
reinvestment of dividends | 12,594 | 978,624 | 29,837 | 1,759,754 |
| Shares repurchased | (521,508) | (36,907,409) | (937,331) | (63,815,711) |
| Net increase (decrease) | (362,377) | $ (25,604,195) | (616,197) | $ (42,236,468) |
| Class C Shares | | | | |
| Shares sold | 17,484 | $ 1,087,208 | 81,722 | $ 4,843,957 |
Shares issued to shareholders in
reinvestment of dividends | 5 | 388 | - | - |
| Shares repurchased | (114,282) | (7,457,977) | (318,422) | (19,681,131) |
| Net increase (decrease) | (96,793) | $ (6,370,381) | (236,700) | $ (14,837,174) |
| Class I Shares | | | | |
| Shares sold | 281,108 | $ 18,484,306 | 436,870 | $ 30,503,549 |
Shares issued to shareholders in
reinvestment of dividends | 24,275 | 1,940,112 | 41,897 | 2,541,041 |
| Shares repurchased | (619,298) | (46,683,397) | (1,268,473) | (88,314,904) |
| Net increase (decrease) | (313,915) | $ (26,258,979) | (789,706) | $ (55,270,314) |
| Class R3 Shares | | | | |
| Shares sold | 25,106 | $ 1,728,255 | 46,946 | $ 3,167,611 |
Shares issued to shareholders in
reinvestment of dividends | 709 | 54,896 | 1,862 | 109,276 |
| Shares repurchased | (67,718) | (4,853,350) | (178,925) | (12,164,959) |
| Net increase (decrease) | (41,903) | $ (3,070,199) | (130,117) | $ (8,888,072) |
| Class R4 Shares | | | | |
| Shares sold | 5,188 | $ 355,515 | 7,385 | $ 507,408 |
Shares issued to shareholders in
reinvestment of dividends | 193 | 15,077 | 401 | 23,796 |
| Shares repurchased | (27,093) | (1,725,003) | (26,747) | (1,825,844) |
| Net increase (decrease) | (21,712) | $ (1,354,411) | (18,961) | $ (1,294,640) |
Thornburg Equity Funds Semi-Annual Report | 109
Notes to Financial Statements, Continued
March 31, 2020 (Unaudited)
| | SIX MONTHS ENDED
March 31, 2020 | YEAR ENDED
September 30, 2019 (AUDITED) |
| VALUE FUND | SHARES | AMOUNT | SHARES | AMOUNT |
| Class R5 Shares | | | | |
| Shares sold | 17,417 | $ 1,229,592 | 33,412 | $ 2,353,451 |
Shares issued to shareholders in
reinvestment of dividends | 1,241 | 99,060 | 2,117 | 128,201 |
| Shares repurchased | (40,844) | (3,050,447) | (46,303) | (3,248,816) |
| Net increase (decrease) | (22,186) | $ (1,721,795) | (10,774) | $ (767,164) |
| | SIX MONTHS ENDED
March 31, 2020 | YEAR ENDED
September 30, 2019 (AUDITED) |
| GROWTH FUND | SHARES | AMOUNT | SHARES | AMOUNT |
| Class A Shares | | | | |
| Shares sold | 281,950 | $ 10,548,259 | 541,287 | $ 20,620,298 |
Shares issued to shareholders in
reinvestment of dividends | 605,285 | 22,341,083 | - | - |
| Shares repurchased | (818,496) | (30,998,904) | (1,275,196) | (48,759,244) |
| Net increase (decrease) | 68,739 | $ 1,890,438 | (733,909) | $ (28,138,946) |
| Class C Shares | | | | |
| Shares sold | 45,083 | $ 1,390,888 | 152,226 | $ 4,818,016 |
Shares issued to shareholders in
reinvestment of dividends | 114,950 | 3,593,352 | - | - |
| Shares repurchased | (213,362) | (6,942,065) | (601,080) | (19,940,062) |
| Net increase (decrease) | (53,329) | $ (1,957,825) | (448,854) | $ (15,122,046) |
| Class I Shares | | | | |
| Shares sold | 284,006 | $ 11,863,988 | 596,624 | $ 24,270,464 |
Shares issued to shareholders in
reinvestment of dividends | 521,774 | 20,870,933 | - | - |
| Shares repurchased | (1,048,494) | (43,710,797) | (1,186,019) | (49,167,840) |
| Net increase (decrease) | (242,714) | $ (10,975,876) | (589,395) | $ (24,897,376) |
| Class R3 Shares | | | | |
| Shares sold | 59,662 | $ 2,178,902 | 111,678 | $ 4,160,104 |
Shares issued to shareholders in
reinvestment of dividends | 71,185 | 2,603,937 | - | - |
| Shares repurchased | (179,738) | (6,807,003) | (361,286) | (13,585,896) |
| Net increase (decrease) | (48,891) | $ (2,024,164) | (249,608) | $ (9,425,792) |
| Class R4 Shares | | | | |
| Shares sold | 247,485 | $ 9,747,588 | 302,187 | $ 11,693,291 |
Shares issued to shareholders in
reinvestment of dividends | 3,935 | 145,702 | - | - |
| Shares repurchased | (285,040) | (11,095,541) | (306,810) | (11,986,440) |
| Net increase (decrease) | (33,620) | $ (1,202,251) | (4,623) | $ (293,149) |
| Class R5 Shares | | | | |
| Shares sold | 64,638 | $ 2,721,068 | 83,722 | $ 3,402,828 |
Shares issued to shareholders in
reinvestment of dividends | 40,988 | 1,637,470 | - | - |
| Shares repurchased | (115,884) | (4,891,447) | (337,535) | (13,819,490) |
| Net increase (decrease) | (10,258) | $ (532,909) | (253,813) | $ (10,416,662) |
110 | Thornburg Equity Funds Semi-Annual Report
Notes to Financial Statements, Continued
March 31, 2020 (Unaudited)
| | SIX MONTHS ENDED
March 31, 2020 | YEAR ENDED
September 30, 2019 (AUDITED) |
| LONG/SHORT EQUITY FUND | SHARES | AMOUNT | SHARES | AMOUNT |
| Class I Shares | | | | |
| Shares sold | 1,703,005 | $ 18,117,229 | 9,825,404 | $ 104,129,031 |
Shares issued to shareholders in
reinvestment of dividends | 356,382 | 3,806,159 | 71,687 | 7,512,803 |
| Shares repurchased | (10,247,051) | (106,921,224) | (7,805,885) | (83,131,053) |
| Net increase (decrease) | (8,187,664) | $ (84,997,836) | 2,735,706 | $ 28,510,781 |
NOTE 7 – INVESTMENT TRANSACTIONS
For the six months ended March 31, 2020, the Funds had purchase and sale transactions of long, cover and sale transactions of securities sold short as below (excluding short term investments).
| | LONG | SOLD SHORT |
| | Purchases | Sales | Cover | Sales |
| Income Builder Fund | $ 2,578,531,883 | $ 2,814,498,984 | $ — | $ — |
| Summit Fund | 23,473,224 | 20,859,952 | 653,556 | 1,221,700 |
| Global Opportunities Fund | 233,415,792 | 477,667,928 | — | — |
| International Value Fund | 1,107,521,463 | 1,228,848,886 | — | — |
| Better World International Fund | 20,881,259 | 21,317,745 | — | — |
| International Growth Fund | 276,032,553 | 358,762,769 | — | — |
| Developing World Fund | 250,641,080 | 224,504,378 | — | — |
| Value Fund | 82,574,401 | 139,748,144 | — | — |
| Growth Fund | 168,086,338 | 209,015,478 | — | — |
| Long/Short Equity Fund | 50,926,833 | 125,754,192 | 83,450,248 | 29,555,888 |
NOTE 8 – DERIVATIVE FINANCIAL INSTRUMENTS WITH OFF-BALANCE
SHEET RISK AND FOREIGN INVESTMENT RISK
The Funds may use a variety of derivative financial instruments to hedge or adjust the risks affecting its investment portfolio or to enhance investment returns. Provisions of the FASB Accounting Standards Codification 815-10-50 (“ASC 815”) require certain disclosures. The disclosures are intended to provide users of financial statements with an understanding of the use of derivative instruments by the Funds and how these derivatives affect the financial position, financial performance and cash flows of the Funds. The Funds do not designate any derivative instruments as hedging instruments under ASC 815. During the six months ended March 31, 2020, the Funds’ principal exposure to derivative financial instruments of the type addressed by ASC 815 was investment in foreign currency contracts. A foreign currency contract is an agreement between two parties to exchange different currencies at a specified rate of exchange at an agreed upon future date. Foreign currency contracts involve risks to the Funds, including the risk that a contract’s counterparty will not meet its obligations to the Funds, the risk that a change in a contract’s value may not correlate perfectly with the currency the contract was intended to track, and the risk that the Funds’ Advisor is unable to correctly implement its strategy in using a contract. In any such instance, the Funds may not achieve the intended benefit of entering into a contract, and may experience a loss.
The Funds entered into forward currency contracts during the six months ended March 31, 2020 in the normal course of pursuing its investment objectives, with the objective of purchasing foreign investments or with the intent of reducing the risk to the value of the Funds’ foreign investments from adverse changes in the relationship between the U.S. dollar and foreign currencies. In each case these contracts have been initiated in conjunction with foreign investment transactions.
The monthly average values of open forward currency sell contracts for the six months ended March 31, 2020 for Income Builder Fund, Global Opportunities Fund, International Value Fund, International Growth Fund and Value Fund were $2,507,102,867; $148,202,816; $42,102,289; $13,136,937 and $23,684,054, respectively.
These contracts are accounted for by the Funds under ASC 815. Unrealized appreciation and depreciation on outstanding contracts are reported in each Fund’s Statement of Assets and Liabilities, as measured by the difference between the forward exchange rates at the reporting date and the forward exchange rates at each contract’s inception date. Net realized gain (loss) on contracts closed during the period, and changes in net unrealized appreciation (depreciation) on outstanding contracts are recognized in each Fund’s Statement of Operations.
Thornburg Equity Funds Semi-Annual Report | 111
Notes to Financial Statements, Continued
March 31, 2020 (Unaudited)
The outstanding forward currency contracts in the table located in the Schedule of Investments, which were entered into with State Street Bank and Trust Company (“SSB”), were entered into pursuant to an International Swaps and Derivatives Association (“ISDA”) Master Agreement. Outstanding forward currency contracts, which were entered into with Brown Brothers Harriman & Co. (“BBH”), were entered into pursuant to a written agreement with BBH. In the event of a default or termination under the ISDA Master Agreement with SSB or the agreement with BBH, the non-defaulting party has the right to close out all outstanding forward currency contracts between the parties and to net any payment amounts under those contracts, resulting in a single net amount payable by one party to the other.
Because the ISDA Master Agreement with SSB and the agreement with BBH do not result in an offset of reported amounts of financial assets and liabilities in the Funds’ Statement of Assets and Liabilities unless there has been an event of default or termination event under such agreements, the Funds do not net its outstanding forward currency contracts for the purpose of disclosure in the Funds’ Statement of Assets and Liabilities. Instead the Funds recognize the unrealized appreciation (depreciation) on those forward currency contracts on a gross basis in the Funds’ Statement of Assets and Liabilities.
The unrealized appreciation (depreciation) of the outstanding forward currency contracts recognized in each Fund’s Statement of Assets and Liabilities at March 31, 2020 is disclosed in the following table:
INCOME BUILDER FUND
| FAIR VALUES OF DERIVATIVE FINANCIAL INSTRUMENTS AT MARCH 31, 2020 |
| ASSET DERIVATIVES | BALANCE SHEET LOCATION | FAIR VALUE |
| Foreign currency contracts | Assets - Unrealized appreciation on forward currency contracts | $ 41,010,141 |
| FAIR VALUES OF DERIVATIVE FINANCIAL INSTRUMENTS AT MARCH 31, 2020 |
| LIABILITY DERIVATIVES | BALANCE SHEET LOCATION | FAIR VALUE |
| Foreign currency contracts | Liabilities - Unrealized depreciation on forward currency contracts | $ (20,852,511) |
Because the Fund does not receive or post cash collateral in connection with its currency forward contracts during the period, the net amounts of the Fund’s assets and liabilities which are attributable to those contracts at March 31, 2020 can be determined by offsetting the dollar amounts shown in the preceding table. Based on those amounts, the net amount of the Fund’s assets which is attributable to its outstanding forward currency contracts at March 31, 2020 is $20,157,630 attributable to the Fund’s contracts with SSB. The Fund’s forward currency contracts are valued each day, and the net amounts of the Fund’s assets and liabilities which are attributable to those contracts are expected to vary over time.
The net realized gain (loss) from forward currency contracts and the net change in unrealized appreciation (depreciation) on outstanding forward currency contracts recognized in the Fund’s Statement of Operations for the six months ended March 31, 2020 are disclosed in the following table:
NET REALIZED GAIN (LOSS) ON DERIVATIVE FINANCIAL INSTRUMENTS
RECOGNIZED IN INCOME FOR THE SIX MONTHS ENDED March 31, 2020 |
| | TOTAL | FORWARD CURRENCY CONTRACTS |
| Foreign currency contracts | $ 47,779,339 | $ 47,779,339 |
NET CHANGE IN UNREALIZED APPRECIATION (DEPRECIATION) OF DERIVATIVE FINANCIAL INSTRUMENTS
RECOGNIZED IN INCOME FOR THE SIX MONTHS ENDED March 31, 2020 |
| | TOTAL | FORWARD CURRENCY CONTRACTS |
| Foreign currency contracts | $ (46,616,205) | $ (46,616,205) |
The unrealized appreciation (depreciation) of the outstanding forward currency contracts recognized in each Fund’s Statement of Assets and Liabilities at March 31, 2020 is disclosed in the following table:
112 | Thornburg Equity Funds Semi-Annual Report
Notes to Financial Statements, Continued
March 31, 2020 (Unaudited)
GLOBAL OPPORTUNITIES FUND
| FAIR VALUES OF DERIVATIVE FINANCIAL INSTRUMENTS AT MARCH 31, 2020 |
| ASSET DERIVATIVES | BALANCE SHEET LOCATION | FAIR VALUE |
| Foreign currency contracts | Assets - Unrealized appreciation on forward currency contracts | $ 2,240,632 |
| FAIR VALUES OF DERIVATIVE FINANCIAL INSTRUMENTS AT MARCH 31, 2020 |
| LIABILITY DERIVATIVES | BALANCE SHEET LOCATION | FAIR VALUE |
| Foreign currency contracts | Liabilities - Unrealized depreciation on forward currency contracts | $ (1,747,164) |
Because the Fund does not receive or post cash collateral in connection with its currency forward contracts during the period, the net amounts of the Fund’s assets and liabilities which are attributable to those contracts at March 31, 2020 can be determined by offsetting the dollar amounts shown in the preceding table. Based on those amounts, the net amount of the Fund’s assets which is attributable to its outstanding forward currency contracts at March 31, 2020 is $1,235,460 attributable to the Fund’s contracts with SSB, and $1,005,172 attributable to the Fund’s contracts with BBH. The net amount of the Fund’s liabilities which is attributable to its outstanding forward currency contracts at March 31, 2020 is $1,747,164 attributable to the Fund’s contracts with SSB. The Fund’s forward currency contracts are valued each day, and the net amounts of the Fund’s assets and liabilities which are attributable to those contracts are expected to vary over time.
The net realized gain (loss) from forward currency contracts and the net change in unrealized appreciation (depreciation) on outstanding forward currency contracts recognized in the Fund’s Statement of Operations for the six months ended March 31, 2020 are disclosed in the following table:
NET REALIZED GAIN (LOSS) ON DERIVATIVE FINANCIAL INSTRUMENTS
RECOGNIZED IN INCOME FOR THE SIX MONTHS ENDED March 31, 2020 |
| | TOTAL | FORWARD CURRENCY CONTRACTS |
| Foreign currency contracts | $ 4,824,797 | $ 4,824,797 |
NET CHANGE IN UNREALIZED APPRECIATION (DEPRECIATION) OF DERIVATIVE FINANCIAL INSTRUMENTS
RECOGNIZED IN INCOME FOR THE SIX MONTHS ENDED March 31, 2020 |
| | TOTAL | FORWARD CURRENCY CONTRACTS |
| Foreign currency contracts | $ (4,033,955) | $ (4,033,955) |
The unrealized appreciation (depreciation) of the outstanding forward currency contracts recognized in each Fund’s Statement of Assets and Liabilities at March 31, 2020 is disclosed in the following table:
INTERNATIONAL VALUE FUND
| FAIR VALUES OF DERIVATIVE FINANCIAL INSTRUMENTS AT MARCH 31, 2020 |
| ASSET DERIVATIVES | BALANCE SHEET LOCATION | FAIR VALUE |
| Foreign currency contracts | Assets - Unrealized appreciation on forward currency contracts | $ 8,551,492 |
Because the Fund does not receive or post cash collateral in connection with its currency forward contracts during the period, the net amounts of the Fund’s assets and liabilities which are attributable to those contracts at March 31, 2020 can be determined by offsetting the dollar amounts shown in the preceding table. Based on those amounts, the net amount of the Fund’s assets which is attributable to its outstanding forward currency contracts at March 31, 2020 is $8,551,492 attributable to the Fund’s contracts with BBH. The Fund’s forward currency contracts are valued each day, and the net amounts of the Fund’s assets and liabilities which are attributable to those contracts are expected to vary over time.
Thornburg Equity Funds Semi-Annual Report | 113
Notes to Financial Statements, Continued
March 31, 2020 (Unaudited)
The net realized gain (loss) from forward currency contracts and the net change in unrealized appreciation (depreciation) on outstanding forward currency contracts recognized in the Fund’s Statement of Operations for the six months ended March 31, 2020 are disclosed in the following table:
NET CHANGE IN UNREALIZED APPRECIATION (DEPRECIATION) OF DERIVATIVE FINANCIAL INSTRUMENTS
RECOGNIZED IN INCOME FOR THE SIX MONTHS ENDED March 31, 2020 |
| | TOTAL | FORWARD CURRENCY CONTRACTS |
| Foreign currency contracts | $ 8,551,492 | $ 8,551,492 |
INTERNATIONAL GROWTH FUND
As of March 31, 2020, the Fund did not have any outstanding forward foreign currency contracts.
The net realized gain (loss) from forward currency contracts and the net change in unrealized appreciation (depreciation) on outstanding forward currency contracts recognized in the Fund’s Statement of Operations for the six months ended March 31, 2020 are disclosed in the following table:
NET REALIZED GAIN (LOSS) ON DERIVATIVE FINANCIAL INSTRUMENTS
RECOGNIZED IN INCOME FOR THE SIX MONTHS ENDED March 31, 2020 |
| | TOTAL | FORWARD CURRENCY CONTRACTS |
| Foreign currency contracts | $ (1,452,058) | $ (1,452,058) |
NET CHANGE IN UNREALIZED APPRECIATION (DEPRECIATION) OF DERIVATIVE FINANCIAL INSTRUMENTS
RECOGNIZED IN INCOME FOR THE SIX MONTHS ENDED March 31, 2020 |
| | TOTAL | FORWARD CURRENCY CONTRACTS |
| Foreign currency contracts | $ (310,039) | $ (310,039) |
The unrealized appreciation (depreciation) of the outstanding forward currency contracts recognized in the Fund’s Statement of Assets and Liabilities at March 31, 2020 is disclosed in the following table:
VALUE FUND
| FAIR VALUES OF DERIVATIVE FINANCIAL INSTRUMENTS AT MARCH 31, 2020 |
| LIABILITY DERIVATIVES | BALANCE SHEET LOCATION | FAIR VALUE |
| Foreign currency contracts | Liabilities - Unrealized depreciation on forward currency contracts | $ (291,779) |
Because the Fund does not receive or post cash collateral in connection with its currency forward contracts during the period, the net amounts of the Fund’s assets and liabilities which are attributable to those contracts at March 31, 2020 can be determined by offsetting the dollar amounts shown in the preceding table. Based on those amounts, the net amount of the Fund’s liabilities which is attributable to its outstanding forward currency contracts at March 31, 2020 is $291,779 attributable to the Fund’s contracts with SSB. The Fund’s forward currency contracts are valued each day, and the net amounts of the Fund’s assets and liabilities which are attributable to those contracts are expected to vary over time.
The net realized gain (loss) from forward currency contracts and the net change in unrealized appreciation (depreciation) on outstanding forward currency contracts recognized in the Fund’s Statement of Operations for the six months ended March 31, 2020 are disclosed in the following table:
NET REALIZED GAIN (LOSS) ON DERIVATIVE FINANCIAL INSTRUMENTS
RECOGNIZED IN INCOME FOR THE SIX MONTHS ENDED March 31, 2020 |
| | TOTAL | FORWARD CURRENCY CONTRACTS |
| Foreign currency contracts | $ 439,137 | $ 439,137 |
NET CHANGE IN UNREALIZED APPRECIATION (DEPRECIATION) OF DERIVATIVE FINANCIAL INSTRUMENTS
RECOGNIZED IN INCOME FOR THE SIX MONTHS ENDED March 31, 2020 |
| | TOTAL | FORWARD CURRENCY CONTRACTS |
| Foreign currency contracts | $ (573,863) | $ (573,863) |
114 | Thornburg Equity Funds Semi-Annual Report
This page intentionally left blank.
Thornburg Equity Funds Semi-Annual Report | 115
Financial Highlights
Income Builder Fund
| | PER SHARE PERFORMANCE (FOR A SHARE OUTSTANDING THROUGHOUT THE PERIOD) |
UNLESS OTHERWISE
NOTED, PERIODS ARE
FISCAL YEARS ENDED
SEPTEMBER 30, | Net Asset
Value,
Beginning of
PERIOD | Net
Investment
Income
(Loss)+ | Net Realized &
Unrealized Gain
(Loss) on
Investments | Total from
Investment
Operations | Dividends
from Net
Investment
Income | Dividends
from Net
Realized
Gains | Total
Dividends | Net Asset
Value,
End of PERIOD |
| CLASS A SHARES(b) |
| 2020(c) | $ 21.72 | 0.33 | (5.07) | (4.74) | (0.49) | — | (0.49) | $ 16.49 |
| 2019 | $ 21.80 | 0.93 | (0.07) | 0.86 | (0.94) | — | (0.94) | $ 21.72 |
| 2018 | $ 21.50 | 0.92 | 0.30 | 1.22 | (0.92) | — | (0.92) | $ 21.80 |
| 2017 | $ 19.82 | 0.92 | 1.61 | 2.53 | (0.85) | — | (0.85) | $ 21.50 |
| 2016 | $ 19.07 | 0.93 | 0.62 | 1.55 | (0.80) | — | (0.80) | $ 19.82 |
| 2015 | $ 21.38 | 0.85 | (2.34) | (1.49) | (0.82) | — | (0.82) | $ 19.07 |
| CLASS C SHARES |
| 2020(c) | $ 21.69 | 0.25 | (5.06) | (4.81) | (0.41) | — | (0.41) | $ 16.47 |
| 2019 | $ 21.78 | 0.76 | (0.06) | 0.70 | (0.79) | — | (0.79) | $ 21.69 |
| 2018 | $ 21.48 | 0.76 | 0.30 | 1.06 | (0.76) | — | (0.76) | $ 21.78 |
| 2017 | $ 19.81 | 0.78 | 1.60 | 2.38 | (0.71) | — | (0.71) | $ 21.48 |
| 2016 | $ 19.06 | 0.79 | 0.62 | 1.41 | (0.66) | — | (0.66) | $ 19.81 |
| 2015 | $ 21.37 | 0.70 | (2.34) | (1.64) | (0.67) | — | (0.67) | $ 19.06 |
| CLASS I SHARES |
| 2020(c) | $ 21.88 | 0.36 | (5.10) | (4.74) | (0.53) | — | (0.53) | $ 16.61 |
| 2019 | $ 21.96 | 0.99 | (0.07) | 0.92 | (1.00) | — | (1.00) | $ 21.88 |
| 2018 | $ 21.65 | 1.00 | 0.29 | 1.29 | (0.98) | — | (0.98) | $ 21.96 |
| 2017 | $ 19.97 | 1.02 | 1.59 | 2.61 | (0.93) | — | (0.93) | $ 21.65 |
| 2016 | $ 19.21 | 1.00 | 0.62 | 1.62 | (0.86) | — | (0.86) | $ 19.97 |
| 2015 | $ 21.53 | 0.93 | (2.35) | (1.42) | (0.90) | — | (0.90) | $ 19.21 |
| CLASS R3 SHARES |
| 2020(c) | $ 21.71 | 0.30 | (5.06) | (4.76) | (0.46) | — | (0.46) | $ 16.49 |
| 2019 | $ 21.80 | 0.84 | (0.07) | 0.77 | (0.86) | — | (0.86) | $ 21.71 |
| 2018 | $ 21.49 | 0.83 | 0.32 | 1.15 | (0.84) | — | (0.84) | $ 21.80 |
| 2017 | $ 19.82 | 0.87 | 1.59 | 2.46 | (0.79) | — | (0.79) | $ 21.49 |
| 2016 | $ 19.07 | 0.87 | 0.62 | 1.49 | (0.74) | — | (0.74) | $ 19.82 |
| 2015 | $ 21.37 | 0.78 | (2.32) | (1.54) | (0.76) | — | (0.76) | $ 19.07 |
| CLASS R4 SHARES |
| 2020(c) | $ 21.74 | 0.30 | (5.07) | (4.77) | (0.46) | — | (0.46) | $ 16.51 |
| 2019 | $ 21.83 | 0.86 | (0.07) | 0.79 | (0.88) | — | (0.88) | $ 21.74 |
| 2018 | $ 21.52 | 0.85 | 0.33 | 1.18 | (0.87) | — | (0.87) | $ 21.83 |
| 2017 | $ 19.85 | 0.89 | 1.59 | 2.48 | (0.81) | — | (0.81) | $ 21.52 |
| 2016 | $ 19.10 | 0.89 | 0.62 | 1.51 | (0.76) | — | (0.76) | $ 19.85 |
| 2015 | $ 21.42 | 0.81 | (2.35) | (1.54) | (0.78) | — | (0.78) | $ 19.10 |
| CLASS R5 SHARES |
| 2020(c) | $ 21.86 | 0.35 | (5.10) | (4.75) | (0.51) | — | (0.51) | $ 16.60 |
| 2019 | $ 21.95 | 0.97 | (0.09) | 0.88 | (0.97) | — | (0.97) | $ 21.86 |
| 2018 | $ 21.64 | 0.94 | 0.33 | 1.27 | (0.96) | — | (0.96) | $ 21.95 |
| 2017 | $ 19.95 | 0.98 | 1.61 | 2.59 | (0.90) | — | (0.90) | $ 21.64 |
| 2016 | $ 19.20 | 0.98 | 0.62 | 1.60 | (0.85) | — | (0.85) | $ 19.95 |
| 2015 | $ 21.52 | 0.90 | (2.35) | (1.45) | (0.87) | — | (0.87) | $ 19.20 |
| CLASS R6 SHARES |
| 2020(c) | $ 21.81 | 0.36 | (5.08) | (4.72) | (0.53) | — | (0.53) | $ 16.56 |
| 2019 | $ 21.89 | 1.01 | (0.08) | 0.93 | (1.01) | — | (1.01) | $ 21.81 |
| 2018 | $ 21.58 | 1.16 | 0.14 | 1.30 | (0.99) | — | (0.99) | $ 21.89 |
| 2017(e) | $ 20.55 | 0.44 | 1.12 | 1.56 | (0.53) | — | (0.53) | $ 21.58 |
| (a) | Not annualized for periods less than one year. |
| (b) | Sales loads are not reflected in computing total return. |
| (c) | Unaudited Six Month Period Ended March 31. |
| (d) | Annualized. |
| (e) | Effective date of this class of shares was April 10, 2017. |
| + | Based on weighted average shares outstanding. |
See notes to financial statements.
116 | Thornburg Equity Funds Semi-Annual Report
Financial Highlights, Continued
Income Builder Fund
| | RATIOS TO AVERAGE NET ASSETS | | Supplemental Data |
UNLESS OTHERWISE
NOTED, PERIODS ARE
FISCAL YEARS ENDED
SEPTEMBER 30, | Net Investment
Income (Loss) (%) | Expenses, After
Expense
Reductions (%) | Expenses,
Before Expense
Reductions (%) | | Total
Return (%)(a) | Portfolio
Turnover
Rate (%)(a) | Net Assets
at End of PERIOD
(Thousands) |
| CLASS A SHARES(b) |
| 2020(c) | 3.06(d) | 1.11(d) | 1.11(d) | | (22.06) | 19.55 | $ 2,569,984 |
| 2019 | 4.42 | 1.13 | 1.13 | | 4.13 | 43.69 | $ 3,458,385 |
| 2018 | 4.25 | 1.15 | 1.15 | | 5.79 | 41.17 | $ 3,378,149 |
| 2017 | 4.52 | 1.19 | 1.19 | | 13.01 | 37.37 | $ 3,374,895 |
| 2016 | 4.82 | 1.18 | 1.18 | | 8.35 | 42.81 | $ 3,778,863 |
| 2015 | 4.02 | 1.17 | 1.17 | | (7.27) | 47.71 | $ 4,257,943 |
| CLASS C SHARES |
| 2020(c) | 2.30(d) | 1.85(d) | 1.85(d) | | (22.38) | 19.55 | $ 1,789,655 |
| 2019 | 3.60 | 1.87 | 1.87 | | 3.35 | 43.69 | $ 2,658,581 |
| 2018 | 3.51 | 1.90 | 1.90 | | 5.01 | 41.17 | $ 3,591,856 |
| 2017 | 3.80 | 1.90 | 1.93 | | 12.19 | 37.37 | $ 4,677,322 |
| 2016 | 4.11 | 1.90 | 1.93 | | 7.59 | 42.81 | $ 5,356,153 |
| 2015 | 3.30 | 1.90 | 1.92 | | (7.93) | 47.71 | $ 5,906,206 |
| CLASS I SHARES |
| 2020(c) | 3.30(d) | 0.86(d) | 0.86(d) | | (21.96) | 19.55 | $ 5,594,652 |
| 2019 | 4.67 | 0.88 | 0.88 | | 4.39 | 43.69 | $ 7,810,067 |
| 2018 | 4.58 | 0.86 | 0.86 | | 6.12 | 41.17 | $ 7,806,245 |
| 2017 | 4.93 | 0.86 | 0.86 | | 13.30 | 37.37 | $ 7,804,930 |
| 2016 | 5.15 | 0.86 | 0.86 | | 8.71 | 42.81 | $ 6,928,783 |
| 2015 | 4.35 | 0.85 | 0.85 | | (6.94) | 47.71 | $ 7,472,344 |
| CLASS R3 SHARES |
| 2020(c) | 2.75(d) | 1.41(d) | 1.41(d) | | (22.16) | 19.55 | $ 25,052 |
| 2019 | 3.97 | 1.50 | 1.58 | | 3.72 | 43.69 | $ 36,155 |
| 2018 | 3.84 | 1.50 | 1.61 | | 5.47 | 41.17 | $ 46,901 |
| 2017 | 4.24 | 1.47 | 1.56 | | 12.63 | 37.37 | $ 67,623 |
| 2016 | 4.53 | 1.50 | 1.59 | | 8.01 | 42.81 | $ 78,188 |
| 2015 | 3.70 | 1.50 | 1.55 | | (7.52) | 47.71 | $ 79,834 |
| CLASS R4 SHARES |
| 2020(c) | 2.75(d) | 1.40(d) | 1.42(d) | | (22.17) | 19.55 | $ 17,256 |
| 2019 | 4.09 | 1.40 | 1.50 | | 3.79 | 43.69 | $ 25,221 |
| 2018 | 3.91 | 1.40 | 1.56 | | 5.58 | 41.17 | $ 31,132 |
| 2017 | 4.35 | 1.40 | 1.51 | | 12.72 | 37.37 | $ 44,069 |
| 2016 | 4.63 | 1.40 | 1.48 | | 8.12 | 42.81 | $ 45,968 |
| 2015 | 3.81 | 1.40 | 1.46 | | (7.48) | 47.71 | $ 42,392 |
| CLASS R5 SHARES |
| 2020(c) | 3.20(d) | 0.96(d) | 0.96(d) | | (21.98) | 19.55 | $ 42,489 |
| 2019 | 4.55 | 0.99 | 1.08 | | 4.20 | 43.69 | $ 59,890 |
| 2018 | 4.30 | 0.99 | 1.12 | | 5.99 | 41.17 | $ 59,545 |
| 2017 | 4.76 | 0.99 | 1.09 | | 13.22 | 37.37 | $ 91,735 |
| 2016 | 5.08 | 0.99 | 1.07 | | 8.52 | 42.81 | $ 86,535 |
| 2015 | 4.23 | 0.98 | 1.07 | | (7.06) | 47.71 | $ 78,945 |
| CLASS R6 SHARES |
| 2020(c) | 3.35(d) | 0.80(d) | 0.82(d) | | (21.92) | 19.55 | $ 113,728 |
| 2019 | 4.76 | 0.80 | 0.82 | | 4.47 | 43.69 | $ 157,924 |
| 2018 | 5.39 | 0.80 | 0.82 | | 6.20 | 41.17 | $ 156,750 |
| 2017(e) | 4.37(d) | 0.80(d) | 1.09(d) | | 7.65 | 37.37 | $ 36,909 |
Thornburg Equity Funds Semi-Annual Report | 117
Financial Highlights
Summit Fund
| | PER SHARE PERFORMANCE (FOR A SHARE OUTSTANDING THROUGHOUT THE PERIOD) |
UNLESS OTHERWISE
NOTED, PERIODS ARE
FISCAL YEARS ENDED
SEPTEMBER 30, | Net Asset
Value,
Beginning of
PERIOD | Net
Investment
Income
(Loss)+ | Net Realized &
Unrealized Gain
(Loss) on
Investments | Total from
Investment
Operations | Dividends
from Net
Investment
Income | Dividends
from Net
Realized
Gains | Total
Dividends | Net Asset
Value,
End of PERIOD |
| CLASS I SHARES |
| 2020(d) | $ 10.47 | 0.06 | (0.64) | (0.58) | (0.13) | (0.05) | (0.18) | $ 9.71 |
| 2019(f) | $ 10.00 | 0.11 | 0.43 | 0.54 | (0.07) | — | (0.07) | $ 10.47 |
| (a) | The Fund incurs certain expenses and fees in connection with investments in short positions. If such expenses and fees had not occurred, the Expenses After Expense Reductions ratios for 2020 and 2019 would have been 0.99% and 0.99%. |
| (b) | The Fund incurs certain expenses and fees in connection with investments in short positions. If such expenses and fees had not occurred, the Expenses Before Expense Reductions ratios for 2020 and 2019 would have been 1.31% and 1.71%. |
| (c) | Not annualized for periods less than one year. |
| (d) | Unaudited Six Month Period Ended March 31. |
| (e) | Annualized. |
| (f) | Fund commenced operations on March 1, 2019. |
| + | Based on weighted average shares outstanding. |
See notes to financial statements.
118 | Thornburg Equity Funds Semi-Annual Report
Financial Highlights, Continued
Summit Fund
| | RATIOS TO AVERAGE NET ASSETS | | Supplemental Data |
UNLESS OTHERWISE
NOTED, PERIODS ARE
FISCAL YEARS ENDED
SEPTEMBER 30, | Net Investment
Income (Loss) (%) | Expenses, After
Expense
Reductions (%)(a) | Expenses,
Before Expense
Reductions (%)(b) | | Total
Return (%)(c) | Portfolio
Turnover
Rate (%)(c) | Net Assets
at End of PERIOD
(Thousands) |
| CLASS I SHARES |
| 2020(d) | 1.22(e) | 1.08(e) | 1.40(e) | | (5.57) | 60.94 | $ 33,748 |
| 2019(f) | 1.78(e) | 1.72(e) | 2.44(e) | | 5.45 | 53.38 | $ 35,489 |
Thornburg Equity Funds Semi-Annual Report | 119
Financial Highlights
Global Opportunities Fund
| | PER SHARE PERFORMANCE (FOR A SHARE OUTSTANDING THROUGHOUT THE PERIOD) |
UNLESS OTHERWISE
NOTED, PERIODS ARE
FISCAL YEARS ENDED
SEPTEMBER 30, | Net Asset
Value,
Beginning of
PERIOD | Net
Investment
Income
(Loss)+ | Net Realized &
Unrealized Gain
(Loss) on
Investments | Total from
Investment
Operations | Dividends
from Net
Investment
Income | Dividends
from Net
Realized
Gains | Total
Dividends | Net Asset
Value,
End of PERIOD |
| CLASS A SHARES(b) |
| 2020(c) | $ 27.56 | (0.01) | (3.74) | (3.75) | (0.14) | (0.28) | (0.42) | $ 23.39 |
| 2019 | $ 29.93 | 0.20 | (2.02) | (1.82) | (0.55) | — | (0.55) | $ 27.56 |
| 2018 | $ 30.98 | 0.44 | (1.42) | (0.98) | (0.07) | — | (0.07) | $ 29.93 |
| 2017 | $ 24.90 | 0.13 | 6.05 | 6.18 | (0.10) | — | (0.10) | $ 30.98 |
| 2016 | $ 24.41 | 0.25 | 0.38 | 0.63 | (0.14) | — | (0.14) | $ 24.90 |
| 2015 | $ 23.74 | (0.11) | 0.78 | 0.67 | — | — | — | $ 24.41 |
| CLASS C SHARES |
| 2020(c) | $ 26.55 | (0.11) | (3.61) | (3.72) | — | (0.28) | (0.28) | $ 22.55 |
| 2019 | $ 28.70 | (0.01) | (1.89) | (1.90) | (0.25) | — | (0.25) | $ 26.55 |
| 2018 | $ 29.88 | 0.23 | (1.39) | (1.16) | (0.02) | — | (0.02) | $ 28.70 |
| 2017 | $ 24.13 | (0.08) | 5.84 | 5.76 | (0.01) | — | (0.01) | $ 29.88 |
| 2016 | $ 23.70 | 0.07 | 0.36 | 0.43 | — | — | — | $ 24.13 |
| 2015 | $ 23.23 | (0.31) | 0.78 | 0.47 | — | — | — | $ 23.70 |
| CLASS I SHARES |
| 2020(c) | $ 27.67 | 0.03 | (3.75) | (3.72) | (0.23) | (0.28) | (0.51) | $ 23.44 |
| 2019 | $ 30.07 | 0.29 | (2.04) | (1.75) | (0.65) | — | (0.65) | $ 27.67 |
| 2018 | $ 31.06 | 0.56 | (1.45) | (0.89) | (0.10) | — | (0.10) | $ 30.07 |
| 2017 | $ 24.96 | 0.23 | 6.07 | 6.30 | (0.20) | — | (0.20) | $ 31.06 |
| 2016 | $ 24.53 | 0.34 | 0.37 | 0.71 | (0.28) | — | (0.28) | $ 24.96 |
| 2015 | $ 23.79 | (0.02) | 0.77 | 0.75 | (0.01) | — | (0.01) | $ 24.53 |
| CLASS R3 SHARES |
| 2020(c) | $ 27.28 | (0.04) | (3.73) | (3.77) | (0.05) | (0.28) | (0.33) | $ 23.18 |
| 2019 | $ 29.57 | 0.15 | (1.98) | (1.83) | (0.46) | — | (0.46) | $ 27.28 |
| 2018 | $ 30.66 | 0.38 | (1.41) | (1.03) | (0.06) | — | (0.06) | $ 29.57 |
| 2017 | $ 24.66 | 0.08 | 5.99 | 6.07 | (0.07) | — | (0.07) | $ 30.66 |
| 2016 | $ 24.18 | 0.20 | 0.38 | 0.58 | (0.10) | — | (0.10) | $ 24.66 |
| 2015 | $ 23.55 | (0.15) | 0.78 | 0.63 | — | — | — | $ 24.18 |
| CLASS R4 SHARES |
| 2020(c) | $ 27.32 | (0.03) | (3.75) | (3.78) | — | (0.28) | (0.28) | $ 23.26 |
| 2019 | $ 29.62 | 0.19 | (2.00) | (1.81) | (0.49) | — | (0.49) | $ 27.32 |
| 2018 | $ 30.69 | 0.46 | (1.47) | (1.01) | (0.06) | — | (0.06) | $ 29.62 |
| 2017 | $ 24.67 | 0.11 | 6.00 | 6.11 | (0.09) | — | (0.09) | $ 30.69 |
| 2016 | $ 24.22 | 0.24 | 0.35 | 0.59 | (0.14) | — | (0.14) | $ 24.67 |
| 2015 | $ 23.57 | (0.13) | 0.78 | 0.65 | — | — | — | $ 24.22 |
| CLASS R5 SHARES |
| 2020(c) | $ 27.70 | 0.03 | (3.76) | (3.73) | (0.23) | (0.28) | (0.51) | $ 23.46 |
| 2019 | $ 30.10 | 0.28 | (2.02) | (1.74) | (0.66) | — | (0.66) | $ 27.70 |
| 2018 | $ 31.10 | 0.57 | (1.47) | (0.90) | (0.10) | — | (0.10) | $ 30.10 |
| 2017 | $ 24.99 | 0.22 | 6.08 | 6.30 | (0.19) | — | (0.19) | $ 31.10 |
| 2016 | $ 24.55 | 0.34 | 0.37 | 0.71 | (0.27) | — | (0.27) | $ 24.99 |
| 2015 | $ 23.81 | (0.03) | 0.78 | 0.75 | (0.01) | — | (0.01) | $ 24.55 |
| CLASS R6 SHARES |
| 2020(c) | $ 27.77 | 0.05 | (3.76) | (3.71) | (0.27) | (0.28) | (0.55) | $ 23.51 |
| 2019 | $ 30.20 | 0.32 | (2.05) | (1.73) | (0.70) | — | (0.70) | $ 27.77 |
| 2018 | $ 31.16 | 0.90 | (1.75) | (0.85) | (0.11) | — | (0.11) | $ 30.20 |
| 2017(e) | $ 28.35 | 0.11 | 2.73 | 2.84 | (0.03) | — | (0.03) | $ 31.16 |
| (a) | Not annualized for periods less than one year. |
| (b) | Sales loads are not reflected in computing total return. |
| (c) | Unaudited Six Month Period Ended March 31. |
| (d) | Annualized. |
| (e) | Effective date of this class of shares was April 10, 2017. |
| (f) | Due to the size of net assets and fixed expenses, ratios may appear disproportionate. |
| + | Based on weighted average shares outstanding. |
See notes to financial statements.
120 | Thornburg Equity Funds Semi-Annual Report
Financial Highlights, Continued
Global Opportunities Fund
| | RATIOS TO AVERAGE NET ASSETS | | Supplemental Data |
UNLESS OTHERWISE
NOTED, PERIODS ARE
FISCAL YEARS ENDED
SEPTEMBER 30, | Net Investment
Income (Loss) (%) | Expenses, After
Expense
Reductions (%) | Expenses,
Before Expense
Reductions (%) | | Total
Return (%)(a) | Portfolio
Turnover
Rate (%)(a) | Net Assets
at End of PERIOD
(Thousands) |
| CLASS A SHARES(b) |
| 2020(c) | (0.06)(d) | 1.26(d) | 1.30(d) | | (13.95) | 20.82 | $ 178,424 |
| 2019 | 0.73 | 1.31 | 1.33 | | (5.78) | 29.12 | $ 236,560 |
| 2018 | 1.40 | 1.28 | 1.28 | | (3.16) | 41.99 | $ 367,449 |
| 2017 | 0.46 | 1.33 | 1.33 | | 24.85 | 43.70 | $ 442,522 |
| 2016 | 1.02 | 1.35 | 1.35 | | 2.57 | 37.11 | $ 443,072 |
| 2015 | (0.42) | 1.32 | 1.32 | | 2.82 | 45.41 | $ 550,327 |
| CLASS C SHARES |
| 2020(c) | (0.81)(d) | 2.00(d) | 2.04(d) | | (14.26) | 20.82 | $ 108,092 |
| 2019 | (0.02) | 2.07 | 2.09 | | (6.49) | 29.12 | $ 151,469 |
| 2018 | 0.78 | 2.03 | 2.03 | | (3.90) | 41.99 | $ 253,907 |
| 2017 | (0.30) | 2.08 | 2.08 | | 23.88 | 43.70 | $ 380,046 |
| 2016 | 0.29 | 2.09 | 2.09 | | 1.81 | 37.11 | $ 359,426 |
| 2015 | (1.20) | 2.10 | 2.10 | | 2.02 | 45.41 | $ 363,615 |
| CLASS I SHARES |
| 2020(c) | 0.18(d) | 0.99(d) | 1.04(d) | | (13.85) | 20.82 | $ 487,379 |
| 2019 | 1.05 | 0.99 | 1.06 | | (5.46) | 29.12 | $ 762,697 |
| 2018 | 1.79 | 0.97 | 0.97 | | (2.88) | 41.99 | $ 1,200,267 |
| 2017 | 0.80 | 0.97 | 0.98 | | 25.31 | 43.70 | $ 1,514,039 |
| 2016 | 1.39 | 0.99 | 0.99 | | 2.91 | 37.11 | $ 996,970 |
| 2015 | (0.08) | 0.97 | 0.98 | | 3.17 | 45.41 | $ 1,285,609 |
| CLASS R3 SHARES |
| 2020(c) | (0.31)(d) | 1.50(d) | 1.87(d) | | (14.08) | 20.82 | $ 2,906 |
| 2019 | 0.55 | 1.50 | 2.20 | | (5.95) | 29.12 | $ 4,317 |
| 2018 | 1.22 | 1.50 | 1.92 | | (3.38) | 41.99 | $ 7,577 |
| 2017 | 0.28 | 1.50 | 1.97 | | 24.66 | 43.70 | $ 12,059 |
| 2016 | 0.84 | 1.50 | 2.01 | | 2.38 | 37.11 | $ 10,645 |
| 2015 | (0.58) | 1.50 | 2.15 | | 2.68 | 45.41 | $ 8,936 |
| CLASS R4 SHARES |
| 2020(c) | (0.22)(d) | 1.40(d) | 1.58(d) | | (14.04) | 20.82 | $ 4,465 |
| 2019 | 0.71 | 1.40 | 1.86 | | (5.84) | 29.12 | $ 9,254 |
| 2018 | 1.49 | 1.40 | 1.61 | | (3.29) | 41.99 | $ 20,786 |
| 2017 | 0.38 | 1.40 | 1.65 | | 24.81 | 43.70 | $ 28,061 |
| 2016 | 0.98 | 1.40 | 1.66 | | 2.45 | 37.11 | $ 21,415 |
| 2015 | (0.51) | 1.40 | 1.76 | | 2.76 | 45.41 | $ 13,175 |
| CLASS R5 SHARES |
| 2020(c) | 0.18(d) | 0.99(d) | 1.20(d) | | (13.87) | 20.82 | $ 27,268 |
| 2019 | 1.04 | 0.99 | 1.27 | | (5.45) | 29.12 | $ 42,354 |
| 2018 | 1.82 | 0.99 | 1.16 | | (2.92) | 41.99 | $ 70,084 |
| 2017 | 0.79 | 0.99 | 1.16 | | 25.29 | 43.70 | $ 80,704 |
| 2016 | 1.38 | 0.99 | 1.07 | | 2.91 | 37.11 | $ 60,252 |
| 2015 | (0.11) | 0.98 | 1.02 | | 3.17 | 45.41 | $ 108,654 |
| CLASS R6 SHARES |
| 2020(c) | 0.34(d) | 0.85(d) | 1.02(d) | | (13.79) | 20.82 | $ 35,631 |
| 2019 | 1.17 | 0.85 | 1.00 | | (5.34) | 29.12 | $ 45,699 |
| 2018 | 2.93 | 0.85 | 0.98 | | (2.75) | 41.99 | $ 51,836 |
| 2017(e) | 0.77(d) | 0.85(d) | 13.31(d)(f) | | 10.02 | 43.70 | $ 1,576 |
Thornburg Equity Funds Semi-Annual Report | 121
Financial Highlights
International Value Fund
| | PER SHARE PERFORMANCE (FOR A SHARE OUTSTANDING THROUGHOUT THE PERIOD) |
UNLESS OTHERWISE
NOTED, PERIODS ARE
FISCAL YEARS ENDED
SEPTEMBER 30, | Net Asset
Value,
Beginning of
PERIOD | Net
Investment
Income
(Loss)+ | Net Realized &
Unrealized Gain
(Loss) on
Investments | Total from
Investment
Operations | Dividends
from Net
Investment
Income | Dividends
from Net
Realized
Gains | Total
Dividends | Net Asset
Value,
End of PERIOD |
| CLASS A SHARES(b) |
| 2020(c) | $ 22.91 | 0.01 | (2.70) | (2.69) | (0.21) | (1.28) | (1.49) | $ 18.73 |
| 2019 | $ 22.69 | 0.19 | 0.31 | 0.50 | (0.28) | — | (0.28) | $ 22.91 |
| 2018 | $ 27.63 | 0.19 | (1.10) | (0.91) | — | (4.03) | (4.03) | $ 22.69 |
| 2017 | $ 23.43 | 0.16 | 4.24 | 4.40 | (0.20) | — | (0.20) | $ 27.63 |
| 2016(e) | $ 27.46 | 0.36 | 0.25 | 0.61 | (0.39) | (4.25) | (4.64) | $ 23.43 |
| 2015 | $ 29.84 | 0.24 | 0.16 | 0.40 | (0.26) | (2.52) | (2.78) | $ 27.46 |
| CLASS C SHARES |
| 2020(c) | $ 20.33 | (0.06) | (2.38) | (2.44) | — | (1.28) | (1.28) | $ 16.61 |
| 2019 | $ 20.01 | —(f) | 0.32 | 0.32 | — | — | — | $ 20.33 |
| 2018 | $ 25.00 | 0.02 | (0.98) | (0.96) | — | (4.03) | (4.03) | $ 20.01 |
| 2017 | $ 21.29 | (0.02) | 3.84 | 3.82 | (0.11) | — | (0.11) | $ 25.00 |
| 2016 | $ 25.40 | 0.17 | 0.24 | 0.41 | (0.27) | (4.25) | (4.52) | $ 21.29 |
| 2015 | $ 27.86 | 0.05 | 0.11 | 0.16 | (0.10) | (2.52) | (2.62) | $ 25.40 |
| CLASS I SHARES |
| 2020(c) | $ 23.69 | 0.05 | (2.79) | (2.74) | (0.28) | (1.28) | (1.56) | $ 19.39 |
| 2019 | $ 23.47 | 0.25 | 0.32 | 0.57 | (0.35) | — | (0.35) | $ 23.69 |
| 2018 | $ 28.37 | 0.29 | (1.15) | (0.86) | (0.01) | (4.03) | (4.04) | $ 23.47 |
| 2017 | $ 24.02 | 0.25 | 4.37 | 4.62 | (0.27) | — | (0.27) | $ 28.37 |
| 2016 | $ 28.04 | 0.47 | 0.23 | 0.70 | (0.47) | (4.25) | (4.72) | $ 24.02 |
| 2015 | $ 30.43 | 0.38 | 0.13 | 0.51 | (0.38) | (2.52) | (2.90) | $ 28.04 |
| CLASS R3 SHARES |
| 2020(c) | $ 22.89 | (0.01) | (2.70) | (2.71) | (0.16) | (1.28) | (1.44) | $ 18.74 |
| 2019 | $ 22.65 | 0.15 | 0.31 | 0.46 | (0.22) | — | (0.22) | $ 22.89 |
| 2018 | $ 27.63 | 0.14 | (1.09) | (0.95) | — | (4.03) | (4.03) | $ 22.65 |
| 2017 | $ 23.44 | 0.14 | 4.22 | 4.36 | (0.17) | — | (0.17) | $ 27.63 |
| 2016 | $ 27.47 | 0.31 | 0.25 | 0.56 | (0.34) | (4.25) | (4.59) | $ 23.44 |
| 2015 | $ 29.86 | 0.21 | 0.13 | 0.34 | (0.21) | (2.52) | (2.73) | $ 27.47 |
| CLASS R4 SHARES |
| 2020(c) | $ 22.74 | 0.01 | (2.68) | (2.67) | (0.20) | (1.28) | (1.48) | $ 18.59 |
| 2019 | $ 22.52 | 0.19 | 0.30 | 0.49 | (0.27) | — | (0.27) | $ 22.74 |
| 2018 | $ 27.45 | 0.20 | (1.10) | (0.90) | — | (4.03) | (4.03) | $ 22.52 |
| 2017 | $ 23.26 | 0.18 | 4.21 | 4.39 | (0.20) | — | (0.20) | $ 27.45 |
| 2016 | $ 27.30 | 0.37 | 0.23 | 0.60 | (0.39) | (4.25) | (4.64) | $ 23.26 |
| 2015 | $ 29.69 | 0.25 | 0.15 | 0.40 | (0.27) | (2.52) | (2.79) | $ 27.30 |
| CLASS R5 SHARES |
| 2020(c) | $ 23.67 | 0.04 | (2.78) | (2.74) | (0.28) | (1.28) | (1.56) | $ 19.37 |
| 2019 | $ 23.44 | 0.25 | 0.32 | 0.57 | (0.34) | — | (0.34) | $ 23.67 |
| 2018 | $ 28.35 | 0.27 | (1.15) | (0.88) | —(g) | (4.03) | (4.03) | $ 23.44 |
| 2017 | $ 24.01 | 0.24 | 4.35 | 4.59 | (0.25) | — | (0.25) | $ 28.35 |
| 2016 | $ 28.03 | 0.46 | 0.23 | 0.69 | (0.46) | (4.25) | (4.71) | $ 24.01 |
| 2015 | $ 30.41 | 0.30 | 0.19 | 0.49 | (0.35) | (2.52) | (2.87) | $ 28.03 |
| CLASS R6 SHARES |
| 2020(c) | $ 23.61 | 0.06 | (2.77) | (2.71) | (0.33) | (1.28) | (1.61) | $ 19.29 |
| 2019 | $ 23.40 | 0.31 | 0.29 | 0.60 | (0.39) | — | (0.39) | $ 23.61 |
| 2018 | $ 28.27 | 0.33 | (1.15) | (0.82) | (0.02) | (4.03) | (4.05) | $ 23.40 |
| 2017 | $ 23.95 | 0.31 | 4.33 | 4.64 | (0.32) | — | (0.32) | $ 28.27 |
| 2016 | $ 27.97 | 0.53 | 0.21 | 0.74 | (0.51) | (4.25) | (4.76) | $ 23.95 |
| 2015 | $ 30.36 | 0.39 | 0.17 | 0.56 | (0.43) | (2.52) | (2.95) | $ 27.97 |
| (a) | Not annualized for periods less than one year. |
| (b) | Sales loads are not reflected in computing total return. |
| (c) | Unaudited Six Month Period Ended March 31. |
| (d) | Annualized. |
| (e) | Class B shares converted to Class A shares on August 29, 2016. |
| (f) | Net investment income (loss) was less than $0.01 per share. |
| (g) | Dividends from net investment income per share were less than $(0.01). |
| + | Based on weighted average shares outstanding. |
See notes to financial statements.
122 | Thornburg Equity Funds Semi-Annual Report
Financial Highlights, Continued
International Value Fund
| | RATIOS TO AVERAGE NET ASSETS | | Supplemental Data |
UNLESS OTHERWISE
NOTED, PERIODS ARE
FISCAL YEARS ENDED
SEPTEMBER 30, | Net Investment
Income (Loss) (%) | Expenses, After
Expense
Reductions (%) | Expenses,
Before Expense
Reductions (%) | | Total
Return (%)(a) | Portfolio
Turnover
Rate (%)(a) | Net Assets
at End of PERIOD
(Thousands) |
| CLASS A SHARES(b) |
| 2020(c) | 0.08(d) | 1.23(d) | 1.24(d) | | (12.78) | 39.23 | $ 517,464 |
| 2019 | 0.86 | 1.26 | 1.26 | | 2.47 | 71.09 | $ 655,807 |
| 2018 | 0.77 | 1.27 | 1.27 | | (4.13) | 44.41 | $ 782,371 |
| 2017 | 0.65 | 1.31 | 1.31 | | 18.78 | 86.88 | $ 840,244 |
| 2016(e) | 1.51 | 1.28 | 1.28 | | 1.90 | 103.90 | $ 990,194 |
| 2015 | 0.82 | 1.27 | 1.27 | | 1.25 | 70.88 | $ 1,361,529 |
| CLASS C SHARES |
| 2020(c) | (0.64)(d) | 1.93(d) | 1.94(d) | | (13.00) | 39.23 | $ 52,140 |
| 2019 | (0.02) | 2.09 | 2.09 | | 1.60 | 71.09 | $ 81,401 |
| 2018 | 0.07 | 2.02 | 2.02 | | (4.86) | 44.41 | $ 159,789 |
| 2017 | (0.08) | 2.04 | 2.04 | | 17.94 | 86.88 | $ 400,859 |
| 2016 | 0.77 | 2.02 | 2.02 | | 1.12 | 103.90 | $ 535,169 |
| 2015 | 0.19 | 1.99 | 1.99 | | 0.52 | 70.88 | $ 706,606 |
| CLASS I SHARES |
| 2020(c) | 0.41(d) | 0.91(d) | 0.92(d) | | (12.63) | 39.23 | $ 1,353,710 |
| 2019 | 1.11 | 0.97 | 0.97 | | 2.76 | 71.09 | $ 1,694,780 |
| 2018 | 1.15 | 0.91 | 0.91 | | (3.81) | 44.41 | $ 2,462,564 |
| 2017 | 0.99 | 0.92 | 0.92 | | 19.29 | 86.88 | $ 3,370,930 |
| 2016 | 1.91 | 0.90 | 0.90 | | 2.21 | 103.90 | $ 4,375,955 |
| 2015 | 1.27 | 0.90 | 0.90 | | 1.65 | 70.88 | $ 5,895,731 |
| CLASS R3 SHARES |
| 2020(c) | (0.13)(d) | 1.45(d) | 1.54(d) | | (12.86) | 39.23 | $ 130,681 |
| 2019 | 0.67 | 1.45 | 1.65 | | 2.25 | 71.09 | $ 164,437 |
| 2018 | 0.59 | 1.45 | 1.64 | | (4.29) | 44.41 | $ ���213,007 |
| 2017 | 0.55 | 1.45 | 1.64 | | 18.63 | 86.88 | $ 285,510 |
| 2016 | 1.31 | 1.45 | 1.62 | | 1.67 | 103.90 | $ 325,135 |
| 2015 | 0.71 | 1.45 | 1.58 | | 1.09 | 70.88 | $ 479,223 |
| CLASS R4 SHARES |
| 2020(c) | 0.06(d) | 1.25(d) | 1.30(d) | | (12.78) | 39.23 | $ 90,811 |
| 2019 | 0.88 | 1.25 | 1.44 | | 2.45 | 71.09 | $ 125,363 |
| 2018 | 0.81 | 1.25 | 1.47 | | (4.11) | 44.41 | $ 164,663 |
| 2017 | 0.74 | 1.25 | 1.46 | | 18.90 | 86.88 | $ 209,066 |
| 2016 | 1.55 | 1.25 | 1.39 | | 1.87 | 103.90 | $ 267,623 |
| 2015 | 0.86 | 1.24 | 1.37 | | 1.30 | 70.88 | $ 333,247 |
| CLASS R5 SHARES |
| 2020(c) | 0.36(d) | 0.94(d) | 0.95(d) | | (12.66) | 39.23 | $ 107,542 |
| 2019 | 1.10 | 0.99 | 1.12 | | 2.74 | 71.09 | $ 153,366 |
| 2018 | 1.06 | 0.99 | 1.17 | | (3.87) | 44.41 | $ 229,485 |
| 2017 | 0.96 | 0.99 | 1.15 | | 19.17 | 86.88 | $ 298,970 |
| 2016 | 1.88 | 0.95 | 0.95 | | 2.19 | 103.90 | $ 529,330 |
| 2015 | 1.01 | 0.98 | 1.11 | | 1.57 | 70.88 | $ 685,617 |
| CLASS R6 SHARES |
| 2020(c) | 0.53(d) | 0.79(d) | 0.90(d) | | (12.59) | 39.23 | $ 186,146 |
| 2019 | 1.37 | 0.79 | 0.88 | | 2.95 | 71.09 | $ 219,441 |
| 2018 | 1.33 | 0.79 | 0.83 | | (3.68) | 44.41 | $ 457,006 |
| 2017 | 1.23 | 0.78 | 0.79 | | 19.40 | 86.88 | $ 536,296 |
| 2016 | 2.19 | 0.74 | 0.74 | | 2.40 | 103.90 | $ 473,941 |
| 2015 | 1.33 | 0.74 | 0.74 | | 1.81 | 70.88 | $ 420,849 |
Thornburg Equity Funds Semi-Annual Report | 123
Financial Highlights
Better World International Fund
| | PER SHARE PERFORMANCE (FOR A SHARE OUTSTANDING THROUGHOUT THE PERIOD) |
UNLESS OTHERWISE
NOTED, PERIODS ARE
FISCAL YEARS ENDED
SEPTEMBER 30, | Net Asset
Value,
Beginning of
PERIOD | Net
Investment
Income
(Loss)+ | Net Realized &
Unrealized Gain
(Loss) on
Investments | Total from
Investment
Operations | Dividends
from Net
Investment
Income | Dividends
from Net
Realized
Gains | Total
Dividends | Net Asset
Value,
End of PERIOD |
| CLASS A SHARES(b) |
| 2020(c) | $ 12.85 | (0.03) | (1.31) | (1.34) | (0.09) | — | (0.09) | $ 11.42 |
| 2019 | $ 14.51 | 0.12 | (0.66) | (0.54) | (0.15) | (0.97) | (1.12) | $ 12.85 |
| 2018 | $ 14.13 | 0.09 | 0.66 | 0.75 | — | (0.37) | (0.37) | $ 14.51 |
| 2017 | $ 13.86 | 0.09 | 0.99 | 1.08 | (0.12) | (0.69) | (0.81) | $ 14.13 |
| 2016(e) | $ 11.94 | 0.03 | 2.04 | 2.07 | (0.15) | — | (0.15) | $ 13.86 |
| CLASS C SHARES |
| 2020(c) | $ 12.72 | (0.07) | (1.30) | (1.37) | (0.01) | — | (0.01) | $ 11.34 |
| 2019 | $ 14.32 | 0.03 | (0.62) | (0.59) | (0.04) | (0.97) | (1.01) | $ 12.72 |
| 2018 | $ 14.02 | —(g) | 0.67 | 0.67 | — | (0.37) | (0.37) | $ 14.32 |
| 2017 | $ 13.79 | 0.02 | 0.97 | 0.99 | (0.07) | (0.69) | (0.76) | $ 14.02 |
| 2016(e) | $ 11.94 | (0.05) | 2.04 | 1.99 | (0.14) | — | (0.14) | $ 13.79 |
| CLASS I SHARES |
| 2020(c) | $ 13.16 | 0.01 | (1.32) | (1.31) | (0.19) | — | (0.19) | $ 11.66 |
| 2019 | $ 14.83 | 0.20 | (0.67) | (0.47) | (0.23) | (0.97) | (1.20) | $ 13.16 |
| 2018 | $ 14.33 | 0.18 | 0.69 | 0.87 | — | (0.37) | (0.37) | $ 14.83 |
| 2017 | $ 13.96 | 0.20 | 1.02 | 1.22 | (0.16) | (0.69) | (0.85) | $ 14.33 |
| 2016(e) | $ 11.94 | 0.10 | 2.01 | 2.11 | (0.09) | — | (0.09) | $ 13.96 |
| (a) | Not annualized for periods less than one year. |
| (b) | Sales loads are not reflected in computing total return. |
| (c) | Unaudited Six Month Period Ended March 31. |
| (d) | Annualized. |
| (e) | Fund commenced operations on October 1, 2015. |
| (f) | Due to the size of net assets and fixed expenses, ratios may appear disproportionate. |
| (g) | Net investment income (loss) was less than $0.01 per share. |
| + | Based on weighted average shares outstanding. |
See notes to financial statements.
124 | Thornburg Equity Funds Semi-Annual Report
Financial Highlights, Continued
Better World International Fund
| | RATIOS TO AVERAGE NET ASSETS | | Supplemental Data |
UNLESS OTHERWISE
NOTED, PERIODS ARE
FISCAL YEARS ENDED
SEPTEMBER 30, | Net Investment
Income (Loss) (%) | Expenses, After
Expense
Reductions (%) | Expenses,
Before Expense
Reductions (%) | | Total
Return (%)(a) | Portfolio
Turnover
Rate (%)(a) | Net Assets
at End of PERIOD
(Thousands) |
| CLASS A SHARES(b) |
| 2020(c) | (0.52)(d) | 1.78(d) | 1.92(d) | | (10.56) | 29.97 | $ 7,915 |
| 2019 | 0.91 | 1.82 | 2.10 | | (3.19) | 62.33 | $ 9,378 |
| 2018 | 0.64 | 1.82 | 2.12 | | 5.37 | 111.99 | $ 8,537 |
| 2017 | 0.64 | 1.79 | 3.21 | | 8.61 | 105.55 | $ 6,450 |
| 2016(e) | 0.21 | 1.83 | 7.27(f) | | 16.60 | 180.60 | $ 1,666 |
| CLASS C SHARES |
| 2020(c) | (1.10)(d) | 2.38(d) | 3.35(d) | | (10.79) | 29.97 | $ 1,574 |
| 2019 | 0.25 | 2.38 | 3.48 | | (3.75) | 62.33 | $ 1,687 |
| 2018 | (0.03) | 2.38 | 3.09 | | 4.82 | 111.99 | $ 2,292 |
| 2017 | 0.18 | 2.32 | 4.48 | | 7.97 | 105.55 | $ 2,205 |
| 2016(e) | (0.40) | 2.38 | 13.13(f) | | 15.94 | 180.60 | $ 822 |
| CLASS I SHARES |
| 2020(c) | 0.18(d) | 1.09(d) | 1.43(d) | | (10.25) | 29.97 | $ 52,619 |
| 2019 | 1.57 | 1.09 | 1.44 | | (2.54) | 62.33 | $ 59,833 |
| 2018 | 1.20 | 1.09 | 1.35 | | 6.15 | 111.99 | $ 55,989 |
| 2017 | 1.48 | 0.94 | 1.62 | | 9.58 | 105.55 | $ 59,951 |
| 2016(e) | 0.76 | 1.09 | 2.28 | | 17.44 | 180.60 | $ 27,781 |
Thornburg Equity Funds Semi-Annual Report | 125
Financial Highlights
International Growth Fund
| | PER SHARE PERFORMANCE (FOR A SHARE OUTSTANDING THROUGHOUT THE PERIOD) |
UNLESS OTHERWISE
NOTED, PERIODS ARE
FISCAL YEARS ENDED
SEPTEMBER 30, | Net Asset
Value,
Beginning of
PERIOD | Net
Investment
Income
(Loss)+ | Net Realized &
Unrealized Gain
(Loss) on
Investments | Total from
Investment
Operations | Dividends
from Net
Investment
Income | Dividends
from Net
Realized
Gains | Total
Dividends | Net Asset
Value,
End of PERIOD |
| CLASS A SHARES(b) |
| 2020(c) | $ 21.46 | (0.03) | (1.19) | (1.22) | —(d) | (0.11) | (0.11) | $ 20.13 |
| 2019 | $ 23.78 | —(f) | (1.55) | (1.55) | (0.02) | (0.75) | (0.77) | $ 21.46 |
| 2018 | $ 23.85 | 0.02 | 0.72 | 0.74 | (0.05) | (0.76) | (0.81) | $ 23.78 |
| 2017 | $ 19.22 | (0.01) | 4.65 | 4.64 | (0.01) | — | (0.01) | $ 23.85 |
| 2016 | $ 17.78 | —(f) | 1.45 | 1.45 | (0.01) | — | (0.01) | $ 19.22 |
| 2015 | $ 19.10 | (0.01) | (0.33) | (0.34) | — | (0.98) | (0.98) | $ 17.78 |
| CLASS C SHARES |
| 2020(c) | $ 19.87 | (0.11) | (1.09) | (1.20) | — | (0.11) | (0.11) | $ 18.56 |
| 2019 | $ 22.21 | (0.15) | (1.44) | (1.59) | — | (0.75) | (0.75) | $ 19.87 |
| 2018 | $ 22.50 | (0.15) | 0.67 | 0.52 | (0.05) | (0.76) | (0.81) | $ 22.21 |
| 2017 | $ 18.26 | (0.13) | 4.37 | 4.24 | — | — | — | $ 22.50 |
| 2016 | $ 17.01 | (0.13) | 1.38 | 1.25 | — | — | — | $ 18.26 |
| 2015 | $ 18.45 | (0.14) | (0.32) | (0.46) | — | (0.98) | (0.98) | $ 17.01 |
| CLASS I SHARES |
| 2020(c) | $ 22.13 | —(f) | (1.22) | (1.22) | (0.07) | (0.11) | (0.18) | $ 20.73 |
| 2019 | $ 24.51 | 0.07 | (1.60) | (1.53) | (0.10) | (0.75) | (0.85) | $ 22.13 |
| 2018 | $ 24.48 | 0.12 | 0.72 | 0.84 | (0.05) | (0.76) | (0.81) | $ 24.51 |
| 2017 | $ 19.69 | 0.10 | 4.75 | 4.85 | (0.06) | — | (0.06) | $ 24.48 |
| 2016 | $ 18.20 | 0.08 | 1.49 | 1.57 | (0.08) | — | (0.08) | $ 19.69 |
| 2015 | $ 19.51 | 0.09 | (0.37) | (0.28) | (0.05) | (0.98) | (1.03) | $ 18.20 |
| CLASS R3 SHARES |
| 2020(c) | $ 21.23 | (0.06) | (1.17) | (1.23) | — | (0.11) | (0.11) | $ 19.89 |
| 2019 | $ 23.54 | (0.04) | (1.52) | (1.56) | — | (0.75) | (0.75) | $ 21.23 |
| 2018 | $ 23.66 | (0.02) | 0.71 | 0.69 | (0.05) | (0.76) | (0.81) | $ 23.54 |
| 2017 | $ 19.07 | (0.01) | 4.60 | 4.59 | — | — | — | $ 23.66 |
| 2016 | $ 17.66 | —(f) | 1.42 | 1.42 | (0.01) | — | (0.01) | $ 19.07 |
| 2015 | $ 18.99 | (0.02) | (0.33) | (0.35) | — | (0.98) | (0.98) | $ 17.66 |
| CLASS R4 SHARES |
| 2020(c) | $ 21.34 | (0.04) | (1.19) | (1.23) | — | (0.11) | (0.11) | $ 20.00 |
| 2019 | $ 23.63 | (0.02) | (1.52) | (1.54) | — | (0.75) | (0.75) | $ 21.34 |
| 2018 | $ 23.73 | (0.01) | 0.72 | 0.71 | (0.05) | (0.76) | (0.81) | $ 23.63 |
| 2017 | $ 19.11 | 0.01 | 4.61 | 4.62 | —(d) | — | — | $ 23.73 |
| 2016 | $ 17.68 | 0.01 | 1.43 | 1.44 | (0.01) | — | (0.01) | $ 19.11 |
| 2015 | $ 19.00 | 0.02 | (0.36) | (0.34) | — | (0.98) | (0.98) | $ 17.68 |
| CLASS R5 SHARES |
| 2020(c) | $ 22.19 | —(f) | (1.22) | (1.22) | (0.07) | (0.11) | (0.18) | $ 20.79 |
| 2019 | $ 24.58 | 0.07 | (1.61) | (1.54) | (0.10) | (0.75) | (0.85) | $ 22.19 |
| 2018 | $ 24.54 | 0.10 | 0.75 | 0.85 | (0.05) | (0.76) | (0.81) | $ 24.58 |
| 2017 | $ 19.73 | 0.08 | 4.79 | 4.87 | (0.06) | — | (0.06) | $ 24.54 |
| 2016 | $ 18.25 | 0.09 | 1.47 | 1.56 | (0.08) | — | (0.08) | $ 19.73 |
| 2015 | $ 19.55 | 0.09 | (0.36) | (0.27) | (0.05) | (0.98) | (1.03) | $ 18.25 |
| CLASS R6 SHARES |
| 2020(c) | $ 22.26 | 0.02 | (1.23) | (1.21) | (0.10) | (0.11) | (0.21) | $ 20.84 |
| 2019 | $ 24.65 | 0.10 | (1.61) | (1.51) | (0.13) | (0.75) | (0.88) | $ 22.26 |
| 2018 | $ 24.59 | 0.21 | 0.66 | 0.87 | (0.05) | (0.76) | (0.81) | $ 24.65 |
| 2017 | $ 19.77 | 0.09 | 4.81 | 4.90 | (0.08) | — | (0.08) | $ 24.59 |
| 2016 | $ 18.29 | 0.11 | 1.47 | 1.58 | (0.10) | — | (0.10) | $ 19.77 |
| 2015 | $ 19.59 | 0.13 | (0.38) | (0.25) | (0.07) | (0.98) | (1.05) | $ 18.29 |
| (a) | Not annualized for periods less than one year. |
| (b) | Sales loads are not reflected in computing total return. |
| (c) | Unaudited Six Month Period Ended March 31. |
| (d) | Dividends from net investment income per share were less than $(0.01). |
| (e) | Annualized. |
| (f) | Net investment income (loss) was less than $0.01 per share. |
| + | Based on weighted average shares outstanding. |
See notes to financial statements.
126 | Thornburg Equity Funds Semi-Annual Report
Financial Highlights, Continued
International Growth Fund
| | RATIOS TO AVERAGE NET ASSETS | | Supplemental Data |
UNLESS OTHERWISE
NOTED, PERIODS ARE
FISCAL YEARS ENDED
SEPTEMBER 30, | Net Investment
Income (Loss) (%) | Expenses, After
Expense
Reductions (%) | Expenses,
Before Expense
Reductions (%) | | Total
Return (%)(a) | Portfolio
Turnover
Rate (%)(a) | Net Assets
at End of PERIOD
(Thousands) |
| CLASS A SHARES(b) |
| 2020(c) | (0.26)(e) | 1.30(e) | 1.30(e) | | (5.71) | 20.30 | $ 94,743 |
| 2019 | 0.02 | 1.32 | 1.32 | | (6.36) | 25.83 | $ 107,196 |
| 2018 | 0.09 | 1.32 | 1.32 | | 3.28 | 33.28 | $ 127,863 |
| 2017 | (0.05) | 1.42 | 1.43 | | 24.12 | 60.88 | $ 121,989 |
| 2016 | 0.03 | 1.39 | 1.39 | | 8.23 | 104.60 | $ 169,248 |
| 2015 | (0.06) | 1.42 | 1.42 | | (2.01) | 92.01 | $ 220,897 |
| CLASS C SHARES |
| 2020(c) | (1.05)(e) | 2.06(e) | 2.06(e) | | (6.08) | 20.30 | $ 38,486 |
| 2019 | (0.78) | 2.08 | 2.08 | | (7.04) | 25.83 | $ 47,980 |
| 2018 | (0.65) | 2.08 | 2.08 | | 2.47 | 33.28 | $ 77,262 |
| 2017 | (0.69) | 2.15 | 2.16 | | 23.22 | 60.88 | $ 90,689 |
| 2016 | (0.73) | 2.15 | 2.15 | | 7.35 | 104.60 | $ 98,633 |
| 2015 | (0.77) | 2.20 | 2.20 | | (2.72) | 92.01 | $ 108,062 |
| CLASS I SHARES |
| 2020(c) | 0.04(e) | 0.99(e) | 1.01(e) | | (5.58) | 20.30 | $ 1,037,437 |
| 2019 | 0.34 | 0.99 | 1.03 | | (6.02) | 25.83 | $ 1,203,538 |
| 2018 | 0.47 | 0.99 | 0.99 | | 3.61 | 33.28 | $ 1,470,211 |
| 2017 | 0.50 | 0.99 | 1.03 | | 24.66 | 60.88 | $ 1,128,804 |
| 2016 | 0.45 | 0.99 | 1.00 | | 8.63 | 104.60 | $ 1,030,921 |
| 2015 | 0.47 | 0.99 | 1.01 | | (1.58) | 92.01 | $ 1,079,791 |
| CLASS R3 SHARES |
| 2020(c) | (0.50)(e) | 1.50(e) | 1.91(e) | | (5.83) | 20.30 | $ 4,685 |
| 2019 | (0.17) | 1.50 | 2.02 | | (6.50) | 25.83 | $ 6,274 |
| 2018 | (0.10) | 1.50 | 1.98 | | 3.08 | 33.28 | $ 8,426 |
| 2017 | (0.03) | 1.50 | 2.08 | | 24.07 | 60.88 | $ 10,525 |
| 2016 | (0.02) | 1.50 | 2.04 | | 8.03 | 104.60 | $ 13,086 |
| 2015 | (0.13) | 1.50 | 1.98 | | (2.03) | 92.01 | $ 15,851 |
| CLASS R4 SHARES |
| 2020(c) | (0.36)(e) | 1.40(e) | 1.43(e) | | (5.80) | 20.30 | $ 7,328 |
| 2019 | (0.09) | 1.40 | 1.91 | | (6.39) | 25.83 | $ 7,515 |
| 2018 | (0.02) | 1.40 | 1.88 | | 3.16 | 33.28 | $ 12,644 |
| 2017 | 0.07 | 1.40 | 1.84 | | 24.19 | 60.88 | $ 17,200 |
| 2016 | 0.04 | 1.40 | 1.68 | | 8.17 | 104.60 | $ 40,999 |
| 2015 | 0.10 | 1.40 | 1.65 | | (1.97) | 92.01 | $ 38,038 |
| CLASS R5 SHARES |
| 2020(c) | 0.04(e) | 0.99(e) | 1.23(e) | | (5.57) | 20.30 | $ 25,898 |
| 2019 | 0.32 | 0.99 | 1.29 | | (6.05) | 25.83 | $ 28,729 |
| 2018 | 0.40 | 0.99 | 1.25 | | 3.64 | 33.28 | $ 38,052 |
| 2017 | 0.40 | 0.99 | 1.28 | | 24.68 | 60.88 | $ 45,591 |
| 2016 | 0.45 | 0.99 | 1.21 | | 8.56 | 104.60 | $ 66,271 |
| 2015 | 0.46 | 0.99 | 1.20 | | (1.53) | 92.01 | $ 66,646 |
| CLASS R6 SHARES |
| 2020(c) | 0.15(e) | 0.89(e) | 1.00(e) | | (5.55) | 20.30 | $ 42,433 |
| 2019 | 0.47 | 0.89 | 0.99 | | (5.91) | 25.83 | $ 44,923 |
| 2018 | 0.82 | 0.89 | 0.99 | | 3.72 | 33.28 | $ 51,091 |
| 2017 | 0.44 | 0.89 | 1.03 | | 24.82 | 60.88 | $ 12,261 |
| 2016 | 0.60 | 0.89 | 1.34 | | 8.65 | 104.60 | $ 5,854 |
| 2015 | 0.66 | 0.89 | 1.43 | | (1.43) | 92.01 | $ 4,191 |
Thornburg Equity Funds Semi-Annual Report | 127
Financial Highlights
Developing World Fund
| | PER SHARE PERFORMANCE (FOR A SHARE OUTSTANDING THROUGHOUT THE PERIOD) |
UNLESS OTHERWISE
NOTED, PERIODS ARE
FISCAL YEARS ENDED
SEPTEMBER 30, | Net Asset
Value,
Beginning of
PERIOD | Net
Investment
Income
(Loss)+ | Net Realized &
Unrealized Gain
(Loss) on
Investments | Total from
Investment
Operations | Dividends
from Net
Investment
Income | Dividends
from Net
Realized
Gains | Total
Dividends | Net Asset
Value,
End of PERIOD |
| CLASS A SHARES(b) |
| 2020(c) | $ 20.43 | (0.02) | (3.09) | (3.11) | (0.23) | — | (0.23) | $ 17.09 |
| 2019 | $ 19.13 | 0.23 | 1.22 | 1.45 | (0.15) | — | (0.15) | $ 20.43 |
| 2018 | $ 19.86 | 0.11 | (0.84) | (0.73) | — | — | — | $ 19.13 |
| 2017 | $ 16.98 | 0.09 | 2.89 | 2.98 | (0.10) | — | (0.10) | $ 19.86 |
| 2016 | $ 15.03 | 0.04 | 1.94 | 1.98 | (0.03) | — | (0.03) | $ 16.98 |
| 2015 | $ 18.61 | 0.02 | (3.58) | (3.56) | (0.02) | — | (0.02) | $ 15.03 |
| CLASS C SHARES |
| 2020(c) | $ 19.35 | (0.09) | (2.96) | (3.05) | (0.05) | — | (0.05) | $ 16.25 |
| 2019 | $ 18.10 | 0.06 | 1.19 | 1.25 | — | — | — | $ 19.35 |
| 2018 | $ 18.93 | (0.05) | (0.78) | (0.83) | — | — | — | $ 18.10 |
| 2017 | $ 16.26 | (0.03) | 2.74 | 2.71 | (0.04) | — | (0.04) | $ 18.93 |
| 2016 | $ 14.48 | (0.08) | 1.86 | 1.78 | — | — | — | $ 16.26 |
| 2015 | $ 18.03 | (0.09) | (3.46) | (3.55) | — | — | — | $ 14.48 |
| CLASS I SHARES |
| 2020(c) | $ 20.86 | 0.02 | (3.15) | (3.13) | (0.31) | — | (0.31) | $ 17.42 |
| 2019 | $ 19.55 | 0.31 | 1.24 | 1.55 | (0.24) | — | (0.24) | $ 20.86 |
| 2018 | $ 20.21 | 0.19 | (0.85) | (0.66) | — | — | — | $ 19.55 |
| 2017 | $ 17.26 | 0.19 | 2.92 | 3.11 | (0.16) | — | (0.16) | $ 20.21 |
| 2016 | $ 15.27 | 0.11 | 1.97 | 2.08 | (0.09) | — | (0.09) | $ 17.26 |
| 2015 | $ 18.92 | 0.10 | (3.65) | (3.55) | (0.10) | — | (0.10) | $ 15.27 |
| CLASS R5 SHARES |
| 2020(c) | $ 20.79 | 0.02 | (3.14) | (3.12) | (0.31) | — | (0.31) | $ 17.36 |
| 2019 | $ 19.48 | 0.27 | 1.28 | 1.55 | (0.24) | — | (0.24) | $ 20.79 |
| 2018 | $ 20.14 | 0.19 | (0.85) | (0.66) | — | — | — | $ 19.48 |
| 2017 | $ 17.20 | 0.18 | 2.92 | 3.10 | (0.16) | — | (0.16) | $ 20.14 |
| 2016 | $ 15.22 | 0.12 | 1.96 | 2.08 | (0.10) | — | (0.10) | $ 17.20 |
| 2015 | $ 18.86 | 0.12 | (3.65) | (3.53) | (0.11) | — | (0.11) | $ 15.22 |
| CLASS R6 SHARES |
| 2020(c) | $ 20.88 | 0.03 | (3.15) | (3.12) | (0.33) | — | (0.33) | $ 17.43 |
| 2019 | $ 19.57 | 0.33 | 1.24 | 1.57 | (0.26) | — | (0.26) | $ 20.88 |
| 2018 | $ 20.21 | 0.24 | (0.88) | (0.64) | — | — | — | $ 19.57 |
| 2017 | $ 17.25 | 0.20 | 2.93 | 3.13 | (0.17) | — | (0.17) | $ 20.21 |
| 2016 | $ 15.25 | 0.13 | 1.98 | 2.11 | (0.11) | — | (0.11) | $ 17.25 |
| 2015 | $ 18.91 | 0.15 | (3.68) | (3.53) | (0.13) | — | (0.13) | $ 15.25 |
| (a) | Not annualized for periods less than one year. |
| (b) | Sales loads are not reflected in computing total return. |
| (c) | Unaudited Six Month Period Ended March 31. |
| (d) | Annualized. |
| + | Based on weighted average shares outstanding. |
See notes to financial statements.
128 | Thornburg Equity Funds Semi-Annual Report
Financial Highlights, Continued
Developing World Fund
| | RATIOS TO AVERAGE NET ASSETS | | Supplemental Data |
UNLESS OTHERWISE
NOTED, PERIODS ARE
FISCAL YEARS ENDED
SEPTEMBER 30, | Net Investment
Income (Loss) (%) | Expenses, After
Expense
Reductions (%) | Expenses,
Before Expense
Reductions (%) | | Total
Return (%)(a) | Portfolio
Turnover
Rate (%)(a) | Net Assets
at End of PERIOD
(Thousands) |
| CLASS A SHARES(b) |
| 2020(c) | (0.17)(d) | 1.42(d) | 1.45(d) | | (15.51) | 27.93 | $ 80,481 |
| 2019 | 1.18 | 1.47 | 1.50 | | 7.74 | 43.52 | $ 96,935 |
| 2018 | 0.55 | 1.46 | 1.48 | | (3.68) | 58.28 | $ 112,082 |
| 2017 | 0.54 | 1.52 | 1.60 | | 17.58 | 77.61 | $ 125,427 |
| 2016 | 0.25 | 1.52 | 1.57 | | 13.20 | 94.68 | $ 166,655 |
| 2015 | 0.14 | 1.53 | 1.53 | | (19.12) | 96.74 | $ 207,282 |
| CLASS C SHARES |
| 2020(c) | (0.91)(d) | 2.16(d) | 2.19(d) | | (15.81) | 27.93 | $ 45,940 |
| 2019 | 0.30 | 2.23 | 2.26 | | 6.91 | 43.52 | $ 63,203 |
| 2018 | (0.23) | 2.23 | 2.25 | | (4.38) | 58.28 | $ 80,728 |
| 2017 | (0.16) | 2.26 | 2.34 | | 16.65 | 77.61 | $ 109,227 |
| 2016 | (0.51) | 2.29 | 2.34 | | 12.29 | 94.68 | $ 134,129 |
| 2015 | (0.55) | 2.27 | 2.27 | | (19.69) | 96.74 | $ 154,943 |
| CLASS I SHARES |
| 2020(c) | 0.16(d) | 1.09(d) | 1.15(d) | | (15.37) | 27.93 | $ 524,147 |
| 2019 | 1.53 | 1.09 | 1.19 | | 8.14 | 43.52 | $ 590,196 |
| 2018 | 0.93 | 1.08 | 1.16 | | (3.27) | 58.28 | $ 634,501 |
| 2017 | 1.05 | 1.07 | 1.20 | | 18.06 | 77.61 | $ 793,069 |
| 2016 | 0.70 | 1.07 | 1.16 | | 13.68 | 94.68 | $ 853,866 |
| 2015 | 0.52 | 1.09 | 1.14 | | (18.75) | 96.74 | $ 1,016,898 |
| CLASS R5 SHARES |
| 2020(c) | 0.16(d) | 1.09(d) | 1.75(d) | | (15.37) | 27.93 | $ 2,039 |
| 2019 | 1.38 | 1.09 | 2.07 | | 8.16 | 43.52 | $ 2,430 |
| 2018 | 0.90 | 1.09 | 1.71 | | (3.28) | 58.28 | $ 3,340 |
| 2017 | 1.04 | 1.08 | 1.77 | | 18.06 | 77.61 | $ 5,506 |
| 2016 | 0.74 | 1.08 | 1.75 | | 13.65 | 94.68 | $ 6,208 |
| 2015 | 0.66 | 1.09 | 1.67 | | (18.72) | 96.74 | $ 5,363 |
| CLASS R6 SHARES |
| 2020(c) | 0.26(d) | 0.99(d) | 1.15(d) | | (15.33) | 27.93 | $ 48,607 |
| 2019 | 1.65 | 0.99 | 1.14 | | 8.25 | 43.52 | $ 56,658 |
| 2018 | 1.16 | 0.99 | 1.14 | | (3.17) | 58.28 | $ 56,258 |
| 2017 | 1.14 | 0.97 | 1.13 | | 18.16 | 77.61 | $ 28,652 |
| 2016 | 0.80 | 0.97 | 1.12 | | 13.81 | 94.68 | $ 48,598 |
| 2015 | 0.84 | 0.99 | 1.10 | | (18.68) | 96.74 | $ 21,055 |
Thornburg Equity Funds Semi-Annual Report | 129
Financial Highlights
Value Fund
| | PER SHARE PERFORMANCE (FOR A SHARE OUTSTANDING THROUGHOUT THE PERIOD) |
UNLESS OTHERWISE
NOTED, PERIODS ARE
FISCAL YEARS ENDED
SEPTEMBER 30, | Net Asset
Value,
Beginning of
PERIOD | Net
Investment
Income
(Loss)+ | Net Realized &
Unrealized Gain
(Loss) on
Investments | Total from
Investment
Operations | Dividends
from Net
Investment
Income | Dividends
from Net
Realized
Gains | Total
Dividends | Net Asset
Value,
End of PERIOD |
| CLASS A SHARES(b) |
| 2020(c) | $ 71.81 | 0.10 | (14.19) | (14.09) | (0.18) | — | (0.18) | $ 57.54 |
| 2019 | $ 72.46 | 0.24 | (0.60) | (0.36) | (0.29) | — | (0.29) | $ 71.81 |
| 2018 | $ 65.26 | 0.39 | 7.17 | 7.56 | (0.36) | — | (0.36) | $ 72.46 |
| 2017 | $ 54.08 | 0.16 | 11.04 | 11.20 | (0.02) | — | (0.02) | $ 65.26 |
| 2016(e) | $ 49.17 | 0.32 | 4.76 | 5.08 | (0.17) | — | (0.17) | $ 54.08 |
| 2015 | $ 48.09 | 0.07 | 1.03 | 1.10 | (0.02) | — | (0.02) | $ 49.17 |
| CLASS C SHARES |
| 2020(c) | $ 65.19 | (0.18) | (12.86) | (13.04) | — | — | — | $ 52.15 |
| 2019 | $ 66.03 | (0.31) | (0.53) | (0.84) | — | — | — | $ 65.19 |
| 2018 | $ 59.87 | (0.11) | 6.52 | 6.41 | (0.25) | — | (0.25) | $ 66.03 |
| 2017 | $ 49.97 | (0.27) | 10.17 | 9.90 | — | — | — | $ 59.87 |
| 2016 | $ 45.63 | (0.06) | 4.40 | 4.34 | — | — | — | $ 49.97 |
| 2015 | $ 44.95 | (0.29) | 0.97 | 0.68 | — | — | — | $ 45.63 |
| CLASS I SHARES |
| 2020(c) | $ 74.04 | 0.22 | (14.59) | (14.37) | (0.43) | — | (0.43) | $ 59.24 |
| 2019 | $ 74.70 | 0.49 | (0.65) | (0.16) | (0.50) | — | (0.50) | $ 74.04 |
| 2018 | $ 67.10 | 0.64 | 7.38 | 8.02 | (0.42) | — | (0.42) | $ 74.70 |
| 2017 | $ 55.58 | 0.42 | 11.35 | 11.77 | (0.25) | — | (0.25) | $ 67.10 |
| 2016 | $ 50.53 | 0.54 | 4.90 | 5.44 | (0.39) | — | (0.39) | $ 55.58 |
| 2015 | $ 49.28 | 0.28 | 1.04 | 1.32 | (0.07) | — | (0.07) | $ 50.53 |
| CLASS R3 SHARES |
| 2020(c) | $ 71.44 | 0.08 | (14.12) | (14.04) | (0.14) | — | (0.14) | $ 57.26 |
| 2019 | $ 72.02 | 0.23 | (0.59) | (0.36) | (0.22) | — | (0.22) | $ 71.44 |
| 2018 | $ 64.88 | 0.39 | 7.11 | 7.50 | (0.36) | — | (0.36) | $ 72.02 |
| 2017 | $ 53.76 | 0.18 | 10.97 | 11.15 | (0.03) | — | (0.03) | $ 64.88 |
| 2016 | $ 48.86 | 0.34 | 4.74 | 5.08 | (0.18) | — | (0.18) | $ 53.76 |
| 2015 | $ 47.79 | 0.08 | 1.01 | 1.09 | (0.02) | — | (0.02) | $ 48.86 |
| CLASS R4 SHARES |
| 2020(c) | $ 72.25 | 0.12 | (14.28) | (14.16) | (0.21) | — | (0.21) | $ 57.88 |
| 2019 | $ 72.83 | 0.30 | (0.60) | (0.30) | (0.28) | — | (0.28) | $ 72.25 |
| 2018 | $ 65.55 | 0.47 | 7.19 | 7.66 | (0.38) | — | (0.38) | $ 72.83 |
| 2017 | $ 54.31 | 0.25 | 11.08 | 11.33 | (0.09) | — | (0.09) | $ 65.55 |
| 2016 | $ 49.36 | 0.40 | 4.78 | 5.18 | (0.23) | — | (0.23) | $ 54.31 |
| 2015 | $ 48.24 | 0.14 | 1.01 | 1.15 | (0.03) | — | (0.03) | $ 49.36 |
| CLASS R5 SHARES |
| 2020(c) | $ 73.93 | 0.22 | (14.57) | (14.35) | (0.43) | — | (0.43) | $ 59.15 |
| 2019 | $ 74.60 | 0.49 | (0.66) | (0.17) | (0.50) | — | (0.50) | $ 73.93 |
| 2018 | $ 67.01 | 0.63 | 7.38 | 8.01 | (0.42) | — | (0.42) | $ 74.60 |
| 2017 | $ 55.50 | 0.41 | 11.35 | 11.76 | (0.25) | — | (0.25) | $ 67.01 |
| 2016 | $ 50.45 | 0.53 | 4.90 | 5.43 | (0.38) | — | (0.38) | $ 55.50 |
| 2015 | $ 49.21 | 0.27 | 1.04 | 1.31 | (0.07) | — | (0.07) | $ 50.45 |
| (a) | Not annualized for periods less than one year. |
| (b) | Sales loads are not reflected in computing total return. |
| (c) | Unaudited Six Month Period Ended March 31. |
| (d) | Annualized. |
| (e) | Class B shares converted to Class A shares on August 29, 2016. |
| + | Based on weighted average shares outstanding. |
See notes to financial statements.
130 | Thornburg Equity Funds Semi-Annual Report
Financial Highlights, Continued
Value Fund
| | RATIOS TO AVERAGE NET ASSETS | | Supplemental Data |
UNLESS OTHERWISE
NOTED, PERIODS ARE
FISCAL YEARS ENDED
SEPTEMBER 30, | Net Investment
Income (Loss) (%) | Expenses, After
Expense
Reductions (%) | Expenses,
Before Expense
Reductions (%) | | Total
Return (%)(a) | Portfolio
Turnover
Rate (%)(a) | Net Assets
at End of PERIOD
(Thousands) |
| CLASS A SHARES(b) |
| 2020(c) | 0.26(d) | 1.30(d) | 1.30(d) | | (19.69) | 10.11 | $ 319,893 |
| 2019 | 0.35 | 1.33 | 1.33 | | (0.42) | 24.94 | $ 425,218 |
| 2018 | 0.56 | 1.33 | 1.33 | | 11.62 | 57.33 | $ 473,740 |
| 2017 | 0.27 | 1.39 | 1.39 | | 20.72 | 43.53 | $ 383,118 |
| 2016(e) | 0.63 | 1.39 | 1.39 | | 10.33 | 31.10 | $ 374,237 |
| 2015 | 0.14 | 1.37 | 1.37 | | 2.28 | 59.70 | $ 377,299 |
| CLASS C SHARES |
| 2020(c) | (0.53)(d) | 2.10(d) | 2.10(d) | | (20.02) | 10.11 | $ 23,699 |
| 2019 | (0.50) | 2.19 | 2.19 | | (1.26) | 24.94 | $ 35,934 |
| 2018 | (0.17) | 2.11 | 2.11 | | 10.73 | 57.33 | $ 52,023 |
| 2017 | (0.49) | 2.14 | 2.14 | | 19.81 | 43.53 | $ 160,663 |
| 2016 | (0.12) | 2.14 | 2.14 | | 9.51 | 31.10 | $ 168,821 |
| 2015 | (0.61) | 2.12 | 2.12 | | 1.51 | 59.70 | $ 168,321 |
| CLASS I SHARES |
| 2020(c) | 0.58(d) | 0.99(d) | 1.04(d) | | (19.56) | 10.11 | $ 269,501 |
| 2019 | 0.70 | 0.99 | 1.07 | | (0.07) | 24.94 | $ 360,070 |
| 2018 | 0.90 | 0.99 | 1.06 | | 12.00 | 57.33 | $ 422,302 |
| 2017 | 0.68 | 0.99 | 1.06 | | 21.20 | 43.53 | $ 368,790 |
| 2016 | 1.02 | 0.99 | 1.07 | | 10.77 | 31.10 | $ 280,570 |
| 2015 | 0.53 | 0.99 | 1.06 | | 2.68 | 59.70 | $ 288,642 |
| CLASS R3 SHARES |
| 2020(c) | 0.22(d) | 1.35(d) | 1.66(d) | | (19.71) | 10.11 | $ 21,327 |
| 2019 | 0.34 | 1.35 | 1.79 | | (0.43) | 24.94 | $ 29,601 |
| 2018 | 0.57 | 1.35 | 1.78 | | 11.60 | 57.33 | $ 39,211 |
| 2017 | 0.30 | 1.35 | 1.82 | | 20.75 | 43.53 | $ 45,668 |
| 2016 | 0.67 | 1.35 | 1.81 | | 10.40 | 31.10 | $ 50,089 |
| 2015 | 0.16 | 1.35 | 1.77 | | 2.28 | 59.70 | $ 59,150 |
| CLASS R4 SHARES |
| 2020(c) | 0.32(d) | 1.25(d) | 1.61(d) | | (19.67) | 10.11 | $ 3,899 |
| 2019 | 0.44 | 1.25 | 1.75 | | (0.33) | 24.94 | $ 6,434 |
| 2018 | 0.68 | 1.25 | 1.77 | | 11.72 | 57.33 | $ 7,868 |
| 2017 | 0.42 | 1.24 | 1.78 | | 20.87 | 43.53 | $ 10,159 |
| 2016 | 0.78 | 1.25 | 1.75 | | 10.50 | 31.10 | $ 9,539 |
| 2015 | 0.26 | 1.25 | 1.67 | | 2.39 | 59.70 | $ 10,167 |
| CLASS R5 SHARES |
| 2020(c) | 0.58(d) | 0.99(d) | 1.32(d) | | (19.57) | 10.11 | $ 13,184 |
| 2019 | 0.70 | 0.99 | 1.43 | | (0.07) | 24.94 | $ 18,119 |
| 2018 | 0.89 | 0.99 | 1.38 | | 12.00 | 57.33 | $ 19,085 |
| 2017 | 0.68 | 0.99 | 1.42 | | 21.21 | 43.53 | $ 17,060 |
| 2016 | 1.00 | 0.99 | 1.46 | | 10.78 | 31.10 | $ 14,738 |
| 2015 | 0.51 | 0.99 | 1.20 | | 2.65 | 59.70 | $ 19,270 |
Thornburg Equity Funds Semi-Annual Report | 131
Financial Highlights
Growth Fund
| | PER SHARE PERFORMANCE (FOR A SHARE OUTSTANDING THROUGHOUT THE PERIOD) |
UNLESS OTHERWISE
NOTED, PERIODS ARE
FISCAL YEARS ENDED
SEPTEMBER 30, | Net Asset
Value,
Beginning of
PERIOD | Net
Investment
Income
(Loss)+ | Net Realized &
Unrealized Gain
(Loss) on
Investments | Total from
Investment
Operations | Dividends
from Net
Investment
Income | Dividends
from Net
Realized
Gains | Total
Dividends | Net Asset
Value,
End of PERIOD |
| CLASS A SHARES(b) |
| 2020(c) | $ 39.37 | (0.11) | (1.73) | (1.84) | — | (3.62) | (3.62) | $ 33.91 |
| 2019 | $ 40.43 | (0.17) | (0.89) | (1.06) | — | — | — | $ 39.37 |
| 2018 | $ 32.46 | (0.21) | 8.18 | 7.97 | — | — | — | $ 40.43 |
| 2017 | $ 28.22 | (0.24) | 4.48 | 4.24 | — | — | — | $ 32.46 |
| 2016 | $ 26.09 | (0.27) | 2.40 | 2.13 | — | — | — | $ 28.22 |
| 2015 | $ 26.44 | (0.26) | (0.09) | (0.35) | — | — | — | $ 26.09 |
| CLASS C SHARES |
| 2020(c) | $ 33.91 | (0.22) | (1.44) | (1.66) | — | (3.62) | (3.62) | $ 28.63 |
| 2019 | $ 35.11 | (0.42) | (0.78) | (1.20) | — | — | — | $ 33.91 |
| 2018 | $ 28.43 | (0.42) | 7.10 | 6.68 | — | — | — | $ 35.11 |
| 2017 | $ 24.90 | (0.41) | 3.94 | 3.53 | — | — | — | $ 28.43 |
| 2016 | $ 23.20 | (0.41) | 2.11 | 1.70 | — | — | — | $ 24.90 |
| 2015 | $ 23.69 | (0.42) | (0.07) | (0.49) | — | — | — | $ 23.20 |
| CLASS I SHARES |
| 2020(c) | $ 42.35 | (0.04) | (1.90) | (1.94) | — | (3.62) | (3.62) | $ 36.79 |
| 2019 | $ 43.33 | (0.03) | (0.95) | (0.98) | — | — | — | $ 42.35 |
| 2018 | $ 34.67 | (0.08) | 8.74 | 8.66 | — | — | — | $ 43.33 |
| 2017 | $ 30.01 | (0.12) | 4.78 | 4.66 | — | — | — | $ 34.67 |
| 2016 | $ 27.64 | (0.17) | 2.54 | 2.37 | — | — | — | $ 30.01 |
| 2015 | $ 27.90 | (0.16) | (0.10) | (0.26) | — | — | — | $ 27.64 |
| CLASS R3 SHARES |
| 2020(c) | $ 39.05 | (0.14) | (1.71) | (1.85) | — | (3.62) | (3.62) | $ 33.58 |
| 2019 | $ 40.16 | (0.23) | (0.88) | (1.11) | — | — | — | $ 39.05 |
| 2018 | $ 32.30 | (0.26) | 8.12 | 7.86 | — | — | — | $ 40.16 |
| 2017 | $ 28.10 | (0.27) | 4.47 | 4.20 | — | — | — | $ 32.30 |
| 2016 | $ 26.01 | (0.29) | 2.38 | 2.09 | — | — | — | $ 28.10 |
| 2015 | $ 26.39 | (0.29) | (0.09) | (0.38) | — | — | — | $ 26.01 |
| CLASS R4 SHARES |
| 2020(c) | $ 39.49 | (0.12) | (1.74) | (1.86) | — | (3.62) | (3.62) | $ 34.01 |
| 2019 | $ 40.56 | (0.19) | (0.88) | (1.07) | — | — | — | $ 39.49 |
| 2018 | $ 32.59 | (0.23) | 8.20 | 7.97 | — | — | — | $ 40.56 |
| 2017 | $ 28.33 | (0.24) | 4.50 | 4.26 | — | — | — | $ 32.59 |
| 2016 | $ 26.19 | (0.27) | 2.41 | 2.14 | — | — | — | $ 28.33 |
| 2015 | $ 26.54 | (0.26) | (0.09) | (0.35) | — | — | — | $ 26.19 |
| CLASS R5 SHARES |
| 2020(c) | $ 42.31 | (0.04) | (1.90) | (1.94) | — | (3.62) | (3.62) | $ 36.75 |
| 2019 | $ 43.29 | (0.04) | (0.94) | (0.98) | — | — | — | $ 42.31 |
| 2018 | $ 34.64 | (0.08) | 8.73 | 8.65 | — | — | — | $ 43.29 |
| 2017 | $ 29.98 | (0.12) | 4.78 | 4.66 | — | — | — | $ 34.64 |
| 2016 | $ 27.61 | (0.17) | 2.54 | 2.37 | — | — | — | $ 29.98 |
| 2015 | $ 27.87 | (0.16) | (0.10) | (0.26) | — | — | — | $ 27.61 |
| (a) | Not annualized for periods less than one year. |
| (b) | Sales loads are not reflected in computing total return. |
| (c) | Unaudited Six Month Period Ended March 31. |
| (d) | Annualized. |
| + | Based on weighted average shares outstanding. |
132 | Thornburg Equity Funds Semi-Annual Report
Financial Highlights, Continued
Growth Fund
| | RATIOS TO AVERAGE NET ASSETS | | Supplemental Data |
UNLESS OTHERWISE
NOTED, PERIODS ARE
FISCAL YEARS ENDED
SEPTEMBER 30, | Net Investment
Income (Loss) (%) | Expenses, After
Expense
Reductions (%) | Expenses,
Before Expense
Reductions (%) | | Total
Return (%)(a) | Portfolio
Turnover
Rate (%)(a) | Net Assets
at End of PERIOD
(Thousands) |
| CLASS A SHARES(b) |
| 2020(c) | (0.54)(d) | 1.32(d) | 1.32(d) | | (5.41) | 29.82 | $ 226,080 |
| 2019 | (0.44) | 1.35 | 1.35 | | (2.62) | 40.69 | $ 259,799 |
| 2018 | (0.57) | 1.34 | 1.34 | | 24.55 | 54.98 | $ 296,429 |
| 2017 | (0.79) | 1.40 | 1.40 | | 15.02 | 72.03 | $ 187,062 |
| 2016 | (1.00) | 1.40 | 1.40 | | 8.16 | 86.24 | $ 199,178 |
| 2015 | (0.93) | 1.39 | 1.39 | | (1.32) | 96.02 | $ 234,284 |
| CLASS C SHARES |
| 2020(c) | (1.30)(d) | 2.09(d) | 2.09(d) | | (5.78) | 29.82 | $ 29,578 |
| 2019 | (1.27) | 2.18 | 2.18 | | (3.42) | 40.69 | $ 36,841 |
| 2018 | (1.33) | 2.14 | 2.14 | | 23.50 | 54.98 | $ 53,903 |
| 2017 | (1.56) | 2.16 | 2.16 | | 14.18 | 72.03 | $ 130,165 |
| 2016 | (1.76) | 2.16 | 2.16 | | 7.33 | 86.24 | $ 156,115 |
| 2015 | (1.69) | 2.15 | 2.15 | | (2.07) | 96.02 | $ 176,422 |
| CLASS I SHARES |
| 2020(c) | (0.21)(d) | 0.99(d) | 1.05(d) | | (5.26) | 29.82 | $ 212,335 |
| 2019 | (0.08) | 0.99 | 1.05 | | (2.26) | 40.69 | $ 254,721 |
| 2018 | (0.20) | 0.99 | 1.05 | | 24.98 | 54.98 | $ 286,152 |
| 2017 | (0.37) | 0.99 | 1.05 | | 15.53 | 72.03 | $ 234,922 |
| 2016 | (0.59) | 0.99 | 1.05 | | 8.57 | 86.24 | $ 198,658 |
| 2015 | (0.53) | 0.99 | 1.05 | | (0.93) | 96.02 | $ 244,691 |
| CLASS R3 SHARES |
| 2020(c) | (0.72)(d) | 1.50(d) | 1.69(d) | | (5.49) | 29.82 | $ 24,224 |
| 2019 | (0.60) | 1.50 | 1.80 | | (2.76) | 40.69 | $ 30,084 |
| 2018 | (0.72) | 1.50 | 1.80 | | 24.33 | 54.98 | $ 40,963 |
| 2017 | (0.90) | 1.50 | 1.84 | | 14.95 | 72.03 | $ 47,064 |
| 2016 | (1.10) | 1.50 | 1.81 | | 8.04 | 86.24 | $ 55,809 |
| 2015 | (1.05) | 1.50 | 1.79 | | (1.44) | 96.02 | $ 70,310 |
| CLASS R4 SHARES |
| 2020(c) | (0.64)(d) | 1.40(d) | 2.00(d) | | (5.45) | 29.82 | $ 2,459 |
| 2019 | (0.50) | 1.40 | 1.91 | | (2.64) | 40.69 | $ 4,183 |
| 2018 | (0.62) | 1.40 | 1.97 | | 24.46 | 54.98 | $ 4,484 |
| 2017 | (0.80) | 1.40 | 2.00 | | 15.04 | 72.03 | $ 5,330 |
| 2016 | (1.00) | 1.40 | 1.86 | | 8.17 | 86.24 | $ 6,821 |
| 2015 | (0.94) | 1.40 | 1.82 | | (1.32) | 96.02 | $ 9,632 |
| CLASS R5 SHARES |
| 2020(c) | (0.21)(d) | 0.99(d) | 1.18(d) | | (5.26) | 29.82 | $ 16,980 |
| 2019 | (0.09) | 0.99 | 1.39 | | (2.26) | 40.69 | $ 19,984 |
| 2018 | (0.21) | 0.99 | 1.33 | | 24.97 | 54.98 | $ 31,433 |
| 2017 | (0.38) | 0.99 | 1.34 | | 15.54 | 72.03 | $ 32,197 |
| 2016 | (0.59) | 0.99 | 1.30 | | 8.58 | 86.24 | $ 38,629 |
| 2015 | (0.54) | 0.99 | 1.24 | | (0.93) | 96.02 | $ 45,126 |
Thornburg Equity Funds Semi-Annual Report | 133
Financial Highlights
Long/Short Equity Fund
| | PER SHARE PERFORMANCE (FOR A SHARE OUTSTANDING THROUGHOUT THE PERIOD) |
UNLESS OTHERWISE
NOTED, PERIODS ARE
FISCAL YEARS ENDED
SEPTEMBER 30, | Net Asset
Value,
Beginning of
PERIOD | Net
Investment
Income
(Loss)+ | Net Realized &
Unrealized Gain
(Loss) on
Investments | Total from
Investment
Operations | Dividends
from Net
Investment
Income | Dividends
from Net
Realized
Gains | Total
Dividends | Net Asset
Value,
End of PERIOD |
| CLASS I SHARES |
| 2020(d) | $ 10.81 | (0.09) | (0.53) | (0.62) | — | (0.20) | (0.20) | $ 9.99 |
| 2019 | $ 11.54 | (0.17) | (0.09) | (0.26) | — | (0.47) | (0.47) | $ 10.81 |
| 2018 | $ 11.13 | (0.08) | 0.83 | 0.75 | — | (0.34) | (0.34) | $ 11.54 |
| 2017(g) | $ 10.00 | (0.13) | 1.26 | 1.13 | — | — | — | $ 11.13 |
| (a) | The Fund incurs certain expenses and fees in connection with investments in short positions. If such expenses and fees had not occurred, the Expenses After Expense Reductions ratios for 2020, 2019, 2018 and 2017 would have been 1.48%, 1.50%, 1.48% and 1.45%, respectively. |
| (b) | The Fund incurs certain expenses and fees in connection with investments in short positions. If such expenses and fees had not occurred, the Expenses Before Expense Reductions ratios for 2020, 2019, 2018 and 2017 would have been 1.48%, 1.53%, 1.48% and 1.81%, respectively. |
| (c) | Not annualized for periods less than one year. |
| (d) | Unaudited Six Month Period Ended March 31. |
| (e) | Annualized. |
| (f) | The amounts reported for periods prior to the year ended September 30, 2019 have been revised to include certain expenses and fees in connection with investments in short positions in order to conform to current year presentation. The amounts reported in 2018 and 2017 were 1.48% and 1.45%, respectively. |
| (g) | Fund commenced operations on December 30, 2016. |
| + | Based on weighted average shares outstanding. |
See notes to financial statements.
134 | Thornburg Equity Funds Semi-Annual Report
Financial Highlights, Continued
Long/Short Equity Fund
| | RATIOS TO AVERAGE NET ASSETS | | Supplemental Data |
UNLESS OTHERWISE
NOTED, PERIODS ARE
FISCAL YEARS ENDED
SEPTEMBER 30, | Net Investment
Income (Loss) (%) | Expenses, After
Expense
Reductions (%)(a) | Expenses,
Before Expense
Reductions (%)(b) | | Total
Return (%)(c) | Portfolio
Turnover
Rate (%)(c) | Net Assets
at End of PERIOD
(Thousands) |
| CLASS I SHARES |
| 2020(d) | (1.63)(e) | 3.01(e) | 3.01(e) | | (5.86) | 24.39 | $ 121,949 |
| 2019 | (1.55) | 3.44 | 3.47 | | (2.10) | 71.43 | $ 220,375 |
| 2018 | (0.74) | 2.82(f) | 2.82 | | 6.83 | 65.72 | $ 203,804 |
| 2017(g) | (1.56)(e) | 3.42(e)(f) | 3.78(e) | | 11.30 | 61.69 | $ 79,739 |
Thornburg Equity Funds Semi-Annual Report | 135
Expense Example
March 31, 2020 (Unaudited)
As a shareholder of the Fund, you incur two types of costs:
| (1) | transaction costs, including |
| (a) | sales charges (loads) on purchase payments, for Class A shares; |
| (b) | a deferred sales charge on redemptions of any part or all of a purchase of $1 million of Class A shares within 12 months of purchase; |
| (c) | a deferred sales charge on redemptions of Class C shares within 12 months of purchase; |
| (2) | ongoing costs, including management fees; distribution and/or service (12b-1) fees; and other Fund expenses. |
This example is intended to help you understand your ongoing costs (in dollars) of investing in the Fund and to compare these costs with the ongoing costs of investing in other mutual funds.
The example is based on a $1,000 investment beginning on October 1, 2019, and held until March 31, 2020.
ACTUAL EXPENSES
For each class of shares, the first line of the accompanying table provides information about actual account values and actual expenses. You may use the information in this line, together with the amount you invested, to estimate the expenses that you paid over the period. Simply divide your account value by $1,000 (for example, an $8,600 account value divided by $1,000 = 8.6), then multiply the result by the number in the first line for your class of shares under the heading entitled “Expenses Paid During Period” to estimate the expenses you paid on your account during this period.
HYPOTHETICAL EXAMPLE FOR COMPARISON PURPOSES
For each class of shares, the second line of the accompanying table provides information about hypothetical account values and hypothetical expenses based on the Fund’s actual expense ratio and an assumed rate of return of 5% per year before expenses, which is not the Fund’s actual return. The hypothetical account values and expenses may not be used to estimate the actual ending account balance or expenses you paid for the period. You may use this information to compare the ongoing costs of investing in the Fund and other funds. To do so, compare this 5% hypothetical example with the 5% hypothetical examples that appear in the shareholder reports of the other funds.
Please note that the expenses shown in the table are meant to highlight your ongoing costs only and do not reflect any transactional costs, such as sales charges (loads), redemption fees, or exchange fees. Therefore, the second line of the table for each class of shares is useful in comparing ongoing costs only, and will not help you determine the relative total costs of owning different funds. In addition, if these transactional costs were included, your costs would have been higher.
| | BEGINNING
ACCOUNT VALUE
10/1/19 | ENDING
ACCOUNT VALUE
3/31/20 | EXPENSES PAID
DURING PERIOD†
10/1/19–3/31/20 |
| INCOME BUILDER FUND |
| Class A Shares |
| Actual | $1,000.00 | $779.36 | $4.94 |
| Hypothetical* | $1,000.00 | $1,019.45 | $5.60 |
| Class C Shares |
| Actual | $1,000.00 | $776.17 | $8.21 |
| Hypothetical* | $1,000.00 | $1,015.75 | $9.32 |
| Class I Shares |
| Actual | $1,000.00 | $780.40 | $3.83 |
| Hypothetical* | $1,000.00 | $1,020.70 | $4.34 |
| Class R3 Shares |
| Actual | $1,000.00 | $778.37 | $6.27 |
| Hypothetical* | $1,000.00 | $1,017.95 | $7.11 |
| Class R4 Shares |
| Actual | $1,000.00 | $778.28 | $6.22 |
| Hypothetical* | $1,000.00 | $1,018.00 | $7.06 |
| Class R5 Shares |
| Actual | $1,000.00 | $780.24 | $4.27 |
| Hypothetical* | $1,000.00 | $1,020.20 | $4.85 |
| Class R6 Shares |
| Actual | $1,000.00 | $780.81 | $3.56 |
| Hypothetical* | $1,000.00 | $1,021.00 | $4.04 |
| SUMMIT FUND |
| Class I Shares |
| Actual | $1,000.00 | $944.31 | $5.25 |
| Hypothetical* | $1,000.00 | $1,019.60 | $5.45 |
| GLOBAL OPPORTUNITIES FUND |
| Class A Shares |
| Actual | $1,000.00 | $860.52 | $5.86 |
| Hypothetical* | $1,000.00 | $1,018.70 | $6.36 |
| Class C Shares |
| Actual | $1,000.00 | $857.36 | $9.29 |
| Hypothetical* | $1,000.00 | $1,015.00 | $10.08 |
| Class I Shares |
| Actual | $1,000.00 | $861.51 | $4.61 |
| Hypothetical* | $1,000.00 | $1,020.05 | $5.00 |
| Class R3 Shares |
| Actual | $1,000.00 | $859.24 | $6.97 |
| Hypothetical* | $1,000.00 | $1,017.50 | $7.57 |
| Class R4 Shares |
| Actual | $1,000.00 | $859.57 | $6.51 |
| Hypothetical* | $1,000.00 | $1,018.00 | $7.06 |
| Class R5 Shares |
| Actual | $1,000.00 | $861.26 | $4.61 |
| Hypothetical* | $1,000.00 | $1,020.05 | $5.00 |
| Class R6 Shares |
| Actual | $1,000.00 | $862.06 | $3.96 |
| Hypothetical* | $1,000.00 | $1,020.75 | $4.29 |
136 | Thornburg Equity Funds Semi-Annual Report
Expense Example, Continued
March 31, 2020 (Unaudited)
| | BEGINNING
ACCOUNT VALUE
10/1/19 | ENDING
ACCOUNT VALUE
3/31/20 | EXPENSES PAID
DURING PERIOD†
10/1/19–3/31/20 |
| INTERNATIONAL VALUE FUND |
| Class A Shares |
| Actual | $1,000.00 | $872.22 | $5.76 |
| Hypothetical* | $1,000.00 | $1,018.85 | $6.21 |
| Class C Shares |
| Actual | $1,000.00 | $869.96 | $9.02 |
| Hypothetical* | $1,000.00 | $1,015.35 | $9.72 |
| Class I Shares |
| Actual | $1,000.00 | $873.70 | $4.26 |
| Hypothetical* | $1,000.00 | $1,020.45 | $4.60 |
| Class R3 Shares |
| Actual | $1,000.00 | $871.38 | $6.78 |
| Hypothetical* | $1,000.00 | $1,017.75 | $7.31 |
| Class R4 Shares |
| Actual | $1,000.00 | $872.18 | $5.85 |
| Hypothetical* | $1,000.00 | $1,018.75 | $6.31 |
| Class R5 Shares |
| Actual | $1,000.00 | $873.41 | $4.40 |
| Hypothetical* | $1,000.00 | $1,020.30 | $4.75 |
| Class R6 Shares |
| Actual | $1,000.00 | $874.10 | $3.70 |
| Hypothetical* | $1,000.00 | $1,021.05 | $3.99 |
| BETTER WORLD INTERNATIONAL FUND |
| Class A Shares |
| Actual | $1,000.00 | $894.41 | $8.43 |
| Hypothetical* | $1,000.00 | $1,016.10 | $8.97 |
| Class C Shares |
| Actual | $1,000.00 | $892.13 | $11.26 |
| Hypothetical* | $1,000.00 | $1,013.10 | $11.98 |
| Class I Shares |
| Actual | $1,000.00 | $897.53 | $5.17 |
| Hypothetical* | $1,000.00 | $1,019.55 | $5.50 |
| INTERNATIONAL GROWTH FUND |
| Class A Shares |
| Actual | $1,000.00 | $942.86 | $6.31 |
| Hypothetical* | $1,000.00 | $1,018.50 | $6.56 |
| Class C Shares |
| Actual | $1,000.00 | $939.20 | $9.99 |
| Hypothetical* | $1,000.00 | $1,014.70 | $10.38 |
| Class I Shares |
| Actual | $1,000.00 | $944.17 | $4.81 |
| Hypothetical* | $1,000.00 | $1,020.05 | $5.00 |
| Class R3 Shares |
| Actual | $1,000.00 | $941.70 | $7.28 |
| Hypothetical* | $1,000.00 | $1,017.50 | $7.57 |
| Class R4 Shares |
| Actual | $1,000.00 | $942.00 | $6.80 |
| Hypothetical* | $1,000.00 | $1,018.00 | $7.06 |
| Class R5 Shares |
| Actual | $1,000.00 | $944.31 | $4.81 |
| Hypothetical* | $1,000.00 | $1,020.05 | $5.00 |
| Class R6 Shares |
| Actual | $1,000.00 | $944.49 | $4.33 |
| Hypothetical* | $1,000.00 | $1,020.55 | $4.50 |
| | BEGINNING
ACCOUNT VALUE
10/1/19 | ENDING
ACCOUNT VALUE
3/31/20 | EXPENSES PAID
DURING PERIOD†
10/1/19–3/31/20 |
| DEVELOPING WORLD FUND |
| Class A Shares |
| Actual | $1,000.00 | $844.92 | $6.55 |
| Hypothetical* | $1,000.00 | $1,017.90 | $7.16 |
| Class C Shares |
| Actual | $1,000.00 | $841.87 | $9.95 |
| Hypothetical* | $1,000.00 | $1,014.20 | $10.88 |
| Class I Shares |
| Actual | $1,000.00 | $846.32 | $5.03 |
| Hypothetical* | $1,000.00 | $1,019.55 | $5.50 |
| Class R5 Shares |
| Actual | $1,000.00 | $846.28 | $5.03 |
| Hypothetical* | $1,000.00 | $1,019.55 | $5.50 |
| Class R6 Shares |
| Actual | $1,000.00 | $846.74 | $4.57 |
| Hypothetical* | $1,000.00 | $1,020.05 | $5.00 |
| VALUE FUND |
| Class A Shares |
| Actual | $1,000.00 | $803.11 | $5.86 |
| Hypothetical* | $1,000.00 | $1,018.50 | $6.56 |
| Class C Shares |
| Actual | $1,000.00 | $799.85 | $9.45 |
| Hypothetical* | $1,000.00 | $1,014.50 | $10.58 |
| Class I Shares |
| Actual | $1,000.00 | $804.39 | $4.47 |
| Hypothetical* | $1,000.00 | $1,020.05 | $5.00 |
| Class R3 Shares |
| Actual | $1,000.00 | $802.88 | $6.08 |
| Hypothetical* | $1,000.00 | $1,018.25 | $6.81 |
| Class R4 Shares |
| Actual | $1,000.00 | $803.26 | $5.64 |
| Hypothetical* | $1,000.00 | $1,018.75 | $6.31 |
| Class R5 Shares |
| Actual | $1,000.00 | $804.26 | $4.47 |
| Hypothetical* | $1,000.00 | $1,020.05 | $5.00 |
| GROWTH FUND |
| Class A Shares |
| Actual | $1,000.00 | $945.89 | $6.42 |
| Hypothetical* | $1,000.00 | $1,018.40 | $6.66 |
| Class C Shares |
| Actual | $1,000.00 | $942.18 | $10.15 |
| Hypothetical* | $1,000.00 | $1,014.55 | $10.53 |
| Class I Shares |
| Actual | $1,000.00 | $947.43 | $4.82 |
| Hypothetical* | $1,000.00 | $1,020.05 | $5.00 |
| Class R3 Shares |
| Actual | $1,000.00 | $945.12 | $7.29 |
| Hypothetical* | $1,000.00 | $1,017.50 | $7.57 |
| Class R4 Shares |
| Actual | $1,000.00 | $945.53 | $6.81 |
| Hypothetical* | $1,000.00 | $1,018.00 | $7.06 |
| Class R5 Shares |
| Actual | $1,000.00 | $947.39 | $4.82 |
| Hypothetical* | $1,000.00 | $1,020.05 | $5.00 |
Thornburg Equity Funds Semi-Annual Report | 137
Expense Example, Continued
March 31, 2020 (Unaudited)
| | BEGINNING
ACCOUNT VALUE
10/1/19 | ENDING
ACCOUNT VALUE
3/31/20 | EXPENSES PAID
DURING PERIOD†
10/1/19–3/31/20 |
| LONG/SHORT EQUITY FUND |
| Class I Shares |
| Actual | $1,000.00 | $941.45 | $14.61 |
| Hypothetical* | $1,000.00 | $1,009.95 | $15.12 |
| † | Investment Income Builder Fund Expenses are equal to the annualized expense ratio for each class (A: 1.11%; C: 1.85%; I: 0.86%; R3: 1.41%; R4: 1.40%; R5: 0.96%; R6: 0.80%) multiplied by the average account value over the period, multiplied by 183/366 to reflect the one-half year period. |
| † | Summit Fund Expenses are equal to the annualized expense ratio for each class (I: 1.08%) multiplied by the average account value over the period, multiplied by 183/366 to reflect the one-half year period. |
| † | Global Opportunities Fund Expenses are equal to the annualized expense ratio for each class (A: 1.26%; C: 2.00%; I: 0.99%; R3: 1.50%; R4: 1.40%; R5: 0.99%; R6: 0.85%) multiplied by the average account value over the period, multiplied by 183/366 to reflect the one-half year period. |
| † | International Value Fund Expenses are equal to the annualized expense ratio for each class (A: 1.23%; C: 1.93%; I: 0.91%; R3: 1.45%; R4: 1.25%; R5: 0.94%; R6: 0.79%) multiplied by the average account value over the period, multiplied by 183/366 to reflect the one-half year period. |
| † | Better World International Fund Expenses are equal to the annualized expense ratio for each class (A: 1.78%; C: 2.38%; I: 1.09%) multiplied by the average account value over the period, multiplied by 183/366 to reflect the one-half year period. |
| † | International Growth Fund Expenses are equal to the annualized expense ratio for each class (A: 1.30%; C: 2.06%; I: 0.99%; R3: 1.50%; R4: 1.40%; R5: 0.99%; R6: 0.89%) multiplied by the average account value over the period, multiplied by 183/366 to reflect the one-half year period. |
| † | Developing World Fund Expenses are equal to the annualized expense ratio for each class (A: 1.42%; C: 2.16%; I: 1.09%; R5: 1.09%; R6: 0.99%) multiplied by the average account value over the period, multiplied by 183/366 to reflect the one-half year period. |
| † | Value Fund Expenses are equal to the annualized expense ratio for each class (A: 1.30%; C: 2.10%; I: 0.99%; R3: 1.35%; R4: 1.25%; R5: 0.99%) multiplied by the average account value over the period, multiplied by 183/366 to reflect the one-half year period. |
| † | Core Growth Fund Expenses are equal to the annualized expense ratio for each class (A: 1.32%; C: 2.09%; I: 0.99%; R3: 1.50%; R4: 1.40%; R5: 0.99%) multiplied by the average account value over the period, multiplied by 183/366 to reflect the one-half year period. |
| † | Long/Short Equity Fund Expenses are equal to the annualized expense ratio for each class (I: 3.01%) multiplied by the average account value over the period, multiplied by 183/366 to reflect the one-half year period. |
| * | Hypothetical assumes a rate of return of 5% per year before expenses. |
138 | Thornburg Equity Funds Semi-Annual Report
Other Information
March 31, 2020 (Unaudited)
PORTFOLIO PROXY VOTING
Policies and Procedures:
The Trust has delegated to the Advisor voting decisions respecting proxies for the Fund’s voting securities. The Advisor makes voting decisions in accordance with its Proxy Voting Policy and Procedures. A description of the Policy and Procedures is available (i) without charge, upon request, by calling the Advisor toll-free at 1-800-847-0200, (ii) on the Thornburg website at www.thornburg.com, and (iii) on the U.S. Securities and Exchange Commission’s website at www.sec.gov.
Information regarding how proxies were voted is available on or before August 31 of each year for the twelve months ending the preceding June 30. This information is available (i) without charge, upon request by calling the Advisor toll-free at 1-800-847-0200, (ii) on the Thornburg website at www.thornburg.com, and (iii) on the U.S. Securities and Exchange Commission’s website at www.sec.gov.
AVAILABILITY OF QUARTERLY PORTFOLIO SCHEDULE
The Fund files with the Securities and Exchange Commission schedules of its portfolio holdings on Form N-PORT EX for the first and third quarters of each fiscal year. The Fund’s Form N-PORT EX are available on the Commission’s website at www.sec.gov, or may be reviewed and copied at the Commission’s Public Reference Room in Washington, D.C. Information on the operation of the Public Reference Room may be obtained by calling 1-800-SEC-0330. The Fund also makes this information available on its website at www.thornburg.com/download or upon request by calling 1-800-847-0200.
STATEMENT REGARDING LIQUIDITY RISK MANAGEMENT PROGRAM
The Trustees of the Trust have appointed the Advisor (“Program Administrator”) to administer the Trust’s liquidity risk management program (the “LRMP”) adopted for each of the Funds under rule 22e-4 under the 1940 Act (the “Liquidity Rule”). The LRMP is designed to reduce the risk that a Fund will be unable to meet its redemption obligations under the 1940 Act, and to mitigate the dilution of the interests of Fund shareholders occasioned by redemptions tendered by other shareholders (“Liquidity Risk”). Pursuant to the LRMP, the Program Administrator has delegated certain functions, including daily oversight and management of the Funds’ Liquidity Risk, to its Liquidity Risk Management Committee (the “Liquidity Committee”). Under the LRMP, the Liquidity Committee performs the annual review of the LRMP required by the Liquidity Rule.
On December 4, 2019, the Trustees reviewed the Liquidity Committee’s initial written report (the “Report”) concerning the operation of the LRMP for the period from December 1, 2018 through November 22, 2019 (the “Reporting Period”). The Report addressed the operation, adequacy and effectiveness of the LRMP, the operation of a Fund’s highly liquid investment minimum, and any material changes to the LRMP during the Reporting Period. The Report provided an assessment of the various factors relevant to each Fund’s Liquidity Risk, an evaluation of data provided by a third-party liquidity assessment vendor and other relevant data, and reports on the Liquidity Committee’s consideration of intermediary firms with the largest beneficial ownership positions in each Fund, the likelihood that any of those firms may redeem their clients’ investments from the Funds without prior notice, and the effect that such redemptions could have on Fund liquidity. The Report concluded that the LRMP remains adequate and effective to address each Fund’s Liquidity Risk, that all of the Funds are able to meet redemption requests in current market conditions and in reasonably expected stressed conditions without significant dilution of remaining shareholders, that each Fund remains primarily highly liquid, and the third-party liquidity assessment vendor’s system continues to be a useful tool for assessing the Funds’ Liquidity Risk. The Report stated that there have been no instances since the LRMP’s adoption in which a Fund exceeded its limitation on illiquid investments, nor have there been any material changes to the LRMP since its adoption.
Thornburg Equity Funds Semi-Annual Report | 139
Trustees’ Statement to Shareholders (Unaudited)
Readopted September 17, 2019
The Trustees believe current and prospective shareholders should know how we discharge our responsibilities in supervising the Funds’ investment advisor and in reviewing the advisor’s contract for renewal. Since 2005, we have issued a statement which sets out clearly the three principal guidelines that we follow in supervising the Trust’s investment advisor on your behalf. In accordance with our customary practice, in September of this year we again reviewed our statement and concluded we should reissue this statement outlining the principal features of our supervision of the advisor’s performance of investment management services for the Funds.
We begin with the premise that each shareholder selected his or her Fund because its investments are managed by the investment advisor identified in the prospectus and in accordance with the objective and policies described in the prospectus. We realize, as each of you do, that if you believe that your Fund’s stated objective and policies no longer serve your personal investment goals, you can sell your shares and leave the Fund.
Therefore, we believe that our primary supervisory task—our principal obligation to you—is to assess the nature and quality of the advisor’s services, and to confirm that the advisor actively and competently pursues the Fund’s objective, in accordance with the policies set out in the prospectus. To do this, we meet regularly with management to review your Fund’s portfolio and to discuss the advisor’s specific actions and judgments in pursuing the Fund’s objective. We do not substitute our own judgment for the advisor’s decisions in selecting investments; the advisor is paid to exercise its informed judgment on investment decisions, and we seek to confirm, in reviewing the advisor’s performance, that the advisor is doing just that.
Second, we are conscious of costs and the effect that costs have on shareholders’ returns. We try to make sure that your Fund’s fees and costs are reasonable in relationship to the services rendered and that they are generally in line with those charged by other expert investment advisors, consistent with our belief that the Fund’s investors searched for and expect that expertise and attention and have decided to pay a reasonable price for it. We do not put the management contract “out to bid” as a matter of course, and we would not do so unless we had concluded that the advisor materially had failed to pursue the Fund’s objectives in accordance with its policies, or for other equally important reasons. We believe that any other approach would be inconsistent with your interests and contrary to your expectations when you bought shares of the Fund in the first place.
Finally, because we believe that most Thornburg Fund shareholders have invested with a long-term perspective, we try not to focus too much on the fashions of the moment and on short-term performance. The market will not favor any specific investment objective or set of policies at all times and under all economic circumstances. A fund will experience periods of both high and low returns relative to other funds and other investments. Even if one of our Funds is not favored by the market at a particular time, we believe that the advisor is nonetheless obliged to remain true to the Fund’s objective and policies, and we watch to see that it does so.
Trustees of Thornburg Investment Trust
140 | Thornburg Equity Funds Semi-Annual Report
Thornburg Investment Management is a privately-owned global investment firm that offers a range of solutions for retail and institutional investors. Founded in 1982 and headquartered in Santa Fe, New Mexico, we manage approximately $35.1 billion (as of March 31, 2020) across U.S. mutual funds, separate accounts for high-net-worth investors, institutional accounts, and UCITS funds for non-U.S. investors.
The fund outlined in this report is one of many equity and fixed-income products available from Thornburg Investment Management.
MULTI ASSET
| ■ | Thornburg Investment Income Builder Fund |
| ■ | Thornburg Summit Fund |
GLOBAL EQUITY
| ■ | Thornburg Global Opportunities Fund |
INTERNATIONAL EQUITY
| ■ | Thornburg International Value Fund |
| ■ | Thornburg Better World Fund |
| ■ | Thornburg International Growth Fund |
| ■ | Thornburg Developing World Fund |
DOMESTIC EQUITY
| ■ | Thornburg Value Fund |
| ■ | Thornburg Core Growth Fund |
ALTERNATIVES
| ■ | Thornburg Long/Short Equity Fund |
FIXED INCOME
| ■ | Thornburg Limited Term U.S. Government Fund |
| ■ | Thornburg Limited Term Income Fund |
| ■ | Thornburg Low Duration Income Fund |
| ■ | Thornburg Strategic Income Fund |
MUNICIPAL
| ■ | Thornburg Short Duration Municipal Fund |
| ■ | Thornburg Limited Term Municipal Fund |
| ■ | Thornburg California Limited Term Municipal Fund |
| ■ | Thornburg New Mexico Intermediate Municipal Fund |
| ■ | Thornburg New York Intermediate Municipal Fund |
| ■ | Thornburg Intermediate Municipal Fund |
| ■ | Thornburg Strategic Municipal Income Fund |
Before investing, carefully consider the Fund’s investment goals, risks, charges, and expenses. For a prospectus or summary prospectus containing this and other information, contact your financial advisor or visit thornburg.com. Read it carefully before investing.
For additional information, please visit thornburg.com
Thornburg Investment Management, Inc. 2300 North Ridgetop Road, Santa Fe, NM 87506
Thornburg Equity Funds Semi-Annual Report | 141
This page intentionally left blank.
142 | Thornburg Equity Funds Semi-Annual Report
This page intentionally left blank.
Thornburg Equity Funds Semi-Annual Report | 143
To receive shareholder reports, prospectuses, and proxy statements electronically, go to www.thornburg.com/edelivery.
This Semi-Annual Report is submitted for the general information of shareholders of the Fund. It is not authorized for distribution to prospective investors in the Fund unless preceded or accompanied by an effective prospectus.
Investment Advisor:
Thornburg Investment Management®
800.847.0200
Distributor:
Thornburg Securities Corporation®
Semi-Annual Report
March 31, 2020
Beginning on January 1, 2021, as permitted by regulations adopted by the Securities and Exchange Commission, paper copies of the Fund’s shareholder reports will no longer be sent by mail, unless you specifically request paper copies of the reports from the Fund or from your financial intermediary, such as a broker-dealer or bank. Instead, the reports will be made available on a website, and you will be notified by mail each time a report is posted and provided with a website link to access the report.
If you already elected to receive shareholder reports electronically, you will not be affected by this change and you need not take any action. You may elect to receive shareholder reports and other communications from the Fund or your financial intermediary electronically by going to thornburg.com/edelivery.
You may elect to receive all future reports in paper free of charge. You can inform the Fund or your financial intermediary that you wish to continue receiving paper copies of your shareholder reports by calling 800.847.0200 or your financial intermediary directly. Your election to receive reports in paper will apply to all funds held with the fund complex/your financial intermediary.
| Thornburg Fixed Income Funds |
| Thornburg Limited Term U.S. Government Fund |
| Thornburg Limited Term Income Fund |
| Thornburg Low Duration Income Fund |
| Thornburg Strategic Income Fund |
At Thornburg, we believe unconstrained investing leads to better outcomes for our clients. Our investment solutions are highly active, high conviction, and benchmark agnostic. When it comes to finding economic opportunity for clients, it’s more than what we do.
It’s how we do it. Active Asbottom-up, fundamental, active managers, we look beyond conventional benchmarks. Long Term We take a long-term view in how we manage our firm and our portfolios. Benchmark Agnostic Investment strategies should have the flexibility to pursue solutions for clients, not stay within the conventional confines of benchmarks. Flexible Perspective Our approach to portfolio construction is guided by our convictions rather than convention. High Conviction We focus our attention and capital on thoroughly researched, well-understood positions. The best form of risk management is to know what you own, and why. Repeatable & Robust Our long-term outperformance of benchmarks verifies that our process works and outperforms conventional thinking. Independent We are independently owned and far from the herd of other investment managers. Investment Driven All members of the investment team are resources for all of our strategies. Collaborative Our team collaborates on opportunities across geography, sector, or asset class.
Thornburg Fixed Income Funds
Semi-Annual Reports | March 31, 2020
Table of Contents
Investments carry risks, including possible loss of principal. Portfolios investing in bonds have the same interest rate, inflation, and credit risks that are associated with the underlying bonds. The value of bonds will fluctuate relative to changes in interest rates, decreasing when interest rates rise. This effect is more pronounced for longer-term bonds. Unlike bonds, bond funds have ongoing fees and expenses. Investments in lower rated and unrated bonds may be more sensitive to default, downgrades, and market volatility; these investments may also be less liquid than higher rated bonds. Investments in derivatives are subject to the risks associated with the securities or other assets underlying the pool of securities, including illiquidity and difficulty in valuation. Investments in equity securities are subject to additional risks, such as greater market fluctuations. Additional risks may be associated with investments outside the United States, especially in emerging markets, including currency fluctuations, illiquidity, volatility, and political and economic risks. Please see the Funds’ prospectus for a discussion of the risks associated with an investment in the Funds. Investments in the Funds are not FDIC insured, nor are they bank deposits or guaranteed by a bank or any other entity.
Thornburg Fixed Income Funds Semi-Annual Report | 3
Letter to Shareholders
March 31, 2020 (Unaudited)
Dear Shareholder:
I hope this letter finds you safe and healthy. Amid the COVID-19 pandemic, we’re all adjusting to the challenges of working and living new ways while trying to see into a cloudy future. In these uncertain times, all of us at Thornburg Investment Management are squarely focused on providing you with the best investment outcomes that we can.
Many of our portfolios were well positioned for higher volatility. While we did not predict the cause of this downturn, it’s clear that high prices make for more vulnerable markets. Given our solid liquidity and preparation, we’ve been able to take advantage of price swings as many assets were on sale after the market’s decline. Longer term, it appears even the extraordinary fiscal and monetary support will merely cushion the blow. After all, the reason policy makers’ actions have been so extreme is in large part because they view them as necessary.
Looking forward, our nimble, collaborative investment team is well suited to deliver. The reason that we have a benchmark agnostic, flexible approach is so that we can go where we find value, within the mandate and objectives of the portfolio. While many investment firms have good products and processes, Thornburg is designed to see the world differently, and our perspective from Santa Fe, NM, is especially valuable in challenging times. While many other professionals are siloed into narrow areas of expertise, without the ability to evaluate the bigger picture, we work across sectors and asset classes to find
great investments and put them into balanced portfolios. The last few months have demonstrated the strength of our approach, given its adaptability and capacity to place new information in the context of broad portfolios quickly. Being nimble is part of Thornburg’s culture, and people across the organization are finding new ways to pitch in for the sake of our clients.
No one can predict with certainty what the market has in store for us, especially in the context of the current health crisis. What does seem certain, however, is that the events of the last few months are accelerating change that was already occurring, as well as underlining the vulnerability of many of the systems that many of us take for granted. That is true in our daily lives, as well as in financial markets. We believe our understanding of and participation in the interconnectedness of these markets is our core competency: We’re built for this.
Thank you so much for your time and your business.

| |
Jason Brady,cfa
Portfolio Manager
CEO, President, and
Managing Director | |
The matters discussed in this report may constitute forward-looking statements made pursuant to the safe harbor provisions of the Securities Litigation Reform Act of 1995. These include any advisor or portfolio manager prediction, assessment, analysis or outlook for individual securities, industries, investment styles, market sectors and/or markets. These statements involve risks and uncertainties. In addition to the general risks described for each fund in its current prospectus, other factors bearing on these reports include the accuracy of the advisor’s or portfolio manager’s forecasts and predictions, the appropriateness of the investment strategies designed by the advisor or portfolio manager and the ability of the advisor or portfolio manager to implement their strategies efficiently and successfully. Any one or more of these factors, as well as other risks affecting the securities markets generally, could cause the actual results of any fund to differ materially as compared to its benchmarks.
The views expressed are subject to change and do not necessarily reflect the views of Thornburg Investment Management, Inc. This information should not be relied upon as a recommendation or investment advice and is not intended to predict the performance of any investment or market.
Performance results of individual share classes will vary based on the fees and expenses associated with each share class, and may be higher or lower than other share classes within the same Fund. Please see Performance Summary for performance results of each share class.
4 | Thornburg Fixed Income Funds Semi-Annual Report
Performance Summary
March 31, 2020 (Unaudited)
AVERAGE ANNUAL TOTAL RETURNS
| THORNBURG LIMITED TERM U.S. GOVERNMENT FUND | 1-YR | 3-YR | 5-YR | 10-YR | SINCE
INCEPTION |
| Class A Shares(Incep: 11/16/87) | | | | | |
| Without sales charge | 4.20% | 2.23% | 1.48% | 1.67% | 4.62% |
| With sales charge | 2.61% | 1.71% | 1.18% | 1.52% | 4.57% |
| Class C Shares(Incep: 9/1/94) | | | | | |
| Without sales charge | 3.86% | 1.90% | 1.17% | 1.38% | 3.54% |
| With sales charge | 3.36% | 1.90% | 1.17% | 1.38% | 3.54% |
| Class I Shares(Incep: 7/5/96) | 4.50% | 2.53% | 1.79% | 2.00% | 4.03% |
| Class R3 Shares(Incep: 7/1/03) | 4.09% | 2.15% | 1.41% | 1.59% | 2.38% |
| Class R4 Shares(Incep: 2/1/14) | 4.10% | 2.14% | 1.40% | - | 1.46% |
| Class R5 Shares(Incep: 5/1/12) | 4.43% | 2.48% | 1.74% | - | 1.49% |
GROWTH OF A HYPOTHETICAL $10,000 INVESTMENT
| THORNBURG LIMITED TERM U.S. GOVERNMENT FUND | FINAL VALUE |
AVERAGE ANNUAL TOTAL RETURNS
| THORNBURG LIMITED TERM INCOME FUND | 1-YR | 3-YR | 5-YR | 10-YR | SINCE
INCEPTION |
| Class A Shares(Incep: 10/1/92) | | | | | |
| Without sales charge | 2.60% | 2.37% | 2.05% | 3.12% | 4.73% |
| With sales charge | 1.09% | 1.86% | 1.73% | 2.96% | 4.67% |
| Class C Shares(Incep: 9/1/94) | | | | | |
| Without sales charge | 2.29% | 2.13% | 1.81% | 2.88% | 4.40% |
| With sales charge | 1.80% | 2.13% | 1.81% | 2.88% | 4.40% |
| Class I Shares(Incep: 7/5/96) | 2.89% | 2.69% | 2.38% | 3.47% | 4.91% |
| Class R3 Shares(Incep: 7/1/03) | 2.38% | 2.20% | 1.89% | 3.02% | 3.47% |
| Class R4 Shares(Incep: 2/1/14) | 2.38% | 2.20% | 1.89% | - | 2.06% |
| Class R5 Shares(Incep: 5/1/12) | 2.82% | 2.57% | 2.26% | - | 2.63% |
| Class R6 Shares(Incep: 4/10/17) | 2.89% | - | - | - | 2.90% |
GROWTH OF A HYPOTHETICAL $10,000 INVESTMENT
| THORNBURG LIMITED TERM INCOME FUND | FINAL VALUE |
Performance data shown represents past performance and is no guarantee of future results. Investment return and principal value will fluctuate so shares, when redeemed, may be worth more or less than their original cost. Current performance may be lower or higher than quoted. For performance current to the most recent month end, visit thornburg.com or call 800-847-0200. The performance information does not reflect the deduction of taxes that a shareholder would pay on distributions or the redemption of Fund shares. Returns reflect the reinvestment of dividends and capital gains. Thornburg Limited Term U.S. Government Fund Class A shares are sold with a maximum sales charge of 1.50%. Class C shares include a 0.50% CDSC for the first year only. There is no sales charge for Class I, Class R3, Class R4 and Class R5 shares. Thornburg Limited Term Income Fund Class A shares are sold with a maximum sales charge of 1.50%. Class C shares include a 0.50% CDSC for the first year only. There is no sales charge for Class I, Class R3, Class R4, Class R5, and Class R6 shares. As disclosed in the Funds’ most recent prospectus, the total annual fund operating expenses before waivers and expense reimbursements are as follows: Limited Term U.S. Government Fund; A shares, 0.90%; C shares, 1.24%; I shares, 0.62%; R3 shares, 1.43%; R4 shares, 1.78%; R5 shares, 2.04%; Limited Term Income Fund; A shares, 0.81%; C shares, 1.02%; I shares, 0.53%; R3 shares, 1.06%; R4 shares, 1.23%; R5 shares, 0.74%; R6 shares, 0.49%. Thornburg Investment Management has contractually agreed to waive fees and reimburse expenses until at least February 1, 2021, for some of the share classes, resulting in net expense ratios of the following: For Limited Term U.S. Government Fund; R3 shares, 0.99%; R4 shares, 0.99%; R5 shares, 0.67%; Limited Term Income Fund; I shares, 0.49%; R3 shares, 0.99%; R4 shares, 0.99%; R5 shares, 0.49%; R6 shares 0.42%. For more detailed information on fund expenses and waivers/reimbursements please see the Funds’ prospectus.
Thornburg Fixed Income Funds Semi-Annual Report | 5
Performance Summary, Continued
March 31, 2020 (Unaudited)
AVERAGE ANNUAL TOTAL RETURNS
| THORNBURG LOW DURATION INCOME FUND | 1-YR | 3-YR | 5-YR | 10-YR | SINCE
INCEPTION |
| Class A Shares(Incep: 12/30/13) | | | | | |
| Without sales charge | 0.62% | 1.38% | 1.24% | - | 1.29% |
| With sales charge | -0.90% | 0.86% | 0.93% | - | 1.04% |
| Class I Shares(Incep: 12/30/13) | 0.90% | 1.60% | 1.43% | - | 1.48% |
GROWTH OF A HYPOTHETICAL $10,000 INVESTMENT
| THORNBURG LOW DURATION INCOME FUND | FINAL VALUE |
AVERAGE ANNUAL TOTAL RETURNS
THORNBURG STRATEGIC
INCOME FUND | 1-YR | 3-YR | 5-YR | 10-YR | SINCE
INCEPTION |
| Class A Shares(Incep: 12/19/07) | | | | | |
| Without sales charge | -1.63% | 1.82% | 2.41% | 4.68% | 5.24% |
| With sales charge | -6.03% | 0.27% | 1.48% | 4.20% | 4.85% |
| Class C Shares(Incep: 12/19/07) | | | | | |
| Without sales charge | -2.37% | 1.09% | 1.73% | 4.05% | 4.61% |
| With sales charge | -3.32% | 1.09% | 1.73% | 4.05% | 4.61% |
| Class I Shares(Incep: 12/19/07) | -1.26% | 2.23% | 2.78% | 5.04% | 5.59% |
| Class R3 Shares(Incep: 5/1/12) | -1.97% | 1.68% | 2.31% | - | 3.49% |
| Class R4 Shares(Incep: 2/1/14) | -1.97% | 1.61% | 2.27% | - | 2.39% |
| Class R5 Shares(Incep: 5/1/12) | -1.25% | 2.27% | 2.80% | - | 3.91% |
| Class R6 Shares(Incep: 4/10/17) | -1.18% | - | - | - | 2.47% |
| Bloomberg Barclays U.S. Universal Bond Index(Since 12/19/07) | 7.15% | 4.37% | 3.35% | 4.05% | 4.38% |
GROWTH OF A HYPOTHETICAL $10,000 INVESTMENT
| THORNBURG STRATEGIC INCOME FUND | FINAL VALUE |
Performance data shown represents past performance and is no guarantee of future results. Investment return and principal value will fluctuate so shares, when redeemed, may be worth more or less than their original cost. Current performance may be lower or higher than quoted. For performance current to the most recent month end, visit thornburg.com or call 800-847-0200. The performance information does not reflect the deduction of taxes that a shareholder would pay on distributions or the redemption of Fund shares. Returns reflect the reinvestment of dividends and capital gains. Thornburg Low Duration Income Fund Class A shares are sold with a maximum sales charge of 1.50%. There is no sales charge for Class I. Thornburg Strategic Income Fund Class A shares are sold with a maximum sales charge of 4.50%. Class C shares include a 1.00% CDSC for the first year only. There is no sales charge for Class I, Class R3, Class R4, Class R5, and Class R6 shares. As disclosed in the Funds’ most recent prospectus, the total annual fund operating expenses before fee waivers and expense reimbursements are as follows: Thornburg Low Duration Income Fund; A shares, 1.65%; I shares, 0.94%. Thornburg Strategic Income Fund; A shares, 1.16%; C shares, 1.92%; I shares, 0.91%; R3 shares, 2.59%; R4 shares, 2.51%; R5 shares, 1.18% and R6 shares, 0.98%. Thornburg Investment Management has contractually agreed to waive fees and reimburse expenses until at least February 1, 2021, resulting in net expense ratios of the following: Thornburg Low Duration Income Fund; A shares, 0.70%; I shares, 0.50%. Thornburg Strategic Income Fund; A shares, 1.05%; C shares, 1.80%; I shares, 0.60%; R3 shares, 1.25%; R4 shares, 1.25%; R5 shares, 0.60% and R6 shares, 0.53%. For more detailed information on fund expenses and waivers/reimbursements please see the Funds’ prospectus. Without the fee waivers and expense reimbursements, the Annualized Distribution yield and the SEC yield would have been 1.08% and 0.83%, respectively, for Thornburg Low Duration Income Fund and 2.93% and 3.37%, respectively, for Thornburg Strategic Income Fund.
6 | Thornburg Fixed Income Funds Semi-Annual Report
Performance Summary, Continued
March 31, 2020 (Unaudited)
30-DAY YIELDS, A SHARES(with sales charge)
| THORNBURG LIMITED TERM U.S. GOVERNMENT FUND | |
| Annualized Distribution Yield | 1.64% |
| SEC Yield | 1.42% |
| THORNBURG LIMITED TERM INCOME FUND | |
| Annualized Distribution Yield | 2.11% |
| SEC Yield | 1.96% |
| THORNBURG LOW DURATION INCOME FUND | |
| Annualized Distribution Yield | 2.05% |
| SEC Yield | 1.93% |
| THORNBURG STRATEGIC INCOME FUND | |
| Annualized Distribution Yield | 2.93% |
| SEC Yield | 3.40% |
TheBloomberg Barclays Intermediate U.S. Government/Credit Total Return Index Value Unhedged is an unmanaged, market-weighted index generally representative of intermediate government and investment-grade corporate debt securities having maturities from one up to ten years.
TheBloomberg Barclays U.S. Universal Total Return Index Value Unhedged is composed of approximately 8,000 publicly traded bonds including U.S. government, mortgage-backed, corporate and Yankee bonds. The index is weighted by the market value of the bonds included in the index.
TheBloomberg Barclays U.S. Government Intermediate Total Return Index Value Unhedged is an unmanaged, market-weighted index generally representative of all public obligations of the U.S. Government, its agencies and instrumentalities having maturities from one up to ten years.
TheBloomberg Barclays U.S. Aggregate 1-3 Year Total Return Index Value Unhedged USD measures the investment grade, U.S. dollar-denominated, fixed-rate taxable bond market with maturities between 1 and 3 years, including Treasuries, government-related and corporate securities, MBS (agency fixed-rate and hybrid ARM passthroughs), ABS, and CMBS.
TheBloomberg Barclays U.S. Universal Total Return Index Value Unhedgedrepresents the union of the U.S. Aggregate Index, U.S. Corporate High-Yield, investment Grade 144A
Index, Eurodollar Index, U.S. Emerging Markets Index, and the non-ERISA eligible portion of the CMBS Index. The index covers USD denominated, taxable bonds that are rated either investment-grade or below investment-grade.
The performance of any index is not indicative of the performance of any particular investment. Unless otherwise noted, index returns reflect the reinvestment of income dividends and capital gains, if any, but do not reflect fees, brokerage commissions or other expenses of investing. Investors may not make direct investments into any index.
Credit risk is the probable risk of loss resulting from a borrower’s failure to repay a loan or meet contractual obligations.
Interest rate risk is the risk that an investment’s value will change due to a change in the absolute level of interest rates, in the spread between two rates, in the shape of the yield curve, or in any other interest rate relationship.
Credit Spread/Quality Spread – The difference between the yields of securities with different credit qualities.
Duration – A bond’s sensitivity to interest rates. Bonds with longer durations experience greater price volatility than bonds with shorter durations. Effective duration incorporates a bond’s embedded option features, such as call provisions.
Thornburg Fixed Income Funds Semi-Annual Report | 7
Fund Summary
Thornburg Limited Term U.S. Government Fund | March 31, 2020 (Unaudited)
OBJECTIVES AND STRATEGIES
The Fund’s primary goal is to provide as high a level of current income as is consistent, in the view of the Fund’s investment advisor, with the safety of capital. As a secondary goal, the Fund seeks to reduce changes in its share price compared to longer term portfolios.
This Fund is a laddered portfolio primarily composed of short/intermediate debt obligations at least 80% of which are issued by the U.S. Government, its agencies, or its instrumentalities, with a dollar-weighted average maturity of normally less than five years.
LONG-TERM STABILITY OF PRINCIPAL
Net Asset Value History of A Shares
| KEY PORTFOLIO ATTRIBUTES | |
| Number of Bonds | 171 |
| Effective Duration | 2.4 Yrs |
| Average Maturity | 3.3 Yrs |
TYPES OF HOLDINGS
PORTFOLIO LADDER
| 5% | 6% | 7% | 33% | 24% | 10% | 6% | 2% | 2% | 0% | 5% |
Percent of portfolio maturing in each year. Cash includes cash equivalents and other.
There is no guarantee that the Fund will meet its investment objectives.
All data is subject to change. Charts may not add up to 100% due to rounding.
8 | Thornburg Fixed Income Funds Semi-Annual Report
Fund Summary
Thornburg Limited Term Income Fund | March 31, 2020 (Unaudited)
The Fund’s primary goal is to provide as high a level of current income as is consistent, in the view of the Fund’s investment advisor, with the preservation of capital. As a secondary goal, the Fund seeks to reduce changes in its share price compared to longer term portfolios.
This Fund is a laddered portfolio primarily composed of short/intermediate debt obligations which are investment grade or judged by the advisor to be of equivalent quality, with a dollar-weighted average maturity of normally less than five years.
LONG-TERM STABILITY OF PRINCIPAL
Net Asset Value History of A Shares
| KEY PORTFOLIO ATTRIBUTES | |
| Number of Bonds | 627 |
| Effective Duration | 3.0 Yrs |
| Average Maturity | 3.9 Yrs |
SECURITY CREDIT RATINGS
A bond credit rating assesses the financial ability of a debt issuer to make timely payments of principal and interest. Ratings of AAA (the highest), AA, A, and BBB are investment-grade quality. Ratings of BB, B, CCC, CC, C and D (the lowest) are considered below investment grade, speculative grade, or junk bonds.
PORTFOLIO LADDER
| 5% | 17% | 15% | 13% | 10% | 11% | 6% | 2% | 4% | 2% | 14% |
Percent of portfolio maturing in each year. Cash includes cash equivalents and other.
There is no guarantee that the Fund will meet its investment objectives.
All data is subject to change. Charts may not add up to 100% due to rounding.
Thornburg Fixed Income Funds Semi-Annual Report | 9
Fund Summary
Thornburg Low Duration Income Fund | March 31, 2020 (Unaudited)
OBJECTIVES AND STRATEGIES
The Fund’s goal is to seek current income, consistent with preservation of capital.
The Fund invests in debt obligations issued by the U.S. Government, its agencies, or its instrumentalities, and in debt obligations rated at the time of purchase in one of the four highest credit ratings categories or, if no credit rating is available, judged to be of comparable quality by the Fund’s advisor. The Fund aims to reduce changes in its share value compared to longer duration fixed income portfolios by maintaining a laddered portfolio of investments with a dollar-weighted average duration of normally no more than three years.
LONG-TERM STABILITY OF PRINCIPAL
Net Asset Value History of A Shares
| KEY PORTFOLIO ATTRIBUTES | |
| Number of Bonds | 273 |
| Effective Duration | 1.0 Yrs |
| Average Maturity | 1.4 Yrs |
SECURITY CREDIT RATINGS
A bond credit rating assesses the financial ability of a debt issuer to make timely payments of principal and interest. Ratings of AAA (the highest), AA, A, and BBB are investment-grade quality. Ratings of BB, B, CCC, CC, C and D (the lowest) are considered below investment grade, speculative grade, or junk bonds.
PORTFOLIO LADDER
Percent of portfolio maturing in each year. Cash includes cash equivalents and other.
There is no guarantee that the Fund will meet its investment objectives.
All data is subject to change. Charts may not add up to 100% due to rounding.
10 | Thornburg Fixed Income Funds Semi-Annual Report
Fund Summary
Thornburg Strategic Income Fund | March 31, 2020 (Unaudited)
OBJECTIVES AND STRATEGIES
The Fund’s primary investment goal is to seek a high level of current income. The Fund’s secondary investment goal is some long-term capital appreciation.
The Fund pursues its investment goals by investing in a broad range of income-producing investments from throughout the world, primarily including debt obligations. The Fund expects, under normal conditions, to invest a majority of its assets in several types of debt obligations.
| PORTFOLIO COMPOSITION |
| Corporate/Convertible Bonds | 54.4% |
| Asset Backed Securities | 20.8% |
| Bank Loans | 4.5% |
| Common & Preferred Stock | 1.4% |
| Exchange-Traded Funds | 0.7% |
| U.S. Treasury Securities | 0.3% |
| Other Fixed Income | 8.4% |
| Other Assets Less Liabilities | 9.5% |
FIXED INCOME CREDIT QUALITY *
| * | Excludes equity securities. |
A bond credit rating assesses the financial ability of a debt issuer to make timely payments of principal and interest. Ratings of AAA (the highest), AA, A, and BBB are investment-grade quality. Ratings of BB, B, CCC, CC, C and D (the lowest) are considered below investment grade, speculative grade, or junk bonds.
Credit quality ratings for Thornburg’s global fixed income portfolios used ratings from Moody’s Investors Service. Where Moody’s ratings are not available, we have used Standard & Poor’s ratings. Where neither rating is available, we have used ratings from other nationally recognized statistical rating organizations (NRSROs). “NR” = not rated.
| TOP TEN INDUSTRY GROUPS |
| Diversified Financials | 7.9% |
| Energy | 6.2% |
| Materials | 4.6% |
| Software & Services | 4.1% |
| Telecommunication Services | 3.5% |
| Commercial & Professional Services | 3.5% |
| Media & Entertainment | 3.0% |
| Technology Hardware & Equipment | 2.8% |
| Utilities | 2.7% |
| Automobiles & Components | 2.6% |
Thornburg Fixed Income Funds Semi-Annual Report | 11
Fund Summary, Continued
Thornburg Strategic Income Fund | March 31, 2020 (Unaudited)
COUNTRY EXPOSURE *
(percent of Fund) |
| United States | 73.0% |
| Canada | 3.6% |
| Germany | 2.0% |
| United Kingdom | 1.5% |
| South Korea | 1.2% |
| France | 0.8% |
| Bermuda | 0.8% |
| China | 0.8% |
| Ireland | 0.8% |
| Japan | 0.7% |
| Luxembourg | 0.6% |
| Belgium | 0.5% |
| Mexico | 0.5% |
| Cayman Islands | 0.5% |
| New Zealand | 0.5% |
| Australia | 0.3% |
| Morocco | 0.3% |
| India | 0.3% |
| Italy | 0.3% |
| South Africa | 0.2% |
| Finland | 0.2% |
| Jamaica | 0.2% |
| Switzerland | 0.2% |
| Turkey | 0.2% |
| Chile | 0.2% |
| Guatemala | 0.1% |
| Brazil | 0.1% |
| Barbados | 0.1% |
| Saint Lucia | 0.0%** |
| United Arab Emirates | 0.0%** |
| Other Assets Less Liabilities | 9.5% |
| * | Holdings are classified by country of risk as determined by MSCI and Bloomberg. |
| ** | Country percentage was less than 0.1%. |
There is no guarantee that the Fund will meet its investment objectives.
All data is subject to change. Charts may not add up to 100% due to rounding.
12 | Thornburg Fixed Income Funds Semi-Annual Report
Schedule of Investments
Thornburg Limited Term U.S. Government Fund | March 31, 2020 (Unaudited)
| | Issuer-Description | PRINCIPAL
AMOUNT | VALUE |
| | U.S. Treasury Securities — 13.6% | | |
| | United States Treasury Notes, | | |
| | 1.125% due 4/30/2020 | $ 4,000,000 | $ 4,003,313 |
| | 1.375% due 10/31/2020 | 1,480,000 | 1,490,623 |
| | 1.50% due 10/31/2024 - 2/15/2030 | 11,635,000 | 12,406,180 |
| | 1.625% due 6/30/2020 | 4,000,000 | 4,015,476 |
| | 2.625% due 8/15/2020 | 4,000,000 | 4,037,739 |
| | United States Treasury Notes Inflationary Index, | | |
| | 0.125% due 7/15/2022 - 1/15/2030 | 12,412,150 | 12,442,614 |
| | 0.25% due 7/15/2029 | 1,270,571 | 1,318,666 |
| | Total U.S. Treasury Securities(Cost $38,948,974) | | 39,714,611 |
| | U.S. Government Agencies — 11.2% | | |
| a | Durrah MSN 35603 (Guaranty: Export-Import Bank of the United States), 1.684% due 1/22/2025 | 635,963 | 641,263 |
| | HNA Group LLC (Guaranty: Export-Import Bank of the United States), Series 2015, 2.291% due 6/30/2027 | 1,943,871 | 2,013,099 |
| a | MSN 41079 and 41084 Ltd. (Guaranty: Export-Import Bank of the United States), 1.717% due 7/13/2024 | 629,837 | 637,107 |
| | Petroleos Mexicanos (Guaranty: Export-Import Bank of the United States), | | |
| a,b | 1.70% due 12/20/2022 | 1,567,500 | 1,577,018 |
| a,b,c | 2.181% (LIBOR 3 Month + 0.35%) due 4/15/2025 | 1,837,500 | 1,790,442 |
| a | 2.46% due 12/15/2025 | 1,500,000 | 1,543,271 |
| | Reliance Industries Ltd. (Guaranty: Export-Import Bank of the United States), | | |
| a | 2.06% due 1/15/2026 | 2,100,000 | 2,134,860 |
| a | 2.512% due 1/15/2026 | 3,165,000 | 3,248,469 |
| | Small Business Administration Participation Certificates, | | |
| | Series 2001-20D Class 1, 6.35% due 4/1/2021 | 96,696 | 96,721 |
| | Series 2001-20F Class 1, 6.44% due 6/1/2021 | 89,804 | 89,819 |
| | Series 2002-20A Class 1, 6.14% due 1/1/2022 | 61,098 | 61,075 |
| | Series 2002-20K Class 1, 5.08% due 11/1/2022 | 81,204 | 82,038 |
| | Series 2005-20H Class 1, 5.11% due 8/1/2025 | 86,327 | 90,112 |
| | Series 2007-20D Class 1, 5.32% due 4/1/2027 | 256,971 | 272,212 |
| | Series 2007-20F Class 1, 5.71% due 6/1/2027 | 135,477 | 145,826 |
| | Series 2007-20I Class 1, 5.56% due 9/1/2027 | 455,252 | 472,223 |
| | Series 2007-20K Class 1, 5.51% due 11/1/2027 | 290,979 | 308,294 |
| | Series 2008-20G Class 1, 5.87% due 7/1/2028 | 811,949 | 887,000 |
| | Series 2011-20G Class 1, 3.74% due 7/1/2031 | 1,146,345 | 1,216,691 |
| | Series 2011-20K Class 1, 2.87% due 11/1/2031 | 1,530,434 | 1,588,056 |
| | Series 2014-20H Class 1, 2.88% due 8/1/2034 | 940,088 | 980,743 |
| | Series 2015-20B Class 1, 2.46% due 2/1/2035 | 788,421 | 798,387 |
| | Series 2015-20G Class 1, 2.88% due 7/1/2035 | 1,684,694 | 1,719,531 |
| b | Series 2015-20I Class 1, 2.82% due 9/1/2035 | 1,688,751 | 1,742,616 |
| | Series 2017-20I Class 1, 2.59% due 9/1/2037 | 3,210,444 | 3,292,456 |
| b | Series 2017-20K Class 1, 2.79% due 11/1/2037 | 1,409,835 | 1,467,424 |
| | Ulani MSN 35940 LLC (Guaranty: Export-Import Bank of the United States), 2.227% due 5/16/2025 | 2,187,500 | 2,235,024 |
| a,c | Washington Aircraft 2 Co. Ltd. (Guaranty: Export-Import Bank of the United States), 1.662% (LIBOR 3 Month + 0.43%) due 6/26/2024 | 1,650,511 | 1,625,813 |
| | Total U.S. Government Agencies(Cost $32,118,728) | | 32,757,590 |
| | Mortgage Backed — 68.4% | | |
| | Federal Home Loan Mtg Corp., | | |
| | Pool J21208 2.50% due 11/1/2027 | 2,319,398 | 2,414,481 |
| | Pool RC1280, 3.00% due 3/1/2035 | 1,239,764 | 1,309,063 |
| | Pool ZS4730 3.50% due 8/1/2047 | 4,000,037 | 4,239,849 |
| | Federal Home Loan Mtg Corp., CMO, | | |
| | Series K035 Class A1, 2.615% due 3/25/2023 | 1,381,659 | 1,404,617 |
| c | Series K035 Class A2, 3.458% due 8/25/2023 | 3,000,000 | 3,197,801 |
| | Series K037 Class A1, 2.592% due 4/25/2023 | 874,638 | 891,642 |
| | Series K038 Class A1, 2.604% due 10/25/2023 | 2,188,012 | 2,230,408 |
| | Series K042 Class A1, 2.267% due 6/25/2024 | 2,458,101 | 2,507,714 |
| c | Series K047 Class A2, 3.329% due 5/25/2025 | 1,250,000 | 1,366,276 |
| c | Series K061 Class A2, 3.347% due 11/25/2026 | 290,000 | 325,348 |
| c | Series K069 Class A2, 3.187% due 9/25/2027 | 180,000 | 203,402 |
| | Series K072 Class A2, 3.444% due 12/25/2027 | 120,000 | 137,477 |
| | Series K095 Class A2, 2.785% due 6/25/2029 | 577,000 | 641,921 |
See notes to financial statements.
| Thornburg Fixed Income Funds Semi-Annual Report | 13 |
Schedule of Investments, Continued
Thornburg Limited Term U.S. Government Fund | March 31, 2020 (Unaudited)
| | Issuer-Description | PRINCIPAL
AMOUNT | VALUE |
| | Series K729 Class A2, 3.136% due 10/25/2024 | $ 3,500,000 | $ 3,743,868 |
| | Series K730 Class A1, 3.452% due 9/25/2024 | 235,399 | 244,371 |
| c | Series K730 Class A2, 3.59% due 1/25/2025 | 190,000 | 207,028 |
| | Series KS03 Class A2, 2.79% due 6/25/2022 | 2,500,000 | 2,560,187 |
| | Federal Home Loan Mtg Corp., CMO REMIC, | | |
| | Series 1351 Class TE, 7.00% due 8/15/2022 | 37,522 | 39,757 |
| | Series 3291 Class BY, 4.50% due 3/15/2022 | 44,445 | 45,142 |
| | Series 3704 Class DC, 4.00% due 11/15/2036 | 247,510 | 259,257 |
| | Series 3867 Class VA, 4.50% due 3/15/2024 | 1,062,179 | 1,121,905 |
| | Series 3922 Class PQ, 2.00% due 4/15/2041 | 481,878 | 486,431 |
| | Series 4050 Class MV, 3.50% due 8/15/2023 | 1,211,198 | 1,253,473 |
| | Series 4072 Class VA, 3.50% due 10/15/2023 | 1,084,261 | 1,118,308 |
| | Series 4097 Class TE, 1.75% due 5/15/2039 | 808,861 | 818,114 |
| c | Series 4105 Class FG, 1.105% (LIBOR 1 Month + 0.40%) due 9/15/2042 | 1,241,140 | 1,219,989 |
| | Series 4120 Class TC, 1.50% due 10/15/2027 | 1,234,618 | 1,239,520 |
| | Series 4120 Class UE, 2.00% due 10/15/2027 | 1,277,712 | 1,299,040 |
| c | Federal Home Loan Mtg Corp., Multi-Family Structured Pass Through, Series KF15 Class A, 2.185% (LIBOR 1 Month + 0.67%) due 2/25/2023 | 518,980 | 518,217 |
| | Federal Home Loan Mtg Corp., REMIC, | | |
| | Pool D98887, 3.50% due 1/1/2032 | 719,161 | 770,578 |
| | Pool E09025 2.50% due 3/1/2028 | 118,530 | 123,389 |
| | Pool G13804, 5.00% due 3/1/2025 | 164,222 | 173,129 |
| | Pool G15227, 3.50% due 12/1/2029 | 1,787,615 | 1,899,983 |
| | Pool G16710, 3.00% due 11/1/2030 | 2,487,601 | 2,613,302 |
| | Pool G18435, 2.50% due 5/1/2027 | 1,254,710 | 1,306,147 |
| d | Pool G18446 2.50% due 10/1/2027 | 2,313,853 | 2,408,710 |
| | Pool J11371, 4.50% due 12/1/2024 | 168,331 | 176,499 |
| | Pool J13583, 3.50% due 11/1/2025 | 323,653 | 340,761 |
| | Pool J14888, 3.50% due 4/1/2026 | 377,137 | 397,072 |
| | Pool J20795 2.50% due 10/1/2027 | 2,882,476 | 3,000,643 |
| | Pool J37586, 3.50% due 9/1/2032 | 298,374 | 319,647 |
| | Pool SB8010, 2.50% due 10/1/2034 | 2,354,815 | 2,444,294 |
| | Pool SB8030, 2.00% due 12/1/2034 | 2,196,247 | 2,255,912 |
| | Pool T61943, 3.50% due 8/1/2045 | 524,023 | 555,752 |
| | Pool T65457, 3.00% due 1/1/2048 | 2,647,988 | 2,743,868 |
| | Pool ZS7299, 3.00% due 10/1/2030 | 1,305,930 | 1,382,600 |
| | Pool ZT1958, 3.00% due 5/1/2034 | 2,693,146 | 2,863,884 |
| | Federal Home Loan Mtg Corp., Seasoned Credit Risk Transfer, Whole Loan Securities Trust CMO, | | |
| c | Series 2017-3 Class HA, 3.25% due 7/25/2056 | 1,872,586 | 1,907,288 |
| c | Series 2017-4 Class HT, 3.25% due 6/25/2057 | 1,048,829 | 1,070,587 |
| c | Series 2018-1 Class HA, 3.00% due 5/25/2057 | 2,343,839 | 2,364,285 |
| c | Series 2018-2 Class HA, 3.00% due 11/25/2057 | 1,413,148 | 1,425,128 |
| | Series 2018-3 Class HA, 3.00% due 8/25/2057 | 1,648,899 | 1,663,030 |
| | Series 2018-3 Class MA, 3.50% due 8/25/2057 | 511,858 | 540,890 |
| | Series 2018-4 Class HA, 3.00% due 3/25/2058 | 2,013,660 | 2,031,091 |
| | Series 2019-1 Class MA, 3.50% due 7/25/2058 | 2,596,601 | 2,743,877 |
| | Series 2019-2 Class MA, 3.50% due 8/25/2058 | 3,748,991 | 3,961,629 |
| | Series 2019-3 Class MA, 3.50% due 10/25/2058 | 1,821,162 | 1,924,456 |
| | Series 2019-4 Class MA, 3.00% due 2/25/2059 | 2,191,704 | 2,297,437 |
| | Series 2020-1 Class MA, 2.50% due 8/25/2059 | 2,965,470 | 3,071,578 |
| | Federal Home Loan Mtg Corp., Whole Loan Securities Trust CMO, | | |
| | Series 2015-SC02 Class 2A, 3.50% due 9/25/2045 | 1,112,677 | 1,082,312 |
| | Series 2016-SC01 Class 2A, 3.50% due 7/25/2046 | 1,206,889 | 1,182,672 |
| | Series 2016-SC02 Class 2A, 3.50% due 10/25/2046 | 929,313 | 915,800 |
| | Series 2017-SC01 Class 1A, 3.00% due 12/25/2046 | 2,017,789 | 1,998,448 |
| | Series 2017-SC02 Class 1A, 3.00% due 5/25/2047 | 1,301,913 | 1,289,494 |
| | Series 2017-SC02 Class 2A, 3.50% due 5/25/2047 | 991,997 | 995,483 |
| | Series 2017-SC02 Class 2A1, 3.50% due 5/25/2047 | 341,119 | 338,531 |
| | Federal National Mtg Assoc., | | |
| | 1.875% due 12/28/2020 | 2,000,000 | 2,020,296 |
| | Pool 252648, 6.50% due 5/1/2022 | 6,822 | 7,085 |
| | Pool 342947, 7.25% due 4/1/2024 | 3,645 | 3,748 |
| c | Pool 895572, 4.695% (LIBOR 12 Month + 1.82%) due 6/1/2036 | 118,310 | 124,075 |
| | Pool AB8442, 2.00% due 2/1/2028 | 2,736,389 | 2,820,134 |
14 | Thornburg Fixed Income Funds Semi-Annual Report
| See notes to financial statements. |
Schedule of Investments, Continued
Thornburg Limited Term U.S. Government Fund | March 31, 2020 (Unaudited)
| | Issuer-Description | PRINCIPAL
AMOUNT | VALUE |
| | Pool AB8447, 2.50% due 2/1/2028 | $ 1,143,046 | $ 1,189,694 |
| | Pool AD8191, 4.00% due 9/1/2025 | 341,531 | 359,636 |
| | Pool AE0704, 4.00% due 1/1/2026 | 1,266,216 | 1,333,339 |
| | Pool AH3487, 3.50% due 2/1/2026 | 1,592,360 | 1,676,065 |
| | Pool AJ1752, 3.50% due 9/1/2026 | 1,101,551 | 1,159,456 |
| | Pool AK6518, 3.00% due 3/1/2027 | 771,905 | 810,951 |
| | Pool AK6768, 3.00% due 3/1/2027 | 1,191,016 | 1,247,913 |
| | Pool AL6582, 3.50% due 4/1/2030 | 1,053,680 | 1,122,239 |
| | Pool AL9445, 3.00% due 7/1/2031 | 28,320 | 29,982 |
| | Pool AL9821, 2.50% due 1/1/2032 | 3,841,421 | 4,011,398 |
| | Pool AS4916, 3.00% due 5/1/2030 | 2,412,437 | 2,533,714 |
| | Pool AS9733, 4.00% due 6/1/2047 | 2,276,752 | 2,492,175 |
| | Pool AS9749, 4.00% due 6/1/2047 | 1,667,091 | 1,783,151 |
| | Pool AU2669, 2.50% due 10/1/2028 | 1,179,402 | 1,229,377 |
| d | Pool AZ3778 3.00% due 4/1/2030 | 3,008,374 | 3,156,790 |
| | Pool BF0130, 3.50% due 8/1/2056 | 583,797 | 632,479 |
| | Pool BF0144, 3.50% due 10/1/2056 | 799,882 | 867,834 |
| | Pool BM4153 3.00% due 6/1/2033 | 3,051,982 | 3,204,457 |
| | Pool BM4864, 3.50% due 5/1/2033 | 1,917,841 | 2,035,436 |
| | Pool BM5490, 3.50% due 11/1/2031 | 2,331,638 | 2,461,490 |
| | Pool CA0200, 3.00% due 8/1/2032 | 1,994,410 | 2,118,980 |
| | Pool CA0942 2.50% due 12/1/2032 | 1,856,084 | 1,936,472 |
| | Pool CA3904, 3.00% due 7/1/2034 | 4,202,944 | 4,474,652 |
| | Pool CA4102, 3.50% due 8/1/2029 | 1,582,573 | 1,677,633 |
| | Pool CA5271 2.50% due 3/1/2035 | 1,988,960 | 2,080,697 |
| | Pool CA5282, 3.00% due 3/1/2035 | 4,439,405 | 4,727,786 |
| | Pool FM1126, 3.00% due 3/1/2033 | 2,973,830 | 3,137,270 |
| | Pool FM1523, 2.50% due 8/1/2029 | 2,689,008 | 2,798,748 |
| | Pool MA0380, 4.00% due 4/1/2020 | 61 | 61 |
| | Pool MA1582, 3.50% due 9/1/2043 | 3,122,338 | 3,349,535 |
| | Pool MA2322, 2.50% due 7/1/2025 | 714,952 | 743,907 |
| | Pool MA2353, 3.00% due 8/1/2035 | 1,781,682 | 1,895,357 |
| | Pool MA2480, 4.00% due 12/1/2035 | 1,652,509 | 1,793,891 |
| | Pool MA2499, 2.50% due 1/1/2026 | 1,262,910 | 1,314,056 |
| | Pool MA3465, 4.00% due 9/1/2038 | 1,711,849 | 1,851,888 |
| | Pool MA3557, 4.00% due 1/1/2029 | 1,917,229 | 2,026,651 |
| | Pool MA3681, 3.00% due 6/1/2034 | 1,836,084 | 1,922,650 |
| | Pool MA3826, 3.00% due 11/1/2029 | 2,827,051 | 2,970,055 |
| | Pool MA3896, 2.50% due 1/1/2035 | 342,002 | 354,998 |
| | Pool MA3953, 2.50% due 3/1/2030 | 1,237,980 | 1,288,890 |
| | Federal National Mtg Assoc., CMO, | | |
| c | Series 2015-SB5 Class A10, 3.15% (LIBOR 1 Month + 3.15%) due 9/25/2035 | 911,174 | 970,628 |
| c | Series 2018-SB47 Class A5H, 2.92% (LIBOR 1 Month + 2.92%) due 1/25/2038 | 1,215,650 | 1,253,742 |
| | Federal National Mtg Assoc., CMO REMIC, | | |
| | Series 1993-32 Class H, 6.00% due 3/25/2023 | 4,960 | 5,256 |
| c | Series 2009-17 Class AH, 0.593% due 3/25/2039 | 323,563 | 294,264 |
| | Series 2009-52 Class AJ, 4.00% due 7/25/2024 | 2,894 | 2,961 |
| | Series 2011-70 Class CA, 3.00% due 8/25/2026 | 1,781,554 | 1,838,581 |
| | Series 2012-20 Class VT, 3.50% due 3/25/2025 | 2,148,658 | 2,171,691 |
| | Series 2012-36 Class CV, 4.00% due 6/25/2023 | 1,302,789 | 1,338,021 |
| c | Series 2013-81 Class FW, 1.247% (LIBOR 1 Month + 0.30%) due 1/25/2043 | 2,014,909 | 1,974,706 |
| c | Series 2013-92 Class FA, 1.497% (LIBOR 1 Month + 0.55%) due 9/25/2043 | 1,445,550 | 1,421,685 |
| | Federal National Mtg Assoc., Grantor Trust, Series 2017-T1 Class A, 2.898% due 6/25/2027 | 997,917 | 904,704 |
| | Government National Mtg Assoc., | | |
| c | Pool 751392, 5.00% due 2/20/2061 | 3,512,643 | 3,604,481 |
| c | Pool 894205, 3.25% (H15T1Y + 1.50%) due 8/20/2039 | 325,301 | 337,487 |
| c | Pool MA0100, 3.875% (H15T1Y + 1.50%) due 5/20/2042 | 431,125 | 444,183 |
| | Pool MA0907, 2.00% due 4/20/2028 | 1,502,349 | 1,545,980 |
| | Government National Mtg Assoc., CMO, | | |
| | Series 2010-160 Class VY, 4.50% due 1/20/2022 | 197,449 | 203,715 |
| | Series 2016-32 Class LJ, 2.50% due 12/20/2040 | 2,728,896 | 2,774,467 |
| | Series 2017-186 Class VA, 3.00% due 2/20/2031 | 2,590,797 | 2,748,559 |
| | Mortgage-Linked Amortizing Notes CMO, Series 2012-1 Class A10, 2.06% due 1/15/2022 | 365,012 | 371,102 |
See notes to financial statements.
| Thornburg Fixed Income Funds Semi-Annual Report | 15 |
Schedule of Investments, Continued
Thornburg Limited Term U.S. Government Fund | March 31, 2020 (Unaudited)
| | Issuer-Description | PRINCIPAL
AMOUNT | VALUE |
| | Total Mortgage Backed(Cost $196,592,261) | | 200,608,096 |
| | Corporate Bonds — 1.3% | | |
| | Telecommunication Services — 1.3% | | |
| | Wireless Telecommunication Services — 1.3% | | |
| | Sprint Communications, Inc., 9.25% due 4/15/2022 | $ 3,500,000 | $ 3,745,000 |
| | | | 3,745,000 |
| | Total Corporate Bonds(Cost $3,920,931) | | 3,745,000 |
| | Short-Term Investments — 9.1% | | |
| | Bank of New York Tri-Party Repurchase Agreement 0.20% dated 3/31/2020 due 4/1/2020, repurchase price $9,000,050 collateralized by 4 U.S. Government debt securities, having an average coupon of 5.04%, a minimum credit rating of BBB-, maturity dates from 4/25/2027 to 6/20/2039, and having an aggregate market value of $9,145,109 at 3/31/2020 | 9,000,000 | 9,000,000 |
| e | State Street Institutional Treasury Money Market Fund Premier Class, 0.58% | 17,682,721 | 17,682,721 |
| | Total Short-Term Investments(Cost $26,682,721) | | 26,682,721 |
| | Total Investments — 103.6%(Cost $298,263,615) | | $303,508,018 |
| | Liabilities Net of Other Assets — (3.6)% | | (10,425,950) |
| | Net Assets — 100.0% | | $293,082,068 |
| Footnote Legend |
| a | Yankee bond denominated in U.S. dollars and is issued in the U.S. by foreign banks and corporations. |
| b | Segregated as collateral for a when-issued security. |
| c | Variable, floating, step, or fixed to floating rate securities are securities for which interest rate changes are based on changes in a designated base rate or on a predetermined schedule. The rates shown are those in effect on March 31, 2020. |
| d | When-issued security. |
| e | Rate represents the money market fund annualized seven-day yield at March 31, 2020. |
Portfolio Abbreviations
To simplify the listings of securities, abbreviations are used per the table below:
| CMO | Collateralized Mortgage Obligation |
| H15T1Y | US Treasury Yield Curve Rate T-Note Constant Maturity 1 Year |
| LIBOR | London Interbank Offered Rates |
| Mtg | Mortgage |
| REMIC | Real Estate Mortgage Investment Conduit |
16 | Thornburg Fixed Income Funds Semi-Annual Report
| See notes to financial statements. |
Schedule of Investments
Thornburg Limited Term Income Fund | March 31, 2020 (Unaudited)
| | Issuer-Description | PRINCIPAL
AMOUNT | VALUE |
| | U.S. Treasury Securities — 11.6% | | |
| | United States Treasury Notes, | | |
| | 1.375% due 5/31/2020 - 8/31/2020 | $ 36,075,000 | $ 36,168,249 |
| | 1.50% due 5/15/2020 - 2/15/2030 | 123,435,000 | 128,380,760 |
| | 1.625% due 2/15/2026 - 8/15/2029 | 174,250,000 | 187,803,803 |
| | 1.75% due 11/15/2029 | 62,136,000 | 68,192,110 |
| | 2.25% due 11/15/2025 - 8/15/2027 | 31,662,000 | 35,092,174 |
| | 2.50% due 5/31/2020 | 7,000,000 | 7,028,808 |
| | 2.625% due 2/15/2029 | 17,058,000 | 19,904,566 |
| | United States Treasury Notes Inflationary Index, | | |
| | 0.25% due 1/15/2025 - 7/15/2029 | 48,851,227 | 50,515,722 |
| | 0.375% due 7/15/2027 | 66,303,816 | 68,096,406 |
| | 0.875% due 1/15/2029 | 83,557,068 | 90,650,043 |
| | Total U.S. Treasury Securities(Cost $648,700,712) | | 691,832,641 |
| | U.S. Government Agencies — 0.6% | | |
| | Export Leasing (2009), LLC (Guaranty: Export-Import Bank of the United States), 1.859% due 8/28/2021 | 1,322,681 | 1,328,015 |
| a | MSN 41079 and 41084 Ltd. (Guaranty: Export-Import Bank of the United States), 1.717% due 7/13/2024 | 4,814,040 | 4,869,605 |
| | Petroleos Mexicanos (Guaranty: Export-Import Bank of the United States), | | |
| a | 1.70% due 12/20/2022 | 3,120,000 | 3,138,945 |
| a,b | 2.181% (LIBOR 3 Month + 0.35%) due 4/15/2025 | 5,439,000 | 5,299,710 |
| | Reliance Industries Ltd. (Guaranty: Export-Import Bank of the United States), | | |
| a | 2.06% due 1/15/2026 | 900,000 | 914,940 |
| a | 2.512% due 1/15/2026 | 3,900,000 | 4,002,852 |
| | Small Business Administration Participation Certificates, | | |
| | Series 2011-20G Class 1, 3.74% due 7/1/2031 | 4,585,380 | 4,866,763 |
| | Series 2011-20K Class 1, 2.87% due 11/1/2031 | 5,957,214 | 6,181,509 |
| b,c,d | U.S. Department of Transportation, 6.001% due 12/7/2031 | 3,000,000 | 3,251,425 |
| | Total U.S. Government Agencies(Cost $33,672,999) | | 33,853,764 |
| | Other Government — 0.6% | | |
| a,c | Bermuda Government International Bond, 4.138% due 1/3/2023 | 4,000,000 | 3,970,000 |
| | Carpintero Finance Ltd. (Guaranty: Export Credits Guarantee Department), | | |
| a,c | 2.004% due 9/18/2024 | 4,645,074 | 4,721,058 |
| a,c | 2.581% due 11/11/2024 | 6,762,281 | 6,972,698 |
| a,c | Khadrawy Ltd. (Guaranty: Export Credits Guarantee Department), 2.471% due 3/31/2025 | 3,364,950 | 3,311,111 |
| a,b,c | Korea Expressway Corp., 2.519% (LIBOR 3 Month + 0.70%) due 4/20/2020 | 15,000,000 | 15,006,600 |
| | Total Other Government(Cost $33,772,341) | | 33,981,467 |
| | Mortgage Backed — 17.7% | | |
| | Angel Oak Mortgage Trust, LLC, Whole Loan Securities Trust CMO, | | |
| b,c | Series 2017-1 Class A2, 3.085% due 1/25/2047 | 631,995 | 618,604 |
| b,c | Series 2017-3 Class A1, 2.708% due 11/25/2047 | 2,008,788 | 1,936,896 |
| b,c | Series 2017-3, 3.90% due 11/25/2047 | 7,244,000 | 6,657,870 |
| b,c | Series 2018-2 Class A1, 3.674% due 7/27/2048 | 4,504,748 | 4,325,692 |
| | Arroyo Mortgage Trust, Whole Loan Securities Trust CMO, | | |
| b,c | Series 2018-1 Class A1, 3.763% due 4/25/2048 | 9,672,644 | 9,222,388 |
| b,c | Series 2018-1 Class A3, 4.218% due 4/25/2048 | 6,418,012 | 6,007,161 |
| b,c | Series 2019-1 Class A1, 3.805% due 1/25/2049 | 15,973,707 | 15,161,315 |
| b,c | Series 2019-2 Class A1, 3.347% due 4/25/2049 | 8,080,154 | 7,512,342 |
| b,c | Series 2019-3 Class A1, 2.962% due 10/25/2048 | 18,798,379 | 17,224,894 |
| c | Barclays Commercial Mortgage Securities LLC, Series 2015-STP Class A, 3.323% due 9/10/2028 | 3,237,712 | 3,228,951 |
| b,c | Bayview Commercial Asset Trust CMO, Series 2004-3 Class A2, 1.577% (LIBOR 1 Month + 0.63%) due 1/25/2035 | 1,396,125 | 1,250,717 |
| c | Bravo Residential Funding Trust, Whole Loan Securities Trust CMO, Series 2019-1 Class A1C, 3.50% due 3/25/2058 | 6,892,559 | 6,789,345 |
| b,c | CIM Trust, Whole Loan Securities Trust CMO, Series 18-INV1 Class A4, 4.00% due 8/25/2048 | 5,908,016 | 5,788,625 |
| | Citigroup Mortgage Loan Trust, Inc., Whole Loan Securities Trust CMO, | | |
| b | Series 2004-HYB2 Class B1, 4.05% due 3/25/2034 | 91,334 | 72,202 |
| b,c | Series 2014-A Class A, 4.00% due 1/25/2035 | 1,282,014 | 1,275,110 |
| b,c | COLT Mortgage Loan Trust, Inc., Whole Loan Securities Trust CMO, Series 2018-3 Class M2, 4.583% due 10/26/2048 | 1,000,000 | 717,722 |
| | COMM Mortgage Trust, Series 2016-DC2 Class A1, 1.82% due 2/10/2049 | 5,590,901 | 5,579,727 |
| b,c | Credit Suisse Mortgage Trust, Whole Loan Securities Trust CMO, Series 2017-HL2 Class A3, 3.50% due 10/25/2047 | 10,017,555 | 9,914,746 |
See notes to financial statements.
| Thornburg Fixed Income Funds Semi-Annual Report | 17 |
Schedule of Investments, Continued
Thornburg Limited Term Income Fund | March 31, 2020 (Unaudited)
| | Issuer-Description | PRINCIPAL
AMOUNT | VALUE |
| b,c | CSMLT Mortgage Trust, Whole Loan Securities Trust CMO, Series 2015-3 Class B1, 3.692% due 11/25/2045 | $ 5,246,328 | $ 5,205,108 |
| b,c | DBUBS Mortgage Trust, Series 2011-LC2A Class A1FL, 2.161% (LIBOR 1 Month + 1.35%) due 7/12/2044 | 926,498 | 924,414 |
| b,c | Ellington Financial Mortgage Trust 2019-2, Whole Loan Securities Trust CMO, Series 2019-2 Class A1, 2.739% due 11/25/2059 | 17,218,988 | 16,503,043 |
| c | FDIC Trust, Whole Loan Securities Trust CMO, Series 2013-R1 Class A, 1.15% due 3/25/2033 | 245,852 | 243,162 |
| | Federal Home Loan Mortgage Corp., | | |
| | Pool J17504, 3.00% due 12/1/2026 | 857,252 | 900,838 |
| | Pool J22899, 2.00% due 3/1/2028 | 5,220,749 | 5,378,223 |
| | Pool RA1833, 4.00% due 10/1/2049 | 2,764,251 | 2,956,176 |
| | Pool SD0257, 3.00% due 1/1/2050 | 2,936,612 | 3,094,606 |
| | Federal Home Loan Mtg Corp., Pool RC1280, 3.00% due 3/1/2035 | 8,331,215 | 8,796,904 |
| | Federal Home Loan Mtg Corp., CMO REMIC, | | |
| | Series 3195 Class PD, 6.50% due 7/15/2036 | 505,909 | 586,608 |
| | Series 3291 Class BY, 4.50% due 3/15/2022 | 59,260 | 60,189 |
| | Series 3504 Class PC, 4.00% due 1/15/2039 | 10,109 | 10,319 |
| | Series 3838 Class GV, 4.00% due 3/15/2024 | 4,437,253 | 4,658,604 |
| | Series 3919 Class VB, 4.00% due 8/15/2024 | 2,394,624 | 2,495,318 |
| | Series 3922 Class PQ, 2.00% due 4/15/2041 | 722,816 | 729,646 |
| | Series 4050 Class MV, 3.50% due 8/15/2023 | 1,383,831 | 1,432,132 |
| | Series 4072 Class VA, 3.50% due 10/15/2023 | 1,091,064 | 1,125,325 |
| | Series 4079 Class WV, 3.50% due 3/15/2027 | 2,046,653 | 2,130,291 |
| | Series 4097 Class TE, 1.75% due 5/15/2039 | 2,426,583 | 2,454,342 |
| | Series 4120 Class TC, 1.50% due 10/15/2027 | 1,603,162 | 1,609,528 |
| | Federal Home Loan Mtg Corp., Multi-Family Structured Pass Through, Series K717 Class A2, 2.991% due 9/25/2021 | 4,671,078 | 4,737,850 |
| | Federal Home Loan Mtg Corp., Multifamily Structured Pass Through Certificates, | | |
| b | Series K719 Class A2, 2.731% due 6/25/2022 | 4,066,356 | 4,143,481 |
| | Series K722 Class A2, 2.406% due 3/25/2023 | 4,800,000 | 4,935,007 |
| | Series K725 Class A1, 2.666% due 5/25/2023 | 6,444,702 | 6,604,372 |
| b,e | Federal Home Loan Mtg Corp., Multifamily Structured Pass Through Certificates IO, Series K008 Class X1, 1.456% due 6/25/2020 | 16,974,263 | 7,832 |
| | Federal Home Loan Mtg Corp., REMIC, | | |
| | Pool D98887, 3.50% due 1/1/2032 | 2,407,387 | 2,579,507 |
| | Pool G16710, 3.00% due 11/1/2030 | 674,736 | 708,831 |
| | Pool T65457, 3.00% due 1/1/2048 | 23,775,150 | 24,636,012 |
| | Federal Home Loan Mtg Corp., Seasoned Credit Risk Transfer, Whole Loan Securities Trust CMO, | | |
| b | Series 2017-1 Class HA, 3.00% due 1/25/2056 | 9,083,433 | 9,163,731 |
| b | Series 2017-3 Class HA, 3.25% due 7/25/2056 | 15,627,103 | 15,916,695 |
| b | Series 2017-4 Class HT, 3.25% due 6/25/2057 | 13,452,934 | 13,732,019 |
| b | Series 2018-1 Class HA, 3.00% due 5/25/2057 | 9,316,759 | 9,398,033 |
| b | Series 2018-2 Class HA, 3.00% due 11/25/2057 | 22,610,366 | 22,802,045 |
| | Series 2018-3 Class HA, 3.00% due 8/25/2057 | 23,744,146 | 23,947,628 |
| | Series 2018-4 Class HA, 3.00% due 3/25/2058 | 19,803,910 | 19,975,342 |
| | Series 2019-1 Class MA, 3.50% due 7/25/2058 | 17,985,790 | 19,005,922 |
| | Series 2019-2 Class MA, 3.50% due 8/25/2058 | 44,908,391 | 47,455,541 |
| | Series 2019-3 Class MA, 3.50% due 10/25/2058 | 25,707,526 | 27,165,626 |
| | Series 2019-4 Class MA, 3.00% due 2/25/2059 | 33,814,185 | 35,445,456 |
| | Series 2020-1 Class MA, 2.50% due 8/25/2059 | 6,290,000 | 6,515,064 |
| | Federal Home Loan Mtg Corp., Whole Loan Securities Trust CMO, | | |
| | Series 2016-SC01 Class 2A, 3.50% due 7/25/2046 | 4,626,410 | 4,533,577 |
| | Series 2017-SC01 Class 1A, 3.00% due 12/25/2046 | 42,428,599 | 42,021,904 |
| | Series 2017-SC02 Class 2A, 3.50% due 5/25/2047 | 3,781,990 | 3,795,279 |
| | Series 2017-SC02 Class 2A1, 3.50% due 5/25/2047 | 2,607,596 | 2,587,808 |
| | Federal National Mtg Assoc., | | |
| | Pool 469616, 3.50% due 11/1/2021 | 3,492,645 | 3,588,643 |
| | Pool 890641, 2.00% due 10/1/2028 | 2,838,380 | 2,923,472 |
| | Pool 897936, 5.50% due 8/1/2021 | 61,084 | 62,239 |
| b | Pool AE0160, 4.548% due 6/1/2020 | 757,894 | 758,150 |
| | Pool AE0704, 4.00% due 1/1/2026 | 3,293,400 | 3,467,985 |
| | Pool AK6518, 3.00% due 3/1/2027 | 1,076,708 | 1,131,173 |
| | Pool AL6582, 3.50% due 4/1/2030 | 3,730,027 | 3,972,727 |
| | Pool AS3111, 3.00% due 8/1/2029 | 6,589,572 | 6,957,908 |
| | Pool AS4916, 3.00% due 5/1/2030 | 751,048 | 788,805 |
| | Pool AS7323, 2.50% due 6/1/2031 | 4,150,838 | 4,331,911 |
| | Pool AS8242, 2.50% due 11/1/2031 | 7,402,296 | 7,704,390 |
| | Pool AS9749, 4.00% due 6/1/2047 | 14,153,038 | 15,138,351 |
18 | Thornburg Fixed Income Funds Semi-Annual Report
| See notes to financial statements. |
Schedule of Investments, Continued
Thornburg Limited Term Income Fund | March 31, 2020 (Unaudited)
| | Issuer-Description | PRINCIPAL
AMOUNT | VALUE |
| | Pool AV5059, 3.00% due 2/1/2029 | $ 4,236,307 | $ 4,473,103 |
| | Pool BM4324, 3.50% due 7/1/2033 | 5,532,500 | 5,925,329 |
| | Pool BM5462, 3.00% due 11/1/2032 | 14,907,702 | 15,727,021 |
| | Pool BM5490, 3.50% due 11/1/2031 | 7,694,405 | 8,122,918 |
| | Pool CA0200, 3.00% due 8/1/2032 | 14,844,040 | 15,771,189 |
| | Pool CA3904, 3.00% due 7/1/2034 | 9,269,473 | 9,868,716 |
| | Pool CA4102, 3.50% due 8/1/2029 | 9,059,551 | 9,603,727 |
| | Pool CA5282, 3.00% due 3/1/2035 | 5,902,672 | 6,286,106 |
| | Pool FM1542, 3.50% due 9/1/2034 | 3,653,063 | 3,917,012 |
| | Pool FP0000, 3.00% due 11/1/2027 | 9,638,881 | 10,120,434 |
| | Pool MA2815, 3.00% due 11/1/2026 | 2,118,764 | 2,221,968 |
| | Pool MA3465, 4.00% due 9/1/2038 | 15,351,859 | 16,607,734 |
| | Pool MA3953, 2.50% due 3/1/2030 | 8,319,229 | 8,661,343 |
| | Federal National Mtg Assoc., CMO REMIC, | | |
| | Series 2007-42 Class PA, 5.50% due 4/25/2037 | 98,169 | 102,862 |
| b | Series 2009-17 Class AH, 0.593% due 3/25/2039 | 539,271 | 490,440 |
| | Series 2009-52 Class AJ, 4.00% due 7/25/2024 | 4,823 | 4,934 |
| | Series 2012-129 Class LA, 3.50% due 12/25/2042 | 5,343,044 | 5,631,859 |
| | Series 2012-36 Class CV, 4.00% due 6/25/2023 | 1,188,469 | 1,220,610 |
| b | Series 2013-81 Class FW, 1.247% (LIBOR 1 Month + 0.30%) due 1/25/2043 | 7,321,108 | 7,175,033 |
| | Federal National Mtg Assoc., Grantor Trust, Series 2017-T1 Class A, 2.898% due 6/25/2027 | 17,962,510 | 16,284,676 |
| b,c | Flagstar Mortgage Trust, Whole Loan Securities Trust CMO, Series 2017-1 Class 2A2, 3.00% due 3/25/2047 | 7,843,551 | 7,656,278 |
| b,c | FWD Securitization Trust, Whole Loan Securities Trust CMO, Series 2019-INV1 Class A1, 2.81% due 6/25/2049 | 6,350,598 | 5,950,255 |
| b,c | Galton Funding Mortgage Trust, Whole Loan Securities Trust CMO, Series 2018-1 Class A43, 3.50% due 11/25/2057 | 1,994,348 | 1,931,442 |
| | GCAT LLC, Whole Loan Securities Trust CMO, | | |
| b,c | Series 2019-NQM1 Class A1, 2.985% due 2/25/2059 | 15,794,953 | 16,170,173 |
| b,c | Series 2019-NQM3 Class A1, 2.686% due 11/25/2059 | 20,215,019 | 20,486,046 |
| b,c | GCAT Trust, Whole Loan Securities Trust CMO, Series 2019-NQM2 Class A1, 2.855% due 9/25/2059 | 17,497,739 | 17,746,711 |
| | Government National Mtg Assoc., | | |
| b | Pool 731491, 5.067% due 12/20/2060 | 251,896 | 256,445 |
| | Pool 783299, 4.50% due 2/15/2022 | 828 | 832 |
| b | Pool MA0100, 3.875% (H15T1Y + 1.50%) due 5/20/2042 | 435,480 | 448,670 |
| | Government National Mtg Assoc., CMO, Series 2016-32 Class LJ, 2.50% due 12/20/2040 | 10,746,887 | 10,926,355 |
| | Homeward Opportunities Fund I Trust, Whole Loan Securities Trust CMO, | | |
| b,c | Series 2018-1 Class A1, 3.766% due 6/25/2048 | 6,656,614 | 6,601,652 |
| b,c | Series 2018-1 Class A3, 3.999% due 6/25/2048 | 3,153,974 | 3,073,613 |
| b,c | Series 2018-1 Class M1, 4.548% due 6/25/2048 | 1,000,000 | 856,376 |
| b,c | Series 2019-1 Class A1, 3.454% due 1/25/2059 | 14,759,516 | 14,537,052 |
| b,c | Series 2019-1, 3.951% due 1/25/2059 | 14,500,000 | 12,000,265 |
| | JPMBB Commercial Mortgage Securities Trust, Series 2016-C1, 2.668% due 3/15/2049 | 4,311,939 | 4,308,315 |
| | JPMorgan Mortgage Trust, Whole Loan Securities Trust CMO, | | |
| b,c | Series 2017-2 Class A6, 3.00% due 5/25/2047 | 12,002,603 | 11,928,991 |
| b,c | Series 2017-6 Class A5, 3.50% due 12/25/2048 | 13,287,170 | 13,449,937 |
| b,c | Mello Mortgage Capital Acceptance, Whole Loan Securities Trust CMO, Series 2018-MTG1 Class A3, 3.50% due 3/25/2048 | 8,189,499 | 8,034,448 |
| b | Merrill Lynch Mortgage Investors Trust, Whole Loan Securities Trust CMO, Series 2004-A4 Class M1, 4.322% due 8/25/2034 | 265,108 | 208,318 |
| b,c | Metlife Securitization Trust, Whole Loan Securities Trust CMO, Series 2019-1A Class A1A, 3.75% due 4/25/2058 | 4,401,741 | 4,356,057 |
| | Morgan Stanley Bank of America Merrill Lynch Trust, Series 2015-C22 Class A4, 3.306% due 4/15/2048 | 1,100,000 | 1,119,261 |
| | Mortgage-Linked Amortizing Notes CMO, Series 2012-1 Class A10, 2.06% due 1/15/2022 | 308,856 | 314,009 |
| | New Residential Mortgage Loan Trust, Whole Loan Securities Trust CMO, | | |
| b,c | Series 2017-2A Class A3, 4.00% due 3/25/2057 | 7,025,908 | 7,286,486 |
| b,c | Series 2017-3A Class A1, 4.00% due 4/25/2057 | 8,523,566 | 8,425,099 |
| b,c | Series 2017-4A Class A1, 4.00% due 5/25/2057 | 10,558,618 | 10,947,667 |
| b,c | Series 2017-5A Class A1, 2.447% (LIBOR 1 Month + 1.50%) due 6/25/2057 | 856,624 | 838,346 |
| b,c | Series 2017-6A Class A1, 4.00% due 8/27/2057 | 3,893,806 | 4,013,204 |
| b,c | Series 2018-1A Class A1A, 4.00% due 12/25/2057 | 4,648,016 | 4,599,343 |
| b,c | Series 2018-2A Class A1, 4.50% due 2/25/2058 | 9,881,887 | 10,313,255 |
| b,c | Series 2018-NQM1 Class A1, 3.986% due 11/25/2048 | 13,926,617 | 13,878,606 |
| b,c | Series 2018-RPL1 Class A1, 3.50% due 12/25/2057 | 6,129,752 | 6,263,552 |
| | RAMP Trust, Whole Loan Securities Trust CMO, Series 2003-SL1 Class A31, 7.125% due 4/25/2031 | 806,198 | 780,637 |
| | Sequoia Mortgage Trust, Whole Loan Securities Trust CMO, | | |
| b,c | Series 2017-4 Class A4, 3.50% due 7/25/2047 | 2,452,770 | 2,420,007 |
| b,c | Series 2017-5 Class A4, 3.50% due 8/25/2047 | 6,430,547 | 6,335,356 |
| b,c | SG Residential Mortgage Trust, Whole Loan Securities Trust CMO, Series 2019-3 Class A1, 2.703% due 9/25/2059 | 14,591,886 | 14,186,048 |
See notes to financial statements.
| Thornburg Fixed Income Funds Semi-Annual Report | 19 |
Schedule of Investments, Continued
Thornburg Limited Term Income Fund | March 31, 2020 (Unaudited)
| | Issuer-Description | PRINCIPAL
AMOUNT | VALUE |
| b,c | Shellpoint Asset Funding Trust, Whole Loan Securities Trust CMO, Series 2013-1 Class A1, 3.75% due 7/25/2043 | $ 4,251,909 | $ 4,149,412 |
| b,c | Spruce Hill Mortgage Loan Trust, Inc., Whole Loan Securities Trust CMO, Series 2020-SH1 Class A1, 2.521% due 1/28/2050 | 44,338,553 | 42,141,671 |
| b,c | Starwood Mortgage Residential Trust, Whole Loan Securities Trust CMO, Series 2019-IMC1, 3.468% due 2/25/2049 | 8,936,525 | 8,815,320 |
| b | Structured Asset Securities Corp. Mortgage Pass-Through Ctfs, Whole Loan Securities Trust CMO, Series 2003-9A Class 2A2, 3.63% due 3/25/2033 | 729,394 | 686,315 |
| | Verus Securitization Trust, Whole Loan Securities Trust CMO, | | |
| b,c | Series 2017-2A Class A1, 2.485% due 7/25/2047 | 4,692,061 | 4,501,296 |
| b,c | Series 2018-2 Class A1, 3.677% due 6/1/2058 | 6,814,290 | 6,610,687 |
| b,c | Series 2018-3 Class A1, 4.108% due 10/25/2058 | 7,130,639 | 6,904,914 |
| b,c | Series 2019-2, 3.211% due 5/25/2059 | 705,227 | 683,912 |
| b,c | Series 2019-3 Class A1, 2.784% due 7/25/2059 | 20,605,571 | 19,993,138 |
| | Total Mortgage Backed(Cost $1,060,187,312) | | 1,062,572,185 |
| | Asset Backed Securities — 19.1% | | |
| | Advance Receivables — 0.5% | | |
| c | New Residential Advance Receivables Trust Advance Receivables Backed 2019-T2, Series 2019-T2 Class AT2, 2.52% due 8/15/2053 | 31,650,000 | 29,618,678 |
| | | | 29,618,678 |
| | Asset-Backed - Finance & Insurance — 6.9% | | |
| | Freed ABS Trust, | | |
| c | Series 2020-FP1 Class A, 2.52% due 3/18/2027 | 14,200,450 | 13,184,447 |
| c | Series 2019-1 Class B, 3.87% due 6/18/2026 | 4,125,000 | 3,363,497 |
| c | Series 2019-1 Class-A, 3.42% due 6/18/2026 | 1,960,790 | 1,952,730 |
| c | Series 2019-2 Class A, 2.62% due 11/18/2026 | 8,397,622 | 8,233,205 |
| c | Series 2019-2, 3.19% due 11/18/2026 | 2,500,000 | 2,000,650 |
| c | Aqua Finance Trust, Series 2019-A Class A, 3.14% due 7/16/2040 | 14,232,358 | 14,514,671 |
| | Conn’s Receivables Funding, LLC, | | |
| c | Series 2019-A Class A, 3.40% due 10/16/2023 | 1,961,044 | 1,922,154 |
| c | Series 2019-B Class A, 2.66% due 6/17/2024 | 4,181,380 | 4,017,056 |
| c | ExteNet, LLC, Series 2019-1A Class A2, 3.204% due 7/26/2049 | 9,855,000 | 8,893,720 |
| c | Hilton Grand Vacations Trust, Series 2019-AA Class A, 2.34% due 7/25/2033 | 11,730,474 | 9,942,984 |
| | Lendingpoint Asset Securitization Trust, | | |
| c | Series 2019-1 Class A, 3.154% due 8/15/2025 | 6,584,525 | 6,587,138 |
| c | Series 2019-2 Class A, 3.071% due 11/10/2025 | 14,551,754 | 14,643,375 |
| c | Series 2020-1 Class A, 2.512% due 2/10/2026 | 17,259,483 | 17,058,921 |
| c | LL ABS Trust, Series 2019-1A Class A, 2.87% due 3/15/2027 | 9,857,971 | 9,688,781 |
| c | MelTel Land Funding, LLC, Series 2019-1A Class A, 3.768% due 4/15/2049 | 9,400,000 | 7,447,941 |
| | New Residential Advance Receivables Trust Advance Receivables Backed, | | |
| c | Series 2019-T4 Class AT4, 2.329% due 10/15/2051 | 17,400,000 | 17,399,734 |
| c | Series 2019-T5 Class AT5, 2.425% due 10/15/2051 | 31,000,000 | 30,302,763 |
| c | NP SPE II, LLC, Series 2019-2A Class A1, 2.864% due 11/19/2049 | 13,788,190 | 13,732,829 |
| c | NRZ Advance Receivables Trust , Series 2019-T1 Class AT1, 2.59% due 7/15/2052 | 27,675,000 | 26,414,946 |
| c | Pawnee Equipment Receivables, Series 2019-1 Class A2, 2.29% due 10/15/2024 | 28,255,000 | 27,716,782 |
| | SCF Equipment Leasing, LLC, | | |
| c | Series 2019-1A Class A1, 3.04% due 3/20/2023 | 5,967,486 | 5,824,407 |
| c | Series 2019-2A Class A1, 2.22% due 6/20/2024 | 15,892,370 | 15,567,914 |
| c | Sierra Timeshare Receivables Funding, LLC, Series 2019-1A Class A, 3.20% due 1/20/2036 | 2,816,350 | 2,789,020 |
| | Small Business Lending Trust, | | |
| c | Series 2019-A Class A, 2.85% due 7/15/2026 | 5,721,817 | 5,649,204 |
| c | Series 2020-A Class A, 2.62% due 12/15/2026 | 16,685,639 | 16,524,930 |
| | Sofi Consumer Loan Program Trust, | | |
| c | Series 2018-1 Class A2, 3.14% due 2/25/2027 | 304,565 | 303,389 |
| c | Series 2019-3 Class A, 2.90% due 5/25/2028 | 14,802,594 | 14,343,981 |
| c | SoFi Consumer Loan Program Trust, Series 2019-2 Class A, 3.01% due 4/25/2028 | 5,175,723 | 5,021,780 |
| c | SpringCastle Funding, Series 2019-AA Class A, 3.20% due 5/27/2036 | 24,888,646 | 24,639,359 |
| b,c | Towd Point Mortgage Trust, Series 2019-HY2 Class 1, 1.947% (LIBOR 1 Month + 1.00%) due 5/25/2058 | 34,057,414 | 33,068,049 |
| c,d | Upstart Pass-Through Trust, Series 2020-ST3 Class A, 3.35% due 4/20/2028 | 11,650,000 | 10,228,700 |
| | Upstart Securitization Trust, | | |
| c | Series 2019-1 Class B, 4.19% due 4/20/2026 | 14,850,000 | 13,553,288 |
| c | Series 2019-2 Class A, 2.897% due 9/20/2029 | 14,534,877 | 14,564,677 |
| c | Series 2019-2 Class B, 3.734% due 9/20/2029 | 10,900,000 | 8,705,508 |
20 | Thornburg Fixed Income Funds Semi-Annual Report
| See notes to financial statements. |
Schedule of Investments, Continued
Thornburg Limited Term Income Fund | March 31, 2020 (Unaudited)
| | Issuer-Description | PRINCIPAL
AMOUNT | VALUE |
| c | Series 2019-3 Class B, 3.829% due 1/21/2030 | $ 2,350,000 | $ 1,582,451 |
| c | Series 2020-1, 3.093% due 4/22/2030 | 3,250,000 | 2,119,863 |
| | | | 413,504,844 |
| | Auto Receivables — 3.4% | | |
| c | ACC Trust, Series 2019-2 Class A, 2.82% due 2/21/2023 | 15,784,415 | 15,533,986 |
| c | American Credit Acceptance Receivables Trust, Series 2018-3 Class B, 3.49% due 6/13/2022 | 692,125 | 692,121 |
| c | Arivo Acceptance Auto Loan Receivables Trust, Series 2019-1 Class A, 2.99% due 7/15/2024 | 4,993,462 | 4,952,068 |
| c | Avid Automobile Receivables Trust, Series 2019-1 Class A, 2.62% due 2/15/2024 | 11,827,545 | 11,462,327 |
| c | Avis Budget Rental Car Funding AESOP, LLC, Series 2015-2A Class A, 2.63% due 12/20/2021 | 6,000,000 | 5,946,536 |
| c | CarNow Auto Receivables Trust, Series 2019-1A Class A, 2.72% due 11/15/2022 | 7,308,514 | 7,156,635 |
| | Carvana Auto Receivables Trust, | | |
| c | Series 2019-1A, 3.88% due 10/15/2024 | 3,223,000 | 3,175,470 |
| c | Series 2020-N1A, 1.53% due 1/16/2024 | 23,800,000 | 23,371,600 |
| c | CIG Auto Receivables Trust, Series 2017-1A Class A, 2.71% due 5/15/2023 | 435,096 | 424,664 |
| | CPS Auto Receivables Trust, | | |
| c | Series 2017-D, 3.73% due 9/15/2023 | 3,000,000 | 2,927,504 |
| c | Series 2019-A Class B, 3.58% due 12/16/2024 | 11,800,000 | 11,662,775 |
| c | Series 2020-A Class A, 2.09% due 5/15/2023 | 17,528,781 | 17,083,806 |
| c | DT Auto Owner Trust, Series 2019-4A, 2.85% due 7/15/2025 | 7,500,000 | 7,218,607 |
| c | Enterprise Fleet Financing, LLC, Series 2017-1 Class A2, 2.13% due 7/20/2022 | 87,845 | 87,844 |
| c | Exeter Automobile Receivables Trust, Series 2019-3A, 3.11% due 8/15/2025 | 2,000,000 | 1,966,558 |
| | Foursight Capital Automobile Receivables Trust, | | |
| c | Series 2016-1 Class A2, 2.87% due 10/15/2021 | 23,295 | 23,295 |
| c | Series 2019-1 Class A2, 2.58% due 3/15/2023 | 6,801,607 | 6,633,915 |
| | GLS Auto Receivables Issuer Trust, | | |
| c | Series 2019-4A Class A, 2.47% due 11/15/2023 | 8,733,331 | 8,001,386 |
| c | Series 2020-1A, 2.17% due 2/15/2024 | 14,594,522 | 14,205,578 |
| | GLS Auto Receivables Trust, | | |
| c | Series 2018-2A Class A, 3.25% due 4/18/2022 | 856,000 | 843,447 |
| c | Series 2018-3A Class A, 3.35% due 8/15/2022 | 2,107,861 | 2,080,995 |
| c | Series 2019-1A Class A, 3.37% due 1/17/2023 | 5,456,053 | 5,405,359 |
| a,c | OSCAR US Funding Trust IX, LLC, Series 2018-2A Class A4, 3.63% due 9/10/2025 | 1,850,000 | 1,936,614 |
| a,c | Oscar US Funding XI, LLC, Series 2019-2A Class A3, 2.59% due 9/11/2023 | 14,400,000 | 13,913,674 |
| c | Skopos Auto Receivables Trust, Series 2019-1A Class A, 2.90% due 12/15/2022 | 18,134,256 | 17,671,317 |
| c | Tesla Auto Lease Trust, Series 2018-B Class A, 3.71% due 8/20/2021 | 4,500,049 | 4,514,638 |
| c | U.S. Auto Funding, LLC, Series 2019-1A Class A, 3.61% due 4/15/2022 | 4,064,693 | 3,994,161 |
| c | United Auto Credit Securitization Trust, Series 2019-1, 3.47% due 8/12/2024 | 6,750,000 | 6,712,470 |
| b,c | Volvo Financial Equipment Master Owner Trust, Series 2017-A Class A, 1.205% (LIBOR 1 Month + 0.50%) due 11/15/2022 | 3,350,000 | 3,235,026 |
| | | | 202,834,376 |
| | Credit Card — 0.2% | | |
| c | Fair Square Issuance Trust, Series 2020-AA Class A, 2.90% due 9/20/2024 | 13,430,000 | 12,361,564 |
| | | | 12,361,564 |
| | Other Asset Backed — 5.3% | | |
| | Appalachian Consumer Rate Relief Funding, LLC, Series 2013-1 Class A1, 2.008% due 2/1/2024 | 5,187,646 | 5,206,459 |
| c | Avant Loans Funding Trust, Series 2019-A Class A, 3.48% due 7/15/2022 | 3,682,165 | 3,621,812 |
| | AXIS Equipment Finance Receivables VI, LLC, | | |
| c | Series 2018-2A Class A2, 3.89% due 7/20/2022 | 3,990,002 | 4,046,256 |
| c | Series 2019-1A Class A2, 2.63% due 6/20/2024 | 8,400,000 | 8,260,941 |
| b,c | Bayview Opportunity Master Fund IV Trust, Series 2017-RT1 Class A1, 3.00% due 3/28/2057 | 2,622,414 | 2,579,640 |
| c | BCC Funding Corp. XVI, LLC, Series 2019-1A Class A2, 2.46% due 8/20/2024 | 25,825,000 | 23,863,550 |
| c | BCC Funding XIV, LLC, Series 2018-1A Class A2, 2.96% due 6/20/2023 | 1,295,276 | 1,267,883 |
| c | BRE Grand Islander Timeshare Issuer, LLC, Series 2017-1A Class A, 2.94% due 5/25/2029 | 2,686,031 | 2,691,193 |
| c | CFG Investments Ltd., Series 2019-1 Class A, 5.56% due 8/15/2029 | 6,000,000 | 4,257,940 |
| | Consumer Loan Underlying Bond Credit Trust, | | |
| c | Series 2018-P2 Class A, 3.47% due 10/15/2025 | 2,099,201 | 1,894,865 |
| c | Series 2018-P3 Class A, 3.82% due 1/15/2026 | 2,542,901 | 2,422,453 |
| c | Dell Equipment Finance Trust, Series 2018-1 Class A2A, 2.97% due 10/22/2020 | 174,706 | 174,704 |
| | Diamond Resorts Owner Trust, | | |
| c | Series 2018-1 Class A, 3.70% due 1/21/2031 | 6,691,873 | 6,803,633 |
| c | Series 2019-1A Class A, 2.89% due 2/20/2032 | 18,206,345 | 18,264,236 |
| a,c | ECAF I Ltd., Series 2015-1A Class A2, 4.947% due 6/15/2040 | 3,923,445 | 3,342,433 |
See notes to financial statements.
| Thornburg Fixed Income Funds Semi-Annual Report | 21 |
Schedule of Investments, Continued
Thornburg Limited Term Income Fund | March 31, 2020 (Unaudited)
| | Issuer-Description | PRINCIPAL
AMOUNT | VALUE |
| | Entergy New Orleans Storm Recovery Funding I, LLC, Series 2015-1 Class A, 2.67% due 6/1/2027 | $ 8,271,525 | $ 8,252,096 |
| | Foundation Finance Trust, | | |
| c | Series 2017-1A Class A, 3.30% due 7/15/2033 | 2,847,652 | 2,791,713 |
| c | Series 2019-1A Class A, 3.86% due 11/15/2034 | 11,749,043 | 11,234,522 |
| a,c | Global SC Finance IV Ltd., Series 2017-1A Class A, 3.85% due 4/15/2037 | 6,151,558 | 6,147,571 |
| | HERO Funding Trust, | | |
| c | Series 2015-1A Class A, 3.84% due 9/21/2040 | 6,104,309 | 6,300,123 |
| c | Series 2017-2A Class A1, 3.28% due 9/20/2048 | 1,176,516 | 1,211,602 |
| c | Marlette Funding Trust, Series 2019-2A Class A, 3.13% due 7/16/2029 | 3,688,187 | 3,540,587 |
| | Nationstar HECM Loan Trust, | | |
| b,c | Series 2018-2A Class A, 3.188% due 7/25/2028 | 1,003,391 | 1,000,905 |
| b,c | Series 2019-1A Class A, 2.651% due 6/25/2029 | 6,962,946 | 6,900,441 |
| b,c,d | Northwind Holdings, LLC, Series 2007-1A Class A1, 2.36% (LIBOR 3 Month + 0.78%) due 12/1/2037 | 568,750 | 553,394 |
| | Ocwen Master Advance Receivables Trust, | | |
| c | Series 2019-T1 Class AT1, 2.514% due 8/15/2050 | 10,500,000 | 10,469,932 |
| c | Series 2019-T2 Class AT2, 2.419% due 8/15/2051 | 7,900,000 | 7,781,440 |
| c | Oportun Funding VII, LLC, Series 2017-B Class A, 3.22% due 10/10/2023 | 30,400,000 | 29,458,366 |
| | PFS Financing Corp., | | |
| c | Series 2017-D Class A, 2.40% due 10/17/2022 | 10,000,000 | 9,966,539 |
| c | Series 2018-B Class A, 2.89% due 2/15/2023 | 7,400,000 | 7,322,775 |
| c | Purchasing Power Funding, LLC, Series 2018-A Class A, 3.34% due 8/15/2022 | 9,400,000 | 9,399,976 |
| c,d | Scala Funding Co., LLC, Series 2016-1 Class A, 3.91% due 2/15/2021 | 2,000,000 | 1,948,000 |
| c | SCF Equipment Leasing, LLC, Series 2018-1A Class A2, 3.63% due 10/20/2024 | 4,033,351 | 3,913,156 |
| c | Sierra Timeshare Receivables Funding, LLC, Series 2015-3A Class A, 2.58% due 9/20/2032 | 1,917,600 | 1,885,302 |
| | Small Business Administration, | | |
| | Series 2001-20J Class 1, 5.76% due 10/1/2021 | 38,546 | 38,557 |
| | Series 2008-20D Class 1, 5.37% due 4/1/2028 | 821,081 | 871,097 |
| | Series 2009-20E Class 1, 4.43% due 5/1/2029 | 466,538 | 486,274 |
| | Series 2009-20K Class 1, 4.09% due 11/1/2029 | 3,559,409 | 3,772,569 |
| | Series 2011-20E Class 1, 3.79% due 5/1/2031 | 4,439,863 | 4,693,716 |
| | Series 2011-20F Class 1, 3.67% due 6/1/2031 | 709,262 | 754,017 |
| | Series 2011-20I Class 1, 2.85% due 9/1/2031 | 7,040,458 | 7,243,706 |
| | Series 2012-20D Class 1, 2.67% due 4/1/2032 | 5,582,245 | 5,849,066 |
| | Series 2012-20J Class 1, 2.18% due 10/1/2032 | 4,513,111 | 4,555,768 |
| | Series 2012-20K Class 1, 2.09% due 11/1/2032 | 2,829,240 | 2,826,465 |
| c | Sofi Consumer Loan Program, LLC, Series 2017-3 Class A, 2.77% due 5/25/2026 | 798,122 | 785,498 |
| c | SPS Servicer Advance Receivables Trust Advance Receivables Backed Notes, Series 2019-T2 Class AT2, 2.32% due 10/15/2052 | 19,637,000 | 18,963,467 |
| c | Tax Ease Funding, LLC, Series 2016-1A Class A, 3.131% due 6/15/2028 | 3,140,363 | 3,124,026 |
| | Towd Point Mortgage Trust, | | |
| b,c | Series 2016-5 Class A1, 2.50% due 10/25/2056 | 6,947,096 | 6,900,944 |
| b,c | Series 2017-1 Class A1, 2.75% due 10/25/2056 | 3,873,521 | 3,867,726 |
| b,c | Series 2018-2 Class A1, 3.25% due 3/25/2058 | 8,970,575 | 9,050,638 |
| b,c | Series 2018-3 Class A1, 3.75% due 5/25/2058 | 6,014,737 | 6,156,343 |
| b,c | Series 2018-6 Class A1A, 3.75% due 3/25/2058 | 11,480,601 | 11,723,440 |
| c | VB-S1 Issuer, LLC,, Series 2016-1A Class C, 3.065% due 6/15/2046 | 1,650,000 | 1,625,856 |
| c | Westgate Resorts, LLC, Series 2016-1A Class A, 3.50% due 12/20/2028 | 2,469,467 | 2,387,343 |
| | | | 314,452,954 |
| | Student Loan — 2.8% | | |
| c | Commonbond Student Loan Trust, Series 18-CGS, Class A1, 3.87% due 2/25/2046 | 7,294,936 | 7,262,534 |
| b,c | Navient Private Education Loan Trust, Student Loan, Series 2015-AA Class A2B, 1.905% (LIBOR 1 Month + 1.20%) due 12/15/2028 | 3,105,381 | 2,890,935 |
| | Navient Private Education Refinance Loan Trust, | | |
| c | Series 2018-CA Class A1, 3.01% due 6/16/2042 | 957,537 | 957,537 |
| b,c | Series 2019-D Class A2B, 1.755% (LIBOR 1 Month + 1.05%) due 12/15/2059 | 14,400,000 | 11,669,015 |
| | Navient Student Loan Trust, | | |
| b | Series 2014-1 Class A3, 1.457% (LIBOR 1 Month + 0.51%) due 6/25/2031 | 7,831,750 | 7,117,538 |
| b,c | Series 2016-6A Class A2, 1.697% (LIBOR 1 Month + 0.75%) due 3/25/2066 | 9,440,670 | 9,275,794 |
| | Nelnet Student Loan Trust, | | |
| b,c | Series 2015-2A Class A2, 1.547% (LIBOR 1 Month + 0.60%) due 9/25/2047 | 37,552,087 | 34,129,319 |
| b,c | Series 2015-3A Class A2, 1.547% (LIBOR 1 Month + 0.60%) due 2/27/2051 | 2,788,686 | 2,630,114 |
| b,c | Series 2016-A Class A1A, 2.697% (LIBOR 1 Month + 1.75%) due 12/26/2040 | 4,717,962 | 4,461,442 |
| b,c | Nelnet Student Loan Trust, Student Loan, Series 2013-1A Class A, 1.547% (LIBOR 1 Month + 0.60%) due 6/25/2041 | 5,322,730 | 5,009,198 |
| b,c | Pennsylvania Higher Education Assistance Agency, Series 2012-1A Class A1, 1.497% (LIBOR 1 Month + 0.55%) due 5/25/2057 | 1,349,182 | 1,267,808 |
22 | Thornburg Fixed Income Funds Semi-Annual Report
| See notes to financial statements. |
Schedule of Investments, Continued
Thornburg Limited Term Income Fund | March 31, 2020 (Unaudited)
| | Issuer-Description | PRINCIPAL
AMOUNT | VALUE |
| | SLM Student Loan Trust, | | |
| b | Series 2011-2 Class A2, 2.147% (LIBOR 1 Month + 1.20%) due 10/25/2034 | $ 13,352,000 | $ 12,848,622 |
| b,c | Series 2011-A Class A3, 3.205% (LIBOR 1 Month + 2.50%) due 1/15/2043 | 1,720,482 | 1,655,266 |
| b | Series 2013-6 Class A3, 1.597% (LIBOR 1 Month + 0.65%) due 6/25/2055 | 36,866,551 | 33,734,937 |
| | SMB Private Education Loan Trust, | | |
| b,c | Series 2019-A Class A1, 1.055% (LIBOR 1 Month + 0.35%) due 2/16/2026 | 1,640,640 | 1,555,481 |
| b,c | Series 2019-B Class A1, 1.055% (LIBOR 1 Month + 0.35%) due 7/15/2026 | 9,641,376 | 9,181,281 |
| b,c | Series 2020-A Class A1, 1.98% (LIBOR 1 Month + 0.30%) due 3/15/2027 | 9,360,000 | 9,059,951 |
| b,c | SMB Private Education Loan Trust, Student Loan, Series 2015-A Class A3, 2.205% (LIBOR 1 Month + 1.50%) due 2/17/2032 | 10,000,000 | 9,602,974 |
| c | SoFi Professional Loan Program, LLC, Student Loan, Series 2017-E Class A2B, 2.72% due 11/26/2040 | 6,000,000 | 5,715,028 |
| | | | 170,024,774 |
| | Total Asset Backed Securities(Cost $1,181,268,655) | | 1,142,797,190 |
| | Corporate Bonds — 42.4% | | |
| | Automobiles & Components — 2.6% | | |
| | Automobiles — 2.5% | | |
| a,b,c | BMW Finance N.V., 2.503% (LIBOR 3 Month + 0.79%) due 8/12/2022 | 25,800,000 | 24,750,059 |
| | BMW US Capital, LLC, | | |
| c | 2.95% due 4/14/2022 | 1,894,000 | 1,862,483 |
| c | 3.25% due 8/14/2020 | 3,892,200 | 3,878,967 |
| | Daimler Finance North America, LLC, | | |
| c | 2.125% due 3/10/2025 | 21,900,000 | 20,151,196 |
| b,c | 2.592% (LIBOR 3 Month + 0.90%) due 2/15/2022 | 19,050,000 | 17,656,933 |
| c | 3.40% due 2/22/2022 | 6,000,000 | 5,832,208 |
| c | 3.70% due 5/4/2023 | 4,725,000 | 4,645,592 |
| | Harley-Davidson Financial Services, Inc., | | |
| c | 2.40% due 6/15/2020 | 9,827,000 | 9,597,707 |
| c | Series CO, 4.05% due 2/4/2022 | 7,976,000 | 7,798,586 |
| | Hyundai Capital America, | | |
| c | 2.375% due 2/10/2023 | 11,460,000 | 10,804,387 |
| c | 2.85% due 11/1/2022 | 6,875,000 | 6,713,621 |
| c | 3.95% due 2/1/2022 | 22,900,000 | 23,080,314 |
| a,c | Hyundai Capital Services, Inc., 3.75% due 3/5/2023 | 7,000,000 | 7,198,170 |
| b,c | Nissan Motor Acceptance Corp., 2.498% (LIBOR 3 Month + 0.65%) due 7/13/2022 | 1,560,000 | 1,497,539 |
| c | Volkswagen Group of America Finance, LLC, 2.50% due 9/24/2021 | 5,375,000 | 5,252,655 |
| | Trading Companies & Distributors — 0.1% | | |
| a,c | Mitsubishi UFJ Lease & Finance Co. Ltd., 3.406% due 2/28/2022 | 2,800,000 | 2,788,127 |
| | | | 153,508,544 |
| | Banks — 2.0% | | |
| | Banks — 2.0% | | |
| a,b,c | ABN AMRO Bank N.V., 2.208% (LIBOR 3 Month + 0.57%) due 8/27/2021 | 6,800,000 | 6,608,654 |
| a,b | Barclays Bank plc, 2.308% (LIBOR 3 Month + 0.46%) due 1/11/2021 | 7,000,000 | 6,858,810 |
| b | Capital One NA/Mclean VA, 2.554% (LIBOR 3 Month + 0.82%) due 8/8/2022 | 28,150,000 | 27,545,927 |
| b | Citizens Bank N.A./Providence RI, 2.325% (LIBOR 3 Month + 0.95%) due 3/29/2023 | 20,500,000 | 19,606,760 |
| | Goldman Sachs Bank USA, | | |
| b | 0.995% (SOFR + 0.60%) due 5/24/2021 | 1,318,000 | 1,281,955 |
| | 3.20% due 6/5/2020 | 5,000,000 | 5,000,895 |
| b | PNC Bank NA, 2.004% (LIBOR 3 Month + 0.33%) due 2/24/2023 | 24,320,000 | 22,921,600 |
| | Santander Holdings USA, Inc., | | |
| | 3.244% due 10/5/2026 | 4,940,000 | 4,378,202 |
| | 3.40% due 1/18/2023 | 7,980,000 | 7,883,641 |
| c | Sovereign Bank Lease Pass-Through Trust, 12.18% due 6/30/2020 | 891,585 | 902,596 |
| a | Sumitomo Mitsui Banking Corp., 2.65% due 7/23/2020 | 10,600,000 | 10,515,597 |
| | Zions Bancorp N.A., 3.35% due 3/4/2022 | 6,750,000 | 6,619,714 |
| | | | 120,124,351 |
| | Capital Goods — 1.3% | | |
| | Aerospace & Defense — 0.3% | | |
| | General Dynamics Corp., 3.625% due 4/1/2030 | 14,805,000 | 16,459,053 |
| | Industrial Conglomerates — 0.4% | | |
See notes to financial statements.
| Thornburg Fixed Income Funds Semi-Annual Report | 23 |
Schedule of Investments, Continued
Thornburg Limited Term Income Fund | March 31, 2020 (Unaudited)
| | Issuer-Description | PRINCIPAL
AMOUNT | VALUE |
| | 3M Co., 3.05% due 4/15/2030 | $ 4,760,000 | $ 4,959,131 |
| b | General Electric Co. MTN, 1.741% (LIBOR 3 Month + 1.00%) due 3/15/2023 | 2,625,000 | 2,443,292 |
| | Ingersoll-Rand Co. (Guaranty: Ingersoll-Rand plc), 6.391% due 11/15/2027 | 3,000,000 | 3,373,193 |
| a | Pentair Finance Sarl, 4.50% due 7/1/2029 | 7,930,000 | 8,338,710 |
| | Textron, Inc., 3.00% due 6/1/2030 | 9,850,000 | 9,207,804 |
| | Machinery — 0.6% | | |
| c | Huntington Ingalls Industries, Inc., 4.20% due 5/1/2030 | 5,920,000 | 6,136,168 |
| | John Deere Capital Corp., 1.75% due 3/9/2027 | 4,540,000 | 4,364,285 |
| | Nvent Finance Sarl, | | |
| a | 3.95% due 4/15/2023 | 7,980,000 | 8,294,675 |
| a | 4.55% due 4/15/2028 | 7,023,000 | 7,825,824 |
| b,c | Otis Worldwide Corp., 2.088% (LIBOR 3 Month + 0.45%) due 4/5/2023 | 9,850,000 | 9,340,952 |
| | | | 80,743,087 |
| | Consumer Durables & Apparel — 0.5% | | |
| | Household Durables — 0.3% | | |
| | Panasonic Corp., | | |
| a,c | 2.536% due 7/19/2022 | 16,810,000 | 16,506,709 |
| a,c | 2.679% due 7/19/2024 | 2,000,000 | 1,952,448 |
| | Textiles, Apparel & Luxury Goods — 0.2% | | |
| | NIKE, Inc., 2.85% due 3/27/2030 | 9,860,000 | 10,417,937 |
| | | | 28,877,094 |
| | Consumer Services — 0.4% | | |
| | Hotels, Restaurants & Leisure — 0.2% | | |
| | McDonald’s Corp., | | |
| | 2.125% due 3/1/2030 | 2,430,000 | 2,244,852 |
| | 3.50% due 3/1/2027 | 1,865,000 | 1,939,568 |
| | 3.60% due 7/1/2030 | 6,865,000 | 7,207,776 |
| | Transportation Infrastructure — 0.2% | | |
| a,c | Adani Ports & Special Economic Zone Ltd., 3.375% due 7/24/2024 | 13,465,000 | 11,506,059 |
| | | | 22,898,255 |
| | Diversified Financials — 7.6% | | |
| | Capital Markets — 1.9% | | |
| | Ares Capital Corp., | | |
| | 3.25% due 7/15/2025 | 18,764,000 | 14,892,211 |
| | 4.20% due 6/10/2024 | 6,509,000 | 5,769,918 |
| | 4.25% due 3/1/2025 | 4,560,000 | 3,918,828 |
| c | Ares Finance Co., LLC, 4.00% due 10/8/2024 | 5,000,000 | 4,939,924 |
| a | Genpact Luxembourg Sarl, 3.375% due 12/1/2024 | 7,160,000 | 7,189,406 |
| c | GTP Acquisition Partners I, LLC (Guaranty: American Tower Holding Sub II, LLC), 2.35% due 6/15/2045 | 10,000,000 | 10,065,764 |
| | Intercontinental Exchange, Inc., 3.75% due 12/1/2025 | 4,415,000 | 4,641,184 |
| | Legg Mason, Inc., 4.75% due 3/15/2026 | 5,000,000 | 5,008,536 |
| | Main Street Capital Corp., 5.20% due 5/1/2024 | 2,970,000 | 2,810,741 |
| | Raymond James Financial, Inc., 4.65% due 4/1/2030 | 4,825,000 | 5,019,209 |
| | Solar Capital Ltd., 4.50% due 1/20/2023 | 12,000,000 | 12,033,297 |
| a,c | SumitG Guaranteed Secured Obligation Issuer DAC, 2.251% due 11/2/2020 | 15,000,000 | 15,100,306 |
| | TPG Specialty Lending, Inc., 3.875% due 11/1/2024 | 27,220,000 | 24,012,012 |
| | Consumer Finance — 0.5% | | |
| b | Citibank N.A., 2.063% (LIBOR 3 Month + 0.35%) due 2/12/2021 | 5,750,000 | 5,697,117 |
| | Wells Fargo & Co., | | |
| b | 2.164% (LIBOR 3 Month + 0.75%) due 2/11/2026 | 4,920,000 | 4,820,042 |
| b | 2.879% (LIBOR 3 Month + 1.17%) due 10/30/2030 | 1,600,000 | 1,584,792 |
| b | 4.478% (LIBOR 3 Month + 3.77%) due 4/4/2031 | 14,900,000 | 16,866,053 |
| | Diversified Financial Services — 4.1% | | |
| d | Ameriprise Financial, Inc., 3.00% due 4/2/2025 | 6,685,000 | 6,656,722 |
| b | Bank of America Corp., 3.419% (LIBOR 3 Month + 1.04%) due 12/20/2028 | 4,440,000 | 4,580,029 |
| a,b | Barclays plc, 3.072% (LIBOR 3 Month + 1.38%) due 5/16/2024 | 17,500,000 | 15,410,599 |
| | Citigroup, Inc., | | |
| | 2.65% due 10/26/2020 | 4,890,000 | 4,898,583 |
24 | Thornburg Fixed Income Funds Semi-Annual Report
| See notes to financial statements. |
Schedule of Investments, Continued
Thornburg Limited Term Income Fund | March 31, 2020 (Unaudited)
| | Issuer-Description | PRINCIPAL
AMOUNT | VALUE |
| | 3.40% due 5/1/2026 | $ 9,700,000 | $ 10,106,214 |
| b | 4.412% (SOFRRATE + 3.91%) due 3/31/2031 | 10,815,000 | 11,882,201 |
| a | Credit Suisse Group Funding Guernsey Ltd. (Guaranty: Credit Suisse Group AG), 3.125% due 12/10/2020 | 10,000,000 | 9,989,974 |
| | Deutsche Bank AG, | | |
| a,b | 2.617% (LIBOR 3 Month + 0.82%) due 1/22/2021 | 8,650,000 | 8,333,640 |
| a,b | 2.868% (LIBOR 3 Month + 1.23%) due 2/27/2023 | 17,100,000 | 14,011,068 |
| a | 5.00% due 2/14/2022 | 6,350,000 | 6,277,849 |
| b | Goldman Sachs Group, Inc., 1.941% (LIBOR 3 Month + 1.20%) due 9/15/2020 | 7,930,000 | 7,924,272 |
| a | HSBC Holdings plc, 4.95% due 3/31/2030 | 4,800,000 | 5,241,592 |
| | JPMorgan Chase & Co., | | |
| b | 2.005% (SOFRRATE + 1.59%) due 3/13/2026 | 4,930,000 | 4,902,409 |
| b | 3.06% (LIBOR 3 Month + 1.48%) due 3/1/2021 | 7,000,000 | 7,019,334 |
| a,b | Lloyds Banking Group plc, 2.438% (H15T1Y + 1.00%) due 2/5/2026 | 5,955,000 | 5,623,152 |
| | Mitsubishi UFJ Financial Group, Inc., | | |
| a | 2.193% due 2/25/2025 | 15,890,000 | 15,807,021 |
| a | 2.623% due 7/18/2022 | 17,800,000 | 17,752,044 |
| | Mizuho Financial Group, Inc., | | |
| a,b | 2.226% (LIBOR 3 Month + 0.83%) due 5/25/2026 | 9,800,000 | 9,602,618 |
| a,b | 2.309% (LIBOR 3 Month + 0.63%) due 5/25/2024 | 8,800,000 | 7,993,920 |
| a,b | 3.922% (LIBOR 3 Month + 1.00%) due 9/11/2024 | 10,850,000 | 11,266,434 |
| | Morgan Stanley, | | |
| b | 0.924% (SOFRRATE + 0.83%) due 6/10/2022 | 4,675,000 | 4,462,343 |
| b | 1.613% (SOFR + 0.70%) due 1/20/2023 | 15,775,000 | 14,684,269 |
| | 2.80% due 6/16/2020 | 1,350,000 | 1,349,811 |
| | Private Export Funding Corp. (Guaranty: Export-Import Bank of the United States), Series KK, 3.55% due 1/15/2024 | 10,000,000 | 11,113,245 |
| a,b | Royal Bank of Scotland Group plc, 3.162% (LIBOR 3 Month + 1.47%) due 5/15/2023 | 1,952,000 | 1,853,845 |
| | Societe Generale S.A., | | |
| a,c | 2.625% due 1/22/2025 | 4,000,000 | 3,850,726 |
| a,c | 3.875% due 3/28/2024 | 8,000,000 | 8,083,920 |
| a,c | 4.25% due 9/14/2023 | 9,000,000 | 9,196,879 |
| a,b,c | UBS Group Funding Switzerland AG, 3.618% (LIBOR 3 Month + 1.78%) due 4/14/2021 | 5,800,000 | 5,680,255 |
| | Insurance — 0.9% | | |
| b,c | AIG Global Funding, 1.676% (LIBOR 3 Month + 0.46%) due 6/25/2021 | 9,910,000 | 9,819,484 |
| | ALEX Alpha, LLC (Guaranty: Export-Import Bank of the United States), 1.617% due 8/15/2024 | 1,956,521 | 1,972,969 |
| a | Gate Capital Cayman One Ltd. (Guaranty: Export-Import Bank of the United States), 1.839% due 3/27/2021 | 1,701,972 | 1,705,657 |
| c | Global Atlantic Fin Co., 4.40% due 10/15/2029 | 27,285,000 | 23,964,297 |
| | Helios Leasing I, LLC (Guaranty: Export-Import Bank of the United States), 1.562% due 9/28/2024 | 2,389,969 | 2,401,249 |
| c | Protective Life Global Funding, 2.615% due 8/22/2022 | 7,500,000 | 7,550,341 |
| | Santa Rosa Leasing, LLC (Guaranty: Export-Import Bank of the United States), | | |
| | 1.472% due 11/3/2024 | 6,704,934 | 6,737,779 |
| | 1.693% due 8/15/2024 | 2,345,643 | 2,367,714 |
| | Mortgage Real Estate Investment Trusts — 0.2% | | |
| | Senior Housing Properties Trust, 4.75% due 2/15/2028 | 13,026,000 | 11,629,712 |
| | | | 458,073,510 |
| | Energy — 3.7% | | |
| | Energy Equipment & Services — 0.2% | | |
| c | Hanwha Energy USA Holdings Corp., 2.375% due 7/30/2022 | 5,100,000 | 5,066,318 |
| | Oceaneering International, Inc., 4.65% due 11/15/2024 | 10,000,000 | 4,000,000 |
| a,c,f,g | Schahin II Finance Co. SPV Ltd., 5.875% due 9/25/2023 | 4,082,733 | 255,171 |
| | Oil, Gas & Consumable Fuels — 3.5% | | |
| | BP Capital Markets America, Inc., | | |
| b | 1.702% (LIBOR 3 Month + 0.65%) due 9/19/2022 | 6,771,000 | 6,477,943 |
| | 3.245% due 5/6/2022 | 9,815,000 | 9,919,993 |
| a | BP Capital Markets plc, 3.062% due 3/17/2022 | 4,910,000 | 4,938,721 |
| | Buckeye Partners L.P., 4.15% due 7/1/2023 | 7,000,000 | 6,055,000 |
| c | Colorado Interstate Gas Co., LLC / Colorado Interstate Issuing Corp., 4.15% due 8/15/2026 | 9,168,000 | 8,900,525 |
| | Energen Corp., 4.625% due 9/1/2021 | 10,000,000 | 9,655,063 |
| | Enterprise Products Operating, LLC, 3.125% due 7/31/2029 | 11,725,000 | 10,784,932 |
| | EQM Midstream Partners L.P., Series 5Y, 4.75% due 7/15/2023 | 11,440,000 | 8,279,128 |
| | Exxon Mobil Corp., 3.482% due 3/19/2030 | 29,265,000 | 32,321,283 |
| c | Florida Gas Transmission Co., LLC, 3.875% due 7/15/2022 | 10,435,000 | 10,666,353 |
| | Gulf South Pipeline Co. L.P., 4.00% due 6/15/2022 | 13,850,000 | 13,213,674 |
See notes to financial statements.
| Thornburg Fixed Income Funds Semi-Annual Report | 25 |
Schedule of Investments, Continued
Thornburg Limited Term Income Fund | March 31, 2020 (Unaudited)
| | Issuer-Description | PRINCIPAL
AMOUNT | VALUE |
| | Midwest Connector Capital Co., LLC, | | |
| c | 3.625% due 4/1/2022 | $ 5,520,000 | $ 5,304,016 |
| c | 3.90% due 4/1/2024 | 5,555,000 | 5,185,694 |
| | NuStar Logistics L.P., 4.75% due 2/1/2022 | 5,000,000 | 3,917,140 |
| | Occidental Petroleum Corp., | | |
| b | 2.957% (LIBOR 3 Month + 1.25%) due 8/13/2021 | 3,950,000 | 2,962,821 |
| b | 3.142% (LIBOR 3 Month + 1.45%) due 8/15/2022 | 11,200,000 | 7,505,753 |
| | ONEOK, Inc., | | |
| | 3.10% due 3/15/2030 | 13,420,000 | 10,071,852 |
| | 3.40% due 9/1/2029 | 3,609,000 | 2,694,029 |
| a | Petroleos Mexicanos (Guaranty: Export-Import Bank of the United States), 6.50% due 1/23/2029 | 10,007,000 | 7,230,058 |
| a,c | Sinopec Group Overseas Development 2018 Ltd., 3.75% due 9/12/2023 | 11,800,000 | 12,394,991 |
| c | Tennessee Gas Pipeline Co., LLC, 2.90% due 3/1/2030 | 17,879,000 | 15,102,969 |
| c | Texas Gas Transmission, LLC, 4.50% due 2/1/2021 | 17,624,000 | 17,156,251 |
| | | | 220,059,678 |
| | Food & Staples Retailing — 0.3% | | |
| | Food & Staples Retailing — 0.3% | | |
| a,c | Alimentation Couche-Tard, Inc., 2.70% due 7/26/2022 | 15,850,000 | 15,668,656 |
| | | | 15,668,656 |
| | Food, Beverage & Tobacco — 1.6% | | |
| | Beverages — 0.3% | | |
| a,c | Becle SAB de CV, 3.75% due 5/13/2025 | 13,750,000 | 13,085,503 |
| | Molson Coors Brewing Co., 2.10% due 7/15/2021 | 3,035,000 | 2,972,807 |
| | Food Products — 1.0% | | |
| b | Conagra Brands, Inc., 2.378% (LIBOR 3 Month + 0.50%) due 10/9/2020 | 14,850,000 | 14,643,229 |
| | General Mills, Inc., | | |
| b | 2.383% (LIBOR 3 Month + 0.54%) due 4/16/2021 | 3,380,000 | 3,290,630 |
| b | 2.846% (LIBOR 3 Month + 1.01%) due 10/17/2023 | 6,475,000 | 6,259,156 |
| | JM Smucker Co., 2.375% due 3/15/2030 | 31,822,000 | 29,504,235 |
| b | Kraft Heinz Foods Co. (Guaranty: Kraft Heinz Co.), 2.304% (LIBOR 3 Month + 0.57%) due 2/10/2021 | 6,693,000 | 6,330,779 |
| b | Tyson Foods, Inc., 2.13% (LIBOR 3 Month + 0.55%) due 6/2/2020 | 2,850,000 | 2,842,832 |
| | Tobacco — 0.3% | | |
| | Altria Group, Inc., 4.40% due 2/14/2026 | 3,683,000 | 3,875,735 |
| b | BAT Capital Corp., 2.294% (LIBOR 3 Month + 0.59%) due 8/14/2020 | 1,450,000 | 1,426,210 |
| a,c | BAT International Finance plc, 3.95% due 6/15/2025 | 3,000,000 | 2,943,279 |
| a,c | Imperial Brands Finance plc, 3.50% due 7/26/2026 | 3,000,000 | 2,768,908 |
| | Reynolds American, Inc., 6.875% due 5/1/2020 | 5,000,000 | 5,013,065 |
| | | | 94,956,368 |
| | Health Care Equipment & Services — 0.8% | | |
| | Health Care Equipment & Supplies — 0.5% | | |
| c | Baxter International, Inc., 3.95% due 4/1/2030 | 1,972,000 | 2,114,371 |
| | Zimmer Biomet Holdings, Inc., 3.55% due 3/20/2030 | 27,208,000 | 27,105,760 |
| | Health Care Providers & Services — 0.3% | | |
| | Catholic Health Initiatives, 2.95% due 11/1/2022 | 7,000,000 | 6,835,806 |
| | Express Scripts Holding Co., 2.60% due 11/30/2020 | 9,750,000 | 9,735,938 |
| | | | 45,791,875 |
| | Household & Personal Products — 0.0% | | |
| | Household Products — 0.0% | | |
| a,c | Kimberly-Clark de Mexico SAB de CV, 3.80% due 4/8/2024 | 3,000,000 | 2,760,000 |
| | | | 2,760,000 |
| | Insurance — 3.1% | | |
| | Insurance — 3.1% | | |
| a,c,h | AIA Group Ltd., 3.375% due 4/7/2030 | 4,800,000 | 4,820,954 |
| a,c | DaVinciRe Holdings Ltd., 4.75% due 5/1/2025 | 10,260,000 | 10,324,387 |
| | Enstar Group Ltd., | | |
| a | 4.50% due 3/10/2022 | 1,950,000 | 1,944,983 |
| a | 4.95% due 6/1/2029 | 19,899,000 | 18,741,293 |
| | Horace Mann Educators Corp., 4.50% due 12/1/2025 | 4,800,000 | 5,418,081 |
26 | Thornburg Fixed Income Funds Semi-Annual Report
| See notes to financial statements. |
Schedule of Investments, Continued
Thornburg Limited Term Income Fund | March 31, 2020 (Unaudited)
| | Issuer-Description | PRINCIPAL
AMOUNT | VALUE |
| | Infinity Property & Casualty Corp., 5.00% due 9/19/2022 | $ 4,690,000 | $ 4,565,120 |
| | Jackson National Life Global Funding, | | |
| b,c | 1.248% (LIBOR 3 Month + 0.48%) due 6/11/2021 | 6,150,000 | 5,899,681 |
| c | 3.25% due 1/30/2024 | 10,000,000 | 9,951,582 |
| a,c | Lancashire Holdings Ltd., 5.70% due 10/1/2022 | 11,000,000 | 11,817,311 |
| c | MassMutual Global Funding II, 2.95% due 1/11/2025 | 20,000,000 | 20,412,814 |
| | Mercury General Corp., 4.40% due 3/15/2027 | 3,751,000 | 4,064,599 |
| | MetLife, Inc., 4.55% due 3/23/2030 | 19,730,000 | 21,712,909 |
| b,c | Metropolitan Life Global Funding, 0.58% (SOFR + 0.57%) due 9/7/2020 | 7,760,000 | 7,676,867 |
| a | Montpelier Re Holdings Ltd., 4.70% due 10/15/2022 | 5,000,000 | 5,226,814 |
| c | Protective Life Corp., 3.40% due 1/15/2030 | 19,740,000 | 18,487,504 |
| b,c | Protective Life Global Funding, 1.895% (LIBOR 3 Month + 0.52%) due 6/28/2021 | 17,000,000 | 16,431,131 |
| c | Reliance Standard Life Global Funding II, 3.85% due 9/19/2023 | 9,950,000 | 10,698,421 |
| c | Sammons Financial Group, Inc., 4.45% due 5/12/2027 | 7,950,000 | 8,305,803 |
| | | | 186,500,254 |
| | Materials — 1.4% | | |
| | Chemicals — 1.2% | | |
| b,c | Albemarle Corp., 2.742% (LIBOR 3 Month + 1.05%) due 11/15/2022 | 5,012,000 | 4,772,614 |
| | Chevron Phillips Chemical Co., LLC / Chevron Phillips Chemical Co., L.P., | | |
| b,c | 2.513% (LIBOR 3 Month + 0.75%) due 5/1/2020 | 29,900,000 | 29,820,924 |
| c,h | 5.125% due 4/1/2025 | 9,870,000 | 10,151,205 |
| | Ecolab, Inc., | | |
| | 3.25% due 12/1/2027 | 2,073,000 | 1,946,836 |
| | 4.80% due 3/24/2030 | 7,965,000 | 8,946,974 |
| a,c | OCP S.A., 5.625% due 4/25/2024 | 8,555,000 | 8,480,144 |
| | Sherwin-Williams Co., 2.30% due 5/15/2030 | 6,715,000 | 6,253,979 |
| | Metals & Mining — 0.2% | | |
| | AngloGold Ashanti Holdings plc (Guaranty: AngloGold Ashanti Ltd.), | | |
| a | 5.125% due 8/1/2022 | 6,500,000 | 6,237,920 |
| a | 5.375% due 4/15/2020 | 8,100,000 | 8,019,000 |
| | | | 84,629,596 |
| | Media & Entertainment — 0.1% | | |
| | Interactive Media & Services — 0.1% | | |
| a | Baidu, Inc., 3.875% due 9/29/2023 | 6,000,000 | 6,201,463 |
| | | | 6,201,463 |
| | Pharmaceuticals, Biotechnology & Life Sciences — 0.7% | | |
| | Pharmaceuticals — 0.7% | | |
| | AbbVie, Inc., | | |
| c | 2.95% due 11/21/2026 | 2,460,000 | 2,471,284 |
| | 3.75% due 11/14/2023 | 6,820,000 | 7,066,273 |
| a | Allergan Funding SCS, 3.45% due 3/15/2022 | 5,000,000 | 5,191,691 |
| a,b | AstraZeneca plc, 2.357% (LIBOR 3 Month + 0.67%) due 8/17/2023 | 10,524,000 | 9,353,593 |
| | Bayer US Finance II, LLC, | | |
| b,c | 1.846% (LIBOR 3 Month + 0.63%) due 6/25/2021 | 9,500,000 | 9,428,483 |
| c | 4.25% due 12/15/2025 | 2,500,000 | 2,596,660 |
| c | Bristol-Myers Squibb Co., 2.75% due 2/15/2023 | 2,265,000 | 2,341,710 |
| a | Shire Acquisitions Investments Ireland DAC, 2.40% due 9/23/2021 | 4,959,000 | 4,917,443 |
| | | | 43,367,137 |
| | Real Estate — 2.1% | | |
| | Equity Real Estate Investment Trusts — 2.1% | | |
| | Alexandria Real Estate Equities, Inc., 4.90% due 12/15/2030 | 6,780,000 | 7,357,275 |
| | American Tower Corp., | | |
| | 2.40% due 3/15/2025 | 7,375,000 | 7,240,488 |
| | 3.375% due 5/15/2024 | 21,625,000 | 21,670,308 |
| | Crown Castle International Corp., 3.30% due 7/1/2030 | 4,945,000 | 4,904,402 |
| | SBA Tower Trust, | | |
| c | 2.836% due 1/15/2025 | 12,525,000 | 12,093,816 |
| c | 2.877% due 7/15/2046 | 9,500,000 | 9,467,426 |
| c | 3.156% due 10/10/2045 | 23,975,000 | 23,939,728 |
See notes to financial statements.
| Thornburg Fixed Income Funds Semi-Annual Report | 27 |
Schedule of Investments, Continued
Thornburg Limited Term Income Fund | March 31, 2020 (Unaudited)
| | Issuer-Description | PRINCIPAL
AMOUNT | VALUE |
| | Service Properties Trust, | | |
| | 4.35% due 10/1/2024 | $ 10,161,000 | $ 7,458,643 |
| | 4.50% due 6/15/2023 | 4,916,000 | 3,692,810 |
| | 4.65% due 3/15/2024 | 4,233,000 | 3,100,090 |
| | 5.00% due 8/15/2022 | 3,159,000 | 2,260,677 |
| | 5.25% due 2/15/2026 | 4,020,000 | 2,879,300 |
| | Washington Real Estate Investment Trust, 4.95% due 10/1/2020 | 19,100,000 | 19,100,000 |
| | | | 125,164,963 |
| | Retailing — 0.8% | | |
| | Internet & Direct Marketing Retail — 0.2% | | |
| | eBay, Inc., 1.90% due 3/11/2025 | 11,247,000 | 10,621,707 |
| | Multiline Retail — 0.3% | | |
| b | Dollar Tree, Inc., 2.536% (LIBOR 3 Month + 0.70%) due 4/17/2020 | 2,062,000 | 2,061,561 |
| | Family Dollar Stores, Inc., 5.00% due 2/1/2021 | 18,475,000 | 18,326,127 |
| | Specialty Retail — 0.3% | | |
| | AutoZone, Inc., 4.00% due 4/15/2030 | 4,935,000 | 5,043,771 |
| | Lowe’s Companies, Inc., 4.50% due 4/15/2030 | 2,787,000 | 3,071,344 |
| | O’Reilly Automotive, Inc., 4.20% due 4/1/2030 | 9,750,000 | 10,086,081 |
| | | | 49,210,591 |
| | Semiconductors & Semiconductor Equipment — 1.0% | | |
| | Semiconductors & Semiconductor Equipment — 1.0% | | |
| | Broadcom Corp. / Broadcom Cayman Finance Ltd., 3.625% due 1/15/2024 | 15,033,000 | 14,766,641 |
| c | Broadcom, Inc., 4.75% due 4/15/2029 | 12,905,000 | 13,090,220 |
| | Intel Corp., 3.90% due 3/25/2030 | 9,320,000 | 10,632,140 |
| | Micron Technology, Inc., | | |
| | 4.663% due 2/15/2030 | 11,731,000 | 12,252,153 |
| | 5.327% due 2/6/2029 | 7,690,000 | 8,398,797 |
| | | | 59,139,951 |
| | Software & Services — 2.3% | | |
| | Information Technology Services — 0.7% | | |
| | Leidos Holdings, Inc. (Guaranty: Leidos, Inc.), 4.45% due 12/1/2020 | 2,000,000 | 1,990,000 |
| | Moody’s Corp., 3.75% due 3/24/2025 | 24,400,000 | 25,600,833 |
| | Total System Services, Inc., | | |
| | 3.80% due 4/1/2021 | 3,000,000 | 3,018,791 |
| | 4.00% due 6/1/2023 | 3,835,000 | 3,971,901 |
| | Western Union Co., 2.85% due 1/10/2025 | 7,256,000 | ���7,220,752 |
| | Interactive Media & Services — 0.1% | | |
| a | Baidu, Inc., 4.375% due 5/14/2024 | 6,376,000 | 6,734,588 |
| | Software — 1.5% | | |
| | Broadridge Financial Solutions, Inc., 3.95% due 9/1/2020 | 8,000,000 | 8,027,854 |
| | CA, Inc., 3.60% due 8/15/2022 | 3,000,000 | 2,812,575 |
| | Citrix Systems, Inc., 4.50% due 12/1/2027 | 32,681,000 | 33,739,428 |
| | Oracle Corp., 2.95% due 4/1/2030 | 34,520,000 | 34,757,678 |
| | VMware, Inc., 2.30% due 8/21/2020 | 7,925,000 | 7,840,538 |
| | | | 135,714,938 |
| | Technology Hardware & Equipment — 1.1% | | |
| | Communications Equipment — 0.6% | | |
| | Motorola Solutions, Inc., 4.60% due 2/23/2028 | 14,205,000 | 14,476,334 |
| a | Telefonaktiebolaget LM Ericsson, 4.125% due 5/15/2022 | 21,215,000 | 21,003,678 |
| | Electronic Equipment, Instruments & Components — 0.5% | | |
| a | Allegion plc, 3.50% due 10/1/2029 | 5,395,000 | 5,226,019 |
| | Ingram Micro, Inc., 5.45% due 12/15/2024 | 5,596,000 | 4,568,823 |
| | PerkinElmer, Inc., 3.30% due 9/15/2029 | 3,310,000 | 3,105,267 |
| | Trimble, Inc., 4.75% due 12/1/2024 | 17,000,000 | 17,861,431 |
| | | | 66,241,552 |
| | Telecommunication Services — 2.2% | | |
| | Diversified Telecommunication Services — 0.7% | | |
28 | Thornburg Fixed Income Funds Semi-Annual Report
| See notes to financial statements. |
Schedule of Investments, Continued
Thornburg Limited Term Income Fund | March 31, 2020 (Unaudited)
| | Issuer-Description | PRINCIPAL
AMOUNT | VALUE |
| | AT&T, Inc., | | |
| b | 1.964% (LIBOR 3 Month + 1.18%) due 6/12/2024 | $ 10,000,000 | $ 9,287,020 |
| | 3.80% due 3/1/2024 - 2/15/2027 | 1,940,000 | 2,026,217 |
| | 3.90% due 3/11/2024 | 10,781,000 | 11,314,918 |
| | 7.85% due 1/15/2022 | 3,000,000 | 3,235,260 |
| | Qwest Corp., 6.75% due 12/1/2021 | 3,000,000 | 3,108,900 |
| | Verizon Communications, Inc., | | |
| | 2.625% due 8/15/2026 | 3,356,000 | 3,464,894 |
| | 3.15% due 3/22/2030 | 9,860,000 | 10,620,733 |
| | Media — 0.7% | | |
| | Cox Communications, Inc., | | |
| c | 2.95% due 6/30/2023 | 1,820,000 | 1,836,983 |
| c | 3.35% due 9/15/2026 | 2,000,000 | 2,018,472 |
| b,c | NBCUniversal Enterprise, Inc., 1.833% (LIBOR 3 Month + 0.40%) due 4/1/2021 | 7,800,000 | 7,696,104 |
| | Omnicom Group, Inc., 4.20% due 6/1/2030 | 4,935,000 | 5,083,257 |
| | Walt Disney Co., 3.80% due 3/22/2030 | 19,730,000 | 22,175,517 |
| | Wireless Telecommunication Services — 0.8% | | |
| | Sprint Communications, Inc., 9.25% due 4/15/2022 | 44,854,000 | 47,993,780 |
| | | | 129,862,055 |
| | Transportation — 0.8% | | |
| | Air Freight & Logistics — 0.4% | | |
| | TTX Co., | | |
| c | 4.15% due 1/15/2024 | 6,000,000 | 6,328,354 |
| c | 5.453% due 1/2/2022 | 943,879 | 996,675 |
| | United Parcel Service, Inc., 4.45% due 4/1/2030 | 12,830,000 | 14,518,435 |
| | Airlines — 0.4% | | |
| | American Airlines Pass Through Trust, Series 2013-2 Class A, 4.95% due 7/15/2024 | 3,530,125 | 3,587,561 |
| | US Airways Pass Through Trust, | | |
| | Series 2010-1 Class A, 6.25% due 10/22/2024 | 3,390,220 | 3,488,761 |
| | Series 2013-1 Class B, 5.375% due 5/15/2023 | 20,137,744 | 19,225,144 |
| | Diversified Consumer Services — 0.0% | | |
| | University of Chicago, Series 12-B, 3.065% due 10/1/2024 | 863,000 | 884,977 |
| | | | 49,029,907 |
| | Utilities — 6.0% | | |
| | Electric Utilities — 5.7% | | |
| c | Alliant Energy Finance, LLC, 3.75% due 6/15/2023 | 11,865,000 | 12,265,785 |
| d | Ameren Corp., 3.50% due 1/15/2031 | 4,605,000 | 4,594,086 |
| | American Electric Power Co., Inc., 2.30% due 3/1/2030 | 9,805,000 | 9,142,751 |
| | Appalachian Power Co., 3.40% due 6/1/2025 | 7,000,000 | 6,813,053 |
| | Avangrid, Inc., | | |
| | 3.15% due 12/1/2024 | 8,870,000 | 8,821,773 |
| | 3.80% due 6/1/2029 | 4,871,000 | 4,980,669 |
| c | Berkshire Hathaway Energy Co., 4.05% due 4/15/2025 | 500,000 | 541,525 |
| | CenterPoint Energy, Inc., 3.60% due 11/1/2021 | 8,901,000 | 8,882,677 |
| | Consolidated Edison Co. of New York, Inc., | | |
| | Series 20A, 3.35% due 4/1/2030 | 6,835,000 | 7,033,612 |
| b | Series C, 1.616% (LIBOR 3 Month + 0.40%) due 6/25/2021 | 19,496,000 | 18,931,786 |
| | Dominion Energy, Inc., | | |
| d | 3.375% due 4/1/2030 | 9,680,000 | 9,582,716 |
| | Series B, 3.60% due 3/15/2027 | 29,576,000 | 30,074,208 |
| | Edison International, 2.40% due 9/15/2022 | 4,900,000 | 4,729,799 |
| a,c | Enel Finance International N.V., 4.625% due 9/14/2025 | 18,443,000 | 19,582,880 |
| | Entergy Arkansas, LLC, 4.00% due 6/1/2028 | 3,965,000 | 4,297,253 |
| | Entergy Louisiana, LLC, 4.80% due 5/1/2021 | 4,300,000 | 4,318,284 |
| | Entergy Mississippi, Inc., 3.25% due 12/1/2027 | 4,727,000 | 4,766,863 |
| | Entergy Texas, Inc., 3.45% due 12/1/2027 | 12,000,000 | 11,724,262 |
| | Evergy, Inc., 2.45% due 9/15/2024 | 4,895,000 | 4,801,971 |
| i | Eversource Energy, 3.80% due 12/1/2023 | 12,395,000 | 13,203,457 |
| | Exelon Corp., | | |
| | 2.85% due 6/15/2020 | 2,950,000 | 2,949,675 |
See notes to financial statements.
| Thornburg Fixed Income Funds Semi-Annual Report | 29 |
Schedule of Investments, Continued
Thornburg Limited Term Income Fund | March 31, 2020 (Unaudited)
| | Issuer-Description | PRINCIPAL
AMOUNT | VALUE |
| | 4.05% due 4/15/2030 | $ 9,640,000 | $ 9,736,402 |
| | Georgia Power Co., Series A, 2.20% due 9/15/2024 | 2,620,000 | 2,457,662 |
| c | Jersey Central Power & Light Co., 4.30% due 1/15/2026 | 14,005,000 | 15,135,551 |
| c | Midland Cogeneration Venture L.P., 6.00% due 3/15/2025 | 4,207,648 | 4,212,186 |
| c | Monongahela Power Co., 4.10% due 4/15/2024 | 5,000,000 | 5,469,168 |
| | NextEra Energy Capital Holdings, Inc., 3.342% due 9/1/2020 | 9,742,000 | 9,752,040 |
| | Northern States Power Co., 3.30% due 6/15/2024 | 10,000,000 | 10,089,915 |
| | NSTAR Electric Co., 3.95% due 4/1/2030 | 4,935,000 | 5,397,182 |
| | Oklahoma Gas & Electric Co., 3.25% due 4/1/2030 | 14,795,000 | 14,810,566 |
| | PacifiCorp, 3.50% due 6/15/2029 | 2,963,000 | 3,013,655 |
| | PNM Resources, Inc., 3.25% due 3/9/2021 | 7,784,000 | 7,833,264 |
| | Public Service Co. of New Mexico, 5.35% due 10/1/2021 | 3,000,000 | 3,149,901 |
| | San Diego Gas & Electric Co., 3.60% due 9/1/2023 | 4,212,000 | 4,437,447 |
| | Southern Co., 3.25% due 7/1/2026 | 8,075,000 | 8,039,563 |
| b,c | Southern Power Co., 1.666% (LIBOR 3 Month + 0.55%) due 12/20/2020 | 1,875,000 | 1,845,322 |
| a,c | State Grid Overseas Investment (2016) Ltd. (Guaranty: State Grid Corp. of China), 2.25% due 5/4/2020 | 10,000,000 | 10,004,600 |
| | Toledo Edison Co., 7.25% due 5/1/2020 | 167,000 | 165,976 |
| a,c | Transelec S.A., 4.25% due 1/14/2025 | 6,000,000 | 5,700,000 |
| | UIL Holdings Corp., 4.625% due 10/1/2020 | 13,335,000 | 13,369,284 |
| | WEC Energy Group, Inc., 3.375% due 6/15/2021 | 4,660,000 | 4,678,675 |
| | Xcel Energy, Inc., 3.40% due 6/1/2030 | 9,855,000 | 9,981,118 |
| | Gas Utilities — 0.3% | | |
| | Dominion Energy Gas Holdings, LLC, 2.80% due 11/15/2020 | 5,225,000 | 5,198,174 |
| c | SEMCO Energy, Inc., 5.15% due 4/21/2020 | 3,000,000 | 3,003,555 |
| | Southern Co. Gas Capital Corp., 3.50% due 9/15/2021 | 9,925,000 | 9,959,704 |
| | | | 359,479,995 |
| | Total Corporate Bonds(Cost $2,586,379,246) | | 2,538,003,820 |
| | Loan Participations — 0.4% | | |
| | Media & Entertainment — 0.1% | | |
| | Media — 0.1% | | |
| j,k | Lamar Media Corp., 2.516% (LIBOR 1 Month + 1.50%) due 2/5/2027 | 5,000,000 | 4,737,500 |
| | | | 4,737,500 |
| | Utilities — 0.3% | | |
| | Electric Utilities — 0.3% | | |
| j | Pacific Gas & Electric Co., 3.12% (LIBOR 1 Month + 2.25%) due 12/31/2020 | 19,000,000 | 18,398,270 |
| | | | 18,398,270 |
| | Total Loan Participations(Cost $23,245,000) | | 23,135,770 |
| | Municipal Bonds — 1.3% | | |
| | California School Finance Authority (LOC City National Bank), 5.041% due 7/1/2020 | 4,000,000 | 4,034,520 |
| | Colorado Educational & Cultural Facilities Authority, | | |
| | Series B, | | |
| | 2.244% due 3/1/2021 | 450,000 | 453,668 |
| | 2.474% due 3/1/2022 | 600,000 | 611,250 |
| | 2.691% due 3/1/2023 | 580,000 | 598,009 |
| | Fort Collins Electric Utility Enterprise Revenue ETM, Series B-Qualified Energy, 4.92% due 12/1/2020 | 1,130,000 | 1,159,685 |
| | Los Angeles County Public Works Financing Authority, 5.591% due 8/1/2020 | 3,350,000 | 3,402,159 |
| | Municipal Improvement Corp. of Los Angeles (Build America-BDS-Recovery Zone), Series B, 6.165% due 11/1/2020 | 6,125,000 | 6,312,180 |
| | New Jersey Transportation Trust Fund Authority, | | |
| | 2.551% due 6/15/2023 | 1,170,000 | 1,194,781 |
| | 2.631% due 6/15/2024 | 860,000 | 883,117 |
| | New York City Transitional Finance Authority Future Tax Secured Revenue (Build America Bonds), 4.075% due 11/1/2020 | 2,500,000 | 2,542,850 |
| | New York State Urban Development Corp., Series D-1, 2.55% due 3/15/2022 | 29,675,000 | 30,301,736 |
| | Oklahoma Development Finance Authority, 8.00% due 5/1/2020 | 410,000 | 410,488 |
| | Orleans Parish Parishwide School District (Insured: AGM) GO, Series B, 4.40% due 2/1/2021 | 10,000,000 | 10,262,700 |
| | Redlands Redevelopment Agency Successor Agency (Insured: AMBAC) ETM, Series A, 5.818% due 8/1/2022 | 810,000 | 863,039 |
| | Rutgers The State University of New Jersey, Series K, 3.028% due 5/1/2021 | 1,500,000 | 1,528,815 |
| | San Bernardino County Redevelopment Agency Successor Agency, Series A, 7.135% due 9/1/2020 | 290,000 | 295,684 |
| | State of Connecticut GO, | | |
30 | Thornburg Fixed Income Funds Semi-Annual Report
| See notes to financial statements. |
Schedule of Investments, Continued
Thornburg Limited Term Income Fund | March 31, 2020 (Unaudited)
| | Issuer-Description | PRINCIPAL
AMOUNT | VALUE |
| | Series A, | | |
| | 3.471% due 9/15/2022 | $ 4,695,000 | $ 4,873,598 |
| | 4.00% due 9/15/2021 | 3,980,000 | 4,123,837 |
| | Tampa-Hillsborough County Expressway Authority, Series C, 2.84% due 7/1/2020 | 1,750,000 | 1,757,962 |
| | Wallenpaupack Area School District (State Aid Withholding) GO, Series B, 4.00% due 9/1/2020 | 2,750,000 | 2,783,742 |
| | Total Municipal Bonds(Cost $76,687,684) | | 78,393,820 |
| | Short-Term Investments — 3.1% | | |
| l | Thornburg Capital Management Fund | 18,470,663 | 184,706,629 |
| | Total Short-Term Investments(Cost $184,706,629) | | 184,706,629 |
| | Total Investments — 96.8%(Cost $5,828,620,578) | | $5,789,277,286 |
| | Other Assets Less Liabilities — 3.2% | | 192,054,680 |
| | Net Assets — 100.0% | | $5,981,331,966 |
| Footnote Legend |
| a | Yankee bond denominated in U.S. dollars and is issued in the U.S. by foreign banks and corporations. |
| b | Variable, floating, step, or fixed to floating rate securities are securities for which interest rate changes are based on changes in a designated base rate or on a predetermined schedule. The rates shown are those in effect on March 31, 2020. |
| c | Securities exempt from registration under Rule 144A of the Securities Act of 1933, as amended. These securities are restricted but liquid and may only be resold in the ordinary course of business in transactions exempt from registration, normally to qualified institutional buyers. As of March 31, 2020, the aggregate value of these securities in the Fund’s portfolio was $2,304,578,775, representing 38.53% of the Fund’s net assets. |
| d | Security currently fair valued by the Valuation and Pricing Committee using procedures approved by the Trustees’ Audit Committee. |
| e | Interest only. |
| f | Bond in default. |
| g | Non-income producing. |
| h | When-issued security. |
| i | Segregated as collateral for a when-issued security. |
| j | The stated coupon rate represents the greater of the LIBOR or the LIBOR floor rate plus a spread at March 31, 2020. |
| k | This position or a portion of this position represents an unsettled loan purchase. The coupon rate will be effective at the time of settlement and will be based upon the London-Interbank Offered Rate ("LIBOR") plus a premium which was determined at the time of purchase. |
| l | Investment in Affiliates. |
Portfolio Abbreviations
To simplify the listings of securities, abbreviations are used per the table below:
| AGM | Insured by Assured Guaranty Municipal Corp. |
| AMBAC | Insured by American Municipal Bond Assurance Corp. |
| CMO | Collateralized Mortgage Obligation |
| ETM | Escrowed to Maturity |
| FDIC | Federal Deposit Insurance Corporation |
| GO | General Obligation |
| H15T1Y | US Treasury Yield Curve Rate T-Note Constant Maturity 1 Year |
| IO | Interest Only Security |
| LIBOR | London Interbank Offered Rates |
| LOC | Letter of Credit |
| Mtg | Mortgage |
| MTN | Medium-Term Note |
| REMIC | Real Estate Mortgage Investment Conduit |
| SOFR | Secured Overnight Financing Rate |
| SPV | Special Purpose Vehicle |
| VA | Veterans Affairs |
See notes to financial statements.
| Thornburg Fixed Income Funds Semi-Annual Report | 31 |
Schedule of Investments
Thornburg Low Duration Income Fund | March 31, 2020 (Unaudited)
| | Issuer-Description | PRINCIPAL
AMOUNT | VALUE |
| | U.S. Treasury Securities — 3.7% | | |
| | United States Treasury Notes, | | |
| | 1.375% due 8/31/2020 | $200,000 | $ 201,050 |
| | 2.375% due 4/30/2020 | 588,000 | 589,141 |
| | United States Treasury Notes Inflationary Index, 0.125% due 4/15/2022 | 318,186 | 313,573 |
| | Total U.S. Treasury Securities(Cost $1,105,560) | | 1,103,764 |
| | U.S. Government Agencies — 1.6% | | |
| | Export Leasing (2009), LLC (Guaranty: Export-Import Bank of the United States), 1.859% due 8/28/2021 | 19,169 | 19,247 |
| a | MSN 41079 and 41084 Ltd. (Guaranty: Export-Import Bank of the United States), 1.717% due 7/13/2024 | 361,053 | 365,220 |
| | Petroleos Mexicanos (Guaranty: Export-Import Bank of the United States), | | |
| a | 1.70% due 12/20/2022 | 30,000 | 30,182 |
| a,b | 2.181% (LIBOR 3 Month + 0.35%) due 4/15/2025 | 52,500 | 51,156 |
| | Total U.S. Government Agencies(Cost $454,116) | | 465,805 |
| | Mortgage Backed — 11.3% | | |
| | Angel Oak Mortgage Trust, LLC, Whole Loan Securities Trust CMO, | | |
| b,c | Series 2017-1 Class A2, 3.085% due 1/25/2047 | 8,442 | 8,263 |
| b,c | Series 2017-1 Class A3, 3.644% due 1/25/2047 | 16,209 | 15,892 |
| b,c | Series 2017-3 Class A1, 2.708% due 11/25/2047 | 10,145 | 9,782 |
| b,c | Series 2017-3, 3.90% due 11/25/2047 | 200,000 | 183,818 |
| b,c | Series 2018-1 Class A1, 3.258% due 4/27/2048 | 27,848 | 26,765 |
| b,c | Series 2018-2 Class A1, 3.674% due 7/27/2048 | 50,901 | 48,878 |
| | Arroyo Mortgage Trust, Whole Loan Securities Trust CMO, | | |
| b,c | Series 2018-1 Class A1, 3.763% due 4/25/2048 | 60,834 | 58,002 |
| b,c | Series 2019-1 Class A1, 3.805% due 1/25/2049 | 74,210 | 70,436 |
| b,c | Series 2019-3 Class A1, 2.962% due 10/25/2048 | 82,449 | 75,548 |
| c | Barclays Commercial Mortgage Securities LLC, Series 2015-STP Class A, 3.323% due 9/10/2028 | 54,877 | 54,728 |
| c | Bravo Residential Funding Trust, Whole Loan Securities Trust CMO, Series 2019-1 Class A1C, 3.50% due 3/25/2058 | 77,882 | 76,716 |
| | COMM Mortgage Trust, Series 2016-DC2 Class A1, 1.82% due 2/10/2049 | 29,527 | 29,468 |
| b,c | Credit Suisse Mortgage Trust, Whole Loan Securities Trust CMO, Series 2017-HL2 Class A3, 3.50% due 10/25/2047 | 98,332 | 97,323 |
| b,c | DBUBS Mortgage Trust, Series 2011-LC2A Class A1FL, 2.161% (LIBOR 1 Month + 1.35%) due 7/12/2044 | 9,430 | 9,409 |
| | Federal Home Loan Mtg Corp., Multi-Family Structured Pass Through, | | |
| | Pool G15523, 2.50% due 8/1/2025 | 62,853 | 65,410 |
| | Series K020 Class A1, 1.573% due 1/25/2022 | 59,838 | 59,880 |
| | Series K036 Class A1, 2.777% due 4/25/2023 | 115,233 | 118,092 |
| | Series K717 Class A2, 2.991% due 9/25/2021 | 99,385 | 100,805 |
| | Federal Home Loan Mtg Corp., Seasoned Credit Risk Transfer, Whole Loan Securities Trust CMO, | | |
| b | Series 2017-3 Class HA, 3.25% due 7/25/2056 | 56,178 | 57,219 |
| b | Series 2018-1 Class HA, 3.00% due 5/25/2057 | 39,064 | 39,405 |
| b | Series 2018-2 Class HA, 3.00% due 11/25/2057 | 161,552 | 162,921 |
| | Federal Home Loan Mtg Corp., Whole Loan Securities Trust CMO, Series 2017-SC02 Class 2A1, 3.50% due 5/25/2047 | 16,400 | 16,276 |
| | Federal National Mtg Assoc., | | |
| | Pool AS7323, 2.50% due 6/1/2031 | 266,259 | 277,874 |
| | Pool AS8538, 2.50% due 12/1/2026 | 155,533 | 161,831 |
| | Pool FM1126, 3.00% due 3/1/2033 | 55,228 | 58,264 |
| | Pool MA3557, 4.00% due 1/1/2029 | 128,212 | 135,530 |
| b,c | Flagstar Mortgage Trust, Whole Loan Securities Trust CMO, Series 2017-1 Class 2A2, 3.00% due 3/25/2047 | 60,803 | 59,351 |
| b,c | FWD Securitization Trust, Whole Loan Securities Trust CMO, Series 2019-INV1 Class A1, 2.81% due 6/25/2049 | 84,675 | 79,337 |
| b,c | GCAT LLC, Whole Loan Securities Trust CMO, Series 2019-NQM1 Class A1, 2.985% due 2/25/2059 | 77,426 | 79,266 |
| b,c | GCAT Trust, Whole Loan Securities Trust CMO, Series 2019-NQM2 Class A1, 2.855% due 9/25/2059 | 87,928 | 89,179 |
| | Homeward Opportunities Fund I Trust, Whole Loan Securities Trust CMO, | | |
| b,c | Series 2018-1 Class A1, 3.766% due 6/25/2048 | 53,232 | 52,792 |
| b,c | Series 2019-1 Class A1, 3.454% due 1/25/2059 | 66,410 | 65,409 |
| | JPMorgan Mortgage Trust, Whole Loan Securities Trust CMO, | | |
| b,c | Series 2017-2 Class A6, 3.00% due 5/25/2047 | 27,403 | 27,235 |
| b,c | Series 2017-6 Class A5, 3.50% due 12/25/2048 | 58,330 | 59,044 |
| b,c | Series 2018-6 Class 1A4, 3.50% due 12/25/2048 | 67,795 | 66,108 |
| b,c | Metlife Securitization Trust, Whole Loan Securities Trust CMO, Series 2019-1A Class A1A, 3.75% due 4/25/2058 | 251,528 | 248,918 |
| | New Residential Mortgage Loan Trust, Whole Loan Securities Trust CMO, | | |
| b,c | Series 2017-5A Class A1, 2.447% (LIBOR 1 Month + 1.50%) due 6/25/2057 | 45,085 | 44,123 |
| b,c | Series 2018-NQM1 Class A1, 3.986% due 11/25/2048 | 63,884 | 63,663 |
32 | Thornburg Fixed Income Funds Semi-Annual Report
| See notes to financial statements. |
Schedule of Investments, Continued
Thornburg Low Duration Income Fund | March 31, 2020 (Unaudited)
| | Issuer-Description | PRINCIPAL
AMOUNT | VALUE |
| b,c | SG Residential Mortgage Trust, Whole Loan Securities Trust CMO, Series 2019-3 Class A1, 2.703% due 9/25/2059 | $116,116 | $ 112,886 |
| | Verus Securitization Trust, Whole Loan Securities Trust CMO, | | |
| b,c | Series 2018-2 Class A1, 3.677% due 6/1/2058 | 48,414 | 46,968 |
| b,c | Series 2018-3 Class A1, 4.108% due 10/25/2058 | 165,829 | 160,579 |
| b,c | Series 2019-3 Class A1, 2.784% due 7/25/2059 | 117,299 | 113,813 |
| | Total Mortgage Backed(Cost $3,416,361) | | 3,387,206 |
| | Asset Backed Securities — 43.2% | | |
| | Asset-Backed - Finance & Insurance — 16.6% | | |
| | Freed ABS Trust, | | |
| c | Series 2020-FP1 Class A, 2.52% due 3/18/2027 | 229,039 | 212,652 |
| c | Series 2019-1 Class B, 3.87% due 6/18/2026 | 100,000 | 81,539 |
| c | Series 2019-1 Class-A, 3.42% due 6/18/2026 | 33,807 | 33,668 |
| c | Series 2019-2 Class A, 2.62% due 11/18/2026 | 123,950 | 121,523 |
| c | Aqua Finance Trust, Series 2019-A Class A, 3.14% due 7/16/2040 | 84,716 | 86,397 |
| c | Ascentium Equipment Receivables Trust, Series 2018-2A Class A2, 3.27% due 10/12/2021 | 47,736 | 46,051 |
| c | BCC Funding Corp. XVI, LLC, Series 2019-1A Class A1, 2.30% due 10/20/2020 | 113,017 | 110,233 |
| c | CCG Receivables Trust, Series 2017-1 Class A2, 1.84% due 11/14/2023 | 8,462 | 8,462 |
| | Conn’s Receivables Funding, LLC, | | |
| c | Series 2019-A Class A, 3.40% due 10/16/2023 | 19,809 | 19,416 |
| c | Series 2019-B Class A, 2.66% due 6/17/2024 | 153,602 | 147,565 |
| c | Foundation Finance Trust, Series 2016-1A Class A, 3.96% due 6/15/2035 | 36,539 | 36,693 |
| c | Hilton Grand Vacations Trust, Series 2019-AA Class A, 2.34% due 7/25/2033 | 135,352 | 114,727 |
| | Lendingpoint Asset Securitization Trust, | | |
| c | Series 2019-1 Class A, 3.154% due 8/15/2025 | 40,396 | 40,412 |
| c | Series 2019-2 Class A, 3.071% due 11/10/2025 | 170,542 | 171,616 |
| c | Series 2020-1 Class A, 2.512% due 2/10/2026 | 239,715 | 236,929 |
| c | LL ABS Trust, Series 2019-1A Class A, 2.87% due 3/15/2027 | 105,470 | 103,660 |
| c | MMAF Equipment Finance, LLC, Series 2017-AA Class A3, 2.04% due 2/16/2022 | 60,807 | 60,199 |
| | New Residential Advance Receivables Trust Advance Receivables Backed, | | |
| c | Series 2019-T3 Class AT3, 2.512% due 9/15/2052 | 300,000 | 300,913 |
| c | Series 2019-T4 Class AT4, 2.329% due 10/15/2051 | 300,000 | 299,995 |
| c | NRZ Advance Receivables Trust , Series 2019-T1 Class AT1, 2.59% due 7/15/2052 | 150,000 | 143,170 |
| c | Pawnee Equipment Receivables, Series 2019-1 Class A2, 2.29% due 10/15/2024 | 175,000 | 171,667 |
| | PFS Financing Corp., | | |
| c | Series 2018-F Class A, 3.52% due 10/15/2023 | 100,000 | 100,049 |
| b,c | Series 2019-B Class A, 1.255% (LIBOR 1 Month + 0.55%) due 9/15/2023 | 250,000 | 250,073 |
| c | Prosper Marketplace Issuance Trust, Series 2019-2A Class A, 3.20% due 9/15/2025 | 34,326 | 33,274 |
| c | Regional Management Issuance Trust, Series 2018-1 Class A, 3.83% due 7/15/2027 | 100,000 | 95,827 |
| | SCF Equipment Leasing, LLC, | | |
| c | Series 2019-1A Class A1, 3.04% due 3/20/2023 | 182,779 | 178,397 |
| c | Series 2019-2A Class A1, 2.22% due 6/20/2024 | 120,093 | 117,642 |
| | Small Business Lending Trust, | | |
| c | Series 2019-A Class A, 2.85% due 7/15/2026 | 68,117 | 67,252 |
| c | Series 2020-A Class A, 2.62% due 12/15/2026 | 263,656 | 261,116 |
| c | SoFi Consumer Loan Program Trust, Series 2019-2 Class A, 3.01% due 4/25/2028 | 79,248 | 76,891 |
| c | SpringCastle Funding, Series 2019-AA Class A, 3.20% due 5/27/2036 | 86,528 | 85,662 |
| c | SPS Servicer Advance Receivables Trust Advance Receivables Backed Notes , Series 2019-T1 Class AT1, 2.24% due 10/15/2051 | 200,000 | 195,578 |
| b,c | Towd Point Mortgage Trust, Series 2019-HY2 Class 1, 1.947% (LIBOR 1 Month + 1.00%) due 5/25/2058 | 142,351 | 138,215 |
| c | Upgrade Receivables Trust, Series 2018-1A Class A, 3.76% due 11/15/2024 | 17,510 | 17,510 |
| c,d | Upstart Pass-Through Trust, Series 2020-ST3 Class A, 3.35% due 4/20/2028 | 100,000 | 87,800 |
| | Upstart Securitization Trust, | | |
| c | Series 2018-2 Class B, 4.445% due 12/22/2025 | 79,994 | 76,624 |
| c | Series 2019-1 Class B, 4.19% due 4/20/2026 | 300,000 | 273,804 |
| c | Series 2019-2 Class A, 2.897% due 9/20/2029 | 139,758 | 140,045 |
| c | Series 2019-2 Class B, 3.734% due 9/20/2029 | 150,000 | 119,801 |
| c | Series 2019-3 Class B, 3.829% due 1/21/2030 | 150,000 | 101,007 |
| | | | 4,964,054 |
| | Auto Receivables — 10.1% | | |
| c | ACC Trust, Series 2019-2 Class A, 2.82% due 2/21/2023 | 77,565 | 76,334 |
| c | American Credit Acceptance Receivables Trust, Series 2018-3 Class B, 3.49% due 6/13/2022 | 22,678 | 22,678 |
See notes to financial statements.
| Thornburg Fixed Income Funds Semi-Annual Report | 33 |
Schedule of Investments, Continued
Thornburg Low Duration Income Fund | March 31, 2020 (Unaudited)
| | Issuer-Description | PRINCIPAL
AMOUNT | VALUE |
| c | Arivo Acceptance Auto Loan Receivables Trust, Series 2019-1 Class A, 2.99% due 7/15/2024 | $ 94,216 | $ 93,435 |
| c | Avid Automobile Receivables Trust, Series 2019-1 Class A, 2.62% due 2/15/2024 | 203,993 | 197,695 |
| c | Bank of The West Auto Trust, Series 2019-1 Class A2, 2.40% due 10/17/2022 | 156,714 | 154,837 |
| | CarMax Auto Owner Trust, Series 2018-3 Class A3, 3.13% due 6/15/2023 | 250,000 | 252,378 |
| | CarNow Auto Receivables Trust, | | |
| c | Series 2017-1A Class B, 4.35% due 9/15/2022 | 75,693 | 74,109 |
| c | Series 2019-1A Class A, 2.72% due 11/15/2022 | 61,057 | 59,788 |
| c | Carvana Auto Receivables Trust, Series 2020-N1A, 1.53% due 1/16/2024 | 200,000 | 196,400 |
| c | CIG Auto Receivables Trust, Series 2017-1A Class A, 2.71% due 5/15/2023 | 177,454 | 173,199 |
| | CPS Auto Receivables Trust, | | |
| c | Series 2019-A Class B, 3.58% due 12/16/2024 | 100,000 | 98,837 |
| c | Series 2020-A Class A, 2.09% due 5/15/2023 | 295,557 | 288,054 |
| c | Exeter Automobile Receivables Trust, Series 2020-1A Class A, 2.05% due 6/15/2023 | 218,469 | 214,821 |
| | Foursight Capital Automobile Receivables Trust, | | |
| c | Series 2016-1 Class A2, 2.87% due 10/15/2021 | 107 | 107 |
| c | Series 2017-1 Class B, 3.05% due 12/15/2022 | 100,000 | 97,989 |
| c | Series 2019-1 Class A2, 2.58% due 3/15/2023 | 76,423 | 74,538 |
| | GLS Auto Receivables Issuer Trust, | | |
| c | Series 2019-4A Class A, 2.47% due 11/15/2023 | 50,192 | 45,985 |
| c | Series 2020-1A, 2.17% due 2/15/2024 | 193,305 | 188,153 |
| | GLS Auto Receivables Trust, | | |
| c | Series 2018-2A Class A, 3.25% due 4/18/2022 | 4,793 | 4,723 |
| c | Series 2018-3A Class A, 3.35% due 8/15/2022 | 23,037 | 22,743 |
| c | Series 2019-1A Class A, 3.37% due 1/17/2023 | 18,931 | 18,756 |
| b,c | Navistar Financial Dealer Note Master Owner Trust II, Series 2018-1 Class D, 2.497% (LIBOR 1 Month + 1.55%) due 9/25/2023 | 100,000 | 98,176 |
| a,c | OSCAR US Funding Trust, Series 2018-1A Class A3, 3.23% due 5/10/2022 | 176,445 | 177,748 |
| a,c | Oscar US Funding XI, LLC, Series 2019-2A Class A3, 2.59% due 9/11/2023 | 100,000 | 96,623 |
| c | Skopos Auto Receivables Trust, Series 2019-1A Class A, 2.90% due 12/15/2022 | 159,072 | 155,012 |
| c | U.S. Auto Funding, LLC, Series 2019-1A Class A, 3.61% due 4/15/2022 | 38,105 | 37,444 |
| c | Veros Automobile Receivables Trust, Series 2018-1 Class A, 3.63% due 5/15/2023 | 15,956 | 15,724 |
| b,c | Volvo Financial Equipment Master Owner Trust, Series 2017-A Class A, 1.205% (LIBOR 1 Month + 0.50%) due 11/15/2022 | 100,000 | 96,568 |
| | | | 3,032,854 |
| | Credit Card — 0.7% | | |
| c | Fair Square Issuance Trust, Series 2020-AA Class A, 2.90% due 9/20/2024 | 120,000 | 110,453 |
| c | Genesis Sales Finance Master Trust, Series 2019-AA Class A, 4.68% due 8/20/2023 | 100,000 | 87,035 |
| | | | 197,488 |
| | Other Asset Backed — 10.8% | | |
| c | Avant Loans Funding Trust, Series 2019-A Class A, 3.48% due 7/15/2022 | 39,593 | 38,944 |
| | AXIS Equipment Finance Receivables VI, LLC, | | |
| c | Series 2018-2A Class A2, 3.89% due 7/20/2022 | 114,000 | 115,607 |
| c | Series 2019-1A Class A2, 2.63% due 6/20/2024 | 100,000 | 98,345 |
| b,c | Bayview Opportunity Master Fund, Series 2017-RT3 Class A, 3.50% due 1/28/2058 | 57,551 | 57,264 |
| b,c | Bayview Opportunity Master Fund IV Trust, Series 2017-RT1 Class A1, 3.00% due 3/28/2057 | 92,977 | 91,460 |
| c | BCC Funding Corp. XVI, LLC, Series 2019-1A Class A2, 2.46% due 8/20/2024 | 175,000 | 161,709 |
| c | BCC Funding XIV, LLC, Series 2018-1A Class A2, 2.96% due 6/20/2023 | 32,382 | 31,697 |
| c | BRE Grand Islander Timeshare Issuer, LLC, Series 2017-1A Class A, 2.94% due 5/25/2029 | 41,969 | 42,050 |
| c | Consumer Loan Underlying Bond CLUB Credit Trust, Series 2020-P1 Class A, 2.26% due 3/15/2028 | 158,521 | 152,014 |
| | Consumer Loan Underlying Bond Credit Trust, | | |
| c | Series 2018-P2 Class A, 3.47% due 10/15/2025 | 24,552 | 22,162 |
| c | Series 2018-P3 Class A, 3.82% due 1/15/2026 | 33,883 | 32,278 |
| c | Series 2019-A Class A, 3.52% due 4/15/2026 | 47,431 | 46,036 |
| | Dell Equipment Finance Trust, | | |
| c | Series 2017-2 2.47% due 10/24/2022 | 150,000 | 146,230 |
| c | Series 2018-1 Class A2A, 2.97% due 10/22/2020 | 2,361 | 2,361 |
| c | Diamond Resorts Owner Trust, Series 2019-1A Class A, 2.89% due 2/20/2032 | 156,278 | 156,775 |
| | Foundation Finance Trust, | | |
| c | Series 2017-1A Class A, 3.30% due 7/15/2033 | 35,596 | 34,896 |
| c | Series 2019-1A Class A, 3.86% due 11/15/2034 | 102,463 | 97,976 |
| | Marlette Funding Trust, | | |
| c | Series 2019-2A Class A, 3.13% due 7/16/2029 | 155,847 | 149,610 |
| c | Series 2020-1A Class B, 2.38% due 3/15/2030 | 150,000 | 114,254 |
| | MVW Owner Trust, Series 2013-1X Class A, 2.15% due 4/22/2030 | 8,791 | 8,791 |
34 | Thornburg Fixed Income Funds Semi-Annual Report
| See notes to financial statements. |
Schedule of Investments, Continued
Thornburg Low Duration Income Fund | March 31, 2020 (Unaudited)
| | Issuer-Description | PRINCIPAL
AMOUNT | VALUE |
| | Nationstar HECM Loan Trust, | | |
| b,c | Series 2018-2A Class A, 3.188% due 7/25/2028 | $ 12,701 | $ 12,670 |
| b,c | Series 2019-1A Class A, 2.651% due 6/25/2029 | 65,074 | 64,490 |
| c | Ocwen Master Advance Receivables Trust, Series 2019-T1 Class AT1, 2.514% due 8/15/2050 | 150,000 | 149,570 |
| c | Oportun Funding VII, LLC, Series 2017-B Class A, 3.22% due 10/10/2023 | 250,000 | 242,256 |
| c | PFS Financing Corp., Series 2018-B Class A, 2.89% due 2/15/2023 | 100,000 | 98,956 |
| | PSNH Funding, LLC 3, Series 2018-1 Class A1, 3.094% due 2/1/2026 | 68,658 | 66,654 |
| c | Purchasing Power Funding, LLC, Series 2018-A Class A, 3.34% due 8/15/2022 | 100,000 | 100,000 |
| | SCF Equipment Leasing, LLC, | | |
| c | Series 2017-2A Class A, 3.41% due 12/20/2023 | 58,434 | 57,300 |
| c | Series 2018-1A Class A2, 3.63% due 10/20/2024 | 40,741 | 39,527 |
| c | Sierra Timeshare Receivables Funding, LLC, Series 2015-3A Class A, 2.58% due 9/20/2032 | 205,026 | 201,573 |
| | Small Business Administration, Series 2009-20E Class 1, 4.43% due 5/1/2029 | 46,654 | 48,627 |
| | Small Business Administration Participation Certificates, Series 2005-20K Class 1, 5.36% due 11/1/2025 | 15,199 | 15,783 |
| c | Sofi Consumer Loan Program, LLC, Series 2016-3 Class A, 3.05% due 12/26/2025 | 88,626 | 86,979 |
| c | Tax Ease Funding, LLC, Series 2016-1A Class A, 3.131% due 6/15/2028 | 36,658 | 36,467 |
| | Towd Point Mortgage Trust, | | |
| b,c | Series 2016-5 Class A1, 2.50% due 10/25/2056 | 46,625 | 46,315 |
| b,c | Series 2018-2 Class A1, 3.25% due 3/25/2058 | 72,931 | 73,582 |
| b,c | Series 2018-6 Class A1A, 3.75% due 3/25/2058 | 234,298 | 239,254 |
| c | VB-S1 Issuer, LLC,, Series 2016-1A Class C, 3.065% due 6/15/2046 | 50,000 | 49,268 |
| | | | 3,229,730 |
| | Student Loan — 5.0% | | |
| b,c | Earnest Student Loan Program, LLC, Series 2016-B Class A1, 2.997% (LIBOR 1 Month + 2.05%) due 2/26/2035 | 188,703 | 177,292 |
| c | Navient Private Education Refi Loan Trust, Series 2019-FA A1 Class A1, 2.18% due 8/15/2068 | 155,506 | 154,042 |
| | Navient Student Loan Trust, | | |
| b,c | Series 2016-6A Class A2, 1.697% (LIBOR 1 Month + 0.75%) due 3/25/2066 | 67,919 | 66,732 |
| c | Series 2018-EA Class A1, 3.43% due 12/15/2059 | 49,954 | 49,565 |
| b,c | Series 2019-D Class A1, 1.105% (LIBOR 1 Month + 0.40%) due 12/15/2059 | 102,285 | 97,450 |
| | Nelnet Student Loan Trust, | | |
| b,c | Series 2012-2A Class A, 1.747% (LIBOR 1 Month + 0.80%) due 12/26/2033 | 135,652 | 125,288 |
| b,c | Series 2015-3A Class A2, 1.547% (LIBOR 1 Month + 0.60%) due 2/27/2051 | 55,496 | 52,341 |
| b,c | Series 2016-A Class A1A, 2.697% (LIBOR 1 Month + 1.75%) due 12/26/2040 | 39,465 | 37,320 |
| b,c | Pennsylvania Higher Education Assistance Agency, Series 2012-1A Class A1, 1.497% (LIBOR 1 Month + 0.55%) due 5/25/2057 | 24,531 | 23,051 |
| | SLM Student Loan Trust, | | |
| b,c | Series 2011-A Class A3, 3.205% (LIBOR 1 Month + 2.50%) due 1/15/2043 | 12,604 | 12,127 |
| b | Series 2013-4 Class A, 1.497% (LIBOR 1 Month + 0.55%) due 6/25/2043 | 34,800 | 32,779 |
| b | Series 2013-6 Class A3, 1.597% (LIBOR 1 Month + 0.65%) due 6/25/2055 | 217,551 | 199,071 |
| | SMB Private Education Loan Trust, | | |
| b,c | Series 2019-A Class A1, 1.055% (LIBOR 1 Month + 0.35%) due 2/16/2026 | 174,891 | 165,813 |
| b,c | Series 2019-B Class A1, 1.055% (LIBOR 1 Month + 0.35%) due 7/15/2026 | 56,638 | 53,935 |
| b,c | Series 2020-A Class A1, 1.98% (LIBOR 1 Month + 0.30%) due 3/15/2027 | 215,000 | 208,108 |
| c | Sofi Professional Loan Program, LLC, Series 2016-B Class A2B, 2.74% due 10/25/2032 | 49,269 | 47,762 |
| | | | 1,502,676 |
| | Total Asset Backed Securities(Cost $13,255,158) | | 12,926,802 |
| | Corporate Bonds — 31.2% | | |
| | Automobiles & Components — 2.4% | | |
| | Automobiles — 1.7% | | |
| c | BMW US Capital, LLC, 2.95% due 4/14/2022 | 60,000 | 59,001 |
| b,c | Daimler Finance North America, LLC, 2.592% (LIBOR 3 Month + 0.90%) due 2/15/2022 | 150,000 | 139,031 |
| c | Harley-Davidson Financial Services, Inc., 2.40% due 6/15/2020 | 144,000 | 140,640 |
| c | Hyundai Capital America, 3.95% due 2/1/2022 | 70,000 | 70,551 |
| b,c | Nissan Motor Acceptance Corp., 2.065% (LIBOR 3 Month + 0.69%) due 9/28/2022 | 33,000 | 30,692 |
| a | Toyota Motor Corp., 2.157% due 7/2/2022 | 18,000 | 17,894 |
| b | Toyota Motor Credit Corp., 2.412% (LIBOR 3 Month + 0.54%) due 1/8/2021 | 50,000 | 49,425 |
| | Trading Companies & Distributors — 0.7% | | |
| a,c | Mitsubishi UFJ Lease & Finance Co. Ltd., 3.406% due 2/28/2022 | 200,000 | 199,152 |
| | | | 706,386 |
| | Banks — 4.7% | | |
See notes to financial statements.
| Thornburg Fixed Income Funds Semi-Annual Report | 35 |
Schedule of Investments, Continued
Thornburg Low Duration Income Fund | March 31, 2020 (Unaudited)
| | Issuer-Description | PRINCIPAL
AMOUNT | VALUE |
| | Banks — 4.7% | | |
| a,b,c | ABN AMRO Bank N.V., 2.208% (LIBOR 3 Month + 0.57%) due 8/27/2021 | $200,000 | $ 194,372 |
| b | Goldman Sachs Bank USA, 0.995% (SOFR + 0.60%) due 5/24/2021 | 50,000 | 48,633 |
| a | Lloyds Bank plc, 3.30% due 5/7/2021 | 200,000 | 200,049 |
| a,c | Mizuho Bank Ltd., 2.70% due 10/20/2020 | 200,000 | 199,677 |
| b | PNC Bank NA, 2.004% (LIBOR 3 Month + 0.33%) due 2/24/2023 | 250,000 | 235,625 |
| | Santander Holdings USA, Inc., 4.45% due 12/3/2021 | 40,000 | 40,817 |
| b | SunTrust Bank, 3.525% (LIBOR 3 Month + 0.50%) due 10/26/2021 | 225,000 | 225,420 |
| | Zions Bancorp N.A., 3.35% due 3/4/2022 | 250,000 | 245,174 |
| | | | 1,389,767 |
| | Capital Goods — 0.3% | | |
| | Machinery — 0.3% | | |
| b | Wabtec Corp., 2.041% (LIBOR 3 Month + 1.30%) due 9/15/2021 | 100,000 | 97,067 |
| | | | 97,067 |
| | Commercial & Professional Services — 0.3% | | |
| | Professional Services — 0.3% | | |
| | Verisk Analytics, Inc., 5.80% due 5/1/2021 | 100,000 | 101,130 |
| | | | 101,130 |
| | Consumer Durables & Apparel — 0.7% | | |
| | Household Durables — 0.7% | | |
| a,c | Panasonic Corp., 2.536% due 7/19/2022 | 200,000 | 196,392 |
| | | | 196,392 |
| | Diversified Financials — 3.6% | | |
| | Capital Markets — 0.3% | | |
| c | GTP Acquisition Partners I, LLC (Guaranty: American Tower Holding Sub II, LLC), 2.35% due 6/15/2045 | 100,000 | 100,658 |
| | Diversified Financial Services — 2.9% | | |
| | Citigroup, Inc., 2.65% due 10/26/2020 | 100,000 | 100,175 |
| a,b | Deutsche Bank AG, 2.868% (LIBOR 3 Month + 1.23%) due 2/27/2023 | 100,000 | 81,936 |
| b | Goldman Sachs Group, Inc., 1.941% (LIBOR 3 Month + 1.20%) due 9/15/2020 | 100,000 | 99,928 |
| b | JPMorgan Chase & Co., 2.98% (LIBOR 3 Month + 1.21%) due 10/29/2020 | 125,000 | 125,179 |
| | Morgan Stanley, | | |
| b | 0.924% (SOFRRATE + 0.83%) due 6/10/2022 | 35,000 | 33,408 |
| b | 1.613% (SOFR + 0.70%) due 1/20/2023 | 125,000 | 116,357 |
| b | State Street Corp., 2.592% (LIBOR 3 Month + 0.90%) due 8/18/2020 | 100,000 | 99,440 |
| a,b,c | UBS Group Funding Switzerland AG, 3.618% (LIBOR 3 Month + 1.78%) due 4/14/2021 | 200,000 | 195,871 |
| | Insurance — 0.4% | | |
| | AIG Global Funding, | | |
| b,c | 1.676% (LIBOR 3 Month + 0.46%) due 6/25/2021 | 50,000 | 49,543 |
| c | 2.30% due 7/1/2022 | 75,000 | 74,646 |
| | | | 1,077,141 |
| | Energy — 1.3% | | |
| | Oil, Gas & Consumable Fuels — 1.3% | | |
| | BP Capital Markets America, Inc., 3.245% due 5/6/2022 | 45,000 | 45,482 |
| a | BP Capital Markets plc, 3.062% due 3/17/2022 | 25,000 | 25,146 |
| | EQM Midstream Partners L.P., Series 5Y, 4.75% due 7/15/2023 | 60,000 | 43,422 |
| c | Midwest Connector Capital Co., LLC, 3.625% due 4/1/2022 | 99,000 | 95,126 |
| | Occidental Petroleum Corp., | | |
| b | 2.957% (LIBOR 3 Month + 1.25%) due 8/13/2021 | 20,000 | 15,002 |
| b | 3.142% (LIBOR 3 Month + 1.45%) due 8/15/2022 | 70,000 | 46,911 |
| c | Texas Gas Transmission, LLC, 4.50% due 2/1/2021 | 129,000 | 125,576 |
| | | | 396,665 |
| | Food & Staples Retailing — 0.3% | | |
| | Food & Staples Retailing — 0.3% | | |
| a,c | Alimentation Couche-Tard, Inc., 2.70% due 7/26/2022 | 100,000 | 98,856 |
| | | | 98,856 |
| | Food, Beverage & Tobacco — 2.6% | | |
36 | Thornburg Fixed Income Funds Semi-Annual Report
| See notes to financial statements. |
Schedule of Investments, Continued
Thornburg Low Duration Income Fund | March 31, 2020 (Unaudited)
| | Issuer-Description | PRINCIPAL
AMOUNT | VALUE |
| | Beverages — 0.8% | | |
| | Molson Coors Brewing Co., 2.10% due 7/15/2021 | $235,000 | $ 230,184 |
| | Food Products — 1.1% | | |
| b | Conagra Brands, Inc., 2.378% (LIBOR 3 Month + 0.50%) due 10/9/2020 | 100,000 | 98,608 |
| b | General Mills, Inc., 2.383% (LIBOR 3 Month + 0.54%) due 4/16/2021 | 20,000 | 19,471 |
| | Mead Johnson Nutrition Co. (Guaranty: Reckitt Benckiser Group plc), 3.00% due 11/15/2020 | 100,000 | 99,806 |
| b | Tyson Foods, Inc., 2.13% (LIBOR 3 Month + 0.55%) due 6/2/2020 | 100,000 | 99,748 |
| | Tobacco — 0.7% | | |
| | Altria Group, Inc. (Guaranty: Philip Morris USA, Inc.), 3.49% due 2/14/2022 | 120,000 | 122,759 |
| b | BAT Capital Corp., 2.294% (LIBOR 3 Month + 0.59%) due 8/14/2020 | 100,000 | 98,359 |
| | | | 768,935 |
| | Health Care Equipment & Services — 0.7% | | |
| | Health Care Providers & Services — 0.7% | | |
| | Anthem, Inc., 2.50% due 11/21/2020 | 75,000 | 74,729 |
| | Cigna Corp., 3.40% due 9/17/2021 | 75,000 | 76,408 |
| | Express Scripts Holding Co., 2.60% due 11/30/2020 | 62,000 | 61,911 |
| | | | 213,048 |
| | Household & Personal Products — 0.2% | | |
| | Household Products — 0.2% | | |
| | Church & Dwight Co., Inc., 2.45% due 8/1/2022 | 50,000 | 49,324 |
| | | | 49,324 |
| | Insurance — 3.5% | | |
| | Insurance — 3.5% | | |
| a | Enstar Group Ltd., 4.50% due 3/10/2022 | 50,000 | 49,871 |
| c | Guardian Life Global Funding, 3.40% due 4/25/2023 | 57,000 | 58,306 |
| | Infinity Property & Casualty Corp., 5.00% due 9/19/2022 | 100,000 | 97,337 |
| | Jackson National Life Global Funding, | | |
| b,c | 1.248% (LIBOR 3 Month + 0.48%) due 6/11/2021 | 100,000 | 95,930 |
| c | 2.10% due 10/25/2021 | 100,000 | 99,407 |
| c | MassMutual Global Funding II, 2.00% due 4/15/2021 | 200,000 | 199,478 |
| b,c | Metropolitan Life Global Funding, 0.58% (SOFR + 0.57%) due 9/7/2020 | 150,000 | 148,393 |
| | Reliance Standard Life Global Funding II, | | |
| c | 2.625% due 7/22/2022 | 75,000 | 75,425 |
| c | 3.85% due 9/19/2023 | 50,000 | 53,761 |
| a | Willis Towers Watson plc, 5.75% due 3/15/2021 | 170,000 | 174,196 |
| | | | 1,052,104 |
| | Materials — 0.4% | | |
| | Chemicals — 0.4% | | |
| b,c | Albemarle Corp., 2.742% (LIBOR 3 Month + 1.05%) due 11/15/2022 | 28,000 | 26,663 |
| b,c | Chevron Phillips Chemical Co., LLC / Chevron Phillips Chemical Co., L.P., 2.513% (LIBOR 3 Month + 0.75%) due 5/1/2020 | 100,000 | 99,735 |
| | | | 126,398 |
| | Media & Entertainment — 0.5% | | |
| | Media — 0.5% | | |
| c | Cox Communications, Inc., 3.25% due 12/15/2022 | 160,000 | 162,135 |
| | | | 162,135 |
| | Pharmaceuticals, Biotechnology & Life Sciences — 0.6% | | |
| | Pharmaceuticals — 0.6% | | |
| a,b | AstraZeneca plc, 2.357% (LIBOR 3 Month + 0.67%) due 8/17/2023 | 65,000 | 57,771 |
| c | Bristol-Myers Squibb Co., 2.75% due 2/15/2023 | 100,000 | 103,387 |
| a | Shire Acquisitions Investments Ireland DAC, 2.40% due 9/23/2021 | 22,000 | 21,816 |
| | | | 182,974 |
| | Real Estate — 1.0% | | |
| | Equity Real Estate Investment Trusts — 1.0% | | |
| | SBA Tower Trust, | | |
| c | 2.836% due 1/15/2025 | 100,000 | 96,557 |
| c | 3.156% due 10/10/2045 | 200,000 | 199,706 |
See notes to financial statements.
| Thornburg Fixed Income Funds Semi-Annual Report | 37 |
Schedule of Investments, Continued
Thornburg Low Duration Income Fund | March 31, 2020 (Unaudited)
| | Issuer-Description | PRINCIPAL
AMOUNT | VALUE |
| | | | 296,263 |
| | Retailing — 0.2% | | |
| | Multiline Retail — 0.2% | | |
| b | Dollar Tree, Inc., 2.536% (LIBOR 3 Month + 0.70%) due 4/17/2020 | $ 58,000 | $ 57,988 |
| | | | 57,988 |
| | Software & Services — 0.2% | | |
| | Software — 0.2% | | |
| | VMware, Inc., 2.30% due 8/21/2020 | 50,000 | 49,467 |
| | | | 49,467 |
| | Telecommunication Services — 2.6% | | |
| | Diversified Telecommunication Services — 0.3% | | |
| | AT&T, Inc., 2.45% due 6/30/2020 | 100,000 | 99,940 |
| | Media — 0.3% | | |
| b,c | NBCUniversal Enterprise, Inc., 1.833% (LIBOR 3 Month + 0.40%) due 4/1/2021 | 100,000 | 98,668 |
| | Wireless Telecommunication Services — 2.0% | | |
| | Sprint Communications, Inc., 9.25% due 4/15/2022 | 400,000 | 428,000 |
| a | Vodafone Group plc, 2.50% due 9/26/2022 | 160,000 | 162,200 |
| | | | 788,808 |
| | Transportation — 1.0% | | |
| | Airlines — 0.5% | | |
| c | American Airlines Pass Through Trust, Series 2013-2 Class B, 5.60% due 7/15/2022 | 149,918 | 148,794 |
| | Road & Rail — 0.5% | | |
| | Penske Truck Leasing Co. L.P. / PTL Finance Corp., | | |
| c | 3.20% due 7/15/2020 | 100,000 | 99,499 |
| c | 3.65% due 7/29/2021 | 35,000 | 35,435 |
| | | | 283,728 |
| | Utilities — 4.1% | | |
| | Electric Utilities — 4.1% | | |
| c | Alliant Energy Finance, LLC, 3.75% due 6/15/2023 | 100,000 | 103,378 |
| | CenterPoint Energy, Inc., 3.60% due 11/1/2021 | 150,000 | 149,691 |
| b | Consolidated Edison Co. of New York, Inc., Series C, 1.616% (LIBOR 3 Month + 0.40%) due 6/25/2021 | 100,000 | 97,106 |
| b | Duke Energy Florida, LLC, Series A, 1.897% (LIBOR 3 Month + 0.25%) due 11/26/2021 | 165,000 | 159,038 |
| | Evergy, Inc., 2.45% due 9/15/2024 | 30,000 | 29,430 |
| | Exelon Corp., 2.85% due 6/15/2020 | 50,000 | 49,994 |
| | PNM Resources, Inc., 3.25% due 3/9/2021 | 100,000 | 100,633 |
| | Public Service Enterprise Group, 2.65% due 11/15/2022 | 50,000 | 49,644 |
| b,c | Southern Power Co., 1.666% (LIBOR 3 Month + 0.55%) due 12/20/2020 | 115,000 | 113,180 |
| | Tampa Electric Co., 2.60% due 9/15/2022 | 185,000 | 182,223 |
| | Virginia Electric & Power Co., 2.95% due 1/15/2022 | 100,000 | 100,779 |
| | WEC Energy Group, Inc., 3.375% due 6/15/2021 | 100,000 | 100,401 |
| | | | 1,235,497 |
| | Total Corporate Bonds(Cost $9,496,300) | | 9,330,073 |
| | Municipal Bonds — 1.4% | | |
| | Colorado Educational & Cultural Facilities Authority, | | |
| | Series B, | | |
| | 2.244% due 3/1/2021 | 50,000 | 50,408 |
| | 2.474% due 3/1/2022 | 50,000 | 50,938 |
| | Los Angeles County Public Works Financing Authority, 5.591% due 8/1/2020 | 100,000 | 101,557 |
| | New Jersey Transportation Trust Fund Authority, | | |
| | 2.551% due 6/15/2023 | 30,000 | 30,635 |
| | 2.631% due 6/15/2024 | 25,000 | 25,672 |
| | New York State Urban Development Corp., Series D-1, 2.55% due 3/15/2022 | 120,000 | 122,534 |
| | State of Connecticut GO, | | |
| | Series A, | | |
| | 3.471% due 9/15/2022 | 20,000 | 20,761 |
| | 4.00% due 9/15/2021 | 20,000 | 20,723 |
38 | Thornburg Fixed Income Funds Semi-Annual Report
| See notes to financial statements. |
Schedule of Investments, Continued
Thornburg Low Duration Income Fund | March 31, 2020 (Unaudited)
| | Issuer-Description | PRINCIPAL
AMOUNT | VALUE |
| | Total Municipal Bonds(Cost $416,371) | | 423,228 |
| | Short-Term Investments — 6.4% | | |
| e | Thornburg Capital Management Fund | 190,823 | $ 1,908,228 |
| | Total Short-Term Investments(Cost $1,908,228) | | 1,908,228 |
| | Total Investments — 98.8%(Cost $30,052,094) | | $29,545,106 |
| | Other Assets Less Liabilities — 1.2% | | 345,950 |
| | Net Assets — 100.0% | | $29,891,056 |
| Footnote Legend |
| a | Yankee bond denominated in U.S. dollars and is issued in the U.S. by foreign banks and corporations. |
| b | Variable, floating, step, or fixed to floating rate securities are securities for which interest rate changes are based on changes in a designated base rate or on a predetermined schedule. The rates shown are those in effect on March 31, 2020. |
| c | Securities exempt from registration under Rule 144A of the Securities Act of 1933, as amended. These securities are restricted but liquid and may only be resold in the ordinary course of business in transactions exempt from registration, normally to qualified institutional buyers. As of March 31, 2020, the aggregate value of these securities in the Fund’s portfolio was $18,394,571, representing 61.54% of the Fund’s net assets. |
| d | Security currently fair valued by the Valuation and Pricing Committee using procedures approved by the Trustees’ Audit Committee. |
| e | Investment in Affiliates. |
Portfolio Abbreviations
To simplify the listings of securities, abbreviations are used per the table below:
| CMO | Collateralized Mortgage Obligation |
| GO | General Obligation |
| LIBOR | London Interbank Offered Rates |
| Mtg | Mortgage |
| SOFR | Secured Overnight Financing Rate |
See notes to financial statements.
| Thornburg Fixed Income Funds Semi-Annual Report | 39 |
Schedule of Investments
Thornburg Strategic Income Fund | March 31, 2020 (Unaudited)
| | Issuer-Description | SHARES/
PRINCIPAL AMOUNT | VALUE |
| | Common Stock — 0.0% | | |
| | Energy — 0.0% | | |
| | Oil, Gas & Consumable Fuels — 0.0% | | |
| a,b | Malamute Energy, Inc. | 847 | $ 8,893 |
| | | | 8,893 |
| | Total Common Stock(Cost $0) | | 8,893 |
| | Preferred Stock — 1.4% | | |
| | Banks — 0.6% | | |
| | Banks — 0.6% | | |
| c,d | AgriBank FCB, 6.875% (LIBOR 3 Month + 4.23%) | $ 40,000 | 3,885,000 |
| c,d | CoBank ACB, Series F, 6.25% (LIBOR 3 Month + 4.56%) | 50,000 | 4,956,500 |
| | | | 8,841,500 |
| | Diversified Financials — 0.2% | | |
| | Diversified Financial Services — 0.2% | | |
| c | Compass Diversified Holdings, Series C, 7.875% | 143,081 | 2,442,393 |
| | | | 2,442,393 |
| | Energy — 0.1% | | |
| | Oil, Gas & Consumable Fuels — 0.1% | | |
| c | Crestwood Equity Partners L.P., 9.25% | 320,654 | 1,218,485 |
| | | | 1,218,485 |
| | Miscellaneous — 0.4% | | |
| | U.S. Government Agencies — 0.4% | | |
| c | Farm Credit Bank of Texas, Series 1, 10.00% | 6,285 | 6,344,707 |
| | | | 6,344,707 |
| | Telecommunication Services — 0.1% | | |
| | Diversified Telecommunication Services — 0.1% | | |
| e,f | Centaur Funding Corp., 9.08%, 4/21/2020 | 2,380 | 2,369,290 |
| | | | 2,369,290 |
| | Total Preferred Stock(Cost $23,845,121) | | 21,216,375 |
| | Asset Backed Securities — 20.8% | | |
| | Asset-Backed - Finance & Insurance — 10.8% | | |
| | Freed ABS Trust, | | |
| e | Series 2020-FP1 Class A, 2.52%, 3/18/2027 | 6,184,067 | 5,741,614 |
| e | Series 2019-1 Class B, 3.87%, 6/18/2026 | 2,500,000 | 2,038,483 |
| e | Series 2019-1 Class-A, 3.42%, 6/18/2026 | 1,352,269 | 1,346,710 |
| e | Series 2019-2 Class A, 2.62%, 11/18/2026 | 3,098,754 | 3,038,083 |
| e | Aqua Finance Trust, Series 2019-A Class C, 4.01%, 7/16/2040 | 10,400,000 | 10,989,341 |
| d,e,f | Blackbird Capital Aircraft Lease Securitization Ltd., Series 2016-1A Class A, 4.213%, 12/16/2041 | 5,586,510 | 4,087,698 |
| | Conn’s Receivables Funding, LLC, | | |
| e | Series 2018-A Class B, 4.65%, 1/15/2023 | 4,714,047 | 4,527,936 |
| e | Series 2019-A Class A, 3.40%, 10/16/2023 | 990,426 | 970,785 |
| e | Series 2019-A Class B, 4.36%, 10/16/2023 | 7,125,000 | 6,845,245 |
| e | Series 2019-B Class A, 2.66%, 6/17/2024 | 3,072,034 | 2,951,306 |
| e | ExteNet, LLC, Series 2019-1A Class A2, 3.204%, 7/26/2049 | 5,000,000 | 4,512,288 |
| e | Hilton Grand Vacations Trust, Series 2019-AA Class A, 2.34%, 7/25/2033 | 3,474,025 | 2,944,653 |
| | Lendingpoint Asset Securitization Trust, | | |
| e | Series 2019-1 Class A, 3.154%, 8/15/2025 | 2,423,752 | 2,424,713 |
| e | Series 2019-2 Class A, 3.071%, 11/10/2025 | 5,394,695 | 5,428,661 |
| e | Series 2020-1 Class A, 2.512%, 2/10/2026 | 3,835,441 | 3,790,871 |
| e | Series 2020-1 Class B, 3.107%, 2/10/2026 | 10,450,000 | 8,369,693 |
| e | LL ABS Trust, Series 2019-1A Class A, 2.87%, 3/15/2027 | 2,812,545 | 2,764,274 |
| e | MelTel Land Funding, LLC, Series 2019-1A Class A, 3.768%, 4/15/2049 | 5,500,000 | 4,357,838 |
| e | New Residential Advance Receivables Trust, Series 2019-T2 Class DT2, 3.06%, 8/15/2053 | 4,875,000 | 4,564,971 |
40 | Thornburg Fixed Income Funds Semi-Annual Report
| See notes to financial statements. |
Schedule of Investments, Continued
Thornburg Strategic Income Fund | March 31, 2020 (Unaudited)
| | Issuer-Description | SHARES/
PRINCIPAL AMOUNT | VALUE |
| | New Residential Advance Receivables Trust Advance Receivables Backed, | | |
| e | Series 2019-T3 Class AT3, 2.512%, 9/15/2052 | $ 400,000 | $ 401,217 |
| e | Series 2019-T3 Class DT3, 3.055%, 9/15/2052 | 1,784,000 | 1,789,404 |
| e | Series 2019-T4 Class DT4, 2.804%, 10/15/2051 | 6,860,000 | 6,859,894 |
| e | Series 2019-T5 Class AT5, 2.425%, 10/15/2051 | 4,000,000 | 3,910,034 |
| e | Series 2019-T5 Class DT5, 2.85%, 10/15/2051 | 4,500,000 | 4,399,246 |
| e | NMEF Funding LLC, Series 2019-A Class A, 2.73%, 8/17/2026 | 4,875,241 | 4,785,000 |
| e | NRZ Advance Receivables Trust , Series 2019-T1 Class AT1, 2.59%, 7/15/2052 | 7,000,000 | 6,681,287 |
| | Ocwen Master Advance Receivables Trust, | | |
| e | Series 2019-T1 Class DT1, 3.107%, 8/15/2050 | 2,050,000 | 2,037,857 |
| e | Series 2019-T2 Class DT2, 3.042%, 8/15/2051 | 3,100,000 | 3,053,335 |
| e | Oportun Funding X, LLC, Series 2018-C Class A, 4.10%, 10/8/2024 | 2,690,000 | 2,703,376 |
| e | Prosper Marketplace Issuance Trust, Series 2019-2A Class A, 3.20%, 9/15/2025 | 1,681,966 | 1,630,427 |
| e | SCF Equipment Leasing LLC, Series 2019-1A Class D, 4.56%, 5/20/2027 | 3,000,000 | 2,589,540 |
| | Small Business Lending Trust, | | |
| e | Series 2019-A Class A, 2.85%, 7/15/2026 | 1,702,922 | 1,681,311 |
| e | Series 2020-A Class A, 2.62%, 12/15/2026 | 7,768,427 | 7,693,605 |
| e | SpringCastle Funding, Series 2019-AA Class A, 3.20%, 5/27/2036 | 6,489,612 | 6,424,612 |
| e | SPS Servicer Advance Receivables Trust Advance Receivables Backed Notes, Series 2019-T2 Class DT2, 2.77%, 10/15/2052 | 3,000,000 | 2,899,157 |
| e | Upgrade Receivables Trust, Series 2019-2A Class A, 2.77%, 10/15/2025 | 2,923,051 | 2,864,528 |
| a,e | Upstart Pass-Through Trust, Series 2020-ST3 Class A, 3.35%, 4/20/2028 | 6,000,000 | 5,268,000 |
| | Upstart Securitization Trust, | | |
| e | Series 2017-1 Class C, 6.35%, 6/20/2024 | 5,681,431 | 5,542,124 |
| e | Series 2017-2 Class C, 5.59%, 3/20/2025 | 4,934,004 | 4,381,359 |
| e | Series 2018-2 Class B, 4.445%, 12/22/2025 | 239,983 | 229,871 |
| e | Series 2019-1 Class B, 4.19%, 4/20/2026 | 5,000,000 | 4,563,397 |
| e | Series 2019-2 Class A, 2.897%, 9/20/2029 | 4,192,753 | 4,201,349 |
| | | | 168,285,093 |
| | Auto Receivables — 3.8% | | |
| e | ACC Trust, Series 2019-2 Class B, 3.63%, 8/21/2023 | 3,400,000 | 3,379,648 |
| e | Arivo Acceptance Auto Loan Receivables Trust, Series 2019-1 Class A, 2.99%, 7/15/2024 | 2,449,623 | 2,429,316 |
| e | Avid Automobile Receivables Trust, Series 2019-1 Class A, 2.62%, 2/15/2024 | 2,447,922 | 2,372,334 |
| e | Avis Budget Rental Car Funding AESOP, LLC, Series 2015-1A Class A, 2.50%, 7/20/2021 | 2,250,667 | 2,240,824 |
| | CarNow Auto Receivables Trust, | | |
| e | Series 2017-1A Class B, 4.35%, 9/15/2022 | 4,390,186 | 4,298,326 |
| e | Series 2019-1A Class A, 2.72%, 11/15/2022 | 1,831,708 | 1,793,643 |
| e | Carvana Auto Receivables Trust, Series 2020-N1A Class E, 5.20%, 7/15/2027 | 10,000,000 | 9,997,537 |
| | CIG Auto Receivables Trust, | | |
| e | Series 2017-1A Class A, 2.71%, 5/15/2023 | 202,817 | 197,954 |
| e | Series 2019-1A Class D, 4.85%, 5/15/2026 | 2,000,000 | 1,400,427 |
| e | CPS Auto Receivables Trust, Series 2019-A Class B, 3.58%, 12/16/2024 | 3,000,000 | 2,965,113 |
| e | First Investors Auto Owner, Series 2019-1A Class E, 4.53%, 6/16/2025 | 3,640,000 | 3,565,534 |
| | Foursight Capital Automobile Receivables Trust, | | |
| e | Series 2016-1 Class A2, 2.87%, 10/15/2021 | 4,861 | 4,861 |
| e | Series 2017-1 Class B, 3.05%, 12/15/2022 | 300,000 | 293,967 |
| e | Series 2018-1 Class E, 5.56%, 1/16/2024 | 1,000,000 | 950,498 |
| e | Series 2018-2 Class E, 5.50%, 10/15/2024 | 1,370,000 | 1,289,080 |
| e | Series 2020-1 Class E, 3.49%, 4/15/2026 | 1,100,000 | 935,547 |
| e | GLS Auto Receivables Issuer Trust, Series 2019-4A Class D, 4.09%, 8/17/2026 | 5,000,000 | 5,124,042 |
| e | GLS Auto Receivables Trust, Series 2018-2A Class A, 3.25%, 4/18/2022 | 287,570 | 283,353 |
| | Skopos Auto Receivables Trust, | | |
| e | Series 2019-1A Class A, 2.90%, 12/15/2022 | 1,749,797 | 1,705,127 |
| e | Series 2019-1A Class C, 3.63%, 9/16/2024 | 2,000,000 | 1,993,053 |
| e | Tesla Auto Lease Trust, Series 2018-B Class E, 7.87%, 6/20/2022 | 7,825,000 | 7,576,672 |
| | U.S. Auto Funding, LLC, | | |
| e | Series 2019-1A Class A, 3.61%, 4/15/2022 | 1,905,265 | 1,872,204 |
| e | Series 2019-1A Class C, 5.34%, 3/15/2023 | 2,511,000 | 2,143,643 |
| | | | 58,812,703 |
| | Credit Card — 0.9% | | |
| e | Fair Square Issuance Trust, Series 2020-AA Class A, 2.90%, 9/20/2024 | 6,000,000 | 5,522,665 |
| e | Genesis Sales Finance Master Trust, Series 2019-AA Class A, 4.68%, 8/20/2023 | 5,550,000 | 4,830,431 |
See notes to financial statements.
| Thornburg Fixed Income Funds Semi-Annual Report | 41 |
Schedule of Investments, Continued
Thornburg Strategic Income Fund | March 31, 2020 (Unaudited)
| | Issuer-Description | SHARES/
PRINCIPAL AMOUNT | VALUE |
| | Perimeter Master Note Business Trust, | | |
| e | Series 2019-2A Class A, 4.23%, 5/15/2024 | $ 2,966,000 | $ 2,868,379 |
| e | Series 2019-2A Class C, 7.06%, 5/15/2024 | 650,000 | 584,802 |
| | | | 13,806,277 |
| | Other Asset Backed — 3.8% | | |
| d,e | 321 Henderson Receivables II, LLC, Series 2006-3A Class A1, 0.905% (LIBOR 1 Month + 0.20%), 9/15/2041 | 1,683,479 | 1,649,958 |
| e | Avant Loans Funding Trust, Series 2019-A Class A, 3.48%, 7/15/2022 | 791,863 | 778,884 |
| e | AXIS Equipment Finance Receivables VI, LLC, Series 2019-1A Class A2, 2.63%, 6/20/2024 | 2,000,000 | 1,966,891 |
| e | BCC Funding XIV, LLC, Series 2018-1A Class A2, 2.96%, 6/20/2023 | 615,256 | 602,244 |
| e | CFG Investments Ltd., Series 2019-1 Class A, 5.56%, 8/15/2029 | 7,300,000 | 5,180,493 |
| e | Consumer Loan Underlying Bond CLUB Credit Trust, Series 2020-P1 Class B, 2.92%, 3/15/2028 | 1,500,000 | 1,117,857 |
| e | Consumer Loan Underlying Bond Credit Trust, Series 2019-A Class A, 3.52%, 4/15/2026 | 1,213,853 | 1,178,154 |
| | Diamond Resorts Owner Trust, | | |
| e | Series 2018-1 Class A, 3.70%, 1/21/2031 | 1,833,390 | 1,864,009 |
| e | Series 2019-1A Class A, 2.89%, 2/20/2032 | 5,079,023 | 5,095,173 |
| e,f | ECAF I Ltd., Series 2015-1A Class B1, 5.802%, 6/15/2040 | 5,133,991 | 4,059,760 |
| | Foundation Finance Trust, | | |
| e | Series 2017-1A Class A, 3.30%, 7/15/2033 | 1,388,230 | 1,360,960 |
| e | Series 2019-1A Class A, 3.86%, 11/15/2034 | 3,961,887 | 3,788,385 |
| e,f | Global SC Finance II SRL, Series 2014-1A Class A1, 3.19%, 7/17/2029 | 2,058,333 | 1,753,437 |
| e | HERO Funding Trust, Series 2017-2A Class A1, 3.28%, 9/20/2048 | 2,353,032 | 2,423,205 |
| e | Marlette Funding Trust, Series 2020-1A Class B, 2.38%, 3/15/2030 | 1,850,000 | 1,409,128 |
| d,e | Nationstar HECM Loan Trust, Series 2018-2A Class A, 3.188%, 7/25/2028 | 254,023 | 253,394 |
| a,d,e | Northwind Holdings, LLC, Series 2007-1A Class A1, 2.36% (LIBOR 3 Month + 0.78%), 12/1/2037 | 162,500 | 158,113 |
| e | Purchasing Power Funding, LLC, Series 2018-A Class A, 3.34%, 8/15/2022 | 3,000,000 | 2,999,992 |
| a,e | Scala Funding Co., LLC, Series 2016-1 Class B, 5.21%, 2/15/2021 | 4,000,000 | 3,868,000 |
| | SCF Equipment Leasing, LLC, | | |
| e | Series 2017-2A Class A, 3.41%, 12/20/2023 | 427,346 | 419,051 |
| e | Series 2018-1A Class A2, 3.63%, 10/20/2024 | 1,222,228 | 1,185,805 |
| e | Sierra Timeshare Receivables Funding, LLC, Series 2015-3A Class A, 2.58%, 9/20/2032 | 1,337,496 | 1,314,968 |
| | Sofi Consumer Loan Program, LLC, | | |
| e | Series 2016-3 Class A, 3.05%, 12/26/2025 | 415,067 | 407,350 |
| e | Series 2017-3 Class A, 2.77%, 5/25/2026 | 248,305 | 244,377 |
| e | SolarCity LMC Series I, LLC, Series 2013-1 Class A, 4.80%, 11/20/2038 | 2,030,673 | 1,878,248 |
| e | SolarCity LMC Series II, LLC, Series 2014-1 Class A, 4.59%, 4/20/2044 | 2,327,014 | 2,219,662 |
| e | SPS Servicer Advance Receivables Trust Advance Receivables Backed Notes, Series 2019-T2 Class AT2, 2.32%, 10/15/2052 | 5,242,000 | 5,062,204 |
| e,f | Textainer Marine Containers V Ltd., Series 2017-1A Class A, 3.72%, 5/20/2042 | 3,914,397 | 3,816,752 |
| e | Tidewater Auto Receivables Trust, Series 2018-AA Class E, 5.48%, 10/15/2026 | 1,000,000 | 1,006,802 |
| e | Westgate Resorts, LLC, Series 2016-1A Class A, 3.50%, 12/20/2028 | 590,479 | 570,842 |
| | | | 59,634,098 |
| | Student Loan — 1.5% | | |
| e | Commonbond Student Loan Trust, Series 18-CGS, Class A1, 3.87%, 2/25/2046 | 1,989,528 | 1,980,691 |
| | Earnest Student Loan Program, LLC, | | |
| d,e | Series 2016-B Class A1, 2.997% (LIBOR 1 Month + 2.05%), 2/26/2035 | 377,406 | 354,584 |
| e | Series 2016-C Class A2, 2.68%, 7/25/2035 | 821,594 | 804,412 |
| d,e | Navient Private Education Refinance Loan Trust, Series 2019-D Class A2B, 1.755% (LIBOR 1 Month + 1.05%), 12/15/2059 | 6,000,000 | 4,862,090 |
| | Nelnet Student Loan Trust, | | |
| d,e | Series 2015-2A Class A2, 1.547% (LIBOR 1 Month + 0.60%), 9/25/2047 | 3,408,293 | 3,097,637 |
| d,e | Series 2016-A Class A1A, 2.697% (LIBOR 1 Month + 1.75%), 12/26/2040 | 1,183,963 | 1,119,590 |
| | SLM Student Loan Trust, | | |
| d | Series 2008-2 Class A3, 2.544% (LIBOR 3 Month + 0.75%), 4/25/2023 | 892,598 | 827,577 |
| d | Series 2008-5 Class A4, 3.494% (LIBOR 3 Month + 1.70%), 7/25/2023 | 1,283,699 | 1,174,475 |
| d | Series 2011-2 Class A2, 2.147% (LIBOR 1 Month + 1.20%), 10/25/2034 | 5,000,000 | 4,811,497 |
| d | Series 2012-1 Class A3, 1.897% (LIBOR 1 Month + 0.95%), 9/25/2028 | 2,352,301 | 2,225,377 |
| d | Series 2013-6 Class A3, 1.597% (LIBOR 1 Month + 0.65%), 6/25/2055 | 2,677,553 | 2,450,109 |
| | | | 23,708,039 |
| | Total Asset Backed Securities(Cost $341,055,006) | | 324,246,210 |
| | Corporate Bonds — 52.8% | | |
| | Automobiles & Components — 2.6% | | |
42 | Thornburg Fixed Income Funds Semi-Annual Report
| See notes to financial statements. |
Schedule of Investments, Continued
Thornburg Strategic Income Fund | March 31, 2020 (Unaudited)
| | Issuer-Description | SHARES/
PRINCIPAL AMOUNT | VALUE |
| | Auto Components — 0.3% | | |
| e | LKQ European Holdings B.V., 4.125%, 4/1/2028 | $ 2,700,000 | $ 2,534,013 |
| e,f | Nexteer Automotive Group Ltd., 5.875%, 11/15/2021 | 2,000,000 | 2,002,111 |
| | Automobiles — 2.3% | | |
| d,e,f | BMW Finance N.V., 2.503% (LIBOR 3 Month + 0.79%), 8/12/2022 | 4,000,000 | 3,837,219 |
| | Daimler Finance North America, LLC, | | |
| e | 2.125%, 3/10/2025 | 7,500,000 | 6,901,095 |
| d,e | 2.592% (LIBOR 3 Month + 0.90%), 2/15/2022 | 5,500,000 | 5,097,802 |
| e | 3.75%, 11/5/2021 | 1,505,000 | 1,492,201 |
| | Hyundai Capital America, | | |
| e | 2.375%, 2/10/2023 | 6,747,000 | 6,361,012 |
| e | 2.85%, 11/1/2022 | 2,900,000 | 2,831,927 |
| e | 3.95%, 2/1/2022 | 2,000,000 | 2,015,748 |
| e,f | Hyundai Capital Services, Inc., 3.75%, 3/5/2023 | 3,000,000 | 3,084,930 |
| | Nissan Motor Acceptance Corp., | | |
| d,e | 2.065% (LIBOR 3 Month + 0.69%), 9/28/2022 | 460,000 | 427,822 |
| d,e | 2.498% (LIBOR 3 Month + 0.65%), 7/13/2022 | 440,000 | 422,383 |
| | Volkswagen Group of America Finance, LLC, | | |
| e | 2.50%, 9/24/2021 | 1,425,000 | 1,392,564 |
| e | 4.00%, 11/12/2021 | 2,500,000 | 2,473,097 |
| | | | 40,873,924 |
| | Banks — 0.6% | | |
| | Banks — 0.6% | | |
| d | Capital One NA/Mclean VA, 2.554% (LIBOR 3 Month + 0.82%), 8/8/2022 | 3,000,000 | 2,935,623 |
| d | Citizens Bank N.A./Providence RI, 2.325% (LIBOR 3 Month + 0.95%), 3/29/2023 | 4,000,000 | 3,825,709 |
| d | Goldman Sachs Bank USA, 0.995% (SOFR + 0.60%), 5/24/2021 | 1,488,000 | 1,447,306 |
| | Santander Holdings USA, Inc., 3.40%, 1/18/2023 | 2,000,000 | 1,975,850 |
| | | | 10,184,488 |
| | Capital Goods — 2.3% | | |
| | Aerospace & Defense — 0.9% | | |
| e | BWX Technologies, Inc., 5.375%, 7/15/2026 | 6,805,000 | 6,532,800 |
| e | TransDigm, Inc., 6.25%, 3/15/2026 | 7,324,000 | 7,296,535 |
| | Industrial Conglomerates — 0.2% | | |
| f | Pentair Finance Sarl, 4.50%, 7/1/2029 | 1,950,000 | 2,050,503 |
| | Textron, Inc., 3.00%, 6/1/2030 | 1,831,000 | 1,711,623 |
| | Machinery — 1.0% | | |
| e,f | ATS Automation Tooling Systems, Inc., 6.50%, 6/15/2023 | 8,090,000 | 7,867,525 |
| | Mueller Industries, Inc., 6.00%, 3/1/2027 | 2,216,000 | 1,999,940 |
| | Nvent Finance Sarl, | | |
| f | 3.95%, 4/15/2023 | 2,000,000 | 2,078,866 |
| f | 4.55%, 4/15/2028 | 3,000,000 | 3,342,941 |
| | Trading Companies & Distributors — 0.2% | | |
| e | IAA, Inc., 5.50%, 6/15/2027 | 1,605,000 | 1,552,837 |
| e | Performance Food Group, Inc., 5.50%, 10/15/2027 | 1,428,000 | 1,324,470 |
| | | | 35,758,040 |
| | Commercial & Professional Services — 2.3% | | |
| | Commercial Services & Supplies — 2.3% | | |
| e | ACCO Brands Corp., 5.25%, 12/15/2024 | 1,835,000 | 1,761,600 |
| e,f | Cimpress plc, 7.00%, 6/15/2026 | 9,141,000 | 8,044,080 |
| e | Nielsen Finance, LLC / Nielsen Finance Co., 5.00%, 4/15/2022 | 15,476,000 | 14,266,086 |
| e | ServiceMaster Co., LLC, 5.125%, 11/15/2024 | 11,329,000 | 11,187,388 |
| | | | 35,259,154 |
| | Consumer Durables & Apparel — 0.7% | | |
| | Household Durables — 0.2% | | |
| e,f | Panasonic Corp., 2.536%, 7/19/2022 | 2,790,000 | 2,739,662 |
| | Leisure Products — 0.2% | | |
| | Vista Outdoor, Inc., 5.875%, 10/1/2023 | 4,537,000 | 3,753,505 |
| | Textiles, Apparel & Luxury Goods — 0.3% | | |
See notes to financial statements.
| Thornburg Fixed Income Funds Semi-Annual Report | 43 |
Schedule of Investments, Continued
Thornburg Strategic Income Fund | March 31, 2020 (Unaudited)
| | Issuer-Description | SHARES/
PRINCIPAL AMOUNT | VALUE |
| | Under Armour, Inc., 3.25%, 6/15/2026 | $ 5,655,000 | $ 4,793,667 |
| | | | 11,286,834 |
| | Consumer Services — 1.2% | | |
| | Hotels, Restaurants & Leisure — 0.9% | | |
| | Aramark Services, Inc., | | |
| | 4.75%, 6/1/2026 | 5,211,000 | 4,910,326 |
| e | 5.00%, 2/1/2028 | 6,221,000 | 5,789,387 |
| e | Nathan’s Famous, Inc., 6.625%, 11/1/2025 | 4,670,000 | 4,343,100 |
| | Transportation Infrastructure — 0.3% | | |
| e,f | Adani Ports & Special Economic Zone Ltd., 3.375%, 7/24/2024 | 5,135,000 | 4,387,940 |
| | | | 19,430,753 |
| | Diversified Financials — 7.0% | | |
| | Capital Markets — 1.9% | | |
| | Ares Capital Corp., | | |
| | 3.25%, 7/15/2025 | 5,320,000 | 4,222,264 |
| | 4.20%, 6/10/2024 | 690,000 | 611,652 |
| | 4.25%, 3/1/2025 | 350,000 | 300,787 |
| e | Ares Finance Co., LLC, 4.00%, 10/8/2024 | 4,160,000 | 4,110,017 |
| e | Compass Group Diversified Holdings, LLC, 8.00%, 5/1/2026 | 2,849,000 | 2,735,040 |
| f | Genpact Luxembourg Sarl, 3.375%, 12/1/2024 | 6,586,000 | 6,613,049 |
| a,e | JPR Royalty Sub, LLC, 14.00%, 9/1/2020 | 2,000,000 | 200,000 |
| f | Nomura Holdings, Inc., 2.648%, 1/16/2025 | 1,000,000 | 978,444 |
| | Solar Capital Ltd., 4.50%, 1/20/2023 | 3,000,000 | 3,008,324 |
| | TPG Specialty Lending, Inc., 3.875%, 11/1/2024 | 7,310,000 | 6,448,487 |
| | Consumer Finance — 0.5% | | |
| e | FirstCash, Inc., 5.375%, 6/1/2024 | 7,500,000 | 7,181,250 |
| | Diversified Financial Services — 3.8% | | |
| e | Antares Holdings L.P., 6.00%, 8/15/2023 | 4,435,000 | 4,568,061 |
| | Bank of America Corp. MTN, 4.20%, 8/26/2024 | 3,200,000 | 3,403,567 |
| d,f | Barclays plc, 3.072% (LIBOR 3 Month + 1.38%), 5/16/2024 | 2,500,000 | 2,201,514 |
| e,f | BNP Paribas S.A., 3.375%, 1/9/2025 | 5,000,000 | 4,956,102 |
| f | Credit Suisse Group Funding Guernsey Ltd. (Guaranty: Credit Suisse Group AG), 3.80%, 6/9/2023 | 400,000 | 404,359 |
| | Deutsche Bank AG, | | |
| d,f | 2.617% (LIBOR 3 Month + 0.82%), 1/22/2021 | 1,350,000 | 1,300,626 |
| d,f | 2.868% (LIBOR 3 Month + 1.23%), 2/27/2023 | 2,800,000 | 2,294,210 |
| f | 5.00%, 2/14/2022 | 3,500,000 | 3,460,232 |
| d | Goldman Sachs Group, Inc., 2.904% (LIBOR 3 Month + 1.11%), 4/26/2022 | 4,000,000 | 3,890,920 |
| | HSBC Holdings plc, | | |
| d,f | 3.803% (LIBOR 3 Month + 1.21%), 3/11/2025 | 1,000,000 | 1,028,534 |
| d,f | 4.292% (LIBOR 3 Month + 1.35%), 9/12/2026 | 2,000,000 | 1,995,704 |
| | Mizuho Financial Group, Inc., | | |
| d,f | 2.226% (LIBOR 3 Month + 0.83%), 5/25/2026 | 1,000,000 | 979,859 |
| d,f | 2.309% (LIBOR 3 Month + 0.63%), 5/25/2024 | 4,000,000 | 3,633,600 |
| d,f | 3.922% (LIBOR 3 Month + 1.00%), 9/11/2024 | 3,150,000 | 3,270,900 |
| | Morgan Stanley, | | |
| d | 1.613% (SOFR + 0.70%), 1/20/2023 | 3,500,000 | 3,257,999 |
| d | 2.732% (LIBOR 3 Month + 0.93%), 7/22/2022 | 3,000,000 | 2,918,976 |
| d | Morgan Stanley MTN, 3.219% (LIBOR 3 Month + 1.40%), 4/21/2021 | 3,000,000 | 2,979,074 |
| | Royal Bank of Scotland Group plc, | | |
| d,f | 3.162% (LIBOR 3 Month + 1.47%), 5/15/2023 | 1,398,000 | 1,327,702 |
| f | 6.125%, 12/15/2022 | 2,000,000 | 2,065,895 |
| | Societe Generale S.A., | | |
| e,f | 2.625%, 1/22/2025 | 3,000,000 | 2,888,045 |
| e,f | 3.875%, 3/28/2024 | 2,000,000 | 2,020,980 |
| e,f | 4.25%, 9/14/2023 | 3,000,000 | 3,065,627 |
| d,e,f | UBS Group Funding Switzerland AG (Guaranty: UBS Group AG), 2.642% (LIBOR 3 Month + 0.95%), 8/15/2023 | 2,000,000 | 1,860,668 |
| | Insurance — 0.7% | | |
| e | AIG Global Funding, 2.30%, 7/1/2022 | 4,000,000 | 3,981,111 |
| e | Global Atlantic Fin Co., 4.40%, 10/15/2029 | 7,275,000 | 6,389,601 |
| | Mortgage Real Estate Investment Trusts — 0.1% | | |
44 | Thornburg Fixed Income Funds Semi-Annual Report
| See notes to financial statements. |
Schedule of Investments, Continued
Thornburg Strategic Income Fund | March 31, 2020 (Unaudited)
| | Issuer-Description | SHARES/
PRINCIPAL AMOUNT | VALUE |
| | Senior Housing Properties Trust, 4.75%, 2/15/2028 | $ 2,485,000 | $ 2,218,627 |
| | | | 108,771,807 |
| | Energy — 5.9% | | |
| | Energy Equipment & Services — 0.6% | | |
| e | Enviva Partners L.P. / Enviva Partners Finance Corp., 6.50%, 1/15/2026 | 5,385,000 | 5,250,375 |
| e | Hanwha Energy USA Holdings Corp., 2.375%, 7/30/2022 | 2,500,000 | 2,483,489 |
| | Odebrecht Offshore Drilling Finance Ltd., | | |
| e,f | 6.72%, 12/1/2022 | 446,660 | 357,328 |
| e,f,g | 7.72%, 12/1/2026 PIK | 2,204,386 | 220,439 |
| c,e,f | Odebrecht Oil & Gas Finance Ltd. (Guaranty: Odebrecht Oleo e Gas S.A.), Zero Coupon, 12/31/2099 | 304,899 | 2,592 |
| b,e,f,h | Schahin II Finance Co. SPV Ltd., 5.875%, 9/25/2023 | 10,684,600 | 667,787 |
| | Oil, Gas & Consumable Fuels — 5.3% | | |
| | Boardwalk Pipelines L.P., 4.80%, 5/3/2029 | 3,920,000 | 2,953,661 |
| e | Citgo Holding, Inc., 9.25%, 8/1/2024 | 7,723,000 | 6,294,245 |
| e | Colorado Interstate Gas Co., LLC / Colorado Interstate Issuing Corp., 4.15%, 8/15/2026 | 725,000 | 703,848 |
| d | Energy Transfer Operating L.P., 4.781% (LIBOR 3 Month + 3.02%), 11/1/2066 | 1,200,000 | 537,000 |
| | Enterprise Products Operating, LLC, 3.125%, 7/31/2029 | 3,188,000 | 2,932,398 |
| | EQM Midstream Partners L.P., Series 5Y, 4.75%, 7/15/2023 | 3,475,000 | 2,514,857 |
| e | Florida Gas Transmission Co., LLC, 3.875%, 7/15/2022 | 4,765,000 | 4,870,644 |
| | Gulf South Pipeline Co. L.P., 4.00%, 6/15/2022 | 4,860,000 | 4,636,712 |
| e | Gulfstream Natural Gas System, LLC, 4.60%, 9/15/2025 | 5,000,000 | 5,193,097 |
| e,f | Harvest Operations Corp. (Guaranty: Korea National Oil Corp.), 3.00%, 9/21/2022 | 4,000,000 | 4,139,360 |
| a,b,e,h | Linc USA GP / Linc Energy Finance USA, Inc., 9.625%, 10/31/2017 | 1,021,371 | 20,427 |
| | Midwest Connector Capital Co., LLC, | | |
| e | 3.625%, 4/1/2022 | 1,310,000 | 1,258,743 |
| e | 3.90%, 4/1/2024 | 3,315,000 | 3,094,613 |
| | Murphy Oil USA, Inc., 4.75%, 9/15/2029 | 1,945,000 | 1,823,438 |
| | Northern Border Pipeline Co., Series A, 7.50%, 9/15/2021 | 2,150,000 | �� 2,142,887 |
| | Occidental Petroleum Corp., | | |
| d | 2.957% (LIBOR 3 Month + 1.25%), 8/13/2021 | 900,000 | 675,073 |
| d | 3.142% (LIBOR 3 Month + 1.45%), 8/15/2022 | 3,500,000 | 2,345,548 |
| | ONEOK, Inc., | | |
| | 3.10%, 3/15/2030 | 3,543,000 | 2,659,059 |
| | 3.40%, 9/1/2029 | 963,000 | 718,856 |
| e | Par Petroleum, LLC / Par Petroleum Finance Corp., 7.75%, 12/15/2025 | 451,000 | 283,003 |
| | Parkland Fuel Corp., | | |
| e,f | 5.875%, 7/15/2027 | 3,726,000 | 3,492,752 |
| e,f | 6.00%, 4/1/2026 | 450,000 | 418,500 |
| e,f | Petroleos Mexicanos, 5.95%, 1/28/2031 | 8,410,000 | 5,832,503 |
| | Plains All American Pipeline L.P. / PAA Finance Corp., 3.55%, 12/15/2029 | 6,795,000 | 4,637,561 |
| b,h | RAAM Global Energy Co., 12.50%, 10/1/2015 | 2,000,000 | 9,600 |
| a,e,f,g | Schahin II Finance Co. SPV Ltd., 8.00%, 5/25/2020 PIK | 649,297 | 768,768 |
| e,f | Sinopec Group Overseas Development Ltd., 4.125%, 9/12/2025 | 6,000,000 | 6,535,117 |
| | Summit Midstream Holdings, LLC / Summit Midstream Finance Corp., 5.50%, 8/15/2022 | 1,210,000 | 217,800 |
| c,d | Summit Midstream Partners L.P., Series A, 9.50% (LIBOR 3 Month + 7.43%), 12/15/2022 | 3,550,000 | 51,014 |
| | Sunoco L.P. / Sunoco Finance Corp., | | |
| | 4.875%, 1/15/2023 | 2,920,000 | 2,788,600 |
| | 5.50%, 2/15/2026 | 1,804,000 | 1,560,965 |
| | 6.00%, 4/15/2027 | 5,315,000 | 4,570,900 |
| | Tennessee Gas Pipeline Co., LLC, 7.00%, 3/15/2027 | 2,251,000 | 2,519,063 |
| | | | 92,182,622 |
| | Food & Staples Retailing — 0.4% | | |
| | Food & Staples Retailing — 0.4% | | |
| e,f | Alimentation Couche-Tard, Inc., 2.70%, 7/26/2022 | 4,000,000 | 3,954,235 |
| e | KeHE Distributors, LLC / KeHE Finance Corp, 8.625%, 10/15/2026 | 2,097,000 | 2,107,485 |
| | | | 6,061,720 |
| | Food, Beverage & Tobacco — 2.3% | | |
| | Beverages — 0.3% | | |
| e,f | Central American Bottling Corp., 5.75%, 1/31/2027 | 2,593,000 | 2,229,980 |
| e,f | Coca-Cola Icecek A/S, 4.215%, 9/19/2024 | 3,000,000 | 2,685,000 |
See notes to financial statements.
| Thornburg Fixed Income Funds Semi-Annual Report | 45 |
Schedule of Investments, Continued
Thornburg Strategic Income Fund | March 31, 2020 (Unaudited)
| | Issuer-Description | SHARES/
PRINCIPAL AMOUNT | VALUE |
| | Food Products — 1.2% | | |
| e,f | Barry Callebaut Services N.V., 5.50%, 6/15/2023 | $ 4,000,000 | $ 4,290,000 |
| d | General Mills, Inc., 2.846% (LIBOR 3 Month + 1.01%), 10/17/2023 | 3,500,000 | 3,383,328 |
| e | Lamb Weston Holdings, Inc., 4.625%, 11/1/2024 | 2,500,000 | 2,462,500 |
| e | Post Holdings, Inc., 4.625%, 4/15/2030 | 8,247,000 | 7,896,502 |
| | Tobacco — 0.8% | | |
| | Altria Group, Inc., 4.40%, 2/14/2026 | 1,000,000 | 1,052,331 |
| d | BAT Capital Corp., 2.294% (LIBOR 3 Month + 0.59%), 8/14/2020 | 950,000 | 934,413 |
| e,f | Imperial Brands Finance plc, 3.50%, 7/26/2026 | 2,000,000 | 1,845,939 |
| | Vector Group Ltd., | | |
| e | 6.125%, 2/1/2025 | 2,194,000 | 1,996,540 |
| e | 10.50%, 11/1/2026 | 8,195,000 | 6,842,825 |
| | | | 35,619,358 |
| | Health Care Equipment & Services — 1.7% | | |
| | Health Care Equipment & Supplies — 0.2% | | |
| | Zimmer Biomet Holdings, Inc., 3.55%, 3/20/2030 | 2,800,000 | 2,789,478 |
| | Health Care Providers & Services — 1.5% | | |
| | Centene Corp., | | |
| e | 4.625%, 12/15/2029 | 815,000 | 819,075 |
| e | 5.375%, 6/1/2026 - 8/15/2026 | 5,545,000 | 5,701,850 |
| | DaVita, Inc., | | |
| | 5.00%, 5/1/2025 | 5,707,000 | 5,699,524 |
| | 5.125%, 7/15/2024 | 1,972,000 | 1,966,084 |
| | Tenet Healthcare Corp., | | |
| | 4.625%, 7/15/2024 | 3,671,000 | 3,505,805 |
| e | 4.875%, 1/1/2026 | 4,671,000 | 4,449,127 |
| e | 5.125%, 11/1/2027 | 1,153,000 | 1,098,233 |
| | | | 26,029,176 |
| | Household & Personal Products — 1.1% | | |
| | Household Products — 1.1% | | |
| | Central Garden & Pet Co., 5.125%, 2/1/2028 | 4,475,000 | 4,139,375 |
| | Prestige Brands, Inc., | | |
| e | 5.125%, 1/15/2028 | 1,530,000 | 1,515,159 |
| e | 6.375%, 3/1/2024 | 3,256,000 | 3,337,400 |
| | Spectrum Brands, Inc., | | |
| | 5.75%, 7/15/2025 | 7,795,000 | 7,288,325 |
| | 6.125%, 12/15/2024 | 936,000 | 893,880 |
| | | | 17,174,139 |
| | Insurance — 2.6% | | |
| | Insurance — 2.6% | | |
| e,f | DaVinciRe Holdings Ltd., 4.75%, 5/1/2025 | 4,790,000 | 4,820,060 |
| | Enstar Group Ltd., | | |
| f | 4.50%, 3/10/2022 | 2,000,000 | 1,994,855 |
| f | 4.95%, 6/1/2029 | 5,835,000 | 5,495,525 |
| f | Fairfax Financial Holdings Ltd., 4.85%, 4/17/2028 | 3,000,000 | 3,251,820 |
| | Infinity Property & Casualty Corp., 5.00%, 9/19/2022 | 1,826,000 | 1,777,379 |
| e,f | Lancashire Holdings Ltd., 5.70%, 10/1/2022 | 4,900,000 | 5,264,075 |
| | Mercury General Corp., 4.40%, 3/15/2027 | 2,438,000 | 2,641,827 |
| d,e | Metropolitan Life Global Funding, 0.58% (SOFR + 0.57%), 9/7/2020 | 1,940,000 | 1,919,217 |
| e | Protective Life Corp., 3.40%, 1/15/2030 | 4,902,000 | 4,590,970 |
| | Reliance Standard Life Global Funding II, | | |
| e | 2.75%, 1/21/2027 | 3,520,000 | 3,271,941 |
| e | 3.85%, 9/19/2023 | 3,000,000 | 3,225,654 |
| e | Sammons Financial Group, Inc., 4.45%, 5/12/2027 | 2,000,000 | 2,089,510 |
| | | | 40,342,833 |
| | Materials — 4.6% | | |
| | Chemicals — 1.5% | | |
| d,e | Albemarle Corp., 2.742% (LIBOR 3 Month + 1.05%), 11/15/2022 | 2,500,000 | 2,380,594 |
| e,f | Consolidated Energy Finance S.A., 6.875%, 6/15/2025 | 500,000 | 432,500 |
46 | Thornburg Fixed Income Funds Semi-Annual Report
| See notes to financial statements. |
Schedule of Investments, Continued
Thornburg Strategic Income Fund | March 31, 2020 (Unaudited)
| | Issuer-Description | SHARES/
PRINCIPAL AMOUNT | VALUE |
| | NOVA Chemicals Corp., | | |
| e,f | 4.875%, 6/1/2024 | $ 4,465,000 | $ 3,918,038 |
| e,f | 5.25%, 6/1/2027 | 5,283,000 | 4,450,927 |
| f | 5.25%, 6/1/2027 | 350,000 | 294,875 |
| e,f | Nufarm Australia Ltd. / Nufarm Americas, Inc., 5.75%, 4/30/2026 | 5,713,000 | 4,941,745 |
| e,f | OCP S.A., 5.625%, 4/25/2024 | 4,710,000 | 4,668,787 |
| | Valvoline, Inc., 4.375%, 8/15/2025 | 2,920,000 | 2,781,300 |
| | Containers & Packaging — 1.6% | | |
| | Ball Corp., 5.00%, 3/15/2022 | 1,373,000 | 1,386,730 |
| | Graphic Packaging International, LLC, | | |
| e | 3.50%, 3/15/2028 | 7,233,000 | 6,507,530 |
| | 4.75%, 4/15/2021 | 7,560,000 | 7,467,768 |
| e | Matthews International Corp., 5.25%, 12/1/2025 | 3,513,000 | 3,109,075 |
| | Sealed Air Corp., | | |
| e | 4.00%, 12/1/2027 | 4,420,000 | 4,111,042 |
| e | 4.875%, 12/1/2022 | 285,000 | 285,356 |
| e | 5.50%, 9/15/2025 | 2,193,000 | 2,220,435 |
| | Metals & Mining — 0.5% | | |
| e | Cleveland-Cliffs, Inc., 6.75%, 3/15/2026 | 6,430,000 | 5,722,700 |
| e | Compass Minerals International, Inc., 6.75%, 12/1/2027 | 2,144,000 | 1,935,496 |
| | Paper & Forest Products — 1.0% | | |
| e | Neenah, Inc., 5.25%, 5/15/2021 | 15,010,000 | 14,634,750 |
| | | | 71,249,648 |
| | Media & Entertainment — 2.1% | | |
| | Interactive Media & Services — 0.1% | | |
| f | Baidu, Inc., 3.875%, 9/29/2023 | 2,000,000 | 2,067,155 |
| | Media — 2.0% | | |
| | CCO Holdings, LLC / CCO Holdings Capital Corp., | | |
| e | 4.50%, 8/15/2030 - 5/1/2032 | 2,700,000 | 2,641,646 |
| e | 4.75%, 3/1/2030 | 2,930,000 | 2,915,350 |
| e | 5.375%, 6/1/2029 | 2,707,000 | 2,781,713 |
| e | CSC Holdings LLC, 6.50%, 2/1/2029 | 1,000,000 | 1,078,490 |
| | CSC Holdings, LLC, | | |
| e | 5.375%, 2/1/2028 | 2,000,000 | 2,040,000 |
| e | 5.50%, 4/15/2027 | 1,825,000 | 1,888,693 |
| a,e,g | Mood Media Borrower, LLC / Mood Media Co-Issuer, Inc., 16.213%, 12/31/2023 PIK | 3,629,396 | 2,261,114 |
| e | Salem Media Group, Inc., 6.75%, 6/1/2024 | 1,585,000 | 1,315,550 |
| e | Sirius XM Radio, Inc., 3.875%, 8/1/2022 | 10,294,000 | 10,255,397 |
| e,f | Telenet Finance Luxembourg Notes Sarl, 5.50%, 3/1/2028 | 4,000,000 | 3,720,000 |
| | | | 32,965,108 |
| | Pharmaceuticals, Biotechnology & Life Sciences — 0.4% | | |
| | Pharmaceuticals — 0.4% | | |
| e | AbbVie, Inc., 2.95%, 11/21/2026 | 3,870,000 | 3,887,751 |
| a,b,h | Atlas U.S. Royalty, LLC Participation Rights, Zero Coupon, 3/15/2027 | 5,450,000 | 0 |
| e | Bayer US Finance II, LLC, 4.25%, 12/15/2025 | 2,500,000 | 2,596,660 |
| | | | 6,484,411 |
| | Real Estate — 1.6% | | |
| | Equity Real Estate Investment Trusts — 1.6% | | |
| | American Tower Corp., | | |
| | 2.40%, 3/15/2025 | 4,560,000 | 4,476,831 |
| | 3.375%, 5/15/2024 | 3,000,000 | 3,006,286 |
| | CoreCivic, Inc., 4.75%, 10/15/2027 | 4,917,000 | 3,687,750 |
| | GEO Group, Inc., 6.00%, 4/15/2026 | 4,625,000 | 3,003,359 |
| | Retail Opportunity Investments Partnership L.P. (Guaranty: Retail Opportunity Investments Corp.), 5.00%, 12/15/2023 | 1,500,000 | 1,583,719 |
| e | SBA Tower Trust, 2.877%, 7/15/2046 | 2,275,000 | 2,267,199 |
| | Service Properties Trust, | | |
| | 4.35%, 10/1/2024 | 2,295,000 | 1,684,636 |
| | 4.50%, 6/15/2023 | 1,290,000 | 969,025 |
| | 4.65%, 3/15/2024 | 900,000 | 659,126 |
| | 4.95%, 2/15/2027 | 2,850,000 | 2,159,684 |
See notes to financial statements.
| Thornburg Fixed Income Funds Semi-Annual Report | 47 |
Schedule of Investments, Continued
Thornburg Strategic Income Fund | March 31, 2020 (Unaudited)
| | Issuer-Description | SHARES/
PRINCIPAL AMOUNT | VALUE |
| | 5.00%, 8/15/2022 | $ 829,000 | $ 593,258 |
| | 5.25%, 2/15/2026 | 700,000 | 501,371 |
| | | | 24,592,244 |
| | Retailing — 0.7% | | |
| | Internet & Direct Marketing Retail — 0.3% | | |
| | Booking Holdings, Inc., 2.75%, 3/15/2023 | 2,000,000 | 1,961,356 |
| | eBay, Inc., 1.90%, 3/11/2025 | 3,213,000 | 3,034,368 |
| | Multiline Retail — 0.1% | | |
| d | Dollar Tree, Inc., 2.536% (LIBOR 3 Month + 0.70%), 4/17/2020 | 1,532,000 | 1,531,674 |
| | Specialty Retail — 0.3% | | |
| e | Michaels Stores, Inc., 8.00%, 7/15/2027 | 5,230,000 | 3,870,200 |
| | | | 10,397,598 |
| | Semiconductors & Semiconductor Equipment — 0.8% | | |
| | Semiconductors & Semiconductor Equipment — 0.8% | | |
| | Broadcom Corp. / Broadcom Cayman Finance Ltd., 3.625%, 1/15/2024 | 2,000,000 | 1,964,563 |
| | Broadcom, Inc., | | |
| e | 3.625%, 10/15/2024 | 2,965,000 | 2,917,718 |
| e | 4.75%, 4/15/2029 | 1,865,000 | 1,891,768 |
| | Micron Technology, Inc., | | |
| | 4.663%, 2/15/2030 | 3,314,000 | 3,461,225 |
| | 5.327%, 2/6/2029 | 2,031,000 | 2,218,200 |
| | | | 12,453,474 |
| | Software & Services — 3.2% | | |
| | Information Technology Services — 0.8% | | |
| e | Alliance Data Systems Corp., 4.75%, 12/15/2024 | 9,334,000 | 7,093,840 |
| e | Science Applications International Corp., 4.875%, 4/1/2028 | 913,000 | 876,480 |
| e | Vericast Corp., 8.375%, 8/15/2022 | 1,955,000 | 1,507,794 |
| | Western Union Co., 2.85%, 1/10/2025 | 2,338,000 | 2,326,642 |
| | Interactive Media & Services — 0.1% | | |
| f | Baidu, Inc., 4.375%, 5/14/2024 | 1,424,000 | 1,504,086 |
| | Internet Software & Services — 0.2% | | |
| e | Twitter, Inc., 3.875%, 12/15/2027 | 3,625,000 | 3,486,797 |
| | Software — 2.1% | | |
| | CDK Global, Inc., | | |
| e | 5.25%, 5/15/2029 | 460,000 | 469,200 |
| | 5.875%, 6/15/2026 | 2,000,000 | 2,113,000 |
| | Citrix Systems, Inc., 4.50%, 12/1/2027 | 7,926,000 | 8,182,697 |
| | Fair Isaac Corp., | | |
| e | 4.00%, 6/15/2028 | 595,000 | 563,762 |
| e | 5.25%, 5/15/2026 | 2,460,000 | 2,435,400 |
| e | MSCI, Inc., 3.625%, 9/1/2030 | 235,000 | 222,956 |
| | Open Text Corp., | | |
| e,f | 3.875%, 2/15/2028 | 4,995,000 | 4,695,300 |
| e,f | 5.875%, 6/1/2026 | 5,187,000 | 5,440,644 |
| e | PTC, Inc., 3.625%, 2/15/2025 | 1,365,000 | 1,276,275 |
| e | Solera, LLC / Solera Finance, Inc., 10.50%, 3/1/2024 | 5,106,000 | 5,003,880 |
| | VMware, Inc., 2.30%, 8/21/2020 | 2,000,000 | 1,978,685 |
| | | | 49,177,438 |
| | Technology Hardware & Equipment — 2.8% | | |
| | Communications Equipment — 1.0% | | |
| | Anixter, Inc. (Guaranty: Anixter International, Inc.), | | |
| | 5.125%, 10/1/2021 | 6,395,000 | 6,363,025 |
| | 6.00%, 12/1/2025 | 3,575,000 | 3,499,031 |
| | Motorola Solutions, Inc., 4.60%, 2/23/2028 - 5/23/2029 | 2,228,000 | 2,253,201 |
| f | Nokia OYJ, 3.375%, 6/12/2022 | 3,583,000 | 3,567,457 |
| | Electronic Equipment, Instruments & Components — 1.3% | | |
| f | Allegion plc, 3.50%, 10/1/2029 | 1,420,000 | 1,375,523 |
| | Ingram Micro, Inc., 5.45%, 12/15/2024 | 1,951,000 | 1,592,883 |
48 | Thornburg Fixed Income Funds Semi-Annual Report
| See notes to financial statements. |
Schedule of Investments, Continued
Thornburg Strategic Income Fund | March 31, 2020 (Unaudited)
| | Issuer-Description | SHARES/
PRINCIPAL AMOUNT | VALUE |
| | PerkinElmer, Inc., 3.30%, 9/15/2029 | $ 3,040,000 | $ 2,851,967 |
| e,f | Sensata Technologies B.V., 4.875%, 10/15/2023 | 3,358,000 | 3,190,100 |
| e | Sensata Technologies, Inc.,Co., 4.375%, 2/15/2030 | 5,745,000 | 5,170,500 |
| | Trimble, Inc., 4.75%, 12/1/2024 | 6,525,000 | 6,855,638 |
| | Office Electronics — 0.5% | | |
| | CDW, LLC / CDW Finance Corp., 4.25%, 4/1/2028 | 930,000 | 934,650 |
| | Xerox Corp., 4.50%, 5/15/2021 | 6,681,000 | 6,588,802 |
| | | | 44,242,777 |
| | Telecommunication Services — 2.8% | | |
| | Diversified Telecommunication Services — 1.5% | | |
| d | AT&T, Inc., 1.964% (LIBOR 3 Month + 1.18%), 6/12/2024 | 3,750,000 | 3,482,632 |
| e,f | Digicel Ltd., 6.00%, 4/15/2021 | 5,750,000 | 3,097,870 |
| e | GTT Communications, Inc., 7.875%, 12/31/2024 | 3,860,000 | 2,489,700 |
| | Qwest Corp., 6.75%, 12/1/2021 | 3,700,000 | 3,834,310 |
| | Videotron Ltd., | | |
| e,f | 5.125%, 4/15/2027 | 2,400,000 | 2,400,000 |
| e,f | 5.375%, 6/15/2024 | 6,000,000 | 6,028,200 |
| e,f | Virgin Media Secured Finance plc, 5.50%, 5/15/2029 | 1,800,000 | 1,793,520 |
| | Wireless Telecommunication Services — 1.3% | | |
| | America Movil SAB de C.V., 6.45%, 12/5/2022 | 45,000,000 | 1,775,359 |
| e,f | Digicel International Finance Ltd., 8.75%, 5/25/2024 | 500,000 | 447,500 |
| e,f | MTN Mauritius Investment Ltd., 4.755%, 11/11/2024 | 4,125,000 | 3,630,000 |
| e,f | SK Telecom Co. Ltd., 3.75%, 4/16/2023 | 3,000,000 | 3,166,170 |
| | Sprint Communications, Inc., 9.25%, 4/15/2022 | 11,516,000 | 12,322,120 |
| | | | 44,467,381 |
| | Transportation — 0.8% | | |
| | Airlines — 0.8% | | |
| | American Airlines Pass Through Trust, | | |
| | Series 2013-2 Class A, 4.95%, 7/15/2024 | 2,418,055 | 2,457,398 |
| e | Series 2013-2 Class B, 5.60%, 7/15/2022 | 5,132,924 | 5,094,427 |
| | Continental Airlines Pass Through Trust, Series 2005-ERJ1, 9.798%, 10/1/2022 | 567,448 | 565,990 |
| | US Airways Pass Through Trust, | | |
| | Series 2010-1 Class A, 6.25%, 10/22/2024 | 902,494 | 928,726 |
| | Series 2012-1 Class A, 5.90%, 4/1/2026 | 1,170,042 | 1,179,027 |
| | Series 2013-1 Class B, 5.375%, 5/15/2023 | 2,010,687 | 1,919,566 |
| | US Airways Pass Through Trust, (MBIA Insurance Corp), Series 2001-1G, 7.076%, 9/20/2022 | 351,219 | 352,423 |
| | | | 12,497,557 |
| | Utilities — 2.3% | | |
| | Electric Utilities — 2.0% | | |
| | Avangrid, Inc., | | |
| | 3.15%, 12/1/2024 | 300,000 | 298,369 |
| | 3.80%, 6/1/2029 | 1,004,000 | 1,026,605 |
| | CenterPoint Energy, Inc., 3.60%, 11/1/2021 | 3,000,000 | 2,993,825 |
| e,f | Colbun S.A., 3.15%, 3/6/2030 | 2,800,000 | 2,436,000 |
| e | Duquesne Light Holdings, Inc., 6.40%, 9/15/2020 | 2,000,000 | 2,042,857 |
| e,f | Enel Finance International N.V., 4.625%, 9/14/2025 | 4,057,000 | 4,307,745 |
| | Entergy Texas, Inc., 3.45%, 12/1/2027 | 3,000,000 | 2,931,066 |
| | Evergy, Inc., 2.45%, 9/15/2024 | 1,970,000 | 1,932,561 |
| e | Jersey Central Power & Light Co., 4.30%, 1/15/2026 | 3,013,000 | 3,256,224 |
| e | Midland Cogeneration Venture L.P., 6.00%, 3/15/2025 | 1,051,912 | 1,053,046 |
| | PNM Resources, Inc., 3.25%, 3/9/2021 | 2,835,000 | 2,852,942 |
| | Puget Energy, Inc., 6.50%, 12/15/2020 | 2,000,000 | 2,042,118 |
| | Southern Co., 3.25%, 7/1/2026 | 3,500,000 | 3,484,640 |
| | Gas Utilities — 0.3% | | |
| e,f | Rockpoint Gas Storage Canada Ltd., 7.00%, 3/31/2023 | 6,587,000 | 4,792,108 |
| | | | 35,450,106 |
| | Total Corporate Bonds(Cost $886,530,805) | | 822,952,590 |
| | Convertible Bonds — 1.6% | | |
See notes to financial statements.
| Thornburg Fixed Income Funds Semi-Annual Report | 49 |
Schedule of Investments, Continued
Thornburg Strategic Income Fund | March 31, 2020 (Unaudited)
| | Issuer-Description | SHARES/
PRINCIPAL AMOUNT | VALUE |
| | Diversified Financials — 0.7% | | |
| | Consumer Finance — 0.7% | | |
| | EZCORP, Inc., 2.375%, 5/1/2025 | $13,431,000 | $ 9,942,260 |
| | Diversified Financial Services — 0.0% | | |
| | EZCORP, Inc., 2.875%, 7/1/2024 | 215,000 | 166,814 |
| | | | 10,109,074 |
| | Food, Beverage & Tobacco — 0.1% | | |
| | Tobacco — 0.1% | | |
| d | Vector Group Ltd., 1.75%, 4/15/2020 | 2,260,000 | 2,255,480 |
| | | | 2,255,480 |
| | Health Care Equipment & Services — 0.0% | | |
| | Health Care Providers & Services — 0.0% | | |
| f | NMC Health Jersey Ltd., 1.875%, 4/30/2025 | 3,800,000 | 247,000 |
| | | | 247,000 |
| | Media & Entertainment — 0.7% | | |
| | Media — 0.7% | | |
| | Comcast Holdings Corp. (Guaranty: Comcast Corp.), 2.00%, 10/15/2029 | 18,000,000 | 10,798,200 |
| | | | 10,798,200 |
| | Pharmaceuticals, Biotechnology & Life Sciences — 0.1% | | |
| | Biotechnology — 0.1% | | |
| | Emergent BioSolutions, Inc., 2.875%, 1/15/2021 | 1,802,000 | 1,729,920 |
| | | | 1,729,920 |
| | Total Convertible Bonds(Cost $28,456,550) | | 25,139,674 |
| | Municipal Bonds — 0.7% | | |
| | California Health Facilities Financing Authority, 7.875%, 2/1/2026 | 1,940,000 | 2,032,460 |
| | City of Chicago IL GO, Series B, 7.045%, 1/1/2029 | 3,000,000 | 3,447,210 |
| | New Jersey Transportation Trust Fund Authority, | | |
| | 2.551%, 6/15/2023 | 2,115,000 | 2,159,796 |
| | 2.631%, 6/15/2024 | 1,565,000 | 1,607,067 |
| | Oklahoma Development Finance Authority, 8.00%, 5/1/2020 | 140,000 | 140,167 |
| | San Bernardino County Redevelopment Agency Successor Agency, Series A, 8.45%, 9/1/2030 | 1,000,000 | 1,019,500 |
| | Total Municipal Bonds(Cost $9,733,072) | | 10,406,200 |
| | U.S. Treasury Securities — 0.3% | | |
| | United States Treasury Notes, 2.50%, 5/31/2020 | 4,865,000 | 4,885,021 |
| | Total U.S. Treasury Securities(Cost $4,865,584) | | 4,885,021 |
| | Mortgage Backed — 7.7% | | |
| | Angel Oak Mortgage Trust, LLC, Whole Loan Securities Trust CMO, | | |
| d,e | Series 2017-3 Class A1, 2.708%, 11/25/2047 | 405,816 | 391,292 |
| d,e | Series 2018-2 Class A1, 3.674%, 7/27/2048 | 1,527,033 | 1,466,336 |
| | Arroyo Mortgage Trust, Whole Loan Securities Trust CMO, | | |
| d,e | Series 2018-1 Class A1, 3.763%, 4/25/2048 | 2,962,627 | 2,824,719 |
| d,e | Series 2018-1 Class A3, 4.218%, 4/25/2048 | 1,046,349 | 979,366 |
| d,e | Series 2019-1 Class A1, 3.805%, 1/25/2049 | 2,968,409 | 2,817,441 |
| d,e | Series 2019-3 Class A1, 2.962%, 10/25/2048 | 6,649,514 | 6,092,929 |
| d | Bear Stearns ARM Trust, Whole Loan Securities Trust CMO, Series 2003-6 Class 2B1, 4.774%, 8/25/2033 | 51,147 | 44,637 |
| e | Bravo Residential Funding Trust, Whole Loan Securities Trust CMO, Series 2019-1 Class A1C, 3.50%, 3/25/2058 | 6,814,677 | 6,712,629 |
| d,e | CFCRE Commercial Mortgage Trust, Series 2011-C1 Class C, 6.089%, 4/15/2044 | 6,200,000 | 6,216,907 |
| d,e | CIM Trust, Whole Loan Securities Trust CMO, Series 18-INV1 Class A4, 4.00%, 8/25/2048 | 1,327,644 | 1,300,815 |
| | Citigroup Mortgage Loan Trust, Inc., Whole Loan Securities Trust CMO, | | |
| d | Series 2004-HYB2 Class B1, 4.05%, 3/25/2034 | 41,142 | 32,524 |
| d,e | Series 2014-A Class A, 4.00%, 1/25/2035 | 987,150 | 981,835 |
| d,e | COLT Mortgage Loan Trust, Inc., Whole Loan Securities Trust CMO, Series 2018-3 Class M2, 4.583%, 10/26/2048 | 940,000 | 674,659 |
| d,e | Credit Suisse Mortgage Trust, Whole Loan Securities Trust CMO, Series 2017-HL2 Class A3, 3.50%, 10/25/2047 | 2,175,592 | 2,153,264 |
| d,e | Ellington Financial Mortgage Trust 2019-2, Whole Loan Securities Trust CMO, Series 2019-2 Class A1, 2.739%, 11/25/2059 | 5,037,470 | 4,828,018 |
50 | Thornburg Fixed Income Funds Semi-Annual Report
| See notes to financial statements. |
Schedule of Investments, Continued
Thornburg Strategic Income Fund | March 31, 2020 (Unaudited)
| | Issuer-Description | SHARES/
PRINCIPAL AMOUNT | VALUE |
| d,e | Ellington Financial Mortgage Trust,Whole Loan Securities Trust CMO, Series 2018-1 Class A1FX, 4.14%, 10/25/2058 | $ 375,477 | $ 371,671 |
| d,i | Federal Home Loan Mtg Corp. Multifamily Structured Pass Through Certificates IO, Series KIR1 Class X, 1.067%, 3/25/2026 | 35,673,002 | 1,851,572 |
| | Federal Home Loan Mtg Corp., Whole Loan Securities Trust CMO, | | |
| d,e | Series 2017-SC01 Class M1, 3.587%, 12/25/2046 | 1,158,388 | 1,152,595 |
| | Series 2017-SC02 Class 2A1, 3.50%, 5/25/2047 | 328,000 | 325,510 |
| d,e | Series 2017-SC02 Class M1, 3.811%, 5/25/2047 | 399,419 | 399,211 |
| | Federal National Mtg Assoc. CMO REMIC, Series 1994-37 Class L, 6.50%, 3/25/2024 | 800 | 864 |
| d,e | Flagstar Mortgage Trust, Whole Loan Securities Trust CMO, Series 2017-1 Class 2A2, 3.00%, 3/25/2047 | 1,216,054 | 1,187,020 |
| d,e | FREMF Mortgage Trust, Series 2016-KF24 Class B, 6.515% (LIBOR 1 Month + 5.00%), 10/25/2026 | 533,994 | 502,744 |
| d,e | Galton Funding Mortgage Trust, Whole Loan Securities Trust CMO, Series 2018-1 Class A43, 3.50%, 11/25/2057 | 906,522 | 877,928 |
| | GCAT LLC, Whole Loan Securities Trust CMO, | | |
| d,e | Series 2019-NQM1 Class A1, 2.985%, 2/25/2059 | 5,032,706 | 5,152,261 |
| d,e | Series 2019-NQM3 Class A1, 2.686%, 11/25/2059 | 3,664,631 | 3,713,763 |
| d,e | GCAT Trust, Whole Loan Securities Trust CMO, Series 2019-NQM2 Class A1, 2.855%, 9/25/2059 | 4,932,780 | 5,002,967 |
| | GS Mortgage Securities Trust, Series 2016-GS3 Class A2, 2.484%, 10/10/2049 | 2,875,000 | 2,883,453 |
| | Homeward Opportunities Fund I Trust, Whole Loan Securities Trust CMO, | | |
| d,e | Series 2018-1 Class A1, 3.766%, 6/25/2048 | 1,064,632 | 1,055,842 |
| d,e | Series 2018-1 Class A3, 3.999%, 6/25/2048 | 4,231,914 | 4,124,088 |
| d,e | Series 2018-1 Class M1, 4.548%, 6/25/2048 | 1,000,000 | 856,376 |
| d,e | Series 2019-1 Class A1, 3.454%, 1/25/2059 | 4,316,619 | 4,251,556 |
| | JPMorgan Mortgage Trust, Whole Loan Securities Trust CMO, | | |
| d,e | Series 2017-2 Class A6, 3.00%, 5/25/2047 | 1,644,192 | 1,634,108 |
| d,e | Series 2017-6 Class A5, 3.50%, 12/25/2048 | 1,749,885 | 1,771,321 |
| d,e | Mello Mortgage Capital Acceptance, Whole Loan Securities Trust CMO, Series 2018-MTG1 Class A3, 3.50%, 3/25/2048 | 1,754,893 | 1,721,667 |
| d | Merrill Lynch Mortgage Investors Trust, Whole Loan Securities Trust CMO, Series 2004-A4 Class M1, 4.322%, 8/25/2034 | 106,043 | 83,327 |
| d,e | Metlife Securitization Trust, Whole Loan Securities Trust CMO, Series 2019-1A Class A1A, 3.75%, 4/25/2058 | 1,676,854 | 1,659,450 |
| | New Residential Mortgage Loan Trust, Whole Loan Securities Trust CMO, | | |
| d,e | Series 2017-3A Class A1, 4.00%, 4/25/2057 | 2,144,293 | 2,119,522 |
| d,e | Series 2017-4A Class A1, 4.00%, 5/25/2057 | 2,011,165 | 2,085,270 |
| d,e | Series 2017-5A Class A1, 2.447% (LIBOR 1 Month + 1.50%), 6/25/2057 | 1,352,564 | 1,323,704 |
| d,e | Series 2017-6A Class A1, 4.00%, 8/27/2057 | 898,571 | 926,124 |
| d,e | Series 2018-1A Class A1A, 4.00%, 12/25/2057 | 1,660,006 | 1,642,622 |
| d,e | Series 2018-NQM1 Class A1, 3.986%, 11/25/2048 | 3,954,393 | 3,940,760 |
| a | Reilly 1997 A Mtg 1, 6.896%, 7/1/2020 | 15,521 | 15,521 |
| | Sequoia Mortgage Trust, Whole Loan Securities Trust CMO, | | |
| d,e | Series 2017-4 Class A4, 3.50%, 7/25/2047 | 1,001,131 | 987,758 |
| d,e | Series 2017-5 Class A4, 3.50%, 8/25/2047 | 2,338,381 | 2,303,766 |
| d,e | SG Residential Mortgage Trust, Whole Loan Securities Trust CMO, Series 2019-3 Class A1, 2.703%, 9/25/2059 | 4,644,632 | 4,515,453 |
| d,e | Spruce Hill Mortgage Loan Trust, Inc., Whole Loan Securities Trust CMO, Series 2020-SH1 Class A1, 2.521%, 1/28/2050 | 6,369,436 | 6,053,844 |
| | Verus Securitization Trust, Whole Loan Securities Trust CMO, | | |
| d,e | Series 2017-2A Class A1, 2.485%, 7/25/2047 | 987,802 | 947,641 |
| d,e | Series 2018-2 Class A1, 3.677%, 6/1/2058 | 2,706,350 | 2,625,488 |
| d,e | Series 2018-3 Class A1, 4.108%, 10/25/2058 | 1,658,288 | 1,605,794 |
| d,e | Series 2019-3 Class A1, 2.784%, 7/25/2059 | 5,082,968 | 4,931,894 |
| | Wells Fargo Commercial Mortgage Trust, Series 2016-C34 Class A2, 2.603%, 6/15/2049 | 6,458,000 | 6,452,044 |
| | Total Mortgage Backed(Cost $123,907,030) | | 120,573,870 |
| | Loan Participations — 4.5% | | |
| | Commercial & Professional Services — 1.2% | | |
| | Professional Services — 1.2% | | |
| j | Par Pacific Holdings, Inc., 8.60% (LIBOR 3 Month + 6.75%), 1/12/2026 | 4,671,039 | 3,176,307 |
| j | R.R. Donnelley & Sons Company, 5.989% (LIBOR 1 Month + 5.00%), 1/15/2024 | 2,962,500 | 2,562,563 |
| | RGIS Services, LLC, | | |
| j | 8.95% (LIBOR 3 Month + 7.50%), 3/31/2023 | 2,136,603 | 1,452,890 |
| j | 9.119% (LIBOR 3 Month + 7.50%), 3/31/2023 | 1,058,548 | 719,812 |
| j | 9.277% (LIBOR 3 Month + 7.50%), 3/31/2023 | 928,958 | 631,691 |
| f,j | Titan Acquisition Co., Ltd., 5.45% (LIBOR 3 Month + 4.00%), 5/1/2026 | 8,757,787 | 7,466,014 |
| j | Vericast Corp., 6.463% (LIBOR 3 Month + 4.75%), 11/3/2023 | 3,343,352 | 2,013,333 |
| | | | 18,022,610 |
| | Consumer Services — 0.4% | | |
See notes to financial statements.
| Thornburg Fixed Income Funds Semi-Annual Report | 51 |
Schedule of Investments, Continued
Thornburg Strategic Income Fund | March 31, 2020 (Unaudited)
| | Issuer-Description | SHARES/
PRINCIPAL AMOUNT | VALUE |
| | Hotels, Restaurants & Leisure — 0.4% | | |
| j | Hanjin International Corp., 3.489% (LIBOR 1 Month + 2.50%), 10/18/2020 | $ 7,845,000 | $ 6,119,100 |
| | | | 6,119,100 |
| | Energy — 0.2% | | |
| | Energy Equipment & Services — 0.1% | | |
| | McDermott Technology Americas, Inc., | | |
| j | 10.647% (LIBOR 3 Month + 9.00%), 10/21/2020 | 239,266 | 216,057 |
| j | 10.647% (LIBOR 3 Month + 9.00%), 10/22/2020 | 1,068,435 | 964,797 |
| j | 10.806% (LIBOR 3 Month + 9.00%), 10/21/2020 | 202,455 | 182,817 |
| | Oil, Gas & Consumable Fuels — 0.1% | | |
| j | Citgo Holding, Inc., 8.00% (LIBOR 1 Month + 7.00%), 8/1/2023 | 1,990,000 | 1,605,273 |
| a,g,j | Malamute Energy, Inc., 2.95% (LIBOR 3 Month + 1.50% PIK), 11/22/2022 | 21,523 | 21,523 |
| | | | 2,990,467 |
| | Food, Beverage & Tobacco — 0.2% | | |
| | Food Products — 0.2% | | |
| j | BellRing Brands, LLC, 6.00% (LIBOR 1 Month + 5.00%), 10/21/2024 | 3,441,437 | 3,209,141 |
| | | | 3,209,141 |
| | Media & Entertainment — 0.2% | | |
| | Media — 0.2% | | |
| j | Lamar Media Corp., 2.516% (LIBOR 1 Month + 1.50%), 2/5/2027 | 3,360,000 | 3,183,600 |
| | | | 3,183,600 |
| | Real Estate — 0.4% | | |
| | Equity Real Estate Investment Trusts — 0.4% | | |
| j | CoreCivic, Inc., 5.50% (LIBOR 1 Month + 4.50%), 12/12/2024 | 2,962,500 | 2,577,375 |
| j | GEO Group, Inc., 2.99% (LIBOR 1 Month + 2.00%), 3/22/2024 | 4,588,175 | 3,736,885 |
| | | | 6,314,260 |
| | Retailing — 0.0% | | |
| | Specialty Retail — 0.0% | | |
| j | Office Depot, Inc., 6.25% (LIBOR 1 Month + 5.25%), 11/8/2022 | 775,197 | 736,437 |
| | | | 736,437 |
| | Software & Services — 0.9% | | |
| | Interactive Media & Services — 0.2% | | |
| j,k | SCIH Salt Holdings, Inc., 5.241% (LIBOR 3 Month + 4.50%), 3/16/2027 | 3,630,000 | 3,194,400 |
| | Internet Software & Services — 0.4% | | |
| j | Dun & Bradstreet Corporation (The), 4.959% (LIBOR 1 Month + 4.00%), 2/6/2026 | 6,510,000 | 5,834,587 |
| | Software — 0.3% | | |
| j,k | Solera, LLC, 4.363% (LIBOR 3 Month + 2.75%), 3/3/2023 | 5,228,284 | 4,875,375 |
| | | | 13,904,362 |
| | Telecommunication Services — 0.6% | | |
| | Diversified Telecommunication Services — 0.6% | | |
| j | Colorado Buyer, Inc., 8.25% (LIBOR 1 Month + 7.25%), 5/1/2025 | 3,000,000 | 1,063,320 |
| f,j,k | Intelsat Jackson Holdings S.A., 6.432% (LIBOR 3 Month + 4.50%), 1/2/2024 | 9,800,000 | 8,957,200 |
| | | | 10,020,520 |
| | Utilities — 0.4% | | |
| | Electric Utilities — 0.4% | | |
| j | Pacific Gas & Electric Co., 3.12% (LIBOR 1 Month + 2.25%), 12/31/2020 | 6,000,000 | 5,809,980 |
| | | | 5,809,980 |
| | Total Loan Participations(Cost $81,946,868) | | 70,310,477 |
| | Exchange-Traded Funds — 0.7% | | |
| | iShares iBoxx High Yield Corporate Bond ETF | 152,631 | 11,763,271 |
| | Total Exchange-Traded Funds(Cost $12,914,414) | | 11,763,271 |
52 | Thornburg Fixed Income Funds Semi-Annual Report
| See notes to financial statements. |
Schedule of Investments, Continued
Thornburg Strategic Income Fund | March 31, 2020 (Unaudited)
| | Issuer-Description | SHARES/
PRINCIPAL AMOUNT | VALUE |
| | Short-Term Investments — 8.9% | | |
| l | Thornburg Capital Management Fund | 13,837,826 | $ 138,378,260 |
| | Total Short-Term Investments(Cost $138,378,260) | | 138,378,260 |
| | Total Investments — 99.4%(Cost $1,651,632,710) | | $1,549,880,841 |
| | Other Assets Less Liabilities — 0.6% | | 9,828,683 |
| | Net Assets — 100.0% | | $1,559,709,524 |
| Outstanding Forward Currency Contracts To Buy Or Sell At March 31, 2020 |
Contract
Description | Contract
Party* | Buy/Sell | Contract
Amount | Contract
Value Date | Value
USD | Unrealized
Appreciation | Unrealized
Depreciation |
| Euro | SSB | Sell | 856,000 | 9/23/2020 | 949,582 | $ — | $ (7,677) |
| Euro | SSB | Sell | 1,239,900 | 9/23/2020 | 1,375,452 | — | (35,466) |
| |
| Total | | | | | | — | $(43,143) |
| |
| Net unrealized appreciation (depreciation) | | | | | | | $(43,143) |
| * | Counterparty includes State Street Bank and Trust Company ("SSB"). |
| Footnote Legend |
| a | Security currently fair valued by the Valuation and Pricing Committee using procedures approved by the Trustees’ Audit Committee. |
| b | Non-income producing. |
| c | Securities are perpetual and, thus, do not have a predetermined maturity date. The date shown, if applicable, reflects the next call date. |
| d | Variable, floating, step, or fixed to floating rate securities are securities for which interest rate changes are based on changes in a designated base rate or on a predetermined schedule. The rates shown are those in effect on March 31, 2020. |
| e | Securities exempt from registration under Rule 144A of the Securities Act of 1933, as amended. These securities are restricted but liquid and may only be resold in the ordinary course of business in transactions exempt from registration, normally to qualified institutional buyers. As of March 31, 2020, the aggregate value of these securities in the Fund’s portfolio was $911,352,145, representing 58.43% of the Fund’s net assets. |
| f | Yankee bond denominated in U.S. dollars and is issued in the U.S. by foreign banks and corporations. |
| g | Pay-In-Kind Payments (PIK). The issuer may pay cash interest and/or interest in additional debt securities. Rates shown are the rates in effect at March 31, 2020. |
| h | Bond in default. |
| i | Interest only. |
| j | The stated coupon rate represents the greater of the LIBOR or the LIBOR floor rate plus a spread at March 31, 2020. |
| k | This position or a portion of this position represents an unsettled loan purchase. The coupon rate will be effective at the time of settlement and will be based upon the London-Interbank Offered Rate ("LIBOR") plus a premium which was determined at the time of purchase. |
| l | Investment in Affiliates. |
See notes to financial statements.
| Thornburg Fixed Income Funds Semi-Annual Report | 53 |
Schedule of Investments, Continued
Thornburg Strategic Income Fund | March 31, 2020 (Unaudited)
Portfolio Abbreviations
To simplify the listings of securities, abbreviations are used per the table below:
| ARM | Adjustable Rate Mortgage |
| CMO | Collateralized Mortgage Obligation |
| FCB | Farm Credit Bank |
| GO | General Obligation |
| IO | Interest Only Security |
| LIBOR | London Interbank Offered Rates |
| Mtg | Mortgage |
| MTN | Medium-Term Note |
| REMIC | Real Estate Mortgage Investment Conduit |
| SOFR | Secured Overnight Financing Rate |
| SPV | Special Purpose Vehicle |
| VA | Veterans Affairs |
54 | Thornburg Fixed Income Funds Semi-Annual Report
| See notes to financial statements. |
This page intentionally left blank.
Thornburg Fixed Income Funds Semi-Annual Report | 55
Statements of Assets and Liabilities
March 31, 2020 (Unaudited)
| | THORNBURG
LIMITED TERM U.S.
GOVERNMENT FUND | THORNBURG
LIMITED TERM
INCOME FUND | THORNBURG
LOW DURATION
INCOME FUND | THORNBURG
STRATEGIC
INCOME FUND |
| ASSETS | | | | |
| Investments at cost | | | | |
| Non-affiliated issuers | $ 298,263,615 | $ 5,643,913,949 | $ 28,143,866 | $ 1,513,254,450 |
| Non-controlled affiliated issuers | - | 184,706,629 | 1,908,228 | 138,378,260 |
| Investments at value | | | | |
| Non-affiliated issuers | 303,508,018 | 5,604,570,657 | 27,636,878 | 1,411,502,581 |
| Non-controlled affiliated issuers | - | 184,706,629 | 1,908,228 | 138,378,260 |
| Cash | - | 995,073 | - | - |
| Receivable for investments sold | 2,459 | 261,877,135 | 404,435 | 181,762 |
| Receivable for fund shares sold | 7,240,599 | 52,094,856 | 789 | 15,300,766 |
| Receivable from investment advisor | - | - | 712 | - |
| Dividends receivable | 880 | 814,657 | 3,895 | 373,663 |
| Interest receivable | 889,787 | 27,055,583 | 104,816 | 13,986,797 |
| Prepaid expenses and other assets | 68,692 | 336,293 | 37,037 | 200,437 |
| Total Assets | 311,710,435 | 6,132,450,883 | 30,096,790 | 1,579,924,266 |
| Liabilities | | | | |
| Unrealized depreciation on forward currency contracts | - | - | - | 43,143 |
| Payable for investments purchased | 17,603,032 | 133,105,233 | 159,145 | 14,254,289 |
| Payable for fund shares redeemed | 758,645 | 13,809,669 | 16,243 | 4,389,250 |
| Payable to investment advisor and other affiliates | 126,205 | 2,436,031 | - | 845,995 |
| Accounts payable and accrued expenses | 65,757 | 167,157 | 27,603 | 82,487 |
| Dividends payable | 74,728 | 1,600,827 | 2,743 | 599,578 |
| Total Liabilities | 18,628,367 | 151,118,917 | 205,734 | 20,214,742 |
| Net Assets | $ 293,082,068 | $ 5,981,331,966 | $ 29,891,056 | $ 1,559,709,524 |
| NET ASSETS CONSIST OF | | | | |
| Net capital paid in on shares of beneficial interest | $ 300,562,903 | $ 5,991,184,240 | $ 30,304,854 | $ 1,681,861,015 |
| Accumulated loss | (7,480,835) | (9,852,274) | (413,798) | (122,151,491) |
| Net Assets | $ 293,082,068 | $ 5,981,331,966 | $ 29,891,056 | $ 1,559,709,524 |
56 | Thornburg Fixed Income Funds Semi-Annual Report
Statements of Assets and Liabilities, Continued
March 31, 2020 (Unaudited)
| | THORNBURG
LIMITED TERM U.S.
GOVERNMENT FUND | THORNBURG
LIMITED TERM
INCOME FUND | THORNBURG
LOW DURATION
INCOME FUND | THORNBURG
STRATEGIC
INCOME FUND |
| NET ASSET VALUE | | | | |
| Class A Shares: | | | | |
| Net assets applicable to shares outstanding | $ 71,276,437 | $ 574,830,430 | $ 5,724,380 | $ 201,081,731 |
| Shares outstanding | 5,386,056 | 43,137,283 | 470,637 | 17,978,819 |
| Net asset value and redemption price per share | $ 13.23 | $ 13.33 | $ 12.16 | $ 11.18 |
| Maximum offering price per share (net asset value, plus 1.50% of offering price) | $ 13.43 | $ 13.53 | $ 12.35 | $ 11.71* |
| Class C Shares: | | | | |
| Net assets applicable to shares outstanding | 16,953,992 | 338,972,510 | - | 101,327,590 |
| Shares outstanding | 1,273,554 | 25,477,582 | - | 9,075,721 |
| Net asset value and redemption price per share** | 13.31 | 13.30 | - | 11.16 |
| Class I Shares: | | | | |
| Net assets applicable to shares outstanding | 191,044,983 | 4,687,194,055 | 24,166,676 | 1,197,957,192 |
| Shares outstanding | 14,436,724 | 351,659,123 | 1,988,009 | 107,424,970 |
| Net asset value and redemption price per share | 13.23 | 13.33 | 12.16 | 11.15 |
| Class R3 Shares: | | | | |
| Net assets applicable to shares outstanding | 9,110,194 | 86,059,798 | - | 1,080,604 |
| Shares outstanding | 687,987 | 6,453,623 | - | 96,748 |
| Net asset value and redemption price per share | 13.24 | 13.34 | - | 11.17 |
| Class R4 Shares: | | | | |
| Net assets applicable to shares outstanding | 2,837,729 | 4,483,271 | - | 1,270,111 |
| Shares outstanding | 214,496 | 336,582 | - | 113,784 |
| Net asset value and redemption price per share | 13.23 | 13.32 | - | 11.16 |
| Class R5 Shares: | | | | |
| Net assets applicable to shares outstanding | 1,858,733 | 176,517,407 | - | 35,829,335 |
| Shares outstanding | 140,361 | 13,248,096 | - | 3,211,019 |
| Net asset value and redemption price per share | 13.24 | 13.32 | - | 11.16 |
| Class R6 Shares: | | | | |
| Net assets applicable to shares outstanding | - | 113,274,495 | - | 21,162,961 |
| Shares outstanding | - | 8,482,916 | - | 1,891,865 |
| Net asset value and redemption price per share | - | 13.35 | - | 11.19 |
| * | Net asset value, plus 4.50% of offering price. |
| ** | Redemption price per share is equal to net asset value less any applicable contingent deferred sales charge. |
See notes to financial statements.
Thornburg Fixed Income Funds Semi-Annual Report | 57
Statements of Operations
Six Months Ended March 31, 2020 (Unaudited)
| | THORNBURG
LIMITED TERM U.S.
GOVERNMENT FUND | THORNBURG
LIMITED TERM
INCOME FUND | THORNBURG
LOW DURATION
INCOME FUND | THORNBURG
STRATEGIC
INCOME FUND |
| INVESTMENT INCOME | | | | |
| Dividend income | | | | |
| Non-affiliated issuers | $ 880 | $ - | $ - | $ 587,186 |
| Non-controlled affiliated issuers | - | 1,529,758 | 29,767 | 1,861,772 |
| Interest income | 2,793,870 | 80,664,863 | 413,212 | 29,080,722 |
| Total Income | 2,794,750 | 82,194,621 | 442,979 | 31,529,680 |
| EXPENSES | | | | |
| Investment management fees | 459,929 | 9,506,723 | 63,983 | 5,423,278 |
| Administration fees | 108,122 | 2,566,013 | 14,094 | 706,563 |
| Distribution and service fees | | | | |
| Class A Shares | 82,755 | 745,505 | 7,123 | 268,426 |
| Class C Shares | 37,356 | 880,281 | - | 570,913 |
| Class R3 Shares | 22,789 | 165,732 | - | 3,804 |
| Class R4 Shares | 3,124 | 8,006 | - | 1,649 |
| Transfer agent fees | | | | |
| Class A Shares | 26,514 | 176,835 | 11,555 | 70,795 |
| Class C Shares | 4,147 | 89,344 | - | 32,331 |
| Class I Shares | 47,495 | 1,362,751 | 4,937 | 429,487 |
| Class R3 Shares | 4,221 | 23,272 | - | 1,060 |
| Class R4 Shares | 4,029 | 14,611 | - | 3,265 |
| Class R5 Shares | 4,904 | 91,756 | - | 8,220 |
| Class R6 Shares | - | 3,749 | - | 2,107 |
| Registration and filing fees | | | | |
| Class A Shares | 6,334 | 10,036 | 7,868 | 7,535 |
| Class C Shares | 6,173 | 8,547 | - | 6,403 |
| Class I Shares | 6,958 | 25,638 | 8,181 | 17,689 |
| Class R3 Shares | 6,122 | 6,504 | - | 6,300 |
| Class R4 Shares | 6,239 | 6,365 | - | 6,260 |
| Class R5 Shares | 6,280 | 6,431 | - | 6,298 |
| Class R6 Shares | - | 6,307 | - | 6,226 |
| Custodian fees | 28,058 | 152,447 | 26,403 | 79,311 |
| Professional fees | 24,344 | 76,170 | 21,925 | 56,080 |
| Trustee and officer fees | 7,432 | 172,601 | 1,033 | 44,483 |
| Other expenses | 19,304 | 245,377 | 5,888 | 70,443 |
| Total Expenses | 922,629 | 16,351,001 | 172,990 | 7,828,926 |
| Less: | | | | |
| Expenses reimbursed | (30,181) | (271,034) | (46,634) | (600,683) |
| Investment management fees waived | - | - | (39,254) | (1,430,100) |
| Net Expenses | 892,448 | 16,079,967 | 87,102 | 5,798,143 |
| Net Investment Income (Loss) | $ 1,902,302 | $ 66,114,654 | $ 355,877 | $ 25,731,537 |
58 | Thornburg Fixed Income Funds Semi-Annual Report
Statements of Operations, Continued
Six Months Ended March 31, 2020 (Unaudited)
| | THORNBURG
LIMITED TERM U.S.
GOVERNMENT FUND | THORNBURG
LIMITED TERM
INCOME FUND | THORNBURG
LOW DURATION
INCOME FUND | THORNBURG
STRATEGIC
INCOME FUND |
| REALIZED AND UNREALIZED GAIN (LOSS) | | | | |
| Net realized gain (loss) on: | | | | |
| Non-affiliated issuer investments | $ 217,502 | $ 38,571,622 | $ 108,025 | $ 4,629,647 |
| Forward currency contracts | - | - | - | 79,435 |
| Foreign currency transactions | - | - | - | (10,263) |
| Net realized gain (loss) | 217,502 | 38,571,622 | 108,025 | 4,698,819 |
| Net change in unrealized appreciation (depreciation) on: | | | | |
| Non-affiliated issuers investments | 2,864,023 | (128,977,795) | (831,111) | (107,442,965) |
| Forward currency contracts | - | - | - | (160,598) |
| Foreign currency translations | - | - | - | (5,912) |
| Change in net unrealized appreciation (depreciation) | 2,864,023 | (128,977,795) | (831,111) | (107,609,475) |
| Net Realized and Unrealized Gain (Loss) | 3,081,525 | (90,406,173) | (723,086) | (102,910,656) |
| Change in Net Assets Resulting from Operations | $ 4,983,827 | $ (24,291,519) | $ (367,209) | $ (77,179,119) |
See notes to financial statements.
Thornburg Fixed Income Funds Semi-Annual Report | 59
Statements of Changes in Net Assets
| | THORNBURG LIMITED TERM U.S. GOVERNMENT FUND | THORNBURG LIMITED TERM INCOME FUND |
| | Six Months Ended
March 31, 2020* | Year Ended
September 30, 2019 | Six Months Ended
March 31, 2020* | Year Ended
September 30, 2019 |
| INCREASE (DECREASE) IN NET ASSETS FROM | | | | |
| OPERATIONS | | | | |
| Net investment income | $ 1,902,302 | $ 3,769,019 | $ 66,114,654 | $ 140,405,650 |
| Net realized gain (loss) | 217,502 | (533,177) | 38,571,622 | 40,927,563 |
| Net change in unrealized appreciation (depreciation) | 2,864,023 | 8,550,764 | (128,977,795) | 140,547,442 |
Net Increase (Decrease) in Net Assets
Resulting from Operations | 4,983,827 | 11,786,606 | (24,291,519) | 321,880,655 |
| DIVIDENDS TO SHAREHOLDERS | | | | |
| From distributable earnings | | | | |
| Class A Shares | (571,456) | (1,199,716) | (10,502,619) | (15,727,847) |
| Class C Shares | (107,428) | (255,887) | (5,858,846) | (9,006,464) |
| Class I Shares | (1,514,287) | (2,750,402) | (87,218,480) | (112,128,865) |
| Class R3 Shares | (73,487) | (151,499) | (1,084,208) | (1,869,318) |
| Class R4 Shares | (20,170) | (38,072) | (113,424) | (212,808) |
| Class R5 Shares | (9,594) | (25,660) | (2,153,359) | (3,178,918) |
| Class R6 Shares | - | - | (1,351,003) | (1,237,001) |
| FUND SHARE TRANSACTIONS | | | | |
| Class A Shares | 4,416,239 | (5,683,527) | (57,151,640) | (55,963,967) |
| Class C Shares | 1,179,189 | (4,644,010) | (9,789,572) | (96,148,218) |
| Class I Shares | 44,089,349 | 9,185,352 | 334,999,635 | 633,212,444 |
| Class R3 Shares | (159,699) | (143,550) | 23,609,605 | (26,586,996) |
| Class R4 Shares | 518,566 | (289,505) | (3,471,634) | (214,678) |
| Class R5 Shares | 949,120 | 187,963 | 73,668,172 | (10,373,438) |
| Class R6 Shares | - | - | 55,395,139 | 29,403,168 |
| Net Increase in Net Assets | 53,680,169 | 5,978,093 | 284,686,247 | 651,847,749 |
| NET ASSETS | | | | |
| Beginning of Period | 239,401,899 | 233,423,806 | 5,696,645,719 | 5,044,797,970 |
| End of Period | $ 293,082,068 | $ 239,401,899 | $ 5,981,331,966 | $ 5,696,645,719 |
See notes to financial statements.
60 | Thornburg Fixed Income Funds Semi-Annual Report
Statements of Changes in Net Assets, Continued
| | THORNBURG LOW DURATION INCOME FUND | THORNBURG STRATEGIC INCOME FUND |
| | Six Months Ended
March 31, 2020* | Year Ended
September 30, 2019 | Six Months Ended
March 31, 2020* | Year Ended
September 30, 2019 |
| INCREASE (DECREASE) IN NET ASSETS FROM | | | | |
| OPERATIONS | | | | |
| Net investment income | $ 355,877 | $ 820,295 | $ 25,731,537 | $ 48,095,037 |
| Net realized gain (loss) | 108,025 | 122,581 | 4,698,819 | 5,209,645 |
| Net change in unrealized appreciation (depreciation) | (831,111) | 476,950 | (107,609,475) | 25,866,150 |
Net Increase (Decrease) in Net Assets
Resulting from Operations | (367,209) | 1,419,826 | (77,179,119) | 79,170,832 |
| DIVIDENDS TO SHAREHOLDERS | | | | |
| From distributable earnings | | | | |
| Class A Shares | (102,498) | (198,275) | (3,404,054) | (6,894,360) |
| Class C Shares | - | - | (1,384,427) | (3,682,212) |
| Class I Shares | (368,406) | (631,318) | (21,617,215) | (36,220,081) |
| Class R3 Shares | - | - | (21,980) | (59,577) |
| Class R4 Shares | - | - | (19,080) | (47,973) |
| Class R5 Shares | - | - | (456,919) | (316,965) |
| Class R6 Shares | - | - | (407,153) | (448,157) |
| FUND SHARE TRANSACTIONS | | | | |
| Class A Shares | (2,120,095) | 721,326 | (971,835) | 12,482,392 |
| Class C Shares | - | - | (10,837,368) | (34,400,304) |
| Class I Shares | (20,687) | 1,670,436 | 137,064,800 | 355,456,316 |
| Class R3 Shares | - | - | (491,854) | (347,860) |
| Class R4 Shares | - | - | 74,905 | (926,459) |
| Class R5 Shares | - | - | 27,094,604 | 3,578,573 |
| Class R6 Shares | - | - | 1,047,070 | 11,717,095 |
| Net Increase (Decrease) in Net Assets | (2,978,895) | 2,981,995 | 48,490,375 | 379,061,260 |
| NET ASSETS | | | | |
| Beginning of Period | 32,869,951 | 29,887,956 | 1,511,219,149 | 1,132,157,889 |
| End of Period | $ 29,891,056 | $ 32,869,951 | $ 1,559,709,524 | $ 1,511,219,149 |
See notes to financial statements.
Thornburg Fixed Income Funds Semi-Annual Report | 61
Notes to Financial Statements
March 31, 2020 (Unaudited)
NOTE 1 – ORGANIZATION
Thornburg Limited Term U.S. Government Fund (the “Limited Term U.S. Government Fund”), Thornburg Limited Term Income Fund (the “Limited Term Income Fund”), Thornburg Low Duration Income Fund (the “Low Duration Income Fund”) and Thornburg Strategic Income Fund (the “Strategic Income Fund”), collectively the (“Funds”), are diversified series of Thornburg Investment Trust (the “Trust”). The Trust is organized as a Massachusetts business trust under a Declaration of Trust dated June 3, 1987 and is registered as a diversified, open-end management investment company under the Investment Company Act of 1940, as amended (the "1940 Act"). The Funds are currently four of twenty-two separate series of the Trust. Each series is considered to be a separate entity for financial reporting and tax purposes and bears expenses directly attributable to it.
Limited Term U.S. Government Fund: The Fund’s primary objective is to provide a high level of current income as is consistent, in the view of the Trust’s investment advisor, Thornburg Investment Management, Inc. (the “Advisor”), with safety of capital. As a secondary objective, the Fund seeks to reduce changes in their share prices compared to longer term portfolios. The Fund’s investments subject it to risks including, but not limited to, management risk, interest rate risk, prepayment and extension risk, credit risk, market and economic risk, liquidity risk, and structured products risk. Please see the Fund’s prospectus for a discussion of the risks associated with an investment in the Fund.
Limited Term Income Fund: The Fund’s primary objective is to provide a high level of current income as is consistent, in the view of the Advisor with safety of capital. As a secondary objective, the Fund seeks to reduce changes in their share prices compared to longer term portfolios. The Fund’s investments subject it to risks including, but not limited to, management risk, interest rate risk, prepayment and extension risk, credit risk, market and economic risk, risks affecting specific issuers, foreign investment risk, liquidity risk, and structured products risk. Please see the Fund’s prospectus for a discussion of the risks associated with an investment in the Fund.
Low Duration Income Fund: The Fund’s primary objective is to seek current income, consistent with preservation of capital. The Fund’s investments subject it to risks including, but not limited to, management risk, interest rate risk, prepayment and extension risk, credit risk, market and economic risk, risks affecting specific issuers, foreign investment risk, liquidity risk, and structured products risk. Please see the Fund’s prospectus for a discussion of the risks associated with an investment in the Fund.
Strategic Income Fund: The Fund’s primary objective is to seek a high level of current income. The Fund’s investments subject it to risks including, but not limited to, management risk, interest rate risk, prepayment and extension risk, credit risk, high-yield risk, market and economic risk, risks affecting specific issuers, liquidity risk, small and mid-cap company risk, foreign investment risk, developing country risk, structured products risk, and derivatives risk. Please see the Fund’s prospectus for a discussion of the risks associated with an investment in the Fund.
The Funds currently offer from one to seven classes of shares of beneficial interest:
Each class of shares of the Funds represents an interest in the same portfolio of investments, except that (i) Class A shares are sold subject to a front-end sales charge collected at the time the shares are purchased and bear a service fee, (ii) Class C shares are sold at net asset value without a sales charge at the time of purchase, but are subject to a contingent deferred sales charge upon redemption within one year of purchase, and bear both a service fee and a distribution fee, (iii) Class I and Class R5 shares are sold at net asset value without a sales charge at the time of purchase and may be subject to a service fee, (iv) Class R3 shares are sold at net asset value without a sales charge, but bear both a service fee and a distribution fee, (v) Class R4 shares are sold at net asset value without a sales charge at the time of purchase but bear a service fee, (vi) Class R6 shares are sold at net asset value without a sales charge at the time of purchase, and (vii) the respective classes may have different reinvestment privileges and conversion rights. Additionally, each Fund may allocate among its classes certain expenses, to the extent allocable to specific classes, including administration fees, transfer agent fees, government registration fees, certain printing and postage costs, and legal expenses. Currently, class specific expenses of the Funds are limited to distribution and service fees, transfer agent fees, and certain registration and filing fees.
At March 31, 2020, the following class of shares are offered in each respective Fund:
| | Class A | Class C | Class I | Class R3 | Class R4 | Class R5 | Class R6 |
| Limited Term U.S. Government Fund | X | X | X | X | X | X | |
| Limited Term Income Fund | X | X | X | X | X | X | X |
| Low Duration Income Fund | X | | X | | | | |
| Strategic Income Fund | X | X | X | X | X | X | X |
NOTE 2 – SIGNIFICANT ACCOUNTING POLICIES
The following is a summary of significant accounting policies followed by each of the Funds in the preparation of its financial statements. Each Fund prepares its financial statements in conformity with United States generally accepted accounting principles (“GAAP”), including
62 | Thornburg Fixed Income Funds Semi-Annual Report
Notes to Financial Statements, Continued
March 31, 2020 (Unaudited)
investment company accounting and reporting guidance in the Financial Accounting Standards Board (the “FASB”) Accounting Standard Codification Topic 946.
Allocation of Income, Gains, Losses and Expenses: Net investment income (other than class specific expenses) and realized and unrealized gains and losses are allocated daily to each class of shares based upon the relative net asset value of outstanding shares (or the value of the dividend-eligible shares, as appropriate) of each class of shares at the beginning of the day (after adjusting for the current capital shares activity of the respective class). Expenses common to all Funds are allocated among the Funds comprising the Trust based upon their relative net asset values or other appropriate allocation methods. Operating expenses directly attributable to a specific class are charged against the operating income of that class.
Dividends and Distributions to Shareholders: Dividends and distributions to shareholders, which are determined in accordance with federal income tax regulations and may differ from GAAP, are recorded on the ex-dividend date. Ordinary income dividends, if any, are declared daily and paid monthly. Capital gain distributions, if any, are declared and paid annually and more often if deemed necessary by the Advisor. Dividends and distributions are paid and are reinvested in additional shares of the Funds at net asset value per share at the close of business on the ex-dividend date, or at the shareholder’s option, paid in cash.
Foreign Currency Translation: Portfolio investments and other assets and liabilities denominated in foreign currencies are translated into U.S. dollars based on the exchange rate of such currencies against the U.S. dollar on the date of valuation. Purchases and sales of investments and income items denominated in foreign currencies are translated into U.S. dollars at the exchange rate in effect on the transaction date. When the Funds purchase or sell foreign investments, they will customarily enter into a foreign exchange contract to minimize foreign exchange risk from the trade date to the settlement date of such transactions. The values of such spot contracts are included in receivable for investments sold and payable for investments purchased on the Statement of Assets and Liabilities.
The Funds do not separately report the effect of changes in foreign exchange rates from changes in market prices on investments held. Such changes are included in net unrealized appreciation (depreciation) from investments in the Statement of Operations.
Reported net realized gains and losses from foreign currency transactions arise due to purchases and sales of foreign currencies, currency gains and losses realized between the trade and settlement dates on investment transactions and the difference between the amounts of dividends, interest, and foreign withholding taxes recorded on the Funds’ books, and the U.S. dollar equivalent of the amounts actually received or paid. These amounts are included in foreign currency transactions in the Statement of Operations.
Net change in unrealized appreciation (depreciation) on foreign currency translations arise from changes in the fair value of assets and liabilities, other than investments at period end, resulting from changes in exchange rates.
Guarantees and Indemnifications: Under the Trust’s organizational documents (and under separate agreements with the independent Trustees), its officers and Trustees are provided with an indemnification against certain liabilities arising out of the performance of their duties to the Funds. In the normal course of business the Trust may also enter into contracts with service providers that contain general indemnifications. The Trust’s maximum exposure under these arrangements is unknown. However, based on experience, the Trust expects the risk of loss to be remote.
Investment Income: Dividend income is recorded on the ex-dividend date. Certain income from foreign investments is recognized as soon as information is available to the Funds. Interest income is accrued as earned. Premiums and discounts are amortized and accreted, respectively, to first call dates or maturity dates using the effective yield method of the respective investments. These amounts are included in Investment Income in the Statement of Operations.
Investment Transactions: Investment transactions are accounted for on a trade date basis. Realized gains and losses from the sale of investments are recorded on an identified cost basis.
Repurchase Agreements: The Funds may invest excess cash in repurchase agreements whereby the Funds purchase investments, which serve as collateral, with an agreement to resell such collateral to the seller at an agreed upon price at the maturity date of the repurchase agreement. Investments pledged as collateral for repurchase agreements are held in custody until maturity of the repurchase agreement. Provisions in the agreements require that the market value of the collateral is at least equal to the repurchase value in the event of default. In the event of default, the Funds have the right to liquidate the collateral and apply the proceeds in satisfaction of the obligation. Under certain circumstances, in the event of default or bankruptcy by the other party to the agreement, realization and/or retention of the collateral may be subject to legal proceedings.
Security Valuation: All investments in securities held by the Funds are valued as described in Note 3.
Unfunded Loan Commitments: The Strategic Income Fund has entered into a loan commitment with Malamute Energy, Inc., of which at March 31, 2020, $21,523 of the $43,227 par commitment had been funded. The maturity date is June 30, 2020.
Thornburg Fixed Income Funds Semi-Annual Report | 63
Notes to Financial Statements, Continued
March 31, 2020 (Unaudited)
Use of Estimates: The preparation of financial statements in conformity with GAAP requires management to make estimates and assumptions that affect the reported amounts of assets and liabilities and disclosure of contingent assets and liabilities at the date of the financial statements and the reported amounts of increases (decreases) in net assets from operations during the reporting period. Actual results could differ from those estimates.
When-Issued and Delayed Delivery Transactions: The Funds may engage in when-issued or delayed delivery transactions. To the extent the Funds engage in such transactions, they will do so for the purpose of acquiring portfolio investments consistent with the Funds’ investment objectives and not for the purpose of investment leverage or to speculate on interest rate or market changes. At the time the Funds make a commitment to purchase an investment on a when-issued or delayed delivery basis, the Funds will record the transaction and reflect the value in determining its net asset value. When effecting such transactions, assets of an amount sufficient to make payment for the portfolio investments to be purchased will be segregated on the Funds’ records on the trade date. Investments purchased on a when-issued or delayed delivery basis do not earn interest until the settlement date. The values of these securities held at March 31, 2020 are detailed in the Schedule of Investments.
NOTE 3 – SECURITY VALUATION
Valuation of the Funds’ portfolio investment securities is performed in accordance with policies and procedures adopted by and under the oversight of the Trustees.
The Trustees of the Trust have appointed the Advisor to assist the Trustees with obtaining fair market values for portfolio investments, evaluating and monitoring professional pricing service providers appointed by the Trustees’ Audit Committee (the “Audit Committee”) to assist in determining fair values for portfolio investments, assisting in calculating fair values for portfolio investments in certain circumstances, and performing other functions in connection with the valuation of investments. The Advisor acts through its Valuation and Pricing Committee (the “Committee”) and other employees of the Advisor. The Committee regularly reviews its own valuation calculations, reviews the valuations, valuation techniques and services furnished by pricing service providers, considers circumstances which may require valuation calculations by the Committee, and reviews previous valuation calculations. The Committee reports to the Audit Committee on the Committee’s activities, the performance of pricing service providers, and other matters relating to valuation of portfolio investments.
In those instances when the Committee assists in calculating a fair value for a portfolio investment, the Committee seeks to determine the price that the Funds would reasonably expect to receive upon a sale of the investment in an orderly transaction between market participants on the valuation date. The Committee customarily utilizes quotations from securities broker dealers in calculating valuations, but also may utilize prices obtained from pricing service providers or other methods approved by the Audit Committee. Because fair values calculated by the Committee are estimates, the calculation of a value for an investment may differ from the price that would be realized by the Funds upon a sale of the investment, and the difference could be material to the Funds’ financial statements. The Committee’s calculation of a fair value for an investment may also differ from the prices obtained by other persons (including other mutual funds) for the investment.
Valuation of Securities: Securities and other portfolio investments which are listed or traded on a United States securities exchange are valued at the last reported sale price on the valuation date. Investments listed or traded on an exchange for which there has been no sale that day are valued at the mean between the last reported bid and asked prices on that valuation date. Portfolio investments reported by NASDAQ are valued at the official closing price on the valuation date. If an investment is traded on more than one exchange, the investment is considered traded on the exchange that is normally the primary market for that investment. Securities and other portfolio investments which are listed or traded on exchanges outside the United States are valued at the last price or the closing price of the investment on the exchange that is normally the primary market for the investment, as of the close of the exchange preceding the Fund’s valuation date. Foreign investments listed or traded on an exchange for which there has been no sale that day are valued at the mean between the last reported bid and asked prices on that valuation date.
In any case when a market quotation is not readily available for a portfolio investment ordinarily valued by market quotation, the Committee calculates a fair value for the investment using alternative methods approved by the Audit Committee. A market quotation is not readily available when the primary market or exchange for the investment is not open for the entire scheduled day of trading. Market quotations for an investment also may not be readily available if developments after the most recent close of the investment’s primary exchange or market, but prior to the close of business on any Fund business day, or an unusual event or significant period of time occurring since the availability of a market quotation, create a serious question concerning the reliability of the most recent market quotation available for the investment. In particular, on days when market volatility thresholds established by the Audit Committee are exceeded, foreign equity investments held by the Fund may be valued using alternative methods. The Committee customarily obtains valuations in these instances from pricing service providers approved by the Audit Committee. Pricing service providers ordinarily calculate valuations using multi-factor models to adjust market prices based upon various inputs, including exchange data, depository receipt prices, futures, index data and other data.
64 | Thornburg Fixed Income Funds Semi-Annual Report
Notes to Financial Statements, Continued
March 31, 2020 (Unaudited)
Debt obligations held by the Funds which are not listed or traded on exchanges or for which no reported market exists are ordinarily valued at the valuation obtained from a pricing service provider approved by the Audit Committee.
In any case when a pricing service provider fails to provide a valuation for a debt obligation held by the Funds, the Committee calculates a fair value for the obligation using alternative methods under procedures approved by the Audit Committee. Additionally, in cases when management believes that a valuation obtained from a pricing service provider is stale, does not reflect material factors affecting the valuation of the investment, is significantly different than the value the Funds are likely to obtain if it sought a bid for the investment, or is otherwise unreliable, the Committee calculates a fair value for the obligation using an alternative method approved by the Audit Committee.
Quotations for foreign investments expressed in foreign currency amounts are converted to U.S. dollar equivalents using a foreign exchange quotation from a third party service provider at the time of valuation. Foreign investments held by the Funds may be traded on days and at times when the Funds are not open for business. Consequently, the value of Funds’ investments may be significantly affected on days when shareholders cannot purchase or sell Funds’ shares.
Valuation Hierarchy: The Funds categorize their investments based upon the inputs used in valuing those investments, according to a three-level hierarchy established in guidance from the FASB. Categorization of investments using this hierarchy is intended by the FASB to maximize the use of observable inputs in valuing investments and minimize the use of unobservable inputs by requiring that the most observable inputs be used when available. Observable inputs are those that market participants would use in valuing an investment based on available market information. Unobservable inputs are those that reflect assumptions about the information market participants would use in valuing an investment. An investment’s level within the hierarchy is based on the lowest level input that is deemed significant to the valuation. The methodologies and inputs used to value investments are not necessarily indications of the risk or liquidity associated with those investments.
Various inputs are used in calculating valuations for the Funds’ investments. These inputs are generally summarized according to the three-level hierarchy below:
Level 1: Quoted prices in active markets for identical investments.
Level 2: Other direct or indirect significant observable inputs (including quoted prices for similar investments in active markets and other observable inputs, such as interest rates, prepayment rates, credit ratings, etc.).
Level 3: Significant unobservable inputs (including the Committee’s own assumptions in calculating the fair values of investments).
Valuations for debt obligations held by the Funds are typically calculated by pricing service providers approved by the Audit Committee and are generally characterized as Level 2 within the valuation hierarchy.
On days when market volatility thresholds established by the Audit Committee are exceeded, foreign securities for which valuations are obtained from pricing service providers are fair valued. On these days, the foreign securities are characterized as Level 2 within the valuation hierarchy and revert to Level 1 after the threshold is no longer exceeded.
In a limited number of cases the Committee calculates a fair value for investments using broker quotations or other methods approved by the Audit Committee. When the Committee uses a single broker quotation to calculate a fair value for an investment without other significant observable inputs, or if a fair value is calculated using other significant inputs that are considered unobservable, the investment is characterized as Level 3 within the hierarchy. Other significant unobservable inputs used to calculate a fair value in these instances might include an income-based valuation approach which considers discounted anticipated future cash flows from the investment and application of discounts due to the nature or duration of any restrictions on the disposition of the investment.
Valuations based upon the use of inputs from Levels 1, 2 or 3 may not represent the actual price received upon the disposition of an investment, and a fund may receive a price that is lower than the valuation based upon these inputs when it sells the investment.
Thornburg Fixed Income Funds Semi-Annual Report | 65
Notes to Financial Statements, Continued
March 31, 2020 (Unaudited)
The following tables display a summary of the fair value hierarchy measurements of each Fund’s investments as of March 31, 2020:
| LIMITED TERM U.S. GOVERNMENT FUND | TOTAL | LEVEL 1 | LEVEL 2 | LEVEL 3 |
| Assets | | | | |
| Investments in Securities | | | | |
| Corporate Bonds | $ 3,745,000 | $ — | $ 3,745,000 | $ — |
| U.S. Treasury Securities | 39,714,611 | 39,714,611 | — | — |
| U.S. Government Agencies | 32,757,590 | — | 32,757,590 | — |
| Mortgage Backed | 200,608,096 | — | 200,608,096 | — |
| Short-Term Investments | 26,682,721 | 17,682,721 | 9,000,000 | — |
| Total Investments in Securities | $303,508,018 | $57,397,332 | $246,110,686 | $— |
| Total Assets | $303,508,018 | $57,397,332 | $246,110,686 | $— |
| LIMITED TERM INCOME FUND | TOTAL | LEVEL 1 | LEVEL 2 | LEVEL 3 |
| Assets | | | | |
| Investments in Securities | | | | |
| Asset Backed Securities | $ 1,142,797,190 | $ — | $ 1,130,067,096 | $ 12,730,094 |
| Corporate Bonds | 2,538,003,820 | — | 2,517,170,296 | 20,833,524 |
| Municipal Bonds | 78,393,820 | — | 78,393,820 | — |
| Other Government | 33,981,467 | — | 33,981,467 | — |
| U.S. Treasury Securities | 691,832,641 | 691,832,641 | — | — |
| U.S. Government Agencies | 33,853,764 | — | 30,602,339 | 3,251,425 |
| Mortgage Backed | 1,062,572,185 | — | 1,062,572,185 | — |
| Loan Participations | 23,135,770 | — | 23,135,770 | — |
| Short-Term Investments | 184,706,629 | 184,706,629 | — | — |
| Total Investments in Securities | $5,789,277,286 | $876,539,270 | $4,875,922,973 | $36,815,043(a) |
| Total Assets | $5,789,277,286 | $876,539,270 | $4,875,922,973 | $36,815,043 |
| (a) | Level 3 investments at the beginning and/or end of the period in relation to net assets were not significant and accordingly, a reconciliation of Level 3 assets for the period ended March 31, 2020 is not presented. |
| LOW DURATION INCOME FUND | TOTAL | LEVEL 1 | LEVEL 2 | LEVEL 3 |
| Assets | | | | |
| Investments in Securities | | | | |
| Asset Backed Securities | $ 12,926,802 | $ — | $ 12,839,002 | $ 87,800 |
| Corporate Bonds | 9,330,073 | — | 9,330,073 | — |
| Municipal Bonds | 423,228 | — | 423,228 | — |
| U.S. Treasury Securities | 1,103,764 | 1,103,764 | — | — |
| U.S. Government Agencies | 465,805 | — | 465,805 | — |
| Mortgage Backed | 3,387,206 | — | 3,387,206 | — |
| Short-Term Investments | 1,908,228 | 1,908,228 | — | — |
| Total Investments in Securities | $29,545,106 | $3,011,992 | $26,445,314 | $87,800(a) |
| Total Assets | $29,545,106 | $3,011,992 | $26,445,314 | $87,800 |
| (a) | Level 3 investments at the beginning and/or end of the period in relation to net assets were not significant and accordingly, a reconciliation of Level 3 assets for the period ended March 31, 2020 is not presented. |
66 | Thornburg Fixed Income Funds Semi-Annual Report
Notes to Financial Statements, Continued
March 31, 2020 (Unaudited)
| STRATEGIC INCOME FUND | TOTAL | LEVEL 1 | LEVEL 2 | LEVEL 3 |
| Assets | | | | |
| Investments in Securities | | | | |
| Common Stock | $ 8,893 | $ — | $ — | $ 8,893 |
| Preferred Stock | 21,216,375 | 12,502,378 | 8,713,997 | — |
| Asset Backed Securities | 324,246,210 | — | 314,952,097 | 9,294,113 |
| Corporate Bonds | 822,952,590 | — | 819,702,281 | 3,250,309 |
| Convertible Bonds | 25,139,674 | — | 25,139,674 | — |
| Municipal Bonds | 10,406,200 | — | 10,406,200 | — |
| U.S. Treasury Securities | 4,885,021 | 4,885,021 | — | — |
| Mortgage Backed | 120,573,870 | — | 120,558,349 | 15,521 |
| Loan Participations | 70,310,477 | — | 70,288,954 | 21,523 |
| Exchange-Traded Funds | 11,763,271 | 11,763,271 | — | — |
| Short-Term Investments | 138,378,260 | 138,378,260 | — | — |
| Total Investments in Securities | $1,549,880,841 | $167,528,930 | $1,369,761,552 | $12,590,359 |
| Total Assets | $1,549,880,841 | $167,528,930 | $1,369,761,552 | $12,590,359 |
| Liabilities | | | | |
| Other Financial Instruments | | | | |
| Forward Currency Contracts | $ (43,143) | $ — | $ (43,143) | $ — |
| Total Liabilities | $(43,143) | $— | $(43,143) | $— |
A rollforward of fair value measurements using significant unobservable inputs (Level 3) for the six months ended March 31, 2020 is as follows:
| STRATEGIC INCOME FUND | COMMON
STOCK | MORTGAGE
BACKED | ASSET BACKED
SECURITIES | CORPORATE
BONDS | LOAN
PARTICIPATIONS | TOTAL(e) |
| Beginning Balance 9/30/2019 | $ 8,893 | $ 46,280 | $ 4,784,651 | $ 10,672,785 | $ 21,360 | $ 15,533,969 |
| Accrued Discounts (Premiums) | – | (84) | 642 | 22,306 | – | 22,864 |
| Net Realized Gain (Loss)(a) | – | (76) | 8,313 | – | – | 8,237 |
| Gross Purchases | – | – | 6,000,000 | 522,249 | 163 | 6,522,412 |
| Gross Sales | – | (30,759) | (681,113) | (40,811) | – | (752,683) |
| Net Change in Unrealized Appreciation (Depreciation)(b)(c) | – | 160 | (818,380) | (663,587) | – | (1,481,807) |
| Transfers into Level 3 | – | – | – | – | – | – |
| Transfers out of Level 3(d) | – | – | – | (7,262,633) | – | (7,262,633) |
| Ending Balance 3/31/2020 | $8,893 | $15,521 | $9,294,113 | $3,250,309 | $21,523 | $12,590,359 |
| (a) | Amount of net realized gain (loss) from investments recognized in income is included in the Fund’s Statement of Operations for the six months ended March 31, 2020. |
| (b) | Amount of net change in unrealized appreciation (depreciation) on investments recognized in income is included in the Fund’s Statement of Operations for the six months ended March 31, 2020. |
| (c) | The net change in unrealized appreciation (depreciation) attributable to securities owned at March 31, 2020, which were valued using significant unobservable inputs, was $(1,485,443). This is included within net change in unrealized appreciation (depreciation) on investments in the Fund’s the Statement of Operations for the six months ended March 31, 2020. |
| (d) | Transfers into or out of Level 3 were out of or into Level 2, and were due to changes in other significant observable inputs available during the six months ended March 31, 2020. Transfers into or out of Level 3 are based on the beginning market value of the period in which they occurred. |
| (e) | Level 3 investments represent 0.81% of total net assets at the six months ended March 31, 2020. Significant fluctuations of the unobservable inputs applied to portfolio securities characterized as Level 3 investments could be expected to increase or decrease the fair value of these portfolio securities. |
Thornburg Fixed Income Funds Semi-Annual Report | 67
Notes to Financial Statements, Continued
March 31, 2020 (Unaudited)
NOTE 4 – INVESTMENT MANAGEMENT FEE AND OTHER TRANSACTIONS WITH AFFILIATES
Pursuant to an investment management agreement, the Advisor serves as the investment advisor and performs services for the Funds for which the fees are payable at the end of each month. Under the investment advisory agreement, Funds pay the Advisor a management fee based on the average daily net assets of the Funds at an annual rate as shown in the following table:
| LIMITED TERM U.S. GOVERNMENT FUND | LIMITED TERM INCOME FUND | LOW DURATION INCOME FUND | STRATEGIC INCOME FUND |
| DAILY NET ASSETS | FEE RATE | DAILY NET ASSETS | FEE RATE | DAILY NET ASSETS | FEE RATE | DAILY NET ASSETS | FEE RATE |
| Up to $1 billion | 0.375% | Up to $500 million | 0.500% | Up to $1 Billion | 0.400% | Up to $500 million | 0.750% |
| Next $1 billion | 0.325 | Next $500 million | 0.450 | Next $500 million | 0.300 | Next $500 million | 0.675 |
| Over $2 billion | 0.275 | Next $500 million | 0.400 | Next $500 million | 0.250 | Next $500 million | 0.625 |
| | | Next $500 million | 0.350 | Over $2 billion | 0.225 | Next $500 million | 0.575 |
| | | Over $2 billion | 0.275 | | | Over $2 billion | 0.500 |
The Funds’ effective management fees of as a percentage of the Funds’ average daily net assets (before applicable management fee waivers) for the six months ended March 31, 2020 were as shown in the following table. Total management fees incurred by the Funds for the six months ended March 31, 2020 are set forth in the Statement of Operations.
| | Effective
Management
Fee |
| Limited Term U.S. Government Fund | 0.375% |
| Limited Term Income Fund | 0.327 |
| Low Duration Income Fund | 0.400 |
| Strategic Income Fund | 0.676 |
The Trust has entered into an administrative services agreement with the Advisor, whereby the Advisor will perform certain administrative services related to each class of the Funds’ shares. The fees are computed as an annual percentage of the aggregate average daily net assets of all shares classes of all Funds in the Trust as follows:
| Administration Fee Schedule |
| Daily Net Assets | Fee Rate |
| Up to $20 billion | 0.100% |
| $20 billion to $40 billion | 0.075 |
| $40 billion to $60 billion | 0.040 |
| Over $60 billion | 0.030 |
The aggregate fee amount is allocated on a daily basis to each Fund based on net assets and subsequently allocated to each class of shares of the Funds. Total administrative service fees incurred by each class of shares of the Funds for the six months ended March 31, 2020, are set forth in the Statement of Operations.
The Trust has an underwriting agreement with Thornburg Securities Corporation (the “Distributor”), an affiliate of the Advisor, which acts as the distributor of the Funds’ shares. For the six months ended March 31, 2020, the Distributor has advised the Funds that they earned net commissions from the sale of Class A shares and collected contingent deferred sales charges ("CDSC Fees") from redemptions of Class C shares as follows:
| | LIMITED TERM U.S. GOVERNMENT FUND | LIMITED TERM INCOME FUND | LOW DURATION INCOME FUND | STRATEGIC INCOME FUND |
| Commissions | $ 471 | $ 2,649 | $ 89 | $ 25,305 |
| CDSC fees | 6 | 7,200 | — | 3,926 |
Pursuant to a service plan under Rule 12b-1 of the 1940 Act, the Funds may reimburse to the Distributor an amount not to exceed .25 of 1% per annum of the average daily net assets attributable to the applicable Class A, Class C, Class I, Class R3, Class R4, and Class R5 shares of the Limited Term U.S. Government Fund, Limited Term Income Fund and Strategic Income Fund and .20 of 1% per annum of the average daily net assets attributable to the applicable Class A and Class I of the Low Duration Income Fund for payments made by the
68 | Thornburg Fixed Income Funds Semi-Annual Report
Notes to Financial Statements, Continued
March 31, 2020 (Unaudited)
Distributor to securities dealers and other financial institutions to obtain various shareholder and distribution related services. For the six months ended March 31, 2020, there were no 12b-1 service plan fees charged for Class I or Class R5 shares. Class R6 shares are not subject to a service plan. The Advisor and Distributor each may pay out of its own resources additional expenses for distribution of each Funds’ shares and shareholder services.
The Trust has also adopted a distribution plan pursuant to Rule 12b-1, applicable to each Fund’s Class C and Class R3 shares, under which the Funds compensate the Distributor for services in promoting the sale of Class C and R3 shares of the Funds at an annual rate of up to .25 of 1% per annum of the average daily net assets attributable to Class C and Class R3 shares. Total fees incurred by each class of shares of the Funds under their respective service and distribution plans for the six months ended March 31, 2020, are set forth in the Statements of Operations.
The Advisor has contractually agreed to waive fees and reimburse expenses incurred by the Funds. The agreement may be terminated by the Funds at any time, but may not be terminated by the Advisor before February 1, 2021, unless the Advisor ceases to be the investment advisor to the Funds prior to that date. The Advisor may recoup amounts waived or reimbursed during the six months ended March 31, 2020 if, during the fiscal year, expenses fall below the contractual limit that was in place at the time these fees and expenses were waived or reimbursed. The Advisor will not recoup fees or expenses as described in the preceding sentence if that recoupment would cause the Fund’s total annual operating expenses (after the recoupment is taken into account) to exceed the lesser of: (a) the expense cap that was in place at the time the waiver or reimbursement occurred; or (b) the expense cap that is in place at the time of the recoupment.
Actual expenses of certain share classes do not exceed levels as specified in each Fund’s most recent prospectus as shown on the following table:
| | Class A | Class C | Class I | Class R3 | Class R4 | Class R5 | Class R6 |
| Limited Term U.S. Government Fund | —% | —% | —% | 0.99% | 0.99% | 0.67% | —% |
| Limited Term Income Fund | — | — | 0.49 | 0.99 | 0.99 | 0.49 | 0.42 |
| Low Duration Income Fund | 0.70 | — | 0.50 | — | — | — | — |
| Strategic Income Fund | 1.05 | 1.80 | 0.60 | 1.25 | 1.25 | 0.60 | 0.53 |
For the six months ended March 31, 2020, the Advisor contractually reimbursed certain class specific expenses and distribution fees and voluntarily waived Fund level investment advisory fees as follows:
| Contractual: | Class A | Class C | Class I | Class R3 | Class R4 | Class R5 | Class R6 |
| Limited Term U.S. Government Fund | $ — | $ — | $ — | $ 12,061 | $ 7,625 | $ 10,495 | $ — |
| Limited Term Income Fund | — | — | 160,688 | 12,717 | 11,247 | 69,035 | 17,347 |
| Low Duration Income Fund | 22,561 | — | 24,073 | — | — | — | — |
| Strategic Income Fund | 245,026 | 130,232 | 1,945,934 | 8,080 | 8,511 | 46,737 | 43,973 |
| Voluntary: | Class A | Class C | Class I | Class R3 | Class R4 | Class R5 | Class R6 |
| Low Duration Income Fund | $ 8,747 | $ — | $ 30,507 | $ — | $ — | $ — | $ — |
| Strategic Income Fund | 53,343 | 28,359 | 303,326 | 378 | 328 | 6,383 | 5,593 |
Certain officers and Trustees of the Trust are also officers or directors of the Advisor and Distributor. The compensation of the independent Trustees is borne by the Trust. The Trust also pays a portion of the Chief Compliance Officer’s compensation. These amounts are reflected as Trustee and officer fees in the Statement of Operations.
The percentage of direct investments in the Funds held by the Trustees, officers of the Trust, and the Advisor is approximately 7.88% for Limited Term U.S. Government Fund, 0.08% for Limited Term Income Fund, 34.29% for Low Duration Income Fund, 1.03% for Strategic Income Fund.
The Funds may purchase or sell securities from or to an affiliated fund, provided the affiliation is due solely to having a common investment advisor, common officers, or common trustees, and provided that all such transactions will comply with Rule 17a-7 under the 1940 Act. For the six months ended March 31, 2020, Limited Term U.S. Government Fund had transactions with affiliated funds of $18,127,798 in purchases and $1,336,324 in sales generating no realized gains or losses, Limited Term Income Fund had transactions with affiliated funds of $235,285 in purchases and $8,377,471 in sales generating realized gains of $228,759, Low Duration Income Fund had transactions with affiliated funds of $151,271 in purchases and $653,597 in sales generating realized gains of $30,291, Strategic Income Fund had transactions with affiliated funds of $7,107,831 in sales generating realized gains of $147,575.
Thornburg Fixed Income Funds Semi-Annual Report | 69
Notes to Financial Statements, Continued
March 31, 2020 (Unaudited)
Shown below are holdings of voting securities of each portfolio company which is considered "affiliated" to the Funds under the 1940 Act, including companies for which the Funds’ holding represented 5% or more of the company’s voting securities, and a series of the Thornburg Investment Trust in which the Funds’ invested for cash management purposes during the period:
| LIMITED TERM INCOME FUND | Market Value
9/30/19 | Purchases
at Cost | Sales
Proceeds | Realized
Gain
(Loss) | Change in
Unrealized
Appr./(Depr.) | Market Value
3/31/20 | Dividend
Income |
| Thornburg Capital Mgmt. Fund | $- | $933,994,958 | $(749,288,329) | $- | $- | $184,706,629 | $1,529,758 |
| LOW DURATION INCOME FUND | | | | | | | |
| Thornburg Capital Mgmt. Fund | $4,400,701 | $10,173,623 | $(12,666,096) | $- | $- | $1,908,228 | $29,767 |
| STRATEGIC INCOME FUND | | | | | | | |
| Thornburg Capital Mgmt. Fund | $202,542,770 | $378,072,200 | $(442,236,710) | $- | $- | $138,378,260 | $1,861,772 |
NOTE 5 – TAXES
Federal Income Taxes: It is the policy of the Trust to comply with the provisions of the Internal Revenue Code applicable to regulated investment companies and to distribute to shareholders substantially all investment company taxable income including net realized gains on investments (if any), and tax exempt income of the Funds. Therefore, no provision for federal income or excise tax is required.
The Funds file income tax returns in United States federal and applicable state jurisdictions. The statute of limitations on the Funds’ tax return filings generally remains open for the three years following a return’s filing date. The Funds have analyzed each uncertain tax position believed to be material in the preparation of the Funds’ financial statements for the six month period ended March 31, 2020, including open tax years, to assess whether it is more likely than not that the position would be sustained upon examination, based on the technical merits of the position. The Funds have not identified any such position for which an asset or liability must be reflected in the Statement of Assets and Liabilities.
At March 31, 2020, information on the tax components of capital was as follows:
| | Cost | Unrealized
Appreciation | Unrealized
Depreciation | Net Unrealized
Appreciation
(Depreciation) |
| Limited Term U.S. Government Fund | $ 298,263,615 | $ 6,023,762 | $ (779,359) | $ 5,244,403 |
| Limited Term Income Fund | 5,828,620,578 | 109,230,296 | (148,573,588) | (39,343,292) |
| Low Duration Income Fund | 30,052,094 | 120,795 | (627,783) | (506,988) |
| Strategic Income Fund | 1,651,632,710 | 12,630,433 | (114,382,302) | (101,751,869) |
At March 31, 2020, the Strategic Income Fund had deferred tax basis late-year ordinary losses losses occurring subsequent to October 31, 2018 through September 30, 2019 of $1,413,244. For tax purposes, such losses will be recognized in the year ending September 30, 2020.
At March 31, 2020, the Funds had deferred tax basis capital losses occurring subsequent to October 31, 2018 through September 30, 2019 per the following table. For tax purposes, such losses will be recognized in the year ending September 30, 2020.
| | Capital Losses |
| Limited Term U.S. Government Fund | $ 1,001,586 |
At March 31, 2020, the Funds had cumulative tax basis capital losses from prior fiscal years as shown on the following table, which may be carried forward to offset future capital gains. To the extent such carryforwards are used, capital gain distributions may be reduced to the extent provided by regulations. Such capital loss carryforwards do not expire.
| | Cumulative Capital Losses |
| | Short-Term | Long-Term |
| Limited Term U.S. Government Fund | $ 2,368,435 | $ 9,134,051 |
| Strategic Income Fund | — | 21,517,681 |
Foreign Withholding Taxes: The Funds are subject to foreign tax withholding imposed by certain foreign countries in which the Funds may invest. Withholding taxes are incurred on certain foreign dividends and are accrued at the time the dividend is recognized based on
70 | Thornburg Fixed Income Funds Semi-Annual Report
Notes to Financial Statements, Continued
March 31, 2020 (Unaudited)
applicable foreign tax laws. The Funds may file withholding tax reclaims in certain jurisdictions to recover a portion of amounts previously withheld, in view of various considerations, including recent decisions rendered by the courts in those and other jurisdictions. The Funds would expect to record a receivable for such a reclaim based on a variety of factors, including assessment of a jurisdiction’s legal obligation to pay reclaims, the jurisdiction’s administrative practices and payment history, and industry convention. To date the Funds have recorded no such receivable because there is limited precedent for collecting such prior year reclaims and the likelihood of collection remains uncertain.
Deferred Foreign Capital Gain Taxes: The Funds are subject to a tax imposed on net realized gains of securities of certain foreign countries. The Funds record an estimated deferred tax liability for net unrealized gains on these investments as reflected in the accompanying financial statements. Such changes are included in net unrealized appreciation (depreciation) from investments in the Statement of Operations.
NOTE 6 – SHARES OF BENEFICIAL INTEREST
At March 31, 2020, there were an unlimited number of shares with no par value of beneficial interest authorized. Transactions in shares of beneficial interest were as follows:
| | SIX MONTHS ENDED
March 31, 2020 | YEAR ENDED
September 30, 2019 (AUDITED) |
| LIMITED TERM U.S. GOVERNMENT FUND | SHARES | AMOUNT | SHARES | AMOUNT |
| Class A Shares | | | | |
| Shares sold | 876,782 | $ 11,534,436 | 1,721,046 | $ 22,033,056 |
Shares issued to shareholders in
reinvestment of dividends | 41,717 | 548,202 | 88,399 | 1,142,632 |
| Shares repurchased | (582,608) | (7,666,399) | (2,246,645) | (28,859,215) |
| Net increase (decrease) | 335,891 | $ 4,416,239 | (437,200) | $ (5,683,527) |
| Class C Shares | | | | |
| Shares sold | 361,296 | $ 4,788,355 | 318,393 | $ 4,102,384 |
Shares issued to shareholders in
reinvestment of dividends | 7,359 | 97,279 | 17,901 | 232,658 |
| Shares repurchased | (280,562) | (3,706,445) | (692,937) | (8,979,052) |
| Net increase (decrease) | 88,093 | $ 1,179,189 | (356,643) | $ (4,644,010) |
| Class I Shares | | | | |
| Shares sold | 5,622,975 | $ 74,025,153 | 3,482,631 | $ 44,982,797 |
Shares issued to shareholders in
reinvestment of dividends | 86,531 | 1,137,380 | 151,069 | 1,954,051 |
| Shares repurchased | (2,365,658) | (31,073,184) | (2,934,949) | (37,751,496) |
| Net increase (decrease) | 3,343,848 | $ 44,089,349 | 698,751 | $ 9,185,352 |
| Class R3 Shares | | | | |
| Shares sold | 150,646 | $ 1,982,497 | 225,399 | $ 2,909,281 |
Shares issued to shareholders in
reinvestment of dividends | 5,100 | 67,054 | 9,883 | 127,893 |
| Shares repurchased | (168,362) | (2,209,250) | (246,350) | (3,180,724) |
| Net increase (decrease) | (12,616) | $ (159,699) | (11,068) | $ (143,550) |
| Class R4 Shares | | | | |
| Shares sold | 67,636 | $ 889,047 | 63,299 | $ 813,546 |
Shares issued to shareholders in
reinvestment of dividends | 1,492 | 19,605 | 2,778 | 35,914 |
| Shares repurchased | (29,719) | (390,086) | (88,727) | (1,138,965) |
| Net increase (decrease) | 39,409 | $ 518,566 | (22,650) | $ (289,505) |
Thornburg Fixed Income Funds Semi-Annual Report | 71
Notes to Financial Statements, Continued
March 31, 2020 (Unaudited)
| | SIX MONTHS ENDED
March 31, 2020 | YEAR ENDED
September 30, 2019 (AUDITED) |
| LIMITED TERM U.S. GOVERNMENT FUND | SHARES | AMOUNT | SHARES | AMOUNT |
| Class R5 Shares | | | | |
| Shares sold | 86,826 | $ 1,145,469 | 184,589 | $ 2,382,395 |
Shares issued to shareholders in
reinvestment of dividends | 715 | 9,406 | 1,872 | 24,305 |
| Shares repurchased | (15,647) | (205,755) | (170,048) | (2,218,737) |
| Net increase (decrease) | 71,894 | $ 949,120 | 16,413 | $ 187,963 |
| | SIX MONTHS ENDED
March 31, 2020 | YEAR ENDED
September 30, 2019 (AUDITED) |
| LIMITED TERM INCOME FUND | SHARES | AMOUNT | SHARES | AMOUNT |
| Class A Shares | | | | |
| Shares sold | 7,857,380 | $ 106,731,709 | 13,748,857 | $ 184,402,206 |
Shares issued to shareholders in
reinvestment of dividends | 732,724 | 9,911,491 | 1,084,259 | 14,505,433 |
| Shares repurchased | (12,855,463) | (173,794,840) | (19,129,192) | (254,871,606) |
| Net increase (decrease) | (4,265,359) | $ (57,151,640) | (4,296,076) | $ (55,963,967) |
| Class C Shares | | | | |
| Shares sold | 2,567,831 | $ 34,729,091 | 3,281,161 | $ 43,830,555 |
Shares issued to shareholders in
reinvestment of dividends | 398,026 | 5,374,515 | 615,065 | 8,208,672 |
| Shares repurchased | (3,692,565) | (49,893,178) | (11,120,955) | (148,187,445) |
| Net increase (decrease) | (726,708) | $ (9,789,572) | (7,224,729) | $ (96,148,218) |
| Class I Shares | | | | |
| Shares sold | 83,070,632 | $ 1,125,280,425 | 131,962,699 | $ 1,761,668,144 |
Shares issued to shareholders in
reinvestment of dividends | 5,561,881 | 75,273,519 | 7,121,081 | 95,348,794 |
| Shares repurchased | (64,156,529) | (865,554,309) | (91,879,373) | (1,223,804,494) |
| Net increase (decrease) | 24,475,984 | $ 334,999,635 | 47,204,407 | $ 633,212,444 |
| Class R3 Shares | | | | |
| Shares sold | 2,887,915 | $ 39,244,903 | 3,355,494 | $ 44,478,093 |
Shares issued to shareholders in
reinvestment of dividends | 76,780 | 1,038,756 | 132,659 | 1,772,552 |
| Shares repurchased | (1,232,896) | (16,674,054) | (5,469,939) | (72,837,641) |
| Net increase (decrease) | 1,731,799 | $ 23,609,605 | (1,981,786) | $ (26,586,996) |
| Class R4 Shares | | | | |
| Shares sold | 68,204 | $ 924,747 | 364,786 | $ 4,838,911 |
Shares issued to shareholders in
reinvestment of dividends | 5,497 | 74,330 | 8,707 | 116,439 |
| Shares repurchased | (330,326) | (4,470,711) | (385,528) | (5,170,028) |
| Net increase (decrease) | (256,625) | $ (3,471,634) | (12,035) | $ (214,678) |
| Class R5 Shares | | | | |
| Shares sold | 7,225,002 | $ 98,197,956 | 6,573,404 | $ 87,102,928 |
Shares issued to shareholders in
reinvestment of dividends | 151,296 | 2,044,545 | 229,191 | 3,061,860 |
| Shares repurchased | (1,969,825) | (26,574,329) | (7,572,567) | (100,538,226) |
| Net increase (decrease) | 5,406,473 | $ 73,668,172 | (769,972) | $ (10,373,438) |
72 | Thornburg Fixed Income Funds Semi-Annual Report
Notes to Financial Statements, Continued
March 31, 2020 (Unaudited)
| | SIX MONTHS ENDED
March 31, 2020 | YEAR ENDED
September 30, 2019 (AUDITED) |
| LIMITED TERM INCOME FUND | SHARES | AMOUNT | SHARES | AMOUNT |
| Class R6 Shares | | | | |
| Shares sold | 4,956,022 | $ 67,521,791 | 4,265,546 | $ 57,037,358 |
Shares issued to shareholders in
reinvestment of dividends | 98,839 | 1,338,689 | 91,789 | 1,232,605 |
| Shares repurchased | (1,001,862) | (13,465,341) | (2,169,399) | (28,866,795) |
| Net increase (decrease) | 4,052,999 | $ 55,395,139 | 2,187,936 | $ 29,403,168 |
| | SIX MONTHS ENDED
March 31, 2020 | YEAR ENDED
September 30, 2019 (AUDITED) |
| LOW DURATION INCOME FUND | SHARES | AMOUNT | SHARES | AMOUNT |
| Class A Shares | | | | |
| Shares sold | 122,279 | $ 1,516,919 | 469,668 | $ 5,773,137 |
Shares issued to shareholders in
reinvestment of dividends | 8,196 | 101,857 | 15,917 | 197,238 |
| Shares repurchased | (301,331) | (3,738,871) | (425,106) | (5,249,049) |
| Net increase (decrease) | (170,856) | $ (2,120,095) | 60,479 | $ 721,326 |
| Class I Shares | | | | |
| Shares sold | 314,110 | $ 3,914,832 | 2,398,897 | $ 29,598,268 |
Shares issued to shareholders in
reinvestment of dividends | 28,323 | 351,544 | 46,385 | 574,411 |
| Shares repurchased | (345,838) | (4,287,063) | (2,305,834) | (28,502,243) |
| Net increase (decrease) | (3,405) | $ (20,687) | 139,448 | $ 1,670,436 |
| | SIX MONTHS ENDED
March 31, 2020 | YEAR ENDED
September 30, 2019 (AUDITED) |
| STRATEGIC INCOME FUND | SHARES | AMOUNT | SHARES | AMOUNT |
| Class A Shares | | | | |
| Shares sold | 2,222,072 | $ 26,372,524 | 4,602,506 | $ 54,164,265 |
Shares issued to shareholders in
reinvestment of dividends | 262,691 | 3,107,433 | 545,564 | 6,404,897 |
| Shares repurchased | (2,577,708) | (30,451,792) | (4,105,748) | (48,086,770) |
| Net increase (decrease) | (92,945) | $ (971,835) | 1,042,322 | $ 12,482,392 |
| Class C Shares | | | | |
| Shares sold | 637,882 | $ 7,550,882 | 1,497,612 | $ 17,532,219 |
Shares issued to shareholders in
reinvestment of dividends | 104,775 | 1,237,513 | 284,168 | 3,326,973 |
| Shares repurchased | (1,665,066) | (19,625,763) | (4,716,285) | (55,259,496) |
| Net increase (decrease) | (922,409) | $ (10,837,368) | (2,934,505) | $ (34,400,304) |
| Class I Shares | | | | |
| Shares sold | 29,947,049 | $ 352,021,884 | 50,512,264 | $ 590,315,060 |
Shares issued to shareholders in
reinvestment of dividends | 1,589,884 | 18,741,404 | 2,632,522 | 30,881,194 |
| Shares repurchased | (20,093,501) | (233,698,488) | (22,772,557) | (265,739,938) |
| Net increase (decrease) | 11,443,432 | $ 137,064,800 | 30,372,229 | $ 355,456,316 |
| Class R3 Shares | | | | |
| Shares sold | 17,925 | $ 213,287 | 25,351 | $ 297,418 |
Shares issued to shareholders in
reinvestment of dividends | 808 | 9,541 | 2,366 | 27,737 |
| Shares repurchased | (61,480) | (714,682) | (57,329) | (673,015) |
| Net increase (decrease) | (42,747) | $ (491,854) | (29,612) | $ (347,860) |
Thornburg Fixed Income Funds Semi-Annual Report | 73
Notes to Financial Statements, Continued
March 31, 2020 (Unaudited)
| | SIX MONTHS ENDED
March 31, 2020 | YEAR ENDED
September 30, 2019 (AUDITED) |
| STRATEGIC INCOME FUND | SHARES | AMOUNT | SHARES | AMOUNT |
| Class R4 Shares | | | | |
| Shares sold | 7,847 | $ 93,323 | 55,791 | $ 650,716 |
Shares issued to shareholders in
reinvestment of dividends | 1,414 | 16,689 | 3,645 | 42,591 |
| Shares repurchased | (2,960) | (35,107) | (139,493) | (1,619,766) |
| Net increase (decrease) | 6,301 | $ 74,905 | (80,057) | $ (926,459) |
| Class R5 Shares | | | | |
| Shares sold | 2,494,618 | $ 29,701,186 | 629,213 | $ 7,426,138 |
Shares issued to shareholders in
reinvestment of dividends | 36,769 | 431,927 | 24,925 | 292,321 |
| Shares repurchased | (260,306) | (3,038,509) | (351,588) | (4,139,886) |
| Net increase (decrease) | 2,271,081 | $ 27,094,604 | 302,550 | $ 3,578,573 |
| Class R6 Shares | | | | |
| Shares sold | 442,657 | $ 5,262,907 | 1,076,161 | $ 12,806,841 |
Shares issued to shareholders in
reinvestment of dividends | 10,113 | 119,513 | 19,711 | 231,827 |
| Shares repurchased | (374,729) | (4,335,350) | (112,525) | (1,321,573) |
| Net increase (decrease) | 78,041 | $ 1,047,070 | 983,347 | $ 11,717,095 |
NOTE 7 – INVESTMENT TRANSACTIONS
For the six months ended March 31, 2020, the Funds had purchase and sale transactions of investments (excluding short-term investments and U.S. Government obligations) as below.
| | Purchases | Sales |
| Limited Term U.S. Government Fund | $ 115,566,322 | $ 13,853,728 |
| Limited Term Income Fund | 2,543,919,591 | 1,677,865,477 |
| Low Duration Income Fund | 10,898,041 | 6,699,014 |
| Strategic Income Fund | 793,967,683 | 494,725,328 |
NOTE 8 – DERIVATIVE FINANCIAL INSTRUMENTS WITH OFF-BALANCE
SHEET RISK AND FOREIGN INVESTMENT RISK
The Funds may use a variety of derivative financial instruments to hedge or adjust the risks affecting its investment portfolio or to enhance investment returns. Provisions of the FASB Accounting Standards Codification 815-10-50 (“ASC 815”) require certain disclosures. The disclosures are intended to provide users of financial statements with an understanding of the use of derivative instruments by the Funds and how these derivatives affect the financial position, financial performance and cash flows of the Funds. The Funds do not designate any derivative instruments as hedging instruments under ASC 815. During the six months ended March 31, 2020, the Funds’ principal exposure to derivative financial instruments of the type addressed by ASC 815 was investment in foreign currency contracts. A foreign currency contract is an agreement between two parties to exchange different currencies at a specified rate of exchange at an agreed upon future date. Foreign currency contracts involve risks to the Funds, including the risk that a contract’s counterparty will not meet its obligations to the Funds, the risk that a change in a contract’s value may not correlate perfectly with the currency the contract was intended to track, and the risk that the Funds’ Advisor is unable to correctly implement its strategy in using a contract. In any such instance, the Funds may not achieve the intended benefit of entering into a contract, and may experience a loss.
The Funds entered into forward currency contracts during the six months ended March 31, 2020 in the normal course of pursuing its investment objectives, with the objective of purchasing foreign investments or with the intent of reducing the risk to the value of the Funds’ foreign investments from adverse changes in the relationship between the U.S. dollar and foreign currencies. In each case these contracts have been initiated in conjunction with foreign investment transactions. The monthly average value of open forward currency sell contracts for the six months ended March 31, 2020 for Strategic Income Fund was $2,263,447.
These contracts are accounted for by the Funds under ASC 815. Unrealized appreciation and depreciation on outstanding contracts are reported in each Fund’s Statement of Assets and Liabilities, as measured by the difference between the forward exchange rates at the
74 | Thornburg Fixed Income Funds Semi-Annual Report
Notes to Financial Statements, Continued
March 31, 2020 (Unaudited)
reporting date and the forward exchange rates at each contract’s inception date. Net realized gain (loss) on contracts closed during the period, and changes in net unrealized appreciation (depreciation) on outstanding contracts are recognized in each Fund’s Statement of Operations.
The outstanding forward currency contracts in the table located in the Strategic Income Fund’s Schedule of Investments, which were entered into with State Street Bank and Trust Company (“SSB”), were entered into pursuant to an International Swaps and Derivatives Association (“ISDA”) Master Agreement. In the event of a default or termination under the ISDA Master Agreement with SSB, the non-defaulting party has the right to close out all outstanding forward currency contracts between the parties and to net any payment amounts under those contracts, resulting in a single net amount payable by one party to the other.
Because the ISDA Master Agreement with SSB does not result in an offset of reported amounts of financial assets and liabilities in the Strategic Income Fund’s Statement of Assets and Liabilities unless there has been an event of default or termination event under that agreement, the Fund does not net its outstanding forward currency contracts for purposes of the disclosure in the Strategic Income Fund’s Statement of Assets and Liabilities. Instead the Fund recognizes the unrealized appreciation (depreciation) on those forward currency contracts on a gross basis in the Strategic Income Fund’s Statement of Assets and Liabilities.
The unrealized appreciation (depreciation) of the outstanding forward currency contracts recognized in the Strategic Income Fund’s Statement of Assets and Liabilities at March 31, 2020 is disclosed in the following table:
STRATEGIC INCOME FUND
| FAIR VALUES OF DERIVATIVE FINANCIAL INSTRUMENTS AT MARCH 31, 2020 |
| LIABILITY DERIVATIVES | BALANCE SHEET LOCATION | FAIR VALUE |
| Foreign currency contracts | Liabilities - Unrealized depreciation on forward currency contracts | $ (43,143) |
Because the Strategic Income Fund does not receive or post cash collateral in connection with its forward currency contracts during the period, the net amounts of the Strategic Income Fund’s assets and liabilities which are attributable to those contracts at March 31, 2020 can be determined by offsetting the dollar amounts shown in the preceding table. Based on those amounts, the net amount of the Strategic Income Fund’s assets which is attributable to its outstanding forward currency contracts with SSB at March 31, 2020 is $0, and the net amount of the liabilities is $43,143. The Strategic Income Fund’s forward currency contracts are valued each day, and the net amounts of the Fund’s assets and liabilities which are attributable to those contracts are expected to vary over time.
The net realized gain (loss) from forward currency contracts and the net change in unrealized appreciation (depreciation) on outstanding forward currency contracts recognized in the Strategic Income Fund’s Statement of Operations for the six months ended March 31, 2020 are disclosed in the following table:
NET REALIZED GAIN (LOSS) ON DERIVATIVE FINANCIAL INSTRUMENTS
RECOGNIZED IN INCOME FOR THE SIX MONTHS ENDED March 31, 2020 |
| | TOTAL | FORWARD CURRENCY CONTRACTS |
| Foreign currency contracts | $ 79,435 | $ 79,435 |
NET CHANGE IN UNREALIZED APPRECIATION (DEPRECIATION) OF DERIVATIVE FINANCIAL INSTRUMENTS
RECOGNIZED IN INCOME FOR THE SIX MONTHS ENDED March 31, 2020 |
| | TOTAL | FORWARD CURRENCY CONTRACTS |
| Foreign currency contracts | $ (160,598) | $ (160,598) |
Thornburg Fixed Income Funds Semi-Annual Report | 75
Financial Highlights
Limited Term U.S. Government Fund
| | PER SHARE PERFORMANCE (FOR A SHARE OUTSTANDING THROUGHOUT THE PERIOD) |
UNLESS OTHERWISE
NOTED, PERIODS ARE
FISCAL YEARS ENDED
SEPTEMBER 30, | Net Asset
Value,
Beginning of
PERIOD | Net
Investment
Income
(Loss)+ | Net Realized &
Unrealized Gain
(Loss) on
Investments | Total from
Investment
Operations | Dividends
from Net
Investment
Income | Dividends
from Net
Realized
Gains | Total
Dividends | Net Asset
Value,
End of PERIOD |
| CLASS A SHARES(b) |
| 2020(c) | $ 13.10 | 0.09 | 0.15 | 0.24 | (0.11) | — | (0.11) | $ 13.23 |
| 2019 | $ 12.69 | 0.19 | 0.45 | 0.64 | (0.23) | — | (0.23) | $ 13.10 |
| 2018 | $ 13.01 | 0.18 | (0.28) | (0.10) | (0.22) | — | (0.22) | $ 12.69 |
| 2017 | $ 13.25 | 0.14 | (0.20) | (0.06) | (0.18) | — | (0.18) | $ 13.01 |
| 2016(e) | $ 13.26 | 0.14 | 0.05 | 0.19 | (0.20) | — | (0.20) | $ 13.25 |
| 2015 | $ 13.27 | 0.15 | 0.06 | 0.21 | (0.22) | — | (0.22) | $ 13.26 |
| CLASS C SHARES |
| 2020(c) | $ 13.17 | 0.07 | 0.16 | 0.23 | (0.09) | — | (0.09) | $ 13.31 |
| 2019 | $ 12.77 | 0.15 | 0.43 | 0.58 | (0.18) | — | (0.18) | $ 13.17 |
| 2018 | $ 13.09 | 0.14 | (0.28) | (0.14) | (0.18) | — | (0.18) | $ 12.77 |
| 2017 | $ 13.33 | 0.10 | (0.20) | (0.10) | (0.14) | — | (0.14) | $ 13.09 |
| 2016 | $ 13.34 | 0.11 | 0.04 | 0.15 | (0.16) | — | (0.16) | $ 13.33 |
| 2015 | $ 13.35 | 0.12 | 0.06 | 0.18 | (0.19) | — | (0.19) | $ 13.34 |
| CLASS I SHARES |
| 2020(c) | $ 13.10 | 0.11 | 0.15 | 0.26 | (0.13) | — | (0.13) | $ 13.23 |
| 2019 | $ 12.69 | 0.23 | 0.44 | 0.67 | (0.26) | — | (0.26) | $ 13.10 |
| 2018 | $ 13.01 | 0.22 | (0.28) | (0.06) | (0.26) | — | (0.26) | $ 12.69 |
| 2017 | $ 13.26 | 0.18 | (0.20) | (0.02) | (0.23) | — | (0.23) | $ 13.01 |
| 2016 | $ 13.26 | 0.19 | 0.05 | 0.24 | (0.24) | — | (0.24) | $ 13.26 |
| 2015 | $ 13.27 | 0.19 | 0.06 | 0.25 | (0.26) | — | (0.26) | $ 13.26 |
| CLASS R3 SHARES |
| 2020(c) | $ 13.10 | 0.08 | 0.17 | 0.25 | (0.11) | — | (0.11) | $ 13.24 |
| 2019 | $ 12.70 | 0.18 | 0.44 | 0.62 | (0.22) | — | (0.22) | $ 13.10 |
| 2018 | $ 13.02 | 0.17 | (0.28) | (0.11) | (0.21) | — | (0.21) | $ 12.70 |
| 2017 | $ 13.26 | 0.13 | (0.19) | (0.06) | (0.18) | — | (0.18) | $ 13.02 |
| 2016 | $ 13.27 | 0.14 | 0.04 | 0.18 | (0.19) | — | (0.19) | $ 13.26 |
| 2015 | $ 13.28 | 0.14 | 0.06 | 0.20 | (0.21) | — | (0.21) | $ 13.27 |
| CLASS R4 SHARES |
| 2020(c) | $ 13.09 | 0.08 | 0.17 | 0.25 | (0.11) | — | (0.11) | $ 13.23 |
| 2019 | $ 12.69 | 0.18 | 0.43 | 0.61 | (0.21) | — | (0.21) | $ 13.09 |
| 2018 | $ 13.01 | 0.17 | (0.28) | (0.11) | (0.21) | — | (0.21) | $ 12.69 |
| 2017 | $ 13.25 | 0.12 | (0.19) | (0.07) | (0.17) | — | (0.17) | $ 13.01 |
| 2016 | $ 13.26 | 0.14 | 0.04 | 0.18 | (0.19) | — | (0.19) | $ 13.25 |
| 2015 | $ 13.27 | 0.13 | 0.08 | 0.21 | (0.22) | — | (0.22) | $ 13.26 |
| CLASS R5 SHARES |
| 2020(c) | $ 13.11 | 0.11 | 0.15 | 0.26 | (0.13) | — | (0.13) | $ 13.24 |
| 2019 | $ 12.70 | 0.23 | 0.44 | 0.67 | (0.26) | — | (0.26) | $ 13.11 |
| 2018 | $ 13.02 | 0.21 | (0.28) | (0.07) | (0.25) | — | (0.25) | $ 12.70 |
| 2017 | $ 13.28 | 0.18 | (0.21) | (0.03) | (0.23) | — | (0.23) | $ 13.02 |
| 2016 | $ 13.27 | 0.17 | 0.07 | 0.24 | (0.23) | — | (0.23) | $ 13.28 |
| 2015 | $ 13.27 | 0.19 | 0.07 | 0.26 | (0.26) | — | (0.26) | $ 13.27 |
| (a) | Not annualized for periods less than one year. |
| (b) | Sales loads are not reflected in computing total return. |
| (c) | Unaudited Six Month Period Ended March 31. |
| (d) | Annualized. |
| (e) | Class B shares converted to Class A shares on August 29, 2016. |
| (f) | Due to the size of net assets and fixed expenses, ratios may appear disproportionate. |
| + | Based on weighted average shares outstanding. |
See notes to financial statements.
76 | Thornburg Fixed Income Funds Semi-Annual Report
Financial Highlights, Continued
Limited Term U.S. Government Fund
| | RATIOS TO AVERAGE NET ASSETS | | Supplemental Data |
UNLESS OTHERWISE
NOTED, PERIODS ARE
FISCAL YEARS ENDED
SEPTEMBER 30, | Net Investment
Income (Loss) (%) | Expenses, After
Expense
Reductions (%) | Expenses,
Before Expense
Reductions (%) | | Total
Return (%)(a) | Portfolio
Turnover
Rate (%)(a) | Net Assets
at End of PERIOD
(Thousands) |
| CLASS A SHARES(b) |
| 2020(c) | 1.41(d) | 0.88(d) | 0.88(d) | | 1.87 | 6.14 | $ 71,276 |
| 2019 | 1.48 | 0.90 | 0.90 | | 5.06 | 29.37 | $ 66,140 |
| 2018 | 1.42 | 0.91 | 0.91 | | (0.77) | 5.93 | $ 69,634 |
| 2017 | 1.03 | 0.93 | 0.93 | | (0.43) | 11.05 | $ 84,674 |
| 2016(e) | 1.08 | 0.91 | 0.91 | | 1.41 | 9.78 | $ 111,874 |
| 2015 | 1.15 | 0.92 | 0.92 | | 1.62 | 14.15 | $ 104,933 |
| CLASS C SHARES |
| 2020(c) | 1.12(d) | 1.17(d) | 1.17(d) | | 1.79 | 6.14 | $ 16,954 |
| 2019 | 1.13 | 1.24 | 1.24 | | 4.60 | 29.37 | $ 15,618 |
| 2018 | 1.10 | 1.23 | 1.23 | | (1.08) | 5.93 | $ 19,686 |
| 2017 | 0.73 | 1.23 | 1.24 | | (0.72) | 11.05 | $ 34,821 |
| 2016 | 0.81 | 1.19 | 1.20 | | 1.13 | 9.78 | $ 48,369 |
| 2015 | 0.88 | 1.20 | 1.21 | | 1.34 | 14.15 | $ 46,777 |
| CLASS I SHARES |
| 2020(c) | 1.68(d) | 0.60(d) | 0.60(d) | | 2.01 | 6.14 | $ 191,045 |
| 2019 | 1.76 | 0.62 | 0.62 | | 5.35 | 29.37 | $ 145,273 |
| 2018 | 1.73 | 0.60 | 0.60 | | (0.47) | 5.93 | $ 131,898 |
| 2017 | 1.36 | 0.60 | 0.60 | | (0.18) | 11.05 | $ 147,464 |
| 2016 | 1.43 | 0.57 | 0.57 | | 1.83 | 9.78 | $ 144,437 |
| 2015 | 1.45 | 0.62 | 0.62 | | 1.93 | 14.15 | $ 112,853 |
| CLASS R3 SHARES |
| 2020(c) | 1.29(d) | 0.99(d) | 1.25(d) | | 1.88 | 6.14 | $ 9,110 |
| 2019 | 1.39 | 0.99 | 1.43 | | 4.88 | 29.37 | $ 9,181 |
| 2018 | 1.34 | 0.99 | 1.45 | | (0.85) | 5.93 | $ 9,036 |
| 2017 | 1.00 | 0.97 | 1.40 | | (0.47) | 11.05 | $ 10,871 |
| 2016 | 1.03 | 0.98 | 1.30 | | 1.34 | 9.78 | $ 28,036 |
| 2015 | 1.09 | 0.99 | 1.35 | | 1.55 | 14.15 | $ 16,320 |
| CLASS R4 SHARES |
| 2020(c) | 1.29(d) | 0.99(d) | 1.60(d) | | 1.89 | 6.14 | $ 2,838 |
| 2019 | 1.38 | 0.99 | 1.78 | | 4.88 | 29.37 | $ 2,293 |
| 2018 | 1.35 | 0.99 | 1.75 | | (0.85) | 5.93 | $ 2,509 |
| 2017 | 0.96 | 0.99 | 1.95 | | (0.49) | 11.05 | $ 3,365 |
| 2016 | 1.04 | 0.99 | 2.71 | | 1.33 | 9.78 | $ 2,097 |
| 2015 | 1.00 | 0.99 | 17.30(f) | | 1.55 | 14.15 | $ 706 |
| CLASS R5 SHARES |
| 2020(c) | 1.62(d) | 0.67(d) | 2.79(d) | | 1.97 | 6.14 | $ 1,859 |
| 2019 | 1.80 | 0.67 | 2.04 | | 5.29 | 29.37 | $ 897 |
| 2018 | 1.60 | 0.65 | 1.94 | | (0.52) | 5.93 | $ 661 |
| 2017 | 1.40 | 0.58 | 1.21 | | (0.23) | 11.05 | $ 4,131 |
| 2016 | 1.30 | 0.67 | 2.05 | | 1.80 | 9.78 | $ 570 |
| 2015 | 1.40 | 0.67 | 2.02 | | 1.95 | 14.15 | $ 2,170 |
Thornburg Fixed Income Funds Semi-Annual Report | 77
Financial Highlights
Limited Term Income Fund
| | PER SHARE PERFORMANCE (FOR A SHARE OUTSTANDING THROUGHOUT THE PERIOD) |
UNLESS OTHERWISE
NOTED, PERIODS ARE
FISCAL YEARS ENDED
SEPTEMBER 30, | Net Asset
Value,
Beginning of
PERIOD | Net
Investment
Income
(Loss)+ | Net Realized &
Unrealized Gain
(Loss) on
Investments | Total from
Investment
Operations | Dividends
from Net
Investment
Income | Dividends
from Net
Realized
Gains | Total
Dividends | Net Asset
Value,
End of PERIOD |
| CLASS A SHARES(b) |
| 2020(c) | $ 13.61 | 0.14 | (0.17) | (0.03) | (0.15) | (0.10) | (0.25) | $ 13.33 |
| 2019 | $ 13.16 | 0.33 | 0.45 | 0.78 | (0.33) | — | (0.33) | $ 13.61 |
| 2018 | $ 13.44 | 0.28 | (0.27) | 0.01 | (0.29) | — | (0.29) | $ 13.16 |
| 2017 | $ 13.51 | 0.24 | (0.07) | 0.17 | (0.24) | — | (0.24) | $ 13.44 |
| 2016 | $ 13.32 | 0.24 | 0.20 | 0.44 | (0.25) | — | (0.25) | $ 13.51 |
| 2015 | $ 13.49 | 0.26 | (0.09) | 0.17 | (0.27) | (0.07) | (0.34) | $ 13.32 |
| CLASS C SHARES |
| 2020(c) | $ 13.59 | 0.12 | (0.18) | (0.06) | (0.13) | (0.10) | (0.23) | $ 13.30 |
| 2019 | $ 13.14 | 0.30 | 0.46 | 0.76 | (0.31) | — | (0.31) | $ 13.59 |
| 2018 | $ 13.42 | 0.25 | (0.27) | (0.02) | (0.26) | — | (0.26) | $ 13.14 |
| 2017 | $ 13.49 | 0.21 | (0.06) | 0.15 | (0.22) | — | (0.22) | $ 13.42 |
| 2016 | $ 13.30 | 0.21 | 0.20 | 0.41 | (0.22) | — | (0.22) | $ 13.49 |
| 2015 | $ 13.47 | 0.23 | (0.09) | 0.14 | (0.24) | (0.07) | (0.31) | $ 13.30 |
| CLASS I SHARES |
| 2020(c) | $ 13.62 | 0.16 | (0.19) | (0.03) | (0.16) | (0.10) | (0.26) | $ 13.33 |
| 2019 | $ 13.16 | 0.37 | 0.47 | 0.84 | (0.38) | — | (0.38) | $ 13.62 |
| 2018 | $ 13.44 | 0.33 | (0.28) | 0.05 | (0.33) | — | (0.33) | $ 13.16 |
| 2017 | $ 13.52 | 0.29 | (0.08) | 0.21 | (0.29) | — | (0.29) | $ 13.44 |
| 2016 | $ 13.33 | 0.29 | 0.20 | 0.49 | (0.30) | — | (0.30) | $ 13.52 |
| 2015 | $ 13.49 | 0.31 | (0.08) | 0.23 | (0.32) | (0.07) | (0.39) | $ 13.33 |
| CLASS R3 SHARES |
| 2020(c) | $ 13.63 | 0.12 | (0.18) | (0.06) | (0.13) | (0.10) | (0.23) | $ 13.34 |
| 2019 | $ 13.17 | 0.30 | 0.47 | 0.77 | (0.31) | — | (0.31) | $ 13.63 |
| 2018 | $ 13.45 | 0.26 | (0.27) | (0.01) | (0.27) | — | (0.27) | $ 13.17 |
| 2017 | $ 13.52 | 0.22 | (0.06) | 0.16 | (0.23) | — | (0.23) | $ 13.45 |
| 2016 | $ 13.33 | 0.23 | 0.20 | 0.43 | (0.24) | — | (0.24) | $ 13.52 |
| 2015 | $ 13.50 | 0.24 | (0.09) | 0.15 | (0.25) | (0.07) | (0.32) | $ 13.33 |
| CLASS R4 SHARES |
| 2020(c) | $ 13.61 | 0.12 | (0.18) | (0.06) | (0.13) | (0.10) | (0.23) | $ 13.32 |
| 2019 | $ 13.16 | 0.30 | 0.46 | 0.76 | (0.31) | — | (0.31) | $ 13.61 |
| 2018 | $ 13.43 | 0.26 | (0.26) | —(e) | (0.27) | — | (0.27) | $ 13.16 |
| 2017 | $ 13.51 | 0.22 | (0.07) | 0.15 | (0.23) | — | (0.23) | $ 13.43 |
| 2016 | $ 13.32 | 0.23 | 0.20 | 0.43 | (0.24) | — | (0.24) | $ 13.51 |
| 2015 | $ 13.48 | 0.24 | (0.08) | 0.16 | (0.25) | (0.07) | (0.32) | $ 13.32 |
| CLASS R5 SHARES |
| 2020(c) | $ 13.61 | 0.16 | (0.19) | (0.03) | (0.16) | (0.10) | (0.26) | $ 13.32 |
| 2019 | $ 13.16 | 0.36 | 0.46 | 0.82 | (0.37) | — | (0.37) | $ 13.61 |
| 2018 | $ 13.44 | 0.31 | (0.28) | 0.03 | (0.31) | — | (0.31) | $ 13.16 |
| 2017 | $ 13.51 | 0.27 | (0.07) | 0.20 | (0.27) | — | (0.27) | $ 13.44 |
| 2016 | $ 13.32 | 0.27 | 0.20 | 0.47 | (0.28) | — | (0.28) | $ 13.51 |
| 2015 | $ 13.49 | 0.29 | (0.09) | 0.20 | (0.30) | (0.07) | (0.37) | $ 13.32 |
| CLASS R6 SHARES |
| 2020(c) | $ 13.64 | 0.16 | (0.18) | (0.02) | (0.17) | (0.10) | (0.27) | $ 13.35 |
| 2019 | $ 13.19 | 0.38 | 0.46 | 0.84 | (0.39) | — | (0.39) | $ 13.64 |
| 2018 | $ 13.46 | 0.35 | (0.28) | 0.07 | (0.34) | — | (0.34) | $ 13.19 |
| 2017(f) | $ 13.40 | 0.15 | 0.11 | 0.26 | (0.20) | — | (0.20) | $ 13.46 |
| (a) | Not annualized for periods less than one year. |
| (b) | Sales loads are not reflected in computing total return. |
| (c) | Unaudited Six Month Period Ended March 31. |
| (d) | Annualized. |
| (e) | Total from investment operations was less than $0.01 per share. |
| (f) | Effective date of this class of shares was April 10, 2017. |
| (g) | Due to the size of net assets and fixed expenses, ratios may appear disproportionate. |
| + | Based on weighted average shares outstanding. |
See notes to financial statements.
78 | Thornburg Fixed Income Funds Semi-Annual Report
Financial Highlights, Continued
Limited Term Income Fund
| | RATIOS TO AVERAGE NET ASSETS | | Supplemental Data |
UNLESS OTHERWISE
NOTED, PERIODS ARE
FISCAL YEARS ENDED
SEPTEMBER 30, | Net Investment
Income (Loss) (%) | Expenses, After
Expense
Reductions (%) | Expenses,
Before Expense
Reductions (%) | | Total
Return (%)(a) | Portfolio
Turnover
Rate (%)(a) | Net Assets
at End of PERIOD
(Thousands) |
| CLASS A SHARES(b) |
| 2020(c) | 2.07(d) | 0.75(d) | 0.75(d) | | (0.30) | 31.46 | $ 574,830 |
| 2019 | 2.44 | 0.81 | 0.81 | | 6.03 | 43.22 | $ 645,383 |
| 2018 | 2.12 | 0.84 | 0.84 | | 0.09 | 33.62 | $ 680,473 |
| 2017 | 1.76 | 0.87 | 0.87 | | 1.31 | 26.90 | $ 890,990 |
| 2016 | 1.82 | 0.86 | 0.86 | | 3.36 | 20.56 | $ 1,111,441 |
| 2015 | 1.94 | 0.87 | 0.87 | | 1.27 | 18.71 | $ 977,470 |
| CLASS C SHARES |
| 2020(c) | 1.83(d) | 0.99(d) | 0.99(d) | | (0.49) | 31.46 | $ 338,973 |
| 2019 | 2.24 | 1.02 | 1.02 | | 5.82 | 43.22 | $ 356,205 |
| 2018 | 1.91 | 1.05 | 1.05 | | (0.13) | 33.62 | $ 439,305 |
| 2017 | 1.56 | 1.08 | 1.08 | | 1.10 | 26.90 | $ 567,771 |
| 2016 | 1.59 | 1.08 | 1.08 | | 3.13 | 20.56 | $ 667,680 |
| 2015 | 1.71 | 1.10 | 1.10 | | 1.04 | 18.71 | $ 611,555 |
| CLASS I SHARES |
| 2020(c) | 2.33(d) | 0.49(d) | 0.50(d) | | (0.24) | 31.46 | $ 4,687,194 |
| 2019 | 2.75 | 0.50 | 0.53 | | 6.44 | 43.22 | $ 4,455,457 |
| 2018 | 2.46 | 0.51 | 0.51 | | 0.41 | 33.62 | $ 3,685,859 |
| 2017 | 2.14 | 0.50 | 0.50 | | 1.61 | 26.90 | $ 3,232,277 |
| 2016 | 2.17 | 0.50 | 0.50 | | 3.73 | 20.56 | $ 2,792,249 |
| 2015 | 2.29 | 0.52 | 0.52 | | 1.71 | 18.71 | $ 1,982,536 |
| CLASS R3 SHARES |
| 2020(c) | 1.85(d) | 0.99(d) | 1.03(d) | | (0.41) | 31.46 | $ 86,060 |
| 2019 | 2.27 | 0.99 | 1.06 | | 5.84 | 43.22 | $ 64,335 |
| 2018 | 1.98 | 0.99 | 1.09 | | (0.06) | 33.62 | $ 88,298 |
| 2017 | 1.65 | 0.99 | 1.12 | | 1.19 | 26.90 | $ 96,715 |
| 2016 | 1.69 | 0.98 | 1.10 | | 3.23 | 20.56 | $ 104,309 |
| 2015 | 1.82 | 0.99 | 1.11 | | 1.16 | 18.71 | $ 172,992 |
| CLASS R4 SHARES |
| 2020(c) | 1.84(d) | 0.99(d) | 1.34(d) | | (0.49) | 31.46 | $ 4,483 |
| 2019 | 2.27 | 0.99 | 1.23 | | 5.84 | 43.22 | $ 8,073 |
| 2018 | 1.98 | 0.99 | 1.45 | | 0.01 | 33.62 | $ 7,962 |
| 2017 | 1.65 | 0.99 | 1.56 | | 1.11 | 26.90 | $ 8,101 |
| 2016 | 1.70 | 0.99 | 1.97 | | 3.23 | 20.56 | $ 6,328 |
| 2015 | 1.82 | 0.98 | 1.66 | | 1.24 | 18.71 | $ 3,908 |
| CLASS R5 SHARES |
| 2020(c) | 2.35(d) | 0.49(d) | 0.61(d) | | (0.24) | 31.46 | $ 176,517 |
| 2019 | 2.70 | 0.56 | 0.74 | | 6.31 | 43.22 | $ 106,753 |
| 2018 | 2.31 | 0.67 | 0.69 | | 0.26 | 33.62 | $ 113,333 |
| 2017 | 1.99 | 0.65 | 0.67 | | 1.53 | 26.90 | $ 101,189 |
| 2016 | 2.05 | 0.62 | 0.72 | | 3.60 | 20.56 | $ 71,864 |
| 2015 | 2.17 | 0.64 | 0.67 | | 1.50 | 18.71 | $ 96,326 |
| CLASS R6 SHARES |
| 2020(c) | 2.42(d) | 0.42(d) | 0.47(d) | | (0.20) | 31.46 | $ 113,275 |
| 2019 | 2.82 | 0.43 | 0.49 | | 6.43 | 43.22 | $ 60,440 |
| 2018 | 2.62 | 0.45 | 0.57 | | 0.56 | 33.62 | $ 29,568 |
| 2017(f) | 2.28(d) | 0.45(d) | 24.38(d)(g) | | 1.92 | 26.90 | $ 770 |
Thornburg Fixed Income Funds Semi-Annual Report | 79
Financial Highlights
Low Duration Income Fund
| | PER SHARE PERFORMANCE (FOR A SHARE OUTSTANDING THROUGHOUT THE PERIOD) |
UNLESS OTHERWISE
NOTED, PERIODS ARE
FISCAL YEARS ENDED
SEPTEMBER 30, | Net Asset
Value,
Beginning of
PERIOD | Net
Investment
Income
(Loss)+ | Net Realized &
Unrealized Gain
(Loss) on
Investments | Total from
Investment
Operations | Dividends
from Net
Investment
Income | Dividends
from Net
Realized
Gains | Total
Dividends | Net Asset
Value,
End of PERIOD |
| CLASS A SHARES(b) |
| 2020(c) | $ 12.49 | 0.13 | (0.29) | (0.16) | (0.13) | (0.04) | (0.17) | $ 12.16 |
| 2019 | $ 12.29 | 0.28 | 0.21 | 0.49 | (0.29) | — | (0.29) | $ 12.49 |
| 2018 | $ 12.42 | 0.22 | (0.13) | 0.09 | (0.22) | — | (0.22) | $ 12.29 |
| 2017 | $ 12.46 | 0.16 | (0.03) | 0.13 | (0.17) | — | (0.17) | $ 12.42 |
| 2016 | $ 12.38 | 0.11 | 0.09 | 0.20 | (0.12) | — | (0.12) | $ 12.46 |
| 2015 | $ 12.38 | 0.08 | —(e) | 0.08 | (0.08) | — | (0.08) | $ 12.38 |
| CLASS I SHARES |
| 2020(c) | $ 12.48 | 0.14 | (0.28) | (0.14) | (0.14) | (0.04) | (0.18) | $ 12.16 |
| 2019 | $ 12.28 | 0.31 | 0.20 | 0.51 | (0.31) | — | (0.31) | $ 12.48 |
| 2018 | $ 12.41 | 0.24 | (0.12) | 0.12 | (0.25) | — | (0.25) | $ 12.28 |
| 2017 | $ 12.45 | 0.18 | (0.03) | 0.15 | (0.19) | — | (0.19) | $ 12.41 |
| 2016 | $ 12.37 | 0.14 | 0.08 | 0.22 | (0.14) | — | (0.14) | $ 12.45 |
| 2015 | $ 12.38 | 0.11 | (0.01) | 0.10 | (0.11) | — | (0.11) | $ 12.37 |
| (a) | Not annualized for periods less than one year. |
| (b) | Sales loads are not reflected in computing total return. |
| (c) | Unaudited Six Month Period Ended March 31. |
| (d) | Annualized. |
| (e) | Net realized and unrealized gain (loss) on investments was less than $0.01 per share. |
| + | Based on weighted average shares outstanding. |
See notes to financial statements.
80 | Thornburg Fixed Income Funds Semi-Annual Report
Financial Highlights, Continued
Low Duration Income Fund
| | RATIOS TO AVERAGE NET ASSETS | | Supplemental Data |
UNLESS OTHERWISE
NOTED, PERIODS ARE
FISCAL YEARS ENDED
SEPTEMBER 30, | Net Investment
Income (Loss) (%) | Expenses, After
Expense
Reductions (%) | Expenses,
Before Expense
Reductions (%) | | Total
Return (%)(a) | Portfolio
Turnover
Rate (%)(a) | Net Assets
at End of PERIOD
(Thousands) |
| CLASS A SHARES(b) |
| 2020(c) | 2.07(d) | 0.70(d) | 1.58(d) | | (1.28) | 23.84 | $ 5,724 |
| 2019 | 2.28 | 0.70 | 1.65 | | 4.00 | 79.59 | $ 8,012 |
| 2018 | 1.75 | 0.70 | 1.82 | | 0.75 | 20.93 | $ 7,140 |
| 2017 | 1.30 | 0.65 | 1.77 | | 1.03 | 34.79 | $ 6,532 |
| 2016 | 0.89 | 0.69 | 1.74 | | 1.60 | 42.99 | $ 10,235 |
| 2015 | 0.67 | 0.70 | 2.10 | | 0.68 | 29.22 | $ 9,940 |
| CLASS I SHARES |
| 2020(c) | 2.27(d) | 0.50(d) | 0.94(d) | | (1.10) | 23.84 | $ 24,167 |
| 2019 | 2.47 | 0.50 | 0.94 | | 4.21 | 79.59 | $ 24,858 |
| 2018 | 1.96 | 0.50 | 1.09 | | 0.95 | 20.93 | $ 22,748 |
| 2017 | 1.46 | 0.50 | 1.03 | | 1.19 | 34.79 | $ 12,854 |
| 2016 | 1.15 | 0.48 | 1.18 | | 1.81 | 42.99 | $ 17,106 |
| 2015 | 0.87 | 0.50 | 1.89 | | 0.80 | 29.22 | $ 8,056 |
Thornburg Fixed Income Funds Semi-Annual Report | 81
Financial Highlights
Strategic Income Fund
| | PER SHARE PERFORMANCE (FOR A SHARE OUTSTANDING THROUGHOUT THE PERIOD) |
UNLESS OTHERWISE
NOTED, PERIODS ARE
FISCAL YEARS ENDED
SEPTEMBER 30, | Net Asset
Value,
Beginning of
PERIOD | Net
Investment
Income
(Loss)+ | Net Realized &
Unrealized Gain
(Loss) on
Investments | Total from
Investment
Operations | Dividends
from Net
Investment
Income | Dividends
from Net
Realized
Gains | Total
Dividends | Net Asset
Value,
End of PERIOD |
| CLASS A SHARES(b) |
| 2020(c) | $ 11.92 | 0.18 | (0.73) | (0.55) | (0.19) | — | (0.19) | $ 11.18 |
| 2019 | $ 11.65 | 0.42 | 0.26 | 0.68 | (0.41) | — | (0.41) | $ 11.92 |
| 2018 | $ 11.82 | 0.40 | (0.24) | 0.16 | (0.33) | — | (0.33) | $ 11.65 |
| 2017 | $ 11.56 | 0.42 | 0.20 | 0.62 | (0.36) | — | (0.36) | $ 11.82 |
| 2016 | $ 11.22 | 0.46 | 0.28 | 0.74 | (0.37) | (0.03) | (0.40) | $ 11.56 |
| 2015 | $ 12.18 | 0.47 | (0.82) | (0.35) | (0.46) | (0.15) | (0.61) | $ 11.22 |
| CLASS C SHARES |
| 2020(c) | $ 11.90 | 0.14 | (0.74) | (0.60) | (0.14) | — | (0.14) | $ 11.16 |
| 2019 | $ 11.63 | 0.33 | 0.26 | 0.59 | (0.32) | — | (0.32) | $ 11.90 |
| 2018 | $ 11.81 | 0.32 | (0.25) | 0.07 | (0.25) | — | (0.25) | $ 11.63 |
| 2017 | $ 11.55 | 0.35 | 0.19 | 0.54 | (0.28) | — | (0.28) | $ 11.81 |
| 2016 | $ 11.20 | 0.40 | 0.28 | 0.68 | (0.30) | (0.03) | (0.33) | $ 11.55 |
| 2015 | $ 12.17 | 0.41 | (0.83) | (0.42) | (0.40) | (0.15) | (0.55) | $ 11.20 |
| CLASS I SHARES |
| 2020(c) | $ 11.89 | 0.20 | (0.73) | (0.53) | (0.21) | — | (0.21) | $ 11.15 |
| 2019 | $ 11.62 | 0.45 | 0.27 | 0.72 | (0.45) | — | (0.45) | $ 11.89 |
| 2018 | $ 11.80 | 0.45 | (0.25) | 0.20 | (0.38) | — | (0.38) | $ 11.62 |
| 2017 | $ 11.54 | 0.47 | 0.19 | 0.66 | (0.40) | — | (0.40) | $ 11.80 |
| 2016 | $ 11.19 | 0.50 | 0.28 | 0.78 | (0.40) | (0.03) | (0.43) | $ 11.54 |
| 2015 | $ 12.16 | 0.51 | (0.83) | (0.32) | (0.50) | (0.15) | (0.65) | $ 11.19 |
| CLASS R3 SHARES |
| 2020(c) | $ 11.91 | 0.16 | (0.73) | (0.57) | (0.17) | — | (0.17) | $ 11.17 |
| 2019 | $ 11.64 | 0.39 | 0.26 | 0.65 | (0.38) | — | (0.38) | $ 11.91 |
| 2018 | $ 11.82 | 0.38 | (0.25) | 0.13 | (0.31) | — | (0.31) | $ 11.64 |
| 2017 | $ 11.55 | 0.42 | 0.20 | 0.62 | (0.35) | — | (0.35) | $ 11.82 |
| 2016 | $ 11.21 | 0.46 | 0.27 | 0.73 | (0.36) | (0.03) | (0.39) | $ 11.55 |
| 2015 | $ 12.18 | 0.47 | (0.83) | (0.36) | (0.46) | (0.15) | (0.61) | $ 11.21 |
| CLASS R4 SHARES |
| 2020(c) | $ 11.90 | 0.16 | (0.73) | (0.57) | (0.17) | — | (0.17) | $ 11.16 |
| 2019 | $ 11.63 | 0.39 | 0.26 | 0.65 | (0.38) | — | (0.38) | $ 11.90 |
| 2018 | $ 11.82 | 0.38 | (0.25) | 0.13 | (0.32) | — | (0.32) | $ 11.63 |
| 2017 | $ 11.56 | 0.41 | 0.20 | 0.61 | (0.35) | — | (0.35) | $ 11.82 |
| 2016 | $ 11.21 | 0.46 | 0.28 | 0.74 | (0.36) | (0.03) | (0.39) | $ 11.56 |
| 2015 | $ 12.18 | 0.48 | (0.84) | (0.36) | (0.46) | (0.15) | (0.61) | $ 11.21 |
| CLASS R5 SHARES |
| 2020(c) | $ 11.89 | 0.20 | (0.72) | (0.52) | (0.21) | — | (0.21) | $ 11.16 |
| 2019 | $ 11.62 | 0.46 | 0.26 | 0.72 | (0.45) | — | (0.45) | $ 11.89 |
| 2018 | $ 11.80 | 0.45 | (0.25) | 0.20 | (0.38) | — | (0.38) | $ 11.62 |
| 2017 | $ 11.54 | 0.47 | 0.19 | 0.66 | (0.40) | — | (0.40) | $ 11.80 |
| 2016 | $ 11.19 | 0.49 | 0.28 | 0.77 | (0.39) | (0.03) | (0.42) | $ 11.54 |
| 2015 | $ 12.15 | 0.50 | (0.82) | (0.32) | (0.49) | (0.15) | (0.64) | $ 11.19 |
| CLASS R6 SHARES |
| 2020(c) | $ 11.93 | 0.20 | (0.73) | (0.53) | (0.21) | — | (0.21) | $ 11.19 |
| 2019 | $ 11.65 | 0.47 | 0.27 | 0.74 | (0.46) | — | (0.46) | $ 11.93 |
| 2018 | $ 11.85 | 0.45 | (0.26) | 0.19 | (0.39) | — | (0.39) | $ 11.65 |
| 2017(e) | $ 11.63 | 0.33 | 0.13 | 0.46 | (0.24) | — | (0.24) | $ 11.85 |
| (a) | Not annualized for periods less than one year. |
| (b) | Sales loads are not reflected in computing total return. |
| (c) | Unaudited Six Month Period Ended March 31. |
| (d) | Annualized. |
| (e) | Effective date of this class of shares was April 10, 2017. |
| (f) | Due to the size of net assets and fixed expenses, ratios may appear disproportionate. |
| (g) | Net Assets at End of Period was less than $1,000. |
| + | Based on weighted average shares outstanding. |
See notes to financial statements.
82 | Thornburg Fixed Income Funds Semi-Annual Report
Financial Highlights, Continued
Strategic Income Fund
| | RATIOS TO AVERAGE NET ASSETS | | Supplemental Data |
UNLESS OTHERWISE
NOTED, PERIODS ARE
FISCAL YEARS ENDED
SEPTEMBER 30, | Net Investment
Income (Loss) (%) | Expenses, After
Expense
Reductions (%) | Expenses,
Before Expense
Reductions (%) | | Total
Return (%)(a) | Portfolio
Turnover
Rate (%)(a) | Net Assets
at End of PERIOD
(Thousands) |
| CLASS A SHARES(b) |
| 2020(c) | 3.04(d) | 0.94(d) | 1.12(d) | | (4.71) | 35.50 | $ 201,082 |
| 2019 | 3.55 | 0.99 | 1.16 | | 5.92 | 31.55 | $ 215,441 |
| 2018 | 3.41 | 1.09 | 1.21 | | 1.39 | 29.90 | $ 198,320 |
| 2017 | 3.61 | 1.17 | 1.25 | | 5.41 | 44.74 | $ 232,938 |
| 2016 | 4.12 | 1.24 | 1.24 | | 6.70 | 29.48 | $ 283,398 |
| 2015 | 4.04 | 1.23 | 1.23 | | (2.97) | 38.40 | $ 338,387 |
| CLASS C SHARES |
| 2020(c) | 2.29(d) | 1.69(d) | 1.86(d) | | (5.07) | 35.50 | $ 101,328 |
| 2019 | 2.80 | 1.75 | 1.92 | | 5.15 | 31.55 | $ 118,982 |
| 2018 | 2.70 | 1.80 | 1.96 | | 0.59 | 29.90 | $ 150,364 |
| 2017 | 2.98 | 1.80 | 1.99 | | 4.76 | 44.74 | $ 205,253 |
| 2016 | 3.56 | 1.80 | 1.99 | | 6.20 | 29.48 | $ 272,691 |
| 2015 | 3.47 | 1.80 | 1.97 | | (3.61) | 38.40 | $ 306,085 |
| CLASS I SHARES |
| 2020(c) | 3.37(d) | 0.60(d) | 0.87(d) | | (4.54) | 35.50 | $ 1,197,957 |
| 2019 | 3.89 | 0.63 | 0.91 | | 6.35 | 31.55 | $ 1,141,046 |
| 2018 | 3.81 | 0.69 | 0.91 | | 1.71 | 29.90 | $ 762,239 |
| 2017 | 4.02 | 0.75 | 0.92 | | 5.85 | 44.74 | $ 620,780 |
| 2016 | 4.45 | 0.91 | 0.91 | | 7.15 | 29.48 | $ 480,143 |
| 2015 | 4.38 | 0.89 | 0.89 | | (2.73) | 38.40 | $ 531,849 |
| CLASS R3 SHARES |
| 2020(c) | 2.72(d) | 1.25(d) | 2.26(d) | | (4.84) | 35.50 | $ 1,081 |
| 2019 | 3.30 | 1.25 | 2.59 | | 5.71 | 31.55 | $ 1,661 |
| 2018 | 3.24 | 1.25 | 2.46 | | 1.16 | 29.90 | $ 1,968 |
| 2017 | 3.65 | 1.12 | 2.58 | | 5.49 | 44.74 | $ 2,667 |
| 2016 | 4.07 | 1.25 | 3.09 | | 6.69 | 29.48 | $ 2,819 |
| 2015 | 3.98 | 1.25 | 2.70 | | (3.07) | 38.40 | $ 1,430 |
| CLASS R4 SHARES |
| 2020(c) | 2.73(d) | 1.25(d) | 2.49(d) | | (4.85) | 35.50 | $ 1,270 |
| 2019 | 3.28 | 1.25 | 2.51 | | 5.71 | 31.55 | $ 1,279 |
| 2018 | 3.25 | 1.25 | 2.14 | | 1.08 | 29.90 | $ 2,182 |
| 2017 | 3.52 | 1.25 | 2.30 | | 5.35 | 44.74 | $ 2,772 |
| 2016 | 4.10 | 1.25 | 2.50 | | 6.79 | 29.48 | $ 3,218 |
| 2015 | 4.15 | 1.25 | 2.64 | | (3.07) | 38.40 | $ 2,106 |
| CLASS R5 SHARES |
| 2020(c) | 3.38(d) | 0.60(d) | 0.91(d) | | (4.45) | 35.50 | $ 35,829 |
| 2019 | 3.94 | 0.59 | 1.18 | | 6.35 | 31.55 | $ 11,180 |
| 2018 | 3.82 | 0.69 | 1.20 | | 1.71 | 29.90 | $ 7,406 |
| 2017 | 4.03 | 0.74 | 1.36 | | 5.84 | 44.74 | $ 6,286 |
| 2016 | 4.34 | 0.99 | 1.37 | | 7.07 | 29.48 | $ 7,191 |
| 2015 | 4.33 | 0.99 | 1.55 | | (2.75) | 38.40 | $ 6,399 |
| CLASS R6 SHARES |
| 2020(c) | 3.45(d) | 0.53(d) | 0.87(d) | | (4.41) | 35.50 | $ 21,163 |
| 2019 | 3.98 | 0.53 | 0.98 | | 6.40 | 31.55 | $ 21,630 |
| 2018 | 3.91 | 0.65 | 1.13 | | 1.66 | 29.90 | $ 9,679 |
| 2017(e) | 5.83(d) | 0.00(d) | 200.66(d)(f) | | 3.99 | 44.74 | $ —(g) |
Thornburg Fixed Income Funds Semi-Annual Report | 83
Expense Example
March 31, 2020 (Unaudited)
As a shareholder of the Fund, you incur two types of costs:
| (1) | transaction costs, including |
| (a) | sales charges (loads) on purchase payments, for Class A shares; |
| (b) | a deferred sales charge on redemptions of any part or all of a purchase of $1 million of Class A shares within 12 months of purchase; |
| (c) | a deferred sales charge on redemptions of Class C shares within 12 months of purchase; |
| (2) | ongoing costs, including management fees; distribution and/or service (12b-1) fees; and other Fund expenses. |
This example is intended to help you understand your ongoing costs (in dollars) of investing in the Fund and to compare these costs with the ongoing costs of investing in other mutual funds.
The example is based on a $1,000 investment beginning on October 1, 2019, and held until March 31, 2020.
ACTUAL EXPENSES
For each class of shares, the first line of the accompanying table provides information about actual account values and actual expenses. You may use the information in this line, together with the amount you invested, to estimate the expenses that you paid over the period. Simply divide your account value by $1,000 (for example, an $8,600 account value divided by $1,000 = 8.6), then multiply the result by the number in the first line for your class of shares under the heading entitled “Expenses Paid During Period” to estimate the expenses you paid on your account during this period.
HYPOTHETICAL EXAMPLE FOR COMPARISON PURPOSES
For each class of shares, the second line of the accompanying table provides information about hypothetical account values and hypothetical expenses based on the Fund’s actual expense ratio and an assumed rate of return of 5% per year before expenses, which is not the Fund’s actual return. The hypothetical account values and expenses may not be used to estimate the actual ending account balance or expenses you paid for the period. You may use this information to compare the ongoing costs of investing in the Fund and other funds. To do so, compare this 5% hypothetical example with the 5% hypothetical examples that appear in the shareholder reports of the other funds.
Please note that the expenses shown in the table are meant to highlight your ongoing costs only and do not reflect any transactional costs, such as sales charges (loads), redemption fees, or exchange fees. Therefore, the second line of the table for each class of shares is useful in comparing ongoing costs only, and will not help you determine the relative total costs of owning different funds. In addition, if these transactional costs were included, your costs would have been higher.
| | BEGINNING
ACCOUNT VALUE
10/1/19 | ENDING
ACCOUNT VALUE
3/31/20 | EXPENSES PAID
DURING PERIOD†
10/1/19–3/31/20 |
| LIMITED TERM U.S. GOVERNMENT FUND |
| Class A Shares |
| Actual | $1,000.00 | $1,018.65 | $4.44 |
| Hypothetical* | $1,000.00 | $1,020.60 | $4.45 |
| Class C Shares |
| Actual | $1,000.00 | $1,017.89 | $5.90 |
| Hypothetical* | $1,000.00 | $1,019.15 | $5.91 |
| Class I Shares |
| Actual | $1,000.00 | $1,020.05 | $3.03 |
| Hypothetical* | $1,000.00 | $1,022.00 | $3.03 |
| Class R3 Shares |
| Actual | $1,000.00 | $1,018.84 | $5.00 |
| Hypothetical* | $1,000.00 | $1,020.05 | $5.00 |
| Class R4 Shares |
| Actual | $1,000.00 | $1,018.86 | $5.00 |
| Hypothetical* | $1,000.00 | $1,020.05 | $5.00 |
| Class R5 Shares |
| Actual | $1,000.00 | $1,019.71 | $3.38 |
| Hypothetical* | $1,000.00 | $1,021.65 | $3.39 |
| LIMITED TERM INCOME FUND |
| Class A Shares |
| Actual | $1,000.00 | $997.04 | $3.74 |
| Hypothetical* | $1,000.00 | $1,021.25 | $3.79 |
| Class C Shares |
| Actual | $1,000.00 | $995.07 | $4.94 |
| Hypothetical* | $1,000.00 | $1,020.05 | $5.00 |
| Class I Shares |
| Actual | $1,000.00 | $997.60 | $2.45 |
| Hypothetical* | $1,000.00 | $1,022.55 | $2.48 |
| Class R3 Shares |
| Actual | $1,000.00 | $995.87 | $4.94 |
| Hypothetical* | $1,000.00 | $1,020.05 | $5.00 |
| Class R4 Shares |
| Actual | $1,000.00 | $995.09 | $4.94 |
| Hypothetical* | $1,000.00 | $1,020.05 | $5.00 |
| Class R5 Shares |
| Actual | $1,000.00 | $997.60 | $2.45 |
| Hypothetical* | $1,000.00 | $1,022.55 | $2.48 |
| Class R6 Shares |
| Actual | $1,000.00 | $997.98 | $2.10 |
| Hypothetical* | $1,000.00 | $1,022.90 | $2.12 |
| LOW DURATION INCOME FUND |
| Class A Shares |
| Actual | $1,000.00 | $987.20 | $3.48 |
| Hypothetical* | $1,000.00 | $1,021.50 | $3.54 |
| Class I Shares |
| Actual | $1,000.00 | $988.98 | $2.49 |
| Hypothetical* | $1,000.00 | $1,022.50 | $2.53 |
84 | Thornburg Fixed Income Funds Semi-Annual Report
Expense Example, Continued
March 31, 2020 (Unaudited)
| | BEGINNING
ACCOUNT VALUE
10/1/19 | ENDING
ACCOUNT VALUE
3/31/20 | EXPENSES PAID
DURING PERIOD†
10/1/19–3/31/20 |
| STRATEGIC INCOME FUND |
| Class A Shares |
| Actual | $1,000.00 | $952.95 | $4.59 |
| Hypothetical* | $1,000.00 | $1,020.30 | $4.75 |
| Class C Shares |
| Actual | $1,000.00 | $949.30 | $8.24 |
| Hypothetical* | $1,000.00 | $1,016.55 | $8.52 |
| Class I Shares |
| Actual | $1,000.00 | $954.56 | $2.93 |
| Hypothetical* | $1,000.00 | $1,022.00 | $3.03 |
| Class R3 Shares |
| Actual | $1,000.00 | $951.57 | $6.10 |
| Hypothetical* | $1,000.00 | $1,018.75 | $6.31 |
| Class R4 Shares |
| Actual | $1,000.00 | $951.52 | $6.10 |
| Hypothetical* | $1,000.00 | $1,018.75 | $6.31 |
| Class R5 Shares |
| Actual | $1,000.00 | $955.47 | $2.93 |
| Hypothetical* | $1,000.00 | $1,022.00 | $3.03 |
| Class R6 Shares |
| Actual | $1,000.00 | $955.94 | $2.59 |
| Hypothetical* | $1,000.00 | $1,022.35 | $2.68 |
| † | Limited Term U.S. Government Fund Expenses are equal to the annualized expense ratio for each class (A: 0.88%; C: 1.17%; I: 0.60%; R3: 0.99%; R4: 0.99%; R5: 0.67%) multiplied by the average account value over the period, multiplied by 183/366 to reflect the one-half year period. |
| † | Limited Term Income Fund Expenses are equal to the annualized expense ratio for each class (A: 0.75%; C: 0.99%; I: 0.49%; R3: 0.99%; R4: 0.99%; R5: 0.49%; R6: 0.42%) multiplied by the average account value over the period, multiplied by 183/366 to reflect the one-half year period. |
| † | Low Duration Income Fund Expenses are equal to the annualized expense ratio for each class (A: 0.70%; I: 0.50%) multiplied by the average account value over the period, multiplied by 183/366 to reflect the one-half year period. |
| † | Strategic Income Fund Expenses are equal to the annualized expense ratio for each class (A: 0.94%; C: 1.69%; I: 0.60%; R3: 1.25%; R4: 1.25%; R5: 0.60%; R6: 0.53%) multiplied by the average account value over the period, multiplied by 183/366 to reflect the one-half year period. |
| * | Hypothetical assumes a rate of return of 5% per year before expenses. |
Thornburg Fixed Income Funds Semi-Annual Report | 85
Other Information
March 31, 2020 (Unaudited)
PORTFOLIO PROXY VOTING
Policies and Procedures:
The Trust has delegated to the Advisor voting decisions respecting proxies for the Fund’s voting securities. The Advisor makes voting decisions in accordance with its Proxy Voting Policy and Procedures. A description of the Policy and Procedures is available (i) without charge, upon request, by calling the Advisor toll-free at 1-800-847-0200, (ii) on the Thornburg website at www.thornburg.com, and (iii) on the U.S. Securities and Exchange Commission’s website at www.sec.gov.
Information regarding how proxies were voted is available on or before August 31 of each year for the twelve months ending the preceding June 30. This information is available (i) without charge, upon request by calling the Advisor toll-free at 1-800-847-0200, (ii) on the Thornburg website at www.thornburg.com, and (iii) on the U.S. Securities and Exchange Commission’s website at www.sec.gov.
AVAILABILITY OF QUARTERLY PORTFOLIO SCHEDULE
The Fund files with the Securities and Exchange Commission schedules of its portfolio holdings on Form N-PORT EX for the first and third quarters of each fiscal year. The Fund’s Form N-PORT EX are available on the Commission’s website at www.sec.gov, or may be reviewed and copied at the Commission’s Public Reference Room in Washington, D.C. Information on the operation of the Public Reference Room may be obtained by calling 1-800-SEC-0330. The Fund also makes this information available on its website at www.thornburg.com/download or upon request by calling 1-800-847-0200.
STATEMENT REGARDING LIQUIDITY RISK MANAGEMENT PROGRAM
The Trustees of the Trust have appointed the Advisor (“Program Administrator”) to administer the Trust’s liquidity risk management program (the “LRMP”) adopted for each of the Funds under rule 22e-4 under the 1940 Act (the “Liquidity Rule”). The LRMP is designed to reduce the risk that a Fund will be unable to meet its redemption obligations under the 1940 Act, and to mitigate the dilution of the interests of Fund shareholders occasioned by redemptions tendered by other shareholders (“Liquidity Risk”). Pursuant to the LRMP, the Program Administrator has delegated certain functions, including daily oversight and management of the Funds’ Liquidity Risk, to its Liquidity Risk Management Committee (the “Liquidity Committee”). Under the LRMP, the Liquidity Committee performs the annual review of the LRMP required by the Liquidity Rule.
On December 4, 2019, the Trustees reviewed the Liquidity Committee’s initial written report (the “Report”) concerning the operation of the LRMP for the period from December 1, 2018 through November 22, 2019 (the “Reporting Period”). The Report addressed the operation, adequacy and effectiveness of the LRMP, the operation of a Fund’s highly liquid investment minimum, and any material changes to the LRMP during the Reporting Period. The Report provided an assessment of the various factors relevant to each Fund’s Liquidity Risk, an evaluation of data provided by a third-party liquidity assessment vendor and other relevant data, and reports on the Liquidity Committee’s consideration of intermediary firms with the largest beneficial ownership positions in each Fund, the likelihood that any of those firms may redeem their clients’ investments from the Funds without prior notice, and the effect that such redemptions could have on Fund liquidity. The Report concluded that the LRMP remains adequate and effective to address each Fund’s Liquidity Risk, that all of the Funds are able to meet redemption requests in current market conditions and in reasonably expected stressed conditions without significant dilution of remaining shareholders, that each Fund remains primarily highly liquid, and the third-party liquidity assessment vendor’s system continues to be a useful tool for assessing the Funds’ Liquidity Risk. The Report stated that there have been no instances since the LRMP’s adoption in which a Fund exceeded its limitation on illiquid investments, nor have there been any material changes to the LRMP since its adoption.
86 | Thornburg Fixed Income Funds Semi-Annual Report
Trustees’ Statement to Shareholders (Unaudited)
Readopted September 17, 2019
The Trustees believe current and prospective shareholders should know how we discharge our responsibilities in supervising the Funds’ investment advisor and in reviewing the advisor’s contract for renewal. Since 2005, we have issued a statement which sets out clearly the three principal guidelines that we follow in supervising the Trust’s investment advisor on your behalf. In accordance with our customary practice, in September of this year we again reviewed our statement and concluded we should reissue this statement outlining the principal features of our supervision of the advisor’s performance of investment management services for the Funds.
We begin with the premise that each shareholder selected his or her Fund because its investments are managed by the investment advisor identified in the prospectus and in accordance with the objective and policies described in the prospectus. We realize, as each of you do, that if you believe that your Fund’s stated objective and policies no longer serve your personal investment goals, you can sell your shares and leave the Fund.
Therefore, we believe that our primary supervisory task—our principal obligation to you—is to assess the nature and quality of the advisor’s services, and to confirm that the advisor actively and competently pursues the Fund’s objective, in accordance with the policies set out in the prospectus. To do this, we meet regularly with management to review your Fund’s portfolio and to discuss the advisor’s specific actions and judgments in pursuing the Fund’s objective. We do not substitute our own judgment for the advisor’s decisions in selecting investments; the advisor is paid to exercise its informed judgment on investment decisions, and we seek to confirm, in reviewing the advisor’s performance, that the advisor is doing just that.
Second, we are conscious of costs and the effect that costs have on shareholders’ returns. We try to make sure that your Fund’s fees and costs are reasonable in relationship to the services rendered and that they are generally in line with those charged by other expert investment advisors, consistent with our belief that the Fund’s investors searched for and expect that expertise and attention and have decided to pay a reasonable price for it. We do not put the management contract “out to bid” as a matter of course, and we would not do so unless we had concluded that the advisor materially had failed to pursue the Fund’s objectives in accordance with its policies, or for other equally important reasons. We believe that any other approach would be inconsistent with your interests and contrary to your expectations when you bought shares of the Fund in the first place.
Finally, because we believe that most Thornburg Fund shareholders have invested with a long-term perspective, we try not to focus too much on the fashions of the moment and on short-term performance. The market will not favor any specific investment objective or set of policies at all times and under all economic circumstances. A fund will experience periods of both high and low returns relative to other funds and other investments. Even if one of our Funds is not favored by the market at a particular time, we believe that the advisor is nonetheless obliged to remain true to the Fund’s objective and policies, and we watch to see that it does so.
Trustees of Thornburg Investment Trust
Thornburg Fixed Income Funds Semi-Annual Report | 87
Thornburg Investment Management is a privately-owned global investment firm that offers a range of solutions for retail and institutional investors. Founded in 1982 and headquartered in Santa Fe, New Mexico, we manage approximately $35.1 billion (as of March 31, 2020) across U.S. mutual funds, separate accounts for high-net-worth investors, institutional accounts, and UCITS funds for non-U.S. investors.
The fund outlined in this report is one of many equity and fixed-income products available from Thornburg Investment Management.
MULTI ASSET
| ■ | Thornburg Investment Income Builder Fund |
| ■ | Thornburg Summit Fund |
GLOBAL EQUITY
| ■ | Thornburg Global Opportunities Fund |
INTERNATIONAL EQUITY
| ■ | Thornburg International Value Fund |
| ■ | Thornburg Better World Fund |
| ■ | Thornburg International Growth Fund |
| ■ | Thornburg Developing World Fund |
DOMESTIC EQUITY
| ■ | Thornburg Value Fund |
| ■ | Thornburg Core Growth Fund |
ALTERNATIVES
| ■ | Thornburg Long/Short Equity Fund |
FIXED INCOME
| ■ | Thornburg Limited Term U.S. Government Fund |
| ■ | Thornburg Limited Term Income Fund |
| ■ | Thornburg Low Duration Income Fund |
| ■ | Thornburg Strategic Income Fund |
MUNICIPAL
| ■ | Thornburg Short Duration Municipal Fund |
| ■ | Thornburg Limited Term Municipal Fund |
| ■ | Thornburg California Limited Term Municipal Fund |
| ■ | Thornburg New Mexico Intermediate Municipal Fund |
| ■ | Thornburg New York Intermediate Municipal Fund |
| ■ | Thornburg Intermediate Municipal Fund |
| ■ | Thornburg Strategic Municipal Income Fund |
Before investing, carefully consider the Fund’s investment goals, risks, charges, and expenses. For a prospectus or summary prospectus containing this and other information, contact your financial advisor or visit thornburg.com. Read it carefully before investing.
For additional information, please visit thornburg.com
Thornburg Investment Management, Inc. 2300 North Ridgetop Road, Santa Fe, NM 87506
88 | Thornburg Fixed Income Funds Semi-Annual Report
This page intentionally left blank.
Thornburg Fixed Income Funds Semi-Annual Report | 89
This page intentionally left blank.
90 | Thornburg Fixed Income Funds Semi-Annual Report
This page intentionally left blank.
Thornburg Fixed Income Funds Semi-Annual Report | 91
To receive shareholder reports, prospectuses, and proxy statements electronically, go to www.thornburg.com/edelivery.
This Semi-Annual Report is submitted for the general information of shareholders of the Fund. It is not authorized for distribution to prospective investors in the Fund unless preceded or accompanied by an effective prospectus.
Investment Advisor:
Thornburg Investment Management®
800.847.0200
Distributor:
Thornburg Securities Corporation®
Semi-Annual Report
March 31, 2020
Beginning on January 1, 2021, as permitted by regulations adopted by the Securities and Exchange Commission, paper copies of the Fund’s shareholder reports will no longer be sent by mail, unless you specifically request paper copies of the reports from the Fund or from your financial intermediary, such as a broker-dealer or bank. Instead, the reports will be made available on a website, and you will be notified by mail each time a report is posted and provided with a website link to access the report.
If you already elected to receive shareholder reports electronically, you will not be affected by this change and you need not take any action. You may elect to receive shareholder reports and other communications from the Fund or your financial intermediary electronically by going to thornburg.com/edelivery.
You may elect to receive all future reports in paper free of charge. You can inform the Fund or your financial intermediary that you wish to continue receiving paper copies of your shareholder reports by calling 800.847.0200 or your financial intermediary directly. Your election to receive reports in paper will apply to all funds held with the fund complex/your financial intermediary.
| Thornburg Municipal Funds |
| Thornburg Short Duration Municipal Fund |
| Thornburg Limited Term Municipal Fund |
| Thornburg California Limited Term Municipal Fund |
| Thornburg New Mexico Intermediate Municipal Fund |
| Thornburg New York Intermediate Municipal Fund |
| Thornburg Intermediate Municipal Fund |
| Thornburg Strategic Municipal Income Fund |
At Thornburg, we believe unconstrained investing leads to better outcomes for our clients. Our investment solutions are highly active, high conviction, and benchmark agnostic. When it comes to finding economic opportunity for clients, it’s more than what we do.
It’s how we do it. Active Asbottom-up, fundamental, active managers, we look beyond conventional benchmarks. Long Term We take a long-term view in how we manage our firm and our portfolios. Benchmark Agnostic Investment strategies should have the flexibility to pursue solutions for clients, not stay within the conventional confines of benchmarks. Flexible Perspective Our approach to portfolio construction is guided by our convictions rather than convention. High Conviction We focus our attention and capital on thoroughly researched, well-understood positions. The best form of risk management is to know what you own, and why. Repeatable & Robust Our long-term outperformance of benchmarks verifies that our process works and outperforms conventional thinking. Independent We are independently owned and far from the herd of other investment managers. Investment Driven All members of the investment team are resources for all of our strategies. Collaborative Our team collaborates on opportunities across geography, sector, or asset class.
Thornburg Municipal Funds
Semi-Annual Reports | March 31, 2020
Table of Contents
Investments carry risks, including possible loss of principal. Portfolios investing in bonds have the same interest rate, inflation, and credit risks that are associated with the underlying bonds. The value of bonds will fluctuate relative to changes in interest rates, decreasing when interest rates rise. Unlike bonds, bond funds have ongoing fees and expenses. Please see the Funds’ prospectus for a discussion of the risks associated with an investment in the Funds. Investments in the Funds are not FDIC insured, nor are they bank deposits or guaranteed by a bank or any other entity.
Thornburg Municipal Funds Semi-Annual Report | 3
Letter to Shareholders
March 31, 2020 (Unaudited)
Dear Shareholder:
I hope this letter finds you safe and healthy. Amid the COVID-19 pandemic, we’re all adjusting to the challenges of working and living new ways while trying to see into a cloudy future. In these uncertain times, all of us at Thornburg Investment Management are squarely focused on providing you with the best investment outcomes that we can.
Many of our portfolios were well positioned for higher volatility. While we did not predict the cause of this downturn, it’s clear that high prices make for more vulnerable markets. Given our solid liquidity and preparation, we’ve been able to take advantage of price swings as many assets were on sale after the market’s decline. Longer term, it appears even the extraordinary fiscal and monetary support will merely cushion the blow. After all, the reason policy makers’ actions have been so extreme is in large part because they view them as necessary.
Looking forward, our nimble, collaborative investment team is well suited to deliver. The reason that we have a benchmark agnostic, flexible approach is so that we can go where we find value, within the mandate and objectives of the portfolio. While many investment firms have good products and processes, Thornburg is designed to see the world differently, and our perspective from Santa Fe, NM, is especially valuable in challenging times. While many other professionals are siloed into narrow areas of expertise, without the ability to evaluate the bigger picture, we work across sectors and asset classes to find
great investments and put them into balanced portfolios. The last few months have demonstrated the strength of our approach, given its adaptability and capacity to place new information in the context of broad portfolios quickly. Being nimble is part of Thornburg’s culture, and people across the organization are finding new ways to pitch in for the sake of our clients.
No one can predict with certainty what the market has in store for us, especially in the context of the current health crisis. What does seem certain, however, is that the events of the last few months are accelerating change that was already occurring, as well as underlining the vulnerability of many of the systems that many of us take for granted. That is true in our daily lives, as well as in financial markets. We believe our understanding of and participation in the interconnectedness of these markets is our core competency: We’re built for this.
Thank you so much for your time and your business.

| |
Jason Brady,cfa
Portfolio Manager
CEO, President, and
Managing Director | |
The matters discussed in this report may constitute forward-looking statements made pursuant to the safe harbor provisions of the Securities Litigation Reform Act of 1995. These include any advisor or portfolio manager prediction, assessment, analysis or outlook for individual securities, industries, investment styles, market sectors and/or markets. These statements involve risks and uncertainties. In addition to the general risks described for each fund in its current prospectus, other factors bearing on these reports include the accuracy of the advisor’s or portfolio manager’s forecasts and predictions, the appropriateness of the investment strategies designed by the advisor or portfolio manager and the ability of the advisor or portfolio manager to implement their strategies efficiently and successfully. Any one or more of these factors, as well as other risks affecting the securities markets generally, could cause the actual results of any fund to differ materially as compared to its benchmarks.
The views expressed are subject to change and do not necessarily reflect the views of Thornburg Investment Management, Inc. This information should not be relied upon as a recommendation or investment advice and is not intended to predict the performance of any investment or market.
Performance results of individual share classes will vary based on the fees and expenses associated with each share class, and may be higher or lower than other share classes within the same Fund. Please see Performance Summary for performance results of each share class.
4 | Thornburg Municipal Funds Semi-Annual Report
Performance Summary
March 31, 2020 (Unaudited)
AVERAGE ANNUAL TOTAL RETURNS
THORNBURG SHORT DURATION
MUNICIPAL FUND | 1-YR | 3-YR | 5-YR | SINCE
INCEPTION |
| Class A Shares(Incep: 12/30/13) | | | | |
| Without sales charge | 0.65% | 0.90% | 0.65% | 0.58% |
| With sales charge | -0.87% | 0.38% | 0.35% | 0.33% |
| Class I Shares(Incep: 12/30/13) | 0.93% | 1.10% | 0.85% | 0.78% |
GROWTH OF A HYPOTHETICAL $10,000 INVESTMENT
| THORNBURG SHORT DURATION MUNICIPAL FUND | FINAL VALUE |
AVERAGE ANNUAL TOTAL RETURNS
| THORNBURG LIMITED TERM MUNICIPAL FUND | 1-YR | 3-YR | 5-YR | 10-YR | SINCE
INCEPTION |
| Class A Shares(Incep: 9/28/84) | | | | | |
| Without sales charge | 1.91% | 1.85% | 1.39% | 2.20% | 4.61% |
| With sales charge | 0.37% | 1.33% | 1.08% | 2.04% | 4.56% |
| Class C Shares(Incep: 9/1/94) | | | | | |
| Without sales charge | 1.65% | 1.60% | 1.14% | 1.94% | 3.09% |
| With sales charge | 1.15% | 1.60% | 1.14% | 1.94% | 3.09% |
| Class I Shares(Incep: 7/5/96) | 2.22% | 2.14% | 1.69% | 2.51% | 3.66% |
GROWTH OF A HYPOTHETICAL $10,000 INVESTMENT
| THORNBURG LIMITED TERM MUNICIPAL FUND | FINAL VALUE |
Performance data shown represents past performance and is no guarantee of future results. Investment return and principal value will fluctuate so shares, when redeemed, may be worth more or less than their original cost. Current performance may be lower or higher than quoted. For performance current to the most recent month end, visit thornburg.com or call 800-847-0200. The performance information does not reflect the deduction of taxes that a shareholder would pay on distributions or the redemption of Fund shares. Returns reflect the reinvestment of dividends and capital gains. Thornburg Short Duration Municipal Fund Class A shares are sold with a maximum sales charge of 1.50%. There is no sales charge for Class I shares. Thornburg Limited Term Municipal Fund Class A shares are sold with a maximum sales charge of 1.50%. Class C shares include a 0.50% CDSC for the first year only. There is no sales charge for Class I shares. As disclosed in the Funds’ most recent prospectus, the total annual fund operating expenses before fee waivers and expense reimbursements are as follows: Thornburg Short Duration Municipal Fund; A shares, 0.99%; I shares, 0.64%; Thornburg Limited Term Municipal Fund; A shares, 0.69%; C shares, 0.94%; I shares, 0.45%. Thornburg Investment Management has contractually agreed to waive fees and reimburse expenses until at least February 1, 2021, for some of the share classes, resulting in net expense ratios of the following: Thornburg Short Duration Municipal Fund; A shares, 0.70%; I shares, 0.50%. For more detailed information on fund expenses and waivers/reimbursements please see the Funds’ prospectus. Without the fee waivers and expense reimbursements, the Annualized Distribution yield and the SEC yield would have been 1.11% and 1.01%, respectively, for Thornburg Short Duration Municipal Fund.
The ICE index data referenced herein is the property of ICE Data Indices, LLC, its affiliates (“ICE Data”) and/or its Third Party Suppliers and has been licensed for use by Thornburg Investment Management, Inc. ICE Data and its Third Party Suppliers accept no liability in connection with its use. See www.thornburg.com/indices for a full copy of the Disclaimer.
Thornburg Municipal Funds Semi-Annual Report | 5
Performance Summary, Continued
March 31, 2020 (Unaudited)
AVERAGE ANNUAL TOTAL RETURNS
| THORNBURG CALIFORNIA LIMITED TERM MUNICIPAL FUND | 1-YR | 3-YR | 5-YR | 10-YR | SINCE
INCEPTION |
| Class A Shares(Incep: 2/19/87) | | | | | |
| Without sales charge | 1.21% | 1.36% | 1.02% | 2.19% | 3.99% |
| With sales charge | -0.33% | 0.84% | 0.71% | 2.04% | 3.94% |
| Class C Shares(Incep: 9/1/94) | | | | | |
| Without sales charge | 0.92% | 1.08% | 0.76% | 1.93% | 2.97% |
| With sales charge | 0.42% | 1.08% | 0.76% | 1.93% | 2.97% |
| Class I Shares(Incep: 4/1/97) | 1.46% | 1.62% | 1.30% | 2.50% | 3.44% |
GROWTH OF A HYPOTHETICAL $10,000 INVESTMENT
| THORNBURG CALIFORNIA LIMITED TERM MUNICIPAL FUND | FINAL VALUE |
AVERAGE ANNUAL TOTAL RETURNS
| THORNBURG NEW MEXICO INTERMEDIATE MUNICIPAL FUND | 1-YR | 3-YR | 5-YR | 10-YR | SINCE
INCEPTION |
| Class A Shares(Incep: 6/18/91) | | | | | |
| Without sales charge | 2.51% | 2.31% | 1.71% | 2.51% | 4.11% |
| With sales charge | 0.45% | 1.63% | 1.30% | 2.31% | 4.04% |
| Class D Shares(Incep: 6/1/99) | | | | | |
| Without sales charge | 2.22% | 2.02% | 1.46% | 2.25% | 3.03% |
| Class I Shares(Incep: 2/1/07) | 2.81% | 2.60% | 2.03% | 2.84% | 3.31% |
GROWTH OF A HYPOTHETICAL $10,000 INVESTMENT
| THORNBURG NEW MEXICO INTERMEDIATE MUNICIPAL FUND | FINAL VALUE |
Performance data shown represents past performance and is no guarantee of future results. Investment return and principal value will fluctuate so shares, when redeemed, may be worth more or less than their original cost. Current performance may be lower or higher than quoted. For performance current to the most recent month end, visit thornburg.com or call 800-847-0200. The performance information does not reflect the deduction of taxes that a shareholder would pay on distributions or the redemption of Fund shares. Returns reflect the reinvestment of dividends and capital gains. Thornburg California Limited Term Municipal Fund Class A shares are sold with a maximum sales charge of 1.50%. Class C shares include a 0.50% CDSC for the first year only. There is no sales charge for Class I shares. Thornburg New Mexico Intermediate Municipal Fund Class A shares are sold with a maximum sales charge of 2.00%. There is no sales charge for Class D and Class I shares. As disclosed in the Funds’ most recent prospectus, the total annual fund operating expenses before fee waivers and expense reimbursements are as follows: Thornburg California Limited Term Municipal Fund; A shares, 0.93%; C shares, 1.21%; I shares, 0.68%; Thornburg New Mexico Intermediate Municipal Fund; A shares, 0.97%; D shares, 1.25%; I shares, 0.69%. Thornburg Investment Management has contractually agreed to waive fees and reimburse expenses until at least February 1, 2021, for some of the share classes, resulting in net expense ratios of the following: Thornburg California Limited Term Municipal Fund; A shares, 0.74%; C shares, 1.02%; I shares, 0.49%; Thornburg New Mexico Intermediate Municipal Fund; I shares, 0.67%. For more detailed information on fund expenses and waivers/reimbursements please see the Funds’ prospectus. Without the fee waivers and expense reimbursements, the Annualized Distribution yield and the SEC yield would have been 1.33% and 0.72%, respectively, for Thornburg California Limited Term Municipal Fund.
The ICE index data referenced herein is the property of ICE Data Indices, LLC, its affiliates (“ICE Data”) and/or its Third Party Suppliers and has been licensed for use by Thornburg Investment Management, Inc. ICE Data and its Third Party Suppliers accept no liability in connection with its use. See www.thornburg.com/indices for a full copy of the Disclaimer.
6 | Thornburg Municipal Funds Semi-Annual Report
Performance Summary, Continued
March 31, 2020 (Unaudited)
AVERAGE ANNUAL TOTAL RETURNS
| THORNBURG NEW YORK INTERMEDIATE MUNICIPAL FUND | 1-YR | 3-YR | 5-YR | 10-YR | SINCE
INCEPTION |
| Class A Shares(Incep: 9/5/97) | | | | | |
| Without sales charge | 2.10% | 1.97% | 1.58% | 2.80% | 3.58% |
| With sales charge | 0.06% | 1.30% | 1.17% | 2.60% | 3.48% |
| Class I Shares(Incep: 2/1/10) | 2.42% | 2.30% | 1.90% | 3.13% | 3.14% |
GROWTH OF A HYPOTHETICAL $10,000 INVESTMENT
| THORNBURG NEW YORK INTERMEDIATE MUNICIPAL FUND | FINAL VALUE |
AVERAGE ANNUAL TOTAL RETURNS
| THORNBURG INTERMEDIATE MUNICIPAL FUND | 1-YR | 3-YR | 5-YR | 10-YR | SINCE
INCEPTION |
| Class A Shares(Incep: 7/22/91) | | | | | |
| Without sales charge | 2.41% | 2.62% | 1.95% | 3.20% | 4.51% |
| With sales charge | 0.34% | 1.92% | 1.54% | 2.99% | 4.43% |
| Class C Shares(Incep: 9/1/94) | | | | | |
| Without sales charge | 2.04% | 2.27% | 1.61% | 2.87% | 3.71% |
| With sales charge | 1.44% | 2.27% | 1.61% | 2.87% | 3.71% |
| Class I Shares(Incep: 7/5/96) | 2.59% | 2.89% | 2.23% | 3.50% | 4.23% |
GROWTH OF A HYPOTHETICAL $10,000 INVESTMENT
| THORNBURG INTERMEDIATE MUNICIPAL FUND | FINAL VALUE |
Performance data shown represents past performance and is no guarantee of future results. Investment return and principal value will fluctuate so shares, when redeemed, may be worth more or less than their original cost. Current performance may be lower or higher than quoted. For performance current to the most recent month end, visit thornburg.com or call 800-847-0200. The performance information does not reflect the deduction of taxes that a shareholder would pay on distributions or the redemption of Fund shares. Returns reflect the reinvestment of dividends and capital gains. Thornburg New York Intermediate Municipal Fund Class A shares are sold with a maximum sales charge of 2.00%. There is no sales charge for Class I shares. Thornburg Intermediate Municipal Fund Class A shares are sold with a maximum sales charge of 2.00%. Class C shares include a 0.60% CDSC for the first year only. There is no sales charge for Class I shares. As disclosed in the Funds’ most recent prospectus, the total annual fund operating expenses before fee waivers and expense reimbursements are as follows: Thornburg New York Intermediate Municipal Fund; A shares, 1.12%; I shares, 0.88%; Thornburg Intermediate Municipal Fund; A shares, 0.89%; C shares, 1.26%; I shares, 0.65%. Thornburg Investment Management has contractually agreed to waive fees and reimburse expenses until at least February 1, 2021, for some of the share classes, resulting in net expense ratios of the following: Thornburg New York Intermediate Municipal Fund; A shares, 0.99%; I shares, 0.67%; Thornburg Intermediate Municipal Fund; A shares, 0.77%; C shares, 1.14%; I shares, 0.53%. For more detailed information on fund expenses and waivers/reimbursements please see the Funds’ prospectus. Without the fee waivers and expense reimbursements, the Annualized Distribution yield and the SEC yield would have been 1.85% and 0.84%, respectively, for Thornburg New York Intermediate Municipal Fund, 2.32% and 1.19%, respectively, for Thornburg Intermediate Municipal Fund.
The ICE index data referenced herein is the property of ICE Data Indices, LLC, its affiliates (“ICE Data”) and/or its Third Party Suppliers and has been licensed for use by Thornburg Investment Management, Inc. ICE Data and its Third Party Suppliers accept no liability in connection with its use. See www.thornburg.com/indices for a full copy of the Disclaimer.
Thornburg Municipal Funds Semi-Annual Report | 7
Performance Summary, Continued
March 31, 2020 (Unaudited)
AVERAGE ANNUAL TOTAL RETURNS
| THORNBURG STRATEGIC MUNICIPAL INCOME FUND | 1-YR | 3-YR | 5-YR | 10-YR | SINCE
INCEPTION |
| Class A Shares(Incep: 4/1/09) | | | | | |
| Without sales charge | 1.77% | 2.61% | 1.95% | 3.98% | 5.35% |
| With sales charge | -0.28% | 1.93% | 1.54% | 3.77% | 5.16% |
| Class C Shares(Incep: 4/1/09) | | | | | |
| Without sales charge | 1.36% | 2.14% | 1.53% | 3.61% | 5.00% |
| With sales charge | 0.77% | 2.14% | 1.53% | 3.61% | 5.00% |
| Class I Shares(Incep: 4/1/09) | 2.00% | 2.83% | 2.20% | 4.26% | 5.64% |
GROWTH OF A HYPOTHETICAL $10,000 INVESTMENT
| THORNBURG STRATEGIC MUNICIPAL INCOME FUND | FINAL VALUE |
Performance data shown represents past performance and is no guarantee of future results. Investment return and principal value will fluctuate so shares, when redeemed, may be worth more or less than their original cost. Current performance may be lower or higher than quoted. For performance current to the most recent month end, visit thornburg.com or call 800-847-0200. The performance information does not reflect the deduction of taxes that a shareholder would pay on distributions or the redemption of Fund shares. Returns reflect the reinvestment of dividends and capital gains. Class A shares are sold with a maximum sales charge of 2.00%. Class C shares include a 0.60% CDSC for the first year only. There is no sales charge for Class I shares. As disclosed in the Fund’s most recent prospectus, the total annual fund operating expenses before fee waivers and expense reimbursements are as follows: A shares, 1.26%; C shares, 1.65% and I shares, 0.98%. Thornburg Investment Management has contractually agreed to waive fees and reimburse expenses until at least February 1, 2021, for some of the share classes, resulting in net expense ratios of the following: A shares, 0.81%; C shares, 1.28% and I shares, 0.59%. For more detailed information on fund expenses and waivers/reimbursements please see the Fund’s prospectus. Without the fee waivers and expense reimbursements, the Annualized Distribution yield would have been 2.27%, and the SEC yield would have been 1.34%.
The ICE index data referenced herein is the property of ICE Data Indices, LLC, its affiliates (“ICE Data”) and/or its Third Party Suppliers and has been licensed for use by Thornburg Investment Management, Inc. ICE Data and its Third Party Suppliers accept no liability in connection with its use. See www.thornburg.com/indices for a full copy of the Disclaimer.
8 | Thornburg Municipal Funds Semi-Annual Report
Performance Summary, Continued
March 31, 2020 (Unaudited)
30-DAY YIELDS, A SHARES(with sales charge)
| THORNBURG SHORT DURATION MUNICIPAL FUND | |
| Annualized Distribution Yield | 1.39% |
| SEC Yield | 1.29% |
| THORNBURG LIMITED TERM MUNICIPAL FUND | |
| Annualized Distribution Yield | 1.69% |
| SEC Yield | 1.10% |
| THORNBURG CALIFORNIA LIMITED TERM MUNICIPAL FUND | |
| Annualized Distribution Yield | 1.49% |
| SEC Yield | 0.89% |
| THORNBURG NEW MEXICO INTERMEDIATE MUNICIPAL FUND | |
| Annualized Distribution Yield | 1.88% |
| SEC Yield | 1.07% |
| THORNBURG NEW YORK INTERMEDIATE MUNICIPAL FUND | |
| Annualized Distribution Yield | 1.94% |
| SEC Yield | 0.94% |
| THORNBURG INTERMEDIATE MUNICIPAL FUND | |
| Annualized Distribution Yield | 2.44% |
| SEC Yield | 1.31% |
| THORNBURG STRATEGIC MUNICIPAL INCOME FUND | |
| Annualized Distribution Yield | 2.54% |
| SEC Yield | 1.61% |
TheICE BofAML 1-3 Year U.S. Municipal Securities Index is a subset of the ICE BofAML Municipal Securities Index including all securities with a remaining term to final maturity greater than or equal to 1 year and less than 3 years.
TheICE BofAML 1-10 Year U.S. Municipal Securities Index is a subset of the ICE BofAML Municipal Securities Index including all securities with a remaining term to final maturity less than 10 years.
TheICE BofAML 3-15 Year U.S. Municipal Securities Index is a subset of the ICE BofAML Municipal Securities Index including all securities with a remaining term to final maturity greater than or equal to 3 years and less than 15 years.
TheICE BofAML U.S. Municipal Master Index tracks the performance of the investment-grade U.S. tax-exempt bond market. Qualifying bonds must have at least one year remaining term to maturity, a fixed coupon schedule, and an investment grade rating (based on average of Moody’s, S&P, and Fitch).
The performance of any index is not indicative of the performance of any particular investment. Unless otherwise noted, index returns reflect the reinvestment of income dividends and capital gains, if any, but do not reflect fees, brokerage commissions or other expenses of investing. Investors may not make direct investments into any index.
Bond Credit Ratings (Credit Quality) – A bond credit rating assesses the financial ability of a debt issuer to make timely payments of principal and interest. Ratings of AAA (the highest), AA, A, and BBB are investment-grade quality. Ratings of BB, B, CCC, CC, C and D (the lowest) are considered below investment grade, speculative grade, or junk bonds.
Duration – A bond’s sensitivity to interest rates. Bonds with longer durations experience greater price volatility than bonds with shorter durations. Effective duration incorporates a bond’s embedded option features, such as call provisions.
Yield Curve – A line that plots the interest rates, at a set point in time, of bonds having equal credit quality, but differing maturity dates.
Thornburg Municipal Funds Semi-Annual Report | 9
Fund Summary
Thornburg Short Duration Municipal Fund | March 31, 2020 (Unaudited)
OBJECTIVES AND STRATEGIES
The Fund seeks current income exempt from federal income tax, consistent with preservation of capital.
This Fund invests principally in a laddered portfolio of municipal bonds with a dollar-weighted average duration of normally no more than three years. Laddering involves building a portfolio of bonds with staggered maturities so that a portion of the portfolio matures each year. Cash from maturing bonds, if not needed for other purposes, is typically invested in bonds with longer maturities at the far end of the ladder. We regard the strategy as a good compromise for managing different types of risk.
LONG-TERM STABILITY OF PRINCIPAL
Net Asset Value History of A Shares
| KEY PORTFOLIO ATTRIBUTES | |
| Number of Bonds | 123 |
| Effective Duration | 1.1 Yrs |
| Average Maturity | 1.4 Yrs |
SECURITY CREDIT RATINGS
A bond credit rating assesses the financial ability of a debt issuer to make timely payments of principal and interest. Ratings of AAA (the highest), AA, A, and BBB are investment-grade quality. Ratings of BB, B, CCC, CC, C and D (the lowest) are considered below investment grade, speculative grade, or junk bonds.
Unrated pre-refunded and escrowed-to-maturity bonds are included in the not rated category.
PORTFOLIO LADDER
Percent of portfolio maturing in each year. Cash includes cash equivalents and other.
There is no guarantee that the Fund will meet its investment objectives.
All data is subject to change. Charts may not add up to 100% due to rounding.
THORNBURG SHORT DURATION
MUNICIPAL FUND | NASDAQ SYMBOLS | CUSIPS |
| Class A | TLMAX | 885-216-788 |
| Class I | TLMIX | 885-216-770 |
Minimum investments for Class I shares may be higher than those for Class A. Class I shares may not be available to all investors.
The laddering strategy does not assure or guarantee better performance and cannot eliminate the risk of investment losses.
Income distributions that are exempt from federal income tax may be subject to the federal alternative minimum tax and to state and local income taxes.
10 | Thornburg Municipal Funds Semi-Annual Report
Fund Summary
Thornburg Limited Term Municipal Fund | March 31, 2020 (Unaudited)
OBJECTIVES AND STRATEGIES
The Fund’s primary investment objective is to obtain as high a level of current income exempt from federal individual income tax as is consistent, in the view of the Fund’s investment advisor, with preservation of capital.
The secondary goal of the Fund is to reduce expected changes in its share price compared to longer intermediate and long-term bond portfolios.
This Fund is a laddered portfolio of municipal bonds with a dollar-weighted average maturity of normally less than five years. Laddering involves building a portfolio of bonds with staggered maturities so that a portion of the portfolio matures each year. Cash from maturing bonds, if not needed for other purposes, is typically invested in bonds with longer maturities at the far end of the ladder. We regard the strategy as a good compromise for managing different types of risk.
LONG-TERM STABILITY OF PRINCIPAL
Net Asset Value History of A Shares
| KEY PORTFOLIO ATTRIBUTES | |
| Number of Bonds | 1,644 |
| Effective Duration | 3.0 Yrs |
| Average Maturity | 3.5 Yrs |
SECURITY CREDIT RATINGS
A bond credit rating assesses the financial ability of a debt issuer to make timely payments of principal and interest. Ratings of AAA (the highest), AA, A, and BBB are investment-grade quality. Ratings of BB, B, CCC, CC, C and D (the lowest) are considered below investment grade, speculative grade, or junk bonds.
Unrated pre-refunded and escrowed-to-maturity bonds are included in the not rated category.
PORTFOLIO LADDER
| 4% | 14% | 16% | 14% | 13% | 13% | 8% | 6% | 5% | 4% | 3% |
Percent of portfolio maturing in each year. Cash includes cash equivalents and other.
There is no guarantee that the Fund will meet its investment objectives.
All data is subject to change. Charts may not add up to 100% due to rounding.
THORNBURG LIMITED TERM
MUNICIPAL FUND | NASDAQ SYMBOLS | CUSIPS |
| Class A | LTMFX | 885-215-459 |
| Class C | LTMCX | 885-215-442 |
| Class I | LTMIX | 885-215-434 |
Minimum investments for Class I shares may be higher than those for other classes. Class I shares may not be available to all investors.
The laddering strategy does not assure or guarantee better performance and cannot eliminate the risk of investment losses.
Thornburg Municipal Funds Semi-Annual Report | 11
Fund Summary
Thornburg California Limited Term Municipal Fund | March 31, 2020 (Unaudited)
OBJECTIVES AND STRATEGIES
The Fund’s primary investment objective is to obtain as high a level of current income exempt from federal and California state individual income taxes as is consistent, in the view of the Fund’s investment advisor, with preservation of capital.
The secondary goal of the Fund is to reduce expected changes in its share price compared to longer intermediate and long-term bond portfolios.
As described in the Fund’s prospectus, the Fund seeks to offer California investors tax-free yields from investments exempt from California and regular federal income taxes in a laddered municipal bond portfolio with a dollar-weighted average maturity of normally less than five years. Laddering involves building a portfolio of bonds with staggered maturities so that a portion of the portfolio matures each year. Cash from maturing bonds, if not needed for other purposes, is typically invested in bonds with longer maturities at the far end of the ladder. We regard this strategy as a good compromise for managing different types of risk.
LONG-TERM STABILITY OF PRINCIPAL
Net Asset Value History of A Shares
| KEY PORTFOLIO ATTRIBUTES | |
| Number of Bonds | 320 |
| Effective Duration | 2.8 Yrs |
| Average Maturity | 3.3 Yrs |
SECURITY CREDIT RATINGS
A bond credit rating assesses the financial ability of a debt issuer to make timely payments of principal and interest. Ratings of AAA (the highest), AA, A, and BBB are investment-grade quality. Ratings of BB, B, CCC, CC, C and D (the lowest) are considered below investment grade, speculative grade, or junk bonds.
Unrated pre-refunded and escrowed-to-maturity bonds are included in the not rated category.
PORTFOLIO LADDER
| 8% | 20% | 11% | 9% | 11% | 13% | 8% | 7% | 5% | 3% | 5% |
Percent of portfolio maturing in each year. Cash includes cash equivalents and other.
There is no guarantee that the Fund will meet its investment objectives.
All data is subject to change. Charts may not add up to 100% due to rounding.
THORNBURG CALIFORNIA LIMITED TERM
MUNICIPAL FUND | NASDAQ SYMBOLS | CUSIPS |
| Class A | LTCAX | 885-215-426 |
| Class C | LTCCX | 885-215-418 |
| Class I | LTCIX | 885-215-392 |
Minimum investments for Class I shares may be higher than those for other classes. Class I shares may not be available to all investors.
The laddering strategy does not assure or guarantee better performance and cannot eliminate the risk of investment losses.
Income distributions that are exempt from federal income tax may be subject to the federal alternative minimum tax and to state and local income taxes.
12 | Thornburg Municipal Funds Semi-Annual Report
Fund Summary
Thornburg New Mexico Intermediate Municipal Fund | March 31, 2020 (Unaudited)
OBJECTIVES AND STRATEGIES
The Fund’s primary investment objective is to obtain as high a level of current income exempt from federal and New Mexico state individual income taxes as is consistent, in the view of the investment advisor, with preservation of capital.
The secondary goal of the Fund is to reduce expected changes in its share price compared to long-term bond portfolios.
This Fund seeks to offer New Mexico investors tax-free yields from investments exempt from New Mexico and regular federal income taxes in a laddered municipal bond portfolio with a dollar-weighted average maturity of normally three to 10 years. Laddering involves building a portfolio of bonds with staggered maturities so that a portion of the portfolio matures each year. Cash from maturing bonds, if not needed for other purposes, is typically invested in bonds with longer maturities at the far end of the ladder. We regard the strategy as a good compromise for managing different types of risk.
LONG-TERM STABILITY OF PRINCIPAL
Net Asset Value History of A Shares
| KEY PORTFOLIO ATTRIBUTES | |
| Number of Bonds | 129 |
| Effective Duration | 5.1 Yrs |
| Average Maturity | 8.5 Yrs |
SECURITY CREDIT RATINGS
A bond credit rating assesses the financial ability of a debt issuer to make timely payments of principal and interest. Ratings of AAA (the highest), AA, A, and BBB are investment-grade quality. Ratings of BB, B, CCC, CC, C and D (the lowest) are considered below investment grade, speculative grade, or junk bonds.
Unrated pre-refunded and escrowed-to-maturity bonds are included in the not rated category.
PORTFOLIO LADDER
| 2% | 14% | 9% | 12% | 15% | 9% | 7% | 8% | 12% | 13% |
Percent of portfolio maturing in each year. Cash includes cash equivalents and other.
There is no guarantee that the Fund will meet its investment objectives.
All data is subject to change. Charts may not add up to 100% due to rounding.
THORNBURG NEW MEXICO INTERMEDIATE
MUNICIPAL FUND | NASDAQ SYMBOLS | CUSIPS |
| Class A | THNMX | 885-215-301 |
| Class D | THNDX | 885-215-624 |
| Class I | THNIX | 885-215-285 |
Minimum investments for Class I shares may be higher than those for other classes. Class I shares may not be available to all investors.
The laddering strategy does not assure or guarantee better performance and cannot eliminate the risk of investment losses.
Income distributions that are exempt from federal income tax may be subject to the federal alternative minimum tax and to state and local income taxes.
Thornburg Municipal Funds Semi-Annual Report | 13
Fund Summary
Thornburg New York Intermediate Municipal Fund | March 31, 2020 (Unaudited)
OBJECTIVES AND STRATEGIES
The Fund’s primary investment objective is to obtain as high a level of current income exempt from federal, New York State and New York City individual income taxes as is consistent, in the view of the Fund’s investment advisor, with preservation of capital.
The secondary goal of the Fund is to reduce expected changes in its share price compared to long-term bond portfolios.
The Fund offers New York investors double (or for New York City residents triple) tax-free yields in a laddered municipal bond portfolio with a dollar-weighted average maturity of normally three to 10 years (may be subject to Alternative Minimum Tax). Laddering involves building a portfolio of bonds with staggered maturities so that a portion of the portfolio matures each year. Cash from maturing bonds, if not needed for other purposes, is typically invested in bonds with longer maturities at the far end of the ladder. We regard the strategy as a good compromise for managing different types of risk.
LONG-TERM STABILITY OF PRINCIPAL
Net Asset Value History of A Shares
| KEY PORTFOLIO ATTRIBUTES | |
| Number of Bonds | 60 |
| Effective Duration | 5.9 Yrs |
| Average Maturity | 9.8 Yrs |
SECURITY CREDIT RATINGS
A bond credit rating assesses the financial ability of a debt issuer to make timely payments of principal and interest. Ratings of AAA (the highest), AA, A, and BBB are investment-grade quality. Ratings of BB, B, CCC, CC, C and D (the lowest) are considered below investment grade, speculative grade, or junk bonds.
Unrated pre-refunded and escrowed-to-maturity bonds are included in the not rated category.
PORTFOLIO LADDER
| 4% | 5% | 10% | 7% | 10% | 14% | 17% | 4% | 7% | 21% |
Percent of portfolio maturing in each year. Cash includes cash equivalents and other.
There is no guarantee that the Fund will meet its investment objectives.
All data is subject to change. Charts may not add up to 100% due to rounding.
THORNBURG NEW YORK INTERMEDIATE
MUNICIPAL FUND | NASDAQ SYMBOLS | CUSIPS |
| Class A | THNYX | 885-215-665 |
| Class I | TNYIX | 885-216-705 |
Minimum investments for Class I shares may be higher than those for Class A. Class I shares may not be available to all investors.
The laddering strategy does not assure or guarantee better performance and cannot eliminate the risk of investment losses.
14 | Thornburg Municipal Funds Semi-Annual Report
Fund Summary
Thornburg Intermediate Municipal Fund | March 31, 2020 (Unaudited)
OBJECTIVES AND STRATEGIES
The Fund’s primary investment goal is to obtain as high a level of current income exempt from federal individual income tax as is consistent, in the view of the Fund’s investment advisor, with preservation of capital.
The secondary goal of the Fund is to reduce expected changes in its share price compared to long-term bond portfolios.
This Fund invests principally in a laddered portfolio of municipal bonds with a dollar-weighted average maturity of normally three to 10 years. Laddering involves building a portfolio of bonds with staggered maturities so that a portion of the portfolio matures each year. Cash from maturing bonds, if not needed for other purposes, is typically invested in bonds with longer maturities at the far end of the ladder. We regard the strategy as a good compromise for managing different types of risk.
LONG-TERM STABILITY OF PRINCIPAL
Net Asset Value History of A Shares
| KEY PORTFOLIO ATTRIBUTES | |
| Number of Bonds | 470 |
| Effective Duration | 5.5 Yrs |
| Average Maturity | 8.8 Yrs |
SECURITY CREDIT RATINGS
A bond credit rating assesses the financial ability of a debt issuer to make timely payments of principal and interest. Ratings of AAA (the highest), AA, A, and BBB are investment-grade quality. Ratings of BB, B, CCC, CC, C and D (the lowest) are considered below investment grade, speculative grade, or junk bonds.
Unrated pre-refunded and escrowed-to-maturity bonds are included in the not rated category.
PORTFOLIO LADDER
| 3% | 10% | 10% | 11% | 13% | 10% | 14% | 10% | 8% | 12% |
Percent of portfolio maturing in each year. Cash includes cash equivalents and other.
There is no guarantee that the Fund will meet its investment objectives.
All data is subject to change. Charts may not add up to 100% due to rounding.
THORNBURG INTERMEDIATE
MUNICIPAL FUND | NASDAQ SYMBOLS | CUSIPS |
| Class A | THIMX | 885-215-202 |
| Class C | THMCX | 885-215-780 |
| Class I | THMIX | 885-215-673 |
Minimum investments for Class I shares may be higher than those for other classes. Class I shares may not be available to all investors.
The laddering strategy does not assure or guarantee better performance and cannot eliminate the risk of investment losses.
Thornburg Municipal Funds Semi-Annual Report | 15
Fund Summary
Thornburg Strategic Municipal Income Fund | March 31, 2020 (Unaudited)
OBJECTIVES AND STRATEGIES
The Fund seeks a high level of current income exempt from federal individual income tax (may be subject to Alternative Minimum Tax).
The Fund invests principally in a portfolio of municipal bonds issued by states and state agencies, local governments and their agencies, and by U.S. territories and possessions.
Not more than 50% of the portfolio may be invested in bonds rated below investment grade (or of equivalent quality as determined in accordance with the prospectus) at the time of purchase. Also, the portfolio is typically diversified among sectors, issuers, credit qualities, geographic regions, and segments of the yield curve. The flexible nature of the Fund allows the team to adapt the portfolio’s duration and credit quality to our perception of future market conditions.
| KEY PORTFOLIO ATTRIBUTES | |
| Number of Bonds | 231 |
| Effective Duration | 5.5 Yrs |
| Average Maturity | 9.5 Yrs |
SECURITY CREDIT RATINGS
A bond credit rating assesses the financial ability of a debt issuer to make timely payments of principal and interest. Ratings of AAA (the highest), AA, A, and BBB are investment-grade quality. Ratings of BB, B, CCC, CC, C and D (the lowest) are considered below investment grade, speculative grade, or junk bonds.
Unrated pre-refunded and escrowed-to-maturity bonds are included in the not rated category.
There is no guarantee that the Fund will meet its investment objectives.
All data is subject to change. Charts may not add up to 100% due to rounding.
THORNBURG STRATEGIC MUNICIPAL
INCOME FUND | NASDAQ SYMBOLS | CUSIPS |
| Class A | TSSAX | 885-216-101 |
| Class C | TSSCX | 885-216-200 |
| Class I | TSSIX | 885-216-309 |
Minimum investments for Class I shares may be higher than those for other classes. Class I shares may not be available to all investors.
16 | Thornburg Municipal Funds Semi-Annual Report
Schedule of Investments
Thornburg Short Duration Municipal Fund | March 31, 2020 (Unaudited)
| | Issuer-Description | PRINCIPAL
AMOUNT | VALUE |
| | Municipal Bonds — 96.0% | | |
| | Alabama — 1.9% | | |
| a | Selma Industrial Development Board (International Paper Co.), Series A, 2.00% due 11/1/2033 (put 10/1/2024) | $1,500,000 | $ 1,470,165 |
| | Southeast Alabama Gas Supply District, Series A, 4.00% due 6/1/2020 | 1,000,000 | 1,002,960 |
| | Arizona — 1.4% | | |
| a | Maricopa County (Banner Health Obligated Group) IDA, Series B, 5.09% (MUNIPSA + 0.55%) due 1/1/2035 (put 10/18/2022) | 945,000 | 943,517 |
| | Mesa Utility System Revenue, 4.00% due 7/1/2020 | 915,000 | 921,606 |
| | California — 8.7% | | |
| | California (Dignity Health) HFFA, Series A, 5.00% due 3/1/2021 | 1,000,000 | 1,019,050 |
| a | California Infrastructure and Economic Development Bank (California Academy of Sciences), Series D, 1.043% (LIBOR 1 Month + 0.38%) due 8/1/2047 (put 8/1/2021) | 2,000,000 | 2,001,540 |
| a | California Infrastructure and Economic Development Bank (Los Angeles County Museum of Art), Series A, 1.321% (LIBOR 1 Month + 0.65%) due 12/1/2050 (put 2/1/2021) | 4,000,000 | 4,005,720 |
| | California Statewide Communities Development Authority (Irvine East Campus Apartments), 5.00% due 5/15/2020 | 565,000 | 567,571 |
| a | Los Angeles Department of Water (SPA Royal Bank of Canada), Series B-2-REMK, 0.52% due 7/1/2035 (put 4/1/2020) | 2,600,000 | 2,600,000 |
| | Northern California Power Agency (LODI Energy Center), Series A, 5.00% due 6/1/2025 (pre-refunded 6/1/2020) | 1,000,000 | 1,005,380 |
| | Colorado — 3.3% | | |
| | Colorado State Education Loan Program, Series B, 1.75% due 6/29/2020 | 2,000,000 | 2,002,320 |
| | Interlocken Metropolitan District (Insured: AGM) GO, Series A-1, 5.00% due 12/1/2020 - 12/1/2023 | 2,000,000 | 2,186,255 |
| | Connecticut — 1.0% | | |
| | State of Connecticut GO, Series C, 5.00% due 6/15/2022 | 715,000 | 768,217 |
| | State of Connecticut Special Tax Revenue, Series B, 5.00% due 10/1/2021 | 525,000 | 550,027 |
| | Florida — 7.1% | | |
| | City of Jacksonville, Series C, 5.00% due 10/1/2020 | 1,000,000 | 1,019,180 |
| | City of Orlando (Insured: AGM), Series A, 4.00% due 11/1/2021 | 900,000 | 939,186 |
| �� | City of Orlando (Senior Tourist Development; Insured: AGM), Series A, 4.00% due 11/1/2020 | 850,000 | 863,668 |
| a | Escambia County (International Paper Co.), 2.00% due 11/1/2033 (put 10/1/2024) | 775,000 | 759,585 |
| a | JEA Water & Sewer System Revenue (SPA U.S. Bank, N.A.), Series A-1, 1.10% due 10/1/2038 (put 4/1/2020) | 700,000 | 700,000 |
| a | Miami-Dade County (Florida Power & Light Co.) IDA, 0.85% due 6/1/2021 (put 4/1/2020) | 3,900,000 | 3,900,000 |
| a | Miami-Dade County (Waste Management, Inc.) IDA, 1.50% due 9/1/2027 (put 11/2/2020) | 1,000,000 | 997,340 |
| | Georgia — 3.6% | | |
| | City of Atlanta (Atlantic Station Project), 5.00% due 12/1/2021 | 650,000 | 688,337 |
| | Main Street Natural Gas, Inc., Series A, 5.00% due 5/15/2022 | 1,000,000 | 1,039,790 |
| a | Monroe County Development Authority (Gulf Power Co.), 2.00% due 9/1/2037 (put 6/25/2020) | 1,000,000 | 1,001,640 |
| | Municipal Electric Authority of Georgia, Series A, 5.00% due 1/1/2024 | 830,000 | 898,433 |
| a | Private Colleges & Universities Authority (Emory University), Series B, 5.13% (MUNIPSA + 0.42%) due 10/1/2039 (put 8/16/2022) | 1,000,000 | 985,010 |
| | Guam — 0.3% | | |
| | Guam Power Authority (Electric Power System; Insured: AGM), Series A, 5.00% due 10/1/2020 | 360,000 | 366,437 |
| | Illinois — 7.9% | | |
| | Chicago Park District GO, Series B, 5.00% due 1/1/2022 | 400,000 | 416,064 |
| | City of Chicago (Water System), | | |
| | 5.00% due 11/1/2020 | 600,000 | 611,874 |
| | Series 2017-2, 5.00% due 11/1/2022 | 600,000 | 648,444 |
| | Cook County Community College District No. 508 (City Colleges of Chicago) GO, 5.00% due 12/1/2023 | 500,000 | 513,120 |
| | Cook County School District No. 170 Chicago Heights (Insured: AGM) GO, Series D, 5.00% due 12/1/2022 | 1,500,000 | 1,613,805 |
| a | Illinois Finance Authority (Peoples Gas Light & Coke Co.), Series B, 1.875% due 2/1/2033 (put 8/1/2020) | 1,600,000 | 1,601,744 |
| | State of Illinois (Build Illinois Program), 5.00% due 6/15/2020 | 535,000 | 538,333 |
| | State of Illinois (State Facilities Improvements) GO, | | |
| | 5.00% due 3/1/2022 | 575,000 | 589,312 |
| | Series A, 5.00% due 10/1/2022 | 1,000,000 | 1,029,280 |
| | Series D, 5.00% due 11/1/2024 | 1,000,000 | 1,047,430 |
| | Village of Tinley Park GO, | | |
| | 4.00% due 12/1/2021 | 585,000 | 611,301 |
| | 5.00% due 12/1/2024 | 870,000 | 985,110 |
| | Indiana — 1.0% | | |
| a | Indiana Finance Authority (Indiana University Health, Inc. Obligated Group), Series L, 4.99% (MUNIPSA + 0.38%) due 12/1/2046 (put 7/2/2021) | 1,300,000 | 1,300,286 |
| | Kentucky — 0.9% | | |
| a | Louisville/Jefferson County Metropolitan Government (Louisville Gas & Electric Co.), 1.85% due 10/1/2033 (put 4/1/2021) | 1,200,000 | 1,202,604 |
| | Louisiana — 2.4% | | |
| | Louisiana Energy & Power Authority (Rodemacher Unit No. 2 Power), 5.00% due 1/1/2021 | 600,000 | 615,258 |
See notes to financial statements.
| Thornburg Municipal Funds Semi-Annual Report | 17 |
Schedule of Investments, Continued
Thornburg Short Duration Municipal Fund | March 31, 2020 (Unaudited)
| | Issuer-Description | PRINCIPAL
AMOUNT | VALUE |
| a | Louisiana Offshore Terminal Authority (Loop, Inc.), 1.65% due 9/1/2027 (put 12/1/2023) | $1,500,000 | $ 1,510,365 |
| | Shreveport Water & Sewer Revenue (Insured: BAM), Series C, 5.00% due 12/1/2023 | 860,000 | 970,493 |
| | Maryland — 0.5% | | |
| | Washington County (Diakon Lutheran Social Ministries Obligated Group), Series B, 5.00% due 1/1/2021 - 1/1/2023 | 670,000 | 698,880 |
| | Michigan — 2.3% | | |
| | City of Detroit Sewage Disposal System Revenue (Great Lakes Water Authority Sewage Disposal System Revenue; Insured: AGM), Series A, 5.25% due 7/1/2020 | 800,000 | 807,936 |
| | Detroit Downtown Development Authority (Catalyst Development Project; Insured: AGM), Series A, 5.00% due 7/1/2021 - 7/1/2022 | 500,000 | 531,323 |
| | Livonia Public Schools School District (Insured: BAM) GO, 5.00% due 5/1/2021 | 585,000 | 608,856 |
| | Northern Michigan University, Series A, 5.00% due 12/1/2020 - 12/1/2021 | 935,000 | 974,594 |
| | Minnesota — 0.8% | | |
| a | Minnesota Housing Finance Agency (Residential Single Family Development; Collateralized: GNMA, FNMA, FHLMC), 5.26% (MUNIPSA + 0.38%) due 7/1/2041 (put 12/12/2023) | 1,000,000 | 998,310 |
| | Mississippi — 2.7% | | |
| a | Jackson County (Chevron Corp.), 0.65% due 6/1/2023 (put 4/1/2020) | 2,100,000 | 2,100,000 |
| a | Mississippi Business Finance Corp. (Chevron USA, Inc.; Guaranty: Chevron Corp.), Series G, 0.65% due 12/1/2030 (put 4/1/2020) | 950,000 | 950,000 |
| | Mississippi Development Bank (Jackson Public School District; Insured: BAM), 5.00% due 10/1/2022 | 375,000 | 407,914 |
| | Missouri — 0.9% | | |
| a | Health and Educational Facilities Authority of the State of Missouri (Washington University; SPA U.S. Bank, N.A.), Series C-REMK, 0.75% due 3/1/2040 (put 4/1/2020) | 1,100,000 | 1,100,000 |
| | Nebraska — 0.8% | | |
| a | Central Plains Energy Project, 5.00% due 3/1/2050 (put 1/1/2024) | 1,000,000 | 1,063,990 |
| | Nevada — 1.8% | | |
| | Clark County Department of Aviation, Series A, 5.00% due 7/1/2021 | 2,000,000 | 2,080,560 |
| | Clark County School District (School Facilities Improvements) GO, Series C, 5.00% due 6/15/2021 | 250,000 | 261,060 |
| | New Hampshire — 2.4% | | |
| a | New Hampshire Health and Education Facilities Authority Act (University System of New Hampshire; SPA Wells Fargo Bank, N.A.), Series B-1, 0.85% due 7/1/2033 (put 4/1/2020) | 3,100,000 | 3,100,000 |
| | New Jersey — 3.7% | | |
| | City of Trenton (Various Capital Improvements; Insured: AGC) (State Aid Withholding) GO, 5.00% due 7/15/2020 | 500,000 | 505,285 |
| | Hudson County Improvement Authority GO, Series B-1, 3.00% due 5/22/2020 | 1,350,000 | 1,353,375 |
| | New Jersey Transportation Trust Fund Authority (State Transportation System Improvements), 5.00% due 6/15/2020 | 500,000 | 501,950 |
| | Passaic Valley Sewer Commissioners (Sewer System), Series G, 5.75% due 12/1/2021 | 500,000 | 535,295 |
| | Tobacco Settlement Financing Corp., Series A, 5.00% due 6/1/2021 | 1,790,000 | 1,837,077 |
| | New Mexico — 2.2% | | |
| a | City of Farmington (Southern California Edison Co.-Four Corners Project), 2.125% due 6/1/2040 (put 6/1/2022) | 1,000,000 | 971,210 |
| | New Mexico Municipal Energy Acquisition Authority, Series A, 4.00% due 11/1/2021 - 11/1/2022 | 1,750,000 | 1,832,199 |
| | New York — 9.3% | | |
| | Metropolitan Transportation Authority, Series D-1, 5.00% due 9/1/2022 | 3,000,000 | 3,172,590 |
| | Metropolitan Transportation Authority (Transit and Commuter System), Series C-1, 5.00% due 9/1/2020 | 2,350,000 | 2,375,521 |
| | New York City Housing Development Corp., 2.00% due 11/1/2020 | 1,780,000 | 1,779,786 |
| a | New York City Water & Sewer System (SPA U.S. Bank, N.A.), Series 3A, 1.10% due 6/15/2043 (put 4/1/2020) | 500,000 | 500,000 |
| | New York State Dormitory Authority (NYSARC, Inc. Developmental Disability Programs; Insured: State Intercept), Series A, 5.00% due 7/1/2020 | 1,175,000 | 1,186,350 |
| a | New York State Housing Finance Agency (LOC Landesbank Hessen-Thuringen), Series A, 0.75% due 11/1/2046 (put 4/1/2020) | 500,000 | 500,000 |
| | Oneida County Local Development Corp. (Utica College), 5.00% due 7/1/2020 - 7/1/2024 | 955,000 | 997,680 |
| | Tobacco Settlement Asset Securitization Corp., Series A, 5.00% due 6/1/2021 | 1,000,000 | 1,027,590 |
| | Westchester County Local Development Corp. (Miriam Osborn Memorial Home Assoc.), 5.00% due 7/1/2023 | 425,000 | 467,071 |
| | North Carolina — 0.2% | | |
| | North Carolina Turnpike Authority, 5.00% due 1/1/2021 | 200,000 | 205,330 |
| | North Dakota — 3.0% | | |
| | County of McKenzie, 5.00% due 8/1/2022 | 2,000,000 | 2,163,340 |
| | Ward County (Insured: AGM), 3.00% due 4/1/2021 | 1,680,000 | 1,682,386 |
| | Ohio — 3.0% | | |
| | City of Cleveland (Parking Facility; Insured: AGM), 5.25% due 9/15/2021 | 500,000 | 528,255 |
| | County of Scioto (Southern Ohio Medical Center), 5.00% due 2/15/2022 - 2/15/2023 | 3,130,000 | 3,396,833 |
| | Oklahoma — 0.2% | | |
| | Muskogee Industrial Trust (Muskogee County Independent School District No. 20), 5.00% due 9/1/2023 | 200,000 | 221,820 |
| | Pennsylvania — 4.0% | | |
| | Coatesville Area School District (Insured: AGM) (State Aid Withholding) GO, 5.00% due 8/1/2021 | 1,000,000 | 1,046,870 |
| | East Penn School District (State Aid Withholding) GO, 2.00% due 9/15/2020 | 555,000 | 555,350 |
18 | Thornburg Municipal Funds Semi-Annual Report
| See notes to financial statements. |
Schedule of Investments, Continued
Thornburg Short Duration Municipal Fund | March 31, 2020 (Unaudited)
| | Issuer-Description | PRINCIPAL
AMOUNT | VALUE |
| | Luzerne County (Insured: AGM) IDA, GO, 5.00% due 12/15/2020 | $ 500,000 | $ 512,320 |
| | Philadelphia Authority for Industrial Development, 5.00% due 5/1/2020 - 5/1/2022 | 745,000 | 776,566 |
| | Philadelphia Water & Wastewater Revenue, Series B, 5.00% due 11/1/2020 | 550,000 | 561,242 |
| | Plum Borough School District (Insured: BAM) (State Aid Withholding) GO, | | |
| | Series A, 4.00% due 9/15/2020 - 9/15/2021 | 830,000 | 850,242 |
| | Series B, | | |
| | 4.00% due 9/15/2020 | 385,000 | 389,427 |
| | 5.00% due 9/15/2021 | 430,000 | 451,926 |
| | South Carolina — 1.9% | | |
| a | City of Charleston Waterworks & Sewer System Revenue (Capital Improvement), Series B, 1.041% (LIBOR 1 Month + 0.36%) due 1/1/2035 (put 1/1/2022) | 2,500,000 | 2,502,450 |
| | Tennessee — 1.1% | | |
| | Tennessee Energy Acquisition Corp. (The Gas Project), Series C, 5.00% due 2/1/2023 | 1,310,000 | 1,374,203 |
| | Texas — 12.6% | | |
| | City of Dallas (Trinity River Corridor Infrastructure) GO, 5.00% due 2/15/2021 | 1,000,000 | 1,033,290 |
| a | City of Houston (Combined Utility System), Series C, 1.007% (LIBOR 1 Month + 0.37%) due 5/15/2034 (put 8/1/2021) | 3,200,000 | 3,192,768 |
| | City of Olmos Park Higher Education Facilities Corp. (University of the Incarnate Word), 5.00% due 12/1/2022 | 1,000,000 | 1,086,460 |
| | City of Texas City Industrial Development Corp. (ARCO Pipe Line Co. Project), 7.375% due 10/1/2020 | 1,000,000 | 1,024,240 |
| a | Cypress-Fairbanks Independent School District (Guaranty: PSF) ISD GO, Series B-1-REMK, 1.25% due 2/15/2036 (put 8/15/2022) | 925,000 | 924,445 |
| a,b | Harris County Cultural Education Facilities Finance Corp. (Memorial Hermann Health System), Series B-REM, 5.085% (MUNIPSA + 0.28%) due 6/1/2032 (put 4/1/2021) | 1,325,000 | 1,325,040 |
| | Harris County Cultural Education Facilities Finance Corp. (Texas Medical Center Central Heating & Cooling Service Corp.), 5.00% due 11/15/2020 | 1,145,000 | 1,171,324 |
| | Houston Airport System Revenue, | | |
| | Series B, | | |
| c | 5.00% due 7/1/2022 | 630,000 | 675,769 |
| | 5.00% due 7/1/2023 | 150,000 | 165,248 |
| | Red River Authority (Insured: Natl-Re), 4.45% due 6/1/2020 | 2,650,000 | 2,661,448 |
| | Sam Rayburn Municipal Power Agency, 5.00% due 10/1/2021 | 510,000 | 534,500 |
| a | San Antonio Electric & Gas Systems Revenue, Series B-REMK, 2.00% due 2/1/2033 (put 12/1/2021) | 100,000 | 100,401 |
| | San Antonio Water System, Series A, 5.00% due 5/15/2021 | 1,250,000 | 1,303,500 |
| | Texas Transportation Commission (Highway Improvements) GO, 5.00% due 4/1/2020 | 1,000,000 | 1,000,000 |
| | Washington — 0.4% | | |
| d | State of Washington GO, 5.00% due 6/1/2024 | 500,000 | 555,210 |
| | West Virginia — 1.9% | | |
| | Mason County (Appalachian Power Co.), Series L, 2.75% due 10/1/2022 | 1,000,000 | 1,024,310 |
| a | West Virginia Economic Development Authority, (Appalachian Power Co.), Series A, 2.625% due 12/1/2042 (put 6/1/2022) | 1,425,000 | 1,434,776 |
| | Wisconsin — 0.8% | | |
| a | Wisconsin Health & Educational Facilities Authority (Ascension Health Alliance System), Series B-4, 5.00% due 11/15/2043 (put 6/1/2021) | 1,000,000 | 1,033,490 |
| | Total Investments — 96.0%(Cost $123,389,300) | | $123,698,938 |
| | Other Assets Less Liabilities — 4.0% | | 5,115,535 |
| | Net Assets — 100.0% | | $128,814,473 |
| Footnote Legend |
| a | Variable, floating, step, or fixed to floating rate securities are securities for which interest rate changes are based on changes in a designated base rate or on a predetermined schedule. The rates shown are those in effect on March 31, 2020. |
| b | Securities exempt from registration under Rule 144A of the Securities Act of 1933, as amended. These securities are restricted but liquid and may only be resold in the ordinary course of business in transactions exempt from registration, normally to qualified institutional buyers. As of March 31, 2020, the aggregate value of these securities in the Fund’s portfolio was $1,325,040, representing 1.03% of the Fund’s net assets. |
| c | Segregated as collateral for a when-issued security. |
| d | When-issued security. |
See notes to financial statements.
| Thornburg Municipal Funds Semi-Annual Report | 19 |
Schedule of Investments, Continued
Thornburg Short Duration Municipal Fund | March 31, 2020 (Unaudited)
Portfolio Abbreviations
To simplify the listings of securities, abbreviations are used per the table below:
| AGC | Insured by Assured Guaranty Corp. |
| AGM | Insured by Assured Guaranty Municipal Corp. |
| BAM | Insured by Build America Mutual Insurance Co. |
| FHLMC | Insured by Federal Home Loan Mortgage Corp. |
| FNMA | Collateralized by Federal National Mortgage Association |
| GNMA | Collateralized by Government National Mortgage Association |
| GO | General Obligation |
| HFFA | Health Facilities Financing Authority |
| IDA | Industrial Development Authority |
| ISD | Independent School District |
| JEA | Jacksonville Electric Authority |
| LIBOR | London Interbank Offered Rates |
| LOC | Letter of Credit |
| MUNIPSA | Securities Industry and Financial Markets Association (SIFMA) Municipal Swap Index |
| Natl-Re | Insured by National Public Finance Guarantee Corp. |
| PSF | Guaranteed by Permanent School Fund |
| SPA | Stand-by Purchase Agreement |
20 | Thornburg Municipal Funds Semi-Annual Report
| See notes to financial statements. |
Schedule of Investments
Thornburg Limited Term Municipal Fund | March 31, 2020 (Unaudited)
| | Issuer-Description | PRINCIPAL
AMOUNT | VALUE |
| | Municipal Bonds — 98.9% | | |
| | Alabama — 0.8% | | |
| | Alabama Public School & College Authority (Education System Capital Improvements), | | |
| | Series A, 5.00% due 6/1/2020 - 6/1/2022 | $16,025,000 | $ 16,756,577 |
| | Series B, 5.00% due 6/1/2023 | 735,000 | 820,635 |
| | Alabama State Board of Education (Calhoun Community College), 4.00% due 5/1/2020 - 5/1/2022 | 3,230,000 | 3,326,605 |
| | East Alabama Health Care Authority, Series A, 5.00% due 9/1/2021 - 9/1/2022 | 2,045,000 | 2,157,697 |
| | Lower Alabama Gas District, Series A, 5.00% due 9/1/2029 | 3,625,000 | 4,235,559 |
| | Lower Alabama Gas District (Guaranty: Goldman Sachs Group, Inc.), 4.00% due 12/1/2023 - 12/1/2025 | 1,220,000 | 1,287,402 |
| a | Selma Industrial Development Board (International Paper Co.), Series A, 2.00% due 11/1/2033 (put 10/1/2024) | 2,500,000 | 2,450,275 |
| | UAB Medicine Finance Authority (University Hospital), Series B, 5.00% due 9/1/2025 - 9/1/2027 | 8,915,000 | 10,828,952 |
| | Water Works Board of the City of Birmingham, 5.00% due 1/1/2029 | 2,230,000 | 2,796,799 |
| | Alaska — 0.4% | | |
| | Alaska Energy Authority (Bradley Lake Hydroelectric Project; Insured: AGM), 6.00% due 7/1/2020 | 2,055,000 | 2,078,139 |
| | City of Valdez (BP Pipelines (Alaska), Inc. Project), | | |
| | Series B, 5.00% due 1/1/2021 | 6,485,000 | 6,553,871 |
| | Series C, 5.00% due 1/1/2021 | 12,000,000 | 12,127,440 |
| | Arizona — 2.4% | | |
| | Arizona (Scottsdale Lincoln Hospitals) HFA, 5.00% due 12/1/2022 - 12/1/2024 | 3,360,000 | 3,755,429 |
| | Arizona Board of Regents (Arizona State University) COP, | | |
| | Series A, 5.00% due 9/1/2020 - 9/1/2023 | 17,150,000 | 18,510,376 |
| | Series C, 5.00% due 6/1/2022 | 6,080,000 | 6,572,298 |
| | Arizona Board of Regents (Northern Arizona University Projects) COP, 5.00% due 9/1/2020 - 9/1/2023 | 6,825,000 | 7,271,581 |
| | Arizona Board of Regents (University of Arizona), 5.00% due 8/1/2020 - 8/1/2024 | 1,925,000 | 2,111,486 |
| | Arizona Board of Regents (University of Arizona) COP, 5.00% due 6/1/2022 - 6/1/2028 | 1,690,000 | 1,968,337 |
| | Arizona Transportation Board, | | |
| | Series A, | | |
| | 5.00% due 7/1/2021 | 7,465,000 | 7,824,514 |
| | 5.00% due 7/1/2022 (pre-refunded 7/1/2021) | 5,000,000 | 5,245,900 |
| a | City of Phoenix (Mayo Clinic Arizona; Guaranty: Mayo Clinic) IDA, Series B-REM, 0.75% due 11/15/2052 (put 4/1/2020) | 550,000 | 550,000 |
| | City of Phoenix Civic Improvement Corp., Series A, 5.00% due 7/1/2022 - 7/1/2025 | 8,580,000 | 9,885,744 |
| | City of Phoenix Civic Improvement Corp. (Phoenix Airport Revenue), Series A, 5.00% due 7/1/2029 (pre-refunded 7/1/2020) | 9,320,000 | 9,408,633 |
| | City of Tucson (Street and Highway Projects), Series A, 5.00% due 7/1/2022 | 2,135,000 | 2,316,774 |
| a | Maricopa County (Banner Health Obligated Group) IDA, Series B, 5.09% (MUNIPSA + 0.55%) due 1/1/2035 (put 10/18/2022) | 8,785,000 | 8,771,208 |
| | Northern Arizona University (Insured: BAM), Series B, 5.00% due 6/1/2025 - 6/1/2030 | 2,105,000 | 2,642,100 |
| | Pima County (Ina & Roger Road Wastewater Reclamation Facilities), | | |
| | Series A, | | |
| | 3.00% due 7/1/2021 - 7/1/2022 | 2,525,000 | 2,607,500 |
| | 5.00% due 7/1/2020 - 7/1/2022 | 1,400,000 | 1,466,691 |
| | Pima County (Sewer System & Fleet Services Facilities Expansion) COP, Series A, 5.00% due 12/1/2020 - 12/1/2022 | 3,260,000 | 3,482,868 |
| | Pinal County (Detention and Training Facilities), Series A, 5.00% due 8/1/2021 - 8/1/2025 | 5,075,000 | 5,692,404 |
| | Pinal County (Hunt Highway (Phases III-V), Ironwood Drive, Public Safety Radio & Court Buildings), 5.00% due 8/1/2025 | 3,000,000 | 3,470,880 |
| | Pinal County (Tucson Electric Power Co.) IDA, 4.00% due 9/1/2029 | 3,320,000 | 3,342,742 |
| | Salt River Project Agricultural Improvement and Power District (Salt River Electric System), 5.00% due 1/1/2026 - 1/1/2029 | 8,405,000 | 10,451,987 |
| | State of Arizona COP, Series A, 5.00% due 10/1/2025 | 3,375,000 | 3,998,666 |
| | State of Arizona Department of Administration (State Lottery; Insured: AGM), Series A, 5.00% due 7/1/2020 | 8,705,000 | 8,789,264 |
| | Arkansas — 0.0% | | |
| | Board of Trustees of the University of Arkansas (Fayetteville Campus Athletic Facilities), Series A, 3.00% due 11/1/2023 | 615,000 | 651,691 |
| | California — 5.5% | | |
| | Alameda County Joint Powers Authority (Alameda County Medical Center Highland Hospital), Series A, 5.00% due 12/1/2021 - 12/1/2023 | 6,200,000 | 6,909,908 |
| | Anaheim Public Financing Authority (Public Improvements; Insured: AGM), Series C, Zero Coupon due 9/1/2022 | 3,250,000 | 3,153,898 |
| | Cabrillo (Educational Facilities; Insured: AMBAC) USD GO, Series A, Zero Coupon due 8/1/2021 | 1,000,000 | 982,770 |
| | California (Community Developmental Disabilities Program; Insured: California Mtg Insurance) HFFA, 5.75% due 2/1/2021 | 1,695,000 | 1,760,529 |
| | California (Dignity Health) HFFA, | | |
| | Series A, | | |
| | 5.00% due 3/1/2021 | 3,450,000 | 3,515,723 |
| | 5.25% due 3/1/2022 | 7,020,000 | 7,167,560 |
| a | California (St. Joseph Health System) HFFA, Series D, 5.00% due 7/1/2043 (put 10/15/2020) | 5,000,000 | 5,096,850 |
| | California Educational Facilities Authority (Chapman University), 5.00% due 4/1/2021 | 4,870,000 | 5,054,865 |
| a | California Infrastructure and Economic Development Bank (Los Angeles County Museum of Art), Series A, 1.321% (LIBOR 1 Month + 0.65%) due 12/1/2050 (put 2/1/2021) | 5,000,000 | 5,007,150 |
See notes to financial statements.
| Thornburg Municipal Funds Semi-Annual Report | 21 |
Schedule of Investments, Continued
Thornburg Limited Term Municipal Fund | March 31, 2020 (Unaudited)
| | Issuer-Description | PRINCIPAL
AMOUNT | VALUE |
| | California State Public Works Board (California School for the Deaf Riverside Campus), Series H, 5.00% due 4/1/2020 - 4/1/2021 | $ 2,475,000 | $ 2,509,425 |
| | California State Public Works Board (California State University), Series A, 5.00% due 10/1/2020 | 1,000,000 | 1,019,340 |
| | California State Public Works Board (Coalinga State Hospital), Series H, 5.00% due 6/1/2020 - 6/1/2022 | 22,240,000 | 23,445,079 |
| | California State Public Works Board (Laboratory Facility and San Diego Courthouse), Series I, 5.00% due 11/1/2021 - 11/1/2022 | 10,825,000 | 11,844,977 |
| | California State Public Works Board (Various Capital Projects), | | |
| | Series A, 5.00% due 10/1/2021 | 1,000,000 | 1,057,910 |
| | Series G, 5.00% due 11/1/2020 - 11/1/2021 | 3,250,000 | 3,390,765 |
| | Castaic Lake Water Agency (Water System Improvement; Insured: AMBAC) COP, Zero Coupon due 8/1/2023 | 10,125,000 | 9,669,881 |
| | County of Los Angeles Redevelopment Refunding Authority (Bunker Hill Project), | | |
| | 5.00% due 12/1/2020 - 12/1/2024 | 26,635,000 | 29,462,249 |
| | Series C, 5.00% due 6/1/2020 - 6/1/2024 | 8,960,000 | 9,923,542 |
| | Escondido Union High School District (Insured: Natl-Re) GO, Zero Coupon due 11/1/2020 | 2,655,000 | 2,636,787 |
| a | Irvine Ranch Water District (LOC Bank of America, N.A.), Series B, 0.52% due 10/1/2041 (put 4/1/2020) | 2,150,000 | 2,150,000 |
| | Los Angeles (Educational Facilities and Information Technology Infrastructure) USD GO, | | |
| | Series A, 5.00% due 7/1/2023 | 8,950,000 | 9,976,923 |
| | Series B, 5.00% due 7/1/2023 | 11,950,000 | 13,317,080 |
| | Series D, 5.00% due 7/1/2022 - 7/1/2024 | 22,900,000 | 25,407,901 |
| a | Los Angeles Department of Water (SPA Royal Bank of Canada), Series B-2-REMK, 0.52% due 7/1/2035 (put 4/1/2020) | 1,800,000 | 1,800,000 |
| | Los Angeles USD GO, Series A, 5.00% due 7/1/2024 | 1,500,000 | 1,714,440 |
| | Needles (Insured: Natl-Re) USD GO, Series B, Zero Coupon due 8/1/2023 | 1,005,000 | 954,127 |
| | North City West School Facilities Financing Authority (Carmel Valley Educational Facilities; Insured: AGM), Series A, 5.00% due 9/1/2023 | 4,545,000 | 4,927,734 |
| a | Northern California Energy Authority (Commodity Supply Revenue), Series A, 4.00% due 7/1/2049 (put 7/1/2024) | 35,000,000 | 36,303,050 |
| | Northern California Power Agency (LODI Energy Center), Series A, 5.00% due 6/1/2025 (pre-refunded 6/1/2020) | 4,000,000 | 4,021,520 |
| | Palomar Community College District GO, Series B, Zero Coupon due 8/1/2021 | 2,560,000 | 2,520,550 |
| | Rocklin (Insured: Natl-Re) USD GO, Zero Coupon due 8/1/2022 | 3,910,000 | 3,790,706 |
| | Sacramento City (Educational Facilities Improvements) USD GO, 5.00% due 7/1/2021 | 3,265,000 | 3,412,252 |
| | Sacramento City Financing Authority (Merged Downtown & Oak Park; Insured: Natl-Re), Series A, Zero Coupon due 12/1/2021 | 1,600,000 | 1,545,840 |
| | San Diego (Educational System Capital Projects; Insured: Natl-Re) USD GO, Series D-1, 5.50% due 7/1/2020 | 10,000,000 | 10,111,100 |
| | San Diego Convention Center Expansion Financing Authority, Series A, 5.00% due 4/15/2020 - 4/15/2022 | 15,000,000 | 15,754,870 |
| | Santa Fe Springs Community Development Commission (Consolidated Redevelopment Project; Insured: Natl-Re), Series A, Zero Coupon due 9/1/2024 | 7,000,000 | 6,497,260 |
| a | Southern California Public Power Authority (Magnolia Power Project; LOC U.S. Bank N.A.), 0.80% due 7/1/2036 (put 4/1/2020) | 870,000 | 870,000 |
| a | State of California ( LOC U.S. Bank N.A.) GO, 0.75% due 5/1/2034 (put 4/1/2020) | 1,900,000 | 1,900,000 |
| | State of California (Various Purposes) GO, 5.00% due 9/1/2020 - 9/1/2021 | 16,000,000 | 16,460,630 |
| | West Contra Costa (Educational Facilities; Insured: AGC) USD GO, Series C-1, Zero Coupon due 8/1/2022 | 4,000,000 | 3,883,360 |
| | West Covina Redevelopment Agency (Fashion Plaza), 6.00% due 9/1/2022 | 4,070,000 | 4,331,579 |
| | Colorado — 2.0% | | |
| | City & County of Denver (Buell Theatre Property) COP, 5.00% due 12/1/2020 - 12/1/2023 | 8,610,000 | 9,159,732 |
| | City & County of Denver School District No. 1 (Eastbridge Elementary and Conservatory Green K-8 Schools) COP, | | |
| | Series C, | | |
| | 4.00% due 12/15/2020 | 600,000 | 611,544 |
| | 5.00% due 12/15/2021 - 12/15/2023 | 3,210,000 | 3,536,653 |
| | City of Aurora COP, 5.00% due 12/1/2027 - 12/1/2029 | 9,655,000 | 12,445,043 |
| a | Colorado (Adventist Health System/Sunbelt Obligated Group) HFA, 5.00% due 11/15/2049 (put 11/19/2026) | 16,100,000 | 19,334,168 |
| | Colorado (Northern Colorado Medical Center) HFA, ETM, 5.00% due 5/15/2025 - 5/15/2026 | 1,305,000 | 1,565,143 |
| | Colorado (Sanford Obligated Group) HFA, Series A, 5.00% due 11/1/2026 - 11/1/2027 | 4,290,000 | 5,261,119 |
| | Colorado Educational & Cultural Facilities Authority (National Conference of State Legislatures), 5.00% due 6/1/2020 - 6/1/2021 | 1,925,000 | 1,971,009 |
| | Colorado State Education Loan Program, Series B, 1.75% due 6/29/2020 | 18,000,000 | 18,020,880 |
| | County of Larimer (Jail Facilities Project) COP, 5.00% due 12/1/2028 - 12/1/2029 | 3,025,000 | 3,915,210 |
| | El Paso County (Judicial Complex; Insured: AGM) COP, 5.00% due 12/1/2022 - 12/1/2028 | 2,500,000 | 3,013,873 |
| | El Paso County (Pikes Peak Regional Development Center) COP, | | |
| | 4.00% due 12/1/2021 | 1,000,000 | 1,047,840 |
| | 5.00% due 12/1/2023 | 1,330,000 | 1,508,020 |
| | El Paso County Falcon School District No. 49 COP, 5.00% due 12/15/2020 - 12/15/2024 | 1,950,000 | 2,195,520 |
| | Interlocken Metropolitan District (Insured: AGM) GO, | | |
| | Series A-1, 5.00% due 12/1/2024 - 12/1/2026 | 2,375,000 | 2,801,545 |
| | Series A-2, 5.00% due 12/1/2027 | 365,000 | 450,775 |
| | Regional Transportation District (FasTracks Transportation System) COP, Series A, 5.00% due 6/1/2020 | 3,655,000 | 3,677,953 |
| | Regional Transportation District (North Metro Rail Line) COP, Series A, 5.00% due 6/1/2023 - 6/1/2024 | 8,000,000 | 8,904,400 |
| | Regional Transportation District (Public Mass Transportation System) COP, Series A, 5.50% due 6/1/2022 (pre-refunded 6/1/2020) | 2,740,000 | 2,758,796 |
| | Regional Transportation District COP, Series A, 5.50% due 6/1/2021 (pre-refunded 6/1/2020) | 2,370,000 | 2,386,258 |
| | State of Colorado COP, Series A, 5.00% due 9/1/2024 - 9/1/2028 | 4,610,000 | 5,579,537 |
| | Connecticut — 1.8% | | |
22 | Thornburg Municipal Funds Semi-Annual Report
| See notes to financial statements. |
Schedule of Investments, Continued
Thornburg Limited Term Municipal Fund | March 31, 2020 (Unaudited)
| | Issuer-Description | PRINCIPAL
AMOUNT | VALUE |
| | City of Hartford (Various Public Improvements; Insured: AGM) GO, | | |
| | Series A, 5.00% due 7/1/2024 - 7/1/2025 | $ 1,820,000 | $ 2,114,374 |
| | Series B, 5.00% due 10/1/2022 | 1,765,000 | 1,924,468 |
| | Connecticut State Health & Educational Facilities Authority (Yale University), | | |
| a | Series V-1, 0.60% due 7/1/2036 (put 4/1/2020) | 2,845,000 | 2,845,000 |
| a | Series V-2, 0.60% due 7/1/2036 (put 4/1/2020) | 1,615,000 | 1,615,000 |
| | State of Connecticut (Educational Facilities) GO, | | |
| | Series B, 5.00% due 6/15/2024 - 6/15/2025 | 30,400,000 | 34,739,807 |
| | Series E, 5.00% due 9/1/2023 | 5,550,000 | 6,173,043 |
| | State of Connecticut (Various Capital Projects) GO, | | |
| | Series B, 5.00% due 5/15/2027 | 16,615,000 | 19,582,439 |
| | Series E, 5.00% due 8/15/2024 | 1,845,000 | 2,046,437 |
| | State of Connecticut GO, | | |
| | Series B, 5.00% due 2/15/2024 | 7,000,000 | 7,863,170 |
| | Series C, 5.00% due 6/15/2022 - 6/15/2028 | 12,540,000 | 14,911,613 |
| | Series E, 5.00% due 9/15/2028 | 2,560,000 | 3,143,936 |
| | State of Connecticut Special Tax Revenue, Series B, 5.00% due 10/1/2021 | 2,200,000 | 2,304,874 |
| | State of Connecticut, Special Tax Revenue (Transportation Infrastructure Purposes), Series A, 5.00% due 8/1/2026 | 1,200,000 | 1,401,552 |
| | Delaware — 0.0% | | |
| | Delaware Transportation Authority (Transportation System), 5.00% due 7/1/2020 - 7/1/2022 | 1,940,000 | 2,066,575 |
| | District of Columbia — 0.2% | | |
| | District of Columbia, Series A, 5.00% due 12/1/2027 | 925,000 | 930,670 |
| | District of Columbia (Insured: Syncora) GO, Series B, 5.25% due 6/1/2020 | 3,005,000 | 3,025,464 |
| | District of Columbia (National Public Radio), Series A, 5.00% due 4/1/2020 | 1,890,000 | 1,890,000 |
| | Washington Metropolitan Area Transit Authority, 5.00% due 7/1/2020 - 7/1/2028 | 6,705,000 | 7,707,049 |
| | Florida — 7.0% | | |
| | Alachua County School Board (Educational Facilities) COP, 5.00% due 7/1/2022 - 7/1/2023 | 3,850,000 | 4,239,916 |
| | Broward County (Airport, Marina & Port Improvements), | | |
| | Series Q-1, | | |
| | 4.00% due 10/1/2020 | 1,660,000 | 1,684,136 |
| | 5.00% due 10/1/2020 | 2,000,000 | 2,038,980 |
| | Broward County School Board (Educational Facilities) COP, | | |
| | Series A, 5.00% due 7/1/2021 - 7/1/2027 | 22,880,000 | 25,803,556 |
| | Series B, 5.00% due 7/1/2023 - 7/1/2025 | 9,000,000 | 10,478,490 |
| | Series C, 5.00% due 7/1/2025 - 7/1/2026 | 12,830,000 | 15,450,929 |
| | Broward County School Board COP, | | |
| | Series A, 5.00% due 7/1/2028 | 8,590,000 | 10,885,076 |
| | Series B, 5.00% due 7/1/2029 | 8,920,000 | 11,515,274 |
| | Central Florida Expressway Authority, 5.00% due 7/1/2022 - 7/1/2026 | 4,100,000 | 4,656,743 |
| | City of Cape Coral (Water and Sewer System Improvements), 5.00% due 10/1/2022 - 10/1/2026 | 5,435,000 | 6,516,841 |
| | City of Jacksonville, Series C, 5.00% due 10/1/2023 | 1,105,000 | 1,246,838 |
| | City of Lakeland (Energy System; Insured: AGM), 5.00% due 10/1/2020 | 1,695,000 | 1,727,612 |
| | City of Lakeland (Lakeland Regional Health Systems), 5.00% due 11/15/2026 | 1,925,000 | 2,317,508 |
| | City of Miami (Stormwater Management Utility System), 5.00% due 9/1/2026 - 9/1/2028 | 2,675,000 | 3,317,384 |
| | City of North Miami Beach (North Miami Beach Water Project), 5.00% due 8/1/2020 - 8/1/2021 | 1,780,000 | 1,840,376 |
| | City of Orlando (Senior Tourist Development; Insured: AGM), 5.00% due 11/1/2023 - 11/1/2027 | 3,545,000 | 4,140,350 |
| | Florida Higher Educational Facilities Financing Authority (Nova Southeastern University), 5.00% due 4/1/2020 | 1,190,000 | 1,190,000 |
| | Florida Higher Educational Facilities Financing Authority (University of Tampa), Series A, 5.00% due 4/1/2022 | 620,000 | 658,868 |
| | Florida State Board of Governors (University System Capital Improvements), Series A, 4.00% due 7/1/2020 - 7/1/2022 | 12,655,000 | 13,105,011 |
| | Fort Myers Utility System Revenue, | | |
| | 5.00% due 10/1/2023 | 990,000 | 1,044,054 |
| | 5.00% due 10/1/2023 (pre-refunded 10/1/2021) | 2,370,000 | 2,506,157 |
| | Hillsborough County (Court Facilities), Series B, 5.00% due 11/1/2020 - 11/1/2021 | 9,525,000 | 9,923,672 |
| | Hillsborough County (Jail and Storm Water Projects), Series A, 5.00% due 11/1/2021 - 11/1/2022 | 5,305,000 | 5,732,184 |
| | Hillsborough County School Board (Master Lease Program) COP, 5.00% due 7/1/2027 - 7/1/2028 | 10,035,000 | 12,534,373 |
| | Jacksonville Electric Authority (Electric System), Series A, 5.00% due 10/1/2024 (pre-refunded 10/1/2023) | 1,200,000 | 1,357,476 |
| | Jacksonville Electric Authority (Electric System) ETM, Series A, 5.00% due 10/1/2023 | 1,395,000 | 1,578,066 |
| | Lee County School Board (School Facilities Improvements) COP, 5.00% due 8/1/2023 - 8/1/2024 | 3,000,000 | 3,432,230 |
| | Manatee County (County Capital Projects), 5.00% due 10/1/2021 | 2,775,000 | 2,936,977 |
| | Manatee County (Public Utilities Improvements), 5.00% due 10/1/2024 - 10/1/2025 | 970,000 | 1,133,624 |
| | Manatee County School District (School Facilities Improvements; Insured: AGM), 5.00% due 10/1/2025 - 10/1/2027 | 2,900,000 | 3,566,715 |
| | Marion County School Board (Insured: BAM) COP, Series B, 5.00% due 6/1/2020 - 6/1/2024 | 8,330,000 | 8,885,541 |
| | Miami Beach GO, | | |
See notes to financial statements.
| Thornburg Municipal Funds Semi-Annual Report | 23 |
Schedule of Investments, Continued
Thornburg Limited Term Municipal Fund | March 31, 2020 (Unaudited)
| | Issuer-Description | PRINCIPAL
AMOUNT | VALUE |
| | 4.00% due 9/1/2021 | $ 1,015,000 | $ 1,056,757 |
| | 5.00% due 9/1/2020 - 9/1/2022 | 4,720,000 | 4,833,548 |
| a | Miami-Dade County (Florida Power & Light Co.) IDA, 0.85% due 6/1/2021 (put 4/1/2020) | 39,700,000 | 39,700,000 |
| | Miami-Dade County (Miami International Airport), Series B, 5.00% due 10/1/2025 | 2,500,000 | 2,806,425 |
| | Miami-Dade County (Transit System), 5.00% due 7/1/2023 - 7/1/2025 | 10,215,000 | 11,882,453 |
| a | Miami-Dade County (Waste Management, Inc.) IDA, 1.50% due 9/1/2027 (put 11/2/2020) | 3,000,000 | 2,992,020 |
| | Miami-Dade County Expressway Authority (Toll System), Series B, 5.00% due 7/1/2024 - 7/1/2025 | 4,000,000 | 4,574,500 |
| | Miami-Dade County School Board (Educational Facilities Improvements) COP, | | |
| | Series A, | | |
| | 5.00% due 5/1/2022 - 5/1/2024 | 15,535,000 | 17,336,243 |
| a | 5.00% due 5/1/2031 (put 5/1/2024) | 2,550,000 | 2,894,633 |
| | Series C, 5.00% due 5/1/2025 | 15,000,000 | 17,532,750 |
| | Orange County (Orlando Health, Inc.; Insured: Natl-Re) HFA ETM, Series C, 6.25% due 10/1/2021 | 820,000 | 857,515 |
| | Orange County School Board (Educational Facilities) COP, Series D, 5.00% due 8/1/2020 - 8/1/2025 | 9,795,000 | 10,687,302 |
| | Palm Beach County (Baptist Health South Florida Obligated Group) HFA, 5.00% due 8/15/2024 - 8/15/2027 | 1,145,000 | 1,376,389 |
| | Palm Beach County (Boca Raton Regional Hospital) HFA, ETM, 5.00% due 12/1/2020 | 600,000 | 615,102 |
| | Palm Beach County School Board (Educational Facilities) COP, | | |
| | Series B, 5.00% due 8/1/2022 - 8/1/2024 | 10,095,000 | 11,463,808 |
| | Series C, | | |
| | 4.00% due 8/1/2021 | 3,835,000 | 3,978,352 |
| | 5.00% due 8/1/2020 - 8/1/2022 | 2,750,000 | 2,909,310 |
| | Palm Beach County School District COP, Series C, 5.00% due 8/1/2021 - 8/1/2026 | 10,130,000 | 11,536,878 |
| | Polk County (Water and Wastewater Utility Systems), 5.00% due 10/1/2023 | 1,420,000 | 1,556,022 |
| | Polk County (Water and Wastewater Utility Systems; Insured: AGM), | | |
| | 3.00% due 10/1/2021 | 3,125,000 | 3,214,812 |
| | 4.00% due 10/1/2020 | 3,100,000 | 3,145,074 |
| | Reedy Creek Improvement District (Buena Vista Drive Corridor Improvements) GO, Series A, 5.00% due 6/1/2023 | 1,940,000 | 2,166,670 |
| | Reedy Creek Improvement District (Walt Disney World Resort Complex Utility Systems), Series 1, 5.00% due 10/1/2021 - 10/1/2023 | 2,575,000 | 2,794,774 |
| | Reedy Creek Improvement District (Walt Disney World Resort Complex Utility Systems) GO, Series A, 5.00% due 6/1/2021 - 6/1/2025 | 4,210,000 | 4,828,896 |
| | South Florida Water Management District (Everglades Restoration Plan) COP, 5.00% due 10/1/2020 - 10/1/2022 | 5,530,000 | 5,852,836 |
| | St. Johns County School Board COP, Series A, 5.00% due 7/1/2023 - 7/1/2029 | 9,515,000 | 11,777,856 |
| | State of Florida GO, 4.00% due 7/1/2030 | 6,460,000 | 6,660,841 |
| | Sunshine State Governmental Financing Commission (Miami-Dade County Program), Series B-1, 5.00% due 9/1/2021 - 9/1/2024 | 7,275,000 | 8,001,716 |
| | Sunshine State Governmental Financing Commission (Miami-Dade County Program; Insured: AGM), Series A, 5.00% due 9/1/2021 | 5,000,000 | 5,272,050 |
| | Volusia County Educational Facilities Authority (Embry-Riddle Aeronautical University, Inc.), Series B, 5.00% due 10/15/2023 - 10/15/2025 | 1,750,000 | 1,969,555 |
| | Volusia County School Board (University High School, River Springs Middle School) COP, Series B, 5.00% due 8/1/2024 | 1,000,000 | 1,156,040 |
| | Georgia — 1.5% | | |
| | Athens-Clarke County Unified Government Development Authority (UGAREF Bolton Commons, LLC), 4.00% due 6/15/2020 | 395,000 | 397,338 |
| | Athens-Clarke County Unified Government Development Authority (UGAREF Central Precinct, LLC), 5.00% due 6/15/2022 - 6/15/2023 | 1,270,000 | 1,390,319 |
| | City of Atlanta (Airport Passenger Facility), | | |
| | 5.00% due 1/1/2024 - 1/1/2025 | 3,850,000 | 4,334,973 |
| | Series B, 5.00% due 1/1/2023 - 1/1/2025 | 2,645,000 | 2,945,406 |
| | City of Atlanta (Atlantic Station Project), 5.00% due 12/1/2020 - 12/1/2024 | 4,290,000 | 4,687,370 |
| | City of Atlanta (BeltLine Project), Series A, 5.00% due 1/1/2021 | 175,000 | 175,520 |
| | City of Atlanta (Hartsfield-Jackson Atlanta International Airport), Series C, 5.50% due 1/1/2021 | 3,525,000 | 3,634,381 |
| | City of Atlanta (Water & Wastewater System), 5.00% due 11/1/2021 - 11/1/2025 | 6,630,000 | 7,376,049 |
| | Development Authority of Fulton County (Georgia Tech Athletic Assoc.), 5.00% due 10/1/2022 | 130,000 | 141,076 |
| | Development Authority of Fulton County (Georgia Tech Athletic Assoc.) ETM, 5.00% due 10/1/2022 | 4,420,000 | 4,837,734 |
| | Main Street Natural Gas, Inc., Series A, 5.00% due 5/15/2023 - 5/15/2029 | 14,265,000 | 15,638,022 |
| a | Monroe County Development Authority (Gulf Power Co.), 2.00% due 9/1/2037 (put 6/25/2020) | 3,300,000 | 3,305,412 |
| | Municipal Electric Authority of Georgia, Series A, 5.00% due 1/1/2026 - 1/1/2030 | 6,300,000 | 7,235,303 |
| a | Private Colleges & Universities Authority (Emory University), Series B, 5.13% (MUNIPSA + 0.42%) due 10/1/2039 (put 8/16/2022) | 18,400,000 | 18,124,184 |
| | Savannah Economic Development Authority (International Paper Co.), 1.90% due 8/1/2024 | 8,000,000 | 7,888,240 |
| | Guam — 0.5% | | |
| | Government of Guam (Various Capital Projects), Series D, 5.00% due 11/15/2020 - 11/15/2024 | 11,170,000 | 11,365,680 |
| | Guam Government, Series A, 5.00% due 1/1/2025 | 305,000 | 307,956 |
| | Guam Government Waterworks Authority (Water & Wastewater System Improvements), | | |
| | 5.25% due 7/1/2020 - 7/1/2022 | 1,350,000 | 1,379,544 |
| b | 5.25% due 7/1/2023 | 645,000 | 668,601 |
| | Guam Power Authority (Electric Power System), Series A, 5.00% due 10/1/2023 - 10/1/2026 | 4,330,000 | 4,493,640 |
| | Guam Power Authority (Electric Power System; Insured: AGM), Series A, 5.00% due 10/1/2020 - 10/1/2022 | 7,840,000 | 7,999,326 |
| | Hawaii — 0.9% | | |
| | City and County of Honolulu (Capital Improvements) GO, | | |
24 | Thornburg Municipal Funds Semi-Annual Report
| See notes to financial statements. |
Schedule of Investments, Continued
Thornburg Limited Term Municipal Fund | March 31, 2020 (Unaudited)
| | Issuer-Description | PRINCIPAL
AMOUNT | VALUE |
| | Series A, 5.00% due 11/1/2020 | $ 8,265,000 | $ 8,452,863 |
| | Series B, 5.00% due 11/1/2021 - 11/1/2022 | 9,465,000 | 10,286,532 |
| | City and County of Honolulu (Capital Improvements) GO ETM, Series A, 5.00% due 11/1/2022 | 1,750,000 | 1,920,345 |
| | County of Hawaii (Capital Improvements) GO, | | |
| | Series A, 5.00% due 9/1/2023 | 800,000 | 900,320 |
| | Series B, 5.00% due 9/1/2023 | 1,500,000 | 1,688,100 |
| | Series C, 5.00% due 9/1/2021 - 9/1/2026 | 5,250,000 | 5,884,408 |
| | Series D, 5.00% due 9/1/2023 - 9/1/2026 | 3,085,000 | 3,646,665 |
| | Series E, 5.00% due 9/1/2021 - 9/1/2026 | 4,665,000 | 5,104,348 |
| | Honolulu City & County Board of Water Supply, Series A, 5.00% due 7/1/2024 | 1,000,000 | 1,082,340 |
| | State of Hawaii (Hawaiian Home Lands Settlement) GO, | | |
| | Series DZ, | | |
| | 5.00% due 12/1/2022 (pre-refunded 12/1/2021) | 3,060,000 | 3,254,616 |
| b | 5.00% due 12/1/2022 (pre-refunded 12/1/2021) | 940,000 | 1,001,391 |
| | Series EA, 5.00% due 12/1/2020 - 12/1/2021 | 5,500,000 | 5,759,350 |
| | State of Hawaii Airports System Revenue, Series A, 5.25% due 7/1/2027 | 2,400,000 | 2,420,544 |
| | Idaho — 0.3% | | |
| | Idaho (Trinity Health Credit Group) HFA, Series D, 5.00% due 12/1/2022 - 12/1/2024 | 4,200,000 | 4,705,662 |
| a | Regents of the University of Idaho, 5.25% due 4/1/2041 (put 4/1/2021) | 11,975,000 | 12,376,043 |
| | Illinois — 6.5% | | |
| | Illinois (United Community & Housing Development Corp.) DFA ETM, Zero Coupon due 4/15/2020 | 20,000,000 | 19,986,600 |
| | Board of Education of the City of Chicago (Educational Facilities; Insured: BHAC-CR FGIC) GO, Series B-1, Zero Coupon due 12/1/2020 | 12,000,000 | 11,832,360 |
| | Board of Trustees of Southern Illinois University (Housing & Auxiliary Facilities; Insured: Natl-Re), Series A, 5.25% due 4/1/2020 | 1,000,000 | 1,000,000 |
| | Chicago Midway International Airport, Series B, 5.00% due 1/1/2022 - 1/1/2024 | 3,700,000 | 4,032,674 |
| | Chicago O’Hare International Airport (2015 Airport Projects), Series B, 5.00% due 1/1/2021 | 3,000,000 | 3,082,890 |
| | Chicago O’Hare International Airport (2016 Airport Projects), Series C, 5.00% due 1/1/2027 | 1,750,000 | 2,012,990 |
| | Chicago O’Hare International Airport (Capital Development Programs), Series B, 5.00% due 1/1/2022 (pre-refunded 1/1/2021) | 5,835,000 | 6,002,873 |
| | Chicago Park District (Capital Improvement Plan) GO, | | |
| | Series A, 5.00% due 1/1/2024 - 1/1/2025 | 1,915,000 | 2,081,205 |
| | Series B, 5.00% due 1/1/2021 - 1/1/2024 | 7,270,000 | 7,585,870 |
| | Series C, 5.00% due 1/1/2022 - 1/1/2023 | 5,155,000 | 5,429,989 |
| | Series D, 5.00% due 1/1/2023 - 1/1/2024 | 3,435,000 | 3,679,868 |
| | Chicago Park District GO, Series D, 5.00% due 1/1/2021 - 1/1/2024 | 2,850,000 | 2,966,890 |
| | Chicago School Reform Board of Trustees of the Board of Education (School District Capital Improvement Program; Insured: Natl-Re) GO, Series A, 5.25% due 12/1/2021 | 1,500,000 | 1,581,375 |
| | City of Chicago (Chicago Midway Airport), Series B, 5.00% due 1/1/2023 - 1/1/2024 | 22,275,000 | 24,184,641 |
| | City of Chicago (Riverwalk Expansion Project; Insured: AGM), 5.00% due 1/1/2021 - 1/1/2023 | 2,410,000 | 2,445,703 |
| | City of Chicago (Wastewater Transmission System), Series C-REMK-10/, 5.00% due 1/1/2021 - 1/1/2025 | 16,750,000 | 18,355,130 |
| | City of Chicago (Water System), | | |
| | Series 2017-2, 5.00% due 11/1/2020 - 11/1/2024 | 4,150,000 | 4,426,069 |
| | Series A, 5.00% due 11/1/2027 | 6,250,000 | 7,505,062 |
| | Series A-1, 5.00% due 11/1/2024 | 4,000,000 | 4,492,880 |
| | City of Chicago (Water System; Insured: AGM), Series 2017-2, 5.00% due 11/1/2028 | 2,000,000 | 2,451,100 |
| | City of Mount Vernon (Various Municipal Capital Improvements; Insured: AGM) GO, 4.00% due 12/15/2020 - 12/15/2021 | 2,425,000 | 2,471,774 |
| | City of Waukegan (Lakehurst Redevelopment Project; Insured: AGM) GO, Series A, 5.00% due 12/30/2020 - 12/30/2022 | 4,100,000 | 4,354,055 |
| | Community College District No. 503 (Black Hawk College; Insured: AGM) GO, 5.00% due 12/1/2021 - 12/1/2024 | 10,935,000 | 12,199,390 |
| | Community College District No. 516 (Waubonsee Community College) GO, | | |
| | Series A, | | |
| | 4.50% due 12/15/2020 | 1,325,000 | 1,355,859 |
| | 5.00% due 12/15/2021 | 6,175,000 | 6,573,534 |
| | Community Unit School District No. 302 (Kane & DeKalb County Educational Facilities; Insured: Natl-Re) GO, Zero Coupon due 2/1/2021 | 3,165,000 | 3,127,495 |
| | Community Unit School District No. 428 (DeKalb County Educational Facilities) GO, Zero Coupon due 1/1/2021 | 6,140,000 | 5,979,807 |
| | Community Unit School District No. 5 (Insured: BAM) GO, 5.00% due 4/15/2024 - 4/15/2026 | 1,650,000 | 1,926,149 |
| | Cook County Community College District No. 508 (City Colleges of Chicago) GO, | | |
| | 5.00% due 12/1/2020 - 12/1/2024 | 8,020,000 | 8,193,530 |
| | 5.25% due 12/1/2025 - 12/1/2026 | 3,365,000 | 3,476,632 |
| | Cook County School District No.170 (Insured: AGM) GO, Series D, 5.00% due 12/1/2024 | 1,190,000 | 1,341,868 |
| | County of Cook (Capital Improvement Plan) GO, | | |
| | Series A, 5.00% due 11/15/2021 | 5,000,000 | 5,084,900 |
| | Series C, | | |
| | 4.00% due 11/15/2020 - 11/15/2022 | 3,925,000 | 3,932,461 |
| | 5.00% due 11/15/2020 - 11/15/2022 | 5,605,000 | 5,699,078 |
| | County of Cook Sales Tax Revenue, 5.00% due 11/15/2028 | 2,250,000 | 2,790,270 |
See notes to financial statements.
| Thornburg Municipal Funds Semi-Annual Report | 25 |
Schedule of Investments, Continued
Thornburg Limited Term Municipal Fund | March 31, 2020 (Unaudited)
| | Issuer-Description | PRINCIPAL
AMOUNT | VALUE |
| | Forest Preserve District of Cook County GO, Series A, 5.00% due 11/15/2021 | $ 1,500,000 | $ 1,573,530 |
| | Forest Preserve District of DuPage County GO, 5.00% due 11/1/2020 - 11/1/2024 | 9,455,000 | 10,658,327 |
| | Illinois Finance Authority (Advocate Health Care), 5.00% due 8/1/2023 - 8/1/2024 | 1,365,000 | 1,553,962 |
| a | Illinois Finance Authority (Northwestern Memorial Healthcare Obligated Group), 1.10% due 8/15/2042 (put 4/1/2020) | 1,850,000 | 1,850,000 |
| a | Illinois Finance Authority (Northwestern Memorial Healthcare Obligated Group; SPA U.S. Bank, N.A.), 1.10% due 8/15/2042 (put 4/1/2020) | 2,000,000 | 2,000,000 |
| a | Illinois Finance Authority (Peoples Gas Light & Coke Co.), Series B, 1.875% due 2/1/2033 (put 8/1/2020) | 2,000,000 | 2,002,180 |
| | Illinois Finance Authority (Rush University Medical Center), Series A, 5.00% due 11/15/2020 - 11/15/2025 | 3,055,000 | 3,421,231 |
| | Illinois Finance Authority (Trinity Health), Series L, 4.00% due 12/1/2021 | 1,265,000 | 1,322,520 |
| | Illinois State Toll Highway Authority, | | |
| | 5.00% due 1/1/2025 | 2,000,000 | 2,295,440 |
| | Series D, 5.00% due 1/1/2023 - 1/1/2024 | 10,500,000 | 11,622,500 |
| | Kane McHenry Cook & DeKalb Counties Unit School District No. 300 (Insured: AMBAC) GO, Zero Coupon due 12/1/2021 | 1,235,000 | 1,200,297 |
| | Kane McHenry Cook & DeKalb Counties Unit School District No. 300 (Insured: AMBAC) GO ETM, Zero Coupon due 12/1/2021 | 765,000 | 749,799 |
| | Kane McHenry Cook & DeKalb Counties Unit School District No. 300 GO, 5.00% due 1/1/2024 | 7,150,000 | 8,094,229 |
| | Knox & Warren Counties Community Unit School District No 205 Galesburg GO, | | |
| | Series B, | | |
| | 4.00% due 12/1/2020 - 12/1/2023 | 3,610,000 | 3,834,546 |
| b | 4.00% due 12/1/2024 | 1,240,000 | 1,371,936 |
| | 5.00% due 12/1/2025 - 12/1/2029 | 7,400,000 | 9,058,267 |
| | McHenry County Conservation District GO, 5.00% due 2/1/2021 - 2/1/2025 | 4,325,000 | 4,733,080 |
| | Metropolitan Pier & Exposition Authority (McCormick Place Expansion) (State Aid Withholding), Series B, 5.00% due 12/15/2020 | 4,000,000 | 4,021,120 |
| | Metropolitan Water Reclamation District of Greater Chicago (Green Bond), GO, Series E, 5.00% due 12/1/2025 | 1,000,000 | 1,177,890 |
| | Peoria Metropolitan Airport Authority GO, Series D, 5.00% due 12/1/2027 | 1,000,000 | 1,170,320 |
| | Sales Tax Securitization Corp., | | |
| | 5.00% due 1/1/2028 | 3,655,000 | 4,208,806 |
| | Series A, 5.00% due 1/1/2029 | 2,790,000 | 3,206,854 |
| | State of Illinois, Series B, 5.00% due 6/15/2026 - 6/15/2029 | 20,000,000 | 20,522,450 |
| | State of Illinois (State Facilities Improvements) GO, | | |
| | 5.00% due 7/1/2021 | 1,735,000 | 1,764,061 |
| | Series D, 5.00% due 11/1/2024 | 3,650,000 | 3,823,119 |
| | State of Illinois GO, | | |
| | Series A, 5.00% due 12/1/2021 | 4,500,000 | 4,599,900 |
| | Series D, 5.00% due 11/1/2028 | 19,750,000 | 20,502,080 |
| | Town of Cicero Cook County (Cicero and Laramie Development Areas; Insured: AGM) GO, Series A, 5.00% due 1/1/2021 | 1,250,000 | 1,280,375 |
| | Village of Tinley Park GO, 4.00% due 12/1/2022 | 625,000 | 666,194 |
| | Will & Kendall Counties Plainfield Community Consolidated School District 202 (Capital Improvements; Insured: BAM) GO, Series A, 5.00% due 1/1/2023 - 1/1/2025 | 21,125,000 | 23,786,272 |
| | Indiana — 2.0% | | |
| | Avon Community School Building Corp (Educational Facilities; Insured: State Intercept), 5.00% due 7/15/2021 - 7/15/2027 | 6,730,000 | 7,611,995 |
| | Board of Trustees for the Vincennes University, Series J, 5.00% due 6/1/2020 | 1,000,000 | 1,006,330 |
| | City of Carmel Redevelopment Authority (Road and Intersection Improvements), 5.00% due 8/1/2021 - 8/1/2022 | 4,915,000 | 5,204,367 |
| | City of Carmel Redevelopment District (CFP Energy Center, LLC Installment Purchase Agreement) COP, Series C, 5.75% due 7/15/2022 (pre-refunded 1/15/2021) | 1,360,000 | 1,395,863 |
| | Duneland School Building Corp. (State Aid Withholding), Zero Coupon due 2/1/2020 - 8/1/2021 | 9,510,000 | 9,398,963 |
| | Hamilton Southeastern Consolidated School Building Corp. (Educational Facilities; Insured: State Intercept), Series D, 5.00% due 7/15/2021 - 1/15/2024 | 3,210,000 | 3,484,299 |
| | Indiana Bond Bank (Columbus Learning Center), 5.00% due 8/1/2021 | 1,300,000 | 1,351,402 |
| | Indiana Finance Authority (Community Health Network), Series A, 5.00% due 5/1/2020 - 5/1/2022 | 4,340,000 | 4,525,251 |
| | Indiana Finance Authority (CWA Authority, Inc. Wastewater System Project), Series A, 5.00% due 10/1/2021 - 10/1/2024 | 2,000,000 | 2,234,650 |
| | Indiana Finance Authority (Indiana University Health System), | | |
| | Series N, | | |
| | 5.00% due 3/1/2021 | 9,880,000 | 10,221,058 |
| | 5.00% due 3/1/2022 (pre-refunded 3/1/2021) | 3,240,000 | 3,347,924 |
| | Indiana Finance Authority (Indiana University Health, Inc. Obligated Group), | | |
| a | Series L, 4.99% (MUNIPSA + 0.38%) due 12/1/2046 (put 7/2/2021) | 8,700,000 | 8,701,914 |
| a | Series M, 4.99% (MUNIPSA + 0.38%) due 12/1/2046 (put 7/2/2021) | 6,000,000 | 6,000,960 |
| | Indiana Finance Authority (Marian University Health Sciences) ETM, 5.00% due 9/15/2020 - 9/15/2021 | 4,565,000 | 4,737,938 |
| a | Indiana Finance Authority (Marion County Capital Improvement Board; SPA U.S. Bank, N.A.), 1.10% due 2/1/2037 (put 4/1/2020) | 19,380,000 | 19,380,000 |
| a | Indiana Finance Authority (Marion County Capital Improvement Board; SPA Wells Fargo Bank, N.A.), 0.74% due 2/1/2037 (put 4/1/2020) | 7,730,000 | 7,730,000 |
| | Indiana Finance Authority (Parkview Health System), 5.00% due 5/1/2022 | 1,135,000 | 1,223,491 |
| | Indiana Municipal Power Agency (Power Supply System), Series A, 5.00% due 1/1/2026 - 1/1/2028 | 4,235,000 | 5,197,036 |
| | Lake Central Multi-District School Building Corp. (Educational Facilities) (State Aid Withholding), | | |
| | Series B, | | |
26 | Thornburg Municipal Funds Semi-Annual Report
| See notes to financial statements. |
100
Schedule of Investments, Continued
Thornburg Limited Term Municipal Fund | March 31, 2020 (Unaudited)
| | Issuer-Description | PRINCIPAL
AMOUNT | VALUE |
| | 4.00% due 1/15/2021 - 1/15/2022 | $ 2,705,000 | $ 2,801,801 |
| | 5.00% due 7/15/2020 - 7/15/2022 | 3,420,000 | 3,575,569 |
| | Perry Township Multischool Building Corp. (Educational Facilities) (State Aid Withholding), 5.00% due 7/10/2020 - 7/10/2021 | 3,090,000 | 3,159,217 |
| | Iowa — 0.3% | | |
| | Des Moines Independent Community School District (School Infrastructure; Insured: AGM), 4.00% due 6/1/2020 - 6/1/2022 | 10,255,000 | 10,303,486 |
| | Iowa Finance Authority (Genesis Health System), 5.00% due 7/1/2022 - 7/1/2024 | 6,085,000 | 6,700,734 |
| | Kansas — 1.1% | | |
| | Kansas (National Bio and Agro-Defense Facility) DFA, Series G, 5.00% due 4/1/2020 - 4/1/2025 | 39,450,000 | 42,504,064 |
| | Kansas (New Jobs Training; Insured: BAM) DFA, Series K, 5.00% due 12/1/2020 | 1,500,000 | 1,504,650 |
| | Kansas (Wichita State University) DFA, Series A, 5.00% due 6/1/2020 | 575,000 | 578,565 |
| | Kansas DFA, Series SRF, 5.00% due 5/1/2026 | 765,000 | 931,112 |
| | Seward County No. 480 USD GO, Series B, 5.00% due 9/1/2024 - 9/1/2027 | 6,120,000 | 7,267,337 |
| | Unified Government of Wyandotte County/Kansas City (Utility Systems Improvement), Series A, 5.00% due 9/1/2022 - 9/1/2024 | 3,600,000 | 3,989,360 |
| | Wyandotte County No. 500 (General Improvement) USD GO, Series A, 5.00% due 9/1/2025 - 9/1/2026 | 5,675,000 | 6,866,376 |
| | Kentucky — 2.2% | | |
| | Kentucky Economic (Norton Healthcare, Inc.; Insured: Natl-Re) DFA, Series B, Zero Coupon due 10/1/2020 - 10/1/2023 | 16,680,000 | 16,195,628 |
| a | Kentucky Public Energy Authority, Series A, 4.00% due 4/1/2048 (put 4/1/2024) | 77,915,000 | 80,520,478 |
| | Lexington-Fayette Urban County Government Public Facilities Corp. (Eastern State Hospital), Series A, 5.00% due 6/1/2022 | 6,165,000 | 6,422,635 |
| a | Louisville/Jefferson County Metropolitan Government (Louisville Gas & Electric Co.), 1.85% due 10/1/2033 (put 4/1/2021) | 6,500,000 | 6,514,105 |
| | Louisville/Jefferson County Metropolitan Government (Norton Healthcare, Inc.), 5.00% due 10/1/2026 | 3,000,000 | 3,655,560 |
| | Turnpike Authority of Kentucky (Revitalization Projects), Series B, 5.00% due 7/1/2025 - 7/1/2026 | 5,615,000 | 6,694,168 |
| | Louisiana — 3.0% | | |
| | City of Bossier (Public Improvements; Insured: AGM), Series ST-2010, 4.50% due 12/1/2021 | 2,240,000 | 2,364,051 |
| | City of New Orleans (Public Improvements) GO, 5.00% due 12/1/2020 - 12/1/2021 | 2,515,000 | 2,623,387 |
| | City of New Orleans (Public Improvements; Insured: AGM) GO, 5.00% due 12/1/2020 - 12/1/2021 | 8,950,000 | 9,389,421 |
| | City of Shreveport (Water and Sewer System; Insured: BAM), Series A, 5.00% due 12/1/2020 - 12/1/2024 | 31,150,000 | 33,699,538 |
| | East Baton Rouge Sewerage Commission (Wastewater System Improvements), Series B, 5.00% due 2/1/2023 - 2/1/2025 | 2,150,000 | 2,457,890 |
| | Ernest N. Morial - New Orleans Exhibition Hall Authority (Convention Center), 5.00% due 7/15/2020 - 7/15/2023 | 3,780,000 | 3,993,648 |
| | Jefferson Sales Tax District (Insured: AGM), | | |
| | Series A, 5.00% due 12/1/2023 - 12/1/2027 | 4,700,000 | 5,621,503 |
| | Series B, 5.00% due 12/1/2027 - 12/1/2028 | 4,690,000 | 5,872,143 |
| | Louisiana Energy & Power Authority (LEPA Unit No. 1 Power; Insured: AGM), Series A, 5.00% due 6/1/2022 - 6/1/2023 | 1,750,000 | 1,917,390 |
| | Louisiana Energy & Power Authority (Rodemacher Unit No. 2 Power), 5.00% due 1/1/2021 - 1/1/2023 | 3,240,000 | 3,438,904 |
| | Louisiana Local Govt Environmental Facilities & Community Development Authority (Bossier Parish Community College - Campus Facilities, Inc. Project), 5.00% due 12/1/2020 | 1,200,000 | 1,229,640 |
| | Louisiana Local Govt Environmental Facilities & Community Development Authority (LCTCS Act 391 Project; Insured: BAM), 5.00% due 10/1/2022 - 10/1/2027 | 15,565,000 | 18,255,544 |
| | Louisiana Local Govt Environmental Facilities & Community Development Authority (Louisiana Community & Technical College System), 5.00% due 10/1/2025 - 10/1/2027 | 2,960,000 | 3,546,442 |
| | Louisiana Offshore Terminal Authority (Loop, INC), | | |
| a | Series A, 1.65% due 9/1/2033 (put 12/1/2023) | 5,000,000 | 5,049,250 |
| a | Series C, 1.65% due 9/1/2034 (put 12/1/2023) | 5,000,000 | 5,046,700 |
| a | Louisiana Offshore Terminal Authority (Loop, Inc.), 1.65% due 9/1/2027 (put 12/1/2023) | 6,150,000 | 6,192,496 |
| | Louisiana Public Facilities Authority (Hurricane Recovery Program), 5.00% due 6/1/2022 - 6/1/2023 | 7,945,000 | 8,727,816 |
| | Louisiana State Office Facilities Corp. (State Capitol), Series A, 5.00% due 5/1/2021 | 4,595,000 | 4,608,739 |
| | New Orleans Regional Transit Authority (Streetcar Rail Lines; Insured: AGM), 5.00% due 12/1/2021 - 12/1/2022 | 2,110,000 | 2,163,796 |
| | Parish of LaFourche (Roads, Highways & Bridges), 5.00% due 1/1/2022 - 1/1/2023 | 930,000 | 1,007,973 |
| | Parish of Orleans School District (Insured: AGM) GO, 5.00% due 9/1/2020 | 3,840,000 | 3,901,478 |
| a | Parish of St. Charles (Valero Energy Corp. Refinery), 4.00% due 12/1/2040 (put 6/1/2022) | 19,125,000 | 19,326,960 |
| | Shreveport Water & Sewer Revenue (Insured: BAM), Series C, 5.00% due 12/1/2024 - 12/1/2026 | 2,420,000 | 2,857,502 |
| | State of Louisiana GO, Series C, 5.00% due 8/1/2021 | 11,175,000 | 11,735,203 |
| | Maine — 0.1% | | |
| | Maine Governmental Facilities Authority (Augusta & Machias Courthouses), Series A, 5.00% due 10/1/2020 - 10/1/2023 | 5,180,000 | 5,575,211 |
| | Maryland — 0.7% | | |
| | Maryland Economic Development Corp. (Public Health Laboratory), | | |
| | 4.00% due 6/1/2022 | 8,245,000 | 8,518,981 |
| | 5.00% due 6/1/2021 | 8,725,000 | 9,121,464 |
| | Montgomery County GO, | | |
| | Series C, 5.00% due 10/1/2025 | 1,000,000 | 1,202,350 |
| a | Series E, 0.75% due 11/1/2037 (put 4/1/2020) | 500,000 | 500,000 |
| | Prince County George’s GO, Series A, 5.00% due 9/15/2026 | 6,110,000 | 7,538,701 |
| | State of Maryland GO, Series B, 5.00% due 8/1/2024 | 6,955,000 | 8,081,780 |
See notes to financial statements.
| Thornburg Municipal Funds Semi-Annual Report | 27 |
Schedule of Investments, Continued
Thornburg Limited Term Municipal Fund | March 31, 2020 (Unaudited)
| | Issuer-Description | PRINCIPAL
AMOUNT | VALUE |
| | Washington Suburban Sanitary Commission, 4.00% due 6/1/2020 | $ 1,900,000 | $ 1,909,101 |
| | Massachusetts — 1.4% | | |
| | Commonwealth of Massachusetts GO, | | |
| a | Series D-1, 1.05% due 8/1/2043 (put 7/1/2020) | 8,150,000 | 8,147,718 |
| | Series G, 5.00% due 9/1/2029 | 5,000,000 | 6,562,450 |
| | Massachusetts (Insured: BHAC-CR FGIC), 5.50% due 1/1/2029 | 8,300,000 | 10,884,205 |
| | Massachusetts Development Finance Agency (Beth Israel Lahey Health Obligated Group), | | |
| | 5.00% due 7/1/2027 - 7/1/2028 | 2,000,000 | 2,433,270 |
| | Series H-1, 5.00% due 7/1/2021 | 2,330,000 | 2,439,836 |
| | Massachusetts Development Finance Agency (CareGroup Healthcare System), | | |
| | Series H-1, 5.00% due 7/1/2020 | 5,000,000 | 5,046,900 |
| | Series I, 5.00% due 7/1/2023 - 7/1/2026 | 11,020,000 | 12,645,581 |
| | Massachusetts Development Finance Agency (CareGroup Obligated Group), Series I, 5.00% due 7/1/2027 | 450,000 | 530,654 |
| | Massachusetts Development Finance Agency (Mount Auburn Hospital Health Records System), Series H-1, 5.00% due 7/1/2022 - 7/1/2025 | 15,415,000 | 17,278,037 |
| | Massachusetts Development Finance Agency (Simmons College), Series J, 5.25% due 10/1/2023 | 595,000 | 660,682 |
| a | Massachusetts Health & Educational Facilities Authority (Baystate Medical Obligated Group; LOC TD Bank N.A.), Series J-2-R, 0.75% due 7/1/2044 (put 4/1/2020) | 2,500,000 | 2,500,000 |
| a | Massachusetts Health & Educational Facilities Authority (Tufts University), Series N-2-REMK, 0.70% due 8/15/2034 (put 4/1/2020) | 2,900,000 | 2,900,000 |
| a | Massachusetts Transportation Trust Fund Metropolitan Highway System Revenue, 5.00% due 1/1/2039 (put 1/1/2023) | 3,630,000 | 3,979,787 |
| | Michigan — 2.4% | | |
| | Board of Governors of Wayne State University (Educational Facilities and Equipment), Series A, 5.00% due 11/15/2022 - 11/15/2025 | 1,870,000 | 2,132,612 |
| | Byron Center Michigan Public Schools (Insured: AGM/Q-SBLF) GO, 4.00% due 5/1/2020 | 1,000,000 | 1,002,340 |
| | City of Detroit Sewage Disposal System Revenue (Great Lakes Water Authority Sewage Disposal System Revenue; Insured: AGM), Series A, 5.25% due 7/1/2020 | 2,000,000 | 2,019,840 |
| | County of Genesee (Water Supply System; Insured: BAM) GO, 5.00% due 11/1/2022 | 600,000 | 653,688 |
| | County of Livingston (Howell Public Schools; Insured: Q-SBLF) GO, 4.00% due 5/1/2020 - 5/1/2021 | 2,000,000 | 2,032,670 |
| | Kalamazoo Hospital Finance Authority (Bronson Healthcare; Insured: AGM), 5.00% due 5/15/2022 (pre-refunded 5/15/2020) | 1,365,000 | 1,371,265 |
| | Kalamazoo Hospital Finance Authority (Bronson Methodist Hospital; Insured: AGM), | | |
| | 5.00% due 5/15/2021 | 1,050,000 | 1,054,820 |
| | 5.00% due 5/15/2021 (pre-refunded 5/15/2020) | 1,300,000 | 1,305,967 |
| | Kalamazoo Hospital Finance Authority (Bronson Methodist Hospital; Insured: AGM) ETM, 5.00% due 5/15/2020 | 1,735,000 | 1,742,964 |
| | Livonia Public Schools School District (School Building & Site) GO, | | |
| | Series I, | | |
| | 4.00% due 5/1/2020 | 800,000 | 801,800 |
| | 5.00% due 5/1/2021 | 900,000 | 936,702 |
| | Michigan Finance Authority ((McLaren Health Care Corp. Obligated Group), 5.00% due 2/15/2029 | 1,000,000 | 1,277,550 |
| | Michigan Finance Authority (Beaumont Health Credit Group), 5.00% due 8/1/2023 - 8/1/2025 | 18,800,000 | 21,471,286 |
| | Michigan Finance Authority (Henry Ford Health System), 5.00% due 11/15/2027 | 1,000,000 | 1,201,400 |
| | Michigan Finance Authority (LOC JPMorgan Chase Bank, N.A.) (State Aid Withholding), Series A-2, 2.00% due 8/20/2020 | 3,800,000 | 3,784,382 |
| | Michigan Finance Authority (McLaren Health Care Corp. Obligated Group), 5.00% due 2/15/2028 | 1,000,000 | 1,254,480 |
| | Michigan Finance Authority (Trinity Health Credit Group), 5.00% due 12/1/2022 - 12/1/2028 | 10,500,000 | 12,161,360 |
| | Michigan Finance Authority (Ypsilanti Community Schools), 5.00% due 8/1/2020 - 8/1/2022 | 3,890,000 | 4,074,267 |
| | Michigan Municipal Bond Authority (Clean Water Fund), 5.00% due 10/1/2020 | 35,000 | 35,110 |
| | Michigan State Building Authority (Facilities Program), Series I, 5.00% due 4/15/2023 - 4/15/2026 | 1,750,000 | 2,014,403 |
| a | Michigan State Hospital Finance Authority (Ascension Health), Series F-2-REMK, 1.90% due 11/15/2047 (put 4/1/2021) | 5,615,000 | 5,605,623 |
| | Michigan Strategic Fund (Detroit Edison Company; Insured: AMBAC), 7.00% due 5/1/2021 | 4,115,000 | 4,361,653 |
| | Plymouth-Canton Community Schools (Insured: Q-SBLF) GO, Series A, 5.00% due 5/1/2020 | 1,000,000 | 1,003,140 |
| | Royal Oak Hospital Finance Authority (William Beaumont Hospital), 5.00% due 9/1/2020 - 9/1/2024 | 6,940,000 | 7,510,715 |
| | School District of the City of Dearborn (Insured: Q-SBLF) (State Aid Withholding) GO, 4.00% due 5/1/2020 - 5/1/2023 | 2,080,000 | 2,180,700 |
| | School District of the City of Detroit (Wayne County School Building & Site; Insured: Q-SBLF) GO, Series A, 5.00% due 5/1/2020 - 5/1/2022 | 9,200,000 | 9,608,440 |
| | Sparta Area Schools, Counties of Kent and Ottawa (School Building & Site; Insured: Q-SBLF) GO, 5.00% due 5/1/2020 | 1,335,000 | 1,339,098 |
| | St. Johns Public Schools (Insured: Natl-Re/Q-SBLF) GO, 5.00% due 5/1/2021 | 665,000 | 679,450 |
| | State Building Authority of the State of Michigan (Higher Education Facilities Program), Series I-A, 5.00% due 10/15/2020 - 10/15/2023 | 12,715,000 | 14,085,211 |
| | Warren Consolidated School District (Insured: Q-SBLF) GO, 5.00% due 5/1/2020 - 5/1/2021 | 2,000,000 | 2,042,530 |
| | Wayne County Airport Authority (Detroit Metropolitan Airport), | | |
| | Series C, 5.50% due 12/1/2020 | 4,395,000 | 4,517,137 |
| | Series D, 5.50% due 12/1/2020 | 3,115,000 | 3,201,566 |
| | Wayne State University, Series A, 5.00% due 11/15/2023 - 11/15/2026 | 12,640,000 | 14,861,441 |
| | Minnesota — 0.6% | | |
| | City of St. Cloud (CentraCare Health System), Series A, 5.00% due 5/1/2020 | 3,310,000 | 3,320,095 |
| | Le Sueur-Henderson No. 2397 (Minnesota School District Credit Enhancement Program) (State Aid Withholding) ISD GO, 3.00% due 4/1/2021 | 1,125,000 | 1,146,589 |
28 | Thornburg Municipal Funds Semi-Annual Report
| See notes to financial statements. |
Schedule of Investments, Continued
Thornburg Limited Term Municipal Fund | March 31, 2020 (Unaudited)
| | Issuer-Description | PRINCIPAL
AMOUNT | VALUE |
| | Minneapolis MN/St Paul Housing & Redevelopment Authority (Allina Health Obligated Group; LOC JPMorgan Chase Bank, N.A.), | | |
| a | Series B-1, 0.73% due 11/15/2035 (put 4/1/2020) | $ 2,500,000 | $ 2,500,000 |
| a | Series B-2, 0.75% due 11/15/2035 (put 4/1/2020) | 5,000,000 | 5,000,000 |
| | Minnesota Higher Education Facilities Authority, 5.00% due 10/1/2029 | 300,000 | 368,985 |
| | Minnesota Housing Finance Agency (Collateralized: GNMA, FNMA, FHLMC), | | |
| | Series F, | | |
| | 1.75% due 7/1/2027 | 920,000 | 910,726 |
| | 1.80% due 1/1/2028 | 1,020,000 | 1,007,780 |
| | 1.85% due 7/1/2028 | 1,205,000 | 1,192,408 |
| | 1.90% due 1/1/2029 | 365,000 | 360,321 |
| | 1.95% due 7/1/2029 | 885,000 | 875,203 |
| a | Minnesota Housing Finance Agency (Residential Single Family Development; Collateralized: GNMA, FNMA, FHLMC), 5.26% (MUNIPSA + 0.38%) due 7/1/2041 (put 12/12/2023) | 7,525,000 | 7,512,283 |
| | Port Authority of the City of St. Paul (Minnesota Andersen Office Building), Series 3, 5.00% due 12/1/2021 - 12/1/2022 | 2,215,000 | 2,397,620 |
| | Port Authority of the City of St. Paul (Minnesota Freeman Office Building), Series 2, 5.00% due 12/1/2020 | 2,675,000 | 2,744,496 |
| | St. Paul Housing and Redevelopment Authority (HealthPartners), 5.00% due 7/1/2023 - 7/1/2025 | 1,850,000 | 2,099,227 |
| | Mississippi — 0.4% | | |
| a | Jackson County (Chevron Corp.), 0.65% due 6/1/2023 (put 4/1/2020) | 500,000 | 500,000 |
| | Mississippi Business Finance Corp. (Chevron USA, Inc.; Guaranty: Chevron Corp.), | | |
| a | Series A, 0.65% due 11/1/2035 (put 4/1/2020) | 1,600,000 | 1,600,000 |
| a | Series C, 0.65% due 12/1/2030 - 11/1/2035 (put 4/1/2020) | 2,200,000 | 2,200,000 |
| a | Series G, 0.65% due 12/1/2030 - 11/1/2035 (put 4/1/2020) | 3,665,000 | 3,665,000 |
| a | Series I, 0.65% due 11/1/2035 (put 4/1/2020) | 2,100,000 | 2,100,000 |
| | Mississippi Development Bank (Jackson Public School District; Insured: BAM), 5.00% due 10/1/2024 - 10/1/2028 | 2,400,000 | 2,887,497 |
| | Mississippi Development Bank (MDOT-Harrison County Highway), Series A-GA, 5.00% due 1/1/2021 - 1/1/2023 | 5,000,000 | 5,283,790 |
| | Mississippi Development Bank (MDOT-Madison County Highway), 5.00% due 1/1/2021 - 1/1/2023 | 4,250,000 | 4,494,982 |
| | Missouri — 0.8% | | |
| | Cass County COP, 5.00% due 5/1/2021 | 1,750,000 | 1,755,495 |
| | Cass County COP ETM, 5.00% due 5/1/2020 | 2,255,000 | 2,262,081 |
| | City of Excelsior Springs (Insured: BAM) COP, | | |
| | Series A, 4.00% due 9/1/2024 - 9/1/2028 | 2,320,000 | 2,678,785 |
| | Series B, 4.00% due 3/1/2025 - 3/1/2030 | 1,665,000 | 1,921,437 |
| a | Health & Educational Facilities Authority of the State of Missouri (Washington University; SPA JP Morgan Chase Bank, N.A.), Series B, 1.10% due 9/1/2030 (put 4/1/2020) | 1,100,000 | 1,100,000 |
| | Jackson County (Parking Facility Projects), 4.00% due 12/1/2021 | 1,000,000 | 1,044,120 |
| | Kansas City Municipal Assistance Corp. (H. Roe Bartle Convention Center & Infrastructure Project; Insured: AMBAC), Series B-1, Zero Coupon due 4/15/2021 - 4/15/2022 | 15,095,000 | 14,768,153 |
| | Missouri Development Finance Board (City of Independence Electric System), Series B, 5.00% due 6/1/2020 | 1,000,000 | 1,006,220 |
| | Missouri Development Finance Board (City of Independence Electric System) ISD, Series F, 4.00% due 6/1/2020 - 6/1/2022 | 6,885,000 | 7,112,891 |
| | Platte County (Community & Resource Centers), 5.00% due 4/1/2021 | 2,440,000 | 2,351,818 |
| | Southeast Missouri State University (City of Cape Girardeau Campus System Facilities), Series A, 5.00% due 4/1/2020 | 2,825,000 | 2,825,000 |
| | Special Administrative Board of the Transitional School District of the City of St. Louis (State Aid Withholding) GO, 4.00% due 4/1/2020 - 4/1/2022 | 6,955,000 | 7,197,465 |
| | Nebraska — 1.1% | | |
| a | Central Plains Energy Project, 5.00% due 3/1/2050 (put 1/1/2024) | 50,000,000 | 53,199,500 |
| | Douglas County Hospital Authority No. 3 (Nebraska Methodist Health System), 5.00% due 11/1/2022 - 11/1/2025 | 6,980,000 | 7,944,236 |
| | Nevada — 3.6% | | |
| | Carson City (Carson Tahoe Regional Healthcare), 5.00% due 9/1/2020 - 9/1/2027 | 5,155,000 | 5,639,735 |
| | Clark County Department of Aviation, | | |
| | Series A, 5.00% due 7/1/2021 | 1,855,000 | 1,929,719 |
| | Series C, 5.00% due 7/1/2021 | 2,500,000 | 2,600,700 |
| | Clark County School District (Acquisition of Transportation & Technology Equipment) GO, | | |
| | Series C, 5.00% due 6/15/2022 | 2,560,000 | 2,747,648 |
| | Series D, 5.00% due 6/15/2021 - 6/15/2022 | 47,150,000 | 50,024,895 |
| | Series E, 5.00% due 6/15/2021 | 21,405,000 | 22,351,957 |
| | Clark County School District GO, Series A, 5.00% due 6/15/2023 | 4,000,000 | 4,418,400 |
| | Las Vegas Convention and Visitors Authority, Series C, 5.00% due 7/1/2023 - 7/1/2026 | 3,050,000 | 3,583,825 |
| | Las Vegas Valley Water District GO, | | |
| | Series A, 5.00% due 6/1/2023 - 6/1/2026 | 55,955,000 | 64,676,780 |
| | Series B, 5.00% due 12/1/2025 | 20,000,000 | 23,733,000 |
| | Series C, 5.00% due 6/1/2020 - 6/1/2021 | 9,255,000 | 9,494,843 |
| | Series D, 5.00% due 6/1/2020 | 5,080,000 | 5,110,734 |
| | Washoe County (Reno-Sparks Convention & Visitors Authority) GO, 5.00% due 7/1/2021 - 7/1/2022 | 4,200,000 | 4,400,989 |
See notes to financial statements.
| Thornburg Municipal Funds Semi-Annual Report | 29 |
Schedule of Investments, Continued
Thornburg Limited Term Municipal Fund | March 31, 2020 (Unaudited)
| | Issuer-Description | PRINCIPAL
AMOUNT | VALUE |
| | New Hampshire — 0.2% | | |
| a | New Hampshire Health and Education Facilities Authority Act (University System of New Hampshire; SPA State Street Bank & Trust Co.), 0.85% due 7/1/2035 (put 4/1/2020) | $ 1,515,000 | $ 1,515,000 |
| a | New Hampshire Health and Education Facilities Authority Act (University System of New Hampshire; SPA Wells Fargo Bank, N.A.), Series B-1, 0.85% due 7/1/2033 (put 4/1/2020) | 3,210,000 | 3,210,000 |
| | New Hampshire Municipal Bond Bank (Educational Facilities; Insured: State Intercept), Series C, 5.25% due 8/15/2020 - 8/15/2022 | 3,770,000 | 4,049,676 |
| | New Hampshire Turnpike System, Series B, 5.00% due 2/1/2021 | 1,260,000 | 1,300,395 |
| | New Jersey — 3.0% | | |
| | City of Jersey City (Qualified General Improvement; Insured: BAM) (State Aid Withholding) GO, | | |
| | Series A, | | |
| | 4.00% due 8/1/2020 - 8/1/2021 | 5,455,000 | 5,583,161 |
| | 5.00% due 8/1/2022 - 8/1/2023 | 4,985,000 | 5,499,505 |
| | Essex County Improvement Authority (County Correctional Facilities & Gibraltar Facilities; Insured: Natl-Re) GO, 5.50% due 10/1/2024 | 5,000,000 | 5,948,750 |
| | Hudson County Improvement Authority (Hudson County Lease; Insured: AGM) GO, 5.375% due 10/1/2020 | 2,020,000 | 2,061,067 |
| | New Jersey (New Jersey Transit Corporation) (State Aid Withholding) EDA, Series B, 5.00% due 11/1/2024 | 8,000,000 | 8,552,640 |
| | New Jersey (New Jersey Transit Corporation) EDA, | | |
| | 5.00% due 11/1/2029 | 7,850,000 | 8,703,295 |
| | Series B, 5.00% due 11/1/2023 | 2,500,000 | 2,647,600 |
| | New Jersey (School Facilities Construction) EDA, | | |
| | 5.00% due 9/1/2020 - 6/15/2029 | 4,325,000 | 4,764,526 |
| | Series G, 5.75% due 9/1/2023 (pre-refunded 3/1/2021) | 4,955,000 | 5,160,632 |
| | Series GG, 5.75% due 9/1/2023 | 550,000 | 570,158 |
| | Series UU, 5.00% due 6/15/2028 | 7,930,000 | 8,379,314 |
| | New Jersey (School Facilities Construction) EDA ETM, 5.00% due 9/1/2020 | 365,000 | 370,964 |
| | New Jersey (State of New Jersey Department of the Treasury) EDA, Series GG, 5.00% due 9/1/2022 | 735,000 | 756,962 |
| | New Jersey (Virtua Health Issue) HFFA, 5.00% due 7/1/2023 - 7/1/2024 | 1,535,000 | 1,731,460 |
| | New Jersey Housing & Mortgage Finance Agency, Series A, 4.65% due 10/1/2029 | 3,885,000 | 3,946,305 |
| | New Jersey Transit Corp. (Urban Public Transportation Capital Improvement), Series A, 5.00% due 9/15/2021 | 3,395,000 | 3,574,663 |
| | New Jersey Transportation Trust Fund Authority, Series A, 5.00% due 12/15/2029 | 1,550,000 | 1,704,737 |
| | New Jersey Transportation Trust Fund Authority (State Transportation System Improvements), | | |
| | 5.00% due 6/15/2020 - 6/15/2028 | 12,740,000 | 13,702,507 |
| | Series A, 5.25% due 12/15/2022 | 2,000,000 | 2,109,560 |
| | Series A-1, | | |
| | 5.00% due 6/15/2025 - 6/15/2027 | 30,535,000 | 34,094,170 |
| a | 5.91% (MUNIPSA + 1.20%) due 6/15/2034 (put 12/15/2021) | 8,250,000 | 8,245,050 |
| | Series B, 5.00% due 6/15/2020 - 6/15/2021 | 3,570,000 | 3,645,264 |
| | New Jersey Transportation Trust Fund Authority (State Transportation System Improvements; Insured: AMBAC), Series B, 5.25% due 12/15/2023 | 3,545,000 | 3,791,413 |
| | New Jersey Transportation Trust Fund Authority (Transportation System), 5.00% due 12/15/2027 - 12/15/2028 | 21,850,000 | 24,139,657 |
| | Passaic Valley Sewer Commissioners (Sewer System), Series G, 5.75% due 12/1/2020 - 12/1/2021 | 8,750,000 | 9,187,887 |
| | New Mexico — 1.6% | | |
| | Carlsbad Municipal School District (Educational Facilities) (State Aid Withholding) GO, 5.00% due 8/1/2023 | 1,650,000 | 1,854,914 |
| | City of Albuquerque (City Infrastructure Improvements) GO, Series A, 5.00% due 7/1/2023 | 1,360,000 | 1,530,367 |
| a | City of Farmington, 1.875% due 4/1/2033 (put 10/1/2021) | 5,335,000 | 5,219,070 |
| | City of Farmington (Arizona Public Service Co.-Four Corners Project), Series A, 4.70% due 5/1/2024 | 2,375,000 | 2,413,617 |
| a | City of Farmington (Southern California Edison Co.-Four Corners Project), 2.125% due 6/1/2040 (put 6/1/2022) | 3,500,000 | 3,399,235 |
| | City of Santa Fe (El Castillo Retirement Residences), 4.50% due 5/15/2022 | 1,615,000 | 1,623,350 |
| | New Mexico Educational Assistance Foundation (Student Loans), Series A-1, 5.00% due 12/1/2021 | 3,000,000 | 3,073,290 |
| | New Mexico Hospital Equipment Loan Council (Presbyterian Healthcare Services), 5.00% due 8/1/2024 - 8/1/2025 | 1,780,000 | 2,072,487 |
| | New Mexico Mortgage Finance Authority (Collateralized: GNMA, FNMA, FHLMC), Series F, 3.50% due 7/1/2050 | 11,225,000 | 11,980,442 |
| | New Mexico Municipal Energy Acquisition Authority, | | |
| | Series A, | | |
| | 4.00% due 5/1/2020 - 11/1/2024 | 5,790,000 | 6,056,008 |
| a | 5.00% due 11/1/2039 (put 5/1/2025) | 30,600,000 | 33,339,006 |
| | New Mexico State University, Series B, 5.00% due 4/1/2020 - 4/1/2022 | 3,015,000 | 3,089,758 |
| | New Mexico State University (Insured: BAM), Series A, 5.00% due 4/1/2029 | 1,645,000 | 2,047,614 |
| | New Mexico State University ETM, Series B, 5.00% due 4/1/2020 - 4/1/2022 | 3,175,000 | 3,266,164 |
| | Rio Rancho Public School District No. 94 (State Aid Withholding) GO, Series A, 5.00% due 8/1/2026 | 1,085,000 | 1,319,642 |
| | Santa Fe County (County Buildings & Facilities) GRT, Series A, 5.00% due 6/1/2025 | 1,250,000 | 1,483,313 |
| | State of New Mexico (Educational Facilities), Series A, 5.00% due 7/1/2020 | 4,000,000 | 4,039,040 |
| | New York — 9.2% | | |
| | City of Long Beach School District (Insured: AGM) (State Aid Withholding) GO, 3.50% due 5/1/2022 | 1,600,000 | 1,603,136 |
| | City of New York (City Budget Financial Management) GO, | | |
| | Series D, 5.00% due 8/1/2021 - 8/1/2022 | 6,000,000 | 6,418,590 |
30 | Thornburg Municipal Funds Semi-Annual Report
| See notes to financial statements. |
Schedule of Investments, Continued
Thornburg Limited Term Municipal Fund | March 31, 2020 (Unaudited)
| | Issuer-Description | PRINCIPAL
AMOUNT | VALUE |
| | Series G, 5.00% due 8/1/2021 - 8/1/2023 | $25,145,000 | $ 27,370,323 |
| | Series J, 5.00% due 8/1/2021 - 8/1/2024 | 80,480,000 | 90,566,649 |
| | Series K, 5.00% due 8/1/2021 - 8/1/2022 | 20,850,000 | 22,402,147 |
| | Metropolitan Transportation Authority, | | |
| | Series A, 5.00% due 11/15/2020 | 2,000,000 | 2,048,240 |
| | Series C, 5.00% due 9/1/2021 | 15,030,000 | 15,582,503 |
| | Series D, 5.00% due 11/15/2020 - 11/15/2021 | 37,280,000 | 38,336,536 |
| | Series D-1, 5.00% due 9/1/2022 | 25,000,000 | 26,438,250 |
| | Metropolitan Transportation Authority (Green Bond), Series A2, 5.00% due 11/15/2025 - 11/15/2027 | 44,520,000 | 48,676,210 |
| | Monroe County Industrial Development Corp. (St. John Fisher College), Series A, 5.00% due 6/1/2022 | 2,000,000 | 2,159,720 |
| | Nassau County, Series B, 2.00% due 9/14/2020 | 21,115,000 | 21,142,449 |
| | New York City Health and Hospital Corp. (Healthcare Facilities Improvements), Series A, 5.00% due 2/15/2021 | 2,615,000 | 2,623,237 |
| | New York City Housing Development Corp., 2.00% due 11/1/2020 | 4,920,000 | 4,919,410 |
| | New York City Transitional Finance Authority Future Tax Secured Revenue, | | |
| a | 0.75% due 11/1/2036 (put 4/1/2020) | 600,000 | 600,000 |
| a | 0.88% due 8/1/2043 (put 4/1/2020) | 580,000 | 580,000 |
| a | Series 1-SUB 1C, 0.75% due 11/1/2022 (put 4/1/2020) | 590,000 | 590,000 |
| a | Series 1-SUB 1D, 0.75% due 11/1/2022 (put 4/1/2020) | 1,265,000 | 1,265,000 |
| a | Series C2, 0.75% due 8/1/2031 (put 4/1/2020) | 650,000 | 650,000 |
| a | New York City Transitional Finance Authority Future Tax Secured Revenue (City Capital Projects; SPA: U.S. Bank, N.A.), 1.10% due 8/1/2039 (put 4/1/2020) | 1,575,000 | 1,575,000 |
| | New York City Trust for Cultural Resources (Lincoln Center for the Performing Arts, Inc.), Series A, 5.00% due 12/1/2026 | 2,500,000 | 3,017,950 |
| | New York City Water & Sewer System, | | |
| a | 0.72% due 6/15/2032 (put 4/1/2020) | 19,500,000 | 19,500,000 |
| a | 0.75% due 6/15/2043 (put 4/1/2020) | 1,600,000 | 1,600,000 |
| a | 0.85% due 6/15/2044 (put 4/1/2020) | 600,000 | 600,000 |
| a | 1.10% due 6/15/2045 (put 4/1/2020) | 18,215,000 | 18,215,000 |
| a | Series BB-5, 0.75% due 6/15/2033 (put 4/1/2020) | 900,000 | 900,000 |
| a | New York City Water & Sewer System (SPA State Street Bank & Trust Co.), 1.10% due 6/15/2045 (put 4/1/2020) | 2,450,000 | 2,450,000 |
| a | New York State Dormitory Authority (Cornell University), 1.05% due 7/1/2039 (put 4/1/2020) | 600,000 | 600,000 |
| | New York State Dormitory Authority (NYSARC, Inc. Developmental Disability Programs; Insured: State Intercept), Series A, 5.00% due 7/1/2020 | 1,000,000 | 1,009,660 |
| | New York State Dormitory Authority (School Districts Financing Program) (State Aid Withholding), | | |
| | Series G, 5.00% due 4/1/2020 - 10/1/2022 | 1,750,000 | 1,796,410 |
| | Series H, 5.00% due 10/1/2020 - 10/1/2021 | 1,750,000 | ��� 1,813,268 |
| | Series J, 5.00% due 10/1/2020 | 2,775,000 | 2,828,530 |
| | New York State Dormitory Authority (School Districts Financing Program; Insured: AGC) (State Aid Withholding), | | |
| | 5.25% due 10/1/2023 | 140,000 | 148,873 |
| | 5.25% due 10/1/2023 (pre-refunded 10/1/2021) | 1,860,000 | 1,977,757 |
| | New York State Dormitory Authority (School Districts Financing Program; Insured: AGM) (State Aid Withholding), | | |
| | Series A, 5.00% due 10/1/2020 - 10/1/2024 | 8,650,000 | 9,597,118 |
| | Series F, 5.00% due 10/1/2020 - 10/1/2021 | 3,350,000 | 3,463,471 |
| | New York State Dormitory Authority (State of New York Sales Tax Revenue), Series E, 5.00% due 3/15/2029 | 4,135,000 | 5,287,342 |
| a | New York State Housing Finance Agency (160 Madison Ave, LLC; LOC Landesbank Hessen-Thuringen), 0.75% due 11/1/2046 (put 4/1/2020) | 47,970,000 | 47,970,000 |
| a | New York State Housing Finance Agency (LOC Landesbank Hessen-Thuringen), Series A, 0.75% due 11/1/2046 (put 4/1/2020) | 600,000 | 600,000 |
| | New York State Thruway Authority (Governor Thomas E. Dewey Thruway), | | |
| | Series I, 5.00% due 1/1/2021 - 1/1/2022 | 5,500,000 | 5,774,205 |
| | Series K, 5.00% due 1/1/2024 - 1/1/2025 | 3,000,000 | 3,453,260 |
| | New York State Thruway Authority (Highway, Bridge, Multi-Modal and MTA Projects), Series A, 5.00% due 3/15/2024 | 18,300,000 | 18,970,878 |
| | State of New York Mortgage Agency, | | |
| | Series 223, | | |
| | 1.85% due 4/1/2026 | 400,000 | 401,044 |
| | 1.90% due 10/1/2026 | 815,000 | 816,385 |
| | 1.95% due 4/1/2027 | 1,000,000 | 1,003,900 |
| | 2.00% due 10/1/2027 | 775,000 | 778,317 |
| | 2.05% due 4/1/2028 | 450,000 | 452,439 |
| | 2.25% due 4/1/2030 | 1,320,000 | 1,329,016 |
| | 2.30% due 10/1/2030 | 1,110,000 | 1,137,162 |
| | Suffolk County Economic Development Corp. (Catholic Health Services), 5.00% due 7/1/2020 - 7/1/2022 | 15,000,000 | 15,492,250 |
| a | Triborough Bridge and Tunnel Authority (LOC Citibank N.A.), Series B-2, 0.70% due 1/1/2032 (put 4/1/2020) | 500,000 | 500,000 |
| a | Triborough Bridge and Tunnel Authority (LOC U.S. Bank N.A.), Series 2005B-4C-REMK, 1.10% due 1/1/2031 (put 4/1/2020) | 7,535,000 | 7,535,000 |
| | Triborough Bridge and Tunnel Authority (MTA Bridges and Tunnels), | | |
| | Series A, 5.00% due 11/15/2021 | 5,140,000 | 5,464,231 |
| | Series C-1, 5.00% due 11/15/2026 | 4,000,000 | 4,965,360 |
See notes to financial statements.
| Thornburg Municipal Funds Semi-Annual Report | 31 |
Schedule of Investments, Continued
Thornburg Limited Term Municipal Fund | March 31, 2020 (Unaudited)
| | Issuer-Description | PRINCIPAL
AMOUNT | VALUE |
| | West Seneca Central School District (Insured: BAM) (State Aid Withholding) GO, 5.00% due 11/15/2022 | $ 1,000,000 | $ 1,100,260 |
| | Westchester County Local Development Corp. (Miriam Osborn Memorial Home Association Obligated Group), 5.00% due 7/1/2024 - 7/1/2028 | 1,395,000 | 1,596,809 |
| | North Carolina — 1.8% | | |
| | Charlotte-Mecklenburg Hospital Authority (Carolinas HealthCare System), | | |
| | Series A, | | |
| | 3.00% due 1/15/2021 | 1,595,000 | 1,618,127 |
| | 4.00% due 1/15/2022 | 845,000 | 887,132 |
| | 5.00% due 1/15/2023 - 1/15/2024 | 4,255,000 | 4,688,124 |
| | City of Charlotte (Equipment Acquisition & Public Facilities) COP, Series C, 5.00% due 12/1/2020 - 12/1/2025 | 8,940,000 | 10,036,733 |
| a | Columbus County Industrial Facilities & Pollution Control Financing Authority (International Paper Co.), 2.00% due 11/1/2033 (put 10/1/2024) | 1,100,000 | 1,078,121 |
| | County of Buncombe (Primary, Middle School & Community College Facilities), Series A, 5.00% due 6/1/2022 - 6/1/2024 | 2,350,000 | 2,611,588 |
| | County of Dare (Educational Facility Capital Projects), | | |
| | Series A, | | |
| | 4.00% due 6/1/2020 - 6/1/2022 | 1,255,000 | 1,287,300 |
| | 5.00% due 6/1/2021 - 6/1/2024 | 1,925,000 | 2,061,498 |
| | County of Randolph, | | |
| | Series B, 5.00% due 10/1/2021 - 10/1/2023 | 3,560,000 | 3,869,176 |
| | Series C, 5.00% due 10/1/2020 - 10/1/2023 | 1,400,000 | 1,489,032 |
| | North Carolina Eastern Municipal Power Agency ETM, | | |
| | Series A, 5.00% due 1/1/2022 | 4,715,000 | 5,028,029 |
| | Series B, 5.00% due 1/1/2021 | 5,000,000 | 5,143,850 |
| | North Carolina Municipal Power Agency (Catawba Electric), Series B, 4.00% due 1/1/2022 | 1,000,000 | 1,047,900 |
| | North Carolina Turnpike Authority, 5.00% due 1/1/2023 - 1/1/2029 | 13,130,000 | 14,869,278 |
| a | University of North Carolina at Chapel Hill, Series A, 1.409% (LIBOR 1 Month + 0.35%) due 12/1/2041 (put 12/1/2021) | 40,500,000 | 40,493,925 |
| | Winston-Salem State University (Student Housing and Student Services Facilities), 5.00% due 4/1/2022 | 945,000 | 1,004,242 |
| | North Dakota — 0.2% | | |
| | County of Mckenzie, 5.00% due 8/1/2020 - 8/1/2023 | 8,285,000 | 8,799,704 |
| | County of McKenzie, 5.00% due 8/1/2022 | 1,425,000 | 1,541,380 |
| | County of Ward (Insured: AGM), 4.00% due 4/1/2020 | 2,445,000 | 2,445,000 |
| | Ohio — 3.5% | | |
| | Akron, Bath & Copley Joint Township Hospital District (Children’s Hospital Medical Center), 5.00% due 11/15/2021 | 1,000,000 | 1,058,420 |
| | American Municipal Power, Inc. (AMP Fremont Energy Center), Series B, 5.00% due 2/15/2021 - 2/15/2022 | 4,050,000 | 4,289,360 |
| | Cincinnati City School District Board of Education (Educational Facilities; Insured: Natl-Re) GO, 5.25% due 12/1/2023 | 2,690,000 | 3,079,270 |
| | City of Akron (Community Learning Centers), Series A, 5.00% due 12/1/2021 | 4,120,000 | 4,386,976 |
| | City of Cleveland (Cleveland Stadium) COP, Series A, 4.75% due 11/15/2020 | 2,000,000 | 2,041,660 |
| | City of Cleveland (Municipal Street System Improvements) GO, | | |
| | Series A, | | |
| | 3.00% due 12/1/2020 - 12/1/2021 | 2,980,000 | 3,060,044 |
| | 4.00% due 12/1/2022 - 12/1/2023 | 6,725,000 | 7,301,633 |
| | 5.00% due 12/1/2025 - 12/1/2026 | 7,165,000 | 8,569,877 |
| | City of Cleveland (Parking Facility; Insured: AGM), 5.25% due 9/15/2021 | 2,035,000 | 2,149,998 |
| | City of Cleveland (Parks & Recreation Facilities), 5.00% due 10/1/2020 - 10/1/2023 | 3,375,000 | 3,649,801 |
| | City of Cleveland (Police & Fire Pension Payment), 5.00% due 5/15/2020 - 5/15/2021 | 2,355,000 | 2,394,794 |
| | City of Cleveland (Public Facilities Improvements), 5.00% due 10/1/2025 - 10/1/2028 | 2,855,000 | 3,522,219 |
| | City of Cleveland (Public Facilities), 5.00% due 10/1/2020 - 10/1/2023 | 2,570,000 | 2,806,812 |
| | City of Toledo (Water System Improvements), 5.00% due 11/15/2020 - 11/15/2023 | 9,005,000 | 9,679,305 |
| | Cleveland Package Facilities (Insured: AGM) ETM, 5.25% due 9/15/2021 | 965,000 | 1,021,549 |
| | Cleveland State University (Campus Capital Projects), 5.00% due 6/1/2020 - 6/1/2022 | 3,700,000 | 3,874,785 |
| | County of Cuyahoga (Convention Hotel Project) COP, 5.00% due 12/1/2022 - 12/1/2024 | 26,885,000 | 30,099,864 |
| | County of Hamilton, Series A, 5.00% due 12/1/2020 | 1,650,000 | 1,692,653 |
| | County of Scioto (Southern Ohio Medical Center), 5.00% due 2/15/2024 - 2/15/2025 | 3,335,000 | 3,804,330 |
| | Franklin County Convention Facilities Authority (Greater Columbus Convention Center), 5.00% due 12/1/2021 - 12/1/2024 | 2,500,000 | 2,773,775 |
| a | Ohio Higher Educational Facility Commission (Case Western Reserve University), 1.625% due 12/1/2034 (put 12/1/2026) | 2,200,000 | 2,118,226 |
| | Ohio Turnpike & Infrastructure Commission, Series A, 5.00% due 2/15/2027 - 2/15/2028 | 14,555,000 | 18,078,185 |
| | Ohio Water Development Authority, Series A, 5.00% due 12/1/2030 | 1,000,000 | 1,213,840 |
| | State of Ohio (Cultural and Sports Capital Facilities), Series A, 5.00% due 10/1/2020 | 3,845,000 | 3,917,978 |
| | State of Ohio (Major New Street Infrastructure Project), | | |
| | Series 1, 5.00% due 12/15/2020 - 12/15/2021 | 3,500,000 | 3,688,130 |
| | Series 2016-1, 5.00% due 12/15/2020 - 12/15/2026 | 2,000,000 | 2,238,500 |
| | State of Ohio GO, Series V, 5.00% due 5/1/2021 - 5/1/2028 | 46,260,000 | 52,729,564 |
| | Youngstown City School District (Educational Facilities) (State Aid Withholding) GO, 4.00% due 12/1/2020 - 12/1/2023 | 6,910,000 | 7,041,275 |
| | Oklahoma — 0.8% | | |
32 | Thornburg Municipal Funds Semi-Annual Report
| See notes to financial statements. |
Schedule of Investments, Continued
Thornburg Limited Term Municipal Fund | March 31, 2020 (Unaudited)
| | Issuer-Description | PRINCIPAL
AMOUNT | VALUE |
| | Canadian County Educational Facilities Authority (Mustang Public Schools) ISD, | | |
| | 4.50% due 9/1/2020 - 9/1/2021 | $ 7,665,000 | $ 7,826,351 |
| | 5.00% due 9/1/2027 | 1,000,000 | 1,208,130 |
| | Cleveland County Educational Facilities Authority (Moore Public Schools) ISD, 5.00% due 6/1/2023 | 5,355,000 | 5,959,472 |
| | Muskogee Industrial Trust (Muskogee County Independent School District No. 20), 5.00% due 9/1/2024 - 9/1/2027 | 3,550,000 | 4,168,274 |
| | Oklahoma (INTEGRIS Health) DFA, Series A, 5.00% due 8/15/2022 - 8/15/2025 | 4,725,000 | 5,357,229 |
| | Oklahoma Capitol Improvement Authority (State Highway Capital Improvement), 5.00% due 7/1/2023 | 325,000 | 364,163 |
| | Oklahoma County Finance Authority (Midwest City Public Service) ISD, 5.00% due 10/1/2022 - 10/1/2026 | 3,200,000 | 3,649,631 |
| | Oklahoma County Finance Authority (Western Heights Public Schools) ISD, 5.00% due 9/1/2020 | 2,000,000 | 2,031,180 |
| | Tulsa County Industrial Authority (Broken Arrow Public Schools) ISD, 4.50% due 9/1/2020 - 9/1/2021 | 10,360,000 | 10,791,570 |
| | Tulsa County Industrial Authority ISD, 5.00% due 9/1/2020 - 9/1/2022 | 4,215,000 | 4,440,271 |
| | Oregon — 0.3% | | |
| | Hillsboro School District No. 1J (School Capital Improvements) (State Aid Withholding) GO, 5.00% due 6/15/2025 - 6/15/2027 | 9,130,000 | 11,141,594 |
| | Polk County Dallas School District No. 2 (Capital Improvements) (State Aid Withholding) GO, Zero Coupon due 6/15/2021 | 1,475,000 | 1,451,901 |
| | Tri-County Metropolitan Transportation District of Oregon, Series A, 5.00% due 10/1/2028 | 2,845,000 | 3,568,569 |
| | Pennsylvania — 6.3% | | |
| | Allegheny County Higher Education Building Authority (Duquesne University of the Holy Spirit), Series A, 5.00% due 3/1/2023 - 3/1/2025 | 1,945,000 | 2,194,475 |
| | Allegheny County Hospital Development Authority, 5.00% due 7/15/2028 - 7/15/2029 | 7,425,000 | 9,501,208 |
| | Allegheny County Sanitary Authority (2015 Capital Project), 5.00% due 12/1/2023 - 12/1/2024 | 19,150,000 | 21,881,208 |
| | Allegheny County Sanitary Authority (2015 Capital Project; Insured: BAM), 5.00% due 12/1/2025 | 1,000,000 | 1,204,260 |
| | Allegheny County Sanitary Authority (Insured: BAM), 5.00% due 12/1/2029 | 2,830,000 | 3,278,725 |
| | Altoona Area School District (Insured: AGM) (State Aid Withholding) GO, 3.00% due 12/1/2022 | 1,335,000 | 1,391,457 |
| | City of Philadelphia (Insured: AGM) GO, 5.00% due 8/1/2025 - 8/1/2027 | 28,685,000 | 34,914,644 |
| | City of Philadelphia (Pennsylvania Gas Works), 5.00% due 8/1/2020 - 8/1/2025 | 15,825,000 | 17,467,627 |
| | City of Philadelphia (Water and Wastewater System), | | |
| | 5.00% due 10/1/2024 - 10/1/2026 | 5,455,000 | 6,358,741 |
| | Series B, 5.00% due 7/1/2020 | 750,000 | 756,525 |
| | City of Philadelphia GO, Series A, 5.00% due 8/1/2025 - 8/1/2026 | 25,130,000 | 29,763,765 |
| | City of Pittsburgh (Insured: BAM) GO, 5.00% due 9/1/2022 | 1,100,000 | 1,200,881 |
| | Commonwealth Financing Authority (Tobacco Master Settlement), 5.00% due 6/1/2023 | 930,000 | 1,020,108 |
| | Commonwealth of Pennsylvania (Capital Facilities Projects) GO, 5.00% due 3/15/2022 | 12,485,000 | 13,382,796 |
| | Commonwealth of Pennsylvania (Capital Facilities) GO, Series D, 5.00% due 8/15/2023 - 8/15/2025 | 49,450,000 | 56,934,775 |
| | Commonwealth of Pennsylvania GO, 5.00% due 7/15/2030 | 12,930,000 | 16,522,600 |
| | Cumberland County Municipal Authority (Penn State Health Obligated Group), 5.00% due 11/1/2027 - 11/1/2029 | 3,150,000 | 4,010,578 |
| | Economy Borough Municipal Authority (Beaver County Sewer System; Insured: BAM), 4.00% due 12/15/2020 - 12/15/2022 | 1,785,000 | 1,879,177 |
| a | Hospitals & Higher Education Facilities Authority of Philadelphia (Children’s Hospital of Philadelphia Obligated Group), 0.75% due 7/1/2041 (put 4/1/2020) | 2,000,000 | 2,000,000 |
| | Lancaster County Solid Waste Management Authority (Harrisburg Resource Recovery Facility), | | |
| | Series A, | | |
| | 5.00% due 12/15/2023 | 2,680,000 | 3,028,856 |
| | 5.25% due 12/15/2024 | 4,770,000 | 5,448,676 |
| | Luzerne County (Insured: AGM) GO, Series A, 5.00% due 11/15/2021 - 11/15/2024 | 11,840,000 | 13,109,287 |
| | Luzerne County (Insured: AGM) IDA GO, 5.00% due 12/15/2021 - 12/15/2027 | 6,045,000 | 6,806,415 |
| | Luzerne County (Insured: AGM) IDA, GO, 5.00% due 12/15/2020 | 500,000 | 512,320 |
| | Monroeville Finance Authority (University of Pittsburgh Medical Center), 5.00% due 2/15/2021 - 2/15/2022 | 3,650,000 | 3,821,788 |
| | Montgomery County Higher Education & Health Authority (Abington Memorial Hospital), 5.00% due 6/1/2022 | 3,000,000 | 3,230,880 |
| | Montgomery County Higher Education & Health Authority (Thomas Jefferson University Obligated Group), 5.00% due 9/1/2026 - 9/1/2029 | 4,140,000 | 4,960,147 |
| | Northampton Borough Municipal Authority (Water System; Insured: AGM), | | |
| | 3.00% due 5/15/2023 | 1,255,000 | 1,294,307 |
| | 4.00% due 5/15/2021 - 5/15/2022 | 1,685,000 | 1,764,202 |
| | Pennsylvania Economic Development Financing Authority, Series A, 5.00% due 11/15/2026 | 2,310,000 | 2,818,154 |
| | Pennsylvania Higher Educational Facilities Authority (Saint Joseph’s University), Series A, 5.00% due 11/1/2023 | 1,075,000 | 1,098,682 |
| | Pennsylvania Higher Educational Facilities Authority (Shippensburg University Student Services, Inc. Student Housing) ETM, 4.00% due 10/1/2022 | 2,075,000 | 2,142,022 |
| | Pennsylvania Higher Educational Facilities Authority (University of Pennsylvania Health System), 5.00% due 8/15/2027 | 1,000,000 | 1,245,380 |
| | Pennsylvania Higher Educational Facilities Authority (University of Pittsburgh Medical Center), Series E, 5.00% due 5/15/2020 | 5,100,000 | 5,123,868 |
| a | Pennsylvania State University, Series B-REMK 06/01/18, 1.58% due 6/1/2031 (put 6/1/2020) | 12,500,000 | 12,505,375 |
| | Pennsylvania Turnpike Commission, Series A-1, 5.00% due 12/1/2022 - 12/1/2027 | 5,050,000 | 6,075,823 |
| | Philadelphia Authority for Industrial Development, 5.00% due 5/1/2024 - 5/1/2028 | 2,975,000 | 3,597,429 |
| | Philadelphia Authority for Industrial Development (Mast Charter School) ETM, 5.00% due 8/1/2020 | 115,000 | 116,462 |
| | Philadelphia Municipal Authority (Juvenile Justice Services Center), 5.00% due 4/1/2021 - 4/1/2027 | 7,850,000 | 8,900,451 |
| | Philadelphia School District (State Aid Withholding) GO, Series E, 5.25% due 9/1/2021 | 2,265,000 | 2,299,587 |
| | Pittsburgh Water and Sewer Authority, | | |
| | Series A, 5.00% due 9/1/2024 | 7,365,000 | 8,225,674 |
See notes to financial statements.
| Thornburg Municipal Funds Semi-Annual Report | 33 |
Schedule of Investments, Continued
Thornburg Limited Term Municipal Fund | March 31, 2020 (Unaudited)
| | Issuer-Description | PRINCIPAL
AMOUNT | VALUE |
| | Series B, 5.00% due 9/1/2024 (pre-refunded 9/1/2023) | $ 2,395,000 | $ 2,697,656 |
| | Pittsburgh Water and Sewer Authority ETM, Series B, 5.00% due 9/1/2023 | 2,520,000 | 2,838,452 |
| | Plum Borough School District (Insured: BAM) (State Aid Withholding) GO, | | |
| | Series A, 5.00% due 9/15/2022 - 9/15/2024 | 4,790,000 | 5,290,489 |
| | Series B, 5.00% due 9/15/2023 | 470,000 | 524,685 |
| | Series C, 4.00% due 9/15/2020 - 9/15/2021 | 3,065,000 | 3,140,529 |
| | School District of Philadelphia (State Aid Withholding) GO, Series A, 5.00% due 9/1/2023 - 9/1/2028 | 2,400,000 | 2,835,654 |
| | Southeastern Pennsylvania Transportation Authority, 5.00% due 6/1/2022 - 6/1/2028 | 7,705,000 | 9,228,631 |
| | Rhode Island — 1.5% | | |
| | Rhode Island Clean Water Finance Agency (Public Drinking Water Supply or Treatment Facilities), Series B, 5.00% due 10/1/2020 - 10/1/2023 | 7,960,000 | 8,632,368 |
| | Rhode Island Convention Center Authority (Convention Center and Parking Projects), 5.00% due 5/15/2020 | 5,890,000 | 5,916,446 |
| | Rhode Island Health and Educational Building Corp. (University of Rhode Island Auxiliary Enterprise), Series C, 5.00% due 9/15/2020 - 9/15/2023 | 2,150,000 | 2,331,360 |
| | Rhode Island Health and Educational Building Corp. (University of Rhode Island), Series B, 5.00% due 9/15/2020 - 9/15/2025 | 1,320,000 | 1,458,193 |
| | State of Rhode Island and Providence Plantations (Consolidated Capital Development Loan) GO, | | |
| | 5.00% due 8/1/2020 - 8/1/2022 | 34,725,000 | 36,528,827 |
| | Series B, 4.00% due 10/15/2020 - 10/15/2022 | 3,200,000 | 3,331,202 |
| | State of Rhode Island and Providence Plantations (Energy Conservation) COP, Series C, 5.00% due 4/1/2022 | 2,020,000 | 2,167,278 |
| | State of Rhode Island and Providence Plantations (Information Technology) COP, 5.00% due 11/1/2024 | 3,010,000 | 3,481,908 |
| | State of Rhode Island and Providence Plantations (Kent County Courthouse) COP, Series A, 5.00% due 10/1/2020 - 10/1/2023 | 6,975,000 | 7,484,892 |
| | State of Rhode Island and Providence Plantations (Training School) COP, Series B, 5.00% due 10/1/2020 - 10/1/2023 | 10,270,000 | 11,027,584 |
| | South Carolina — 0.8% | | |
| | Beaufort-Jasper Water & Sewer Authority (Waterworks & Sewer System), Series B, 5.00% due 3/1/2021 - 3/1/2025 | 4,750,000 | 5,283,728 |
| | Berkeley County School District (School Facility Equipment Acquisition), 5.00% due 12/1/2020 - 12/1/2024 | 3,550,000 | 3,948,862 |
| | Charleston County (South Aviation Ave. Construction), 5.00% due 12/1/2022 - 12/1/2023 | 4,270,000 | 4,786,352 |
| | City of Charleston Public Facilities Corp. (City of Charleston Project), Series A, 5.00% due 9/1/2020 - 9/1/2025 | 2,860,000 | 3,161,146 |
| a | City of Charleston Waterworks & Sewer System Revenue (Capital Improvement), Series B, 1.041% (LIBOR 1 Month + 0.36%) due 1/1/2035 (put 1/1/2022) | 17,800,000 | 17,817,444 |
| | Greenwood County (Self Regional Healthcare), Series B, 5.00% due 10/1/2022 | 1,000,000 | 1,070,650 |
| | SCAGO Educational Facilities Corp. (School District of Pickens County), 5.00% due 12/1/2021 - 12/1/2025 | 5,320,000 | 5,942,470 |
| | South Dakota — 0.1% | | |
| | South Dakota Building Authority, | | |
| | Series B, | | |
| | 5.00% due 6/1/2022 | 500,000 | 540,485 |
| | 5.00% due 6/1/2024 (pre-refunded 6/1/2023) | 1,000,000 | 1,115,630 |
| | South Dakota Health & Educational Facilities Authority (Avera Health) ETM, Series A, 5.00% due 7/1/2021 | 1,670,000 | 1,745,734 |
| | South Dakota Health & Educational Facilities Authority (Regional Health) ETM, 5.00% due 9/1/2020 | 1,000,000 | 1,013,200 |
| | South Dakota Health & Educational Facilities Authority (Sanford Health), 5.00% due 11/1/2021 - 11/1/2025 | 2,825,000 | 3,199,035 |
| | Tennessee — 0.4% | | |
| | State of Tennessee GO, | | |
| | Series A, 5.00% due 8/1/2020 | 2,000,000 | 2,025,700 |
| | Series B, 5.00% due 8/1/2020 | 2,000,000 | 2,025,700 |
| | Tennessee Energy Acquisition Corp., Series A, 5.25% due 9/1/2020 | 1,190,000 | 1,201,079 |
| | Tennessee Energy Acquisition Corp. (The Gas Project), | | |
| | Series A, | | |
| a | 4.00% due 5/1/2048 (put 5/1/2023) | 13,750,000 | 14,084,675 |
| | 5.25% due 9/1/2023 | 1,025,000 | 1,095,950 |
| | Texas — 13.2% | | |
| | Austin Convention Enterprises, Inc. (Convention Center Hotel First Tier), Series A, 5.00% due 1/1/2021 - 1/1/2027 | 3,680,000 | 3,722,864 |
| | Bexar County Hospital District (University Health System) GO, 5.00% due 2/15/2022 - 2/15/2027 | 7,355,000 | 8,490,743 |
| | Cities of Dallas and Fort Worth (DFW International Airport Terminal Renewal & Improvement Program), Series D, 5.25% due 11/1/2023 | 3,000,000 | 3,155,820 |
| | City of Austin (Water and Wastewater System), | | |
| | 5.00% due 11/15/2022 | 1,940,000 | 2,060,784 |
| | 5.00% due 11/15/2022 (pre-refunded 11/15/2021) | 700,000 | 742,875 |
| | City of Beaumont (Waterworks & Sewer System Improvements; Insured: AGM), Series A, 5.00% due 9/1/2023 - 9/1/2024 | 7,500,000 | 8,398,650 |
| | City of Beaumont GO, 5.00% due 3/1/2022 - 3/1/2026 | 3,930,000 | 4,507,854 |
| | City of Brownsville (Water, Wastewater & Electric Utilities Systems), | | |
| b | 5.00% due 9/1/2022 | 1,300,000 | 1,412,073 |
| | Series A, 5.00% due 9/1/2020 - 9/1/2023 | 5,400,000 | 5,838,573 |
| | City of Bryan (Electric System Improvements), 5.00% due 7/1/2026 | 535,000 | 646,858 |
| | City of Dallas (Public Improvements) GO, 5.00% due 2/15/2022 - 2/15/2025 | 5,500,000 | 6,169,500 |
| | City of Dallas (Trinity River Corridor Infrastructure) GO, | | |
| | 5.00% due 2/15/2021 - 2/15/2026 | 22,605,000 | 25,418,944 |
34 | Thornburg Municipal Funds Semi-Annual Report
| See notes to financial statements. |
Schedule of Investments, Continued
Thornburg Limited Term Municipal Fund | March 31, 2020 (Unaudited)
| | Issuer-Description | PRINCIPAL
AMOUNT | VALUE |
| | Series A, 5.00% due 2/15/2024 | $10,235,000 | $ 11,262,799 |
| | City of Dallas GO, 5.00% due 2/15/2022 - 2/15/2024 | 20,635,000 | 22,040,829 |
| | City of Houston (Combined Utility System), | | |
| | Series C, | | |
| a | 1.007% (LIBOR 1 Month + 0.37%) due 5/15/2034 (put 8/1/2021) | 23,525,000 | 23,471,833 |
| | 5.00% due 5/15/2022 - 5/15/2024 | 14,695,000 | 16,576,872 |
| | Series D, 5.00% due 11/15/2022 - 11/15/2024 | 17,535,000 | 19,822,765 |
| | City of Houston (Convention & Entertainment Facilities), 5.00% due 9/1/2020 - 9/1/2024 | 3,965,000 | 4,284,488 |
| | City of Houston (Convention & Entertainment Facilities; Insured: AGM/AMBAC), Series B, Zero Coupon due 9/1/2020 | 3,650,000 | 3,630,618 |
| | City of Houston (Convention & Entertainment), 5.00% due 9/1/2025 - 9/1/2029 | 6,415,000 | 7,729,356 |
| | City of Houston (Public Improvements) GO, Series A, 5.00% due 3/1/2021 - 3/1/2028 | 53,905,000 | 62,884,536 |
| | City of Laredo (Acquire & Purchase Personal Property) GO, 5.00% due 2/15/2021 - 2/15/2026 | 5,280,000 | 5,946,039 |
| | City of Laredo (City Infrastructure Improvements) GO, Series A, 5.00% due 2/15/2021 - 2/15/2027 | 2,875,000 | 3,352,162 |
| | City of Laredo (Sports Venues; Insured: AGM), 5.00% due 3/15/2021 - 3/15/2024 | 4,400,000 | 4,756,471 |
| | City of Lubbock (Waterworks System) GO, 5.00% due 2/15/2021 - 2/15/2025 | 37,425,000 | 41,851,757 |
| | City of McAllen (International Toll Bridge System; Insured: AGM), Series A, 5.00% due 3/1/2024 - 3/1/2027 | 3,015,000 | 3,514,274 |
| | City of Olmos Park Higher Education Facilities Corp. (University of the Incarnate Word), 5.00% due 12/1/2020 - 12/1/2021 | 4,620,000 | 4,772,621 |
| a | City of San Antonio, 1.75% due 2/1/2049 (put 12/1/2025) | 10,750,000 | 10,742,690 |
| | City of San Antonio (CPS Energy), 5.25% due 2/1/2024 | 7,000,000 | 8,034,600 |
| | City of San Antonio (San Antonio Water System), Series A, 5.00% due 5/15/2023 - 5/15/2026 | 3,700,000 | 4,287,000 |
| | City of San Antonio Public Facilities Corp. (Convention Center Refinancing & Expansion), 5.00% due 9/15/2022 | 1,450,000 | 1,578,760 |
| | City of Texas City Industrial Development Corp. (ARCO Pipe Line Co. Project), 7.375% due 10/1/2020 | 7,000,000 | 7,169,680 |
| | Clifton Higher Education Finance Corp. (IDEA Public Schools), 5.00% due 8/15/2023 | 1,100,000 | 1,159,983 |
| | Corpus Christi Business and Job Development Corp. (Seawall Project), 5.00% due 3/1/2021 | 625,000 | 646,750 |
| a | Cypress-Fairbanks Independent School District (Guaranty: PSF) ISD GO, Series B-1-REMK, 1.25% due 2/15/2036 (put 8/15/2022) | 3,500,000 | 3,497,900 |
| | Cypress-Fairbanks Independent School District (Guaranty: PSF-GTD) ISD GO, | | |
| a | Series A-2- REMK, 1.25% due 2/15/2036 (put 8/15/2022) | 5,500,000 | 5,496,700 |
| a | Series B-3- REMK, 1.25% due 2/15/2040 (put 8/15/2022) | 7,000,000 | 6,974,660 |
| | Dallas County Utility & Reclamation District GO, 5.00% due 2/15/2021 - 2/15/2027 | 15,435,000 | 17,649,291 |
| | Dallas Independent School District (Guaranty: PSF-GTD) ISD GO, | | |
| a | 5.00% due 2/15/2036 (pre-refunded 2/15/2022) | 1,635,000 | 1,752,638 |
| | 5.00% due 2/15/2036 (pre-refunded 2/15/2022) | 760,000 | 814,682 |
| a | 5.00% due 2/15/2036 (put 2/15/2022) | 1,580,000 | 1,677,913 |
| | Grayson County (State Highway Toll System) GO, 5.00% due 1/1/2022 | 3,000,000 | 3,202,410 |
| a | Gulf Coast (Exxon Mobil Corp.) IDA, 0.65% due 11/1/2041 (put 4/1/2020) | 1,675,000 | 1,675,000 |
| | Gulf Coast Waste Disposal Authority (Bayport Area Wastewater Treatment System; Insured: AGM), 5.00% due 10/1/2020 - 10/1/2025 | 5,485,000 | 5,961,835 |
| | Harris County (Flood Control), 5.00% due 10/1/2025 - 10/1/2027 | 14,305,000 | 17,776,723 |
| | Harris County (Tax Road) GO, Series A, 5.00% due 10/1/2025 - 10/1/2028 | 8,985,000 | 11,124,581 |
| | Harris County (Texas Permanent Improvement) GO, | | |
| | Series A, 5.00% due 10/1/2025 - 10/1/2027 | 11,565,000 | 14,288,331 |
| | Series B, 5.00% due 10/1/2020 | 500,000 | 509,720 |
| a,c | Harris County Cultural Education Facilities Finance Corp. (Memorial Hermann Health System), Series B-REM, 5.085% (MUNIPSA + 0.28%) due 6/1/2032 (put 4/1/2021) | 24,875,000 | 24,875,746 |
| | Harris County Cultural Education Facilities Finance Corp. (Memorial Hermann Health), Series A, 5.00% due 12/1/2022 - 12/1/2025 | 6,445,000 | 7,290,720 |
| | Harris County Cultural Education Facilities Finance Corp. (TECO Project), | | |
| | 5.00% due 11/15/2020 - 11/15/2027 | 4,675,000 | 5,419,183 |
| b | 5.00% due 11/15/2026 | 1,150,000 | 1,400,551 |
| | Harris County Cultural Education Facilities Finance Corp. (Texas Medical Center), Series A, 5.00% due 5/15/2020 - 5/15/2029 | 12,300,000 | 14,778,354 |
| | Harris County-Houston Sports Authority (Insured: AGM), Series A, 5.00% due 11/15/2022 - 11/15/2024 | 23,315,000 | 26,358,553 |
| | Hays County GO, 5.00% due 2/15/2022 - 2/15/2025 | 4,050,000 | 4,527,719 |
| | Houston Airport System Revenue, | | |
| | Series B, 5.00% due 7/1/2020 - 7/1/2028 | 10,380,000 | 12,068,999 |
| | Series D, 5.00% due 7/1/2027 | 3,355,000 | 4,023,450 |
| | Houston Higher Education Finance Corp. (Cosmos Foundation, Inc.) ETM, Series A, 5.875% due 5/15/2021 | 615,000 | 630,221 |
| | Houston Higher Education Finance Corp. (KIPP, Inc.; Guaranty: PSF-GTD), 5.00% due 8/15/2021 - 8/15/2022 | 1,485,000 | 1,600,200 |
| | Houston Independent School District (Guaranty: PSF) ISD GO, | | |
| a | 2.40% due 6/1/2030 (put 6/1/2021) | 4,000,000 | 4,045,040 |
| a | Series A-1B, 2.20% due 6/1/2039 (put 6/1/2020) | 12,765,000 | 12,781,084 |
| a | Houston Independent School District (Insured: PSF-GTD) GO, Series B-REM, 2.40% due 6/1/2036 (put 6/1/2021) | 1,725,000 | 1,744,424 |
| | Katy (Educational Facilities Improvements; Guaranty: PSF-GTD) ISD GO, Series A, 5.00% due 2/15/2023 - 2/15/2026 | 9,670,000 | 11,270,354 |
| | Keller (Guaranty: PSF-GTD) ISD GO, Series A, 5.00% due 8/15/2023 | 1,715,000 | 1,932,205 |
| | La Salle County (Insured: AGM) GO, 5.00% due 3/1/2022 - 3/1/2028 | 18,885,000 | 22,388,460 |
| | Laredo Community College District (School Facilities Improvements) GO, 5.00% due 8/1/2020 - 8/1/2024 | 3,340,000 | 3,587,007 |
See notes to financial statements.
| Thornburg Municipal Funds Semi-Annual Report | 35 |
Schedule of Investments, Continued
Thornburg Limited Term Municipal Fund | March 31, 2020 (Unaudited)
| | Issuer-Description | PRINCIPAL
AMOUNT | VALUE |
| | Lower Colorado River Authority, | | |
| | Series A, | | |
| | 5.00% due 5/15/2025 | $ 8,020,000 | $ 8,612,758 |
| | 5.00% due 5/15/2025 (pre-refunded 5/15/2022) | 55,000 | 59,360 |
| a | Lower Neches Valley Authority Industrial Development Corp. (Exxon Capital Ventures, Inc.; Guaranty: Exxon MobilCorp.), 0.70% due 11/1/2051 (put 4/1/2020) | 6,550,000 | 6,550,000 |
| | Metropolitan Transit Authority of Harris County, | | |
| | 5.00% due 11/1/2022 - 11/1/2028 | 18,750,000 | 22,589,232 |
| | Series D, 5.00% due 11/1/2020 - 11/1/2027 | 9,920,000 | 11,262,954 |
| b | New Caney (Guaranty: PSF-GTD) ISD GO, 5.00% due 2/15/2024 | 865,000 | 940,791 |
| | North Harris County Regional Water Authority (Regional Water Production Design, Acquisition and Construction), 5.00% due 12/15/2020 - 12/15/2026 | 6,490,000 | 7,440,670 |
| | North Texas Tollway Authority (North Texas Tollway System), Series A, 5.00% due 1/1/2026 - 1/1/2029 | 7,550,000 | 9,371,828 |
| a | Pflugerville Independent School District (Guaranty: PSF-GTD) ISD GO, Series A, 2.25% due 8/15/2037 (put 8/15/2022) | 2,750,000 | 2,801,975 |
| | Round Rock (Educational Facilities Improvements) ISD GO, 5.00% due 8/1/2026 - 8/1/2027 | 2,100,000 | 2,602,143 |
| | Round Rock (Educational Facilities Improvements; Guaranty: PSF-GTD) ISD GO, 5.00% due 8/1/2020 - 8/1/2029 | 9,065,000 | 10,512,094 |
| | Sam Rayburn Municipal Power Agency, 5.00% due 10/1/2020 - 10/1/2021 | 2,950,000 | 3,035,839 |
| | San Antonio Public Facilities Corp. (Convention Center Refinancing & Expansion), 5.00% due 9/15/2020 | 915,000 | 930,939 |
| | San Antonio Water System, Series A, 5.00% due 5/15/2020 - 5/15/2029 | 2,755,000 | 3,280,676 |
| | San Juan Higher Education Finance Authority (IDEA Public Schools), Series A, 5.125% due 8/15/2020 | 300,000 | 304,188 |
| | Tarrant Regional Water District, Series A, 5.00% due 3/1/2021 - 3/1/2027 | 8,850,000 | 10,250,083 |
| | Texas State University System, Series A, 5.00% due 3/15/2028 - 3/15/2030 | 13,090,000 | 16,680,461 |
| | Texas Transportation Commission (Central Texas Turnpike System), Series C, 5.00% due 8/15/2022 - 8/15/2024 | 2,130,000 | 2,276,737 |
| | Texas Transportation Commission (Highway Improvements) GO, 5.00% due 4/1/2020 - 4/1/2024 | 13,330,000 | 14,558,536 |
| | Texas Transportation Commission State Highway Fund, Series A, 5.00% due 4/1/2024 | 1,650,000 | 1,890,818 |
| | Walnut Creek Special Utility District (Water System Improvements; Insured: BAM), | | |
| | 4.00% due 1/10/2021 | 445,000 | 453,918 |
| | 5.00% due 1/10/2022 - 1/10/2024 | 1,275,000 | 1,399,989 |
| | Utah — 1.0% | | |
| | City of Murray (IHC Health Services, Inc. Obligated Group), | | |
| a | Series B, 0.75% due 5/15/2037 (put 4/1/2020) | 2,350,000 | 2,350,000 |
| a | Series C, 0.70% due 5/15/2036 (put 4/1/2020) | 1,750,000 | 1,750,000 |
| a | County of Utah (IHC Health Services, Inc. Obligated Group), Series B-1, 5.00% due 5/15/2056 (put 8/1/2022) | 7,500,000 | 7,993,875 |
| | Utah State Board of Regents (Insured; Natl-Re), Series A, 5.50% due 4/1/2029 | 30,365,000 | 38,764,263 |
| | Utah Transit Authority (Integrated Mass Transit System), Series A-SUB, 5.00% due 6/15/2022 - 6/15/2025 | 3,545,000 | 4,045,273 |
| | Vermont — 0.3% | | |
| | Vermont (Vermont Public Service Corp.) EDA, 5.00% due 12/15/2020 | 14,250,000 | 14,547,398 |
| | Virginia — 0.4% | | |
| | Fairfax County (Inova Health System) IDA, | | |
| | 4.00% due 5/15/2022 | 5,500,000 | 5,827,745 |
| | 5.00% due 5/15/2022 | 5,000,000 | 5,402,350 |
| | Fairfax County (State Aid Withholding) GO, Series A, 4.50% due 10/1/2027 | 4,975,000 | 6,113,380 |
| | Virginia Commonwealth Transportation Board, 5.00% due 9/15/2028 | 3,945,000 | 4,915,943 |
| | Washington — 2.8% | | |
| | Clark County School District No 37 Vancouver (State Aid Withholding) GO, 5.00% due 12/1/2026 - 12/1/2029 | 5,150,000 | 6,633,992 |
| | Energy Northwest (Nine Canyon Wind Project Phase I-III), 5.00% due 7/1/2020 - 7/1/2025 | 6,850,000 | 7,294,996 |
| | Marysville School District No. 25 (Snohomish County Educational Facilities) (State Aid Withholding) GO, 5.00% due 12/1/2020 - 12/1/2023 | 7,695,000 | 8,303,663 |
| | Skagit County Public Hospital District No. 1 (Skagit Regional Health), Series A, 5.00% due 12/1/2021 - 12/1/2023 | 2,410,000 | 2,589,557 |
| | Skagit County Public Hospital District No. 1 (Skagit Regional Health) GO, 5.00% due 12/1/2020 - 12/1/2022 | 8,340,000 | 8,916,675 |
| | Skagit County Public Hospital District No. 2 (Island Hospital) GO, | | |
| | 4.00% due 12/1/2020 - 12/1/2021 | 2,000,000 | 2,062,500 |
| | 5.00% due 12/1/2022 | 1,700,000 | 1,860,514 |
| | State of Washington (Capital Projects) GO, Series R-G-Ref, 5.00% due 7/1/2025 | 10,475,000 | 12,267,377 |
| | State of Washington (State and Local Agency Real and Personal Property Projects) (Insured: State Intercept) COP, 5.00% due 7/1/2020 - 7/1/2022 | 9,415,000 | 9,825,153 |
| | State of Washington (State and Local Agency Real and Personal Property Projects) COP, Series A, 5.00% due 7/1/2024 - 7/1/2027 | 17,775,000 | 21,009,543 |
| | State of Washington (Various Purposes) GO, Series C, 5.00% due 2/1/2025 - 2/1/2029 | 50,385,000 | 62,324,528 |
| d | State of Washington GO, 5.00% due 6/1/2025 - 6/1/2030 | 4,900,000 | 5,915,474 |
| | Tacoma School District No.10 (Pierce County Capital Projects) (State Aid Withholding) GO, 5.00% due 12/1/2020 | 2,500,000 | 2,564,625 |
| | Washington Health Care Facilities Authority (Overlake Hospital Medical Center) ETM, 4.75% due 7/1/2020 | 1,000,000 | 1,008,790 |
| | West Virginia — 0.5% | | |
| | Mason County (Appalachian Power Co.), Series L, 2.75% due 10/1/2022 | 15,000,000 | 15,364,650 |
| a | West Virginia (Appalachian Power Co.) EDA, Series B, 2.625% due 12/1/2042 (put 6/1/2022) | 6,000,000 | 6,041,160 |
36 | Thornburg Municipal Funds Semi-Annual Report
| See notes to financial statements. |
Schedule of Investments, Continued
Thornburg Limited Term Municipal Fund | March 31, 2020 (Unaudited)
| | Issuer-Description | PRINCIPAL
AMOUNT | VALUE |
| a | West Virginia Economic Development Authority, (Appalachian Power Co.), Series A, 2.625% due 12/1/2042 (put 6/1/2022) | $ 4,500,000 | $ 4,530,870 |
| | West Virginia Higher Education Policy Commission (Higher Education Facilities), Series A, 5.00% due 4/1/2020 - 4/1/2022 | 3,500,000 | 3,647,535 |
| | Wisconsin — 1.5% | | |
| | Wisconsin Health & Educational Facilities Authority (Advocate Aurora Health Obligated Group), | | |
| a | 5.00% due 8/15/2054 (put 1/25/2023) | 10,485,000 | 11,414,600 |
| a | 5.00% due 8/15/2054 (put 1/26/2022) | 9,520,000 | 10,162,695 |
| a | 5.00% due 8/15/2054 (put 1/29/2025) | 16,065,000 | 18,409,526 |
| | Wisconsin Health & Educational Facilities Authority (Agnesian Healthcare, Inc.) ETM, 5.00% due 7/1/2020 | 2,110,000 | 2,129,517 |
| | Wisconsin Health & Educational Facilities Authority (Ascension Health Alliance System), | | |
| | 5.00% due 11/15/2025 - 11/15/2026 | 3,235,000 | 3,811,778 |
| a | Series B-4, 5.00% due 11/15/2043 (put 6/1/2021) | 13,245,000 | 13,688,575 |
| | Wisconsin Health & Educational Facilities Authority (Marquette University), 5.00% due 10/1/2023 - 10/1/2026 | 1,575,000 | 1,812,263 |
| | Wisconsin Health & Educational Facilities Authority (ProHealth Care, Inc.), 5.00% due 8/15/2020 - 8/15/2022 | 5,250,000 | 5,476,043 |
| | Wisconsin Health & Educational Facilities Authority (UnityPoint Health), Series A, 5.00% due 12/1/2022 | 1,000,000 | 1,096,620 |
| | Wisconsin Housing & Economic Development Authority (Collateralized: FNMA), | | |
| | Series C, | | |
| | 1.65% due 9/1/2026 | 1,615,000 | 1,585,995 |
| | 1.70% due 3/1/2027 | 1,605,000 | 1,580,460 |
| | 1.75% due 9/1/2027 | 1,645,000 | 1,616,180 |
| | 1.80% due 3/1/2028 | 1,660,000 | 1,627,016 |
| | 1.85% due 9/1/2028 | 1,680,000 | 1,648,332 |
| | 1.95% due 3/1/2029 | 1,695,000 | 1,671,914 |
| | WPPI Energy, Series A, 5.00% due 7/1/2022 - 7/1/2028 | 1,835,000 | 2,125,443 |
| | WPPI Energy (Power Supply System), Series A, 5.00% due 7/1/2021 | 4,100,000 | 4,277,612 |
| | Wyoming — 0.0% | | |
| a | Uinta County (Chevron Corp.; Guaranty: Chevron Corp.), 0.65% due 8/15/2020 (put 4/1/2020) | 950,000 | 950,000 |
| | Total Investments — 98.9%(Cost $5,343,909,092) | | $5,476,516,048 |
| | Other Assets Less Liabilities — 1.1% | | 60,073,290 |
| | Net Assets — 100.0% | | $5,536,589,338 |
| Footnote Legend |
| a | Variable, floating, step, or fixed to floating rate securities are securities for which interest rate changes are based on changes in a designated base rate or on a predetermined schedule. The rates shown are those in effect on March 31, 2020. |
| b | Segregated as collateral for a when-issued security. |
| c | Securities exempt from registration under Rule 144A of the Securities Act of 1933, as amended. These securities are restricted but liquid and may only be resold in the ordinary course of business in transactions exempt from registration, normally to qualified institutional buyers. As of March 31, 2020, the aggregate value of these securities in the Fund’s portfolio was $24,875,746, representing 0.45% of the Fund’s net assets. |
| d | When-issued security. |
See notes to financial statements.
| Thornburg Municipal Funds Semi-Annual Report | 37 |
Schedule of Investments, Continued
Thornburg Limited Term Municipal Fund | March 31, 2020 (Unaudited)
Portfolio Abbreviations
To simplify the listings of securities, abbreviations are used per the table below:
| AGC | Insured by Assured Guaranty Corp. |
| AGM | Insured by Assured Guaranty Municipal Corp. |
| AMBAC | Insured by American Municipal Bond Assurance Corp. |
| BAM | Insured by Build America Mutual Insurance Co. |
| BHAC-CR | Berkshire Hathaway Assurance Corp. Custodial Receipts |
| COP | Certificates of Participation |
| DFA | Development Finance Authority |
| EDA | Economic Development Authority |
| ETM | Escrowed to Maturity |
| FGIC | Insured by Financial Guaranty Insurance Co. |
| FHLMC | Insured by Federal Home Loan Mortgage Corp. |
| FNMA | Collateralized by Federal National Mortgage Association |
| GNMA | Collateralized by Government National Mortgage Association |
| GO | General Obligation |
| GRT | Gross Receipts Tax |
| HFA | Health Facilities Authority |
| HFFA | Health Facilities Financing Authority |
| IDA | Industrial Development Authority |
| ISD | Independent School District |
| LIBOR | London Interbank Offered Rates |
| LOC | Letter of Credit |
| Mtg | Mortgage |
| MUNIPSA | Securities Industry and Financial Markets Association (SIFMA) Municipal Swap Index |
| Natl-Re | Insured by National Public Finance Guarantee Corp. |
| PSF | Guaranteed by Permanent School Fund |
| Q-SBLF | Insured by Qualified School Bond Loan Fund |
| SPA | Stand-by Purchase Agreement |
| Syncora | Insured by Syncora Guarantee Inc. |
| USD | Unified School District |
38 | Thornburg Municipal Funds Semi-Annual Report
| See notes to financial statements. |
Schedule of Investments
Thornburg California Limited Term Municipal Fund | March 31, 2020 (Unaudited)
| Issuer-Description | PRINCIPAL
AMOUNT | VALUE |
| | MUNICIPAL BONDS — 95.5% | | |
| | Alameda County Joint Powers Authority (Alameda County Medical Center Highland Hospital), Series A, 5.00% due 12/1/2020 - 12/1/2024 | $ 3,225,000 | $ 3,591,961 |
| | Alameda County Joint Powers Authority (Juvenile Justice), 5.00% due 12/1/2021 | 500,000 | 532,400 |
| | Alameda County Joint Powers Authority (Public Facilities Capital Projects), 5.00% due 12/1/2021 | 1,000,000 | 1,064,800 |
| | Anaheim Public Financing Authority (Public Improvements; Insured: AGM), Series C, Zero Coupon due 9/1/2022 | 3,000,000 | 2,911,290 |
| | Bay Area Toll Authority (San Francisco Bay Area Toll Bridge), | | |
| a | Series A, 2.95% due 4/1/2047 (put 4/1/2026) | 4,775,000 | 5,163,494 |
| a | Series G, 2.00% due 4/1/2053 (put 4/1/2024) | 1,500,000 | 1,524,525 |
| | Bonita (Educational Facilities) USD GO, 5.00% due 8/1/2024 | 1,000,000 | 1,082,150 |
| | Brentwood Infrastructure Financing Authority (Residential Single Family Development; Insured: AGM), Series A, 5.00% due 9/2/2020 - 9/2/2023 | 6,220,000 | 6,725,130 |
| a | California (Adventist Health System/West Obligated Group; LOC U.S. Bank N.A.) HFFA, Series B-2-RMKT, 0.80% due 9/1/2028 (put 4/1/2020) | 670,000 | 670,000 |
| | California (Children’s Hospital Los Angeles Obligated Group) HFFA, Series A, 5.00% due 8/15/2030 | 1,990,000 | 2,406,308 |
| | California (Children’s Hospital Los Angeles) HFFA, Series A, 5.00% due 11/15/2020 - 11/15/2023 | 3,025,000 | 3,211,761 |
| | California (Children’s Hospital of Orange County Obligated Group) HFFA, | | |
| | 4.00% due 11/1/2020 | 750,000 | 762,720 |
| | 5.00% due 11/1/2021 - 11/1/2028 | 4,295,000 | 5,101,528 |
| | California (Dignity Health) HFFA, | | |
| | Series A, | | |
| | 5.00% due 3/1/2021 | 1,675,000 | 1,706,909 |
| | 5.25% due 3/1/2022 | 1,000,000 | 1,021,020 |
| | California (Kaiser Permanente) HFFA, Series A-1, 5.00% due 11/1/2027 | 3,000,000 | 3,742,050 |
| a | California (Providence St. Joseph Health Obligated Group) HFFA, 5.00% due 10/1/2039 (put 10/1/2027) | 3,000,000 | 3,536,400 |
| | California (St. Joseph Health System) HFFA, | | |
| | Series A, 5.00% due 7/1/2024 | 1,000,000 | 1,120,250 |
| a | Series D, 5.00% due 7/1/2043 (put 10/15/2020) | 5,575,000 | 5,682,988 |
| | California Educational Facilities Authority (Chapman University), 5.00% due 4/1/2022 | 2,000,000 | 2,063,160 |
| | California Educational Facilities Authority (Pitzer College) ETM, 5.00% due 4/1/2020 | 1,445,000 | 1,445,000 |
| | California Infrastructure and Economic Development Bank (California Academy of Sciences), | | |
| a | Series C, 1.043% (LIBOR 1 Month + 0.38%) due 8/1/2047 (put 8/1/2021) | 4,985,000 | 4,988,838 |
| a | Series D, 1.043% (LIBOR 1 Month + 0.38%) due 8/1/2047 (put 8/1/2021) | 6,000,000 | 6,004,620 |
| a | California Infrastructure and Economic Development Bank (J Paul Getty Trust), Series B1, 1.31% (LIBOR 1 Month + 0.20%) due 10/1/2047 (put 4/1/2021) | 1,000,000 | 995,310 |
| | California Infrastructure and Economic Development Bank (King City High School), 5.25% due 8/15/2020 | 515,000 | 515,834 |
| a | California Infrastructure and Economic Development Bank (Los Angeles County Museum of Art), Series A, 1.321% (LIBOR 1 Month + 0.65%) due 12/1/2050 (put 2/1/2021) | 6,250,000 | 6,258,937 |
| | California Infrastructure and Economic Development Bank (The Scripps Research Institute), 5.00% due 7/1/2020 - 7/1/2027 | 1,050,000 | 1,193,750 |
| | California Municipal Finance Authority (Biola University Residential Hall and Parking Structure), 5.00% due 10/1/2021 - 10/1/2023 | 555,000 | 588,768 |
| | California Municipal Finance Authority (Biola University), 5.00% due 10/1/2020 - 10/1/2027 | 3,215,000 | 3,486,475 |
| | California Municipal Finance Authority (Biola University, Inc.), 5.00% due 10/1/2030 | 1,000,000 | 1,115,920 |
| a | California Municipal Finance Authority (Chevron USA, Inc.; Guaranty: Chevron Corp.), 0.50% due 11/1/2035 (put 4/1/2020) | 700,000 | 700,000 |
| | California Municipal Finance Authority (CHF-DAVIS I, LLC-WEST VILLAGE; Insured: BAM), 5.00% due 5/15/2028 | 2,905,000 | 3,277,944 |
| a,b | California Pollution Control Financing Authority (Republic Services, Inc.) AMT, 1.17% due 11/1/2042 (put 4/15/2020) | 4,000,000 | 3,999,720 |
| a | California Pollution Control Financing Authority AMT, Series A-REMK, 2.50% due 7/1/2031 (put 5/1/2024) | 1,125,000 | 1,122,817 |
| | California State Public Works Board (California School for the Deaf Riverside Campus), Series H, 5.00% due 4/1/2022 | 565,000 | 607,703 |
| | California State Public Works Board (Correctional and Rehabilitation Facilities), | | |
| | Series A, 5.00% due 9/1/2022 - 9/1/2024 | 13,780,000 | 15,348,703 |
| | Series G, 5.00% due 11/1/2022 | 1,500,000 | 1,645,035 |
| | California State Public Works Board (Judicial Council Projects), | | |
| | Series A, 5.00% due 3/1/2023 - 3/1/2024 | 2,400,000 | 2,659,080 |
| | Series D, 5.00% due 12/1/2021 - 12/1/2022 | 4,300,000 | 4,575,984 |
| | California State Public Works Board (Laboratory Facility and San Diego Courthouse), Series I, 5.00% due 11/1/2023 - 11/1/2024 | 7,000,000 | 7,923,240 |
| | California State Public Works Board (University of California; Insured: Natl-Re) ETM, Series A, 5.00% due 6/1/2020 | 1,185,000 | 1,192,857 |
| | California State Public Works Board (Yuba City Courthouse), Series D, 5.00% due 6/1/2022 | 1,950,000 | 2,109,217 |
| | California Statewide Communities Development Authority (CHF-Irvine, LLC), Series A, 5.00% due 5/15/2027 | 500,000 | 582,650 |
| | California Statewide Communities Development Authority (Cottage Health System), 5.00% due 11/1/2025 (pre-refunded 11/1/2024) | 135,000 | 157,337 |
| | California Statewide Communities Development Authority (Cottage Health System) ETM, | | |
| | 4.00% due 11/1/2021 | 150,000 | 156,917 |
| | 5.00% due 11/1/2020 - 11/1/2024 | 575,000 | 642,534 |
| | California Statewide Communities Development Authority (Irvine East Campus Apartments), 5.00% due 5/15/2021 - 5/15/2027 | 2,760,000 | 3,024,298 |
| a | California Statewide Communities Development Authority (Kaiser Foundation Hospitals), Series 2003-D-REMK, 5.00% due 5/1/2033 (put 11/1/2029) | 3,500,000 | 4,546,010 |
| | California Statewide Communities Development Authority (Methodist Hospital of Southern California Obligated Group), 5.00% due 1/1/2021 - 1/1/2024 | 1,455,000 | 1,553,608 |
| a | California Statewide Communities Development Authority (Southern California Edison Company), 2.625% due 11/1/2033 (put 12/1/2023) | 4,895,000 | 5,011,256 |
| | California Statewide Communities Development Authority (Sutter Health Obligated Group), Series A, 5.00% due 8/15/2024 | 535,000 | 578,490 |
See notes to financial statements.
| Thornburg Municipal Funds Semi-Annual Report | 39 |
Schedule of Investments, Continued
Thornburg California Limited Term Municipal Fund | March 31, 2020 (Unaudited)
| Issuer-Description | PRINCIPAL
AMOUNT | VALUE |
| | Calipatria (Educational Facilities; Insured: ACA) USD GO, Series B, Zero Coupon due 8/1/2025 | $ 4,015,000 | $ 3,261,786 |
| | Carson Redevelopment Successor Agency (Redevelopment Project Area No 1; Insured: AGM), Series A, 5.00% due 10/1/2026 | 500,000 | 576,830 |
| | CDC Successor Agency of the City of Santee (Redevelopment and Low and Moderate Income Housing; Insured: BAM), Series A, 5.00% due 8/1/2025 | 550,000 | 656,937 |
| | Central Valley Financing Authority (Carson Ice) ETM, 5.25% due 7/1/2020 | 500,000 | 505,250 |
| | City and County of San Francisco (525 Golden Gate Avenue-Public Utilities Commission Office Project) COP, Series C, 5.00% due 11/1/2022 | 700,000 | 702,205 |
| | City of Antioch Public Financing Authority (Municipal Facilities Project), 5.00% due 5/1/2022 - 5/1/2024 | 1,400,000 | 1,577,886 |
| | City of Burbank (Burbank Water and Power System), Series A, 5.00% due 6/1/2020 | 625,000 | 629,013 |
| | City of Chula Vista (Police Facility Project) COP, 5.00% due 10/1/2024 | 1,700,000 | 1,985,430 |
| | City of Chula Vista Financing Authority (Infrastructure, Facilities and Equipment), 5.00% due 5/1/2026 - 5/1/2027 | 3,500,000 | 4,308,160 |
| | City of Clovis (Water System Facilities; Insured: BAM), 5.00% due 3/1/2021 - 3/1/2023 | 2,270,000 | 2,453,514 |
| | City of Delano (Central California Foundation for Health) COP, 5.00% due 1/1/2024 (pre-refunded 1/1/2023) | 270,000 | 298,026 |
| a,b | City of Irvine Reassessment District No 05-21(Public Improvments; LOC U.S. Bank N.A.), Series A, 0.80% due 9/2/2050 (put 4/1/2020) | 900,000 | 900,000 |
| a | City of Livermore (Variable-COPS-REF-Performing A; LOC U.S. Bank N.A.) COP, 0.80% due 10/1/2041 (put 4/1/2020) | 2,250,000 | 2,250,000 |
| | City of Los Angeles (JUDGMENT OBLIG-A), 5.00% due 6/1/2020 | 2,000,000 | 2,010,000 |
| | City of Manteca (Water Supply System), 5.00% due 7/1/2021 - 7/1/2023 | 1,650,000 | 1,751,932 |
| | City of Norco CA, 5.00% due 9/1/2025 | 1,000,000 | 1,172,010 |
| | City of San Jose Financing Authority (Civic Center Project), | | |
| | Series A, | | |
| | 4.00% due 6/1/2021 | 1,000,000 | 1,033,910 |
| | 5.00% due 6/1/2020 - 6/1/2024 | 3,095,000 | 3,369,803 |
| | City of Torrance (Torrance Memorial Medical Center), Series A, 5.00% due 9/1/2020 | 1,155,000 | 1,173,249 |
| | Compton (Insured: BAM) USD GO, Series B, 5.00% due 6/1/2028 - 6/1/2029 | 1,625,000 | 1,996,947 |
| a | Contra Costa Transportation Authority, Series A, 1.36% (LIBOR 1 Month + 0.25%) due 3/1/2034 (put 9/1/2021) | 7,500,000 | 7,492,200 |
| | County of Los Angeles Redevelopment Refunding Authority (Bunker Hill Project), Series C, 5.00% due 6/1/2020 - 6/1/2024 | 3,500,000 | 3,787,450 |
| | Desert Sands (Educational Facilities; Insured: BAM) USD COP, 5.00% due 3/1/2021 | 1,080,000 | 1,118,588 |
| | Dinuba (CAP APPREC; Insured AGM) USD GO, Zero Coupon due 8/1/2030 | 460,000 | 367,407 |
| | Downey Public Financing Authority (Public Capital Improvements), 5.00% due 12/1/2025 - 12/1/2027 | 1,445,000 | 1,788,022 |
| | Eden Township Healthcare District (Eden Hospital Health Services Corp.) COP, 6.125% due 6/1/2034 (pre-refunded 6/1/2020) | 1,500,000 | 1,511,940 |
| | Elk Grove Finance Authority (Poppy Ridge CFD No. 2003-1 and East Franklin CFD No. 2002-1), | | |
| | 4.00% due 9/1/2020 | 575,000 | 581,595 |
| | 5.00% due 9/1/2021 - 9/1/2025 | 1,200,000 | 1,367,832 |
| | Emeryville Redevelopment Agency (Emeryville and Shellmound Park Projects; Insured: AGM), Series A, 5.00% due 9/1/2022 - 9/1/2024 | 9,095,000 | 10,307,076 |
| | Fresno County (Educational Facilities; Insured: Natl-Re) USD GO, Series C, 5.90% due 8/1/2020 | 720,000 | 731,455 |
| | Grossmont Healthcare District (REF-SER D) GO, Series D, 5.00% due 7/15/2022 | 960,000 | 1,024,406 |
| | Guam Power Authority (Electric Power System), Series A, 5.00% due 10/1/2027 | 1,230,000 | 1,286,420 |
| | Guam Power Authority (Electric Power System; Insured: AGM), Series A, 5.00% due 10/1/2021 | 1,275,000 | 1,293,806 |
| | Guam Waterworks Authority (Water and Wastewater System), 5.00% due 7/1/2021 - 7/1/2027 | 2,735,000 | 2,826,651 |
| | Hacienda La Puente (Educational Facilities; Insured: AGM) USD COP, 5.00% due 6/1/2020 - 6/1/2025 | 3,495,000 | 3,896,370 |
| | Imperial Irrigation District Electric System Revenue, Series C, 5.00% due 11/1/2024 (pre-refunded 11/1/2020) | 500,000 | 511,750 |
| a | Irvine Ranch Water District (Variable-IMPT Dists-Cons; LOC U.S. Bank N.A.), Series A, 0.80% due 10/1/2041 (put 4/1/2020) | 9,845,000 | 9,845,000 |
| | Jurupa Public Financing Authority (Community Services District-Eastvale Area; Insured: AGM), Series A, 4.50% due 9/1/2020 | 945,000 | 957,984 |
| | La Quinta Redevelopment Agency (Redevelopment Project Areas No. 1 and 2), Series A, 5.00% due 9/1/2021 - 9/1/2023 | 4,500,000 | 4,933,545 |
| | Lodi Public Financing Authority (City Police Building and Jail), 5.00% due 10/1/2020 - 10/1/2023 | 4,145,000 | 4,377,300 |
| | Los Altos Elementary School District (REF) GO, 5.00% due 8/1/2020 | 5,465,000 | 5,535,007 |
| | Los Angeles (Educational Facilities and Information Technology Infrastructure) USD GO, | | |
| | Series B, 5.00% due 7/1/2023 | 3,000,000 | 3,343,200 |
| | Series D, 5.00% due 7/1/2022 - 7/1/2024 | 5,750,000 | 6,400,227 |
| | Los Angeles (Insured: BAM) USD GO, Series B-1, 5.00% due 7/1/2029 | 2,500,000 | 3,045,325 |
| | Los Angeles County, 5.00% due 6/25/2020 | 10,000,000 | 10,087,600 |
| | Los Angeles County Schools Regionalized Business Services Corp. (Insured: AMBAC) COP, Series A, Zero Coupon due 8/1/2021 | 2,135,000 | 2,087,987 |
| | Los Angeles County Schools USD, Series A-2, 3.00% due 6/1/2020 | 7,000,000 | 7,020,580 |
| | Los Angeles Department of Airports AMT, | | |
| | Series A, 5.00% due 5/15/2029 | 4,000,000 | 4,643,560 |
| | Series B, 5.00% due 5/15/2025 - 5/15/2026 | 10,220,000 | 11,943,411 |
| | Los Angeles Department of Water, Series A, 5.00% due 7/1/2027 | 1,565,000 | 1,963,073 |
| | Los Angeles Department of Water and Power (Power System Capital Improvements), Series A, 5.00% due 7/1/2025 - 7/1/2026 | 800,000 | 958,472 |
| a | Los Angeles Department of Water and Power (Power System Revenue; SPA Barclays Bank), Series B-3-REMK, 0.50% due 7/1/2034 (put 4/1/2020) | 4,400,000 | 4,400,000 |
| | Los Angeles USD GO, Series A, 5.00% due 7/1/2024 | 4,600,000 | 5,257,616 |
| | Lynwood (Insured: AGM) USD GO, 5.00% due 8/1/2023 | 1,000,000 | 1,115,490 |
| | Manteca Community Facilities District No. 1989-2 (Educational Facilities; Insured: AGM) USD, Series F, 5.00% due 9/1/2020 - 9/1/2023 | 2,675,000 | 2,795,398 |
| | Mark West Union School District (Educational Facilities; Insured: Natl-Re) GO, 4.125% due 8/1/2020 | 670,000 | 671,642 |
| a | Metropolitan Water District Southern California Waterworks Revenue, Series B-3, 0.65% due 7/1/2035 (put 4/1/2020) | 9,300,000 | 9,300,000 |
| | Milpitas Redevelopment Agency (Redevelopment Project Area No. 1), 5.00% due 9/1/2025 | 2,300,000 | 2,758,919 |
40 | Thornburg Municipal Funds Semi-Annual Report
| See notes to financial statements. |
Schedule of Investments, Continued
Thornburg California Limited Term Municipal Fund | March 31, 2020 (Unaudited)
| Issuer-Description | PRINCIPAL
AMOUNT | VALUE |
| | Modesto Irrigation District (San Joaquin Valley Electric System), Series A, 5.00% due 7/1/2022 | $ 1,000,000 | $ 1,086,300 |
| | Moreno Valley Public Financing Authority (Public Improvements), 5.00% due 11/1/2024 | 1,455,000 | 1,700,720 |
| | Murrieta Valley Public Financing Authority (Educational Facilities; Insured: BAM) USD GO, 5.00% due 9/1/2023 | 1,080,000 | 1,207,742 |
| | North City West School Facilities Financing Authority (Carmel Valley; Insured: AGM), Series A, 5.00% due 9/1/2021 - 9/1/2022 | 4,415,000 | 4,722,712 |
| a | Northern California Energy Authority (Commodity Supply Revenue), Series A, 4.00% due 7/1/2049 (put 7/1/2024) | 5,000,000 | 5,186,150 |
| | Oakland (County of Alameda Educational Facilities) USD GO, Series A, 5.00% due 8/1/2022 - 8/1/2025 | 2,745,000 | 3,105,532 |
| | Palomar Pomerado Health (Insured: Natl-Re) GO, Series A, Zero Coupon due 8/1/2021 | 2,850,000 | 2,795,365 |
| | Pittsburg Successor Agency Redevelopment Agency (Insured: AGM), Series A, 5.00% due 9/1/2021 | 1,000,000 | 1,053,400 |
| | Pomona Public Financing Authority (Facilities Improvements), Series BC, 3.00% due 6/1/2020 | 250,000 | 250,755 |
| | Pomona Public Financing Authority (Facilities Improvements; Insured: AGM), Series BC, 4.00% due 6/1/2024 - 6/1/2026 | 725,000 | 819,534 |
| | Rancho Santa Fe Community Services District Financing Authority, Series A, 5.00% due 9/1/2025 | 1,745,000 | 2,089,131 |
| | Redevelopment Agency of the City and County of San Francisco (Yerba Buena Center Redevelopment Project Area; Insured: AGM), 5.00% due 6/1/2020 | 1,730,000 | 1,740,812 |
| | Redevelopment Agency of the City of Rialto (Merged Project Area; Insured: BAM), Series A, 5.00% due 9/1/2023 - 9/1/2024 | 1,050,000 | 1,203,425 |
| a | Regents of the University of California Medical Center Pooled Revenue (VAR-REF-Series B-1-REMK 8/17/16), 0.60% due 5/15/2032 (put 4/1/2020) | 850,000 | 850,000 |
| a | Regents of the University of California Medical Center Pooled Revenue (VAR-REF-Series B-2-REMK 8/17/16), 0.50% due 5/15/2032 (put 4/1/2020) | 500,000 | 500,000 |
| | Ridgecrest Redevelopment Agency (Redevelopment Project) ETM, 5.50% due 6/30/2020 | 1,040,000 | 1,051,430 |
| | Riverside County Infrastructure Financing Authority (Capital Improvement Projects), Series A, 5.00% due 11/1/2020 - 11/1/2021 | 1,205,000 | 1,251,815 |
| | Riverside County Public Financing Authority, 4.00% due 5/1/2021 | 295,000 | 304,163 |
| | Riverside County Public Financing Authority (Capital Facilities Project), | | |
| | 4.00% due 11/1/2020 | 465,000 | 472,886 |
| | 5.00% due 11/1/2021 - 11/1/2025 | 2,000,000 | 2,258,940 |
| | Riverside Financing Authority (Educational Facilities; Insured: BAM) USD, 5.00% due 9/1/2022 - 9/1/2025 | 1,245,000 | 1,424,151 |
| | Sacramento City (Educational Facilities Improvements) USD GO, 5.00% due 7/1/2021 | 3,600,000 | 3,762,360 |
| | Sacramento City (Educational Facilities Improvements; Insured: AGM) USD GO, 5.00% due 7/1/2020 - 7/1/2022 | 1,600,000 | 1,679,269 |
| | Sacramento City Schools Joint Power Financing Authority (Sacramento City USD Educational Facility Sublease; Insured: BAM), Series A, 5.00% due 3/1/2021 - 3/1/2025 | 5,360,000 | 5,923,590 |
| | Salinas Valley Solid Waste Authority AMT (Insured: AGM), Series A, 5.00% due 8/1/2023 | 1,530,000 | 1,712,544 |
| | San Diego (Educational System Capital Projects) USD GO, Series R-3, 5.00% due 7/1/2023 - 7/1/2024 | 8,000,000 | 8,964,640 |
| | San Diego (Educational System Capital Projects; Insured: Natl-Re) USD GO, Series D-1, 5.50% due 7/1/2020 | 1,390,000 | 1,405,443 |
| | San Diego County Regional Airport Authority, Series A, 5.00% due 7/1/2030 | 330,000 | 419,783 |
| | San Francisco City and County Airports Commission (San Francisco International Airport), REF-Series A, 5.00% due 5/1/2026 | 5,000,000 | 6,017,500 |
| | San Francisco City and County Airports Commission (San Francisco International Airport) AMT, | | |
| | REF-Series 2018A, 5.00% due 5/1/2020 | 1,000,000 | 1,002,630 |
| | REF-Series H, 5.00% due 5/1/2028 | 6,500,000 | 7,781,865 |
| | San Jose, Series A-1, 3.50% due 10/1/2021 | 75,000 | 75,950 |
| | San Mateo County Joint Powers Financing Authority (Maple Street Correctional Center), 5.00% due 6/15/2021 - 6/15/2023 | 1,995,000 | 2,169,831 |
| | Santa Ana Public Facilities Corp. (Insured: Natl-Re) USD GO, Series B, Zero Coupon due 8/1/2020 | 2,035,000 | 2,025,965 |
| | Santa Clara County Financing Authority (Multiple Facilities Projects), Series P, 5.00% due 5/15/2025 | 6,755,000 | 8,016,902 |
| | Santa Margarita Water District (Talega Community Facilities), Series A, 5.00% due 9/1/2026 - 9/1/2027 | 1,050,000 | 1,313,237 |
| | Semitropic Water Storage Improvement District (Irrigation Water System; Insured: AGM), Series A, 5.00% due 12/1/2022 - 12/1/2027 | 3,535,000 | 4,177,541 |
| | South Bay/San Diego County USD GO, Zero Coupon due 8/1/2022 | 2,250,000 | 2,174,287 |
| a | Southern California Public Power Authority (Magnolia Power Project A), Series 1, 2.00% due 7/1/2036 (put 7/1/2020) | 5,000,000 | 5,003,750 |
| a | Southern California Public Power Authority (VAR-REF-Magnolia Power Project; LOC U.S. Bank N.A.), Series A1, 0.80% due 7/1/2036 (put 4/1/2020) | 300,000 | 300,000 |
| | Southwestern Community College District GO, Series B, 4.00% due 8/1/2024 - 8/1/2026 | 1,125,000 | 1,275,779 |
| a | State of California (Kindergarten-B1-RMKT-11/13; LOC State Street B&T Co.) GO, 0.50% due 5/1/2034 (put 4/1/2020) | 1,000,000 | 1,000,000 |
| a | State of California (LOC Barclays Bank Plc) GO, Series A-1-REMK-08/29/2018, 0.60% due 5/1/2033 (put 4/1/2020) | 5,170,000 | 5,170,000 |
| | State of California (Various Capital Projects) GO, 5.00% due 9/1/2020 | 2,000,000 | 2,032,440 |
| | State of California Department of Water Resources Power Supply Revenue, Series N, 5.00% due 5/1/2020 | 1,700,000 | 1,705,185 |
| | State of California GO, 5.00% due 11/1/2029 | 5,000,000 | 6,553,550 |
| | Stockton Public Financing Authority (Stockton Water Revenue; Green Bond; Insured: BAM), Series A, 5.00% due 10/1/2020 - 10/1/2027 | 3,960,000 | 4,577,596 |
| | Successor Agency to the City of Colton Redevelopment Agency (Multiple Redevelopment Project Areas; Insured: BAM), 5.00% due 8/1/2021 - 8/1/2025 | 2,815,000 | 3,158,675 |
| | Successor Agency to the City of Riverside Redevelopment Agency (Multiple Redevelopment Project Areas), Series A, 5.00% due 9/1/2023 - 9/1/2024 | 2,985,000 | 3,414,998 |
| | Successor Agency to the City of San Diego Redevelopment Agency (Multiple Redevelopment Project Areas), Series A, 5.00% due 9/1/2025 - 9/1/2026 | 1,770,000 | 2,095,837 |
| | Successor Agency to the Commerce Community Development Commission (Multiple Redevelopment Project Areas; Insured: AGM), Series A, 5.00% due 8/1/2027 - 8/1/2030 | 3,315,000 | 3,999,020 |
| | Successor Agency to the Community Development Agency of the City of Menlo Park (Las Pulgas Community Development Project), 5.00% due 10/1/2020 | 325,000 | 331,201 |
| | Successor Agency to the Community Development Agency of the City of Menlo Park (Las Pulgas Community Development Project; Insured: AGM), 5.00% due 10/1/2022 - 10/1/2025 | 1,400,000 | 1,587,152 |
See notes to financial statements.
| Thornburg Municipal Funds Semi-Annual Report | 41 |
Schedule of Investments, Continued
Thornburg California Limited Term Municipal Fund | March 31, 2020 (Unaudited)
| Issuer-Description | PRINCIPAL
AMOUNT | VALUE |
| | Successor Agency to the Community Redevelopment Agency of the City of Palmdale (Merged Redevelopment Project Areas), Series A, 5.00% due 9/1/2025 - 9/1/2026 | $ 1,000,000 | $ 1,212,429 |
| | Successor Agency to the Poway Redevelopment Agency (Paguay Redevelopment Project), Series A, 5.00% due 6/15/2025 | 4,665,000 | 5,562,453 |
| | Successor Agency to the Rancho Cucamonga Redevelopment Project (Rancho Redevelopment Project Area; Insured: AGM), 5.00% due 9/1/2023 - 9/1/2024 | 3,000,000 | 3,458,910 |
| | Successor Agency to the Redevelopment Agency of the City and County of San Francisco (San Francisco Redevelopment Projects), Series C, 5.00% due 8/1/2020 - 8/1/2021 | 2,685,000 | 2,758,721 |
| | Successor Agency to the Redevelopment Agency of the City of San Mateo (Multiple Redevelopment Project Areas), Series A, 5.00% due 8/1/2025 | 425,000 | 508,602 |
| | Successor Agency to the Redevelopment Agency of the City of Stockton (Redevelopment of Midtown, North and South Stockton and Waterfront Areas; Insured: AGM), Series A, 5.00% due 9/1/2026 - 9/1/2027 | 2,000,000 | 2,446,490 |
| | Successor Agency to the Richmond County Redevelopment Agency (Joint Powers Financing Authority & Harbour Redevelopment Project; Insured: BAM), Series A, 5.00% due 9/1/2022 - 9/1/2024 | 1,250,000 | 1,409,677 |
| | Successor Agency to the Rosemead Community Development Commission (Rosemead Merged Project Area; Insured: BAM), 5.00% due 10/1/2020 - 10/1/2026 | 4,835,000 | 5,421,785 |
| | Temecula Valley Financing Authority (Educational Facilities; Insured: BAM) USD, 5.00% due 9/1/2020 - 9/1/2025 | 2,090,000 | 2,278,531 |
| | Temecula Valley Financing Authority (Insured: BAM) USD, 5.00% due 9/1/2027 | 2,220,000 | 2,580,128 |
| | Trustees of the California State University (Educational Facilities Improvements), Series A, 5.00% due 11/1/2026 | 1,000,000 | 1,207,380 |
| | Tulare Public Financing Authority (Insured: BAM), | | |
| | 4.00% due 4/1/2020 - 4/1/2022 | 725,000 | 747,330 |
| | 5.00% due 4/1/2023 - 4/1/2028 | 1,410,000 | 1,670,759 |
| | Upper Lake Union High School District (Insured: Natl-Re) GO, Series A, Zero Coupon due 8/1/2020 | 330,000 | 328,568 |
| | Ventura County Public Financing Authority (Office Building Purchase and Improvements), Series B, 5.00% due 11/1/2023 - 11/1/2024 | 1,560,000 | 1,771,902 |
| | Vista Redevelopment Agency (Vista Redevelopment Project; Insured: AGM), Series B1, 5.00% due 9/1/2020 - 9/1/2023 | 1,275,000 | 1,375,695 |
| | West Contra Costa (Insured: Natl-Re) USD GO, Zero Coupon due 8/1/2028 | 160,000 | 134,314 |
| | West Sacramento Financing Authority (Insured: AGC), Series A, 5.00% due 9/1/2020 | 1,040,000 | 1,054,986 |
| | William S. Hart Union High School District (Educational Facilities; Insured: AGM) GO, Series B, Zero Coupon due 9/1/2021 | 800,000 | 786,664 |
| | Total Investments — 95.5%(Cost $478,043,899) | | $490,195,695 |
| | Other Assets Less Liabilities — 4.5% | | 23,269,839 |
| | Net Assets — 100.0% | | $513,465,534 |
| Footnote Legend |
| a | Variable, floating, step, or fixed to floating rate securities are securities for which interest rate changes are based on changes in a designated base rate or on a predetermined schedule. The rates shown are those in effect on March 31, 2020. |
| b | Securities exempt from registration under Rule 144A of the Securities Act of 1933, as amended. These securities are restricted but liquid and may only be resold in the ordinary course of business in transactions exempt from registration, normally to qualified institutional buyers. As of March 31, 2020, the aggregate value of these securities in the Fund’s portfolio was $4,899,720, representing 0.95% of the Fund’s net assets. |
Portfolio Abbreviations
To simplify the listings of securities, abbreviations are used per the table below:
| ACA | Insured by American Capital Access |
| AGC | Insured by Assured Guaranty Corp. |
| AGM | Insured by Assured Guaranty Municipal Corp. |
| AMBAC | Insured by American Municipal Bond Assurance Corp. |
| AMT | Alternative Minimum Tax |
| BAM | Insured by Build America Mutual Insurance Co. |
| COP | Certificates of Participation |
| ETM | Escrowed to Maturity |
| GO | General Obligation |
| HFFA | Health Facilities Financing Authority |
| LIBOR | London Interbank Offered Rates |
| LOC | Letter of Credit |
| Natl-Re | Insured by National Public Finance Guarantee Corp. |
| SPA | Stand-by Purchase Agreement |
| USD | Unified School District |
42 | Thornburg Municipal Funds Semi-Annual Report
| See notes to financial statements. |
Schedule of Investments
Thornburg New Mexico Intermediate Municipal Fund | March 31, 2020 (Unaudited)
| Issuer-Description | PRINCIPAL
AMOUNT | VALUE |
| | MUNICIPAL BONDS — 97.7% | | |
| | Albuquerque Bernalillo County Water Utility Authority (2005 NMFA Loan and Joint Water and Sewer System Improvements), Series A, 5.00% due 7/1/2026 | $ 2,000,000 | $ 2,307,320 |
| | Albuquerque Bernalillo County Water Utility Authority (2007 NMFA Loan and Joint Water and Sewer System Improvements), 5.00% due 7/1/2031 - 7/1/2032 | 1,500,000 | 1,758,010 |
| | Albuquerque Municipal School District No. 12 (Bernalillo and Sandoval Counties School Facilities) (State Aid Withholding) GO, | | |
| | 5.00% due 8/1/2031 - 8/1/2034 | 2,260,000 | 2,787,482 |
| | Series A, 4.00% due 8/1/2029 | 1,300,000 | 1,401,868 |
| | Albuquerque Municipal School District No. 12 (State Aid Withholding) GO, Series B, 5.00% due 8/1/2020 | 150,000 | 151,917 |
| | Bernalillo County (Government Services), | | |
| | 5.25% due 4/1/2027 | 300,000 | 352,380 |
| | Series B, 5.70% due 4/1/2027 | 3,000,000 | 3,596,910 |
| | Bernalillo County (Government Services; Insured: AMBAC), 5.25% due 10/1/2022 - 10/1/2025 | 8,295,000 | 9,608,930 |
| | Bernalillo County (Government Services; Insured: Natl-IBC), | | |
| | Series B, | | |
| | 5.00% due 4/1/2021 | 1,290,000 | 1,315,697 |
| | 5.70% due 4/1/2027 | 815,000 | 977,161 |
| | Central New Mexico Community College (Campus Buildings Acquisition & Improvements) GO, | | |
| | 4.00% due 8/15/2023 | 1,920,000 | 1,988,352 |
| | Series A, 5.00% due 8/15/2021 - 8/15/2022 | 2,535,000 | 2,710,192 |
| | City of Albuquerque (City Infrastructure Improvements), | | |
| | Series A, | | |
| | 4.00% due 7/1/2020 - 7/1/2035 | 3,150,000 | 3,509,883 |
| | 5.00% due 7/1/2025 - 7/1/2034 | 2,500,000 | 2,952,693 |
| | Series B, 4.00% due 7/1/2020 | 1,500,000 | 1,510,800 |
| | City of Albuquerque (City Infrastructure Improvements) GO, Series A, 5.00% due 7/1/2026 | 870,000 | 1,067,629 |
| | City of Albuquerque (I-25/Paseo del Norte Interchange), 5.00% due 7/1/2025 - 7/1/2027 | 1,095,000 | 1,222,654 |
| | City of Albuquerque GO, Series A, 4.00% due 7/1/2024 | 2,500,000 | 2,515,800 |
| | City of Farmington (Arizona Public Service Co.-Four Corners Project), | | |
| | Series A, 4.70% due 5/1/2024 | 965,000 | 980,691 |
| | Series B, 4.70% due 9/1/2024 | 4,000,000 | 4,062,080 |
| | City of Las Cruces (Joint Utility System), Series A, 4.00% due 6/1/2021 - 6/1/2025 | 2,215,000 | 2,422,644 |
| | City of Las Cruces (NMFA Loan), 5.00% due 6/1/2021 - 6/1/2037 | 10,135,000 | 10,199,661 |
| | City of Roswell, 4.00% due 8/1/2029 | 260,000 | 300,362 |
| | City of Roswell (Joint Water and Sewer Improvement; Insured: BAM), 5.00% due 6/1/2026 - 6/1/2036 | 2,050,000 | 2,441,106 |
| | City of Santa Fe, Series A, 5.00% due 6/1/2034 - 6/1/2038 | 1,870,000 | 2,312,266 |
| | City of Santa Fe (El Castillo Retirement Residences), | | |
| | 4.50% due 5/15/2027 | 3,275,000 | 3,282,729 |
| | 5.00% due 5/15/2034 | 1,465,000 | 1,471,050 |
| | City of Santa Fe (Public Facilities) GRT, 5.00% due 6/1/2028 - 6/1/2029 | 1,880,000 | 2,152,408 |
| | County of Sandoval GO, 5.00% due 8/1/2025 - 8/1/2029 | 2,015,000 | 2,477,072 |
| | County of Santa Fe GO, 5.00% due 7/1/2024 | 825,000 | 955,102 |
| | Guam Power Authority (Electric Power System; Insured: AGM), Series A, 5.00% due 10/1/2026 | 2,000,000 | 2,069,100 |
| | Guam Waterworks Authority (Water and Wastewater System), 5.00% due 7/1/2035 - 7/1/2037 | 2,200,000 | 2,228,642 |
| | New Mexico Educational Assistance Foundation (Student Loans), Series A-1, 5.00% due 12/1/2022 | 3,000,000 | 3,073,140 |
| | New Mexico Finance Authority, | | |
| | 5.00% due 6/15/2029 - 6/1/2038 | 1,450,000 | 1,816,119 |
| | Series B, 5.00% due 6/1/2032 - 6/1/2033 | 4,125,000 | 5,278,814 |
| | Series D, 5.00% due 6/1/2033 | 695,000 | 872,559 |
| | New Mexico Finance Authority (State Highway Infrastructure), Series A, 5.00% due 6/15/2026 - 6/15/2027 | 2,415,000 | 2,762,189 |
| | New Mexico Finance Authority (The Public Project Revolving Fund Program), Series A, 5.00% due 6/15/2031 | 1,000,000 | 1,172,500 |
| | New Mexico Hospital Equipment Loan Council (Haverland Carter Lifestyle Group), 5.00% due 7/1/2032 | 2,000,000 | 2,012,520 |
| | New Mexico Hospital Equipment Loan Council (Haverland Carter Lifestyle Obligated Group), Series A, 5.00% due 7/1/2030 - 7/1/2039 | 3,605,000 | 3,661,462 |
| | New Mexico Hospital Equipment Loan Council (Presbyterian Healthcare Services Obligated Group), Series A, 5.00% due 8/1/2036 - 8/1/2038 | 2,955,000 | 3,657,195 |
| a | New Mexico Hospital Equipment Loan Council (Presbyterian Healthcare Services Obligated Group; SPA Wells Fargo Bank, N.A.), Series D, 0.75% due 8/1/2034 (put 4/1/2020) | 500,000 | 500,000 |
| | New Mexico Hospital Equipment Loan Council (Presbyterian Healthcare Services), 5.00% due 8/1/2031 | 1,750,000 | 2,116,675 |
| | New Mexico Housing Authority (El Paseo Apartments; Insured: AMBAC) AMT, Series A, 5.30% due 12/1/2022 | 15,000 | 15,006 |
| | New Mexico Institute of Mining and Technology (Campus Buildings Acquisition & Improvements), 5.00% due 7/1/2020 - 7/1/2028 | 3,805,000 | 3,956,002 |
| | New Mexico Institute of Mining and Technology (Campus Buildings Acquisition & Improvements; Insured: AGM), 4.00% due 12/1/2035 - 12/1/2040 | 2,595,000 | 2,923,012 |
| | New Mexico Mortgage Finance Authority (Collateralized: GNMA, FNMA, FHLMC), | | |
| | Series C, 2.85% due 7/1/2031 | 635,000 | 665,074 |
| | Series F, | | |
See notes to financial statements.
| Thornburg Municipal Funds Semi-Annual Report | 43 |
Schedule of Investments, Continued
Thornburg New Mexico Intermediate Municipal Fund | March 31, 2020 (Unaudited)
| Issuer-Description | PRINCIPAL
AMOUNT | VALUE |
| | 2.60% due 7/1/2034 | $ 620,000 | $ 625,847 |
| | 2.85% due 7/1/2039 | 1,600,000 | 1,612,464 |
| | 3.50% due 7/1/2050 | 1,000,000 | 1,067,300 |
| | New Mexico Mortgage Finance Authority (NIBP SFM Loan Program; Collateralized: GNMA, FNMA, FHLMC), 4.625% due 3/1/2028 | 580,000 | 592,018 |
| | New Mexico Municipal Energy Acquisition Authority, | | |
| | Series A, | | |
| | 4.00% due 5/1/2024 | 250,000 | 270,030 |
| a | 5.00% due 11/1/2039 (put 5/1/2025) | 1,000,000 | 1,089,510 |
| | Regents of New Mexico State University (Campus Buildings Acquisition & Improvements), Series A, 5.00% due 4/1/2032 - 4/1/2036 | 5,935,000 | 7,134,057 |
| | Regents of New Mexico State University (Campus Buildings Acquisition & Improvements; Insured: BAM), Series A, 5.00% due 4/1/2030 | 1,440,000 | 1,786,435 |
| | Regents of the University of New Mexico (Campus Buildings Acquisition & Improvements), | | |
| | Series A, | | |
| | 4.50% due 6/1/2034 - 6/1/2036 | 4,500,000 | 5,123,130 |
| | 6.00% due 6/1/2021 | 100,000 | 103,200 |
| a | Regents of the University of New Mexico (Campus Buildings Acquisition & Improvements; SPA U.S. Bank, N.A.), 4.50% due 6/1/2026 (put 4/7/2020) | 1,000,000 | 1,000,000 |
| | Rio Rancho Public School District No. 94 (Insured: BAM) (State Aid Withholding) GO, 5.00% due 8/1/2020 | 550,000 | 556,842 |
| | San Juan County (County Capital Improvements), Series B, 5.00% due 6/15/2028 - 6/15/2030 | 2,645,000 | 3,012,908 |
| | Santa Fe County (County Buildings & Facilities) GRT, Series A, 5.00% due 6/1/2026 - 6/1/2027 | 940,000 | 1,110,561 |
| | Santa Fe County (County Correctional System; Insured: AGM), 6.00% due 2/1/2027 | 1,250,000 | 1,458,350 |
| | Santa Fe Gasoline Tax, 5.00% due 6/1/2024 - 6/1/2028 | 1,540,000 | 1,854,691 |
| | State of New Mexico (Educational Facilities), | | |
| | 5.00% due 7/1/2028 | 465,000 | 587,183 |
| | Series A, 5.00% due 7/1/2025 | 2,040,000 | 2,401,386 |
| | Series B, 4.00% due 7/1/2020 | 225,000 | 226,643 |
| | State of New Mexico GO, 5.00% due 3/1/2029 | 2,000,000 | 2,595,860 |
| | Town of Silver City (Public Facility Capital Projects), | | |
| | Series A, | | |
| | 4.00% due 6/1/2029 | 1,000,000 | 1,015,630 |
| | 4.25% due 6/1/2032 | 1,050,000 | 1,070,128 |
| | Village of Los Ranchos de Albuquerque (Albuquerque Academy), 4.50% due 9/1/2040 | 3,000,000 | 3,032,190 |
| | Zuni Public School District (Teacher Housing Projects), 5.00% due 8/1/2028 | 1,600,000 | 1,711,680 |
| | Total Investments — 97.7%(Cost $149,613,789) | | $154,610,901 |
| | Other Assets Less Liabilities — 2.3% | | 3,570,676 |
| | Net Assets — 100.0% | | $158,181,577 |
| Footnote Legend |
| a | Variable, floating, step, or fixed to floating rate securities are securities for which interest rate changes are based on changes in a designated base rate or on a predetermined schedule. The rates shown are those in effect on March 31, 2020. |
Portfolio Abbreviations
To simplify the listings of securities, abbreviations are used per the table below:
| AGM | Insured by Assured Guaranty Municipal Corp. |
| AMBAC | Insured by American Municipal Bond Assurance Corp. |
| AMT | Alternative Minimum Tax |
| BAM | Insured by Build America Mutual Insurance Co. |
| FHLMC | Insured by Federal Home Loan Mortgage Corp. |
| FNMA | Collateralized by Federal National Mortgage Association |
| GNMA | Collateralized by Government National Mortgage Association |
| GO | General Obligation |
| GRT | Gross Receipts Tax |
| Natl-IBC | Insured by National Public Finance Gurantee Corp. and IBC Bank |
| SPA | Stand-by Purchase Agreement |
44 | Thornburg Municipal Funds Semi-Annual Report
| See notes to financial statements. |
Schedule of Investments
Thornburg New York Intermediate Municipal Fund | March 31, 2020 (Unaudited)
| Issuer-Description | PRINCIPAL
AMOUNT | VALUE |
| | MUNICIPAL BONDS — 99.8% | | |
| | City of New York (City Budget Financial Management) GO, Series G, 5.00% due 8/1/2030 | $1,000,000 | $ 1,132,870 |
| | City of New York GO, | | |
| | Series A, 5.00% due 8/1/2039 | 1,000,000 | 1,235,960 |
| | Series F1, 5.00% due 4/1/2037 | 940,000 | 1,139,788 |
| | County of Nassau (Insured: BAM) GO, Series B, 5.00% due 4/1/2026 | 1,000,000 | 1,115,620 |
| | Erie County Fiscal Stability Authority, Series D, 5.00% due 9/1/2034 | 850,000 | 1,056,150 |
| | Guam Waterworks Authority (Water and Wastewater System), 5.00% due 7/1/2028 - 7/1/2036 | 1,500,000 | 1,523,785 |
| | Hempstead Town Local Development Corp. (Hofstra University), 5.00% due 7/1/2028 | 500,000 | 522,310 |
| | Hudson Yards Infrastructure Corp. (Hudson Yards Subway Station), Series A, 5.00% due 2/15/2035 | 1,000,000 | 1,202,300 |
| | Long Island Power Authority (Electric System Capital Improvements; Insured: AGC), Series C, 5.25% due 9/1/2029 | 645,000 | 840,725 |
| | Metropolitan Transportation Authority, Series D-1, 5.00% due 9/1/2022 | 600,000 | 634,518 |
| | Metropolitan Transportation Authority (Green Bond), Series C-1, 5.00% due 11/15/2028 | 1,000,000 | 1,107,040 |
| | Monroe County Industrial Development Corp. (Monroe Community College Association, Inc.; Insured: AGM), 5.00% due 1/15/2028 - 1/15/2029 | 550,000 | 617,702 |
| | Nassau County Sewer & Storm Water Finance Authority (Sewerage and Storm Water Resource Facilities), Series A, 5.00% due 10/1/2021 - 10/1/2031 | 1,675,000 | 1,908,344 |
| | New York City Health and Hospitals Corp. (Healthcare Facilities Improvements) GO, Series A, 5.00% due 2/15/2025 | 1,000,000 | 1,002,230 |
| | New York City Transitional Finance Authority Future Tax Secured Revenue, | | |
| | Series A1, 5.00% due 8/1/2038 | 1,000,000 | 1,217,620 |
| | Series A2, 5.00% due 5/1/2039 | 1,000,000 | 1,233,300 |
| a | New York City Water & Sewer System (SPA U.S. Bank, N.A.), Series 3A, 1.10% due 6/15/2043 (put 4/1/2020) | 500,000 | 500,000 |
| | New York State Dormitory Authority, Series A, 5.00% due 2/15/2032 | 1,000,000 | 1,212,370 |
| | New York State Dormitory Authority (Barnard College), Series A 4.00% due 7/1/2024 - 7/1/2025 | 350,000 | 394,343 |
| | New York State Dormitory Authority (Catholic Health System Obligated Group), Series A, 5.00% due 7/1/2036 | 400,000 | 490,524 |
| | New York State Dormitory Authority (Columbia University Teachers College), Series A, 5.00% due 7/1/2027 | 750,000 | 804,832 |
| | New York State Dormitory Authority (Green Bond-Cornell University), Series D, 5.00% due 7/1/2036 | 1,000,000 | 1,398,720 |
| | New York State Dormitory Authority (Metropolitan Transportation Authority & State Urban Development Corp.), Series A, 5.00% due 12/15/2027 | 1,500,000 | 1,643,160 |
| | New York State Dormitory Authority (Northwell Health Obligated Group), Series A, 5.00% due 5/1/2033 | 100,000 | 124,425 |
| | New York State Dormitory Authority (School District Financing Program) (State Aid Withholding), Series C, 5.00% due 10/1/2023 | 575,000 | 652,619 |
| | New York State Dormitory Authority (School District Financing Program; Insured: AGM) (State Aid Withholding), | | |
| | Series A, 5.00% due 10/1/2028 | 200,000 | 230,166 |
| | Series H, | | |
| | 5.00% due 10/1/2024 | 480,000 | 507,019 |
| | 5.00% due 10/1/2024 (pre-refunded 10/1/2021) | 520,000 | 550,992 |
| | New York State Dormitory Authority (St. John’s University; Insured: Natl-Re), Series C, 5.25% due 7/1/2022 | 1,000,000 | 1,088,100 |
| | New York State Dormitory Authority (State of New York Personal Income Tax Revenue), Series D, 4.00% due 2/15/2040 | 500,000 | 570,110 |
| | New York State Dormitory Authority (State of New York Sales Tax Revenue), Series A, 5.00% due 3/15/2033 | 1,000,000 | 1,211,710 |
| a | New York State Housing Finance Agency (LOC Landesbank Hessen-Thuringen), Series A, 0.75% due 11/1/2046 (put 4/1/2020) | 1,900,000 | 1,900,000 |
| | New York State Urban Development Corp. (State of New York Sales Tax Revenue), Series A, 5.00% due 3/15/2037 | 500,000 | 641,125 |
| | Oneida County Local Development Corp. (Utica College), 5.00% due 7/1/2025 - 7/1/2032 | 855,000 | 925,077 |
| | Onondaga Civic Development Corp. (Le Moyne College), 5.00% due 7/1/2021 | 685,000 | 691,302 |
| | Onondaga Civic Development Corp. (State University of New York Upstate Medical University), 5.50% due 12/1/2031 | 1,000,000 | 1,070,430 |
| | Port Authority of New York & New Jersey AMT, 5.00% due 11/1/2039 | 200,000 | 245,754 |
| | Sales Tax Asset Receivable Corp. (New York Local Government Assistance Corp.), Series A, 5.00% due 10/15/2029 - 10/15/2031 | 2,250,000 | 2,575,785 |
| | State of New York Mortgage Agency, Series 223, 2.65% due 10/1/2034 | 450,000 | 460,642 |
| | Syracuse Industrial Development Agency (Syracuse City School District) (State Aid Withholding), 5.25% due 5/1/2026 | 2,150,000 | 2,245,030 |
| | Tompkins County Development Corp. (Ithaca College Project), | | |
| | 5.00% due 7/1/2034 - 7/1/2035 | 450,000 | 551,306 |
| b | 5.00% due 7/1/2037 | 370,000 | 449,502 |
| | Town of Amherst Development Corp. (University at Buffalo Foundation Facility-Student Housing; Insured: AGM) ETM, Series A, 5.00% due 10/1/2020 | 1,000,000 | 1,019,490 |
| | Triborough Bridge & Tunnel Authority (MTA Bridges and Tunnels) GO, | | |
| | Series A, | | |
| | 5.00% due 11/15/2028 (pre-refunded 5/15/2024) | 1,000,000 | 1,157,080 |
| | 5.00% due 11/15/2029 | 1,000,000 | 1,138,930 |
| c | Troy Capital Resource Corp. (Rensselaer Polytechnic Institute), Series A, 5.00% due 9/1/2038 | 250,000 | 313,440 |
| | Utility Debt Securitization Authority (Long Island Power Authority-Electric Service), Series TE, 5.00% due 12/15/2029 - 12/15/2030 | 2,000,000 | 2,268,480 |
| | West Seneca Central School District (Facilities Improvements; Insured: BAM) (State Aid Withholding) GO, 5.00% due 11/15/2023 | 1,300,000 | 1,475,435 |
| | Westchester County Local Development Corp. (Miriam Osborn Memorial Home Association Obligated Group), 5.00% due 7/1/2029 - 7/1/2034 | 450,000 | 513,764 |
| | Total Investments — 99.8%(Cost $46,667,916) | | $48,511,924 |
| | Other Assets Less Liabilities — 0.2% | | 108,172 |
| | Net Assets — 100.0% | | $48,620,096 |
See notes to financial statements.
| Thornburg Municipal Funds Semi-Annual Report | 45 |
Schedule of Investments, Continued
Thornburg New York Intermediate Municipal Fund | March 31, 2020 (Unaudited)
| Footnote Legend |
| a | Variable, floating, step, or fixed to floating rate securities are securities for which interest rate changes are based on changes in a designated base rate or on a predetermined schedule. The rates shown are those in effect on March 31, 2020. |
| b | Segregated as collateral for a when-issued security. |
| c | When-issued security. |
Portfolio Abbreviations
To simplify the listings of securities, abbreviations are used per the table below:
| AGC | Insured by Assured Guaranty Corp. |
| AGM | Insured by Assured Guaranty Municipal Corp. |
| AMT | Alternative Minimum Tax |
| BAM | Insured by Build America Mutual Insurance Co. |
| ETM | Escrowed to Maturity |
| GO | General Obligation |
| LOC | Letter of Credit |
| Natl-Re | Insured by National Public Finance Guarantee Corp. |
| SPA | Stand-by Purchase Agreement |
46 | Thornburg Municipal Funds Semi-Annual Report
| See notes to financial statements. |
Schedule of Investments
Thornburg Intermediate Municipal Fund | March 31, 2020 (Unaudited)
| | Issuer-Description | PRINCIPAL
AMOUNT | VALUE |
| | Municipal Bonds — 98.6% | | |
| | Alabama — 1.7% | | |
| | Alabama Public School & College Authority (Educational Facilities), Series B, 5.00% due 6/1/2026 | $ 4,380,000 | $ 4,894,694 |
| | East Alabama Health Care Authority (Health Care Facilities Capital Improvements) GO, Series A, 5.00% due 9/1/2027 | 1,250,000 | 1,323,800 |
| | Lower Alabama Gas District, Series A, 5.00% due 9/1/2034 | 3,000,000 | 3,563,160 |
| | UAB Medicine Finance Authority (University Hospital), Series B, 5.00% due 9/1/2032 | 6,000,000 | 7,264,200 |
| | Alaska — 0.2% | | |
| | Alaska Housing Finance Corp. (State Capital Project) GO, Series A, 5.00% due 12/1/2021 (pre-refunded 12/1/2020) | 500,000 | 512,585 |
| | City of Valdez (BP Pipelines (Alaska), Inc. Project), Series C, 5.00% due 1/1/2021 | 2,000,000 | 2,021,240 |
| | Arizona — 2.1% | | |
| | Arizona (Scottsdale Lincoln Hospitals) HFA , 5.00% due 12/1/2031 | 2,500,000 | 2,807,100 |
| | Arizona Board of Regents (University of Arizona SPEED), 5.00% due 8/1/2024 - 8/1/2029 | 2,635,000 | 2,861,994 |
| | County of Pima (Providence Day School Project) IDA, 5.00% due 12/1/2030 | 2,000,000 | 2,029,420 |
| a | County of Yavapai, (Waste Management, Inc.) AMT, IDA, 2.80% due 6/1/2027 (put 6/1/2021) | 2,000,000 | 2,016,900 |
| | Salt River Project Agricultural Improvement and Power District (Salt River Electric System), 5.00% due 1/1/2033 - 1/1/2037 | 7,000,000 | 8,695,445 |
| | Salt Verde Financial Corp. (Gas Supply Acquisition), 5.25% due 12/1/2022 - 12/1/2028 | 2,770,000 | 3,050,044 |
| | Arkansas — 0.4% | | |
| | Board of Trustees of the University of Arkansas (Fayetteville Campus), 5.00% due 11/1/2031 - 11/1/2034 | 3,655,000 | 4,186,666 |
| | California — 5.7% | | |
| | Alameda County Joint Powers Authority (Alameda County Medical Center Highland Hospital), Series A, 5.25% due 12/1/2027 - 12/1/2029 | 3,650,000 | 4,179,267 |
| | Brentwood Infrastructure Financing Authority (Insured: AGM), 5.00% due 11/1/2026 | 2,000,000 | 2,115,760 |
| | California (Adventist Health System/West) HFFA, Series A, 5.00% due 3/1/2026 | 3,020,000 | 3,328,312 |
| | California (Children’s Hospital Los Angeles) HFFA, Series A, 5.00% due 11/15/2022 - 8/15/2033 | 1,950,000 | 2,231,803 |
| | California (Dignity Health) HFFA, Series A, 5.25% due 3/1/2027 | 5,250,000 | 5,361,405 |
| | California Infrastructure and Economic Development Bank (King City Joint Union High School District), 5.75% due 8/15/2029 | 1,500,000 | 1,502,400 |
| | Corona-Norco (Insured: AGM) USD COP, Series A, 5.00% due 4/15/2021 | 1,000,000 | 1,001,440 |
| | Delano Financing Authority (City of Delano Police Station and Woollomes Avenue Bridge), Series A, 5.00% due 12/1/2025 | 2,555,000 | 2,616,550 |
| | Franklin-McKinley School District (Insured: Natl-Re) GO, 5.25% due 8/1/2027 | 1,000,000 | 1,259,200 |
| | Fresno (Educational Facilities and Improvements; Insured: Natl-Re) USD GO, Series A, 6.00% due 8/1/2026 | 1,410,000 | 1,634,303 |
| | Jurupa Public Financing Authority (Eastvale Community Services; Insured: AGM), Series A, 5.50% due 9/1/2025 - 9/1/2027 | 2,530,000 | 2,898,570 |
| | M-S-R Energy Authority, Series B, 6.125% due 11/1/2029 | 2,480,000 | 2,992,591 |
| | North City West School Facilities Financing Authority (Carmel Valley Schools; Insured: AGM), Series A, 5.00% due 9/1/2024 | 1,080,000 | 1,170,418 |
| a | Northern California Energy Authority (Commodity Supply Revenue), Series A, 4.00% due 7/1/2049 (put 7/1/2024) | 8,000,000 | 8,297,840 |
| | Oakland (County of Alameda Educational Facilities) USD GO, Series A, 5.00% due 8/1/2032 - 8/1/2034 | 3,000,000 | 3,485,050 |
| | Redwood City Redevelopment Agency (Redevelopment Area A-2; Insured: AMBAC), Series A-2, Zero Coupon due 7/15/2023 | 2,065,000 | 1,959,953 |
| | San Francisco City and County Airports Commission (San Francisco International Airport) AMT, REF-Series 2018A, 5.00% due 5/1/2020 | 2,000,000 | 2,005,260 |
| | San Jose Redevelopment Agency (Merged Area Redevelopment Project), | | |
| | 5.25% due 8/1/2027 (pre-refunded 8/1/2020) | 2,400,000 | 2,432,880 |
| | 5.375% due 8/1/2028 (pre-refunded 8/1/2020) | 1,175,000 | 1,190,992 |
| | Saratoga Union School District (Insured: Natl-Re) USD GO, Series B, Zero Coupon due 9/1/2023 | 900,000 | 861,732 |
| | State of California (Kindergarten-University Facilities) GO, 5.25% due 9/1/2026 | 5,000,000 | 5,293,000 |
| | Colorado — 1.2% | | |
| | Colorado (Sanford Obligated Group) HFA, Series A, 5.00% due 11/1/2039 | 1,925,000 | 2,369,097 |
| | Housing Authority of the City and County of Denver (Three Towers Rehabilitation; Insured: AGM) AMT, 5.20% due 11/1/2027 | 1,335,000 | 1,339,179 |
| | Regional Transportation District (North Metro Rail Line) COP, Series A, 5.00% due 6/1/2028 | 1,650,000 | 1,825,972 |
| | Regional Transportation District (Public Mass Transportation System) COP, Series A, 5.50% due 6/1/2022 (pre-refunded 6/1/2020) | 260,000 | 261,784 |
| | State of Colorado COP, | | |
| | Series A, | | |
| | 5.00% due 9/1/2029 - 9/1/2032 | 2,915,000 | 3,635,081 |
| b | 5.00% due 9/1/2031 | 2,290,000 | 2,842,737 |
| | Connecticut — 2.3% | | |
| | City of Hartford (Various Public Improvements; Insured: AGM) GO, Series A, 5.00% due 7/1/2031 | 1,700,000 | 1,969,501 |
| | State of Connecticut (Various Capital Projects) GO, Series B, 5.00% due 5/15/2027 | 1,000,000 | 1,178,600 |
| | State of Connecticut GO, | | |
| | Series A, 5.00% due 4/15/2033 - 4/15/2035 | 12,415,000 | 14,901,596 |
| | Series C, 5.00% due 6/15/2028 - 6/15/2029 | 1,890,000 | 2,307,840 |
| | Series E, 5.00% due 9/15/2033 | 2,650,000 | 3,209,256 |
| | District of Columbia — 1.8% | | |
| | Metropolitan Washington Airports Authority (Dulles Toll Road Revenue), Series A-Dulles Metrorail and capital improvement project, 5.00% due 10/1/2038 - 10/1/2039 | 3,000,000 | 3,519,390 |
| | Metropolitan Washington Airports Authority (Dulles Toll Road Revenue; Insured: AGC), Series B, Zero Coupon due 10/1/2023 - 10/1/2024 | 9,890,000 | 9,258,078 |
See notes to financial statements.
| Thornburg Municipal Funds Semi-Annual Report | 47 |
Schedule of Investments, Continued
Thornburg Intermediate Municipal Fund | March 31, 2020 (Unaudited)
| | Issuer-Description | PRINCIPAL
AMOUNT | VALUE |
| | Washington Convention & Sports Authority, Series A, 5.00% due 10/1/2028 | $ 1,105,000 | $ 1,305,270 |
| | Washington Metropolitan Area Transit Authority, 5.00% due 7/1/2032 - 7/1/2037 | 3,325,000 | 3,964,779 |
| | Florida — 8.0% | | |
| | Broward County (Airport System Improvements) AMT, 5.00% due 10/1/2034 - 10/1/2035 | 3,500,000 | 4,029,995 |
| | Central Florida Expressway Authority, 5.00% due 7/1/2037 | 1,095,000 | 1,327,677 |
| | City of Jacksonville (Better Jacksonville Plan), Series A, 5.00% due 10/1/2026 | 2,075,000 | 2,253,927 |
| | City of Lakeland (Electric Power System Smart Grid Project; Insured: AGM), 5.25% due 10/1/2027 - 10/1/2036 | 6,450,000 | 8,598,933 |
| | City of Orlando (Senior Tourist Development; Insured: AGM), Series A, 5.00% due 11/1/2032 - 11/1/2037 | 3,430,000 | 4,137,498 |
| | Escambia County (Florida Health Care Facility Loan Program; Insured: AMBAC) HFA ETM, 5.95% due 7/1/2020 | 260,000 | 263,078 |
| a | JEA Water & Sewer System Revenue (SPA U.S. Bank, N.A.), Series A-1, 1.10% due 10/1/2038 (put 4/1/2020) | 13,000,000 | 13,000,000 |
| | Lake County School Board (School District Facility Projects) COP, Series B, 5.00% due 6/1/2026 | 1,210,000 | 1,300,690 |
| | Manatee County (Public Utilities System Improvements), 5.00% due 10/1/2026 - 10/1/2033 | 6,080,000 | 7,100,411 |
| | Miami-Dade County (Miami International Airport), Series B, 5.00% due 10/1/2028 - 10/1/2031 | 5,335,000 | 5,943,732 |
| | Miami-Dade County (Nicklaus Children’s Hospital) HFA, 5.00% due 8/1/2035 - 8/1/2037 | 2,905,000 | 3,475,757 |
| | Miami-Dade County (Seaport Properties) GO, Series C, 5.00% due 10/1/2023 | 1,040,000 | 1,098,219 |
| | Miami-Dade County Educational Facilities Authority (University of Miami; Insured: AMBAC), Series B, 5.25% due 4/1/2024 | 1,000,000 | 1,110,200 |
| | Miami-Dade County School Board (Insured: AMBAC) COP, Series D, 5.00% due 10/1/2021 | 3,035,000 | 3,209,816 |
| | Miami-Dade County School Board COP, Series A, 5.00% due 5/1/2030 | 3,250,000 | 3,745,462 |
| | Orange County (Tourist Development), Series A, 5.00% due 10/1/2031 | 2,000,000 | 2,406,800 |
| | Palm Beach County (Boca Raton Regional Hospital) HFA, 5.00% due 12/1/2025 (pre-refunded 12/1/2024) | 500,000 | 572,945 |
| | Palm Beach County School District COP, Series C, 5.00% due 8/1/2028 | 595,000 | 760,624 |
| a | Sarasota County Public Hospital Board (Sarasota Memorial Hospital; Insured: Natl-Re), Series A, 3.147% (CPI + 2.05%) due 10/1/2021 | 2,000,000 | 2,056,080 |
| | School Board of Broward County (Educational Facilities and Equipment) COP, Series A, 5.00% due 7/1/2027 | 2,000,000 | 2,158,660 |
| | School Board of Broward County (Educational Facilities) COP, Series B, 5.00% due 7/1/2032 | 2,000,000 | 2,321,380 |
| | School District of Broward County COP, | | |
| | Series A, | | |
| | 5.00% due 7/1/2026 | 545,000 | 589,875 |
| | 5.00% due 7/1/2026 (pre-refunded 7/1/2022) | 2,455,000 | 2,655,475 |
| | School District of Manatee County (School Facilities Improvement; Insured: AGM), 5.00% due 10/1/2032 | 2,250,000 | 2,747,813 |
| | State of Florida GO, 4.00% due 7/1/2030 | 1,000,000 | 1,031,090 |
| | Sunshine State Governmental Finance Commission (Miami-Dade County Program), Series B-1-RMKT, 5.00% due 9/1/2028 | 3,500,000 | 3,907,785 |
| | Georgia — 2.7% | | |
| | Athens-Clarke County Unified Government Development Authority (UGAREF Bolton Commons, LLC), 5.00% due 6/15/2024 - 6/15/2028 | 2,320,000 | 2,593,359 |
| a | Athens-Clarke County Unified Government Development Authority (UGAREF Bolton Commons, LLC; SPA Wells Fargo Bank), 0.78% due 7/1/2035 (put 4/1/2020) | 500,000 | 500,000 |
| | City of Atlanta (Water & Wastewater System; Insured: Natl-Re), Series A, 5.50% due 11/1/2022 | 530,000 | 566,247 |
| | Clarke County Hospital Authority (Athens Regional Medical Center), 5.00% due 1/1/2023 - 1/1/2026 (pre-refunded 1/1/2022) | 5,620,000 | 5,998,169 |
| | Main Street Natural Gas, Inc., Series A, 5.00% due 5/15/2035 - 5/15/2037 | 11,170,000 | 12,681,229 |
| | Municipal Electric Authority of Georgia, Series A, 5.00% due 1/1/2035 - 1/1/2038 | 4,340,000 | 5,001,600 |
| | Guam — 0.8% | | |
| | Guam Power Authority (Electric Power System; Insured: AGM), Series A, 5.00% due 10/1/2023 - 10/1/2025 | 6,500,000 | 6,711,240 |
| | Guam Waterworks Authority (Water and Wastewater System), 5.25% due 7/1/2024 | 1,000,000 | 1,036,060 |
| | Hawaii — 1.3% | | |
| | County of Hawaii GO, Series A, 5.00% due 9/1/2033 | 1,250,000 | 1,491,137 |
| | State of Hawaii Airports System Revenue, Series A, 5.00% due 7/1/2034 | 945,000 | 951,936 |
| | State of Hawaii GO, | | |
| | Series DZ, 5.00% due 12/1/2027 (pre-refunded 12/1/2021) | 3,635,000 | 3,866,186 |
| | Series DZ-2016, 5.00% due 12/1/2027 (pre-refunded 12/1/2021) | 6,365,000 | 6,776,338 |
| | Illinois — 10.4% | | |
| | Chicago O’Hare International Airport (2016 Airport Projects), Series C, 5.00% due 1/1/2029 - 1/1/2030 | 1,765,000 | 2,010,653 |
| | Chicago O’Hare International Airport (2017 Airport Projects), Series B, 5.00% due 1/1/2034 - 1/1/2037 | 8,160,000 | 9,304,586 |
| | Chicago Park District (Capital Improvement Plan) GO, | | |
| | Series A, 5.00% due 1/1/2027 - 1/1/2029 | 3,940,000 | 4,243,489 |
| | Series B, 5.00% due 1/1/2025 - 1/1/2030 | 4,500,000 | 4,841,910 |
| | Series D, 5.00% due 1/1/2028 | 3,450,000 | 3,715,926 |
| | City of Chicago (Midway Airport), | | |
| | Series B, | | |
| | 5.00% due 1/1/2032 - 1/1/2033 | 9,805,000 | 10,892,804 |
| | 5.25% due 1/1/2034 | 4,700,000 | 5,129,862 |
| | City of Chicago (Wastewater Transmission System), Series C-2-RMKT, 5.00% due 1/1/2028 - 1/1/2029 | 7,865,000 | 9,041,241 |
| | City of Chicago (Wastewater Transmission System; Insured: AGM), Series B-AGM-CR, 5.00% due 1/1/2034 | 1,375,000 | 1,633,473 |
| | City of Chicago (Water System), Series A-1, 5.00% due 11/1/2024 | 1,000,000 | 1,123,220 |
48 | Thornburg Municipal Funds Semi-Annual Report
| See notes to financial statements. |
Schedule of Investments, Continued
Thornburg Intermediate Municipal Fund | March 31, 2020 (Unaudited)
| | Issuer-Description | PRINCIPAL
AMOUNT | VALUE |
| | City of Chicago (Water System; Insured: AGM), Series 2017-2, 5.00% due 11/1/2037 | $ 4,250,000 | $ 5,011,387 |
| | City of Chicago (Water System; Insured: BHAC-CR AMBAC), 5.75% due 11/1/2030 | 1,270,000 | 1,610,487 |
| | City of Mount Vernon (Various Municipal Capital Improvements; Insured: AGM) GO, 4.00% due 12/15/2025 | 1,900,000 | 1,934,390 |
| | Cook County GO, Series A, 5.25% due 11/15/2024 | 3,000,000 | 3,027,570 |
| | Cook County School District No. 104 (Argo Summit Elementary School Facilities; Insured: AGM) GO ETM, Series D, Zero Coupon due 12/1/2022 | 2,000,000 | 1,932,140 |
| | Illinois (Midwest Care Center I, Inc.; Collateralized: GNMA) HFA, 5.70% due 2/20/2021 | 95,000 | 95,170 |
| | Illinois Finance Authority (Rush University Medical Center), Series A, 5.00% due 11/15/2033 | 1,000,000 | 1,135,800 |
| | Illinois Finance Authority (Silver Cross Hospital and Medical Centers), 5.00% due 8/15/2024 | 1,000,000 | 1,133,210 |
| | Illinois Toll Highway Authority (Move Illinois Program), Series A, 5.00% due 1/1/2037 | 5,550,000 | 6,343,095 |
| | Knox & Warren Counties Community Unit School District No. 205 Galesburg GO, Series B, 5.00% due 12/1/2030 - 12/1/2031 | 2,655,000 | 3,310,551 |
| | Metropolitan Pier & Exposition Authority (McCormick Place Expansion Project), Series B, 5.00% due 12/15/2022 | 1,000,000 | 1,015,160 |
| | Monroe and St. Clair Counties (Community Unit School District No. 5; Insured: BAM) GO, 5.00% due 4/15/2027 - 4/15/2031 | 6,285,000 | 7,479,521 |
| | Regional Transportation Authority (Insured: Natl-Re), Series A, 6.00% due 7/1/2031 | 1,070,000 | 1,443,130 |
| | Sales Tax Securitization Corp., Series A, 5.00% due 1/1/2029 | 2,000,000 | 2,298,820 |
| | State of Illinois, Series B, 5.00% due 6/15/2030 - 6/15/2032 | 12,165,000 | 12,392,232 |
| | State of Illinois GO, Series D, 5.00% due 11/1/2028 | 2,250,000 | 2,335,680 |
| | Tazewell County School District (Insured: Natl-Re) GO, 9.00% due 12/1/2024 | 1,205,000 | 1,591,299 |
| | Indiana — 3.0% | | |
| | Board of Trustees for the Vincennes University, Series J, 5.375% due 6/1/2022 | 895,000 | 901,032 |
| | City of Carmel Redevelopment Authority (Performing Arts Center) GO, Zero Coupon due 2/1/2021 | 2,000,000 | 1,977,780 |
| | City of Carmel Redevelopment District (Performing Arts Center) COP, Series C, 6.50% due 7/15/2035 (pre-refunded 1/15/2021) | 2,730,000 | 2,842,149 |
| a | City of Whiting Environmental Facilities (BP Products North America Inc. Project) AMT, Series A, 5.00% due 3/1/2046 (put 3/1/2023) | 1,000,000 | 1,049,100 |
| | Indiana (Ascension Health Credit Group) HFFA, 5.00% due 11/15/2034 - 11/15/2036 | 8,325,000 | 9,575,548 |
| | Indiana Bond Bank (Hendricks Regional Health Financing Program; Insured: AMBAC), Series A, 5.25% due 4/1/2023 | 2,000,000 | 2,215,860 |
| | Indiana Bond Bank (Natural Gas Utility Improvements), Series A, 5.25% due 10/15/2020 | 5,340,000 | 5,429,445 |
| a | Indiana Finance Authority (Franciscan Alliance, Inc. Obligated Group; LOC Barclays Bank Plc), 0.85% due 11/1/2037 (put 4/1/2020) | 600,000 | 600,000 |
| | Indiana Finance Authority (Marian University), 5.25% due 9/15/2022 - 9/15/2023 (pre-refunded 9/15/2021) | 5,085,000 | 5,394,371 |
| a | Indiana Finance Authority (Marion County Capital Improvement Board; SPA Wells Fargo Bank, N.A.), 0.74% due 2/1/2037 (put 4/1/2020) | 525,000 | 525,000 |
| | Indiana Finance Authority (Sisters of St. Francis Health Services, Inc.), 5.00% due 11/1/2021 | 605,000 | 606,906 |
| | Iowa — 0.4% | | |
| | Iowa Finance Authority (UnityPoint Health), Series C, 5.00% due 2/15/2030 - 2/15/2032 | 4,100,000 | 4,586,353 |
| | Kansas — 0.1% | | |
| | Unified Government of Wyandotte County/Kansas City (School Improvement Project; Insured: AGM) USD GO, Series A, 5.00% due 9/1/2030 - 9/1/2031 | 640,000 | 792,793 |
| | Kentucky — 0.9% | | |
| a | Kentucky Public Energy Authority, Series A, 4.00% due 4/1/2048 (put 4/1/2024) | 6,500,000 | 6,717,360 |
| | Louisville/Jefferson County Metropolitan Government (Norton Suburban Hospital and Kosair Children’s Hospital), Series A, 5.25% due 10/1/2026 | 2,320,000 | 2,613,457 |
| | Louisiana — 2.3% | | |
| | East Baton Rouge Sewerage Commission, Series B, 5.00% due 2/1/2030 - 2/1/2032 | 6,825,000 | 7,949,906 |
| | Jefferson Sales Tax District (Insured: AGM), Series B, 5.00% due 12/1/2034 - 12/1/2035 | 1,500,000 | 1,845,095 |
| | Louisiana Energy and Power Authority (LEPA Unit No. 1; Insured: AGM), Series A, 5.25% due 6/1/2029 - 6/1/2031 | 6,100,000 | 6,806,245 |
| | New Orleans Regional Transit Authority (Insured: AGM), 5.00% due 12/1/2023 - 12/1/2024 | 2,000,000 | 2,050,200 |
| | Parish of Lafourche (Roads, Highways and Bridges), 5.00% due 1/1/2024 - 1/1/2025 | 3,685,000 | 4,258,153 |
| a | Parish of St. Charles (Valero Energy Corp. Refinery), 4.00% due 12/1/2040 (put 6/1/2022) | 1,000,000 | 1,010,560 |
| | Maryland — 0.0% | | |
| | Montgomery County GO, Series C, 5.00% due 10/1/2025 | 365,000 | 438,858 |
| | Massachusetts — 1.8% | | |
| | Massachusetts (Insured: BHAC-CR FGIC), 5.50% due 1/1/2029 | 8,370,000 | 10,976,000 |
| | Massachusetts Bay Transportation Authority (Transportation Capital Program), Series A, 5.25% due 7/1/2030 | 1,000,000 | 1,352,280 |
| | Massachusetts Development Finance Agency (CareGroup Healthcare System), Series I, 5.00% due 7/1/2036 | 1,750,000 | 2,026,500 |
| | Massachusetts Development Finance Agency (Simmons College), Series J, 5.50% due 10/1/2025 - 10/1/2028 | 1,790,000 | 2,002,174 |
| a | Massachusetts Development Finance Agency (Tufts University; SPA U.S. Bank, N.A.), Series R 0.80% due 8/15/2048 (put 4/1/2020) | 600,000 | 600,000 |
| | Massachusetts Educational Financing Authority (Higher Education Student Loans), Series A, 5.50% due 1/1/2022 | 1,130,000 | 1,131,288 |
| a | Massachusetts Health & Educational Facilities Authority (Baystate Medical Obligated Group; LOC TD Bank N.A.), Series J-2-R, 0.75% due 7/1/2044 (put 4/1/2020) | 750,000 | 750,000 |
| | Michigan — 3.0% | | |
| | Board of Governors of Wayne State University (Educational Facilities and Equipment), Series A, 5.00% due 11/15/2031 | 1,010,000 | 1,161,278 |
| | City of Troy (Downtown Development Authority-Community Center Facilities) GO, 5.00% due 11/1/2025 | 300,000 | 318,192 |
| | County of Genesee (Water Supply System; Insured: BAM) GO, | | |
| | 5.00% due 11/1/2024 - 11/1/2030 | 3,360,000 | 3,702,532 |
| | 5.125% due 11/1/2032 | 750,000 | 827,438 |
| | 5.25% due 11/1/2026 - 11/1/2028 | 2,920,000 | 3,241,941 |
See notes to financial statements.
| Thornburg Municipal Funds Semi-Annual Report | 49 |
Schedule of Investments, Continued
Thornburg Intermediate Municipal Fund | March 31, 2020 (Unaudited)
| | Issuer-Description | PRINCIPAL
AMOUNT | VALUE |
| | Detroit City School District (School Building & Site Improvement; Insured: AGM Q-SBLF) GO, Series A, 5.25% due 5/1/2026 | $ 3,150,000 | $ 3,789,922 |
| | Detroit City School District (School Building & Site; Insured: AGM Q-SBLF) GO, Series A, 5.25% due 5/1/2027 | 1,100,000 | 1,364,979 |
| | Kalamazoo Hospital Finance Authority (Bronson Healthcare), | | |
| | 5.25% due 5/15/2026 | 175,000 | 182,179 |
| | 5.25% due 5/15/2026 (pre-refunded 5/15/2021) | 1,110,000 | 1,160,205 |
| | Kalamazoo Hospital Finance Authority (Bronson Healthcare; Insured: AGM), 5.00% due 5/15/2022 | 1,105,000 | 1,110,072 |
| | Michigan Finance Authority (Government Loan Program), Series F, 5.00% due 4/1/2026 | 1,580,000 | 1,665,067 |
| | Michigan Finance Authority (McLaren Health System), Series A, 5.00% due 2/15/2039 | 3,200,000 | 3,929,856 |
| | Michigan Public School Academy (Will Carleton Charter School), 8.00% due 8/1/2035 | 845,000 | 845,008 |
| | Michigan State Housing Development Authority, Series B, 2.95% due 12/1/2039 | 7,000,000 | 7,110,600 |
| | Minnesota — 0.6% | | |
| | Minnesota Higher Education Facilities Authority, (University of St. Thomas), 5.00% due 10/1/2034 - 10/1/2035 | 600,000 | 713,844 |
| | Minnesota Housing Finance Agency (Collateralized: GNMA, FNMA, FHLMC), | | |
| | Series F, | | |
| | 2.45% due 7/1/2034 | 2,765,000 | 2,769,452 |
| | 2.55% due 7/1/2039 | 2,235,000 | 2,191,864 |
| | Mississippi — 1.1% | | |
| a | Jackson County (Chevron Corp.), 0.65% due 6/1/2023 (put 4/1/2020) | 900,000 | 900,000 |
| | Mississippi Development Bank (Department of Corrections), Series D, 5.25% due 8/1/2027 (pre-refunded 8/1/2020) | 3,415,000 | 3,458,917 |
| | Mississippi Development Bank (Jackson Public School District; Insured BAM) GO, 5.25% due 10/1/2037 - 10/1/2038 | 5,250,000 | 6,506,495 |
| | Mississippi Development Bank (Vicksburg Warren School District; Insured: BAM), 5.50% due 3/1/2038 | 700,000 | 890,008 |
| | Missouri — 0.3% | | |
| | City of Excelsior Springs (Insured: BAM) COP, Series B 4.00% due 3/1/2031 | 150,000 | 180,495 |
| | Missouri Health and Educational Facilities Authority (Webster University) ETM, 5.00% due 4/1/2021 | 2,520,000 | 2,616,692 |
| | Nebraska — 0.9% | | |
| a | Central Plains Energy Project, 5.00% due 3/1/2050 (put 1/1/2024) | 8,350,000 | 8,884,317 |
| | Nevada — 1.3% | | |
| | Carson City (Carson Tahoe Regional Healthcare), 5.00% due 9/1/2027 - 9/1/2032 | 3,180,000 | 3,514,087 |
| | Washoe County (Reno Sparks Convention & Visitors Authority) GO, 5.00% due 7/1/2026 - 7/1/2032 (pre-refunded 7/1/2021) | 7,095,000 | 7,439,332 |
| | Washoe County NV GO, 5.00% due 7/1/2032 (pre-refunded 7/1/2021) | 1,905,000 | 1,997,390 |
| | New Hampshire — 0.6% | | |
| | New Hampshire Municipal Bond Bank, Series C, 5.00% due 8/15/2026 | 1,860,000 | 2,085,730 |
| | State of New Hampshire (Turnpike System), Series B, 5.00% due 2/1/2022 - 2/1/2024 | 4,005,000 | 4,278,397 |
| | New Jersey — 3.6% | | |
| | Cape May County Industrial Pollution Control Financing Authority (Atlantic City Electric Company; Insured: Natl-Re), Series A, 6.80% due 3/1/2021 | 675,000 | 707,596 |
| | Essex County Improvement Authority (County Correctional Facilities & Gibraltar Facilities; Insured: Natl-Re) GO, 5.50% due 10/1/2024 | 2,500,000 | 2,974,375 |
| | New Jersey (School Facilities Construction) EDA, 5.00% due 3/1/2026 - 6/15/2038 | 6,515,000 | 6,914,758 |
| | New Jersey (School Facilities Construction; Insured: AMBAC) EDA, Series N-1, 5.50% due 9/1/2026 | 3,000,000 | 3,356,730 |
| | New Jersey (School Facilities Construction; Insured: Natl-Re) EDA, Series N-1, 5.50% due 9/1/2027 | 1,700,000 | 1,925,573 |
| | New Jersey (Transit Corp.) EDA, 5.00% due 11/1/2036 | 2,950,000 | 3,150,275 |
| a | New Jersey State Health Care Facilities Financing Authority (Virtua Health Obligated Group; LOC JPMorgan Chase Bank, N.A), Series B 0.50% due 7/1/2043 (put 4/1/2020) | 1,080,000 | 1,080,000 |
| | New Jersey State Health Care Facilities Financing Authority (Virtua Health), 5.00% due 7/1/2027 - 7/1/2028 | 3,000,000 | 3,387,920 |
| | New Jersey Transportation Trust Fund Authority, Series A, 5.00% due 12/15/2032 | 485,000 | 523,402 |
| | New Jersey Transportation Trust Fund Authority (State Transportation System Improvements), 5.00% due 6/15/2023 - 6/15/2031 | 3,500,000 | 3,796,415 |
| | New Jersey Transportation Trust Fund Authority (Transportation System), Series A, 5.00% due 12/15/2034 - 12/15/2036 | 5,500,000 | 5,846,205 |
| | Passaic Valley Sewage Commissioners GO, Series G, 5.75% due 12/1/2022 | 3,000,000 | 3,331,890 |
| | New Mexico — 1.1% | | |
| | City of Farmington (Arizona Public Service Co.-Four Corners Project), Series B, 4.70% due 9/1/2024 | 3,000,000 | 3,046,560 |
| | City of Las Cruces (NMFA Loan), 5.00% due 6/1/2030 | 2,040,000 | 2,053,015 |
| | New Mexico Hospital Equipment Loan Council (Haverland Carter Lifestyle Group), 5.00% due 7/1/2032 | 2,130,000 | 2,143,334 |
| | New Mexico Hospital Equipment Loan Council (Presbyterian Healthcare Services Obligated Group), Series A, 5.00% due 8/1/2035 - 8/1/2039 | 3,090,000 | 3,835,394 |
| | New York — 4.9% | | |
| | City of New York (City Budget Financial Management) GO, | | |
| | Series G, 5.00% due 8/1/2027 | 4,530,000 | 5,151,878 |
| | Series J, 5.00% due 8/1/2030 - 8/1/2031 | 9,000,000 | 10,335,610 |
| a | City of New York (SPA JPMorgan Chase Bank, N.A) GO, Series 1-SUBSER I-2 0.75% due 3/1/2040 (put 4/1/2020) | 1,530,000 | 1,530,000 |
| | County of Nassau (Insured: BAM) GO, Series B, 5.00% due 4/1/2026 | 1,300,000 | 1,450,306 |
| | Erie County Industrial Development Agency (City of Buffalo School District) (State Aid Withholding), Series A, 5.00% due 5/1/2027 | 5,000,000 | 5,515,000 |
| | Metropolitan Transportation Authority (Green Bond), | | |
| | Series A2, 5.00% due 11/15/2025 | 7,500,000 | 8,132,400 |
50 | Thornburg Municipal Funds Semi-Annual Report
| See notes to financial statements. |
Schedule of Investments, Continued
Thornburg Intermediate Municipal Fund | March 31, 2020 (Unaudited)
| | Issuer-Description | PRINCIPAL
AMOUNT | VALUE |
| | Series C-1, 5.00% due 11/15/2030 | $ 8,500,000 | $ 9,722,300 |
| a | New York City Water & Sewer System (SPA JPMorgan Chase Bank, N.A), 0.75% due 6/15/2050 (put 4/1/2020) | 540,000 | 540,000 |
| a | New York City Water & Sewer System (SPA Mizuho Bank, Ltd.), 0.75% due 6/15/2048 (put 4/1/2020) | 3,000,000 | 3,000,000 |
| | New York State Dormitory Authority (Metropolitan Transportation Authority & State Urban Development Corp.), Series A, 5.00% due 12/15/2027 | 2,500,000 | 2,738,600 |
| | New York State Dormitory Authority (State of New York Personal Income Tax Revenue), Series D, 4.00% due 2/15/2040 | 1,000,000 | 1,140,220 |
| | New York State Dormitory Authority (State University Educational Facilities), Series A, 5.25% due 5/15/2021 | 500,000 | 512,705 |
| a | Triborough Bridge and Tunnel Authority (LOC Citibank N.A.), Series B-2, 0.70% due 1/1/2032 (put 4/1/2020) | 600,000 | 600,000 |
| | North Carolina — 1.2% | | |
| | Charlotte-Mecklenburg Hospital Authority (Carolinas HealthCare System), Series A, 5.00% due 1/15/2028 | 2,190,000 | 2,390,254 |
| | North Carolina Medical Care Commission (Vidant Health), 5.00% due 6/1/2030 | 3,000,000 | 3,498,750 |
| | State of North Carolina, 5.00% due 3/1/2033 | 5,000,000 | 6,310,550 |
| | Ohio — 5.8% | | |
| | Akron, Bath and Copley Joint Township Hospital District (Children’s Hospital Medical Center of Akron), 5.00% due 11/15/2024 | 1,000,000 | 1,068,380 |
| | American Municipal Power, Inc. (AMP Fremont Energy Center), Series B, 5.25% due 2/15/2028 (pre-refunded 2/15/2022) | 4,000,000 | 4,302,400 |
| | Cincinnati City School District (School Improvement Project) COP, 5.00% due 12/15/2031 | 3,075,000 | 3,522,320 |
| | City of Cleveland (Bridges and Roadways), Series A-2, 5.00% due 10/1/2028 - 10/1/2029 (pre-refunded 10/1/2023) | 2,520,000 | 2,855,336 |
| | City of Cleveland (Public Facilities Improvements), | | |
| | Series A-1, 5.00% due 11/15/2027 - 11/15/2030 (pre-refunded 11/15/2023) | 5,185,000 | 5,898,560 |
| | Series B1, 5.00% due 10/1/2029 | 1,500,000 | 1,876,065 |
| | City of Cleveland (Various Municipal Capital Improvements) GO, 5.00% due 12/1/2024 | 1,000,000 | 1,097,450 |
| | City of Cleveland GO, | | |
| | 5.00% due 12/1/2026 | 15,000 | 16,445 |
| | 5.00% due 12/1/2026 (pre-refunded 12/1/2022) | 1,215,000 | 1,340,728 |
| | City of Cleveland Income Tax Revenue, 5.00% due 10/1/2033 - 10/1/2035 | 1,450,000 | 1,784,834 |
| | Cleveland-Cuyahoga County Port Authority (Cleveland Museum of Art), 5.00% due 10/1/2021 | 2,040,000 | 2,079,760 |
| | Cleveland-Cuyahoga County Port Authority (County Administration Offices), 5.00% due 7/1/2025 | 1,780,000 | 2,080,624 |
| | County of Allen (Catholic Health Partners-Mercy Health West Facility), Series A, 5.00% due 5/1/2025 - 5/1/2026 | 8,325,000 | 8,912,851 |
| | County of Cuyahoga (Convention Center Hotel) COP, 5.00% due 12/1/2026 | 2,910,000 | 3,310,794 |
| | County of Cuyahoga (Musical Arts Association), 5.00% due 1/1/2030 - 1/1/2039 | 3,170,000 | 3,800,879 |
| | County of Hamilton (Cincinnati Children’s Hospital Medical Center), 5.00% due 5/15/2028 - 5/15/2031 | 8,085,000 | 9,227,158 |
| | Deerfield Township (Public Street Improvements-Wilkens Blvd.), 5.00% due 12/1/2025 | 840,000 | 842,486 |
| | Greene County Vocational School District (School Facilities Construction and Improvement) GO, 5.00% due 12/1/2030 - 12/1/2033 | 2,580,000 | 3,272,888 |
| | Lucas County Health Care Facility (Sunset Retirement Community), | | |
| | 5.00% due 8/15/2021 | 505,000 | 518,186 |
| | 5.125% due 8/15/2025 | 1,350,000 | 1,400,854 |
| | Oklahoma — 0.3% | | |
| | Oklahoma (INTEGRIS Health) DFA, Series A, 5.00% due 8/15/2026 - 8/15/2027 | 2,230,000 | 2,634,479 |
| | Pennsylvania — 8.4% | | |
| | Allegheny County (Propel Charter School-McKeesport) IDA, | | |
| | Series C, | | |
| | 5.90% due 8/15/2026 | 685,000 | 691,624 |
| | 6.375% due 8/15/2035 | 1,130,000 | 1,140,543 |
| | Allegheny County Hospital Development Authority (University of Pittsburgh Medical Center), Series A, 5.00% due 7/15/2034 | 1,150,000 | 1,444,216 |
| | Bucks County (Waste Management, Inc.) AMT, IDA, Series A-2-RMKT, 2.75% due 12/1/2022 | 7,000,000 | 6,964,230 |
| | City of Philadelphia (Pennsylvania Gas Works), 5.00% due 8/1/2032 - 8/1/2034 | 2,300,000 | 2,650,491 |
| | City of Philadelphia (Philadelphia Gas Works), 5.00% due 8/1/2036 - 8/1/2037 | 5,485,000 | 6,552,473 |
| | City of Philadelphia (Water and Wastewater System), 5.00% due 10/1/2029 - 10/1/2030 | 3,510,000 | 4,163,526 |
| | City of Pittsburgh (Capital Projects) GO, 5.00% due 9/1/2035 - 9/1/2036 | 1,215,000 | 1,470,800 |
| | County of Luzerne (Insured: AGM) GO, Series A, 5.00% due 11/15/2029 | 3,000,000 | 3,501,900 |
| | Dallastown Area School District (State Aid Withholding) GO, Series A, 4.00% due 5/1/2021 | 460,000 | 473,933 |
| a | Hospitals & Higher Education Facilities Authority of Philadelphia (SPA Wells Fargo Bank, N.A.), 0.75% due 7/1/2022 (put 4/1/2020) | 1,300,000 | 1,300,000 |
| | Lancaster County Solid Waste Management Authority (Acquisition of Susquehanna Resource Management Facility), Series A, 5.25% due 12/15/2030 | 3,000,000 | 3,407,010 |
| | Monroeville Financing Authority (University of Pittsburgh Medical Center), 5.00% due 2/15/2026 | 3,490,000 | 4,180,357 |
| | Pennsylvania Higher Educational Facilities Authority (Insured: AMBAC), Series 14, Zero Coupon due 7/1/2020 | 2,032,839 | 2,004,196 |
| | Pennsylvania State Public School Building Authority (Philadelphia School District; Insured: AGM) (State Aid Withholding) GO, Series B, 5.00% due 6/1/2027 | 5,000,000 | 6,083,400 |
| | Pennsylvania Turnpike Commission (Highway Improvements), | | |
| | Series A, 5.35% due 12/1/2030 (pre-refunded 12/1/2020) | 1,540,000 | 1,581,796 |
| | Series A-1, 5.00% due 12/1/2035 - 12/1/2036 | 1,750,000 | 2,132,357 |
| | Series C-2, 5.35% due 12/1/2030 (pre-refunded 12/1/2020) | 2,460,000 | 2,526,765 |
| | Philadelphia Authority for Industrial Development (Thomas Jefferson University), Series A, 5.00% due 9/1/2032 - 9/1/2034 | 5,685,000 | 6,522,648 |
| | Philadelphia Municipal Authority (Juvenile Justice Services Center), 5.00% due 4/1/2032 - 4/1/2036 | 11,125,000 | 13,301,402 |
See notes to financial statements.
| Thornburg Municipal Funds Semi-Annual Report | 51 |
Schedule of Investments, Continued
Thornburg Intermediate Municipal Fund | March 31, 2020 (Unaudited)
| | Issuer-Description | PRINCIPAL
AMOUNT | VALUE |
| | Pittsburgh Water & Sewer Authority (Water and Sewer System; Insured: AGM), | | |
| | Series A, 5.00% due 9/1/2030 - 9/1/2031 | $ 8,740,000 | $ 9,725,608 |
| | Series B, 5.00% due 9/1/2031 (pre-refunded 9/1/2023) | 3,665,000 | 4,128,146 |
| | Rhode Island — 0.5% | | |
| | State of Rhode Island and Providence Plantations (Consolidated Capital Development Loan) GO, Series B, 4.00% due 10/15/2023 | 800,000 | 853,736 |
| | State of Rhode Island and Providence Plantations (Training School Project) COP, Series B, 5.00% due 10/1/2024 | 3,595,000 | 4,017,161 |
| | South Carolina — 0.2% | | |
| | City of Myrtle Beach (Municipal Sports Complex), Series B, 5.00% due 6/1/2028 - 6/1/2030 | 2,000,000 | 2,281,350 |
| | South Dakota — 0.4% | | |
| | South Dakota Health and Educational Facilities Authority (Avera Health), Series A, 5.00% due 7/1/2023 (pre-refunded 7/1/2021) | 1,575,000 | 1,646,426 |
| | South Dakota Health and Educational Facilities Authority (Sanford Health), 5.00% due 11/1/2028 - 11/1/2029 | 1,800,000 | 2,118,346 |
| | Tennessee — 2.0% | | |
| | County of Shelby Health, Educational and Housing Facility Board (Methodist Le Bonheur Healthcare), 5.00% due 5/1/2027 - 5/1/2035 | 3,560,000 | 4,310,397 |
| | Metropolitan Government of Nashville and Davidson County (Green Projects), Series B, 5.00% due 7/1/2033 - 7/1/2036 | 3,000,000 | 3,643,360 |
| | Tennessee Energy Acquisition Corp. (The Gas Project), | | |
| | Series A, | | |
| a | 4.00% due 5/1/2048 (put 5/1/2023) | 1,850,000 | 1,895,029 |
| | 5.25% due 9/1/2023 | 7,000,000 | 7,484,540 |
| | Series C, 5.00% due 2/1/2023 | 2,500,000 | 2,622,525 |
| | Texas — 8.2% | | |
| | City of Dallas (Public Improvements) GO, 5.00% due 2/15/2025 - 2/15/2034 | 9,720,000 | 11,237,144 |
| | City of Dallas (Trinity River Corridor Infrastructure) GO, 5.00% due 2/15/2028 | 1,000,000 | 1,129,320 |
| | City of Galveston (Galveston Island Convention Center; Insured: AGM), | | |
| | Series A, 5.00% due 9/1/2021 | 545,000 | 571,896 |
| | Series B, 5.00% due 9/1/2024 | 1,115,000 | 1,208,627 |
| | City of Houston (Convention & Entertainment Facilities), 5.00% due 9/1/2032 | 3,560,000 | 4,019,347 |
| | City of Houston (Public Improvements) GO, Series A, 5.00% due 3/1/2027 | 1,175,000 | 1,405,335 |
| | City of Houston Airport System Revenue, Series D, 5.00% due 7/1/2030 | 2,000,000 | 2,416,240 |
| | City of McAllen (International Toll Bridge; Insured: AGM), Series A, 5.00% due 3/1/2028 - 3/1/2032 | 6,120,000 | 7,199,579 |
| | City of San Antonio (Airport System Capital Improvements) AMT, 5.00% due 7/1/2024 - 7/1/2025 | 3,225,000 | 3,430,561 |
| | City of San Antonio (Water System), Series A, 5.00% due 5/15/2033 - 5/15/2034 | 3,075,000 | 3,628,275 |
| | City of Texas City Industrial Development Corp. (ARCO Pipe Line Co. Project), 7.375% due 10/1/2020 | 2,705,000 | 2,770,569 |
| | Dallas Area Rapid Transit, Series A, 5.00% due 12/1/2035 - 12/1/2036 | 7,200,000 | 8,487,928 |
| | Dallas County Utility & Reclamation District GO, 5.00% due 2/15/2027 | 1,905,000 | 2,336,425 |
| a | Gulf Coast (Exxon Mobil Corp.) IDA, 0.65% due 11/1/2041 (put 4/1/2020) | 840,000 | 840,000 |
| | Harris County Cultural Education Facilities Finance Corp. (Memorial Hermann Health System), Series A, 5.00% due 12/1/2028 | 3,000,000 | 3,375,000 |
| | Harris County Cultural Education Facilities Finance Corp. (TECO Project), 5.00% due 11/15/2028 - 11/15/2033 | 2,225,000 | 2,732,022 |
| | Houston Airport System Revenue, Series D, 5.00% due 7/1/2035 | 1,750,000 | 2,085,965 |
| | Houston Higher Education Finance Corp. (Cosmos Foundation, Inc.), | | |
| | 6.50% due 5/15/2031 (pre-refunded 5/15/2021) | 360,000 | 381,229 |
| | Series S, 6.50% due 5/15/2031 (pre-refunded 5/15/2021) | 415,000 | 439,473 |
| | Lower Colorado River Authority, | | |
| | Series A, | | |
| | 5.00% due 5/15/2026 | 9,415,000 | 10,104,743 |
| | 5.00% due 5/15/2026 (pre-refunded 5/15/2022) | 55,000 | 59,360 |
| a | Lower Neches Valley Authority Industrial Development Corp., 0.70% due 11/1/2038 (put 4/1/2020) | 700,000 | 700,000 |
| | Metropolitan Transit Authority of Harris County, 5.00% due 11/1/2029 - 11/1/2030 | 4,040,000 | 5,165,214 |
| | North Texas Tollway Authority (NTTA System), Series A, 5.00% due 1/1/2037 | 1,750,000 | 2,088,292 |
| | San Antonio Water System, Series A, 5.00% due 5/15/2037 | 500,000 | 617,975 |
| | San Juan Higher Education Finance Authority (IDEA Public Schools), Series A, 5.75% due 8/15/2024 (pre-refunded 8/15/2020) | 1,590,000 | 1,616,378 |
| | Stephen F Austin State University (Financing System), Series A, 5.00% due 10/15/2030 - 10/15/2033 | 1,265,000 | 1,586,495 |
| | Texas Transportation Commission (Central Texas Turnpike System), Series C, 5.00% due 8/15/2024 - 8/15/2025 | 2,250,000 | 2,425,305 |
| | Utah — 0.4% | | |
| a | City of Murray (IHC Health Services, Inc. Obligated Group; SPA JPMorgan Chase Bank, N.A), Series A 0.75% due 5/15/2037 (put 4/1/2020) | 1,220,000 | 1,220,000 |
| a | County of Utah (IHC Health Services, Inc. Obligated Group), Series B-1, 5.00% due 5/15/2056 (put 8/1/2022) | 2,500,000 | 2,664,625 |
| | Washington — 4.4% | | |
| | King County Public Hospital District No. 2 (EvergreenHealth Medical Center) GO, 5.00% due 12/1/2028 - 12/1/2030 | 4,545,000 | 5,248,121 |
| | Port of Seattle AMT, 5.00% due 4/1/2039 | 4,000,000 | 4,614,440 |
| | Skagit County Public Hospital District No. 1 (Skagit Regional Health) GO, 5.00% due 12/1/2025 - 12/1/2028 (pre-refunded 12/1/2022) | 7,860,000 | 8,640,655 |
| | Skagit County Public Hospital District No. 2 (Island Hospital) GO, 5.00% due 12/1/2027 - 12/1/2028 (pre-refunded 12/1/2022) | 4,640,000 | 5,113,698 |
| | State of Washington (Acquisition and Improvements of Real and Personal Property) COP, Series A, 5.00% due 7/1/2030 | 4,415,000 | 5,362,900 |
52 | Thornburg Municipal Funds Semi-Annual Report
| See notes to financial statements. |
Schedule of Investments, Continued
Thornburg Intermediate Municipal Fund | March 31, 2020 (Unaudited)
| | Issuer-Description | PRINCIPAL
AMOUNT | VALUE |
| | State of Washington (Various Purposes) GO, | | |
| c | 5.00% due 6/1/2038 | $ 1,965,000 | $ 2,430,548 |
| | Series C, 5.00% due 2/1/2036 - 2/1/2037 | 7,425,000 | 9,317,527 |
| | Washington Higher Education Facilities Authority (Seattle Pacific University), 5.00% due 10/1/2038 - 10/1/2040 | 3,340,000 | 3,948,143 |
| | West Virginia — 0.1% | | |
| a | West Virginia (Appalachian Power Co.) AMT, EDA, Series A, 1.70% due 1/1/2041 (put 9/1/2020) | 1,500,000 | 1,495,680 |
| | Wisconsin — 2.2% | | |
| | Wisconsin Health & Educational Facilities Authority (Agnesian Healthcare), | | |
| | 5.00% due 7/1/2021 (pre-refunded 7/1/2020) | 2,170,000 | 2,190,073 |
| | 5.50% due 7/1/2025 (pre-refunded 7/1/2020) | 5,000,000 | 5,052,400 |
| | Wisconsin Health & Educational Facilities Authority (ProHealth Care, Inc.), 5.00% due 8/15/2023 - 8/15/2026 | 10,925,000 | 11,435,895 |
| | WPPI Energy, Series A, 5.00% due 7/1/2029 - 7/1/2036 | 2,980,000 | 3,711,913 |
| | Total Investments — 98.6%(Cost $958,092,887) | | $1,006,610,163 |
| | Other Assets Less Liabilities — 1.4% | | 14,382,275 |
| | Net Assets — 100.0% | | $1,020,992,438 |
| Footnote Legend |
| a | Variable, floating, step, or fixed to floating rate securities are securities for which interest rate changes are based on changes in a designated base rate or on a predetermined schedule. The rates shown are those in effect on March 31, 2020. |
| b | Segregated as collateral for a when-issued security. |
| c | When-issued security. |
Portfolio Abbreviations
To simplify the listings of securities, abbreviations are used per the table below:
| AGC | Insured by Assured Guaranty Corp. |
| AGM | Insured by Assured Guaranty Municipal Corp. |
| AMBAC | Insured by American Municipal Bond Assurance Corp. |
| AMT | Alternative Minimum Tax |
| BAM | Insured by Build America Mutual Insurance Co. |
| BHAC-CR | Berkshire Hathaway Assurance Corp. Custodial Receipts |
| COP | Certificates of Participation |
| CPI | Consumer Price Index |
| DFA | Development Finance Authority |
| EDA | Economic Development Authority |
| ETM | Escrowed to Maturity |
| FGIC | Insured by Financial Guaranty Insurance Co. |
| FHLMC | Insured by Federal Home Loan Mortgage Corp. |
| FNMA | Collateralized by Federal National Mortgage Association |
| GNMA | Collateralized by Government National Mortgage Association |
| GO | General Obligation |
| HFA | Health Facilities Authority |
| HFFA | Health Facilities Financing Authority |
| IDA | Industrial Development Authority |
| JEA | Jacksonville Electric Authority |
| LOC | Letter of Credit |
| Natl-Re | Insured by National Public Finance Guarantee Corp. |
| Q-SBLF | Insured by Qualified School Bond Loan Fund |
| SPA | Stand-by Purchase Agreement |
| USD | Unified School District |
See notes to financial statements.
| Thornburg Municipal Funds Semi-Annual Report | 53 |
Schedule of Investments
Thornburg Strategic Municipal Income Fund | March 31, 2020 (Unaudited)
| | Issuer-Description | PRINCIPAL
AMOUNT | VALUE |
| | Municipal Bonds — 99.1% | | |
| | Alabama — 2.2% | | |
| | Lower Alabama Gas District, Series A, 5.00% due 9/1/2034 | $2,000,000 | $ 2,375,440 |
| a | Selma Industrial Development Board (International Paper Co.), Series A, 2.00% due 11/1/2033 (put 10/1/2024) | 4,025,000 | 3,944,943 |
| | Arizona — 2.3% | | |
| | Arizona (Scottsdale Lincoln Hospitals) HFA , 5.00% due 12/1/2031 | 2,500,000 | 2,807,100 |
| a | County of Yavapai, (Waste Management, Inc.) AMT, IDA, 2.80% due 6/1/2027 (put 6/1/2021) | 1,500,000 | 1,512,675 |
| | Pima County (Providence Day School) IDA, 5.125% due 12/1/2040 | 710,000 | 717,533 |
| | Pinal County (Tucson Electric Power Co.) IDA, 4.00% due 9/1/2029 | 1,520,000 | 1,530,412 |
| | Arkansas — 0.4% | | |
| | University of Arkansas Board of Trustees (Fayetteville Campus), 5.00% due 11/1/2036 | 1,000,000 | 1,138,460 |
| | California — 8.5% | | |
| | ABAG Finance Authority for Nonprofit Corporations (Episcopal Senior Communities), 5.00% due 7/1/2047 | 1,635,000 | 1,704,635 |
| | Benicia (Benicia High School; Insured: AGM) USD GO, Series C, Zero Coupon due 8/1/2026 | 830,000 | 745,838 |
| | California (Children’s Hospital Los Angeles) HFFA, | | |
| | 5.00% due 11/15/2034 | 420,000 | 455,045 |
| | Series A, 5.00% due 8/15/2036 | 500,000 | 595,250 |
| | California (Community Program Developmental Disabilities; Insured: California Mtg Insurance) HFFA, 6.25% due 2/1/2026 | 1,500,000 | 1,564,185 |
| a | California Infrastructure and Economic Development Bank (Los Angeles County Museum of Art), Series A, 1.321% (LIBOR 1 Month + 0.65%) due 12/1/2050 (put 2/1/2021) | 1,000,000 | 1,001,430 |
| b | California Pollution Control Financing Authority (Poseidon Resources (Channelside) L.P. Desalination Project) AMT, 5.00% due 11/21/2045 | 1,000,000 | 978,720 |
| | Calipatria (Educational Facilities; Insured: ACA) USD GO, Series B, Zero Coupon due 8/1/2025 | 1,945,000 | 1,580,118 |
| | City of Moorpark Mobile Home Park (Villa Del Arroyo), Series A, 6.15% due 5/15/2031 | 1,000,000 | 1,045,190 |
| | City of Palm Springs Financing Authority (Downtown Revitalization Project), 5.25% due 6/1/2027 | 1,620,000 | 1,761,620 |
| | Corona-Norco (Insured: AGM) USD COP, Series A, 5.00% due 4/15/2031 | 1,750,000 | 1,752,520 |
| | County of El Dorado (El Dorado Hills Development-Community Facilities), 5.00% due 9/1/2026 | 630,000 | 688,092 |
| | Daly County Housing Development Finance Agency (Franciscan Country Club Mobile Home Park Acquisition), Series A, 5.25% due 12/15/2023 | 650,000 | 652,171 |
| | M-S-R Energy Authority, Series A, 6.50% due 11/1/2039 | 1,245,000 | 1,739,887 |
| a | Northern California Energy Authority (Commodity Supply Revenue), Series A, 4.00% due 7/1/2049 (put 7/1/2024) | 2,000,000 | 2,074,460 |
| | Oakland (County of Alameda Educational Facilities) USD GO, Series A, 5.00% due 8/1/2035 | 1,000,000 | 1,157,460 |
| | Redwood City Redevelopment Agency (Redevelopment Project Area 2; Insured: AMBAC), Zero Coupon due 7/15/2021 | 1,285,000 | 1,262,333 |
| | Riverside County Asset Leasing Corp. (Riverside County Hospital; Insured: Natl-Re), Zero Coupon due 6/1/2021 | 535,000 | 527,446 |
| | San Francisco City & County Redevelopment Financing Authority (Mission Bay North Redevelopment), Series C, 6.75% due 8/1/2041 (pre-refunded 2/1/2021) | 500,000 | 523,195 |
| | San Francisco City & County Redevelopment Financing Authority (Redevelopment Project; Insured: Natl-Re), Zero Coupon due 8/1/2023 | 1,025,000 | 977,307 |
| | San Jose Redevelopment Agency (Merged Area Redevelopment), 5.50% due 8/1/2035 (pre-refunded 8/1/2020) | 1,000,000 | 1,014,530 |
| | Union Elementary School District (Santa Clara County District Schools; Insured: Natl-Re) GO, Series D, Zero Coupon due 9/1/2027 | 905,000 | 799,115 |
| | Colorado — 1.1% | | |
| | Denver Convention Center Hotel Authority, 5.00% due 12/1/2028 | 1,000,000 | 1,039,720 |
| | Public Authority for Colorado Energy (Natural Gas Purchase), 6.50% due 11/15/2038 | 260,000 | 368,095 |
| | Regional Transportation District (FasTracks Transportation System) COP, | | |
| | Series A, | | |
| | 5.00% due 6/1/2044 | 565,000 | 618,099 |
| | 5.375% due 6/1/2031 (pre-refunded 6/1/2020) | 500,000 | 503,330 |
| | Wild Plum Metropolitan District GO, Series A, 5.00% due 12/1/2049 | 595,000 | 617,729 |
| | Connecticut — 4.6% | | |
| | City of New Haven (Insured: AGM) GO, Series B, 5.00% due 2/1/2026 - 2/1/2030 | 2,620,000 | 3,059,264 |
| a | Connecticut State Health & Educational Facilities Authority (Yale University), Series V-2, 0.60% due 7/1/2036 (put 4/1/2020) | 3,800,000 | 3,800,000 |
| | State of Connecticut GO, | | |
| | Series A, 5.00% due 4/15/2035 | 2,000,000 | 2,391,220 |
| | Series E, 5.00% due 9/15/2033 | 1,350,000 | 1,634,904 |
| | University of Connecticut (Insured: AGM-CR), Series A, 5.00% due 4/15/2028 | 1,975,000 | 2,474,675 |
| | Delaware — 0.4% | | |
| | Delaware (Nanticoke Memorial Hospital) HFA, 5.00% due 7/1/2021 | 1,000,000 | 1,035,510 |
| | District of Columbia — 0.4% | | |
| | Metropolitan Washington Airports Authority (Dulles Toll Road; Insured: AGC), Series B, Zero Coupon due 10/1/2027 | 1,500,000 | 1,294,170 |
| | Florida — 3.7% | | |
| | Broward County (Airport System Improvements) AMT, 5.00% due 10/1/2037 | 1,000,000 | 1,142,310 |
| b | Charlotte County (Town & Country Utilities Projects) IDA, AMT, 5.00% due 10/1/2029 | 500,000 | 545,230 |
| | Florida Higher Educational Facilities Financing Authority (Nova Southeastern University), 5.00% due 4/1/2027 - 4/1/2028 | 2,250,000 | 2,492,692 |
| | Miami-Dade County Expressway Authority (Toll System Five-Year Work Program), Series A, 5.00% due 7/1/2022 - 7/1/2024 | 1,250,000 | 1,387,506 |
54 | Thornburg Municipal Funds Semi-Annual Report
| See notes to financial statements. |
Schedule of Investments, Continued
Thornburg Strategic Municipal Income Fund | March 31, 2020 (Unaudited)
| | Issuer-Description | PRINCIPAL
AMOUNT | VALUE |
| | Miami-Dade County School Board (District School Facilities and Infrastructure) COP, Series A, 5.00% due 8/1/2027 | $1,100,000 | $ 1,189,837 |
| | Orange County (Tourist Development), Series A, 5.00% due 10/1/2031 | 1,000,000 | 1,203,400 |
| a | Sarasota County Public Hospital Board (Sarasota Memorial Hospital; Insured: Natl-Re), Series A, 3.147% (CPI + 2.05%) due 10/1/2021 | 1,015,000 | 1,043,461 |
| | Tampa Sports Authority (Tampa Bay Arena; Insured: Natl-Re), 5.75% due 10/1/2020 | 110,000 | 111,240 |
| | Volusia County Educational Facilities Authority (Embry-Riddle Aeronautical University, Inc.), Series B, 5.00% due 10/15/2030 | 1,500,000 | 1,688,685 |
| | Georgia — 1.7% | | |
| | Main Street Natural Gas, Inc., Series A, 5.00% due 5/15/2037 | 2,640,000 | 2,998,037 |
| | Main Street Natural Gas, Inc. (Georgia Gas), Series A, 5.50% due 9/15/2023 | 350,000 | 384,311 |
| | Municipal Electric Authority of Georgia, Series A, 5.00% due 1/1/2039 | 1,225,000 | 1,401,277 |
| | Guam — 0.7% | | |
| | Guam Power Authority (Electric Power System; Insured: AGM), Series A, 5.00% due 10/1/2027 | 1,000,000 | 1,033,670 |
| | Guam Waterworks Authority (Water and Wastewater System), | | |
| | 5.00% due 7/1/2028 | 500,000 | 510,655 |
| | 5.25% due 7/1/2024 | 500,000 | 518,030 |
| | Hawaii — 0.3% | | |
| | State of Hawaii Airports System Revenue, Series A, 5.00% due 7/1/2034 | 1,000,000 | 1,007,340 |
| | Illinois — 14.6% | | |
| | Chicago Park District (Various Capital Projects) GO, Series A, 5.00% due 1/1/2035 | 2,000,000 | 2,138,100 |
| | Chicago Park District GO, Series A, 5.00% due 1/1/2027 | 825,000 | 921,088 |
| | City of Chicago, 5.00% due 1/1/2022 | 1,195,000 | 1,241,139 |
| | City of Chicago (Chicago O’Hare International Airport), Series C, 5.00% due 1/1/2031 | 500,000 | 567,155 |
| | City of Chicago (Riverwalk Expansion Project; Insured: AGM), 5.00% due 1/1/2031 | 500,000 | 546,350 |
| | City of Chicago (Wastewater Transmission System), Series C, 5.00% due 1/1/2030 | 1,500,000 | 1,717,890 |
| | City of Chicago (Water System Improvements), 5.00% due 11/1/2029 | 200,000 | 215,886 |
| | City of Chicago (Water System; Insured: AGM), Series 2017-2, 5.00% due 11/1/2037 | 1,500,000 | 1,768,725 |
| | City of Chicago GO, Series A, 5.00% due 1/1/2039 | 1,000,000 | 1,009,300 |
| | Cook County GO, Series A, 5.25% due 11/15/2033 | 1,000,000 | 1,007,230 |
| | Illinois Finance Authority (Advocate Health Care Network), 5.00% due 8/1/2029 | 2,195,000 | 2,504,473 |
| a | Illinois Finance Authority (Northwestern Memorial Healthcare Obligated Group; SPA U.S. Bank, N.A.), 1.10% due 8/15/2042 (put 4/1/2020) | 6,200,000 | 6,200,000 |
| | Illinois Finance Authority (OSF Healthcare System), 6.00% due 5/15/2039 (pre-refunded 5/15/2020) | 990,000 | 994,871 |
| | Illinois Finance Authority (Silver Cross Hospital & Medical Centers), 5.00% due 8/15/2035 | 2,355,000 | 2,670,099 |
| | Illinois Finance Authority (Southern Illinois Healthcare), 5.00% due 3/1/2032 - 3/1/2034 | 700,000 | 825,532 |
| | Illinois State University (Insured: AGM), Series A, 5.00% due 4/1/2021 - 4/1/2036 | 1,915,000 | 2,214,385 |
| | Illinois Toll Highway Authority (Move Illinois Program), Series A, 5.00% due 1/1/2037 | 1,000,000 | 1,142,900 |
| | Kane, Cook, & DuPage Counties School District No. 46 GO, | | |
| | Series A, 5.00% due 1/1/2031 | 2,255,000 | 2,531,688 |
| | Series D, 5.00% due 1/1/2028 | 1,000,000 | 1,126,200 |
| | Metropolitan Water Reclamation District of Greater Chicago (Various Capital Improvement Projects) GO, Series C, 5.25% due 12/1/2032 | 40,000 | 54,129 |
| | Regional Transportation Authority (Insured: AGM), Series A, 5.75% due 6/1/2034 | 1,100,000 | 1,487,475 |
| | Sales Tax Securitization Corp., Series A, 5.00% due 1/1/2029 | 1,000,000 | 1,149,410 |
| | State of Illinois, Series B, 5.00% due 6/15/2032 - 6/15/2035 | 4,500,000 | 4,553,475 |
| | State of Illinois GO, Series D, 5.00% due 11/1/2028 | 3,000,000 | 3,114,240 |
| | Will County School District No. 114 (Educational Facilities; Insured: Natl-Re) GO, Series C, Zero Coupon due 12/1/2023 | 570,000 | 524,366 |
| | Indiana — 0.7% | | |
| | City of Carmel Redevelopment District (Performing Arts Center) COP, Series C, 6.50% due 7/15/2035 (pre-refunded 1/15/2021) | 1,000,000 | 1,041,080 |
| | Indiana Finance Authority (Marian University), 6.375% due 9/15/2041 (pre-refunded 9/15/2021) | 1,000,000 | 1,076,260 |
| | Kansas — 0.8% | | |
| | Unified Government of Wyandotte County/Kansas City (Utility System Improvement), Series A, 5.00% due 9/1/2031 - 9/1/2032 | 2,000,000 | 2,292,260 |
| | Kentucky — 3.1% | | |
| | Kentucky Economic (Norton Healthcare, Inc.; Insured: Natl-Re) DFA, Series B, Zero Coupon due 10/1/2021 - 10/1/2022 | 3,365,000 | 3,208,288 |
| | Kentucky Higher Education Student Loan Corp. AMT, Series A-1, 5.00% due 6/1/2028 - 6/1/2029 | 1,250,000 | 1,516,102 |
| a | Kentucky Public Energy Authority, Series A, 4.00% due 4/1/2048 (put 4/1/2024) | 4,000,000 | 4,133,760 |
| | Louisiana — 2.3% | | |
| | City of New Orleans (Water System Facilities Improvement), 5.00% due 12/1/2034 | 400,000 | 458,364 |
| | Louisiana Energy and Power Authority (LEPA Unit No. 1; Insured: AGM), Series A, 5.25% due 6/1/2038 | 2,250,000 | 2,505,375 |
| | New Orleans Aviation Board (Louis Armstrong New Orleans International Airport CFC Revenue; Insured: AGM), 5.00% due 1/1/2029 | 700,000 | 844,935 |
| a | Parish of St. Charles (Valero Energy Corp. Refinery), 4.00% due 12/1/2040 (put 6/1/2022) | 2,750,000 | 2,779,040 |
| | Maine — 0.4% | | |
| | Maine State Housing Authority AMT, Series C-1, 3.00% due 11/15/2023 | 1,000,000 | 1,042,570 |
| | Massachusetts — 0.2% | | |
| | Massachusetts Development Finance Agency (Jordan Hospital and Milton Hospital), Series H-1, 5.00% due 7/1/2032 - 7/1/2033 | 555,000 | 637,100 |
See notes to financial statements.
| Thornburg Municipal Funds Semi-Annual Report | 55 |
Schedule of Investments, Continued
Thornburg Strategic Municipal Income Fund | March 31, 2020 (Unaudited)
| | Issuer-Description | PRINCIPAL
AMOUNT | VALUE |
| | Massachusetts Educational Financing Authority (MEFA Loan Program), Series I, 6.00% due 1/1/2028 | $ 60,000 | $ 60,061 |
| | Michigan — 6.6% | | |
| | Board of Governors of Wayne State University (Educational Facilities and Equipment), Series A, 5.00% due 11/15/2033 | 1,250,000 | 1,432,400 |
| | City of Detroit GO, 5.00% due 4/1/2023 - 4/1/2024 | 900,000 | 921,996 |
| | City of Troy (Downtown Development Authority-Community Center Facilities) GO, 5.25% due 11/1/2032 | 1,025,000 | 1,089,165 |
| | County of Genesee (Water Supply System; Insured: BAM) GO, 5.375% due 11/1/2038 | 1,000,000 | 1,111,360 |
| | Detroit City School District (School Building & Site; Insured: AGM Q-SBLF) GO, Series A, 5.25% due 5/1/2027 | 1,000,000 | 1,240,890 |
| | Detroit City School District (School Building & Site; Insured: Q-SBLF) GO, Series A, 5.00% due 5/1/2025 | 1,000,000 | 1,067,080 |
| | Detroit Downtown Development Authority (Catalyst Development Project; Insured: AGM), Series A, 5.00% due 7/1/2024 | 850,000 | 966,254 |
| | Kalamazoo Hospital Finance Authority (Bronson Methodist Hospital), | | |
| | 5.00% due 5/15/2036 | 450,000 | 452,066 |
| | 5.00% due 5/15/2036 (pre-refunded 5/15/2020) | 550,000 | 552,525 |
| | 5.25% due 5/15/2041 | 140,000 | 144,865 |
| | 5.25% due 5/15/2041 (pre-refunded 5/15/2021) | 860,000 | 898,898 |
| | Livonia Public School District (School Building & Site; Insured: AGM) GO, Series I, 5.00% due 5/1/2036 | 225,000 | 248,533 |
| | Michigan Finance Authority (State Dept. of Human Services Office Buildings), Series F, 5.00% due 4/1/2031 | 1,000,000 | 1,053,690 |
| | Michigan Finance Authority (Trinity Health Corp. Obligated Group), 5.00% due 12/1/2027 | 165,000 | 199,419 |
| | Michigan Public School Academy (Will Carleton Charter School), 8.00% due 8/1/2035 | 920,000 | 920,009 |
| | Michigan State Housing Development Authority, Series B, 2.95% due 12/1/2039 | 3,500,000 | 3,555,300 |
| | Michigan Strategic Fund (Detroit Edison Company; Insured: Natl-IBC, AMBAC), 7.00% due 5/1/2021 | 250,000 | 264,985 |
| | Wayne County Airport Authority (Detroit Metropolitan Wayne County Airport), Series B, 5.00% due 12/1/2031 - 12/1/2034 | 2,615,000 | 2,931,571 |
| | Minnesota — 1.2% | | |
| | Minnesota Housing Finance Agency (Collateralized: GNMA, FNMA, FHLMC), Series F, 2.55% due 7/1/2039 | 3,500,000 | 3,432,450 |
| | Missouri — 0.7% | | |
| | Platte County, 5.00% due 4/1/2020 | 350,000 | 350,000 |
| | Tax Increment Financing Commission of Kansas City (Union Hill Redevelopment Project), 6.00% due 5/1/2030 | 1,805,000 | 1,811,967 |
| | Nebraska — 1.3% | | |
| a | Central Plains Energy Project, 5.00% due 3/1/2050 (put 1/1/2024) | 1,650,000 | 1,755,583 |
| | Douglas County Health Facilities (Nebraska Methodist Health System), 5.00% due 11/1/2029 - 11/1/2030 | 1,750,000 | 2,039,415 |
| | Nevada — 1.5% | | |
| | Carson City (Carson Tahoe Regional Healthcare), 5.00% due 9/1/2037 | 1,000,000 | 1,173,990 |
| | City of Las Vegas Special Improvement District No. 814 (Summerlin Vlg 21 & 24A), 4.00% due 6/1/2039 - 6/1/2044 | 1,100,000 | 969,574 |
| | Clark County School District (Insured: AGM), GO, Series B, 5.00% due 6/15/2031 | 1,650,000 | 2,061,510 |
| | New Jersey — 4.6% | | |
| | New Jersey (New Jersey Transit Corp.) EDA, 5.00% due 11/1/2033 | 500,000 | 539,455 |
| | New Jersey (School Facilities Construction) EDA, 5.00% due 3/1/2026 - 6/15/2038 | 2,250,000 | 2,377,405 |
| | New Jersey (School Facilities Construction; Insured: Natl-Re) EDA, Series N-1, 5.50% due 9/1/2027 | 1,000,000 | 1,132,690 |
| | New Jersey Transportation Trust Fund Authority (State Transportation System Improvements), | | |
| | Series A-1, | | |
| | 5.00% due 6/15/2027 | 3,000,000 | 3,350,160 |
| a | 5.91% (MUNIPSA + 1.20%) due 6/15/2034 (put 12/15/2021) | 1,000,000 | 999,400 |
| | New Jersey Transportation Trust Fund Authority (Transportation System), Series A, 5.00% due 12/15/2034 - 12/15/2039 | 4,700,000 | 4,993,437 |
| | New Mexico — 3.6% | | |
| a | City of Farmington, 1.875% due 4/1/2033 (put 10/1/2021) | 1,500,000 | 1,467,405 |
| | City of Farmington (Arizona Public Service Co.-Four Corners Project), Series B, 4.70% due 9/1/2024 | 1,000,000 | 1,015,520 |
| | City of Santa Fe (El Castillo Retirement Project), Series A, 5.00% due 5/15/2044 | 950,000 | 906,424 |
| | New Mexico Hospital Equipment Loan Council (Haverland Carter Lifestyle Group), 5.00% due 7/1/2032 | 2,525,000 | 2,540,806 |
| | New Mexico Hospital Equipment Loan Council (Presbyterian Healthcare Services Obligated Group), Series A, 5.00% due 8/1/2039 | 1,000,000 | 1,232,160 |
| | New Mexico Mortgage Finance Authority (Collateralized: GNMA, FNMA, FHLMC), | | |
| | Series F, | | |
| | 2.85% due 7/1/2039 | 1,000,000 | 1,007,790 |
| | 3.50% due 7/1/2050 | 2,000,000 | 2,134,600 |
| | New York — 4.8% | | |
| | City of New York (City Budget Financial Management) GO, | | |
| | Series G, 5.00% due 8/1/2023 | 3,000,000 | 3,371,520 |
| | Series J, 5.00% due 8/1/2031 | 2,000,000 | 2,294,780 |
| | Metropolitan Transportation Authority, Series D-1, 5.00% due 9/1/2022 | 2,000,000 | 2,115,060 |
| | Metropolitan Transportation Authority (Transit and Commuter System), Series C-1, 5.00% due 9/1/2020 | 5,000,000 | 5,054,300 |
| | New York State Dormitory Authority (State of New York Personal Income Tax Revenue), Series D, 4.00% due 2/15/2040 | 1,000,000 | 1,140,220 |
| | North Carolina — 1.3% | | |
| | North Carolina Medical Care Commission (Vidant Health), 5.00% due 6/1/2029 | 1,500,000 | 1,754,310 |
56 | Thornburg Municipal Funds Semi-Annual Report
| See notes to financial statements. |
Schedule of Investments, Continued
Thornburg Strategic Municipal Income Fund | March 31, 2020 (Unaudited)
| | Issuer-Description | PRINCIPAL
AMOUNT | VALUE |
| | North Carolina Turnpike Authority, 5.00% due 1/1/2029 - 1/1/2030 | $1,000,000 | $ 1,158,175 |
| a | University of North Carolina at Chapel Hill, Series A, 1.409% (LIBOR 1 Month + 0.35%) due 12/1/2041 (put 12/1/2021) | 1,000,000 | 999,850 |
| | Ohio — 1.1% | | |
| | Akron, Bath and Copley Joint Hospital District (Summa Health), 5.25% due 11/15/2030 | 1,420,000 | 1,710,475 |
| | City of Akron (Community Learning Centers), 5.00% due 12/1/2031 | 625,000 | 672,956 |
| | Cleveland-Cuyahoga County Port Authority (Flats East Development Project; LOC Fifth Third Bank), 7.00% due 5/15/2040 | 895,000 | 906,913 |
| | Pennsylvania — 6.8% | | |
| | Allegheny County (Propel Charter School) IDA, Series A, 6.75% due 8/15/2035 | 875,000 | 884,354 |
| | Bucks County (Waste Management, Inc.) AMT, IDA, Series A-2-RMKT, 2.75% due 12/1/2022 | 5,000,000 | 4,974,450 |
| | Coatesville Area School District (Insured: AGM) (State Aid Withholding) GO, 5.00% due 8/1/2024 - 8/1/2025 | 1,475,000 | 1,692,897 |
| | Commonwealth Financing Authority, 5.00% due 6/1/2029 | 1,000,000 | 1,217,440 |
| | County of Luzerne (Insured: AGM) GO, Series A, 5.00% due 11/15/2029 | 1,000,000 | 1,167,300 |
| | Montgomery County Higher Education & Health Authority (Thomas Jefferson University Obligated Group), 5.00% due 9/1/2033 | 700,000 | 836,689 |
| | Pennsylvania Turnpike Commission, Series A-1, 5.00% due 12/1/2037 | 750,000 | 909,990 |
| | Pennsylvania Turnpike Commission (Highway Improvements), | | |
| | Series A, 5.35% due 12/1/2030 (pre-refunded 12/1/2020) | 770,000 | 790,898 |
| | Series C-2, 5.35% due 12/1/2030 (pre-refunded 12/1/2020) | 1,230,000 | 1,263,382 |
| | Philadelphia (Mast Charter School) IDA, 6.00% due 8/1/2035 (pre-refunded 8/1/2020) | 1,000,000 | 1,015,830 |
| | Philadelphia (Thomas Jefferson University) IDA, 5.00% due 9/1/2035 | 1,500,000 | 1,707,540 |
| | Philadelphia Municipal Authority (Juvenile Justice Services Center), 5.00% due 4/1/2038 | 1,360,000 | 1,606,350 |
| | Pittsburgh Water & Sewer Authority (Insured: AGM), Series B, 5.00% due 9/1/2033 | 1,000,000 | 1,369,350 |
| | School District of Philadelphia (State Aid Witholding) GO, Series A, 5.00% due 9/1/2038 | 100,000 | 120,571 |
| | Rhode Island — 0.2% | | |
| | Pawtucket Housing Authority, | | |
| | 5.50% due 9/1/2022 - 9/1/2024 | 475,000 | 496,741 |
| | 5.50% due 9/1/2022 - 9/1/2024 (pre-refunded 9/1/2020) | 190,000 | 199,008 |
| | South Dakota — 0.1% | | |
| | South Dakota Health & Educational Facilities Authority (Avera Health), Series A, 5.00% due 7/1/2027 (pre-refunded 7/1/2021) | 400,000 | 418,140 |
| | Tennessee — 0.9% | | |
| | Shelby County Health, Educational and Housing Facility (Methodist Le Bonheur Healthcare), 5.00% due 5/1/2036 | 1,000,000 | 1,195,940 |
| | Tennessee Energy Acquisition Corp. (The Gas Project), | | |
| | Series A, | | |
| a | 4.00% due 5/1/2048 (put 5/1/2023) | 750,000 | 768,255 |
| | 5.25% due 9/1/2024 | 500,000 | 543,680 |
| | Texas — 9.1% | | |
| | Austin Convention Enterprises, Inc. (Convention Center Hotel First Tier), | | |
| | 5.00% due 1/1/2032 - 1/1/2034 | 1,600,000 | 1,562,687 |
| | Series A, 5.00% due 1/1/2022 | 250,000 | 252,425 |
| | City of Dallas (Public Improvements) GO, 5.00% due 2/15/2031 | 1,930,000 | 2,226,718 |
| | City of Houston (Combined Utility System), Series D, 5.00% due 11/15/2028 | 2,500,000 | 2,942,800 |
| | City of Houston (Convention & Entertainment Facilities Department), 5.00% due 9/1/2025 - 9/1/2034 | 2,875,000 | 3,257,398 |
| | City of Houston (Public Improvements) GO, Series A, 5.00% due 3/1/2032 | 3,000,000 | 3,545,250 |
| | City of Texas City Industrial Development Corp. (ARCO Pipe Line Co. Project), 7.375% due 10/1/2020 | 1,165,000 | 1,193,240 |
| | Harris County-Houston Sports Authority, Series A, 5.00% due 11/15/2030 | 2,000,000 | 2,277,600 |
| | Lower Colorado River Authority, | | |
| | Series A, | | |
| | 5.00% due 5/15/2026 | 2,980,000 | 3,198,315 |
| | 5.00% due 5/15/2026 (pre-refunded 5/15/2022) | 20,000 | 21,586 |
| | North Texas Tollway Authority (NTTA System), Series A, 5.00% due 1/1/2034 | 750,000 | 1,023,922 |
| | Red River Authority (Insured: Natl-Re), 4.45% due 6/1/2020 | 2,500,000 | 2,510,800 |
| | San Antonio Energy Acquisition Public Facilities Corp. (Natural Gas Supply Agreement), 5.50% due 8/1/2021 | 40,000 | 41,468 |
| | San Juan Higher Education Finance Authority (IDEA Public Schools), Series A, 6.70% due 8/15/2040 (pre-refunded 8/15/2020) | 1,000,000 | 1,019,850 |
| | Texas Transportation Commission (Central Texas Turnpike System), Series C, 5.00% due 8/15/2034 | 1,250,000 | 1,303,987 |
| | U. S. Virgin Islands — 0.7% | | |
| | Virgin Islands Public Finance Authority GO, Series C, 5.00% due 10/1/2021 | 2,000,000 | 1,988,760 |
| | Utah — 1.1% | | |
| | Herriman City (Towne Center Access and Utility Improvements), 4.75% due 11/1/2022 (pre-refunded 5/1/2020) | 1,000,000 | 1,002,990 |
| | Utah Charter School Finance Authority (Summit Academy, Inc.), Series A, 5.00% due 4/15/2039 | 700,000 | 857,465 |
| | Utah Transit Authority (Integrated Mass Transit System), Series A, 5.00% due 6/15/2033 (pre-refunded 6/15/2025) | 1,000,000 | 1,193,320 |
| | Washington — 2.6% | | |
| | Port of Seattle AMT, 5.00% due 4/1/2039 | 1,705,000 | 1,966,905 |
See notes to financial statements.
| Thornburg Municipal Funds Semi-Annual Report | 57 |
Schedule of Investments, Continued
Thornburg Strategic Municipal Income Fund | March 31, 2020 (Unaudited)
| | Issuer-Description | PRINCIPAL
AMOUNT | VALUE |
| c | State of Washington (Various Purposes) GO, 5.00% due 6/1/2038 | $1,000,000 | $ 1,236,920 |
| | Washington Health Care Facilities Authority (Catholic Health Initiatives), Series A, 5.75% due 1/1/2045 | 2,000,000 | 2,226,840 |
| | Washington Health Care Facilities Authority (Overlake Hospital Medical Center), Series A, 5.70% due 7/1/2038 (pre-refunded 7/1/2020) | 1,000,000 | 1,011,100 |
| b | Washington State Housing Finance Commission (Presbyterian Retirement Communities Northwest Obligated Group), 5.00% due 1/1/2044 | 1,000,000 | 991,680 |
| | West Virginia — 0.9% | | |
| a | West Virginia (Appalachian Power Co.) AMT, EDA, Series A, 1.70% due 1/1/2041 (put 9/1/2020) | 1,000,000 | 997,120 |
| a | West Virginia (Appalachian Power Co.) EDA, Series B, 2.625% due 12/1/2042 (put 6/1/2022) | 1,500,000 | 1,510,290 |
| | Wisconsin — 1.6% | | |
| b | Public Finance Authority (Alabama Proton Therapy Center), 6.25% due 10/1/2031 | 1,000,000 | 1,102,600 |
| a,d | Wisconsin Health & Educational Facilities Authority (Advocate Aurora Health Obligated Group), 5.00% due 8/15/2054 (put 1/29/2025) | 1,250,000 | 1,432,425 |
| | Wisconsin Housing (Collateralized: FNMA) EDA, Series C, 2.75% due 9/1/2039 | 2,000,000 | 2,071,460 |
| | Total Investments — 99.1%(Cost $275,975,289) | | $286,610,840 |
| | Other Assets Less Liabilities — 0.9% | | 2,619,544 |
| | Net Assets — 100.0% | | $289,230,384 |
| Footnote Legend |
| a | Variable, floating, step, or fixed to floating rate securities are securities for which interest rate changes are based on changes in a designated base rate or on a predetermined schedule. The rates shown are those in effect on March 31, 2020. |
| b | Securities exempt from registration under Rule 144A of the Securities Act of 1933, as amended. These securities are restricted but liquid and may only be resold in the ordinary course of business in transactions exempt from registration, normally to qualified institutional buyers. As of March 31, 2020, the aggregate value of these securities in the Fund’s portfolio was $3,618,230, representing 1.25% of the Fund’s net assets. |
| c | When-issued security. |
| d | Segregated as collateral for a when-issued security. |
Portfolio Abbreviations
To simplify the listings of securities, abbreviations are used per the table below:
| ABAG | Association of Bay Area Governments |
| ACA | Insured by American Capital Access |
| AGC | Insured by Assured Guaranty Corp. |
| AGM | Insured by Assured Guaranty Municipal Corp. |
| AMBAC | Insured by American Municipal Bond Assurance Corp. |
| AMT | Alternative Minimum Tax |
| BAM | Insured by Build America Mutual Insurance Co. |
| COP | Certificates of Participation |
| CPI | Consumer Price Index |
| DFA | Development Finance Authority |
| EDA | Economic Development Authority |
| FHLMC | Insured by Federal Home Loan Mortgage Corp. |
| FNMA | Collateralized by Federal National Mortgage Association |
| GNMA | Collateralized by Government National Mortgage Association |
| GO | General Obligation |
| HFA | Health Facilities Authority |
| HFFA | Health Facilities Financing Authority |
| IDA | Industrial Development Authority |
| LIBOR | London Interbank Offered Rates |
| LOC | Letter of Credit |
| Mtg | Mortgage |
| MUNIPSA | Securities Industry and Financial Markets Association (SIFMA) Municipal Swap Index |
| Natl-IBC | Insured by National Public Finance Gurantee Corp. and IBC Bank |
| Natl-Re | Insured by National Public Finance Guarantee Corp. |
| Q-SBLF | Insured by Qualified School Bond Loan Fund |
| SPA | Stand-by Purchase Agreement |
| USD | Unified School District |
58 | Thornburg Municipal Funds Semi-Annual Report
| See notes to financial statements. |
This page intentionally left blank.
Thornburg Municipal Funds Semi-Annual Report | 59
Statements of Assets and Liabilities
March 31, 2020 (Unaudited)
| | THORNBURG
SHORT DURATION
MUNICIPAL FUND | THORNBURG
LIMITED TERM
MUNICIPAL FUND | THORNBURG
CALIFORNIA LIMITED TERM
MUNICIPAL FUND | THORNBURG
NEW MEXICO INTERMEDIATE
MUNICIPAL FUND |
| ASSETS | | | | |
| Investment in securities, at cost | $ 123,389,300 | $ 5,343,909,092 | $ 478,043,899 | $ 149,613,789 |
| Investments at value | 123,698,938 | 5,476,516,048 | 490,195,695 | 154,610,901 |
| Cash | 684,847 | 862,805 | 3,565,995 | 971,328 |
| Receivable for investments sold | 3,780,000 | 9,780,000 | 14,020,000 | 1,005,230 |
| Receivable for fund shares sold | 17,752 | 19,588,420 | 1,565,641 | 30,819 |
| Interest receivable | 1,342,285 | 62,840,878 | 5,456,456 | 2,093,098 |
| Prepaid expenses and other assets | 156,696 | 298,539 | 25,976 | 17,414 |
| Total Assets | 129,680,518 | 5,569,886,690 | 514,829,763 | 158,728,790 |
| Liabilities | | | | |
| Payable for investments purchased | 649,364 | 6,628,858 | - | - |
| Payable for fund shares redeemed | 124,849 | 23,456,591 | 976,285 | 383,881 |
| Payable to investment advisor and other affiliates | ��� 66,877 | 2,076,615 | 212,682 | 105,947 |
| Accounts payable and accrued expenses | 20,852 | 308,013 | 44,373 | 39,277 |
| Dividends payable | 4,103 | 827,275 | 130,889 | 18,108 |
| Total Liabilities | 866,045 | 33,297,352 | 1,364,229 | 547,213 |
| Net Assets | $ 128,814,473 | $ 5,536,589,338 | $ 513,465,534 | $ 158,181,577 |
| NET ASSETS CONSIST OF | | | | |
| Net capital paid in on shares of beneficial interest | $ 130,463,626 | $ 5,441,052,737 | $ 506,150,713 | $ 154,112,845 |
| Distributable earnings (accumulated loss) | (1,649,153) | 95,536,601 | 7,314,821 | 4,068,732 |
| Net Assets | $ 128,814,473 | $ 5,536,589,338 | $ 513,465,534 | $ 158,181,577 |
| NET ASSET VALUE | | | | |
| Class A Shares: | | | | |
| Net assets applicable to shares outstanding | $ 21,966,177 | $ 881,374,952 | $ 105,847,823 | $ 80,081,979 |
| Shares outstanding | 1,789,723 | 61,358,479 | 7,790,360 | 6,054,544 |
| Net asset value and redemption price per share | $ 12.27 | $ 14.36 | $ 13.59 | $ 13.23 |
| Maximum offering price per share (net asset value, plus 1.50% of offering price) | $ 12.46 | $ 14.58 | $ 13.80 | $ 13.50* |
| Class C Shares: | | | | |
| Net assets applicable to shares outstanding | - | 279,335,931 | 24,850,989 | - |
| Shares outstanding | - | 19,411,563 | 1,827,311 | - |
| Net asset value and redemption price per share** | - | 14.39 | 13.60 | - |
| Class D Shares: | | | | |
| Net assets applicable to shares outstanding | - | - | - | 14,652,040 |
| Shares outstanding | - | - | - | 1,107,228 |
| Net asset value and redemption price per share | - | - | - | 13.23 |
| Class I Shares: | | | | |
| Net assets applicable to shares outstanding | 106,848,296 | 4,375,878,455 | 382,766,722 | 63,447,558 |
| Shares outstanding | 8,710,444 | 304,595,775 | 28,142,790 | 4,798,941 |
| Net asset value and redemption price per share | 12.27 | 14.37 | 13.60 | 13.22 |
| * | Net asset value, plus 2.00% of offering price. |
| ** | Redemption price per share is equal to net asset value less any applicable contingent deferred sales charge. |
See notes to financial statements.
60 | Thornburg Municipal Funds Semi-Annual Report
Statements of Assets and Liabilities, Continued
March 31, 2020 (Unaudited)
| | THORNBURG
NEW YORK INTERMEDIATE
MUNICIPAL FUND | THORNBURG
INTERMEDIATE
MUNICIPAL FUND | THORNBURG
STRATEGIC MUNICIPAL
INCOME FUND |
| ASSETS | | | |
| Investment in securities, at cost | $ 46,667,916 | $ 958,092,887 | $ 275,975,289 |
| Investments at value | 48,511,924 | 1,006,610,163 | 286,610,840 |
| Cash | 449,695 | 4,877,517 | 592,211 |
| Receivable for investments sold | - | 1,500,000 | 110,000 |
| Receivable for fund shares sold | 44,506 | 1,177,789 | 816,792 |
| Interest receivable | 624,156 | 12,501,118 | 3,469,207 |
| Prepaid expenses and other assets | 14,502 | 97,138 | 66,320 |
| Total Assets | 49,644,783 | 1,026,763,725 | 291,665,370 |
| Liabilities | | | |
| Payable for investments purchased | 926,228 | 2,327,170 | 1,184,310 |
| Payable for fund shares redeemed | 22,205 | 2,490,771 | 1,062,365 |
| Payable to investment advisor and other affiliates | 25,218 | 513,921 | 144,295 |
| Accounts payable and accrued expenses | 35,690 | 121,072 | 27,958 |
| Dividends payable | 15,346 | 318,353 | 16,058 |
| Total Liabilities | 1,024,687 | 5,771,287 | 2,434,986 |
| Net Assets | $ 48,620,096 | $ 1,020,992,438 | $ 289,230,384 |
| NET ASSETS CONSIST OF | | | |
| Net capital paid in on shares of beneficial interest | $ 47,196,130 | $ 982,110,861 | $ 280,196,773 |
| Distributable earnings | 1,423,966 | 38,881,577 | 9,033,611 |
| Net Assets | $ 48,620,096 | $ 1,020,992,438 | $ 289,230,384 |
| NET ASSET VALUE | | | |
| Class A Shares: | | | |
| Net assets applicable to shares outstanding | $ 27,586,570 | $ 306,502,744 | $ 57,388,118 |
| Shares outstanding | 2,157,655 | 21,781,561 | 3,836,091 |
| Net asset value and redemption price per share | $ 12.79 | $ 14.07 | $ 14.96 |
| Maximum offering price per share (net asset value, plus 2.00% of offering price) | $ 13.05 | $ 14.36 | $ 15.27 |
| Class C Shares: | | | |
| Net assets applicable to shares outstanding | - | 66,800,697 | 18,096,652 |
| Shares outstanding | - | 4,741,426 | 1,208,448 |
| Net asset value and redemption price per share* | - | 14.09 | 14.98 |
| Class I Shares: | | | |
| Net assets applicable to shares outstanding | 21,033,526 | 647,688,997 | 213,745,614 |
| Shares outstanding | 1,644,967 | 46,084,939 | 14,275,211 |
| Net asset value and redemption price per share | 12.79 | 14.05 | 14.97 |
| * | Redemption price per share is equal to net asset value less any applicable contingent deferred sales charge. |
See notes to financial statements.
Thornburg Municipal Funds Semi-Annual Report | 61
Statements of Operations
Six Months Ended March 31, 2020 (Unaudited)
| | THORNBURG
SHORT DURATION
MUNICIPAL FUND | THORNBURG
LIMITED TERM
MUNICIPAL FUND | THORNBURG
CALIFORNIA LIMITED TERM
MUNICIPAL FUND | THORNBURG
NEW MEXICO INTERMEDIATE
MUNICIPAL FUND |
| INVESTMENT INCOME | | | | |
| Interest income | $ 2,129,478 | $ 70,567,540 | $ 5,779,719 | $ 2,348,894 |
| EXPENSES | | | | |
| Investment management fees | 461,339 | 7,946,679 | 1,255,581 | 401,493 |
| Administration fees | 101,592 | 2,573,495 | 221,890 | 70,756 |
| Distribution and service fees | | | | |
| Class A Shares | 17,169 | 1,130,129 | 138,561 | 103,254 |
| Class C Shares | - | 762,308 | 66,700 | - |
| Class D Shares | - | - | - | 38,354 |
| Transfer agent fees | | | | |
| Class A Shares | 11,639 | 204,634 | 15,894 | 18,484 |
| Class C Shares | - | 65,377 | 6,030 | - |
| Class D Shares | - | - | - | 5,185 |
| Class I Shares | 50,950 | 1,139,915 | 69,335 | 7,778 |
| Registration and filing fees | | | | |
| Class A Shares | 8,254 | 11,176 | 3,481 | 2,434 |
| Class C Shares | - | 9,235 | 2,813 | - |
| Class D Shares | - | - | - | 2,077 |
| Class I Shares | 8,027 | 24,599 | 4,635 | 2,468 |
| Custodian fees | 21,594 | 181,351 | 34,081 | 19,429 |
| Professional fees | 23,623 | 76,942 | 25,712 | 22,334 |
| Trustee and officer fees | 7,206 | 190,135 | 15,661 | 5,095 |
| Other expenses | 9,851 | 188,235 | 21,614 | 12,613 |
| Total Expenses | 721,244 | 14,504,210 | 1,881,988 | 711,754 |
| Less: | | | | |
| Expenses reimbursed | (127,400) | - | (142,374) | (9,091) |
| Net Expenses | 593,844 | 14,504,210 | 1,739,614 | 702,663 |
| Net Investment Income (Loss) | $ 1,535,634 | $ 56,063,330 | $ 4,040,105 | $ 1,646,231 |
| REALIZED AND UNREALIZED GAIN (LOSS) | | | | |
| Net realized gain (loss) | (1,737,326) | (3,835,763) | (263,532) | 40,407 |
| Net change in unrealized appreciation (depreciation) | (1,119,908) | (38,912,557) | (4,882,145) | (1,550,865) |
| Net Realized and Unrealized Gain (Loss) | (2,857,234) | (42,748,320) | (5,145,677) | (1,510,458) |
| Change in Net Assets Resulting from Operations | $ (1,321,600) | $ 13,315,010 | $ (1,105,572) | $ 135,773 |
See notes to financial statements.
62 | Thornburg Municipal Funds Semi-Annual Report
Statements of Operations, Continued
Six Months Ended March 31, 2020 (Unaudited)
| | THORNBURG
NEW YORK INTERMEDIATE
MUNICIPAL FUND | THORNBURG
INTERMEDIATE
MUNICIPAL FUND | THORNBURG
STRATEGIC MUNICIPAL
INCOME FUND |
| INVESTMENT INCOME | | | |
| Interest income | $ 751,670 | $ 18,049,841 | $ 5,176,427 |
| EXPENSES | | | |
| Investment management fees | 121,157 | 2,572,269 | 1,150,811 |
| Administration fees | 21,353 | 483,994 | 135,195 |
| Distribution and service fees | | | |
| Class A Shares | 33,580 | 391,570 | 73,267 |
| Class C Shares | - | 219,675 | 57,991 |
| Transfer agent fees | | | |
| Class A Shares | 7,643 | 68,434 | 19,305 |
| Class C Shares | - | 17,009 | 4,776 |
| Class I Shares | 6,887 | 138,703 | 63,121 |
| Registration and filing fees | | | |
| Class A Shares | 3,524 | 8,938 | 7,421 |
| Class C Shares | - | 7,645 | 7,304 |
| Class I Shares | 2,605 | 10,228 | 7,945 |
| Custodian fees | 14,084 | 50,543 | 25,963 |
| Professional fees | 21,185 | 31,092 | 24,854 |
| Trustee and officer fees | 1,585 | 36,560 | 9,016 |
| Other expenses | 9,774 | 46,269 | 17,840 |
| Total Expenses | 243,377 | 4,082,929 | 1,604,809 |
| Less: | | | |
| Expenses reimbursed | (32,662) | (188,585) | (144,379) |
| Investment management fees waived | (5,384) | - | (230,162) |
| Net Expenses | 205,331 | 3,894,344 | 1,230,268 |
| Net Investment Income (Loss) | $ 546,339 | $ 14,155,497 | $ 3,946,159 |
| REALIZED AND UNREALIZED GAIN (LOSS) | | | |
| Net realized gain (loss) | 124,780 | (87,805) | (716,460) |
| Net change in unrealized appreciation (depreciation) | (874,792) | (21,054,493) | (6,800,807) |
| Net Realized and Unrealized Gain (Loss) | (750,012) | (21,142,298) | (7,517,267) |
| Change in Net Assets Resulting from Operations | $ (203,673) | $ (6,986,801) | $ (3,571,108) |
See notes to financial statements.
Thornburg Municipal Funds Semi-Annual Report | 63
Statements of Changes in Net Assets
| | THORNBURG SHORT DURATION MUNICIPAL FUND | THORNBURG LIMITED TERM MUNICIPAL FUND |
| | Six Months Ended
March 31, 2020* | Year Ended
September 30, 2019 | Six Months Ended
March 31, 2020* | Year Ended
September 30, 2019 |
| INCREASE (DECREASE) IN NET ASSETS FROM | | | | |
| OPERATIONS | | | | |
| Net investment income | $ 1,535,634 | $ 3,215,935 | $ 56,063,330 | $ 122,156,025 |
| Net realized gain (loss) | (1,737,326) | (169,603) | (3,835,763) | (11,356,119) |
| Net change in unrealized appreciation (depreciation) | (1,119,908) | 1,829,461 | (38,912,557) | 165,364,756 |
Net Increase (Decrease) in Net Assets
Resulting from Operations | (1,321,600) | 4,875,793 | 13,315,010 | 276,164,662 |
| DIVIDENDS TO SHAREHOLDERS | | | | |
| From distributable earnings | | | | |
| Class A Shares | (100,496) | (262,793) | (7,718,097) | (17,773,721) |
| Class C Shares | - | - | (2,217,183) | (6,148,179) |
| Class I Shares | (1,435,138) | (2,953,142) | (45,242,775) | (98,235,022) |
| FUND SHARE TRANSACTIONS | | | | |
| Class A Shares | 5,166,866 | (2,770,805) | (28,196,509) | (146,463,605) |
| Class C Shares | - | - | (44,006,480) | (135,672,142) |
| Class I Shares | (114,736,932) | 60,596,807 | (484,038,018) | (315,109,295) |
| Net Increase (Decrease) in Net Assets | (112,427,300) | 59,485,860 | (598,104,052) | (443,237,302) |
| NET ASSETS | | | | |
| Beginning of Period | 241,241,773 | 181,755,913 | 6,134,693,390 | 6,577,930,692 |
| End of Period | $ 128,814,473 | $ 241,241,773 | $ 5,536,589,338 | $ 6,134,693,390 |
See notes to financial statements.
64 | Thornburg Municipal Funds Semi-Annual Report
Statements of Changes in Net Assets, Continued
| | THORNBURG CALIFORNIA LIMITED TERM MUNICIPAL FUND | THORNBURG NEW MEXICO INTERMEDIATE MUNICIPAL FUND |
| | Six Months Ended
March 31, 2020* | Year Ended
September 30, 2019 | Six Months Ended
March 31, 2020* | Year Ended
September 30, 2019 |
| INCREASE (DECREASE) IN NET ASSETS FROM | | | | |
| OPERATIONS | | | | |
| Net investment income | $ 4,040,105 | $ 8,754,413 | $ 1,646,231 | $ 3,980,700 |
| Net realized gain (loss) | (263,532) | (967,268) | 40,407 | 506,448 |
| Net change in unrealized appreciation (depreciation) | (4,882,145) | 10,697,992 | (1,550,865) | 3,783,935 |
Net Increase (Decrease) in Net Assets
Resulting from Operations | (1,105,572) | 18,485,137 | 135,773 | 8,271,083 |
| DIVIDENDS TO SHAREHOLDERS | | | | |
| From distributable earnings | | | | |
| Class A Shares | (797,171) | (1,870,732) | (845,314) | (2,111,980) |
| Class C Shares | (153,432) | (451,533) | - | - |
| Class D Shares | - | - | (135,746) | (356,830) |
| Class I Shares | (3,082,343) | (6,432,174) | (732,810) | (1,511,890) |
| FUND SHARE TRANSACTIONS | | | | |
| Class A Shares | (6,767,315) | (15,984,630) | (3,959,071) | (12,251,499) |
| Class C Shares | (3,000,878) | (13,246,225) | - | - |
| Class D Shares | - | - | (1,091,777) | (2,990,005) |
| Class I Shares | 35,692,670 | (24,597,797) | 1,978,555 | 6,986,154 |
| Net Increase (Decrease) in Net Assets | 20,785,959 | (44,097,954) | (4,650,390) | (3,964,967) |
| NET ASSETS | | | | |
| Beginning of Period | 492,679,575 | 536,777,529 | 162,831,967 | 166,796,934 |
| End of Period | $ 513,465,534 | $ 492,679,575 | $ 158,181,577 | $ 162,831,967 |
See notes to financial statements.
Thornburg Municipal Funds Semi-Annual Report | 65
Statements of Changes in Net Assets, Continued
| | THORNBURG NEW YORK INTERMEDIATE MUNICIPAL FUND | THORNBURG INTERMEDIATE MUNICIPAL FUND |
| | Six Months Ended
March 31, 2020* | Year Ended
September 30, 2019 | Six Months Ended
March 31, 2020* | Year Ended
September 30, 2019 |
| INCREASE (DECREASE) IN NET ASSETS FROM | | | | |
| OPERATIONS | | | | |
| Net investment income | $ 546,339 | $ 1,336,401 | $ 14,155,497 | $ 31,318,235 |
| Net realized gain (loss) | 124,780 | 83,145 | (87,805) | (1,568,098) |
| Net change in unrealized appreciation (depreciation) | (874,792) | 1,328,381 | (21,054,493) | 46,711,129 |
Net Increase (Decrease) in Net Assets
Resulting from Operations | (203,673) | 2,747,927 | (6,986,801) | 76,461,266 |
| DIVIDENDS TO SHAREHOLDERS | | | | |
| From distributable earnings | | | | |
| Class A Shares | (275,718) | �� (719,633) | (3,832,778) | (7,524,534) |
| Class C Shares | - | - | (762,504) | (1,916,359) |
| Class I Shares | (255,778) | (616,768) | (9,591,874) | (21,877,342) |
| FUND SHARE TRANSACTIONS | | | | |
| Class A Shares | 1,572,084 | (8,173,078) | (1,626,154) | (21,630,968) |
| Class C Shares | - | - | (8,941,292) | (30,593,410) |
| Class I Shares | (3,183,296) | (59,783) | (68,371,337) | (205,746,732) |
| Net Decrease in Net Assets | (2,346,381) | (6,821,335) | (100,112,740) | (212,828,079) |
| NET ASSETS | | | | |
| Beginning of Period | 50,966,477 | 57,787,812 | 1,121,105,178 | 1,333,933,257 |
| End of Period | $ 48,620,096 | $ 50,966,477 | $ 1,020,992,438 | $ 1,121,105,178 |
See notes to financial statements.
66 | Thornburg Municipal Funds Semi-Annual Report
Statements of Changes in Net Assets, Continued
| | THORNBURG STRATEGIC MUNICIPAL INCOME FUND |
| | Six Months Ended
March 31, 2020* | Year Ended
September 30, 2019 |
| INCREASE (DECREASE) IN NET ASSETS FROM | | |
| OPERATIONS | | |
| Net investment income | $ 3,946,159 | $ 7,434,381 |
| Net realized gain (loss) | (716,460) | (38,431) |
| Net change in unrealized appreciation (depreciation) | (6,800,807) | 9,029,130 |
Net Increase (Decrease) in Net Assets
Resulting from Operations | (3,571,108) | 16,425,080 |
| DIVIDENDS TO SHAREHOLDERS | | |
| From distributable earnings | | |
| Class A Shares | (716,210) | (1,394,124) |
| Class C Shares | (190,853) | (475,727) |
| Class I Shares | (3,044,784) | (5,564,530) |
| FUND SHARE TRANSACTIONS | | |
| Class A Shares | 2,776,179 | 643,486 |
| Class C Shares | (1,538,003) | (5,595,820) |
| Class I Shares | (229,139) | 27,507,142 |
| Net Increase (Decrease) in Net Assets | (6,513,918) | 31,545,507 |
| NET ASSETS | | |
| Beginning of Period | 295,744,302 | 264,198,795 |
| End of Period | $ 289,230,384 | $ 295,744,302 |
See notes to financial statements.
Thornburg Municipal Funds Semi-Annual Report | 67
Notes to Financial Statements
March 31, 2020 (Unaudited)
NOTE 1 – ORGANIZATION
Thornburg Short Duration Municipal Fund (“Short Duration Municipal Fund”), Thornburg Limited Term Municipal Fund (“Limited Term Municipal Fund”), Thornburg Intermediate Municipal Fund (“Intermediate Municipal Fund ”), Thornburg California Limited Term Municipal Fund (“Limited Term California Fund”), Thornburg New Mexico Intermediate Municipal Fund (“Intermediate New Mexico Fund”), Thornburg New York Intermediate Municipal Fund (“Intermediate New York Fund”), and Thornburg Strategic Municipal Income Fund (“Strategic Municipal Income Fund”) collectively the "Funds", are diversified series of Thornburg Investment Trust (the “Trust”). The Trust is organized as a Massachusetts business trust under a Declaration of Trust dated June 3, 1987 and is registered as a diversified, open-end management investment company under the Investment Company Act of 1940, as amended (the "1940 Act"). The Funds are currently seven of twenty-two separate series of the Trust. Each series is considered to be a separate entity for financial reporting and tax purposes and bears expenses directly attributable to it.
Short Duration Municipal Fund:The Fund seeks current income exempt from federal income tax, consistent with preservation of capital. The Fund’s investments subject it to risks including, but not limited to, management risk, interest rate risk, credit risk, market and economic risk, and liquidity risk. Please see the Fund’s prospectus for a discussion of the risks associated with an investment in the Fund.
Limited Term Municipal Fund: The Fund’s primary investment objective is to obtain as high a level of current income exempt from federal individual income taxes as is consistent, in the view of Thornburg Investment Management, Inc., the Trust’s investment advisor (the “Advisor”), with the preservation of capital. The Fund’s secondary objective is to reduce expected changes in its share price compared to longer intermediate and long-term bond portfolios. The Fund’s investments subject it to risks including, but not limited to, management risk, interest rate risk, credit risk, market and economic risk, and liquidity risk. Please see the Fund’s prospectus for a discussion of the risks associated with an investment in the Fund.
Intermediate Municipal Fund: The Fund’s primary investment objective is to obtain as high a level of current income exempt from federal individual income taxes as is consistent, in the view of the Advisor, with the preservation of capital. The Fund’s secondary objective is to reduce expected changes in its share price compared to long-term bond portfolios. The Fund’s investments subject it to risks including, but not limited to, management risk, interest rate risk, credit risk, market and economic risk, and liquidity risk. Please see the Fund’s prospectus for a discussion of the risks associated with an investment in the Fund.
Limited Term California Fund: The Fund’s primary investment objective is to obtain as high a level of current income exempt from federal and California state individual income tax as is consistent, in the view of the Advisor, with the preservation of capital. The Fund’s secondary objective is to reduce expected changes in its share price compared to longer intermediate and long-term bond portfolios.The Fund’s investments subject it to risks including, but not limited to, management risk, interest rate risk, credit risk, market and economic risk, liquidity risk, and single state risk. Please see the Fund’s prospectus for a discussion of the risks associated with an investment in the Fund.
Intermediate New Mexico Fund: The Fund’s primary investment objective is to obtain as high a level of current income exempt from federal and New Mexico state individual income tax as is consistent, in the view of the Advisor, with the preservation of capital. The Fund’s secondary objective is to reduce expected changes in its share price compared to long-term bond portfolios. The Fund’s investments subject it to risks including, but not limited to, management risk, interest rate risk, credit risk, market and economic risk, liquidity risk, single state risk, and non-diversification risk. Please see the Fund’s prospectus for a discussion of the risks associated with an investment in the Fund.
Intermediate New York Fund: The Fund’s primary investment objective is to obtain as high a level of current income exempt from federal, New York State, and New York City individual income taxes as is consistent, in the view of the Advisor, with the preservation of capital. The Fund’s secondary objective is to reduce expected changes in its share price compared to long-term bond portfolios. The Fund’s investments subject it to risks including, but not limited to, management risk, interest rate risk, credit risk, market and economic risk, liquidity risk, single state risk, and non-diversification risk. Please see the Fund’s prospectus for a discussion of the risks associated with an investment in the Fund
Strategic Municipal Income Fund: The Fund seeks a high level of current income exempt from federal individual income tax. The Fund’s investments subject it to risks including, but not limited to, management risk, interest rate risk, credit risk, high yield risk, market and economic risk, liquidity risk, and derivatives risk. Please see the Fund’s prospectus for a discussion of the risks associated with an investment in the Fund.
The Funds currently offer from one to four classes of shares of beneficial interest:
Each class of shares of the Funds represents an interest in the same portfolio of investments, except that (i) Class A shares are sold subject to a front-end sales charge collected at the time the shares are purchased and bear a service fee, (ii) Class C shares are sold at net asset value without a sales charge at the time of purchase, but are subject to a contingent deferred sales charge upon redemption within one year of purchase, and bear both a service fee and a distribution fee, (iii) Class D shares are sold at net asset value without a sales charge at the time of purchase or redemption, (iv) Class I shares are sold at net asset value without a sales charge at the time of purchase and may
68 | Thornburg Municipal Funds Semi-Annual Report
Notes to Financial Statements, Continued
March 31, 2020 (Unaudited)
be subject to a service fee, and bear both a service fee and a distribution fee, and (vii) the respective classes may have different reinvestment privileges and conversion rights. Additionally, each Fund may allocate among its classes certain expenses, to the extent allocable to specific classes, including administration fees, transfer agent fees, government registration fees, certain printing and postage costs, and legal expenses. Currently, class specific expenses of the Funds are limited to distribution and service fees and certain registration and filing fees.
At March 31, 2020, the following class of shares are offered in each respective Fund:
| | Class A | Class C | Class D | Class I |
| Short Duration Municipal Fund | X | | | X |
| Limited Term Municipal Fund | X | X | | X |
| Limited Term California Fund | X | X | | X |
| Intermediate New Mexico Fund | X | | X | X |
| Intermediate New York Fund | X | | | X |
| Intermediate Municipal Fund | X | X | | X |
| Strategic Municipal Income Fund | X | X | | X |
NOTE 2 – SIGNIFICANT ACCOUNTING POLICIES
The following is a summary of significant accounting policies followed by each of the Funds in the preparation of its financial statements. Each Fund prepares its financial statements in conformity with United States generally accepted accounting principles (“GAAP”), including investment company accounting and reporting guidance in the Financial Accounting Standards Board (the “FASB”) Accounting Standard Codification Topic 946.
Allocation of Income, Gains, Losses and Expenses: Net investment income (other than class specific expenses) and realized and unrealized gains and losses are allocated daily to each class of shares based upon the relative net asset value of outstanding shares (or the value of the dividend-eligible shares, as appropriate) of each class of shares at the beginning of the day (after adjusting for the current capital shares activity of the respective class). Expenses common to all Funds are allocated among the Funds comprising the Trust based upon their relative net asset values or other appropriate allocation methods. Operating expenses directly attributable to a specific class are charged against the operating income of that class.
Dividends and Distributions to Shareholders: Dividends and distributions to shareholders, which are determined in accordance with federal income tax regulations and may differ from GAAP, are recorded on the ex-dividend date. Ordinary income dividends, if any, are declared daily and paid monthly. Capital gain distributions, if any, are declared and paid annually and more often if deemed necessary by Thornburg Investment Management, Inc., the Trust’s investment advisor (the "Advisor"). Dividends and distributions are paid and are reinvested in additional shares of the Funds at net asset value per share at the close of business on the ex-dividend date, or at the shareholder’s option, paid in cash.
Guarantees and Indemnifications: Under the Trust’s organizational documents (and under separate agreements with the independent Trustees), its officers and Trustees are provided with an indemnification against certain liabilities arising out of the performance of their duties to the Funds. In the normal course of business the Trust may also enter into contracts with service providers that contain general indemnifications. The Trust’s maximum exposure under these arrangements is unknown. However, based on experience, the Trust expects the risk of loss to be remote.
Investment Income: Interest income is accrued as earned. Premiums and discounts are amortized and accreted, respectively, to first call dates or maturity dates using the effective yield method of the respective investments. These amounts are included in Investment Income in the Statement of Operations.
Investment Transactions: Investment transactions are accounted for on a trade date basis. Realized gains and losses from the sale of investments are recorded on an identified cost basis.
Security Valuation: All investments in securities held by the Funds are valued as described in Note 3.
Use of Estimates: The preparation of financial statements in conformity with GAAP requires management to make estimates and assumptions that affect the reported amounts of assets and liabilities and disclosure of contingent assets and liabilities at the date of the financial statements and the reported amounts of increases (decreases) in net assets from operations during the reporting period. Actual results could differ from those estimates.
When-Issued and Delayed Delivery Transactions: The Funds may engage in when-issued or delayed delivery transactions. To the extent the Funds engage in such transactions, they will do so for the purpose of acquiring portfolio investments consistent with the Funds’ investment
Thornburg Municipal Funds Semi-Annual Report | 69
Notes to Financial Statements, Continued
March 31, 2020 (Unaudited)
objectives and not for the purpose of investment leverage or to speculate on interest rate or market changes. At the time the Funds make a commitment to purchase an investment on a when-issued or delayed delivery basis, the Funds will record the transaction and reflect the value in determining its net asset value. When effecting such transactions, assets of an amount sufficient to make payment for the portfolio investments to be purchased will be segregated on the Funds’ records on the trade date. Investments purchased on a when-issued or delayed delivery basis do not earn interest until the settlement date. The values of these securities held at March 31, 2020 are detailed in the Schedule of Investments.
NOTE 3 – SECURITY VALUATION
Valuation of the Funds’ portfolio investment securities is performed in accordance with policies and procedures adopted by and under the oversight of the Trustees.
The Trustees of the Trust have appointed the Advisor to assist the Trustees with obtaining fair market values for portfolio investments, evaluating and monitoring professional pricing service providers appointed by the Trustees’ Audit Committee (the “Audit Committee”) to assist in determining fair values for portfolio investments, assisting in calculating fair values for portfolio investments in certain circumstances, and performing other functions in connection with the valuation of investments. The Advisor acts through its Valuation and Pricing Committee (the “Committee”) and other employees of the Advisor. The Committee regularly reviews its own valuation calculations, reviews the valuations, valuation techniques and services furnished by pricing service providers, considers circumstances which may require valuation calculations by the Committee, and reviews previous valuation calculations. The Committee reports to the Audit Committee on the Committee’s activities, the performance of pricing service providers, and other matters relating to valuation of portfolio investments.
In those instances when the Committee assists in calculating a fair value for a portfolio investment, the Committee seeks to determine the price that the Funds would reasonably expect to receive upon a sale of the investment in an orderly transaction between market participants on the valuation date. The Committee customarily utilizes quotations from securities broker dealers in calculating valuations, but also may utilize prices obtained from pricing service providers or other methods approved by the Audit Committee. Because fair values calculated by the Committee are estimates, the calculation of a value for an investment may differ from the price that would be realized by the Funds upon a sale of the investment, and the difference could be material to the Funds’ financial statements. The Committee’s calculation of a fair value for an investment may also differ from the prices obtained by other persons (including other mutual funds) for the investment.
Valuation of Securities: Debt obligations held by the Funds which are not listed or traded on exchanges or for which no reported market exists are ordinarily valued at the valuation obtained from a pricing service provider approved by the Audit Committee.
In any case when a pricing service provider fails to provide a valuation for a debt obligation held by the Funds, the Committee calculates a fair value for the obligation using alternative methods under procedures approved by the Audit Committee. Additionally, in cases when management believes that a valuation obtained from a pricing service provider is stale, does not reflect material factors affecting the valuation of the investment, is significantly different than the value the Funds are likely to obtain if it sought a bid for the investment, or is otherwise unreliable, the Committee calculates a fair value for the obligation using an alternative method approved by the Audit Committee.
Valuation Hierarchy: The Funds categorize their investments based upon the inputs used in valuing those investments, according to a three-level hierarchy established in guidance from the FASB. Categorization of investments using this hierarchy is intended by the FASB to maximize the use of observable inputs in valuing investments and minimize the use of unobservable inputs by requiring that the most observable inputs be used when available. Observable inputs are those that market participants would use in valuing an investment based on available market information. Unobservable inputs are those that reflect assumptions about the information market participants would use in valuing an investment. An investment’s level within the hierarchy is based on the lowest level input that is deemed significant to the valuation. The methodologies and inputs used to value investments are not necessarily indications of the risk or liquidity associated with those investments.
Various inputs are used in calculating valuations for the Fund’s investments. These inputs are generally summarized according to the three-level hierarchy below:
Level 1: Quoted prices in active markets for identical investments.
Level 2: Other direct or indirect significant observable inputs (including quoted prices for similar investments in active markets and other observable inputs, such as interest rates, prepayment rates, credit ratings, etc.).
Level 3: Significant unobservable inputs (including the Committee’s own assumptions in calculating the fair values of investments).
70 | Thornburg Municipal Funds Semi-Annual Report
Notes to Financial Statements, Continued
March 31, 2020 (Unaudited)
Valuations for debt obligations held by the Funds are typically calculated by pricing service providers approved by the Audit Committee and are generally characterized as Level 2 within the valuation hierarchy.
In a limited number of cases the Committee calculates a fair value for investments using broker quotations or other methods approved by the Audit Committee. When the Committee uses a single broker quotation to calculate a fair value for an investment without other significant observable inputs, or if a fair value is calculated using other significant inputs that are considered unobservable, the investment is characterized as Level 3 within the hierarchy. Other significant unobservable inputs used to calculate a fair value in these instances might include an income-based valuation approach which considers discounted anticipated future cash flows from the investment and application of discounts due to the nature or duration of any restrictions on the disposition of the investment.
Valuations based upon the use of inputs from Levels 1, 2 or 3 may not represent the actual price received upon the disposition of an investment, and a fund may receive a price that is lower than the valuation based upon these inputs when it sells the investment.
The following tables display a summary of the fair value hierarchy measurements of each Fund’s investments as of March 31, 2020:
| SHORT DURATION MUNICIPAL FUND | TOTAL | LEVEL 1 | LEVEL 2 | LEVEL 3 |
| Assets | | | | |
| Investments in Securities | | | | |
| Municipal Bonds | $ 108,248,938 | $ — | $ 108,248,938 | $ — |
| Short-Term Investments | 15,450,000 | — | 15,450,000 | — |
| Total Investments in Securities | $123,698,938 | $— | $123,698,938 | $— |
| Total Assets | $123,698,938 | $— | $123,698,938 | $— |
| LIMITED TERM MUNICIPAL FUND | TOTAL | LEVEL 1 | LEVEL 2 | LEVEL 3 |
| Assets | | | | |
| Investments in Securities | | | | |
| Municipal Bonds | $ 5,246,276,048 | $ — | $ 5,246,276,048 | $ — |
| Short-Term Investments | 230,240,000 | — | 230,240,000 | — |
| Total Investments in Securities | $5,476,516,048 | $— | $5,476,516,048 | $— |
| Total Assets | $5,476,516,048 | $— | $5,476,516,048 | $— |
| LIMITED TERM CALIFORNIA FUND | TOTAL | LEVEL 1 | LEVEL 2 | LEVEL 3 |
| Assets | | | | |
| Investments in Securities | | | | |
| Municipal Bonds | $ 454,310,695 | $ — | $ 454,310,695 | $ — |
| Short-Term Investments | 35,885,000 | — | 35,885,000 | — |
| Total Investments in Securities | $490,195,695 | $— | $490,195,695 | $— |
| Total Assets | $490,195,695 | $— | $490,195,695 | $— |
| INTERMEDIATE NEW MEXICO FUND | TOTAL | LEVEL 1 | LEVEL 2 | LEVEL 3 |
| Assets | | | | |
| Investments in Securities | | | | |
| Municipal Bonds | $ 153,110,901 | $ — | $ 153,110,901 | $ — |
| Short-Term Investments | 1,500,000 | — | 1,500,000 | — |
| Total Investments in Securities | $154,610,901 | $— | $154,610,901 | $— |
| Total Assets | $154,610,901 | $— | $154,610,901 | $— |
| INTERMEDIATE NEW YORK FUND | TOTAL | LEVEL 1 | LEVEL 2 | LEVEL 3 |
| Assets | | | | |
| Investments in Securities | | | | |
| Municipal Bonds | $ 46,111,924 | $ — | $ 46,111,924 | $ — |
| Short-Term Investments | 2,400,000 | — | 2,400,000 | — |
| Total Investments in Securities | $48,511,924 | $— | $48,511,924 | $— |
| Total Assets | $48,511,924 | $— | $48,511,924 | $— |
Thornburg Municipal Funds Semi-Annual Report | 71
Notes to Financial Statements, Continued
March 31, 2020 (Unaudited)
| INTERMEDIATE MUNICIPAL FUND | TOTAL | LEVEL 1 | LEVEL 2 | LEVEL 3 |
| Assets | | | | |
| Investments in Securities | | | | |
| Municipal Bonds | $ 978,925,163 | $ — | $ 978,925,163 | $ — |
| Short-Term Investments | 27,685,000 | — | 27,685,000 | — |
| Total Investments in Securities | $1,006,610,163 | $— | $1,006,610,163 | $— |
| Total Assets | $1,006,610,163 | $— | $1,006,610,163 | $— |
| STRATEGIC MUNICIPAL INCOME FUND | TOTAL | LEVEL 1 | LEVEL 2 | LEVEL 3 |
| Assets | | | | |
| Investments in Securities | | | | |
| Municipal Bonds | $ 276,610,840 | $ — | $ 276,610,840 | $ — |
| Short-Term Investments | 10,000,000 | — | 10,000,000 | — |
| Total Investments in Securities | $286,610,840 | $— | $286,610,840 | $— |
| Total Assets | $286,610,840 | $— | $286,610,840 | $— |
NOTE 4 – INVESTMENT MANAGEMENT FEE AND OTHER TRANSACTIONS WITH AFFILIATES
Pursuant to an investment management agreement, the Advisor serves as the investment advisor and performs services for the Funds for which the fees are payable at the end of each month. Under the investment advisory agreement, Funds pay the Advisor a management fee based on the average daily net assets of the Funds at an annual rate as shown in the following table:
| SHORT DURATION MUNICIPAL FUND | LIMITED TERM MUNICIPAL FUND,
LIMITED TERM CALIFORNIA FUND | INTERMEDIATE NEW MEXICO FUND,
INTERMEDIATE NEW YORK FUND,
INTERMEDIATE MUNICIPAL FUND | STRATEGIC MUNICIPAL INCOME FUND |
| DAILY NET ASSETS | FEE RATE | DAILY NET ASSETS | FEE RATE | DAILY NET ASSETS | FEE RATE | DAILY NET ASSETS | FEE RATE |
| Up to $1 billion | 0.400% | Up to $500 million | 0.500% | Up to $500 million | 0.500% | Up to $500 million | 0.750% |
| Next $500 million | 0.300 | Next $500 million | 0.400 | Next $500 million | 0.450 | Next $500 million | 0.675 |
| Next $500 million | 0.250 | Next $500 million | 0.300 | Next $500 million | 0.400 | Next $500 million | 0.625 |
| Over $2 billion | 0.225 | Next $500 million | 0.250 | Next $500 million | 0.350 | Next $500 million | 0.575 |
| | | Over $2 billion | 0.225 | Over $2 billion | 0.275 | Over $2 billion | 0.500 |
The Funds’ effective management fees of as a percentage of the Funds’ average daily net assets (before applicable management fee waivers) for the six months ended March 31, 2020 were as shown in the following table. Total management fees incurred by the Funds for the six months ended March 31, 2020 are set forth in the Statement of Operations.
| | Effective
Management
Fee |
| Short Duration Municipal Fund | 0.400% |
| Limited Term Municipal Fund | 0.272 |
| Limited Term California Fund | 0.499 |
| Intermediate New Mexico Fund | 0.500 |
| Intermediate New York Fund | 0.500 |
| Intermediate Municipal Fund | 0.468 |
| Strategic Municipal Income Fund | 0.750 |
72 | Thornburg Municipal Funds Semi-Annual Report
Notes to Financial Statements, Continued
March 31, 2020 (Unaudited)
The Trust has entered into an administrative services agreement with the Advisor, whereby the Advisor will perform certain administrative services related to each class of the Funds’ shares. The fees are computed as an annual percentage of the aggregate average daily net assets of all shares classes of all Funds in the Trust as follows:
| Administration Fee Schedule |
| Daily Net Assets | Fee Rate |
| Up to $20 billion | 0.100% |
| $20 billion to $40 billion | 0.075 |
| $40 billion to $60 billion | 0.040 |
| Over $60 billion | 0.030 |
The aggregate fee amount is allocated on a daily basis to each Fund based on net assets and subsequently allocated to each class of shares of the Funds. Total administrative service fees incurred by each class of shares of the Funds for the six months ended March 31, 2020, are set forth in the Statement of Operations.
The Trust has an underwriting agreement with Thornburg Securities Corporation (the “Distributor”), an affiliate of the Advisor, which acts as the distributor of the Funds’ shares. For the six months ended March 31, 2020, the Distributor has advised the Funds that they earned net commissions from the sale of Class A shares and collected contingent deferred sales charges ("CDSC Fees") from redemptions of Class C shares as follows:
| | Commissions | CDSC fees |
| Limited Term Municipal Fund | $ 1,313 | $ 2,492 |
| Limited Term California Fund | 483 | 471 |
| Intermediate New Mexico Fund | 52 | — |
| Intermediate New York Fund | 13 | — |
| Intermediate Municipal Fund | 1,125 | 173 |
| Strategic Municipal Income Fund | 958 | 1,383 |
Pursuant to a service plan under Rule 12b-1 of the 1940 Act, the Funds may reimburse to the Distributor an amount not to exceed .25 of 1% per annum of the average daily net assets attributable to the applicable Class A, Class C and Class I shares of the Limited Term Municipal Fund, Limited Term California Fund, Intermediate Municipal Fund and Strategic Municipal Income Fund, Class A and Class I shares of the Short Duration Municipal Fund and Intermediate New York Fund and Class A, Class D and Class I shares of the Intermediate New Mexico Fund for payments made by the Distributor to securities dealers and other financial institutions to obtain various shareholder and distribution related services. For the six months ended March 31, 2020, there were no 12b-1 service plan fees charged for Class I. The Advisor and Distributor each may pay out of its own resources additional expenses for distribution of each Fund’s shares and shareholder services.
The Trust has also adopted a distribution plan pursuant to Rule 12b-1, applicable only to the Fund’s Class C shares, under which the Fund compensates the Distributor for services in promoting the sale of Class C shares of the Fund at an annual rate of up to .25 of 1% per annum of the average daily net assets attributable to Class C shares. Total fees incurred by each class of shares of the Funds under their respective service and distribution plans for the six months ended March 31, 2020, are set forth in the Statements of Operations.
The Advisor has contractually agreed to waive fees and reimburse expenses incurred by the Funds. The agreement may be terminated by the Funds at any time, but may not be terminated by the Advisor before February 1, 2021, unless the Advisor ceases to be the investment advisor to the Funds prior to that date. The Advisor may recoup amounts waived or reimbursed during the six months ended March 31, 2020 if, during the fiscal year, expenses fall below the contractual limit that was in place at the time these fees and expenses were waived or reimbursed. The Advisor will not recoup fees or expenses as described in the preceding sentence if that recoupment would cause the Fund’s total annual operating expenses (after the recoupment is taken into account) to exceed the lesser of: (a) the expense cap that was in place at the time the waiver or reimbursement occurred; or (b) the expense cap that is in place at the time of the recoupment.
Thornburg Municipal Funds Semi-Annual Report | 73
Notes to Financial Statements, Continued
March 31, 2020 (Unaudited)
Actual expenses of certain share classes do not exceed levels as specified in each Fund’s most recent prospectus as shown on the following table:
| | Class A | Class C | Class I |
| Short Duration Municipal Fund | 0.70% | —% | 0.50% |
| Limited Term California Fund | 0.74 | 1.02 | 0.49 |
| Intermediate New Mexico Fund | — | — | 0.67 |
| Intermediate New York Fund | 0.99 | — | 0.67 |
| Intermediate Municipal Fund | 0.77 | 1.14 | 0.53 |
| Strategic Municipal Income Fund | 0.81 | 1.28 | 0.59 |
For the six months ended March 31, 2020, the Advisor contractually reimbursed certain class specific expenses and distribution fees and voluntarily waived Fund level investment advisory fees as follows:
| Contractual: | Class A | Class C | Class I |
| Short Duration Municipal Fund | $ 23,926 | $ — | $ 103,474 |
| Limited Term California Fund | 30,084 | 6,496 | 105,794 |
| Intermediate New Mexico Fund | — | — | 7,802 |
| Intermediate New York Fund | 13,661 | — | 19,001 |
| Intermediate Municipal Fund | 60,008 | 16,497 | 112,080 |
| Strategic Municipal Income Fund | 86,254 | 20,170 | 268,117 |
| Voluntary: | Class A | Class D | Class I |
| Intermediate New Mexico Fund | $ — | $ 1,289 | $ — |
| Intermediate New York Fund | 2,986 | — | 2,398 |
The Funds may purchase or sell securities from or to an affiliated fund, provided the affiliation is due solely to having a common investment advisor, common officers, or common trustees, and provided that all such transactions will comply with Rule 17a-7 under the 1940 Act. For the six months ended March 31, 2020, Short Duration Municipal Fund had transactions with affiliated funds of $15,104,119 in purchases and $30,692,046 in sales generating realized losses of $696,968. Limited Term Municipal Fund had transactions with affiliated funds of $59,490,236 in purchases. Limited Term California Fund had transactions with affiliated funds of $3,862,984 in purchases. Intermediate New Mexico Fund had transactions with affiliated funds of $2,174,991 in purchases. Intermediate New York Fund had transactions with affiliated funds of $3,131,363 in sales generating realized gains of $30,332. Intermediate Municipal Fund had transactions with affiliated funds of $44,236,081 in sales generating realized gains of $215,872. Strategic Municipal Income Fund had transactions with affiliated funds of $2,572,840 in sales generating realized gains of $1,914.
NOTE 5 – TAXES
Federal Income Taxes: It is the policy of the Trust to comply with the provisions of the Internal Revenue Code applicable to regulated investment companies and to distribute to shareholders substantially all investment company taxable income including net realized gains on investments (if any), and tax exempt income of the Funds. Therefore, no provision for federal income or excise tax is required.
The Funds file income tax returns in United States federal and applicable state jurisdictions. The statute of limitations on the Funds’ tax return filings generally remains open for the three years following a return’s filing date. The Funds have analyzed each uncertain tax position believed to be material in the preparation of the Funds’ financial statements for the six month period ended March 31, 2020, including open tax years, to assess whether it is more likely than not that the position would be sustained upon examination, based on the technical merits of the position. The Funds have not identified any such position for which an asset or liability must be reflected in the Statement of Assets and Liabilities.
74 | Thornburg Municipal Funds Semi-Annual Report
Notes to Financial Statements, Continued
March 31, 2020 (Unaudited)
At March 31, 2020, information on the tax components of capital was as follows:
| | Cost | Unrealized
Appreciation | Unrealized
Depreciation | Net Unrealized
Appreciation
(Depreciation) |
| Short Duration Municipal Fund | $ 123,389,300 | $ 624,555 | $ (314,917) | $ 309,638 |
| Limited Term Municipal Fund | 5,343,909,092 | 147,050,612 | (14,443,656) | 132,606,956 |
| Limited Term California Fund | 478,043,899 | 13,485,571 | (1,333,775) | 12,151,796 |
| Intermediate New Mexico Fund | 149,613,789 | 5,730,591 | (733,479) | 4,997,112 |
| Intermediate New York Fund | 46,667,916 | 2,090,149 | (246,141) | 1,844,008 |
| Intermediate Municipal Fund | 958,092,887 | 53,239,216 | (4,721,940) | 48,517,276 |
| Strategic Municipal Income Fund | 275,975,289 | 12,764,405 | (2,128,854) | 10,635,551 |
At March 31, 2020, the Funds had deferred tax basis capital losses occurring subsequent to October 31, 2018 through September 30, 2019 per the following table. For tax purposes, such losses will be recognized in the year ending September 30, 2020.
| | Capital Losses |
| Short Duration Municipal Fund | $ 169,603 |
| Limited Term Municipal Fund | 11,325,459 |
| Limited Term California Fund | 967,307 |
| Intermediate New Mexico Fund | 1,637 |
| Intermediate New York Fund | 64,050 |
| Intermediate Municipal Fund | 178,409 |
| Strategic Municipal Income Fund | 246,733 |
At March 31, 2020, the Funds had cumulative tax basis capital losses from prior fiscal years as shown on the following table, which may be carried forward to offset future capital gains. To the extent such carryforwards are used, capital gain distributions may be reduced to the extent provided by regulations. Such capital loss carryforwards do not expire.
| | Cumulative Capital Losses |
| | Short-Term | Long-Term |
| Short Duration Municipal Fund | $ 9,613 | $ 42,248 |
| Limited Term Municipal Fund | 17,014,543 | 4,875,697 |
| Limited Term California Fund | 2,809,058 | 806,613 |
| Intermediate New Mexico Fund | 109,867 | 766,613 |
| Intermediate New York Fund | 412,560 | 66,465 |
| Intermediate Municipal Fund | 4,347,434 | 4,986,817 |
| Strategic Municipal Income Fund | 636,169 | — |
NOTE 6 – SHARES OF BENEFICIAL INTEREST
At March 31, 2020, there were an unlimited number of shares with no par value of beneficial interest authorized. Transactions in shares of beneficial interest were as follows:
| | SIX MONTHS ENDED
March 31, 2020 | YEAR ENDED
September 30, 2019 (AUDITED) |
| SHORT DURATION MUNICIPAL FUND | SHARES | AMOUNT | SHARES | AMOUNT |
| Class A Shares | | | | |
| Shares sold | 482,730 | $ 5,904,459 | 985,212 | $ 12,093,230 |
Shares issued to shareholders in
reinvestment of dividends | 8,113 | 100,249 | 21,204 | 261,359 |
| Shares repurchased | (67,996) | (837,842) | (1,228,414) | (15,125,394) |
| Net increase (decrease) | 422,847 | $ 5,166,866 | (221,998) | $ (2,770,805) |
Thornburg Municipal Funds Semi-Annual Report | 75
Notes to Financial Statements, Continued
March 31, 2020 (Unaudited)
| | SIX MONTHS ENDED
March 31, 2020 | YEAR ENDED
September 30, 2019 (AUDITED) |
| SHORT DURATION MUNICIPAL FUND | SHARES | AMOUNT | SHARES | AMOUNT |
| Class I Shares | | | | |
| Shares sold | 1,475,589 | $ 18,261,608 | 8,234,527 | $ 101,374,617 |
Shares issued to shareholders in
reinvestment of dividends | 112,365 | 1,389,216 | 230,292 | 2,839,589 |
| Shares repurchased | (11,030,224) | (134,387,756) | (3,539,014) | (43,617,399) |
| Net increase (decrease) | (9,442,270) | $ (114,736,932) | 4,925,805 | $ 60,596,807 |
| | SIX MONTHS ENDED
March 31, 2020 | YEAR ENDED
September 30, 2019 (AUDITED) |
| LIMITED TERM MUNICIPAL FUND | SHARES | AMOUNT | SHARES | AMOUNT |
| Class A Shares | | | | |
| Shares sold | 5,903,140 | $ 85,382,564 | 13,658,346 | $ 195,633,417 |
Shares issued to shareholders in
reinvestment of dividends | 489,581 | 7,095,794 | 1,149,701 | 16,469,051 |
| Shares repurchased | (8,379,788) | (120,674,867) | (25,081,271) | (358,566,073) |
| Net increase (decrease) | (1,987,067) | $ (28,196,509) | (10,273,224) | $ (146,463,605) |
| Class C Shares | | | | |
| Shares sold | 892,964 | $ 12,973,029 | 1,605,055 | $ 22,970,017 |
Shares issued to shareholders in
reinvestment of dividends | 132,729 | 1,927,273 | 376,902 | 5,404,463 |
| Shares repurchased | (4,066,772) | (58,906,782) | (11,422,496) | (164,046,622) |
| Net increase (decrease) | (3,041,079) | $ (44,006,480) | (9,440,539) | $ (135,672,142) |
| Class I Shares | | | | |
| Shares sold | 44,068,021 | $ 637,569,339 | 104,092,829 | $ 1,488,791,962 |
Shares issued to shareholders in
reinvestment of dividends | 2,792,466 | 40,478,449 | 6,098,914 | 87,365,336 |
| Shares repurchased | (80,775,895) | (1,162,085,806) | (132,701,949) | (1,891,266,593) |
| Net increase (decrease) | (33,915,408) | $ (484,038,018) | (22,510,206) | $ (315,109,295) |
| | SIX MONTHS ENDED
March 31, 2020 | YEAR ENDED
September 30, 2019 (AUDITED) |
| LIMITED TERM CALIFORNIA FUND | SHARES | AMOUNT | SHARES | AMOUNT |
| Class A Shares | | | | |
| Shares sold | 373,211 | $ 5,102,259 | 1,166,943 | $ 15,894,863 |
Shares issued to shareholders in
reinvestment of dividends | 52,176 | 717,093 | 124,346 | 1,692,823 |
| Shares repurchased | (920,464) | (12,586,667) | (2,474,418) | (33,572,316) |
| Net increase (decrease) | (495,077) | $ (6,767,315) | (1,183,129) | $ (15,984,630) |
| Class C Shares | | | | |
| Shares sold | 74,849 | $ 1,027,632 | 152,314 | $ 2,075,247 |
Shares issued to shareholders in
reinvestment of dividends | 8,506 | 117,028 | 25,843 | 351,865 |
| Shares repurchased | (301,723) | (4,145,538) | (1,149,285) | (15,673,337) |
| Net increase (decrease) | (218,368) | $ (3,000,878) | (971,128) | $ (13,246,225) |
| Class I Shares | | | | |
| Shares sold | 7,677,382 | $ 105,360,933 | 8,778,679 | $ 119,359,166 |
Shares issued to shareholders in
reinvestment of dividends | 177,982 | 2,448,577 | 361,463 | 4,927,943 |
| Shares repurchased | (5,275,611) | (72,116,840) | (10,973,012) | (148,884,906) |
| Net increase (decrease) | 2,579,753 | $ 35,692,670 | (1,832,870) | $ (24,597,797) |
76 | Thornburg Municipal Funds Semi-Annual Report
Notes to Financial Statements, Continued
March 31, 2020 (Unaudited)
| | SIX MONTHS ENDED
March 31, 2020 | YEAR ENDED
September 30, 2019 (AUDITED) |
| INTERMEDIATE NEW MEXICO FUND | SHARES | AMOUNT | SHARES | AMOUNT |
| Class A Shares | | | | |
| Shares sold | 196,563 | $ 2,601,576 | 234,408 | $ 3,072,960 |
Shares issued to shareholders in
reinvestment of dividends | 55,883 | 747,780 | 141,896 | 1,869,564 |
| Shares repurchased | (548,751) | (7,308,427) | (1,308,484) | (17,194,023) |
| Net increase (decrease) | (296,305) | $ (3,959,071) | (932,180) | $ (12,251,499) |
| Class D Shares | | | | |
| Shares sold | 28,879 | $ 387,242 | 49,324 | $ 646,870 |
Shares issued to shareholders in
reinvestment of dividends | 9,857 | 131,973 | 25,795 | 339,947 |
| Shares repurchased | (121,034) | (1,610,992) | (302,963) | (3,976,822) |
| Net increase (decrease) | (82,298) | $ (1,091,777) | (227,844) | $ (2,990,005) |
| Class I Shares | | | | |
| Shares sold | 467,123 | $ 6,279,799 | 1,057,272 | $ 13,882,892 |
Shares issued to shareholders in
reinvestment of dividends | 49,880 | 667,072 | 103,598 | 1,365,495 |
| Shares repurchased | (376,368) | (4,968,316) | (632,748) | (8,262,233) |
| Net increase (decrease) | 140,635 | $ 1,978,555 | 528,122 | $ 6,986,154 |
| | SIX MONTHS ENDED
March 31, 2020 | YEAR ENDED
September 30, 2019 (AUDITED) |
| INTERMEDIATE NEW YORK FUND | SHARES | AMOUNT | SHARES | AMOUNT |
| Class A Shares | | | | |
| Shares sold | 315,269 | $ 4,096,373 | 109,181 | $ 1,394,851 |
Shares issued to shareholders in
reinvestment of dividends | 17,261 | 223,955 | 46,317 | 591,531 |
| Shares repurchased | (214,278) | (2,748,244) | (794,796) | (10,159,460) |
| Net increase (decrease) | 118,252 | $ 1,572,084 | (639,298) | $ (8,173,078) |
| Class I Shares | | | | |
| Shares sold | 178,614 | $ 2,337,526 | 742,617 | $ 9,506,280 |
Shares issued to shareholders in
reinvestment of dividends | 16,536 | 214,520 | 43,073 | 550,736 |
| Shares repurchased | (445,409) | (5,735,342) | (794,596) | (10,116,799) |
| Net increase (decrease) | (250,259) | $ (3,183,296) | (8,906) | $ (59,783) |
| | SIX MONTHS ENDED
March 31, 2020 | YEAR ENDED
September 30, 2019 (AUDITED) |
| INTERMEDIATE MUNICIPAL FUND | SHARES | AMOUNT | SHARES | AMOUNT |
| Class A Shares | | | | |
| Shares sold | 1,400,367 | $ 20,118,300 | 3,767,982 | $ 53,079,171 |
Shares issued to shareholders in
reinvestment of dividends | 249,523 | 3,580,761 | 496,765 | 6,996,037 |
| Shares repurchased | (1,778,748) | (25,325,215) | (5,845,339) | (81,706,176) |
| Net increase (decrease) | (128,858) | $ (1,626,154) | (1,580,592) | $ (21,630,968) |
| Class C Shares | | | | |
| Shares sold | 283,927 | $ 4,080,279 | 595,781 | $ 8,375,099 |
Shares issued to shareholders in
reinvestment of dividends | 42,749 | 614,284 | 113,502 | 1,598,215 |
| Shares repurchased | (951,751) | (13,635,855) | (2,875,902) | (40,566,724) |
| Net increase (decrease) | (625,075) | $ (8,941,292) | (2,166,619) | $ (30,593,410) |
Thornburg Municipal Funds Semi-Annual Report | 77
Notes to Financial Statements, Continued
March 31, 2020 (Unaudited)
| | SIX MONTHS ENDED
March 31, 2020 | YEAR ENDED
September 30, 2019 (AUDITED) |
| INTERMEDIATE MUNICIPAL FUND | SHARES | AMOUNT | SHARES | AMOUNT |
| Class I Shares | | | | |
| Shares sold | 6,046,310 | $ 86,615,050 | 20,388,015 | $ 284,155,586 |
Shares issued to shareholders in
reinvestment of dividends | 527,139 | 7,555,384 | 1,175,839 | 16,516,753 |
| Shares repurchased | (11,505,957) | (162,541,771) | (36,252,366) | (506,419,071) |
| Net increase (decrease) | (4,932,508) | $ (68,371,337) | (14,688,512) | $ (205,746,732) |
| | SIX MONTHS ENDED
March 31, 2020 | YEAR ENDED
September 30, 2019 (AUDITED) |
| STRATEGIC MUNICIPAL INCOME FUND | SHARES | AMOUNT | SHARES | AMOUNT |
| Class A Shares | | | | |
| Shares sold | 491,231 | $ 7,529,468 | 1,105,890 | $ 16,584,191 |
Shares issued to shareholders in
reinvestment of dividends | 46,322 | 710,106 | 91,356 | 1,376,932 |
| Shares repurchased | (364,713) | (5,463,395) | (1,156,578) | (17,317,637) |
| Net increase (decrease) | 172,840 | $ 2,776,179 | 40,668 | $ 643,486 |
| Class C Shares | | | | |
| Shares sold | 39,946 | $ 616,345 | 168,343 | $ 2,526,426 |
Shares issued to shareholders in
reinvestment of dividends | 11,663 | 178,997 | 29,512 | 444,738 |
| Shares repurchased | (152,821) | (2,333,345) | (569,863) | (8,566,984) |
| Net increase (decrease) | (101,212) | $ (1,538,003) | (372,008) | $ (5,595,820) |
| Class I Shares | | | | |
| Shares sold | 2,713,893 | $ 41,546,715 | 5,083,758 | $ 76,479,655 |
Shares issued to shareholders in
reinvestment of dividends | 195,785 | 3,004,720 | 358,400 | 5,409,565 |
| Shares repurchased | (2,951,092) | (44,780,574) | (3,633,064) | (54,382,078) |
| Net increase (decrease) | (41,414) | $ (229,139) | 1,809,094 | $ 27,507,142 |
NOTE 7 – INVESTMENT TRANSACTIONS
For the six months ended March 31, 2020, the Funds had purchase and sale transactions of investments as below (excluding short-term investments).
| | Purchases | Sales |
| Short Duration Municipal Fund | $ 35,941,514 | $ 99,767,641 |
| Limited Term Municipal Fund | 604,604,646 | 909,346,849 |
| Limited Term California Fund | 47,050,158 | 49,478,379 |
| Intermediate New Mexico Fund | 16,957,775 | 11,803,694 |
| Intermediate New York Fund | 5,454,968 | 5,621,790 |
| Intermediate Municipal Fund | 105,972,841 | 159,892,302 |
| Strategic Municipal Income Fund | 64,579,225 | 47,100,695 |
78 | Thornburg Municipal Funds Semi-Annual Report
This page intentionally left blank.
Thornburg Municipal Funds Semi-Annual Report | 79
Financial Highlights
Short Duration Municipal Fund
| | PER SHARE PERFORMANCE (FOR A SHARE OUTSTANDING THROUGHOUT THE PERIOD) |
UNLESS OTHERWISE
NOTED, PERIODS ARE
FISCAL YEARS ENDED
SEPTEMBER 30, | Net Asset
Value,
Beginning of
PERIOD | Net
Investment
Income
(Loss)+ | Net Realized &
Unrealized Gain
(Loss) on
Investments | Total from
Investment
Operations | Dividends
from Net
Investment
Income | Dividends
from Net
Realized
Gains | Total
Dividends | Net Asset
Value,
End of PERIOD |
| CLASS A SHARES(b) |
| 2020(c) | $ 12.36 | 0.07 | (0.09) | (0.02) | (0.07) | — | (0.07) | $ 12.27 |
| 2019 | $ 12.27 | 0.16 | 0.09 | 0.25 | (0.16) | — | (0.16) | $ 12.36 |
| 2018 | $ 12.38 | 0.11 | (0.11) | —(e) | (0.11) | — | (0.11) | $ 12.27 |
| 2017 | $ 12.34 | 0.08 | 0.04 | 0.12 | (0.08) | — | (0.08) | $ 12.38 |
| 2016 | $ 12.35 | 0.03 | (0.01) | 0.02 | (0.03) | — | (0.03) | $ 12.34 |
| 2015 | $ 12.34 | 0.02 | 0.01 | 0.03 | (0.02) | — | (0.02) | $ 12.35 |
| CLASS I SHARES |
| 2020(c) | $ 12.36 | 0.08 | (0.09) | (0.01) | (0.08) | — | (0.08) | $ 12.27 |
| 2019 | $ 12.27 | 0.18 | 0.09 | 0.27 | (0.18) | — | (0.18) | $ 12.36 |
| 2018 | $ 12.37 | 0.14 | (0.10) | 0.04 | (0.14) | — | (0.14) | $ 12.27 |
| 2017 | $ 12.34 | 0.10 | 0.03 | 0.13 | (0.10) | — | (0.10) | $ 12.37 |
| 2016 | $ 12.35 | 0.05 | (0.01) | 0.04 | (0.05) | — | (0.05) | $ 12.34 |
| 2015 | $ 12.34 | 0.04 | 0.01 | 0.05 | (0.04) | — | (0.04) | $ 12.35 |
| (a) | Not annualized for periods less than one year. |
| (b) | Sales loads are not reflected in computing total return. |
| (c) | Unaudited Six Month Period Ended March 31. |
| (d) | Annualized. |
| (e) | Total from investment operations was less than $0.01 per share. |
| + | Based on weighted average shares outstanding. |
See notes to financial statements.
80 | Thornburg Municipal Funds Semi-Annual Report
Financial Highlights, Continued
Short Duration Municipal Fund
| | RATIOS TO AVERAGE NET ASSETS | | Supplemental Data |
UNLESS OTHERWISE
NOTED, PERIODS ARE
FISCAL YEARS ENDED
SEPTEMBER 30, | Net Investment
Income (Loss) (%) | Expenses, After
Expense
Reductions (%) | Expenses,
Before Expense
Reductions (%) | | Total
Return (%)(a) | Portfolio
Turnover
Rate (%)(a) | Net Assets
at End of PERIOD
(Thousands) |
| CLASS A SHARES(b) |
| 2020(c) | 1.17(d) | 0.70(d) | 0.98(d) | | (0.15) | 21.74 | $ 21,966 |
| 2019 | 1.26 | 0.70 | 0.99 | | 2.02 | 33.60 | $ 16,899 |
| 2018 | 0.92 | 0.70 | 1.06 | | 0.02 | 35.36 | $ 19,497 |
| 2017 | 0.72 | 0.67 | 1.16 | | 0.98 | 42.94 | $ 16,412 |
| 2016 | 0.24 | 0.70 | 2.19 | | 0.15 | 21.17 | $ 4,241 |
| 2015 | 0.15 | 0.67 | 2.85 | | 0.22 | 15.75 | $ 3,273 |
| CLASS I SHARES |
| 2020(c) | 1.34(d) | 0.50(d) | 0.60(d) | | (0.05) | 21.74 | $ 106,848 |
| 2019 | 1.47 | 0.50 | 0.64 | | 2.22 | 33.60 | $ 224,343 |
| 2018 | 1.12 | 0.50 | 0.64 | | 0.30 | 35.36 | $ 162,259 |
| 2017 | 0.85 | 0.49 | 0.67 | | 1.09 | 42.94 | $ 53,765 |
| 2016 | 0.43 | 0.50 | 0.72 | | 0.36 | 21.17 | $ 38,572 |
| 2015 | 0.32 | 0.50 | 0.82 | | 0.40 | 15.75 | $ 41,755 |
Thornburg Municipal Funds Semi-Annual Report | 81
Financial Highlights
Limited Term Municipal Fund
| | PER SHARE PERFORMANCE (FOR A SHARE OUTSTANDING THROUGHOUT THE PERIOD) |
UNLESS OTHERWISE
NOTED, PERIODS ARE
FISCAL YEARS ENDED
SEPTEMBER 30, | Net Asset
Value,
Beginning of
PERIOD | Net
Investment
Income
(Loss)+ | Net Realized &
Unrealized Gain
(Loss) on
Investments | Total from
Investment
Operations | Dividends
from Net
Investment
Income | Dividends
from Net
Realized
Gains | Total
Dividends | Net Asset
Value,
End of PERIOD |
| CLASS A SHARES(b) |
| 2020(c) | $ 14.46 | 0.12 | (0.10) | 0.02 | (0.12) | — | (0.12) | $ 14.36 |
| 2019 | $ 14.10 | 0.26 | 0.36 | 0.62 | (0.26) | — | (0.26) | $ 14.46 |
| 2018 | $ 14.43 | 0.24 | (0.33) | (0.09) | (0.24) | — | (0.24) | $ 14.10 |
| 2017 | $ 14.63 | 0.23 | (0.20) | 0.03 | (0.23) | — | (0.23) | $ 14.43 |
| 2016 | $ 14.52 | 0.22 | 0.11 | 0.33 | (0.22) | — | (0.22) | $ 14.63 |
| 2015 | $ 14.58 | 0.23 | (0.06) | 0.17 | (0.23) | — | (0.23) | $ 14.52 |
| CLASS C SHARES |
| 2020(c) | $ 14.48 | 0.11 | (0.09) | 0.02 | (0.11) | — | (0.11) | $ 14.39 |
| 2019 | $ 14.12 | 0.22 | 0.36 | 0.58 | (0.22) | — | (0.22) | $ 14.48 |
| 2018 | $ 14.46 | 0.20 | (0.34) | (0.14) | (0.20) | — | (0.20) | $ 14.12 |
| 2017 | $ 14.66 | 0.20 | (0.20) | — | (0.20) | — | (0.20) | $ 14.46 |
| 2016 | $ 14.55 | 0.19 | 0.11 | 0.30 | (0.19) | — | (0.19) | $ 14.66 |
| 2015 | $ 14.60 | 0.19 | (0.05) | 0.14 | (0.19) | — | (0.19) | $ 14.55 |
| CLASS I SHARES |
| 2020(c) | $ 14.46 | 0.14 | (0.09) | 0.05 | (0.14) | — | (0.14) | $ 14.37 |
| 2019 | $ 14.10 | 0.29 | 0.36 | 0.65 | (0.29) | — | (0.29) | $ 14.46 |
| 2018 | $ 14.43 | 0.28 | (0.33) | (0.05) | (0.28) | — | (0.28) | $ 14.10 |
| 2017 | $ 14.64 | 0.28 | (0.21) | 0.07 | (0.28) | — | (0.28) | $ 14.43 |
| 2016 | $ 14.53 | 0.27 | 0.11 | 0.38 | (0.27) | — | (0.27) | $ 14.64 |
| 2015 | $ 14.58 | 0.27 | (0.05) | 0.22 | (0.27) | — | (0.27) | $ 14.53 |
| (a) | Not annualized for periods less than one year. |
| (b) | Sales loads are not reflected in computing total return. |
| (c) | Unaudited Six Month Period Ended March 31. |
| (d) | Annualized. |
| + | Based on weighted average shares outstanding. |
See notes to financial statements.
82 | Thornburg Municipal Funds Semi-Annual Report
Financial Highlights, Continued
Limited Term Municipal Fund
| | RATIOS TO AVERAGE NET ASSETS | | Supplemental Data |
UNLESS OTHERWISE
NOTED, PERIODS ARE
FISCAL YEARS ENDED
SEPTEMBER 30, | Net Investment
Income (Loss) (%) | Expenses, After
Expense
Reductions (%) | Expenses,
Before Expense
Reductions (%) | | Total
Return (%)(a) | Portfolio
Turnover
Rate (%)(a) | Net Assets
at End of PERIOD
(Thousands) |
| CLASS A SHARES(b) |
| 2020(c) | 1.71(d) | 0.68(d) | 0.68(d) | | 0.16 | 11.20 | $ 881,375 |
| 2019 | 1.80 | 0.69 | 0.69 | | 4.41 | 21.22 | $ 915,684 |
| 2018 | 1.67 | 0.71 | 0.71 | | (0.64) | 16.29 | $ 1,037,769 |
| 2017 | 1.62 | 0.73 | 0.73 | | 0.24 | 17.56 | $ 1,314,094 |
| 2016 | 1.54 | 0.72 | 0.72 | | 2.32 | 14.53 | $ 1,697,329 |
| 2015 | 1.56 | 0.73 | 0.73 | | 1.15 | 18.56 | $ 1,700,127 |
| CLASS C SHARES |
| 2020(c) | 1.45(d) | 0.93(d) | 0.93(d) | | 0.10 | 11.20 | $ 279,336 |
| 2019 | 1.56 | 0.94 | 0.94 | | 4.16 | 21.22 | $ 325,144 |
| 2018 | 1.43 | 0.95 | 0.95 | | (0.94) | 16.29 | $ 450,402 |
| 2017 | 1.38 | 0.97 | 0.97 | | 0.01 | 17.56 | $ 605,898 |
| 2016 | 1.30 | 0.96 | 0.96 | | 2.07 | 14.53 | $ 741,637 |
| 2015 | 1.32 | 0.96 | 0.96 | | 0.98 | 18.56 | $ 730,395 |
| CLASS I SHARES |
| 2020(c) | 1.95(d) | 0.43(d) | 0.43(d) | | 0.35 | 11.20 | $ 4,375,878 |
| 2019 | 2.04 | 0.45 | 0.45 | | 4.67 | 21.22 | $ 4,893,865 |
| 2018 | 1.95 | 0.43 | 0.43 | | (0.36) | 16.29 | $ 5,089,760 |
| 2017 | 1.93 | 0.42 | 0.42 | | 0.49 | 17.56 | $ 5,265,576 |
| 2016 | 1.85 | 0.41 | 0.41 | | 2.64 | 14.53 | $ 5,506,166 |
| 2015 | 1.88 | 0.41 | 0.41 | | 1.54 | 18.56 | $ 4,832,467 |
Thornburg Municipal Funds Semi-Annual Report | 83
Financial Highlights
Limited Term California Fund
| | PER SHARE PERFORMANCE (FOR A SHARE OUTSTANDING THROUGHOUT THE PERIOD) |
UNLESS OTHERWISE
NOTED, PERIODS ARE
FISCAL YEARS ENDED
SEPTEMBER 30, | Net Asset
Value,
Beginning of
PERIOD | Net
Investment
Income
(Loss)+ | Net Realized &
Unrealized Gain
(Loss) on
Investments | Total from
Investment
Operations | Dividends
from Net
Investment
Income | Dividends
from Net
Realized
Gains | Total
Dividends | Net Asset
Value,
End of PERIOD |
| CLASS A SHARES(b) |
| 2020(c) | $ 13.72 | 0.10 | (0.13) | (0.03) | (0.10) | — | (0.10) | $ 13.59 |
| 2019 | $ 13.45 | 0.22 | 0.27 | 0.49 | (0.22) | — | (0.22) | $ 13.72 |
| 2018 | $ 13.78 | 0.20 | (0.33) | (0.13) | (0.20) | — | (0.20) | $ 13.45 |
| 2017 | $ 13.98 | 0.18 | (0.20) | (0.02) | (0.18) | — | (0.18) | $ 13.78 |
| 2016 | $ 13.84 | 0.18 | 0.14 | 0.32 | (0.18) | — | (0.18) | $ 13.98 |
| 2015 | $ 13.84 | 0.19 | —(e) | 0.19 | (0.19) | — | (0.19) | $ 13.84 |
| CLASS C SHARES |
| 2020(c) | $ 13.73 | 0.08 | (0.13) | (0.05) | (0.08) | — | (0.08) | $ 13.60 |
| 2019 | $ 13.46 | 0.18 | 0.27 | 0.45 | (0.18) | — | (0.18) | $ 13.73 |
| 2018 | $ 13.79 | 0.17 | (0.33) | (0.16) | (0.17) | — | (0.17) | $ 13.46 |
| 2017 | $ 13.99 | 0.15 | (0.20) | (0.05) | (0.15) | — | (0.15) | $ 13.79 |
| 2016 | $ 13.85 | 0.14 | 0.14 | 0.28 | (0.14) | — | (0.14) | $ 13.99 |
| 2015 | $ 13.85 | 0.16 | —(e) | 0.16 | (0.16) | — | (0.16) | $ 13.85 |
| CLASS I SHARES |
| 2020(c) | $ 13.73 | 0.12 | (0.13) | (0.01) | (0.12) | — | (0.12) | $ 13.60 |
| 2019 | $ 13.46 | 0.25 | 0.27 | 0.52 | (0.25) | — | (0.25) | $ 13.73 |
| 2018 | $ 13.79 | 0.24 | (0.33) | (0.09) | (0.24) | — | (0.24) | $ 13.46 |
| 2017 | $ 13.99 | 0.22 | (0.20) | 0.02 | (0.22) | — | (0.22) | $ 13.79 |
| 2016 | $ 13.85 | 0.22 | 0.14 | 0.36 | (0.22) | — | (0.22) | $ 13.99 |
| 2015 | $ 13.85 | 0.24 | —(e) | 0.24 | (0.24) | — | (0.24) | $ 13.85 |
| (a) | Not annualized for periods less than one year. |
| (b) | Sales loads are not reflected in computing total return. |
| (c) | Unaudited Six Month Period Ended March 31. |
| (d) | Annualized. |
| (e) | Net realized and unrealized gain (loss) on investments was less than $0.01 per share. |
| + | Based on weighted average shares outstanding. |
See notes to financial statements.
84 | Thornburg Municipal Funds Semi-Annual Report
Financial Highlights, Continued
Limited Term California Fund
| | RATIOS TO AVERAGE NET ASSETS | | Supplemental Data |
UNLESS OTHERWISE
NOTED, PERIODS ARE
FISCAL YEARS ENDED
SEPTEMBER 30, | Net Investment
Income (Loss) (%) | Expenses, After
Expense
Reductions (%) | Expenses,
Before Expense
Reductions (%) | | Total
Return (%)(a) | Portfolio
Turnover
Rate (%)(a) | Net Assets
at End of PERIOD
(Thousands) |
| CLASS A SHARES(b) |
| 2020(c) | 1.44(d) | 0.86(d) | 0.91(d) | | (0.23) | 10.59 | $ 105,848 |
| 2019 | 1.58 | 0.93 | 0.93 | | 3.63 | 17.86 | $ 113,635 |
| 2018 | 1.50 | 0.92 | 0.92 | | (0.92) | 25.20 | $ 127,346 |
| 2017 | 1.33 | 0.93 | 0.93 | | (0.11) | 18.25 | $ 158,142 |
| 2016 | 1.28 | 0.93 | 0.93 | | 2.32 | 16.47 | $ 193,321 |
| 2015 | 1.39 | 0.94 | 0.94 | | 1.40 | 14.43 | $ 171,344 |
| CLASS C SHARES |
| 2020(c) | 1.15(d) | 1.14(d) | 1.19(d) | | (0.37) | 10.59 | $ 24,851 |
| 2019 | 1.31 | 1.21 | 1.21 | | 3.34 | 17.86 | $ 28,083 |
| 2018 | 1.23 | 1.19 | 1.19 | | (1.18) | 25.20 | $ 40,608 |
| 2017 | 1.08 | 1.19 | 1.19 | | (0.36) | 18.25 | $ 56,737 |
| 2016 | 1.04 | 1.18 | 1.18 | | 2.06 | 16.47 | $ 68,229 |
| 2015 | 1.15 | 1.18 | 1.18 | | 1.15 | 14.43 | $ 64,216 |
| CLASS I SHARES |
| 2020(c) | 1.68(d) | 0.61(d) | 0.67(d) | | (0.11) | 10.59 | $ 382,767 |
| 2019 | 1.84 | 0.67 | 0.68 | | 3.90 | 17.86 | $ 350,962 |
| 2018 | 1.76 | 0.66 | 0.67 | | (0.65) | 25.20 | $ 368,824 |
| 2017 | 1.62 | 0.64 | 0.64 | | 0.19 | 18.25 | $ 434,859 |
| 2016 | 1.60 | 0.62 | 0.62 | | 2.64 | 16.47 | $ 476,364 |
| 2015 | 1.70 | 0.63 | 0.63 | | 1.72 | 14.43 | $ 407,557 |
Thornburg Municipal Funds Semi-Annual Report | 85
Financial Highlights
Intermediate New Mexico Fund
| | PER SHARE PERFORMANCE (FOR A SHARE OUTSTANDING THROUGHOUT THE PERIOD) |
UNLESS OTHERWISE
NOTED, PERIODS ARE
FISCAL YEARS ENDED
SEPTEMBER 30, | Net Asset
Value,
Beginning of
PERIOD | Net
Investment
Income
(Loss)+ | Net Realized &
Unrealized Gain
(Loss) on
Investments | Total from
Investment
Operations | Dividends
from Net
Investment
Income | Dividends
from Net
Realized
Gains | Total
Dividends | Net Asset
Value,
End of PERIOD |
| CLASS A SHARES(b) |
| 2020(c) | $ 13.35 | 0.14 | (0.12) | 0.02 | (0.14) | — | (0.14) | $ 13.23 |
| 2019 | $ 13.00 | 0.31 | 0.35 | 0.66 | (0.31) | — | (0.31) | $ 13.35 |
| 2018 | $ 13.30 | 0.33 | (0.30) | 0.03 | (0.33) | — | (0.33) | $ 13.00 |
| 2017 | $ 13.67 | 0.31 | (0.37) | (0.06) | (0.31) | — | (0.31) | $ 13.30 |
| 2016 | $ 13.55 | 0.30 | 0.12 | 0.42 | (0.30) | — | (0.30) | $ 13.67 |
| 2015 | $ 13.60 | 0.34 | (0.05) | 0.29 | (0.34) | — | (0.34) | $ 13.55 |
| CLASS D SHARES |
| 2020(c) | $ 13.36 | 0.12 | (0.13) | (0.01) | (0.12) | — | (0.12) | $ 13.23 |
| 2019 | $ 13.01 | 0.28 | 0.35 | 0.63 | (0.28) | — | (0.28) | $ 13.36 |
| 2018 | $ 13.31 | 0.30 | (0.30) | — | (0.30) | — | (0.30) | $ 13.01 |
| 2017 | $ 13.68 | 0.28 | (0.37) | (0.09) | (0.28) | — | (0.28) | $ 13.31 |
| 2016 | $ 13.55 | 0.28 | 0.12 | 0.40 | (0.27) | — | (0.27) | $ 13.68 |
| 2015 | $ 13.61 | 0.31 | (0.06) | 0.25 | (0.31) | — | (0.31) | $ 13.55 |
| CLASS I SHARES |
| 2020(c) | $ 13.34 | 0.16 | (0.12) | 0.04 | (0.16) | — | (0.16) | $ 13.22 |
| 2019 | $ 13.00 | 0.35 | 0.34 | 0.69 | (0.35) | — | (0.35) | $ 13.34 |
| 2018 | $ 13.29 | 0.37 | (0.29) | 0.08 | (0.37) | — | (0.37) | $ 13.00 |
| 2017 | $ 13.67 | 0.36 | (0.38) | (0.02) | (0.36) | — | (0.36) | $ 13.29 |
| 2016 | $ 13.54 | 0.35 | 0.12 | 0.47 | (0.34) | — | (0.34) | $ 13.67 |
| 2015 | $ 13.59 | 0.38 | (0.05) | 0.33 | (0.38) | — | (0.38) | $ 13.54 |
| (a) | Not annualized for periods less than one year. |
| (b) | Sales loads are not reflected in computing total return. |
| (c) | Unaudited Six Month Period Ended March 31. |
| (d) | Annualized. |
| + | Based on weighted average shares outstanding. |
See notes to financial statements.
86 | Thornburg Municipal Funds Semi-Annual Report
Financial Highlights, Continued
Intermediate New Mexico Fund
| | RATIOS TO AVERAGE NET ASSETS | | Supplemental Data |
UNLESS OTHERWISE
NOTED, PERIODS ARE
FISCAL YEARS ENDED
SEPTEMBER 30, | Net Investment
Income (Loss) (%) | Expenses, After
Expense
Reductions (%) | Expenses,
Before Expense
Reductions (%) | | Total
Return (%)(a) | Portfolio
Turnover
Rate (%)(a) | Net Assets
at End of PERIOD
(Thousands) |
| CLASS A SHARES(b) |
| 2020(c) | 2.05(d) | 0.96(d) | 0.96(d) | | 0.12 | 7.77 | $ 80,082 |
| 2019 | 2.37 | 0.97 | 0.97 | | 5.15 | 17.26 | $ 84,782 |
| 2018 | 2.51 | 0.97 | 0.97 | | 0.24 | 7.77 | $ 94,686 |
| 2017 | 2.36 | 0.98 | 0.98 | | (0.38) | 8.61 | $ 116,915 |
| 2016 | 2.18 | 0.97 | 0.97 | | 3.11 | 6.80 | $ 136,743 |
| 2015 | 2.50 | 0.98 | 0.98 | | 2.15 | 19.01 | $ 139,939 |
| CLASS D SHARES |
| 2020(c) | 1.77(d) | 1.24(d) | 1.26(d) | | (0.10) | 7.77 | $ 14,652 |
| 2019 | 2.10 | 1.24 | 1.25 | | 4.87 | 17.26 | $ 15,888 |
| 2018 | 2.26 | 1.23 | 1.23 | | (0.02) | 7.77 | $ 18,436 |
| 2017 | 2.13 | 1.21 | 1.21 | | (0.61) | 8.61 | $ 22,666 |
| 2016 | 1.94 | 1.21 | 1.21 | | 2.94 | 6.80 | $ 28,489 |
| 2015 | 2.27 | 1.20 | 1.20 | | 1.84 | 19.01 | $ 28,953 |
| CLASS I SHARES |
| 2020(c) | 2.34(d) | 0.67(d) | 0.69(d) | | 0.26 | 7.77 | $ 63,448 |
| 2019 | 2.66 | 0.67 | 0.69 | | 5.39 | 17.26 | $ 62,162 |
| 2018 | 2.82 | 0.67 | 0.68 | | 0.62 | 7.77 | $ 53,675 |
| 2017 | 2.68 | 0.66 | 0.66 | | (0.13) | 8.61 | $ 62,243 |
| 2016 | 2.52 | 0.63 | 0.63 | | 3.53 | 6.80 | $ 65,843 |
| 2015 | 2.80 | 0.65 | 0.65 | | 2.48 | 19.01 | $ 57,958 |
Thornburg Municipal Funds Semi-Annual Report | 87
Financial Highlights
Intermediate New York Fund
| | PER SHARE PERFORMANCE (FOR A SHARE OUTSTANDING THROUGHOUT THE PERIOD) |
UNLESS OTHERWISE
NOTED, PERIODS ARE
FISCAL YEARS ENDED
SEPTEMBER 30, | Net Asset
Value,
Beginning of
PERIOD | Net
Investment
Income
(Loss)+ | Net Realized &
Unrealized Gain
(Loss) on
Investments | Total from
Investment
Operations | Dividends
from Net
Investment
Income | Dividends
from Net
Realized
Gains | Total
Dividends | Net Asset
Value,
End of PERIOD |
| CLASS A SHARES(b) |
| 2020(c) | $ 12.95 | 0.13 | (0.16) | (0.03) | (0.13) | — | (0.13) | $ 12.79 |
| 2019 | $ 12.61 | 0.30 | 0.34 | 0.64 | (0.30) | — | (0.30) | $ 12.95 |
| 2018 | $ 13.00 | 0.30 | (0.39) | (0.09) | (0.30) | — | (0.30) | $ 12.61 |
| 2017 | $ 13.40 | 0.33 | (0.40) | (0.07) | (0.33) | — | (0.33) | $ 13.00 |
| 2016 | $ 13.18 | 0.29 | 0.22 | 0.51 | (0.29) | — | (0.29) | $ 13.40 |
| 2015 | $ 13.22 | 0.29 | (0.04) | 0.25 | (0.29) | — | (0.29) | $ 13.18 |
| CLASS I SHARES |
| 2020(c) | $ 12.95 | 0.15 | (0.16) | (0.01) | (0.15) | — | (0.15) | $ 12.79 |
| 2019 | $ 12.61 | 0.34 | 0.34 | 0.68 | (0.34) | — | (0.34) | $ 12.95 |
| 2018 | $ 13.00 | 0.34 | (0.39) | (0.05) | (0.34) | — | (0.34) | $ 12.61 |
| 2017 | $ 13.40 | 0.37 | (0.40) | (0.03) | (0.37) | — | (0.37) | $ 13.00 |
| 2016 | $ 13.18 | 0.33 | 0.22 | 0.55 | (0.33) | — | (0.33) | $ 13.40 |
| 2015 | $ 13.22 | 0.33 | (0.04) | 0.29 | (0.33) | — | (0.33) | $ 13.18 |
| (a) | Not annualized for periods less than one year. |
| (b) | Sales loads are not reflected in computing total return. |
| (c) | Unaudited Six Month Period Ended March 31. |
| (d) | Annualized. |
| + | Based on weighted average shares outstanding. |
See notes to financial statements.
88 | Thornburg Municipal Funds Semi-Annual Report
Financial Highlights, Continued
Intermediate New York Fund
| | RATIOS TO AVERAGE NET ASSETS | | Supplemental Data |
UNLESS OTHERWISE
NOTED, PERIODS ARE
FISCAL YEARS ENDED
SEPTEMBER 30, | Net Investment
Income (Loss) (%) | Expenses, After
Expense
Reductions (%) | Expenses,
Before Expense
Reductions (%) | | Total
Return (%)(a) | Portfolio
Turnover
Rate (%)(a) | Net Assets
at End of PERIOD
(Thousands) |
| CLASS A SHARES(b) |
| 2020(c) | 2.05(d) | 0.99(d) | 1.11(d) | | (0.22) | 11.71 | $ 27,587 |
| 2019 | 2.38 | 0.99 | 1.12 | | 5.16 | 17.75 | $ 26,416 |
| 2018 | 2.36 | 0.99 | 1.08 | | (0.68) | 15.88 | $ 33,778 |
| 2017 | 2.50 | 0.99 | 1.09 | | (0.52) | 11.11 | $ 36,576 |
| 2016 | 2.18 | 0.96 | 1.03 | | 3.91 | 7.02 | $ 45,009 |
| 2015 | 2.16 | 0.98 | 1.05 | | 1.87 | 7.72 | $ 49,845 |
| CLASS I SHARES |
| 2020(c) | 2.37(d) | 0.67(d) | 0.87(d) | | (0.06) | 11.71 | $ 21,033 |
| 2019 | 2.69 | 0.67 | 0.88 | | 5.50 | 17.75 | $ 24,550 |
| 2018 | 2.68 | 0.67 | 0.82 | | (0.36) | 15.88 | $ 24,010 |
| 2017 | 2.81 | 0.67 | 0.77 | | (0.20) | 11.11 | $ 27,217 |
| 2016 | 2.51 | 0.63 | 0.72 | | 4.25 | 7.02 | $ 31,498 |
| 2015 | 2.47 | 0.67 | 0.76 | | 2.19 | 7.72 | $ 30,242 |
Thornburg Municipal Funds Semi-Annual Report | 89
Financial Highlights
Intermediate Municipal Fund
| | PER SHARE PERFORMANCE (FOR A SHARE OUTSTANDING THROUGHOUT THE PERIOD) |
UNLESS OTHERWISE
NOTED, PERIODS ARE
FISCAL YEARS ENDED
SEPTEMBER 30, | Net Asset
Value,
Beginning of
PERIOD | Net
Investment
Income
(Loss)+ | Net Realized &
Unrealized Gain
(Loss) on
Investments | Total from
Investment
Operations | Dividends
from Net
Investment
Income | Dividends
from Net
Realized
Gains | Total
Dividends | Net Asset
Value,
End of PERIOD |
| CLASS A SHARES(b) |
| 2020(c) | $ 14.33 | 0.18 | (0.26) | (0.08) | (0.18) | — | (0.18) | $ 14.07 |
| 2019 | $ 13.80 | 0.34 | 0.53 | 0.87 | (0.34) | — | (0.34) | $ 14.33 |
| 2018 | $ 14.15 | 0.32 | (0.35) | (0.03) | (0.32) | — | (0.32) | $ 13.80 |
| 2017 | $ 14.47 | 0.30 | (0.32) | (0.02) | (0.30) | — | (0.30) | $ 14.15 |
| 2016 | $ 14.17 | 0.29 | 0.30 | 0.59 | (0.29) | — | (0.29) | $ 14.47 |
| 2015 | $ 14.23 | 0.30 | (0.06) | 0.24 | (0.30) | — | (0.30) | $ 14.17 |
| CLASS C SHARES |
| 2020(c) | $ 14.35 | 0.15 | (0.26) | (0.11) | (0.15) | — | (0.15) | $ 14.09 |
| 2019 | $ 13.82 | 0.29 | 0.53 | 0.82 | (0.29) | — | (0.29) | $ 14.35 |
| 2018 | $ 14.17 | 0.27 | (0.35) | (0.08) | (0.27) | — | (0.27) | $ 13.82 |
| 2017 | $ 14.49 | 0.26 | (0.32) | (0.06) | (0.26) | — | (0.26) | $ 14.17 |
| 2016 | $ 14.19 | 0.24 | 0.30 | 0.54 | (0.24) | — | (0.24) | $ 14.49 |
| 2015 | $ 14.25 | 0.25 | (0.06) | 0.19 | (0.25) | — | (0.25) | $ 14.19 |
| CLASS I SHARES |
| 2020(c) | $ 14.31 | 0.19 | (0.26) | (0.07) | (0.19) | — | (0.19) | $ 14.05 |
| 2019 | $ 13.78 | 0.38 | 0.53 | 0.91 | (0.38) | — | (0.38) | $ 14.31 |
| 2018 | $ 14.13 | 0.36 | (0.35) | 0.01 | (0.36) | — | (0.36) | $ 13.78 |
| 2017 | $ 14.46 | 0.35 | (0.33) | 0.02 | (0.35) | — | (0.35) | $ 14.13 |
| 2016 | $ 14.15 | 0.33 | 0.31 | 0.64 | (0.33) | — | (0.33) | $ 14.46 |
| 2015 | $ 14.22 | 0.34 | (0.07) | 0.27 | (0.34) | — | (0.34) | $ 14.15 |
| (a) | Not annualized for periods less than one year. |
| (b) | Sales loads are not reflected in computing total return. |
| (c) | Unaudited Six Month Period Ended March 31. |
| (d) | Annualized. |
| + | Based on weighted average shares outstanding. |
See notes to financial statements.
90 | Thornburg Municipal Funds Semi-Annual Report
Financial Highlights, Continued
Intermediate Municipal Fund
| | RATIOS TO AVERAGE NET ASSETS | | Supplemental Data |
UNLESS OTHERWISE
NOTED, PERIODS ARE
FISCAL YEARS ENDED
SEPTEMBER 30, | Net Investment
Income (Loss) (%) | Expenses, After
Expense
Reductions (%) | Expenses,
Before Expense
Reductions (%) | | Total
Return (%)(a) | Portfolio
Turnover
Rate (%)(a) | Net Assets
at End of PERIOD
(Thousands) |
| CLASS A SHARES(b) |
| 2020(c) | 2.45(d) | 0.85(d) | 0.89(d) | | (0.61) | 9.99 | $ 306,503 |
| 2019 | 2.44 | 0.89 | 0.89 | | 6.39 | 15.88 | $ 313,967 |
| 2018 | 2.29 | 0.89 | 0.89 | | (0.21) | 20.68 | $ 324,199 |
| 2017 | 2.15 | 0.92 | 0.92 | | (0.08) | 24.04 | $ 387,790 |
| 2016 | 2.00 | 0.92 | 0.92 | | 4.17 | 10.80 | $ 467,335 |
| 2015 | 2.09 | 0.92 | 0.92 | | 1.68 | 13.49 | $ 423,113 |
| CLASS C SHARES |
| 2020(c) | 2.08(d) | 1.21(d) | 1.25(d) | | (0.78) | 9.99 | $ 66,800 |
| 2019 | 2.08 | 1.24 | 1.26 | | 6.02 | 15.88 | $ 76,994 |
| 2018 | 1.94 | 1.24 | 1.26 | | (0.55) | 20.68 | $ 104,093 |
| 2017 | 1.83 | 1.24 | 1.27 | | (0.40) | 24.04 | $ 140,176 |
| 2016 | 1.68 | 1.24 | 1.27 | | 3.84 | 10.80 | $ 170,149 |
| 2015 | 1.77 | 1.24 | 1.28 | | 1.35 | 13.49 | $ 160,042 |
| CLASS I SHARES |
| 2020(c) | 2.69(d) | 0.60(d) | 0.63(d) | | (0.49) | 9.99 | $ 647,689 |
| 2019 | 2.67 | 0.65 | 0.65 | | 6.66 | 15.88 | $ 730,144 |
| 2018 | 2.55 | 0.63 | 0.63 | | 0.05 | 20.68 | $ 905,641 |
| 2017 | 2.45 | 0.62 | 0.62 | | 0.15 | 24.04 | $ 951,888 |
| 2016 | 2.30 | 0.61 | 0.61 | | 4.57 | 10.80 | $ 958,674 |
| 2015 | 2.39 | 0.62 | 0.62 | | 1.91 | 13.49 | $ 751,486 |
Thornburg Municipal Funds Semi-Annual Report | 91
Financial Highlights
Strategic Municipal Income Fund
| | PER SHARE PERFORMANCE (FOR A SHARE OUTSTANDING THROUGHOUT THE PERIOD) |
UNLESS OTHERWISE
NOTED, PERIODS ARE
FISCAL YEARS ENDED
SEPTEMBER 30, | Net Asset
Value,
Beginning of
PERIOD | Net
Investment
Income
(Loss)+ | Net Realized &
Unrealized Gain
(Loss) on
Investments | Total from
Investment
Operations | Dividends
from Net
Investment
Income | Dividends
from Net
Realized
Gains | Total
Dividends | Net Asset
Value,
End of PERIOD |
| CLASS A SHARES(b) |
| 2020(c) | $ 15.32 | 0.19 | (0.36) | (0.17) | (0.19) | — | (0.19) | $ 14.96 |
| 2019 | $ 14.82 | 0.39 | 0.50 | 0.89 | (0.39) | — | (0.39) | $ 15.32 |
| 2018 | $ 15.14 | 0.37 | (0.32) | 0.05 | (0.37) | — | (0.37) | $ 14.82 |
| 2017 | $ 15.53 | 0.35 | (0.39) | (0.04) | (0.35) | — | (0.35) | $ 15.14 |
| 2016 | $ 15.16 | 0.33 | 0.37 | 0.70 | (0.33) | — | (0.33) | $ 15.53 |
| 2015 | $ 15.19 | 0.35 | (0.02) | 0.33 | (0.35) | (0.01) | (0.36) | $ 15.16 |
| CLASS C SHARES |
| 2020(c) | $ 15.34 | 0.15 | (0.36) | (0.21) | (0.15) | — | (0.15) | $ 14.98 |
| 2019 | $ 14.84 | 0.32 | 0.50 | 0.82 | (0.32) | — | (0.32) | $ 15.34 |
| 2018 | $ 15.16 | 0.30 | (0.32) | (0.02) | (0.30) | — | (0.30) | $ 14.84 |
| 2017 | $ 15.54 | 0.28 | (0.38) | (0.10) | (0.28) | — | (0.28) | $ 15.16 |
| 2016 | $ 15.17 | 0.28 | 0.37 | 0.65 | (0.28) | — | (0.28) | $ 15.54 |
| 2015 | $ 15.20 | 0.30 | (0.02) | 0.28 | (0.30) | (0.01) | (0.31) | $ 15.17 |
| CLASS I SHARES |
| 2020(c) | $ 15.33 | 0.20 | (0.36) | (0.16) | (0.20) | — | (0.20) | $ 14.97 |
| 2019 | $ 14.84 | 0.42 | 0.49 | 0.91 | (0.42) | — | (0.42) | $ 15.33 |
| 2018 | $ 15.16 | 0.41 | (0.32) | 0.09 | (0.41) | — | (0.41) | $ 14.84 |
| 2017 | $ 15.54 | 0.39 | (0.38) | 0.01 | (0.39) | — | (0.39) | $ 15.16 |
| 2016 | $ 15.17 | 0.38 | 0.37 | 0.75 | (0.38) | — | (0.38) | $ 15.54 |
| 2015 | $ 15.20 | 0.39 | (0.01) | 0.38 | (0.40) | (0.01) | (0.41) | $ 15.17 |
| (a) | Not annualized for periods less than one year. |
| (b) | Sales loads are not reflected in computing total return. |
| (c) | Unaudited Six Month Period Ended March 31. |
| (d) | Annualized. |
| + | Based on weighted average shares outstanding. |
See notes to financial statements.
92 | Thornburg Municipal Funds Semi-Annual Report
Financial Highlights, Continued
Strategic Municipal Income Fund
| | RATIOS TO AVERAGE NET ASSETS | | Supplemental Data |
UNLESS OTHERWISE
NOTED, PERIODS ARE
FISCAL YEARS ENDED
SEPTEMBER 30, | Net Investment
Income (Loss) (%) | Expenses, After
Expense
Reductions (%) | Expenses,
Before Expense
Reductions (%) | | Total
Return (%)(a) | Portfolio
Turnover
Rate (%)(a) | Net Assets
at End of PERIOD
(Thousands) |
| CLASS A SHARES(b) |
| 2020(c) | 2.44(d) | 0.94(d) | 1.23(d) | | (1.15) | 16.24 | $ 57,388 |
| 2019 | 2.59 | 1.00 | 1.26 | | 6.08 | 20.04 | $ 56,124 |
| 2018 | 2.49 | 1.00 | 1.28 | | 0.36 | 21.06 | $ 53,693 |
| 2017 | 2.30 | 1.09 | 1.30 | | (0.23) | 27.35 | $ 61,525 |
| 2016 | 2.11 | 1.25 | 1.29 | | 4.63 | 11.24 | $ 79,058 |
| 2015 | 2.28 | 1.25 | 1.31 | | 2.18 | 12.13 | $ 66,722 |
| CLASS C SHARES |
| 2020(c) | 1.97(d) | 1.41(d) | 1.61(d) | | (1.38) | 16.24 | $ 18,097 |
| 2019 | 2.13 | 1.47 | 1.65 | | 5.58 | 20.04 | $ 20,085 |
| 2018 | 2.01 | 1.48 | 1.64 | | (0.12) | 21.06 | $ 24,951 |
| 2017 | 1.88 | 1.52 | 1.66 | | (0.59) | 27.35 | $ 32,926 |
| 2016 | 1.80 | 1.55 | 1.66 | | 4.32 | 11.24 | $ 38,773 |
| 2015 | 1.98 | 1.55 | 1.70 | | 1.87 | 12.13 | $ 29,073 |
| CLASS I SHARES |
| 2020(c) | 2.66(d) | 0.72(d) | 0.95(d) | | (1.04) | 16.24 | $ 213,745 |
| 2019 | 2.81 | 0.78 | 0.98 | | 6.24 | 20.04 | $ 219,535 |
| 2018 | 2.72 | 0.78 | 0.96 | | 0.59 | 21.06 | $ 185,555 |
| 2017 | 2.56 | 0.83 | 0.94 | | 0.09 | 27.35 | $ 174,892 |
| 2016 | 2.42 | 0.93 | 0.93 | | 4.96 | 11.24 | $ 190,658 |
| 2015 | 2.60 | 0.93 | 0.93 | | 2.50 | 12.13 | $ 151,992 |
Thornburg Municipal Funds Semi-Annual Report | 93
Expense Example
March 31, 2020 (Unaudited)
As a shareholder of the Fund, you incur two types of costs:
| (1) | transaction costs, including |
| (a) | sales charges (loads) on purchase payments, for Class A shares; |
| (b) | a deferred sales charge on redemptions of any part or all of a purchase of $1 million of Class A shares within 12 months of purchase; |
| (c) | a deferred sales charge on redemptions of Class C shares within 12 months of purchase; |
| (2) | ongoing costs, including management fees; distribution and/or service (12b-1) fees; and other Fund expenses. |
This example is intended to help you understand your ongoing costs (in dollars) of investing in the Fund and to compare these costs with the ongoing costs of investing in other mutual funds.
The example is based on a $1,000 investment beginning on October 1, 2019, and held until March 31, 2020.
ACTUAL EXPENSES
For each class of shares, the first line of the accompanying table provides information about actual account values and actual expenses. You may use the information in this line, together with the amount you invested, to estimate the expenses that you paid over the period. Simply divide your account value by $1,000 (for example, an $8,600 account value divided by $1,000 = 8.6), then multiply the result by the number in the first line for your class of shares under the heading entitled “Expenses Paid During Period” to estimate the expenses you paid on your account during this period.
HYPOTHETICAL EXAMPLE FOR COMPARISON PURPOSES
For each class of shares, the second line of the accompanying table provides information about hypothetical account values and hypothetical expenses based on the Fund’s actual expense ratio and an assumed rate of return of 5% per year before expenses, which is not the Fund’s actual return. The hypothetical account values and expenses may not be used to estimate the actual ending account balance or expenses you paid for the period. You may use this information to compare the ongoing costs of investing in the Fund and other funds. To do so, compare this 5% hypothetical example with the 5% hypothetical examples that appear in the shareholder reports of the other funds.
Please note that the expenses shown in the table are meant to highlight your ongoing costs only and do not reflect any transactional costs, such as sales charges (loads), redemption fees, or exchange fees. Therefore, the second line of the table for each class of shares is useful in comparing ongoing costs only, and will not help you determine the relative total costs of owning different funds. In addition, if these transactional costs were included, your costs would have been higher.
| | BEGINNING
ACCOUNT VALUE
10/1/19 | ENDING
ACCOUNT VALUE
3/31/20 | EXPENSES PAID
DURING PERIOD†
10/1/19–3/31/20 |
| SHORT DURATION MUNICIPAL FUND |
| Class A Shares |
| Actual | $1,000.00 | $998.50 | $3.50 |
| Hypothetical* | $1,000.00 | $1,021.50 | $3.54 |
| Class I Shares |
| Actual | $1,000.00 | $999.48 | $2.50 |
| Hypothetical* | $1,000.00 | $1,022.50 | $2.53 |
| LIMITED TERM MUNICIPAL FUND |
| Class A Shares |
| Actual | $1,000.00 | $1,001.58 | $3.40 |
| Hypothetical* | $1,000.00 | $1,021.60 | $3.44 |
| Class C Shares |
| Actual | $1,000.00 | $1,001.03 | $4.65 |
| Hypothetical* | $1,000.00 | $1,020.35 | $4.70 |
| Class I Shares |
| Actual | $1,000.00 | $1,003.52 | $2.15 |
| Hypothetical* | $1,000.00 | $1,022.85 | $2.17 |
| LIMITED TERM CALIFORNIA FUND |
| Class A Shares |
| Actual | $1,000.00 | $997.67 | $4.29 |
| Hypothetical* | $1,000.00 | $1,020.70 | $4.34 |
| Class C Shares |
| Actual | $1,000.00 | $996.26 | $5.69 |
| Hypothetical* | $1,000.00 | $1,019.30 | $5.76 |
| Class I Shares |
| Actual | $1,000.00 | $998.90 | $3.05 |
| Hypothetical* | $1,000.00 | $1,021.95 | $3.08 |
| INTERMEDIATE NEW MEXICO FUND |
| Class A Shares |
| Actual | $1,000.00 | $1,001.17 | $4.80 |
| Hypothetical* | $1,000.00 | $1,020.20 | $4.85 |
| Class D Shares |
| Actual | $1,000.00 | $999.05 | $6.20 |
| Hypothetical* | $1,000.00 | $1,018.80 | $6.26 |
| Class I Shares |
| Actual | $1,000.00 | $1,002.63 | $3.35 |
| Hypothetical* | $1,000.00 | $1,021.65 | $3.39 |
| INTERMEDIATE NEW YORK FUND |
| Class A Shares |
| Actual | $1,000.00 | $997.79 | $4.94 |
| Hypothetical* | $1,000.00 | $1,020.05 | $5.00 |
| Class I Shares |
| Actual | $1,000.00 | $999.37 | $3.35 |
| Hypothetical* | $1,000.00 | $1,021.65 | $3.39 |
| INTERMEDIATE MUNICIPAL FUND |
| Class A Shares |
| Actual | $1,000.00 | $993.91 | $4.24 |
| Hypothetical* | $1,000.00 | $1,020.75 | $4.29 |
| Class C Shares |
| Actual | $1,000.00 | $992.16 | $6.03 |
| Hypothetical* | $1,000.00 | $1,018.95 | $6.11 |
| Class I Shares |
| Actual | $1,000.00 | $995.13 | $2.99 |
| Hypothetical* | $1,000.00 | $1,022.00 | $3.03 |
94 | Thornburg Municipal Funds Semi-Annual Report
Expense Example, Continued
March 31, 2020 (Unaudited)
| | BEGINNING
ACCOUNT VALUE
10/1/19 | ENDING
ACCOUNT VALUE
3/31/20 | EXPENSES PAID
DURING PERIOD†
10/1/19–3/31/20 |
| STRATEGIC MUNICIPAL INCOME FUND |
| Class A Shares |
| Actual | $1,000.00 | $988.49 | $4.67 |
| Hypothetical* | $1,000.00 | $1,020.30 | $4.75 |
| Class C Shares |
| Actual | $1,000.00 | $986.22 | $7.00 |
| Hypothetical* | $1,000.00 | $1,017.95 | $7.11 |
| Class I Shares |
| Actual | $1,000.00 | $989.58 | $3.58 |
| Hypothetical* | $1,000.00 | $1,021.40 | $3.64 |
| † | Short Duration Municipal Fund Expenses are equal to the annualized expense ratio for each class (A: 0.70%; I: 0.50%) multiplied by the average account value over the period, multiplied by 183/366 to reflect the one-half year period. |
| † | Limited Term Municipal Fund Expenses are equal to the annualized expense ratio for each class (A: 0.68%; C: 0.93%; I: 0.43%) multiplied by the average account value over the period, multiplied by 183/366 to reflect the one-half year period. |
| † | Limited Term California Fund Expenses are equal to the annualized expense ratio for each class (A: 0.86%; C: 1.14%; I: 0.61%) multiplied by the average account value over the period, multiplied by 183/366 to reflect the one-half year period. |
| † | Intermediate New Mexico Fund Expenses are equal to the annualized expense ratio for each class (A: 0.96%; D: 1.24%; I: 0.67%) multiplied by the average account value over the period, multiplied by 183/366 to reflect the one-half year period. |
| † | Intermediate New York Fund Expenses are equal to the annualized expense ratio for each class (A: 0.99%; I: 0.67%) multiplied by the average account value over the period, multiplied by 183/366 to reflect the one-half year period. |
| † | Intermediate Municipal Fund Expenses are equal to the annualized expense ratio for each class (A: 0.85%; C: 1.21%; I: 0.60%) multiplied by the average account value over the period, multiplied by 183/366 to reflect the one-half year period. |
| † | Strategic Municipal Income Fund Expenses are equal to the annualized expense ratio for each class (A: 0.94%; C: 1.41%; I: 0.72%) multiplied by the average account value over the period, multiplied by 183/366 to reflect the one-half year period. |
| * | Hypothetical assumes a rate of return of 5% per year before expenses. |
Thornburg Municipal Funds Semi-Annual Report | 95
Other Information
March 31, 2020 (Unaudited)
PORTFOLIO PROXY VOTING
Policies and Procedures:
The Trust has delegated to the Advisor voting decisions respecting proxies for the Fund’s voting securities. The Advisor makes voting decisions in accordance with its Proxy Voting Policy and Procedures. A description of the Policy and Procedures is available (i) without charge, upon request, by calling the Advisor toll-free at 1-800-847-0200, (ii) on the Thornburg website at www.thornburg.com, and (iii) on the U.S. Securities and Exchange Commission’s website at www.sec.gov.
Information regarding how proxies were voted is available on or before August 31 of each year for the twelve months ending the preceding June 30. This information is available (i) without charge, upon request by calling the Advisor toll-free at 1-800-847-0200, (ii) on the Thornburg website at www.thornburg.com, and (iii) on the U.S. Securities and Exchange Commission’s website at www.sec.gov.
AVAILABILITY OF QUARTERLY PORTFOLIO SCHEDULE
The Fund files with the Securities and Exchange Commission schedules of its portfolio holdings on Form N-PORT EX for the first and third quarters of each fiscal year. The Fund’s Form N-PORT EX are available on the Commission’s website at www.sec.gov, or may be reviewed and copied at the Commission’s Public Reference Room in Washington, D.C. Information on the operation of the Public Reference Room may be obtained by calling 1-800-SEC-0330. The Fund also makes this information available on its website at www.thornburg.com/download or upon request by calling 1-800-847-0200.
STATEMENT REGARDING LIQUIDITY RISK MANAGEMENT PROGRAM
The Trustees of the Trust have appointed the Advisor (“Program Administrator”) to administer the Trust’s liquidity risk management program (the “LRMP”) adopted for each of the Funds under rule 22e-4 under the 1940 Act (the “Liquidity Rule”). The LRMP is designed to reduce the risk that a Fund will be unable to meet its redemption obligations under the 1940 Act, and to mitigate the dilution of the interests of Fund shareholders occasioned by redemptions tendered by other shareholders (“Liquidity Risk”). Pursuant to the LRMP, the Program Administrator has delegated certain functions, including daily oversight and management of the Funds’ Liquidity Risk, to its Liquidity Risk Management Committee (the “Liquidity Committee”). Under the LRMP, the Liquidity Committee performs the annual review of the LRMP required by the Liquidity Rule.
On December 4, 2019, the Trustees reviewed the Liquidity Committee’s initial written report (the “Report”) concerning the operation of the LRMP for the period from December 1, 2018 through November 22, 2019 (the “Reporting Period”). The Report addressed the operation, adequacy and effectiveness of the LRMP, the operation of a Fund’s highly liquid investment minimum, and any material changes to the LRMP during the Reporting Period. The Report provided an assessment of the various factors relevant to each Fund’s Liquidity Risk, an evaluation of data provided by a third-party liquidity assessment vendor and other relevant data, and reports on the Liquidity Committee’s consideration of intermediary firms with the largest beneficial ownership positions in each Fund, the likelihood that any of those firms may redeem their clients’ investments from the Funds without prior notice, and the effect that such redemptions could have on Fund liquidity. The Report concluded that the LRMP remains adequate and effective to address each Fund’s Liquidity Risk, that all of the Funds are able to meet redemption requests in current market conditions and in reasonably expected stressed conditions without significant dilution of remaining shareholders, that each Fund remains primarily highly liquid, and the third-party liquidity assessment vendor’s system continues to be a useful tool for assessing the Funds’ Liquidity Risk. The Report stated that there have been no instances since the LRMP’s adoption in which a Fund exceeded its limitation on illiquid investments, nor have there been any material changes to the LRMP since its adoption.
96 | Thornburg Municipal Funds Semi-Annual Report
Trustees’ Statement to Shareholders (Unaudited)
Readopted September 17, 2019
The Trustees believe current and prospective shareholders should know how we discharge our responsibilities in supervising the Funds’ investment advisor and in reviewing the advisor’s contract for renewal. Since 2005, we have issued a statement which sets out clearly the three principal guidelines that we follow in supervising the Trust’s investment advisor on your behalf. In accordance with our customary practice, in September of this year we again reviewed our statement and concluded we should reissue this statement outlining the principal features of our supervision of the advisor’s performance of investment management services for the Funds.
We begin with the premise that each shareholder selected his or her Fund because its investments are managed by the investment advisor identified in the prospectus and in accordance with the objective and policies described in the prospectus. We realize, as each of you do, that if you believe that your Fund’s stated objective and policies no longer serve your personal investment goals, you can sell your shares and leave the Fund.
Therefore, we believe that our primary supervisory task—our principal obligation to you—is to assess the nature and quality of the advisor’s services, and to confirm that the advisor actively and competently pursues the Fund’s objective, in accordance with the policies set out in the prospectus. To do this, we meet regularly with management to review your Fund’s portfolio and to discuss the advisor’s specific actions and judgments in pursuing the Fund’s objective. We do not substitute our own judgment for the advisor’s decisions in selecting investments; the advisor is paid to exercise its informed judgment on investment decisions, and we seek to confirm, in reviewing the advisor’s performance, that the advisor is doing just that.
Second, we are conscious of costs and the effect that costs have on shareholders’ returns. We try to make sure that your Fund’s fees and costs are reasonable in relationship to the services rendered and that they are generally in line with those charged by other expert investment advisors, consistent with our belief that the Fund’s investors searched for and expect that expertise and attention and have decided to pay a reasonable price for it. We do not put the management contract “out to bid” as a matter of course, and we would not do so unless we had concluded that the advisor materially had failed to pursue the Fund’s objectives in accordance with its policies, or for other equally important reasons. We believe that any other approach would be inconsistent with your interests and contrary to your expectations when you bought shares of the Fund in the first place.
Finally, because we believe that most Thornburg Fund shareholders have invested with a long-term perspective, we try not to focus too much on the fashions of the moment and on short-term performance. The market will not favor any specific investment objective or set of policies at all times and under all economic circumstances. A fund will experience periods of both high and low returns relative to other funds and other investments. Even if one of our Funds is not favored by the market at a particular time, we believe that the advisor is nonetheless obliged to remain true to the Fund’s objective and policies, and we watch to see that it does so.
Trustees of Thornburg Investment Trust
Thornburg Municipal Funds Semi-Annual Report | 97
Thornburg Investment Management is a privately-owned global investment firm that offers a range of solutions for retail and institutional investors. Founded in 1982 and headquartered in Santa Fe, New Mexico, we manage approximately $35.1 billion (as of March 31, 2020) across U.S. mutual funds, separate accounts for high-net-worth investors, institutional accounts, and UCITS funds for non-U.S. investors.
The fund outlined in this report is one of many equity and fixed-income products available from Thornburg Investment Management.
MULTI ASSET
| ■ | Thornburg Investment Income Builder Fund |
| ■ | Thornburg Summit Fund |
GLOBAL EQUITY
| ■ | Thornburg Global Opportunities Fund |
INTERNATIONAL EQUITY
| ■ | Thornburg International Value Fund |
| ■ | Thornburg Better World Fund |
| ■ | Thornburg International Growth Fund |
| ■ | Thornburg Developing World Fund |
DOMESTIC EQUITY
| ■ | Thornburg Value Fund |
| ■ | Thornburg Core Growth Fund |
ALTERNATIVES
| ■ | Thornburg Long/Short Equity Fund |
FIXED INCOME
| ■ | Thornburg Limited Term U.S. Government Fund |
| ■ | Thornburg Limited Term Income Fund |
| ■ | Thornburg Low Duration Income Fund |
| ■ | Thornburg Strategic Income Fund |
MUNICIPAL
| ■ | Thornburg Short Duration Municipal Fund |
| ■ | Thornburg Limited Term Municipal Fund |
| ■ | Thornburg California Limited Term Municipal Fund |
| ■ | Thornburg New Mexico Intermediate Municipal Fund |
| ■ | Thornburg New York Intermediate Municipal Fund |
| ■ | Thornburg Intermediate Municipal Fund |
| ■ | Thornburg Strategic Municipal Income Fund |
Before investing, carefully consider the Fund’s investment goals, risks, charges, and expenses. For a prospectus or summary prospectus containing this and other information, contact your financial advisor or visit thornburg.com. Read it carefully before investing.
For additional information, please visit thornburg.com
Thornburg Investment Management, Inc. 2300 North Ridgetop Road, Santa Fe, NM 87506
98 | Thornburg Municipal Funds Semi-Annual Report
This page intentionally left blank.
Thornburg Municipal Funds Semi-Annual Report | 99
To receive shareholder reports, prospectuses, and proxy statements electronically, go to www.thornburg.com/edelivery.
This Semi-Annual Report is submitted for the general information of shareholders of the Fund. It is not authorized for distribution to prospective investors in the Fund unless preceded or accompanied by an effective prospectus.
Investment Advisor:
Thornburg Investment Management®
800.847.0200
Distributor:
Thornburg Securities Corporation®
Semi-Annual Report
March 31, 2020
Beginning on January 1, 2021, as permitted by regulations adopted by the Securities and Exchange Commission, paper copies of the Fund’s shareholder reports will no longer be sent by mail, unless you specifically request paper copies of the reports from the Fund or from your financial intermediary, such as a broker-dealer or bank. Instead, the reports will be made available on a website, and you will be notified by mail each time a report is posted and provided with a website link to access the report.
If you already elected to receive shareholder reports electronically, you will not be affected by this change and you need not take any action. You may elect to receive shareholder reports and other communications from the Fund or your financial intermediary electronically by going to thornburg.com/edelivery.
You may elect to receive all future reports in paper free of charge. You can inform the Fund or your financial intermediary that you wish to continue receiving paper copies of your shareholder reports by calling 800.847.0200 or your financial intermediary directly. Your election to receive reports in paper will apply to all funds held with the fund complex/your financial intermediary.
At Thornburg, we believe unconstrained investing leads to better outcomes for our clients. Our investment solutions are highly active, high conviction, and benchmark agnostic. When it comes to finding economic opportunity for clients, it’s more than what we do.
It’s how we do it. Active Asbottom-up, fundamental, active managers, we look beyond conventional benchmarks. Long Term We take a long-term view in how we manage our firm and our portfolios. Benchmark Agnostic Investment strategies should have the flexibility to pursue solutions for clients, not stay within the conventional confines of benchmarks. Flexible Perspective Our approach to portfolio construction is guided by our convictions rather than convention. High Conviction We focus our attention and capital on thoroughly researched, well-understood positions. The best form of risk management is to know what you own, and why. Repeatable & Robust Our long-term outperformance of benchmarks verifies that our process works and outperforms conventional thinking. Independent We are independently owned and far from the herd of other investment managers. Investment Driven All members of the investment team are resources for all of our strategies. Collaborative Our team collaborates on opportunities across geography, sector, or asset class.
Thornburg Capital Management Fund
Semi-Annual Report | March 31, 2020
Table of Contents
| SHARE CLASS | NASDAQ SYMBOL | CUSIP |
| Class I | N/A | 885-216-739 |
Letter to Shareholders
Thornburg Capital Management Fund | March 31, 2020 (Unaudited)
Dear Shareholder:
I hope this letter finds you safe and healthy. Amid the COVID-19 pandemic, we’re all adjusting to the challenges of working and living new ways while trying to see into a cloudy future. In these uncertain times, all of us at Thornburg Investment Management are squarely focused on providing you with the best investment outcomes that we can.
Many of our portfolios were well positioned for higher volatility. While we did not predict the cause of this downturn, it’s clear that high prices make for more vulnerable markets. Given our solid liquidity and preparation, we’ve been able to take advantage of price swings as many assets were on sale after the market’s decline. Longer term, it appears even the extraordinary fiscal and monetary support will merely cushion the blow. After all, the reason policy makers’ actions have been so extreme is in large part because they view them as necessary.
Looking forward, our nimble, collaborative investment team is well suited to deliver. The reason that we have a benchmark agnostic, flexible approach is so that we can go where we find value, within the mandate and objectives of the portfolio. While many investment firms have good products and processes, Thornburg is designed to see the world differently, and our perspective from Santa Fe, NM, is especially valuable in challenging times. While many other professionals are siloed into narrow areas of expertise, without the ability to evaluate the bigger picture, we work across sectors and asset classes to find
great investments and put them into balanced portfolios. The last few months have demonstrated the strength of our approach, given its adaptability and capacity to place new information in the context of broad portfolios quickly. Being nimble is part of Thornburg’s culture, and people across the organization are finding new ways to pitch in for the sake of our clients.
No one can predict with certainty what the market has in store for us, especially in the context of the current health crisis. What does seem certain, however, is that the events of the last few months are accelerating change that was already occurring, as well as underlining the vulnerability of many of the systems that many of us take for granted. That is true in our daily lives, as well as in financial markets. We believe our understanding of and participation in the interconnectedness of these markets is our core competency: We’re built for this.
Thank you so much for your time and your business.

| |
Jason Brady,cfa
Portfolio Manager
CEO, President, and
Managing Director | |
The matters discussed in this report may constitute forward-looking statements made pursuant to the safe harbor provisions of the Securities Litigation Reform Act of 1995. These include any advisor or portfolio manager prediction, assessment, analysis or outlook for individual securities, industries, investment styles, market sectors and/or markets. These statements involve risks and uncertainties. In addition to the general risks described for each fund in its current prospectus, other factors bearing on these reports include the accuracy of the advisor’s or portfolio manager’s forecasts and predictions, the appropriateness of the investment strategies designed by the advisor or portfolio manager and the ability of the advisor or portfolio manager to implement their strategies efficiently and successfully. Any one or more of these factors, as well as other risks affecting the securities markets generally, could cause the actual results of any fund to differ materially as compared to its benchmarks.
The views expressed are subject to change and do not necessarily reflect the views of Thornburg Investment Management, Inc. This information should not be relied upon as a recommendation or investment advice and is not intended to predict the performance of any investment or market.
Performance results of individual share classes will vary based on the fees and expenses associated with each share class, and may be higher or lower than other share classes within the same Fund. Please see Performance Summary for performance results of each share class.
Performance Summary
Thornburg Capital Management Fund | March 31, 2020 (Unaudited)
AVERAGE ANNUAL TOTAL RETURNS
| | 1-YR | 3-YR | SINCE
INCEP. |
| Class I Shares(Incep: 7/31/15) | 2.14% | 1.91% | 1.40% |
| FTSE 1-Month T-Bill Index(Since 7/31/15) | 1.97% | 1.70% | 1.16% |
30-DAY YIELDS, I SHARES(with sales charge)
| Annualized Distribution Yield | 1.89% |
| SEC Yield | 1.85% |
GROWTH OF A HYPOTHETICAL $10,000 INVESTMENT
Performance data shown represents past performance and is no guarantee of future results. Investment return and principal value will fluctuate so shares, when redeemed, may be worth more or less than their original cost. Current performance may be lower or higher than quoted. For performance current to the most recent month end, call 800-847-0200. There is no sales charge for class I shares.
Fund Summary
PORTFOLIO COMPOSITION
There is no guarantee that the Fund will meet its investment objectives.
All data is subject to change. Charts may not add up to 100% due to rounding.
Glossary
FTSE 1-Month Treasury Bill Index - Measures monthly return equivalents of yield averages that are not marked to market. The One-Month Treasury Bill Index consists of the last one-month Treasury bill issue.
The performance of any index is not indicative of the performance of any particular investment. Unless otherwise noted, index returns reflect the reinvestment of income dividends and capital gains, if any, but do not reflect fees, brokerage commissions or other expenses of investing. Investors may not make direct investments into any index.
Annualized Distribution Yield – The distribution yield reflects actual distributions made to shareholders. The annualized distribution yield is calculated by summing the last 30 days of income at a given month end and annualizing to a 360-day year. The result is divided by the ending maximum offering price or net asset value.
Short-Term Credit Ratings - A bond credit rating assesses the financial ability of a debt issuer to make timely payments of principal and interest. Short-term obligation ratings of A-1 (the highest), A-2 and A-3 are investment-grade quality. Ratings of B, C and D (the lowest) are considered below investment grade, speculative grade, or junk bonds.
Schedule of Investments
Thornburg Capital Management Fund | March 31, 2020 (Unaudited)
| | | SHARES/
PRINCIPAL AMOUNT | VALUE |
| SHORT-TERM INVESTMENTS — 103.0% |
| | American Honda Finance, 1.100%, 4/7/2020 | $23,000,000 | $ 22,995,783 |
| a | AON Corp., 3.450%, 4/6/2020 | 2,000,000 | 1,999,042 |
| | Apple, Inc., | | |
| a | 1.150%, 4/22/2020 | 15,000,000 | 14,989,937 |
| a | 1.150%, 4/23/2020 | 1,000,000 | 999,297 |
| a | Archer-Daniels-Midland Company, 1.950%, 4/2/2020 | 11,817,000 | 11,816,360 |
| a | AT&T, Inc., 2.500%, 4/1/2020 | 9,707,000 | 9,707,000 |
| a | Atmos Energy Corp., 2.100%, 4/1/2020 | 15,000,000 | 15,000,000 |
| a | AVANGRID, Inc., 1.400%, 4/2/2020 | 16,000,000 | 15,999,378 |
| a,b | BAT International Finance plc, 1.450%, 4/3/2020 | 21,000,000 | 20,998,308 |
| a | Berkshire Hathaway Energy, 1.700%, 4/1/2020 | 8,400,000 | 8,400,000 |
| a | Brown-Forman Corp., 1.550%, 4/7/2020 | 10,000,000 | 9,997,417 |
| a,b | Canadian National Railway Co., 1.150%, 4/7/2020 | 15,000,000 | 14,997,125 |
| | Caterpillar Financial Services Corp., | | |
| | 1.550%, 4/6/2020 | 1,000,000 | 999,785 |
| | 1.750%, 4/1/2020 | 15,000,000 | 15,000,000 |
| | CenterPoint Energy, Inc., | | |
| a | 2.570%, 4/2/2020 | 12,000,000 | 11,999,143 |
| a | 2.750%, 4/1/2020 | 13,000,000 | 13,000,000 |
| a | Chevron Corp., 1.950%, 4/8/2020 | 2,000,000 | 1,999,242 |
| c | City & County of Denver (SPA JP Morgan Chase Bank, N.A.) COP, 0.750%, 12/1/2029 (put 4/1/2020) | 6,155,000 | 6,155,000 |
| a,c | City of Irvine Reassessment District No 05-21(Public Improvments; LOC U.S. Bank N.A.), 0.800%, 9/2/2050 (put 4/1/2020) | 500,000 | 500,000 |
| c | City of New York (SPA Landesbank Hessen-Thuringen) GO, 0.850%, 8/1/2035 (put 4/1/2020) | 4,805,000 | 4,805,000 |
| c | County of Weber (IHC Health Services, Inc. Obligated Group; SPA Bank of New York Mellon), 0.750%, 2/15/2031 (put 4/1/2020) | 11,700,000 | 11,700,000 |
| a | Cummins, Inc., 1.500%, 4/2/2020 | 20,000,000 | 19,999,167 |
| a | Daimler Finance North America, 3.250%, 4/20/2020 | 16,000,000 | 15,972,556 |
| | Emerson Electric Co., | | |
| a | 2.050%, 4/13/2020 | 4,500,000 | 4,496,925 |
| a | 2.100%, 4/2/2020 | 7,213,000 | 7,212,579 |
| | Experian Finance plc, | | |
| a,b | 2.500%, 4/1/2020 | 1,000,000 | 1,000,000 |
| a,b | 3.250%, 4/16/2020 | 15,000,000 | 14,979,687 |
| | Florida Power & Light Co., | | |
| | 1.710%, 4/1/2020 | 1,000,000 | 1,000,000 |
| | 1.720%, 4/1/2020 | 14,000,000 | 14,000,000 |
| a | General Dynamics Corp., 1.150%, 4/8/2020 | 20,000,000 | 19,995,528 |
| | General Electric Co., 2.100%, 4/17/2020 | 16,000,000 | 15,985,067 |
| c | Health & Educational Facilities Authority of the State of Missouri (Washington University; SPA JP Morgan Chase Bank, N.A.), 1.100%, 9/1/2030 (put 4/1/2020) | 2,300,000 | 2,300,000 |
| | Hitachi America Capital Ltd., 1.300%, 4/3/2020 | 5,343,000 | 5,342,614 |
| c | Illinois (NorthShore University HealthSystem; SPA JP Morgan Chase Bank, N.A.) DFA, 0.750%, 5/1/2031 (put 4/1/2020) | 1,770,000 | 1,770,000 |
| c | Illinois Finance Authority (Northwestern Memorial Healthcare Obligated Group; SPA U.S. Bank, N.A.), 1.100%, 8/15/2042 (put 4/1/2020) | 3,960,000 | 3,960,000 |
| c | Indiana Finance Authority (Franciscan Alliance, Inc. Obligated Group; LOC Barclays Bank Plc), 0.850%, 11/1/2037 (put 4/1/2020) | 635,000 | 635,000 |
| c | Indiana Finance Authority (Marion County Capital Improvement Board; SPA U.S. Bank, N.A.), 1.100%, 2/1/2037 (put 4/1/2020) | 18,585,000 | 18,585,000 |
| c | Irvine Ranch Water District (Variable-IMPT Dists-Cons; LOC U.S. Bank N.A.), 0.800%, 10/1/2041 (put 4/1/2020) | 585,000 | 585,000 |
| c | JEA Water & Sewer System Revenue (SPA U.S. Bank, N.A.), 1.100%, 10/1/2038 (put 4/1/2020) | 8,400,000 | 8,400,000 |
| a | Johnson Controls, Inc., 3.250%, 4/2/2020 | 1,000,000 | 999,910 |
| | Kellogg Co., | | |
| a | 3.650%, 4/9/2020 | 16,000,000 | 15,987,022 |
| a | 3.800%, 4/15/2020 | 16,000,000 | 15,976,356 |
| a | Keurig Dr Pepper, Inc., 3.250%, 4/13/2020 | 16,000,000 | 15,982,667 |
| a | L’oreal USA, Inc., 1.500%, 4/2/2020 | 13,000,000 | 12,999,458 |
| a | Louisville Gas & Electric Co., 1.480%, 4/7/2020 | 13,000,000 | 12,996,793 |
| a | Lowes Co., 2.700%, 4/2/2020 | 1,000,000 | 999,925 |
| c | Manatee County (Florida Power & Light Co.), 0.850%, 9/1/2024 (put 4/1/2020) | 1,800,000 | 1,800,000 |
| | Marriott International, Inc., | | |
| a | 3.750%, 4/8/2020 | 7,000,000 | 6,994,896 |
| a | 3.750%, 4/14/2020 | 3,935,000 | 3,929,671 |
| a | 14.000%, 4/22/2020 | 500,000 | 495,917 |
| a | Merck & Co., Inc., 1.170%, 4/2/2020 | 20,000,000 | 19,999,350 |
| c | Missouri Development Finance Board (Nelson Gallery Foundation; SPA U.S. Bank, N.A.), 1.100%, 12/1/2037 (put 4/1/2020) | 15,730,000 | 15,730,000 |
| a | Mondelez International, Inc., 3.080%, 4/7/2020 | 16,000,000 | 15,991,787 |
6 | Semi-Annual Report
| See notes to financial statements. |
Schedule of Investments, Continued
Thornburg Capital Management Fund | March 31, 2020 (Unaudited)
| | | SHARES/
PRINCIPAL AMOUNT | VALUE |
| a | National Grid USA, 2.960%, 4/6/2020 | $16,000,000 | $ 15,993,422 |
| | New Hampshire Health and Education Facilities Authority Act (University System of New Hampshire; SPA State Street Bank & Trust Co.), | | |
| c | 0.750%, 7/1/2035 (put 4/1/2020) | 3,775,000 | 3,775,000 |
| c | 0.850%, 7/1/2035 (put 4/1/2020) | 2,715,000 | 2,715,000 |
| c | New Hampshire Health and Education Facilities Authority Act (University System of New Hampshire; SPA Wells Fargo Bank, N.A.), 0.850%, 7/1/2033 (put 4/1/2020) | 10,730,000 | 10,730,000 |
| c | New York City Transitional Finance Authority Future Tax Secured Revenue (SPA State Street Bank & Trust Co.), 1.100%, 8/1/2039 (put 4/1/2020) | 500,000 | 500,000 |
| c | New York City Transitional Finance Authority Future Tax Secured Revenue (SPA U.S. Bank, N.A.), 1.100%, 8/1/2042 (put 4/1/2020) | 7,550,000 | 7,550,000 |
| c | New York City Water & Sewer System (SPA State Street Bank & Trust Co.), 1.100%, 6/15/2045 (put 4/1/2020) | 16,415,000 | 16,415,000 |
| a | NextEra Energy Capital Holdings, Inc., 3.250%, 4/1/2020 | 14,000,000 | 14,000,000 |
| a | Oglethorpe Power Corp., 1.800%, 4/23/2020 | 12,000,000 | 11,986,800 |
| c | Ohio Higher Educational Facility Commission (Cleveland Clinic Health System Obligated Group; SPA U.S. Bank, N.A.), 1.050%, 1/1/2039 (put 4/1/2020) | 3,025,000 | 3,025,000 |
| c | Ohio Higher Educational Facility Commission (LOC Barclays Bank Plc), 0.850%, 1/1/2043 (put 4/1/2020) | 2,500,000 | 2,500,000 |
| | One Gas, Inc., | | |
| a | 2.050%, 4/20/2020 | 5,120,000 | 5,114,460 |
| a | 2.100%, 4/2/2020 | 5,000,000 | 4,999,708 |
| | Pacific Corp., 3.150%, 4/2/2020 | 16,000,000 | 15,998,600 |
| a | Pfizer, Inc., 1.950%, 4/6/2020 | 13,390,000 | 13,386,373 |
| | Philip Morris International, Inc., | | |
| a | 1.050%, 4/20/2020 | 9,860,000 | 9,854,536 |
| a | 1.250%, 4/16/2020 | 3,140,000 | 3,138,365 |
| a | Roche Holding, Inc., 1.350%, 4/2/2020 | 15,000,000 | 14,999,437 |
| | Ryder System, Inc., | | |
| | 1.900%, 4/2/2020 | 1,000,000 | 999,947 |
| | 3.250%, 4/1/2020 | 15,000,000 | 15,000,000 |
| a | Southern California Edison Co., 2.700%, 4/2/2020 | 12,000,000 | 11,999,100 |
| a | Southern Co. Gas Capital Corp., 1.440%, 4/1/2020 | 15,031,000 | 15,031,000 |
| | Stanley Works (The), | | |
| a | 2.300%, 4/16/2020 | 10,248,000 | 10,238,179 |
| a | 2.550%, 4/6/2020 | 1,000,000 | 999,646 |
| d | State Street Institutional Treasury Money Market Fund Premier Class,, 0.580%, | 32,114,217 | 32,114,217 |
| | Total Capital Canada, Ltd., | | |
| a,b | 1.380%, 4/6/2020 | 600,000 | 599,885 |
| a,b | 1.700%, 4/23/2020 | 7,300,000 | 7,292,416 |
| c | Triborough Bridge and Tunnel Authority (LOC U.S. Bank N.A.), 1.100%, 1/1/2031 (put 4/1/2020) | 1,985,000 | 1,985,000 |
| | Union Pacific Corp., | | |
| a | 1.100%, 4/8/2020 | 16,000,000 | 15,996,578 |
| a | 1.400%, 4/3/2020 | 7,000,000 | 6,999,456 |
| c | University of North Carolina at Chapel Hill (SPA Landesbank Hessen-Thuringen), 0.800%, 2/15/2031 (put 4/1/2020) | 2,085,000 | 2,085,000 |
| a | Viacomcbs Inc., 3.000%, 4/2/2020 | 16,000,000 | 15,998,667 |
| a | Western Union Co., 2.950%, 4/1/2020 | 10,000,000 | 10,000,000 |
| | TOTAL SHORT-TERM INVESTMENTS(Cost $815,181,484) | | 815,181,484 |
| | Total Investments — 103.0%(Cost $815,181,484) | | $815,181,484 |
| | Liabilities Net of Other Assets — (3.0)% | | (23,646,544) |
| | Net Assets — 100.0% | | $791,534,940 |
| Footnote Legend |
| a | Securities exempt from registration under Rule 144A of the Securities Act of 1933, as amended. These securities are restricted but liquid and may only be resold in the ordinary course of business in transactions exempt from registration, normally to qualified institutional buyers. As of March 31, 2020, the aggregate value of these securities in the Fund’s portfolio was $548,040,471, representing 69.24% of the Fund’s net assets. |
| b | Yankee bond denominated in U.S. dollars and is issued in the U.S. by foreign banks and corporations. |
| c | Variable Rate Demand Notes are instruments whose interest rates change on a specific date (such as coupon date or interest payment date) or whose interest rates vary with changes in a designated base rate (such as the prime interest rate). This instrument is payable on demand and is secured by letters of credit or other credit support agreements from major banks. |
| d | Rate represents the money market fund annualized seven-day yield at March 31, 2020. |
See notes to financial statements.
| Semi-Annual Report | 7 |
Schedule of Investments, Continued
Thornburg Capital Management Fund | March 31, 2020 (Unaudited)
Portfolio Abbreviations
To simplify the listings of securities, abbreviations are used per the table below:
| COP | Certificates of Participation |
| DFA | Development Finance Authority |
| GO | General Obligation |
| JEA | Jacksonville Electric Authority |
| LOC | Letter of Credit |
| SPA | Stand-by Purchase Agreement |
8 | Semi-Annual Report
| See notes to financial statements. |
Statement of Assets and Liabilities
Thornburg Capital Management Fund | March 31, 2020 (Unaudited)
| ASSETS | |
| Investment in securities, at cost | $ 815,181,484 |
| Investments at value | 815,181,484 |
| Cash | 104,235 |
| Dividends receivable | 1,598 |
| Interest receivable | 278,993 |
| Prepaid expenses and other assets | 5,179 |
| Total Assets | 815,571,489 |
| Liabilities | |
| Payable for investments purchased | 23,998,243 |
| Accounts payable and accrued expenses | 38,306 |
| Total Liabilities | 24,036,549 |
| Net Assets | $ 791,534,940 |
| NET ASSETS CONSIST OF | |
| Net capital paid in on shares of beneficial interest | $ 791,534,940 |
| Net Assets | $ 791,534,940 |
| NET ASSET VALUE | |
| Class I Shares: | |
| Net assets applicable to shares outstanding | $ 791,534,940 |
| Shares outstanding | 79,155,863 |
| Net asset value and redemption price per share | $ 10.00 |
See notes to financial statements.
Statement of Operations
Thornburg Capital Management Fund | Six Months Ended March 31, 2020 (Unaudited)
| INVESTMENT INCOME | |
| Interest income | $11,689,647 |
| Dividend income | 1,598 |
| Total Income | 11,691,245 |
| EXPENSES | |
| Transfer agent fees | 1,913 |
| Custodian fees | 46,973 |
| Professional fees | 15,489 |
| Officer fees | 5,448 |
| Other expenses | 14,501 |
| Total Expenses | 84,324 |
| Net Investment Income (Loss) | $ 11,606,921 |
See notes to financial statements.
Statements of Changes in Net Assets
Thornburg Capital Management Fund
| | Six Months Ended
March 31, 2020* | Year Ended
September 30, 2019 |
| INCREASE (DECREASE) IN NET ASSETS FROM | | |
| OPERATIONS | | |
| Net investment income | $ 11,606,921 | $ 27,257,128 |
| Net Increase in Net Assets Resulting from Operations | 11,606,921 | 27,257,128 |
| DIVIDENDS TO SHAREHOLDERS | | |
| From distributable earnings | | |
| Class I Shares | (11,630,616) | (27,257,128) |
| FUND SHARE TRANSACTIONS | | |
| Class I Shares | (761,118,513) | 227,151,860 |
| Net Increase (Decrease) in Net Assets | (761,142,208) | 227,151,860 |
| NET ASSETS | | |
| Beginning of Period | 1,552,677,148 | 1,325,525,288 |
| End of Period | $ 791,534,940 | $ 1,552,677,148 |
See notes to financial statements.
Notes to Financial Statements
Thornburg Capital Management Fund | March 31, 2020 (Unaudited)
NOTE 1 – ORGANIZATION
Thornburg Capital Management Fund (the “Fund”) is a non-diversified series of Thornburg Investment Trust (the “Trust”). The Trust was organized as a Massachusetts business trust under a Declaration of Trust dated June 3, 1987 and is registered as a diversified, open-end management investment company under the Investment Company Act of 1940, as amended (the "1940 Act"). The Fund is currently one of twenty-two separate series of the Trust. Each series is considered to be a separate entity for financial reporting and tax purposes and bears expenses directly attributable to it. The Fund’s investment objective is to seek current income consistent with liquidity management and safety of capital. The Fund’s investments subject it to risks including, but not limited to, management risk, interest rate risk, prepayment and extension risk, credit risk, market and economic risk, foreign investment risk, liquidity risk and diversification risk. Please see the Fund’s prospectus for a discussion of the risks associated with an investment in the Fund.
The Fund currently offers one class of shares of beneficial interest: Institutional Class (“Class I”). This class of shares of the Fund represents all interest in the portfolio of investments. Class I shares are sold at net asset value without a sales charge at the time of purchase and may be subject to a service fee. All expenses are allocated to the class including administration fees, transfer agent fees, government registration fees, printing and postage costs, and legal expenses.
Shares of the Fund are issued solely in private placement transactions that do not involve any “public offering” within the meaning of Section (4)2 of the 1933 Act. Investments in the Fund may only be made by investment companies, or other persons that are “accredited investors” within the meaning of Regulation D under the 1933 Act. Thornburg Investment Management, Inc. (the "Advisor"), acting as the agent for the other series of the Trust, will affect all purchases and sells of shares of the Fund on behalf of any series of the Trust.
NOTE 2 – SIGNIFICANT ACCOUNTING POLICIES
The following is a summary of significant accounting policies followed by the Fund in the preparation of its financial statements. The Fund prepares its financial statements in conformity with United States generally accepted accounting principles (“GAAP”), including investment company accounting and reporting guidance in the Financial Accounting Standards Board (the “FASB”) Accounting Standard Codification Topic 946.
Allocation of Expenses: Expenses common to all Funds are allocated among the Funds comprising the Trust based upon their relative net asset values or other appropriate allocation methods.
Dividends and Distributions to Shareholders: Dividends and distributions to shareholders, which are determined in accordance with federal income tax regulations and may differ from GAAP, are recorded on the ex-dividend date. Ordinary income dividends, if any, are declared daily and paid monthly. Capital gain distributions, if any, are declared and paid annually and more often if deemed necessary by the Advisor. Dividends and distributions are paid and are reinvested in additional shares of the Fund at net asset value per share at the close of business on the ex-dividend date, or at the shareholder’s option, paid in cash.
Guarantees and Indemnifications: Under the Trust’s organizational documents (and under separate agreements with the independent Trustees), its officers and Trustees are provided with an indemnification against certain liabilities arising out of the performance of their duties to the Fund. In the normal course of business the Trust may also enter into contracts with service providers that contain general indemnifications. The Trust’s maximum exposure under these arrangements is unknown. However, based on experience, the Trust expects the risk of loss to be remote.
Investment Income: Interest income is accrued as earned. Premiums and discounts are amortized and accreted, respectively, to first call dates or maturity dates using the effective yield method of the respective investments. These amounts are included in Investment Income in the Statement of Operations.
Investment Transactions: Investment transactions are accounted for on a trade date basis. Realized gains and losses from the sale of investments are recorded on an identified cost basis.
Repurchase Agreements: The Fund may invest excess cash in repurchase agreements whereby the Fund purchases investments, which serve as collateral, with an agreement to resell such collateral to the seller at an agreed upon price at the maturity date of the repurchase agreement. Investments pledged as collateral for repurchase agreements are held in custody until maturity of the repurchase agreement. Provisions in the agreements require that the market value of the collateral is at least equal to the repurchase value in the event of default. In the event of default, the Fund has the right to liquidate the collateral and apply the proceeds in satisfaction of the obligation. Under certain circumstances, in the event of default or bankruptcy by the other party to the agreement, realization and/or retention of the collateral may be subject to legal proceedings.
Security Valuation: All investments in securities held by the Fund are valued as described in Note 3.
Notes to Financial Statements, Continued
Thornburg Capital Management Fund | March 31, 2020 (Unaudited)
Use of Estimates: The preparation of financial statements in conformity with GAAP requires management to make estimates and assumptions that affect the reported amounts of assets and liabilities and disclosure of contingent assets and liabilities at the date of the financial statements and the reported amounts of increases (decreases) in net assets from operations during the reporting period. Actual results could differ from those estimates.
When-Issued and Delayed Delivery Transactions: The Fund may engage in when-issued or delayed delivery transactions. To the extent the Fund engages in such transactions, it will do so for the purpose of acquiring portfolio investments consistent with the Fund’s investment objectives and not for the purpose of investment leverage or to speculate on interest rate or market changes. At the time the Fund makes a commitment to purchase an investment on a when-issued or delayed delivery basis, the Fund will record the transaction and reflect the value in determining its net asset value. When effecting such transactions, assets of an amount sufficient to make payment for the portfolio investments to be purchased will be segregated on the Fund’s records on the trade date. Investments purchased on a when-issued or delayed delivery basis do not earn interest until the settlement date. The values of these securities held at March 31, 2020 are detailed in the Schedule of Investments.
NOTE 3 – SECURITY VALUATION
Valuation of the Fund’s portfolio investment securities is performed in accordance with policies and procedures adopted by and under the oversight of the Trustees.
The Trustees of the Trust have appointed the Advisor to assist the Trustees with obtaining fair market values for portfolio investments, evaluating and monitoring professional pricing service providers appointed by the Trustees’ Audit Committee (the “Audit Committee”) to assist in determining fair values for portfolio investments, assisting in calculating fair values for portfolio investments in certain circumstances, and performing other functions in connection with the valuation of investments. The Advisor acts through its Valuation and Pricing Committee (the “Committee”) and other employees of the Advisor. The Committee regularly reviews its own valuation calculations, reviews the valuations, valuation techniques and services furnished by pricing service providers, considers circumstances which may require valuation calculations by the Committee, and reviews previous valuation calculations. The Committee reports to the Audit Committee on the Committee’s activities, the performance of pricing service providers, and other matters relating to valuation of portfolio investments.
In those instances when the Committee assists in calculating a fair value for a portfolio investment, the Committee seeks to determine the price that the Fund would reasonably expect to receive upon a sale of the investment in an orderly transaction between market participants on the valuation date. The Committee customarily utilizes quotations from securities broker dealers in calculating valuations, but also may utilize prices obtained from pricing service providers or other methods approved by the Audit Committee. Because fair values calculated by the Committee are estimates, the calculation of a value for an investment may differ from the price that would be realized by the Fund upon a sale of the investment, and the difference could be material to the Fund’s financial statements. The Committee’s calculation of a fair value for an investment may also differ from the prices obtained by other persons (including other mutual funds) for the investment.
Valuation of Securities: Securities held with a maturity of less than 60 days are valued using the amortized cost method. The amortized cost method of valuation involves valuing a security at its cost initially and thereafter assuming a constant amortization to maturity of any discount or premium, regardless of the impact of fluctuating interest rates on the market value of the security. This method may result in periods during which value, as determined by amortized cost, is higher or lower than the price each Fund would receive if it sold the security. The market value of securities in the Fund can be expected to vary inversely with changes in prevailing interest rates.
Debt obligations held by the Fund which are not listed or traded on exchanges or for which no reported market exists are ordinarily valued at the valuation obtained from a pricing service provider approved by the Audit Committee.
In any case when a pricing service provider fails to provide a valuation for a debt obligation held by the Fund, the Committee calculates a fair value for the obligation using alternative methods under procedures approved by the Audit Committee. Additionally, in cases when management believes that a valuation obtained from a pricing service provider is stale, does not reflect material factors affecting the valuation of the investment, is significantly different than the value the Fund is likely to obtain if it sought a bid for the investment, or is otherwise unreliable, the Committee calculates a fair value for the obligation using an alternative method approved by the Audit Committee.
Valuation Hierarchy: The Fund categorizes its investments based upon the inputs used in valuing those investments, according to a three-level hierarchy established in guidance from the FASB. Categorization of investments using this hierarchy is intended by the FASB to maximize the use of observable inputs in valuing investments and minimize the use of unobservable inputs by requiring that the most observable inputs be used when available. Observable inputs are those that market participants would use in valuing an investment based on available market information. Unobservable inputs are those that reflect assumptions about the information market participants would use in valuing an investment. An investment’s level within the hierarchy is based on the lowest level input that is deemed significant to the valuation. The methodologies and inputs used to value investments are not necessarily indications of the risk or liquidity associated with those investments.
Notes to Financial Statements, Continued
Thornburg Capital Management Fund | March 31, 2020 (Unaudited)
Various inputs are used in calculating valuations for the Fund’s investments. These inputs are generally summarized according to the three-level hierarchy below:
Level 1: Quoted prices in active markets for identical investments.
Level 2: Other direct or indirect significant observable inputs (including quoted prices for similar investments in active markets and other observable inputs, such as interest rates, prepayment rates, credit ratings, etc.).
Level 3: Significant unobservable inputs (including the Committee’s own assumptions in calculating the fair values of investments).
Valuations for debt obligations held by the Fund is typically calculated by pricing service providers approved by the Audit Committee and are generally characterized as Level 2 within the valuation hierarchy.
In a limited number of cases the Committee calculates a fair value for investments using broker quotations or other methods approved by the Audit Committee. When the Committee uses a single broker quotation to calculate a fair value for an investment without other significant observable inputs, or if a fair value is calculated using other significant inputs that are considered unobservable, the investment is characterized as Level 3 within the hierarchy. Other significant unobservable inputs used to calculate a fair value in these instances might include an income-based valuation approach which considers discounted anticipated future cash flows from the investment and application of discounts due to the nature or duration of any restrictions on the disposition of the investment.
Valuations based upon the use of inputs from Levels 1, 2 or 3 may not represent the actual price received upon the disposition of an investment, and a fund may receive a price that is lower than the valuation based upon these inputs when it sells the investment.
The following table displays a summary of the fair value hierarchy measurements of the Fund’s investments as of March 31, 2020:
| | TOTAL | LEVEL 1 | LEVEL 2 | LEVEL 3 |
| Assets | | | | |
| Investments in Securities | | | | |
| Short-Term Investments | $ 815,181,484 | $ 32,114,217 | $ 783,067,267 | $ — |
| Total Assets | $815,181,484 | $32,114,217 | $783,067,267 | $— |
NOTE 4 – INVESTMENT MANAGEMENT FEE AND OTHER TRANSACTIONS WITH AFFILIATES
Pursuant to an investment advisory agreement, the Advisor serves as the investment advisor and performs services for the Fund. The Fund does not pay an advisory fee to the Advisor under this agreement.
The Advisor provides certain administrative services to the Fund. No fees are charged for these services.
The Fund may purchase or sell securities from or to an affiliated fund, provided the affiliation is due solely to having a common investment advisor, common officers, or common trustees, and provided that all such transactions will comply with Rule 17a-7 under the 1940 Act. For the six months ended March 31, 2020, the Fund had no such transactions with affiliated funds.
NOTE 5 – TAXES
Federal Income Taxes: It is the policy of the Trust to comply with the provisions of the Internal Revenue Code applicable to regulated investment companies and to distribute to shareholders substantially all investment company taxable income including net realized gains on investments (if any), and tax exempt income of the Fund. Therefore, no provision for federal income or excise tax is required.
The Fund files income tax returns in United States federal and applicable state jurisdictions. The statute of limitations on the Fund’s tax return filings generally remains open for the three years following a return’s filing date. The Fund has analyzed each uncertain tax position believed to be material in the preparation of the Fund’s financial statements for the six month period ended March 31, 2020, including open tax years, to assess whether it is more likely than not that the position would be sustained upon examination, based on the technical merits of the position. The Fund has not identified any such position for which an asset or liability must be reflected in the Statement of Assets and Liabilities.
Notes to Financial Statements, Continued
Thornburg Capital Management Fund | March 31, 2020 (Unaudited)
At March 31, 2020, information on the tax components of capital was as follows:
| Cost of investments for tax purposes | $ 815,181,484 |
| Net unrealized appreciation (depreciation) on investments (tax basis) | $ - |
There is no unrealized gain (loss) in the Fund at March 31, 2020 due to all securities with less than 60 days to maturity being valued by the amortized cost method.
NOTE 6 – SHARES OF BENEFICIAL INTEREST
At March 31, 2020, there were an unlimited number of shares with no par value of beneficial interest authorized. Transactions in shares of beneficial interest were as follows:
| | SIX MONTHS ENDED
March 31, 2020 | YEAR ENDED
September 30, 2019 (AUDITED) |
| | SHARES | AMOUNT | SHARES | AMOUNT |
| Class I Shares | | | | |
| Shares sold | 410,446,608 | $ 4,104,466,085 | 710,137,132 | $ 7,101,371,322 |
| Shares issued to shareholders in reinvestment of dividends | 1,163,062 | 11,630,616 | 2,724,210 | 27,242,096 |
| Shares repurchased | (487,721,522) | (4,877,215,214) | (690,146,156) | (6,901,461,558) |
| Net increase (decrease) | (76,111,852) | $ (761,118,513) | 22,715,186 | $ 227,151,860 |
NOTE 7 – INVESTMENT TRANSACTIONS
For the six months ended March 31, 2020, the Fund had no purchase and sale transactions of investments other than short-term investments.
| | Per Share Performance (For a Share Outstanding throughout the Period) |
UNLESS OTHERWISE
NOTED, PERIODS ARE
FISCAL YEARS ENDED
SEPTEMBER 30, | Net Asset
Value,
Beginning of
Period | Net
Investment
Income
(Loss)+ | Net Realized &
Unrealized Gain
(Loss) on
Investments | Total from
Investment
Operations | Dividends
from Net
Investment
Income | Dividends
from Net
Realized
Gains | Total
Dividends | Net Asset
Value,
End of Period |
| Class I |
| 2020(b) | $ 10.00 | 0.09 | — | 0.09 | (0.09) | — | (0.09) | $ 10.00 |
| 2019 | $ 10.00 | 0.24 | — | 0.24 | (0.24) | — | (0.24) | $ 10.00 |
| 2018 | $ 10.00 | 0.18 | — | 0.18 | (0.18) | — | (0.18) | $ 10.00 |
| 2017 | $ 10.00 | 0.09 | — | 0.09 | (0.09) | — | (0.09) | $ 10.00 |
| 2016 | $ 10.00 | 0.05 | — | 0.05 | (0.05) | — | (0.05) | $ 10.00 |
| 2015(e) | $ 10.00 | —(f) | —(g) | —(h) | —(i) | — | — | $ 10.00 |
| (a) | Not annualized for periods less than one year. |
| (b) | Unaudited Six Month Period Ended March 31. |
| (c) | Annualized. |
| (d) | Portfolio turnover rate equals zero due to no long term investment transactions in the period. |
| (e) | Fund commenced operations on July 31, 2015. |
| (f) | Net investment income (loss) was less than $0.01 per share. |
| (g) | Net realized and unrealized gain (loss) on investments was less than $0.01 per share. |
| (h) | Total from investment operations was less than $0.01 per share. |
| (i) | Dividends from net investment income per share were less than $(0.01). |
| + | Based on weighted average shares outstanding. |
See notes to financial statements.
Financial Highlights, Continued
| | Ratios to Average Net Assets | | Supplemental Data |
UNLESS OTHERWISE
NOTED, PERIODS ARE
FISCAL YEARS ENDED
SEPTEMBER 30, | Net Investment
Income (Loss) (%) | Expenses, After
Expense
Reductions (%) | Expenses,
Before Expense
Reductions (%) | | Total
Return (%)(a) | Portfolio
Turnover
Rate (%)(a) | Net Assets
at End of Period
(Thousands) |
| Class I |
| 2020(b) | 1.79(c) | 0.01(c) | 0.01(c) | | 0.91 | —(d) | $ 791,535 |
| 2019 | 2.44 | 0.02 | 0.02 | | 2.48 | —(d) | $ 1,552,677 |
| 2018 | 1.76 | 0.02 | 0.02 | | 1.76 | —(d) | $ 1,325,525 |
| 2017 | 0.89 | 0.03 | 0.03 | | 0.87 | —(d) | $ 1,130,021 |
| 2016 | 0.45 | 0.03 | 0.03 | | 0.45 | —(d) | $ 1,393,536 |
| 2015(e) | 0.26(c) | 0.03(c) | 0.03(c) | | 0.04 | —(d) | $ 1,772,860 |
Expense Example
Thornburg Capital Management Fund | March 31, 2020 (Unaudited)
As a shareholder of the Fund, you incur ongoing costs of investing in the Fund. Because the Fund does not pay any management fee or distribution and/or service (12b-1) fee, the Fund’s ongoing costs are comprised of other Fund expenses. Shareholders of the Fund do not incur any transaction costs.
This example is intended to help you understand your ongoing costs (in dollars) of investing in the Fund and to compare these costs with the ongoing costs of investing in other mutual funds.
The example is based on a $1,000 investment beginning on October 1, 2019, and held until March 31, 2020.
| | BEGINNING
ACCOUNT VALUE
10/1/19 | ENDING
ACCOUNT VALUE
3/31/20 | EXPENSES PAID
DURING PERIOD†
10/1/19—3/31/20 |
| CLASS I SHARES |
| Actual | $1,000.00 | $1,009.11 | $0.05 |
| Hypothetical* | $1,000.00 | $1,024.95 | $0.05 |
| † | Expenses are equal to the annualized expense ratio for each class (I: 0.01%) multiplied by the average account value over the period, multiplied by 183/366 to reflect the one-half year period. |
| * | Hypothetical assumes a rate of return of 5% per year before expenses. |
ACTUAL EXPENSES
For each class of shares, the first line of the accompanying table provides information about actual account values and actual expenses. You may use the information in this line, together with the amount you invested, to estimate the expenses that you paid over the period. Simply divide your account value by $1,000 (for example, an $8,600 account value divided by $1,000 = 8.6), then multiply the result by the number in the first line for your class of shares under the heading entitled “Expenses Paid During Period” to estimate the expenses you paid on your account during this period.
HYPOTHETICAL EXAMPLE FOR COMPARISON PURPOSES
For each class of shares, the second line of the accompanying table provides information about hypothetical account values and hypothetical expenses based on the Fund’s actual expense ratio and an assumed rate of return of 5% per year before expenses, which is not the Fund’s actual return. The hypothetical account values and expenses may not be used to estimate the actual ending account balance or expenses you paid for the period. You may use this information to compare the ongoing costs of investing in the Fund and other funds. To do so, compare this 5% hypothetical example with the 5% hypothetical examples that appear in the shareholder reports of the other funds.
Please note that the expenses shown in the table are meant to highlight your ongoing costs only and do not reflect any transactional costs, such as sales charges (loads), redemption fees, or exchange fees. Therefore, the second line of the table for each class of shares is useful in comparing ongoing costs only, and will not help you determine the relative total costs of owning different funds. In addition, if these transactional costs were included, your costs would have been higher.
Other Information
March 31, 2020 (Unaudited)
PORTFOLIO PROXY VOTING
Policies and Procedures:
The Trust has delegated to the Advisor voting decisions respecting proxies for the Fund’s voting securities. The Advisor makes voting decisions in accordance with its Proxy Voting Policy and Procedures. A description of the Policy and Procedures is available (i) without charge, upon request, by calling the Advisor toll-free at 1-800-847-0200, (ii) on the Thornburg website at www.thornburg.com, and (iii) on the U.S. Securities and Exchange Commission’s website at www.sec.gov.
Information regarding how proxies were voted is available on or before August 31 of each year for the twelve months ending the preceding June 30. This information is available (i) without charge, upon request by calling the Advisor toll-free at 1-800-847-0200, (ii) on the Thornburg website at www.thornburg.com, and (iii) on the U.S. Securities and Exchange Commission’s website at www.sec.gov.
AVAILABILITY OF QUARTERLY PORTFOLIO SCHEDULE
The Fund files with the Securities and Exchange Commission schedules of its portfolio holdings on Form N-PORT EX for the first and third quarters of each fiscal year. The Fund’s Form N-PORT EX are available on the Commission’s website at www.sec.gov, or may be reviewed and copied at the Commission’s Public Reference Room in Washington, D.C. Information on the operation of the Public Reference Room may be obtained by calling 1-800-SEC-0330. The Fund also makes this information available on its website at www.thornburg.com/download or upon request by calling 1-800-847-0200.
STATEMENT REGARDING LIQUIDITY RISK MANAGEMENT PROGRAM
The Trustees of the Trust have appointed the Advisor (“Program Administrator”) to administer the Trust’s liquidity risk management program (the “LRMP”) adopted for the Fund under rule 22e-4 under the 1940 Act (the “Liquidity Rule”). The LRMP is designed to reduce the risk that the Fund will be unable to meet its redemption obligations under the 1940 Act, and to mitigate the dilution of the interests of Fund shareholders occasioned by redemptions tendered by other shareholders (“Liquidity Risk”). Pursuant to the LRMP, the Program Administrator has delegated certain functions, including daily oversight and management of the Fund’s Liquidity Risk, to its Liquidity Risk Management Committee (the “Liquidity Committee”). Under the LRMP, the Liquidity Committee performs the annual review of the LRMP required by the Liquidity Rule.
On December 4, 2019, the Trustees reviewed the Liquidity Committee’s initial written report (the “Report”) concerning the operation of the LRMP for the period from December 1, 2018 through November 22, 2019 (the “Reporting Period”). The Report addressed the operation, adequacy and effectiveness of the LRMP, the operation of the Fund’s highly liquid investment minimum, and any material changes to the LRMP during the Reporting Period. The Report provided an assessment of the various factors relevant to the Fund’s Liquidity Risk, an evaluation of data provided by a third-party liquidity assessment vendor and other relevant data, and reports on the Liquidity Committee’s consideration of intermediary firms with the largest beneficial ownership positions in the Fund, the likelihood that any of those firms may redeem their clients’ investments from the Fund without prior notice, and the effect that such redemptions could have on Fund liquidity. The Report concluded that the LRMP remains adequate and effective to address the Fund’s Liquidity Risk, that the Fund is able to meet redemption requests in current market conditions and in reasonably expected stressed conditions without significant dilution of remaining shareholders, that the Fund remains primarily highly liquid, and the third-party liquidity assessment vendor’s system continues to be a useful tool for assessing the Fund’s Liquidity Risk. The Report stated that there have been no instances since the LRMP’s adoption in which the Fund exceeded its limitation on illiquid investments, nor have there been any material changes to the LRMP since its adoption.
Trustees’ Statement to Shareholders (Unaudited)
Readopted September 17, 2019
The Trustees believe current and prospective shareholders should know how we discharge our responsibilities in supervising the Funds’ investment advisor and in reviewing the advisor’s contract for renewal. Since 2005, we have issued a statement which sets out clearly the three principal guidelines that we follow in supervising the Trust’s investment advisor on your behalf. In accordance with our customary practice, in September of this year we again reviewed our statement and concluded we should reissue this statement outlining the principal features of our supervision of the advisor’s performance of investment management services for the Funds.
We begin with the premise that each shareholder selected his or her Fund because its investments are managed by the investment advisor identified in the prospectus and in accordance with the objective and policies described in the prospectus. We realize, as each of you do, that if you believe that your Fund’s stated objective and policies no longer serve your personal investment goals, you can sell your shares and leave the Fund.
Therefore, we believe that our primary supervisory task—our principal obligation to you—is to assess the nature and quality of the advisor’s services, and to confirm that the advisor actively and competently pursues the Fund’s objective, in accordance with the policies set out in the prospectus. To do this, we meet regularly with management to review your Fund’s portfolio and to discuss the advisor’s specific actions and judgments in pursuing the Fund’s objective. We do not substitute our own judgment for the advisor’s decisions in selecting investments; the advisor is paid to exercise its informed judgment on investment decisions, and we seek to confirm, in reviewing the advisor’s performance, that the advisor is doing just that.
Second, we are conscious of costs and the effect that costs have on shareholders’ returns. We try to make sure that your Fund’s fees and costs are reasonable in relationship to the services rendered and that they are generally in line with those charged by other expert investment advisors, consistent with our belief that the Fund’s investors searched for and expect that expertise and attention and have decided to pay a reasonable price for it. We do not put the management contract “out to bid” as a matter of course, and we would not do so unless we had concluded that the advisor materially had failed to pursue the Fund’s objectives in accordance with its policies, or for other equally important reasons. We believe that any other approach would be inconsistent with your interests and contrary to your expectations when you bought shares of the Fund in the first place.
Finally, because we believe that most Thornburg Fund shareholders have invested with a long-term perspective, we try not to focus too much on the fashions of the moment and on short-term performance. The market will not favor any specific investment objective or set of policies at all times and under all economic circumstances. A fund will experience periods of both high and low returns relative to other funds and other investments. Even if one of our Funds is not favored by the market at a particular time, we believe that the advisor is nonetheless obliged to remain true to the Fund’s objective and policies, and we watch to see that it does so.
Trustees of Thornburg Investment Trust
Thornburg Investment Management is a privately-owned global investment firm that offers a range of solutions for retail and institutional investors. Founded in 1982 and headquartered in Santa Fe, New Mexico, we manage approximately $35.1 billion (as of March 31, 2020) across U.S. mutual funds, separate accounts for high-net-worth investors, institutional accounts, and UCITS funds for non-U.S. investors.
The fund outlined in this report is one of many equity and fixed-income products available from Thornburg Investment Management.
MULTI ASSET
| ■ | Thornburg Investment Income Builder Fund |
| ■ | Thornburg Summit Fund |
GLOBAL EQUITY
| ■ | Thornburg Global Opportunities Fund |
INTERNATIONAL EQUITY
| ■ | Thornburg International Value Fund |
| ■ | Thornburg Better World Fund |
| ■ | Thornburg International Growth Fund |
| ■ | Thornburg Developing World Fund |
DOMESTIC EQUITY
| ■ | Thornburg Value Fund |
| ■ | Thornburg Core Growth Fund |
ALTERNATIVES
| ■ | Thornburg Long/Short Equity Fund |
FIXED INCOME
| ■ | Thornburg Limited Term U.S. Government Fund |
| ■ | Thornburg Limited Term Income Fund |
| ■ | Thornburg Low Duration Income Fund |
| ■ | Thornburg Strategic Income Fund |
MUNICIPAL
| ■ | Thornburg Short Duration Municipal Fund |
| ■ | Thornburg Limited Term Municipal Fund |
| ■ | Thornburg California Limited Term Municipal Fund |
| ■ | Thornburg New Mexico Intermediate Municipal Fund |
| ■ | Thornburg New York Intermediate Municipal Fund |
| ■ | Thornburg Intermediate Municipal Fund |
| ■ | Thornburg Strategic Municipal Income Fund |
Before investing, carefully consider the Fund’s investment goals, risks, charges, and expenses. For a prospectus or summary prospectus containing this and other information, contact your financial advisor or visit thornburg.com. Read it carefully before investing.
For additional information, please visit thornburg.com
Thornburg Investment Management, Inc. 2300 North Ridgetop Road, Santa Fe, NM 87506
This page intentionally left blank.
This page intentionally left blank.
To receive shareholder reports, prospectuses, and proxy statements electronically, go to www.thornburg.com/edelivery.
This Semi-Annual Report is submitted for the general information of shareholders of the Fund. It is not authorized for distribution to prospective investors in the Fund unless preceded or accompanied by an effective prospectus.
Investment Advisor:
Thornburg Investment Management®
800.847.0200
Distributor:
Thornburg Securities Corporation®
Item 2.Code of Ethics
Not applicable.
Item 3.Audit Committee Financial Expert
Not applicable.
Item 4.Principal Accountant Fees and Services
Not applicable.
Item 5.Audit Committee of Listed Registrants
Not applicable.
Item 6.Schedule of Investments
Filed as part of the reports to shareholders filed under item 1 of this Form.
Item 7.Disclosure of Proxy Voting Policies and Procedures for Closed-End Management Investment Companies
Not applicable.
Item 8.Portfolio Managers of Closed-End Management Investment Companies
Not applicable.
Item 9.Purchases of Equity Securities by Closed-End Management Investment Companies and Affiliated Purchasers.
Not applicable.
Item 10.Submission of Matters to a Vote of Security Holders
The authority to consider candidates recommended by the shareholders in accordance with the Trust’s Procedures for Shareholder Communications is committed to the Governance and Nominating Committee.
Item 11.Controls and Procedures
(a) The principal executive officer and the principal financial officer have concluded that Thornburg Investment Trust’s disclosure controls and procedures provide reasonable assurance that material information relating to Thornburg Investment Trust is made known to them by the appropriate persons, based on their evaluation of these controls and procedures as of a date within 90 days prior to the filing date of this report.
(b) There was no change in Thornburg Investment Trust’s internal control over financial reporting that occurred during the registrant’s second fiscal quarter of the period covered by this report (that is, the registrant’s second fiscal quarter) that has materially affected, or is reasonably likely to materially affect, the registrant’s internal control over financial reporting.
Item 12.Disclosure of Securities Lending Activities for Closed-End Management Investment Companies
Not applicable.
Item 13.Exhibits
SIGNATURES
Pursuant to the requirements of the Securities Exchange Act of 1934 and the Investment Company Act of 1940, the registrant has duly caused this report to be signed on its behalf by the undersigned, thereunto duly authorized.
Thornburg Investment Trust, in respect of the following Thornburg Funds: Short Duration Municipal Fund, Limited Term Municipal Fund, Intermediate Municipal Fund, Strategic Municipal Income Fund, California Limited Term Municipal Fund, New Mexico Intermediate Municipal Fund, New York Intermediate Municipal Fund, Limited Term U.S. Government Fund, Limited Term Income Fund, Low Duration Income Fund, Strategic Income Fund, Value Fund, International Value Fund, Core Growth Fund, International Growth Fund, Investment Income Builder Fund, Global Opportunities Fund, Developing World Fund, Better World International Fund, Capital Management Fund, Long/Short Equity Fund and Summit Fund.
| | |
| |
| By: | | /s/ Jason H. Brady |
| |
| | Jason H. Brady |
| |
| | President and principal executive officer |
| |
| Date: | | May 19, 2020 |
Pursuant to the requirements of the Securities Exchange Act of 1934 and the Investment Company Act of 1940, this report has been signed below by the following persons on behalf of the registrant and in the capacities and on the dates indicated.
| | |
| |
| By: | | /s/ Jason H. Brady |
| |
| | Jason H. Brady |
| |
| | President and principal executive officer |
| |
| Date: | | May 19, 2020 |
| |
| By: | | /s/ Nimish Bhatt |
| |
| | Nimish Bhatt |
| |
| | Principal financial officer |
| |
| Date: | | May 19, 2020 |