UNITED STATES
SECURITIES AND EXCHANGE COMMISSION
Washington, D.C. 20549
FORM N-CSR
CERTIFIED SHAREHOLDER REPORT OF REGISTERED MANAGEMENT INVESTMENT
COMPANIES
Investment Company Act file number 811-05201
Thornburg Investment Trust
(Exact name of registrant as specified in charter)
c/o Thornburg Investment Management, Inc.
2300 North Ridgetop Road, Santa Fe, New Mexico 87506
(Address of principal executive offices) (Zip code)
Garrett Thornburg, 2300 North Ridgetop Road, Santa Fe, New Mexico 87506
(Name and address of agent for service)
Registrant’s telephone number, including area code: 505-984-0200
Date of fiscal year end: September 30
Date of reporting period: March 31, 2018
Item 1. Reports to Stockholders
The following Semi-annual reports are attached hereto, in order:
Thornburg Low Duration Municipal Fund
Thornburg Limited Term Municipal Fund
Thornburg Intermediate Municipal Fund
Thornburg Strategic Municipal Income Fund
Thornburg California Limited Term Municipal Fund
Thornburg New Mexico Intermediate Municipal Fund
Thornburg New York Intermediate Municipal Fund
Thornburg Limited Term U.S. Government Fund
Thornburg Limited Term Income Fund
Thornburg Low Duration Income Fund
Thornburg Strategic Income Fund
Thornburg Value Fund
Thornburg International Value Fund
Thornburg Core Growth Fund
Thornburg International Growth Fund
Thornburg Investment Income Builder Fund
Thornburg Global Opportunities Fund
Thornburg Developing World Fund
Thornburg Better World International Fund
Thornburg Capital Management Fund
Thornburg Long/Short Equity Fund
Semi-Annual Report
March 31, 2018
THORNBURG
LOW DURATION
MUNICIPAL
FUND

About Thornburg Investment Management
It’s more than what we do. It’s how we do it.
At Thornburg, we are very different in how we think, invest, and are structured. We believe this difference is what makes us successful in helping individuals reach their long-term financial goals.

Flexible Perspective
Our perspective on investment opportunities is more flexible than most, viewing a wide range of opportunities beyond conventional boundaries to find hidden value.
Collaboration
Collectively, we hone ideas via borderless cross-pollination for better judgment and better results.

Portfolio Construction
Disciplined construction guided more by our convictions than convention.
CONVICTION
Thorough analysis and our relative-value framework lead to conviction in our securities selection.
UNCONVENTIONAL
Active management means we seek the best value for our clients rather than using conventional benchmarks as our starting point.

Structured for Excellence
How we think and how we invest is made possible by how we’re structured.
TEAM APPROACH
FAR FROM THE HERD
ACCESS & TRANSPARENCY
2 | Semi-Annual Report
Thornburg Low Duration Municipal Fund
Semi-Annual Report ^ March 31, 2018
Table of Contents
| | | | | | | | | | |
| SHARE CLASS | | NASDAQ SYMBOL | | CUSIP |
| | |
| Class A | | TLMAX | | | | 885-216-788 | |
| Class I | | TLMIX | | | | 885-216-770 | |
Minimum investments for Class I shares may be higher than those for Class A. Class I shares may not be available to all investors.
Investments carry risks, including possible loss of principal. Portfolios investing in bonds have the same interest rate, inflation, and credit risks that are associated with the underlying bonds. The value of bonds will fluctuate relative to changes in interest rates, decreasing when interest rates rise. Unlike bonds, bond funds have ongoing fees and expenses. Please see the Fund’s prospectus for a discussion of the risks associated with an investment in the Fund. Investments in the Funds are not FDIC insured, nor are they bank deposits or guaranteed by a bank or any other entity.
The laddering strategy does not assure or guarantee better performance and cannot eliminate the risk of investment losses.
Semi-Annual Report | 3
Letter to Shareholders
Thornburg Low Duration Municipal Fund | March 31, 2018 (Unaudited)
April 25, 2018
Dear Fellow Shareholder:
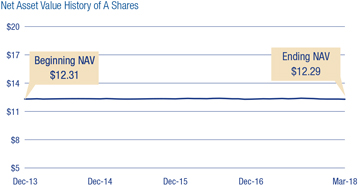
We are pleased to present the semi-annual report for Thornburg Low Duration Municipal Fund. The net asset value (NAV) of the Class I shares decreased by 8 cents to $12.29 per share during the six-month period ended March 31, 2018. During the period, the Class I shares of the Fund outperformed the index with a negative 0.11% total return, compared to the negative 0.29% return for the ICE BofAML 1-3 Year U.S. Municipal Securities Index.
The Fund’s duration, as well as curve positioning, contributed 0.06% to relative performance. Security selection, which is performance not attributable to duration and sector selection, was the major driver of relative performance, contributing 0.36%. Sector selection had a slightly negative impact, detracting 0.04% from relative performance.
The topic of tax reform consumed municipal market participants in the fourth quarter of 2017, with several proposals being bandied about that would significantly impact the supply/ demand dynamics of the market for years to come. Ultimately, the legislation was not as radical as initially feared. On the supply side of the equation, issuers lost the ability to advance refund debt. Much like a homeowner refinancing an existing mortgage to save on interest costs, an issuer would refinance debt when interest rates were low to provide some present value savings. While many thought this would have a large impact on supply, we did not agree. Advance refunding is highly correlated to the current level of interest rates, and many issuers had already accomplished any possible refunding over the previous several years.
Instead, we found the impact of tax reform on the demand side of the equation to be far more interesting. What was overlooked was the reduction of the corporate tax rate from 35% to 21%, and the idea that corporations evaluating municipal bonds versus other fixed income securities on a tax equivalent basis would now require a higher hurdle rate to buy municipal securities. We felt that the impact this may have on two specific buyers of municipals, banks, and property and casualty insurance companies, which own roughly 20 to 25% of outstanding municipal bonds, could lead both to re-evaluate their decision to own municipal bonds. While we do not believe this to be an Armageddon type of scenario; we expect it to be more like a weight leaning on the market for the next 12 to 18 months.
Another impact on the demand side is the limitations on the deductibility of state and local taxes (SALT), which has led
many market observers to postulate that the demand for municipal bonds in high tax states will increase. Again, we did not share the same opinion. In California, the demand for California bonds has already driven prices to a level where we feel there is little value when compared to other municipal securities on a tax-equivalent basis. Demand for municipal securities in other high tax states, such as Connecticut, Pennsylvania, and New Jersey, is not as cut and dry because there is significant credit risk associated with each. Nevertheless, these concerns caused the supply of municipal bonds to spike in November and December as issuers rushed to market to hedge against the potential threat of tax reform. Some investors viewed this period as an opportunity to buy extra municipal bonds in anticipation of a January rally, which never materialized. We did not view the market the same way, and kept our strategies positioned at the lower end of their relative risk spectrums (i.e. lower duration, higher credit quality, and higher reserve positions). The last fear facing the municipal bond market is the long-advertised infrastructure plan. While the plan has experienced several failed launches, and what is known suggests it will have little impact on the supply of municipal bonds, we are still monitoring the details of the proposal for potential impacts to our strategies.
The fourth quarter of 2017 saw yields of shorter maturity bonds increase more than the yields of longer maturity bonds, leading to a flattening of the yield curve. At the time, many analysts and pundits harped on the fact that the phenomenon portends a future recession. In the first quarter of 2018, the market watched as yields of longer maturity bonds increased more than yields of shorter maturity bonds, leading to a steepening of the yield curve. The steepening of the curve is an indication that market participants have a growing concern about increases in inflation – the enemy of the fixed income investor. The Fund’s conservative positioning was a headwind to performance in the fourth quarter of 2017, but acted as a tailwind to performance in the first quarter of 2018.
Thank you for your continued trust in us.
Sincerely,
| | |
 | |  |
Christopher Ryon,CFA | | Nicholos Venditti,CFA |
| Portfolio Manager | | Portfolio Manager |
| Managing Director | | Managing Director |
The matters discussed in this report may constitute forward-looking statements made pursuant to the safe harbor provisions of the Securities Litigation Reform Act of 1995. These include any advisor or portfolio manager prediction, assessment, analysis or outlook for individual securities, industries, investment styles, market sectors and/or markets. These statements involve risks and uncertainties. In addition to the general risks described for each fund in its current prospectus, other factors bearing on these reports include the accuracy of the advisor’s or portfolio manager’s forecasts and predictions, the appropriateness of the investment strategies designed by the advisor or portfolio manager and the ability of the advisor or portfolio manager to implement their strategies efficiently and successfully. Any one or more of these factors, as well as other risks affecting the securities markets generally, could cause the actual results of any fund to differ materially as compared to its benchmarks.
The views expressed are subject to change and do not necessarily reflect the views of Thornburg Investment Management, Inc. This information should not be relied upon as a recommendation or investment advice and is not intended to predict the performance of any investment or market.
Performance results of individual share classes will vary based on the fees and expenses associated with each share class, and may be higher or lower than other share classes within the same Fund. Please see Performance Summary for performance results of each share class.
4 | Semi-Annual Report
Performance Summary
Thornburg Low Duration Municipal Fund | March 31, 2018 (Unaudited)
AVERAGE ANNUAL TOTAL RETURNS
| | | | | | | | | | | | | | | |
| | | 1-YR | | 3-YR | | SINCE
INCEP. |
| | | |
Class A Shares (Incep: 12/30/13) | | | | | | | | | | | | | | | |
Without sales charge | | | | 0.52% | | | | | 0.37% | | | | | 0.34% | |
| | | |
With sales charge | | | | -1.00% | | | | | -0.15% | | | | | -0.02% | |
| | | |
Class I Shares (Incep: 12/30/13) | | | | 0.72% | | | | | 0.56% | | | | | 0.54% | |
30-DAY YIELDS, A SHARES (with sales charge)
| | | | | |
| Annualized Distribution Yield | | | | 0.82% | |
| SEC Yield | | | | 1.08% | |
GROWTH OF A HYPOTHETICAL $10,000 INVESTMENT
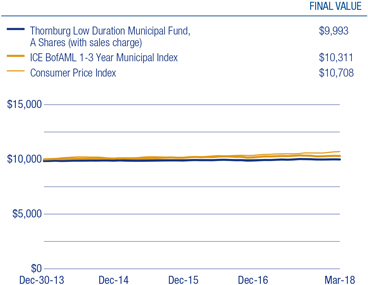
Performance data shown represents past performance and is no guarantee of future results. Investment return and principal value will fluctuate so shares, when redeemed, may be worth more or less than their original cost. Current performance may be lower or higher than quoted. For performance current to the most recent month end, visit thornburg.com or call 800-847-0200. The performance information does not reflect the deduction of taxes that a shareholder would pay on distributions or the redemption of Fund shares. Returns reflect the reinvestment of dividends and capital gains. Class A shares are sold with a maximum sales charge of 1.50%. There is no sales charge for Class I shares.
As disclosed in the most recent prospectus, the total annual fund operating expenses before fee waivers and expense reimbursements are as follows: A shares, 1.12%; I shares, 0.70%. Thornburg Investment Management and/or Thornburg Securities Corporation have contractually agreed to waive fees and reimburse expenses through at least February 1, 2019, for some of the share classes, resulting in net expense ratios of the following: A shares, 0.70%; I shares, 0.50%. For more detailed information on fund expenses and waivers/reimbursements please see the Fund’s prospectus. Without the fee waivers and expense reimbursements, the Annualized Distribution yield would have been 0.48%, and the SEC yield would have been 0.73%.
The ICE index data referenced herein is the property of ICE Data Indices, LLC, its affiliates (“ICE Data”) and/or its Third Party Suppliers and has been licensed for use by Thornburg Investment Management, Inc. ICE Data and its Third Party Suppliers accept no liability in connection with its use. See www.thornburg.com/indices for a full copy of the Disclaimer.
Glossary
The ICEBofAML 1-3 Year U.S. Municipal Securities Index is a subset of the BofAML U.S. Municipal Securities Index including all securities with a remaining term to final maturity greater than or equal to 1 year and less than 3 years.
The performance of any index is not indicative of the performance of any particular investment. Unless otherwise noted, index returns reflect the reinvestment of income dividends and capital gains, if any, but do not reflect fees, brokerage commissions or other expenses of investing. Investors may not make direct investments into any index.
Annualized Distribution Yield – The distribution yield reflects actual distributions made to shareholders. The annualized distribution yield is calculated by summing the last 30 days of income at a given month end and annualizing to a 360-day year. The result is divided by the ending maximum offering price or net asset value.
SEC Yield – A yield computed in accordance with SEC standards measuring the net investment income per share over a specified 30-day period expressed as a percentage of the maximum offering price of the Fund’s shares at the end of the period.
Advance refunding – Advance refunding can also refer to bond issuance in which new bonds are sold at a lower rate than outstanding ones. The proceeds are then invested, and when the older bonds become callable, they are paid off with the invested proceeds.
Bond Credit Ratings (Credit Quality) – A bond credit rating assesses the financial ability of a debt issuer to make timely payments of principal and interest. Rating of AAA (the highest), AA, A, and BBB are investment-grade quality. Rating of BB, B, CCC, CC, C and D (the lowest) are considered below investment grade, speculative grade, or junk bonds.
Credit Spread/Quality Spread – The difference between the yields of securities with different credit qualities.
Duration – A bond’s sensitivity to interest rates. Bonds with longer durations experience greater price volatility than bonds with shorter durations. Effective duration incorporates a bond’s embedded option features, such as call provisions.
Laddering – Laddering involves building a portfolio of bonds with staggered maturities so that a portion matures each year. Money that comes in from maturing bonds is typically invested in bonds with longer maturities at the far end of the portfolio.
Yield Curve – A line that plots the interest rate, at a set point in time, of bonds having equal credit quality, but offering maturity dates.
Semi-Annual Report | 5
Fund Summary
Thornburg Low Duration Municipal Fund | March 31, 2018 (Unaudited)
OBJECTIVES AND STRATEGIES
The Fund seeks current income exempt from federal income tax, consistent with preservation of capital (may be subject to Alternative Minimum Tax).
This Fund invests principally in a laddered portfolio of municipal bonds with a dollar-weighted average duration of normally no more than three years. Laddering involves building a portfolio of bonds with staggered maturities so that a portion of the portfolio matures each year. Cash from maturing bonds, if not needed for other purposes, is typically invested in bonds with longer maturities at the far end of the ladder. We regard the strategy as a good compromise for managing different types of risk.
LONG-TERM STABILITY OF PRINCIPAL
Net Asset Value History of A Shares
KEY PORTFOLIO ATTRIBUTES
| | | | | |
| Number of Bonds | | | | 96 | |
| Effective Duration | | | | 1.1 Yrs | |
| Average Maturity | | | | 1.2 Yrs | |
SECURITY CREDIT RATINGS
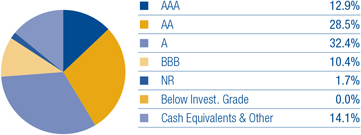
A bond credit rating assesses the financial ability of a debt issuer to make timely payments of principal and interest. Ratings of AAA (the highest), AA, A, and BBB are investment-grade quality. Ratings of BB, B, CCC, CC, C and D (the lowest) are considered below investment grade, speculative grade, or junk bonds.
Unrated pre-refunded and escrowed-to-maturity bonds are included in the not rated category.
PORTFOLIO LADDER
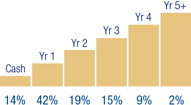
Percent of portfolio maturing in each year. Cash includes cash equivalents and other.
There is no guarantee that the Fund will meet its investment objectives.
All data is subject to change. Charts may not add up to 100% due to rounding.
6 | Semi-Annual Report
Schedule of Investments
Thornburg Low Duration Municipal Fund | March 31, 2018 (Unaudited)
| | | | | | | | | | | | |
| | | | | PRINCIPAL AMOUNT | | VALUE |
| | | |
| | MUNICIPAL BONDS — 98.1% | | | | | | | | | | |
| | | |
| | ALABAMA — 1.3% | | | | | | | | | | |
| | City of Mobile Industrial Development Board (Alabama Power Company Barry Plant), 1.85% due 6/1/2034 (put 3/24/2020) | | | $ | 1,000,000 | | | | $ | 994,420 | |
| | ARIZONA — 2.0% | | | | | | | | | | |
| a | | Arizona (LOC: Bank of America N.A.) HFA, Series C-RMK, 1.70% due 1/1/2046 (put 4/2/2018) | | | | 1,500,000 | | | | | 1,500,000 | |
| | ARKANSAS — 0.4% | | | | | | | | | | |
| | Board of Trustees of the University of Arkansas (Fayetteville Campus), 4.00% due 11/1/2018 | | | | 295,000 | | | | | 299,086 | |
| | CALIFORNIA — 10.8% | | | | | | | | | | |
| b | | California Infrastructure and Economic Development Bank (Los Angeles County Museum of Art), 1.971% (LIBOR 1 Month + 0.65%) due 12/1/2050 (put 2/1/2021) | | | | 1,000,000 | | | | | 1,002,980 | |
| | California Municipal Finance Authority, 1.40% due 9/1/2021 (put 7/2/2018) | | | | 1,000,000 | | | | | 1,000,000 | |
| | California School Cash Reserve Program Authority, 3.00% due 6/29/2018 | | | | 1,500,000 | | | | | 1,505,490 | |
| | California Statewide Communities Development Authority (Irvine East Campus Apartments), 5.00% due 5/15/2019 - 5/15/2020 | | | | 1,220,000 | | | | | 1,279,314 | |
| | City of Chula Vista (San Diego Gas & Electric Co.), Series A, 1.65% due 7/1/2018 | | | | 1,000,000 | | | | | 1,000,310 | |
| | City of Los Angeles (Cash Flow Management) GO, 5.00% due 6/28/2018 | | | | 500,000 | | | | | 504,190 | |
| | County of Los Angeles (Fiscal Year 2017-2018 Expenditures) GO, 5.00% due 6/29/2018 | | | | 1,000,000 | | | | | 1,008,480 | |
| | County of Riverside (Fiscal Year 2017-2018 Expenditures), 2.00% due 6/29/2018 | | | | 1,000,000 | | | | | 1,001,280 | |
| | COLORADO — 1.7% | | | | | | | | | | |
| a | | City & County of Denver COP, Series A2, 1.70% due 12/1/2029 (put 4/2/2018) | | | | 900,000 | | | | | 900,000 | |
| | City of Aurora (Sports Park and E-911 Projects) COP, 5.00% due 12/1/2019 | | | | 365,000 | | | | | 384,451 | |
| | CONNECTICUT — 3.4% | | | | | | | | | | |
| b | | State of Connecticut GO (Various Capital Projects), Series D, 2.33% (MUNIPSA + 0.75%) due 6/15/2018 | | | | 1,000,000 | | | | | 1,000,320 | |
| | State of Connecticut Health and Educational Facilities Authority (Ascension Health Credit Group), 1.65% due 11/15/2029 (put 3/1/2019) | | | | 1,645,000 | | | | | 1,643,503 | |
| | FLORIDA — 2.6% | | | | | | | | | | |
| | City of Cape Coral (Utility Improvement; Insured: AGM), 1.40% due 9/1/2018 | | | | 495,000 | | | | | 494,168 | |
| a | | Gainesville Utilities System Revenue, Series C-REMK 12/14/15, 1.71% due 10/1/2026 (put 4/2/2018) | | | | 1,200,000 | | | | | 1,200,000 | |
| | Hillsborough County (Tampa Electric Co.) IDA, 5.65% due 5/15/2018 | | | | 200,000 | | | | | 200,894 | |
| | Volusia County Educational Facilities Authority (Embry-Riddle Aeronautical University, Inc.), 3.00% due 10/15/2018 | | | | 120,000 | | | | | 120,857 | |
| | GEORGIA — 2.2% | | | | | | | | | | |
| | City of Atlanta (Atlantic Station Project), 5.00% due 12/1/2019 - 12/1/2021 | | | | 1,000,000 | | | | | 1,078,559 | |
| | City of Atlanta (BeltLine Project), Series A, 4.00% due 1/1/2019 | | | | 580,000 | | | | | 589,425 | |
| | GUAM — 2.6% | | | | | | | | | | |
| | Government of Guam (Economic Development), 5.00% due 11/15/2018 - 1/1/2019 | | | | 1,400,000 | | | | | 1,424,324 | |
| | Series D-REF, 4.00% due 11/15/2018 | | | | 275,000 | | | | | 277,689 | |
| | Guam Power Authority (Electric Power System; Insured: AGM), Series A, 5.00% due 10/1/2020 | | | | 300,000 | | | | | 320,130 | |
| | HAWAII — 1.3% | | | | | | | | | | |
| b | | City and County of Honolulu GO Floating Rate Note (Rail Transit Project), 1.90% (MUNISPA + 0.32%) due 9/1/2028 (put 9/1/2020) | | | | 1,000,000 | | | | | 1,000,390 | |
| | IDAHO — 0.7% | | | | | | | | | | |
| | State of Idaho (Cash Flow Management) GO, 4.00% due 6/29/2018 | | | | 500,000 | | | | | 502,905 | |
| | ILLINOIS — 10.2% | | | | | | | | | | |
| | Chicago O’Hare International Airport (2016 Airport Projects), Series B, 5.00% due 1/1/2019 | | | | 500,000 | | | | | 512,480 | |
| | Chicago Park District (Capital Improvement Plan) GO, Series D, 5.00% due 1/1/2020 | | | | 500,000 | | | | | 523,465 | |
| | Chicago Transit Authority (Rail Car and Rail System Improvements), 5.50% due 6/1/2019 (pre-refunded 12/1/2018) | | | | 815,000 | | | | | 835,913 | |
| | City of Chicago (Water System), Series 2017-2, 5.00% due 11/1/2022 | | | | 600,000 | | | | | 661,488 | |
| | City of Chicago, 5.00% due 1/1/2020 | | | | 600,000 | | | | | 633,132 | |
| | County of Cook (Capital Improvement Plan) GO, Series A, 5.00% due 11/15/2019 | | | | 615,000 | | | | | 643,493 | |
| | Du Page County High School District No. 88 (Addison Trail and Willowbrook High Schools), 3.00% due 1/15/2020 | | | | 1,245,000 | | | | | 1,267,560 | |
| | Illinois Finance Authority (Rush University Medical Center), Series A, 5.00% due 11/15/2018 | | | | 500,000 | | | | | 509,760 | |
| | Illinois Finance Authority (Silver Cross Hospital and Medical Centers), 5.00% due 8/15/2018 | | | | 500,000 | | | | | 504,475 | |
| | State of Illinois (Build Illinois Program), 5.00% due 6/15/2020 | | | | 535,000 | | | | | 568,405 | |
| | Series A, 4.00% due 6/15/2019 | | | | 520,000 | | | | | 532,631 | |
| | State of Illinois (State Facilities Improvements) GO, 5.00% due 3/1/2022 | | | | 575,000 | | | | | 597,718 | |
| | INDIANA — 2.0% | | | | | | | | | | |
| a | | Indiana Finance Authority, 1.72% due 2/1/2037 (put 4/2/2018) | | | | 1,500,000 | | | | | 1,500,000 | |
| | KANSAS — 3.0% | | | | | | | | | | |
| | Kansas (Department of Commerce Impact Program) DFA, Series K, 5.00% due 12/1/2018 | | | | 1,250,000 | | | | | 1,264,975 | |
| | Topeka Public Building Commission (10th and Jackson Projects; Insured: Natl-Re), Series A, 5.00% due 6/1/2018 | | | | 1,000,000 | | | | | 1,005,490 | |
| | KENTUCKY — 2.7% | | | | | | | | | | |
| | Commonwealth of Kentucky State Property and Buildings Commission (Project No. 112), Series B, 5.00% due 11/1/2019 | | | | 1,000,000 | | | | | 1,048,580 | |
| | Louisville/Jefferson County Metropolitan Government (Louisville Gas and Electric Company), 1.50% due 10/1/2033 (put 4/1/2019) | | | | 1,000,000 | | | | | 996,080 | |
| | LOUISIANA — 0.8% | | | | | | | | | | |
| | Louisiana Energy & Power Authority (Rodemacher Unit No. 2 Power), 5.00% due 1/1/2021 | | | | 600,000 | | | | | 643,158 | |
Semi-Annual Report | 7
Schedule of Investments, Continued
Thornburg Low Duration Municipal Fund | March 31, 2018 (Unaudited)
| | | | | | | | | | | | |
| | | | | PRINCIPAL AMOUNT | | VALUE |
| | MASSACHUSETTS — 2.0% | | | | | | | | | | |
| | Massachusetts Housing Finance Agency (Low and Moderate Income Housing), Series B, 2.00% due 6/1/2019 | | | $ | 1,500,000 | | | | $ | 1,500,810 | |
| | MICHIGAN — 2.6% | | | | | | | | | | |
| | Berkley School District (Educational Facilities; Insured: Q-SBLF) GO, 4.00% due 5/1/2018 | | | | 1,000,000 | | | | | 1,001,860 | |
| | Charles Stewart Mott Community College (Higher Education Facilities) GO, 5.00% due 5/1/2018 | | | | 750,000 | | | | | 751,935 | |
| | Michigan Finance Authority (School District of the City of Detroit; Insured: Q-SBLF), Series A, 5.00% due 5/1/2018 | | | | 250,000 | | | | | 250,657 | |
| | MINNESOTA — 2.0% | | | | | | | | | | |
| a | | Minneapolis MN/St Paul Housing & Redevelopment Authority (LOC: JPMorgan Chase Bank, N.A.), Series B-1, 1.71% due 11/15/2035 (put 4/2/2018) | | | | 1,500,000 | | | | | 1,500,000 | |
| | MISSOURI — 0.6% | | | | | | | | | | |
| | City of St. Louis (Cash Flow Management) GO, 3.00% due 6/1/2018 | | | | 500,000 | | | | | 501,155 | |
| | NEVADA — 0.3% | | | | | | | | | | |
| | Clark County School District (School Facilities Improvements) GO, Series C, 5.00% due 6/15/2021 | | | | 250,000 | | | | | 272,803 | |
| | NEW JERSEY — 6.9% | | | | | | | | | | |
| | City of Trenton (Various Capital Improvements; Insured: AGM) (State Aid Withholding) GO, 5.00% due 7/15/2020 | | | | 500,000 | | | | | 533,535 | |
| | New Jersey (Cigarette Tax) EDA, 5.00% due 6/15/2019 | | | | 550,000 | | | | | 568,854 | |
| | New Jersey (School Facilities Construction; Insured: AMBAC) EDA, Series K, 5.50% due 12/15/2019 | | | | 200,000 | | | | | 210,672 | |
| | New Jersey Transit Corp. (Urban Public Transportation Capital Improvement), Series A, 5.00% due 9/15/2019 | | | | 1,250,000 | | | | | 1,293,487 | |
| | New Jersey Transportation Trust Fund Authority (State Transportation System Improvements), 5.00% due 6/15/2020 | | | | 500,000 | | | | | 526,140 | |
| | New Jersey Transportation Trust Fund Authority (State Transportation System Improvements; Insured: Natl-Re), Series B, 5.50% due 12/15/2020 | | | | 2,000,000 | | | | | 2,156,720 | |
| | NEW MEXICO — 1.3% | | | | | | | | | | |
| | County of Taos (County Educational Improvements; Insured: BAM), 3.00% due 4/1/2018 | | | | 1,000,000 | | | | | 1,000,000 | |
| | NEW YORK — 7.1% | | | | | | | | | | |
| | City of New York (Capital Projects) GO, Series C, 5.00% due 8/1/2019 | | | | 450,000 | | | | | 469,589 | |
| | Metropolitan Transportation Authority (Transit and Commuter System), Series C-1A, 4.00% due 2/15/2019 | | �� | | 1,000,000 | | | | | 1,020,360 | |
| a | | New York City Transitional Finance Authority Future Tax Secured Revenue, 1.75% due 8/1/2031 (put 4/2/2018) | | | | 1,500,000 | | | | | 1,500,000 | |
| a | | New York City Water & Sewer System, 1.71% due 6/15/2039 (put 4/2/2018) | | | | 700,000 | | | | | 700,000 | |
| | Tobacco Settlement Asset Securitization Corp., Series A, 5.00% due 6/1/2021 | | | | 1,000,000 | | | | | 1,085,020 | |
| | Town of Oyster Bay (Plainview, Locust Valley, South Farmingdale, Jericho, Bethpage, Oyster Bay Water Districts) GO, Series C, 2.50% due 6/1/2018 | | | | 645,000 | | | | | 645,432 | |
| | NORTH CAROLINA — 1.8% | | | | | | | | | | |
| a | | Charlotte-Mecklenburg Hospital Authority, 1.73% due 1/15/2037 - 1/15/2038 (put 4/2/2018) | | | | 1,420,000 | | | | | 1,420,000 | |
| | OHIO — 0.7% | | | | | | | | | | |
| | Clty of Cleveland (Parking Facility; Insured: AGM), 5.25% due 9/15/2021 | | | | 500,000 | | | | | 547,080 | |
| | OKLAHOMA — 1.7% | | | | | | | | | | |
| | Oklahoma (INTEGRIS Health) DFA, Series A, 5.00% due 8/15/2018 | | | | 270,000 | | | | | 273,316 | |
| | Tulsa County Industrial Authority (Jenks Public Schools), 5.50% due 9/1/2018 | | | | 1,000,000 | | | | | 1,016,110 | |
| | OREGON — 1.3% | | | | | | | | | | |
| | State of Oregon (Cash Management) GO, Series A, 5.00% due 9/28/2018 | | | | 1,000,000 | | | | | 1,016,690 | |
| | PENNSYLVANIA — 6.7% | | | | | | | | | | |
| | City of Philadelphia (Pennsylvania Gas Works), 5.00% due 10/1/2020 | | | | 500,000 | | | | | 535,565 | |
| | Series 1998, 5.00% due 7/1/2018 | | | | 350,000 | | | | | 352,940 | |
| | Coatesville Area School District (Insured: AGM) (State Aid Withholding) GO, 5.00% due 8/1/2021 | | | | 1,000,000 | | | | | 1,089,010 | |
| | East Penn School District (State Aid Withholding) GO, 2.00% due 9/15/2020 | | | | 555,000 | | | | | 555,000 | |
| | Lancaster County Hospital Authority (Masonic Villages Project), 5.00% due 11/1/2018 | | | | 1,500,000 | | | | | 1,527,975 | |
| | Luzerne County Industrial Development Authority (Insured: AGM) GO, 5.00% due 12/15/2019 - 12/15/2020 | | | | 1,000,000 | | | | | 1,054,220 | |
| | SOUTH CAROLINA — 0.7% | | | | | | | | | | |
| | South Carolina Public Service Authority (Capital Improvement), Series A, 5.00% due 12/1/2021 | | | | 515,000 | | | | | 562,215 | |
| | TEXAS — 11.7% | | | | | | | | | | |
| | City of Dallas (Trinity River Corridor Infrastructure) GO, 5.00% due 2/15/2021 | | | | 1,000,000 | | | | | 1,080,250 | |
| | City of Houston (Convention & Entertainment Facilities Department), 4.00% due 9/1/2018 | | | | 675,000 | | | | | 680,873 | |
| | City of Houston Higher Education Finance Corp.) (KIPP Program; Guaranty: PSF), 5.00% due 8/15/2018 | | | | 970,000 | | | | | 981,698 | |
| | City of San Antonio (Electric and Gas Systems), 2.25% due 2/1/2033 (put 12/1/2019) | | | | 1,000,000 | | | | | 1,006,990 | |
| | City of Texas City Industrial Development Corp. (ARCO Pipe Line Co. Project), 7.375% due 10/1/2020 | | | | 1,000,000 | | | | | 1,118,210 | |
| | Dallas Independent School District (School District Buildings Renovations; Insured: PSF-GTD) GO, Series B-4, 5.00% due 2/15/2036 (put 2/15/2020) | | | | 325,000 | | | | | 343,814 | |
| | Houston Airport System Revenue, Series B, 5.00% due 7/1/2022 - 7/1/2023 | | | | 780,000 | | | | | 876,940 | |
| | North Texas Tollway Authority, Series A, 5.00% due 1/1/2022 | | | | 1,000,000 | | | | | 1,103,490 | |
| | Sam Rayburn Municipal Power Agency, 5.00% due 10/1/2021 | | | | 510,000 | | | | | 555,803 | |
| | State of Texas (Cash Flow Management), 4.00% due 8/30/2018 | | | | 1,240,000 | | | | | 1,252,487 | |
| | UTAH — 1.6% | | | | | | | | | | |
| a | | Murray, Series A, 1.72% due 5/15/2037 (put 4/2/2018) | | | | 700,000 | | | | | 700,000 | |
| a | | Weber County, Series C, 1.72% due 2/15/2035 (put 4/2/2018) | | | | 500,000 | | | | | 500,000 | |
| | WASHINGTON — 1.1% | | | | | | | | | | |
| | King County Public Hospital District No. 2 (Evergreen Health) GO, 5.00% due 12/1/2018 | | | | 835,000 | | | | | 853,412 | |
8 | Semi-Annual Report
Schedule of Investments, Continued
Thornburg Low Duration Municipal Fund | March 31, 2018 (Unaudited)
| | | | | | | | | | | | |
| | | | | PRINCIPAL AMOUNT | | VALUE |
| | WEST VIRGINIA — 0.3% | | | | | | | | | | |
| | Mason County (Appalachian Power Company), Series L-REMK, 1.625% due 10/1/2022 (put 10/1/2018) | | | $ | 200,000 | | | | $ | 199,544 | |
| | | | | | | | | | | | |
| | | |
| | TOTAL INVESTMENTS — 98.1% (Cost $75,319,118) | | | | | | | | $ | 75,174,629 | |
| | | |
| | OTHER ASSETS LESS LIABILITIES — 1.9% | | | | | | | | | 1,424,354 | |
| | | | | | | | | | | | |
| | | |
| | NET ASSETS — 100.0% | | | | | | | | $ | 76,598,983 | |
| | | | | | | | | | | | |
| | | | | | | | | | | | |
Footnote Legend
| a | Variable Rate Demand Notes are instruments whose interest rates change on a specific date (such as coupon date or interest payment date) or whose interest rates vary with changes in a designated base rate (such as the prime interest rate). This instrument is payable on demand and is secured by letters of credit or other credit support agreements from major banks. |
| b | Floating Rate Security. Stated interest/floor rate was in effect at March 31, 2018. |
Portfolio Abbreviations
To simplify the listings of securities, abbreviations are used per the table below:
| | |
| AGM | | Insured by Assured Guaranty Municipal Corp. |
| AMBAC | | Insured by American Municipal Bond Assurance Corp. |
| BAM | | Insured by Build America Mutual Insurance Co. |
| COP | | Certificates of Participation |
| DFA | | Development Finance Authority |
| EDA | | Economic Development Authority |
| GO | | General Obligation |
| HFA | | Health Facilities Authority |
| | |
| IDA | | Industrial Development Authority |
| LIBOR | | London Interbank Offered Rates |
| MUNIPSA | | Securities Industry and Financial Markets Association (SIFMA) Municipal Swap Index |
| Natl-Re | | Insured by National Public Finance Guarantee Corp. |
| PSF | | Guaranteed by Permanent School Fund |
| Q-SBLF | | Insured by Qualified School Bond Loan Fund |
See notes to financial statements.
Semi-Annual Report | 9
Statement of Assets and Liabilities
Thornburg Low Duration Municipal Fund | March 31, 2018 (Unaudited)
| | | | |
ASSETS | | | | |
| |
Investments at value (cost $75,319,118) (Note 3) | | $ | 75,174,629 | |
Cash | | | 286,416 | |
Receivable for investments sold | | | 1,000,000 | |
Receivable for fund shares sold | | | 350,130 | |
Interest receivable | | | 838,387 | |
Prepaid expenses and other assets | | | 24,052 | |
| | | | |
| |
Total Assets | | | 77,673,614 | |
| | | | |
| |
LIABILITIES | | | | |
| |
Payable for investments purchased | | | 1,000,000 | |
Payable for fund shares redeemed | | | 19,023 | |
Payable to investment advisor and other affiliates (Note 4) | | | 20,004 | |
Accounts payable and accrued expenses | | | 33,032 | |
Dividends payable | | | 2,572 | |
| | | | |
| |
Total Liabilities | | | 1,074,631 | |
| | | | |
| |
NET ASSETS | | $ | 76,598,983 | |
| | | | |
| |
NET ASSETS CONSIST OF | | | | |
| |
Net unrealized depreciation on investments | | $ | (144,488 | ) |
Accumulated net realized gain (loss) | | | (41,193 | ) |
Net capital paid in on shares of beneficial interest | | | 76,784,664 | |
| | | | |
| |
| | $ | 76,598,983 | |
| | | | |
| |
NET ASSET VALUE | | | | |
| |
Class A Shares: | | | | |
Net asset value and redemption price per share
($17,950,555 applicable to 1,460,123 shares of beneficial
interest outstanding - Note 5) | | $ | 12.29 | |
| |
Maximum sales charge, 1.50% of offering price | | | 0.19 | |
| | | | |
| |
Maximum offering price per share | | $ | 12.48 | |
| | | | |
| |
Class I Shares: | | | | |
Net asset value, offering and redemption price per share
($58,648,428 applicable to 4,772,626 shares of beneficial
interest outstanding - Note 5) | | $ | 12.29 | |
| | | | |
See notes to financial statements.
10 | Semi-Annual Report
Statement of Operations
Thornburg Low Duration Municipal Fund | Six Months Ended March 31, 2018 (Unaudited)
| | | | |
INVESTMENT INCOME | | | | |
Interest income (net of premium amortized of $710,144) | | $ | 579,450 | |
| | | | |
| |
EXPENSES | | | | |
| |
Investment advisory fees (Note 4) | | | 146,174 | |
Administration fees (Note 4) | | | | |
Class A Shares | | | 10,217 | |
Class I Shares | | | 16,724 | |
Distribution and service fees (Note 4) | | | | |
Class A Shares | | | 18,308 | |
Transfer agent fees | | | | |
Class A Shares | | | 13,225 | |
Class I Shares | | | 8,440 | |
Registration and filing fees | | | | |
Class A Shares | | | 9,225 | |
Class I Shares | | | 9,274 | |
Custodian fees (Note 2) | | | 14,235 | |
Professional fees | | | 21,162 | |
Trustee and officer fees (Note 4) | | | 1,592 | |
Other expenses | | | 8,808 | |
| | | | |
| |
Total Expenses | | | 277,384 | |
| |
Less: | | | | |
Expenses reimbursed by investment advisor (Note 4) | | | (56,917 | ) |
Investment advisory fees waived by investment advisor (Note 4) | | | (18,959 | ) |
| | | | |
| |
Net Expenses | | | 201,508 | |
| | | | |
| |
Net Investment Income | | $ | 377,942 | |
| | | | |
| |
REALIZED AND UNREALIZED GAIN (LOSS) | | | | |
Net realized gain (loss) on investments | | | 14 | |
Net change in unrealized appreciation (depreciation) on investments | | | (489,162 | ) |
| | | | |
| |
Net Realized and Unrealized Loss | | | (489,148 | ) |
| | | | |
| |
Net Decrease in Net Assets Resulting from Operations | | $ | (111,206 | ) |
| | | | |
See notes to financial statements.
Semi-Annual Report | 11
Statements of Changes in Net Assets
Thornburg Low Duration Municipal Fund
| | | | | | | | | | |
| | | SIX MONTHS ENDED
MARCH 31, 2018* | | YEAR ENDED
SEPTEMBER 30, 2017 |
INCREASE (DECREASE) IN NET ASSETS FROM | | | | | | | | | | |
| | |
OPERATIONS | | | | | | | | | | |
| | |
Net investment income | | | $ | 377,942 | | | | $ | 531,327 | |
Net realized gain (loss) on investments | | | | 14 | | | | | (17,874 | ) |
Net unrealized appreciation (depreciation) on investments | | | | (489,162 | ) | | | | 303,247 | |
| | | | | |
| | |
Net Increase (Decrease) in Net Assets Resulting from Operations | | | | (111,206 | ) | | | | 816,700 | |
| | |
DIVIDENDS TO SHAREHOLDERS | | | | | | | | | | |
| | |
From net investment income | | | | | | | | | | |
Class A Shares | | | | (81,173 | ) | | | | (125,749 | ) |
Class I Shares | | | | (296,769 | ) | | | | (405,578 | ) |
| | |
FUND SHARE TRANSACTIONS (NOTE 5) | | | | | | | | | | |
Class A Shares | | | | 1,660,037 | | | | | 12,051,896 | |
Class I Shares | | | | 5,251,079 | | | | | 15,026,270 | |
| | | | | |
| | |
Net Increase in Net Assets | | | | 6,421,968 | | | | | 27,363,539 | |
| | |
NET ASSETS | | | | | | | | | | |
| | |
Beginning of Period | | | | 70,177,015 | | | | | 42,813,476 | |
| | | | | |
| | |
End of Period | | | $ | 76,598,983 | | | | $ | 70,177,015 | |
* Unaudited.
See notes to financial statements.
12 | Semi-Annual Report
Notes to Financial Statements
Thornburg Low Duration Municipal Fund | March 31, 2018 (Unaudited)
NOTE 1 – ORGANIZATION
Thornburg Low Duration Municipal Fund (the “Fund”) is a diversified series of Thornburg Investment Trust (the “Trust”). The Trust was organized as a Massachusetts business trust under a Declaration of Trust dated June 3, 1987 and is registered as a diversified, open-end management investment company under the Investment Company Act of 1940, as amended. The Fund is currently one of twenty-one separate series of the Trust. Each series is considered to be a separate entity for financial reporting and tax purposes and bears expenses directly attributable to it. The Fund’s investment objective is to seek current income exempt from federal income tax, as is consistent, in the view of Thornburg Investment Management, Inc., the Trust’s investment advisor (the “Advisor”), with preservation of capital.
The Fund currently offers two classes of shares of beneficial interest: Class A and Institutional Class (“Class I”) shares. Each class of shares of the Fund represents an interest in the same portfolio of investments, except that (i) Class A shares are sold subject to a front-end sales charge collected at the time the shares are purchased and bear a service fee, (ii) Class I shares are sold at net asset value without a sales charge at the time of purchase and may be subject to a service fee, and (iii) the respective classes may have different reinvestment privileges and conversion rights. Additionally, the Fund may allocate among its classes certain expenses, to the extent allocable to specific classes, including transfer agent fees, government registration fees, certain printing and postage costs, and administrative and legal expenses. Currently, class specific expenses of the Fund are limited to service and distribution fees, administration fees, and certain registration and transfer agent expenses.
The following is a summary of significant accounting policies followed by the Fund in the preparation of its financial statements. The Fund prepares its financial statements in conformity with United States generally accepted accounting principles (“GAAP”), including investment company accounting and reporting guidance in the Financial Accounting Standards Board (the “FASB”) Accounting Standard Codification Topic 946.
NOTE 2 – SIGNIFICANT ACCOUNTING POLICIES
Security Valuation: All investments in securities held by the Fund are valued as described in Note 3.
Allocation of Income, Gains, Losses and Expenses: Net investment income (other than class specific expenses) and realized and unrealized gains and losses are allocated daily to each class of shares based upon the relative net asset value of outstanding shares (or the value of the dividend-eligible shares, as appropriate) of each class of shares at the beginning of the day (after adjusting for the current capital shares activity of the respective class). Expenses common to all Funds are allocated among the Funds comprising the Trust based upon their relative net asset values or other appropriate allocation methods. Operating expenses directly attributable to a specific class are charged against the operating income of that class.
Dividends and Distributions to Shareholders: Dividends and distributions to shareholders, which are determined in accordance with federal income tax regulations and may differ from GAAP, are recorded on the ex-dividend date. Ordinary income distributions, if any, are declared daily and paid monthly. Capital gain distributions, if any, are declared and paid annually and more often if deemed necessary by the Advisor. Dividends are paid and are reinvested in additional shares of the Fund at net asset value per share at the close of business on the ex-dividend date, or at the shareholder’s option, paid in cash.
Investment Income: Interest income is accrued as earned. Premiums and discounts are amortized and accreted, respectively, to call dates or maturity dates using the effective yield method of the respective investments. These amounts are included in Interest income on the Statement of Operations.
Custodian Fees: Custodian fees disclosed in the Statement of Operations may include interest expenses incurred by the Fund on any cash overdrafts of its custodian account during the period. Such cash overdrafts may result from the effects of failed trades in portfolio securities and from cash outflows resulting from unanticipated shareholder redemption activity. The Fund pays interest to its custodian on any such cash overdraft at a rate set periodically at the custodian’s discretion of the overdraft amount in excess of $50,000.
Investment Transactions: Investment transactions are accounted for on a trade date basis. Realized gains and losses from the sale of investments are recorded on an identified cost basis.
When-Issued and Delayed Delivery Transactions: The Fund may engage in when-issued or delayed delivery transactions. To the extent the Fund engages in such transactions, it will do so for the purpose of acquiring portfolio investments consistent with the Fund’s investment objectives and not for the purpose of investment leverage or to speculate on interest rate or market changes. At the time the Fund makes a commitment to purchase an investment on a when-issued or delayed delivery basis, the Fund will record the transaction and reflect the value in determining its net asset value. When effecting such transactions, assets of an amount sufficient to make payment for the portfolio investments to be purchased will be segregated on the Fund’s records on the trade date. Investments purchased on a when-issued or delayed delivery basis do not earn interest until the settlement date.
Semi-Annual Report | 13
Notes to Financial Statements, Continued
Thornburg Low Duration Municipal Fund | March 31, 2018 (Unaudited)
Guarantees and Indemnifications: Under the Trust’s organizational documents (and under separate agreements with the independent Trustees), its officers and Trustees are provided with an indemnification against certain liabilities arising out of the performance of their duties to the Fund. In the normal course of business the Trust may also enter into contracts with service providers that contain general indemnifications. The Trust’s maximum exposure under these arrangements is unknown. However, based on experience, the Trust expects the risk of loss to be remote.
Use of Estimates: The preparation of financial statements in conformity with GAAP requires management to make estimates and assumptions that affect the reported amounts of assets and liabilities and disclosure of contingent assets and liabilities at the date of the financial statements and the reported amounts of increases (decreases) in net assets from operations during the reporting period. Actual results could differ from those estimates.
Federal Income Taxes: It is the policy of the Trust to comply with the provisions of the Internal Revenue Code applicable to regulated investment companies and to distribute to shareholders substantially all investment company taxable income including net realized gains on investments (if any), and tax exempt income of the Fund. Therefore, no provision for federal income or excise tax is required.
The Fund files income tax returns in United States federal and applicable state jurisdictions. The statute of limitations on the Fund’s tax return filings generally remains open for the three years following a return’s filing date. The Fund has analyzed each uncertain tax position believed to be material in the preparation of the Fund’s financial statements for the six month period ended March 31, 2018, including open tax years, to assess whether it is more likely than not that the position would be sustained upon examination, based on the technical merits of the position. The Fund has not identified any such position for which an asset or liability must be reflected in the Statement of Assets and Liabilities.
At March 31, 2018, information on the tax components of capital was as follows:
| | | | | |
Cost of investments for tax purposes | | | $ | 75,319,118 | |
| | | | | |
Gross unrealized appreciation on a tax basis | | | | 61,957 | |
Gross unrealized depreciation on a tax basis | | | | (206,445 | ) |
| | | | | |
Net unrealized appreciation (depreciation) on investments (tax basis) | | | $ | (144,488 | ) |
| | | | | |
At March 31, 2018, the Fund had deferred tax basis capital losses occurring subsequent to October 31, 2016 through September 30, 2017 of $17,873. For tax purposes, such losses will be recognized in the year ending September 30, 2018.
At March 31, 2018, the Fund had cumulative tax basis capital losses of $23,333 (of which $1,073 are short-term and $22,260 are long-term) generated after September 30, 2011, which may be carried forward to offset future capital gains. To the extent such carryforwards are used, capital gain distributions may be reduced to the extent provided by regulations. Such capital loss carryforwards do not expire.
NOTE 3 – SECURITY VALUATION
Valuation of the Fund’s portfolio investment securities is performed in accordance with policies and procedures adopted by and under the oversight of the Trustees.
The Trustees of the Trust have appointed the Advisor to assist the Trustees to obtain market values for portfolio investments, evaluate and monitor professional pricing service providers appointed by the Trustees’ Audit Committee (the “Audit Committee”) to assist in determining fair values for portfolio investments, assist in calculating fair values for portfolio investments in certain circumstances, and to perform other functions in connection with the valuation of investments. The Advisor acts through its Valuation and Pricing Committee (the “Committee”) and other employees of the Advisor. The Committee regularly reviews its own valuation calculations, as well as the valuations, valuation techniques and services furnished by pricing service providers, considers circumstances which may require valuation calculations by the Committee, and reviews previous valuation calculations. The Committee reports to the Audit Committee on the Committee’s activities, the performance of pricing service providers, and other matters relating to valuation of portfolio investments.
In those instances when the Committee assists in calculating a fair value for a portfolio investment, the Committee seeks to determine the price that the Fund would reasonably expect to receive upon a sale of the investment in an orderly transaction between market participants on the valuation date. The Committee customarily utilizes quotations from securities broker dealers in calculating valuations, but also may utilize prices obtained from pricing service providers or other methods approved by the Audit Committee. Because fair values calculated by the Committee are estimates, the calculation of a value for an investment may differ from the price that would be realized by the Fund upon a sale of the investment, and the difference could be material to the Fund’s financial statements. The Committee’s calculation of a fair value for an investment may also differ from the prices obtained by other persons (including other mutual funds) for the investment.
14 | Semi-Annual Report
Notes to Financial Statements, Continued
Thornburg Low Duration Municipal Fund | March 31, 2018 (Unaudited)
Valuation of Securities: Debt obligations held by the Fund which are not listed or traded on exchanges or for which no reported market exists are ordinarily valued at the valuation obtained from a pricing service provider approved by the Audit Committee.
In any case when a pricing service provider fails to provide a valuation for a debt obligation held by the Fund, the Committee calculates a fair value for the obligation using alternative methods under procedures approved by the Audit Committee. Additionally, in cases when management believes that a valuation obtained from a pricing service provider merits review for significant reasons, the Committee decides whether or not to use the valuation calculated by the pricing service provider or to use an alternative method approved by the Audit Committee to calculate a fair value for the obligation.
Valuation Hierarchy: The Fund categorizes its investments based upon the inputs used in valuing those investments, according to a three-level hierarchy established in guidance from the FASB. Categorization of investments using this hierarchy is intended by the FASB to maximize the use of observable inputs in valuing investments and minimize the use of unobservable inputs by requiring that the most observable inputs be used when available. Observable inputs are those that market participants would use in valuing an investment based on available market information. Unobservable inputs are those that reflect assumptions about the information market participants would use in valuing an investment. An investment’s level within the hierarchy is based on the lowest level input that is deemed significant to the valuation. The methodologies and inputs used to value investments are not necessarily indications of the risk or liquidity associated with those investments.
Various inputs are used in calculating valuations for the Fund’s investments. These inputs are generally summarized according to the three-level hierarchy below:
Level 1: Quoted prices in active markets for identical investments.
Level 2: Other direct or indirect significant observable inputs (including quoted prices for similar investments in active markets and other observable inputs, such as interest rates, prepayment rates, credit risk, etc.).
Level 3: Significant unobservable inputs (including the Committee’s own assumptions in calculating the fair values of investments).
Valuations for debt obligations held by the Fund are typically calculated by pricing service providers approved by the Audit Committee and are generally characterized as Level 2 within the valuation hierarchy.
In a limited number of cases the Committee calculates a fair value for investments using broker quotations or other methods approved by the Audit Committee. When the Committee uses a single broker quotation to calculate a fair value for an investment without other significant observable inputs, or if a fair value is calculated using other significant inputs that are considered unobservable, the investment is characterized as Level 3 within the hierarchy. Other significant unobservable inputs used to calculate a fair value in these instances might include an income-based valuation approach which considers discounted anticipated future cash flows from the investment and application of discounts due to the nature or duration of any restrictions on the disposition of the investment.
Valuations based upon the use of inputs from Levels 1, 2 or 3 may not represent the actual price received upon the disposition of an investment, and the Fund may receive a price that is lower than the valuation based upon these inputs when it sells the investment.
The following table displays a summary of the fair value hierarchy measurements of the Fund’s investments as of March 31, 2018. In any instance when valuation inputs from more than one level are used to determine the fair value of a specific investment, the investment is placed in the level of the table based upon the lowest level input that is significant in determining the fair value of the investment:
| | | | | | | | | | | | | | | | | | | | |
| | | FAIR VALUE MEASUREMENTS AT MARCH 31, 2018 |
| | | TOTAL | | LEVEL 1 | | LEVEL 2 | | LEVEL 3 |
Assets | | | | | | | | | | | | | | | | | | | | |
Investments in Securities | | | | | | | | | | | | | | | | | | | | |
Municipal Bonds | | | $ | 75,174,629 | | | | $ | – | | | | $ | 75,174,629 | | | | $ | – | |
| | | | | |
Total Investments in Securities | | | $ | 75,174,629 | | | | $ | – | | | | $ | 75,174,629 | | | | $ | – | |
In accordance with the guidance prescribed in Accounting Standards Update No. 2011-04, it is the policy of the Fund to recognize transfers between levels and the underlying events which caused the movement. The Fund recognized no transfers between levels for the six months ended March 31, 2018.
Semi-Annual Report | 15
Notes to Financial Statements, Continued
Thornburg Low Duration Municipal Fund | March 31, 2018 (Unaudited)
NOTE 4 – INVESTMENT ADVISORY FEE AND OTHER TRANSACTIONS WITH AFFILIATES
Pursuant to an investment advisory agreement, the Advisor serves as the investment advisor and performs services for the Fund for which the fees are payable at the end of each month. Under the investment advisory agreement, the Fund pays the Advisor a management fee based on the daily net assets of the Fund at an annual rate as shown in the following table:
| | | | | |
| MANAGEMENT FEE SCHEDULE |
| DAILY NET ASSETS | | FEE RATE |
| |
Up to $1 billion | | | | 0.400 | % |
| |
Next $500 million | | | | 0.300 | |
| |
Next $500 million | | | | 0.250 | |
| |
Over $2 billion | | | | 0.225 | |
The Fund’s effective management fee for the six months ended March 31, 2018 was 0.40% of the Fund’s average net assets (before applicable management fee waiver of $18,959).
The Trust has entered into administrative service agreements with the Advisor, whereby the Advisor will perform certain administrative services related to each class of the Fund’s shares. Until January 31, 2018, the fees were payable at an annual rate of up to 0.125 of 1% per annum of the average daily net assets attributable to each class of shares. As of February 1, 2018, the fees are computed as an annual percentage of the aggregate average daily net assets of all shares classes of all Funds in the Trust as follows:
| | | | | |
| ADMINISTRATION FEE SCHEDULE |
| DAILY NET ASSETS | | FEE RATE |
| |
Up to $20 billion | | | | 0.100 | % |
| |
$20 billion to $40 billion | | | | 0.075 | |
| |
$40 billion to $60 billion | | | | 0.040 | |
| |
Over $60 billion | | | | 0.030 | |
The aggregate fee amount is allocated on a daily basis to each Fund based on net assets and subsequently allocated to each class of shares of the Fund. Total administrative service fees incurred by each class of shares of the Fund for the six months ended March 31, 2018, are set forth in the Statement of Operations.
The Trust has an underwriting agreement with Thornburg Securities Corporation (the “Distributor”), an affiliate of the Advisor, which acts as the distributor of the Fund’s shares. For the six months ended March 31, 2018, the Distributor has advised the Fund that it earned net commissions aggregating $2 from the sale of Class A shares.
Pursuant to a service plan under Rule 12b-1 of the Investment Company Act of 1940, the Fund may pay to the Distributor or securities dealers and other financial institutions at the Distributor’s direction an amount not to exceed .25 of 1% per annum of the average daily net assets attributable to Class A shares of the Fund to obtain various shareholder and distribution related services. For the six months ended March 31, 2018, there were no 12b-1 service plan fees charged for Class I shares. The Advisor and Distributor each may pay out of its own resources additional expenses for distribution of the Fund’s shares and shareholder services.
The Advisor and Distributor have contractually agreed to waive fees and reimburse expenses incurred by the Fund so that actual expenses of certain share classes do not exceed levels as specified in each Fund’s most recent prospectus. The agreement may be terminated by the Fund at any time, but may not be terminated by the Advisor or Distributor before February 1, 2019, unless the Advisor ceases to be the investment advisor to the Fund or the Distributor ceases to be the distributor of the Fund prior to that date. The Advisor and Distributor may recoup amounts waived or reimbursed during the fiscal year if expenses fall below the contractual limit during that year.
For the six months ended March 31, 2018, the Advisor voluntarily waived Fund level investment advisory fees of $18,959. The Advisor contractually reimbursed certain class specific expenses, administrative fees, and distribution fees of $30,133 for Class A shares and $26,784 for Class I shares.
Certain officers and Trustees of the Trust are also officers or directors of the Advisor and Distributor. The compensation of the independent Trustees is borne by the Trust. The Trust also pays a portion of the Chief Compliance Officer’s compensation. These amounts are reflected as “Trustee and officer fees” in the Statement of Operations.
The percentage of direct investments in the Fund held by the Trustees, officers of the Trust, and the Advisor is approximately 48.32%.
16 | Semi-Annual Report
Notes to Financial Statements, Continued
Thornburg Low Duration Municipal Fund | March 31, 2018 (Unaudited)
The Fund may purchase or sell securities from, or to an affiliated fund, provided the affiliation is due solely to having a common investment advisor, common officers, or common trustees, and provided that all such transactions will comply with Rule 17a-7 under the 1940 Act. For the six months ended March 31, 2018, the Fund had transactions with affiliated funds of $4,100,000 in purchases and $5,875,000 in sales generating no realized gains or losses.
NOTE 5 – SHARES OF BENEFICIAL INTEREST
At March 31, 2018, there were an unlimited number of shares with no par value of beneficial interest authorized. Transactions in shares of beneficial interest were as follows:
| | | | | | | | | | | | | | | | |
| | | SIX MONTHS ENDED
MARCH 31, 2018 (UNAUDITED) | | | YEAR ENDED
SEPTEMBER 30, 2017 (AUDITED) | |
| | | SHARES | | | AMOUNT | | | SHARES | | | AMOUNT | |
Class A Shares | | | | | | | | | | | | | | | | |
Shares sold | | | 747,640 | | | $ | 9,213,023 | | | | 2,922,719 | | | $ | 35,953,976 | |
Shares issued to shareholders in
reinvestment of dividends | | | 6,263 | | | | 77,124 | | | | 9,827 | | | | 121,339 | |
Shares repurchased | | | (619,780 | ) | | | (7,630,110 | ) | | | (1,950,171 | ) | | | (24,023,419 | ) |
| | | | |
| | | | |
Net increase | | | 134,123 | | | $ | 1,660,037 | | | | 982,375 | | | $ | 12,051,896 | |
| | | | |
Class I Shares | | | | | | | | | | | | | | | | |
Shares sold | | | 1,038,791 | | | $ | 12,791,296 | | | | 2,760,039 | | | $ | 34,004,864 | |
Shares issued to shareholders in
reinvestment of dividends | | | 23,146 | | | | 284,931 | | | | 31,595 | | | | 390,018 | |
Shares repurchased | | | (634,845 | ) | | | (7,825,148 | ) | | | (1,571,733 | ) | | | (19,368,612 | ) |
| | | | |
| | | | |
Net increase | | | 427,092 | | | $ | 5,251,079 | | | | 1,219,901 | | | $ | 15,026,270 | |
| | | | |
NOTE 6 – INVESTMENT TRANSACTIONS
For the six months ended March 31, 2018, the Fund had purchase and sale transactions of investments (excluding short-term investments) of $10,947,202 and $7,450,000, respectively.
OTHER NOTES
Risks: The Fund’s investments subject it to risks including, but not limited to, credit risk, interest rate risk, management risk, market and economic risk, and liquidity risk. Please see the Fund’s prospectus for a discussion of the risks associated with an investment in the Fund.
Subsequent Events: Fund management believes no events have occurred between March 31, 2018 and the date of issuance of the financial statements that require adjustment to or disclosure in the accompanying financial statements.
Semi-Annual Report | 17
Financial Highlights
Thornburg Low Duration Municipal Fund
| | | | | | | | | | | | | | | | | | | | | | | | | | | | | | | | | | | | | | | | |
| | | PER SHARE PERFORMANCE (FOR A SHARE OUTSTANDING THROUGHOUT THE PERIOD) |
| | | | | | | | | | | | | | | | | |
UNLESS OTHERWISE
NOTED, PERIODS ARE
FISCAL YEARS ENDED
SEPTEMBER 30, | | NET ASSET
VALUE,
BEGINNING OF
PERIOD | | NET
INVESTMENT
INCOME
(LOSS)+ | | NET REALIZED &
UNREALIZED GAIN
(LOSS) ON
INVESTMENTS | | TOTAL FROM
INVESTMENT
OPERATIONS | | DIVIDENDS
FROM NET
INVESTMENT
INCOME | | DIVIDENDS
FROM NET
REALIZED
GAINS | | TOTAL
DIVIDENDS | | NET ASSET
VALUE,
END OF PERIOD |
| | | | | | | |
| CLASS A SHARES | | | | | | | | | | | | | | | | | | | | | | | | | | | | | | | | | | | | |
| | | | | | | | |
2018(b)(c) | | | $ | 12.38 | | | | | 0.05 | | | | | (0.09 | ) | | | | (0.04 | ) | | | | (0.05 | ) | | | | – | | | | | (0.05 | ) | | | $ | 12.29 | |
2017(b) | | | $ | 12.34 | | | | | 0.08 | | | | | 0.04 | | | | | 0.12 | | | | | (0.08 | ) | | | | – | | | | | (0.08 | ) | | | $ | 12.38 | |
2016(b) | | | $ | 12.35 | | | | | 0.03 | | | | | (0.01 | ) | | | | 0.02 | | | | | (0.03 | ) | | | | – | | | | | (0.03 | ) | | | $ | 12.34 | |
2015(b) | | | $ | 12.34 | | | | | 0.02 | | | | | 0.01 | | | | | 0.03 | | | | | (0.02 | ) | | | | – | | | | | (0.02 | ) | | | $ | 12.35 | |
2014(b)(e) | | | $ | 12.31 | | | | | 0.02 | | | | | 0.03 | | | | | 0.05 | | | | | (0.02 | ) | | | | – | | | | | (0.02 | ) | | | $ | 12.34 | |
| | | | | | | |
| CLASS I SHARES | | | | | | | | | | | | | | | | | | | | | | | | | | | | | | | | | | | | |
| | | | | | | | |
2018(c) | | | $ | 12.37 | | | | | 0.07 | | | | | (0.08 | ) | | | | (0.01 | ) | | | | (0.07 | ) | | | | – | | | | | (0.07 | ) | | | $ | 12.29 | |
2017 | | | $ | 12.34 | | | | | 0.10 | | | | | 0.03 | | | | | 0.13 | | | | | (0.10 | ) | | | | – | | | | | (0.10 | ) | | | $ | 12.37 | |
2016 | | | $ | 12.35 | | | | | 0.05 | | | | | (0.01 | ) | | | | 0.04 | | | | | (0.05 | ) | | | | – | | | | | (0.05 | ) | | | $ | 12.34 | |
2015 | | | $ | 12.34 | | | | | 0.04 | | | | | 0.01 | | | | | 0.05 | | | | | (0.04 | ) | | | | – | | | | | (0.04 | ) | | | $ | 12.35 | |
2014(e) | | | $ | 12.31 | | | | | 0.04 | | | | | 0.03 | | | | | 0.07 | | | | | (0.04 | ) | | | | – | | | | | (0.04 | ) | | | $ | 12.34 | |
| (a) | Not annualized for periods less than one year. |
| (b) | Sales loads are not reflected in computing total return. |
| (c) | Unaudited Six Month Period Ended March 31. |
| (e) | Fund commenced operations on December 30, 2013. |
| + | Based on weighted average shares outstanding. |
See notes to financial statements.
18 | Semi-Annual Report
Financial Highlights, Continued
Thornburg Low Duration Municipal Fund
| | | | | | | | | | | | | | | | | | | | | | | | | | | | | | |
| RATIOS TO AVERAGE NET ASSETS | | | | | | SUPPLEMENTAL DATA | |
| | | | | | | EXPENSES, AFTER | | | | | | | | | | | | | | | | |
NET INVESTMENT
INCOME (LOSS) (%) | | | EXPENSES, AFTER
EXPENSE
REDUCTIONS (%) | | | EXPENSE
REDUCTIONS AND
NET OF CUSTODY
CREDITS (%) | | | EXPENSES,
BEFORE EXPENSE
REDUCTIONS (%) | | | | | | TOTAL
RETURN (%)(a) | | | PORTFOLIO
TURNOVER
RATE (%)(a) | | | NET ASSETS AT
END OF PERIOD
(THOUSANDS) | |
| | | | | | | |
| | | | | | | | | | | | | | | | | | | | | | | | | | | | | | |
| | | | | | | |
| | 0.89 | (d) | | | 0.70 | (d) | | | 0.70 | (d) | | | 1.08 | (d) | | | | | | | (0.29 | ) | | | 12.18 | | | $ | 17,951 | |
| | 0.72 | | | | 0.67 | | | | 0.67 | | | | 1.16 | | | | | | | | 0.98 | | | | 42.94 | | | $ | 16,412 | |
| | 0.24 | | | | 0.70 | | | | 0.70 | | | | 2.19 | | | | | | | | 0.15 | | | | 21.17 | | | $ | 4,241 | |
| | 0.15 | | | | 0.67 | | | | 0.67 | | | | 2.85 | | | | | | | | 0.22 | | | | 15.75 | | | $ | 3,273 | |
| | 0.20 | (d) | | | 0.66 | (d) | | | 0.65 | (d) | | | 3.14 | (d) | | | | | | | 0.40 | | | | 4.54 | | | $ | 2,751 | |
| | | | | | | |
| | | | | | | | | | | | | | | | | | | | | | | | | | | | | | |
| | | | | | | |
| | 1.08 | (d) | | | 0.50 | (d) | | | 0.50 | (d) | | | 0.65 | (d) | | | | | | | (0.11 | ) | | | 12.18 | | | $ | 58,648 | |
| | 0.85 | | | | 0.49 | | | | 0.49 | | | | 0.67 | | | | | | | | 1.09 | | | | 42.94 | | | $ | 53,765 | |
| | 0.43 | | | | 0.50 | | | | 0.50 | | | | 0.72 | | | | | | | | 0.36 | | | | 21.17 | | | $ | 38,572 | |
| | 0.32 | | | | 0.50 | | | | 0.50 | | | | 0.82 | | | | | | | | 0.40 | | | | 15.75 | | | $ | 41,755 | |
| | 0.42 | (d) | | | 0.44 | (d) | | | 0.44 | (d) | | | 1.77 | (d) | | | | | | | 0.56 | | | | 4.54 | | | $ | 12,672 | |
Semi-Annual Report | 19
Expense Example
Thornburg Low Duration Municipal Fund | March 31, 2018 (Unaudited)
As a shareholder of the Fund, you incur two types of costs:
| | (1) | transaction costs, including |
| | (a) | sales charges (loads) on purchase payments, for Class A shares; |
| | (b) | a deferred sales charge on redemptions of any part or all of a purchase of $1 million of Class A shares within 12 months of purchase; |
| | (2) | ongoing costs, including management fees; distribution and/or service (12b-1) fees; and other Fund expenses. |
This example is intended to help you understand your ongoing costs (in dollars) of investing in the Fund and to compare these costs with the ongoing costs of investing in other mutual funds.
The example is based on a $1,000 investment beginning on October 1, 2017, and held until March 31, 2018.
| | | | | | | | | | | | | | | |
| | | BEGINNING
ACCOUNT VALUE
10/1/17 | | ENDING
ACCOUNT VALUE
3/31/18 | | EXPENSES PAID
DURING PERIOD†
10/1/17–3/31/18 |
| | | |
| CLASS A SHARES | | | | | | | | | | | | | | | |
| | | |
Actual | | | $ | 1,000.00 | | | | $ | 997.10 | | | | $ | 3.49 | |
Hypothetical* | | | $ | 1,000.00 | | | | $ | 1,021.44 | | | | $ | 3.53 | |
| | | |
| CLASS I SHARES | | | | | | | | | | | | | | | |
| | | |
Actual | | | $ | 1,000.00 | | | | $ | 998.90 | | | | $ | 2.49 | |
Hypothetical* | | | $ | 1,000.00 | | | | $ | 1,022.44 | | | | $ | 2.52 | |
| † | Expenses are equal to the annualized expense ratio for each class (A: 0.70%; I: 0.50%) multiplied by the average account value over the period, multiplied by 182/365 to reflect the one-half year period. |
| * | Hypothetical assumes a rate of return of 5% per year before expenses. |
ACTUAL EXPENSES
For each class of shares, the first line of the accompanying table provides information about actual account values and actual expenses. You may use the information in this line, together with the amount you invested, to estimate the expenses that you paid over the period. Simply divide your account value by $1,000 (for example, an $8,600 account value divided by $1,000 = 8.6), then multiply the result by the number in the first line for your class of shares under the heading entitled “Expenses Paid During Period” to estimate the expenses you paid on your account during this period.
HYPOTHETICAL EXAMPLE FOR COMPARISON PURPOSES
For each class of shares, the second line of the accompanying table provides information about hypothetical account values and hypothetical expenses based on the Fund’s actual expense ratio and an assumed rate of return of 5% per year before expenses, which is not the Fund’s actual return. The hypothetical account values and expenses may not be used to estimate the actual ending account balance or expenses you paid for the period. You may use this information to compare the ongoing costs of investing in the Fund and other funds. To do so, compare this 5% hypothetical example with the 5% hypothetical examples that appear in the shareholder reports of the other funds.
Please note that the expenses shown in the table are meant to highlight your ongoing costs only and do not reflect any transactional costs, such as sales charges (loads), redemption fees, or exchange fees. Therefore, the second line of the table for each class of shares is useful in comparing ongoing costs only, and will not help you determine the relative total costs of owning different funds. In addition, if these transactional costs were included, your costs would have been higher.
20 | Semi-Annual Report
Other Information
Thornburg Low Duration Municipal Fund | March 31, 2018 (Unaudited)
PORTFOLIO PROXY VOTING
Policies and Procedures:
The Trust has delegated to Thornburg Investment Management, Inc. (the “Advisor”) voting decisions respecting proxies for the Fund’s voting securities. The Advisor makes voting decisions in accordance with its Proxy Voting Policy and Procedures. A description of the Policy and Procedures is available (i) without charge, upon request, by calling the Advisor toll-free at 1-800-847-0200, (ii) on the Thornburg website at www.thornburg.com, and (iii) on the Securities and Exchange Commission’s website at www.sec.gov.
Information regarding how proxies were voted is available on or before August 31 of each year for the twelve months ending the preceding June 30. This information is available (i) without charge, upon request by calling the Advisor toll-free at 1-800-847-0200, (ii) on the Thornburg website at www.thornburg.com, and (iii) on the Securities and Exchange Commission’s website at www.sec.gov.
AVAILABILITY OF QUARTERLY PORTFOLIO SCHEDULE
The Fund files with the Securities and Exchange Commission schedules of its portfolio holdings on Form N-Q for the first and third quarters of each fiscal year. The Fund’s Forms N-Q are available on the Commission’s website at www.sec.gov, or may be reviewed and copied at the Commission’s Public Reference Room in Washington, D.C. Information on the operation of the Public Reference Room may be obtained by calling 1-800-SEC-0330. The Fund also makes this information available on its website at www.thornburg.com/download or upon request by calling 1-800-847-0200.
Semi-Annual Report | 21
Trustees’ Statement to Shareholders
Readopted September 11, 2017
The Trustees believe current and prospective shareholders should know how we discharge our responsibilities in supervising the Funds’ investment advisor and in reviewing the advisor’s contract for renewal. Since 2005, we have issued a statement which sets out clearly the three principal guidelines that we follow in supervising the Trust’s investment advisor on your behalf. In accordance with our customary practice, in September of this year we again reviewed our statement and concluded we should reissue this statement outlining the principal features of our supervision of the advisor’s performance of investment management services for the Funds.
We begin with the premise that each shareholder selected his or her Fund because its investments are managed by the investment advisor identified in the prospectus and in accordance with the objective and policies described in the prospectus. We realize, as each of you do, that if you believe that your Fund’s stated objective and policies no longer serve your personal investment goals, you can sell your shares and leave the Fund.
Therefore, we believe that our primary supervisory task—our principal obligation to you—is to assess the nature and quality of the advisor’s services, and to confirm that the advisor actively and competently pursues the Fund’s objective, in accordance with the policies set out in the prospectus. To do this, we meet regularly with management to review your Fund’s portfolio and to discuss the advisor’s specific actions and judgments in pursuing the Fund’s objective. We do not substitute our own judgment for the advisor’s decisions in selecting investments; the advisor is paid to exercise its informed judgment on investment decisions, and we seek to confirm, in reviewing the advisor’s performance, that the advisor is doing just that.
Second, we are conscious of costs and the effect that costs have on shareholders’ returns. We try to make sure that your Fund’s fees and costs are reasonable in relationship to the services rendered and that they are generally in line with those charged by other expert investment advisors, consistent with our belief that the Fund’s investors searched for and expect that expertise and attention and have decided to pay a reasonable price for it. We do not put the management contract “out to bid” as a matter of course, and we would not do so unless we had concluded that the advisor materially had failed to pursue the Fund’s objectives in accordance with its policies, or for other equally important reasons. We believe that any other approach would be inconsistent with your interests and contrary to your expectations when you bought shares of the Fund in the first place.
Finally, because we believe that most Thornburg Fund shareholders have invested with a long-term perspective, we try not to focus too much on the fashions of the moment and on short-term performance. The market will not favor any specific investment objective or set of policies at all times and under all economic circumstances. A fund will experience periods of both high and low returns relative to other funds and other investments. Even if one of our Funds is not favored by the market at a particular time, we believe that the advisor is nonetheless obliged to remain true to the Fund’s objective and policies, and we watch to see that it does so.
Trustees of Thornburg Investment Trust
22 | Semi-Annual Report
Thornburg Funds
Thornburg Investment Management is a privately-owned global investment firm that offers a range of solutions for retail and institutional investors. Founded in 1982 and headquartered in Santa Fe, New Mexico, we manage approximately $49 billion (as of March 31, 2018) across U.S. mutual funds, separate accounts for high-net-worth investors, institutional accounts, and UCITS funds for non-U.S. investors.
EQUITY FUNDS
| | ∎ | | Thornburg Investment Income Builder Fund |
| | ∎ | | Thornburg Global Opportunities Fund |
| | ∎ | | Thornburg International Value Fund |
| | ∎ | | Thornburg Better World International Fund |
| | ∎ | | Thornburg International Growth Fund |
| | ∎ | | Thornburg Developing World Fund |
| | ∎ | | Thornburg Core Growth Fund |
FIXED INCOME FUNDS
| | ∎ | | Thornburg Low Duration Income Fund |
| | ∎ | | Thornburg Limited Term U.S. Government Fund |
| | ∎ | | Thornburg Limited Term Income Fund |
| | ∎ | | Thornburg Strategic Income Fund |
| | ∎ | | Thornburg Low Duration Municipal Fund |
| | ∎ | | Thornburg Limited Term Municipal Fund |
| | ∎ | | Thornburg Intermediate Municipal Fund |
| | ∎ | | Thornburg California Limited Term Municipal Fund |
| | ∎ | | Thornburg New Mexico Intermediate Municipal Fund |
| | ∎ | | Thornburg New York Intermediate Municipal Fund |
| | ∎ | | Thornburg Strategic Municipal Income Fund |
ALTERNATIVE FUNDS
| | ∎ | | Thornburg Long/Short Equity Fund |
Before investing, carefully consider the Fund’s investment goals, risks, charges, and expenses. For a prospectus or summary prospectus containing this and other information, contact your financial advisor or visit thornburg.com. Read it carefully before investing.
For additional information, please visit thornburg.com
Thornburg Investment Management, Inc. 2300 North Ridgetop Road, Santa Fe, NM 87506
Semi-Annual Report | 23
| | | | |
| To receive shareholder reports, prospectuses, and proxy statements electronically, go to www.thornburg.com/edelivery. | | |  | |
| This Semi-Annual Report is submitted for the general information of shareholders of the Fund. It is not authorized for distribution to prospective investors in the Fund unless preceded or accompanied by an effective prospectus. | |
| | | | |
Investment Advisor: | | Distributor: | | |
Thornburg Investment Management® | | Thornburg Securities Corporation® | | |
800.847.0200 | | 800.847.0200 | | TH3053 |
Semi-Annual Report
March 31, 2018
THORNBURG LIMITED TERM MUNICIPAL FUND
About Thornburg Investment Management
It’s more than what we do.
It’s how we do it.
At Thornburg, we are very different in how we think, invest, and are structured. We believe this difference is what makes us successful in helping individuals reach their long-term financial goals.
Flexible Perspective
Our perspective on investment opportunities is more flexible than most, viewing a wide range of opportunities beyond conventional boundaries to find hidden value.
Collaboration
Collectively, we hone ideas via borderless cross-pollination for better judgment and better results.
Portfolio Construction
Disciplined construction guided more by our convictions than convention.
CONVICTION
Thorough analysis and our relative-value framework lead to conviction in our securities selection.
UNCONVENTIONAL
Active management means we seek the best value for our clients rather than using conventional benchmarks as our starting point.
Structured for Excellence
How we think and how we invest is made possible by how we’re structured.
TEAM APPROACH
FAR FROM THE HERD
ACCESS & TRANSPARENCY
2 | Semi-Annual Report
Thornburg Limited Term Municipal Fund
Semi-Annual Report | March 31, 2018
Table of Contents
| | | | | | | | | | |
| SHARE CLASS | | NASDAQ SYMBOL | | CUSIP |
| | |
| Class A | | LTMFX | | | | 885-215-459 | |
| Class C | | LTMCX | | | | 885-215-442 | |
| Class I | | LTMIX | | | | 885-215-434 | |
Minimum investments for Class I shares may be higher than those for Class A. Class I shares may not be available to all investors.
Investments carry risks, including possible loss of principal. Portfolios investing in bonds have the same interest rate, inflation, and credit risks that are associated with the underlying bonds. The value of bonds will fluctuate relative to changes in interest rates, decreasing when interest rates rise. Unlike bonds, bond funds have ongoing fees and expenses. Please see the Fund’s prospectus for a discussion of the risks associated with an investment in the Fund. Investments in the Funds are not FDIC insured, nor are they bank deposits or guaranteed by a bank or any other entity.
The laddering strategy does not assure or guarantee better performance and cannot eliminate the risk of investment losses.
Semi-Annual Report | 3
Letter to Shareholders
Thornburg Limited Term Municipal Fund | March 31, 2018 (Unaudited)
April 25, 2018
Dear Fellow Shareholder:
We are pleased to present the semi-annual report for Thornburg Limited Term Municipal Fund. The net asset value (NAV) of the Class I shares decreased by 26 cents to $14.17 per share during the six-month period ended March 31, 2018. During the period, the Class I shares of the Fund outperformed the index with a negative 0.85% total return, compared to the negative 1.03% total return for the ICE BofAML 1-10 Year U.S. Municipal Securities Index.
The Fund’s duration, as well as curve positioning, contributed 0.15% to relative performance. Sector selection was also a positive contributor to performance, adding 0.07%. Lastly, security selection, which is performance not attributable to duration and sector selection, added 0.11% to relative performance.
The topic of tax reform consumed municipal market participants in the fourth quarter of 2017, with several proposals being bandied about that would significantly impact the supply/ demand dynamics of the market for years to come. Ultimately, the legislation was not as radical as initially feared. On the supply side of the equation, issuers lost the ability to advance refund debt. Much like a homeowner refinancing an existing mortgage to save on interest costs, an issuer would refinance debt when interest rates were low to provide some present value savings. While many thought this would have a large impact on supply, we did not agree. Advance refunding is highly correlated to the current level of interest rates, and many issuers had already accomplished any possible refunding over the previous several years.
Instead, we found the impact of tax reform on the demand side of the equation to be far more interesting. What was overlooked was the reduction of the corporate tax rate from 35% to 21%, and the idea that corporations evaluating municipal bonds versus other fixed income securities on a tax equivalent basis would now require a higher hurdle rate to buy municipal securities. We felt that the impact this may have on two specific buyers of municipals, banks, and property and casualty insurance companies, which own roughly 20 to 25% of outstanding municipal bonds, could lead both to re-evaluate their decision to own municipal bonds. While we do not believe this to be an Armageddon type of scenario; we expect it to be more like a weight leaning on the market for the next 12 to 18 months.
Another impact on the demand side is the limitations on the deductibility of state and local taxes (SALT), which has led
many market observers to postulate that the demand for municipal bonds in high tax states will increase. Again, we did not share the same opinion. In California, the demand for California bonds has already driven prices to a level where we feel there is little value when compared to other municipal securities on a tax-equivalent basis. Demand for municipal securities in other high tax states, such as Connecticut, Pennsylvania, and New Jersey, is not as cut and dry because there is significant credit risk associated with each. Nevertheless, these concerns caused the supply of municipal bonds to spike in November and December as issuers rushed to market to hedge against the potential threat of tax reform. Some investors viewed this period as an opportunity to buy extra municipal bonds in anticipation of a January rally, which never materialized. We did not view the market the same way, and kept our strategies positioned at the lower end of their relative risk spectrums (i.e. lower duration, higher credit quality, and higher reserve positions). The last fear facing the municipal bond market is the long-advertised infrastructure plan. While the plan has experienced several failed launches, and what is known suggests it will have little impact on the supply of municipal bonds, we are still monitoring the details of the proposal for potential impacts to our strategies.
The fourth quarter of 2017 saw yields of shorter maturity bonds increase more than the yields of longer maturity bonds, leading to a flattening of the yield curve. At the time, many analysts and pundits harped on the fact that the phenomenon portends a future recession. In the first quarter of 2018, the market watched as yields of longer maturity bonds increased more than yields of shorter maturity bonds, leading to a steepening of the yield curve. The steepening of the curve is an indication that market participants have a growing concern about increases in inflation – the enemy of the fixed income investor. The Fund’s conservative positioning was a headwind to performance in the fourth quarter of 2017, but acted as a tailwind to performance in the first quarter of 2018.
Thank you for your continued trust in us.
Sincerely,
| | |
Christopher Ryon,CFA Portfolio Manager Managing Director | |
Nicholos Venditti,CFA Portfolio Manager Managing Director |
The matters discussed in this report may constitute forward-looking statements made pursuant to the safe harbor provisions of the Securities Litigation Reform Act of 1995. These include any advisor or portfolio manager prediction, assessment, analysis or outlook for individual securities, industries, investment styles, market sectors and/or markets. These statements involve risks and uncertainties. In addition to the general risks described for each fund in its current prospectus, other factors bearing on these reports include the accuracy of the advisor’s or portfolio manager’s forecasts and predictions, the appropriateness of the investment strategies designed by the advisor or portfolio manager and the ability of the advisor or portfolio manager to implement their strategies efficiently and successfully. Any one or more of these factors, as well as other risks affecting the securities markets generally, could cause the actual results of any fund to differ materially as compared to its benchmarks.
The views expressed are subject to change and do not necessarily reflect the views of Thornburg Investment Management, Inc. This information should not be relied upon as a recommendation or investment advice and is not intended to predict the performance of any investment or market.
Performance results of individual share classes will vary based on the fees and expenses associated with each share class, and may be higher or lower than other share classes within the same Fund. Please see Performance Summary for performance results of each share class.
4 | Semi-Annual Report
Performance Summary
Thornburg Limited Term Municipal Fund | March 31, 2018 (Unaudited)
AVERAGE ANNUAL TOTAL RETURNS
| | | | | | | | | | | | | | | | | | | | | | | | | |
| | | 1-YR | | 3-YR | | 5-YR | | 10-YR | | SINCE
INCEP. |
| | | | | |
Class A Shares (Incep: 9/28/84) | | | | | | | | | | | | | | | | | | | | | | | | | |
Without sales charge | | | | 0.58% | | | | | 0.66% | | | | | 0.92% | | | | | 2.65% | | | | | 4.73% | |
| | | | | |
With sales charge | | | | -0.94% | | | | | 0.16% | | | | | 0.62% | | | | | 2.49% | | | | | 4.69% | |
Class C Shares (Incep: 9/1/94) | | | | | | | | | | | | | | | | | | | | | | | | | |
Without sales charge | | | | 0.34% | | | | | 0.42% | | | | | 0.70% | | | | | 2.39% | | | | | 3.17% | |
| | | | | |
With sales charge | | | | -0.15% | | | | | 0.42% | | | | | 0.70% | | | | | 2.39% | | | | | 3.17% | |
| | | | | |
Class I Shares (Incep: 7/5/96) | | | | 0.96% | | | | | 0.99% | | | | | 1.26% | | | | | 2.99% | | | | | 3.74% | |
30-DAY YIELDS, A SHARES (with sales charge)
| | | | |
| Annualized Distribution Yield | | | 1.57% | |
| SEC Yield | | | 1.34% | |
GROWTH OF A HYPOTHETICAL $10,000 INVESTMENT

Performance data shown represents past performance and is no guarantee of future results. Investment return and principal value will fluctuate so shares, when redeemed, may be worth more or less than their original cost. Current performance may be lower or higher than quoted. For performance current to the most recent month end, visit thornburg.com or call 800-847-0200. The performance information does not reflect the deduction of taxes that a shareholder would pay on distributions or the redemption of Fund shares. Returns reflect the reinvestment of dividends and capital gains. Class A shares are sold with a maximum sales charge of 1.50%. There is no sales charge for Class I shares.
As disclosed in the most recent prospectus, the total annual fund operating expenses are as follows: A shares, 0.69%; C shares, 0.93%; I shares, 0.45%.
The ICE index data referenced herein is the property of ICE Data Indices, LLC, its affiliates (“ICE Data”) and/or its Third Party Suppliers and has been licensed for use by Thornburg Investment Management, Inc. ICE Data and its Third Party Suppliers accept no liability in connection with its use. See www.thornburg.com/indices for a full copy of the Disclaimer.
Glossary
The ICE BofAML 1-10 Year Municipal Securities Index is a subset of the ICE BofAML U.S. Municipal Securities Index including all securities with a remaining term to final maturity less than 10 years.
The performance of any index is not indicative of the performance of any particular investment. Unless otherwise noted, index returns reflect the reinvestment of income dividends and capital gains, if any, but do not reflect fees, brokerage commissions or other expenses of investing. Investors may not make direct investments into any index.
Annualized Distribution Yield – The distribution yield reflects actual distributions made to shareholders. The annualized distribution yield is calculated by summing the last 30 days of income at a given month end and annualizing to a 360-day year. The result is divided by the ending maximum offering price or net asset value.
SEC Yield – A yield computed in accordance with SEC standards measuring the net investment income per share over a specified 30-day period expressed as a percentage of the maximum offering price of the Fund’s shares at the end of the period.
Advance refunding – Advance refunding can also refer to bond issuance in which new bonds are sold at a lower rate than outstanding ones. The proceeds are then invested, and when the older bonds become callable, they are paid off with the invested proceeds.
Bond Credit Ratings (Credit Quality) – A bond credit rating assesses the financial ability of a debt issuer to make timely payments of principal and interest. Rating of AAA (the highest), AA, A, and BBB are investment-grade quality. Rating of BB, B, CCC, CC, C and D (the lowest) are considered below investment grade, speculative grade, or junk bonds.
Credit Spread/Quality Spread – The difference between the yields of securities with different credit qualities.
Duration – A bond’s sensitivity to interest rates. Bonds with longer durations experience greater price volatility than bonds with shorter durations. Effective duration incorporates a bond’s embedded option features, such as call provisions.
Laddering – Laddering involves building a portfolio of bonds with staggered maturities so that a portion matures each year. Money that comes in from maturing bonds is typically invested in bonds with longer maturities at the far end of the portfolio.
Yield Curve – A line that plots the interest rate, at a set point in time, of bonds having equal credit quality, but offering maturity dates.
Semi-Annual Report | 5
Fund Summary
Thornburg Limited Term Municipal Fund | March 31, 2018 (Unaudited)
OBJECTIVES AND STRATEGIES
The Fund’s primary investment objective is to obtain as high a level of current income exempt from federal individual income tax as is consistent, in the view of the Fund’s investment advisor, with preservation of capital (may be subject to Alternative Minimum Tax).
The secondary goal of the Fund is to reduce expected changes in its share price compared to longer intermediate and long-term bond portfolios.
This Fund is a laddered portfolio of municipal bonds with a dollar-weighted average maturity of normally less than five years. Laddering involves building a portfolio of bonds with staggered maturities so that a portion of the portfolio matures each year. Cash from maturing bonds, if not needed for other purposes, is typically invested in bonds with longer maturities at the far end of the ladder. We regard the strategy as a good compromise for managing different types of risk.
LONG-TERM STABILITY OF PRINCIPAL
Net Asset Value History of A Shares
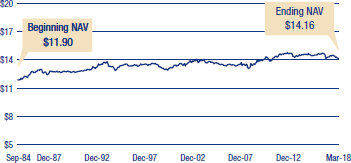
KEY PORTFOLIO ATTRIBUTES
| | | | | |
| Number of Bonds | | | | 1,886 | |
| Effective Duration | | | | 3.1 Yrs | |
| Average Maturity | | | | 3.6 Yrs | |
SECURITY CREDIT RATINGS
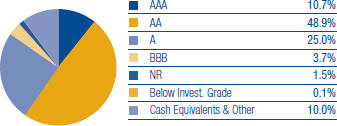
A bond credit rating assesses the financial ability of a debt issuer to make timely payments of principal and interest. Ratings of AAA (the highest), AA, A, and BBB are investment-grade quality. Ratings of BB, B, CCC, CC, C and D (the lowest) are considered below investment grade, speculative grade, or junk bonds.
Unrated pre-refunded and escrowed-to-maturity bonds are included in the not rated category.
PORTFOLIO LADDER
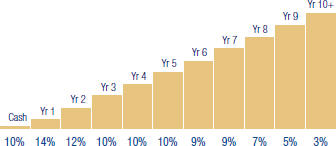
There is no guarantee that the Fund will meet its investment objectives.
All data is subject to change. Charts may not add up to 100% due to rounding.
6 | Semi-Annual Report
Schedule of Investments
Thornburg Limited Term Municipal Fund | March 31, 2018 (Unaudited)
| | | | | | | | | | | | |
| | | | | PRINCIPAL AMOUNT | | VALUE |
| | | |
| | MUNICIPAL BONDS — 98.9% | | | | | | | | | | |
| | | |
| | ALABAMA — 1.1% | | | | | | | | | | |
| | Alabama Public School & College Authority (Education System Capital Improvements), | | | | | | | | | | |
| | Series A, 5.00% due 6/1/2019 - 6/1/2022 | | | $ | 20,865,000 | | | | $ | 22,585,517 | |
| | Series B, 5.00% due 6/1/2019 - 6/1/2023 | | | | 1,505,000 | | | | | 1,636,709 | |
| | Alabama State Board of Education (Calhoun Community College), | | | | | | | | | | |
| | 3.00% due 5/1/2018 | | | | 2,130,000 | | | | | 2,132,258 | |
| | 4.00% due 5/1/2019 - 5/1/2022 | | | | 5,425,000 | | | | | 5,650,058 | |
| | City of Mobile Industrial Development Board (Alabama Power Company Barry Plant), 1.85% due 6/1/2034 (put 3/24/2020) | | | | 25,500,000 | | | | | 25,357,710 | |
| | East Alabama Health Care Authority GO, 5.00% due 9/1/2021 - 9/1/2022 | | | | 2,045,000 | | | | | 2,226,159 | |
| | Montgomery Waterworks and Sanitation, 5.00% due 9/1/2019 | | | | 3,375,000 | | | | | 3,423,161 | |
| | UAB Medicine Finance Authority (University Hospital), Series B, 5.00% due 9/1/2025 - 9/1/2027 | | | | 8,915,000 | | | | | 10,524,404 | |
| | University of Alabama at Birmingham Hospital, 5.00% due 9/1/2018 | | | | 1,700,000 | | | | | 1,723,562 | |
| | ALASKA — 0.3% | | | | | | | | | | |
| | Alaska Energy Authority (Bradley Lake Hydroelectric Project; Insured: AGM), 6.00% due 7/1/2020 | | | | 1,790,000 | | | | | 1,948,791 | |
| | Alaska Industrial Development & Export Authority (DeLong Mountain Transportation Project) GO, Series A, 5.00% due 4/1/2018 | | | | 2,455,000 | | | | | 2,455,000 | |
| | City of Valdez (BP Pipelines (Alaska), Inc. Project), | | | | | | | | | | |
| | 5.00% due 1/1/2021 | | | | 12,000,000 | | | | | 12,936,360 | |
| | Series B, 5.00% due 1/1/2021 | | | | 3,700,000 | | | | | 3,988,711 | |
| | ARIZONA — 2.8% | | | | | | | | | | |
| | Arizona (Dignity Health) HFA, 5.00% due 7/1/2018 - 7/1/2020 | | | | 4,125,000 | | | | | 4,242,477 | |
| a | | Arizona (LOC: Bank of America N.A.) HFA, Series C-RMK, 1.70% due 1/1/2046 (put 4/2/2018) | | | | 21,400,000 | | | | | 21,400,000 | |
| | Arizona (Scottsdale Lincoln Hospitals) HFA, 5.00% due 12/1/2022 - 12/1/2024 | | | | 3,100,000 | | | | | 3,508,929 | |
| | Arizona Board of Regents (Arizona State University) COP, | | | | | | | | | | |
| | Series A, 5.00% due 9/1/2019 - 9/1/2023 | | | | 18,235,000 | | | | | 20,205,756 | |
| | Series C, 5.00% due 6/1/2022 | | | | 6,080,000 | | | | | 6,781,450 | |
| | Arizona Board of Regents (Northern Arizona University Projects) COP, | | | | | | | | | | |
| | 3.00% due 9/1/2018 - 9/1/2019 | | | | 3,525,000 | | | | | 3,573,567 | |
| | 5.00% due 9/1/2020 - 9/1/2023 | | | | 6,825,000 | | | | | 7,493,696 | |
| | Arizona Board of Regents (University of Arizona SPEED), 5.00% due 8/1/2020 - 8/1/2024 | | | | 1,925,000 | | | | | 2,159,343 | |
| | Arizona Board of Regents COP, 5.00% due 6/1/2022 - 6/1/2028 | | | | 1,690,000 | | | | | 1,948,084 | |
| | Arizona School Facilities Board (School Site and Building Projects) COP, 5.25% due 9/1/2023 (pre-refunded 9/1/2018) | | | | 1,315,000 | | | | | 1,335,106 | |
| | Arizona School Facilities Board (State School Land Trust; Insured: AMBAC), 5.00% due 7/1/2018 | | | | 4,540,000 | | | | | 4,578,045 | |
| | Arizona Transportation Board, Series A, 5.00% due 7/1/2019 - 7/1/2022 | | | | 15,975,000 | | | | | 17,332,835 | |
| | City of Phoenix Civic Improvement Corp., Series A, 5.00% due 7/1/2022 - 7/1/2025 | | | | 8,580,000 | | | | | 9,912,765 | |
| | City of Tucson (Street and Highway Projects), Series A, 5.00% due 7/1/2022 | | | | 2,135,000 | | | | | 2,385,094 | |
| | Pima County (Ina & Roger Road Wastewater Reclamation Facilities), | | | | | | | | | | |
| | 5.00% due 7/1/2018 | | | | 2,000,000 | | | | | 2,016,960 | |
| | Series A, | | | | | | | | | | |
| | 3.00% due 7/1/2018 - 7/1/2022 | | | | 3,025,000 | | | | | 3,123,687 | |
| | 5.00% due 7/1/2018 - 7/1/2022 | | | | 2,100,000 | | | | | 2,241,874 | |
| | Pima County (Ina & Roger Road Wastewater Reclamation Facilities; Insured: AGM), 5.00% due 7/1/2018 | | | | 5,000,000 | | | | | 5,042,400 | |
| | Pima County (Sewer System & Fleet Services Facilities Expansion) COP, 5.00% due 12/1/2018 - 12/1/2022 | | | | 7,460,000 | | | | | 7,946,413 | |
| | Pinal County (Detention and Training Facilities), Series A, 5.00% due 8/1/2019 - 8/1/2025 | | | | 6,190,000 | | | | | 6,904,479 | |
| | Pinal County (Hunt Highway (Phases III-V), Ironwood Drive, Public Safety Radio & Court Buildings), 5.00% due 8/1/2025 | | | | 3,000,000 | | | | | 3,438,210 | |
| | Salt River Project Agricultural Improvement and Power District (Salt River Electric System), 5.00% due 1/1/2024 - 1/1/2028 | | | | 25,175,000 | | | | | 29,791,457 | |
| | Scottsdale (Scottsdale Healthcare) IDA, 5.00% due 9/1/2019 | | | | 6,885,000 | | | | | 6,976,984 | |
| | State of Arizona Department of Administration (State Lottery; Insured: AGM), 5.00% due 7/1/2018 - 7/1/2020 | | | | 17,075,000 | | | | | 17,751,487 | |
| | ARKANSAS — 0.1% | | | | | | | | | | |
| b | | Board of Trustees of the University of Arkansas (Fayetteville Campus Athletic Facilities), 3.00% due 11/1/2023 | | | | 615,000 | | | | | 640,356 | |
| | City of Fort Smith (Water and Sewer System Construction; Insured: AGM), 4.00% due 10/1/2018 - 10/1/2019 | | | | 2,670,000 | | | | | 2,733,218 | |
| | Jefferson County (Jefferson Regional Medical Center; Insured: AGM), 4.50% due 6/1/2018 - 6/1/2019 | | | | 3,075,000 | | | | | 3,120,748 | |
| | CALIFORNIA — 8.5% | | | | | | | | | | |
| | Alameda County Joint Powers Authority (Alameda County Medical Center Highland Hospital), Series A, 5.00% due 12/1/2021 - 12/1/2023 | | | | 6,200,000 | | | | | 7,094,810 | |
| | Anaheim Public Financing Authority (Public Improvements; Insured: AGM), 0.00%, due 9/1/2022 | | | | 3,250,000 | | | | | 2,894,938 | |
| | Brentwood Infrastructure Financing Authority (Redevelopment Agency of the City of Brentwood; Insured: AGM), 5.25% due 11/1/2018 - 11/1/2019 | | | | 1,745,000 | | | | | 1,807,029 | |
| | Cabrillo (Educational Facilities; Insured: AMBAC) USD GO, 0.00%, Series A, due 8/1/2021 | | | | 1,000,000 | | | | | 929,780 | |
| | California (Community Developmental Disabilities Program; Insured: California Mtg Insurance) HFFA, | | | | | | | | | | |
| | 5.50% due 2/1/2019 | | | | 2,865,000 | | | | | 2,959,574 | |
| | 5.75% due 2/1/2020 - 2/1/2021 | | | | 3,670,000 | | | | | 3,996,047 | |
| | California (Dignity Health) HFFA, | | | | | | | | | | |
| | Series A, | | | | | | | | | | |
| | 5.00% due 3/1/2020 - 3/1/2021 | | | | 7,850,000 | | | | | 8,413,523 | |
| | 5.25% due 3/1/2022 | | | | 7,020,000 | | | | | 7,628,704 | |
| | California (St. Joseph Health System) HFFA, Series D, 5.00% due 7/1/2043 (put 10/15/2020) | | | | 5,000,000 | | | | | 5,407,400 | |
| | California Educational Facilities Authority (Chapman University), 5.00% due 4/1/2021 | | | | 4,870,000 | | | | | 5,319,355 | |
| c | | California Infrastructure and Economic Development Bank (Los Angeles County Museum of Art), 1.971% (LIBOR 1 Month + 0.65%) due 12/1/2050 (put 2/1/2021) | | | | 5,000,000 | | | | | 5,014,900 | |
Semi-Annual Report | 7
Schedule of Investments, Continued
Thornburg Limited Term Municipal Fund | March 31, 2018 (Unaudited)
| | | | | | | | | | | | |
| | | | | PRINCIPAL AMOUNT | | VALUE |
| | California Municipal Finance Authority, 1.40% due 9/1/2021 (put 7/2/2018) | | | $ | 25,600,000 | | | | $ | 25,600,000 | |
| | California School Cash Reserve Program Authority, 3.00% due 6/29/2018 | | | | 20,300,000 | | | | | 20,374,298 | |
| | California State Economic Recovery GO, Series A, 5.00% due 7/1/2020 (pre-refunded 7/1/2019) | | | | 4,200,000 | | | | | 4,379,424 | |
| | California State Public Works Board (California School for the Deaf Riverside Campus), Series H, 5.00% due 4/1/2020 - 4/1/2021 | | | | 2,475,000 | | | | | 2,661,100 | |
| | California State Public Works Board (California State University), | | | | | | | | | | |
| | 5.00% due 11/1/2018 | | | | 2,700,000 | | | | | 2,755,404 | |
| | Series A, 5.00% due 10/1/2020 | | | | 1,000,000 | | | | | 1,079,500 | |
| | California State Public Works Board (Coalinga State Hospital), 5.00% due 6/1/2020 - 6/1/2022 | | | | 22,240,000 | | | | | 24,517,267 | |
| | California State Public Works Board (Laboratory Facility and San Diego Courthouse), Series I, 5.00% due 11/1/2021 - 11/1/2022 | | | | 10,825,000 | | | | | 12,212,459 | |
| | California State Public Works Board (Various Capital Projects), | | | | | | | | | | |
| | Series A, 5.00% due 10/1/2021 | | | | 1,000,000 | | | | | 1,106,120 | |
| | Series G, 5.00% due 11/1/2020 - 11/1/2021 | | | | 3,250,000 | | | | | 3,562,045 | |
| | California Statewide Communities Development Authority (Aspire Public Schools; LOC: PCSD; Guaranty Pool I, LLC), 5.00% due 7/1/2020 (pre-refunded 1/1/2019) | | | | 985,000 | | | | | 1,003,745 | |
| | California Statewide Communities Development Authority (Kaiser Foundation Hospitals), Series A, 5.00% due 4/1/2019 | | | | 27,000,000 | | | | | 27,902,070 | |
| | Castaic (Insured: Natl-Re) USD GO, 0.00%, Series A, due 5/1/2018 | | | | 1,300,000 | | | | | 1,298,453 | |
| | Castaic Lake Water Agency (Water System Improvement; Insured: AMBAC) COP, 0.00%, due 8/1/2023 | | | | 10,125,000 | | | | | 8,860,387 | |
| | Central Valley Financing Authority (Carson Ice), 5.00% due 7/1/2019 | | | | 1,750,000 | | | | | 1,824,305 | |
| | Chula Vista COP, 5.25% due 3/1/2019 | | | | 1,235,000 | | | | | 1,276,508 | |
| | City of Los Angeles (Cash Flow Management) GO, 5.00% due 6/28/2018 | | | | 45,745,000 | | | | | 46,128,343 | |
| | City of Redding (City Electric System; Insured: AGM) COP, | | | | | | | | | | |
| | Series A, | | | | | | | | | | |
| | 5.00% due 6/1/2020 | | | | 1,665,000 | | | | | 1,674,524 | |
| | 5.00% due 6/1/2020 (pre-refunded 6/1/2018) | | | | 2,290,000 | | | | | 2,303,099 | |
| | Clovis (Insured: Natl-Re) USD GO, 0.00%, Series B, due 8/1/2019 | | | | 2,685,000 | | | | | 2,620,479 | |
| | Community Facilities District No. 86-1 of the Irvine (Educational Facilities; Insured: AGM) USD, 5.25% due 9/1/2018 - 9/1/2019 | | | | 6,000,000 | | | | | 6,202,080 | |
| | County of Los Angeles (Fiscal Year 2017-2018 Expenditures) GO, 5.00% due 6/29/2018 | | | | 4,435,000 | | | | | 4,472,609 | |
| | County of Los Angeles Redevelopment Refunding Authority (Bunker Hill Project), 5.00% due 6/1/2020 - 12/1/2024 | | | | 35,595,000 | | | | | 40,252,072 | |
| | County of Monterey (2009 Refinancing Project; Insured: AGM) COP, 5.00% due 8/1/2018 | | | | 2,260,000 | | | | | 2,286,465 | |
| | County of Riverside (Fiscal Year 2017-2018 Expenditures), 2.00% due 6/29/2018 | | | | 71,000,000 | | | | | 71,090,880 | |
| | Escondido Union High School District (Insured: Natl-Re) GO, 0.00%, due 11/1/2020 | | | | 2,655,000 | | | | | 2,520,949 | |
| | Los Angeles (Educational Facilities and Information Technology Infrastructure) USD COP, Series B-2, 5.50% due 12/1/2018 - 12/1/2019 | | | | 11,640,000 | | | | | 12,209,284 | |
| | Los Angeles (Educational Facilities and Information Technology Infrastructure) USD GO, | | | | | | | | | | |
| | Series B, 5.00% due 7/1/2023 | | | | 11,950,000 | | | | | 13,732,581 | |
| | Series D, 5.00% due 7/1/2022 - 7/1/2024 | | | | 22,900,000 | | | | | 26,280,756 | |
| | Los Angeles Convention and Exhibition Center Authority, Series A, 5.00% due 8/15/2018 | | | | 2,295,000 | | | | | 2,325,156 | |
| | Los Angeles County Public Works Financing Authority (Multiple Capital Projects), Series A, 5.00% due 8/1/2018 - 8/1/2019 | | | | 21,935,000 | | | | | 22,806,533 | |
| | Needles USD GO, 0.00%, Series B, due 8/1/2023 | | | | 1,005,000 | | | | | 874,400 | |
| | North City West School Facilities Financing Authority (Carmel Valley Educational Facilities; Insured: AGM), Series A, 5.00% due 9/1/2023 | | | | 4,545,000 | | | | | 5,103,581 | |
| | Northern California Power Agency (Hydroelectric Project), Series A, 5.00% due 7/1/2019 - 7/1/2020 | | | | 2,325,000 | | | | | 2,423,697 | |
| | Northern California Power Agency (Lodi Energy Center), Series A, 5.00% due 6/1/2018 | | | | 4,480,000 | | | | | 4,505,402 | |
| | Oakland (Construction & Modernization Project; Insured: AGM) USD GO, 5.00% due 8/1/2022 - 8/1/2025 | | | | 6,780,000 | | | | | 7,861,611 | |
| | Oakland State Building Authority (Elihu M. Harris State Office Building), 5.00% due 12/1/2018 | | | | 7,240,000 | | | | | 7,405,434 | |
| | Palo Alto USD GO, 0.00%, due 8/1/2019 | | | | 1,000,000 | | | | | 978,290 | |
| | Palomar Community College District GO, 0.00%, Series B, due 8/1/2021 | | | | 2,560,000 | | | | | 2,401,485 | |
| | Rocklin (Insured: Natl-Re) USD GO, 0.00%, due 8/1/2022 | | | | 3,910,000 | | | | | 3,549,146 | |
| | Sacramento City (Educational Facilities Improvements) USD GO, 5.00% due 7/1/2021 | | | | 3,265,000 | | | | | 3,603,613 | |
| | Sacramento City Financing Authority (Merged Downtown & Oak Park; Insured: Natl-Re), 0.00%, due 12/1/2019 - 12/1/2021 | | | | 4,520,000 | | | | | 4,274,492 | |
| | San Diego (Educational System Capital Projects; Insured: Natl-Re) GO, Series D-1, 5.50% due 7/1/2020 | | | | 10,000,000 | | | | | 10,867,700 | |
| | San Diego Convention Center Expansion Financing Authority, Series A, 5.00% due 4/15/2020 - 4/15/2022 | | | | 15,000,000 | | | | | 16,500,340 | |
| | San Francisco Building Authority (San Francisco Civic Center Complex), 5.00% due 12/1/2018 | | | | 13,130,000 | | | | | 13,430,020 | |
| | San Joaquin Delta Community College District (Insured: AGM) GO, 0.00%, Series B, due 8/1/2019 | | | | 7,600,000 | | | | | 7,187,852 | |
| | Santa Ana (Insured: Natl-Re) USD GO, 0.00%, Series B, due 8/1/2019 | | | | 3,425,000 | | | | | 3,340,951 | |
| | Santa Ana Financing Authority (Police Administration & Holding Facility; Insured: Natl-Re), 6.25% due 7/1/2018 | | | | 4,035,000 | | | | | 4,081,604 | |
| | Santa Fe Springs Community Development Commission (Consolidated Redevelopment Project; Insured: Natl-Re), 0.00%, due 9/1/2024 | | | | 7,000,000 | | | | | 5,860,750 | |
| | South San Francisco (Educational Facilities) USD GO, Series E, 4.00% due 6/15/2018 | | | | 5,130,000 | | | | | 5,156,727 | |
| | State of California (Various Purposes) GO, | | | | | | | | | | |
| | 4.75% due 4/1/2018 | | | | 1,250,000 | | | | | 1,250,000 | |
| | 5.00% due 9/1/2020 - 9/1/2021 | | | | 15,000,000 | | | | | 16,316,600 | |
| | State of California Economic Recovery GO, Series A, 5.00% due 7/1/2018 | | | | 4,000,000 | | | | | 4,035,120 | |
| | Tuolumne Wind Project Authority, Series A, 5.00% due 1/1/2019 | | | | 2,000,000 | | | | | 2,052,800 | |
| | Tustin Community Redevelopment Agency (Tustin Redevelopment), 4.00% due 9/1/2019 - 9/1/2020 (pre-refunded 9/1/2018) | | | | 2,060,000 | | | | | 2,121,945 | |
| | West Contra Costa (Educational Facilities; Insured: AGM) USD GO, 0.00%, Series C-1, due 8/1/2022 | | | | 4,000,000 | | | | | 3,583,040 | |
| | West Covina Redevelopment Agency (Fashion Plaza), 6.00% due 9/1/2022 | | | | 6,135,000 | | | | | 6,662,978 | |
| | COLORADO — 1.3% | | | | | | | | | | |
| | City & County of Denver (Buell Theatre Property) COP, 5.00% due 12/1/2020 - 12/1/2023 | | | | 8,610,000 | | | | | 9,517,351 | |
| | City & County of Denver COP, | | | | | | | | | | |
| a | | Series A1, 1.70% due 12/1/2029 (put 4/2/2018) | | | | 26,225,000 | | | | | 26,225,000 | |
| a | | Series A2, 1.70% due 12/1/2029 (put 4/2/2018) | | | | 4,475,000 | | | | | 4,475,000 | |
| a | | Series A3, 1.70% due 12/1/2031 (put 4/2/2018) | | | | 795,000 | | | | | 795,000 | |
8 | Semi-Annual Report
Schedule of Investments, Continued
Thornburg Limited Term Municipal Fund | March 31, 2018 (Unaudited)
| | | | | | | | | | | | |
| | | | | PRINCIPAL AMOUNT | | VALUE |
| | City & County of Denver School District No. 1 (Eastbridge Elementary and Conservatory Green K-8 Schools) COP, | | | | | | | | | | |
| | 4.00% due 12/15/2019 - 12/15/2020 | | | $ | 1,000,000 | | | | $ | 1,048,904 | |
| | 5.00% due 12/15/2021 - 12/15/2023 | | | | 3,210,000 | | | | | 3,613,095 | |
| | City of Longmont, 6.00% due 5/15/2019 | | | | 3,215,000 | | | | | 3,304,570 | |
| | Colorado (Northern Colorado Medical Center) HFA, 5.00% due 5/15/2025 - 5/15/2026 | | | | 1,305,000 | | | | | 1,509,571 | |
| | Colorado (Northern Colorado Medical Center; Insured: AGM) HFA, Series B-REMK, 5.25% due 5/15/2019 | | | | 2,225,000 | | | | | 2,310,707 | |
| | Colorado Educational & Cultural Facilities Authority (National Conference of State Legislatures), 5.00% due 6/1/2018 - 6/1/2021 | | | | 3,640,000 | | | | | 3,811,757 | |
| | El Paso County (Pikes Peak Regional Development Center) COP, | | | | | | | | | | |
| | 4.00% due 12/1/2021 | | | | 1,000,000 | | | | | 1,068,420 | |
| | 5.00% due 12/1/2023 | | | | 1,330,000 | | | | | 1,515,003 | |
| | El Paso County Falcon School District No. 49 COP, 5.00% due 12/15/2020 - 12/15/2024 | | | | 1,950,000 | | | | | 2,200,989 | |
| | Park Creek Metropolitan District (Insured: AGM), 5.50% due 12/1/2018 - 12/1/2019 | | | | 2,200,000 | | | | | 2,292,402 | |
| | Regional Transportation District COP, | | | | | | | | | | |
| | Series A, | | | | | | | | | | |
| b | | 5.50% due 6/1/2021 | | | | 205,000 | | | | | 220,412 | |
| | 5.50% due 6/1/2021 (pre-refunded 6/1/2020) | | | | 2,165,000 | | | | | 2,334,476 | |
| | Regional Transportation District (FasTracks Transportation System) COP, 5.00% due 6/1/2018 - 6/1/2020 | | | | 10,135,000 | | | | | 10,567,829 | |
| | Regional Transportation District (North Metro Rail Line) COP, Series A, 5.00% due 6/1/2023 - 6/1/2024 | | | | 8,000,000 | | | | | 9,016,240 | |
| | State of Colorado COP, Series A, 5.00% due 9/1/2024 - 9/1/2028 | | | | 4,610,000 | | | | | 5,429,530 | |
| | CONNECTICUT — 1.4% | | | | | | | | | | |
| | City of Hartford (Various Public Improvements; Insured: AGM) GO, | | | | | | | | | | |
| | 5.00% due 10/1/2022 | | | | 1,765,000 | | | | | 1,913,931 | |
| | Series A, 5.00% due 7/1/2024 - 7/1/2025 | | | | 1,820,000 | | | | | 2,028,905 | |
| | City of West Haven (Insured: AGM) GO, 4.00% due 8/1/2018 | | | | 2,080,000 | | | | | 2,093,312 | |
| | State of Connecticut (Educational Facilities) GO, 5.00% due 9/1/2023 - 6/15/2025 | | | | 35,950,000 | | | | | 40,134,389 | |
| | State of Connecticut (Various Capital Projects) GO, | | | | | | | | | | |
| | 5.00% due 8/15/2024 | | | | 1,845,000 | | | | | 2,039,112 | |
| | Series B, 5.00% due 5/15/2024 - 5/15/2027 | | | | 44,500,000 | | | | | 49,814,455 | |
| c | | Series D, 2.50% (MUNISPA + 0.92%) due 9/15/2019 | | | | 1,000,000 | | | | | 1,006,440 | |
| c | | State of Connecticut GO (Various Capital Projects), Series D, 2.35% (MUNISPA + 0.77%) due 9/15/2018 | | | | 725,000 | | | | | 725,696 | |
| | DELAWARE — 0.0% | | | | | | | | | | |
| | Delaware Transportation Authority (Transportation System), | | | | | | | | | | |
| b | | 5.00% due 7/1/2020 | | | | 500,000 | | | | | 535,485 | |
| | 5.00% due 7/1/2022 | | | | 1,440,000 | | | | | 1,613,045 | |
| | DISTRICT OF COLUMBIA — 0.2% | | | | | | | | | | |
| | District of Columbia (Insured: Natl-Re) GO, Series B, 6.00% due 6/1/2018 | | | | 5,000,000 | | | | | 5,036,150 | |
| | District of Columbia (Insured: Syncora) GO, Series B, 5.25% due 6/1/2020 | | | | 3,005,000 | | | | | 3,228,362 | |
| | District of Columbia (National Public Radio), | | | | | | | | | | |
| | 5.00% due 4/1/2018 | | | | 1,745,000 | | | | | 1,745,000 | |
| | Series A, 5.00% due 4/1/2019 - 4/1/2020 | | | | 2,695,000 | | | | | 2,832,424 | |
| | FLORIDA — 6.6% | | | | | | | | | | |
| | Alachua County School Board (Educational Facilities) COP, 5.00% due 7/1/2022 - 7/1/2023 | | | | 3,850,000 | | | | | 4,326,805 | |
| | Broward County (Airport, Marina & Port Improvements), | | | | | | | | | | |
| | 4.00% due 10/1/2018 - 10/1/2020 | | | | 2,085,000 | | | | | 2,176,685 | |
| | 5.00% due 10/1/2018 - 10/1/2020 | | | | 3,500,000 | | | | | 3,709,935 | |
| | Broward County (Port Facilities), 5.50% due 9/1/2018 - 9/1/2019 | | | | 6,300,000 | | | | | 6,502,538 | |
| | Broward County School Board (Educational Facilities) COP, | | | | | | | | | | |
| | Series A, 5.00% due 7/1/2021 - 7/1/2025 | | | | 22,580,000 | | | | | 25,668,832 | |
| | Series B, 5.00% due 7/1/2023 - 7/1/2025 | | | | 9,000,000 | | | | | 10,402,400 | |
| | Series C, 5.00% due 7/1/2025 - 7/1/2026 | | | | 12,830,000 | | | | | 15,044,773 | |
| | Central Florida Expressway Authority, 5.00% due 7/1/2022 - 7/1/2024 | | | | 3,525,000 | | | | | 4,018,972 | |
| | City of Cape Coral (Water and Sewer System Improvements), 5.00% due 10/1/2022 - 10/1/2026 | | | | 5,435,000 | | | | | 6,344,517 | |
| | City of Fort Myers (Gulf Breeze Loan Program; Insured: Natl-Re), 5.00% due 12/1/2018 | | | | 2,195,000 | | | | | 2,200,619 | |
| | City of Jacksonville, Series C, 5.00% due 10/1/2018 - 10/1/2023 | | | | 3,655,000 | | | | | 3,926,629 | |
| | City of Lakeland (Energy System; Insured: AGM), 5.00% due 10/1/2019 - 10/1/2020 | | | | 6,695,000 | | | | | 7,059,971 | |
| | City of Lakeland (Lakeland Regional Health Systems), 5.00% due 11/15/2019 - 11/15/2026 | | | | 9,525,000 | | | | | 10,427,362 | |
| | City of Miami (Stormwater Management Utility System), 5.00% due 9/1/2026 - 9/1/2028 | | | | 2,675,000 | | | | | 3,154,144 | |
| | City of North Miami Beach (North Miami Beach Water Project), | | | | | | | | | | |
| | 3.00% due 8/1/2018 | | | | 1,280,000 | | | | | 1,285,811 | |
| | 5.00% due 8/1/2019 - 8/1/2021 | | | | 3,430,000 | | | | | 3,643,931 | |
| | City of Orlando (Senior Tourist Development; Insured: AGM), 5.00% due 11/1/2023 - 11/1/2027 | | | | 3,530,000 | | | | | 4,099,116 | |
| | Florida Higher Educational Facilities Financing Authority (Nova Southeastern University), | | | | | | | | | | |
| | 5.00% due 4/1/2019 - 4/1/2020 | | | | 2,225,000 | | | | | 2,321,482 | |
| | 5.25% due 4/1/2018 | | | | 2,630,000 | | | | | 2,630,000 | |
| | 5.50% due 4/1/2019 | | | | 1,705,000 | | | | | 1,769,824 | |
| | Florida Higher Educational Facilities Financing Authority (University of Tampa), Series A, 5.00% due 4/1/2019 - 4/1/2022 | | | | 1,845,000 | | | | | 1,945,386 | |
| | Florida State Board of Governors (University System Capital Improvements), Series A, 4.00% due 7/1/2020 - 7/1/2022 | | | | 12,655,000 | | | | | 13,437,373 | |
Semi-Annual Report | 9
Schedule of Investments, Continued
Thornburg Limited Term Municipal Fund | March 31, 2018 (Unaudited)
| | | | | | | | | | | | |
| | | | | PRINCIPAL AMOUNT | | VALUE |
| | Fort Myers Utility System Revenue, | | | | | | | | | | |
| | 5.00% due 10/1/2023 | | | $ | 990,000 | | | | $ | 1,089,059 | |
| | 5.00% due 10/1/2023 (pre-refunded 10/1/2021) | | | | 2,370,000 | | | | | 2,613,873 | |
| | Gainesville Utilities System Revenue, | | | | | | | | | | |
| a | | Series A-REMK 12/14/15, 1.72% due 10/1/2026 (put 4/2/2018) | | | | 2,210,000 | | | | | 2,210,000 | |
| a | | Series C-REMK 12/14/15, 1.71% due 10/1/2026 (put 4/2/2018) | | | | 24,215,000 | | | | | 24,215,000 | |
| | Highlands County Health Facilities Authority ETM, 5.00% due 11/15/2019 | | | | 5,000 | | | | | 5,257 | |
| | Highlands County Health Facilities Authority, 5.00% due 11/15/2019 | | | | 2,995,000 | | | | | 3,147,475 | |
| | Hillsborough County (Court Facilities), Series B, 5.00% due 11/1/2018 - 11/1/2021 | | | | 18,155,000 | | | | | 19,326,304 | |
| | Hillsborough County (Jail and Storm Water Projects), Series A, 5.00% due 11/1/2021 - 11/1/2022 | | | | 5,305,000 | | | | | 5,898,441 | |
| | Hillsborough County (Tampa Electric Co.) IDA, 5.65% due 5/15/2018 | | | | 3,200,000 | | | | | 3,214,304 | |
| | Hillsborough County School Board (Master Lease Program) COP, 5.00% due 7/1/2028 | | | | 4,835,000 | | | | | 5,734,842 | |
| | Jacksonville Electric Authority (Electric System), Series A, 5.00% due 10/1/2023 - 10/1/2024 | | | | 2,595,000 | | | | | 2,947,626 | |
| | Jacksonville Electric Authority (Water and Sewer System), 5.00% due 10/1/2018 | | | | 1,500,000 | | | | | 1,525,845 | |
| | Lake County School Board (Insured: AMBAC) COP, 5.25% due 6/1/2018 | | | | 1,475,000 | | | | | 1,483,629 | |
| | Lee County School Board (School Facilities Improvements) COP, 5.00% due 8/1/2023 - 8/1/2024 | | | | 3,000,000 | | | | | 3,430,030 | |
| | Manatee County (County Capital Projects), 5.00% due 10/1/2018 - 10/1/2021 | | | | 5,175,000 | | | | | 5,498,930 | |
| | Manatee County (Public Utilities Improvements), 5.00% due 10/1/2024 - 10/1/2025 | | | | 970,000 | | | | | 1,126,306 | |
| | Manatee County School District (School Facilities Improvements; Insured: AGM), 5.00% due 10/1/2025 - 10/1/2027 | | | | 2,900,000 | | | | | 3,409,996 | |
| | Marion County School Board (Insured: BAM) COP, Series B, 5.00% due 6/1/2018 - 6/1/2024 | | | | 13,465,000 | | | | | 14,330,688 | |
| | Miami Beach GO, | | | | | | | | | | |
| | 4.00% due 9/1/2019 - 9/1/2021 | | | | 3,760,000 | | | | | 3,913,469 | |
| | 5.00% due 9/1/2020 - 9/1/2022 | | | | 4,720,000 | | | | | 5,085,293 | |
| | Miami-Dade County (Building Better Communities) GO, Series B, 5.25% due 7/1/2018 | | | | 5,040,000 | | | | | 5,086,418 | |
| | Miami-Dade County (Miami International Airport), Series B, 5.00% due 10/1/2025 | | | | 2,500,000 | | | | | 2,882,225 | |
| | Miami-Dade County (Professional Sports Franchise Facilities; Insured: AGM), 0.00%, Series C, due 10/1/2018 - 10/1/2019 | | | | 7,555,000 | | | | | 7,424,096 | |
| | Miami-Dade County (Transit System), 5.00% due 7/1/2023 - 7/1/2025 | | | | 10,215,000 | | | | | 11,864,523 | |
| | Miami-Dade County Expressway Authority (Toll System), Series B, 5.00% due 7/1/2024 - 7/1/2025 | | | | 4,000,000 | | | | | 4,589,640 | |
| | Miami-Dade County Expressway Authority (Toll System; Insured: AGM), 5.00% due 7/1/2019 | | | | 7,530,000 | | | | | 7,829,769 | |
| | Miami-Dade County School Board (Educational Facilities Improvements) COP, | | | | | | | | | | |
| | Series A, | | | | | | | | | | |
| | 5.00% due 5/1/2022 - 5/1/2024 | | | | 15,535,000 | | | | | 17,498,933 | |
| | 5.00% due 5/1/2031 (put 5/1/2024) | | | | 2,425,000 | | | | | 2,764,815 | |
| | Series C, 5.00% due 5/1/2025 | | | | 15,000,000 | | | | | 17,240,100 | |
| | Orange County (Orlando Health, Inc.) HFA, | | | | | | | | | | |
| | 5.25% due 10/1/2019 | | | | 6,050,000 | | | | | 6,353,649 | |
| | 5.375% due 10/1/2023 | | | | 4,150,000 | | | | | 4,369,037 | |
| | Orange County (Orlando Health, Inc.; Insured: Natl-Re) HFA, 6.25% due 10/1/2021 | | | | 1,540,000 | | | | | 1,672,178 | |
| | Orange County School Board (Educational Facilities) COP, Series D, 5.00% due 8/1/2019 - 8/1/2025 | | | | 10,795,000 | | | | | 12,009,905 | |
| | Palm Beach County (Boca Raton Regional Hospital) HFA, 5.00% due 12/1/2020 | | | | 600,000 | | | | | 641,406 | |
| | Palm Beach County School Board (Educational Facilities) COP, | | | | | | | | | | |
| | Series B, 5.00% due 8/1/2022 - 8/1/2024 | | | | 10,370,000 | | | | | 11,821,938 | |
| | Series C, | | | | | | | | | | |
| | 4.00% due 8/1/2019 - 8/1/2021 | | | | 4,775,000 | | | | | 5,041,799 | |
| | 5.00% due 8/1/2018 - 8/1/2022 | | | | 3,550,000 | | | | | 3,826,604 | |
| | Palm Beach County School District COP, Series C, 5.00% due 8/1/2021 - 8/1/2026 | | | | 10,130,000 | | | | | 11,554,066 | |
| | Polk County (Water and Wastewater Utility Systems), 5.00% due 10/1/2023 | | | | 1,420,000 | | | | | 1,596,378 | |
| | Polk County (Water and Wastewater Utility Systems; Insured: AGM), | | | | | | | | | | |
| | 3.00% due 10/1/2021 | | | | 3,125,000 | | | | | 3,213,969 | |
| | 4.00% due 10/1/2020 | | | | 3,100,000 | | | | | 3,254,008 | |
| | Putnam County Development Authority (Seminole Project; Insured: AMBAC), 5.35% due 3/15/2042 (put 5/1/2018) | | | | 14,765,000 | | | | | 14,806,489 | |
| | Reedy Creek Improvement District (Buena Vista Drive Corridor Improvements), 5.00% due 6/1/2023 | | | | 1,940,000 | | | | | 2,206,634 | |
| | Reedy Creek Improvement District (Walt Disney World Resort Complex Utility Systems) GO, | | | | | | | | | | |
| | Series A, | | | | | | | | | | |
| | 5.00% due 6/1/2021 - 6/1/2025 | | | | 3,350,000 | | | | | 3,865,562 | |
| b | | 5.00% due 6/1/2023 | | | | 860,000 | | | | | 978,198 | |
| | Reedy Creek Improvement District (Walt Disney World Resort Complex Utility Systems), Series 1, 5.00% due 10/1/2018 - 10/1/2023 | | | | 3,330,000 | | | | | 3,647,944 | |
| | South Florida Water Management District (Everglades Restoration Plan) COP, 5.00% due 10/1/2018 - 10/1/2022 | | | | 9,530,000 | | | | | 10,185,136 | |
| | South Lake County Hospital District, 5.00% due 10/1/2025 | | | | 4,140,000 | | | | | 4,383,308 | |
| | Sunshine State Governmental Financing Commission (Miami-Dade County Program), 5.00% due 9/1/2021 - 9/1/2024 | | | | 7,275,000 | | | | | 8,155,678 | |
| | Sunshine State Governmental Financing Commission (Miami-Dade County Program; Insured: AGM), 5.00% due 9/1/2021 | | | | 5,000,000 | | | | | 5,483,450 | |
| | Tampa Bay Regional Water Supply Authority, 5.00% due 10/1/2018 - 10/1/2019 | | | | 5,890,000 | | | | | 6,086,967 | |
| | Volusia County Educational Facilities Authority (Embry-Riddle Aeronautical University, Inc.), | | | | | | | | | | |
| | 5.00% due 10/15/2023 - 10/15/2024 | | | | 1,350,000 | | | | | 1,536,695 | |
| b | | 5.00% due 10/15/2025 | | | | 400,000 | | | | | 457,744 | |
| | Volusia County Educational Facilities Authority (Embry-Riddle Aeronautical University, Inc.; Insured: AGM), 5.00% due 10/15/2018 - 10/15/2019 | | | | 4,425,000 | | | | | 4,579,610 | |
| | Volusia County School Board (University High School, River Springs Middle School) COP, 5.00% due 8/1/2024 | | | | 1,000,000 | | | | | 1,147,340 | |
10 | Semi-Annual Report
Schedule of Investments, Continued
Thornburg Limited Term Municipal Fund | March 31, 2018 (Unaudited)
| | | | | | | | | | | | |
| | | | | PRINCIPAL AMOUNT | | VALUE |
| | GEORGIA — 1.2% | | | | | | | | | | |
| a | | Athens-Clarke County Unified Government Development Authority (LOC: Wells Fargo Bank N.A.), 1.70% due 7/1/2035 (put 4/2/2018) | | | $ | 500,000 | | | | $ | 500,000 | |
| | Athens-Clarke County Unified Government Development Authority (UGAREF Bolton Commons, LLC), | | | | | | | | | | |
| | 4.00% due 6/15/2020 | | | | 395,000 | | | | | 413,917 | |
| | 5.00% due 6/15/2019 | | | | 400,000 | | | | | 414,972 | |
| | Athens-Clarke County Unified Government Development Authority (UGAREF Central Precinct, LLC), 5.00% due 6/15/2022 - 6/15/2024 | | | | 1,790,000 | | | | | 2,022,141 | |
| | City of Atlanta (Airport Passenger Facility), | | | | | | | | | | |
| | 5.00% due 1/1/2024 - 1/1/2025 | | | | 3,850,000 | | | | | 4,401,372 | |
| | Series B, 5.00% due 1/1/2023 - 1/1/2025 | | | | 2,645,000 | | | | | 3,003,856 | |
| | City of Atlanta (Atlantic Station Project), 5.00% due 12/1/2018 - 12/1/2024 | | | | 5,500,000 | | | | | 5,975,361 | |
| | City of Atlanta (BeltLine Project), Series A, 5.00% due 1/1/2020 - 1/1/2021 | | | | 585,000 | | | | | 615,821 | |
| | City of Atlanta (Hartsfield-Jackson Atlanta International Airport), | | | | | | | | | | |
| | Series B, 5.00% due 1/1/2020 - 1/1/2021 | | | | 13,000,000 | | | | | 13,717,860 | |
| | Series C, | | | | | | | | | | |
| | 5.00% due 1/1/2019 | | | | 3,145,000 | | | | | 3,222,556 | |
| | 5.25% due 1/1/2020 | | | | 5,000,000 | | | | | 5,297,450 | |
| | 5.50% due 1/1/2021 | | | | 3,525,000 | | | | | 3,868,617 | |
| | City of Atlanta (Water & Wastewater System), | | | | | | | | | | |
| | 5.00% due 11/1/2021 - 11/1/2025 | | | | 6,630,000 | | | | | 7,521,238 | |
| | 6.00% due 11/1/2019 | | | | 5,650,000 | | | | | 6,030,245 | |
| | Development Authority of Bartow County (Georgia Power Co. Plant Bowen Project), 2.70% due 8/1/2043 (put 8/23/2018) | | | | 6,000,000 | | | | | 6,016,740 | |
| | Fulton County Development Authority (Georgia Tech Athletic Association), 5.00% due 10/1/2022 | | | | 4,550,000 | | | | | 5,049,135 | |
| | Fulton County Facilities Corp. (Public Purpose Project) COP, 5.00% due 11/1/2019 | | | | 6,600,000 | | | | | 6,936,534 | |
| | Hospital Authority of Gwinnett County (Gwinnett Hospital System, Inc.; Insured: AGM), Series A, 5.00% due 7/1/2023 | | | | 5,000,000 | | | | | 5,192,100 | |
| | LaGrange-Troup County Hospital Authority (West Georgia Health Foundation, Inc.), 5.00% due 7/1/2018 | | | | 550,000 | | | | | 554,691 | |
| | Valdosta and Lowndes County Hospital Authority (South Medical Center), Series B, 5.00% due 10/1/2022 | | | | 1,500,000 | | | | | 1,650,615 | |
| | GUAM — 0.6% | | | | | | | | | | |
| | Government of Guam (Economic Development), 5.00% due 1/1/2019 | | | | 680,000 | | | | | 692,226 | |
| | Government of Guam (Layon Solid Waste Disposal Facility), Series A, 5.50% due 12/1/2018 - 12/1/2019 | | | | 5,000,000 | | | | | 5,204,510 | |
| | Government of Guam (Various Capital Projects), Series D-REF, 5.00% due 11/15/2019 - 11/15/2024 | | | | 18,450,000 | | | | | 19,964,268 | |
| | Guam Government Waterworks Authority (Water & Wastewater System Improvements), 5.25% due 7/1/2020 - 7/1/2023 | | | | 1,995,000 | | | | | 2,178,372 | |
| | Guam Government, 5.00% due 1/1/2025 | | | | 305,000 | | | | | 317,429 | |
| | Guam Power Authority (Electric Power System), Series A, 5.00% due 10/1/2023 - 10/1/2026 | | | | 5,070,000 | | | | | 5,545,796 | |
| | Guam Power Authority (Electric Power System; Insured: AGM), Series A, 5.00% due 10/1/2019 - 10/1/2022 | | | | 8,840,000 | | | | | 9,626,023 | |
| | HAWAII — 1.5% | | | | | | | | | | |
| | City and County of Honolulu (Capital Improvements) GO, 5.00% due 11/1/2019 - 11/1/2022 | | | | 23,100,000 | | | | | 25,330,468 | |
| c | | City and County of Honolulu GO Floating Rate Note (Rail Transit Project), 1.90% (MUNISPA + 0.32%) due 9/1/2025 - 9/1/2028 (put 9/1/2020) | | | | 17,075,000 | | | | | 17,081,659 | |
| | County of Hawaii (Capital Improvements) GO, | | | | | | | | | | |
| | 5.00% due 9/1/2023 | | | | 800,000 | | | | | 914,104 | |
| | Series B, 5.00% due 9/1/2023 | | | | 1,500,000 | | | | | 1,713,945 | |
| | Series C, 5.00% due 9/1/2021 - 9/1/2026 | | | | 9,250,000 | | | | | 10,636,453 | |
| | Series D, 5.00% due 9/1/2023 - 9/1/2026 | | | | 5,770,000 | | | | | 6,731,762 | |
| | Series E, 5.00% due 9/1/2021 - 9/1/2026 | | | | 6,180,000 | | | | | 6,998,474 | |
| | State of Hawaii (Hawaiian Home Lands Settlement) GO, | | | | | | | | | | |
| | Series DZ, | | | | | | | | | | |
| | 5.00% due 12/1/2019 | | | | 1,545,000 | | | | | 1,623,687 | |
| | 5.00% due 12/1/2022 (pre-refunded 12/1/2021) | | | | 4,000,000 | | | | | 4,418,102 | |
| | Series DZ-2017, 5.00% due 12/1/2019 | | | | 1,455,000 | | | | | 1,533,445 | |
| | Series EA, 5.00% due 12/1/2020 - 12/1/2021 | | | | 5,500,000 | | | | | 6,032,655 | |
| | Series EF, 5.00% due 11/1/2018 | | | | 20,000,000 | | | | | 20,399,800 | |
| | IDAHO — 0.7% | | | | | | | | | | |
| | Idaho (Trinity Health Credit Group) HFA, Series D, 5.00% due 12/1/2022 - 12/1/2024 | | | | 4,200,000 | | | | | 4,797,060 | |
| | Regents of the University of Idaho, 5.25% due 4/1/2041 (put 4/1/2021) | | | | 12,600,000 | | | | | 13,711,572 | |
| | State of Idaho (Cash Flow Management) GO, 4.00% due 6/29/2018 | | | | 30,760,000 | | | | | 30,938,716 | |
| | ILLINOIS — 7.0% | | | | | | | | | | |
| | Board of Education of the City of Chicago (Educational Facilities; Insured: BHAC) GO, 0.00%, due 12/1/2020 | | | | 12,000,000 | | | | | 11,173,440 | |
| | Board of Trustees of Southern Illinois University (Housing & Auxiliary Facilities; Insured: Natl-re), Series A, 5.25% due 4/1/2020 | | | | 1,000,000 | | | | | 1,050,780 | |
| | Chicago Midway International Airport, Series B, 5.00% due 1/1/2022 - 1/1/2024 | | | | 3,700,000 | | | | | 4,134,677 | |
| | Chicago O’Hare International Airport (2015 Airport Projects), 5.00% due 1/1/2019 - 1/1/2021 | | | | 8,350,000 | | | | | 8,789,558 | |
| | Chicago O’Hare International Airport (2016 Airport Projects), | | | | | | | | | | |
| | Series B, 5.00% due 1/1/2019 | | | | 8,500,000 | | | | | 8,712,160 | |
| | Series C, 5.00% due 1/1/2027 | | | | 1,750,000 | | | | | 2,016,315 | |
| | Chicago O’Hare International Airport (Capital Development Programs), Series B, 5.00% due 1/1/2022 (pre-refunded 1/1/2021) | | | | 5,835,000 | | | | | 6,335,935 | |
| | Chicago Park District (Capital Improvement Plan) GO, | | | | | | | | | | |
| | 4.00% due 1/1/2019 - 1/1/2020 | | | | 1,635,000 | | | | | 1,669,651 | |
| | 5.00% due 1/1/2023 - 1/1/2025 | | | | 5,350,000 | | | | | 5,963,347 | |
| | Series B, | | | | | | | | | | |
| | 4.00% due 1/1/2019 - 1/1/2020 | | | | 4,475,000 | | | | | 4,578,529 | |
| | 5.00% due 1/1/2021 - 1/1/2024 | | | | 7,270,000 | | | | | 7,917,378 | |
Semi-Annual Report | 11
Schedule of Investments, Continued
Thornburg Limited Term Municipal Fund | March 31, 2018 (Unaudited)
| | | | | | | | | | | | |
| | | | | PRINCIPAL AMOUNT | | VALUE |
| | Series C, 5.00% due 1/1/2022 - 1/1/2023 | | | $ | 5,155,000 | | | | $ | 5,653,010 | |
| | Series D, 5.00% due 1/1/2020 | | | | 530,000 | | | | | 554,873 | |
| | Chicago School Reform Board of Trustees of the Board of Education (School District Capital Improvement Program; Insured: Natl-Re) GO, Series A, 5.25% due 12/1/2021 | | | | 1,500,000 | | | | | 1,608,060 | |
| | Chicago Transit Authority (Federal Transit Program-Rail Systems; Insured: AGM), 5.50% due 6/1/2018 | | | | 2,500,000 | | | | | 2,514,400 | |
| | City of Chicago (Chicago Midway Airport), Series B, 5.00% due 1/1/2023 - 1/1/2024 | | | | 22,275,000 | | | | | 24,824,354 | |
| | City of Chicago (Project Fund), Series A, 5.00% due 1/1/2024 - 1/1/2027 (pre-refunded 1/1/2020) | | | | 17,850,000 | | | | | 18,835,677 | |
| | City of Chicago (Riverwalk Expansion Project; Insured: AGM), 5.00% due 1/1/2021 - 1/1/2023 | | | | 2,410,000 | | | | | 2,536,472 | |
| | City of Chicago (Wastewater Transmission System), Series C-REMK-10/, 5.00% due 1/1/2019 - 1/1/2025 | | | | 19,500,000 | | | | | 21,433,487 | |
| | City of Chicago (Wastewater Transmission System; Insured: BHAC), Series A, 5.50% due 1/1/2020 | | | | 1,400,000 | | | | | 1,403,948 | |
| | City of Chicago (Water System), | | | | | | | | | | |
| | 5.00% due 11/1/2027 | | | | 6,250,000 | | | | | 7,077,875 | |
| | Series 2017-2, 5.00% due 11/1/2018 - 11/1/2024 | | | | 7,250,000 | | | | | 7,741,354 | |
| | City of Chicago (Water System; Insured: AGM), Series 2017-2, 5.00% due 11/1/2028 | | | | 2,000,000 | | | | | 2,309,180 | |
| | City of Chicago Board of Education (Insured: Natl-Re) GO, Series A, 5.00% due 12/1/2018 | | | | 1,000,000 | | | | | 1,014,410 | |
| | City of Mount Vernon (Various Municipal Capital Improvements; Insured: AGM) GO, 4.00% due 12/15/2019 - 12/15/2021 | | | | 3,425,000 | | | | | 3,576,934 | |
| | City of Waukegan (Lakehurst Redevelopment Project; Insured: AGM) GO, Series A, 5.00% due 12/30/2019 - 12/30/2022 | | | | 6,035,000 | | | | | 6,455,452 | |
| | Community College District No. 503 (Black Hawk College; Insured: AGM) GO, 5.00% due 12/1/2021 - 12/1/2024 | | | | 10,935,000 | | | | | 12,298,812 | |
| | Community College District No. 516 (Waubonsee Community College) GO, | | | | | | | | | | |
| | 4.50% due 12/15/2020 | | | | 1,325,000 | | | | | 1,414,491 | |
| | 5.00% due 12/15/2021 | | | | 6,175,000 | | | | | 6,820,720 | |
| | Community High School District No. 127 (Lake County-Grayslake Educational Facilities.; Insured: Syncora) GO, 7.375% due 2/1/2020 | | | | 1,000,000 | | | | | 1,096,720 | |
| | Community Unit School District No. 200 (DuPage County Educational Facilities; Insured: FSA) GO, Series D, 5.25% due 10/1/2023 | | | | 1,000,000 | | | | | 1,049,280 | |
| | Community Unit School District No. 302 (Kane & DeKalb County Educational Facilities; Insured: Natl-Re) GO, 0.00%, due 2/1/2021 | | | | 3,165,000 | | | | | 2,928,131 | |
| | Community Unit School District No. 428 (DeKalb County Educational Facilities) GO, 0.00%, due 1/1/2021 | | | | 6,140,000 | | | | | 5,696,201 | |
| | Community Unit School District No. 5 (Insured: BAM) GO, 5.00% due 4/15/2024 - 4/15/2026 | | | | 1,650,000 | | | | | 1,893,786 | |
| | Cook County Community College District No. 508 (City Colleges of Chicago) GO, | | | | | | | | | | |
| | 5.00% due 12/1/2020 - 12/1/2024 | | | | 8,020,000 | | | | | 8,638,733 | |
| | 5.25% due 12/1/2025 - 12/1/2026 | | | | 3,315,000 | | | | | 3,605,816 | |
| | Cook County School District No. 97 (Village of Oak Park; Insured: Natl-Re) GO, 9.00% due 12/1/2018 | | | | 4,000,000 | | | | | 4,188,240 | |
| | County of Cook (Capital Improvement Plan) GO, | | | | | | | | | | |
| | Series A, 5.00% due 11/15/2021 | | | | 5,000,000 | | | | | 5,487,700 | |
| | Series C, | | | | | | | | | | |
| | 4.00% due 11/15/2020 - 11/15/2022 | | | | 3,925,000 | | | | | 4,168,626 | |
| | 5.00% due 11/15/2020 - 11/15/2022 | | | | 9,195,000 | | | | | 9,894,710 | |
| | Series D, 5.00% due 11/15/2019 | | | | 3,690,000 | | | | | 3,860,958 | |
| | Du Page County High School District No. 88 (Addison Trail and Willowbrook High Schools), 3.00% due 1/15/2020 | | | | 2,630,000 | | | | | 2,677,656 | |
| | Forest Preserve District of Cook County GO, Series A, 5.00% due 11/15/2021 | | | | 1,500,000 | | | | | 1,607,370 | |
| | Forest Preserve District of DuPage County GO, 5.00% due 11/1/2020 - 11/1/2024 | | | | 9,125,000 | | | | | 10,328,693 | |
| a | | Illinois Development Finance Authority, 1.70% due 5/1/2031 (put 4/2/2018) | | | | 34,300,000 | | | | | 34,300,000 | |
| | Illinois Finance Authority (Advocate Health Care), | | | | | | | | | | |
| | 5.00% due 8/1/2023 - 8/1/2025 | | | | 2,765,000 | | | | | 3,169,299 | |
| | 5.50% due 11/1/2018 | | | | 510,000 | | | | | 521,179 | |
| | Series A-1, 5.00% due 11/1/2030 (put 1/15/2020) | | | | 1,250,000 | | | | | 1,317,138 | |
| | Series D, 5.00% due 4/1/2020 (pre-refunded 4/1/2019) | | | | 1,315,000 | | | | | 1,359,197 | |
| | Illinois Finance Authority (Rush University Medical Center), Series A, 5.00% due 11/15/2020 - 11/15/2025 | | | | 4,020,000 | | | | | 4,559,375 | |
| | Illinois Finance Authority (Trinity Health), Series L, 4.00% due 12/1/2021 | | | | 1,000,000 | | | | | 1,068,780 | |
| a | | Illinois Finance Authority, 1.70% due 8/15/2042 (put 4/2/2018) | | | | 47,675,000 | | | | | 47,675,000 | |
| | Illinois State Toll Highway Authority, | | | | | | | | | | |
| | Series A-1, 5.00% due 1/1/2025 | | | | 6,500,000 | | | | | 6,848,530 | |
| | Series D, 5.00% due 1/1/2023 - 1/1/2024 | | | | 10,500,000 | | | | | 11,899,275 | |
| | Kane McHenry Cook & DeKalb Counties Unit School District No. 300 (Insured: AMBAC) GO, 0.00%, due 12/1/2021 | | | | 2,000,000 | | | | | 1,833,772 | |
| | Kane McHenry Cook & DeKalb Counties Unit School District No. 300 GO, 5.00% due 1/1/2024 | | | | 7,150,000 | | | | | 8,072,135 | |
| | McHenry County Conservation District GO, 5.00% due 2/1/2021 - 2/1/2025 | | | | 4,325,000 | | | | | 4,819,580 | |
| | Metropolitan Pier & Exposition Authority (McCormick Place Expansion), Series B, 5.00% due 12/15/2020 | | | | 4,000,000 | | | | | 4,225,000 | |
| | Railsplitter Tobacco Settlement Authority, | | | | | | | | | | |
| | 5.00% due 6/1/2019 | | | | 22,000,000 | | | | | 22,776,380 | |
| | 5.125% due 6/1/2019 | | | | 6,780,000 | | | | | 7,028,962 | |
| | State of Illinois (Build Illinois) GO, 5.00% due 4/1/2026 | | | | 5,000,000 | | | | | 5,006,550 | |
| | State of Illinois (Build Illinois), | | | | | | | | | | |
| | Series A, 5.00% due 6/15/2023 - 6/15/2025 | | | | 14,650,000 | | | | | 16,537,109 | |
| | Series B, 5.00% due 6/15/2021 (pre-refunded 6/15/2019) | | | | 9,945,000 | | | | | 10,337,827 | |
| | State of Illinois (Insured: BAM-TCRS National), Series BAM-TCRS, 6.00% due 6/15/2026 | | | | 3,455,000 | | | | | 4,242,809 | |
| | Town of Cicero Cook County (Cicero and Laramie Development Areas; Insured: AGM) GO, Series A, 5.00% due 1/1/2019 - 1/1/2021 | | | | 4,700,000 | | | | | 4,883,456 | |
| | University of Illinois Board of Trustees (Insured: AGM) COP, Series B, 5.00% due 10/1/2019 | | | | 955,000 | | | | | 964,158 | |
| | Village of Melrose Park (Insured: Natl-Re), Series A, 5.20% due 7/1/2018 | | | | 580,000 | | | | | 584,808 | |
| | Village of Tinley Park GO, 4.00% due 12/1/2022 | | | | 625,000 | | | | | 668,550 | |
| | Will & Kendall Counties Plainfield Community Consolidated School District 202 (Capital Improvements; Insured: BAM) GO, Series A, 5.00% due 1/1/2023 - 1/1/2025 | | | | 21,125,000 | | | | | 23,845,277 | |
| | Will County Valley View Community Unit School District No. 365 (Insured: AGM) GO, 0.00%, Series B, due 11/1/2018 | | | | 3,370,000 | | | | | 3,332,795 | |
12 | Semi-Annual Report
Schedule of Investments, Continued
Thornburg Limited Term Municipal Fund | March 31, 2018 (Unaudited)
| | | | | | | | | | | | |
| | | | | PRINCIPAL AMOUNT | | VALUE |
| | INDIANA — 2.1% | | | | | | | | | | |
| | Avon Community School Building Corp., | | | | | | | | | | |
| | 4.00% due 7/15/2018 - 7/15/2019 | | | $ | 2,000,000 | | | | $ | 2,035,360 | |
| | 5.00% due 7/15/2021 - 7/15/2027 | | | | 6,730,000 | | | | | 7,612,036 | |
| | Board of Trustees for the Vincennes University, | | | | | | | | | | |
| | Series J, | | | | | | | | | | |
| | 4.00% due 6/1/2018 | | | | 1,000,000 | | | | | 1,003,970 | |
| | 5.00% due 6/1/2020 | | | | 1,000,000 | | | | | 1,067,730 | |
| | City of Carmel Redevelopment Authority (Road and Intersection Improvements), 5.00% due 8/1/2021 - 8/1/2022 | | | | 4,915,000 | | | | | 5,413,213 | |
| | City of Carmel Redevelopment District (CFP Energy Center, LLC Installment Purchase Agreement) COP, 5.75% due 7/15/2022 (pre-refunded 1/15/2021) | | | | 2,320,000 | | | | | 2,481,147 | |
| | Duneland School Building Corp. (State Aid Withholding), 0.00%, due 2/1/2020 - 8/1/2021 | | | | 12,480,000 | | | | | 11,797,572 | |
| | Hamilton Southeastern Consolidated School Building Corp. (Educational Facilities; Insured: State Intercept), Series D, 5.00% due 7/15/2021 -1/15/2024 | | | | 3,210,000 | | | | | 3,583,076 | |
| | Indiana Bond Bank (Columbus Learning Center), 5.00% due 8/1/2021 | | | | 1,300,000 | | | | | 1,419,704 | |
| | Indiana Finance Authority (Community Health Network), | | | | | | | | | | |
| | Series A, | | | | | | | | | | |
| | 4.00% due 5/1/2018 | | | | 2,820,000 | | | | | 2,825,076 | |
| | 5.00% due 5/1/2019 - 5/1/2022 | | | | 6,130,000 | | | | | 6,574,749 | |
| | Indiana Finance Authority (CWA Authority, Inc. Wastewater System Project), Series A, 5.00% due 10/1/2021 - 10/1/2024 | | | | 2,000,000 | | | | | 2,261,680 | |
| | Indiana Finance Authority (Indiana University Health System), Series N, 5.00% due 3/1/2020 - 3/1/2022 | | | | 18,120,000 | | | | | 19,542,416 | |
| | Indiana Finance Authority (Indianapolis Airport), Series A-1, 5.00% due 11/1/2018 | | | | 2,750,000 | | | | | 2,804,477 | |
| a | | Indiana Finance Authority (LOC: Barclays Bank plc), 1.72% due 11/1/2037 (put 4/2/2018) | | | | 24,000,000 | | | | | 24,000,000 | |
| | Indiana Finance Authority (Marian University Health Sciences), 5.00% due 9/15/2018 - 9/15/2021 | | | | 7,605,000 | | | | | 8,018,319 | |
| | Indiana Finance Authority (Parkview Health System), 5.00% due 5/1/2022 | | | | 1,135,000 | | | | | 1,263,934 | |
| | Indiana Finance Authority (Rockville Correctional Facilities), 5.25% due 7/1/2018 | | | | 2,150,000 | | | | | 2,169,629 | |
| | Indiana Finance Authority (Sisters of St. Francis Health Services, Inc.), 5.00% due 11/1/2018 | | | | 1,250,000 | | | | | 1,273,450 | |
| | Indiana Finance Authority (Wabash Correctional Facilities), 5.25% due 7/1/2018 | | | | 1,000,000 | | | | | 1,009,110 | |
| a | | Indiana Finance Authority, 1.72% due 2/1/2037 (put 4/2/2018) | | | | 10,075,000 | | | | | 10,075,000 | |
| | Indiana Municipal Power Agency (Power Supply System), Series A, 5.00% due 1/1/2026 - 1/1/2028 | | | | 4,235,000 | | | | | 4,990,896 | |
| | Knox Middle School Building Corp. (Insured: Natl-Re) (State Aid Withholding), 0.00%, due 1/15/2020 | | | | 1,295,000 | | | | | 1,234,744 | |
| | Lake Central Multi-District School Building Corp. (Educational Facilities) (State Aid Withholding), | | | | | | | | | | |
| | Series B, | | | | | | | | | | |
| | 4.00% due 1/15/2019 - 1/15/2022 | | | | 5,050,000 | | | | | 5,270,750 | |
| | 5.00% due 7/15/2019 - 7/15/2022 | | | | 5,100,000 | | | | | 5,468,910 | |
| | Perry Township Multischool Building Corp. (Educational Facilities) (State Aid Withholding), | | | | | | | | | | |
| | 3.00% due 1/10/2019 | | | | 1,000,000 | | | | | 1,010,110 | |
| | 4.00% due 7/10/2019 | | | | 1,000,000 | | | | | 1,028,230 | |
| | 5.00% due 7/10/2020 - 7/10/2021 | | | | 3,090,000 | | | | | 3,319,340 | |
| | Whitko High School Building Corp. (School Corp. Capital Improvements) (State Aid Withholding), 4.00% due 7/15/2018 | | | | 1,025,000 | | | | | 1,031,837 | |
| | Zionsville Community Schools Building Corp. (Insured: AGM) (State Aid Withholding), 5.00% due 7/15/2019 | | | | 1,100,000 | | | | | 1,135,739 | |
| | IOWA — 0.3% | | | | | | | | | | |
| | Des Moines Independent Community School District (School Infrastructure; Insured: AGM), 4.00% due 6/1/2019 - 6/1/2022 | | | | 14,125,000 | | | | | 14,687,459 | |
| | Iowa Finance Authority (Genesis Health System), 5.00% due 7/1/2022 - 7/1/2024 | | | | 6,085,000 | | | | | 6,865,878 | |
| | KANSAS — 0.9% | | | | | | | | | | |
| | Kansas (National Bio and Agro-Defense Facility) DFA, 5.00% due 4/1/2020 - 4/1/2025 | | | | 39,450,000 | | | | | 43,702,893 | |
| | Kansas (New Jobs Training; Insured: BAM) DFA, 5.00% due 12/1/2020 | | | | 1,500,000 | | | | | 1,576,905 | |
| | Seward County No. 480 USD GO, Series B, 5.00% due 9/1/2024 - 9/1/2027 | | | | 6,120,000 | | | | | 7,051,436 | |
| | Unified Government of Wyandotte County/Kansas City (Utility Systems Improvement), Series A, 5.00% due 9/1/2022 - 9/1/2024 | | | | 3,600,000 | | | | | 4,055,734 | |
| | Wyandotte County No. 500 (General Improvement) USD GO, Series A, 5.00% due 9/1/2025 - 9/1/2026 | | | | 5,675,000 | | | | | 6,609,355 | |
| | KENTUCKY — 1.8% | | | | | | | | | | |
| | Commonwealth of Kentucky State Property and Buildings Commission (Project No. 112), Series B, 5.00% due 11/1/2021 - 11/1/2026 | | | | 61,960,000 | | | | | 70,417,051 | |
| | Kentucky Economic (Norton Healthcare, Inc.; Insured: Natl-Re) DFA, 0.00%, Series B, due 10/1/2019 - 10/1/2023 | | | | 21,680,000 | | | | | 19,974,378 | |
| | Lexington-Fayette Urban County Government Public Facilities Corp. (Eastern State Hospital), Series A, 5.00% due 6/1/2022 | | | | 6,165,000 | | | | | 6,712,822 | |
| | Louisville/Jefferson County Metropolitan Government (Louisville Gas and Electric Company), 1.50% due 10/1/2033 (put 4/1/2019) | | | | 16,725,000 | | | | | 16,659,438 | |
| | Louisville/Jefferson County Metropolitan Government (Norton Healthcare, Inc.), 5.00% due 10/1/2024 - 10/1/2026 | | | | 5,200,000 | | | | | 6,014,788 | |
| | Turnpike Authority of Kentucky (Revitalization Projects), Series B, 5.00% due 7/1/2025 - 7/1/2026 | | | | 5,615,000 | | | | | 6,575,444 | |
| | LOUISIANA — 2.6% | | | | | | | | | | |
| | City of Bossier (Public Improvements; Insured: AGM), | | | | | | | | | | |
| | Series ST-2010, | | | | | | | | | | |
| | 4.00% due 12/1/2018 | | | | 2,020,000 | | | | | 2,051,997 | |
| | 4.50% due 12/1/2021 | | | | 2,240,000 | | | | | 2,422,672 | |
| | City of Lafayette (Utilities System Improvements), 5.00% due 11/1/2019 | | | | 1,000,000 | | | | | 1,048,580 | |
| | City of New Orleans (Audubon Park Aquarium; Insured: AGM) GO, Series A1, 4.00% due 10/1/2018 | | | | 1,110,000 | | | | | 1,123,453 | |
| | City of New Orleans (Public Improvements) GO, | | | | | | | | | | |
| | 4.00% due 12/1/2018 - 12/1/2019 | | | | 1,450,000 | | | | | 1,484,900 | |
| | 5.00% due 12/1/2020 - 12/1/2021 | | | | 2,515,000 | | | | | 2,736,817 | |
| | City of New Orleans (Public Improvements; Insured: AGM) GO, 5.00% due 12/1/2019 - 12/1/2021 | | | | 12,030,000 | | | | | 13,002,782 | |
| | City of Shreveport (Water and Sewer System; Insured: BAM), Series A, 5.00% due 12/1/2020 - 12/1/2024 | | | | 31,150,000 | | | | | 34,724,835 | |
Semi-Annual Report | 13
Schedule of Investments, Continued
Thornburg Limited Term Municipal Fund | March 31, 2018 (Unaudited)
| | | | | | | | | | | | |
| | | | | PRINCIPAL AMOUNT | | VALUE |
| | Consolidated Sales Tax District A of the Parish of LaFourche (Roads, Bridges & Drainage Works), 4.00% due 3/1/2021 - 3/1/2022 | | | $ | 3,535,000 | | | | $ | 3,726,028 | |
| | East Baton Rouge Sewerage Commission (Wastewater System Improvements), Series B, 5.00% due 2/1/2023 - 2/1/2025 | | | | 2,150,000 | | | | | 2,442,201 | |
| | Ernest N. Morial - New Orleans Exhibition Hall Authority (Convention Center), 5.00% due 7/15/2020 - 7/15/2023 | | | | 3,780,000 | | | | | 4,136,160 | |
| | Jefferson Sales Tax District Parish of Jefferson (Sewerage Capital Project; Insured: AGM), Series B, 5.00% due 12/1/2018 | | | | 2,000,000 | | | | | 2,044,360 | |
| | Louisiana Energy & Power Authority (LEPA Unit No. 1 Power; Insured: AGM), Series A, 5.00% due 6/1/2022 - 6/1/2023 | | | | 1,750,000 | | | | | 1,963,655 | |
| | Louisiana Energy & Power Authority (Rodemacher Unit No. 2 Power), 5.00% due 1/1/2020 - 1/1/2023 | | | | 4,240,000 | | | | | 4,585,870 | |
| | Louisiana Local Govt Environmental Facilities & Community Development Authority (Bossier Parish Community College - Campus Facilities, Inc. Project), | | | | | | | | | | |
| | 4.00% due 12/1/2018 - 12/1/2019 | | | | 3,965,000 | | | | | 4,050,681 | |
| | 5.00% due 12/1/2020 | | | | 1,200,000 | | | | | 1,294,752 | |
| | Louisiana Local Govt Environmental Facilities & Community Development Authority (LCTCS Act 391 Project; Insured: BAM), 5.00% due 10/1/2022 -10/1/2027 | | | | 19,015,000 | | | | | 21,862,711 | |
| | Louisiana Local Govt Environmental Facilities & Community Development Authority (Town of Vinton Public Power Authority; Insured: AGM), 4.50% due 10/1/2018 - 10/1/2019 | | | | 2,000,000 | | | | | 2,055,410 | |
| | Louisiana Offshore Terminal Authority (Deepwater Oil Port-Loop, LLC), Series A, 5.00% due 10/1/2018 | | | | 22,140,000 | | | | | 22,470,550 | |
| | Louisiana Public Facilities Authority (Hurricane Recovery Program), 5.00% due 6/1/2022 - 6/1/2023 | | | | 7,945,000 | | | | | 8,916,474 | |
| | Louisiana State Office Facilities Corp. (State Capitol), Series A, 5.00% due 5/1/2018 - 5/1/2021 | | | | 7,095,000 | | | | | 7,368,081 | |
| | New Orleans Regional Transit Authority (Streetcar Rail Lines; Insured: AGM), 5.00% due 12/1/2019 - 12/1/2022 | | | | 3,110,000 | | | | | 3,320,579 | |
| | Parish of LaFourche (Roads, Highways & Bridges), 5.00% due 1/1/2019 - 1/1/2023 | | | | 1,525,000 | | | | | 1,639,394 | |
| | Parish of Orleans School District (Insured: AGM) GO, 5.00% due 9/1/2018 - 9/1/2020 | | | | 8,640,000 | | | | | 8,975,366 | |
| | Parish of Plaquemines Law Enforcement District GO, | | | | | | | | | | |
| | 5.00% due 9/1/2019 | | | | 1,005,000 | | | | | 1,030,517 | |
| | 5.00% due 9/1/2021 (pre-refunded 9/1/2019) | | | | 1,115,000 | | | | | 1,166,234 | |
| | Parish of St. Charles (Valero Energy Corp. Refinery), 4.00% due 12/1/2040 (put 6/1/2022) | | | | 14,195,000 | | | | | 15,089,001 | |
| | Parish of Terrebonne Hospital Service District No. 1 (Terrebonne General Medical Center), | | | | | | | | | | |
| | 5.00% due 4/1/2018 - 4/1/2021 | | | | 4,295,000 | | | | | 4,435,548 | |
| | 5.00% due 4/1/2021 (pre-refunded 4/1/2020) | | | | 835,000 | | | | | 887,288 | |
| | MAINE — 0.1% | | | | | | | | | | |
| | Maine Governmental Facilities Authority (Augusta & Machias Courthouses), 5.00% due 10/1/2020 - 10/1/2023 | | | | 5,180,000 | | | | | 5,746,370 | |
| | MARYLAND — 0.3% | | | | | | | | | | |
| | Maryland Economic Development Corp. (Public Health Laboratory), | | | | | | | | | | |
| | 4.00% due 6/1/2022 | | | | 8,245,000 | | | | | 8,744,894 | |
| | 5.00% due 6/1/2021 | | | | 8,725,000 | | | | | 9,576,211 | |
| a | | Montgomery County GO, Series E, 1.71% due 11/1/2037 (put 4/2/2018) | | | | 700,000 | | | | | 700,000 | |
| | MASSACHUSETTS — 1.2% | | | | | | | | | | |
| | Berkshire Wind Power Cooperative Corp., | | | | | | | | | | |
| | 5.00% due 7/1/2018 - 7/1/2019 | | | | 5,590,000 | | | | | 5,723,184 | |
| | 5.00% due 7/1/2020 (pre-refunded 1/1/2020) | | | | 2,965,000 | | | | | 3,133,975 | |
| | Massachusetts (Insured BHAC-CR FGIC), 5.50% due 1/1/2029 | | | | 8,300,000 | | | | | 10,410,441 | |
| | Massachusetts Development Finance Agency (CareGroup Healthcare System), Series H-1, 5.00% due 7/1/2020 | | | | 5,000,000 | | | | | 5,337,700 | |
| | Massachusetts Development Finance Agency (CareGroup Healthcare), Series I, 5.00% due 7/1/2023 - 7/1/2026 | | | | 11,020,000 | | | | | 12,670,448 | |
| | Massachusetts Development Finance Agency (Dominion Energy Brayton Point Station Units 1 and 2), 5.75% due 12/1/2042 (pre-refunded 5/1/2019) | | | | 2,000,000 | | | | | 2,086,120 | |
| | Massachusetts Development Finance Agency (Mount Auburn Hospital Health Records System), | | | | | | | | | | |
| | Series H-1, | | | | | | | | | | |
| | 3.00% due 7/1/2018 | | | | 1,000,000 | | | | | 1,003,230 | |
| | 5.00% due 7/1/2022 - 7/1/2025 | | | | 15,265,000 | | | | | 17,353,365 | |
| | Massachusetts Development Finance Agency (Simmons College), Series J, 5.25% due 10/1/2023 | | | | 595,000 | | | | | 685,113 | |
| | Massachusetts Educational Financing Authority, 5.75% due 1/1/2020 | | | | 7,500,000 | | | | | 7,952,925 | |
| | Massachusetts Health & Educational Facilities Authority (UMass Memorial Health Care), Series G, 5.00% due 7/1/2018 | | | | 4,290,000 | | | | | 4,323,076 | |
| | Massachusetts Housing Finance Agency (Low and Moderate Income Housing), Series B, 2.00% due 6/1/2019 | | | | 11,915,000 | | | | | 11,921,434 | |
| | MICHIGAN — 3.0% | | | | | | | | | | |
| | Board of Governors of Wayne State University (Educational Facilities and Equipment), Series A, 5.00% due 11/15/2022 - 11/15/2025 | | | | 1,870,000 | | | | | 2,131,043 | |
| | Byron Center Michigan Public Schools (Insured: AGM/Q-SBLF), 4.00% due 5/1/2018 - 5/1/2020 | | | | 2,935,000 | | | | | 2,983,624 | |
| | County of Genesee (Water Supply System; Insured: BAM) GO, 5.00% due 11/1/2022 | | | | 600,000 | | | | | 667,788 | |
| | County of Livingston (Howell Public Schools; Insured: Q-SBLF) GO, 4.00% due 5/1/2018 - 5/1/2021 | | | | 3,000,000 | | | | | 3,104,860 | |
| | Kalamazoo Hospital Finance Authority (Bronson Methodist Hospital; Insured: AGM), | | | | | | | | | | |
| | 5.00% due 5/15/2018 - 5/15/2021 | | | | 6,805,000 | | | | | 6,978,686 | |
| | 5.00% due 5/15/2021 (pre-refunded 5/15/2020) | | | | 1,300,000 | | | | | 1,384,877 | |
| | Livonia Public Schools School District (School Building & Site) GO, | | | | | | | | | | |
| | Series I, | | | | | | | | | | |
| | 4.00% due 5/1/2020 | | | | 800,000 | | | | | 827,264 | |
| | 5.00% due 5/1/2021 | | | | 900,000 | | | | | 971,514 | |
| | Michigan Finance Authority (Beaumont Health Credit Group), | | | | | | | | | | |
| | 4.00% due 8/1/2018 | | | | 500,000 | | | | | 503,665 | |
| | 5.00% due 8/1/2023 - 8/1/2025 | | | | 18,800,000 | | | | | 21,467,684 | |
| | Michigan Finance Authority (Henry Ford Health System), 5.00% due 11/15/2027 | | | | 1,000,000 | | | | | 1,156,590 | |
| | Michigan Finance Authority (Trinity Health Credit Group), 5.00% due 12/1/2022 - 12/1/2028 | | | | 10,500,000 | | | | | 12,159,995 | |
| | Michigan Finance Authority (Ypsilanti Community Schools), 5.00% due 8/1/2019 - 8/1/2022 | | | | 5,040,000 | | | | | 5,404,584 | |
| | Michigan Municipal Bond Authority (Clean Water Fund), 5.00% due 10/1/2020 | | | | 35,000 | | | | | 35,947 | |
14 | Semi-Annual Report
Schedule of Investments, Continued
Thornburg Limited Term Municipal Fund | March 31, 2018 (Unaudited)
| | | | | | | | | | | | |
| | | | | PRINCIPAL AMOUNT | | VALUE |
| | Michigan State Building Authority (Facilities Program), Series I, 5.00% due 4/15/2023 - 4/15/2026 | | | $ | 4,305,000 | | | | $ | 4,958,578 | |
| | Michigan State Hospital Finance Authority (Ascension Health), Series F-2-REM, 1.90% due 11/15/2047 (put 4/1/2021) | | | | 2,900,000 | | | | | 2,882,426 | |
| | Michigan State Hospital Finance Authority (Henry Ford Health System), 5.50% due 11/15/2018 | | | | 3,500,000 | | | | | 3,582,915 | |
| | Michigan State Hospital Finance Authority (Trinity Health), 6.00% due 12/1/2018 | | | | 2,000,000 | | | | | 2,057,180 | |
| | Michigan Strategic Fund (Michigan House of Representatives Facilities; Insured: AGM), Series A, 5.25% due 10/15/2019 - 10/15/2020 (pre-refunded 10/15/2018) | | | | 6,575,000 | | | | | 6,705,119 | |
| | Novi Community School District (Michigan School Bond Qualification and Loan Program; Insured: Q-SBLF) GO, 5.00% due 5/1/2018 - 5/1/2019 | | | | 1,800,000 | | | | | 1,831,234 | |
| | Plymouth-Canton Community Schools (Insured: Q-SBLF) GO, | | | | | | | | | | |
| | Series A, | | | | | | | | | | |
| | 4.00% due 5/1/2018 - 5/1/2019 | | | | 2,500,000 | | | | | 2,527,580 | |
| | 5.00% due 5/1/2020 | | | | 1,000,000 | | | | | 1,063,480 | |
| | Royal Oak Hospital Finance Authority (William Beaumont Hospital), 5.00% due 9/1/2020 - 9/1/2024 | | | | 6,940,000 | | | | | 7,709,339 | |
| | School District of the City of Dearborn (Insured: Q-SBLF) (State Aid Withholding) GO, | | | | | | | | | | |
| | 3.00% due 5/1/2019 | | | | 445,000 | | | | | 450,767 | |
b | | 4.00% due 5/1/2020 | | | | 350,000 | | | | | 365,047 | |
| | 4.00% due 5/1/2021 - 5/1/2023 | | | | 1,730,000 | | | | | 1,852,468 | |
| | School District of the City of Detroit (Wayne County School Building & Site; Insured: Q-SBLF) GO, Series A, 5.00% due 5/1/2020 - 5/1/2022 | | | | 9,200,000 | | | | | 9,983,282 | |
| | Sparta Area Schools, Counties of Kent and Ottawa (School Building & Site; Insured: Q-SBLF) GO, 5.00% due 5/1/2018 - 5/1/2020 | | | | 2,620,000 | | | | | 2,707,004 | |
| | St. Johns Public Schools (Insured: Natl-Re/FGIC/Q-SBLF) GO, 5.00% due 5/1/2021 | | | | 1,000,000 | | | | | 1,060,870 | |
| | State Building Authority of the State of Michigan (Higher Education Facilities Program), Series I-A, 5.00% due 10/15/2020 - 10/15/2023 | | | | 12,715,000 | | | | | 14,321,793 | |
| | State of Michigan (Jobs Today Highway Program & Governor’s Economic Stimulus Program), 5.00% due 3/15/2025 | | | | 19,000,000 | | | | | 21,986,610 | |
| | Utica Community Schools County of Macomb (Technology Infrastructure Improvements; Insured: Q-SBLF) GO, 4.00% due 5/1/2018 - 5/1/2019 | | | | 11,650,000 | | | | | 11,876,382 | |
| | Warren Consolidated School District (Insured: Q-SBLF) GO, 5.00% due 5/1/2018 - 5/1/2021 | | | | 3,000,000 | | | | | 3,153,830 | |
| | Wayne County Airport Authority (Detroit Metropolitan Airport), | | | | | | | | | | |
| | Series C, | | | | | | | | | | |
| | 5.00% due 12/1/2019 | | | | 12,645,000 | | | | | 13,323,151 | |
| | 5.50% due 12/1/2020 | | | | 4,395,000 | | | | | 4,765,367 | |
| | Series D, 5.50% due 12/1/2019 - 12/1/2020 | | | | 5,715,000 | | | | | 6,138,129 | |
| | Wayne State University, Series A, 5.00% due 11/15/2023 - 11/15/2026 | | | | 17,480,000 | | | | | 20,214,468 | |
| | MINNESOTA — 1.1% | | | | | | | | | | |
| | City of Rochester (Mayo Clinic), Series A, 4.00% due 11/15/2030 (put 11/15/2018) | | | | 1,450,000 | | | | | 1,471,605 | |
| | City of St. Cloud (CentraCare Health System), Series A, 5.00% due 5/1/2018 - 5/1/2020 | | | | 9,910,000 | | | | | 10,250,016 | |
| | City of St. Paul Housing & Redevelopment Authority (Gillette Children’s Specialty Healthcare Project), 5.25% due 2/1/2020 (pre-refunded 2/1/2019) | | | | 2,010,000 | | | | | 2,068,717 | |
| | County of Clay (State-Aid Road Improvements) GO, Series A, 3.00% due 4/1/2018 | | | | 1,225,000 | | | | | 1,225,000 | |
| | Le Sueur-Henderson No. 2397 (Minnesota School District Credit Enhancement Program) ISD, 3.00% due 4/1/2021 | | | | 1,125,000 | | | | | 1,157,209 | |
| | Minneapolis MN/St Paul Housing & Redevelopment Authority (LOC: JPMorgan Chase Bank, N.A.), | | | | | | | | | | |
a | | Series B-1, 1.71% due 11/15/2035 (put 4/2/2018) | | | | 4,530,000 | | | | | 4,530,000 | |
a | | Series B-2, 1.70% due 11/15/2035 (put 4/2/2018) | | | | 34,115,000 | | | | | 34,115,000 | |
| | Northern Municipal Power Agency (Electric System), Series A1, 5.00% due 1/1/2019 - 1/1/2020 | | | | 8,500,000 | | | | | 8,811,555 | |
| | Port Authority of the City of St. Paul (Minnesota Andersen Office Building), Series 3, 5.00% due 12/1/2021 - 12/1/2022 | | | | 2,215,000 | | | | | 2,468,281 | |
| | Port Authority of the City of St. Paul (Minnesota Freeman Office Building), | | | | | | | | | | |
| | Series 2, | | | | | | | | | | |
| | 4.00% due 12/1/2018 | | | | 3,925,000 | | | | | 3,988,467 | |
| | 5.00% due 12/1/2019 - 12/1/2020 | | | | 4,675,000 | | | | | 4,992,547 | |
| | St. Paul Housing and Redevelopment Authority (HealthPartners), 5.00% due 7/1/2023 - 7/1/2025 | | | | 1,850,000 | | | | | 2,109,419 | |
| | MISSISSIPPI — 0.3% | | | | | | | | | | |
| | Mississippi Development Bank (Department of Corrections), Series C, 5.00% due 8/1/2018 | | | | 4,910,000 | | | | | 4,964,059 | |
| | Mississippi Development Bank (MDOT-Harrison County Highway), Series A-GA, 5.00% due 1/1/2020 - 1/1/2023 | | | | 6,500,000 | | | | | 7,031,165 | |
| | Mississippi Development Bank (MDOT-Madison County Highway), 5.00% due 1/1/2020 - 1/1/2023 | | | | 5,250,000 | | | | | 5,689,155 | |
| | MISSOURI — 1.2% | | | | | | | | | | |
| | Cass County COP, | | | | | | | | | | |
| | 4.00% due 5/1/2018 | | | | 2,255,000 | | | | | 2,259,059 | |
| | 4.50% due 5/1/2019 | | | | 1,270,000 | | | | | 1,305,319 | |
| | 5.00% due 5/1/2020 - 5/1/2021 | | | | 4,005,000 | | | | | 4,221,746 | |
| | City of St. Louis (Cash Flow Management) GO, 3.00% due 6/1/2018 | | | | 4,500,000 | | | | | 4,510,395 | |
| a | | Health & Educational Facilities Authority of the State of Missouri, Series C-REMK, 1.70% due 3/1/2040 (put 4/2/2018) | | | | 1,600,000 | | | | | 1,600,000 | |
| | Jackson County (Parking Facility Projects), 4.00% due 12/1/2019 - 12/1/2021 | | | | 1,500,000 | | | | | 1,587,960 | |
| | Kansas City (Kansas City Redevelopment District) IDA, | | | | | | | | | | |
b | | 5.00% due 9/1/2018 | | | | 695,000 | | | | | 704,487 | |
| | 5.00% due 9/1/2018 | | | | 1,305,000 | | | | | 1,322,813 | |
| | Kansas City Municipal Assistance Corp. (H. Roe Bartle Convention Center & Infrastructure Project; Insured: AMBAC), 0.00%, Series B-1, due 4/15/2021 | | | | 10,055,000 | | | | | 9,333,453 | |
| | Kansas City Municipal Assistance Corp. (H. Roe Bartle Convention Center & Infrastructure Project; Insured: AMBAC), 0.00%, Series B-1, due 4/15/2022 | | | | 5,040,000 | | | | | 4,534,085 | |
| | Kansas City Municipal Assistance Corp. (H. Roe Bartle Convention Center & Infrastructure Project; Insured: Natl-Re), 5.00% due 4/15/2018 | | | | 1,000,000 | | | | | 1,001,140 | |
| | Missouri Development Finance Board (City of Independence Electric System), | | | | | | | | | | |
| | Series B, 5.00% due 6/1/2018 - 6/1/2020 | | | | 4,495,000 | | | | | 4,624,418 | |
| | Series F, 4.00% due 6/1/2019 - 6/1/2022 | | | | 7,885,000 | | | | | 8,233,718 | |
| a | | Missouri Development Finance Board, Series A, 1.70% due 12/1/2033 (put 4/2/2018) | | | | 16,410,000 | | | | | 16,410,000 | |
Semi-Annual Report | 15
Schedule of Investments, Continued
Thornburg Limited Term Municipal Fund | March 31, 2018 (Unaudited)
| | | | | | | | | | | | |
| | | | | PRINCIPAL AMOUNT | | VALUE |
| | Missouri Health and Educational Facilities Authority (Children’s Mercy Hospital), | | | | | | | | | | |
| | 5.00% due 5/15/2019 - 5/15/2020 | | | $ | 1,170,000 | | | | $ | 1,211,779 | |
| | 5.00% due 5/15/2020 (pre-refunded 5/15/2019) | | | | 830,000 | | | | | 860,154 | |
| | Platte County (Community & Resource Centers), | | | | | | | | | | |
| | 4.00% due 4/1/2018 | | | | 2,110,000 | | | | | 2,110,000 | |
| | 5.00% due 4/1/2019 - 4/1/2021 | | | | 4,440,000 | | | | | 4,693,188 | |
| | Southeast Missouri State University (City of Cape Girardeau Campus System Facilities), 5.00% due 4/1/2018 - 4/1/2020 | | | | 3,990,000 | | | | | 4,168,031 | |
| | Special Administrative Board of the Transitional School District of the City of St. Louis (State Aid Withholding) GO, 4.00% due 4/1/2019 - 4/1/2022 | | | | 8,570,000 | | | | | 9,038,472 | |
| | NEBRASKA — 0.1% | | | | | | | | | | |
| | Douglas County Hospital Authority No. 3 (Nebraska Methodist Health System), 5.00% due 11/1/2022 - 11/1/2025 | | | | 6,980,000 | | | | | 7,894,210 | |
| | NEVADA — 3.0% | | | | | | | | | | |
| | Carson City (Carson Tahoe Regional Healthcare), 5.00% due 9/1/2019 - 9/1/2027 | | | | 6,155,000 | | | | | 6,756,790 | |
| | City of Las Vegas (City Hall) COP, 5.00% due 9/1/2018 | | | | 4,000,000 | | | | | 4,056,260 | |
| | City of Las Vegas (Performing Arts Center) GO, 7.00% due 4/1/2018 | | | | 2,095,000 | | | | | 2,095,000 | |
| | City of Reno (Washoe Medical Center; Insured: AGM), 5.25% due 6/1/2018 | | | | 1,000,000 | | | | | 1,005,740 | |
| | Clark County School District (Acquisition of Transportation & Technology Equipment) GO, | | | | | | | | | | |
| | Series C, 5.00% due 6/15/2022 | | | | 2,560,000 | | | | | 2,841,626 | |
| | Series D, 5.00% due 6/15/2021 - 6/15/2022 | | | | 47,150,000 | | | | | 51,960,971 | |
| | Series E, 5.00% due 6/15/2021 | | | | 21,405,000 | | | | | 23,357,350 | |
| | Las Vegas Clark County Library District GO, 5.00% due 1/1/2019 | | | | 3,000,000 | | | | | 3,076,230 | |
| | Las Vegas Convention and Visitors Authority, Series C, 5.00% due 7/1/2023 - 7/1/2026 | | | | 6,205,000 | | | | | 7,083,705 | |
| | Las Vegas Valley Water District GO, | | | | | | | | | | |
| | Series A, 5.00% due 6/1/2023 - 6/1/2026 | | | | 55,955,000 | | | | | 64,712,728 | |
| | Series B, 5.00% due 12/1/2025 | | | | 20,000,000 | | | | | 23,416,400 | |
| | Series C, 5.00% due 6/1/2020 - 6/1/2021 | | | | 9,255,000 | | | | | 10,023,658 | |
| | Series D, 5.00% due 6/1/2019 - 6/1/2020 | | | | 6,080,000 | | | | | 6,469,714 | |
| | Washoe County (Reno-Sparks Convention & Visitors Authority) GO, 5.00% due 7/1/2021 - 7/1/2022 | | | | 4,200,000 | | | | | 4,608,502 | |
| | NEW HAMPSHIRE — 0.2% | | | | | | | | | | |
| a | | New Hampshire Health and Education Facilities Authority Act, 1.70% due 7/1/2033 - 7/1/2035 (put 4/2/2018) | | | | 4,650,000 | | | | | 4,650,000 | |
| | New Hampshire Municipal Bond Bank, 5.25% due 8/15/2020 - 8/15/2022 | | | | 3,770,000 | | | | | 4,219,125 | |
| | New Hampshire Turnpike System, Series B, 5.00% due 2/1/2020 - 2/1/2021 | | | | 2,260,000 | | | | | 2,422,092 | |
| | NEW JERSEY — 2.9% | | | | | | | | | | |
| | Burlington County Bridge Commission (County Governmental Loan Program), 5.00% due 12/1/2018 | | | | 1,000,000 | | | | | 1,022,580 | |
| | City of Jersey City (Qualified General Improvement; Insured: BAM) (State Aid Withholding) GO, | | | | | | | | | | |
| | Series A, | | | | | | | | | | |
| | 4.00% due 8/1/2020 - 8/1/2021 | | | | 5,455,000 | | | | | 5,759,186 | |
| | 5.00% due 8/1/2022 - 8/1/2023 | | | | 4,985,000 | | | | | 5,596,659 | |
| | Essex County Improvement Authority (County Correctional Facilities & Gibraltar Facilities; Insured: Natl-Re), 5.50% due 10/1/2024 | | | | 5,000,000 | | | | | 5,926,950 | |
| | Hudson County Improvement Authority (Hudson County Lease; Insured: AGM), | | | | | | | | | | |
| | 4.75% due 10/1/2018 - 10/1/2019 | | | | 6,390,000 | | | | | 6,619,377 | |
| | 5.375% due 10/1/2020 | | | | 2,020,000 | | | | | 2,180,469 | |
| | New Jersey (New Jersey Transit Corporation) EDA, Series B, 5.00% due 11/1/2024 - 11/1/2026 | | | | 16,000,000 | | | | | 17,579,680 | |
| | New Jersey (School Facilities Construction) EDA, | | | | | | | | | | |
| | 5.00% due 9/1/2020 - 3/1/2026 | | | | 11,650,000 | | | | | 12,423,230 | |
| | Series G, 5.75% due 9/1/2023 (pre-refunded 3/1/2021) | | | | 4,955,000 | | | | | 5,492,667 | |
| | Series GG, 5.75% due 9/1/2023 | | | | 550,000 | | | | | 592,163 | |
| | New Jersey (School Facilities Construction; Insured: AMBAC) EDA, Series K, 5.50% due 12/15/2019 | | | | 5,525,000 | | | | | 5,819,814 | |
| | New Jersey Health Care Facilities Financing Authority (Virtua Health Issue), 5.00% due 7/1/2023 - 7/1/2024 | | | | 1,535,000 | | | | | 1,746,390 | |
| | New Jersey Higher Educational Assistance Authority, | | | | | | | | | | |
| | Series 1A, | | | | | | | | | | |
| | 5.00% due 12/1/2018 | | | | 3,000,000 | | | | | 3,056,940 | |
| | 5.25% due 12/1/2019 | | | | 5,650,000 | | | | | 5,918,996 | |
| | New Jersey Transit Corp. (Urban Public Transportation Capital Improvement), Series A, 5.00% due 9/15/2021 | | | | 3,395,000 | | | | | 3,640,119 | |
| | New Jersey Transportation Trust Fund Authority (Federal Highway), 5.00% due 6/15/2028 | | | | 7,330,000 | | | | | 7,368,922 | |
| | New Jersey Transportation Trust Fund Authority (State Transportation System Improvements), | | | | | | | | | | |
| c | | 2.78% (MUNIPSA + 1.20%) due 6/15/2034 (put 12/15/2021) | | | | 6,250,000 | | | | | 6,274,625 | |
| | 5.00% due 6/15/2020 - 6/15/2027 | | | | 49,285,000 | | | | | 53,443,448 | |
| | Series A, | | | | | | | | | | |
| | 5.00% due 6/15/2024 | | | | 1,710,000 | | | | | 1,871,715 | |
| | 5.25% due 12/15/2022 | | | | 2,000,000 | | | | | 2,185,720 | |
| | Series B, 5.00% due 6/15/2019 - 6/15/2021 | | | | 4,570,000 | | | | | 4,830,058 | |
| | New Jersey Transportation Trust Fund Authority (State Transportation System Improvements; Insured: AMBAC), Series B, 5.25% due 12/15/2023 | | | | 3,545,000 | | | | | 3,983,587 | |
| | New Jersey Transportation Trust Fund Authority, 5.00% due 6/15/2022 | | | | 22,595,000 | | | | | 22,735,541 | |
| | Passaic Valley Sewer Commissioners (Sewer System) GO, | | | | | | | | | | |
| | Series G, | | | | | | | | | | |
| | 5.625% due 12/1/2018 | | | | 1,210,000 | | | | | 1,241,303 | |
| | 5.75% due 12/1/2019 - 12/1/2021 | | | | 10,750,000 | | | | | 11,815,678 | |
16 | Semi-Annual Report
Schedule of Investments, Continued
Thornburg Limited Term Municipal Fund | March 31, 2018 (Unaudited)
| | | | | | | | | | | | |
| | | | | PRINCIPAL AMOUNT | | VALUE |
| | NEW MEXICO — 1.4% | | | | | | | | | | |
| | Albuquerque Municipal School District No. 12 (Bernalillo and Sandoval Counties School Facilities) (State Aid Withholding) GO, 5.00% due 8/1/2019 | | | $ | 5,885,000 | | | | $ | 6,141,174 | |
| | Carlsbad Municipal School District (Educational Facilities) GO, 5.00% due 8/1/2023 | | | | 1,650,000 | | | | | 1,882,798 | |
| | City of Albuquerque (City Infrastructure Improvements) GO, 5.00% due 7/1/2023 | | | | 1,360,000 | | | | | 1,552,671 | |
| | City of Farmington (Southern California Edison Co.-Four Corners Project), 1.875% due 4/1/2029 (put 4/1/2020) | | | | 3,000,000 | | | | | 2,979,330 | |
| | City of Santa Fe (El Castillo Retirement Residences), 4.50% due 5/15/2022 | | | | 2,585,000 | | | | | 2,756,747 | |
| | County of Los Alamos (Public Facilities), 5.50% due 6/1/2018 | | | | 1,205,000 | | | | | 1,212,555 | |
| | New Mexico Educational Assistance Foundation (Student Loans), Series A-1, 5.00% due 12/1/2018 - 12/1/2021 | | | | 8,000,000 | | | | | 8,344,460 | |
| | New Mexico Hospital Equipment Loan Council (Presbyterian Healthcare Services), 5.00% due 8/1/2024 - 8/1/2025 | | | | 1,780,000 | | | | | 2,051,011 | |
| a | | New Mexico Hospital Equipment Loan Council, 1.70% due 8/1/2034 (put 4/2/2018) | | | | 51,460,000 | | | | | 51,460,000 | |
| | New Mexico State University, Series B, 5.00% due 4/1/2020 - 4/1/2022 | | | | 6,190,000 | | | | | 6,683,869 | |
| | Rio Rancho Public School District No 94 GO, 5.00% due 8/1/2026 | | | | 1,085,000 | | | | | 1,280,604 | |
| | Rio Rancho Public School District No. 94 (State Aid Withholding) GO, 4.00% due 8/1/2018 | | | | 3,940,000 | | | | | 3,970,417 | |
| | Santa Fe County (County Buildings & Facilities) GRT, Series A, 5.00% due 6/1/2025 | | | | 1,250,000 | | | | | 1,468,013 | |
| | State of New Mexico (Educational Facilities), 5.00% due 7/1/2020 | | | | 4,000,000 | | | | | 4,285,720 | |
| | NEW YORK — 11.7% | | | | | | | | | | |
| | City of Long Beach School District (Insured: AGM) (State Aid Withholding) GO, 3.50% due 5/1/2022 | | | | 1,600,000 | | | | | 1,659,536 | |
| | City of New York (City Budget Financial Management) GO, | | | | | | | | | | |
| | 5.00% due 8/1/2021 - 8/1/2023 | | | | 25,145,000 | | | | | 28,145,215 | |
| | Series D, 5.00% due 8/1/2021 - 8/1/2022 | | | | 6,000,000 | | | | | 6,655,740 | |
| | Series J, 5.00% due 8/1/2021 - 8/1/2024 | | | | 80,480,000 | | | | | 91,644,132 | |
| | Series K, 5.00% due 8/1/2021 - 8/1/2022 | | | | 20,850,000 | | | | | 23,184,293 | |
| | Erie County Individual Development Agency (Buffalo School District), Series A, 5.00% due 5/1/2018 | | | | 5,000,000 | | | | | 5,014,000 | |
| | Metropolitan Transportation Authority (Transit and Commuter System), Series C-1A, 4.00% due 2/15/2019 | | | | 14,500,000 | | | | | 14,795,220 | |
| | Metropolitan Transportation Authority, | | | | | | | | | | |
| | Series A, 5.00% due 11/15/2020 | | | | 2,000,000 | | | | | 2,164,960 | |
| | Series A2-GREEN BOND, 5.00% due 11/15/2025 - 11/15/2027 | | | | 44,520,000 | | | | | 52,306,053 | |
| | Series C-1, 5.00% due 11/15/2027 - 11/15/2028 | | | | 21,960,000 | | | | | 26,032,293 | |
| | Series C-2B, 5.00% due 11/15/2034 (put 2/15/2020) | | | | 550,000 | | | | | 580,074 | |
| | Series D, 5.00% due 11/15/2020 - 11/15/2021 | | | | 37,280,000 | | | | | 40,863,140 | |
| | Monroe County Industrial Development Corp. (St. John Fisher College), Series A, 5.00% due 6/1/2018 - 6/1/2022 | | | | 4,455,000 | | | | | 4,724,496 | |
| | Nassau County (New York Institute of Technology) IDA, Series A, 5.25% due 3/1/2020 | | | | 1,715,000 | | | | | 1,826,629 | |
| | New York City Health and Hospital Corp. (Healthcare Facilities Improvements) GO, Series A, 5.00% due 2/15/2019 - 2/15/2021 | | | | 15,315,000 | | | | | 16,151,878 | |
| | New York City Transitional Finance Authority (City Capital Projects & WTC Recovery Costs), | | | | | | | | | | |
| | 5.00% due 11/1/2018 | | | | 3,075,000 | | | | | 3,136,285 | |
| | Series B, 5.00% due 11/1/2018 | | | | 3,145,000 | | | | | 3,207,680 | |
| | Series D, 5.00% due 11/1/2018 | | | | 11,730,000 | | | | | 11,963,779 | |
| | Series E, 5.00% due 11/1/2018 | | | | 14,725,000 | | | | | 15,018,469 | |
| | New York City Transitional Finance Authority Future Tax Secured Revenue, | | | | | | | | | | |
| a | | 1.73% due 11/1/2036 - 2/1/2045 (put 4/2/2018) | | | | 84,260,000 | | | | | 84,260,000 | |
| a | | 1.75% due 8/1/2031 (put 4/2/2018) | | | | 3,700,000 | | | | | 3,700,000 | |
| a | | Series 1-SUB 1D, 1.75% due 11/1/2022 (put 4/2/2018) | | | | 15,750,000 | | | | | 15,750,000 | |
| | New York City Trust for Cultural Resources (Lincoln Center for the Performing Arts, Inc.), 5.00% due 12/1/2026 | | | | 2,500,000 | | | | | 2,975,350 | |
| a | | New York City Water & Sewer System (LOC: Citibank N.A.), Series F-SUBSER F-2-REMK 10/2, 1.70% due 6/15/2035 (put 4/2/2018) | | | | 9,510,000 | | | | | 9,510,000 | |
| | New York City Water & Sewer System, | | | | | | | | | | |
| a | | 1.71% due 6/15/2039 (put 4/2/2018) | | | | 3,100,000 | | | | | 3,100,000 | |
| a | | 1.73% due 6/15/2032 - 6/15/2050 (put 4/2/2018) | | | | 132,060,000 | | | | | 132,060,000 | |
| a | | 1.77% due 6/15/2044 (put 4/2/2018) | | | | 2,700,000 | | | | | 2,700,000 | |
| a | | New York GO, Series 1-SUBSER I-2, 1.73% due 3/1/2040 (put 4/2/2018) | | | | 11,100,000 | | | | | 11,100,000 | |
| | New York State Dormitory Authority (Metropolitan Transportation Authority Service Contract), Series A, 5.00% due 12/15/2019 | | | | 60,000,000 | | | | | 63,364,800 | |
| | New York State Dormitory Authority (NYSARC, Inc. Developmental Disability Programs), Series A, 5.00% due 7/1/2020 | | | | 1,000,000 | | | | | 1,068,230 | |
| | New York State Dormitory Authority (School Districts Financing Program) (State Aid Withholding), | | | | | | | | | | |
| | 5.25% due 10/1/2023 | | | | 140,000 | | | | | 155,483 | |
| | 5.25% due 10/1/2023 (pre-refunded 10/1/2021) | | | | 1,860,000 | | | | | 2,072,375 | |
| | Series G, | | | | | | | | | | |
| | 2.25% due 4/1/2018 | | | | 4,800,000 | | | | | 4,800,000 | |
| | 5.00% due 4/1/2018 - 10/1/2022 | | | | 2,685,000 | | | | | 2,848,039 | |
| | Series H, 5.00% due 10/1/2018 - 10/1/2021 | | | | 4,730,000 | | | | | 4,988,201 | |
| | Series J, 5.00% due 10/1/2018 - 10/1/2020 | | | | 7,940,000 | | | | | 8,328,133 | |
| | New York State Dormitory Authority (School Districts Financing Program; Insured: AGM) (State Aid Withholding), Series F, 5.00% due 10/1/2018 -10/1/2021 | | | | 7,950,000 | | | | | 8,387,741 | |
| | New York State Dormitory Authority (School Districts Financing Program; Insured: AGM), Series A, 5.00% due 10/1/2020 - 10/1/2024 | | | | 8,650,000 | | | | | 9,776,051 | |
| | New York State Thruway Authority (Governor Thomas E. Dewey Thruway), | | | | | | | | | | |
| | 5.00% due 1/1/2020 - 1/1/2022 | | | | 7,500,000 | | | | | 8,135,655 | |
| | Series K, 5.00% due 1/1/2024 - 1/1/2025 | | | | 3,000,000 | | | | | 3,464,680 | |
| | New York State Thruway Authority (Highway, Bridge, Multi-Modal and MTA Projects), Series A, 5.00% due 3/15/2024 | | | | 18,300,000 | | | | | 19,914,243 | |
| | New York State Thruway Authority (New NY Bridge), 5.00% due 5/1/2019 | | | | 5,000,000 | | | | | 5,177,050 | |
| | Suffolk County Economic Development Corp. (Catholic Health Services), 5.00% due 7/1/2020 - 7/1/2022 | | | | 15,000,000 | | | | | 16,143,050 | |
| | Town of Oyster Bay GO, Series A, 3.50% due 6/1/2018 | | | | 5,125,000 | | | | | 5,136,787 | |
Semi-Annual Report | 17
Schedule of Investments, Continued
Thornburg Limited Term Municipal Fund | March 31, 2018 (Unaudited)
| | | | | | | | | | | | |
| | | | | PRINCIPAL AMOUNT | | VALUE |
| | Triborough Bridge and Tunnel Authority (MTA Bridges and Tunnels), | | | | | | | | | | |
| | 5.00% due 11/15/2025 - 11/15/2027 | | | $ | 19,730,000 | | | | $ | 23,688,566 | |
| | Series A, 5.00% due 11/15/2021 | | | | 5,140,000 | | | | | 5,709,512 | |
| | United Nations Development Corp. (One, Two and Three U.N. Plaza), Series A, 5.00% due 7/1/2019 | | | | 4,000,000 | | | | | 4,159,240 | |
| | West Seneca Central School District (Insured: BAM) (State Aid Withholding) GO, 5.00% due 11/15/2022 | | | | 1,000,000 | | | | | 1,123,190 | |
| | NORTH CAROLINA — 2.1% | | | | | | | | | | |
| | Charlotte-Mecklenburg Hospital Authority (Carolinas HealthCare System), | | | | | | | | | | |
| | Series A, | | | | | | | | | | |
| | 3.00% due 1/15/2021 | | | | 1,595,000 | | | | | 1,641,446 | |
| | 4.00% due 1/15/2019 - 1/15/2022 | | | | 1,445,000 | | | | | 1,515,394 | |
| | 5.00% due 1/15/2023 - 1/15/2024 | | | | 4,255,000 | | | | | 4,789,506 | |
| a | | Charlotte-Mecklenburg Hospital Authority, 1.73% due 1/15/2037 - 1/15/2038 (put 4/2/2018) | | | | 68,820,000 | | | | | 68,820,000 | |
| | City of Charlotte (Equipment Acquisition & Public Facilities) COP, Series C, 5.00% due 12/1/2020 - 12/1/2025 | | | | 8,940,000 | | | | | 10,159,955 | |
| | County of Buncombe (Primary, Middle School & Community College Facilities), Series A, 5.00% due 6/1/2022 - 6/1/2024 | | | | 2,350,000 | | | | | 2,669,413 | |
| | County of Dare (Educational Facility Capital Projects), | | | | | | | | | | |
| | Series A, | | | | | | | | | | |
| | 4.00% due 6/1/2018 - 6/1/2022 | | | | 2,180,000 | | | | | 2,262,853 | |
| | 5.00% due 6/1/2021 - 6/1/2024 | | | | 1,925,000 | | | | | 2,120,435 | |
| | County of Mecklenburg (County Debt Restructuring) GO, Series A, 5.00% due 12/1/2018 | | | | 3,015,000 | | | | | 3,083,501 | |
| | County of Randolph, | | | | | | | | | | |
| | Series B, 5.00% due 10/1/2021 - 10/1/2023 | | | | 3,560,000 | | | | | 3,952,532 | |
| | Series C, 5.00% due 10/1/2020 - 10/1/2023 | | | | 1,400,000 | | | | | 1,535,836 | |
| | North Carolina Eastern Municipal Power Agency, | | | | | | | | | | |
| | 5.00% due 1/1/2022 | | | | 4,715,000 | | | | | 5,226,295 | |
| | Series B, 5.00% due 1/1/2021 | | | | 5,000,000 | | | | | 5,429,250 | |
| | North Carolina Municipal Power Agency (Catawba Electric), | | | | | | | | | | |
| | 4.00% due 1/1/2022 | | | | 1,000,000 | | | | | 1,067,310 | |
| | Series A, 4.00% due 1/1/2020 | | | | 1,550,000 | | | | | 1,610,951 | |
| | 5.00% due 1/1/2019 - 1/1/2020 | | | | 5,500,000 | | | | | 5,669,098 | |
| | State of North Carolina (State Capital Projects and Correctional Facilities), Series B, 5.00% due 11/1/2019 | | | | 23,635,000 | | | | | 24,851,494 | |
| | Winston-Salem State University (Student Housing and Student Services Facilities), 5.00% due 4/1/2019 - 4/1/2022 | | | | 1,760,000 | | | | | 1,875,540 | |
| | NORTH DAKOTA — 0.0% | | | | | | | | | | |
| | County of Ward (Insured: AGM), 4.00% due 4/1/2020 | | | | 2,445,000 | | | | | 2,546,981 | |
| | OHIO — 3.1% | | | | | | | | | | |
| | Akron, Bath & Copley Joint Township Hospital District (Children’s Hospital Medical Center), 5.00% due 11/15/2021 | | | | 1,000,000 | | | | | 1,099,370 | |
| | American Municipal Power, Inc. (AMP Combined Hydroelectric Projects), Series C, 5.25% due 2/15/2019 | | | | 5,595,000 | | | | | 5,768,501 | |
| | American Municipal Power, Inc. (AMP Fremont Energy Center), 5.00% due 2/15/2020 - 2/15/2022 | | | | 5,915,000 | | | | | 6,410,191 | |
| | Cincinnati City School District Board of Education (Educational Facilities; Insured: Natl-Re) GO, 5.25% due 12/1/2023 | | | | 2,690,000 | | | | | 3,111,980 | |
| | City of Akron (Community Learning Centers), 5.00% due 12/1/2021 | | | | 4,120,000 | | | | | 4,547,986 | |
| | City of Akron (Various Municipal Capital Projects) GO, Series A, 5.00% due 12/1/2019 | | | | 1,685,000 | | | | | 1,774,794 | |
| | City of Cleveland (City Capital Projects) GO, Series A, 2.00% due 12/1/2018 | | | | 700,000 | | | | | 702,380 | |
| | City of Cleveland (City Capital Projects; Insured: AMBAC) GO, 5.50% due 10/1/2019 | | | | 1,260,000 | | | | | 1,330,736 | |
| | City of Cleveland (Cleveland Stadium) COP, 4.75% due 11/15/2020 | | | | 2,000,000 | | | | | 2,126,320 | |
| | City of Cleveland (Municipal Street System Improvements) GO, | | | | | | | | | | |
| | Series A, | | | | | | | | | | |
| | 3.00% due 12/1/2020 - 12/1/2021 | | | | 2,980,000 | | | | | 3,076,978 | |
| | 4.00% due 12/1/2022 - 12/1/2023 | | | | 6,725,000 | | | | | 7,280,899 | |
| | 5.00% due 12/1/2024 - 12/1/2026 | | | | 10,895,000 | | | | | 12,649,278 | |
| | City of Cleveland (Parks & Recreation Facilities), | | | | | | | | | | |
| | 4.00% due 10/1/2018 - 10/1/2019 | | | | 1,020,000 | | | | | 1,044,117 | |
| | 5.00% due 10/1/2020 - 10/1/2023 | | | | 3,375,000 | | | | | 3,751,769 | |
| | City of Cleveland (Police & Fire Pension Payment), 5.00% due 5/15/2019 - 5/15/2021 | | | | 4,105,000 | | | | | 4,342,963 | |
| | City of Cleveland (Public Facilities Improvements), 5.00% due 10/1/2025 - 10/1/2028 | | | | 2,855,000 | | | | | 3,345,210 | |
| | City of Cleveland (Public Facilities), | | | | | | | | | | |
| b | | 4.00% due 10/1/2019 | | | | 600,000 | | | | | 620,460 | |
| | 5.00% due 10/1/2020 - 10/1/2023 | | | | 2,570,000 | | | | | 2,869,093 | |
| | City of Toledo (Water System Improvements), 5.00% due 11/15/2018 - 11/15/2023 | | | | 12,440,000 | | | | | 13,612,864 | |
| | Cleveland Package Facilities (Insured: AGM), 5.25% due 9/15/2021 | | | | 965,000 | | | | | 1,069,722 | |
| | Cleveland State University (Campus Capital Projects), 5.00% due 6/1/2019 - 6/1/2022 | | | | 4,700,000 | | | | | 5,073,365 | |
| | Cleveland-Cuyahoga County Port Authority (Cleveland Museum of Art), 5.00% due 10/1/2019 | | | | 2,000,000 | | | | | 2,093,340 | |
| | Clty of Cleveland (Parking Facility; Insured: AGM), 5.25% due 9/15/2021 | | | | 2,035,000 | | | | | 2,226,616 | |
| | County of Clermont (Sanitary Sewer System), 4.00% due 8/1/2019 | | | | 1,420,000 | | | | | 1,431,062 | |
| | County of Cuyahoga (Convention Hotel Project) COP, 5.00% due 12/1/2019 - 12/1/2024 | | | | 29,470,000 | | | | | 33,112,166 | |
| | County of Hamilton, Series A, 5.00% due 12/1/2018 - 12/1/2026 | | | | 20,150,000 | | | | | 22,731,377 | |
| | County of Scioto, 5.00% due 2/15/2022 - 2/15/2025 | | | | 6,465,000 | | | | | 7,288,621 | |
| | Franklin County Convention Facilities Authority (Greater Columbus Convention Center), 5.00% due 12/1/2021 - 12/1/2024 | | | | 2,500,000 | | | | | 2,811,850 | |
18 | Semi-Annual Report
Schedule of Investments, Continued
Thornburg Limited Term Municipal Fund | March 31, 2018 (Unaudited)
| | | | | | | | | | | | |
| | | | | PRINCIPAL AMOUNT | | VALUE |
| | Kent State University (Insured: AGC), | | | | | | | | | | |
| | Series B, | | | | | | | | | | |
| | 5.00% due 5/1/2020 | | | $ | 85,000 | | | | $ | 88,038 | |
| | 5.00% due 5/1/2020 (pre-refunded 5/1/2019) | | | | 915,000 | | | | | 947,601 | |
| a | | Ohio Higher Educational Facility Commission, 1.70% due 1/1/2043 (put 4/2/2018) | | | | 1,660,000 | | | | | 1,660,000 | |
| | Ohio State Building Authority, 5.00% due 10/1/2020 | | | | 1,700,000 | | | | | 1,783,470 | |
| | Ohio Turnpike & Infrastructure Commission, 5.00% due 2/15/2027 - 2/15/2028 | | | | 14,555,000 | | | | | 17,335,951 | |
| | RiverSouth Authority (RiverSouth Area Redevelopment), 5.00% due 12/1/2019 | | | | 2,500,000 | | | | | 2,634,500 | |
| | State of Ohio (Common Schools Capital Facilities) GO, Series D, 5.50% due 9/15/2019 | | | | 4,150,000 | | | | | 4,379,785 | |
| | State of Ohio (Cultural and Sports Capital Facilities), 5.00% due 10/1/2020 | | | | 3,845,000 | | | | | 4,137,951 | |
| | State of Ohio (Major New Street Infrastructure Project), | | | | | | | | | | |
| | 4.00% due 12/15/2018 - 12/15/2019 | | | | 2,000,000 | | | | | 2,053,720 | |
| | 5.00% due 12/15/2020 - 12/15/2026 | | | | 10,500,000 | | | | | 11,959,075 | |
| | Youngstown City School District (Educational Facilities) (State Aid Withholding) GO, 4.00% due 12/1/2018 - 12/1/2023 | | | | 10,060,000 | | | | | 10,507,045 | |
| | OKLAHOMA — 0.7% | | | | | | | | | | |
| | Canadian County Educational Facilities Authority (Mustang Public Schools), | | | | | | | | | | |
| | 4.00% due 9/1/2019 | | | | 1,410,000 | | | | | 1,453,611 | |
| | 4.50% due 9/1/2020 - 9/1/2021 | | | | 4,980,000 | | | | | 5,311,459 | |
| | Cleveland County Educational Facilities Authority (Moore Public Schools), 5.00% due 6/1/2023 | | | | 5,355,000 | | | | | 6,024,161 | |
| | Oklahoma (INTEGRIS Health) DFA, | | | | | | | | | | |
| | 5.00% due 8/15/2018 | | | | 500,000 | | | | | 506,380 | |
| | Series A, 5.00% due 8/15/2022 - 8/15/2025 | | | | 4,725,000 | | | | | 5,428,609 | |
| | Oklahoma Capitol Improvement Authority (State Highway Capital Improvement), 5.00% due 7/1/2023 - 7/1/2024 | | | | 1,125,000 | | | | | 1,291,918 | |
| | Oklahoma County Finance Authority (Western Heights Public Schools), | | | | | | | | | | |
| | 4.00% due 9/1/2018 | | | | 250,000 | | | | | 252,290 | |
| | 5.00% due 9/1/2018 - 9/1/2020 | | | | 4,120,000 | | | | | 4,288,478 | |
| | Oklahoma County Finance Authority, 5.00% due 10/1/2022 - 10/1/2026 | | | | 3,200,000 | | | | | 3,619,020 | |
| | Tulsa County Industrial Authority (Broken Arrow Public Schools), 4.50% due 9/1/2020 - 9/1/2021 | | | | 10,360,000 | | | | | 11,200,617 | |
| | Tulsa County Industrial Authority (Jenks Public Schools), 5.50% due 9/1/2018 | | | | 4,210,000 | | | | | 4,277,823 | |
| | Tulsa County Industrial Authority, 5.00% due 9/1/2020 - 9/1/2022 | | | | 4,215,000 | | | | | 4,626,030 | |
| | OREGON — 0.7% | | | | | | | | | | |
| | Hillsboro School District No. 1J (School Capital Improvements) GO, 5.00% due 6/15/2025 - 6/15/2027 | | | | 10,630,000 | | | | | 12,640,849 | |
| | Polk County Dallas School District No. 2 (Capital Improvements) GO, 0.00%, due 6/15/2019 - 6/15/2021 | | | | 1,990,000 | | | | | 1,887,760 | |
| | State of Oregon (Cash Management) GO, Series A, 5.00% due 9/28/2018 | | | | 31,500,000 | | | | | 32,025,735 | |
| | Tri-County Metropolitan Transportation District of Oregon, 5.00% due 10/1/2028 | | | | 2,845,000 | | | | | 3,357,442 | |
| | PENNSYLVANIA — 5.2% | | | | | | | | | | |
| | Adams County (Gettysburg College) IDA, 5.00% due 8/15/2019 | | | | 1,765,000 | | | | | 1,840,630 | |
| | Allegheny County Higher Education Building Authority (Duquesne University of the Holy Spirit), Series A, 5.00% due 3/1/2020 - 3/1/2025 | | | | 2,195,000 | | | | | 2,469,948 | |
| | Allegheny County Hospital Development Authority (University of Pittsburgh Medical Center), | | | | | | | | | | |
| | 5.00% due 5/15/2018 | | | | 5,915,000 | | | | | 5,938,305 | |
| | Series A, 5.00% due 9/1/2018 | | | | 3,100,000 | | | | | 3,142,563 | |
| | Series B, 5.00% due 6/15/2018 | | | | 3,310,000 | | | | | 3,332,342 | |
| | Allegheny County Sanitary Authority (2015 Capital Project), | | | | | | | | | | |
| | 4.00% due 12/1/2018 | | | | 650,000 | | | | | 660,205 | |
| | 5.00% due 12/1/2023 - 12/1/2024 | | | | 19,150,000 | | | | | 21,844,252 | |
| | Allegheny County Sanitary Authority (2015 Capital Project; Insured: BAM), 5.00% due 12/1/2025 | | | | 1,000,000 | | | | | 1,173,290 | |
| | Altoona Area School District (Insured: AGM) (State Aid Withholding) GO, 3.00% due 12/1/2022 | | | | 1,335,000 | | | | | 1,372,473 | |
| | Athens Area School District (Insured: AGM) (State Aid Withholding) GO, Series B, 3.00% due 4/15/2018 - 4/15/2019 | | | | 5,280,000 | | | | | 5,283,826 | |
| | City of Philadelphia (Insured: AGM) GO, 5.00% due 8/1/2025 - 8/1/2027 | | | | 28,685,000 | | | | | 33,233,802 | |
| | City of Philadelphia (Pennsylvania Gas Works), | | | | | | | | | | |
| | 5.00% due 10/1/2020 - 8/1/2025 | | | | 12,200,000 | | | | | 13,770,919 | |
| | Series 1998, 5.00% due 7/1/2018 | | | | 1,395,000 | | | | | 1,406,718 | |
| | City of Philadelphia (Philadelphia Gas Works), 2.00% due 8/1/2018 | | | | 4,765,000 | | | | | 4,771,290 | |
| | City of Philadelphia (Water and Wastewater System), 5.00% due 10/1/2024 - 10/1/2026 | | | | 9,885,000 | | | | | 11,524,220 | |
| | City of Philadelphia GO, Series A, 5.00% due 8/1/2025 - 8/1/2026 | | | | 25,130,000 | | | | | 28,833,655 | |
| | City of Pittsburgh (Insured: BAM) GO, 5.00% due 9/1/2022 | | | | 1,100,000 | | | | | 1,222,419 | |
| | Commonwealth Financing Authority, 5.00% due 6/1/2023 | | | | 930,000 | | | | | 1,024,832 | |
| | Commonwealth of Pennsylvania (Capital Facilities Projects) GO, 5.00% due 3/15/2022 | | | | 12,485,000 | | | | | 13,745,735 | |
| | Commonwealth of Pennsylvania (Capital Facilities) GO, Series D, 5.00% due 8/15/2023 - 8/15/2025 | | | | 49,450,000 | | | | | 56,095,191 | |
| | Economy Borough Municipal Authority (Beaver County Sewer System; Insured: BAM), | | | | | | | | | | |
| | 3.00% due 12/15/2018 | | | | 435,000 | | | | | 439,367 | |
| | 4.00% due 12/15/2020 - 12/15/2022 | | | | 1,785,000 | | | | | 1,901,567 | |
| a | | Hospitals & Higher Education Facilities Authority of Philadelphia, 1.70% due 2/15/2021 (put 4/2/2018) | | | | 785,000 | | | | | 785,000 | |
| | Lancaster County Hospital Authority (Masonic Villages Project), 5.00% due 11/1/2018 | | | | 1,105,000 | | | | | 1,125,608 | |
| | Lancaster County Solid Waste Management Authority (Harrisburg Resource Recovery Facility), | | | | | | | | | | |
| | 5.00% due 12/15/2023 | | | | 2,680,000 | | | | | 3,024,675 | |
| | 5.25% due 12/15/2024 | | | | 4,770,000 | | | | | 5,421,916 | |
| | Luzerne County (Insured: AGM) GO, Series A, 5.00% due 11/15/2021 - 11/15/2024 | | | | 11,840,000 | | | | | 13,209,632 | |
| | Luzerne County Industrial Development Authority (Insured: AGM) GO, 5.00% due 12/15/2020 - 12/15/2027 | | | | 6,545,000 | | | | | 7,175,848 | |
| | Monroeville Finance Authority (University of Pittsburgh Medical Center), 5.00% due 2/15/2021 - 2/15/2022 | | | | 3,650,000 | | | | | 3,984,818 | |
Semi-Annual Report | 19
Schedule of Investments, Continued
Thornburg Limited Term Municipal Fund | March 31, 2018 (Unaudited)
| | | | | | | | | | | | |
| | | | | PRINCIPAL AMOUNT | | VALUE |
| | Montgomery County Higher Education & Health Authority (Abington Memorial Hospital), 5.00% due 6/1/2022 | | | $ | 3,000,000 | | | | $ | 3,315,810 | |
| | Northampton Borough Municipal Authority (Water System; Insured: AGM), | | | | | | | | | | |
| | 3.00% due 5/15/2023 | | | | 1,255,000 | | | | | 1,282,848 | |
| | 4.00% due 5/15/2021 - 5/15/2022 | | | | 1,685,000 | | | | | 1,792,496 | |
| | Norwin School District (Insured: AGM) (State Aid Withholding) GO, 4.00% due 4/1/2018 | | | | 1,835,000 | | | | | 1,835,000 | |
| | Pennsylvania Economic Development Financing Authority, Series A, 5.00% due 11/15/2026 | | | | 2,310,000 | | | | | 2,712,079 | |
| | Pennsylvania Higher Educational Facilities Authority (Saint Joseph’s University), Series A, 5.00% due 11/1/2023 | | | | 1,075,000 | | | | | 1,155,335 | |
| | Pennsylvania Higher Educational Facilities Authority (Shippensburg University Student Services, Inc. Student Housing), 4.00% due 10/1/2022 | | | | 2,075,000 | | | | | 2,128,825 | |
| | Pennsylvania Higher Educational Facilities Authority (Univerity of Pennsylvania Health System), 5.00% due 8/15/2027 | | | | 1,000,000 | | | | | 1,192,850 | |
| | Pennsylvania Higher Educational Facilities Authority (University of Pittsburgh Medical Center), Series E, 5.00% due 5/15/2019 - 5/15/2020 | | | | 10,700,000 | | | | | 11,234,689 | |
| | Pennsylvania Turnpike Commission, 5.00% due 12/1/2022 - 12/1/2027 | | | | 6,725,000 | | | | | 7,809,232 | |
| | Philadelphia Authority for Industrial Development (Mast Charter School), 5.00% due 8/1/2020 | | | | 325,000 | | | | | 337,038 | |
| | Philadelphia Municipal Authority (Juvenile Justice Services Center), 5.00% due 4/1/2021 - 4/1/2027 | | | | 7,850,000 | | | | | 8,799,014 | |
| | Philadelphia School District (State Aid Withholding) GO, | | | | | | | | | | |
| | Series C, 5.00% due 9/1/2019 | | | | 18,410,000 | | | | | 19,211,203 | |
| | Series E, | | | | | | | | | | |
| | 5.00% due 9/1/2019 | | | | 4,210,000 | | | | | 4,393,219 | |
| | 5.25% due 9/1/2021 | | | | 2,265,000 | | | | | 2,425,770 | |
| | Pittsburgh Water and Sewer Authority, | | | | | | | | | | |
| | Series A, 5.00% due 9/1/2024 | | | | 7,365,000 | | | | | 8,299,250 | |
| | Series B, | | | | | | | | | | |
| | 5.00% due 9/1/2023 | | | | 2,520,000 | | | | | 2,869,776 | |
| | 5.00% due 9/1/2024 (pre-refunded 9/1/2023) | | | | 2,395,000 | | | | | 2,727,426 | |
| | Plum Borough School District (Insured: BAM) (State Aid Withholding) GO, | | | | | | | | | | |
| | 4.00% due 9/15/2018 - 9/15/2021 | | | | 5,795,000 | | | | | 6,021,458 | |
| | 5.00% due 9/15/2022 - 9/15/2024 | | | | 5,260,000 | | | | | 5,892,743 | |
| | School District of Philadelphia (School Reform Commission) (State Aid Withholding) GO, Series D, 5.00% due 9/1/2018 | | | | 5,250,000 | | | | | 5,318,407 | |
| d | | School District of Philadelphia GO, 5.00% due 9/1/2023 - 9/1/2028 | | | | 2,400,000 | | | | | 2,714,219 | |
| | Southeastern Pennsylvania Transportation Authority, 5.00% due 6/1/2022 - 6/1/2028 | | | | 7,705,000 | | | | | 8,969,437 | |
| | Wayne County Hospital and (Wayne Memorial Hospital; Insured: AGM) HFA, | | | | | | | | | | |
| | 2.00% due 7/1/2018 | | | | 625,000 | | | | | 625,763 | |
| | 3.00% due 7/1/2019 | | | | 1,185,000 | | | | | 1,188,247 | |
| | RHODE ISLAND — 1.6% | | | | | | | | | | |
| | Rhode Island Clean Water Finance Agency (Public Drinking Water Supply or Treatment Facilities), Series B, 5.00% due 10/1/2018 - 10/1/2023 | | | | 10,080,000 | | | | | 11,107,642 | |
| | Rhode Island Convention Center Authority (Convention Center and Parking Projects), 5.00% due 5/15/2018 - 5/15/2020 | | | | 19,090,000 | | | | | 19,731,101 | |
| | Rhode Island Health and Educational Building Corp. (University of Rhode Island Auxiliary Enterprise), Series C, 5.00% due 9/15/2020 - 9/15/2023 | | | | 2,150,000 | | | | | 2,391,839 | |
| | Rhode Island Health and Educational Building Corp. (University of Rhode Island), Series B, 5.00% due 9/15/2020 - 9/15/2025 | | | | 1,320,000 | | | | | 1,480,774 | |
| | State of Rhode Island and Providence Plantations (Consolidated Capital Development Loan) GO, | | | | | | | | | | |
| | 5.00% due 8/1/2020 - 8/1/2022 | | | | 34,725,000 | | | | | 38,147,202 | |
| | Series A, 5.00% due 10/1/2019 | | | | 5,000,000 | | | | | 5,243,950 | |
| | Series B, 4.00% due 10/15/2020 - 10/15/2022 | | | | 3,200,000 | | | | | 3,414,886 | |
| | State of Rhode Island and Providence Plantations (Energy Conservation) COP, 5.00% due 4/1/2022 | | | | 2,020,000 | | | | | 2,236,786 | |
| | State of Rhode Island and Providence Plantations (Information Technology) COP, 5.00% due 11/1/2024 | | | | 3,010,000 | | | | | 3,467,701 | |
| | State of Rhode Island and Providence Plantations (Kent County Courthouse) COP, Series A, 5.00% due 10/1/2019 - 10/1/2023 | | | | 7,575,000 | | | | | 8,355,146 | |
| | State of Rhode Island and Providence Plantations (Training School) COP, Series B, 5.00% due 10/1/2019 - 10/1/2023 | | | | 11,845,000 | | | | | 13,034,102 | |
| | SOUTH CAROLINA — 0.5% | | | | | | | | | | |
| | Beaufort-Jasper Water & Sewer Authority (Waterworks & Sewer System), Series B, 5.00% due 3/1/2019 - 3/1/2025 | | | | 5,750,000 | | | | | 6,412,580 | |
| | Berkeley County School District (School Facility Equipment Acquisition), | | | | | | | | | | |
| b | | 5.00% due 12/1/2020 | | | | 550,000 | | | | | 594,325 | |
| | 5.00% due 12/1/2021 - 12/1/2024 | | | | 3,000,000 | | | | | 3,408,490 | |
| | Charleston County (South Aviation Ave. Construction), 5.00% due 12/1/2022 - 12/1/2023 | | | | 4,270,000 | | | | | 4,854,947 | |
| | City of Charleston Public Facilities Corp. (City of Charleston Project), 5.00% due 9/1/2019 - 9/1/2025 | | | | 3,250,000 | | | | | 3,629,998 | |
| | Greenwood County (Self Regional Healthcare), Series B, 5.00% due 10/1/2022 | | | | 1,000,000 | | | | | 1,107,320 | |
| | Piedmont Municipal Power Agency (Insured: Natl-Re), 6.75% due 1/1/2019 | | | | 3,800,000 | | | | | 3,941,208 | |
| | SCAGO Educational Facilities Corp. (School District of Pickens County), 5.00% due 12/1/2021 - 12/1/2025 | | | | 5,320,000 | | | | | 6,002,457 | |
| | South Carolina Public Service Authority, | | | | | | | | | | |
| | Series A, 5.00% due 12/1/2026 | | | | 1,000,000 | | | | | 1,134,490 | |
| | Series C, 5.00% due 12/1/2027 | | | | 580,000 | | | | | 648,057 | |
| | SOUTH DAKOTA — 0.2% | | | | | | | | | | |
| | South Dakota Building Authority, 5.00% due 6/1/2022 - 6/1/2024 | | | | 1,500,000 | | | | | 1,686,900 | |
| | South Dakota Health & Educational Facilities Authority (Avera Health), Series A, 5.00% due 7/1/2021 | | | | 1,670,000 | | | | | 1,830,988 | |
| | South Dakota Health & Educational Facilities Authority (Prairie Lakes Health), 5.00% due 4/1/2018 - 4/1/2019 | | | | 4,730,000 | | | | | 4,807,592 | |
| | South Dakota Health & Educational Facilities Authority (Regional Health), 5.00% due 9/1/2018 - 9/1/2020 | | | | 3,275,000 | | | | | 3,379,971 | |
| | South Dakota Health & Educational Facilities Authority (Sanford Health), | | | | | | | | | | |
| | 4.00% due 11/1/2018 | | | | 800,000 | | | | | 809,688 | |
| | 5.00% due 11/1/2021 - 11/1/2025 | | | | 2,385,000 | | | | | 2,707,173 | |
| b | | 5.00% due 11/1/2024 | | | | 400,000 | | | | | 460,560 | |
| | South Dakota Housing Development Authority (Single Family Mtg), Series 2, 4.00% due 11/1/2018 | | | | 1,165,000 | | | | | 1,180,797 | |
20 | Semi-Annual Report
Schedule of Investments, Continued
Thornburg Limited Term Municipal Fund | March 31, 2018 (Unaudited)
| | | | | | | | | | | | |
| | | | | PRINCIPAL AMOUNT | | VALUE |
| | TENNESSEE — 0.5% | | | | | | | | | | |
| | Clarksville Natural Gas Acquisition Corp., 5.00% due 12/15/2019 | | | $ | 6,000,000 | | | | $ | 6,289,920 | |
| | Metropolitan Government of Nashville and Davidson County GO, 5.00% due 1/1/2024 | | | | 7,000,000 | | | | | 8,043,840 | |
| | State of Tennessee GO, | | | | | | | | | | |
| | 5.00% due 8/1/2018 - 8/1/2020 | | | | 7,000,000 | | | | | 7,306,980 | |
| | Series B, | | | | | | | | | | |
| | 4.00% due 8/1/2018 | | | | 2,000,000 | | | | | 2,016,700 | |
| | 5.00% due 8/1/2019 - 8/1/2020 | | | | 4,000,000 | | | | | 4,239,160 | |
| | Tennessee Energy Acquisition Corp., 5.25% due 9/1/2018 - 9/1/2020 | | | | 6,190,000 | | | | | 6,348,238 | |
| | TEXAS — 13.0% | | | | | | | | | | |
| | Austin Convention Enterprises, Inc. (Convention Center Hotel First Tier), 5.00% due 1/1/2021 - 1/1/2027 | | | | 3,680,000 | | | | | 4,164,821 | |
| | Bexar County Hospital District (University Health System) GO, 5.00% due 2/15/2022 - 2/15/2027 | | | | 9,355,000 | | | | | 10,666,461 | |
| | Capital Area Cultural Education Facilities Finance Corp. (Roman Catholic Diocese of Austin), 5.00% due 4/1/2018 | | | | 1,370,000 | | | | | 1,370,000 | |
| | Cities of Dallas and Fort Worth (DFW International Airport Terminal Renewal & Improvement Program), Series D, 5.25% due 11/1/2023 | | | | 3,000,000 | | | | | 3,329,490 | |
| | City of Austin (Water and Wastewater System), 5.00% due 11/15/2022 - 11/15/2026 | | | | 8,455,000 | | | | | 9,821,933 | |
| | City of Beaumont (Waterworks & Sewer System Improvements; Insured: AGM), Series A, 5.00% due 9/1/2023 - 9/1/2024 | | | | 7,500,000 | | | | | 8,468,975 | |
| | City of Beaumont GO, 5.00% due 3/1/2022 - 3/1/2026 | | | | 8,490,000 | | | | | 9,737,799 | |
| | City of Brownsville (Water, Wastewater & Electric Utilities Systems), | | | | | | | | | | |
| | 5.00% due 9/1/2022 | | | | 1,300,000 | | | | | 1,444,677 | |
| | Series A, 5.00% due 9/1/2020 - 9/1/2023 | | | | 5,400,000 | | | | | 5,983,050 | |
| | City of Bryan (Electric System Improvements), 5.00% due 7/1/2019 - 7/1/2026 | | | | 8,535,000 | | | | | 8,869,402 | |
| | City of Dallas (Public Improvements) GO, 5.00% due 2/15/2022 - 2/15/2025 | | | | 5,500,000 | | | | | 6,200,190 | |
| | City of Dallas (Trinity River Corridor Infrastructure) GO, | | | | | | | | | | |
| | 5.00% due 2/15/2021 - 2/15/2026 | | | | 22,605,000 | | | | | 25,588,733 | |
| | Series A, 5.00% due 2/15/2024 | | | | 10,235,000 | | | | | 11,510,281 | |
| | City of Dallas GO, 5.00% due 2/15/2022 - 2/15/2023 | | | | 18,955,000 | | | | | 20,874,980 | |
| | City of Denton GO, 5.00% due 2/15/2019 - 2/15/2020 | | | | 8,185,000 | | | | | 8,427,049 | |
| | City of Houston (Airport System), Series A, 5.00% due 7/1/2018 | | | | 1,000,000 | | | | | 1,008,650 | |
| | City of Houston (Combined Utility System), | | | | | | | | | | |
| | Series B, 5.00% due 11/15/2021 - 11/15/2023 | | | | 19,965,000 | | | | | 22,453,953 | |
| | Series C, 5.00% due 5/15/2022 - 5/15/2024 | | | | 14,695,000 | | | | | 16,703,292 | |
| | Series D, 5.00% due 11/15/2022 - 11/15/2024 | | | | 17,535,000 | | | | | 19,968,570 | |
| | City of Houston (Convention & Entertainment Facilities), 5.00% due 9/1/2020 - 9/1/2024 | | | | 3,965,000 | | | | | 4,366,112 | |
| | City of Houston (Convention & Entertainment Facilities; Insured: AGM/AMBAC), 0.00%, Series B-AGM-CR, due 9/1/2020 | | | | 3,650,000 | | | | | 3,477,355 | |
| | City of Houston (Public Improvements) GO, Series A, 5.00% due 3/1/2020 - 3/1/2028 | | | | 62,905,000 | | | | | 71,734,933 | |
| | City of Laredo (Acquire & Purchase Personal Property) GO, | | | | | | | | | | |
| d | | 4.00% due 2/15/2019 | | | | 305,000 | | | | | 311,378 | |
| d | | 5.00% due 2/15/2020 - 2/15/2026 | | | | 6,015,000 | | | | | 6,751,646 | |
| | City of Laredo (City Infrastructure Improvements) GO, | | | | | | | | | | |
| | Series A, | | | | | | | | | | |
| | 4.00% due 2/15/2019 - 2/15/2020 | | | | 175,000 | | | | | 181,048 | |
| | 5.00% due 2/15/2021 - 2/15/2027 | | | | 2,875,000 | | | | | 3,301,620 | |
| | City of Laredo (Sports Venues; Insured: AGM), 5.00% due 3/15/2021 - 3/15/2024 | | | | 4,400,000 | | | | | 4,873,319 | |
| | City of Lubbock (Waterworks System) GO, 5.00% due 2/15/2020 - 2/15/2025 | | | | 41,750,000 | | | | | 46,961,440 | |
| | City of McAllen (International Toll Bridge System; Insured: AGM), Series A, 5.00% due 3/1/2024 - 3/1/2027 | | | | 3,015,000 | | | | | 3,475,445 | |
| | City of Olmos Park Higher Education Facilities Corp. (University of the Incarnate Word), 5.00% due 12/1/2020 - 12/1/2021 | | | | 4,620,000 | | | | | 4,981,313 | |
| | City of San Antonio (CPS Energy), | | | | | | | | | | |
| | 3.00% due 12/1/2045 (put 12/1/2020) | | | | 36,000,000 | | | | | 36,824,400 | |
| | 5.25% due 2/1/2024 | | | | 7,000,000 | | | | | 8,157,380 | |
| | City of San Antonio (Electric and Gas Systems), | | | | | | | | | | |
| | 2.25% due 2/1/2033 (put 12/1/2019) | | | | 4,655,000 | | | | | 4,687,538 | |
| | Series C, 3.00% due 12/1/2045 (put 12/1/2019) | | | | 5,200,000 | | | | | 5,299,892 | |
| | City of San Antonio (San Antonio Water System) GO, 5.00% due 2/1/2023 - 2/1/2025 | | | | 43,815,000 | | | | | 50,361,351 | |
| | City of San Antonio (San Antonio Water System), Series A, 5.00% due 5/15/2023 - 5/15/2026 | | | | 5,200,000 | | | | | 6,013,658 | |
| | City of San Antonio Public Facilities Corp. (Convention Center Refinancing & Expansion), 5.00% due 9/15/2022 | | | | 1,450,000 | | | | | 1,616,634 | |
| | City of Texas City Industrial Development Corp. (ARCO Pipe Line Co. Project), 7.375% due 10/1/2020 | | | | 4,000,000 | | | | | 4,472,840 | |
| | Clifton Higher Education Finance Corp. (IDEA Public Schools), 5.00% due 8/15/2018 - 8/15/2023 | | | | 1,870,000 | | | | | 2,025,105 | |
| | Corpus Christi Business and Job Development Corp. (Seawall Project), 5.00% due 3/1/2021 | | | | 625,000 | | | | | 676,100 | |
| | Dallas (Educational Facilities Improvements; Guaranty: PSF) ISD GO, Series B-6, 5.00% due 2/15/2036 (put 2/15/2022) | | | | 3,975,000 | | | | | 4,391,500 | |
| | Dallas Area Rapid Transit, Series A, 5.00% due 12/1/2026 | | | | 2,245,000 | | | | | 2,639,155 | |
| | Dallas Convention Center Hotel Development Corp., 5.00% due 1/1/2019 | | | | 5,200,000 | | | | | 5,317,676 | |
| | Dallas County Utility & Reclamation District GO, 5.00% due 2/15/2019 - 2/15/2027 | | | | 17,535,000 | | | | | 19,753,333 | |
| | Grayson County (State Highway Toll System) GO, | | | | | | | | | | |
| | 4.00% due 1/1/2020 | | | | 2,000,000 | | | | | 2,079,740 | |
| | 5.00% due 1/1/2022 | | | | 3,000,000 | | | | | 3,304,800 | |
| | Gulf Coast Waste Disposal Authority (Bayport Area Wastewater Treatment System; Insured: AGM), 5.00% due 10/1/2019 - 10/1/2025 | | | | 6,485,000 | | | | | 7,132,857 | |
| | Harris County GO, | | | | | | | | | | |
| | Series A, 5.00% due 10/1/2025 - 10/1/2027 | | | | 17,345,000 | | | | | 20,724,206 | |
| | Series B, 5.00% due 10/1/2018 - 10/1/2020 | | | | 4,200,000 | | | | | 4,324,235 | |
| | Harris County (Flood Control), 5.00% due 10/1/2025 - 10/1/2027 | | | | 14,305,000 | | | | | 17,119,094 | |
Semi-Annual Report | 21
Schedule of Investments, Continued
Thornburg Limited Term Municipal Fund | March 31, 2018 (Unaudited)
| | | | | | | | | | | | |
| | | | | PRINCIPAL AMOUNT | | VALUE |
| | Harris County Cultural Education Facilites Finance Corp. (TECO Project), 5.00% due 11/15/2024 - 11/15/2025 | | | $ | 2,300,000 | | | | $ | 2,684,187 | |
| | Harris County Cultural Education Facilities Finance Corp. (LOC: JPMorgan Chase Bank, N.A.), | | | | | | | | | | |
| a | | 1.70% due 9/1/2031 (put 4/2/2018) | | | | 1,245,000 | | | | | 1,245,000 | |
| a | | Series A, 1.70% due 9/1/2031 (put 4/2/2018) | | | | 1,200,000 | | | | | 1,200,000 | |
| | Harris County Cultural Education Facilities Finance Corp. (Memorial Hermann Health), | | | | | | | | | | |
| | Series A, | | | | | | | | | | |
b | | 5.00% due 12/1/2022 | | | | 200,000 | | | | | 224,014 | |
| | 5.00% due 12/1/2023 - 12/1/2025 | | | | 6,245,000 | | | | | 7,168,299 | |
| | Harris County Cultural Education Facilities Finance Corp. (TECO Project), 5.00% due 11/15/2020 - 11/15/2027 | | | | 3,525,000 | | | | | 4,069,986 | |
| | Harris County Cultural Education Facilities Finance Corp. (Texas Medical Center Central Heating & Cooling Services Corp.), Series A, 5.00% due 11/15/2018 - 11/15/2019 | | | | 3,365,000 | | | | | 3,464,604 | |
| | Harris County GO, Series A, 5.00% due 10/1/2028 | | | | 3,205,000 | | | | | 3,848,468 | |
| | Harris County Health Facilities Development Corp. (Memorial Hermann Health; LOC: JPMorgan Chase Bank, N.A.), 7.00% due 12/1/2027 (pre-refunded 12/1/2018) | | | | 1,245,000 | | | | | 1,289,173 | |
| | Harris County-Houston Sports Authority (Insured: AGM), Series A, 5.00% due 11/15/2022 - 11/15/2024 | | | | 23,315,000 | | | | | 26,502,351 | |
| | Hays County GO, 5.00% due 2/15/2022 - 2/15/2025 | | | | 4,050,000 | | | | | 4,594,104 | |
| | Houston Airport System Revenue, Series B, 5.00% due 7/1/2019 - 7/1/2028 | | | | 11,660,000 | | | | | 13,457,928 | |
| | Houston Higher Education Finance Corp. (Cosmos Foundation, Inc.), Series A, 5.875% due 5/15/2021 | | | | 1,160,000 | | | | | 1,229,055 | |
| | Houston Higher Education Finance Corp. (KIPP, Inc.; Guaranty: PSF), 5.00% due 8/15/2019 - 8/15/2022 | | | | 2,505,000 | | | | | 2,711,760 | |
| | Katy (Educational Facilities Improvements; Guaranty: PSF) ISD GO, Series A, 5.00% due 2/15/2023 - 2/15/2026 | | | | 9,670,000 | | | | | 11,217,068 | |
| | Keller ISD GO, Series A, 5.00% due 8/15/2023 - 8/15/2026 | | | | 20,530,000 | | | | | 24,004,751 | |
| | Laredo Community College District (School Facilities Improvements) GO, 5.00% due 8/1/2019 - 8/1/2024 | | | | 4,220,000 | | | | | 4,609,078 | |
| | Lower Colorado River Authority, | | | | | | | | | | |
| | Series A, | | | | | | | | | | |
| | 5.00% due 5/15/2025 | | | | 8,020,000 | | | | | 8,852,396 | |
| | 5.00% due 5/15/2025 (pre-refunded 5/15/2022) | | | | 55,000 | | | | | 61,235 | |
| | Metropolitan Transit Authority of Harris County, 5.00% due 11/1/2019 - 11/1/2027 | | | | 12,880,000 | | | | | 14,426,065 | |
| | New Caney (Guaranty: PSF) ISD GO, 5.00% due 2/15/2024 | | | | 865,000 | | | | | 972,199 | |
| | North East (Educational Facilities; Guaranty: PSF) ISD GO, 2.00% due 8/1/2044 (put 8/1/2019) | | | | 10,265,000 | | | | | 10,287,686 | |
| | North Harris County Regional Water Authority (Regional Water Production Design, Acquisition and Construction), 5.00% due 12/15/2020 - 12/15/2026 | | | | 6,490,000 | | | | | 7,433,884 | |
| | North Texas Tollway Authority, Series A, 5.00% due 1/1/2024 | | | | 12,000,000 | | | | | 13,692,120 | |
| | Northside (Educational Facilities; Guaranty: PSF) ISD GO, Series A, 2.00% due 6/1/2039 (put 6/1/2019) | | | | 2,085,000 | | | | | 2,090,233 | |
| | Pasadena (Educational Facilities; Guaranty: PSF) ISD GO, Series B, 3.00% due 2/15/2044 (put 8/15/2019) | | | | 9,155,000 | | | | | 9,298,825 | |
| | Round Rock (Educational Facilities Improvements) ISD GO, 5.00% due 8/1/2025 - 8/1/2027 | | | | 3,100,000 | | | | | 3,695,165 | |
| | Round Rock (Educational Facilities Improvements; Guaranty: PSF) ISD GO, 5.00% due 8/1/2018 - 8/1/2026 | | | | 11,125,000 | | | | | 12,388,614 | |
| | Sam Rayburn Municipal Power Agency, 5.00% due 10/1/2019 - 10/1/2021 | | | | 5,390,000 | | | | | 5,709,426 | |
| | San Antonio Public Facilities Corp. (Convention Center Refinancing & Expansion), 5.00% due 9/15/2020 | | | | 915,000 | | | | | 982,124 | |
| | San Juan Higher Education Finance Authority (IDEA Public Schools), Series A, 5.125% due 8/15/2020 | | | | 860,000 | | | | | 894,821 | |
| | State of Texas (Cash Flow Management), 4.00% due 8/30/2018 | | | | 94,120,000 | | | | | 95,067,788 | |
| a | | Tarrant County Cultural Education Facilities Finance Corp. (LOC: TD Bank N.A.), 1.70% due 11/15/2050 (put 4/2/2018) | | | | 800,000 | | | | | 800,000 | |
| | Tarrant Regional Water District, | | | | | | | | | | |
| | 2.00% due 3/1/2020 | | | | 800,000 | | | | | 804,192 | |
| | 5.00% due 3/1/2021 - 3/1/2027 | | | | 8,850,000 | | | | | 10,205,572 | |
| | Texas Transportation Commission (Central Texas Turnpike System), Series C, 5.00% due 8/15/2022 - 8/15/2024 | | | | 2,130,000 | | | | | 2,394,188 | |
| | Texas Transportation Commission (Highway Improvements) GO, 5.00% due 4/1/2022 - 4/1/2024 | | | | 10,380,000 | | | | | 11,805,066 | |
| | Texas Transportation Commission State Highway Fund, Series A, 5.00% due 4/1/2024 | | | | 1,650,000 | | | | | 1,901,130 | |
| | University of Texas System (Campus Improvements), 5.00% due 8/15/2025 - 8/15/2026 | | | | 10,750,000 | | | | | 12,723,477 | |
| | Uptown Development Authority (Infrastructure Improvements), 5.00% due 9/1/2018 - 9/1/2019 | | | | 3,815,000 | | | | | 3,917,983 | |
| | Walnut Creek Special Utility District (Water System Improvements; Insured: BAM), | | | | | | | | | | |
| | 4.00% due 1/10/2020 - 1/10/2021 | | | | 965,000 | | | | | 1,008,154 | |
| | 5.00% due 1/10/2022 - 1/10/2024 | | | | 1,275,000 | | | | | 1,425,317 | |
| | U. S. VIRGIN ISLANDS — 0.0% | | | | | | | | | | |
| | Virgin Islands Public Finance Authority (Diageo Project), 6.75% due 10/1/2019 | | | | 3,390,000 | | | | | 2,745,900 | |
| | UTAH — 1.0% | | | | | | | | | | |
| | Murray, | | | | | | | | | | |
a | | Series A, 1.72% due 5/15/2037 (put 4/2/2018) | | | | 1,025,000 | | | | | 1,025,000 | |
a | | Series B, 1.72% due 5/15/2037 (put 4/2/2018) | | | | 17,365,000 | | | | | 17,365,000 | |
a | | Series C, 1.72% due 5/15/2036 (put 4/2/2018) | | | | 600,000 | | | | | 600,000 | |
a | | Series D, 1.72% due 5/15/2036 (put 4/2/2018) | | | | 19,400,000 | | | | | 19,400,000 | |
| | Utah Transit Authority (Integrated Mass Transit System), Series A-SUB, 5.00% due 6/15/2022 - 6/15/2025 | | | | 3,545,000 | | | | | 4,052,413 | |
| | Weber County, | | | | | | | | | | |
a | | Series A, 1.72% due 2/15/2031 (put 4/2/2018) | | | | 12,500,000 | | | | | 12,500,000 | |
a | | Series C, 1.72% due 2/15/2035 (put 4/2/2018) | | | | 16,500,000 | | | | | 16,500,000 | |
| | VERMONT — 0.2% | | | | | | | | | | |
| | Vermont (Vermont Public Service Corp.) EDA, 5.00% due 12/15/2020 | | | | 14,250,000 | | | | | 15,410,805 | |
22 | Semi-Annual Report
Schedule of Investments, Continued
Thornburg Limited Term Municipal Fund | March 31, 2018 (Unaudited)
| | | | | | | | | | | | |
| | | | | PRINCIPAL AMOUNT | | VALUE |
| | VIRGINIA — 0.2% | | | | | | | | | | |
| | Fairfax County (Inova Health System) IDA, | | | | | | | | | | |
| | 4.00% due 5/15/2022 | | | $ | 5,500,000 | | | | $ | 5,934,775 | |
| | 5.00% due 5/15/2022 | | | | 5,000,000 | | | | | 5,591,950 | |
| | WASHINGTON — 1.8% | | | | | | | | | | |
| | Energy Northwest (Nine Canyon Wind Project Phase I-III), 5.00% due 7/1/2018 - 7/1/2025 | | | | 9,850,000 | | | | | 10,594,743 | |
| | Marysville School District No. 25 (Snohomish County Educational Facilities) (State Aid Withholding) GO, | | | | | | | | | | |
| | 4.00% due 12/1/2018 | | | | 1,100,000 | | | | | 1,117,424 | |
| | 5.00% due 12/1/2019 - 12/1/2023 | | | | 9,085,000 | | | | | 10,035,726 | |
| | Port of Seattle (Insured: Natl-Re), 5.50% due 9/1/2018 | | | | 5,000,000 | | | | | 5,077,400 | |
| | Skagit County Public Hospital District No. 1 (Skagit Regional Health) GO, | | | | | | | | | | |
| | 4.00% due 12/1/2018 | | | | 1,270,000 | | | | | 1,289,266 | |
| | 5.00% due 12/1/2019 - 12/1/2022 | | | | 10,035,000 | | | | | 10,994,620 | |
| | Skagit County Public Hospital District No. 1 (Skagit Regional Health), Series A, 5.00% due 12/1/2018 - 12/1/2023 | | | | 4,045,000 | | | | | 4,293,131 | |
| | Skagit County Public Hospital District No. 2 (Island Hospital) GO, | | | | | | | | | | |
| | 4.00% due 12/1/2018 - 12/1/2021 | | | | 4,000,000 | | | | | 4,162,300 | |
| | 5.00% due 12/1/2022 | | | | 1,700,000 | | | | | 1,896,146 | |
| | State of Washington (Capital Projects) GO, 5.00% due 7/1/2025 | | | | 10,475,000 | | | | | 12,161,161 | |
| | State of Washington (Public Highway, Bridge, Ferry Capital and Operating Costs; Insured: Natl-Re) GO, 0.00%, Series F, due 12/1/2019 | | | | 3,030,000 | | | | | 2,937,282 | |
| | State of Washington (Stadium and Exhibition Center; Insured: Natl-Re) GO, 0.00%, Series S-5, due 1/1/2019 | | | | 3,000,000 | | | | | 2,961,990 | |
| | State of Washington (State Agency Real Property Projects) (State Aid Withholding) COP, Series B, 5.00% due 7/1/2018 | | | | 2,670,000 | | | | | 2,692,775 | |
| | State of Washington (State and Local Agency Real and Personal Property Projects) (State Aid Withholding) COP, 5.00% due 7/1/2019 - 7/1/2022 | | | | 10,415,000 | | | | | 11,338,300 | |
| | State of Washington (State and Local Agency Real and Personal Property Projects) COP, Series A, 5.00% due 7/1/2024 - 7/1/2027 | | | | 17,775,000 | | | | | 20,853,315 | |
| | Tacoma School District No.10 (Pierce County Capital Projects) GO, 5.00% due 12/1/2018 - 12/1/2020 | | | | 8,500,000 | | | | | 8,906,175 | |
| | Washington Health Care Facilities Authority (Highline Medical Center; Insured: FHA 242), 5.25% due 8/1/2018 | | | | 7,935,000 | | | | | 8,030,617 | |
| | Washington Health Care Facilities Authority (MultiCare Health Systems), Series A, 5.00% due 8/15/2018 | | | | 2,000,000 | | | | | 2,024,420 | |
| | Washington Health Care Facilities Authority (Overlake Hospital Medical Center), | | | | | | | | | | |
| | 4.75% due 7/1/2020 | | | | 1,000,000 | | | | | 1,064,580 | |
| | 5.00% due 7/1/2019 | | | | 1,050,000 | | | | | 1,091,538 | |
| | WEST VIRGINIA — 0.1% | | | | | | | | | | |
| | Mason County (Appalachian Power Company), Series L-REMK, 1.625% due 10/1/2022 (put 10/1/2018) | | | | 3,300,000 | | | | | 3,292,476 | |
| | West Virginia Higher Education Policy Commission (Higher Education Facilities), Series A, 5.00% due 4/1/2020 - 4/1/2022 | | | | 3,500,000 | | | | | 3,807,840 | |
| | WISCONSIN — 0.5% | | | | | | | | | | |
| | Wisconsin Health & Educational Facilities Authority (Agnesian Healthcare, Inc.), 5.00% due 7/1/2018 - 7/1/2020 | | | | 4,965,000 | | | | | 5,156,582 | |
| | Wisconsin Health & Educational Facilities Authority (Ascension Health Alliance System), | | | | | | | | | | |
| | 5.00% due 11/15/2024 - 11/15/2026 | | | | 3,840,000 | | | | | 4,497,702 | |
| | 5.00% due 11/15/2043 (put 6/1/2021) | | | | 10,000,000 | | | | | 10,875,800 | |
| | Wisconsin Health & Educational Facilities Authority (ProHealth Care, Inc.), 5.00% due 8/15/2020 - 8/15/2022 | | | | 5,250,000 | | | | | 5,717,727 | |
| | Wisconsin Health & Educational Facilities Authority (UnityPoint Health), Series A, 5.00% due 12/1/2022 | | | | 1,000,000 | | | | | 1,121,010 | |
| | WPPI Energy (Power Supply System), 5.00% due 7/1/2021 | | | | 4,100,000 | | | | | 4,502,046 | |
| d | | WPPI Energy, Series A, 5.00% due 7/1/2022 - 7/1/2028 | | | | 1,835,000 | | | | | 2,119,524 | |
| | | | | | | | | | | | |
| | | |
| | TOTAL INVESTMENTS — 98.9% (Cost $6,831,012,565) | | | | | | | | $ | 6,870,723,997 | |
| | | |
| | OTHER ASSETS LESS LIABILITIES — 1.1% | | | | | | | | | 79,604,178 | |
| | | | | | | | | | | | |
| | | |
| | NET ASSETS — 100.0% | | | | | | | | $ | 6,950,328,175 | |
| | | | | | | | | | | | |
Footnote Legend
| a | Variable Rate Demand Notes are instruments whose interest rates change on a specific date (such as coupon date or interest payment date) or whose interest rates vary with changes in a designated base rate (such as the prime interest rate). This instrument is payable on demand and is secured by letters of credit or other credit support agreements from major banks. |
| b | Segregated as collateral for a when-issued security. |
| c | Floating Rate Security. Stated interest/floor rate was in effect at March 31, 2018. |
Portfolio Abbreviations
To simplify the listings of securities, abbreviations are used per the table below:
| | |
| AGC | | Insured by Associated General Contractors |
| AGM | | Insured by Assured Guaranty Municipal Corp. |
| AMBAC | | Insured by American Municipal Bond Assurance Corp. |
| BAM | | Insured by Build America Mutual Insurance Co. |
| BHAC | | Insured by Berkshire Hathaway Assurance Corp. |
| COP | | Certificates of Participation |
| DFA | | Development Finance Authority |
| EDA | | Economic Development Authority |
| ETM | | Escrowed to Maturity |
| FGIC | | Insured by Financial Guaranty Insurance Co. |
| FHA | | Insured by Federal Housing Administration |
| | |
| FSA | | Insured by Financial Security Assurance Co. |
| GO | | General Obligation |
| GRT | | Gross Receipts Tax |
| HFA | | Health Facilities Authority |
| HFFA | | Health Facilities Financing Authority |
| IDA | | Industrial Development Authority |
| ISD | | Independent School District |
| LIBOR | | London Interbank Offered Rates |
| Mtg | | Mortgage |
| MUNIPSA | | Securities Industry and Financial Markets Association (SIFMA) Municipal Swap Index |
Semi-Annual Report | 23
Schedule of Investments, Continued
Thornburg Limited Term Municipal Fund | March 31, 2018 (Unaudited)
| | |
| Natl-Re | | Insured by National Public Finance Guarantee Corp. |
| PSF | | Guaranteed by Permanent School Fund |
| | |
| Q-SBLF | | Insured by Qualified School Bond Loan Fund |
| Syncora | | Insured by Syncora Guarantee Inc. |
See notes to financial statements.
24 | Semi-Annual Report
Statement of Assets and Liabilities
Thornburg Limited Term Municipal Fund | March 31, 2018 (Unaudited)
| | | | |
ASSETS | | | | |
| |
Investments at value (cost $6,831,012,565) (Note 3) | | $ | 6,870,723,997 | |
Cash | | | 15,336,069 | |
Receivable for investments sold | | | 19,810,000 | |
Receivable for fund shares sold | | | 14,639,359 | |
Interest receivable | | | 80,329,623 | |
Prepaid expenses and other assets | | | 146,109 | |
| | | | |
| |
Total Assets | | | 7,000,985,157 | |
| | | | |
| |
LIABILITIES | | | | |
| |
Payable for investments purchased | | | 32,687,698 | |
Payable for fund shares redeemed | | | 13,382,464 | |
Payable to investment advisor and other affiliates (Note 4) | | | 2,517,165 | |
Accounts payable and accrued expenses | | | 1,076,869 | |
Dividends payable | | | 992,786 | |
| | | | |
| |
Total Liabilities | | | 50,656,982 | |
| | | | |
| |
NET ASSETS | | $ | 6,950,328,175 | |
| | | | |
| |
NET ASSETS CONSIST OF | | | | |
| |
Distribution in excess of net investment income | | $ | (903,271 | ) |
Net unrealized appreciation on investments | | | 39,711,432 | |
Accumulated net realized gain (loss) | | | (23,213,752 | ) |
Net capital paid in on shares of beneficial interest | | | 6,934,733,766 | |
| | | | |
| |
| | $ | 6,950,328,175 | |
| | | | |
| |
NET ASSET VALUE | | | | |
| |
Class A Shares: | | | | |
Net asset value and redemption price per share
($1,165,319,918 applicable to 82,269,237 shares of beneficial
interest outstanding - Note 5) | | $ | 14.16 | |
| |
Maximum sales charge, 1.50% of offering price | | | 0.22 | |
| | | | |
| |
Maximum offering price per share | | $ | 14.38 | |
| | | | |
| |
Class C Shares: | | | | |
Net asset value and offering price per share*
($537,691,953 applicable to 37,890,327 shares of beneficial
interest outstanding - Note 5) | | $ | 14.19 | |
| | | | |
| |
Class I Shares: | | | | |
Net asset value, offering and redemption price per share
($5,247,316,304 applicable to 370,398,828 shares of beneficial
interest outstanding - Note 5) | | $ | 14.17 | |
| | | | |
* Redemption price per share is equal to net asset value less any applicable contingent deferred sales charge.
See notes to financial statements.
Semi-Annual Report | 25
Statement of Operations
Thornburg Limited Term Municipal Fund | Six Months Ended March 31, 2018 (Unaudited)
| | | | |
INVESTMENT INCOME | | | | |
| |
Interest income (net of premium amortized of $55,261,175) | | $ | 82,929,511 | |
| | | | |
| |
EXPENSES | | | | |
| |
Investment advisory fees (Note 4) | | | 9,301,608 | |
Administration fees (Note 4) | | | | |
Class A Shares | | | 691,786 | |
Class C Shares | | | 319,341 | |
Class I Shares | | | 1,589,228 | |
Distribution and service fees (Note 4) | | | | |
Class A Shares | | | 1,545,562 | |
Class C Shares | | | 1,426,652 | |
Transfer agent fees | | | | |
Class A Shares | | | 439,570 | |
Class C Shares | | | 164,990 | |
Class I Shares | | | 1,936,441 | |
Registration and filing fees | | | | |
Class A Shares | | | 10,392 | |
Class C Shares | | | 9,079 | |
Class I Shares | | | 19,992 | |
Custodian fees (Note 2) | | | 293,453 | |
Professional fees | | | 70,552 | |
Trustee and officer fees (Note 4) | | | 159,802 | |
Other expenses | | | 188,055 | |
| | | | |
| |
Total Expenses | | | 18,166,503 | |
| | | | |
| |
Net Investment Income | | $ | 64,763,008 | |
| | | | |
| |
REALIZED AND UNREALIZED GAIN (LOSS) | | | | |
| |
Net realized gain (loss) on investments | | | 786,357 | |
Net change in unrealized appreciation (depreciation) on investments | | | (133,011,818 | ) |
| | | | |
| |
Net Realized and Unrealized Loss | | | (132,225,461 | ) |
| | | | |
| |
Net Decrease in Net Assets Resulting from Operations | | $ | (67,462,453 | ) |
| | | | |
See notes to financial statements.
26 | Semi-Annual Report
Statements of Changes in Net Assets
Thornburg Limited Term Municipal Fund
| | | | | | | | | | |
| | | SIX MONTHS
ENDED MARCH 31, 2018* | | YEAR ENDED
SEPTEMBER 30, 2017 |
INCREASE (DECREASE) IN NET ASSETS FROM | | | | | | | | | | |
| | |
OPERATIONS | | | | | | | | | | |
| | |
Net investment income | | | $ | 64,763,008 | | | | $ | 132,782,432 | |
Net realized gain (loss) on investments | | | | 786,357 | | | | | (21,832,872 | ) |
Net unrealized appreciation (depreciation) on investments | | | | (133,011,818 | ) | | | | (97,990,138 | ) |
| | | | | |
| | |
Net Increase (Decrease) in Net Assets Resulting from Operations | | | | (67,462,453 | ) | | | | 12,959,422 | |
| | |
DIVIDENDS TO SHAREHOLDERS | | | | | | | | | | |
| | |
From net investment income | | | | | | | | | | |
Class A Shares | | | | (10,095,427 | ) | | | | (23,541,216 | ) |
Class C Shares | | | | (3,981,066 | ) | | | | (9,107,804 | ) |
Class I Shares | | | | (50,686,515 | ) | | | | (100,133,412 | ) |
| | |
FUND SHARE TRANSACTIONS (NOTE 5) | | | | | | | | | | |
Class A Shares | | | | (125,658,489 | ) | | | | (356,275,275 | ) |
Class C Shares | | | | (57,536,772 | ) | | | | (124,624,936 | ) |
Class I Shares | | | | 80,180,673 | | | | | (158,840,121 | ) |
| | | | | |
| | |
Net Decrease in Net Assets | | | | (235,240,049 | ) | | | | (759,563,342 | ) |
| | |
NET ASSETS | | | | | | | | | | |
| | |
Beginning of Period | | | | 7,185,568,224 | | | | | 7,945,131,566 | |
| | | | | |
| | |
End of Period | | | $ | 6,950,328,175 | | | | $ | 7,185,568,224 | |
| | | | | |
| | |
Distribution in excess of net investment income | | | $ | (903,271 | ) | | | $ | (903,271 | ) |
* Unaudited.
See notes to financial statements.
Semi-Annual Report | 27
Notes to Financial Statements
Thornburg Limited Term Municipal Fund | March 31, 2018 (Unaudited)
NOTE 1 – ORGANIZATION
Thornburg Limited Term Municipal Fund (the “Fund”) is a diversified series of Thornburg Investment Trust (the “Trust”). The Trust was organized as a Massachusetts business trust under a Declaration of Trust dated June 3, 1987 and is registered as a diversified, open-end management investment company under the Investment Company Act of 1940, as amended. The Fund is currently one of twenty-one separate series of the Trust. Each series is considered to be a separate entity for financial reporting and tax purposes and bears expenses directly attributable to it. The Fund’s primary investment objective is to obtain as high a level of current income exempt from federal individual income taxes as is consistent, in the view of Thornburg Investment Management, Inc., the Trust’s investment advisor (the “Advisor”), with the preservation of capital. The Fund’s secondary objective is to reduce expected changes in its share price compared to longer intermediate and long-term bond portfolios.
The Fund currently offers three classes of shares of beneficial interest: Class A, Class C, and Institutional Class (“Class I”). Each class of shares of the Fund represents an interest in the same portfolio of investments, except that (i) Class A shares are sold subject to a front-end sales charge collected at the time the shares are purchased and bear a service fee, (ii) Class C shares are sold at net asset value without a sales charge at the time of purchase, but are subject to a contingent deferred sales charge upon redemption within one year of purchase, and bear both a service fee and a distribution fee, (iii) Class I shares are sold at net asset value without a sales charge at the time of purchase and may be subject to a service fee, and (iv) the respective classes may have different reinvestment privileges and conversion rights. Additionally, the Fund may allocate among its classes certain expenses, to the extent allocable to specific classes, including transfer agent fees, government registration fees, certain printing and postage costs, and administrative and legal expenses. Currently, class specific expenses of the Fund are limited to service and distribution fees, administration fees, and certain registration and transfer agent expenses.
The following is a summary of significant accounting policies followed by the Fund in the preparation of its financial statements. The Fund prepares its financial statements in conformity with United States generally accepted accounting principles (“GAAP”), including investment company accounting and reporting guidance in the Financial Accounting Standards Board (the “FASB”) Accounting Standard Codification Topic 946.
NOTE 2 – SIGNIFICANT ACCOUNTING POLICIES
Security Valuation: All investments in securities held by the Fund are valued as described in Note 3.
Allocation of Income, Gains, Losses and Expenses: Net investment income (other than class specific expenses) and realized and unrealized gains and losses are allocated daily to each class of shares based upon the relative net asset value of outstanding shares (or the value of the dividend-eligible shares, as appropriate) of each class of shares at the beginning of the day (after adjusting for the current capital shares activity of the respective class). Expenses common to all Funds are allocated among the Funds comprising the Trust based upon their relative net asset values or other appropriate allocation methods. Operating expenses directly attributable to a specific class are charged against the operating income of that class.
Dividends and Distributions to Shareholders: Dividends and distributions to shareholders, which are determined in accordance with federal income tax regulations and may differ from GAAP, are recorded on the ex-dividend date. Ordinary income distributions, if any, are declared daily and paid monthly. Capital gain distributions, if any, are declared and paid annually and more often if deemed necessary by the Advisor. Dividends are paid and are reinvested in additional shares of the Fund at net asset value per share at the close of business on the ex-dividend date, or at the shareholder’s option, paid in cash.
Investment Income: Interest income is accrued as earned. Premiums and discounts are amortized and accreted, respectively, to call dates or maturity dates using the effective yield method of the respective investments. These amounts are included in Interest income on the Statement of Operations.
Custodian Fees: Custodian fees disclosed in the Statement of Operations may include interest expenses incurred by the Fund on any cash overdrafts of its custodian account during the period. Such cash overdrafts may result from the effects of failed trades in portfolio securities and from cash outflows resulting from unanticipated shareholder redemption activity. The Fund pays interest to its custodian on any such cash overdraft at a rate set periodically at the custodian’s discretion of the overdraft amount in excess of $50,000.
Investment Transactions: Investment transactions are accounted for on a trade date basis. Realized gains and losses from the sale of investments are recorded on an identified cost basis.
When-Issued and Delayed Delivery Transactions: The Fund may engage in when-issued or delayed delivery transactions. To the extent the Fund engages in such transactions, it will do so for the purpose of acquiring portfolio investments consistent with the Fund’s investment objectives and not for the purpose of investment leverage or to speculate on interest rate or market changes. At the time the Fund makes a commitment to purchase an investment on a when-issued or delayed delivery basis, the Fund will record the transaction and reflect the
28 | Semi-Annual Report
Notes to Financial Statements, Continued
Thornburg Limited Term Municipal Fund | March 31, 2018 (Unaudited)
value in determining its net asset value. When effecting such transactions, assets of an amount sufficient to make payment for the portfolio investments to be purchased will be segregated on the Fund’s records on the trade date. Investments purchased on a when-issued or delayed delivery basis do not earn interest until the settlement date.
Guarantees and Indemnifications: Under the Trust’s organizational documents (and under separate agreements with the independent Trustees), its officers and Trustees are provided with an indemnification against certain liabilities arising out of the performance of their duties to the Fund. In the normal course of business the Trust may also enter into contracts with service providers that contain general indemnifications. The Trust’s maximum exposure under these arrangements is unknown. However, based on experience, the Trust expects the risk of loss to be remote.
Use of Estimates: The preparation of financial statements in conformity with GAAP requires management to make estimates and assumptions that affect the reported amounts of assets and liabilities and disclosure of contingent assets and liabilities at the date of the financial statements and the reported amounts of increases (decreases) in net assets from operations during the reporting period. Actual results could differ from those estimates.
Federal Income Taxes: It is the policy of the Trust to comply with the provisions of the Internal Revenue Code applicable to regulated investment companies and to distribute to shareholders substantially all investment company taxable income including net realized gains on investments (if any), and tax exempt income of the Fund. Therefore, no provision for federal income or excise tax is required.
The Fund files income tax returns in United States federal and applicable state jurisdictions. The statute of limitations on the Fund’s tax return filings generally remains open for the three years following a return’s filing date. The Fund has analyzed each uncertain tax position believed to be material in the preparation of the Fund’s financial statements for the six month period ended March 31, 2018, including open tax years, to assess whether it is more likely than not that the position would be sustained upon examination, based on the technical merits of the position. The Fund has not identified any such position for which an asset or liability must be reflected in the Statement of Assets and Liabilities.
At March 31, 2018, information on the tax components of capital was as follows:
| | | | | |
Cost of investments for tax purposes | | | $ | 6,831,012,565 | |
| | | | | |
Gross unrealized appreciation on a tax basis | | | | 77,897,480 | |
Gross unrealized depreciation on a tax basis | | | | (38,186,048 | ) |
| | | | | |
Net unrealized appreciation (depreciation) on investments (tax basis) | | | $ | 39,711,432 | |
| | | | | |
At March 31, 2018, the Fund had deferred tax basis capital losses occurring subsequent to October 31, 2016 through September 30, 2017 of $21,341,245. For tax purposes, such losses will be recognized in the year ending September 30, 2018.
At March 31, 2018, the Fund had cumulative tax basis capital losses of $2,658,865 (of which $403,305 are short-term and $2,255,560 are long-term) generated after September 30, 2011, which may be carried forward to offset future capital gains. To the extent such carryforwards are used, capital gain distributions may be reduced to the extent provided by regulations. Such capital loss carryforwards do not expire.
NOTE 3 – SECURITY VALUATION
Valuation of the Fund’s portfolio investment securities is performed in accordance with policies and procedures adopted by and under the oversight of the Trustees.
The Trustees of the Trust have appointed the Advisor to assist the Trustees to obtain market values for portfolio investments, evaluate and monitor professional pricing service providers appointed by the Trustees’ Audit Committee (the “Audit Committee”) to assist in determining fair values for portfolio investments, assist in calculating fair values for portfolio investments in certain circumstances, and to perform other functions in connection with the valuation of investments. The Advisor acts through its Valuation and Pricing Committee (the “Committee”) and other employees of the Advisor. The Committee regularly reviews its own valuation calculations, as well as the valuations, valuation techniques and services furnished by pricing service providers, considers circumstances which may require valuation calculations by the Committee, and reviews previous valuation calculations. The Committee reports to the Audit Committee on the Committee’s activities, the performance of pricing service providers, and other matters relating to valuation of portfolio investments.
In those instances when the Committee assists in calculating a fair value for a portfolio investment, the Committee seeks to determine the price that the Fund would reasonably expect to receive upon a sale of the investment in an orderly transaction between market participants on the valuation date. The Committee customarily utilizes quotations from securities broker dealers in calculating valuations, but also may utilize prices obtained from pricing service providers or other methods approved by the Audit Committee. Because fair values calculated by
Semi-Annual Report | 29
Notes to Financial Statements, Continued
Thornburg Limited Term Municipal Fund | March 31, 2018 (Unaudited)
the Committee are estimates, the calculation of a value for an investment may differ from the price that would be realized by the Fund upon a sale of the investment, and the difference could be material to the Fund’s financial statements. The Committee’s calculation of a fair value for an investment may also differ from the prices obtained by other persons (including other mutual funds) for the investment.
Valuation of Securities: Debt obligations held by the Fund which are not listed or traded on exchanges or for which no reported market exists are ordinarily valued at the valuation obtained from a pricing service provider approved by the Audit Committee.
In any case when a pricing service provider fails to provide a valuation for a debt obligation held by the Fund, the Committee calculates a fair value for the obligation using alternative methods under procedures approved by the Audit Committee. Additionally, in cases when management believes that a valuation obtained from a pricing service provider merits review for significant reasons, the Committee decides whether or not to use the valuation calculated by the pricing service provider or to use an alternative method approved by the Audit Committee to calculate a fair value for the obligation.
Valuation Hierarchy: The Fund categorizes its investments based upon the inputs used in valuing those investments, according to a three-level hierarchy established in guidance from the FASB. Categorization of investments using this hierarchy is intended by the FASB to maximize the use of observable inputs in valuing investments and minimize the use of unobservable inputs by requiring that the most observable inputs be used when available. Observable inputs are those that market participants would use in valuing an investment based on available market information. Unobservable inputs are those that reflect assumptions about the information market participants would use in valuing an investment. An investment’s level within the hierarchy is based on the lowest level input that is deemed significant to the valuation. The methodologies and inputs used to value investments are not necessarily indications of the risk or liquidity associated with those investments.
Various inputs are used in calculating valuations for the Fund’s investments. These inputs are generally summarized according to the three-level hierarchy below:
Level 1: Quoted prices in active markets for identical investments.
Level 2: Other direct or indirect significant observable inputs (including quoted prices for similar investments in active markets and other observable inputs, such as interest rates, prepayment rates, credit risk, etc.).
Level 3: Significant unobservable inputs (including the Committee’s own assumptions in calculating the fair values of investments).
Valuations for debt obligations held by the Fund are typically calculated by pricing service providers approved by the Audit Committee and are generally characterized as Level 2 within the valuation hierarchy.
In a limited number of cases the Committee calculates a fair value for investments using broker quotations or other methods approved by the Audit Committee. When the Committee uses a single broker quotation to calculate a fair value for an investment without other significant observable inputs, or if a fair value is calculated using other significant inputs that are considered unobservable, the investment is characterized as Level 3 within the hierarchy. Other significant unobservable inputs used to calculate a fair value in these instances might include an income-based valuation approach which considers discounted anticipated future cash flows from the investment and application of discounts due to the nature or duration of any restrictions on the disposition of the investment.
Valuations based upon the use of inputs from Levels 1, 2 or 3 may not represent the actual price received upon the disposition of an investment, and the Fund may receive a price that is lower than the valuation based upon these inputs when it sells the investment.
The following table displays a summary of the fair value hierarchy measurements of the Fund’s investments as of March 31, 2018. In any instance when valuation inputs from more than one level are used to determine the fair value of a specific investment, the investment is placed in the level of the table based upon the lowest level input that is significant in determining the fair value of the investment:
| | | | | | | | | | | | | | | | | | | | |
| | | FAIR VALUE MEASUREMENTS AT MARCH 31, 2018 |
| | | TOTAL | | LEVEL 1 | | LEVEL 2 | | LEVEL 3 |
Assets | | | | | | | | | | | | | | | | | | | | |
Investments in Securities | | | | | | | | | | | | | | | | | | | | |
Municipal Bonds | | | $ | 6,870,723,997 | | | | $ | – | | | | $ | 6,870,723,997 | | | | $ | – | |
| | | | | | | | | | | | | | | | | | | | |
Total Investments in Securities | | | $ | 6,870,723,997 | | | | $ | – | | | | $ | 6,870,723,997 | | | | $ | – | |
In accordance with the guidance prescribed in Accounting Standards Update No. 2011-04, it is the policy of the Fund to recognize transfers between levels and the underlying events which caused the movement. The Fund recognized no transfers between levels for the six months ended March 31, 2018.
30 | Semi-Annual Report
Notes to Financial Statements, Continued
Thornburg Limited Term Municipal Fund | March 31, 2018 (Unaudited)
NOTE 4 – INVESTMENT ADVISORY FEE AND OTHER TRANSACTIONS WITH AFFILIATES
Pursuant to an investment advisory agreement, the Advisor serves as the investment advisor and performs services for the Fund for which the fees are payable at the end of each month. Under the investment advisory agreement, the Fund pays the Advisor a management fee based on the daily net assets of the Fund at an annual rate as shown in the following table:
| | | | | |
| MANAGEMENT FEE SCHEDULE |
| DAILY NET ASSETS | | FEE RATE |
| |
Up to $500 million | | | | 0.500 | % |
| |
Next $500 million | | | | 0.400 | |
| |
Next $500 million | | | | 0.300 | |
| |
Next $500 million | | | | 0.250 | |
| |
Over $2 billion | | | | 0.225 | |
The Fund’s effective management fee for the six months ended March 31, 2018 was 0.264% of the Fund’s average net assets.
The Trust has entered into administrative service agreements with the Advisor, whereby the Advisor will perform certain administrative services related to each class of the Fund’s shares. Until January 31, 2018, the fees were payable at an annual rate of up to 0.125 of 1% per annum of the average daily net assets attributable to each class of shares. As of February 1, 2018, the fees are computed as an annual percentage of the aggregate average daily net assets of all shares classes of all Funds in the Trust as follows:
| | | | | |
| ADMINISTRATION FEE SCHEDULE |
| DAILY NET ASSETS | | FEE RATE |
| |
Up to $20 billion | | | | 0.100 | % |
| |
$20 billion to $40 billion | | | | 0.075 | |
| |
$40 billion to $60 billion | | | | 0.040 | |
| |
Over $60 billion | | | | 0.030 | |
The aggregate fee amount is allocated on a daily basis to each Fund based on net assets and subsequently allocated to each class of shares of the Fund. Total administrative service fees incurred by each class of shares of the Fund for the six months ended March 31, 2018, are set forth in the Statement of Operations.
The Trust has an underwriting agreement with Thornburg Securities Corporation (the “Distributor”), an affiliate of the Advisor, which acts as the distributor of the Fund’s shares. For the six months ended March 31, 2018, the Distributor has advised the Fund that it earned net commissions aggregating $5,809 from the sale of Class A shares, and collected contingent deferred sales charges aggregating $7,370 from redemptions of Class C shares of the Fund.
Pursuant to a service plan under Rule 12b-1 of the Investment Company Act of 1940, the Fund may pay to the Distributor or securities dealers and other financial institutions at the Distributor’s direction an amount not to exceed .25 of 1% per annum of the average daily net assets attributable to Class A and Class C shares of the Fund to obtain various shareholder and distribution related services. For the six months ended March 31, 2018, there were no 12b-1 service plan fees charged for Class I shares. The Advisor and Distributor each may pay out of its own resources additional expenses for distribution of the Fund’s shares and shareholder services.
The Trust has also adopted a distribution plan pursuant to Rule 12b-1, applicable only to the Fund’s Class C shares under which the Fund compensates the Distributor for services in promoting the sale of Class C shares of the Fund at an annual rate of up to .25 of 1% per annum of the average daily net assets attributable to Class C shares.
Total fees incurred by each class of shares of the Fund under their respective service and distribution plans for the six months ended March 31, 2018, are set forth in the Statement of Operations.
Certain officers and Trustees of the Trust are also officers or directors of the Advisor and Distributor. The compensation of the independent Trustees is borne by the Trust. The Trust also pays a portion of the Chief Compliance Officer’s compensation. These amounts are reflected as “Trustee and officer fees” in the Statement of Operations.
The percentage of direct investments in the Fund held by the Trustees, officers of the Trust, and the Advisor is approximately 1.21%.
Semi-Annual Report | 31
Notes to Financial Statements, Continued
Thornburg Limited Term Municipal Fund | March 31, 2018 (Unaudited)
The Fund may purchase or sell securities from, or to an affiliated fund, provided the affiliation is due solely to having a common investment advisor, common officers, or common trustees, and provided that all such transactions will comply with Rule 17a-7 under the 1940 Act. For the six months ended March 31, 2018, the Fund had transactions with affiliated funds of $112,655,248 in purchases and $22,852,478 in sales generating realized losses of $19,459.
NOTE 5 – SHARES OF BENEFICIAL INTEREST
At March 31, 2018, there were an unlimited number of shares with no par value of beneficial interest authorized. Transactions in shares of beneficial interest were as follows:
| | | | | | | | | | | | | | | | |
| | | SIX MONTHS ENDED MARCH 31, 2018 (UNAUDITED) | | | YEAR ENDED SEPTEMBER 30, 2017 (AUDITED) | |
| | | SHARES | | | AMOUNT | | | SHARES | | | AMOUNT | |
Class A Shares | | | | | | | | | | | | | | | | |
Shares sold | | | 5,448,903 | | | $ | 77,921,723 | | | | 15,208,492 | | | $ | 218,389,244 | |
Shares issued to shareholders in
reinvestment of dividends | | | 656,289 | | | | 9,360,726 | | | | 1,490,020 | | | | 21,412,134 | |
Shares repurchased | | | (14,892,541 | ) | | | (212,940,938 | ) | | | (41,628,282 | ) | | | (596,076,653 | ) |
| | | | |
| | | | |
Net decrease | | | (8,787,349 | ) | | $ | (125,658,489 | ) | | | (24,929,770 | ) | | $ | (356,275,275 | ) |
| | | | |
Class C Shares | | | | | | | | | | | | | | | | |
Shares sold | | | 1,304,633 | | | $ | 18,703,511 | | | | 3,377,811 | | | $ | 48,659,522 | |
Shares issued to shareholders in
reinvestment of dividends | | | 245,440 | | | | 3,506,577 | | | | 551,982 | | | | 7,947,573 | |
Shares repurchased | | | (5,566,681 | ) | | | (79,746,860 | ) | | | (12,609,555 | ) | | | (181,232,031 | ) |
| | | | |
| | | | |
Net decrease | | | (4,016,608 | ) | | $ | (57,536,772 | ) | | | (8,679,762 | ) | | $ | (124,624,936 | ) |
| | | | |
Class I Shares | | | | | | | | | | | | | | | | |
Shares sold | | | 57,901,741 | | | $ | 827,832,214 | | | | 106,338,216 | | | $ | 1,527,896,825 | |
Shares issued to shareholders in
reinvestment of dividends | | | 3,215,509 | | | | 45,870,596 | | | | 6,364,932 | | | | 91,492,526 | |
Shares repurchased | | | (55,531,433 | ) | | | (793,522,137 | ) | | | (124,099,454 | ) | | | (1,778,229,472 | ) |
| | | | |
| | | | |
Net increase (decrease) | | | 5,585,817 | | | $ | 80,180,673 | | | | (11,396,306 | ) | | $ | (158,840,121 | ) |
| | | | |
NOTE 6 – INVESTMENT TRANSACTIONS
For the six months ended March 31, 2018, the Fund had purchase and sale transactions of investments (excluding short-term investments) of $555,540,900 and $474,764,186, respectively.
OTHER NOTES
Risks: The Fund’s investments subject it to risks including, but not limited to, credit risk, interest rate risk, management risk, market and economic risk, and liquidity risk. Please see the Fund’s prospectus for a discussion of the risks associated with an investment in the Fund.
Subsequent Events: Fund management believes no events have occurred between March 31, 2018 and the date of issuance of the financial statements that require adjustment to or disclosure in the accompanying financial statements.
32 | Semi-Annual Report
This page intentionally left blank.
Semi-Annual Report | 33
Financial Highlights
Thornburg Limited Term Municipal Fund
| | | | | | | | | | | | | | | | | | | | | | | | | | | | | | | | | | | | | | | | |
| | | PER SHARE PERFORMANCE (FOR A SHARE OUTSTANDING THROUGHOUT THE PERIOD) |
| | | | | | | | | | | | | | | | | |
UNLESS OTHERWISE
NOTED, PERIODS ARE
FISCAL YEARS ENDED
SEPTEMBER 30, | | NET ASSET
VALUE,
BEGINNING OF
PERIOD | | NET
INVESTMENT
INCOME
(LOSS)+ | | NET REALIZED &
UNREALIZED GAIN
(LOSS) ON
INVESTMENTS | | TOTAL FROM
INVESTMENT
OPERATIONS | | DIVIDENDS
FROM NET
INVESTMENT
INCOME | | DIVIDENDS
FROM NET
REALIZED
GAINS | | TOTAL
DIVIDENDS | | NET ASSET
VALUE,
END OF PERIOD |
| | | | | | | | |
| CLASS A SHARES | | | | | | | | | | | | | | | | | | | | | | | | | | | | | | | | | | | | | | | | |
| | | | | | | | |
2018(b)(c) | | | $ | 14.43 | | | | | 0.12 | | | | | (0.27 | ) | | | | (0.15 | ) | | | | (0.12 | ) | | | | – | | | | | (0.12 | ) | | | $ | 14.16 | |
2017(b) | | | $ | 14.63 | | | | | 0.23 | | | | | (0.20 | ) | | | | 0.03 | | | | | (0.23 | ) | | | | – | | | | | (0.23 | ) | | | $ | 14.43 | |
2016(b) | | | $ | 14.52 | | | | | 0.22 | | | | | 0.11 | | | | | 0.33 | | | | | (0.22 | ) | | | | – | | | | | (0.22 | ) | | | $ | 14.63 | |
2015(b) | | | $ | 14.58 | | | | | 0.23 | | | | | (0.06 | ) | | | | 0.17 | | | | | (0.23 | ) | | | | – | | | | | (0.23 | ) | | | $ | 14.52 | |
2014(b) | | | $ | 14.38 | | | | | 0.26 | | | | | 0.20 | | | | | 0.46 | | | | | (0.26 | ) | | | | – | | | | | (0.26 | ) | | | $ | 14.58 | |
2013(b) | | | $ | 14.70 | | | | | 0.26 | | | | | (0.32 | ) | | | | (0.06 | ) | | | | (0.26 | ) | | | | – | | | | | (0.26 | ) | | | $ | 14.38 | |
| | | | | | | | |
| CLASS C SHARES | | | | | | | | | | | | | | | | | | | | | | | | | | | | | | | | | | | | | | | | |
| | | | | | | | |
2018(c) | | | $ | 14.46 | | | | | 0.10 | | | | | (0.27 | ) | | | | (0.17 | ) | | | | (0.10 | ) | | | | – | | | | | (0.10 | ) | | | $ | 14.19 | |
2017 | | | $ | 14.66 | | | | | 0.20 | | | | | (0.20 | ) | | | | – | | | | | (0.20 | ) | | | | – | | | | | (0.20 | ) | | | $ | 14.46 | |
2016 | | | $ | 14.55 | | | | | 0.19 | | | | | 0.11 | | | | | 0.30 | | | | | (0.19 | ) | | | | – | | | | | (0.19 | ) | | | $ | 14.66 | |
2015 | | | $ | 14.60 | | | | | 0.19 | | | | | (0.05 | ) | | | | 0.14 | | | | | (0.19 | ) | | | | – | | | | | (0.19 | ) | | | $ | 14.55 | |
2014 | | | $ | 14.41 | | | | | 0.22 | | | | | 0.19 | | | | | 0.41 | | | | | (0.22 | ) | | | | – | | | | | (0.22 | ) | | | $ | 14.60 | |
2013 | | | $ | 14.72 | | | | | 0.23 | | | | | (0.31 | ) | | | | (0.08 | ) | | | | (0.23 | ) | | | | – | | | | | (0.23 | ) | | | $ | 14.41 | |
| | | | | | | | |
| CLASS I SHARES | | | | | | | | | | | | | | | | | | | | | | | | | | | | | | | | | | | | | | | | |
| | | | | | | | |
2018(c) | | | $ | 14.43 | | | | | 0.14 | | | | | (0.26 | ) | | | | (0.12 | ) | | | | (0.14 | ) | | | | – | | | | | (0.14 | ) | | | $ | 14.17 | |
2017 | | | $ | 14.64 | | | | | 0.28 | | | | | (0.21 | ) | | | | 0.07 | | | | | (0.28 | ) | | | | – | | | | | (0.28 | ) | | | $ | 14.43 | |
2016 | | | $ | 14.53 | | | | | 0.27 | | | | | 0.11 | | | | | 0.38 | | | | | (0.27 | ) | | | | – | | | | | (0.27 | ) | | | $ | 14.64 | |
2015 | | | $ | 14.58 | | | | | 0.27 | | | | | (0.05 | ) | | | | 0.22 | | | | | (0.27 | ) | | | | – | | | | | (0.27 | ) | | | $ | 14.53 | |
2014 | | | $ | 14.38 | | | | | 0.30 | | | | | 0.20 | | | | | 0.50 | | | | | (0.30 | ) | | | | – | | | | | (0.30 | ) | | | $ | 14.58 | |
2013 | | | $ | 14.70 | | | | | 0.31 | | | | | (0.32 | ) | | | | (0.01 | ) | | | | (0.31 | ) | | | | – | | | �� | | (0.31 | ) | | | $ | 14.38 | |
| (a) | Not annualized for periods less than one year. |
| (b) | Sales loads are not reflected in computing total return. |
| (c) | Unaudited Six Month Period Ended March 31. |
| + | Based on weighted average shares outstanding. |
See notes to financial statements.
34 | Semi-Annual Report
Financial Highlights, Continued
Thornburg Limited Term Municipal Fund
| | | | | | | | | | | | | | | | | | | | | | | | | | | | | | |
| RATIOS TO AVERAGE NET ASSETS | | | | | | SUPPLEMENTAL DATA | |
| | | | | | | EXPENSES, AFTER | | | | | | | | | | | | | | | | |
NET INVESTMENT
INCOME (LOSS) (%) | | | EXPENSES, AFTER
EXPENSE
REDUCTIONS (%) | | | EXPENSE
REDUCTIONS AND
NET OF CUSTODY
CREDITS (%) | | | EXPENSES,
BEFORE EXPENSE
REDUCTIONS (%) | | | | | | TOTAL
RETURN (%)(a) | | | PORTFOLIO TURNOVER RATE (%)(a) | | | NET ASSETS AT
END OF PERIOD (THOUSANDS) | |
| | | | | | | |
| | | | | | | | | | | | | | | | | | | | | | | | | | | | | | |
| | | | | | | |
| | 1.63 | (d) | | | 0.72 | (d) | | | 0.72 | (d) | | | 0.72 | (d) | | | | | | | (1.07 | ) | | | 7.74 | | | $ | 1,165,320 | |
| | 1.62 | | | | 0.73 | | | | 0.73 | | | | 0.73 | | | | | | | | 0.24 | | | | 17.56 | | | $ | 1,314,094 | |
| | 1.54 | | | | 0.72 | | | | 0.72 | | | | 0.72 | | | | | | | | 2.32 | | | | 14.53 | | | $ | 1,697,329 | |
| | 1.56 | | | | 0.73 | | | | 0.73 | | | | 0.73 | | | | | | | | 1.15 | | | | 18.56 | | | $ | 1,700,127 | |
| | 1.78 | | | | 0.72 | | | | 0.71 | | | | 0.72 | | | | | | | | 3.20 | | | | 14.46 | | | $ | 1,865,213 | |
| | 1.81 | | | | 0.71 | | | | 0.71 | | | | 0.71 | | | | | | | | (0.39 | ) | | | 17.47 | | | $ | 2,178,317 | |
| | | | | | | |
| | | | | | | | | | | | | | | | | | | | | | | | | | | | | | |
| | | | | | | |
| | 1.40 | (d) | | | 0.96 | (d) | | | 0.96 | (d) | | | 0.96 | (d) | | | | | | | (1.18 | ) | | | 7.74 | | | $ | 537,692 | |
| | 1.38 | | | | 0.97 | | | | 0.97 | | | | 0.97 | | | | | | | | 0.01 | | | | 17.56 | | | $ | 605,898 | |
| | 1.30 | | | | 0.96 | | | | 0.96 | | | | 0.96 | | | | | | | | 2.07 | | | | 14.53 | | | $ | 741,637 | |
| | 1.32 | | | | 0.96 | | | | 0.96 | | | | 0.96 | | | | | | | | 0.98 | | | | 18.56 | | | $ | 730,395 | |
| | 1.52 | | | | 0.97 | | | | 0.96 | | | | 0.97 | | | | | | | | 2.87 | | | | 14.46 | | | $ | 749,648 | |
| | 1.55 | | | | 0.97 | | | | 0.97 | | | | 0.97 | | | | | | | | (0.58 | ) | | | 17.47 | | | $ | 795,052 | |
| | | | | | | |
| | | | | | | | | | | | | | | | | | | | | | | | | | | | | | |
| | | | | | | |
| | 1.93 | (d) | | | 0.42 | (d) | | | 0.42 | (d) | | | 0.42 | (d) | | | | | | | (0.85 | ) | | | 7.74 | | | $ | 5,247,316 | |
| | 1.93 | | | | 0.42 | | | | 0.42 | | | | 0.42 | | | | | | | | 0.49 | | | | 17.56 | | | $ | 5,265,576 | |
| | 1.85 | | | | 0.41 | | | | 0.41 | | | | 0.41 | | | | | | | | 2.64 | | | | 14.53 | | | $ | 5,506,166 | |
| | 1.88 | | | | 0.41 | | | | 0.41 | | | | 0.41 | | | | | | | | 1.54 | | | | 18.56 | | | $ | 4,832,467 | |
| | 2.09 | | | | 0.40 | | | | 0.40 | | | | 0.40 | | | | | | | | 3.53 | | | | 14.46 | | | $ | 4,417,547 | |
| | 2.15 | | | | 0.37 | | | | 0.37 | | | | 0.37 | | | | | | | | (0.05 | ) | | | 17.47 | | | $ | 3,502,580 | |
Semi-Annual Report | 35
Expense Example
Thornburg Limited Term Municipal Fund | March 31, 2018 (Unaudited)
As a shareholder of the Fund, you incur two types of costs:
| | (1) | transaction costs, including |
| | (a) | sales charges (loads) on purchase payments, for Class A shares; |
| | (b) | a deferred sales charge on redemptions of any part or all of a purchase of $1 million of Class A shares within 12 months of purchase; |
| | (c) | a deferred sales charge on redemptions of Class C shares within 12 months of purchase; |
| | (2) | ongoing costs, including management fees; distribution and/or service (12b-1) fees; and other Fund expenses. This example is intended to help you understand your ongoing costs (in dollars) of investing in the Fund and to compare these costs with the ongoing costs of investing in other mutual funds. |
The example is based on a $1,000 investment beginning on October 1, 2017, and held until March 31, 2018.
| | | | | | | | | | | | | | | |
| | | BEGINNING
ACCOUNT VALUE
10/1/17 | | ENDING
ACCOUNT VALUE
3/31/18 | | EXPENSES PAID
DURING PERIOD†
10/1/17–3/31/18 |
| | | |
| CLASS A SHARES | | | | | | | | | | | | | | | |
| | | |
Actual | | | $ | 1,000.00 | | | | $ | 989.30 | | | | $ | 3.57 | |
Hypothetical* | | | $ | 1,000.00 | | | | $ | 1,021.34 | | | | $ | 3.63 | |
| | | |
| CLASS C SHARES | | | | | | | | | | | | | | | |
| | | |
Actual | | | $ | 1,000.00 | | | | $ | 988.20 | | | | $ | 4.76 | |
Hypothetical* | | | $ | 1,000.00 | | | | $ | 1,020.14 | | | | $ | 4.84 | |
| | | |
| CLASS I SHARES | | | | | | | | | | | | | | | |
| | | |
Actual | | | $ | 1,000.00 | | | | $ | 991.50 | | | | $ | 2.09 | |
Hypothetical* | | | $ | 1,000.00 | | | | $ | 1,022.84 | | | | $ | 2.12 | |
| † | Expenses are equal to the annualized expense ratio for each class (A: 0.72%; C: 0.96%; I: 0.42%) multiplied by the average account value over the period, multiplied by 182/365 to reflect the one-half year period. |
| * | Hypothetical assumes a rate of return of 5% per year before expenses. |
ACTUAL EXPENSES
For each class of shares, the first line of the accompanying table provides information about actual account values and actual expenses. You may use the information in this line, together with the amount you invested, to estimate the expenses that you paid over the period. Simply divide your account value by $1,000 (for example, an $8,600 account value divided by $1,000 = 8.6), then multiply the result by the number in the first line for your class of shares under the heading entitled “Expenses Paid During Period” to estimate the expenses you paid on your account during this period.
HYPOTHETICAL EXAMPLE FOR COMPARISON PURPOSES
For each class of shares, the second line of the accompanying table provides information about hypothetical account values and hypothetical expenses based on the Fund’s actual expense ratio and an assumed rate of return of 5% per year before expenses, which is not the Fund’s actual return. The hypothetical account values and expenses may not be used to estimate the actual ending account balance or expenses you paid for the period. You may use this information to compare the ongoing costs of investing in the Fund and other funds. To do so, compare this 5% hypothetical example with the 5% hypothetical examples that appear in the shareholder reports of the other funds.
Please note that the expenses shown in the table are meant to highlight your ongoing costs only and do not reflect any transactional costs, such as sales charges (loads), redemption fees, or exchange fees. Therefore, the second line of the table for each class of shares is useful in comparing ongoing costs only, and will not help you determine the relative total costs of owning different funds. In addition, if these transactional costs were included, your costs would have been higher.
36 | Semi-Annual Report
Other Information
Thornburg Limited Term Municipal Fund | March 31, 2018 (Unaudited)
PORTFOLIO PROXY VOTING
Policies and Procedures:
The Trust has delegated to Thornburg Investment Management, Inc. (the “Advisor”) voting decisions respecting proxies for the Fund’s voting securities. The Advisor makes voting decisions in accordance with its Proxy Voting Policy and Procedures. A description of the Policy and Procedures is available (i) without charge, upon request, by calling the Advisor toll-free at 1-800-847-0200, (ii) on the Thornburg website at www.thornburg.com, and (iii) on the Securities and Exchange Commission’s website at www.sec.gov.
Information regarding how proxies were voted is available on or before August 31 of each year for the twelve months ending the preceding June 30. This information is available (i) without charge, upon request by calling the Advisor toll-free at 1-800-847-0200, (ii) on the Thornburg website at www.thornburg.com, and (iii) on the Securities and Exchange Commission’s website at www.sec.gov.
AVAILABILITY OF QUARTERLY PORTFOLIO SCHEDULE
The Fund files with the Securities and Exchange Commission schedules of its portfolio holdings on Form N-Q for the first and third quarters of each fiscal year. The Fund’s Forms N-Q are available on the Commission’s website at www.sec.gov, or may be reviewed and copied at the Commission’s Public Reference Room in Washington, D.C. Information on the operation of the Public Reference Room may be obtained by calling 1-800-SEC-0330. The Fund also makes this information available on its website at www.thornburg.com/download or upon request by calling
1-800-847-0200.
Semi-Annual Report | 37
Trustees’ Statement to Shareholders
Readopted September 11, 2017
The Trustees believe current and prospective shareholders should know how we discharge our responsibilities in supervising the Funds’ investment advisor and in reviewing the advisor’s contract for renewal. Since 2005, we have issued a statement which sets out clearly the three principal guidelines that we follow in supervising the Trust’s investment advisor on your behalf. In accordance with our customary practice, in September of this year we again reviewed our statement and concluded we should reissue this statement outlining the principal features of our supervision of the advisor’s performance of investment management services for the Funds.
We begin with the premise that each shareholder selected his or her Fund because its investments are managed by the investment advisor identified in the prospectus and in accordance with the objective and policies described in the prospectus. We realize, as each of you do, that if you believe that your Fund’s stated objective and policies no longer serve your personal investment goals, you can sell your shares and leave the Fund.
Therefore, we believe that our primary supervisory task—our principal obligation to you—is to assess the nature and quality of the advisor’s services, and to confirm that the advisor actively and competently pursues the Fund’s objective, in accordance with the policies set out in the prospectus. To do this, we meet regularly with management to review your Fund’s portfolio and to discuss the advisor’s specific actions and judgments in pursuing the Fund’s objective. We do not substitute our own judgment for the advisor’s decisions in selecting investments; the advisor is paid to exercise its informed judgment on investment decisions, and we seek to confirm, in reviewing the advisor’s performance, that the advisor is doing just that.
Second, we are conscious of costs and the effect that costs have on shareholders’ returns. We try to make sure that your Fund’s fees and costs are reasonable in relationship to the services rendered and that they are generally in line with those charged by other expert investment advisors, consistent with our belief that the Fund’s investors searched for and expect that expertise and attention and have decided to pay a reasonable price for it. We do not put the management contract “out to bid” as a matter of course, and we would not do so unless we had concluded that the advisor materially had failed to pursue the Fund’s objectives in accordance with its policies, or for other equally important reasons. We believe that any other approach would be inconsistent with your interests and contrary to your expectations when you bought shares of the Fund in the first place.
Finally, because we believe that most Thornburg Fund shareholders have invested with a long-term perspective, we try not to focus too much on the fashions of the moment and on short-term performance. The market will not favor any specific investment objective or set of policies at all times and under all economic circumstances. A fund will experience periods of both high and low returns relative to other funds and other investments. Even if one of our Funds is not favored by the market at a particular time, we believe that the advisor is nonetheless obliged to remain true to the Fund’s objective and policies, and we watch to see that it does so.
Trustees of Thornburg Investment Trust
38 | Semi-Annual Report
Thornburg Funds
Thornburg Investment Management is a privately-owned global investment firm that offers a range of solutions for retail and institutional investors. Founded in 1982 and headquartered in Santa Fe, New Mexico, we manage approximately $49 billion (as of March 31, 2018) across U.S. mutual funds, separate accounts for high-net-worth investors, institutional accounts, and UCITS funds for non-U.S. investors.
EQUITY FUNDS
| | ∎ | | Thornburg Investment Income Builder Fund |
| | ∎ | | Thornburg Global Opportunities Fund |
| | ∎ | | Thornburg International Value Fund |
| | ∎ | | Thornburg Better World International Fund |
| | ∎ | | Thornburg International Growth Fund |
| | ∎ | | Thornburg Developing World Fund |
| | ∎ | | Thornburg Core Growth Fund |
FIXED INCOME FUNDS
| | ∎ | | Thornburg Low Duration Income Fund |
| | ∎ | | Thornburg Limited Term U.S. Government Fund |
| | ∎ | | Thornburg Limited Term Income Fund |
| | ∎ | | Thornburg Strategic Income Fund |
| | ∎ | | Thornburg Low Duration Municipal Fund |
| | ∎ | | Thornburg Limited Term Municipal Fund |
| | ∎ | | Thornburg Intermediate Municipal Fund |
| | ∎ | | Thornburg California Limited Term Municipal Fund |
| | ∎ | | Thornburg New Mexico Intermediate Municipal Fund |
| | ∎ | | Thornburg New York Intermediate Municipal Fund |
| | ∎ | | Thornburg Strategic Municipal Income Fund |
ALTERNATIVE FUNDS
| | ∎ | | Thornburg Long/Short Equity Fund |
Before investing, carefully consider the Fund’s investment goals, risks, charges, and expenses. For a prospectus or summary prospectus containing this and other information, contact your financial advisor or visit thornburg.com. Read it carefully before investing.
For additional information, please visit thornburg.com
Thornburg Investment Management, Inc. 2300 North Ridgetop Road, Santa Fe, NM 87506
Semi-Annual Report | 39
| | | | |
| To receive shareholder reports, prospectuses, and proxy statements electronically, go to www.thornburg.com/edelivery. | | | | |
| This Semi-Annual Report is submitted for the general information of shareholders of the Fund. It is not authorized for distribution to prospective investors in the Fund unless preceded or accompanied by an effective prospectus. | |
| | | | |
Investment Advisor: | | Distributor: | | |
Thornburg Investment Management® | | Thornburg Securities Corporation® | | |
800.847.0200 | | 800.847.0200 | | TH1072 |
Semi-Annual Report
March 31, 2018
THORNBURG
INTERMEDIATE
MUNICIPAL
FUND

About Thornburg Investment Management
It’s more than what we do.
It’s how we do it.
At Thornburg, we are very different in how we think, invest, and are structured. We believe this difference is what makes us successful in helping individuals reach their long-term financial goals.

Flexible Perspective
Our perspective on investment opportunities is more flexible than most, viewing a wide range of opportunities beyond conventional boundaries to find hidden value.
Collaboration
Collectively, we hone ideas via borderless cross-pollination for better judgment and better results.

Portfolio Construction
Disciplined construction guided more by our convictions than convention.
CONVICTION
Thorough analysis and our relative-value framework lead to conviction in our securities selection.
UNCONVENTIONAL
Active management means we seek the best value for our clients rather than using conventional benchmarks as our starting point.

Structured for Excellence
How we think and how we invest is made possible by how we’re structured.
TEAM APPROACH
FAR FROM THE HERD
ACCESS & TRANSPARENCY
2 | Semi-Annual Report
Thornburg Intermediate Municipal Fund
Semi-Annual Report | March 31, 2018
Table of Contents
| | | | | | | | | | |
| SHARE CLASS | | NASDAQ SYMBOL | | CUSIP |
| | |
| Class A | | THIMX | | | | 885-215-202 | |
| Class C | | THMCX | | | | 885-215-780 | |
| Class I | | THMIX | | | | 885-215-673 | |
Minimum investments for Class I shares may be higher than those for other classes. Class I shares may not be available to all investors.
Investments carry risks, including possible loss of principal. Portfolios investing in bonds have the same interest rate, inflation, and credit risks that are associated with the underlying bonds. The value of bonds will fluctuate relative to changes in interest rates, decreasing when interest rates rise. Unlike bonds, bond funds have ongoing fees and expenses. Please see the Fund’s prospectus for a discussion of the risks associated with an investment in the Fund. Investments in the Funds are not FDIC insured, nor are they bank deposits or guaranteed by a bank or any other entity.
The laddering strategy does not assure or guarantee better performance and cannot eliminate the risk of investment losses.
Semi-Annual Report | 3
Letter to Shareholders
Thornburg Intermediate Municipal Fund | March 31, 2018 (Unaudited)
April 25, 2018
Dear Fellow Shareholder:
We are pleased to present the semi-annual report for Thornburg Intermediate Municipal Fund. The net asset value (NAV) of the Class I shares decreased by 26 cents to $13.87 per share during the six-month period ended March 31, 2018. During the period, the Class I shares of the Fund outperformed the index with a negative 0.59% total return, compared to the negative 1.17% total return for the ICE BofAML 3-15 Year U.S. Municipal Securities Index.
The Fund’s duration, as well as curve positioning, contributed 0.45% to relative performance. Sector selection was also a positive contributor to relative performance, adding 0.14%. Lastly, security selection, which is performance not attributable to duration and sector selection, added 0.32% to relative performance.
The topic of tax reform consumed municipal market participants in the fourth quarter of 2017, with several proposals being bandied about that would significantly impact the supply/ demand dynamics of the market for years to come. Ultimately, the legislation was not as radical as initially feared. On the supply side of the equation, issuers lost the ability to advance refund debt. Much like a homeowner refinancing an existing mortgage to save on interest costs, an issuer would refinance debt when interest rates were low to provide some present value savings. While many thought this would have a large impact on supply, we did not agree. Advance refunding is highly correlated to the current level of interest rates, and many issuers had already accomplished any possible refunding over the previous several years.
Instead, we found the impact of tax reform on the demand side of the equation to be far more interesting. What was overlooked was the reduction of the corporate tax rate from 35% to 21%, and the idea that corporations evaluating municipal bonds versus other fixed income securities on a tax equivalent basis would now require a higher hurdle rate to buy municipal securities. We felt that the impact this may have on two specific buyers of municipals, banks, and property and casualty insurance companies, which own roughly 20 to 25% of outstanding municipal bonds, could lead both to re-evaluate their decision to own municipal bonds. While we do not believe this to be an Armageddon type of scenario; we expect it to be more like a weight leaning on the market for the next 12 to 18 months.
Another impact on the demand side is the limitations on the deductibility of state and local taxes (SALT), which has led
many market observers to postulate that the demand for municipal bonds in high tax states will increase. Again, we did not share the same opinion. In California, the demand for California bonds has already driven prices to a level where we feel there is little value when compared to other municipal securities on a tax-equivalent basis. Demand for municipal securities in other high tax states, such as Connecticut, Pennsylvania, and New Jersey, is not as cut and dry because there is significant credit risk associated with each. Nevertheless, these concerns caused the supply of municipal bonds to spike in November and December as issuers rushed to market to hedge against the potential threat of tax reform. Some investors viewed this period as an opportunity to buy extra municipal bonds in anticipation of a January rally, which never materialized. We did not view the market the same way, and kept our strategies positioned at the lower end of their relative risk spectrums (i.e. lower duration, higher credit quality, and higher reserve positions). The last fear facing the municipal bond market is the long-advertised infrastructure plan. While the plan has experienced several failed launches, and what is known suggests it will have little impact on the supply of municipal bonds, we are still monitoring the details of the proposal for potential impacts to our strategies.
The fourth quarter of 2017 saw yields of shorter maturity bonds increase more than the yields of longer maturity bonds, leading to a flattening of the yield curve. At the time, many analysts and pundits harped on the fact that the phenomenon portends a future recession. In the first quarter of 2018, the market watched as yields of longer maturity bonds increased more than yields of shorter maturity bonds, leading to a steepening of the yield curve. The steepening of the curve is an indication that market participants have a growing concern about increases in inflation – the enemy of the fixed income investor. The Fund’s conservative positioning was a headwind to performance in the fourth quarter of 2017, but acted as a tailwind to performance in the first quarter of 2018.
Thank you for your continued trust in us.
Sincerely,
| | |
 | |  |
| Christopher Ryon, CFA | | Nicholos Venditti, CFA |
| Portfolio Manager | | Portfolio Manager |
| Managing Director | | Managing Director |
The matters discussed in this report may constitute forward-looking statements made pursuant to the safe harbor provisions of the Securities Litigation Reform Act of 1995. These include any advisor or portfolio manager prediction, assessment, analysis or outlook for individual securities, industries, investment styles, market sectors and/or markets. These statements involve risks and uncertainties. In addition to the general risks described for each fund in its current prospectus, other factors bearing on these reports include the accuracy of the advisor’s or portfolio manager’s forecasts and predictions, the appropriateness of the investment strategies designed by the advisor or portfolio manager and the ability of the advisor or portfolio manager to implement their strategies efficiently and successfully. Any one or more of these factors, as well as other risks affecting the securities markets generally, could cause the actual results of any fund to differ materially as compared to its benchmarks.
The views expressed are subject to change and do not necessarily reflect the views of Thornburg Investment Management, Inc. This information should not be relied upon as a recommendation or investment advice and is not intended to predict the performance of any investment or market.
Performance results of individual share classes will vary based on the fees and expenses associated with each share class, and may be higher or lower than other share classes within the same Fund. Please see Performance Summary for performance results of each share class.
4 | Semi-Annual Report
Performance Summary
Thornburg Intermediate Municipal Fund | March 31, 2018 (Unaudited)
AVERAGE ANNUAL TOTAL RETURNS
| | | | | | | | | | | | | | | | | | | | | | | | | |
| | | 1-YR | | 3-YR | | 5-YR | | 10-YR | | SINCE
INCEP. |
| | | | | |
Class A Shares (Incep: 7/22/91) | | | | | | | | | | | | | | | | | | | | | | | | | |
Without sales charge | | | | 1.66% | | | | | 1.19% | | | | | 1.73% | | | | | 3.57% | | | | | 4.61% | |
| | | | | |
With sales charge | | | | -0.41% | | | | | 0.51% | | | | | 1.32% | | | | | 3.36% | | | | | 4.53% | |
| | | | | |
Class C Shares (Incep: 9/1/94) | | | | | | | | | | | | | | | | | | | | | | | | | |
Without sales charge | | | | 1.33% | | | | | 0.86% | | | | | 1.41% | | | | | 3.27% | | | | | 3.79% | |
| | | | | |
With sales charge | | | | 0.73% | | | | | 0.86% | | | | | 1.41% | | | | | 3.27% | | | | | 3.79% | |
| | | | | |
Class I Shares (Incep: 7/5/96) | | | | 1.96% | | | | | 1.48% | | | | | 2.04% | | | | | 3.89% | | | | | 4.32% | |
30-DAY YIELDS, A SHARES (with sales charge)
| | | | |
| Annualized Distribution Yield | | | 2.17% | |
| SEC Yield | | | 1.64% | |
GROWTH OF A HYPOTHETICAL $10,000 INVESTMENT
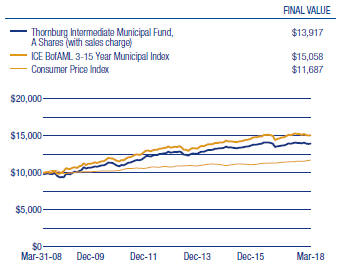
Performance data shown represents past performance and is no guarantee of future results. Investment return and principal value will fluctuate so shares, when redeemed, may be worth more or less than their original cost. Current performance may be lower or higher than quoted. For performance current to the most recent month end, visit thornburg.com or call 800-847-0200. The performance information does not reflect the deduction of taxes that a shareholder would pay on distributions or the redemption of Fund shares. Returns reflect the reinvestment of dividends and capital gains. Class A shares are sold with a maximum sales charge of 2.00%. Class C shares include a 0.60% CDSC for the first year only. There is no sales charge for Class I shares. As disclosed in the most recent prospectus, the total annual fund operating expenses before fee waivers and expense reimbursements are as follows: A shares, 0.88%; C shares, 1.23%; I shares, 0.65%. Thornburg Investment Management and/or Thornburg Securities Corporation have contractually agreed to waive fees and reimburse expenses through at least February 1, 2019, for some of the share classes, resulting in net expense ratios of the following: C shares, 1.24%. For more detailed information on fund expenses and waivers/reimbursements please see the Fund’s prospectus.
The ICE index data referenced herein is the property of ICE Data Indices, LLC, its affiliates (“ICE Data”) and/or its Third Party Suppliers and has been licensed for use by Thornburg Investment Management, Inc. ICE Data and its Third Party Suppliers accept no liability in connection with its use. See www.thornburg.com/indices for a full copy of the Disclaimer.
Glossary
The ICE BofAML 3-15 Year U.S. Municipal Securities Index is a subset of the ICE BofAML U.S. Municipal Securities Index including all securities with a remaining term to final maturity greater than or equal to 3 years and less than 15 years.
The performance of any index is not indicative of the performance of any particular investment. Unless otherwise noted, index returns reflect the reinvestment of income dividends and capital gains, if any, but do not reflect fees, brokerage commissions or other expenses of investing. Investors may not make direct investments into any index.
Annualized Distribution Yield – The distribution yield reflects actual distributions made to shareholders. The annualized distribution yield is calculated by summing the last 30 days of income at a given month end and annualizing to a 360-day year. The result is divided by the ending maximum offering price or net asset value.
SEC Yield – A yield computed in accordance with SEC standards measuring the net investment income per share over a specified 30-day period expressed as a percentage of the maximum offering price of the Fund’s shares at the end of the period.
Advance refunding – Advance refunding can also refer to bond issuance in which new bonds are sold at a lower rate than outstanding ones. The proceeds are then invested, and when the older bonds become callable, they are paid off with the invested proceeds.
Bond Credit Ratings (Credit Quality) – A bond credit rating assesses the financial ability of a debt issuer to make timely payments of principal and interest. Rating of AAA (the highest), AA, A, and BBB are investment-grade quality. Rating of BB, B, CCC, CC, C and D (the lowest) are considered below investment grade, speculative grade, or junk bonds.
Credit Spread/Quality Spread – The difference between the yields of securities with different credit qualities.
Duration – A bond’s sensitivity to interest rates. Bonds with longer durations experience greater price volatility than bonds with shorter durations. Effective duration incorporates a bond’s embedded option features, such as call provisions.
Laddering – Laddering involves building a portfolio of bonds with staggered maturities so that a portion matures each year. Money that comes in from maturing bonds is typically invested in bonds with longer maturities at the far end of the portfolio.
Yield Curve – A line that plots the interest rate, at a set point in time, of bonds having equal credit quality, but offering maturity dates.
Semi-Annual Report | 5
Fund Summary
Thornburg Intermediate Municipal Fund | March 31, 2018 (Unaudited)
OBJECTIVES AND STRATEGIES
The Fund’s primary investment goal is to obtain as high a level of current income exempt from federal individual income tax as is consistent, in the view of the Fund’s investment advisor, with preservation of capital (may be subject to Alternative Minimum Tax).
The secondary goal of the Fund is to reduce expected changes in its share price compared to long-term bond portfolios.
This Fund invests principally in a laddered portfolio of municipal bonds with a dollar-weighted average maturity of normally three to 10 years. Laddering involves building a portfolio of bonds with staggered maturities so that a portion of the portfolio matures each year. Cash from maturing bonds, if not needed for other purposes, is typically invested in bonds with longer maturities at the far end of the ladder. We regard the strategy as a good compromise for managing different types of risk.
LONG-TERM STABILITY OF PRINCIPAL
Net Asset Value History of A Shares
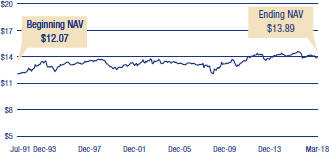
KEY PORTFOLIO ATTRIBUTES
| | | | | |
| Number of Bonds | | | | 565 | |
| Effective Duration | | | | 5.0 Yrs | |
| Average Maturity | | | | 8.5 Yrs | |
SECURITY CREDIT RATINGS
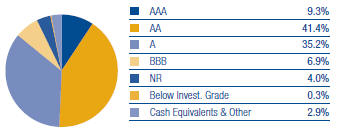
A bond credit rating assesses the financial ability of a debt issuer to make timely payments of principal and interest. Ratings of AAA (the highest), AA, A, and BBB are investment-grade quality. Ratings of BB, B, CCC, CC, C and D (the lowest) are considered below investment grade, speculative grade, or junk bonds.
Unrated pre-refunded and escrowed-to-maturity bonds are included in the not rated category.
PORTFOLIO LADDER
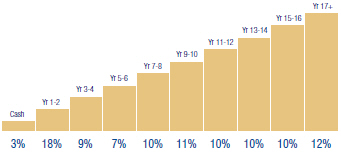
Percent of portfolio maturing in each year. Cash includes cash equivalents and other.
There is no guarantee that the Fund will meet its investment objectives.
All data is subject to change. Charts may not add up to 100% due to rounding.
6 | Semi-Annual Report
Schedule of Investments
Thornburg Intermediate Municipal Fund | March 31, 2018 (Unaudited)
| | | | | | | | | | | | |
| | | | | PRINCIPAL AMOUNT | | VALUE |
| | | |
| | MUNICIPAL BONDS — 98.5% | | | | | | | | | | |
| | | |
| | ALABAMA — 1.5% | | | | | | | | | | |
| | | |
| | Alabama Capital Region Solid Waste Disposal Authority (Montgomery Materials Recovery Facility), | | | | | | | | | | |
| | 4.00% due 6/15/2019 | | | $ | 815,000 | | | | $ | 826,728 | |
| | 5.00% due 6/15/2020 - 6/15/2023 | | | | 3,645,000 | | | | | 3,830,041 | |
| | Alabama Public School & College Authority (Educational Facilities), Series B, 5.00% due 6/1/2021 - 6/1/2026 | | | | 5,155,000 | | | | | 5,795,563 | |
| | Board of Trustees of the University of Alabama (Birmingham Hospital), 5.25% due 9/1/2025
(pre-refunded 9/1/2018) | | | | 2,000,000 | | | | | 2,029,760 | |
| | East Alabama Health Care Authority (Health Care Facilities Capital Improvements) GO, 5.00% due 9/1/2027 | | | | 1,250,000 | | | | | 1,337,763 | |
| a | | UAB Medicine Finance Authority (University Hospital), Series B, 5.00% due 9/1/2032 | | | | 6,000,000 | | | | | 6,978,060 | |
| | ALASKA — 0.2% | | | | | | | | | | |
| | Alaska Housing Finance Corp. (State Capital Project) GO, Series A, 5.00% due 12/1/2021
(pre-refunded 12/1/2020) | | | | 500,000 | | | | | 542,195 | |
| | City of Valdez (BP Pipelines (Alaska), Inc. Project), 5.00% due 1/1/2021 | | | | 2,000,000 | | | | | 2,156,060 | |
| | ARIZONA — 2.6% | | | | | | | | | | |
| b | | Arizona (LOC: Bank of America N.A.) HFA, Series C-RMK, 1.70% due 1/1/2046 (put 4/2/2018) | | | | 4,900,000 | | | | | 4,900,000 | |
| | Arizona (Scottsdale Lincoln Hospitals) HFA, 5.00% due 12/1/2031 | | | | 2,500,000 | | | | | 2,804,575 | |
| | Arizona Board of Regents (University of Arizona SPEED), 5.00% due 8/1/2024 - 8/1/2029 | | | | 2,635,000 | | | | | 2,917,641 | |
| | City of Flagstaff (Urban Trail, Street and Utilities Improvements) GO, | | | | | | | | | | |
| | 3.00% due 7/1/2020 | | | | 700,000 | | | | | 717,605 | |
| a | | 4.00% due 7/1/2022 | | | | 420,000 | | | | | 452,941 | |
| | 4.00% due 7/1/2023 | | | | 200,000 | | | | | 217,630 | |
| | County of Pima (Providence Day School Project) IDA, 5.00% due 12/1/2030 | | | | 2,000,000 | | | | | 2,106,740 | |
| | Salt River Project Agricultural Improvement and Power District (Salt River Electric System), | | | | | | | | | | |
| a | | 5.00% due 1/1/2029 | | | | 2,000,000 | | | | | 2,422,260 | |
| | 5.00% due 1/1/2033 - 1/1/2037 | | | | 8,000,000 | | | | | 9,460,755 | |
| | Salt Verde Financial Corp. (Gas Supply Acquisition), 5.25% due 12/1/2022 - 12/1/2028 | | | | 2,770,000 | | | | | 3,141,344 | |
| | State of Arizona (Insured: AGM), 5.00% due 7/1/2019 | | | | 7,280,000 | | | | | 7,569,817 | |
| | ARKANSAS — 0.3% | | | | | | | | | | |
| | Board of Trustees of the University of Arkansas (Fayetteville Campus), 5.00% due 11/1/2031 - 11/1/2034 | | | | 3,655,000 | | | | | 4,166,838 | |
| | CALIFORNIA — 8.7% | | | | | | | | | | |
| | Alameda County Joint Powers Authority (Alameda County Medical Center Highland Hospital), Series A, 5.25% due 12/1/2027 - 12/1/2029 | | | | 3,650,000 | | | | | 4,209,418 | |
| | Brentwood Infrastructure Financing Authority (Insured: AGM), 5.00% due 11/1/2026 | | | | 2,000,000 | | | | | 2,189,460 | |
| | California (Adventist Health System/West) HFFA, Series A, 5.00% due 3/1/2026 | | | | 3,020,000 | | | | | 3,390,584 | |
| | California (Childrens Hospital Los Angeles) HFFA, | | | | | | | | | | |
| | Series A, | | | | | | | | | | |
| a | | 5.00% due 8/15/2032 | | | | 350,000 | | | | | 403,074 | |
| | 5.00% due 8/15/2033 | | | | 600,000 | | | | | 687,312 | |
| | California (Children’s Hospital Los Angeles) HFFA, 5.00% due 11/15/2022 | | | | 1,000,000 | | | | | 1,116,670 | |
| | California (Dignity Health) HFFA, Series A, 5.25% due 3/1/2027 | | | | 5,250,000 | | | | | 5,703,652 | |
| | California Educational Facilities Authority (Pitzer College), 5.50% due 4/1/2029 (pre-refunded 4/1/2020) | | | | 3,000,000 | | | | | 3,226,320 | |
| | California Infrastructure and Economic Development Bank (King City Joint Union High School District), 5.75% due 8/15/2029 | | | | 1,500,000 | | | | | 1,608,825 | |
| c | | California Infrastructure and Economic Development Bank (Los Angeles County Museum of Art), 1.971% (LIBOR 1 Month + 0.65%) due 12/1/2050 (put 2/1/2021) | | | | 3,000,000 | | | | | 3,008,940 | |
| | California Municipal Finance Authority, 1.40% due 9/1/2021 (put 7/2/2018) | | | | 9,900,000 | | | | | 9,900,000 | |
| | California School Cash Reserve Program Authority, 3.00% due 6/29/2018 | | | | 7,000,000 | | | | | 7,025,620 | |
| | California Statewide Community Development Authority (Aspire Public Schools), 6.00% due 7/1/2030 (pre-refunded 1/1/2019) | | | | 7,015,000 | | | | | 7,244,952 | |
| | California Statewide Community Development Authority (Enloe Medical Center; Insured: California Mtg Insurance), 6.25% due 8/15/2028 (pre-refunded 8/15/2018) | | | | 1,050,000 | | | | | 1,068,574 | |
| | Carson Redevelopment Agency (Redevelopment Project Area No. 1), | | | | | | | | | | |
| | Series A, | | | | | | | | | | |
| | 6.25% due 10/1/2022 (pre-refunded 10/1/2019) | | | | 1,620,000 | | | | | 1,730,808 | |
| | 6.375% due 10/1/2024 (pre-refunded 10/1/2019) | | | | 1,300,000 | | | | | 1,391,299 | |
| | City of Los Angeles (Cash Flow Management) GO, 5.00% due 6/28/2018 | | | | 10,000,000 | | | | | 10,083,800 | |
| | Corona-Norco (Insured: AGM) USD COP, 5.00% due 4/15/2018 - 4/15/2021 | | | | 2,245,000 | | | | | 2,309,002 | |
| | County of Los Angeles (Fiscal Year 2017-2018 Expenditures) GO, 5.00% due 6/29/2018 | | | | 5,000,000 | | | | | 5,042,400 | |
| | County of Riverside (Fiscal Year 2017-2018 Expenditures), 2.00% due 6/29/2018 | | | | 15,000,000 | | | | | 15,019,200 | |
| | Delano Financing Authority (City of Delano Police Station and Woollomes Avenue Bridge), Series A, 5.00% due 12/1/2025 | | | | 2,555,000 | | | | | 2,733,365 | |
| | Franklin-McKinley School District (Insured: Natl-Re) GO, 5.25% due 8/1/2027 | | | | 1,000,000 | | | | | 1,239,720 | |
| | Fresno (Educational Facilities and Improvements; Insured: Natl-Re) USD GO, Series A, 6.00% due 8/1/2026 | | | | 1,410,000 | | | | | 1,675,489 | |
| | Jurupa Public Financing Authority (Eastvale Community Services; Insured: AGM), 5.50% due
9/1/2025 - 9/1/2027 | | | | 2,530,000 | | | | | 2,908,361 | |
| | M-S-R Energy Authority, 6.125% due 11/1/2029 | | | | 2,500,000 | | | | | 3,095,975 | |
| | North City West School Facilities Financing Authority (Carmel Valley Schools; Insured: AGM), Series A, 5.00% due 9/1/2024 | | | | 1,080,000 | | | | | 1,212,732 | |
| | Oakland (County of Alameda Educational Facilities) USD GO, 5.00% due 8/1/2032 - 8/1/2034 | | | | 3,000,000 | | | | | 3,442,980 | |
| | Redwood City Redevelopment Agency (Redevelopment Area A-2; Insured: AMBAC), 0.00%, due 7/15/2023 | | | | 2,065,000 | | | | | 1,794,051 | |
| | San Jose Redevelopment Agency (Merged Area Redevelopment Project), | | | | | | | | | | |
| | 5.25% due 8/1/2027 (pre-refunded 8/1/2020) | | | | 2,400,000 | | | | | 2,598,744 | |
| | 5.375% due 8/1/2028 (pre-refunded 8/1/2020) | | | | 1,175,000 | | | | | 1,275,650 | |
| | San Mateo Union High School District (Educational Facilities; Insured: Natl-Re) GO, 0.00%, due 9/1/2019 | | | | 3,000,000 | | | | | 2,929,590 | |
| | Saratoga Union School District (Insured: Natl-Re) GO, 0.00%, Series B, due 9/1/2023 | | | | 900,000 | | | | | 797,805 | |
Semi-Annual Report | 7
Schedule of Investments, Continued
Thornburg Intermediate Municipal Fund | March 31, 2018 (Unaudited)
| | | | | | | | | | | | |
| | | | | PRINCIPAL AMOUNT | | VALUE |
| | State of California (Kindergarten-University Facilities) GO, 5.25% due 9/1/2026 | | | $ | 5,000,000 | | | | $ | 5,562,900 | |
| | Tuolumne Wind Project Authority, Series A, 5.875% due 1/1/2029 (pre-refunded 1/1/2019) | | | | 3,000,000 | | | | | 3,096,720 | |
| | Turlock Irrigation District, | | | | | | | | | | |
| | Series A, | | | | | | | | | | |
| | 5.00% due 1/1/2021 | | | | 1,005,000 | | | | | 1,062,456 | |
| | 5.00% due 1/1/2021 (pre-refunded 1/1/2020) | | | | 745,000 | | | | | 786,795 | |
| | William S. Hart Union High School District (Educational Facilities) GO, 0.00%, Series B, due 9/1/2021 | | | | 800,000 | | | | | 746,736 | |
| | COLORADO — 1.0% | | | | | | | | | | |
| | Housing Authority of the City and County of Denver (Three Towers Rehabilitation; Insured: AGM), 5.20% due 11/1/2027 | | | | 1,335,000 | | | | | 1,338,271 | |
| | Park Creek Metropolitan District (Insured: AGM), 5.25% due 12/1/2020 (pre-refunded 12/1/2019) | | | | 1,120,000 | | | | | 1,184,445 | |
| | Regional Transportation District (North Metro Rail Line) COP, Series A, 5.00% due 6/1/2028 | | | | 1,550,000 | | | | | 1,724,576 | |
| | Regional Transportation District (Public Mass Transportation System) COP, | | | | | | | | | | |
| | Series A, | | | | | | | | | | |
| | 5.50% due 6/1/2022 | | | | 260,000 | | | | | 279,490 | |
| | 5.50% due 6/1/2022 (pre-refunded 6/1/2020) | | | | 2,740,000 | | | | | 2,954,487 | |
| | State of Colorado COP, Series A, 5.00% due 9/1/2029 - 9/1/2032 | | | | 5,205,000 | | | | | 6,145,361 | |
| | CONNECTICUT — 1.7% | | | | | | | | | | |
| | City of Hartford (Various Public Improvements; Insured: AGM) GO, Series A, 5.00% due 7/1/2031 | | | | 1,700,000 | | | | | 1,857,284 | |
| | Connecticut Health & Educational Facilities Authority (Ethel Walker School), Series B, 5.75% due 7/1/2029 (pre-refunded 7/1/2019) | | | | 1,350,000 | | | | | 1,417,514 | |
| c | | State of Connecticut GO (Various Capital Projects), Series D, 2.33% (MUNIPSA + 0.75%) due 6/15/2018 | | | | 6,820,000 | | | | | 6,822,182 | |
| d | | State of Connecticut GO, 5.00% due 4/15/2033 - 4/15/2035 | | | | 12,415,000 | | | | | 13,776,640 | |
| | DISTRICT OF COLUMBIA — 0.7% | | | | | | | | | | |
| | Metropolitan Airports Authority (Dulles Toll Road; Insured: AGM), 0.00%, due 10/1/2023 - 10/1/2024 | | | | 9,890,000 | | | | | 8,181,306 | |
| | Washington Convention & Sports Authority, Series A, 5.00% due 10/1/2028 | | | | 1,105,000 | | | | | 1,304,431 | |
| | FLORIDA — 7.8% | | | | | | | | | | |
| | Broward County (Airport System Improvements), 5.00% due 10/1/2033 - 10/1/2036 | | | | 4,500,000 | | | | | 5,097,890 | |
| | Central Florida Expressway Authority, 5.00% due 7/1/2037 | | | | 1,095,000 | | | | | 1,265,831 | |
| | City of Jacksonville (Better Jacksonville Plan), Series A, 5.00% due 10/1/2026 | | | | 2,075,000 | | | | | 2,292,377 | |
| | City of Lakeland (Electric Power System Smart Grid Project; Insured: AGM), | | | | | | | | | | |
| | 5.00% due 10/1/2018 | | | | 2,000,000 | | | | | 2,032,460 | |
| | 5.25% due 10/1/2027 - 10/1/2036 | | | | 6,450,000 | | | | | 8,018,892 | |
| | City of Lakeland (Lakeland Regional Health Systems), 5.00% due 11/15/2028 | | | | 2,775,000 | | | | | 3,202,683 | |
| | City of Miami (Stormwater Management Utility System), | | | | | | | | | | |
| a | | 5.00% due 9/1/2022 - 9/1/2023 | | | | 1,260,000 | | | | | 1,418,345 | |
| | 5.00% due 9/1/2024 - 9/1/2025 | | | | 2,010,000 | | | | | 2,323,877 | |
| | City of Orlando (Senior Tourist Development; Insured: AGM), 5.00% due 11/1/2032 - 11/1/2037 | | | | 3,430,000 | | | | | 3,915,210 | |
| | Escambia County (Florida Health Care Facility Loan Program; Insured: AMBAC) HFA, 5.95% due 7/1/2020 | | | | 260,000 | | | | | 283,621 | |
| | Florida State Department of Children & Families (South Florida Evaluation Treatment Center) COP,
5.00% due 10/1/2018 - 10/1/2019 | | | | 4,345,000 | | | | | 4,356,020 | |
| | Lake County School Board (School District Facility Projects) COP, Series B, 5.00% due 6/1/2026 | | | | 1,210,000 | | | | | 1,329,306 | |
| | Manatee County (Public Utilities System Improvements), 5.00% due 10/1/2026 - 10/1/2033 | | | | 6,080,000 | | | | | 6,976,923 | |
| | Miami-Dade County (Building Better Communities) GO, Series B, 6.25% due 7/1/2026 (pre-refunded 7/1/2018) | | | | 2,130,000 | | | | | 2,154,367 | |
| | Miami-Dade County (Miami International Airport), Series B, 5.00% due 10/1/2028 - 10/1/2031 | | | | 5,335,000 | | | | | 6,036,687 | |
| | Miami-Dade County (Seaport Properties) GO, Series C, 5.00% due 10/1/2023 | | | | 1,040,000 | | | | | 1,146,652 | |
| | Miami-Dade County Educational Facilities Authority (University of Miami; Insured: AMBAC), Series B, 5.25% due 4/1/2024 | | | | 1,000,000 | | | | | 1,144,420 | |
| | Miami-Dade County Health Facilities Authority (Nicklaus Children’s Hospital), 5.00% due 8/1/2035 - 8/1/2037 | | | | 2,905,000 | | | | | 3,278,750 | |
| | Miami-Dade County School Board COP, Series A, 5.00% due 5/1/2030 | | | | 3,250,000 | | | | | 3,650,627 | |
| | Miami-Dade County School Board (Insured: AMBAC) COP, Series D, 5.00% due 10/1/2021 | | | | 3,035,000 | | | | | 3,333,280 | |
| | Orange County (Orlando Health, Inc.) HFA, 5.125% due 10/1/2026 | | | | 2,000,000 | | | | | 2,092,180 | |
| | Orange County (Tourist Development), Series A, 5.00% due 10/1/2031 | | | | 2,000,000 | | | | | 2,307,700 | |
| a | | Palm Beach County (Boca Raton Regional Hospital) HFA, 5.00% due 12/1/2025 | | | | 500,000 | | | | | 557,395 | |
| | Palm Beach County School District COP, Series C, 5.00% due 8/1/2028 - 8/1/2029 | | | | 13,250,000 | | | | | 15,864,273 | |
| | Sarasota County Public Hospital Board (Sarasota Memorial Hospital; Insured: Natl-Re), 4.871% due 10/1/2021 | | | | 2,000,000 | | | | | 2,089,960 | |
| | School Board of Broward County (Educational Facilities and Equipment) COP, Series A, 5.00% due 7/1/2027 | | | | 2,000,000 | | | | | 2,193,320 | |
| | School Board of Broward County (Educational Facilities) COP, | | | | | | | | | | |
| | Series A, 5.00% due 7/1/2030 | | | | 1,250,000 | | | | | 1,418,613 | |
| | Series B, 5.00% due 7/1/2032 | | | | 2,000,000 | | | | | 2,255,840 | |
| | Series C, 5.00% due 7/1/2022 - 7/1/2024 | | | | 7,880,000 | | | | | 8,963,816 | |
| | School District of Broward County COP, | | | | | | | | | | |
| | Series A, | | | | | | | | | | |
| | 5.00% due 7/1/2026 | | | | 545,000 | | | | | 599,293 | |
| | 5.00% due 7/1/2026 (pre-refunded 7/1/2022) | | | | 2,455,000 | | | | | 2,745,770 | |
| | School District of Manatee County (School Facilities Improvement; Insured: AGM), 5.00% due 10/1/2032 | | | | 2,250,000 | | | | | 2,585,228 | |
| | Sunshine State Governmental Finance Commission (Miami-Dade County Program), 5.00% due 9/1/2028 | | | | 3,500,000 | | | | | 3,923,255 | |
| | GEORGIA — 1.3% | | | | | | | | | | |
| | Athens-Clarke County Unified Government Development Authority (UGAREF Bolton Commons, LLC), 5.00% due 6/15/2024 - 6/15/2028 | | | | 2,320,000 | | | | | 2,622,164 | |
| | City of Atlanta (Water & Wastewater System; Insured: AGM), | | | | | | | | | | |
| | Series B, | | | | | | | | | | |
| | 5.50% due 11/1/2024 | | | | 1,740,000 | | | | | 1,841,355 | |
| | 5.50% due 11/1/2024 (pre-refunded 11/1/2019) | | | | 3,260,000 | | | | | 3,454,100 | |
8 | Semi-Annual Report
Schedule of Investments, Continued
Thornburg Intermediate Municipal Fund | March 31, 2018 (Unaudited)
| | | | | | | | | | | | |
| | | | | PRINCIPAL AMOUNT | | VALUE |
| | City of Atlanta (Water & Wastewater System; Insured: Natl-Re), Series A, 5.50% due 11/1/2022 | | | $ | 530,000 | | | | $ | 589,254 | |
| | Clarke County Hospital Authority (Athens Regional Medical Center), 5.00% due 1/1/2023 - 1/1/2026 (pre-refunded 1/1/2022) | | | | 5,620,000 | | | | | 6,240,224 | |
| | Development Authority of Fulton County (Georgia Tech Athletic Assoc.), 5.00% due 10/1/2019 | | | | 3,000,000 | | | | | 3,139,560 | |
| | Valdosta and Lowndes County Hospital Authority (South Medical Center), Series B, 5.00% due 10/1/2024 | | | | 1,200,000 | | | | | 1,314,960 | |
| | GUAM — 2.8% | | | | | | | | | | |
| | Government of Guam (Economic Development), Series D-REF, 5.00% due 11/15/2031 | | | | 5,500,000 | | | | | 5,795,020 | |
| | Government of Guam (Various Capital Projects), Series D-REF, 5.00% due 11/15/2032 - 11/15/2033 | | | | 22,500,000 | | | | | 23,620,170 | |
| | Guam Power Authority (Electric Power System), Series A, 5.00% due 10/1/2033 | | | | 1,650,000 | | | | | 1,784,986 | |
| | Guam Power Authority (Electric Power System; Insured: AGM), Series A, 5.00% due 10/1/2023 - 10/1/2025 | | | | 6,500,000 | | | | | 7,088,020 | |
| | Guam Waterworks Authority (Water and Wastewater System), 5.25% due 7/1/2024 | | | | 1,000,000 | | | | | 1,105,380 | |
| | HAWAII — 1.2% | | | | | | | | | | |
| c | | City and County of Honolulu GO (Rail Transit Project), 1.90% (MUNIPSA + 0.32%) due 9/1/2027
(put 9/1/2020) | | | | 4,000,000 | | | | | 4,001,560 | |
| | County of Hawaii GO, 5.00% due 9/1/2033 | | | | 1,250,000 | | | | | 1,444,862 | |
| | State of Hawaii GO, | | | | | | | | | | |
| | Series DZ, 5.00% due 12/1/2027 (pre-refunded 12/1/2021) | | | | 3,635,000 | | | | | 4,008,569 | |
| | Series DZ-2016, 5.00% due 12/1/2027 (pre-refunded 12/1/2021) | | | | 6,365,000 | | | | | 7,057,115 | |
| | IDAHO — 0.4% | | | | | | | | | | |
| | State of Idaho (Cash Flow Management) GO, 4.00% due 6/29/2018 | | | | 6,000,000 | | | | | 6,034,860 | |
| | ILLINOIS — 7.3% | | | | | | | | | | |
| | Board of Trustees of Southern Illinois University (Housing & Auxiliary Facilities; Insured: Natl-Re), Series A, 5.25% due 4/1/2019 | | | | 1,000,000 | | | | | 1,026,840 | |
| | Chicago O’Hare International Airport (2015 Airport Projects), 5.00% due 1/1/2019 - 1/1/2021 | | | | 3,000,000 | | | | | 3,158,330 | |
| | Chicago O’Hare International Airport (2016 Airport Projects), Series C, 5.00% due 1/1/2029 - 1/1/2030 | | | | 1,765,000 | | | | | 2,013,012 | |
| | Chicago O’Hare International Airport (2017 Airport Projects), Series B, 5.00% due 1/1/2034 - 1/1/2037 | | | | 8,160,000 | | | | | 9,235,892 | |
| | Chicago Park District (Capital Improvement Plan) GO, | | | | | | | | | | |
| | 5.00% due 1/1/2027 - 1/1/2029 | | | | 7,390,000 | | | | | 8,140,837 | |
| | Series B, 5.00% due 1/1/2025 - 1/1/2030 | | | | 4,500,000 | | | | | 4,944,630 | |
| | Chicago Transit Authority (Bombardier Transit Rail System), 5.00% due 12/1/2018 | | | | 1,500,000 | | | | | 1,529,865 | |
| | City of Chicago (Midway Airport), | | | | | | | | | | |
| | Series B, | | | | | | | | | | |
| | 5.00% due 1/1/2032 - 1/1/2033 | | | | 9,805,000 | | | | | 10,856,669 | |
| | 5.25% due 1/1/2034 | | | | 4,700,000 | | | | | 5,181,703 | |
| | City of Chicago (Modern Schools Across Chicago Program; Insured: AMBAC) GO, 5.00% due
12/1/2022 - 12/1/2024 | | | | 820,000 | | | | | 822,727 | |
| | City of Chicago (Wastewater Transmission System), Series C-REMK-10/, 5.00% due 1/1/2028 - 1/1/2029 | | | | 7,865,000 | | | | | 8,676,082 | |
| | City of Chicago (Wastewater Transmission System; Insured: AGM), Series B-AGM-CR, 5.00% due 1/1/2034 | | | | 1,375,000 | | | | | 1,544,565 | |
| | City of Chicago (Water System; Insured: AGM), Series 2017-2, 5.00% due 11/1/2037 | | | | 3,250,000 | | | | | 3,638,115 | |
| | City of Chicago (Water System; Insured: AMBAC), 5.75% due 11/1/2030 | | | | 1,270,000 | | | | | 1,533,144 | |
| | City of Mount Vernon (Various Municipal Capital Improvements; Insured: AGM) GO, 4.00% due 12/15/2025 | | | | 1,900,000 | | | | | 1,978,451 | |
| | City of Waukegan (Insured: AGM) GO, Series A, 5.00% due 12/30/2018 | | | | 2,000,000 | | | | | 2,047,340 | |
| | Community College District No. 525 (Joliet Junior College) GO, 6.25% due 6/1/2024 | | | | 500,000 | | | | | 503,560 | |
| | Cook County GO, Series A, 5.25% due 11/15/2024 | | | | 3,000,000 | | | | | 3,226,590 | |
| | Cook County Community College District No. 508 (City Colleges of Chicago) GO, 5.25% due 12/1/2026 | | | | 1,000,000 | | | | | 1,084,840 | |
| | Cook County School District No. 104 (Argo Summit Elementary School Facilities; Insured: AGM) GO, 0.00%, Series D, due 12/1/2022 | | | | 2,000,000 | | | | | 1,801,100 | |
| | Forest Preserve District of DuPage County (Land Acquisition and Development) GO, 4.00% due 11/1/2022 | | | | 750,000 | | | | | 809,835 | |
| | Illinois (Midwest Care Center I, Inc.; Collateralized: GNMA) HFA, 5.70% due 2/20/2021 | | | | 275,000 | | | | | 275,369 | |
| | Illinois Educational Facilities Authority (Rush University Medical Center), Series B, 5.75% due 11/1/2028 (pre-refunded 11/1/2018) | | | | 1,000,000 | | | | | 1,023,930 | |
| | Illinois Finance Authority (Advocate Health Care Network), 6.125% due 11/1/2023 (pre-refunded 11/1/2018) | | | | 5,175,000 | | | | | 5,308,463 | |
| | Illinois Finance Authority (Rush University Medical Center), Series A, 5.00% due 11/15/2033 | | | | 1,000,000 | | | | | 1,116,410 | |
| | Illinois Finance Authority (Silver Cross Hospital and Medical Centers), 5.00% due 8/15/2024 | | | | 1,000,000 | | | | | 1,109,590 | |
| a | | Illinois Toll Highway Authority (Move Illinois Program), 5.00% due 1/1/2037 | | | | 5,550,000 | | | | | 6,217,776 | |
| | Metropolitan Pier & Exposition Authority (McCormick Place Expansion Project), Series B, 5.00% due 12/15/2022 | | | | 1,000,000 | | | | | 1,072,500 | |
| | Monroe and St. Clair Counties (Community Unit School District No. 5; Insured: BAM) GO, 5.00% due
4/15/2027 - 4/15/2031 | | | | 6,285,000 | | | | | 7,138,420 | |
| | Niles Park District (Parks and Recreation Projects) GO, 3.00% due 12/1/2018 - 12/1/2020 | | | | 1,080,000 | | | | | 1,097,052 | |
| | State of Illinois, 5.00% due 6/15/2018 | | | | 2,000,000 | | | | | 2,012,800 | |
| | Tazewell County School District (Insured: Natl-Re) GO, 9.00% due 12/1/2024 | | | | 1,205,000 | | | | | 1,620,339 | |
| | Village of Tinley Park GO, | | | | | | | | | | |
| a | | 4.00% due 12/1/2021 | | | | 585,000 | | | | | 620,983 | |
| | 5.00% due 12/1/2024 | | | | 870,000 | | | | | 981,177 | |
| | INDIANA — 2.5% | | | | | | | | | | |
| | Board of Trustees for the Vincennes University, Series J, 5.375% due 6/1/2022 | | | | 895,000 | | | | | 961,901 | |
| | City of Carmel Redevelopment Authority (Performing Arts Center), 0.00%, due 2/1/2021 | | | | 2,000,000 | | | | | 1,881,580 | |
| | City of Carmel Redevelopment District (Performing Arts Center) COP, 6.50% due 7/15/2035
(pre-refunded 1/15/2021) | | | | 2,730,000 | | | | | 3,062,459 | |
| | Hobart Building Corp. (Insured: Natl-Re) (State Aid Withholding), 6.50% due 7/15/2019 | | | | 1,000,000 | | | | | 1,047,530 | |
| | Indiana (Ascension Health Credit Group) HFFA, 5.00% due 11/15/2034 - 11/15/2036 | | | | 8,325,000 | | | | | 9,455,062 | |
| | Indiana Bond Bank (Hendricks Regional Health Financing Program; Insured: AMBAC), 5.25% due 4/1/2023 | | | | 2,000,000 | | | | | 2,256,740 | |
| | Indiana Bond Bank (Natural Gas Utility Improvements), Series A, 5.25% due 10/15/2020 | | | | 5,340,000 | | | | | 5,758,336 | |
| | Indiana Finance Authority (Indiana University Health), Series N, 5.00% due 3/1/2019 | | | | 5,000,000 | | | | | 5,149,850 | |
| | Indiana Finance Authority (Marian University), 5.25% due 9/15/2022 - 9/15/2023 | | | | 5,085,000 | | | | | 5,515,407 | |
| | Indiana Finance Authority (Sisters of St. Francis Health Services, Inc.), 5.00% due 11/1/2021 | | | | 605,000 | | | | | 616,707 | |
Semi-Annual Report | 9
Schedule of Investments, Continued
Thornburg Intermediate Municipal Fund | March 31, 2018 (Unaudited)
| | | | | | | | | | | | |
| | | | | PRINCIPAL AMOUNT | | VALUE |
| | IOWA — 0.3% | | | | | | | | | | |
| | Iowa Finance Authority (UnityPoint Health), Series C, 5.00% due 2/15/2030 - 2/15/2032 | | | $ | 4,100,000 | | | | $ | 4,528,792 | |
| | KANSAS — 0.0% | | | | | | | | | | |
| | Kansas (Wichita State University) DFA, Series A, 5.00% due 6/1/2020 | | | | 575,000 | | | | | 612,047 | |
| | KENTUCKY — 1.2% | | | | | | | | | | |
| | Commonwealth of Kentucky State Property and Buildings Commission (Project No. 112), Series B, 5.00% due 11/1/2020 - 11/1/2023 | | | | 12,815,000 | | | | | 14,011,552 | |
| | Louisville/Jefferson County Metropolitan Government (Norton Suburban Hospital and Kosair Children’s Hospital), 5.25% due 10/1/2026 | | | | 2,320,000 | | | | | 2,627,818 | |
| | LOUISIANA — 2.4% | | | | | | | | | | |
| | City of New Orleans (Sewerage System; Insured: AGM), 6.00% due 6/1/2024 (pre-refunded 6/1/2019) | | | | 750,000 | | | | | 787,260 | |
| | East Baton Rouge Sewerage Commission, Series B, 5.00% due 2/1/2030 - 2/1/2032 | | | | 6,825,000 | | | | | 7,709,514 | |
| | Jefferson Sales Tax District (Insured: AGM), 5.00% due 12/1/2034 | | | | 1,000,000 | | | | | 1,149,430 | |
| | Law Enforcement District of the Parish of Plaquemines, | | | | | | | | | | |
| | 5.00% due 9/1/2023 - 9/1/2025 (pre-refunded 9/1/2019) | | | | 2,580,000 | | | | | 2,698,552 | |
| | 5.15% due 9/1/2027 (pre-refunded 9/1/2019) | | | | 1,490,000 | | | | | 1,561,565 | |
| | 5.30% due 9/1/2029 (pre-refunded 9/1/2019) | | | | 1,650,000 | | | | | 1,732,681 | |
| | Louisiana Energy and Power Authority (LEPA Unit No. 1; Insured: AGM), Series A, 5.25% due
6/1/2029 - 6/1/2031 | | | | 6,100,000 | | | | | 6,791,970 | |
| | Louisiana Local Government Environmental Facilities and Community Development Authority (Louisiana Community and Technical College System; | | | | | | | | | | |
| | Insured: BAM), 5.00% due 10/1/2028 | | | | 2,875,000 | | | | | 3,397,905 | |
| | New Orleans Regional Transit Authority (Insured: AGM), 5.00% due 12/1/2023 - 12/1/2024 | | | | 2,000,000 | | | | | 2,147,950 | |
| | Office Facilities Corp. (Louisiana State Capitol Complex Program), 5.00% due 3/1/2019 | | | | 390,000 | | | | | 401,330 | |
| | Parish of Lafourche (Roads, Highways and Bridges), 5.00% due 1/1/2024 - 1/1/2025 | | | | 3,685,000 | | | | | 4,208,484 | |
| | Terrebonne Parish Hospital Service District No. 1 (General Medical Center), | | | | | | | | | | |
| | 4.75% due 4/1/2028 | | | | 960,000 | | | | | 994,742 | |
| | 5.00% due 4/1/2028 (pre-refunded 4/1/2020) | | | | 540,000 | | | | | 573,815 | |
| | MASSACHUSETTS — 2.1% | | | | | | | | | | |
| | Massachusetts (Insured BHAC-CR FGIC), 5.50% due 1/1/2029 | | | | 8,370,000 | | | | | 10,498,240 | |
| | Massachusetts Bay Transportation Authority (Transportation Capital Program), Series A, 5.25% due 7/1/2030 | | | | 1,000,000 | | | | | 1,252,450 | |
| | Massachusetts Development Finance Agency (CareGroup Healthcare System), | | | | | | | | | | |
| | Series H-1, 5.00% due 7/1/2019 - 7/1/2021 | | | | 5,130,000 | | | | | 5,456,963 | |
| | Series I, 5.00% due 7/1/2033 - 7/1/2036 | | | | 9,070,000 | | | | | 10,125,651 | |
| | Massachusetts Development Finance Agency (Simmons College), Series J, 5.50% due 10/1/2025 - 10/1/2028 | | | | 1,790,000 | | | | | 2,051,532 | |
| | Massachusetts Educational Financing Authority (Higher Education Student Loans), Series A, 5.50% due 1/1/2022 | | | | 1,130,000 | | | | | 1,187,065 | |
| | MICHIGAN — 3.8% | | | | | | | | | | |
| | Board of Governors of Wayne State University (Educational Facilities and Equipment), Series A, 5.00% due 11/15/2031 | | | | 1,010,000 | | | | | 1,144,633 | |
| | City of Troy (Downtown Development Authority-Community Center Facilities) GO, 5.00% due 11/1/2025 | | | | 300,000 | | | | | 331,578 | |
| | County of Genesee (Water Supply System; Insured: BAM), | | | | | | | | | | |
| | 5.00% due 11/1/2024 - 11/1/2030 | | | | 3,360,000 | | | | | 3,712,282 | |
| | 5.125% due 11/1/2032 | | | | 750,000 | | | | | 828,623 | |
| | 5.25% due 11/1/2026 - 11/1/2028 | | | | 2,920,000 | | | | | 3,263,388 | |
| | Detroit City School District (School Building & Site Improvement; Insured: AGM/Q-SBLF) GO, Series A, 5.25% due 5/1/2026 | | | | 3,150,000 | | | | | 3,620,894 | |
| | Detroit City School District (School Building & Site; Insured: AGM) GO, Series A, 5.25% due 5/1/2027 | | | | 1,100,000 | | | | | 1,275,472 | |
| | Kalamazoo Hospital Finance Authority (Bronson Healthcare), | | | | | | | | | | |
| | 5.00% due 5/15/2029 | | | | 2,150,000 | | | | | 2,427,909 | |
| | 5.25% due 5/15/2026 | | | | 175,000 | | | | | 189,887 | |
| | 5.25% due 5/15/2026 (pre-refunded 5/15/2021) | | | | 1,110,000 | | | | | 1,219,868 | |
| | Kalamazoo Hospital Finance Authority (Bronson Healthcare; Insured: AGM), | | | | | | | | | | |
| | 5.00% due 5/15/2019 - 5/15/2022 | | | | 3,105,000 | | | | | 3,171,731 | |
| | 5.00% due 5/15/2022 (pre-refunded 5/15/2020) | | | | 1,365,000 | | | | | 1,454,121 | |
| | Michigan Finance Authority (Beaumont Health Credit Group), 5.00% due 8/1/2031 | | | | 19,080,000 | | | | | 21,275,345 | |
| | Michigan Finance Authority (Government Loan Program), Series F, 5.00% due 4/1/2026 | | | | 1,580,000 | | | | | 1,715,801 | |
| | Michigan Public School Academy (Will Carleton Charter School), 8.00% due 8/1/2035 | | | | 890,000 | | | | | 912,588 | |
| | Michigan State Hospital Finance Authority (Henry Ford Health System), 5.625% due 11/15/2029
(pre-refunded 11/15/2019) | | | | 2,500,000 | | | | | 2,653,300 | |
| | Michigan Strategic Fund (Michigan House of Representatives Facilities; Insured: AGM), Series A, 5.25% due
10/15/2023 (pre-refunded 10/15/2018) | | | | 1,000,000 | | | | | 1,019,790 | |
| | Royal Oak Hospital Finance Authority (William Beaumont Hospital), Series V, 8.00% due 9/1/2029 (pre-refunded 9/1/2018) | | | | 2,540,000 | | | | | 2,606,497 | |
| | State of Michigan (Trunk Line Fund; Insured: AGM), 5.50% due 11/1/2020 | | | | 1,500,000 | | | | | 1,638,765 | |
| | MINNESOTA — 0.2% | | | | | | | | | | |
| | Minnesota Agriculture & Economic Development Board (Essentia Health; Insured: AGM), 5.50% due 2/15/2025 | | | | 2,500,000 | | | | | 2,661,850 | |
| | MISSISSIPPI — 0.5% | | | | | | | | | | |
| | Mississippi Development Bank (Capital City Convention Center) GO, 5.00% due 3/1/2025 | | | | 2,850,000 | | | | | 3,169,485 | |
| | Mississippi Development Bank (Department of Corrections), Series D, 5.25% due 8/1/2027
(pre-refunded 8/1/2020) | | | | 3,415,000 | | | | | 3,681,507 | |
| | MISSOURI — 0.6% | | | | | | | | | | |
| b | | Missouri Development Finance Board, Series A, 1.70% due 12/1/2033 (put 4/2/2018) | | | | 1,600,000 | | | | | 1,600,000 | |
| | Missouri Health and Educational Facilities Authority (Webster University), 5.00% due 4/1/2019 - 4/1/2021 | | | | 4,755,000 | | | | | 5,054,591 | |
| | Tax Increment Financing Commission of Kansas City (Union Hill Redevelopment Project), 5.00% due 5/1/2022 | | | | 2,035,000 | | | | | 2,060,377 | |
| | NEVADA — 1.0% | | | | | | | | | | |
| | Carson City (Carson Tahoe Regional Healthcare), 5.00% due 9/1/2027 - 9/1/2032 | | | | 3,180,000 | | | | | 3,479,676 | |
| | Clark County School District (School Facilities Improvements) GO, Series C, 5.00% due 6/15/2022 | | | | 1,110,000 | | | | | 1,232,111 | |
| | Washoe County (Reno Sparks Convention & Visitors Authority) GO, 5.00% due 7/1/2026 - 7/1/2032 | | | | 9,000,000 | | | | | 9,842,190 | |
10 | Semi-Annual Report
Schedule of Investments, Continued
Thornburg Intermediate Municipal Fund | March 31, 2018 (Unaudited)
| | | | | | | | | | | | |
| | | | | PRINCIPAL AMOUNT | | VALUE |
| | NEW HAMPSHIRE — 0.4% | | | | | | | | | | |
| | New Hampshire Municipal Bond Bank, 5.00% due 8/15/2026 | | | $ | 1,860,000 | | | | $ | 2,109,110 | |
| | State of New Hampshire (Turnpike System), Series B, 5.00% due 2/1/2022 - 2/1/2024 | | | | 4,005,000 | | | | | 4,410,420 | |
| | NEW JERSEY — 2.7% | | | | | | | | | | |
| | Cape May County Industrial Pollution Control Financing Authority (Atlantic City Electric Company; Insured: Natl-Re), 6.80% due 3/1/2021 | | | | 575,000 | | | | | 639,532 | |
| | Essex County Improvement Authority (County Correctional Facilities & Gibraltar Facilities; Insured: Natl-Re), 5.50% due 10/1/2024 | | | | 2,500,000 | | | | | 2,963,475 | |
| | New Jersey (School Facilities Construction) EDA, 5.00% due 3/1/2026 | | | | 2,000,000 | | | | | 2,132,360 | |
| | New Jersey (School Facilities Construction; Insured: AMBAC) EDA, Series N-1, 5.50% due 9/1/2026 | | | | 3,000,000 | | | | | 3,436,170 | |
| | New Jersey (School Facilities Construction; Insured: Natl-Re) EDA, Series N-1, 5.50% due 9/1/2027 | | | | 1,700,000 | | | | | 2,014,007 | |
| | New Jersey State Health Care Facilities Financing Authority (Virtua Health), 5.00% due 7/1/2027 - 7/1/2028 | | | | 3,000,000 | | | | | 3,341,680 | |
| | New Jersey Transportation Trust Fund Authority (State Transportation System Improvements), | | | | | | | | | | |
| c | | 2.78% (MUNIPSA + 1.20%) due 6/15/2034 (put 12/15/2021) | | | | 2,000,000 | | | | | 2,007,880 | |
| | 5.00% due 6/15/2023 - 6/15/2027 | | | | 14,250,000 | | | | | 15,575,137 | |
| | New Jersey Transportation Trust Fund Authority (State Transportation System Improvements; Insured: Natl-Re), Series B, 5.50% due 12/15/2020 | | | | 3,185,000 | | | | | 3,434,577 | |
| | Passaic Valley Sewage Commissioners GO, Series G, 5.75% due 12/1/2022 | | | | 3,000,000 | | | | | 3,426,360 | |
| | NEW MEXICO — 0.8% | | | | | | | | | | |
| | City of Farmington (Arizona Public Service Co.-Four Corners Project), 4.70% due 9/1/2024 | | | | 3,000,000 | | | | | 3,195,960 | |
| | City of Las Cruces (NMFA Loan), 5.00% due 6/1/2030 | | | | 2,040,000 | | | | | 2,164,746 | |
| | New Mexico Hospital Equipment Loan Council (Haverland Carter Lifestyle Group), 5.00% due 7/1/2032 | | | | 2,130,000 | | | | | 2,250,579 | |
| b | | New Mexico Hospital Equipment Loan Council, 1.70% due 8/1/2034 (put 4/2/2018) | | | | 1,300,000 | | | | | 1,300,000 | |
| | Regents of New Mexico State University (Campus Buildings Acquisition & Improvements), Series A, 5.00% due 4/1/2034 | | | | 1,810,000 | | | | | 2,073,554 | |
| | NEW YORK — 8.3% | | | | | | | | | | |
| | City of New York (City Budget Financial Management) GO, | | | | | | | | | | |
| | 5.00% due 8/1/2027 | | | | 4,530,000 | | | | | 5,145,717 | |
| | Series J, 5.00% due 8/1/2030 - 8/1/2031 | | | | 9,000,000 | | | | | 10,239,340 | |
| | County of Nassau (Insured: BAM) GO, Series B-BAM-TCRS, 5.00% due 4/1/2026 | | | | 1,300,000 | | | | | 1,478,529 | |
| | Erie County Industrial Development Agency (City of Buffalo School District) (State Aid Withholding), 5.00% due 5/1/2019 - 5/1/2027 | | | | 8,000,000 | | | | | 8,745,541 | |
| | Metropolitan Transportation Authority (Transit and Commuter System), | | | | | | | | | | |
| | Series A2-GREEN BOND, 5.00% due 11/15/2024 | | | | 5,435,000 | | | | | 6,287,425 | |
| | Series C-1, 5.00% due 11/15/2033 | | | | 8,500,000 | | | | | 9,860,935 | |
| | Series C-1A, 4.00% due 2/15/2019 | | | | 2,250,000 | | | | | 2,295,810 | |
| | Metropolitan Transportation Authority, Series A2-GREEN BOND, 5.00% due 11/15/2025 | | | | 10,000,000 | | | | | 11,708,700 | |
| | New York City Transitional Finance Authority Future Tax Secured Revenue, | | | | | | | | | | |
| b | | 1.73% due 11/1/2036 - 11/1/2042 (put 4/2/2018) | | | | 11,800,000 | | | | | 11,800,000 | |
| b | | 1.75% due 8/1/2031 (put 4/2/2018) | | | | 4,600,000 | | | | | 4,600,000 | |
| | New York City Water & Sewer System, | | | | | | | | | | |
| b | | 1.73% due 6/15/2032 - 6/15/2050 (put 4/2/2018) | | | | 18,245,000 | | | | | 18,245,000 | |
| b | | 1.77% due 6/15/2044 (put 4/2/2018) | | | | 550,000 | | | | | 550,000 | |
| b | | New York GO, 1.73% due 1/1/2036 (put 4/2/2018) | | | | 11,500,000 | | | | | 11,500,000 | |
| | New York State Dormitory Authority (Metropolitan Transportation Authority & State Urban Development Corp.), Series A, 5.00% due 12/15/2027 | | | | 2,500,000 | | | | | 2,803,725 | |
| | New York State Dormitory Authority (Miriam Osborn Memorial Home Assoc.), 5.00% due 7/1/2023 | | | | 2,180,000 | | | | | 2,268,987 | |
| | New York State Dormitory Authority (State University Educational Facilities), Series A, 5.25% due 5/15/2021 | | | | 500,000 | | | | | 542,500 | |
| | New York State Thruway Authority (Multi-Year Highway and Bridge Capital Program), Series K, 5.00% due 1/1/2030 | | | | 7,480,000 | | | | | 8,534,007 | |
| | United Nations Development Corp. (One, Two and Three U.N. Plaza), Series A, 5.00% due 7/1/2025 | | | | 1,700,000 | | | | | 1,766,810 | |
| | NORTH CAROLINA — 0.5% | | | | | | | | | | |
| | Charlotte-Mecklenburg Hospital Authority (Carolinas HealthCare System), Series A, 5.00% due 1/15/2028 | | | | 2,190,000 | | | | | 2,456,304 | |
| b | | Charlotte-Mecklenburg Hospital Authority, 1.73% due 1/15/2037 (put 4/2/2018) | | | | 900,000 | | | | | 900,000 | |
| | North Carolina Medical Care Commission (Vidant Health), 5.00% due 6/1/2030 | | | | 3,000,000 | | | | | 3,410,880 | |
| | OHIO — 4.1% | | | | | | | | | | |
| | Akron, Bath and Copley Joint Township Hospital District (Children’s Hospital Medical Center of Akron), 5.00% due 11/15/2024 | | | | 1,000,000 | | | | | 1,099,250 | |
| | American Municipal Power, Inc. (AMP Fremont Energy Center), 5.25% due 2/15/2028 (pre-refunded 2/15/2022) | | | | 4,000,000 | | | | | 4,474,960 | |
| | Cincinnati City School District (School Improvement Project) COP, 5.00% due 12/15/2031 | | | | 3,075,000 | | | | | 3,459,529 | |
| | City of Cleveland (Bridges and Roadways), 5.00% due 10/1/2028 - 10/1/2029 (pre-refunded 10/1/2023) | | | | 2,520,000 | | | | | 2,888,903 | |
| | City of Cleveland (Public Facilities Improvements), | | | | | | | | | | |
| | 5.00% due 10/1/2029 | | | | 1,500,000 | | | | | 1,754,580 | |
| | Series A-1, 5.00% due 11/15/2027 - 11/15/2030 (pre-refunded 11/15/2023) | | | | 5,185,000 | | | | | 5,956,839 | |
| | City of Cleveland (Various Municipal Capital Improvements) GO, 5.00% due 12/1/2024 - 12/1/2026 | | | | 2,230,000 | | | | | 2,507,945 | |
| | Cleveland-Cuyahoga County Port Authority (Cleveland Museum of Art), 5.00% due 10/1/2021 | | | | 2,040,000 | | | | | 2,197,508 | |
| | Cleveland-Cuyahoga County Port Authority (County Administration Offices), 5.00% due 7/1/2025 | | | | 1,780,000 | | | | | 2,041,375 | |
| | County of Allen (Catholic Health Partners-Mercy Health West Facility), 5.00% due 5/1/2025 - 5/1/2026 | | | | 8,325,000 | | | | | 9,109,217 | |
| | County of Cuyahoga (Convention Center Hotel) COP, 5.00% due 12/1/2026 | | | | 2,910,000 | | | | | 3,264,613 | |
| | County of Hamilton (Cincinnati Children’s Hospital Medical Center), 5.00% due 5/15/2028 - 5/15/2031 | | | | 8,085,000 | | | | | 9,201,017 | |
| | County of Hamilton, Series A, 5.00% due 12/1/2018 - 12/1/2023 | | | | 3,100,000 | | | | | 3,384,932 | |
| | County of Scioto (Southern Ohio Medical Center), 5.00% due 2/15/2030 - 2/15/2033 | | | | 3,615,000 | | | | | 4,068,849 | |
| | Deerfield Township (Public Street Improvements-Wilkens Blvd.), 5.00% due 12/1/2025 | | | | 1,000,000 | | | | | 1,002,450 | |
| | Lucas County Health Care Facility (Sunset Retirement Community), | | | | | | | | | | |
| | 5.00% due 8/15/2021 | | | | 970,000 | | | | | 1,013,049 | |
| | 5.125% due 8/15/2025 | | | | 1,250,000 | | | | | 1,337,725 | |
Semi-Annual Report | 11
Schedule of Investments, Continued
Thornburg Intermediate Municipal Fund | March 31, 2018 (Unaudited)
| | | | | | | | | | | | |
| | | | | PRINCIPAL AMOUNT | | VALUE |
| | OKLAHOMA — 0.4% | | | | | | | | | | |
| | Oklahoma (INTEGRIS Health) DFA, Series A, 5.00% due 8/15/2026 - 8/15/2027 | | | $ | 2,000,000 | | | | $ | 2,296,020 | |
| | Oklahoma Industries Authority (Oklahoma Medical Research Foundation), 5.50% due 7/1/2023
(pre-refunded 7/1/2018) | | | | 3,730,000 | | | | | 3,765,398 | |
| | OREGON — 0.7% | | | | | | | | | | |
| | State of Oregon (Cash Management) GO, Series A, 5.00% due 9/28/2018 | | | | 10,000,000 | | | | | 10,166,900 | |
| | PENNSYLVANIA — 6.7% | | | | | | | | | | |
| | Allegheny County (Propel Charter School-McKeesport) IDA, | | | | | | | | | | |
| | Series C, | | | | | | | | | | |
| | 5.90% due 8/15/2026 | | | | 835,000 | | | | | 879,238 | |
| | 6.375% due 8/15/2035 | | | | 1,130,000 | | | | | 1,185,008 | |
| | Allegheny County Hospital Development Authority (University of Pittsburgh Medical Center), 5.00% due 5/15/2019 | | | | 2,500,000 | | | | | 2,590,550 | |
| | Bethlehem Area School District (Northampton and Lehigh Counties District; Insured: AGM) (State Aid Withholding) GO, | | | | | | | | | | |
| | Series A, | | | | | | | | | | |
| | 5.00% due 10/15/2020 | | | | 380,000 | | | | | 391,085 | |
| | 5.00% due 10/15/2020 (pre-refunded 4/15/2019) | | | | 95,000 | | | | | 98,267 | |
| | City of Philadelphia (Pennsylvania Gas Works), 5.00% due 8/1/2032 - 8/1/2034 | | | | 2,300,000 | | | | | 2,595,237 | |
| | City of Philadelphia (Philadelphia Gas Works), 5.00% due 8/1/2034 - 8/1/2037 | | | | 10,985,000 | | | | | 12,496,210 | |
| | City of Philadelphia (Water and Wastewater System), 5.00% due 10/1/2029 - 10/1/2030 | | | | 3,510,000 | | | | | 4,048,793 | |
| | City of Pittsburgh (Capital Projects) GO, 5.00% due 9/1/2024 - 9/1/2036 | | | | 1,715,000 | | | | | 1,959,968 | |
| | County of Luzerne (Insured: AGM) GO, Series A, 5.00% due 11/15/2029 | | | | 3,000,000 | | | | | 3,373,140 | |
| | Dallastown Area School District (State Aid Withholding) GO, Series A, 4.00% due 5/1/2021 | | | | 460,000 | | | | | 488,032 | |
| b | | Hospitals & Higher Education Facilities Authority of Philadelphia, 1.70% due 7/1/2041 (put 4/2/2018) | | | | 1,000,000 | | | | | 1,000,000 | |
| | Lancaster County Solid Waste Management Authority (Acquisition of Susquehanna Resource Management Facility), 5.25% due 12/15/2030 | | | | 3,000,000 | | | | | 3,327,870 | |
| | Monroeville Financing Authority (University of Pittsburgh Medical Center), 5.00% due 2/15/2026 | | | | 3,490,000 | | | | | 4,063,442 | |
| | Pennsylvania Economic (Colver Project; Insured: AMBAC) DFA, Series F, 4.625% due 12/1/2018 | | | | 1,335,000 | | | | | 1,344,839 | |
| | Pennsylvania Higher Educational Facilities Authority (Insured: AMBAC), 0.00%, Series 14, due 7/1/2020 | | | | 2,032,839 | | | | | 1,727,263 | |
| | Pennsylvania Higher Educational Facilities Authority (University of Pennsylvania Health System), 5.00% due 8/15/2037 | | | | 5,500,000 | | | | | 6,266,920 | |
| | Pennsylvania State Public School Building Authority (Philadelphia School District; Insured: AGM) (State Aid Withholding) GO, Series B, 5.00% due 6/1/2027 | | | | 5,000,000 | | | | | 5,718,100 | |
| | Pennsylvania Turnpike Commission (Highway Improvements), | | | | | | | | | | |
| | 5.00% due 12/1/2035 - 12/1/2036 | | | | 1,750,000 | | | | | 1,990,110 | |
| | 5.35% due 12/1/2030 (pre-refunded 12/1/2020) | | | | 1,540,000 | | | | | 1,677,614 | |
| | Series C-2, 5.35% due 12/1/2030 (pre-refunded 12/1/2020) | | | | 2,460,000 | | | | | 2,682,746 | |
| | Philadelphia Authority for Industrial Development (Thomas Jefferson University), 5.00% due 9/1/2032 - 9/1/2034 | | | | 5,685,000 | | | | | 6,439,036 | |
| | Philadelphia Municipal Authority (Juvenile Justice Services Center), 5.00% due 4/1/2032 - 4/1/2036 | | | | 11,125,000 | | | | | 12,403,519 | |
| | Pittsburgh Water & Sewer Authority (Water and Sewer System; Insured: AGM), | | | | | | | | | | |
| | Series A, 5.00% due 9/1/2030 - 9/1/2031 | | | | 8,740,000 | | | | | 9,696,412 | |
| | Series B, 5.00% due 9/1/2031 (pre-refunded 9/1/2023) | | | | 3,665,000 | | | | | 4,173,702 | |
| | Plum Borough School District (Insured: BAM) (State Aid Withholding) GO, | | | | | | | | | | |
| | 4.00% due 9/15/2018 - 9/15/2021 | | | | 1,570,000 | | | | | 1,634,252 | |
| | 5.00% due 9/15/2021 | | | | 430,000 | | | | | 469,487 | |
| | RHODE ISLAND — 0.3% | | | | | | | | | | |
| | State of Rhode Island and Providence Plantations (Consolidated Capital Development Loan) GO, Series B, 4.00% due 10/15/2023 | | | | 800,000 | | | | | 863,960 | |
| | State of Rhode Island and Providence Plantations (Training School Project) COP, Series B, 5.00% due 10/1/2024 | | | | 3,595,000 | | | | | 4,077,413 | |
| | SOUTH CAROLINA — 0.5% | | | | | | | | | | |
| | City of Myrtle Beach (Municipal Sports Complex), Series B, 5.00% due 6/1/2028 - 6/1/2030 | | | | 2,000,000 | | | | | 2,242,530 | |
| | South Carolina Public Service Authority (Capital Improvement Program), | | | | | | | | | | |
| | Series B, 5.00% due 12/1/2031 | | | | 2,385,000 | | | | | 2,612,052 | |
| | Series C, 5.00% due 12/1/2031 | | | | 1,515,000 | | | | | 1,695,467 | |
| | SOUTH DAKOTA — 0.4% | | | | | | | | | | |
| | South Dakota Health and Educational Facilities Authority (Avera Health), Series A, 5.00% due 7/1/2023 | | | | 1,575,000 | | | | | 1,716,451 | |
| | South Dakota Health and Educational Facilities Authority (Sanford Health), 5.00% due 11/1/2024 - 11/1/2029 | | | | 3,500,000 | | | | | 3,834,319 | |
| | TENNESSEE — 1.3% | | | | | | | | | | |
| | County of Shelby Health, Educational and Housing Facility Board (Methodist Le Bonheur Healthcare), 5.00% due 5/1/2027 - 5/1/2035 | | | | 3,560,000 | | | | | 4,119,485 | |
| | Metropolitan Government of Nashville and Davidson County (Green Projects), Series B, 5.00% due
7/1/2033 - 7/1/2036 | | | | 3,000,000 | | | | | 3,498,740 | |
| | Tennessee Energy Acquisition Corp. (The Gas Project), | | | | | | | | | | |
| | 5.00% due 2/1/2023 | | | | 2,500,000 | | | | | 2,766,900 | |
| | 5.25% due 9/1/2023 | | | | 7,000,000 | | | | | 7,904,190 | |
| | TEXAS — 12.9% | | | | | | | | | | |
| | Austin Community College District (Round Rock Campus), 5.50% due 8/1/2023 (pre-refunded 8/1/2018) | | | | 2,180,000 | | | | | 2,207,686 | |
| | City of Austin (Travis, Williamson and Hays Counties) (Water and Wastewater System), 5.00% due
11/15/2033 - 11/15/2036 | | | | 19,170,000 | | | | | 22,165,297 | |
| | City of Brownsville (Water, Wastewater & Electric Utilities Systems), 5.00% due 9/1/2020 | | | | 1,000,000 | | | | | 1,071,230 | |
| | City of Dallas (Public Improvements) GO, 5.00% due 2/15/2025 - 2/15/2034 | | | | 9,720,000 | | | | | 11,019,941 | |
| | City of Dallas (Trinity River Corridor Infrastructure) GO, 5.00% due 2/15/2028 | | | | 1,000,000 | | | | | 1,122,260 | |
| | City of Galveston (Galveston Island Convention Center; Insured: AGM), | | | | | | | | | | |
| | Series A, 5.00% due 9/1/2021 | | | | 545,000 | | | | | 588,714 | |
| | Series B, 5.00% due 9/1/2024 | | | | 1,115,000 | | | | | 1,237,115 | |
| | City of Houston (Convention & Entertainment Facilities), 5.00% due 9/1/2032 | | | | 3,560,000 | | | | | 3,941,703 | |
12 | Semi-Annual Report
Schedule of Investments, Continued
Thornburg Intermediate Municipal Fund | March 31, 2018 (Unaudited)
| | | | | | | | | | | | |
| | | | | PRINCIPAL AMOUNT | | VALUE |
| | City of Houston (Public Improvements) GO, Series A, 5.00% due 3/1/2027 | | | $ | 1,175,000 | | | | $ | 1,371,789 | |
| | City of McAllen (International Toll Bridge; Insured: AGM), Series A, 5.00% due 3/1/2028 - 3/1/2032 | | | | 6,120,000 | | | | | 6,964,115 | |
| | City of Pharr Higher Education Finance Authority (IDEA Public Schools), Series A, 5.75% due 8/15/2024 (pre-refunded 8/15/2019) | | | | 5,050,000 | | | | | 5,284,522 | |
| | City of San Antonio (Airport System Capital Improvements), 5.00% due 7/1/2024 - 7/1/2025 | | | | 3,225,000 | | | | | 3,484,469 | |
| | City of San Antonio (Water System), Series A, 5.00% due 5/15/2033 - 5/15/2034 | | | | 3,075,000 | | | | | 3,531,628 | |
| | City of Texas City Industrial Development Corp. (ARCO Pipe Line Co. Project), 7.375% due 10/1/2020 | | | | 2,705,000 | | | | | 3,024,758 | |
| | Dallas Area Rapid Transit, Series A, 5.00% due 12/1/2034 - 12/1/2036 | | | | 12,475,000 | | | | | 14,187,335 | |
| | Dallas County Utility & Reclamation District GO, 5.00% due 2/15/2027 | | | | 1,905,000 | | | | | 2,245,081 | |
| | Harris County GO, Series A, 5.00% due 10/1/2035 - 10/1/2037 | | | | 7,815,000 | | | | | 9,128,455 | |
| | Harris County (Flood Control), 5.00% due 10/1/2033 - 10/1/2034 | | | | 4,000,000 | | | | | 4,709,140 | |
| | Harris County Cultural Education Facilities Finance Corp. (LOC: JPMorgan Chase Bank, N.A.), | | | | | | | | | | |
| b | | 1.70% due 9/1/2031 (put 4/2/2018) | | | | 700,000 | | | | | 700,000 | |
| b | | Series A, 1.70% due 9/1/2031 (put 4/2/2018) | | | | 2,000,000 | | | | | 2,000,000 | |
| | Harris County Cultural Education Facilities Finance Corp. (Memorial Hermann Health System), Series A, 5.00% due 12/1/2028 | | | | 3,000,000 | | | | | 3,396,480 | |
| | Harris County Cultural Education Facilities Finance Corp. (TECO Project), 5.00% due
11/15/2028 - 11/15/2033 | | | | 2,225,000 | | | | | 2,624,453 | |
| | Houston Higher Education Finance Corp. (Cosmos Foundation, Inc.), 6.50% due 5/15/2031
(pre-refunded 5/15/2021) | | | | 775,000 | | | | | 879,594 | |
| | Katy (Educational Facilities Improvements; Guaranty: PSF) ISD GO, Series B, 5.00% due 2/15/2034 | | | | 7,560,000 | | | | | 8,680,770 | |
| | Kimble County Hospital District (Medical Facilities Improvements) GO, Series A, 5.00% due 8/15/2018 | | | | 525,000 | | | | | 531,410 | |
| | La Vernia Higher Education Finance Corp. (Kipp, Inc.), Series A, 5.75% due 8/15/2024
(pre-refunded 8/15/2019) | | | | 3,000,000 | | | | | 3,160,020 | |
| | Lone Star College System (Harris, Montgomery and San Jacinto Counties) GO, 5.00% due 8/15/2033 | | | | 4,335,000 | | | | | 5,053,179 | |
| | Lower Colorado River Authority, | | | | | | | | | | |
| | Series A, | | | | | | | | | | |
| | 5.00% due 5/15/2026 | | | | 9,415,000 | | | | | 10,368,834 | |
| | 5.00% due 5/15/2026 (pre-refunded 5/15/2022) | | | | 55,000 | | | | | 61,235 | |
| | North Central Texas Health Facilities Development Corp. (Children’s Medical Center of Dallas), 5.00% due 8/15/2019 | | | | 270,000 | | | | | 281,418 | |
| | North Texas Tollway Authority (NTTA System), Series A, 5.00% due 1/1/2020 - 1/1/2037 | | | | 3,750,000 | | | | | 4,102,880 | |
| | Round Rock (Educational Facilities Improvements; Guaranty: PSF) ISD GO, 5.00% due 8/1/2028 - 8/1/2029 | | | | 5,820,000 | | | | | 6,843,707 | |
| | San Juan Higher Education Finance Authority (IDEA Public Schools), Series A, 5.75% due 8/15/2024 (pre-refunded 8/15/2020) | | | | 1,590,000 | | | | | 1,732,512 | |
| | State of Texas (Cash Flow Management), 4.00% due 8/30/2018 | | | | 20,000,000 | | | | | 20,201,400 | |
| b | | Tarrant County Cultural Education Facilities Finance Corp. (LOC: TD Bank N.A.), 1.70% due 11/15/2050 (put 4/2/2018) | | | | 800,000 | | | | | 800,000 | |
| | Tarrant Regional Water District (Water Control and Improvement), 5.00% due 3/1/2028 - 3/1/2029 | | | | 3,650,000 | | | | | 4,254,900 | |
| | Texas Public Finance Authority Charter School Finance Corp. (Cosmos Foundation, Inc.), Series A, 6.00% due 2/15/2030 (pre-refunded 2/15/2020) | | | | 1,750,000 | | | | | 1,879,920 | |
| | Texas Transportation Commission (Central Texas Turnpike System), Series C, 5.00% due
8/15/2024 - 8/15/2025 | | | | 2,250,000 | | | | | 2,546,565 | |
| | Texas Transportation Commission (Highway Improvements) GO, 5.00% due 4/1/2022 - 4/1/2024 | | | | 3,000,000 | | | | | 3,405,450 | |
| | Trinity River Authority (Red Oak Creek System), 5.00% due 2/1/2025 | | | | 625,000 | | | | | 722,494 | |
| | Uptown Development Authority (Infrastructure Improvements), 5.50% due 9/1/2029 (pre-refunded 9/1/2019) | | | | 1,250,000 | | | | | 1,315,212 | |
| | U. S. VIRGIN ISLANDS — 0.2% | | | | | | | | | | |
| | Virgin Islands Public Finance Authority, 6.625% due 10/1/2029 | | | | 5,000,000 | | | | | 3,425,000 | |
| | UTAH — 0.5% | | | | | | | | | | |
| b | | Murray, Series A, 1.72% due 5/15/2037 (put 4/2/2018) | | | | 940,000 | | | | | 940,000 | |
| | Weber County, | | | | | | | | | | |
| b | | Series A, 1.72% due 2/15/2031 (put 4/2/2018) | | | | 1,100,000 | | | | | 1,100,000 | |
| b | | Series C, 1.72% due 2/15/2035 (put 4/2/2018) | | | | 5,475,000 | | | | | 5,475,000 | |
| | VIRGINIA — 0.0% | | | | | | | | | | |
| a | | County of Hanover (FirstHealth Richmond Memorial Hospital) IDA, 6.00% due 10/1/2021 | | | | 490,000 | | | | | 507,993 | |
| | WASHINGTON — 3.0% | | | | | | | | | | |
| | City of Seattle (Light and Power Improvements), Series B, 5.00% due 2/1/2019 | | | | 3,000,000 | | | | | 3,083,730 | |
| | King County Public Hospital District No. 2 (EvergreenHealth Medical Center) GO, 5.00% due
12/1/2028 - 12/1/2031 | | | | 6,585,000 | | | | | 7,482,083 | |
| | Skagit County Public Hospital District No. 1 (Skagit Regional Health) GO, 5.00% due 12/1/2025 - 12/1/2028 | | | | 7,860,000 | | | | | 8,741,747 | |
| | Skagit County Public Hospital District No. 2 (Island Hospital) GO, 5.00% due 12/1/2027 - 12/1/2028 | | | | 4,640,000 | | | | | 5,066,251 | |
| | State of Washington (Acquisition and Improvements of Real and Personal Property) COP, Series A, 5.00% due 7/1/2030 - 7/1/2031 | | | | 9,050,000 | | | | | 10,560,639 | |
| | Tacoma School District No.10 (Pierce County Capital Projects) GO, 5.00% due 12/1/2019 - 12/1/2020 | | | | 2,000,000 | | | | | 2,137,170 | |
| | Washington Health Care Facilities Authority (Highline Medical Centers; Insured: FHA 242), 6.25% due 8/1/2028 (pre-refunded 8/1/2018) | | | | 3,985,000 | | | | | 4,046,010 | |
| | Washington Health Care Facilities Authority (MultiCare Systems; Insured: AGM), Series C-RMKT, 5.25% due 8/15/2024 (pre-refunded 8/15/2018) | | | | 1,000,000 | | | | | 1,013,670 | |
| | WISCONSIN — 2.7% | | | | | | | | | | |
| | Wisconsin Health & Educational Facilities Authority (Agnesian Healthcare), | | | | | | | | | | |
| | 5.00% due 7/1/2021 | | | | 1,400,000 | | | | | 1,485,344 | |
| | 5.00% due 7/1/2021 (pre-refunded 7/1/2020) | | | | 770,000 | | | | | 823,939 | |
| | Wisconsin Health & Educational Facilities Authority (Agnesian Healthcare, Inc.), 5.50% due 7/1/2025 | | | | 5,000,000 | | | | | 5,343,300 | |
| | Wisconsin Health & Educational Facilities Authority (Ascension Health), 5.00% due 11/15/2035 - 11/15/2036 | | | | 13,000,000 | | | | | 14,803,190 | |
| | Wisconsin Health & Educational Facilities Authority (ProHealth Care, Inc.), 5.00% due 8/15/2023 - 8/15/2026 | | | | 10,925,000 | | | | | 11,860,159 | |
| d | | WPPI Energy, Series A, 5.00% due 7/1/2029 - 7/1/2036 | | | | 2,980,000 | | | | | 3,486,172 | |
| | | | | | | | | | | | |
| | | |
| | TOTAL INVESTMENTS — 98.5% (Cost $1,369,766,426) | | | | | | | | $ | 1,400,351,608 | |
| | | |
| | OTHER ASSETS LESS LIABILITIES — 1.5% | | | | | | | | | 21,011,290 | |
| | | | | | | | | | | | |
| | | |
| | NET ASSETS — 100.0% | | | | | | | | $ | 1,421,362,898 | |
| | | | | | | | | | | | |
Semi-Annual Report | 13
Schedule of Investments, Continued
Thornburg Intermediate Municipal Fund | March 31, 2018 (Unaudited)
Footnote Legend
| a | Segregated as collateral for a when-issued security. |
| b | Variable Rate Demand Notes are instruments whose interest rates change on a specific date (such as coupon date or interest payment date) or whose interest rates vary with changes in a designated base rate (such as the prime interest rate). This instrument is payable on demand and is secured by letters of credit or other credit support agreements from major banks. |
| c | Floating Rate Security. Stated interest/floor rate was in effect at March 31, 2018. |
Portfolio Abbreviations
To simplify the listings of securities, abbreviations are used per the table below:
| | |
| AGM | | Insured by Assured Guaranty Municipal Corp. |
| AMBAC | | Insured by American Municipal Bond Assurance Corp. |
| BAM | | Insured by Build America Mutual Insurance Co. |
| COP | | Certificates of Participation |
| DFA | | Development Finance Authority |
| EDA | | Economic Development Authority |
| FGIC | | Insured by Financial Guaranty Insurance Co. |
| FHA | | Insured by Federal Housing Administration |
| GNMA | | Collateralized by Government National Mortgage Association |
| GO | | General Obligation |
| | |
| | | |
| | | |
| HFA | | Health Facilities Authority |
| HFFA | | Health Facilities Financing Authority |
| IDA | | Industrial Development Authority |
| ISD | | Independent School District |
| LIBOR | | London Interbank Offered Rates |
| Mtg | | Mortgage |
| MUNIPSA | | Securities Industry and Financial Markets Association (SIFMA) Municipal Swap Index |
| Natl-Re | | Insured by National Public Finance Guarantee Corp. |
| PSF | | Guaranteed by Permanent School Fund |
14 | Semi-Annual Report
Statement of Assets and Liabilities
Thornburg Intermediate Municipal Fund | March 31, 2018 (Unaudited)
| | | | |
ASSETS | | | | |
Investments at value (cost $1,369,766,426) (Note 3) | | $ | 1,400,351,608 | |
Cash | | | 10,838 | |
Receivable for investments sold | | | 31,239,400 | |
Receivable for fund shares sold | | | 3,130,300 | |
Interest receivable | | | 17,859,801 | |
Prepaid expenses and other assets | | | 48,972 | |
| | | | |
| |
Total Assets | | | 1,452,640,919 | |
| | | | |
| |
LIABILITIES | | | | |
| |
Payable for investments purchased | | | 27,119,319 | |
Payable for fund shares redeemed | | | 2,677,185 | |
Payable to investment advisor and other affiliates (Note 4) | | | 782,207 | |
Accounts payable and accrued expenses | | | 221,796 | |
Dividends payable | | | 477,514 | |
| | | | |
| |
Total Liabilities | | | 31,278,021 | |
| | | | |
| |
NET ASSETS | | $ | 1,421,362,898 | |
| | | | |
| |
NET ASSETS CONSIST OF | | | | |
| |
Distribution in excess of net investment income | | $ | (3,657 | ) |
Net unrealized appreciation on investments | | | 30,585,182 | |
Accumulated net realized gain (loss) | | | (6,821,325 | ) |
Net capital paid in on shares of beneficial interest | | | 1,397,602,698 | |
| | | | |
| |
| | $ | 1,421,362,898 | |
| | | | |
| |
NET ASSET VALUE | | | | |
| |
Class A Shares: | | | | |
Net asset value and redemption price per share
($356,048,411 applicable to 25,632,630 shares of beneficial
interest outstanding - Note 5) | | $ | 13.89 | |
| |
Maximum sales charge, 2.00% of offering price | | | 0.28 | |
| | | | |
| |
Maximum offering price per share | | $ | 14.17 | |
| | | | |
| |
Class C Shares: | | | | |
Net asset value and offering price per share*
($129,542,434 applicable to 9,314,017 shares of beneficial
interest outstanding - Note 5) | | $ | 13.91 | |
| | | | |
| |
Class I Shares: | | | | |
Net asset value, offering and redemption price per share
($935,772,053 applicable to 67,453,347 shares of beneficial
interest outstanding - Note 5) | | $ | 13.87 | |
| | | | |
* Redemption price per share is equal to net asset value less any applicable contingent deferred sales charge.
See notes to financial statements.
Semi-Annual Report | 15
Statement of Operations
Thornburg Intermediate Municipal Fund | Six Months Ended March 31, 2018 (Unaudited)
| | | | |
INVESTMENT INCOME | | | | |
| |
Interest income (net of premium amortized of $7,869,447) | | $ | 22,765,444 | |
| | | | |
| |
EXPENSES | | | | |
| |
Investment advisory fees (Note 4) | | | 3,263,802 | |
Administration fees (Note 4) | | | | |
Class A Shares | | | 207,498 | |
Class C Shares | | | 75,594 | |
Class I Shares | | | 284,010 | |
Distribution and service fees (Note 4) | | | | |
Class A Shares | | | 464,080 | |
Class C Shares | | | 405,780 | |
Transfer agent fees | | | | |
Class A Shares | | | 108,777 | |
Class C Shares | | | 38,967 | |
Class I Shares | | | 366,442 | |
Registration and filing fees | | | | |
Class A Shares | | | 7,779 | |
Class C Shares | | | 7,212 | |
Class I Shares | | | 10,727 | |
Custodian fees (Note 2) | | | 77,333 | |
Professional fees | | | 32,060 | |
Trustee and officer fees (Note 4) | | | 32,810 | |
Other expenses | | | 46,552 | |
| | | | |
| |
Total Expenses | | | 5,429,423 | |
| |
Less: | | | | |
Expenses reimbursed by investment advisor (Note 4) | | | (13,158 | ) |
| | | | |
| |
Net Expenses | | | 5,416,265 | |
| | | | |
| |
Net Investment Income | | $ | 17,349,179 | |
| | | | |
| |
REALIZED AND UNREALIZED GAIN (LOSS) | | | | |
| |
Net realized gain (loss) on investments | | | 615,095 | |
Net change in unrealized appreciation (depreciation) on investments | | | (27,093,235 | ) |
| | | | |
| |
Net Realized and Unrealized Loss | | | (26,478,140 | ) |
| | | | |
| |
Net Decrease in Net Assets Resulting from Operations | | $ | (9,128,961 | ) |
| | | | |
See notes to financial statements.
16 | Semi-Annual Report
Statements of Changes in Net Assets
Thornburg Intermediate Municipal Fund
| | | | | | | | | | |
| | | SIX MONTHS ENDED
MARCH 31, 2018* | | YEAR ENDED
SEPTEMBER 30, 2017 |
INCREASE (DECREASE) IN NET ASSETS FROM | | | | | | | | | | |
| | |
OPERATIONS | | | | | | | | | | |
| | |
Net investment income | | | $ | 17,349,179 | | | | $ | 34,311,048 | |
Net realized gain (loss) on investments | | | | 615,095 | | | | | (7,345,009 | ) |
Net unrealized appreciation (depreciation) on investments | | | | (27,093,235 | ) | | | | (30,486,170 | ) |
| | | | | |
| | |
Net Decrease in Net Assets Resulting from Operations | | | | (9,128,961 | ) | | | | (3,520,131 | ) |
| | |
DIVIDENDS TO SHAREHOLDERS | | | | | | | | | | |
| | |
From net investment income | | | | | | | | | | |
Class A Shares | | | | (4,173,138 | ) | | | | (8,971,652 | ) |
Class C Shares | | | | (1,293,640 | ) | | | | (2,814,365 | ) |
Class I Shares | | | | (11,882,401 | ) | | | | (22,525,031 | ) |
| | |
FUND SHARE TRANSACTIONS (NOTE 5) | | | | | | | | | | |
Class A Shares | | | | (24,973,721 | ) | | | | (68,147,256 | ) |
Class C Shares | | | | (8,167,014 | ) | | | | (25,962,271 | ) |
Class I Shares | | | | 1,127,729 | | | | | 15,637,165 | |
| | | | | |
| | |
Net Decrease in Net Assets | | | | (58,491,146 | ) | | | | (116,303,541 | ) |
| | |
NET ASSETS | | | | | | | | | | |
| | |
Beginning of Period | | | | 1,479,854,044 | | | | | 1,596,157,585 | |
| | | | | |
| | |
End of Period | | | $ | 1,421,362,898 | | | | $ | 1,479,854,044 | |
| | | | | |
| | |
Distribution in excess of net investment income | | | $ | (3,657 | ) | | | $ | (3,657 | ) |
* Unaudited.
See notes to financial statements.
Semi-Annual Report | 17
Notes to Financial Statements
Thornburg Intermediate Municipal Fund | March 31, 2018 (Unaudited)
NOTE 1 – ORGANIZATION
Thornburg Intermediate Municipal Fund (the “Fund”) is a diversified series of Thornburg Investment Trust (the “Trust”). The Trust was organized as a Massachusetts business trust under a Declaration of Trust dated June 3, 1987 and is registered as a diversified, open-end management investment company under the Investment Company Act of 1940, as amended. The Fund is currently one of twenty-one separate series of the Trust. Each series is considered to be a separate entity for financial reporting and tax purposes and bears expenses directly attributable to it. The Fund’s primary investment objective is to obtain as high a level of current income exempt from federal individual income taxes as is consistent, in the view of Thornburg Investment Management, Inc., the Trust’s investment advisor (the “Advisor”), with the preservation of capital. The Fund’s secondary objective is to reduce expected changes in its share price compared to long-term bond portfolios.
The Fund currently offers three classes of shares of beneficial interest: Class A, Class C, and Institutional Class (“Class I”). Each class of shares of the Fund represents an interest in the same portfolio of investments, except that (i) Class A shares are sold subject to a front-end sales charge collected at the time the shares are purchased and bear a service fee, (ii) Class C shares are sold at net asset value without a sales charge at the time of purchase, but are subject to a contingent deferred sales charge upon redemption within one year of purchase, and bear both a service fee and a distribution fee, (iii) Class I shares are sold at net asset value without a sales charge at the time of purchase and may be subject to a service fee, and (iv) the respective classes may have different reinvestment privileges and conversion rights. Additionally, the Fund may allocate among its classes certain expenses, to the extent allocable to specific classes, including transfer agent fees, government registration fees, certain printing and postage costs, and administrative and legal expenses. Currently, class specific expenses of the Fund are limited to service and distribution fees, administration fees, and certain registration and transfer agent expenses.
The following is a summary of significant accounting policies followed by the Fund in the preparation of its financial statements. The Fund prepares its financial statements in conformity with United States generally accepted accounting principles (“GAAP”), including investment company accounting and reporting guidance in the Financial Accounting Standards Board (the “FASB”) Accounting Standard Codification Topic 946.
NOTE 2 – SIGNIFICANT ACCOUNTING POLICIES
Security Valuation: All investments in securities held by the Fund are valued as described in Note 3.
Allocation of Income, Gains, Losses and Expenses: Net investment income (other than class specific expenses) and realized and unrealized gains and losses are allocated daily to each class of shares based upon the relative net asset value of outstanding shares (or the value of the dividend-eligible shares, as appropriate) of each class of shares at the beginning of the day (after adjusting for the current capital shares activity of the respective class). Expenses common to all Funds are allocated among the Funds comprising the Trust based upon their relative net asset values or other appropriate allocation methods. Operating expenses directly attributable to a specific class are charged against the operating income of that class.
Dividends and Distributions to Shareholders: Dividends and distributions to shareholders, which are determined in accordance with federal income tax regulations and may differ from GAAP, are recorded on the ex-dividend date. Ordinary income distributions, if any, are declared daily and paid monthly. Capital gain distributions, if any, are declared and paid annually and more often if deemed necessary by the Advisor. Dividends are paid and are reinvested in additional shares of the Fund at net asset value per share at the close of business on the ex-dividend date, or at the shareholder’s option, paid in cash.
Investment Income: Interest income is accrued as earned. Premiums and discounts are amortized and accreted, respectively, to call dates or maturity dates using the effective yield method of the respective investments. These amounts are included in Interest income on the Statement of Operations.
Custodian Fees: Custodian fees disclosed in the Statement of Operations may include interest expenses incurred by the Fund on any cash overdrafts of its custodian account during the period. Such cash overdrafts may result from the effects of failed trades in portfolio securities and from cash outflows resulting from unanticipated shareholder redemption activity. The Fund pays interest to its custodian on any such cash overdraft at a rate set periodically at the custodian’s discretion of the overdraft amount in excess of $50,000.
Investment Transactions: Investment transactions are accounted for on a trade date basis. Realized gains and losses from the sale of investments are recorded on an identified cost basis.
When-Issued and Delayed Delivery Transactions: The Fund may engage in when-issued or delayed delivery transactions. To the extent the Fund engages in such transactions, it will do so for the purpose of acquiring portfolio investments consistent with the Fund’s investment objectives and not for the purpose of investment leverage or to speculate on interest rate or market changes. At the time the Fund makes a commitment to purchase an investment on a when-issued or delayed delivery basis, the Fund will record the transaction and reflect the
18 | Semi-Annual Report
Notes to Financial Statements, Continued
Thornburg Intermediate Municipal Fund | March 31, 2018 (Unaudited)
value in determining its net asset value. When effecting such transactions, assets of an amount sufficient to make payment for the portfolio investments to be purchased will be segregated on the Fund’s records on the trade date. Investments purchased on a when-issued or delayed delivery basis do not earn interest until the settlement date.
Guarantees and Indemnifications: Under the Trust’s organizational documents (and under separate agreements with the independent Trustees), its officers and Trustees are provided with an indemnification against certain liabilities arising out of the performance of their duties to the Fund. In the normal course of business the Trust may also enter into contracts with service providers that contain general indemnifications. The Trust’s maximum exposure under these arrangements is unknown. However, based on experience, the Trust expects the risk of loss to be remote.
Use of Estimates: The preparation of financial statements in conformity with GAAP requires management to make estimates and assumptions that affect the reported amounts of assets and liabilities and disclosure of contingent assets and liabilities at the date of the financial statements and the reported amounts of increases (decreases) in net assets from operations during the reporting period. Actual results could differ from those estimates.
Federal Income Taxes: It is the policy of the Trust to comply with the provisions of the Internal Revenue Code applicable to regulated investment companies and to distribute to shareholders substantially all investment company taxable income including net realized gains on investments (if any), and tax exempt income of the Fund. Therefore, no provision for federal income or excise tax is required.
The Fund files income tax returns in United States federal and applicable state jurisdictions. The statute of limitations on the Fund’s tax return filings generally remains open for the three years following a return’s filing date. The Fund has analyzed each uncertain tax position believed to be material in the preparation of the Fund’s financial statements for the six month period ended March 31, 2018, including open tax years, to assess whether it is more likely than not that the position would be sustained upon examination, based on the technical merits of the position. The Fund has not identified any such position for which an asset or liability must be reflected in the Statement of Assets and Liabilities.
At March 31, 2018, information on the tax components of capital was as follows:
| | | | | |
Cost of investments for tax purposes | | | $ | 1,369,766,426 | |
| | | | | |
Gross unrealized appreciation on a tax basis | | | | 38,931,038 | |
Gross unrealized depreciation on a tax basis | | | | (8,345,856 | ) |
| | | | | |
Net unrealized appreciation (depreciation) on investments (tax basis) | | | $ | 30,585,182 | |
| | | | | |
At March 31, 2018, the Fund had deferred tax basis capital losses occurring subsequent to October 31, 2016 through September 30, 2017 of $7,436,422. For tax purposes, such losses will be recognized in the year ending September 30, 2018.
NOTE 3 – SECURITY VALUATION
Valuation of the Fund’s portfolio investment securities is performed in accordance with policies and procedures adopted by and under the oversight of the Trustees.
The Trustees of the Trust have appointed the Advisor to assist the Trustees to obtain market values for portfolio investments, evaluate and monitor professional pricing service providers appointed by the Trustees’ Audit Committee (the “Audit Committee”) to assist in determining fair values for portfolio investments, assist in calculating fair values for portfolio investments in certain circumstances, and to perform other functions in connection with the valuation of investments. The Advisor acts through its Valuation and Pricing Committee (the “Committee”) and other employees of the Advisor. The Committee regularly reviews its own valuation calculations, as well as the valuations, valuation techniques and services furnished by pricing service providers, considers circumstances which may require valuation calculations by the Committee, and reviews previous valuation calculations. The Committee reports to the Audit Committee on the Committee’s activities, the performance of pricing service providers, and other matters relating to valuation of portfolio investments.
In those instances when the Committee assists in calculating a fair value for a portfolio investment, the Committee seeks to determine the price that the Fund would reasonably expect to receive upon a sale of the investment in an orderly transaction between market participants on the valuation date. The Committee customarily utilizes quotations from securities broker dealers in calculating valuations, but also may utilize prices obtained from pricing service providers or other methods approved by the Audit Committee. Because fair values calculated by the Committee are estimates, the calculation of a value for an investment may differ from the price that would be realized by the Fund upon a sale of the investment, and the difference could be material to the Fund’s financial statements. The Committee’s calculation of a fair value for an investment may also differ from the prices obtained by other persons (including other mutual funds) for the investment.
Semi-Annual Report | 19
Notes to Financial Statements, Continued
Thornburg Intermediate Municipal Fund | March 31, 2018 (Unaudited)
Valuation of Securities: Debt obligations held by the Fund which are not listed or traded on exchanges or for which no reported market exists are ordinarily valued at the valuation obtained from a pricing service provider approved by the Audit Committee.
In any case when a pricing service provider fails to provide a valuation for a debt obligation held by the Fund, the Committee calculates a fair value for the obligation using alternative methods under procedures approved by the Audit Committee. Additionally, in cases when management believes that a valuation obtained from a pricing service provider merits review for significant reasons, the Committee decides whether or not to use the valuation calculated by the pricing service provider or to use an alternative method approved by the Audit Committee to calculate a fair value for the obligation.
Valuation Hierarchy: The Fund categorizes its investments based upon the inputs used in valuing those investments, according to a three-level hierarchy established in guidance from the FASB. Categorization of investments using this hierarchy is intended by the FASB to maximize the use of observable inputs in valuing investments and minimize the use of unobservable inputs by requiring that the most observable inputs be used when available. Observable inputs are those that market participants would use in valuing an investment based on available market information. Unobservable inputs are those that reflect assumptions about the information market participants would use in valuing an investment. An investment’s level within the hierarchy is based on the lowest level input that is deemed significant to the valuation. The methodologies and inputs used to value investments are not necessarily indications of the risk or liquidity associated with those investments.
Various inputs are used in calculating valuations for the Fund’s investments. These inputs are generally summarized according to the three-level hierarchy below:
Level 1: Quoted prices in active markets for identical investments.
Level 2: Other direct or indirect significant observable inputs (including quoted prices for similar investments in active markets and other observable inputs, such as interest rates, prepayment rates, credit risk, etc.).
Level 3: Significant unobservable inputs (including the Committee’s own assumptions in calculating the fair values of investments).
Valuations for debt obligations held by the Fund are typically calculated by pricing service providers approved by the Audit Committee and are generally characterized as Level 2 within the valuation hierarchy.
In a limited number of cases the Committee calculates a fair value for investments using broker quotations or other methods approved by the Audit Committee. When the Committee uses a single broker quotation to calculate a fair value for an investment without other significant observable inputs, or if a fair value is calculated using other significant inputs that are considered unobservable, the investment is characterized as Level 3 within the hierarchy. Other significant unobservable inputs used to calculate a fair value in these instances might include an income-based valuation approach which considers discounted anticipated future cash flows from the investment and application of discounts due to the nature or duration of any restrictions on the disposition of the investment.
Valuations based upon the use of inputs from Levels 1, 2 or 3 may not represent the actual price received upon the disposition of an investment, and the Fund may receive a price that is lower than the valuation based upon these inputs when it sells the investment.
The following table displays a summary of the fair value hierarchy measurements of the Fund’s investments as of March 31, 2018. In any instance when valuation inputs from more than one level are used to determine the fair value of a specific investment, the investment is placed in the level of the table based upon the lowest level input that is significant in determining the fair value of the investment:
| | | | | | | | | | | | | | | | | | | | |
| | | FAIR VALUE MEASUREMENTS AT MARCH 31, 2018 |
| | | TOTAL | | LEVEL 1 | | LEVEL 2 | | LEVEL 3 |
Assets | | | | | | | | | | | | | | | | | | | | |
Investments in Securities | | | | | | | | | | | | | | | | | | | | |
Municipal Bonds | | | $ | 1,400,351,608 | | | | $ | – | | | | $ | 1,400,351,608 | | | | $ | – | |
| | | | | |
Total Investments in Securities | | | $ | 1,400,351,608 | | | | $ | – | | | | $ | 1,400,351,608 | | | | $ | – | |
In accordance with the guidance prescribed in Accounting Standards Update No. 2011-04, it is the policy of the Fund to recognize transfers between levels and the underlying events which caused the movement. The Fund recognized no transfers between levels for the six months ended March 31, 2018.
20 | Semi-Annual Report
Notes to Financial Statements, Continued
Thornburg Intermediate Municipal Fund | March 31, 2018 (Unaudited)
NOTE 4 – INVESTMENT ADVISORY FEE AND OTHER TRANSACTIONS WITH AFFILIATES
Pursuant to an investment advisory agreement, the Advisor serves as the investment advisor and performs services for the Fund for which the fees are payable at the end of each month. Under the investment advisory agreement, the Fund pays the Advisor a management fee based on the daily net assets of the Fund at an annual rate as shown in the following table:
| | | | | |
| MANAGEMENT FEE SCHEDULE |
| DAILY NET ASSETS | | FEE RATE |
| |
Up to $500 million | | | | 0.500 | % |
| |
Next $500 million | | | | 0.450 | |
| |
Next $500 million | | | | 0.400 | |
| |
Next $500 million | | | | 0.350 | |
| |
Over $2 billion | | | | 0.275 | |
The Fund’s effective management fee for the six months ended March 31, 2018 was 0.452% of the Fund’s average net assets.
The Trust has entered into administrative service agreements with the Advisor, whereby the Advisor will perform certain administrative services related to each class of the Fund’s shares. Until January 31, 2018, the fees were payable at an annual rate of up to 0.125 of 1% per annum of the average daily net assets attributable to each class of shares. As of February 1, 2018, the fees are computed as an annual percentage of the aggregate average daily net assets of all shares classes of all Funds in the Trust as follows:
| | | | | |
| ADMINISTRATION FEE SCHEDULE |
| DAILY NET ASSETS | | FEE RATE |
| |
Up to $20 billion | | | | 0.100 | % |
| |
$20 billion to $40 billion | | | | 0.075 | |
| |
$40 billion to $60 billion | | | | 0.040 | |
| |
Over $60 billion | | | | 0.030 | |
The aggregate fee amount is allocated on a daily basis to each Fund based on net assets and subsequently allocated to each class of shares of the Fund. Total administrative service fees incurred by each class of shares of the Fund for the six months ended March 31, 2018, are set forth in the Statement of Operations.
The Trust has an underwriting agreement with Thornburg Securities Corporation (the “Distributor”), an affiliate of the Advisor, which acts as the distributor of the Fund’s shares. For the six months ended March 31, 2018, the Distributor has advised the Fund that it earned net commissions aggregating $512 from the sale of Class A shares, and collected contingent deferred sales charges aggregating $2,098 from redemptions of Class C shares of the Fund.
Pursuant to a service plan under Rule 12b-1 of the Investment Company Act of 1940, the Fund may pay to the Distributor or securities dealers and other financial institutions at the Distributor’s direction an amount not to exceed .25 of 1% per annum of the average daily net assets attributable to Class A and Class C shares of the Fund to obtain various shareholder and distribution related services. For the six months ended March 31, 2018, there were no 12b-1 service plan fees charged for Class I shares. The Advisor and Distributor each may pay out of its own resources additional expenses for distribution of the Fund’s shares and shareholder services.
The Trust has also adopted a distribution plan pursuant to Rule 12b-1, applicable only to the Fund’s Class C shares under which the Fund compensates the Distributor for services in promoting the sale of Class C shares of the Fund at an annual rate of up to .35 of 1% per annum of the average daily net assets attributable to Class C shares.
Total fees incurred by each class of shares of the Fund under their respective service and distribution plans for the six months ended March 31, 2018, are set forth in the Statement of Operations.
The Advisor and Distributor have contractually agreed to waive fees and reimburse expenses incurred by the Fund so that actual expenses of certain share classes do not exceed levels as specified in each Fund’s most recent prospectus. The agreement may be terminated by the Fund at any time, but may not be terminated by the Advisor or Distributor before February 1, 2019, unless the Advisor ceases to be the investment advisor to the Fund or the Distributor ceases to be the distributor of the Fund prior to that date. The Advisor and Distributor may recoup amounts waived or reimbursed during the fiscal year if expenses fall below the contractual limit during that year.
Semi-Annual Report | 21
Notes to Financial Statements, Continued
Thornburg Intermediate Municipal Fund | March 31, 2018 (Unaudited)
For the six months ended March 31, 2018, the Advisor contractually reimbursed certain class specific expenses, administrative fees, and distribution fees of $13,158 for Class C shares.
Certain officers and Trustees of the Trust are also officers or directors of the Advisor and Distributor. The compensation of the independent Trustees is borne by the Trust. The Trust also pays a portion of the Chief Compliance Officer’s compensation. These amounts are reflected as “Trustee and officer fees” in the Statement of Operations.
The percentage of direct investments in the Fund held by the Trustees, officers of the Trust, and the Advisor is approximately 0.10%.
The Fund may purchase or sell securities from, or to an affiliated fund, provided the affiliation is due solely to having a common investment advisor, common officers, or common trustees, and provided that all such transactions will comply with Rule 17a-7 under the 1940 Act. For the six months ended March 31, 2018, the Fund had transactions with affiliated funds of $22,202,478 in purchases and $91,236,647 in sales generating realized losses of $598,396.
NOTE 5 – SHARES OF BENEFICIAL INTEREST
At March 31, 2018, there were an unlimited number of shares with no par value of beneficial interest authorized. Transactions in shares of beneficial interest were as follows:
| | | | | | | | | | | | | | | | |
| | | SIX MONTHS ENDED MARCH 31, 2018 (UNAUDITED) | | | YEAR ENDED SEPTEMBER 30, 2017 (AUDITED) | |
| | | SHARES | | | AMOUNT | | | SHARES | | | AMOUNT | |
Class A Shares | | | | | | | | | | | | | | | | |
Shares sold | | | 1,567,004 | | | $ | 22,022,819 | | | | 3,977,534 | | | $ | 55,804,317 | |
Shares issued to shareholders in
reinvestment of dividends | | | 277,585 | | | | 3,887,080 | | | | 590,411 | | | | 8,305,921 | |
Shares repurchased | | | (3,622,346 | ) | | | (50,883,620 | ) | | | (9,443,471 | ) | | | (132,257,494 | ) |
| | | | |
| | | | |
Net decrease | | | (1,777,757 | ) | | $ | (24,973,721 | ) | | | (4,875,526 | ) | | $ | (68,147,256 | ) |
| | | | |
Class C Shares | | | | | | | | | | | | | | | | |
Shares sold | | | 416,361 | | | $ | 5,865,852 | | | | 802,423 | | | $ | 11,309,603 | |
Shares issued to shareholders in
reinvestment of dividends | | | 80,170 | | | | 1,123,960 | | | | 170,880 | | | | 2,407,180 | |
Shares repurchased | | | (1,077,811 | ) | | | (15,156,826 | ) | | | (2,817,438 | ) | | | (39,679,054 | ) |
| | | | |
| | | | |
Net decrease | | | (581,280 | ) | | $ | (8,167,014 | ) | | | (1,844,135 | ) | | $ | (25,962,271 | ) |
| | | | |
Class I Shares | | | | | | | | | | | | | | | | |
Shares sold | | | 9,378,397 | | | $ | 131,360,163 | | | | 24,690,644 | | | $ | 345,934,491 | |
Shares issued to shareholders in
reinvestment of dividends | | | 717,855 | | | | 10,042,831 | | | | 1,412,131 | | | | 19,847,563 | |
Shares repurchased | | | (10,010,264 | ) | | | (140,275,265 | ) | | | (25,049,596 | ) | | | (350,144,889 | ) |
| | | | |
| | | | |
Net increase | | | 85,988 | | | $ | 1,127,729 | | | | 1,053,179 | | | $ | 15,637,165 | |
| | | | |
NOTE 6 – INVESTMENT TRANSACTIONS
For the six months ended March 31, 2018, the Fund had purchase and sale transactions of investments (excluding short-term investments) of $181,842,310 and $162,310,953, respectively.
OTHER NOTES
Risks: The Fund’s investments subject it to risks including, but not limited to, credit risk, interest rate risk, management risk, market and economic risk, and liquidity risk. Please see the Fund’s prospectus for a discussion of the risks associated with an investment in the Fund.
Subsequent Events: Fund management believes no events have occurred between March 31, 2018 and the date of issuance of the financial statements that require adjustment to or disclosure in the accompanying financial statements.
22 | Semi-Annual Report
This page intentionally left blank.
Semi-Annual Report | 23
Financial Highlights
Thornburg Intermediate Municipal Fund
| | | | | | | | | | | | | | | | | | | | | | | | | | | | | | | | | | | | | | | | |
| | | PER SHARE PERFORMANCE (FOR A SHARE OUTSTANDING THROUGHOUT THE PERIOD) |
| | | | | | | | | | | | | | | | | |
UNLESS OTHERWISE NOTED, PERIODS ARE FISCAL YEARS ENDED SEPTEMBER 30, | | NET ASSET
VALUE,
BEGINNING OF
PERIOD | | NET
INVESTMENT
INCOME
(LOSS)+ | | NET REALIZED &
UNREALIZED GAIN
(LOSS) ON
INVESTMENTS | | TOTAL FROM
INVESTMENT
OPERATIONS | | DIVIDENDS
FROM NET
INVESTMENT
INCOME | | DIVIDENDS
FROM NET
REALIZED
GAINS | | TOTAL
DIVIDENDS | | NET ASSET
VALUE,
END OF PERIOD |
| | | | | | | |
| CLASS A SHARES | | | | | | | | | | | | | | | | | | | | | | | | | | | | | | | | | | | | |
| | | | | | | | |
2018(b)(c) | | | $ | 14.15 | | | | | 0.16 | | | | | (0.26 | ) | | | | (0.10 | ) | | | | (0.16 | ) | | | | – | | | | | (0.16 | ) | | | $ | 13.89 | |
2017(b) | | | $ | 14.47 | | | | | 0.30 | | | | | (0.32 | ) | | | | (0.02 | ) | | | | (0.30 | ) | | | | – | | | | | (0.30 | ) | | | $ | 14.15 | |
2016(b) | | | $ | 14.17 | | | | | 0.29 | | | | | 0.30 | | | | | 0.59 | | | | | (0.29 | ) | | | | – | | | | | (0.29 | ) | | | $ | 14.47 | |
2015(b) | | | $ | 14.23 | | | | | 0.30 | | | | | (0.06 | ) | | | | 0.24 | | | | | (0.30 | ) | | | | – | | | | | (0.30 | ) | | | $ | 14.17 | |
2014(b) | | | $ | 13.76 | | | | | 0.34 | | | | | 0.47 | | | | | 0.81 | | | | | (0.34 | ) | | | | – | | | | | (0.34 | ) | | | $ | 14.23 | |
2013(b) | | | $ | 14.22 | | | | | 0.33 | | | | | (0.46 | ) | | | | (0.13 | ) | | | | (0.33 | ) | | | | – | | | | | (0.33 | ) | | | $ | 13.76 | |
| | | | | | | |
| CLASS C SHARES | | | | | | | | | | | | | | | | | | | | | | | | | | | | | | | | | | | | |
| | | | | | | | |
2018(c) | | | $ | 14.17 | | | | | 0.13 | | | | | (0.26 | ) | | | | (0.13 | ) | | | | (0.13 | ) | | | | – | | | | | (0.13 | ) | | | $ | 13.91 | |
2017 | | | $ | 14.49 | | | | | 0.26 | | | | | (0.32 | ) | | | | (0.06 | ) | | | | (0.26 | ) | | | | – | | | | | (0.26 | ) | | | $ | 14.17 | |
2016 | | | $ | 14.19 | | | | | 0.24 | | | | | 0.30 | | | | | 0.54 | | | | | (0.24 | ) | | | | – | | | | | (0.24 | ) | | | $ | 14.49 | |
2015 | | | $ | 14.25 | | | | | 0.25 | | | | | (0.06 | ) | | | | 0.19 | | | | | (0.25 | ) | | | | – | | | | | (0.25 | ) | | | $ | 14.19 | |
2014 | | | $ | 13.78 | | | | | 0.30 | | | | | 0.47 | | | | | 0.77 | | | | | (0.30 | ) | | | | – | | | | | (0.30 | ) | | | $ | 14.25 | |
2013 | | | $ | 14.24 | | | | | 0.29 | | | | | (0.46 | ) | | | | (0.17 | ) | | | | (0.29 | ) | | | | – | | | | | (0.29 | ) | | | $ | 13.78 | |
| | | | | | | |
| CLASS I SHARES | | | | | | | | | | | | | | | | | | | | | | | | | | | | | | | | | | | | |
| | | | | | | | |
2018(c) | | | $ | 14.13 | | | | | 0.18 | | | | | (0.26 | ) | | | | (0.08 | ) | | | | (0.18 | ) | | | | – | | | | | (0.18 | ) | | | $ | 13.87 | |
2017 | | | $ | 14.46 | | | | | 0.35 | | | | | (0.33 | ) | | | | 0.02 | | | | | (0.35 | ) | | | | – | | | | | (0.35 | ) | | | $ | 14.13 | |
2016 | | | $ | 14.15 | | | | | 0.33 | | | | | 0.31 | | | | | 0.64 | | | | | (0.33 | ) | | | | – | | | | | (0.33 | ) | | | $ | 14.46 | |
2015 | | | $ | 14.22 | | | | | 0.34 | | | | | (0.07 | ) | | | | 0.27 | | | | | (0.34 | ) | | | | – | | | | | (0.34 | ) | | | $ | 14.15 | |
2014 | | | $ | 13.75 | | | | | 0.38 | | | | | 0.47 | | | | | 0.85 | | | | | (0.38 | ) | | | | – | | | | | (0.38 | ) | | | $ | 14.22 | |
2013 | | | $ | 14.20 | | | | | 0.38 | | | | | (0.45 | ) | | | | (0.07 | ) | | | | (0.38 | ) | | | | – | | | | | (0.38 | ) | | | $ | 13.75 | |
| (a) | Not annualized for periods less than one year. |
| (b) | Sales loads are not reflected in computing total return. |
| (c) | Unaudited Six Month Period Ended March 31. |
| + | Based on weighted average shares outstanding. |
See notes to financial statements.
24 | Semi-Annual Report
Financial Highlights, Continued
Thornburg Intermediate Municipal Fund
| | | | | | | | | | | | | | | | | | | | | | | | | | | | | | |
| RATIOS TO AVERAGE NET ASSETS | | | | | | SUPPLEMENTAL DATA | |
| | | | | | | EXPENSES, AFTER | | | | | | | | | | | | | | | | |
NET INVESTMENT
INCOME (LOSS) (%) | | | EXPENSES, AFTER
EXPENSE
REDUCTIONS (%) | | | EXPENSE
REDUCTIONS AND
NET OF CUSTODY
CREDITS (%) | | | EXPENSES,
BEFORE EXPENSE
REDUCTIONS (%) | | | | | | TOTAL
RETURN (%)(a)
| | | PORTFOLIO
TURNOVER
RATE (%)(a) | | | NET ASSETS AT END OF PERIOD
(THOUSANDS) | |
| | | | | | | |
| | | | | | | | | | | | | | | | | | | | | | | | | | | | | | |
| | | | | | | |
| | 2.25 | (d) | | | 0.90 | (d) | | | 0.90 | (d) | | | 0.90 | (d) | | | | | | | (0.73 | ) | | | 12.12 | | | $ | 356,048 | |
| | 2.15 | | | | 0.92 | | | | 0.92 | | | | 0.92 | | | | | | | | (0.08 | ) | | | 24.04 | | | $ | 387,790 | |
| | 2.00 | | | | 0.92 | | | | 0.92 | | | | 0.92 | | | | | | | | 4.17 | | | | 10.80 | | | $ | 467,335 | |
| | 2.09 | | | | 0.92 | | | | 0.92 | | | | 0.92 | | | | | | | | 1.68 | | | | 13.49 | | | $ | 423,113 | |
| | 2.43 | | | | 0.92 | | | | 0.92 | | | | 0.92 | | | | | | | | 5.95 | | | | 14.85 | | | $ | 417,369 | |
| | 2.37 | | | | 0.92 | | | | 0.92 | | | | 0.92 | | | | | | | | (0.91 | ) | | | 29.18 | | | $ | 429,941 | |
| | | | | | | |
| | | | | | | | | | | | | | | | | | | | | | | | | | | | | | |
| | | | | | | |
| | 1.91 | (d) | | | 1.24 | (d) | | | 1.24 | (d) | | | 1.26 | (d) | | | | | | | (0.89 | ) | | | 12.12 | | | $ | 129,542 | |
| | 1.83 | | | | 1.24 | | | | 1.24 | | | | 1.27 | | | | | | | | (0.40 | ) | | | 24.04 | | | $ | 140,176 | |
| | 1.68 | | | | 1.24 | | | | 1.24 | | | | 1.27 | | | | | | | | 3.84 | | | | 10.80 | | | $ | 170,149 | |
| | 1.77 | | | | 1.24 | | | | 1.24 | | | | 1.28 | | | | | | | | 1.35 | | | | 13.49 | | | $ | 160,042 | |
| | 2.11 | | | | 1.24 | | | | 1.24 | | | | 1.29 | | | | | | | | 5.61 | | | | 14.85 | | | $ | 157,126 | |
| | 2.05 | | | | 1.24 | | | | 1.24 | | | | 1.30 | | | | | | | | (1.22 | ) | | | 29.18 | | | $ | 159,727 | |
| | | | | | | |
| | | | | | | | | | | | | | | | | | | | | | | | | | | | | | |
| | | | | | | |
| | 2.53 | (d) | | | 0.62 | (d) | | | 0.62 | (d) | | | 0.62 | (d) | | | | | | | (0.59 | ) | | | 12.12 | | | $ | 935,772 | |
| | 2.45 | | | | 0.62 | | | | 0.62 | | | | 0.62 | | | | | | | | 0.15 | | | | 24.04 | | | $ | 951,888 | |
| | 2.30 | | | | 0.61 | | | | 0.61 | | | | 0.61 | | | | | | | | 4.57 | | | | 10.80 | | | $ | 958,674 | |
| | 2.39 | | | | 0.62 | | | | 0.62 | | | | 0.62 | | | | | | | | 1.91 | | | | 13.49 | | | $ | 751,486 | |
| | 2.73 | | | | 0.62 | | | | 0.61 | | | | 0.62 | | | | | | | | 6.28 | | | | 14.85 | | | $ | 618,280 | |
| | 2.68 | | | | 0.61 | | | | 0.61 | | | | 0.61 | | | | | | | | (0.53 | ) | | | 29.18 | | | $ | 449,501 | |
Semi-Annual Report | 25
Expense Example
Thornburg Intermediate Municipal Fund | March 31, 2018 (Unaudited)
As a shareholder of the Fund, you incur two types of costs:
| | (1) | transaction costs, including |
| | (a) | sales charges (loads) on purchase payments, for Class A shares; |
| | (b) | a deferred sales charge on redemptions of any part or all of a purchase of $1 million of Class A shares within 12 months of purchase; |
| | (c) | a deferred sales charge on redemptions of Class C shares within 12 months of purchase; |
| | (2) | ongoing costs, including management fees; distribution and/or service (12b-1) fees; and other Fund expenses. |
This example is intended to help you understand your ongoing costs (in dollars) of investing in the Fund and to compare these costs with the ongoing costs of investing in other mutual funds.
The example is based on a $1,000 investment beginning on October 1, 2017, and held until March 31, 2018.
| | | | | | | | | | | | | | | |
| | | BEGINNING
ACCOUNT VALUE
10/1/17 | | ENDING
ACCOUNT VALUE
3/31/18 | | EXPENSES PAID
DURING PERIOD†
10/1/17–3/31/18 |
| | | |
| CLASS A SHARES | | | | | | | | | | | | | | | |
| | | |
Actual | | | $ | 1,000.00 | | | | $ | 992.70 | | | | $ | 4.47 | |
Hypothetical* | | | $ | 1,000.00 | | | | $ | 1,020.44 | | | | $ | 4.53 | |
| | | |
| CLASS C SHARES | | | | | | | | | | | | | | | |
| | | |
Actual | | | $ | 1,000.00 | | | | $ | 991.10 | | | | $ | 6.16 | |
Hypothetical* | | | $ | 1,000.00 | | | | $ | 1,018.75 | | | | $ | 6.24 | |
| | | |
| CLASS I SHARES | | | | | | | | | | | | | | | |
| | | |
Actual | | | $ | 1,000.00 | | | | $ | 994.10 | | | | $ | 3.08 | |
Hypothetical* | | | $ | 1,000.00 | | | | $ | 1,021.84 | | | | $ | 3.13 | |
| † | Expenses are equal to the annualized expense ratio for each class (A: 0.90%; C: 1.24%; I: 0.62%) multiplied by the average account value over the period, multiplied by 182/365 to reflect the one-half year period. |
| * | Hypothetical assumes a rate of return of 5% per year before expenses. |
ACTUAL EXPENSES
For each class of shares, the first line of the accompanying table provides information about actual account values and actual expenses. You may use the information in this line, together with the amount you invested, to estimate the expenses that you paid over the period. Simply divide your account value by $1,000 (for example, an $8,600 account value divided by $1,000 = 8.6), then multiply the result by the number in the first line for your class of shares under the heading entitled “Expenses Paid During Period” to estimate the expenses you paid on your account during this period.
HYPOTHETICAL EXAMPLE FOR COMPARISON PURPOSES
For each class of shares, the second line of the accompanying table provides information about hypothetical account values and hypothetical expenses based on the Fund’s actual expense ratio and an assumed rate of return of 5% per year before expenses, which is not the Fund’s actual return. The hypothetical account values and expenses may not be used to estimate the actual ending account balance or expenses you paid for the period. You may use this information to compare the ongoing costs of investing in the Fund and other funds. To do so, compare this 5% hypothetical example with the 5% hypothetical examples that appear in the shareholder reports of the other funds.
Please note that the expenses shown in the table are meant to highlight your ongoing costs only and do not reflect any transactional costs, such as sales charges (loads), redemption fees, or exchange fees. Therefore, the second line of the table for each class of shares is useful in comparing ongoing costs only, and will not help you determine the relative total costs of owning different funds. In addition, if these transactional costs were included, your costs would have been higher.
26 | Semi-Annual Report
Other Information
Thornburg Intermediate Municipal Fund | March 31, 2018 (Unaudited)
PORTFOLIO PROXY VOTING
Policies and Procedures:
The Trust has delegated to Thornburg Investment Management, Inc. (the “Advisor”) voting decisions respecting proxies for the Fund’s voting securities. The Advisor makes voting decisions in accordance with its Proxy Voting Policy and Procedures. A description of the Policy and Procedures is available (i) without charge, upon request, by calling the Advisor toll-free at 1-800-847-0200, (ii) on the Thornburg website at www.thornburg.com, and (iii) on the Securities and Exchange Commission’s website at www.sec.gov.
Information regarding how proxies were voted is available on or before August 31 of each year for the twelve months ending the preceding June 30. This information is available (i) without charge, upon request by calling the Advisor toll-free at 1-800-847-0200, (ii) on the Thornburg website at www.thornburg.com, and (iii) on the Securities and Exchange Commission’s website at www.sec.gov.
AVAILABILITY OF QUARTERLY PORTFOLIO SCHEDULE
The Fund files with the Securities and Exchange Commission schedules of its portfolio holdings on Form N-Q for the first and third quarters of each fiscal year. The Fund’s Forms N-Q are available on the Commission’s website at www.sec.gov, or may be reviewed and copied at the Commission’s Public Reference Room in Washington, D.C. Information on the operation of the Public Reference Room may be obtained by calling 1-800-SEC-0330. The Fund also makes this information available on its website at www.thornburg.com/download or upon request by calling 1-800-847-0200.
Semi-Annual Report | 27
Trustees’ Statement to Shareholders
Readopted September 11, 2017
The Trustees believe current and prospective shareholders should know how we discharge our responsibilities in supervising the Funds’ investment advisor and in reviewing the advisor’s contract for renewal. Since 2005, we have issued a statement which sets out clearly the three principal guidelines that we follow in supervising the Trust’s investment advisor on your behalf. In accordance with our customary practice, in September of this year we again reviewed our statement and concluded we should reissue this statement outlining the principal features of our supervision of the advisor’s performance of investment management services for the Funds.
We begin with the premise that each shareholder selected his or her Fund because its investments are managed by the investment advisor identified in the prospectus and in accordance with the objective and policies described in the prospectus. We realize, as each of you do, that if you believe that your Fund’s stated objective and policies no longer serve your personal investment goals, you can sell your shares and leave the Fund.
Therefore, we believe that our primary supervisory task—our principal obligation to you—is to assess the nature and quality of the advisor’s services, and to confirm that the advisor actively and competently pursues the Fund’s objective, in accordance with the policies set out in the prospectus. To do this, we meet regularly with management to review your Fund’s portfolio and to discuss the advisor’s specific actions and judgments in pursuing the Fund’s objective. We do not substitute our own judgment for the advisor’s decisions in selecting investments; the advisor is paid to exercise its informed judgment on investment decisions, and we seek to confirm, in reviewing the advisor’s performance, that the advisor is doing just that.
Second, we are conscious of costs and the effect that costs have on shareholders’ returns. We try to make sure that your Fund’s fees and costs are reasonable in relationship to the services rendered and that they are generally in line with those charged by other expert investment advisors, consistent with our belief that the Fund’s investors searched for and expect that expertise and attention and have decided to pay a reasonable price for it. We do not put the management contract “out to bid” as a matter of course, and we would not do so unless we had concluded that the advisor materially had failed to pursue the Fund’s objectives in accordance with its policies, or for other equally important reasons. We believe that any other approach would be inconsistent with your interests and contrary to your expectations when you bought shares of the Fund in the first place.
Finally, because we believe that most Thornburg Fund shareholders have invested with a long-term perspective, we try not to focus too much on the fashions of the moment and on short-term performance. The market will not favor any specific investment objective or set of policies at all times and under all economic circumstances. A fund will experience periods of both high and low returns relative to other funds and other investments. Even if one of our Funds is not favored by the market at a particular time, we believe that the advisor is nonetheless obliged to remain true to the Fund’s objective and policies, and we watch to see that it does so.
Trustees of Thornburg Investment Trust
28 | Semi-Annual Report
Thornburg Funds
Thornburg Investment Management is a privately-owned global investment firm that offers a range of solutions for retail and institutional investors. Founded in 1982 and headquartered in Santa Fe, New Mexico, we manage approximately $49 billion (as of March 31, 2018) across U.S. mutual funds, separate accounts for high-net-worth investors, institutional accounts, and UCITS funds for non-U.S. investors.
EQUITY FUNDS
| | ∎ | | Thornburg Investment Income Builder Fund |
| | ∎ | | Thornburg Global Opportunities Fund |
| | ∎ | | Thornburg International Value Fund |
| | ∎ | | Thornburg Better World International Fund |
| | ∎ | | Thornburg International Growth Fund |
| | ∎ | | Thornburg Developing World Fund |
| | ∎ | | Thornburg Core Growth Fund |
FIXED INCOME FUNDS
| | ∎ | | Thornburg Low Duration Income Fund |
| | ∎ | | Thornburg Limited Term U.S. Government Fund |
| | ∎ | | Thornburg Limited Term Income Fund |
| | ∎ | | Thornburg Strategic Income Fund |
| | ∎ | | Thornburg Low Duration Municipal Fund |
| | ∎ | | Thornburg Limited Term Municipal Fund |
| | ∎ | | Thornburg Intermediate Municipal Fund |
| | ∎ | | Thornburg California Limited Term Municipal Fund |
| | ∎ | | Thornburg New Mexico Intermediate Municipal Fund |
| | ∎ | | Thornburg New York Intermediate Municipal Fund |
| | ∎ | | Thornburg Strategic Municipal Income Fund |
ALTERNATIVE FUNDS
| | ∎ | | Thornburg Long/Short Equity Fund |
Before investing, carefully consider the Fund’s investment goals, risks, charges, and expenses. For a prospectus or summary prospectus containing this and other information, contact your financial advisor or visit thornburg.com. Read it carefully before investing.
For additional information, please visit thornburg.com
Thornburg Investment Management, Inc. 2300 North Ridgetop Road, Santa Fe, NM 87506
Semi-Annual Report | 29
This page intentionally left blank.
30 | Semi-Annual Report
This page intentionally left blank.
Semi-Annual Report | 31
| | | | |
To receive shareholder reports, prospectuses, and proxy statements electronically, go to www.thornburg.com/edelivery. | | |  | |
| This Semi-Annual Report is submitted for the general information of shareholders of the Fund. It is not authorized for distribution to prospective investors in the Fund unless preceded or accompanied by an effective prospectus. | |
| | | | |
Investment Advisor: | | Distributor: | | |
Thornburg Investment Management® | | Thornburg Securities Corporation® | | |
800.847.0200 | | 800.847.0200 | | TH172 |
Semi-Annual Report
March 31, 2018
THORNBURG
STRATEGIC
MUNICIPAL
INCOME
FUND
About Thornburg Investment Management
It’s more than what we do.
It’s how we do it.
At Thornburg, we are very different in how we think, invest, and are structured. We believe this difference is what makes us successful in helping individuals reach their long-term financial goals.
Flexible Perspective
Our perspective on investment opportunities is more flexible than most, viewing a wide range of opportunities beyond conventional boundaries to find hidden value.
Collaboration
Collectively, we hone ideas via borderless cross-pollination for better judgment and better results.
Portfolio Construction
Disciplined construction guided more by our convictions than convention.
CONVICTION
Thorough analysis and our relative-value framework lead to conviction in our securities selection.
UNCONVENTIONAL
Active management means we seek the best value for our clients rather than using conventional benchmarks as our starting point.
Structured for Excellence
How we think and how we invest is made possible by how we’re structured.
TEAM APPROACH
FAR FROM THE HERD
ACCESS & TRANSPARENCY
2 | Semi-Annual Report
Thornburg Strategic Municipal Income Fund
Semi-Annual Report ^ March 31, 2018
Table of Contents
| | | | | | | | | | |
| SHARE CLASS | | NASDAQ SYMBOL | | CUSIP |
| | |
| Class A | | TSSAX | | | | 885-216-101 | |
| Class C | | TSSCX | | | | 885-216-200 | |
| Class I | | TSSIX | | | | 885-216-309 | |
Minimum investments for Class I shares may be higher than those for Class A. Class I shares may not be available to all investors.
Investments carry risks, including possible loss of principal. Portfolios investing in bonds have the same interest rate, inflation, and credit risks that are associated with the
underlying bonds. The value of bonds will fluctuate relative to changes in interest rates, decreasing when interest rates rise. This effect is more pronounced for longer-term bonds. Unlike bonds, bond funds have ongoing fees and expenses. Investments in lower rated and unrated bonds may be more sensitive to default, downgrades, and market volatility; these investments may also be less liquid than higher rated bonds. Investments in derivatives are subject to the risks associated with the securities or other assets underlying the pool of securities, including illiquidity and difficulty in valuation. Please see the Fund’s prospectus for a discussion of the risks associated with an investment in the Fund. Investments in the Funds are not FDIC insured, nor are they bank deposits or guaranteed by a bank or any other entity.
Semi-Annual Report | 3
Letter to Shareholders
Thornburg Strategic Municipal Income Fund | March 31, 2018 (Unaudited)
April 25, 2018
Dear Fellow Shareholder:
We are pleased to present the semi-annual report for Thornburg Strategic Municipal Income Fund. The net asset value (NAV) of the Class I shares decreased by 24 cents to $14.92 per share during the six-month period ended March 31, 2018. During the period, the Class I shares of the Fund outperformed the index with a negative 0.25% total return, compared to the negative 0.40% total return for the ICE BofAML Municipal Master Index.
The Fund’s duration, as well as curve positioning, detracted 0.03% from relative performance. Sector selection was a positive contributor to performance, adding 0.17%. Lastly, security selection, which is performance not attributable to duration and sector selection, was the major driver of relative performance, contributing 0.44%.
The topic of tax reform consumed municipal market participants in the fourth quarter of 2017, with several proposals being bandied about that would significantly impact the supply/ demand dynamics of the market for years to come. Ultimately, the legislation was not as radical as initially feared. On the supply side of the equation, issuers lost the ability to advance refund debt. Much like a homeowner refinancing an existing mortgage to save on interest costs, an issuer would refinance debt when interest rates were low to provide some present value savings. While many thought this would have a large impact on supply, we did not agree. Advance refunding is highly correlated to the current level of interest rates, and many issuers had already accomplished any possible refunding over the previous several years.
Instead, we found the impact of tax reform on the demand side of the equation to be far more interesting. What was overlooked was the reduction of the corporate tax rate from 35% to 21%, and the idea that corporations evaluating municipal bonds versus other fixed income securities on a tax equivalent basis would now require a higher hurdle rate to buy municipal securities. We felt that the impact this may have on two specific buyers of municipals, banks, and property and casualty insurance companies, which own roughly 20 to 25% of outstanding municipal bonds, could lead both to re-evaluate their decision to own municipal bonds. While we do not believe this to be an Armageddon type of scenario; we expect it to be more like a weight leaning on the market for the next 12 to 18 months.
Another impact on the demand side is the limitations on the deductibility of state and local taxes (SALT), which has led many market observers to postulate that the demand for municipal bonds in high tax states will increase. Again, we did not share the same opinion. In California, the demand for California bonds has already driven prices to a level where we feel there is little value when compared to other municipal securities on a tax-equivalent
basis. Demand for municipal securities in other high tax states, such as Connecticut, Pennsylvania, and New Jersey, is not as cut and dry because there is significant credit risk associated with each. Nevertheless, these concerns caused the supply of municipal bonds to spike in November and December as issuers rushed to market to hedge against the potential threat of tax reform. Some investors viewed this period as an opportunity to buy extra municipal bonds in anticipation of a January rally, which never materialized. We did not view the market the same way, and kept our strategies positioned at the lower end of their relative risk spectrums (i.e. lower duration, higher credit quality, and higher reserve positions). The last fear facing the municipal bond market is the long-advertised infrastructure plan. While the plan has experienced several failed launches, and what is known suggests it will have little impact on the supply of municipal bonds, we are still monitoring the details of the proposal for potential impacts to our strategies.
The fourth quarter of 2017 saw yields of shorter maturity bonds increase more than the yields of longer maturity bonds, leading to a flattening of the yield curve. At the time, many analysts and pundits harped on the fact that the phenomenon portends a future recession. In the first quarter of 2018, the market watched as yields of longer maturity bonds increased more than yields of shorter maturity bonds, leading to a steepening of the yield curve. The steepening of the curve is an indication that market participants have a growing concern about increases in inflation – the enemy of the fixed income investor. The Fund’s conservative positioning was a headwind to performance in the fourth quarter of 2017, but acted as a tailwind to performance in the first quarter of 2018.
Thank you for your continued trust in us.
Sincerely,
| | |
| | |
Christopher Ryon, CFA | | Nicholos Venditti, CFA |
| Portfolio Manager | | Portfolio Manager |
| Managing Director | | Managing Director |
The matters discussed in this report may constitute forward-looking statements made pursuant to the safe harbor provisions of the Securities Litigation Reform Act of 1995. These include any advisor or portfolio manager prediction, assessment, analysis or outlook for individual securities, industries, investment styles, market sectors and/or markets. These statements involve risks and uncertainties. In addition to the general risks described for each fund in its current prospectus, other factors bearing on these reports include the accuracy of the advisor’s or portfolio manager’s forecasts and predictions, the appropriateness of the investment strategies designed by the advisor or portfolio manager and the ability of the advisor or portfolio manager to implement their strategies efficiently and successfully. Any one or more of these factors, as well as other risks affecting the securities markets generally, could cause the actual results of any fund to differ materially as compared to its benchmarks.
The views expressed are subject to change and do not necessarily reflect the views of Thornburg Investment Management, Inc. This information should not be relied upon as a recommendation or investment advice and is not intended to predict the performance of any investment or market.
Performance results of individual share classes will vary based on the fees and expenses associated with each share class, and may be higher or lower than other share classes within the same Fund. Please see Performance Summary for performance results of each share class.
4 | Semi-Annual Report
Performance Summary
Thornburg Strategic Municipal Income Fund | March 31, 2018 (Unaudited)
AVERAGE ANNUAL TOTAL RETURNS
| | | | | | | | | | | | | | | | | | | | |
| | | 1-YR | | 3-YR | | 5-YR | | SINCE
INCEP. |
| | | | |
Class A Shares (Incep: 4/1/09) | | | | | | | | | | | | | | | | | | | | |
Without sales charge | | | | 2.35% | | | | | 1.43% | | | | | 2.22% | | | | | 5.94% | |
| | | | |
With sales charge | | | | 0.34% | | | | | 0.75% | | | | | 1.80% | | | | | 5.71% | |
| | | | |
Class C Shares (Incep: 4/1/09) | | | | | | | | | | | | | | | | | | | | |
Without sales charge | | | | 1.84% | | | | | 1.03% | | | | | 1.85% | | | | | 5.61% | |
| | | | |
With sales charge | | | | 1.24% | | | | | 1.03% | | | | | 1.85% | | | | | 5.61% | |
| | | | |
Class I Shares (Incep: 4/1/09) | | | | 2.58% | | | | | 1.69% | | | | | 2.50% | | | | | 6.25% | |
30-DAY YIELDS, A SHARES (with sales charge)
| | | | |
| Annualized Distribution Yield | | | 2.32% | |
| SEC Yield | | | 1.65% | |
GROWTH OF A HYPOTHETICAL $10,000 INVESTMENT
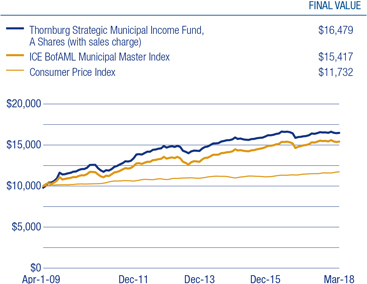
Performance data shown represents past performance and is no guarantee of future results. Investment return and principal value will fluctuate so shares, when redeemed, may be worth more or less than their original cost. Current performance may be lower or higher than quoted. For performance current to the most recent month end, visit thornburg.com or call 800-847-0200. The performance information does not reflect the deduction of taxes that a shareholder would pay on distributions or the redemption of Fund shares. Returns reflect the reinvestment of dividends and capital gains. Class A shares are sold with a maximum sales charge of 2.00%. Class C shares include a 0.60% CDSC for the first year only. There is no sales charge for Class I shares.
As disclosed in the most recent prospectus, the total annual fund operating expenses before fee waivers and expense reimbursements are as follows: A shares, 1.26%; C shares, 1.62%; I shares, 0.97%. Thornburg Investment Management and/or Thornburg Securities Corporation have contractually agreed to waive fees and reimburse expenses through at least February 1, 2019, for some of the share classes, resulting in net expense ratios of the following: A shares, 1.00%; C shares, 1.51%; I shares, 0.78%. For more detailed information on fund expenses and waivers/reimbursements please see the Fund’s prospectus. Without the fee waivers and expense reimbursements, the Annualized Distribution yield would have been 2.20%, and the SEC yield would have been 1.54%.
The ICE index data referenced herein is the property of ICE Data Indices, LLC, its affiliates (“ICE Data”) and/or its Third Party Suppliers and has been licensed for use by Thornburg Investment Management, Inc. ICE Data and its Third Party Suppliers accept no liability in connection with its use. See www.thornburg.com/indices for a full copy of the Disclaimer.
Glossary
The ICE BofAML Municipal Master Index tracks the performance of the investment-grade U.S. tax-exempt bond market. Qualifying bonds must have at least one year remaining term to maturity, a fixed coupon schedule, and an investment grade rating (based on average of Moody’s, S&P, and Fitch).
The performance of any index is not indicative of the performance of any particular investment. Unless otherwise noted, index returns reflect the reinvestment of income dividends and capital gains, if any, but do not reflect fees, brokerage commissions or other expenses of investing. Investors may not make direct investments into any index.
Annualized Distribution Yield - The distribution yield reflects actual distributions made to shareholders. The annualized distribution yield is calculated by summing the last 30 days of income at a given month end and annualizing to a 360-day year. The result is divided by the ending maximum offering price or net asset value.
SEC Yield - A yield computed in accordance with SEC standards measuring the net investment income per share over a specified 30-day period expressed as a percentage of the maximum offering price of the Fund’s shares at the end of the period.
Advance refunding - Advance refunding can also refer to bond issuance in which new bonds are sold at a lower rate than outstanding ones. The proceeds are then invested, and when the older bonds become callable, they are paid off with the invested proceeds.
Bond Credit Ratings (Credit Quality) - A bond credit rating assesses the financial ability of a debt issuer to make timely payments of principal and interest. Rating of AAA (the highest), AA, A, and BBB are investment-grade quality. Rating of BB, B, CCC, CC, C and D (the lowest) are considered below investment grade, speculative grade, or junk bonds.
Credit Spread/Quality Spread - The difference between the yields of securities with different credit qualities.
Duration - A bond’s sensitivity to interest rates. Bonds with longer durations experience greater price volatility than bonds with shorter durations. Effective duration incorporates a bond’s embedded option features, such as call provisions.
Laddering - Laddering involves building a portfolio of bonds with staggered maturities so that a portion matures each year. Money that comes in from maturing bonds is typically invested in bonds with longer maturities at the far end of the portfolio.
Yield Curve - A line that plots the interest rate, at a set point in time, of bonds having equal credit quality, but offering maturity dates.
Semi-Annual Report | 5
Fund Summary
Thornburg Strategic Municipal Income Fund | March 31, 2018 (Unaudited)
OBJECTIVES AND STRATEGIES
The Fund seeks a high level of current income exempt from federal individual income tax (may be subject to Alternative Minimum Tax).
The Fund invests principally in a portfolio of municipal bonds issued by states and state agencies, local governments and their agencies, and by U.S. territories and possessions.
Not more than 50% of the portfolio is invested in bonds rated below investment grade (or of equivalent quality as determined in accordance with the prospectus) at the time of purchase. Also, the portfolio is typically diversified among sectors, issuers, credit qualities, geographic regions, and segments of the yield curve. The flexible nature of the Fund allows the team to adapt the portfolio’s duration and credit quality to our perception of future market conditions.
KEY PORTFOLIO ATTRIBUTES
| | | | | |
| Number of Bonds | | | | 219 | |
| Effective Duration | | | | 4.7 Yrs | |
| Average Maturity | | | | 9.2 Yrs | |
SECURITY CREDIT RATINGS
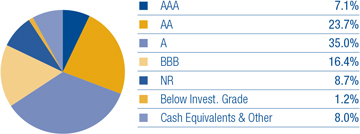
A bond credit rating assesses the financial ability of a debt issuer to make timely payments of principal and interest. Ratings of AAA (the highest), AA, A, and BBB are investment-grade quality. Ratings of BB, B, CCC, CC, C and D (the lowest) are considered below investment grade, speculative grade, or junk bonds.
Unrated pre-refunded and escrowed-to-maturity bonds are included in the not rated category.
There is no guarantee that the Fund will meet its investment objectives.
All data is subject to change. Charts may not add up to 100% due to rounding.
6 | Semi-Annual Report
Schedule of Investments
Thornburg Strategic Municipal Income Fund | March 31, 2018 (Unaudited)
| | | | | | | | | | | | |
| | | | | PRINCIPAL AMOUNT | | VALUE |
| | | |
| | MUNICIPAL BONDS — 99.6% | | | | | | | | | | |
| | | |
| | ARIZONA — 3.1% | | | | | | | | | | |
| a | | Arizona (LOC: Bank of America N.A.) HFA, Series C-RMK, 1.70% due 1/1/2046 (put 4/2/2018) | | | $ | 4,800,000 | | | | $ | 4,800,000 | |
| | Arizona (Scottsdale Lincoln Hospitals) HFA, 5.00% due 12/1/2031 | | | | 2,500,000 | | | | | 2,804,575 | |
| | Pima County (Providence Day School) IDA, 5.125% due 12/1/2040 | | | | 710,000 | | | | | 734,467 | |
| | | |
| | ARKANSAS — 0.4% | | | | | | | | | | |
| | University of Arkansas Board of Trustees (Fayetteville Campus), 5.00% due 11/1/2036 | | | | 1,000,000 | | | | | 1,133,240 | |
| | | |
| | CALIFORNIA — 14.8% | | | | | | | | | | |
| | ABAG Finance Authority for Nonprofit Corporations (Episcopal Senior Communities), 5.00% due 7/1/2047 | | | | 1,635,000 | | | | | 1,738,822 | |
| | Benicia (Benicia High School; Insured: AGM) USD GO, 0.00%, due 8/1/2026 | | | | 830,000 | | | | | 654,123 | |
| | California (Children’s Hospital Los Angeles) HFFA, | | | | | | | | | | |
| | 5.00% due 11/15/2034 | | | | 420,000 | | | | | 451,445 | |
| | Series A, 5.00% due 8/15/2036 | | | | 500,000 | | | | | 566,265 | |
| | California (Community Program Developmental Disabilities; Insured: California Mtg Insurance) HFFA, 6.25% due 2/1/2026 | | | | 1,500,000 | | | | | 1,676,565 | |
| b | | California Infrastructure and Economic Development Bank (Los Angeles County Museum of Art), 1.971% (LIBOR 1 Month + 0.65%) due 12/1/2050 (put 2/1/2021) | | | | 1,000,000 | | | | | 1,002,980 | |
| | California Infrastructure and Economic Development Bank (Pacific Gas and Electric Company), Series E, 1.75% due 11/1/2026 (put 6/1/2022) | | | | 1,000,000 | | | | | 960,920 | |
| | California Municipal Finance Authority (Harbor Regional Center), 8.50% due 11/1/2039 (pre-refunded 11/1/2019) | | | | 1,000,000 | | | | | 1,103,910 | |
| | California Municipal Finance Authority, 1.40% due 9/1/2021 (put 7/2/2018) | | | | 2,000,000 | | | | | 2,000,000 | |
| c | | California Pollution Control Financing Authority (Poseidon Resources (Channelside) L.P. Desalination Project), 5.00% due 11/21/2045 | | | | 1,000,000 | | | | | 1,064,730 | |
| | California School Cash Reserve Program Authority, 3.00% due 6/29/2018 | | | | 2,000,000 | | | | | 2,007,320 | |
| | California State Public Works Board (Department of General Services-Office Buildings 8 and 9 Renovation), 6.25% due 4/1/2034 (pre-refunded 4/1/2019) | | | | 100,000 | | | | | 104,691 | |
| | California Statewide Communities Development Authority (Aspire Public Schools), 6.125% due 7/1/2046 (pre-refunded 1/1/2019) | | | | 995,000 | | | | | 1,028,532 | |
| | California Statewide Communities Development Authority (Aspire Public Schools; LOC: PCSD; Guaranty Pool I, LLC), 5.00% due 7/1/2020 (pre-refunded 1/1/2019) | | | | 95,000 | | | | | 96,808 | |
| | California Statewide Communities Development Authority (Irvine East Campus Apartments), 5.00% due 5/15/2035 | | | | 2,975,000 | | | | | 3,330,185 | |
| | Calipatria (Educational Facilities; Insured: ACA) USD GO, 0.00%, due 8/1/2025 | | | | 2,115,000 | | | | | 1,544,204 | |
| | Carson Redevelopment Agency (Project Area 1), Series A, 7.00% due 10/1/2036 (pre-refunded 10/1/2019) | | | | 500,000 | | | | | 539,325 | |
| | City of Los Angeles (Cash Flow Management) GO, 5.00% due 6/28/2018 | | | | 2,000,000 | | | | | 2,016,760 | |
| | City of Moorpark Mobile Home Park (Villa Del Arroyo), Series A, 6.15% due 5/15/2031 | | | | 1,000,000 | | | | | 1,091,150 | |
| | City of Palm Springs Financing Authority (Downtown Revitalization Project), 5.25% due 6/1/2027 | | | | 1,620,000 | | | | | 1,809,929 | |
| | Corona-Norco (Insured: AGM) USD COP, 5.00% due 4/15/2031 | | | | 1,750,000 | | | | | 1,846,897 | |
| | County of El Dorado (El Dorado Hills Development-Community Facilities), 5.00% due 9/1/2026 | | | | 630,000 | | | | | 694,827 | |
| | County of Los Angeles (Fiscal Year 2017-2018 Expenditures) GO, 5.00% due 6/29/2018 | | | | 1,000,000 | | | | | 1,008,480 | |
| | County of Riverside (Fiscal Year 2017-2018 Expenditures), 2.00% due 6/29/2018 | | | | 3,000,000 | | | | | 3,003,840 | |
| | Daly County Housing Development Finance Agency (Franciscan Country Club Mobile Home Park Acquisition), 5.25% due 12/15/2023 | | | | 650,000 | | | | | 651,554 | |
| | M-S-R Energy Authority, 6.50% due 11/1/2039 | | | | 1,000,000 | | | | | 1,404,340 | |
| | Oakland (County of Alameda Educational Facilities) USD GO, 5.00% due 8/1/2035 | | | | 1,000,000 | | | | | 1,137,700 | |
| | Redwood City Redevelopment Agency (Redevelopment Project Area 2; Insured: AMBAC), 0.00%, due 7/15/2021 | | | | 1,285,000 | | | | | 1,190,501 | |
| | Riverside County Asset Leasing Corp. (Riverside County Hospital; Insured: Natl-Re), 0.00%, due 6/1/2021 | | | | 535,000 | | | | | 497,379 | |
| | San Francisco City & County Redevelopment Financing Authority (Mission Bay North Redevelopment), | | | | | | | | | | |
| | Series C, | | | | | | | | | | |
| | 6.50% due 8/1/2039 (pre-refunded 8/1/2019) | | | | 250,000 | | | | | 265,920 | |
| | 6.75% due 8/1/2041 (pre-refunded 2/1/2021) | | | | 500,000 | | | | | 568,665 | |
| | San Francisco City & County Redevelopment Financing Authority (Redevelopment Project; Insured: Natl-Re), 0.00%, due 8/1/2023 | | | | 1,025,000 | | | | | 889,454 | |
| | San Jose Redevelopment Agency (Merged Area Redevelopment), 5.50% due 8/1/2035 (pre-refunded 8/1/2020) | | | | 1,000,000 | | | | | 1,088,500 | |
| | Union Elementary School District (Santa Clara County District Schools; Insured: Natl-Re), 0.00%, Series D, due 9/1/2027 | | | | 905,000 | | | | | 699,873 | |
| | | |
| | COLORADO — 1.3% | | | | | | | | | | |
| | Denver Convention Center Hotel Authority, 5.00% due 12/1/2028 | | | | 1,000,000 | | | | | 1,148,220 | |
| | Eagle River Fire District, | | | | | | | | | | |
| | 6.625% due 12/1/2024 (pre-refunded 12/1/2019) | | | | 225,000 | | | | | 242,410 | |
| | 6.875% due 12/1/2030 (pre-refunded 12/1/2019) | | | | 400,000 | | | | | 432,580 | |
| | Public Authority for Colorado Energy (Natural Gas Purchase), | | | | | | | | | | |
| | 5.75% due 11/15/2018 | | | | 150,000 | | | | | 153,521 | |
| | 6.50% due 11/15/2038 | | | | 260,000 | | | | | 361,088 | |
| | Regional Transportation District (FasTracks Transportation System) COP, | | | | | | | | | | |
| | 5.375% due 6/1/2031 | | | | 500,000 | | | | | 533,965 | |
| | Series A, 5.00% due 6/1/2044 | | | | 565,000 | | | | | 616,375 | |
Semi-Annual Report | 7
Schedule of Investments, Continued
Thornburg Strategic Municipal Income Fund | March 31, 2018 (Unaudited)
| | | | | | | | | | | | |
| | | | | PRINCIPAL AMOUNT | | VALUE |
| | | |
| | CONNECTICUT — 2.3% | | | | | | | | | | |
| | Connecticut Health & Educational Facilities Authority (Ethel Walker School), Series B, 6.00% due 7/1/2039 (pre-refunded 7/1/2019) | | | $ | 1,000,000 | | | | $ | 1,053,080 | |
| b | | State of Connecticut GO (Various Capital Projects), Series D, 2.33% (MUNIPSA + 0.75%) due 6/15/2018 | | | | 3,000,000 | | | | | 3,000,960 | |
| d | | State of Connecticut GO, 5.00% due 4/15/2035 | | | | 2,000,000 | | | | | 2,210,580 | |
| | | |
| | DELAWARE — 0.4% | | | | | | | | | | |
| | Delaware (Nanticoke Memorial Hospital) HFA, 5.00% due 7/1/2021 | | | | 1,000,000 | | | | | 1,067,420 | |
| | | |
| | DISTRICT OF COLUMBIA — 0.4% | | | | | | | | | | |
| | Metropolitan Washington Airports Authority (Dulles Toll Road; Insured: AGM), 0.00%, due 10/1/2027 | | | | 1,500,000 | | | | | 1,076,985 | |
| | | |
| | FLORIDA — 4.0% | | | | | | | | | | |
| | Broward County (Airport System Improvements), 5.00% due 10/1/2037 | | | | 1,000,000 | | | | | 1,125,450 | |
| | Florida Higher Educational Facilities Financing Authority (Nova Southeastern University), 5.00% due 4/1/2027 - 4/1/2028 | | | | 2,250,000 | | | | | 2,509,185 | |
| | Miami-Dade County Expressway Authority (Toll System Five-Year Work Program), 5.00% due 7/1/2022 - 7/1/2024 | | | | 1,250,000 | | | | | 1,414,631 | |
| | Miami-Dade County School Board (District School Facilities and Infrastructure) COP, 5.00% due 8/1/2027 | | | | 1,100,000 | | | | | 1,204,995 | |
| | Orange County (Tourist Development), Series A, 5.00% due 10/1/2031 | | | | 1,000,000 | | | | | 1,153,850 | |
| | Sarasota County Public Hospital Board (Sarasota Memorial Hospital; Insured: Natl-Re), 4.871% due 10/1/2021 | | | | 1,000,000 | | | | | 1,044,980 | |
| | Tampa Sports Authority (Tampa Bay Arena; Insured: Natl-Re), 5.75% due 10/1/2020 | | | | 530,000 | | | | | 555,578 | |
| | Volusia County Educational Facilities Authority (Embry-Riddle Aeronautical University, Inc.), 5.00% due 10/15/2030 | | | | 1,500,000 | | | | | 1,680,855 | |
| | | |
| | GEORGIA — 0.7% | | | | | | | | | | |
| | City of Atlanta (Water and Wastewater Capital Improvement Program), 6.25% due 11/1/2034 (pre-refunded 11/1/2019) | | | | 500,000 | | | | | 535,180 | |
| | Development Authority of Fulton County (Georgia Tech Athletic Assoc.), 5.00% due 10/1/2019 | | | | 1,000,000 | | | | | 1,046,520 | |
| | Main Street Natural Gas, Inc. (Georgia Gas), 5.50% due 9/15/2023 | | | | 350,000 | | | | | 399,924 | |
| | | |
| | GUAM—3.6% | | | | | | | | | | |
| | Government of Guam (Economic Development) GO, 7.00% due 11/15/2039 (pre-refunded 11/15/2019) | | | | 520,000 | | | | | 562,619 | |
| | Government of Guam (Economic Development), Series D-REF, 5.00% due 11/15/2031 | | | | 2,000,000 | | | | | 2,107,280 | |
| | Government of Guam (Layon Solid Waste Disposal Facility), Series A, 5.75% due 12/1/2034 (pre-refunded 12/1/2019) | | | | 500,000 | | | | | 533,525 | |
| | Government of Guam (Various Capital Projects), Series D-REF, 5.00% due 11/15/2032 | | | | 3,000,000 | | | | | 3,153,150 | |
| | Guam Power Authority (Electric Power System), Series A, 5.00% due 10/1/2033 | | | | 1,000,000 | | | | | 1,081,810 | |
| | Guam Power Authority (Electric Power System; Insured: AGM), Series A, 5.00% due 10/1/2027 | | | | 1,000,000 | | | | | 1,087,600 | |
| | Guam Waterworks Authority (Water and Wastewater System), 5.00% due 7/1/2028 | | | | 500,000 | | | | | 539,350 | |
| | 5.25% due 7/1/2024 | | | | 500,000 | | | | | 552,690 | |
| | | |
| | HAWAII — 0.4% | | | | | | | | | | |
| b | | City and County of Honolulu GO Floating Rate Note (Rail Transit Project), 1.90% (MUNISPA + 0.32%) due 9/1/2028 (put 9/1/2020) | | | | 1,000,000 | | | | | 1,000,390 | |
| | | |
| | IDAHO — 0.6% | | | | | | | | | | |
| | State of Idaho (Cash Flow Management) GO, 4.00% due 6/29/2018 | | | | 1,500,000 | | | | | 1,508,715 | |
| | | |
| | ILLINOIS — 8.8% | | | | | | | | | | |
| | Chicago Park District (Various Capital Projects) GO, 5.00% due 1/1/2035 | | | | 2,000,000 | | | | | 2,156,940 | |
| | Chicago Park District, 5.00% due 1/1/2027 | | | | 825,000 | | | | | 939,461 | |
| | City of Chicago (Chicago O’Hare International Airport), Series C, 5.00% due 1/1/2031 | | | | 500,000 | | | | | 566,780 | |
| | City of Chicago (Riverwalk Expansion Project; Insured: AGM), 5.00% due 1/1/2031 | | | | 500,000 | | | | | 540,400 | |
| | City of Chicago (Wastewater Transmission System), Series C-REMK-10/, 5.00% due 1/1/2030 | | | | 1,500,000 | | | | | 1,644,435 | |
| | City of Chicago (Water System Improvements), 5.00% due 11/1/2029 | | | | 200,000 | | | | | 217,164 | |
| | City of Chicago (Water System Improvements; Insured: AMBAC), 0.00%, due 11/1/2018 | | | | 305,000 | | | | | 301,529 | |
| | City of Chicago, 5.00% due 1/1/2022 | | | | 1,195,000 | | | | | 1,258,192 | |
| | Cook County GO, Series A, 5.25% due 11/15/2033 | | | | 1,000,000 | | | | | 1,060,070 | |
| | Illinois Finance Authority (Advocate Health Care Network), 5.00% due 8/1/2029 | | | | 2,195,000 | | | | | 2,486,781 | |
| | Illinois Finance Authority (OSF Healthcare System), 6.00% due 5/15/2039 (pre-refunded 5/15/2020) | | | | 990,000 | | | | | 1,074,011 | |
| | Illinois Finance Authority (Silver Cross Hospital & Medical Centers), 5.00% due 8/15/2035 | | | | 2,355,000 | | | | | 2,533,438 | |
| | Illinois Finance Authority (Southern Illinois Healthcare), 5.00% due 3/1/2027 - 3/1/2034 | | | | 1,200,000 | | | | | 1,366,556 | |
| | Illinois State University (Insured AGM), Series A, 5.00% due 4/1/2021 - 4/1/2036 | | | | 1,915,000 | | | | | 2,101,319 | |
| | Illinois Toll Highway Authority (Move Illinois Program), 5.00% due 1/1/2037 | | | | 1,000,000 | | | | | 1,120,320 | |
| | Kane, Cook, & DuPage Counties School District No. 46 GO, | | | | | | | | | | |
| | Series A, 5.00% due 1/1/2031 | | | | 2,255,000 | | | | | 2,520,278 | |
| | Series D, 5.00% due 1/1/2028 | | | | 1,000,000 | | | | | 1,126,690 | |
| | Metropolitan Water Reclamation District of Greater Chicago (Various Capital Improvement Projects) GO, Series C, 5.25% due 12/1/2032 | | | | 40,000 | | | | | 48,075 | |
| | Will County School District No. 114 (Educational Facilities; Insured: Natl-Re) GO, 0.00%, Series C, due 12/1/2023 | | | | 570,000 | | | | | 470,700 | |
| | | |
| | INDIANA — 1.9% | | | | | | | | | | |
| | City of Carmel Redevelopment District (Performing Arts Center) COP, 6.50% due 7/15/2035 (pre-refunded 1/15/2021) | | | | 1,000,000 | | | | | 1,121,780 | |
| | City of Whiting Environmental Facilities (BP Products North America Inc. Project), 5.00% due 3/1/2046 (put 3/1/2023) | | | | 2,500,000 | | | | | 2,816,675 | |
| | Indiana Finance Authority (Marian University), 6.375% due 9/15/2041 | | | | 1,000,000 | | | | | 1,081,830 | |
8 | Semi-Annual Report
Schedule of Investments, Continued
Thornburg Strategic Municipal Income Fund | March 31, 2018 (Unaudited)
| | | | | | | | | | | | |
| | | | | PRINCIPAL AMOUNT | | VALUE |
| | | |
| | KANSAS — 1.1% | | | | | | | | | | |
| | City of Wichita (Brentwood Apartments), 5.85% due 12/1/2025 | | | $ | 825,000 | | | | $ | 805,068 | |
| | Unified Government of Wyandotte County/Kansas City (Utility System Improvement), Series A, 5.00% due 9/1/2031 - 9/1/2032 | | | | 2,000,000 | | | | | 2,244,680 | |
| | | |
| | KENTUCKY — 2.3% | | | | | | | | | | |
| e | | Commonwealth of Kentucky State Property and Buildings Commission (Project No. 89; Insured: AGM), 5.00% due 11/1/2020 (pre-refunded 11/1/2018) | | | | 2,500,000 | | | | | 2,549,825 | |
| | County of Owen (Kentucky-American Water Co. Project), Series A-KY, 6.25% due 6/1/2039 | | | | 540,000 | | | | | 566,703 | |
| | Kentucky Economic (Norton Healthcare, Inc.; Insured: Natl-Re) DFA, 0.00%, Series B, due 10/1/2021 - 10/1/2022 | | | | 3,365,000 | | | | | 2,974,484 | |
| | | |
| | LOUISIANA — 1.9% | | | | | | | | | | |
| | City of New Orleans (Water System Facilities Improvement), 5.00% due 12/1/2034 | | | | 400,000 | | | | | 444,896 | |
| | Louisiana Energy and Power Authority (LEPA Unit No. 1; Insured: AGM), Series A, 5.25% due 6/1/2038 | | | | 2,000,000 | | | | | 2,218,640 | |
| | Parish of St. Charles (Valero Energy Corp. Refinery), 4.00% due 12/1/2040 (put 6/1/2022) | | | | 2,250,000 | | | | | 2,391,705 | |
| | | |
| | MASSACHUSETTS — 0.3% | | | | | | | | | | |
| | Massachusetts Development Finance Agency (Jordan Hospital and Milton Hospital), Series H-1, 5.00% due 7/1/2032 - 7/1/2033 | | | | 555,000 | | | | | 618,209 | |
| | Massachusetts Educational Financing Authority (MEFA Loan Program), 6.00% due 1/1/2028 | | | | 195,000 | | | | | 203,406 | |
| | | |
| | MICHIGAN — 5.5% | | | | | | | | | | |
| | Board of Governors of Wayne State University (Educational Facilities and Equipment), Series A, 5.00% due 11/15/2033 | | | | 1,250,000 | | | | | 1,419,050 | |
| | City of Troy (Downtown Development Authority-Community Center Facilities) GO, 5.25% due 11/1/2032 | | | | 1,025,000 | | | | | 1,140,958 | |
| | County of Genesee (Water Supply System; Insured: BAM) GO, 5.375% due 11/1/2038 | | | | 1,000,000 | | | | | 1,118,060 | |
| | Detroit City School District (School Building & Site; Insured: AGM) GO, Series A, 5.25% due 5/1/2027 | | | | 1,000,000 | | | | | 1,159,520 | |
| | Detroit City School District (School Building & Site; Insured: Q-SBLF), Series A, 5.00% due 5/1/2025 | | | | 1,000,000 | | | | | 1,103,680 | |
| | Kalamazoo Hospital Finance Authority (Bronson Methodist Hospital), | | | | | | | | | | |
| | 5.00% due 5/15/2036 | | | | 450,000 | | | | | 469,251 | |
| | 5.00% due 5/15/2036 (pre-refunded 5/15/2020) | | | | 550,000 | | | | | 585,910 | |
| e | | 5.25% due 5/15/2041 | | | | 140,000 | | | | | 150,511 | |
| | 5.25% due 5/15/2041 (pre-refunded 5/15/2021) | | | | 860,000 | | | | | 945,123 | |
| | Livonia Public School District (School Building & Site) GO, Series I, 5.00% due 5/1/2036 | | | | 225,000 | | | | | 249,849 | |
| | Michigan Finance Authority (State Dept. of Human Services Office Buildings), Series F, 5.00% due 4/1/2031 | | | | 1,000,000 | | | | | 1,083,850 | |
| | Michigan Public School Academy (Will Carleton Charter School), 8.00% due 8/1/2035 | | | | 975,000 | | | | | 999,745 | |
| | Michigan State Hospital Finance Authority (Henry Ford Health System), 5.75% due 11/15/2039 (pre-refunded 11/15/2019) | | | | 1,000,000 | | | | | 1,063,300 | |
| | Michigan Strategic Fund (Detroit Edison Company; Insured: Natl-Re/AMBAC), 7.00% due 5/1/2021 | | | | 250,000 | | | | | 285,595 | |
| | Wayne County Airport Authority (Detroit Metropolitan Wayne County Airport), Series B, 5.00% due 12/1/2031 - 12/1/2034 | | | | 2,615,000 | | | | | 2,924,561 | |
| | | |
| | MISSOURI — 0.9% | | | | | | | | | | |
| | Tax Increment Financing Commission of Kansas City (Union Hill Redevelopment Project), 6.00% due 5/1/2030 | | | | 2,505,000 | | | | | 2,537,315 | |
| | | |
| | NEBRASKA — 0.7% | | | | | | | | | | |
| | Douglas County Health Facilities (Nebraska Methodist Health System), 5.00% due 11/1/2029 - 11/1/2030 | | | | 1,750,000 | | | | | 1,970,797 | |
| | | |
| | NEVADA — 0.4% | | | | | | | | | | |
| | Carson City (Carson Tahoe Regional Healthcare), 5.00% due 9/1/2037 | | | | 1,000,000 | | | | | 1,102,490 | |
| | | |
| | NEW JERSEY — 4.3% | | | | | | | | | | |
| | Higher Education Student Assistance Authority (NJCLASS Student Loan Program), Series 1B, 5.75% due 12/1/2039 | | | | 750,000 | | | | | 816,232 | |
| | New Jersey (School Facilities Construction) EDA, 5.00% due 3/1/2026 | | | | 1,000,000 | | | | | 1,066,180 | |
| | New Jersey (School Facilities Construction; Insured: Natl-Re) EDA, Series N-1, 5.50% due 9/1/2027 | | | | 1,000,000 | | | | | 1,184,710 | |
| | New Jersey Economic Development Authority (School Facilities Construction), Series BBB, 5.50% due 6/15/2030 | | | | 1,000,000 | | | | | 1,140,780 | |
| | New Jersey Transit Corp. (Federal Transit Administration Section 5307 Urbanized Area Formula Funds), Series A, 5.00% due 9/15/2020 | | | | 1,000,000 | | | | | 1,057,820 | |
| | New Jersey Transportation Trust Fund Authority (State Transportation System Improvements), | | | | 1,000,000 | | | | | 1,003,940 | |
| b | | 2.78% (MUNIPSA + 1.20%) due 6/15/2034 (put 12/15/2021) | | | | | | | | | | |
| | 5.00% due 6/15/2027 | | | | 3,000,000 | | | | | 3,331,770 | |
| | New Jersey Transportation Trust Fund Authority, 5.00% due 6/15/2022 | | | | 2,000,000 | | | | | 2,012,440 | |
| | | |
| | NEW MEXICO — 1.4% | | | | | | | | | | |
| | City of Farmington (Arizona Public Service Co.-Four Corners Project), 4.70% due 9/1/2024 | | | | 1,000,000 | | | | | 1,065,320 | |
| | New Mexico Hospital Equipment Loan Council (Haverland Carter Lifestyle Group), 5.00% due 7/1/2032 | | | | 2,500,000 | | | | | 2,641,525 | |
| | | |
| | NEW YORK — 11.5% | | | | | | | | | | |
| | City of New York (City Budget Financial Management) GO, | | | | | | | | | | |
| | 5.00% due 8/1/2023 | | | | 3,000,000 | | | | | 3,415,170 | |
| | Series J, 5.00% due 8/1/2031 | | | | 2,000,000 | | | | | 2,273,320 | |
| a | | City of New York GO, 1.73% due 1/1/2036 - 10/1/2046 (put 4/2/2018) | | | | 5,600,000 | | | | | 5,600,000 | |
| | Metropolitan Transportation Authority (Transit and Commuter System), Series C-1A, 4.00% due 2/15/2019 | | | | 1,000,000 | | | | | 1,020,360 | |
| | Metropolitan Transportation Authority, Series C-1, 5.00% due 11/15/2031 | | | | 2,000,000 | | | | | 2,344,840 | |
| | New York City Transitional Finance Authority Future Tax Secured Revenue, | | | | | | | | | | |
| a | | 1.73% due 11/1/2042 (put 4/2/2018) | | | | 3,850,000 | | | | | 3,850,000 | |
| a | | 1.75% due 8/1/2031 (put 4/2/2018) | | | | 3,650,000 | | | | | 3,650,000 | |
| a | | Series 1-SUB 1D, 1.75% due 11/1/2022 (put 4/2/2018) | | | | 1,600,000 | | | | | 1,600,000 | |
Semi-Annual Report | 9
Schedule of Investments, Continued
Thornburg Strategic Municipal Income Fund | March 31, 2018 (Unaudited)
| | | | | | | | | | | | |
| | | | | PRINCIPAL AMOUNT | | VALUE |
| a | | New York City Water & Sewer System, 1.73% due 6/15/2050 (put 4/2/2018) | | | $ | 4,000,000 | | | | $ | 4,000,000 | |
| | Tobacco Settlement Asset Securitization Corp., Series A, 5.00% due 6/1/2022 | | | | 1,000,000 | | | | | 1,103,600 | |
| | Town of Oyster Bay (Plainview, Locust Valley, South Farmingdale, Jericho, Bethpage, Oyster Bay Water Districts) GO, Series C, 2.50% due 6/1/2018 | | | | 1,985,000 | | | | | 1,986,330 | |
| | | |
| | NORTH CAROLINA — 1.4% | | | | | | | | | | |
| a | | Charlotte-Mecklenburg Hospital Authority, 1.73% due 1/15/2037 (put 4/2/2018) | | | | 1,900,000 | | | | | 1,900,000 | |
| | North Carolina Medical Care Commission (Vidant Health), 5.00% due 6/1/2029 | | | | 1,500,000 | | | | | 1,712,730 | |
| | | |
| | OHIO — 1.2% | | | | | | | | | | |
| | Akron, Bath and Copley Joint Hospital District (Summa Health), 5.25% due 11/15/2030 | | | | 1,420,000 | | | | | 1,605,679 | |
| | City of Akron (Community Learning Centers), 5.00% due 12/1/2031 | | | | 625,000 | | | | | 687,144 | |
| | Cleveland-Cuyahoga County Port Authority (Flats East Development Project; LOC: Fifth Third Bank), 7.00% due 5/15/2040 | | | | 925,000 | | | | | 1,021,588 | |
| | | |
| | OREGON — 1.0% | | | | | | | | | | |
| | State of Oregon (Cash Management) GO, Series A, 5.00% due 9/28/2018 | | | | 2,500,000 | | | | | 2,541,725 | |
| | | |
| | PENNSYLVANIA — 7.0% | | | | | | | | | | |
| | Allegheny County (Propel Charter School) IDA, Series A, 6.75% due 8/15/2035 | | | | 895,000 | | | | | 946,051 | |
| | City of Philadelphia (Philadelphia Gas Works), 5.00% due 8/1/2036 | | | | 1,000,000 | | | | | 1,136,350 | |
| | Coatesville Area School District (Insured: AGM) (State Aid Withholding) GO, 5.00% due 8/1/2024 - 8/1/2025 | | | | 1,475,000 | | | | | 1,690,289 | |
| | Commonwealth Financing Authority, 5.00% due 6/1/2029 | | | | 1,000,000 | | | | | 1,137,370 | |
| | County of Luzerne (Insured: AGM) GO, Series A, 5.00% due 11/15/2029 | | | | 1,000,000 | | | | | 1,124,380 | |
| | Lancaster County Hospital Authority (Masonic Villages Project), 5.00% due 11/1/2019 | | | | 2,675,000 | | | | | 2,797,275 | |
| | Pennsylvania Economic (Colver Project; Insured: AMBAC) DFA, Series F, 4.625% due 12/1/2018 | | | | 325,000 | | | | | 327,395 | |
| | Pennsylvania Higher Educational Facilities Authority (University of Pennsylvania Health System), 5.00% due 8/15/2037 | | | | 2,000,000 | | | | | 2,278,880 | |
| | Pennsylvania Turnpike Commission (Highway Improvements), | | | | | | | | | | |
| | 5.35% due 12/1/2030 (pre-refunded 12/1/2020) | | | | 770,000 | | | | | 838,807 | |
| | Series C-2, 5.35% due 12/1/2030 (pre-refunded 12/1/2020) | | | | 1,230,000 | | | | | 1,341,373 | |
| | Pennsylvania Turnpike Commission, 5.00% due 12/1/2037 | | | | 750,000 | | | | | 850,065 | |
| | Philadelphia (Mast Charter School) IDA, 6.00% due 8/1/2035 (pre-refunded 8/1/2020) | | | | 1,000,000 | | | | | 1,095,060 | |
| | Philadelphia Authority for Industrial Development (Thomas Jefferson University), 5.00% due 9/1/2035 | | | | 1,500,000 | | | | | 1,686,810 | |
| | Philadelphia Municipal Authority (Juvenile Justice Services Center), 5.00% due 4/1/2038 | | | | 1,360,000 | | | | | 1,500,787 | |
| d | | School District of Philadelphia GO, 5.00% due 9/1/2038 | | | | 100,000 | | | | | 111,381 | |
| | | |
| | RHODE ISLAND — 0.3% | | | | | | | | | | |
| | Pawtucket Housing Authority, 5.50% due 9/1/2022 - 9/1/2024 | | | | 475,000 | | | | | 523,438 | |
| | 5.50% due 9/1/2022 - 9/1/2024 (pre-refunded 9/1/2020) | | | | 190,000 | | | | | 211,392 | |
| | | |
| | SOUTH CAROLINA — 0.7% | | | | | | | | | | |
| | South Carolina Public Service Authority (Summer Nuclear Units 2 and 3), Series B, 5.00% due 12/1/2034 | | | | 1,780,000 | | | | | 1,937,032 | |
| | | |
| | SOUTH DAKOTA — 0.5% | | | | | | | | | | |
| | South Dakota Health & Educational Facilities Authority (Avera Health), Series A, 5.00% due 7/1/2027 | | | | 400,000 | | | | | 430,184 | |
| | South Dakota Health & Educational Facilities Authority (Sanford Health), 5.50% due 11/1/2040 | | | | 750,000 | | | | | 786,248 | |
| | | |
| | TENNESSEE — 0.6% | | | | | | | | | | |
| | Shelby County Health, Educational and Housing Facility (Methodist Le Bonheur Healthcare), 5.00% due 5/1/2036 | | | | 1,000,000 | | | | | 1,143,350 | |
| | Tennessee Energy Acquisition Corp., 5.25% due 9/1/2024 | | | | 500,000 | | | | | 570,160 | |
| | | |
| | TEXAS — 11.1% | | | | | | | | | | |
| | Austin Convention Enterprises, Inc. (Convention Center Hotel First Tier), 5.00% due 1/1/2032 - 1/1/2034 | | | | 1,600,000 | | | | | 1,813,549 | |
| | City of Dallas (Public Improvements) GO, 5.00% due 2/15/2031 | | | | 1,930,000 | | | | | 2,174,241 | |
| | City of Houston (Combined Utility System), Series D, 5.00% due 11/15/2028 | | | | 2,500,000 | | | | | 2,865,775 | |
| | City of Houston (Convention & Entertainment Facilities Department), 5.00% due 9/1/2025 - 9/1/2034 | | | | 2,875,000 | | | | | 3,209,663 | |
| | City of Houston (Public Improvements) GO, Series A, 5.00% due 3/1/2032 | | | | 3,000,000 | | | | | 3,451,590 | |
| | City of Texas City Industrial Development Corp. (ARCO Pipe Line Co. Project), 7.375% due 10/1/2020 | | | | 1,165,000 | | | | | 1,302,715 | |
| | Harris County-Houston Sports Authority, Series A, 5.00% due 11/15/2030 | | | | 2,000,000 | | | | | 2,228,220 | |
| | Kimble County Hospital District, Series A, 6.25% due 8/15/2033 (pre-refunded 8/15/2019) | | | | 500,000 | | | | | 530,030 | |
| | La Vernia Higher Education Finance Corp. (Kipp, Inc.), Series A, 6.25% due 8/15/2039 (pre-refunded 8/15/2019) | | | | 1,000,000 | | | | | 1,060,060 | |
| | Lower Colorado River Authority, | | | | | | | | | | |
| | Series A, | | | | | | | | | | |
| | 5.00% due 5/15/2026 | | | | 2,980,000 | | | | | 3,281,904 | |
| | 5.00% due 5/15/2026 (pre-refunded 5/15/2022) | | | | 20,000 | | | | | 22,267 | |
| | North Texas Tollway Authority (NTTA System), Series A, 5.00% due 1/1/2034 | | | | 750,000 | | | | | 904,522 | |
| | San Antonio Energy Acquisition Public Facilities Corp. (Natural Gas Supply Agreement), 5.50% due 8/1/2021 | | | | 40,000 | | | | | 44,185 | |
| | San Juan Higher Education Finance Authority (IDEA Public Schools), Series A, 6.70% due 8/15/2040 (pre-refunded 8/15/2020) | | | | 1,000,000 | | | | | 1,110,290 | |
| | State of Texas (Cash Flow Management), 4.00% due 8/30/2018 | | | | 3,400,000 | | | | | 3,434,238 | |
| | Texas Public Finance Authority Charter School Finance Corp. (Cosmos Foundation, Inc.), Series A, 6.20% due 2/15/2040 (pre-refunded 2/15/2020) | | | | 1,000,000 | | | | | 1,077,890 | |
| | Texas Transportation Commission (Central Texas Turnpike System), Series C, 5.00% due 8/15/2034 | | | | 1,000,000 | | | | | 1,095,660 | |
10 | Semi-Annual Report
Schedule of Investments, Continued
Thornburg Strategic Municipal Income Fund | March 31, 2018 (Unaudited)
| | | | | | | | | | | | |
| | | | | PRINCIPAL AMOUNT | | VALUE |
| | | |
| | U. S. VIRGIN ISLANDS — 0.4% | | | | | | | | | | |
| | Virgin Islands Public Finance Authority (Diageo Project), 6.75% due 10/1/2037 | | | $ | 1,500,000 | | | | $ | 1,020,000 | |
| | | |
| | UTAH — 0.8% | | | | | | | | | | |
| | Herriman City (Towne Center Access and Utility Improvements), 4.75% due 11/1/2022 (pre-refunded 5/1/2020) | | | | 1,000,000 | | | | | 1,062,210 | |
| | Utah Transit Authority (Integrated Mass Transit System), Series A-SUB, 5.00% due 6/15/2033 | | | | 1,000,000 | | | | | 1,124,470 | |
| | | |
| | WASHINGTON — 1.2% | | | | | | | | | | |
| | Washington Health Care Facilities Authority (Catholic Health Initiatives), Series A, 5.75% due 1/1/2045 | | | | 2,000,000 | | | | | 2,200,540 | |
| | Washington Health Care Facilities Authority (Overlake Hospital Medical Center), 5.70% due 7/1/2038 (pre-refunded 7/1/2020) | | | | 1,000,000 | | | | | 1,085,380 | |
| | | |
| | WISCONSIN — 0.4% | | | | | | | | | | |
| c | | Public Finance Authority (Alabama Proton Therapy Center), 6.25% due 10/1/2031 | | | | 1,000,000 | | | | | 979,510 | |
| | | | | | | | | | | | |
| | | |
| | TOTAL INVESTMENTS — 99.6% (Cost $256,578,378) | | | | | | | | $ | 266,961,131 | |
| | | |
| | OTHER ASSETS LESS LIABILITIES — 0.4% | | | | | | | | | 984,820 | |
| | | | | | | | | | | | |
| | | |
| | NET ASSETS — 100.0% | | | | | | | | $ | 267,945,951 | |
| | | | | | | | | | | | |
Footnote Legend
| a | Variable Rate Demand Notes are instruments whose interest rates change on a specific date (such as coupon date or interest payment date) or whose interest rates vary with changes in a designated base rate (such as the prime interest rate). This instrument is payable on demand and is secured by letters of credit or other credit support agreements from major banks. |
| b | Floating Rate Security. Stated interest/floor rate was in effect at March 31, 2018. |
| c | Securities exempt from registration under Rule 144A of the Securities Act of 1933, as amended. These securities are restricted but liquid and may only be resold in the ordinary course of business in transactions exempt from registration, normally to qualified institutional buyers. As of March 31, 2018, the aggregate value of these securities in the Fund’s portfolio was $2,044,240, representing 0.76% of the Fund’s net assets. |
| e | Segregated as collateral for a when-issued security. |
Portfolio Abbreviations
To simplify the listings of securities, abbreviations are used per the table below:
| | |
| ABAG | | Association of Bay Area Governments |
| ACA | | Insured by American Capital Access |
| AGM | | Insured by Assured Guaranty Municipal Corp. |
| AMBAC | | Insured by American Municipal Bond Assurance Corp. |
| BAM | | Insured by Build America Mutual Insurance Co. |
| COP | | Certificates of Participation |
| DFA | | Development Finance Authority |
| EDA | | Economic Development Authority |
| GO | | General Obligation |
| | |
| | |
| | |
| HFA | | Health Facilities Authority |
| HFFA | | Health Facilities Financing Authority |
| IDA | | Industrial Development Authority |
| LIBOR | | London Interbank Offered Rates |
| Mtg | | Mortgage |
| MUNIPSA | | Securities Industry and Financial Markets Association (SIFMA) Municipal Swap Index |
| Natl-Re | | Insured by National Public Finance Guarantee Corp. |
| Q-SBLF | | Insured by Qualified School Bond Loan Fund |
See notes to financial statements.
Semi-Annual Report | 11
Statement of Assets and Liabilities
Thornburg Strategic Municipal Income Fund | March 31, 2018 (Unaudited)
| | | | |
ASSETS | | | | |
| |
Investments at value (cost $256,578,378) (Note 3) | | $ | 266,961,131 | |
Cash | | | 377,733 | |
Receivable for investments sold | | | 2,110,000 | |
Receivable for fund shares sold | | | 606,997 | |
Interest receivable | | | 3,288,842 | |
Prepaid expenses and other assets | | | 39,212 | |
| | | | |
| |
Total Assets | | | 273,383,915 | |
| | | | |
| |
LIABILITIES | | | | |
| |
Payable for investments purchased | | | 4,317,602 | |
Payable for fund shares redeemed | | | 848,023 | |
Payable to investment advisor and other affiliates (Note 4) | | | 169,487 | |
Accounts payable and accrued expenses | | | 71,318 | |
Dividends payable | | | 31,534 | |
| | | | |
| |
Total Liabilities | | | 5,437,964 | |
| | | | |
| |
NET ASSETS | | $ | 267,945,951 | |
| | | | |
| |
NET ASSETS CONSIST OF | | | | |
| |
Undistributed net investment income | | $ | 3,111 | |
Net unrealized appreciation on investments | | | 10,382,753 | |
Accumulated net realized gain (loss) | | | (1,254,043 | ) |
Net capital paid in on shares of beneficial interest | | | 258,814,130 | |
| | | | |
| |
| | $ | 267,945,951 | |
| | | | |
NET ASSET VALUE | | | | |
| |
Class A Shares: | | | | |
Net asset value and redemption price per share
($58,239,304 applicable to 3,906,322 shares of beneficial
interest outstanding - Note 5) | | $ | 14.91 | |
| |
Maximum sales charge, 2.00% of offering price | | | 0.30 | |
| | | | |
| |
Maximum offering price per share | | $ | 15.21 | |
| | | | |
| |
Class C Shares: | | | | |
Net asset value and offering price per share*
($29,791,201 applicable to 1,996,151 shares of beneficial
interest outstanding - Note 5) | | $ | 14.92 | |
| | | | |
| |
Class I Shares: | | | | |
Net asset value, offering and redemption price per share
($179,915,446 applicable to 12,056,314 shares of beneficial
interest outstanding - Note 5) | | $ | 14.92 | |
| | | | |
* Redemption price per share is equal to net asset value less any applicable contingent deferred sales charge.
See notes to financial statements.
12 | Semi-Annual Report
Statement of Operations
Thornburg Strategic Municipal Income Fund | Six Months Ended March 31, 2018 (Unaudited)
| | | | |
| |
INVESTMENT INCOME | | | | |
| |
Interest income (net of premium amortized of $1,100,417) | | $ | 4,648,066 | |
| | | | |
| |
EXPENSES | | | | |
| |
Investment advisory fees (Note 4) | | | 1,003,591 | |
Administration fees (Note 4) | | | | |
Class A Shares | | | 33,352 | |
Class C Shares | | | 17,614 | |
Class I Shares | | | 53,608 | |
Distribution and service fees (Note 4) | | | | |
Class A Shares | | | 74,697 | |
Class C Shares | | | 94,468 | |
Transfer agent fees | | | | |
Class A Shares | | | 29,245 | |
Class C Shares | | | 11,494 | |
Class I Shares | | | 55,180 | |
Registration and filing fees | | | | |
Class A Shares | | | 7,948 | |
Class C Shares | | | 8,130 | |
Class I Shares | | | 8,490 | |
Custodian fees (Note 2) | | | 28,880 | |
Professional fees | | | 24,472 | |
Trustee and officer fees (Note 4) | | | 5,914 | |
Other expenses | | | 17,554 | |
| | | | |
| |
Total Expenses | | | 1,474,637 | |
| |
Less: | | | | |
Expenses reimbursed by investment advisor (Note 4) | | | (53,672 | ) |
Investment advisory fees waived by investment advisor (Note 4) | | | (200,718 | ) |
| | | | |
| |
Net Expenses | | | 1,220,247 | |
| | | | |
| |
Net Investment Income | | $ | 3,427,819 | |
| | | | |
| |
REALIZED AND UNREALIZED GAIN (LOSS) | | | | |
| |
Net realized gain (loss) on investments | | | 156,353 | |
Net change in unrealized appreciation (depreciation) on investments | | | (4,348,725 | ) |
| | | | |
| |
Net Realized and Unrealized Loss | | | (4,192,372 | ) |
| | | | |
| |
Net Decrease in Net Assets Resulting from Operations | | $ | (764,553 | ) |
| | | | |
Semi-Annual Report | 13
Statements of Changes in Net Assets
Thornburg Strategic Municipal Income Fund
| | | | | | | | | | |
| | | SIX MONTHS ENDED
MARCH 31, 2018* | | YEAR ENDED
SEPTEMBER 30, 2017 |
INCREASE (DECREASE) IN NET ASSETS FROM | | | | | | | | | | |
| | |
OPERATIONS | | | | | | | | | | |
| | |
Net investment income | | | $ | 3,427,819 | | | | $ | 6,887,834 | |
Net realized gain (loss) on investments | | | | 156,353 | | | | | (1,331,206 | ) |
Net unrealized appreciation (depreciation) on investments | | | | (4,348,725 | ) | | | | (6,558,226 | ) |
| | | | | |
| | |
Net Decrease in Net Assets Resulting from Operations | | | | (764,553 | ) | | | | (1,001,598 | ) |
| | |
DIVIDENDS TO SHAREHOLDERS | | | | | | | | | | |
| | |
From net investment income | | | | | | | | | | |
Class A Shares | | | | (739,026 | ) | | | | (1,557,265 | ) |
Class C Shares | | | | (311,636 | ) | | | | (672,205 | ) |
Class I Shares | | | | (2,377,157 | ) | | | | (4,658,606 | ) |
| | |
FUND SHARE TRANSACTIONS (NOTE 5) | | | | | | | | | | |
| | |
Class A Shares | | | | (2,357,368 | ) | | | | (15,311,985 | ) |
Class C Shares | | | | (2,647,167 | ) | | | | (4,851,450 | ) |
Class I Shares | | | | 7,800,170 | | | | | (11,093,234 | ) |
| | | | | |
| | |
Net Decrease in Net Assets | | | | (1,396,737 | ) | | | | (39,146,343 | ) |
| | |
NET ASSETS | | | | | | | | | | |
| | |
Beginning of Period | | | | 269,342,688 | | | | | 308,489,031 | |
| | | | | |
| | |
End of Period | | | $ | 267,945,951 | | | | $ | 269,342,688 | |
| | | | | |
| | |
Undistributed net investment income | | | $ | 3,111 | | | | $ | 3,111 | |
* Unaudited.
See notes to financial statements.
14 | Semi-Annual Report
Notes to Financial Statements
Thornburg Strategic Municipal Income Fund | March 31, 2018 (Unaudited)
NOTE 1 – ORGANIZATION
Thornburg Strategic Municipal Income Fund (the “Fund”) is a diversified series of Thornburg Investment Trust (the “Trust”). The Trust was organized as a Massachusetts business trust under a Declaration of Trust dated June 3, 1987 and is registered as a diversified, open-end management investment company under the Investment Company Act of 1940, as amended. The Fund is currently one of twenty-one separate series of the Trust. Each series is considered to be a separate entity for financial reporting and tax purposes and bears expenses directly attributable to it. The Fund’s primary investment objective is to seek a high level of current income exempt from federal individual income tax, as is consistent in the view of Thornburg Investment Management, Inc., the Trust’s investment advisor (the “Advisor”).
The Fund currently offers three classes of shares of beneficial interest: Class A, Class C, and Institutional Class (“Class I”). Each class of shares of the Fund represents an interest in the same portfolio of investments, except that (i) Class A shares are sold subject to a front-end sales charge collected at the time the shares are purchased and bear a service fee, (ii) Class C shares are sold at net asset value without a sales charge at the time of purchase, but are subject to a contingent deferred sales charge upon redemption within one year of purchase, and bear both a service fee and a distribution fee, (iii) Class I shares are sold at net asset value without a sales charge at the time of purchase and may be subject to a service fee, and (iv) the respective classes may have different reinvestment privileges and conversion rights. Additionally, the Fund may allocate among its classes certain expenses, to the extent allocable to specific classes, including transfer agent fees, government registration fees, certain printing and postage costs, and administrative and legal expenses. Currently, class specific expenses of the Fund are limited to service and distribution fees, administration fees, and certain registration and transfer agent expenses.
The following is a summary of significant accounting policies followed by the Fund in the preparation of its financial statements. The Fund prepares its financial statements in conformity with United States generally accepted accounting principles (“GAAP”), including investment company accounting and reporting guidance in the Financial Accounting Standards Board (the “FASB”) Accounting Standard Codification Topic 946.
NOTE 2 – SIGNIFICANT ACCOUNTING POLICIES
Security Valuation: All investments in securities held by the Fund are valued as described in Note 3.
Allocation of Income, Gains, Losses and Expenses: Net investment income (other than class specific expenses) and realized and unrealized gains and losses are allocated daily to each class of shares based upon the relative net asset value of outstanding shares (or the value of the dividend-eligible shares, as appropriate) of each class of shares at the beginning of the day (after adjusting for the current capital shares activity of the respective class). Expenses common to all Funds are allocated among the Funds comprising the Trust based upon their relative net asset values or other appropriate allocation methods. Operating expenses directly attributable to a specific class are charged against the operating income of that class.
Dividends and Distributions to Shareholders: Dividends and distributions to shareholders, which are determined in accordance with federal income tax regulations and may differ from GAAP, are recorded on the ex-dividend date. Ordinary income distributions, if any, are declared daily and paid monthly. Capital gain distributions, if any, are declared and paid annually and more often if deemed necessary by the Advisor. Dividends are paid and are reinvested in additional shares of the Fund at net asset value per share at the close of business on the ex-dividend date, or at the shareholder’s option, paid in cash.
Investment Income: Interest income is accrued as earned. Premiums and discounts are amortized and accreted, respectively, to call dates or maturity dates using the effective yield method of the respective investments. These amounts are included in Interest income on the Statement of Operations.
Custodian Fees: Custodian fees disclosed in the Statement of Operations may include interest expenses incurred by the Fund on any cash overdrafts of its custodian account during the period. Such cash overdrafts may result from the effects of failed trades in portfolio securities and from cash outflows resulting from unanticipated shareholder redemption activity. The Fund pays interest to its custodian on any such cash overdraft at a rate set periodically at the custodian’s discretion of the overdraft amount in excess of $50,000.
Investment Transactions: Investment transactions are accounted for on a trade date basis. Realized gains and losses from the sale of investments are recorded on an identified cost basis.
When-Issued and Delayed Delivery Transactions: The Fund may engage in when-issued or delayed delivery transactions. To the extent the Fund engages in such transactions, it will do so for the purpose of acquiring portfolio investments consistent with the Fund’s investment objectives and not for the purpose of investment leverage or to speculate on interest rate or market changes. At the time the Fund makes a commitment to purchase an investment on a when-issued or delayed delivery basis, the Fund will record the transaction and reflect the value in determining its net asset value. When effecting such transactions, assets of an amount sufficient to make payment for the portfolio
Semi-Annual Report | 15
Notes to Financial Statements, Continued
Thornburg Strategic Municipal Income Fund | March 31, 2018 (Unaudited)
investments to be purchased will be segregated on the Fund’s records on the trade date. Investments purchased on a when-issued or delayed delivery basis do not earn interest until the settlement date.
Guarantees and Indemnifications: Under the Trust’s organizational documents (and under separate agreements with the independent Trustees), its officers and Trustees are provided with an indemnification against certain liabilities arising out of the performance of their duties to the Fund. In the normal course of business the Trust may also enter into contracts with service providers that contain general indemnifications. The Trust’s maximum exposure under these arrangements is unknown. However, based on experience, the Trust expects the risk of loss to be remote.
Use of Estimates: The preparation of financial statements in conformity with GAAP requires management to make estimates and assumptions that affect the reported amounts of assets and liabilities and disclosure of contingent assets and liabilities at the date of the financial statements and the reported amounts of increases (decreases) in net assets from operations during the reporting period. Actual results could differ from those estimates.
Federal Income Taxes: It is the policy of the Trust to comply with the provisions of the Internal Revenue Code applicable to regulated investment companies and to distribute to shareholders substantially all investment company taxable income including net realized gains on investments (if any), and tax exempt income of the Fund. Therefore, no provision for federal income or excise tax is required.
The Fund files income tax returns in United States federal and applicable state jurisdictions. The statute of limitations on the Fund’s tax return filings generally remains open for the three years following a return’s filing date. The Fund has analyzed each uncertain tax position believed to be material in the preparation of the Fund’s financial statements for the six month period ended March 31, 2018, including open tax years, to assess whether it is more likely than not that the position would be sustained upon examination, based on the technical merits of the position. The Fund has not identified any such position for which an asset or liability must be reflected in the Statement of Assets and Liabilities.
At March 31, 2018, information on the tax components of capital was as follows:
| | | | | |
Cost of investments for tax purposes | | | $ | 256,578,378 | |
| | | | | |
Gross unrealized appreciation on a tax basis | | | | 10,895,569 | |
Gross unrealized depreciation on a tax basis | | | | (512,816 | ) |
| | | | | |
Net unrealized appreciation (depreciation) on investments (tax basis) | | | $ | 10,382,753 | |
| | | | | |
At March 31, 2018, the Fund had deferred tax basis capital losses occurring subsequent to October 31, 2016 through September 30, 2017 of $1,331,205. For tax purposes, such losses will be recognized in the year ending September 30, 2018.
At March 31, 2018, the Fund had cumulative tax basis capital losses of $79,190 (of which $0 are short-term and $79,190 are long-term) generated after September 30, 2011, which may be carried forward to offset future capital gains. To the extent such carryforwards are used, capital gain distributions may be reduced to the extent provided by regulations. Such capital loss carryforwards do not expire.
NOTE 3 – SECURITY VALUATION
Valuation of the Fund’s portfolio investment securities is performed in accordance with policies and procedures adopted by and under the oversight of the Trustees.
The Trustees of the Trust have appointed the Advisor to assist the Trustees to obtain market values for portfolio investments, evaluate and monitor professional pricing service providers appointed by the Trustees’ Audit Committee (the “Audit Committee”) to assist in determining fair values for portfolio investments, assist in calculating fair values for portfolio investments in certain circumstances, and to perform other functions in connection with the valuation of investments. The Advisor acts through its Valuation and Pricing Committee (the “Committee”) and other employees of the Advisor. The Committee regularly reviews its own valuation calculations, as well as the valuations, valuation techniques and services furnished by pricing service providers, considers circumstances which may require valuation calculations by the Committee, and reviews previous valuation calculations. The Committee reports to the Audit Committee on the Committee’s activities, the performance of pricing service providers, and other matters relating to valuation of portfolio investments.
In those instances when the Committee assists in calculating a fair value for a portfolio investment, the Committee seeks to determine the price that the Fund would reasonably expect to receive upon a sale of the investment in an orderly transaction between market participants on the valuation date. The Committee customarily utilizes quotations from securities broker dealers in calculating valuations, but also may utilize prices obtained from pricing service providers or other methods approved by the Audit Committee. Because fair values calculated by the Committee are estimates, the calculation of a value for an investment may differ from the price that would be realized by the Fund upon
16 | Semi-Annual Report
Notes to Financial Statements, Continued
Thornburg Strategic Municipal Income Fund | March 31, 2018 (Unaudited)
a sale of the investment, and the difference could be material to the Fund’s financial statements. The Committee’s calculation of a fair value for an investment may also differ from the prices obtained by other persons (including other mutual funds) for the investment.
Valuation of Securities: Debt obligations held by the Fund which are not listed or traded on exchanges or for which no reported market exists are ordinarily valued at the valuation obtained from a pricing service provider approved by the Audit Committee.
In any case when a pricing service provider fails to provide a valuation for a debt obligation held by the Fund, the Committee calculates a fair value for the obligation using alternative methods under procedures approved by the Audit Committee. Additionally, in cases when management believes that a valuation obtained from a pricing service provider merits review for significant reasons, the Committee decides whether or not to use the valuation calculated by the pricing service provider or to use an alternative method approved by the Audit Committee to calculate a fair value for the obligation.
Valuation Hierarchy: The Fund categorizes its investments based upon the inputs used in valuing those investments, according to a three-level hierarchy established in guidance from the FASB. Categorization of investments using this hierarchy is intended by the FASB to maximize the use of observable inputs in valuing investments and minimize the use of unobservable inputs by requiring that the most observable inputs be used when available. Observable inputs are those that market participants would use in valuing an investment based on available market information. Unobservable inputs are those that reflect assumptions about the information market participants would use in valuing an investment. An investment’s level within the hierarchy is based on the lowest level input that is deemed significant to the valuation. The methodologies and inputs used to value investments are not necessarily indications of the risk or liquidity associated with those investments.
Various inputs are used in calculating valuations for the Fund’s investments. These inputs are generally summarized according to the three-level hierarchy below:
Level 1: Quoted prices in active markets for identical investments.
Level 2: Other direct or indirect significant observable inputs (including quoted prices for similar investments in active markets and other observable inputs, such as interest rates, prepayment rates, credit risk, etc.).
Level 3: Significant unobservable inputs (including the Committee’s own assumptions in calculating the fair values of investments).
Valuations for debt obligations held by the Fund are typically calculated by pricing service providers approved by the Audit Committee and are generally characterized as Level 2 within the valuation hierarchy.
In a limited number of cases the Committee calculates a fair value for investments using broker quotations or other methods approved by the Audit Committee. When the Committee uses a single broker quotation to calculate a fair value for an investment without other significant observable inputs, or if a fair value is calculated using other significant inputs that are considered unobservable, the investment is characterized as Level 3 within the hierarchy. Other significant unobservable inputs used to calculate a fair value in these instances might include an income-based valuation approach which considers discounted anticipated future cash flows from the investment and application of discounts due to the nature or duration of any restrictions on the disposition of the investment.
Valuations based upon the use of inputs from Levels 1, 2 or 3 may not represent the actual price received upon the disposition of an investment, and the Fund may receive a price that is lower than the valuation based upon these inputs when it sells the investment.
The following table displays a summary of the fair value hierarchy measurements of the Fund’s investments as of March 31, 2018. In any instance when valuation inputs from more than one level are used to determine the fair value of a specific investment, the investment is placed in the level of the table based upon the lowest level input that is significant in determining the fair value of the investment:
| | | | | | | | | | | | | | | | | | | | |
| | | FAIR VALUE MEASUREMENTS AT MARCH 31, 2018 |
| | | TOTAL | | LEVEL 1 | | LEVEL 2 | | LEVEL 3 |
Assets | | | | | | | | | | | | | | | | | | | | |
Investments in Securities | | | | | | | | | | | | | | | | | | | | |
Municipal Bonds | | | $ | 266,961,131 | | | | $ | – | | | | $ | 266,961,131 | | | | $ | – | |
| | | | | |
Total Investments in Securities | | | $ | 266,961,131 | | | | $ | – | | | | $ | 266,961,131 | | | | $ | – | |
In accordance with the guidance prescribed in Accounting Standards Update No. 2011-04, it is the policy of the Fund to recognize transfers between levels and the underlying events which caused the movement. The Fund recognized no transfers between levels for the six months ended March 31, 2018.
Semi-Annual Report | 17
Notes to Financial Statements, Continued
Thornburg Strategic Municipal Income Fund | March 31, 2018 (Unaudited)
NOTE 4 – INVESTMENT ADVISORY FEE AND OTHER TRANSACTIONS WITH AFFILIATES
Pursuant to an investment advisory agreement, the Advisor serves as the investment advisor and performs services for the Fund for which the fees are payable at the end of each month. Under the investment advisory agreement, the Fund pays the Advisor a management fee based on the daily net assets of the Fund at an annual rate as shown in the following table:
| | | | | |
| MANAGEMENT FEE SCHEDULE |
| DAILY NET ASSETS | | FEE RATE |
| |
Up to $500 million | | | | 0.750 | % |
| |
Next $500 million | | | | 0.675 | |
| |
Next $500 million | | | | 0.625 | |
| |
Next $500 million | | | | 0.575 | |
| |
Over $2 billion | | | | 0.500 | |
The Fund’s effective management fee for the six months ended March 31, 2018 was 0.75% of the Fund’s average net assets (before applicable management fee waiver of $200,718).
The Trust has entered into administrative service agreements with the Advisor, whereby the Advisor will perform certain administrative services related to each class of the Fund’s shares. Until January 31, 2018, the fees were payable at an annual rate of up to 0.125 of 1% per annum of the average daily net assets attributable to each class of shares. As of February 1, 2018, the fees are computed as an annual percentage of the aggregate average daily net assets of all shares classes of all Funds in the Trust as follows:
| | | | | |
| ADMINISTRATION FEE SCHEDULE |
| DAILY NET ASSETS | | FEE RATE |
| |
Up to $20 billion | | | | 0.100 | % |
| |
$20 billion to $40 billion | | | | 0.075 | |
| |
$40 billion to $60 billion | | | | 0.040 | |
| |
Over $60 billion | | | | 0.030 | |
The aggregate fee amount is allocated on a daily basis to each Fund based on net assets and subsequently allocated to each class of shares of the Fund. Total administrative service fees incurred by each class of shares of the Fund for the six months ended March 31, 2018, are set forth in the Statement of Operations.
The Trust has an underwriting agreement with Thornburg Securities Corporation (the “Distributor”), an affiliate of the Advisor, which acts as the distributor of the Fund’s shares. For the six months ended March 31, 2018, the Distributor has advised the Fund that it earned net commissions aggregating $28 from the sale of Class A shares, and collected contingent deferred sales charges aggregating $474 from redemptions of Class C shares of the Fund.
Pursuant to a service plan under Rule 12b-1 of the Investment Company Act of 1940, the Fund may pay to the Distributor or securities dealers and other financial institutions at the Distributor’s direction an amount not to exceed .25 of 1% per annum of the average daily net assets attributable to Class A and Class C shares of the Fund to obtain various shareholder and distribution related services. For the six months ended March 31, 2018, there were no 12b-1 service plan fees charged for Class I shares. The Advisor and Distributor each may pay out of its own resources additional expenses for distribution of the Fund’s shares and shareholder services.
The Trust has also adopted a distribution plan pursuant to Rule 12b-1, applicable only to the Fund’s Class C shares under which the Fund compensates the Distributor for services in promoting the sale of Class C shares of the Fund at an annual rate of up to .35 of 1% per annum of the average daily net assets attributable to Class C shares.
Total fees incurred by each class of shares of the Fund under their respective service and distribution plans for the six months ended March 31, 2018, are set forth in the Statement of Operations.
The Advisor and Distributor have contractually agreed to waive fees and reimburse expenses incurred by the Fund so that actual expenses of certain share classes do not exceed levels as specified in each Fund’s most recent prospectus. The agreement may be terminated by the Fund at any time, but may not be terminated by the Advisor or Distributor before February 1, 2019, unless the Advisor ceases to be the investment advisor to the Fund or the Distributor ceases to be the distributor of the Fund prior to that date. The Advisor and Distributor may recoup amounts waived or reimbursed during the fiscal year if expenses fall below the contractual limit during that year.
18 | Semi-Annual Report
Notes to Financial Statements, Continued
Thornburg Strategic Municipal Income Fund | March 31, 2018 (Unaudited)
For the six months ended March 31, 2018, the Advisor contractually waived Fund level investment advisory fees of $200,718. The Advisor contractually reimbursed certain class specific expenses, administrative fees, and distribution fees of $42,874 for Class A shares and $10,798 for Class I shares.
Certain officers and Trustees of the Trust are also officers or directors of the Advisor and Distributor. The compensation of the independent Trustees is borne by the Trust. The Trust also pays a portion of the Chief Compliance Officer’s compensation. These amounts are reflected as “Trustee and officer fees” in the Statement of Operations.
The percentage of direct investments in the Fund held by the Trustees, officers of the Trust, and the Advisor is approximately 8.28%.
The Fund may purchase or sell securities from, or to an affiliated fund, provided the affiliation is due solely to having a common investment advisor, common officers, or common trustees, and provided that all such transactions will comply with Rule 17a-7 under the 1940 Act. For the six months ended March 31, 2018, the Fund had transactions with affiliated funds of $4,865,000 in purchases and $1,800,000 in sales generating no realized gains or losses.
NOTE 5 – SHARES OF BENEFICIAL INTEREST
At March 31, 2018, there were an unlimited number of shares with no par value of beneficial interest authorized. Transactions in shares of beneficial interest were as follows:
| | | | | | | | | | | | | | | | |
| | | SIX MONTHS ENDED
MARCH 31, 2018 (UNAUDITED) | | | YEAR ENDED
SEPTEMBER 30, 2017 (AUDITED) | |
| | | SHARES | | | AMOUNT | | | SHARES | | | AMOUNT | |
Class A Shares | | | | | | | | | | | | | | | | |
Shares sold | | | 419,509 | | | $ | 6,315,695 | | | | 1,322,804 | | | $ | 19,909,384 | |
Shares issued to shareholders in reinvestment of dividends | | | 48,471 | | | | 727,808 | | | | 100,078 | | | | 1,505,509 | |
Shares repurchased | | | (624,577 | ) | | | (9,400,871 | ) | | | (2,451,992 | ) | | | (36,726,878 | ) |
| | | | |
| | | | |
Net decrease | | | (156,597 | ) | | $ | (2,357,368 | ) | | | (1,029,110 | ) | | $ | (15,311,985 | ) |
| | | | |
Class C Shares | | | | | | | | | | | | | | | | |
Shares sold | | | 126,307 | | | $ | 1,903,821 | | | | 493,092 | | | $ | 7,406,382 | |
Shares issued to shareholders in reinvestment of dividends | | | 19,400 | | | | 291,633 | | | | 41,235 | | | | 620,979 | |
Shares repurchased | | | (321,694 | ) | | | (4,842,621 | ) | | | (856,940 | ) | | | (12,878,811 | ) |
| | | | |
| | | | |
Net decrease | | | (175,987 | ) | | $ | (2,647,167 | ) | | | (322,613 | ) | | $ | (4,851,450 | ) |
| | | | |
Class I Shares | | | | | | | | | | | | | | | | |
Shares sold | | | 1,956,921 | | | $ | 29,478,637 | | | | 5,124,506 | | | $ | 76,773,451 | |
Shares issued to shareholders in reinvestment of dividends | | | 149,330 | | | | 2,244,026 | | | | 284,146 | | | | 4,280,377 | |
Shares repurchased | | | (1,588,427 | ) | | | (23,922,493 | ) | | | (6,138,227 | ) | | | (92,147,062 | ) |
| | | | |
| | | | |
Net increase (decrease) | | | 517,824 | | | $ | 7,800,170 | | | | (729,575 | ) | | $ | (11,093,234 | ) |
| | | | |
NOTE 6 – INVESTMENT TRANSACTIONS
For the six months ended March 31, 2018, the Fund had purchase and sale transactions of investments (excluding short-term investments) of $25,381,234 and $21,118,407, respectively.
OTHER NOTES
Risks: The Fund’s investments subject it to risks including, but not limited to, credit risk, interest rate risk, high yield risk, management risk, derivatives risk, market and economic risk, and liquidity risk. Please see the Fund’s prospectus for a discussion of the risks associated with an investment in the Fund.
Subsequent Events: Fund management believes no events have occurred between March 31, 2018 and the date of issuance of the financial statements that require adjustment to or disclosure in the accompanying financial statements.
Semi-Annual Report | 19
Financial Highlights
Thornburg Strategic Municipal Income Fund
| | | | | | | | | | | | | | | | | | | | | | | | | | | | | | | | | | | | | | | | |
| | | PER SHARE PERFORMANCE (FOR A SHARE OUTSTANDING THROUGHOUT THE PERIOD) |
| | | | | | | | | | | | | | | | | |
UNLESS OTHERWISE
NOTED, PERIODS ARE
FISCAL YEARS ENDED
SEPTEMBER 30, | | NET ASSET
VALUE,
BEGINNING OF
PERIOD | | NET
INVESTMENT
INCOME
(LOSS)+ | | NET REALIZED &
UNREALIZED GAIN
(LOSS) ON
INVESTMENTS | | TOTAL FROM
INVESTMENT
OPERATIONS | | DIVIDENDS
FROM NET
INVESTMENT
INCOME | | DIVIDENDS
FROM NET
REALIZED
GAINS | | TOTAL
DIVIDENDS | | NET ASSET
VALUE,
END OF PERIOD |
| | | | | | | |
| CLASS A SHARES | | | | | | | | | | | | | | | | | | | | | | | | | | | | | | | | | | | | |
| | | | | | | | |
2018(b)(c) | | | $ | 15.14 | | | | | 0.19 | | | | | (0.23 | ) | | | | (0.04 | ) | | | | (0.19 | ) | | | | – | | | | | (0.19 | ) | | | $ | 14.91 | |
2017(b) | | | $ | 15.53 | | | | | 0.35 | | | | | (0.39 | ) | | | | (0.04 | ) | | | | (0.35 | ) | | | | – | | | | | (0.35 | ) | | | $ | 15.14 | |
2016(b) | | | $ | 15.16 | | | | | 0.33 | | | | | 0.37 | | | | | 0.70 | | | | | (0.33 | ) | | | | – | | | | | (0.33 | ) | | | $ | 15.53 | |
2015(b) | | | $ | 15.19 | | | | | 0.35 | | | | | (0.02 | ) | | | | 0.33 | | | | | (0.35 | ) | | | | (0.01 | ) | | | | (0.36 | ) | | | $ | 15.16 | |
2014(b) | | | $ | 14.40 | | | | | 0.41 | | | | | 0.85 | | | | | 1.26 | | | | | (0.42 | ) | | | | (0.05 | ) | | | | (0.47 | ) | | | $ | 15.19 | |
2013(b) | | | $ | 15.17 | | | | | 0.41 | | | | | (0.74 | ) | | | | (0.33 | ) | | | | (0.41 | ) | | | | (0.03 | ) | | | | (0.44 | ) | | | $ | 14.40 | |
| | | | | | | |
| CLASS C SHARES | | | | | | | | | | | | | | | | | | | | | | | | | | | | | | | | | | | | |
| | | | | | | | |
2018(c) | | | $ | 15.16 | | | | | 0.15 | | | | | (0.24 | ) | | | | (0.09 | ) | | | | (0.15 | ) | | | | – | | | | | (0.15 | ) | | | $ | 14.92 | |
2017 | | | $ | 15.54 | | | | | 0.28 | | | | | (0.38 | ) | | | | (0.10 | ) | | | | (0.28 | ) | | | | – | | | | | (0.28 | ) | | | $ | 15.16 | |
2016 | | | $ | 15.17 | | | | | 0.28 | | | | | 0.37 | | | | | 0.65 | | | | | (0.28 | ) | | | | – | | | | | (0.28 | ) | | | $ | 15.54 | |
2015 | | | $ | 15.20 | | | | | 0.30 | | | | | (0.02 | ) | | | | 0.28 | | | | | (0.30 | ) | | | | (0.01 | ) | | | | (0.31 | ) | | | $ | 15.17 | |
2014 | | | $ | 14.41 | | | | | 0.37 | | | | | 0.84 | | | | | 1.21 | | | | | (0.37 | ) | | | | (0.05 | ) | | | | (0.42 | ) | | | $ | 15.20 | |
2013 | | | $ | 15.18 | | | | | 0.37 | | | | | (0.74 | ) | | | | (0.37 | ) | | | | (0.37 | ) | | | | (0.03 | ) | | | | (0.40 | ) | | | $ | 14.41 | |
| | | | | | | |
| CLASS I SHARES | | | | | | | | | | | | | | | | | | | | | | | | | | | | | | | | | | | | |
| | | | | | | | |
2018(c) | | | $ | 15.16 | | | | | 0.20 | | | | | (0.24 | ) | | | | (0.04 | ) | | | | (0.20 | ) | | | | – | | | | | (0.20 | ) | | | $ | 14.92 | |
2017 | | | $ | 15.54 | | | | | 0.39 | | | | | (0.38 | ) | | | | 0.01 | | | | | (0.39 | ) | | | | – | | | | | (0.39 | ) | | | $ | 15.16 | |
2016 | | | $ | 15.17 | | | | | 0.38 | | | | | 0.37 | | | | | 0.75 | | | | | (0.38 | ) | | | | – | | | | | (0.38 | ) | | | $ | 15.54 | |
2015 | | | $ | 15.20 | | | | | 0.39 | | | | | (0.01 | ) | | | | 0.38 | | | | | (0.40 | ) | | | | (0.01 | ) | | | | (0.41 | ) | | | $ | 15.17 | |
2014 | | | $ | 14.41 | | | | | 0.46 | | | | | 0.85 | | | | | 1.31 | | | | | (0.47 | ) | | | | (0.05 | ) | | | | (0.52 | ) | | | $ | 15.20 | |
2013 | | | $ | 15.18 | | | | | 0.45 | | | | | (0.73 | ) | | | | (0.28 | ) | | | | (0.46 | ) | | | | (0.03 | ) | | | | (0.49 | ) | | | $ | 14.41 | |
| (a) | Not annualized for periods less than one year. |
| (b) | Sales loads are not reflected in computing total return. |
| (c) | Unaudited Six Month Period Ended March 31. |
| + | Based on weighted average shares outstanding. |
See notes to financial statements.
20 | Semi-Annual Report
Financial Highlights, Continued
Thornburg Strategic Municipal Income Fund
| | | | | | | | | | | | | | | | | | | | | | | | | | | | | | |
| RATIOS TO AVERAGE NET ASSETS | | | | | | SUPPLEMENTAL DATA | |
| | | | | | | EXPENSES, AFTER | | | | | | | | | | | | | | | | |
NET INVESTMENT
INCOME (LOSS) (%) | | | EXPENSES, AFTER
EXPENSE
REDUCTIONS (%) | | | EXPENSE
REDUCTIONS AND
NET OF CUSTODY
CREDITS (%) | | | EXPENSES,
BEFORE EXPENSE
REDUCTIONS (%) | | | | | | TOTAL
RETURN (%)(a) | | | PORTFOLIO
TURNOVER
RATE (%)(a) | | | NET ASSETS AT
END OF PERIOD
(THOUSANDS) | |
| | | | | | | |
| | | | | | | | | | | | | | | | | | | | | | | | | | | | | | |
| | | | | | | |
| | 2.47 | (d) | | | 1.00 | (d) | | | 1.00 | (d) | | | 1.29 | (d) | | | | | | | (0.29 | ) | | | 8.86 | | | $ | 58,239 | |
| | 2.30 | | | | 1.09 | | | | 1.09 | | | | 1.30 | | | | | | | | (0.23 | ) | | | 27.35 | | | $ | 61,525 | |
| | 2.11 | | | | 1.25 | | | | 1.25 | | | | 1.29 | | | | | | | | 4.63 | | | | 11.24 | | | $ | 79,058 | |
| | 2.28 | | | | 1.25 | | | | 1.25 | | | | 1.31 | | | | | | | | 2.18 | | | | 12.13 | | �� | $ | 66,722 | |
| | 2.82 | | | | 1.25 | | | | 1.25 | | | | 1.31 | | | | | | | | 8.93 | | | | 21.89 | | | $ | 61,424 | |
| | 2.74 | | | | 1.25 | | | | 1.25 | | | | 1.31 | | | | | | | | (2.21 | ) | | | 37.42 | | | $ | 52,278 | |
| | | | | | | |
| | | | | | | | | | | | | | | | | | | | | | | | | | | | | | |
| | | | | | | |
| | 1.98 | (d) | | | 1.49 | (d) | | | 1.49 | (d) | | | 1.64 | (d) | | | | | | | (0.60 | ) | | | 8.86 | | | $ | 29,791 | |
| | 1.88 | | | | 1.52 | | | | 1.52 | | | | 1.66 | | | | | | | | (0.59 | ) | | | 27.35 | | | $ | 32,926 | |
| | 1.80 | | | | 1.55 | | | | 1.55 | | | | 1.66 | | | | | | | | 4.32 | | | | 11.24 | | | $ | 38,773 | |
| | 1.98 | | | | 1.55 | | | | 1.55 | | | | 1.70 | | | | | | | | 1.87 | | | | 12.13 | | | $ | 29,073 | |
| | 2.53 | | | | 1.55 | | | | 1.55 | | | | 1.72 | | | | | | | | 8.60 | | | | 21.89 | | | $ | 26,168 | |
| | 2.44 | | | | 1.55 | | | | 1.55 | | | | 1.73 | | | | | | | | (2.50 | ) | | | 37.42 | | | $ | 21,344 | |
| | | | | | | |
| | | | | | | | | | | | | | | | | | | | | | | | | | | | | | |
| | | | | | | |
| | 2.70 | (d) | | | 0.78 | (d) | | | 0.78 | (d) | | | 0.94 | (d) | | | | | | | (0.25 | ) | | | 8.86 | | | $ | 179,915 | |
| | 2.56 | | | | 0.83 | | | | 0.83 | | | | 0.94 | | | | | | | | 0.09 | | | | 27.35 | | | $ | 174,892 | |
| | 2.42 | | | | 0.93 | | | | 0.93 | | | | 0.93 | | | | | | | | 4.96 | | | | 11.24 | | | $ | 190,658 | |
| | 2.60 | | | | 0.93 | | | | 0.93 | | | | 0.93 | | | | | | | | 2.50 | | | | 12.13 | | | $ | 151,992 | |
| | 3.12 | | | | 0.94 | | | | 0.93 | | | | 0.94 | | | | | | | | 9.27 | | | | 21.89 | | | $ | 137,109 | |
| | 3.04 | | | | 0.95 | | | | 0.95 | | | | 0.96 | | | | | | | | (1.92 | ) | | | 37.42 | | | $ | 89,262 | |
Semi-Annual Report | 21
Expense Example
Thornburg Strategic Municipal Income Fund | March 31, 2018 (Unaudited)
As a shareholder of the Fund, you incur two types of costs:
| | (1) | transaction costs, including |
| | (a) | sales charges (loads) on purchase payments, for Class A shares; |
| | (b) | a deferred sales charge on redemptions of any part or all of a purchase of $1 million of Class A shares within 12 months of purchase; |
| | (c) | a deferred sales charge on redemptions of Class C shares within 12 months of purchase; |
| | (2) | ongoing costs, including management fees; distribution and/or service (12b-1) fees; and other Fund expenses. |
This example is intended to help you understand your ongoing costs (in dollars) of investing in the Fund and to compare these costs with the ongoing costs of investing in other mutual funds.
The example is based on a $1,000 investment beginning on October 1, 2017, and held until March 31, 2018.
ACTUAL EXPENSES
For each class of shares, the first line of the accompanying table provides information about actual account values and actual expenses. You may use the information in this line, together with the amount you invested, to estimate the expenses that you paid over the period. Simply divide your account value by $1,000 (for example, an $8,600 account value divided by $1,000 = 8.6), then multiply the result by the number in the first line for your class of shares under the heading entitled “Expenses Paid During Period” to estimate the expenses you paid on your account during this period.
| | | | | | | | | | | | | | | |
| | | BEGINNING
ACCOUNT VALUE
10/1/17 | | ENDING
ACCOUNT VALUE
3/31/18 | | EXPENSES PAID
DURING PERIOD†
10/1/17–3/31/18 |
| | | |
| CLASS A SHARES | | | | | | | | | | | | | | | |
| | | |
Actual | | | $ | 1,000.00 | | | | $ | 997.10 | | | | $ | 4.98 | |
Hypothetical* | | | $ | 1,000.00 | | | | $ | 1,019.95 | | | | $ | 5.04 | |
| | | |
| CLASS C SHARES | | | | | | | | | | | | | | | |
| | | |
Actual | | | $ | 1,000.00 | | | | $ | 994.00 | | | | $ | 7.41 | |
Hypothetical* | | | $ | 1,000.00 | | | | $ | 1,017.50 | | | | $ | 7.49 | |
| | | |
| CLASS I SHARES | | | | | | | | | | | | | | | |
| | | |
Actual | | | $ | 1,000.00 | | | | $ | 997.50 | | | | $ | 3.88 | |
Hypothetical* | | | $ | 1,000.00 | | | | $ | 1,021.04 | | | | $ | 3.93 | |
| † | Expenses are equal to the annualized expense ratio for each class (A: 1.00%; C: 1.49%; I: 0.78%) multiplied by the average account value over the period, multiplied by 182/365 to reflect the one-half year period. |
| * | Hypothetical assumes a rate of return of 5% per year before expenses. |
HYPOTHETICAL EXAMPLE FOR COMPARISON PURPOSES
For each class of shares, the second line of the accompanying table provides information about hypothetical account values and hypothetical expenses based on the Fund’s actual expense ratio and an assumed rate of return of 5% per year before expenses, which is not the Fund’s actual return. The hypothetical account values and expenses may not be used to estimate the actual ending account balance or expenses you paid for the period. You may use this information to compare the ongoing costs of investing in the Fund and other funds. To do so, compare this 5% hypothetical example with the 5% hypothetical examples that appear in the shareholder reports of the other funds.
Please note that the expenses shown in the table are meant to highlight your ongoing costs only and do not reflect any transactional costs, such as sales charges (loads), redemption fees, or exchange fees. Therefore, the second line of the table for each class of shares is useful in comparing ongoing costs only, and will not help you determine the relative total costs of owning different funds. In addition, if these transactional costs were included, your costs would have been higher.
22 | Semi-Annual Report
Other Information
Thornburg Strategic Municipal Income Fund | March 31, 2018 (Unaudited)
PORTFOLIO PROXY VOTING
Policies and Procedures:
The Trust has delegated to Thornburg Investment Management, Inc. (the “Advisor”) voting decisions respecting proxies for the Fund’s voting securities. The Advisor makes voting decisions in accordance with its Proxy Voting Policy and Procedures. A description of the Policy and Procedures is available (i) without charge, upon request, by calling the Advisor toll-free at 1-800-847-0200, (ii) on the Thornburg website at www.thornburg.com, and (iii) on the Securities and Exchange Commission’s website at www.sec.gov.
Information regarding how proxies were voted is available on or before August 31 of each year for the twelve months ending the preceding June 30. This information is available (i) without charge, upon request by calling the Advisor toll-free at 1-800-847-0200, (ii) on the Thornburg website at www.thornburg.com, and (iii) on the Securities and Exchange Commission’s website at www.sec.gov.
AVAILABILITY OF QUARTERLY PORTFOLIO SCHEDULE
The Fund files with the Securities and Exchange Commission schedules of its portfolio holdings on Form N-Q for the first and third quarters of each fiscal year. The Fund’s Forms N-Q are available on the Commission’s website at www.sec.gov, or may be reviewed and copied at the Commission’s Public Reference Room in Washington, D.C. Information on the operation of the Public Reference Room may be obtained by calling 1-800-SEC-0330. The Fund also makes this information available on its website at www.thornburg.com/download or upon request by calling 1-800-847-0200.
Semi-Annual Report | 23
Trustees’ Statement to Shareholders
Readopted September 11, 2017
The Trustees believe current and prospective shareholders should know how we discharge our responsibilities in supervising the Funds’ investment advisor and in reviewing the advisor’s contract for renewal. Since 2005, we have issued a statement which sets out clearly the three principal guidelines that we follow in supervising the Trust’s investment advisor on your behalf. In accordance with our customary practice, in September of this year we again reviewed our statement and concluded we should reissue this statement outlining the principal features of our supervision of the advisor’s performance of investment management services for the Funds.
We begin with the premise that each shareholder selected his or her Fund because its investments are managed by the investment advisor identified in the prospectus and in accordance with the objective and policies described in the prospectus. We realize, as each of you do, that if you believe that your Fund’s stated objective and policies no longer serve your personal investment goals, you can sell your shares and leave the Fund.
Therefore, we believe that our primary supervisory task—our principal obligation to you—is to assess the nature and quality of the advisor’s services, and to confirm that the advisor actively and competently pursues the Fund’s objective, in accordance with the policies set out in the prospectus. To do this, we meet regularly with management to review your Fund’s portfolio and to discuss the advisor’s specific actions and judgments in pursuing the Fund’s objective. We do not substitute our own judgment for the advisor’s decisions in selecting investments; the advisor is paid to exercise its informed judgment on investment decisions, and we seek to confirm, in reviewing the advisor’s performance, that the advisor is doing just that.
Second, we are conscious of costs and the effect that costs have on shareholders’ returns. We try to make sure that your Fund’s fees and costs are reasonable in relationship to the services rendered and that they are generally in line with those charged by other expert investment advisors, consistent with our belief that the Fund’s investors searched for and expect that expertise and attention and have decided to pay a reasonable price for it. We do not put the management contract “out to bid” as a matter of course, and we would not do so unless we had concluded that the advisor materially had failed to pursue the Fund’s objectives in accordance with its policies, or for other equally important reasons. We believe that any other approach would be inconsistent with your interests and contrary to your expectations when you bought shares of the Fund in the first place.
Finally, because we believe that most Thornburg Fund shareholders have invested with a long-term perspective, we try not to focus too much on the fashions of the moment and on short-term performance. The market will not favor any specific investment objective or set of policies at all times and under all economic circumstances. A fund will experience periods of both high and low returns relative to other funds and other investments. Even if one of our Funds is not favored by the market at a particular time, we believe that the advisor is nonetheless obliged to remain true to the Fund’s objective and policies, and we watch to see that it does so.
Trustees of Thornburg Investment Trust
24 | Semi-Annual Report
Thornburg Funds
Thornburg Investment Management is a privately-owned global investment firm that offers a range of solutions for retail and institutional investors. Founded in 1982 and headquartered in Santa Fe, New Mexico, we manage approximately $49 billion (as of March 31, 2018) across U.S. mutual funds, separate accounts for high-net-worth investors, institutional accounts, and UCITS funds for non-U.S. investors.
EQUITY FUNDS
| | ∎ | | Thornburg Investment Income Builder Fund |
| | ∎ | | Thornburg Global Opportunities Fund |
| | ∎ | | Thornburg International Value Fund |
| | ∎ | | Thornburg Better World International Fund |
| | ∎ | | Thornburg International Growth Fund |
| | ∎ | | Thornburg Developing World Fund |
| | ∎ | | Thornburg Core Growth Fund |
FIXED INCOME FUNDS
| | ∎ | | Thornburg Low Duration Income Fund |
| | ∎ | | Thornburg Limited Term U.S. Government Fund |
| | ∎ | | Thornburg Limited Term Income Fund |
| | ∎ | | Thornburg Strategic Income Fund |
| | ∎ | | Thornburg Low Duration Municipal Fund |
| | ∎ | | Thornburg Limited Term Municipal Fund |
| | ∎ | | Thornburg Intermediate Municipal Fund |
| | ∎ | | Thornburg California Limited Term Municipal Fund |
| | ∎ | | Thornburg New Mexico Intermediate Municipal Fund |
| | ∎ | | Thornburg New York Intermediate Municipal Fund |
| | ∎ | | Thornburg Strategic Municipal Income Fund |
ALTERNATIVE FUNDS
| | ∎ | | Thornburg Long/Short Equity Fund |
Before investing, carefully consider the Fund’s investment goals, risks, charges, and expenses. For a prospectus or summary prospectus containing this and other information, contact your financial advisor or visit thornburg.com. Read it carefully before investing.
For additional information, please visit thornburg.com
Thornburg Investment Management, Inc. 2300 North Ridgetop Road, Santa Fe, NM 87506
Semi-Annual Report | 25
This page intentionally left blank.
26 | Semi-Annual Report
This page intentionally left blank.
Semi-Annual Report | 27
| | | | |
| To receive shareholder reports, prospectuses, and proxy statements electronically, go to www.thornburg.com/edelivery. | | |  | |
| This Semi-Annual Report is submitted for the general information of shareholders of the Fund. It is not authorized for distribution to prospective investors in the Fund unless preceded or accompanied by an effective prospectus. | |
| | | | |
Investment Advisor: | | Distributor: | | |
Thornburg Investment Management® | | Thornburg Securities Corporation® | | |
800.847.0200 | | 800.847.0200 | | TH1979 |
Semi-Annual Report
March 31, 2018
THORNBURG
CALIFORNIA
LIMITED TERM MUNICIPAL FUND
About Thornburg Investment Management
It’s more than what we do.
It’s how we do it.
At Thornburg, we are very different in how we think, invest, and are structured. We believe this difference is what makes us successful in helping individuals reach their long-term financial goals.
Flexible Perspective
Our perspective on investment opportunities is more flexible than most, viewing a wide range of opportunities beyond conventional boundaries to find hidden value.
Collaboration
Collectively, we hone ideas via borderless cross-pollination for better judgment and better results.
Portfolio Construction
Disciplined construction guided more by our convictions than convention.
CONVICTION
Thorough analysis and our relative-value framework lead to conviction in our securities selection.
UNCONVENTIONAL
Active management means we seek the best value for our clients rather than using conventional benchmarks as our starting point.
Structured for Excellence
How we think and how we invest is made possible by how we’re structured.
TEAM APPROACH
FAR FROM THE HERD
ACCESS & TRANSPARENCY
2 | Semi-Annual Report
Thornburg California Limited Term Municipal Fund
Semi-Annual Report | March 31, 2018
Table of Contents
| | | | | | | | | | |
| SHARE CLASS | | NASDAQ SYMBOL | | CUSIP |
| | |
| Class A | | LTCAX | | | | 885-215-426 | |
| Class C | | LTCCX | | | | 885-215-418 | |
| Class I | | LTCIX | | | | 885-215-392 | |
Minimum investments for Class I shares may be higher than those for Class A. Class I shares may not be available to all investors.
Investments carry risks, including possible loss of principal. Portfolios investing in bonds have the same interest rate, inflation, and credit risks that are associated with the underlying bonds. The value of bonds will fluctuate relative to changes in interest rates, decreasing when interest rates rise. Unlike bonds, bond funds have ongoing fees and expenses. Please see the Fund’s prospectus for a discussion of the risks associated with an investment in the Fund. Investments in the Funds are not FDIC insured, nor are they bank deposits or guaranteed by a bank or any other entity.
The laddering strategy does not assure or guarantee better performance and cannot eliminate the risk of investment losses.
Semi-Annual Report | 3
Letter to Shareholders
Thornburg California Limited Term Municipal Fund | March 31, 2018 (Unaudited)
April 25, 2018
Dear Fellow Shareholder:
We are pleased to present the semi-annual report for Thornburg California Limited Term Municipal Fund. The net asset value (NAV) of the Class I shares decreased by 28 cents to $13.51 per share during the six-month period ended March 31, 2018. During the period, the Class I shares of the Fund outperformed the index with a negative 1.18% total return, compared to the negative 1.03% total return for the ICE BofAML 1-10 Year U.S. Municipal Securities Index.
The Fund’s duration, as well as curve positioning, added 0.04% to relative performance. Sector selection was also a positive contributor to performance, adding 0.06%. Lastly, security selection, which is performance not attributable to duration and sector selection, was the major driver of relative performance, contributing 0.11%.
The topic of tax reform consumed municipal market participants in the fourth quarter of 2017, with several proposals being bandied about that would significantly impact the supply/ demand dynamics of the market for years to come. Ultimately, the legislation was not as radical as initially feared. On the supply side of the equation, issuers lost the ability to advance refund debt. Much like a homeowner refinancing an existing mortgage to save on interest costs, an issuer would refinance debt when interest rates were low to provide some present value savings. While many thought this would have a large impact on supply, we did not agree. Advance refunding is highly correlated to the current level of interest rates, and many issuers had already accomplished any possible refunding over the previous several years.
Instead, we found the impact of tax reform on the demand side of the equation to be far more interesting. What was overlooked was the reduction of the corporate tax rate from 35% to 21%, and the idea that corporations evaluating municipal bonds versus other fixed income securities on a tax equivalent basis would now require a higher hurdle rate to buy municipal securities. We felt that the impact this may have on two specific buyers of municipals, banks, and property and casualty insurance companies, which own roughly 20 to 25% of outstanding municipal bonds, could lead both to re-evaluate their decision to own municipal bonds. While we do not believe this to be an Armageddon type of scenario; we expect it to be more like a weight leaning on the market for the next 12 to 18 months.
Another impact on the demand side is the limitations on the deductibility of state and local taxes (SALT), which has led
many market observers to postulate that the demand for municipal bonds in high tax states will increase. Again, we did not share the same opinion. In California, the demand for California bonds has already driven prices to a level where we feel there is little value when compared to other municipal securities on a tax-equivalent basis. Demand for municipal securities in other high tax states, such as Connecticut, Pennsylvania, and New Jersey, is not as cut and dry because there is significant credit risk associated with each. Nevertheless, these concerns caused the supply of municipal bonds to spike in November and December as issuers rushed to market to hedge against the potential threat of tax reform. Some investors viewed this period as an opportunity to buy extra municipal bonds in anticipation of a January rally, which never materialized. We did not view the market the same way, and kept our strategies positioned at the lower end of their relative risk spectrums (i.e. lower duration, higher credit quality, and higher reserve positions). The last fear facing the municipal bond market is the long-advertised infrastructure plan. While the plan has experienced several failed launches, and what is known suggests it will have little impact on the supply of municipal bonds, we are still monitoring the details of the proposal for potential impacts to our strategies.
The fourth quarter of 2017 saw yields of shorter maturity bonds increase more than the yields of longer maturity bonds, leading to a flattening of the yield curve. At the time, many analysts and pundits harped on the fact that the phenomenon portends a future recession. In the first quarter of 2018, the market watched as yields of longer maturity bonds increased more than yields of shorter maturity bonds, leading to a steepening of the yield curve. The steepening of the curve is an indication that market participants have a growing concern about increases in inflation – the enemy of the fixed income investor. The Fund’s conservative positioning was a headwind to performance in the fourth quarter of 2017, but acted as a tailwind to performance in the first quarter of 2018.
Thank you for your continued trust in us.
Sincerely,
| | |
| | |
| Christopher Ryon,CFA | | Nicholos Venditti,CFA |
| Portfolio Manager | | Portfolio Manager |
| Managing Director | | Managing Director |
The matters discussed in this report may constitute forward-looking statements made pursuant to the safe harbor provisions of the Securities Litigation Reform Act of 1995. These include any advisor or portfolio manager prediction, assessment, analysis or outlook for individual securities, industries, investment styles, market sectors and/or markets. These statements involve risks and uncertainties. In addition to the general risks described for each fund in its current prospectus, other factors bearing on these reports include the accuracy of the advisor’s or portfolio manager’s forecasts and predictions, the appropriateness of the investment strategies designed by the advisor or portfolio manager and the ability of the advisor or portfolio manager to implement their strategies efficiently and successfully. Any one or more of these factors, as well as other risks affecting the securities markets generally, could cause the actual results of any fund to differ materially as compared to its benchmarks.
The views expressed are subject to change and do not necessarily reflect the views of Thornburg Investment Management, Inc. This information should not be relied upon as a recommendation or investment advice and is not intended to predict the performance of any investment or market.
Performance results of individual share classes will vary based on the fees and expenses associated with each share class, and may be higher or lower than other share classes within the same Fund. Please see Performance Summary for performance results of each share class.
4 | Semi-Annual Report
Performance Summary
Thornburg California Limited Term Municipal Fund | March 31, 2018 (Unaudited)
AVERAGE ANNUAL TOTAL RETURNS
| | | | | | | | | | | | | | | | | | | | | | | | | |
| | | 1-YR | | 3-YR | | 5-YR | | 10-YR | | SINCE
INCEP. |
| | | | | |
Class A Shares (Incep: 2/19/87) | | | | | | | | | | | | | | | | | | | | | | | | | |
Without sales charge | | | | 0.23% | | | | | 0.42% | | | | | 1.06% | | | | | 2.71% | | | | | 4.13% | |
| | | | | |
With sales charge | | | | -1.29% | | | | | -0.08% | | | | | 0.75% | | | | | 2.56% | | | | | 4.07% | |
Class C Shares (Incep: 9/1/94) | | | | | | | | | | | | | | | | | | | | | | | | | |
Without sales charge | | | | 0.04% | | | | | 0.20% | | | | | 0.80% | | | | | 2.45% | | | | | 3.08% | |
| | | | | |
With sales charge | | | | -0.45% | | | | | 0.20% | | | | | 0.80% | | | | | 2.45% | | | | | 3.08% | |
| | | | | |
Class I Shares (Incep: 4/1/97) | | | | 0.59% | | | | | 0.74% | | | | | 1.37% | | | | | 3.05% | | | | | 3.56% | |
30-DAY YIELDS, A SHARES (with sales charge)
| | | | |
| Annualized Distribution Yield | | | 1.46% | |
| SEC Yield | | | 1.06% | |
GROWTH OF A HYPOTHETICAL $10,000 INVESTMENT
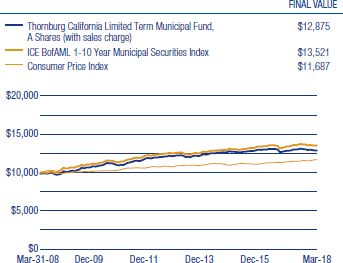
Performance data shown represents past performance and is no guarantee of future results. Investment return and principal value will fluctuate so shares, when redeemed, may be worth more or less than their original cost. Current performance may be lower or higher than quoted. For performance current to the most recent month end, visit thornburg.com or call 800-847-0200. The performance information does not reflect the deduction of taxes that a shareholder would pay on distributions or the redemption of Fund shares. Returns reflect the reinvestment of dividends and capital gains. Class A shares are sold with a maximum sales charge of 1.50%. There is no sales charge for Class I shares. As disclosed in the most recent prospectus, the total annual fund operating expenses are as follows: A shares, 0.89%; C shares, 1.15%; I shares, 0.67%.
The ICE index data referenced herein is the property of ICE Data Indices, LLC, its affiliates (“ICE Data”) and/or its Third Party Suppliers and has been licensed for use by Thornburg Investment Management, Inc. ICE Data and its Third Party Suppliers accept no liability in connection with its use. See www.thornburg.com/indices for a full copy of the Disclaimer.
Glossary
The ICE BofAML 1-10 Year Municipal Securities Index is a subset of the ICE BofAML U.S. Municipal Securities Index including all securities with a remaining term to final maturity less than 10 years.
The performance of any index is not indicative of the performance of any particular investment. Unless otherwise noted, index returns reflect the reinvestment of income dividends and capital gains, if any, but do not reflect fees, brokerage commissions or other expenses of investing. Investors may not make direct investments into any index.
Annualized Distribution Yield – The distribution yield reflects actual distributions made to shareholders. The annualized distribution yield is calculated by summing the last 30 days of income at a given month end and annualizing to a 360-day year. The result is divided by the ending maximum offering price or net asset value.
SEC Yield – A yield computed in accordance with SEC standards measuring the net investment income per share over a specified 30-day period expressed as a percentage of the maximum offering price of the Fund’s shares at the end of the period.
Advance refunding – Advance refunding can also refer to bond issuance in which new bonds are sold at a lower rate than outstanding ones. The proceeds are then invested, and when the older bonds become callable, they are paid off with the invested proceeds.
Bond Credit Ratings (Credit Quality) – A bond credit rating assesses the financial ability of a debt issuer to make timely payments of principal and interest. Rating of AAA (the highest), AA, A, and BBB are investment-grade quality. Rating of BB, B, CCC, CC, C and D (the lowest) are considered below investment grade, speculative grade, or junk bonds.
Credit Spread/Quality Spread – The difference between the yields of securities with different credit qualities.
Duration – A bond’s sensitivity to interest rates. Bonds with longer durations experience greater price volatility than bonds with shorter durations. Effective duration incorporates a bond’s embedded option features, such as call provisions.
Laddering – Laddering involves building a portfolio of bonds with staggered maturities so that a portion matures each year. Money that comes in from maturing bonds is typically invested in bonds with longer maturities at the far end of the portfolio.
Yield Curve – A line that plots the interest rate, at a set point in time, of bonds having equal credit quality, but offering maturity dates.
Semi-Annual Report | 5
Fund Summary
Thornburg California Limited Term Municipal Fund | March 31, 2018 (Unaudited)
OBJECTIVES AND STRATEGIES
The Fund’s primary investment objective is to obtain as high a level of current income exempt from federal and California state individual income taxes as is consistent, in the view of the Fund’s investment advisor, with preservation of capital.
The secondary goal of the Fund is to reduce expected changes in its share price compared to longer intermediate and long-term bond portfolios.
As described in the Fund’s prospectus, the Fund offers California investors double tax-free yields (may be subject to Alternative Minimum Tax) in a laddered municipal bond portfolio with a dollar-weighted average maturity of normally less than five years. Laddering involves building a portfolio of bonds with staggered maturities so that a portion of the portfolio matures each year. Cash from maturing bonds, if not needed for other purposes, is typically invested in bonds with longer maturities at the far end of the ladder. We regard this strategy as a good compromise for managing different types of risk.
LONG-TERM STABILITY OF PRINCIPAL
Net Asset Value History of A Shares
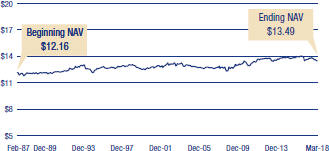
KEY PORTFOLIO ATTRIBUTES
| | | | | |
| Number of Bonds | | | | 389 | |
| Effective Duration | | | | 3.6 Yrs | |
| Average Maturity | | | | 4.4 Yrs | |
SECURITY CREDIT RATINGS
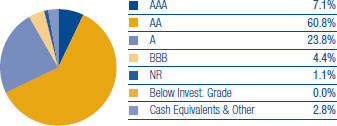
A bond credit rating assesses the financial ability of a debt issuer to make timely payments of principal and interest. Ratings of AAA (the highest), AA, A, and BBB are investment-grade quality. Ratings of BB, B, CCC, CC, C and D (the lowest) are considered below investment grade, speculative grade, or junk bonds.
Unrated pre-refunded and escrowed-to-maturity bonds are included in the not rated category.
PORTFOLIO LADDER
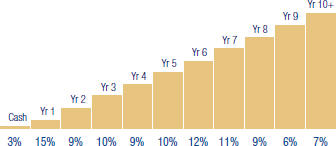
Percent of portfolio maturing in each year. Cash includes cash equivalents and other.
There is no guarantee that the Fund will meet its investment objectives.
All data is subject to change. Charts may not add up to 100% due to rounding.
6 | Semi-Annual Report
Schedule of Investments, Continued
Thornburg California Limited Term Municipal Fund | March 31, 2018 (Unaudited)
| | | | | | | | | | | | |
| | | ISSUER-DESCRIPTION | | PRINCIPAL AMOUNT | | VALUE |
| | Alameda County Joint Powers Authority (Alameda County Medical Center Highland Hospital), Series A, 5.00% due 12/1/2018 - 12/1/2024 | | | $ | 4,375,000 | | | | $ | 4,870,313 | |
| | Alameda County Joint Powers Authority (Juvenile Justice), 5.00% due 12/1/2021 | | | | 500,000 | | | | | 557,375 | |
| | Alameda County Joint Powers Authority (Public Facilities Capital Projects), 5.00% due 12/1/2021 | | | | 1,000,000 | | | | | 1,114,750 | |
| | Anaheim Public Financing Authority (Public Improvements; Insured: AGM), 0.00%, due 9/1/2022 | | | | 3,000,000 | | | | | 2,672,250 | |
| a | | Bay Area Toll Authority (San Francisco Bay Area Toll Bridge), 2.28% (MUNIPSA + 0.70%) due 4/1/2047 (put 10/1/2019) | | | | 5,000,000 | | | | | 5,027,450 | |
| | 2.95% due 4/1/2047 (put 4/1/2026) | | | | 4,775,000 | | | | | 4,914,430 | |
| | Series E, 2.00% due 4/1/2034 (put 4/1/2021) | | | | 5,300,000 | | | | | 5,292,315 | |
| | Bonita (Educational Facilities) USD GO, 5.00% due 8/1/2024 | | | | 1,000,000 | | | | | 1,122,430 | |
| | Brentwood Infrastructure Financing Authority (Residential Single Family Development; Insured: AGM),
Series A, 5.00% due 9/2/2020 - 9/2/2023 | | | | 6,225,000 | | | | | 6,943,718 | |
| | California (Children’s Hospital Los Angeles) HFFA, 5.00% due 11/15/2018 - 11/15/2023 | | | | 3,425,000 | | | | | 3,651,715 | |
| | California (Dignity Health) HFFA, Series A, 5.25% due 3/1/2022 | | | | 1,000,000 | | | | | 1,086,710 | |
| | California (Episcopal Home; Insured: California Mtg Insurance) HFFA, Series B, 5.10% due 2/1/2019 | | | | 290,000 | | | | | 298,648 | |
| | California (Kaiser Permanente) HFFA, 5.00% due 11/1/2027 | | | | 3,000,000 | | | | | 3,666,690 | |
| | California (Providence Health and Services) HFFA, Series C, 6.00% due 10/1/2018 | | | | 1,000,000 | | | | | 1,022,230 | |
| | California (St. Joseph Health System) HFFA, 5.00% due 7/1/2034 (put 10/18/2022) | | | | 2,000,000 | | | | | 2,241,680 | |
| | Series A, 5.00% due 7/1/2024 | | | | 1,000,000 | | | | | 1,141,130 | |
| | Series D, 5.00% due 7/1/2043 (put 10/15/2020) | | | | 5,000,000 | | | | | 5,407,400 | |
| | California Educational Facilities Authority (Chapman University), 5.00% due 4/1/2022 | | | | 2,000,000 | | | | | 2,183,300 | |
| | California Educational Facilities Authority (Loyola Marymount University; Insured: Natl-Re), 0.00%,
Series A, due 10/1/2019 | | | | 2,025,000 | | | | | 1,970,608 | |
| | California Educational Facilities Authority (Pitzer College), 5.00% due 4/1/2018 - 4/1/2020 | | | | 2,985,000 | | | | | 3,079,879 | |
| b | | California Health Facilities Financing Authority (LOC: US Bank N.A.), 1.45% due 9/1/2028 (put 4/2/2018) | | | | 1,600,000 | | | | | 1,600,000 | |
| | California Infrastructure and Economic Development Bank (King City High School), 5.25% due 8/15/2020 | | | | 1,000,000 | | | | | 1,063,980 | |
| a | | California Infrastructure and Economic Development Bank (Los Angeles County Museum of Art), 1.971% (LIBOR 1 Month + 0.65%) due 12/1/2050 (put 2/1/2021) | | | | 6,250,000 | | | | | 6,268,625 | |
| c | | California Infrastructure and Economic Development Bank (Pacific Gas and Electric Company), 1.75% due 11/1/2026 (put 6/1/2022) | | | | 4,500,000 | | | | | 4,324,140 | |
| | Series E, 1.75% due 11/1/2026 (put 6/1/2022) | | | | 3,500,000 | | | | | 3,363,220 | |
| | California Infrastructure and Economic Development Bank (The Scripps Research Institute),
5.00% due 7/1/2018 - 7/1/2027 | | | | 2,025,000 | | | | | 2,253,171 | |
| | California Municipal Finance Authority (Biola University Residential Hall and Parking Structure),
5.00% due 10/1/2021 - 10/1/2023 | | | | 435,000 | | | | | 484,246 | |
| | California Municipal Finance Authority (Biola University), 4.00% due 10/1/2019 | | | | 405,000 | | | | | 420,580 | |
| | 5.00% due 10/1/2020 - 10/1/2027 | | | | 2,855,000 | | | | | 3,240,377 | |
| | California Municipal Finance Authority, 1.40% due 9/1/2021 (put 7/2/2018) | | | | 4,000,000 | | | | | 4,000,000 | |
| b | | California Public Finance Authority (LOC: Barclays Bank plc), Series C, 1.50% due 8/1/2052 (put 4/2/2018) | | | | 2,300,000 | | | | | 2,300,000 | |
| | California School Cash Reserve Program Authority, 3.00% due 6/29/2018 | | | | 6,000,000 | | | | | 6,021,960 | |
| | California State Housing Finance Agency (Multi-Family Housing; Insured: FHA), 3.05% due 12/1/2019 | | | | 735,000 | | | | | 735,412 | |
| | California State Public Works Board (California School for the Deaf Riverside Campus),
Series H, 5.00% due 4/1/2022 | | | | 565,000 | | | | | 630,681 | |
| | California State Public Works Board (Correctional and Rehabilitation Facilities), 5.00% due 4/1/2024 | | | | 3,350,000 | | | | | 3,739,437 | |
| | Series A, 5.00% due 9/1/2022 - 9/1/2024 | | | | 10,430,000 | | | | | 11,951,955 | |
| | Series G, 5.00% due 11/1/2022 | | | | 1,500,000 | | | | | 1,694,490 | |
| | California State Public Works Board (Judicial Council Projects), Series A, 5.00% due 3/1/2023 - 3/1/2024 | | | | 2,400,000 | | | | | 2,720,136 | |
| | Series D, 5.00% due 12/1/2021 - 12/1/2022 | | | | 4,300,000 | | | | | 4,776,732 | |
| | California State Public Works Board (Laboratory Facility and San Diego Courthouse), Series I,
5.00% due 11/1/2023 - 11/1/2024 | | | | 7,000,000 | | | | | 8,042,680 | |
| | California State Public Works Board (University of California; Insured: Natl-Re), Series A, 5.00% due 6/1/2020 | | | | 1,185,000 | | | | | 1,270,486 | |
| | California State Public Works Board (Various State Participating Agency Capital Projects), 5.125% due 3/1/2021 (pre-refunded 3/1/2020) | | | | 1,635,000 | | | | | 1,743,351 | |
| | California State Public Works Board (Yuba City Courthouse), 5.00% due 6/1/2022 | | | | 1,950,000 | | | | | 2,184,897 | |
| | California Statewide Communities Development Authority (Aspire Public Schools; LOC: PCSD; Guaranty Pool I, LLC), 5.00% due 7/1/2020 (pre-refunded 1/1/2019) | | | | 685,000 | | | | | 698,036 | |
| | California Statewide Communities Development Authority (Cottage Health System), 4.00% due 11/1/2021 | | | | 150,000 | | | | | 160,253 | |
| | 5.00% due 11/1/2020 - 11/1/2025 | | | | 710,000 | | | | | 807,944 | |
| | California Statewide Communities Development Authority (Irvine East Campus Apartments),
5.00% due 5/15/2021 - 5/15/2027 | | | | 2,260,000 | | | | | 2,538,308 | |
| | California Statewide Communities Development Authority (Kaiser Foundation Hospitals),
Series A, 5.00% due 4/1/2019 | | | | 3,715,000 | | | | | 3,839,118 | |
| | California Statewide Communities Development Authority (Southern California Edison Company),
2.625% due 11/1/2033 (put 12/1/2023) | | | | 4,195,000 | | | | | 4,218,031 | |
| | Calipatria (Educational Facilities; Insured: ACA) USD GO, 0.00%, due 8/1/2025 | | | | 4,360,000 | | | | | 3,183,323 | |
| | Carson Redevelopment Agency (Project Area 1), Series A, 6.00% due 10/1/2019 | | | | 1,050,000 | | | | | 1,091,727 | |
| | Castaic (Insured: Natl-Re) USD GO, 0.00%, Series A, due 5/1/2018 | | | | 615,000 | | | | | 614,268 | |
| | CDC Successor Agency of the City of Santee (Redevelopment and Low and Moderate Income Housing; Insured: BAM), Series A, 5.00% due 8/1/2023 - 8/1/2027 | | | | 2,050,000 | | | | | 2,390,414 | |
Semi-Annual Report | 7
Schedule of Investments, Continued
Thornburg California Limited Term Municipal Fund | March 31, 2018 (Unaudited)
| | | | | | | | | | | | |
| | | ISSUER-DESCRIPTION | | PRINCIPAL AMOUNT | | VALUE |
| | Central Valley Financing Authority (Carson Ice), 5.25% due 7/1/2020 | | | $ | 500,000 | | | | $ | 539,260 | |
| | Chabot-Las Positas Community College District (Educational Facilities) GO, 4.00% due 8/1/2019 | | | | 360,000 | | | | | 371,830 | |
| | 5.00% due 8/1/2020 - 8/1/2021 | | | | 885,000 | | | | | 965,412 | |
| | City and County of San Francisco (525 Golden Gate Avenue-Public Utilities Commission Office Project) COP, 5.00% due 11/1/2022 | | | | 700,000 | | | | | 736,701 | |
| | City of Antioch Public Financing Authority (Municipal Facilities Project), 5.00% due 5/1/2022 - 5/1/2024 | | | | 1,400,000 | | | | | 1,591,186 | |
| | City of Burbank (Burbank Water and Power System), Series A, 5.00% due 6/1/2018 - 6/1/2020 | | | | 985,000 | | | | | 1,032,313 | |
| | City of Chula Vista (Capital Facilities Project) COP, 5.25% due 3/1/2020 | | | | 1,300,000 | | | | | 1,387,919 | |
| | City of Chula Vista (Police Facility Project) COP, 5.00% due 10/1/2024 | | | | 1,700,000 | | | | | 1,993,335 | |
| | City of Chula Vista (San Diego Gas & Electric Co.), Series A, 1.65% due 7/1/2018 | | | | 3,500,000 | | | | | 3,501,085 | |
| | City of Chula Vista Financing Authority (Infrastructure, Facilities and Equipment), 5.00% due 5/1/2026 - 5/1/2027 | | | | 3,500,000 | | | | | 4,196,845 | |
| | City of Clovis (Water System Facilities; Insured: BAM), 5.00% due 3/1/2021 - 3/1/2023 | | | | 2,270,000 | | | | | 2,532,253 | |
| | City of Folsom (Community Facilities District No. 2), 5.00% due 12/1/2018 | | | | 965,000 | | | | | 986,732 | |
| | City of Los Angeles (Cash Flow Management) GO, 5.00% due 6/28/2018 | | | | 7,500,000 | | | | | 7,562,850 | |
| | City of Manteca (Wastewater Quality Control Facility), 4.00% due 12/1/2018 | | | | 375,000 | | | | | 381,315 | |
| | City of Manteca (Water Supply System), 4.00% due 7/1/2018 | | | | 550,000 | | | | | 553,410 | |
| | 5.00% due 7/1/2019 - 7/1/2023 | | | | 2,050,000 | | | | | 2,243,302 | |
| | City of Porterville (Public Service Capital Projects; Insured: AMBAC) COP, 6.30% due 10/1/2018 | | | | 245,000 | | | | | 250,760 | |
| | City of Redding (City Electric System; Insured: AGM) COP, Series A, 5.00% due 6/1/2020 | | | | 1,055,000 | | | | | 1,061,035 | |
| | 5.00% due 6/1/2020 (pre-refunded 6/1/2018) | | | | 1,445,000 | | | | | 1,453,265 | |
| | City of San Jose Financing Authority (Civic Center Project), | | | | | | | | | | |
| | Series A, 4.00% due 6/1/2021 | | | | 1,000,000 | | | | | 1,069,840 | |
| | 5.00% due 6/1/2019 - 6/1/2024 | | | | 3,745,000 | | | | | 4,158,613 | |
| | City of Torrance (Torrance Memorial Medical Center), 5.00% due 9/1/2020 | | | | 1,155,000 | | | | | 1,235,584 | |
| | County of El Dorado Community Facilities District (El Dorado Hills Development), 5.00% due 9/1/2019 | | | | 1,700,000 | | | | | 1,777,860 | |
| | County of Los Angeles (Fiscal Year 2017-2018 Expenditures) GO, 5.00% due 6/29/2018 | | | | 7,000,000 | | | | | 7,059,360 | |
| | County of Los Angeles Redevelopment Refunding Authority (Bunker Hill Project), 5.00% due 6/1/2020 - 6/1/2024 | | | | 6,000,000 | | | | | 6,648,515 | |
| | County of Monterey (Natividad Medical Center; Insured: AGM) COP, 5.25% due 8/1/2021 | | | | 3,700,000 | | | | | 3,935,320 | |
| | Delano Financing Authority (Police Station and Capital Improvements), Series A,
5.00% due 12/1/2018 - 12/1/2019 | | | | 2,330,000 | | | | | 2,417,478 | |
| | Desert Sands (Educational Facilities; Insured: BAM) USD COP, 4.00% due 3/1/2019 | | | | 1,000,000 | | | | | 1,022,070 | |
| | 5.00% due 3/1/2020 - 3/1/2021 | | | | 1,780,000 | | | | | 1,919,113 | |
| | Downey Public Financing Authority (Public Capital Improvements), 5.00% due 12/1/2025 - 12/1/2027 | | | | 1,445,000 | | | | | 1,722,916 | |
| | El Dorado Irrigation District (Water System Capital Improvements) COP, 5.00% due 3/1/2025 - 3/1/2026 | | | | 2,700,000 | | | | | 3,201,978 | |
| | Elk Grove Finance Authority (Poppy Ridge CFD No. 2003-1 and East Franklin CFD No. 2002-1),
4.00% due 9/1/2020 | | | | 575,000 | | | | | 604,428 | |
| | 5.00% due 9/1/2021 - 9/1/2025 | | | | 1,200,000 | | | | | 1,373,244 | |
| | Emeryville Redevelopment Agency (Emeryville and Shellmound Park Projects; Insured: AGM),
Series A, 5.00% due 9/1/2022 - 9/1/2024 | | | | 9,095,000 | | | | | 10,428,375 | |
| | Fresno County (Educational Facilities; Insured: Natl-Re) USD GO,
Series B, 5.00% due 2/1/2020 | | | | 2,510,000 | | | | | 2,657,914 | |
| | Series C, 5.90% due 8/1/2018 - 8/1/2020 | | | | 2,025,000 | | | | | 2,139,640 | |
| | Government of Guam (Various Capital Projects), Series D-REF, 5.00% due 11/15/2023 - 11/15/2025 | | | | 5,425,000 | | | | | 5,860,482 | |
| | Guam Power Authority (Electric Power System), Series A, 5.00% due 10/1/2027 - 10/1/2028 | | | | 3,810,000 | | | | | 4,204,068 | |
| | Guam Power Authority (Electric Power System; Insured: AGM), Series A, 5.00% due 10/1/2021 | | | | 1,275,000 | | | | | 1,385,032 | |
| | Guam Waterworks Authority (Water and Wastewater System), 5.00% due 7/1/2021 - 7/1/2027 | | | | 2,735,000 | | | | | 3,007,343 | |
| | Hacienda La Puente (Educational Facilities; Insured: AGM) USD COP, 4.00% due 6/1/2018 | | | | 705,000 | | | | | 707,820 | |
| | 5.00% due 6/1/2019 - 6/1/2025 | | | | 5,905,000 | | | | | 6,611,999 | |
| | Hemet (Insured: AGM) USD GO, 4.00% due 8/1/2018 | | | | 1,335,000 | | | | | 1,346,107 | |
| b | | Irvine Ranch Water District (LOC: US Bank N.A.), Series A, 1.45% due 10/1/2041 (put 4/2/2018) | | | | 2,725,000 | | | | | 2,725,000 | |
| b | | Irvine Unified School District (LOC: US Bank N.A.), 1.45% due 9/1/2056 (put 4/2/2018) | | | | 2,875,000 | | | | | 2,875,000 | |
| | Jurupa Public Financing Authority (Community Services District-Eastvale Area; Insured: AGM),
4.50% due 9/1/2018 - 9/1/2020 | | | | 2,720,000 | | | | | 2,821,401 | |
| | Series A, 4.00% due 9/1/2018 | | | | 320,000 | | | | | 323,395 | |
| | Kern High School District (Insured: AGM) GO, 4.00% due 8/1/2018 | | | | 500,000 | | | | | 504,195 | |
| | La Quinta Redevelopment Agency (Redevelopment Project Areas No. 1 and 2), 5.00% due 9/1/2021 - 9/1/2023 | | | | 4,500,000 | | | | | 5,086,285 | |
| | Lodi Public Financing Authority (City Police Building and Jail), 5.00% due 10/1/2020 - 10/1/2023 | | | | 4,145,000 | | | | | 4,552,982 | |
| | Los Angeles (Educational Facilities and Information Technology Infrastructure) USD COP,
Series B-2, 5.50% due 12/1/2018 | | | | 2,000,000 | | | | | 2,052,660 | |
8 | Semi-Annual Report
Schedule of Investments, Continued
Thornburg California Limited Term Municipal Fund | March 31, 2018 (Unaudited)
| | | | | | | | | | | | |
| | | ISSUER-DESCRIPTION | | PRINCIPAL AMOUNT | | VALUE |
| c | | Los Angeles (Educational Facilities and Information Technology Infrastructure) USD GO,
Series A, 5.00% due 7/1/2023 | | | $ | 8,950,000 | | | | $ | 10,285,071 | |
| | Series B, 5.00% due 7/1/2023 | | | | 3,000,000 | | | | | 3,447,510 | |
| | Series D, 5.00% due 7/1/2022 - 7/1/2024 | | | | 5,750,000 | | | | | 6,613,072 | |
| | Los Angeles Community College District (Facilities Projects) GO, Series J, 5.00% due 8/1/2026 - 8/1/2027 | | | | 2,000,000 | | | | | 2,434,900 | |
| | Los Angeles County Metropolitan Transportation Authority (Rail Transit System Improvements),
Series A, 5.00% due 7/1/2028 | | | | 5,620,000 | | | | | 6,856,063 | |
| | Los Angeles County Public Works Financing Authority (Multiple Capital Projects), Series A, 5.00% due 8/1/2018 | | | | 2,060,000 | | | | | 2,084,329 | |
| | Los Angeles County Schools Pooled Financing Program (Compton USD; Insured: AGM) COP,
Series A, 5.00% due 6/1/2022 | | | | 1,500,000 | | | | | 1,686,435 | |
| | Los Angeles County Schools Regionalized Business Services Corp. (Insured: AMBAC) COP, 0.00%,
Series A, due 8/1/2021 | | | | 2,135,000 | | | | | 1,975,302 | |
| d | | Los Angeles Department of Airports AMT, Series B, 5.00% due 5/15/2025 - 5/15/2026 | | | | 10,220,000 | | | | | 11,931,924 | |
| | Los Angeles Department of Airports (Los Angeles International Airport), 5.50% due 5/15/2018 | | | | 2,000,000 | | | | | 2,009,260 | |
| b | | Los Angeles Department of Water & Power Power System Revenue, 1.47% due 7/1/2034 (put 4/2/2018) | | | | 19,100,000 | | | | | 19,100,000 | |
| | Los Angeles Department of Water and Power (Power System Capital Improvements),
Series A, 5.00% due 7/1/2024 - 7/1/2026 | | | | 1,800,000 | | | | | 2,128,343 | |
| | Los Angeles Department of Water, Series A, 5.00% due 7/1/2027 - 7/1/2028 | | | | 4,405,000 | | | | | 5,388,753 | |
| | Lynwood (Insured: AGM) USD GO, 5.00% due 8/1/2023 | | | | 1,000,000 | | | | | 1,143,260 | |
| | Manteca Community Facilities District No. 1989-2 (Educational Facilities; Insured: AGM) USD,
Series F, 4.00% due 9/1/2018 - 9/1/2019 | | | | 1,370,000 | | | | | 1,404,792 | |
| | 5.00% due 9/1/2020 - 9/1/2023 | | | | 2,675,000 | | | | | 2,927,745 | |
| | Mark West Union School District (Educational Facilities; Insured: Natl-Re) GO, 4.125% due 8/1/2020 | | | | 1,275,000 | | | | | 1,277,422 | |
| b | | Metropolitan Water District of Southern California, Series B-3-REMK 03/29/17,
1.49% due 7/1/2035 (put 4/2/2018) | | | | 3,300,000 | | | | | 3,300,000 | |
| | Milpitas Redevelopment Agency (Redevelopment Project Area No. 1), 5.00% due 9/1/2025 | | | | 2,300,000 | | | | | 2,720,877 | |
| | Modesto Irrigation District (San Joaquin Valley Electric System), Series A, 5.00% due 7/1/2022 | | | | 1,000,000 | | | | | 1,127,120 | |
| | Moreno Valley Public Financing Authority (Public Improvements), 5.00% due 11/1/2024 | | | | 1,455,000 | | | | | 1,696,414 | |
| | Murrieta Valley Public Financing Authority (Educational Facilities; Insured: BAM) USD GO, 5.00% due 9/1/2023 | | | | 1,080,000 | | | | | 1,239,991 | |
| | Natomas (Insured: BAM) USD GO, 5.00% due 8/1/2024 | | | | 2,425,000 | | | | | 2,763,215 | |
| | North City West School Facilities Financing Authority (Carmel Valley; Insured: AGM),
Series A, 5.00% due 9/1/2021 - 9/1/2022 | | | | 4,415,000 | | | | | 4,908,565 | |
| | Northern California Power Agency (Hydroelectric Project), Series A, 5.00% due 7/1/2018 | | | | 1,250,000 | | | | | 1,261,037 | |
| | Northern California Power Agency (Lodi Energy Center), Series A, 5.00% due 6/1/2019 | | | | 2,340,000 | | | | | 2,431,658 | |
| | Oakland (County of Alameda Educational Facilities) USD GO, 5.00% due 8/1/2022 - 8/1/2025 | | | | 2,745,000 | | | | | 3,197,129 | |
| | Palomar Pomerado Health (Insured: AGM) GO, 0.00%, Series A, due 8/1/2019 | | | | 2,000,000 | | | | | 1,949,120 | |
| | Palomar Pomerado Health (Insured: Natl-Re) GO, 0.00%, due 8/1/2021 | | | | 2,850,000 | | | | | 2,635,936 | |
| | Pasadena (2019 Crossover) USD GO, Series B, 5.00% due 8/1/2024 - 8/1/2026 | | | | 2,800,000 | | | | | 3,335,788 | |
| | Pasadena (Educational Facilities Improvements) USD GO, 5.00% due 8/1/2024 - 8/1/2026 | | | | 1,115,000 | | | | | 1,331,402 | |
| | Pomona (Educational Facilities Improvements; Insured: Natl-Re) USD GO, Series A, 6.10% due 2/1/2020 | | | | 465,000 | | | | | 501,744 | |
| | Pomona Public Financing Authority (Facilities Improvements),
Series BC, 2.00% due 6/1/2018 | | | | 500,000 | | | | | 500,400 | |
| | 3.00% due 6/1/2020 | | | | 250,000 | | | | | 256,973 | |
| | Pomona Public Financing Authority (Facilities Improvements; Insured: AGM),
Series BC, 4.00% due 6/1/2024 - 6/1/2026 | | | | 725,000 | | | | | 802,168 | |
| | Port of Oakland, Series D, 5.00% due 11/1/2020 | | | | 4,810,000 | | | | | 5,173,251 | |
| | Rancho Santa Fe Community Services District Financing Authority,
Series A, 3.00% due 9/1/2018 - 9/1/2019 | | | | 1,805,000 | | | | | 1,823,745 | |
| | 4.00% due 9/1/2020 - 9/1/2023 | | | | 2,675,000 | | | | | 2,858,616 | |
| | 5.00% due 9/1/2024 - 9/1/2026 | | | | 3,410,000 | | | | | 3,961,054 | |
| | Redevelopment Agency of the City and County of San Francisco (Yerba Buena Center Redevelopment Project Area; Insured: AGM), 5.00% due 6/1/2020 | | | | 1,730,000 | | | | | 1,850,598 | |
| | Redevelopment Agency of the City of Rialto (Merged Project Area; Insured: BAM),
Series A, 5.00% due 9/1/2023 - 9/1/2024 | | | | 1,050,000 | | | | | 1,214,752 | |
| | Ridgecrest Redevelopment Agency (Redevelopment Project), 5.25% due 6/30/2018 | | | | 1,050,000 | | | | | 1,056,772 | |
| | 5.50% due 6/30/2019 - 6/30/2020 | | | | 2,090,000 | | | | | 2,192,193 | |
| | Riverside County Infrastructure Financing Authority (Capital Improvement Projects),
Series A, 4.00% due 11/1/2018 - 11/1/2019 | | | | 2,700,000 | | | | | 2,778,717 | |
| | 5.00% due 11/1/2020 - 11/1/2021 | | | | 1,105,000 | | | | | 1,207,383 | |
| | Riverside County Public Financing Authority (Capital Facilities Project), 4.00% due 11/1/2020 | | | | 465,000 | | | | | 490,529 | |
| | 5.00% due 11/1/2019 - 11/1/2025 | | | | 4,000,000 | | | | | 4,388,220 | |
| | Riverside County Public Financing Authority, 4.00% due 5/1/2021 | | | | 295,000 | | | | | 313,432 | |
| | Riverside Financing Authority (Educational Facilities; Insured: BAM) USD, 5.00% due 9/1/2019 - 9/1/2025 | | | | 2,195,000 | | | | | 2,422,076 | |
| | Sacramento City (Educational Facilities Improvements) USD GO, 4.00% due 7/1/2019 | | | | 5,455,000 | | | | | 5,621,705 | |
| | 5.00% due 7/1/2021 | | | | 3,600,000 | | | | | 3,973,356 | |
Semi-Annual Report | 9
Schedule of Investments, Continued
Thornburg California Limited Term Municipal Fund | March 31, 2018 (Unaudited)
| | | | | | | | | | | | |
| | | ISSUER-DESCRIPTION | | PRINCIPAL AMOUNT | | VALUE |
| | Sacramento City (Educational Facilities Improvements; Insured: AGM) USD GO, 5.00% due 7/1/2018 - 7/1/2022 | | | $ | 2,595,000 | | | | $ | 2,790,965 | |
| | Sacramento City Schools Joint Power Financing Authority (Sacramento City USD Educational Facility Sublease; Insured: BAM), Series A, 5.00% due 3/1/2021 - 3/1/2025 | | | | 5,360,000 | | | | | 6,051,108 | |
| | Sacramento Cogeneration Authority (Procter & Gamble Project), 5.00% due 7/1/2019 | | | | 625,000 | | | | | 651,537 | |
| | Salinas Valley Solid Waste Authority (Insured: AGM), Series A, 5.00% due 8/1/2023 | | | | 1,530,000 | | | | | 1,718,833 | |
| | San Diego (Educational System Capital Projects) GO, Series R-3, 5.00% due 7/1/2023 - 7/1/2024 | | | | 8,000,000 | | | | | 9,233,780 | |
| | San Diego (Educational System Capital Projects; Insured: Natl-Re) GO, Series D-1, 5.50% due 7/1/2020 | | | | 1,390,000 | | | | | 1,510,610 | |
| | San Diego Redevelopment Agency (Centre City Redevelopment; Insured: AGM), 0.00%, due 9/1/2019 | | | | 1,910,000 | | | | | 1,863,606 | |
| | San Francisco City and County Airports Commission (San Francisco International Airport),
Series A, 5.00% due 5/1/2026 | | | | 5,000,000 | | | | | 5,941,250 | |
| | San Joaquin Delta Community College District (Insured: AGM) GO, 0.00%, Series B, due 8/1/2019 | | | | 5,000,000 | | | | | 4,728,850 | |
| | San Jose, Series A1, 3.50% due 10/1/2021 | | | | 170,000 | | | | | 173,208 | |
| | San Mateo County Joint Powers Financing Authority (County Capital Projects), Series A, 5.00% due 7/15/2018 | | | | 800,000 | | | | | 808,208 | |
| | San Mateo County Joint Powers Financing Authority (Maple Street Correctional Center),
5.00% due 6/15/2021 - 6/15/2023 | | | | 1,995,000 | | | | | 2,249,472 | |
| | San Mateo Union High School District (Educational Facilities; Insured: Natl-Re) GO, 0.00%, due 9/1/2019 | | | | 2,000,000 | | | | | 1,953,060 | |
| | Santa Ana (Insured: Natl-Re) USD GO, 0.00%, Series B, due 8/1/2020 | | | | 2,035,000 | | | | | 1,940,189 | |
| | Santa Ana Financing Authority (Police Administration & Holding Facility; Insured: Natl-Re), 6.25% due 7/1/2018 | | | | 2,000,000 | | | | | 2,023,100 | |
| | Santa Clara County Financing Authority (Multiple Facilities Projects), Series P, 5.00% due 5/15/2025 | | | | 6,755,000 | | | | | 7,970,157 | |
| | Santa Margarita Water District (Talega Community Facilities), 5.00% due 9/1/2026 - 9/1/2027 | | | | 1,050,000 | | | | | 1,253,615 | |
| | Semitropic Water Storage Improvement District (Irrigation Water System; Insured: AGM),
Series A, 5.00% due 12/1/2019 - 12/1/2027 | | | | 4,060,000 | | | | | 4,694,770 | |
| | South San Francisco (Educational Facilities) USD GO, Series E, 4.00% due 6/15/2018 | | | | 5,000,000 | | | | | 5,026,050 | |
| | Southeast Resource Recovery Facilities Authority (Insured: AMBAC), Series B, 5.375% due 12/1/2018 | | | | 2,000,000 | | | | | 2,005,860 | |
| | Southern California Public Power Authority (Magnolia Power Project A),
Series 1, 2.00% due 7/1/2036 (put 7/1/2020) | | | | 3,000,000 | | | | | 3,019,920 | |
| | Southwestern Community College District GO, Series B, 4.00% due 8/1/2022 - 8/1/2026 | | | | 1,670,000 | | | | | 1,861,698 | |
| | State of California (Various Capital Projects) GO, 5.00% due 9/1/2020 | | | | 2,000,000 | | | | | 2,157,220 | |
| | State of California (Various Capital Projects; Insured: AGM) GO, 4.75% due 9/1/2018 | | | | 70,000 | | | | | 70,963 | |
| | State of California Economic Recovery GO, Series A, 5.00% due 7/1/2018 | | | | 3,000,000 | | | | | 3,026,340 | |
| | Successor Agency to the City of Colton Redevelopment Agency (Multiple Redevelopment Project Areas; Insured: BAM), 5.00% due 8/1/2021 - 8/1/2025 | | | | 2,815,000 | | | | | 3,208,749 | |
| | Successor Agency to the City of Riverside Redevelopment Agency (Multiple Redevelopment Project Areas), Series A, 5.00% due 9/1/2023 - 9/1/2024 | | | | 2,985,000 | | | | | 3,444,093 | |
| | Successor Agency to the City of San Diego Redevelopment Agency (Multiple Redevelopment Project Areas), Series A, 5.00% due 9/1/2025 - 9/1/2026 | | | | 4,245,000 | | | | | 5,036,028 | |
| | Successor Agency to the Commerce Community Development Commission (Multiple Redevelopment Project Areas; Insured: AGM), Series A, 5.00% due 8/1/2027 | | | | 1,760,000 | | | | | 2,080,179 | |
| | Successor Agency to the Community Development Agency of the City of Menlo Park (Las Pulgas Community Development Project), 5.00% due 10/1/2019 - 10/1/2020 | | | | 725,000 | | | | | 771,472 | |
| | Successor Agency to the Community Development Agency of the City of Menlo Park (Las Pulgas Community Development Project; Insured: AGM), 5.00% due 10/1/2022 - 10/1/2025 | | | | 1,400,000 | | | | | 1,610,815 | |
| | Successor Agency to the Community Redevelopment Agency of the City of Palmdale (Merged Redevelopment Project Areas), Series A, 5.00% due 9/1/2024 - 9/1/2026 | | | | 1,600,000 | | | | | 1,877,881 | |
| | Successor Agency to the Poway Redevelopment Agency (Paguay Redevelopment Project),
Series A, 5.00% due 6/15/2025 | | | | 4,665,000 | | | | | 5,496,210 | |
| | Successor Agency to the Rancho Cucamonga Redevelopment Project (Rancho Redevelopment Project Area; Insured: AGM), 5.00% due 9/1/2023 - 9/1/2024 | | | | 3,000,000 | | | | | 3,473,850 | |
| | Successor Agency to the Redevelopment Agency of the City and County of San Francisco (San Francisco Redevelopment Projects), Series C, 5.00% due 8/1/2019 - 8/1/2021 | | | | 4,735,000 | | | | | 5,061,175 | |
| | Successor Agency to the Redevelopment Agency of the City of San Mateo (Multiple Redevelopment Project Areas), Series A, 5.00% due 8/1/2025 | | | | 425,000 | | | | | 505,431 | |
| | Successor Agency to the Redevelopment Agency of the City of Stockton (Redevelopment of Midtown, North and South Stockton and Waterfront Areas;
Insured: AGM), Series A, 5.00% due 9/1/2026 - 9/1/2027 | | | | 2,000,000 | | | | | 2,354,020 | |
| | Successor Agency to the Richmond County Redevelopment Agency (Joint Powers Financing Authority & Harbour Redevelopment Project; Insured: BAM), Series A, 5.00% due 9/1/2022 - 9/1/2024 | | | | 1,250,000 | | | | | 1,428,600 | |
| | Successor Agency to the Rosemead Community Development Commission (Rosemead Merged Project Area; Insured: BAM), 5.00% due 10/1/2020 - 10/1/2026 | | | | 4,835,000 | | | | | 5,496,765 | |
| | Temecula Valley Financing Authority (Educational Facilities; Insured: BAM) USD, 5.00% due 9/1/2018 - 9/1/2025 | | | | 2,790,000 | | | | | 3,060,058 | |
| | Temecula Valley Unified School District Financing Authority (Insured BAM), 5.00% due 9/1/2027 | | | | 2,220,000 | | | | | 2,548,937 | |
| | Trustees of the California State University (Educational Facilities Improvements), Series A, 5.00% due 11/1/2026 | | | | 1,000,000 | | | | | 1,203,710 | |
| | Tulare Public Financing Authority (Insured BAM), 3.00% due 4/1/2019 | | | | 200,000 | | | | | 202,930 | |
| | 4.00% due 4/1/2020 - 4/1/2022 | | | | 725,000 | | | | | 771,166 | |
| | 5.00% due 4/1/2023 - 4/1/2028 | | | | 1,410,000 | | | | | 1,646,921 | |
| | Turlock Irrigation District, 5.00% due 1/1/2025 - 1/1/2026 | | | | 2,000,000 | | | | | 2,358,540 | |
| | Series A, 5.00% due 1/1/2019 | | | | 1,000,000 | | | | | 1,026,090 | |
| | Ukiah (Insured: Natl-Re) USD GO, 0.00%, due 8/1/2019 | | | | 2,000,000 | | | | | 1,952,460 | |
| | Upper Lake Union High School District (Insured: Natl-Re) GO, 0.00%, Series A, due 8/1/2020 | | | | 1,050,000 | | | | | 959,364 | |
| | Ventura County Public Financing Authority (Office Building Purchase and Improvements),
5.00% due 11/1/2023 - 11/1/2024 | | | | 1,560,000 | | | | | 1,797,429 | |
10 | Semi-Annual Report
Schedule of Investments, Continued
Thornburg California Limited Term Municipal Fund | March 31, 2018 (Unaudited)
| | | | | | | | | | | | |
| | | ISSUER-DESCRIPTION | | PRINCIPAL AMOUNT | | VALUE |
| | Vista Redevelopment Agency (Vista Redevelopment Project; Insured: AGM), Series B1, 5.00% due 9/1/2019 - 9/1/2023 | | | $ | 1,575,000 | | | | $ | 1,737,297 | |
| | Walnut Improvement Agency (City of Walnut Improvement Plan; Insured: BAM), 5.00% due 3/1/2019 | | | | 400,000 | | | | | 412,800 | |
| | Westminster Redevelopment Agency (Commercial Redevelopment Project No. 1; Insured: AGM), 5.00% due 8/1/2024 | | | | 1,205,000 | | | | | 1,217,821 | |
| | | | | | | | | | | | |
| | | |
| | TOTAL INVESTMENTS — 99.7% (Cost $574,012,259) | | | | | | | | $ | 580,859,101 | |
| | | |
| | OTHER ASSETS LESS LIABILITIES — 0.3% | | | | | | | | | 1,863,380 | |
| | | | | | | | | | | | |
| | | |
| | NET ASSETS — 100.0% | | | | | | | | $ | 582,722,481 | |
| | | | | | | | | | | | |
Footnote Legend
| a | Floating Rate Security. Stated interest/floor rate was in effect at March 31, 2018. |
| b | Variable Rate Demand Notes are instruments whose interest rates change on a specific date (such as coupon date or interest payment date) or whose interest rates vary with changes in a designated base rate (such as the prime interest rate). This instrument is payable on demand and is secured by letters of credit or other credit support agreements from major banks. |
| c | Segregated as collateral for a when-issued security. |
Portfolio Abbreviations
To simplify the listings of securities, abbreviations are used per the table below:
| | |
| ACA | | Insured by American Capital Access |
| AGM | | Insured by Assured Guaranty Municipal Corp. |
| AMBAC | | Insured by American Municipal Bond Assurance Corp. |
| AMT | | Alternative Minimum Tax |
| BAM | | Insured by Build America Mutual Insurance Co. |
| COP | | Certificates of Participation |
| FHA | | Insured by Federal Housing Administration |
| GO | | General Obligation |
| HFFA | | Health Facilities Financing Authority |
| LIBOR | | London Interbank Offered Rates |
| Mtg | | Mortgage |
| MUNIPSA | | Securities Industry and Financial Markets Association (SIFMA) Municipal Swap Index |
| Natl-Re | | Insured by National Public Finance Guarantee Corp. |
See notes to financial statements.
Semi-Annual Report | 11
Statement of Assets and Liabilities
Thornburg California Limited Term Municipal Fund | March 31, 2018 (Unaudited)
| | | | |
ASSETS | | | | |
| |
Investments at value (cost $574,017,979) (Note 3) | | $ | 580,859,101 | |
Cash | | | 326,098 | |
Receivable for investments sold | | | 11,000,959 | |
Receivable for fund shares sold | | | 2,030,395 | |
Interest receivable | | | 5,990,395 | |
Prepaid expenses and other assets | | | 10,780 | |
| | | | |
| |
Total Assets | | | 600,217,728 | |
| | | | |
| |
LIABILITIES | | | | |
| |
Payable for investments purchased | | | 15,907,378 | |
Payable for fund shares redeemed | | | 937,473 | |
Payable to investment advisor and other affiliates (Note 4) | | | 331,930 | |
Accounts payable and accrued expenses | | | 144,741 | |
Dividends payable | | | 173,725 | |
| | | | |
| |
Total Liabilities | | | 17,495,247 | |
| | | | |
| |
NET ASSETS | | $ | 582,722,481 | |
| | | | |
| |
NET ASSETS CONSIST OF | | | | |
| |
Undistributed net investment income | | $ | 2,404 | |
Net unrealized appreciation on investments | | | 6,841,121 | |
Accumulated net realized gain (loss) | | | (2,278,431 | ) |
Net capital paid in on shares of beneficial interest | | | 578,157,387 | |
| | | | |
| | $ | 582,722,481 | |
| | | | |
| |
NET ASSET VALUE | | | | |
| |
Class A Shares: | | | | |
Net asset value and redemption price per share
($137,017,380 applicable to 10,153,493 shares of beneficial interest outstanding - Note 5) | | $ | 13.49 | |
| |
Maximum sales charge, 1.50% of offering price | | | 0.21 | |
| | | | |
| |
Maximum offering price per share | | $ | 13.70 | |
| | | | |
| |
Class C Shares: | | | | |
Net asset value and offering price per share*
($49,688,397 applicable to 3,679,112 shares of beneficial interest outstanding - Note 5) | | $ | 13.51 | |
| | | | |
| |
Class I Shares: | | | | |
Net asset value, offering and redemption price per share
($396,016,704 applicable to 29,317,636 shares of beneficial interest outstanding - Note 5) | | $ | 13.51 | |
| | | | |
* Redemption price per share is equal to net asset value less any applicable contingent deferred sales charge.
See notes to financial statements.
12 | Semi-Annual Report
Statement of Operations
Thornburg California Limited Term Municipal Fund | Six Months Ended March 31, 2018 (Unaudited)
| | | | |
INVESTMENT INCOME | | | | |
| |
Interest income (net of premium amortized of $4,642,717) | | $ | 7,369,273 | |
| | | | |
| |
EXPENSES | | | | |
| |
Investment advisory fees (Note 4) | | | 1,487,420 | |
Administration fees (Note 4) | | | | |
Class A Shares | | | 82,207 | |
Class C Shares | | | 29,598 | |
Class I Shares | | | 126,035 | |
Distribution and service fees (Note 4) | | | | |
Class A Shares | | | 183,309 | |
Class C Shares | | | 132,018 | |
Transfer agent fees | | | | |
Class A Shares | | | 33,417 | |
Class C Shares | | | 14,715 | |
Class I Shares | | | 160,481 | |
Registration and filing fees | | | | |
Class A Shares | | | 2,300 | |
Class C Shares | | | 1,950 | |
Class I Shares | | | 4,013 | |
Custodian fees (Note 2) | | | 49,312 | |
Professional fees | | | 25,986 | |
Trustee and officer fees (Note 4) | | | 14,275 | |
Other expenses | | | 24,234 | |
| | | | |
| |
Total Expenses | | | 2,371,270 | |
| |
Less: | | | | |
Expenses reimbursed by investment advisor (Note 4) | | | (646 | ) |
| | | | |
| |
Net Expenses | | | 2,370,624 | |
| | | | |
| |
Net Investment Income | | $ | 4,998,649 | |
| | | | |
| |
REALIZED AND UNREALIZED GAIN (LOSS) | | | | |
| |
Net realized gain (loss) on investments | | | (409,995 | ) |
Net change in unrealized appreciation (depreciation) on investments | | | (12,488,716 | ) |
| | | | |
| |
Net Realized and Unrealized Loss | | | (12,898,711 | ) |
| | | | |
| |
Net Decrease in Net Assets Resulting from Operations | | $ | (7,900,062 | ) |
| | | | |
See notes to financial statements.
Semi-Annual Report | 13
Statements of Changes in Net Assets
Thornburg California Limited Term Municipal Fund
| | | | | | | | | | |
| | | SIX MONTHS ENDED
MARCH 31, 2018* | | YEAR ENDED
SEPTEMBER 30, 2017 |
INCREASE (DECREASE) IN NET ASSETS FROM | | | | | | | | | | |
| | |
OPERATIONS | | | | | | | | | | |
| | |
Net investment income | | | $ | 4,998,649 | | | | $ | 10,168,283 | |
Net realized gain (loss) on investments | | | | (409,995 | ) | | | | (1,852,646 | ) |
Net unrealized appreciation (depreciation) on investments | | | | (12,488,716 | ) | | | | (9,948,197 | ) |
| | | | | |
| | |
Net Decrease in Net Assets Resulting from Operations | | | | (7,900,062 | ) | | | | (1,632,560 | ) |
| | |
DIVIDENDS TO SHAREHOLDERS | | | | | | | | | | |
| | |
From net investment income | | | | | | | | | | |
Class A Shares | | | | (1,065,190 | ) | | | | (2,189,461 | ) |
Class C Shares | | | | (314,340 | ) | | | | (661,782 | ) |
Class I Shares | | | | (3,619,119 | ) | | | | (7,317,040 | ) |
| | |
FUND SHARE TRANSACTIONS (NOTE 5) | | | | | | | | | | |
| | |
Class A Shares | | | | (18,067,828 | ) | | | | (31,828,772 | ) |
Class C Shares | | | | (5,959,397 | ) | | | | (10,448,138 | ) |
Class I Shares | | | | (30,089,982 | ) | | | | (34,098,001 | ) |
| | | | | |
| | |
Net Decrease in Net Assets | | | | (67,015,918 | ) | | | | (88,175,754 | ) |
| | |
NET ASSETS | | | | | | | | | | |
| | |
Beginning of Period | | | | 649,738,399 | | | | | 737,914,153 | |
| | | | | |
| | |
End of Period | | | $ | 582,722,481 | | | | $ | 649,738,399 | |
| | | | | |
| | |
Undistributed net investment income | | | $ | 2,404 | | | | $ | 2,404 | |
* Unaudited.
See notes to financial statements.
14 | Semi-Annual Report
Notes to Financial Statements
Thornburg California Limited Term Municipal Fund | March 31, 2018 (Unaudited)
NOTE 1 – ORGANIZATION
Thornburg California Limited Term Municipal Fund (the “Fund”) is a diversified series of Thornburg Investment Trust (the “Trust”). The Trust was organized as a Massachusetts business trust under a Declaration of Trust dated June 3, 1987 and is registered as a diversified, open-end management investment company under the Investment Company Act of 1940, as amended. The Fund is currently one of twenty-one separate series of the Trust. Each series is considered to be a separate entity for financial reporting and tax purposes and bears expenses directly attributable to it. The Fund’s primary investment objective is to obtain as high a level of current income exempt from federal and California state individual income tax as is consistent, in the view of Thornburg Investment Management, Inc., the Trust’s investment advisor (the “Advisor”), with the preservation of capital. The Fund’s secondary objective is to reduce expected changes in its share price compared to longer intermediate and long-term bond portfolios.
The Fund currently offers three classes of shares of beneficial interest: Class A, Class C, and Institutional Class (“Class I”). Each class of shares of the Fund represents an interest in the same portfolio of investments, except that (i) Class A shares are sold subject to a front-end sales charge collected at the time the shares are purchased and bear a service fee, (ii) Class C shares are sold at net asset value without a sales charge at the time of purchase, but are subject to a contingent deferred sales charge upon redemption within one year of purchase, and bear both a service fee and a distribution fee, (iii) Class I shares are sold at net asset value without a sales charge at the time of purchase and may be subject to a service fee, and (iv) the respective classes may have different reinvestment privileges and conversion rights. Additionally, the Fund may allocate among its classes certain expenses, to the extent allocable to specific classes, including transfer agent fees, government registration fees, certain printing and postage costs, and administrative and legal expenses. Currently, class specific expenses of the Fund are limited to service and distribution fees, administration fees, and certain registration and transfer agent expenses.
The following is a summary of significant accounting policies followed by the Fund in the preparation of its financial statements. The Fund prepares its financial statements in conformity with United States generally accepted accounting principles (“GAAP”), including investment company accounting and reporting guidance in the Financial Accounting Standards Board (the “FASB”) Accounting Standard Codification Topic 946.
NOTE 2 – SIGNIFICANT ACCOUNTING POLICIES
Security Valuation: All investments in securities held by the Fund are valued as described in Note 3.
Allocation of Income, Gains, Losses and Expenses: Net investment income (other than class specific expenses) and realized and unrealized gains and losses are allocated daily to each class of shares based upon the relative net asset value of outstanding shares (or the value of the dividend-eligible shares, as appropriate) of each class of shares at the beginning of the day (after adjusting for the current capital shares activity of the respective class). Expenses common to all Funds are allocated among the Funds comprising the Trust based upon their relative net asset values or other appropriate allocation methods. Operating expenses directly attributable to a specific class are charged against the operating income of that class.
Dividends and Distributions to Shareholders: Dividends and distributions to shareholders, which are determined in accordance with federal income tax regulations and may differ from GAAP, are recorded on the ex-dividend date. Ordinary income distributions, if any, are declared daily and paid monthly. Capital gain distributions, if any, are declared and paid annually and more often if deemed necessary by the Advisor. Dividends are paid and are reinvested in additional shares of the Fund at net asset value per share at the close of business on the ex-dividend date, or at the shareholder’s option, paid in cash.
Investment Income: Interest income is accrued as earned. Premiums and discounts are amortized and accreted, respectively, to call dates or maturity dates using the effective yield method of the respective investments. These amounts are included in Interest income on the Statement of Operations.
Custodian Fees: Custodian fees disclosed in the Statement of Operations may include interest expenses incurred by the Fund on any cash overdrafts of its custodian account during the period. Such cash overdrafts may result from the effects of failed trades in portfolio securities and from cash outflows resulting from unanticipated shareholder redemption activity. The Fund pays interest to its custodian on any such cash overdraft at a rate set periodically at the custodian’s discretion of the overdraft amount in excess of $50,000.
Investment Transactions: Investment transactions are accounted for on a trade date basis. Realized gains and losses from the sale of investments are recorded on an identified cost basis.
When-Issued and Delayed Delivery Transactions: The Fund may engage in when-issued or delayed delivery transactions. To the extent the Fund engages in such transactions, it will do so for the purpose of acquiring portfolio investments consistent with the Fund’s investment objectives and not for the purpose of investment leverage or to speculate on interest rate or market changes. At the time the Fund makes a commitment to purchase an investment on a when-issued or delayed delivery basis, the Fund will record the transaction and reflect the
Semi-Annual Report | 15
Notes to Financial Statements, Continued
Thornburg California Limited Term Municipal Fund | March 31, 2018 (Unaudited)
value in determining its net asset value. When effecting such transactions, assets of an amount sufficient to make payment for the portfolio investments to be purchased will be segregated on the Fund’s records on the trade date. Investments purchased on a when-issued or delayed delivery basis do not earn interest until the settlement date.
Guarantees and Indemnifications: Under the Trust’s organizational documents (and under separate agreements with the independent Trustees), its officers and Trustees are provided with an indemnification against certain liabilities arising out of the performance of their duties to the Fund. In the normal course of business the Trust may also enter into contracts with service providers that contain general indemnifications. The Trust’s maximum exposure under these arrangements is unknown. However, based on experience, the Trust expects the risk of loss to be remote.
Use of Estimates: The preparation of financial statements in conformity with GAAP requires management to make estimates and assumptions that affect the reported amounts of assets and liabilities and disclosure of contingent assets and liabilities at the date of the financial statements and the reported amounts of increases (decreases) in net assets from operations during the reporting period. Actual results could differ from those estimates.
Federal Income Taxes: It is the policy of the Trust to comply with the provisions of the Internal Revenue Code applicable to regulated investment companies and to distribute to shareholders substantially all investment company taxable income including net realized gains on investments (if any), and tax exempt income of the Fund. Therefore, no provision for federal income or excise tax is required.
The Fund files income tax returns in United States federal and applicable state jurisdictions. The statute of limitations on the Fund’s tax return filings generally remains open for the three years following a return’s filing date. The Fund has analyzed each uncertain tax position believed to be material in the preparation of the Fund’s financial statements for the six month period ended March 31, 2018, including open tax years, to assess whether it is more likely than not that the position would be sustained upon examination, based on the technical merits of the position. The Fund has not identified any such position for which an asset or liability must be reflected in the Statement of Assets and Liabilities.
At March 31, 2018, information on the tax components of capital was as follows:
| | | | | |
Cost of investments for tax purposes | | | $ | 574,017,979 | |
| | | | | |
Gross unrealized appreciation on a tax basis | | | | 10,345,841 | |
Gross unrealized depreciation on a tax basis | | | | (3,504,719 | ) |
| | | | | |
Net unrealized appreciation (depreciation) on investments (tax basis) | | | $ | 6,841,122 | |
| | | | | |
At March 31, 2018, the Fund had deferred tax basis capital losses occurring subsequent to October 31, 2016 through September 30, 2017 of $1,853,735. For tax purposes, such losses will be recognized in the year ending September 30, 2018.
At March 31, 2018, the Fund had cumulative tax basis capital losses of $14,699 (of which $14,699 are short-term and $0 are long-term) generated after September 30, 2011, which may be carried forward to offset future capital gains. To the extent such carryforwards are used, capital gain distributions may be reduced to the extent provided by regulations. Such capital loss carryforwards do not expire.
NOTE 3 – SECURITY VALUATION
Valuation of the Fund’s portfolio investment securities is performed in accordance with policies and procedures adopted by and under the oversight of the Trustees.
The Trustees of the Trust have appointed the Advisor to assist the Trustees to obtain market values for portfolio investments, evaluate and monitor professional pricing service providers appointed by the Trustees’ Audit Committee (the “Audit Committee”) to assist in determining fair values for portfolio investments, assist in calculating fair values for portfolio investments in certain circumstances, and to perform other functions in connection with the valuation of investments. The Advisor acts through its Valuation and Pricing Committee (the “Committee”) and other employees of the Advisor. The Committee regularly reviews its own valuation calculations, as well as the valuations, valuation techniques and services furnished by pricing service providers, considers circumstances which may require valuation calculations by the Committee, and reviews previous valuation calculations. The Committee reports to the Audit Committee on the Committee’s activities, the performance of pricing service providers, and other matters relating to valuation of portfolio investments.
In those instances when the Committee assists in calculating a fair value for a portfolio investment, the Committee seeks to determine the price that the Fund would reasonably expect to receive upon a sale of the investment in an orderly transaction between market participants on the valuation date. The Committee customarily utilizes quotations from securities broker dealers in calculating valuations, but also may utilize prices obtained from pricing service providers or other methods approved by the Audit Committee. Because fair values calculated by the Committee are estimates, the calculation of a value for an investment may differ from the price that would be realized by the Fund upon
16 | Semi-Annual Report
Notes to Financial Statements, Continued
Thornburg California Limited Term Municipal Fund | March 31, 2018 (Unaudited)
a sale of the investment, and the difference could be material to the Fund’s financial statements. The Committee’s calculation of a fair value for an investment may also differ from the prices obtained by other persons (including other mutual funds) for the investment.
Valuation of Securities: Debt obligations held by the Fund which are not listed or traded on exchanges or for which no reported market exists are ordinarily valued at the valuation obtained from a pricing service provider approved by the Audit Committee.
In any case when a pricing service provider fails to provide a valuation for a debt obligation held by the Fund, the Committee calculates a fair value for the obligation using alternative methods under procedures approved by the Audit Committee. Additionally, in cases when management believes that a valuation obtained from a pricing service provider merits review for significant reasons, the Committee decides whether or not to use the valuation calculated by the pricing service provider or to use an alternative method approved by the Audit Committee to calculate a fair value for the obligation.
Valuation Hierarchy: The Fund categorizes its investments based upon the inputs used in valuing those investments, according to a three-level hierarchy established in guidance from the FASB. Categorization of investments using this hierarchy is intended by the FASB to maximize the use of observable inputs in valuing investments and minimize the use of unobservable inputs by requiring that the most observable inputs be used when available. Observable inputs are those that market participants would use in valuing an investment based on available market information. Unobservable inputs are those that reflect assumptions about the information market participants would use in valuing an investment. An investment’s level within the hierarchy is based on the lowest level input that is deemed significant to the valuation. The methodologies and inputs used to value investments are not necessarily indications of the risk or liquidity associated with those investments.
Various inputs are used in calculating valuations for the Fund’s investments. These inputs are generally summarized according to the three-level hierarchy below:
Level 1: Quoted prices in active markets for identical investments.
Level 2: Other direct or indirect significant observable inputs (including quoted prices for similar investments in active markets and other observable inputs, such as interest rates, prepayment rates, credit risk, etc.).
Level 3: Significant unobservable inputs (including the Committee’s own assumptions in calculating the fair values of investments).
Valuations for debt obligations held by the Fund are typically calculated by pricing service providers approved by the Audit Committee and are generally characterized as Level 2 within the valuation hierarchy.
In a limited number of cases the Committee calculates a fair value for investments using broker quotations or other methods approved by the Audit Committee. When the Committee uses a single broker quotation to calculate a fair value for an investment without other significant observable inputs, or if a fair value is calculated using other significant inputs that are considered unobservable, the investment is characterized as Level 3 within the hierarchy. Other significant unobservable inputs used to calculate a fair value in these instances might include an income-based valuation approach which considers discounted anticipated future cash flows from the investment and application of discounts due to the nature or duration of any restrictions on the disposition of the investment.
Valuations based upon the use of inputs from Levels 1, 2 or 3 may not represent the actual price received upon the disposition of an investment, and the Fund may receive a price that is lower than the valuation based upon these inputs when it sells the investment.
The following table displays a summary of the fair value hierarchy measurements of the Fund’s investments as of March 31, 2018. In any instance when valuation inputs from more than one level are used to determine the fair value of a specific investment, the investment is placed in the level of the table based upon the lowest level input that is significant in determining the fair value of the investment:
| | | | | | | | | | | | | | | | | | | | |
| | | FAIR VALUE MEASUREMENTS AT MARCH 31, 2018 |
| | | TOTAL | | LEVEL 1 | | LEVEL 2 | | LEVEL 3 |
Assets | | | | | | | | | | | | | | | | | | | | |
Investments in Securities | | | | | | | | | | | | | | | | | | | | |
Municipal Bonds | | | $ | 580,859,101 | | | | $ | – | | | | $ | 580,859,101 | | | | $ | – | |
| | | | | |
Total Investments in Securities | | | $ | 580,859,101 | | | | $ | – | | | | $ | 580,859,101 | | | | $ | – | |
In accordance with the guidance prescribed in Accounting Standards Update No. 2011-04, it is the policy of the Fund to recognize transfers between levels and the underlying events which caused the movement. The Fund recognized no transfers between levels for the six months ended March 31, 2018.
Semi-Annual Report | 17
Notes to Financial Statements, Continued
Thornburg California Limited Term Municipal Fund | March 31, 2018 (Unaudited)
NOTE 4 – INVESTMENT ADVISORY FEE AND OTHER TRANSACTIONS WITH AFFILIATES
Pursuant to an investment advisory agreement, the Advisor serves as the investment advisor and performs services for the Fund for which the fees are payable at the end of each month. Under the investment advisory agreement, the Fund pays the Advisor a management fee based on the daily net assets of the Fund at an annual rate as shown in the following table:
| | | | | |
| Management Fee Schedule |
| DAILY NET ASSETS | | FEE RATE |
| |
Up to $500 million | | | | 0.500 | % |
| |
Next $500 million | | | | 0.400 | |
| |
Next $500 million | | | | 0.300 | |
| |
Next $500 million | | | | 0.250 | |
| |
Over $2 billion | | | | 0.225 | |
The Fund’s effective management fee for the six months ended March 31, 2018 was 0.481% of the Fund’s average net assets.
The Trust has entered into administrative service agreements with the Advisor, whereby the Advisor will perform certain administrative services related to each class of the Fund’s shares. Until January 31, 2018, the fees were payable at an annual rate of up to 0.125 of 1% per annum of the average daily net assets attributable to each class of shares. As of February 1, 2018, the fees are computed as an annual percentage of the aggregate average daily net assets of all shares classes of all Funds in the Trust as follows:
| | | | | |
| Administration Fee Schedule |
| DAILY NET ASSETS | | FEE RATE |
| |
Up to $20 billion | | | | 0.100 | % |
| |
$20 billion to $40 billion | | | | 0.075 | |
| |
$40 billion to $60 billion | | | | 0.040 | |
| |
Over $60 billion | | | | 0.030 | |
The aggregate fee amount is allocated on a daily basis to each Fund based on net assets and subsequently allocated to each class of shares of the Fund. Total administrative service fees incurred by each class of shares of the Fund for the six months ended March 31, 2018, are set forth in the Statement of Operations.
The Trust has an underwriting agreement with Thornburg Securities Corporation (the “Distributor”), an affiliate of the Advisor, which acts as the distributor of the Fund’s shares. For the six months ended March 31, 2018, the Distributor has advised the Fund that it earned net commissions aggregating $574 from the sale of Class A shares, and collected contingent deferred sales charges aggregating $3,077 from redemptions of Class C shares of the Fund.
Pursuant to a service plan under Rule 12b-1 of the Investment Company Act of 1940, the Fund may pay to the Distributor or securities dealers and other financial institutions at the Distributor’s direction an amount not to exceed .25 of 1% per annum of the average daily net assets attributable to Class A and Class C shares of the Fund to obtain various shareholder and distribution related services. For the six months ended March 31, 2018, there were no 12b-1 service plan fees charged for Class I shares. The Advisor and Distributor each may pay out of its own resources additional expenses for distribution of the Fund’s shares and shareholder services.
The Trust has also adopted a distribution plan pursuant to Rule 12b-1, applicable only to the Fund’s Class C shares under which the Fund compensates the Distributor for services in promoting the sale of Class C shares of the Fund at an annual rate of up to .25 of 1% per annum of the average daily net assets attributable to Class C shares.
Total fees incurred by each class of shares of the Fund under their respective service and distribution plans for the six months ended March 31, 2018, are set forth in the Statement of Operations.
For the six months ended March 31, 2018, the Advisor reimbursed certain class specific expenses, administrative fees, and distribution fees of $646 for Class I shares.
Certain officers and Trustees of the Trust are also officers or directors of the Advisor and Distributor. The compensation of the independent Trustees is borne by the Trust. The Trust also pays a portion of the Chief Compliance Officer’s compensation. These amounts are reflected as “Trustee and officer fees” in the Statement of Operations.
18 | Semi-Annual Report
Notes to Financial Statements, Continued
Thornburg California Limited Term Municipal Fund | March 31, 2018 (Unaudited)
The Fund may purchase or sell securities from, or to an affiliated fund, provided the affiliation is due solely to having a common investment advisor, common officers, or common trustees, and provided that all such transactions will comply with Rule 17a-7 under the 1940 Act. For the six months ended March 31, 2018, the Fund had transactions with affiliated funds of $1,500,000 in purchases.
NOTE 5 – SHARES OF BENEFICIAL INTEREST
At March 31, 2018, there were an unlimited number of shares with no par value of beneficial interest authorized. Transactions in shares of beneficial interest were as follows:
| | | | | | | | | | | | | | | | |
| | | SIX MONTHS ENDED
MARCH 31, 2018 (UNAUDITED) | | | YEAR ENDED
SEPTEMBER 30, 2017 (AUDITED) | |
| | | SHARES | | | AMOUNT | | | SHARES | | | AMOUNT | |
Class A Shares | | | | | | | | | | | | | | | | |
Shares sold | | | 712,095 | | | $ | 9,717,394 | | | | 2,739,756 | | | $ | 37,595,214 | |
Shares issued to shareholders in reinvestment of dividends | | | 69,176 | | | | 940,756 | | | | 138,354 | | | | 1,897,094 | |
Shares repurchased | | | (2,106,591 | ) | | | (28,725,978 | ) | | | (5,230,354 | ) | | | (71,321,080 | ) |
| | | | |
| | | | |
Net decrease | | | (1,325,320 | ) | | $ | (18,067,828 | ) | | | (2,352,244 | ) | | $ | (31,828,772 | ) |
| | | | |
Class C Shares | | | | | | | | | | | | | | | | |
Shares sold | | | 95,533 | | | $ | 1,303,186 | | | | 357,233 | | | $ | 4,900,123 | |
Shares issued to shareholders in reinvestment of dividends | | | 18,693 | | | | 254,413 | | | | 38,241 | | | | 524,749 | |
Shares repurchased | | | (550,075 | ) | | | (7,516,996 | ) | | | (1,157,958 | ) | | | (15,873,010 | ) |
| | | | |
| | | | |
Net decrease | | | (435,849 | ) | | $ | (5,959,397 | ) | | | (762,484 | ) | | $ | (10,448,138 | ) |
| | | | |
Class I Shares | | | | | | | | | | | | | | | | |
Shares sold | | | 6,610,128 | | | $ | 90,200,582 | | | | 16,070,560 | | | $ | 220,028,391 | |
Shares issued to shareholders in reinvestment of dividends | | | 206,379 | | | | 2,810,126 | | | | 425,235 | | | | 5,835,381 | |
Shares repurchased | | | (9,032,526 | ) | | | (123,100,690 | ) | | | (19,010,492 | ) | | | (259,961,773 | ) |
| | | | |
| | | | |
Net decrease | | | (2,216,019 | ) | | $ | (30,089,982 | ) | | | (2,514,697 | ) | | $ | (34,098,001 | ) |
| | | | |
NOTE 6 – INVESTMENT TRANSACTIONS
For the six months ended March 31, 2018, the Fund had purchase and sale transactions of investments (excluding short-term investments) of $96,004,890 and $88,413,326, respectively.
OTHER NOTES
Risks: The Fund’s investments subject it to risks including, but not limited to, management risk, interest rate risk, credit risk, market and economic risk, liquidity risk, and the risk of investing mainly in the obligations primarily originating in a single state. Please see the Fund’s prospectus for a discussion of the risks associated with an investment in the Fund.
Subsequent Events: Fund management believes no events have occurred between March 31, 2018 and the date of issuance of the financial statements that require adjustment to or disclosure in the accompanying financial statements.
Semi-Annual Report | 19
Financial Highlights
Thornburg California Limited Term Municipal Fund
| | | | | | | | | | | | | | | | | | | | | | | | | | | | | | | | | | | | | | | | |
| | | PER SHARE PERFORMANCE (FOR A SHARE OUTSTANDING THROUGHOUT THE PERIOD) |
| | | | | | | | | | | | | | | | | |
UNLESS OTHERWISE
NOTED, PERIODS ARE
FISCAL YEARS ENDED
SEPTEMBER 30, | | NET ASSET
VALUE,
BEGINNING OF
PERIOD | | NET
INVESTMENT
INCOME
(LOSS)+ | | NET REALIZED &
UNREALIZED GAIN
(LOSS) ON
INVESTMENTS | | TOTAL FROM
INVESTMENT
OPERATIONS | | DIVIDENDS
FROM NET
INVESTMENT
INCOME | | DIVIDENDS
FROM NET
REALIZED
GAINS | | TOTAL
DIVIDENDS | | NET ASSET
VALUE,
END OF PERIOD |
| | | | | | | |
| CLASS A SHARES | | | | | | | | | | | | | | | | | | | | | | | | | | | | | | | | | | | | |
| | | | | | | | |
2018(b)(c) | | | $ | 13.78 | | | | | 0.10 | | | | | (0.29 | ) | | | | (0.19 | ) | | | | (0.10 | ) | | | | – | | | | | (0.10 | ) | | | $ | 13.49 | |
2017(b) | | | $ | 13.98 | | | | | 0.18 | | | | | (0.20 | ) | | | | (0.02 | ) | | | | (0.18 | ) | | | | – | | | | | (0.18 | ) | | | $ | 13.78 | |
2016(b) | | | $ | 13.84 | | | | | 0.18 | | | | | 0.14 | | | | | 0.32 | | | | | (0.18 | ) | | | | – | | | | | (0.18 | ) | | | $ | 13.98 | |
2015(b) | | | $ | 13.84 | | | | | 0.19 | | | | | – | (e) | | | | 0.19 | | | | | (0.19 | ) | | | | – | | | | | (0.19 | ) | | | $ | 13.84 | |
2014(b) | | | $ | 13.54 | | | | | 0.23 | | | | | 0.30 | | | | | 0.53 | | | | | (0.23 | ) | | | | – | | | | | (0.23 | ) | | | $ | 13.84 | |
2013(b) | | | $ | 13.75 | | | | | 0.24 | | | | | (0.20 | ) | | | | 0.04 | | | | | (0.24 | ) | | | | (0.01 | ) | | | | (0.25 | ) | | | $ | 13.54 | |
| | | | | | | |
| CLASS C SHARES | | | | | | | | | | | | | | | | | | | | | | | | | | | | | | | | | | | | |
| | | | | | | | |
2018(c) | | | $ | 13.79 | | | | | 0.08 | | | | | (0.28 | ) | | | | (0.20 | ) | | | | (0.08 | ) | | | | – | | | | | (0.08 | ) | | | $ | 13.51 | |
2017 | | | $ | 13.99 | | | | | 0.15 | | | | | (0.20 | ) | | | | (0.05 | ) | | | | (0.15 | ) | | | | – | | | | | (0.15 | ) | | | $ | 13.79 | |
2016 | | | $ | 13.85 | | | | | 0.14 | | | | | 0.14 | | | | | 0.28 | | | | | (0.14 | ) | | | | – | | | | | (0.14 | ) | | | $ | 13.99 | |
2015 | | | $ | 13.85 | | | | | 0.16 | | | | | – | (e) | | | | 0.16 | | | | | (0.16 | ) | | | | – | | | | | (0.16 | ) | | | $ | 13.85 | |
2014 | | | $ | 13.55 | | | | | 0.19 | | | | | 0.30 | | | | | 0.49 | | | | | (0.19 | ) | | | | – | | | | | (0.19 | ) | | | $ | 13.85 | |
2013 | | | $ | 13.76 | | | | | 0.20 | | | | | (0.20 | ) | | | | – | | | | | (0.20 | ) | | | | (0.01 | ) | | | | (0.21 | ) | | | $ | 13.55 | |
| | | | | | | |
| CLASS I SHARES | | | | | | | | | | | | | | | | | | | | | | | | | | | | | | | | | | | | |
| | | | | | | | |
2018(c) | | | $ | 13.79 | | | | | 0.12 | | | | | (0.28 | ) | | | | (0.16 | ) | | | | (0.12 | ) | | | | – | | | | | (0.12 | ) | | | $ | 13.51 | |
2017 | | | $ | 13.99 | | | | | 0.22 | | | | | (0.20 | ) | | | | 0.02 | | | | | (0.22 | ) | | | | – | | | | | (0.22 | ) | | | $ | 13.79 | |
2016 | | | $ | 13.85 | | | | | 0.22 | | | | | 0.14 | | | | | 0.36 | | | | | (0.22 | ) | | | | – | | | | | (0.22 | ) | | | $ | 13.99 | |
2015 | | | $ | 13.85 | | | | | 0.24 | | | | | – | (e) | | | | 0.24 | | | | | (0.24 | ) | | | | – | | | | | (0.24 | ) | | | $ | 13.85 | |
2014 | | | $ | 13.55 | | | | | 0.27 | | | | | 0.30 | | | | | 0.57 | | | | | (0.27 | ) | | | | – | | | | | (0.27 | ) | | | $ | 13.85 | |
2013 | | | $ | 13.76 | | | | | 0.28 | | | | | (0.19 | ) | | | | 0.09 | | | | | (0.29 | ) | | | | (0.01 | ) | | | | (0.30 | ) | | | $ | 13.55 | |
| (a) | Not annualized for periods less than one year. |
| (b) | Sales loads are not reflected in computing total return. |
| (c) | Unaudited Six Month Period Ended March 31. |
| (e) | Net realized and unrealized gain (loss) on investments was less than $0.01 per share. |
| + | Based on weighted average shares outstanding. |
See notes to financial statements.
20 | Semi-Annual Report
Financial Highlights, Continued
Thornburg California Limited Term Municipal Fund
| | | | | | | | | | | | | | | | | | | | | | | | | | | | | | |
| RATIOS TO AVERAGE NET ASSETS | | | | | | SUPPLEMENTAL DATA | |
| | | | | | | EXPENSES, AFTER | | | | | | | | | | | | | | | | |
NET INVESTMENT
INCOME (LOSS) (%) | | | EXPENSES, AFTER
EXPENSE
REDUCTIONS (%) | | | EXPENSE
REDUCTIONS AND
NET OF CUSTODY
CREDITS (%) | | | EXPENSES,
BEFORE EXPENSE
REDUCTIONS (%) | | | | | | TOTAL
RETURN (%)(a)
| | | PORTFOLIO
TURNOVER
RATE (%)(a) | | | NET ASSETS AT
END OF PERIOD
(THOUSANDS) | |
| | | | | | | |
| | | | | | | | | | | | | | | | | | | | | | | | | | | | | | |
| | | | | | | |
| | 1.45 | (d) | | | 0.93 | (d) | | | 0.93 | (d) | | | 0.93 | (d) | | | | | | | (1.39 | ) | | | 15.82 | | | $ | 137,017 | |
| | 1.33 | | | | 0.93 | | | | 0.93 | | | | 0.93 | | | | | | | | (0.11 | ) | | | 18.25 | | | $ | 158,142 | |
| | 1.28 | | | | 0.93 | | | | 0.93 | | | | 0.93 | | | | | | | | 2.32 | | | | 16.47 | | | $ | 193,321 | |
| | 1.39 | | | | 0.94 | | | | 0.94 | | | | 0.94 | | | | | | | | 1.40 | | | | 14.43 | | | $ | 171,344 | |
| | 1.67 | | | | 0.95 | | | | 0.94 | | | | 0.95 | | | | | | | | 3.93 | | | | 16.85 | | | $ | 160,151 | |
| | 1.75 | | | | 0.94 | | | | 0.94 | | | | 0.94 | | | | | | | | 0.28 | | | | 17.57 | | | $ | 159,058 | |
| | | | | | | |
| | | | | | | | | | | | | | | | | | | | | | | | | | | | | | |
| | | | | | | |
| | 1.19 | (d) | | | 1.19 | (d) | | | 1.19 | (d) | | | 1.19 | (d) | | | | | | | (1.44 | ) | | | 15.82 | | | $ | 49,688 | |
| | 1.08 | | | | 1.19 | | | | 1.19 | | | | 1.19 | | | | | | | | (0.36 | ) | | | 18.25 | | | $ | 56,737 | |
| | 1.04 | | | | 1.18 | | | | 1.18 | | | | 1.18 | | | | | | | | 2.06 | | | | 16.47 | | | $ | 68,229 | |
| | 1.15 | | | | 1.18 | | | | 1.18 | | | | 1.18 | | | | | | | | 1.15 | | | | 14.43 | | | $ | 64,216 | |
| | 1.41 | | | | 1.21 | | | | 1.20 | | | | 1.21 | | | | | | | | 3.66 | | | | 16.85 | | | $ | 62,858 | |
| | 1.48 | | | | 1.21 | | | | 1.21 | | | | 1.21 | | | | | | | | 0.02 | | | | 17.57 | | | $ | 59,585 | |
| | | | | | | |
| | | | | | | | | | | | | | | | | | | | | | | | | | | | | | |
| | | | | | | |
| | 1.73 | (d) | | | 0.66 | (d) | | | 0.66 | (d) | | | 0.66 | (d) | | | | | | | (1.18 | ) | | | 15.82 | | | $ | 396,017 | |
| | 1.62 | | | | 0.64 | | | | 0.64 | | | | 0.64 | | | | | | | | 0.19 | | | | 18.25 | | | $ | 434,859 | |
| | 1.60 | | | | 0.62 | | | | 0.62 | | | | 0.62 | | | | | | | | 2.64 | | | | 16.47 | | | $ | 476,364 | |
| | 1.70 | | | | 0.63 | | | | 0.63 | | | | 0.63 | | | | | | | | 1.72 | | | | 14.43 | | | $ | 407,557 | |
| | 1.99 | | | | 0.62 | | | | 0.62 | | | | 0.62 | | | | | | | | 4.27 | | | | 16.85 | | | $ | 361,015 | |
| | 2.08 | | | | 0.61 | | | | 0.61 | | | | 0.61 | | | | | | | | 0.62 | | | | 17.57 | | | $ | 254,869 | |
Semi-Annual Report | 21
Expense Example
Thornburg California Limited Term Municipal Fund | March 31, 2018 (Unaudited)
As a shareholder of the Fund, you incur two types of costs:
| | (1) | transaction costs, including |
| | (a) | sales charges (loads) on purchase payments, for Class A shares; |
| | (b) | a deferred sales charge on redemptions of any part or all of a purchase of $1 million of Class A shares within 12 months of purchase; |
| | (c) | a deferred sales charge on redemptions of Class C shares within 12 months of purchase; |
| | (2) | ongoing costs, including management fees; distribution and/or service (12b-1) fees; and other Fund expenses. This example is intended to help you understand your ongoing costs (in dollars) of investing in the Fund and to compare these costs with the ongoing costs of investing in other mutual funds. |
The example is based on a $1,000 investment beginning on October 1, 2017, and held until March 31, 2018.
| | | | | | | | | | | | | | | |
| | | BEGINNING
ACCOUNT VALUE
10/1/17 | | ENDING
ACCOUNT VALUE
3/31/18 | | EXPENSES PAID
DURING PERIOD†
10/1/17–3/31/18 |
| | | |
| CLASS A SHARES | | | | | | | | | | | | | | | |
| | | |
Actual | | | $ | 1,000.00 | | | | $ | 986.10 | | | | $ | 4.61 | |
Hypothetical* | | | $ | 1,000.00 | | | | $ | 1,020.29 | | | | $ | 4.68 | |
| | | |
| CLASS C SHARES | | | | | | | | | | | | | | | |
| | | |
Actual | | | $ | 1,000.00 | | | | $ | 985.60 | | | | $ | 5.89 | |
Hypothetical* | | | $ | 1,000.00 | | | | $ | 1,019.00 | | | | $ | 5.99 | |
| | | |
| CLASS I SHARES | | | | | | | | | | | | | | | |
| | | |
Actual | | | $ | 1,000.00 | | | | $ | 988.20 | | | | $ | 3.27 | |
Hypothetical* | | | $ | 1,000.00 | | | | $ | 1,021.64 | | | | $ | 3.33 | |
| † | Expenses are equal to the annualized expense ratio for each class (A: 0.93%; C: 1.19%; I: 0.66%) multiplied by the average account value over the period, multiplied by 182/365 to reflect the one-half year period. |
| * | Hypothetical assumes a rate of return of 5% per year before expenses. |
ACTUAL EXPENSES
For each class of shares, the first line of the accompanying table provides information about actual account values and actual expenses. You may use the information in this line, together with the amount you invested, to estimate the expenses that you paid over the period. Simply divide your account value by $1,000 (for example, an $8,600 account value divided by $1,000 = 8.6), then multiply the result by the number in the first line for your class of shares under the heading entitled “Expenses Paid During Period” to estimate the expenses you paid on your account during this period.
HYPOTHETICAL EXAMPLE FOR COMPARISON PURPOSES
For each class of shares, the second line of the accompanying table provides information about hypothetical account values and hypothetical expenses based on the Fund’s actual expense ratio and an assumed rate of return of 5% per year before expenses, which is not the Fund’s actual return. The hypothetical account values and expenses may not be used to estimate the actual ending account balance or expenses you paid for the period. You may use this information to compare the ongoing costs of investing in the Fund and other funds. To do so, compare this 5% hypothetical example with the 5% hypothetical examples that appear in the shareholder reports of the other funds.
Please note that the expenses shown in the table are meant to highlight your ongoing costs only and do not reflect any transactional costs, such as sales charges (loads), redemption fees, or exchange fees. Therefore, the second line of the table for each class of shares is useful in comparing ongoing costs only, and will not help you determine the relative total costs of owning different funds. In addition, if these transactional costs were included, your costs would have been higher.
22 | Semi-Annual Report
Other Information
Thornburg California Limited Term Municipal Fund | March 31, 2018 (Unaudited)
PORTFOLIO PROXY VOTING
Policies and Procedures:
The Trust has delegated to Thornburg Investment Management, Inc. (the “Advisor”) voting decisions respecting proxies for the Fund’s voting securities. The Advisor makes voting decisions in accordance with its Proxy Voting Policy and Procedures. A description of the Policy and Procedures is available (i) without charge, upon request, by calling the Advisor toll-free at 1-800-847-0200, (ii) on the Thornburg website at www.thornburg.com, and (iii) on the Securities and Exchange Commission’s website at www.sec.gov.
Information regarding how proxies were voted is available on or before August 31 of each year for the twelve months ending the preceding June 30. This information is available (i) without charge, upon request by calling the Advisor toll-free at 1-800-847-0200, (ii) on the Thornburg website at www.thornburg.com, and (iii) on the Securities and Exchange Commission’s website at www.sec.gov.
AVAILABILITY OF QUARTERLY PORTFOLIO SCHEDULE
The Fund files with the Securities and Exchange Commission schedules of its portfolio holdings on Form N-Q for the first and third quarters of each fiscal year. The Fund’s Forms N-Q are available on the Commission’s website at www.sec.gov, or may be reviewed and copied at the Commission’s Public Reference Room in Washington, D.C. Information on the operation of the Public Reference Room may be obtained by calling 1-800-SEC-0330. The Fund also makes this information available on its website at www.thornburg.com/download or upon request by calling 1-800-847-0200.
Semi-Annual Report | 23
Trustees’ Statement to Shareholders
Readopted September 11, 2017
The Trustees believe current and prospective shareholders should know how we discharge our responsibilities in supervising the Funds’ investment advisor and in reviewing the advisor’s contract for renewal. Since 2005, we have issued a statement which sets out clearly the three principal guidelines that we follow in supervising the Trust’s investment advisor on your behalf. In accordance with our customary practice, in September of this year we again reviewed our statement and concluded we should reissue this statement outlining the principal features of our supervision of the advisor’s performance of investment management services for the Funds.
We begin with the premise that each shareholder selected his or her Fund because its investments are managed by the investment advisor identified in the prospectus and in accordance with the objective and policies described in the prospectus. We realize, as each of you do, that if you believe that your Fund’s stated objective and policies no longer serve your personal investment goals, you can sell your shares and leave the Fund.
Therefore, we believe that our primary supervisory task—our principal obligation to you—is to assess the nature and quality of the advisor’s services, and to confirm that the advisor actively and competently pursues the Fund’s objective, in accordance with the policies set out in the prospectus. To do this, we meet regularly with management to review your Fund’s portfolio and to discuss the advisor’s specific actions and judgments in pursuing the Fund’s objective. We do not substitute our own judgment for the advisor’s decisions in selecting investments; the advisor is paid to exercise its informed judgment on investment decisions, and we seek to confirm, in reviewing the advisor’s performance, that the advisor is doing just that.
Second, we are conscious of costs and the effect that costs have on shareholders’ returns. We try to make sure that your Fund’s fees and costs are reasonable in relationship to the services rendered and that they are generally in line with those charged by other expert investment advisors, consistent with our belief that the Fund’s investors searched for and expect that expertise and attention and have decided to pay a reasonable price for it. We do not put the management contract “out to bid” as a matter of course, and we would not do so unless we had concluded that the advisor materially had failed to pursue the Fund’s objectives in accordance with its policies, or for other equally important reasons. We believe that any other approach would be inconsistent with your interests and contrary to your expectations when you bought shares of the Fund in the first place.
Finally, because we believe that most Thornburg Fund shareholders have invested with a long-term perspective, we try not to focus too much on the fashions of the moment and on short-term performance. The market will not favor any specific investment objective or set of policies at all times and under all economic circumstances. A fund will experience periods of both high and low returns relative to other funds and other investments. Even if one of our Funds is not favored by the market at a particular time, we believe that the advisor is nonetheless obliged to remain true to the Fund’s objective and policies, and we watch to see that it does so.
Trustees of Thornburg Investment Trust
24 | Semi-Annual Report
Thornburg Funds
Thornburg Investment Management is a privately-owned global investment firm that offers a range of solutions for retail and institutional investors. Founded in 1982 and headquartered in Santa Fe, New Mexico, we manage approximately $49 billion (as of March 31, 2018) across U.S. mutual funds, separate accounts for high-net-worth investors, institutional accounts, and UCITS funds for non-U.S. investors.
EQUITY FUNDS
| | ∎ | | Thornburg Investment Income Builder Fund |
| | ∎ | | Thornburg Global Opportunities Fund |
| | ∎ | | Thornburg International Value Fund |
| | ∎ | | Thornburg Better World International Fund |
| | ∎ | | Thornburg International Growth Fund |
| | ∎ | | Thornburg Developing World Fund |
| | ∎ | | Thornburg Core Growth Fund |
FIXED INCOME FUNDS
| | ∎ | | Thornburg Low Duration Income Fund |
| | ∎ | | Thornburg Limited Term U.S. Government Fund |
| | ∎ | | Thornburg Limited Term Income Fund |
| | ∎ | | Thornburg Strategic Income Fund |
| | ∎ | | Thornburg Low Duration Municipal Fund |
| | ∎ | | Thornburg Limited Term Municipal Fund |
| | ∎ | | Thornburg Intermediate Municipal Fund |
| | ∎ | | Thornburg California Limited Term Municipal Fund |
| | ∎ | | Thornburg New Mexico Intermediate Municipal Fund |
| | ∎ | | Thornburg New York Intermediate Municipal Fund |
| | ∎ | | Thornburg Strategic Municipal Income Fund |
ALTERNATIVE FUNDS
| | ∎ | | Thornburg Long/Short Equity Fund |
Before investing, carefully consider the Fund’s investment goals, risks, charges, and expenses. For a prospectus or summary prospectus containing this and other information, contact your financial advisor or visit thornburg.com. Read it carefully before investing.
For additional information, please visit thornburg.com
Thornburg Investment Management, Inc. 2300 North Ridgetop Road, Santa Fe, NM 87506
Semi-Annual Report | 25
This page intentionally left blank.
26 | Semi-Annual Report
This page intentionally left blank.
Semi-Annual Report | 27
| | | | |
| To receive shareholder reports, prospectuses, and proxy statements electronically, go to www.thornburg.com/edelivery. | | | | |
| This Semi-Annual Report is submitted for the general information of shareholders of the Fund. It is not authorized for distribution to prospective investors in the Fund unless preceded or accompanied by an effective prospectus. | |
| | | | |
Investment Advisor: | | Distributor: | | |
Thornburg Investment Management® | | Thornburg Securities Corporation® | | |
800.847.0200 | | 800.847.0200 | | TH1070 |
Semi-Annual Report
March 31, 2018
THORNBURG
NEW MEXICO
INTERMEDIATE
MUNICIPAL
FUND
About Thornburg Investment Management
It’s more than what we do.
It’s how we do it.
At Thornburg, we are very different in how we think, invest, and are structured. We believe this difference is what makes us successful in helping individuals reach their long-term financial goals.
Flexible Perspective
Our perspective on investment opportunities is more flexible than most, viewing a wide range of opportunities beyond conventional boundaries to find hidden value.
Collaboration
Collectively, we hone ideas via borderless cross-pollination for better judgment and better results.
Portfolio Construction
Disciplined construction guided more by our convictions than convention.
CONVICTION
Thorough analysis and our relative-value framework lead to conviction in our securities selection.
UNCONVENTIONAL
Active management means we seek the best value for our clients rather than using conventional benchmarks as our starting point.
Structured for Excellence
How we think and how we invest is made possible by how we’re structured.
TEAM APPROACH
FAR FROM THE HERD
ACCESS & TRANSPARENCY
2 | Semi-Annual Report
Thornburg New Mexico Intermediate Municipal Fund
Semi-Annual Report | March 31, 2018
Table of Contents
| | | | | | | | | | |
| SHARE CLASS | | NASDAQ SYMBOL | | CUSIP |
| | |
| Class A | | THNMX | | | | 885-215-301 | |
| | |
| Class D | | THNDX | | | | 885-215-624 | |
| | |
| Class I | | THNIX | | | | 885-215-285 | |
Minimum investments for Class I shares may be higher than those for other classes. Class I shares may not be available to all investors.
Investments carry risks, including possible loss of principal. Portfolios investing in bonds have the same interest rate, inflation, and credit risks that are associated with the underlying bonds. The value of bonds will fluctuate relative to changes in interest rates, decreasing when interest rates rise. Unlike bonds, bond funds have ongoing fees and expenses. Please see the Fund’s prospectus for a discussion of the risks associated with an investment in the Fund. Investments in the Funds are not FDIC insured, nor are they bank deposits or guaranteed by a bank or any other entity.
The laddering strategy does not assure or guarantee better performance and cannot eliminate the risk of investment losses.
Semi-Annual Report | 3
Letter to Shareholders
Thornburg New Mexico Intermediate Municipal Fund | March 31, 2018 (Unaudited)
April 25, 2018
Dear Fellow Shareholder:
We are pleased to present the semi-annual report for Thornburg New Mexico Intermediate Municipal Fund. The net asset value (NAV) of the Class I shares decreased by 27 cents to $13.02 per share during the six-month period ended March 31, 2018. During the period, the Class I shares of the Fund outperformed the index with a negative 0.64% total return, compared to the negative 1.17% total return for the ICE BofAML 3-15 Year U.S. Municipal Securities Index.
The Fund’s duration, as well as curve positioning, was the largest driver of outperformance, adding 0.55% to relative performance. Sector selection was another driver of relative performance, adding 0.16%. Lastly, security selection, which is performance not attributable to duration and sector selection, added 0.17% to relative performance.
The topic of tax reform consumed municipal market participants in the fourth quarter of 2017, with several proposals being bandied about that would significantly impact the supply/ demand dynamics of the market for years to come. Ultimately, the legislation was not as radical as initially feared. On the supply side of the equation, issuers lost the ability to advance refund debt. Much like a homeowner refinancing an existing mortgage to save on interest costs, an issuer would refinance debt when interest rates were low to provide some present value savings. While many thought this would have a large impact on supply, we did not agree. Advance refunding is highly correlated to the current level of interest rates, and many issuers had already accomplished any possible refunding over the previous several years.
Instead, we found the impact of tax reform on the demand side of the equation to be far more interesting. What was overlooked was the reduction of the corporate tax rate from 35% to 21%, and the idea that corporations evaluating municipal bonds versus other fixed income securities on a tax equivalent basis would now require a higher hurdle rate to buy municipal securities. We felt that the impact this may have on two specific buyers of municipals, banks, and property and casualty insurance companies, which own roughly 20 to 25% of outstanding municipal bonds, could lead both to re-evaluate their decision to own municipal bonds. While we do not believe this to be an Armageddon type of scenario; we expect it to be more like a weight leaning on the market for the next 12 to 18 months.
Another impact on the demand side is the limitations on the deductibility of state and local taxes (SALT), which has led
many market observers to postulate that the demand for municipal bonds in high tax states will increase. Again, we did not share the same opinion. In California, the demand for California bonds has already driven prices to a level where we feel there is little value when compared to other municipal securities on a tax-equivalent basis. Demand for municipal securities in other high tax states, such as Connecticut, Pennsylvania, and New Jersey, is not as cut and dry because there is significant credit risk associated with each. Nevertheless, these concerns caused the supply of municipal bonds to spike in November and December as issuers rushed to market to hedge against the potential threat of tax reform. Some investors viewed this period as an opportunity to buy extra municipal bonds in anticipation of a January rally, which never materialized. We did not view the market the same way, and kept our strategies positioned at the lower end of their relative risk spectrums (i.e. lower duration, higher credit quality, and higher reserve positions). The last fear facing the municipal bond market is the long-advertised infrastructure plan. While the plan has experienced several failed launches, and what is known suggests it will have little impact on the supply of municipal bonds, we are still monitoring the details of the proposal for potential impacts to our strategies.
The fourth quarter of 2017 saw yields of shorter maturity bonds increase more than the yields of longer maturity bonds, leading to a flattening of the yield curve. At the time, many analysts and pundits harped on the fact that the phenomenon portends a future recession. In the first quarter of 2018, the market watched as yields of longer maturity bonds increased more than yields of shorter maturity bonds, leading to a steepening of the yield curve. The steepening of the curve is an indication that market participants have a growing concern about increases in inflation – the enemy of the fixed income investor. The Fund’s conservative positioning was a headwind to performance in the fourth quarter of 2017, but acted as a tailwind to performance in the first quarter of 2018.
Thank you for your continued trust in us.
Sincerely,
| | |
 | | |
| |
Christopher Ryon,CFA Portfolio Manager Managing Director | | Nicholos Venditti,CFA Portfolio Manager Managing Director |
The matters discussed in this report may constitute forward-looking statements made pursuant to the safe harbor provisions of the Securities Litigation Reform Act of 1995. These include any advisor or portfolio manager prediction, assessment, analysis or outlook for individual securities, industries, investment styles, market sectors and/or markets. These statements involve risks and uncertainties. In addition to the general risks described for each fund in its current prospectus, other factors bearing on these reports include the accuracy of the advisor’s or portfolio manager’s forecasts and predictions, the appropriateness of the investment strategies designed by the advisor or portfolio manager and the ability of the advisor or portfolio manager to implement their strategies efficiently and successfully. Any one or more of these factors, as well as other risks affecting the securities markets generally, could cause the actual results of any fund to differ materially as compared to its benchmarks.
The views expressed are subject to change and do not necessarily reflect the views of Thornburg Investment Management, Inc. This information should not be relied upon as a recommendation or investment advice and is not intended to predict the performance of any investment or market.
Performance results of individual share classes will vary based on the fees and expenses associated with each share class, and may be higher or lower than other share classes within the same Fund. Please see Performance Summary for performance results of each share class.
4 | Semi-Annual Report
Performance Summary
Thornburg New Mexico Intermediate Municipal Fund | March 31, 2018 (Unaudited)
AVERAGE ANNUAL TOTAL RETURNS
| | | | | | | | | | | | | | | | | | | | | | | | | |
| | | 1-YR | | 3-YR | | 5-YR | | 10-YR | | SINCE
INCEP. |
| | | | | |
Class A Shares (Incep: 6/18/91) | | | | | | | | | | | | | | | | | | | | | | | | | |
Without sales charge | | | | 0.68% | | | | | 0.77% | | | | | 1.33% | | | | | 2.86% | | | | | 4.18% | |
| | | | | |
With sales charge | | | | -1.33% | | | | | 0.09% | | | | | 0.93% | | | | | 2.65% | | | | | 4.11% | |
| | | | | |
Class D Shares (Incep: 6/1/99) | | | | | | | | | | | | | | | | | | | | | | | | | |
| | | | | |
Without sales charge | | | | 0.44% | | | | | 0.56% | | | | | 1.09% | | | | | 2.61% | | | | | 3.05% | |
| | | | | |
Class I Shares (Incep: 2/1/07) | | | | 0.93% | | | | | 1.10% | | | | | 1.65% | | | | | 3.20% | | | | | 3.29% | |
| | | | | |
30-DAY YIELDS, A SHARES (with sales charge) |
| |
Annualized Distribution Yield | | | | 2.48% | |
| |
SEC Yield | | | | 1.51% | |
GROWTH OF A HYPOTHETICAL $10,000 INVESTMENT
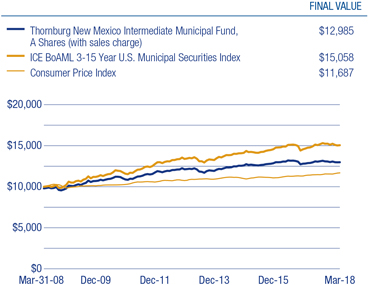
Performance data shown represents past performance and is no guarantee of future results. Investment return and principal value will fluctuate so shares, when redeemed, may be worth more or less than their original cost. Current performance may be lower or higher than quoted. For performance current to the most recent month end, visit thornburg.com or call 800-847-0200. The performance information does not reflect the deduction of taxes that a shareholder would pay on distributions or the redemption of Fund shares. Returns reflect the reinvestment of dividends and capital gains. Class A shares are sold with a maximum sales charge of 2.00%. There is no sales charge for Class D and Class I shares. As disclosed in the most recent prospectus, the total annual fund operating expenses before any fee waivers or expense reimbursements are as follows: A shares, 0.94%; D shares, 1.17%; I shares, 0.69%. Thornburg Investment Management and/or Thornburg Securities Corporation have contractually agreed to waive fees and reimburse expense through at least February 1, 2019 for some of the share classes, resulting in net expense ratios of the following: I shares, 0.67%. For more detailed information on fund expenses and waivers/reimbursements please see the Fund’s prospectus.
The ICE index data referenced herein is the property of ICE Data Indices, LLC, its affiliates (“ICE Data”) and/or its Third Party Suppliers and has been licensed for use by Thornburg Investment Management, Inc. ICE Data and its Third Party Suppliers accept no liability in connection with its use. See www.thornburg.com/indices for a full copy of the Disclaimer.
Glossary
The ICE BofAML 3-15 Year U.S. Municipal Securities Index is a subset of the ICE BofAML U.S. Municipal Securities Index including all securities with a remaining term to final maturity greater than or equal to 3 years and less than 15 years.
The performance of any index is not indicative of the performance of any particular investment. Unless otherwise noted, index returns reflect the reinvestment of income dividends and capital gains, if any, but do not reflect fees, brokerage commissions or other expenses of investing. Investors may not make direct investments into any index.
Annualized Distribution Yield – The distribution yield reflects actual distributions made to shareholders. The annualized distribution yield is calculated by summing the last 30 days of income at a given month end and annualizing to a 360-day year. The result is divided by the ending maximum offering price or net asset value.
SEC Yield – A yield computed in accordance with SEC standards measuring the net investment income per share over a specified 30-day period expressed as a percentage of the maximum offering price of the Fund’s shares at the end of the period.
Advance refunding – Advance refunding can also refer to bond issuance in which new bonds are sold at a lower rate than outstanding ones. The proceeds are then invested, and when the older bonds become callable, they are paid off with the invested proceeds.
Bond Credit Ratings (Credit Quality) – A bond credit rating assesses the financial ability of a debt issuer to make timely payments of principal and interest. Rating of AAA (the highest), AA, A, and BBB are investment-grade quality. Rating of BB, B, CCC, CC, C and D (the lowest) are considered below investment grade, speculative grade, or junk bonds.
Credit Spread/Quality Spread – The difference between the yields of securities with different credit qualities.
Duration – A bond’s sensitivity to interest rates. Bonds with longer durations experience greater price volatility than bonds with shorter durations. Effective duration incorporates a bond’s embedded option features, such as call provisions.
Laddering – Laddering involves building a portfolio of bonds with staggered maturities so that a portion matures each year. Money that comes in from maturing bonds is typically invested in bonds with longer maturities at the far end of the portfolio.
Yield Curve – A line that plots the interest rate, at a set point in time, of bonds having equal credit quality, but offering maturity dates.
Semi-Annual Report | 5
Fund Summary
Thornburg New Mexico Intermediate Municipal Fund | March 31, 2018 (Unaudited)
OBJECTIVES AND STRATEGIES
The Fund’s primary investment objective is to obtain as high a level of current income exempt from federal and New Mexico state individual income taxes as is consistent, in the view of the investment advisor, with preservation of capital.
The secondary goal of the Fund is to reduce expected changes in its share price compared to long-term bond portfolios.
This Fund offers New Mexico investors double tax-free yields (may be subject to Alternative Minimum Tax) in a laddered municipal bond portfolio with a dollar-weighted average maturity of normally three to 10 years. Laddering involves building a portfolio of bonds with staggered maturities so that a portion of the portfolio matures each year. Cash from maturing bonds, if not needed for other purposes, is typically invested in bonds with longer maturities at the far end of the ladder. We regard the strategy as a good compromise for managing different types of risk.
LONG-TERM STABILITY OF PRINCIPAL
Net Asset Value History of A Shares
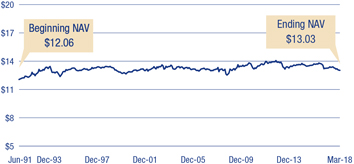
KEY PORTFOLIO ATTRIBUTES
| | | | | |
| Number of Bonds | | | | 121 | |
| Effective Duration | | | | 4.0 Yrs | |
| Average Maturity | | | | 7.8 Yrs | |
SECURITY CREDIT RATINGS
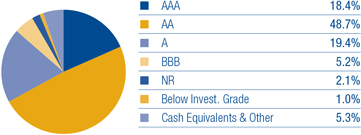
A bond credit rating assesses the financial ability of a debt issuer to make timely payments of principal and interest. Ratings of AAA (the highest), AA, A, and BBB are investment-grade quality. Ratings of BB, B, CCC, CC, C and D (the lowest) are considered below investment grade, speculative grade, or junk bonds.
Unrated pre-refunded and escrowed-to-maturity bonds are included in the not rated category.
PORTFOLIO LADDER
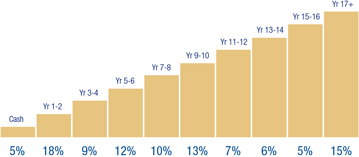
There is no guarantee that the Fund will meet its investment objectives.
All data is subject to change. Charts may not add up to 100% due to rounding.
6 | Semi-Annual Report
Schedule of Investments
Thornburg New Mexico Intermediate Municipal Fund | March 31, 2018 (Unaudited)
| | | | | | | | | | | | |
| | | ISSUER-DESCRIPTION | | PRINCIPAL
AMOUNT | | VALUE |
| | Albuquerque Bernalillo County Water Utility Authority (2005 NMFA Loan and Joint Water and Sewer System Improvements), Series A, 5.00% due 7/1/2026 | | | $ | 2,000,000 | | | | $ | 2,294,820 | |
| | Albuquerque Bernalillo County Water Utility Authority (2007 NMFA Loan and Joint Water and Sewer System Improvements), 5.00% due 7/1/2031 - 7/1/2032 | | | | 1,500,000 | | | | | 1,710,040 | |
| | Albuquerque Bernalillo County Water Utility Authority (New Mexico Utilities, Inc. Water System), | | | | | | | | | | |
| | Series A-1, | | | | | | | | | | |
| | 5.00% due 7/1/2021 (pre-refunded 7/1/2019) | | | | 1,760,000 | | | | | 1,832,952 | |
| | 5.50% due 7/1/2025 (pre-refunded 7/1/2019) | | | | 1,000,000 | | | | | 1,047,580 | |
| | Albuquerque Bernalillo County Water Utility Authority (San Juan-Chama Drinking Water Project), 5.00% due 7/1/2026 (pre-refunded 7/1/2018) | | | | 1,420,000 | | | | | 1,432,113 | |
| | Albuquerque Municipal School District No. 12 (Bernalillo and Sandoval Counties School Facilities) GO, | | | | | | | | | | |
| | 5.00% due 8/1/2031 | | | | 1,000,000 | | | | | 1,163,990 | |
| | Series A, 4.00% due 8/1/2029 | | | | 1,300,000 | | | | | 1,376,011 | |
| | Bernalillo County (Government Services), | | | | | | | | | | |
| | 5.25% due 4/1/2027 | | | | 300,000 | | | | | 351,888 | |
| | 5.70% due 4/1/2027 | | | | 3,000,000 | | | | | 3,589,470 | |
| | Bernalillo County (Government Services; Insured: AMBAC), 5.25% due 10/1/2022 - 10/1/2025 | | | | 8,295,000 | | | | | 9,681,541 | |
| | Bernalillo County (Government Services; Insured: Natl-Re), | | | | | | | | | | |
| | 5.00% due 4/1/2021 | | | | 2,455,000 | | | | | 2,569,919 | |
| | 5.70% due 4/1/2027 | | | | 815,000 | | | | | 977,951 | |
| | Central New Mexico Community College (Campus Buildings Acquisition & Improvements) GO, | | | | | | | | | | |
| | 4.00% due 8/15/2023 | | | | 1,920,000 | | | | | 2,047,622 | |
| | 5.00% due 8/15/2020 - 8/15/2022 | | | | 3,910,000 | | | | | 4,296,299 | |
| | Cibola County (County Building Improvements), | | | | | | | | | | |
| | 5.00% due 6/1/2025 | | | | 355,000 | | | | | 350,307 | |
| | Series A, 5.00% due 6/1/2025 | | | | 360,000 | | | | | 355,241 | |
| | City of Albuquerque (City Infrastructure Improvements) GO, 5.00% due 7/1/2026 | | | | 870,000 | | | | | 1,038,258 | |
| | City of Albuquerque (City Infrastructure Improvements), 5.00% due 7/1/2033 - 7/1/2034 | | | | 2,300,000 | | | | | 2,610,096 | |
| | City of Albuquerque (I-25/Paseo del Norte Interchange), 5.00% due 7/1/2025 - 7/1/2027 | | | | 1,095,000 | | | | | 1,240,493 | |
| | City of Albuquerque (Lodgers’ Tax Obligation Reserve Fund), | | | | | | | | | | |
| | Series A, 5.00% due 7/1/2021 | | | | 1,340,000 | | | | | 1,394,699 | |
| | Series B, 5.00% due 7/1/2021 | | | | 3,000,000 | | | | | 3,122,460 | |
| | City of Farmington (Arizona Public Service Co.-Four Corners Project), 4.70% due 5/1/2024 - 9/1/2024 | | | | 4,965,000 | | | | | 5,289,314 | |
| | City of Farmington (San Juan Regional Medical Center), | | | | | | | | | | |
| | Series A, | | | | | | | | | | |
| | 5.00% due 6/1/2022 | | | | 2,825,000 | | | | | 2,832,204 | |
| | 5.125% due 6/1/2018 - 6/1/2019 | | | | 1,215,000 | | | | | 1,217,874 | |
| | City of Gallup (City Infrastructure Improvements), Series A, 5.125% due 6/1/2019 | | | | 310,000 | | | | | 318,847 | |
| | City of Las Cruces (Joint Utility System), Series A, 4.00% due 6/1/2021 - 6/1/2025 | | | | 2,215,000 | | | | | 2,412,435 | |
| | City of Las Cruces (NMFA Loan), 5.00% due 6/1/2021 - 6/1/2037 | | | | 10,135,000 | | | | | 10,749,034 | |
| | City of Roswell (Joint Water and Sewer Improvement; Insured: BAM), 5.00% due 6/1/2026 - 6/1/2036 | | | | 1,470,000 | | | | | 1,685,348 | |
| | City of Roswell (Joint Water and Sewer Improvement; lnsured: BAM), 5.00% due 6/1/2035 | | | | 580,000 | | | | | 653,109 | |
| | City of Santa Fe (El Castillo Retirement Residences), | | | | | | | | | | |
| | 4.50% due 5/15/2027 | | | | 3,275,000 | | | | | 3,371,547 | |
| | 5.00% due 5/15/2034 | | | | 1,465,000 | | | | | 1,525,109 | |
| | City of Santa Fe (Public Facilities) GRT, 5.00% due 6/1/2028 - 6/1/2029 | | | | 1,880,000 | | | | | 2,146,735 | |
| | Colfax County (Government Center Facility), | | | | | | | | | | |
| | 5.00% due 9/1/2019 | | | | 240,000 | | | | | 242,887 | |
| | 5.50% due 9/1/2029 (pre-refunded 9/1/2019) | | | | 2,510,000 | | | | | 2,642,754 | |
| | County of Los Alamos (Public Facilities), | | | | | | | | | | |
| | 4.875% due 6/1/2018 | | | | 500,000 | | | | | 502,635 | |
| | 5.625% due 6/1/2023 (pre-refunded 6/1/2018) | | | | 1,000,000 | | | | | 1,006,630 | |
| | 5.75% due 6/1/2024 - 6/1/2025 (pre-refunded 6/1/2018) | | | | 4,000,000 | | | | | 4,027,320 | |
| | Farmington Municipal School District No. 5 (Educational Facilities) GO, 5.00% due 9/1/2019 | | | | 600,000 | | | | | 627,312 | |
| | Government of Guam (Economic Development), Series D-REF, 5.00% due 11/15/2031 | | | | 2,500,000 | | | | | 2,634,100 | |
| | Government of Guam (Layon Solid Waste Disposal Facility), Series A, 5.375% due 12/1/2024 (pre-refunded 12/1/2019) | | | | 2,000,000 | | | | | 2,121,860 | |
| | Government of Guam (Various Capital Projects), Series D-REF, 5.00% due 11/15/2033 | | | | 2,500,000 | | | | | 2,620,850 | |
| | Grant County (State Dept. of Health-Ft. Bayard Project), 5.50% due 7/1/2020 - 7/1/2022 | | | | 4,965,000 | | | | | 5,012,054 | |
| | Guam Power Authority (Electric Power System), Series A, 5.00% due 10/1/2034 | | | | 1,825,000 | | | | | 1,971,219 | |
| | Guam Power Authority (Electric Power System; Insured: AGM), Series A, 5.00% due 10/1/2026 | | | | 2,000,000 | | | | | 2,176,080 | |
| | Guam Waterworks Authority (Water and Wastewater System), 5.00% due 7/1/2035 - 7/1/2037 | | | | 2,200,000 | | | | | 2,378,430 | |
| | New Mexico Educational Assistance Foundation (Student Loans), Series A-1, 5.00% due 12/1/2019 - 12/1/2022 | | | | 4,000,000 | | | | | 4,277,580 | |
| | New Mexico Finance Authority (State Highway Infrastructure), 5.00% due 6/15/2026 - 6/15/2027 | | | | 2,415,000 | | | | | 2,770,968 | |
| | New Mexico Finance Authority (The Public Project Revolving Fund Program), Series A, 5.00% due 6/15/2031 | | | | 1,000,000 | | | | | 1,143,210 | |
| | New Mexico Hospital Equipment Loan Council (Haverland Carter Lifestyle Group), 5.00% due 7/1/2032 | | | | 2,000,000 | | | | | 2,113,220 | |
| | New Mexico Hospital Equipment Loan Council (Presbyterian Healthcare Services), | | | | | | | | | | |
| | 5.00% due 8/1/2031 | | | | 1,750,000 | | | | | 2,025,106 | |
| | 5.00% due 8/1/2039 (pre-refunded 8/1/2019) | | | | 3,000,000 | | | | | 3,132,180 | |
| | 6.00% due 8/1/2023 (pre-refunded 8/1/2018) | | | | 6,000,000 | | | | | 6,087,960 | |
| a | | New Mexico Hospital Equipment Loan Council, 1.70% due 8/1/2034 (put 4/2/2018) | | | | 4,500,000 | | | | | 4,500,000 | |
| | New Mexico Housing Authority (El Paseo Apartments; Insured: AMBAC), Series A, 5.30% due 12/1/2022 | | | | 450,000 | | | | | 450,270 | |
Semi-Annual Report | 7
Schedule of Investments, Continued
Thornburg New Mexico Intermediate Municipal Fund | March 31, 2018 (Unaudited)
| | | | | | | | | | | | |
| | | ISSUER-DESCRIPTION | | PRINCIPAL
AMOUNT | | VALUE |
| | New Mexico Institute of Mining and Technology (Campus Buildings Acquisition & Improvements), 5.00% due 7/1/2020 - 7/1/2028 | | | $ | 3,805,000 | | | | $ | 4,118,840 | |
| | New Mexico Mortgage Finance Authority (NIBP SFM Loan Program; Collateralized: GNMA/FNMA/FHLMC), 4.625% due 3/1/2028 | | | | 770,000 | | | | | 798,259 | |
| | New Mexico Mortgage Finance Authority (Saver SFM Loan Program; Collateralized: GNMA/FNMA/FHLMC), | | | | | | | | | | |
| | 5.40% due 9/1/2029 | | | | 455,000 | | | | | 463,618 | |
| | Series C, | | | | | | | | | | |
| | 5.375% due 7/1/2023 | | | | 175,000 | | | | | 175,340 | |
| | 5.60% due 7/1/2028 | | | | 160,000 | | | | | 160,240 | |
| | Regents of New Mexico State University (Campus Buildings Acquisition & Improvements), Series A, 5.00% due 4/1/2032 - 4/1/2036 | | | | 4,095,000 | | | | | 4,676,351 | |
| | Regents of the University of New Mexico (Campus Buildings Acquisition & Improvements), | | | | | | | | | | |
| | Series A, | | | | | | | | | | |
| | 4.50% due 6/1/2034 - 6/1/2036 | | | | 4,500,000 | | | | | 4,945,365 | |
| | 6.00% due 6/1/2021 | | | | 300,000 | | | | | 315,852 | |
| | San Juan County (County Capital Improvements), 5.00% due 6/15/2028 - 6/15/2030 | | | | 2,645,000 | | | | | 2,970,541 | |
| | Santa Fe County (County Buildings & Facilities) GRT, Series A, 5.00% due 6/1/2026 - 6/1/2027 | | | | 915,000 | | | | | 1,063,843 | |
| | Santa Fe County (County Correctional System; Insured: AGM), 6.00% due 2/1/2027 | | | | 1,520,000 | | | | | 1,779,418 | |
| | Santa Fe County (County Courthouse and Other Public Facilities), 5.00% due 6/1/2025 - 6/1/2026 (pre-refunded 6/1/2018) | | | | 2,935,000 | | | | | 2,951,524 | |
| | Santa Fe Gasoline Tax, 5.00% due 6/1/2024 - 6/1/2028 | | | | 1,540,000 | | | | | 1,806,048 | |
| | State of New Mexico (Capital Improvements), 5.00% due 7/1/2022 (pre-refunded 7/1/2019) | | | | 350,000 | | | | | 364,507 | |
| | State of New Mexico (Educational Facilities), 5.00% due 7/1/2025 | | | | 2,000,000 | | | | | 2,343,820 | |
| | Taos Municipal School District No. 1 (Educational Facilities) GO, 5.00% due 9/1/2021 | | | | 520,000 | | | | | 572,629 | |
| | Town of Silver City (Joint Utility System Improvement; Insured: BAM), Series B, 2.00% due 12/1/2018 - 12/1/2019 | | | | 525,000 | | | | | 527,213 | |
| | Town of Silver City (Public Facility Capital Projects), | | | | | | | | | | |
| | Series A, | | | | | | | | | | |
| | 4.00% due 6/1/2029 | | | | 1,000,000 | | | | | 1,026,260 | |
| | 4.25% due 6/1/2032 | | | | 1,050,000 | | | | | 1,080,628 | |
| | University of New Mexico, | | | | | | | | | | |
| a | | 1.59% due 6/1/2026 (put 4/6/2018) | | | | 2,800,000 | | | | | 2,800,000 | |
| a | | Series C, 1.59% due 6/1/2030 (put 4/6/2018) | | | | 1,000,000 | | | | | 1,000,000 | |
| | Village of Los Ranchos de Albuquerque (Albuquerque Academy), 4.50% due 9/1/2040 | | | | 3,000,000 | | | | | 3,098,190 | |
| | Virgin Islands Public Finance Authority, 6.625% due 10/1/2029 | | | | 2,500,000 | | | | | 1,712,500 | |
| | Zuni Public School District (Teacher Housing Projects), 5.00% due 8/1/2028 | | | | 1,600,000 | | | | | 1,758,224 | |
| | | | | | | | | | | | |
| | | |
| | TOTAL INVESTMENTS — 98.3% (Cost $170,461,293) | | | | | | | | $ | 173,659,141 | |
| | | |
| | OTHER ASSETS LESS LIABILITIES — 1.7% | | | | | | | | | 3,050,672 | |
| | | | | | | | | | | | |
| | | |
| | NET ASSETS — 100.0% | | | | | | | | $ | 176,709,813 | |
| | | | | | | | | | | | |
Footnote Legend
| a | Variable Rate Demand Notes are instruments whose interest rates change on a specific date (such as coupon date or interest payment date) or whose interest rates vary with changes in a designated base rate (such as the prime interest rate). This instrument is payable on demand and is secured by letters of credit or other credit support agreements from major banks. |
Portfolio Abbreviations
To simplify the listings of securities, abbreviations are used per the table below:
| | |
| AGM | | Insured by Assured Guaranty Municipal Corp. |
| AMBAC | | Insured by American Municipal Bond Assurance Corp. |
| BAM | | Insured by Build America Mutual Insurance Co. |
| GO | | General Obligation |
| GRT | | Gross Receipts Tax |
| Natl-Re | | Insured by National Public Finance Guarantee Corp. |
See notes to financial statements.
8 | Semi-Annual Report
Statement of Assets and Liabilities
Thornburg New Mexico Intermediate Municipal Fund | March 31, 2018 (Unaudited)
| | | | |
ASSETS | | | | |
| |
Investments at value (cost $170,461,293) (Note 3) | | $ | 173,659,141 | |
Cash | | | 970,612 | |
Receivable for fund shares sold | | | 14,316 | |
Interest receivable | | | 2,422,889 | |
Prepaid expenses and other assets | | | 6,573 | |
| | | | |
| |
Total Assets | | | 177,073,531 | |
| | | | |
| |
LIABILITIES | | | | |
| |
Payable for fund shares redeemed | | | 150,985 | |
Payable to investment advisor and other affiliates (Note 4) | | | 122,669 | |
Accounts payable and accrued expenses | | | 54,141 | |
Dividends payable | | | 35,923 | |
| | | | |
| |
Total Liabilities | | | 363,718 | |
| | | | |
| |
NET ASSETS | | $ | 176,709,813 | |
| | | | |
| |
NET ASSETS CONSIST OF | | | | |
| |
Distribution in excess of net investment income | | $ | (25,896 | ) |
Net unrealized appreciation on investments | | | 3,197,848 | |
Accumulated net realized gain (loss) | | | (1,449,004 | ) |
Net capital paid in on shares of beneficial interest | | | 174,986,865 | |
| | | | |
| |
| | $ | 176,709,813 | |
| | | | |
| |
NET ASSET VALUE | | | | |
| |
Class A Shares: | | | | |
Net asset value and redemption price per share
($102,057,646 applicable to 7,832,505 shares of beneficial
interest outstanding - Note 5) | | $ | 13.03 | |
Maximum sales charge, 2.00% of offering price | | | 0.27 | |
| | | | |
Maximum offering price per share | | $ | 13.30 | |
| | | | |
| |
Class D Shares: | | | | |
| |
Net asset value, offering and redemption price per share
($20,489,264 applicable to 1,571,677 shares of beneficial
interest outstanding - Note 5) | | $ | 13.04 | |
| | | | |
| |
Class I Shares: | | | | |
Net asset value, offering and redemption price per share
($54,162,903 applicable to 4,158,533 shares of beneficial
interest outstanding - Note 5) | | $ | 13.02 | |
| | | | |
See notes to financial statements.
Semi-Annual Report | 9
Statement of Operations
Thornburg New Mexico Intermediate Municipal Fund | Six Months Ended March 31, 2018 (Unaudited)
| | | | |
INVESTMENT INCOME | | | | |
| |
Interest income (net of premium amortized of $870,970) | | $ | 3,299,991 | |
| | | | |
| |
EXPENSES | | | | |
| |
Investment advisory fees (Note 4) | | | 474,634 | |
Administration fees (Note 4) | | | | |
Class A Shares | | | 60,714 | |
Class D Shares | | | 12,321 | |
Class I Shares | | | 17,833 | |
Distribution and service fees (Note 4) | | | | |
Class A Shares | | | 135,489 | |
Class D Shares | | | 55,062 | |
Transfer agent fees | | | | |
Class A Shares | | | 28,898 | |
Class D Shares | | | 5,067 | |
Class I Shares | | | 11,384 | |
Registration and filing fees | | | | |
Class A Shares | | | 2,187 | |
Class D Shares | | | 1,650 | |
Class I Shares | | | 2,254 | |
Custodian fees (Note 2) | | | 21,823 | |
Professional fees | | | 23,773 | |
Trustee and officer fees (Note 4) | | | 4,309 | |
Other expenses | | | 12,537 | |
| | | | |
| |
Total Expenses | | | 869,935 | |
Less: | | | | |
Expenses reimbursed by investment advisor (Note 4) | | | (1,298 | ) |
| | | | |
| |
Net Expenses | | | 868,637 | |
| | | | |
| |
Net Investment Income | | $ | 2,431,354 | |
| | | | |
| |
REALIZED AND UNREALIZED GAIN (LOSS) | | | | |
Net realized gain (loss) on investments | | | (194,431 | ) |
Net change in unrealized appreciation (depreciation) on investments | | | (3,683,229 | ) |
| | | | |
| |
Net Realized and Unrealized Loss | | | (3,877,660 | ) |
| | | | |
| |
Net Decrease in Net Assets Resulting from Operations | | $ | (1,446,306 | ) |
| | | | |
See notes to financial statements.
10 | Semi-Annual Report
Statements of Changes in Net Assets
Thornburg New Mexico Intermediate Municipal Fund
| | | | | | | | | | |
| | | SIX MONTHS ENDED
MARCH 31, 2018* | | YEAR ENDED
SEPTEMBER 30, 2017 |
INCREASE (DECREASE) IN NET ASSETS FROM | | | | | | | | | | |
| | |
OPERATIONS | | | | | | | | | | |
| | |
Net investment income | | | $ | 2,431,354 | | | | $ | 5,055,641 | |
Net realized gain (loss) on investments | | | | (194,431 | ) | | | | (100,189 | ) |
Net unrealized appreciation (depreciation) on investments | | | | (3,683,229 | ) | | | | (6,289,705 | ) |
| | | | | |
| | |
Net Decrease in Net Assets Resulting from Operations | | | | (1,446,306 | ) | | | | (1,334,253 | ) |
| | |
DIVIDENDS TO SHAREHOLDERS | | | | | | | | | | |
| | |
From net investment income | | | | | | | | | | |
Class A Shares | | | | (1,349,966 | ) | | | | (2,929,452 | ) |
Class D Shares | | | | (246,912 | ) | | | | (522,688 | ) |
Class I Shares | | | | (834,476 | ) | | | | (1,603,501 | ) |
| | |
FUND SHARE TRANSACTIONS (NOTE 5) | | | | | | | | | | |
| | |
Class A Shares | | | | (12,651,331 | ) | | | | (16,089,076 | ) |
Class D Shares | | | | (1,724,286 | ) | | | | (5,032,358 | ) |
Class I Shares | | | | (6,861,143 | ) | | | | (1,739,640 | ) |
| | | | | |
| | |
Net Decrease in Net Assets | | | | (25,114,420 | ) | | | | (29,250,968 | ) |
| | |
NET ASSETS | | | | | | | | | | |
| | |
Beginning of Period | | | | 201,824,233 | | | | | 231,075,201 | |
| | | | | |
| | |
End of Period | | | $ | 176,709,813 | | | | $ | 201,824,233 | |
| | | | | |
| | |
Distribution in excess of net investment income | | | $ | (25,896 | ) | | | $ | (25,896 | ) |
See notes to financial statements.
Semi-Annual Report | 11
Notes to Financial Statements
Thornburg New Mexico Intermediate Municipal Fund | March 31, 2018 (Unaudited)
NOTE 1 – ORGANIZATION
Thornburg New Mexico Intermediate Municipal Fund (the “Fund”) is a non-diversified series of Thornburg Investment Trust (the “Trust”). The Trust was organized as a Massachusetts business trust under a Declaration of Trust dated June 3, 1987 and is registered as a diversified, open-end management investment company under the Investment Company Act of 1940, as amended. The Fund is currently one of twenty-one separate series of the Trust. Each series is considered to be a separate entity for financial reporting and tax purposes and bears expenses directly attributable to it. The Fund’s primary investment objective is to obtain as high a level of current income exempt from federal and New Mexico state individual income tax as is consistent, in the view of Thornburg Investment Management, Inc., the Trust’s investment advisor (the “Advisor”), with the preservation of capital. The Fund’s secondary objective is to reduce expected changes in its share price compared to long-term bond portfolios.
The Fund currently offers three classes of shares of beneficial interest: Class A, Class D, and Institutional Class (“Class I”). Each class of shares of the Fund represents an interest in the same portfolio of investments, except that (i) Class A shares are sold subject to a front-end sales charge collected at the time the shares are purchased and bear a service fee, (ii) Class D shares are sold at net asset value without a sales charge at the time of purchase or redemption, and bear both a service fee and a distribution fee, (iii) Class I shares are sold at net asset value without a sales charge at the time of purchase and may be subject to a service fee, and (iv) the respective classes may have different reinvestment privileges and conversion rights. Additionally, the Fund may allocate among its classes certain expenses, to the extent allocable to specific classes, including transfer agent fees, government registration fees, certain printing and postage costs, and administrative and legal expenses. Currently, class specific expenses of the Fund are limited to service and distribution fees, administration fees, and certain registration and transfer agent expenses.
The following is a summary of significant accounting policies followed by the Fund in the preparation of its financial statements. The Fund prepares its financial statements in conformity with United States generally accepted accounting principles (“GAAP”), including investment company accounting and reporting guidance in the Financial Accounting Standards Board (the “FASB”) Accounting Standard Codification Topic 946.
NOTE 2 – SIGNIFICANT ACCOUNTING POLICIES
Security Valuation: All investments in securities held by the Fund are valued as described in Note 3.
Allocation of Income, Gains, Losses and Expenses: Net investment income (other than class specific expenses) and realized and unrealized gains and losses are allocated daily to each class of shares based upon the relative net asset value of outstanding shares (or the value of the dividend-eligible shares, as appropriate) of each class of shares at the beginning of the day (after adjusting for the current capital shares activity of the respective class). Expenses common to all Funds are allocated among the Funds comprising the Trust based upon their relative net asset values or other appropriate allocation methods. Operating expenses directly attributable to a specific class are charged against the operating income of that class.
Dividends and Distributions to Shareholders: Dividends and distributions to shareholders, which are determined in accordance with federal income tax regulations and may differ from GAAP, are recorded on the ex-dividend date. Ordinary income distributions, if any, are declared daily and paid monthly. Capital gain distributions, if any, are declared and paid annually and more often if deemed necessary by the Advisor. Dividends are paid and are reinvested in additional shares of the Fund at net asset value per share at the close of business on the ex-dividend date, or at the shareholder’s option, paid in cash.
Investment Income: Interest income is accrued as earned. Premiums and discounts are amortized and accreted, respectively, to call dates or maturity dates using the effective yield method of the respective investments. These amounts are included in Interest income on the Statement of Operations.
Custodian Fees: Custodian fees disclosed in the Statement of Operations may include interest expenses incurred by the Fund on any cash overdrafts of its custodian account during the period. Such cash overdrafts may result from the effects of failed trades in portfolio securities and from cash outflows resulting from unanticipated shareholder redemption activity. The Fund pays interest to its custodian on any such cash overdraft at a rate set periodically at the custodian’s discretion of the overdraft amount in excess of $50,000.
Investment Transactions: Investment transactions are accounted for on a trade date basis. Realized gains and losses from the sale of investments are recorded on an identified cost basis.
When-Issued and Delayed Delivery Transactions: The Fund may engage in when-issued or delayed delivery transactions. To the extent the Fund engages in such transactions, it will do so for the purpose of acquiring portfolio investments consistent with the Fund’s investment objectives and not for the purpose of investment leverage or to speculate on interest rate or market changes. At the time the Fund makes a commitment to purchase an investment on a when-issued or delayed delivery basis, the Fund will record the transaction and reflect the value in determining its net asset value. When effecting such transactions, assets of an amount sufficient to make payment for the portfolio
12 | Semi-Annual Report
Notes to Financial Statements, Continued
Thornburg New Mexico Intermediate Municipal Fund | March 31, 2018 (Unaudited)
investments to be purchased will be segregated on the Fund’s records on the trade date. Investments purchased on a when-issued or delayed delivery basis do not earn interest until the settlement date.
Guarantees and Indemnifications: Under the Trust’s organizational documents (and under separate agreements with the independent Trustees), its officers and Trustees are provided with an indemnification against certain liabilities arising out of the performance of their duties to the Fund. In the normal course of business the Trust may also enter into contracts with service providers that contain general indemnifications. The Trust’s maximum exposure under these arrangements is unknown. However, based on experience, the Trust expects the risk of loss to be remote.
Use of Estimates: The preparation of financial statements in conformity with GAAP requires management to make estimates and assumptions that affect the reported amounts of assets and liabilities and disclosure of contingent assets and liabilities at the date of the financial statements and the reported amounts of increases (decreases) in net assets from operations during the reporting period. Actual results could differ from those estimates.
Federal Income Taxes: It is the policy of the Trust to comply with the provisions of the Internal Revenue Code applicable to regulated investment companies and to distribute to shareholders substantially all investment company taxable income including net realized gains on investments (if any), and tax exempt income of the Fund. Therefore, no provision for federal income or excise tax is required.
The Fund files income tax returns in United States federal and applicable state jurisdictions. The statute of limitations on the Fund’s tax return filings generally remains open for the three years following a return’s filing date. The Fund has analyzed each uncertain tax position believed to be material in the preparation of the Fund’s financial statements for the six month period ended March 31, 2018, including open tax years, to assess whether it is more likely than not that the position would be sustained upon examination, based on the technical merits of the position. The Fund has not identified any such position for which an asset or liability must be reflected in the Statement of Assets and Liabilities.
At March 31, 2018, information on the tax components of capital was as follows:
| | | | | |
Cost of investments for tax purposes | | | $ | 170,461,293 | |
| | | | | |
Gross unrealized appreciation on a tax basis | | | | 4,714,316 | |
Gross unrealized depreciation on a tax basis | | | | (1,516,468 | ) |
| | | | | |
Net unrealized appreciation (depreciation) on investments (tax basis) | | | $ | 3,197,848 | |
| | | | | |
At March 31, 2018, the Fund had deferred tax basis capital losses occurring subsequent to October 31, 2016 through September 30, 2017 of $100,189. For tax purposes, such losses will be recognized in the year ending September 30, 2018.
At March 31, 2018, the Fund had cumulative tax basis capital losses of $1,154,384 (of which $87,413 are short-term and $1,066,971 are long-term) generated after September 30, 2011, which may be carried forward to offset future capital gains. To the extent such carryforwards are used, capital gain distributions may be reduced to the extent provided by regulations. Such capital loss carryforwards do not expire.
NOTE 3 – SECURITY VALUATION
Valuation of the Fund’s portfolio investment securities is performed in accordance with policies and procedures adopted by and under the oversight of the Trustees.
The Trustees of the Trust have appointed the Advisor to assist the Trustees to obtain market values for portfolio investments, evaluate and monitor professional pricing service providers appointed by the Trustees’ Audit Committee (the “Audit Committee”) to assist in determining fair values for portfolio investments, assist in calculating fair values for portfolio investments in certain circumstances, and to perform other functions in connection with the valuation of investments. The Advisor acts through its Valuation and Pricing Committee (the “Committee”) and other employees of the Advisor. The Committee regularly reviews its own valuation calculations, as well as the valuations, valuation techniques and services furnished by pricing service providers, considers circumstances which may require valuation calculations by the Committee, and reviews previous valuation calculations. The Committee reports to the Audit Committee on the Committee’s activities, the performance of pricing service providers, and other matters relating to valuation of portfolio investments.
In those instances when the Committee assists in calculating a fair value for a portfolio investment, the Committee seeks to determine the price that the Fund would reasonably expect to receive upon a sale of the investment in an orderly transaction between market participants on the valuation date. The Committee customarily utilizes quotations from securities broker dealers in calculating valuations, but also may utilize prices obtained from pricing service providers or other methods approved by the Audit Committee. Because fair values calculated by the Committee are estimates, the calculation of a value for an investment may differ from the price that would be realized by the Fund upon
Semi-Annual Report | 13
Notes to Financial Statements, Continued
Thornburg New Mexico Intermediate Municipal Fund | March 31, 2018 (Unaudited)
a sale of the investment, and the difference could be material to the Fund’s financial statements. The Committee’s calculation of a fair value for an investment may also differ from the prices obtained by other persons (including other mutual funds) for the investment.
Valuation of Securities: Debt obligations held by the Fund which are not listed or traded on exchanges or for which no reported market exists are ordinarily valued at the valuation obtained from a pricing service provider approved by the Audit Committee.
In any case when a pricing service provider fails to provide a valuation for a debt obligation held by the Fund, the Committee calculates a fair value for the obligation using alternative methods under procedures approved by the Audit Committee. Additionally, in cases when management believes that a valuation obtained from a pricing service provider merits review for significant reasons, the Committee decides whether or not to use the valuation calculated by the pricing service provider or to use an alternative method approved by the Audit Committee to calculate a fair value for the obligation.
Valuation Hierarchy: The Fund categorizes its investments based upon the inputs used in valuing those investments, according to a three-level hierarchy established in guidance from the FASB. Categorization of investments using this hierarchy is intended by the FASB to maximize the use of observable inputs in valuing investments and minimize the use of unobservable inputs by requiring that the most observable inputs be used when available. Observable inputs are those that market participants would use in valuing an investment based on available market information. Unobservable inputs are those that reflect assumptions about the information market participants would use in valuing an investment. An investment’s level within the hierarchy is based on the lowest level input that is deemed significant to the valuation. The methodologies and inputs used to value investments are not necessarily indications of the risk or liquidity associated with those investments.
Various inputs are used in calculating valuations for the Fund’s investments. These inputs are generally summarized according to the three-level hierarchy below:
Level 1: Quoted prices in active markets for identical investments.
Level 2: Other direct or indirect significant observable inputs (including quoted prices for similar investments in active markets and other observable inputs, such as interest rates, prepayment rates, credit risk, etc.).
Level 3: Significant unobservable inputs (including the Committee’s own assumptions in calculating the fair values of investments).
Valuations for debt obligations held by the Fund are typically calculated by pricing service providers approved by the Audit Committee and are generally characterized as Level 2 within the valuation hierarchy.
In a limited number of cases the Committee calculates a fair value for investments using broker quotations or other methods approved by the Audit Committee. When the Committee uses a single broker quotation to calculate a fair value for an investment without other significant observable inputs, or if a fair value is calculated using other significant inputs that are considered unobservable, the investment is characterized as Level 3 within the hierarchy. Other significant unobservable inputs used to calculate a fair value in these instances might include an income-based valuation approach which considers discounted anticipated future cash flows from the investment and application of discounts due to the nature or duration of any restrictions on the disposition of the investment.
Valuations based upon the use of inputs from Levels 1, 2 or 3 may not represent the actual price received upon the disposition of an investment, and the Fund may receive a price that is lower than the valuation based upon these inputs when it sells the investment.
The following table displays a summary of the fair value hierarchy measurements of the Fund’s investments as of March 31, 2018. In any instance when valuation inputs from more than one level are used to determine the fair value of a specific investment, the investment is placed in the level of the table based upon the lowest level input that is significant in determining the fair value of the investment:
| | | | | | | | | | | | | | | | | | | | |
| | | FAIR VALUE MEASUREMENTS AT MARCH 31, 2018 |
| | | TOTAL | | LEVEL 1 | | LEVEL 2 | | LEVEL 3 |
Assets | | | | | | | | | | | | | | | | | | | | |
Investments in Securities | | | | | | | | | | | | | | | | | | | | |
Municipal Bonds | | | $ | 173,659,141 | | | | $ | – | | | | $ | 173,659,141 | | | | $ | – | |
| | | | | |
Total Investments in Securities | | | $ | 173,659,141 | | | | $ | – | | | | $ | 173,659,141 | | | | $ | – | |
In accordance with the guidance prescribed in Accounting Standards Update No. 2011-04, it is the policy of the Fund to recognize transfers between levels and the underlying events which caused the movement. The Fund recognized no transfers between levels for the six months ended March 31, 2018.
14 | Semi-Annual Report
Notes to Financial Statements, Continued
Thornburg New Mexico Intermediate Municipal Fund | March 31, 2018 (Unaudited)
NOTE 4 – INVESTMENT ADVISORY FEE AND OTHER TRANSACTIONS WITH AFFILIATES
Pursuant to an investment advisory agreement, the Advisor serves as the investment advisor and performs services for the Fund for which the fees are payable at the end of each month. Under the investment advisory agreement, the Fund pays the Advisor a management fee based on the daily net assets of the Fund at an annual rate as shown in the following table:
| | | | | |
| MANAGEMENT FEE SCHEDULE |
| DAILY NET ASSETS | | FEE RATE |
| |
Up to $500 million | | | | 0.500 | % |
| |
Next $500 million | | | | 0.450 | |
| |
Next $500 million | | | | 0.400 | |
| |
Next $500 million | | | | 0.350 | |
| |
Over $2 billion | | | | 0.275 | |
The Fund’s effective management fee for the six months ended March 31, 2018 was 0.50% of the Fund’s average net assets.
The Trust has entered into administrative service agreements with the Advisor, whereby the Advisor will perform certain administrative services related to each class of the Fund’s shares. Until January 31, 2018, the fees were payable at an annual rate of up to 0.125 of 1% per annum of the average daily net assets attributable to each class of shares. As of February 1, 2018, the fees are computed as an annual percentage of the aggregate average daily net assets of all shares classes of all Funds in the Trust as follows:
| | | | | |
| ADMINISTRATION FEE SCHEDULE |
| DAILY NET ASSETS | | FEE RATE |
| |
Up to $20 billion | | | | 0.100 | % |
| |
$20 billion to $40 billion | | | | 0.075 | |
| |
$40 billion to $60 billion | | | | 0.040 | |
| |
Over $60 billion | | | | 0.030 | |
The aggregate fee amount is allocated on a daily basis to each Fund based on net assets and subsequently allocated to each class of shares of the Fund. Total administrative service fees incurred by each class of shares of the Fund for the six months ended March 31, 2018, are set forth in the Statement of Operations.
The Trust has an underwriting agreement with Thornburg Securities Corporation (the “Distributor”), an affiliate of the Advisor, which acts as the distributor of the Fund’s shares. For the six months ended March 31, 2018, the Distributor has advised the Fund that it earned net commissions aggregating $42 from the sale of Class A shares.
Pursuant to a service plan under Rule 12b-1 of the Investment Company Act of 1940, the Fund may pay to the Distributor or securities dealers and other financial institutions at the Distributor’s direction an amount not to exceed .25 of 1% per annum of the average daily net assets attributable to Class A and Class D shares of the Fund to obtain various shareholder and distribution related services. For the six months ended March 31, 2018, there were no 12b-1 service plan fees charged for Class I shares. The Advisor and the Distributor each may pay out of its own resources additional expenses for distribution of the Fund’s shares and shareholder services.
The Trust has also adopted a distribution plan pursuant to Rule 12b-1, applicable only to the Fund’s Class D shares under which the Fund compensates the Distributor for services in promoting the sale of Class D shares of the Fund at an annual rate of up to .25 of 1% per annum of the average daily net assets attributable to Class D shares.
Total fees incurred by each class of shares of the Fund under their respective service and distribution plans for the six months ended March 31, 2018, are set forth in the Statement of Operations.
For the six months ended March 31, 2018, the Advisor reimbursed certain class specific expenses, administrative fees, and distribution fees of $195 for Class D shares and $1,103 for Class I shares.
Certain officers and Trustees of the Trust are also officers or directors of the Advisor and Distributor. The compensation of the independent Trustees is borne by the Trust. The Trust also pays a portion of the Chief Compliance Officer’s compensation. These amounts are reflected as “Trustee and officer fees” in the Statement of Operations.
The percentage of direct investments in the Fund held by the Trustees, officers of the Trust, and the Advisor is approximately 12.01%.
Semi-Annual Report | 15
Notes to Financial Statements, Continued
Thornburg New Mexico Intermediate Municipal Fund | March 31, 2018 (Unaudited)
The Fund may purchase or sell securities from, or to an affiliated fund, provided the affiliation is due solely to having a common investment advisor, common officers, or common trustees, and provided that all such transactions will comply with Rule 17a-7 under the 1940 Act. For the six months ended March 31, 2018, the Fund had transactions with affiliated funds of $23,708,601 in sales generating realized losses of $186,505.
NOTE 5 – SHARES OF BENEFICIAL INTEREST
At March 31, 2018, there were an unlimited number of shares with no par value of beneficial interest authorized. Transactions in shares of beneficial interest were as follows:
| | | | | | | | | | | | | | | | |
| | | SIX MONTHS ENDED
MARCH 31, 2018 (UNAUDITED) | | | YEAR ENDED
SEPTEMBER 30, 2017 (AUDITED) | |
| | | SHARES | | | AMOUNT | | | SHARES | | | AMOUNT | |
Class A Shares | | | | | | | | | | | | | | | | |
Shares sold | | | 102,214 | | | $ | 1,349,015 | | | | 542,204 | | | $ | 7,240,912 | |
Shares issued to shareholders in
reinvestment of dividends | | | 90,175 | | | | 1,184,014 | | | | 190,890 | | | | 2,543,123 | |
Shares repurchased | | | (1,151,283 | ) | | | (15,184,360 | ) | | | (1,943,296 | ) | | | (25,873,111 | ) |
| | | | |
| | | | |
Net decrease | | | (958,894 | ) | | $ | (12,651,331 | ) | | | (1,210,202 | ) | | $ | (16,089,076 | ) |
| | | | |
Class D Shares | | | | | | | | | | | | | | | | |
Shares sold | | | 128,274 | | | $ | 1,694,928 | | | | 262,935 | | | $ | 3,500,603 | |
Shares issued to shareholders in
reinvestment of dividends | | | 17,998 | | | | 236,442 | | | | 36,187 | | | | 482,399 | |
Shares repurchased | | | (278,109 | ) | | | (3,655,656 | ) | | | (678,301 | ) | | | (9,015,360 | ) |
| | | | |
| | | | |
Net decrease | | | (131,837 | ) | | $ | (1,724,286 | ) | | | (379,179 | ) | | $ | (5,032,358 | ) |
| | | | |
Class I Shares | | | | | | | | | | | | | | | | |
Shares sold | | | 459,099 | | | $ | 6,063,979 | | | | 1,135,137 | | | $ | 15,113,318 | |
Shares issued to shareholders in
reinvestment of dividends | | | 57,188 | | | | 750,726 | | | | 111,415 | | | | 1,483,821 | |
Shares repurchased | | | (1,040,144 | ) | | | (13,675,848 | ) | | | (1,382,452 | ) | | | (18,336,779 | ) |
| | | | |
| | | | |
Net decrease | | | (523,857 | ) | | $ | (6,861,143 | ) | | | (135,900 | ) | | $ | (1,739,640 | ) |
| | | | |
NOTE 6 – INVESTMENT TRANSACTIONS
For the six months ended March 31, 2018, the Fund had purchase and sale transactions of investments (excluding short-term investments) of $7,845,322 and $20,880,403, respectively.
OTHER NOTES
Risks: The Fund’s investments subject it to risks including, but not limited to, management risk, interest rate risk, credit risk, market and economic risk, liquidity risk, and the risk of investing mainly in the obligations primarily originating in a single state. Please see the Fund’s prospectus for a discussion of the risks associated with an investment in the Fund.
Subsequent Events: Fund management believes no events have occurred between March 31, 2018 and the date of issuance of the financial statements that require adjustment to or disclosure in the accompanying financial statements.
16 | Semi-Annual Report
This page intentionally left blank.
Semi-Annual Report | 17
Financial Highlights
Thornburg New Mexico Intermediate Municipal Fund
| | | | | | | | | | | | | | | | | | | | | | | | | | | | | | | | | | | | | | | | |
| | | PER SHARE PERFORMANCE (FOR A SHARE OUTSTANDING THROUGHOUT THE PERIOD) |
| | | | | | | | | | | | | | | | | |
UNLESS OTHERWISE
NOTED, PERIODS ARE
FISCAL YEARS ENDED
SEPTEMBER 30, | | NET ASSET
VALUE,
BEGINNING OF
PERIOD | | NET
INVESTMENT
INCOME
(LOSS)+ | | NET REALIZED &
UNREALIZED GAIN
(LOSS) ON
INVESTMENTS | | TOTAL FROM
INVESTMENT
OPERATIONS | | DIVIDENDS
FROM NET
INVESTMENT
INCOME | | DIVIDENDS
FROM NET
REALIZED
GAINS | | TOTAL
DIVIDENDS | | NET ASSET
VALUE,
END OF PERIOD |
| | | | | | | |
| CLASS A SHARES | | | | | | | | | | | | | | | | | | | | | | | | | | | | | | | | | | | | |
| | | | | | | | |
2018(b)(c) | | | $ | 13.30 | | | | | 0.16 | | | | | (0.27 | ) | | | | (0.11 | ) | | | | (0.16 | ) | | | | – | | | | | (0.16 | ) | | | $ | 13.03 | |
2017(b) | | | $ | 13.67 | | | | | 0.31 | | | | | (0.37 | ) | | | | (0.06 | ) | | | | (0.31 | ) | | | | – | | | | | (0.31 | ) | | | $ | 13.30 | |
2016(b) | | | $ | 13.55 | | | | | 0.30 | | | | | 0.12 | | | | | 0.42 | | | | | (0.30 | ) | | | | – | | | | | (0.30 | ) | | | $ | 13.67 | |
2015(b) | | | $ | 13.60 | | | | | 0.34 | | | | | (0.05 | ) | | | | 0.29 | | | | | (0.34 | ) | | | | – | | | | | (0.34 | ) | | | $ | 13.55 | |
2014(b) | | | $ | 13.35 | | | | | 0.39 | | | | | 0.25 | | | | | 0.64 | | | | | (0.39 | ) | | | | – | | | | | (0.39 | ) | | | $ | 13.60 | |
2013(b) | | | $ | 13.95 | | | | | 0.38 | | | | | (0.60 | ) | | | | (0.22 | ) | | | | (0.38 | ) | | | | – | | | | | (0.38 | ) | | | $ | 13.35 | |
| | | | | | | |
| CLASS D SHARES | | | | | | | | | | | | | | | | | | | | | | | | | | | | | | | | | | | | |
| | | | | | | | |
2018(c) | | | $ | 13.31 | | | | | 0.15 | | | | | (0.27 | ) | | | | (0.12 | ) | | | | (0.15 | ) | | | | – | | | | | (0.15 | ) | | | $ | 13.04 | |
2017 | | | $ | 13.68 | | | | | 0.28 | | | | | (0.37 | ) | | | | (0.09 | ) | | | | (0.28 | ) | | | | – | | | | | (0.28 | ) | | | $ | 13.31 | |
2016 | | | $ | 13.55 | | | | | 0.28 | | | | | 0.12 | | | | | 0.40 | | | | | (0.27 | ) | | | | – | | | | | (0.27 | ) | | | $ | 13.68 | |
2015 | | | $ | 13.61 | | | | | 0.31 | | | | | (0.06 | ) | | | | 0.25 | | | | | (0.31 | ) | | | | – | | | | | (0.31 | ) | | | $ | 13.55 | |
2014 | | | $ | 13.36 | | | | | 0.35 | | | | | 0.25 | | | | | 0.60 | | | | | (0.35 | ) | | | | – | | | | | (0.35 | ) | | | $ | 13.61 | |
2013 | | | $ | 13.96 | | | | | 0.34 | | | | | (0.59 | ) | | | | (0.25 | ) | | | | (0.35 | ) | | | | – | | | | | (0.35 | ) | | | $ | 13.36 | |
| | | | | | | |
| CLASS I SHARES | | | | | | | | | | | | | | | | | | | | | | | | | | | | | | | | | | | | |
| | | | | | | | |
2018(c) | | | $ | 13.29 | | | | | 0.18 | | | | | (0.27 | ) | | | | (0.09 | ) | | | | (0.18 | ) | | | | – | | | | | (0.18 | ) | | | $ | 13.02 | |
2017 | | | $ | 13.67 | | | | | 0.36 | | | | | (0.38 | ) | | | | (0.02 | ) | | | | (0.36 | ) | | | | – | | | | | (0.36 | ) | | | $ | 13.29 | |
2016 | | | $ | 13.54 | | | | | 0.35 | | | | | 0.12 | | | | | 0.47 | | | | | (0.34 | ) | | | | – | | | | | (0.34 | ) | | | $ | 13.67 | |
2015 | | | $ | 13.59 | | | | | 0.38 | | | | | (0.05 | ) | | | | 0.33 | | | | | (0.38 | ) | | | | – | | | | | (0.38 | ) | | | $ | 13.54 | |
2014 | | | $ | 13.35 | | | | | 0.43 | | | | | 0.24 | | | | | 0.67 | | | | | (0.43 | ) | | | | – | | | | | (0.43 | ) | | | $ | 13.59 | |
2013 | | | $ | 13.95 | | | | | 0.43 | | | | | (0.61 | ) | | | | (0.18 | ) | | | | (0.42 | ) | | | | – | | | | | (0.42 | ) | | | $ | 13.35 | |
| (a) | Not annualized for periods less than one year. |
| (b) | Sales loads are not reflected in computing total return. |
| (c) | Unaudited Six Month Period Ended March 31. |
| + | Based on weighted average shares outstanding. |
See notes to financial statements.
18 | Semi-Annual Report
Financial Highlights, Continued
Thornburg New Mexico Intermediate Municipal Fund
| | | | | | | | | | | | | | | | | | | | | | | | | | | | | | |
| RATIOS TO AVERAGE NET ASSETS | | | | | | SUPPLEMENTAL DATA | |
| | | | | | | EXPENSES, AFTER | | | | | | | | | | | | | | | | |
NET INVESTMENT
INCOME (LOSS) (%) | | | EXPENSES, AFTER
EXPENSE
REDUCTIONS (%) | | | EXPENSE
REDUCTIONS AND NET OF CUSTODY
CREDITS (%) | | | EXPENSES,
BEFORE EXPENSE
REDUCTIONS (%) | | | | | | TOTAL
RETURN (%)(a) | | | PORTFOLIO
TURNOVER
RATE (%)(a) | | | NET ASSETS AT
END OF PERIOD
(THOUSANDS) | |
| | | | | | | |
| | | | | | | | | | | | | | | | | | | | | | | | | | | | | | |
| | | | | | | |
| | 2.49 | (d) | | | 0.99 | (d) | | | 0.99 | (d) | | | 0.99 | (d) | | | | | | | (0.80 | ) | | | 4.45 | | | $ | 102,058 | |
| | 2.36 | | | | 0.98 | | | | 0.98 | | | | 0.98 | | | | | | | | (0.38 | ) | | | 8.61 | | | $ | 116,915 | |
| | 2.18 | | | | 0.97 | | | | 0.97 | | | | 0.97 | | | | | | | | 3.11 | | | | 6.80 | | | $ | 136,743 | |
| | 2.50 | | | | 0.98 | | | | 0.98 | | | | 0.98 | | | | | | | | 2.15 | | | | 19.01 | | | $ | 139,939 | |
| | 2.87 | | | | 0.97 | | | | 0.97 | | | | 0.97 | | | | | | | | 4.83 | | | | 10.79 | | | $ | 143,994 | |
| | 2.76 | | | | 0.96 | | | | 0.95 | | | | 0.96 | | | | | | | | (1.61 | ) | | | 11.78 | | | $ | 148,499 | |
| | | | | | | |
| | | | | | | | | | | | | | | | | | | | | | | | | | | | | | |
| | | | | | | |
| | 2.24 | (d) | | | 1.24 | (d) | | | 1.24 | (d) | | | 1.24 | (d) | | | | | | | (0.92 | ) | | | 4.45 | | | $ | 20,489 | |
| | 2.13 | | | | 1.21 | | | | 1.21 | | | | 1.21 | | | | | | | | (0.61 | ) | | | 8.61 | | | $ | 22,666 | |
| | 1.94 | | | | 1.21 | | | | 1.21 | | | | 1.21 | | | | | | | | 2.94 | | | | 6.80 | | | $ | 28,489 | |
| | 2.27 | | | | 1.20 | | | | 1.20 | | | | 1.20 | | | | | | | | 1.84 | | | | 19.01 | | | $ | 28,953 | |
| | 2.60 | | | | 1.23 | | | | 1.23 | | | | 1.23 | | | | | | | | 4.55 | | | | 10.79 | | | $ | 28,438 | |
| | 2.51 | | | | 1.21 | | | | 1.21 | | | | 1.22 | | | | | | | | (1.85 | ) | | | 11.78 | | | $ | 28,858 | |
| | | | | | | |
| | | | | | | | | | | | | | | | | | | | | | | | | | | | | | |
| | | | | | | |
| | 2.81 | (d) | | | 0.67 | (d) | | | 0.67 | (d) | | | 0.67 | (d) | | | | | | | (0.64 | ) | | | 4.45 | | | $ | 54,163 | |
| | 2.68 | | | | 0.66 | | | | 0.66 | | | | 0.66 | | | | | | | | (0.13 | ) | | | 8.61 | | | $ | 62,243 | |
| | 2.52 | | | | 0.63 | | | | 0.63 | | | | 0.63 | | | | | | | | 3.53 | | | | 6.80 | | | $ | 65,843 | |
| | 2.80 | | | | 0.65 | | | | 0.65 | | | | 0.65 | | | | | | | | 2.48 | | | | 19.01 | | | $ | 57,958 | |
| | 3.19 | | | | 0.65 | | | | 0.64 | | | | 0.65 | | | | | | | | 5.09 | | | | 10.79 | | | $ | 37,380 | |
| | 3.09 | | | | 0.61 | | | | 0.61 | | | | 0.61 | | | | | | | | (1.29 | ) | | | 11.78 | | | $ | 25,590 | |
Semi-Annual Report | 19
Expense Example
Thornburg New Mexico Intermediate Municipal Fund | March 31, 2018 (Unaudited)
As a shareholder of the Fund, you incur two types of costs:
| | (1) | transaction costs, including |
| | (a) | sales charges (loads) on purchase payments, for Class A shares; |
| | (b) | a deferred sales charge on redemptions of any part or all of a purchase of $1 million of Class A shares within 12 months of purchase; |
| | (2) | ongoing costs, including management fees; distribution and/or service (12b-1) fees; and other Fund expenses. This example is intended to help you understand your ongoing costs (in dollars) of investing in the Fund and to compare these costs with the ongoing costs of investing in other mutual funds |
This example is intended to help you understand your ongoing costs (in dollars) of investing in the Fund and to compare these costs with the ongoing costs of investing in other mutual funds.
The example is based on a $1,000 investment beginning on October 1, 2017, and held until March 31, 2018.
ACTUAL EXPENSES
For each class of shares, the first line of the accompanying table provides information about actual account values and actual expenses. You may use the information in this line, together with the amount you invested, to estimate the expenses that you paid over the period. Simply divide your account value by $1,000 (for example, an $8,600 account value divided by $1,000 = 8.6), then multiply the result by the number in the first line for your class of shares under the heading entitled “Expenses Paid During Period” to estimate the expenses you paid on your account during this period.
| | | | | | | | | | | | | | | |
| | | BEGINNING
ACCOUNT VALUE
10/1/17 | | ENDING
ACCOUNT VALUE
3/31/18 | | EXPENSES PAID
DURING PERIOD†
10/1/17–3/31/18 |
| | | |
| CLASS A SHARES | | | | | | | | | | | | | | | |
| | | |
Actual | | | $ | 1,000.00 | | | | $ | 992.00 | | | | $ | 4.92 | |
Hypothetical* | | | $ | 1,000.00 | | | | $ | 1,020.00 | | | | $ | 4.99 | |
| | | |
| CLASS D SHARES | | | | | | | | | | | | | | | |
| | | |
Actual | | | $ | 1,000.00 | | | | $ | 990.80 | | | | $ | 6.15 | |
Hypothetical* | | | $ | 1,000.00 | | | | $ | 1,018.75 | | | | $ | 6.24 | |
| | | |
| CLASS I SHARES | | | | | | | | | | | | | | | |
| | | |
Actual | | | $ | 1,000.00 | | | | $ | 993.60 | | | | $ | 3.33 | |
Hypothetical* | | | $ | 1,000.00 | | | | $ | 1,021.59 | | | | $ | 3.38 | |
| † | Expenses are equal to the annualized expense ratio for each class (A: 0.99%; D: 1.24%; I: 0.67%) multiplied by the average account value over the period, multiplied by 182/365 to reflect the one-half year period. |
| * | Hypothetical assumes a rate of return of 5% per year before expenses. |
HYPOTHETICAL EXAMPLE FOR COMPARISON PURPOSES
For each class of shares, the second line of the accompanying table provides information about hypothetical account values and hypothetical expenses based on the Fund’s actual expense ratio and an assumed rate of return of 5% per year before expenses, which is not the Fund’s actual return. The hypothetical account values and expenses may not be used to estimate the actual ending account balance or expenses you paid for the period. You may use this information to compare the ongoing costs of investing in the Fund and other funds. To do so, compare this 5% hypothetical example with the 5% hypothetical examples that appear in the shareholder reports of the other funds.
Please note that the expenses shown in the table are meant to highlight your ongoing costs only and do not reflect any transactional costs, such as sales charges (loads), redemption fees, or exchange fees. Therefore, the second line of the table for each class of shares is useful in comparing ongoing costs only, and will not help you determine the relative total costs of owning different funds. In addition, if these transactional costs were included, your costs would have been higher.
20 | Semi-Annual Report
Other Information
Thornburg New Mexico Intermediate Municipal Fund | March 31, 2018 (Unaudited)
PORTFOLIO PROXY VOTING
Policies and Procedures:
The Trust has delegated to Thornburg Investment Management, Inc. (the “Advisor”) voting decisions respecting proxies for the Fund’s voting securities. The Advisor makes voting decisions in accordance with its Proxy Voting Policy and Procedures. A description of the Policy and Procedures is available (i) without charge, upon request, by calling the Advisor toll-free at 1-800-847-0200, (ii) on the Thornburg website at www.thornburg.com, and (iii) on the Securities and Exchange Commission’s website at www.sec.gov.
Information regarding how proxies were voted is available on or before August 31 of each year for the twelve months ending the preceding June 30. This information is available (i) without charge, upon request by calling the Advisor toll-free at 1-800-847-0200, (ii) on the Thornburg website at www.thornburg.com, and (iii) on the Securities and Exchange Commission’s website at www.sec.gov.
AVAILABILITY OF QUARTERLY PORTFOLIO SCHEDULE
The Fund files with the Securities and Exchange Commission schedules of its portfolio holdings on Form N-Q for the first and third quarters of each fiscal year. The Fund’s Forms N-Q are available on the Commission’s website at www.sec.gov, or may be reviewed and copied at the Commission’s Public Reference Room in Washington, D.C. Information on the operation of the Public Reference Room may be obtained by calling 1-800-SEC-0330. The Fund also makes this information available on its website at www.thornburg.com/download or upon request by calling 1-800-847-0200.
Semi-Annual Report | 21
Trustees’ Statement to Shareholders
Readopted September 11, 2017
The Trustees believe current and prospective shareholders should know how we discharge our responsibilities in supervising the Funds’ investment advisor and in reviewing the advisor’s contract for renewal. Since 2005, we have issued a statement which sets out clearly the three principal guidelines that we follow in supervising the Trust’s investment advisor on your behalf. In accordance with our customary practice, in September of this year we again reviewed our statement and concluded we should reissue this statement outlining the principal features of our supervision of the advisor’s performance of investment management services for the Funds.
We begin with the premise that each shareholder selected his or her Fund because its investments are managed by the investment advisor identified in the prospectus and in accordance with the objective and policies described in the prospectus. We realize, as each of you do, that if you believe that your Fund’s stated objective and policies no longer serve your personal investment goals, you can sell your shares and leave the Fund.
Therefore, we believe that our primary supervisory task—our principal obligation to you—is to assess the nature and quality of the advisor’s services, and to confirm that the advisor actively and competently pursues the Fund’s objective, in accordance with the policies set out in the prospectus. To do this, we meet regularly with management to review your Fund’s portfolio and to discuss the advisor’s specific actions and judgments in pursuing the Fund’s objective. We do not substitute our own judgment for the advisor’s decisions in selecting investments; the advisor is paid to exercise its informed judgment on investment decisions, and we seek to confirm, in reviewing the advisor’s performance, that the advisor is doing just that.
Second, we are conscious of costs and the effect that costs have on shareholders’ returns. We try to make sure that your Fund’s fees and costs are reasonable in relationship to the services rendered and that they are generally in line with those charged by other expert investment advisors, consistent with our belief that the Fund’s investors searched for and expect that expertise and attention and have decided to pay a reasonable price for it. We do not put the management contract “out to bid” as a matter of course, and we would not do so unless we had concluded that the advisor materially had failed to pursue the Fund’s objectives in accordance with its policies, or for other equally important reasons. We believe that any other approach would be inconsistent with your interests and contrary to your expectations when you bought shares of the Fund in the first place.
Finally, because we believe that most Thornburg Fund shareholders have invested with a long-term perspective, we try not to focus too much on the fashions of the moment and on short-term performance. The market will not favor any specific investment objective or set of policies at all times and under all economic circumstances. A fund will experience periods of both high and low returns relative to other funds and other investments. Even if one of our Funds is not favored by the market at a particular time, we believe that the advisor is nonetheless obliged to remain true to the Fund’s objective and policies, and we watch to see that it does so.
Trustees of Thornburg Investment Trust
22 | Semi-Annual Report
Thornburg Funds
Thornburg Investment Management is a privately-owned global investment firm that offers a range of solutions for retail and institutional investors. Founded in 1982 and headquartered in Santa Fe, New Mexico, we manage approximately $49 billion (as of March 31, 2018) across U.S. mutual funds, separate accounts for high-net-worth investors, institutional accounts, and UCITS funds for non-U.S. investors.
EQUITY FUNDS
| | ∎ | | Thornburg Investment Income Builder Fund |
| | ∎ | | Thornburg Global Opportunities Fund |
| | ∎ | | Thornburg International Value Fund |
| | ∎ | | Thornburg Better World International Fund |
| | ∎ | | Thornburg International Growth Fund |
| | ∎ | | Thornburg Developing World Fund |
| | ∎ | | Thornburg Core Growth Fund |
FIXED INCOME FUNDS
| | ∎ | | Thornburg Low Duration Income Fund |
| | ∎ | | Thornburg Limited Term U.S. Government Fund |
| | ∎ | | Thornburg Limited Term Income Fund |
| | ∎ | | Thornburg Strategic Income Fund |
| | ∎ | | Thornburg Low Duration Municipal Fund |
| | ∎ | | Thornburg Limited Term Municipal Fund |
| | ∎ | | Thornburg Intermediate Municipal Fund |
| | ∎ | | Thornburg California Limited Term Municipal Fund |
| | ∎ | | Thornburg New Mexico Intermediate Municipal Fund |
| | ∎ | | Thornburg New York Intermediate Municipal Fund |
| | ∎ | | Thornburg Strategic Municipal Income Fund |
ALTERNATIVE FUNDS
| | ∎ | | Thornburg Long/Short Equity Fund |
Before investing, carefully consider the Fund’s investment goals, risks, charges, and expenses. For a prospectus or summary prospectus containing this and other information, contact your financial advisor or visit thornburg.com. Read it carefully before investing.
For additional information, please visit thornburg.com
Thornburg Investment Management, Inc. 2300 North Ridgetop Road, Santa Fe, NM 87506
Semi-Annual Report | 23
| | | | |
| To receive shareholder reports, prospectuses, and proxy statements electronically, go to www.thornburg.com/edelivery. | | | | |
| This Semi-Annual Report is submitted for the general information of shareholders of the Fund. It is not authorized for distribution to prospective investors in the Fund unless preceded or accompanied by an effective prospectus. | |
| | | | |
Investment Advisor: | | Distributor: | | |
Thornburg Investment Management® | | Thornburg Securities Corporation® | | |
800.847.0200 | | 800.847.0200 | | TH178 |
Semi-Annual Report
March 31, 2018
THORNBURG
NEW YORK
INTERMEDIATE
MUNICIPAL
FUND
About Thornburg Investment Management
It’s more than what we do.
It’s how we do it.
At Thornburg, we are very different in how we think, invest, and are structured. We believe this difference is what makes us successful in helping individuals reach their long-term financial goals.
Flexible Perspective
Our perspective on investment opportunities is more flexible than most, viewing a wide range of opportunities beyond conventional boundaries to find hidden value.
Collaboration
Collectively, we hone ideas via borderless cross-pollination for better judgment and better results.
Portfolio Construction
Disciplined construction guided more by our convictions than convention.
CONVICTION
Thorough analysis and our relative-value framework lead to conviction in our securities selection.
UNCONVENTIONAL
Active management means we seek the best value for our clients rather than using conventional benchmarks as our starting point.
Structured for Excellence
How we think and how we invest is made possible by how we’re structured.
TEAM APPROACH
FAR FROM THE HERD
ACCESS & TRANSPARENCY
2 | Semi-Annual Report
Thornburg New York Intermediate Municipal Fund
Semi-Annual Report ^ March 31, 2018
Table of Contents
| | | | | | | | | | |
| SHARE CLASS | | NASDAQ SYMBOL | | CUSIP |
| | |
| Class A | | THNYX | | | | 885-215-665 | |
| Class I | | TNYIX | | | | 885-216-705 | |
Minimum investments for Class I shares may be higher than those for Class A. Class I shares may not be available to all investors.
Investments carry risks, including possible loss of principal. Portfolios investing in bonds have the same interest rate, inflation, and credit risks that are associated with the underlying bonds. The value of bonds will fluctuate relative to changes in interest rates, decreasing when interest rates rise. Unlike bonds, bond funds have ongoing fees and expenses. Please see the Fund’s prospectus for a discussion of the risks associated with an investment in the Fund. Investments in the Funds are not FDIC insured, nor are they bank deposits or guaranteed by a bank or any other entity.
The laddering strategy does not assure or guarantee better performance and cannot eliminate the risk of investment losses.
Semi-Annual Report | 3
Letter to Shareholders
Thornburg New York Intermediate Municipal Fund | March 31, 2018 (Unaudited)
April 25, 2018
Dear Fellow Shareholder:
We are pleased to present the semi-annual report for Thornburg New York Intermediate Municipal Fund. The net asset value (NAV) of the Class I shares decreased by 28 cents to $12.72 per share during the six-month period ended March 31, 2018. During the period, the Class I shares of the Fund outperformed the index with a negative 0.86% total return, compared to the negative 1.17% total return for the ICE BofAML 3-15 Year U.S. Municipal Securities Index.
The Fund’s duration, as well as curve positioning, was the largest driver of outperformance, adding 0.59% to relative performance. Security selection, which is performance not attributable to duration and sector selection, was also a driver of relative performance, contributing 0.06%. Sector selection was a small detractor during the period, detracting 0.04% from relative performance.
The topic of tax reform consumed municipal market participants in the fourth quarter of 2017, with several proposals being bandied about that would significantly impact the supply/ demand dynamics of the market for years to come. Ultimately, the legislation was not as radical as initially feared. On the supply side of the equation, issuers lost the ability to advance refund debt. Much like a homeowner refinancing an existing mortgage to save on interest costs, an issuer would refinance debt when interest rates were low to provide some present value savings. While many thought this would have a large impact on supply, we did not agree. Advance refunding is highly correlated to the current level of interest rates, and many issuers had already accomplished any possible refunding over the previous several years.
Instead, we found the impact of tax reform on the demand side of the equation to be far more interesting. What was overlooked was the reduction of the corporate tax rate from 35% to 21%, and the idea that corporations evaluating municipal bonds versus other fixed income securities on a tax equivalent basis would now require a higher hurdle rate to buy municipal securities. We felt that the impact this may have on two specific buyers of municipals, banks, and property and casualty insurance companies, which own roughly 20 to 25% of outstanding municipal bonds, could lead both to re-evaluate their decision to own municipal bonds. While we do not believe this to be an Armageddon type of scenario; we expect it to be more like a weight leaning on the market for the next 12 to 18 months.
Another impact on the demand side is the limitations on the deductibility of state and local taxes (SALT), which has led
many market observers to postulate that the demand for municipal bonds in high tax states will increase. Again, we did not share the same opinion. In California, the demand for California bonds has already driven prices to a level where we feel there is little value when compared to other municipal securities on a tax-equivalent basis. Demand for municipal securities in other high tax states, such as Connecticut, Pennsylvania, and New Jersey, is not as cut and dry because there is significant credit risk associated with each. Nevertheless, these concerns caused the supply of municipal bonds to spike in November and December as issuers rushed to market to hedge against the potential threat of tax reform. Some investors viewed this period as an opportunity to buy extra municipal bonds in anticipation of a January rally, which never materialized. We did not view the market the same way, and kept our strategies positioned at the lower end of their relative risk spectrums (i.e. lower duration, higher credit quality, and higher reserve positions). The last fear facing the municipal bond market is the long-advertised infrastructure plan. While the plan has experienced several failed launches, and what is known suggests it will have little impact on the supply of municipal bonds, we are still monitoring the details of the proposal for potential impacts to our strategies.
The fourth quarter of 2017 saw yields of shorter maturity bonds increase more than the yields of longer maturity bonds, leading to a flattening of the yield curve. At the time, many analysts and pundits harped on the fact that the phenomenon portends a future recession. In the first quarter of 2018, the market watched as yields of longer maturity bonds increased more than yields of shorter maturity bonds, leading to a steepening of the yield curve. The steepening of the curve is an indication that market participants have a growing concern about increases in inflation – the enemy of the fixed income investor. The Fund’s conservative positioning was a headwind to performance in the fourth quarter of 2017, but acted as a tailwind to performance in the first quarter of 2018.
Thank you for your continued trust in us.
Sincerely,
| | |
| | |
| Christopher Ryon,CFA | | Nicholos Venditti,CFA |
| Portfolio Manager | | Portfolio Manager |
| Managing Director | | Managing Director |
The matters discussed in this report may constitute forward-looking statements made pursuant to the safe harbor provisions of the Securities Litigation Reform Act of 1995. These include any advisor or portfolio manager prediction, assessment, analysis or outlook for individual securities, industries, investment styles, market sectors and/or markets. These statements involve risks and uncertainties. In addition to the general risks described for each fund in its current prospectus, other factors bearing on these reports include the accuracy of the advisor’s or portfolio manager’s forecasts and predictions, the appropriateness of the investment strategies designed by the advisor or portfolio manager and the ability of the advisor or portfolio manager to implement their strategies efficiently and successfully. Any one or more of these factors, as well as other risks affecting the securities markets generally, could cause the actual results of any fund to differ materially as compared to its benchmarks.
The views expressed are subject to change and do not necessarily reflect the views of Thornburg Investment Management, Inc. This information should not be relied upon as a recommendation or investment advice and is not intended to predict the performance of any investment or market.
Performance results of individual share classes will vary based on the fees and expenses associated with each share class, and may be higher or lower than other share classes within the same Fund. Please see Performance Summary for performance results of each share class.
4 | Semi-Annual Report
Performance Summary
Thornburg New York Intermediate Municipal Fund | March 31, 2018 (Unaudited)
AVERAGE ANNUAL TOTAL RETURNS
| | | | | | | | | | | | | | | | | | | | | | | | | |
| | | 1-YR | | 3-YR | | 5-YR | | 10-YR | | SINCE
INCEP. |
| | | | | |
Class A Shares (Incep: 9/5/97) | | | | | | | | | | | | | | | | | | | | | | | | | |
Without sales charge | | | | 0.71% | | | | | 0.90% | | | | | 1.35% | | | | | 3.18% | | | | | 3.67% | |
| | | | | |
With sales charge | | | | -1.28% | | | | | 0.22% | | | | | 0.94% | | | | | 2.98% | | | | | 3.57% | |
| | | | | |
Class I Shares (Incep: 2/1/10) | | | | 1.03% | | | | | 1.22% | | | | | 1.67% | | | | | - | | | | | 3.18% | |
30-DAY YIELDS, A SHARES (with sales charge)
| | | | |
| Annualized Distribution Yield | | | 2.24% | |
| SEC Yield | | | 1.27% | |
GROWTH OF A HYPOTHETICAL $10,000 INVESTMENT
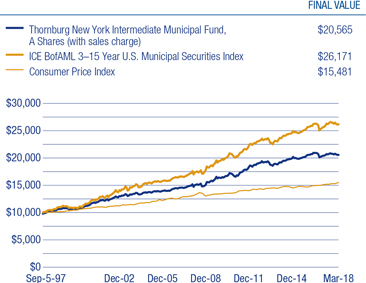
Performance data shown represents past performance and is no guarantee of future results. Investment return and principal value will fluctuate so shares, when redeemed, may be worth more or less than their original cost. Current performance may be lower or higher than quoted. For performance current to the most recent month end, visit thornburg.com or call 800-847-0200. The performance information does not reflect the deduction of taxes that a shareholder would pay on distributions or the redemption of Fund shares. Returns reflect the reinvestment of dividends and capital gains. Class A shares are sold with a maximum sales charge of 2.00%. There is no sales charge for Class I shares. As disclosed in the most recent prospectus, the total annual fund operating expenses before fee waivers and expense reimbursements are as follows: A shares, 1.05%; I shares, 0.80%. Thornburg Investment Management and/or Thornburg Securities Corporation have contractually agreed to waive fees and reimburse expenses through at least February 1, 2019, for all share classes, resulting in net expense ratios of the following: A shares, 0.99%; I shares, 0.67%. For more detailed information on fund expenses and waivers/reimbursements please see the Fund’s prospectus. Without the fee waivers and expense reimbursements, the Annualized Distribution yield would have been 2.16%, and the SEC yield would have been 1.19%.
The ICE index data referenced herein is the property of ICE Data Indices, LLC, its affiliates (“ICE Data”) and/or its Third Party Suppliers and has been licensed for use by Thornburg Investment Management, Inc. ICE Data and its Third Party Suppliers accept no liability in connection with its use. See www.thornburg.com/indices for a full copy of the Disclaimer.
Glossary
The ICE BofAML 3-15 Year U.S. Municipal Securities Index is a subset of the ICE BofAML U.S. Municipal Securities Index including all securities with a remaining term to final maturity greater than or equal to 3 years and less than 15 years.
The performance of any index is not indicative of the performance of any particular investment. Unless otherwise noted, index returns reflect the reinvestment of income dividends and capital gains, if any, but do not reflect fees, brokerage commissions or other expenses of investing. Investors may not make direct investments into any index.
Annualized Distribution Yield – The distribution yield reflects actual distributions made to shareholders. The annualized distribution yield is calculated by summing the last 30 days of income at a given month end and annualizing to a 360-day year. The result is divided by the ending maximum offering price or net asset value.
SEC Yield – A yield computed in accordance with SEC standards measuring the net investment income per share over a specified 30-day period expressed as a percentage of the maximum offering price of the Fund’s shares at the end of the period.
Advance refunding – Advance refunding can also refer to bond issuance in which new bonds are sold at a lower rate than outstanding ones. The proceeds are then invested, and when the older bonds become callable, they are paid off with the invested proceeds.
Bond Credit Ratings (Credit Quality) – A bond credit rating assesses the financial ability of a debt issuer to make timely payments of principal and interest. Rating of AAA (the highest), AA, A, and BBB are investment-grade quality. Rating of BB, B, CCC, CC, C and D (the lowest) are considered below investment grade, speculative grade, or junk bonds.
Credit Spread/Quality Spread – The difference between the yields of securities with different credit qualities.
Duration – A bond’s sensitivity to interest rates. Bonds with longer durations experience greater price volatility than bonds with shorter durations. Effective duration incorporates a bond’s embedded option features, such as call provisions.
Laddering – Laddering involves building a portfolio of bonds with staggered maturities so that a portion matures each year. Money that comes in from maturing bonds is typically invested in bonds with longer maturities at the far end of the portfolio.
Yield Curve – A line that plots the interest rate, at a set point in time, of bonds having equal credit quality, but offering maturity dates.
Semi-Annual Report | 5
Fund Summary
Thornburg New York Intermediate Municipal Fund | March 31, 2018 (Unaudited)
OBJECTIVES AND STRATEGIES
The Fund’s primary investment objective is to obtain as high a level of current income exempt from federal, New York State and New York City individual income taxes as is consistent, in the view of the Fund’s investment advisor, with preservation of capital.
The secondary goal of the Fund is to reduce expected changes in its share price compared to long-term bond portfolios.
The Fund offers New York investors double (or for New York City residents triple) tax-free yields in a laddered municipal bond portfolio with a dollar-weighted average maturity of normally three to 10 years (may be subject to Alternative Minimum Tax). Laddering involves building a portfolio of bonds with staggered maturities so that a portion of the portfolio matures each year. Cash from maturing bonds, if not needed for other purposes, is typically invested in bonds with longer maturities at the far end of the ladder. We regard the strategy as a good compromise for managing different types of risk.
LONG-TERM STABILITY OF PRINCIPAL
Net Asset Value History of A Shares
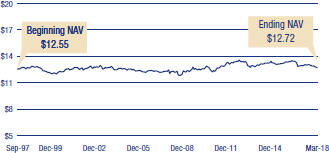
KEY PORTFOLIO ATTRIBUTES
| | | | | |
| Number of Bonds | | | | 70 | |
| Effective Duration | | | | 4.0 Yrs | |
| Average Maturity | | | | 7.4 Yrs | |
SECURITY CREDIT RATINGS
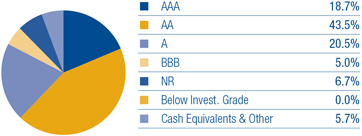
A bond credit rating assesses the financial ability of a debt issuer to make timely payments of principal and interest. Ratings of AAA (the highest), AA, A, and BBB are investment-grade quality. Ratings of BB, B, CCC, CC, C and D (the lowest) are considered below investment grade, speculative grade, or junk bonds.
Unrated pre-refunded and escrowed-to-maturity bonds are included in the not rated category.
PORTFOLIO LADDER
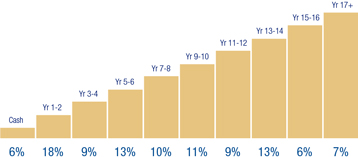
There is no guarantee that the Fund will meet its investment objectives.
All data is subject to change. Charts may not add up to 100% due to rounding.
6 | Semi-Annual Report
Schedule of Investments
Thornburg New York Intermediate Municipal Fund | March 31, 2018 (Unaudited)
| | | | | | | | | | | | |
| | | ISSUER-DESCRIPTION | | PRINCIPAL AMOUNT | | VALUE |
| | City of New York (City Budget Financial Management) GO, 5.00% due 8/1/2030 | | | $ | 1,000,000 | | | | $ | 1,128,400 | |
| | County of Nassau (Insured: BAM) GO, Series B-BAM-TCRS, 5.00% due 4/1/2026 | | | | 1,000,000 | | | | | 1,137,330 | |
| | Dutchess County Local Development Corp. (Health Quest Systems, Inc.; Insured: AGM), Series A, 5.00% due 7/1/2021 - 7/1/2022 | | | | 1,045,000 | | | | | 1,112,156 | |
| | Erie County Fiscal Stability Authority, 5.00% due 9/1/2034 | | | | 850,000 | | | | | 1,001,436 | |
| | Erie County Industrial Development Agency (Buffalo City School District), Series A, 5.25% due 5/1/2025 (pre-refunded 5/1/2019) | | | | 1,000,000 | | | | | 1,038,940 | |
| | Government of Guam (Layon Solid Waste Disposal Facility), Series A, 5.375% due 12/1/2024 (pre-refunded 12/1/2019) | | | | 1,000,000 | | | | | 1,060,930 | |
| | Government of Guam (Various Capital Projects), Series D-REF, 5.00% due 11/15/2033 | | | | 2,000,000 | | | | | 2,096,680 | |
| | Guam Waterworks Authority (Water and Wastewater System), 5.00% due 7/1/2028 - 7/1/2036 | | | | 1,500,000 | | | | | 1,620,350 | |
| | Hempstead Town Local Development Corp. (Hofstra University), 5.00% due 7/1/2028 | | | | 500,000 | | | | | 542,935 | |
| | Hudson Yards Infrastructure Corp. (Hudson Yards Subway Station), Series A, 5.00% due 2/15/2035 | | | | 1,000,000 | | | | | 1,151,300 | |
| | Long Island Power Authority (Electric System Capital Improvements), Series C, 5.25% due 9/1/2029 | | | | 645,000 | | | | | 777,231 | |
| | Metropolitan Transportation Authority (Transit and Commuter System), 6.25% due 11/15/2023 | | | | 190,000 | | | | | 195,491 | |
| | Series C, 6.25% due 11/15/2023 (pre-refunded 11/15/2018) | | | | 800,000 | | | | | 823,168 | |
| | Series C-1, 5.00% due 11/15/2033 | | | | 1,000,000 | | | | | 1,160,110 | |
| | Series C-1A, 4.00% due 2/15/2019 | | | | 1,000,000 | | | | | 1,020,360 | |
| | Metropolitan Transportation Authority, 6.25% due 11/15/2023 (pre-refunded 11/15/2018) | | | | 10,000 | | | | | 10,290 | |
| | Monroe County Industrial Development Corp. (Monroe Community College Association, Inc.; Insured: AGM), 5.00% due 1/15/2028 - 1/15/2029 | | | | 550,000 | | | | | 611,153 | |
| | Nassau County (New York Institute of Technology) IDA, Series A, 4.75% due 3/1/2026 (pre-refunded 3/1/2020) | | | | 1,000,000 | | | | | 1,055,740 | |
| | Nassau County Sewer & Storm Water Finance Authority (Sewerage and Storm Water Resource Facilities), Series A, 5.00% due 10/1/2021 - 10/1/2031 | | | | 1,675,000 | | | | | 1,912,131 | |
| a | | New York City (LOC: Mizuho Bank Ltd.) GO, 1.77% due 4/1/2042 (put 4/2/2018) | | | | 1,100,000 | | | | | 1,100,000 | |
| | New York City Health and Hospital Corp. (Healthcare Facilities Improvements) GO, Series A, 5.00% due 2/15/2020 | | | | 770,000 | | | | | 816,623 | |
| | New York City Health and Hospitals Corp. (Healthcare Facilities Improvements) GO, Series A, 5.00% due 2/15/2025 | | | | 1,000,000 | | | | | 1,056,190 | |
| | New York City Municipal Water Finance Authority (Water & Sewer System), Series BB-2, 5.00% due 6/15/2032 | | | | 250,000 | | | | | 293,663 | |
| | New York City Transitional Finance Authority (Educational Facilities) (State Aid Withholding), Series S-4, 5.00% due 1/15/2020 | | | | 1,000,000 | | | | | 1,026,890 | |
| a | | New York City Transitional Finance Authority Future Tax Secured Revenue, 1.75% due 8/1/2031 (put 4/2/2018) | | | | 1,500,000 | | | | | 1,500,000 | |
| a | | New York City Transitional Finance Authority, 1.70% due 8/1/2043 (put 4/2/2018) | | | | 800,000 | | | | | 800,000 | |
| | New York City Trust for Cultural Resources (Lincoln Center for the Performing Arts), Series C, 5.25% due 12/1/2018 | | | | 175,000 | | | | | 179,216 | |
| | New York Municipal Bond Bank Agency (Insured: AGM), Series B1, 5.00% due 4/15/2018 | | | | 1,000,000 | | | | | 1,001,100 | |
| | New York State Dormitory Authority (Columbia University Teachers College), Series A, 5.00% due 7/1/2027 | | | | 750,000 | | | | | 824,715 | |
| | New York State Dormitory Authority (Health Quest Systems; Insured: AGM), Series A, 5.25% due 7/1/2027 | | | | 500,000 | | | | | 501,365 | |
| | New York State Dormitory Authority (Metropolitan Transportation Authority & State Urban Development Corp.), Series A, 5.00% due 12/15/2027 | | | | 2,500,000 | | | | | 2,803,725 | |
| | New York State Dormitory Authority (Miriam Osborn Memorial Home Assoc.), 5.00% due 7/1/2024 - 7/1/2025 | | | | 2,645,000 | | | | | 2,747,421 | |
| | New York State Dormitory Authority (Municipal Health Facilities), 5.00% due 1/15/2023 | | | | 1,000,000 | | | | | 1,002,600 | |
| | New York State Dormitory Authority (North Shore Long Island Jewish Medical), 5.25% due 5/1/2030 (pre-refunded 5/1/2019) | | | | 1,000,000 | | | | | 1,037,300 | |
| | New York State Dormitory Authority (NYSARC, Inc. Developmental Disability Programs), Series A, 5.00% due 7/1/2020 | | | | 1,175,000 | | | | | 1,255,170 | |
| | New York State Dormitory Authority (School District Financing Program) (State Aid Withholding), Series C, 5.00% due 10/1/2023 | | | | 575,000 | | | | | 658,214 | |
| | New York State Dormitory Authority (School District Financing Program; Insured: AGM) (State Aid Withholding), 5.00% due 10/1/2024 | | | | 480,000 | | | | | 529,906 | |
| | 5.00% due 10/1/2024 (pre-refunded 10/1/2021) | | | | 520,000 | | | | | 574,995 | |
| | New York State Dormitory Authority (School District Financing Program; Insured: AGM), | | | | | | | | | | |
| | Series A, 5.00% due 10/1/2028 | | | | 200,000 | | | | | 227,488 | |
| | 5.25% due 10/1/2018 | | | | 775,000 | | | | | 789,144 | |
| | Series C, 5.00% due 10/1/2018 | | | | 130,000 | | | | | 130,852 | |
| | New York State Dormitory Authority (St. John’s University; Insured: Natl-Re), Series C, 5.25% due 7/1/2022 | | | | 1,000,000 | | | | | 1,123,780 | |
| | New York State Dormitory Authority, Series A, 5.00% due 2/15/2032 | | | | 1,000,000 | | | | | 1,165,670 | |
| | New York State Urban Development Corp., Series D, 5.25% due 1/1/2021 | | | | 1,000,000 | | | | | 1,027,410 | |
| | Onondaga Civic Development Corp. (Le Moyne College), 5.00% due 7/1/2021 | | | | 1,000,000 | | | | | 1,071,430 | |
| | Onondaga Civic Development Corp. (State University of New York Upstate Medical University), 5.50% due 12/1/2031 | | | | 1,000,000 | | | | | 1,113,570 | |
| | Rensselaer City School District (Unified School Campus Project; Insured: AGM) (State Aid Withholding) COP, 5.00% due 6/1/2023 | | | | 1,000,000 | | | | | 1,126,510 | |
| | Sales Tax Asset Receivable Corp. (New York Local Government Assistance Corp.), Series A, 5.00% due 10/15/2029 - 10/15/2031 | | | | 2,250,000 | | | | | 2,582,070 | |
| | Syracuse Industrial Development Agency (Syracuse City School District), 5.25% due 5/1/2026 | | | | 2,150,000 | | | | | 2,360,915 | |
| | Tobacco Settlement Asset Securitization Corp., Series A, 5.00% due 6/1/2022 | | | | 1,000,000 | | | | | 1,103,600 | |
| | Tompkins County Development Corp. (Ithaca College Project), 5.00% due 7/1/2034 - 7/1/2037 | | | | 820,000 | | | | | 948,280 | |
| | Town of Amherst Development Corp. (University at Buffalo Foundation Facility-Student Housing; Insured: AGM), 5.00% due 10/1/2020 | | | | 1,000,000 | | | | | 1,078,990 | |
| | Town of Oyster Bay (Plainview, Locust Valley, South Farmingdale, Jericho, Bethpage, Oyster Bay Water Districts) GO, Series C, 2.50% due 6/1/2018 | | | | 620,000 | | | | | 620,415 | |
| | Triborough Bridge & Tunnel Authority (MTA Bridges and Tunnels) GO, 5.00% due 11/15/2028 (pre-refunded 5/15/2024) | | | | 1,000,000 | | | | | 1,163,130 | |
| | 5.00% due 11/15/2029 | | | | 1,000,000 | | | | | 1,134,890 | |
| | United Nations Development Corp. (One, Two and Three U.N. Plaza), Series A, 5.00% due 7/1/2019 - 7/1/2025 | | | | 940,000 | | | | | 977,059 | |
| | Utility Debt Securitization Authority (Long Island Power Authority-Electric Service), Series TE, 5.00% due 12/15/2029 - 12/15/2030 | | | | 2,000,000 | | | | | 2,278,270 | |
| | West Seneca Central School District (Facilities Improvements; Insured: BAM) (State Aid Withholding) GO, 5.00% due 11/15/2023 | | | | 1,300,000 | | | | | 1,480,973 | |
| | | | | | | | | | | | |
| | | |
| | TOTAL INVESTMENTS — 98.2% (Cost $60,785,670) | | | | | | | | $ | 62,669,670 | |
| | | |
| | OTHER ASSETS LESS LIABILITIES — 1.8% | | | | | | | | | 1,147,676 | |
| | | | | | | | | | | | |
| | | |
| | NET ASSETS — 100.0% | | | | | | | | $ | 63,817,346 | |
| | | | | | | | | | | | |
Semi-Annual Report | 7
Schedule of Investments, Continued
Thornburg New York Intermediate Municipal Fund | March 31, 2018 (Unaudited)
| a | Variable Rate Demand Notes are instruments whose interest rates change on a specific date (such as coupon date or interest payment date) or whose interest rates vary with changes in a designated base rate (such as the prime interest rate). This instrument is payable on demand and is secured by letters of credit or other credit support agreements from major banks. |
Portfolio Abbreviations
To simplify the listings of securities, abbreviations are used per the table below:
| | |
| AGM | | Insured by Assured Guaranty Municipal Corp. |
| BAM | | Insured by Build America Mutual Insurance Co. |
| COP | | Certificates of Participation |
| GO | | General Obligation |
| IDA | | Industrial Development Authority |
| Natl-Re | | Insured by National Public Finance Guarantee Corp. |
See notes to financial statements.
8 | Semi-Annual Report
Statement of Assets and Liabilities
Thornburg New York Intermediate Municipal Fund | March 31, 2018 (Unaudited)
| | | | |
ASSETS | | | | |
Investments at value (cost $60,785,670) (Note 3) | | $ | 62,669,670 | |
Cash | | | 211,578 | |
Receivable for investments sold | | | 215,000 | |
Receivable for fund shares sold | | | 25,449 | |
Interest receivable | | | 900,820 | |
Prepaid expenses and other assets | | | 4,375 | |
| | | | |
| |
Total Assets | | | 64,026,892 | |
| | | | |
| |
LIABILITIES | | | | |
| |
Payable for fund shares redeemed | | | 122,324 | |
Payable to investment advisor and other affiliates (Note 4) | | | 33,183 | |
Accounts payable and accrued expenses | | | 37,944 | |
Dividends payable | | | 16,095 | |
| | | | |
| |
Total Liabilities | | | 209,546 | |
| | | | |
| |
NET ASSETS | | $ | 63,817,346 | |
| | | | |
| |
NET ASSETS CONSIST OF | | | | |
| |
Distribution in excess of net investment income | | $ | (16,847 | ) |
Net unrealized appreciation on investments | | | 1,884,000 | |
Accumulated net realized gain (loss) | | | (616,445 | ) |
Net capital paid in on shares of beneficial interest | | | 62,566,638 | |
| | | | |
| | $ | 63,817,346 | |
| | | | |
| |
NET ASSET VALUE | | | | |
Class A Shares: | | | | |
Net asset value and redemption price per share
($36,992,740 applicable to 2,908,983 shares of beneficial
interest outstanding - Note 5) | | $ | 12.72 | |
| |
Maximum sales charge, 2.00% of offering price | | | 0.26 | |
| | | | |
| |
Maximum offering price per share | | $ | 12.98 | |
| | | | |
| |
Class I Shares: | | | | |
Net asset value, offering and redemption price per share
($26,824,606 applicable to 2,109,501 shares of beneficial
interest outstanding - Note 5) | | $ | 12.72 | |
| | | | |
See notes to financial statements.
Semi-Annual Report | 9
Statement of Operations
Thornburg New York Intermediate Municipal Fund | Six Months Ended March 31, 2018 (Unaudited)
| | | | |
INVESTMENT INCOME | | | | |
| |
Interest income (net of premium amortized of $295,557) | | $ | 1,080,987 | |
| | | | |
| |
EXPENSES | | | | |
| |
Investment advisory fees (Note 4) | | | 164,254 | |
Administration fees (Note 4) | | | | |
Class A Shares | | | 21,085 | |
Class I Shares | | | 8,430 | |
Distribution and service fees (Note 4) | | | | |
Class A Shares | | | 47,251 | |
Transfer agent fees | | | | |
Class A Shares | | | 13,747 | |
Class I Shares | | | 11,350 | |
Registration and filing fees | | | | |
Class A Shares | | | 2,507 | |
Class I Shares | | | 1,596 | |
Custodian fees (Note 2) | | | 11,674 | |
Professional fees | | | 21,623 | |
Trustee and officer fees (Note 4) | | | 1,422 | |
Other expenses | | | 9,651 | |
| | | | |
| |
Total Expenses | | | 314,590 | |
| |
Less: | | | | |
Expenses reimbursed by investment advisor (Note 4) | | | (34,047 | ) |
| | | | |
| |
Net Expenses | | | 280,543 | |
| | | | |
| |
Net Investment Income | | $ | 800,444 | |
| | | | |
| |
REALIZED AND UNREALIZED GAIN (LOSS) | | | | |
| |
Net realized gain (loss) on investments | | | 214 | |
Net change in unrealized appreciation (depreciation) on investments | | | (1,458,223 | ) |
| | | | |
| |
Net Realized and Unrealized Loss | | | (1,458,009 | ) |
| | | | |
| |
Net Decrease in Net Assets Resulting from Operations | | $ | (657,565 | ) |
| | | | |
See notes to financial statements.
10 | Semi-Annual Report
Statements of Changes in Net Assets
Thornburg New York Intermediate Municipal Fund
| | | | | | | | | | |
| | | SIX MONTHS ENDED
MARCH 31, 2018* | | YEAR ENDED
SEPTEMBER 30, 2017 |
INCREASE (DECREASE) IN NET ASSETS FROM | | | | | | | | | | |
| | |
OPERATIONS | | | | | | | | | | |
| | |
Net investment income | | | $ | 800,444 | | | | $ | 1,695,867 | |
Net realized gain (loss) on investments | | | | 214 | | | | | (123,791 | ) |
Net unrealized appreciation (depreciation) on investments | | | | (1,458,223 | ) | | | | (2,289,319 | ) |
| | | | | |
| | |
Net Decrease in Net Assets Resulting from Operations | | | | (657,565 | ) | | | | (717,243 | ) |
| | |
DIVIDENDS TO SHAREHOLDERS | | | | | | | | | | |
| | |
From net investment income | | | | | | | | | | |
Class A Shares | | | | (434,643 | ) | | | | (979,082 | ) |
Class I Shares | | | | (365,801 | ) | | | | (716,785 | ) |
| | |
FUND SHARE TRANSACTIONS (NOTE 5) | | | | | | | | | | |
| | |
Class A Shares | | | | 1,257,043 | | | | | (7,051,787 | ) |
Class I Shares | | | | 224,569 | | | | | (3,248,623 | ) |
| | | | | |
| | |
Net Increase (Decrease) in Net Assets | | | | 23,603 | | | | | (12,713,520 | ) |
| | |
NET ASSETS | | | | | | | | | | |
| | |
Beginning of Period | | | | 63,793,743 | | | | | 76,507,263 | |
| | | | | |
| | |
End of Period | | | $ | 63,817,346 | | | | $ | 63,793,743 | |
| | | | | |
| | |
Distribution in excess of net investment income | | | $ | (16,847 | ) | | | $ | (16,847 | ) |
* Unaudited.
See notes to financial statements.
Semi-Annual Report | 11
Notes to Financial Statements
Thornburg New York Intermediate Municipal Fund | March 31, 2018 (Unaudited)
NOTE 1 – ORGANIZATION
Thornburg New York Intermediate Municipal Fund (the “Fund”) is a non-diversified series of Thornburg Investment Trust (the “Trust”). The Trust was organized as a Massachusetts business trust under a Declaration of Trust dated June 3, 1987 and is registered as a diversified, open-end management investment company under the Investment Company Act of 1940, as amended. The Fund is currently one of twenty-one separate series of the Trust. Each series is considered to be a separate entity for financial reporting and tax purposes and bears expenses directly attributable to it. The Fund’s primary investment objective is to obtain as high a level of current income exempt from federal, New York State, and New York City individual income tax as is consistent, in the view of Thornburg Investment Management, Inc., the Trust’s investment advisor (the “Advisor”), with the preservation of capital. The Fund’s secondary objective is to reduce expected changes in its share price compared to long-term bond portfolios. The Fund will invest primarily in municipal obligations within the state of New York.
The Fund currently offers two classes of shares of beneficial interest: Class A and Institutional Class (“Class I”) shares. Each class of shares of the Fund represents an interest in the same portfolio of investments, except that (i) Class A shares are sold subject to a front-end sales charge collected at the time the shares are purchased and bear a service fee, (ii) Class I shares are sold at net asset value without a sales charge at the time of purchase and may be subject to a service fee, and (iii) the respective classes may have different reinvestment privileges and conversion rights. Additionally, the Fund may allocate among its classes certain expenses, to the extent allocable to specific classes, including transfer agent fees, government registration fees, certain printing and postage costs, and administrative and legal expenses. Currently, class specific expenses of the Fund are limited to service and distribution fees, administration fees, and certain registration and transfer agent expenses.
The following is a summary of significant accounting policies followed by the Fund in the preparation of its financial statements. The Fund prepares its financial statements in conformity with United States generally accepted accounting principles (“GAAP”), including investment company accounting and reporting guidance in the Financial Accounting Standards Board (the “FASB”) Accounting Standard Codification Topic 946.
NOTE 2 – SIGNIFICANT ACCOUNTING POLICIES
Security Valuation: All investments in securities held by the Fund are valued as described in Note 3.
Allocation of Income, Gains, Losses and Expenses: Net investment income (other than class specific expenses) and realized and unrealized gains and losses are allocated daily to each class of shares based upon the relative net asset value of outstanding shares (or the value of the dividend-eligible shares, as appropriate) of each class of shares at the beginning of the day (after adjusting for the current capital shares activity of the respective class). Expenses common to all Funds are allocated among the Funds comprising the Trust based upon their relative net asset values or other appropriate allocation methods. Operating expenses directly attributable to a specific class are charged against the operating income of that class.
Dividends and Distributions to Shareholders: Dividends and distributions to shareholders, which are determined in accordance with federal income tax regulations and may differ from GAAP, are recorded on the ex-dividend date. Ordinary income distributions, if any, are declared daily and paid monthly. Capital gain distributions, if any, are declared and paid annually and more often if deemed necessary by the Advisor. Dividends are paid and are reinvested in additional shares of the Fund at net asset value per share at the close of business on the ex-dividend date, or at the shareholder’s option, paid in cash.
Investment Income: Interest income is accrued as earned. Premiums and discounts are amortized and accreted, respectively, to call dates or maturity dates using the effective yield method of the respective investments. These amounts are included in Interest income on the Statement of Operations.
Custodian Fees: Custodian fees disclosed in the Statement of Operations may include interest expenses incurred by the Fund on any cash overdrafts of its custodian account during the period. Such cash overdrafts may result from the effects of failed trades in portfolio securities and from cash outflows resulting from unanticipated shareholder redemption activity. The Fund pays interest to its custodian on any such cash overdraft at a rate set periodically at the custodian’s discretion of the overdraft amount in excess of $50,000.
Investment Transactions: Investment transactions are accounted for on a trade date basis. Realized gains and losses from the sale of investments are recorded on an identified cost basis.
When-Issued and Delayed Delivery Transactions: The Fund may engage in when-issued or delayed delivery transactions. To the extent the Fund engages in such transactions, it will do so for the purpose of acquiring portfolio investments consistent with the Fund’s investment objectives and not for the purpose of investment leverage or to speculate on interest rate or market changes. At the time the Fund makes a commitment to purchase an investment on a when-issued or delayed delivery basis, the Fund will record the transaction and reflect the value in determining its net asset value. When effecting such transactions, assets of an amount sufficient to make payment for the portfolio
12 | Semi-Annual Report
Notes to Financial Statements, Continued
Thornburg New York Intermediate Municipal Fund | March 31, 2018 (Unaudited)
investments to be purchased will be segregated on the Fund’s records on the trade date. Investments purchased on a when-issued or delayed delivery basis do not earn interest until the settlement date.
Guarantees and Indemnifications: Under the Trust’s organizational documents (and under separate agreements with the independent Trustees), its officers and Trustees are provided with an indemnification against certain liabilities arising out of the performance of their duties to the Fund. In the normal course of business the Trust may also enter into contracts with service providers that contain general indemnifications. The Trust’s maximum exposure under these arrangements is unknown. However, based on experience, the Trust expects the risk of loss to be remote.
Use of Estimates: The preparation of financial statements in conformity with GAAP requires management to make estimates and assumptions that affect the reported amounts of assets and liabilities and disclosure of contingent assets and liabilities at the date of the financial statements and the reported amounts of increases (decreases) in net assets from operations during the reporting period. Actual results could differ from those estimates.
Federal Income Taxes: It is the policy of the Trust to comply with the provisions of the Internal Revenue Code applicable to regulated investment companies and to distribute to shareholders substantially all investment company taxable income including net realized gains on investments (if any), and tax exempt income of the Fund. Therefore, no provision for federal income or excise tax is required.
The Fund files income tax returns in United States federal and applicable state jurisdictions. The statute of limitations on the Fund’s tax return filings generally remains open for the three years following a return’s filing date. The Fund has analyzed each uncertain tax position believed to be material in the preparation of the Fund’s financial statements for the six month period ended March 31, 2018, including open tax years, to assess whether it is more likely than not that the position would be sustained upon examination, based on the technical merits of the position. The Fund has not identified any such position for which an asset or liability must be reflected in the Statement of Assets and Liabilities.
At March 31, 2018, information on the tax components of capital was as follows:
| | | | | |
Cost of investments for tax purposes | | | $ | 60,785,670 | |
| | | | | |
Gross unrealized appreciation on a tax basis | | | | 2,139,567 | |
Gross unrealized depreciation on a tax basis | | | | (255,567 | ) |
| | | | | |
Net unrealized appreciation (depreciation) on investments (tax basis) | | | $ | 1,884,000 | |
| | | | | |
At March 31, 2018, the Fund had deferred tax basis capital losses occurring subsequent to October 31, 2016 through September 30, 2017 of $241,886. For tax purposes, such losses will be recognized in the year ending September 30, 2018.
At March 31, 2018, the Fund had cumulative tax basis capital losses of $374,772 (of which $127,505 are short-term and $247,267 are long-term) generated after September 30, 2011, which may be carried forward to offset future capital gains. To the extent such carryforwards are used, capital gain distributions may be reduced to the extent provided by regulations. Such capital loss carryforwards do not expire.
NOTE 3 – SECURITY VALUATION
Valuation of the Fund’s portfolio investment securities is performed in accordance with policies and procedures adopted by and under the oversight of the Trustees.
The Trustees of the Trust have appointed the Advisor to assist the Trustees to obtain market values for portfolio investments, evaluate and monitor professional pricing service providers appointed by the Trustees’ Audit Committee (the “Audit Committee”) to assist in determining fair values for portfolio investments, assist in calculating fair values for portfolio investments in certain circumstances, and to perform other functions in connection with the valuation of investments. The Advisor acts through its Valuation and Pricing Committee (the “Committee”) and other employees of the Advisor. The Committee regularly reviews its own valuation calculations, as well as the valuations, valuation techniques and services furnished by pricing service providers, considers circumstances which may require valuation calculations by the Committee, and reviews previous valuation calculations. The Committee reports to the Audit Committee on the Committee’s activities, the performance of pricing service providers, and other matters relating to valuation of portfolio investments.
In those instances when the Committee assists in calculating a fair value for a portfolio investment, the Committee seeks to determine the price that the Fund would reasonably expect to receive upon a sale of the investment in an orderly transaction between market participants on the valuation date. The Committee customarily utilizes quotations from securities broker dealers in calculating valuations, but also may utilize prices obtained from pricing service providers or other methods approved by the Audit Committee. Because fair values calculated by the Committee are estimates, the calculation of a value for an investment may differ from the price that would be realized by the Fund upon
Semi-Annual Report | 13
Notes to Financial Statements, Continued
Thornburg New York Intermediate Municipal Fund | March 31, 2018 (Unaudited)
a sale of the investment, and the difference could be material to the Fund’s financial statements. The Committee’s calculation of a fair value for an investment may also differ from the prices obtained by other persons (including other mutual funds) for the investment.
Valuation of Securities: Debt obligations held by the Fund which are not listed or traded on exchanges or for which no reported market exists are ordinarily valued at the valuation obtained from a pricing service provider approved by the Audit Committee.
In any case when a pricing service provider fails to provide a valuation for a debt obligation held by the Fund, the Committee calculates a fair value for the obligation using alternative methods under procedures approved by the Audit Committee. Additionally, in cases when management believes that a valuation obtained from a pricing service provider merits review for significant reasons, the Committee decides whether or not to use the valuation calculated by the pricing service provider or to use an alternative method approved by the Audit Committee to calculate a fair value for the obligation.
Valuation Hierarchy: The Fund categorizes its investments based upon the inputs used in valuing those investments, according to a three-level hierarchy established in guidance from the FASB. Categorization of investments using this hierarchy is intended by the FASB to maximize the use of observable inputs in valuing investments and minimize the use of unobservable inputs by requiring that the most observable inputs be used when available. Observable inputs are those that market participants would use in valuing an investment based on available market information. Unobservable inputs are those that reflect assumptions about the information market participants would use in valuing an investment. An investment’s level within the hierarchy is based on the lowest level input that is deemed significant to the valuation. The methodologies and inputs used to value investments are not necessarily indications of the risk or liquidity associated with those investments.
Various inputs are used in calculating valuations for the Fund’s investments. These inputs are generally summarized according to the three-level hierarchy below:
Level 1: Quoted prices in active markets for identical investments.
Level 2: Other direct or indirect significant observable inputs (including quoted prices for similar investments in active markets and other observable inputs, such as interest rates, prepayment rates, credit risk, etc.).
Level 3: Significant unobservable inputs (including the Committee’s own assumptions in calculating the fair values of investments).
Valuations for debt obligations held by the Fund are typically calculated by pricing service providers approved by the Audit Committee and are generally characterized as Level 2 within the valuation hierarchy.
In a limited number of cases the Committee calculates a fair value for investments using broker quotations or other methods approved by the Audit Committee. When the Committee uses a single broker quotation to calculate a fair value for an investment without other significant observable inputs, or if a fair value is calculated using other significant inputs that are considered unobservable, the investment is characterized as Level 3 within the hierarchy. Other significant unobservable inputs used to calculate a fair value in these instances might include an income-based valuation approach which considers discounted anticipated future cash flows from the investment and application of discounts due to the nature or duration of any restrictions on the disposition of the investment.
Valuations based upon the use of inputs from Levels 1, 2 or 3 may not represent the actual price received upon the disposition of an investment, and the Fund may receive a price that is lower than the valuation based upon these inputs when it sells the investment.
The following table displays a summary of the fair value hierarchy measurements of the Fund’s investments as of March 31, 2018. In any instance when valuation inputs from more than one level are used to determine the fair value of a specific investment, the investment is placed in the level of the table based upon the lowest level input that is significant in determining the fair value of the investment:
| | | | | | | | | | | | | | | | | | | | |
| | | FAIR VALUE MEASUREMENTS AT MARCH 31, 2018 |
| | | TOTAL | | LEVEL 1 | | LEVEL 2 | | LEVEL 3 |
Assets | | | | | | | | | | | | | | | | | | | | |
Investments in Securities | | | | | | | | | | | | | | | | | | | | |
Municipal Bonds | | | $ | 62,669,670 | | | | $ | – | | | | $ | 62,669,670 | | | | $ | – | |
| | | | | |
Total Investments in Securities | | | $ | 62,669,670 | | | | $ | – | | | | $ | 62,669,670 | | | | $ | – | |
In accordance with the guidance prescribed in Accounting Standards Update No. 2011-04, it is the policy of the Fund to recognize transfers between levels and the underlying events which caused the movement. The Fund recognized no transfers between levels for the six months ended March 31, 2018.
14 | Semi-Annual Report
Notes to Financial Statements, Continued
Thornburg New York Intermediate Municipal Fund | March 31, 2018
NOTE 4 – INVESTMENT ADVISORY FEE AND OTHER TRANSACTIONS WITH AFFILIATES
Pursuant to an investment advisory agreement, the Advisor serves as the investment advisor and performs services for the Fund for which the fees are payable at the end of each month. Under the investment advisory agreement, the Fund pays the Advisor a management fee based on the daily net assets of the Fund at an annual rate as shown in the following table:
| | | | | |
| MANAGEMENT FEE SCHEDULE |
| DAILY NET ASSETS | | FEE RATE |
| |
Up to $500 million | | | | 0.500 | % |
| |
Next $500 million | | | | 0.450 | |
| |
Next $500 million | | | | 0.400 | |
| |
Next $500 million | | | | 0.350 | |
| |
Over $2 billion | | | | 0.275 | |
The Fund’s effective management fee for the six months ended March 31, 2018 was 0.50% of the Fund’s average net assets.
The Trust has entered into administrative service agreements with the Advisor, whereby the Advisor will perform certain administrative services related to each class of the Fund’s shares. Until January 31, 2018, the fees were payable at an annual rate of up to 0.125 of 1% per annum of the average daily net assets attributable to each class of shares. As of February 1, 2018, the fees are computed as an annual percentage of the aggregate average daily net assets of all shares classes of all Funds in the Trust as follows:
| | | | | |
| ADMINISTRATION FEE SCHEDULE |
| DAILY NET ASSETS | | FEE RATE |
| |
Up to $20 billion | | | | 0.100 | % |
| |
$20 billion to $40 billion | | | | 0.075 | |
| |
$40 billion to $60 billion | | | | 0.040 | |
| |
Over $60 billion | | | | 0.030 | |
The aggregate fee amount is allocated on a daily basis to each Fund based on net assets and subsequently allocated to each class of shares of the Fund. Total administrative service fees incurred by each class of shares of the Fund for the six months ended March 31, 2018, are set forth in the Statement of Operations.
The Trust has an underwriting agreement with Thornburg Securities Corporation (the “Distributor”), an affiliate of the Advisor, which acts as the distributor of the Fund’s shares. For the six months ended March 31, 2018, the Distributor has advised the Fund that it earned net commissions aggregating $1,284 from the sale of Class A shares.
Pursuant to a service plan under Rule 12b-1 of the Investment Company Act of 1940, the Fund may pay to the Distributor or securities dealers and other financial institutions at the Distributor’s direction an amount not to exceed .25 of 1% per annum of the average daily net assets attributable to Class A shares of the Fund to obtain various shareholder and distribution related services. For the six months ended March 31, 2018, there were no 12b-1 service plan fees charged for Class I shares. The Advisor and Distributor each may pay out of its own resources additional expenses for distribution of the Fund’s shares and shareholder services.
The Advisor and Distributor have contractually agreed to waive fees and reimburse expenses incurred by the Fund so that actual expenses of certain share classes do not exceed levels as specified in each Fund’s most recent prospectus. The agreement may be terminated by the Fund at any time, but may not be terminated by the Advisor or Distributor before February 1, 2019, unless the Advisor ceases to be the investment advisor to the Fund or the Distributor ceases to be the distributor of the Fund prior to that date. The Advisor and Distributor may recoup amounts waived or reimbursed during the fiscal year if expenses fall below the contractual limit during that year.
For the six months ended March 31, 2018, the Advisor contractually reimbursed expenses and administrative fees of $17,449 for Class A shares and $16,598 for Class I shares.
Certain officers and Trustees of the Trust are also officers or directors of the Advisor and Distributor. The compensation of the independent Trustees is borne by the Trust. The Trust also pays a portion of the Chief Compliance Officer’s compensation. These amounts are reflected as “Trustee and officer fees” in the Statement of Operations.
Semi-Annual Report | 15
Notes to Financial Statements, Continued
Thornburg New York Intermediate Municipal Fund | March 31, 2018
The Fund may purchase or sell securities from, or to an affiliated fund, provided the affiliation is due solely to having a common investment advisor, common officers, or common trustees, and provided that all such transactions will comply with Rule 17a-7 under the 1940 Act. For the six months ended March 31, 2018, the Fund had transactions with affiliated funds of $850,000 in purchases and $700,000 in sales.
NOTE 5 – SHARES OF BENEFICIAL INTEREST
At March 31, 2018, there were an unlimited number of shares with no par value of beneficial interest authorized. Transactions in shares of beneficial interest were as follows:
| | | | | | | | | | | | | | | | |
| | | SIX MONTHS ENDED
MARCH 31, 2018 (UNAUDITED) | | | YEAR ENDED
SEPTEMBER 30, 2017 (AUDITED) | |
| | | SHARES | | | AMOUNT | | | SHARES | | | AMOUNT | |
Class A Shares | | | | | | | | | | | | | | | | |
Shares sold | | | 451,364 | | | $ | 5,855,279 | | | | 273,384 | | | $ | 3,551,462 | |
Shares issued to shareholders in
reinvestment of dividends | | | 27,891 | | | | 358,185 | | | | 58,019 | | | | 754,362 | |
Shares repurchased | | | (383,641 | ) | | | (4,956,421 | ) | | | (876,328 | ) | | | (11,357,611 | ) |
| | | | | | | | | | | | | | | | |
| | | | |
Net increase (decrease) | | | 95,614 | | | $ | 1,257,043 | | | | (544,925 | ) | | $ | (7,051,787 | ) |
| | | | | | | | | | | | | | | | |
Class I Shares | | | | | | | | | | | | | | | | |
Shares sold | | | 486,565 | | | $ | 6,285,464 | | | | 739,573 | | | $ | 9,621,219 | |
Shares issued to shareholders in
reinvestment of dividends | | | 26,600 | | | | 341,695 | | | | 54,399 | | | | 707,544 | |
Shares repurchased | | | (497,253 | ) | �� | | (6,402,590 | ) | | | (1,050,573 | ) | | | (13,577,386 | ) |
| | | | | | | | | | | | | | | | |
| | | | |
Net increase (decrease) | | | 15,912 | | | $ | 224,569 | | | | (256,601 | ) | | $ | (3,248,623 | ) |
| | | | | | | | | | | | | | | | |
NOTE 6 – INVESTMENT TRANSACTIONS
For the six months ended March 31, 2018, the Fund had purchase and sale transactions of investments (excluding short-term investments) of $5,368,981 and $2,666,600, respectively.
OTHER NOTES
Risks: The Fund’s investments subject it to risks including, but not limited to, management risk, interest rate risk, credit risk, market and economic risk, liquidity risk, and the risk of investing mainly in the obligations primarily originating in a single state. Please see the Fund’s prospectus for a discussion of the risks associated with an investment in the Fund.
Subsequent Events: Fund management believes no events have occurred between March 31, 2018 and the date of issuance of the financial statements that require adjustment to or disclosure in the accompanying financial statements.
16 | Semi-Annual Report
This page intentionally left blank.
Semi-Annual Report | 17
Financial Highlights
Thornburg New York Intermediate Municipal Fund
| | | | | | | | | | | | | | | | | | | | | | | | | | | | | | | | | | | | | | | | |
| | | PER SHARE PERFORMANCE (FOR A SHARE OUTSTANDING THROUGHOUT THE PERIOD) |
| | | |
UNLESS OTHERWISE
NOTED, PERIODS ARE
FISCAL YEARS ENDED
SEPTEMBER 30, | | NET ASSET
VALUE,
BEGINNING OF
PERIOD | | NET
INVESTMENT
INCOME
(LOSS)+ | | NET REALIZED &
UNREALIZED GAIN
(LOSS) ON
INVESTMENTS | | TOTAL FROM
INVESTMENT
OPERATIONS | | DIVIDENDS
FROM NET
INVESTMENT
INCOME | | DIVIDENDS
FROM NET
REALIZED
GAINS | | TOTAL
DIVIDENDS | | NET ASSET
VALUE,
END OF PERIOD |
| | | | | | | |
| CLASS A SHARES | | | | | | | | | | | | | | | | | | | | | | | | | | | | | | | | | | | | |
| | | | | | | | |
2018(b)(c) | | | $ | 13.00 | | | | | 0.15 | | | | | (0.28 | ) | | | | (0.13 | ) | | | | (0.15 | ) | | | | – | | | | | (0.15 | ) | | | $ | 12.72 | |
2017(b) | | | $ | 13.40 | | | | | 0.33 | | | | | (0.40 | ) | | | | (0.07 | ) | | | | (0.33 | ) | | | | – | | | | | (0.33 | ) | | | $ | 13.00 | |
2016(b) | | | $ | 13.18 | | | | | 0.29 | | | | | 0.22 | | | | | 0.51 | | | | | (0.29 | ) | | | | – | | | | | (0.29 | ) | | | $ | 13.40 | |
2015(b) | | | $ | 13.22 | | | | | 0.29 | | | | | (0.04 | ) | | | | 0.25 | | | | | (0.29 | ) | | | | – | | | | | (0.29 | ) | | | $ | 13.18 | |
2014(b) | | | $ | 12.93 | | | | | 0.30 | | | | | 0.29 | | | | | 0.59 | | | | | (0.30 | ) | | | | – | | | | | (0.30 | ) | | | $ | 13.22 | |
2013(b) | | | $ | 13.44 | | | | | 0.34 | | | | | (0.51 | ) | | | | (0.17 | ) | | | | (0.34 | ) | | | | – | | | | | (0.34 | ) | | | $ | 12.93 | |
| | | | | | | |
| CLASS I SHARES | | | | | | | | | | | | | | | | | | | | | | | | | | | | | | | | | | | | |
| | | | | | | | |
2018(c) | | | $ | 13.00 | | | | | 0.17 | | | | | (0.28 | ) | | | | (0.11 | ) | | | | (0.17 | ) | | | | – | | | | | (0.17 | ) | | | $ | 12.72 | |
2017 | | | $ | 13.40 | | | | | 0.37 | | | | | (0.40 | ) | | | | (0.03 | ) | | | | (0.37 | ) | | | | – | | | | | (0.37 | ) | | | $ | 13.00 | |
2016 | | | $ | 13.18 | | | | | 0.33 | | | | | 0.22 | | | | | 0.55 | | | | | (0.33 | ) | | | | – | | | | | (0.33 | ) | | | $ | 13.40 | |
2015 | | | $ | 13.22 | | | | | 0.33 | | | | | (0.04 | ) | | | | 0.29 | | | | | (0.33 | ) | | | | – | | | | | (0.33 | ) | | | $ | 13.18 | |
2014 | | | $ | 12.93 | | | | | 0.33 | | | | | 0.30 | | | | | 0.63 | | | | | (0.34 | ) | | | | – | | | | | (0.34 | ) | | | $ | 13.22 | |
2013 | | | $ | 13.44 | | | | | 0.38 | | | | | (0.51 | ) | | | | (0.13 | ) | | | | (0.38 | ) | | | | – | | | | | (0.38 | ) | | | $ | 12.93 | |
| (a) | Not annualized for periods less than one year. |
| (b) | Sales loads are not reflected in computing total return. |
| (c) | Unaudited Six Month Period Ended March 31. |
| + | Based on weighted average shares outstanding. |
See notes to financial statements.
18 | Semi-Annual Report
Financial Highlights, Continued
Thornburg New York Intermediate Municipal Fund
| | | | | | | | | | | | | | | | | | | | | | | | | | | | | | |
| RATIOS TO AVERAGE NET ASSETS | | | | | | SUPPLEMENTAL DATA | |
| | | | | | | EXPENSES, AFTER | | | | | | | | | | | | | | | | |
NET INVESTMENT
INCOME (LOSS) (%) | | | EXPENSES, AFTER
EXPENSE
REDUCTIONS (%) | | | EXPENSE
REDUCTIONS AND
NET OF CUSTODY
CREDITS (%) | | | EXPENSES,
BEFORE EXPENSE
REDUCTIONS (%) | | | | | | TOTAL
RETURN (%)(a) | | | PORTFOLIO
TURNOVER
RATE (%)(a) | | | NET ASSETS AT
END OF PERIOD
(THOUSANDS) | |
| | | | | | | |
| | | | | | | | | | | | | | | | | | | | | | | | | | | | | | |
| | | | | | | |
| | 2.30 | (d) | | | 0.99 | (d) | | | 0.99 | (d) | | | 1.08 | (d) | | | | | | | (1.02 | ) | | | 4.54 | | | $ | 36,993 | |
| | 2.50 | | | | 0.99 | | | | 0.99 | | | | 1.09 | | | | | | | | (0.52 | ) | | | 11.11 | | | $ | 36,576 | |
| | 2.18 | | | | 0.96 | | | | 0.96 | | | | 1.03 | | | | | | | | 3.91 | | | | 7.02 | | | $ | 45,009 | |
| | 2.16 | | | | 0.98 | | | | 0.98 | | | | 1.05 | | | | | | | | 1.87 | | | | 7.72 | | | $ | 49,845 | |
| | 2.27 | | | | 0.99 | | | | 0.99 | | | | 1.05 | | | | | | | | 4.59 | | | | 14.12 | | | $ | 54,301 | |
| | 2.54 | | | | 0.99 | | | | 0.99 | | | | 1.05 | | | | | | | | (1.32 | ) | | | 11.31 | | | $ | 54,061 | |
| | | | | | | |
| | | | | | | | | | | | | | | | | | | | | | | | | | | | | | |
| | | | | | | |
| | 2.62 | (d) | | | 0.67 | (d) | | | 0.67 | (d) | | | 0.79 | (d) | | | | | | | (0.86 | ) | | | 4.54 | | | $ | 26,824 | |
| | 2.81 | | | | 0.67 | | | | 0.67 | | | | 0.77 | | | | | | | | (0.20 | ) | | | 11.11 | | | $ | 27,217 | |
| | 2.51 | | | | 0.63 | | | | 0.63 | | | | 0.72 | | | | | | | | 4.25 | | | | 7.02 | | | $ | 31,498 | |
| | 2.47 | | | | 0.67 | | | | 0.67 | | | | 0.76 | | | | | | | | 2.19 | | | | 7.72 | | | $ | 30,242 | |
| | 2.57 | | | | 0.67 | | | | 0.67 | | | | 0.73 | | | | | | | | 4.93 | | | | 14.12 | | | $ | 23,922 | |
| | 2.86 | | | | 0.67 | | | | 0.67 | | | | 0.74 | | | | | | | | (1.00 | ) | | | 11.31 | | | $ | 7,060 | |
Semi-Annual Report | 19
Expense Example
Thornburg New York Intermediate Municipal Fund | March 31, 2018 (Unaudited)
As a shareholder of the Fund, you incur two types of costs:
| | (1) | transaction costs, including |
| | (a) | sales charges (loads) on purchase payments, for Class A shares; |
| | (b) | a deferred sales charge on redemptions of any part or all of a purchase of $1 million of Class A shares within 12 months of purchase; |
| | (c) | a deferred sales charge on redemptions of Class C shares within 12 months of purchase; |
| | (2) | ongoing costs, including management fees; distribution and/or service (12b-1) fees; and other Fund expenses. |
This example is intended to help you understand your ongoing costs (in dollars) of investing in the Fund and to compare these costs with the ongoing costs of investing in other mutual funds.
The example is based on a $1,000 investment beginning on October 1, 2017, and held until March 31, 2018.
ACTUAL EXPENSES
For each class of shares, the first line of the accompanying table provides information about actual account values and actual expenses. You may use the information in this line, together with the amount you invested, to estimate the expenses that you paid over the period. Simply divide your account value by $1,000 (for example, an $8,600 account value divided by $1,000 = 8.6), then multiply the result by the number in the first line for your class of shares under the heading entitled “Expenses Paid During Period” to estimate the expenses you paid on your account during this period.
| | | | | | | | | | | | | | | |
| | | BEGINNING
ACCOUNT VALUE
10/1/17 | | ENDING
ACCOUNT VALUE
3/31/18 | | EXPENSES PAID
DURING PERIOD†
10/1/17–3/31/18 |
| | | |
| CLASS A SHARES | | | | | | | | | | | | | | | |
| | | |
Actual | | | $ | 1,000.00 | | | | $ | 989.80 | | | | $ | 4.91 | |
Hypothetical* | | | $ | 1,000.00 | | | | $ | 1,020.00 | | | | $ | 4.99 | |
| | | |
| CLASS I SHARES | | | | | | | | | | | | | | | |
| | | |
Actual | | | $ | 1,000.00 | | | | $ | 991.40 | | | | $ | 3.33 | |
Hypothetical* | | | $ | 1,000.00 | | | | $ | 1,021.59 | | | | $ | 3.38 | |
| † | Expenses are equal to the annualized expense ratio for each class (A: 0.99%; I: 0.67%) multiplied by the average account value over the period, multiplied by 182/365 to reflect the one-half year period. |
| * | Hypothetical assumes a rate of return of 5% per year before expenses. |
HYPOTHETICAL EXAMPLE FOR COMPARISON PURPOSES
For each class of shares, the second line of the accompanying table provides information about hypothetical account values and hypothetical expenses based on the Fund’s actual expense ratio and an assumed rate of return of 5% per year before expenses, which is not the Fund’s actual return. The hypothetical account values and expenses may not be used to estimate the actual ending account balance or expenses you paid for the period. You may use this information to compare the ongoing costs of investing in the Fund and other funds. To do so, compare this 5% hypothetical example with the 5% hypothetical examples that appear in the shareholder reports of the other funds.
Please note that the expenses shown in the table are meant to highlight your ongoing costs only and do not reflect any transactional costs, such as sales charges (loads), redemption fees, or exchange fees. Therefore, the second line of the table for each class of shares is useful in comparing ongoing costs only, and will not help you determine the relative total costs of owning different funds. In addition, if these transactional costs were included, your costs would have been higher.
20 | Semi-Annual Report
Other Information
Thornburg New York Intermediate Municipal Fund | March 31, 2018 (Unaudited)
PORTFOLIO PROXY VOTING
Policies and Procedures:
The Trust has delegated to Thornburg Investment Management, Inc. (the “Advisor”) voting decisions respecting proxies for the Fund’s voting securities. The Advisor makes voting decisions in accordance with its Proxy Voting Policy and Procedures. A description of the Policy and Procedures is available (i) without charge, upon request, by calling the Advisor toll-free at 1-800-847-0200, (ii) on the Thornburg website at www.thornburg.com, and (iii) on the Securities and Exchange Commission’s website at www.sec.gov.
Information regarding how proxies were voted is available on or before August 31 of each year for the twelve months ending the preceding June 30. This information is available (i) without charge, upon request by calling the Advisor toll-free at 1-800-847-0200, (ii) on the Thornburg website at www.thornburg.com, and (iii) on the Securities and Exchange Commission’s website at www.sec.gov.
AVAILABILITY OF QUARTERLY PORTFOLIO SCHEDULE
The Fund files with the Securities and Exchange Commission schedules of its portfolio holdings on Form N-Q for the first and third quarters of each fiscal year. The Fund’s Forms N-Q are available on the Commission’s website at www.sec.gov, or may be reviewed and copied at the Commission’s Public Reference Room in Washington, D.C. Information on the operation of the Public Reference Room may be obtained by calling 1-800-SEC-0330. The Fund also makes this information available on its website at www.thornburg.com/download or upon request by calling 1-800-847-0200.
Semi-Annual Report | 21
Trustees’ Statement to Shareholders
Readopted September 11, 2017
The Trustees believe current and prospective shareholders should know how we discharge our responsibilities in supervising the Funds’ investment advisor and in reviewing the advisor’s contract for renewal. Since 2005, we have issued a statement which sets out clearly the three principal guidelines that we follow in supervising the Trust’s investment advisor on your behalf. In accordance with our customary practice, in September of this year we again reviewed our statement and concluded we should reissue this statement outlining the principal features of our supervision of the advisor’s performance of investment management services for the Funds.
We begin with the premise that each shareholder selected his or her Fund because its investments are managed by the investment advisor identified in the prospectus and in accordance with the objective and policies described in the prospectus. We realize, as each of you do, that if you believe that your Fund’s stated objective and policies no longer serve your personal investment goals, you can sell your shares and leave the Fund.
Therefore, we believe that our primary supervisory task—our principal obligation to you—is to assess the nature and quality of the advisor’s services, and to confirm that the advisor actively and competently pursues the Fund’s objective, in accordance with the policies set out in the prospectus. To do this, we meet regularly with management to review your Fund’s portfolio and to discuss the advisor’s specific actions and judgments in pursuing the Fund’s objective. We do not substitute our own judgment for the advisor’s decisions in selecting investments; the advisor is paid to exercise its informed judgment on investment decisions, and we seek to confirm, in reviewing the advisor’s performance, that the advisor is doing just that.
Second, we are conscious of costs and the effect that costs have on shareholders’ returns. We try to make sure that your Fund’s fees and costs are reasonable in relationship to the services rendered and that they are generally in line with those charged by other expert investment advisors, consistent with our belief that the Fund’s investors searched for and expect that expertise and attention and have decided to pay a reasonable price for it. We do not put the management contract “out to bid” as a matter of course, and we would not do so unless we had concluded that the advisor materially had failed to pursue the Fund’s objectives in accordance with its policies, or for other equally important reasons. We believe that any other approach would be inconsistent with your interests and contrary to your expectations when you bought shares of the Fund in the first place.
Finally, because we believe that most Thornburg Fund shareholders have invested with a long-term perspective, we try not to focus too much on the fashions of the moment and on short-term performance. The market will not favor any specific investment objective or set of policies at all times and under all economic circumstances. A fund will experience periods of both high and low returns relative to other funds and other investments. Even if one of our Funds is not favored by the market at a particular time, we believe that the advisor is nonetheless obliged to remain true to the Fund’s objective and policies, and we watch to see that it does so.
Trustees of Thornburg Investment Trust
22 | Semi-Annual Report
Thornburg Funds
Thornburg Investment Management is a privately-owned global investment firm that offers a range of solutions for retail and institutional investors. Founded in 1982 and headquartered in Santa Fe, New Mexico, we manage approximately $49 billion (as of March 31, 2018) across U.S. mutual funds, separate accounts for high-net-worth investors, institutional accounts, and UCITS funds for non-U.S. investors.
EQUITY FUNDS
| | ∎ | | Thornburg Investment Income Builder Fund |
| | ∎ | | Thornburg Global Opportunities Fund |
| | ∎ | | Thornburg International Value Fund |
| | ∎ | | Thornburg Better World International Fund |
| | ∎ | | Thornburg International Growth Fund |
| | ∎ | | Thornburg Developing World Fund |
| | ∎ | | Thornburg Core Growth Fund |
FIXED INCOME FUNDS
| | ∎ | | Thornburg Low Duration Income Fund |
| | ∎ | | Thornburg Limited Term U.S. Government Fund |
| | ∎ | | Thornburg Limited Term Income Fund |
| | ∎ | | Thornburg Strategic Income Fund |
| | ∎ | | Thornburg Low Duration Municipal Fund |
| | ∎ | | Thornburg Limited Term Municipal Fund |
| | ∎ | | Thornburg Intermediate Municipal Fund |
| | ∎ | | Thornburg California Limited Term Municipal Fund |
| | ∎ | | Thornburg New Mexico Intermediate Municipal Fund |
| | ∎ | | Thornburg New York Intermediate Municipal Fund |
| | ∎ | | Thornburg Strategic Municipal Income Fund |
ALTERNATIVE FUNDS
| | ∎ | | Thornburg Long/Short Equity Fund |
Before investing, carefully consider the Fund’s investment goals, risks, charges, and expenses. For a prospectus or summary prospectus containing this and other information, contact your financial advisor or visit thornburg.com. Read it carefully before investing.
For additional information, please visit thornburg.com
Thornburg Investment Management, Inc. 2300 North Ridgetop Road, Santa Fe, NM 87506
Semi-Annual Report | 23
| | | | |
| To receive shareholder reports, prospectuses, and proxy statements electronically, go to www.thornburg.com/edelivery. | | | | |
| This Semi-Annual Report is submitted for the general information of shareholders of the Fund. It is not authorized for distribution to prospective investors in the Fund unless preceded or accompanied by an effective prospectus. | |
| | | | |
Investment Advisor: | | Distributor: | | |
Thornburg Investment Management® | | Thornburg Securities Corporation® | | |
800.847.0200 | | 800.847.0200 | | TH1069 |
Semi-Annual Reports
March 31, 2018
THORNBURG LIMITED TERM U.S. GOVERNMENT FUND
THORNBURG LIMITED TERM INCOME FUND
THORNBURG LOW DURATION INCOME FUND
About Thornburg Investment Management
It’s more than what we do.
It’s how we do it.
At Thornburg, we are very different in how we think, invest, and are structured. We believe this difference is what makes us successful in helping individuals reach their long-term financial goals.
Flexible Perspective
Our perspective on investment opportunities is more flexible than most, viewing a wide range of opportunities beyond conventional boundaries to find hidden value.
Collaboration
Collectively, we hone ideas via borderless cross-pollination for better judgment and better results.
Portfolio Construction
Disciplined construction guided more by our convictions than convention.
CONVICTION
Thorough analysis and our relative-value framework lead to conviction in our securities selection.
UNCONVENTIONAL
Active management means we seek the best value for our clients rather than using conventional benchmarks as our starting point.
Structured for Excellence
How we think and how we invest is made possible by how we’re structured.
TEAM APPROACH
FAR FROM THE HERD
ACCESS & TRANSPARENCY
2 | Semi-Annual Reports
Thornburg Limited Term U.S. Government Fund
Thornburg Limited Term Income Fund
Thornburg Low Duration Income Fund
Semi-Annual Reports | March 31, 2018
Table of Contents
| | | | | | | | | | |
LIMITED TERM U.S. GOVERNMENT FUND | | NASDAQ
SYMBOLS | | CUSIPS |
| | |
| Class A | | LTUSX | | | | 885-215-103 | |
| Class C | | LTUCX | | | | 885-215-830 | |
| Class I | | LTUIX | | | | 885-215-699 | |
| Class R3 | | LTURX | | | | 885-215-491 | |
| Class R4 | | LTUGX | | | | 885-216-747 | |
| Class R5 | | LTGRX | | | | 885-216-861 | |
|
| LIMITED TERM INCOME FUND |
| | |
| Class A | | THIFX | | | | 885-215-509 | |
| Class C | | THICX | | | | 885-215-764 | |
| Class I | | THIIX | | | | 885-215-681 | |
| Class R3 | | THIRX | | | | 885-215-483 | |
| Class R4 | | THRIX | | | | 885-216-762 | |
| Class R5 | | THRRX | | | | 885-216-853 | |
| Class R6 | | THRLX | | | | 885-216-671 | |
|
| LOW DURATION INCOME FUND |
| | |
| Class A | | TLDAX | | | | 885-216-812 | |
| Class I | | TLDIX | | | | 885-216-796 | |
Class I, R3, R4, R5, and R6 shares may not be available to all investors. Minimum investments for Class I shares may be higher than those for other classes.
Investments carry risks, including possible loss of principal. Portfolios investing in bonds have the same interest rate, inflation, and credit risks that are associated with the underlying bonds. The value of bonds will fluctuate relative to changes in interest rates, decreasing when interest rates rise. Unlike bonds, bond funds have ongoing fees and expenses. Investments in mortgage backed securities (MBS) may bear additional risk. Please see the Fund’s prospectus for a discussion of the risks associated with an investment in the Fund. Investments in the Funds are not FDIC insured, nor are they bank deposits or guaranteed by a bank or any other entity.
The laddering strategy does not assure or guarantee better performance and cannot eliminate the risk of investment losses.
Semi-Annual Reports | 3
Letter to Shareholders
March 31, 2018 (Unaudited)
April 18, 2018
Dear Fellow Shareholder:
We are pleased to present the semi-annual report for Thornburg Limited Term U.S. Government Fund, Thornburg Limited Term Income Fund, and Thornburg Low Duration Income Fund for the six months ended March 31, 2018. The net asset value (NAV) of a Class I share of the Limited Term U.S. Government Fund decreased by twenty cents in the period to $12.81, and if you were invested for the entire period, you received dividends of $0.122 per share. If you reinvested your dividends, you received $0.123 per share. The NAV of a Class I share of the Limited Term Income Fund decreased eighteen cents in the period to $13.26. If you were invested for the entire period, you received dividends of $0.159 per share. If you reinvested your dividends, you received $0.160 cents per share. The NAV of a Class I share of the Low Duration Income Fund decreased ten cents to $12.31 per share. If you were invested for the entire period, you received dividends of $0.1115 per share. If you reinvested your dividends, you received $0.1120 per share. Dividends per share varied for other share classes to account for varying class-specific expenses.
Combining income and change in price, Class I shares of the Thornburg Limited Term U.S. Government Fund produced a total return of negative 0.60% over the six-month period. The Bloomberg Barclays Intermediate Government Bond Index produced a total return of negative 1.13% over the same period. Class I shares of the Thornburg Limited Term Income Fund produced a total return of negative 0.16% over the year ended March 31, 2018. The Bloomberg Barclays Intermediate Government/Credit Bond Index produced a negative 1.18% total return over the same period. Class I shares of the Thornburg Low Duration Income Fund produced a total return of 0.09% over the year ended March 31, 2018. The Bloomberg Barclays U.S. Aggregate Bond 1-3 Year Index produced a negative 0.41% total return over the same period.
We mentioned in previous communications what we believe to be the largest risk to markets going forward: the removal of policy accommodation by most major central banks around the world. In the most recent six-month period, the Federal Reserve Board (Fed) began shrinking its balance sheet while raising its policy rates, the European Central Bank (ECB) began tapering its purchases, and even the Bank of Japan (BOJ) signaled that 0% interest rates won’t last forever. Although central banks are slowly withdrawing the punchbowl, general macroeconomic and market indicators suggest expansion amid still relatively loose financial conditions. Synchronized global growth has given global central bankers an ideal environment to pursue potential normalization.
Another major development during the period was the U.S. announcement of additional fiscal stimulus (e.g. the tax bill). While a short-term positive, our view is that it could potentially fuel inflation. But perhaps more important in the long run is
that the tax bill immediately increases the U.S. fiscal deficit. If growth doesn’t pick up on a sustainable basis, and as of this writing the jury is still out, then that deficit increase will become long-lasting. In previous commentaries, we mentioned government balance sheets as an area of concern for us going forward.
Investment-grade spreads tightened slightly over the first half of the period, with brief moments of volatility caused by heavy supply and knock-on effects from brief wobbles within the high-yield complex. Option-adjusted spreads ended 2017 near post-crisis tights (lower than summer 2014 levels) and not that far from pre-crisis (2004–2007) tights, reflecting limited compensation for risk heading into 2018. We remained conservatively positioned in credit, given unattractive compensation levels at the time. Overall, our generally conservative positioning in credit is not really about credit ratings, though there has been some migration to higher credit rungs within Thornburg Limited Term Income Fund. Rather, it’s about the assets that generate the cash flows behind the bonds we purchase. For example, we prefer less cyclical businesses, such as utilities. In our view, business models are often more informative than credit ratings during times of stress, and stress certainly appeared in the second half of the period.
The first quarter of 2018 marked the return of volatility from the muted levels experienced throughout 2017. As volatility rose, asset returns became highly correlated to the downside, catching many investors off guard. In January alone, the U.S. 10-year jumped 31 basis points; by the end of the quarter the 10-year yielded 2.77%. During the quarter, the Bloomberg Barclays U.S. Aggregate Bond Index delivered a negative 1.46% return, reminding investors of the potential perils found in longer duration, core bond indices.
The S&P 500 Index gave back all the gains from the best January in 20 years, returning negative 0.76% in the first quarter. Volatility, as measured by the CBOE Volatility Index (VIX), spiked in early February as investor fears over suddenly increasing inflation gripped markets. Leveraged VIX ETN products quickly exacerbated the issue as the popular short volatility trade of 2017 unwound. Equities sold off significantly (~10%) over nine days before rallying as fears subsided. Treasury yields remained elevated throughout the second half of the period as potential changes to monetary policy from the new Jerome Powell-led Fed remained top of mind for investors.
Statements from former Fed Chairwoman Janet Yellen’s last meeting generally read more hawkish than anticipated, and Powell’s first Humphrey Hawkins performance came off a bit hawkish as well. Market participants focused on any signs of inflation acceleration and what that might do to the pace of Fed, Bank of England, ECB, and BOJ tightening. Despite acceleration concerns, sub-target inflation continues to provide the Fed, ECB, and other developed market central banks, enough wiggle room to move slowly. However, gross domestic product (GDP) output gaps continue to shrink (i.e. at neutral
4 | Semi-Annual Reports
Letter to Shareholders, Continued
March 31, 2018 (Unaudited)
level), and most notably, unemployment rates continue to fall, with the U.S. and various European economies at or near full employment. Although we’ve recently experienced some weaknesses in spending and housing data, synchronized global growth appears sustainable and the general economic environment remains benign.
In terms of positioning, stronger economic growth continues to give us confidence to hold a decent amount of credit currently, though we have lowered risk exposures in the portfolios over time as risk compensation has declined. In general, we remain disciplined and defensive regarding interest-rate and credit risk. Depending upon the mandate, we added modest exposure to relatively short-term investment-grade floating-rate bonds. Where appropriate, given each portfolio’s guidelines, these additions came by way of various structures, including asset-backed securities and corporates—the common link being that, regardless of structure, they were backed by high-quality assets.
While neither interest rate nor credit risk is wholesale attractive today, we still are finding select opportunities for portfolios in both areas. Recently, as duration risk has become more attractively priced, we have increased our exposure to it. And, across the portfolios we added modest mortgage-backed securities exposure. In all instances these were high-quality, short-term bonds. Additionally, they were structured to limit the potential range of pre-payment or extension risk outcomes, giving us confidence in their likely weighted-average life. We also continue to take advantage of market pullbacks to pick up
attractively priced risk assets, though as suggested, these pullbacks have not yet offered widespread opportunity, neither in rate nor credit.
We continue to follow our central tenant of investing – seeking the best relative value in terms of risk and reward. Our 10–year results within Limited Term Income suggest this process works, and as such, we’ll remain focused on executing it in the years to come.
Thank you for your continued trust in us. We look forward to working hard to add value to your holdings.
Sincerely,

Jason Brady,CFA
Portfolio Manager
CEO, President, and Managing Director

Lon R. Erickson,CFA
Portfolio Manager
Managing Director

Jeff Klingelhofer,CFA
Portfolio Manager
Managing Director
The matters discussed in this report may constitute forward-looking statements made pursuant to the safe harbor provisions of the Securities Litigation Reform Act of 1995. These include any advisor or portfolio manager prediction, assessment, analysis or outlook for individual securities, industries, investment styles, market sectors and/or markets. These statements involve risks and uncertainties. In addition to the general risks described for each fund in its current prospectus, other factors bearing on these reports include the accuracy of the advisor’s or portfolio manager’s forecasts and predictions, the appropriateness of the investment strategies designed by the advisor or portfolio manager and the ability of the advisor or portfolio manager to implement their strategies efficiently and successfully. Any one or more of these factors, as well as other risks affecting the securities markets generally, could cause the actual results of any fund to differ materially as compared to its benchmarks.
The views expressed are subject to change and do not necessarily reflect the views of Thornburg Investment Management, Inc. This information should not be relied upon as a recommendation or investment advice and is not intended to predict the performance of any investment or market.
Performance results of individual share classes will vary based on the fees and expenses associated with each share class, and may be higher or lower than other share classes within the same Fund. Please see Performance Summary for performance results of each share class.
Semi-Annual Reports | 5
Performance Summary
March 31, 2018
AVERAGE ANNUAL TOTAL RETURNS
| | | | | | | | | | | | | | | | | | | | | | | | | |
LIMITED TERM U.S.
GOVERNMENT
FUND | | 1-YR | | 3-YR | | 5-YR | | 10-YR | | SINCE
INCEP. |
| | | | | |
Class A Shares (Incep: 11/16/87) | | | | | | | | | | | | | | | | | | | | | | | | | |
Without sales charge | | | | -0.15% | | | | | 0.19% | | | | | 0.36% | | | | | 1.86% | | | | | 4.70% | |
| | | | | |
With sales charge | | | | -1.66% | | | | | -0.30% | | | | | 0.06% | | | | | 1.71% | | | | | 4.65% | |
Class C Shares (Incep: 9/1/94) | | | | | | | | | | | | | | | | | | | | | | | | | |
Without sales charge | | | | -0.52% | | | | | -0.12% | | | | | 0.06% | | | | | 1.57% | | | | | 3.58% | |
| | | | | |
With sales charge | | | | -1.02% | | | | | -0.12% | | | | | 0.06% | | | | | 1.57% | | | | | 3.58% | |
| | | | | |
Class I Shares (Incep: 7/5/96) | | | | 0.18% | | | | | 0.52% | | | | | 0.69% | | | | | 2.19% | | | | | 4.06% | |
| | | | | |
Class R3 Shares (Incep: 7/1/03) | | | | -0.19% | | | | | 0.14% | | | | | 0.30% | | | | | 1.80% | | | | | 2.25% | |
| | | | | |
Class R4 Shares (Incep: 2/1/14) | | | | -0.21% | | | | | 0.13% | | | | | - | | | | | - | | | | | 0.57% | |
| | | | | |
Class R5 Shares (Incep: 5/1/12) | | | | 0.14% | | | | | 0.48% | | | | | 0.65% | | | | | - | | | | | 0.77% | |
| | | | | |
LIMITED TERM
INCOME
FUND | | | | | | | | | | |
| | | | | |
Class A Shares (Incep: 10/1/92) | | | | | | | | | | | | | | | | | | | | | | | | | |
Without sales charge | | | | 0.97% | | | | | 1.36% | | | | | 1.56% | | | | | 3.79% | | | | | 4.86% | |
| | | | | |
With sales charge | | | | -0.52% | | | | | 0.84% | | | | | 1.25% | | | | | 3.63% | | | | | 4.80% | |
Class C Shares (Incep: 9/1/94) | | | | | | | | | | | | | | | | | | | | | | | | | |
Without sales charge | | | | 0.76% | | | | | 1.15% | | | | | 1.34% | | | | | 3.55% | | | | | 4.54% | |
| | | | | |
With sales charge | | | | 0.27% | | | | | 1.15% | | | | | 1.34% | | | | | 3.55% | | | | | 4.54% | |
| | | | | |
Class I Shares (Incep: 7/5/96) | | | | 1.42% | | | | | 1.75% | | | | | 1.94% | | | | | 4.16% | | | | | 5.05% | |
| | | | | |
Class R3 Shares (Incep: 7/1/03) | | | | 0.85% | | | | | 1.24% | | | | | 1.44% | | | | | 3.72% | | | | | 3.55% | |
| | | | | |
Class R4 Shares (Incep: 2/1/14) | | | | 0.92% | | | | | 1.27% | | | | | - | | | | | - | | | | | 1.68% | |
| | | | | |
Class R5 Shares (Incep: 5/1/12) | | | | 1.18% | | | | | 1.59% | | | | | 1.79% | | | | | - | | | | | 2.41% | |
| | | | | |
Class R6 Shares (Incep: 4/10/17) | | | | - | | | | | - | | | | | - | | | | | - | | | | | 1.79% | |
| | | | | |
LOW DURATION
INCOME
FUND | | | | | | | | | | |
| | | | | |
Class A Shares (Incep: 12/30/13) | | | | | | | | | | | | | | | | | | | | | | | | | |
Without sales charge | | | | 0.63% | | | | | 0.90% | | | | | - | | | | | - | | | | | 1.07% | |
| | | | | |
With sales charge | | | | -0.88% | | | | | 0.39% | | | | | - | | | | | - | | | | | 0.71% | |
| | | | | |
Class I Shares (Incep: 12/30/13) | | | | 0.91% | | | | | 1.09% | | | | | - | | | | | - | | | | | 1.26% | |
30-DAY YIELDS, A SHARES (WITH SALES CHARGE)
| | | | | |
| |
THORNBURG LIMITED TERM U.S. GOVERNMENT FUND | | | | | |
Annualized Distribution Yield | | | | 1.96% | |
SEC Yield | | | | 2.00% | |
| |
THORNBURG LIMITED TERM INCOME FUND | | | | | |
Annualized Distribution Yield | | | | 2.12% | |
SEC Yield | | | | 2.16% | |
| |
THORNBURG LOW DURATION INCOME FUND | | | | | |
Annualized Distribution Yield | | | | 1.88% | |
SEC Yield | | | | 1.79% | |
GROWTH OF A HYPOTHETICAL $10,000 INVESTMENT
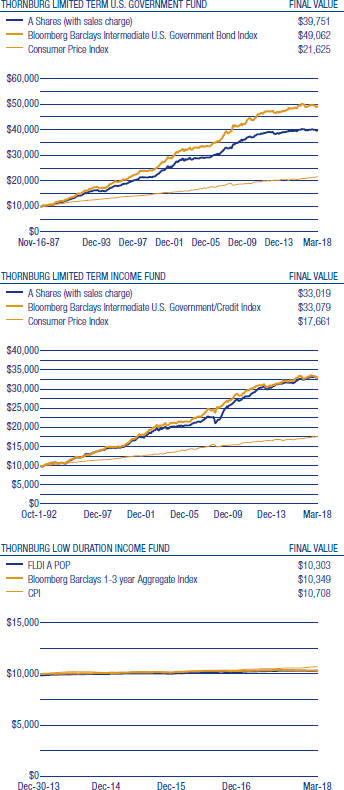
6 | Semi-Annual Reports
Performance Summary, Continued
March 31, 2018
Performance data shown represents past performance and is no guarantee of future results. Investment return and principal value will fluctuate so shares, when redeemed, may be worth more or less than their original cost. Current performance may be lower or higher than quoted. For performance current to the most recent month end, visit thornburg.com or call 800-847-0200. The performance information does not reflect the deduction of taxes that a shareholder would pay on distributions or the redemption of Fund shares. Returns reflect the reinvestment of dividends and capital gains. Class A shares are sold with a maximum sales charge of 1.50%. Class C shares include a 0.50% CDSC for the first year only. There is no sales charge for Class I, Class R3, Class R4, Class R5, and Class R6 shares. As disclosed in the most recent prospectus, the total annual fund operating expenses before waivers and expense reimbursements are as follows: Limited Term U.S. Government Fund A shares, 0.89%; C shares, 1.20%; I shares, 0.63%; R3 shares, 1.36%; R4 shares, 1.91%; R5 shares, 1.24%; Limited Term Income Fund A shares, 0.83%; C shares, 1.04%; I shares, 0.53%; R3 shares, 1.08%; R4 shares, 1.52%; R5 shares, 0.70%; R6 shares, 1.00%; and Low Duration Income Fund A shares, 1.73%; I shares, 1.06%. Thornburg Investment Management and/or Thornburg Securities Corporation have contractually agreed to waive fees and reimburse expenses through at least February 1, 2019, for some of the share classes, resulting in net expense ratios of the following: For Limited Term U.S. Government Fund R3 shares, 0.99%; R4 shares, 0.99%; R5 shares, 0.67%. Limited Term Income Fund R3 shares, 0.99%; R4 shares, 0.99%; R5 shares, 0.67%; R6 shares 0.45%. Low Duration Income Fund A shares, 0.70%; I shares, 0.50%. For more detailed information on fund expenses and waivers/reimbursements please see the Fund’s prospectus. Without the fee waivers and expense reimbursements, the Annualized Distribution yield for Low Duration Income Fund A shares would have been 0.74%, and the SEC yield would have been 0.64%.
Glossary
The Bloomberg Barclays Intermediate Government Bond Index is an unmanaged, market-weighted index generally representative of all public obligations of the U.S. Government, its agencies and instrumentalities having maturities from one up to ten years.
The Bloomberg Barclays Intermediate Government/Credit Bond Index is an unmanaged, market-weighted index generally representative of intermediate government and investment-grade corporate debt securities having maturities from one up to ten years.
The Bloomberg Barclays U.S. Aggregate Bond Index is composed of approximately 8,000 publicly traded bonds including U.S. government, mortgage-backed, corporate and Yankee bonds. The index is weighted by the market value of the bonds included in the index.
The Bloomberg Barclays U.S. 1-3 Yr Aggregate Bond Index measures the investment grade, U.S. dollar-denominated, fixed-rate taxable bond market with maturities between 1 and 3 years, including Treasuries, government-related and corporate securities, MBS (agency fixed-rate and hybrid ARM passthroughs), ABS, and CMBS.
The S&P 500 Index is an unmanaged broad measure of the U.S. stock market.
The CBOE Volatility Index (VIX Index) shows the market’s expectation of 30-day volatility. It is constructed using the implied volatilities of a wide range of S&P 500 Index options. This volatility is meant to be forward looking and is calculated from both calls and puts.
The performance of any index is not indicative of the performance of any particular investment. Unless otherwise noted, index returns reflect the reinvestment of income dividends and capital gains, if any, but do not reflect fees, brokerage commissions or other expenses of investing. Investors may not make direct investments into any index.
Annualized Distribution Yield – The distribution yield reflects actual distributions made to shareholders. The annualized distribution yield is calculated by summing the last 30 days of income at a given month end and annualizing to a 360-day year. The result is divided by the ending maximum offering price or net asset value.
Bond Credit Ratings (Credit Quality) – A bond credit rating assesses the financial ability of a debt issuer to make timely payments of principal and interest. Rating of AAA (the highest), AA, A, and BBB are investment-grade quality. Rating of BB, B, CCC, CC, C and D (the lowest) are considered below investment grade, speculative grade, or junk bonds.
Credit Spread/Quality Spread – The difference between the yields of securities with different credit qualities.
Duration – A bond’s sensitivity to interest rates. Bonds with longer durations experience greater price volatility than bonds with shorter durations. Effective duration incorporates a bond’s embedded option features, such as call provisions.
Semi-Annual Reports | 7
Fund Summary
Thornburg Limited Term U.S. Government Fund | March 31, 2018 (Unaudited)
OBJECTIVES AND STRATEGIES
The Fund’s primary objective is to provide as high a level of current income as is consistent, in the view of the Fund’s investment advisor, with the safety of capital. As a secondary goal, the Fund seeks to reduce changes in its share price compared to longer term portfolios.
This Fund is a laddered portfolio primarily composed of short/intermediate debt obligations at least 80% of which are issued by the U.S. Government, its agencies, or its instrumentalities, with a dollar-weighted average maturity of normally less than five years.
LONG-TERM STABILITY OF PRINCIPAL
Net Asset Value History of A Shares
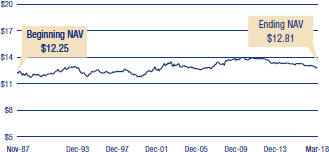
KEY PORTFOLIO ATTRIBUTES
| | | | | |
| Number of Bonds | | | | 156 | |
| Effective Duration | | | | 2.8 Yrs | |
| Average Maturity | | | | 3.6 Yrs | |
There is no guarantee that the Fund will meet its investment objectives.
All data is subject to change. Charts may not add up to 100% due to rounding.
TYPES OF HOLDINGS
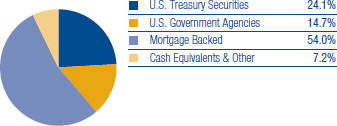
PORTFOLIO LADDER
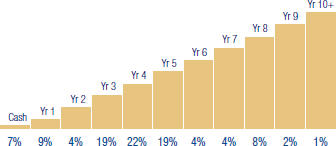
Percent of portfolio maturing in each year. Cash includes cash equivalents.
8 | Semi-Annual Reports
Schedule of Investments
Thornburg Limited Term U.S. Government Fund | March 31, 2018 (Unaudited)
| | | | | | | | | | | | |
| | | | | SHARES/
PRINCIPAL AMOUNT | | VALUE |
| | | |
| | MORTGAGE BACKED — 54.0% | | | | | | | | | | |
| | Federal Home Loan Mtg Corp., | | | | | | | | | | |
| | 4.875%, 6/13/2018 | | | $ | 3,000,000 | | | | $ | 3,017,521 | |
| | Pool AK6768, 3.00%, 3/1/2027 | | | | 1,554,697 | | | | | 1,563,989 | |
| | Pool B14155, 3.50%, 5/1/2019 | | | | 49,072 | | | | | 50,040 | |
| | Pool D98887, 3.50%, 1/1/2032 | | | | 966,717 | | | | | 986,806 | |
| | Pool E96575, 4.50%, 6/1/2018 | | | | 8,803 | | | | | 8,816 | |
| | Pool G12079, 4.50%, 4/1/2019 | | | | 47,951 | | | | | 48,349 | |
| | Pool G12140, 4.00%, 2/1/2020 | | | | 18,641 | | | | | 19,179 | |
| | Pool G13804, 5.00%, 3/1/2025 | | | | 337,936 | | | | | 354,271 | |
| | Pool G15227, 3.50%, 12/1/2029 | | | | 2,812,468 | | | | | 2,874,100 | |
| | Pool G18435, 2.50%, 5/1/2027 | | | | 1,973,321 | | | | | 1,955,823 | |
| | Pool J11371, 4.50%, 12/1/2024 | | | | 353,960 | | | | | 367,880 | |
| | Pool J13583, 3.50%, 11/1/2025 | | | | 603,607 | | | | | 616,835 | |
| | Pool J14888, 3.50%, 4/1/2026 | | | | 667,201 | | | | | 681,717 | |
| | Pool T61943, 3.50%, 8/1/2045 | | | | 762,082 | | | | | 758,718 | |
| | Federal Home Loan Mtg Corp., CMO, | | | | | | | | | | |
| | Series 1351 Class TE, 7.00%, 8/15/2022 | | | | 90,360 | | | | | 94,632 | |
| | Series 2015-SC02 Class 2A, 3.50%, 9/25/2045 | | | | 1,612,008 | | | | | 1,581,451 | |
| | Series 2622 Class PE, 4.50%, 5/15/2018 | | | | 6,281 | | | | | 6,281 | |
| | Series 2641 Class WE, 4.50%, 1/15/2033 | | | | 7,098 | | | | | 7,126 | |
| | Series 2649 Class QH, 4.50%, 7/15/2018 | | | | 6,246 | | | | | 6,248 | |
| | Series 2827 Class BU, 3.50%, 7/15/2019 | | | | 38,851 | | | | | 38,894 | |
| | Series 3291 Class BY, 4.50%, 3/15/2022 | | | | 344,821 | | | | | 350,680 | |
| | Series 3640 Class EL, 4.00%, 3/15/2020 | | | | 204,538 | | | | | 206,993 | |
| | Series 3704 Class DC, 4.00%, 11/15/2036 | | | | 410,382 | | | | | 420,207 | |
| | Series 3867 Class VA, 4.50%, 3/15/2024 | | | | 1,536,432 | | | | | 1,604,092 | |
| | Series 3922 Class PQ, 2.00%, 4/15/2041 | | | | 747,838 | | | | | 736,065 | |
| | Series 4050 Class MV, 3.50%, 8/15/2023 | | | | 1,856,680 | | | | | 1,888,291 | |
| | Series 4097 Class TE, 1.75%, 5/15/2039 | | | | 1,501,682 | | | | | 1,442,275 | |
| a | | Series 4105 Class FG, 2.177% (LIBOR 1 Month + 0.40%), 9/15/2042 | | | | 1,709,432 | | | | | 1,718,873 | |
| | Series 4120 Class TC, 1.50%, 10/15/2027 | | | | 2,001,849 | | | | | 1,913,034 | |
| | Series 4120 Class UE, 2.00%, 10/15/2027 | | | | 2,099,655 | | | | | 2,034,225 | |
| | Series K018 Class A1, 1.781%, 10/25/2020 | | | | 835,290 | | | | | 826,419 | |
| | Series K035 Class A1, 2.615%, 3/25/2023 | | | | 2,388,305 | | | | | 2,368,684 | |
| | Series K037 Class A1, 2.592%, 4/25/2023 | | | | 1,386,795 | | | | | 1,377,326 | |
| | Series K038 Class A1, 2.604%, 10/25/2023 | | | | 4,322,137 | | | | | 4,281,715 | |
| | Series K042 Class A1, 2.267%, 6/25/2024 | | | | 3,134,733 | | | | | 3,055,295 | |
| | Series K709 Class A2, 2.086%, 3/25/2019 | | | | 3,000,000 | | | | | 2,981,100 | |
| | Series K716 Class A1, 2.413%, 1/25/2021 | | | | 1,099,765 | | | | | 1,091,282 | |
| a | | Series KF15 Class A, 2.34% (LIBOR 1 Month + 0.67%), 2/25/2023 | | | | 1,916,369 | | | | | 1,923,998 | |
| a | | Series KLH1 Class A, 2.37% (LIBOR 1 Month + 0.70%), 11/25/2022 | | | | 2,000,000 | | | | | 2,005,526 | |
| b | | Series KP02 Class A2, 2.355%, 4/25/2021 | | | | 2,815,357 | | | | | 2,801,068 | |
| | Series KS03 Class A2, 2.79%, 6/25/2022 | | | | 2,500,000 | | | | | 2,446,138 | |
| a | | Federal Home Loan Mtg Corp., Multi-Family Structured Pass Through, Series KLH3 Class A, 2.37% (LIBOR 1 Month + 0.70%), 11/25/2022 | | | | 2,998,695 | | | | | 3,001,427 | |
| | Federal Home Loan Mtg Corp., REMIC, Series 4072 Class VA, 3.50%, 10/15/2023 | | | | 1,634,504 | | | | | 1,662,757 | |
| | Federal Home Loan Mtg Corp., Seasoned Credit Risk Transfer, | | | | | | | | | | |
| | Series 2017-3 Class HA, 2.25%, 7/25/2056 | | | | 2,359,262 | | | | | 2,330,815 | |
| | Series 2017-4 Class HT, 2.25%, 6/25/2057 | | | | 1,339,636 | | | | | 1,307,755 | |
| c | | Series 2018-1 Class HA, 2.00%, 5/25/2057 | | | | 2,986,223 | | | | | 2,895,031 | |
| | Federal Home Loan Mtg Corp., Whole Loan Securities, | | | | | | | | | | |
| | Series 2016-SC01 Class 2A, 3.50%, 7/25/2046 | | | | 1,781,378 | | | | | 1,741,116 | |
| | Series 2016-SC02 Class 2A, 3.50%, 10/25/2046 | | | | 1,419,019 | | | | | 1,410,222 | |
| | Series 2017-SC02 Class 2A1, 3.50%, 5/25/2047 | | | | 776,051 | | | | | 781,128 | |
| | Federal National Mtg Assoc., | | | | | | | | | | |
| | 1.875%, 12/28/2020 | | | | 2,000,000 | | | | | 1,971,691 | |
| | Pool 252648, 6.50%, 5/1/2022 | | | | 17,452 | | | | | 18,397 | |
| | Pool 342947, 7.25%, 4/1/2024 | | | | 43,509 | | | | | 47,107 | |
| | Pool 443909, 6.50%, 9/1/2018 | | | | 964 | | | | | 976 | |
| | Pool 726308, 4.00%, 7/1/2018 | | | | 14,343 | | | | | 14,368 | |
| | Pool 889906, 4.00%, 7/1/2023 | | | | 119,670 | | | | | 123,120 | |
| a | | Pool 895572, 3.691% (LIBOR 12 Month + 1.82%), 6/1/2036 | | | | 241,789 | | | | | 254,188 | |
| | Pool 930986, 4.50%, 4/1/2019 | | | | 60,957 | | | | | 61,430 | |
Semi-Annual Reports | 9
Schedule of Investments, Continued
Thornburg Limited Term U.S. Government Fund | March 31, 2018 (Unaudited)
| | | | | | | | | | | | |
| | | | | SHARES/
PRINCIPAL AMOUNT | | VALUE |
| | Pool AA2870, 4.00%, 3/1/2024 | | | $ | 337,280 | | | | $ | 347,479 | |
| | Pool AB7997, 2.50%, 2/1/2023 | | | | 554,005 | | | | | 552,715 | |
| | Pool AB8447, 2.50%, 2/1/2028 | | | | 1,679,388 | | | | | 1,657,018 | |
| | Pool AD8191, 4.00%, 9/1/2025 | | | | 567,402 | | | | | 585,973 | |
| | Pool AE0704, 4.00%, 1/1/2026 | | | | 2,267,942 | | | | | 2,343,220 | |
| | Pool AH3487, 3.50%, 2/1/2026 | | | | 2,556,406 | | | | | 2,613,127 | |
| | Pool AJ1752, 3.50%, 9/1/2026 | | | | 1,766,761 | | | | | 1,805,685 | |
| | Pool AK6518, 3.00%, 3/1/2027 | | | | 1,419,624 | | | | | 1,428,774 | |
| | Pool AL9821, 2.50%, 1/1/2032 | | | | 5,757,993 | | | | | 5,650,705 | |
| | Pool AS9749, 4.00%, 6/1/2047 | | | | 2,458,596 | | | | | 2,525,439 | |
| | Pool AU2669, 2.50%, 10/1/2028 | | | | 1,740,515 | | | | | 1,717,331 | |
| | Pool MA0045, 4.00%, 4/1/2019 | | | | 37,788 | | | | | 38,046 | |
| | Pool MA0071, 4.50%, 5/1/2019 | | | | 33,629 | | | | | 33,890 | |
| | Pool MA0125, 4.50%, 7/1/2019 | | | | 28,855 | | | | | 29,100 | |
| | Pool MA0380, 4.00%, 4/1/2020 | | | | 102,091 | | | | | 105,035 | |
| | Pool MA1582, 3.50%, 9/1/2043 | | | | 4,176,382 | | | | | 4,212,925 | |
| | Pool MA1585, 2.00%, 9/1/2023 | | | | 1,504,343 | | | | | 1,485,576 | |
| | Pool MA1625, 3.00%, 10/1/2023 | | | | 1,551,153 | | | | | 1,566,328 | |
| | Pool MA2322, 2.50%, 7/1/2025 | | | | 1,361,191 | | | | | 1,355,396 | |
| | Pool MA2353, 3.00%, 8/1/2035 | | | | 2,347,418 | | | | | 2,335,131 | |
| | Pool MA2480, 4.00%, 12/1/2035 | | | | 2,355,841 | | | | | 2,448,418 | |
| | Pool MA2499, 2.50%, 1/1/2026 | | | | 2,263,504 | | | | | 2,253,867 | |
| | Series 2017-T1 Class A, 2.898%, 6/25/2027 | | | | 999,606 | | | | | 968,770 | |
| | Federal National Mtg Assoc., CMO, | | | | | | | | | | |
| | Series 1993-32 Class H, 6.00%, 3/25/2023 | | | | 11,154 | | | | | 11,673 | |
| b | | Series 2009-17 Class AH, 0.736%, 3/25/2039 | | | | 385,087 | | | | | 323,938 | |
| | Series 2009-52 Class AJ, 4.00%, 7/25/2024 | | | | 63,478 | | | | | 64,033 | |
| | Series 2009-70 Class NK, 4.50%, 8/25/2019 | | | | 6,845 | | | | | 6,862 | |
| | Series 2009-78 Class A, 4.50%, 8/25/2019 | | | | 15,212 | | | | | 15,280 | |
| | Series 2011-124 Class QA, 2.00%, 12/25/2041 | | | | 32,175 | | | | | 32,113 | |
| | Series 2011-45 Class VA, 4.00%, 3/25/2024 | | | | 2,098,243 | | | | | 2,123,295 | |
| | Series 2011-63 Class MV, 3.50%, 7/25/2024 | | | | 2,140,842 | | | | | 2,154,758 | |
| | Series 2011-70 Class CA, 3.00%, 8/25/2026 | | | | 3,818,794 | | | | | 3,740,410 | |
| | Series 2011-72 Class KV, 3.50%, 11/25/2022 | | | | 1,081,304 | | | | | 1,084,900 | |
| | Series 2012-20 Class VT, 3.50%, 3/25/2025 | | | | 2,930,828 | | | | | 2,984,037 | |
| | Series 2012-36 Class CV, 4.00%, 6/25/2023 | | | | 2,059,890 | | | | | 2,095,207 | |
| a | | Series 2013-81 Class FW, 2.172% (LIBOR 1 Month + 0.30%), 1/25/2043 | | | | 2,806,525 | | | | | 2,791,723 | |
| a | | Series 2013-92 Class FA, 2.422% (LIBOR 1 Month + 0.55%), 9/25/2043 | | | | 1,984,390 | | | | | 1,999,433 | |
| a | | Series 2015-SB5 Class A10, 3.15% (LIBOR 1 Month + 3.15%), 9/25/2035 | | | | 1,994,125 | | | | | 1,951,669 | |
| d | | Series 2018-SB47 Class A5H, 2.92%, 1/25/2038 | | | | 1,477,296 | | | | | 1,475,117 | |
| | Government National Mtg Assoc., | | | | | | | | | | |
| | Pool 3550, 5.00%, 5/20/2019 | | | | 28,900 | | | | | 29,234 | |
| b | | Pool 714631, 5.853%, 10/20/2059 | | | | 55,248 | | | | | 55,373 | |
| b | | Pool 721652, 5.051%, 5/20/2061 | | | | 1,397,144 | | | | | 1,412,520 | |
| b | | Pool 751388, 5.304%, 1/20/2061 | | | | 1,602,539 | | | | | 1,645,080 | |
| b | | Pool 751392, 5.00%, 2/20/2061 | | | | 4,254,343 | | | | | 4,485,899 | |
| b | | Pool 757313, 4.294%, 12/20/2060 | | | | 518,842 | | | | | 518,799 | |
| a | | Pool 894205, 2.75% (H15T1Y + 1.50%), 8/20/2039 | | | | 347,750 | | | | | 357,232 | |
| a | | Pool MA0100, 2.625% (H15T1Y + 1.50%), 5/20/2042 | | | | 907,147 | | | | | 938,745 | |
| | Pool MA0907, 2.00%, 4/20/2028 | | | | 2,346,832 | | | | | 2,251,125 | |
| | Government National Mtg Assoc., CMO, Series 2010-160 Class VY, 4.50%, 1/20/2022 | | | | 400,264 | | | | | 412,322 | |
| | | | | | | | | | | | |
| | TOTAL MORTGAGE BACKED (Cost $145,902,462) | | | | | | | | | 143,154,215 | |
| | | | | | | | | | | | |
| | | |
| | U.S. TREASURY SECURITIES — 24.1% | | | | | | | | | | |
| | United States Treasury Notes Inflationary Index, | | | | | | | | | | |
| | 0.125%, 4/15/2020 - 7/15/2026 | | | | 12,787,532 | | | | | 12,613,177 | |
| | 0.375%, 7/15/2025 | | | | 6,008,980 | | | | | 5,931,812 | |
| | 0.625%, 7/15/2021 - 1/15/2026 | | | | 6,034,287 | | | | | 6,065,788 | |
| | United States Treasury Notes, | | | | | | | | | | |
| | 0.125%, 4/15/2021 | | | | 3,032,356 | | | | | 3,006,637 | |
| | 0.75%, 4/30/2018 | | | | 4,750,000 | | | | | 4,746,475 | |
| | 1.125%, 6/15/2018 | | | | 4,000,000 | | | | | 3,995,410 | |
10 | Semi-Annual Reports
Schedule of Investments, Continued
Thornburg Limited Term U.S. Government Fund | March 31, 2018 (Unaudited)
| | | | | | | | | | | | |
| | | | | SHARES/
PRINCIPAL AMOUNT | | VALUE |
| | 1.25%, 8/31/2019 | | | $ | 1,480,000 | | | | $ | 1,460,040 | |
| | 1.375%, 2/29/2020 - 10/31/2020 | | | | 3,980,000 | | | | | 3,901,235 | |
| | 1.50%, 8/15/2026 | | | | 1,500,000 | | | | | 1,361,733 | |
| | 1.625%, 6/30/2020 | | | | 4,000,000 | | | | | 3,938,828 | |
| | 1.875%, 1/31/2022 - 8/31/2024 | | | | 5,555,000 | | | | | 5,386,053 | |
| | 2.125%, 1/31/2021 | | | | 1,500,000 | | | | | 1,489,233 | |
| | 2.25%, 4/30/2021 - 8/15/2027 | | | | 8,965,000 | | | | | 8,837,620 | |
| | 3.625%, 2/15/2020 | | | | 1,000,000 | | | | | 1,024,492 | |
| | | | | | | | | | | | |
| | TOTAL U.S. TREASURY SECURITIES (Cost $64,607,884) | | | | | | | | | 63,758,533 | |
| | | | | | | | | | | | |
| | | |
| | U.S. GOVERNMENT AGENCIES — 14.7% | | | | | | | | | | |
| | HNA Group 2015 LLC (Guaranty: Export-Import Bank of the United States), 2.291%, 6/30/2027 | | | | 2,426,402 | | | | | 2,364,505 | |
| | Mortgage-Linked Amortizing Notes, Series 2012-1 Class A10, 2.06%, 1/15/2022 | | | | 534,029 | | | | | 525,895 | |
| | New Valley Generation I, Tennessee Valley Authority, 7.299%, 3/15/2019 | | | | 370,233 | | | | | 376,078 | |
| | Petroleos Mexicanos (Guaranty: Export-Import Bank of the United States), | | | | | | | | | | |
| e | | 1.70%, 12/20/2022 | | | | 2,612,500 | | | | | 2,552,717 | |
| a,e | | 2.072% (LIBOR 3 Month + 0.35%), 4/15/2025 | | | | 2,537,500 | | | | | 2,547,164 | |
| e | | 2.46%, 12/15/2025 | | | | 2,000,000 | | | | | 1,977,620 | |
| | Reliance Industries Ltd. (Guaranty: Export-Import Bank of the United States), | | | | | | | | | | |
| e | | 1.87%, 1/15/2026 | | | | 1,894,737 | | | | | 1,830,073 | |
| e | | 2.06%, 1/15/2026 | | | | 2,800,000 | | | | | 2,724,529 | |
| e | | 2.512%, 1/15/2026 | | | | 2,800,000 | | | | | 2,767,041 | |
| | Small Business Administration Participation Certificates, | | | | | | | | | | |
| | Series 2001-20D Class 1, 6.35%, 4/1/2021 | | | | 322,937 | | | | | 333,555 | |
| | Series 2001-20F Class 1, 6.44%, 6/1/2021 | | | | 314,512 | | | | | 323,434 | |
| | Series 2002-20A Class 1, 6.14%, 1/1/2022 | | | | 163,711 | | | | | 170,500 | |
| | Series 2002-20K Class 1, 5.08%, 11/1/2022 | | | | 189,447 | | | | | 194,848 | |
| | Series 2005-20H Class 1, 5.11%, 8/1/2025 | | | | 167,770 | | | | | 172,431 | |
| | Series 2007-20D Class 1, 5.32%, 4/1/2027 | | | | 449,713 | | | | | 471,567 | |
| | Series 2007-20F Class 1, 5.71%, 6/1/2027 | | | | 250,499 | | | | | 261,378 | |
| | Series 2007-20I Class 1, 5.56%, 9/1/2027 | | | | 793,336 | | | | | 832,516 | |
| | Series 2007-20K Class 1, 5.51%, 11/1/2027 | | | | 559,831 | | | | | 579,349 | |
| | Series 2008-20G Class 1, 5.87%, 7/1/2028 | | | | 1,430,013 | | | | | 1,520,525 | |
| | Series 2011-20G Class 1, 3.74%, 7/1/2031 | | | | 1,765,810 | | | | | 1,820,998 | |
| | Series 2011-20K Class 1, 2.87%, 11/1/2031 | | | | 2,083,824 | | | | | 2,073,297 | |
| | Series 2015-20G Class 1, 2.88%, 7/1/2035 | | | | 2,054,303 | | | | | 2,040,710 | |
| | Series 2015-20I Class 1, 2.82%, 9/1/2035 | | | | 2,323,033 | | | | | 2,301,662 | |
| | Ulani MSN 35940 LLC (Guaranty: Export-Import Bank of the United States), 2.227%, 5/16/2025 | | | | 3,020,833 | | | | | 2,965,243 | |
| | Union 13 Leasing LLC (Guaranty: Export-Import Bank of the United States), 1.87%, 6/28/2024 | | | | 1,651,460 | | | | | 1,603,883 | |
| a | | Washington Aircraft 2 Co. Ltd. (Guaranty: Export-Import Bank of the United States), 2.716% (LIBOR 3 Month + 0.43%), 6/26/2024 | | | | 3,645,996 | | | | | 3,632,053 | |
| | | | | | | | | | | | |
| | TOTAL U.S. GOVERNMENT AGENCIES (Cost $39,514,424) | | | | | | | | | 38,963,571 | |
| | | | | | | | | | | | |
| | | |
| | SHORT-TERM INVESTMENTS — 6.7% | | | | | | | | | | |
| | Bank of New York Tri-Party Repurchase Agreement 1.80% dated 3/29/2018 due 4/2/2018, repurchase price $12,002,407 collateralized by 19 U.S. Government debt securities, having an average coupon of 3.78%, a minimum credit rating of BBB-, maturity dates from 3/25/2019 to 4/25/2042, and having an aggregated market value of $12,240,000 at 3/31/2018 | | | | 12,000,000 | | | | | 12,000,000 | |
| | Federal Home Loan Bank Discount Notes, 0%, 4/2/2018 | | | | 5,732,000 | | | | | 5,731,809 | |
| | | | | | | | | | | | |
| | TOTAL SHORT-TERM INVESTMENTS (Cost $17,731,809) | | | | | | | | | 17,731,809 | |
| | | | | | | | | | | | |
| | | |
| | TOTAL INVESTMENTS — 99.5% (Cost $267,756,579) | | | | | | | | $ | 263,608,128 | |
| | | |
| | OTHER ASSETS LESS LIABILITIES — 0.5% | | | | | | | | | 1,365,478 | |
| | | | | | | | | | | | |
| | | |
| | NET ASSETS — 100.0% | | | | | | | | $ | 264,973,606 | |
| | | | | | | | | | | | |
Footnote Legend
| a | Floating Rate Security. Stated interest/floor rate was in effect at March 31, 2018. |
| b | Variable rate coupon, rate shown as of March 31, 2018. |
| c | Security currently fair valued by the Valuation and Pricing Committee using procedures approved by the Trustees’ Audit Committee. |
| d | Fixed to floating security that initially pays a fixed rate and converts to a floating rate coupon at a specified date in the future. The rate presented is a fixed rate. |
| e | Yankee bond denominated in U.S. dollars and is issued in the U.S. by foreign banks and corporations. |
Semi-Annual Reports | 11
Schedule of Investments, Continued
Thornburg Limited Term U.S. Government Fund | March 31, 2018 (Unaudited)
Portfolio Abbreviations
To simplify the listings of securities, abbreviations are used per the table below:
| | |
| CMO | | Collateralized Mortgage Obligation |
| H15T1Y | | US Treasury Yield Curve Rate T-Note Constant Maturity 1 Year |
| LIBOR | | London Interbank Offered Rates |
| Mtg | | Mortgage |
| REMIC | | Real Estate Mortgage Investment Conduit |
| VA | | Veterans Affairs |
12 | Semi-Annual Reports
Fund Summary
Thornburg Limited Term Income Fund | March 31, 2018 (Unaudited)
OBJECTIVES AND STRATEGIES
The Fund’s primary objective is to provide as high a level of current income as is consistent, in the view of the Fund’s investment advisor, with the preservation of capital. As a secondary goal, the Fund seeks to reduce changes in its share price compared to longer term portfolios.
This Fund is a laddered portfolio primarily composed of short/ intermediate debt obligations which are investment grade or judged by the advisor to be of equivalent quality, with a dollar-weighted average maturity of normally less than five years.
LONG-TERM STABILITY OF PRINCIPAL
Net Asset Value History of A Shares
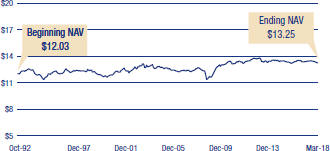
KEY PORTFOLIO ATTRIBUTES
| | | | | |
| Number of Bonds | | | | 612 | |
| Effective Duration | | | | 2.8 Yrs | |
| Average Maturity | | | | 3.7 Yrs | |
SECURITY CREDIT RATINGS
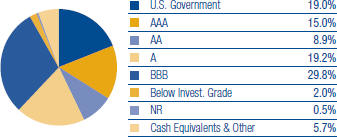
A bond credit rating assesses the financial ability of a debt issuer to make timely payments of principal and interest. Ratings of AAA (the highest), AA, A, and BBB are investment-grade quality. Ratings of BB, B, CCC, CC, C and D (the lowest) are considered below investment grade, speculative grade, or junk bonds.
PORTFOLIO LADDER
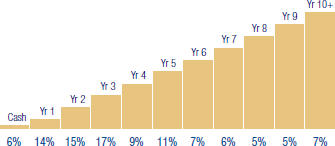
Percent of portfolio maturing in each year. Cash includes cash equivalents.
There is no guarantee that the Fund will meet its investment objectives.
All data is subject to change. Charts may not add up to 100% due to rounding.
Semi-Annual Reports | 13
Schedule of Investments
Thornburg Limited Term Income Fund | March 31, 2018 (Unaudited)
| | | | | | | | | | | | |
| | | | | PRINCIPAL AMOUNT | | VALUE |
| | | |
| | U.S. TREASURY SECURITIES — 8.5% | | | | | | | | | | |
| | United States Treasury Inflation Protected Security, | | | | | | | | | | |
| | 0.25% due 1/15/2025 | | | $ | 5,754,705 | | | | $ | 5,625,630 | |
| | 0.375% due 7/15/2027 | | | | 45,285,570 | | | | | 44,179,044 | |
| | United States Treasury Notes Inflationary Index, 0.125% due 4/15/2020 | | | | 17,522,669 | | | | | 17,454,783 | |
| | United States Treasury Notes, | | | | | | | | | | |
| | 0.75% due 4/30/2018 | | | | 6,875,000 | | | | | 6,869,897 | |
| | 1.50% due 5/31/2019 - 8/15/2026 | | | | 33,000,000 | | | | | 30,802,569 | |
| | 1.625% due 3/31/2019 - 2/15/2026 | | | | 92,700,000 | | | | | 86,614,582 | |
| | 1.875% due 1/31/2022 | | | | 33,000,000 | | | | | 32,252,989 | |
| | 2.00% due 11/15/2026 | | | | 22,633,000 | | | | | 21,348,842 | |
| | 2.125% due 1/31/2021 | | | | 17,000,000 | | | | | 16,877,979 | |
| | 2.25% due 2/15/2027 - 8/15/2027 | | | | 90,020,000 | | | | | 86,386,035 | |
| | 2.375% due 5/15/2027 | | | | 86,090,000 | | | | | 83,541,771 | |
| | 2.75% due 11/15/2023 | | | | 5,500,000 | | | | | 5,539,102 | |
| | | | | | | | | | | | |
| | TOTAL U.S. TREASURY SECURITIES (Cost $441,480,192) | | | | | | | | | 437,493,223 | |
| | | | | | | | | | | | |
| | | |
| | U.S. GOVERNMENT AGENCIES — 1.1% | | | | | | | | | | |
| | Mortgage-Linked Amortizing Notes, Series 2012-1 Class A10, 2.06% due 1/15/2022 | | | | 451,871 | | | | | 444,988 | |
| | Petroleos Mexicanos (Guaranty: Export-Import Bank of the United States), | | | | | | | | | | |
| a | | 1.70% due 12/20/2022 | | | | 5,200,000 | | | | | 5,081,006 | |
| a,b | | 2.072% (LIBOR 3 Month + 0.35%) due 4/15/2025 | | | | 7,511,000 | | | | | 7,539,604 | |
| a | | 2.46% due 12/15/2025 | | | | 6,000,000 | | | | | 5,932,861 | |
| | Reliance Industries Ltd. (Guaranty: Export-Import Bank of the United States), | | | | | | | | | | |
| a | | 1.87% due 1/15/2026 | | | | 5,743,158 | | | | | 5,547,154 | |
| a | | 2.06% due 1/15/2026 | | | | 1,200,000 | | | | | 1,167,655 | |
| a | | 2.512% due 1/15/2026 | | | | 5,200,000 | | | | | 5,138,790 | |
| | Small Business Administration Participation Certificates, | | | | | | | | | | |
| | Series 2011-20G Class 1, 3.74% due 7/1/2031 | | | | 7,063,240 | | | | | 7,283,993 | |
| | Series 2011-20K Class 1, 2.87% due 11/1/2031 | | | | 8,111,285 | | | | | 8,070,307 | |
| c,d | | United States Department of Transportation, 6.001% due 12/7/2031 | | | | 3,000,000 | | | | | 3,284,220 | |
| b | | Washington Aircraft 2 Co. Ltd. (Guaranty: Export-Import Bank of the United States), 2.716% (LIBOR 3 Month + 0.43%) due 6/26/2024 | | | | 6,446,342 | | | | | 6,421,690 | |
| | | | | | | | | | | | |
| | TOTAL U.S. GOVERNMENT AGENCIES (Cost $56,898,081) | | | | | | | | | 55,912,268 | |
| | | | | | | | | | | | |
| | | |
| | OTHER GOVERNMENT — 0.9% | | | | | | | | | | |
| | Carpintero Finance Ltd. (Guaranty: Export Credits Guarantee Department), | | | | | | | | | | |
| a,e | | 2.004% due 9/18/2024 | | | | 6,563,595 | | | | | 6,401,402 | |
| a,e | | 2.581% due 11/11/2024 | | | | 9,360,910 | | | | | 9,290,034 | |
| a,e | | Khadrawy Ltd. (Guaranty: Export Credits Guarantee Department), 2.471% due 3/31/2025 | | | | 4,386,308 | | | | | 4,309,547 | |
| a | | North American Development Bank, 4.375% due 2/11/2020 | | | | 15,500,000 | | | | | 15,968,658 | |
| a,b,e | | Seven & Seven Ltd. (Guaranty: Export-Import Bank of Korea), 3.259% (LIBOR 6 Month + 1.00%) due 9/11/2019 | | | | 10,255,500 | | | | | 10,199,374 | |
| | | | | | | | | | | | |
| | TOTAL OTHER GOVERNMENT (Cost $46,643,024) | | | | | | | | | 46,169,015 | |
| | | | | | | | | | | | |
| | | |
| | MORTGAGE BACKED — 5.5% | | | | | | | | | | |
| | Federal Home Loan Mtg Corp. CMO REMIC, Series 3195 Class PD, 6.50% due 7/15/2036 | | | | 737,030 | | | | | 816,540 | |
| | Federal Home Loan Mtg Corp. CMO, | | | | | | | | | | |
| | Series 2627 Class GY, 4.50% due 6/15/2018 | | | | 18,209 | | | | | 18,220 | |
| | Series 2628 Class AB, 4.50% due 6/15/2018 | | | | 4,977 | | | | | 4,982 | |
| | Series 2682 Class JG, 4.50% due 10/15/2023 | | | | 449,853 | | | | | 465,419 | |
| | Series 3504 Class PC, 4.00% due 1/15/2039 | | | | 42,221 | | | | | 42,638 | |
| | Series 3838 Class GV, 4.00% due 3/15/2024 | | | | 6,425,811 | | | | | 6,609,605 | |
| | Series 3919 Class VB, 4.00% due 8/15/2024 | | | | 3,356,144 | | | | | 3,471,605 | |
| | Series 4079 Class WV, 3.50% due 3/15/2027 | | | | 2,549,392 | | | | | 2,578,293 | |
| | Federal Home Loan Mtg Corp., | | | | | | | | | | |
| | Pool D98887, 3.50% due 1/1/2032 | | | | 3,236,080 | | | | | 3,303,330 | |
| | Pool J17504, 3.00% due 12/1/2026 | | | | 1,506,905 | | | | | 1,517,795 | |
| | Series K705 Class A1, 1.626% due 7/25/2018 | | | | 2,554,672 | | | | | 2,547,289 | |
| | Federal Home Loan Mtg Corp., CMO, | | | | | | | | | | |
| | Series 2827 Class BU, 3.50% due 7/15/2019 | | | | 46,621 | | | | | 46,673 | |
| | Series 3291 Class BY, 4.50% due 3/15/2022 | | | | 459,762 | | | | | 467,573 | |
| | Series 3922 Class PQ, 2.00% due 4/15/2041 | | | | 1,121,757 | | | | | 1,104,097 | |
14 | Semi-Annual Reports
Schedule of Investments, Continued
Thornburg Limited Term Income Fund | March 31, 2018 (Unaudited)
| | | | | | | | | | | | |
| | | | | PRINCIPAL AMOUNT | | VALUE |
| | Series 4050 Class MV, 3.50% due 8/15/2023 | | | $ | 2,121,314 | | | | $ | 2,157,430 | |
| | Series 4097 Class TE, 1.75% due 5/15/2039 | | | | 4,505,045 | | | | | 4,326,825 | |
| | Series 4120 Class TC, 1.50% due 10/15/2027 | | | | 2,599,419 | | | | | 2,484,091 | |
| | Series K038 Class A1, 2.604% due 10/25/2023 | | | | 10,139,012 | | | | | 10,044,190 | |
| | Series K716 Class A1, 2.413% due 1/25/2021 | | | | 3,381,779 | | | | | 3,355,691 | |
| | Federal Home Loan Mtg Corp., Multi-Family Structured Pass Through, Series K030 Class A1, 2.779% due 9/25/2022 | | | | 3,484,285 | | | | | 3,469,766 | |
| | Series K710 Class A2, 1.883% due 5/25/2019 | | | | 7,605,000 | | | | | 7,529,282 | |
| | Series K717 Class A2, 2.991% due 9/25/2021 | | | | 4,700,000 | | | | | 4,713,394 | |
| b | | Series KLH3 Class A, 2.37% (LIBOR 1 Month + 0.70%) due 11/25/2022 | | | | 17,617,333 | | | | | 17,633,384 | |
| | Federal Home Loan Mtg Corp., REMIC, Series 4072 Class VA, 3.50% due 10/15/2023 | | | | 1,644,760 | | | | | 1,673,190 | |
| | Federal Home Loan Mtg Corp., Seasoned Credit Risk Transfer, Series 2017-3 Class HA, 2.25% due 7/25/2056 | | | | 19,688,515 | | | | | 19,451,117 | |
| | Series 2017-4 Class HT, 2.25% due 6/25/2057 | | | | 17,185,616 | | | | | 16,776,624 | |
| d | | Series 2018-1 Class HA, 2.00% due 5/25/2057 | | | | 11,870,235 | | | | | 11,507,748 | |
| | Federal Home Loan Mtg Corp., Whole Loan Securities, Series 2016-SC01 Class 2A, 3.50% due 7/25/2046 | | | | 6,828,615 | | | | | 6,674,278 | |
| | Series 2017-SC02 Class 2A1, 3.50% due 5/25/2047 | | | | 6,169,606 | | | | | 6,209,968 | |
| | Federal National Mtg Assoc. CMO REMIC, Series 2003-74 Class KN, 4.50% due 8/25/2018 | | | | 6,013 | | | | | 6,023 | |
| | Series 2005-48 Class AR, 5.50% due 2/25/2035 | | | | 104,217 | | | | | 106,032 | |
| | Series 2007-42 Class PA, 5.50% due 4/25/2037 | | | | 218,388 | | | | | 225,719 | |
| | Series 2009-5 Class A, 4.50% due 12/25/2023 | | | | 23,698 | | | | | 23,687 | |
| | Series 2011-15 Class VA, 4.00% due 4/25/2022 | | | | 823,936 | | | | | 827,041 | |
| | Series 2012-129 Class LA, 3.50% due 12/25/2042 | | | | 7,737,162 | | | | | 7,706,159 | |
| | Federal National Mtg Assoc., Pool 357384, 4.50% due 5/1/2018 | | | | 1,435 | | | | | 1,435 | |
| | Pool 469616, 3.50% due 11/1/2021 | | | | 3,671,285 | | | | | 3,745,419 | |
| | Pool 897936, 5.50% due 8/1/2021 | | | | 243,568 | | | | | 252,288 | |
| | Pool AB7997, 2.50% due 2/1/2023 | | | | 3,016,120 | | | | | 3,009,098 | |
| | Pool AE0160, 4.416% due 6/1/2020 | | | | 5,751,973 | | | | | 5,931,141 | |
| | Pool AE0704, 4.00% due 1/1/2026 | | | | 5,898,867 | | | | | 6,094,662 | |
| | Pool AK6518, 3.00% due 3/1/2027 | | | | 1,980,195 | | | | | 1,992,958 | |
| | Pool AL9612, 3.50% due 11/1/2043 | | | | 8,137,973 | | | | | 8,220,624 | |
| | Pool AS9733, 4.00% due 6/1/2047 | | | | 31,350,942 | | | | | 32,455,573 | |
| | Pool AS9749, 4.00% due 6/1/2047 | | | | 20,872,651 | | | | | 21,440,126 | |
| | Pool MA1278, 2.50% due 12/1/2022 | | | | 4,222,232 | | | | | 4,213,171 | |
| | Pool MA1585, 2.00% due 9/1/2023 | | | | 5,697,701 | | | | | 5,626,619 | |
| | Pool MA2815, 3.00% due 11/1/2026 | | | | 3,546,795 | | | | | 3,575,752 | |
| | Series 2017-T1 Class A, 2.898% due 6/25/2027 | | | | 17,992,908 | | | | | 17,437,865 | |
| f | | Federal National Mtg Assoc., CMO, Series 2009-17 Class AH, 0.736% due 3/25/2039 | | | | 641,812 | | | | | 539,897 | |
| | Series 2009-52 Class AJ, 4.00% due 7/25/2024 | | | | 105,797 | | | | | 106,721 | |
| | Series 2009-70 Class NK, 4.50% due 8/25/2019 | | | | 17,114 | | | | | 17,156 | |
| | Series 2012-36 Class CV, 4.00% due 6/25/2023 | | | | 1,879,134 | | | | | 1,911,353 | |
| b | | Series 2013-81 Class FW, 2.172% (LIBOR 1 Month + 0.30%) due 1/25/2043 | | | | 10,197,422 | | | | | 10,143,637 | |
| | Government National Mtg Assoc. CMO, Series 2009-68 Class DP, 4.50% due 11/16/2038 | | | | 250,289 | | | | | 256,307 | |
| f | | Government National Mtg Assoc., Pool 714631, 5.853% due 10/20/2059 | | | | 149,169 | | | | | 149,507 | |
| f | | Pool 721652, 5.051% due 5/20/2061 | | | | 2,036,973 | | | | | 2,059,390 | |
| f | | Pool 731491, 5.154% due 12/20/2060 | | | | 1,660,012 | | | | | 1,707,530 | |
| f | | Pool 751388, 5.304% due 1/20/2061 | | | | 2,518,276 | | | | | 2,585,126 | |
| | Pool 783299, 4.50% due 2/15/2022 | | | | 229,459 | | | | | 232,243 | |
| b | | Pool MA0100, 2.625% (H15T1Y + 1.50%) due 5/20/2042 | | | | 916,311 | | | | | 948,227 | |
| | | | | | | | | | | | |
| | TOTAL MORTGAGE BACKED (Cost $290,660,823) | | | | | | | | | 284,549,523 | |
| | | | | | | | | | | | |
| | | |
| | ASSET BACKED SECURITIES — 23.2% | | | | | | | | | | |
| | | |
| | ADVANCE RECEIVABLES — 0.7% | | | | | | | | | | |
| e | | New Residential Advance Receivables Trust, Series 2016-T2 Class AT2, 2.575% due 10/15/2049 | | | | 22,700,000 | | | | | 22,466,689 | |
| e | | SPS Servicer Advance Receivables Trust Advance Receivables Backed Notes, Series 2016-T1 Class AT1, 2.53% due 11/16/2048 | | | | 12,000,000 | | | | | 11,973,756 | |
| | | | | | | | | | | | |
| | | | | | | | | | | 34,440,445 | |
| | | | | | | | | | | | |
Semi-Annual Reports | 15
Schedule of Investments, Continued
Thornburg Limited Term Income Fund | March 31, 2018 (Unaudited)
| | | | | | | | | | | | |
| | | | | PRINCIPAL AMOUNT | | VALUE |
| | AUTO RECEIVABLES — 3.1% | | | | | | | | | | |
| e | | American Credit Acceptance Receivables Trust, Series 2016-4 Class C, 2.91% due 2/13/2023 | | | $ | 2,375,000 | | | | $ | 2,367,811 | |
| e | | Series 2017-3 Class A, 1.82% due 3/10/2020 | | | | 5,605,811 | | | | | 5,593,472 | |
| e | | Avis Budget Rental Car Funding AESOP, LLC, Series 2015-2A Class A, 2.63% due 12/20/2021 | | | | 6,000,000 | | | | | 5,943,057 | |
| e | | Chesapeake Funding II, LLC, Series 2016-1A Class A1, 2.11% due 3/15/2028 | | | | 7,356,291 | | | | | 7,332,354 | |
| e | | CIG Auto Receivables Trust, Series 2017-1A Class A, 2.71% due 5/15/2023 | | | | 3,985,758 | | | | | 3,963,201 | |
| e | | Drive Auto Receivables Trust, Series 2017-AA Class B, 2.51% due 1/15/2021 | | | | 8,875,000 | | | | | 8,871,351 | |
| e | | Enterprise Fleet Financing, LLC, Series 2017-1 Class A2, 2.13% due 7/20/2022 | | | | 5,201,050 | | | | | 5,175,954 | |
| e | | Exeter Automobile Receivables Trust, Series 2015-1A Class B, 2.84% due 3/16/2020 | | | | 2,285,415 | | | | | 2,285,443 | |
| e | | Ford Credit Auto Owner Trust, Series 2014-2 Class A, 2.31% due 4/15/2026 | | | | 18,000,000 | | | | | 17,899,243 | |
| e | | Series 2015-1 Class A, 2.12% due 7/15/2026 | | | | 9,900,000 | | | | | 9,784,452 | |
| e | | Foursight Capital Automobile Receivables Trust, Series 2016-1 Class A2, 2.87% due 10/15/2021 | | | | 10,618,364 | | | | | 10,578,293 | |
| | Harley-Davidson Motorcycle Trust, Series 2015-2 Class A4, 1.66% due 12/15/2022 | | | | 22,544,000 | | | | | 22,434,461 | |
| b,e | | Hertz Fleet Lease Funding LP, Series 2016-1 Class A1, 2.84% (LIBOR 1 Month + 1.10%) due 4/10/2030 | | | | 13,120,422 | | | | | 13,198,537 | |
| e | | Hertz Vehicle Financing II L.P., Series 2015-2A Class A, 2.02% due 9/25/2019 | | | | 15,047,000 | | | | | 14,989,475 | |
| e | | Hertz Vehicle Financing, LLC, Series 2013-1A Class A2, 1.83% due 8/25/2019 | | | | 8,666,667 | | | | | 8,649,863 | |
| b | | Nissan Auto Receivables Owner Trust, Series 2016-B Class A2B, 2.077% (LIBOR 1 Month + 0.30%) due 4/15/2019 | | | | 401,721 | | | | | 401,761 | |
| e,f | | OSCAR US Funding Trust VII, LLC, Series 2017-2A Class A2B, 2.39% due 11/10/2020 | | | | 4,670,000 | | | | | 4,673,311 | |
| d,e | | OSCAR US Funding Trust, Series 2016-2A Class A3, 2.73% due 12/15/2020 | | | | 7,430,000 | | | | | 7,415,140 | |
| e | | Veros Automobile Receivables Trust, Series 2017-1 Class A, 2.84% due 4/17/2023 | | | | 5,704,458 | | | | | 5,684,735 | |
| | | | | | | | | | | | |
| | | | | | | | | | | 157,241,914 | |
| | | | | | | | | | | | |
| | COMMERCIAL MTG TRUST — 3.7% | | | | | | | | | | |
| e | | Barclays Commercial Mortgage Securities, LLC, Series 2015-STP Class A, 3.323% due 9/10/2028 | | | | 5,646,019 | | | | | 5,681,063 | |
| b,e | | Bayview Commercial Asset Trust, Series 2004-3 Class A2, 2.292% (LIBOR 1 Month + 0.63%) due 1/25/2035 | | | | 2,248,893 | | | | | 2,187,904 | |
| b,e | | BHMS Mortgage Trust, Series 2014-ATLS Class AFL, 3.164% (LIBOR 1 Month + 1.50%) due 7/5/2033 | | | | 10,000,000 | | | | | 10,024,805 | |
| e,f,g | | CFCRE Commercial Mortgage Trust, Series 2011-C1 Class A4, 4.961% due 4/15/2044 | | | | 10,158,351 | | | | | 10,598,270 | |
| f | | CHL Mortgage Pass-Through Trust CMO, Series 2004-HYB2 Class 1A, 3.982% due 7/20/2034 | | | | 157,275 | | | | | 163,548 | |
| f | | Citigroup Mortgage Loan Trust, Inc. CMO, Series 2004-HYB2 Class B1, 3.848% due 3/25/2034 | | | | 139,868 | | | | | 114,917 | |
| | COMM Mortgage Trust, Series 2016-DC2 Class A1, 1.82% due 2/10/2049 | | | | 17,422,260 | | | | | 17,194,182 | |
| e,f | | Credit Suisse Mortgage Trust, Series 2017-HL2 Class A3, 3.50% due 10/25/2047 | | | | 15,327,082 | | | | | 15,179,552 | |
| b,e | | DBUBS Mortgage Trust, CMO, Series 2011-LC2A Class A1FL, 3.09% (LIBOR 1 Month + 1.35%) due 7/12/2044 | | | | 2,982,498 | | | | | 3,014,282 | |
| e | | FDIC Trust CMO, Series 2013-R1 Class A, 1.15% due 3/25/2033 | | | | 1,681,081 | | | | | 1,653,823 | |
| f,h | | Federal Home Loan Mtg Corp. Multifamily Structured Pass Through Certificates IO, Series K008 Class X1, 1.531% due 6/25/2020 | | | | 30,757,202 | | | | | 842,926 | |
| f,h | | Series K710 Class X1, 1.731% due 5/25/2019 | | | | 44,474,797 | | | | | 651,947 | |
| f | | Federal Home Loan Mtg Corp. Multifamily Structured Pass Through Certificates, Series K031 Class A2, 3.30% due 4/25/2023 | | | | 9,200,000 | | | | | 9,330,374 | |
| | Series K039 Class A1, 2.683% due 12/25/2023 | | | | 5,190,842 | | | | | 5,167,164 | |
| f | | Series K719 Class A2, 2.731% due 6/25/2022 | | | | 6,355,000 | | | | | 6,315,152 | |
| | Series K722 Class A2, 2.406% due 3/25/2023 | | | | 4,800,000 | | | | | 4,681,061 | |
| | Series K725 Class A1, 2.666% due 5/25/2023 | | | | 7,808,041 | | | | | 7,759,150 | |
| | Federal Home Loan Mtg Corp. Whole Loan Securities Trust CMO, Series 2017-SC01 Class 1A, 3.00% due 12/25/2046 | | | | 25,222,338 | | | | | 24,292,265 | |
| b,e | | FREMF Mortgage Trust, Series 2013-KF02 Class B, 4.67% (LIBOR 1 Month + 3.00%) due 12/25/2045 | | | | 475,117 | | | | | 476,108 | |
| e,f | | GAHR Commercial Mortgage Trust, Series 2015-NRF Class BFX, 3.382% due 12/15/2034 | | | | 25,010,000 | | | | | 24,965,892 | |
| e,f | | Galton Funding Mortgage Trust 2017-1 CMO, Series 2018-1 Class A43, 3.50% due 11/25/2057 | | | | 5,059,972 | | | | | 5,074,291 | |
| | RAMP Trust CMO, Series 2003-SL1 Class A31, 7.125% due 4/25/2031 | | | | 1,131,075 | | | | | 1,139,233 | |
| | Seasoned Credit Risk Transfer Trust Series CMO, Series 2017-1 Class HA, 2.25% due 1/25/2056 | | | | 10,844,907 | | | | | 10,495,295 | |
| e,f | | Shellpoint Asset Funding Trust CMO, Series 2013-1 Class A1, 3.75% due 7/25/2043 | | | | 5,472,096 | | | | | 5,507,432 | |
| f | | Structured Asset Securities Corp. Mortgage Pass-Through Ctfs CMO, Series 2003-9A Class 2A2, 3.517% due 3/25/2033 | | | | 1,140,188 | | | | | 1,172,886 | |
| | WaMu Mortgage Pass-Through Certificates Series Trust CMO, Series 2003-S13 Class 21A1, 4.50% due 12/25/2018 | | | | 53,532 | | | | | 53,281 | |
| e,f | | Wells Fargo Commercial Mortgage Trust, Series 2013-120B Class A, 2.71% due 3/18/2028 | | | | 15,000,000 | | | | | 14,902,398 | |
| | WFRBS Commercial Mortgage Trust, Series 2014-C22 Class A1, 1.479% due 9/15/2057 | | | | 1,801,559 | | | | | 1,788,969 | |
| | | | | | | | | | | | |
| | | | | | | | | | | 190,428,170 | |
| | | | | | | | | | | | |
| | COMMERCIAL SERVICES — 0.3% | | | | | | | | | | |
| a,b,e | | Korea Expressway Corp., Series 144A, 2.445% (LIBOR 3 Month + 0.70%) due 4/20/2020 | | | | 14,800,000 | | | | | 14,799,556 | |
| | | | | | | | | | | | |
| | | | | | | | | | �� | 14,799,556 | |
| | | | | | | | | | | | |
| | ELECTRIC — 0.1% | | | | | | | | | | |
| e | | Korea Hydro & Nuclear Power Co. Ltd., Series 144A, 2.875% due 10/2/2018 | | | | 7,000,000 | | | | | 6,996,442 | |
| | | | | | | | | | | | |
| | | | | | | | | | | 6,996,442 | |
| | | | | | | | | | | | |
16 | Semi-Annual Reports
Schedule of Investments, Continued
Thornburg Limited Term Income Fund | March 31, 2018 (Unaudited)
| | | | | | | | | | | | |
| | | | | PRINCIPAL AMOUNT | | VALUE |
| | FOREST PRODUCTS & PAPER — 1.4% | | | | | | | | | | |
| | Barclays Dryrock Issuance Trust, Series 2015-4 Class A, 1.72% due 8/16/2021 | | | $ | 13,630,000 | | | | $ | 13,576,724 | |
| | Series 2016-1 Class A, 1.52% due 5/16/2022 | | | | 10,365,000 | | | | | 10,220,231 | |
| b | | Cabela’s Credit Card Master Note Trust, Series 2015-1A Class A2, 2.317% (LIBOR 1 Month + 0.54%) due 3/15/2023 | | | | 15,665,000 | | | | | 15,762,173 | |
| b | | Series 2016-1 Class A2, 2.627% (LIBOR 1 Month + 0.85%) due 6/15/2022 | | | | 15,000,000 | | | | | 15,104,859 | |
| | Synchrony Credit Card Master Note Trust, Series 2015-2 Class A, 1.60% due 4/15/2021 | | | | 7,400,000 | | | | | 7,397,613 | |
| | Series 2016-1 Class A, 2.04% due 3/15/2022 | | | | 8,500,000 | | | | | 8,460,736 | |
| | | | | | | | | | | | |
| | | | | | | | | | | 70,522,336 | |
| | | | | | | | | | | | |
| | IRON/STEEL — 0.1% | | | | | | | | | | |
| e,f | | New Residential Mortgage Trust 2018-1, Series 2018-1A Class A1A, 4.00% due 12/25/2057 | | | | 6,793,461 | | | | | 6,906,724 | |
| b | | Option One Mortgage Loan Trust Asset-Backed Certificates Series, Series 2005-5 Class A3, 2.082%
(LIBOR 1 Month + 0.21%) due 12/25/2035 | | | | 68,335 | | | | | 68,355 | |
| | | | | | | | | | | | |
| | | | | | | | | | | 6,975,079 | |
| | | | | | | | | | | | |
| | OIL & GAS — 0.1% | | | | | | | | | | |
| e | | Korea National Oil Corp., Series 144A, 2.75% due 1/23/2019 | | | | 5,000,000 | | | | | 4,992,817 | |
| | | | | | | | | | | | |
| | | | | | | | | | | 4,992,817 | |
| | | | | | | | | | | | |
| | OTHER ASSET BACKED — 10.1% | | | | | | | | | | |
| b,e | | AMSR Trust, Series 2016-SFR1 Class A, 3.208% (LIBOR 1 Month + 1.40%) due 11/17/2033 | | | | 15,900,000 | | | | | 15,965,456 | |
| | Appalachian Consumer Rate Relief Funding, LLC, Series 2013-1 Class A1, 2.008% due 2/1/2024 | | | | 8,626,060 | | | | | 8,447,103 | |
| e,f | | Bayview Opportunity Master Fund IVa Trust, Series 2017-RT1 Class A1, 3.00% due 3/28/2057 | | | | 4,415,948 | | | | | 4,398,097 | |
| e | | BCC Funding XIV, LLC, Series 2018-1A Class A2, 2.96% due 6/20/2023 | | | | 4,000,000 | | | | | 3,992,498 | |
| e | | BRE Grand Islander Timeshare Issuer, LLC, Series 2017-1A Class A, 2.94% due 5/25/2029 | | | | 5,075,024 | | | | | 4,971,593 | |
| e | | CLI Funding V, LLC, Series 2014-2A Class A, 3.38% due 10/18/2029 | | | | 6,441,113 | | | | | 6,377,263 | |
| e | | Consumer Loan Underlying Bond Credit Trust, Series 2017-NP2 Class A, 2.55% due 1/16/2024 | | | | 1,947,854 | | | | | 1,946,324 | |
| e | | Series 2017-P1 Class A, 2.42% due 9/15/2023 | | | | 9,736,436 | | | | | 9,714,643 | |
| e | | Cronos Containers Program I Ltd., Series 2013-1A Class A, 3.08% due 4/18/2028 | | | | 5,083,333 | | | | | 5,011,321 | |
| e | | Series 2014-2A Class A, 3.27% due 11/18/2029 | | | | 1,611,852 | | | | | 1,596,755 | |
| e | | Dell Equipment Finance Trust, Series 2016-1 Class A3, 1.65% due 7/22/2021 | | | | 6,187,065 | | | | | 6,172,427 | |
| e | | Series 2017-1 Class A2, 1.86% due 6/24/2019 | | | | 5,119,907 | | | | | 5,107,739 | |
| e | | Series 2017-2 Class A2A, 1.97% due 2/24/2020 | | | | 6,400,000 | | | | | 6,366,235 | |
| e | | Diamond Resorts Owner Trust, Series 2014-1 Class A, 2.54% due 5/20/2027 | | | | 10,210,744 | | | | | 10,170,563 | |
| e | | ECAF I Ltd., Series 2015-1A Class A2, 4.947% due 6/15/2040 | | | | 4,620,561 | | | | | 4,637,888 | |
| e | | Engs Commercial Finance Trust, Series 2018-1A Class A1, 2.97% due 2/22/2021 | | | | 5,550,000 | | | | | 5,549,489 | |
| | Entergy New Orleans Storm Recovery Funding I, LLC, Series 2015-1 Class A, 2.67% due 6/1/2027 | | | | 11,654,085 | | | | | 11,463,864 | |
| e | | Fairway Outdoor Funding, LLC, Series 2012-1A Class A2, 4.212% due 10/15/2042 | | | | 5,920,482 | | | | | 5,971,126 | |
| e | | Foundation Finance Trust, Series 2017-1A Class A, 3.30% due 7/15/2033 | | | | 7,212,261 | | | | | 7,163,830 | |
| e | | Global SC Finance IV Ltd., Series 2017-1A Class A, 3.85% due 4/15/2037 | | | | 7,809,187 | | | | | 7,803,150 | |
| e | | HERO Funding Trust, Series 2015-1A Class A, 3.84% due 9/21/2040 | | | | 10,768,610 | | | | | 10,942,200 | |
| e | | Series 2017-2A Class A1, 3.28% due 9/20/2048 | | | | 1,845,804 | | | | | 1,843,145 | |
| | Louisiana Local Government Environmental Facilities & Community Development Authority, Series 2014-ELL Class A1, 1.66% due 2/1/2022 | | | | 2,820,747 | | | | | 2,764,924 | |
| e | | Marlette Funding Trust, Series 2017-2A Class A, 2.39% due 7/15/2024 | | | | 6,787,926 | | | | | 6,772,021 | |
| e,f | | Nationstar HECM Loan Trust 2018-1, Series 2018-1A Class A, 2.76% due 2/25/2028 | | | | 13,325,715 | | | | | 13,325,712 | |
| e,f | | Nationstar HECM Loan Trust, Series 2017-2A Class A1, 2.038% due 9/25/2027 | | | | 8,206,424 | | | | | 8,155,133 | |
| b,e | | Navient Private Education Loan Trust, Series 2015-AA Class A2B, 2.977% (LIBOR 1 Month + 1.20%) due 12/15/2028 | | | | 5,855,472 | | | | | 5,993,249 | |
| b | | Navient Student Loan Trust, Series 2014-1 Class A3, 2.382% (LIBOR 1 Month + 0.51%) due 6/25/2031 | | | | 10,750,000 | | | | | 10,808,328 | |
| b,e | | Series 2016-6A Class A2, 2.622% (LIBOR 1 Month + 0.75%) due 3/25/2066 | | | | 13,900,000 | | | | | 14,049,880 | |
| b,e | | Nelnet Student Loan Trust, Series 2013-1A Class A, 2.221% (LIBOR 1 Month + 0.60%) due 6/25/2041 | | | | 7,195,598 | | | | | 7,244,171 | |
| b,c,d | | Northwind Holdings, LLC, Series 2007-1A Class A1, 2.786% (LIBOR 3 Month + 0.78%) due 12/1/2037 | | | | 1,618,750 | | | | | 1,552,381 | |
| e | | OnDeck Asset Securitization Trust II, LLC, Series 2016-1A Class A, 4.21% due 5/17/2020 | | | | 6,700,000 | | | | | 6,703,530 | |
| e | | OneMain Financial Issuance Trust, Series 2016-2A Class A, 4.10% due 3/20/2028 | | | | 12,272,069 | | | | | 12,362,971 | |
| e | | Oportun Funding VI, LLC, Series 2017-A Class A, 3.23% due 6/8/2023 | | | | 5,500,000 | | | | | 5,409,290 | |
| e | | Oportun Funding VII, LLC, Series 2017-B Class A, 3.22% due 10/10/2023 | | | | 7,500,000 | | | | | 7,399,537 | |
| b,e | | Pennsylvania Higher Education Assistance Agency, Series 2012-1A Class A1, 2.422% (LIBOR 1 Month + 0.55%) due 5/25/2057 | | | | 2,129,878 | | | | | 2,124,423 | |
Semi-Annual Reports | 17
Schedule of Investments, Continued
Thornburg Limited Term Income Fund | March 31, 2018 (Unaudited)
| | | | | | | | | | | | |
| | | | | PRINCIPAL
AMOUNT | | VALUE |
| | PFS Financing Corp., | | | | | | | | | | |
| b,e | | Series 2015-AA Class A, 2.397% (LIBOR 1 Month + 0.62%) due 4/15/2020 | | | $ | 7,400,000 | | | | $ | 7,395,539 | |
| e | | Series 2016-BA Class A, 1.87% due 10/15/2021 | | | | 5,610,000 | | | | | 5,530,385 | |
| b,e | | Series 2017-BA Class A1, 2.377% (LIBOR 1 Month + 0.60%) due 7/15/2022 | | | | 16,900,000 | | | | | 16,894,180 | |
| e | | Series 2017-D Class A, 2.40% due 10/17/2022 | | | | 10,000,000 | | | | | 9,848,020 | |
| e | | Series 2018-B Class A, 2.89% due 2/15/2023 | | | | 7,400,000 | | | | | 7,357,286 | |
| | Prosper Marketplace Issuance Trust, | | | | | | | | | | |
| e | | Series 2017-2A Class A, 2.41% due 9/15/2023 | | | | 5,673,773 | | | | | 5,658,662 | |
| e | | Series 2017-3A Class A, 2.36% due 11/15/2023 | | | | 5,142,358 | | | | | 5,122,258 | |
| d,e | | Purchasing Power Funding, LLC, Series 2018-A Class A, 3.34% due 8/15/2022 | | | | 9,400,000 | | | | | 9,412,117 | |
| | SBA Tower Trust, | | | | | | | | | | |
| e | | 2.877% due 7/10/2046 | | | | 9,500,000 | | | | | 9,356,550 | |
| e | | 3.156% due 10/10/2045 | | | | 5,000,000 | | | | | 4,915,850 | |
| e | | Series 2014-1A Class C, 2.898% due 10/15/2044 | | | | 17,900,000 | | | | | 17,808,748 | |
| | Sierra Receivables Funding Co., LLC, | | | | | | | | | | |
| e | | Series 2014-1A Class A, 2.07% due 3/20/2030 | | | | 2,581,102 | | | | | 2,576,572 | |
| e | | Series 2015-1A Class A, 2.40% due 3/22/2032 | | | | 2,286,437 | | | | | 2,244,867 | |
| e | | Series 2015-3A Class A, 2.58% due 9/20/2032 | | | | 4,365,439 | | | | | 4,308,139 | |
| | Sierra Timeshare Receivables Funding, LLC, | | | | | | | | | | |
| e,f | | Series 2014-2A Class A, 2.05% due 6/20/2031 | | | | 1,003,635 | | | | | 997,790 | |
| e | | Series 2015-2A Class A, 2.43% due 6/20/2032 | | | | 1,581,262 | | | | | 1,567,618 | |
| e | | SLM Private Education Loan Trust, Series 2011-B Class A2, 3.74% due 2/15/2029 | | | | 2,230,508 | | | | | 2,248,194 | |
| | SLM Student Loan Trust, | | | | | | | | | | |
| b,e | | Series 2011-A Class A3, 4.277% (LIBOR 1 Month + 2.50%) due 1/15/2043 | | | | 13,650,000 | | | | | 14,081,814 | |
| b | | Series 2013-6 Class A3, 2.522% (LIBOR 1 Month + 0.65%) due 6/25/2055 | | | | 22,784,240 | | | | | 22,976,448 | |
| b,e | | Series 2013-B Class A2B, 2.877% (LIBOR 1 Month + 1.10%) due 6/17/2030 | | | | 731,676 | | | | | 736,793 | |
| | Small Business Administration, | | | | | | | | | | |
| | Series 2001-20J Class 1, 5.76% due 10/1/2021 | | | | 138,996 | | | | | 142,948 | |
| | Series 2008-20D Class 1, 5.37% due 4/1/2028 | | | | 1,383,108 | | | | | 1,437,789 | |
| | Series 2009-20E Class 1, 4.43% due 5/1/2029 | | | | 818,792 | | | | | 842,444 | |
| | Series 2009-20K Class 1, 4.09% due 11/1/2029 | | | | 5,142,375 | | | | | 5,330,744 | |
| | Series 2011-20E Class 1, 3.79% due 5/1/2031 | | | | 6,439,855 | | | | | 6,641,635 | |
| | Series 2011-20F Class 1, 3.67% due 6/1/2031 | | | | 1,041,642 | | | | | 1,072,727 | |
| | Series 2011-20I Class 1, 2.85% due 9/1/2031 | | | | 9,870,151 | | | | | 9,807,240 | |
| | Series 2012-20D Class 1, 2.67% due 4/1/2032 | | | | 8,236,576 | | | | | 8,173,564 | |
| | Series 2012-20J Class 1, 2.18% due 10/1/2032 | | | | 6,521,923 | | | | | 6,363,146 | |
| | Series 2012-20K Class 1, 2.09% due 11/1/2032 | | | | 4,029,955 | | | | | 3,918,671 | |
| b,e | | SMB Private Education Loan Trust, Series 2015-A Class A3, 3.277% (LIBOR 1 Month + 1.50%) due 2/17/2032 | | | | 10,000,000 | | | | | 10,263,739 | |
| | Social Professional Loan Program, LLC, | | | | | | | | | | |
| b,e | | Series 2014-A Class A1, 3.472% (LIBOR 1 Month + 1.60%) due 6/25/2025 | | | | 998,236 | | | | | 1,011,978 | |
| e | | Series 2014-B Class A2, 2.55% due 8/27/2029 | | | | 500,259 | | | | | 494,965 | |
| e | | Sofi Consumer Loan Program, LLC, Series 2017-3 Class A, 2.77% due 5/25/2026 | | | | 2,994,508 | | | | | 2,972,154 | |
| e | | SoFi Professional Loan Program, LLC, Series 2017-E Class A2B, 2.72% due 11/26/2040 | | | | 6,000,000 | | | | | 5,890,067 | |
| e | | Sonic Capital, LLC, Series 2016-1A Class A2, 4.472% due 5/20/2046 | | | | 8,892,084 | | | | | 9,151,783 | |
| e | | Springleaf Funding Trust, Series 2015-AA Class A, 3.16% due 11/15/2024 | | | | 11,476,251 | | | | | 11,489,399 | |
| e | | Tax Ease Funding, LLC, Series 2016-1A Class A, 3.131% due 6/15/2028 | | | | 7,149,250 | | | | | 7,111,859 | |
| | Towd Point Mortgage Trust, | | | | | | | | | | |
| e,f | | Series 2016-5 Class A1, 2.50% due 10/25/2056 | | | | 11,347,937 | | | | | 11,171,779 | |
| e,f | | Series 2017-1 Class A1, 2.75% due 10/25/2056 | | | | 6,166,033 | | | | | 6,106,559 | |
| b,e | | Volvo Financial Equipment Master Owner Trust, Series 2017-A Class A, 2.277% (LIBOR 1 Month + 0.50%) due 11/15/2022 | | | | 3,350,000 | | | | | 3,367,146 | |
| e | | Westgate Resorts, LLC, Series 2016-1A Class A, 3.50% due 12/20/2028 | | | | 7,023,443 | | | | | 7,033,190 | |
| | | | | | | | | | | | |
| | | | | | | | | | | 521,111,615 | |
| | | | | | | | | | | | |
| | RESIDENTIAL MTG TRUST — 3.2% | | | | | | | | | | |
| | Angel Oak Mortgage Trust, LLC, | | | | | | | | | | |
| e,f | | Series 2017-1 Class A2, 3.085% due 1/25/2047 | | | | 4,099,137 | | | | | 4,048,674 | |
| e,f | | Series 2017-3 Class A1, 2.708% due 11/25/2047 | | | | 8,632,658 | | | | | 8,480,167 | |
| d,e,f,i | | Series 2018-1 Class A1, 3.258% due 4/27/2048 | | | | 10,925,000 | | | | | 10,924,965 | |
| e,f | | Citigroup Mortgage Loan Trust CMO, Series 2014-A Class A, 4.00% due 1/25/2035 | | | | 2,268,559 | | | | | 2,316,066 | |
| e,f | | Finance of America Structured Securities Trust, Series 2017-HB1 Class A, 2.321% due 11/25/2027 | | | | 11,440,909 | | | | | 11,398,578 | |
| e,f | | Flagstar Mortgage Trust, Series 2017-1 Class 2A2, 3.00% due 3/25/2047 | | | | 11,721,951 | | | | | 11,557,746 | |
18 | Semi-Annual Reports
Schedule of Investments, Continued
Thornburg Limited Term Income Fund | March 31, 2018 (Unaudited)
| | | | | | | | | | | | |
| | | | | PRINCIPAL
AMOUNT | | VALUE |
| | JPMorgan Mortgage Trust, | | | | | | | | | | |
| e,f | | Series 2017-2 Class A6, 3.00% due 5/25/2047 | | | $ | 18,921,539 | | | | $ | 18,657,447 | |
| e,f | | Series 2017-6 Class A5, 3.50% due 12/25/2048 | | | | 21,908,941 | | | | | 21,984,437 | |
| f | | Merrill Lynch Mortgage Investors Trust Series MLMI CMO, Series 2004-A4 Class M1, 3.274% due 8/25/2034 | | | | 508,554 | | | | | 479,160 | |
| | New Residential Mortgage Loan Trust CMO, | | | | | | | | | | |
| e,f | | Series 2017-3A Class A1, 4.00% due 4/25/2057 | | | | 13,126,377 | | | | | 13,320,529 | |
| e,f | | Series 2017-4A Class A1, 4.00% due 5/25/2057 | | | | 17,085,304 | | | | | 17,414,675 | |
| | New Residential Mortgage Loan Trust, | | | | | | | | | | |
| e,f | | Series 2017-2A Class A3, 4.00% due 3/25/2057 | | | | 10,259,165 | | | | | 10,580,568 | |
| b,e | | Series 2017-5A Class A1, 3.372% (LIBOR 1 Month + 1.50%) due 6/25/2057 | | | | 1,596,552 | | | | | 1,636,485 | |
| e,f | | Series 2017-6A Class A1, 4.00% due 8/27/2057 | | | | 5,863,231 | | | | | 5,961,993 | |
| | Sequoia Mortgage Trust CMO, | | | | | | | | | | |
| e,f | | Series 2017-4 Class A4, 3.50% due 7/25/2047 | | | | 4,180,776 | | | | | 4,190,574 | |
| e,f | | Series 2017-5 Class A4, 3.50% due 8/25/2047 | | | | 9,738,566 | | | | | 9,763,215 | |
| e,f | | Verus Securitization Trust CMO, Series 2017-2A Class A1, 2.485% due 7/25/2047 | | | | 14,782,586 | | | | | 14,681,296 | |
| | | | | | | | | | | | |
| | | | | | | | | | | 167,396,575 | |
| | | | | | | | | | | | |
| | SOVEREIGN — 0.1% | | | | | | | | | | |
| | Bermuda Government International Bond, | | | | | | | | | | |
| | Series 144A, | | | | | | | | | | |
| c | | 4.138% due 1/3/2023 | | | | 4,000,000 | | | | | 4,130,000 | |
| c | | 5.603% due 7/20/2020 | | | | 3,000,000 | | | | | 3,172,500 | |
| | | | | | | | | | | | |
| | | | | | | | | | | 7,302,500 | |
| | | | | | | | | | | | |
| | STUDENT LOAN — 0.3% | | | | | | | | | | |
| b,e | | Nelnet Student Loan Trust, Series 2016-A Class A1A, 3.622% (LIBOR 1 Month + 1.75%) due 12/26/2040 | | | | 10,634,241 | | | | | 10,654,405 | |
| | SoFi Professional Loan Program, LLC, | | | | | | | | | | |
| e | | Series 2014-A Class A2, 3.02% due 10/25/2027 | | | | 5,542,017 | | | | | 5,526,337 | |
| b,e | | Series 2014-B Class A1, 3.122% (LIBOR 1 Month + 1.25%) due 8/25/2032 | | | | 1,603,672 | | | | | 1,621,869 | |
| | | | | | | | | | | | |
| | | | | | | | | | | 17,802,611 | |
| | | | | | | | | | | | |
| | TOTAL ASSET BACKED SECURITIES (Cost $1,207,648,876) | | | | | | | | | 1,200,010,060 | |
| | | | | | | | | | | | |
| | | |
| | CORPORATE BONDS — 51.3% | | | | | | | | | | |
| | | |
| | AUTOMOBILES & COMPONENTS — 1.7% | | | | | | | | | | |
| | Automobiles — 1.4% | | | | | | | | | | |
| | Daimler Finance North America, LLC (Guaranty: Daimler AG), | | | | | | | | | | |
| a,b,e | | 2.354% (LIBOR 3 Month + 0.45%) due 2/22/2021 | | | | 14,850,000 | | | | | 14,859,311 | |
| a,e | | 2.45% due 5/18/2020 | | | | 9,850,000 | | | | | 9,710,267 | |
| e | | Hyundai Capital America, 2.40% due 10/30/2018 | | | | 9,950,000 | | | | | 9,921,298 | |
| a,e | | Hyundai Capital Services, Inc., 3.75% due 3/5/2023 | | | | 7,000,000 | | | | | 6,948,326 | |
| b | | Toyota Motor Credit Corp., 2.22% (LIBOR 3 Month + 0.40%) due 2/13/2020 | | | | 20,090,000 | | | | | 20,109,076 | |
| a,e | | Volkswagen Group of America Finance, LLC (Guaranty: Volkswagen AG), 1.65% due 5/22/2018 | | | | 10,000,000 | | | | | 9,985,900 | |
| | Trading Companies & Distributors — 0.3% | | | | | | | | | | |
| | Altitude Investments 12, LLC (Guaranty: Export-Import Bank of the United States), 2.454% due 12/9/2025 | | | | 4,745,149 | | | | | 4,687,816 | |
| a,e | | LeasePlan Corp. N.V., 2.50% due 5/16/2018 | | | | 10,000,000 | | | | | 9,993,602 | |
| | | | | | | | | | | | |
| | | | | | | | | | | 86,215,596 | |
| | | | | | | | | | | | |
| | BANKS — 3.4% | �� | | | | | | | | | |
| | Banks — 3.4% | | | | | | | | | | |
| a,b | | Barclays Bank plc, 2.165% (LIBOR 3 Month + 0.46%) due 1/11/2021 | | | | 24,400,000 | | | | | 24,380,925 | |
| b | | Capital One NA/Mclean VA, 2.611% (LIBOR 3 Month + 0.82%) due 8/8/2022 | | | | 27,000,000 | | | | | 27,041,347 | |
| | Citizens Bank N.A./Providence RI, | | | | | | | | | | |
| | 2.25% due 3/2/2020 | | | | 5,000,000 | | | | | 4,914,331 | |
| f | | 3.252% due 3/29/2023 | | | | 26,500,000 | | | | | 26,511,660 | |
| a | | Credit Suisse AG, 1.70% due 4/27/2018 | | | | 9,325,000 | | | | | 9,321,736 | |
| | Fifth Third Bank, 2.30% due 3/15/2019 | | | | 3,800,000 | | | | | 3,784,147 | |
| | First Tennessee Bank N.A., 2.95% due 12/1/2019 | | | | 7,000,000 | | | | | 6,984,051 | |
| | Manufacturers & Traders Trust Co., 2.30% due 1/30/2019 | | | | 10,000,000 | | | | | 9,961,134 | |
| | Mizuho Bank Ltd. (Guaranty: Mizuho Financial Group, Inc.), | | | | | | | | | | |
| a,e | | 2.45% due 4/16/2019 | | | | 7,000,000 | | | | | 6,968,622 | |
| a,b,e | | 2.935% (LIBOR 3 Month + 1.19%) due 10/20/2018 | | | | 5,000,000 | | | | | 5,025,913 | |
| | Santander Holdings USA, Inc., 3.40% due 1/18/2023 | | | | 7,937,000 | | | | | 7,752,901 | |
Semi-Annual Reports | 19
Schedule of Investments, Continued
Thornburg Limited Term Income Fund | March 31, 2018 (Unaudited)
| | | | | | | | | | | | |
| | | | | PRINCIPAL
AMOUNT | | VALUE |
| a,b | | Santander UK plc, 3.587% (LIBOR 3 Month + 1.48%) due 3/14/2019 | | | $ | 9,900,000 | | | | $ | 10,010,096 | |
| e | | Sovereign Bank Lease Pass-Through Trust, 12.18% due 6/30/2020 | | | | 2,803,944 | | | | | 3,262,949 | |
| a,f | | Sumitomo Mitsui Banking Corp. (Guaranty: Sumitomo Mitsui Banking Corp/New York), 2.044% due 10/18/2019 | | | | 15,000,000 | | | | | 14,990,550 | |
| a,b | | Sumitomo Mitsui Banking Corp. (Guaranty: Sumitomo Mitsui Banking Corp/New York, 2.485% (LIBOR 3 Month + 0.74%) due 7/23/2018 | | | | 14,700,000 | | | | | 14,725,218 | |
| | | | | | | | | | | | |
| | | | | | | | | | | 175,635,580 | |
| | | | | | | | | | | | |
| | CAPITAL GOODS — 1.6% | | | | | | | | | | |
| | Industrial Conglomerates — 0.6% | | | | | | | | | | |
| j | | Aeroquip-Vickers, Inc., 6.875% due 4/9/2018 | | | | 1,500,000 | | | | | 1,500,698 | |
| | Carlisle Companies, Inc., 3.50% due 12/1/2024 | | | | 6,787,000 | | | | | 6,652,574 | |
| b | | General Electric Co. MTN, 3.125% (LIBOR 3 Month + 1.00%) due 3/15/2023 | | | | 7,725,000 | | | | | 7,709,968 | |
| b | | General Electric Co., 2.352% (LIBOR 3 Month + 0.15%) due 12/28/2018 | | | | 4,850,000 | | | | | 4,839,878 | |
| | Ingersoll-Rand Co. (Guaranty: Ingersoll-Rand plc), 6.391% due 11/15/2027 | | | | 3,000,000 | | | | | 3,408,152 | |
| a,b,e | | Siemens Financieringsmaatschappij N.V. (Guaranty: Siemens AG), 2.755% (LIBOR 3 Month + 0.61%) due 3/16/2022 | | | | 5,000,000 | | | | | 5,048,800 | |
| a,e | | Smiths Group plc (Guaranty: Smiths Group International Holdings Ltd.), 7.20% due 5/15/2019 | | | | 3,000,000 | | | | | 3,132,120 | |
| | Machinery — 1.0% | | | | | | | | | | |
| | Nvent Finance Sarl, | | | | | | | | | | |
| a,e | | 3.95% due 4/15/2023 | | | | 7,870,000 | | | | | 7,893,131 | |
| a,e | | 4.55% due 4/15/2028 | | | | 16,970,000 | | | | | 17,048,280 | |
| | Roper Technologies, Inc., 3.00% due 12/15/2020 | | | | 4,870,000 | | | | | 4,853,069 | |
| | Stanley Black & Decker, Inc., 2.451% due 11/17/2018 | | | | 6,900,000 | | | | | 6,886,021 | |
| | Wabtec Corp., | | | | | | | | | | |
| | 3.45% due 11/15/2026 | | | | 5,000,000 | | | | | 4,791,698 | |
| | 4.375% due 8/15/2023 | | | | 10,590,000 | | | | | 10,699,094 | |
| | | | | | | | | | | | |
| | | | | | | | | | | 84,463,483 | |
| | | | | | | | | | | | |
| | COMMERCIAL & PROFESSIONAL SERVICES — 0.7% | | | | | | | | | | |
| | Commercial Services & Supplies — 0.1% | | | | | | | | | | |
| | Cintas Corp. No. 2, 2.90% due 4/1/2022 | | | | 2,622,000 | | | | | 2,581,030 | |
| | Republic Services, Inc., 3.375% due 11/15/2027 | | | | 2,980,000 | | | | | 2,875,808 | |
| | Leisure Products — 0.4% | | | | | | | | | | |
| | Hasbro, Inc., 3.50% due 9/15/2027 | | | | 13,174,000 | | | | | 12,339,637 | |
| | Mattel, Inc., 2.35% due 8/15/2021 | | | | 9,915,000 | | | | | 8,774,874 | |
| | Professional Services — 0.2% | | | | | | | | | | |
| | Verisk Analytics, Inc., 4.00% due 6/15/2025 | | | | 6,930,000 | | | | | 6,974,335 | |
| | | | | | | | | | | | |
| | | | | | | | | | | 33,545,684 | |
| | | | | | | | | | | | |
| | CONSUMER DURABLES & APPAREL — 0.2% | | | | | | | | | | |
| | Household Durables — 0.2% | | | | | | | | | | |
| | Tupperware Brands Corp. (Guaranty: Dart Industries, Inc.), 4.75% due 6/1/2021 | | | | 10,000,000 | | | | | 10,284,797 | |
| | | | | | | | | | | | |
| | | | | | | | | | | 10,284,797 | |
| | | | | | | | | | | | |
| | CONSUMER SERVICES — 0.2% | | | | | | | | | | |
| | Transportation Infrastructure — 0.2% | | | | | | | | | | |
| | Mexico City Airport Trust, | | | | | | | | | | |
| a,e | | 3.875% due 4/30/2028 | | | | 5,000,000 | | | | | 4,588,100 | |
| a,e | | 4.25% due 10/31/2026 | | | | 3,750,000 | | | | | 3,609,375 | |
| | | | | | | | | | | | |
| | | | | | | | | | | 8,197,475 | |
| | | | | | | | | | | | |
| | DIVERSIFIED FINANCIALS — 9.8% | | | | | | | | | | |
| | Capital Markets — 2.1% | | | | | | | | | | |
| | Ares Capital Corp., 4.875% due 11/30/2018 | | | | 24,550,000 | | | | | 24,790,022 | |
| e | | Ares Finance Co., LLC, 4.00% due 10/8/2024 | | | | 5,000,000 | | | | | 4,857,884 | |
| | CBOE Holdings, Inc., 1.95% due 6/28/2019 | | | | 1,745,000 | | | | | 1,724,567 | |
| | DY8 Leasing, LLC (Guaranty: Export-Import Bank of the United States), 2.627% due 4/29/2026 | | | | 3,523,438 | | | | | 3,503,476 | |
| | Export Leasing (2009), LLC (Guaranty: Export-Import Bank of the United States), 1.859% due 8/28/2021 | | | | 3,181,143 | | | | | 3,146,196 | |
| | FS Investment Corp., 4.00% due 7/15/2019 | | | | 12,000,000 | | | | | 12,059,958 | |
| e | | GTP Acquisition Partners I, LLC (Guaranty: American Tower Holding Sub II, LLC), 2.35% due 6/15/2045 | | | | 10,000,000 | | | | | 9,883,887 | |
| | Legg Mason, Inc., | | | | | | | | | | |
| | 2.70% due 7/15/2019 | | | | 1,660,000 | | | | | 1,653,777 | |
| | 4.75% due 3/15/2026 | | | | 5,000,000 | | | | | 5,228,173 | |
| | National Rural Utilities Cooperative Finance Corp., 10.375% due 11/1/2018 | | | | 2,623,000 | | | | | 2,740,012 | |
| | Sandalwood 2013, LLC (Guaranty: Export-Import Bank of the United States), 2.821% due 2/12/2026 | | | | 4,905,113 | | | | | 4,906,420 | |
20 | Semi-Annual Reports
Schedule of Investments, Continued
Thornburg Limited Term Income Fund | March 31, 2018 (Unaudited)
| | | | | | | | | | | | |
| | | | | PRINCIPAL AMOUNT | | VALUE |
| | Solar Capital Ltd., 4.50% due 1/20/2023 | | | $ | 12,000,000 | | | | $ | 11,692,051 | |
| a,e | | SumitG Guaranteed Secured Obligation Issuer DAC, 2.251% due 11/2/2020 | | | | 15,000,000 | | | | | 14,693,589 | |
| | TPG Specialty Lending, Inc., 4.50% due 1/22/2023 | | | | 7,440,000 | | | | | 7,442,098 | |
| | Consumer Finance — 0.8% | | | | | | | | | | |
| f | | Citibank N.A., 2.189% due 2/12/2021 | | | | 21,750,000 | | | | | 21,729,510 | |
| b | | Wells Fargo & Co., MTN, 3.045% (LIBOR 3 Month + 1.01%) due 12/7/2020 | | | | 4,400,000 | | | | | 4,452,788 | |
| f | | Wells Fargo Bank N.A., 1.975% due 1/15/2020 | | | | 17,000,000 | | | | | 16,979,557 | |
| | Diversified Financial Services — 5.1% | | | | | | | | | | |
| b | | Bank of America Corp. MTN, 3.178% (LIBOR 3 Month + 0.87%) due 4/1/2019 | | | | 8,000,000 | | | | | 8,049,681 | |
| b | | Bank of America Corp., 2.762% (LIBOR 3 Month + 1.04%) due 1/15/2019 | | | | 4,225,000 | | | | | 4,253,709 | |
| | Bank of New York Mellon Corp., | | | | | | | | | | |
| b | | 2.755% (LIBOR 3 Month + 0.87%) due 8/17/2020 | | | | 4,525,000 | | | | | 4,585,305 | |
| b | | 2.817% (LIBOR 3 Month + 1.05%) due 10/30/2023 | | | | 11,835,000 | | | | | 12,028,934 | |
| | Barclays plc, | | | | | | | | | | |
| a,b | | 3.333% (LIBOR 3 Month + 1.63%) due 1/10/2023 | | | | 11,000,000 | | | | | 11,269,830 | |
| a | | 3.684% due 1/10/2023 | | | | 10,000,000 | | | | | 9,913,167 | |
| a,e | | BNP Paribas S.A., 3.375% due 1/9/2025 | | | | 6,000,000 | | | | | 5,803,726 | |
| | Citigroup, Inc., | | | | | | | | | | |
| | 2.50% due 7/29/2019 | | | | 2,925,000 | | | | | 2,913,107 | |
| | 2.65% due 10/26/2020 | | | | 4,890,000 | | | | | 4,831,589 | |
| b | | 3.436% (LIBOR 3 Month + 1.43%) due 9/1/2023 | | | | 8,000,000 | | | | | 8,195,005 | |
| | Credit Suisse Group Funding Guernsey Ltd. (Guaranty: Credit Suisse Group AG), | | | | | | | | | | |
| a | | 3.125% due 12/10/2020 | | | | 10,000,000 | | | | | 9,944,323 | |
| a | | 3.80% due 9/15/2022 | | | | 7,000,000 | | | | | 7,048,920 | |
| a | | 4.55% due 4/17/2026 | | | | 7,000,000 | | | | | 7,151,930 | |
| | Deutsche Bank AG, | | | | | | | | | | |
| a,f | | 2.56% due 1/22/2021 | | | | 17,300,000 | | | | | 17,231,441 | |
| a,b | | 3.186% (LIBOR 3 Month + 1.23%) due 2/27/2023 | | | | 17,100,000 | | | | | 17,020,405 | |
| | Goldman Sachs Group, Inc., | | | | | | | | | | |
| f | | 2.556% due 2/23/2023 | | | | 8,368,000 | | | | | 8,335,386 | |
| b | | 2.765% (LIBOR 3 Month + 1.02%) due 10/23/2019 | | | | 11,517,000 | | | | | 11,619,206 | |
| b | | 3.325% (LIBOR 3 Month + 1.20%) due 9/15/2020 | | | | 17,900,000 | | | | | 18,182,624 | |
| b | | JPMorgan Chase & Co., 3.486% (LIBOR 3 Month + 1.48%) due 3/1/2021 | | | | 7,000,000 | | | | | 7,199,762 | |
| a | | Lloyds Banking Group plc (Guaranty: Lloyds Bank plc), 4.375% due 3/22/2028 | | | | 5,000,000 | | | | | 5,049,989 | |
| a,b | | Mitsubishi UFJ Financial Group, Inc., 3.886% (LIBOR 3 Month + 1.88%) due 3/1/2021 | | | | 3,907,000 | | | | | 4,047,782 | |
| a,f | | Mizuho Financial Group, Inc., 2.815% due 3/5/2023 | | | | 14,000,000 | | | | | 13,980,400 | |
| b | | Morgan Stanley MTN, 3.141% (LIBOR 3 Month + 1.40%) due 10/24/2023 | | | | 12,900,000 | | | | | 13,192,701 | |
| | Morgan Stanley, | | | | | | | | | | |
| | 2.80% due 6/16/2020 | | | | 1,350,000 | | | | | 1,340,917 | |
| b | | 2.90% (LIBOR 3 Month + 1.14%) due 1/27/2020 | | | | 925,000 | | | | | 936,496 | |
| | Private Export Funding Corp. (Guaranty: Export-Import Bank of the United States), Series KK, 3.55% due 1/15/2024 | | | | 10,000,000 | | | | | 10,399,710 | |
| b | | State Street Corp., 2.785% (LIBOR 3 Month + 0.90%) due 8/18/2020 | | | | 9,475,000 | | | | | 9,591,713 | |
| | Synchrony Financial, 3.00% due 8/15/2019 | | | | 1,950,000 | | | | | 1,944,121 | |
| a,b,e | | UBS AG Jersey (Guaranty: UBS Group AG), 3.726% (LIBOR 3 Month + 1.44%) due 9/24/2020 | | | | 10,800,000 | | | | | 11,037,767 | |
| | UBS AG, | | | | | | | | | | |
| a,e,f | | 2.304% due 5/28/2019 | | | | 5,000,000 | | | | | 5,001,400 | |
| a | | 2.375% due 8/14/2019 | | | | 4,500,000 | | | | | 4,467,090 | |
| a,e,f | | UBS Group Funding Switzerland AG) (Guaranty: UBS Group AG), 2.789% due 8/15/2023 | | | | 4,000,000 | | | | | 4,021,883 | |
| | Insurance — 1.3% | | | | | | | | | | |
| | AIG Global Funding, | | | | | | | | | | |
| e | | 1.95% due 10/18/2019 | | | | 2,900,000 | | | | | 2,864,072 | |
| b,e | | 2.788% (LIBOR 3 Month + 0.48%) due 7/2/2020 | | | | 3,000,000 | | | | | 3,003,233 | |
| | ALEX Alpha, LLC (Guaranty: Export-Import Bank of the United States), 1.617% due 8/15/2024 | | | | 2,826,086 | | | | | 2,723,510 | |
| a | | Durrah MSN 35603 (Guaranty: Export-Import Bank of the United States), 1.684% due 1/22/2025 | | | | 9,075,665 | | | | | 8,735,899 | |
| a | | Gate Capital Cayman One Ltd. (Guaranty: Export-Import Bank of the United States), 1.839% due 3/27/2021 | | | | 5,009,069 | | | | | 4,960,238 | |
| | Helios Leasing I, LLC (Guaranty: Export-Import Bank of the United States), 1.562% due 9/28/2024 | | | | 3,396,643 | | | | | 3,279,530 | |
| | MSN 41079 and 41084 Ltd. (Guaranty: Export-Import Bank of the United States), 1.717% due 7/13/2024 | | | | 6,828,577 | | | | | 6,599,435 | |
| e | | Protective Life Global Funding, 2.615% due 8/22/2022 | | | | 15,000,000 | | | | | 14,549,999 | |
| | Santa Rosa Leasing, LLC (Guaranty: Export-Import Bank of the United States), | | | | | | | | | | |
| | 1.472% due 11/3/2024 | | | | 9,378,514 | | | | | 9,024,894 | |
| | 1.693% due 8/15/2024 | | | | 3,368,757 | | | | | 3,272,819 | |
| | Union 13 Leasing, LLC (Guaranty: Export-Import Bank of the United States), 1.682% due 12/19/2024 | | | | 8,794,740 | | | | | 8,479,778 | |
Semi-Annual Reports | 21
Schedule of Investments, Continued
Thornburg Limited Term Income Fund | March 31, 2018 (Unaudited)
| | | | | | | | | | | | |
| | | | | PRINCIPAL AMOUNT | | VALUE |
| | Mortgage Real Estate Investment Trusts — 0.5% | | | | | | | | | | |
| | Healthcare Trust of America Holdings L.P. (Guaranty: Healthcare Trust of America, Inc.), 2.95% due 7/1/2022 | | | $ | 3,920,000 | | | | $ | 3,834,832 | |
| | Senior Housing Properties Trust, 4.75% due 2/15/2028 | | | | 20,960,000 | | | | | 20,535,863 | |
| | | | | | | | | | | | |
| | | | | | | | | | | 503,938,086 | |
| | | | | | | | | | | | |
| | ENERGY — 4.2% | | | | | | | | | | |
| | Energy Equipment & Services — 0.2% | | | | | | | | | | |
| | Oceaneering International, Inc., 4.65% due 11/15/2024 | | | | 10,000,000 | | | | | 9,649,761 | |
| a,e,k,l | | Schahin II Finance Co. SPV Ltd., 5.875% due 9/25/2023 | | | | 4,082,733 | | | | | 500,135 | |
| | Oil, Gas & Consumable Fuels — 4.0% | | | | | | | | | | |
| a,b | | BP Capital Markets plc (Guaranty: BP plc), 2.183% (LIBOR 3 Month + 0.35%) due 8/14/2018 | | | | 11,380,000 | | | | | 11,386,809 | |
| | Buckeye Partners L.P., 4.15% due 7/1/2023 | | | | 7,000,000 | | | | | 7,038,952 | |
| a,e | | CNPC General Capital Ltd. (Guaranty: CNPC Finance HK Ltd.), 2.75% due 5/14/2019 | | | | 5,000,000 | | | | | 4,985,614 | |
| e | | Colorado Interstate Gas Co., LLC / Colorado Interstate Issuing Corp., 4.15% due 8/15/2026 | | | | 26,000,000 | | | | | 25,418,795 | |
| e | | Enable Oklahoma Intrastate Transmission, LLC (Guaranty: Enable Midstream Partners L.P.), 6.25% due 3/15/2020 | | | | 3,640,000 | | | | | 3,800,918 | |
| | Energen Corp., 4.625% due 9/1/2021 | | | | 10,000,000 | | | | | 9,825,000 | |
| b | | Exxon Mobil Corp., 2.786% (LIBOR 3 Month + 0.78%) due 3/1/2019 | | | | 6,625,000 | | | | | 6,667,691 | |
| e | | Florida Gas Transmission Co., LLC, 3.875% due 7/15/2022 | | | | 10,435,000 | | | | | 10,589,480 | |
| | Gulf South Pipeline Co. L.P., 4.00% due 6/15/2022 | | | | 13,690,000 | | | | | 13,761,139 | |
| a,e | | Harvest Operations Corp. (Guaranty: Korea National Oil Corp.), 2.125% due 5/14/2018 | | | | 7,000,000 | | | | | 6,991,634 | |
| | HollyFrontier Corp., 5.875% due 4/1/2026 | | | | 25,000,000 | | | | | 26,900,214 | |
| e | | Northern Natural Gas Co., 5.75% due 7/15/2018 | | | | 50,000 | | | | | 50,443 | |
| | Northwest Pipeline, LLC, 4.00% due 4/1/2027 | | | | 10,000,000 | | | | | 9,709,758 | |
| | NuStar Logistics L.P., 4.75% due 2/1/2022 | | | | 5,000,000 | | | | | 4,862,500 | |
| a,b | | Petroleos Mexicanos, 3.754% (LIBOR 3 Month + 2.02%) due 7/18/2018 | | | | 10,000,000 | | | | | 10,043,300 | |
| b,e | | Phillips 66 (Guaranty: Phillips 66 Co.), 2.372% (LIBOR 3 Month + 0.65%) due 4/15/2019 | | | | 6,925,000 | | | | | 6,926,910 | |
| a | | Sasol Financing International Ltd. (Guaranty: Sasol Ltd.), 4.50% due 11/14/2022 | | | | 4,000,000 | | | | | 4,001,200 | |
| a,e | | Sinopec Group Overseas Development 2017 Ltd. (Guaranty: China Petrochemical Corp.), 2.25% due 9/13/2020 | | | | 16,000,000 | | | | | 15,644,880 | |
| e | | Texas Gas Transmission, LLC, 4.50% due 2/1/2021 | | | | 16,286,000 | | | | | 16,617,656 | |
| | Transcontinental Gas Pipe Line Co., LLC, 7.85% due 2/1/2026 | | | | 11,000,000 | | | | | 13,534,986 | |
| | | | | | | | | | | | |
| | | | | | | | | | | 218,907,775 | |
| | | | | | | | | | | | |
| | FOOD & STAPLES RETAILING — 0.2% | | | | | | | | | | |
| | Food & Staples Retailing — 0.2% | | | | | | | | | | |
| a,e | | Alimentation Couche-Tard, Inc., 2.70% due 7/26/2022 | | | | 7,900,000 | | | | | 7,659,115 | |
| | Sysco Corp., 3.55% due 3/15/2025 | | | | 4,990,000 | | | | | 4,962,718 | |
| | | | | | | | | | | | |
| | | | | | | | | | | 12,621,833 | |
| | | | | | | | | | | | |
| | FOOD, BEVERAGE & TOBACCO — 3.2% | | | | | | | | | | |
| | Beverages — 1.1% | | | | | | | | | | |
| a | | Anheuser-Busch InBev Finance, Inc., 3.30% due 2/1/2023 | | | | 9,650,000 | | | | | 9,657,092 | |
| a,b,i | | Anheuser-Busch InBev Worldwide, Inc., Series 5FRN, 3.052% (LIBOR 3 Month + 0.74%) due 1/12/2024 | | | | 9,236,000 | | | | | 9,290,308 | |
| a,e | | Becle SAB de CV, 3.75% due 5/13/2025 | | | | 13,750,000 | | | | | 13,561,603 | |
| a,e | | Coca-Cola Icecek A/S, 4.75% due 10/1/2018 | | | | 5,000,000 | | | | | 5,016,730 | |
| b | | PepsiCo, Inc., 2.234% (LIBOR 3 Month + 0.53%) due 10/6/2021 | | | | 19,230,000 | | | | | 19,466,929 | |
| | Food Products — 1.5% | | | | | | | | | | |
| b | | Conagra Brands, Inc., 2.204% (LIBOR 3 Month + 0.50%) due 10/9/2020 | | | | 14,850,000 | | | | | 14,860,769 | |
| | General Mills, Inc., 2.60% due 10/12/2022 | | | | 14,850,000 | | | | | 14,304,605 | |
| | JM Smucker Co., 2.50% due 3/15/2020 | | | | 10,494,000 | | | | | 10,380,620 | |
| | Kraft Heinz Foods Co. (Guaranty: Kraft Heinz Co.), | | | | | | | | | | |
| b | | 2.22% (LIBOR 3 Month + 0.42%) due 8/9/2019 | | | | 14,925,000 | | | | | 14,931,294 | |
| b | | 2.381% (LIBOR 3 Month + 0.57%) due 2/10/2021 | | | | 14,815,000 | | | | | 14,774,543 | |
| | Mead Johnson Nutrition Co. (Guaranty: Reckitt Benckiser Group plc), | | | | | | | | | | |
| a | | 3.00% due 11/15/2020 | | | | 1,900,000 | | | | | 1,892,633 | |
| a | | 4.125% due 11/15/2025 | | | | 3,000,000 | | | | | 3,078,859 | |
| b | | Tyson Foods, Inc., 2.567% (LIBOR 3 Month + 0.55%) due 6/2/2020 | | | | 2,850,000 | | | | | 2,856,212 | |
| | Tobacco — 0.6% | | | | | | | | | | |
| | Altria Group, Inc. (Guaranty: Philip Morris USA, Inc.), 2.625% due 1/14/2020 | | | | 5,790,000 | | | | | 5,755,783 | |
| | BAT Capital Corp., | | | | | | | | | | |
| a,b,e | | 2.423% (LIBOR 3 Month + 0.59%) due 8/14/2020 | | | | 7,370,000 | | | | | 7,393,107 | |
| a,e,f | | 2.719% due 8/15/2022 | | | | 5,000,000 | | | | | 5,030,031 | |
| a,e | | 3.222% due 8/15/2024 | | | | 2,980,000 | | | | | 2,873,090 | |
22 | Semi-Annual Reports
Schedule of Investments, Continued
Thornburg Limited Term Income Fund | March 31, 2018 (Unaudited)
| | | | | | | | | | | | |
| | | | | PRINCIPAL
AMOUNT | | VALUE |
| a,e | | BAT International Finance plc, 3.95% due 6/15/2025 | | | $ | 3,000,000 | | | | $ | 3,010,344 | |
| a | | Reynolds American, Inc., 6.875% due 5/1/2020 | | | | 5,000,000 | | | | | 5,362,373 | |
| | | | | | | | | | | | |
| | | | | | | | | | | 163,496,925 | |
| | | | | | | | | | | | |
| | HEALTHCARE EQUIPMENT & SERVICES — 0.9% | | | | | | | | | | |
| | Health Care Providers & Services — 0.9% | | | | | | | | | | |
| | Anthem, Inc., | | | | | | | | | | |
| | 2.25% due 8/15/2019 | | | | 10,000,000 | | | | | 9,903,926 | |
| | 2.50% due 11/21/2020 | | | | 7,905,000 | | | | | 7,771,055 | |
| | 3.35% due 12/1/2024 | | | | 3,896,000 | | | | | 3,782,483 | |
| | Catholic Health Initiatives, 2.95% due 11/1/2022 | | | | 7,000,000 | | | | | 6,850,428 | |
| b | | CVS Health Corp., 2.687% (LIBOR 3 Month + 0.63%) due 3/9/2020 | | | | 7,786,000 | | | | | 7,815,197 | |
| | Express Scripts Holding Co., 2.60% due 11/30/2020 | | | | 9,750,000 | | | | | 9,574,953 | |
| | | | | | | | | | | | |
| | | | | | | | | | | 45,698,042 | |
| | | | | | | | | | | | |
| | HOUSEHOLD & PERSONAL PRODUCTS — 0.2% | | | | | | | | | | |
| | Household Products — 0.2% | | | | | | | | | | |
| | Church & Dwight Co., Inc., 2.45% due 8/1/2022 | | | | 4,716,000 | | | | | 4,568,358 | |
| a,e | | Kimberly-Clark de Mexico SAB de CV, 3.80% due 4/8/2024 | | | | 3,000,000 | | | | | 2,980,063 | |
| | Personal Products — 0.0% | | | | | | | | | | |
| | Edgewell Personal Care Co., 4.70% due 5/24/2022 | | | | 2,000,000 | | | | | 1,940,000 | |
| | | | | | | | | | | | |
| | | | | | | | | | | 9,488,421 | |
| | | | | | | | | | | | |
| | INSURANCE — 4.6% | | | | | | | | | | |
| | Insurance — 4.4% | | | | | | | | | | |
| e | | Athene Global Funding, 2.875% due 10/23/2018 | | | | 13,925,000 | | | | | 13,912,269 | |
| a,e | | DaVinciRe Holdings Ltd., 4.75% due 5/1/2025 | | | | 10,260,000 | | | | | 10,142,633 | |
| a | | Enstar Group Ltd., 4.50% due 3/10/2022 | | | | 1,950,000 | | | | | 1,958,785 | |
| | Hanover Insurance Group, Inc., 4.50% due 4/15/2026 | | | | 10,000,000 | | | | | 10,003,928 | |
| | Horace Mann Educators Corp., 4.50% due 12/1/2025 | | | | 4,800,000 | | | | | 4,862,193 | |
| j | | Infinity Property & Casualty Corp., 5.00% due 9/19/2022 | | | | 4,690,000 | | | | | 4,887,923 | |
| b,e | | Jackson National Life Global Co., 3.022% (LIBOR 3 Month + 0.73%) due 6/27/2022 | | | | 7,900,000 | | | | | 7,989,823 | |
| | Jackson National Life Global Funding, | | | | | | | | | | |
| e | | 2.20% due 1/30/2020 | | | | 8,000,000 | | | | | 7,908,520 | |
| e | | 3.25% due 1/30/2024 | | | | 10,000,000 | | | | | 9,900,435 | |
| | Kemper Corp., 4.35% due 2/15/2025 | | | | 20,020,000 | | | | | 20,035,274 | |
| a,e | | Lancashire Holdings Ltd., 5.70% due 10/1/2022 | | | | 11,000,000 | | | | | 11,412,280 | |
| e | | MassMutual Global Funding II, 2.95% due 1/11/2025 | | | | 25,000,000 | | | | | 24,198,761 | |
| | Mercury General Corp., 4.40% due 3/15/2027 | | | | 16,000,000 | | | | | 16,006,830 | |
| | Metropolitan Life Global Funding I, | | | | | | | | | | |
| b,e | | 1.938% (LIBOR 3 Month + 0.23%) due 1/8/2021 | | | | 19,850,000 | | | | | 19,816,262 | |
| b,e | | 2.471% (LIBOR 3 Month + 0.40%) due 6/12/2020 | | | | 8,000,000 | | | | | 8,034,852 | |
| | Montpelier Re Holdings Ltd., 4.70% due 10/15/2022 | | | | 5,000,000 | | | | | 5,162,930 | |
| | Principal Life Global Funding II (Guaranty: Principal Financial Group, Inc.), | | | | | | | | | | |
| e | | 2.20% due 4/8/2020 | | | | 7,000,000 | | | | | 6,894,276 | |
| e | | 2.375% due 9/11/2019 | | | | 2,450,000 | | | | | 2,434,207 | |
| | Reinsurance Group of America, Inc., 3.95% due 9/15/2026 | | | | 3,765,000 | | | | | 3,726,518 | |
| e | | Reliance Standard Life Global Funding II, 2.50% due 1/15/2020 | | | | 15,000,000 | | | | | 14,850,441 | |
| | Reliance Standard Life Insurance Co., | | | | | | | | | | |
| e | | 2.50% due 4/24/2019 | | | | 9,900,000 | | | | | 9,857,443 | |
| e | | 3.05% due 1/20/2021 | | | | 3,975,000 | | | | | 3,957,751 | |
| e | | Sammons Financial Group, Inc., 4.45% due 5/12/2027 | | | | 7,950,000 | | | | | 7,894,494 | |
| | Semiconductors & Semiconductor Equipment — 0.2% | | | | | | | | | | |
| | QUALCOMM, Inc., | | | | | | | | | | |
| b | | 2.245% (LIBOR 3 Month + 0.36%) due 5/20/2019 | | | | 6,583,000 | | | | | 6,595,477 | |
| b | | 2.335% (LIBOR 3 Month + 0.45%) due 5/20/2020 | | | | 4,747,000 | | | | | 4,754,453 | |
| | | | | | | | | | | | |
| | | | | | | | | | | 237,198,758 | |
| | | | | | | | | | | | |
| | MATERIALS — 1.3% | | | | | | | | | | |
| | Chemicals — 1.0% | | | | | | | | | | |
| b,e | | Chevron Phillips Chemical Co., LLC, 2.523% (LIBOR 3 Month + 0.75%) due 5/1/2020 | | | | 29,900,000 | | | | | 30,080,007 | |
| a,e | | Incitec Pivot Finance, LLC (Guaranty: Incitec Pivot Ltd.), 6.00% due 12/10/2019 | | | | 4,538,000 | | | | | 4,738,206 | |
Semi-Annual Reports | 23
Schedule of Investments, Continued
Thornburg Limited Term Income Fund | March 31, 2018 (Unaudited)
| | | | | | | | | | | | |
| | | | | PRINCIPAL AMOUNT | | VALUE |
| a,e | | OCP S.A., 5.625% due 4/25/2024 | | | $ | 8,555,000 | | | | $ | 9,025,525 | |
| a,e | | Yara International ASA, 3.80% due 6/6/2026 | | | | 5,000,000 | | | | | 4,850,959 | |
| | Metals & Mining — 0.3% | | | | | | | | | | |
| | AngloGold Ashanti Holdings plc (Guaranty: AngloGold Ashanti Ltd.), | | | | | | | | | | |
| a | | 5.125% due 8/1/2022 | | | | 6,500,000 | | | | | 6,699,563 | |
| a | | 5.375% due 4/15/2020 | | | | 9,100,000 | | | | | 9,367,267 | |
| | | | | | | | | | | | |
| | | | | | | | | | | 64,761,527 | |
| | | | | | | | | | | | |
| | MEDIA — 0.1% | | | | | | | | | | |
| | Media — 0.1% | | | | | | | | | | |
| e | | Cox Communications, Inc., 3.15% due 8/15/2024 | | | | 8,000,000 | | | | | 7,672,131 | |
| | | | | | | | | | | | |
| | | | | | | | | | | 7,672,131 | |
| | | | | | | | | | | | |
| | PHARMACEUTICALS, BIOTECHNOLOGY & LIFE SCIENCES — 1.1% | | | | | | | | | | |
| | Biotechnology — 0.2% | | | | | | | | | | |
| | Celgene Corp., | | | | | | | | | | |
| | 2.75% due 2/15/2023 | | | | 2,265,000 | | | | | 2,174,153 | |
| | 3.25% due 2/20/2023 | | | | 9,936,000 | | | | | 9,774,054 | |
| | Life Sciences Tools & Services — 0.3% | | | | | | | | | | |
| | Abbott Laboratories, | | | | | | | | | | |
| | 2.35% due 11/22/2019 | | | | 9,340,000 | | | | | 9,259,505 | |
| | 3.40% due 11/30/2023 | | | | 6,860,000 | | | | | 6,792,726 | |
| | Pharmaceuticals — 0.6% | | | | | | | | | | |
| | Allergan Funding SCS, | | | | | | | | | | |
| b | | 3.326% (LIBOR 3 Month + 1.26%) due 3/12/2020 | | | | 5,000,000 | | | | | 5,059,165 | |
| | 3.45% due 3/15/2022 | | | | 5,000,000 | | | | | 4,957,253 | |
| | 3.80% due 3/15/2025 | | | | 5,000,000 | | | | | 4,911,920 | |
| | Mylan N.V. (Guaranty: Mylan, Inc.), 3.00% due 12/15/2018 | | | | 4,900,000 | | | | | 4,899,925 | |
| | Shire Acquisitions Investments Ireland DAC, 2.40% due 9/23/2021 | | | | 9,776,000 | | | | | 9,438,943 | |
| | Zoetis, Inc., 3.45% due 11/13/2020 | | | | 2,000,000 | | | | | 2,014,026 | |
| | | | | | | | | | | | |
| | | | | | | | | | | 59,281,670 | |
| | | | | | | | | | | | |
| | REAL ESTATE — 0.9% | | | | | | | | | | |
| | Equity Real Estate Investment Trusts — 0.9% | | | | | | | | | | |
| | Alexandria Real Estate Equities, Inc. (Guaranty: Alexandria Real Estate Equities L.P.), | | | | | | | | | | |
| | 3.90% due 6/15/2023 | | | | 11,700,000 | | | | | 11,829,175 | |
| | 3.95% due 1/15/2027 | | | | 3,975,000 | | | | | 3,889,885 | |
| | Crown Castle International Corp., 3.20% due 9/1/2024 | | | | 3,870,000 | | | | | 3,710,527 | |
| | EPR Properties, 5.25% due 7/15/2023 | | | | 4,041,000 | | | | | 4,224,520 | |
| | Hospitality Properties Trust, 4.95% due 2/15/2027 | | | | 2,000,000 | | | | | 2,034,218 | |
| | Washington Real Estate Investment Trust, 4.95% due 10/1/2020 | | | | 19,100,000 | | | | | 19,739,060 | |
| | Real Estate Management & Development — 0.0% | | | | | | | | | | |
| | Jones Lang LaSalle, Inc., 4.40% due 11/15/2022 | | | | 3,000,000 | | | | | 3,108,014 | |
| | | | | | | | | | | | |
| | | | | | | | | | | 48,535,399 | |
| | | | | | | | | | | | |
| | RETAILING — 0.9% | | | | | | | | | | |
| | Internet & Direct Marketing Retail — 0.5% | | | | | | | | | | |
| | Amazon.com, Inc., 5.20% due 12/3/2025 | | | | 18,175,000 | | | | | 20,255,290 | |
| | Booking Holdings, Inc., 2.75% due 3/15/2023 | | | | 7,925,000 | | | | | 7,647,790 | |
| | Multiline Retail — 0.4% | | | | | | | | | | |
| | Family Dollar Stores, Inc., 5.00% due 2/1/2021 | | | | 18,475,000 | | | | | 19,121,625 | |
| | | | | | | | | | | | |
| | | | | | | | | | | 47,024,705 | |
| | | | | | | | | | | | |
| | SEMICONDUCTORS & SEMICONDUCTOR EQUIPMENT — 0.5% | | | | | | | | | | |
| | Semiconductors & Semiconductor Equipment — 0.5% | | | | | | | | | | |
| | Broadcom Corp. / Broadcom Cayman Finance Ltd., | | | | | | | | | | |
| | 2.375% due 1/15/2020 | | | | 8,875,000 | | | | | 8,751,167 | |
| | 3.00% due 1/15/2022 | | | | 9,000,000 | | | | | 8,831,217 | |
| | 3.625% due 1/15/2024 | | | | 9,000,000 | | | | | 8,853,566 | |
| a | | Micron Semiconductor Ltd. (Guaranty: Export-Import Bank of the United States), 1.258% due 1/15/2019 | | | | 860,000 | | | | | 855,334 | |
| | | | | | | | | | | | |
| | | | | | | | | | | 27,291,284 | |
| | | | | | | | | | | | |
24 | Semi-Annual Reports
Schedule of Investments, Continued
Thornburg Limited Term Income Fund | March 31, 2018 (Unaudited)
| | | | | | | | | | | | |
| | | | | PRINCIPAL AMOUNT | | VALUE |
| | SOFTWARE & SERVICES — 4.2% | | | | | | | | | | |
| | Information Technology Services — 2.3% | | | | | | | | | | |
| | American Express Co., | | | | | | | | | | |
| | 3.00% due 10/30/2024 | | | $ | 10,934,000 | | | | $ | 10,498,353 | |
| | 3.40% due 2/27/2023 | | | | 8,734,000 | | | | | 8,704,533 | |
| | Capital One Bank USA N.A., 2.30% due 6/5/2019 | | | | 3,000,000 | | | | | 2,979,413 | |
| | Leidos Holdings, Inc. (Guaranty: Leidos, Inc.), 4.45% due 12/1/2020 | | | | 2,000,000 | | | | | 2,030,000 | |
| | Moody’s Corp., | | | | | | | | | | |
| b | | 2.375% (LIBOR 3 Month + 0.35%) due 9/4/2018 | | | | 6,950,000 | | | | | 6,950,939 | |
| | 2.75% due 7/15/2019 | | | | 14,850,000 | | | | | 14,801,680 | |
| | 4.875% due 2/15/2024 | | | | 17,000,000 | | | | | 18,036,258 | |
| | S&P Global, Inc. (Guaranty: Standard & Poor’s Financial Services, LLC), | | | | | | | | | | |
| | 2.50% due 8/15/2018 | | | | 2,950,000 | | | | | 2,948,331 | |
| | 3.30% due 8/14/2020 | | | | 2,450,000 | | | | | 2,463,734 | |
| | 4.00% due 6/15/2025 | | | | 8,000,000 | | | | | 8,173,465 | |
| | Total System Services, Inc., | | | | | | | | | | |
| | 2.375% due 6/1/2018 | | | | 20,915,000 | | | | | 20,896,152 | |
| | 3.80% due 4/1/2021 | | | | 3,000,000 | | | | | 3,031,272 | |
| | Western Union Co., | | | | | | | | | | |
| b | | 2.704% (LIBOR 3 Month + 0.80%) due 5/22/2019 | | | | 5,410,000 | | | | | 5,426,842 | |
| | 3.35% due 5/22/2019 | | | | 11,350,000 | | | | | 11,362,738 | |
| | 3.65% due 8/22/2018 | | | | 2,000,000 | | | | | 2,006,998 | |
| | Internet Software & Services — 0.5% | | | | | | | | | | |
| a | | Baidu, Inc., 3.875% due 9/29/2023 | | | | 17,000,000 | | | | | 16,988,474 | |
| a,e | | Tencent Holdings Ltd., 2.985% due 1/19/2023 | | | | 6,450,000 | | | | | 6,285,805 | |
| | Software — 1.4% | | | | | | | | | | |
| | Autodesk, Inc., 3.125% due 6/15/2020 | | | | 1,945,000 | | | | | 1,946,964 | |
| | Broadridge Financial Solutions, Inc., 3.95% due 9/1/2020 | | | | 8,000,000 | | | | | 8,148,288 | |
| | CA Technologies, Inc., 2.875% due 8/15/2018 | | | | 4,082,000 | | | | | 4,090,003 | |
| | CA, Inc., 3.60% due 8/1/2020 - 8/15/2022 | | | | 16,905,000 | | | | | 17,070,536 | |
| | CDK Global, Inc., 3.80% due 10/15/2019 | | | | 5,000,000 | | | | | 5,012,500 | |
| | Dun & Bradstreet, Inc., 4.25% due 6/15/2020 | | | | 7,175,000 | | | | | 7,256,940 | |
| | Fidelity National Information Services, Inc., 2.85% due 10/15/2018 | | | | 4,850,000 | | | | | 4,852,221 | |
| | Oracle Corp., | | | | | | | | | | |
| g | | 1.90% due 9/15/2021 | | | | 11,825,000 | | | | | 11,416,522 | |
| | 2.50% due 5/15/2022 | | | | 4,400,000 | | | | | 4,313,620 | |
| | VMware, Inc., 2.30% due 8/21/2020 | | | | 7,925,000 | | | | | 7,708,344 | |
| | | | | | | | | | | | |
| | | | | | | | | | | 215,400,925 | |
| | | | | | | | | | | | |
| | TECHNOLOGY HARDWARE & EQUIPMENT — 2.0% | | | | | | | | | | |
| | Communications Equipment — 0.7% | | | | | | | | | | |
| | Juniper Networks, Inc., | | | | | | | | | | |
| | 3.125% due 2/26/2019 | | | | 10,000,000 | | | | | 10,012,952 | |
| | 3.30% due 6/15/2020 | | | | 4,825,000 | | | | | 4,827,145 | |
| | Motorola Solutions, Inc., 4.60% due 2/23/2028 | | | | 3,340,000 | | | | | 3,362,020 | |
| a | | Telefonaktiebolaget LM Ericsson, 4.125% due 5/15/2022 | | | | 21,215,000 | | | | | 21,062,660 | |
| | Electronic Equipment, Instruments & Components — 0.6% | | | | | | | | | | |
| | Ingram Micro, Inc., 5.45% due 12/15/2024 | | | | 5,596,000 | | | | | 5,417,539 | |
| | Tech Data Corp., 4.95% due 2/15/2027 | | | | 6,000,000 | | | | | 6,014,952 | |
| | Trimble, Inc., 4.75% due 12/1/2024 | | | | 17,000,000 | | | | | 17,706,561 | |
| | Office Electronics — 0.1% | | | | | | | | | | |
| | Lexmark International, Inc., 7.125% due 3/15/2020 | | | | 5,375,000 | | | | | 4,086,881 | |
| | Technology Hardware, Storage & Peripherals — 0.6% | | | | | | | | | | |
| | Apple, Inc., | | | | | | | | | | |
| b | | 2.30% (LIBOR 3 Month + 0.50%) due 2/9/2022 | | | | 11,975,000 | | | | | 12,113,350 | |
| b | | 2.74% (LIBOR 3 Month + 0.82%) due 2/22/2019 | | | | 4,950,000 | | | | | 4,985,119 | |
| b | | 3.05% (LIBOR 3 Month + 1.13%) due 2/23/2021 | | | | 9,050,000 | | | | | 9,291,458 | |
| b | | Hewlett Packard Enterprise Co., 3.626% (LIBOR 3 Month + 1.93%) due 10/5/2018 | | | | 4,900,000 | | | | | 4,943,203 | |
| | | | | | | | | | | | |
| | | | | | | | | | | 103,823,840 | |
| | | | | | | | | | | | |
Semi-Annual Reports | 25
Schedule of Investments, Continued
Thornburg Limited Term Income Fund | March 31, 2018 (Unaudited)
| | | | | | | | | | | | |
| | | | | PRINCIPAL AMOUNT | | VALUE |
| | TELECOMMUNICATION SERVICES — 1.5% | | | | | | | | | | |
| | Diversified Telecommunication Services — 1.5% | | | | | | | | | | |
| | AT&T, Inc., | | | | | | | | | | |
| b | | 2.866% (LIBOR 3 Month + 0.91%) due 11/27/2018 | | | $ | 11,350,000 | | | | $ | 11,397,123 | |
| b | | 3.232% (LIBOR 3 Month + 0.93%) due 6/30/2020 | | | | 4,950,000 | | | | | 5,002,070 | |
| | 3.60% due 2/17/2023 | | | | 8,000,000 | | | | | 8,047,777 | |
| | 3.90% due 3/11/2024 | | | | 4,500,000 | | | | | 4,532,296 | |
| | 4.45% due 4/1/2024 | | | | 10,000,000 | | | | | 10,321,533 | |
| e | | 7.85% due 1/15/2022 | | | | 3,000,000 | | | | | 3,438,577 | |
| | Qwest Corp., 6.75% due 12/1/2021 | | | | 3,000,000 | | | | | 3,216,264 | |
| a | | Telefonica Emisiones SAU (Guaranty: Telefonica S.A.), 4.103% due 3/8/2027 | | | | 8,500,000 | | | | | 8,491,285 | |
| | Verizon Communications, Inc., | | | | | | | | | | |
| b | | 3.145% (LIBOR 3 Month + 1.00%) due 3/16/2022 | | | | 7,500,000 | | | | | 7,643,356 | |
| | 3.376% due 2/15/2025 | | | | 14,757,000 | | | | | 14,504,874 | |
| | | | | | | | | | | | |
| | | | | | | | | | | 76,595,155 | |
| | | | | | | | | | | | |
| | TRANSPORTATION — 1.2% | | | | | | | | | | |
| | Air Freight & Logistics — 0.3% | | | | | | | | | | |
| a,e | | Asciano Finance Ltd., 5.00% due 4/7/2018 | | | | 2,000,000 | | | | | 2,000,432 | |
| | TTX Co., | | | | | | | | | | |
| e | | 2.25% due 2/1/2019 | | | | 5,000,000 | | | | | 4,978,441 | |
| e | | 4.15% due 1/15/2024 | | | | 6,000,000 | | | | | 6,171,175 | |
| e | | 5.453% due 1/2/2022 | | | | 2,424,501 | | | | | 2,493,259 | |
| | Airlines — 0.3% | | | | | | | | | | |
| | American Airlines 2013-2 Class A Pass Through Trust, 4.95% due 7/15/2024 | | | | 5,221,590 | | | | | 5,430,454 | |
| | Northwest Airlines Pass Through Trust, Series 2007-1 Class A, 7.027% due 5/1/2021 | | | | 3,568,013 | | | | | 3,757,832 | |
| | US Airways Pass Through Trust, Series 2010-1 Class A, 6.25% due 10/22/2024 | | | | 4,360,291 | | | | | 4,702,137 | |
| | Diversified Consumer Services — 0.3% | | | | | | | | | | |
| | Graham Holdings Co., 7.25% due 2/1/2019 | | | | 5,000,000 | | | | | 5,147,500 | |
| | Rensselaer Polytechnic Institute, 5.60% due 9/1/2020 | | | | 10,925,000 | | | | | 11,531,618 | |
| | University of Chicago, Series 12-B, 3.065% due 10/1/2024 | | | | 1,174,000 | | | | | 1,150,802 | |
| | Road & Rail — 0.3% | | | | | | | | | | |
| e | | BNSF Railway Co. 2015-1 Pass Through Trust, 3.442% due 6/16/2028 | | | | 13,589,511 | | | | | 13,538,783 | |
| | | | | | | | | | | | |
| | | | | | | | | | | 60,902,433 | |
| | | | | | | | | | | | |
| | UTILITIES — 6.7% | | | | | | | | | | |
| | Electric Utilities — 5.7% | | | | | | | | | | |
| | Appalachian Power Co., 3.40% due 6/1/2025 | | | | 7,000,000 | | | | | 6,924,653 | |
| | Avangrid, Inc., 3.15% due 12/1/2024 | | | | 8,870,000 | | | | | 8,611,078 | |
| | Duke Energy Florida Project Finance, LLC, Series 2018, 1.196% due 3/1/2022 | | | | 11,181,946 | | | | | 10,993,726 | |
| | Edison International, 2.40% due 9/15/2022 | | | | 4,900,000 | | | | | 4,672,104 | |
| a,e | | Electricite de France S.A., 2.15% due 1/22/2019 | | | | 4,900,000 | | | | | 4,876,914 | |
| | Enel Finance International N.V. (Guaranty: Enel S.p.A), | | | | | | | | | | |
| a,e | | 2.75% due 4/6/2023 | | | | 8,000,000 | | | | | 7,730,704 | |
| a,e | | 2.875% due 5/25/2022 | | | | 7,000,000 | | | | | 6,831,442 | |
| | Entergy Louisiana, LLC, 4.80% due 5/1/2021 | | | | 4,300,000 | | | | | 4,494,344 | |
| | Entergy Mississippi, Inc., 3.25% due 12/1/2027 | | | | 9,502,000 | | | | | 9,215,886 | |
| | Entergy Texas, Inc., | | | | | | | | | | |
| | 3.45% due 12/1/2027 | | | | 12,000,000 | | | | | 11,733,802 | |
| | 7.125% due 2/1/2019 | | | | 2,000,000 | | | | | 2,065,296 | |
| | Exelon Corp., 2.85% due 6/15/2020 | | | | 2,950,000 | | | | | 2,923,532 | |
| | Interstate Power & Light Co., 3.25% due 12/1/2024 | | | | 24,950,000 | | | | | 24,571,343 | |
| e | | Jersey Central Power & Light Co., 4.30% due 1/15/2026 | | | | 15,000,000 | | | | | 15,438,553 | |
| a,e | | Korea Western Power Co. Ltd., 2.875% due 10/10/2018 | | | | 10,000,000 | | | | | 9,987,215 | |
| e | | Midland Cogeneration Venture L.P., 6.00% due 3/15/2025 | | | | 5,407,192 | | | | | 5,568,508 | |
| b | | Mississippi Power Co., 2.942% (LIBOR 3 Month + 0.65%) due 3/27/2020 | | | | 4,965,000 | | | | | 4,966,723 | |
| e | | Monongahela Power Co., 4.10% due 4/15/2024 | | | | 12,500,000 | | | | | 12,947,280 | |
| e | | Niagara Mohawk Power Corp., 4.881% due 8/15/2019 | | | | 10,000,000 | | | | | 10,260,858 | |
| | Northern States Power Co., 3.30% due 6/15/2024 | | | | 10,000,000 | | | | | 9,987,408 | |
| b,e | | Pacific Gas & Electric Co., 2.214% (LIBOR 3 Month + 0.23%) due 11/28/2018 | | | | 9,950,000 | | | | | 9,925,672 | |
| | PNM Resources, Inc., 3.25% due 3/9/2021 | | | | 7,784,000 | | | | | 7,775,974 | |
| | Public Service Co. of New Mexico, 5.35% due 10/1/2021 | | | | 3,000,000 | | | | | 3,176,289 | |
26 | Semi-Annual Reports
Schedule of Investments, Continued
Thornburg Limited Term Income Fund | March 31, 2018 (Unaudited)
| | | | | | | | | | | | |
| | | | | PRINCIPAL AMOUNT | | VALUE |
| e | | Rochester Gas & Electric Corp., 5.90% due 7/15/2019 | | | $ | 11,732,000 | | | | $ | 12,143,831 | |
| | SCANA Corp., 4.125% due 2/1/2022 | | | | 2,000,000 | | | | | 1,986,394 | |
| b | | Sempra Energy, 1.959% (LIBOR 3 Month + 0.25%) due 7/15/2019 | | | | 16,800,000 | | | | | 16,800,606 | |
| | Southern Power Co., Series 15B, 2.375% due 6/1/2020 | | | | 9,793,000 | | | | | 9,656,772 | |
| a,e | | State Grid Overseas Investment (2014) Ltd. (Guaranty: State Grid Corp. of China), 2.75% due 5/7/2019 | | | | 14,800,000 | | | | | 14,769,101 | |
| a,e | | State Grid Overseas Investment 2016 Ltd. (Guaranty: State Grid Corp. of China), 2.25% due 5/4/2020 | | | | 10,000,000 | | | | | 9,828,417 | |
| | The Southern Co., 2.45% due 9/1/2018 | | | | 4,825,000 | | | | | 4,819,614 | |
| | Toledo Edison Co., 7.25% due 5/1/2020 | | | | 167,000 | | | | | 179,120 | |
| a,e | | Transelec S.A., 4.25% due 1/14/2025 | | | | 6,000,000 | | | | | 6,050,912 | |
| | UIL Holdings Corp., 4.625% due 10/1/2020 | | | | 13,110,000 | | | | | 13,552,959 | |
| | Virginia Electric & Power Co., Series A, 3.80% due 4/1/2028 | | | | 9,985,000 | | | | | 10,109,612 | |
| | Gas Utilities — 1.0% | | | | | | | | | | |
| | Dominion Energy Gas Holdings, LLC, 2.80% due 11/15/2020 | | | | 5,000,000 | | | | | 4,951,755 | |
| | Dominion Gas Holdings, LLC, 2.50% due 12/15/2019 | | | | 3,900,000 | | | | | 3,864,336 | |
| e | | SEMCO Energy, Inc., 5.15% due 4/21/2020 | | | | 3,000,000 | | | | | 3,127,482 | |
| | Southern Co. Gas Capital Corp., 3.50% due 9/15/2021 | | | | 9,925,000 | | | | | 9,981,650 | |
| | Spire, Inc., 2.55% due 8/15/2019 | | | | 2,350,000 | | | | | 2,332,643 | |
| | WGL Holdings, Inc., | | | | | | | | | | |
| b | | 2.384% (LIBOR 3 Month + 0.40%) due 11/29/2019 | | | | 13,883,000 | | | | | 13,855,975 | |
| b | | 2.657% (LIBOR 3 Month + 0.55%) due 3/12/2020 | | | | 12,318,000 | | | | | 12,317,994 | |
| | | | | | | | | | | | |
| | | | | | | | | | | 346,008,477 | |
| | | | | | | | | | | | |
| | TOTAL CORPORATE BONDS (Cost $2,650,645,461) | | | | | | | | | 2,646,990,001 | |
| | | | | | | | | | | | |
| | MUNICIPAL BONDS — 2.4% | | | | | | | | | | |
| | Anaheim Public Financing Authority (Insured NATL), 5.486% due 9/1/2020 | | | | 3,270,000 | | | | | 3,311,660 | |
| j | | Brentwood Infrastructure Financing Authority, 6.16% due 10/1/2019 | | | | 1,435,000 | | | | | 1,485,713 | |
| | California Health Facilities Financing Authority, 6.76% due 2/1/2019 | | | | 2,015,000 | | | | | 2,071,138 | |
| | California School Finance Authority (LOC: City National Bank), 5.041% due 7/1/2020 | | | | 4,000,000 | | | | | 4,133,320 | |
| | Camden County Improvement Authority, | | | | | | | | | | |
| | 5.47% due 7/1/2018 | | | | 2,140,000 | | | | | 2,152,776 | |
| | 5.62% due 7/1/2019 | | | | 3,025,000 | | | | | 3,097,600 | |
| | Colorado Educational & Cultural Facilities Authority, | | | | | | | | | | |
| | Series B, | | | | | | | | | | |
| | 2.244% due 3/1/2021 | | | | 450,000 | | | | | 441,360 | |
| | 2.474% due 3/1/2022 | | | | 600,000 | | | | | 586,380 | |
| | 2.691% due 3/1/2023 | | | | 580,000 | | | | | 567,483 | |
| j | | Connecticut Housing Finance Authority, Series D, 5.071% due 11/15/2019 | | | | 1,090,000 | | | | | 1,110,459 | |
| | Denver City & County School District No. 1 COP, Series B, 2.018% due 12/15/2019 | | | | 3,000,000 | | | | | 2,981,070 | |
| | Fort Collins Electric Utility Enterprise Revenue, Series B-QUALIFIED ENERGY, 4.92% due 12/1/2020 | | | | 2,250,000 | | | | | 2,304,877 | |
| | JobsOhio Beverage System, Series B, 2.217% due 1/1/2019 | | | | 11,245,000 | | | | | 11,237,016 | |
| | Kentucky Asset Liability Commission, 2.099% due 4/1/2019 | | | | 3,000,000 | | | | | 2,988,690 | |
| | Los Angeles County Public Works Financing Authority, 5.591% due 8/1/2020 | | | | 3,350,000 | | | | | 3,555,891 | |
| | Municipal Improvement Corp. of Los Angeles (Build America-BDS-Recovery Zone), 6.165% due 11/1/2020 | | | | 11,885,000 | | | | | 12,638,271 | |
| | New York City Transitional Finance Authority Future Tax Secured Revenue (Build America Bonds), 4.075% due 11/1/2020 | | | | 2,500,000 | | | | | 2,590,225 | |
| | New York State Urban Development Corp., Series D-1, 2.55% due 3/15/2022 | | | | 29,675,000 | | | | | 29,379,734 | |
| j | | Oklahoma Development Finance Authority, 8.00% due 5/1/2020 | | | | 1,930,000 | | | | | 1,949,667 | |
| | Orleans Parish Parishwide School District (Insured AGM) GO, 4.40% due 2/1/2021 | | | | 10,000,000 | | | | | 10,335,300 | |
| j | | Redlands Redevelopment Agency Successor Agency (Insured AMBAC) ETM, Series A, 5.818% due 8/1/2022 | | | | 1,275,000 | | | | | 1,373,073 | |
| | Rutgers The State University of New Jersey, | | | | | | | | | | |
| | Series K, | | | | | | | | | | |
| | 2.342% due 5/1/2019 | | | | 3,485,000 | | | | | 3,469,945 | |
| | 3.028% due 5/1/2021 | | | | 1,500,000 | | | | | 1,491,990 | |
| | San Bernardino County Redevelopment Agency Successor Agency, 7.135% due 9/1/2020 | | | | 810,000 | | | | | 850,978 | |
| | San Francisco City & County Redevelopment Financing Authority ETM, 8.00% due 8/1/2019 | | | | 4,265,000 | | | | | 4,479,359 | |
| | San Francisco City & County Redevelopment Financing Authority, 8.00% due 8/1/2019 | | | | 525,000 | | | | | 547,612 | |
| | Tampa-Hillsborough County Expressway Authority, | | | | | | | | | | |
| | Series C, | | | | | | | | | | |
| | 2.22% due 7/1/2018 | | | | 2,000,000 | | | | | 1,998,420 | |
| | 2.49% due 7/1/2019 | | | | 2,500,000 | | | | | 2,481,925 | |
| | 2.84% due 7/1/2020 | | | | 1,750,000 | | | | | 1,731,100 | |
Semi-Annual Reports | 27
Schedule of Investments, Continued
Thornburg Limited Term Income Fund | March 31, 2018 (Unaudited)
| | | | | | | | | | | | |
| | | | | PRINCIPAL
AMOUNT | | VALUE |
| | Wallenpaupack Area School District GO, | | | | | | | | | | |
| | Series B, | | | | | | | | | | |
| | 3.80% due 9/1/2019 | | | $ | 3,000,000 | | | | $ | 3,051,600 | |
| | 4.00% due 9/1/2020 | | | | 2,750,000 | | | | | 2,825,652 | |
| | | | | | | | | | | | |
| | TOTAL MUNICIPAL BONDS (Cost $121,398,089) | | | | | | | | | 123,220,284 | |
| | | | | | | | | | | | |
| | | |
| | SHORT-TERM INVESTMENTS — 6.0% | | | | | | | | | | |
| | Alabama Power Co., 2.20% due 4/2/2018 | | | | 23,000,000 | | | | | 22,998,594 | |
| | Bank of New York Tri-Party Repurchase Agreement 1.88% dated 3/29/2018 due 4/2/2018, repurchase price $40,008,379 collateralized by 30 corporate debt securities, having an average coupon of 3.70%, a minimum credit rating of BBB-, maturity dates from 9/8/2020 to 6/1/2065, and having an aggregate market value of $42,795,164 at 3/29/2018 1.88% due 4/2/2018 | | | | 120,000,000 | | | | | 120,000,000 | |
| | Cintas Corp., 2.15% due 4/2/2018 | | | | 22,066,000 | | | | | 22,064,682 | |
| | Electricite de France S.A., 2.15% due 4/3/2018 | | | | 8,246,000 | | | | | 8,245,015 | |
| | Intercontinental Exchange, Inc., 1.80% due 4/3/2018 | | | | 2,000,000 | | | | | 1,999,800 | |
| | Kentucky Utilities Co., 2.30% due 4/4/2018 | | | | 17,000,000 | | | | | 16,996,742 | |
| | Louisville Gas & Electric Co., | | | | | | | | | | |
| | 2.20% due 4/2/2018 | | | | 13,000,000 | | | | | 12,999,206 | |
| | 2.25% due 4/4/2018 | | | | 10,000,000 | | | | | 9,998,125 | |
| | NSTAR Electric Co., 1.70% due 4/4/2018 | | | | 23,000,000 | | | | | 22,996,742 | |
| | PacifiCorp, 2.15% due 4/2/2018 | | | | 2,700,000 | | | | | 2,699,842 | |
| | San Diego Gas & Electric, 1.384% due 4/2/2018 | | | | 23,000,000 | | | | | 22,998,895 | |
| | Snap-on Inc., | | | | | | | | | | |
| | 2.04% due 4/2/2018 | | | | 10,733,000 | | | | | 10,732,392 | |
| | 2.05% due 4/4/2018 | | | | 12,900,000 | | | | | 12,897,796 | |
| | Sysco Corp., 2.10% due 4/2/2018 | | | | 23,000,000 | | | | | 22,998,658 | |
| | | | | | | | | | | | |
| | TOTAL SHORT-TERM INVESTMENTS (Cost $310,626,489) | | | | | | | | | 310,626,489 | |
| | | | | | | | | | | | |
| | | |
| | TOTAL INVESTMENTS — 98.9% (Cost $5,126,001,035) | | | | | | | | $ | 5,104,970,863 | |
| | | |
| | OTHER ASSETS LESS LIABILITIES — 1.1% | | | | | | | | | 58,175,904 | |
| | | | | | | | | | | | |
| | | |
| | NET ASSETS — 100.0% | | | | | | | | $ | 5,163,146,767 | |
| | | | | | | | | | | | |
Footnote Legend
| a | Yankee bond denominated in U.S. dollars and is issued in the U.S. by foreign banks and corporations. |
| b | Floating Rate Security. Stated interest/floor rate was in effect at March 31, 2018. |
| c | Securities exempt from registration under Rule 144A of the Securities Act of 1933, as amended. These securities are restricted and illiquid. As of March 31, 2018, the aggregate value of these securities in the Fund’s portfolio was $12,139,101, representing 0.24% of the Fund’s net assets. Additional information is as follows: |
| | | | | | | | | | | | | | | | | | | | |
| 144A/RESTRICTED & ILLIQUID SECURITIES | | ACQUISITION
DATE | | COST | | MARKET
VALUE | | PERCENTAGE OF
NET ASSETS |
Bermuda Government International Bond, 4.138%, 1/03/2023 | | 6/26/2012 | | | $ | 4,000,000 | | | | $ | 4,130,000 | | | | | 0.1 | % |
Bermuda Government International Bond, 5.603%, 7/20/2020 | | 7/13/2010 | | | | 3,005,045 | | | | | 3,172,500 | | | | | 0.0 | |
Northwind Holdings, LLC, 2.786%, 12/01/2037 | | 1/29/2010 | | | | 1,421,327 | | | | | 1,552,381 | | | | | 0.0 | |
United States Department of Transportation, 6.001%, 12/07/2031 | | 12/16/2011 | | | | 3,172,625 | | | | | 3,284,220 | | | | | 0.1 | |
| d | Security currently fair valued by the Valuation and Pricing Committee using procedures approved by the Trustees’ Audit Committee. |
| e | Securities exempt from registration under Rule 144A of the Securities Act of 1933, as amended. These securities are restricted but liquid and may only be resold in the ordinary course of business in transactions exempt from registration, normally to qualified institutional buyers. As of March 31, 2018, the aggregate value of these securities in the Fund’s portfolio was $1,652,824,156, representing 32.01% of the Fund’s net assets. |
| f | Variable rate coupon, rate shown as of March 31, 2018. |
| g | Segregated as collateral for a when-issued security. |
Portfolio Abbreviations
28 | Semi-Annual Reports
Schedule of Investments, Continued
Thornburg Limited Term Income Fund | March 31, 2018 (Unaudited)
To simplify the listings of securities, abbreviations are used per the table below:
| | |
| AGM | | Insured by Assured Guaranty Municipal Corp. |
| AMBAC | | Insured by American Municipal Bond Assurance Corp. |
| CHL | | Denominated in Chilean Peso |
| CMO | | Collateralized Mortgage Obligation |
| COP | | Certificates of Participation |
| ETM | | Escrowed to Maturity |
| GO | | General Obligation |
| H15T1Y | | US Treasury Yield Curve Rate T-Note Constant Maturity 1 Year |
| LIBOR | | London Interbank Offered Rates |
| Mtg | | Mortgage |
| MTN | | Medium-Term Note |
| REMIC | | Real Estate Mortgage Investment Conduit |
| SBA | | Small Business Administration |
| SPV | | Special Purpose Vehicle |
| VA | | Veterans Affairs |
Semi-Annual Reports | 29
Fund Summary
Thornburg Low Duration Income Fund | March 31, 2018 (Unaudited)
OBJECTIVES AND STRATEGIES
The Fund’s objective is to seek current income, consistent with preservation of capital.
The Fund invests in debt obligations issued by the U.S. Government, its agencies, or its instrumentalities, and in debt obligations rated at the time of purchase in one of the four highest credit ratings categories or, if no credit rating is available, judged to be of comparable quality by the Fund’s advisor. The Fund aims to reduce changes in its share value compared to longer duration fixed income portfolios by maintaining a laddered portfolio of investments with a dollar-weighted average duration of normally no more than three years.
LONG-TERM STABILITY OF PRINCIPAL
Net Asset Value History of A Shares
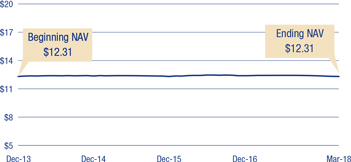
KEY PORTFOLIO ATTRIBUTES
| | | | | |
| Number of Bonds | | | | 208 | |
| Effective Duration | | | | 1.3 Yrs | |
| Average Maturity | | | | 1.9 Yrs | |
There is no guarantee that the Fund will meet its investment objectives.
All data is subject to change. Charts may not add up to 100% due to rounding.
SECURITY CREDIT RATINGS
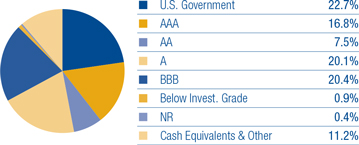
A bond credit rating assesses the financial ability of a debt issuer to make timely payments of principal and interest. Ratings of AAA (the highest), AA, A, and BBB are investment-grade quality. Ratings of BB, B, CCC, CC, C and D (the lowest) are considered below investment grade, speculative grade, or junk bonds.
PORTFOLIO LADDER
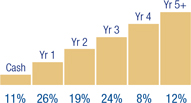
Percent of portfolio maturing in each year. Cash includes cash equivalents.
30 | Semi-Annual Reports
Schedule of Investments
Thornburg Low Duration Income Fund | March 31, 2018 (Unaudited)
| | | | | | | | | | | | |
| | | | | PRINCIPAL
AMOUNT | | VALUE |
| | | |
| | U.S. TREASURY SECURITIES — 14.7% | | | | | | | | | | |
| | United States Treasury Notes Inflationary Index, 0.125% due 4/15/2020 - 4/15/2022 | | | $ | 702,556 | | | | $ | 696,683 | |
| | United States Treasury Notes, | | | | | | | | | | |
| | 0.125% due 4/15/2019 | | | | 237,967 | | | | | 237,747 | |
| | 1.25% due 10/31/2018 - 8/31/2019 | | | | 1,700,000 | | | | | 1,688,124 | |
| | 1.625% due 11/30/2020 | | | | 100,000 | | | | | 98,087 | |
| | 1.875% due 10/31/2022 | | | | 100,000 | | | | | 97,150 | |
| | 2.125% due 12/31/2022 | | | | 275,000 | | | | | 269,715 | |
| | 2.375% due 12/31/2020 | | | | 400,000 | | | | | 399,992 | |
| | | | | | | | | | | | |
| | TOTAL U.S. TREASURY SECURITIES (Cost $3,505,649) | | | | | | | | | 3,487,498 | |
| | | | | | | | | | | | |
| | | |
| | U.S. GOVERNMENT AGENCIES — 1.5% | | | | | | | | | | |
| | Petroleos Mexicanos (Guaranty: Export-Import Bank of the United States), | | | | | | | | | | |
| a | | 1.70% due 12/20/2022 | | | | 50,000 | | | | | 48,856 | |
| a,b | | 2.072% (LIBOR 3 Month + 0.35%) due 4/15/2025 | | | | 72,500 | | | | | 72,776 | |
| a | | Reliance Industries Ltd. (Guaranty: Export-Import Bank of the United States), 1.87% due 1/15/2026 | | | | 105,263 | | | | | 101,670 | |
| b | | Washington Aircraft 2 Co. Ltd. (Guaranty: Export-Import Bank of the United States), 2.716% (LIBOR 3 Month + 0.43%) due 6/26/2024 | | | | 138,631 | | | | | 138,101 | |
| | | | | | | | | | | | |
| | TOTAL U.S. GOVERNMENT AGENCIES (Cost $365,137) | | | | | | | | | 361,403 | |
| | | | | | | | | | | | |
| | | |
| | OTHER GOVERNMENT — 0.2% | | | | | | | | | | |
| a,b,c | | Seven & Seven Ltd. (Guaranty: Export-Import Bank of Korea), 3.259% (LIBOR 6 Month + 1.00%) due 9/11/2019 | | | | 60,000 | | | | | 59,672 | |
| | | | | | | | | | | | |
| | TOTAL OTHER GOVERNMENT (Cost $59,646) | | | | | | | | | 59,672 | |
| | | | | | | | | | | | |
| | | |
| | MORTGAGE BACKED — 5.9% | | | | | | | | | | |
| | Federal Home Loan Mtg Corp., | | | | | | | | | | |
| | Pool G15523, 2.50% due 8/1/2025 | | | | 117,293 | | | | | 116,390 | |
| | Series K705 Class A1, 1.626% due 7/25/2018 | | | | 113,949 | | | | | 113,620 | |
| | Federal Home Loan Mtg Corp., CMO, Series K716 Class A1, 2.413% due 1/25/2021 | | | | 54,988 | | | | | 54,564 | |
| | Federal Home Loan Mtg Corp., Multi-Family Structured Pass Through, | | | | | | | | | | |
| | Series K030 Class A1, 2.779% due 9/25/2022 | | | | 87,915 | | | | | 87,549 | |
| | Series K036 Class A1, 2.777% due 4/25/2023 | | | | 180,054 | | | | | 179,252 | |
| | Series K710 Class A2, 1.883% due 5/25/2019 | | | | 275,000 | | | | | 272,262 | |
| | Series K717 Class A2, 2.991% due 9/25/2021 | | | | 100,000 | | | | | 100,285 | |
| | Federal Home Loan Mtg Corp., Seasoned Credit Risk Transfer, | | | | | | | | | | |
| | Series 2017-3 Class HA, 2.25% due 7/25/2056 | | | | 70,778 | | | | | 69,924 | |
| d | | Series 2018-1 Class HA, 2.00% due 5/25/2057 | | | | 49,770 | | | | | 48,251 | |
| | Federal Home Loan Mtg Corp., Whole Loan Securities, Series 2017-SC02 Class 2A1, 3.50% due 5/25/2047 | | | | 38,803 | | | | | 39,056 | |
| | Federal National Mtg Assoc., | | | | | | | | | | |
| | Pool AS3705, 2.50% due 11/1/2024 | | | | 69,248 | | | | | 68,953 | |
| | Pool AS8538, 2.50% due 12/1/2026 | | | | 243,698 | | | | | 242,508 | |
| | | | | | | | | | | | |
| | TOTAL MORTGAGE BACKED (Cost $1,417,088) | | | | | | | | | 1,392,614 | |
| | | | | | | | | | | | |
| | | |
| | ASSET BACKED SECURITIES — 22.3% | | | | | | | | | | |
| | | |
| | ADVANCE RECEIVABLES — 0.4% | | | | | | | | | | |
| c | | New Residential Advance Receivables Trust, Series 2016-T2 Class AT2, 2.575% due 10/15/2049 | | | | 100,000 | | | | | 98,972 | |
| | | | | | | | | | | | |
| | | | | | | | | | | 98,972 | |
| | | | | | | | | | | | |
| | AUTO RECEIVABLES — 3.4% | | | | | | | | | | |
| | Ally Auto Receivables Trust, | | | | | | | | | | |
| | Series 2015-1 Class A3, 1.39% due 9/16/2019 | | | | 26,352 | | | | | 26,312 | |
| | Series 2015-2 Class A3, 1.49% due 11/15/2019 | | | | 24,439 | | | | | 24,392 | |
| c | | American Credit Acceptance Receivables Trust, Series 2017-3 Class A, 1.82% due 3/10/2020 | | | | 45,208 | | | | | 45,109 | |
| c | | Chesapeake Funding II, LLC, Series 2016-1A Class A1, 2.11% due 3/15/2028 | | | | 106,613 | | | | | 106,266 | |
| c | | CIG Auto Receivables Trust, Series 2017-1A Class A, 2.71% due 5/15/2023 | | | | 32,306 | | | | | 32,123 | |
| c | | Drive Auto Receivables Trust, Series 2017-AA Class B, 2.51% due 1/15/2021 | | | | 125,000 | | | | | 124,949 | |
| c | | Ford Credit Auto Owner Trust, Series 2015-1 Class A, 2.12% due 7/15/2026 | | | | 100,000 | | | | | 98,833 | |
| c | | Foursight Capital Automobile Receivables Trust, Series 2016-1 Class A2, 2.87% due 10/15/2021 | | | | 48,708 | | | | | 48,524 | |
| | Harley-Davidson Motorcycle Trust, Series 2015-2 Class A4, 1.66% due 12/15/2022 | | | | 100,000 | | | | | 99,514 | |
Semi-Annual Reports | 31
Schedule of Investments, Continued
Thornburg Low Duration Income Fund | March 31, 2018 (Unaudited)
| | | | | | | | | | | | |
| | | | | PRINCIPAL
AMOUNT | | VALUE |
| b,c | | Hertz Fleet Lease Funding LP, Series 2016-1 Class A1, 2.84% (LIBOR 1 Month + 1.10%) due 4/10/2030 | | | $ | 132,529 | | | | $ | 133,319 | |
| c,d | | OSCAR US Funding Trust, Series 2016-2A Class A3, 2.73% due 12/15/2020 | | | | 70,000 | | | | | 69,860 | |
| | | | | | | | | | | | |
| | | | | | | | | | | 809,201 | |
| | | | | | | | | | | | |
| | COMMERCIAL MTG TRUST — 1.8% | | | | | | | | | | |
| c | | Barclays Commercial Mortgage Securities, LLC, Series 2015-STP Class A, 3.323% due 9/10/2028 | | | | 95,695 | | | | | 96,289 | |
| | COMM Mortgage Trust, Series 2016-DC2 Class A1, 1.82% due 2/10/2049 | | | | 92,013 | | | | | 90,808 | |
| c,e | | Credit Suisse Mortgage Trust, Series 2017-HL2 Class A3, 3.50% due 10/25/2047 | | | | 150,450 | | | | | 149,002 | |
| b,c | | DBUBS Mortgage Trust, CMO, Series 2011-LC2A Class A1FL, 3.09% (LIBOR 1 Month + 1.35%) due 7/12/2044 | | | | 30,356 | | | | | 30,680 | |
| b,c | | FREMF Mortgage Trust, Series 2013-KF02 Class B, 4.67% (LIBOR 1 Month + 3.00%) due 12/25/2045 | | | | 8,263 | | | | | 8,280 | |
| | WFRBS Commercial Mortgage Trust, Series 2014-C22 Class A1, 1.479% due 9/15/2057 | | | | 48,413 | | | | | 48,075 | |
| | | | | | | | | | | | |
| | | | | | | | | | | 423,134 | |
| | | | | | | | | | | | |
| | COMMERCIAL SERVICES — 0.8% | | | | | | | | | | |
| a,b,c | | Korea Expressway Corp., Series 144A, 2.445% (LIBOR 3 Month + 0.70%) due 4/20/2020 | | | | 200,000 | | | | | 199,994 | |
| | | | | | | | | | | | |
| | | | | | | | | | | 199,994 | |
| | | | | | | | | | | | |
| | FOREST PRODUCTS & PAPER — 1.6% | | | | | | | | | | |
| | Barclays Dryrock Issuance Trust, | | | | | | | | | | |
| | Series 2015-4 Class A, 1.72% due 8/16/2021 | | | | 100,000 | | | | | 99,609 | |
| | Series 2016-1 Class A, 1.52% due 5/16/2022 | | | | 135,000 | | | | | 133,115 | |
| c | | Cabela’s Master Credit Card Trust, Series 2013-2A Class A1, 2.17% due 8/16/2021 | | | | 150,000 | | | | | 149,867 | |
| | | | | | | | | | | | |
| | | | | | | | | | | 382,591 | |
| | | | | | | | | | | | |
| | OTHER ASSET BACKED — 10.7% | | | | | | | | | | |
| b,c | | AMSR Trust, Series 2016-SFR1 Class A, 3.208% (LIBOR 1 Month + 1.40%) due 11/17/2033 | | | | 100,000 | | | | | 100,412 | |
| c | | BCC Funding XIV, LLC, Series 2018-1A Class A2, 2.96% due 6/20/2023 | | | | 100,000 | | | | | 99,812 | |
| c | | BRE Grand Islander Timeshare Issuer, LLC, Series 2017-1A Class A, 2.94% due 5/25/2029 | | | | 79,297 | | | | | 77,681 | |
| c | | CLI Funding, LLC, Series 2014-1A Class A, 3.29% due 6/18/2029 | | | | 62,208 | | | | | 61,523 | |
| | Consumer Loan Underlying Bond Credit Trust, | | | | | | | | | | |
| c | | Series 2017-NP2 Class A, 2.55% due 1/16/2024 | | | | 77,914 | | | | | 77,853 | |
| c | | Series 2017-P1 Class A, 2.42% due 9/15/2023 | | | | 67,614 | | | | | 67,463 | |
| c | | Dell Equipment Finance Trust, Series 2017-2 Class A2A, 1.97% due 2/24/2020 | | | | 100,000 | | | | | 99,472 | |
| c | | Diamond Resorts Owner Trust, Series 2014-1 Class A, 2.54% due 5/20/2027 | | | | 71,318 | | | | | 71,038 | |
| c | | Engs Commercial Finance Trust, Series 2018-1A Class A1, 2.97% due 2/22/2021 | | | | 100,000 | | | | | 99,991 | |
| c | | Foundation Finance Trust, Series 2017-1A Class A, 3.30% due 7/15/2033 | | | | 90,153 | | | | | 89,548 | |
| | Louisiana Local Government Environmental Facilities & Community Development Authority, Series 2014-ELL Class A1, 1.66% due 2/1/2022 | | | | 33,782 | | | | | 33,113 | |
| | MVW Owner Trust, 2.15% due 4/22/2030 | | | | 21,922 | | | | | 21,632 | |
| c,e | | Nationstar HECM Loan Trust, Series 2017-2A Class A1, 2.038% due 9/25/2027 | | | | 72,623 | | | | | 72,169 | |
| b,c | | Navient Student Loan Trust, Series 2016-6A Class A2, 2.622% (LIBOR 1 Month + 0.75%) due 3/25/2066 | | | | 100,000 | | | | | 101,078 | |
| c | | OnDeck Asset Securitization Trust II, LLC, Series 2016-1A Class A, 4.21% due 5/17/2020 | | | | 100,000 | | | | | 100,053 | |
| c | | OneMain Financial Issuance Trust, Series 2016-2A Class A, 4.10% due 3/20/2028 | | | | 95,132 | | | | | 95,837 | |
| b,c | | Pennsylvania Higher Education Assistance Agency, Series 2012-1A Class A1, 2.422% (LIBOR 1 Month + 0.55%) due 5/25/2057 | | | | 38,725 | | | | | 38,626 | |
| | PFS Financing Corp., | | | | | | | | | | |
| b,c | | Series 2015-AA Class A, 2.397% (LIBOR 1 Month + 0.62%) due 4/15/2020 | | | | 100,000 | | | | | 99,940 | |
| c | | Series 2018-B Class A, 2.89% due 2/15/2023 | | | | 100,000 | | | | | 99,423 | |
| c | | Prosper Marketplace Issuance Trust, Series 2017-3A Class A, 2.36% due 11/15/2023 | | | | 72,941 | | | | | 72,656 | |
| c,d | | Purchasing Power Funding, LLC, Series 2018-A Class A, 3.34% due 8/15/2022 | | | | 100,000 | | | | | 100,129 | |
| c | | SBA Tower Trust, Series 2014-1A Class C, 2.898% due 10/15/2044 | | | | 100,000 | | | | | 99,490 | |
| | Sierra Receivables Funding Co., LLC, | | | | | | | | | | |
| c | | Series 2014-1A Class A, 2.07% due 3/20/2030 | | | | 12,382 | | | | | 12,361 | |
| c | | Series 2015-1A Class A, 2.40% due 3/22/2032 | | | | 65,037 | | | | | 63,854 | |
| c | | Series 2015-3A Class A, 2.58% due 9/20/2032 | | | | 27,456 | | | | | 27,095 | |
| | SLM Student Loan Trust, | | | | | | | | | | |
| b,c | | Series 2011-A Class A3, 4.277% (LIBOR 1 Month + 2.50%) due 1/15/2043 | | | | 100,000 | | | | | 103,163 | |
| b | | Series 2013-4 Class A, 2.422% (LIBOR 1 Month + 0.55%) due 6/25/2043 | | | | 47,845 | | | | | 47,921 | |
| b,c | | Series 2013-B Class A2B, 2.877% (LIBOR 1 Month + 1.10%) due 6/17/2030 | | | | 146,335 | | | | | 147,359 | |
| | Small Business Administration Participation Certificates, Series 2005-20K Class 1, 5.36% due 11/1/2025 | | | | 23,296 | | | | | 24,361 | |
| | Social Professional Loan Program, LLC, | | | | | | | | | | |
| b,c | | Series 2014-A Class A1, 3.472% (LIBOR 1 Month + 1.60%) due 6/25/2025 | | | | 48,203 | | | | | 48,866 | |
| c | | Series 2014-B Class A2, 2.55% due 8/27/2029 | | | | 20,844 | | | | | 20,624 | |
| c | | Tax Ease Funding, LLC, Series 2016-1A Class A, 3.131% due 6/15/2028 | | | | 83,454 | | | | | 83,018 | |
32 | Semi-Annual Reports
Schedule of Investments, Continued
Thornburg Low Duration Income Fund | March 31, 2018 (Unaudited)
| | | | | | | | | | | | |
| | | | | PRINCIPAL
AMOUNT | | VALUE |
| c,e | | Towd Point Mortgage Trust, Series 2016-5 Class A1, 2.50% due 10/25/2056 | | | $ | 76,161 | | | | $ | 74,978 | |
| b,c | | Volvo Financial Equipment Master Owner Trust, Series 2017-A Class A, 2.277% (LIBOR 1 Month + 0.50%) due 11/15/2022 | | | | 100,000 | | | | | 100,512 | |
| | | | | | | | | | | | |
| | | | | | | | | | | 2,533,051 | |
| | | | | | | | | | | | |
| | RESIDENTIAL MTG TRUST — 3.2% | | | | | | | | | | |
| | Angel Oak Mortgage Trust, LLC, | | | | | | | | | | |
| c,e | | Series 2017-1 Class A2, 3.085% due 1/25/2047 | | | | 54,758 | | | | | 54,083 | |
| c,e | | Series 2017-3 Class A1, 2.708% due 11/25/2047 | | | | 43,599 | | | | | 42,829 | |
| c,d,e,f | | Series 2018-1 Class A1, 3.258% due 4/27/2048 | | | | 75,000 | | | | | 75,000 | |
| c,e | | Finance of America Structured Securities Trust, Series 2017-HB1 Class A, 2.321% due 11/25/2027 | | | | 69,762 | | | | | 69,504 | |
| c,e | | Flagstar Mortgage Trust, Series 2017-1 Class 2A2, 3.00% due 3/25/2047 | | | | 90,868 | | | | | 89,595 | |
| | JPMorgan Mortgage Trust, | | | | | | | | | | |
| c,e | | Series 2017-2 Class A6, 3.00% due 5/25/2047 | | | | 43,200 | | | | | 42,597 | |
| c,e | | Series 2017-6 Class A5, 3.50% due 12/25/2048 | | | | 96,178 | | | | | 96,510 | |
| | New Residential Mortgage Loan Trust, | | | | | | | | | | |
| c,e | | Series 2017-2A Class A3, 4.00% due 3/25/2057 | | | | 76,561 | | | | | 78,959 | |
| b,c | | Series 2017-5A Class A1, 3.372% (LIBOR 1 Month + 1.50%) due 6/25/2057 | | | | 84,029 | | | | | 86,131 | |
| c,e | | WinWater Mortgage Loan Trust, Series 2014-3 Class A7, 3.00% due 11/20/2044 | | | | 122,800 | | | | | 122,468 | |
| | | | | | | | | | | | |
| | | | | | | | | | | 757,676 | |
| | | | | | | | | | | | |
| | STUDENT LOAN — 0.4% | | | | | | | | | | |
| b,c | | Nelnet Student Loan Trust, Series 2016-A Class A1A, 3.622% (LIBOR 1 Month + 1.75%) due 12/26/2040 | | | | 88,955 | | | | | 89,123 | |
| | | | | | | | | | | | |
| | | | | | | | | | | 89,123 | |
| | | | | | | | | | | | |
| | TOTAL ASSET BACKED SECURITIES (Cost $5,320,040) | | | | | | | | | 5,293,742 | |
| | | | | | | | | | | | |
| | | |
| | CORPORATE BONDS — 42.0% | | | | | | | | | | |
| | | |
| | AUTOMOBILES & COMPONENTS — 1.3% | | | | | | | | | | |
| | Automobiles — 1.3% | | | | | | | | | | |
| a,b,c | | Daimler Finance North America, LLC (Guaranty: Daimler AG), 2.354% (LIBOR 3 Month + 0.45%) due 2/22/2021 | | | | 150,000 | | | | | 150,094 | |
| c | | Hyundai Capital America, 2.40% due 10/30/2018 | | | | 50,000 | | | | | 49,856 | |
| b | | Toyota Motor Credit Corp., 2.22% (LIBOR 3 Month + 0.40%) due 2/13/2020 | | | | 100,000 | | | | | 100,095 | |
| | | | | | | | | | | | |
| | | | | | | | | | | 300,045 | |
| | | | | | | | | | | | |
| | BANKS — 2.3% | | | | | | | | | | |
| | Banks — 2.3% | | | | | | | | | | |
| a,b,g | | Barclays Bank plc, 2.165% (LIBOR 3 Month + 0.46%) due 1/11/2021 | | | | 200,000 | | | | | 199,844 | |
| | Fifth Third Bank, 2.30% due 3/15/2019 | | | | 200,000 | | | | | 199,165 | |
| | Santander Holdings USA, Inc., 3.40% due 1/18/2023 | | | | 43,000 | | | | | 42,003 | |
| a,b | | Santander UK plc, 3.587% (LIBOR 3 Month + 1.48%) due 3/14/2019 | | | | 100,000 | | | | | 101,112 | |
| | | | | | | | | | | | |
| | | | | | | | | | | 542,124 | |
| | | | | | | | | | | | |
| | CAPITAL GOODS — 0.9% | | | | | | | | | | |
| | Machinery — 0.9% | | | | | | | | | | |
| a,c | | Nvent Finance Sarl, 3.95% due 4/15/2023 | | | | 110,000 | | | | | 110,323 | |
| | Stanley Black & Decker, Inc., 2.451% due 11/17/2018 | | | | 100,000 | | | | | 99,798 | |
| | | | | | | | | | | | |
| | | | | | | | | | | 210,121 | |
| | | | | | | | | | | | |
| | COMMERCIAL & PROFESSIONAL SERVICES — 0.9% | | | | | | | | | | |
| | Commercial Services & Supplies — 0.4% | | | | | | | | | | |
| | Cintas Corp. No. 2, 2.90% due 4/1/2022 | | | | 100,000 | | | | | 98,438 | |
| | Leisure Products — 0.5% | | | | | | | | | | |
| | Mattel, Inc., 2.35% due 8/15/2021 | | | | 125,000 | | | | | 110,626 | |
| | | | | | | | | | | | |
| | | | | | | | | | | 209,064 | |
| | | | | | | | | | | | |
| | DIVERSIFIED FINANCIALS — 10.1% | | | | | | | | | | |
| | Capital Markets — 2.8% | | | | | | | | | | |
| | Ares Capital Corp., 4.875% due 11/30/2018 | | | | 150,000 | | | | | 151,467 | |
| | CBOE Holdings, Inc., 1.95% due 6/28/2019 | | | | 100,000 | | | | | 98,829 | |
| | Export Leasing (2009), LLC (Guaranty: Export-Import Bank of the United States), 1.859% due 8/28/2021 | | | | 46,103 | | | | | 45,597 | |
| c | | GTP Acquisition Partners I, LLC (Guaranty: American Tower Holding Sub II, LLC), 2.35% due 6/15/2045 | | | | 100,000 | | | | | 98,839 | |
| | Legg Mason, Inc., 2.70% due 7/15/2019 | | | | 100,000 | | | | | 99,625 | |
Semi-Annual Reports | 33
Schedule of Investments, Continued
Thornburg Low Duration Income Fund | March 31, 2018 (Unaudited)
| | | | | | | | | | | | |
| | | | | PRINCIPAL
AMOUNT | | VALUE |
| | National Rural Utilities Cooperative Finance Corp., 10.375% due 11/1/2018 | | | $ | 112,000 | | | | $ | 116,996 | |
| | TPG Specialty Lending, Inc., 4.50% due 1/22/2023 | | | | 40,000 | | | | | 40,011 | |
| | Consumer Finance — 0.6% | | | | | | | | | | |
| | Wells Fargo & Co., 2.10% due 7/26/2021 | | | | 52,000 | | | | | 50,217 | |
| b | | Wells Fargo & Co., MTN, 3.045% (LIBOR 3 Month + 1.01%) due 12/7/2020 | | | | 100,000 | | | | | 101,200 | |
| | Diversified Financial Services — 6.1% | | | | | | | | | | |
| b | | Bank of America Corp., 2.762% (LIBOR 3 Month + 1.04%) due 1/15/2019 | | | | 100,000 | | | | | 100,679 | |
| | Bank of New York Mellon Corp., 2.05% due 5/3/2021 | | | | 154,000 | | | | | 149,502 | |
| | Citigroup, Inc., | | | | | | | | | | |
| | 1.70% due 4/27/2018 | | | | 75,000 | | | | | 74,959 | |
| | 2.65% due 10/26/2020 | | | | 100,000 | | | | | 98,805 | |
| a,b | | Deutsche Bank AG, 3.186% (LIBOR 3 Month + 1.23%) due 2/27/2023 | | | | 100,000 | | | | | 99,535 | |
| b | | Goldman Sachs Group, Inc., 3.325% (LIBOR 3 Month + 1.20%) due 9/15/2020 | | | | 100,000 | | | | | 101,579 | |
| b | | JPMorgan Chase & Co., 2.965% (LIBOR 3 Month + 1.21%) due 10/29/2020 | | | | 125,000 | | | | | 127,652 | |
| a,b | | Mitsubishi UFJ Financial Group, Inc., 3.886% (LIBOR 3 Month + 1.88%) due 3/1/2021 | | | | 200,000 | | | | | 207,207 | |
| | Morgan Stanley, | | | | | | | | | | |
| | 2.80% due 6/16/2020 | | | | 50,000 | | | | | 49,664 | |
| b | | 2.90% (LIBOR 3 Month + 1.14%) due 1/27/2020 | | | | 75,000 | | | | | 75,932 | |
| b | | State Street Corp., 2.785% (LIBOR 3 Month + 0.90%) due 8/18/2020 | | | | 100,000 | | | | | 101,232 | |
| | Synchrony Financial, 3.00% due 8/15/2019 | | | | 50,000 | | | | | 49,849 | |
| a,b,c | | UBS AG Jersey (Guaranty: UBS Group AG), 3.726% (LIBOR 3 Month + 1.44%) due 9/24/2020 | | | | 200,000 | | | | | 204,403 | |
| | Insurance — 0.4% | | | | | | | | | | |
| c | | AIG Global Funding, 1.95% due 10/18/2019 | | | | 100,000 | | | | | 98,761 | |
| | Mortgage Real Estate Investment Trusts — 0.2% | | | | | | | | | | |
| | Healthcare Trust of America Holdings L.P. (Guaranty: Healthcare Trust of America, Inc.), 2.95% due 7/1/2022 | | | | 50,000 | | | | | 48,914 | |
| | | | | | | | | | | | |
| | | | | | | | | | | 2,391,454 | |
| | | | | | | | | | | | |
| | ENERGY — 1.5% | | | | | | | | | | |
| | Oil, Gas & Consumable Fuels — 1.5% | | | | | | | | | | |
| a,b | | BP Capital Markets plc (Guaranty: BP plc), 2.183% (LIBOR 3 Month + 0.35%) due 8/14/2018 | | | | 150,000 | | | | | 150,090 | |
| b | | Exxon Mobil Corp., 2.786% (LIBOR 3 Month + 0.78%) due 3/1/2019 | | | | 75,000 | | | | | 75,483 | |
| b,c | | Phillips 66 (Guaranty: Phillips 66 Co.), 2.372% (LIBOR 3 Month + 0.65%) due 4/15/2019 | | | | 75,000 | | | | | 75,021 | |
| c | | Texas Gas Transmission, LLC, 4.50% due 2/1/2021 | | | | 62,000 | | | | | 63,262 | |
| | | | | | | | | | | | |
| | | | | | | | | | | 363,856 | |
| | | | | | | | | | | | |
| | FOOD & STAPLES RETAILING — 0.2% | | | | | | | | | | |
| | Food & Staples Retailing — 0.2% | | | | | | | | | | |
| a,c | | Alimentation Couche-Tard, Inc., 2.70% due 7/26/2022 | | | | 50,000 | | | | | 48,475 | |
| | Smith’s Food & Drug Centers, Inc. 1994-A3 Pass Through Trust, Series 94A3, 9.20% due 7/2/2018 | | | | 9,943 | | | | | 10,068 | |
| | | | | | | | | | | | |
| | | | | | | | | | | 58,543 | |
| | | | | | | | | | | | |
| | FOOD, BEVERAGE & TOBACCO — 5.7% | | | | | | | | | | |
| | Beverages — 2.1% | | | | | | | | | | |
| a,b,f | | Anheuser-Busch InBev Worldwide, Inc., Series 5FRN, 3.052% (LIBOR 3 Month + 0.74%) due 1/12/2024 | | | | 150,000 | | | | | 150,882 | |
| | Molson Coors Brewing Co., 2.10% due 7/15/2021 | | | | 150,000 | | | | | 143,931 | |
| b | | PepsiCo, Inc., 2.234% (LIBOR 3 Month + 0.53%) due 10/6/2021 | | | | 200,000 | | | | | 202,464 | |
| | Food Products — 2.3% | | | | | | | | | | |
| b | | Conagra Brands, Inc., 2.204% (LIBOR 3 Month + 0.50%) due 10/9/2020 | | | | 100,000 | | | | | 100,073 | |
| | General Mills, Inc., 2.60% due 10/12/2022 | | | | 100,000 | | | | | 96,327 | |
| | JM Smucker Co., 2.50% due 3/15/2020 | | | | 50,000 | | | | | 49,460 | |
| | Kraft Heinz Foods Co. (Guaranty: Kraft Heinz Co.), | | | | | | | | | | |
| b | | 2.22% (LIBOR 3 Month + 0.42%) due 8/9/2019 | | | | 50,000 | | | | | 50,021 | |
| b | | 2.381% (LIBOR 3 Month + 0.57%) due 2/10/2021 | | | | 50,000 | | | | | 49,863 | |
| a | | Mead Johnson Nutrition Co. (Guaranty: Reckitt Benckiser Group plc), 3.00% due 11/15/2020 | | | | 100,000 | | | | | 99,612 | |
| b | | Tyson Foods, Inc., 2.567% (LIBOR 3 Month + 0.55%) due 6/2/2020 | | | | 100,000 | | | | | 100,218 | |
| | Tobacco — 1.3% | | | | | | | | | | |
| | Altria Group, Inc. (Guaranty: Philip Morris USA, Inc.), 2.625% due 1/14/2020 | | | | 200,000 | | | | | 198,818 | |
| a,b,c | | BAT Capital Corp., 2.423% (LIBOR 3 Month + 0.59%) due 8/14/2020 | | | | 100,000 | | | | | 100,314 | |
| | | | | | | | | | | | |
| | | | | | | | | | | 1,341,983 | |
| | | | | | | | | | | | |
34 | Semi-Annual Reports
Schedule of Investments, Continued
Thornburg Low Duration Income Fund | March 31, 2018 (Unaudited)
| | | | | | | | | | | | |
| | | | | PRINCIPAL
AMOUNT | | VALUE |
| | HEALTHCARE EQUIPMENT & SERVICES — 1.6% | | | | | | | | | | |
| | Health Care Providers & Services — 1.6% | | | | | | | | | | |
| | Anthem, Inc., 2.50% due 11/21/2020 | | | $ | 75,000 | | | | $ | 73,729 | |
| b | | CVS Health Corp., 2.687% (LIBOR 3 Month + 0.63%) due 3/9/2020 | | | | 40,000 | | | | | 40,150 | |
| | Express Scripts Holding Co., 2.60% due 11/30/2020 | | | | 62,000 | | | | | 60,887 | |
| a,b,c | | Roche Holdings, Inc. (Guaranty: Roche Holding AG), 2.642% (LIBOR 3 Month + 0.34%) due 9/30/2019 | | | | 200,000 | | | | | 200,656 | |
| | | | | | | | | | | | |
| | | | | | | | | | | 375,422 | |
| | | | | | | | | | | | |
| | HOUSEHOLD & PERSONAL PRODUCTS — 0.2% | | | | | | | | | | |
| | Household Products — 0.2% | | | | | | | | | | |
| | Church & Dwight Co., Inc., 2.45% due 8/1/2022 | | | | 50,000 | | | | | 48,435 | |
| | | | | | | | | | | | |
| | | | | | | | | | | 48,435 | |
| | | | | | | | | | | | |
| | INSURANCE — 3.2% | | | | | | | | | | |
| | Insurance — 2.8% | | | | | | | | | | |
| c | | Athene Global Funding, 2.875% due 10/23/2018 | | | | 75,000 | | | | | 74,931 | |
| a | | Enstar Group Ltd., 4.50% due 3/10/2022 | | | | 50,000 | | | | | 50,225 | |
| h | | Infinity Property & Casualty Corp., 5.00% due 9/19/2022 | | | | 100,000 | | | | | 104,220 | |
| b,c | | Jackson National Life Global Co., 3.022% (LIBOR 3 Month + 0.73%) due 6/27/2022 | | | | 100,000 | | | | | 101,137 | |
| b,c | | Metropolitan Life Global Funding I, 1.938% (LIBOR 3 Month + 0.23%) due 1/8/2021 | | | | 150,000 | | | | | 149,745 | |
| c | | Principal Life Global Funding II (Guaranty: Principal Financial Group, Inc.), 2.375% due 9/11/2019 | | | | 50,000 | | | | | 49,678 | |
| | Reliance Standard Life Insurance Co., | | | | | | | | | | |
| c | | 2.50% due 4/24/2019 | | | | 100,000 | | | | | 99,570 | |
| c | | 3.05% due 1/20/2021 | | | | 25,000 | | | | | 24,892 | |
| | Semiconductors & Semiconductor Equipment — 0.4% | | | | | | | | | | |
| | QUALCOMM, Inc., | | | | | | | | | | |
| b | | 2.245% (LIBOR 3 Month + 0.36%) due 5/20/2019 | | | | 50,000 | | | | | 50,095 | |
| b | | 2.335% (LIBOR 3 Month + 0.45%) due 5/20/2020 | | | | 50,000 | | | | | 50,078 | |
| | | | | | | | | | | | |
| | | | | | | | | | | 754,571 | |
| | | | | | | | | | | | |
| | MATERIALS — 0.4% | | | | | | | | | | |
| | Chemicals — 0.4% | | | | | | | | | | |
| b,c | | Chevron Phillips Chemical Co., LLC, 2.523% (LIBOR 3 Month + 0.75%) due 5/1/2020 | | | | 100,000 | | | | | 100,602 | |
| | | | | | | | | | | | |
| | | | | | | | | | | 100,602 | |
| | | | | | | | | | | | |
| | PHARMACEUTICALS, BIOTECHNOLOGY & LIFE SCIENCES — 1.6% | | | | | | | | | | |
| | Biotechnology — 0.6% | | | | | | | | | | |
| | Celgene Corp., | | | | | | | | | | |
| | 2.75% due 2/15/2023 | | | | 100,000 | | | | | 95,989 | |
| | 3.25% due 2/20/2023 | | | | 44,000 | | | | | 43,283 | |
| | Life Sciences Tools & Services — 0.4% | | | | | | | | | | |
| | Abbott Laboratories, 2.35% due 11/22/2019 | | | | 94,000 | | | | | 93,190 | |
| | Pharmaceuticals — 0.6% | | | | | | | | | | |
| | Mylan N.V. (Guaranty: Mylan, Inc.), 3.00% due 12/15/2018 | | | | 100,000 | | | | | 99,998 | |
| | Shire Acquisitions Investments Ireland DAC, 2.40% due 9/23/2021 | | | | 44,000 | | | | | 42,483 | |
| | | | | | | | | | | | |
| | | | | | | | | | | 374,943 | |
| | | | | | | | | | | | |
| | RETAILING — 0.2% | | | | | | | | | | |
| | Internet & Direct Marketing Retail — 0.2% | | | | | | | | | | |
| | Booking Holdings, Inc., 2.75% due 3/15/2023 | | | | 50,000 | | | | | 48,251 | |
| | | | | | | | | | | | |
| | | | | | | | | | | 48,251 | |
| | | | | | | | | | | | |
| | SEMICONDUCTORS & SEMICONDUCTOR EQUIPMENT — 0.9% | | | | | | | | | | |
| | Semiconductors & Semiconductor Equipment — 0.9% | | | | | | | | | | |
| | Broadcom Corp. / Broadcom Cayman Finance Ltd., 2.375% due 1/15/2020 | | | | 125,000 | | | | | 123,256 | |
| a | | Micron Semiconductor Ltd. (Guaranty: Export-Import Bank of the United States), 1.258% due 1/15/2019 | | | | 100,000 | | | | | 99,457 | |
| | | | | | | | | | | | |
| | | | | | | | | | | 222,713 | |
| | | | | | | | | | | | |
Semi-Annual Reports | 35
Schedule of Investments, Continued
Thornburg Low Duration Income Fund | March 31, 2018 (Unaudited)
| | | | | | | | | | | | |
| | | | | PRINCIPAL
AMOUNT | | VALUE |
| | SOFTWARE & SERVICES — 3.7% | | | | | | | | | | |
| | Information Technology Services — 1.6% | | | | | | | | | | |
| | Moody’s Corp., | | | | | | | | | | |
| b | | 2.375% (LIBOR 3 Month + 0.35%) due 9/4/2018 | | | $ | 50,000 | | | | $ | 50,007 | |
| | 2.75% due 7/15/2019 | | | | 75,000 | | | | | 74,756 | |
| | S&P Global, Inc. (Guaranty: Standard & Poor’s Financial Services, LLC), | | | | | | | | | | |
| | 2.50% due 8/15/2018 | | | | 50,000 | | | | | 49,972 | |
| | 3.30% due 8/14/2020 | | | | 50,000 | | | | | 50,280 | |
| | Total System Services, Inc., 2.375% due 6/1/2018 | | | | 100,000 | | | | | 99,910 | |
| b | | Western Union Co., 2.704% (LIBOR 3 Month + 0.80%) due 5/22/2019 | | | | 60,000 | | | | | 60,187 | |
| | Software — 2.1% | | | | | | | | | | |
| | Autodesk, Inc., 3.125% due 6/15/2020 | | | | 100,000 | | | | | 100,101 | |
| | CA Technologies, Inc., 2.875% due 8/15/2018 | | | | 125,000 | | | | | 125,245 | |
| | Dun & Bradstreet, Inc., 4.25% due 6/15/2020 | | | | 75,000 | | | | | 75,856 | |
| | Fidelity National Information Services, Inc., 2.85% due 10/15/2018 | | | | 150,000 | | | | | 150,069 | |
| | VMware, Inc., 2.30% due 8/21/2020 | | | | 50,000 | | | | | 48,633 | |
| | | | | | | | | | | | |
| | | | | | | | | | | 885,016 | |
| | | | | | | | | | | | |
| | TECHNOLOGY HARDWARE & EQUIPMENT — 1.4% | | | | | | | | | | |
| | Communications Equipment — 0.4% | | | | | | | | | | |
| | Juniper Networks, Inc., 3.30% due 6/15/2020 | | | | 100,000 | | | | | 100,045 | |
| | Technology Hardware, Storage & Peripherals — 1.0% | | | | | | | | | | |
| | Apple, Inc., | | | | | | | | | | |
| b | | 2.30% (LIBOR 3 Month + 0.50%) due 2/9/2022 | | | | 25,000 | | | | | 25,289 | |
| b | | 2.74% (LIBOR 3 Month + 0.82%) due 2/22/2019 | | | | 50,000 | | | | | 50,355 | |
| b | | 3.05% (LIBOR 3 Month + 1.13%) due 2/23/2021 | | | | 50,000 | | | | | 51,334 | |
| b | | Hewlett Packard Enterprise Co., 3.626% (LIBOR 3 Month + 1.93%) due 10/5/2018 | | | | 100,000 | | | | | 100,881 | |
| | | | | | | | | | | | |
| | | | | | | | | | | 327,904 | |
| | | | | | | | | | | | |
| | TELECOMMUNICATION SERVICES — 0.8% | | | | | | | | | | |
| | Diversified Telecommunication Services — 0.8% | | | | | | | | | | |
| | AT&T, Inc., | | | | | | | | | | |
| | 2.45% due 6/30/2020 | | | | 100,000 | | | | | 98,852 | |
| b | | 2.866% (LIBOR 3 Month + 0.91%) due 11/27/2018 | | | | 50,000 | | | | | 50,208 | |
| b | | 3.232% (LIBOR 3 Month + 0.93%) due 6/30/2020 | | | | 50,000 | | | | | 50,526 | |
| | | | | | | | | | | | |
| | | | | | | | | | | 199,586 | |
| | | | | | | | | | | | |
| | TRANSPORTATION — 0.4% | | | | | | | | | | |
| | Road & Rail — 0.4% | | | | | | | | | | |
| c | | Penske Truck Leasing Co. LP / PTL Finance Corp., 3.20% due 7/15/2020 | | | | 100,000 | | | | | 100,144 | |
| | | | | | | | | | | | |
| | | | | | | | | | | 100,144 | |
| | | | | | | | | | | | |
| | UTILITIES — 4.7% | | | | | | | | | | |
| | Electric Utilities — 3.8% | | | | | | | | | | |
| | Duke Energy Florida Project Finance, LLC, Series 2018, 1.196% due 3/1/2022 | | | | 125,640 | | | | | 123,525 | |
| a,c | | Electricite de France S.A., 2.15% due 1/22/2019 | | | | 100,000 | | | | | 99,529 | |
| | Exelon Corp., 2.85% due 6/15/2020 | | | | 50,000 | | | | | 49,551 | |
| b | | Mississippi Power Co., 2.942% (LIBOR 3 Month + 0.65%) due 3/27/2020 | | | | 25,000 | | | | | 25,009 | |
| b,c | | Pacific Gas & Electric Co., 2.214% (LIBOR 3 Month + 0.23%) due 11/28/2018 | | | | 50,000 | | | | | 49,878 | |
| g | | PNM Resources, Inc., 3.25% due 3/9/2021 | | | | 100,000 | | | | | 99,897 | |
| | Public Service Enterprise Group, 2.65% due 11/15/2022 | | | | 50,000 | | | | | 48,599 | |
| b | | Sempra Energy, 1.959% (LIBOR 3 Month + 0.25%) due 7/15/2019 | | | | 110,000 | | | | | 110,004 | |
| a,c | | State Grid Overseas Investment (2014) Ltd. (Guaranty: State Grid Corp. of China), 2.75% due 5/7/2019 | | | | 200,000 | | | | | 199,583 | |
| | The Southern Co., 2.45% due 9/1/2018 | | | | 100,000 | | | | | 99,888 | |
| | Gas Utilities — 0.9% | | | | | | | | | | |
| | Dominion Gas Holdings, LLC, 2.50% due 12/15/2019 | | | | 100,000 | | | | | 99,085 | |
| | WGL Holdings, Inc., | | | | | | | | | | |
| b | | 2.384% (LIBOR 3 Month + 0.40%) due 11/29/2019 | | | | 50,000 | | | | | 49,903 | |
| b | | 2.657% (LIBOR 3 Month + 0.55%) due 3/12/2020 | | | | 58,000 | | | | | 58,000 | |
| | | | | | | | | | | | |
| | | | | | | | | | | 1,112,451 | |
| | | | | | | | | | | | |
| | TOTAL CORPORATE BONDS (Cost $9,990,836) | | | | | | | | | 9,967,228 | |
| | | | | | | | | | | | |
36 | Semi-Annual Reports
Schedule of Investments, Continued
Thornburg Low Duration Income Fund | March 31, 2018 (Unaudited)
| | | | | | | | | | | | |
| | | | | PRINCIPAL
AMOUNT | | VALUE |
| | | |
| | MUNICIPAL BONDS — 1.8% | | | | | | | | | | |
| | Colorado Educational & Cultural Facilities Authority, | | | | | | | | | | |
| | Series B, | | | | | | | | | | |
| | 2.244% due 3/1/2021 | | | $ | 50,000 | | | | $ | 49,040 | |
| | 2.474% due 3/1/2022 | | | | 50,000 | | | | | 48,865 | |
| | JobsOhio Beverage System, Series B, 2.217% due 1/1/2019 | | | | 100,000 | | | | | 99,929 | |
| | Los Angeles County Public Works Financing Authority, 5.591% due 8/1/2020 | | | | 100,000 | | | | | 106,146 | |
| | New York State Urban Development Corp., Series D-1, 2.55% due 3/15/2022 | | | | 120,000 | | | | | 118,806 | |
| | | | | | | | | | | | |
| | TOTAL MUNICIPAL BONDS (Cost $427,375) | | | | | | | | | 422,786 | |
| | | | | | | | | | | | |
| | | |
| | SHORT-TERM INVESTMENTS — 12.2% | | | | | | | | | | |
| i | | Thornburg Capital Management Fund | | | | 289,095 | | | | | 2,890,950 | |
| | | | | | | | | | | | |
| | TOTAL SHORT-TERM INVESTMENTS (Cost $2,890,950) | | | | | | | | | 2,890,950 | |
| | | | | | | | | | | | |
| | | |
| | TOTAL INVESTMENTS — 100.6% (Cost $23,976,721) | | | | | | | | $ | 23,875,893 | |
| | | |
| | LIABILITIES NET OF OTHER ASSETS — (0.6)% | | | | | | | | | (139,140 | ) |
| | | | | | | | | | | | |
| | | |
| | NET ASSETS — 100.0% | | | | | | | | $ | 23,736,753 | |
| | | | | | | | | | | | |
Footnote Legend
| a | Yankee bond denominated in U.S. dollars and is issued in the U.S. by foreign banks and corporations. |
| b | Floating Rate Security. Stated interest/floor rate was in effect at March 31, 2018. |
| c | Securities exempt from registration under Rule 144A of the Securities Act of 1933, as amended. These securities are restricted but liquid and may only be resold in the ordinary course of business in transactions exempt from registration, normally to qualified institutional buyers. As of March 31, 2018, the aggregate value of these securities in the Fund’s portfolio was $6,954,255, representing 29.30% of the Fund’s net assets. |
| d | Security currently fair valued by the Valuation and Pricing Committee using procedures approved by the Trustees’ Audit Committee. |
| e | Variable rate coupon, rate shown as of March 31, 2018. |
| g | Segregated as collateral for a when-issued security. |
| i | Investment in Affiliates. |
Portfolio Abbreviations
To simplify the listings of securities, abbreviations are used per the table below:
| | |
| CMO | | Collateralized Mortgage Obligation |
| LIBOR | | London Interbank Offered Rates |
| Mtg | | Mortgage |
| MTN | | Medium-Term Note |
| SBA | | Small Business Administration |
Semi-Annual Reports | 37
Statements of Assets and Liabilities
March 31, 2018 (Unaudited)
| | | | | | | | | | | | |
| | | THORNBURG
LIMITED TERM U.S.
GOVERNMENT FUND | | | THORNBURG
LIMITED TERM
INCOME FUND | | | THORNBURG
LOW DURATION
INCOME FUND | |
ASSETS | | | | | | | | | | | | |
| | | |
Investments at value (Note 3) | | | | | | | | | | | | |
Non-affiliated issuers (cost $267,756,579, $5,126,001,035 and $21,085,771, respectively) | | $ | 263,608,128 | | | $ | 5,104,970,863 | | | $ | 20,984,943 | |
Non-controlled affiliated issuer (cost $0, $0 and $2,890,950, respectively) | | | – | | | | – | | | | 2,890,950 | |
Cash | | | 22,491 | | | | 169,968 | | | | – | |
Receivable for investments sold | | | – | | | | 1,425,000 | | | | – | |
Principal receivable | | | 51,913 | | | | 141,686 | | | | – | |
Receivable for fund shares sold | | | 1,104,287 | | | | 65,916,664 | | | | 23,110 | |
Receivable from investment advisor | | | – | | | | – | | | | 5,316 | |
Dividends receivable | | | – | | | | – | | | | 4,483 | |
Dividend and interest reclaim receivable | | | – | | | | 6,451 | | | | – | |
Interest receivable | | | 800,320 | | | | 27,472,907 | | | | 82,478 | |
Prepaid expenses and other assets | | | 46,318 | | | | 167,702 | | | | 22,796 | |
| | | | |
| | | |
Total Assets | | | 265,633,457 | | | | 5,200,271,241 | | | | 24,014,076 | |
| | | | |
| | | |
LIABILITIES | | | | | | | | | | | | |
| | | |
Payable for investments purchased | | | – | | | | 20,193,593 | | | | 225,224 | |
Payable for fund shares redeemed | | | 307,578 | | | | 12,717,251 | | | | 4,118 | |
Payable to investment advisor and other affiliates (Note 4) | | | 128,898 | | | | 2,198,597 | | | | – | |
Accounts payable and accrued expenses | | | 112,403 | | | | 781,130 | | | | 43,932 | |
Dividends payable | | | 110,972 | | | | 1,233,903 | | | | 4,049 | |
| | | | |
| | | |
Total Liabilities | | | 659,851 | | | | 37,124,474 | | | | 277,323 | |
| | | | |
| | | |
NET ASSETS | | $ | 264,973,606 | | | $ | 5,163,146,767 | | | $ | 23,736,753 | |
| | | | |
| | | |
NET ASSETS CONSIST OF | | | | | | | | | | | | |
| | | |
Distribution in excess of net investment income | | $ | (417,199 | ) | | $ | (2,042,169 | ) | | $ | (1,573 | ) |
Net unrealized depreciation on investments | | | (4,148,451 | ) | | | (21,030,172 | ) | | | (100,828 | ) |
Accumulated net realized gain (loss) | | | (10,738,349 | ) | | | 4,840,550 | | | | (10,594 | ) |
Net capital paid in on shares of beneficial interest | | | 280,277,605 | | | | 5,181,378,558 | | | | 23,849,748 | |
| | | | |
| | $ | 264,973,606 | | | $ | 5,163,146,767 | | | $ | 23,736,753 | |
| | | | |
38 | Semi-Annual Reports
Statements of Assets and Liabilities, Continued
March 31, 2018 (Unaudited)
| | | | | | | | | | | | |
| | | THORNBURG
LIMITED TERM U.S.
GOVERNMENT FUND | | | THORNBURG
LIMITED TERM
INCOME FUND | | | THORNBURG
LOW DURATION
INCOME FUND | |
NET ASSET VALUE | | | | | | | | | | | | |
| | | |
Class A Shares: | | | | | | | | | | | | |
Net asset value and redemption price per share
($74,099,718, $775,029,738 and $7,166,160 applicable to
5,785,060, 58,471,414 and 581,987 shares of beneficial
interest outstanding - Note 5) | | $ | 12.81 | | | $ | 13.25 | | | $ | 12.31 | |
| | | |
Maximum sales charge, 1.50% of offering price | | | 0.20 | | | | 0.20 | | | | 0.19 | |
| | | | |
| | | |
Maximum offering price per share | | $ | 13.01 | | | $ | 13.45 | | | $ | 12.50 | |
| | | | |
| | | |
Class C Shares: | | | | | | | | | | | | |
Net asset value and offering price per share*
($29,931,534, $518,933,341 and $0 applicable to
2,323,037, 39,213,694 and 0 shares of beneficial
interest outstanding - Note 5) | | $ | 12.88 | | | $ | 13.23 | | | $ | – | |
| | | | |
| | | |
Class I Shares: | | | | | | | | | | | | |
Net asset value, offering and redemption price per share
($146,636,281, $3,643,857,195 and $16,570,593 applicable to
11,448,308, 274,859,234 and 1,346,367 shares of beneficial
interest outstanding - Note 5) | | $ | 12.81 | | | $ | 13.26 | | | $ | 12.31 | |
| | | | |
| | | |
Class R3 Shares: | | | | | | | | | | | | |
Net asset value, offering and redemption price per share
($10,052,522, $96,109,596 and $0 applicable to
784,317, 7,245,874 and 0 shares of beneficial
interest outstanding - Note 5) | | $ | 12.82 | | | $ | 13.26 | | | $ | – | |
| | | | |
| | | |
Class R4 Shares: | | | | | | | | | | | | |
Net asset value, offering and redemption price per share
($3,195,191, $8,824,801 and $0 applicable to
249,503, 666,134 and 0 shares of beneficial
interest outstanding - Note 5) | | $ | 12.81 | | | $ | 13.25 | | | $ | – | |
| | | | |
| | | |
Class R5 Shares: | | | | | | | | | | | | |
Net asset value, offering and redemption price per share
($1,058,360, $108,027,530 and $0 applicable to
82,571, 8,151,459 and 0 shares of beneficial
interest outstanding - Note 5) | | $ | 12.82 | | | $ | 13.25 | | | $ | – | |
| | | | |
| | | |
Class R6 Shares: | | | | | | | | | | | | |
Net asset value, offering and redemption price per share
($0, $12,364,566 and $0 applicable to
0, 931,050 and 0 shares of beneficial
interest outstanding - Note 5) | | $ | – | | | $ | 13.28 | | | $ | – | |
| | | | |
* Redemption price per share is equal to net asset value less any applicable contingent deferred sales charge.
See notes to financial statements.
Semi-Annual Reports | 39
Statements of Operations
Six Months Ended March 31, 2018 (Unaudited)
| | | | | | | | | | | | |
| | | THORNBURG
LIMITED TERM U.S.
GOVERNMENT FUND | | | THORNBURG
LIMITED TERM
INCOME FUND | | | THORNBURG
LOW DURATION
INCOME FUND | |
INVESTMENT INCOME | | | | | | | | | | | | |
| | | |
Dividend income non-controlled affiliated issuer | | $ | – | | | $ | – | | | $ | 18,902 | |
Interest income (net of premium amortized of $283,701, $3,101,638, and $10,413, respectively) | | | 3,017,977 | | | | 70,183,850 | | | | 233,469 | |
| | | | |
| | | |
Total Income | | | 3,017,977 | | | | 70,183,850 | | | | 252,371 | |
| | | | |
| | | |
EXPENSES | | | | | | | | | | | | |
| | | |
Investment advisory fees (Note 4) | | | 507,556 | | | | 8,341,853 | | | | 45,067 | |
Administration fees (Note 4) | | | | | | | | | | | | |
Class A Shares | | | 44,230 | | | | 471,983 | | | | 3,939 | |
Class C Shares | | | 18,089 | | | | 303,790 | | | | – | |
Class I Shares | | | 43,312 | | | | 1,029,658 | | | | 4,730 | |
Class R3 Shares | | | 5,876 | | | | 53,180 | | | | – | |
Class R4 Shares | | | 1,695 | | | | 4,625 | | | | – | |
Class R5 Shares | | | 700 | | | | 31,264 | | | | – | |
Class R6 Shares | | | – | | | | 2,270 | | | | – | |
Distribution and service fees (Note 4) | | | | | | | | | | | | |
Class A Shares | | | 98,724 | | | | 1,055,289 | | | | 7,089 | |
Class C Shares | | | 80,676 | | | | 1,358,963 | | | | – | |
Class R3 Shares | | | 26,282 | | | | 238,828 | | | | – | |
Class R4 Shares | | | 3,814 | | | | 10,416 | | | | – | |
Transfer agent fees | | | | | | | | | | | | |
Class A Shares | | | 38,411 | | | | 555,635 | | | | 13,768 | |
Class C Shares | | | 22,508 | | | | 244,441 | | | | – | |
Class I Shares | | | 57,031 | | | | 1,310,455 | | | | 3,124 | |
Class R3 Shares | | | 15,399 | | | | 59,381 | | | | – | |
Class R4 Shares | | | 5,948 | | | | 22,513 | | | | – | |
Class R5 Shares | | | 5,219 | | | | 120,451 | | | | – | |
Class R6 Shares | | | – | | | | 182 | | | | – | |
Registration and filing fees | | | | | | | | | | | | |
Class A Shares | | | 6,446 | | | | 9,933 | | | | 9,043 | |
Class C Shares | | | 5,898 | | | | 8,445 | | | | – | |
Class I Shares | | | 6,514 | | | | 17,310 | | | | 9,055 | |
Class R3 Shares | | | 5,869 | | | | 5,940 | | | | – | |
Class R4 Shares | | | 7,347 | | | | 7,248 | | | | – | |
Class R5 Shares | | | 6,731 | | | | 6,870 | | | | – | |
Class R6 Shares | | | – | | | | 7,802 | | | | – | |
Custodian fees (Note 2) | | | 49,116 | | | | 209,900 | | | | 23,936 | |
Professional fees | | | 25,226 | | | | 59,735 | | | | 22,975 | |
Trustee and officer fees (Note 4) | | | 6,074 | | | | 112,141 | | | | 485 | |
Other expenses | | | 23,832 | | | | 196,901 | | | | 6,817 | |
| | | | |
| | | |
Total Expenses | | | 1,118,523 | | | | 15,857,402 | | | | 150,028 | |
| | | |
Less: | | | | | | | | | | | | |
Expenses reimbursed by investment advisor (Note 4) | | | (46,688 | ) | | | (81,138 | ) | | | (41,189 | ) |
Investment advisory fees waived by investment advisor (Note 4) | | | – | | | | – | | | | (45,771 | ) |
| | | | |
| | | |
Net Expenses | | | 1,071,835 | | | | 15,776,264 | | | | 63,068 | |
| | | | |
| | | |
Net Investment Income | | $ | 1,946,142 | | | $ | 54,407,586 | | | $ | 189,303 | |
| | | | |
| | | |
REALIZED AND UNREALIZED GAIN (LOSS) | | | | | | | | | | | | |
| | | |
Net realized gain (loss) on investments | | | (42,992 | ) | | | 5,947,291 | | | | (6,356 | ) |
Net change in unrealized appreciation (depreciation) on investments | | | (3,785,316 | ) | | | (74,236,534 | ) | | | (177,584 | ) |
| | | | |
| | | |
Net Realized and Unrealized Loss | | | (3,828,308 | ) | | | (68,289,243 | ) | | | (183,940 | ) |
| | | | |
| | | |
Net Increase (Decrease) in Net Assets Resulting from Operations | | $ | (1,882,166 | ) | | $ | (13,881,657 | ) | | $ | 5,363 | |
| | | | |
See notes to financial statements.
40 | Semi-Annual Reports
Statements of Changes in Net Assets
Thornburg Limited Term U.S. Government Fund
| | | | | | | | | | |
| | | SIX MONTHS ENDED
MARCH 31, 2018* | | YEAR ENDED
SEPTEMBER 30, 2017 |
INCREASE (DECREASE) IN NET ASSETS FROM | | | | | | | | | | |
| | |
OPERATIONS | | | | | | | | | | |
| | |
Net investment income | | | $ | 1,946,142 | | | | $ | 3,412,467 | |
Net realized gain (loss) on investments | | | | (42,992 | ) | | | | (141,703 | ) |
Net unrealized appreciation (depreciation) on investments | | | | (3,785,316 | ) | | | | (4,990,963 | ) |
| | | | | |
| | |
Net Decrease in Net Assets Resulting from Operations | | | | (1,882,166 | ) | | | | (1,720,199 | ) |
| | |
DIVIDENDS TO SHAREHOLDERS | | | | | | | | | | |
| | |
From net investment income | | | | | | | | | | |
Class A Shares | | | | (623,530 | ) | | | | (1,410,540 | ) |
Class C Shares | | | | (205,228 | ) | | | | (453,387 | ) |
Class I Shares | | | | (1,364,721 | ) | | | | (2,295,862 | ) |
Class R3 Shares | | | | (79,626 | ) | | | | (224,875 | ) |
Class R4 Shares | | | | (23,212 | ) | | | | (33,868 | ) |
Class R5 Shares | | | | (23,612 | ) | | | | (68,706 | ) |
| | |
FUND SHARE TRANSACTIONS (NOTE 5) | | | | | | | | | | |
| | |
Class A Shares | | | | (9,336,057 | ) | | | | (25,179,028 | ) |
Class C Shares | | | | (4,383,442 | ) | | | | (12,696,392 | ) |
Class I Shares | | | | 1,385,020 | | | | | 5,699,193 | |
Class R3 Shares | | | | (653,486 | ) | | | | (16,613,329 | ) |
Class R4 Shares | | | | (122,777 | ) | | | | 1,309,741 | |
Class R5 Shares | | | | (3,039,364 | ) | | | | 3,629,750 | |
| | | | | |
| | |
Net Decrease in Net Assets | | | | (20,352,201 | ) | | | | (50,057,502 | ) |
| | |
NET ASSETS | | | | | | | | | | |
| | |
Beginning of Period | | | | 285,325,807 | | | | | 335,383,309 | |
| | | | | |
| | |
End of Period | | | $ | 264,973,606 | | | | $ | 285,325,807 | |
| | | | | |
| | |
Distribution in excess of net investment income | | | $ | (417,199 | ) | | | $ | (43,412 | ) |
* Unaudited.
See notes to financial statements.
Semi-Annual Reports | 41
Statements of Changes in Net Assets
Thornburg Limited Term Income Fund
| | | | | | | | | | |
| | | SIX MONTHS ENDED
MARCH 31, 2018* | | YEAR ENDED
SEPTEMBER 30, 2017 |
INCREASE (DECREASE) IN NET ASSETS FROM | | | | | | | | | | |
| | |
OPERATIONS | | | | | | | | | | |
| | |
Net investment income | | | $ | 54,407,586 | | | | $ | 94,912,629 | |
Net realized gain (loss) on investments | | | | 5,947,291 | | | | | 4,118,291 | |
Net unrealized appreciation (depreciation) on investments | | | | (74,236,534 | ) | | | | (26,512,951 | ) |
| | | | | |
| | |
Net Increase (Decrease) in Net Assets Resulting from Operations | | | | (13,881,657 | ) | | | | 72,517,969 | |
| | |
DIVIDENDS TO SHAREHOLDERS | | | | | | | | | | |
| | |
From net investment income | | | | | | | | | | |
Class A Shares | | | | (8,527,943 | ) | | | | (18,084,025 | ) |
Class C Shares | | | | (4,930,395 | ) | | | | (9,988,539 | ) |
Class I Shares | | | | (40,233,256 | ) | | | | (65,949,540 | ) |
Class R3 Shares | | | | (903,911 | ) | | | | (1,708,910 | ) |
Class R4 Shares | | | | (78,857 | ) | | | | (127,206 | ) |
Class R5 Shares | | | | (1,135,146 | ) | | | | (1,755,011 | ) |
Class R6 Shares | | | | (88,294 | ) | | | | (2,397 | ) |
| | |
FUND SHARE TRANSACTIONS (NOTE 5) | | | | | | | | | | |
| | |
Class A Shares | | | | (104,139,541 | ) | | | | (213,573,151 | ) |
Class C Shares | | | | (41,253,414 | ) | | | | (96,012,073 | ) |
Class I Shares | | | | 458,957,100 | | | | | 453,482,010 | |
Class R3 Shares | | | | 726,138 | | | | | (7,046,773 | ) |
Class R4 Shares | | | | 841,350 | | | | | 1,803,524 | |
Class R5 Shares | | | | 8,262,739 | | | | | 29,614,902 | |
Class R6 Shares | | | | 11,719,351 | | | | | 770,866 | |
| | | | | |
| | |
Net Increase in Net Assets | | | | 265,334,264 | | | | | 143,941,646 | |
| | |
NET ASSETS | | | | | | | | | | |
| | |
Beginning of Period | | | | 4,897,812,503 | | | | | 4,753,870,857 | |
| | | | | |
| | |
End of Period | | | $ | 5,163,146,767 | | | | $ | 4,897,812,503 | |
| | | | | |
| | |
Distribution in excess of net investment income | | | $ | (2,042,169 | ) | | | $ | (551,953 | ) |
* Unaudited.
See notes to financial statements.
42 | Semi-Annual Reports
Statements of Changes in Net Assets
Thornburg Low Duration Income Fund
| | | | | | | | | | |
| | | SIX MONTHS ENDED
MARCH 31, 2018* | | YEAR ENDED
SEPTEMBER 30, 2017 |
INCREASE (DECREASE) IN NET ASSETS FROM | | | | | | | | | | |
| | |
OPERATIONS | | | | | | | | | | |
| | |
Net investment income | | | $ | 189,303 | | | | $ | 306,960 | |
Net realized gain (loss) on investments | | | | (6,356 | ) | | | | 15,683 | |
Net unrealized appreciation (depreciation) on investments | | | | (177,584 | ) | | | | (100,999 | ) |
| | | | | |
| | |
Net Increase in Net Assets Resulting from Operations | | | | 5,363 | | | | | 221,644 | |
| | |
DIVIDENDS TO SHAREHOLDERS | | | | | | | | | | |
| | |
From net investment income | | | | | | | | | | |
Class A Shares | | | | (57,053 | ) | | | | (101,667 | ) |
Class I Shares | | | | (140,085 | ) | | | | (213,139 | ) |
| | |
FUND SHARE TRANSACTIONS (NOTE 5) | | | | | | | | | | |
| | |
Class A Shares | | | | 695,158 | | | | | (3,672,037 | ) |
Class I Shares | | | | 3,847,412 | | | | | (4,189,755 | ) |
| | | | | |
| | |
Net Increase (Decrease) in Net Assets | | | | 4,350,795 | | | | | (7,954,954 | ) |
| | |
NET ASSETS | | | | | | | | | | |
| | |
Beginning of Period | | | | 19,385,958 | | | | | 27,340,912 | |
| | | | | |
| | |
End of Period | | | $ | 23,736,753 | | | | $ | 19,385,958 | |
| | | | | |
| | |
Undistributed (distribution in excess of) net investment income | | | $ | (1,573 | ) | | | $ | 6,262 | |
* Unaudited.
See notes to financial statements.
Semi-Annual Reports | 43
Notes to Financial Statements
March 31, 2018 (Unaudited)
NOTE 1 – ORGANIZATION
Thornburg Limited Term U.S. Government Fund (the “Government Fund”), Thornburg Limited Term Income Fund (the “Income Fund”) and Thornburg Low Duration Income Fund (the “Low Duration Fund”), collectively the (“Funds”), are diversified series of Thornburg Investment Trust (the “Trust”). The Trust is organized as a Massachusetts business trust under a Declaration of Trust dated June 3, 1987 and is registered as a diversified, open-end management investment company under the Investment Company Act of 1940, as amended. The Funds are currently three of twenty-one separate series of the Trust. Each series is considered to be a separate entity for financial reporting and tax purposes and bears expenses directly attributable to it. The Funds’ primary objectives are to obtain as high a level of current income as is consistent, in the view of Thornburg Investment Management, Inc., the Trust’s investment advisor (the “Advisor”), with the preservation of capital. As a secondary objective, the Government Fund and the Income Fund seek to reduce changes in their share prices compared to longer term portfolios.
The Government Fund currently has six classes of shares of beneficial interest: Class A, Class C, Institutional Class (“Class I”), and Retirement Classes (“Class R3,” “Class R4,” and “Class R5”).
The Income Fund currently offers seven classes of shares of beneficial interest outstanding, Class A, Class C, Institutional Class (“Class I”), and Retirement Classes (“Class R3,” “Class R4,” “Class R5,” and “Class R6”).
The Low Duration Fund currently offers two classes of shares of beneficial interest outstanding, Class A and Institutional Class (“Class I”).
Each class of shares of the Funds represents an interest in the same portfolio of investments, except that (i) Class A shares are sold subject to a front-end sales charge collected at the time the shares are purchased and bear a service fee, (ii) Class B shares were sold at net asset value without a sales charge at the time of purchase, but were subject to a contingent deferred sales charge upon redemption and bear both a service fee and distribution fee, (iii) Class C shares are sold at net asset value without a sales charge at the time of purchase, but are subject to a contingent deferred sales charge upon redemption within one year of purchase, and bear both a service fee and a distribution fee, (iv) Class I and Class R5 shares are sold at net asset value without a sales charge at the time of purchase and may be subject to a service fee, (v) Class R3 shares are sold at net asset value without a sales charge, but bear both a service fee and a distribution fee, (vi) Class R4 shares are sold at net asset value without a sales charge at the time of purchase but bear a service fee, (vii) Class R6 shares are sold at net asset value without a sales charge at the time of purchase, and (viii) the respective classes may have different reinvestment privileges and conversion rights. Additionally, each Fund may allocate among its classes certain expenses, to the extent allocable to specific classes, including transfer agent fees, government registration fees, certain printing and postage costs, and administrative and legal expenses. Currently, class specific expenses of the Funds are limited to distribution and service fees, administration fees, and certain registration and transfer agent expenses.
The following is a summary of significant accounting policies followed by the Funds in the preparation of its financial statements. Each Fund prepares its financial statements in conformity with United States generally accepted accounting principles (“GAAP”), including investment company accounting and reporting guidance in the Financial Accounting Standards Board (the “FASB”) Accounting Standard Codification Topic 946.
NOTE 2 – SIGNIFICANT ACCOUNTING POLICIES
Security Valuation: All investments in securities held by the Fund are valued as described in Note 3.
Allocation of Income, Gains, Losses and Expenses: Net investment income (other than class specific expenses) and realized and unrealized gains and losses are allocated daily to each class of shares based upon the relative net asset value of outstanding shares (or the value of the dividend-eligible shares, as appropriate) of each class of shares at the beginning of the day (after adjusting for the current capital shares activity of the respective class). Expenses common to all Funds are allocated among the Funds comprising the Trust based upon their relative net asset values or other appropriate allocation methods. Operating expenses directly attributable to a specific class are charged against the operating income of that class.
Dividends and Distributions to Shareholders: Dividends and distributions to shareholders, which are determined in accordance with federal income tax regulations and may differ from GAAP, are recorded on the ex-dividend date. Ordinary income distributions, if any, are declared daily and paid monthly. Capital gain distributions, if any, are declared and paid annually and more often if deemed necessary by the Advisor. Dividends are paid and are reinvested in additional shares of the Fund at net asset value per share at the close of business on the ex-dividend date, or at the shareholder’s option, paid in cash.
Investment Income: Interest income is accrued as earned. Premiums and discounts are amortized and accreted, respectively, to call dates or maturity dates using the effective yield method of the respective investments. These amounts are included in Interest income on the Statement of Operations. Dividend income is recorded on the ex-dividend date.
44 | Semi-Annual Reports
Notes to Financial Statements, Continued
March 31, 2018 (Unaudited)
Custodian Fees: Custodian fees disclosed in the Statement of Operations may include interest expenses incurred by the Fund on any cash overdrafts of its custodian account during the period. Such cash overdrafts may result from the effects of failed trades in portfolio securities and from cash outflows resulting from unanticipated shareholder redemption activity. The Fund pays interest to its custodian on any such cash overdraft at a rate set periodically at the custodian’s discretion of the overdraft amount in excess of $50,000.
Investment Transactions: Investment transactions are accounted for on a trade date basis. Realized gains and losses from the sale of investments are recorded on an identified cost basis.
Repurchase Agreements: The Funds may invest excess cash in repurchase agreements whereby the Funds purchase investments, which serve as collateral, with an agreement to resell such collateral to the seller at an agreed upon price at the maturity date of the repurchase agreement. Investments pledged as collateral for repurchase agreements are held in custody until maturity of the repurchase agreement. Provisions in the agreements require that the market value of the collateral is at least equal to the repurchase value in the event of default. In the event of default, the Funds have the right to liquidate the collateral and apply the proceeds in satisfaction of the obligation. Under certain circumstances, in the event of default or bankruptcy by the other party to the agreement, realization and/or retention of the collateral may be subject to legal proceedings.
When-Issued and Delayed Delivery Transactions: The Fund may engage in when-issued or delayed delivery transactions. To the extent the Fund engages in such transactions, it will do so for the purpose of acquiring portfolio investments consistent with the Fund’s investment objectives and not for the purpose of investment leverage or to speculate on interest rate or market changes. At the time the Fund makes a commitment to purchase an investment on a when-issued or delayed delivery basis, the Fund will record the transaction and reflect the value in determining its net asset value. When effecting such transactions, assets of an amount sufficient to make payment for the portfolio investments to be purchased will be segregated on the Fund’s records on the trade date. Investments purchased on a when-issued or delayed delivery basis do not earn interest until the settlement date.
Guarantees and Indemnifications: Under the Trust’s organizational documents (and under separate agreements with the independent Trustees), its officers and Trustees are provided with an indemnification against certain liabilities arising out of the performance of their duties to the Fund. In the normal course of business the Trust may also enter into contracts with service providers that contain general indemnifications. The Trust’s maximum exposure under these arrangements is unknown. However, based on experience, the Trust expects the risk of loss to be remote.
Use of Estimates: The preparation of financial statements in conformity with GAAP requires management to make estimates and assumptions that affect the reported amounts of assets and liabilities and disclosure of contingent assets and liabilities at the date of the financial statements and the reported amounts of increases (decreases) in net assets from operations during the reporting period. Actual results could differ from those estimates.
Federal Income Taxes: It is the policy of the Trust to comply with the provisions of the Internal Revenue Code applicable to regulated investment companies and to distribute to shareholders substantially all investment company taxable income including net realized gains on investments (if any), and tax exempt income of the Fund. Therefore, no provision for federal income or excise tax is required.
The Fund files income tax returns in United States federal and applicable state jurisdictions. The statute of limitations on the Fund’s tax return filings generally remains open for the three years following a return’s filing date. The Fund has analyzed each uncertain tax position believed to be material in the preparation of the Fund’s financial statements for the six month period ended March 31, 2018, including open tax years, to assess whether it is more likely than not that the position would be sustained upon examination, based on the technical merits of the position. The Fund has not identified any such position for which an asset or liability must be reflected in the Statement of Assets and Liabilities.
At March 31, 2018, information on the tax components of capital was as follows:
| | | | | | | | | | | | | | | | | | | | | | | | | | | | | | |
| | | GOVERNMENT FUND | | INCOME FUND | | LOW DURATION FUND |
Cost of investments for tax purposes | | | $ | | | | | | 267,756,579 | | | | $ | | | | | | 5,126,001,035 | | | | $ | | | | | | 23,976,721 | |
| | | | | |
Gross unrealized appreciation on a tax basis | | | | | | | | | 443,372 | | | | | | | | | | 26,355,553 | | | | | | | | | | 45,889 | |
Gross unrealized depreciation on a tax basis | | | | | | | | | (4,591,823 | ) | | | | | | | | | (47,385,725 | ) | | | | | | | | | (146,717 | ) |
| | | | | |
Net unrealized appreciation (depreciation) on investments (tax basis) | | | $ | | | | | | (4,148,451 | ) | | | $ | | | | | | (21,030,172 | ) | | | $ | | | | | | (100,828 | ) |
| | | | | |
At March 31, 2018, the Funds had deferred tax basis capital losses occurring subsequent to October 31, 2016 through September 30, 2017 as follows. For tax purposes, such losses will be recognized in the year ending September 30, 2018.
| | | | | | | | | | | | | | | | | | | | | | | | | | | | | | |
| | | GOVERNMENT FUND | | INCOME FUND | | LOW DURATION FUND |
Deferred tax basis capital losses | | | $ | | | | | | 1,148,202 | | | | $ | | | | | | – | | | | $ | | | | | | 4,239 | |
| | | | | |
Semi-Annual Reports | 45
Notes to Financial Statements, Continued
March 31, 2018 (Unaudited)
At March 31, 2018, the Government Fund had cumulative tax basis capital losses of $9,423,085 (of which $2,067,255 are short-term and $7,355,830 are long-term) generated after September 30, 2011, which may be carried forward to offset future capital gains. To the extent such carryforwards are used, capital gain distributions may be reduced to the extent provided by regulations. Such capital loss carryforwards do not expire, but are required to be utilized to offset future gains prior to the utilization of losses generated prior to October 1, 2011 which may expire prior to utilization.
Capital loss carryforwards generated prior to October 31, 2011 expire as follows:
| | | | | |
2018 | | | $ | 17,316 | |
2019 | | | | 106,151 | |
| | | | | |
| | | $ | 123,467 | |
| | | | | |
At March 31, 2018, the Income Fund had cumulative tax basis capital losses of $1,098,922 (of which $1,098,922 are short-term and $0 are long-term) generated after September 30, 2011, which may be carried forward to offset future capital gains. To the extent such carryforwards are used, capital gain distributions may be reduced to the extent provided by regulations. Such capital loss carryforwards do not expire.
NOTE 3 – SECURITY VALUATION
Valuation of the Fund’s portfolio investment securities is performed in accordance with policies and procedures adopted by and under the oversight of the Trustees.
The Trustees of the Trust have appointed the Advisor to assist the Trustees to obtain market values for portfolio investments, evaluate and monitor professional pricing service providers appointed by the Trustees’ Audit Committee (the “Audit Committee”) to assist in determining fair values for portfolio investments, assist in calculating fair values for portfolio investments in certain circumstances, and to perform other functions in connection with the valuation of investments. The Advisor acts through its Valuation and Pricing Committee (the “Committee”) and other employees of the Advisor. The Committee regularly reviews its own valuation calculations, as well as the valuations, valuation techniques and services furnished by pricing service providers, considers circumstances which may require valuation calculations by the Committee, and reviews previous valuation calculations. The Committee reports to the Audit Committee on the Committee’s activities, the performance of pricing service providers, and other matters relating to valuation of portfolio investments.
In those instances when the Committee assists in calculating a fair value for a portfolio investment, the Committee seeks to determine the price that the Fund would reasonably expect to receive upon a sale of the investment in an orderly transaction between market participants on the valuation date. The Committee customarily utilizes quotations from securities broker dealers in calculating valuations, but also may utilize prices obtained from pricing service providers or other methods approved by the Audit Committee. Because fair values calculated by the Committee are estimates, the calculation of a value for an investment may differ from the price that would be realized by the Fund upon a sale of the investment, and the difference could be material to the Fund’s financial statements. The Committee’s calculation of a fair value for an investment may also differ from the prices obtained by other persons (including other mutual funds) for the investment.
Valuation of Securities: Debt obligations held by the Funds which are not listed or traded on exchanges or for which no reported market exists are ordinarily valued at the valuation obtained from a pricing service provider approved by the Audit Committee.
In any case when a pricing service provider fails to provide a valuation for a debt obligation held by the Funds, the Committee calculates a fair value for the obligation using alternative methods under procedures approved by the Audit Committee. Additionally, in cases when management believes that a valuation obtained from a pricing service provider merits review for significant reasons, the Committee decides whether or not to use the valuation calculated by the pricing service provider or to use an alternative method approved by the Audit Committee to calculate a fair value for the obligation.
Valuation Hierarchy: The Funds categorize its investments based upon the inputs used in valuing those investments, according to a three-level hierarchy established in guidance from the FASB. Categorization of investments using this hierarchy is intended by the FASB to maximize the use of observable inputs in valuing investments and minimize the use of unobservable inputs by requiring that the most observable inputs be used when available. Observable inputs are those that market participants would use in valuing an investment based on available market information. Unobservable inputs are those that reflect assumptions about the information market participants would use in valuing an investment. An investment’s level within the hierarchy is based on the lowest level input that is deemed significant to the valuation. The methodologies and inputs used to value investments are not necessarily indications of the risk or liquidity associated with those investments.
Various inputs are used in calculating valuations for a Fund’s investments. These inputs are generally summarized according to the three-level hierarchy below:
46 | Semi-Annual Reports
Notes to Financial Statements, Continued
March 31, 2018 (Unaudited)
Level 1: Quoted prices in active markets for identical investments.
Level 2: Other direct or indirect significant observable inputs (including quoted prices for similar investments in active markets and other observable inputs, such as interest rates, prepayment rates, credit risk, etc.).
Level 3: Significant unobservable inputs (including the Committee’s own assumptions in calculating the fair values of investments).
Valuations for debt obligations held by a Fund are typically calculated by pricing service providers approved by the Audit Committee and are generally characterized as Level 2 within the valuation hierarchy.
In a limited number of cases the Committee calculates a fair value for investments using broker quotations or other methods approved by the Audit Committee. When the Committee uses a single broker quotation to calculate a fair value for an investment without other significant observable inputs, or if a fair value is calculated using other significant inputs that are considered unobservable, the investment is characterized as Level 3 within the hierarchy. Other significant unobservable inputs used to calculate a fair value in these instances might include an income-based valuation approach which considers discounted anticipated future cash flows from the investment and application of discounts due to the nature or duration of any restrictions on the disposition of the investment.
Valuations based upon the use of inputs from Levels 1, 2 or 3 may not represent the actual price received upon the disposition of an investment, and a Fund may receive a price that is lower than the valuation based upon these inputs when it sells the investment.
GOVERNMENT FUND
The following table displays a summary of the fair value hierarchy measurements of the Government Fund’s investments as of March 31, 2018. In any instance when valuation inputs from more than one level are used to determine the fair value of a specific investment, the investment is placed in the level of the table based upon the lowest level input that is significant in determining the fair value of the investment:
| | | | | | | | | | | | | | | | | | | | |
| | | FAIR VALUE MEASUREMENTS AT MARCH 31, 2018 |
| | | TOTAL | | LEVEL 1 | | LEVEL 2 | | LEVEL 3 |
Assets | | | | | | | | | | | | | | | | | | | | |
Investments in Securities | | | | | | | | | | | | | | | | | | | | |
U.S. Government Agencies | | | $ | 38,963,571 | | | | $ | – | | | | $ | 38,963,571 | | | | $ | – | |
U.S. Treasury Securities | | | | 63,758,533 | | | | | 63,758,533 | | | | | – | | | | | – | |
Mortgage Backed | | | | 143,154,215 | | | | | 1,971,691 | | | | | 138,287,493 | | | | | 2,895,031 | |
Short Term Investment | | | | 17,731,809 | | | | | – | | | | | 17,731,809 | | | | | – | |
| | | | | |
Total Investments in Securities | | | $ | 263,608,128 | | | | $ | 65,730,224 | | | | $ | 194,982,873 | | | | $ | 2,895,031(a) | |
| (a) | In accordance with the guidance prescribed in Accounting Standards Update (“ASU”) No. 2011-04, the following table displays a summary of the valuation techniques and unobservable inputs used to value portfolio securities characterized as Level 3 investments for the period ended at March 31, 2018: |
| | | | | | | | | | |
| | | FAIR VALUE AT
SEPTEMBER 30, 2017 | | | VALUATION TECHNIQUE(S) | | UNOBSERVABLE INPUT | | RANGE
(WEIGHTED AVERAGE) |
| | | | |
Mortgage Backed | | $ | 2,895,031 | | | Cost basis | | Cost basis | | $ 96.95/(N/A) |
| | | | |
Total | | $ | 2,895,031 | | | | | | | |
In accordance with the guidance prescribed in Accounting Standards Update No. 2011-04, it is the policy of the Fund to recognize transfers between levels and the underlying events which caused the movement. The Fund recognized no transfers between levels for the six months ended March 31, 2018.
A rollforward of fair value measurements using significant unobservable inputs (Level 3) for the six months ended March 31, 2018 is as follows:
Semi-Annual Reports | 47
Notes to Financial Statements, Continued
March 31, 2018 (Unaudited)
| | | | | | | | | | |
| | | MORTGAGE BACKED | | TOTAL(d) |
Beginning Balance 9/30/2017 | | | $ | – | | | | $ | – | |
Accrued Discounts (Premiums) | | | | 87 | | | | | 87 | |
Net Realized Gain (Loss)(a) | | | | 421 | | | | | 421 | |
Gross Purchases | | | | 2,908,388 | | | | | 2,908,388 | |
Gross Sales | | | | (13,778 | ) | | | | (13,778 | ) |
Net Change in Unrealized Appreciation (Depreciation)(b)(c) | | | | (87 | ) | | | | (87 | ) |
Transfers into Level 3 | | | | – | | | | | – | |
Transfers out of Level 3 | | | | – | | | | | – | |
| | | | | |
Ending Balance 3/31/2018 | | | $ | 2,895,031 | | | | $ | 2,895,031 | |
| (a) | Amount of net realized gain (loss) from investments recognized in income is included in the Fund’s Statement of Operations for the six months ended March 31, 2018. |
| (b) | Amount of net change in unrealized appreciation (depreciation) on investments recognized in income is included in the Fund’s Statement of Operations for the six months ended March 31, 2018. |
| (c) | The net change in unrealized appreciation (depreciation) attributable to securities owned at March 31, 2018, which were valued using significant unobservable inputs, was $(87). This is included within net change in unrealized appreciation (depreciation) on investments in the Fund’s the Statement of Operations for the six months ended March 31, 2018. |
| (d) | Level 3 investments represent 1.09% of total net assets at the six months ended March 31, 2018. Significant fluctuations of the unobservable inputs applied to portfolio securities characterized as Level 3 investments could be expected to increase or decrease the fair value of these portfolio securities. |
INCOME FUND
The following table displays a summary of the fair value hierarchy measurements of the Income Fund’s investments as of March 31, 2018. In any instance when valuation inputs from more than one level are used to determine the fair value of a specific investment, the investment is placed in the level of the table based upon the lowest level input that is significant in determining the fair value of the investment:
| | | | | | | | | | | | | | | | | | | | |
| | | FAIR VALUE MEASUREMENTS AT MARCH 31, 2018 |
| | | TOTAL | | LEVEL 1 | | LEVEL 2 | | LEVEL 3 |
Assets | | | | | | | | | | | | | | | | | | | | |
Investments in Securities | | | | | | | | | | | | | | | | | | | | |
U.S. Treasury Securities | | | $ | 437,493,223 | | | | $ | 437,493,223 | | | | $ | – | | | | $ | – | |
U.S. Government Agencies | | | | 55,912,268 | | | | | – | | | | | 52,628,048 | | | | | 3,284,220 | |
Other Government | | | | 46,169,015 | | | | | – | | | | | 46,169,015 | | | | | – | |
Mortgage Backed | | | | 284,549,523 | | | | | – | | | | | 273,041,775 | | | | | 11,507,748 | |
Asset Backed Securities | | | | 1,200,010,060 | | | | | – | | | | | 1,170,705,457 | | | | | 29,304,603 | |
Corporate Bonds | | | | 2,646,990,001 | | | | | – | | | | | 2,646,990,001 | | | | | – | |
Municipal Bonds | | | | 123,220,284 | | | | | – | | | | | 123,220,284 | | | | | – | |
Commercial Paper | | | | 190,626,489 | | | | | – | | | | | 190,626,489 | | | | | – | |
Repurchase Agreement | | | | 120,000,000 | | | | | – | | | | | 120,000,000 | | | | | – | |
| | | | | |
Total Investments in Securities | | | $ | 5,104,970,863 | | | | $ | 437,493,223 | | | | $ | 4,623,381,069 | | | | $ | 44,096,571(a) | |
| (a) | In accordance with the guidance prescribed in Accounting Standards Update (“ASU”) No. 2011-04, the following table displays a summary of the valuation techniques and unobservable inputs used to value portfolio securities characterized as Level 3 investments for the period ended at March 31, 2018: |
| | | | | | | | | | |
| | | FAIR VALUE AT
SEPTEMBER 30, 2017 | | | VALUATION TECHNIQUE(S) | | UNOBSERVABLE INPUT | | RANGE
(WEIGHTED AVERAGE) |
| | | | |
U.S. Government Agencies | | $ | 3,284,220 | | | Market comparable securities yield method | | Yields of comparable securities | | 3.29%/(N/A) |
| | | | |
Asset Backed Securities | | | 20,337,082 | | | Cost basis | | Cost basis | | $99.99/(3.30%) |
| | | | |
| | | | 8,967,521 | | | Discounted cash flows | | Third Party Vendor Discounted cash flows | | 3.0%-5.7%/(2.76%) |
| | | | |
Mortgage Backed | | | 11,507,748 | | | Cost basis | | Cost basis | | $96.95/(N/A) |
| | | | |
Total | | $ | 44,096,571 | | | | | | | |
In accordance with the guidance prescribed in Accounting Standards Update No. 2011-04, it is the policy of the Fund to recognize transfers between levels and the underlying events which caused the movement. The Fund recognized no transfers between Levels 1 and 2 for the six months ended March 31, 2018.
A rollforward of fair value measurements using significant unobservable inputs (Level 3) for the six months ended March 31, 2018 is as follows:
48 | Semi-Annual Reports
Notes to Financial Statements, Continued
March 31, 2018 (Unaudited)
| | | | | | | | | | | | | | | | | | | | |
| | | U.S. GOVERNMENT
AGENCIES | | ASSET BACKED
SECURITIES | | MORTGAGE BACKED | | TOTAL(e) |
Beginning Balance 9/30/2017 | | | $ | 3,347,400 | | | | $ | 20,533,738 | | | | $ | – | | | | $ | 23,881,138 | |
Accrued Discounts (Premiums) | | | | (21,095 | ) | | | | 5,552 | | | | | 348 | | | | | (15,195 | ) |
Net Realized Gain (Loss)(a) | | | | – | | | | | 32,353 | | | | | 1,672 | | | | | 34,025 | |
Gross Purchases | | | | – | | | | | 20,324,795 | | | | | 11,560,840 | | | | | 31,885,635 | |
Gross Sales | | | | – | | | | | (262,500 | ) | | | | (54,765 | ) | | | | (317,265 | ) |
Net Change in Unrealized Appreciation (Depreciation)(b)(c) | | | | (42,085 | ) | | | | (29,336 | ) | | | | (347 | ) | | | | (71,768 | ) |
Transfers into Level 3(d) | | | | – | | | | | – | | | | | – | | | | | – | |
Transfers out of Level 3(d) | | | | – | | | | | (11,299,999 | ) | | | | – | | | | | (11,299,999 | ) |
| | | | | |
Ending Balance 3/31/2018 | | | $ | 3,284,220 | | | | $ | 29,304,603 | | | | $ | 11,507,748 | | | | $ | 44,096,571 | |
| (a) | Amount of net realized gain (loss) from investments recognized in income is included in the Fund’s Statement of Operations for the six months ended March 31, 2018. |
| (b) | Amount of net change in unrealized appreciation (depreciation) on investments recognized in income is included in the Fund’s Statement of Operations for the six months ended March 31, 2018. |
| (c) | The net change in unrealized appreciation (depreciation) attributable to securities owned at March 31, 2018, which were valued using significant unobservable inputs, was $(71,768). This is included within net change in unrealized appreciation (depreciation) on investments in the Fund’s the Statement of Operations for the six months ended March 31, 2018. |
| (d) | Transfers into or out of Level 3 were out of or into Level 2, and were due to changes in other significant observable inputs available during the six months ended March 31, 2018. Transfers into or out of Level 3 are based on the beginning market value of the period in which they occurred. |
| (e) | Level 3 investments represent 0.85% of total net assets at the six months ended March 31, 2018. Significant fluctuations of the unobservable inputs applied to portfolio securities characterized as Level 3 investments could be expected to increase or decrease the fair value of these portfolio securities. |
LOW DURATION FUND
The following table displays a summary of the fair value hierarchy measurements of the Low Duration Fund’s investments as of March 31, 2018. In any instance when valuation inputs from more than one level are used to determine the fair value of a specific investment, the investment is placed in the level of the table based upon the lowest level input that is significant in determining the fair value of the investment:
| | | | | | | | | | | | | | | | | | | | |
| | | FAIR VALUE MEASUREMENTS AT MARCH 31, 2018 |
| | | TOTAL | | LEVEL 1 | | LEVEL 2 | | LEVEL 3 |
Assets | | | | | | | | | | | | | | | | | | | | |
Investments in Securities | | | | | | | | | | | | | | | | | | | | |
U.S. Treasury Securities | | | $ | 3,487,498 | | | | $ | 3,487,498 | | | | $ | – | | | | $ | – | |
U.S. Government Agencies | | | | 361,403 | | | | | – | | | | | 361,403 | | | | | – | |
Other Government | | | | 59,672 | | | | | – | | | | | 59,672 | | | | | – | |
Mortgage Backed | | | | 1,392,614 | | | | | – | | | | | 1,344,363 | | | | | 48,251 | |
Asset Backed Securities | | | | 5,293,742 | | | | | – | | | | | 5,048,753 | | | | | 244,989 | |
Corporate Bonds | | | | 9,967,228 | | | | | – | | | | | 9,967,228 | | | | | – | |
Municipal Bonds | | | | 422,786 | | | | | – | | | | | 422,786 | | | | | – | |
Short-Term Investments | | | | 2,890,950 | | | | | 2,890,950 | | | | | – | | | | | – | |
| | | | | |
Total Investments in Securities | | | $ | 23,875,893 | | | | $ | 6,378,448 | | | | $ | 17,204,205 | | | | $ | 293,240 | (a) |
| (a) | In accordance with the guidance prescribed in Accounting Standards Update (“ASU”) No. 2011-04, the following table displays a summary of the valuation techniques and unobservable inputs used to value portfolio securities characterized as Level 3 investments for the period ended at March 31, 2018: |
| | | | | | | | | | |
| | | FAIR VALUE AT
SEPTEMBER 30, 2017 | | | VALUATION TECHNIQUE(S) | | UNOBSERVABLE INPUT | | RANGE
(WEIGHTED AVERAGE) |
| | | | |
Asset Backed Securities | | $ | 69,860 | | | Discounted cash flows | | Third Party Vendor Discounted cash flows | | 3.0%/(N/A) |
| | | | |
| | | | 175,129 | | | Cost basis | | Cost basis | | $99.99/(N/A) |
| | | | |
Mortgage Backed | | | 48,251 | | | Cost basis | | Cost basis | | $96.95 |
| | | | |
Total | | $ | 293,240 | | | | | | | |
In accordance with the guidance prescribed in Accounting Standards Update No. 2011-04, it is the policy of the Fund to recognize transfers between levels and the underlying events which caused the movement. The Fund recognized no transfers between Levels 1 and 2 for the six months ended March 31, 2018.
A rollforward of fair value measurements using significant unobservable inputs (Level 3) for the six months ended March 31, 2018 is as follows:
Semi-Annual Reports | 49
Notes to Financial Statements, Continued
March 31, 2018 (Unaudited)
| | | | | | | | | | | | | | | |
| | | ASSET BACKED
SECURITIES | | MORTGAGE BACKED | | TOTAL(e) |
Beginning Balance 9/30/2017 | | | $ | 170,280 | | | | $ | – | | | | $ | 170,280 | |
Accrued Discounts (Premiums) | | | | 1 | | | | | 2 | | | | | 3 | |
Net Realized Gain (Loss)(a) | | | | – | | | | | 7 | | | | | 7 | |
Gross Purchases | | | | 174,998 | | | | | 48,473 | | | | | 223,471 | |
Gross Sales | | | | – | | | | | (230 | ) | | | | (230 | ) |
Net Change in Unrealized Appreciation (Depreciation)(b)(c) | | | | (290 | ) | | | | (1 | ) | | | | (291 | ) |
Transfers into Level 3(d) | | | | – | | | | | – | | | | | – | |
Transfers out of Level 3(d) | | | | (100,000 | ) | | | | – | | | | | (100,000 | ) |
| | | | | |
Ending Balance 3/31/2018 | | | $ | 244,989 | | | | $ | 48,251 | | | | $ | 293,240 | |
| (a) | Amount of net realized gain (loss) from investments recognized in income is included in the Fund’s Statement of Operations for the six months ended March 31, 2018. |
| (b) | Amount of net change in unrealized appreciation (depreciation) on investments recognized in income is included in the Fund’s Statement of Operations for the six months ended March 31, 2018. |
| (c) | The net change in unrealized appreciation (depreciation) attributable to securities owned at March 31, 2018, which were valued using significant unobservable inputs, was $(291). This is included within net change in unrealized appreciation (depreciation) on investments in the Fund’s the Statement of Operations for the six months ended March 31, 2018. |
| (d) | Transfers into or out of Level 3 were out of or into Level 2, and were due to changes in other significant observable inputs available during the six months ended March 31, 2018. Transfers into or out of Level 3 are based on the beginning market value of the period in which they occurred. |
| (e) | Level 3 investments represent 1.24% of total net assets at the six months ended March 31, 2018. Significant fluctuations of the unobservable inputs applied to portfolio securities characterized as Level 3 investments could be expected to increase or decrease the fair value of these portfolio securities. |
NOTE 4 – INVESTMENT ADVISORY FEE AND OTHER TRANSACTIONS WITH AFFILIATES
Pursuant to an investment advisory agreement, the Advisor serves as the investment advisor and performs services for the Funds for which the fees are payable at the end of each month. Under the investment advisory agreement, a Fund pays the Advisor a management fee based on the daily net assets of a Fund at an annual rate as shown in the following table:
| | | | | | | | | | | | | | | | | | | |
| MANAGEMENT FEE SCHEDULE |
| GOVERNMENT FUND | | INCOME FUND | | LOW DURATION FUND |
| DAILY NET ASSETS | | FEE RATE | | DAILY NET ASSETS | | FEE RATE | | DAILY NET ASSETS | | FEE RATE |
| | | | | |
Up to $1 billion | | | | 0.375 | % | | Up to $500 million | | | | 0.500 | % | | Up to $1 Billion | | | | 0.400 | % |
| | | | | |
Next $1 billion | | | | 0.325 | | | Next $500 million | | | | 0.450 | | | Next $500 million | | | | 0.300 | |
| | | | | |
Over $2 billion | | | | 0.275 | | | Next $500 million | | | | 0.400 | | | Next $500 million | | | | 0.250 | |
| | | | | |
| | | | | | | Next $500 million | | | | 0.350 | | | Over $2 billion | | | | 0.225 | |
| | | | | |
| | | | | | | Over $2 billion | | | | 0.275 | | | | | | | | |
The Government Fund’s effective management fee for the six months ended March 31, 2018 was 0.375% of the Fund’s average net assets.
The Income Fund’s effective management fee for the six months ended March 31, 2018 was 0.335% of the Fund’s average net assets.
The Low Duration Fund’s effective management fee for the six months ended March 31, 2018 was 0.40% of the Fund’s average net assets (before applicable management fee waiver of $45,771).
The Trust has entered into administrative service agreements with the Advisor, whereby the Advisor will perform certain administrative services related to each class of the Funds’ shares. Until January 31, 2018, the fees were payable at an annual rate of up to 0.125 of 1% per annum of the average daily net assets attributable to Class A, Class C, Class R3, and Class R4 shares, and up to .05 of 1% per annum of the average daily net assets attributable to Class I, Class R5, and Class R6 shares. As of February 1, 2018, the fees are computed as an annual percentage of the aggregate average daily net assets of all shares classes of all Funds in the Trust as follows:
| | | | | |
| ADMINISTRATION FEE SCHEDULE |
| DAILY NET ASSETS | | FEE RATE |
| |
Up to $20 billion | | | | 0.100 | % |
| |
$20 billion to $40 billion | | | | 0.075 | |
| |
$40 billion to $60 billion | | | | 0.040 | |
| |
Over $60 billion | | | | 0.030 | |
50 | Semi-Annual Reports
Notes to Financial Statements, Continued
March 31, 2018 (Unaudited)
The aggregate fee amount is allocated on a daily basis to each Fund based on net assets and subsequently allocated to each class of shares of the Funds. Total administrative service fees incurred by each class of shares of the Funds for the six months ended March 31, 2018, are set forth in the Statement of Operations.
The Trust has an underwriting agreement with Thornburg Securities Corporation (the “Distributor”), an affiliate of the Advisor, which acts as the distributor of the Funds’ shares. For the six months ended March 31, 2018, the Distributor has advised the Funds that they earned net commissions from the sale of Class A shares and collected contingent deferred sales charges (CDSC fees) from redemptions of Class C shares as follows:
| | | | | | | | | | | | | | | |
| | | GOVERNMENT FUND | | INCOME FUND | | LOW DURATION FUND |
Commissions | | | $ | 246 | | | | $ | 1,661 | | | | $ | 26 | |
CDSC fees | | | $ | 239 | | | | $ | 12,011 | | | | $ | – | |
Pursuant to a service plan under Rule 12b-1 of the Investment Company Act of 1940, the Funds may reimburse to the Distributor an amount not to exceed .25 of 1% per annum of the average daily net assets attributable to the applicable Class A, Class C, Class I, Class R3, Class R4, and Class R5 shares of the Funds for payments made by the Distributor to securities dealers and other financial institutions to obtain various shareholder and distribution related services. For the six months ended March 31, 2018, there were no 12b-1 service plan fees charged for Class I or Class R5 shares. Class R6 shares are not subject to a service plan. The Advisor and Distributor each may pay out of its own resources additional expenses for distribution of each Fund’s shares and shareholder services.
The Trust has also adopted distribution plans pursuant to Rule 12b-1, applicable to each Fund’s Class C and Class R3 shares under which the Funds compensate the Distributor for services in promoting the sale of Class C and R3 shares of the Funds at an annual rate of up to .25 of 1% per annum of the average daily net assets attributable to Class C and Class R3 shares.
Total fees incurred by each class of shares of the Funds under their respective service and distribution plans for the six months ended March 31, 2018, are set forth in the Statements of Operations.
The Advisor and Distributor have contractually agreed to waive fees and reimburse expenses incurred by the Funds so that actual expenses of certain share classes do not exceed levels as specified in each Fund’s most recent prospectus. The agreement may be terminated by the Funds at any time, but may not be terminated by the Advisor or Distributor before February 1, 2019, unless the Advisor ceases to be the investment advisor to the Funds or the Distributor ceases to be the distributor of the Funds prior to that date. The Advisor and Distributor retain the right to be repaid by the Funds for fee waivers and expense reimbursements if expenses fall below the contractual limit prior to the end of the fiscal year.
For the six months ended March 31, 2018, the Advisor contractually reimbursed certain class specific expenses, administration fees, distribution fees and voluntarily waived Fund level investment advisory fees as follows:
| | | | | | | | | | | | | | | |
| | | GOVERNMENT FUND | | INCOME FUND | | LOW DURATION FUND |
Contractual: | | | | | | | | | | | | | | | |
Class A | | | $ | – | | | | $ | – | | | | $ | 26,022 | |
Class C | | | $ | 915 | | | | $ | – | | | | $ | – | |
Class I | | | $ | – | | | | $ | – | | | | $ | 15,167 | |
Class R3 | | | $ | 25,161 | | | | $ | 55,542 | | | | $ | – | |
Class R4 | | | $ | 10,606 | | | | $ | 18,432 | | | | $ | – | |
Class R5 | | | $ | 10,006 | | | | $ | 108 | | | | $ | – | |
Class R6 | | | $ | – | | | | $ | 7,057 | | | | $ | – | |
| | | |
| | | GOVERNMENT FUND | | INCOME FUND | | LOW DURATION FUND |
Voluntary: | | | | | | | | | | | | | | | |
Class A | | | $ | – | | | | $ | – | | | | $ | 14,375 | |
Class I | | | $ | – | | | | $ | – | | | | $ | 31,396 | |
Certain officers and Trustees of the Trust are also officers or directors of the Advisor and Distributor. The compensation of the independent Trustees is borne by the Trust. The Trust also pays a portion of the Chief Compliance Officer’s compensation. These amounts are reflected as “Trustee and officer fees” in the Statement of Operations.
The percentage of direct investments in the Fund held by the Trustees, officers of the Trust, and the Advisor is approximately 7.0%, 0.0% and 40.5% for the Government Fund, Income Fund and Low Duration Fund, respectively.
Semi-Annual Reports | 51
Notes to Financial Statements, Continued
March 31, 2018 (Unaudited)
The Funds may purchase or sell securities from, or to an affiliated fund, provided the affiliation is due solely to having a common investment advisor, common officers, or common trustees, and provided that all such transactions will comply with Rule 17a-7 under the 1940 Act. For the six months ended March 31, 2018, the Government Fund, Income Fund and Low Duration Fund had no such transactions with affiliated funds.
Shown below are holdings of voting securities of each portfolio company which is considered “affiliated” to the Fund under the Investment Company Act of 1940, including companies for which the Fund’s holding represented 5% or more of the company’s voting securities, and a series of the Thornburg Investment Trust in which the Fund invested for cash management purposes during the period:
| | | | | | | | | | | | | | | | | | | | | | | | | | | | | | | | | | | | | | | | |
| FUND | | MARKET VALUE
9/30/17 | | PURCHASES
AT COST | | SALES
PROCEEDS | | REALIZED
GAIN
(LOSS) | | CHANGE IN
UNREALIZED
APPR./(DEPR.) | | MARKET VALUE
3/31/18 | | DIVIDEND
INCOME | | ROC
ADJUSTMENT |
Thornburg Capital Management Fund | | | $ | 2,435,027 | | | | $ | 7,879,214 | | | | $ | | (7,423,291) | | | $ | – | | | | $ | – | | | | $ | 2,890,950 | | | | $ | 18,902 | | | | $ | – | |
NOTE 5 – SHARES OF BENEFICIAL INTEREST
At March 31, 2018, there were an unlimited number of shares with no par value of beneficial interest authorized. Transactions in shares of beneficial interest were as follows:
GOVERNMENT FUND
| | | | | | | | | | | | | | | | |
| | | SIX MONTHS ENDED MARCH 31, 2018 (UNAUDITED) | | | YEAR ENDED SEPTEMBER 30, 2017 (AUDITED) | |
| | | SHARES | | | AMOUNT | | | SHARES | | | AMOUNT | |
Class A Shares | | | | | | | | | | | | | | | | |
Shares sold | | | 299,494 | | | $ | 3,862,628 | | | | 1,043,182 | | | $ | 13,641,984 | |
Shares issued to shareholders in
reinvestment of dividends | | | 45,014 | | | | 579,895 | | | | 98,647 | | | | 1,287,783 | |
Shares repurchased | | | (1,068,681 | ) | | | (13,778,580 | ) | | | (3,072,808 | ) | | | (40,108,795 | ) |
| | | | |
| | | | |
Net decrease | | | (724,173 | ) | | $ | (9,336,057 | ) | | | (1,930,979 | ) | | $ | (25,179,028 | ) |
| | | | |
Class C Shares | | | | | | | | | | | | | | | | |
Shares sold | | | 104,115 | | | $ | 1,349,412 | | | | 340,307 | | | $ | 4,480,824 | |
Shares issued to shareholders in
reinvestment of dividends | | | 14,830 | | | | 192,154 | | | | 30,959 | | | | 406,592 | |
Shares repurchased | | | (456,959 | ) | | | (5,925,008 | ) | | | (1,337,648 | ) | | | (17,583,808 | ) |
| | | | |
| | | | |
Net decrease | | | (338,014 | ) | | $ | (4,383,442 | ) | | | (966,382 | ) | | $ | (12,696,392 | ) |
| | | | |
Class I Shares | | | | | | | | | | | | | | | | |
Shares sold | | | 2,822,705 | | | $ | 36,347,955 | | | | 6,118,960 | | | $ | 79,886,935 | |
Shares issued to shareholders in
reinvestment of dividends | | | 70,610 | | | | 909,520 | | | | 119,832 | | | | 1,564,295 | |
Shares repurchased | | | (2,781,193 | ) | | | (35,872,455 | ) | | | (5,799,169 | ) | | | (75,752,037 | ) |
| | | | |
| | | | |
Net increase | | | 112,122 | | | $ | 1,385,020 | | | | 439,623 | | | $ | 5,699,193 | |
| | | | |
Class R3 Shares | | | | | | | | | | | | | | | | |
Shares sold | | | 102,802 | | | $ | 1,325,772 | | | | 466,176 | | | $ | 6,115,277 | |
Shares issued to shareholders in
reinvestment of dividends | | | 5,149 | | | | 66,364 | | | | 14,207 | | | | 185,714 | |
Shares repurchased | | | (158,814 | ) | | | (2,045,622 | ) | | | (1,759,168 | ) | | | (22,914,320 | ) |
| | | | |
| | | | |
Net decrease | | | (50,863 | ) | | $ | (653,486 | ) | | | (1,278,785 | ) | | $ | (16,613,329 | ) |
| | | | |
Class R4 Shares | | | | | | | | | | | | | | | | |
Shares sold | | | 33,459 | | | $ | 430,517 | | | | 169,933 | | | $ | 2,216,399 | |
Shares issued to shareholders in
reinvestment of dividends | | | 1,652 | | | | 21,273 | | | | 2,394 | | | | 31,240 | |
Shares repurchased | | | (44,312 | ) | | | (574,567 | ) | | | (71,845 | ) | | | (937,898 | ) |
| | | | |
| | | | |
Net increase (decrease) | | | (9,201 | ) | | $ | (122,777 | ) | | | 100,482 | | | $ | 1,309,741 | |
| | | | |
52 | Semi-Annual Reports
Notes to Financial Statements, Continued
March 31, 2018 (Unaudited)
GOVERNMENT FUND (continued)
| | | | | | | | | | | | | | | | |
| | | SIX MONTHS ENDED MARCH 31, 2018 (UNAUDITED) | | | YEAR ENDED SEPTEMBER 30, 2017 (AUDITED) | |
| | | SHARES | | | AMOUNT | | | SHARES | | | AMOUNT | |
Class R5 Shares | | | | | | | | | | | | | | | | |
Shares sold | | | 33,702 | | | $ | 435,348 | | | | 329,217 | | | $ | 4,347,313 | |
Shares issued to shareholders in
reinvestment of dividends | | | 1,803 | | | | 23,330 | | | | 5,220 | | | | 68,160 | |
Shares repurchased | | | (270,131 | ) | | | (3,498,042 | ) | | | (60,176 | ) | | | (785,723 | ) |
| | | | |
| | | | |
Net increase (decrease) | | | (234,626 | ) | | $ | (3,039,364 | ) | | | 274,261 | | | $ | 3,629,750 | |
| | | | |
INCOME FUND
| | | | | | | | | | | | | | | | |
| | | SIX MONTHS ENDED MARCH 31, 2018 (UNAUDITED) | | | YEAR ENDED SEPTEMBER 30, 2017 (AUDITED) | |
| | | SHARES | | | AMOUNT | | | SHARES | | | AMOUNT | |
Class A Shares | | | | | | | | | | | | | | | | |
Shares sold | | | 5,749,575 | | | $ | 76,827,800 | | | | 16,198,382 | | | $ | 217,089,363 | |
Shares issued to shareholders in
reinvestment of dividends | | | 587,003 | | | | 7,831,018 | | | | 1,221,584 | | | | 16,387,209 | |
Shares repurchased | | | (14,154,275 | ) | | | (188,798,359 | ) | | | (33,369,740 | ) | | | (447,049,723 | ) |
| | | | |
| | | | |
Net decrease | | | (7,817,697 | ) | | $ | (104,139,541 | ) | | | (15,949,774 | ) | | $ | (213,573,151 | ) |
| | | | |
Class C Shares | | | | | | | | | | | | | | | | |
Shares sold | | | 2,213,592 | | | $ | 29,544,626 | | | | 5,961,821 | | | $ | 79,804,114 | |
Shares issued to shareholders in
reinvestment of dividends | | | 339,289 | | | | 4,518,056 | | | | 673,533 | | | | 9,021,184 | |
Shares repurchased | | | (5,649,022 | ) | | | (75,316,096 | ) | | | (13,809,256 | ) | | | (184,837,371 | ) |
| | | | |
| | | | |
Net decrease | | | (3,096,141 | ) | | $ | (41,253,414 | ) | | | (7,173,902 | ) | | $ | (96,012,073 | ) |
| | | | |
Class I Shares | | | | | | | | | | | | | | | | |
Shares sold | | | 70,293,414 | | | $ | 937,845,512 | | | | 108,211,987 | | | $ | 1,450,721,919 | |
Shares issued to shareholders in
reinvestment of dividends | | | 2,663,608 | | | | 35,541,933 | | | | 4,372,629 | | | | 58,676,460 | |
Shares repurchased | | | (38,536,531 | ) | | | (514,430,345 | ) | | | (78,719,123 | ) | | | (1,055,916,369 | ) |
| | | | |
| | | | |
Net increase | | | 34,420,491 | | | $ | 458,957,100 | | | | 33,865,493 | | | $ | 453,482,010 | |
| | | | |
Class R3 Shares | | | | | | | | | | | | | | | | |
Shares sold | | | 1,613,542 | | | $ | 21,545,230 | | | | 2,932,660 | | | $ | 39,309,579 | |
Shares issued to shareholders in
reinvestment of dividends | | | 60,676 | | | | 809,880 | | | | 114,540 | | | | 1,538,044 | |
Shares repurchased | | | (1,618,864 | ) | | | (21,628,972 | ) | | | (3,569,214 | ) | | | (47,894,396 | ) |
| | | | |
| | | | |
Net increase (decrease) | | | 55,354 | | | $ | 726,138 | | | | (522,014 | ) | | $ | (7,046,773 | ) |
| | | | |
Class R4 Shares | | | | | | | | | | | | | | | | |
Shares sold | | | 112,608 | | | $ | 1,501,268 | | | | 331,345 | | | $ | 4,441,374 | |
Shares issued to shareholders in
reinvestment of dividends | | | 2,890 | | | | 38,538 | | | | 4,271 | | | | 57,281 | |
Shares repurchased | | | (52,362 | ) | | | (698,456 | ) | | | (201,080 | ) | | | (2,695,131 | ) |
| | | | |
| | | | |
Net increase | | | 63,136 | | | $ | 841,350 | | | | 134,536 | | | $ | 1,803,524 | |
| | | | |
Class R5 Shares | | | | | | | | | | | | | | | | |
Shares sold | | | 1,890,916 | | | $ | 25,192,788 | | | | 4,583,147 | | | $ | 61,386,517 | |
Shares issued to shareholders in
reinvestment of dividends | | | 83,629 | | | | 1,115,017 | | | | 128,065 | | | | 1,718,641 | |
Shares repurchased | | | (1,352,588 | ) | | | (18,045,066 | ) | | | (2,499,758 | ) | | | (33,490,256 | ) |
| | | | |
| | | | |
Net increase | | | 621,957 | | | $ | 8,262,739 | | | | 2,211,454 | | | $ | 29,614,902 | |
| | | | |
Semi-Annual Reports | 53
Notes to Financial Statements, Continued
March 31, 2018 (Unaudited)
INCOME FUND (continued)
| | | | | | | | | | | | | | | | |
| | | SIX MONTHS ENDED MARCH 31, 2018 (UNAUDITED) | | | YEAR ENDED
SEPTEMBER 30, 2017 (AUDITED) | |
| | | SHARES | | | AMOUNT | | | SHARES | | | AMOUNT | |
Class R6 Shares | | | | | | | | | | | | | | | | |
Shares sold | | | 1,002,098 | | | $ | 13,437,133 | | | | 56,985 | | | $ | 768,647 | |
Shares issued to shareholders in
reinvestment of dividends | | | 6,604 | | | | 88,122 | | | | 174 | | | | 2,348 | |
Shares repurchased | | | (134,802 | ) | | | (1,805,904 | ) | | | (9 | ) | | | (129 | ) |
| | | | |
| | | | |
Net increase | | | 873,900 | | | $ | 11,719,351 | | | | 57,150 | | | $ | 770,866 | |
| | | | |
LOW DURATION FUND
| | | | | | | | | | | | | | | | |
| | | SIX MONTHS ENDED MARCH 31, 2018 (UNAUDITED) | | | YEAR ENDED
SEPTEMBER 30, 2017 (AUDITED) | |
| | | SHARES | | | AMOUNT | | | SHARES | | | AMOUNT | |
Class A Shares | | | | | | | | | | | | | | | | |
Shares sold | | | 154,888 | | | $ | 1,917,177 | | | | 444,814 | | | $ | 5,522,323 | |
Shares issued to shareholders in
reinvestment of dividends | | | 4,588 | | | | 56,669 | | | | 8,111 | | | | 100,709 | |
Shares repurchased | | | (103,454 | ) | | | (1,278,688 | ) | | | (748,676 | ) | | | (9,295,069 | ) |
| | | | |
| | | | |
Net increase (decrease) | | | 56,022 | | | $ | 695,158 | | | | (295,751 | ) | | $ | (3,672,037 | ) |
| | | | |
Class I Shares | | | | | | | | | | | | | | | | |
Shares sold | | | 447,158 | | | $ | 5,533,558 | | | | 269,260 | | | $ | 3,343,267 | |
Shares issued to shareholders in
reinvestment of dividends | | | 9,728 | | | | 120,100 | | | | 16,170 | | | | 200,711 | |
Shares repurchased | | | (146,117 | ) | | | (1,806,246 | ) | | | (623,427 | ) | | | (7,733,733 | ) |
| | | | |
| | | | |
Net increase (decrease) | | | 310,769 | | | $ | 3,847,412 | | | | (337,997 | ) | | $ | (4,189,755 | ) |
| | | | |
NOTE 6 – INVESTMENT TRANSACTIONS
For the six months ended March 31, 2018, the Government Fund had purchase and sale transactions of investments (excluding short-term investments) of $16,581,464 and $31,248,139, respectively.
The Income Fund had purchase and sale transactions of investments (excluding short-term investments and U.S. Government obligations) of $1,261,643,456 and $745,487,762, respectively.
The Low Duration Fund had purchase and sale transactions of investments (excluding short-term investments and U.S. Government obligations) of $7,257,556 and $3,896,457, respectively.
OTHER NOTES
Risks: Each Fund’s investments subject it to risks including, but not limited to, management risk, interest rate risk, credit risk, prepayment risk, market and economic risk, liquidity risk, structured products risk and, in the case of Income Fund and Low Duration Fund, the risks associated with investments in non-U.S. issuers. Please see each Fund’s prospectus for a discussion of the risks associated with an investment in the Funds.
Subsequent Events: Fund management believes no events have occurred between March 31, 2018 and the date of issuance of the financial statements that require adjustment to or disclosure in the accompanying financial statements.
54 | Semi-Annual Reports
This page intentionally left blank.
Semi-Annual Reports | 55
Financial Highlights
Thornburg Limited Term U.S. Government Fund
| | | | | | | | | | | | | | | | | | | | | | | | | | | | | | | | | | | | | | | | |
| | | PER SHARE PERFORMANCE (FOR A SHARE OUTSTANDING THROUGHOUT THE PERIOD) |
| | | | | | | | | | | | | | | | | |
UNLESS OTHERWISE
NOTED, PERIODS ARE
FISCAL YEARS ENDED
SEPTEMBER 30, | | NET ASSET
VALUE,
BEGINNING OF
PERIOD | | NET
INVESTMENT
INCOME
(LOSS)+ | | NET REALIZED &
UNREALIZED GAIN
(LOSS) ON
INVESTMENTS | | TOTAL FROM
INVESTMENT
OPERATIONS | | DIVIDENDS
FROM NET
INVESTMENT
INCOME | | DIVIDENDS
FROM NET
REALIZED
GAINS | | TOTAL
DIVIDENDS | | NET ASSET
VALUE,
END OF PERIOD |
| | | | | | | |
| CLASS A SHARES | | | | | | | | | | | | | | | | | | | | | | | | | | | | | | | | | | | | |
| | | | | | | | |
2018(b)(c) | | | $ | 13.01 | | | | | 0.08 | | | | | (0.18 | ) | | | | (0.10 | ) | | | | (0.10 | ) | | | | – | | | | | (0.10 | ) | | | $ | 12.81 | |
2017(b) | | | $ | 13.25 | | | | | 0.14 | | | | | (0.20 | ) | | | | (0.06 | ) | | | | (0.18 | ) | | | | – | | | | | (0.18 | ) | | | $ | 13.01 | |
2016(b)(e) | | | $ | 13.26 | | | | | 0.14 | | | | | 0.05 | | | | | 0.19 | | | | | (0.20 | ) | | | | – | | | | | (0.20 | ) | | | $ | 13.25 | |
2015(b) | | | $ | 13.27 | | | | | 0.15 | | | | | 0.06 | | | | | 0.21 | | | | | (0.22 | ) | | | | – | | | | | (0.22 | ) | | | $ | 13.26 | |
2014(b) | | | $ | 13.36 | | | | | 0.19 | | | | | (0.02 | ) | | | | 0.17 | | | | | (0.26 | ) | | | | – | | | | | (0.26 | ) | | | $ | 13.27 | |
2013(b) | | | $ | 13.86 | | | | | 0.20 | | | | | (0.39 | ) | | | | (0.19 | ) | | | | (0.31 | ) | | | | – | | | | | (0.31 | ) | | | $ | 13.36 | |
| | | | | | | |
| CLASS C SHARES | | | | | | | | | | | | | | | | | | | | | | | | | | | | | | | | | | | | |
| | | | | | | | |
2018(c) | | | $ | 13.09 | | | | | 0.06 | | | | | (0.19 | ) | | | | (0.13 | ) | | | | (0.08 | ) | | | | – | | | | | (0.08 | ) | | | $ | 12.88 | |
2017 | | | $ | 13.33 | | | | | 0.10 | | | | | (0.20 | ) | | | | (0.10 | ) | | | | (0.14 | ) | | | | – | | | | | (0.14 | ) | | | $ | 13.09 | |
2016 | | | $ | 13.34 | | | | | 0.11 | | | | | 0.04 | | | | | 0.15 | | | | | (0.16 | ) | | | | – | | | | | (0.16 | ) | | | $ | 13.33 | |
2015 | | | $ | 13.35 | | | | | 0.12 | | | | | 0.06 | | | | | 0.18 | | | | | (0.19 | ) | | | | – | | | | | (0.19 | ) | | | $ | 13.34 | |
2014 | | | $ | 13.45 | | | | | 0.15 | | | | | (0.02 | ) | | | | 0.13 | | | | | (0.23 | ) | | | | – | | | | | (0.23 | ) | | | $ | 13.35 | |
2013 | | | $ | 13.94 | | | | | 0.16 | | | | | (0.37 | ) | | | | (0.21 | ) | | | | (0.28 | ) | | | | – | | | | | (0.28 | ) | | | $ | 13.45 | |
| | | | | | | |
| CLASS I SHARES | | | | | | | | | | | | | | | | | | | | | | | | | | | | | | | | | | | | |
| | | | | | | | |
2018(c) | | | $ | 13.01 | | | | | 0.10 | | | | | (0.18 | ) | | | | (0.08 | ) | | | | (0.12 | ) | | | | – | | | | | (0.12 | ) | | | $ | 12.81 | |
2017 | | | $ | 13.26 | | | | | 0.18 | | | | | (0.20 | ) | | | | (0.02 | ) | | | | (0.23 | ) | | | | – | | | | | (0.23 | ) | | | $ | 13.01 | |
2016 | | | $ | 13.26 | | | | | 0.19 | | | | | 0.05 | | | | | 0.24 | | | | | (0.24 | ) | | | | – | | | | | (0.24 | ) | | | $ | 13.26 | |
2015 | | | $ | 13.27 | | | | | 0.19 | | | | | 0.06 | | | | | 0.25 | | | | | (0.26 | ) | | | | – | | | | | (0.26 | ) | | | $ | 13.26 | |
2014 | | | $ | 13.36 | | | | | 0.23 | | | | | (0.02 | ) | | | | 0.21 | | | | | (0.30 | ) | | | | – | | | | | (0.30 | ) | | | $ | 13.27 | |
2013 | | | $ | 13.86 | | | | | 0.24 | | | | | (0.38 | ) | | | | (0.14 | ) | | | | (0.36 | ) | | | | – | | | | | (0.36 | ) | | | $ | 13.36 | |
| | | | | | | |
| CLASS R3 SHARES | | | | | | | | | | | | | | | | | | | | | | | | | | | | | | | | | | | | |
| | | | | | | | |
2018(c) | | | $ | 13.02 | | | | | 0.08 | | | | | (0.18 | ) | | | | (0.10 | ) | | | | (0.10 | ) | | | | – | | | | | (0.10 | ) | | | $ | 12.82 | |
2017 | | | $ | 13.26 | | | | | 0.13 | | | | | (0.19 | ) | | | | (0.06 | ) | | | | (0.18 | ) | | | | – | | | | | (0.18 | ) | | | $ | 13.02 | |
2016 | | | $ | 13.27 | | | | | 0.14 | | | | | 0.04 | | | | | 0.18 | | | | | (0.19 | ) | | | | – | | | | | (0.19 | ) | | | $ | 13.26 | |
2015 | | | $ | 13.28 | | | | | 0.14 | | | | | 0.06 | | | | | 0.20 | | | | | (0.21 | ) | | | | – | | | | | (0.21 | ) | | | $ | 13.27 | |
2014 | | | $ | 13.37 | | | | | 0.18 | | | | | (0.02 | ) | | | | 0.16 | | | | | (0.25 | ) | | | | – | | | | | (0.25 | ) | | | $ | 13.28 | |
2013 | | | $ | 13.87 | | | | | 0.18 | | | | | (0.38 | ) | | | | (0.20 | ) | | | | (0.30 | ) | | | | – | | | | | (0.30 | ) | | | $ | 13.37 | |
| | | | | | | |
| CLASS R4 SHARES | | | | | | | | | | | | | | | | | | | | | | | | | | | | | | | | | | | | |
| | | | | | | | |
2018(c) | | | $ | 13.01 | | | | | 0.08 | | | | | (0.18 | ) | | | | (0.10 | ) | | | | (0.10 | ) | | | | – | | | | | (0.10 | ) | | | $ | 12.81 | |
2017 | | | $ | 13.25 | | | | | 0.12 | | | | | (0.19 | ) | | | | (0.07 | ) | | | | (0.17 | ) | | | | – | | | | | (0.17 | ) | | | $ | 13.01 | |
2016 | | | $ | 13.26 | | | | | 0.14 | | | | | 0.04 | | | | | 0.18 | | | | | (0.19 | ) | | | | – | | | | | (0.19 | ) | | | $ | 13.25 | |
2015 | | | $ | 13.27 | | | | | 0.13 | | | | | 0.08 | | | | | 0.21 | | | | | (0.22 | ) | | | | – | | | | | (0.22 | ) | | | $ | 13.26 | |
2014(g) | | | $ | 13.36 | | | | | 0.14 | | | | | (0.03 | ) | | | | 0.11 | | | | | (0.20 | ) | | | | – | | | | | (0.20 | ) | | | $ | 13.27 | |
| | | | | | | |
| CLASS R5 SHARES | | | | | | | | | | | | | | | | | | | | | | | | | | | | | | | | | | | | |
| | | | | | | | |
2018(c) | | | $ | 13.02 | | | | | 0.10 | | | | | (0.18 | ) | | | | (0.08 | ) | | | | (0.12 | ) | | | | – | | | | | (0.12 | ) | | | $ | 12.82 | |
2017 | | | $ | 13.28 | | | | | 0.18 | | | | | (0.21 | ) | | | | (0.03 | ) | | | | (0.23 | ) | | | | – | | | | | (0.23 | ) | | | $ | 13.02 | |
2016 | | | $ | 13.27 | | | | | 0.17 | | | | | 0.07 | | | | | 0.24 | | | | | (0.23 | ) | | | | – | | | | | (0.23 | ) | | | $ | 13.28 | |
2015 | | | $ | 13.27 | | | | | 0.19 | | | | | 0.07 | | | | | 0.26 | | | | | (0.26 | ) | | | | – | | | | | (0.26 | ) | | | $ | 13.27 | |
2014 | | | $ | 13.36 | | | | | 0.21 | | | | | – | (h) | | | | 0.21 | | | | | (0.30 | ) | | | | – | | | | | (0.30 | ) | | | $ | 13.27 | |
2013 | | | $ | 13.85 | | | | | 0.24 | | | | | (0.39 | ) | | | | (0.15 | ) | | | | (0.34 | ) | | | | – | | | | | (0.34 | ) | | | $ | 13.36 | |
| (a) | Not annualized for periods less than one year. |
| (b) | Sales loads are not reflected in computing total return. |
| (c) | Unaudited Six Month Period Ended March 31. |
| (e) | Class B shares converted to Class A shares on August 29, 2016. |
| (f) | Due to the size of net assets and fixed expenses, ratios may appear disproportionate. |
| (g) | Effective date of this class of shares was February 1, 2014. |
| (h) | Net realized and unrealized gain (loss) on investments was less than $0.01 per share. |
| + | Based on weighted average shares outstanding. |
See notes to financial statements.
56 | Semi-Annual Reports
Financial Highlights, Continued
Thornburg Limited Term U.S. Government Fund
| | | | | | | | | | | | | | | | | | | | | | | | | | | | | | |
| RATIOS TO AVERAGE NET ASSETS | | | | | | SUPPLEMENTAL DATA | |
| | | | | | | EXPENSES, AFTER | | | | | | | | | | | | | | | | |
NET INVESTMENT
INCOME (LOSS) (%) | | | EXPENSES, AFTER
EXPENSE
REDUCTIONS (%) | | | EXPENSE
REDUCTIONS AND
NET OF CUSTODY
CREDITS (%) | | | EXPENSES,
BEFORE EXPENSE
REDUCTIONS (%) | | | | | | TOTAL
RETURN (%)(a) | | | PORTFOLIO
TURNOVER
RATE (%)(a) | | | NET ASSETS AT
END OF PERIOD
(THOUSANDS) | |
| | | | | | | |
| | | | | | | | | | | | | | | | | | | | | | | | | | | | | | |
| | | | | | | |
| | 1.30 | (d) | | | 0.93 | (d) | | | 0.93 | (d) | | | 0.93 | (d) | | | | | | | (0.76 | ) | | | 6.53 | | | $ | 74,100 | |
| | 1.03 | | | | 0.93 | | | | 0.93 | | | | 0.93 | | | | | | | | (0.43 | ) | | | 11.05 | | | $ | 84,674 | |
| | 1.08 | | | | 0.91 | | | | 0.91 | | | | 0.91 | | | | | | | | 1.41 | | | | 9.78 | | | $ | 111,874 | |
| | 1.15 | | | | 0.92 | | | | 0.92 | | | | 0.92 | | | | | | | | 1.62 | | | | 14.15 | | | $ | 104,933 | |
| | 1.41 | | | | 0.93 | | | | 0.93 | | | | 0.94 | | | | | | | | 1.30 | | | | 8.14 | | | $ | 132,916 | |
| | 1.45 | | | | 0.89 | | | | 0.89 | | | | 0.89 | | | | | | | | (1.38 | ) | | | 12.18 | | | $ | 159,225 | |
| | | | | | | |
| | | | | | | | | | | | | | | | | | | | | | | | | | | | | | |
| | | | | | | |
| | 1.00 | (d) | | | 1.23 | (d) | | | 1.23 | (d) | | | 1.24 | (d) | | | | | | | (0.98 | ) | | | 6.53 | | | $ | 29,932 | |
| | 0.73 | | | | 1.23 | | | | 1.23 | | | | 1.24 | | | | | | | | (0.72 | ) | | | 11.05 | | | $ | 34,821 | |
| | 0.81 | | | | 1.19 | | | | 1.19 | | | | 1.20 | | | | | | | | 1.13 | | | | 9.78 | | | $ | 48,369 | |
| | 0.88 | | | | 1.20 | | | | 1.20 | | | | 1.21 | | | | | | | | 1.34 | | | | 14.15 | | | $ | 46,777 | |
| | 1.14 | | | | 1.19 | | | | 1.19 | | | | 1.20 | | | | | | | | 0.96 | | | | 8.14 | | | $ | 51,001 | |
| | 1.17 | | | | 1.17 | | | | 1.17 | | | | 1.17 | | | | | | | | (1.56 | ) | | | 12.18 | | | $ | 73,877 | |
| | | | | | | |
| | | | | | | | | | | | | | | | | | | | | | | | | | | | | | |
| | | | | | | |
| | 1.63 | (d) | | | 0.60 | (d) | | | 0.60 | (d) | | | 0.60 | (d) | | | | | | | (0.60 | ) | | | 6.53 | | | $ | 146,636 | |
| | 1.36 | | | | 0.60 | | | | 0.60 | | | | 0.60 | | | | | | | | (0.18 | ) | | | 11.05 | | | $ | 147,464 | |
| | 1.43 | | | | 0.57 | | | | 0.57 | | | | 0.57 | | | | | | | | 1.83 | | | | 9.78 | | | $ | 144,437 | |
| | 1.45 | | | | 0.62 | | | | 0.62 | | | | 0.62 | | | | | | | | 1.93 | | | | 14.15 | | | $ | 112,853 | |
| | 1.73 | | | | 0.61 | | | | 0.61 | | | | 0.61 | | | | | | | | 1.62 | | | | 8.14 | | | $ | 69,309 | |
| | 1.78 | | | | 0.56 | | | | 0.56 | | | | 0.56 | | | | | | | | (1.05 | ) | | | 12.18 | | | $ | 73,645 | |
| | | | | | | |
| | | | | | | | | | | | | | | | | | | | | | | | | | | | | | |
| | | | | | | |
| | 1.24 | (d) | | | 0.99 | (d) | | | 0.99 | (d) | | | 1.47 | (d) | | | | | | | (0.79 | ) | | | 6.53 | | | $ | 10,053 | |
| | 1.00 | | | | 0.97 | | | | 0.97 | | | | 1.40 | | | | | | | | (0.47 | ) | | | 11.05 | | | $ | 10,871 | |
| | 1.03 | | | | 0.98 | | | | 0.98 | | | | 1.30 | | | | | | | | 1.34 | | | | 9.78 | | | $ | 28,036 | |
| | 1.09 | | | | 0.99 | | | | 0.99 | | | | 1.35 | | | | | | | | 1.55 | | | | 14.15 | | | $ | 16,320 | |
| | 1.35 | | | | 0.99 | | | | 0.99 | | | | 1.31 | | | | | | | | 1.23 | | | | 8.14 | | | $ | 13,748 | |
| | 1.35 | | | | 0.99 | | | | 0.99 | | | | 1.27 | | | | | | | | (1.47 | ) | | | 12.18 | | | $ | 15,350 | |
| | | | | | | |
| | | | | | | | | | | | | | | | | | | | | | | | | | | | | | |
| | | | | | | |
| | 1.25 | (d) | | | 0.99 | (d) | | | 0.99 | (d) | | | 1.69 | (d) | | | | | | | (0.79 | ) | | | 6.53 | | | $ | 3,195 | |
| | 0.96 | | | | 0.99 | | | | 0.99 | | | | 1.95 | | | | | | | | (0.49 | ) | | | 11.05 | | | $ | 3,365 | |
| | 1.04 | | | | 0.99 | | | | 0.99 | | | | 2.71 | | | | | | | | 1.33 | | | | 9.78 | | | $ | 2,097 | |
| | 1.00 | | | | 0.99 | | | | 0.99 | | | | 17.30 | (f) | | | | | | | 1.55 | | | | 14.15 | | | $ | 706 | |
| | 1.57 | (d) | | | 0.99 | (d) | | | 0.99 | (d) | | | 64.66 | (d)(f) | | | | | | | 0.78 | | | | 8.14 | | | $ | 15 | |
| | | | | | | |
| | | | | | | | | | | | | | | | | | | | | | | | | | | | | | |
| | | | | | | |
| | 1.56 | (d) | | | 0.65 | (d) | | | 0.65 | (d) | | | 1.42 | (d) | | | | | | | (0.62 | ) | | | 6.53 | | | $ | 1,058 | |
| | 1.40 | | | | 0.58 | | | | 0.58 | | | | 1.21 | | | | | | | | (0.23 | ) | | | 11.05 | | | $ | 4,131 | |
| | 1.30 | | | | 0.67 | | | | 0.67 | | | | 2.05 | | | | | | | | 1.80 | | | | 9.78 | | | $ | 570 | |
| | 1.40 | | | | 0.67 | | | | 0.67 | | | | 2.02 | | | | | | | | 1.95 | | | | 14.15 | | | $ | 2,170 | |
| | 1.59 | | | | 0.67 | | | | 0.67 | | | | 2.87 | | | | | | | | 1.56 | | | | 8.14 | | | $ | 1,859 | |
| | 1.83 | | | | 0.67 | | | | 0.67 | | | | 7.28 | (f) | | | | | | | (1.09 | ) | | | 12.18 | | | $ | 881 | |
Semi-Annual Reports | 57
Financial Highlights
Thornburg Limited Term Income Fund
| | | | | | | | | | | | | | | | | | | | | | | | | | | | | | | | | | | | | | | | |
| | | PER SHARE PERFORMANCE (FOR A SHARE OUTSTANDING THROUGHOUT THE PERIOD) |
| | | | | | | | | | | | | | | | | |
UNLESS OTHERWISE
NOTED, PERIODS ARE
FISCAL YEARS ENDED
SEPTEMBER 30, | | NET ASSET
VALUE,
BEGINNING OF
PERIOD | | NET
INVESTMENT
INCOME
(LOSS)+ | | NET REALIZED &
UNREALIZED GAIN
(LOSS) ON
INVESTMENTS | | TOTAL FROM
INVESTMENT
OPERATIONS | | DIVIDENDS
FROM NET
INVESTMENT
INCOME | | DIVIDENDS
FROM NET
REALIZED
GAINS | | TOTAL
DIVIDENDS | | NET ASSET
VALUE,
END OF PERIOD |
| | | | | | | |
| CLASS A SHARES | | | | | | | | | | | | | | | | | | | | | | | | | | | | | | | | | | | | |
| | | | | | | | |
2018(b)(c) | | | $ | 13.44 | | | | | 0.13 | | | | | (0.19 | ) | | | | (0.06 | ) | | | | (0.13 | ) | | | | – | | | | | (0.13 | ) | | | $ | 13.25 | |
2017(b) | | | $ | 13.51 | | | | | 0.24 | | | | | (0.07 | ) | | | | 0.17 | | | | | (0.24 | ) | | | | – | | | | | (0.24 | ) | | | $ | 13.44 | |
2016(b) | | | $ | 13.32 | | | | | 0.24 | | | | | 0.20 | | | | | 0.44 | | | | | (0.25 | ) | | | | – | | | | | (0.25 | ) | | | $ | 13.51 | |
2015(b) | | | $ | 13.49 | | | | | 0.26 | | | | | (0.09 | ) | | | | 0.17 | | | | | (0.27 | ) | | | | (0.07 | ) | | | | (0.34 | ) | | | $ | 13.32 | |
2014(b) | | | $ | 13.42 | | | | | 0.29 | | | | | 0.19 | | | | | 0.48 | | | | | (0.30 | ) | | | | (0.11 | ) | | | | (0.41 | ) | | | $ | 13.49 | |
2013(b) | | | $ | 13.72 | | | | | 0.32 | | | | | (0.22 | ) | | | | 0.10 | | | | | (0.34 | ) | | | | (0.06 | ) | | | | (0.40 | ) | | | $ | 13.42 | |
| | | | | | | |
| CLASS C SHARES | | | | | | | | | | | | | | | | | | | | | | | | | | | | | | | | | | | | |
| | | | | | | | |
2018(c) | | | $ | 13.42 | | | | | 0.12 | | | | | (0.19 | ) | | | | (0.07 | ) | | | | (0.12 | ) | | | | – | | | | | (0.12 | ) | | | $ | 13.23 | |
2017 | | | $ | 13.49 | | | | | 0.21 | | | | | (0.06 | ) | | | | 0.15 | | | | | (0.22 | ) | | | | – | | | | | (0.22 | ) | | | $ | 13.42 | |
2016 | | | $ | 13.30 | | | | | 0.21 | | | | | 0.20 | | | | | 0.41 | | | | | (0.22 | ) | | | | – | | | | | (0.22 | ) | | | $ | 13.49 | |
2015 | | | $ | 13.47 | | | | | 0.23 | | | | | (0.09 | ) | | | | 0.14 | | | | | (0.24 | ) | | | | (0.07 | ) | | | | (0.31 | ) | | | $ | 13.30 | |
2014 | | | $ | 13.39 | | | | | 0.26 | | | | | 0.20 | | | | | 0.46 | | | | | (0.27 | ) | | | | (0.11 | ) | | | | (0.38 | ) | | | $ | 13.47 | |
2013 | | | $ | 13.70 | | | | | 0.28 | | | | | (0.23 | ) | | | | 0.05 | | | | | (0.30 | ) | | | | (0.06 | ) | | | | (0.36 | ) | | | $ | 13.39 | |
| | | | | | | |
| CLASS I SHARES | | | | | | | | | | | | | | | | | | | | | | | | | | | | | | | | | | | | |
| | | | | | | | |
2018(c) | | | $ | 13.44 | | | | | 0.15 | | | | | (0.17 | ) | | | | (0.02 | ) | | | | (0.16 | ) | | | | – | | | | | (0.16 | ) | | | $ | 13.26 | |
2017 | | | $ | 13.52 | | | | | 0.29 | | | | | (0.08 | ) | | | | 0.21 | | | | | (0.29 | ) | | | | – | | | | | (0.29 | ) | | | $ | 13.44 | |
2016 | | | $ | 13.33 | | | | | 0.29 | | | | | 0.20 | | | | | 0.49 | | | | | (0.30 | ) | | | | – | | | | | (0.30 | ) | | | $ | 13.52 | |
2015 | | | $ | 13.49 | | | | | 0.31 | | | | | (0.08 | ) | | | | 0.23 | | | | | (0.32 | ) | | | | (0.07 | ) | | | | (0.39 | ) | | | $ | 13.33 | |
2014 | | | $ | 13.42 | | | | | 0.33 | | | | | 0.20 | | | | | 0.53 | | | | | (0.35 | ) | | | | (0.11 | ) | | | | (0.46 | ) | | | $ | 13.49 | |
2013 | | | $ | 13.73 | | | | | 0.36 | | | | | (0.23 | ) | | | | 0.13 | | | | | (0.38 | ) | | | | (0.06 | ) | | | | (0.44 | ) | | | $ | 13.42 | |
| | | | | | | |
| CLASS R3 SHARES | | | | | | | | | | | | | | | | | | | | | | | | | | | | | | | | | | | | |
| | | | | | | | |
2018(c) | | | $ | 13.45 | | | | | 0.12 | | | | | (0.18 | ) | | | | (0.06 | ) | | | | (0.13 | ) | | | | – | | | | | (0.13 | ) | | | $ | 13.26 | |
2017 | | | $ | 13.52 | | | | | 0.22 | | | | | (0.06 | ) | | | | 0.16 | | | | | (0.23 | ) | | | | – | | | | | (0.23 | ) | | | $ | 13.45 | |
2016 | | | $ | 13.33 | | | | | 0.23 | | | | | 0.20 | | | | | 0.43 | | | | | (0.24 | ) | | | | – | | | | | (0.24 | ) | | | $ | 13.52 | |
2015 | | | $ | 13.50 | | | | | 0.24 | | | | | (0.09 | ) | | | | 0.15 | | | | | (0.25 | ) | | | | (0.07 | ) | | | | (0.32 | ) | | | $ | 13.33 | |
2014 | | | $ | 13.43 | | | | | 0.27 | | | | | 0.19 | | | | | 0.46 | | | | | (0.28 | ) | | | | (0.11 | ) | | | | (0.39 | ) | | | $ | 13.50 | |
2013 | | | $ | 13.73 | | | | | 0.30 | | | | | (0.22 | ) | | | | 0.08 | | | | | (0.32 | ) | | | | (0.06 | ) | | | | (0.38 | ) | | | $ | 13.43 | |
| | | | | | | |
| CLASS R4 SHARES | | | | | | | | | | | | | | | | | | | | | | | | | | | | | | | | | | | | |
| | | | | | | | |
2018(c) | | | $ | 13.43 | | | | | 0.12 | | | | | (0.17 | ) | | | | (0.05 | ) | | | | (0.13 | ) | | | | – | | | | | (0.13 | ) | | | $ | 13.25 | |
2017 | | | $ | 13.51 | | | | | 0.22 | | | | | (0.07 | ) | | | | 0.15 | | | | | (0.23 | ) | | | | – | | | | | (0.23 | ) | | | $ | 13.43 | |
2016 | | | $ | 13.32 | | | | | 0.23 | | | | | 0.20 | | | | | 0.43 | | | | | (0.24 | ) | | | | – | | | | | (0.24 | ) | | | $ | 13.51 | |
2015 | | | $ | 13.48 | | | | | 0.24 | | | | | (0.08 | ) | | | | 0.16 | | | | | (0.25 | ) | | | | (0.07 | ) | | | | (0.32 | ) | | | $ | 13.32 | |
2014(e) | | | $ | 13.42 | | | | | 0.18 | | | | | 0.07 | | | | | 0.25 | | | | | (0.19 | ) | | | | – | | | | | (0.19 | ) | | | $ | 13.48 | |
| | | | | | | |
| CLASS R5 SHARES | | | | | | | | | | | | | | | | | | | | | | | | | | | | | | | | | | | | |
| | | | | | | | |
2018(c) | | | $ | 13.44 | | | | | 0.14 | | | | | (0.18 | ) | | | | (0.04 | ) | | | | (0.15 | ) | | | | – | | | | | (0.15 | ) | | | $ | 13.25 | |
2017 | | | $ | 13.51 | | | | | 0.27 | | | | | (0.07 | ) | | | | 0.20 | | | | | (0.27 | ) | | | | – | | | | | (0.27 | ) | | | $ | 13.44 | |
2016 | | | $ | 13.32 | | | | | 0.27 | | | | | 0.20 | | | | | 0.47 | | | | | (0.28 | ) | | | | – | | | | | (0.28 | ) | | | $ | 13.51 | |
2015 | | | $ | 13.49 | | | | | 0.29 | | | | | (0.09 | ) | | | | 0.20 | | | | | (0.30 | ) | | | | (0.07 | ) | | | | (0.37 | ) | | | $ | 13.32 | |
2014 | | | $ | 13.42 | | | | | 0.32 | | | | | 0.19 | | | | | 0.51 | | | | | (0.33 | ) | | | | (0.11 | ) | | | | (0.44 | ) | | | $ | 13.49 | |
2013 | | | $ | 13.72 | | | | | 0.34 | | | | | (0.21 | ) | | | | 0.13 | | | | | (0.37 | ) | | | | (0.06 | ) | | | | (0.43 | ) | | | $ | 13.42 | |
| | | | | | | |
| CLASS R6 SHARES | | | | | | | | | | | | | | | | | | | | | | | | | | | | | | | | | | | | |
| | | | | | | | |
2018(c) | | | $ | 13.46 | | | | | 0.16 | | | | | (0.18 | ) | | | | (0.02 | ) | | | | (0.16 | ) | | | | – | | | | | (0.16 | ) | | | $ | 13.28 | |
2017(g) | | | $ | 13.40 | | | | | 0.15 | | | | | 0.11 | | | | | 0.26 | | | | | (0.20 | ) | | | | – | | | | | (0.20 | ) | | | $ | 13.46 | |
| (a) | Not annualized for periods less than one year. |
| (b) | Sales loads are not reflected in computing total return. |
| (c) | Unaudited Six Month Period Ended March 31. |
| (e) | Effective date of this class of shares was February 1, 2014. |
| (f) | Due to the size of net assets and fixed expenses, ratios may appear disproportionate. |
| (g) | Effective date of this class of shares was April 10, 2017. |
| + | Based on weighted average shares outstanding. |
See notes to financial statements.
58 | Semi-Annual Reports
Financial Highlights, Continued
Thornburg Limited Term Income Fund
| | | | | | | | | | | | | | | | | | | | | | | | | | | | | | |
| RATIOS TO AVERAGE NET ASSETS | | | | | | SUPPLEMENTAL DATA | |
| | | | | | | EXPENSES, AFTER | | | | | | | | | | | | | | | | |
NET INVESTMENT
INCOME (LOSS) (%) | | | EXPENSES, AFTER
EXPENSE
REDUCTIONS (%) | | | EXPENSE
REDUCTIONS AND
NET OF CUSTODY
CREDITS (%) | | | EXPENSES,
BEFORE EXPENSE
REDUCTIONS (%) | | | | | | TOTAL
RETURN (%)(a) | | | PORTFOLIO
TURNOVER
RATE (%)(a) | | | NET ASSETS AT
END OF PERIOD
(THOUSANDS) | |
| | | | | | | |
| | | | | | | | | | | | | | | | | | | | | | | | | | | | | | |
| | | | | | | |
| | 1.96 | (d) | | | 0.85 | (d) | | | 0.85 | (d) | | | 0.85 | (d) | | | | | | | (0.41 | ) | | | 16.31 | | | $ | 775,030 | |
| | 1.76 | | | | 0.87 | | | | 0.87 | | | | 0.87 | | | | | | | | 1.31 | | | | 26.90 | | | $ | 890,990 | |
| | 1.82 | | | | 0.86 | | | | 0.86 | | | | 0.86 | | | | | | | | 3.36 | | | | 20.56 | | | $ | 1,111,441 | |
| | 1.94 | | | | 0.87 | | | | 0.87 | | | | 0.87 | | | | | | | | 1.27 | | | | 18.71 | | | $ | 977,470 | |
| | 2.15 | | | | 0.89 | | | | 0.89 | | | | 0.89 | | | | | | | | 3.61 | | | | 29.41 | | | $ | 906,708 | |
| | 2.33 | | | | 0.88 | | | | 0.88 | | | | 0.88 | | | | | | | | 0.69 | | | | 36.66 | | | $ | 1,029,692 | |
| | | | | | | |
| | | | | | | | | | | | | | | | | | | | | | | | | | | | | | |
| | | | | | | |
| | 1.75 | (d) | | | 1.06 | (d) | | | 1.06 | (d) | | | 1.06 | (d) | | | | | | | (0.52 | ) | | | 16.31 | | | $ | 518,933 | |
| | 1.56 | | | | 1.08 | | | | 1.08 | | | | 1.08 | | | | | | | | 1.10 | | | | 26.90 | | | $ | 567,771 | |
| | 1.59 | | | | 1.08 | | | | 1.08 | | | | 1.08 | | | | | | | | 3.13 | | | | 20.56 | | | $ | 667,680 | |
| | 1.71 | | | | 1.10 | | | | 1.10 | | | | 1.10 | | | | | | | | 1.04 | | | | 18.71 | | | $ | 611,555 | |
| | 1.92 | | | | 1.11 | | | | 1.11 | | | | 1.11 | | | | | | | | 3.46 | | | | 29.41 | | | $ | 593,658 | |
| | 2.09 | | | | 1.12 | | | | 1.12 | | | | 1.12 | | | | | | | | 0.38 | | | | 36.66 | | | $ | 632,918 | |
| | | | | | | |
| | | | | | | | | | | | | | | | | | | | | | | | | | | | | | |
| | | | | | | |
| | 2.32 | (d) | | | 0.50 | (d) | | | 0.50 | (d) | | | 0.50 | (d) | | | | | | | (0.16 | ) | | | 16.31 | | | $ | 3,643,857 | |
| | 2.14 | | | | 0.50 | | | | 0.50 | | | | 0.50 | | | | | | | | 1.61 | | | | 26.90 | | | $ | 3,232,277 | |
| | 2.17 | | | | 0.50 | | | | 0.50 | | | | 0.50 | | | | | | | | 3.73 | | | | 20.56 | | | $ | 2,792,249 | |
| | 2.29 | | | | 0.52 | | | | 0.52 | | | | 0.52 | | | | | | | | 1.71 | | | | 18.71 | | | $ | 1,982,536 | |
| | 2.49 | | | | 0.54 | | | | 0.54 | | | | 0.54 | | | | | | | | 3.98 | | | | 29.41 | | | $ | 1,578,168 | |
| | 2.68 | | | | 0.53 | | | | 0.53 | | | | 0.53 | | | | | | | | 0.98 | | | | 36.66 | | | $ | 1,260,449 | |
| | | | | | | |
| | | | | | | | | | | | | | | | | | | | | | | | | | | | | | |
| | | | | | | |
| | 1.83 | (d) | | | 0.99 | (d) | | | 0.99 | (d) | | | 1.11 | (d) | | | | | | | (0.48 | ) | | | 16.31 | | | $ | 96,110 | |
| | 1.65 | | | | 0.99 | | | | 0.99 | | | | 1.12 | | | | | | | | 1.19 | | | | 26.90 | | | $ | 96,715 | |
| | 1.69 | | | | 0.98 | | | | 0.98 | | | | 1.10 | | | | | | | | 3.23 | | | | 20.56 | | | $ | 104,309 | |
| | 1.82 | | | | 0.99 | | | | 0.99 | | | | 1.11 | | | | | | | | 1.16 | | | | 18.71 | | | $ | 172,992 | |
| | 2.04 | | | | 0.99 | | | | 0.99 | | | | 1.12 | | | | | | | | 3.51 | | | | 29.41 | | | $ | 120,013 | |
| | 2.22 | | | | 0.99 | | | | 0.99 | | | | 1.14 | | | | | | | | 0.59 | | | | 36.66 | | | $ | 81,585 | |
| | | | | | | |
| | | | | | | | | | | | | | | | | | | | | | | | | | | | | | |
| | | | | | | |
| | 1.83 | (d) | | | 0.99 | (d) | | | 0.99 | (d) | | | 1.43 | (d) | | | | | | | (0.40 | ) | | | 16.31 | | | $ | 8,825 | |
| | 1.65 | | | | 0.99 | | | | 0.99 | | | | 1.56 | | | | | | | | 1.11 | | | | 26.90 | | | $ | 8,101 | |
| | 1.70 | | | | 0.99 | | | | 0.99 | | | | 1.97 | | | | | | | | 3.23 | | | | 20.56 | | | $ | 6,328 | |
| | 1.82 | | | | 0.98 | | | | 0.98 | | | | 1.66 | | | | | | | | 1.24 | | | | 18.71 | | | $ | 3,908 | |
| | 1.99 | (d) | | | 0.99 | (d) | | | 0.99 | (d) | | | 61.75 | (d)(f) | | | | | | | 1.84 | | | | 29.41 | | | $ | 47 | |
| | | | | | | |
| | | | | | | | | | | | | | | | | | | | | | | | | | | | | | |
| | | | | | | |
| | 2.16 | (d) | | | 0.67 | (d) | | | 0.67 | (d) | | | 0.67 | (d) | | | | | | | (0.32 | ) | | | 16.31 | | | $ | 108,027 | |
| | 1.99 | | | | 0.65 | | | | 0.65 | | | | 0.67 | | | | | | | | 1.53 | | | | 26.90 | | | $ | 101,189 | |
| | 2.05 | | | | 0.62 | | | | 0.62 | | | | 0.72 | | | | | | | | 3.60 | | | | 20.56 | | | $ | 71,864 | |
| | 2.17 | | | | 0.64 | | | | 0.64 | | | | 0.67 | | | | | | | | 1.50 | | | | 18.71 | | | $ | 96,326 | |
| | 2.38 | | | | 0.64 | | | | 0.64 | | | | 0.72 | | | | | | | | 3.86 | | | | 29.41 | | | $ | 16,825 | |
| | 2.52 | | | | 0.65 | | | | 0.65 | | | | 1.01 | | | | | | | | 0.92 | | | | 36.66 | | | $ | 8,164 | |
| | | | | | | |
| | | | | | | | | | | | | | | | | | | | | | | | | | | | | | |
| | | | | | | |
| | 2.42 | (d) | | | 0.45 | (d) | | | 0.45 | (d) | | | 0.65 | (d) | | | | | | | (0.13 | ) | | | 16.31 | | | $ | 12,365 | |
| | 2.28 | (d) | | | 0.45 | (d) | | | 0.45 | (d) | | | 24.38 | (d)(f) | | | | | | | 1.92 | | | | 26.90 | | | $ | 770 | |
Semi-Annual Reports | 59
Financial Highlights
Thornburg Low Duration Income Fund
| | | | | | | | | | | | | | | | | | | | | | | | | | | | | | | | | | | | | | | | |
| | | PER SHARE PERFORMANCE (FOR A SHARE OUTSTANDING THROUGHOUT THE PERIOD) |
| | | | | | | | | | | | | | | | | |
UNLESS OTHERWISE
NOTED, PERIODS ARE
FISCAL YEARS ENDED
SEPTEMBER 30, | | NET ASSET
VALUE,
BEGINNING OF
PERIOD | | NET
INVESTMENT
INCOME
(LOSS)+ | | NET REALIZED &
UNREALIZED GAIN
(LOSS) ON
INVESTMENTS | | TOTAL FROM
INVESTMENT
OPERATIONS | | DIVIDENDS
FROM NET
INVESTMENT
INCOME | | DIVIDENDS
FROM NET
REALIZED
GAINS | | TOTAL
DIVIDENDS | | NET ASSET
VALUE,
END OF PERIOD |
| | | | | | | |
| CLASS A SHARES | | | | | | | | | | | | | | | | | | | | | | | | | | | | | | | | | | | | |
| | | | | | | | |
2018(b)(c) | | | $ | 12.42 | | | | | 0.09 | | | | | (0.10 | ) | | | | (0.01 | ) | | | | (0.10 | ) | | | | – | | | | | (0.10 | ) | | | $ | 12.31 | |
2017(b) | | | $ | 12.46 | | | | | 0.16 | | | | | (0.03 | ) | | | | 0.13 | | | | | (0.17 | ) | | | | – | | | | | (0.17 | ) | | | $ | 12.42 | |
2016(b) | | | $ | 12.38 | | | | | 0.11 | | | | | 0.09 | | | | | 0.20 | | | | | (0.12 | ) | | | | – | | | | | (0.12 | ) | | | $ | 12.46 | |
2015(b) | | | $ | 12.38 | | | | | 0.08 | | | | | – | (e) | | | | 0.08 | | | | | (0.08 | ) | | | | – | | | | | (0.08 | ) | | | $ | 12.38 | |
2014(b)(f) | | | $ | 12.31 | | | | | 0.08 | | | | | 0.08 | | | | | 0.16 | | | | | (0.09 | ) | | | | – | | | | | (0.09 | ) | | | $ | 12.38 | |
| | | | | | | |
| CLASS I SHARES | | | | | | | | | | | | | | | | | | | | | | | | | | | | | | | | | | | | |
| | | | | | | | |
2018(c) | | | $ | 12.41 | | | | | 0.11 | | | | | (0.10 | ) | | | | 0.01 | | | | | (0.11 | ) | | | | – | | | | | (0.11 | ) | | | $ | 12.31 | |
2017 | | | $ | 12.45 | | | | | 0.18 | | | | | (0.03 | ) | | | | 0.15 | | | | | (0.19 | ) | | | | – | | | | | (0.19 | ) | | | $ | 12.41 | |
2016 | | | $ | 12.37 | | | | | 0.14 | | | | | 0.08 | | | | | 0.22 | | | | | (0.14 | ) | | | | – | | | | | (0.14 | ) | | | $ | 12.45 | |
2015 | | | $ | 12.38 | | | | | 0.11 | | | | | (0.01 | ) | | | | 0.10 | | | | | (0.11 | ) | | | | – | | | | | (0.11 | ) | | | $ | 12.37 | |
2014(f) | | | $ | 12.31 | | | | | 0.11 | | | | | 0.07 | | | | | 0.18 | | | | | (0.11 | ) | | | | – | | | | | (0.11 | ) | | | $ | 12.38 | |
| (a) | Not annualized for periods less than one year. |
| (b) | Sales loads are not reflected in computing total return. |
| (c) | Unaudited Six Month Period Ended March 31. |
| (e) | Net realized and unrealized gain (loss) on investments was less than $0.01 per share. |
| (f) | Fund commenced operations on December 30, 2013. |
| + | Based on weighted average shares outstanding. |
See notes to financial statements.
60 | Semi-Annual Reports
Financial Highlights, Continued
Thornburg Low Duration Income Fund
| | | | | | | | | | | | | | | | | | | | | | | | | | | | | | |
| RATIOS TO AVERAGE NET ASSETS | | | | | | SUPPLEMENTAL DATA | |
| | | | | | | EXPENSES, AFTER | | | | | | | | | | | | | | | | |
NET INVESTMENT
INCOME (LOSS) (%) | | | EXPENSES, AFTER
EXPENSE
REDUCTIONS (%) | | | EXPENSE
REDUCTIONS AND
NET OF CUSTODY
CREDITS (%) | | | EXPENSES,
BEFORE EXPENSE
REDUCTIONS (%) | | | | | | TOTAL
RETURN (%)(a) | | | PORTFOLIO
TURNOVER
RATE (%)(a) | | | NET ASSETS AT
END OF PERIOD
(THOUSANDS) | |
| | | | | | | |
| | | | | | | | | | | | | | | | | | | | | | | | | | | | | | |
| | | | | | | |
| | 1.54 | (d) | | | 0.70 | (d) | | | 0.70 | (d) | | | 1.84 | (d) | | | | | | | (0.08 | ) | | | 20.25 | | | $ | 7,166 | |
| | 1.30 | | | | 0.65 | | | | 0.65 | | | | 1.77 | | | | | | | | 1.03 | | | | 34.79 | | | $ | 6,532 | |
| | 0.89 | | | | 0.69 | | | | 0.69 | | | | 1.74 | | | | | | | | 1.60 | | | | 42.99 | | | $ | 10,235 | |
| | 0.67 | | | | 0.70 | | | | 0.70 | | | | 2.10 | | | | | | | | 0.68 | | | | 29.22 | | | $ | 9,940 | |
| | 0.92 | (d) | | | 0.62 | (d) | | | 0.61 | (d) | | | 3.14 | (d) | | | | | | | 1.33 | | | | 23.70 | | | $ | 6,678 | |
| | | | | | | |
| | | | | | | | | | | | | | | | | | | | | | | | | | | | | | |
| | | | | | | |
| | 1.75 | (d) | | | 0.50 | (d) | | | 0.50 | (d) | | | 1.10 | (d) | | | | | | | 0.09 | | | | 20.25 | | | $ | 16,571 | |
| | 1.46 | | | | 0.50 | | | | 0.50 | | | | 1.03 | | | | | | | | 1.19 | | | | 34.79 | | | $ | 12,854 | |
| | 1.15 | | | | 0.48 | | | | 0.48 | | | | 1.18 | | | | | | | | 1.81 | | | | 42.99 | | | $ | 17,106 | |
| | 0.87 | | | | 0.50 | | | | 0.50 | | | | 1.89 | | | | | | | | 0.80 | | | | 29.22 | | | $ | 8,056 | |
| | 1.19 | (d) | | | 0.41 | (d) | | | 0.41 | (d) | | | 3.19 | (d) | | | | | | | 1.48 | | | | 23.70 | | | $ | 3,698 | |
Semi-Annual Reports | 61
Expense Example
March 31, 2018 (Unaudited)
As a shareholder of the Fund, you incur two types of costs:
| | (1) | transaction costs, including |
| | (a) | sales charges (loads) on purchase payments, for Class A shares; |
| | (b) | a deferred sales charge on redemptions of any part or all of a purchase of $1 million of Class A shares within 12 months of purchase; |
| | (c) | a deferred sales charge on redemptions of Class C shares within 12 months of purchase; |
| | (2) | ongoing costs, including management fees; distribution and/or service (12b-1) fees; and other Fund expenses. This example is intended to help you understand your ongoing costs (in dollars) of investing in the Fund and to compare these costs with the ongoing costs of investing in other mutual funds. |
The example is based on a $1,000 investment beginning on October 1, 2017, and held until March 31, 2018.
ACTUAL EXPENSES
For each class of shares, the first line of the accompanying table provides information about actual account values and actual expenses. You may use the information in this line, together with the amount you invested, to estimate the expenses that you paid over the period. Simply divide your account value by $1,000 (for example, an $8,600 account value divided by $1,000 = 8.6), then multiply the result by the number in the first line for your class of shares under the heading entitled “Expenses Paid During Period” to estimate the expenses you paid on your account during this period.
HYPOTHETICAL EXAMPLE FOR COMPARISON PURPOSES
For each class of shares, the second line of the accompanying table provides information about hypothetical account values and hypothetical expenses based on the Fund’s actual expense ratio and an assumed rate of return of 5% per year before expenses, which is not the Fund’s actual return. The hypothetical account values and expenses may not be used to estimate the actual ending account balance or expenses you paid for the period. You may use this information to compare the ongoing costs of investing in the Fund and other funds. To do so, compare this 5% hypothetical example with the 5% hypothetical examples that appear in the shareholder reports of the other funds.
Please note that the expenses shown in the table are meant to highlight your ongoing costs only and do not reflect any transactional costs, such as sales charges (loads), redemption fees, or exchange fees. Therefore, the second line of the table for each class of shares is useful in comparing ongoing costs only, and will not help you determine the relative total costs of owning different funds. In addition, if these transactional costs were included, your costs would have been higher.
| | | | | | | | | | | | | | | |
| | | BEGINNING
ACCOUNT VALUE
10/1/17 | | ENDING
ACCOUNT VALUE
3/31/18 | | EXPENSES PAID
DURING PERIOD†
10/1/17–3/31/18 |
| LIMITED TERM U.S. GOVERNMENT FUND | | | | | | |
| CLASS A SHARES | | | | | | | | | | | | | | | |
Actual | | | $ | 1,000.00 | | | | $ | 992.40 | | | | $ | 4.62 | |
Hypothetical* | | | $ | 1,000.00 | | | | $ | 1,020.29 | | | | $ | 4.68 | |
| CLASS C SHARES | | | | | | | | | | | | | | | |
Actual | | | $ | 1,000.00 | | | | $ | 990.20 | | | | $ | 6.10 | |
Hypothetical* | | | $ | 1,000.00 | | | | $ | 1,018.80 | | | | $ | 6.19 | |
| CLASS I SHARES | | | | | | | | | | | | | | | |
Actual | | | $ | 1,000.00 | | | | $ | 994.00 | | | | $ | 2.98 | |
Hypothetical* | | | $ | 1,000.00 | | | | $ | 1,021.94 | | | | $ | 3.02 | |
| CLASS R3 SHARES | | | | | | | | | | | | | | | |
Actual | | | $ | 1,000.00 | | | | $ | 992.10 | | | | $ | 4.92 | |
Hypothetical* | | | $ | 1,000.00 | | | | $ | 1,020.00 | | | | $ | 4.99 | |
| CLASS R4 SHARES | | | | | | | | | | | | | | | |
Actual | | | $ | 1,000.00 | | | | $ | 992.10 | | | | $ | 4.92 | |
Hypothetical* | | | $ | 1,000.00 | | | | $ | 1,020.00 | | | | $ | 4.99 | |
| CLASS R5 SHARES | | | | | | | | | | | | | | | |
Actual | | | $ | 1,000.00 | | | | $ | 993.80 | | | | $ | 3.23 | |
Hypothetical* | | | $ | 1,000.00 | | | | $ | 1,021.69 | | | | $ | 3.28 | |
| LIMITED TERM INCOME FUND | | | | | | |
| CLASS A SHARES | | | | | | | | | | | | | | | |
Actual | | | $ | 1,000.00 | | | | $ | 995.90 | | | | $ | 4.23 | |
Hypothetical* | | | $ | 1,000.00 | | | | $ | 1,020.69 | | | | $ | 4.28 | |
| CLASS C SHARES | | | | | | | | | | | | | | | |
Actual | | | $ | 1,000.00 | | | | $ | 994.80 | | | | $ | 5.27 | |
Hypothetical* | | | $ | 1,000.00 | | | | $ | 1,019.65 | | | | $ | 5.34 | |
| CLASS I SHARES | | | | | | | | | | | | | | | |
Actual | | | $ | 1,000.00 | | | | $ | 998.40 | | | | $ | 2.49 | |
Hypothetical* | | | $ | 1,000.00 | | | | $ | 1,022.44 | | | | $ | 2.52 | |
| CLASS R3 SHARES | | | | | | | | | | | | | | | |
Actual | | | $ | 1,000.00 | | | | $ | 995.20 | | | | $ | 4.92 | |
Hypothetical* | | | $ | 1,000.00 | | | | $ | 1,020.00 | | | | $ | 4.99 | |
| CLASS R4 SHARES | | | | | | | | | | | | | | | |
Actual | | | $ | 1,000.00 | | | | $ | 996.00 | | | | $ | 4.93 | |
Hypothetical* | | | $ | 1,000.00 | | | | $ | 1,020.00 | | | | $ | 4.99 | |
| CLASS R5 SHARES | | | | | | | | | | | | | | | |
Actual | | | $ | 1,000.00 | | | | $ | 996.80 | | | | $ | 3.34 | |
Hypothetical* | | | $ | 1,000.00 | | | | $ | 1,021.59 | | | | $ | 3.38 | |
| CLASS R6 SHARES | | | | | | | | | | | | | | | |
Actual | | | $ | 1,000.00 | | | | $ | 998.70 | | | | $ | 2.24 | |
Hypothetical* | | | $ | 1,000.00 | | | | $ | 1,022.69 | | | | $ | 2.27 | |
| LOW DURATION INCOME FUND | | | | | | |
| CLASS A SHARES | | | | | | | | | | | | | | | |
Actual | | | $ | 1,000.00 | | | | $ | 999.20 | | | | $ | 3.49 | |
Hypothetical* | | | $ | 1,000.00 | | | | $ | 1,021.44 | | | | $ | 3.53 | |
| CLASS I SHARES | | | | | | | | | | | | | | | |
Actual | | | $ | 1,000.00 | | | | $ | 1,000.90 | | | | $ | 2.49 | |
Hypothetical* | | | $ | 1,000.00 | | | | $ | 1,022.44 | | | | $ | 2.52 | |
| † | Thornburg Limited Term U.S. Government Fund Expenses are equal to the annualized expense ratio for each class (A: 0.93%; C: 1.23%; I: 0.60%; R3: 0.99%; R4: 0.99%; R5: 0.65%) multiplied by the average account value over the period, multiplied by 182/365 to reflect the one-half year period. |
| † | Thornburg Limited Term Income Fund Expenses are equal to the annualized expense ratio for each class (A: 0.85%; C: 1.06%; I: 0.50%; R3: 0.99%; R4: 0.99%; R5: 0.67%; R6: 0.45%) multiplied by the average account value over the period, multiplied by 182/365 to reflect the one-half year period. |
| † | Thornburg Low Duration Income Fund Expenses are equal to the annualized expense ratio for each class (A: 0.70%; I: 0.50%) multiplied by the average account value over the period, multiplied by 182/365 to reflect the one-half year period. |
| * | Hypothetical assumes a rate of return of 5% per year before expenses. |
62 | Semi-Annual Reports
Other Information
March 31, 2018 (Unaudited)
PORTFOLIO PROXY VOTING
Policies and Procedures:
The Trust has delegated to Thornburg Investment Management, Inc. (the “Advisor”) voting decisions respecting proxies for the Fund’s voting securities. The Advisor makes voting decisions in accordance with its Proxy Voting Policy and Procedures. A description of the Policy and Procedures is available (i) without charge, upon request, by calling the Advisor toll-free at 1-800-847-0200, (ii) on the Thornburg website at www.thornburg.com, and (iii) on the Securities and Exchange Commission’s website at www.sec.gov.
Information regarding how proxies were voted is available on or before August 31 of each year for the twelve months ending the preceding June 30. This information is available (i) without charge, upon request by calling the Advisor toll-free at 1-800-847-0200, (ii) on the Thornburg website at www.thornburg.com, and (iii) on the Securities and Exchange Commission’s website at www.sec.gov.
AVAILABILITY OF QUARTERLY PORTFOLIO SCHEDULE
The Fund files with the Securities and Exchange Commission schedules of its portfolio holdings on Form N-Q for the first and third quarters of each fiscal year. The Fund’s Forms N-Q are available on the Commission’s website at www.sec.gov, or may be reviewed and copied at the Commission’s Public Reference Room in Washington, D.C. Information on the operation of the Public Reference Room may be obtained by calling 1-800-SEC-0330. The Fund also makes this information available on its website at www.thornburg.com/download or upon request by calling 1-800-847-0200.
Semi-Annual Reports | 63
Trustees’ Statement to Shareholders
Readopted September 11, 2017
The Trustees believe current and prospective shareholders should know how we discharge our responsibilities in supervising the Funds’ investment advisor and in reviewing the advisor’s contract for renewal. Since 2005, we have issued a statement which sets out clearly the three principal guidelines that we follow in supervising the Trust’s investment advisor on your behalf. In accordance with our customary practice, in September of this year we again reviewed our statement and concluded we should reissue this statement outlining the principal features of our supervision of the advisor’s performance of investment management services for the Funds.
We begin with the premise that each shareholder selected his or her Fund because its investments are managed by the investment advisor identified in the prospectus and in accordance with the objective and policies described in the prospectus. We realize, as each of you do, that if you believe that your Fund’s stated objective and policies no longer serve your personal investment goals, you can sell your shares and leave the Fund.
Therefore, we believe that our primary supervisory task—our principal obligation to you—is to assess the nature and quality of the advisor’s services, and to confirm that the advisor actively and competently pursues the Fund’s objective, in accordance with the policies set out in the prospectus. To do this, we meet regularly with management to review your Fund’s portfolio and to discuss the advisor’s specific actions and judgments in pursuing the Fund’s objective. We do not substitute our own judgment for the advisor’s decisions in selecting investments; the advisor is paid to exercise its informed judgment on investment decisions, and we seek to confirm, in reviewing the advisor’s performance, that the advisor is doing just that.
Second, we are conscious of costs and the effect that costs have on shareholders’ returns. We try to make sure that your Fund’s fees and costs are reasonable in relationship to the services rendered and that they are generally in line with those charged by other expert investment advisors, consistent with our belief that the Fund’s investors searched for and expect that expertise and attention and have decided to pay a reasonable price for it. We do not put the management contract “out to bid” as a matter of course, and we would not do so unless we had concluded that the advisor materially had failed to pursue the Fund’s objectives in accordance with its policies, or for other equally important reasons. We believe that any other approach would be inconsistent with your interests and contrary to your expectations when you bought shares of the Fund in the first place.
Finally, because we believe that most Thornburg Fund shareholders have invested with a long-term perspective, we try not to focus too much on the fashions of the moment and on short-term performance. The market will not favor any specific investment objective or set of policies at all times and under all economic circumstances. A fund will experience periods of both high and low returns relative to other funds and other investments. Even if one of our Funds is not favored by the market at a particular time, we believe that the advisor is nonetheless obliged to remain true to the Fund’s objective and policies, and we watch to see that it does so.
Trustees of Thornburg Investment Trust
64 | Semi-Annual Reports
Thornburg Funds
Thornburg Investment Management is a privately-owned global investment firm that offers a range of solutions for retail and institutional investors. Founded in 1982 and headquartered in Santa Fe, New Mexico, we manage approximately $49 billion (as of March 31, 2018) across U.S. mutual funds, separate accounts for high-net-worth investors, institutional accounts, and UCITS funds for non-U.S. investors.
EQUITY FUNDS
| | ∎ | | Thornburg Investment Income Builder Fund |
| | ∎ | | Thornburg Global Opportunities Fund |
| | ∎ | | Thornburg International Value Fund |
| | ∎ | | Thornburg Better World International Fund |
| | ∎ | | Thornburg International Growth Fund |
| | ∎ | | Thornburg Developing World Fund |
| | ∎ | | Thornburg Core Growth Fund |
FIXED INCOME FUNDS
| | ∎ | | Thornburg Low Duration Income Fund |
| | ∎ | | Thornburg Limited Term U.S. Government Fund |
| | ∎ | | Thornburg Limited Term Income Fund |
| | ∎ | | Thornburg Strategic Income Fund |
| | ∎ | | Thornburg Low Duration Municipal Fund |
| | ∎ | | Thornburg Limited Term Municipal Fund |
| | ∎ | | Thornburg Intermediate Municipal Fund |
| | ∎ | | Thornburg California Limited Term Municipal Fund |
| | ∎ | | Thornburg New Mexico Intermediate Municipal Fund |
| | ∎ | | Thornburg New York Intermediate Municipal Fund |
| | ∎ | | Thornburg Strategic Municipal Income Fund |
ALTERNATIVE FUNDS
| | ∎ | | Thornburg Long/Short Equity Fund |
Before investing, carefully consider the Fund’s investment goals, risks, charges, and expenses. For a prospectus or summary prospectus containing this and other information, contact your financial advisor or visit thornburg.com. Read it carefully before investing.
For additional information, please visit thornburg.com
Thornburg Investment Management, Inc. 2300 North Ridgetop Road, Santa Fe, NM 87506
Semi-Annual Reports | 65
This page intentionally left blank.
66 | Semi-Annual Reports
This page intentionally left blank.
Semi-Annual Reports | 67
| | | | |
| To receive shareholder reports, prospectuses, and proxy statements electronically, go to www.thornburg.com/edelivery. | | | | |
| This Semi-Annual Report is submitted for the general information of shareholders of the Fund. It is not authorized for distribution to prospective investors in the Fund unless preceded or accompanied by an effective prospectus. | |
| | | | |
Investment Advisor: | | Distributor: | | |
Thornburg Investment Management® | | Thornburg Securities Corporation® | | |
800.847.0200 | | 800.847.0200 | | TH174 |
Semi-Annual Report
March 31, 2018
THORNBURG STRATEGIC INCOME FUND
About Thornburg Investment Management
It’s more than what we do.
It’s how we do it.
At Thornburg, we are very different in how we think, invest, and are structured. We believe this difference is what makes us successful in helping individuals reach their long-term financial goals.

Flexible Perspective
Our perspective on investment opportunities is more flexible than most, viewing a wide range of opportunities beyond conventional boundaries to find hidden value.
Collaboration
Collectively, we hone ideas via borderless cross-pollination for better judgment and better results.

Portfolio Construction
Disciplined construction guided more by our convictions than convention.
CONVICTION
Thorough analysis and our relative-value framework lead to conviction in our securities selection.
UNCONVENTIONAL
Active management means we seek the best value for our clients rather than using conventional benchmarks as our starting point.

Structured for Excellence
How we think and how we invest is made possible by how we’re structured.
TEAM APPROACH
FAR FROM THE HERD
ACCESS & TRANSPARENCY
2 | Semi-Annual Report
Thornburg Strategic Income Fund
Semi-Annual Report | March 31, 2018
Table of Contents
| | | | | | | | | | |
| SHARE CLASS | | NASDAQ SYMBOL | | CUSIP |
| | |
| Class A | | TSIAX | | | | 885-215-228 | |
| Class C | | TSICX | | | | 885-215-210 | |
| Class I | | TSIIX | | | | 885-215-194 | |
| Class R3 | | TSIRX | | | | 885-216-887 | |
| Class R4 | | TSRIX | | | | 885-216-754 | |
| Class R5 | | TSRRX | | | | 885-216-879 | |
| Class R6 | | TSRSX | | | | 885-216-648 | |
Class I, R3, R4, R5, and R6 shares may not be available to all investors. Minimum investments for Class I shares may be higher than those for other classes.
Investments carry risks, including possible loss of principal. Portfolios investing in bonds have the same interest rate, inflation, and credit risks that are associated with the underlying bonds. The value of bonds will fluctuate relative to changes in interest rates, decreasing when interest rates rise. This effect is more pronounced for longer-term bonds. Unlike bonds, bond funds have ongoing fees and expenses. Investments in lower rated and unrated bonds may be more sensitive to default, downgrades, and market volatility; these investments may also be less liquid than higher rated bonds. Investments in derivatives are subject to the risks associated with the securities or other assets underlying the pool of securities, including illiquidity and difficulty in valuation. Investments in equity securities are subject to additional risks, such as greater market fluctuations. Additional risks may be associated with investments outside the United States, especially in emerging markets, including currency fluctuations, illiquidity, volatility, and political and economic risks. Please see the Fund’s prospectus for a discussion of the risks associated with an investment in the Fund. Investments in the Funds are not FDIC insured, nor are they bank deposits or guaranteed by a bank or any other entity.
Semi-Annual Report | 3
Letter to Shareholders
Thornburg Strategic Income Fund | March 31, 2018 (Unaudited)
April 17, 2018
Dear Fellow Shareholder:
We are pleased to present the semi-annual report for Thornburg Strategic Income Fund for the six-month period ended March 31, 2018. The net asset value (NAV) of a Class I share of the Thornburg Strategic Income Fund decreased 13 cents in the period to $11.67. If you were invested for the entire period, you received dividends of $0.183 per share. If you reinvested your dividends, you received $0.184 per share. Dividends per share varied for other share classes to account for class-specific expenses. Combining income and change in price, Class I shares of the Thornburg Strategic Income Fund produced a total return of 0.45% over the six-month period. The Bloomberg Barclays U.S. Universal Bond Index produced a return of negative 1.00%, and a blended index of 80% Bloomberg Barclays U.S. Aggregate Bond Index and 20% MSCI World Index produced a 0.00% total return over the same time.
During the period, the Fund we launched so that clients could take advantage of the growing breadth of the global bond market, combined with our broad investment perspective, has reached its 10-year anniversary. Late 2007 was an interesting time. While we believed the coming years and decades would provide interesting opportunities for investing, the scale of that “opportunity” just one year later was both immense and enormously valuable. Around the holidays in that year we began the portfolio with just $3 million of seed money from various partners at Thornburg, and as we began to invest, the added pressure of putting the personal money of our colleagues to work was a tangible reminder that the job we do is really for those who entrust us with their savings. It’s a lesson that we keep at the front of our minds every day, even as the portfolio has grown to more than $1 billion.
Overall, we are pleased with our record over the past decade and through several different market episodes. Today, though we are more defensive due to the current state of rate and credit markets, we have still been able to generate significant value for shareholders. Because we are uniquely structured with a distinct investment process, we believe we are well positioned to provide a differentiated set of outcomes.
Another important development during the period was the promotion of Christian Hoffmann to Strategic Income Fund’s portfolio management team. Christian joined Thornburg in 2012 as an analyst and was promoted to associate portfolio manager in 2014. During his tenure, he has made substantial contributions to the Fund’s performance through his excellent credit analysis and investment ideas as well as his overall thoughts and leadership in navigating credit and fixed income markets. This promotion recognizes this past success and demonstrates our complete confidence in his ability to create even greater shareholder value in the future as a member of the management team. Congratulations to Christian.
Heading into the six-month period, the market continued to feel awash in complacency, given both known risks and unknown risks lurking beneath the surface. Yet credit spreads and asset prices generally remained at very lofty levels. We mentioned in previous communications what we believe to be the largest risk to markets going forward: the removal of
monetary policy accommodation by most major central banks around the world. In the most recent six-month period, the Federal Reserve (Fed) begun shrinking its balance sheet while raising its policy rates, the European Central Bank began tapering its purchases, and even the Bank of Japan signaled that 0% interest rates won’t last forever. Despite central banks taking punch out of the punchbowl, general macroeconomic and market indicators point toward relatively loose financial conditions. Synchronized global growth appears to have given global central bankers an ideal environment for potential normalization.
Another major development during the period was the U.S. announcement of additional fiscal stimulus (e.g. the tax bill). While short-term positive, we think this could potentially result in inflation. But perhaps more important in the long run is that the tax bill immediately increases the U.S. fiscal deficit. If growth doesn’t pick up on a sustainable basis, and as of this writing, the jury is still out, then that deficit increase will become long-lasting. In previous commentaries, we mentioned government balance sheets as an area of concern for us going forward.
The six-month period marked the return of volatility from the muted levels experienced throughout 2017. As volatility rose, asset returns became highly correlated to the downside, catching many investors off guard. In January alone, the U.S. 10-year jumped 31 basis points, by the end of the quarter the 10-year yielded 2.77%. During the quarter, the Bloomberg Barclays U.S. Aggregate Bond Index delivered a negative 1.46% return, reminding investors of the potential perils found in longer duration, core bond indices.
Near the end of the period, the S&P 500 Index gave back all the gains from the best January in 20 years, returning negative 0.76% for the first quarter. Volatility, as measured by the CBOE Volatility Index (VIX), spiked in early February as investor fears over suddenly increasing inflation gripped markets. Leveraged VIX ETN products quickly exacerbated the issue as the popular short volatility trade of 2017 unwound. Equities sold off significantly (~10%) over period of nine days before rallying as fears subsided. Treasury yields remained elevated throughout the second half of the period as potential changes to monetary policy from the new Jerome Powell-led Fed remained a top concern for investors.
Statements from former Fed Chairwoman Janet Yellen’s last meeting generally read more hawkish than anticipated, and Powell’s first Humphrey Hawkins performance came off a bit hawkish as well. Market participants focused on signs of inflation acceleration and what that might do to the pace of Fed, Bank of England, European Central Bank and Bank of Japan tightening. Despite acceleration concerns, sub-target inflation continues to provide the Fed, ECB, and other developed market centrals banks, enough wiggle room to move slowly. However, GDP output gaps have shrunk back to neutral levels and most notably, unemployment rates continue to fall such that the U.S. and various European economies are at or near full employment. Although we’ve recently experienced mixed spending and housing data, synchronized global growth appears sustainable and the general economic environment remains benign.
4 | Semi-Annual Report
Letter to Shareholders, Continued
Thornburg Strategic Income Fund | March 31, 2018 (Unaudited)
Recent volatility has presented opportunity in select names that we have been following, but that we had generally passed on or remained light in due to the tightness of spreads. The combination of higher rates and higher credit spreads has resulted in below-par prices in many names, resulting in better convexity around potential calls and better loss, given default metrics. Opportunities were not incredibly abundant, however. In any case, we identified several opportunities to add dislocated corporates at a notable dollar price discount compared to the recent past.
While stronger economic growth continues to give us confidence to hold a decent amount of credit currently, we have lowered risk exposures in the portfolios over time as risk compensation has declined. Throughout the period we expressed a defensive posture in multiple ways. Given our guiding philosophy of managing a diversified portfolio to be robust across many macro environments, we continued to build balanced risk exposures to avoid overdependence upon any singular outcome. Within our high-yield holdings for example, we’ve continued to upgrade quality and reduce potential volatility. All high-yield bonds are not created equal. We’ve focused on shorter maturities, less cyclical cash flows, and companies focused on the stronger segments of the economy that will generally lower volatility at the portfolio level in times of stress.
Generally, we have favored investing behind the U.S. consumer, whose balance sheet has notably improved since 2008–2009. This has meant senior-most tranches of asset-back securities, grouping consumer loans, auto loans and student loans. These tend to be short-lived assets that rapidly build upon already strong credit enhancements. We’ve also increased exposure to mortgages. Given the type of mortgages we have purchased, we perceive the credit risk to be minimal and are focused on the convexity profile of purchases with a close eye on structural enhancements and the incentive profile of underlying borrowers. As opportunities present themselves across sectors and classes, we remain ready to deploy capital if adequately compensated.
While portfolio objectives can range from managing yield within price volatility constraints to maximizing total returns, all investors must consider the risk/reward trade-offs inherent in various investments. Higher yields tend to come with higher price volatility, whether driven by credit, duration, or both. On the other hand, defensive products offer limited volatility but produce low-yield returns. The key to a successful portfolio is balancing these competing variables into an optimal combination that meets overall objectives. The problem is most organizations aren’t structured to find relative value across the available spectrum of investment opportunities. The “risk bucket” methodologies utilized by the majority of players within the space, may be using a sub-optimal structure for the fixed income environment we are moving into. We believe our unique approach and structure offers our investor an edge in this strange and tumultuous environment.
Thank you for investing alongside us.
Sincerely,
The matters discussed in this report may constitute forward-looking statements made pursuant to the safe harbor provisions of the Securities Litigation Reform Act of 1995. These include any advisor or portfolio manager prediction, assessment, analysis or outlook for individual securities, industries, investment styles, market sectors and/or markets. These statements involve risks and uncertainties. In addition to the general risks described for each fund in its current prospectus, other factors bearing on these reports include the accuracy of the advisor’s or portfolio manager’s forecasts and predictions, the appropriateness of the investment strategies designed by the advisor or portfolio manager and the ability of the advisor or portfolio manager to implement their strategies efficiently and successfully. Any one or more of these factors, as well as other risks affecting the securities markets generally, could cause the actual results of any fund to differ materially as compared to its benchmarks.
The views expressed are subject to change and do not necessarily reflect the views of Thornburg Investment Management, Inc. This information should not be relied upon as a recommendation or investment advice and is not intended to predict the performance of any investment or market.
Performance results of individual share classes will vary based on the fees and expenses associated with each share class, and may be higher or lower than other share classes within the same Fund. Please see Performance Summary for performance results of each share class.
Semi-Annual Report | 5
Performance Summary
Thornburg Strategic Income Fund | March 31, 2018 (Unaudited)
AVERAGE ANNUAL TOTAL RETURNS
| | | | | | | | | | | | | | | | | | | | | | | | | |
| | | 1-YR | | 3-YR | | 5-YR | | 10-YR | | SINCE
INCEP. |
| | | | | |
Class A Shares (Incep: 12/19/07) | | | | | | | | | | | | | | | | | | | | | | | | | |
Without sales charge | | | | 3.39% | | | | | 3.34% | | | | | 3.30% | | | | | 6.06% | | | | | 6.08% | |
| | | | | |
With sales charge | | | | -1.27% | | | | | 1.77% | | | | | 2.35% | | | | | 5.58% | | | | | 5.61% | |
Class C Shares (Incep: 12/19/07) | | | | | | | | | | | | | | | | | | | | | | | | | |
Without sales charge | | | | 2.70% | | | | | 2.69% | | | | | 2.68% | | | | | 5.45% | | | | | 5.47% | |
| | | | | |
With sales charge | | | | 1.70% | | | | | 2.69% | | | | | 2.68% | | | | | 5.45% | | | | | 5.47% | |
| | | | | |
Class I Shares (Incep: 12/19/07) | | | | 3.93% | | | | | 3.73% | | | | | 3.67% | | | | | 6.41% | | | | | 6.43% | |
| | | | | |
Class R3 Shares (Incep: 5/1/12) | | | | 3.50% | | | | | 3.34% | | | | | 3.28% | | | | | - | | | | | 4.42% | |
| | | | | |
Class R4 Shares (Incep: 2/1/14) | | | | 3.29% | | | | | 3.27% | | | | | - | | | | | - | | | | | 3.17% | |
| | | | | |
Class R5 Shares (Incep: 5/1/12) | | | | 3.95% | | | | | 3.71% | | | | | 3.62% | | | | | - | | | | | 4.76% | |
| | | | | |
Class R6 Shares (Incep: 4/10/17) | | | | - | | | | | - | | | | | - | | | | | - | | | | | 4.38% | |
| | | | | |
Bloomberg Barclays U.S. Universal Bond Index (Since 12/19/07) | | | | 1.52% | | | | | 1.73% | | | | | 2.19% | | | | | 4.01% | | | | | 4.10% | |
30-DAY YIELDS, A SHARES (with sales charge)
| | | | | |
| Annualized Distribution Yield | | | | 2.45% | |
| SEC Yield | | | | 2.84% | |
GROWTH OF A HYPOTHETICAL $10,000 INVESTMENT
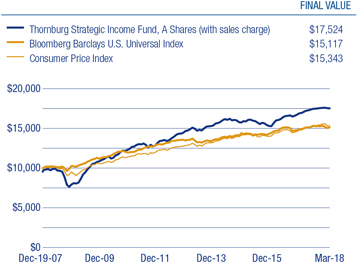
Performance data shown represents past performance and is no guarantee of future results. Investment return and principal value will fluctuate so shares, when redeemed, may be worth more or less than their original cost. Current performance may be lower or higher than quoted. For performance current to the most recent month end, visit thornburg.com or call 800-847-0200. The performance information does not reflect the deduction of taxes that a shareholder would pay on distributions or the redemption of Fund shares. Returns reflect the reinvestment of dividends and capital gains. Class A shares are sold with a maximum sales charge of 4.50%. Class C shares are subject to a 1% CDSC for the first year only. There is no sales charge for Class I, R3, R4, R5 and R6 shares.
As disclosed in the most recent prospectus, the total annual fund operating expenses before fee waivers and expense reimbursements are as follows: A shares, 1.21%; C shares, 1.95%; I shares, 0.95%; R3 shares, 2.54%; R4 shares, 2.26%; R5 shares, 1.39%; R6 shares, 1.00%. Thornburg Investment Management and/or Thornburg Securities Corporation have contractually agreed to waive fees and reimburse expenses through at least February 1, 2019, for some of the share classes, resulting in net expense ratios of the following: A shares, 1.13%; C shares, 1.80%; I shares, 0.69%; R3 shares, 1.25%; R4 shares, 1.25%; R5 shares, 0.69%; R6 shares, 0.65%. For more detailed information on fund expenses and waivers/reimbursements please see the Fund’s prospectus. Without the fee waivers and expense reimbursements, the yields for Class A shares would have remained the same as those stated above.
Glossary
The Bloomberg Barclays U.S. Aggregate Bond Index is composed of approximately 8,000 publicly traded bonds including U.S. government, mortgage-backed, corporate and Yankee bonds. The index is weighted by the market value of the bonds included in the index.
The Bloomberg Barclays U.S. Universal Bond Index represents the union of the
U.S. Aggregate Index, U.S. Corporate High-Yield, investment Grade 144A Index, Eurodollar Index, U.S. Emerging Markets Index, and the non-ERISA eligible portion of the CMBS Index. The index covers USD denominated, taxable bonds that are rated either investment-grade or below investment-grade.
Thornburg Strategic Income Fund’s Blended Index is composed of 80% Bloomberg Barclays U.S. Aggregate Bond Index and 20% MSCI World Index, rebalanced monthly.
The MSCI World Index is an unmanaged market-weighted index that consists of securities traded in 23 of the world’s most developed countries. Securities are listed on exchanges in the U.S., Europe, Canada, Australia, New Zealand, and the Far East. The index is calculated with net dividends reinvested in U.S. dollars.
The S&P 500 Index is an unmanaged broad measure of the U.S. stock market.
The CBOE Volatility Index (VIX Index) shows the market’s expectation of 30-day volatility. It is constructed using the implied volatilities of a wide range of S&P 500 Index options. This volatility is meant to be forward looking and is calculated from both calls and puts.
The performance of any index is not indicative of the performance of any particular investment. Unless otherwise noted, index returns reflect the reinvestment of income
dividends and capital gains, if any, but do not reflect fees, brokerage commissions or other expenses of investing. Investors may not make direct investments into any index.
Bond Credit Ratings (Credit Quality) – A bond credit rating assesses the financial ability of a debt issuer to make timely payments of principal and interest. Rating of AAA (the highest), AA, A, and BBB are investment-grade quality. Rating of BB, B, CCC, CC, C and D (the lowest) are considered below investment grade, speculative grade, or junk bonds.
High yield bonds may offer higher yields in return for risk exposure.
Convexity – A measure of the curvature in the relationship between bond prices and bond yields that demonstrates how the duration of a bond changes as the interest rate changes.
Credit Spread/Quality Spread – The difference between the yields of securities with different credit qualities.
Quantitative Easing (QE) – An unconventional monetary policy in which a central bank purchases financial assets from the market in order to lower interest rates and increase the money supply.
Yield Curve – A line that plots the interest rate, at a set point in time, of bonds having equal credit quality, but offering maturity dates.
6 | Semi-Annual Report
Fund Summary
Thornburg Strategic Income Fund | March 31, 2018 (Unaudited)
OBJECTIVES AND STRATEGIES
The Fund’s primary investment goal is to seek a high level of current income. The Fund’s secondary investment goal is some long-term capital appreciation.
The Fund pursues its investment goals by investing in a broad range of income-producing investments from throughout the world, primarily including debt obligations and income-producing stocks. The Fund expects, under normal conditions, to invest a majority of its assets in debt obligations, but the relative proportions of the Fund’s investments in debt obligations and in income-producing stocks can be expected to vary over time.
PORTFOLIO COMPOSITION
| | | | | |
| Corporate/Convertible Bonds | | | | 61.3% | |
| Asset Backed Securities | | | | 18.2% | |
| Bank Loans | | | | 5.1% | |
| Common & Preferred Stock | | | | 1.6% | |
| Other Fixed Income | | | | 2.1% | |
| Other Assets Less Liabilities | | | | 11.7% | |
FIXED INCOME CREDIT QUALITY*
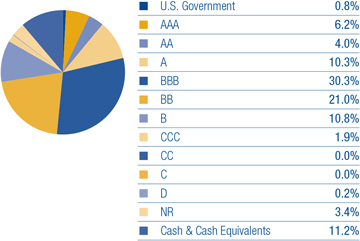
| * | Excludes equity securities. |
A bond credit rating assesses the financial ability of a debt issuer to make timely payments of principal and interest. Ratings of AAA (the highest), AA, A, and BBB are investment-grade quality. Ratings of BB, B, CCC, CC, C and D (the lowest) are considered below investment grade, speculative grade, or junk bonds.
Credit quality ratings for Thornburg’s global fixed income portfolios used ratings from Moody’s Investors Service. Where Moody’s ratings are not available, we have used Standard & Poor’s ratings. Where neither rating is available, we have used ratings from other nationally recognized statistical rating organizations (NRSROs). “NR” = not rated.
TOP TEN INDUSTRY GROUPS
| | | | | |
| Diversified Financials | | | | 9.3% | |
| Energy | | | | 5.3% | |
| Materials | | | | 4.0% | |
| Telecommunication Services | | | | 3.9% | |
| Software & Services | | | | 3.6% | |
| Utilities | | | | 3.3% | |
| Insurance | | | | 3.2% | |
| Technology Hardware & Equipment | | | | 2.9% | |
| Transportation | | | | 2.8% | |
| Media | | | | 2.6% | |
COUNTRY EXPOSURE *
(percent of Fund)
| | | | | |
| United States | | | | 69.1% | |
| United Kingdom | | | | 2.4% | |
| Canada | | | | 2.4% | |
| China | | | | 1.3% | |
| Mexico | | | | 1.1% | |
| Bermuda | | | | 1.0% | |
| South Korea | | | | 0.9% | |
| Cayman Islands | | | | 0.9% | |
| Sweden | | | | 0.8% | |
| Belgium | | | | 0.7% | |
| Japan | | | | 0.7% | |
| South Africa | | | | 0.7% | |
| Brazil | | | | 0.6% | |
| Switzerland | | | | 0.6% | |
| Ireland | | | | 0.6% | |
| Germany | | | | 0.5% | |
| Jamaica | | | | 0.5% | |
| Trinidad And Tobago | | | | 0.5% | |
| Guatemala | | | | 0.5% | |
| Morocco | | | | 0.5% | |
| France | | | | 0.4% | |
| Luxembourg | | | | 0.4% | |
| Chile | | | | 0.3% | |
| Barbados | | | | 0.3% | |
| Italy | | | | 0.3% | |
| Turkey | | | | 0.1% | |
| Panama | | | | 0.0%** | |
| Australia | | | | 0.0%** | |
| Other Assets Less Liabilities | | | | 11.7% | |
| * | Holdings are classified by country of risk as determined by MSCI and Bloomberg. |
| ** | Country percentage was less than 0.1%. |
There is no guarantee that the Fund will meet its investment objectives.
All data is subject to change. Charts may not add up to 100% due to rounding.
Semi-Annual Report | 7
Schedule of Investments
Thornburg Strategic Income Fund | March 31, 2018 (Unaudited)
| | | | | | | | | | | | |
| | | | | SHARES/
PRINCIPAL AMOUNT | | VALUE |
| | | |
| | COMMON STOCK — 0.0% | | | | | | | | | | |
| | | |
| | ENERGY — 0.0% | | | | | | | | | | |
| | Oil, Gas & Consumable Fuels — 0.0% | | | | | | | | | | |
| a,b,c | | Malamute Energy, Inc. | | | | 847 | | | | $ | 8,893 | |
| | | | | | | | | | | | |
| | | | | | | | | | | 8,893 | |
| | | | | | | | | | | | |
| | TOTAL COMMON STOCK (Cost $0) | | | | | | | | | 8,893 | |
| | | | | | | | | | | | |
| | | |
| | PREFERRED STOCK — 1.6% | | | | | | | | | | |
| | BANKS — 0.9% | | | | | | | | | | |
| | Banks — 0.9% | | | | | | | | | | |
| d | | AgriBank FCB, 6.875% (LIBOR 3 Month + 4.23%) | | | | 40,000 | | | | | 4,322,500 | |
| d,e | | CoBank ACB, Series F, 6.25% (LIBOR 3 Month + 4.56%) | | | | 50,000 | | | | | 5,300,000 | |
| | | | | | | | | | | | |
| | | | | | | | | | | 9,622,500 | |
| | | | | | | | | | | | |
| | ENERGY — 0.3% | | | | | | | | | | |
| | Oil, Gas & Consumable Fuels — 0.3% | | | | | | | | | | |
| b,e | | Crestwood Equity Partners LP, 9.25% | | | | 320,654 | | | | | 3,043,006 | |
| | | | | | | | | | | | |
| | | | | | | | | | | 3,043,006 | |
| | | | | | | | | | | | |
| | MISCELLANEOUS — 0.1% | | | | | | | | | | |
| | U.S. Government Agencies — 0.1% | | | | | | | | | | |
| e | | Farm Credit Bank of Texas, Series 1, 10.00% | | | | 1,000 | | | | | 1,175,000 | |
| | | | | | | | | | | | |
| | | | | | | | | | | 1,175,000 | |
| | | | | | | | | | | | |
| | REAL ESTATE — 0.1% | | | | | | | | | | |
| | Equity Real Estate Investment Trusts — 0.1% | | | | | | | | | | |
| e | | VEREIT, Inc., Series F, 6.70% | | | | 25,857 | | | | | 656,768 | |
| | | | | | | | | | | | |
| | | | | | | | | | | 656,768 | |
| | | | | | | | | | | | |
| | TELECOMMUNICATION SERVICES — 0.2% | | | | | | | | | | |
| | Diversified Telecommunication Services — 0.2% | | | | | | | | | | |
| f | | Centaur Funding Corp., 9.08%, 4/21/2020 | | | | 2,380 | | | | | 2,677,491 | |
| | | | | | | | | | | | |
| | | | | | | | | | | 2,677,491 | |
| | | | | | | | | | | | |
| | TOTAL PREFERRED STOCK (Cost $16,575,977) | | | | | | | | | 17,174,765 | |
| | | | | | | | | | | | |
| | | |
| | ASSET BACKED SECURITIES — 18.2% | | | | | | | | | | |
| | ADVANCE RECEIVABLES — 0.5% | | | | | | | | | | |
| g | | New Residential Advance Receivables Trust, Series 2016-T2 Class AT2, 2.575%, 10/15/2049 | | | $ | 5,000,000 | | | | | 4,948,610 | |
| g | | SPS Servicer Advance Receivables Trust Advance Receivables Backed Notes, Series 2016-T1 Class AT1, 2.53%, 11/16/2048 | | | | 800,000 | | | | | 798,251 | |
| | | | | | | | | | | | |
| | | | | | | | | | | 5,746,861 | |
| | | | | | | | | | | | |
| | AUTO RECEIVABLES — 2.8% | | | | | | | | | | |
| | American Credit Acceptance Receivables Trust, | | | | | | | | | | |
| g | | Series 2016-4 Class C, 2.91%, 2/13/2023 | | | | 4,000,000 | | | | | 3,987,893 | |
| g | | Series 2017-3 Class A, 1.82%, 3/10/2020 | | | | 1,356,245 | | | | | 1,353,259 | |
| g | | Avis Budget Rental Car Funding AESOP, LLC, Series 2015-1A Class A, 2.50%, 7/20/2021 | | | | 2,900,000 | | | | | 2,869,823 | |
| g | | CIG Auto Receivables Trust, Series 2017-1A Class A, 2.71%, 5/15/2023 | | | | 1,413,389 | | | | | 1,405,390 | |
| g | | Foursight Capital Automobile Receivables Trust 2018-1, Series 2018-1 Class E, 5.56%, 1/16/2024 | | | | 1,000,000 | | | | | 1,005,989 | |
| | Foursight Capital Automobile Receivables Trust, | | | | | | | | | | |
| g | | Series 2014-1 Class B, 3.56%, 11/22/2021 | | | | 5,454,000 | | | | | 5,428,006 | |
| g | | Series 2016-1 Class A2, 2.87%, 10/15/2021 | | | | 2,215,731 | | | | | 2,207,369 | |
| g | | Hertz Vehicle Financing II L.P., Series 2015-1A Class A, 2.73%, 3/25/2021 | | | | 4,000,000 | | | | | 3,971,959 | |
| b,g | | OSCAR US Funding Trust V, Series 2016-2A Class A2A, 2.31%, 11/15/2019 | | | | 699,300 | | | | | 698,601 | |
| g,h | | OSCAR US Funding Trust VII, LLC, Series 2017-2A Class A2B, 2.39%, 11/10/2020 | | | | 1,800,000 | | | | | 1,801,276 | |
| g | | Sierra Auto Receivables Securitization Trust 2016-1, Series 2016-1A Class B, 6.84%, 1/18/2022 | | | | 4,500,000 | | | | | 4,636,664 | |
| g | | Veros Automobile Receivables Trust, Series 2017-1 Class A, 2.84%, 4/17/2023 | | | | 1,429,689 | | | | | 1,424,746 | |
| | | | | | | | | | | | |
| | | | | | | | | | | 30,790,975 | |
| | | | | | | | | | | | |
8 | Semi-Annual Report
Schedule of Investments, Continued
Thornburg Strategic Income Fund | March 31, 2018 (Unaudited)
| | | | | | | | | | | | |
| | | | | SHARES/
PRINCIPAL AMOUNT | | VALUE |
| | COMMERCIAL MTG TRUST — 1.6% | | | | | | | | | | |
| g,h | | CFCRE Commercial Mortgage Trust, Series 2011-C1 Class C, 6.093%, 4/15/2044 | | | $ | 6,200,000 | | | | $ | 6,517,059 | |
| h | | Citigroup Mortgage Loan Trust, Inc. CMO, Series 2004-HYB2 Class B1, 3.848%, 3/25/2034 | | | | 63,003 | | | | | 51,765 | |
| g,h | | Credit Suisse Mortgage Trust, Series 2017-HL2 Class A3, 3.50%, 10/25/2047 | | | | 3,328,704 | | | | | 3,296,663 | |
| d,g | | CSMC Trust, Series 2016-BDWN Class E, 13.277% (LIBOR 1 Month + 11.50%), 2/15/2029 | | | | 3,000,000 | | | | | 3,014,873 | |
| | FREMF Mortgage Trust, | | | | | | | | | | |
| d,g | | Series 2013-KF02 Class B, 4.67% (LIBOR 1 Month + 3.00%), 12/25/2045 | | | | 347,042 | | | | | 347,766 | |
| d,g | | Series 2016-KF24 Class B, 6.67% (LIBOR 1 Month + 5.00%), 10/25/2026 | | | | 1,698,438 | | | | | 1,792,084 | |
| g,h | | Galton Funding Mortgage Trust 2017-1 CMO, Series 2018-1 Class A43, 3.50%, 11/25/2057 | | | | 2,299,987 | | | | | 2,306,496 | |
| | | | | | | | | | | | |
| | | | | | | | | | | 17,326,706 | |
| | | | | | | | | | | | |
| | IRON/STEEL — 0.2% | | | | | | | | | | |
| g,h | | New Residential Mortgage Trust 2018-1, Series 2018-1A Class A1A, 4.00%, 12/25/2057 | | | | 2,426,236 | | | | | 2,466,687 | |
| | | | | | | | | | | | |
| | | | | | | | | | | 2,466,687 | |
| | | | | | | | | | | | |
| | OTHER ASSET BACKED — 8.5% | | | | | | | | | | |
| d,g | | 321 Henderson Receivables II, LLC, Series 2006-3A Class A1, 1.977% (LIBOR 1 Month + 0.20%), 9/15/2041 | | | | 2,204,751 | | | | | 2,088,919 | |
| g | | BCC Funding XIV, LLC, Series 2018-1A Class A2, 2.96%, 6/20/2023 | | | | 1,900,000 | | | | | 1,896,436 | |
| g | | CFG Investments Ltd., Series 2017-1 Class A, 7.87%, 11/15/2026 | | | | 3,000,000 | | | | | 3,130,708 | |
| g | | CLUB Credit Trust 2017-P2, Series 2017-P2 Class A, 2.61%, 1/15/2024 | | | | 1,720,980 | | | | | 1,716,457 | |
| g | | Consumer Loan Underlying Bond Credit Trust, Series 2017-NP2 Class A, 2.55%, 1/16/2024 | | | | 1,869,940 | | | | | 1,868,471 | |
| g | | Diamond Resorts Owner Trust, Series 2014-1 Class A, 2.54%, 5/20/2027 | | | | 742,729 | | | | | 739,806 | |
| g | | ECAF I Ltd., Series 2015-1A Class B1, 5.802%, 6/15/2040 | | | | 6,015,076 | | | | | 6,102,847 | |
| g | | Engs Commercial Finance Trust, Series 2018-1A Class A1, 2.97%, 2/22/2021 | | | | 1,000,000 | | | | | 999,908 | |
| f | | Fairway Outdoor Funding, LLC, Series 2012-1A Class B, 8.835%, 10/15/2042 | | | | 3,000,000 | | | | | 3,139,338 | |
| g | | Foundation Finance Trust, Series 2017-1A Class A, 3.30%, 7/15/2033 | | | | 3,515,977 | | | | | 3,492,367 | |
| g | | Global SC Finance II SRL, Series 2014-1A Class A1, 3.19%, 7/17/2029 | | | | 3,008,333 | | | | | 2,961,390 | |
| g | | HERO Funding Trust, Series 2017-2A Class A1, 3.28%, 9/20/2048 | | | | 3,691,609 | | | | | 3,686,289 | |
| f | | JPR Royalty Sub, LLC, 14.00%, 9/1/2020 | | | | 2,000,000 | | | | | 1,000,000 | |
| g | | Marlette Funding Trust 2018-1, Series 2018-1A Class A, 2.61%, 3/15/2028 | | | | 4,213,232 | | | | | 4,207,086 | |
| g | | Marlette Funding Trust, Series 2017-2A Class A, 2.39%, 7/15/2024 | | | | 2,118,248 | | | | | 2,113,285 | |
| g | | Murray Hill Marketplace Trust, Series 2016-LC1 Class B, 6.15%, 11/25/2022 | | | | 3,083,961 | | | | | 3,099,824 | |
| g,h | | Nationstar HECM Loan Trust 2018-1, Series 2018-1A Class A, 2.76%, 2/25/2028 | | | | 3,216,552 | | | | | 3,216,551 | |
| b,d,f | | Northwind Holdings, LLC, Series 2007-1A Class A1, 2.786% (LIBOR 3 Month + 0.78%), 12/1/2037 | | | | 462,500 | | | | | 443,538 | |
| g | | OnDeck Asset Securitization Trust II, LLC, Series 2016-1A Class A, 4.21%, 5/17/2020 | | | | 4,470,000 | | | | | 4,472,355 | |
| g | | Oportun Funding VI, LLC, Series 2017-A Class A, 3.23%, 6/8/2023 | | | | 4,000,000 | | | | | 3,934,029 | |
| g | | PFS Financing Corp., Series 2018-B Class A, 2.89%, 2/15/2023 | | | | 3,000,000 | | | | | 2,982,684 | |
| g | | Prosper Marketplace Issuance Trust, Series 2017-3A Class A, 2.36%, 11/15/2023 | | | | 1,349,413 | | | | | 1,344,139 | |
| b,g | | Purchasing Power Funding, LLC, Series 2018-A Class A, 3.34%, 8/15/2022 | | | | 3,000,000 | | | | | 3,003,867 | |
| | SBA Tower Trust, | | | | | | | | | | |
| g | | 2.877%, 7/10/2046 | | | | 2,275,000 | | | | | 2,240,648 | |
| g | | 3.156%, 10/10/2045 | | | | 3,750,000 | | | | | 3,686,888 | |
| b,g | | Scala Funding Co., LLC Series, Series 2016-1 Class B, 5.21%, 2/15/2021 | | | | 4,000,000 | | | | | 3,964,000 | |
| g | | Sierra Timeshare Receivables Funding, LLC, Series 2015-2A Class A, 2.43%, 6/20/2032 | | | | 2,936,630 | | | | | 2,911,291 | |
| g | | Sofi Consumer Loan Program, LLC, Series 2017-3 Class A, 2.77%, 5/25/2026 | | | | 931,625 | | | | | 924,670 | |
| g | | SolarCity LMC Series I, LLC, Series 2013-1 Class A, 4.80%, 11/20/2038 | | | | 2,575,894 | | | | | 2,598,823 | |
| g | | Solarcity LMC Series II, LLC, Series 2014-1 Class A, 4.59%, 4/20/2044 | | | | 2,817,007 | | | | | 2,824,443 | |
| g | | Sonic Capital, LLC, Series 2016-1A Class A2, 4.472%, 5/20/2046 | | | | 2,932,496 | | | | | 3,018,141 | |
| g | | Textainer Marine Containers V Ltd., Series 2017-1A Class A, 3.72%, 5/20/2042 | | | | 4,265,445 | | | | | 4,257,228 | |
| g | | VB-S1 Issuer, LLC, Series 2016-1A Class C, 3.065%, 6/15/2046 | | | | 3,100,000 | | | | | 3,093,018 | |
| g | | Westgate Resorts, LLC, Series 2016-1A Class A, 3.50%, 12/20/2028 | | | | 1,679,389 | | | | | 1,681,719 | |
| | | | | | | | | | | | |
| | | | | | | | | | | 92,841,163 | |
| | | | | | | | | | | | |
| | RESIDENTIAL MTG TRUST — 3.3% | | | | | | | | | | |
| | Angel Oak Mortgage Trust, LLC, | | | | | | | | | | |
| g,h | | Series 2017-3 Class A1, 2.708%, 11/25/2047 | | | | 1,743,971 | | | | | 1,713,165 | |
| b,g,h,i | | Series 2018-1 Class A1, 3.258%, 4/27/2048 | | | | 2,500,000 | | | | | 2,499,992 | |
| h | | Bear Stearns ARM Trust CMO, Series 2003-6 Class 2B1, 3.373%, 8/25/2033 | | | | 97,246 | | | | | 97,962 | |
| g,h | | Citigroup Mortgage Loan Trust CMO, Series 2014-A Class A, 4.00%, 1/25/2035 | | | | 1,746,790 | | | | | 1,783,371 | |
| d,g | | Credit Suisse First Boston Mortgage Securities Corp. CMO, Series 2005-CF1 Class M1, 2.572% (LIBOR 1 Month + 0.70%), 3/25/2045 | | | | 286,827 | | | | | 286,149 | |
| h | | CWABS Asset-Backed Certificates Trust, Series 2005-11 Class AF3, 4.495%, 2/25/2036 | | | | 59,065 | | | | | 59,031 | |
| g,h | | Finance of America Structured Securities Trust, Series 2017-HB1 Class A, 2.321%, 11/25/2027 | | | | 2,441,658 | | | | | 2,432,623 | |
| g,h | | Flagstar Mortgage Trust, Series 2017-1 Class 2A2, 3.00%, 3/25/2047 | | | | 1,817,357 | | | | | 1,791,899 | |
Semi-Annual Report | 9
Schedule of Investments, Continued
Thornburg Strategic Income Fund | March 31, 2018 (Unaudited)
| | | | | | | | | | | | |
| | | | | SHARES/
PRINCIPAL AMOUNT | | VALUE |
| | JPMorgan Mortgage Trust, | | | | | | | | | | |
| g,h | | Series 2017-2 Class A6, 3.00%, 5/25/2047 | | | $ | 2,591,992 | | | | $ | 2,555,815 | |
| g,h | | Series 2017-6 Class A5, 3.50%, 12/25/2048 | | | | 2,885,350 | | | | | 2,895,292 | |
| h | | Merrill Lynch Mortgage Investors Trust Series MLMI CMO, Series 2004-A4 Class M1, 3.274%, 8/25/2034 | | | | 203,422 | | | | | 191,664 | |
| d | | Morgan Stanley ABS Capital I, Inc. Trust, Series 2005-HE7 Class A2C, 2.192% (LIBOR 1 Month + 0.32%), 11/25/2035 | | | | 107,631 | | | | | 107,763 | |
| | New Residential Mortgage Loan Trust CMO, | | | | | | | | | | |
| g,h | | Series 2017-3A Class A1, 4.00%, 4/25/2057 | | | | 3,302,233 | | | | | 3,351,077 | |
| g,h | | Series 2017-4A Class A1, 4.00%, 5/25/2057 | | | | 3,254,344 | | | | | 3,317,081 | |
| | New Residential Mortgage Loan Trust, | | | | | | | | | | |
| d,g | | Series 2017-5A Class A1, 3.372% (LIBOR 1 Month + 1.50%), 6/25/2057 | | | | 2,520,871 | | | | | 2,583,924 | |
| g,h | | Series 2017-6A Class A1, 4.00%, 8/27/2057 | | | | 1,353,053 | | | | | 1,375,845 | |
| | Sequoia Mortgage Trust CMO, | | | | | | | | | | |
| g,h | | Series 2017-4 Class A4, 3.50%, 7/25/2047 | | | | 1,706,439 | | | | | 1,710,438 | |
| g,h | | Series 2017-5 Class A4, 3.50%, 8/25/2047 | | | | 3,541,297 | | | | | 3,550,260 | |
| g,h | | Verus Securitization Trust CMO, Series 2017-2A Class A1, 2.485%, 7/25/2047 | | | | 3,112,123 | | | | | 3,090,799 | |
| | | | | | | | | | | | |
| | | | | | | | | | | 35,394,150 | |
| | | | | | | | | | | | |
| | STUDENT LOAN — 1.3% | | | | | | | | | | |
| g | | Earnest Student Loan Program, LLC, Series 2016-C Class A2, 2.68%, 7/25/2035 | | | | 2,117,207 | | | | | 2,047,985 | |
| d,g | | Nelnet Student Loan Trust, Series 2016-A Class A1A, 3.622% (LIBOR 1 Month + 1.75%), 12/26/2040 | | | | 2,668,642 | | | | | 2,673,702 | |
| | SLM Student Loan Trust, | | | | | | | | | | |
| d | | Series 2008-2 Class A3, 2.495% (LIBOR 3 Month + 0.75%), 4/25/2023 | | | | 1,194,253 | | | | | 1,190,072 | |
| d | | Series 2008-5 Class A4, 3.445% (LIBOR 3 Month + 1.70%), 7/25/2023 | | | | 3,124,947 | | | | | 3,208,841 | |
| d | | Series 2012-1 Class A3, 2.822% (LIBOR 1 Month + 0.95%), 9/25/2028 | | | | 3,097,530 | | | | | 3,113,117 | |
| | SoFi Professional Loan Program, LLC, | | | | | | | | | | |
| g | | Series 2014-A Class A2, 3.02%, 10/25/2027 | | | | 1,096,801 | | | | | 1,093,697 | |
| d,g | | Series 2014-B Class A1, 3.122% (LIBOR 1 Month + 1.25%), 8/25/2032 | | | | 1,067,708 | | | | | 1,079,824 | |
| | | | | | | | | | | | |
| | | | | | | | | | | 14,407,238 | |
| | | | | | | | | | | | |
| | TOTAL ASSET BACKED SECURITIES (Cost $200,841,964) | | | | | | | | | 198,973,780 | |
| | | | | | | | | | | | |
| | | |
| | CORPORATE BONDS — 59.1% | | | | | | | | | | |
| | AUTOMOBILES & COMPONENTS — 1.2% | | | | | | | | | | |
| | Auto Components — 0.2% | | | | | | | | | | |
| g,j | | Nexteer Automotive Group Ltd., 5.875%, 11/15/2021 | | | | 2,000,000 | | | | | 2,060,000 | |
| | Automobiles — 0.3% | | | | | | | | | | |
| g,j | | Hyundai Capital Services, Inc., 3.75%, 3/5/2023 | | | | 3,000,000 | | | | | 2,977,854 | |
| | Trading Companies & Distributors — 0.7% | | | | | | | | | | |
| g | | International Lease Finance Corp., 7.125%, 9/1/2018 | | | | 8,000,000 | | | | | 8,133,238 | |
| | | | | | | | | | | | |
| | | | | | | | | | | 13,171,092 | |
| | | | | | | | | | | | |
| | BANKS — 0.8% | | | | | | | | | | |
| | Banks — 0.8% | | | | | | | | | | |
| d | | Capital One NA/Mclean VA, 2.611% (LIBOR 3 Month + 0.82%), 8/8/2022 | | | | 3,000,000 | | | | | 3,004,594 | |
| h | | Citizens Bank N.A./Providence RI, 3.252%, 3/29/2023 | | | | 4,000,000 | | | | | 4,001,760 | |
| | Santander Holdings USA, Inc., 3.40%, 1/18/2023 | | | | 2,000,000 | | | | | 1,953,610 | |
| | | | | | | | | | | | |
| | | | | | | | | | | 8,959,964 | |
| | | | | | | | | | | | |
| | CAPITAL GOODS — 2.5% | | | | | | | | | | |
| | Construction & Engineering — 0.6% | | | | | | | | | | |
| g | | Zachry Holdings, Inc., 7.50%, 2/1/2020 | | | | 6,310,000 | | | | | 6,357,325 | |
| | Machinery — 0.9% | | | | | | | | | | |
| g,j | | ATS Automation Tooling Systems, Inc., 6.50%, 6/15/2023 | | | | 3,125,000 | | | | | 3,265,625 | |
| | Mueller Industries, Inc., 6.00%, 3/1/2027 | | | | 2,132,000 | | | | | 2,129,335 | |
| | Nvent Finance Sarl, | | | | | | | | | | |
| g,j | | 3.95%, 4/15/2023 | | | | 2,000,000 | | | | | 2,005,878 | |
| g,j | | 4.55%, 4/15/2028 | | | | 3,000,000 | | | | | 3,013,839 | |
| | Trading Companies & Distributors — 1.0% | | | | | | | | | | |
| | Global Partners L.P. / GLP Finance Corp., 6.25%, 7/15/2022 | | | | 4,975,000 | | | | | 4,950,125 | |
| | LKQ Corp., 4.75%, 5/15/2023 | | | | 6,045,000 | | | | | 6,014,775 | |
| | | | | | | | | | | | |
| | | | | | | | | | | 27,736,902 | |
| | | | | | | | | | | | |
10 | Semi-Annual Report
Schedule of Investments, Continued
Thornburg Strategic Income Fund | March 31, 2018 (Unaudited)
| | | | | | | | | | |
| | | | | SHARES/
PRINCIPAL AMOUNT | | | VALUE | |
| | COMMERCIAL & PROFESSIONAL SERVICES — 2.0% | | | | | | | | |
| | Commercial Services & Supplies — 1.4% | | | | | | | | |
| g | | ACCO Brands Corp., 5.25%, 12/15/2024 | | $ | 3,000,000 | | | $ | 3,015,000 | |
| g | | Nielsen Finance, LLC / Nielsen Finance Co., 5.00%, 4/15/2022 | | | 7,420,000 | | | | 7,414,212 | |
| g | | ServiceMaster Co., LLC, 5.125%, 11/15/2024 | | | 5,330,000 | | | | 5,156,775 | |
| | Leisure Products — 0.2% | | | | | | | | |
| | Mattel, Inc., 2.35%, 8/15/2021 | | | 3,000,000 | | | | 2,655,030 | |
| | Professional Services — 0.4% | | | | | | | | |
| | Verisk Analytics, Inc., 4.00%, 6/15/2025 | | | 3,920,000 | | | | 3,945,079 | |
| | | | | | | | | | |
| | | | | | | | | 22,186,096 | |
| | | | | | | | | | |
| | | |
| | CONSUMER DURABLES & APPAREL — 1.5% | | | | | | | | |
| | Commercial Services & Supplies — 0.2% | | | | | | | | |
| | RR Donnelley & Sons Co., 7.875%, 3/15/2021 | | | 2,000,000 | | | | 2,074,900 | |
| | Leisure Products — 0.3% | | | | | | | | |
| | Vista Outdoor, Inc., 5.875%, 10/1/2023 | | | 3,530,000 | | | | 3,291,725 | |
| | Textiles, Apparel & Luxury Goods — 1.0% | | | | | | | | |
| g | | Hanesbrands, Inc., 4.625%, 5/15/2024 | | | 5,000,000 | | | | 4,893,750 | |
| g | | Michael Kors USA, Inc., 4.00%, 11/1/2024 | | | 3,000,000 | | | | 3,000,897 | |
| | Under Armour, Inc., 3.25%, 6/15/2026 | | | 3,500,000 | | | | 3,086,252 | |
| | | | | | | | | | |
| | | | | | | | | 16,347,524 | |
| | | | | | | | | | |
| | | |
| | CONSUMER SERVICES — 0.9% | | | | | | | | |
| | Hotels, Restaurants & Leisure — 0.7% | | | | | | | | |
| g | | Aramark International Finance Sarl, 3.125%, 4/1/2025 | | | 500,000 | | | | 638,936 | |
| | Aramark Services, Inc., 4.75%, 6/1/2026 | | | 5,000,000 | | | | 4,837,500 | |
| g | | Nathan’s Famous, Inc., 6.625%, 11/1/2025 | | | 2,500,000 | | | | 2,512,500 | |
| | Transportation Infrastructure — 0.2% | | | | | | | | |
| | Mexico City Airport Trust, | | | | | | | | |
| g,j | | 3.875%, 4/30/2028 | | | 1,000,000 | | | | 917,620 | |
| g,j | | 4.25%, 10/31/2026 | | | 842,000 | | | | 810,425 | |
| | | | | | | | | | |
| | | | | | | | | 9,716,981 | |
| | | | | | | | | | |
| | | |
| | DIVERSIFIED FINANCIALS — 9.3% | | | | | | | | |
| | Capital Markets — 2.6% | | | | | | | | |
| | Ares Capital Corp., 4.875%, 11/30/2018 | | | 9,000,000 | | | | 9,087,992 | |
| g | | Ares Finance Co., LLC, 4.00%, 10/8/2024 | | | 4,025,000 | | | | 3,910,596 | |
| | FS Investment Corp., 4.00%, 7/15/2019 | | | 6,286,000 | | | | 6,317,408 | |
| g | | Genpact Luxembourg Sarl (Guaranty: Genpact Ltd.), 3.70%, 4/1/2022 | | | 3,000,000 | | | | 2,944,034 | |
| | Solar Capital Ltd., 4.50%, 1/20/2023 | | | 3,000,000 | | | | 2,923,013 | |
| | TPG Specialty Lending, Inc., 4.50%, 1/22/2023 | | | 2,500,000 | | | | 2,500,705 | |
| | Consumer Finance — 1.6% | | | | | | | | |
| | Ally Financial, Inc., 4.75%, 9/10/2018 | | | 4,000,000 | | | | 4,030,800 | |
| h | | Citibank N.A., 2.189%, 2/12/2021 | | | 3,000,000 | | | | 2,997,174 | |
| g | | FirstCash, Inc., 5.375%, 6/1/2024 | | | 7,500,000 | | | | 7,619,625 | |
| h | | Wells Fargo Bank N.A., 1.975%, 1/15/2020 | | | 3,000,000 | | | | 2,996,392 | |
| | Diversified Financial Services — 4.3% | | | | | | | | |
| | Bank of America Corp. MTN, 4.20%, 8/26/2024 | | | 3,200,000 | | | | 3,250,162 | |
| d,j | | Barclays plc, 3.333% (LIBOR 3 Month + 1.63%), 1/10/2023 | | | 4,000,000 | | | | 4,098,120 | |
| j | | Barclays PLC, 4.836%, 5/9/2028 | | | 4,000,000 | | | | 3,933,434 | |
| g,j | | BNP Paribas S.A., 3.375%, 1/9/2025 | | | 2,000,000 | | | | 1,934,575 | |
| j | | Credit Suisse Group Funding Guernsey Ltd. (Guaranty: Credit Suisse Group AG), 3.80%, 9/15/2022—6/9/2023 | | | 2,850,000 | | | | 2,867,880 | |
| | Deutsche Bank AG, | | | | | | | | |
| h,j | | 2.56%, 1/22/2021 | | | 2,700,000 | | | | 2,689,300 | |
| d,j | | 3.186% (LIBOR 3 Month + 1.23%), 2/27/2023 | | | 2,800,000 | | | | 2,786,967 | |
| h | | Goldman Sachs Group, Inc., 2.556%, 2/23/2023 | | | 4,000,000 | | | | 3,984,410 | |
| h,j | | Mizuho Financial Group, Inc., 2.815%, 3/5/2023 | | | 6,000,000 | | | | 5,991,600 | |
| d | | Morgan Stanley MTN, 3.145% (LIBOR 3 Month + 1.40%), 4/21/2021 | | | 3,000,000 | | | | 3,077,009 | |
| d | | Morgan Stanley, 2.675% (LIBOR 3 Month + 0.93%), 7/22/2022 | | | 3,000,000 | | | | 3,011,370 | |
| j | | Royal Bank of Scotland Group PLC, 6.125%, 12/15/2022 | | | 2,000,000 | | | | 2,118,626 | |
| g | | TMX Finance, LLC / TitleMax Finance Corp., 8.50%, 9/15/2018 | | | 3,115,000 | | | | 2,967,038 | |
| g,h,j | | UBS Group Funding Switzerland AG) (Guaranty: UBS Group AG), 2.789%, 8/15/2023 | | | 4,000,000 | | | | 4,021,883 | |
Semi-Annual Report | 11
Schedule of Investments, Continued
Thornburg Strategic Income Fund | March 31, 2018 (Unaudited)
| | | | | | | | | | | | |
| | | | | SHARES/
PRINCIPAL AMOUNT | | VALUE |
| | Insurance — 0.2% | | | | | | | | | | |
| d,g | | AIG Global Funding, 2.788% (LIBOR 3 Month + 0.48%), 7/2/2020 | | | $ | 2,000,000 | | | | $ | 2,002,155 | |
| f | | Citicorp Lease Pass-Through Trust 1999-1, 8.04%, 12/15/2019 | | | | 186,087 | | | | | 200,942 | |
| | Mortgage Real Estate Investment Trusts — 0.6% | | | | | | | | | | |
| | Healthcare Trust of America Holdings L.P. (Guaranty: Healthcare Trust of America, Inc.), 2.95%, 7/1/2022 | | | | 3,000,000 | | | | | 2,934,820 | |
| | Senior Housing Properties Trust, 4.75%, 2/15/2028 | | | | 4,000,000 | | | | | 3,919,058 | |
| | | | | | | | | | | | |
| | | | | | | | | | | 101,117,088 | |
| | | | | | | | | | | | |
| | ENERGY — 5.3% | | | | | | | | | | |
| | Energy Equipment & Services — 0.4% | | | | | | | | | | |
| | Enviva Partners L.P. / Enviva Partners Finance Corp., 8.50%, 11/1/2021 | | | | 1,900,000 | | | | | 2,009,250 | |
| | Odebrecht Offshore Drilling Finance Ltd., | | | | | | | | | | |
| g,j | | 6.72%, 12/1/2022 | | | | 639,873 | | | | | 614,278 | |
| g,j | | 7.72%, 12/1/2026 | | | | 1,929,738 | | | | | 559,624 | |
| e,g,j | | Odebrecht Oil & Gas Finance Ltd. (Guaranty: Odebrecht Oleo e Gas S.A.), 4/30/2018 | | | | 304,899 | | | | | 5,946 | |
| c,g,j,k | | Schahin II Finance Co. SPV Ltd., 5.875%, 9/25/2023 | | | | 10,684,600 | | | | | 1,308,863 | |
| | Oil, Gas & Consumable Fuels — 4.9% | | | | | | | | | | |
| g | | Colorado Interstate Gas Co., LLC / Colorado Interstate Issuing Corp., 4.15%, 8/15/2026 | | | | 4,500,000 | | | | | 4,399,407 | |
| d | | Energy Transfer Partners L.P., 4.791% (LIBOR 3 Month + 3.02%), 11/1/2066 | | | | 1,200,000 | | | | | 1,056,000 | |
| g | | Florida Gas Transmission Co., LLC, 3.875%, 7/15/2022 | | | | 4,765,000 | | | | | 4,835,541 | |
| | Gulf South Pipeline Co. L.P., 4.00%, 6/15/2022 | | | | 4,860,000 | | | | | 4,885,254 | |
| g | | Gulfstream Natural Gas System, LLC, 4.60%, 9/15/2025 | | | | 5,000,000 | | | | | 5,239,135 | |
| g,j | | Harvest Operations Corp. (Guaranty: Korea National Oil Corp.), 3.00%, 9/21/2022 | | | | 4,000,000 | | | | | 3,876,936 | |
| | HollyFrontier Corp., 5.875%, 4/1/2026 | | | | 3,500,000 | | | | | 3,766,030 | |
| b,c,f,j,k | | Linc USA GP / Linc Energy Finance USA, Inc., 9.625%, 10/31/2017 | | | | 1,100,236 | | | | | 45,660 | |
| | Marathon Oil Corp., 3.85%, 6/1/2025 | | | | 2,000,000 | | | | | 1,976,179 | |
| | Northern Border Pipeline Co., Series A, 7.50%, 9/15/2021 | | | | 2,150,000 | | | | | 2,374,737 | |
| | Northwest Pipeline, LLC, 4.00%, 4/1/2027 | | | | 2,000,000 | | | | | 1,941,952 | |
| g,j | | QGOG Atlantic / Alaskan Rigs Ltd., 5.25%, 7/30/2019 | | | | 337,500 | | | | | 329,062 | |
| c,k | | RAAM Global Energy Co., 12.50%, 10/1/2015 | | | | 2,000,000 | | | | | 18,140 | |
| g | | Rockies Express Pipeline, LLC, 6.85%, 7/15/2018 | | | | 2,000,000 | | | | | 2,015,200 | |
| g,j | | Sinopec Group Overseas Development 2017 Ltd. (Guaranty: China Petrochemical Corp.), 2.25%, 9/13/2020 | | | | 4,000,000 | | | | | 3,911,220 | |
| | Summit Midstream Holdings, LLC / Summit Midstream Finance Corp., 5.50%, 8/15/2022 | | | | 1,210,000 | | | | | 1,179,750 | |
| e,h | | Summit Midstream Partners LP, Series A, 9.50%, 12/15/2022 | | | | 3,000,000 | | | | | 3,048,750 | |
| | Tennessee Gas Pipeline Co., LLC, 7.00%, 3/15/2027 | | | | 2,251,000 | | | | | 2,643,941 | |
| g | | Texas Gas Transmission, LLC, 4.50%, 2/1/2021 | | | | 940,000 | | | | | 959,143 | |
| | Transcontinental Gas Pipe Line Co., LLC, 7.85%, 2/1/2026 | | | | 3,600,000 | | | | | 4,429,632 | |
| | | | | | | | | | | | |
| | | | | | | | | | | 57,429,630 | |
| | | | | | | | | | | | |
| | FOOD & STAPLES RETAILING — 0.9% | | | | | | | | | | |
| | Food & Staples Retailing — 0.9% | | | | | | | | | | |
| g,j | | Alimentation Couche-Tard, Inc., 2.70%, 7/26/2022 | | | | 2,000,000 | | | | | 1,939,016 | |
| g | | C&S Group Enterprises, LLC, 5.375%, 7/15/2022 | | | | 3,935,000 | | | | | 3,708,226 | |
| | Ingles Markets, Inc., 5.75%, 6/15/2023 | | | | 4,500,000 | | | | | 4,498,650 | |
| | | | | | | | | | | | |
| | | | | | | | | | | 10,145,892 | |
| | | | | | | | | | | | |
| | FOOD, BEVERAGE & TOBACCO — 2.4% | | | | | | | | | | |
| | Beverages — 0.6% | | | | | | | | | | |
| g,j | | Central American Bottling Corp., 5.75%, 1/31/2027 | | | | 5,000,000 | | | | | 5,132,550 | |
| g,j | | Coca-Cola Icecek A/S, 4.215%, 9/19/2024 | | | | 1,000,000 | | | | | 971,564 | |
| | Food Products — 1.2% | | | | | | | | | | |
| | B&G Foods, Inc., 5.25%, 4/1/2025 | | | | 2,000,000 | | | | | 1,863,100 | |
| g,j | | Barry Callebaut Services N.V., 5.50%, 6/15/2023 | | | | 4,000,000 | | | | | 4,270,000 | |
| g,j | | BRF S.A., 4.75%, 5/22/2024 | | | | 4,650,000 | | | | | 4,291,997 | |
| g | | Pilgrim’s Pride Corp., 5.875%, 9/30/2027 | | | | 3,000,000 | | | | | 2,826,900 | |
| | Tobacco — 0.6% | | | | | | | | | | |
| d,g,j | | BAT Capital Corp., 2.423% (LIBOR 3 Month + 0.59%), 8/14/2020 | | | | 2,500,000 | | | | | 2,507,838 | |
| g | | Vector Group Ltd., 6.125%, 2/1/2025 | | | | 4,000,000 | | | | | 4,000,000 | |
| | | | | | | | | | | | |
| | | | | | | | | | | 25,863,949 | |
| | | | | | | | | | | | |
| | HEALTHCARE EQUIPMENT & SERVICES — 2.6% | | | | | | | | | | |
| | Health Care Equipment & Supplies — 0.3% | | | | | | | | | | |
| g | | Hologic, Inc., 4.375%, 10/15/2025 | | | | 3,000,000 | | | | | 2,895,000 | |
12 | Semi-Annual Report
Schedule of Investments, Continued
Thornburg Strategic Income Fund | March 31, 2018 (Unaudited)
| | | | | | | | | | | | |
| | | | | SHARES/
PRINCIPAL AMOUNT | | VALUE |
| | Health Care Providers & Services — 2.3% | | | | | | | | | | |
| | Anthem, Inc., | | | | | | | | | | |
| | 2.50%, 11/21/2020 | | | $ | 2,000,000 | | | | $ | 1,966,111 | |
| | 3.35%, 12/1/2024 | | | | 1,000,000 | | | | | 970,863 | |
| d | | CVS Health Corp., 2.687% (LIBOR 3 Month + 0.63%), 3/9/2020 | | | | 2,000,000 | | | | | 2,007,500 | |
| | DaVita, Inc., | | | | | | | | | | |
| | 5.00%, 5/1/2025 | | | | 3,450,000 | | | | | 3,334,598 | |
| | 5.125%, 7/15/2024 | | | | 1,000,000 | | | | | 976,250 | |
| | HCA, Inc., | | | | | | | | | | |
| | 4.50%, 2/15/2027 | | | | 1,475,000 | | | | | 1,423,375 | |
| | 4.75%, 5/1/2023 | | | | 1,735,000 | | | | | 1,754,519 | |
| | 5.25%, 4/15/2025 | | | | 1,520,000 | | | | | 1,553,744 | |
| | 6.50%, 2/15/2020 | | | | 2,000,000 | | | | | 2,097,500 | |
| | LifePoint Health, Inc., 5.375%, 5/1/2024 | | | | 4,000,000 | | | | | 3,910,000 | |
| | WellCare Health Plans, Inc., 5.25%, 4/1/2025 | | | | 5,000,000 | | | | | 5,018,750 | |
| | | | | | | | | | | | |
| | | | | | | | | | | 27,908,210 | |
| | | | | | | | | | | | |
| | HOUSEHOLD & PERSONAL PRODUCTS — 1.1% | | | | | | | | | | |
| | Household Products — 0.3% | | | | | | | | | | |
| | Central Garden & Pet Co., 5.125%, 2/1/2028 | | | | 2,469,000 | | | | | 2,345,550 | |
| g | | Prestige Brands, Inc., 6.375%, 3/1/2024 | | | | 1,000,000 | | | | | 1,025,000 | |
| | Personal Products — 0.8% | | | | | | | | | | |
| | Edgewell Personal Care Co., 4.70%, 5/19/2021—5/24/2022 | | | | 6,000,000 | | | | | 5,845,000 | |
| g | | First Quality Finance Co., Inc., 5.00%, 7/1/2025 | | | | 3,000,000 | | | | | 2,872,500 | |
| | | | | | | | | | | | |
| | | | | | | | | | | 12,088,050 | |
| | | | | | | | | | | | |
| | INSURANCE — 3.2% | | | | | | | | | | |
| | Insurance — 3.2% | | | | | | | | | | |
| g | | Athene Global Funding, 2.875%, 10/23/2018 | | | | 4,725,000 | | | | | 4,720,680 | |
| g,j | | DaVinciRe Holdings Ltd., 4.75%, 5/1/2025 | | | | 4,790,000 | | | | | 4,735,206 | |
| j | | Enstar Group Ltd., 4.50%, 3/10/2022 | | | | 2,000,000 | | | | | 2,009,011 | |
| d,g | | Jackson National Life Global Co., 3.022% (LIBOR 3 Month + 0.73%), 6/27/2022 | | | | 4,000,000 | | | | | 4,045,480 | |
| | Kemper Corp., 4.35%, 2/15/2025 | | | | 4,290,000 | | | | | 4,293,273 | |
| g,j | | Lancashire Holdings Ltd., 5.70%, 10/1/2022 | | | | 4,900,000 | | | | | 5,083,652 | |
| | Mercury General Corp., 4.40%, 3/15/2027 | | | | 4,000,000 | | | | | 4,001,708 | |
| d,g | | Metropolitan Life Global Funding I, 2.471% (LIBOR 3 Month + 0.40%), 6/12/2020 | | | | 2,000,000 | | | | | 2,008,713 | |
| g | | National Life Insurance Co., 10.50%, 9/15/2039 | | | | 1,000,000 | | | | | 1,620,731 | |
| | Reinsurance Group of America, Inc., 3.95%, 9/15/2026 | | | | 990,000 | | | | | 979,881 | |
| g | | Sammons Financial Group, Inc., 4.45%, 5/12/2027 | | | | 2,000,000 | | | | | 1,986,036 | |
| | | | | | | | | | | | |
| | | | | | | | | | | 35,484,371 | |
| | | | | | | | | | | | |
| | MATERIALS — 4.0% | | | | | | | | | | |
| | Chemicals — 2.3% | | | | | | | | | | |
| d,g | | Chevron Phillips Chemical Co., LLC, 2.523% (LIBOR 3 Month + 0.75%), 5/1/2020 | | | | 4,000,000 | | | | | 4,024,081 | |
| g,j | | Consolidated Energy Finance S.A., 6.75%, 10/15/2019 | | | | 5,194,000 | | | | | 5,252,433 | |
| g,j | | Kissner Holdings L.P. / Kissner Milling Co. Ltd. / BSC Holding, Inc. / Kissner USA, 8.375%, 12/1/2022 | | | | 4,170,000 | | | | | 4,253,400 | |
| | NOVA Chemicals Corp., | | | | | | | | | | |
| g,j | | 4.875%, 6/1/2024 | | | | 1,500,000 | | | | | 1,436,250 | |
| g,j | | 5.25%, 6/1/2027 | | | | 4,000,000 | | | | | 3,800,000 | |
| g,j | | OCP S.A., 5.625%, 4/25/2024 | | | | 4,710,000 | | | | | 4,969,050 | |
| | Valvoline, Inc., 4.375%, 8/15/2025 | | | | 1,000,000 | | | | | 971,250 | |
| | Containers & Packaging — 0.8% | | | | | | | | | | |
| | Ball Corp., | | | | | | | | | | |
| | 4.375%, 12/15/2020 | | | | 2,000,000 | | | | | 2,032,500 | |
| | 4.875%, 3/15/2026 | | | | 1,500,000 | | | | | 1,503,900 | |
| | Graphic Packaging International, LLC, 4.125%, 8/15/2024 | | | | 3,225,000 | | | | | 3,168,562 | |
| | Silgan Holdings, Inc., 4.75%, 3/15/2025 | | | | 2,000,000 | | | | | 1,940,000 | |
| | Metals & Mining — 0.3% | | | | | | | | | | |
| g | | International Wire Group, Inc., 10.75%, 8/1/2021 | | | | 3,200,000 | | | | | 3,024,000 | |
| | Paper & Forest Products — 0.6% | | | | | | | | | | |
| g | | Neenah, Inc., 5.25%, 5/15/2021 | | | | 7,075,000 | | | | | 7,181,125 | |
| | | | | | | | | | | | |
| | | | | | | | | | | 43,556,551 | |
| | | | | | | | | | | | |
Semi-Annual Report | 13
Schedule of Investments, Continued
Thornburg Strategic Income Fund | March 31, 2018 (Unaudited)
| | | | | | | | | | | | |
| | | | | SHARES/
PRINCIPAL AMOUNT | | VALUE |
| | MEDIA — 2.6% | | | | | | | | | | |
| | Media — 2.6% | | | | | | | | | | |
| | Altice France S.A., | | | | | | | | | | |
| g,j | | 6.00%, 5/15/2022 | | | $ | 1,500,000 | | | | $ | 1,466,220 | |
| g,j | | 7.375%, 5/1/2026 | | | | 1,005,000 | | | | | 957,263 | |
| g | | Cable One, Inc., 5.75%, 6/15/2022 | | | | 5,000,000 | | | | | 5,100,000 | |
| g | | Cox Communications, Inc., 3.15%, 8/15/2024 | | | | 1,950,000 | | | | | 1,870,082 | |
| | CSC Holdings, LLC, | | | | | | | | | | |
| g | | 5.375%, 2/1/2028 | | | | 2,000,000 | | | | | 1,889,180 | |
| g | | 5.50%, 4/15/2027 | | | | 1,825,000 | | | | | 1,747,437 | |
| | Live Nation Entertainment, Inc. 5.625%, 3/15/2026 | | | | 1,000,000 | | | | | 1,012,500 | |
| b,l | | Mood Media Borrower, LLC / Mood Media Co-Issuer, Inc., 14.00%, 7/1/2024 | | | | 2,081,333 | | | | | 2,070,926 | |
| g | | Sirius XM Radio, Inc., 3.875%, 8/1/2022 | | | | 5,000,000 | | | | | 4,790,000 | |
| g,j | | Telenet Finance Luxembourg Notes Sarl, 5.50%, 3/1/2028 | | | | 4,000,000 | | | | | 3,825,000 | |
| g,j | | Virgin Media Secured Finance plc, 5.50%, 8/15/2026 | | | | 4,000,000 | | | | | 3,887,480 | |
| | | | | | | | | | | | |
| | | | | | | | | | | 28,616,088 | |
| | | | | | | | | | | | |
| | PHARMACEUTICALS, BIOTECHNOLOGY & LIFE SCIENCES — 0.0% | | | | | | | | | | |
| | Pharmaceuticals — 0.0% | | | | | | | | | | |
| a,b,c,k | | Atlas U.S. Royalty, LLC Participation Rights, 3/15/2027 | | | | 5,450,000 | | | | | 0 | |
| | | | | | | | | | | | |
| | | | | | | | | | | 0 | |
| | | | | | | | | | | | |
| | REAL ESTATE — 1.1% | | | | | | | | | | |
| | Equity Real Estate Investment Trusts — 1.1% | | | | | | | | | | |
| | Crown Castle International Corp., 3.20%, 9/1/2024 | | | | 1,000,000 | | | | | 958,792 | |
| | EPR Properties, 5.25%, 7/15/2023 | | | | 5,000,000 | | | | | 5,227,073 | |
| | Hospitality Properties Trust, 4.95%, 2/15/2027 | | | | 2,850,000 | | | | | 2,898,761 | |
| g | | Iron Mountain, Inc., 5.25%, 3/15/2028 | | | | 2,000,000 | | | | | 1,882,500 | |
| | Retail Opportunity Investments Partnership L.P. (Guaranty: Retail Opportunity Investments Corp.), 5.00%, 12/15/2023 | | | | 1,500,000 | | | | | 1,527,291 | |
| | | | | | | | | | | | |
| | | | | | | | | | | 12,494,417 | |
| | | | | | | | | | | | |
| | RETAILING — 0.6% | | | | | | | | | | |
| | Internet & Direct Marketing Retail — 0.6% | | | | | | | | | | |
| | Amazon.com, Inc., 5.20%, 12/3/2025 | | | | 2,830,000 | | | | | 3,153,918 | |
| | Booking Holdings, Inc., 2.75%, 3/15/2023 | | | | 2,000,000 | | | | | 1,930,042 | |
| | Zillow Group, Inc., 2.00%, 12/1/2021 | | | | 1,000,000 | | | | | 1,208,631 | |
| | | | | | | | | | | | |
| | | | | | | | | | | 6,292,591 | |
| | | | | | | | | | | | |
| | SEMICONDUCTORS & SEMICONDUCTOR EQUIPMENT — 0.6% | | | | | | | | | | |
| | Semiconductors & Semiconductor Equipment — 0.6% | | | | | | | | | | |
| | Broadcom Corp. / Broadcom Cayman Finance Ltd., | | | | | | | | | | |
| | 2.375%, 1/15/2020 | | | | 1,000,000 | | | | | 986,047 | |
| | 3.00%, 1/15/2022 | | | | 1,000,000 | | | | | 981,246 | |
| | 3.625%, 1/15/2024 | | | | 1,000,000 | | | | | 983,730 | |
| g | | Sensata Technologies B.V., 5.00%, 10/1/2025 | | | | 3,530,000 | | | | | 3,477,050 | |
| | | | | | | | | | | | |
| | | | | | | | | | | 6,428,073 | |
| | | | | | | | | | | | |
| | SOFTWARE & SERVICES — 3.6% | | | | | | | | | | |
| | Information Technology Services — 1.3% | | | | | | | | | | |
| g | | Alliance Data Systems Corp., 5.375%, 8/1/2022 | | | | 4,190,000 | | | | | 4,190,000 | |
| | American Express Co., | | | | | | | | | | |
| | 3.00%, 10/30/2024 | | | | 1,500,000 | | | | | 1,440,235 | |
| | 3.40%, 2/27/2023 | | | | 1,200,000 | | | | | 1,195,952 | |
| | S&P Global, Inc. (Guaranty: Standard & Poor’s Financial Services, LLC), | | | | | | | | | | |
| | 3.30%, 8/14/2020 | | | | 1,975,000 | | | | | 1,986,071 | |
| | 4.00%, 6/15/2025 | | | | 1,590,000 | | | | | 1,624,476 | |
| h | | Western Union Co., 2.704% (LIBOR 3 Month + 0.80%), 5/22/2019 | | | | 3,500,000 | | | | | 3,510,896 | |
| | Internet Software & Services — 0.3% | | | | | | | | | | |
| j | | Baidu, Inc., 3.875%, 9/29/2023 | | | | 3,800,000 | | | | | 3,797,423 | |
| | Software — 2.0% | | | | | | | | | | |
| | Autodesk, Inc., 3.125%, 6/15/2020 | | | | 2,350,000 | | | | | 2,352,373 | |
| | Citrix Systems, Inc., 4.50%, 12/1/2027 | | | | 3,000,000 | | | | | 2,980,247 | |
| | Dun & Bradstreet, Inc., 4.25%, 6/15/2020 | | | | 4,185,000 | | | | | 4,232,793 | |
14 | Semi-Annual Report
Schedule of Investments, Continued
Thornburg Strategic Income Fund | March 31, 2018 (Unaudited)
| | | | | | | | | | | | |
| | | | | SHARES/
PRINCIPAL AMOUNT | | VALUE |
| g | | j2 Cloud Services, LLC / j2 Global Co-Obligor, Inc., 6.00%, 7/15/2025 | | | $ | 2,000,000 | | | | $ | 2,047,500 | |
| | MSCI, Inc., | | | | | | | | | | |
| g | | 5.25%, 11/15/2024 | | | | 2,625,000 | | | | | 2,680,125 | |
| g | | 5.75%, 8/15/2025 | | | | 2,000,000 | | | | | 2,089,400 | |
| g,j | | Open Text Corp., 5.875%, 6/1/2026 | | | | 3,320,000 | | | | | 3,414,454 | |
| | VMware, Inc., 2.30%, 8/21/2020 | | | | 2,000,000 | | | | | 1,945,324 | |
| | | | | | | | | | | | |
| | | | | | | | | | | 39,487,269 | |
| | | | | | | | | | | | |
| | | |
| | TECHNOLOGY HARDWARE & EQUIPMENT — 2.9% | | | | | | | | | | |
| | Communications Equipment — 1.0% | | | | | | | | | | |
| | Anixter, Inc. (Guaranty: Anixter International, Inc.), 5.125%, 10/1/2021 | | | | 6,395,000 | | | | | 6,554,875 | |
| | Motorola Solutions, Inc., 4.60%, 2/23/2028 | | | | 1,429,000 | | | | | 1,438,421 | |
| j | | Telefonaktiebolaget LM Ericsson, 4.125%, 5/15/2022 | | | | 3,490,000 | | | | | 3,464,939 | |
| | Electronic Equipment, Instruments & Components — 1.2% | | | | | | | | | | |
| | Ingram Micro, Inc., 5.45%, 12/15/2024 | | | | 1,951,000 | | | | | 1,888,781 | |
| | Tech Data Corp., 4.95%, 2/15/2027 | | | | 4,000,000 | | | | | 4,009,968 | |
| | Trimble, Inc., 4.75%, 12/1/2024 | | | | 6,525,000 | | | | | 6,796,195 | |
| | Office Electronics — 0.7% | | | | | | | | | | |
| | CDW, LLC / CDW Finance Corp., 5.00%, 9/1/2025 | | | | 2,000,000 | | | | | 1,990,000 | |
| | Lexmark International, Inc., 7.125%, 3/15/2020 | | | | 1,797,000 | | | | | 1,366,349 | |
| | Pitney Bowes, Inc., | | | | | | | | | | |
| | 4.125%, 5/15/2022 | | | | 1,000,000 | | | | | 945,000 | |
| | 4.70%, 4/1/2023 | | | | 4,000,000 | | | | | 3,750,000 | |
| | | | | | | | | | | | |
| | | | | | | | | | | 32,204,528 | |
| | | | | | | | | | | | |
| | | |
| | TELECOMMUNICATION SERVICES — 3.9% | | | | | | | | | | |
| | Diversified Telecommunication Services — 2.0% | | | | | | | | | | |
| | AT&T, Inc., 3.90%, 3/11/2024 | | | | 2,395,000 | | | | | 2,412,189 | |
| g,j | | Digicel Ltd., 6.00%, 4/15/2021 | | | | 5,750,000 | | | | | 5,397,813 | |
| | Qwest Corp., 6.75%, 12/1/2021 | | | | 3,700,000 | | | | | 3,966,725 | |
| g | | Unison Ground Lease Funding, LLC, 5.78%, 3/15/2043 | | | | 1,920,000 | | | | | 1,923,384 | |
| d | | Verizon Communications, Inc., 3.145% (LIBOR 3 Month + 1.00%), 3/16/2022 | | | | 2,500,000 | | | | | 2,547,785 | |
| g,j | | Videotron Ltd., 5.375%, 6/15/2024 | | | | 6,000,000 | | | | | 6,195,000 | |
| | Wireless Telecommunication Services — 1.9% | | | | | | | | | | |
| j | | America Movil SAB de C.V., 6.45%, 12/5/2022 | | | | 120,000,000 | | | | | 6,097,426 | |
| | MTN Mauritius Investment Ltd., | | | | | | | | | | |
| g,j | | 4.755%, 11/11/2024 | | | | 4,125,000 | | | | | 3,954,844 | |
| g,j | | 5.373%, 2/13/2022 | | | | 3,450,000 | | | | | 3,480,187 | |
| | WCP Issuer, LLC, | | | | | | | | | | |
| f | | 6.657%, 8/15/2043 | | | | 386,000 | | | | | 406,523 | |
| f | | 7.143%, 8/15/2043 | | | | 6,000,000 | | | | | 6,372,360 | |
| | | | | | | | | | | | |
| | | | | | | | | | | 42,754,236 | |
| | | | | | | | | | | | |
| | | |
| | TRANSPORTATION — 2.8% | | | | | | | | | | |
| | Airlines — 2.1% | | | | | | | | | | |
| | American Airlines 2013-2 Class A Pass Through Trust, 4.95%, 7/15/2024 | | | | 2,093,661 | | | | | 2,177,407 | |
| g | | American Airlines Pass Through Trust, Series 2013-2 Class B, 5.60%, 1/15/2022 | | | | 10,151,786 | | | | | 10,403,453 | |
| | Continental Airlines Pass Through Trust Series ERJ1, Series 2005-ERJ1, 9.798%, 10/1/2022 | | | | 3,173,153 | | | | | 3,367,508 | |
| g,j | | Guanay Finance Ltd., 6.00%, 12/15/2020 | | | | 3,491,585 | | | | | 3,562,617 | |
| | US Airways Pass Through Trust, | | | | | | | | | | |
| | Series 2010-1 Class A, 6.25%, 10/22/2024 | | | | 1,160,732 | | | | | 1,251,734 | |
| | Series 2012-1 Class A, 5.90%, 4/1/2026 | | | | 1,453,715 | | | | | 1,570,012 | |
| | US Airways Pass Through Trust, (MBIA Insurance Corp), Series 2001-1G, 7.076%, 9/20/2022 | | | | 613,848 | | | | | 652,597 | |
| | Diversified Consumer Services — 0.7% | | | | | | | | | | |
| | Graham Holdings Co., 7.25%, 2/1/2019 | | | | 2,100,000 | | | | | 2,161,950 | |
| g | | Laureate Education, Inc., 8.25%, 5/1/2025 | | | | 5,000,000 | | | | | 5,362,500 | |
| | | | | | | | | | | | |
| | | | | | | | | | | 30,509,778 | |
| | | | | | | | | | | | |
| | | |
| | UTILITIES — 3.3% | | | | | | | | | | |
| | Electric Utilities — 2.8% | | | | | | | | | | |
| | Avangrid, Inc., 3.15%, 12/1/2024 | | | | 3,000,000 | | | | | 2,912,428 | |
| | CMS Energy Corp., 8.75%, 6/15/2019 | | | | 667,000 | | | | | 709,576 | |
| g | | Duquesne Light Holdings, Inc., 6.40%, 9/15/2020 | | | | 2,000,000 | | | | | 2,140,123 | |
Semi-Annual Report | 15
Schedule of Investments, Continued
Thornburg Strategic Income Fund | March 31, 2018 (Unaudited)
| | | | | | | | | | | | |
| | | | | SHARES/
PRINCIPAL AMOUNT | | VALUE |
| g,j,m | | Enel Finance International N.V. (Guaranty: Enel S.p.A), 2.75%, 4/6/2023 | | | $ | 3,000,000 | | | | $ | 2,899,014 | |
| | Entergy Texas, Inc., 3.45%, 12/1/2027 | | | | 3,000,000 | | | | | 2,933,451 | |
| g | | Jersey Central Power & Light Co., 4.30%, 1/15/2026 | | | | 3,965,000 | | | | | 4,080,924 | |
| g | | Midland Cogeneration Venture L.P., 6.00%, 3/15/2025 | | | | 1,351,798 | | | | | 1,392,127 | |
| | PNM Resources, Inc., 3.25%, 3/9/2021 | | | | 2,000,000 | | | | | 1,997,938 | |
| | Puget Energy, Inc., | | | | | | | | | | |
| | 5.625%, 7/15/2022 | | | | 2,500,000 | | | | | 2,687,187 | |
| | 6.50%, 12/15/2020 | | | | 2,000,000 | | | | | 2,157,321 | |
| h | | Sempra Energy, 1.959% (LIBOR 3 Month + 0.25%), 7/15/2019 | | | | 3,000,000 | | | | | 3,000,108 | |
| g,j | | State Grid Overseas Investment (2014) Ltd. (Guaranty: State Grid Corp. of China), 2.75%, 5/7/2019 | | | | 4,000,000 | | | | | 3,991,649 | |
| | Gas Utilities — 0.5% | | | | | | | | | | |
| | NGL Energy Partners L.P. / NGL Energy Finance Corp., 6.875%, 10/15/2021 | | | | 3,000,000 | | | | | 2,992,500 | |
| g,j | | Rockpoint Gas Storage Canada Ltd., 7.00%, 3/31/2023 | | | | 2,000,000 | | | | | 1,997,500 | |
| | | | | | | | | | | | |
| | | | | | | | | | | 35,891,846 | |
| | | | | | | | | | | | |
| | TOTAL CORPORATE BONDS (Cost $658,482,060) | | | | | | | | | 646,391,126 | |
| | | | | | | | | | | | |
| | | |
| | CONVERTIBLE BONDS — 2.2% | | | | | | | | | | |
| | | |
| | DIVERSIFIED FINANCIALS — 0.7% | | | | | | | | | | |
| | Consumer Finance — 0.7% | | | | | | | | | | |
| | EZCORP, Inc., 2.125%, 6/15/2019 | | | | 7,404,000 | | | | | 7,784,603 | |
| | | | | | | | | | | | |
| | | | | | | | | | | 7,784,603 | |
| | | | | | | | | | | | |
| | | |
| | FOOD, BEVERAGE & TOBACCO — 0.2% | | | | | | | | | | |
| | Tobacco — 0.2% | | | | | | | | | | |
| h | | Vector Group Ltd., 1.75%, 4/15/2020 | | | | 2,260,000 | | | | | 2,479,534 | |
| | | | | | | | | | | | |
| | | | | | | | | | | 2,479,534 | |
| | | | | | | | | | | | |
| | | |
| | MEDIA — 0.9% | | | | | | | | | | |
| | Media — 0.9% | | | | | | | | | | |
| a | | Comcast Holdings Corp. (Guaranty: Comcast Corp.), 2.00%, 10/15/2029 | | | | 18,000,000 | | | | | 9,900,000 | |
| | | | | | | | | | | | |
| | | | | | | | | | | 9,900,000 | |
| | | | | | | | | | | | |
| | | |
| | REAL ESTATE — 0.4% | | | | | | | | | | |
| | Equity Real Estate Investment Trusts — 0.4% | | | | | | | | | | |
| | VEREIT, Inc., 3.00%, 8/1/2018 | | | | 3,890,000 | | | | | 3,890,000 | |
| | | | | | | | | | | | |
| | | | | | | | | | | 3,890,000 | |
| | | | | | | | | | | | |
| | TOTAL CONVERTIBLE BONDS (Cost $22,392,878) | | | | | | | | | 24,054,137 | |
| | | | | | | | | | | | |
| | | |
| | MUNICIPAL BONDS — 0.6% | | | | | | | | | | |
| | California Health Facilities Financing Authority, 7.875%, 2/1/2026 | | | | 1,940,000 | | | | | 2,150,761 | |
| | City of Chicago IL GO, Series B, 7.045%, 1/1/2029 | | | | 3,000,000 | | | | | 3,234,930 | |
| a | | Oklahoma Development Finance Authority, 8.00%, 5/1/2020 | | | | 340,000 | | | | | 343,465 | |
| | San Bernardino County Redevelopment Agency Successor Agency, 8.45%, 9/1/2030 | | | | 1,000,000 | | | | | 1,098,000 | |
| | | | | | | | | | | | |
| | TOTAL MUNICIPAL BONDS (Cost $6,248,539) | | | | | | | | | 6,827,156 | |
| | | | | | | | | | | | |
| | | |
| | OTHER GOVERNMENT — 0.7% | | | | | | | | | | |
| | Mexican Bonos, Series M, 4.75%, 6/14/2018 | | | | 77,700,000 | | | | | 4,244,224 | |
| d,g,j | | Seven & Seven Ltd. (Guaranty: Export-Import Bank of Korea), 3.259% (LIBOR 6 Month + 1.00%), 9/11/2019 | | | | 3,300,000 | | | | | 3,281,940 | |
| | | | | | | | | | | | |
| | TOTAL OTHER GOVERNMENT (Cost $8,582,683) | | | | | | | | | 7,526,164 | |
| | | | | | | | | | | | |
| | | |
| | MORTGAGE BACKED — 0.8% | | | | | | | | | | |
| h,n | | Federal Home Loan Mtg Corp. Multifamily Structured Pass Through Certificates IO, Series KIR1 Class X, 1.085%, 3/25/2026 | | | | 37,041,705 | | | | | 2,485,554 | |
| | Federal Home Loan Mtg Corp., Seasoned Credit Risk Transfer, Series 2017-4 Class HT, 2.25%, 6/25/2057 | | | | 1,913,766 | | | | | 1,868,221 | |
| | Federal Home Loan Mtg Corp., Whole Loan Securities, Series 2017-SC02 Class 2A1, 3.50%, 5/25/2047 | | | | 776,051 | | | | | 781,128 | |
| | Federal National Mtg Assoc. CMO REMIC, Series 1994-37 Class L, 6.50%, 3/25/2024 | | | | 1,727 | | | | | 1,831 | |
| | Federal National Mtg Assoc., Pool AS9733, 4.00%, 6/1/2047 | | | | 2,854,410 | | | | | 2,954,984 | |
| b,f | | Reilly 1997 A Mtg 1, 6.896%, 7/1/2020 | | | | 145,047 | | | | | 145,047 | |
| | | | | | | | | | | | |
| | TOTAL MORTGAGE BACKED (Cost $8,352,762) | | | | | | | | | 8,236,765 | |
| | | | | | | | | | | | |
16 | Semi-Annual Report
Schedule of Investments, Continued
Thornburg Strategic Income Fund | March 31, 2018 (Unaudited)
| | | | | | | | | | | | |
| | | | | SHARES/
PRINCIPAL AMOUNT | | VALUE |
| | | |
| | LOAN PARTICIPATIONS — 5.1% | | | | | | | | | | |
| | COMMERCIAL & PROFESSIONAL SERVICES — 0.6% | | | | | | | | | | |
| | Professional Services — 0.6% | | | | | | | | | | |
| o | | Harland Clarke Holdings Corp., 7.052% (LIBOR 3 Month + 4.75%), 11/3/2023 | | | $ | 3,777,844 | | | | $ | 3,807,236 | |
| | RGIS Services, LLC | | | | | | | | | | |
| o | | 9.343% (LIBOR 1 Month + 7.50%), 3/31/2023 | | | | 1,151,894 | | | | | 1,062,622 | |
| o | | 9.377% (LIBOR 1 Month + 7.50%), 3/31/2023 | | | | 1,500,627 | | | | | 1,384,328 | |
| o | | 9.953% (LIBOR 1 Month + 7.50%), 3/31/2023 | | | | 264,893 | | | | | 244,364 | |
| | | | | | | | | | | | |
| | | | | | | | | | | 6,498,550 | |
| | | | | | | | | | | | |
| | CONSUMER SERVICES — 0.3% | | | | | | | | | | |
| | Hotels, Restaurants & Leisure — 0.3% | | | | | | | | | | |
| o | | Hanjin International Corp., 4.234% (LIBOR 3 Month + 2.50%), 9/20/2020 | | | | 3,500,000 | | | | | 3,510,955 | |
| | | | | | | | | | | | |
| | | | | | | | | | | 3,510,955 | |
| | | | | | | | | | | | |
| | DIVERSIFIED FINANCIALS — 0.5% | | | | | | | | | | |
| | Diversified Financial Services — 0.5% | | | | | | | | | | |
| o | | Stena International Sarl, 5.31% (LIBOR 3 Month + 3.00%), 3/3/2021 | | | | 5,155,200 | | | | | 4,932,908 | |
| | | | | | | | | | | | |
| | | | | | | | | | | 4,932,908 | |
| | | | | | | | | | | | |
| | ENERGY — 0.4% | | | | | | | | | | |
| | Oil, Gas & Consumable Fuels — 0.4% | | | | | | | | | | |
| o | | Citgo Petroleum Corporation, 5.195% (LIBOR 3 Month + 3.50%), 7/29/2021 | | | | 4,500,000 | | | | | 4,503,735 | |
| b,l | | Malamute Energy, Inc., 1.50%, 11/22/2022 | | | | 14,534 | | | | | 14,534 | |
| | | | | | | | | | | | |
| | | | | | | | | | | 4,518,269 | |
| | | | | | | | | | | | |
| | FOOD, BEVERAGE & TOBACCO — 0.1% | | | | | | | | | | |
| | Food Products — 0.1% | | | | | | | | | | |
| i | | Wells Enterprises, Inc., 3/21/2025 | | | | 1,000,000 | | | | | 1,010,000 | |
| | | | | | | | | | | | |
| | | | | | | | | | | 1,010,000 | |
| | | | | | | | | | | | |
| | HEALTHCARE EQUIPMENT & SERVICES — 0.3% | | | | | | | | | | |
| | Health Care Providers & Services — 0.3% | | | | | | | | | | |
| o | | Prospect Medical Holdings, Inc., 7.188% (LIBOR 1 Month + 5.50%), 2/22/2024 | | | | 3,644,500 | | | | | 3,644,500 | |
| | | | | | | | | | | | |
| | | | | | | | | | | 3,644,500 | |
| | | | | | | | | | | | |
| | HOUSEHOLD & PERSONAL PRODUCTS — 0.2% | | | | | | | | | | |
| | Household Products — 0.2% | | | | | | | | | | |
| o | | Energizer Holdings, Inc., 3.688% (LIBOR 1 Month + 2.00%), 6/30/2022 | | | | 2,474,619 | | | | | 2,476,673 | |
| | | | | | | | | | | | |
| | | | | | | | | | | 2,476,673 | |
| | | | | | | | | | | | |
| | MATERIALS — 0.3% | | | | | | | | | | |
| | Containers & Packaging — 0.3% | | | | | | | | | | |
| i | | Crown Holdings, Inc., 1/18/2025 - 1/29/2025 | | | | 2,500,000 | | | | | 2,751,025 | |
| | | | | | | | | | | | |
| | | | | | | | | | | 2,751,025 | |
| | | | | | | | | | | | |
| | MEDIA — 0.7% | | | | | | | | | | |
| | Media — 0.7% | | | | | | | | | | |
| o | | ABG Intermediate Holdings, 10.052% (LIBOR 3 Month + 7.75%), 9/29/2025 | | | | 3,000,000 | | | | | 3,033,750 | |
| i | | Lamar Media Corporation, 2/16/2025 | | | | 5,000,000 | | | | | 5,006,250 | |
| | | | | | | | | | | | |
| | | | | | | | | | | 8,040,000 | |
| | | | | | | | | | | | |
| | REAL ESTATE — 0.0% | | | | | | | | | | |
| | Real Estate Management & Development — 0.0% | | | | | | | | | | |
| o | | DTZ US Borrower, LLC, 10.022% (LIBOR 3 Month + 8.25%), 11/4/2022 | | | | 318,298 | | | | | 317,502 | |
| | | | | | | | | | | | |
| | | | | | | | | | | 317,502 | |
| | | | | | | | | | | | |
Semi-Annual Report | 17
Schedule of Investments, Continued
Thornburg Strategic Income Fund | March 31, 2018 (Unaudited)
| | | | | | | | | | | | |
| | | | | SHARES/
PRINCIPAL AMOUNT | | VALUE |
| | RETAILING — 0.1% | | | | | | | | | | |
| | Specialty Retail — 0.1% | | | | | | | | | | |
| | Office Depot, Inc. | | | | | | | | | | |
| o | | 8.594% (LIBOR 1 Month + 7.00%), 11/8/2022 | | | $ | 250,000 | | | | $ | 254,063 | |
| o | | 8.711% (LIBOR 1 Month + 7.00%), 11/8/2022 | | | | 1,100,000 | | | | | 1,117,875 | |
| o | | 9.125% (LIBOR 1 Month + 7.00%), 11/8/2022 | | | | 112,500 | | | | | 114,328 | |
| | | | | | | | | | | | |
| | | | | | | | | | | 1,486,266 | |
| | | | | | | | | | | | |
| | | |
| | SOFTWARE & SERVICES — 0.6% | | | | | | | | | | |
| | Information Technology Services — 0.4% | | | | | | | | | | |
| o | | Cypress Intermediate Holdings III, Inc., 8.627% (LIBOR 1 Month + 6.75%), 4/27/2025 | | | | 1,000,000 | | | | | 1,014,500 | |
| o | | NeuStar, Inc., 4.802% (LIBOR 3 Month + 2.50%), 1/8/2020 | | | | 651,416 | | | | | 653,454 | |
| o | | VeriFone Inc., 3.88% (LIBOR 1 Month + 2.00%), 1/31/2025 | | | | 3,000,000 | | | | | 3,001,260 | |
| | Internet Software & Services — 0.2% | | | | | | | | | | |
| o | | CareerBuilder, LLC, 9.052% (LIBOR 3 Month + 6.75%), 7/26/2023 | | | | 1,950,000 | | | | | 1,940,250 | |
| | | | | | | | | | | | |
| | | | | | | | | | | 6,609,464 | |
| | | | | | | | | | | | |
| | | |
| | TELECOMMUNICATION SERVICES — 0.5% | | | | | | | | | | |
| | Diversified Telecommunication Services — 0.5% | | | | | | | | | | |
| o | | Colorado Buyer Inc, 9.03% (LIBOR 3 Month + 7.25%), 5/1/2025 | | | | 3,000,000 | | | | | 2,998,140 | |
| o | | Intelsat Jackson Holdings S.A., 6.456% (LIBOR 3 Month + 4.50%), 1/14/2024 | | | | 2,000,000 | | | | | 2,051,420 | |
| | | | | | | | | | | | |
| | | | | | | | | | | 5,049,560 | |
| | | | | | | | | | | | |
| | | |
| | TRANSPORTATION — 0.5% | | | | | | | | | | |
| | Airlines — 0.1% | | | | | | | | | | |
| a,b,c,k | | OS Two, LLC, 12.00%, 12/15/2020 | | | | 654,564 | | | | | 330,555 | |
| | Road & Rail — 0.4% | | | | | | | | | | |
| o | | Avolon TLB Borrower 1 (Luxembourg) S.a.r.l., 4.072% (LIBOR 1 Month + 2.25%), 4/3/2022 | | | | 4,471,225 | | | | | 4,472,611 | |
| | | | | | | | | | | | |
| | | | | | | | | | | 4,803,166 | |
| | | | | | | | | | | | |
| | TOTAL LOAN PARTICIPATIONS (Cost $55,670,937) | | | | | | | | | 55,648,838 | |
| | | | | | | | | | | | |
| | | |
| | SHORT-TERM INVESTMENTS — 11.6% | | | | | | | | | | |
| p | | Thornburg Capital Management Fund | | | | 12,689,310 | | | | | 126,893,099 | |
| | | | | | | | | | | | |
| | TOTAL SHORT-TERM INVESTMENTS (Cost $126,893,099) | | | | | | | | | 126,893,099 | |
| | | | | | | | | | | | |
| | | |
| | TOTAL INVESTMENTS — 99.9% (Cost $1,104,040,899) | | | | | | | | $ | 1,091,734,723 | |
| | | |
| | OTHER ASSETS LESS LIABILITIES — 0.1% | | | | | | | | | 1,505,289 | |
| | | | | | | | | | | | |
| | | |
| | NET ASSETS — 100.0% | | | | | | | | $ | 1,093,240,012 | |
| | | | | | | | | | | | |
| | | | | | | | | | | | | | | | | | | | | | | | | | | | | | | | | | | |
| OUTSTANDING FORWARD CURRENCY CONTRACTS TO BUY OR SELL AT MARCH 31, 2018 |
| | | | | | | |
CONTRACT
DESCRIPTION | | CONTRACT
PARTY* | | BUY/SELL | | CONTRACT
AMOUNT | | CONTRACT
VALUE DATE | | VALUE
USD | | UNREALIZED
APPRECIATION | | UNREALIZED
DEPRECIATION |
| | | | | | | |
Euro | | | | SSB | | | | | Sell | | | | | 1,463,800 | | | | | 6/21/2018 | | | | | 1,811,520 | | | | $ | 3,759 | | | | $ | – | |
| | | | | | | | | | | | | | | | | | | | | | | | | | | | | | |
Net unrealized appreciation/depreciation | | | | | | | | | | | | | | | | | | | | | | | | | | | | $ | 3,759 | | | | | | |
| | | | | | | | | | | | | | | | | | | | | | | | | | | | | | | | | | | |
| * | Counterparty includes State Street Bank and Trust Company (“SSB”). |
Footnote Legend
| b | Security currently fair valued by the Valuation and Pricing Committee using procedures approved by the Trustees’ Audit Committee. |
| d | Floating Rate Security. Stated interest/floor rate was in effect at March 31, 2018. |
| e | Securities are perpetual and, thus, do not have a predetermined maturity date. The date shown, if applicable, reflects the next call date. |
18 | Semi-Annual Report
Schedule of Investments, Continued
Thornburg Strategic Income Fund | March 31, 2018 (Unaudited)
| f | Securities exempt from registration under Rule 144A of the Securities Act of 1933, as amended. These securities are restricted and illiquid. As of March 31, 2018, the aggregate value of these securities in the Fund’s portfolio was $14,430,899, representing 1.32% of the Fund’s net assets. Additional information is as follows: |
| | | | | | | | | | | | | | | | | | | | |
144A/RESTRICTED & ILLIQUID SECURITIES | | ACQUISITION
DATE | | COST | | MARKET
VALUE | | PERCENTAGE OF
NET ASSETS |
Centaur Funding Corp., 9.08%, 4/21/2020 | | 1/22/2014 | | | $ | 2,908,487 | | | | $ | 2,677,491 | | | | | 0.2 | % |
Citicorp Lease Pass-Through Trust 1999-1, 8.04%, 12/15/2019 | | 12/31/2008 | | | | 180,437 | | | | | 200,942 | | | | | 0.0 | |
Linc USA GP / Linc Energy Finance USA, Inc., 9.625%, 10/31/2017 | | 8/08/2014 | | | | 1,100,236 | | | | | 45,660 | | | | | 0.0 | |
WCP Issuer, LLC, 6.657%, 8/15/2043 | | 6/23/2016 | | | | 356,754 | | | | | 406,523 | | | | | 0.0 | |
WCP Issuer, LLC, 7.143%, 8/15/2043 | | 8/01/2013 | | | | 6,000,000 | | | | | 6,372,360 | | | | | 0.6 | |
Fairway Outdoor Funding, LLC, 8.835%, 10/15/2042 | | 10/19/2012 | | | | 3,000,000 | | | | | 3,139,338 | | | | | 0.3 | |
JPR Royalty Sub, LLC, 14.00%, 9/01/2020 | | 3/01/2011 | | | | 2,000,000 | | | | | 1,000,000 | | | | | 0.1 | |
Northwind Holdings, LLC, 2.786%, 12/01/2037 | | 1/29/2010 | | | | 406,093 | | | | | 443,538 | | | | | 0.0 | |
Reilly 1997 A Mtg 1, 6.896%, 7/01/2020 | | 3/07/2013 | | | | 146,673 | | | | | 145,047 | | | | | 0.0 | |
| g | Securities exempt from registration under Rule 144A of the Securities Act of 1933, as amended. These securities are restricted but liquid and may only be resold in the ordinary course of business in transactions exempt from registration, normally to qualified institutional buyers. As of March 31, 2018, the aggregate value of these securities in the Fund’s portfolio was $495,957,018, representing 45.37% of the Fund’s net assets. |
| h | Variable rate coupon, rate shown as of March 31, 2018. |
| j | Yankee bond denominated in U.S. dollars and is issued in the U.S. by foreign banks and corporations. |
| l | Pay-In-Kind Payments (PIK). The issuer may pay cash interest and/or interest in additional debt securities. Rates shown are the rates in effect at March 31, 2018. |
| m | Segregated as collateral for a when-issued security. |
| o | The stated coupon rate represents the greater of the LIBOR or the LIBOR floor rate plus a spread at March 31, 2018. |
| p | Investment in Affiliates. |
Portfolio Abbreviations
To simplify the listings of securities, abbreviations are used per the table below:
| | |
| ARM | | Adjustable Rate Mortgage |
| CMO | | Collateralized Mortgage Obligation |
| FCB | | Farm Credit Bank |
| GO | | General Obligation |
| LIBOR | | London Interbank Offered Rates |
| Mtg | | Mortgage |
| MTN | | Medium-Term Note |
| REMIC | | Real Estate Mortgage Investment Conduit |
| SBA | | Small Business Administration |
| SPV | | Special Purpose Vehicle |
| VA | | Veterans Affairs |
See notes to financial statements.
Semi-Annual Report | 19
Statement of Assets and Liabilities
Thornburg Strategic Income Fund | March 31, 2018 (Unaudited)
| | | | |
ASSETS | | | | |
| |
Investments at value (Note 3) | | | | |
Non-affiliated issuers (cost $977,147,800) | | $ | 964,841,624 | |
Non-controlled affiliated issuer (cost $126,893,099) | | | 126,893,099 | |
Cash denominated in foreign currency (cost $1,226,750) | | | 1,230,450 | |
Receivable for investments sold | | | 3,254,291 | |
Receivable for fund shares sold | | | 7,059,561 | |
Unrealized appreciation on forward currency contracts (Note 7) | | | 3,759 | |
Dividends receivable | | | 427,628 | |
Dividend and interest reclaim receivable | | | 5,554 | |
Interest receivable | | | 9,962,248 | |
Prepaid expenses and other assets | | | 88,705 | |
| | | | |
| |
Total Assets | | | 1,113,766,919 | |
| | | | |
| |
LIABILITIES | | | | |
| |
Payable for investments purchased | | | 11,229,158 | |
Payable for fund shares redeemed | | | 7,100,224 | |
Payable to investment advisor and other affiliates (Note 4) | | | 746,464 | |
Accounts payable and accrued expenses | | | 1,086,660 | |
Dividends payable | | | 364,401 | |
| | | | |
| |
Total Liabilities | | | 20,526,907 | |
| | | | |
| |
NET ASSETS | | $ | 1,093,240,012 | |
| | | | |
| |
NET ASSETS CONSIST OF | | | | |
| |
Distribution in excess of net investment income | | $ | (1,900,722 | ) |
Net unrealized depreciation on investments | | | (12,299,770 | ) |
Accumulated net realized gain (loss) | | | (30,500,426 | ) |
Net capital paid in on shares of beneficial interest | | | 1,137,940,930 | |
| | | | |
| |
| | $ | 1,093,240,012 | |
| | | | |
20 | Semi-Annual Report
Statement of Assets and Liabilities, Continued
Thornburg Strategic Income Fund | March 31, 2018 (Unaudited)
| | | | |
NET ASSET VALUE | | | | |
| |
Class A Shares: | | | | |
Net asset value and redemption price per share
($210,533,751 applicable to 18,004,506 shares of beneficial
interest outstanding - Note 5) | | $ | 11.69 | |
| |
Maximum sales charge, 4.50% of offering price | | | 0.55 | |
| | | | |
| |
Maximum offering price per share | | $ | 12.24 | |
| | | | |
| |
Class C Shares: | | | | |
Net asset value and offering price per share*
($185,066,963 applicable to 15,852,988 shares of beneficial
interest outstanding - Note 5) | | $ | 11.67 | |
| | | | |
| |
Class I Shares: | | | | |
Net asset value, offering and redemption price per share
($675,602,009 applicable to 57,915,722 shares of beneficial
interest outstanding - Note 5) | | $ | 11.67 | |
| | | | |
| |
Class R3 Shares: | | | | |
Net asset value, offering and redemption price per share
($2,292,408 applicable to 196,154 shares of beneficial
interest outstanding - Note 5) | | $ | 11.69 | |
| | | | |
| |
Class R4 Shares: | | | | |
Net asset value, offering and redemption price per share
($2,654,565 applicable to 227,249 shares of beneficial
interest outstanding - Note 5) | | $ | 11.68 | |
| | | | |
| |
Class R5 Shares: | | | | |
Net asset value, offering and redemption price per share
($7,289,004 applicable to 624,740 shares of beneficial
interest outstanding - Note 5) | | $ | 11.67 | |
| | | | |
| |
Class R6 Shares: | | | | |
Net asset value, offering and redemption price per share
($9,801,312 applicable to 837,609 shares of beneficial
interest outstanding - Note 5) | | $ | 11.70 | |
| | | | |
* Redemption price per share is equal to net asset value less any applicable contingent deferred sales charge.
See notes to financial statements.
Semi-Annual Report | 21
Statement of Operations
Thornburg Strategic Income Fund | Six Months Ended March 31, 2018 (Unaudited)
| | | | |
INVESTMENT INCOME | | | | |
| |
Dividend income | | | | |
Non-affiliated issuers (net of foreign taxes withheld of $13,147) | | $ | 972,782 | |
Non-controlled affiliated issuer | | | 984,038 | |
Interest income (net of premium amortized of $738,196) | | | 22,061,218 | |
| | | | |
| |
Total Income | | | 24,018,038 | |
| | | | |
| |
EXPENSES | | | | |
| |
Investment advisory fees (Note 4) | | | 3,800,062 | |
Administration fees (Note 4) | | | | |
Class A Shares | | | 125,353 | |
Class C Shares | | | 108,774 | |
Class I Shares | | | 196,963 | |
Class R3 Shares | | | 1,401 | |
Class R4 Shares | | | 1,551 | |
Class R5 Shares | | | 2,095 | |
Class R6 Shares | | | 252 | |
Distribution and service fees (Note 4) | | | | |
Class A Shares | | | 279,867 | |
Class C Shares | | | 972,667 | |
Class R3 Shares | | | 6,232 | |
Class R4 Shares | | | 3,465 | |
Transfer agent fees | | | | |
Class A Shares | | | 118,952 | |
Class C Shares | | | 104,990 | |
Class I Shares | | | 291,129 | |
Class R3 Shares | | | 6,494 | |
Class R4 Shares | | | 5,855 | |
Class R5 Shares | | | 6,492 | |
Class R6 Shares | | | 182 | |
Registration and filing fees | | | | |
Class A Shares | | | 7,763 | |
Class C Shares | | | 7,094 | |
Class I Shares | | | 10,296 | |
Class R3 Shares | | | 6,757 | |
Class R4 Shares | | | 7,373 | |
Class R5 Shares | | | 6,757 | |
Class R6 Shares | | | 7,555 | |
Custodian fees (Note 2) | | | 94,815 | |
Professional fees | | | 46,876 | |
Trustee and officer fees (Note 4) | | | 24,379 | |
Other expenses | | | 57,535 | |
| | | | |
| |
Total Expenses | | | 6,309,976 | |
| |
Less: | | | | |
Expenses reimbursed by investment advisor (Note 4) | | | (421,924 | ) |
Investment advisory fees waived by investment advisor (Note 4) | | | (610,423 | ) |
| | | | |
| |
Net Expenses | | | 5,277,629 | |
| | | | |
| |
Net Investment Income | | $ | 18,740,409 | |
| | | | |
22 | Semi-Annual Report
Statement of Operations, Continued
Thornburg Strategic Income Fund | Six Months Ended March 31, 2018 (Unaudited)
| | | | |
REALIZED AND UNREALIZED GAIN (LOSS) | | | | |
| |
Net realized gain (loss) on: | | | | |
Non-affiliated issuer investments | | $ | 3,973,865 | |
Forward currency contracts (Note 7) | | | 14,370 | |
Foreign currency transactions | | | (62,529 | ) |
| | | | |
| |
| | | 3,925,706 | |
| | | | |
Net change in unrealized appreciation (depreciation) on: | | | | |
Non-affiliated issuer investments | | | (19,630,935 | ) |
Forward currency contracts (Note 7) | | | 13,826 | |
Foreign currency translations | | | 65 | |
| | | | |
| |
| | | (19,617,044 | ) |
| | | | |
| |
Net Realized and Unrealized Loss | | | (15,691,338 | ) |
| | | | |
| |
Net Increase in Net Assets Resulting from Operations | | $ | 3,049,071 | |
| | | | |
See notes to financial statements.
Semi-Annual Report | 23
Statements of Changes in Net Assets
Thornburg Strategic Income Fund
| | | | | | | | | | |
| | | SIX MONTHS ENDED
MARCH 31, 2018* | | YEAR ENDED
SEPTEMBER 30, 2017 |
INCREASE (DECREASE) IN NET ASSETS FROM | | | | | | | | | | |
| | |
OPERATIONS | | | | | | | | | | |
| | |
Net investment income | | | $ | 18,740,409 | | | | $ | 38,738,362 | |
Net realized gain (loss) on investments, forward currency contracts and foreign currency transactions | | | | 3,925,706 | | | | | (8,083,486 | ) |
Net unrealized appreciation (depreciation) on investments, forward currency contracts and foreign currency translations | | | | (19,617,044 | ) | | | | 25,868,234 | |
| | | | | |
| | |
Net Increase in Net Assets Resulting from Operations | | | | 3,049,071 | | | | | 56,523,110 | |
| | |
DIVIDENDS TO SHAREHOLDERS | | | | | | | | | | |
| | |
From net investment income | | | | | | | | | | |
Class A Shares | | | | (3,017,325 | ) | | | | (7,693,979 | ) |
Class C Shares | | | | (1,957,818 | ) | | | | (5,690,905 | ) |
Class I Shares | | | | (10,033,490 | ) | | | | (19,277,454 | ) |
Class R3 Shares | | | | (32,166 | ) | | | | (85,292 | ) |
Class R4 Shares | | | | (36,056 | ) | | | | (85,574 | ) |
Class R5 Shares | | | | (107,194 | ) | | | | (208,615 | ) |
Class R6 Shares** | | | | (9,558 | ) | | | | (5 | ) |
| | |
FUND SHARE TRANSACTIONS (NOTE 5) | | | | | | | | | | |
| | |
Class A Shares | | | | (19,962,465 | ) | | | | (55,984,696 | ) |
Class C Shares | | | | (18,042,869 | ) | | | | (72,453,957 | ) |
Class I Shares | | | | 62,237,397 | | | | | 127,943,899 | |
Class R3 Shares | | | | (347,085 | ) | | | | (215,525 | ) |
Class R4 Shares | | | | (86,417 | ) | | | | (504,525 | ) |
Class R5 Shares | | | | 1,078,572 | | | | | (1,030,788 | ) |
Class R6 Shares** | | | | 9,811,732 | | | | | 255 | |
| | | | | |
| | |
Net Increase in Net Assets | | | | 22,544,329 | | | | | 21,235,949 | |
| | |
NET ASSETS | | | | | | | | | | |
| | |
Beginning of Period | | | | 1,070,695,683 | | | | | 1,049,459,734 | |
| | | | | |
| | |
End of Period | | | $ | 1,093,240,012 | | | | $ | 1,070,695,683 | |
| | | | | |
| | |
Distribution in excess of net investment income | | | $ | (1,900,722 | ) | | | $ | (5,447,524 | ) |
* Unaudited.
** Class R6 Shares commenced operations on April 10, 2017.
See notes to financial statements.
24 | Semi-Annual Report
Notes to Financial Statements
Thornburg Strategic Income Fund | March 31, 2018 (Unaudited)
NOTE 1 – ORGANIZATION
Thornburg Strategic Income Fund (the “Fund”) is a diversified series of Thornburg Investment Trust (the “Trust”). The Fund commenced operations on December 19, 2007. The Trust was organized as a Massachusetts business trust under a Declaration of Trust dated June 3, 1987 and is registered as a diversified, open-end management investment company under the Investment Company Act of 1940, as amended. The Fund is currently one of twenty-one separate series of the Trust. Each series is considered to be a separate entity for financial reporting and tax purposes and bears expenses directly attributable to it. The Fund’s primary investment goal is to seek a high level of current income. The Fund’s secondary investment goal is some long-term capital appreciation.
The Fund currently offers seven classes of shares of beneficial interest: Class A, Class C, Institutional Class (“Class I”), and Retirement Classes (“Class R3”, “Class R4”, “Class R5”, and “Class R6”). Each class of shares of the Fund represents an interest in the same portfolio of investments, except that (i) Class A shares are sold subject to a front-end sales charge collected at the time the shares are purchased and bear a service fee, (ii) Class C shares are sold at net asset value without a sales charge at the time of purchase, but are subject to a contingent deferred sales charge upon redemption within one year of purchase, and bear both a service fee and a distribution fee, (iii) Class I and Class R5 shares are sold at net asset value without a sales charge at the time of purchase and may be subject to a service fee, (iv) Class R3 shares are sold at net asset value without a sales charge at the time of purchase, but bear both a service fee and distribution fee, (v) Class R4 shares are sold at net asset value without a sales charge at the time of purchase, but bear a service fee, (vi) Class R6 shares are sold at net asset value without a sales charge at the time of purchase, and (vii) the respective classes may have different reinvestment privileges and conversion rights. Additionally, the Fund may allocate among its classes certain expenses, to the extent allocable to specific classes, including transfer agent fees, government registration fees, certain printing and postage costs, and administrative and legal expenses. Currently, class specific expenses of the Fund are limited to service and distribution fees, administration fees, and certain registration and transfer agent expenses.
The following is a summary of significant accounting policies followed by the Fund in the preparation of its financial statements. The Fund prepares its financial statements in conformity with United States generally accepted accounting principles (“GAAP”), including investment company accounting and reporting guidance in the Financial Accounting Standards Board (the “FASB”) Accounting Standard Codification Topic 946.
NOTE 2 – SIGNIFICANT ACCOUNTING POLICIES
Security Valuation: All investments in securities held by the Fund are valued as described in Note 3.
Allocation of Income, Gains, Losses and Expenses: Net investment income (other than class specific expenses) and realized and unrealized gains and losses are allocated daily to each class of shares based upon the relative net asset value of outstanding shares (or the value of the dividend-eligible shares, as appropriate) of each class of shares at the beginning of the day (after adjusting for the current capital shares activity of the respective class). Expenses common to all Funds are allocated among the Funds comprising the Trust based upon their relative net asset values or other appropriate allocation methods. Operating expenses directly attributable to a specific class are charged against the operating income of that class.
Dividends and Distributions to Shareholders: Dividends and distributions to shareholders, which are determined in accordance with federal income tax regulations and may differ from GAAP, are recorded on the ex-dividend date. Ordinary income distributions, if any, are declared and paid monthly. Capital gain distributions, if any, are declared and paid annually and more often if deemed necessary by Thornburg Investment Management, Inc., the Trust’s investment advisor (the “Advisor”). Dividends are paid and are reinvested in additional shares of the Fund at net asset value per share at the close of business on the ex-dividend date, or at the shareholder’s option, paid in cash.
Investment Income: Dividend income is recorded on the ex-dividend date. Certain income from foreign investments is recognized as soon as information is available to the Fund. Interest income is accrued as earned. Premiums and discounts are amortized and accreted, respectively, to call dates or maturity dates using the effective yield method of the respective investments. These amounts are included in Interest income on the Statement of Operations.
Custodian Fees: Custodian fees disclosed in the Statement of Operations may include interest expenses incurred by the Fund on any cash overdrafts of its custodian account during the period. Such cash overdrafts may result from the effects of failed trades in portfolio securities and from cash outflows resulting from unanticipated shareholder redemption activity. The Fund pays interest to its custodian on any such cash overdraft at a rate set periodically at the custodian’s discretion of the overdraft amount in excess of $50,000.
Investment Transactions: Investment transactions are accounted for on a trade date basis. Realized gains and losses from the sale of investments are recorded on an identified cost basis.
Repurchase Agreements: The Fund may invest excess cash in repurchase agreements whereby the Fund purchases investments, which serve as collateral, with an agreement to resell such collateral to the seller at an agreed upon price at the maturity date of the repurchase
Semi-Annual Report | 25
Notes to Financial Statements, Continued
Thornburg Strategic Income Fund | March 31, 2018 (Unaudited)
agreement. Investments pledged as collateral for repurchase agreements are held in custody until maturity of the repurchase agreement. Provisions in the agreements require that the market value of the collateral is at least equal to the repurchase value in the event of default. In the event of default, the Fund has the right to liquidate the collateral and apply the proceeds in satisfaction of the obligation. Under certain circumstances, in the event of default or bankruptcy by the other party to the agreement, realization and/or retention of the collateral may be subject to legal proceedings.
Unfunded Loan Commitments: The Fund has entered into a loan commitment with Malamute Energy, Inc., of which at March 31, 2018, $14,534 of the $42,591 par commitment had been funded. The maturity date is November 22, 2022.
When-Issued and Delayed Delivery Transactions: The Fund may engage in when-issued or delayed delivery transactions. To the extent the Fund engages in such transactions, it will do so for the purpose of acquiring portfolio investments consistent with the Fund’s investment objectives and not for the purpose of investment leverage or to speculate on interest rate or market changes. At the time the Fund makes a commitment to purchase an investment on a when-issued or delayed delivery basis, the Fund will record the transaction and reflect the value in determining its net asset value. When effecting such transactions, assets of an amount sufficient to make payment for the portfolio investments to be purchased will be segregated on the Fund’s records on the trade date. Investments purchased on a when-issued or delayed delivery basis do not earn interest until the settlement date.
Foreign Currency Translation: Portfolio investments and other assets and liabilities denominated in foreign currencies are translated into U.S. dollars based on the exchange rate of such currencies against the U.S. dollar on the date of valuation. Purchases and sales of investments and income items denominated in foreign currencies are translated into U.S. dollars at the exchange rate in effect on the transaction date. When the Fund purchases or sells foreign investments, it will customarily enter into a foreign exchange contract to minimize foreign exchange risk from the trade date to the settlement date of such transactions. The values of such spot contracts are included in receivable for investments sold and payable for investments purchased on the Statement of Assets and Liabilities.
The Fund does not separately report the effect of changes in foreign exchange rates from changes in market prices on investments held. Such changes are included in net unrealized appreciation (depreciation) from investments.
Reported net realized gains and losses from foreign currency transactions arise due to purchases and sales of foreign currencies, currency gains and losses realized between the trade and settlement dates on investment transactions and the difference between the amounts of dividends, interest, and foreign withholding taxes recorded on the Fund’s books, and the U.S. dollar equivalent of the amounts actually received or paid.
Net change in unrealized appreciation (depreciation) on foreign currency translations arise from changes in the fair value of assets and liabilities, other than investments at period end, resulting from changes in exchange rates.
Guarantees and Indemnifications: Under the Trust’s organizational documents (and under separate agreements with the independent Trustees), its officers and Trustees are provided with an indemnification against certain liabilities arising out of the performance of their duties to the Fund. In the normal course of business the Trust may also enter into contracts with service providers that contain general indemnifications. The Trust’s maximum exposure under these arrangements is unknown. However, based on experience, the Trust expects the risk of loss to be remote.
Use of Estimates: The preparation of financial statements in conformity with GAAP requires management to make estimates and assumptions that affect the reported amounts of assets and liabilities and disclosure of contingent assets and liabilities at the date of the financial statements and the reported amounts of increases (decreases) in net assets from operations during the reporting period. Actual results could differ from those estimates.
Federal Income Taxes: It is the policy of the Trust to comply with the provisions of the Internal Revenue Code applicable to regulated investment companies and to distribute to shareholders substantially all investment company taxable income including net realized gains on investments (if any), and tax exempt income of the Fund. Therefore, no provision for federal income or excise tax is required.
The Fund files income tax returns in United States federal and applicable state jurisdictions. The statute of limitations on the Fund’s tax return filings generally remains open for the three years following a return’s filing date. The Fund has analyzed each uncertain tax position believed to be material in the preparation of the Fund’s financial statements for the six month period ended March 31, 2018, including open tax years, to assess whether it is more likely than not that the position would be sustained upon examination, based on the technical merits of the position. The Fund has not identified any such position for which an asset or liability must be reflected in the Statement of Assets and Liabilities.
At March 31, 2018, information on the tax components of capital was as follows:
26 | Semi-Annual Report
Notes to Financial Statements, Continued
Thornburg Strategic Income Fund | March 31, 2018 (Unaudited)
| | | | | |
Cost of investments for tax purposes | | | $ | 1,104,040,899 | |
| | | | | |
Gross unrealized appreciation on a tax basis | | | | 14,038,293 | |
Gross unrealized depreciation on a tax basis | | | | (26,344,469 | ) |
| | | | | |
Net unrealized appreciation (depreciation) on investments (tax basis) | | | $ | (12,306,176 | ) |
| | | | | |
At March 31, 2018, the Fund had deferred tax basis late-year specified ordinary losses occurring subsequent to October 31, 2016 through September 30, 2017 of $6,524,340. For tax purposes, such losses will be recognized in the year ending September 30, 2018.
At March 31, 2018, the Fund had deferred tax basis capital losses occurring subsequent to October 31, 2016 through September 30, 2017 of $1,012,053. For tax purposes, such losses will be recognized in the year ending September 30, 2018.
At March 31, 2018, the Fund had cumulative tax basis capital losses of $33,422,715 (of which $0 are short-term and $33,422,715 are long-term) generated after September 30, 2011, which may be carried forward to offset future capital gains. To the extent such carryforwards are used, capital gain distributions may be reduced to the extent provided by regulations. Such capital loss carryforwards do not expire.
Foreign Withholding Taxes: The Fund is subject to foreign tax withholding imposed by certain foreign countries in which the Fund may invest. Withholding taxes are incurred on certain foreign dividends and are accrued at the time the dividend is recognized based on applicable foreign tax laws. The Fund may file withholding tax reclaims in certain jurisdictions to recover a portion of amounts previously withheld, in view of various considerations, including recent decisions rendered by the courts in those and other jurisdictions. The Fund would expect to record a receivable for such a reclaim based on a variety of factors, including assessment of a jurisdiction’s legal obligation to pay reclaims, the jurisdiction’s administrative practices and payment history, and industry convention. To date the Fund has recorded no such receivable because there is limited precedent for collecting such prior year reclaims and the likelihood of collection remains uncertain.
Deferred Foreign Capital Gain Taxes: The Fund is subject to a tax imposed on net realized gains of securities of certain foreign countries. The Fund records an estimated deferred tax liability for net unrealized gains on these investments as reflected in the accompanying financial statements.
NOTE 3 – SECURITY VALUATION
Valuation of the Fund’s portfolio investment securities is performed in accordance with policies and procedures adopted by and under the oversight of the Trustees.
The Trustees of the Trust have appointed the Advisor to assist the Trustees to obtain market values for portfolio investments, evaluate and monitor professional pricing service providers appointed by the Trustees’ Audit Committee (the “Audit Committee”) to assist in determining fair values for portfolio investments, assist in calculating fair values for portfolio investments in certain circumstances, and to perform other functions in connection with the valuation of investments. The Advisor acts through its Valuation and Pricing Committee (the “Committee”) and other employees of the Advisor. The Committee regularly reviews its own valuation calculations, as well as the valuations, valuation techniques and services furnished by pricing service providers, considers circumstances which may require valuation calculations by the Committee, and reviews previous valuation calculations. The Committee reports to the Audit Committee on the Committee’s activities, the performance of pricing service providers, and other matters relating to valuation of portfolio investments.
In those instances when the Committee assists in calculating a fair value for a portfolio investment, the Committee seeks to determine the price that the Fund would reasonably expect to receive upon a sale of the investment in an orderly transaction between market participants on the valuation date. The Committee customarily utilizes quotations from securities broker dealers in calculating valuations, but also may utilize prices obtained from pricing service providers or other methods approved by the Audit Committee. Because fair values calculated by the Committee are estimates, the calculation of a value for an investment may differ from the price that would be realized by the Fund upon a sale of the investment, and the difference could be material to the Fund’s financial statements. The Committee’s calculation of a fair value for an investment may also differ from the prices obtained by other persons (including other mutual funds) for the investment.
Valuation of Securities: Securities and other portfolio investments which are listed or traded on a United States securities exchange are valued at the last reported sale price on the valuation date. Investments listed or traded on an exchange for which there has been no sale that day are valued at the mean between the last reported bid and asked prices on that valuation date. Portfolio investments reported by NASDAQ are valued at the official closing price on the valuation date. If an investment is traded on more than one exchange, the investment is considered traded on the exchange that is normally the primary market for that investment. Securities and other portfolio investments which are listed or traded on exchanges outside the United States are valued at the last price or the closing price of the investment on the exchange that is normally the primary market for the investment, as of the close of the exchange preceding the Fund’s valuation date. Foreign investments listed or traded on an exchange for which there has been no sale that day are valued at the mean between the last reported bid and asked prices on that valuation date.
Semi-Annual Report | 27
Notes to Financial Statements, Continued
Thornburg Strategic Income Fund | March 31, 2018 (Unaudited)
In any case when a market quotation is not readily available for a portfolio investment ordinarily valued by market quotation, the Committee calculates a fair value for the investment using alternative methods approved by the Audit Committee. A market quotation is not readily available when the primary market or exchange for the investment is not open for the entire scheduled day of trading. Market quotations for an investment also may not be readily available if developments after the most recent close of the investment’s primary exchange or market, but prior to the close of business on any Fund business day, or an unusual event or significant period of time occurring since the availability of a market quotation, create a serious question concerning the reliability of the most recent market quotation available for the investment. In particular, on days when market volatility thresholds established by the Audit Committee are exceeded, foreign equity investments held by the Fund may be valued using alternative methods. The Committee customarily obtains valuations in these instances from pricing service providers approved by the Audit Committee. Pricing service providers ordinarily calculate valuations using multi-factor models to adjust market prices based upon various inputs, including exchange data, depository receipt prices, futures, index data and other data.
Debt obligations held by the Fund which are not listed or traded on exchanges or for which no reported market exists are ordinarily valued at the valuation obtained from a pricing service provider approved by the Audit Committee.
In any case when a pricing service provider fails to provide a valuation for a debt obligation held by the Fund, the Committee calculates a fair value for the obligation using alternative methods under procedures approved by the Audit Committee. Additionally, in cases when management believes that a valuation obtained from a pricing service provider merits review for significant reasons, the Committee decides whether or not to use the valuation calculated by the pricing service provider or to use an alternative method approved by the Audit Committee to calculate a fair value for the obligation.
Quotations for foreign investments expressed in foreign currency amounts are converted to U.S. dollar equivalents using a foreign exchange quotation from a third party service provider at the time of valuation. Foreign investments held by the Fund may be traded on days and at times when the Fund is not open for business. Consequently, the value of Fund investments may be significantly affected on days when shareholders cannot purchase or sell Fund shares. Futures contracts and other financial and derivative instruments traded on an exchange are valued at the latest published price for the instrument on its primary exchange. Listed options are valued at the last bid price.
Valuation Hierarchy: The Fund categorizes its investments based upon the inputs used in valuing those investments, according to a three-level hierarchy established in guidance from the FASB. Categorization of investments using this hierarchy is intended by the FASB to maximize the use of observable inputs in valuing investments and minimize the use of unobservable inputs by requiring that the most observable inputs be used when available. Observable inputs are those that market participants would use in valuing an investment based on available market information. Unobservable inputs are those that reflect assumptions about the information market participants would use in valuing an investment. An investment’s level within the hierarchy is based on the lowest level input that is deemed significant to the valuation. The methodologies and inputs used to value investments are not necessarily indications of the risk or liquidity associated with those investments.
Various inputs are used in calculating valuations for the Fund’s investments. These inputs are generally summarized according to the three-level hierarchy below:
Level 1: Quoted prices in active markets for identical investments.
Level 2: Other direct or indirect significant observable inputs (including quoted prices for similar investments in active markets and other observable inputs, such as interest rates, prepayment rates, credit risk, etc.).
Level 3: Significant unobservable inputs (including the Committee’s own assumptions in calculating the fair values of investments).
Valuations for debt obligations held by the Fund are typically calculated by pricing service providers approved by the Audit Committee and are generally characterized as Level 2 within the valuation hierarchy.
On days when market volatility thresholds established by the Audit Committee are exceeded, foreign securities for which valuations are obtained from pricing service providers are fair valued. On these days, the foreign securities are characterized as Level 2 within the valuation hierarchy and revert to Level 1 after the threshold is no longer exceeded.
In a limited number of cases the Committee calculates a fair value for investments using broker quotations or other methods approved by the Audit Committee. When the Committee uses a single broker quotation to calculate a fair value for an investment without other significant observable inputs, or if a fair value is calculated using other significant inputs that are considered unobservable, the investment is characterized as Level 3 within the hierarchy. Other significant unobservable inputs used to calculate a fair value in these instances might include an income-based valuation approach which considers discounted anticipated future cash flows from the investment and application of discounts due to the nature or duration of any restrictions on the disposition of the investment.
28 | Semi-Annual Report
Notes to Financial Statements, Continued
Thornburg Strategic Income Fund | March 31, 2018 (Unaudited)
Valuations based upon the use of inputs from Levels 1, 2 or 3 may not represent the actual price received upon the disposition of an investment, and the Fund may receive a price that is lower than the valuation based upon these inputs when it sells the investment.
The following table displays a summary of the fair value hierarchy measurements of the Fund’s investments as of March 31, 2018. In any instance when valuation inputs from more than one level are used to determine the fair value of a specific investment, the investment is placed in the level of the table based upon the lowest level input that is significant in determining the fair value of the investment:
| | | | | | | | | | | | | | | | | | | | |
| | | FAIR VALUE MEASUREMENTS AT MARCH 31, 2018 |
| | | TOTAL | | LEVEL 1 | | LEVEL 2 | | LEVEL 3 |
Assets | | | | | | | | | | | | | | | | | | | | |
Investments in Securities* | | | | | | | | | | | | | | | | | | | | |
Corporate Bonds | | | $ | 646,391,126 | | | | $ | – | | | | $ | 644,274,540 | | | | $ | 2,116,586 | |
Convertible Bonds | | | | 24,054,137 | | | | | – | | | | | 24,054,137 | | | | | – | |
Asset Backed Securities | | | | 198,973,780 | | | | | – | | | | | 188,363,782 | | | | | 10,609,998 | |
Mortgage Backed | | | | 8,236,765 | | | | | – | | | | | 8,091,718 | | | | | 145,047 | |
Preferred Stock(a) | | | | 17,174,765 | | | | | 656,768 | | | | | 13,474,991 | | | | | 3,043,006 | |
Common Stock(a) | | | | 8,893 | | | | | – | | | | | – | | | | | 8,893 | |
Loan Participations | | | | 55,648,838 | | | | | – | | | | | 55,303,749 | | | | | 345,089 | |
Municipal Bonds | | | | 6,827,156 | | | | | – | | | | | 6,827,156 | | | | | – | |
Other Government | | | | 7,526,164 | | | | | – | | | | | 7,526,164 | | | | | – | |
Short Term Investment | | | | 126,893,099 | | | | | 126,893,099 | | | | | – | | | | | – | |
| | | | | |
Total Investments in Securities | | | $ | 1,091,734,723 | | | | $ | 127,549,867 | | | | $ | 947,916,237 | | | | $ | 16,268,619 | (b) |
| | | | |
Other Financial Instruments** | | | | | | | | | | | | | | | | | | | | |
Forward Currency Contracts | | | $ | 3,759 | | | | $ | 3,759 | | | | $ | – | | | | $ | – | |
| (a) | At March 31, 2018, industry classifications for Common Stock and Preferred Stock in level 2 and Level 3 consist of $9,622,500 in Banks, $3,051,899 in Energy, $1,175,000 in Miscellaneous, and $2,677,491 Telecommunication Services. |
| (b) | In accordance with the guidance prescribed in Accounting Standards Update (“ASU”) No. 2011-04, the following table displays a summary of the valuation techniques and unobservable inputs used to value portfolio securities characterized as Level 3 investments for the period ended at March 31, 2018: |
| * | See Schedule of Investments for a summary of the industry exposure as grouped according to the Global Industry Classification Standard (GICS), which is an industry taxonomy developed by MSCI, Inc. and Standard & Poor’s (S&P). |
| ** | Other Financial Instruments include investments not reflected in the Schedule of Investments, which may include futures, forwards and swap contracts, which are valued at the unrealized appreciation (depreciation) on the investment. |
Semi-Annual Report | 29
Notes to Financial Statements, Continued
Thornburg Strategic Income Fund | March 31, 2018 (Unaudited)
| | | | | | | | | | |
| | | FAIR VALUE AT
MARCH 31, 2018 | | | VALUATION TECHNIQUE(S) | | UNOBSERVABLE INPUT | | RANGE
(WEIGHTED AVERAGE) |
| | | | |
Common Stock | | $ | 8,893 | | | Discount to valuation | | Valuation and Pricing Committee value due to halt in trading of the security and lack of information as well as liquidity | | $10.50/(N/A) |
| | | | |
Asset-Backed Securities | | | 5,503,859 | | | Cost basis | | Cost basis | | $99.99/(3.3%) |
| | | | |
| | | | 5,106,139 | | | Discounted cash flows | | Third party vendor projection of discounted cash flows | | 2.7%-5.7%/(3.44%) |
| | | | |
Corporate Bond | | | 45,660 | | | Discount to valuation | | Valuation and Pricing Committee value due to halt in trading of the security and lack of information as well as liquidity | | $4.15/(N/A) |
| | | | |
| | | | 2,070,926 | | | Cost basis | | Cost basis | | $100.00/(N/A) |
| | | | |
Loan Participations | | | 330,555 | | | Discounted cash flows | | Third party vendor projection of discounted cash flows | | 25.0%/(N/A) |
| | | | |
| | | | 14,534 | | | Discount to valuation | | Valuation and Pricing Committee value due to halt in trading of the security and lack of information as well as liquidity | | $100.00/(N/A) |
| | | | |
Mortgage Backed | | | 145,047 | | | Unadjusted broker quote | | Unadjusted broker quote | | $100.00/(N/A) |
| | | | |
Preferred Stock | | | 3,043,006 | | | Unadjusted broker quote | | Unadjusted broker quote | | $9.49/(N/A) |
| | | | |
Total | | $ | 16,268,619 | | | | | | | |
A rollforward of fair value measurements using significant unobservable inputs (Level 3) for the six months ended March 31, 2018 is as follows:
| | | | | | | | | | | | | | | | | | | | | | | | | | | | | | | | | | | |
| | | COMMON
STOCK | | PREFERRED
STOCK | | ASSET BACKED
SECURITIES | | CORPORATE
BONDS | | MORTGAGE
BACKED | | LOAN
PARTICIPATIONS | | TOTAL(e) |
Beginning Balance 9/30/2017 | | | $ | 8,893 | | | | $ | 2,543,121 | | | | $ | 7,008,072 | | | | $ | 2,045,660 | | | | $ | 188,343 | | | | $ | 545,640 | | | | $ | 12,339,729 | |
Accrued Discounts (Premiums) | | | | – | | | | | – | | | | | 1,662 | | | | | – | | | | | (365 | ) | | | | – | | | | | 1,297 | |
Net Realized Gain (Loss)(a) | | | | – | | | | | – | | | | | 23,562 | | | | | – | | | | | (549 | ) | | | | – | | | | | 23,013 | |
Gross Purchases | | | | – | | | | | 3,109,509 | | | | | 5,499,938 | | | | | 81,333 | | | | | – | | | | | 55 | | | | | 8,690,835 | |
Gross Sales | | | | – | | | | | (2,609,497 | ) | | | | (1,855,506 | ) | | | | – | | | | | (43,296 | ) | | | | (18,644 | ) | | | | (4,526,943 | ) |
Net Change in Unrealized Appreciation (Depreciation)(b)(c) | | | | – | | | | | (127 | ) | | | | (67,730 | ) | | | | (10,407 | ) | | | | 914 | | | | | (181,962 | ) | | | | (259,312 | ) |
Transfers into Level 3(d) | | | | – | | | | | – | | | | | – | | | | | – | | | | | – | | | | | – | | | | | – | |
Transfers out of Level 3(d) | | | | – | | | | | – | | | | | – | | | | | – | | | | | – | | | | | – | | | | | – | |
| | | | | |
Ending Balance 3/31/2018 | | | $ | 8,893 | | | | $ | 3,043,006 | | | | $ | 10,609,998 | | | | $ | 2,116,586 | | | | $ | 145,047 | | | | $ | 345,089 | | | | $ | 16,268,619 | |
| (a) | Amount of net realized gain (loss) from investments recognized in income is included in the Fund’s Statement of Operations for the six months ended March 31, 2018. |
| (b) | Amount of net change in unrealized appreciation (depreciation) on investments recognized in income is included in the Fund’s Statement of Operations for the six months ended March 31, 2018. |
| (c) | The net change in unrealized appreciation (depreciation) attributable to securities owned at March 31, 2018, which were valued using significant unobservable inputs, was $(244,969). This is included within net change in unrealized appreciation (depreciation) on investments in the Fund’s the Statement of Operations for the six months ended March 31, 2018. |
| (d) | Transfers into or out of Level 3 were out of or into Level 2, and were due to changes in other significant observable inputs available during the six months ended March 31, 2018. Transfers into or out of Level 3 are based on the beginning market value of the period in which they occurred. |
| (e) | Level 3 investments represent 1.49% of total net assets at the six months ended March 31, 2018. Significant fluctuations of the unobservable inputs applied to portfolio securities characterized as Level 3 investments could be expected to increase or decrease the fair value of these portfolio securities. |
NOTE 4 – INVESTMENT ADVISORY FEE AND OTHER TRANSACTIONS WITH AFFILIATES
Pursuant to an investment advisory agreement, the Advisor serves as the investment advisor and performs services for the Fund for which the fees are payable at the end of each month. Under the investment advisory agreement, the Fund pays the Advisor a management fee based on the daily net assets of the Fund at an annual rate as shown in the following table:
30 | Semi-Annual Report
Notes to Financial Statements, Continued
Thornburg Strategic Income Fund | March 31, 2018 (Unaudited)
| | | | | |
| MANAGEMENT FEE SCHEDULE |
| DAILY NET ASSETS | | FEE RATE |
| |
Up to $500 million | | | | 0.750 | % |
| |
Next $500 million | | | | 0.675 | |
| |
Next $500 million | | | | 0.625 | |
| |
Next $500 million | | | | 0.575 | |
| |
Over $2 billion | | | | 0.500 | |
The Fund’s effective management fee for the six months ended March 31, 2018 was 0.706% of the Fund’s average net assets (before applicable management fee waiver of $610,423).
The Trust has entered into administrative service agreements with the Advisor, whereby the Advisor will perform certain administrative services related to each class of the Fund’s shares. Until January 31, 2018, the fees were payable at an annual rate of up to 0.125 of 1% per annum of the average daily net assets attributable to each class of shares. As of February 1, 2018, the fees are computed as an annual percentage of the aggregate average daily net assets of all shares classes of all Funds in the Trust as follows:
| | | | | |
| ADMINISTRATION FEE SCHEDULE |
| DAILY NET ASSETS | | FEE RATE |
| |
Up to $20 billion | | | | 0.100 | % |
| |
$20 billion to $40 billion | | | | 0.075 | |
| |
$40 billion to $60 billion | | | | 0.040 | |
| |
Over $60 billion | | | | 0.030 | |
The aggregate fee amount is allocated on a daily basis to each Fund based on net assets and subsequently allocated to each class of shares of the Fund. Total administrative service fees incurred by each class of shares of the Fund for the six months ended March 31, 2018, are set forth in the Statement of Operations.
The Trust has an underwriting agreement with Thornburg Securities Corporation (the “Distributor”), an affiliate of the Advisor, which acts as the distributor of the Fund’s shares. For the six months ended March 31, 2018, the Distributor has advised the Fund that it earned net commissions aggregating $12,757 from the sale of Class A shares, and collected contingent deferred sales charges aggregating $2,541 from redemptions of Class C shares of the Fund.
Pursuant to a service plan under Rule 12b-1 of the Investment Company Act of 1940, the Fund may pay to the Distributor or securities dealers and other financial institutions at the Distributor’s direction an amount not to exceed .25 of 1% per annum of the average daily net assets attributable to Class A, Class C, Class I, Class R3, Class R4, and Class R5 shares of the Fund to obtain various shareholder and distribution related services. For the six months ended March 31, 2018, there were no 12b-1 service plan fees charged for Class I or Class R5 shares. Class R6 shares are not subject to a service plan. The Advisor and Distributor each may pay out of its own resources additional expenses for distribution of the Fund’s shares and shareholder services.
The Trust has also adopted distribution plans pursuant to Rule 12b-1, applicable only to the Fund’s Class C and Class R3 shares, under which the Fund compensates the Distributor for services in promoting the sale of Class C and Class R3 shares of the Fund at an annual rate of up to .75 of 1% per annum of the average daily net assets attributable to Class C shares, and an annual rate of up to .25 of 1% per annum of the average daily net assets attributable to Class R3 shares.
Total fees incurred by each class of shares of the Fund under their respective service and distribution plans for the six months ended March 31, 2018, are set forth in the Statement of Operations.
The Advisor and Distributor have contractually agreed to waive fees and reimburse expenses incurred by the Fund so that actual expenses of certain share classes do not exceed levels as specified in each Fund’s most recent prospectus. The agreement may be terminated by the Fund at any time, but may not be terminated by the Advisor or Distributor before February 1, 2019, unless the Advisor ceases to be the investment advisor to the Fund or the Distributor ceases to be the distributor of the Fund prior to that date. The Advisor and Distributor may recoup amounts waived or reimbursed during the fiscal year if expenses fall below the contractual limit during that year.
For the six months ended March 31, 2018, the Advisor contractually waived Fund level investment advisory fees of $610,423. The Advisor contractually reimbursed certain class specific expenses, administrative fees, and distribution fees of $59,980 for Class C shares, $317,485 for Class I shares, $13,215 for Class R3 shares, $9,728 for Class R4 shares, $13,495 for Class R5 shares, and $8,021 for Class R6 shares.
Semi-Annual Report | 31
Notes to Financial Statements, Continued
Thornburg Strategic Income Fund | March 31, 2018 (Unaudited)
Certain officers and Trustees of the Trust are also officers or directors of the Advisor and Distributor. The compensation of the independent Trustees is borne by the Trust. The Trust also pays a portion of the Chief Compliance Officer’s compensation. These amounts are reflected as “Trustee and officer fees” in the Statement of Operations.
The percentage of direct investments in the Fund held by the Trustees, officers of the Trust, and the Advisor is approximately 1.27%.
The Fund may purchase or sell securities from, or to an affiliated fund, provided the affiliation is due solely to having a common investment advisor, common officers, or common trustees, and provided that all such transactions will comply with Rule 17a-7 under the 1940 Act. For the six months ended March 31, 2018, the Fund had no such transactions with affiliated funds.
Shown below are holdings of voting securities of each portfolio company which is considered “affiliated” to the Fund under the Investment Company Act of 1940, including companies for which the Fund’s holding represented 5% or more of the company’s voting securities, and a series of the Thornburg Investment Trust in which the Fund invested for cash management purposes during the period:
| | | | | | | | | | | | | | | | | | | | | | | | | | | | |
| FUND | | MARKET
VALUE
9/30/17 | | | PURCHASES
AT COST | | SALES
PROCEEDS | | REALIZED
GAIN
(LOSS) | | | CHANGE IN
UNREALIZED
APPR./(DEPR.) | | | MARKET
VALUE
3/31/18 | | | DIVIDEND
INCOME | | | ROC
ADJUSTMENT | |
| | | | | | | | |
Thornburg Capital Management Fund | | $ | 119,020,538 | | | $167,960,601 | | $(160,088,040) | | $ | – | | | $ | – | | | $ | 126,893,099 | | | $ | 984,038 | | | $ | – | |
NOTE 5 – SHARES OF BENEFICIAL INTEREST
At March 31, 2018, there were an unlimited number of shares with no par value of beneficial interest authorized. Transactions in shares of beneficial interest were as follows:
| | | | | | | | | | | | | | | | |
| | | SIX MONTHS ENDED MARCH 31, 2018 (UNAUDITED) | | | YEAR ENDED SEPTEMBER 30, 2017 (AUDITED) | |
| | | SHARES | | | AMOUNT | | | SHARES | | | AMOUNT | |
Class A Shares | | | | | | | | | | | | | | | | |
Shares sold | | | 1,506,737 | | | $ | 17,763,486 | | | | 4,853,150 | | | $ | 56,589,297 | |
Shares issued to shareholders in
reinvestment of dividends | | | 235,377 | | | | 2,772,234 | | | | 608,305 | | | | 7,110,704 | |
Shares repurchased | | | (3,436,887 | ) | | | (40,498,185 | ) | | | (10,269,851 | ) | | | (119,684,697 | ) |
| | | | |
| | | | |
Net decrease | | | (1,694,773 | ) | | $ | (19,962,465 | ) | | | (4,808,396 | ) | | $ | (55,984,696 | ) |
| | | | |
Class C Shares | | | | | | | | | | | | | | | | |
Shares sold | | | 811,215 | | | $ | 9,543,750 | | | | 1,477,872 | | | $ | 17,155,384 | |
Shares issued to shareholders in
reinvestment of dividends | | | 150,482 | | | | 1,769,687 | | | | 431,435 | | | | 5,035,580 | |
Shares repurchased | | | (2,494,965 | ) | | | (29,356,306 | ) | | | (8,139,965 | ) | | | (94,644,921 | ) |
| | | | |
| | | | |
Net decrease | | | (1,533,268 | ) | | $ | (18,042,869 | ) | | | (6,230,658 | ) | | $ | (72,453,957 | ) |
| | | | |
Class I Shares | | | | | | | | | | | | | | | | |
Shares sold | | | 13,902,246 | | | $ | 163,350,490 | | | | 23,950,880 | | | $ | 278,540,691 | |
Shares issued to shareholders in
reinvestment of dividends | | | 709,152 | | | | 8,331,485 | | | | 1,399,591 | | | | 16,342,095 | |
Shares repurchased | | | (9,317,880 | ) | | | (109,444,578 | ) | | | (14,342,119 | ) | | | (166,938,887 | ) |
| | | | |
| | | | |
Net increase | | | 5,293,518 | | | $ | 62,237,397 | | | | 11,008,352 | | | $ | 127,943,899 | |
| | | | |
Class R3 Shares | | | | | | | | | | | | | | | | |
Shares sold | | | 58,852 | | | $ | 693,610 | | | | 70,158 | | | $ | 814,706 | |
Shares issued to shareholders in
reinvestment of dividends | | | 1,151 | | | | 13,553 | | | | 3,015 | | | | 35,213 | |
Shares repurchased | | | (89,505 | ) | | | (1,054,248 | ) | | | (91,558 | ) | | | (1,065,444 | ) |
| | | | |
| | | | |
Net decrease | | | (29,502 | ) | | $ | (347,085 | ) | | | (18,385 | ) | | $ | (215,525 | ) |
| | | | |
32 | Semi-Annual Report
Notes to Financial Statements, Continued
Thornburg Strategic Income Fund | March 31, 2018 (Unaudited)
| | | | | | | | | | | | | | | | |
| | | SIX MONTHS ENDED MARCH 31, 2018 (UNAUDITED) | | | YEAR ENDED SEPTEMBER 30, 2017 (AUDITED) | |
| | | SHARES | | | AMOUNT | | | SHARES | | | AMOUNT | |
Class R4 Shares | | | | | | | | | | | | | | | | |
Shares sold | | | 34,113 | | | $ | 402,262 | | | | 73,696 | | | $ | 851,251 | |
Shares issued to shareholders in
reinvestment of dividends | | | 2,259 | | | | 26,577 | | | | 5,060 | | | | 59,147 | |
Shares repurchased | | | (43,719 | ) | | | (515,256 | ) | | | (122,542 | ) | | | (1,414,923 | ) |
| | | | |
| | | | |
Net decrease | | | (7,347 | ) | | $ | (86,417 | ) | | | (43,786 | ) | | $ | (504,525 | ) |
| | | | |
Class R5 Shares | | | | | | | | | | | | | | | | |
Shares sold | | | 271,865 | | | $ | 3,196,240 | | | | 247,053 | | | $ | 2,875,564 | |
Shares issued to shareholders in
reinvestment of dividends | | | 8,311 | | | | 97,646 | | | | 15,463 | | | | 180,494 | |
Shares repurchased | | | (188,197 | ) | | | (2,215,314 | ) | | | (353,105 | ) | | | (4,086,846 | ) |
| | | | |
| | | | |
Net increase (decrease) | | | 91,979 | | | $ | 1,078,572 | | | | (90,589 | ) | | $ | (1,030,788 | ) |
| | | | |
Class R6 Shares* | | | | | | | | | | | | | | | | |
Shares sold | | | 837,561 | | | $ | 9,811,435 | | | | 22 | | | $ | 250 | |
Shares issued to shareholders in
reinvestment of dividends | | | 37 | | | | 431 | | | | – | | | | 5 | |
Shares repurchased | | | (11 | ) | | | (134 | ) | | | – | | | | – | |
| | | | |
| | | | |
Net increase | | | 837,587 | | | $ | 9,811,732 | | | | 22 | | | $ | 255 | |
| | | | |
* The effective date of this class of shares was April 10, 2017.
NOTE 6 – INVESTMENT TRANSACTIONS
For the six months ended March 31, 2018, the Fund had purchase and sale transactions of investments (excluding short-term investments and U.S. Government obligations) of $251,359,004 and $190,102,617, respectively.
NOTE 7 – DERIVATIVE FINANCIAL INSTRUMENTS WITH OFF-BALANCE SHEET RISK AND FOREIGN INVESTMENT RISK
The Fund may use a variety of derivative financial instruments to hedge or adjust the risks affecting its investment portfolio or to enhance investment returns. Provisions of the FASB Accounting Standards Codification 815-10-50 (“ASC 815”) require certain disclosures. The disclosures are intended to provide users of financial statements with an understanding of the use of derivative instruments by the Fund and how these derivatives affect the financial position, financial performance and cash flows of the Fund. The Fund does not designate any derivative instruments as hedging instruments under ASC 815. During the six months ended March 31, 2018, the Fund’s principal exposure to derivative financial instruments of the type addressed by ASC 815 was investment in foreign exchange contracts. A foreign exchange contract is an agreement between two parties to exchange different currencies at a specified rate of exchange at an agreed upon future date. Foreign exchange contracts involve risks to the Fund, including the risk that a contract’s counterparty will not meet its obligations to the Fund, the risk that a change in a contract’s value may not correlate perfectly with the currency the contract was intended to track, and the risk that the Fund’s Advisor is unable to correctly implement its strategy in using a contract. In any such instance, the Fund may not achieve the intended benefit of entering into a contract, and may experience a loss.
The Fund entered into forward currency contracts during the six months ended March 31, 2018 in the normal course of pursuing its investment objectives, with the objective of purchasing foreign investments or with the intent of reducing the risk to the value of the Fund’s foreign investments from adverse changes in the relationship between the U.S. dollar and foreign currencies. In each case these contracts have been initiated in conjunction with foreign investment transactions. The monthly average value of open forward currency sell contracts for the six months ended March 31, 2018 was $2,538,225.
These contracts are accounted for by the Fund under ASC 815. Unrealized appreciation and depreciation on outstanding contracts are reported in the Fund’s Statement of Assets and Liabilities, as measured by the difference between the forward exchange rates at the reporting date and the forward exchange rates at each contract’s inception date. Net realized gain (loss) on contracts closed during the period, and changes in net unrealized appreciation (depreciation) on outstanding contracts are recognized in the Fund’s Statement of Operations.
Semi-Annual Report | 33
Semi-Annual Report | 33
Notes to Financial Statements, Continued
Thornburg Strategic Income Fund | March 31, 2018 (Unaudited)
The outstanding forward currency contracts in the Schedule of Investments were entered into with State Street Bank and Trust Company (“SSB”), pursuant to an International Swaps and Derivatives Association (“ISDA”) Master Agreement. In the event of a default or termination under the ISDA Master Agreement with SSB, the non-defaulting party has the right to close out all outstanding forward currency contracts between the parties and to net any payment amounts under those contracts, resulting in a single net amount payable by one party to the other.
Because the ISDA Master Agreement with SSB does not result in an offset of reported amounts of financial assets and liabilities in the Fund’s Statement of Assets and Liabilities unless there has been an event of default or termination event under that agreement, the Fund does not net its outstanding forward currency contracts for purposes of the disclosure in the Fund’s Statement of Assets and Liabilities. Instead the Fund recognizes the unrealized appreciation or depreciation on those forward currency contracts on a gross basis in the Fund’s Statement of Assets and Liabilities.
The unrealized appreciation (depreciation) of the outstanding forward currency contracts recognized in the Fund’s Statement of Assets and Liabilities at March 31, 2018 is disclosed in the following table:
| | | | | | |
| FAIR VALUES OF DERIVATIVE FINANCIAL INSTRUMENTS AT MARCH 31, 2018 | |
| | |
| ASSET DERIVATIVES | | BALANCE SHEET LOCATION | | FAIR VALUE | |
| | |
Foreign exchange contracts | | Assets - Unrealized appreciation on forward currency contracts | | $ | 3,759 | |
|
| FAIR VALUES OF DERIVATIVE FINANCIAL INSTRUMENTS AT MARCH 31, 2018 | |
| | |
| LIABILITY DERIVATIVES | | BALANCE SHEET LOCATION | | FAIR VALUE | |
| | |
Foreign exchange contracts | | Liabilities - Unrealized depreciation on forward currency contracts | | $ | 0 | |
Because the Fund did not receive or post cash collateral in connection with its currency forward contracts during the period, and because all of the Fund’s outstanding currency forward contracts are with SSB, the net amounts of the Fund’s assets and liabilities which are attributable to those contracts at March 31, 2018 can be determined by offsetting the dollar amounts shown in the preceding table. Based on those amounts, the net amount of the Fund’s assets which is attributable to its outstanding forward currency contracts at March 31, 2018 is $3,759, and the net amount of the Fund’s liabilities which is attributable to those contracts at that date is $0. The Fund’s forward currency contracts are valued each day, and the net amounts of the Fund’s assets and liabilities which are attributable to those contracts are expected to vary over time.
The net realized gain (loss) from forward currency contracts and the net change in unrealized appreciation (depreciation) on outstanding forward currency contracts recognized in the Fund’s Statement of Operations for the six months ended March 31, 2018 are disclosed in the following tables:
| | | | | | | | |
NET REALIZED GAIN (LOSS) ON DERIVATIVE FINANCIAL INSTRUMENTS RECOGNIZED IN INCOME FOR THE SIX MONTHS ENDED MARCH 31, 2018 | |
| | |
| | | TOTAL | | | FORWARD CURRENCY CONTRACTS | |
| | |
Foreign exchange contracts | | $ | 14,370 | | | $ | 14,370 | |
|
NET CHANGE IN UNREALIZED APPRECIATION (DEPRECIATION) OF DERIVATIVE FINANCIAL INSTRUMENTS RECOGNIZED IN INCOME FOR THE SIX MONTHS ENDED MARCH 31, 2018 | |
| | |
| | | TOTAL | | | FORWARD CURRENCY CONTRACTS | |
| | |
Foreign exchange contracts | | $ | 13,826 | | | $ | 13,826 | |
OTHER NOTES
Risks: The Fund’s investments subject it to risks including, but not limited to, credit risk, interest rate risk, prepayment risk, management risk, market and economic risk, liquidity risk, risks affecting specific issuers, and the risks associated with investments in derivative instruments, small- and mid-cap companies, non-U.S. issuers, real estate investment trusts, below investment grade debt obligations, and structured finance arrangements. Please see the Fund’s prospectus for a discussion of the risks associated with an investment in the Fund.
Subsequent Events: Fund management believes no events have occurred between March 31, 2018 and the date of issuance of the financial statements that require adjustment to or disclosure in the accompanying financial statements.
34 | Semi-Annual Report
This page intentionally left blank.
Semi-Annual Report | 35
Financial Highlights
Thornburg Strategic Income Fund
| | | | | | | | | | | | | | | | | | | | | | | | | | | | | | | | | | | | | | | | |
| | | PER SHARE PERFORMANCE (FOR A SHARE OUTSTANDING THROUGHOUT THE PERIOD) |
| | | | | | | | | | | | | | | | | |
UNLESS OTHERWISE NOTED, PERIODS ARE FISCAL YEARS ENDED SEPTEMBER 30, | | NET ASSET
VALUE,
BEGINNING OF
PERIOD | | NET
INVESTMENT
INCOME
(LOSS)+ | | NET REALIZED &
UNREALIZED GAIN
(LOSS) ON
INVESTMENTS | | TOTAL FROM
INVESTMENT
OPERATIONS | | DIVIDENDS
FROM NET
INVESTMENT
INCOME | | DIVIDENDS
FROM NET
REALIZED
GAINS | | TOTAL
DIVIDENDS | | NET ASSET
VALUE,
END OF PERIOD |
| | | | | | | |
| CLASS A SHARES | | | | | | | | | | | | | | | | | | | | | | | | | | | | | | | | | | | | |
| | | | | | | | |
2018(b)(c) | | | $ | 11.82 | | | | | 0.20 | | | | | (0.17 | ) | | | | 0.03 | | | | | (0.16 | ) | | | | – | | | | | (0.16 | ) | | | $ | 11.69 | |
2017(b) | | | $ | 11.56 | | | | | 0.42 | | | | | 0.20 | | | | | 0.62 | | | | | (0.36 | ) | | | | – | | | | | (0.36 | ) | | | $ | 11.82 | |
2016(b) | | | $ | 11.22 | | | | | 0.46 | | | | | 0.28 | | | | | 0.74 | | | | | (0.37 | ) | | | | (0.03 | ) | | | | (0.40 | ) | | | $ | 11.56 | |
2015(b) | | | $ | 12.18 | | | | | 0.47 | | | | | (0.82 | ) | | | | (0.35 | ) | | | | (0.46 | ) | | | | (0.15 | ) | | | | (0.61 | ) | | | $ | 11.22 | |
2014(b) | | | $ | 12.19 | | | | | 0.52 | | | | | 0.28 | | | | | 0.80 | | | | | (0.54 | ) | | | | (0.27 | ) | | | | (0.81 | ) | | | $ | 12.18 | |
2013(b) | | | $ | 12.28 | | | | | 0.67 | | | | | 0.03 | | | | | 0.70 | | | | | (0.65 | ) | | | | (0.14 | ) | | | | (0.79 | ) | | | $ | 12.19 | |
| | | | | | | |
| CLASS C SHARES | | | | | | | | | | | | | | | | | | | | | | | | | | | | | | | | | | | | |
| | | | | | | | |
2018(c) | | | $ | 11.81 | | | | | 0.16 | | | | | (0.18 | ) | | | | (0.02 | ) | | | | (0.12 | ) | | | | – | | | | | (0.12 | ) | | | $ | 11.67 | |
2017 | | | $ | 11.55 | | | | | 0.35 | | | | | 0.19 | | | | | 0.54 | | | | | (0.28 | ) | | | | – | | | | | (0.28 | ) | | | $ | 11.81 | |
2016 | | | $ | 11.20 | | | | | 0.40 | | | | | 0.28 | | | | | 0.68 | | | | | (0.30 | ) | | | | (0.03 | ) | | | | (0.33 | ) | | | $ | 11.55 | |
2015 | | | $ | 12.17 | | | | | 0.41 | | | | | (0.83 | ) | | | | (0.42 | ) | | | | (0.40 | ) | | | | (0.15 | ) | | | | (0.55 | ) | | | $ | 11.20 | |
2014 | | | $ | 12.17 | | | | | 0.45 | | | | | 0.29 | | | | | 0.74 | | | | | (0.47 | ) | | | | (0.27 | ) | | | | (0.74 | ) | | | $ | 12.17 | |
2013 | | | $ | 12.26 | | | | | 0.60 | | | | | 0.03 | | | | | 0.63 | | | | | (0.58 | ) | | | | (0.14 | ) | | | | (0.72 | ) | | | $ | 12.17 | |
| | | | | | | |
| CLASS I SHARES | | | | | | | | | | | | | | | | | | | | | | | | | | | | | | | | | | | | |
| | | | | | | | |
2018(c) | | | $ | 11.80 | | | | | 0.22 | | | | | (0.17 | ) | | | | 0.05 | | | | | (0.18 | ) | | | | – | | | | | (0.18 | ) | | | $ | 11.67 | |
2017 | | | $ | 11.54 | | | | | 0.47 | | | | | 0.19 | | | | | 0.66 | | | | | (0.40 | ) | | | | – | | | | | (0.40 | ) | | | $ | 11.80 | |
2016 | | | $ | 11.19 | | | | | 0.50 | | | | | 0.28 | | | | | 0.78 | | | | | (0.40 | ) | | | | (0.03 | ) | | | | (0.43 | ) | | | $ | 11.54 | |
2015 | | | $ | 12.16 | | | | | 0.51 | | | | | (0.83 | ) | | | | (0.32 | ) | | | | (0.50 | ) | | | | (0.15 | ) | | | | (0.65 | ) | | | $ | 11.19 | |
2014 | | | $ | 12.17 | | | | | 0.56 | | | | | 0.28 | | | | | 0.84 | | | | | (0.58 | ) | | | | (0.27 | ) | | | | (0.85 | ) | | | $ | 12.16 | |
2013 | | | $ | 12.25 | | | | | 0.70 | | | | | 0.04 | | | | | 0.74 | | | | | (0.68 | ) | | | | (0.14 | ) | | | | (0.82 | ) | | | $ | 12.17 | |
| | | | | | | |
| CLASS R3 SHARES | | | | | | | | | | | | | | | | | | | | | | | | | | | | | | | | | | | | |
| | | | | | | | |
2018(c) | | | $ | 11.82 | | | | | 0.19 | | | | | (0.17 | ) | | | | 0.02 | | | | | (0.15 | ) | | | | – | | | | | (0.15 | ) | | | $ | 11.69 | |
2017 | | | $ | 11.55 | | | | | 0.42 | | | | | 0.20 | | | | | 0.62 | | | | | (0.35 | ) | | | | – | | | | | (0.35 | ) | | | $ | 11.82 | |
2016 | | | $ | 11.21 | | | | | 0.46 | | | | | 0.27 | | | | | 0.73 | | | | | (0.36 | ) | | | | (0.03 | ) | | | | (0.39 | ) | | | $ | 11.55 | |
2015 | | | $ | 12.18 | | | | | 0.47 | | | | | (0.83 | ) | | | | (0.36 | ) | | | | (0.46 | ) | | | | (0.15 | ) | | | | (0.61 | ) | | | $ | 11.21 | |
2014 | | | $ | 12.19 | | | | | 0.49 | | | | | 0.31 | | | | | 0.80 | | | | | (0.54 | ) | | | | (0.27 | ) | | | | (0.81 | ) | | | $ | 12.18 | |
2013 | | | $ | 12.28 | | | | | 0.63 | | | | | 0.06 | | | | | 0.69 | | | | | (0.64 | ) | | | | (0.14 | ) | | | | (0.78 | ) | | | $ | 12.19 | |
| | | | | | | |
| CLASS R4 SHARES | | | | | | | | | | | | | | | | | | | | | | | | | | | | | | | | | | | | |
| | | | | | | | |
2018(c) | | | $ | 11.82 | | | | | 0.19 | | | | | (0.18 | ) | | | | 0.01 | | | | | (0.15 | ) | | | | – | | | | | (0.15 | ) | | | $ | 11.68 | |
2017 | | | $ | 11.56 | | | | | 0.41 | | | | | 0.20 | | | | | 0.61 | | | | | (0.35 | ) | | | | – | | | | | (0.35 | ) | | | $ | 11.82 | |
2016 | | | $ | 11.21 | | | | | 0.46 | | | | | 0.28 | | | | | 0.74 | | | | | (0.36 | ) | | | | (0.03 | ) | | | | (0.39 | ) | | | $ | 11.56 | |
2015 | | | $ | 12.18 | | | | | 0.48 | | | | | (0.84 | ) | | | | (0.36 | ) | | | | (0.46 | ) | | | | (0.15 | ) | | | | (0.61 | ) | | | $ | 11.21 | |
2014(f) | | | $ | 12.00 | | | | | 0.35 | | | | | 0.17 | | | | | 0.52 | | | | | (0.34 | ) | | | | – | | | | | (0.34 | ) | | | $ | 12.18 | |
| | | | | | | |
| CLASS R5 SHARES | | | | | | | | | | | | | | | | | | | | | | | | | | | | | | | | | | | | |
| | | | | | | | |
2018(c) | | | $ | 11.80 | | | | | 0.22 | | | | | (0.17 | ) | | | | 0.05 | | | | | (0.18 | ) | | | | – | | | | | (0.18 | ) | | | $ | 11.67 | |
2017 | | | $ | 11.54 | | | | | 0.47 | | | | | 0.19 | | | | | 0.66 | | | | | (0.40 | ) | | | | – | | | | | (0.40 | ) | | | $ | 11.80 | |
2016 | | | $ | 11.19 | | | | | 0.49 | | | | | 0.28 | | | | | 0.77 | | | | | (0.39 | ) | | | | (0.03 | ) | | | | (0.42 | ) | | | $ | 11.54 | |
2015 | | | $ | 12.15 | | | | | 0.50 | | | | | (0.82 | ) | | | | (0.32 | ) | | | | (0.49 | ) | | | | (0.15 | ) | | | | (0.64 | ) | | | $ | 11.19 | |
2014 | | | $ | 12.16 | | | | | 0.55 | | | | | 0.28 | | | | | 0.83 | | | | | (0.57 | ) | | | | (0.27 | ) | | | | (0.84 | ) | | | $ | 12.15 | |
2013 | | | $ | 12.25 | | | | | 0.70 | | | | | 0.03 | | | | | 0.73 | | | | | (0.68 | ) | | | | (0.14 | ) | | | | (0.82 | ) | | | $ | 12.16 | |
| | | | | | | |
| CLASS R6 SHARES | | | | | | | | | | | | | | | | | | | | | | | | | | | | | | | | | | | | |
| | | | | | | | |
2018(c) | | | $ | 11.85 | | | | | 0.22 | | | | | (0.18 | ) | | | | 0.04 | | | | | (0.19 | ) | | | | – | | | | | (0.19 | ) | | | $ | 11.70 | |
2017(g) | | | $ | 11.63 | | | | | 0.33 | | | | | 0.13 | | | | | 0.46 | | | | | (0.24 | ) | | | | – | | | | | (0.24 | ) | | | $ | 11.85 | |
| (a) | Not annualized for periods less than one year. |
| (b) | Sales loads are not reflected in computing total return. |
| (c) | Unaudited Six Month Period Ended March 31. |
| (e) | Due to the size of net assets and fixed expenses, ratios may appear disproportionate. |
| (f) | Effective date of this class of shares was February 1, 2014. |
| (g) | Effective date of this class of shares was April 10, 2017. |
| (h) | Net Assets at End of Year was less than $1,000. |
| + | Based on weighted average shares outstanding. |
See notes to financial statements.
36 | Semi-Annual Report
Financial Highlights, Continued
Thornburg Strategic Income Fund
| | | | | | | | | | | | | | | | | | | | | | | | | | | | | | |
| RATIOS TO AVERAGE NET ASSETS | | | | | | SUPPLEMENTAL DATA | |
| | | | | | | EXPENSES, AFTER | | | | | | | | | | | | | | | | |
NET INVESTMENT
INCOME (LOSS) (%) | | | EXPENSES, AFTER
EXPENSE
REDUCTIONS (%) | | | EXPENSE
REDUCTIONS AND
NET OF CUSTODY
CREDITS (%) | | | EXPENSES,
BEFORE EXPENSE
REDUCTIONS (%) | | | | | | TOTAL
RETURN (%)(a) | | | PORTFOLIO
TURNOVER
RATE (%)(a) | | | NET ASSETS AT
END OF PERIOD
(THOUSANDS) | |
| | | | | | | |
| | | | | | | | | | | | | | | | | | | | | | | | | | | | | | |
| | | | | | | |
| | 3.35 | (d) | | | 1.11 | (d) | | | 1.11 | (d) | | | 1.22 | (d) | | | | | | | 0.24 | | | | 20.27 | | | $ | 210,534 | |
| | 3.61 | | | | 1.17 | | | | 1.17 | | | | 1.25 | | | | | | | | 5.41 | | | | 44.74 | | | $ | 232,938 | |
| | 4.12 | | | | 1.24 | | | | 1.24 | | | | 1.24 | | | | | | | | 6.70 | | | | 29.48 | | | $ | 283,398 | |
| | 4.04 | | | | 1.23 | | | | 1.23 | | | | 1.23 | | | | | | | | (2.97 | ) | | | 38.40 | | | $ | 338,387 | |
| | 4.30 | | | | 1.22 | | | | 1.22 | | | | 1.24 | | | | | | | | 6.79 | | | | 51.20 | | | $ | 392,604 | |
| | 5.44 | | | | 1.25 | | | | 1.25 | | | | 1.27 | | | | | | | | 5.79 | | | | 76.47 | | | $ | 251,106 | |
| | | | | | | |
| | | | | | | | | | | | | | | | | | | | | | | | | | | | | | |
| | | | | | | |
| | 2.66 | (d) | | | 1.80 | (d) | | | 1.80 | (d) | | | 1.97 | (d) | | | | | | | (0.19 | ) | | | 20.27 | | | $ | 185,067 | |
| | 2.98 | | | | 1.80 | | | | 1.80 | | | | 1.99 | | | | | | | | 4.76 | | | | 44.74 | | | $ | 205,253 | |
| | 3.56 | | | | 1.80 | | | | 1.80 | | | | 1.99 | | | | | | | | 6.20 | | | | 29.48 | | | $ | 272,691 | |
| | 3.47 | | | | 1.80 | | | | 1.80 | | | | 1.97 | | | | | | | | (3.61 | ) | | | 38.40 | | | $ | 306,085 | |
| | 3.73 | | | | 1.80 | | | | 1.80 | | | | 1.98 | | | | | | | | 6.27 | | | | 51.20 | | | $ | 348,334 | |
| | 4.88 | | | | 1.80 | | | | 1.80 | | | | 2.02 | | | | | | | | 5.21 | | | | 76.47 | | | $ | 237,177 | |
| | | | | | | |
| | | | | | | | | | | | | | | | | | | | | | | | | | | | | | |
| | | | | | | |
| | 3.77 | (d) | | | 0.69 | (d) | | | 0.69 | (d) | | | 0.90 | (d) | | | | | | | 0.45 | | | | 20.27 | | | $ | 675,602 | |
| | 4.02 | | | | 0.75 | | | | 0.75 | | | | 0.92 | | | | | | | | 5.85 | | | | 44.74 | | | $ | 620,780 | |
| | 4.45 | | | | 0.91 | | | | 0.91 | | | | 0.91 | | | | | | | | 7.15 | | | | 29.48 | | | $ | 480,143 | |
| | 4.38 | | | | 0.89 | | | | 0.89 | | | | 0.89 | | | | | | | | (2.73 | ) | | | 38.40 | | | $ | 531,849 | |
| | 4.60 | | | | 0.90 | | | | 0.90 | | | | 0.90 | | | | | | | | 7.15 | | | | 51.20 | | | $ | 552,182 | |
| | 5.75 | | | | 0.94 | | | | 0.94 | | | | 0.94 | | | | | | | | 6.21 | | | | 76.47 | | | $ | 246,332 | |
| | | | | | | |
| | | | | | | | | | | | | | | | | | | | | | | | | | | | | | |
| | | | | | | |
| | 3.21 | (d) | | | 1.25 | (d) | | | 1.25 | (d) | | | 2.42 | (d) | | | | | | | 0.18 | | | | 20.27 | | | $ | 2,292 | |
| | 3.65 | | | | 1.12 | | | | 1.12 | | | | 2.58 | | | | | | | | 5.49 | | | | 44.74 | | | $ | 2,667 | |
| | 4.07 | | | | 1.25 | | | | 1.25 | | | | 3.09 | | | | | | | | 6.69 | | | | 29.48 | | | $ | 2,819 | |
| | 3.98 | | | | 1.25 | | | | 1.25 | | | | 2.70 | | | | | | | | (3.07 | ) | | | 38.40 | | | $ | 1,430 | |
| | 4.10 | | | | 1.25 | | | | 1.25 | | | | 3.10 | | | | | | | | 6.76 | | | | 51.20 | | | $ | 3,049 | |
| | 5.19 | | | | 1.25 | | | | 1.25 | | | | 32.64 | (e) | | | | | | | 5.78 | | | | 76.47 | | | $ | 171 | |
| | | | | | | |
| | | | | | | | | | | | | | | | | | | | | | | | | | | | | | |
| | | | | | | |
| | 3.22 | (d) | | | 1.25 | (d) | | | 1.25 | (d) | | | 2.07 | (d) | | | | | | | 0.11 | | | | 20.27 | | | $ | 2,655 | |
| | 3.52 | | | | 1.25 | | | | 1.25 | | | | 2.30 | | | | | | | | 5.35 | | | | 44.74 | | | $ | 2,772 | |
| | 4.10 | | | | 1.25 | | | | 1.25 | | | | 2.50 | | | | | | | | 6.79 | | | | 29.48 | | | $ | 3,218 | |
| | 4.15 | | | | 1.25 | | | | 1.25 | | | | 2.64 | | | | | | | | (3.07 | ) | | | 38.40 | | | $ | 2,106 | |
| | 4.25 | (d) | | | 1.25 | (d) | | | 1.25 | (d) | | | 60.66 | (d)(e) | | | | | | | 4.29 | | | | 51.20 | | | $ | 16 | |
| | | | | | | |
| | | | | | | | | | | | | | | | | | | | | | | | | | | | | | |
| | | | | | | |
| | 3.79 | (d) | | | 0.69 | (d) | | | 0.69 | (d) | | | 1.20 | (d) | | | | | | | 0.45 | | | | 20.27 | | | $ | 7,289 | |
| | 4.03 | | | | 0.74 | | | | 0.74 | | | | 1.36 | | | | | | | | 5.84 | | | | 44.74 | | | $ | 6,286 | |
| | 4.34 | | | | 0.99 | | | | 0.99 | | | | 1.37 | | | | | | | | 7.07 | | | | 29.48 | | | $ | 7,191 | |
| | 4.33 | | | | 0.99 | | | | 0.99 | | | | 1.55 | | | | | | | | (2.75 | ) | | | 38.40 | | | $ | 6,399 | |
| | 4.51 | | | | 0.99 | | | | 0.99 | | | | 2.11 | | | | | | | | 7.05 | | | | 51.20 | | | $ | 2,565 | |
| | 5.68 | | | | 0.99 | | | | 0.99 | | | | 227.33 | (e) | | | | | | | 6.07 | | | | 76.47 | | | $ | 11 | |
| | | | | | | |
| | | | | | | | | | | | | | | | | | | | | | | | | | | | | | |
| | | | | | | |
| | 3.86 | (d) | | | 0.65 | (d) | | | 0.65 | (d) | | | 3.51 | (d) | | | | | | | 0.38 | | | | 20.27 | | | $ | 9,801 | |
| | 5.83 | (d) | | | 0.00 | (d) | | | 0.00 | (d) | | | 200.66 | (d)(e) | | | | | | | 3.99 | | | | 44.74 | | | $ | – | (h) |
Semi-Annual Reportt | 37
Expense Example
Thornburg Strategic Income Fund | March 31, 2018 (Unaudited)
As a shareholder of the Fund, you incur two types of costs:
| | (1) | transaction costs, including |
| | (a) | sales charges (loads) on purchase payments, for Class A shares; |
| | (b) | a deferred sales charge on redemptions of any part or all of a purchase of $1 million of Class A shares within 12 months of purchase; |
| | (c) | a deferred sales charge on redemptions of Class C shares within 12 months of purchase; |
| | (2) | ongoing costs, including management fees; distribution and/or service (12b-1) fees; and other Fund expenses. |
This example is intended to help you understand your ongoing costs (in dollars) of investing in the Fund and to compare these costs with the ongoing costs of investing in other mutual funds.
The example is based on a $1,000 investment beginning on October 1, 2017, and held until March 31, 2018.
ACTUAL EXPENSES
For each class of shares, the first line of the accompanying table provides information about actual account values and actual expenses. You may use the information in this line, together with the amount you invested, to estimate the expenses that you paid over the period. Simply divide your account value by $1,000 (for example, an $8,600 account value divided by $1,000 = 8.6), then multiply the result by the number in the first line for your class of shares under the heading entitled “Expenses Paid During Period” to estimate the expenses you paid on your account during this period.
| | | | | | | | | | | | | | | |
| | | BEGINNING
ACCOUNT VALUE
10/1/17 | | ENDING
ACCOUNT VALUE
3/31/18 | | EXPENSES PAID
DURING PERIOD†
10/1/17–3/31/18 |
| | | |
| CLASS A SHARES | | | | | | | | | | | | | | | |
| | | |
Actual | | | $ | 1,000.00 | | | | $ | 1,002.40 | | | | $ | 5.54 | |
Hypothetical* | | | $ | 1,000.00 | | | | $ | 1,019.40 | | | | $ | 5.59 | |
| | | |
| CLASS C SHARES | | | | | | | | | | | | | | | |
| | | |
Actual | | | $ | 1,000.00 | | | | $ | 998.10 | | | | $ | 8.97 | |
Hypothetical* | | | $ | 1,000.00 | | | | $ | 1,015.96 | | | | $ | 9.05 | |
| | | |
| CLASS I SHARES | | | | | | | | | | | | | | | |
| | | |
Actual | | | $ | 1,000.00 | | | | $ | 1,004.50 | | | | $ | 3.45 | |
Hypothetical* | | | $ | 1,000.00 | | | | $ | 1,021.49 | | | | $ | 3.48 | |
| | | |
| CLASS R3 SHARES | | | | | | | | | | | | | | | |
| | | |
Actual | | | $ | 1,000.00 | | | | $ | 1,001.80 | | | | $ | 6.24 | |
Hypothetical* | | | $ | 1,000.00 | | | | $ | 1,018.70 | | | | $ | 6.29 | |
| | | |
| CLASS R4 SHARES | | | | | | | | | | | | | | | |
| | | |
Actual | | | $ | 1,000.00 | | | | $ | 1,001.10 | | | | $ | 6.24 | |
Hypothetical* | | | $ | 1,000.00 | | | | $ | 1,018.70 | | | | $ | 6.29 | |
| | | |
| CLASS R5 SHARES | | | | | | | | | | | | | | | |
| | | |
Actual | | | $ | 1,000.00 | | | | $ | 1,004.50 | | | | $ | 3.45 | |
Hypothetical* | | | $ | 1,000.00 | | | | $ | 1,021.49 | | | | $ | 3.48 | |
| | | |
| CLASS R6 SHARES | | | | | | | | | | | | | | | |
| | | |
Actual | | | $ | 1,000.00 | | | | $ | 1,003.80 | | | | $ | 3.25 | |
Hypothetical* | | | $ | 1,000.00 | | | | $ | 1,021.69 | | | | $ | 3.28 | |
| † | Expenses are equal to the annualized expense ratio for each class (A: 1.11%; C: 1.80%; I: 0.69%; R3: 1.25%; R4: 1.25%; R5: 0.69%; R6: 0.65%) multiplied by the average account value over the period, multiplied by 182/365 to reflect the one-half year period. |
| * | Hypothetical assumes a rate of return of 5% per year before expenses. |
HYPOTHETICAL EXAMPLE FOR COMPARISON PURPOSES
For each class of shares, the second line of the accompanying table provides information about hypothetical account values and hypothetical expenses based on the Fund’s actual expense ratio and an assumed rate of return of 5% per year before expenses, which is not the Fund’s actual return. The hypothetical account values and expenses may not be used to estimate the actual ending account balance or expenses you paid for the period. You may use this information to compare the ongoing costs of investing in the Fund and other funds. To do so, compare this 5% hypothetical example with the 5% hypothetical examples that appear in the shareholder reports of the other funds.
Please note that the expenses shown in the table are meant to highlight your ongoing costs only and do not reflect any transactional costs, such as sales charges (loads), redemption fees, or exchange fees. Therefore, the second line of the table for each class of shares is useful in comparing ongoing costs only, and will not help you determine the relative total costs of owning different funds. In addition, if these transactional costs were included, your costs would have been higher.
38 | Semi-Annual Report
Other Information
Thornburg Strategic Income Fund | March 31, 2018 (Unaudited)
PORTFOLIO PROXY VOTING
Policies and Procedures:
The Trust has delegated to Thornburg Investment Management, Inc. (the “Advisor”) voting decisions respecting proxies for the Fund’s voting securities. The Advisor makes voting decisions in accordance with its Proxy Voting Policy and Procedures. A description of the Policy and Procedures is available (i) without charge, upon request, by calling the Advisor toll-free at 1-800-847-0200, (ii) on the Thornburg website at www.thornburg.com, and (iii) on the Securities and Exchange Commission’s website at www.sec.gov.
Information regarding how proxies were voted is available on or before August 31 of each year for the twelve months ending the preceding June 30. This information is available (i) without charge, upon request by calling the Advisor toll-free at 1-800-847-0200, (ii) on the Thornburg website at www.thornburg.com, and (iii) on the Securities and Exchange Commission’s website at www.sec.gov.
AVAILABILITY OF QUARTERLY PORTFOLIO SCHEDULE
The Fund files with the Securities and Exchange Commission schedules of its portfolio holdings on Form N-Q for the first and third quarters of each fiscal year. The Fund’s Forms N-Q are available on the Commission’s website at www.sec.gov, or may be reviewed and copied at the Commission’s Public Reference Room in Washington, D.C. Information on the operation of the Public Reference Room may be obtained by calling 1-800-SEC-0330. The Fund also makes this information available on its website at www.thornburg.com/download or upon request by calling 1-800-847-0200.
Semi-Annual Report | 39
Trustees’ Statement to Shareholders
Readopted September 11, 2017
The Trustees believe current and prospective shareholders should know how we discharge our responsibilities in supervising the Funds’ investment advisor and in reviewing the advisor’s contract for renewal. Since 2005, we have issued a statement which sets out clearly the three principal guidelines that we follow in supervising the Trust’s investment advisor on your behalf. In accordance with our customary practice, in September of this year we again reviewed our statement and concluded we should reissue this statement outlining the principal features of our supervision of the advisor’s performance of investment management services for the Funds.
We begin with the premise that each shareholder selected his or her Fund because its investments are managed by the investment advisor identified in the prospectus and in accordance with the objective and policies described in the prospectus. We realize, as each of you do, that if you believe that your Fund’s stated objective and policies no longer serve your personal investment goals, you can sell your shares and leave the Fund.
Therefore, we believe that our primary supervisory task—our principal obligation to you—is to assess the nature and quality of the advisor’s services, and to confirm that the advisor actively and competently pursues the Fund’s objective, in accordance with the policies set out in the prospectus. To do this, we meet regularly with management to review your Fund’s portfolio and to discuss the advisor’s specific actions and judgments in pursuing the Fund’s objective. We do not substitute our own judgment for the advisor’s decisions in selecting investments; the advisor is paid to exercise its informed judgment on investment decisions, and we seek to confirm, in reviewing the advisor’s performance, that the advisor is doing just that.
Second, we are conscious of costs and the effect that costs have on shareholders’ returns. We try to make sure that your Fund’s fees and costs are reasonable in relationship to the services rendered and that they are generally in line with those charged by other expert investment advisors, consistent with our belief that the Fund’s investors searched for and expect that expertise and attention and have decided to pay a reasonable price for it. We do not put the management contract “out to bid” as a matter of course, and we would not do so unless we had concluded that the advisor materially had failed to pursue the Fund’s objectives in accordance with its policies, or for other equally important reasons. We believe that any other approach would be inconsistent with your interests and contrary to your expectations when you bought shares of the Fund in the first place.
Finally, because we believe that most Thornburg Fund shareholders have invested with a long-term perspective, we try not to focus too much on the fashions of the moment and on short-term performance. The market will not favor any specific investment objective or set of policies at all times and under all economic circumstances. A fund will experience periods of both high and low returns relative to other funds and other investments. Even if one of our Funds is not favored by the market at a particular time, we believe that the advisor is nonetheless obliged to remain true to the Fund’s objective and policies, and we watch to see that it does so.
Trustees of Thornburg Investment Trust
40 | Semi-Annual Report
Thornburg Funds
Thornburg Investment Management is a privately-owned global investment firm that offers a range of solutions for retail and institutional investors. Founded in 1982 and headquartered in Santa Fe, New Mexico, we manage approximately $49 billion (as of March 31, 2018) across U.S. mutual funds, separate accounts for high-net-worth investors, institutional accounts, and UCITS funds for non-U.S. investors.
EQUITY FUNDS
| | ∎ | | Thornburg Investment Income Builder Fund |
| | ∎ | | Thornburg Global Opportunities Fund |
| | ∎ | | Thornburg International Value Fund |
| | ∎ | | Thornburg Better World International Fund |
| | ∎ | | Thornburg International Growth Fund |
| | ∎ | | Thornburg Developing World Fund |
| | ∎ | | Thornburg Core Growth Fund |
FIXED INCOME FUNDS
| | ∎ | | Thornburg Low Duration Income Fund |
| | ∎ | | Thornburg Limited Term U.S. Government Fund |
| | ∎ | | Thornburg Limited Term Income Fund |
| | ∎ | | Thornburg Strategic Income Fund |
| | ∎ | | Thornburg Low Duration Municipal Fund |
| | ∎ | | Thornburg Limited Term Municipal Fund |
| | ∎ | | Thornburg Intermediate Municipal Fund |
| | ∎ | | Thornburg California Limited Term Municipal Fund |
| | ∎ | | Thornburg New Mexico Intermediate Municipal Fund |
| | ∎ | | Thornburg New York Intermediate Municipal Fund |
| | ∎ | | Thornburg Strategic Municipal Income Fund |
ALTERNATIVE FUNDS
| | ∎ | | Thornburg Long/Short Equity Fund |
Before investing, carefully consider the Fund’s investment goals, risks, charges, and expenses. For a prospectus or summary prospectus containing this and other information, contact your financial advisor or visit thornburg.com. Read it carefully before investing.
For additional information, please visit thornburg.com
Thornburg Investment Management, Inc. 2300 North Ridgetop Road, Santa Fe, NM 87506
Semi-Annual Report | 41
This page intentionally left blank.
42 | Semi-Annual Report
This page intentionally left blank.
Semi-Annual Report | 43
| | | | |
| To receive shareholder reports, prospectuses, and proxy statements electronically, go to www.thornburg.com/edelivery. | | | | |
| This Semi-Annual Report is submitted for the general information of shareholders of the Fund. It is not authorized for distribution to prospective investors in the Fund unless preceded or accompanied by an effective prospectus. | |
| | | | |
Investment Advisor: | | Distributor: | | |
Thornburg Investment Management® | | Thornburg Securities Corporation® | | |
800.847.0200 | | 800.847.0200 | | TH1663 |
Semi-Annual Report
March 31, 2018
THORNBURG VALUE FUND
About Thornburg Investment Management
It’s more than what we do.
It’s how we do it.
At Thornburg, we are very different in how we think, invest, and are structured. We believe this difference is what makes us successful in helping individuals reach their long-term financial goals.
Flexible Perspective
Our perspective on investment opportunities is more flexible than most, viewing a wide range of opportunities beyond conventional boundaries to find hidden value.
Collaboration
Collectively, we hone ideas via borderless cross-pollination for better judgment and better results.
Portfolio Construction
Disciplined construction guided more by our convictions than convention.
CONVICTION
Thorough analysis and our relative-value framework lead to conviction in our securities selection.
UNCONVENTIONAL
Active management means we seek the best value for our clients rather than using conventional benchmarks as our starting point.
Structured for Excellence
How we think and how we invest is made possible by how we’re structured.
TEAM APPROACH
FAR FROM THE HERD
ACCESS & TRANSPARENCY
2 | Semi-Annual Report
Thornburg Value Fund
Semi-Annual Report | March 31, 2018
Table of Contents
| | | | | | | | | | |
| SHARE CLASS | | NASDAQ SYMBOL | | CUSIP |
| | |
| Class A | | TVAFX | | | | 885-215-731 | |
| Class C | | TVCFX | | | | 885-215-715 | |
| Class I | | TVIFX | | | | 885-215-632 | |
| Class R3 | | TVRFX | | | | 885-215-533 | |
| Class R4 | | TVIRX | | | | 885-215-277 | |
| Class R5 | | TVRRX | | | | 885-215-376 | |
Class I, R3, R4, and R5 shares may not be available to all investors. Minimum investments for Class I shares may be higher than those for other classes.
Investments carry risks, including possible loss of principal. Additional risks may be associated with investments outside the United States, especially in emerging markets, including currency fluctuations, illiquidity, volatility, and political and economic risks. Investments in small- and mid-capitalization companies may increase the risk of greater price fluctuations. Please see the Fund’s prospectus for a discussion of the risks associated with an investment in the Fund. Investments in the Fund are not FDIC insured, nor are they deposits of or guaranteed by a bank or any other entity.
Semi-Annual Report | 3
Letter to Shareholders
Thornburg Value Fund | March 31, 2018 (Unaudited)
May 3, 2018
Dear Fellow Shareholder:
Following a very strong first nine months of calendar year 2017, with Value Fund I shares returning 18.9% vs. the S&P 500 Index return of 14.2%, the Fund didn’t keep up during the most recent semi-annual period ended March 31, 2018. Over the six months, the Fund returned 2.4% vs. the S&P 500 Index return of 5.8%. Stock selection was the main driver of our relative underperformance in the period. Our large cash position of 8.0% on average also weighed on our return relative to that of the benchmark.
Over the period interest rates increased dramatically, and many of the “expensive defensive” investments that we’ve long avoided performed poorly. We’ve long had exposure to some of the largest technology companies in our consistent earner basket instead of traditional consumer staples or telecom investments. Given this positioning, we would have expected much better performance during the period.
But we had sold Amazon and Netflix, and trimmed other information technology investments, abiding by our valuation discipline. While these investments were never cheap by traditional valuation metrics such as share price-to-earnings, we have long used “sum-of-the-parts” valuation approaches for each to calculate our estimate of intrinsic value. Still, even against our most innovative valuation approaches, Amazon and Netflix had reached our price targets. These, and other information technology investments, were strong contributors to the index returns. Meanwhile, our information technology exposure was lower than that of the S&P 500 Index during the six months covered in this report, and performed worse.
The financials sector was another strong contributor to the index return during the period. Rising interest rates are good for banks, and the group benefited. While we were overweight financials, a few of our individual investments in the sector didn’t keep pace. In particular, investment firm Oaktree Capital lagged as a result of the counter-cyclical aspects of its investment approach.
A few individual investments were particularly painful during the period, and our contributors didn’t do enough to offset the detractors this time around. Our stock selection was strongest in the consumer staples and materials sectors, while our industrials exposures proved a drag.
Contributors
Warrior Met Coal, Inc. Strong commodity pricing for hard coking coal has provided significant cash flow upside for this company. A large cash return to shareholders also aided total return during the period.
U.S. Foods Holding Corp. Continued market share gains with independent restaurant customers, improved margins from higher sales of private-label products, and an intentional shift in
customer mix toward higher-value independent customers allowed the company to grow operating income at a high single-digit rate.
Walmart, Inc. Walmart’s re-investment in its business (both in stores and online) continues to pay off. In particular, traffic in Walmart U.S.-based stores grew solidly throughout 2017.
JPMorgan Chase & Co. The passing of tax reform and higher interest rates have helped move the stock higher during the period.
TRI Pointe Homes, Inc. Strength in the construction and sale of single-family attached and detached homes continues, benefiting shares of California-based home builder TRI Pointe.
Detractors
ADT, Inc. Security monitoring company ADT was brought back to the public markets by its private equity owner Apollo Group. We like the long-term secular growth trend in household security monitoring in the U.S.; ADT’s leadership position in a very fragmented market; its sustained, strong competitive position despite significant cable and telecom provider attempts to gain share; and the predictable nature of a subscription-based revenue model. We don’t like the legacy controversy around this investment, mainly the short investor interest the company has attracted; management’s decision to disclose less data; and ADT’s hefty debt load. We worked with the underwriter on the initial public offering (IPO) to help set a price that was well below the original “range,” at which we believed the positives outweighed the negatives. So far that has not been our experience, and the stock broke its IPO price and has traded materially lower since. We are monitoring developments against our initial investment thesis closely.
General Electric Co. This diversified industrial and financial services conglomerate serves a wide variety of end markets globally, including power and water, aviation, oil and gas, health care, appliances and lighting, energy management, transportation, and finance. During the period, its share price declined on continued disappointment from its power segment and upcoming accounting restatement. We exited the position.
Expedia Group, Inc. The online travel platform’s fourth quarter earnings miss contributed to weakness in its share price during the period. We believe increased investment will lead to faster sales growth.
Oaktree Capital Group LLC The investment manager has had difficulty deploying capital in the current market environment. As a result, it is not yet earning management fees on some assets. We believe Oaktree will be particularly well positioned to deploy fresh capital in the case of a market correction.
Gilead Sciences, Inc. Earnings from this pharmaceutical company, a long-time Value Fund holding, declined due to the erosion of its hepatitis C revenues during the period. We continue to believe that growth in the company’s HIV business
4 | Semi-Annual Report
Letter to Shareholders, Continued
Thornburg Value Fund | March 31, 2018 (Unaudited)
over the coming years will more than justify the current stock price. Pipeline optionality should add further upside.
| | |
| PURCHASES | | |
| ITT, Inc. | | Basic Value |
| Evolent Health, Inc. | | Emerging Franchise |
| ADT, Inc. | | Basic Value |
| RPC Group plc | | Consistent Earner |
| Teekay LNG Partners LP | | Basic Value |
| Starbucks Corp. | | Consistent Earner |
| CarMax, Inc. | | Consistent Earner |
| |
| SALES | | |
| Office Depot, Inc. | | fundamental deterioration |
| Grand Canyon Education, Inc. | | price target |
| General Electric Co. | | fundamental deterioration |
| Intl Flavors and Fragrances | | sold for more attractive opportunities |
| Phibro Animal Health Corp. | | price target |
We always have names that perform well and some that don’t during any short-term period. The good news is that this year’s
increased volatility and a number of significant moves lower in individual stocks that we don’t own have left the team more excited about our investment priorities lists than we have been for a long time. We are constructive on the long-term investment opportunities created by the recent increase in stock market volatility.
Thank you for your continued trust and for investing alongside us in Thornburg Value Fund.
Sincerely,
| | |
 | |  |
| Connor Browne, CFA | | Robert MacDonald, CFA |
| Portfolio Manager | | Portfolio Manager |
| Managing Director | | Managing Director |
The matters discussed in this report may constitute forward-looking statements made pursuant to the safe harbor provisions of the Securities Litigation Reform Act of 1995. These include any advisor or portfolio manager prediction, assessment, analysis or outlook for individual securities, industries, investment styles, market sectors and/or markets. These statements involve risks and uncertainties. In addition to the general risks described for each fund in its current prospectus, other factors bearing on these reports include the accuracy of the advisor’s or portfolio manager’s forecasts and predictions, the appropriateness of the investment strategies designed by the advisor or portfolio manager and the ability of the advisor or portfolio manager to implement their strategies efficiently and successfully. Any one or more of these factors, as well as other risks affecting the securities markets generally, could cause the actual results of any fund to differ materially as compared to its benchmarks.
The views expressed are subject to change and do not necessarily reflect the views of Thornburg Investment Management, Inc. This information should not be relied upon as a recommendation or investment advice and is not intended to predict the performance of any investment or market.
Performance results of individual share classes will vary based on the fees and expenses associated with each share class, and may be higher or lower than other share classes within the same Fund. Please see Performance Summary for performance results of each share class.
Semi-Annual Report | 5
Performance Summary
Thornburg Value Fund | March 31, 2018 (Unaudited)
AVERAGE ANNUAL TOTAL RETURNS
| | | | | | | | | | | | | | | | | | | | | | | | | |
| | | 1-YR | | 3-YR | | 5-YR | | 10-YR | | SINCE INCEP. |
| | | | | |
Class A Shares (Incep: 10/2/95) | | | | | | | | | | | | | | | | | | | | | | | | | |
Without sales charge | | | | 12.38% | | | | | 8.88% | | | | | 13.35% | | | | | 7.62% | | | | | 9.90% | |
| | | | | |
With sales charge | | | | 7.32% | | | | | 7.22% | | | | | 12.31% | | | | | 7.13% | | | | | 9.68% | |
Class C Shares (Incep: 10/2/95) | | | | | | | | | | | | | | | | | | | | | | | | | |
Without sales charge | | | | 11.53% | | | | | 8.06% | | | | | 12.50% | | | | | 6.81% | | | | | 9.06% | |
| | | | | |
With sales charge | | | | 10.53% | | | | | 8.06% | | | | | 12.50% | | | | | 6.81% | | | | | 9.06% | |
Class I Shares
(Incep: 11/2/98) | | | | 12.80% | | | | | 9.30% | | | | | 13.79% | | | | | 8.04% | | | | | 7.83% | |
| | | | | |
Class R3 Shares
(Incep: 7/1/03) | | | | 12.40% | | | | | 8.91% | | | | | 13.39% | | | | | 7.62% | | | | | 8.09% | |
| | | | | |
Class R4 Shares
(Incep: 2/1/07) | | | | 12.52% | | | | | 9.02% | | | | | 13.50% | | | | | 7.74% | | | | | 5.88% | |
| | | | | |
Class R5 Shares
(Incep: 2/1/05) | | | | 12.80% | | | | | 9.31% | | | | | 13.79% | | | | | 8.02% | | | | | 8.11% | |
| | | | | |
S&P 500 Index
(Since 10/2/95) | | | | 13.99% | | | | | 10.78% | | | | | 13.31% | | | | | 9.50% | | | | | 9.01% | |
GROWTH OF A HYPOTHETICAL $10,000 INVESTMENT
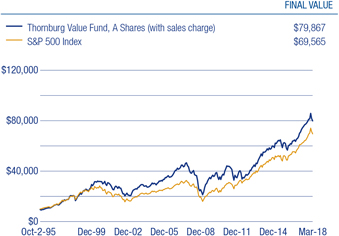
Performance data shown represents past performance and is no guarantee of future results. Investment return and principal value will fluctuate so shares, when redeemed, may be worth more or less than their original cost. Current performance may be lower or higher than quoted. For performance current to the most recent month end, visit thornburg.com or call 800-847-0200. The performance information does not reflect the deduction of taxes that a shareholder would pay on distributions or the redemption of Fund shares. Returns reflect the reinvestment of dividends and capital gains. Class A shares are sold with a maximum sales charge of 4.50%. Class C shares are subject to a 1% CDSC for the first year only. There is no sales charge for Class I, R3, R4 and R5 shares.
As disclosed in the most recent prospectus, the total annual fund operating expenses before any fee waivers or expense reimbursements are as follows: A shares, 1.35%; C shares, 2.10%; I shares, 1.09%; R3 shares, 1.78%; R4 shares, 1.74%; R5 shares, 1.45%. Thornburg Investment Management and/or Thornburg Securities Corporation have contractually agreed to waive fees and reimburse expenses through at least February 1, 2019, for some of the share classes, resulting in net expense ratios of the following: I shares, 0.99%; R3 shares, 1.35%; R4 shares, 1.25%; R5 shares, 0.99%. For more detailed information on fund expenses and waivers/reimbursements please see the Fund’s prospectus.
Due to the Fund’s relatively small asset base, performance was positively impacted by IPOs to a greater degree than it may be in the future. IPO investments are not an integral component of the Fund’s investment process and may not be utilized to the same extent in the future.
Glossary
The S&P 500 Index is an unmanaged broad measure of the U.S. stock market.
The performance of any index is not indicative of the performance of any particular investment. Unless otherwise noted, index returns reflect the reinvestment of income dividends and capital gains, if any, but do not reflect fees, brokerage commissions or other expenses of investing. Investors may not make direct investments into any index.
P/E - Price/Earnings ratio (P/E ratio) is a valuation ratio of a company’s current share price compared to its per-share earnings. P/E equals a company’s market value per share divided by earnings per share. Forecasted P/E is not intended to be a forecast of the fund’s future performance.
6 | Semi-Annual Report
Fund Summary
Thornburg Value Fund | March 31, 2018 (Unaudited)
OBJECTIVES AND STRATEGIES
The Fund seeks long-term capital appreciation by investing in equity and debt securities of all types. As a secondary goal, the Fund also seeks some current income.
The Fund expects to invest primarily in domestic equity securities (primarily common stocks) selected on a value basis. However, the Fund may own a variety of securities, including foreign equity securities, partnership interests, and foreign and domestic debt obligations which, in the opinion of the Fund’s investment advisor, offer prospects for meeting the Fund’s investment goals.
MARKET CAPITALIZATION EXPOSURE
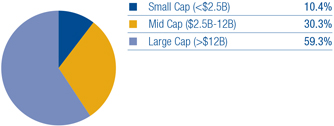
BASKET STRUCTURE
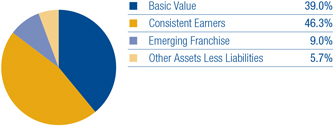
TOP TEN EQUITY HOLDINGS
| | | | | |
| Thermo Fisher Scientific, Inc. | | | | 4.7% | |
| JPMorgan Chase & Co. | | | | 4.4% | |
| Gilead Sciences, Inc. | | | | 4.2% | |
| US Foods Holding Corp. | | | | 4.2% | |
| Alphabet, Inc. | | | | 3.6% | |
| Assured Guaranty Ltd. | | | | 3.4% | |
| RPC Group plc | | | | 3.0% | |
| Medtronic plc | | | | 2.8% | |
| Citigroup, Inc. | | | | 2.7% | |
| Enterprise Products Partners L.P. | | | | 2.7% | |
SECTOR EXPOSURE
| | | | | |
| Information Technology | | | | 18.6% | |
| Financials | | | | 17.4% | |
| Health Care | | | | 15.8% | |
| Consumer Discretionary | | | | 14.1% | |
| Consumer Staples | | | | 9.3% | |
| Energy | | | | 5.9% | |
| Industrials | | | | 4.4% | |
| Materials | | | | 4.1% | |
| Telecommunication Services | | | | 2.6% | |
| Utilities | | | | 1.3% | |
| Real Estate | | | | 0.8% | |
| Other Assets Less Liabilities | | | | 5.7% | |
TOP TEN INDUSTRY GROUPS
| | | | | |
| Pharmaceuticals, Biotechnology & Life Sciences | | | | 11.7% | |
| Technology Hardware & Equipment | | | | 9.6% | |
| Software & Services | | | | 9.0% | |
| Banks | | | | 8.1% | |
| Food & Staples Retailing | | | | 6.7% | |
| Diversified Financials | | | | 5.9% | |
| Energy | | | | 5.9% | |
| Consumer Services | | | | 5.0% | |
| Consumer Durables & Apparel | | | | 4.9% | |
| Retailing | | | | 4.2% | |
There is no guarantee that the Fund will meet its investment objectives.
All data is subject to change. Charts may not add up to 100% due to rounding.
Semi-Annual Report | 7
Schedule of Investments
Thornburg Value Fund | March 31, 2018 (Unaudited)
| | | | | | | | | | | | |
| | | | | SHARES/ PRINCIPAL AMOUNT | | VALUE |
| | | |
| | COMMON STOCK — 94.3% | | | | | | | | | | |
| | | |
| | BANKS — 8.1% | | | | | | | | | | |
| | Banks — 8.1% | | | | | | | | | | |
| | Citigroup, Inc. | | | | 391,156 | | | | $ | 26,403,030 | |
| | Citizens Financial Group, Inc. | | | | 225,620 | | | | | 9,471,527 | |
| | JPMorgan Chase & Co. | | | | 382,211 | | | | | 42,031,744 | |
| | | | | | | | | | | | |
| | | | | | | | | | | 77,906,301 | |
| | | | | | | | | | | | |
| | CAPITAL GOODS — 1.0% | | | | | | | | | | |
| | Machinery — 1.0% | | | | | | | | | | |
| | ITT, Inc. | | | | 199,263 | | | | | 9,759,902 | |
| | | | | | | | | | | | |
| | | | | | | | | | | 9,759,902 | |
| | | | | | | | | | | | |
| | COMMERCIAL & PROFESSIONAL SERVICES — 1.8% | | | | | | | | | | |
| | Commercial Services & Supplies — 1.8% | | | | | | | | | | |
| | ADT, Inc. | | | | 2,164,261 | | | | | 17,162,590 | |
| | | | | | | | | | | | |
| | | | | | | | | | | 17,162,590 | |
| | | | | | | | | | | | |
| | CONSUMER DURABLES & APPAREL — 4.9% | | | | | | | | | | |
| | Household Durables — 2.4% | | | | | | | | | | |
| a | | TRI Pointe Group, Inc. | | | | 1,384,811 | | | | | 22,752,445 | |
| | Leisure Products — 2.5% | | | | | | | | | | |
| | Acushnet Holdings Corp. | | | | 561,809 | | | | | 12,972,169 | |
| | Callaway Golf Co. | | | | 669,908 | | | | | 10,959,695 | |
| | | | | | | | | | | | |
| | | | | | | | | | | 46,684,309 | |
| | | | | | | | | | | | |
| | CONSUMER SERVICES — 5.0% | | | | | | | | | | |
| | Hotels, Restaurants & Leisure — 5.0% | | | | | | | | | | |
| | Aramark | | | | 377,512 | | | | | 14,934,375 | |
| | Domino’s Pizza Group plc | | | | 2,785,000 | | | | | 12,913,815 | |
| | Starbucks Corp. | | | | 355,700 | | | | | 20,591,473 | |
| | | | | | | | | | | | |
| | | | | | | | | | | 48,439,663 | |
| | | | | | | | | | | | |
| | DIVERSIFIED FINANCIALS — 5.9% | | | | | | | | | | |
| | Capital Markets — 3.7% | | | | | | | | | | |
| | Apollo Global Management, LLC Class A | | | | 449,130 | | | | | 13,303,231 | |
| | Oaktree Capital Group, LLC | | | | 555,021 | | | | | 21,978,831 | |
| | Mortgage Real Estate Investment Trusts — 2.2% | | | | | | | | | | |
| | PennyMac Mortgage Investment Trust | | | | 1,207,530 | | | | | 21,771,766 | |
| | | | | | | | | | | | |
| | | | | | | | | | | 57,053,828 | |
| | | | | | | | | | | | |
| | ENERGY — 5.9% | | | | | | | | | | |
| | Oil, Gas & Consumable Fuels — 5.9% | | | | | | | | | | |
| | Devon Energy Corp. | | | | 673,652 | | | | | 21,415,397 | |
| | Enterprise Products Partners L.P. | | | | 1,072,386 | | | | | 26,252,009 | |
| | Teekay LNG Partners L.P. | | | | 519,879 | | | | | 9,305,834 | |
| | | | | | | | | | | | |
| | | | | | | | | | | 56,973,240 | |
| | | | | | | | | | | | |
| | FOOD & STAPLES RETAILING — 6.7% | | | | | | | | | | |
| | Food & Staples Retailing — 6.7% | | | | | | | | | | |
| a | | US Foods Holding Corp. | | | | 1,227,123 | | | | | 40,212,821 | |
| | Walmart, Inc. | | | | 272,621 | | | | | 24,255,090 | |
| | | | | | | | | | | | |
| | | | | | | | | | | 64,467,911 | |
| | | | | | | | | | | | |
| | FOOD, BEVERAGE & TOBACCO — 2.6% | | | | | | | | | | |
| | Food Products — 2.6% | | | | | | | | | | |
| a | | Nomad Foods Ltd. | | | | 1,597,755 | | | | | 25,148,664 | |
| | | | | | | | | | | | |
| | | | | | | | | | | 25,148,664 | |
| | | | | | | | | | | | |
| | HEALTHCARE EQUIPMENT & SERVICES — 4.2% | | | | | | | | | | |
| | Health Care Equipment & Supplies — 2.8% | | | | | | | | | | |
| | Medtronic plc | | | | 334,237 | | | | | 26,812,492 | |
| | Health Care Technology — 1.4% | | | | | | | | | | |
| a | | Evolent Health, Inc. Class A | | | | 921,635 | | | | | 13,133,299 | |
| | | | | | | | | | | | |
| | | | | | | | | | | 39,945,791 | |
| | | | | | | | | | | | |
8 | Semi-Annual Report
Schedule of Investments, Continued
Thornburg Value Fund | March 31, 2018 (Unaudited)
| | | | | | | | | | | | |
| | | | | SHARES/
PRINCIPAL AMOUNT | | VALUE |
| | INSURANCE — 3.4% | | | | | | | | | | |
| | Insurance — 3.4% | | | | | | | | | | |
| | Assured Guaranty Ltd. | | | | 899,585 | | | | $ | 32,564,977 | |
| | | | | | | | | | | | |
| | | | | | | | | | | 32,564,977 | |
| | | | | | | | | | | | |
| | MATERIALS — 4.1% | | | | | | | | | | |
| | Containers & Packaging — 3.0% | | | | | | | | | | |
| | RPC Group plc | | | | 2,674,747 | | | | | 29,015,660 | |
| | Metals & Mining — 1.1% | | | | | | | | | | |
| | Warrior Met Coal, Inc. | | | | 362,321 | | | | | 10,148,611 | |
| | | | | | | | | | | | |
| | | | | | | | | | | 39,164,271 | |
| | | | | | | | | | | | |
| | PHARMACEUTICALS, BIOTECHNOLOGY & LIFE SCIENCES — 11.7% | | | | | | | | | | |
| | Biotechnology — 6.6% | | | | | | | | | | |
| a | | Alkermes plc | | | | 406,842 | | | | | 23,580,562 | |
| | Gilead Sciences, Inc. | | | | 533,439 | | | | | 40,215,966 | |
| | Life Sciences Tools & Services — 4.8% | | | | | | | | | | |
| | Thermo Fisher Scientific, Inc. | | | | 220,638 | | | | | 45,552,921 | |
| | Pharmaceuticals — 0.3% | | | | | | | | | | |
| a | | Akorn, Inc. | | | | 165,574 | | | | | 3,097,890 | |
| | | | | | | | | | | | |
| | | | | | | | | | | 112,447,339 | |
| | | | | | | | | | | | |
| | REAL ESTATE — 0.8% | | | | | | | | | | |
| | Real Estate Management & Development — 0.8% | | | | | | | | | | |
| a | | CBRE Group, Inc. Class A | | | | 153,398 | | | | | 7,243,454 | |
| | | | | | | | | | | | |
| | | | | | | | | | | 7,243,454 | |
| | | | | | | | | | | | |
| | RETAILING — 4.2% | | | | | | | | | | |
| | Internet & Direct Marketing Retail — 1.3% | | | | | | | | | | |
| | Expedia Group, Inc. | | | | 117,672 | | | | | 12,992,165 | |
| | Specialty Retail — 2.9% | | | | | | | | | | |
| a | | CarMax, Inc. | | | | 30,966 | | | | | 1,918,034 | |
| a | | O’Reilly Automotive, Inc. | | | | 104,162 | | | | | 25,767,596 | |
| | | | | | | | | | | | |
| | | | | | | | | | | 40,677,795 | |
| | | | | | | | | | | | |
| | SOFTWARE & SERVICES — 9.0% | | | | | | | | | | |
| | Information Technology Services — 1.3% | | | | | | | | | | |
| | Cognizant Technology Solutions Corp. Class A | | | | 153,844 | | | | | 12,384,442 | |
| | Internet Software & Services — 6.0% | | | | | | | | | | |
| a | | Alphabet, Inc. Class C | | | | 33,858 | | | | | 34,934,346 | |
| a | | Facebook, Inc. Class A | | | | 146,684 | | | | | 23,438,636 | |
| | Software — 1.7% | | | | | | | | | | |
| | Activision Blizzard, Inc. | | | | 239,145 | | | | | 16,132,722 | |
| | | | | | | | | | | | |
| | | | | | | | | | | 86,890,146 | |
| | | | | | | | | | | | |
| | TECHNOLOGY HARDWARE & EQUIPMENT — 9.6% | | | | | | | | | | |
| | Communications Equipment — 4.0% | | | | | | | | | | |
| a | | ARRIS International plc | | | | 587,364 | | | | | 15,606,262 | |
| a | | EchoStar Corp. Class A | | | | 166,700 | | | | | 8,796,759 | |
| a | | Palo Alto Networks, Inc. | | | | 76,474 | | | | | 13,881,560 | |
| | Technology Hardware, Storage & Peripherals — 5.6% | | | | | | | | | | |
| | Apple, Inc. | | | | 141,048 | | | | | 23,665,033 | |
| | HP, Inc. | | | | 867,177 | | | | | 19,008,520 | |
| a | | Pure Storage, Inc. Class A | | | | 555,167 | | | | | 11,075,582 | |
| | | | | | | | | | | | |
| | | | | | | | | | | 92,033,716 | |
| | | | | | | | | | | | |
| | TELECOMMUNICATION SERVICES — 2.5% | | | | | | | | | | |
| | Wireless Telecommunication Services — 2.5% | | | | | | | | | | |
| | China Mobile Ltd. | | | | 2,674,772 | | | | | 24,521,683 | |
| | | | | | | | | | | | |
| | | | | | | | | | | 24,521,683 | |
| | | | | | | | | | | | |
| | TRANSPORTATION — 1.6% | | | | | | | | | | |
| | Air Freight & Logistics — 1.6% | | | | | | | | | | |
| | United Parcel Service, Inc. Class B | | | | 151,101 | | | | | 15,814,231 | |
| | | | | | | | | | | | |
| | | | | | | | | | | 15,814,231 | |
| | | | | | | | | | | | |
Semi-Annual Report | 9
Schedule of Investments, Continued
Thornburg Value Fund | March 31, 2018 (Unaudited)
| | | | | | | | | | | | |
| | | | | SHARES/
PRINCIPAL AMOUNT | | VALUE |
| | UTILITIES — 1.3% | | | | | | | | | | |
| | Electric Utilities — 1.3% | | | | | | | | | | |
| | Fortis, Inc. | | | | 363,537 | | | | $ | 12,276,644 | |
| | | | | | | | | | | | |
| | | | | | | | | | | 12,276,644 | |
| | | | | | | | | | | | |
| | TOTAL COMMON STOCK (Cost $691,938,393) | | | | | | | | | 907,176,455 | |
| | | | | | | | | | | | |
| | | |
| | SHORT-TERM INVESTMENTS — 5.9% | | | | | | | | | | |
| b | | Thornburg Capital Management Fund | | | | 5,666,897 | | | | | 56,668,972 | |
| | | | | | | | | | | | |
| | TOTAL SHORT-TERM INVESTMENTS (Cost $56,668,972) | | | | | | | | | 56,668,972 | |
| | | | | | | | | | | | |
| | | |
| | TOTAL INVESTMENTS — 100.2% (Cost $748,607,365) | | | | | | | | $ | 963,845,427 | |
| | | |
| | LIABILITIES NET OF OTHER ASSETS — (0.2)% | | | | | | | | | (2,319,477 | ) |
| | | | | | | | | | | | |
| | | |
| | NET ASSETS — 100.0% | | | | | | | | $ | 961,525,950 | |
| | | | | | | | | | | | |
| | | | | | | | | | | | | | | | | | | | | | | | | | | | | | | | | | | |
| OUTSTANDING FORWARD CURRENCY CONTRACTS TO BUY OR SELL AT MARCH 31, 2018 |
| | | | | | | |
CONTRACT DESCRIPTION | | CONTRACT
PARTY* | | BUY/SELL | | CONTRACT
AMOUNT | | CONTRACT
VALUE DATE | | VALUE USD | | UNREALIZED
APPRECIATION | | UNREALIZED
DEPRECIATION |
| | | | | | | |
Great Britain Pound | | | | SSB | | | | | Sell | | | | | 11,193,200 | | | | | 5/8/2018 | | | | | 15,726,470 | | | | $ | 27,623 | | | | $ | – | |
Great Britain Pound | | | | SSB | | | | | Sell | | | | | 3,607,400 | | | | | 5/8/2018 | | | | | 5,068,405 | | | | | – | | | | | (17,450 | ) |
Great Britain Pound | | | | SSB | | | | | Sell | | | | | 3,714,300 | | | | | 5/8/2018 | | | | | 5,218,600 | | | | | 18,437 | | | | | – | |
Euro | | | | SSB | | | | | Sell | | | | | 20,815,100 | | | | | 5/29/2018 | | | | | 25,712,484 | | | | | 103,569 | | | | | – | |
Euro | | | | SSB | | | | | Buy | | | | | 1,170,700 | | | | | 5/29/2018 | | | | | 1,446,143 | | | | | – | | | | | (6,957 | ) |
| | | | | | | | | | | | | | | | | | | | | | | | | | | | | | |
Total | | | | | | | | | | | | | | | | | | | | | | | | | | | | $ | 149,629 | | | | $ | (24,407) | |
| | | | | | | | | | | | | | | | | | | | | | | | | | | | | | |
Net unrealized appreciation/depreciation | | | | | | | | | | | | | | | | | | | | | | | | | | | | $ | 125,222 | | | | | | |
| | | | | | | | | | | | | | | | | | | | | | | | | | | | | | |
| * | Counterparty includes State Street Bank and Trust Company (“SSB”). |
Footnote Legend
| b | Investment in Affiliates. |
See notes to financial statements.
10 | Semi-Annual Report
Statement of Assets and Liabilities
Thornburg Value Fund | March 31, 2018 (Unaudited)
| | | | |
ASSETS | | | | |
| |
Investments at value (Note 3) | | | | |
Non-affiliated issuers (cost $691,938,393) | | $ | 907,176,455 | |
Non-controlled affiliated issuer (cost $56,668,972) | | | 56,668,972 | |
Receivable for fund shares sold | | | 698,672 | |
Unrealized appreciation on forward currency contracts (Note 7) | | | 149,629 | |
Dividends receivable | | | 933,968 | |
Prepaid expenses and other assets | | | 46,722 | |
| | | | |
| |
Total Assets | | | 965,674,418 | |
| | | | |
| |
LIABILITIES | | | | |
| |
Payable for investments purchased | | | 1,927,535 | |
Payable for fund shares redeemed | | | 932,504 | |
Unrealized depreciation on forward currency contracts (Note 7) | | | 24,407 | |
Payable to investment advisor and other affiliates (Note 4) | | | 960,721 | |
Accounts payable and accrued expenses | | | 303,301 | |
| | | | |
| |
Total Liabilities | | | 4,148,468 | |
| | | | |
| |
NET ASSETS | | $ | 961,525,950 | |
| | | | |
| |
NET ASSETS CONSIST OF | | | | |
| |
Distribution in excess of net investment income | | $ | (3,280,523 | ) |
Net unrealized appreciation on investments | | | 215,364,497 | |
Accumulated net realized gain (loss) | | | (207,396,860 | ) |
Net capital paid in on shares of beneficial interest | | | 956,838,836 | |
| | | | |
| |
| | $ | 961,525,950 | |
| | | | |
Semi-Annual Report | 11
Statement of Assets and Liabilities, Continued
Thornburg Value Fund | March 31, 2018 (Unaudited)
| | | | |
NET ASSET VALUE | | | | |
| |
Class A Shares: | | | | |
Net asset value and redemption price per share
($ 367,746,928 applicable to 5,541,591 shares of beneficial
interest outstanding - Note 5) | | $ | 66.36 | |
| |
Maximum sales charge, 4.50% of offering price | | | 3.13 | |
| | | | |
| |
Maximum offering price per share | | $ | 69.49 | |
| | | | |
| |
Class C Shares: | | | | |
Net asset value and offering price per share*
($ 152,988,466 applicable to 2,519,061 shares of beneficial
interest outstanding - Note 5) | | $ | 60.73 | |
| | | | |
| |
Class I Shares: | | | | |
Net asset value, offering and redemption price per share
($ 371,162,552 applicable to 5,434,123 shares of beneficial
interest outstanding - Note 5) | | $ | 68.30 | |
| | | | |
| |
Class R3 Shares: | | | | |
Net asset value, offering and redemption price per share
($ 42,286,389 applicable to 641,023 shares of beneficial
interest outstanding - Note 5) | | $ | 65.97 | |
| | | | |
| |
Class R4 Shares: | | | | |
Net asset value, offering and redemption price per share
($ 8,988,691 applicable to 134,806 shares of beneficial
interest outstanding - Note 5) | | $ | 66.68 | |
| | | | |
| |
Class R5 Shares: | | | | |
Net asset value, offering and redemption price per share
($ 18,352,924 applicable to 269,085 shares of beneficial
interest outstanding - Note 5) | | $ | 68.21 | |
| | | | |
* Redemption price per share is equal to net asset value less any applicable contingent deferred sales charge.
See notes to financial statements.
12 | Semi-Annual Report
Statement of Operations
Thornburg Value Fund | Six Months Ended March 31, 2018 (Unaudited)
| | | | |
INVESTMENT INCOME | | | | |
| |
Dividend income | | | | |
Non-affiliated issuers (net of foreign taxes withheld of $41,105) | | $ | 9,445,332 | |
Non-controlled affiliated issuer | | | 566,983 | |
| | | | |
| |
Total Income | | | 10,012,315 | |
| | | | |
| |
EXPENSES | | | | |
| |
Investment advisory fees (Note 4) | | | 4,238,897 | |
Administration fees (Note 4) | | | | |
Class A Shares | | | 214,177 | |
Class C Shares | | | 90,183 | |
Class I Shares | | | 114,707 | |
Class R3 Shares | | | 25,461 | |
Class R4 Shares | | | 5,421 | |
Class R5 Shares | | | 5,645 | |
Distribution and service fees (Note 4) | | | | |
Class A Shares | | | 480,087 | |
Class C Shares | | | 808,943 | |
Class R3 Shares | | | 114,056 | |
Class R4 Shares | | | 12,131 | |
Transfer agent fees | | | | |
Class A Shares | | | 200,663 | |
Class C Shares | | | 87,706 | |
Class I Shares | | | 183,035 | |
Class R3 Shares | | | 63,016 | |
Class R4 Shares | | | 17,201 | |
Class R5 Shares | | | 30,832 | |
Registration and filing fees | | | | |
Class A Shares | | | 6,883 | |
Class C Shares | | | 5,941 | |
Class I Shares | | | 9,405 | |
Class R3 Shares | | | 5,940 | |
Class R4 Shares | | | 7,276 | |
Class R5 Shares | | | 6,636 | |
Custodian fees (Note 2) | | | 52,301 | |
Professional fees | | | 44,760 | |
Trustee and officer fees (Note 4) | | | 22,465 | |
Other expenses | | | 47,238 | |
| | | | |
| |
Total Expenses | | | 6,901,006 | |
Less: | | | | |
Expenses reimbursed by investment advisor (Note 4) | | | (263,519 | ) |
| | | | |
| |
Net Expenses | | | 6,637,487 | |
| | | | |
| |
Net Investment Income | | $ | 3,374,828 | |
| | | | |
Semi-Annual Report | 13
Statement of Operations, Continued
Thornburg Value Fund | Six Months Ended March 31, 2018 (Unaudited)
| | | | |
REALIZED AND UNREALIZED GAIN (LOSS) | | | | |
| |
Net realized gain (loss) on: | | | | |
Non-affiliated issuer investments | | $ | 32,983,450 | |
Forward currency contracts (Note 7) | | | (663,798 | ) |
Foreign currency transactions | | | 37,653 | |
| | | | |
| |
| | | 32,357,305 | |
| | | | |
Net change in unrealized appreciation (depreciation) on: | | | | |
Non-affiliated issuer investments | | | (13,083,398 | ) |
Forward currency contracts (Note 7) | | | (22,733 | ) |
Foreign currency translations | | | 1,214 | |
| | | | |
| |
| | | (13,104,917 | ) |
| | | | |
| |
Net Realized and Unrealized Gain | | | 19,252,388 | |
| | | | |
| |
Net Increase in Net Assets Resulting from Operations | | $ | 22,627,216 | |
| | | | |
See notes to financial statements.
14 | Semi-Annual Report
Statements of Changes in Net Assets
Thornburg Value Fund
| | | | | | | | |
| | | SIX MONTHS ENDED MARCH 31, 2018* | | | YEAR ENDED SEPTEMBER 30, 2017 | |
INCREASE (DECREASE) IN NET ASSETS FROM | | | | | | | | |
| | |
OPERATIONS | | | | | | | | |
| | |
Net investment income | | $ | 3,374,828 | | | $ | 2,653,866 | |
Net realized gain (loss) on investments, forward currency contracts and foreign currency transactions | | | 32,357,305 | | | | 98,042,230 | |
Net unrealized appreciation (depreciation) on investments, forward currency contracts and foreign currency translations | | | (13,104,917 | ) | | | 72,245,110 | |
| | | | |
| | |
Net Increase in Net Assets Resulting from Operations | | | 22,627,216 | | | | 172,941,206 | |
| | |
DIVIDENDS TO SHAREHOLDERS | | | | | | | | |
| | |
From net investment income | | | | | | | | |
Class A Shares | | | (2,045,321 | ) | | | (133,853 | ) |
Class C Shares | | | (643,910 | ) | | | (0 | ) |
Class I Shares | | | (2,283,277 | ) | | | (1,304,890 | ) |
Class R3 Shares | | | (248,385 | ) | | | (27,639 | ) |
Class R4 Shares | | | (51,776 | ) | | | (14,298 | ) |
Class R5 Shares | | | (113,541 | ) | | | (63,188 | ) |
| | |
FUND SHARE TRANSACTIONS (NOTE 5) | | | | | | | | |
| | |
Class A Shares | | | (22,387,436 | ) | | | (59,269,385 | ) |
Class C Shares | | | (10,201,239 | ) | | | (35,922,707 | ) |
Class I Shares | | | (3,974,885 | ) | | | 28,427,284 | |
Class R3 Shares | | | (4,243,972 | ) | | | (13,321,472 | ) |
Class R4 Shares | | | (1,363,314 | ) | | | (1,188,133 | ) |
Class R5 Shares | | | 998,206 | | | | (659,441 | ) |
| | | | |
| | |
Net Increase (Decrease) in Net Assets | | | (23,931,634 | ) | | | 89,463,484 | |
| | |
NET ASSETS | | | | | | | | |
| | |
Beginning of Period | | | 985,457,584 | | | | 895,994,100 | |
| | | | |
| | |
End of Period | | $ | 961,525,950 | | | $ | 985,457,584 | |
| | | | |
| | |
Distribution in excess of net investment income | | $ | (3,280,523 | ) | | $ | (1,269,141 | ) |
See notes to financial statements.
Semi-Annual Report | 15
Notes to Financial Statements
Thornburg Value Fund | March 31, 2018 (Unaudited)
NOTE 1 – ORGANIZATION
Thornburg Value Fund (the “Fund”) is a diversified series of Thornburg Investment Trust (the “Trust”). The Trust was organized as a Massachusetts business trust under a Declaration of Trust dated June 3, 1987 and is registered as a diversified, open-end management investment company under the Investment Company Act of 1940, as amended. The Fund is currently one of twenty-one separate series of the Trust. Each series is considered to be a separate entity for financial reporting and tax purposes and bears expenses directly attributable to it. The Fund seeks long-term capital appreciation by investing in equity and debt securities of all types. As a secondary objective, the Fund also seeks some current income.
The Fund currently offers six classes of shares of beneficial interest: Class A, Class C, Institutional Class (“Class I”), and Retirement Classes (“Class R3”, “Class R4”, and “Class R5”). Each class of shares of the Fund represents an interest in the same portfolio of investments, except that (i) Class A shares are sold subject to a front-end sales charge collected at the time the shares are purchased and bear a service fee, (ii) Class C shares are sold at net asset value without a sales charge at the time of purchase, but are subject to a contingent deferred sales charge upon redemption within one year of purchase, and bear both a service fee and a distribution fee, (iii) Class I shares are sold at net asset value without a sales charge at the time of purchase and may be subject to a service fee, (iv) Class R3 shares are sold at net asset value without a sales charge at the time of purchase, but bear both a service fee and distribution fee, (v) Class R4 shares are sold at net asset value without a sales charge at the time of purchase, but bear a service fee, (vi) Class R5 shares are sold at net asset value without a sales charge at the time of purchase and may be subject to a service fee, and (vii) the respective classes may have different reinvestment privileges and conversion rights. Additionally, the Fund may allocate among its classes certain expenses, to the extent allocable to specific classes, including transfer agent fees, government registration fees, certain printing and postage costs, and administrative and legal expenses. Currently, class specific expenses of the Fund are limited to service and distribution fees, administration fees, and certain registration and transfer agent expenses.
The following is a summary of significant accounting policies followed by the Fund in the preparation of its financial statements. The Fund prepares its financial statements in conformity with United States generally accepted accounting principles (“GAAP”), including investment company accounting and reporting guidance in the Financial Accounting Standards Board (the “FASB”) Accounting Standard Codification Topic 946.
NOTE 2 – SIGNIFICANT ACCOUNTING POLICIES
Security Valuation: All investments in securities held by the Fund are valued as described in Note 3.
Allocation of Income, Gains, Losses and Expenses: Net investment income (other than class specific expenses) and realized and unrealized gains and losses are allocated daily to each class of shares based upon the relative net asset value of outstanding shares (or the value of the dividend-eligible shares, as appropriate) of each class of shares at the beginning of the day (after adjusting for the current capital shares activity of the respective class). Expenses common to all Funds are allocated among the Funds comprising the Trust based upon their relative net asset values or other appropriate allocation methods. Operating expenses directly attributable to a specific class are charged against the operating income of that class.
Dividends and Distributions to Shareholders: Dividends and distributions to shareholders, which are determined in accordance with federal income tax regulations and may differ from GAAP, are recorded on the ex-dividend date. Ordinary income distributions, if any, are declared and paid annually. Capital gain distributions, if any, are declared and paid annually and more often if deemed necessary by Thornburg Investment Management, Inc., the Trust’s investment advisor (the “Advisor”). Dividends are paid and are reinvested in additional shares of the Fund at net asset value per share at the close of business on the ex-dividend date, or at the shareholder’s option, paid in cash.
Investment Income: Dividend income is recorded on the ex-dividend date. Certain income from foreign investments is recognized as soon as information is available to the Fund. Interest income is accrued as earned. Premiums and discounts are amortized and accreted, respectively, to call dates or maturity dates using the effective yield method of the respective investments. These amounts are included in Interest income on the Statement of Operations.
Custodian Fees: Custodian fees disclosed in the Statement of Operations may include interest expenses incurred by the Fund on any cash overdrafts of its custodian account during the period. Such cash overdrafts may result from the effects of failed trades in portfolio securities and from cash outflows resulting from unanticipated shareholder redemption activity. The Fund pays interest to its custodian on any such cash overdraft at a rate set periodically at the custodian’s discretion of the overdraft amount in excess of $50,000.
Investment Transactions: Investment transactions are accounted for on a trade date basis. Realized gains and losses from the sale of investments are recorded on an identified cost basis.
Repurchase Agreements: The Fund may invest excess cash in repurchase agreements whereby the Fund purchases investments, which serve as collateral, with an agreement to resell such collateral to the seller at an agreed upon price at the maturity date of the repurchase
16 | Semi-Annual Report
Notes to Financial Statements, Continued
Thornburg Value Fund | March 31, 2018 (Unaudited)
agreement. Investments pledged as collateral for repurchase agreements are held in custody until maturity of the repurchase agreement. Provisions in the agreements require that the market value of the collateral is at least equal to the repurchase value in the event of default. In the event of default, the Fund has the right to liquidate the collateral and apply the proceeds in satisfaction of the obligation. Under certain circumstances, in the event of default or bankruptcy by the other party to the agreement, realization and/or retention of the collateral may be subject to legal proceedings.
When-Issued and Delayed Delivery Transactions: The Fund may engage in when-issued or delayed delivery transactions. To the extent the Fund engages in such transactions, it will do so for the purpose of acquiring portfolio investments consistent with the Fund’s investment objectives and not for the purpose of investment leverage or to speculate on interest rate or market changes. At the time the Fund makes a commitment to purchase an investment on a when-issued or delayed delivery basis, the Fund will record the transaction and reflect the value in determining its net asset value. When effecting such transactions, assets of an amount sufficient to make payment for the portfolio investments to be purchased will be segregated on the Fund’s records on the trade date. Investments purchased on a when-issued or delayed delivery basis do not earn interest until the settlement date.
Foreign Currency Translation: Portfolio investments and other assets and liabilities denominated in foreign currencies are translated into U.S. dollars based on the exchange rate of such currencies against the U.S. dollar on the date of valuation. Purchases and sales of investments and income items denominated in foreign currencies are translated into U.S. dollars at the exchange rate in effect on the transaction date. When the Fund purchases or sells foreign investments, it will customarily enter into a foreign exchange contract to minimize foreign exchange risk from the trade date to the settlement date of such transactions. The values of such spot contracts are included in receivable for investments sold and payable for investments purchased on the Statement of Assets and Liabilities.
The Fund does not separately report the effect of changes in foreign exchange rates from changes in market prices on investments held. Such changes are included in net unrealized appreciation (depreciation) from investments.
Reported net realized gains and losses from foreign currency transactions arise due to purchases and sales of foreign currencies, currency gains and losses realized between the trade and settlement dates on investment transactions and the difference between the amounts of dividends, interest, and foreign withholding taxes recorded on the Fund’s books, and the U.S. dollar equivalent of the amounts actually received or paid.
Net change in unrealized appreciation (depreciation) on foreign currency translations arise from changes in the fair value of assets and liabilities, other than investments at period end, resulting from changes in exchange rates.
Guarantees and Indemnifications: Under the Trust’s organizational documents (and under separate agreements with the independent Trustees), its officers and Trustees are provided with an indemnification against certain liabilities arising out of the performance of their duties to the Fund. In the normal course of business the Trust may also enter into contracts with service providers that contain general indemnifications. The Trust’s maximum exposure under these arrangements is unknown. However, based on experience, the Trust expects the risk of loss to be remote.
Use of Estimates: The preparation of financial statements in conformity with GAAP requires management to make estimates and assumptions that affect the reported amounts of assets and liabilities and disclosure of contingent assets and liabilities at the date of the financial statements and the reported amounts of increases (decreases) in net assets from operations during the reporting period. Actual results could differ from those estimates.
Federal Income Taxes: It is the policy of the Trust to comply with the provisions of the Internal Revenue Code applicable to regulated investment companies and to distribute to shareholders substantially all investment company taxable income including net realized gains on investments (if any), and tax exempt income of the Fund. Therefore, no provision for federal income or excise tax is required.
The Fund files income tax returns in United States federal and applicable state jurisdictions. The statute of limitations on the Fund’s tax return filings generally remains open for the three years following a return’s filing date. The Fund has analyzed each uncertain tax position believed to be material in the preparation of the Fund’s financial statements for the six month period ended March 31, 2018, including open tax years, to assess whether it is more likely than not that the position would be sustained upon examination, based on the technical merits of the position. The Fund has not identified any such position for which an asset or liability must be reflected in the Statement of Assets and Liabilities.
At March 31, 2018, information on the tax components of capital was as follows:
| | | | | |
Cost of investments for tax purposes | | | $ | 748,607,365 | |
| | | | | |
Gross unrealized appreciation on a tax basis | | | | 247,408,519 | |
Gross unrealized depreciation on a tax basis | | | | (32,170,457 | ) |
| | | | | |
Net unrealized appreciation (depreciation) on investments (tax basis) | | | $ | 215,238,062 | |
| | | | | |
Semi-Annual Report | 17
Notes to Financial Statements, Continued
Thornburg Value Fund | March 31, 2018 (Unaudited)
At March 31, 2018, the Fund had cumulative tax basis capital losses of $242,353,997 generated prior to October 1, 2011 which may be carried forward to offset future capital gains. To the extent such carryforwards are utilized, capital gain distributions may be reduced to the extent provided by regulations. Such capital loss carryforwards expire September 30, 2018.
Foreign Withholding Taxes: The Fund is subject to foreign tax withholding imposed by certain foreign countries in which the Fund may invest. Withholding taxes are incurred on certain foreign dividends and are accrued at the time the dividend is recognized based on applicable foreign tax laws. The Fund may file withholding tax reclaims in certain jurisdictions to recover a portion of amounts previously withheld, in view of various considerations, including recent decisions rendered by the courts in those and other jurisdictions. The Fund would expect to record a receivable for such a reclaim based on a variety of factors, including assessment of a jurisdiction’s legal obligation to pay reclaims, the jurisdiction’s administrative practices and payment history, and industry convention. To date the Fund has recorded no such receivable because there is limited precedent for collecting such prior year reclaims and the likelihood of collection remains uncertain.
Deferred Foreign Capital Gain Taxes: The Fund is subject to a tax imposed on net realized gains of securities of certain foreign countries. The Fund records an estimated deferred tax liability for net unrealized gains on these investments as reflected in the accompanying financial statements.
NOTE 3 – SECURITY VALUATION
Valuation of the Fund’s portfolio investment securities is performed in accordance with policies and procedures adopted by and under the oversight of the Trustees.
The Trustees of the Trust have appointed the Advisor to assist the Trustees to obtain market values for portfolio investments, evaluate and monitor professional pricing service providers appointed by the Trustees’ Audit Committee (the “Audit Committee”) to assist in determining fair values for portfolio investments, assist in calculating fair values for portfolio investments in certain circumstances, and to perform other functions in connection with the valuation of investments. The Advisor acts through its Valuation and Pricing Committee (the “Committee”) and other employees of the Advisor. The Committee regularly reviews its own valuation calculations, as well as the valuations, valuation techniques and services furnished by pricing service providers, considers circumstances which may require valuation calculations by the Committee, and reviews previous valuation calculations. The Committee reports to the Audit Committee on the Committee’s activities, the performance of pricing service providers, and other matters relating to valuation of portfolio investments.
In those instances when the Committee assists in calculating a fair value for a portfolio investment, the Committee seeks to determine the price that the Fund would reasonably expect to receive upon a sale of the investment in an orderly transaction between market participants on the valuation date. The Committee customarily utilizes quotations from securities broker dealers in calculating valuations, but also may utilize prices obtained from pricing service providers or other methods approved by the Audit Committee. Because fair values calculated by the Committee are estimates, the calculation of a value for an investment may differ from the price that would be realized by the Fund upon a sale of the investment, and the difference could be material to the Fund’s financial statements. The Committee’s calculation of a fair value for an investment may also differ from the prices obtained by other persons (including other mutual funds) for the investment.
Valuation of Securities: Securities and other portfolio investments which are listed or traded on a United States securities exchange are valued at the last reported sale price on the valuation date. Investments listed or traded on an exchange for which there has been no sale that day are valued at the mean between the last reported bid and asked prices on that valuation date. Portfolio investments reported by NASDAQ are valued at the official closing price on the valuation date. If an investment is traded on more than one exchange, the investment is considered traded on the exchange that is normally the primary market for that investment. Securities and other portfolio investments which are listed or traded on exchanges outside the United States are valued at the last price or the closing price of the investment on the exchange that is normally the primary market for the investment, as of the close of the exchange preceding the Fund’s valuation date. Foreign investments listed or traded on an exchange for which there has been no sale that day are valued at the mean between the last reported bid and asked prices on that valuation date.
In any case when a market quotation is not readily available for a portfolio investment ordinarily valued by market quotation, the Committee calculates a fair value for the investment using alternative methods approved by the Audit Committee. A market quotation is not readily available when the primary market or exchange for the investment is not open for the entire scheduled day of trading. Market quotations for an investment also may not be readily available if developments after the most recent close of the investment’s primary exchange or market, but prior to the close of business on any Fund business day, or an unusual event or significant period of time occurring since the availability of a market quotation, create a serious question concerning the reliability of the most recent market quotation available for the investment. In particular, on days when market volatility thresholds established by the Audit Committee are exceeded, foreign equity investments held by the Fund may be valued using alternative methods. The Committee customarily obtains valuations in these instances from pricing service providers approved by the Audit Committee. Pricing service providers ordinarily calculate valuations using multi-factor models to adjust market prices based upon various inputs, including exchange data, depository receipt prices, futures, index data and other data.
18 | Semi-Annual Report
Notes to Financial Statements, Continued
Thornburg Value Fund | March 31, 2018 (Unaudited)
Debt obligations held by the Fund which are not listed or traded on exchanges or for which no reported market exists are ordinarily valued at the valuation obtained from a pricing service provider approved by the Audit Committee.
In any case when a pricing service provider fails to provide a valuation for a debt obligation held by the Fund, the Committee calculates a fair value for the obligation using alternative methods under procedures approved by the Audit Committee. Additionally, in cases when management believes that a valuation obtained from a pricing service provider merits review for significant reasons, the Committee decides whether or not to use the valuation calculated by the pricing service provider or to use an alternative method approved by the Audit Committee to calculate a fair value for the obligation.
Quotations for foreign investments expressed in foreign currency amounts are converted to U.S. dollar equivalents using a foreign exchange quotation from a third party service provider at the time of valuation. Foreign investments held by the Fund may be traded on days and at times when the Fund is not open for business. Consequently, the value of Fund investments may be significantly affected on days when shareholders cannot purchase or sell Fund shares. Futures contracts and other financial and derivative instruments traded on an exchange are valued at the latest published price for the instrument on its primary exchange. Listed options are valued at the last bid price.
Valuation Hierarchy: The Fund categorizes its investments based upon the inputs used in valuing those investments, according to a three-level hierarchy established in guidance from the FASB. Categorization of investments using this hierarchy is intended by the FASB to maximize the use of observable inputs in valuing investments and minimize the use of unobservable inputs by requiring that the most observable inputs be used when available. Observable inputs are those that market participants would use in valuing an investment based on available market information. Unobservable inputs are those that reflect assumptions about the information market participants would use in valuing an investment. An investment’s level within the hierarchy is based on the lowest level input that is deemed significant to the valuation. The methodologies and inputs used to value investments are not necessarily indications of the risk or liquidity associated with those investments.
Various inputs are used in calculating valuations for the Fund’s investments. These inputs are generally summarized according to the three-level hierarchy below:
Level 1: Quoted prices in active markets for identical investments.
Level 2: Other direct or indirect significant observable inputs (including quoted prices for similar investments in active markets and other observable inputs, such as interest rates, prepayment rates, credit risk, etc.).
Level 3: Significant unobservable inputs (including the Committee’s own assumptions in calculating the fair values of investments).
Valuations for debt obligations held by the Fund are typically calculated by pricing service providers approved by the Audit Committee and are generally characterized as Level 2 within the valuation hierarchy.
On days when market volatility thresholds established by the Audit Committee are exceeded, foreign securities for which valuations are obtained from pricing service providers are fair valued. On these days, the foreign securities are characterized as Level 2 within the valuation hierarchy and revert to Level 1 after the threshold is no longer exceeded.
In a limited number of cases the Committee calculates a fair value for investments using broker quotations or other methods approved by the Audit Committee. When the Committee uses a single broker quotation to calculate a fair value for an investment without other significant observable inputs, or if a fair value is calculated using other significant inputs that are considered unobservable, the investment is characterized as Level 3 within the hierarchy. Other significant unobservable inputs used to calculate a fair value in these instances might include an income-based valuation approach which considers discounted anticipated future cash flows from the investment and application of discounts due to the nature or duration of any restrictions on the disposition of the investment.
Valuations based upon the use of inputs from Levels 1, 2 or 3 may not represent the actual price received upon the disposition of an investment, and the Fund may receive a price that is lower than the valuation based upon these inputs when it sells the investment.
The following table displays a summary of the fair value hierarchy measurements of the Fund’s investments as of March 31, 2018. In any instance when valuation inputs from more than one level are used to determine the fair value of a specific investment, the investment is placed in the level of the table based upon the lowest level input that is significant in determining the fair value of the investment:
Semi-Annual Report | 19
Notes to Financial Statements, Continued
Thornburg Value Fund | March 31, 2018 (Unaudited)
| | | | | | | | | | | | | | | | | | | | |
| | | FAIR VALUE MEASUREMENTS AT MARCH 31, 2018 |
| | | TOTAL | | LEVEL 1 | | LEVEL 2 | | LEVEL 3 |
Assets | | | | | | | | | | | | | | | | | | | | |
Investments in Securities* | | | | | | | | | | | | | | | | | | | | |
Common Stock | | | $ | 907,176,455 | | | | $ | 907,176,455 | | | | $ | – | | | | $ | – | |
Short Term Investment | | | | 56,668,972 | | | | | 56,668,972 | | | | | – | | | | | – | |
| | | | | |
Total Investments in Securities | | | $ | 963,845,427 | | | | $ | 963,845,427 | | | | $ | – | | | | $ | – | |
| | | | |
Other Financial Instruments** | | | | | | | | | | | | | | | | | | | | |
Forward Currency Contracts | | | $ | 149,629 | | | | $ | – | | | | $ | 149,629 | | | | $ | – | |
| | | | |
Liabilities | | | | | | | | | | | | | | | | | | | | |
Other Financial Instruments** | | | | | | | | | | | | | | | | | | | | |
Forward Currency Contracts | | | $ | (24,407 | ) | | | $ | – | | | | $ | (24,407 | ) | | | $ | – | |
| * | See Schedule of Investments for a summary of the industry exposure as grouped according to the Global Industry Classification Standard (GICS), which is an industry taxonomy developed by MSCI, Inc. and Standard & Poor’s (S&P). |
| ** | Other Financial Instruments include investments not reflected in the Schedule of Investments, which may include futures, forwards and swap contracts, which are valued at the unrealized appreciation (depreciation) on the investment. |
In accordance with the guidance prescribed in Accounting Standards Update No. 2011-04, it is the policy of the Fund to recognize transfers between levels and the underlying events which caused the movement. The Fund recognized no transfers between levels 1 and 2 for the six months ended March 31, 2018, other than when the Fund exceeded market volatility thresholds for foreign equity investments during the period.
NOTE 4 – INVESTMENT ADVISORY FEE AND OTHER TRANSACTIONS WITH AFFILIATES
Pursuant to an investment advisory agreement, the Advisor serves as the investment advisor and performs services for the Fund for which the fees are payable at the end of each month. Under the investment advisory agreement, the Fund pays the Advisor a management fee based on the daily net assets of the Fund at an annual rate as shown in the following table:
| | | | | |
| MANAGEMENT FEE SCHEDULE |
| DAILY NET ASSETS | | FEE RATE |
| |
Up to $500 million | | | | 0.875 | % |
| |
Next $500 million | | | | 0.825 | |
| |
Next $500 million | | | | 0.775 | |
| |
Next $500 million | | | | 0.725 | |
| |
Over $2 billion | | | | 0.675 | |
The Fund’s effective management fee for the six months ended March 31, 2018 was 0.85% of the Fund’s average net assets.
The Trust has entered into administrative service agreements with the Advisor, whereby the Advisor will perform certain administrative services related to each class of the Fund’s shares. Until January 31, 2018, the fees were payable at an annual rate of up to 0.125 of 1% per annum of the average daily net assets attributable to each class of shares. As of February 1, 2018, the fees are computed as an annual percentage of the aggregate average daily net assets of all shares classes of all Funds in the Trust as follows:
| | | | | |
| ADMINISTRATION FEE SCHEDULE |
| DAILY NET ASSETS | | FEE RATE |
| |
Up to $20 billion | | | | 0.100 | % |
| |
$20 billion to $40 billion | | | | 0.075 | |
| |
$40 billion to $60 billion | | | | 0.040 | |
| |
Over $60 billion | | | | 0.030 | |
The aggregate fee amount is allocated on a daily basis to each Fund based on net assets and subsequently allocated to each class of shares of the Fund. Total administrative service fees incurred by each class of shares of the Fund for the six months ended March 31, 2018, are set forth in the Statement of Operations.
20 | Semi-Annual Report
Notes to Financial Statements, Continued
Thornburg Value Fund | March 31, 2018 (Unaudited)
Trust has an underwriting agreement with Thornburg Securities Corporation (the “Distributor”), an affiliate of the Advisor, which acts as the distributor of the Fund’s shares. For the six months ended March 31, 2018, the Distributor has advised the Fund that it earned net commissions aggregating $9,538 from the sale of Class A shares, and collected no contingent deferred sales charges from redemptions of Class C shares of the Fund.
Pursuant to a service plan under Rule 12b-1 of the Investment Company Act of 1940, the Fund may pay to the Distributor or securities dealers and other financial institutions at the Distributor’s direction an amount not to exceed .25 of 1% per annum of the average daily net assets attributable to Class A, Class C, Class I, Class R3, Class R4, and Class R5 shares of the Fund to obtain various shareholder and distribution related services. For the six months ended March 31, 2018, there were no 12b-1 service plan fees charged for Class I or Class R5 shares. The Advisor and the Distributor each may pay out of its own resources additional expenses for distribution of the Fund’s shares and shareholder services.
The Trust has also adopted distribution plans pursuant to Rule 12b-1, applicable only to the Fund’s Class C and Class R3 shares, under which the Fund compensates the Distributor for services in promoting the sale of Class C and Class R3 shares of the Fund at an annual rate of up to .75 of 1% per annum of the average daily net assets attributable to Class C shares, and an annual rate of up to .25 of 1% per annum of the average daily net assets attributable to Class R3 shares.
Total fees incurred by each class of shares of the Fund under their respective service and distribution plans for the six months ended March 31, 2018, are set forth in the Statement of Operations.
The Advisor and Distributor have contractually agreed to waive fees and reimburse expenses incurred by the Fund so that actual expenses of certain share classes do not exceed levels as specified in each Fund’s most recent prospectus. The agreement may be terminated by the Fund at any time, but may not be terminated by the Advisor or Distributor before February 1, 2019, unless the Advisor ceases to be the investment advisor to the Fund or the Distributor ceases to be the distributor of the Fund prior to that date. The Advisor and Distributor may recoup amounts waived or reimbursed during the fiscal year if expenses fall below the contractual limit during that year.
For the six months ended March 31, 2018, the Advisor contractually reimbursed certain class specific expenses, administrative fees, and distribution fees of $104,937 for Class I shares, $101,425 for Class R3 shares, $24,092 for Class R4 shares, and $33,065 for Class R5 shares.
Certain officers and Trustees of the Trust are also officers or directors of the Advisor and Distributor. The compensation of the independent Trustees is borne by the Trust. The Trust also pays a portion of the Chief Compliance Officer’s compensation. These amounts are reflected as “Trustee and officer fees” in the Statement of Operations.
The percentage of direct investments in the Fund held by the Trustees, officers of the Trust, and the Advisor is approximately 6.80%.
The Fund may purchase or sell securities from, or to an affiliated fund, provided the affiliation is due solely to having a common investment advisor, common officers, or common trustees, and provided that all such transactions will comply with Rule 17a-7 under the 1940 Act. For the six months ended March 31, 2018, the Fund had no such transactions with affiliated funds.
Shown below are holdings of voting securities of each portfolio company which is considered “affiliated” to the Fund under the Investment Company Act of 1940, including companies for which the Fund’s holding represented 5% or more of the company’s voting securities, and a series of the Thornburg Investment Trust in which the Fund invested for cash management purposes during the period:
| | | | | | | | | | | | | | | | | | | | | | | | | | | | | | | | | | | | | | | | |
FUND | | MARKET VALUE
9/30/17 | | PURCHASES AT
COST | | SALES
PROCEEDS | | REALIZED
GAIN
(LOSS) | | CHANGE IN
UNREALIZED
APPR./(DEPR.) | | MARKET VALUE
3/31/18 | | DIVIDEND
INCOME | | ROC
ADJUSTMENT |
Thornburg Capital Management Fund | | $ 92,220,297 | | | $ | 120,034,360 | | | | $ | (155,585,685 | ) | | | $ | – | | | | $ | – | | | | $ | 56,668,972 | | | | $ | 566,983 | | | | $ | – | |
NOTE 5 – SHARES OF BENEFICIAL INTEREST
At March 31, 2018, there were an unlimited number of shares with no par value of beneficial interest authorized. Transactions in shares of beneficial interest were as follows:
Semi-Annual Report | 21
Notes to Financial Statements, Continued
Thornburg Value Fund | March 31, 2018 (Unaudited)
| | | | | | | | | | | | | | | | |
| | | SIX MONTHS ENDED
MARCH 31, 2018 (UNAUDITED) | | | YEAR ENDED SEPTEMBER 30, 2017 (AUDITED) | |
| | | SHARES | | | AMOUNT | | | SHARES | | | AMOUNT | |
Class A Shares | | | | | | | | | | | | | | | | |
Shares sold | | | 198,401 | | | $ | 13,532,458 | | | | 444,285 | | | $ | 26,930,666 | |
Shares issued to shareholders in
reinvestment of dividends | | | 28,581 | | | | 1,940,082 | | | | 2,296 | | | | 127,693 | |
Shares repurchased | | | (555,951 | ) | | | (37,859,976 | ) | | | (1,495,891 | ) | | | (86,327,744 | ) |
| | | | |
| | | | |
Net decrease | | | (328,969 | ) | | $ | (22,387,436 | ) | | | (1,049,310 | ) | | $ | (59,269,385 | ) |
| | | | |
Class C Shares | | | | | | | | | | | | | | | | |
Shares sold | | | 53,395 | | | $ | 3,336,214 | | | | 140,318 | | | $ | 7,533,627 | |
Shares issued to shareholders in
reinvestment of dividends | | | 10,014 | | | | 623,226 | | | | – | | | | – | |
Shares repurchased | | | (227,758 | ) | | | (14,160,679 | ) | | | (795,262 | ) | | | (43,456,334 | ) |
| | | | |
| | | | |
Net decrease | | | (164,349 | ) | | $ | (10,201,239 | ) | | | (654,944 | ) | | $ | (35,922,707 | ) |
| | | | |
Class I Shares | | | | | | | | | | | | | | | | |
Shares sold | | | 515,913 | | | $ | 36,067,721 | | | | 1,473,850 | | | $ | 90,172,554 | |
Shares issued to shareholders in
reinvestment of dividends | | | 30,761 | | | | 2,147,141 | | | | 19,708 | | | | 1,233,783 | |
Shares repurchased | | | (608,727 | ) | | | (42,189,747 | ) | | | (1,045,227 | ) | | | (62,979,053 | ) |
| | | | |
| | | | |
Net increase (decrease) | | | (62,053 | ) | | $ | (3,974,885 | ) | | | 448,331 | | | $ | 28,427,284 | |
| | | | |
Class R3 Shares | | | | | | | | | | | | | | | | |
Shares sold | | | 49,400 | | | $ | 3,334,785 | | | | 102,105 | | | $ | 6,017,056 | |
Shares issued to shareholders in
reinvestment of dividends | | | 3,542 | | | | 239,041 | | | | 479 | | | | 26,680 | |
Shares repurchased | | | (115,821 | ) | | | (7,817,798 | ) | | | (330,468 | ) | | | (19,365,208 | ) |
| | | | |
| | | | |
Net decrease | | | (62,879 | ) | | $ | (4,243,972 | ) | | | (227,884 | ) | | $ | (13,321,472 | ) |
| | | | |
Class R4 Shares | | | | | | | | | | | | | | | | |
Shares sold | | | 11,858 | | | $ | 810,124 | | | | 25,776 | | | $ | 1,539,597 | |
Shares issued to shareholders in
reinvestment of dividends | | | 541 | | | | 36,893 | | | | 166 | | | | 9,828 | |
Shares repurchased | | | (32,566 | ) | | | (2,210,331 | ) | | | (46,623 | ) | | | (2,737,558 | ) |
| | | | |
| | | | |
Net decrease | | | (20,167 | ) | | $ | (1,363,314 | ) | | | (20,681 | ) | | $ | (1,188,133 | ) |
| | | | |
Class R5 Shares | | | | | | | | | | | | | | | | |
Shares sold | | | 33,473 | | | $ | 2,327,178 | | | | 60,187 | | | $ | 3,682,653 | |
Shares issued to shareholders in
reinvestment of dividends | | | 1,616 | | | | 112,647 | | | | 1,004 | | | | 62,680 | |
Shares repurchased | | | (20,605 | ) | | | (1,441,619 | ) | | | (72,130 | ) | | | (4,404,774 | ) |
| | | | |
| | | | |
Net increase (decrease) | | | 14,484 | | | $ | 998,206 | | | | (10,939 | ) | | $ | (659,441 | ) |
| | | | |
NOTE 6 – INVESTMENT TRANSACTIONS
For the six months ended March 31, 2018, the Fund had purchase and sale transactions of investments (excluding short-term investments) of $162,395,005 and $163,751,818, respectively.
NOTE 7 – DERIVATIVE FINANCIAL INSTRUMENTS WITH OFF-BALANCE SHEET RISK AND FOREIGN INVESTMENT RISK
The Fund may use a variety of derivative financial instruments to hedge or adjust the risks affecting its investment portfolio or to enhance investment returns. Provisions of the FASB Accounting Standards Codification 815-10-50 (“ASC 815”) require certain disclosures. The disclosures are intended to provide users of financial statements with an understanding of the use of derivative instruments by the Fund and how these derivatives affect the financial position, financial performance and cash flows of the Fund. The Fund does not designate any derivative instruments as hedging instruments under ASC 815. During the six months ended March 31, 2018, the Fund’s principal
22 | Semi-Annual Report
Notes to Financial Statements, Continued
Thornburg Value Fund | March 31, 2018 (Unaudited)
exposure to derivative financial instruments of the type addressed by ASC 815 was investment in foreign exchange contracts. A foreign exchange contract is an agreement between two parties to exchange different currencies at a specified rate of exchange at an agreed upon future date. Foreign exchange contracts involve risks to the Fund, including the risk that a contract’s counterparty will not meet its obligations to the Fund, the risk that a change in a contract’s value may not correlate perfectly with the currency the contract was intended to track, and the risk that the Fund’s Advisor is unable to correctly implement its strategy in using a contract. In any such instance, the Fund may not achieve the intended benefit of entering into a contract, and may experience a loss.
The Fund entered into forward currency contracts during the six months ended March 31, 2018 in the normal course of pursuing its investment objectives, with the objective of purchasing foreign investments or with the intent of reducing the risk to the value of the Fund’s foreign investments from adverse changes in the relationship between the U.S. dollar and foreign currencies. In each case these contracts have been initiated in conjunction with foreign investment transactions. The monthly average value of open forward currency sell contracts for the six months ended March 31, 2018 was $38,476,446.
These contracts are accounted for by the Fund under ASC 815. Unrealized appreciation and depreciation on outstanding contracts are reported in the Fund’s Statement of Assets and Liabilities, as measured by the difference between the forward exchange rates at the reporting date and the forward exchange rates at each contract’s inception date. Net realized gain (loss) on contracts closed during the period, and changes in net unrealized appreciation (depreciation) on outstanding contracts are recognized in the Fund’s Statement of Operations.
The outstanding forward currency contracts in the Schedule of Investments were entered into with State Street Bank and Trust Company (“SSB”), pursuant to an International Swaps and Derivatives Association (“ISDA”) Master Agreement. In the event of a default or termination under the ISDA Master Agreement with SSB, the non-defaulting party has the right to close out all outstanding forward currency contracts between the parties and to net any payment amounts under those contracts, resulting in a single net amount payable by one party to the other.
Because the ISDA Master Agreement with SSB does not result in an offset of reported amounts of financial assets and liabilities in the Fund’s Statement of Assets and Liabilities unless there has been an event of default or termination event under that agreement, the Fund does not net its outstanding forward currency contracts for purposes of the disclosure in the Fund’s Statement of Assets and Liabilities. Instead the Fund recognizes the unrealized appreciation or depreciation on those forward currency contracts on a gross basis in the Fund’s Statement of Assets and Liabilities.
The unrealized appreciation (depreciation) of the outstanding forward currency contracts recognized in the Fund’s Statement of Assets and Liabilities at March 31, 2018 is disclosed in the following table:
| | | | | | |
FAIR VALUES OF DERIVATIVE FINANCIAL INSTRUMENTS AT MARCH 31, 2018 | |
| | |
| ASSET DERIVATIVES | | BALANCE SHEET LOCATION | | FAIR VALUE | |
| | |
Foreign exchange contracts | | Assets - Unrealized appreciation
on forward currency contracts | | $ | 149,629 | |
|
| FAIR VALUES OF DERIVATIVE FINANCIAL INSTRUMENTS AT MARCH 31, 2018 | |
| | |
| LIABILITY DERIVATIVES | | BALANCE SHEET LOCATION | | FAIR VALUE | |
| | |
Foreign exchange contracts | | Liabilities - Unrealized depreciation
on forward currency contracts | | $ | (24,407 | ) |
Because the Fund did not receive or post cash collateral in connection with its currency forward contracts during the period, and because all of the Fund’s outstanding currency forward contracts are with SSB, the net amounts of the Fund’s assets and liabilities which are attributable to those contracts at March 31, 2018 can be determined by offsetting the dollar amounts shown in the preceding table. Based on those amounts, the net amount of the Fund’s assets which is attributable to its outstanding forward currency contracts at March 31, 2018 is $125,222, and the net amount of the Fund’s liabilities which is attributable to those contracts at that date is $0. The Fund’s forward currency contracts are valued each day, and the net amounts of the Fund’s assets and liabilities which are attributable to those contracts are expected to vary over time.
The net realized gain (loss) from forward currency contracts and the net change in unrealized appreciation (depreciation) on outstanding forward currency contracts recognized in the Fund’s Statement of Operations for the six months ended March 31, 2018 are disclosed in the following tables:
Semi-Annual Repor | 23
Notes to Financial Statements, Continued
Thornburg Value Fund | March 31, 2018 (Unaudited)
| | | | | | | | |
NET REALIZED GAIN (LOSS) ON DERIVATIVE FINANCIAL INSTRUMENTS
RECOGNIZED IN INCOME FOR THE SIX MONTHS ENDED MARCH 31, 2018 | |
| | |
| | | TOTAL | | | FORWARD CURRENCY CONTRACTS | |
| | |
Foreign exchange contracts | | $ | (663,798 | ) | | $ | | (663,798) |
|
NET CHANGE IN UNREALIZED APPRECIATION (DEPRECIATION) OF DERIVATIVE FINANCIAL INSTRUMENTS
RECOGNIZED IN INCOME FOR THE SIX MONTHS ENDED MARCH 31, 2018 | |
| | |
| | | TOTAL | | | FORWARD CURRENCY CONTRACTS | |
| | |
Foreign exchange contracts | | $ | (22,733 | ) | | $ | | (22,733) |
OTHER NOTES
Risks: The Fund’s investments subject it to risks including, but not limited to, management risk, market and economic risk, risks affecting specific issuers, liquidity risk, the risks associated with investments in small- and mid-cap companies and non-U.S. issuers (including developing country issuers), credit risk, and interest rate risk. Please see the Fund’s prospectus for a discussion of the risks associated with an investment in the Fund.
Subsequent Events: Fund management believes no events have occurred between March 31, 2018 and the date of issuance of the financial statements that require adjustment to or disclosure in the accompanying financial statements.
24 | Semi-Annual Report
This page intentionally left blank.
Semi-Annual Report | 25
Financial Highlights
Thornburg Value Fund
| | | | | | | | | | | | | | | | | | | | | | | | | | | | | | | | | | | | | | | | |
| | | PER SHARE PERFORMANCE (FOR A SHARE OUTSTANDING THROUGHOUT THE PERIOD) |
| | | | | | | | | | | | | | | | | |
UNLESS OTHERWISE
NOTED, PERIODS ARE
FISCAL YEARS ENDED
SEPTEMBER 30, | | NET ASSET
VALUE,
BEGINNING OF
PERIOD | | NET
INVESTMENT
INCOME
(LOSS)+ | | NET REALIZED &
UNREALIZED GAIN
(LOSS) ON
INVESTMENTS | | TOTAL FROM
INVESTMENT
OPERATIONS | | DIVIDENDS
FROM NET
INVESTMENT
INCOME | | DIVIDENDS
FROM NET
REALIZED
GAINS | | TOTAL
DIVIDENDS | | NET ASSET
VALUE,
END OF PERIOD |
| | | | | | | |
| CLASS A SHARES | | | | | | | | | | | | | | | | | | | | | | | | | | | | | | | | | | | | |
| | | | | | | | |
2018(b)(c) | | | $ | 65.26 | | | | | 0.22 | | | | | 1.24 | | | | | 1.46 | | | | | (0.36 | ) | | | | – | | | | | (0.36 | ) | | | $ | 66.36 | |
2017(b)(e) | | | $ | 54.08 | | | | | 0.16 | | | | | 11.04 | | | | | 11.20 | | | | | (0.02 | ) | | | | – | | | | | (0.02 | ) | | | $ | 65.26 | |
2016(b) | | | $ | 49.17 | | | | | 0.32 | | | | | 4.76 | | | | | 5.08 | | | | | (0.17 | ) | | | | – | | | | | (0.17 | ) | | | $ | 54.08 | |
2015(b) | | | $ | 48.09 | | | | | 0.07 | | | | | 1.03 | | | | | 1.10 | | | | | (0.02 | ) | | | | – | | | | | (0.02 | ) | | | $ | 49.17 | |
2014(b) | | | $ | 40.84 | | | | | 0.10 | | | | | 7.41 | | | | | 7.51 | | | | | (0.26 | ) | | | | – | | | | | (0.26 | ) | | | $ | 48.09 | |
2013(b) | | | $ | 31.51 | | | | | 0.08 | | | | | 9.25 | | | | | 9.33 | | | | | – | | | | | – | | | | | – | | | | $ | 40.84 | |
| | | | | | | |
| CLASS C SHARES | | | | | | | | | | | | | | | | | | | | | | | | | | | | | | | | | | | | |
| | | | | | | | |
2018(c) | | | $ | 59.87 | | | | | (0.03 | ) | | | | 1.14 | | | | | 1.11 | | | | | (0.25 | ) | | | | – | | | | | (0.25 | ) | | | $ | 60.73 | |
2017 | | | $ | 49.97 | | | | | (0.27 | ) | | | | 10.17 | | | | | 9.90 | | | | | – | | | | | – | | | | | – | | | | $ | 59.87 | |
2016 | | | $ | 45.63 | | | | | (0.06 | ) | | | | 4.40 | | | | | 4.34 | | | | | – | | | | | – | | | | | – | | | | $ | 49.97 | |
2015 | | | $ | 44.95 | | | | | (0.29 | ) | | | | 0.97 | | | | | 0.68 | | | | | – | | | | | – | | | | | – | | | | $ | 45.63 | |
2014 | | | $ | 38.26 | | | | | (0.24 | ) | | | | 6.93 | | | | | 6.69 | | | | | – | | | | | – | | | | | – | | | | $ | 44.95 | |
2013 | | | $ | 29.75 | | | | | (0.18 | ) | | | | 8.69 | | | | | 8.51 | | | | | – | | | | | – | | | | | – | | | | $ | 38.26 | |
| | | | | | | |
| CLASS I SHARES | | | | | | | | | | | | | | | | | | | | | | | | | | | | | | | | | | | | |
| | | | | | | | |
2018(c) | | | $ | 67.10 | | | | | 0.35 | | | | | 1.27 | | | | | 1.62 | | | | | (0.42 | ) | | | | – | | | | | (0.42 | ) | | | $ | 68.30 | |
2017 | | | $ | 55.58 | | | | | 0.42 | | | | | 11.35 | | | | | 11.77 | | | | | (0.25 | ) | | | | – | | | | | (0.25 | ) | | | $ | 67.10 | |
2016 | | | $ | 50.53 | | | | | 0.54 | | | | | 4.90 | | | | | 5.44 | | | | | (0.39 | ) | | | | – | | | | | (0.39 | ) | | | $ | 55.58 | |
2015 | | | $ | 49.28 | | | | | 0.28 | | | | | 1.04 | | | | | 1.32 | | | | | (0.07 | ) | | | | – | | | | | (0.07 | ) | | | $ | 50.53 | |
2014 | | | $ | 41.96 | | | | | 0.28 | | | | | 7.62 | | | | | 7.90 | | | | | (0.58 | ) | | | | – | | | | | (0.58 | ) | | | $ | 49.28 | |
2013 | | | $ | 32.24 | | | | | 0.20 | | | | | 9.52 | | | | | 9.72 | | | | | – | | | | | – | | | | | – | | | | $ | 41.96 | |
| | | | | | | |
| CLASS R3 SHARES | | | | | | | | | | | | | | | | | | | | | | | | | | | | | | | | | | | | |
| | | | | | | | |
2018(c) | | | $ | 64.88 | | | | | 0.23 | | | | | 1.22 | | | | | 1.45 | | | | | (0.36 | ) | | | | – | | | | | (0.36 | ) | | | $ | 65.97 | |
2017 | | | $ | 53.76 | | | | | 0.18 | | | | | 10.97 | | | | | 11.15 | | | | | (0.03 | ) | | | | – | | | | | (0.03 | ) | | | $ | 64.88 | |
2016 | | | $ | 48.86 | | | | | 0.34 | | | | | 4.74 | | | | | 5.08 | | | | | (0.18 | ) | | | | – | | | | | (0.18 | ) | | | $ | 53.76 | |
2015 | | | $ | 47.79 | | | | | 0.08 | | | | | 1.01 | | | | | 1.09 | | | | | (0.02 | ) | | | | – | | | | | (0.02 | ) | | | $ | 48.86 | |
2014 | | | $ | 40.56 | | | | | 0.11 | | | | | 7.37 | | | | | 7.48 | | | | | (0.25 | ) | | | | – | | | | | (0.25 | ) | | | $ | 47.79 | |
2013 | | | $ | 31.28 | | | | | 0.10 | | | | | 9.18 | | | | | 9.28 | | | | | – | | | | | – | | | | | – | | | | $ | 40.56 | |
| | | | | | | |
| CLASS R4 SHARES | | | | | | | | | | | | | | | | | | | | | | | | | | | | | | | | | | | | |
| | | | | | | | |
2018(c) | | | $ | 65.55 | | | | | 0.27 | | | | | 1.24 | | | | | 1.51 | | | | | (0.38 | ) | | | | – | | | | | (0.38 | ) | | | $ | 66.68 | |
2017 | | | $ | 54.31 | | | | | 0.25 | | | | | 11.08 | | | | | 11.33 | | | | | (0.09 | ) | | | | – | | | | | (0.09 | ) | | | $ | 65.55 | |
2016 | | | $ | 49.36 | | | | | 0.40 | | | | | 4.78 | | | | | 5.18 | | | | | (0.23 | ) | | | | – | | | | | (0.23 | ) | | | $ | 54.31 | |
2015 | | | $ | 48.24 | | | | | 0.14 | | | | | 1.01 | | | | | 1.15 | | | | | (0.03 | ) | | | | – | | | | | (0.03 | ) | | | $ | 49.36 | |
2014 | | | $ | 40.89 | | | | | 0.16 | | | | | 7.43 | | | | | 7.59 | | | | | (0.24 | ) | | | | – | | | | | (0.24 | ) | | | $ | 48.24 | |
2013 | | | $ | 31.50 | | | | | 0.13 | | | | | 9.26 | | | | | 9.39 | | | | | – | | | | | – | | | | | – | | | | $ | 40.89 | |
| | | | | | | |
| CLASS R5 SHARES | | | | | | | | | | | | | | | | | | | | | | | | | | | | | | | | | | | | |
| | | | | | | | |
2018(c) | | | $ | 67.01 | | | | | 0.34 | | | | | 1.28 | | | | | 1.62 | | | | | (0.42 | ) | | | | – | | | | | (0.42 | ) | | | $ | 68.21 | |
2017 | | | $ | 55.50 | | | | | 0.41 | | | | | 11.35 | | | | | 11.76 | | | | | (0.25 | ) | | | | – | | | | | (0.25 | ) | | | $ | 67.01 | |
2016 | | | $ | 50.45 | | | | | 0.53 | | | | | 4.90 | | | | | 5.43 | | | | | (0.38 | ) | | | | – | | | | | (0.38 | ) | | | $ | 55.50 | |
2015 | | | $ | 49.21 | | | | | 0.27 | | | | | 1.04 | | | | | 1.31 | | | | | (0.07 | ) | | | | – | | | | | (0.07 | ) | | | $ | 50.45 | |
2014 | | | $ | 41.89 | | | | | 0.28 | | | | | 7.61 | | | | | 7.89 | | | | | (0.57 | ) | | | | – | | | | | (0.57 | ) | | | $ | 49.21 | |
2013 | | | $ | 32.19 | | | | | 0.22 | | | | | 9.48 | | | | | 9.70 | | | | | – | | | | | – | | | | | – | | | | $ | 41.89 | |
| (a) | Not annualized for periods less than one year. |
| (b) | Sales loads are not reflected in computing total return. |
| (c) | Unaudited Six Month Period Ended March 31. |
| (e) | Class B shares converted to Class A shares on August 29, 2016. |
| + | Based on weighted average shares outstanding. |
See notes to financial statements.
26 | Semi-Annual Report
Financial Highlights, Continued
Thornburg Value Fund
| | | | | | | | | | | | | | | | | | | | | | | | | | | | | | |
| RATIOS TO AVERAGE NET ASSETS | | | | | | SUPPLEMENTAL DATA | |
| | | | | | | EXPENSES, AFTER | | | | | | | | | | | | | | | | |
NET INVESTMENT
INCOME (LOSS) (%) | | | EXPENSES, AFTER
EXPENSE
REDUCTIONS (%) | | | EXPENSE
REDUCTIONS AND
NET OF CUSTODY
CREDITS (%) | | | EXPENSES,
BEFORE EXPENSE
REDUCTIONS (%) | | | | | | TOTAL
RETURN (%)(a) | | | PORTFOLIO
TURNOVER
RATE (%)(a) | | | NET ASSETS AT
END OF PERIOD (THOUSANDS) | |
| | | | | | | |
| | | | | | | | | | | | | | | | | | | | | | | | | | | | | | |
| | | | | | | |
| | 0.66 | (d) | | | 1.35 | (d) | | | 1.35 | (d) | | | 1.35 | (d) | | | | | | | 2.22 | | | | 17.62 | | | $ | 367,747 | |
| | 0.27 | | | | 1.39 | | | | 1.39 | | | | 1.39 | | | | | | | | 20.72 | | | | 43.53 | | | $ | 383,118 | |
| | 0.63 | | | | 1.39 | | | | 1.39 | | | | 1.39 | | | | | | | | 10.33 | | | | 31.10 | | | $ | 374,237 | |
| | 0.14 | | | | 1.37 | | | | 1.37 | | | | 1.37 | | | | | | | | 2.28 | | | | 59.70 | | | $ | 377,299 | |
| | 0.22 | | | | 1.37 | | | | 1.37 | | | | 1.37 | | | | | | | | 18.40 | | | | 72.43 | | | $ | 395,216 | |
| | 0.23 | | | | 1.40 | | | | 1.40 | | | | 1.40 | | | | | | | | 29.61 | | | | 61.50 | | | $ | 400,275 | |
| | | | | | | |
| | | | | | | | | | | | | | | | | | | | | | | | | | | | | | |
| | | | | | | |
| | (0.08 | )(d) | | | 2.11 | (d) | | | 2.11 | (d) | | | 2.11 | (d) | | | | | | | 1.84 | | | | 17.62 | | | $ | 152,988 | |
| | (0.49 | ) | | | 2.14 | | | | 2.14 | | | | 2.14 | | | | | | | | 19.81 | | | | 43.53 | | | $ | 160,663 | |
| | (0.12 | ) | | | 2.14 | | | | 2.14 | | | | 2.14 | | | | | | | | 9.51 | | | | 31.10 | | | $ | 168,821 | |
| | (0.61 | ) | | | 2.12 | | | | 2.12 | | | | 2.12 | | | | | | | | 1.51 | | | | 59.70 | | | $ | 168,321 | |
| | (0.55 | ) | | | 2.14 | | | | 2.14 | | | | 2.14 | | | | | | | | 17.49 | | | | 72.43 | | | $ | 175,495 | |
| | (0.55 | ) | | | 2.18 | | | | 2.18 | | | | 2.18 | | | | | | | | 28.60 | | | | 61.50 | | | $ | 166,971 | |
| | | | | | | | | | | | | | | | | | | | | | | | | | | | | | |
| | | | | | | |
| | 0.99 | (d) | | | 0.99 | (d) | | | 0.99 | (d) | | | 1.05 | (d) | | | | | | | 2.40 | | | | 17.62 | | | $ | 371,163 | |
| | 0.68 | | | | 0.99 | | | | 0.99 | | | | 1.06 | | | | | | | | 21.20 | | | | 43.53 | | | $ | 368,790 | |
| | 1.02 | | | | 0.99 | | | | 0.99 | | | | 1.07 | | | | | | | | 10.77 | | | | 31.10 | | | $ | 280,570 | |
| | 0.53 | | | | 0.99 | | | | 0.99 | | | | 1.06 | | | | | | | | 2.68 | | | | 59.70 | | | $ | 288,642 | |
| | 0.60 | | | | 0.99 | | | | 0.99 | | | | 1.06 | | | | | | | | 18.86 | | | | 72.43 | | | $ | 299,568 | |
| | 0.59 | | | | 0.98 | | | | 0.98 | | | | 1.01 | | | | | | | | 30.15 | | | | 61.50 | | | $ | 272,468 | |
| | | | | | | | | | | | | | | | | | | | | | | | | | | | | | |
| | | | | | | |
| | 0.69 | (d) | | | 1.35 | (d) | | | 1.35 | (d) | | | 1.80 | (d) | | | | | | | 2.23 | | | | 17.62 | | | $ | 42,286 | |
| | 0.30 | | | | 1.35 | | | | 1.35 | | | | 1.82 | | | | | | | | 20.75 | | | | 43.53 | | | $ | 45,668 | |
| | 0.67 | | | | 1.35 | | | | 1.35 | | | | 1.81 | | | | | | | | 10.40 | | | | 31.10 | | | $ | 50,089 | |
| | 0.16 | | | | 1.35 | | | | 1.35 | | | | 1.77 | | | | | | | | 2.28 | | | | 59.70 | | | $ | 59,150 | |
| | 0.23 | | | | 1.35 | | | | 1.35 | | | | 1.77 | | | | | | | | 18.45 | | | | 72.43 | | | $ | 74,579 | |
| | 0.29 | | | | 1.34 | | | | 1.34 | | | | 1.78 | | | | | | | | 29.67 | | | | 61.50 | | | $ | 80,671 | |
| | | | | | | | | | | | | | | | | | | | | | | | | | | | | | |
| | | | | | | |
| | 0.80 | (d) | | | 1.25 | (d) | | | 1.25 | (d) | | | 1.75 | (d) | | | | | | | 2.28 | | | | 17.62 | | | $ | 8,989 | |
| | 0.42 | | | | 1.24 | | | | 1.24 | | | | 1.78 | | | | | | | | 20.87 | | | | 43.53 | | | $ | 10,159 | |
| | 0.78 | | | | 1.25 | | | | 1.25 | | | | 1.75 | | | | | | | | 10.50 | | | | 31.10 | | | $ | 9,539 | |
| | 0.26 | | | | 1.25 | | | | 1.25 | | | | 1.67 | | | | | | | | 2.39 | | | | 59.70 | | | $ | 10,167 | |
| | 0.36 | | | | 1.24 | | | | 1.24 | | | | 1.69 | | | | | | | | 18.56 | | | | 72.43 | | | $ | 11,330 | |
| | 0.39 | | | | 1.25 | | | | 1.25 | | | | 1.67 | | | | | | | | 29.81 | | | | 61.50 | | | $ | 13,340 | |
| | | | | | | |
| | | | | | | | | | | | | | | | | | | | | | | | | | | | | | |
| | | | | | | |
| | 0.98 | (d) | | | 0.99 | (d) | | | 0.99 | (d) | | | 1.35 | (d) | | | | | | | 2.41 | | | | 17.62 | | | $ | 18,353 | |
| | 0.68 | | | | 0.99 | | | | 0.99 | | | | 1.42 | | | | | | | | 21.21 | | | | 43.53 | | | $ | 17,060 | |
| | 1.00 | | | | 0.99 | | | | 0.99 | | | | 1.46 | | | | | | | | 10.78 | | | | 31.10 | | | $ | 14,738 | |
| | 0.51 | | | | 0.99 | | | | 0.99 | | | | 1.20 | | | | | | | | 2.65 | | | | 59.70 | | | $ | 19,270 | |
| | 0.59 | | | | 0.98 | | | | 0.98 | | | | 1.42 | | | | | | | | 18.88 | | | | 72.43 | | | $ | 30,676 | |
| | 0.63 | | | | 0.99 | | | | 0.99 | | | | 1.37 | | | | | | | | 30.13 | | | | 61.50 | | | $ | 47,076 | |
Semi-Annual Report | 27
Expense Example
Thornburg Value Fund | March 31, 2018 (Unaudited)
As a shareholder of the Fund, you incur two types of costs:
| | (1) | transaction costs, including |
| | (a) | sales charges (loads) on purchase payments, for Class A shares; |
| | (b) | a deferred sales charge on redemptions of any part or all of a purchase of $1 million of Class A shares within 12 months of purchase; |
| | (c) | a deferred sales charge on redemptions of Class C shares within 12 months of purchase; |
| | (2) | ongoing costs, including management fees; distribution and/or service (12b-1) fees; and other Fund expenses. |
This example is intended to help you understand your ongoing costs (in dollars) of investing in the Fund and to compare these costs with the ongoing costs of investing in other mutual funds.
The example is based on a $1,000 investment beginning on October 1, 2017, and held until March 31, 2018.
ACTUAL EXPENSES
For each class of shares, the first line of the accompanying table provides information about actual account values and actual expenses. You may use the information in this line, together with the amount you invested, to estimate the expenses that you paid over the period. Simply divide your account value by $1,000 (for example, an $8,600 account value divided by $1,000 = 8.6), then multiply the result by the number in the first line for your class of shares under the heading entitled “Expenses Paid During Period” to estimate the expenses you paid on your account during this period.
| | | | | | | | | | | | | | | |
| | | BEGINNING
ACCOUNT VALUE
10/1/17 | | ENDING
ACCOUNT VALUE
3/31/18 | | EXPENSES PAID
DURING PERIOD†
10/1/17–3/31/18 |
| | | |
| CLASS A SHARES | | | | | | | | | | | | | | | |
| | | |
Actual | | | $ | 1,000.00 | | | | $ | 1,022.20 | | | | $ | 6.81 | |
Hypothetical* | | | $ | 1,000.00 | | | | $ | 1,018.20 | | | | $ | 6.79 | |
| | | |
| CLASS C SHARES | | | | | | | | | | | | | | | |
| | | |
Actual | | | $ | 1,000.00 | | | | $ | 1,018.40 | | | | $ | 10.62 | |
Hypothetical* | | | $ | 1,000.00 | | | | $ | 1,014.41 | | | | $ | 10.60 | |
| | | |
| CLASS I SHARES | | | | | | | | | | | | | | | |
| | | |
Actual | | | $ | 1,000.00 | | | | $ | 1,024.00 | | | | $ | 5.00 | |
Hypothetical* | | | $ | 1,000.00 | | | | $ | 1,020.00 | | | | $ | 4.99 | |
| | | |
| CLASS R3 SHARES | | | | | | | | | | | | | | | |
| | | |
Actual | | | $ | 1,000.00 | | | | $ | 1,022.30 | | | | $ | 6.81 | |
Hypothetical* | | | $ | 1,000.00 | | | | $ | 1,018.20 | | | | $ | 6.79 | |
| | | |
| CLASS R4 SHARES | | | | | | | | | | | | | | | |
| | | |
Actual | | | $ | 1,000.00 | | | | $ | 1,022.80 | | | | $ | 6.30 | |
Hypothetical* | | | $ | 1,000.00 | | | | $ | 1,018.70 | | | | $ | 6.29 | |
| | | |
| CLASS R5 SHARES | | | | | | | | | | | | | | | |
| | | |
Actual | | | $ | 1,000.00 | | | | $ | 1,024.10 | | | | $ | 5.00 | |
Hypothetical* | | | $ | 1,000.00 | | | | $ | 1,020.00 | | | | $ | 4.99 | |
| † | Expenses are equal to the annualized expense ratio for each class (A: 1.35%; C: 2.11%; I: 0.99%; R3: 1.35%; R4: 1.25%; R5: 0.99%) multiplied by the average account value over the period, multiplied by 182/365 to reflect the one-half year period. |
| * | Hypothetical assumes a rate of return of 5% per year before expenses. |
HYPOTHETICAL EXAMPLE FOR COMPARISON PURPOSES
For each class of shares, the second line of the accompanying table provides information about hypothetical account values and hypothetical expenses based on the Fund’s actual expense ratio and an assumed rate of return of 5% per year before expenses, which is not the Fund’s actual return. The hypothetical account values and expenses may not be used to estimate the actual ending account balance or expenses you paid for the period. You may use this information to compare the ongoing costs of investing in the Fund and other funds. To do so, compare this 5% hypothetical example with the 5% hypothetical examples that appear in the shareholder reports of the other funds.
Please note that the expenses shown in the table are meant to highlight your ongoing costs only and do not reflect any transactional costs, such as sales charges (loads), redemption fees, or exchange fees. Therefore, the second line of the table for each class of shares is useful in comparing ongoing costs only, and will not help you determine the relative total costs of owning different funds. In addition, if these transactional costs were included, your costs would have been higher.
28 | Semi-Annual Report
Other Information
Thornburg Value Fund | March 31, 2018 (Unaudited)
PORTFOLIO PROXY VOTING
Policies and Procedures:
The Trust has delegated to Thornburg Investment Management, Inc. (the “Advisor”) voting decisions respecting proxies for the Fund’s voting securities. The Advisor makes voting decisions in accordance with its Proxy Voting Policy and Procedures. A description of the Policy and Procedures is available (i) without charge, upon request, by calling the Advisor toll-free at 1-800-847-0200, (ii) on the Thornburg website at www.thornburg.com, and (iii) on the Securities and Exchange Commission’s website at www.sec.gov.
Information regarding how proxies were voted is available on or before August 31 of each year for the twelve months ending the preceding June 30. This information is available (i) without charge, upon request by calling the Advisor toll-free at 1-800-847-0200, (ii) on the Thornburg website at www.thornburg.com, and (iii) on the Securities and Exchange Commission’s website at www.sec.gov.
AVAILABILITY OF QUARTERLY PORTFOLIO SCHEDULE
The Fund files with the Securities and Exchange Commission schedules of its portfolio holdings on Form N-Q for the first and third quarters of each fiscal year. The Fund’s Forms N-Q are available on the Commission’s website at www.sec.gov, or may be reviewed and copied at the Commission’s Public Reference Room in Washington, D.C. Information on the operation of the Public Reference Room may be obtained by calling 1-800-SEC-0330. The Fund also makes this information available on its website at www.thornburg.com/download or upon request by calling 1-800-847-0200.
Semi-Annual Report | 29
Trustees’ Statement to Shareholders
Readopted September 11, 2017
The Trustees believe current and prospective shareholders should know how we discharge our responsibilities in supervising the Funds’ investment advisor and in reviewing the advisor’s contract for renewal. Since 2005, we have issued a statement which sets out clearly the three principal guidelines that we follow in supervising the Trust’s investment advisor on your behalf. In accordance with our customary practice, in September of this year we again reviewed our statement and concluded we should reissue this statement outlining the principal features of our supervision of the advisor’s performance of investment management services for the Funds.
We begin with the premise that each shareholder selected his or her Fund because its investments are managed by the investment advisor identified in the prospectus and in accordance with the objective and policies described in the prospectus. We realize, as each of you do, that if you believe that your Fund’s stated objective and policies no longer serve your personal investment goals, you can sell your shares and leave the Fund.
Therefore, we believe that our primary supervisory task—our principal obligation to you—is to assess the nature and quality of the advisor’s services, and to confirm that the advisor actively and competently pursues the Fund’s objective, in accordance with the policies set out in the prospectus. To do this, we meet regularly with management to review your Fund’s portfolio and to discuss the advisor’s specific actions and judgments in pursuing the Fund’s objective. We do not substitute our own judgment for the advisor’s decisions in selecting investments; the advisor is paid to exercise its informed judgment on investment decisions, and we seek to confirm, in reviewing the advisor’s performance, that the advisor is doing just that.
Second, we are conscious of costs and the effect that costs have on shareholders’ returns. We try to make sure that your Fund’s fees and costs are reasonable in relationship to the services rendered and that they are generally in line with those charged by other expert investment advisors, consistent with our belief that the Fund’s investors searched for and expect that expertise and attention and have decided to pay a reasonable price for it. We do not put the management contract “out to bid” as a matter of course, and we would not do so unless we had concluded that the advisor materially had failed to pursue the Fund’s objectives in accordance with its policies, or for other equally important reasons. We believe that any other approach would be inconsistent with your interests and contrary to your expectations when you bought shares of the Fund in the first place.
Finally, because we believe that most Thornburg Fund shareholders have invested with a long-term perspective, we try not to focus too much on the fashions of the moment and on short-term performance. The market will not favor any specific investment objective or set of policies at all times and under all economic circumstances. A fund will experience periods of both high and low returns relative to other funds and other investments. Even if one of our Funds is not favored by the market at a particular time, we believe that the advisor is nonetheless obliged to remain true to the Fund’s objective and policies, and we watch to see that it does so.
Trustees of Thornburg Investment Trust
30 | Semi-Annual Report
Thornburg Funds
Thornburg Investment Management is a privately-owned global investment firm that offers a range of solutions for retail and institutional investors. Founded in 1982 and headquartered in Santa Fe, New Mexico, we manage approximately $49 billion (as of March 31, 2018) across U.S. mutual funds, separate accounts for high-net-worth investors, institutional accounts, and UCITS funds for non-U.S. investors.
EQUITY FUNDS
| | ∎ | | Thornburg Investment Income Builder Fund |
| | ∎ | | Thornburg Global Opportunities Fund |
| | ∎ | | Thornburg International Value Fund |
| | ∎ | | Thornburg Better World International Fund |
| | ∎ | | Thornburg International Growth Fund |
| | ∎ | | Thornburg Developing World Fund |
| | ∎ | | Thornburg Core Growth Fund |
FIXED INCOME FUNDS
| | ∎ | | Thornburg Low Duration Income Fund |
| | ∎ | | Thornburg Limited Term U.S. Government Fund |
| | ∎ | | Thornburg Limited Term Income Fund |
| | ∎ | | Thornburg Strategic Income Fund |
| | ∎ | | Thornburg Low Duration Municipal Fund |
| | ∎ | | Thornburg Limited Term Municipal Fund |
| | ∎ | | Thornburg Intermediate Municipal Fund |
| | ∎ | | Thornburg California Limited Term Municipal Fund |
| | ∎ | | Thornburg New Mexico Intermediate Municipal Fund |
| | ∎ | | Thornburg New York Intermediate Municipal Fund |
| | ∎ | | Thornburg Strategic Municipal Income Fund |
ALTERNATIVE FUNDS
| | ∎ | | Thornburg Long/Short Equity Fund |
Before investing, carefully consider the Fund’s investment goals, risks, charges, and expenses. For a prospectus or summary prospectus containing this and other information, contact your financial advisor or visit thornburg.com. Read it carefully before investing.
For additional information, please visit thornburg.com
Thornburg Investment Management, Inc. 2300 North Ridgetop Road, Santa Fe, NM 87506
Semi-Annual Report | 31
| | | | |
| To receive shareholder reports, prospectuses, and proxy statements electronically, go to www.thornburg.com/edelivery. | | | | |
| This Semi-Annual Report is submitted for the general information of shareholders of the Fund. It is not authorized for distribution to prospective investors in the Fund unless preceded or accompanied by an effective prospectus. | |
| | | | |
Investment Advisor: | | Distributor: | | |
Thornburg Investment Management® | | Thornburg Securities Corporation® | | |
800.847.0200 | | 800.847.0200 | | TH170 |
Semi-Annual Report
March 31, 2018
THORNBURG
INTERNATIONAL
VALUE FUND
About Thornburg Investment Management
It’s more than what we do. It’s how we do it.
At Thornburg, we are very different in how we think, invest, and are structured. We believe this difference is what makes us successful in helping individuals reach their long-term financial goals.
Flexible Perspective
Our perspective on investment opportunities is more flexible than most, viewing a wide range of opportunities beyond conventional boundaries to find hidden value.
Collaboration
Collectively, we hone ideas via borderless cross-pollination for better judgment and better results.
Portfolio Construction
Disciplined construction guided more by our convictions than convention.
CONVICTION
Thorough analysis and our relative-value framework lead to conviction in our securities selection.
UNCONVENTIONAL
Active management means we seek the best value for our clients rather than using conventional benchmarks as our starting point.
Structured for Excellence
How we think and how we invest is made possible by how we’re structured.
TEAM APPROACH
FAR FROM THE HERD
ACCESS & TRANSPARENCY
2 | Semi-Annual Report
Thornburg International Value Fund
Semi-Annual Report | March 31, 2018
Table of Contents
| | | | | | | | | | |
| SHARE CLASS | | NASDAQ SYMBOL | | CUSIP |
| | |
| Class A | | TGVAX | | | | 885-215-657 | |
| Class C | | THGCX | | | | 885-215-640 | |
| Class I | | TGVIX | | | | 885-215-566 | |
| Class R3 | | TGVRX | | | | 885-215-525 | |
| Class R4 | | THVRX | | | | 885-215-269 | |
| Class R5 | | TIVRX | | | | 885-215-368 | |
| Class R6 | | TGIRX | | | | 885-216-804 | |
Class I, R3, R4, R5, and R6 shares may not be available to all investors. Minimum investments for Class I shares may be higher than those for other classes.
Investments carry risks, including possible loss of principal. Additional risks may be associated with investments outside the United States, especially in emerging markets, including currency fluctuations, illiquidity, volatility, and political and economic risks. Investments in small- and mid-capitalization companies may increase the risk of greater price fluctuations. Please see the Fund’s prospectus for a discussion of the risks associated with an investment in the Fund. Investments in the Fund are not FDIC insured, nor are they deposits of or guaranteed by a bank or any other entity.
Funds invested in a smaller number of holdings may expose an investor to greater volatility.
Semi-Annual Report | 3
Letter to Shareholders
Thornburg International Value Fund | March 31, 2018 (Unaudited)
April 20, 2018
Dear Fellow Shareholder:
In 2017, we saw synchronized global expansion, low inflation, and accommodative monetary policy leading to strong equity returns, and that sentiment carried into January as fundamentals pointed to further solid economic development and robust corporate earnings growth. Following the strong January, investors began fretting about higher inflation and a potentially more hawkish U.S. Federal Reserve. Subsequently, trade tensions began escalating notably. We, however, expect the U.S. and China to reach agreements and avoid a global trade war, in turn improving access to the Chinese market. In the interim, expect noisy, headline-driven negotiations to keep volatility on the forefront.
During the last two months of the period, the S&P 500 Index, the MSCI EAFE Index, and the MSCI Emerging Markets Index all declined over 6%. On the European political front, Germany finally formed a government where Germany’s center-left Social Democratic Party of Germany (SPD) agreed to join chancellor Merkel’s center-right Christian Democratic Union and Christian Social Union parties (CDU/CSU) in a renewed “grand coalition.” Political uncertainty continues in Italy after its election, in which the anti-establishment Five-Star Movement and anti-immigration League party garnered increasing support. On a positive note, both parties downplayed anti-European Union rhetoric as of late; therefore, we don’t see Italy attempting to part from the E.U. However, the road to form a coalition government could be lengthy, further supporting elevated levels of market volatility.
For the six-month period ended March 31, 2018, Thornburg International Value Fund returned 1.23% (I shares), compared to the MSCI EAFE and MSCI All-Country World ex-U.S. indices’ returns of 2.63% and 3.76% respectively.
Contributors to Performance
Électricité de France S.A.
Électricité de France (EDF) produces, transmits, distributes, imports, and exports electricity. EDF boasts the largest nuclear power generation capacity in France and is vital for the reliability of electricity provisions across Europe. We believe the company possesses undervalued nuclear assets and the arrival of France’s new long-term energy plan and carbon price could provide upside potential in share prices.
Ping An Insurance Group Co.
Ping An Insurance, a leading financial conglomerate involved in insurance, pension, banking, brokerage, trust, and other financial services, is the second-largest life and property & casualty insurer in China in terms of premiums. Coupled with the improving macroeconomic environment in China and balance sheet risk reduction, shares of Ping An Insurance fared well over the six month period. We believe that the stock
remains discounted relative to top peers and expect the valuation discount to narrow from continued growth in its P&C business, coupled with the potential to unlock value from its digital businesses via listing.
China Petroleum & Chemical Corp.
China Petroleum & Chemical Corp. (Sinopec) is China’s largest oil refiner and petrochemical producer and distributor. Its upstream business benefited from increasing oil prices, and its strong cash generation supports a high dividend payout ratio. During the period, the State Administration of Taxation announced that refineries and wholesalers will be required to draw up invoices through the value added tax system to close consumption tax loopholes. This decision should eliminate capacity from uneconomical refineries in an over supplied industry, resulting in higher refinery margin, beneficial to Sinopec.
Shin-Etsu Chemical Co. Ltd.
Shin-Etsu, a premier Japanese chemicals firm supplying highly competitive products, benefits from its leading global market share in PVC resin through its U.S.-based subsidiary, Shintech, and significant production cost advantages. The increasingly robust global economy drove demand for Shin-Etsu Chemicals’ various applications, driving top-line volume growth. Along with volume growth, price improvement, and margin expansion, Shin-Etsu Chemical shares performed robustly.
Nike, Inc.
Nike, a global athletic footwear and apparel company, continues to deliver solid earnings growth as it shifts distribution from wholesale (via retailing intermediary) to “direct-to-consumer” with particular strength coming from international divisions.
Detractors from Performance
General Electric Co.
General Electric is a diversified industrial and financial services conglomerate. The company serves a wide variety of end markets globally, including power and water, aviation, oil and gas, health care, appliances and lighting, energy management, transportation, and finance. During the period, its share price declined on continued disappointment from its power segment and upcoming accounting restatement. We have reduced our stake.
BRF S.A.
BRF (Brasil Foods) is one of the world’s largest protein companies, focusing on poultry and processed food under brands such as Perdigao, Sadia, and Qualy. BRF is among the world’s largest exporters of poultry meat, accounting for approximately 14.5% of world trade in poultry. It is well positioned to capture growing global protein consumption, as consumer incomes increase. In addition, the agricultural advantages of Brazil—climate, water, and soil conditions—give BRF a cost
4 | Semi-Annual Report
Letter to Shareholders, Continued
Thornburg International Value Fund | March 31, 2018 (Unaudited)
advantage, facilitating international expansion. BRF underperformed during the period as its domestic business margins shrank from investment to re-establish shelf space, coupled with management turnover.
ConvaTec Group plc
ConvaTec is one of three large manufacturers of chronic and heavily recurring health-care products, such as ostomy bags and urinary catheters. Production challenges arose as the company moved some of its manufacturing lines to a lower-cost jurisdiction, leading to downward earnings revisions as sales and margins came under pressure. We sold our position in the company.
China Unicom Hong Kong Ltd.
China Unicom, the second largest mobile and fixed-line operator in China, underperformed the market following its announcement of mixed ownership reform and increased employee ownership, although we view the announcement as positive. China Unicom also stands to benefit from an upcoming public listing of joint-venture tower company, China Tower Co., potentially unlocking value for China Unicom shareholders.
Ctrip.com International Ltd.
Ctrip.com, the premier online travel agency in China, offers a broad set of travel-related services, such as air tickets, train tickets, hotel, car rental, travel insurance, etc. As discretionary
income in China grows, experience-based consumption, such as travel, should continue to gain consumers’ wallet share. While Ctrip delivered better-than-expected third quarter sales and earnings, fourth quarter guidance was lowered due to regulatory changes influencing bundled sales of air ticketing, affecting short-term revenue and margins.
We maintain conviction in our portfolio in a volatile market driven by headlines on trade tensions, inflation, a hawkish U.S. Federal Reserve, and geopolitical uncertainties. With volatility comes opportunity to acquire good companies at compelling prices. Our bottom-up process continues leading us to interesting companies across our baskets: basic value, consistent earners, and emerging franchises. We are confident that our investment philosophy and process will continue to deliver attractive risk-adjusted returns over a full market cycle.
Thank you for investing alongside us in Thornburg International Value Fund.
Sincerely,
| | |
 | |  |
| Lei Wang, CFA | | Di Zhou, CFA |
| Portfolio Manager | | Portfolio Manager |
| Managing Director | | Managing Director |
The matters discussed in this report may constitute forward-looking statements made pursuant to the safe harbor provisions of the Securities Litigation Reform Act of 1995. These include any advisor or portfolio manager prediction, assessment, analysis or outlook for individual securities, industries, investment styles, market sectors and/or markets. These statements involve risks and uncertainties. In addition to the general risks described for each fund in its current prospectus, other factors bearing on these reports include the accuracy of the advisor’s or portfolio manager’s forecasts and predictions, the appropriateness of the investment strategies designed by the advisor or portfolio manager and the ability of the advisor or portfolio manager to implement their strategies efficiently and successfully. Any one or more of these factors, as well as other risks affecting the securities markets generally, could cause the actual results of any fund to differ materially as compared to its benchmarks.
The views expressed are subject to change and do not necessarily reflect the views of Thornburg Investment Management, Inc. This information should not be relied upon as a recommendation or investment advice and is not intended to predict the performance of any investment or market.
Performance results of individual share classes will vary based on the fees and expenses associated with each share class, and may be higher or lower than other share classes within the same Fund. Please see Performance Summary for performance results of each share class.
Semi-Annual Report | 5
Performance Summary
Thornburg International Value Fund | March 31, 2018 (Unaudited)
AVERAGE ANNUAL TOTAL RETURNS
| | | | | | | | | | | | | | | | | | | | | | | | | |
| | | 1-YR | | 3-YR | | 5-YR | | 10-YR | | SINCE
INCEP. |
| | | | | |
Class A Shares (Incep: 5/28/98) | | | | | | | | | | | | | | | | | | | | | | | | | |
Without sales charge | | | | 14.15% | | | | | 5.47% | | | | | 5.96% | | | | | 2.91% | | | | | 7.66% | |
| | | | | |
With sales charge | | | | 9.02% | | | | | 3.86% | | | | | 4.99% | | | | | 2.43% | | | | | 7.41% | |
Class C Shares (Incep: 5/28/98) | | | | | | | | | | | | | | | | | | | | | | | | | |
Without sales charge | | | | 13.33% | | | | | 4.71% | | | | | 5.19% | | | | | 2.16% | | | | | 6.82% | |
| | | | | |
With sales charge | | | | 12.38% | | | | | 4.71% | | | | | 5.19% | | | | | 2.16% | | | | | 6.82% | |
| | | | | |
Class I Shares (Incep: 3/30/01) | | | | 14.62% | | | | | 5.88% | | | | | 6.37% | | | | | 3.31% | | | | | 7.46% | |
| | | | | |
Class R3 Shares (Incep: 7/1/03) | | | | 13.97% | | | | | 5.31% | | | | | 5.78% | | | | | 2.74% | | | | | 8.50% | |
| | | | | |
Class R4 Shares (Incep: 2/1/07) | | | | 14.24% | | | | | 5.52% | | | | | 5.99% | | | | | 2.95% | | | | | 3.73% | |
| | | | | |
Class R5 Shares (Incep: 2/1/05) | | | | 14.50% | | | | | 5.80% | | | | | 6.28% | | | | | 3.22% | | | | | 6.82% | |
| | | | | |
Class R6 Shares (Incep: 5/1/12) | | | | 14.73% | | | | | 6.03% | | | | | 6.53% | | | | | - | | | | | 6.74% | |
| | | | | |
MSCI EAFE Index (Since 5/28/98) | | | | 14.80% | | | | | 5.55% | | | | | 6.50% | | | | | 2.74% | | | | | 4.44% | |
| | | | | |
MSCI AC World ex-U.S. Index (Net) (Since 5/28/98) | | | | 16.53% | | | | | 6.18% | | | | | 5.89% | | | | | 2.70% | | | | | 5.01% | |
GROWTH OF A HYPOTHETICAL $10,000 INVESTMENT
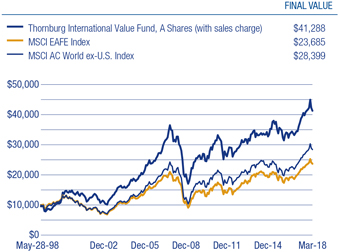
Performance data shown represents past performance and is no guarantee of future results. Investment return and principal value will fluctuate so shares, when redeemed, may be worth more or less than their original cost. Current performance may be lower or higher than quoted. For performance current to the most recent month end, visit thornburg.com or call 800-847-0200. The performance information does not reflect the deduction of taxes that a shareholder would pay on distributions or the redemption of Fund shares. Returns reflect the reinvestment of dividends and capital gains. Class A shares are sold with a maximum sales charge of 4.50%. Class C shares are subject to a 1% CDSC for the first year only. There is no sales charge for Class I, R3, R4, R5 and R6 shares.
As disclosed in the most recent prospectus, the total annual fund operating expenses before any fee waivers or expense reimbursements are as follows: A shares, 1.27%; C shares, 2.00%; I shares, 0.95%; R3 shares, 1.60%; R4 shares, 1.42%; R5 shares, 1.18%; R6 shares, 0.82%. Thornburg Investment Management and/or Thornburg Securities Corporation have contractually agreed to waive fees and reimburse expenses through at least February 1, 2019, for some of the share classes, resulting in net expense ratios of the following: R3 shares, 1.45%; R4 shares, 1.25%; R5 shares, 0.99%. For more detailed information on fund expenses and waivers/reimbursements please see the Fund’s prospectus.
Glossary
The MSCI All Country (AC) World ex-US Index is a market capitalization weighted index representative of the market structure of 45 developed and emerging market countries in North and South America, Europe, Africa, and the Pacific Rim, excluding securities of United States issuers. Beginning in January 2001, the index is calculated with net dividends reinvested in U.S. dollars.
The MSCI Emerging Markets Index is a free float-adjusted market capitalization index that is designed to measure equity market performance of emerging markets. The MSCI Emerging Markets Index consists of the following 24 emerging market country indexes: Brazil, Chile, China, Colombia, Czech Republic, Egypt, Greece, Hungary, India, Indonesia, Korea, Malaysia, Mexico, Pakistan, Peru, Philippines, Poland, Qatar, Russia, South Africa, Taiwan, Thailand, Turkey and United Arab Emirates.
The S&P 500 Index is an unmanaged broad measure of the U.S. stock market.
The MSCI EAFE (Europe, Australasia, Far East) Index is an unmanaged index. It is a generally accepted benchmark for major overseas markets. Index weightings represent the relative capitalizations of the major overseas developed markets on a U.S. dollar adjusted basis. The index is calculated with net dividends reinvested in U.S. dollars.
The performance of any index is not indicative of the performance of any particular investment. Unless otherwise noted, index returns reflect the reinvestment of income dividends and capital gains, if any, but do not reflect fees, brokerage commissions or other expenses of investing. Investors may not make direct investments into any index.
6 | Semi-Annual Report
Fund Summary
Thornburg International Value Fund | March 31, 2018 (Unaudited)
OBJECTIVES AND STRATEGIES
The Fund seeks long-term capital appreciation by investing in equity and debt securities of all types. As a secondary goal, the Fund also seeks some current income.
The Fund invests primarily in foreign securities or depositary receipts of foreign securities. The Fund may invest in developing countries.
MARKET CAPITALIZATION EXPOSURE
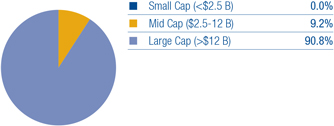
BASKET STRUCTURE
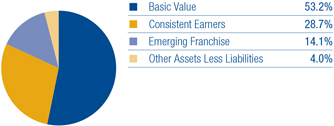
TOP TEN EQUITY HOLDINGS
| | | | | |
| UniCredit S.p.A. | | | | 4.8% | |
| Electricite de France S.A. | | | | 4.5% | |
| China Petroleum & Chemical Corp. | | | | 3.9% | |
| Credit Suisse Group AG | | | | 3.6% | |
| Canadian Pacific Railway Ltd. | | | | 3.5% | |
| Ping An Insurance Group Co. of China Ltd. | | | | 3.5% | |
| Commerzbank AG | | | | 3.3% | |
| Halliburton Co. | | | | 3.2% | |
| SAP SE | | | | 3.2% | |
| Infineon Technologies AG | | | | 3.1% | |
SECTOR EXPOSURE
| | | | | |
| Financials | | | | 20.6% | |
| Energy | | | | 12.6% | |
| Industrials | | | | 12.2% | |
| Information Technology | | | | 11.8% | |
| Consumer Staples | | | | 9.4% | |
| Health Care | | | | 7.9% | |
| Utilities | | | | 7.0% | |
| Consumer Discretionary | | | | 6.8% | |
| Materials | | | | 4.4% | |
| Telecommunication Services | | | | 2.9% | |
| Other Assets Less Liabilities | | | | 4.0% | |
TOP TEN INDUSTRY GROUPS
| | | | | |
| Energy | | | | 12.6% | |
| Banks | | | | 10.9% | |
| Capital Goods | | | | 8.7% | |
| Food, Beverage & Tobacco | | | | 7.7% | |
| Utilities | | | | 7.0% | |
| Insurance | | | | 6.1% | |
| Pharmaceuticals, Biotechnology & Life Sciences | | | | 5.5% | |
| Software & Services | | | | 4.9% | |
| Semiconductors & Semiconductor Equipment | | | | 4.9% | |
| Materials | | | | 4.4% | |
COUNTRY EXPOSURE*
(percent of equity holdings)
| | | | | |
| China | | | | 22.2% | |
| France | | | | 13.1% | |
| Germany | | | | 12.5% | |
| United Kingdom | | | | 8.1% | |
| Switzerland | | | | 7.7% | |
| Japan | | | | 6.6% | |
| United States | | | | 6.4% | |
| Netherlands | | | | 5.6% | |
| Italy | | | | 5.0% | |
| Spain | | | | 4.4% | |
| Canada | | | | 3.7% | |
| India | | | | 2.8% | |
| Brazil | | | | 1.0% | |
| Israel | | | | 1.0% | |
| * | Holdings are classified by country of risk as determined by MSCI and Bloomberg. |
There is no guarantee that the Fund will meet its investment objectives.
All data is subject to change. Charts may not add up to 100% due to rounding.
Semi-Annual Report | 7
Schedule of Investments
Thornburg International Value Fund | March 31, 2018 (Unaudited)
| | | | | | | | | | | | |
| | | | | SHARES/
PRINCIPAL AMOUNT | | VALUE |
| | | |
| | COMMON STOCK — 96.0% | | | | | | | | | | |
| | | |
| | AUTOMOBILES & COMPONENTS — 0.5% | | | | | | | | | | |
| | Automobiles — 0.5% | | | | | | | | | | |
| | Subaru Corp. | | | | 810,061 | | | | $ | 26,561,748 | |
| | | | | | | | | | | | |
| | | | | | | | | | | 26,561,748 | |
| | | | | | | | | | | | |
| | BANKS — 10.9% | | | | | | | | | | |
| | Banks — 10.9% | | | | | | | | | | |
| | Barclays plc | | | | 52,528,746 | | | | | 152,186,100 | |
| a | | Commerzbank AG | | | | 13,539,433 | | | | | 175,658,729 | |
| a | | UniCredit S.p.A. | | | | 12,504,044 | | | | | 261,370,524 | |
| | | | | | | | | | | | |
| | | | | | | | | | | 589,215,353 | |
| | | | | | | | | | | | |
| | CAPITAL GOODS — 8.7% | | | | | | | | | | |
| | Building Products — 3.2% | | | | | | | | | | |
| | Cie de Saint-Gobain | | | | 1,775,524 | | | | | 93,635,940 | |
| | Daikin Industries Ltd. | | | | 714,078 | | | | | 78,148,943 | |
| | Construction & Engineering — 5.2% | | | | | | | | | | |
| | Ferrovial S.A. | | | | 6,902,866 | | | | | 144,094,422 | |
| | Vinci S.A. | | | | 1,414,001 | | | | | 139,014,582 | |
| | Industrial Conglomerates — 0.3% | | | | | | | | | | |
| | General Electric Co. | | | | 1,002,089 | | | | | 13,508,160 | |
| | | | | | | | | | | | |
| | | | | | | | | | | 468,402,047 | |
| | | | | | | | | | | | |
| | CONSUMER DURABLES & APPAREL — 0.3% | | | | | | | | | | |
| | Textiles, Apparel & Luxury Goods — 0.3% | | | | | | | | | | |
| | NIKE, Inc. Class B | | | | 203,353 | | | | | 13,510,773 | |
| | | | | | | | | | | | |
| | | | | | | | | | | 13,510,773 | |
| | | | | | | | | | | | |
| | CONSUMER SERVICES — 2.7% | | | | | | | | | | |
| | Diversified Consumer Services — 2.7% | | | | | | | | | | |
| | TAL Education Group ADR | | | | 3,986,519 | | | | | 147,859,990 | |
| | | | | | | | | | | | |
| | | | | | | | | | | 147,859,990 | |
| | | | | | | | | | | | |
| | DIVERSIFIED FINANCIALS — 3.6% | | | | | | | | | | |
| | Capital Markets — 3.6% | | | | | | | | | | |
| | Credit Suisse Group AG | | | | 11,715,595 | | | | | 195,954,356 | |
| | | | | | | | | | | | |
| | | | | | | | | | | 195,954,356 | |
| | | | | | | | | | | | |
| | ENERGY — 12.6% | | | | | | | | | | |
| | Energy Equipment & Services — 3.2% | | | | | | | | | | |
| | Halliburton Co. | | | | 3,677,450 | | | | | 172,619,503 | |
| | Oil, Gas & Consumable Fuels — 9.4% | | | | | | | | | | |
| | China Petroleum & Chemical Corp. Class H | | | | 242,029,988 | | | | | 212,481,492 | |
| | Reliance Industries Ltd. | | | | 10,608,516 | | | | | 143,395,031 | |
| | Royal Dutch Shell plc ADR Class A | | | | 2,353,983 | | | | | 150,207,655 | |
| | | | | | | | | | | | |
| | | | | | | | | | | 678,703,681 | |
| | | | | | | | | | | | |
| | FOOD, BEVERAGE & TOBACCO — 7.7% | | | | | | | | | | |
| | Food Products — 5.7% | | | | | | | | | | |
| a | | BRF S.A. | | | | 7,197,463 | | | | | 49,771,488 | |
| | Danone S.A. | | | | 1,679,891 | | | | | 135,865,314 | |
| | Inner Mongolia Yili Industrial Group Co. Ltd. Class A | | | | 27,514,123 | | | | | 122,358,848 | |
| | Tobacco — 2.0% | | | | | | | | | | |
| | British American Tobacco plc Sponsored ADR | | | | 1,861,092 | | | | | 107,366,398 | |
| | | | | | | | | | | | |
| | | | | | | | | | | 415,362,048 | |
| | | | | | | | | | | | |
| | HEALTHCARE EQUIPMENT & SERVICES — 2.4% | | | | | | | | | | |
| | Health Care Providers & Services — 2.4% | | | | | | | | | | |
| | Fresenius SE & Co. KGaA | | | | 1,707,027 | | | | | 130,351,497 | |
| | | | | | | | | | | | |
| | | | | | | | | | | 130,351,497 | |
| | | | | | | | | | | | |
| | HOUSEHOLD & PERSONAL PRODUCTS — 1.7% | | | | | | | | | | |
| | Household Products — 1.7% | | | | | | | | | | |
| | Reckitt Benckiser Group plc | | | | 1,095,524 | | | | | 92,743,846 | |
| | | | | | | | | | | | |
| | | | | | | | | | | 92,743,846 | |
| | | | | | | | | | | | |
8 | Semi-Annual Report
Schedule of Investments, Continued
Thornburg International Value Fund | March 31, 2018 (Unaudited)
| | | | | | | | | | | | |
| | | | | SHARES/
PRINCIPAL AMOUNT | | VALUE |
| | INSURANCE — 6.1% | | | | | | | | | | |
| | Insurance — 6.1% | | | | | | | | | | |
| | NN Group N.V. | | | | 3,105,471 | | | | $ | 137,713,375 | |
| | Ping An Insurance Group Co. of China Ltd. Class H | | | | 18,604,917 | | | | | 189,174,822 | |
| | | | | | | | | | | | |
| | | | | | | | | | | 326,888,197 | |
| | | | | | | | | | | | |
| | MATERIALS — 4.4% | | | | | | | | | | |
| | Chemicals — 2.4% | | | | | | | | | | |
| | Shin-Etsu Chemical Co. Ltd. | | | | 1,249,167 | | | | | 127,669,669 | |
| | Construction Materials — 2.0% | | | | | | | | | | |
| | LafargeHolcim Ltd. | | | | 2,028,366 | | | | | 110,966,048 | |
| | | | | | | | | | | | |
| | | | | | | | | | | 238,635,717 | |
| | | | | | | | | | | | |
| | MEDIA — 1.2% | | | | | | | | | | |
| | Media — 1.2% | | | | | | | | | | |
| a | | Liberty Global plc | | | | 2,095,992 | | | | | 63,781,036 | |
| | | | | | | | | | | | |
| | | | | | | | | | | 63,781,036 | |
| | | | | | | | | | | | |
| | PHARMACEUTICALS, BIOTECHNOLOGY & LIFE SCIENCES — 5.5% | | | | | | | | | | |
| | Biotechnology — 1.3% | | | | | | | | | | |
| a | | Alkermes plc | | | | 1,192,283 | | | | | 69,104,723 | |
| | Pharmaceuticals — 4.2% | | | | | | | | | | |
| | Dong-E-E-Jiao Co. Ltd. Class A | | | | 7,810,360 | | | | | 75,674,229 | |
| | Teva Pharmaceutical Industries Ltd. Sponsored ADR | | | | 2,904,261 | | | | | 49,633,820 | |
| | Yunnan Baiyao Group Co. Ltd. Class A | | | | 6,550,897 | | | | | 103,755,247 | |
| | | | | | | | | | | | |
| | | | | | | | | | | 298,168,019 | |
| | | | | | | | | | | | |
| | RETAILING — 2.2% | | | | | | | | | | |
| | Internet & Direct Marketing Retail — 0.7% | | | | | | | | | | |
| a | | Ctrip.com International Ltd. ADR | | | | 739,607 | | | | | 34,480,479 | |
| | Specialty Retail — 1.5% | | | | | | | | | | |
| | Industria de Diseno Textil S.A. | | | | 419,346 | | | | | 13,121,477 | |
| | Kingfisher plc | | | | 16,632,949 | | | | | 68,257,916 | |
| | | | | | | | | | | | |
| | | | | | | | | | | 115,859,872 | |
| | | | | | | | | | | | |
| | SEMICONDUCTORS & SEMICONDUCTOR EQUIPMENT — 4.9% | | | | | | | | | | |
| | Semiconductors & Semiconductor Equipment — 4.9% | | | | | | | | | | |
| | ams AG | | | | 901,796 | | | | | 94,198,063 | |
| | Infineon Technologies AG | | | | 6,317,808 | | | | | 169,001,215 | |
| | | | | | | | | | | | |
| | | | | | | | | | | 263,199,278 | |
| | | | | | | | | | | | |
| | SOFTWARE & SERVICES — 5.1% | | | | | | | | | | |
| | Internet Software & Services — 1.9% | | | | | | | | | | |
| a | | Alibaba Group Holding Ltd. Sponsored ADR | | | | 150,071 | | | | | 27,544,031 | |
| a | | iQIYI, Inc. ADR | | | | 756,322 | | | | | 11,760,807 | |
| | Tencent Holdings Ltd. | | | | 1,264,500 | | | | | 65,995,069 | |
| | Software — 3.2% | | | | | | | | | | |
| | SAP SE | | | | 1,638,130 | | | | | 171,268,638 | |
| | | | | | | | | | | | |
| | | | | | | | | | | 276,568,545 | |
| | | | | | | | | | | | |
| | TECHNOLOGY HARDWARE & EQUIPMENT — 2.0% | | | | | | | | | | |
| | Electronic Equipment, Instruments & Components — 2.0% | | | | | | | | | | |
| | Omron Corp. | | | | 1,910,794 | | | | | 109,721,830 | |
| | | | | | | | | | | | |
| | | | | | | | | | | 109,721,830 | |
| | | | | | | | | | | | |
| | TELECOMMUNICATION SERVICES — 2.9% | | | | | | | | | | |
| | Diversified Telecommunication Services — 2.9% | | | | | | | | | | |
| a | | China Unicom Hong Kong Ltd. | | | | 124,953,427 | | | | | 157,621,723 | |
| | | | | | | | | | | | |
| | | | | | | | | | | 157,621,723 | |
| | | | | | | | | | | | |
| | TRANSPORTATION — 3.6% | | | | | | | | | | |
| | Road & Rail — 3.6% | | | | | | | | | | |
| | Canadian Pacific Railway Ltd. | | | | 1,084,042 | | | | | 191,333,413 | |
| | | | | | | | | | | | |
| | | | | | | | | | | 191,333,413 | |
| | | | | | | | | | | | |
Semi-Annual Report | 9
Schedule of Investments, Continued
Thornburg International Value Fund | March 31, 2018 (Unaudited)
| | | | | | | | | | | | |
| | | | | SHARES/
PRINCIPAL AMOUNT | | VALUE |
| | UTILITIES — 7.0% | | | | | | | | | | |
| | Electric Utilities — 5.8% | | | | | | | | | | |
| | Electricite de France S.A. | | | | 16,671,216 | | | | $ | 241,233,969 | |
| | Iberdrola S.A. | | | | 9,475,850 | | | | | 69,630,873 | |
| | Multi-Utilities — 1.2% | | | | | | | | | | |
| | Veolia Environnement S.A. | | | | 2,847,896 | | | | | 67,438,189 | |
| | | | | | | | | | | | |
| | | | | | | | | | | 378,303,031 | |
| | | | | | | | | | | | |
| | TOTAL COMMON STOCK (Cost $4,424,314,510) | | | | | | | | | 5,178,746,000 | |
| | | | | | | | | | | | |
| | | |
| | SHORT-TERM INVESTMENTS — 4.5% | | | | | | | | | | |
| b | | Thornburg Capital Management Fund | | | | 24,415,984 | | | | | 244,159,836 | |
| | | | | | | | | | | | |
| | TOTAL SHORT-TERM INVESTMENTS (Cost $244,159,836) | | | | | | | | | 244,159,836 | |
| | | | | | | | | | | | |
| | | |
| | TOTAL INVESTMENTS — 100.5% (Cost $4,668,474,346) | | | | | | | | $ | 5,422,905,836 | |
| | | |
| | LIABILITIES NET OF OTHER ASSETS — (0.5)% | | | | | | | | | (28,898,144 | ) |
| | | | | | | | | | | | |
| | | |
| | NET ASSETS — 100.0% | | | | | | | | $ | 5,394,007,692 | |
| | | | | | | | | | | | |
Footnote Legend
| b | Investment in Affiliates. |
Portfolio Abbreviations
To simplify the listings of securities, abbreviations are used per the table below:
| | |
| ADR | | American Depositary Receipt |
See notes to financial statements.
10 | Semi-Annual Report
Statement of Assets and Liabilities
Thornburg International Value Fund | March 31, 2018 (Unaudited)
| | | | |
ASSETS | | | | |
| |
Investments at value (Note 3) | | | | |
Non-affiliated issuers (cost $4,424,314,510) | | $ | 5,178,746,000 | |
Non-controlled affiliated issuer (cost $244,159,836) | | | 244,159,836 | |
Cash denominated in foreign currency (cost $16) | | | 16 | |
Receivable for investments sold | | | 55,430,443 | |
Receivable for fund shares sold | | | 4,858,356 | |
Dividends receivable | | | 9,351,330 | |
Dividend and interest reclaim receivable | | | 11,788,491 | |
Prepaid expenses and other assets | | | 146,580 | |
| | | | |
| |
Total Assets | | | 5,504,481,052 | |
| | | | |
| |
LIABILITIES | | | | |
| |
Payable for investments purchased | | | 81,202,144 | |
Payable for fund shares redeemed | | | 11,197,149 | |
Payable to investment advisor and other affiliates (Note 4) | | | 4,222,351 | |
Deferred taxes payable (Note 2) | | | 9,916,154 | |
Accounts payable and accrued expenses | | | 3,935,562 | |
| | | | |
| |
Total Liabilities | | | 110,473,360 | |
| | | | |
| |
NET ASSETS | | $ | 5,394,007,692 | |
| | | | |
| |
NET ASSETS CONSIST OF | | | | |
| |
Distribution in excess of net investment income | | $ | (3,488,555 | ) |
Net unrealized appreciation on investments | | | 744,963,601 | |
Accumulated net realized gain (loss) | | | 93,512,644 | |
Net capital paid in on shares of beneficial interest | | | 4,559,020,002 | |
| | | | |
| |
| | $ | 5,394,007,692 | |
| | | | |
Semi-Annual Report | 11
Statement of Assets and Liabilities, Continued
Thornburg International Value Fund | March 31, 2018 (Unaudited)
| | | | |
NET ASSET VALUE | | | | |
| |
Class A Shares: | | | | |
Net asset value and redemption price per share
($771,491,697 applicable to 32,261,693 shares of beneficial
interest outstanding - Note 5) | | $ | 23.91 | |
| |
Maximum sales charge, 4.50% of offering price | | | 1.13 | |
| | | | |
| |
Maximum offering price per share | | $ | 25.04 | |
| | | | |
| |
Class C Shares: | | | | |
Net asset value and offering price per share*
($350,637,922 applicable to 16,564,076 shares of beneficial
interest outstanding - Note 5) | | $ | 21.17 | |
| | | | |
| |
Class I Shares: | | | | |
Net asset value, offering and redemption price per share
($2,978,680,458 applicable to 120,612,320 shares of beneficial
interest outstanding - Note 5) | | $ | 24.70 | |
| | | | |
| |
Class R3 Shares: | | | | |
Net asset value, offering and redemption price per share
($249,143,415 applicable to 10,428,961 shares of beneficial
interest outstanding - Note 5) | | $ | 23.89 | |
| | | | |
| |
Class R4 Shares: | | | | |
Net asset value, offering and redemption price per share
($193,647,576 applicable to 8,160,927 shares of beneficial
interest outstanding - Note 5) | | $ | 23.73 | |
| | | | |
| |
Class R5 Shares: | | | | |
Net asset value, offering and redemption price per share
($273,321,929 applicable to 11,078,067 shares of beneficial
interest outstanding - Note 5) | | $ | 24.67 | |
| | | | |
| |
Class R6 Shares: | | | | |
Net asset value, offering and redemption price per share
($577,084,695 applicable to 23,451,405 shares of beneficial
interest outstanding - Note 5) | | $ | 24.61 | |
| | | | |
* Redemption price per share is equal to net asset value less any applicable contingent deferred sales charge.
See notes to financial statements.
12 | Semi-Annual Report
Statement of Operations
Thornburg International Value Fund | Six Months Ended March 31, 2018 (Unaudited)
| | | | |
INVESTMENT INCOME | | | | |
| |
Dividend income | | | | |
Non-affiliated issuers (net of foreign taxes withheld of $1,567,279) | | $ | 25,868,399 | |
Non-controlled affiliated issuer | | | 1,276,276 | |
| | | | |
| |
Total Income | | | 27,144,675 | |
| | | | |
| |
EXPENSES | | | | |
| |
Investment advisory fees (Note 4) | | | 20,498,927 | |
Administration fees (Note 4) | | | | |
Class A Shares | | | 458,560 | |
Class C Shares | | | 214,809 | |
Class I Shares | | | 955,844 | |
Class R3 Shares | | | 153,496 | |
Class R4 Shares | | | 115,735 | |
Class R5 Shares | | | 87,879 | |
Class R6 Shares | | | 217,671 | |
Distribution and service fees (Note 4) | | | | |
Class A Shares | | | 1,026,299 | |
Class C Shares | | | 1,919,517 | |
Class R3 Shares | | | 685,008 | |
Class R4 Shares | | | 258,953 | |
Transfer agent fees | | | | |
Class A Shares | | | 711,303 | |
Class C Shares | | | 313,479 | |
Class I Shares | | | 1,487,256 | |
Class R3 Shares | | | 395,161 | |
Class R4 Shares | | | 366,654 | |
Class R5 Shares | | | 583,465 | |
Class R6 Shares | | | 5,216 | |
Registration and filing fees | | | | |
Class A Shares | | | 8,565 | |
Class C Shares | | | 7,506 | |
Class I Shares | | | 29,623 | |
Class R3 Shares | | | 6,745 | |
Class R4 Shares | | | 8,296 | |
Class R5 Shares | | | 7,750 | |
Class R6 Shares | | | 8,637 | |
Custodian fees (Note 2) | | | 703,325 | |
Professional fees | | | 125,629 | |
Trustee and officer fees (Note 4) | | | 128,520 | |
Other expenses | | | 149,178 | |
| | | | |
| |
Total Expenses | | | 31,639,006 | |
| |
Less: | | | | |
Expenses reimbursed by investment advisor (Note 4) | | | (1,007,763 | ) |
| | | | |
| |
Net Expenses | | | 30,631,243 | |
| | | | |
| |
Net Investment Loss | | $ | (3,486,568 | ) |
| | | | |
Semi-Annual Report | 13
Statement of Operations, Continued
Thornburg International Value Fund | Six Months Ended March 31, 2018 (Unaudited)
| | | | |
REALIZED AND UNREALIZED GAIN (LOSS) | | | | |
| |
Net realized gain (loss) on: | | | | |
Non-affiliated issuer investments | | $ | 171,919,955 | |
Forward currency contracts (Note 7) | | | (11,400,521 | ) |
Foreign currency transactions | | | (430,244 | ) |
| | | | |
| |
| | | 160,089,190 | |
| | | | |
Net change in unrealized appreciation (depreciation) on: | | | | |
Non-affiliated issuer investments (net of change in deferred taxes payable of $6,134,927) | | | (95,547,780 | ) |
Forward currency contracts (Note 7) | | | 11,400,521 | |
Foreign currency translations | | | 119,034 | |
| | | | |
| |
| | | (84,028,225 | ) |
| | | | |
| |
Net Realized and Unrealized Gain | | | 76,060,965 | |
| |
Net Increase in Net Assets Resulting from Operations | | $ | 72,574,397 | |
| | | | |
See notes to financial statements.
14 | Semi-Annual Report
Statements of Changes in Net Assets
Thornburg International Value Fund
| | | | | | | | | | |
| | | SIX MONTHS ENDED
MARCH 31, 2018* | | YEAR ENDED
SEPTEMBER 30, 2017 |
INCREASE (DECREASE) IN NET ASSETS FROM | | | | | | | | | | |
| | |
OPERATIONS | | | | | | | | | | |
| | |
Net investment income (loss) | | | $ | (3,486,568 | ) | | | $ | 53,878,936 | |
Net realized gain (loss) on investments, forward currency contracts and foreign currency transactions | | | | 160,089,190 | | | | | 907,533,262 | |
Net unrealized appreciation (depreciation) on investments, forward currency contracts, foreign currency translations and deferred taxes | | | | (84,028,225 | ) | | | | 75,527,352 | |
| | | | | |
| | |
Net Increase in Net Assets Resulting from Operations | | | | 72,574,397 | | | | | 1,036,939,550 | |
| | |
DIVIDENDS TO SHAREHOLDERS | | | | | | | | | | |
| | |
From net investment income | | | | | | | | | | |
Class A Shares | | | | – | | | | | (6,065,117 | ) |
Class C Shares | | | | – | | | | | (1,766,237 | ) |
Class I Shares | | | | (1,203,423 | ) | | | | (33,169,653 | ) |
Class R3 Shares | | |
| –
|
| | | | (1,862,018 | ) |
Class R4 Shares | | | | – | | | | | (1,676,630 | ) |
Class R5 Shares | | | | (50,528 | ) | | | | (3,189,993 | ) |
Class R6 Shares | | | | (379,022 | ) | | | | (5,709,079 | ) |
| | |
From realized gains | | | | | | | | | | |
Class A Shares | | | | (119,664,083 | ) | | | | – | |
Class C Shares | | | | (62,573,001 | ) | | | | – | |
Class I Shares | | | | (449,716,402 | ) | | | | – | |
Class R3 Shares | | | | (40,754,715 | ) | | | | – | |
Class R4 Shares | | | | (30,158,902 | ) | | | | – | |
Class R5 Shares | | | | (40,573,732 | ) | | | | – | |
Class R6 Shares | | | | (75,860,621 | ) | | | | – | |
| | |
FUND SHARE TRANSACTIONS (NOTE 5) | | | | | | | | | | |
| | |
Class A Shares | | | | 40,657,046 | | | | | (286,423,403 | ) |
Class C Shares | | | | 8,524,519 | | | | | (203,047,421 | ) |
Class I Shares | | | | 16,255,384 | | | | | (1,555,349,057 | ) |
Class R3 Shares | | | | 673,388 | | | | | (87,487,739 | ) |
Class R4 Shares | | | | 11,979,934 | | | | | (95,176,715 | ) |
Class R5 Shares | | | | 10,846,079 | | | | | (297,802,637 | ) |
Class R6 Shares | | | | 111,556,573 | | | | | (13,685,709 | ) |
| | | | | |
| | |
Net Decrease in Net Assets | | | | (547,867,109 | ) | | | | (1,555,417,858 | ) |
| | |
NET ASSETS | | | | | | | | | | |
| | |
Beginning of Period | | | | 5,941,874,801 | | | | | 7,497,346,659 | |
| | | | | |
| | |
End of Period | | | $ | 5,394,007,692 | | | | $ | 5,941,874,801 | |
| | | | | |
| | |
Undistributed (distribution in excess of) net investment income | | | $ | (3,488,555 | ) | | | $ | 1,630,986 | |
| | |
| * Unaudited. | | | | | | | | | | |
See notes to financial statements.
Semi-Annual Report | 15
Notes to Financial Statements
Thornburg International Value Fund | March 31, 2018 (Unaudited)
NOTE 1 – ORGANIZATION
Thornburg International Value Fund (the “Fund”) is a diversified series of Thornburg Investment Trust (the “Trust”). The Trust was organized as a Massachusetts business trust under a Declaration of Trust dated June 3, 1987 and is registered as a diversified, open-end management investment company under the Investment Company Act of 1940, as amended. The Fund is currently one of twenty-one separate series of the Trust. Each series is considered to be a separate entity for financial reporting and tax purposes and bears expenses directly attributable to it. The Fund seeks long-term capital appreciation by investing in equity and debt securities of all types. As a secondary objective, the Fund also seeks some current income.
The Fund currently offers seven classes of shares of beneficial interest: Class A, Class C, Institutional Class (“Class I”), and Retirement Classes (“Class R3”, “Class R4”, “Class R5”, and “Class R6”). Each class of shares of the Fund represents an interest in the same portfolio of investments, except that (i) Class A shares are sold subject to a front-end sales charge collected at the time the shares are purchased and bear a service fee, (ii) Class C shares are sold at net asset value without a sales charge at the time of purchase, but are subject to a contingent deferred sales charge upon redemption within one year of purchase, and bear both a service fee and a distribution fee, (iii) Class I and Class R5 shares are sold at net asset value without a sales charge at the time of purchase and may be subject to a service fee, (iv) Class R3 shares are sold at net asset value without a sales charge at the time of purchase, but bear both a service fee and distribution fee, (v) Class R4 shares are sold at net asset value without a sales charge at the time of purchase, but bear a service fee, (vi) Class R6 shares are sold at net asset value without a sales charge at the time of purchase, and (vii) the respective classes may have different reinvestment privileges and conversion rights. Additionally, the Fund may allocate among its classes certain expenses, to the extent allocable to specific classes, including transfer agent fees, government registration fees, certain printing and postage costs, and administrative and legal expenses. Currently, class specific expenses of the Fund are limited to service and distribution fees, administration fees, and certain registration and transfer agent expenses.
The following is a summary of significant accounting policies followed by the Fund in the preparation of its financial statements. The Fund prepares its financial statements in conformity with United States generally accepted accounting principles (“GAAP”), including investment company accounting and reporting guidance in the Financial Accounting Standards Board (the “FASB”) Accounting Standard Codification Topic 946.
NOTE 2 – SIGNIFICANT ACCOUNTING POLICIES
Security Valuation: All investments in securities held by the Fund are valued as described in Note 3.
Allocation of Income, Gains, Losses and Expenses: Net investment income (other than class specific expenses) and realized and unrealized gains and losses are allocated daily to each class of shares based upon the relative net asset value of outstanding shares (or the value of the dividend-eligible shares, as appropriate) of each class of shares at the beginning of the day (after adjusting for the current capital shares activity of the respective class). Expenses common to all Funds are allocated among the Funds comprising the Trust based upon their relative net asset values or other appropriate allocation methods. Operating expenses directly attributable to a specific class are charged against the operating income of that class.
Dividends and Distributions to Shareholders: Dividends and distributions to shareholders, which are determined in accordance with federal income tax regulations and may differ from GAAP, are recorded on the ex-dividend date. Ordinary income distributions, if any, are declared and paid annually. Capital gain distributions, if any, are declared and paid annually and more often if deemed necessary by Thornburg Investment Management, Inc., the Trust’s investment advisor (the “Advisor”). Dividends are paid and are reinvested in additional shares of the Fund at net asset value per share at the close of business on the ex-dividend date, or at the shareholder’s option, paid in cash.
Investment Income: Dividend income is recorded on the ex-dividend date. Certain income from foreign investments is recognized as soon as information is available to the Fund. Interest income is accrued as earned. Premiums and discounts are amortized and accreted, respectively, to call dates or maturity dates using the effective yield method of the respective investments. These amounts are included in Interest income on the Statement of Operations.
Custodian Fees: Custodian fees disclosed in the Statement of Operations may include interest expenses incurred by the Fund on any cash overdrafts of its custodian account during the period. Such cash overdrafts may result from the effects of failed trades in portfolio securities and from cash outflows resulting from unanticipated shareholder redemption activity. The Fund pays interest to its custodian on any such cash overdraft at a rate set periodically at the custodian’s discretion of the overdraft amount in excess of $50,000.
Investment Transactions: Investment transactions are accounted for on a trade date basis. Realized gains and losses from the sale of investments are recorded on an identified cost basis.
Repurchase Agreements: The Fund may invest excess cash in repurchase agreements whereby the Fund purchases investments, which serve as collateral, with an agreement to resell such collateral to the seller at an agreed upon price at the maturity date of the repurchase
16 | Semi-Annual Report
Notes to Financial Statements, Continued
Thornburg International Value Fund | March 31, 2018 (Unaudited)
agreement. Investments pledged as collateral for repurchase agreements are held in custody until maturity of the repurchase agreement. Provisions in the agreements require that the market value of the collateral is at least equal to the repurchase value in the event of default. In the event of default, the Fund has the right to liquidate the collateral and apply the proceeds in satisfaction of the obligation. Under certain circumstances, in the event of default or bankruptcy by the other party to the agreement, realization and/or retention of the collateral may be subject to legal proceedings.
When-Issued and Delayed Delivery Transactions: The Fund may engage in when-issued or delayed delivery transactions. To the extent the Fund engages in such transactions, it will do so for the purpose of acquiring portfolio investments consistent with the Fund’s investment objectives and not for the purpose of investment leverage or to speculate on interest rate or market changes. At the time the Fund makes a commitment to purchase an investment on a when-issued or delayed delivery basis, the Fund will record the transaction and reflect the value in determining its net asset value. When effecting such transactions, assets of an amount sufficient to make payment for the portfolio investments to be purchased will be segregated on the Fund’s records on the trade date. Investments purchased on a when-issued or delayed delivery basis do not earn interest until the settlement date.
Foreign Currency Translation: Portfolio investments and other assets and liabilities denominated in foreign currencies are translated into U.S. dollars based on the exchange rate of such currencies against the U.S. dollar on the date of valuation. Purchases and sales of investments and income items denominated in foreign currencies are translated into U.S. dollars at the exchange rate in effect on the transaction date. When the Fund purchases or sells foreign investments, it will customarily enter into a foreign exchange contract to minimize foreign exchange risk from the trade date to the settlement date of such transactions. The values of such spot contracts are included in receivable for investments sold and payable for investments purchased on the Statement of Assets and Liabilities.
The Fund does not separately report the effect of changes in foreign exchange rates from changes in market prices on investments held. Such changes are included in net unrealized appreciation (depreciation) from investments.
Reported net realized gains and losses from foreign currency transactions arise due to purchases and sales of foreign currencies, currency gains and losses realized between the trade and settlement dates on investment transactions and the difference between the amounts of dividends, interest, and foreign withholding taxes recorded on the Fund’s books, and the U.S. dollar equivalent of the amounts actually received or paid.
Net change in unrealized appreciation (depreciation) on foreign currency translations arise from changes in the fair value of assets and liabilities, other than investments at period end, resulting from changes in exchange rates.
Guarantees and Indemnifications: Under the Trust’s organizational documents (and under separate agreements with the independent Trustees), its officers and Trustees are provided with an indemnification against certain liabilities arising out of the performance of their duties to the Fund. In the normal course of business the Trust may also enter into contracts with service providers that contain general indemnifications. The Trust’s maximum exposure under these arrangements is unknown. However, based on experience, the Trust expects the risk of loss to be remote.
Use of Estimates: The preparation of financial statements in conformity with GAAP requires management to make estimates and assumptions that affect the reported amounts of assets and liabilities and disclosure of contingent assets and liabilities at the date of the financial statements and the reported amounts of increases (decreases) in net assets from operations during the reporting period. Actual results could differ from those estimates.
Federal Income Taxes: It is the policy of the Trust to comply with the provisions of the Internal Revenue Code applicable to regulated investment companies and to distribute to shareholders substantially all investment company taxable income including net realized gains on investments (if any), and tax exempt income of the Fund. Therefore, no provision for federal income or excise tax is required.
The Fund files income tax returns in United States federal and applicable state jurisdictions. The statute of limitations on the Fund’s tax return filings generally remains open for the three years following a return’s filing date. The Fund has analyzed each uncertain tax position believed to be material in the preparation of the Fund’s financial statements for the six month period ended March 31, 2018, including open tax years, to assess whether it is more likely than not that the position would be sustained upon examination, based on the technical merits of the position. The Fund has not identified any such position for which an asset or liability must be reflected in the Statement of Assets and Liabilities.
At March 31, 2018, information on the tax components of capital was as follows:
| | | | | |
Cost of investments for tax purposes | | | $ | 4,668,474,346 | |
| | | | | |
Gross unrealized appreciation on a tax basis | | | | 863,763,034 | |
Gross unrealized depreciation on a tax basis | | | | (109,331,544 | ) |
| | | | | |
Net unrealized appreciation (depreciation) on investments (tax basis) | | | $ | 754,431,490 | |
| | | | | |
Semi-Annual Report | 17
Notes to Financial Statements, Continued
Thornburg International Value Fund | March 31, 2018 (Unaudited)
Foreign Withholding Taxes: The Fund is subject to foreign tax withholding imposed by certain foreign countries in which the Fund may invest. Withholding taxes are incurred on certain foreign dividends and are accrued at the time the dividend is recognized based on applicable foreign tax laws. The Fund may file withholding tax reclaims in certain jurisdictions to recover a portion of amounts previously withheld, in view of various considerations, including recent decisions rendered by the courts in those and other jurisdictions. The Fund would expect to record a receivable for such a reclaim based on a variety of factors, including assessment of a jurisdiction’s legal obligation to pay reclaims, the jurisdiction’s administrative practices and payment history, and industry convention. To date the Fund has recorded no such receivable because there is limited precedent for collecting such prior year reclaims and the likelihood of collection remains uncertain.
Deferred Foreign Capital Gain Taxes: The Fund is subject to a tax imposed on net realized gains of securities of certain foreign countries. The Fund records an estimated deferred tax liability for net unrealized gains on these investments as reflected in the accompanying financial statements.
NOTE 3 – SECURITY VALUATION
Valuation of the Fund’s portfolio investment securities is performed in accordance with policies and procedures adopted by and under the oversight of the Trustees.
The Trustees of the Trust have appointed the Advisor to assist the Trustees to obtain market values for portfolio investments, evaluate and monitor professional pricing service providers appointed by the Trustees’ Audit Committee (the “Audit Committee”) to assist in determining fair values for portfolio investments, assist in calculating fair values for portfolio investments in certain circumstances, and to perform other functions in connection with the valuation of investments. The Advisor acts through its Valuation and Pricing Committee (the “Committee”) and other employees of the Advisor. The Committee regularly reviews its own valuation calculations, as well as the valuations, valuation techniques and services furnished by pricing service providers, considers circumstances which may require valuation calculations by the Committee, and reviews previous valuation calculations. The Committee reports to the Audit Committee on the Committee’s activities, the performance of pricing service providers, and other matters relating to valuation of portfolio investments.
In those instances when the Committee assists in calculating a fair value for a portfolio investment, the Committee seeks to determine the price that the Fund would reasonably expect to receive upon a sale of the investment in an orderly transaction between market participants on the valuation date. The Committee customarily utilizes quotations from securities broker dealers in calculating valuations, but also may utilize prices obtained from pricing service providers or other methods approved by the Audit Committee. Because fair values calculated by the Committee are estimates, the calculation of a value for an investment may differ from the price that would be realized by the Fund upon a sale of the investment, and the difference could be material to the Fund’s financial statements. The Committee’s calculation of a fair value for an investment may also differ from the prices obtained by other persons (including other mutual funds) for the investment.
Valuation of Securities: Securities and other portfolio investments which are listed or traded on a United States securities exchange are valued at the last reported sale price on the valuation date. Investments listed or traded on an exchange for which there has been no sale that day are valued at the mean between the last reported bid and asked prices on that valuation date. Portfolio investments reported by NASDAQ are valued at the official closing price on the valuation date. If an investment is traded on more than one exchange, the investment is considered traded on the exchange that is normally the primary market for that investment. Securities and other portfolio investments which are listed or traded on exchanges outside the United States are valued at the last price or the closing price of the investment on the exchange that is normally the primary market for the investment, as of the close of the exchange preceding the Fund’s valuation date. Foreign investments listed or traded on an exchange for which there has been no sale that day are valued at the mean between the last reported bid and asked prices on that valuation date.
In any case when a market quotation is not readily available for a portfolio investment ordinarily valued by market quotation, the Committee calculates a fair value for the investment using alternative methods approved by the Audit Committee. A market quotation is not readily available when the primary market or exchange for the investment is not open for the entire scheduled day of trading. Market quotations for an investment also may not be readily available if developments after the most recent close of the investment’s primary exchange or market, but prior to the close of business on any Fund business day, or an unusual event or significant period of time occurring since the availability of a market quotation, create a serious question concerning the reliability of the most recent market quotation available for the investment. In particular, on days when market volatility thresholds established by the Audit Committee are exceeded, foreign equity investments held by the Fund may be valued using alternative methods. The Committee customarily obtains valuations in these instances from pricing service providers approved by the Audit Committee. Pricing service providers ordinarily calculate valuations using multi-factor models to adjust market prices based upon various inputs, including exchange data, depository receipt prices, futures, index data and other data.
Debt obligations held by the Fund which are not listed or traded on exchanges or for which no reported market exists are ordinarily valued at the valuation obtained from a pricing service provider approved by the Audit Committee.
18 | Semi-Annual Report
Notes to Financial Statements, Continued
Thornburg International Value Fund | March 31, 2018 (Unaudited)
In any case when a pricing service provider fails to provide a valuation for a debt obligation held by the Fund, the Committee calculates a fair value for the obligation using alternative methods under procedures approved by the Audit Committee. Additionally, in cases when management believes that a valuation obtained from a pricing service provider merits review for significant reasons, the Committee decides whether or not to use the valuation calculated by the pricing service provider or to use an alternative method approved by the Audit Committee to calculate a fair value for the obligation.
Quotations for foreign investments expressed in foreign currency amounts are converted to U.S. dollar equivalents using a foreign exchange quotation from a third party service provider at the time of valuation. Foreign investments held by the Fund may be traded on days and at times when the Fund is not open for business. Consequently, the value of Fund investments may be significantly affected on days when shareholders cannot purchase or sell Fund shares. Futures contracts and other financial and derivative instruments traded on an exchange are valued at the latest published price for the instrument on its primary exchange. Listed options are valued at the last bid price.
Valuation Hierarchy: The Fund categorizes its investments based upon the inputs used in valuing those investments, according to a three-level hierarchy established in guidance from the FASB. Categorization of investments using this hierarchy is intended by the FASB to maximize the use of observable inputs in valuing investments and minimize the use of unobservable inputs by requiring that the most observable inputs be used when available. Observable inputs are those that market participants would use in valuing an investment based on available market information. Unobservable inputs are those that reflect assumptions about the information market participants would use in valuing an investment. An investment’s level within the hierarchy is based on the lowest level input that is deemed significant to the valuation. The methodologies and inputs used to value investments are not necessarily indications of the risk or liquidity associated with those investments.
Various inputs are used in calculating valuations for the Fund’s investments. These inputs are generally summarized according to the three-level hierarchy below:
Level 1: Quoted prices in active markets for identical investments.
Level 2: Other direct or indirect significant observable inputs (including quoted prices for similar investments in active markets and other observable inputs, such as interest rates, prepayment rates, credit risk, etc.).
Level 3: Significant unobservable inputs (including the Committee’s own assumptions in calculating the fair values of investments).
Valuations for debt obligations held by the Fund are typically calculated by pricing service providers approved by the Audit Committee and are generally characterized as Level 2 within the valuation hierarchy.
On days when market volatility thresholds established by the Audit Committee are exceeded, foreign securities for which valuations are obtained from pricing service providers are fair valued. On these days, the foreign securities are characterized as Level 2 within the valuation hierarchy and revert to Level 1 after the threshold is no longer exceeded.
In a limited number of cases the Committee calculates a fair value for investments using broker quotations or other methods approved by the Audit Committee. When the Committee uses a single broker quotation to calculate a fair value for an investment without other significant observable inputs, or if a fair value is calculated using other significant inputs that are considered unobservable, the investment is characterized as Level 3 within the hierarchy. Other significant unobservable inputs used to calculate a fair value in these instances might include an income-based valuation approach which considers discounted anticipated future cash flows from the investment and application of discounts due to the nature or duration of any restrictions on the disposition of the investment.
Valuations based upon the use of inputs from Levels 1, 2 or 3 may not represent the actual price received upon the disposition of an investment, and the Fund may receive a price that is lower than the valuation based upon these inputs when it sells the investment.
The following table displays a summary of the fair value hierarchy measurements of the Fund’s investments as of March 31, 2018. In any instance when valuation inputs from more than one level are used to determine the fair value of a specific investment, the investment is placed in the level of the table based upon the lowest level input that is significant in determining the fair value of the investment:
| | | | | | | | | | | | | | | | | | | | |
| | | FAIR VALUE MEASUREMENTS AT MARCH 31, 2018 |
| | | TOTAL | | LEVEL 1 | | LEVEL 2 | | LEVEL 3 |
Assets | | | | | | | | | | | | | | | | | | | | |
Investments in Securities* | | | | | | | | | | | | | | | | | | | | |
Common Stock | | | $ | 5,178,746,000 | | | | $ | 5,178,746,000 | | | | $ | – | | | | $ | – | |
Short Term Investment | | | | 244,159,836 | | | | | 244,159,836 | | | | | – | | | | | – | |
| | | | | |
Total Investments in Securities | | | $ | 5,422,905,836 | | | | $ | 5,422,905,836 | | | | $ | – | | | | $ | – | |
Semi-Annual Report | 19
Notes to Financial Statements, Continued
Thornburg International Value Fund | March 31, 2018 (Unaudited)
| | | | | | | | | | | | | | | | | | | | |
| | | FAIR VALUE MEASUREMENTS AT MARCH 31, 2018 |
| | | TOTAL | | LEVEL 1 | | LEVEL 2 | | LEVEL 3 |
Other Financial Instruments** | | | | | | | | | | | | | | | | | | | | |
Spot Currency | | | $ | 13,646 | | | | $ | 13,646 | | | | $ | – | | | | $ | – | |
| | | | |
Liabilities | | | | | | | | | | | | | | | | | | | | |
Other Financial Instruments** | | | | | | | | | | | | | | | | | | | | |
Spot Currency | | | $ | (18,859 | ) | | | $ | (18,859 | ) | | | $ | – | | | | $ | – | |
| * | See Schedule of Investments for a summary of the industry exposure as grouped according to the Global Industry Classification Standard (GICS), which is an industry taxonomy developed by MSCI, Inc. and Standard & Poor’s (S&P). |
| ** | Other Financial Instruments include investments not reflected in the Schedule of Investments, which may include futures, forwards and swap contracts, which are valued at the unrealized appreciation (depreciation) on the investment. |
In accordance with the guidance prescribed in Accounting Standards Update No. 2011-04, it is the policy of the Fund to recognize transfers between levels and the underlying events which caused the movement. The Fund recognized no transfers between levels 1 and 2 for the six months ended March 31, 2018, other than when the Fund exceeded market volatility thresholds for foreign equity investments during the period.
NOTE 4 – INVESTMENT ADVISORY FEE AND OTHER TRANSACTIONS WITH AFFILIATES
Pursuant to an investment advisory agreement, the Advisor serves as the investment advisor and performs services for the Fund for which the fees are payable at the end of each month. Under the investment advisory agreement, the Fund pays the Advisor a management fee based on the daily net assets of the Fund at an annual rate as shown in the following table:
| | | | | |
| MANAGEMENT FEE SCHEDULE |
| DAILY NET ASSETS | | FEE RATE |
| |
Up to $500 million | | | | 0.875 | % |
| |
Next $500 million | | | | 0.825 | |
| |
Next $500 million | | | | 0.775 | |
| |
Next $500 million | | | | 0.725 | |
| |
Over $2 billion | | | | 0.675 | |
The Fund’s effective management fee for the six months ended March 31, 2018 was 0.719% of the Fund’s average net assets.
The Trust has entered into administrative service agreements with the Advisor, whereby the Advisor will perform certain administrative services related to each class of the Fund’s shares. Until January 31, 2018, the fees were payable at an annual rate of up to 0.125 of 1% per annum of the average daily net assets attributable to each class of shares. As of February 1, 2018, the fees are computed as an annual percentage of the aggregate average daily net assets of all shares classes of all Funds in the Trust as follows:
| | | | | |
| ADMINISTRATION FEE SCHEDULE |
| DAILY NET ASSETS | | FEE RATE |
| |
Up to $20 billion | | | | 0.100 | % |
| |
$20 billion to $40 billion | | | | 0.075 | |
| |
$40 billion to $60 billion | | | | 0.040 | |
| |
Over $60 billion | | | | 0.030 | |
The aggregate fee amount is allocated on a daily basis to each Fund based on net assets and subsequently allocated to each class of shares of the Fund. Total administrative service fees incurred by each class of shares of the Fund for the six months ended March 31, 2018, are set forth in the Statement of Operations.
The Trust has an underwriting agreement with Thornburg Securities Corporation (the “Distributor”), an affiliate of the Advisor, which acts as the distributor of the Fund’s shares. For the six months ended March 31, 2018, the Distributor has advised the Fund that it earned net commissions aggregating $19,383 from the sale of Class A shares, and collected contingent deferred sales charges aggregating $6,296 from redemptions of Class C shares of the Fund.
20 | Semi-Annual Report
Notes to Financial Statements, Continued
Thornburg International Value Fund | March 31, 2018 (Unaudited)
Pursuant to a service plan under Rule 12b-1 of the Investment Company Act of 1940, the Fund may pay to the Distributor or securities dealers and other financial institutions at the Distributor’s direction an amount not to exceed .25 of 1% per annum of the average daily net assets attributable to Class A, Class C, Class I, Class R3, Class R4, and Class R5 shares of the Fund to obtain various shareholder and distribution related services. For the six months ended March 31, 2018, there were no 12b-1 service plan fees charged for Class I or Class R5 shares. Class R6 shares are not subject to a service plan. The Advisor and Distributor each may pay out of its own resources additional expenses for distribution of the Fund’s shares and shareholder services.
The Trust has also adopted distribution plans pursuant to Rule 12b-1, applicable only to the Fund’s Class C and Class R3 shares, under which the Fund compensates the Distributor for services in promoting the sale of Class C and Class R3 shares of the Fund at an annual rate of up to .75 of 1% per annum of the average daily net assets attributable to Class C shares, and an annual rate of up to .25 of 1% per annum of the average daily net assets attributable to Class R3 shares.
Total fees incurred by each class of shares of the Fund under their respective service and distribution plans for the six months ended March 31, 2018, are set forth in the Statement of Operations.
The Advisor and Distributor have contractually agreed to waive fees and reimburse expenses incurred by the Fund so that actual expenses of certain share classes do not exceed levels as specified in each Fund’s most recent prospectus. The agreement may be terminated by the Fund at any time, but may not be terminated by the Advisor or Distributor before February 1, 2019, unless the Advisor ceases to be the investment advisor to the Fund or the Distributor ceases to be the distributor of the Fund prior to that date. The Advisor and Distributor may recoup amounts waived or reimbursed during the fiscal year if expenses fall below the contractual limit during that year.
For the six months ended March 31, 2018, the Advisor contractually reimbursed certain class specific expenses, administrative fees, and distribution fees of $290,800 for Class R3 shares, $238,781 for Class R4 shares, $339,185 for Class R5 shares, and $138,997 for Class R6 shares.
Certain officers and Trustees of the Trust are also officers or directors of the Advisor and Distributor. The compensation of the independent Trustees is borne by the Trust. The Trust also pays a portion of the Chief Compliance Officer’s compensation. These amounts are reflected as “Trustee and officer fees” in the Statement of Operations.
The percentage of direct investments in the Fund held by the Trustees, officers of the Trust, and the Advisor is approximately 0.82%.
The Fund may purchase or sell securities from, or to an affiliated fund, provided the affiliation is due solely to having a common investment advisor, common officers, or common trustees, and provided that all such transactions will comply with Rule 17a-7 under the 1940 Act. For the six months ended March 31, 2018, the Fund had no such transactions with affiliated funds.
Shown below are holdings of voting securities of each portfolio company which is considered “affiliated” to the Fund under the Investment Company Act of 1940, including companies for which the Fund’s holding represented 5% or more of the company’s voting securities, and a series of the Thornburg Investment Trust in which the Fund invested for cash management purposes during the period:
| | | | | | | | | | | | | | | | | | | | | | | | | | | | | | | | |
| FUND | | MARKET VALUE
9/30/17 | | | PURCHASES
AT COST | | | SALES
PROCEEDS | | | REALIZED
GAIN
(LOSS) | | | CHANGE IN
UNREALIZED
APPR./(DEPR.) | | | MARKET VALUE
3/31/18 | | | DIVIDEND
INCOME | | | ROC
ADJUSTMENT | |
Thornburg Capital Management Fund | | $ | 244,716,904 | | | $ | 980,042,087 | | | $ | (980,599,155 | ) | | $ | – | | | $ | – | | | $ | 244,159,836 | | | $ | 1,276,276 | | | $ | – | |
NOTE 5 – SHARES OF BENEFICIAL INTEREST
At March 31, 2018, there were an unlimited number of shares with no par value of beneficial interest authorized. Transactions in shares of beneficial interest were as follows:
| | | | | | | | | | | | | | | | |
| | | SIX MONTHS ENDED
MARCH 31, 2018 (UNAUDITED) | | | YEAR ENDED
SEPTEMBER 30, 2017 (AUDITED) | |
| | | SHARES | | | AMOUNT | | | SHARES | | | AMOUNT | |
Class A Shares | | | | | | | | | | | | | | | | |
Shares sold | | | 2,257,228 | | | $ | 57,100,275 | | | | 5,307,478 | | | $ | 132,239,213 | |
Shares issued to shareholders in
reinvestment of dividends | | | 4,440,886 | | | | 106,847,709 | | | | 198,635 | | | | 5,389,356 | |
Shares repurchased | | | (4,842,397 | ) | | | (123,290,938 | ) | | | (17,364,628 | ) | | | (424,051,972 | ) |
| | | | |
| | | | |
Net increase (decrease) | | | 1,855,717 | | | $ | 40,657,046 | | | | (11,858,515 | ) | | $ | (286,423,403 | ) |
| | | | |
Semi-Annual Report | 21
Notes to Financial Statements, Continued
Thornburg International Value Fund | March 31, 2018 (Unaudited)
| | | | | | | | | | | | | | | | |
| | | SIX MONTHS ENDED
MARCH 31, 2018 (UNAUDITED) | | | YEAR ENDED
SEPTEMBER 30, 2017 (AUDITED) | |
| | | SHARES | | | AMOUNT | | | SHARES | | | AMOUNT | |
Class C Shares | | | | | | | | | | | | | | | | |
Shares sold | | | 647,389 | | | $ | 14,354,776 | | | | 629,556 | | | $ | 14,380,219 | |
Shares issued to shareholders in
reinvestment of dividends | | | 2,608,038 | | | | 55,707,675 | | | | 63,092 | | | | 1,548,644 | |
Shares repurchased | | | (2,727,100 | ) | | | (61,537,932 | ) | | | (9,797,675 | ) | | | (218,976,284 | ) |
| | | | |
| | | | |
Net increase (decrease) | | | 528,327 | | | $ | 8,524,519 | | | | (9,105,027 | ) | | $ | (203,047,421 | ) |
| | | | |
Class I Shares | | | | | | | | | | | | | | | | |
Shares sold | | | 13,239,526 | | | $ | 344,893,811 | | | | 21,729,602 | | | $ | 551,381,100 | |
Shares issued to shareholders
in reinvestment of dividends | | | 15,260,324 | | | | 378,932,754 | | | | 1,019,337 | | | | 28,095,572 | |
Shares repurchased | | | (26,710,790 | ) | | | (707,571,181 | ) | | | (86,075,544 | ) | | | (2,134,825,729 | ) |
| | | | |
| | | | |
Net increase (decrease) | | | 1,789,060 | | | $ | 16,255,384 | | | | (63,326,605 | ) | | $ | (1,555,349,057 | ) |
| | | | |
Class R3 Shares | | | | | | | | | | | | | | | | |
Shares sold | | | 928,938 | | | $ | 23,468,576 | | | | 1,663,868 | | | $ | 41,062,892 | |
Shares issued to shareholders in
reinvestment of dividends | | | 1,519,952 | | | | 36,554,848 | | | | 61,642 | | | | 1,670,703 | |
Shares repurchased | | | (2,353,457 | ) | | | (59,350,036) | | | | (5,264,000 | ) | | | (130,221,334 | ) |
| | | | |
| | | | |
Net increase (decrease) | | | 95,433 | | | $ | 673,388 | | | | (3,538,490 | ) | | $ | (87,487,739 | ) |
| | | | |
Class R4 Shares | | | | | | | | | | | | | | | | |
Shares sold | | | 1,375,010 | | | $ | 34,111,449 | | | | 1,650,790 | | | $ | 40,696,547 | |
Shares issued to shareholders in
reinvestment of dividends | | | 847,935 | | | | 20,240,210 | | | | 41,500 | | | | 1,116,929 | |
Shares repurchased | | | (1,679,398 | ) | | | (42,371,725) | | | | (5,580,017 | ) | | | (136,990,191 | ) |
| | | | |
| | | | |
Net increase (decrease) | | | 543,547 | | | $ | 11,979,934 | | | | (3,887,727 | ) | | $ | (95,176,715 | ) |
| | | | |
Class R5 Shares | | | | | | | | | | | | | | | | |
Shares sold | | | 1,078,642 | | | $ | 28,082,815 | | | | 2,773,059 | | | $ | 70,084,793 | |
Shares issued to shareholders in
reinvestment of dividends | | | 1,570,373 | | | | 38,946,199 | | | | 112,189 | | | | 3,077,952 | |
Shares repurchased | | | (2,116,318 | ) | | | (56,182,935) | | | | (14,388,522 | ) | | | (370,965,382 | ) |
| | | | |
| | | | |
Net increase (decrease) | | | 532,697 | | | $ | 10,846,079 | | | | (11,503,274 | ) | | $ | (297,802,637 | ) |
| | | | |
Class R6 Shares | | | | | | | | | | | | | | | | |
Shares sold | | | 3,071,650 | | | $ | 78,837,586 | | | | 3,806,317 | | | $ | 99,561,832 | |
Shares issued to shareholders in
reinvestment of dividends | | | 3,027,488 | | | | 74,876,752 | | | | 204,703 | | | | 5,593,550 | |
Shares repurchased | | | (1,615,514 | ) | | | (42,157,765) | | | | (4,833,544 | ) | | | (118,841,091 | ) |
| | | | |
| | | | |
Net increase (decrease) | | | 4,483,624 | | | $ | 111,556,573 | | | | (822,524 | ) | | $ | (13,685,709 | ) |
| | | | |
NOTE 6 – INVESTMENT TRANSACTIONS
For the six months ended March 31, 2018, the Fund had purchase and sale transactions of investments (excluding short-term investments) of $1,177,279,458 and $1,797,704,220, respectively.
NOTE 7 – DERIVATIVE FINANCIAL INSTRUMENTS WITH OFF-BALANCE SHEET RISK AND FOREIGN INVESTMENT RISK
The Fund may use a variety of derivative financial instruments to hedge or adjust the risks affecting its investment portfolio or to enhance investment returns. Provisions of the FASB Accounting Standards Codification 815-10-50 (“ASC 815”) require certain disclosures. The disclosures are intended to provide users of financial statements with an understanding of the use of derivative instruments by the Fund and how these derivatives affect the financial position, financial performance and cash flows of the Fund. The Fund does not designate any derivative instruments as hedging instruments under ASC 815. During the six months ended March 31, 2018, the Fund’s principal
22 | Semi-Annual Report
Notes to Financial Statements, Continued
Thornburg International Value Fund | March 31, 2018 (Unaudited)
exposure to derivative financial instruments of the type addressed by ASC 815 was investment in foreign exchange contracts. A foreign exchange contract is an agreement between two parties to exchange different currencies at a specified rate of exchange at an agreed upon future date. Foreign exchange contracts involve risks to the Fund, including the risk that a contract’s counterparty will not meet its obligations to the Fund, the risk that a change in a contract’s value may not correlate perfectly with the currency the contract was intended to track, and the risk that the Fund’s Advisor is unable to correctly implement its strategy in using a contract. In any such instance, the Fund may not achieve the intended benefit of entering into a contract, and may experience a loss.
The Fund entered into forward currency contracts during the six months ended March 31, 2018 in the normal course of pursuing its investment objectives, with the objective of purchasing foreign investments or with the intent of reducing the risk to the value of the Fund’s foreign investments from adverse changes in the relationship between the U.S. dollar and foreign currencies. In each case these contracts have been initiated in conjunction with foreign investment transactions. The monthly average value of open forward currency sell contracts for the six months ended March 31, 2018 was $87,087,504.
These contracts are accounted for by the Fund under ASC 815. Unrealized appreciation and depreciation on outstanding contracts are reported in the Fund’s Statement of Assets and Liabilities, as measured by the difference between the forward exchange rates at the reporting date and the forward exchange rates at each contract’s inception date. Net realized gain (loss) on contracts closed during the period, and changes in net unrealized appreciation (depreciation) on outstanding contracts are recognized in the Fund’s Statement of Operations.
As of March 31, 2018, the Fund did not have any outstanding forward currency contracts.
Forward currency contracts were entered into with State Street Bank and Trust Company (“SSB”), pursuant to an International Swaps and Derivatives Association (“ISDA”) Master Agreement. In the event of a default or termination under the ISDA Master Agreement with SSB, the non-defaulting party has the right to close out all outstanding forward currency contracts between the parties and to net any payment amounts under those contracts, resulting in a single net amount payable by one party to the other.
Because the ISDA Master Agreement with SSB does not result in an offset of reported amounts of financial assets and liabilities in the Fund’s Statement of Assets and Liabilities unless there has been an event of default or termination event under that agreement, the Fund does not net its outstanding forward currency contracts for purposes of the disclosure in the Fund’s Statement of Assets and Liabilities. Instead the Fund recognizes the unrealized appreciation or depreciation on those forward currency contracts on a gross basis in the Fund’s Statement of Assets and Liabilities.
The net realized gain (loss) from forward currency contracts and the net change in unrealized appreciation (depreciation) on outstanding forward currency contracts recognized in the Fund’s Statement of Operations for the six months ended March 31, 2018 are disclosed in the following tables:
| | | | | | | | |
NET REALIZED GAIN (LOSS) ON DERIVATIVE FINANCIAL INSTRUMENTS
RECOGNIZED IN INCOME FOR THE SIX MONTHS ENDED MARCH 31, 2018 | |
| | |
| | | TOTAL | | | FORWARD CURRENCY CONTRACTS | |
| | |
Foreign exchange contracts | | $ | (11,400,521 | ) | | $ | (11,400,521 | ) |
|
NET CHANGE IN UNREALIZED APPRECIATION (DEPRECIATION) OF DERIVATIVE FINANCIAL INSTRUMENTS
RECOGNIZED IN INCOME FOR THE SIX MONTHS ENDED MARCH 31, 2018 | |
| | |
| | | TOTAL | | | FORWARD CURRENCY CONTRACTS | |
| | |
Foreign exchange contracts | | $ | 11,400,521 | | | $ | 11,400,521 | |
OTHER NOTES
Risks: The Fund’s investments subject it to risks including, but not limited to, management risk, market and economic risk, risks affecting specific issuers, liquidity risk, the risks associated with investments in small- and mid-cap companies and non-U.S. issuers (including developing country issuers), credit risk, and interest rate risk. Please see the Fund’s prospectus for a discussion of the risks associated with an investment in the Fund.
Subsequent Events: Fund management believes no events have occurred between March 31, 2018 and the date of issuance of the financial statements that require adjustment to or disclosure in the accompanying financial statements.
Semi-Annual Report | 23
Financial Highlights
Thornburg International Value Fund
| | | | | | | | | | | | | | | | | | | | | | | | | | | | | | | | | | | | | | | | |
| | | PER SHARE PERFORMANCE (FOR A SHARE OUTSTANDING THROUGHOUT THE PERIOD) |
| | | | | | | | | | | | | | | | | |
UNLESS OTHERWISE
NOTED, PERIODS ARE
FISCAL YEARS ENDED
SEPTEMBER 30, | | NET ASSET
VALUE,
BEGINNING OF
PERIOD | | NET
INVESTMENT
INCOME
(LOSS)+ | | NET REALIZED &
UNREALIZED GAIN
(LOSS) ON
INVESTMENTS | | TOTAL FROM
INVESTMENT
OPERATIONS | | DIVIDENDS
FROM NET
INVESTMENT
INCOME | | DIVIDENDS
FROM NET
REALIZED
GAINS | | TOTAL
DIVIDENDS | | NET ASSET
VALUE,
END OF PERIOD |
| | | | | | | |
| CLASS A SHARES | | | | | | | | | | | | | | | | | | | | | | | | | | | | | | | | | | | | |
| | | | | | | | |
2018(b)(c) | | | $ | 27.63 | | | | | (0.04 | ) | | | | 0.35 | | | | | 0.31 | | | | | – | | | | | (4.03 | ) | | | | (4.03 | ) | | | $ | 23.91 | |
2017(b) | | | $ | 23.43 | | | | | 0.16 | | | | | 4.24 | | | | | 4.40 | | | | | (0.20 | ) | | | | – | | | | | (0.20 | ) | | | $ | 27.63 | |
2016(b)(e) | | | $ | 27.46 | | | | | 0.36 | | | | | 0.25 | | | | | 0.61 | | | | | (0.39 | ) | | | | (4.25 | ) | | | | (4.64 | ) | | | $ | 23.43 | |
2015(b) | | | $ | 29.84 | | | | | 0.24 | | | | | 0.16 | | | | | 0.40 | | | | | (0.26 | ) | | | | (2.52 | ) | | | | (2.78 | ) | | | $ | 27.46 | |
2014(b) | | | $ | 30.12 | | | | | 0.19 | | | | | (0.23 | ) | | | | (0.04 | ) | | | | (0.24 | ) | | | | – | | | | | (0.24 | ) | | | $ | 29.84 | |
2013(b) | | | $ | 26.08 | | | | | 0.26 | | | | | 4.02 | | | | | 4.28 | | | | | (0.24 | ) | | | | – | | | | | (0.24 | ) | | | $ | 30.12 | |
| | | | | | | |
| CLASS C SHARES | | | | | | | | | | | | | | | | | | | | | | | | | | | | | | | | | | | | |
| | | | | | | | |
2018(c) | | | $ | 25.00 | | | | | (0.12 | ) | | | | 0.32 | | | | | 0.20 | | | | | – | | | | | (4.03 | ) | | | | (4.03 | ) | | | $ | 21.17 | |
2017 | | | $ | 21.29 | | | | | (0.02 | ) | | | | 3.84 | | | | | 3.82 | | | | | (0.11 | ) | | | | – | | | | | (0.11 | ) | | | $ | 25.00 | |
2016 | | | $ | 25.40 | | | | | 0.17 | | | | | 0.24 | | | | | 0.41 | | | | | (0.27 | ) | | | | (4.25 | ) | | | | (4.52 | ) | | | $ | 21.29 | |
2015 | | | $ | 27.86 | | | | | 0.05 | | | | | 0.11 | | | | | 0.16 | | | | | (0.10 | ) | | | | (2.52 | ) | | | | (2.62 | ) | | | $ | 25.40 | |
2014 | | | $ | 28.17 | | | | | – | (f) | | | | (0.23 | ) | | | | (0.23 | ) | | | | (0.08 | ) | | | | – | | | | | (0.08 | ) | | | $ | 27.86 | |
2013 | | | $ | 24.48 | | | | | 0.04 | | | | | 3.77 | | | | | 3.81 | | | | | (0.12 | ) | | | | – | | | | | (0.12 | ) | | | $ | 28.17 | |
| | | | | | | |
| CLASS I SHARES | | | | | | | | | | | | | | | | | | | | | | | | | | | | | | | | | | | | |
| | | | | | | | |
2018(c) | | | $ | 28.37 | | | | | – | (f) | | | | 0.37 | | | | | 0.37 | | | | | (0.01 | ) | | | | (4.03 | ) | | | | (4.04 | ) | | | $ | 24.70 | |
2017 | | | $ | 24.02 | | | | | 0.25 | | | | | 4.37 | | | | | 4.62 | | | | | (0.27 | ) | | | | – | | | | | (0.27 | ) | | | $ | 28.37 | |
2016 | | | $ | 28.04 | | | | | 0.47 | | | | | 0.23 | | | | | 0.70 | | | | | (0.47 | ) | | | | (4.25 | ) | | | | (4.72 | ) | | | $ | 24.02 | |
2015 | | | $ | 30.43 | | | | | 0.38 | | | | | 0.13 | | | | | 0.51 | | | | | (0.38 | ) | | | | (2.52 | ) | | | | (2.90 | ) | | | $ | 28.04 | |
2014 | | | $ | 30.76 | | | | | 0.33 | | | | | (0.25 | ) | | | | 0.08 | | | | | (0.41 | ) | | | | – | | | | | (0.41 | ) | | | $ | 30.43 | |
2013 | | | $ | 26.66 | | | | | 0.38 | | | | | 4.10 | | | | | 4.48 | | | | | (0.38 | ) | | | | – | | | | | (0.38 | ) | | | $ | 30.76 | |
| | | | | | | |
| CLASS R3 SHARES | | | | | | | | | | | | | | | | | | | | | | | | | | | | | | | | | | | | |
| | | | | | | | |
2018(c) | | | $ | 27.63 | | | | | (0.06 | ) | | | | 0.35 | | | | | 0.29 | | | | | – | | | | | (4.03 | ) | | | | (4.03 | ) | | | $ | 23.89 | |
2017 | | | $ | 23.44 | | | | | 0.14 | | | | | 4.22 | | | | | 4.36 | | | | | (0.17 | ) | | | | – | | | | | (0.17 | ) | | | $ | 27.63 | |
2016 | | | $ | 27.47 | | | | | 0.31 | | | | | 0.25 | | | | | 0.56 | | | | | (0.34 | ) | | | | (4.25 | ) | | | | (4.59 | ) | | | $ | 23.44 | |
2015 | | | $ | 29.86 | | | | | 0.21 | | | | | 0.13 | | | | | 0.34 | | | | | (0.21 | ) | | | | (2.52 | ) | | | | (2.73 | ) | | | $ | 27.47 | |
2014 | | | $ | 30.14 | | | | | 0.15 | | | | | (0.24 | ) | | | | (0.09 | ) | | | | (0.19 | ) | | | | – | | | | | (0.19 | ) | | | $ | 29.86 | |
2013 | | | $ | 26.11 | | | | | 0.20 | | | | | 4.02 | | | | | 4.22 | | | | | (0.19 | ) | | | | – | | | | | (0.19 | ) | | | $ | 30.14 | |
| | | | | | | |
| CLASS R4 SHARES | | | | | | | | | | | | | | | | | | | | | | | | | | | | | | | | | | | | |
| | | | | | | | |
2018(c) | | | $ | 27.45 | | | | | (0.04 | ) | | | | 0.35 | | | | | 0.31 | | | | | – | | | | | (4.03 | ) | | | | (4.03 | ) | | | $ | 23.73 | |
2017 | | | $ | 23.26 | | | | | 0.18 | | | | | 4.21 | | | | | 4.39 | | | | | (0.20 | ) | | | | – | | | | | (0.20 | ) | | | $ | 27.45 | |
2016 | | | $ | 27.30 | | | | | 0.37 | | | | | 0.23 | | | | | 0.60 | | | | | (0.39 | ) | | | | (4.25 | ) | | | | (4.64 | ) | | | $ | 23.26 | |
2015 | | | $ | 29.69 | | | | | 0.25 | | | | | 0.15 | | | | | 0.40 | | | | | (0.27 | ) | | | | (2.25 | ) | | | | (2.79 | ) | | | $ | 27.30 | |
2014 | | | $ | 29.98 | | | | | 0.21 | | | | | (0.24 | ) | | | | (0.03 | ) | | | | (0.26 | ) | | | | – | | | | | (0.26 | ) | | | $ | 29.69 | |
2013 | | | $ | 25.96 | | | | | 0.25 | | | | | 4.01 | | | | | 4.26 | | | | | (0.24 | ) | | | | – | | | | | (0.24 | ) | | | $ | 29.98 | |
| | | | | | | |
| CLASS R5 SHARES | | | | | | | | | | | | | | | | | | | | | | | | | | | | | | | | | | | | |
| | | | | | | | |
2018(c) | | | $ | 28.35 | | | | | (0.01 | ) | | | | 0.36 | | | | | 0.35 | | | | | – | (h) | | | | (4.03 | ) | | | | (4.03 | ) | | | $ | 24.67 | |
2017 | | | $ | 24.01 | | | | | 0.24 | | | | | 4.35 | | | | | 4.59 | | | | | (0.25 | ) | | | | – | | | | | (0.25 | ) | | | $ | 28.35 | |
2016 | | | $ | 28.03 | | | | | 0.46 | | | | | 0.23 | | | | | 0.69 | | | | | (0.46 | ) | | | | (4.25 | ) | | | | (4.71 | ) | | | $ | 24.01 | |
2015 | | | $ | 30.41 | | | | | 0.30 | | | | | 0.19 | | | | | 0.49 | | | | | (0.35 | ) | | | | (2.52 | ) | | | | (2.87 | ) | | | $ | 28.03 | |
2014 | | | $ | 30.71 | | | | | 0.30 | | | | | (0.24 | ) | | | | 0.06 | | | | | (0.36 | ) | | | | – | | | | | (0.36 | ) | | | $ | 30.41 | |
2013 | | | $ | 26.61 | | | | | 0.34 | | | | | 4.10 | | | | | 4.44 | | | | | (0.34 | ) | | | | – | | | | | (0.34 | ) | | | $ | 30.71 | |
| | | | | | | |
| CLASS R6 SHARES | | | | | | | | | | | | | | | | | | | | | | | | | | | | | | | | | | | | |
| | | | | | | | |
2018(c) | | | $ | 28.27 | | | | | 0.02 | | | | | 0.37 | | | | | 0.39 | | | | | (0.02 | ) | | | | (4.03 | ) | | | | (4.05 | ) | | | $ | 24.61 | |
2017 | | | $ | 23.95 | | | | | 0.31 | | | | | 4.33 | | | | | 4.64 | | | | | (0.32 | ) | | | | – | | | | | (0.32 | ) | | | $ | 28.27 | |
2016 | | | $ | 27.97 | | | | | 0.53 | | | | | 0.21 | | | | | 0.74 | | | | | (0.51 | ) | | | | (4.25 | ) | | | | (4.76 | ) | | | $ | 23.95 | |
2015 | | | $ | 30.36 | | | | | 0.39 | | | | | 0.17 | | | | | 0.56 | | | | | (0.43 | ) | | | | (2.52 | ) | | | | (2.95 | ) | | | $ | 27.97 | |
2014 | | | $ | 30.70 | | | | | 0.40 | | | | | (0.26 | ) | | | | 0.14 | | | | | (0.48 | ) | | | | – | | | | | (0.48 | ) | | | $ | 30.36 | |
2013 | | | $ | 26.62 | | | | | 0.46 | | | | | 4.05 | | | | | 4.51 | | | | | (0.43 | ) | | | | – | | | | | (0.43 | ) | | | $ | 30.70 | |
| (a) | Not annualized for periods less than one year. |
| (b) | Sales loads are not reflected in computing total return. |
| (c) | Unaudited Six Month Period Ended March 31. |
| (e) | Class B shares converted to Class A shares on August 29, 2016. |
| (f) | Net investment income (loss) was less than $0.01 per share. |
| (g) | Net investment income (Loss) is less than 0.01%. |
| (h) | Dividends from net investment income per share were less than $(0.01). |
| + | Based on weighted average shares outstanding. |
See notes to financial statements.
24 | Semi-Annual Report
Financial Highlights, Continued
Thornburg International Value Fund
| | | | | | | | | | | | | | | | | | | | | | | | | | | | | | |
| RATIOS TO AVERAGE NET ASSETS | | | | | | SUPPLEMENTAL DATA | |
| | | | | | | EXPENSES, AFTER | | | | | | | | | | | | | | | | |
NET INVESTMENT
INCOME (LOSS) (%) | | | EXPENSES, AFTER
EXPENSE
REDUCTIONS (%) | | | EXPENSE
REDUCTIONS AND
NET OF CUSTODY
CREDITS (%) | | | EXPENSES,
BEFORE EXPENSE
REDUCTIONS (%) | | | | | | TOTAL
RETURN (%)(a) | | | PORTFOLIO
TURNOVER
RATE (%)(a) | | | NET ASSETS AT
END OF PERIOD
(THOUSANDS) | |
| | | | | | | |
| | | | | | | | | | | | | | | | | | | | | | | | | | | | | | |
| | | | | | | |
| | (0.34 | )(d) | | | 1.29 | (d) | | | 1.29 | (d) | | | 1.29 | (d) | | | | | | | 1.03 | | | | 21.28 | | | $ | 771,492 | |
| | 0.65 | | | | 1.31 | | | | 1.31 | | | | 1.31 | | | | | | | | 18.78 | | | | 86.88 | | | $ | 840,244 | |
| | 1.51 | | | | 1.28 | | | | 1.28 | | | | 1.28 | | | | | | | | 1.90 | | | | 103.90 | | | $ | 990,194 | |
| | 0.82 | | | | 1.27 | | | | 1.27 | | | | 1.27 | | | | | | | | 1.25 | | | | 70.88 | | | $ | 1,361,529 | |
| | 0.63 | | | | 1.26 | | | | 1.26 | | | | 1.26 | | | | | | | | (0.14 | ) | | | 37.25 | | | $ | 2,601,689 | |
| | 0.92 | | | | 1.25 | | | | 1.25 | | | | 1.25 | | | | | | | | 16.49 | | | | 34.67 | | | $ | 5,212,813 | |
| | | | | | | |
| | | | | | | | | | | | | | | | | | | | | | | | | | | | | | |
| | | | | | | |
| | (1.09 | )(d) | | | 2.04 | (d) | | | 2.04 | (d) | | | 2.04 | (d) | | | | | | | 0.65 | | | | 21.28 | | | $ | 350,638 | |
| | (0.08 | ) | | | 2.04 | | | | 2.04 | | | | 2.04 | | | | | | | | 17.94 | | | | 86.88 | | | $ | 400,859 | |
| | 0.77 | | | | 2.02 | | | | 2.02 | | | | 2.02 | | | | | | | | 1.12 | | | | 103.90 | | | $ | 535,169 | |
| | 0.19 | | | | 1.99 | | | | 1.99 | | | | 1.99 | | | | | | | | 0.52 | | | | 70.88 | | | $ | 706,606 | |
| | – | (g) | | | 1.99 | | | | 1.99 | | | | 1.99 | | | | | | | | (0.83 | ) | | | 37.25 | | | $ | 874,358 | |
| | 0.15 | | | | 2.01 | | | | 2.01 | | | | 2.01 | | | | | | | | 15.62 | | | | 34.67 | | | $ | 1,181,438 | |
| | | | | | | |
| | | | | | | | | | | | | | | | | | | | | | | | | | | | | | |
| | | | | | | |
| | 0.04 | (d) | | | 0.91 | (d) | | | 0.91 | (d) | | | 0.91 | (d) | | | | | | | 1.23 | | | | 21.28 | | | $ | 2,978,680 | |
| | 0.99 | | | | 0.92 | | | | 0.92 | | | | 0.92 | | | | | | | | 19.29 | | | | 86.88 | | | $ | 3,370,930 | |
| | 1.91 | | | | 0.90 | | | | 0.90 | | | | 0.90 | | | | | | | | 2.21 | | | | 103.90 | | | $ | 4,375,955 | |
| | 1.27 | | | | 0.90 | | | | 0.90 | | | | 0.90 | | | | | | | | 1.65 | | | | 70.88 | | | $ | 5,895,731 | |
| | 1.05 | | | | 0.88 | | | | 0.88 | | | | 0.88 | | | | | | | | 0.23 | | | | 37.25 | | | $ | 7,748,950 | |
| | 1.34 | | | | 0.86 | | | | 0.86 | | | | 0.86 | | | | | | | | 16.94 | | | | 34.67 | | | $ | 14,601,876 | |
| | | | | | | |
| | | | | | | | | | | | | | | | | | | | | | | | | | | | | | |
| | | | | | | |
| | (0.50 | )(d) | | | 1.45 | (d) | | | 1.45 | (d) | | | 1.66 | (d) | | | | | | | 0.95 | | | | 21.28 | | | $ | 249,143 | |
| | 0.55 | | | | 1.45 | | | | 1.45 | | | | 1.64 | | | | | | | | 18.63 | | | | 86.88 | | | $ | 285,510 | |
| | 1.31 | | | | 1.45 | | | | 1.45 | | | | 1.62 | | | | | | | | 1.67 | | | | 103.90 | | | $ | 325,135 | |
| | 0.71 | | | | 1.45 | | | | 1.45 | | | | 1.58 | | | | | | | | 1.09 | | | | 70.88 | | | $ | 479,223 | |
| | 0.51 | | | | 1.45 | | | | 1.45 | | | | 1.61 | | | | | | | | (0.30 | ) | | | 37.25 | | | $ | 754,139 | |
| | 0.71 | | | | 1.45 | | | | 1.45 | | | | 1.57 | | | | | | | | 16.23 | | | | 34.67 | | | $ | 1,152,795 | |
| | | | | | | |
| | | | | | | | | | | | | | | | | | | | | | | | | | | | | | |
| | | | | | | |
| | (0.30 | )(d) | | | 1.25 | (d) | | | 1.25 | (d) | | | 1.48 | (d) | | | | | | | 1.04 | | | | 21.28 | | | $ | 193,648 | |
| | 0.74 | | | | 1.25 | | | | 1.25 | | | | 1.46 | | | | | | | | 18.90 | | | | 86.88 | | | $ | 209,066 | |
| | 1.55 | | | | 1.25 | | | | 1.25 | | | | 1.39 | | | | | | | | 1.87 | | | | 103.90 | | | $ | 267,623 | |
| | 0.86 | | | | 1.24 | | | | 1.24 | | | | 1.37 | | | | | | | | 1.30 | | | | 70.88 | | | $ | 333,247 | |
| | 0.70 | | | | 1.25 | | | | 1.25 | | | | 1.49 | | | | | | | | (0.12 | ) | | | 37.25 | | | $ | 722,349 | |
| | 0.91 | | | | 1.25 | | | | 1.25 | | | | 1.38 | | | | | | | | 16.49 | | | | 34.67 | | | $ | 1,342,883 | |
| | | | | | | |
| | | | | | | | | | | | | | | | | | | | | | | | | | | | | | |
| | | | | | | |
| | (0.04 | )(d) | | | 0.99 | (d) | | | 0.99 | (d) | | | 1.22 | (d) | | | | | | | 1.17 | | | | 21.28 | | | $ | 273,322 | |
| | 0.96 | | | | 0.99 | | | | 0.99 | | | | 1.15 | | | | | | | | 19.17 | | | | 86.88 | | | $ | 298,970 | |
| | 1.88 | | | | 0.95 | | | | 0.95 | | | | 0.95 | | | | | | | | 2.19 | | | | 103.90 | | | $ | 529,330 | |
| | 1.01 | | | | 0.98 | | | | 0.98 | | | | 1.11 | | | | | | | | 1.57 | | | | 70.88 | | | $ | 685,617 | |
| | 0.97 | | | | 0.99 | | | | 0.99 | | | | 1.12 | | | | | | | | 0.17 | | | | 37.25 | | | $ | 2,171,673 | |
| | 1.20 | | | | 0.96 | | | | 0.96 | | | | 1.00 | | | | | | | | 16.80 | | | | 34.67 | | | $ | 4,376,567 | |
| | | | | | | |
| | | | | | | | | | | | | | | | | | | | | | | | | | | | | | |
| | | | | | | |
| | 0.17 | (d) | | | 0.79 | (d) | | | 0.79 | (d) | | | 0.84 | (d) | | | | | | | 1.30 | | | | 21.28 | | | $ | 577,085 | |
| | 1.23 | | | | 0.78 | | | | 0.78 | | | | 0.79 | | | | | | | | 19.40 | | | | 86.88 | | | $ | 536,296 | |
| | 2.19 | | | | 0.74 | | | | 0.74 | | | | 0.74 | | | | | | | | 2.40 | | | | 103.90 | | | $ | 473,941 | |
| | 1.33 | | | | 0.74 | | | | 0.74 | | | | 0.74 | | | | | | | | 1.81 | | | | 70.88 | | | $ | 420,849 | |
| | 1.28 | | | | 0.73 | | | | 0.73 | | | | 0.73 | | | | | | | | 0.42 | | | | 37.25 | | | $ | 872,512 | |
| | 1.59 | | | | 0.74 | | | | 0.74 | | | | 0.74 | | | | | | | | 17.07 | | | | 34.67 | | | $ | 1,345,680 | |
Semi-Annual Report | 25
Expense Example
Thornburg International Value Fund | March 31, 2018 (Unaudited)
As a shareholder of the Fund, you incur two types of costs:
| | (1) | transaction costs, including |
| | (a) | sales charges (loads) on purchase payments, for Class A shares; |
| | (b) | a deferred sales charge on redemptions of any part or all of a purchase of $1 million of Class A shares within 12 months of purchase; |
| | (c) | a deferred sales charge on redemptions of Class C shares within 12 months of purchase; |
| | (2) | ongoing costs, including management fees; distribution and/or service (12b-1) fees; and other Fund expenses. This example is intended to help you understand your ongoing costs (in dollars) of investing in the Fund and to compare these costs with the ongoing costs of investing in other mutual funds. |
The example is based on a $1,000 investment beginning on October 1, 2017, and held until March 31, 2018.
ACTUAL EXPENSES
For each class of shares, the first line of the accompanying table provides information about actual account values and actual expenses. You may use the information in this line, together with the amount you invested, to estimate the expenses that you paid over the period. Simply divide your account value by $1,000 (for example, an $8,600 account value divided by $1,000 = 8.6), then multiply the result by the number in the first line for your class of shares under the heading entitled “Expenses Paid During Period” to estimate the expenses you paid on your account during this period.
| | | | | | | | | | | | | | | |
| | | BEGINNING
ACCOUNT VALUE
10/1/17 | | ENDING
ACCOUNT VALUE
3/31/18 | | EXPENSES PAID
DURING PERIOD†
10/1/17–3/31/18 |
| | | |
| CLASS A SHARES | | | | | | | | | | | | | | | |
| | | |
Actual | | | $ | 1,000.00 | | | | $ | 1,010.30 | | | | $ | 6.47 | |
Hypothetical* | | | $ | 1,000.00 | | | | $ | 1,018.50 | | | | $ | 6.49 | |
| | | |
| CLASS C SHARES | | | | | | | | | | | | | | | |
| | | |
Actual | | | $ | 1,000.00 | | | | $ | 1,006.50 | | | | $ | 10.21 | |
Hypothetical* | | | $ | 1,000.00 | | | | $ | 1,014.76 | | | | $ | 10.25 | |
| | | |
| CLASS I SHARES | | | | | | | | | | | | | | | |
| | | |
Actual | | | $ | 1,000.00 | | | | $ | 1,012.30 | | | | $ | 4.57 | |
Hypothetical* | | | $ | 1,000.00 | | | | $ | 1,020.39 | | | | $ | 4.58 | |
| | | |
| CLASS R3 SHARES | | | | | | | | | | | | | | | |
| | | |
Actual | | | $ | 1,000.00 | | | | $ | 1,009.50 | | | | $ | 7.26 | |
Hypothetical* | | | $ | 1,000.00 | | | | $ | 1,017.70 | | | | $ | 7.29 | |
| | | |
| CLASS R4 SHARES | | | | | | | | | | | | | | | |
| | | |
Actual | | | $ | 1,000.00 | | | | $ | 1,010.40 | | | | $ | 6.27 | |
Hypothetical* | | | $ | 1,000.00 | | | | $ | 1,018.70 | | | | $ | 6.29 | |
| | | |
| CLASS R5 SHARES | | | | | | | | | | | | | | | |
| | | |
Actual | | | $ | 1,000.00 | | | | $ | 1,011.70 | | | | $ | 4.97 | |
Hypothetical* | | | $ | 1,000.00 | | | | $ | 1,020.00 | | | | $ | 4.99 | |
| | | |
| CLASS R6 SHARES | | | | | | | | | | | | | | | |
| | | |
Actual | | | $ | 1,000.00 | | | | $ | 1,013.00 | | | | $ | 3.96 | |
Hypothetical* | | | $ | 1,000.00 | | | | $ | 1,020.99 | | | | $ | 3.98 | |
| † | Expenses are equal to the annualized expense ratio for each class (A: 1.29%; C: 2.04%; I: 0.91%; R3: 1.45%; R4: 1.25%; R5: 0.99%; R6: 0.79%) multiplied by the average account value over the period, multiplied by 182/365 to reflect the one-half year period. |
| * | Hypothetical assumes a rate of return of 5% per year before expenses. |
HYPOTHETICAL EXAMPLE FOR COMPARISON PURPOSES
For each class of shares, the second line of the accompanying table provides information about hypothetical account values and hypothetical expenses based on the Fund’s actual expense ratio and an assumed rate of return of 5% per year before expenses, which is not the Fund’s actual return. The hypothetical account values and expenses may not be used to estimate the actual ending account balance or expenses you paid for the period. You may use this information to compare the ongoing costs of investing in the Fund and other funds. To do so, compare this 5% hypothetical example with the 5% hypothetical examples that appear in the shareholder reports of the other funds.
Please note that the expenses shown in the table are meant to highlight your ongoing costs only and do not reflect any transactional costs, such as sales charges (loads), redemption fees, or exchange fees. Therefore, the second line of the table for each class of shares is useful in comparing ongoing costs only, and will not help you determine the relative total costs of owning different funds. In addition, if these transactional costs were included, your costs would have been higher.
26 | Semi-Annual Report
Other Information
Thornburg International Value Fund | March 31, 2018 (Unaudited)
PORTFOLIO PROXY VOTING
Policies and Procedures:
The Trust has delegated to Thornburg Investment Management, Inc. (the “Advisor”) voting decisions respecting proxies for the Fund’s voting securities. The Advisor makes voting decisions in accordance with its Proxy Voting Policy and Procedures. A description of the Policy and Procedures is available (i) without charge, upon request, by calling the Advisor toll-free at 1-800-847-0200, (ii) on the Thornburg website at www.thornburg.com, and (iii) on the Securities and Exchange Commission’s website at www.sec.gov.
Information regarding how proxies were voted is available on or before August 31 of each year for the twelve months ending the preceding June 30. This information is available (i) without charge, upon request by calling the Advisor toll-free at 1-800-847-0200, (ii) on the Thornburg website at www.thornburg.com, and (iii) on the Securities and Exchange Commission’s website at www.sec.gov.
AVAILABILITY OF QUARTERLY PORTFOLIO SCHEDULE
The Fund files with the Securities and Exchange Commission schedules of its portfolio holdings on Form N-Q for the first and third quarters of each fiscal year. The Fund’s Forms N-Q are available on the Commission’s website at www.sec.gov, or may be reviewed and copied at the Commission’s Public Reference Room in Washington, D.C. Information on the operation of the Public Reference Room may be obtained by calling 1-800-SEC-0330. The Fund also makes this information available on its website at www.thornburg.com/download or upon request by calling 1-800-847-0200.
Semi-Annual Report | 27
Trustees’ Statement to Shareholders
Readopted September 11, 2017
The Trustees believe current and prospective shareholders should know how we discharge our responsibilities in supervising the Funds’ investment advisor and in reviewing the advisor’s contract for renewal. Since 2005, we have issued a statement which sets out clearly the three principal guidelines that we follow in supervising the Trust’s investment advisor on your behalf. In accordance with our customary practice, in September of this year we again reviewed our statement and concluded we should reissue this statement outlining the principal features of our supervision of the advisor’s performance of investment management services for the Funds.
We begin with the premise that each shareholder selected his or her Fund because its investments are managed by the investment advisor identified in the prospectus and in accordance with the objective and policies described in the prospectus. We realize, as each of you do, that if you believe that your Fund’s stated objective and policies no longer serve your personal investment goals, you can sell your shares and leave the Fund.
Therefore, we believe that our primary supervisory task—our principal obligation to you—is to assess the nature and quality of the advisor’s services, and to confirm that the advisor actively and competently pursues the Fund’s objective, in accordance with the policies set out in the prospectus. To do this, we meet regularly with management to review your Fund’s portfolio and to discuss the advisor’s specific actions and judgments in pursuing the Fund’s objective. We do not substitute our own judgment for the advisor’s decisions in selecting investments; the advisor is paid to exercise its informed judgment on investment decisions, and we seek to confirm, in reviewing the advisor’s performance, that the advisor is doing just that.
Second, we are conscious of costs and the effect that costs have on shareholders’ returns. We try to make sure that your Fund’s fees and costs are reasonable in relationship to the services rendered and that they are generally in line with those charged by other expert investment advisors, consistent with our belief that the Fund’s investors searched for and expect that expertise and attention and have decided to pay a reasonable price for it. We do not put the management contract “out to bid” as a matter of course, and we would not do so unless we had concluded that the advisor materially had failed to pursue the Fund’s objectives in accordance with its policies, or for other equally important reasons. We believe that any other approach would be inconsistent with your interests and contrary to your expectations when you bought shares of the Fund in the first place.
Finally, because we believe that most Thornburg Fund shareholders have invested with a long-term perspective, we try not to focus too much on the fashions of the moment and on short-term performance. The market will not favor any specific investment objective or set of policies at all times and under all economic circumstances. A fund will experience periods of both high and low returns relative to other funds and other investments. Even if one of our Funds is not favored by the market at a particular time, we believe that the advisor is nonetheless obliged to remain true to the Fund’s objective and policies, and we watch to see that it does so.
Trustees of Thornburg Investment Trust
28 | Semi-Annual Report
Thornburg Funds
Thornburg Investment Management is a privately-owned global investment firm that offers a range of solutions for retail and institutional investors. Founded in 1982 and headquartered in Santa Fe, New Mexico, we manage approximately $49 billion (as of March 31, 2018) across U.S. mutual funds, separate accounts for high-net-worth investors, institutional accounts, and UCITS funds for non-U.S. investors.
EQUITY FUNDS
| | ∎ | | Thornburg Investment Income Builder Fund |
| | ∎ | | Thornburg Global Opportunities Fund |
| | ∎ | | Thornburg International Value Fund |
| | ∎ | | Thornburg Better World International Fund |
| | ∎ | | Thornburg International Growth Fund |
| | ∎ | | Thornburg Developing World Fund |
| | ∎ | | Thornburg Core Growth Fund |
FIXED INCOME FUNDS
| | ∎ | | Thornburg Low Duration Income Fund |
| | ∎ | | Thornburg Limited Term U.S. Government Fund |
| | ∎ | | Thornburg Limited Term Income Fund |
| | ∎ | | Thornburg Strategic Income Fund |
| | ∎ | | Thornburg Low Duration Municipal Fund |
| | ∎ | | Thornburg Limited Term Municipal Fund |
| | ∎ | | Thornburg Intermediate Municipal Fund |
| | ∎ | | Thornburg California Limited Term Municipal Fund |
| | ∎ | | Thornburg New Mexico Intermediate Municipal Fund |
| | ∎ | | Thornburg New York Intermediate Municipal Fund |
| | ∎ | | Thornburg Strategic Municipal Income Fund |
ALTERNATIVE FUNDS
| | ∎ | | Thornburg Long/Short Equity Fund |
Before investing, carefully consider the Fund’s investment goals, risks, charges, and expenses. For a prospectus or summary prospectus containing this and other information, contact your financial advisor or visit thornburg.com. Read it carefully before investing.
For additional information, please visit thornburg.com
Thornburg Investment Management, Inc. 2300 North Ridgetop Road, Santa Fe, NM 87506
Semi-Annual Report | 29
This page intentionally left blank.
30 | Semi-Annual Report
This page intentionally left blank.
Semi-Annual Report | 31
| | | | |
| To receive shareholder reports, prospectuses, and proxy statements electronically, go to www.thornburg.com/edelivery. | | | | |
| This Semi-Annual Report is submitted for the general information of shareholders of the Fund. It is not authorized for distribution to prospective investors in the Fund unless preceded or accompanied by an effective prospectus. | |
| | | | |
Investment Advisor: | | Distributor: | | |
Thornburg Investment Management® | | Thornburg Securities Corporation® | | |
800.847.0200 | | 800.847.0200 | | TH176 |
Semi-Annual Report
March 31, 2018
THORNBURG
CORE GROWTH
FUND
About Thornburg Investment Management
It’s more than what we do.
It’s how we do it.
At Thornburg, we are very different in how we think, invest, and are structured. We believe this difference is what makes us successful in helping individuals reach their long-term financial goals.
Flexible Perspective
Our perspective on investment opportunities is more flexible than most, viewing a wide range of opportunities beyond conventional boundaries to find hidden value.
Collaboration
Collectively, we hone ideas via borderless cross-pollination for better judgment and better results.
Portfolio Construction
Disciplined construction guided more by our convictions than convention.
CONVICTION
Thorough analysis and our relative-value framework lead to conviction in our securities selection.
UNCONVENTIONAL
Active management means we seek the best value for our clients rather than using conventional benchmarks as our starting point.
Structured for Excellence
How we think and how we invest is made possible by how we’re structured.
TEAM APPROACH
FAR FROM THE HERD
ACCESS & TRANSPARENCY
2 | Semi-Annual Report
Thornburg Core Growth Fund
Semi-Annual Report | March 31, 2018
Table of Contents
| | | | | | | | | | |
| SHARE CLASS | | NASDAQ SYMBOL | | CUSIP |
| | |
| Class A | | THCGX | | | | 885-215-582 | |
| Class C | | TCGCX | | | | 885-215-574 | |
| Class I | | THIGX | | | | 885-215-475 | |
| Class R3 | | THCRX | | | | 885-215-517 | |
| Class R4 | | TCGRX | | | | 885-215-251 | |
| Class R5 | | THGRX | | | | 885-215-350 | |
Class I, R3, R4, and R5 shares may not be available to all investors. Minimum investments for Class I shares may be higher than those for other classes.
Investments carry risks, including possible loss of principal. Additional risks may be associated with investments outside the United States, especially in emerging markets, including currency fluctuations, illiquidity, volatility, and political and economic risks. Investments in small- and mid-capitalization companies may increase the risk of greater price fluctuations. Please see the Fund’s prospectus for a discussion of the risks associated with an investment in the Fund. Investments in the Fund are not FDIC insured, nor are they deposits of or guaranteed by a bank or any other entity.
Funds invested in a smaller number of holdings may expose an investor to greater volatility.
Semi-Annual Report | 3
Letter to Shareholders
Thornburg Core Growth Fund | March 31, 2018 (Unaudited)
April 30, 2018
Dear Fellow Shareholder:
For the six months ended March 31, 2018, Thornburg Core Growth Fund returned 10.97% for class A shares, at net asset value (NAV), outperforming its benchmark, the Russell 3000 Growth Index, which returned 9.20%. On March 31, 2018, the NAV per share of the Class A shares was $36.02.
The beginning of the period shared the low volatility, positive return characteristics of the 2017 calendar year. But that changed as we entered 2018 and volatility returned to equity markets after an extended period of calm. During the first quarter, U.S. markets rallied nearly 10%, then declined 10%, rebounded 10% and declined 10% again. Late-cycle economic worries are starting to weigh on market sentiment as rate hikes will eventually have a tightening effect. That’s especially the case as we may be starting to see the beginning of wage inflation, which is generally a reliable indicator of the end of a cycle. Geopolitical risks are also ramping, with a trade war a possibility and increased conflict in the Middle East a reality.
Performance Discussion
The Core Growth portfolio struggled to keep up with the market during the first half of the period, but weathered the volatile beginning of the year quite well. Strong performance in the consumer discretionary, technology and financial sectors drove market returns. Health care, energy and materials were weak performers. Core Growth was led by technology, financials, consumer staples and energy stocks, with the primary areas of weakness being the consumer discretionary and industrial sectors.
Leading contributors to performance for the period included Amazon, DexCom, FleetCor Technologies, ServiceNow and Netflix.
Amazon and Netflix continued to deliver very strong fundamental results as their well-publicized businesses grow at a high rate.
Dexcom bounced back during the period after concerns around competition brought the stock down during the second half of 2017. Dexcom makes a glucose monitoring system for diabetes patients that we believe is the best on the market and will remain so for the foreseeable future.
ServiceNow is a software-as-a-service (SAAS) company that provides enterprise software for IT management. It has continued to grow at a high rate as its leading platform is being broadly adopted.
FleetCor Technologies provides services that help customers manage their motor fleets. FleetCor’s primary services are fleet cards and payment processing services. FleetCor has grown organically as it takes share with its superior product, and through acquisition as it rolls up smaller competitors and gradually expands its geographic footprint.
Leading detractors to performance for the period included Criteo, Newell Brands, General Electric, Expedia, and Alexion Pharmaceuticals.
During the period General Electric cut its dividend and future earnings expectations. Its power business has been the largest disappointment, with heightened competition and softening end demand. We exited the stock due to fundamental deterioration.
Criteo is a re-targeting company that works with retailers to serve personalized online advertisements to consumers who have previously visited the company’s website. During the year, Apple announced that its new operating system would automatically purge third-party internet cookies that Criteo uses to track users of Safari, Apple’s internet browser. The stock has been depressed while it works through this period of transition. We still believe Criteo is well positioned as the only independent provider of retargeting services.
Newell Brands is a global marketer of consumer and commercial products with a portfolio of over 200 leading brands, including Sharpie, Rubbermaid, Graco, Coleman, Yankee Candle and many others. The company reported a weak set of third-quarter earnings, and core sales growth fell short of expectations due to retailer destocking and inventory adjustments at some key accounts. With limited growth and earnings visibility going forward, we exited the position in favor of more compelling opportunities.
Expedia is one of the world’s leading online travel agents. During the period the stock was under pressure as it kicked off a campaign to accelerate growth. We think the increased investments in its business are a prudent long-term decision and are willing to look past the near-term earnings pressure.
Alexion Pharmaceuticals is a biopharmaceutical company that develops and commercializes drugs to treat rare disorders such as paroxysmal nocturnal hemoglobinuria. During the period revenue from its largest drug, Soliris, was slightly disappointing and the stock de-rated.
4 | Semi-Annual Report
Letter to Shareholders, Continued
Thornburg Core Growth Fund | March 31, 2018 (Unaudited)
Outlook
We remain optimistic that global growth can continue to be broad based and above trend, but we do see moderation in its momentum. As always, we do not attempt to time markets or geopolitical events, but rather take a long-term disciplined approach to investing. We seek to capture returns through our fundamentally driven process that leads us to the most compelling, high-quality growth stocks.
Thank you for investing alongside us in Thornburg Core Growth Fund.
Sincerely,

Greg Dunn
Managing Director
Portfolio Manager
The matters discussed in this report may constitute forward-looking statements made pursuant to the safe harbor provisions of the Securities Litigation Reform Act of 1995. These include any advisor or portfolio manager prediction, assessment, analysis or outlook for individual securities, industries, investment styles, market sectors and/or markets. These statements involve risks and uncertainties. In addition to the general risks described for each fund in its current prospectus, other factors bearing on these reports include the accuracy of the advisor’s or portfolio manager’s forecasts and predictions, the appropriateness of the investment strategies designed by the advisor or portfolio manager and the ability of the advisor or portfolio manager to implement their strategies efficiently and successfully. Any one or more of these factors, as well as other risks affecting the securities markets generally, could cause the actual results of any fund to differ materially as compared to its benchmarks.
The views expressed are subject to change and do not necessarily reflect the views of Thornburg Investment Management, Inc. This information should not be relied upon as a recommendation or investment advice and is not intended to predict the performance of any investment or market.
Performance results of individual share classes will vary based on the fees and expenses associated with each share class, and may be higher or lower than other share classes within the same Fund. Please see Performance Summary for performance results of each share class.
Semi-Annual Report | 5
Performance Summary
Thornburg Core Growth Fund | March 31, 2018 (Unaudited)
AVERAGE ANNUAL TOTAL RETURNS
| | | | | | | | | | | | | | | | | | | | | | | | | |
| | | 1-YR | | 3-YR | | 5-YR | | 10-YR | | SINCE
INCEP. |
| | | | | |
Class A Shares (Incep: 12/27/00) | | | | | | | | | | | | | | | | | | | | | | | | | |
Without sales charge | | | | 20.31% | | | | | 8.35% | | | | | 11.09% | | | | | 8.27% | | | | | 6.71% | |
| | | | | |
With sales charge | | | | 14.90% | | | | | 6.70% | | | | | 10.07% | | | | | 7.77% | | | | | 6.43% | |
Class C Shares (Incep: 12/27/00) | | | | | | | | | | | | | | | | | | | | | | | | | |
Without sales charge | | | | 19.38% | | | | | 7.52% | | | | | 10.25% | | | | | 7.45% | | | | | 5.88% | |
| | | | | |
With sales charge | | | | 18.38% | | | | | 7.52% | | | | | 10.25% | | | | | 7.45% | | | | | 5.88% | |
| | | | | |
Class I Shares (Incep: 11/3/03) | | | | 20.81% | | | | | 8.79% | | | | | 11.54% | | | | | 8.75% | | | | | 9.31% | |
| | | | | |
Class R3 Shares (Incep: 7/1/03) | | | | 20.20% | | | | | 8.24% | | | | | 10.98% | | | | | 8.20% | | | | | 9.47% | |
| | | | | |
Class R4 Shares (Incep: 2/1/07) | | | | 20.33% | | | | | 8.35% | | | | | 11.09% | | | | | 8.31% | | | | | 5.99% | |
| | | | | |
Class R5 Shares (Incep: 10/3/05) | | | | 20.77% | | | | | 8.78% | | | | | 11.54% | | | | | 8.74% | | | | | 8.32% | |
| | | | | |
Russell 3000 Growth Index (Since 12/27/00) | | | | 21.06% | | | | | 12.57% | | | | | 15.32% | | | | | 11.31% | | | | | 5.87% | |
GROWTH OF A HYPOTHETICAL $10,000 INVESTMENT
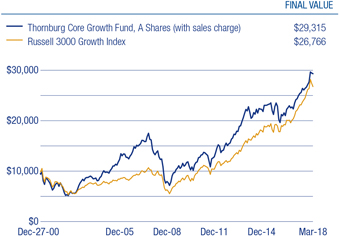
Performance data shown represents past performance and is no guarantee of future results. Investment return and principal value will fluctuate so shares, when redeemed, may be worth more or less than their original cost. Current performance may be lower or higher than quoted. For performance current to the most recent month end, visit thornburg.com or call 800-847-0200. The performance information does not reflect the deduction of taxes that a shareholder would pay on distributions or the redemption of Fund shares. Returns reflect the reinvestment of dividends and capital gains. Class A shares are sold with a maximum sales charge of 4.50%. Class C shares are subject to a 1% CDSC for the first year only. There is no sales charge for Class I, R3, R4 and R5 shares.
As disclosed in the most recent prospectus, the total annual fund operating expenses before any fee waivers or expense reimbursements are as follows: A shares, 1.36%; C shares, 2.12%; I shares, 1.08%; R3 shares, 1.80%; R4 shares, 1.96%; R5 shares, 1.37%. Thornburg Investment Management and/or Thornburg Securities Corporation have contractually agreed to waive fees and reimburse expenses through at least February 1, 2019, for some of the share classes, resulting in net expense ratios of the following: I shares, 0.99%, R3 shares, 1.50%; R4 shares, 1.40%; R5 shares, 0.99%. For more detailed information on fund expenses and waivers/reimbursements please see the Fund’s prospectus.
Glossary
The Russell 3000 Growth Index is an unmanaged index comprised of those Russell 3000 companies with higher price-to-book ratios and high forecasted growth values. The stocks in this index are members of either the Russell 1000 Growth or the Russell 2000 Growth indices. Source: Frank Russell Company.
The performance of any index is not indicative of the performance of any particular investment. Unless otherwise noted, index returns reflect the reinvestment of income dividends and capital gains, if any, but do not reflect fees, brokerage commissions or other expenses of investing. Investors may not make direct investments into any index.
6 | Semi-Annual Report
Fund Summary
Thornburg Core Growth Fund | March 31, 2018 (Unaudited)
OBJECTIVES AND STRATEGIES
The Fund seeks long-term growth of capital by investing in equity securities selected for their growth potential.
The Fund expects to invest primarily in domestic equity securities (primarily common stocks) selected for their growth potential. However, the Fund may own a variety of securities, including foreign equity securities and partnership interests. The Fund may also invest in developing countries.
MARKET CAPITALIZATION EXPOSURE
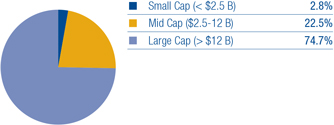
BASKET STRUCTURE
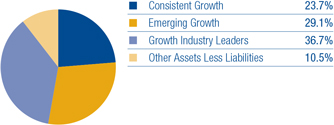
TOP TEN EQUITY HOLDINGS
| | | | | |
| Visa, Inc. | | | | 4.4% | |
| FleetCor Technologies, Inc. | | | | 3.3% | |
| Amazon.com, Inc. | | | | 3.3% | |
| Las Vegas Sands Corp. | | | | 3.2% | |
| Alphabet, Inc. | | | | 2.9% | |
| Facebook, Inc. | | | | 2.8% | |
| SVB Financial Group | | | | 2.6% | |
| Comcast Corp. | | | | 2.6% | |
| Nevro Corp. | | | | 2.5% | |
| Worldpay, Inc. | | | | 2.4% | |
SECTOR EXPOSURE
| | | | | |
| Information Technology | | | | 36.1% | |
| Consumer Discretionary | | | | 17.3% | |
| Health Care | | | | 13.6% | |
| Financials | | | | 9.1% | |
| Consumer Staples | | | | 6.6% | |
| Energy | | | | 3.5% | |
| Materials | | | | 3.3% | |
| Other Assets Less Liabilities | | | | 10.5% | |
TOP TEN INDUSTRY GROUPS
| | | | | |
| Software & Services | | | | 32.5% | |
| Retailing | | | | 10.5% | |
| Healthcare Equipment & Services | | | | 7.4% | |
| Pharmaceuticals, Biotechnology & Life Sciences | | | | 6.2% | |
| Banks | | | | 4.9% | |
| Food, Beverage & Tobacco | | | | 4.5% | |
| Diversified Financials | | | | 4.2% | |
| Media | | | | 3.6% | |
| Technology Hardware & Equipment | | | | 3.6% | |
| Energy | | | | 3.5% | |
COUNTRY EXPOSURE*
(percent of equity holdings)
| | | | | |
| United States | | | | 89.4% | |
| Ireland | | | | 2.6% | |
| Israel | | | | 1.9% | |
| United Kingdom | | | | 1.9% | |
| Argentina | | | | 1.6% | |
| Germany | | | | 1.4% | |
| France | | | | 1.2% | |
| * | Holdings are classified by country of risk as determined by MSCI and Bloomberg. |
There is no guarantee that the Fund will meet its investment objectives.
All data is subject to change. Charts may not add up to 100% due to rounding.
Semi-Annual Report | 7
Schedule of Investments
Thornburg Core Growth Fund | March 31, 2018
| | | | | | | | | | | | |
| | | | | SHARES/
PRINCIPAL AMOUNT | | VALUE |
| | | |
| | COMMON STOCK — 89.5% | | | | | | | | | | |
| | | |
| | BANKS — 4.9% | | | | | | | | | | |
| | Banks — 4.9% | | | | | | | | | | |
| | JPMorgan Chase & Co. | | | | 136,234 | | | | $ | 14,981,653 | |
| a | | SVB Financial Group | | | | 72,713 | | | | | 17,451,847 | |
| | | | | | | | | | | | |
| | | | | | | | | | | 32,433,500 | |
| | | | | | | | | | | | |
| | CONSUMER SERVICES — 3.2% | | | | | | | | | | |
| | Hotels, Restaurants & Leisure — 3.2% | | | | | | | | | | |
| | Las Vegas Sands Corp. | | | | 296,200 | | | | | 21,296,780 | |
| | | | | | | | | | | | |
| | | | | | | | | | | 21,296,780 | |
| | | | | | | | | | | | |
| | DIVERSIFIED FINANCIALS — 4.2% | | | | | | | | | | |
| | Capital Markets — 4.2% | | | | | | | | | | |
| | Affiliated Managers Group, Inc. | | | | 75,921 | | | | | 14,393,103 | |
| | CME Group, Inc. | | | | 81,050 | | | | | 13,109,027 | |
| | | | | | | | | | | | |
| | | | | | | | | | | 27,502,130 | |
| | | | | | | | | | | | |
| | ENERGY — 3.5% | | | | | | | | | | |
| | Oil, Gas & Consumable Fuels — 3.5% | | | | | | | | | | |
| a | | Concho Resources, Inc. | | | | 77,309 | | | | | 11,621,862 | |
| | Pioneer Natural Resources Co. | | | | 65,924 | | | | | 11,324,425 | |
| | | | | | | | | | | | |
| | | | | | | | | | | 22,946,287 | |
| | | | | | | | | | | | |
| | FOOD & STAPLES RETAILING — 2.1% | | | | | | | | | | |
| | Food & Staples Retailing — 2.1% | | | | | | | | | | |
| | Walmart, Inc. | | | | 155,678 | | | | | 13,850,672 | |
| | | | | | | | | | | | |
| | | | | | | | | | | 13,850,672 | |
| | | | | | | | | | | | |
| | FOOD, BEVERAGE & TOBACCO — 4.5% | | | | | | | | | | |
| | Beverages — 2.2% | | | | | | | | | | |
| a | | Monster Beverage Corp. | | | | 256,349 | | | | | 14,665,726 | |
| | Food Products — 2.3% | | | | | | | | | | |
| | Kerry Group plc Class A | | | | 149,820 | | | | | 15,190,108 | |
| | | | | | | | | | | | |
| | | | | | | | | | | 29,855,834 | |
| | | | | | | | | | | | |
| | HEALTHCARE EQUIPMENT & SERVICES — 7.4% | | | | | | | | | | |
| | Health Care Equipment & Supplies — 5.6% | | | | | | | | | | |
| a | | DexCom, Inc. | | | | 189,048 | | | | | 14,019,800 | |
| a | | Inogen, Inc. | | | | 52,994 | | | | | 6,509,783 | |
| a | | Nevro Corp. | | | | 191,732 | | | | | 16,617,412 | |
| | Health Care Providers & Services — 1.8% | | | | | | | | | | |
| a | | DaVita, Inc. | | | | 175,114 | | | | | 11,547,017 | |
| | | | | | | | | | | | |
| | | | | | | | | | | 48,694,012 | |
| | | | | | | | | | | | |
| | MATERIALS — 3.3% | | | | | | | | | | |
| | Chemicals — 3.3% | | | | | | | | | | |
| | CF Industries Holdings, Inc. | | | | 320,001 | | | | | 12,073,638 | |
| | Monsanto Co. | | | | 86,300 | | | | | 10,070,347 | |
| | | | | | | | | | | | |
| | | | | | | | | | | 22,143,985 | |
| | | | | | | | | | | | |
| | MEDIA — 3.6% | | | | | | | | | | |
| | Media — 3.6% | | | | | | | | | | |
| | Comcast Corp. Class A | | | | 498,426 | | | | | 17,031,217 | |
| a | | Criteo S.A. ADR | | | | 267,005 | | | | | 6,899,409 | |
| | | | | | | | | | | | |
| | | | | | | | | | | 23,930,626 | |
| | | | | | | | | | | | |
| | PHARMACEUTICALS, BIOTECHNOLOGY & LIFE SCIENCES — 6.2% | | | | | | | | | | |
| | Biotechnology — 4.9% | | | | | | | | | | |
| a | | Alexion Pharmaceuticals, Inc. | | | | 114,625 | | | | | 12,776,103 | |
| a | | Alkermes plc | | | | 158,592 | | | | | 9,191,992 | |
| | Gilead Sciences, Inc. | | | | 136,300 | | | | | 10,275,657 | |
8 | Semi-Annual Report
Schedule of Investments, Continued
Thornburg Core Growth Fund | March 31, 2018
| | | | | | | | | | | | |
| | | | | SHARES/
PRINCIPAL AMOUNT | | VALUE |
| | Pharmaceuticals — 1.3% | | | | | | | | | | |
| | Bayer AG | | | | 76,500 | | | | $ | 8,640,137 | |
| | | | | | | | | | | | |
| | | | | | | | | | | 40,883,889 | |
| | | | | | | | | | | | |
| | RETAILING — 10.5% | | | | | | | | | | |
| | Internet & Direct Marketing Retail — 8.4% | | | | | | | | | | |
| a | | Amazon.com, Inc. | | | | 14,976 | | | | | 21,675,364 | |
| a | | Booking Holdings, Inc. | | | | 6,496 | | | | | 13,514,214 | |
| | Expedia Group, Inc. | | | | 108,535 | | | | | 11,983,349 | |
| a | | Netflix, Inc. | | | | 26,829 | | | | | 7,923,945 | |
| | Specialty Retail — 2.1% | | | | | | | | | | |
| | TJX Companies, Inc. | | | | 172,100 | | | | | 14,036,476 | |
| | | | | | | | | | | | |
| | | | | | | | | | | 69,133,348 | |
| | | | | | | | | | | | |
| | SOFTWARE & SERVICES — 32.5% | | | | | | | | | | |
| | Information Technology Services — 13.0% | | | | | | | | | | |
| a | | FleetCor Technologies, Inc. | | | | 107,656 | | | | | 21,800,340 | |
| a | | PayPal Holdings, Inc. | | | | 178,704 | | | | | 13,558,272 | |
| | Switch, Inc. Class A | | | | 336,800 | | | | | 5,358,488 | |
| | Visa, Inc. Class A | | | | 242,429 | | | | | 28,999,357 | |
| a | | Worldpay, Inc. Class A | | | | 194,621 | | | | | 16,005,631 | |
| | Internet Software & Services — 11.0% | | | | | | | | | | |
| a | | Alphabet, Inc. Class C | | | | 18,729 | | | | | 19,324,395 | |
| | Auto Trader Group plc | | | | 2,250,674 | | | | | 11,070,887 | |
| a | | Facebook, Inc. Class A | | | | 114,662 | | | | | 18,321,841 | |
| a | | Wix.com Ltd. | | | | 141,507 | | | | | 11,256,882 | |
| a | | Zillow Group, Inc. | | | | 241,138 | | | | | 12,973,224 | |
| | Software — 8.5% | | | | | | | | | | |
| | Activision Blizzard, Inc. | | | | 127,100 | | | | | 8,574,166 | |
| a | | Globant S.A. | | | | 190,509 | | | | | 9,818,834 | |
| a | | Proofpoint, Inc. | | | | 71,634 | | | | | 8,141,204 | |
| a | | ServiceNow, Inc. | | | | 78,712 | | | | | 13,022,900 | |
| a | | Splunk, Inc. | | | | 87,374 | | | | | 8,596,728 | |
| a | | Workday, Inc. Class A | | | | 64,828 | | | | | 8,240,287 | |
| | | | | | | | | | | | |
| | | | | | | | | | | 215,063,436 | |
| | | | | | | | | | | | |
| | TECHNOLOGY HARDWARE & EQUIPMENT — 3.6% | | | | | | | | | | |
| | Communications Equipment — 1.5% | | | | | | | | | | |
| a | | Palo Alto Networks, Inc. | | | | 54,675 | | | | | 9,924,606 | |
| | Technology Hardware, Storage & Peripherals — 2.1% | | | | | | | | | | |
| | Apple, Inc. | | | | 81,792 | | | | | 13,723,062 | |
| | | | | | | | | | | | |
| | | | | | | | | | | 23,647,668 | |
| | | | | | | | | | | | |
| | TOTAL COMMON STOCK (Cost $389,164,727) | | | | | | | | | 591,382,167 | |
| | | | | | | | | | | | |
| | | |
| | SHORT-TERM INVESTMENTS — 9.5% | | | | | | | | | | |
| b | | Thornburg Capital Management Fund | | | | 6,274,543 | | | | | 62,745,435 | |
| | | | | | | | | | | | |
| | TOTAL SHORT-TERM INVESTMENTS (Cost $62,745,435) | | | | | | | | | 62,745,435 | |
| | | | | | | | | | | | |
| | | |
| | TOTAL INVESTMENTS — 99.0% (Cost $451,910,162) | | | | | | | | $ | 654,127,602 | |
| | | |
| | OTHER ASSETS LESS LIABILITIES — 1.0% | | | | | | | | | 6,865,844 | |
| | | |
| | NET ASSETS — 100.0% | | | | | | | | $ | 660,993,446 | |
| | | | | | | | | | | | |
Footnote Legend
| b | Investment in Affiliates. |
Portfolio Abbreviations
To simplify the listings of securities, abbreviations are used per the table below:
| | |
| ADR | | American Depositary Receipt |
See notes to financial statements.
Semi-Annual Report | 9
Statement of Assets and Liabilities
Thornburg Core Growth Fund | March 31, 2018 (Unaudited)
| | | | |
ASSETS | | | | |
| |
Investments at value (Note 3) | | | | |
Non-affiliated issuers (cost $389,164,727) | | $ | 591,382,167 | |
Non-controlled affiliated issuer (cost $62,745,435) | | | 62,745,435 | |
Cash | | | 222,150 | |
Receivable for investments sold | | | 12,746,010 | |
Receivable for fund shares sold | | | 299,375 | |
Dividends receivable | | | 202,792 | |
Dividend and interest reclaim receivable | | | 1,089 | |
Prepaid expenses and other assets | | | 42,606 | |
| | | | |
| |
Total Assets | | | 667,641,624 | |
| | | | |
| |
LIABILITIES | | | | |
| |
Payable for investments purchased | | | 4,952,944 | |
Payable for fund shares redeemed | | | 795,428 | |
Payable to investment advisor and other affiliates (Note 4) | | | 678,432 | |
Accounts payable and accrued expenses | | | 221,374 | |
| | | | |
| |
Total Liabilities | | | 6,648,178 | |
| | | | |
| |
NET ASSETS | | $ | 660,993,446 | |
| | | | |
| |
NET ASSETS CONSIST OF | | | | |
| |
Accumulated net investment loss | | $ | (5,536,192 | ) |
Net unrealized appreciation on investments | | | 202,217,347 | |
Accumulated net realized gain (loss) | | | (148,125,653 | ) |
Net capital paid in on shares of beneficial interest | | | 612,437,944 | |
| | | | |
| |
| | $ | 660,993,446 | |
| | | | |
10 | Semi-Annual Report
Statement of Assets and Liabilities, Continued
Thornburg Core Growth Fund | March 31, 2018 (Unaudited)
| | | | |
NET ASSET VALUE | | | | |
| |
Class A Shares: | | | | |
Net asset value and redemption price per share
($197,865,927 applicable to 5,493,508 shares of beneficial
interest outstanding - Note 5) | | $ | 36.02 | |
| |
Maximum sales charge, 4.50% of offering price | | | 1.70 | |
| | | | |
| |
Maximum offering price per share | | $ | 37.72 | |
| | | | |
| |
Class C Shares: | | | | |
Net asset value and offering price per share*
($130,038,710 applicable to 4,138,368 shares of beneficial
interest outstanding - Note 5) | | $ | 31.42 | |
| | | | |
| |
Class I Shares: | | | | |
Net asset value, offering and redemption price per share
($253,575,319 applicable to 6,578,629 shares of beneficial
interest outstanding - Note 5) | | $ | 38.55 | |
| | | | |
| |
Class R3 Shares: | | | | |
Net asset value, offering and redemption price per share
($44,363,168 applicable to 1,238,604 shares of beneficial
interest outstanding - Note 5) | | $ | 35.82 | |
| | | | |
| |
Class R4 Shares: | | | | |
Net asset value, offering and redemption price per share
($4,755,842 applicable to 131,536 shares of beneficial
interest outstanding - Note 5) | | $ | 36.16 | |
| | | | |
| |
Class R5 Shares: | | | | |
Net asset value, offering and redemption price per share
($30,394,480 applicable to 789,373 shares of beneficial
interest outstanding - Note 5) | | $ | 38.50 | |
| | | | |
* Redemption price per share is equal to net asset value less any applicable contingent deferred sales charge.
See notes to financial statements.
Semi-Annual Report | 11
Statement of Operations
Thornburg Core Growth Fund | Six Months Ended March 31, 2018 (Unaudited)
| | | | |
INVESTMENT INCOME | | | | |
| |
Dividend income | | | | |
Non-affiliated issuers | | $ | 2,145,935 | |
Non-controlled affiliated issuer | | | 269,138 | |
| | | | |
| |
Total Income | | | 2,415,073 | |
| | | | |
| |
EXPENSES | | | | |
| |
Investment advisory fees (Note 4) | | | 2,815,134 | |
Administration fees (Note 4) | | | | |
Class A Shares | | | 107,100 | |
Class C Shares | | | 72,737 | |
Class I Shares | | | 75,132 | |
Class R3 Shares | | | 25,501 | |
Class R4 Shares | | | 2,801 | |
Class R5 Shares | | | 9,380 | |
Distribution and service fees (Note 4) | | | | |
Class A Shares | | | 241,580 | |
Class C Shares | | | 654,641 | |
Class R3 Shares | | | 114,340 | |
Class R4 Shares | | | 6,189 | |
Transfer agent fees | | | | |
Class A Shares | | | 104,585 | |
Class C Shares | | | 81,346 | |
Class I Shares | | | 95,222 | |
Class R3 Shares | | | 66,987 | |
Class R4 Shares | | | 10,311 | |
Class R5 Shares | | | 51,150 | |
Registration and filing fees | | | | |
Class A Shares | | | 6,602 | |
Class C Shares | | | 6,630 | |
Class I Shares | | | 6,024 | |
Class R3 Shares | | | 5,852 | |
Class R4 Shares | | | 7,157 | |
Class R5 Shares | | | 6,040 | |
Custodian fees (Note 2) | | | 37,430 | |
Professional fees | | | 26,203 | |
Trustee and officer fees (Note 4) | | | 14,427 | |
Other expenses | | | 36,006 | |
| | | | |
| |
Total Expenses | | | 4,686,507 | |
| |
Less: | | | | |
Expenses reimbursed by investment advisor (Note 4) | | | (203,901 | ) |
| | | | |
| |
Net Expenses | | | 4,482,606 | |
| | | | |
| |
Net Investment Loss | | $ | (2,067,533 | ) |
| | | | |
12 | Semi-Annual Report
Statement of Operations, Continued
Thornburg Core Growth Fund | Six Months Ended March 31, 2018 (Unaudited)
| | | | |
REALIZED AND UNREALIZED GAIN (LOSS) | | | | |
| |
Net realized gain (loss) on: | | | | |
Non-affiliated issuer investments | | $ | 31,155,910 | |
Foreign currency transactions | | | (704 | ) |
| | | | |
| |
| | | 31,155,206 | |
| | | | |
Net change in unrealized appreciation (depreciation) on: | | | | |
Non-affiliated issuer investments | | | 38,678,329 | |
Foreign currency translations | | | 45 | |
| | | | |
| |
| | | 38,678,374 | |
| | | | |
| |
Net Realized and Unrealized Gain | | | 69,833,580 | |
| | | | |
| |
Net Increase in Net Assets Resulting from Operations | | $ | 67,766,047 | |
| | | | |
See notes to financial statements.
Semi-Annual Report | 13
Statements of Changes in Net Assets
Thornburg Core Growth Fund
| | | | | | | | | | |
| | | SIX MONTHS ENDED MARCH 31, 2018* | | YEAR ENDED SEPTEMBER 30, 2017 |
INCREASE (DECREASE) IN NET ASSETS FROM | | | | | | | | | | |
| | |
OPERATIONS | | | | | | | | | | |
| | |
Net investment loss | | | $ | (2,067,533 | ) | | | $ | (5,077,617 | ) |
Net realized gain (loss) on investments and foreign currency transactions | | | | 31,155,206 | | | | | 74,010,155 | |
Net unrealized appreciation (depreciation) on investments and foreign currency translations | | | | 38,678,374 | | | | | 18,445,509 | |
| | | | | |
| | |
Net Increase in Net Assets Resulting from Operations | | | | 67,766,047 | | | | | 87,378,047 | |
| | |
FUND SHARE TRANSACTIONS (NOTE 5) | | | | | | | | | | |
Class A Shares | | | | (9,298,116 | ) | | | | (38,160,794 | ) |
Class C Shares | | | | (13,297,945 | ) | | | | (44,372,259 | ) |
Class I Shares | | | | (7,299,452 | ) | | | | 5,746,285 | |
Class R3 Shares | | | | (7,454,295 | ) | | | | (15,580,646 | ) |
Class R4 Shares | | | | (1,105,623 | ) | | | | (2,258,476 | ) |
Class R5 Shares | | | | (5,057,371 | ) | | | | (11,221,929 | ) |
| | | | | |
| | |
Net Increase (Decrease) in Net Assets | | | | 24,253,245 | | | | | (18,469,772 | ) |
| | |
NET ASSETS | | | | | | | | | | |
| | |
Beginning of Period | | | | 636,740,201 | | | | | 655,209,973 | |
| | | | | |
| | |
End of Period | | | $ | 660,993,446 | | | | $ | 636,740,201 | |
| | | | | |
| | |
Accumulated net investment loss | | | $ | (5,536,192 | ) | | | $ | (3,468,659 | ) |
* Unaudited.
See notes to financial statements.
14 | Semi-Annual Report
Notes to Financial Statements
Thornburg Core Growth Fund | March 31, 2018 (Unaudited)
NOTE 1 – ORGANIZATION
Thornburg Core Growth Fund (the “Fund”) is a diversified series of Thornburg Investment Trust (the “Trust”). The Trust was organized as a Massachusetts business trust under a Declaration of Trust dated June 3, 1987 and is registered as a diversified, open-end management investment company under the Investment Company Act of 1940, as amended. The Fund is currently one of twenty-one separate series of the Trust. Each series is considered to be a separate entity for financial reporting and tax purposes and bears expenses directly attributable to it. The Fund seeks long-term capital appreciation by investing in equity securities selected for their growth potential.
The Fund currently offers six classes of shares of beneficial interest: Class A, Class C, Institutional Class (“Class I”), and Retirement Classes (“Class R3”, “Class R4”, and “Class R5”). Each class of shares of the Fund represents an interest in the same portfolio of investments, except that (i) Class A shares are sold subject to a front-end sales charge collected at the time the shares are purchased and bear a service fee, (ii) Class C shares are sold at net asset value without a sales charge at the time of purchase, but are subject to a contingent deferred sales charge upon redemption within one year of purchase, and bear both a service fee and a distribution fee, (iii) Class I shares are sold at net asset value without a sales charge at the time of purchase and may be subject to a service fee, (iv) Class R3 shares are sold at net asset value without a sales charge at the time of purchase, but bear both a service fee and distribution fee, (v) Class R4 shares are sold at net asset value without a sales charge at the time of purchase, but bear a service fee, (vi) Class R5 shares are sold at net asset value without a sales charge at the time of purchase and may be subject to a service fee, and (vii) the respective classes may have different reinvestment privileges and conversion rights. Additionally, the Fund may allocate among its classes certain expenses, to the extent allocable to specific classes, including transfer agent fees, government registration fees, certain printing and postage costs, and administrative and legal expenses. Currently, class specific expenses of the Fund are limited to service and distribution fees, administration fees, and certain registration and transfer agent expenses.
The following is a summary of significant accounting policies followed by the Fund in the preparation of its financial statements. The Fund prepares its financial statements in conformity with United States generally accepted accounting principles (“GAAP”), including investment company accounting and reporting guidance in the Financial Accounting Standards Board (the “FASB”) Accounting Standard Codification Topic 946.
NOTE 2 – SIGNIFICANT ACCOUNTING POLICIES
Security Valuation: All investments in securities held by the Fund are valued as described in Note 3.
Allocation of Income, Gains, Losses and Expenses: Net investment income (other than class specific expenses) and realized and unrealized gains and losses are allocated daily to each class of shares based upon the relative net asset value of outstanding shares (or the value of the dividend-eligible shares, as appropriate) of each class of shares at the beginning of the day (after adjusting for the current capital shares activity of the respective class). Expenses common to all Funds are allocated among the Funds comprising the Trust based upon their relative net asset values or other appropriate allocation methods. Operating expenses directly attributable to a specific class are charged against the operating income of that class.
Dividends and Distributions to Shareholders: Dividends and distributions to shareholders, which are determined in accordance with federal income tax regulations and may differ from GAAP, are recorded on the ex-dividend date. Ordinary income distributions, if any, are declared and paid annually. Capital gain distributions, if any, are declared and paid annually and more often if deemed necessary by Thornburg Investment Management, Inc., the Trust’s investment advisor (the “Advisor”). Dividends are paid and are reinvested in additional shares of the Fund at net asset value per share at the close of business on the ex-dividend date, or at the shareholder’s option, paid in cash.
Investment Income: Dividend income is recorded on the ex-dividend date. Certain income from foreign investments is recognized as soon as information is available to the Fund. Interest income is accrued as earned. Premiums and discounts are amortized and accreted, respectively, to call dates or maturity dates using the effective yield method of the respective investments. These amounts are included in Interest income on the Statement of Operations.
Custodian Fees: Custodian fees disclosed in the Statement of Operations may include interest expenses incurred by the Fund on any cash overdrafts of its custodian account during the period. Such cash overdrafts may result from the effects of failed trades in portfolio securities and from cash outflows resulting from unanticipated shareholder redemption activity. The Fund pays interest to its custodian on any such cash overdraft at a rate set periodically at the custodian’s discretion of the overdraft amount in excess of $50,000.
Investment Transactions: Investment transactions are accounted for on a trade date basis. Realized gains and losses from the sale of investments are recorded on an identified cost basis.
Repurchase Agreements: The Fund may invest excess cash in repurchase agreements whereby the Fund purchases investments, which serve as collateral, with an agreement to resell such collateral to the seller at an agreed upon price at the maturity date of the repurchase agreement. Investments pledged as collateral for repurchase agreements are held in custody until maturity of the repurchase agreement.
Semi-Annual Report | 15
Notes to Financial Statements, Continued
Thornburg Core Growth Fund | March 31, 2018 (Unaudited)
Provisions in the agreements require that the market value of the collateral is at least equal to the repurchase value in the event of default. In the event of default, the Fund has the right to liquidate the collateral and apply the proceeds in satisfaction of the obligation. Under certain circumstances, in the event of default or bankruptcy by the other party to the agreement, realization and/or retention of the collateral may be subject to legal proceedings.
When-Issued and Delayed Delivery Transactions: The Fund may engage in when-issued or delayed delivery transactions. To the extent the Fund engages in such transactions, it will do so for the purpose of acquiring portfolio investments consistent with the Fund’s investment objectives and not for the purpose of investment leverage or to speculate on interest rate or market changes. At the time the Fund makes a commitment to purchase an investment on a when-issued or delayed delivery basis, the Fund will record the transaction and reflect the value in determining its net asset value. When effecting such transactions, assets of an amount sufficient to make payment for the portfolio investments to be purchased will be segregated on the Fund’s records on the trade date. Investments purchased on a when-issued or delayed delivery basis do not earn interest until the settlement date.
Foreign Currency Translation: Portfolio investments and other assets and liabilities denominated in foreign currencies are translated into U.S. dollars based on the exchange rate of such currencies against the U.S. dollar on the date of valuation. Purchases and sales of investments and income items denominated in foreign currencies are translated into U.S. dollars at the exchange rate in effect on the transaction date. When the Fund purchases or sells foreign investments, it will customarily enter into a foreign exchange contract to minimize foreign exchange risk from the trade date to the settlement date of such transactions. The values of such spot contracts are included in receivable for investments sold and payable for investments purchased on the Statement of Assets and Liabilities.
The Fund does not separately report the effect of changes in foreign exchange rates from changes in market prices on investments held. Such changes are included in net unrealized appreciation (depreciation) from investments.
Reported net realized gains and losses from foreign currency transactions arise due to purchases and sales of foreign currencies, currency gains and losses realized between the trade and settlement dates on investment transactions and the difference between the amounts of dividends, interest, and foreign withholding taxes recorded on the Fund’s books, and the U.S. dollar equivalent of the amounts actually received or paid.
Net change in unrealized appreciation (depreciation) on foreign currency translations arise from changes in the fair value of assets and liabilities, other than investments at period end, resulting from changes in exchange rates.
Guarantees and Indemnifications: Under the Trust’s organizational documents (and under separate agreements with the independent Trustees), its officers and Trustees are provided with an indemnification against certain liabilities arising out of the performance of their duties to the Fund. In the normal course of business the Trust may also enter into contracts with service providers that contain general indemnifications. The Trust’s maximum exposure under these arrangements is unknown. However, based on experience, the Trust expects the risk of loss to be remote.
Use of Estimates: The preparation of financial statements in conformity with GAAP requires management to make estimates and assumptions that affect the reported amounts of assets and liabilities and disclosure of contingent assets and liabilities at the date of the financial statements and the reported amounts of increases (decreases) in net assets from operations during the reporting period. Actual results could differ from those estimates.
Federal Income Taxes: It is the policy of the Trust to comply with the provisions of the Internal Revenue Code applicable to regulated investment companies and to distribute to shareholders substantially all investment company taxable income including net realized gains on investments (if any), and tax exempt income of the Fund. Therefore, no provision for federal income or excise tax is required.
The Fund files income tax returns in United States federal and applicable state jurisdictions. The statute of limitations on the Fund’s tax return filings generally remains open for the three years following a return’s filing date. The Fund has analyzed each uncertain tax position believed to be material in the preparation of the Fund’s financial statements for the six month period ended March 31, 2018, including open tax years, to assess whether it is more likely than not that the position would be sustained upon examination, based on the technical merits of the position. The Fund has not identified any such position for which an asset or liability must be reflected in the Statement of Assets and Liabilities.
At March 31, 2018, information on the tax components of capital was as follows:
| | | | | |
Cost of investments for tax purposes | | | $ | 451,910,162 | |
| | | | | |
Gross unrealized appreciation on a tax basis | | | | 208,127,161 | |
Gross unrealized depreciation on a tax basis | | | | (5,909,721 | ) |
| | | | | |
Net unrealized appreciation (depreciation) on investments (tax basis) | | | $ | 202,217,440 | |
| | | | | |
16 | Semi-Annual Report
Notes to Financial Statements, Continued
Thornburg Core Growth Fund | March 31, 2018 (Unaudited)
At March 31, 2018, the Fund had deferred tax basis late-year ordinary investment losses occurring subsequent to December 31, 2016 through September 30, 2017 of $3,460,783. For tax purposes, such ordinary losses will be recognized in the year ending September 30, 2018.
At March 31, 2018, the Fund had deferred tax basis late-year specified ordinary losses occurring subsequent to October 31, 2016 through September 30, 2017 of $7,876. For tax purposes, such losses will be recognized in the year ending September 30, 2018.
At March 31, 2018, the Fund had cumulative tax basis capital losses of $177,130,558 generated prior to October 1, 2011 which may be carried forward to offset future capital gains. To the extent such carryforwards are utilized, capital gain distributions may be reduced to the extent provided by regulations. Such capital loss carryforwards expire September 30, 2018.
Foreign Withholding Taxes: The Fund is subject to foreign tax withholding imposed by certain foreign countries in which the Fund may invest. Withholding taxes are incurred on certain foreign dividends and are accrued at the time the dividend is recognized based on applicable foreign tax laws. The Fund may file withholding tax reclaims in certain jurisdictions to recover a portion of amounts previously withheld, in view of various considerations, including recent decisions rendered by the courts in those and other jurisdictions. The Fund would expect to record a receivable for such a reclaim based on a variety of factors, including assessment of a jurisdiction’s legal obligation to pay reclaims, the jurisdiction’s administrative practices and payment history, and industry convention. To date the Fund has recorded no such receivable because there is limited precedent for collecting such prior year reclaims and the likelihood of collection remains uncertain.
Deferred Foreign Capital Gain Taxes: The Fund is subject to a tax imposed on net realized gains of securities of certain foreign countries. The Fund records an estimated deferred tax liability for net unrealized gains on these investments as reflected in the accompanying financial statements.
NOTE 3 – SECURITY VALUATION
Valuation of the Fund’s portfolio investment securities is performed in accordance with policies and procedures adopted by and under the oversight of the Trustees.
The Trustees of the Trust have appointed the Advisor to assist the Trustees to obtain market values for portfolio investments, evaluate and monitor professional pricing service providers appointed by the Trustees’ Audit Committee (the “Audit Committee”) to assist in determining fair values for portfolio investments, assist in calculating fair values for portfolio investments in certain circumstances, and to perform other functions in connection with the valuation of investments. The Advisor acts through its Valuation and Pricing Committee (the “Committee”) and other employees of the Advisor. The Committee regularly reviews its own valuation calculations, as well as the valuations, valuation techniques and services furnished by pricing service providers, considers circumstances which may require valuation calculations by the Committee, and reviews previous valuation calculations. The Committee reports to the Audit Committee on the Committee’s activities, the performance of pricing service providers, and other matters relating to valuation of portfolio investments.
In those instances when the Committee assists in calculating a fair value for a portfolio investment, the Committee seeks to determine the price that the Fund would reasonably expect to receive upon a sale of the investment in an orderly transaction between market participants on the valuation date. The Committee customarily utilizes quotations from securities broker dealers in calculating valuations, but also may utilize prices obtained from pricing service providers or other methods approved by the Audit Committee. Because fair values calculated by the Committee are estimates, the calculation of a value for an investment may differ from the price that would be realized by the Fund upon a sale of the investment, and the difference could be material to the Fund’s financial statements. The Committee’s calculation of a fair value for an investment may also differ from the prices obtained by other persons (including other mutual funds) for the investment.
Valuation of Securities: Securities and other portfolio investments which are listed or traded on a United States securities exchange are valued at the last reported sale price on the valuation date. Investments listed or traded on an exchange for which there has been no sale that day are valued at the mean between the last reported bid and asked prices on that valuation date. Portfolio investments reported by NASDAQ are valued at the official closing price on the valuation date. If an investment is traded on more than one exchange, the investment is considered traded on the exchange that is normally the primary market for that investment. Securities and other portfolio investments which are listed or traded on exchanges outside the United States are valued at the last price or the closing price of the investment on the exchange that is normally the primary market for the investment, as of the close of the exchange preceding the Fund’s valuation date. Foreign investments listed or traded on an exchange for which there has been no sale that day are valued at the mean between the last reported bid and asked prices on that valuation date.
In any case when a market quotation is not readily available for a portfolio investment ordinarily valued by market quotation, the Committee calculates a fair value for the investment using alternative methods approved by the Audit Committee. A market quotation is not readily available when the primary market or exchange for the investment is not open for the entire scheduled day of trading. Market quotations for an investment also may not be readily available if developments after the most recent close of the investment’s primary exchange or market, but prior to the close of business on any Fund business day, or an unusual event or significant period of time occurring since the
Semi-Annual Report | 17
Notes to Financial Statements, Continued
Thornburg Core Growth Fund | March 31, 2018 (Unaudited)
availability of a market quotation, create a serious question concerning the reliability of the most recent market quotation available for the investment. In particular, on days when market volatility thresholds established by the Audit Committee are exceeded, foreign equity investments held by the Fund may be valued using alternative methods. The Committee customarily obtains valuations in these instances from pricing service providers approved by the Audit Committee. Pricing service providers ordinarily calculate valuations using multi-factor models to adjust market prices based upon various inputs, including exchange data, depository receipt prices, futures, index data and other data.
Debt obligations held by the Fund which are not listed or traded on exchanges or for which no reported market exists are ordinarily valued at the valuation obtained from a pricing service provider approved by the Audit Committee.
In any case when a pricing service provider fails to provide a valuation for a debt obligation held by the Fund, the Committee calculates a fair value for the obligation using alternative methods under procedures approved by the Audit Committee. Additionally, in cases when management believes that a valuation obtained from a pricing service provider merits review for significant reasons, the Committee decides whether or not to use the valuation calculated by the pricing service provider or to use an alternative method approved by the Audit Committee to calculate a fair value for the obligation.
Quotations for foreign investments expressed in foreign currency amounts are converted to U.S. dollar equivalents using a foreign exchange quotation from a third party service provider at the time of valuation. Foreign investments held by the Fund may be traded on days and at times when the Fund is not open for business. Consequently, the value of Fund investments may be significantly affected on days when shareholders cannot purchase or sell Fund shares.
Valuation Hierarchy: The Fund categorizes its investments based upon the inputs used in valuing those investments, according to a three-level hierarchy established in guidance from the FASB. Categorization of investments using this hierarchy is intended by the FASB to maximize the use of observable inputs in valuing investments and minimize the use of unobservable inputs by requiring that the most observable inputs be used when available. Observable inputs are those that market participants would use in valuing an investment based on available market information. Unobservable inputs are those that reflect assumptions about the information market participants would use in valuing an investment. An investment’s level within the hierarchy is based on the lowest level input that is deemed significant to the valuation. The methodologies and inputs used to value investments are not necessarily indications of the risk or liquidity associated with those investments.
Various inputs are used in calculating valuations for the Fund’s investments. These inputs are generally summarized according to the three-level hierarchy below:
Level 1: Quoted prices in active markets for identical investments.
Level 2: Other direct or indirect significant observable inputs (including quoted prices for similar investments in active markets and other observable inputs, such as interest rates, prepayment rates, credit risk, etc.).
Level 3: Significant unobservable inputs (including the Committee’s own assumptions in calculating the fair values of investments).
Valuations for debt obligations held by the Fund are typically calculated by pricing service providers approved by the Audit Committee and are generally characterized as Level 2 within the valuation hierarchy.
On days when market volatility thresholds established by the Audit Committee are exceeded, foreign securities for which valuations are obtained from pricing service providers are fair valued. On these days, the foreign securities are characterized as Level 2 within the valuation hierarchy and revert to Level 1 after the threshold is no longer exceeded.
In a limited number of cases the Committee calculates a fair value for investments using broker quotations or other methods approved by the Audit Committee. When the Committee uses a single broker quotation to calculate a fair value for an investment without other significant observable inputs, or if a fair value is calculated using other significant inputs that are considered unobservable, the investment is characterized as Level 3 within the hierarchy. Other significant unobservable inputs used to calculate a fair value in these instances might include an income-based valuation approach which considers discounted anticipated future cash flows from the investment and application of discounts due to the nature or duration of any restrictions on the disposition of the investment.
Valuations based upon the use of inputs from Levels 1, 2 or 3 may not represent the actual price received upon the disposition of an investment, and the Fund may receive a price that is lower than the valuation based upon these inputs when it sells the investment.
The following table displays a summary of the fair value hierarchy measurements of the Fund’s investments as of March 31, 2018. In any instance when valuation inputs from more than one level are used to determine the fair value of a specific investment, the investment is placed in the level of the table based upon the lowest level input that is significant in determining the fair value of the investment:
18 | Semi-Annual Report
Notes to Financial Statements, Continued
Thornburg Core Growth Fund | March 31, 2018 (Unaudited)
| | | | | | | | | | | | | | | | | | | | |
| | | FAIR VALUE MEASUREMENTS AT MARCH 31, 2018 |
| | | TOTAL | | LEVEL 1 | | LEVEL 2 | | LEVEL 3 |
Assets | | | | | | | | | | | | | | | | | | | | |
Investments in Securities* | | | | | | | | | | | | | | | | | | | | |
Common Stock | | | $ | 591,382,167 | | | | $ | 591,382,167 | | | | $ | – | | | | $ | – | |
Short Term Investment | | | | 62,745,435 | | | | | 62,745,435 | | | | | – | | | | | – | |
| | | | | |
Total Investments in Securities | | | $ | 654,127,602 | | | | $ | 654,127,602 | | | | $ | – | | | | $ | – | |
| * | See Schedule of Investments for a summary of the industry exposure as grouped according to the Global Industry Classification Standard (GICS), which is an industry taxonomy developed by MSCI, Inc. and Standard & Poor’s (S&P). |
In accordance with the guidance prescribed in Accounting Standards Update No. 2011-04, it is the policy of the Fund to recognize transfers between levels and the underlying events which caused the movement. The Fund recognized no transfers between levels for the six months ended March 31, 2018, other than when the Fund exceeded market volatility thresholds for foreign equity investments during the period.
NOTE 4 – INVESTMENT ADVISORY FEE AND OTHER TRANSACTIONS WITH AFFILIATES
Pursuant to an investment advisory agreement, the Advisor serves as the investment advisor and performs services for the Fund for which the fees are payable at the end of each month. Under the investment advisory agreement, the Fund pays the Advisor a management fee based on the daily net assets of the Fund at an annual rate as shown in the following table:
| | | | | |
| MANAGEMENT FEE SCHEDULE |
| DAILY NET ASSETS | | FEE RATE |
| |
Up to $500 million | | | | 0.875 | % |
| |
Next $500 million | | | | 0.825 | |
| |
Next $500 million | | | | 0.775 | |
| |
Next $500 million | | | | 0.725 | |
| |
Over $2 billion | | | | 0.675 | |
The Fund’s effective management fee for the six months ended March 31, 2018 was 0.863% of the Fund’s average net assets.
The Trust has entered into administrative service agreements with the Advisor, whereby the Advisor will perform certain administrative services related to each class of the Fund’s shares. Until January 31, 2018, the fees were payable at an annual rate of up to 0.125 of 1% per annum of the average daily net assets attributable to each class of shares. As of February 1, 2018, the fees are computed as an annual percentage of the aggregate average daily net assets of all shares classes of all Funds in the Trust as follows:
| | | | | |
| ADMINISTRATION FEE SCHEDULE |
| DAILY NET ASSETS | | FEE RATE |
| |
Up to $20 billion | | | | 0.100 | % |
| |
$20 billion to $40 billion | | | | 0.075 | |
| |
$40 billion to $60 billion | | | | 0.040 | |
| |
Over $60 billion | | | | 0.030 | |
The aggregate fee amount is allocated on a daily basis to each Fund based on net assets and subsequently allocated to each class of shares of the Fund. Total administrative service fees incurred by each class of shares of the Fund for the six months ended March 31, 2018, are set forth in the Statement of Operations.
The Trust has an underwriting agreement with Thornburg Securities Corporation (the “Distributor”), an affiliate of the Advisor, which acts as the distributor of the Fund’s shares. For the six months ended March 31, 2018, the Distributor has advised the Fund that it earned net commissions aggregating $5,113 from the sale of Class A shares, and collected contingent deferred sales charges aggregating $207 from redemptions of Class C shares of the Fund.
Pursuant to a service plan under Rule 12b-1 of the Investment Company Act of 1940, the Fund may pay to the Distributor or securities dealers and other financial institutions at the Distributor’s direction an amount not to exceed .25 of 1% per annum of the average daily net assets attributable to Class A, Class C, Class I, Class R3, Class R4, and Class R5 shares of the Fund to obtain various shareholder and distribution related services. For the six months ended March 31, 2018, there were no 12b-1 service plan fees charged for Class I or
Semi-Annual Report | 19
Notes to Financial Statements, Continued
Thornburg Core Growth Fund | March 31, 2018 (Unaudited)
Class R5 shares. The Advisor and the Distributor each may pay out of its own resources additional expenses for distribution of the Fund’s shares and shareholder services.
The Trust has also adopted distribution plans pursuant to Rule 12b-1, applicable only to the Fund’s Class C and Class R3 shares, under which the Fund compensates the Distributor for services in promoting the sale of Class C and Class R3 shares of the Fund at an annual rate of up to .75 of 1% per annum of the average daily net assets attributable to Class C shares, and an annual rate of up to .25 of 1% per annum of the average daily net assets attributable to Class R3 shares.
Total fees incurred by each class of shares of the Fund under their respective service and distribution plans for the six months ended March 31, 2018, are set forth in the Statement of Operations.
The Advisor and Distributor have contractually agreed to waive fees and reimburse expenses incurred by the Fund so that actual expenses of certain share classes do not exceed levels as specified in each Fund’s most recent prospectus. The agreement may be terminated by the Fund at any time, but may not be terminated by the Advisor or Distributor before February 1, 2019, unless the Advisor ceases to be the investment advisor to the Fund or the Distributor ceases to be the distributor of the Fund prior to that date. The Advisor and Distributor may recoup amounts waived or reimbursed during the fiscal year if expenses fall below the contractual limit during that year.
For the six months ended March 31, 2018, the Advisor contractually reimbursed certain class specific expenses, administrative fees, and distribution fees of $63,156 for Class I shares, $74,553 for Class R3 shares, $14,238 for Class R4 shares, and $51,954 for Class R5 shares.
Certain officers and Trustees of the Trust are also officers or directors of the Advisor and Distributor. The compensation of the independent Trustees is borne by the Trust. The Trust also pays a portion of the Chief Compliance Officer’s compensation. These amounts are reflected as “Trustee and officer fees” in the Statement of Operations.
The percentage of direct investments in the Fund held by the Trustees, officers of the Trust, and the Advisor is approximately 10.60%.
The Fund may purchase or sell securities from, or to an affiliated fund, provided the affiliation is due solely to having a common investment advisor, common officers, or common trustees, and provided that all such transactions will comply with Rule 17a-7 under the 1940 Act. For the six months ended March 31, 2018, the Fund had no such transactions with affiliated funds.
Shown below are holdings of voting securities of each portfolio company which is considered “affiliated” to the Fund under the Investment Company Act of 1940, including companies for which the Fund’s holding represented 5% or more of the company’s voting securities, and a series of the Thornburg Investment Trust in which the Fund invested for cash management purposes during the period:
| | | | | | | | | | | | | | | | | | | | | | | | | | | | | | | | |
| FUND | | MARKET VALUE
9/30/17 | | | PURCHASES
AT COST | | | SALES
PROCEEDS | | | REALIZED
GAIN
(LOSS) | | | CHANGE IN
UNREALIZED
APPR./(DEPR.) | | | MARKET VALUE
3/31/18 | | | DIVIDEND
INCOME | | | ROC
ADJUSTMENT | |
Thornburg Capital Management Fund | | $ | 15,059,338 | | | $ | 146,607,327 | | | $ | (98,921,230) | | | $ | – | | | $ | – | | | $ | 62,745,435 | | | $ | 269,138 | | | $ | – | |
NOTE 5 – SHARES OF BENEFICIAL INTEREST
At March 31, 2018, there were an unlimited number of shares with no par value of beneficial interest authorized. Transactions in shares of beneficial interest were as follows:
| | | | | | | | | | | | | | | | |
| | | SIX MONTHS ENDED
MARCH 31, 2018 (UNAUDITED) | | | YEAR ENDED SEPTEMBER 30, 2017 (AUDITED) | |
| | | SHARES | | | AMOUNT | | | SHARES | | | AMOUNT | |
Class A Shares | | | | | | | | | | | | | | | | |
Shares sold | | | 222,663 | | | $ | 7,679,287 | | | | 528,036 | | | $ | 16,129,664 | |
Shares issued to shareholders in reinvestment of dividends | | | – | | | | – | | | | – | | | | – | |
Shares repurchased | | | (491,895 | ) | | | (16,977,403 | ) | | | (1,824,517 | ) | | | (54,290,458 | ) |
| | | | |
| | | | |
Net decrease | | | (269,232 | ) | | $ | (9,298,116 | ) | | | (1,296,481 | ) | | $ | (38,160,794 | ) |
| | | | |
20 | Semi-Annual Report
Notes to Financial Statements, Continued
Thornburg Core Growth Fund | March 31, 2018 (Unaudited)
| | | | | | | | | | | | | | | | |
| | | SIX MONTHS ENDED
MARCH 31, 2018 (UNAUDITED) | | | YEAR ENDED
SEPTEMBER 30, 2017 (AUDITED) | |
| | | SHARES | | | AMOUNT | | | SHARES | | | AMOUNT | |
Class C Shares | | | | | | | | | | | | | | | | |
Shares sold | | | 39,322 | | | $ | 1,187,467 | | | | 156,108 | | | $ | 4,025,557 | |
Shares issued to shareholders in
reinvestment of dividends | | | – | | | | – | | | | – | | | | – | |
Shares repurchased | | | (479,761 | ) | | | (14,485,412 | ) | | | (1,847,158 | ) | | | (48,397,816 | ) |
| | | | |
| | | | |
Net decrease | | | (440,439 | ) | | $ | (13,297,945 | ) | | | (1,691,050 | ) | | $ | (44,372,259 | ) |
| | | | |
Class I Shares | | | | | | | | | | | | | | | | |
Shares sold | | | 343,512 | | | $ | 12,517,384 | | | | 1,507,646 | | | $ | 48,394,315 | |
Shares issued to shareholders in
reinvestment of dividends | | | – | | | | – | | | | – | | | | – | |
Shares repurchased | | | (540,462 | ) | | | (19,816,836 | ) | | | (1,350,791 | ) | | | (42,648,030 | ) |
| | | | |
| | | | |
Net increase (decrease) | | | (196,950 | ) | | $ | (7,299,452 | ) | | | 156,855 | | | $ | 5,746,285 | |
| | | | |
Class R3 Shares | | | | | | | | | | | | | | | | |
Shares sold | | | 72,478 | | | $ | 2,492,252 | | | | 208,990 | | | $ | 6,187,881 | |
Shares issued to shareholders in
reinvestment of dividends | | | – | | | | – | | | | – | | | | – | |
Shares repurchased | | | (290,945 | ) | | | (9,946,547 | ) | | | (737,733 | ) | | | (21,768,527 | ) |
| | | | |
| | | | |
Net decrease | | | (218,467 | ) | | $ | (7,454,295 | ) | | | (528,743 | ) | | $ | (15,580,646 | ) |
| | | | |
Class R4 Shares | | | | | | | | | | | | | | | | |
Shares sold | | | 92,004 | | | $ | 3,190,323 | | | | 86,518 | | | $ | 2,612,583 | |
Shares issued to shareholders in
reinvestment of dividends | | | – | | | | – | | | | – | | | | – | |
Shares repurchased | | | (124,026 | ) | | | (4,295,946 | ) | | | (163,743 | ) | | | (4,871,059 | ) |
| | | | |
| | | | |
Net decrease | | | (32,022 | ) | | $ | (1,105,623 | ) | | | (77,225 | ) | | $ | (2,258,476 | ) |
| | | | |
Class R5 Shares | | | | | | | | | | | | | | | | |
Shares sold | | | 86,033 | | | $ | 3,217,890 | | | | 170,920 | | | $ | 5,460,302 | |
Shares issued to shareholders in
reinvestment of dividends | | | – | | | | – | | | | – | | | | – | |
Shares repurchased | | | (226,254 | ) | | | (8,275,261 | ) | | | (529,696 | ) | | | (16,682,231 | ) |
| | | | |
| | | | |
Net decrease | | | (140,221 | ) | | $ | (5,057,371 | ) | | | (358,776 | ) | | $ | (11,221,929 | ) |
| | | | |
NOTE 6 – INVESTMENT TRANSACTIONS
For the six months ended March 31, 2018, the Fund had purchase and sale transactions of investments (excluding short-term investments) of $106,589,985 and $205,983,929, respectively.
NOTE 7 – DERIVATIVE FINANCIAL INSTRUMENTS WITH OFF-BALANCE SHEET RISK AND FOREIGN INVESTMENT RISK
The Fund may use a variety of derivative financial instruments to hedge or adjust the risks affecting its investment portfolio or to enhance investment returns. Provisions of FASB Accounting Standards Codification ASC 815-10-50 (“ASC 815”) require certain disclosures. The disclosures are intended to provide users of financial statements with an understanding of the use of derivative instruments by the Fund and how these derivatives affect the financial position, financial performance and cash flows of the Fund. The Fund does not designate any derivative instruments as hedging instruments under ASC 815. Additionally, the Fund’s risk of loss may exceed the amounts recognized on the Statement of Assets and Liabilities.
During the six months ended March 31, 2018, the Fund did not invest in any derivative financial instruments of the type addressed by ASC 815.
Semi-Annual Report | 21
Notes to Financial Statements, Continued
Thornburg Core Growth Fund | March 31, 2018 (Unaudited)
OTHER NOTES
Risks: The Fund’s investments subject it to risks including, but not limited to, management risk, market and economic risk, risks affecting specific issuers, liquidity risk, the risks associated with investments in small- and mid-cap companies and non-U.S. issuers, credit risk, and interest rate risk. Please see the Fund’s prospectus for a discussion of the risks associated with an investment in the Fund.
Subsequent Events: Fund management believes no events have occurred between March 31, 2018 and the date of issuance of the financial statements that require adjustment to or disclosure in the accompanying financial statements.
22 | Semi-Annual Report
This page intentionally left blank.
Semi-Annual Report | 23
Financial Highlights
Thornburg Core Growth Fund
| | | | | | | | | | | | | | | | | | | | | | | | | | | | | | | | | | | | | | | | |
| | | PER SHARE PERFORMANCE (FOR A SHARE OUTSTANDING THROUGHOUT THE PERIOD) |
| | | | | | | | | | | | | | | | | |
UNLESS OTHERWISE
NOTED, PERIODS ARE
FISCAL YEARS ENDED
SEPTEMBER 30, | | NET ASSET
VALUE,
BEGINNING OF
PERIOD | | NET
INVESTMENT
INCOME
(LOSS)+ | | NET REALIZED &
UNREALIZED GAIN
(LOSS) ON
INVESTMENTS | | TOTAL FROM
INVESTMENT
OPERATIONS | | DIVIDENDS
FROM NET
INVESTMENT
INCOME | | DIVIDENDS
FROM NET
REALIZED
GAINS | | TOTAL
DIVIDENDS | | NET ASSET
VALUE,
END OF PERIOD |
| | | | | | | |
| CLASS A SHARES | | | | | | | | | | | | | | | | | | | | | | | | | | | | | | | | | | | | |
| | | | | | | | |
2018(b)(c) | | | $ | 32.46 | | | | | (0.11 | ) | | | | 3.67 | | | | | 3.56 | | | | | – | | | | | – | | | | | – | | | | $ | 36.02 | |
2017(b) | | | $ | 28.22 | | | | | (0.24 | ) | | | | 4.48 | | | | | 4.24 | | | | | – | | | | | – | | | | | – | | | | $ | 32.46 | |
2016(b) | | | $ | 26.09 | | | | | (0.27 | ) | | | | 2.40 | | | | | 2.13 | | | | | – | | | | | – | | | | | – | | | | $ | 28.22 | |
2015(b) | | | $ | 26.44 | | | | | (0.26 | ) | | | | (0.09 | ) | | | | (0.35 | ) | | | | – | | | | | – | | | | | – | | | | $ | 26.09 | |
2014(b) | | | $ | 24.35 | | | | | (0.28 | ) | | | | 2.37 | | | | | 2.09 | | | | | – | | | | | – | | | | | – | | | | $ | 26.44 | |
2013(b) | | | $ | 19.11 | | | | | (0.21 | ) | | | | 5.45 | | | | | 5.24 | | | | | – | | | | | – | | | | | – | | | | $ | 24.35 | |
| | | | | | | |
| CLASS C SHARES | | | | | | | | | | | | | | | | | | | | | | | | | | | | | | | | | | | | |
| | | | | | | | |
2018(c) | | | $ | 28.43 | | | | | (0.21 | ) | | | | 3.20 | | | | | 2.99 | | | | | – | | | | | – | | | | | – | | | | $ | 31.42 | |
2017 | | | $ | 24.90 | | | | | (0.41 | ) | | | | 3.94 | | | | | 3.53 | | | | | – | | | | | – | | | | | – | | | | $ | 28.43 | |
2016 | | | $ | 23.20 | | | | | (0.41 | ) | | | | 2.11 | | | | | 1.70 | | | | | – | | | | | – | | | | | – | | | | $ | 24.90 | |
2015 | | | $ | 23.69 | | | | | (0.42 | ) | | | | (0.07 | ) | | | | (0.49 | ) | | | | – | | | | | – | | | | | – | | | | $ | 23.20 | |
2014 | | | $ | 21.98 | | | | | (0.43 | ) | | | | 2.14 | | | | | 1.71 | | | | | – | | | | | – | | | | | – | | | | $ | 23.69 | |
2013 | | | $ | 17.38 | | | | | (0.34 | ) | | | | 4.94 | | | | | 4.60 | | | | | – | | | | | – | | | | | – | | | | $ | 21.98 | |
| | | | | | | |
| CLASS I SHARES | | | | | | | | | | | | | | | | | | | | | | | | | | | | | | | | | | | | |
| | | | | | | | |
2018(c) | | | $ | 34.67 | | | | | (0.05 | ) | | | | 3.93 | | | | | 3.88 | | | | | – | | | | | – | | | | | – | | | | $ | 38.55 | |
2017 | | | $ | 30.01 | | | | | (0.12 | ) | | | | 4.78 | | | | | 4.66 | | | | | – | | | | | – | | | | | – | | | | $ | 34.67 | |
2016 | | | $ | 27.64 | | | | | (0.17 | ) | | | | 2.54 | | | | | 2.37 | | | | | – | | | | | – | | | | | – | | | | $ | 30.01 | |
2015 | | | $ | 27.90 | | | | | (0.16 | ) | | | | (0.10 | ) | | | | (0.26 | ) | | | | – | | | | | – | | | | | – | | | | $ | 27.64 | |
2014 | | | $ | 25.59 | | | | | (0.18 | ) | | | | 2.49 | | | | | 2.31 | | | | | – | | | | | – | | | | | – | | | | $ | 27.90 | |
2013 | | | $ | 19.99 | | | | | (0.12 | ) | | | | 5.72 | | | | | 5.60 | | | | | – | | | | | – | | | | | – | | | | $ | 25.59 | |
| | | | | | | |
| CLASS R3 SHARES | | | | | | | | | | | | | | | | | | | | | | | | | | | | | | | | | | | | |
| | | | | | | | |
2018(c) | | | $ | 32.30 | | | | | (0.13 | ) | | | | 3.65 | | | | | 3.52 | | | | | – | | | | | – | | | | | – | | | | $ | 35.82 | |
2017 | | | $ | 28.10 | | | | | (0.27 | ) | | | | 4.47 | | | | | 4.20 | | | | | – | | | | | – | | | | | – | | | | $ | 32.30 | |
2016 | | | $ | 26.01 | | | | | (0.29 | ) | | | | 2.38 | | | | | 2.09 | | | | | – | | | | | – | | | | | – | | | | $ | 28.10 | |
2015 | | | $ | 26.39 | | | | | (0.29 | ) | | | | (0.09 | ) | | | | (0.38 | ) | | | | – | | | | | – | | | | | – | | | | $ | 26.01 | |
2014 | | | $ | 24.33 | | | | | (0.31 | ) | | | | 2.37 | | | | | 2.06 | | | | | – | | | | | – | | | | | – | | | | $ | 26.39 | |
2013 | | | $ | 19.11 | | | | | (0.22 | ) | | | | 5.44 | | | | | 5.22 | | | | | – | | | | | – | | | | | – | | | | $ | 24.33 | |
| | | | | | | |
| CLASS R4 SHARES | | | | | | | | | | | | | | | | | | | | | | | | | | | | | | | | | | | | |
| | | | | | | | |
2018(c) | | | $ | 32.59 | | | | | (0.11 | ) | | | | 3.68 | | | | | 3.57 | | | | | – | | | | | – | | | | | – | | | | $ | 36.16 | |
2017 | | | $ | 28.33 | | | | | (0.24 | ) | | | | 4.50 | | | | | 4.26 | | | | | – | | | | | – | | | | | – | | | | $ | 32.59 | |
2016 | | | $ | 26.19 | | | | | (0.27 | ) | | | | 2.41 | | | | | 2.14 | | | | | – | | | | | – | | | | | – | | | | $ | 28.33 | |
2015 | | | $ | 26.54 | | | | | (0.26 | ) | | | | (0.09 | ) | | | | (0.35 | ) | | | | – | | | | | – | | | | | – | | | | $ | 26.19 | |
2014 | | | $ | 24.44 | | | | | (0.28 | ) | | | | 2.38 | | | | | 2.10 | | | | | – | | | | | – | | | | | – | | | | $ | 26.54 | |
2013 | | | $ | 19.18 | | | | | (0.20 | ) | | | | 5.46 | | | | | 5.26 | | | | | – | | | | | – | | | | | – | | | | $ | 24.44 | |
| | | | | | | |
| CLASS R5 SHARES | | | | | | | | | | | | | | | | | | | | | | | | | | | | | | | | | | | | |
| | | | | | | | |
2018(c) | | | $ | 34.64 | | | | | (0.05 | ) | | | | 3.91 | | | | | 3.86 | | | | | – | | | | | – | | | | | – | | | | $ | 38.50 | |
2017 | | | $ | 29.98 | | | | | (0.12 | ) | | | | 4.78 | | | | | 4.66 | | | | | – | | | | | – | | | | | – | | | | $ | 34.64 | |
2016 | | | $ | 27.61 | | | | | (0.17 | ) | | | | 2.54 | | | | | 2.37 | | | | | – | | | | | – | | | | | – | | | | $ | 29.98 | |
2015 | | | $ | 27.87 | | | | | (0.16 | ) | | | | (0.10 | ) | | | | (0.26 | ) | | | | – | | | | | – | | | | | – | | | | $ | 27.61 | |
2014 | | | $ | 25.56 | | | | | (0.18 | ) | | | | 2.49 | | | | | 2.31 | | | | | – | | | | | – | | | | | – | | | | $ | 27.87 | |
2013 | | | $ | 19.97 | | | | | (0.12 | ) | | | | 5.71 | | | | | 5.59 | | | | | – | | | | | – | | | | | – | | | | $ | 25.56 | |
| (a) | Not annualized for periods less than one year. |
| (b) | Sales loads are not reflected in computing total return. |
| (c) | Unaudited Six Month Period Ended March 31. |
| + | Based on weighted average shares outstanding. |
See notes to financial statements.
24 | Semi-Annual Report
Financial Highlights, Continued
Thornburg Core Growth Fund
| | | | | | | | | | | | | | | | | | | | | | | | | | | | | | |
| RATIOS TO AVERAGE NET ASSETS | | | | | | SUPPLEMENTAL DATA | |
| | | | | | | EXPENSES, AFTER | | | | | | | | | | | | | | | | |
NET INVESTMENT
INCOME (LOSS) (%) | | | EXPENSES, AFTER
EXPENSE
REDUCTIONS (%) | | | EXPENSE
REDUCTIONS AND
NET OF CUSTODY
CREDITS (%) | | | EXPENSES,
BEFORE EXPENSE
REDUCTIONS (%) | | | | | | TOTAL
RETURN (%)(a) | | | PORTFOLIO
TURNOVER
RATE (%)(a) | | | NET ASSETS AT
END OF PERIOD
(THOUSANDS) | |
| | | | | | | |
| | | | | | | | | | | | | | | | | | | | | | | | | | | | | | |
| | | | | | | |
| | (0.63 | )(d) | | | 1.37 | (d) | | | 1.37 | (d) | | | 1.37 | (d) | | | | | | | 10.97 | | | | 17.36 | | | $ | 197,866 | |
| | (0.79 | ) | | | 1.40 | | | | 1.40 | | | | 1.40 | | | | | | | | 15.02 | | | | 72.03 | | | $ | 187,062 | |
| | (1.00 | ) | | | 1.40 | | | | 1.40 | | | | 1.40 | | | | | | | | 8.16 | | | | 86.24 | | | $ | 199,178 | |
| | (0.93 | ) | | | 1.39 | | | | 1.39 | | | | 1.39 | | | | | | | | (1.32 | ) | | | 96.02 | | | $ | 234,284 | |
| | (1.06 | ) | | | 1.40 | | | | 1.40 | | | | 1.40 | | | | | | | | 8.58 | | | | 100.62 | | | $ | 277,099 | |
| | (1.01 | ) | | | 1.45 | | | | 1.45 | | | | 1.45 | | | | | | | | 27.42 | | | | 91.92 | | | $ | 279,483 | |
| | | | | | | |
| | | | | | | | | | | | | | | | | | | | | | | | | | | | | | |
| | | | | | | |
| | (1.40 | )(d) | | | 2.14 | (d) | | | 2.14 | (d) | | | 2.14 | (d) | | | | | | | 10.52 | | | | 17.36 | | | $ | 130,039 | |
| | (1.56 | ) | | | 2.16 | | | | 2.16 | | | | 2.16 | | | | | | | | 14.18 | | | | 72.03 | | | $ | 130,165 | |
| | (1.76 | ) | | | 2.16 | | | | 2.16 | | | | 2.16 | | | | | | | | 7.33 | | | | 86.24 | | | $ | 156,115 | |
| | (1.69 | ) | | | 2.15 | | | | 2.15 | | | | 2.15 | | | | | | | | (2.07 | ) | | | 96.02 | | | $ | 176,422 | |
| | (1.81 | ) | | | 2.14 | | | | 2.14 | | | | 2.14 | | | | | | | | 7.78 | | | | 100.62 | | | $ | 200,664 | |
| | (1.76 | ) | | | 2.20 | | | | 2.20 | | | | 2.20 | | | | | | | | 26.47 | | | | 91.92 | | | $ | 182,999 | |
| | | | | | | |
| | | | | | | | | | | | | | | | | | | | | | | | | | | | | | |
| | | | | | | |
| | (0.25 | )(d) | | | 0.99 | (d) | | | 0.99 | (d) | | | 1.04 | (d) | | | | | | | 11.19 | | | | 17.36 | | | $ | 253,575 | |
| | (0.37 | ) | | | 0.99 | | | | 0.99 | | | | 1.05 | | | | | | | | 15.53 | | | | 72.03 | | | $ | 234,922 | |
| | (0.59 | ) | | | 0.99 | | | | 0.99 | | | | 1.05 | | | | | | | | 8.57 | | | | 86.24 | | | $ | 198,658 | |
| | (0.53 | ) | | | 0.99 | | | | 0.99 | | | | 1.05 | | | | | | | | (0.93 | ) | | | 96.02 | | | $ | 244,691 | |
| | (0.65 | ) | | | 0.99 | | | | 0.99 | | | | 1.03 | | | | | | | | 9.03 | | | | 100.62 | | | $ | 251,122 | |
| | (0.55 | ) | | | 0.99 | | | | 0.99 | | | | 0.02 | | | | | | | | 28.01 | | | | 91.92 | | | $ | 191,358 | |
| | | | | | | |
| | | | | | | | | | | | | | | | | | | | | | | | | | | | | | |
| | | | | | | |
| | (0.76 | )(d) | | | 1.50 | (d) | | | 1.50 | (d) | | | 1.83 | (d) | | | | | | | 10.90 | | | | 17.36 | | | $ | 44,363 | |
| | (0.90 | ) | | | 1.50 | | | | 1.50 | | | | 1.84 | | | | | | | | 14.95 | | | | 72.03 | | | $ | 47,064 | |
| | (1.10 | ) | | | 1.50 | | | | 1.50 | | | | 1.81 | | | | | | | | 8.04 | | | | 86.24 | | | $ | 55,809 | |
| | (1.05 | ) | | | 1.50 | | | | 1.50 | | | | 1.79 | | | | | | | | (1.44 | ) | | | 96.02 | | | $ | 70,310 | |
| | (1.16 | ) | | | 1.50 | | | | 1.50 | | | | 1.80 | | | | | | | | 8.47 | | | | 100.62 | | | $ | 90,788 | |
| | (1.06 | ) | | | 1.50 | | | | 1.50 | | | | 1.79 | | | | | | | | 27.32 | | | | 91.92 | | | $ | 95,545 | |
| | | | | | | |
| | | | | | | | | | | | | | | | | | | | | | | | | | | | | | |
| | | | | | | |
| | (0.65 | )(d) | | | 1.39 | (d) | | | 1.39 | (d) | | | 1.97 | (d) | | | | | | | 10.95 | | | | 17.36 | | | $ | 4,756 | |
| | (0.80 | ) | | | 1.40 | | | | 1.40 | | | | 2.00 | | | | | | | | 15.04 | | | | 72.03 | | | $ | 5,330 | |
| | (1.00 | ) | | | 1.40 | | | | 1.40 | | | | 1.86 | | | | | | | | 8.17 | | | | 86.24 | | | $ | 6,821 | |
| | (0.94 | ) | | | 1.40 | | | | 1.40 | | | | 1.82 | | | | | | | | (1.32 | ) | | | 96.02 | | | $ | 9,632 | |
| | (1.06 | ) | | | 1.40 | | | | 1.40 | | | | 1.77 | | | | | | | | 8.59 | | | | 100.62 | | | $ | 11,306 | |
| | (0.96 | ) | | | 1.40 | | | | 1.40 | | | | 1.79 | | | | | | | | 27.42 | | | | 91.92 | | | $ | 10,277 | |
| | | | | | | |
| | | | | | | | | | | | | | | | | | | | | | | | | | | | | | |
| | | | | | | |
| | (0.26 | )(d) | | | 0.99 | (d) | | | 0.99 | (d) | | | 1.33 | (d) | | | | | | | 11.14 | | | | 17.36 | | | $ | 30,394 | |
| | (0.38 | ) | | | 0.99 | | | | 0.99 | | | | 1.34 | | | | | | | | 15.54 | | | | 72.03 | | | $ | 32,197 | |
| | (0.59 | ) | | | 0.99 | | | | 0.99 | | | | 1.30 | | | | | | | | 8.58 | | | | 86.24 | | | $ | 38,629 | |
| | (0.54 | ) | | | 0.99 | | | | 0.99 | | | | 1.24 | | | | | | | | (0.93 | ) | | | 96.02 | | | $ | 45,126 | |
| | (0.65 | ) | | | 0.99 | | | | 0.99 | | | | 1.28 | | | | | | | | 9.04 | | | | 100.62 | | | $ | 61,818 | |
| | (0.55 | ) | | | 0.99 | | | | 0.99 | | | | 1.12 | | | | | | | | 27.99 | | | | 91.92 | | | $ | 62,146 | |
Semi-Annual Report | 25
Expense Example
Thornburg Core Growth Fund | March 31, 2018 (Unaudited)
As a shareholder of the Fund, you incur two types of costs:
| | (1) | transaction costs, including |
| | (a) | sales charges (loads) on purchase payments, for Class A shares; |
| | (b) | a deferred sales charge on redemptions of any part or all of a purchase of $1 million of Class A shares within 12 months of purchase; |
| | (c) | a deferred sales charge on redemptions of Class C shares within 12 months of purchase; |
| | (2) | ongoing costs, including management fees; distribution and/or service (12b-1) fees; and other Fund expenses. This example is intended to help you understand your ongoing costs (in dollars) of investing in the Fund and to compare these costs with the ongoing costs of investing in other mutual funds. |
The example is based on a $1,000 investment beginning on October 1, 2017, and held until March 31, 2018.
ACTUAL EXPENSES
For each class of shares, the first line of the accompanying table provides information about actual account values and actual expenses. You may use the information in this line, together with the amount you invested, to estimate the expenses that you paid over the period. Simply divide your account value by $1,000 (for example, an $8,600 account value divided by $1,000 = 8.6), then multiply the result by the number in the first line for your class of shares under the heading entitled “Expenses Paid During Period” to estimate the expenses you paid on your account during this period.
| | | | | | | | | | | | | | | |
| | | BEGINNING
ACCOUNT VALUE
10/1/17 | | ENDING
ACCOUNT VALUE
3/31/18 | | EXPENSES PAID
DURING PERIOD†
10/1/17–3/31/18 |
| | | |
| CLASS A SHARES | | | | | | | | | | | | | | | |
| | | |
Actual | | | $ | 1,000.00 | | | | $ | 1,109.70 | | | | $ | 7.21 | |
Hypothetical* | | | $ | 1,000.00 | | | | $ | 1,018.10 | | | | $ | 6.89 | |
| | | |
| CLASS C SHARES | | | | | | | | | | | | | | | |
| | | |
Actual | | | $ | 1,000.00 | | | | $ | 1,105.20 | | | | $ | 11.23 | |
Hypothetical* | | | $ | 1,000.00 | | | | $ | 1,014.26 | | | | $ | 10.75 | |
| | | |
| CLASS I SHARES | | | | | | | | | | | | | | | |
| | | |
Actual | | | $ | 1,000.00 | | | | $ | 1,111.90 | | | | $ | 5.21 | |
Hypothetical* | | | $ | 1,000.00 | | | | $ | 1,020.00 | | | | $ | 4.99 | |
| | | |
| CLASS R3 SHARES | | | | | | | | | | | | | | | |
| | | |
Actual | | | $ | 1,000.00 | | | | $ | 1,109.00 | | | | $ | 7.89 | |
Hypothetical* | | | $ | 1,000.00 | | | | $ | 1,017.45 | | | | $ | 7.54 | |
| | | |
| CLASS R4 SHARES | | | | | | | | | | | | | | | |
| | | |
Actual | | | $ | 1,000.00 | | | | $ | 1,109.50 | | | | $ | 7.31 | |
Hypothetical* | | | $ | 1,000.00 | | | | $ | 1,018.00 | | | | $ | 6.99 | |
| | | |
| CLASS R5 SHARES | | | | | | | | | | | | | | | |
| | | |
Actual | | | $ | 1,000.00 | | | | $ | 1,111.40 | | | | $ | 5.21 | |
Hypothetical* | | | $ | 1,000.00 | | | | $ | 1,020.00 | | | | $ | 4.99 | |
| † | Expenses are equal to the annualized expense ratio for each class (A: 1.37%; C: 2.14%; I: 0.99%; R3: 1.50%; R4: 1.39%; R5: 0.99%) multiplied by the average account value over the period, multiplied by 182/365 to reflect the one-half year period. |
| * | Hypothetical assumes a rate of return of 5% per year before expenses. |
HYPOTHETICAL EXAMPLE FOR COMPARISON PURPOSES
For each class of shares, the second line of the accompanying table provides information about hypothetical account values and hypothetical expenses based on the Fund’s actual expense ratio and an assumed rate of return of 5% per year before expenses, which is not the Fund’s actual return. The hypothetical account values and expenses may not be used to estimate the actual ending account balance or expenses you paid for the period. You may use this information to compare the ongoing costs of investing in the Fund and other funds. To do so, compare this 5% hypothetical example with the 5% hypothetical examples that appear in the shareholder reports of the other funds.
Please note that the expenses shown in the table are meant to highlight your ongoing costs only and do not reflect any transactional costs, such as sales charges (loads), redemption fees, or exchange fees. Therefore, the second line of the table for each class of shares is useful in comparing ongoing costs only, and will not help you determine the relative total costs of owning different funds. In addition, if these transactional costs were included, your costs would have been higher.
26 | Semi-Annual Report
Other Information
Thornburg Core Growth Fund | March 31, 2018 (Unaudited)
PORTFOLIO PROXY VOTING
Policies and Procedures:
The Trust has delegated to Thornburg Investment Management, Inc. (the “Advisor”) voting decisions respecting proxies for the Fund’s voting securities. The Advisor makes voting decisions in accordance with its Proxy Voting Policy and Procedures. A description of the Policy and Procedures is available (i) without charge, upon request, by calling the Advisor toll-free at 1-800-847-0200, (ii) on the Thornburg website at www.thornburg.com, and (iii) on the Securities and Exchange Commission’s website at www.sec.gov.
Information regarding how proxies were voted is available on or before August 31 of each year for the twelve months ending the preceding June 30. This information is available (i) without charge, upon request by calling the Advisor toll-free at 1-800-847-0200, (ii) on the Thornburg website at www.thornburg.com, and (iii) on the Securities and Exchange Commission’s website at www.sec.gov.
AVAILABILITY OF QUARTERLY PORTFOLIO SCHEDULE
The Fund files with the Securities and Exchange Commission schedules of its portfolio holdings on Form N-Q for the first and third quarters of each fiscal year. The Fund’s Forms N-Q are available on the Commission’s website at www.sec.gov, or may be reviewed and copied at the Commission’s Public Reference Room in Washington, D.C. Information on the operation of the Public Reference Room may be obtained by calling 1-800-SEC-0330. The Fund also makes this information available on its website at www.thornburg.com/download or upon request by calling 1-800-847-0200.
Semi-Annual Report | 27
Trustees’ Statement to Shareholders
Readopted September 11, 2017
The Trustees believe current and prospective shareholders should know how we discharge our responsibilities in supervising the Funds’ investment advisor and in reviewing the advisor’s contract for renewal. Since 2005, we have issued a statement which sets out clearly the three principal guidelines that we follow in supervising the Trust’s investment advisor on your behalf. In accordance with our customary practice, in September of this year we again reviewed our statement and concluded we should reissue this statement outlining the principal features of our supervision of the advisor’s performance of investment management services for the Funds.
We begin with the premise that each shareholder selected his or her Fund because its investments are managed by the investment advisor identified in the prospectus and in accordance with the objective and policies described in the prospectus. We realize, as each of you do, that if you believe that your Fund’s stated objective and policies no longer serve your personal investment goals, you can sell your shares and leave the Fund.
Therefore, we believe that our primary supervisory task—our principal obligation to you—is to assess the nature and quality of the advisor’s services, and to confirm that the advisor actively and competently pursues the Fund’s objective, in accordance with the policies set out in the prospectus. To do this, we meet regularly with management to review your Fund’s portfolio and to discuss the advisor’s specific actions and judgments in pursuing the Fund’s objective. We do not substitute our own judgment for the advisor’s decisions in selecting investments; the advisor is paid to exercise its informed judgment on investment decisions, and we seek to confirm, in reviewing the advisor’s performance, that the advisor is doing just that.
Second, we are conscious of costs and the effect that costs have on shareholders’ returns. We try to make sure that your Fund’s fees and costs are reasonable in relationship to the services rendered and that they are generally in line with those charged by other expert investment advisors, consistent with our belief that the Fund’s investors searched for and expect that expertise and attention and have decided to pay a reasonable price for it. We do not put the management contract “out to bid” as a matter of course, and we would not do so unless we had concluded that the advisor materially had failed to pursue the Fund’s objectives in accordance with its policies, or for other equally important reasons. We believe that any other approach would be inconsistent with your interests and contrary to your expectations when you bought shares of the Fund in the first place.
Finally, because we believe that most Thornburg Fund shareholders have invested with a long-term perspective, we try not to focus too much on the fashions of the moment and on short-term performance. The market will not favor any specific investment objective or set of policies at all times and under all economic circumstances. A fund will experience periods of both high and low returns relative to other funds and other investments. Even if one of our Funds is not favored by the market at a particular time, we believe that the advisor is nonetheless obliged to remain true to the Fund’s objective and policies, and we watch to see that it does so.
Trustees of Thornburg Investment Trust
28 | Semi-Annual Report
Thornburg Funds
Thornburg Investment Management is a privately-owned global investment firm that offers a range of solutions for retail and institutional investors. Founded in 1982 and headquartered in Santa Fe, New Mexico, we manage approximately $49 billion (as of March 31, 2018) across U.S. mutual funds, separate accounts for high-net-worth investors, institutional accounts, and UCITS funds for non-U.S. investors.
EQUITY FUNDS
| | ∎ | | Thornburg Investment Income Builder Fund |
| | ∎ | | Thornburg Global Opportunities Fund |
| | ∎ | | Thornburg International Value Fund |
| | ∎ | | Thornburg Better World International Fund |
| | ∎ | | Thornburg International Growth Fund |
| | ∎ | | Thornburg Developing World Fund |
| | ∎ | | Thornburg Core Growth Fund |
FIXED INCOME FUNDS
| | ∎ | | Thornburg Low Duration Income Fund |
| | ∎ | | Thornburg Limited Term U.S. Government Fund |
| | ∎ | | Thornburg Limited Term Income Fund |
| | ∎ | | Thornburg Strategic Income Fund |
| | ∎ | | Thornburg Low Duration Municipal Fund |
| | ∎ | | Thornburg Limited Term Municipal Fund |
| | ∎ | | Thornburg Intermediate Municipal Fund |
| | ∎ | | Thornburg California Limited Term Municipal Fund |
| | ∎ | | Thornburg New Mexico Intermediate Municipal Fund |
| | ∎ | | Thornburg New York Intermediate Municipal Fund |
| | ∎ | | Thornburg Strategic Municipal Income Fund |
ALTERNATIVE FUNDS
| | ∎ | | Thornburg Long/Short Equity Fund |
Before investing, carefully consider the Fund’s investment goals, risks, charges, and expenses. For a prospectus or summary prospectus containing this and other information, contact your financial advisor or visit thornburg.com. Read it carefully before investing.
For additional information, please visit thornburg.com
Thornburg Investment Management, Inc. 2300 North Ridgetop Road, Santa Fe, NM 87506
Semi-Annual Report | 29
This page intentionally left blank.
30 | Semi-Annual Report
This page intentionally left blank.
Semi-Annual Report | 31
| | | | |
| To receive shareholder reports, prospectuses, and proxy statements electronically, go to www.thornburg.com/edelivery. | | | | |
| This Semi-Annual Report is submitted for the general information of shareholders of the Fund. It is not authorized for distribution to prospective investors in the Fund unless preceded or accompanied by an effective prospectus. | |
| | | | |
Investment Advisor: | | Distributor: | | |
Thornburg Investment Management® | | Thornburg Securities Corporation® | | |
800.847.0200 | | 800.847.0200 | | TH180 |
Semi-Annual Report
March 31, 2018
THORNBURG
INTERNATIONAL
GROWTH
FUND
About Thornburg Investment Management
It’s more than what we do.
It’s how we do it.
At Thornburg, we are very different in how we think, invest, and are structured. We believe this difference is what makes us successful in helping individuals reach their long-term financial goals.
Flexible Perspective
Our perspective on investment opportunities is more flexible than most, viewing a wide range of opportunities beyond conventional boundaries to find hidden value.
Collaboration
Collectively, we hone ideas via borderless cross-pollination for better judgment and better results.
Portfolio Construction
Disciplined construction guided more by our convictions than convention.
CONVICTION
Thorough analysis and our relative-value framework lead to conviction in our securities selection.
UNCONVENTIONAL
Active management means we seek the best value for our clients rather than using conventional benchmarks as our starting point.
Structured for Excellence
How we think and how we invest is made possible by how we’re structured.
TEAM APPROACH
FAR FROM THE HERD
ACCESS & TRANSPARENCY
2 | Semi-Annual Report
Thornburg International Growth Fund
Semi-Annual Report | March 31, 2018
Table of Contents
| | | | | | | | | | |
| SHARE CLASS | | NASDAQ SYMBOL | | CUSIP |
| | |
| Class A | | TIGAX | | | | 885-215-319 | |
| Class C | | TIGCX | | | | 885-215-293 | |
| Class I | | TINGX | | | | 885-215-244 | |
| Class R3 | | TIGVX | | | | 885-215-178 | |
| Class R4 | | TINVX | | | | 885-215-160 | |
| Class R5 | | TINFX | | | | 885-215-152 | |
| Class R6 | | THGIX | | | | 885-216-820 | |
Class I, R3, R4, R5, and R6 shares may not be available to all investors. Minimum investments for Class I shares may be higher than those for other classes.
Investments carry risks, including possible loss of principal. Additional risks may be associated with investments outside the United States, especially in emerging markets, including currency fluctuations, illiquidity, volatility, and political and economic risks. Investments in small- and mid-capitalization companies may increase the risk of greater price fluctuations. Please see the Fund’s prospectus for a discussion of the risks associated with an investment in the Fund. Investments in the Fund are not FDIC insured, nor are they deposits of or guaranteed by a bank or any other entity.
Semi-Annual Report | 3
Letter to Shareholders
Thornburg International Growth Fund | March 31, 2018 (Unaudited)
April 11, 2018
Dear Fellow Shareholder:
From the start of this semi-annual period through the end of January, global markets rallied sharply as investors reacted favorably to upbeat global economic fundamentals, coupled with muted inflation trends and the considerable level of fiscal stimulus that recently enacted U.S. tax reform was expected to unleash. However, over the past few months, that excitement quickly gave way to mounting concerns around elevating trade tensions and increasingly hawkish central bank policies. This rattled markets and we experienced a sharp rise in volatility for the first time in well over a year. Rather than de-escalating quickly, we saw proposed tariff plans between the U.S. and China increase in a tit-for-tat manner. Although global growth remains generally above trend, a full-blown trade conflict between the world’s super powers would create a “stagflationary” environment that will both dampen growth and boost inflation, negatively impacting the ability of central banks to effectively set policy. With volatility returning and trade concerns mounting, equity indexes in the U.S. and internationally retraced much of their gains, although still finished positively for the trailing six months.
Performance Discussion
During this period, information technology was the best performing sector in the benchmark. Although the portfolio realized a nice tailwind from being overweight information technology, our best performing sector was consumer staples, as we achieved strong underlying stock selection effects despite being underweight relative to the benchmark. The worst performing sectors during this semi-annual period were telecommunication services, energy, utilities and real estate, with the portfolio benefiting from having limited to no exposure to these sectors.
Geographically, Japan and emerging Asia, which includes China, were leading performers within the benchmark, while Canada, other developed Europe and Latin America posted negative returns in dollar-denominated terms. The portfolio saw mixed returns in terms of our regional positioning, but this was more than offset by positive stock selection.
A weaker U.S. dollar during this period enhanced the returns of non-U.S. equities in both the benchmark and our portfolio; however, on a relative basis, our portfolio benefitted modestly less than the benchmark due to our regional positioning and underlying currency mix.
Leading contributors to performance for the semi-annual period included Japanese cosmetics company KOSE Corp., German digital payments company Wirecard AG, Macau-based casino operator Galaxy Entertainment Group Ltd. global payments
company Mastercard, Inc., and French employee benefits and solutions administrator Edenred.
KOSE continues to benefit from multiple growth drivers, including rising demand for its premium skincare products from Chinese consumers, increasing market share in its domestic market and the rapid growth of its Tarte brand, which according to some surveys, is one of the most popular cosmetics brands in the U.S. with millennials.
Wirecard, a long-term holding of the Fund, continues to outgrow peers in the digital payments space and has seen recent industry consolidation boost its valuation multiple.
Galaxy shares rose during this period as the company continues to take share of gaming revenues within Macau thanks to a differentiated product offering. Galaxy is also benefiting from healthy visitation trends to Macau.
Mastercard reported accelerating volume and growth trends that surpassed market expectations. Additionally, U.S. tax reform will generate significant additional cash flow that the company plans to deploy to enhance business growth and return capital to shareholders.
Edenred posted a strong earnings report, exceeding its own mid-term guidance targets. Furthermore, improving economic fundamentals in one of its key markets, Brazil, offers potential for further upside to earnings power.
Principal detractors from performance were multi-national telecommunications company Altice NV, German pharmaceuticals, agriculture and consumer health company Bayer AG, French online advertising services company Criteo S.A., U.K.-headquartered data measurement and analytics services firm Nielsen Holdings plc, and Swedish online casino software developer NetEnt AB.
Altice sold off heavily as a mismanaged pricing increase in France led to elevated subscriber churn and a shortfall to earnings. Investors have begun to question whether the company can turn around its prospects enough to service its heavy debt burden. Due to the increased uncertainty and weaker growth prospects, we sold the position.
Bayer experienced share weakness due to slowing industry-wide growth in agriculture and consumer health, which has also impacted peers. Although the timeline for the completion of the acquisition of Monsanto has been extended, recent news suggests the company may be finally nearing U.S. anti-trust approval.
Criteo shares fell as the company cut guidance and disclosed that a solution it had developed to mitigate revenue declines on mobile Safari web browsers had been blocked by Apple upon the release of iOS version 11.2. Shares have recovered since the
4 | Semi-Annual Report
Letter to Shareholders, Continued
Thornburg International Growth Fund | March 31, 2018 (Unaudited)
guidance cut as performance has been better than initially feared, but not quite to prior levels.
Nielsen continues to experience structural weakness in its ‘Buy’ division as customers purchase fewer services. We have since exited from this position for better opportunities.
NetEnt has seen organic growth slow in the face of maturing end markets and unfavorable regulatory changes. Furthermore, the company is undergoing a management transition as the board recently fired the chief executive for underperformance.
Outlook
We remain optimistic that global growth can continue to be broad based and above trend, but we do see a moderation in momentum. Although there are few, if any overall winners in a trade conflict, we do expect the companies we own in this portfolio to prove relatively more insulated in such an event thanks to their robust business models and sustainable competitive advantages within the secular growth themes we favor.
As we always have, we do not attempt to time markets or geopolitical events. Rather, we take a long-term, disciplined approach to investing. Through our fundamentally driven process, we seek to capture the most compelling high-quality growth stocks internationally, while effectively managing risk, to
deliver our shareholders superior risk-adjusted returns through the market cycle. The effectiveness of our process and philosophy was recently recognized in Thomson Reuters Lipper Fund Award for
best International Multi-Cap Growth Fund (I Shares) for the 10-year period ended 11/30/17, among 245 funds. We are pleased to have received this prestigious award as it recognizes the hard work of everyone here at Thornburg and the leading risk-adjusted returns we have delivered for our shareholders over the past decade. We look forward to the next ten years as we strive to continue delivering strong long-term performance.
We thank you for your confidence, trust, and investing alongside us in the Thornburg International Growth Fund.
Sincerely,

Greg Dunn
Managing Director
Portfolio Manager

Sean Koung Sun, CFA
Managing Director
Portfolio Manager
The matters discussed in this report may constitute forward-looking statements made pursuant to the safe harbor provisions of the Securities Litigation Reform Act of 1995. These include any advisor or portfolio manager prediction, assessment, analysis or outlook for individual securities, industries, investment styles, market sectors and/or markets. These statements involve risks and uncertainties. In addition to the general risks described for each fund in its current prospectus, other factors bearing on these reports include the accuracy of the advisor’s or portfolio manager’s forecasts and predictions, the appropriateness of the investment strategies designed by the advisor or portfolio manager and the ability of the advisor or portfolio manager to implement their strategies efficiently and successfully. Any one or more of these factors, as well as other risks affecting the securities markets generally, could cause the actual results of any fund to differ materially as compared to its benchmarks.
The views expressed are subject to change and do not necessarily reflect the views of Thornburg Investment Management, Inc. This information should not be relied upon as a recommendation or investment advice and is not intended to predict the performance of any investment or market.
Performance results of individual share classes will vary based on the fees and expenses associated with each share class, and may be higher or lower than other share classes within the same Fund. Please see Performance Summary for performance results of each share class.
Semi-Annual Report | 5
Performance Summary
Thornburg International Growth Fund | March 31, 2018 (Unaudited)
AVERAGE ANNUAL TOTAL RETURNS
| | | | | | | | | | | | | | | | | | | | | | | | | |
| | | 1-YR | | 3-YR | | 5-YR | | 10-YR | | SINCE
INCEP. |
| | | | | |
Class A Shares (Incep: 2/1/07) | | | | | | | | | | | | | | | | | | | | | | | | | |
Without sales charge | | | | 23.58% | | | | | 9.65% | | | | | 8.30% | | | | | 7.48% | | | | | 8.04% | |
| | | | | |
With sales charge | | | | 18.01% | | | | | 7.98% | | | | | 7.31% | | | | | 6.99% | | | | | 7.59% | |
| | | | | |
Class C Shares (Incep: 2/1/07) | | | | | | | | | | | | | | | | | | | | | | | | | |
Without sales charge | | | | 22.65% | | | | | 8.82% | | | | | 7.48% | | | | | 6.72% | | | | | 7.28% | |
| | | | | |
With sales charge | | | | 21.65% | | | | | 8.82% | | | | | 7.48% | | | | | 6.72% | | | | | 7.28% | |
| | | | | |
Class I Shares (Incep: 2/1/07) | | | | 24.08% | | | | | 10.11% | | | | | 8.73% | | | | | 8.00% | | | | | 8.58% | |
| | | | | |
Class R3 Shares (Incep: 2/1/08) | | | | 23.43% | | | | | 9.54% | | | | | 8.18% | | | | | 7.45% | | | | | 6.94% | |
| | | | | |
Class R4 Shares (Incep: 2/1/08) | | | | 23.58% | | | | | 9.65% | | | | | 8.29% | | | | | 7.56% | | | | | 7.05% | |
| | | | | |
Class R5 Shares (Incep: 2/1/08) | | | | 24.05% | | | | | 10.10% | | | | | 8.72% | | | | | 8.00% | | | | | 7.48% | |
| | | | | |
Class R6 Shares (Incep: 2/1/13) | | | | 24.23% | | | | | 10.23% | | | | | 8.83% | | | | | - | | | | | 9.66% | |
| | | | | |
MSCI AC World ex-U.S. Growth Index (Since 2/1/07) | | | | 19.92% | | | | | 7.28% | | | | | 6.84% | | | | | 3.25% | | | | | 3.66% | |
GROWTH OF A HYPOTHETICAL $10,000 INVESTMENT
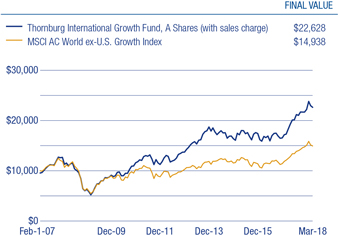
Performance data shown represents past performance and is no guarantee of future results. Investment return and principal value will fluctuate so shares, when redeemed, may be worth more or less than their original cost. Current performance may be lower or higher than quoted. For performance current to the most recent month end, visit thornburg.com or call 800-847-0200. The performance information does not reflect the deduction of taxes that a shareholder would pay on distributions or the redemption of Fund shares. Returns reflect the reinvestment of dividends and capital gains. Class A shares are sold with a maximum sales charge of 4.50%. Class C shares are subject to a 1% CDSC for the first year only. There is no sales charge for Class I, R3, R4, R5 and R6 shares.
As disclosed in the most recent prospectus, the total annual fund operating expenses before any fee waivers or expense reimbursements are as follows: A shares, 1.39%; C shares, 2.12%; I shares, 1.06%; R3 shares, 2.04%; R4 shares, 1.80%; R5 shares, 1.31%; R6 shares, 1.06%. Thornburg Investment Management and/or Thornburg Securities Corporation have contractually agreed to waive fees and reimburse expenses through at least February 1, 2019, for some of the share classes, resulting in net expense ratios of the following: I shares, 0.99%; R3 shares, 1.50%; R4 shares, 1.40%; R5 shares, 0.99%; R6 shares, 0.89%. For more detailed information on fund expenses and waivers/reimbursements please see the Fund’s prospectus.

| | |
Best International Multi-Cap Growth Fund Thornburg International Growth Fund | | |
Thornburg International Growth Fund’s I shares were awarded Lipper’s Best International Multi-Cap Growth Fund in 2018 for the 10-year period; among 245 funds, for period ended November 30, 2017. Individual fund awards are granted annually for three-year, five-year, and 10-year periods to the fund in each Lipper classification that consistently delivered the strongest risk-adjusted performance (calculated with dividends reinvested and without sales charges). The fund did not win the award for all eligible time periods. Past performance does not guarantee future results. From Thomson Reuters Lipper Awards, © 2018 Thomson Reuters. All rights reserved.
Glossary
The MSCI All Country (AC) World ex-U.S. Growth Index is a market capitalization weighted index that includes growth companies in developed and emerging markets throughout the world, excluding the United States.
The performance of any index is not indicative of the performance of any particular investment. Unless otherwise noted, index returns reflect the reinvestment of income dividends and capital gains, if any, but do not reflect fees, brokerage commissions or other expenses of investing. Investors may not make direct investments into any index.
Stagflation – Stagflation is a condition of slow economic growth and relatively high unemployment – economic stagnation – accompanied by rising prices, or inflation, or inflation and a decline in Gross Domestic Product (GDP). Stagflation is an economic problem defined in equal parts by its rarity and by the lack of consensus among academics on how exactly it comes to pass.
6 | Semi-Annual Report
Fund Summary
Thornburg International Growth Fund | March 31, 2018 (Unaudited)
OBJECTIVES AND STRATEGIES
The Fund seeks long-term growth of capital by investing in equity securities selected for their growth potential.
The Fund normally invests at least 75% of its assets in foreign securities or depositary receipts of foreign securities. However, the Fund may own a variety of securities, including domestic equity securities, partnership interests, and debt obligations. The Fund may also invest in developing countries.
MARKET CAPITALIZATION EXPOSURE
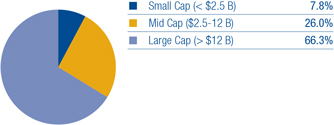
BASKET STRUCTURE
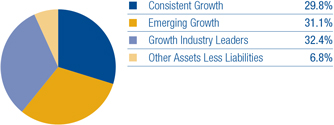
TOP TEN EQUITY HOLDINGS
| | | | | |
| Galaxy Entertainment Group Ltd. | | | | 3.1% | |
| Fresenius Medical Care AG & Co. KGaA | | | | 2.8% | |
| Bayer AG | | | | 2.6% | |
| Wirecard AG | | | | 2.6% | |
| Worldpay, Inc. | | | | 2.5% | |
| adidas AG | | | | 2.5% | |
| Yoox Net-A-Porter Group S.p.A. | | | | 2.5% | |
| Kose Corp. | | | | 2.4% | |
| Domino’s Pizza Group plc | | | | 2.3% | |
| Auto Trader Group plc | | | | 2.3% | |
SECTOR EXPOSURE
| | | | | |
| Consumer Discretionary | | | | 28.4% | |
| Information Technology | | | | 25.7% | |
| Health Care | | | | 13.9% | |
| Consumer Staples | | | | 12.3% | |
| Financials | | | | 7.1% | |
| Industrials | | | | 4.1% | |
| Energy | | | | 1.9% | |
| Other Assets Less Liabilities | | | | 6.8% | |
TOP TEN INDUSTRY GROUPS
| | | | | |
| Software & Services | | | | 25.1% | |
| Consumer Services | | | | 13.1% | |
| Retailing | | | | 12.0% | |
| Food, Beverage & Tobacco | | | | 9.3% | |
| Pharmaceuticals, Biotechnology & Life Sciences | | | | 8.8% | |
| Healthcare Equipment & Services | | | | 5.0% | |
| Diversified Financials | | | | 5.0% | |
| Consumer Durables & Apparel | | | | 2.5% | |
| Household & Personal Products | | | | 2.4% | |
| Commercial & Professional Services | | | | 2.2% | |
COUNTRY EXPOSURE*
(percent of equity holdings)
| | | | | |
| United Kingdom | | | | 19.9% | |
| Germany | | | | 13.5% | |
| China | | | | 11.1% | |
| United States | | | | 10.7% | |
| Hong Kong | | | | 6.7% | |
| France | | | | 6.6% | |
| Japan | | | | 4.7% | |
| Ireland | | | | 4.1% | |
| Netherlands | | | | 3.3% | |
| Mexico | | | | 3.0% | |
| India | | | | 2.8% | |
| Italy | | | | 2.6% | |
| Sweden | | | | 2.5% | |
| Australia | | | | 2.3% | |
| Russian Federation | | | | 2.2% | |
| Brazil | | | | 1.6% | |
| Spain | | | | 1.5% | |
| Denmark | | | | 0.9% | |
| * | Holdings are classified by country of risk as determined by MSCI and Bloomberg. |
There is no guarantee that the Fund will meet its investment objectives.
All data is subject to change. Charts may not add up to 100% due to rounding.
Semi-Annual Report | 7
Schedule of Investments
Thornburg International Growth Fund | March 31, 2018 (Unaudited)
| | | | | | | | | | | | |
| | | | | SHARES/
PRINCIPAL AMOUNT | | VALUE |
| | | |
| | COMMON STOCK — 93.2% | | | | | | | | | | |
| | | |
| | BANKS — 2.1% | | | | | | | | | | |
| | Banks — 1.2% | | | | | | | | | | |
| | ING Groep N.V. | | | | 1,196,126 | | | | $ | 20,163,288 | |
| | Thrifts & Mortgage Finance — 0.9% | | | | | | | | | | |
| | Housing Development Finance Corp. Ltd. | | | | 516,469 | | | | | 14,419,895 | |
| | | | | | | | | | | | |
| | | | | | | | | | | 34,583,183 | |
| | | | | | | | | | | | |
| | COMMERCIAL & PROFESSIONAL SERVICES — 2.2% | | | | | | | | | | |
| | Commercial Services & Supplies — 2.2% | | | | | | | | | | |
| | Edenred | | | | 1,045,547 | | | | | 36,330,562 | |
| | | | | | | | | | | | |
| | | | | | | | | | | 36,330,562 | |
| | | | | | | | | | | | |
| | CONSUMER DURABLES & APPAREL — 2.5% | | | | | | | | | | |
| | Textiles, Apparel & Luxury Goods — 2.5% | | | | | | | | | | |
| | adidas AG | | | | 172,701 | | | | | 41,788,104 | |
| | | | | | | | | | | | |
| | | | | | | | | | | 41,788,104 | |
| | | | | | | | | | | | |
| | CONSUMER SERVICES — 13.1% | | | | | | | | | | |
| | Diversified Consumer Services — 1.7% | | | | | | | | | | |
| | TAL Education Group ADR | | | | 767,738 | | | | | 28,475,402 | |
| | Hotels, Restaurants & Leisure — 11.4% | | | | | | | | | | |
| | Alsea SAB de CV | | | | 4,038,939 | | | | | 14,149,616 | |
| | Domino’s Pizza Enterprises Ltd. | | | | 237,272 | | | | | 7,604,737 | |
| | Domino’s Pizza Group plc | | | | 8,488,756 | | | | | 39,361,661 | |
| | Evolution Gaming Group AB | | | | 164,221 | | | | | 8,995,986 | |
| | Galaxy Entertainment Group Ltd. | | | | 5,684,834 | | | | | 51,610,179 | |
| | Merlin Entertainments plc | | | | 3,305,114 | | | | | 16,072,110 | |
| | MGM China Holdings Ltd. | | | | 10,406,800 | | | | | 26,851,895 | |
| | Sands China Ltd. | | | | 4,937,800 | | | | | 26,550,864 | |
| | | | | | | | | | | | |
| | | | | | | | | | | 219,672,450 | |
| | | | | | | | | | | | |
| | DIVERSIFIED FINANCIALS — 5.0% | | | | | | | | | | |
| | Capital Markets — 5.0% | | | | | | | | | | |
| | Hargreaves Lansdown plc | | | | 817,950 | | | | | 18,740,054 | |
| | Japan Exchange Group, Inc. | | | | 1,781,213 | | | | | 32,893,976 | |
| | St James’s Place plc | | | | 2,155,478 | | | | | 32,857,251 | |
| | | | | | | | | | | | |
| | | | | | | | | | | 84,491,281 | |
| | | | | | | | | | | | |
| | ENERGY — 1.9% | | | | | | | | | | |
| | Oil, Gas & Consumable Fuels — 1.9% | | | | | | | | | | |
| | Royal Dutch Shell plc Class A | | | | 1,010,145 | | | | | 32,049,017 | |
| | | | | | | | | | | | |
| | | | | | | | | | | 32,049,017 | |
| | | | | | | | | | | | |
| | FOOD & STAPLES RETAILING — 0.5% | | | | | | | | | | |
| | Food & Staples Retailing — 0.5% | | | | | | | | | | |
| | PriceSmart, Inc. | | | | 105,586 | | | | | 8,821,710 | |
| | | | | | | | | | | | |
| | | | | | | | | | | 8,821,710 | |
| | | | | | | | | | | | |
| | FOOD, BEVERAGE & TOBACCO — 9.3% | | | | | | | | | | |
| | Beverages — 2.0% | | | | | | | | | | |
| | Fomento Economico Mexicano SAB de CV Sponsored ADR | | | | 363,419 | | | | | 33,227,399 | |
| | Food Products — 3.8% | | | | | | | | | | |
| | Danone S.A. | | | | 367,364 | | | | | 29,711,467 | |
| | Kerry Group plc Class A | | | | 336,048 | | | | | 34,071,589 | |
| | Tobacco — 3.5% | | | | | | | | | | |
| | British American Tobacco plc | | | | 537,828 | | | | | 31,171,414 | |
| | ITC Ltd. | | | | 7,324,419 | | | | | 28,636,586 | |
| | | | | | | | | | | | |
| | | | | | | | | | | 156,818,455 | |
| | | | | | | | | | | | |
| | HEALTHCARE EQUIPMENT & SERVICES — 5.0% | | | | | | | | | | |
| | Health Care Equipment & Supplies — 2.2% | | | | | | | | | | |
| | Coloplast A/S Class B | | | | 175,368 | | | | | 14,779,471 | |
| | Essilor International Cie Generale d’Optique S.A. | | | | 164,500 | | | | | 22,184,024 | |
8 | Semi-Annual Report
Schedule of Investments, Continued
Thornburg International Growth Fund | March 31, 2018 (Unaudited)
| | | | | | | | | | | | |
| | | | | SHARES/
PRINCIPAL AMOUNT | | VALUE |
| | Health Care Providers & Services — 2.8% | | | | | | | | | | |
| | Fresenius Medical Care AG & Co. KGaA | | | | 465,745 | | | | $ | 47,553,829 | |
| | | | | | | | | | | | |
| | | | | | | | | | | 84,517,324 | |
| | | | | | | | | | | | |
| | HOUSEHOLD & PERSONAL PRODUCTS — 2.4% | | | | | | | | | | |
| | Personal Products — 2.4% | | | | | | | | | | |
| | Kose Corp. | | | | 196,300 | | | | | 40,752,474 | |
| | | | | | | | | | | | |
| | | | | | | | | | | 40,752,474 | |
| | | | | | | | | | | | |
| | MEDIA — 0.9% | | | | | | | | | | |
| | Media — 0.9% | | | | | | | | | | |
| a | | Criteo S.A. ADR | | | | 577,757 | | | | | 14,929,241 | |
| | | | | | | | | | | | |
| | | | | | | | | | | 14,929,241 | |
| | | | | | | | | | | | |
| | PHARMACEUTICALS, BIOTECHNOLOGY & LIFE SCIENCES — 8.8% | | | | | | | | | | |
| | Biotechnology — 3.0% | | | | | | | | | | |
| a | | Alkermes plc | | | | 467,877 | | | | | 27,118,151 | |
| | Grifols S.A. | | | | 851,938 | | | | | 24,120,620 | |
| | Pharmaceuticals — 5.8% | | | | | | | | | | |
| | AstraZeneca plc | | | | 561,329 | | | | | 38,554,266 | |
| | Bayer AG | | | | 385,258 | | | | | 43,512,186 | |
| | Yunnan Baiyao Group Co. Ltd. Class A | | | | 958,969 | | | | | 15,188,464 | |
| | | | | | | | | | | | |
| | | | | | | | | | | 148,493,687 | |
| | | | | | | | | | | | |
| | RETAILING — 12.0% | | | | | | | | | | |
| | Internet & Direct Marketing Retail — 10.0% | | | | | | | | | | |
| a | | ASOS plc | | | | 286,697 | | | | | 27,995,633 | |
| a | | Booking Holdings, Inc. | | | | 10,427 | | | | | 21,692,226 | |
| a | | Boozt AB | | | | 2,230,815 | | | | | 19,770,571 | |
| a | | Ctrip.com International Ltd. ADR | | | | 491,504 | | | | | 22,913,916 | |
| a | | Yoox Net-A-Porter Group S.p.A. | | | | 887,938 | | | | | 41,298,883 | |
| a | | Zalando SE | | | | 634,718 | | | | | 34,582,174 | |
| | Multiline Retail — 2.0% | | | | | | | | | | |
| | B&M European Value Retail S.A. | | | | 5,918,455 | | | | | 32,491,974 | |
| | | | | | | | | | | | |
| | | | | | | | | | | 200,745,377 | |
| | | | | | | | | | | | |
| | SOFTWARE & SERVICES — 25.7% | | | | | | | | | | |
| | Information Technology Services — 10.6% | | | | | | | | | | |
| | Cielo S.A. | | | | 3,933,863 | | | | | 24,653,296 | |
| | Mastercard, Inc. Class A | | | | 191,047 | | | | | 33,463,793 | |
| | Visa, Inc. Class A | | | | 282,380 | | | | | 33,778,296 | |
| | Wirecard AG | | | | 364,610 | | | | | 43,032,998 | |
| a | | Worldpay, Inc. Class A | | | | 528,976 | | | | | 42,651,574 | |
| | Internet Software & Services — 15.1% | | | | | | | | | | |
| a | | Alibaba Group Holding Ltd. Sponsored ADR | | | | 189,340 | | | | | 34,751,464 | |
| | Auto Trader Group plc | | | | 7,863,297 | | | | | 38,678,934 | |
| a | | Baidu, Inc. Sponored ADR | | | | 134,192 | | | | | 29,950,312 | |
| | carsales.com Ltd. | | | | 2,733,510 | | | | | 28,363,862 | |
| a | | iQIYI, Inc. ADR | | | | 597,970 | | | | | 9,298,434 | |
| a | | Just Eat plc | | | | 3,553,804 | | | | | 34,822,152 | |
| | NetEnt AB | | | | 2,013,270 | | | | | 10,112,403 | |
| | Tencent Holdings Ltd. | | | | 625,200 | | | | | 32,629,590 | |
| a | | Yandex N.V. Class A | | | | 886,136 | | | | | 34,958,065 | |
| | | | | | | | | | | | |
| | | | | | | | | | | 431,145,173 | |
| | | | | | | | | | | | |
| | TRANSPORTATION — 1.8% | | | | | | | | | | |
| | Airlines — 1.8% | | | | | | | | | | |
| a | | Ryanair Holdings plc Sponored ADR | | | | 239,634 | | | | | 29,439,037 | |
| | | | | | | | | | | | |
| | | | | | | | | | | 29,439,037 | |
| | | | | | | | | | | | |
| | TOTAL COMMON STOCK (Cost $1,230,506,919) | | | | | | | | | 1,564,577,075 | |
| | | | | | | | | | | | |
Semi-Annual Report | 9
Schedule of Investments, Continued
Thornburg International Growth Fund | March 31, 2018 (Unaudited)
| | | | | | | | | | | | |
| | | | | SHARES/
PRINCIPAL AMOUNT | | VALUE |
| | | |
| | SHORT-TERM INVESTMENTS — 7.9% | | | | | | | | | | |
| b | | Thornburg Capital Management Fund | | | | 13,312,600 | | | | $ | 133,126,002 | |
| | | | | | | | | | | | |
| | TOTAL SHORT-TERM INVESTMENTS (Cost $133,126,002) | | | | | | | | | 133,126,002 | |
| | | | | | | | | | | | |
| | | |
| | TOTAL INVESTMENTS — 101.1% (Cost $1,363,632,921) | | | | | | | | $ | 1,697,703,077 | |
| | | |
| | LIABILITIES NET OF OTHER ASSETS — (1.1)% | | | | | | | | | (18,915,391 | ) |
| | | | | | | | | | | | |
| | | |
| | NET ASSETS — 100.0% | | | | | | | | $ | 1,678,787,686 | |
| | | | | | | | | | | | |
| | | | | | | | | | | | | | | | | | | | | | | | | | | | | | | | | | | |
| OUTSTANDING FORWARD CURRENCY CONTRACTS TO BUY OR SELL AT MARCH 31, 2018 |
| | | | | | | |
CONTRACT DESCRIPTION | | CONTRACT
PARTY* | | BUY/SELL | | CONTRACT
AMOUNT | | CONTRACT
VALUE DATE | | VALUE USD | | UNREALIZED
APPRECIATION | | UNREALIZED
DEPRECIATION |
| | | | | | | |
Great Britain Pound | | | | BBH | | | | | Sell | | | | | 73,278,000 | | | | | 4/6/2018 | | | | | 102,817,670 | | | | $ | – | | | | $ | (1,641,270 | ) |
| | | | | | | | | | | | | | | | | | | | | | | | | | | | | | |
Net unrealized appreciation/depreciation | | | | | | | | | | | | | | | | | | | | | | | | | | | | | | | | | $ | (1,641,270 | ) |
| | | | | | | | | | | | | | | | | | | | | | | | | | | | | | | | | | | |
| * | Counterparty includes Brown Brothers Harriman & Co. (“BBH”). |
Footnote Legend
| b | Investment in Affiliates. |
Portfolio Abbreviations
To simplify the listings of securities, abbreviations are used per the table below:
| | |
| ADR | | American Depositary Receipt |
See notes to financial statements.
10 | Semi-Annual Report
Statement of Assets and Liabilities
Thornburg International Growth Fund | March 31, 2018 (Unaudited)
| | | | |
ASSETS | | | | |
| |
Investments at value (Note 3) | | | | |
Non-affiliated issuers (cost $1,230,506,919) | | $ | 1,564,577,075 | |
Non-controlled affiliated issuer (cost $133,126,002) | | | 133,126,002 | |
Cash denominated in foreign currency (cost $615,171) | | | 620,226 | |
Receivable for investments sold | | | 2,003,315 | |
Receivable for fund shares sold | | | 7,668,137 | |
Dividends receivable | | | 2,620,255 | |
Dividend and interest reclaim receivable | | | 892,549 | |
Prepaid expenses and other assets | | | 105,443 | |
| | | | |
| |
Total Assets | | | 1,711,613,002 | |
| | | | |
| |
LIABILITIES | | | | |
| |
Payable for investments purchased | | | 22,274,724 | |
Payable for fund shares redeemed | | | 7,018,479 | |
Unrealized depreciation on forward currency contracts (Note 7) | | | 1,641,270 | |
Payable to investment advisor and other affiliates (Note 4) | | | 1,385,690 | |
Accounts payable and accrued expenses | | | 503,840 | |
Dividends payable | | | 1,313 | |
| | | | |
| |
Total Liabilities | | | 32,825,316 | |
| | | | |
| |
NET ASSETS | | $ | 1,678,787,686 | |
| | | | |
| |
NET ASSETS CONSIST OF | | | | |
| |
Accumulated net investment loss | | $ | (352,986 | ) |
Net unrealized appreciation on investments | | | 332,477,063 | |
Accumulated net realized gain (loss) | | | 51,909,637 | |
Net capital paid in on shares of beneficial interest | | | 1,294,753,972 | |
| | | | |
| | $ | 1,678,787,686 | |
| | | | |
Semi-Annual Report | 11
Statement of Assets and Liabilities, Continued
Thornburg International Growth Fund | March 31, 2018 (Unaudited)
| | | | |
NET ASSET VALUE | | | | |
| |
Class A Shares: | | | | |
Net asset value and redemption price per share
($128,460,290 applicable to 5,349,658 shares of beneficial
interest outstanding - Note 5) | | $ | 24.01 | |
| |
Maximum sales charge, 4.50% of offering price | | | 1.13 | |
| | | | |
| |
Maximum offering price per share | | $ | 25.14 | |
| | | | |
| |
Class C Shares: | | | | |
Net asset value and offering price per share*
($95,400,985 applicable to 4,236,275 shares of beneficial
interest outstanding - Note 5) | | $ | 22.52 | |
| | | | |
| |
Class I Shares: | | | | |
Net asset value, offering and redemption price per share
($1,347,353,625 applicable to 54,510,151 shares of beneficial
interest outstanding - Note 5) | | $ | 24.72 | |
| | | | |
| |
Class R3 Shares: | | | | |
Net asset value, offering and redemption price per share
($9,747,367 applicable to 409,660 shares of beneficial
interest outstanding - Note 5) | | $ | 23.79 | |
| | | | |
| |
Class R4 Shares: | | | | |
Net asset value, offering and redemption price per share
($14,439,855 applicable to 604,710 shares of beneficial
interest outstanding - Note 5) | | $ | 23.88 | |
| | | | |
| |
Class R5 Shares: | | | | |
Net asset value, offering and redemption price per share
($39,819,497 applicable to 1,606,815 shares of beneficial
interest outstanding - Note 5) | | $ | 24.78 | |
| | | | |
| |
Class R6 Shares: | | | | |
Net asset value, offering and redemption price per share
($43,566,067 applicable to 1,753,387 shares of beneficial
interest outstanding - Note 5) | | $ | 24.85 | |
| | | | |
* Redemption price per share is equal to net asset value less any applicable contingent deferred sales charge.
See notes to financial statements.
12 | Semi-Annual Report
Statement of Operations
Thornburg International Growth Fund | Six Months Ended March 31, 2018 (Unaudited)
| | | | |
INVESTMENT INCOME | | | | |
| |
Dividend income | | | | |
Non-affiliated issuers (net of foreign taxes withheld of $331,161) | | $ | 6,824,859 | |
Non-controlled affiliated issuer | | | 957,905 | |
| | | | |
| |
Total Income | | | 7,782,764 | |
| | | | |
| |
EXPENSES | | | | |
| |
Investment advisory fees (Note 4) | | | 6,391,287 | |
Administration fees (Note 4) | | | | |
Class A Shares | | | 72,044 | |
Class C Shares | | | 52,013 | |
Class I Shares | | | 383,151 | |
Class R3 Shares | | | 5,721 | |
Class R4 Shares | | | 8,909 | |
Class R5 Shares | | | 14,044 | |
Class R6 Shares | | | 5,680 | |
Distribution and service fees (Note 4) | | | | |
Class A Shares | | | 162,178 | |
Class C Shares | | | 469,197 | |
Class R3 Shares | | | 25,650 | |
Class R4 Shares | | | 19,772 | |
Transfer agent fees | | | | |
Class A Shares | | | 74,444 | |
Class C Shares | | | 52,972 | |
Class I Shares | | | 394,809 | |
Class R3 Shares | | | 19,716 | |
Class R4 Shares | | | 62,495 | |
Class R5 Shares | | | 65,691 | |
Class R6 Shares | | | 1,456 | |
Registration and filing fees | | | | |
Class A Shares | | | 9,318 | |
Class C Shares | | | 9,080 | |
Class I Shares | | | 12,993 | |
Class R3 Shares | | | 6,297 | |
Class R4 Shares | | | 6,297 | |
Class R5 Shares | | | 6,335 | |
Class R6 Shares | | | 7,349 | |
Custodian fees (Note 2) | | | 162,376 | |
Professional fees | | | 49,886 | |
Trustee and officer fees (Note 4) | | | 33,664 | |
Other expenses | | | 57,822 | |
| | | | |
| |
Total Expenses | | | 8,642,646 | |
| |
Less: | | | | |
Expenses reimbursed by investment advisor (Note 4) | | | (148,437 | ) |
| | | | |
| |
Net Expenses | | | 8,494,209 | |
| | | | |
| |
Net Investment Loss | | $ | (711,445 | ) |
| | | | |
Semi-Annual Report | 13
Statement of Operations, Continued
Thornburg International Growth Fund | Six Months Ended March 31, 2018 (Unaudited)
| | | | |
REALIZED AND UNREALIZED GAIN (LOSS) | | | | |
| |
Net realized gain (loss) on: | | | | |
Non-affiliated issuer investments | | $ | 64,094,439 | |
Forward currency contracts (Note 7) | | | (1,520,245 | ) |
Foreign currency transactions | | | 620,428 | |
| | | | |
| |
| | | 63,194,622 | |
| | | | |
Net change in unrealized appreciation (depreciation) on: | | | | |
Non-affiliated issuer investments (net of change in deferred taxes payable of $119,703) | | | 2,501,388 | |
Forward currency contracts (Note 7) | | | (1,641,270 | ) |
Foreign currency translations | | | 20,818 | |
| | | | |
| |
| | | 880,936 | |
| | | | |
| |
Net Realized and Unrealized Gain | | | 64,075,558 | |
| | | | |
| |
Net Increase in Net Assets Resulting from Operations | | $ | 63,364,113 | |
| | | | |
See notes to financial statements.
14 | Semi-Annual Report
Statements of Changes in Net Assets
Thornburg International Growth Fund
| | | | | | | | | | |
| | | SIX MONTHS ENDED
MARCH 31, 2018* | | YEAR ENDED
SEPTEMBER 30, 2017 |
INCREASE (DECREASE) IN NET ASSETS FROM | | | | | | | | | | |
| | |
OPERATIONS | | | | | | | | | | |
| | |
Net investment income (loss) | | | $ | (711,445 | ) | | | $ | 4,391,619 | |
Net realized gain (loss) on investments, forward currency contracts, foreign currency transactions and capital gain taxes | | | | 63,194,622 | | | | | 54,252,107 | |
Net unrealized appreciation (depreciation) on investments, forward currency contracts, foreign currency translations and deferred taxes | | | | 880,936 | | | | | 207,472,745 | |
| | | | | |
| | |
Net Increase in Net Assets Resulting from Operations | | | | 63,364,113 | | | | | 266,116,471 | |
| | |
DIVIDENDS TO SHAREHOLDERS | | | | | | | | | | |
| | |
From net investment income | | | | | | | | | | |
Class A Shares | | | | – | | | | | (33,259 | ) |
Class I Shares | | | | – | | | | | (2,772,232 | ) |
Class R4 Shares | | | | – | | | | | (1,560 | ) |
Class R5 Shares | | | | – | | | | | (109,111 | ) |
Class R6 Shares | | | | – | | | | | (39,079 | ) |
| | |
From realized gains | | | | | | | | | | |
Class A Shares | | | | (4,353,047 | ) | | | | – | |
Class C Shares | | | | (3,292,844 | ) | | | | – | |
Class I Shares | | | | (39,027,537 | ) | | | | – | |
Class R3 Shares | | | | (362,877 | ) | | | | – | |
Class R4 Shares | | | | (585,837 | ) | | | | – | |
Class R5 Shares | | | | (1,479,338 | ) | | | | – | |
Class R6 Shares | | | | (427,324 | ) | | | | – | |
| | |
FUND SHARE TRANSACTIONS (NOTE 5) | | | | | | | | | | |
| | |
Class A Shares | | | | 5,258,229 | | | | | (68,891,176 | ) |
Class C Shares | | | | 4,442,953 | | | | | (24,825,716 | ) |
Class I Shares | | | | 206,539,062 | | | | | (105,022,196 | ) |
Class R3 Shares | | | | (833,404 | ) | | | | (4,722,550 | ) |
Class R4 Shares | | | | (2,896,630 | ) | | | | (29,943,271 | ) |
Class R5 Shares | | | | (6,288,620 | ) | | | | (29,956,856 | ) |
Class R6 Shares | | | | 31,672,137 | | | | | 2,247,588 | |
| | | | | |
| | |
Net Increase in Net Assets | | | | 251,729,036 | | | | | 2,047,053 | |
| | |
NET ASSETS | | | | | | | | | | |
| | |
Beginning of Period | | | | 1,427,058,650 | | | | | 1,425,011,597 | |
| | | | | |
| | |
End of Period | | | $ | 1,678,787,686 | | | | $ | 1,427,058,650 | |
| | | | | |
| | |
Includes accumulated net investment loss and accumulated net investment income, respectively | | | $ | (352,986 | ) | | | $ | 358,459 | |
* Unaudited.
See notes to financial statements.
Semi-Annual Report | 15
Notes to Financial Statements
Thornburg International Growth Fund | March 31, 2018 (Unaudited)
NOTE 1 – ORGANIZATION
Thornburg International Growth Fund (the “Fund”) is a diversified series of Thornburg Investment Trust (the “Trust”). The Fund commenced operations on February 1, 2007. The Trust was organized as a Massachusetts business trust under a Declaration of Trust dated June 3, 1987 and is registered as a diversified, open-end management investment company under the Investment Company Act of 1940, as amended. The Fund is currently one of twenty-one separate series of the Trust. Each series is considered to be a separate entity for financial reporting and tax purposes and bears expenses directly attributable to it. The Fund seeks long-term capital appreciation by investing in equity securities selected for their growth potential.
The Fund currently offers seven classes of shares of beneficial interest: Class A, Class C, Institutional Class (“Class I”), and Retirement Classes (“Class R3”, “Class R4”, “Class R5”, and “Class R6”). Each class of shares of the Fund represents an interest in the same portfolio of investments, except that (i) Class A shares are sold subject to a front-end sales charge collected at the time the shares are purchased and bear a service fee, (ii) Class C shares are sold at net asset value without a sales charge at the time of purchase, but are subject to a contingent deferred sales charge upon redemption within one year of purchase, and bear both a service fee and a distribution fee, (iii) Class I and Class R5 shares are sold at net asset value without a sales charge at the time of purchase and may be subject to a service fee, (iv) Class R3 shares are sold at net asset value without a sales charge at the time of purchase, but bear both a service fee and distribution fee, (v) Class R4 shares are sold at net asset value without a sales charge at the time of purchase, but bear a service fee, (vi) Class R6 shares are sold at net asset value without a sales charge at the time of purchase, and (vii) the respective classes may have different reinvestment privileges and conversion rights. Additionally, the Fund may allocate among its classes certain expenses, to the extent allocable to specific classes, including transfer agent fees, government registration fees, certain printing and postage costs, and administrative and legal expenses. Currently, class specific expenses of the Fund are limited to service and distribution fees, administration fees, and certain registration and transfer agent expenses.
The following is a summary of significant accounting policies followed by the Fund in the preparation of its financial statements. The Fund prepares its financial statements in conformity with United States generally accepted accounting principles (“GAAP”), including investment company accounting and reporting guidance in the Financial Accounting Standards Board (the “FASB”) Accounting Standard Codification Topic 946.
NOTE 2 – SIGNIFICANT ACCOUNTING POLICIES
Security Valuation: All investments in securities held by the Fund are valued as described in Note 3.
Allocation of Income, Gains, Losses and Expenses: Net investment income (other than class specific expenses) and realized and unrealized gains and losses are allocated daily to each class of shares based upon the relative net asset value of outstanding shares (or the value of the dividend-eligible shares, as appropriate) of each class of shares at the beginning of the day (after adjusting for the current capital shares activity of the respective class). Expenses common to all Funds are allocated among the Funds comprising the Trust based upon their relative net asset values or other appropriate allocation methods. Operating expenses directly attributable to a specific class are charged against the operating income of that class.
Dividends and Distributions to Shareholders: Dividends and distributions to shareholders, which are determined in accordance with federal income tax regulations and may differ from GAAP, are recorded on the ex-dividend date. Ordinary income distributions, if any, are declared and paid annually. Capital gain distributions, if any, are declared and paid annually and more often if deemed necessary by Thornburg Investment Management, Inc., the Trust’s investment advisor (the “Advisor”). Dividends are paid and are reinvested in additional shares of the Fund at net asset value per share at the close of business on the ex-dividend date, or at the shareholder’s option, paid in cash.
Investment Income: Dividend income is recorded on the ex-dividend date. Certain income from foreign investments is recognized as soon as information is available to the Fund. Interest income is accrued as earned. Premiums and discounts are amortized and accreted, respectively, to call dates or maturity dates using the effective yield method of the respective investments. These amounts are included in Interest income on the Statement of Operations.
Custodian Fees: Custodian fees disclosed in the Statement of Operations may include interest expenses incurred by the Fund on any cash overdrafts of its custodian account during the period. Such cash overdrafts may result from the effects of failed trades in portfolio securities and from cash outflows resulting from unanticipated shareholder redemption activity. The Fund pays interest to its custodian on any such cash overdraft at a rate set periodically at the custodian’s discretion of the overdraft amount in excess of $50,000.
Investment Transactions: Investment transactions are accounted for on a trade date basis. Realized gains and losses from the sale of investments are recorded on an identified cost basis.
Repurchase Agreements: The Fund may invest excess cash in repurchase agreements whereby the Fund purchases investments, which serve as collateral, with an agreement to resell such collateral to the seller at an agreed upon price at the maturity date of the repurchase
16 | Semi-Annual Report
Notes to Financial Statements, Continued
Thornburg International Growth Fund | March 31, 2018 (Unaudited)
agreement. Investments pledged as collateral for repurchase agreements are held in custody until maturity of the repurchase agreement. Provisions in the agreements require that the market value of the collateral is at least equal to the repurchase value in the event of default. In the event of default, the Fund has the right to liquidate the collateral and apply the proceeds in satisfaction of the obligation. Under certain circumstances, in the event of default or bankruptcy by the other party to the agreement, realization and/or retention of the collateral may be subject to legal proceedings.
When-Issued and Delayed Delivery Transactions: The Fund may engage in when-issued or delayed delivery transactions. To the extent the Fund engages in such transactions, it will do so for the purpose of acquiring portfolio investments consistent with the Fund’s investment objectives and not for the purpose of investment leverage or to speculate on interest rate or market changes. At the time the Fund makes a commitment to purchase an investment on a when-issued or delayed delivery basis, the Fund will record the transaction and reflect the value in determining its net asset value. When effecting such transactions, assets of an amount sufficient to make payment for the portfolio investments to be purchased will be segregated on the Fund’s records on the trade date. Investments purchased on a when-issued or delayed delivery basis do not earn interest until the settlement date.
Foreign Currency Translation: Portfolio investments and other assets and liabilities denominated in foreign currencies are translated into U.S. dollars based on the exchange rate of such currencies against the U.S. dollar on the date of valuation. Purchases and sales of investments and income items denominated in foreign currencies are translated into U.S. dollars at the exchange rate in effect on the transaction date. When the Fund purchases or sells foreign investments, it will customarily enter into a foreign exchange contract to minimize foreign exchange risk from the trade date to the settlement date of such transactions. The values of such spot contracts are included in receivable for investments sold and payable for investments purchased on the Statement of Assets and Liabilities.
The Fund does not separately report the effect of changes in foreign exchange rates from changes in market prices on investments held. Such changes are included in net unrealized appreciation (depreciation) from investments.
Reported net realized gains and losses from foreign currency transactions arise due to purchases and sales of foreign currencies, currency gains and losses realized between the trade and settlement dates on investment transactions and the difference between the amounts of dividends, interest, and foreign withholding taxes recorded on the Fund’s books, and the U.S. dollar equivalent of the amounts actually received or paid.
Net change in unrealized appreciation (depreciation) on foreign currency translations arise from changes in the fair value of assets and liabilities, other than investments at period end, resulting from changes in exchange rates.
Guarantees and Indemnifications: Under the Trust’s organizational documents (and under separate agreements with the independent Trustees), its officers and Trustees are provided with an indemnification against certain liabilities arising out of the performance of their duties to the Fund. In the normal course of business the Trust may also enter into contracts with service providers that contain general indemnifications. The Trust’s maximum exposure under these arrangements is unknown. However, based on experience, the Trust expects the risk of loss to be remote.
Use of Estimates: The preparation of financial statements in conformity with GAAP requires management to make estimates and assumptions that affect the reported amounts of assets and liabilities and disclosure of contingent assets and liabilities at the date of the financial statements and the reported amounts of increases (decreases) in net assets from operations during the reporting period. Actual results could differ from those estimates.
Federal Income Taxes: It is the policy of the Trust to comply with the provisions of the Internal Revenue Code applicable to regulated investment companies and to distribute to shareholders substantially all investment company taxable income including net realized gains on investments (if any), and tax exempt income of the Fund. Therefore, no provision for federal income or excise tax is required.
The Fund files income tax returns in United States federal and applicable state jurisdictions. The statute of limitations on the Fund’s tax return filings generally remains open for the three years following a return’s filing date. The Fund has analyzed each uncertain tax position believed to be material in the preparation of the Fund’s financial statements for the six month period ended March 31, 2018, including open tax years, to assess whether it is more likely than not that the position would be sustained upon examination, based on the technical merits of the position. The Fund has not identified any such position for which an asset or liability must be reflected in the Statement of Assets and Liabilities.
At March 31, 2018, information on the tax components of capital was as follows:
| | | | | |
Cost of investments for tax purposes | | | $ | 1,363,632,921 | |
| | | | | |
Gross unrealized appreciation on a tax basis | | | | 361,483,351 | |
Gross unrealized depreciation on a tax basis | | | | (27,413,195 | ) |
| | | | | |
Net unrealized appreciation (depreciation) on investments (tax basis) | | | $ | 334,070,156 | |
| | | | | |
Semi-Annual Report | 17
Notes to Financial Statements, Continued
Thornburg International Growth Fund | March 31, 2018 (Unaudited)
Foreign Withholding Taxes: The Fund is subject to foreign tax withholding imposed by certain foreign countries in which the Fund may invest. Withholding taxes are incurred on certain foreign dividends and are accrued at the time the dividend is recognized based on applicable foreign tax laws. The Fund may file withholding tax reclaims in certain jurisdictions to recover a portion of amounts previously withheld, in view of various considerations, including recent decisions rendered by the courts in those and other jurisdictions. The Fund would expect to record a receivable for such a reclaim based on a variety of factors, including assessment of a jurisdiction’s legal obligation to pay reclaims, the jurisdiction’s administrative practices and payment history, and industry convention. To date the Fund has recorded no such receivable because there is limited precedent for collecting such prior year reclaims and the likelihood of collection remains uncertain.
Deferred Foreign Capital Gain Taxes: The Fund is subject to a tax imposed on net realized gains of securities of certain foreign countries. The Fund records an estimated deferred tax liability for net unrealized gains on these investments as reflected in the accompanying financial statements.
NOTE 3 – SECURITY VALUATION
Valuation of the Fund’s portfolio investment securities is performed in accordance with policies and procedures adopted by and under the oversight of the Trustees.
The Trustees of the Trust have appointed the Advisor to assist the Trustees to obtain market values for portfolio investments, evaluate and monitor professional pricing service providers appointed by the Trustees’ Audit Committee (the “Audit Committee”) to assist in determining fair values for portfolio investments, assist in calculating fair values for portfolio investments in certain circumstances, and to perform other functions in connection with the valuation of investments. The Advisor acts through its Valuation and Pricing Committee (the “Committee”) and other employees of the Advisor. The Committee regularly reviews its own valuation calculations, as well as the valuations, valuation techniques and services furnished by pricing service providers, considers circumstances which may require valuation calculations by the Committee, and reviews previous valuation calculations. The Committee reports to the Audit Committee on the Committee’s activities, the performance of pricing service providers, and other matters relating to valuation of portfolio investments.
In those instances when the Committee assists in calculating a fair value for a portfolio investment, the Committee seeks to determine the price that the Fund would reasonably expect to receive upon a sale of the investment in an orderly transaction between market participants on the valuation date. The Committee customarily utilizes quotations from securities broker dealers in calculating valuations, but also may utilize prices obtained from pricing service providers or other methods approved by the Audit Committee. Because fair values calculated by the Committee are estimates, the calculation of a value for an investment may differ from the price that would be realized by the Fund upon a sale of the investment, and the difference could be material to the Fund’s financial statements. The Committee’s calculation of a fair value for an investment may also differ from the prices obtained by other persons (including other mutual funds) for the investment.
Valuation of Securities: Securities and other portfolio investments which are listed or traded on a United States securities exchange are valued at the last reported sale price on the valuation date. Investments listed or traded on an exchange for which there has been no sale that day are valued at the mean between the last reported bid and asked prices on that valuation date. Portfolio investments reported by NASDAQ are valued at the official closing price on the valuation date. If an investment is traded on more than one exchange, the investment is considered traded on the exchange that is normally the primary market for that investment. Securities and other portfolio investments which are listed or traded on exchanges outside the United States are valued at the last price or the closing price of the investment on the exchange that is normally the primary market for the investment, as of the close of the exchange preceding the Fund’s valuation date. Foreign investments listed or traded on an exchange for which there has been no sale that day are valued at the mean between the last reported bid and asked prices on that valuation date.
In any case when a market quotation is not readily available for a portfolio investment ordinarily valued by market quotation, the Committee calculates a fair value for the investment using alternative methods approved by the Audit Committee. A market quotation is not readily available when the primary market or exchange for the investment is not open for the entire scheduled day of trading. Market quotations for an investment also may not be readily available if developments after the most recent close of the investment’s primary exchange or market, but prior to the close of business on any Fund business day, or an unusual event or significant period of time occurring since the availability of a market quotation, create a serious question concerning the reliability of the most recent market quotation available for the investment. In particular, on days when market volatility thresholds established by the Audit Committee are exceeded, foreign equity investments held by the Fund may be valued using alternative methods. The Committee customarily obtains valuations in these instances from pricing service providers approved by the Audit Committee. Pricing service providers ordinarily calculate valuations using multi-factor models to adjust market prices based upon various inputs, including exchange data, depository receipt prices, futures, index data and other data.
Debt obligations held by the Fund which are not listed or traded on exchanges or for which no reported market exists are ordinarily valued at the valuation obtained from a pricing service provider approved by the Audit Committee.
18 | Semi-Annual Report
Notes to Financial Statements, Continued
Thornburg International Growth Fund | March 31, 2018 (Unaudited)
In any case when a pricing service provider fails to provide a valuation for a debt obligation held by the Fund, the Committee calculates a fair value for the obligation using alternative methods under procedures approved by the Audit Committee. Additionally, in cases when management believes that a valuation obtained from a pricing service provider merits review for significant reasons, the Committee decides whether or not to use the valuation calculated by the pricing service provider or to use an alternative method approved by the Audit Committee to calculate a fair value for the obligation.
Quotations for foreign investments expressed in foreign currency amounts are converted to U.S. dollar equivalents using a foreign exchange quotation from a third party service provider at the time of valuation. Foreign investments held by the Fund may be traded on days and at times when the Fund is not open for business. Consequently, the value of Fund investments may be significantly affected on days when shareholders cannot purchase or sell Fund shares. Futures contracts and other financial and derivative instruments traded on an exchange are valued at the latest published price for the instrument on its primary exchange. Listed options are valued at the last bid price.
Valuation Hierarchy: The Fund categorizes its investments based upon the inputs used in valuing those investments, according to a three-level hierarchy established in guidance from the FASB. Categorization of investments using this hierarchy is intended by the FASB to maximize the use of observable inputs in valuing investments and minimize the use of unobservable inputs by requiring that the most observable inputs be used when available. Observable inputs are those that market participants would use in valuing an investment based on available market information. Unobservable inputs are those that reflect assumptions about the information market participants would use in valuing an investment. An investment’s level within the hierarchy is based on the lowest level input that is deemed significant to the valuation. The methodologies and inputs used to value investments are not necessarily indications of the risk or liquidity associated with those investments.
Various inputs are used in calculating valuations for the Fund’s investments. These inputs are generally summarized according to the three-level hierarchy below:
Level 1: Quoted prices in active markets for identical investments.
Level 2: Other direct or indirect significant observable inputs (including quoted prices for similar investments in active markets and other observable inputs, such as interest rates, prepayment rates, credit risk, etc.).
Level 3: Significant unobservable inputs (including the Committee’s own assumptions in calculating the fair values of investments).
Valuations for debt obligations held by the Fund are typically calculated by pricing service providers approved by the Audit Committee and are generally characterized as Level 2 within the valuation hierarchy.
On days when market volatility thresholds established by the Audit Committee are exceeded, foreign securities for which valuations are obtained from pricing service providers are fair valued. On these days, the foreign securities are characterized as Level 2 within the valuation hierarchy and revert to Level 1 after the threshold is no longer exceeded.
In a limited number of cases the Committee calculates a fair value for investments using broker quotations or other methods approved by the Audit Committee. When the Committee uses a single broker quotation to calculate a fair value for an investment without other significant observable inputs, or if a fair value is calculated using other significant inputs that are considered unobservable, the investment is characterized as Level 3 within the hierarchy. Other significant unobservable inputs used to calculate a fair value in these instances might include an income-based valuation approach which considers discounted anticipated future cash flows from the investment and application of discounts due to the nature or duration of any restrictions on the disposition of the investment.
Valuations based upon the use of inputs from Levels 1, 2 or 3 may not represent the actual price received upon the disposition of an investment, and the Fund may receive a price that is lower than the valuation based upon these inputs when it sells the investment.
The following table displays a summary of the fair value hierarchy measurements of the Fund’s investments as of March 31, 2018. In any instance when valuation inputs from more than one level are used to determine the fair value of a specific investment, the investment is placed in the level of the table based upon the lowest level input that is significant in determining the fair value of the investment:
| | | | | | | | | | | | | | | | | | | | |
| | | FAIR VALUE MEASUREMENTS AT MARCH 31, 2018 |
| | | TOTAL | | LEVEL 1 | | LEVEL 2 | | LEVEL 3 |
Assets | | | | | | | | | | | | | | | | | | | | |
Investments in Securities* | | | | | | | | | | | | | | | | | | | | |
Common Stock | | | $ | 1,564,577,075 | | | | $ | 1,564,577,075 | | | | $ | – | | | | $ | – | |
Short Term Investment | | | | 133,126,002 | | | | | 133,126,002 | | | | | – | | | | | – | |
| | | | | |
Total Investments in Securities | | | $ | 1,697,703,077 | | | | $ | 1,697,703,077 | | | | $ | – | | | | $ | – | |
Semi-Annual Report | 19
Notes to Financial Statements, Continued
Thornburg International Growth Fund | March 31, 2018 (Unaudited)
| | | | | | | | | | | | | | | | | | | | |
| | | FAIR VALUE MEASUREMENTS AT MARCH 31, 2018 |
| | | TOTAL | | LEVEL 1 | | LEVEL 2 | | LEVEL 3 |
| | | | |
Other Financial Instruments** | | | | | | | | | | | | | | | | | | | | |
Spot Currency | | | $ | 3,218 | | | | $ | 3,218 | | | | $ | – | | | | $ | – | |
| | | | |
Liabilities | | | | | | | | | | | | | | | | | | | | |
Other Financial Instruments** | | | | | | | | | | | | | | | | | | | | |
Forward Currency Contracts | | | $ | (1,641,270 | ) | | | $ | – | | | | $ | (1,641,270 | ) | | | $ | – | |
Spot Currency | | | | (12,504 | ) | | | | (12,504 | ) | | | | – | | | | | – | |
| | | | | |
Total Other Financial Instruments | | | $ | (1,653,774 | ) | | | $ | (12,504 | ) | | | $ | (1,641,270 | ) | | | $ | – | |
| * | See Schedule of Investments for a summary of the industry exposure as grouped according to the Global Industry Classification Standard (GICS), which is an industry taxonomy developed by MSCI, Inc. and Standard & Poor’s (S&P). |
| ** | Other Financial Instruments include investments not reflected in the Schedule of Investments, which may include futures, forwards and swap contracts, which are valued at the unrealized appreciation (depreciation) on the investment. |
In accordance with the guidance prescribed in Accounting Standards Update No. 2011-04, it is the policy of the Fund to recognize transfers between levels and the underlying events which caused the movement. The Fund recognized no transfers between levels 1 and 2 for the six months ended March 31, 2018, other than when the Fund exceeded market volatility thresholds for foreign equity investments during the period.
NOTE 4 – INVESTMENT ADVISORY FEE AND OTHER TRANSACTIONS WITH AFFILIATES
Pursuant to an investment advisory agreement, the Advisor serves as the investment advisor and performs services for the Fund for which the fees are payable at the end of each month. Under the investment advisory agreement, the Fund pays the Advisor a management fee based on the daily net assets of the Fund at an annual rate as shown in the following table:
| | | | | |
| MANAGEMENT FEE SCHEDULE |
| DAILY NET ASSETS | | FEE RATE |
| |
Up to $500 million | | | | 0.875 | % |
| |
Next $500 million | | | | 0.825 | |
| |
Next $500 million | | | | 0.775 | |
| |
Next $500 million | | | | 0.725 | |
| |
Over $2 billion | | | | 0.675 | |
The Fund’s effective management fee for the six months ended March 31, 2018 was 0.82% of the Fund’s average net assets.
The Trust has entered into administrative service agreements with the Advisor, whereby the Advisor will perform certain administrative services related to each class of the Fund’s shares. Until January 31, 2018, the fees were payable at an annual rate of up to 0.125 of 1% per annum of the average daily net assets attributable to each class of shares. As of February 1, 2018, the fees are computed as an annual percentage of the aggregate average daily net assets of all shares classes of all Funds in the Trust as follows:
| | | | | |
| ADMINISTRATION FEE SCHEDULE |
| DAILY NET ASSETS | | FEE RATE |
| |
Up to $20 billion | | | | 0.100 | % |
| |
$20 billion to $40 billion | | | | 0.075 | |
| |
$40 billion to $60 billion | | | | 0.040 | |
| |
Over $60 billion | | | | 0.030 | |
The aggregate fee amount is allocated on a daily basis to each Fund based on net assets and subsequently allocated to each class of shares of the Fund. Total administrative service fees incurred by each class of shares of the Fund for the six months ended March 31, 2018, are set forth in the Statement of Operations.
The Trust has an underwriting agreement with Thornburg Securities Corporation (the “Distributor”), an affiliate of the Advisor, which acts as the distributor of the Fund’s shares. For the six months ended March 31, 2018, the Distributor has advised the Fund that it earned net commissions aggregating $20,027 from the sale of Class A shares, and collected contingent deferred sales charges aggregating $2,497 from redemptions of Class C shares of the Fund.
20 | Semi-Annual Report
Notes to Financial Statements, Continued
Thornburg International Growth Fund | March 31, 2018 (Unaudited)
Pursuant to a service plan under Rule 12b-1 of the Investment Company Act of 1940, the Fund may pay to the Distributor or securities dealers and other financial institutions at the Distributor’s direction an amount not to exceed .25 of 1% per annum of the average daily net assets attributable to Class A, Class C, Class I, Class R3, Class R4, and Class R5 shares of the Fund to obtain various shareholder and distribution related services. For the six months ended March 31, 2018, there were no 12b-1 service plan fees charged for Class I or Class R5 shares. Class R6 shares are not subject to a service plan. The Advisor and Distributor each may pay out of its own resources additional expenses for distribution of the Fund’s shares and shareholder services.
The Trust has also adopted distribution plans pursuant to Rule 12b-1, applicable only to the Fund’s Class C and Class R3 shares, under which the Fund compensates the Distributor for services in promoting the sale of Class C and Class R3 shares of the Fund at an annual rate of up to .75 of 1% per annum of the average daily net assets attributable to Class C shares, and an annual rate of up to .25 of 1% per annum of the average daily net assets attributable to Class R3 shares.
Total fees incurred by each class of shares of the Fund under their respective service and distribution plans for the six months ended March 31, 2018, are set forth in the Statement of Operations.
The Advisor and Distributor have contractually agreed to waive fees and reimburse expenses incurred by the Fund so that actual expenses of certain share classes do not exceed levels as specified in each Fund’s most recent prospectus. The agreement may be terminated by the Fund at any time, but may not be terminated by the Advisor or Distributor before February 1, 2019, unless the Advisor ceases to be the investment advisor to the Fund or the Distributor ceases to be the distributor of the Fund prior to that date. The Advisor and Distributor may recoup amounts waived or reimbursed during the fiscal year if expenses fall below the contractual limit during that year.
For the six months ended March 31, 2018, the Advisor contractually reimbursed certain class specific expenses, administrative fees, and distribution fees of $1,629 for Class I shares, $24,356 for Class R3 shares, $55,108 for Class R4 shares, $55,284 for Class R5 shares, and $12,060 for Class R6 shares.
Certain officers and Trustees of the Trust are also officers or directors of the Advisor and Distributor. The compensation of the independent Trustees is borne by the Trust. The Trust also pays a portion of the Chief Compliance Officer’s compensation. These amounts are reflected as “Trustee and officer fees” in the Statement of Operations.
The percentage of direct investments in the Fund held by the Trustees, officers of the Trust, and the Advisor is approximately 2.71%.
The Fund may purchase or sell securities from, or to an affiliated fund, provided the affiliation is due solely to having a common investment advisor, common officers, or common trustees, and provided that all such transactions will comply with Rule 17a-7 under the 1940 Act. For the six months ended March 31, 2018, the Fund had no such transactions with affiliated funds.
Shown below are holdings of voting securities of each portfolio company which is considered “affiliated” to the Fund under the Investment Company Act of 1940, including companies for which the Fund’s holding represented 5% or more of the company’s voting securities, and a series of the Thornburg Investment Trust in which the Fund invested for cash management purposes during the period:
| | | | | | | | | | | | | | | | | | | | | | | | | | | | | | | | | | | | | | | | |
| FUND | | MARKET VALUE
9/30/17 | | PURCHASES
AT COST | | SALES
PROCEEDS | | REALIZED
GAIN
(LOSS) | | CHANGE IN
UNREALIZED
APPR./(DEPR.) | | MARKET VALUE
3/31/18 | | DIVIDEND
INCOME | | ROC
ADJUSTMENT |
Thornburg Capital Management Fund | | $ 113,407,454 | | | $ | 271,230,524 | | | | $ | (251,511,976 | ) | | | $ | – | | | | $ | – | | | | $ | 133,126,002 | | | | $ | 957,905 | | | | $ | – | |
NOTE 5 – SHARES OF BENEFICIAL INTEREST
At March 31, 2018, there were an unlimited number of shares with no par value of beneficial interest authorized. Transactions in shares of beneficial interest were as follows:
| | | | | | | | | | | | | | | | |
| | | SIX MONTHS ENDED MARCH 31, 2018 (UNAUDITED) | | | YEAR ENDED SEPTEMBER 30, 2017 (AUDITED) | |
| | | SHARES | | | AMOUNT | | | SHARES | | | AMOUNT | |
Class A Shares | | | | | | | | | | | | | | | | |
Shares sold | | | 1,028,536 | | | $ | 24,663,680 | | | | 1,524,481 | | | $ | 32,559,158 | |
Shares issued to shareholders in
reinvestment of dividends | | | 176,065 | | | | 3,991,389 | | | | 1,301 | | | | 30,926 | |
Shares repurchased | | | (970,069 | ) | | | (23,396,840 | ) | | | (5,218,623 | ) | | | (101,481,260 | ) |
| | | | |
| | | | |
Net increase (decrease) | | | 234,532 | | | $ | 5,258,229 | | | | (3,692,841 | ) | | $ | (68,891,176 | ) |
| | | | |
Semi-Annual Report | 21
Notes to Financial Statements, Continued
Thornburg International Growth Fund | March 31, 2018 (Unaudited)
| | | | | | | | | | | | | | | | |
| | | SIX MONTHS ENDED MARCH 31, 2018 (UNAUDITED) | | | YEAR ENDED SEPTEMBER 30, 2017 (AUDITED) | |
| | | SHARES | | | AMOUNT | | | SHARES | | | AMOUNT | |
Class C Shares | | | | | | | | | | | | | | | | |
Shares sold | | | 481,439 | | | $ | 10,850,739 | | | | 476,447 | | | $ | 9,727,710 | |
Shares issued to shareholders in
reinvestment of dividends | | | 141,824 | | | | 3,023,696 | | | | – | | | | – | |
Shares repurchased | | | (417,720 | ) | | | (9,431,482 | ) | | | (1,848,320 | ) | | | (34,553,426 | ) |
| | | | |
| | | | |
Net increase (decrease) | | | 205,543 | | | $ | 4,442,953 | | | | (1,371,873 | ) | | $ | (24,825,716 | ) |
| | | | |
Class I Shares | | | | | | | | | | | | | | | | |
Shares sold | | | 12,991,278 | | | $ | 321,719,443 | | | | 14,858,952 | | | $ | 318,552,650 | |
Shares issued to shareholders in
reinvestment of dividends | | | 1,552,672 | | | | 36,192,788 | | | | 109,759 | | | | 2,578,227 | |
Shares repurchased | | | (6,143,413 | ) | | | (151,373,169 | ) | | | (21,227,762 | ) | | | (426,153,073 | ) |
| | | | |
| | | | |
Net increase (decrease) | | | 8,400,537 | | | $ | 206,539,062 | | | | (6,259,051 | ) | | $ | (105,022,196 | ) |
| | | | |
Class R3 Shares | | | | | | | | | | | | | | | | |
Shares sold | | | 73,912 | | | $ | 1,758,151 | | | | 134,140 | | | $ | 2,780,591 | |
Shares issued to shareholders in
reinvestment of dividends | | | 12,148 | | | | 273,090 | | | | – | | | | – | |
Shares repurchased | | | (121,295 | ) | | | (2,864,645 | ) | | | (375,435 | ) | | | (7,503,141 | ) |
| | | | |
| | | | |
Net decrease | | | (35,235 | ) | | $ | (833,404 | ) | | | (241,295 | ) | | $ | (4,722,550 | ) |
| | | | |
Class R4 Shares | | | | | | | | | | | | | | | | |
Shares sold | | | 181,735 | | | $ | 4,314,780 | | | | 371,414 | | | $ | 7,282,773 | |
Shares issued to shareholders in
reinvestment of dividends | | | 11,955 | | | | 269,581 | | | | 30 | | | | 703 | |
Shares repurchased | | | (313,929 | ) | | | (7,480,991 | ) | | | (1,792,234 | ) | | | (37,226,747 | ) |
| | | | |
| | | | |
Net decrease | | | (120,239 | ) | | $ | (2,896,630 | ) | | | (1,420,790 | ) | | $ | (29,943,271 | ) |
| | | | |
Class R5 Shares | | | | | | | | | | | | | | | | |
Shares sold | | | 248,030 | | | $ | 6,166,432 | | | | 618,222 | | | $ | 13,028,340 | |
Shares issued to shareholders in
reinvestment of dividends | | | 63,259 | | | | 1,478,350 | | | | 4,628 | | | | 109,043 | |
Shares repurchased | | | (562,093 | ) | | | (13,933,402 | ) | | | (2,123,484 | ) | | | (43,094,239 | ) |
| | | | |
| | | | |
Net decrease | | | (250,804 | ) | | $ | (6,288,620 | ) | | | (1,500,634 | ) | | $ | (29,956,856 | ) |
| | | | |
Class R6 Shares | | | | | | | | | | | | | | | | |
Shares sold | | | 1,356,425 | | | $ | 34,214,120 | | | | 1,356,236 | | | $ | 26,361,838 | |
Shares issued to shareholders in
reinvestment of dividends | | | 18,246 | | | | 427,324 | | | | 1,659 | | | | 39,079 | |
Shares repurchased | | | (119,865 | ) | | | (2,969,307 | ) | | | (1,155,373 | ) | | | (24,153,329 | ) |
| | | | |
| | | | |
Net increase | | | 1,254,806 | | | $ | 31,672,137 | | | | 202,522 | | | $ | 2,247,588 | |
| | | | |
NOTE 6 – INVESTMENT TRANSACTIONS
For the six months ended March 31, 2018, the Fund had purchase and sale transactions of investments (excluding short-term investments) of $426,094,260 and $199,845,260, respectively.
NOTE 7 – DERIVATIVE FINANCIAL INSTRUMENTS WITH OFF-BALANCE SHEET RISK AND FOREIGN INVESTMENT RISK
The Fund may use a variety of derivative financial instruments to hedge or adjust the risks affecting its investment portfolio or to enhance investment returns. Provisions of the FASB Accounting Standards Codification 815-10-50 (“ASC 815”) require certain disclosures. The disclosures are intended to provide users of financial statements with an understanding of the use of derivative instruments by the Fund and how these derivatives affect the financial position, financial performance and cash flows of the Fund. The Fund does not designate any derivative instruments as hedging instruments under ASC 815. During the six months ended March 31, 2018, the Fund’s principal
22 | Semi-Annual Report
Notes to Financial Statements, Continued
Thornburg International Growth Fund | March 31, 2018 (Unaudited)
exposure to derivative financial instruments of the type addressed by ASC 815 was investment in foreign exchange contracts. A foreign exchange contract is an agreement between two parties to exchange different currencies at a specified rate of exchange at an agreed upon future date. Foreign exchange contracts involve risks to the Fund, including the risk that a contract’s counterparty will not meet its obligations to the Fund, the risk that a change in a contract’s value may not correlate perfectly with the currency the contract was intended to track, and the risk that the Fund’s Advisor is unable to correctly implement its strategy in using a contract. In any such instance, the Fund may not achieve the intended benefit of entering into a contract, and may experience a loss.
The Fund entered into forward currency contracts during the six months ended March 31, 2018 in the normal course of pursuing its investment objectives, with the objective of purchasing foreign investments or with the intent of reducing the risk to the value of the Fund’s foreign investments from adverse changes in the relationship between the U.S. dollar and foreign currencies. In each case these contracts have been initiated in conjunction with foreign investment transactions. The monthly average value of open forward currency sell contracts for the six months ended March 31, 2018 was $45,235,646.
These contracts are accounted for by the Fund under ASC 815. Unrealized appreciation and depreciation on outstanding contracts are reported in the Fund’s Statement of Assets and Liabilities, as measured by the difference between the forward exchange rates at the reporting date and the forward exchange rates at each contract’s inception date. Net realized gain (loss) on contracts closed during the period, and changes in net unrealized appreciation (depreciation) on outstanding contracts are recognized in the Fund’s Statement of Operations.
Forward currency contracts were entered into with Brown Brothers Harriman & Co. (“BBH”), pursuant to an International Swaps and Derivatives Association (“ISDA”) Master Agreement. In the event of a default or termination under the ISDA Master Agreement with BBH, the non-defaulting party has the right to close out all outstanding forward currency contracts between the parties and to net any payment amounts under those contracts, resulting in a single net amount payable by one party to the other.
Because the ISDA Master Agreement with BBH does not result in an offset of reported amounts of financial assets and liabilities in the Fund’s Statement of Assets and Liabilities unless there has been an event of default or termination event under that agreement, the Fund does not net its outstanding forward currency contracts for purposes of the disclosure in the Fund’s Statement of Assets and Liabilities. Instead the Fund recognizes the unrealized appreciation or depreciation on those forward currency contracts on a gross basis in the Fund’s Statement of Assets and Liabilities.
The net realized gain (loss) from forward currency contracts and the net change in unrealized appreciation (depreciation) on outstanding forward currency contracts recognized in the Fund’s Statement of Operations for the six months ended March 31, 2018 are disclosed in the following tables:
| | | | | | | | |
NET REALIZED GAIN (LOSS) ON DERIVATIVE FINANCIAL INSTRUMENTS RECOGNIZED IN INCOME FOR THE SIX MONTHS ENDED MARCH 31, 2018 | |
| | |
| | | TOTAL | | | FORWARD CURRENCY CONTRACTS | |
| | |
Foreign exchange contracts | | $ | (1,520,245 | ) | | $ | (1,520,245 | ) |
|
NET CHANGE IN UNREALIZED APPRECIATION (DEPRECIATION) OF DERIVATIVE FINANCIAL INSTRUMENTS RECOGNIZED IN INCOME FOR THE SIX MONTHS ENDED MARCH 31, 2018 | |
| | |
| | | TOTAL | | | FORWARD CURRENCY CONTRACTS | |
| | |
Foreign exchange contracts | | $ | (1,641,270 | ) | | $ | (1,641,270 | ) |
OTHER NOTES
Risks: The Fund’s investments subject it to risks including, but not limited to, management risk, market and economic risk, risks affecting specific issuers, liquidity risk, the risks associated with investments in small- and mid-cap companies and non-U.S. issuers (including developing country issuers), credit risk, and interest rate risk. Please see the Fund’s prospectus for a discussion of the risks associated with an investment in the Fund.
Subsequent Events: Fund management believes no events have occurred between March 31, 2018 and the date of issuance of the financial statements that require adjustment to or disclosure in the accompanying financial statements.
Semi-Annual Report | 23
Financial Highlights
Thornburg International Growth Fund
| | | | | | | | | | | | | | | | | | | | | | | | | | | | | | | | | | | | | | | | |
| | | PER SHARE PERFORMANCE (FOR A SHARE OUTSTANDING THROUGHOUT THE PERIOD) |
| | | | | | | | | | | | | | | | | |
UNLESS OTHERWISE NOTED, PERIODS ARE FISCAL YEARS ENDED SEPTEMBER 30, | | NET ASSET VALUE, BEGINNING OF PERIOD | | NET INVESTMENT INCOME (LOSS)+ | | NET REALIZED & UNREALIZED GAIN (LOSS) ON INVESTMENTS | | TOTAL FROM INVESTMENT OPERATIONS | | DIVIDENDS FROM NET INVESTMENT INCOME | | DIVIDENDS FROM NET REALIZED GAINS | | TOTAL DIVIDENDS | | NET ASSET VALUE, END OF PERIOD |
| | | | | | | |
| CLASS A SHARES | | | | | | | | | | | | | | | | | | | | | | | | | | | | | | | | | | | | |
| | | | | | | | |
2018(b)(c) | | | $ | 23.85 | | | | | (0.04 | ) | | | | 1.01 | | | | | 0.97 | | | | | – | | | | | (0.81 | ) | | | | (0.81 | ) | | | $ | 24.01 | |
2017(b) | | | $ | 19.22 | | | | | (0.01 | ) | | | | 4.65 | | | | | 4.64 | | | | | (0.01 | ) | | | | – | | | | | (0.01 | ) | | | $ | 23.85 | |
2016(b) | | | $ | 17.78 | | | | | – | (e) | | | | 1.45 | | | | | 1.45 | | | | | (0.01 | ) | | | | – | | | | | (0.01 | ) | | | $ | 19.22 | |
2015(b) | | | $ | 19.10 | | | | | (0.01 | ) | | | | (0.33 | ) | | | | (0.34 | ) | | | | – | | | | | (0.98 | ) | | | | (0.98 | ) | | | $ | 17.78 | |
2014(b) | | | $ | 20.54 | | | | | 0.02 | | | | | (0.89 | ) | | | | (0.87 | ) | | | | – | | | | | (0.57 | ) | | | | (0.57 | ) | | | $ | 19.10 | |
2013(b) | | | $ | 15.78 | | | | | (0.01 | ) | | | | 4.77 | | | | | 4.76 | | | | | – | | | | | – | | | | | – | | | | $ | 20.54 | |
| | | | | | | |
| CLASS C SHARES | | | | | | | | | | | | | | | | | | | | | | | | | | | | | | | | | | | | |
| | | | | | | | |
2018(c) | | | $ | 22.50 | | | | | (0.13 | ) | | | | 0.96 | | | | | 0.83 | | | | | – | | | | | (0.81 | ) | | | | (0.81 | ) | | | $ | 22.52 | |
2017 | | | $ | 18.26 | | | | | (0.13 | ) | | | | 4.37 | | | | | 4.24 | | | | | – | | | | | – | | | | | – | | | | $ | 22.50 | |
2016 | | | $ | 17.01 | | | | | (0.13 | ) | | | | 1.38 | | | | | 1.25 | | | | | – | | | | | – | | | | | – | | | | $ | 18.26 | |
2015 | | | $ | 18.45 | | | | | (0.14 | ) | | | | (0.32 | ) | | | | (0.46 | ) | | | | – | | | | | (0.98 | ) | | | | (0.98 | ) | | | $ | 17.01 | |
2014 | | | $ | 20.01 | | | | | (0.13 | ) | | | | (0.86 | ) | | | | (0.99 | ) | | | | – | | | | | (0.57 | ) | | | | (0.57 | ) | | | $ | 18.45 | |
2013 | | | $ | 15.49 | | | | | (0.14 | ) | | | | 4.66 | | | | | 4.52 | | | | | – | | | | | – | | | | | – | | | | $ | 20.01 | |
| | | | | | | |
| CLASS I SHARES | | | | | | | | | | | | | | | | | | | | | | | | | | | | | | | | | | | | |
| | | | | | | | |
2018(c) | | | $ | 24.48 | | | | | – | (e) | | | | 1.05 | | | | | 1.05 | | | | | – | | | | | (0.81 | ) | | | | (0.81 | ) | | | $ | 24.72 | |
2017 | | | $ | 19.69 | | | | | 0.10 | | | | | 4.75 | | | | | 4.85 | | | | | (0.06 | ) | | | | – | | | | | (0.06 | ) | | | $ | 24.48 | |
2016 | | | $ | 18.20 | | | | | 0.08 | | | | | 1.49 | | | | | 1.57 | | | | | (0.08 | ) | | | | – | | | | | (0.08 | ) | | | $ | 19.69 | |
2015 | | | $ | 19.51 | | | | | 0.02 | | | | | (0.37 | ) | | | | (0.28 | ) | | | | (0.05 | ) | | | | (0.98 | ) | | | | (1.03 | ) | | | $ | 18.20 | |
2014 | | | $ | 20.96 | | | | | 0.10 | | | | | (0.91 | ) | | | | (0.81 | ) | | | | (0.07 | ) | | | | (0.57 | ) | | | | (0.64 | ) | | | $ | 19.51 | |
2013 | | | $ | 16.04 | | | | | 0.07 | | | | | 4.85 | | | | | 4.92 | | | | | – | | | | | – | | | | | – | | | | $ | 20.96 | |
| | | | | | | |
| CLASS R3 SHARES | | | | | | | | | | | | | | | | | | | | | | | | | | | | | | | | | | | | |
| | | | | | | | |
2018(c) | | | $ | 23.66 | | | | | (0.06 | ) | | | | 1.00 | | | | | 0.94 | | | | | – | | | | | (0.81 | ) | | | | (0.81 | ) | | | $ | 23.79 | |
2017 | | | $ | 19.07 | | | | | (0.01 | ) | | | | 4.60 | | | | | 4.59 | | | | | – | | | | | – | | | | | – | | | | $ | 23.66 | |
2016 | | | $ | 17.66 | | | | | – | (e) | | | | 1.42 | | | | | 1.42 | | | | | (0.01 | ) | | | | – | | | | | (0.01 | ) | | | $ | 19.07 | |
2015 | | | $ | 18.99 | | | | | (0.02 | ) | | | | (0.33 | ) | | | | (0.35 | ) | | | | – | | | | | (0.98 | ) | | | | (0.98 | ) | | | $ | 17.66 | |
2014 | | | $ | 20.46 | | | | | – | (e) | | | | (0.90 | ) | | | | (0.90 | ) | | | | – | | | | | (0.57 | ) | | | | (0.57 | ) | | | $ | 18.99 | |
2013 | | | $ | 15.73 | | | | | (0.03 | ) | | | | 4.76 | | | | | 4.73 | | | | | – | | | | | – | | | | | – | | | | $ | 20.46 | |
| | | | | | | |
| CLASS R4 SHARES | | | | | | | | | | | | | | | | | | | | | | | | | | | | | | | | | | | | |
| | | | | | | | |
2018(c) | | | $ | 23.73 | | | | | (0.05 | ) | | | | 1.01 | | | | | 0.96 | | | | | – | | | | | (0.81 | ) | | | | (0.81 | ) | | | $ | 23.88 | |
2017 | | | $ | 19.11 | | | | | 0.01 | | | | | 4.61 | | | | | 4.62 | | | | | – | (g) | | | | – | | | | | – | | | | $ | 23.73 | |
2016 | | | $ | 17.68 | | | | | 0.01 | | | | | 1.43 | | | | | 1.44 | | | | | (0.01 | ) | | | | – | | | | | (0.01 | ) | | | $ | 19.11 | |
2015 | | | $ | 19.00 | | | | | 0.02 | | | | | (0.36 | ) | | | | (0.34 | ) | | | | – | | | | | (0.98 | ) | | | | (0.98 | ) | | | $ | 17.68 | |
2014 | | | $ | 20.45 | | | | | 0.01 | | | | | (0.89 | ) | | | | (0.88 | ) | | | | – | | | | | (0.57 | ) | | | | (0.57 | ) | | | $ | 19.00 | |
2013 | | | $ | 15.70 | | | | | (0.01 | ) | | | | 4.76 | | | | | 4.75 | | | | | – | | | | | – | | | | | – | | | | $ | 20.45 | |
| | | | | | | |
| CLASS R5 SHARES | | | | | | | | | | | | | | | | | | | | | | | | | | | | | | | | | | | | |
| | | | | | | | |
2018(c) | | | $ | 24.54 | | | | | – | (e) | | | | 1.05 | | | | | 1.05 | | | | | – | | | | | (0.81 | ) | | | | (0.81 | ) | | | $ | 24.78 | |
2017 | | | $ | 19.73 | | | | | 0.08 | | | | | 4.79 | | | | | 4.87 | | | | | (0.06 | ) | | | | – | | | | | (0.06 | ) | | | $ | 24.54 | |
2016 | | | $ | 18.25 | | | | | 0.09 | | | | | 1.47 | | | | | 1.56 | | | | | (0.08 | ) | | | | – | | | | | (0.08 | ) | | | $ | 19.73 | |
2015 | | | $ | 19.55 | | | | | 0.09 | | | | | (0.36 | ) | | | | (0.27 | ) | | | | (0.05 | ) | | | | (0.98 | ) | | | | (1.03 | ) | | | $ | 18.25 | |
2014 | | | $ | 21.01 | | | | | 0.10 | | | | | (0.93 | ) | | | | (0.83 | ) | | | | (0.06 | ) | | | | (0.57 | ) | | | | (0.63 | ) | | | $ | 19.55 | |
2013 | | | $ | 16.07 | | | | | 0.07 | | | | | 4.87 | | | | | 4.94 | | | | | – | | | | | – | | | | | – | | | | $ | 21.01 | |
| | | | | | | |
| CLASS R6 SHARES | | | | | | | | | | | | | | | | | | | | | | | | | | | | | | | | | | | | |
| | | | | | | | |
2018(c) | | | $ | 24.59 | | | | | 0.06 | | | | | 1.01 | | | | | 1.07 | | | | | – | | | | | (0.81 | ) | | | | (0.81 | ) | | | $ | 24.85 | |
2017 | | | $ | 19.77 | | | | | 0.09 | | | | | 4.81 | | | | | 4.90 | | | | | (0.08 | ) | | | | – | | | | | (0.08 | ) | | | $ | 24.59 | |
2016 | | | $ | 18.29 | | | | | 0.11 | | | | | 1.47 | | | | | 1.58 | | | | | (0.10 | ) | | | | – | | | | | (0.10 | ) | | | $ | 19.77 | |
2015 | | | $ | 19.59 | | | | | 0.13 | | | | | (0.38 | ) | | | | (0.25 | ) | | | | (0.07 | ) | | | | (0.98 | ) | | | | (1.05 | ) | | | $ | 18.29 | |
2014 | | | $ | 21.05 | | | | | 0.12 | | | | | (0.93 | ) | | | | (0.81 | ) | | | | (0.08 | ) | | | | (0.57 | ) | | | | (0.65 | ) | | | $ | 19.59 | |
2013(h) | | | $ | 17.54 | | | | | 0.46 | | | | | 3.05 | | | | | 3.51 | | | | | – | | | | | – | | | | | – | | | | $ | 21.05 | |
| (a) | Not annualized for periods less than one year. |
| (b) | Sales loads are not reflected in computing total return. |
| (c) | Unaudited Six Month Period Ended March 31. |
| (e) | Net investment income (loss) was less than $0.01 per share. |
| (f) | Net investment income (Loss) is less than 0.01%. |
| (g) | Dividends from net investment income per share were less than $(0.01). |
| (h) | Effective date of this class of shares was February 01, 2013. |
| (i) | Due to the size of net assets and fixed expenses, ratios may appear disproportionate. |
| + | Based on weighted average shares outstanding. |
See notes to financial statements.
24 | Semi-Annual Report
Financial Highlights, Continued
Thornburg International Growth Fund
| | | | | | | | | | | | | | | | | | | | | | | | | | | | | | |
| RATIOS TO AVERAGE NET ASSETS | | | | | | SUPPLEMENTAL DATA | |
| | | | | | | EXPENSES, AFTER | | | | | | | | | | | | | | | | |
NET INVESTMENT INCOME (LOSS) (%) | | | EXPENSES, AFTER EXPENSE REDUCTIONS (%) | | | EXPENSE REDUCTIONS AND NET OF CUSTODY CREDITS (%) | | | EXPENSES, BEFORE EXPENSE REDUCTIONS (%) | | | | | | TOTAL RETURN (%)(a) | | | PORTFOLIO TURNOVER RATE (%)(a) | | | NET ASSETS AT
END OF PERIOD (THOUSANDS) | |
| | | | | | | |
| | | | | | | | | | | | | | | | | | | | | | | | | | | | | | |
| | | | | | | |
| | (0.38 | )(d) | | | 1.35 | (d) | | | 1.35 | (d) | | | 1.35 | (d) | | | | | | | 4.27 | | | | 13.95 | | | $ | 128,460 | |
| | (0.05 | ) | | | 1.42 | | | | 1.42 | | | | 1.43 | | | | | | | | 24.12 | | | | 60.88 | | | $ | 121,989 | |
| | 0.03 | | | | 1.39 | | | | 1.39 | | | | 1.39 | | | | | | | | 8.23 | | | | 104.60 | | | $ | 169,248 | |
| | (0.06 | ) | | | 1.42 | | | | 1.42 | | | | 1.42 | | | | | | | | (2.01 | ) | | | 92.01 | | | $ | 220,897 | |
| | 0.07 | | | | 1.33 | | | | 1.33 | | | | 1.33 | | | | | | | | (4.46 | ) | | | 106.18 | | | $ | 508,044 | |
| | (0.06 | ) | | | 1.41 | | | | 1.41 | | | | 1.42 | | | | | | | | 30.16 | | | | 89.17 | | | $ | 580,194 | |
| | | | | | | |
| | | | | | | | | | | | | | | | | | | | | | | | | | | | | | |
| | | | | | | |
| | (1.12 | )(d) | | | 2.10 | (d) | | | 2.10 | (d) | | | 2.10 | (d) | | | | | | | 3.90 | | | | 13.95 | | | $ | 95,401 | |
| | (0.69 | ) | | | 2.15 | | | | 2.15 | | | | 2.16 | | | | | | | | 23.22 | | | | 60.88 | | | $ | 90,689 | |
| | (0.73 | ) | | | 2.15 | | | | 2.15 | | | | 2.15 | | | | | | | | 7.35 | | | | 104.60 | | | $ | 98,633 | |
| | (0.77 | ) | | | 2.20 | | | | 2.20 | | | | 2.20 | | | | | | | | (2.72 | ) | | | 92.01 | | | $ | 108,062 | |
| | (0.65 | ) | | | 2.09 | | | | 2.09 | | | | 2.09 | | | | | | | | (5.19 | ) | | | 106.18 | | | $ | 146,399 | |
| | (0.81 | ) | | | 2.15 | | | | 2.15 | | | | 2.17 | | | | | | | | 29.18 | | | | 89.17 | | | $ | 116,453 | |
| | | | | | | |
| | | | | | | | | | | | | | | | | | | | | | | | | | | | | | |
| | | | | | | |
| | 0.01 | (d) | | | 0.99 | (d) | | | 0.99 | (d) | | | 0.99 | (d) | | | | | | | 4.50 | | | | 13.95 | | | $ | 1,347,354 | |
| | 0.50 | | | | 0.99 | | | | 0.99 | | | | 1.03 | | | | | | | | 24.66 | | | | 60.88 | | | $ | 1,128,804 | |
| | 0.45 | | | | 0.99 | | | | 0.99 | | | | 1.00 | | | | | | | | 8.63 | | | | 104.60 | | | $ | 1,030,921 | |
| | 0.47 | | | | 0.99 | | | | 0.99 | | | | 1.01 | | | | | | | | (1.58 | ) | | | 92.01 | | | $ | 1,079,791 | |
| | 0.47 | | | | 0.98 | | | | 0.98 | | | | 0.98 | | | | | | | | (4.09 | ) | | | 106.18 | | | $ | 1,171,032 | |
| | 0.38 | | | | 0.99 | | | | 0.99 | | | | 1.04 | | | | | | | | 30.67 | | | | 89.17 | | | $ | 737,536 | |
| | | | | | | |
| | | | | | | | | | | | | | | | | | | | | | | | | | | | | | |
| | | | | | | |
| | (0.54 | )(d) | | | 1.50 | (d) | | | 1.50 | (d) | | | 1.98 | (d) | | | | | | | 4.18 | | | | 13.95 | | | $ | 9,747 | |
| | (0.03 | ) | | | 1.50 | | | | 1.50 | | | | 2.08 | | | | | | | | 24.07 | | | | 60.88 | | | $ | 10,525 | |
| | (0.02 | ) | | | 1.50 | | | | 1.50 | | | | 2.04 | | | | | | | | 8.03 | | | | 104.60 | | | $ | 13,086 | |
| | (0.13 | ) | | | 1.50 | | | | 1.50 | | | | 1.98 | | | | | | | | (2.03 | ) | | | 92.01 | | | $ | 15,851 | |
| | – | (f) | | | 1.50 | | | | 1.50 | | | | 1.86 | | | | | | | | (4.63 | ) | | | 106.18 | | | $ | 22,739 | |
| | (0.15 | ) | | | 1.50 | | | | 1.50 | | | | 2.01 | | | | | | | | 30.07 | | | | 89.17 | | | $ | 13,982 | |
| | | | | | | |
| | | | | | | | | | | | | | | | | | | | | | | | | | | | | | |
| | | | | | | |
| | (0.46 | )(d) | | | 1.39 | (d) | | | 1.39 | (d) | | | 2.09 | (d) | | | | | | | 4.25 | | | | 13.95 | | | $ | 14,440 | |
| | 0.07 | | | | 1.40 | | | | 1.40 | | | | 1.84 | | | | | | | | 24.19 | | | | 60.88 | | | $ | 17,200 | |
| | 0.04 | | | | 1.40 | | | | 1.40 | | | | 1.68 | | | | | | | | 8.17 | | | | 104.60 | | | $ | 40,999 | |
| | 0.10 | | | | 1.40 | | | | 1.40 | | | | 1.65 | | | | | | | | (1.97 | ) | | | 92.01 | | | $ | 38,038 | |
| | 0.04 | | | | 1.39 | | | | 1.39 | | | | 1.63 | | | | | | | | (4.53 | ) | | | 106.18 | | | $ | 38,575 | |
| | (0.04 | ) | | | 1.38 | | | | 1.38 | | | | 1.68 | | | | | | | | 30.25 | | | | 89.17 | | | $ | 26,441 | |
| | | | | | | |
| | | | | | | | | | | | | | | | | | | | | | | | | | | | | | |
| | | | | | | |
| | (0.01 | )(d) | | | 0.99 | (d) | | | 0.99 | (d) | | | 1.23 | (d) | | | | | | | 4.48 | | | | 13.95 | | | $ | 39,820 | |
| | 0.40 | | | | 0.99 | | | | 0.99 | | | | 1.28 | | | | | | | | 24.68 | | | | 60.88 | | | $ | 45,591 | |
| | 0.45 | | | | 0.99 | | | | 0.99 | | | | 1.21 | | | | | | | | 8.56 | | | | 104.60 | | | $ | 66,271 | |
| | 0.46 | | | | 0.99 | | | | 0.99 | | | | 1.20 | | | | | | | | (1.53 | ) | | | 92.01 | | | $ | 66,646 | |
| | 0.46 | | | | 0.99 | | | | 0.99 | | | | 1.18 | | | | | | | | (4.15 | ) | | | 106.18 | | | $ | 69,217 | |
| | 0.35 | | | | 0.99 | | | | 0.99 | | | | 1.22 | | | | | | | | 30.74 | | | | 89.17 | | | $ | 43,209 | |
| | | | | | | |
| | | | | | | | | | | | | | | | | | | | | | | | | | | | | | |
| | | | | | | |
| | 0.49 | (d) | | | 0.89 | (d) | | | 0.89 | (d) | | | 1.04 | (d) | | | | | | | 4.56 | | | | 13.95 | | | $ | 43,566 | |
| | 0.44 | | | | 0.89 | | | | 0.89 | | | | 1.03 | | | | | | | | 24.82 | | | | 60.88 | | | $ | 12,261 | |
| | 0.60 | | | | 0.89 | | | | 0.89 | | | | 1.34 | | | | | | | | 8.65 | | | | 104.60 | | | $ | 5,854 | |
| | 0.66 | | | | 0.89 | | | | 0.89 | | | | 1.43 | | | | | | | | (1.43 | ) | | | 92.01 | | | $ | 4,191 | |
| | 0.58 | | | | 0.89 | | | | 0.89 | | | | 1.34 | | | | | | | | (4.05 | ) | | | 106.18 | | | $ | 3,950 | |
| | 2.21 | (d) | | | 0.89 | (d) | | | 0.89 | (d) | | | 11.83 | (d)(i) | | | | | | | 20.01 | | | | 89.17 | | | $ | 2,553 | |
Semi-Annual Report | 25
Expense Example
Thornburg International Growth Fund | March 31, 2018 (Unaudited)
As a shareholder of the Fund, you incur two types of costs:
| | (1) | transaction costs, including |
| | (a) | sales charges (loads) on purchase payments, for Class A shares; |
| | (b) | a deferred sales charge on redemptions of any part or all of a purchase of $1 million of Class A shares within 12 months of purchase; |
| | (c) | a deferred sales charge on redemptions of Class C shares within 12 months of purchase; |
| | (2) | ongoing costs, including management fees; distribution and/or service (12b-1) fees; and other Fund expenses. This example is intended to help you understand your ongoing costs (in dollars) of investing in the Fund and to compare these costs with the ongoing costs of investing in other mutual funds. |
The example is based on a $1,000 investment beginning on October 1, 2017, and held until March 31, 2018.
ACTUAL EXPENSES
For each class of shares, the first line of the accompanying table provides information about actual account values and actual expenses. You may use the information in this line, together with the amount you invested, to estimate the expenses that you paid over the period. Simply divide your account value by $1,000 (for example, an $8,600 account value divided by $1,000 = 8.6), then multiply the result by the number in the first line for your class of shares under the heading entitled “Expenses Paid During Period” to estimate the expenses you paid on your account during this period.
| | | | | | | | | | | | | | | |
| | | BEGINNING ACCOUNT VALUE 10/1/17 | | ENDING ACCOUNT VALUE 3/31/18 | | EXPENSES PAID DURING PERIOD† 10/1/17–3/31/18 |
| | | |
| CLASS A SHARES | | | | | | | | | | | | | | | |
| | | |
Actual | | | $ | 1,000.00 | | | | $ | 1,042.70 | | | | $ | 6.88 | |
Hypothetical* | | | $ | 1,000.00 | | | | $ | 1,018.20 | | | | $ | 6.79 | |
| | | |
| CLASS C SHARES | | | | | | | | | | | | | | | |
| | | |
Actual | | | $ | 1,000.00 | | | | $ | 1,039.00 | | | | $ | 10.68 | |
Hypothetical* | | | $ | 1,000.00 | | | | $ | 1,014.46 | | | | $ | 10.55 | |
| | | |
| CLASS I SHARES | | | | | | | | | | | | | | | |
| | | |
Actual | | | $ | 1,000.00 | | | | $ | 1,045.00 | | | | $ | 5.05 | |
Hypothetical* | | | $ | 1,000.00 | | | | $ | 1,020.00 | | | | $ | 4.99 | |
| | | |
| CLASS R3 SHARES | | | | | | | | | | | | | | | |
| | | |
Actual | | | $ | 1,000.00 | | | | $ | 1,041.80 | | | | $ | 7.64 | |
Hypothetical* | | | $ | 1,000.00 | | | | $ | 1,017.45 | | | | $ | 7.54 | |
| | | |
| CLASS R4 SHARES | | | | | | | | | | | | | | | |
| | | |
Actual | | | $ | 1,000.00 | | | | $ | 1,042.50 | | | | $ | 7.08 | |
Hypothetical* | | | $ | 1,000.00 | | | | $ | 1,018.00 | | | | $ | 6.99 | |
| | | |
| CLASS R5 SHARES | | | | | | | | | | | | | | | |
| | | |
Actual | | | $ | 1,000.00 | | | | $ | 1,044.80 | | | | $ | 5.05 | |
Hypothetical* | | | $ | 1,000.00 | | | | $ | 1,020.00 | | | | $ | 4.99 | |
| | | |
| CLASS R6 SHARES | | | | | | | | | | | | | | | |
| | | |
Actual | | | $ | 1,000.00 | | | | $ | 1,045.60 | | | | $ | 4.54 | |
Hypothetical* | | | $ | 1,000.00 | | | | $ | 1,020.49 | | | | $ | 4.48 | |
| † | Expenses are equal to the annualized expense ratio for each class (A: 1.35%; C: 2.10%; I: 0.99%; R3: 1.50%; R4: 1.39%; R5: 0.99%; R6: 0.89%) multiplied by the average account value over the period, multiplied by 182/365 to reflect the one-half year period. |
| * | Hypothetical assumes a rate of return of 5% per year before expenses. |
HYPOTHETICAL EXAMPLE FOR COMPARISON PURPOSES
For each class of shares, the second line of the accompanying table provides information about hypothetical account values and hypothetical expenses based on the Fund’s actual expense ratio and an assumed rate of return of 5% per year before expenses, which is not the Fund’s actual return. The hypothetical account values and expenses may not be used to estimate the actual ending account balance or expenses you paid for the period. You may use this information to compare the ongoing costs of investing in the Fund and other funds. To do so, compare this 5% hypothetical example with the 5% hypothetical examples that appear in the shareholder reports of the other funds.
Please note that the expenses shown in the table are meant to highlight your ongoing costs only and do not reflect any transactional costs, such as sales charges (loads), redemption fees, or exchange fees. Therefore, the second line of the table for each class of shares is useful in comparing ongoing costs only, and will not help you determine the relative total costs of owning different funds. In addition, if these transactional costs were included, your costs would have been higher.
26 | Semi-Annual Report
Other Information
Thornburg International Growth Fund | March 31, 2018 (Unaudited)
PORTFOLIO PROXY VOTING
Policies and Procedures:
The Trust has delegated to Thornburg Investment Management, Inc. (the “Advisor”) voting decisions respecting proxies for the Fund’s voting securities. The Advisor makes voting decisions in accordance with its Proxy Voting Policy and Procedures. A description of the Policy and Procedures is available (i) without charge, upon request, by calling the Advisor toll-free at 1-800-847-0200, (ii) on the Thornburg website at www.thornburg.com, and (iii) on the Securities and Exchange Commission’s website at www.sec.gov.
Information regarding how proxies were voted is available on or before August 31 of each year for the twelve months ending the preceding June 30. This information is available (i) without charge, upon request by calling the Advisor toll-free at 1-800-847-0200, (ii) on the Thornburg website at www.thornburg.com, and (iii) on the Securities and Exchange Commission’s website at www.sec.gov.
AVAILABILITY OF QUARTERLY PORTFOLIO SCHEDULE
The Fund files with the Securities and Exchange Commission schedules of its portfolio holdings on Form N-Q for the first and third quarters of each fiscal year. The Fund’s Forms N-Q are available on the Commission’s website at www.sec.gov, or may be reviewed and copied at the Commission’s Public Reference Room in Washington, D.C. Information on the operation of the Public Reference Room may be obtained by calling 1-800-SEC-0330. The Fund also makes this information available on its website at www.thornburg.com/download or upon request by calling 1-800-847-0200.
Semi-Annual Report | 27
Trustees’ Statement to Shareholders
Readopted September 11, 2017
The Trustees believe current and prospective shareholders should know how we discharge our responsibilities in supervising the Funds’ investment advisor and in reviewing the advisor’s contract for renewal. Since 2005, we have issued a statement which sets out clearly the three principal guidelines that we follow in supervising the Trust’s investment advisor on your behalf. In accordance with our customary practice, in September of this year we again reviewed our statement and concluded we should reissue this statement outlining the principal features of our supervision of the advisor’s performance of investment management services for the Funds.
We begin with the premise that each shareholder selected his or her Fund because its investments are managed by the investment advisor identified in the prospectus and in accordance with the objective and policies described in the prospectus. We realize, as each of you do, that if you believe that your Fund’s stated objective and policies no longer serve your personal investment goals, you can sell your shares and leave the Fund.
Therefore, we believe that our primary supervisory task—our principal obligation to you—is to assess the nature and quality of the advisor’s services, and to confirm that the advisor actively and competently pursues the Fund’s objective, in accordance with the policies set out in the prospectus. To do this, we meet regularly with management to review your Fund’s portfolio and to discuss the advisor’s specific actions and judgments in pursuing the Fund’s objective. We do not substitute our own judgment for the advisor’s decisions in selecting investments; the advisor is paid to exercise its informed judgment on investment decisions, and we seek to confirm, in reviewing the advisor’s performance, that the advisor is doing just that.
Second, we are conscious of costs and the effect that costs have on shareholders’ returns. We try to make sure that your Fund’s fees and costs are reasonable in relationship to the services rendered and that they are generally in line with those charged by other expert investment advisors, consistent with our belief that the Fund’s investors searched for and expect that expertise and attention and have decided to pay a reasonable price for it. We do not put the management contract “out to bid” as a matter of course, and we would not do so unless we had concluded that the advisor materially had failed to pursue the Fund’s objectives in accordance with its policies, or for other equally important reasons. We believe that any other approach would be inconsistent with your interests and contrary to your expectations when you bought shares of the Fund in the first place.
Finally, because we believe that most Thornburg Fund shareholders have invested with a long-term perspective, we try not to focus too much on the fashions of the moment and on short-term performance. The market will not favor any specific investment objective or set of policies at all times and under all economic circumstances. A fund will experience periods of both high and low returns relative to other funds and other investments. Even if one of our Funds is not favored by the market at a particular time, we believe that the advisor is nonetheless obliged to remain true to the Fund’s objective and policies, and we watch to see that it does so.
Trustees of Thornburg Investment Trust
28 | Semi-Annual Report
Thornburg Funds
Thornburg Investment Management is a privately-owned global investment firm that offers a range of solutions for retail and institutional investors. Founded in 1982 and headquartered in Santa Fe, New Mexico, we manage approximately $49 billion (as of March 31, 2018) across U.S. mutual funds, separate accounts for high-net-worth investors, institutional accounts, and UCITS funds for non-U.S. investors.
EQUITY FUNDS
| | ∎ | | Thornburg Investment Income Builder Fund |
| | ∎ | | Thornburg Global Opportunities Fund |
| | ∎ | | Thornburg International Value Fund |
| | ∎ | | Thornburg Better World International Fund |
| | ∎ | | Thornburg International Growth Fund |
| | ∎ | | Thornburg Developing World Fund |
| | ∎ | | Thornburg Core Growth Fund |
FIXED INCOME FUNDS
| | ∎ | | Thornburg Low Duration Income Fund |
| | ∎ | | Thornburg Limited Term U.S. Government Fund |
| | ∎ | | Thornburg Limited Term Income Fund |
| | ∎ | | Thornburg Strategic Income Fund |
| | ∎ | | Thornburg Low Duration Municipal Fund |
| | ∎ | | Thornburg Limited Term Municipal Fund |
| | ∎ | | Thornburg Intermediate Municipal Fund |
| | ∎ | | Thornburg California Limited Term Municipal Fund |
| | ∎ | | Thornburg New Mexico Intermediate Municipal Fund |
| | ∎ | | Thornburg New York Intermediate Municipal Fund |
| | ∎ | | Thornburg Strategic Municipal Income Fund |
ALTERNATIVE FUNDS
| | ∎ | | Thornburg Long/Short Equity Fund |
Before investing, carefully consider the Fund’s investment goals, risks, charges, and expenses. For a prospectus or summary prospectus containing this and other information, contact your financial advisor or visit thornburg.com. Read it carefully before investing.
For additional information, please visit thornburg.com
Thornburg Investment Management, Inc. 2300 North Ridgetop Road, Santa Fe, NM 87506
Semi-Annual Report | 29
This page intentionally left blank.
30 | Semi-Annual Report
This page intentionally left blank.
Semi-Annual Report | 31
| | | | |
| To receive shareholder reports, prospectuses, and proxy statements electronically, go to www.thornburg.com/edelivery. | | | | |
| This Semi-Annual Report is submitted for the general information of shareholders of the Fund. It is not authorized for distribution to prospective investors in the Fund unless preceded or accompanied by an effective prospectus. | |
| | | | |
Investment Advisor: | | Distributor: | | |
Thornburg Investment Management® | | Thornburg Securities Corporation® | | |
800.847.0200 | | 800.847.0200 | | TH1409 |
Semi-Annual Report
March 31, 2018
THORNBURG
INVESTMENT
INCOME BUILDER
FUND
About Thornburg Investment Management
It’s more than what we do.
It’s how we do it.
At Thornburg, we are very different in how we think, invest, and are structured. We believe this difference is what makes us successful in helping individuals reach their long-term financial goals.
Flexible Perspective
Our perspective on investment opportunities is more flexible than most, viewing a wide range of opportunities beyond conventional boundaries to find hidden value.
Collaboration
Collectively, we hone ideas via borderless cross-pollination for better judgment and better results.
Portfolio Construction
Disciplined construction guided more by our convictions than convention.
CONVICTION
Thorough analysis and our relative-value framework lead to conviction in our securities selection.
UNCONVENTIONAL
Active management means we seek the best value for our clients rather than using conventional benchmarks as our starting point.
Structured for Excellence
How we think and how we invest is made possible by how we’re structured.
TEAM APPROACH
FAR FROM THE HERD
ACCESS & TRANSPARENCY
2 | Semi-Annual Report
Thornburg Investment Income Builder Fund
Semi-Annual Report ^ March 31, 2018
Table of Contents
| | | | | | | | | | |
| SHARE CLASS | | NASDAQ SYMBOL | | CUSIP |
| | |
| Class A | | TIBAX | | | | 885-215-558 | |
| Class C | | TIBCX | | | | 885-215-541 | |
| Class I | | TIBIX | | | | 885-215-467 | |
| Class R3 | | TIBRX | | | | 885-215-384 | |
| Class R4 | | TIBGX | | | | 885-215-186 | |
| Class R5 | | TIBMX | | | | 885-215-236 | |
| Class R6 | | TIBOX | | | | 885-216-663 | |
Class I, R3, R4, R5, and R6 shares may not be available to all investors. Minimum
investments for Class I shares may be higher than those for other classes.
Investments carry risks, including possible loss of principal. Additional risks may be associated with investments outside the United States, especially in emerging markets, including currency fluctuations, illiquidity, volatility, and political and economic risks. Investments in small- and mid-capitalization companies may increase the risk of greater price fluctuations. Portfolios investing in bonds have the same interest rate, inflation, and credit risks that are associated with the underlying bonds. The value of bonds will fluctuate relative to changes in interest rates, decreasing when interest rates rise. Please see the Fund’s prospectus for a discussion of the risks associated with an investment in the Fund. Investments in the Fund are not FDIC insured, nor are they deposits of or guaranteed by a bank or any other entity.
Semi-Annual Report | 3
Letter to Shareholders
Thornburg Investment Income Builder Fund | March 31, 2018 (Unaudited)
April 25, 2018
Dear Fellow Shareholders:
This letter will highlight the basic results of Thornburg Investment Income Builder Fund’s investment activities for the six-month period ended March 31, 2018. In addition, we will comment on the evolving investment landscape.
Thornburg Investment Income Builder Fund paid dividends of $0.512 per Class I share in the six months ended March 31, 2018, up 22% from the $0.419 per share paid in the comparable prior-year period. The dividends per share were lower on the Class A, C, R3, R4, and R5 shares, and higher for Class R6 shares, to account for varying class-specific expenses.
The net asset value of the Fund’s Class I shares declined by $0.29 per share during the six-month period, from $21.65 to $21.36, giving a total return including dividends of 0.99%. The Fund’s total return for the six-month period underperformed the blended index of 75% MSCI World Index/25% Bloomberg Barclays U.S Aggregate Bond Index total return of 2.89%. Performance relative to the blended index for all share classes over various periods is set forth on page 10.
The quarter ended March 31, 2018 was the 61st full calendar quarter since the inception of Thornburg Investment Income Builder in December 2002. In 45 of these quarters the Fund delivered a positive total return. Your Fund has delivered positive total returns in 13 of its 15 calendar years of existence. As of March 31, 2018, Thornburg Investment Income Builder has delivered tax efficient average annual total returns of more than 9.4% since its inception. The Fund’s dividends and net asset value increased at average annual rates of 4.5% and 3.6%, respectively, from 2003 to 2017.
We do not expect to pay any capital gain dividend for 2018. At March 31, 2018 the Fund had realized capital losses of more than $700 million, which may be carried forward to offset future capital gains to the extent permitted by regulations.
Dividend increases from your Fund’s equity portfolio holdings drove a majority of the year-over-year increase in the dividend paid by Thornburg Investment Income Builder. We were also helped by special dividends paid by CME Group and GE Baker Hughes, as well as by a positive translation effect for dividends paid by most of the Fund’s foreign equities (as foreign currencies strengthened against the U.S. dollar). We are optimistic that a significant majority of your Fund’s equities will pay higher regular dividends in their home currencies in 2018. However, it is too early to know if we will be able to capture special dividends this year.
In assessing the performance of Thornburg Investment Income Builder for the period under review, it is instructive to consider the performance in U.S. dollars of the sector components of the MSCI World Index over the six months ended March 31, 2018. The MSCI World Index comprises 75%, and the entire equity portion, of the Fund’s global performance benchmark (75% MSCI World Index and 25% Bloomberg Barclays U.S. Aggregate Bond Index):
| | 1. | The MSCI World Index showed a return of 4.15% for the six months ended March 31, 2018. Eight of eleven index sectors showed positive total returns, with individual sector returns ranging from 12% (information technology) to negative 4% (telecommunications). Only stocks in the consumer discretionary sector joined technology stocks in outperforming the index, an unusually narrow channel of relative outperformance. Stocks of firms in the utilities and health care sectors joined telecommunications sector stocks in delivering modest negative returns for the period, while stocks of firms in the other six sectors were modestly positive, on average. |
| | 2. | Income Builder Fund investments in firms in the following sectors comprised the largest average sector weightings in the Fund portfolio during the semi-annual period: |
| | • | | Financials (27% average equity weighting) |
| | • | | Telecommunications (17% average equity weighting) |
| | • | | Energy (13% average equity weighting) |
| | • | | Industrials (7% average equity weighting) |
| | • | | Health care (7% average equity weighting) |
| | • | | Information technology (7% average equity weighting) |
| | • | | Consumer staples (6% average equity weighting) |
| | • | | Consumer discretionary (5% average equity weighting) |
| | 3. | The Fund’s performance relative to the MSCI World Index was hurt by the comparatively large weight of our holdings in the telecommunications sector, the comparatively low weightings of our holdings in the information technology and consumer discretionary sectors (sectors with fewer companies paying attractive dividends), and the sluggish performance of our holdings in the consumer staples sector. The Fund’s performance was helped by comparative outperformance from our holdings in the financial sector. |
| | 4. | In the Income Builder portfolio, 27 equity investments contributed positive returns of at least .05% (five basis points) to the portfolio during the semi-annual period, considering both portfolio weights and individual security returns. Twenty one of the Fund’s equity investments contributed returns of negative 0.05% or worse for the period. Three of these were sold to fund other investments. |
Investment Income Builder’s bond holdings delivered breakeven returns during the semi-annual period.
Your Fund’s average return from equity investments in the financial sector exceeded the performance of the equities in the finance sector of the MSCI World Index in the semi-annual period. Fund investments in JPMorgan Chase, CME Group, DBS Group Holdings, Itau Unibanco Holding, Deutsche Boerse, and NN Group were among the strongest performers in the portfolio. HSBC Holdings, ING Groep, MFA Financial, and BNP Paribas each detracted from Fund performance. The
4 | Semi-Annual Report
Letter to Shareholders, Continued
Thornburg Investment Income Builder Fund | March 31, 2018 (Unaudited)
latter three holdings also contributed strongly to the Fund’s performance in the prior fiscal year, while HSBC was a recent addition.
Your Fund’s significant holdings in the telecommunications sector were the largest detractor from relative performance vis-á-vis the index. England’s BT Group, China Mobile, the Netherlands’ KPN, and AT&T each delivered negative returns, accounting for most of the drag. French multi-national Orange and Norway’s Telenor each delivered positive returns, but these were insufficient to offset the performance laggards. We see expanding consumer and business demand for digital communications around the world, using both wireless and terrestrial networks. Your Fund’s communications services firms face varied competitive and regulatory landscapes, and each of these pay interesting dividends. You can expect us to prioritize investments in those firms that we believe can grow their customer bases while managing operating expenses and capital budgets well enough to sustain and grow these dividends over time. In most geographies, there are a small number of competitors, relative to many other industries.
Among Income Builder’s investments in the energy sector, Royal Dutch Shell, refiner Valero Energy, multinational integrated energy firm Total, Russia’s Lukoil, and Italy’s ENI each made significant positive contributions to portfolio performance in the semi-annual period. The price of oil rose by approximately 21% over the six months, providing a tailwind to share prices and dividend payment capacity for virtually all your Fund’s energy sector investments. Global demand for oil and gas has increased, even as exploration and resource development budgets have been cut. We expect global oil prices to be sustained at levels that should allow producers to generate free cash flows in the coming quarters. Current oil prices could be at risk of declining if there were a notable increase in investments to sustain aging fields and develop new resources or if we were to see material improvements in new energy technologies.
The performance of Investment Income Builder’s holdings in the health care sector was disappointing during the semi-annual period. Novartis, AstraZeneca, Roche Holding, and Merck each generated negative returns that significantly lagged the overall market. The latter two of these delivered promising results for cancer fighting immuno-therapies in large-scale patient trials. Political rhetoric has turned against for-profit health care firms. We have modestly reduced your Fund’s investment exposure to this sector.
Your Fund’s investments in the information technology sector delivered strong returns, led by Taiwan Semiconductor, Advanced Semiconductor Engineering, Qualcomm, and Thailand’s optical fiber network provider Jasmine Broadband Infrastructure. Korea’s Samsung Electronics continued to deliver strong business results although its share price declined in the period under review. Most firms in the rapidly evolving technology sector do not pay interesting dividends, and consequently Thornburg Investment Income Builder has traditionally been underweight investments in firms from this sector.
Income Builder investments in firms in the industrials sector delivered only slightly positive returns during the period under review, although the companies maintained solid fundamental momentum. Traffic growth on our European toll road holdings (Vinci, Atlantia) was encouraging, as was passenger growth for our various airport operators (Ferrovial, Sydney Airport, AENA). Importantly, most of these investments have growing dividends.
Your Fund’s investments in the consumer discretionary sector lagged the performance of this sector in the index portfolio during the six-month period, mostly due to lower overall exposure to the sector. Home Depot, Las Vegas Sands, and vehicle manufacturer Daimler were solid positive contributors to portfolio performance. No investments from this group were significant detractors.
Income Builder investments in the consumer staples sector delivered disappointing performance for the semi-annual period. Share prices of Nestle Corporation, Walgreens Boots Alliance, and CVS Health each declined, and a modest positive contribution from Korea’s KT&G was insufficient to offset the negatives. We added to your Fund’s investments in Nestle and Walgreens after their share prices dropped sharply during the March quarter. We sold the investment in CVS Health following its announcement of an expensive proposal to acquire Aetna.
Among other portfolio holdings, notable contributors included European utilities Electricite de France and ENEL, chemicals producer LyondellBasell, miner Norilsk Nickel and cellular communications tower owner Crown Castle International. Negative contributors included Washington REIT and institutional real estate manager Colony NorthStar.
The value of the U.S. dollar generally declined by low single-digit percentages vis-á-vis major world currencies during semi-annual period. We hedged a majority of the currency exposure to the Australian dollar, Japanese yen, Chinese Yuan, the euro and other European currencies tied to the euro. Currency hedges hurt your Fund’s performance _relative_ to the MSCI World Index by approximately one percentage point during the period, since we did not fully participate in the appreciation of foreign currencies against the U.S. dollar. We are more focused on risk control than on reaping possible currency gains from exposure to assets denominated in these currencies.
Within its bond portfolio, Investment Income Builder owned significantly fewer U.S. government and agency bonds than the Bloomberg Barclays U.S. Aggregate Bond Index. Yields on U.S. government bonds with maturities between one and ten years rose by amounts ranging between 0.4% to 0.8% over the semi-annual period, with benchmark 10-year U.S. Treasury Note rates rising from 2.33% to 2.74%. The FINRA-Bloomberg Index of Active High Yield U.S. Corporate Bond Yields rose in line with government bonds by 0.62% during the fiscal period, from 5.39% to 5.97%. The Fund’s bond portfolio had an effective duration of approximately 4.4 years as of March 31, 2018.
Semi-Annual Report | 5
Letter to Shareholders, Continued
Thornburg Investment Income Builder Fund | March 31, 2018 (Unaudited)
Readers of this commentary who are long time shareholders of Income Builder will recall that the interest-bearing debt portion of the Fund’s portfolio has varied over time, ranging from around 9% currently to 45% at June 30, 2009.
| | | | |
| Chart I | | | | | Interest-Bearing Investments as a Percentage of Total Portfolio as of March 31, 2017 |
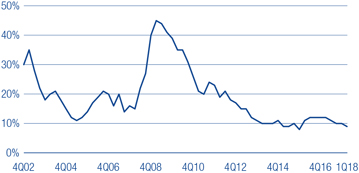
As of March 31st, the Fund portfolio included more than 80 bonds and hybrid securities.
Today, investors debate the future direction of the economies of China, Europe, various emerging markets, and the U.S. They consider potential policy actions by the U.S. Federal Reserve and other central banks, Congress, the Trump administration, and foreign government regulatory and policy actions, including trade policies. Many political and macroeconomic issues remain open, but people around the world will continue to buy goods and services and trade with one another. Importantly, overall global consumer spending is growing in 2018, along with global industrial production and global population. Most macroeconomic indicators around the world positively surprised in 2017 and the first quarter of 2018, with the U.S. a relative laggard.
Owing to strong recent results, aggregate earnings expectations for the MSCI All Country World Index for 2018 have improved in recent months, along with global economic growth expectations. Most firms held in Thornburg Investment Income Builder’s portfolio are also expected to deliver positive year-over-year growth in earnings and dividends in 2018. These positive trends continue to support a rotation of investor preferences from more defensive debt and equity assets to more economically sensitive assets, though with increasing debate around valuation and the expected duration of the global economic growth cycle. Following passage of significant changes to U.S. corporate and personal income tax laws, it appears that
political gridlock will prevail in Washington DC in 2018. The U.S. Federal Reserve has stepped up the pace of Federal Funds target rate hikes, moving the target from 0.75% to 1.75% over the last five quarters. In contrast, most major central banks around the world continue to pursue very easy monetary conditions, which artificially suppress interest rates.
While low interest rates are good news for borrowers, they have negative consequences for conservative savers. Interest income as a percentage of the aggregate adjusted gross income of U.S. households fell from 2.2% in 2009 to less than 0.7% in 2015, according to Statistics of Income published by the Internal Revenue Service.
Investors must consider other options. U.S. banks offer below-inflation yields on most deposits. A very large pool of investor dollars is looking for better returns elsewhere, but in sensible investments. We are optimistic that the types of income producing investments owned by the Thornburg Investment Income Builder Fund will experience sustainable popularity among investors as their intrinsic values for income production are recognized. A high percentage of investor funds belong to people over the age of 55, for whom income is an increasingly necessary and desirable attribute.
Thank you for being a shareholder of the Thornburg Investment Income Builder Fund. Remember that you can review descriptions of many of the stocks in your portfolio at your leisure by visiting our web site, www.thornburg.com/IIB. Best wishes for a wonderful summer.
Sincerely,
| | |
 | | |
| Brian McMahon | | Jason Brady,CFA |
| Portfolio Manager | | Portfolio Manager |
| Chief Investment Officer and Managing Director | | CEO, President, and Managing Director |

Ben Kirby,CFA
Portfolio Manager
Managing Director
The matters discussed in this report may constitute forward-looking statements made pursuant to the safe harbor provisions of the Securities Litigation Reform Act of 1995. These include any advisor or portfolio manager prediction, assessment, analysis or outlook for individual securities, industries, investment styles, market sectors and/or markets. These statements involve risks and uncertainties. In addition to the general risks described for each fund in its current prospectus, other factors bearing on these reports include the accuracy of the advisor’s or portfolio manager’s forecasts and predictions, the appropriateness of the investment strategies designed by the advisor or portfolio manager and the ability of the advisor or portfolio manager to implement their strategies efficiently and successfully. Any one or more of these factors, as well as other risks affecting the securities markets generally, could cause the actual results of any fund to differ materially as compared to its benchmarks.
The views expressed are subject to change and do not necessarily reflect the views of Thornburg Investment Management, Inc. This information should not be relied upon as a recommendation or investment advice and is not intended to predict the performance of any investment or market.
Performance results of individual share classes will vary based on the fees and expenses associated with each share class, and may be higher or lower than other share classes within the same Fund. Please see Performance Summary for performance results of each share class.
6 | Semi-Annual Report
This page intentionally left blank.
Semi-Annual Report | 7
The Dividend Landscape
Thornburg Investment Income Builder Fund | March 31, 2018
To appreciate the investment environment in which Thornburg Investment Income Builder Fund operates, you may wish to review these highlights of the “dividend landscape.”
The S&P 500 Index Payout Ratio — A Historical Perspective
The dividend payout ratio is a fraction that expresses dividend payments as a percentage of per-share earnings. As the economy slowed in the wake of the financial crisis, earnings-per-share on average declined, causing the payout ratio to spike, even as dividends paid by the S&P 500 portfolio declined. Earnings have since materially improved, bringing the payout ratio back in line with the overall trend in recent times.
Corporate Willingness to Pay Dividends is Key to the Fund’s Investment Process
The Russell 1000 Index includes approximately 1,000 public companies that are supposed to be generally representative of corporate America. Between 1980 and 1993, at least 75% of these firms paid some dividend. Between 1994 and 2001, the percentage of Russell 1000 companies paying dividends sank to just over 50%, indicating a preference towards reinvesting retained earnings in growth initiatives. Dividends returned to fashion between 2002 and 2008. A reduction in the number of Russell 1000 firms paying dividends followed the 2008 recession. However, from early 2010, the number steadily climbed back to around 70%.
Rising Dividend Payments Despite Decreasing Dividend Yields
Over time, the dollar dividend per unit of the S&P 500 Index has generally increased. Because the price of the index itself has increased even more, the yield on the S&P 500 Index, as a percentage of the current index price, has generally decreased in recent decades. You should note, however, that the dollar yield on an original investment made at a fixed point in time (say, 1970 or 1989) has increased, even without reinvestment of dividends.
S&P 500 Index Payout Ratio
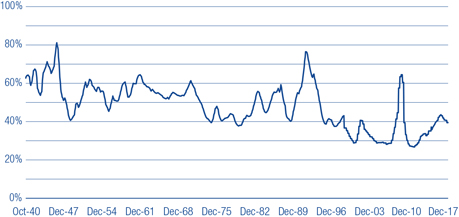
Source: Bloomberg, beginning in 1999 (uses operating earnings); “Irrational Exuberance”
by Robert J. Shiller, through 1998 (uses reported earnings).
Percentage of Companies Paying Dividends in Russell 1000 Index
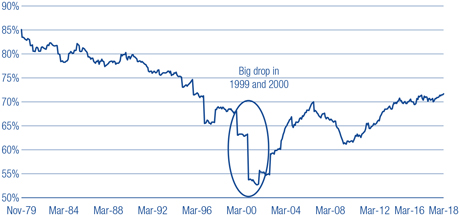
Source: CSFB Quantitative and Equity Derivatives Strategy, Baseline, and FactSet.
S&P 500 Index Average Yield vs. Annual Dividends from a Hypothetical $100,000 Investment (Dividends not Reinvested)
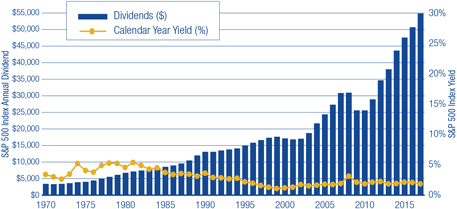
Source: Bloomberg and FactSet as of 12/31/17
Past performance does not guarantee future results.
8 | Semi-Annual Report
The Dividend Landscape, Continued
Thornburg Investment Income Builder Fund | March 31, 2018
The Top 100 Dividend Yields
| | | | | | | | | | |
| | | RUSSELL 1000
INDEX | | RUSSELL 2000
INDEX |
| Real Estate | | | | 45% | | | | | 33% | |
| Financials | | | | 14% | | | | | 29% | |
| Utilities | | | | 10% | | | | | 4% | |
| Consumer Discretionary | | | | 9% | | | | | 13% | |
| Energy | | | | 7% | | | | | 7% | |
| Consumer Staples | | | | 4% | | | | | 2% | |
| Industrials | | | | 3% | | | | | 5% | |
| Telecommunication Services | | | | 3% | | | | | 4% | |
| Information Technology | | | | 2% | | | | | 1% | |
| Materials | | | | 2% | | | | | 1% | |
| Health Care | | | | 1% | | | | | 1% | |
Source: FactSet as of March 31, 2018.
Estimated Average Dividend Yields (MSCI Indices) of Markets Around the Globe
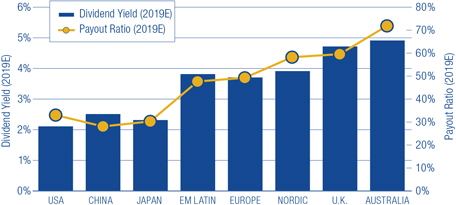
Source: Bloomberg as of March 31, 2018.
A Truly Diversified Dividend-Paying Portfolio Must Look Beyond the Obvious High-Yield Stocks!
In the (large cap) Russell 1000 Index, 59% of the top 100 dividend payers are in the real estate and financials sectors. In the (small cap) Russell 2000 Index, 62% of the top 100 dividend-yielding stocks are real estate or financials companies. To construct a diversified portfolio of attractive yielding stocks, one must look beyond these sectors. We certainly do.
Dividend yield is a ratio that shows how much a company pays out in dividends each year relative to its share price.
Global Diversification Can Improve the Portfolio Yield
Since firms outside the U.S. tend to pay higher dividends than U.S. firms, particularly outside the financial and utility sectors, we maintain the ability to diversify the Thornburg Investment Income Builder Fund into foreign dividend-paying stocks to try to take advantage of these opportunities.
Diversification does not assure or guarantee better performance and cannot eliminate the risk of investment losses.
Dividends are not guaranteed.
Semi-Annual Report | 9
Performance Summary
Thornburg Investment Income Builder Fund | March 31, 2018 (Unaudited)
AVERAGE ANNUAL TOTAL RETURNS
| | | | | | | | | | | | | | | | | | | | | | | | | |
| | | 1-YR | | 3-YR | | 5-YR | | 10-YR | | SINCE
INCEP. |
| | | | | |
Class A Shares (Incep: 12/24/02) | | | | | | | | | | | | | | | | | | | | | | | | | |
Without sales charge | | | | 7.98% | | | | | 3.91% | | | | | 5.53% | | | | | 5.77% | | | | | 9.41% | |
| | | | | |
With sales charge | | | | 3.11% | | | | | 2.32% | | | | | 4.56% | | | | | 5.28% | | | | | 9.08% | |
| | | | | |
Class C Shares (Incep: 12/24/02) | | | | | | | | | | | | | | | | | | | | | | | | | |
Without sales charge | | | | 7.22% | | | | | 3.16% | | | | | 4.77% | | | | | 5.04% | | | | | 8.73% | |
| | | | | |
With sales charge | | | | 6.22% | | | | | 3.16% | | | | | 4.77% | | | | | 5.04% | | | | | 8.73% | |
| | | | | |
Class I Shares (Incep: 11/3/03) | | | | 8.34% | | | | | 4.24% | | | | | 5.87% | | | | | 6.11% | | | | | 8.72% | |
| | | | | |
Class R3 Shares (Incep: 2/1/05) | | | | 7.65% | | | | | 3.57% | | | | | 5.20% | | | | | 5.48% | | | | | 7.15% | |
| | | | | |
Class R4 Shares (Incep: 2/1/08) | | | | 7.75% | | | | | 3.66% | | | | | 5.31% | | | | | 5.56% | | | | | 5.21% | |
| | | | | |
Class R5 Shares (Incep: 2/1/07) | | | | 8.20% | | | | | 4.11% | | | | | 5.74% | | | | | 6.00% | | | | | 6.00% | |
| | | | | |
Class R6 Shares (Incep: 4/10/17) | | | | - | | | | | - | | | | | - | | | | | - | | | | | 8.74% | |
| | | | | |
MSCI THE WORLD INDEX Net (USD) | | | | 13.59% | | | | | 7.97% | | | | | 9.70% | | | | | 5.90% | | | | | 8.57% | |
GROWTH OF A HYPOTHETICAL $10,000 INVESTMENT
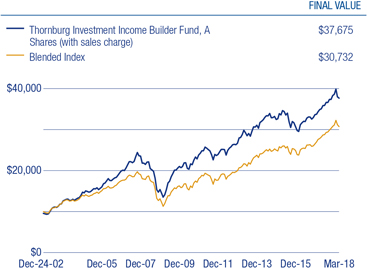
Performance data shown represents past performance and is no guarantee of future results. Investment return and principal value will fluctuate so shares, when redeemed, may be worth more or less than their original cost. Current performance may be lower or higher than quoted. For performance current to the most recent month end, visit thornburg.com or call 800-847-0200. The performance information does not reflect the deduction of taxes that a shareholder would pay on distributions or the redemption of Fund shares. Returns reflect the reinvestment of dividends and capital gains. Class A shares are sold with a maximum sales charge of 4.50%. Class C shares are subject to a 1% CDSC for the first year only. There is no sales charge for Class I, R3, R4, R5 and R6 shares.
As disclosed in the most recent prospectus, the total annual fund operating expenses before fee waivers and expense reimbursements are as follows: A shares, 1.35%; C shares, 2.10%; I shares, 1.09%; R3 shares, 1.72%; R4 shares, 1.67%; R5 shares, 1.32%; R6 shares, 1.32%. Thornburg Investment Management and/or Thornburg Securities Corporation have contractually agreed to waive fees and reimburse expenses through at least February 1, 2019, for some of the share classes, resulting in net expense ratios of the following: R3 shares, 1.70%; R4 shares, 1.60%; R5 shares, 1.19%; R6 shares, 1.00%. For more detailed information on fund expenses and waivers/reimbursements please see the Fund’s prospectus.
30-day SEC Yield as of 3/31/18 (A Shares): 2.95%
Glossary
The Bloomberg Barclays U.S. Aggregate Bond Index is composed of approximately 8,000 publicly traded bonds including U.S. government, mortgage-backed, corporate and Yankee bonds. The index is weighted by the market value of the bonds included in the index.
The FlNRA-Bloomberg Active High Yield U.S. Corporate Bond Index is comprised of the “active” (most frequently traded) fixed-coupon, high-yield bonds represented by FINRA TRACE, FINRA’s transaction reporting facility that disseminates all over-the-counter secondary market transactions in these public bonds.
The MSCI World Index is an unmanaged market-weighted index that consists of securities traded in 23 of the world’s most developed countries. Securities are listed on exchanges in the U.S., Europe, Canada, Australia, New Zealand, and the Far East. The index is calculated with net dividends reinvested in U.S. dollars.
The Russell 1000 Index measures the performance of the large-cap segment of the U.S. equity universe. It is a subset of the Russell 3000 Index and includes approximately 1,000 of the largest securities based on a combination of their market cap and current index membership. Source: Frank Russell Company.
The Russell 2000 Index measures the performance of the small-cap segment of the U.S. equity universe. The Russell 2000 Index is a subset of the Russell 3000 Index including approximately 2,000 of the smallest securities based on a combination of their market cap and current index membership. Source: Frank Russell Company.
The S&P 500 Index is an unmanaged broad measure of the U.S. stock market.
The MSCI country indices are free float-adjusted market capitalization indices that are designed to measure equity market performance in that specific country in U.S. dollars.
Thornburg Investment Income Builder Fund’s Blended Index is composed of 25% Bloomberg Barclays U.S. Aggregate Bond Index and 75% MSCI World Index, rebalanced monthly.
The performance of any index is not indicative of the performance of any particular investment. Unless otherwise noted, index returns reflect the reinvestment of income dividends and capital gains, if any, but do not reflect fees, brokerage commissions or other expenses of investing. Investors may not make direct investments into any index.
Yield Spread – The difference between yields on differing debt instruments, calculated by deducting the yield of one instrument from another.
Effective Duration – A bond’s sensitivity to interest rates, incorporating the embedded option features, such as call provisions. Bonds with longer durations experience greater price volatility than bonds with shorter durations.
10 | Semi-Annual Report
Fund Summary
Thornburg Investment Income Builder Fund | March 31, 2018 (Unaudited)
OBJECTIVES AND STRATEGIES
The Fund seeks to provide a level of current income which exceeds the average yield on U.S. stocks generally, and which will generally grow, subject to periodic fluctuations, over the years on a per share basis. The Fund’s secondary investment objective is long-term capital appreciation.
The Fund may invest in any domestic or foreign equity or debt security which Thornburg Investment Management believes may assist the Fund in pursuing its investment goals, although the Fund expects that equity securities in its portfolio will normally be weighted in favor of companies that pay dividends or other current income.
PORTFOLIO COMPOSITION
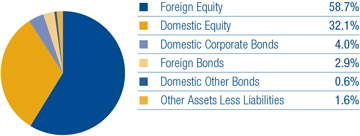
TOP TEN EQUITY HOLDINGS
| | | | | |
| CME Group, Inc. | | | | 3.9% | �� |
| China Mobile Ltd. | | | | 3.5% | |
| Royal Dutch Shell plc | | | | 3.5% | |
| JPMorgan Chase & Co. | | | | 3.1% | |
| Roche Holding AG | | | | 2.9% | |
| Orange S.A. | | | | 2.8% | |
| NN Group N.V. | | | | 2.7% | |
| Electricite de France S.A. | | | | 2.6% | |
| Taiwan Semiconductor Manufacturing Co. Ltd. | | | | 2.6% | |
| The Home Depot, Inc. | | | | 2.2% | |
SECTOR EXPOSURE
(percent of equity holdings)
| | | | | |
| Financials | | | | 28.0% | |
| Telecommunication Services | | | | 14.5% | |
| Energy | | | | 12.3% | |
| Health Care | | | | 8.5% | |
| Industrials | | | | 7.0% | |
| Consumer Staples | | | | 6.5% | |
| Information Technology | | | | 6.2% | |
| Consumer Discretionary | | | | 5.7% | |
| Utilities | | | | 3.8% | |
| Real Estate | | | | 3.5% | |
| Materials | | | | 3.1% | |
| Other | | | | 0.5% | |
| Financials | | | | 0.2% | |
| Energy | | | | 0.1% | |
| Telecommunication Services | | | | 0.1% | |
COUNTRY EXPOSURE*
(percent of Fund)
| | | | | |
| United States | | | | 36.8% | |
| France | | | | 10.8% | |
| Netherlands | | | | 9.0% | |
| Switzerland | | | | 8.8% | |
| United Kingdom | | | | 6.6% | |
| Italy | | | | 5.0% | |
| China | | | | 3.6% | |
| Taiwan | | | | 3.2% | |
| South Korea | | | | 2.4% | |
| Germany | | | | 2.2% | |
| Russian Federation | | | | 1.7% | |
| Spain | | | | 1.3% | |
| Hong Kong | | | | 1.2% | |
| Canada | | | | 1.0% | |
| Sweden | | | | 0.8% | |
| Australia | | | | 0.7% | |
| South Africa | | | | 0.7% | |
| Norway | | | | 0.5% | |
| Thailand | | | | 0.4% | |
| Jamaica | | | | 0.3% | |
| Cayman Islands | | | | 0.3% | |
| Singapore | | | | 0.2% | |
| Brazil | | | | 0.2% | |
| Colombia | | | | 0.2% | |
| Trinidad And Tobago | | | | 0.1% | |
| Ireland | | | | 0.1% | |
| Japan | | | | 0.1% | |
| Belgium | | | | 0.1% | |
| Chile | | | | 0.1% | |
| Panama | | | | 0.0% | ** |
| Other Assets Less Liabilities | | | | 1.6% | |
| * | Holdings are classified by country of risk as determined by MSCI and Bloomberg. |
| ** | Country percentage was less than 0.1%. |
There is no guarantee that the Fund will meet its investment objectives.
All data is subject to change. Charts may not add up to 100% due to rounding.
Semi-Annual Report | 11
Fund Summary, Continued
Thornburg Investment Income Builder Fund | March 31, 2018 (Unaudited)
QUARTERLY DIVIDEND HISTORY, CLASS A
| | | | | | | | | | | | | | | | | | | | |
| YEAR | | Q1 | | | Q2 | | | Q3 | | | Q4 | | | TOTAL | |
| 2003 | | | 9.2¢ | | | | 11.2¢ | | | | 12.4¢ | | | | 17.5¢ | | | | 50.3¢ | |
| 2004 | | | 10.2¢ | | | | 12.5¢ | | | | 15.0¢ | | | | 21.8¢ | | | | 59.5¢ | |
| 2005 | | | 11.0¢ | | | | 13.6¢ | | | | 17.4¢ | | | | 29.0¢ | | | | 71.0¢ | |
| 2006 | | | 12.5¢ | | | | 16.0¢ | | | | 19.2¢ | | | | 33.0¢ | | | | 80.7¢ | |
| 2007 | | | 14.2¢ | | | | 18.5¢ | | | | 21.5¢ | | | | 36.8¢ | | | | 91.0¢ | |
| 2008 | | | 17.9¢ | | | | 21.8¢ | | | | 26.0¢ | | | | 36.8¢ | | | | 102.5¢ | |
| 2009 | | | 18.0¢ | | | | 24.2¢ | | | | 28.0¢ | | | | 34.5¢ | | | | 104.7¢ | |
| 2010 | | | 19.8¢ | | | | 25.0¢ | | | | 32.0¢ | | | | 36.0¢ | | | | 112.8¢ | |
| 2011 | | | 21.0¢ | | | | 26.0¢ | | | | 32.0¢ | | | | 37.5¢ | | | | 116.5¢ | |
| 2012 | | | 21.5¢ | | | | 26.0¢ | | | | 28.5¢ | | | | 36.0¢ | | | | 112.0¢ | |
| 2013 | | | 21.5¢ | | | | 25.3¢ | | | | 25.0¢ | | | | 24.5¢ | | | | 96.3¢ | |
| 2014 | | | 22.5¢ | | | | 24.0¢ | | | | 27.0¢ | | | | 26.0¢ | | | | 99.5¢ | |
| 2015 | | | 16.5¢ | | | | 20.0¢ | | | | 20.0¢ | | | | 25.3¢ | | | | 81.8¢ | |
| 2016 | | | 17.0¢ | | | | 18.5¢ | | | | 19.5¢ | | | | 21.5¢ | | | | 76.5¢ | |
| 2017 | | | 17.0¢ | | | | 20.0¢ | | | | 26.0¢ | | | | 29.5¢ | | | | 92.5¢ | |
| 2018 | | | 18.0¢ | | | | | | | | | | | | | | | | | |
We do not expect each sequential quarter’s dividend to increase over that of the prior quarter, since dividend payments outside the United States tend to be seasonal. Rather, the Fund aspires to increase the dividend paid on an annual basis.
12 | Semi-Annual Report
Fund Summary, Continued
Thornburg Investment Income Builder Fund | March 31, 2018 (Unaudited)
EVOLUTION OF INDUSTRY GROUP EXPOSURE
Top 10 industry groups quarter by quarter (percent of equity holdings)
As of 3/31/2018
| | | | | |
| Telecommunication Services | | | | 14.5% | |
| [INDUSTRY]Diversified Financials | | | | 13.6% | |
| [INDUSTRY]Energy | | | | 12.5% | |
| Banks | | | | 9.2% | |
| Pharmaceuticals, Biotechnology & Life Sciences | | | | 8.5% | |
| [INDUSTRY]Semiconductors & Semiconductor Equipment | | | | 5.4% | |
| [INDUSTRY]Insurance | | | | 5.2% | |
| [INDUSTRY]Food, Beverage & Tobacco | | | | 4.7% | |
| [INDUSTRY]Capital Goods | | | | 4.1% | |
| Utilities | | | | 3.8% | |
As of 9/30/2017
| | | | | |
| Telecommunication Services | | | | 19.5% | |
| Diversified Financials | | | | 12.9% | |
| Energy | | | | 12.0% | |
| Banks | | | | 9.1% | |
| Pharma, Biotech & Life Sciences | | | | 6.9% | |
| Semiconductors & Equipment | | | | 4.9% | |
| Insurance | | | | 4.8% | |
| Utilities | | | | 4.4% | |
| Transportation | | | | 3.8% | |
| Food & Staples Retailing | | | | 3.7% | |
As of 12/31/2017
| | | | |
| Telecommunication Services | | | 18.3% | |
| Energy | | | 13.0% | |
| Diversified Financials | | | 12.5% | |
| Banks | | | 9.5% | |
| Pharma, Biotech & Life Sciences | | | 6.7% | |
| Semiconductors & Equipment | | | 5.5% | |
| Insurance | | | 4.4% | |
| Utilities | | | 4.2% | |
| Food, Beverage & Tobacco | | | 4.1% | |
| Real Estate | | | 3.6% | |
As of 6/30/2017
| | | | |
| Telecommunication Services | | | 19.8% | |
| Diversified Financials | | | 13.4% | |
| Energy | | | 10.7% | |
| Banks | | | 10.3% | |
| Pharma, Biotech & Life Sciences | | | 6.7% | |
| Insurance | | | 4.7% | |
| Semiconductors & Equipment | | | 4.4% | |
| Utilities | | | 4.0% | |
| Food & Staples Retailing | | | 3.9% | |
| Transportation | | | 3.8% | |
Semi-Annual Report | 13
Schedule of Investments
Thornburg Investment Income Builder Fund | March 31, 2018 (Unaudited)
| | | | | | | | | | | | |
| | | | | SHARES/
PRINCIPAL AMOUNT | | VALUE |
| | | |
| | COMMON STOCK — 90.4% | | | | | | | | | | |
| | | |
| | AUTOMOBILES & COMPONENTS — 1.1% | | | | | | | | | | |
| | Automobiles — 1.1% | | | | | | | | | | |
| a | | Daimler AG | | | | 2,068,003 | | | | $ | 175,499,245 | |
| | | | | | | | | | | | |
| | | | | | | | | | | 175,499,245 | |
| | | | | | | | | | | | |
| | BANKS — 8.3% | | | | | | | | | | |
| | Banks — 8.3% | | | | | | | | | | |
| | BNP Paribas S.A. | | | | 3,598,572 | | | | | 266,424,445 | |
| | DBS Group Holdings Ltd. | | | | 1,810,200 | | | | | 37,967,052 | |
| | HSBC Holdings plc | | | | 15,005,301 | | | | | 141,484,589 | |
| | ING Groep N.V. | | | | 14,400,300 | | | | | 242,748,172 | |
| | JPMorgan Chase & Co. | | | | 4,325,000 | | | | | 475,620,250 | |
| | Swedbank AB Class A | | | | 5,201,400 | | | | | 116,489,233 | |
| | | | | | | | | | | | |
| | | | | | | | | | | 1,280,733,741 | |
| | | | | | | | | | | | |
| | CAPITAL GOODS — 4.2% | | | | | | | | | | |
| | Aerospace & Defense — 0.7% | | | | | | | | | | |
| | BAE Systems plc | | | | 13,259,400 | | | | | 108,157,540 | |
| | Construction & Engineering — 1.5% | | | | | | | | | | |
| | Ferrovial S.A. | | | | 3,068,600 | | | | | 64,055,733 | |
| | Vinci S.A. | | | | 1,713,219 | | | | | 168,431,581 | |
| | Electrical Equipment — 0.5% | | | | | | | | | | |
| | ABB Ltd. | | | | 2,990,200 | | | | | 71,064,167 | |
| | Industrial Conglomerates — 1.5% | | | | | | | | | | |
| | Hopewell Holdings Ltd. | | | | 30,726,340 | | | | | 117,844,694 | |
| | Jasmine Broadband Internet Infrastructure Fund | | | | 177,442,000 | | | | | 66,391,794 | |
| | NWS Holdings Ltd. | | | | 25,000,000 | | | | | 45,361,008 | |
| | | | | | | | | | | | |
| | | | | | | | | | | 641,306,517 | |
| | | | | | | | | | | | |
| | CONSUMER SERVICES — 1.9% | | | | | | | | | | |
| | Hotels, Restaurants & Leisure — 1.9% | | | | | | | | | | |
| | Las Vegas Sands Corp. | | | | 3,840,712 | | | | | 276,147,193 | |
| | Sands China Ltd. | | | | 3,897,200 | | | | | 20,955,491 | |
| | | | | | | | | | | | |
| | | | | | | | | | | 297,102,684 | |
| | | | | | | | | | | | |
| | DIVERSIFIED FINANCIALS — 12.4% | | | | | | | | | | |
| | Capital Markets — 9.8% | | | | | | | | | | |
| b | | Apollo Investment Corp. | | | | 24,368,156 | | | | | 127,201,774 | |
| | Ares Capital Corp. | | | | 15,132,345 | | | | | 240,150,315 | |
| | CME Group, Inc. | | | | 3,736,541 | | | | | 604,348,141 | |
| | Deutsche Boerse AG | | | | 974,200 | | | | | 132,576,673 | |
| b | | Solar Capital Ltd. | | | | 4,607,900 | | | | | 93,586,449 | |
| | UBS Group AG | | | | 17,095,972 | | | | | 300,341,893 | |
| | Mortgage Real Estate Investment Trusts — 2.6% | | | | | | | | | | |
| | Chimera Investment Corp. | | | | 6,750,000 | | | | | 117,517,500 | |
| | Granite Point Mortgage Trust, Inc. | | | | 1,417,500 | | | | | 23,445,450 | |
| b | | MFA Financial, Inc. | | | | 34,220,151 | | | | | 257,677,737 | |
| | | | | | | | | | | | |
| | | | | | | | | | | 1,896,845,932 | |
| | | | | | | | | | | | |
| | ENERGY — 11.2% | | | | | | | | | | |
| | Oil, Gas & Consumable Fuels — 11.2% | | | | | | | | | | |
| | Eni S.p.A. | | | | 16,927,752 | | | | | 297,601,141 | |
| | LUKOIL PJSC Sponored ADR | | | | 721,500 | | | | | 49,942,230 | |
| a,c,d | | Malamute Energy, Inc. | | | | 12,439 | | | | | 130,610 | |
| | ONEOK, Inc. | | | | 4,209,400 | | | | | 239,599,048 | |
| | Royal Dutch Shell plc ADR Class A | | | | 8,343,000 | | | | | 532,366,830 | |
| | Suncor Energy, Inc. | | | | 3,900,000 | | | | | 134,676,912 | |
| | TOTAL S.A. | | | | 5,149,300 | | | | | 292,277,586 | |
| | Valero Energy Corp. | | | | 1,898,272 | | | | | 176,102,693 | |
| | | | | | | | | | | | |
| | | | | | | | | | | 1,722,697,050 | |
| | | | | | | | | | | | |
14 | Semi-Annual Report
Schedule of Investments, Continued
Thornburg Investment Income Builder Fund | March 31, 2018 (Unaudited)
| | | | | | | | | | | | |
| | | | | SHARES/
PRINCIPAL AMOUNT | | VALUE |
| | FOOD & STAPLES RETAILING — 1.6% | | | | | | | | | | |
| | Food & Staples Retailing — 1.6% | | | | | | | | | | |
| | Walgreens Boots Alliance, Inc. | | | | 3,821,906 | | | | $ | 250,220,186 | |
| | | | | | | | | | | | |
| | | | | | | | | | | 250,220,186 | |
| | | | | | | | | | | | |
| | FOOD, BEVERAGE & TOBACCO — 4.3% | | | | | | | | | | |
| | Food Products — 1.7% | | | | | | | | | | |
| | Nestle S.A. | | | | 3,184,200 | | | | | 251,871,552 | |
| | Tobacco — 2.6% | | | | | | | | | | |
| | British American Tobacco plc | | | | 2,409,700 | | | | | 139,661,298 | |
| | KT&G Corp. | | | | 2,808,000 | | | | | 263,439,347 | |
| | | | | | | | | | | | |
| | | | | | | | | | | 654,972,197 | |
| | | | | | | | | | | | |
| | INSURANCE — 4.7% | | | | | | | | | | |
| | Insurance — 4.7% | | | | | | | | | | |
| | Assicurazioni Generali S.p.A. | | | | 2,197,747 | | | | | 42,253,392 | |
| | AXA S.A. | | | | 2,861,900 | | | | | 76,062,758 | |
| | Gjensidige Forsikring ASA | | | | 4,110,476 | | | | | 75,300,346 | |
| | Legal & General Group plc | | | | 32,707,000 | | | | | 118,299,123 | |
| | NN Group N.V. | | | | 9,304,300 | | | | | 412,602,970 | |
| | | | | | | | | | | | |
| | | | | | | | | | | 724,518,589 | |
| | | | | | | | | | | | |
| | MATERIALS — 2.8% | | | | | | | | | | |
| | Chemicals — 1.2% | | | | | | | | | | |
| | LyondellBasell Industries N.V. Class A | | | | 1,715,000 | | | | | 181,241,200 | |
| | Metals & Mining — 1.6% | | | | | | | | | | |
| | Glencore plc | | | | 7,458,900 | | | | | 37,024,612 | |
| | MMC Norilsk Nickel PJSC ADR | | | | 11,359,000 | | | | | 211,218,700 | |
| | | | | | | | | | | | |
| | | | | | | | | | | 429,484,512 | |
| | | | | | | | | | | | |
| | PHARMACEUTICALS, BIOTECHNOLOGY & LIFE SCIENCES — 7.7% | | | | | | | | | | |
| | Pharmaceuticals — 7.7% | | | | | | | | | | |
| | AstraZeneca plc | | | | 1,704,300 | | | | | 117,057,973 | |
| | Merck & Co., Inc. | | | | 4,643,625 | | | | | 252,938,254 | |
| | Novartis AG | | | | 3,532,900 | | | | | 285,514,492 | |
| | Pfizer, Inc. | | | | 2,502,048 | | | | | 88,797,683 | |
| | Roche Holding AG | | | | 1,917,400 | | | | | 439,437,594 | |
| | | | | | | | | | | | |
| | | | | | | | | | | 1,183,745,996 | |
| | | | | | | | | | | | |
| | REAL ESTATE — 3.2% | | | | | | | | | | |
| | Equity Real Estate Investment Trusts — 3.2% | | | | | | | | | | |
| | Colony NorthStar, Inc. Class A | | | | 7,462,000 | | | | | 41,936,440 | |
| | Crown Castle International Corp. | | | | 1,996,101 | | | | | 218,792,630 | |
| | Lamar Advertising Co. Class A | | | | 1,621,351 | | | | | 103,215,205 | |
| | Outfront Media, Inc. | | | | 2,315,000 | | | | | 43,383,100 | |
| | Washington Real Estate Investment Trust | | | | 2,973,840 | | | | | 81,185,832 | |
| | | | | | | | | | | | |
| | | | | | | | | | | 488,513,207 | |
| | | | | | | | | | | | |
| | RETAILING — 2.2% | | | | | | | | | | |
| | Specialty Retail — 2.2% | | | | | | | | | | |
| | Home Depot, Inc. | | | | 1,856,181 | | | | | 330,845,701 | |
| | | | | | | | | | | | |
| | | | | | | | | | | 330,845,701 | |
| | | | | | | | | | | | |
| | SEMICONDUCTORS & SEMICONDUCTOR EQUIPMENT — 4.9% | | | | | | | | | | |
| | Semiconductors & Semiconductor Equipment — 4.9% | | | | | | | | | | |
| | Advanced Semiconductor Engineering, Inc. | | | | 60,164,954 | | | | | 86,975,780 | |
| | QUALCOMM, Inc. | | | | 4,900,000 | | | | | 271,509,000 | |
| | Taiwan Semiconductor Manufacturing Co., Ltd. | | | | 47,908,000 | | | | | 400,917,515 | |
| | | | | | | | | | | | |
| | | | | | | | | | | 759,402,295 | |
| | | | | | | | | | | | |
Semi-Annual Report | 15
Schedule of Investments, Continued
Thornburg Investment Income Builder Fund | March 31, 2018 (Unaudited)
| | | | | | | | | | | | |
| | | | | SHARES/
PRINCIPAL AMOUNT | | VALUE |
| | TECHNOLOGY HARDWARE & EQUIPMENT — 0.7% | | | | | | | | | | |
| | Technology Hardware, Storage & Peripherals — 0.7% | | | | | | | | | | |
| | Samsung Electronics Co., Ltd. | | | | 46,073 | | | | $ | 105,986,486 | |
| | | | | | | | | | | | |
| | | | | | | | | | | 105,986,486 | |
| | | | | | | | | | | | |
| | TELECOMMUNICATION SERVICES — 13.1% | | | | | | | | | | |
| | Diversified Telecommunication Services — 7.7% | | | | | | | | | | |
| | AT&T, Inc. | | | | 8,947,800 | | | | | 318,989,070 | |
| | BT Group plc | | | | 53,616,284 | | | | | 171,133,886 | |
| | CenturyLink, Inc. | | | | 4,581,493 | | | | | 75,273,930 | |
| | Koninklijke KPN N.V. | | | | 63,810,100 | | | | | 191,341,342 | |
| | Orange S.A. | | | | 25,239,780 | | | | | 428,110,814 | |
| | Wireless Telecommunication Services — 5.4% | | | | | | | | | | |
| | China Mobile Ltd. | | | | 59,425,774 | | | | | 544,801,570 | |
| | MTN Group Ltd. | | | | 10,443,786 | | | | | 104,995,832 | |
| | Vodafone Group plc | | | | 67,090,424 | | | | | 182,815,235 | |
| | | | | | | | | | | | |
| | | | | | | | | | | 2,017,461,679 | |
| | | | | | | | | | | | |
| | TRANSPORTATION — 2.6% | | | | | | | | | | |
| | Transportation Infrastructure — 2.6% | | | | | | | | | | |
| e | | Aena SME S.A. | | | | 152,400 | | | | | 30,687,735 | |
| | Atlantia S.p.A. | | | | 9,804,878 | | | | | 303,419,890 | |
| | Sydney Airport | | | | 12,791,554 | | | | | 65,922,729 | |
| | | | | | | | | | | | |
| | | | | | | | | | | 400,030,354 | |
| | | | | | | | | | | | |
| | UTILITIES — 3.5% | | | | | | | | | | |
| | Electric Utilities — 3.5% | | | | | | | | | | |
| | Electricite de France S.A. | | | | 27,824,658 | | | | | 402,625,260 | |
| | Enel S.p.A. | | | | 21,090,971 | | | | | 128,978,353 | |
| | | | | | | | | | | | |
| | | | | | | | | | | 531,603,613 | |
| | | | | | | | | | | | |
| | TOTAL COMMON STOCK (Cost $11,717,982,912) | | | | | | | | | 13,890,969,984 | |
| | | | | | | | | | | | |
| | | |
| | PREFERRED STOCK — 0.4% | | | | | | | | | | |
| | | |
| | BANKS — 0.1% | | | | | | | | | | |
| | Banks — 0.1% | | | | | | | | | | |
| f,g | | First Tennessee Bank N.A. 3.75% (LIBOR 3 Month + 0.85%) | | | | 12,000 | | | | | 9,360,000 | |
| | | | | | | | | | | | |
| | | | | | | | | | | 9,360,000 | |
| | | | | | | | | | | | |
| | DIVERSIFIED FINANCIALS — 0.0% | | | | | | | | | | |
| | Capital Markets — 0.0% | | | | | | | | | | |
| g | | Morgan Stanley Series A 4.00% (LIBOR 3 Month + 0.70%) | | | | 120,000 | | | | | 2,734,800 | |
| | | | | | | | | | | | |
| | | | | | | | | | | 2,734,800 | |
| | | | | | | | | | | | |
| | ENERGY — 0.1% | | | | | | | | | | |
| | Oil, Gas & Consumable Fuels — 0.1% | | | | | | | | | | |
| d | | Crestwood Equity Partners LP, 9.25% | | | | 2,166,596 | | | | | 20,560,996 | |
| | | | | | | | | | | | |
| | | | | | | | | | | 20,560,996 | |
| | | | | | | | | | | | |
| | MISCELLANEOUS — 0.1% | | | | | | | | | | |
| | U.S. Government Agencies — 0.1% | | | | | | | | | | |
| | Farm Credit Bank of Texas, Series 1, 10.00% | | | | 9,000 | | | | | 10,575,000 | |
| | | | | | | | | | | | |
| | | | | | | | | | | 10,575,000 | |
| | | | | | | | | | | | |
| | TELECOMMUNICATION SERVICES — 0.1% | | | | | | | | | | |
| | Diversified Telecommunication Services — 0.1% | | | | | | | | | | |
| f | | Centaur Funding Corp., 9.08%, 4/21/2020 | | | | 15,000 | | | | | 16,874,942 | |
| | | | | | | | | | | | |
| | | | | | | | | | | 16,874,942 | |
| | | | | | | | | | | | |
| | TOTAL PREFERRED STOCK (Cost $60,828,706) | | | | | | | | | 60,105,738 | |
| | | | | | | | | | | | |
16 | Semi-Annual Report
Schedule of Investments, Continued
Thornburg Investment Income Builder Fund | March 31, 2018 (Unaudited)
| | | | | | | | | | | | |
| | | | | SHARES/
PRINCIPAL AMOUNT | | VALUE |
| | | |
| | ASSET BACKED SECURITIES — 0.3% | | | | | | | | | | |
| | COMMERCIAL MTG TRUST — 0.0% | | | | | | | | | | |
| h | | Citigroup Mortgage Loan Trust, Inc. CMO, Series 2004-HYB2 Class B1, 3.848%, 3/25/2034 | | | $ | 504,028 | | | | $ | 414,117 | |
| e,g | | CSMC Trust, Series 2016-BDWN Class E, 13.277% (LIBOR 1 Month + 11.50%), 2/15/2029 | | | | 2,000,000 | | | | | 2,009,915 | |
| | | | | | | | | | | | |
| | | | | | | | | | | 2,424,032 | |
| | | | | | | | | | | | |
| | OTHER ASSET BACKED — 0.2% | | | | | | | | | | |
| e | | CFG Investments Ltd., Series 2017-1 Class A, 7.87%, 11/15/2026 | | | | 26,000,000 | | | | | 27,132,799 | |
| f | | Fairway Outdoor Funding, LLC, Series 2012-1A Class B, 8.835%, 10/15/2042 | | | | 7,000,000 | | | | | 7,325,123 | |
| f | | JPR Royalty Sub, LLC, 14.00%, 9/1/2020 | | | | 5,000,000 | | | | | 2,500,000 | |
| d,f,g | | Northwind Holdings, LLC, Series 2007-1A Class A1, 2.786% (LIBOR 3 Month + 0.78%), 12/1/2037 | | | | 1,618,750 | | | | | 1,552,381 | |
| | | | | | | | | | | | |
| | | | | | | | | | | 38,510,303 | |
| | | | | | | | | | | | |
| | RESIDENTIAL MTG TRUST — 0.1% | | | | | | | | | | |
| h | | Bear Stearns ARM Trust CMO, Series 2003-6 Class 2B1, 3.373%, 8/25/2033 | | | | 97,246 | | | | | 97,961 | |
| g | | FBR Securitization Trust Series 2005-2 Class M1 2.592% (LIBOR 1 Month + 0.72%), 9/25/2035 | | | | 3,729,314 | | | | | 3,740,143 | |
| h | | Merrill Lynch Mortgage Investors Trust Series MLMI CMO, Series 2004-A4 Class M1, 3.274%, 8/25/2034 | | | | 3,742,958 | | | | | 3,526,615 | |
| g | | Morgan Stanley ABS Capital I, Inc. Trust, Series 2005-HE7 Class A2C, 2.192% (LIBOR 1 Month + 0.32%), 11/25/2035 | | | | 573,117 | | | | | 573,818 | |
| | | | | | | | | | | | |
| | | | | | | | | | | 7,938,537 | |
| | | | | | | | | | | | |
| | TOTAL ASSET BACKED SECURITIES (Cost $49,674,670) | | | | | | | | | 48,872,872 | |
| | | | | | | | | | | | |
| | | |
| | CORPORATE BONDS — 6.7% | | | | | | | | | | |
| | | |
| | AUTOMOBILES & COMPONENTS — 0.0% | | | | | | | | | | |
| | Auto Components — 0.0% | | | | | | | | | | |
| e,i | | Nexteer Automotive Group Ltd., 5.875%, 11/15/2021 | | | | 4,300,000 | | | | | 4,429,000 | |
| | | | | | | | | | | | |
| | | | | | | | | | | 4,429,000 | |
| | | | | | | | | | | | |
| | | |
| | BANKS — 0.1% | | | | | | | | | | |
| | Banks — 0.1% | | | | | | | | | | |
| e,g,i,j | | BPCE S.A. 12.50% (LIBOR 3 Month + 12.98%), 9/30/2019 | | | | 10,211,000 | | | | | 11,474,611 | |
| | | | | | | | | | | | |
| | | | | | | | | | | 11,474,611 | |
| | | | | | | | | | | | |
| | | |
| | CAPITAL GOODS — 0.2% | | | | | | | | | | |
| | Construction & Engineering — 0.1% | | | | | | | | | | |
| e | | Zachry Holdings, Inc., 7.50%, 2/1/2020 | | | | 15,420,000 | | | | | 15,535,650 | |
| | Machinery — 0.1% | | | | | | | | | | |
| | Mueller Industries, Inc., 6.00%, 3/1/2027 | | | | 7,679,000 | | | | | 7,669,401 | |
| | | | | | | | | | | | |
| | | | | | | | | | | 23,205,051 | |
| | | | | | | | | | | | |
| | | |
| | CONSUMER DURABLES & APPAREL — 0.1% | | | | | | | | | | |
| | Leisure Products — 0.1% | | | | | | | | | | |
| | Vista Outdoor, Inc., 5.875%, 10/1/2023 | | | | 10,625,000 | | | | | 9,907,812 | |
| | | | | | | | | | | | |
| | | | | | | | | | | 9,907,812 | |
| | | | | | | | | | | | |
| | | |
| | DIVERSIFIED FINANCIALS — 0.2% | | | | | | | | | | |
| | Capital Markets — 0.0% | | | | | | | | | | |
| | National Rural Utilities Cooperative Finance Corp., 10.375%, 11/1/2018 | | | | 5,000,000 | | | | | 5,223,049 | |
| | Consumer Finance — 0.1% | | | | | | | | | | |
| e | | FirstCash, Inc., 5.375%, 6/1/2024 | | | | 7,500,000 | | | | | 7,619,625 | |
| | Diversified Financial Services — 0.1% | | | | | | | | | | |
| | Bank of America Corp. (BRL) 10.75%, 8/20/2018 | | | | 5,000,000 | | | | | 1,545,412 | |
| g,j | | JPMorgan Chase & Co. Series I 7.90% (LIBOR 3 Month + 3.47%), 7/30/2018 | | | | 15,000,000 | | | | | 15,076,500 | |
| e | | TMX Finance, LLC / TitleMax Finance Corp., 8.50%, 9/15/2018 | | | | 5,385,000 | | | | | 5,129,213 | |
| | | | | | | | | | | | |
| | | | | | | | | | | 34,593,799 | |
| | | | | | | | | | | | |
| | | |
| | ENERGY — 2.5% | | | | | | | | | | |
| | Energy Equipment & Services — 0.1% | | | | | | | | | | |
| | Enviva Partners L.P. / Enviva Partners Finance Corp., 8.50%, 11/1/2021 | | | | 7,500,000 | | | | | 7,931,250 | |
| | Odebrecht Offshore Drilling Finance Ltd., | | | | | | | | | | |
| e,i | | 6.72%, 12/1/2022 | | | | 4,906,047 | | | | | 4,709,805 | |
| e,i,k | | 7.72%, 12/1/2026 | | | | 14,795,740 | | | | | 4,290,765 | |
Semi-Annual Report | 17
Schedule of Investments, Continued
Thornburg Investment Income Builder Fund | March 31, 2018 (Unaudited)
| | | | | | | | | | | | |
| | | | | SHARES/
PRINCIPAL AMOUNT | | VALUE |
| e,i,j | | Odebrecht Oil & Gas Finance Ltd. (Guaranty: Odebrecht Oleo e Gas S.A.), 4/30/2018 | | | $ | 2,337,727 | | | | $ | 45,586 | |
| e,i,l | | Schahin II Finance Co. SPV Ltd., 5.875%, 9/25/2023 | | | | 11,640,134 | | | | | 1,425,916 | |
| | Oil, Gas & Consumable Fuels — 2.4% | | | | | | | | | | |
| e | | CITGO Petroleum Corp. 6.25%, 8/15/2022 | | | | 27,000,000 | | | | | 26,763,750 | |
| e | | DCP Midstream Operating L.P. (Guaranty: DCP Midstream L.P.) 9.75%, 3/15/2019 | | | | 5,000,000 | | | | | 5,275,000 | |
| e | | Enable Oklahoma Intrastate Transmission, LLC (Guaranty: Enable Midstream Partners L.P.), 6.25%, 3/15/2020 | | | | 2,500,000 | | | | | 2,610,521 | |
| | Enbridge Energy Partners L.P. 9.875%, 3/1/2019 | | | | 9,750,000 | | | | | 10,332,844 | |
| g | | Energy Transfer Partners L.P., 4.791% (LIBOR 3 Month + 3.02%), 11/1/2066 | | | | 13,820,000 | | | | | 12,161,600 | |
| c,g | | Enterprise TE Partners L.P. Series 1 4.784% (LIBOR 3 Month + 2.78%), 6/1/2067 | | | | 7,000,000 | | | | | 6,695,500 | |
| e,i | | Gazprom OAO Via Gaz Capital S.A. 8.146%, 4/11/2018 | | | | 2,000,000 | | | | | 2,002,340 | |
| | HollyFrontier Corp., 5.875%, 4/1/2026 | | | | 25,000,000 | | | | | 26,900,214 | |
| | Kinder Morgan Energy Partners L.P. | | | | | | | | | | |
| | 5.00%, 3/1/2043 | | | | 10,000,000 | | | | | 9,651,860 | |
| | 5.80%, 3/15/2035 | | | | 10,000,000 | | | | | 10,712,978 | |
| | 9.00%, 2/1/2019 | | | | 8,000,000 | | | | | 8,384,373 | |
| | Kinder Morgan, Inc. | | | | | | | | | | |
| | 5.30%, 12/1/2034 | | | | 23,630,000 | | | | | 24,238,676 | |
| | 5.55%, 6/1/2045 | | | | 5,000,000 | | | | | 5,247,291 | |
| d,f,i,l | | Linc USA GP / Linc Energy Finance USA, Inc., 9.625%, 10/31/2017 | | | | 16,148,704 | | | | | 670,171 | |
| | NuStar Logistics L.P. 8.40%, 4/15/2018 | | | | 18,000,000 | | | | | 18,022,500 | |
| | ONEOK Partners L.P. 8.625%, 3/1/2019 | | | | 8,000,000 | | | | | 8,398,384 | |
| e,i | | Petroleum Co. of Trinidad & Tobago Ltd. 9.75%, 8/14/2019 | | | | 4,000,000 | | | | | 4,210,000 | |
| a,l | | RAAM Global Energy Co., 12.50%, 10/1/2015 | | | | 15,000,000 | | | | | 136,050 | |
| | Summit Midstream Holdings, LLC / Summit Midstream Finance Corp., 5.50%, 8/15/2022 | | | | 7,497,000 | | | | | 7,309,575 | |
| h,j | | Summit Midstream Partners LP, Series A, 9.50%, 12/15/2022 | | | | 17,000,000 | | | | | 17,276,250 | |
| | Transcontinental Gas Pipe Line Co., LLC, 7.85%, 2/1/2026 | | | | 32,700,000 | | | | | 40,235,822 | |
| | Williams Companies, Inc. | | | | | | | | | | |
| | 3.70%, 1/15/2023 | | | | 29,129,000 | | | | | 28,327,953 | |
| | 4.55%, 6/24/2024 | | | | 69,318,000 | | | | | 69,801,146 | |
| | 5.75%, 6/24/2044 | | | | 14,198,000 | | | | | 15,014,385 | |
| | | | | | | | | | | | |
| | | | | | | | | | | 378,782,505 | |
| | | | | | | | | | | | |
| | FOOD & STAPLES RETAILING — 0.0% | | | | | | | | | | |
| | Food & Staples Retailing — 0.0% | | | | | | | | | | |
| e | | C&S Group Enterprises, LLC, 5.375%, 7/15/2022 | | | | 7,860,000 | | | | | 7,407,028 | |
| | | | | | | | | | | | |
| | | | | | | | | | | 7,407,028 | |
| | | | | | | | | | | | |
| | FOOD, BEVERAGE & TOBACCO — 0.1% | | | | | | | | | | |
| | Food Products — 0.0% | | | | | | | | | | |
| e,i | | BRF S.A., 4.75%, 5/22/2024 | | | | 6,000,000 | | | | | 5,538,060 | |
| | Tobacco — 0.1% | | | | | | | | | | |
| e | | Vector Group Ltd., 6.125%, 2/1/2025 | | | | 16,000,000 | | | | | 16,000,000 | |
| | | | | | | | | | | | |
| | | | | | | | | | | 21,538,060 | |
| | | | | | | | | | | | |
| | HOUSEHOLD & PERSONAL PRODUCTS — 0.0% | | | | | | | | | | |
| | Household Products — 0.0% | | | | | | | | | | |
| e | | Energizer Holdings, Inc., 5.50%, 6/15/2025 | | | | 7,500,000 | | | | | 7,556,250 | |
| | | | | | | | | | | | |
| | | | | | | | | | | 7,556,250 | |
| | | | | | | | | | | | |
| | INSURANCE — 0.6% | | | | | | | | | | |
| | Insurance — 0.6% | | | | | | | | | | |
| e,g,i,j | | Dai-ichi Life Insurance Co. Ltd. 7.25% (LIBOR 3 Month + 4.56%), 7/25/2021 | | | �� | 9,000,000 | | | | | 9,945,000 | |
| g | | Hartford Financial Services Group, Inc. 8.125% (LIBOR 3 Month + 4.60%), 6/15/2068 | | | | 9,650,000 | | | | | 9,746,500 | |
| | MetLife, Inc. | | | | | | | | | | |
| e | | 9.25%, 4/8/2038 | | | | 12,000,000 | | | | | 16,320,000 | |
| | Series A 6.817%, 8/15/2018 | | | | 4,000,000 | | | | | 4,059,683 | |
| e | | National Life Insurance Co., 10.50%, 9/15/2039 | | | | 2,000,000 | | | | | 3,241,462 | |
| e,g,i | | QBE Insurance Group Ltd. 7.50% (10-Yr. Semi-Annual USD Swap + 6.03%), 11/24/2043 | | | | 40,000,000 | | | | | 44,937,600 | |
| | | | | | | | | | | | |
| | | | | | | | | | | 88,250,245 | |
| | | | | | | | | | | | |
18 | Semi-Annual Report
Schedule of Investments, Continued
Thornburg Investment Income Builder Fund | March 31, 2018 (Unaudited)
| | | | | | | | | | | | |
| | | | | SHARES/
PRINCIPAL AMOUNT | | VALUE |
| | MATERIALS — 0.4% | | | | | | | | | | |
| | Chemicals — 0.2% | | | | | | | | | | |
| | Consolidated Energy Finance S.A., | | | | | | | | | | |
| e,i | | 6.75%, 10/15/2019 | | | $ | 4,330,000 | | | | $ | 4,378,713 | |
| e,i | | 6.875%, 6/15/2025 | | | | 13,000,000 | | | | | 13,617,500 | |
| e,i | | Kissner Holdings L.P. / Kissner Milling Co. Ltd. / BSC Holding, Inc. / Kissner USA, 8.375%, 12/1/2022 | | | | 14,520,000 | | | | | 14,810,400 | |
| | Construction Materials — 0.1% | | | | | | | | | | |
| e,i | | CIMPOR Financial Operations B.V. 5.75%, 7/17/2024 | | | | 8,000,000 | | | | | 7,628,000 | |
| i | | CRH America, Inc. (Guaranty: CRH plc) 8.125%, 7/15/2018 | | | | 12,000,000 | | | | | 12,180,236 | |
| | Metals & Mining — 0.1% | | | | | | | | | | |
| e | | International Wire Group, Inc., 10.75%, 8/1/2021 | | | | 15,780,000 | | | | | 14,912,100 | |
| | | | | | | | | | | | |
| | | | | | | | | | | 67,526,949 | |
| | | | | | | | | | | | |
| | MEDIA — 0.2% | | | | | | | | | | |
| | Media — 0.2% | | | | | | | | | | |
| e,i | | Altice France S.A., 7.375%, 5/1/2026 | | | | 14,840,000 | | | | | 14,135,100 | |
| e,i | | Telenet Finance Luxembourg Notes Sarl, 5.50%, 3/1/2028 | | | | 10,000,000 | | | | | 9,562,500 | |
| | Time Warner Cable, LLC 8.75%, 2/14/2019 | | | | 14,000,000 | | | | | 14,660,028 | |
| | | | | | | | | | | | |
| | | | | | | | | | | 38,357,628 | |
| | | | | | | | | | | | |
| | SOFTWARE & SERVICES — 0.2% | | | | | | | | | | |
| | Information Technology Services — 0.1% | | | | | | | | | | |
| e | | Alliance Data Systems Corp., 5.375%, 8/1/2022 | | | | 10,000,000 | | | | | 10,000,000 | |
| e | | Harland Clarke Holdings Corp. 8.375%, 8/15/2022 | | | | 6,500,000 | | | | | 6,613,750 | |
| | Internet Software & Services — 0.1% | | | | | | | | | | |
| d,f | | YAHOO, Inc. 6.65%, 8/10/2026 | | | | 6,281,540 | | | | | 6,872,005 | |
| | | | | | | | | | | | |
| | | | | | | | | | | 23,485,755 | |
| | | | | | | | | | | | |
| | TELECOMMUNICATION SERVICES — 1.6% | | | | | | | | | | |
| | Diversified Telecommunication Services — 1.3% | | | | | | | | | | |
| i | | Deutsche Telekom International Finance B.V. (Guaranty: Deutsche Telekom AG) 8.75%, 6/15/2030 | | | | 26,150,000 | | | | | 37,037,690 | |
| e,i | | Digicel Ltd., 6.00%, 4/15/2021 | | | | 51,737,000 | | | | | 48,568,109 | |
| | Qwest Corp., 6.75%, 12/1/2021 | | | | 9,000,000 | | | | | 9,648,792 | |
| i | | Telefonica Emisiones SAU (Guaranty: Telefonica S.A. 7.045%, 6/20/2036 | | | | 85,390,000 | | | | | 108,325,916 | |
| | Wireless Telecommunication Services — 0.3% | | | | | | | | | | |
| e,i | | Millicom International Cellular S.A. 6.00%, 3/15/2025 | | | | 28,423,000 | | | | | 29,240,161 | |
| e,i | | VEON Holdings B.V. (Guaranty: Vimpel-Communications PJSC) 7.504%, 3/1/2022 | | | | 8,735,000 | | | | | 9,674,013 | |
| | | | | | | | | | | | |
| | | | | | | | | | | 242,494,681 | |
| | | | | | | | | | | | |
| | TRANSPORTATION — 0.3% | | | | | | | | | | |
| | Airlines — 0.1% | | | | | | | | | | |
| | American Airlines 2013-2 Class A Pass Through Trust, 4.95%, 7/15/2024 | | | | 3,716,248 | | | | | 3,864,898 | |
| e,i | | Guanay Finance Ltd., 6.00%, 12/15/2020 | | | | 9,045,845 | | | | | 9,229,870 | |
| | US Airways Pass Through Trust, Series 2010-1 Class A, 6.25%, 10/22/2024 | | | | 1,741,099 | | | | | 1,877,601 | |
| | Diversified Consumer Services — 0.2% | | | | | | | | | | |
| e | | Laureate Education, Inc., 8.25%, 5/1/2025 | | | | 25,000,000 | | | | | 26,812,500 | |
| | | | | | | | | | | | |
| | | | | | | | | | | 41,784,869 | |
| | | | | | | | | | | | |
| | UTILITIES — 0.2% | | | | | | | | | | |
| | Electric Utilities — 0.1% | | | | | | | | | | |
| | Ameren Illinois Co. 9.75%, 11/15/2018 | | | | 5,000,000 | | | | | 5,207,613 | |
| | Arizona Public Service Co. 8.75%, 3/1/2019 | | | | 6,500,000 | | | | | 6,848,440 | |
| | Entergy Gulf States Louisiana, LLC 6.00%, 5/1/2018 | | | | 8,000,000 | | | | | 8,020,480 | |
| | Gas Utilities — 0.1% | | | | | | | | | | |
| | Sempra Energy 9.80%, 2/15/2019 | | | | 7,750,000 | | | | | 8,205,356 | |
| | | | | | | | | | | | |
| | | | | | | | | | | 28,281,889 | |
| | | | | | | | | | | | |
| | TOTAL CORPORATE BONDS (Cost $941,687,609) | | | | | | | | | 1,029,076,132 | |
| | | | | | | | | | | | |
Semi-Annual Report | 19
Schedule of Investments, Continued
Thornburg Investment Income Builder Fund | March 31, 2018 (Unaudited)
| | | | | | | | | | | | |
| | | | | SHARES/
PRINCIPAL AMOUNT | | VALUE |
| | | |
| | CONVERTIBLE BONDS — 0.1% | | | | | | | | | | |
| | DIVERSIFIED FINANCIALS — 0.1% | | | | | | | | | | |
| | Consumer Finance — 0.1% | | | | | | | | | | |
| | EZCORP, Inc., 2.125%, 6/15/2019 | | | $ | 6,733,000 | | | | $ | 7,079,110 | |
| | | | | | | | | | | | |
| | | | | | | | | | | 7,079,110 | |
| | | | | | | | | | | | |
| | TOTAL CONVERTIBLE BONDS (Cost $6,563,920) | | | | | | | | | 7,079,110 | |
| | | | | | | | | | | | |
| | MUNICIPAL BONDS — 0.0% | | | | | | | | | | |
| | San Bernardino County Redevelopment Agency Successor Agency, 8.45%, 9/1/2030 | | | | 2,555,000 | | | | | 2,805,390 | |
| | | | | | | | | | | | |
| | TOTAL MUNICIPAL BONDS (Cost $2,510,405) | | | | | | | | | 2,805,390 | |
| | | | | | | | | | | | |
| | OTHER GOVERNMENT — 0.0% | | | | | | | | | | |
| | Brazilian Government International Bond (BRL) 12.50%, 1/5/2022 | | | | 20,000,000 | | | | | 7,056,839 | |
| | | | | | | | | | | | |
| | TOTAL OTHER GOVERNMENT (Cost $12,655,324) | | | | | | | | | 7,056,839 | |
| | | | | | | | | | | | |
| | | |
| | LOAN PARTICIPATIONS — 0.5% | | | | | | | | | | |
| | COMMERCIAL & PROFESSIONAL SERVICES — 0.2% | | | | | | | | | | |
| | Professional Services — 0.2% | | | | | | | | | | |
| m | | Harland Clarke Holdings Corp., 7.052% (LIBOR 3 Month + 4.75%), 11/3/2023 | | | | 14,319,079 | | | | | 14,430,482 | |
| | RGIS Services, LLC | | | | | | | | | | |
| m | | 9.343% (LIBOR 1 Month + 7.50%), 3/31/2023 | | | | 4,609,981 | | | | | 4,252,707 | |
| m | | 9.377% (LIBOR 1 Month + 7.50%), 3/31/2023 | | | | 6,005,639 | | | | | 5,540,202 | |
| m | | 9.953% (LIBOR 1 Month + 7.50%), 3/31/2023 | | | | 1,060,126 | | | | | 977,966 | |
| | | | | | | | | | | | |
| | | | | | | | | | | 25,201,357 | |
| | | | | | | | | | | | |
| | ENERGY — 0.0% | | | | | | | | | | |
| | Oil, Gas & Consumable Fuels — 0.0% | | | | | | | | | | |
| d,k | | Malamute Energy, Inc., 1.50%, 11/22/2022 | | | | 213,447 | | | | | 213,447 | |
| | | | | | | | | | | | |
| | | | | | | | | | | 213,447 | |
| | | | | | | | | | | | |
| | MEDIA — 0.1% | | | | | | | | | | |
| | Media — 0.1% | | | | | | | | | | |
| m | | ABG Intermediate Holdings, 10.052% (LIBOR 3 Month + 7.75%), 9/29/2025 | | | | 15,000,000 | | | | | 15,168,750 | |
| | | | | | | | | | | | |
| | | | | | | | | | | 15,168,750 | |
| | | | | | | | | | | | |
| | RETAILING — 0.0% | | | | | | | | | | |
| | Specialty Retail — 0.0% | | | | | | | | | | |
| | Office Depot, Inc. | | | | | | | | | | |
| m | | 8.594% (LIBOR 1 Month + 7.00%), 11/8/2022 | | | | 750,000 | | | | | 762,188 | |
| m | | 8.711% (LIBOR 1 Month + 7.00%), 11/8/2022 | | | | 3,300,000 | | | | | 3,353,625 | |
| m | | 9.125% (LIBOR 1 Month + 7.00%), 11/8/2022 | | | | 337,500 | | | | | 342,984 | |
| | | | | | | | | | | | |
| | | | | | | | | | | 4,458,797 | |
| | | | | | | | | | | | |
| | SOFTWARE & SERVICES — 0.1% | | | | | | | | | | |
| | Internet Software & Services — 0.1% | | | | | | | | | | |
| m | | CareerBuilder, LLC, 9.052% (LIBOR 3 Month + 6.75%), 7/26/2023 | | | | 9,750,000 | | | | | 9,701,250 | |
| | | | | | | | | | | | |
| | | | | | | | | | | 9,701,250 | |
| | | | | | | | | | | | |
| | TRANSPORTATION — 0.1% | | | | | | | | | | |
| | Airlines — 0.1% | | | | | | | | | | |
| a,c,d,i | | OS Two, LLC, 12.00%, 12/15/2020 | | | | 4,254,414 | | | | | 2,148,479 | |
| c,d,m | | Wheels Up Partners, LLC 8.506% (LIBOR 3 Month + 6.50%), 8/17/2025 | | | | 13,192,174 | | | | | 12,928,330 | |
| | | | | | | | | | | | |
| | | | | | | | | | | 15,076,809 | |
| | | | | | | | | | | | |
| | TOTAL LOAN PARTICIPATIONS (Cost $70,203,319) | | | | | | | | | 69,820,410 | |
| | | | | | | | | | | | |
20 | Semi-Annual Report
Schedule of Investments, Continued
Thornburg Investment Income Builder Fund | March 31, 2018 (Unaudited)
| | | | | | | | | | | | |
| | | | | SHARES/
PRINCIPAL AMOUNT | | VALUE |
| | | |
| | SHORT-TERM INVESTMENTS — 1.1% | | | | | | | | | | |
| b | | Thornburg Capital Management Fund | | | | 16,174,648 | | | | $ | 161,746,474 | |
| | | | | | | | | | | | |
| | TOTAL SHORT-TERM INVESTMENTS (Cost $161,746,474) | | | | | | | | | 161,746,474 | |
| | | | | | | | | | | | |
| | | |
| | TOTAL INVESTMENTS — 99.5% (Cost $13,023,853,339) | | | | | | | | $ | 15,277,532,949 | |
| | | |
| | OTHER ASSETS LESS LIABILITIES — 0.5% | | | | | | | | | 82,107,437 | |
| | | | | | | | | | | | |
| | | |
| | NET ASSETS — 100.0% | | | | | | | | $ | 15,359,640,386 | |
| | | | | | | | | | | | |
| | | | | | | | | | | | | | | | | | | | | | | | | | | | | | | | | | | |
| OUTSTANDING FORWARD CURRENCY CONTRACTS TO BUY OR SELL AT MARCH 31, 2018 |
| | | | | | | |
CONTRACT DESCRIPTION | | CONTRACT
PARTY* | | BUY/SELL | | CONTRACT
AMOUNT | | CONTRACT
VALUE DATE | | VALUE USD | | UNREALIZED
APPRECIATION | | UNREALIZED
DEPRECIATION |
| | | | | | | |
Great Britain Pound | | | | SSB | | | | | Sell | | | | | 548,854,900 | | | | | 4/10/2018 | | | | | 770,236,705 | | | | $ | – | | | | $ | (22,449,346 | ) |
Great Britain Pound | | | | SSB | | | | | Sell | | | | | 26,126,900 | | | | | 4/10/2018 | | | | | 36,665,241 | | | | | – | | | | | (108,483 | ) |
Great Britain Pound | | | | SSB | | | | | Buy | | | | | 60,994,200 | | | | | 4/10/2018 | | | | | 85,596,342 | | | | | 1,430,140 | | | | | – | |
Swiss Franc | | | | SSB | | | | | Sell | | | | | 207,779,900 | | | | | 4/23/2018 | | | | | 217,678,697 | | | | | 6,836,571 | | | | | – | |
Swiss Franc | | | | SSB | | | | | Buy | | | | | 25,851,500 | | | | | 4/23/2018 | | | | | 27,083,086 | | | | | – | | | | | (603,332 | ) |
Chinese Yuan Renminbi | | | | SSB | | | | | Sell | | | | | 2,809,507,100 | | | | | 4/25/2018 | | | | | 447,533,310 | | | | | – | | | | | (11,491,110 | ) |
Korean Won | | | | SSB | | | | | Sell | | | | | 202,561,600,000 | | | | | 5/8/2018 | | | | | 190,267,915 | | | | | – | | | | | (2,905,179 | ) |
Euro | | | | SSB | | | | | Sell | | | | | 1,984,699,300 | | | | | 5/15/2018 | | | | | 2,449,212,258 | | | | | 20,428,469 | | | | | – | |
Thailand Baht | | | | BBH | | | | | Sell | | | | | 1,478,091,900 | | | | | 5/16/2018 | | | | | 47,336,230 | | | | | – | | | | | (141,495 | ) |
| | | | | | | | | | | | | | | | | | | | | | | | | | | | | | |
Total | | | | | | | | | | | | | | | | | | | | | | | | | | | | $ | 28,695,180 | | | | $ | (37,698,945) | |
| | | | | | | | | | | | | | | | | | | | | | | | | | | | | | |
Net unrealized appreciation/depreciation | | | | | | | | | | | | | | | | | | | | | | | | | | | | | | | | | $ | (9,003,765 | ) |
| | | | | | | | | | | | | | | | | | | | | | | | | | | | | | | | | | | |
| * | Counterparties include State Street Bank and Trust Company (“SSB”) and Brown Brothers Harriman & Co. (“BBH”). |
Footnote Legend
| b | Investment in Affiliates. |
| d | Security currently fair valued by the Valuation and Pricing Committee using procedures approved by the Trustees’ Audit Committee. |
| e | Securities exempt from registration under Rule 144A of the Securities Act of 1933, as amended. These securities are restricted but liquid and may only be resold in the ordinary course of business in transactions exempt from registration, normally to qualified institutional buyers. As of March 31, 2018, the aggregate value of these securities in the Fund’s portfolio was $485,480,347, representing 3.16% of the Fund’s net assets. |
| f | Securities exempt from registration under Rule 144A of the Securities Act of 1933, as amended. These securities are restricted and illiquid. As of March 31, 2018, the aggregate value of these securities in the Fund’s portfolio was $45,154,622, representing 0.29% of the Fund’s net assets. Additional information is as follows: |
| | | | | | | | | | | | | | | | | | | | |
| 144A/RESTRICTED & ILLIQUID SECURITIES | | ACQUISITION
DATE | | COST | | MARKET VALUE | | PERCENTAGE OF
NET ASSETS |
Centaur Funding Corp., 9.08%, 4/21/2020 | | | | 6/30/2010 | | | | $ | 15,937,500 | | | | $ | 16,874,942 | | | | | 0.1 | % |
First Tennessee Bank N.A. 3.75% | | | | 3/17/2005 | | | | | 11,968,750 | | | | | 9,360,000 | | | | | 0.1 | |
Fairway Outdoor Funding, LLC, 8.835%, 10/15/2042 | | | | 10/19/2012 | | | | | 7,000,000 | | | | | 7,325,123 | | | | | 0.0 | |
JPR Royalty Sub, LLC, 14.00%, 9/01/2020 | | | | 3/01/2011 | | | | | 5,000,000 | | | | | 2,500,000 | | | | | 0.0 | |
Northwind Holdings, LLC, 2.786%, 12/01/2037 | | | | 1/29/2010 | | | | | 1,421,327 | | | | | 1,552,381 | | | | | 0.0 | |
Linc USA GP / Linc Energy Finance USA, Inc., 9.625%, 10/31/2017 | | | | 8/08/2014 | | | | | 16,148,704 | | | | | 670,171 | | | | | 0.0 | |
YAHOO, Inc. 6.65%, 8/10/2026 | | | | 8/04/2009 | | | | | 5,579,107 | | | | | 6,872,005 | | | | | 0.1 | |
| g | Floating Rate Security. Stated interest/floor rate was in effect at March 31, 2018. |
| h | Variable rate coupon, rate shown as of March 31, 2018. |
| i | Yankee bond denominated in U.S. dollars and is issued in the U.S. by foreign banks and corporations. |
| j | Securities are perpetual and, thus, do not have a predetermined maturity date. The date shown, if applicable, reflects the next call date. |
| k | Pay-In-Kind Payments (PIK). The issuer may pay cash interest and/or interest in additional debt securities. Rates shown are the rates in effect at March 31, 2018. |
Semi-Annual Report | 21
Schedule of Investments, Continued
Thornburg Investment Income Builder Fund | March 31, 2018 (Unaudited)
| m | The stated coupon rate represents the greater of the LIBOR or the LIBOR floor rate plus a spread at March 31, 2018. |
Portfolio Abbreviations
To simplify the listings of securities, abbreviations are used per the table below:
| | |
| ADR | | American Depositary Receipt |
| ARM | | Adjustable Rate Mortgage |
| BRL | | Denominated in Brazilian Real |
| CMO | | Collateralized Mortgage Obligation |
| LIBOR | | London Interbank Offered Rates |
| MFA | | Mortgage Finance Authority |
| SPV | | Special Purpose Vehicle |
See notes to financial statements.
22 | Semi-Annual Report
Statement of Assets and Liabilities
Thornburg Investment Income Builder Fund | March 31, 2018 (Unaudited)
| | | | |
ASSETS | | | | |
| |
Investments at value (Note 3) | | | | |
Non-affiliated issuers (cost $12,339,667,225) | | $ | 14,637,320,515 | |
Non-controlled affiliated issuers (cost $684,186,114) | | | 640,212,434 | |
Cash | | | 13,296,314 | |
Cash denominated in foreign currency (cost $11,351,509) | | | 11,381,415 | |
Cash segregated as collateral on securities sold short | | | 3,300,000 | |
Receivable for investments sold | | | 87,144,432 | |
Receivable for fund shares sold | | | 46,719,295 | |
Unrealized appreciation on forward currency contracts (Note 7) | | | 28,695,180 | |
Dividends receivable | | | 49,932,863 | |
Dividend and interest reclaim receivable | | | 44,099,179 | |
Interest receivable | | | 20,382,968 | |
Prepaid expenses and other assets | | | 184,382 | |
| | | | |
| |
Total Assets | | | 15,582,668,977 | |
| | | | |
| |
LIABILITIES | | | | |
| |
Payable for investments purchased | | | 108,710,009 | |
Payable for fund shares redeemed | | | 44,554,467 | |
Unrealized depreciation on forward currency contracts (Note 7) | | | 37,698,945 | |
Payable to investment advisor and other affiliates (Note 4) | | | 14,468,373 | |
Deferred taxes payable (Note 2) | | | 1,447,001 | |
Accounts payable and accrued expenses | | | 7,809,743 | |
Dividends payable | | | 8,340,053 | |
| | | | |
| |
Total Liabilities | | | 223,028,591 | |
| | | | |
| |
NET ASSETS | | $ | 15,359,640,386 | |
| | | | |
| |
NET ASSETS CONSIST OF | | | | |
| |
Distribution in excess of net investment income | | $ | (20,770,868 | ) |
Net unrealized appreciation on investments | | | 2,244,607,414 | |
Accumulated net realized gain (loss) | | | (1,024,179,438 | ) |
Net capital paid in on shares of beneficial interest | | | 14,159,983,278 | |
| | | | |
| | $ | 15,359,640,386 | |
| | | | |
Semi-Annual Report | 23
Statement of Assets and Liabilities, Continued
Thornburg Investment Income Builder Fund | March 31, 2018 (Unaudited)
| | | | |
NET ASSET VALUE | | | | |
| |
Class A Shares: | | | | |
Net asset value and redemption price per share
($3,140,758,169 applicable to 148,113,358 shares of beneficial
interest outstanding - Note 5) | | $ | 21.21 | |
| |
Maximum sales charge, 4.50% of offering price | | | 1.00 | |
| | | | |
| |
Maximum offering price per share | | $ | 22.21 | |
| | | | |
| |
Class C Shares: | | | | |
Net asset value and offering price per share*
($4,323,340,542 applicable to 204,051,443 shares of beneficial
interest outstanding - Note 5) | | $ | 21.19 | |
| | | | |
| |
Class I Shares: | | | | |
Net asset value, offering and redemption price per share
($7,598,507,173 applicable to 355,765,633 shares of beneficial
interest outstanding - Note 5) | | $ | 21.36 | |
| | | | |
| |
Class R3 Shares: | | | | |
Net asset value, offering and redemption price per share
($56,112,041 applicable to 2,646,614 shares of beneficial
interest outstanding - Note 5) | | $ | 21.20 | |
| | | | |
| |
Class R4 Shares: | | | | |
Net asset value, offering and redemption price per share
($35,602,972 applicable to 1,677,025 shares of beneficial
interest outstanding - Note 5) | | $ | 21.23 | |
| | | | |
| |
Class R5 Shares: | | | | |
Net asset value, offering and redemption price per share
($61,591,238 applicable to 2,885,439 shares of beneficial
interest outstanding - Note 5) | | $ | 21.35 | |
| | | | |
| |
Class R6 Shares: | | | | |
Net asset value, offering and redemption price per share
($143,728,251 applicable to 6,751,567 shares of beneficial
interest outstanding - Note 5) | | $ | 21.29 | |
| | | | |
* Redemption price per share is equal to net asset value less any applicable contingent deferred sales charge.
See notes to financial statements.
24 | Semi-Annual Report
Statement of Operations
Thornburg Investment Income Builder Fund | Six Months Ended March 31, 2018 (Unaudited)
| | | | |
INVESTMENT INCOME | | | | |
| |
Dividend income | | | | |
Non-affiliated issuers (net of foreign taxes withheld of $21,503,427) | | $ | 272,377,716 | |
Non-controlled affiliated issuer | | | 26,374,378 | |
Interest income (net of premium amortized of $419,643) | | | 45,489,858 | |
| | | | |
| |
Total Income | | | 344,241,952 | |
| | | | |
| |
EXPENSES | | | | |
| |
Investment advisory fees (Note 4) | | | 55,027,851 | |
Administration fees (Note 4) | | | | |
Class A Shares | | | 1,841,114 | |
Class C Shares | | | 2,549,808 | |
Class I Shares | | | 2,372,185 | |
Class R3 Shares | | | 34,475 | |
Class R4 Shares | | | 22,740 | |
Class R5 Shares | | | 23,372 | |
Class R6 Shares | | | 16,317 | |
Distribution and service fees (Note 4) | | | | |
Class A Shares | | | 4,119,077 | |
Class C Shares | | | 22,817,523 | |
Class R3 Shares | | | 153,586 | |
Class R4 Shares | | | 50,546 | |
Transfer agent fees | | | | |
Class A Shares | | | 1,364,983 | |
Class C Shares | | | 1,802,660 | |
Class I Shares | | | 2,804,843 | |
Class R3 Shares | | | 82,766 | |
Class R4 Shares | | | 86,485 | |
Class R5 Shares | | | 124,223 | |
Class R6 Shares | | | 1,091 | |
Registration and filing fees | | | | |
Class A Shares | | | 11,997 | |
Class C Shares | | | 11,449 | |
Class I Shares | | | 15,831 | |
Class R3 Shares | | | 6,666 | |
Class R4 Shares | | | 6,532 | |
Class R5 Shares | | | 7,764 | |
Class R6 Shares | | | 7,688 | |
Custodian fees (Note 2) | | | 1,630,090 | |
Professional fees | | | 197,690 | |
Trustee and officer fees (Note 4) | | | 363,405 | |
Other expenses | | | 481,135 | |
| | | | |
| |
Total Expenses | | | 98,035,892 | |
| |
Less: | | | | |
Expenses reimbursed by investment advisor (Note 4) | | | (543,583 | ) |
| | | | |
| |
Net Expenses | | | 97,492,309 | |
| | | | |
| |
Net Investment Income | | $ | 246,749,643 | |
| | | | |
Semi-Annual Report | 25
Statement of Operations Continued
Thornburg Investment Income Builder Fund | March 31, 2018 (Unaudited)
| | | | |
REALIZED AND UNREALIZED GAIN (LOSS) | | | | |
| |
Net realized gain (loss) on: | | | | |
Investments | | | | |
Non-affiliated issuer investments (net of realized capital gain taxes paid of $56,851) | | $ | 120,484,161 | |
Non-controlled affiliated issuers | | | (2,191,245 | ) |
Forward currency contracts (Note 7) | | | (175,970,328 | ) |
Foreign currency transactions | | | (1,198,630 | ) |
| | | | |
| |
| | | (58,876,042 | ) |
| | | | |
Net change in unrealized appreciation (depreciation) on: | | | | |
Investments | | | | |
Non-affiliated issuers investments (net of change in deferred taxes payable of $207,484) | | | (8,672,042 | ) |
Non-controlled affiliated issuers | | | (65,099,291 | ) |
Forward currency contracts (Note 7) | | | 26,126,778 | |
Foreign currency translations | | | 379,881 | |
| | | | |
| |
| | | (47,264,674 | ) |
| | | | |
| |
Net Realized and Unrealized Loss | | | (106,140,716 | ) |
| | | | |
| |
Net Increase in Net Assets Resulting from Operations | | $ | 140,608,927 | |
| | | | |
See notes to financial statements.
26 | Semi-Annual Report
Statements of Changes in Net Assets
Thornburg Investment Income Builder Fund
| | | | | | | | | | |
| | | SIX MONTHS ENDED
MARCH 31, 2018* | | YEAR ENDED
SEPTEMBER 30, 2017 |
INCREASE (DECREASE) IN NET ASSETS FROM | | | | | | | | | | |
| | |
OPERATIONS | | | | | | | | | | |
| | |
Net investment income | | | $ | 246,749,643 | | | | $ | 713,438,685 | |
Net realized gain (loss) on investments, forward currency contracts, foreign currency transactions and capital gain taxes | | | | (58,876,042 | ) | | | | 74,956,744 | |
Net unrealized appreciation (depreciation) on investments, forward currency contracts, foreign currency translations and deferred taxes | | | | (47,264,674 | ) | | | | 1,146,112,414 | |
| | | | | |
| | |
Net Increase in Net Assets Resulting from Operations | | | | 140,608,927 | | | | | 1,934,507,843 | |
| | |
DIVIDENDS TO SHAREHOLDERS | | | | | | | | | | |
| | |
From net investment income | | | | | | | | | | |
Class A Shares | | | | (71,446,760 | ) | | | | (145,807,664 | ) |
Class C Shares | | | | (82,719,916 | ) | | | | (169,819,712 | ) |
Class I Shares | | | | (181,751,896 | ) | | | | (326,276,247 | ) |
Class R3 Shares | | | | (1,238,296 | ) | | | | (2,817,410 | ) |
Class R4 Shares | | | | (842,108 | ) | | | | (1,773,997 | ) |
Class R5 Shares | | | | (1,823,541 | ) | | | | (3,754,769 | ) |
Class R6 Shares** | | | | (1,155,150 | ) | | | | (418,446 | ) |
| | |
FUND SHARE TRANSACTIONS (NOTE 5) | | | | | | | | | | |
| | |
Class A Shares | | | | (194,520,075 | ) | | | | (684,365,525 | ) |
Class C Shares | | | | (298,081,257 | ) | | | | (1,070,786,197 | ) |
Class I Shares | | | | (104,043,986 | ) | | | | 282,343,203 | |
Class R3 Shares | | | | (10,903,973 | ) | | | | (16,459,277 | ) |
Class R4 Shares | | | | (8,099,211 | ) | | | | (5,515,961 | ) |
Class R5 Shares | | | | (30,078,118 | ) | | | | (1,790,155 | ) |
Class R6 Shares** | | | | 108,252,310 | | | | | 35,727,882 | |
| | | | | |
| | |
Net Decrease in Net Assets | | | | (737,843,050 | ) | | | | (177,006,432 | ) |
| | |
NET ASSETS | | | | | | | | | | |
| | |
Beginning of Period | | | | 16,097,483,436 | | | | | 16,274,489,868 | |
| | | | | |
| | |
End of Period | | | $ | 15,359,640,386 | | | | $ | 16,097,483,436 | |
| | | | | |
| | |
Undistributed (distribution in excess of) net investment income | | | $ | (20,770,868 | ) | | | $ | 73,457,156 | |
| ** | Class R6 Shares commenced operations on April 10, 2017. |
See notes to financial statements.
Semi-Annual Report | 27
Notes to Financial Statements
Thornburg Investment Income Builder Fund | March 31, 2018 (Unaudited)
NOTE 1 – ORGANIZATION
Thornburg Investment Income Builder Fund (the “Fund”) is a diversified series of Thornburg Investment Trust (the “Trust”). The Trust was organized as a Massachusetts business trust under a Declaration of Trust dated June 3, 1987 and is registered as a diversified, open-end management investment company under the Investment Company Act of 1940, as amended. The Fund is currently one of twenty-one separate series of the Trust. Each series is considered to be a separate entity for financial reporting and tax purposes and bears expenses directly attributable to it. The Fund’s primary investment goal is to provide a level of current income which exceeds the average yield on U.S. stocks generally, and which will generally grow, subject to periodic fluctuations, over the years on a per share basis. The Fund’s secondary investment goal is long-term capital appreciation.
The Fund currently offers seven classes of shares of beneficial interest: Class A, Class C, Institutional Class (“Class I”), and Retirement Classes (“Class R3”, “Class R4”, “Class R5”, and “Class R6”). Each class of shares of the Fund represents an interest in the same portfolio of investments, except that (i) Class A shares are sold subject to a front-end sales charge collected at the time the shares are purchased and bear a service fee, (ii) Class C shares are sold at net asset value without a sales charge at the time of purchase, but are subject to a contingent deferred sales charge upon redemption within one year of purchase, and bear both a service fee and a distribution fee, (iii) Class I and Class R5 shares are sold at net asset value without a sales charge at the time of purchase and may be subject to a service fee, (iv) Class R3 shares are sold at net asset value without a sales charge at the time of purchase, but bear both a service fee and distribution fee, (v) Class R4 shares are sold at net asset value without a sales charge at the time of purchase, but bear a service fee, (vi) Class R6 shares are sold at net asset value without a sales charge at the time of purchase, and (vii) the respective classes may have different reinvestment privileges and conversion rights. Additionally, the Fund may allocate among its classes certain expenses, to the extent allocable to specific classes, including transfer agent fees, government registration fees, certain printing and postage costs, and administrative and legal expenses. Currently, class specific expenses of the Fund are limited to service and distribution fees, administration fees, and certain registration and transfer agent expenses.
The following is a summary of significant accounting policies followed by the Fund in the preparation of its financial statements. The Fund prepares its financial statements in conformity with United States generally accepted accounting principles (“GAAP”), including investment company accounting and reporting guidance in the Financial Accounting Standards Board (the “FASB”) Accounting Standard Codification Topic 946.
NOTE 2 – SIGNIFICANT ACCOUNTING POLICIES
Security Valuation: All investments in securities held by the Fund are valued as described in Note 3.
Allocation of Income, Gains, Losses and Expenses: Net investment income (other than class specific expenses) and realized and unrealized gains and losses are allocated daily to each class of shares based upon the relative net asset value of outstanding shares (or the value of the dividend-eligible shares, as appropriate) of each class of shares at the beginning of the day (after adjusting for the current capital shares activity of the respective class). Expenses common to all Funds are allocated among the Funds comprising the Trust based upon their relative net asset values or other appropriate allocation methods. Operating expenses directly attributable to a specific class are charged against the operating income of that class.
Dividends and Distributions to Shareholders: Dividends and distributions to shareholders, which are determined in accordance with federal income tax regulations and may differ from GAAP, are recorded on the ex-dividend date. Ordinary income distributions, if any, are declared and paid quarterly. Capital gain distributions, if any, are declared and paid annually and more often if deemed necessary by Thornburg Investment Management, Inc., the Trust’s investment advisor (the “Advisor”). Dividends are paid and are reinvested in additional shares of the Fund at net asset value per share at the close of business on the ex-dividend date, or at the shareholder’s option, paid in cash.
Investment Income: Dividend income is recorded on the ex-dividend date. Certain income from foreign investments is recognized as soon as information is available to the Fund. Interest income is accrued as earned. Premiums and discounts are amortized and accreted, respectively, to call dates or maturity dates using the effective yield method of the respective investments. These amounts are included in Interest income on the Statement of Operations.
Custodian Fees: Custodian fees disclosed in the Statement of Operations may include interest expenses incurred by the Fund on any cash overdrafts of its custodian account during the period. Such cash overdrafts may result from the effects of failed trades in portfolio securities and from cash outflows resulting from unanticipated shareholder redemption activity. The Fund pays interest to its custodian on any such cash overdraft at a rate set periodically at the custodian’s discretion of the overdraft amount in excess of $50,000.
Investment Transactions: Investment transactions are accounted for on a trade date basis. Realized gains and losses from the sale of investments are recorded on an identified cost basis.
28 | Semi-Annual Report
Notes to Financial Statements, Continued
Thornburg Investment Income Builder Fund | March 31, 2018
Repurchase Agreements: The Fund may invest excess cash in repurchase agreements whereby the Fund purchases investments, which serve as collateral, with an agreement to resell such collateral to the seller at an agreed upon price at the maturity date of the repurchase agreement. Investments pledged as collateral for repurchase agreements are held in custody until maturity of the repurchase agreement. Provisions in the agreements require that the market value of the collateral is at least equal to the repurchase value in the event of default. In the event of default, the Fund has the right to liquidate the collateral and apply the proceeds in satisfaction of the obligation. Under certain circumstances, in the event of default or bankruptcy by the other party to the agreement, realization and/or retention of the collateral may be subject to legal proceedings.
Unfunded Loan Commitments: The Fund has entered into a loan commitment with Malamute Energy, Inc., of which at March 31, 2018, $213,447 of the $625,489 par commitment had been funded. The maturity date is November 22, 2022.
When-Issued and Delayed Delivery Transactions: The Fund may engage in when-issued or delayed delivery transactions. To the extent the Fund engages in such transactions, it will do so for the purpose of acquiring portfolio investments consistent with the Fund’s investment objectives and not for the purpose of investment leverage or to speculate on interest rate or market changes. At the time the Fund makes a commitment to purchase an investment on a when-issued or delayed delivery basis, the Fund will record the transaction and reflect the value in determining its net asset value. When effecting such transactions, assets of an amount sufficient to make payment for the portfolio investments to be purchased will be segregated on the Fund’s records on the trade date. Investments purchased on a when-issued or delayed delivery basis do not earn interest until the settlement date.
Foreign Currency Translation: Portfolio investments and other assets and liabilities denominated in foreign currencies are translated into U.S. dollars based on the exchange rate of such currencies against the U.S. dollar on the date of valuation. Purchases and sales of investments and income items denominated in foreign currencies are translated into U.S. dollars at the exchange rate in effect on the transaction date. When the Fund purchases or sells foreign investments, it will customarily enter into a foreign exchange contract to minimize foreign exchange risk from the trade date to the settlement date of such transactions. The values of such spot contracts are included in receivable for investments sold and payable for investments purchased on the Statement of Assets and Liabilities.
The Fund does not separately report the effect of changes in foreign exchange rates from changes in market prices on investments held. Such changes are included in net unrealized appreciation (depreciation) from investments.
Reported net realized gains and losses from foreign currency transactions arise due to purchases and sales of foreign currencies, currency gains and losses realized between the trade and settlement dates on investment transactions and the difference between the amounts of dividends, interest, and foreign withholding taxes recorded on the Fund’s books, and the U.S. dollar equivalent of the amounts actually received or paid.
Net change in unrealized appreciation (depreciation) on foreign currency translations arise from changes in the fair value of assets and liabilities, other than investments at period end, resulting from changes in exchange rates.
Guarantees and Indemnifications: Under the Trust’s organizational documents (and under separate agreements with the independent Trustees), its officers and Trustees are provided with an indemnification against certain liabilities arising out of the performance of their duties to the Fund. In the normal course of business the Trust may also enter into contracts with service providers that contain general indemnifications. The Trust’s maximum exposure under these arrangements is unknown. However, based on experience, the Trust expects the risk of loss to be remote.
Use of Estimates: The preparation of financial statements in conformity with GAAP requires management to make estimates and assumptions that affect the reported amounts of assets and liabilities and disclosure of contingent assets and liabilities at the date of the financial statements and the reported amounts of increases (decreases) in net assets from operations during the reporting period. Actual results could differ from those estimates.
Federal Income Taxes: It is the policy of the Trust to comply with the provisions of the Internal Revenue Code applicable to regulated investment companies and to distribute to shareholders substantially all investment company taxable income including net realized gains on investments (if any), and tax exempt income of the Fund. Therefore, no provision for federal income or excise tax is required.
The Fund files income tax returns in United States federal and applicable state jurisdictions. The statute of limitations on the Fund’s tax return filings generally remains open for the three years following a return’s filing date. The Fund has analyzed each uncertain tax position believed to be material in the preparation of the Fund’s financial statements for the six month period ended March 31, 2018, including open tax years, to assess whether it is more likely than not that the position would be sustained upon examination, based on the technical merits of the position. The Fund has not identified any such position for which an asset or liability must be reflected in the Statement of Assets and Liabilities.
At March 31, 2018, information on the tax components of capital was as follows:
Semi-Annual Report | 29
Notes to Financial Statements, Continued
Thornburg Investment Income Builder Fund | March 31, 2018
| | | | | |
Cost of investments for tax purposes | | | $ | 13,023,853,339 | |
| | | | | |
Gross unrealized appreciation on a tax basis | | | | 2,906,098,083 | |
Gross unrealized depreciation on a tax basis | | | | (652,418,473 | ) |
| | | | | |
Net unrealized appreciation (depreciation) on investments (tax basis) | | | $ | 2,253,679,610 | |
| | | | | |
At March 31, 2018, the Fund had deferred tax basis late-year specified ordinary losses occurring subsequent to October 31, 2016 through September 30, 2017 of $7,868,551. For tax purposes, such losses will be recognized in the year ending September 30, 2018.
At March 31, 2018, the Fund had deferred tax basis capital losses occurring subsequent to October 31, 2016 through September 30, 2017 of $93,840,885. For tax purposes, such losses will be recognized in the year ending September 30, 2018.
At March 31, 2018, the Fund had cumulative tax basis capital losses of $796,043,865 (of which $324,683,523 are short-term and $471,360,342 are long-term) generated after September 30, 2011, which may be carried forward to offset future capital gains. To the extent such carryforwards are used, capital gain distributions may be reduced to the extent provided by regulations. Such capital loss carryforwards do not expire.
Foreign Withholding Taxes: The Fund is subject to foreign tax withholding imposed by certain foreign countries in which the Fund may invest. Withholding taxes are incurred on certain foreign dividends and are accrued at the time the dividend is recognized based on applicable foreign tax laws. The Fund may file withholding tax reclaims in certain jurisdictions to recover a portion of amounts previously withheld, in view of various considerations, including recent decisions rendered by the courts in those and other jurisdictions. The Fund would expect to record a receivable for such a reclaim based on a variety of factors, including assessment of a jurisdiction’s legal obligation to pay reclaims, the jurisdiction’s administrative practices and payment history, and industry convention. To date the Fund has recorded no such receivable because there is limited precedent for collecting such prior year reclaims and the likelihood of collection remains uncertain.
Deferred Foreign Capital Gain Taxes: The Fund is subject to a tax imposed on net realized gains of securities of certain foreign countries. The Fund records an estimated deferred tax liability for net unrealized gains on these investments as reflected in the accompanying financial statements.
NOTE 3 – SECURITY VALUATION
Valuation of the Fund’s portfolio investment securities is performed in accordance with policies and procedures adopted by and under the oversight of the Trustees.
The Trustees of the Trust have appointed the Advisor to assist the Trustees to obtain market values for portfolio investments, evaluate and monitor professional pricing service providers appointed by the Trustees’ Audit Committee (the “Audit Committee”) to assist in determining fair values for portfolio investments, assist in calculating fair values for portfolio investments in certain circumstances, and to perform other functions in connection with the valuation of investments. The Advisor acts through its Valuation and Pricing Committee (the “Committee”) and other employees of the Advisor. The Committee regularly reviews its own valuation calculations, as well as the valuations, valuation techniques and services furnished by pricing service providers, considers circumstances which may require valuation calculations by the Committee, and reviews previous valuation calculations. The Committee reports to the Audit Committee on the Committee’s activities, the performance of pricing service providers, and other matters relating to valuation of portfolio investments.
In those instances when the Committee assists in calculating a fair value for a portfolio investment, the Committee seeks to determine the price that the Fund would reasonably expect to receive upon a sale of the investment in an orderly transaction between market participants on the valuation date. The Committee customarily utilizes quotations from securities broker dealers in calculating valuations, but also may utilize prices obtained from pricing service providers or other methods approved by the Audit Committee. Because fair values calculated by the Committee are estimates, the calculation of a value for an investment may differ from the price that would be realized by the Fund upon a sale of the investment, and the difference could be material to the Fund’s financial statements. The Committee’s calculation of a fair value for an investment may also differ from the prices obtained by other persons (including other mutual funds) for the investment.
Valuation of Securities: Securities and other portfolio investments which are listed or traded on a United States securities exchange are valued at the last reported sale price on the valuation date. Investments listed or traded on an exchange for which there has been no sale that day are valued at the mean between the last reported bid and asked prices on that valuation date. Portfolio investments reported by NASDAQ are valued at the official closing price on the valuation date. If an investment is traded on more than one exchange, the investment is considered traded on the exchange that is normally the primary market for that investment. Securities and other portfolio investments which are listed or traded on exchanges outside the United States are valued at the last price or the closing price of the investment on the exchange that is normally the primary market for the investment, as of the close of the exchange preceding the Fund’s valuation date. Foreign investments listed or traded on an exchange for which there has been no sale that day are valued at the mean between the last reported bid and asked prices on that valuation date.
30 | Semi-Annual Report
Notes to Financial Statements, Continued
Thornburg Investment Income Builder Fund | March 31, 2018
In any case when a market quotation is not readily available for a portfolio investment ordinarily valued by market quotation, the Committee calculates a fair value for the investment using alternative methods approved by the Audit Committee. A market quotation is not readily available when the primary market or exchange for the investment is not open for the entire scheduled day of trading. Market quotations for an investment also may not be readily available if developments after the most recent close of the investment’s primary exchange or market, but prior to the close of business on any Fund business day, or an unusual event or significant period of time occurring since the availability of a market quotation, create a serious question concerning the reliability of the most recent market quotation available for the investment. In particular, on days when market volatility thresholds established by the Audit Committee are exceeded, foreign equity investments held by the Fund may be valued using alternative methods. The Committee customarily obtains valuations in these instances from pricing service providers approved by the Audit Committee. Pricing service providers ordinarily calculate valuations using multi-factor models to adjust market prices based upon various inputs, including exchange data, depository receipt prices, futures, index data and other data.
Debt obligations held by the Fund which are not listed or traded on exchanges or for which no reported market exists are ordinarily valued at the valuation obtained from a pricing service provider approved by the Audit Committee.
In any case when a pricing service provider fails to provide a valuation for a debt obligation held by the Fund, the Committee calculates a fair value for the obligation using alternative methods under procedures approved by the Audit Committee. Additionally, in cases when management believes that a valuation obtained from a pricing service provider merits review for significant reasons, the Committee decides whether or not to use the valuation calculated by the pricing service provider or to use an alternative method approved by the Audit Committee to calculate a fair value for the obligation.
The following table displays a summary of the fair value hierarchy measurements of the Fund’s investments as of March 31, 2018. In any instance when valuation inputs from more than one level are used to determine the fair value of a specific investment, the investment is placed in the level of the table based upon the lowest level input that is significant in determining the fair value of the investment:
| | | | | | | | | | | | | | | | | | | | |
| | | FAIR VALUE MEASUREMENTS AT MARCH 31, 2018 |
| | | TOTAL | | LEVEL 1 | | LEVEL 2 | | LEVEL 3 |
Assets | | | | | | | | | | | | | | | | | | | | |
Investments in Securities* | | | | | | | | | | | | | | | | | | | | |
Corporate Bonds | | | $ | 1,029,076,132 | | | | $ | – | | | | $ | 1,021,533,956 | | | | $ | 7,542,176 | |
Convertible Bonds | | | | 7,079,110 | | | | | – | | | | | 7,079,110 | | | | | – | |
Asset Backed Securities | | | | 48,872,872 | | | | | – | | | | | 47,320,491 | | | | | 1,552,381 | |
Common Stock(a) | | | | 13,890,969,984 | | | | | 13,824,447,580 | | | | | 66,391,794 | | | | | 130,610 | |
Preferred Stock(a) | | | | 60,105,738 | | | | | 2,734,800 | | | | | 36,809,942 | | | | | 20,560,996 | |
Loan Participations | | | | 69,820,410 | | | | | – | | | | | 54,530,154 | | | | | 15,290,256 | |
Municipal Bonds | | | | 2,805,390 | | | | | – | | | | | 2,805,390 | | | | | – | |
Other Government | | | | 7,056,839 | | | | | – | | | | | 7,056,839 | | | | | – | |
Short Term Investment | | | | 161,746,474 | | | | | 161,746,474 | | | | | – | | | | | – | |
| | | | | |
Total Investments in Securities | | | $ | 15,277,532,949 | | | | $ | 13,988,928,854 | | | | $ | 1,243,527,676 | | | | $ | 45,076,419 | (b) |
| | | | |
Other Financial Instruments** | | | | | | | | | | | | | | | | | | | | |
Forward Currency Contracts | | | $ | 28,695,180 | | | | $ | – | | | | $ | 28,695,180 | | | | $ | – | |
Spot Currency | | | | 178,315 | | | | | 178,315 | | | | | – | | | | | – | |
| | | | | |
Total Other Financial Instruments | | | $ | 28,873,495 | | | | $ | 178,315 | | | | $ | 28,695,180 | | | | $ | – | |
| | | | |
Liabilities | | | | | | | | | | | | | | | | | | | | |
Other Financial Instruments** | | | | | | | | | | | | | | | | | | | | |
Forward Currency Contracts | | | $ | (37,698,945 | ) | | | $ | – | | | | $ | (37,698,945 | ) | | | $ | – | |
Spot Currency | | | | (213,595 | ) | | | | (213,595 | ) | | | | – | | | | | – | |
| | | | | |
Total Other Financial Instruments | | | $ | (37,912,540 | ) | | | $ | (213,595 | ) | | | $ | (37,698,945 | ) | | | $ | – | |
| (a) | At March 31, 2018, industry classifications for Common Stock and Preferred Stock in level 2 and Level 3 consist of $9,360,000 in Banks, $66,391,794 in Capital Goods, $20,691,606 in Energy, $10,575,000 in Miscellaneous, and $16,874,942 Telecommunication Services. |
| (b) | In accordance with the guidance prescribed in Accounting Standards Update (“ASU”) No. 2011-04, the following table displays a summary of the valuation techniques and unobservable inputs used to value portfolio securities characterized as Level 3 investments for the period ended at March 31, 2018: |
| * | See Schedule of Investments for a summary of the industry exposure as grouped according to the Global Industry Classification Standard (GICS), which is an industry taxonomy developed by MSCI, Inc. and Standard & Poor’s (S&P). |
| ** | Other Financial Instruments include investments not reflected in the Schedule of Investments, which may include futures, forwards and swap contracts, which are valued at the unrealized appreciation (depreciation) on the investment. |
Semi-Annual Report | 31
Notes to Financial Statements, Continued
Thornburg Investment Income Builder Fund | March 31, 2018
| | | | | | | | | | |
| | | FAIR VALUE AT
MARCH 31,2018 | | | VALUATION
TECHNIQUE(S) | | UNOBSERVABLE
INPUT | | RANGE
(WEIGHTED AVERAGE) |
| | | | |
Common Stock | | $ | 130,610 | | | Discount to valuation | | Fair valued by the Committee due to halt in trading and lack of information and liquidity | | $10.50/(N/A) |
| | | | |
Preferred Stock | | | 20,560,996 | | | Unadjusted broker quote | | Unadjusted broker quote | | $9.49/(N/A) |
| | | | |
Asset-Backed Securities | | | 1,552,381 | | | Discounted cash flows | | Third party vendor projection of discounted cash flows | | 5.7%/(N/A) |
| | | | |
Corporate Bond | | | 670,171 | | | Discount to valuation | | Fair valued by the Committee due to halt in trading and lack of information and liquidity | | $4.15/(N/A) |
| | | | |
| | | | 6,872,005 | | | Discounted cash flows | | Third party vendor projection of discounted cash flows | | 4.1%-5.0%/(N/A) |
| | | | |
Loan Participations | | | 15,076,809 | | | Discounted cash flows | | Third party vendor projection of discounted cash flows | | 9.5%-25.0%/(9.26%) |
| | | | |
| | | | 213,447 | | | Discount to valuation | | Fair valued by the Committee due to halt in trading and lack of information and liquidity | | $100.00/(N/A) |
| | | | |
Total | | $ | 45,076,419 | | | | | | | |
In accordance with the guidance prescribed in Accounting Standards Update No. 2011-04, it is the policy of the Fund to recognize transfers between levels and the underlying events which caused the movement. The Fund recognized no transfers between levels 1 and 2 for the six months ended March 31, 2018, other than when the Fund exceeded market volatility thresholds for foreign equity investments during the period.
A rollforward of fair value measurements using significant unobservable inputs (Level 3) for the six months ended March 31, 2018 is as follows:
| | | | | | | | | | | | | | | | | | | | | | | | | | | | | | |
| | | PREFERRED
STOCK | | ASSET BACKED
SECURITIES | | COMMON
STOCK | | CORPORATE
BONDS | | LOAN
PARTICIPATIONS | | TOTAL(e) |
Beginning Balance 9/30/2017 | | | $ | 13,782,716 | | | | $ | 1,774,019 | | | | $ | 130,610 | | | | $ | 7,999,393 | | | | $ | 17,155,748 | | | | $ | 40,842,486 | |
Accrued Discounts (Premiums) | | | | – | | | | | 5,474 | | | | | – | | | | | 28,604 | | | | | 7,257 | | | | | 41,335 | |
Net Realized Gain (Loss)(a) | | | | – | | | | | 32,353 | | | | | – | | | | | 25,653 | | | | | 4,723 | | | | | 62,729 | |
Gross Purchases | | | | 20,922,456 | | | | | – | | | | | – | | | | | – | | | | | 806 | | | | | 20,923,262 | |
Gross Sales | | | | (14,142,462 | ) | | | | (262,500 | ) | | | | – | | | | | (215,997 | ) | | | | (695,090 | ) | | | | (15,316,049 | ) |
Net Change in Unrealized Appreciation (Depreciation)(b)(c) | | | | (1,714 | ) | | | | 3,035 | | | | | – | | | | | (295,477 | ) | | | | (1,183,188 | ) | | | | (1,477,344 | ) |
Transfers into Level 3(d) | | | | – | | | | | – | | | | | – | | | | | – | | | | | – | | | | | – | |
Transfers out of Level 3(d) | | | | – | | | | | – | | | | | – | | | | | – | | | | | – | | | | | – | |
| | | | | |
Ending Balance 3/31/2018 | | | $ | 20,560,996 | | | | $ | 1,552,381 | | | | $ | 130,610 | | | | $ | 7,542,176 | | | | $ | 15,290,256 | | | | $ | 45,076,419 | |
| (a) | Amount of net realized gain (loss) from investments recognized in income is included in the Fund’s Statement of Operations for the six months ended March 31, 2018. |
| (b) | Amount of net change in unrealized appreciation (depreciation) on investments recognized in income is included in the Fund’s Statement of Operations for the six months ended March 31, 2018. |
| (c) | The net change in unrealized appreciation (depreciation) attributable to securities owned at March 31, 2018, which were valued using significant unobservable inputs, was $(1,477,344). This is included within net change in unrealized appreciation (depreciation) on investments in the Fund’s the Statement of Operations for the six months ended March 31, 2018. |
| (d) | Transfers into or out of Level 3 were out of or into Level 2, and were due to changes in other significant observable inputs available during the six months ended March 31, 2018. Transfers into or out of Level 3 are based on the beginning market value of the period in which they occurred. |
| (e) | Level 3 investments represent 0.29% of total net assets at the six months ended March 31, 2018. Significant fluctuations of the unobservable inputs applied to portfolio securities characterized as Level 3 investments could be expected to increase or decrease the fair value of these portfolio securities. |
NOTE 4 – INVESTMENT ADVISORY FEE AND OTHER TRANSACTIONS WITH AFFILIATES
Pursuant to an investment advisory agreement, the Advisor serves as the investment advisor and performs services for the Fund for which the fees are payable at the end of each month. Under the investment advisory agreement, the Fund pays the Advisor a management fee based on the daily net assets of the Fund at an annual rate as shown in the following table:
32 | Semi-Annual Report
Notes to Financial Statements, Continued
Thornburg Investment Income Builder Fund | March 31, 2018
| | | | | |
| MANAGEMENT FEE SCHEDULE |
| DAILY NET ASSETS | | FEE RATE |
| |
Up to $500 million | | | | 0.875 | % |
| |
Next $500 million | | | | 0.825 | |
| |
Next $500 million | | | | 0.775 | |
| |
Next $500 million | | | | 0.725 | |
| |
Over $2 billion | | | | 0.675 | |
The Fund’s effective management fee for the six months ended March 31, 2018 was 0.691% of the Fund’s average net assets.
The Trust has entered into administrative service agreements with the Advisor, whereby the Advisor will perform certain administrative services related to each class of the Fund’s shares. Until January 31, 2018, the fees were payable at an annual rate of up to 0.125 of 1% per annum of the average daily net assets attributable to each class of shares. As of February 1, 2018, the fees are computed as an annual percentage of the aggregate average daily net assets of all shares classes of all Funds in the Trust as follows:
| | | | | |
| ADMINISTRATION FEE SCHEDULE |
| DAILY NET ASSETS | | FEE RATE |
| |
Up to $20 billion | | | | 0.100 | % |
| |
$20 billion to $40 billion | | | | 0.075 | |
| |
$40 billion to $60 billion | | | | 0.040 | |
| |
Over $60 billion | | | | 0.030 | |
The aggregate fee amount is allocated on a daily basis to each Fund based on net assets and subsequently allocated to each class of shares of the Fund. Total administrative service fees incurred by each class of shares of the Fund for the six months ended March 31, 2018, are set forth in the Statement of Operations.
The Trust has an underwriting agreement with Thornburg Securities Corporation (the “Distributor”), an affiliate of the Advisor, which acts as the distributor of the Fund’s shares. For the six months ended March 31, 2018, the Distributor has advised the Fund that it earned net commissions aggregating $157,703 from the sale of Class A shares, and collected contingent deferred sales charges aggregating $36,558 from redemptions of Class C shares of the Fund.
Pursuant to a service plan under Rule 12b-1 of the Investment Company Act of 1940, the Fund may pay to the Distributor or securities dealers and other financial institutions at the Distributor’s direction an amount not to exceed .25 of 1% per annum of the average daily net assets attributable to Class A, Class C, Class I, Class R3, Class R4, and Class R5 shares of the Fund to obtain various shareholder and distribution related services. For the six months ended March 31, 2018, there were no 12b-1 service plan fees charged for Class I or Class R5 shares. Class R6 shares are not subject to a service plan. The Advisor and Distributor each may pay out of its own resources additional expenses for distribution of the Fund’s shares and shareholder services.
The Trust has also adopted distribution plans pursuant to Rule 12b-1, applicable only to the Fund’s Class C and Class R3 shares, under which the Fund compensates the Distributor for services in promoting the sale of Class C and Class R3 shares of the Fund at an annual rate of up to .75 of 1% per annum of the average daily net assets attributable to Class C shares, and an annual rate of up to .25 of 1% per annum of the average daily net assets attributable to Class R3 shares.
Total fees incurred by each class of shares of the Fund under their respective service and distribution plans for the six months ended March 31, 2018, are set forth in the Statement of Operations.
The Advisor and Distributor have contractually agreed to waive fees and reimburse expenses incurred by the Fund so that actual expenses of certain share classes do not exceed levels as specified in each Fund’s most recent prospectus. The agreement may be terminated by the Fund at any time, but may not be terminated by the Advisor or Distributor before February 1, 2019, unless the Advisor ceases to be the investment advisor to the Fund or the Distributor ceases to be the distributor of the Fund prior to that date. The Advisor and Distributor may recoup amounts waived or reimbursed during the fiscal year if expenses fall below the contractual limit during that year.
For the six months ended March 31, 2018, the Advisor contractually reimbursed certain class specific expenses, administrative fees, and distribution fees of $412,030 for Class C shares, $40,812 for Class R3 shares, $30,855 for Class R4 shares, $52,363 for Class R5 shares, and $7,523 for Class R6 shares.
The percentage of direct investments in the Fund held by the Trustees, officers of the Trust, and the Advisor is approximately 1.06%.
Semi-Annual Report | 33
Notes to Financial Statements, Continued
Thornburg Investment Income Builder Fund | March 31, 2018
Certain officers and Trustees of the Trust are also officers or directors of the Advisor and Distributor. The compensation of the independent Trustees is borne by the Trust. The Trust also pays a portion of the Chief Compliance Officer’s compensation. These amounts are reflected as “Trustee and officer fees” in the Statement of Operations.
The Fund may purchase or sell securities from, or to an affiliated fund, provided the affiliation is due solely to having a common investment advisor, common officers, or common trustees, and provided that all such transactions will comply with Rule 17a-7 under the 1940 Act. For the six months ended March 31, 2018, the Fund had no such transactions with affiliated funds.
Shown below are holdings of voting securities of each portfolio company which is considered “affiliated” to the Fund under the Investment Company Act of 1940, including companies for which the Fund’s holding represented 5% or more of the company’s voting securities, and a series of the Thornburg Investment Trust in which the Fund invested for cash management purposes during the period:
| | | | | | | | | | | | | | | | | | | | | | | | | | | | | | | | | | | | | | | | |
FUND | | MARKET VALUE
9/30/17 | | PURCHASES
AT COST | | SALES
PROCEEDS | | REALIZED
GAIN
(LOSS) | | CHANGE IN
UNREALIZED
APPR./(DEPR.) | | MARKET VALUE
3/31/18 | | DIVIDEND
INCOME | | ROC
ADJUSTMENT |
Apollo Investment Corp. | | | $ | 151,528,000 | | | | $ | – | | | | $ | (2,322,272 | ) | | | $ | (2,191,245 | ) | | | $ | (17,791,598 | ) | | | $ | 127,201,774 | | | | $ | 7,375,223 | | | | $ | (2,021,111 | ) |
MFA Financial, Inc. | | | | 295,388,523 | | | | | 3,468,400 | | | | | – | | | | | – | | | | | (41,179,186 | ) | | | | 257,677,737 | | | | | 13,588,061 | | | | | – | |
Solar Capital Ltd. | | | | 99,714,956 | | | | | – | | | | | – | | | | | – | | | | | (6,128,507 | ) | | | | 93,586,449 | | | | | 3,732,399 | | | | | – | |
Thornburg Capital | | | | | | | | | | | | | | | | | | | | | | | | | | | | | | | | | | | | | | | | |
Management Fund | | | | 274,117,324 | | | | | 1,330,325,668 | | | | | (1,442,696,518 | ) | | | | – | | | | | – | | | | | 161,746,474 | | | | | 1,678,695 | | | | | – | |
| | | | | | | | | | | | | | | | | | | | | | | | | | | | | | | | | | | | | | | | |
Total | | | $ | 820,748,803 | | | | $ | 1,333,794,068 | | | | $ | (1,445,018,790 | ) | | | $ | (2,191,245 | ) | | | $ | (65,099,291 | ) | | | $ | 640,212,434 | | | | $ | 26,374,378 | | | | $ | (2,021,111 | ) |
| | | | | | | | | | | | | | | | | | | | | | | | | | | | | | | | | | | | | | | | |
NOTE 5 – SHARES OF BENEFICIAL INTEREST
At March 31, 2018, there were an unlimited number of shares with no par value of beneficial interest authorized. Transactions in shares of beneficial interest were as follows:
| | | | | | | | | | | | | | | | |
| | | SIX MONTHS ENDED
MARCH 31, 2018 (UNAUDITED) | | | YEAR ENDED
SEPTEMBER 30, 2017 (AUDITED) | |
| | | SHARES | | | AMOUNT | | | SHARES | | | AMOUNT | |
Class A Shares | | | | | | | | | | | | | | | | |
Shares sold | | | 5,907,472 | | | $ | 128,673,582 | | | | 14,566,252 | | | $ | 298,469,059 | |
Shares issued to shareholders in
reinvestment of dividends | | | 3,143,634 | | | | 67,536,520 | | | | 6,515,771 | | | | 134,786,562 | |
Shares repurchased | | | (17,937,431 | ) | | | (390,730,177 | ) | | | (54,700,491 | ) | | | (1,117,621,146 | ) |
| | | | | | | | | | | | | | | | |
| | | | |
Net decrease | | | (8,886,325 | ) | | $ | (194,520,075 | ) | | | (33,618,468 | ) | | $ | (684,365,525 | ) |
| | | | | | | | | | | | | | | | |
Class C Shares | | | | | | | | | | | | | | | | |
Shares sold | | | 4,531,896 | | | $ | 98,662,527 | | | | 9,304,338 | | | $ | 189,891,258 | |
Shares issued to shareholders in
reinvestment of dividends | | | 3,566,697 | | | | 76,653,192 | | | | 7,239,895 | | | | 149,671,164 | |
Shares repurchased | | | (21,798,637 | ) | | | (473,396,976 | ) | | | (69,148,037 | ) | | | (1,410,348,619 | ) |
| | | | | | | | | | | | | | | | |
| | | | |
Net decrease | | | (13,700,044 | ) | | $ | (298,081,257 | ) | | | (52,603,804 | ) | | $ | (1,070,786,197 | ) |
| | | | | | | | | | | | | | | | |
Class I Shares | | | | | | | | | | | | | | | | |
Shares sold | | | 34,253,908 | | | $ | 750,710,195 | | | | 84,715,252 | | | $ | 1,745,294,495 | |
Shares issued to shareholders in
reinvestment of dividends | | | 7,370,310 | | | | 159,413,038 | | | | 13,469,392 | | | | 281,043,982 | |
Shares repurchased | | | (46,352,844 | ) | | | (1,014,167,219 | ) | | | (84,709,982 | ) | | | (1,743,995,274 | ) |
| | | | | | | | | | | | | | | | |
| | | | |
Net increase (decrease) | | | (4,728,626 | ) | | $ | (104,043,986 | ) | | | 13,474,662 | | | $ | 282,343,203 | |
| | | | | | | | | | | | | | | | |
Class R3 Shares | | | | | | | | | | | | | | | | |
Shares sold | | | 143,028 | | | $ | 3,100,731 | | | | 633,260 | | | $ | 12,952,555 | |
Shares issued to shareholders in
reinvestment of dividends | | | 52,829 | | | | 1,135,963 | | | | 119,475 | | | | 2,470,331 | |
Shares repurchased | | | (695,509 | ) | | | (15,140,667 | ) | | | (1,551,779 | ) | | | (31,882,163 | ) |
| | | | | | | | | | | | | | | | |
| | | | |
Net decrease | | | (499,652 | ) | | $ | (10,903,973 | ) | | | (799,044 | ) | | $ | (16,459,277 | ) |
| | | | | | | | | | | | | | | | |
34 | Semi-Annual Report
Notes to Financial Statements, Continued
Thornburg Investment Income Builder Fund | March 31, 2018
| | | | | | | | | | | | | | | | |
| | | SIX MONTHS ENDED
MARCH 31, 2018 (UNAUDITED) | | | YEAR ENDED
SEPTEMBER 30, 2017 (AUDITED) | |
| | | SHARES | | | AMOUNT | | | SHARES | | | AMOUNT | |
Class R4 Shares | | | | | | | | | | | | | | | | |
Shares sold | | | 171,686 | | | $ | 3,737,075 | | | | 552,681 | | | $ | 11,378,772 | |
Shares issued to shareholders in
reinvestment of dividends | | | 25,837 | | | | 556,887 | | | | 54,770 | | | | 1,134,615 | |
Shares repurchased | | | (567,922 | ) | | | (12,393,173 | ) | | | (875,534 | ) | | | (18,029,348 | ) |
| | | | |
| | | | |
Net decrease | | | (370,399 | ) | | $ | (8,099,211 | ) | | | (268,083 | ) | | $ | (5,515,961 | ) |
| | | | |
Class R5 Shares | | | | | | | | | | | | | | | | |
Shares sold | | | 328,676 | | | $ | 7,161,892 | | | | 1,192,147 | | | $ | 24,606,916 | |
Shares issued to shareholders in
reinvestment of dividends | | | 78,720 | | | | 1,707,987 | | | | 165,956 | | | | 3,460,075 | |
Shares repurchased | | | (1,761,540 | ) | | | (38,947,997 | ) | | | (1,455,231 | ) | | | (29,857,146 | ) |
| | | | |
| | | | |
Net decrease | | | (1,354,144 | ) | | $ | (30,078,118 | ) | | | (97,128 | ) | | $ | (1,790,155 | ) |
| | | | |
Class R6 Shares* | | | | | | | | | | | | | | | | |
Shares sold | | | 5,158,515 | | | $ | 110,836,439 | | | | 1,698,497 | | | $ | 35,467,321 | |
Shares issued to shareholders in
reinvestment of dividends | | | 50,042 | | | | 1,073,089 | | | | 17,998 | | | | 386,382 | |
Shares repurchased | | | (167,590 | ) | | | (3,657,218 | ) | | | (5,895 | ) | | | (125,821 | ) |
| | | | |
| | | | |
Net increase | | | 5,040,967 | | | $ | 108,252,310 | | | | 1,710,600 | | | $ | 35,727,882 | |
| | | | |
| * | The effective date of this class of shares was April 10, 2017. |
NOTE 6 – INVESTMENT TRANSACTIONS
For the six months ended March 31, 2018, the Fund had purchase and sale transactions of investments (excluding short-term investments and U.S. Government obligations) of $2,616,162,793 and $3,289,173,497, respectively.
NOTE 7 – DERIVATIVE FINANCIAL INSTRUMENTS WITH OFF-BALANCE SHEET RISK AND FOREIGN INVESTMENT RISK
The Fund may use a variety of derivative financial instruments to hedge or adjust the risks affecting its investment portfolio or to enhance investment returns. Provisions of the FASB Accounting Standards Codification 815-10-50 (“ASC 815”) require certain disclosures. The disclosures are intended to provide users of financial statements with an understanding of the use of derivative instruments by the Fund and how these derivatives affect the financial position, financial performance and cash flows of the Fund. The Fund does not designate any derivative instruments as hedging instruments under ASC 815. During the six months ended March 31, 2018, the Fund’s principal exposure to derivative financial instruments of the type addressed by ASC 815 was investment in foreign exchange contracts. A foreign exchange contract is an agreement between two parties to exchange different currencies at a specified rate of exchange at an agreed upon future date. Foreign exchange contracts involve risks to the Fund, including the risk that a contract’s counterparty will not meet its obligations to the Fund, the risk that a change in a contract’s value may not correlate perfectly with the currency the contract was intended to track, and the risk that the Fund’s Advisor is unable to correctly implement its strategy in using a contract. In any such instance, the Fund may not achieve the intended benefit of entering into a contract, and may experience a loss.
The Fund entered into forward currency contracts during the six months ended March 31, 2018 in the normal course of pursuing its investment objectives, with the objective of purchasing foreign investments or with the intent of reducing the risk to the value of the Fund’s foreign investments from adverse changes in the relationship between the U.S. dollar and foreign currencies. In each case these contracts have been initiated in conjunction with foreign investment transactions.
These contracts are accounted for by the Fund under ASC 815. Unrealized appreciation and depreciation on outstanding contracts are reported in the Fund’s Statement of Assets and Liabilities, as measured by the difference between the forward exchange rates at the reporting date and the forward exchange rates at each contract’s inception date. Net realized gain (loss) on contracts closed during the period, and changes in net unrealized appreciation (depreciation) on outstanding contracts are recognized in the Fund’s Statement of Operations.
Semi-Annual Report | 35
Notes to Financial Statements, Continued
Thornburg Investment Income Builder Fund | March 31, 2018
The monthly average value of open sell currency contracts for the six months ended March 31, 2018 was $4,225,537,059. Open buy currency contracts are entered into for the purpose of closing open sell currency contracts and the values are dependent upon the values of the open sell currency contracts to which they relate.
The outstanding forward currency contracts table located in the Schedule of Investments which were entered into with State Street Bank and Trust Company (“SSB”), were entered into pursuant to an International Swaps and Derivatives Association (“ISDA”) Master Agreement. Outstanding forward currency contracts which were entered into with Brown Brothers Harriman & Co. (“BBH”) were entered into pursuant to a written agreement with BBH. In the event of a default or termination under the ISDA Master Agreement with SSB or the agreement with BBH, the non-defaulting party has the right to close out all outstanding forward currency contracts between the parties and to net any payment amounts under those contracts, resulting in a single net amount payable by one party to the other.
Because the ISDA Master Agreement with SSB and the agreement with BBH does not result in an offset of reported amounts of financial assets and liabilities in the Fund’s Statement of Assets and Liabilities unless there has been an event of default or termination event under such agreements, the Fund does not net its outstanding forward currency contracts for the purpose of disclosure in the Fund’s Statement of Assets and Liabilities. Instead the Fund recognizes the unrealized appreciation (depreciation) on those forward currency contracts on a gross basis in the Fund’s Statement of Assets and Liabilities.
The unrealized appreciation (depreciation) of the outstanding forward currency contracts recognized in the Fund’s Statement of Assets and Liabilities at March 31, 2018 is disclosed in the following table:
| | | | | | |
FAIR VALUES OF DERIVATIVE FINANCIAL INSTRUMENTS AT MARCH 31, 2018 | |
| | |
| ASSET DERIVATIVES | | BALANCE SHEET LOCATION | | FAIR VALUE | |
| | |
Foreign exchange contracts | | Assets - Unrealized appreciation on forward currency contracts | | $ | 28,695,180 | |
|
FAIR VALUES OF DERIVATIVE FINANCIAL INSTRUMENTS AT MARCH 31, 2018 | |
| | |
| LIABILITY DERIVATIVES | | BALANCE SHEET LOCATION | | FAIR VALUE | |
| | |
Foreign exchange contracts | | Liabilities - Unrealized depreciation on forward currency contracts | | $ | (37,698,945 | ) |
The Fund receives or posts cash collateral in connection with its currency forward contracts for non-deliverable currencies. The Fund does not currently receive or post cash collateral in connection with its currency forward contracts for deliverable currencies. The net amounts of the Fund’s assets and liabilities which are attributable to deliverable currency contracts at March 31, 2018 can be determined by offsetting the dollar amounts shown in the preceding table. Based on those amounts, the net amount of the Fund’s liabilities which is attributable to its outstanding forward currency contracts at March 31, 2018 is $8,862,270 attributable to the Fund’s contracts with SSB, and the net amount of the Fund’s liabilities which is attributable to those contracts at that date is $141,495 attributable to the Fund’s contracts with BBH. The Fund’s forward currency contracts are valued each day, and the net amounts of the Fund’s assets and liabilities which are attributable to those contracts are expected to vary over time.
The net realized gain (loss) from forward currency contracts and the net change in unrealized appreciation (depreciation) on outstanding forward currency contracts recognized in the Fund’s Statement of Operations for the six months ended March 31, 2018 are disclosed in the following tables:
| | | | | | | | |
NET REALIZED GAIN (LOSS) ON DERIVATIVE FINANCIAL INSTRUMENTS
RECOGNIZED IN INCOME FOR THE SIX MONTHS ENDED MARCH 31, 2018 | |
| | |
| | | TOTAL | | | FORWARD CURRENCY CONTRACTS | |
| | |
Foreign exchange contracts | | $ | (175,970,328) | | | $ | (175,970,328) | |
|
NET CHANGE IN UNREALIZED APPRECIATION (DEPRECIATION) OF DERIVATIVE FINANCIAL INSTRUMENTS
RECOGNIZED IN INCOME FOR THE SIX MONTHS ENDED MARCH 31, 2018 | |
| | |
| | | TOTAL | | | FORWARD CURRENCY CONTRACTS | |
| | |
Foreign exchange contracts | | $ | 26,126,778 | | | $ | 26,126,778 | |
OTHER NOTES
Risks: The Fund’s investments subject it to risks including, but not limited to, management risk, market and economic risk, risks affecting specific issuers, the risks associated with investments in small- and mid-cap companies, credit risk, interest rate risk, high-yield risk, prepayment risk, foreign investment and developing country risks, liquidity risk, and real estate investment trust risk. Please see the Fund’s prospectus for a discussion of the risks associated with an investment in the Fund.
36 | Semi-Annual Report
Notes to Financial Statements, Continued
Thornburg Investment Income Builder Fund | March 31, 2018
Subsequent Events: Fund management believes no events have occurred between March 31, 2018 and the date of issuance of the financial statements that require adjustment to or disclosure in the accompanying financial statements.
Semi-Annual Report | 37
Financial Highlights
Thornburg Investment Income Builder Fund
| | | | | | | | | | | | | | | | | | | | | | | | | | | | | | | | | | | | | | | | |
| | | PER SHARE PERFORMANCE (FOR A SHARE OUTSTANDING THROUGHOUT THE PERIOD) |
| | | | | | | | | | | | | | | | | |
UNLESS OTHERWISE NOTED, PERIODS ARE FISCAL YEARS ENDED SEPTEMBER 30, | | NET ASSET VALUE, BEGINNING OF PERIOD | | NET INVESTMENT INCOME (LOSS)+ | | NET REALIZED & UNREALIZED GAIN (LOSS) ON INVESTMENTS | | TOTAL FROM INVESTMENT OPERATIONS | | DIVIDENDS FROM NET INVESTMENT INCOME | | DIVIDENDS FROM NET REALIZED GAINS | | TOTAL DIVIDENDS | | NET ASSET VALUE, END OF PERIOD |
| | | | | | | |
| CLASS A SHARES | | | | | | | | | | | | | | | | | | | | | | | | | | | | | | | | | | | | |
| | | | | | | | |
2018(b)(c) | | | $ | 21.50 | | | | | 0.34 | | | | | (0.16 | ) | | | | 0.18 | | | | | (0.47 | ) | | | | – | | | | | (0.47 | ) | | | $ | 21.21 | |
2017(b) | | | $ | 19.82 | | | | | 0.92 | | | | | 1.61 | | | | | 2.53 | | | | | (0.85 | ) | | | | – | | | | | (0.85 | ) | | | $ | 21.50 | |
2016(b) | | | $ | 19.07 | | | | | 0.93 | | | | | 0.62 | | | | | 1.55 | | | | | (0.80 | ) | | | | – | | | | | (0.80 | ) | | | $ | 19.82 | |
2015(b) | | | $ | 21.38 | | | | | 0.85 | | | | | (2.34 | ) | | | | (1.49 | ) | | | | (0.82 | ) | | | | – | | | | | (0.82 | ) | | | $ | 19.07 | |
2014(b) | | | $ | 20.13 | | | | | 1.10 | | | | | 1.13 | | | | | 2.23 | | | | | (0.98 | ) | | | | – | | | | | (0.98 | ) | | | $ | 21.38 | |
2013(b) | | | $ | 18.90 | | | | | 1.03 | | | | | 1.27 | | | | | 2.30 | | | | | (1.07 | ) | | | | – | | | | | (1.07 | ) | | | $ | 20.13 | |
| | | | | | | |
| CLASS C SHARES | | | | | | | | | | | | | | | | | | | | | | | | | | | | | | | | | | | | |
| | | | | | | | |
2018(c) | | | $ | 21.48 | | | | | 0.26 | | | | | (0.16 | ) | | | | 0.10 | | | | | (0.39 | ) | | | | – | | | | | (0.39 | ) | | | $ | 21.19 | |
2017 | | | $ | 19.81 | | | | | 0.78 | | | | | 1.60 | | | | | 2.38 | | | | | (0.71 | ) | | | | – | | | | | (0.71 | ) | | | $ | 21.48 | |
2016 | | | $ | 19.06 | | | | | 0.79 | | | | | 0.62 | | | | | 1.41 | | | | | (0.66 | ) | | | | – | | | | | (0.66 | ) | | | $ | 19.81 | |
2015 | | | $ | 21.37 | | | | | 0.70 | | | | | (2.34 | ) | | | | (1.64 | ) | | | | (0.67 | ) | | | | – | | | | | (0.67 | ) | | | $ | 19.06 | |
2014 | | | $ | 20.13 | | | | | 0.94 | | | | | 1.13 | | | | | 2.07 | | | | | (0.83 | ) | | | | – | | | | | (0.83 | ) | | | $ | 21.37 | |
2013 | | | $ | 18.89 | | | | | 0.89 | | | | | 1.28 | | | | | 2.17 | | | | | (0.93 | ) | | | | – | | | | | (0.93 | ) | | | $ | 20.13 | |
| | | | | | | |
| CLASS I SHARES | | | | | | | | | | | | | | | | | | | | | | | | | | | | | | | | | | | | |
| | | | | | | | |
2018(c) | | | $ | 21.65 | | | | | 0.38 | | | | | (0.16 | ) | | | | 0.22 | | | | | (0.51 | ) | | | | – | | | | | (0.51 | ) | | | $ | 21.36 | |
2017 | | | $ | 19.97 | | | | | 1.02 | | | | | 1.59 | | | | | 2.61 | | | | | (0.93 | ) | | | | – | | | | | (0.93 | ) | | | $ | 21.65 | |
2016 | | | $ | 19.21 | | | | | 1.00 | | | | | 0.62 | | | | | 1.62 | | | | | (0.86 | ) | | | | – | | | | | (0.86 | ) | | | $ | 19.97 | |
2015 | | | $ | 21.53 | | | | | 0.93 | | | | | (2.35 | ) | | | | (1.42 | ) | | | | (0.90 | ) | | | | – | | | | | (0.90 | ) | | | $ | 19.21 | |
2014 | | | $ | 20.27 | | | | | 1.16 | | | | | 1.15 | | | | | 2.31 | | | | | (1.05 | ) | | | | – | | | | | (1.05 | ) | | | $ | 21.53 | |
2013 | | | $ | 19.03 | | | | | 1.10 | | | | | 1.28 | | | | | 2.38 | | | | | (1.14 | ) | | | | – | | | | | (1.14 | ) | | | $ | 20.27 | |
| | | | | | | |
| CLASS R3 SHARES | | | | | | | | | | | | | | | | | | | | | | | | | | | | | | | | | | | | |
| | | | | | | | |
2018(c) | | | $ | 21.49 | | | | | 0.30 | | | | | (0.15 | ) | | | | 0.15 | | | | | (0.44 | ) | | | | – | | | | | (0.44 | ) | | | $ | 21.20 | |
2017 | | | $ | 19.82 | | | | | 0.87 | | | | | 1.59 | | | | | 2.46 | | | | | (0.79 | ) | | | | – | | | | | (0.79 | ) | | | $ | 21.49 | |
2016 | | | $ | 19.07 | | | | | 0.87 | | | | | 0.62 | | | | | 1.49 | | | | | (0.74 | ) | | | | – | | | | | (0.74 | ) | | | $ | 19.82 | |
2015 | | | $ | 21.37 | | | | | 0.78 | | | | | (2.32 | ) | | | | (1.54 | ) | | | | (0.76 | ) | | | | – | | | | | (0.76 | ) | | | $ | 19.07 | |
2014 | | | $ | 20.13 | | | | | 1.03 | | | | | 1.12 | | | | | 2.15 | | | | | (0.91 | ) | | | | – | | | | | (0.91 | ) | | | $ | 21.37 | |
2013 | | | $ | 18.89 | | | | | 0.97 | | | | | 1.28 | | | | | 2.25 | | | | | (1.01 | ) | | | | – | | | | | (1.01 | ) | | | $ | 20.13 | |
| | | | | | | |
| CLASS R4 SHARES | | | | | | | | | | | | | | | | | | | | | | | | | | | | | | | | | | | | |
| | | | | | | | |
2018(c) | | | $ | 21.52 | | | | | 0.32 | | | | | (0.16 | ) | | | | 0.16 | | | | | (0.45 | ) | | | | – | | | | | (0.45 | ) | | | $ | 21.23 | |
2017 | | | $ | 19.85 | | | | | 0.89 | | | | | 1.59 | | | | | 2.48 | | | | | (0.81 | ) | | | | – | | | | | (0.81 | ) | | | $ | 21.52 | |
2016 | | | $ | 19.10 | | | | | 0.89 | | | | | 0.62 | | | | | 1.51 | | | | | (0.76 | ) | | | | – | | | | | (0.76 | ) | | | $ | 19.85 | |
2015 | | | $ | 21.42 | | | | | 0.81 | | | | | (2.35 | ) | | | | (1.54 | ) | | | | (0.78 | ) | | | | – | | | | | (0.78 | ) | | | $ | 19.10 | |
2014 | | | $ | 20.17 | | | | | 1.04 | | | | | 1.16 | | | | | 2.20 | | | | | (0.95 | ) | | | | – | | | | | (0.95 | ) | | | $ | 21.42 | |
2013 | | | $ | 18.93 | | | | | 0.99 | | | | | 1.29 | | | | | 2.28 | | | | | (1.04 | ) | | | | – | | | | | (1.04 | ) | | | $ | 20.17 | |
| | | | | | | |
| CLASS R5 SHARES | | | | | | | | | | | | | | | | | | | | | | | | | | | | | | | | | | | | |
| | | | | | | | |
2018(c) | | | $ | 21.64 | | | | | 0.36 | | | | | (0.16 | ) | | | | 0.20 | | | | | (0.49 | ) | | | | – | | | | | (0.49 | ) | | | $ | 21.35 | |
2017 | | | $ | 19.95 | | | | | 0.98 | | | | | 1.61 | | | | | 2.59 | | | | | (0.90 | ) | | | | – | | | | | (0.90 | ) | | | $ | 21.64 | |
2016 | | | $ | 19.20 | | | | | 0.98 | | | | | 0.62 | | | | | 1.60 | | | | | (0.85 | ) | | | | – | | | | | (0.85 | ) | | | $ | 19.95 | |
2015 | | | $ | 21.52 | | | | | 0.90 | | | | | (2.35 | ) | | | | (1.45 | ) | | | | (0.87 | ) | | | | – | | | | | (0.87 | ) | | | $ | 19.20 | |
2014 | | | $ | 20.26 | | | | | 1.10 | | | | | 1.19 | | | | | 2.29 | | | | | (1.03 | ) | | | | – | | | | | (1.03 | ) | | | $ | 21.52 | |
2013 | | | $ | 19.01 | | | | | 1.07 | | | | | 1.30 | | | | | 2.37 | | | | | (1.12 | ) | | | | – | | | | | (1.12 | ) | | | $ | 20.26 | |
| | | | | | | |
| CLASS R6 SHARES | | | | | | | | | | | | | | | | | | | | | | | | | | | | | | | | | | | | |
| | | | | | | | |
2018(c) | | | $ | 21.58 | | | | | 0.46 | | | | | (0.24 | ) | | | | 0.22 | | | | | (0.51 | ) | | | | – | | | | | (0.51 | ) | | | $ | 21.29 | |
2017(e) | | | $ | 20.55 | | | | | 0.44 | | | | | 1.12 | | | | | 1.56 | | | | | (0.53 | ) | | | | – | | | | | (0.53 | ) | | | $ | 21.58 | |
| (a) | Not annualized for periods less than one year. |
| (b) | Sales loads are not reflected in computing total return. |
| (c) | Unaudited Six Month Period Ended March 31. |
| (e) | Effective date of this class of shares was April 10, 2017. |
| + | Based on weighted average shares outstanding. |
See notes to financial statements.
38 | Semi-Annual Report
Financial Highlights, Continued
Thornburg Investment Income Builder Fund
| | | | | | | | | | | | | | | | | | | | | | | | | | | | | | |
| RATIOS TO AVERAGE NET ASSETS | | | | | | SUPPLEMENTAL DATA | |
| | | | | | | EXPENSES, AFTER | | | | | | | | | | | | | | | | |
NET INVESTMENT
INCOME (LOSS) (%) | | | EXPENSES, AFTER
EXPENSE
REDUCTIONS (%) | | | EXPENSE
REDUCTIONS AND
NET OF CUSTODY
CREDITS (%) | | | EXPENSES,
BEFORE EXPENSE
REDUCTIONS (%) | | | | | | TOTAL
RETURN (%)(a) | | | PORTFOLIO
TURNOVER
RATE (%)(a) | | | NET ASSETS AT
END OF PERIOD
(THOUSANDS) | |
| | | | | | | |
| | | | | | | | | | | | | | | | | | | | | | | | | | | | | | |
| | | | | | | |
| | 3.14 | (d) | | | 1.17 | (d) | | | 1.17 | (d) | | | 1.17 | (d) | | | | | | | 0.82 | | | | 16.62 | | | $ | 3,140,758 | |
| | 4.52 | | | | 1.19 | | | | 1.19 | | | | 1.19 | | | | | | | | 13.01 | | | | 37.37 | | | $ | 3,374,895 | |
| | 4.82 | | | | 1.18 | | | | 1.18 | | | | 1.18 | | | | | | | | 8.35 | | | | 42.81 | | | $ | 3,778,863 | |
| | 4.02 | | | | 1.17 | | | | 1.17 | | | | 1.17 | | | | | | | | (7.27 | ) | | | 47.71 | | | $ | 4,257,943 | |
| | 5.21 | | | | 1.18 | | | | 1.18 | | | | 1.18 | | | | | | | | 11.19 | | | | 38.81 | | | $ | 4,588,033 | |
| | 5.26 | | | | 1.18 | | | | 1.18 | | | | 1.18 | | | | | | | | 12.51 | | | | 46.14 | | | $ | 4,281,060 | |
| | | | | | | |
| | | | | | | | | | | | | | | | | | | | | | | | | | | | | | |
| | | | | | | |
| | 2.41 | (d) | | | 1.90 | (d) | | | 1.90 | (d) | | | 1.92 | (d) | | | | | | | 0.46 | | | | 16.62 | | | $ | 4,323,341 | |
| | 3.80 | | | | 1.90 | | | | 1.90 | | | | 1.93 | | | | | | | | 12.19 | | | | 37.37 | | | $ | 4,677,322 | |
| | 4.11 | | | | 1.90 | | | | 1.90 | | | | 1.93 | | | | | | | | 7.59 | | | | 42.81 | | | $ | 5,356,153 | |
| | 3.30 | | | | 1.90 | | | | 1.90 | | | | 1.92 | | | | | | | | (7.93 | ) | | | 47.71 | | | $ | 5,906,206 | |
| | 4.44 | | | | 1.90 | | | | 1.90 | | | | 1.93 | | | | | | | | 10.36 | | | | 38.81 | | | $ | 6,266,270 | |
| | 4.55 | | | | 1.90 | | | | 1.90 | | | | 1.94 | | | | | | | | 11.78 | | | | 46.14 | | | $ | 5,160,706 | |
| | | | | | | |
| | | | | | | | | | | | | | | | | | | | | | | | | | | | | | |
| | | | | | | |
| | 3.47 | (d) | | | 0.86 | (d) | | | 0.86 | (d) | | | 0.86 | (d) | | | | | | | 0.99 | | | | 16.62 | | | $ | 7,598,507 | |
| | 4.93 | | | | 0.86 | | | | 0.86 | | | | 0.86 | | | | | | | | 13.30 | | | | 37.37 | | | $ | 7,804,930 | |
| | 5.15 | | | | 0.86 | | | | 0.86 | | | | 0.86 | | | | | | | | 8.71 | | | | 42.81 | | | $ | 6,928,783 | |
| | 4.35 | | | | 0.85 | | | | 0.85 | | | | 0.85 | | | | | | | | (6.94 | ) | | | 47.71 | | | $ | 7,472,344 | |
| | 5.45 | | | | 0.86 | | | | 0.86 | | | | 0.86 | | | | | | | | 11.54 | | | | 38.81 | | | $ | 7,454,275 | |
| | 5.58 | | | | 0.85 | | | | 0.85 | | | | 0.85 | | | | | | | | 12.94 | | | | 46.14 | | | $ | 5,567,617 | |
| | | | | | | |
| | | | | | | | | | | | | | | | | | | | | | | | | | | | | | |
| | | | | | | |
| | 2.79 | (d) | | | 1.49 | (d) | | | 1.49 | (d) | | | 1.63 | (d) | | | | | | | 0.66 | | | | 16.62 | | | $ | 56,112 | |
| | 4.24 | | | | 1.47 | | | | 1.47 | | | | 1.56 | | | | | | | | 12.63 | | | | 37.37 | | | $ | 67,623 | |
| | 4.53 | | | | 1.50 | | | | 1.50 | | | | 1.59 | | | | | | | | 8.01 | | | | 42.81 | | | $ | 78,188 | |
| | 3.70 | | | | 1.50 | | | | 1.50 | | | | 1.55 | | | | | | | | (7.52 | ) | | | 47.71 | | | $ | 79,834 | |
| | 4.84 | | | | 1.49 | | | | 1.49 | | | | 1.55 | | | | | | | | 10.80 | | | | 38.81 | | | $ | 83,670 | |
| | 4.96 | | | | 1.49 | | | | 1.49 | | | | 1.70 | | | | | | | | 12.23 | | | | 46.14 | | | $ | 61,334 | |
| | | | | | | |
| | | | | | | | | | | | | | | | | | | | | | | | | | | | | | |
| | | | | | | |
| | 2.91 | (d) | | | 1.39 | (d) | | | 1.39 | (d) | | | 1.55 | (d) | | | | | | | 0.72 | | | | 16.62 | | | $ | 35,603 | |
| | 4.35 | | | | 1.40 | | | | 1.40 | | | | 1.51 | | | | | | | | 12.72 | | | | 37.37 | | | $ | 44,069 | |
| | 4.63 | | | | 1.40 | | | | 1.40 | | | | 1.48 | | | | | | | | 8.12 | | | | 42.81 | | | $ | 45,968 | |
| | 3.81 | | | | 1.40 | | | | 1.40 | | | | 1.46 | | | | | | | | (7.48 | ) | | | 47.71 | | | $ | 42,392 | |
| | 4.88 | | | | 1.35 | | | | 1.35 | | | | 1.40 | | | | | | | | 11.00 | | | | 38.81 | | | $ | 39,890 | |
| | 5.05 | | | | 1.37 | | | | 1.37 | | | | 1.41 | | | | | | | | 12.35 | | | | 46.14 | | | $ | 24,906 | |
| | | | | | | |
| | | | | | | | | | | | | | | | | | | | | | | | | | | | | | |
| | | | | | | |
| | 3.30 | (d) | | | 0.98 | (d) | | | 0.98 | (d) | | | 1.11 | (d) | | | | | | | 0.92 | | | | 16.62 | | | $ | 61,591 | |
| | 4.76 | | | | 0.99 | | | | 0.99 | | | | 1.09 | | | | | | | | 13.22 | | | | 37.37 | | | $ | 91,735 | |
| | 5.08 | | | | 0.99 | | | | 0.99 | | | | 1.07 | | | | | | | | 8.52 | | | | 42.81 | | | $ | 86,535 | |
| | 4.23 | | | | 0.98 | | | | 0.98 | | | | 1.07 | | | | | | | | (7.06 | ) | | | 47.71 | | | $ | 78,945 | |
| | 5.15 | | | | 0.99 | | | | 0.99 | | | | 1.10 | | | | | | | | 11.40 | | | | 38.81 | | | $ | 64,748 | |
| | 5.37 | | | | 0.99 | | | | 0.98 | | | | 1.05 | | | | | | | | 12.80 | | | | 46.14 | | | $ | 39,985 | |
| | | | | | | |
| | | | | | | | | | | | | | | | | | | | | | | | | | | | | | |
| | | | | | | |
| | 4.26 | (d) | | | 0.80 | (d) | | | 0.80 | (d) | | | 0.83 | (d) | | | | | | | 1.01 | | | | 16.62 | | | $ | 143,728 | |
| | 4.37 | (d) | | | 0.80 | (d) | | | 0.80 | (d) | | | 1.09 | (d) | | | | | | | 7.65 | | | | 37.37 | | | $ | 36,909 | |
Semi-Annual Report | 39
Expense Example
Thornburg Investment Income Builder Fund | March 31, 2018 (Unaudited)
As a shareholder of the Fund, you incur two types of costs:
| | (1) | transaction costs, including |
| | (a) | sales charges (loads) on purchase payments, for Class A shares; |
| | (b) | a deferred sales charge on redemptions of any part or all of a purchase of $1 million of Class A shares within 12 months of purchase; |
| | (c) | a deferred sales charge on redemptions of Class C shares within 12 months of purchase; |
| | (2) | ongoing costs, including management fees; distribution and/or service (12b-1) fees; and other Fund expenses. |
This example is intended to help you understand your ongoing costs (in dollars) of investing in the Fund and to compare these costs with the ongoing costs of investing in other mutual funds.
The example is based on a $1,000 investment beginning on October 1, 2017, and held until March 31, 2018.
ACTUAL EXPENSES
For each class of shares, the first line of the accompanying table provides information about actual account values and actual expenses. You may use the information in this line, together with the amount you invested, to estimate the expenses that you paid over the period. Simply divide your account value by $1,000 (for example, an $8,600 account value divided by $1,000 = 8.6), then multiply the result by the number in the first line for your class of shares under the heading entitled “Expenses Paid During Period” to estimate the expenses you paid on your account during this period.
| | | | | | | | | | | | | | | |
| | | BEGINNING
ACCOUNT VALUE
10/1/17 | | ENDING
ACCOUNT VALUE
3/31/18 | | EXPENSES PAID
DURING PERIOD†
10/1/17–3/31/18 |
| | | |
| CLASS A SHARES | | | | | | | | | | | | | | | |
| | | |
Actual | | | $ | 1,000.00 | | | | $ | 1,008.20 | | | | $ | 5.86 | |
Hypothetical* | | | $ | 1,000.00 | | | | $ | 1,019.10 | | | | $ | 5.89 | |
| | | |
| CLASS C SHARES | | | | | | | | | | | | | | | |
| | | |
Actual | | | $ | 1,000.00 | | | | $ | 1,004.60 | | | | $ | 9.50 | |
Hypothetical* | | | $ | 1,000.00 | | | | $ | 1,015.46 | | | | $ | 9.55 | |
| | | |
| CLASS I SHARES | | | | | | | | | | | | | | | |
| | | |
Actual | | | $ | 1,000.00 | | | | $ | 1,009.90 | | | | $ | 4.31 | |
Hypothetical* | | | $ | 1,000.00 | | | | $ | 1,020.64 | | | | $ | 4.33 | |
| | | |
| CLASS R3 SHARES | | | | | | | | | | | | | | | |
| | | |
Actual | | | $ | 1,000.00 | | | | $ | 1,006.60 | | | | $ | 7.45 | |
Hypothetical* | | | $ | 1,000.00 | | | | $ | 1,017.50 | | | | $ | 7.49 | |
| | | |
| CLASS R4 SHARES | | | | | | | | | | | | | | | |
| | | |
Actual | | | $ | 1,000.00 | | | | $ | 1,007.20 | | | | $ | 6.96 | |
Hypothetical* | | | $ | 1,000.00 | | | | $ | 1,018.00 | | | | $ | 6.99 | |
| | | |
| CLASS R5 SHARES | | | | | | | | | | | | | | | |
| | | |
Actual | | | $ | 1,000.00 | | | | $ | 1,009.20 | | | | $ | 4.91 | |
Hypothetical* | | | $ | 1,000.00 | | | | $ | 1,020.04 | | | | $ | 4.94 | |
| | | |
| CLASS R6 SHARES | | | | | | | | | | | | | | | |
| | | |
Actual | | | $ | 1,000.00 | | | | $ | 1,010.10 | | | | $ | 4.01 | |
Hypothetical* | | | $ | 1,000.00 | | | | $ | 1,020.94 | | | | $ | 4.03 | |
| † | Expenses are equal to the annualized expense ratio for each class (A: 1.17%; C: 1.90%; I: 0.86%; R3: 1.49%; R4: 1.39%; R5: 0.98%; R6: 0.80%) multiplied by the average account value over the period, multiplied by 182/365 to reflect the one-half year period. |
| * | Hypothetical assumes a rate of return of 5% per year before expenses. |
HYPOTHETICAL EXAMPLE FOR COMPARISON PURPOSES
For each class of shares, the second line of the accompanying table provides information about hypothetical account values and hypothetical expenses based on the Fund’s actual expense ratio and an assumed rate of return of 5% per year before expenses, which is not the Fund’s actual return. The hypothetical account values and expenses may not be used to estimate the actual ending account balance or expenses you paid for the period. You may use this information to compare the ongoing costs of investing in the Fund and other funds. To do so, compare this 5% hypothetical example with the 5% hypothetical examples that appear in the shareholder reports of the other funds.
Please note that the expenses shown in the table are meant to highlight your ongoing costs only and do not reflect any transactional costs, such as sales charges (loads), redemption fees, or exchange fees. Therefore, the second line of the table for each class of shares is useful in comparing ongoing costs only, and will not help you determine the relative total costs of owning different funds. In addition, if these transactional costs were included, your costs would have been higher.
40 | Semi-Annual Report
Other Information
Thornburg Investment Income Builder Fund | March 31, 2018 (Unaudited)
PORTFOLIO PROXY VOTING
Policies and Procedures:
The Trust has delegated to Thornburg Investment Management, Inc. (the “Advisor”) voting decisions respecting proxies for the Fund’s voting securities. The Advisor makes voting decisions in accordance with its Proxy Voting Policy and Procedures. A description of the Policy and Procedures is available (i) without charge, upon request, by calling the Advisor toll-free at 1-800-847-0200, (ii) on the Thornburg website at www.thornburg.com, and (iii) on the Securities and Exchange Commission’s website at www.sec.gov.
Information regarding how proxies were voted is available on or before August 31 of each year for the twelve months ending the preceding June 30. This information is available (i) without charge, upon request by calling the Advisor toll-free at 1-800-847-0200, (ii) on the Thornburg website at www.thornburg.com, and (iii) on the Securities and Exchange Commission’s website at www.sec.gov.
AVAILABILITY OF QUARTERLY PORTFOLIO SCHEDULE
The Fund files with the Securities and Exchange Commission schedules of its portfolio holdings on Form N-Q for the first and third quarters of each fiscal year. The Fund’s Forms N-Q are available on the Commission’s website at www.sec.gov, or may be reviewed and copied at the Commission’s Public Reference Room in Washington, D.C. Information on the operation of the Public Reference Room may be obtained by calling 1-800-SEC-0330. The Fund also makes this information available on its website at www.thornburg.com/download or upon request by calling 1-800-847-0200.
Semi-Annual Report | 41
Trustees’ Statement to Shareholders
Readopted September 11, 2017
The Trustees believe current and prospective shareholders should know how we discharge our responsibilities in supervising the Funds’ investment advisor and in reviewing the advisor’s contract for renewal. Since 2005, we have issued a statement which sets out clearly the three principal guidelines that we follow in supervising the Trust’s investment advisor on your behalf. In accordance with our customary practice, in September of this year we again reviewed our statement and concluded we should reissue this statement outlining the principal features of our supervision of the advisor’s performance of investment management services for the Funds.
We begin with the premise that each shareholder selected his or her Fund because its investments are managed by the investment advisor identified in the prospectus and in accordance with the objective and policies described in the prospectus. We realize, as each of you do, that if you believe that your Fund’s stated objective and policies no longer serve your personal investment goals, you can sell your shares and leave the Fund.
Therefore, we believe that our primary supervisory task—our principal obligation to you—is to assess the nature and quality of the advisor’s services, and to confirm that the advisor actively and competently pursues the Fund’s objective, in accordance with the policies set out in the prospectus. To do this, we meet regularly with management to review your Fund’s portfolio and to discuss the advisor’s specific actions and judgments in pursuing the Fund’s objective. We do not substitute our own judgment for the advisor’s decisions in selecting investments; the advisor is paid to exercise its informed judgment on investment decisions, and we seek to confirm, in reviewing the advisor’s performance, that the advisor is doing just that.
Second, we are conscious of costs and the effect that costs have on shareholders’ returns. We try to make sure that your Fund’s fees and costs are reasonable in relationship to the services rendered and that they are generally in line with those charged by other expert investment advisors, consistent with our belief that the Fund’s investors searched for and expect that expertise and attention and have decided to pay a reasonable price for it. We do not put the management contract “out to bid” as a matter of course, and we would not do so unless we had concluded that the advisor materially had failed to pursue the Fund’s objectives in accordance with its policies, or for other equally important reasons. We believe that any other approach would be inconsistent with your interests and contrary to your expectations when you bought shares of the Fund in the first place.
Finally, because we believe that most Thornburg Fund shareholders have invested with a long-term perspective, we try not to focus too much on the fashions of the moment and on short-term performance. The market will not favor any specific investment objective or set of policies at all times and under all economic circumstances. A fund will experience periods of both high and low returns relative to other funds and other investments. Even if one of our Funds is not favored by the market at a particular time, we believe that the advisor is nonetheless obliged to remain true to the Fund’s objective and policies, and we watch to see that it does so.
Trustees of Thornburg Investment Trust
42 | Semi-Annual Report
Thornburg Funds
Thornburg Investment Management is a privately-owned global investment firm that offers a range of solutions for retail and institutional investors. Founded in 1982 and headquartered in Santa Fe, New Mexico, we manage approximately $49 billion (as of March 31, 2018) across U.S. mutual funds, separate accounts for high-net-worth investors, institutional accounts, and UCITS funds for non-U.S. investors.
EQUITY FUNDS
| | ∎ | | Thornburg Investment Income Builder Fund |
| | ∎ | | Thornburg Global Opportunities Fund |
| | ∎ | | Thornburg International Value Fund |
| | ∎ | | Thornburg Better World International Fund |
| | ∎ | | Thornburg International Growth Fund |
| | ∎ | | Thornburg Developing World Fund |
| | ∎ | | Thornburg Core Growth Fund |
FIXED INCOME FUNDS
| | ∎ | | Thornburg Low Duration Income Fund |
| | ∎ | | Thornburg Limited Term U.S. Government Fund |
| | ∎ | | Thornburg Limited Term Income Fund |
| | ∎ | | Thornburg Strategic Income Fund |
| | ∎ | | Thornburg Low Duration Municipal Fund |
| | ∎ | | Thornburg Limited Term Municipal Fund |
| | ∎ | | Thornburg Intermediate Municipal Fund |
| | ∎ | | Thornburg California Limited Term Municipal Fund |
| | �� | | Thornburg New Mexico Intermediate Municipal Fund |
| | ∎ | | Thornburg New York Intermediate Municipal Fund |
| | ∎ | | Thornburg Strategic Municipal Income Fund |
ALTERNATIVE FUNDS
| | ∎ | | Thornburg Long/Short Equity Fund |
Before investing, carefully consider the Fund’s investment goals, risks, charges, and expenses. For a prospectus or summary prospectus containing this and other information, contact your financial advisor or visit thornburg.com. Read it carefully before investing.
For additional information, please visit thornburg.com
Thornburg Investment Management, Inc. 2300 North Ridgetop Road, Santa Fe, NM 87506
Semi-Annual Report | 43
| | | | |
| To receive shareholder reports, prospectuses, and proxy statements electronically, go to www.thornburg.com/edelivery. | | | | |
| This Semi-Annual Report is submitted for the general information of shareholders of the Fund. It is not authorized for distribution to prospective investors in the Fund unless preceded or accompanied by an effective prospectus. | |
| | | | |
Investment Advisor: | | Distributor: | | |
Thornburg Investment Management® | | Thornburg Securities Corporation® | | |
800.847.0200 | | 800.847.0200 | | TH1075 |
Semi-Annual Report
March 31, 2018
THORNBURG
GLOBAL
OPPORTUNTITIES
FUND
About Thornburg Investment Management
It’s more than what we do.
It’s how we do it.
At Thornburg, we are very different in how we think, invest, and are structured. We believe this difference is what makes us successful in helping individuals reach their long-term financial goals.
Flexible Perspective
Our perspective on investment opportunities is more flexible than most, viewing a wide range of opportunities beyond conventional boundaries to find hidden value.
Collaboration
Collectively, we hone ideas via borderless cross-pollination for better judgment and better results.
Portfolio Construction
Disciplined construction guided more by our convictions than convention.
CONVICTION
Thorough analysis and our relative-value framework lead to conviction in our securities selection.
UNCONVENTIONAL
Active management means we seek the best value for our clients rather than using conventional benchmarks as our starting point.
Structured for Excellence
How we think and how we invest is made possible by how we’re structured.
TEAM APPROACH
FAR FROM THE HERD
ACCESS & TRANSPARENCY
2 | Semi-Annual Report
Thornburg Global Opportunities Fund
Semi-Annual Report | March 31, 2018
Table of Contents
| | | | | | | | | | |
| SHARE CLASS | | NASDAQ SYMBOL | | CUSIP |
| | |
| Class A | | THOAX | | | | 885-215-343 | |
| Class C | | THOCX | | | | 885-215-335 | |
| Class I | | THOIX | | | | 885-215-327 | |
| Class R3 | | THORX | | | | 885-215-145 | |
| Class R4 | | THOVX | | | | 885-215-137 | |
| Class R5 | | THOFX | | | | 885-215-129 | |
| Class R6 | | THOGX | | | | 885-216-655 | |
Class I, R3, R4, R5, and R6 shares may not be available to all investors. Minimum investments for Class I shares may be higher than those for other classes.
Investments carry risks, including possible loss of principal. Additional risks may be associated with investments outside the United States, especially in emerging markets, including currency fluctuations, illiquidity, volatility, and political and economic risks. Investments in small- and mid-capitalization companies may increase the risk of greater price fluctuations. Please see the Fund’s prospectus for a discussion of the risks associated with an investment in the Fund. Investments in the Fund are not FDIC insured, nor are they deposits of or guaranteed by a bank or any other entity.
Funds invested in a smaller number of holdings may expose an investor to greater volatility.
Semi-Annual Report | 3
Letter to Shareholders
Thornburg Global Opportunities Fund | March 31, 2018 (Unaudited)
May 8, 2018
Dear Shareholder:
This letter reviews the results of Thornburg Global Opportunities Fund’s investment activities for the six-month period ended March 31, 2018. We will also comment on the overall investment landscape. Recall that Thornburg Global Opportunities Fund seeks capital appreciation from a portfolio of typically 30–40 equity investments from around the world. We believe the structure of the Fund—built on our core investment principles of flexibility, focus, and value—gives us a durable framework for value-added investing.
Following a stretch of strong results since the summer of 2016, the Fund’s performance over the past several months was not satisfying. In the six months ended March 31, 2018, Thornburg Global Opportunities Fund produced a total return of negative 2.68% (I shares). The net asset value (NAV) per Class I share decreased 3.0%, from $31.06 to $30.13, and the Fund paid an income distribution in December 2017 of $0.102 per Class I share. The Fund’s performance for this semi-annual period lagged the MSCI All Country World Index (ACWI) return of 4.71%. We were particularly challenged by certain individual stock holdings, discussed below, in November 2017 and March 2018.
We remain focused on executing our investment process, which has produced constructive results over the long term. From its inception on July 28, 2006 through March 31, 2018, Global Opportunities Fund has outperformed the ACWI by an average margin of over four percentage points per year, resulting in a total cumulative return since inception of 212.54% (Class I shares) versus 97.11% for the ACWI. As of March 31, 2018, your Fund’s Class A and I shares rank in the top 1% of Morningstar World Large Stock funds for the time period starting August 2006 (based on total returns without sales charge, among 431 funds).
Performance data shown represents past performance and is no guarantee of future results. Investment return and principal value will fluctuate so shares, when redeemed, may be worth more or less than their original cost. Current performance may be lower or higher than quoted. For performance current to the most recent month end, visit thornburg.com or call 800.847.0200.
There is no sales charge for Class I shares. The total annual fund operating expense of Class I shares is 1.01%, as disclosed in the most recent prospectus. Thornburg Investment Management and/or Thornburg Securities Corporation have contractually agreed to waive fees and reimburse expenses through at least February 1, 2019, for some of the share classes, resulting in a net expense ratio of 0.99% for Class I shares.
| | | | |
| Table 1 | | | | | Morningstar World Large Stock Category Rankings as of 3/31/2018 |
| | | | | | | | | | | | | | | | | | | | | | | | | |
| | | RANKINGS |
| | | 1-YR | | 3-YR | | 5-YR | | 10-YR | | SINCE INCEP. |
| | | | | |
A Shares | | | | 92% | | | | | 94% | | | | | 16% | | | | | 20% | | | | | 1% | |
| | | | | |
I Shares | | | | 91% | | | | | 92% | | | | | 14% | | | | | 11% | | | | | 1% | |
| | | | | |
# of Funds | | | | 873 | | | | | 717 | | | | | 591 | | | | | 340 | | | | | 431 | |
Source: Morningstar
Percentile rankings are based on total returns, without sales charge.
Past performance does not guarantee future results.
Table I displays your Fund’s ranking over various periods by performance percentile relative to the Morningstar World Large Stock category (lower numbers represent higher ranking). Performance data for various measurement periods are included on page 7 of this report.
After the steady price appreciation and calm of 2017, the early months of 2018 featured significant volatility—recessionary fears, trade conflicts, and political uncertainty all played a role. Global equities were marked down by approximately $5 trillion in early February, and the first quarter of 2018 was the first time in the past eight quarters that the ACWI index showed a negative return. However, major equity indices returns were positive in U.S. dollars for the six months ended March 31, 2018. Currency was a key component of results for U.S.-based investors, as the U.S. Dollar Index weakened 3.3% over this time compared to other major currencies.
Technology was the strongest performing sector in the index, nearly tripling the index’s total return. The consumer discretionary sector was the second best performer, led by a small handful of names including Amazon.com. The telecommunications and utilities sectors had negative returns, reflecting in part their steady, low-growth (i.e. bond-like) qualities as the U.S. 10-year Treasury yield rose from 2.33% to 2.74% in the six months ended March 31.
Regarding Thornburg Global Opportunities portfolio, ten stocks contributed at least 25 basis points (0.25%) to overall Fund performance during the semi-annual period, while 11 subtracted at least 25 basis points. Contribution to overall Fund performance takes into account both position size and return on the investment.
Our investments in the consumer discretionary, consumer staples and real estate sectors significantly hampered the performance of the Fund for the period. Significant detractors included telecom group Altice NV; Brazilian food giant BRF S.A.; U.S. REIT Colony NorthStar; and the German pharmaceutical leader Bayer AG. In November Altice announced third-quarter results, which were surprisingly[1] soft and revealed a deceleration in operating momentum in Altice’s French and Portuguese markets. This was exacerbated by relatively high debt levels and weak demand for stocks in European telecoms. Colony NorthStar was a frustrating
4 | Semi-Annual Report
Letter to Shareholders, Continued
Thornburg Global Opportunities Fund | March 31, 2018 (Unaudited)
holding; we were attracted to this diversified real estate company based in part on its valuation (priced at a discount to net asset value), cost savings opportunity, and stated plan to swiftly streamline its portfolio. However, the company’s progress fell well short of our expectations and we sold our shares to focus elsewhere. German pharmaceutical concern Bayer AG was hampered by a delay in its pending acquisition of agricultural science leader Monsanto; the shares have recovered somewhat as of this writing.
Significant positive contributors to your Fund’s performance were European low-cost airlines easyJet and Ryanair; casino companies Galaxy Entertainment and Wynn Resorts; and U.S. onshore drilling rig operator Helmerich & Payne.
European airlines easyJet and Ryanair are both enjoying cyclical improvement in their markets following the industry’s oversupplied conditions of 2015 and 2016. Passenger growth for each company has been in the mid-single digit area recently. Ryanair is also making strides this year toward additional network expansion, including new routes serving cities in Germany and Ukraine. Helmerich & Payne was buoyed by rising oil prices and correspondingly higher activity levels of customers; we sold HP as the shares rose more than 50% since last September. Galaxy Entertainment appears poised to gain from the opening of the Hong Kong–Zhuhai–Macau bridge and improved rail access from mainland China.
During the period we made an important new investment in Facebook—the shares dropped sharply in March following controversy over how the tech giant handles users’ privacy, but recovered subsequently when the company reported robust first quarter results. Thus far Facebook’s profits are derived predominantly from the United States, which is home to about 10% of its users [see chart below]. We note that trust in Facebook has suffered due to the privacy scandal, while user engagement and revenue from advertisers seem resilient. “Desktop, mobile, and app usage has remained steady and well
within the expected range,” reported SimilarWeb, a firm that tracks internet audiences. We will monitor this closely.
| | | | |
| Facebook | | – | | Daily Active Users by Region (in millions) as of December 31, 2017 |
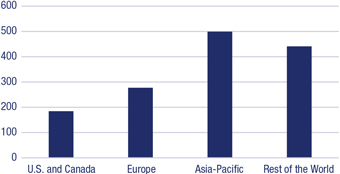
Thornburg, Facebook, Inc. (10K filing)
Note: For purposes of reporting DAUs by geographic region, Europe includes all users in Russia and Turkey and Rest of World includes all users in Africa, Latin America, and the Middle East.
With a portfolio of 30-40 stocks, Thornburg Global Opportunities Fund’s portfolio construction has always differed from the benchmark, which includes nearly 2,500 constituents. The Fund continues to look different today, with the following top sector weightings on March 31, 2018: technology (20.4% portfolio weighting), financials (17.4%), industrials (15.7%), consumer discretionary (10.4%), and materials (9.0%). The average expected 2018 price-to-earnings multiple for companies owned by the Fund stood at 14.7x versus 15.3x for the MSCI All Country World Index, while the price to book is 1.7x, compared to 2.2x for the index. Relative to the index, your Fund is overweight Europe and Asia, but has no direct exposure to Japan. Firms located in emerging market countries currently constitute about 12% of the portfolio. The Fund’s largest geographic exposures are shown in the table below:
| | | | |
| Table 2 | | | | | Largest Geographic Weightings |
| | | | | |
| COUNTRY | | WEIGHTING AS OF
3/31/2018 |
| United States | | | | 37.3% | |
| Netherlands | | | | 12.1% | |
| Hong Kong | | | | 8.7% | |
| United Kingdom | | | | 7.9% | |
| Spain | | | | 6.4% | |
As a percent of the equity holdings. Holdings are classified by country of risk as determined by MSCI and Bloomberg.
Investors are ratcheting up debates about the future direction of the major economies and potential policy actions by the U.S. Federal Reserve and the Trump administration. Trade conflicts, asset prices, and Brexit uncertainty are also in focus. Importantly, overall global consumer spending is growing in 2018, along with industrial production and the global population. These trends continue to support a rotation of
Semi-Annual Report | 5
Letter to Shareholders, Continued
Thornburg Global Opportunities Fund | March 31, 2018 (Unaudited)
investor preferences from defensive debt and equity to more economically sensitive assets. The U.S. Federal Reserve has stepped up the pace of Federal funds target rate hikes, and other major central banks around the world continue to pursue easy monetary conditions, which suppress interest rates. This calendar year should be the first in three years that the net supply of sovereign bonds, after central bank purchases, is positive.
We recognize that this was an unsatisfying six-month period, and we are working to improve the outcomes. In this effort we remain intent on adapting to market conditions and executing our investment process, which has produced favorable results over the long term. It’s important to reiterate that our strategy for Thornburg Global Opportunities Fund is founded on fundamental analysis of individual businesses, not over-reliance on macroeconomic forecasts. We have managed the Fund this way through a wide variety of macroeconomic settings since its inception in 2006.
Thank you for investing alongside us in Thornburg Global Opportunities Fund. Remember that you can review
descriptions of many of the stocks in your portfolio at www.thornburg.com/global.
Best wishes for a great summer.
Sincerely,
| | |
| |  |
Brian McMahon Portfolio Manager Chief Investment Officer and Managing Director | | W. Vinson Walden,CFA Portfolio Manager Managing Director |
| [1] | Recall that we have invested with Altice companies since 2013, and previously had a successful investment with the French subsidiary, known as SFR. Altice announced a EUR1 billion share buyback in August 2017 and privatized SFR in September. |
6 | Semi-Annual Report
Performance Summary
Thornburg Global Opportunities Fund | March 31, 2018 (Unaudited)
AVERAGE ANNUAL TOTAL RETURNS
| | | | | | | | | | | | | | | | | | | | | | | | | |
| | | 1-YR | | 3-YR | | 5-YR | | 10-YR | | SINCE
INCEP. |
| | | | | |
Class A Shares (Incep: 7/28/06) | | | | | | | | | | | | | | | | | | | | | | | | | |
Without sales charge | | | | 7.25% | | | | | 4.13% | | | | | 11.11% | | | | | 7.17% | | | | | 9.76% | |
| | | | | |
With sales charge | | | | 2.44% | | | | | 2.54% | | | | | 10.09% | | | | | 6.68% | | | | | 9.33% | |
Class C Shares (Incep: 7/28/06) | | | | | | | | | | | | | | | | | | | | | | | | | |
Without sales charge | | | | 6.42% | | | | | 3.36% | | | | | 10.27% | | | | | 6.35% | | | | | 8.92% | |
| | | | | |
With sales charge | | | | 5.42% | | | | | 3.36% | | | | | 10.27% | | | | | 6.35% | | | | | 8.92% | |
| | | | | |
Class I Shares (Incep: 7/28/06) | | | | 7.59% | | | | | 4.49% | | | | | 11.54% | | | | | 7.65% | | | | | 10.25% | |
| | | | | |
Class R3 Shares (Incep: 2/1/08) | | | | 7.03% | | | | | 3.95% | | | | | 10.96% | | | | | 7.09% | | | | | 6.44% | |
| | | | | |
Class R4 Shares (Incep: 2/1/08) | | | | 7.11% | | | | | 4.05% | | | | | 11.05% | | | | | 7.19% | | | | | 6.53% | |
| | | | | |
Class R5 Shares (Incep: 2/1/08) | | | | 7.55% | | | | | 4.48% | | | | | 11.51% | | | | | 7.65% | | | | | 6.99% | |
| | | | | |
Class R6 Shares (Incep: 4/10/17) | | | | - | | | | | - | | | | | - | | | | | - | | | | | 7.10% | |
| | | | | |
MSCI AC World Index (Since 7/28/06) | | | | 14.85% | | | | | 8.12% | | | | | 9.20% | | | | | 5.57% | | | | | 5.99% | |
GROWTH OF A HYPOTHETICAL $10,000 INVESTMENT
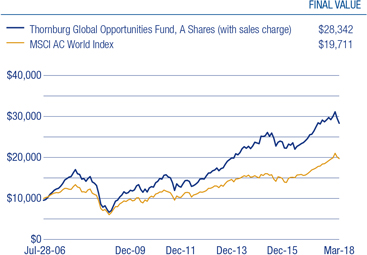
Performance data shown represents past performance and is no guarantee of future results. Investment return and principal value will fluctuate so shares, when redeemed, may be worth more or less than their original cost. Current performance may be lower or higher than quoted. For performance current to the most recent month end, visit thornburg.com or call 800-847-0200. The performance information does not reflect the deduction of taxes that a shareholder would pay on distributions or the redemption of Fund shares. Returns reflect the reinvestment of dividends and capital gains. Class A shares are sold with a maximum sales charge of 4.50%. Class C shares are subject to a 1% CDSC for the first year only. There is no sales charge for Class I, R3, R4, R5 and R6 shares.
As disclosed in the most recent prospectus, the total annual fund operating expenses before fee waivers and expense reimbursements are as follows: A shares, 1.29%; C shares, 2.04%; I shares, 1.01%; R3 shares, 1.93%; R4 shares, 1.61%; R5 shares, 1.19% and R6, 1.25%. Thornburg Investment Management and/or Thornburg Securities Corporation have contractually agreed to waive fees and reimburse expenses through at least February 1, 2019, for some of the share classes, resulting in net expense ratios of the following: I shares, 0.99%; R3 shares, 1.50%; R4 shares, 1.40%; R5 shares, 0.99%, and R6 shares, 0.85%. For more detailed information on fund expenses and waivers/reimbursements please see the Fund’s prospectus.
Glossary
The MSCI All Country (AC) World Index is a market capitalization weighted index that is representative of the market structure of 47 developed and emerging market countries in North and South America, Europe, Africa, the Middle East, and the Pacific Rim. The index is calculated with net dividends reinvested in U.S. dollars.
The performance of any index is not indicative of the performance of any particular investment. Unless otherwise noted, index returns reflect the reinvestment of income dividends and capital gains, if any, but do not reflect fees, brokerage commissions or other expenses of investing. Investors may not make direct investments into any index.
P/E – Price/Earnings ratio (P/E ratio) is a valuation ratio of a company’s current share price compared to its per-share earnings. P/E equals a company’s market value per share divided by earnings per share. Forecasted P/E is not intended to be a forecast of the fund’s future performance.
Price/Book ratio (P/B ratio) – A ratio used to compare a stock’s market value to its book value. It is calculated by dividing the current closing price of the stock by the latest quarter’s book value per share.
Semi-Annual Report | 7
Fund Summary
Thornburg Global Opportunities Fund | March 31, 2018 (Unaudited)
OBJECTIVES AND STRATEGIES
The Fund seeks long-term capital appreciation by investing in equity and debt securities of all types from issuers around the world.
The Fund pursues its investment goals by investing primarily in a broad range of equity securities, including common stocks, preferred stocks, real estate investment trusts, other equity trusts, and partnership interests. The Fund may invest in any stock or other equity security which the investment advisor believes may assist the Fund in pursuing its goals, including smaller companies with market capitalizations of less than $500 million. The Fund may also invest in debt obligations of any kind.
ASSET STRUCTURE
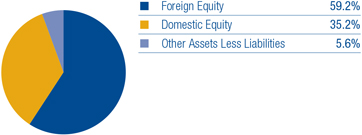
MARKET CAPITALIZATION EXPOSURE
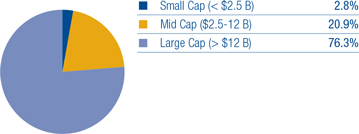
TOP TEN EQUITY HOLDINGS
| | | | | |
| Aena SME S.A. | | | | 6.0% | |
| Alphabet, Inc. | | | | 5.7% | |
| T-Mobile US, Inc. | | | | 5.0% | |
| Ryanair Holdings plc | | | | 4.9% | |
| easyJet plc | | | | 4.9% | |
| Galaxy Entertainment Group Ltd. | | | | 4.5% | |
| Facebook, Inc. | | | | 4.3% | |
| Citigroup, Inc. | | | | 4.2% | |
| Reliance Industries Ltd. | | | | 4.2% | |
| Samsung Electronics Co. Ltd. | | | | 3.9% | |
There is no guarantee that the Fund will meet its investment objectives.
All data is subject to change. Charts may not add up to 100% due to rounding.
SECTOR EXPOSURE
| | | | | |
| Information Technology | | | | 20.5% | |
| Financials | | | | 17.5% | |
| Industrials | | | | 15.8% | |
| Consumer Discretionary | | | | 10.4% | |
| Materials | | | | 9.0% | |
| Telecommunication Services | | | | 7.6% | |
| Energy | | | | 4.2% | |
| Real Estate | | | | 3.9% | |
| Health Care | | | | 2.9% | |
| Consumer Staples | | | | 2.6% | |
| Other Assets Less Liabilities | | | | 5.6% | |
TOP TEN INDUSTRY GROUPS
| | | | | |
| Transportation | | | | 15.8% | |
| Software & Services | | | | 14.2% | |
| Banks | | | | 9.2% | |
| Materials | | | | 9.0% | |
| Telecommunication Services | | | | 7.6% | |
| Technology Hardware & Equipment | | | | 6.3% | |
| Consumer Services | | | | 4.5% | |
| Diversified Financials | | | | 4.5% | |
| Energy | | | | 4.2% | |
| Real Estate | | | | 3.9% | |
COUNTRY EXPOSURE*
(percent of equity holdings)
| | | | | |
| United States | | | | 37.3% | |
| Netherlands | | | | 12.1% | |
| Hong Kong | | | | 8.7% | |
| United Kingdom | | | | 7.9% | |
| Spain | | | | 6.3% | |
| Ireland | | | | 5.2% | |
| China | | | | 4.5% | |
| India | | | | 4.4% | |
| South Korea | | | | 4.2% | |
| Germany | | | | 3.0% | |
| France | | | | 2.9% | |
| Australia | | | | 2.8% | |
| Switzerland | | | | 0.7% | |
| * | Holdings are classified by country of risk as determined by MSCI and Bloomberg. |
8 | Semi-Annual Report
Schedule of Investments
Thornburg Global Opportunities Fund | March 31, 2018 (Unaudited)
| | | | | | | | | | | | |
| | | | | SHARES/
PRINCIPAL AMOUNT | | VALUE |
| | | |
| | COMMON STOCK — 94.4% | | | | | | | | | | |
| | | |
| | AUTOMOBILES & COMPONENTS — 0.2% | | | | | | | | | | |
| | Auto Components — 0.2% | | | | | | | | | | |
| | Delphi Technologies plc | | | | 85,406 | | | | $ | 4,069,596 | |
| | | | | | | | | | | | |
| | | | | | | | | | | 4,069,596 | |
| | | | | | | | | | | | |
| | BANKS — 9.2% | | | | | | | | | | |
| | Banks — 9.2% | | | | | | | | | | |
| | BNP Paribas S.A. | | | | 869,775 | | | | | 64,394,799 | |
| | Citigroup, Inc. | | | | 1,477,731 | | | | | 99,746,843 | |
| | ING Groep N.V. | | | | 3,257,752 | | | | | 54,916,449 | |
| | | | | | | | | | | | |
| | | | | | | | | | | 219,058,091 | |
| | | | | | | | | | | | |
| | CONSUMER DURABLES & APPAREL — 2.5% | | | | | | | | | | |
| | Household Durables — 2.5% | | | | | | | | | | |
| | Barratt Developments plc | | | | 8,121,125 | | | | | 60,433,481 | |
| | | | | | | | | | | | |
| | | | | | | | | | | 60,433,481 | |
| | | | | | | | | | | | |
| | CONSUMER SERVICES — 4.5% | | | | | | | | | | |
| | Hotels, Restaurants & Leisure — 4.5% | | | | | | | | | | |
| | Galaxy Entertainment Group Ltd. | | | | 11,734,001 | | | | | 106,527,981 | |
| | | | | | | | | | | | |
| | | | | | | | | | | 106,527,981 | |
| | | | | | | | | | | | |
| | DIVERSIFIED FINANCIALS — 4.5% | | | | | | | | | | |
| | Capital Markets — 0.7% | | | | | | | | | | |
| | UBS Group AG | | | | 875,012 | | | | | 15,372,203 | |
| | Consumer Finance — 3.8% | | | | | | | | | | |
| | Capital One Financial Corp. | | | | 947,508 | | | | | 90,790,217 | |
| | | | | | | | | | | | |
| | | | | | | | | | | 106,162,420 | |
| | | | | | | | | | | | |
| | ENERGY — 4.2% | | | | | | | | | | |
| | Oil, Gas & Consumable Fuels — 4.2% | | | | | | | | | | |
| | Reliance Industries Ltd. | | | | 7,331,800 | | | | | 99,103,747 | |
| | | | | | | | | | | | |
| | | | | | | | | | | 99,103,747 | |
| | | | | | | | | | | | |
| | FOOD & STAPLES RETAILING — 2.6% | | | | | | | | | | |
| | Food & Staples Retailing — 2.6% | | | | | | | | | | |
| | Walgreens Boots Alliance, Inc. | | | | 964,342 | | | | | 63,135,471 | |
| | | | | | | | | | | | |
| | | | | | | | | | | 63,135,471 | |
| | | | | | | | | | | | |
| | INSURANCE — 3.8% | | | | | | | | | | |
| | Insurance — 3.8% | | | | | | | | | | |
| | NN Group N.V. | | | | 2,023,563 | | | | | 89,735,725 | |
| | | | | | | | | | | | |
| | | | | | | | | | | 89,735,725 | |
| | | | | | | | | | | | |
| | MATERIALS — 9.0% | | | | | | | | | | |
| | Chemicals — 6.4% | | | | | | | | | | |
| | CF Industries Holdings, Inc. | | | | 2,024,981 | | | | | 76,402,533 | |
| a | | OCI N.V. | | | | 3,247,950 | | | | | 74,953,215 | |
| | Metals & Mining — 2.6% | | | | | | | | | | |
| | Mineral Resources Ltd. | | | | 4,791,315 | | | | | 62,522,661 | |
| | | | | | | | | | | | |
| | | | | | | | | | | 213,878,409 | |
| | | | | | | | | | | | |
| | MEDIA — 3.2% | | | | | | | | | | |
| | Media — 3.2% | | | | | | | | | | |
| a | | Altice N.V. Class A | | | | 6,231,706 | | | | | 51,358,929 | |
| a | | Altice USA, Inc. Class A | | | | 1,322,451 | | | | | 24,438,895 | |
| | | | | | | | | | | | |
| | | | | | | | | | | 75,797,824 | |
| | | | | | | | | | | | |
Semi-Annual Report | 9
Schedule of Investments, Continued
Thornburg Global Opportunities Fund | March 31, 2018 (Unaudited)
| | | | | | | | | | | | |
| | | | | SHARES/
PRINCIPAL AMOUNT | | VALUE |
| | PHARMACEUTICALS, BIOTECHNOLOGY & LIFE SCIENCES — 2.9% | | | | | | | | | | |
| | Pharmaceuticals — 2.9% | | | | | | | | | | |
| | Bayer AG | | | | 605,927 | | | | $ | 68,435,199 | |
| | | | | | | | | | | | |
| | | | | | | | | | | 68,435,199 | |
| | | | | | | | | | | | |
| | REAL ESTATE — 3.9% | | | | | | | | | | |
| | Equity Real Estate Investment Trusts — 0.2% | | | | | | | | | | |
| | Colony NorthStar, Inc. Class A | | | | 845,350 | | | | | 4,750,867 | |
| | Real Estate Management & Development — 3.7% | | | | | | | | | | |
| | New World Development Co. Ltd. | | | | 61,976,396 | | | | | 87,498,132 | |
| | | | | | | | | | | | |
| | | | | | | | | | | 92,248,999 | |
| | | | | | | | | | | | |
| | SOFTWARE & SERVICES — 14.2% | | | | | | | | | | |
| | Internet Software & Services — 14.2% | | | | | | | | | | |
| a | | Alphabet, Inc. Class A | | | | 130,918 | | | | | 135,780,295 | |
| a | | Baidu, Inc. Sponored ADR | | | | 389,473 | | | | | 86,926,479 | |
| a | | Facebook, Inc. Class A | | | | 635,044 | | | | | 101,473,680 | |
| a | | iQIYI, Inc. ADR | | | | 845,090 | | | | | 13,141,149 | |
| | | | | | | | | | | | |
| | | | | | | | | | | 337,321,603 | |
| | | | | | | | | | | | |
| | TECHNOLOGY HARDWARE & EQUIPMENT — 6.3% | | | | | | | | | | |
| | Communications Equipment — 2.3% | | | | | | | | | | |
| a | | EchoStar Corp. Class A | | | | 1,042,709 | | | | | 55,023,754 | |
| | Technology Hardware, Storage & Peripherals — 4.0% | | | | | | | | | | |
| | Samsung Electronics Co., Ltd. | | | | 40,680 | | | | | 93,580,411 | |
| | | | | | | | | | | | |
| | | | | | | | | | | 148,604,165 | |
| | | | | | | | | | | | |
| | TELECOMMUNICATION SERVICES — 7.6% | | | | | | | | | | |
| | Diversified Telecommunication Services — 2.6% | | | | | | | | | | |
| a | | Zayo Group Holdings, Inc. | | | | 1,835,994 | | | | | 62,717,555 | |
| | Wireless Telecommunication Services — 5.0% | | | | | | | | | | |
| a | | T-Mobile US, Inc. | | | | 1,922,471 | | | | | 117,347,630 | |
| | | | | | | | | | | | |
| | | | | | | | | | | 180,065,185 | |
| | | | | | | | | | | | |
| | TRANSPORTATION — 15.8% | | | | | | | | | | |
| | Airlines — 9.8% | | | | | | | | | | |
| | easyJet plc | | | | 5,161,172 | | | | | 116,183,900 | |
| a | | Ryanair Holdings plc Sponored ADR | | | | 946,508 | | | | | 116,278,508 | |
| | Transportation Infrastructure — 6.0% | | | | | | | | | | |
| | Aena SME S.A. | | | | 707,453 | | | | | 142,454,924 | |
| | | | | | | | | | | | |
| | | | | | | | | | | 374,917,332 | |
| | | | | | | | | | | | |
| | TOTAL COMMON STOCK (Cost $1,808,742,480) | | | | | | | | | 2,239,495,228 | |
| | | | | | | | | | | | |
| | | |
| | SHORT-TERM INVESTMENTS — 6.2% | | | | | | | | | | |
| b | | Thornburg Capital Management Fund | | | | 14,703,317 | | | | | 147,033,174 | |
| | | | | | | | | | | | |
| | TOTAL SHORT-TERM INVESTMENTS (Cost $147,033,174) | | | | | | | | | 147,033,174 | |
| | | | | | | | | | | | |
| | | |
| | TOTAL INVESTMENTS — 100.6% (Cost $1,955,775,654) | | | | | | | | $ | 2,386,528,402 | |
| | | |
| | LIABILITIES NET OF OTHER ASSETS — (0.6)% | | | | | | | | | (15,069,762 | ) |
| | | | | | | | | | | | |
| | | |
| | NET ASSETS — 100.0% | | | | | | | | $ | 2,371,458,640 | |
| | | | | | | | | | | | |
10 | Semi-Annual Report
Schedule of Investments, Continued
Thornburg Global Opportunities Fund | March 31, 2018 (Unaudited)
| | | | | | | | | | | | | | | | | | | | | | | | | | | | | | | | | | | |
| OUTSTANDING FORWARD CURRENCY CONTRACTS TO BUY OR SELL AT MARCH 31, 2018 |
| | | | | | | |
CONTRACT
DESCRIPTION | | CONTRACT
PARTY* | | BUY/SELL | | CONTRACT
AMOUNT | | CONTRACT
VALUE DATE | | VALUE
USD | | UNREALIZED
APPRECIATION | | UNREALIZED
DEPRECIATION |
| | | | | | | |
Great Britain Pound | | | | SSB | | | | | Sell | | | | | 87,174,600 | | | | | 4/10/2018 | | | | | 122,336,663 | | | | $ | – | | | | $ | (3,565,629 | ) |
Great Britain Pound | | | | SSB | | | | | Sell | | | | | 1,529,300 | | | | | 4/10/2018 | | | | | 2,146,146 | | | | | – | | | | | (6,350 | ) |
Swiss Franc | | | | SSB | | | | | Sell | | | | | 8,500,700 | | | | | 4/23/2018 | | | | | 8,905,680 | | | | | 279,698 | | | | | – | |
Australian Dollar | | | | BBH | | | | | Sell | | | | | 46,059,800 | | | | | 4/30/2018 | | | | | 35,376,438 | | | | | 1,778,621 | | | | | – | |
Euro | | | | SSB | | | | | Sell | | | | | 275,974,500 | | | | | 5/15/2018 | | | | | 340,565,509 | | | | | 2,840,600 | | | | | – | |
| | | | | | | | | | | | | | | | | | | | | | | | | | | | | | |
Total | | | | | | | | | | | | | | | | | | | | | | | | | | | | $ | 4,898,919 | | | | $ | (3,571,979 | ) |
| | | | | | | | | | | | | | | | | | | | | | | | | | | | | | |
Net unrealized appreciation/depreciation | | | | | | | | | | | | | | | | | | | | | | | | | | | | $ | 1,326,940 | | | | | | |
| | | | | | | | | | | | | | | | | | | | | | | | | | | | | | |
* Counterparties include State Street Bank and Trust Company (“SSB”) and Brown Brothers Harriman & Co. (“BBH”).
Footnote Legend
| b | Investment in Affiliates. |
Portfolio Abbreviations
To simplify the listings of securities, abbreviations are used per the table below:
| | |
| ADR | | American Depositary Receipt |
See notes to financial statements.
Semi-Annual Report | 11
Statement of Assets and Liabilities
Thornburg Global Opportunities Fund | March 31, 2018 (Unaudited)
| | | | |
ASSETS | | | | |
| |
Investments at value (Note 3) | | | | |
Non-affiliated issuers (cost $1,808,742,480) | | $ | 2,239,495,228 | |
Non-controlled affiliated issuer (cost $147,033,174) | | | 147,033,174 | |
Cash denominated in foreign currency (cost $3) | | | 3 | |
Receivable for investments sold | | | 7,253,025 | |
Receivable for fund shares sold | | | 16,037,655 | |
Unrealized appreciation on forward currency contracts (Note 7) | | | 4,898,919 | |
Dividends receivable | | | 2,904,772 | |
Prepaid expenses and other assets | | | 106,878 | |
| | | | |
| |
Total Assets | | | 2,417,729,654 | |
| | | | |
| |
LIABILITIES | | | | |
| |
Payable for investments purchased | | | 15,211,075 | |
Payable for fund shares redeemed | | | 17,682,625 | |
Unrealized depreciation on forward currency contracts (Note 7) | | | 3,571,979 | |
Payable to investment advisor and other affiliates (Note 4) | | | 2,156,584 | |
Deferred taxes payable (Note 2) | | | 6,974,809 | |
Accounts payable and accrued expenses | | | 673,750 | |
Dividends payable | | | 192 | |
| | | | |
| |
Total Liabilities | | | 46,271,014 | |
| | | | |
| |
NET ASSETS | | $ | 2,371,458,640 | |
| | | | |
| |
NET ASSETS CONSIST OF | | | | |
| |
Distribution in excess of net investment income | | $ | (1,257,842 | ) |
Net unrealized appreciation on investments | | | 425,110,963 | |
Accumulated net realized gain (loss) | | | (94,868,385 | ) |
Net capital paid in on shares of beneficial interest | | | 2,042,473,904 | |
| | | | |
| |
| | $ | 2,371,458,640 | |
| | | | |
12 | Semi-Annual Report
Statement of Assets and Liabilities, Continued
Thornburg Global Opportunities Fund | March 31, 2018 (Unaudited)
| | | | |
NET ASSET VALUE | | | | |
| |
Class A Shares: | | | | |
Net asset value and redemption price per share
($ 390,689,820 applicable to 13,010,784 shares of beneficial
interest outstanding - Note 5) | | $ | 30.03 | |
| |
Maximum sales charge, 4.50% of offering price | | | 1.42 | |
| | | | |
| |
Maximum offering price per share | | $ | 31.45 | |
| | | | |
| |
Class C Shares: | | | | |
Net asset value and offering price per share*
($ 345,894,785 applicable to 11,966,373 shares of beneficial
interest outstanding - Note 5) | | $ | 28.91 | |
| | | | |
| |
Class I Shares: | | | | |
Net asset value, offering and redemption price per share
($ 1,476,706,891 applicable to 49,010,926 shares of beneficial
interest outstanding - Note 5) | | $ | 30.13 | |
| | | | |
| |
Class R3 Shares: | | | | |
Net asset value, offering and redemption price per share
($ 9,994,360 applicable to 336,560 shares of beneficial
interest outstanding - Note 5) | | $ | 29.70 | |
| | | | |
| |
Class R4 Shares: | | | | |
Net asset value, offering and redemption price per share
($ 25,955,541 applicable to 872,936 shares of beneficial
interest outstanding - Note 5) | | $ | 29.73 | |
| | | | |
| |
Class R5 Shares: | | | | |
Net asset value, offering and redemption price per share
($ 78,956,109 applicable to 2,617,992 shares of beneficial
interest outstanding - Note 5) | | $ | 30.16 | |
| | | | |
| |
Class R6 Shares: | | | | |
Net asset value, offering and redemption price per share
($ 43,261,134 applicable to 1,431,045 shares of beneficial
interest outstanding - Note 5) | | $ | 30.23 | |
| | | | |
* Redemption price per share is equal to net asset value less any applicable contingent deferred sales charge.
See notes to financial statements.
Semi-Annual Report | 13
Statement of Operations
Thornburg Global Opportunities Fund | Six Months Ended March 31, 2018 (Unaudited)
| | | | |
INVESTMENT INCOME | | | | |
| |
Dividend income | | | | |
Non-affiliated issuers (net of foreign taxes withheld of $214,317) | | $ | 17,688,367 | |
Non-controlled affiliated issuer | | | 1,327,120 | |
| | | | |
| |
Total Income | | | 19,015,487 | |
| | | | |
| |
EXPENSES | | | | |
| |
Investment advisory fees (Note 4) | | | 9,768,062 | |
Administration fees (Note 4) | | | | |
Class A Shares | | | 243,106 | |
Class C Shares | | | 210,213 | |
Class I Shares | | | 480,795 | |
Class R3 Shares | | | 6,461 | |
Class R4 Shares | | | 15,161 | |
Class R5 Shares | | | 24,771 | |
Class R6 Shares | | | 2,541 | |
Distribution and service fees (Note 4) | | | | |
Class A Shares | | | 542,945 | |
Class C Shares | | | 1,881,689 | |
Class R3 Shares | | | 28,848 | |
Class R4 Shares | | | 33,946 | |
Transfer agent fees | | | | |
Class A Shares | | | 229,377 | |
Class C Shares | | | 212,796 | |
Class I Shares | | | 608,100 | |
Class R3 Shares | | | 19,062 | |
Class R4 Shares | | | 49,236 | |
Class R5 Shares | | | 93,698 | |
Class R6 Shares | | | 272 | |
Registration and filing fees | | | | |
Class A Shares | | | 7,761 | |
Class C Shares | | | 8,120 | |
Class I Shares | | | 14,010 | |
Class R3 Shares | | | 6,312 | |
Class R4 Shares | | | 6,418 | |
Class R5 Shares | | | 6,386 | |
Class R6 Shares | | | 7,904 | |
Custodian fees (Note 2) | | | 216,626 | |
Professional fees | | | 52,027 | |
Trustee and officer fees (Note 4) | | | 57,660 | |
Other expenses | | | 75,141 | |
| | | | |
| |
Total Expenses | | | 14,909,444 | |
| |
Less: | | | | |
Expenses reimbursed by investment advisor (Note 4) | | | (104,234 | ) |
| | | | |
| |
Net Expenses | | | 14,805,210 | |
| | | | |
| |
Net Investment Income | | $ | 4,210,277 | |
| | | | |
14 | Semi-Annual Report
Statement of Operations, Continued
Thornburg Global Opportunities Fund | Six Months Ended March 31, 2018 (Unaudited)
| | | | |
REALIZED AND UNREALIZED GAIN (LOSS) | | | | |
| |
Net realized gain (loss) on: | | | | |
Non-affiliated issuer investments | | $ | 50,751,357 | |
Forward currency contracts (Note 7) | | | (18,118,960 | ) |
Foreign currency transactions | | | 35,979 | |
| | | | |
| |
| | | 32,668,376 | |
| | | | |
Net change in unrealized appreciation (depreciation) on: | | | | |
Non-affiliated issuer investments (net of change in deferred taxes payable of $ 3,298,698) | | | (108,777,777 | ) |
Forward currency contracts (Note 7) | | | 4,760,901 | |
Foreign currency translations | | | 5,939 | |
| | | | |
| |
| | | (104,010,937 | ) |
| | | | |
| |
Net Realized and Unrealized Loss | | | (71,342,561 | ) |
| | | | |
| |
Net Decrease in Net Assets Resulting from Operations | | $ | (67,132,284 | ) |
| | | | |
See notes to financial statements.
Semi-Annual Report | 15
Statements of Changes in Net Assets
Thornburg Global Opportunities Fund
| | | | | | | | | | |
| | | SIX MONTHS ENDED
MARCH 31, 2018* | | YEAR ENDED
SEPTEMBER 30, 2017 |
INCREASE (DECREASE) IN NET ASSETS FROM | | | | | | | | | | |
| | |
OPERATIONS | | | | | | | | | | |
| | |
Net investment income | | | $ | 4,210,277 | | | | $ | 11,219,780 | |
Net realized gain (loss) on investments, forward currency contracts and foreign currency transactions | | | | 32,668,376 | | | | | 93,133,977 | |
Net unrealized appreciation (depreciation) on investments, forward currency contracts, foreign currency translations and deferred taxes | | | | (104,010,937 | ) | | | | 352,999,183 | |
| | | | | |
| | |
Net Increase (Decrease) in Net Assets Resulting from Operations | | | | (67,132,284 | ) | | | | 457,352,940 | |
| | |
DIVIDENDS TO SHAREHOLDERS | | | | | | | | | | |
| | |
From net investment income | | | | | | | | | | |
Class A Shares | | | | (1,042,666 | ) | | | | (1,462,031 | ) |
Class C Shares | | | | (214,888 | ) | | | | (156,914 | ) |
Class I Shares | | | | (5,175,786 | ) | | | | (8,363,693 | ) |
Class R3 Shares | | | | (21,199 | ) | | | | (28,856 | ) |
Class R4 Shares | | | | (52,807 | ) | | | | (80,474 | ) |
Class R5 Shares | | | | (248,810 | ) | | | | (464,031 | ) |
Class R6 Shares** | | | | (10,671 | ) | | | | (1,432 | ) |
| | |
FUND SHARE TRANSACTIONS (NOTE 5) | | | | | | | | | | |
| | |
Class A Shares | | | | (40,619,968 | ) | | | | (91,022,880 | ) |
Class C Shares | | | | (22,913,823 | ) | | | | (56,935,405 | ) |
Class I Shares | | | | 9,256,854 | | | | | 260,846,687 | |
Class R3 Shares | | | | (1,750,663 | ) | | | | (975,984 | ) |
Class R4 Shares | | | | (1,278,798 | ) | | | | 1,367,163 | |
Class R5 Shares | | | | 722,716 | | | | | 5,598,085 | |
Class R6 Shares** | | | | 42,934,114 | | | | | 1,554,205 | |
| | | | | |
| | |
Net Increase (Decrease) in Net Assets | | | | (87,548,679 | ) | | | | 567,227,380 | |
| | |
NET ASSETS | | | | | | | | | | |
| | |
Beginning of Period | | | | 2,459,007,319 | | | | | 1,891,779,939 | |
| | | | | |
| | |
End of Period | | | $ | 2,371,458,640 | | | | $ | 2,459,007,319 | |
| | | | | |
| | |
Undistributed (distribution in excess of) net investment income | | | $ | (1,257,842 | ) | | | $ | 1,298,708 | |
* Unaudited.
** Class R6 Shares commenced operations on April 10, 2017.
See notes to financial statements.
16 | Semi-Annual Report
Notes to Financial Statements
Thornburg Global Opportunities Fund | March 31, 2018 (Unaudited)
NOTE 1 – ORGANIZATION
Thornburg Global Opportunities Fund (the “Fund”) is a diversified series of Thornburg Investment Trust (the “Trust”). The Trust was organized as a Massachusetts business trust under a Declaration of Trust dated June 3, 1987 and is registered as a diversified, open-end management investment company under the Investment Company Act of 1940, as amended. The Fund is currently one of twenty-one separate series of the Trust. Each series is considered to be a separate entity for financial reporting and tax purposes and bears expenses directly attributable to it. The Fund seeks long-term capital appreciation by investing in equity and debt securities of all types from issuers around the world.
The Fund currently offers seven classes of shares of beneficial interest: Class A, Class C, Institutional Class (“Class I”), and Retirement Classes (“Class R3”, “Class R4”, “Class R5”, and “Class R6”). Each class of shares of the Fund represents an interest in the same portfolio of investments, except that (i) Class A shares are sold subject to a front-end sales charge collected at the time the shares are purchased and bear a service fee, (ii) Class C shares are sold at net asset value without a sales charge at the time of purchase, but are subject to a contingent deferred sales charge upon redemption within one year of purchase, and bear both a service fee and a distribution fee, (iii) Class I and Class R5 shares are sold at net asset value without a sales charge at the time of purchase and may be subject to a service fee, (iv) Class R3 shares are sold at net asset value without a sales charge at the time of purchase, but bear both a service fee and distribution fee, (v) Class R4 shares are sold at net asset value without a sales charge at the time of purchase, but bear a service fee, (vi) Class R6 shares are sold at net asset value without a sales charge at the time of purchase, and (vii) the respective classes may have different reinvestment privileges and conversion rights. Additionally, the Fund may allocate among its classes certain expenses, to the extent allocable to specific classes, including transfer agent fees, government registration fees, certain printing and postage costs, and administrative and legal expenses. Currently, class specific expenses of the Fund are limited to service and distribution fees, administration fees, and certain registration and transfer agent expenses.
The following is a summary of significant accounting policies followed by the Fund in the preparation of its financial statements. The Fund prepares its financial statements in conformity with United States generally accepted accounting principles (“GAAP”), including investment company accounting and reporting guidance in the Financial Accounting Standards Board (the “FASB”) Accounting Standard Codification Topic 946.
NOTE 2 – SIGNIFICANT ACCOUNTING POLICIES
Security Valuation: All investments in securities held by the Fund are valued as described in Note 3.
Allocation of Income, Gains, Losses and Expenses: Net investment income (other than class specific expenses) and realized and unrealized gains and losses are allocated daily to each class of shares based upon the relative net asset value of outstanding shares (or the value of the dividend-eligible shares, as appropriate) of each class of shares at the beginning of the day (after adjusting for the current capital shares activity of the respective class). Expenses common to all Funds are allocated among the Funds comprising the Trust based upon their relative net asset values or other appropriate allocation methods. Operating expenses directly attributable to a specific class are charged against the operating income of that class.
Dividends and Distributions to Shareholders: Dividends and distributions to shareholders, which are determined in accordance with federal income tax regulations and may differ from GAAP, are recorded on the ex-dividend date. Ordinary income distributions, if any, are declared and paid annually. Capital gain distributions, if any, are declared and paid annually and more often if deemed necessary by Thornburg Investment Management, Inc., the Trust’s investment advisor (the “Advisor”). Dividends are paid and are reinvested in additional shares of the Fund at net asset value per share at the close of business on the ex-dividend date, or at the shareholder’s option, paid in cash.
Investment Income: Dividend income is recorded on the ex-dividend date. Certain income from foreign investments is recognized as soon as information is available to the Fund. Interest income is accrued as earned. Premiums and discounts are amortized and accreted, respectively, to call dates or maturity dates using the effective yield method of the respective investments. These amounts are included in Interest income on the Statement of Operations.
Custodian Fees: Custodian fees disclosed in the Statement of Operations may include interest expenses incurred by the Fund on any cash overdrafts of its custodian account during the period. Such cash overdrafts may result from the effects of failed trades in portfolio securities and from cash outflows resulting from unanticipated shareholder redemption activity. The Fund pays interest to its custodian on any such cash overdraft at a rate set periodically at the custodian’s discretion of the overdraft amount in excess of $50,000.
Investment Transactions: Investment transactions are accounted for on a trade date basis. Realized gains and losses from the sale of investments are recorded on an identified cost basis.
Repurchase Agreements: The Fund may invest excess cash in repurchase agreements whereby the Fund purchases investments, which serve as collateral, with an agreement to resell such collateral to the seller at an agreed upon price at the maturity date of the repurchase
Semi-Annual Report | 17
Notes to Financial Statements, Continued
Thornburg Global Opportunities Fund | March 31, 2018 (Unaudited)
agreement. Investments pledged as collateral for repurchase agreements are held in custody until maturity of the repurchase agreement. Provisions in the agreements require that the market value of the collateral is at least equal to the repurchase value in the event of default. In the event of default, the Fund has the right to liquidate the collateral and apply the proceeds in satisfaction of the obligation. Under certain circumstances, in the event of default or bankruptcy by the other party to the agreement, realization and/or retention of the collateral may be subject to legal proceedings.
When-Issued and Delayed Delivery Transactions: The Fund may engage in when-issued or delayed delivery transactions. To the extent the Fund engages in such transactions, it will do so for the purpose of acquiring portfolio investments consistent with the Fund’s investment objectives and not for the purpose of investment leverage or to speculate on interest rate or market changes. At the time the Fund makes a commitment to purchase an investment on a when-issued or delayed delivery basis, the Fund will record the transaction and reflect the value in determining its net asset value. When effecting such transactions, assets of an amount sufficient to make payment for the portfolio investments to be purchased will be segregated on the Fund’s records on the trade date. Investments purchased on a when-issued or delayed delivery basis do not earn interest until the settlement date.
Foreign Currency Translation: Portfolio investments and other assets and liabilities denominated in foreign currencies are translated into U.S. dollars based on the exchange rate of such currencies against the U.S. dollar on the date of valuation. Purchases and sales of investments and income items denominated in foreign currencies are translated into U.S. dollars at the exchange rate in effect on the transaction date. When the Fund purchases or sells foreign investments, it will customarily enter into a foreign exchange contract to minimize foreign exchange risk from the trade date to the settlement date of such transactions. The values of such spot contracts are included in receivable for investments sold and payable for investments purchased on the Statement of Assets and Liabilities.
The Fund does not separately report the effect of changes in foreign exchange rates from changes in market prices on investments held. Such changes are included in net unrealized appreciation (depreciation) from investments.
Reported net realized gains and losses from foreign currency transactions arise due to purchases and sales of foreign currencies, currency gains and losses realized between the trade and settlement dates on investment transactions and the difference between the amounts of dividends, interest, and foreign withholding taxes recorded on the Fund’s books, and the U.S. dollar equivalent of the amounts actually received or paid.
Net change in unrealized appreciation (depreciation) on foreign currency translations arise from changes in the fair value of assets and liabilities, other than investments at period end, resulting from changes in exchange rates.
Guarantees and Indemnifications: Under the Trust’s organizational documents (and under separate agreements with the independent Trustees), its officers and Trustees are provided with an indemnification against certain liabilities arising out of the performance of their duties to the Fund. In the normal course of business the Trust may also enter into contracts with service providers that contain general indemnifications. The Trust’s maximum exposure under these arrangements is unknown. However, based on experience, the Trust expects the risk of loss to be remote.
Use of Estimates: The preparation of financial statements in conformity with GAAP requires management to make estimates and assumptions that affect the reported amounts of assets and liabilities and disclosure of contingent assets and liabilities at the date of the financial statements and the reported amounts of increases (decreases) in net assets from operations during the reporting period. Actual results could differ from those estimates.
Federal Income Taxes: It is the policy of the Trust to comply with the provisions of the Internal Revenue Code applicable to regulated investment companies and to distribute to shareholders substantially all investment company taxable income including net realized gains on investments (if any), and tax exempt income of the Fund. Therefore, no provision for federal income or excise tax is required.
The Fund files income tax returns in United States federal and applicable state jurisdictions. The statute of limitations on the Fund’s tax return filings generally remains open for the three years following a return’s filing date. The Fund has analyzed each uncertain tax position believed to be material in the preparation of the Fund’s financial statements for the six month period ended March 31, 2018, including open tax years, to assess whether it is more likely than not that the position would be sustained upon examination, based on the technical merits of the position. The Fund has not identified any such position for which an asset or liability must be reflected in the Statement of Assets and Liabilities.
At March 31, 2018, information on the tax components of capital was as follows:
| | | | | |
Cost of investments for tax purposes | | | $ | 1,955,775,654 | |
| | | | | |
Gross unrealized appreciation on a tax basis | | | | 561,133,937 | |
Gross unrealized depreciation on a tax basis | | | | (130,381,189 | ) |
| | | | | |
Net unrealized appreciation (depreciation) on investments (tax basis) | | | $ | 430,752,748 | |
| | | | | |
18 | Semi-Annual Report
Notes to Financial Statements, Continued
Thornburg Investment Income Builder Fund | March 31, 2018 (Unaudited)
At March 31, 2018, the Fund had deferred tax basis late-year specified ordinary losses occurring subsequent to October 31, 2016 through September 30, 2017 of $273,926. For tax purposes, such losses will be recognized in the year ending September 30, 2018.
At March 31, 2018, the Fund had deferred tax basis capital losses occurring subsequent to October 31, 2016 through September 30, 2017 of $6,411,773. For tax purposes, such losses will be recognized in the year ending September 30, 2018.
At March 31, 2018, the Fund had cumulative tax basis capital losses of $58,578,031 (of which $58,578,031 are short-term and $0 are long-term) generated after September 30, 2011, which may be carried forward to offset future capital gains. To the extent such carryforwards are used, capital gain distributions may be reduced to the extent provided by regulations. Such capital loss carryforwards do not expire, but are required to be utilized to offset future gains prior to the utilization of losses generated prior to October 1, 2011.
At March 31, 2018, the Fund had cumulative tax basis capital losses of $65,016,060 generated prior to October 1, 2011 which may be carried forward to offset future capital gains. To the extent such carryforwards are utilized, capital gain distributions may be reduced to the extent provided by regulations. Such capital loss carryforwards expire September 30, 2018.
Foreign Withholding Taxes: The Fund is subject to foreign tax withholding imposed by certain foreign countries in which the Fund may invest. Withholding taxes are incurred on certain foreign dividends and are accrued at the time the dividend is recognized based on applicable foreign tax laws. The Fund may file withholding tax reclaims in certain jurisdictions to recover a portion of amounts previously withheld, in view of various considerations, including recent decisions rendered by the courts in those and other jurisdictions. The Fund would expect to record a receivable for such a reclaim based on a variety of factors, including assessment of a jurisdiction’s legal obligation to pay reclaims, the jurisdiction’s administrative practices and payment history, and industry convention. To date the Fund has recorded no such receivable because there is limited precedent for collecting such prior year reclaims and the likelihood of collection remains uncertain.
Deferred Foreign Capital Gain Taxes: The Fund is subject to a tax imposed on net realized gains of securities of certain foreign countries. The Fund records an estimated deferred tax liability for net unrealized gains on these investments as reflected in the accompanying financial statements.
NOTE 3 – SECURITY VALUATION
Valuation of the Fund’s portfolio investment securities is performed in accordance with policies and procedures adopted by and under the oversight of the Trustees.
The Trustees of the Trust have appointed the Advisor to assist the Trustees to obtain market values for portfolio investments, evaluate and monitor professional pricing service providers appointed by the Trustees’ Audit Committee (the “Audit Committee”) to assist in determining fair values for portfolio investments, assist in calculating fair values for portfolio investments in certain circumstances, and to perform other functions in connection with the valuation of investments. The Advisor acts through its Valuation and Pricing Committee (the “Committee”) and other employees of the Advisor. The Committee regularly reviews its own valuation calculations, as well as the valuations, valuation techniques and services furnished by pricing service providers, considers circumstances which may require valuation calculations by the Committee, and reviews previous valuation calculations. The Committee reports to the Audit Committee on the Committee’s activities, the performance of pricing service providers, and other matters relating to valuation of portfolio investments.
In those instances when the Committee assists in calculating a fair value for a portfolio investment, the Committee seeks to determine the price that the Fund would reasonably expect to receive upon a sale of the investment in an orderly transaction between market participants on the valuation date. The Committee customarily utilizes quotations from securities broker dealers in calculating valuations, but also may utilize prices obtained from pricing service providers or other methods approved by the Audit Committee. Because fair values calculated by the Committee are estimates, the calculation of a value for an investment may differ from the price that would be realized by the Fund upon a sale of the investment, and the difference could be material to the Fund’s financial statements. The Committee’s calculation of a fair value for an investment may also differ from the prices obtained by other persons (including other mutual funds) for the investment.
Valuation of Securities: Securities and other portfolio investments which are listed or traded on a United States securities exchange are valued at the last reported sale price on the valuation date. Investments listed or traded on an exchange for which there has been no sale that day are valued at the mean between the last reported bid and asked prices on that valuation date. Portfolio investments reported by NASDAQ are valued at the official closing price on the valuation date. If an investment is traded on more than one exchange, the investment is considered traded on the exchange that is normally the primary market for that investment. Securities and other portfolio investments which are listed or traded on exchanges outside the United States are valued at the last price or the closing price of the investment on the exchange that is normally the primary market for the investment, as of the close of the exchange preceding the Fund’s valuation date. Foreign investments listed or traded on an exchange for which there has been no sale that day are valued at the mean between the last reported bid and asked prices on that valuation date.
Semi-Annual Report | 19
Notes to Financial Statements, Continued
Thornburg Global Opportunities Fund | March 31, 2018 (Unaudited)
In any case when a market quotation is not readily available for a portfolio investment ordinarily valued by market quotation, the Committee calculates a fair value for the investment using alternative methods approved by the Audit Committee. A market quotation is not readily available when the primary market or exchange for the investment is not open for the entire scheduled day of trading. Market quotations for an investment also may not be readily available if developments after the most recent close of the investment’s primary exchange or market, but prior to the close of business on any Fund business day, or an unusual event or significant period of time occurring since the availability of a market quotation, create a serious question concerning the reliability of the most recent market quotation available for the investment. In particular, on days when market volatility thresholds established by the Audit Committee are exceeded, foreign equity investments held by the Fund may be valued using alternative methods. The Committee customarily obtains valuations in these instances from pricing service providers approved by the Audit Committee. Pricing service providers ordinarily calculate valuations using multi-factor models to adjust market prices based upon various inputs, including exchange data, depository receipt prices, futures, index data and other data.
Debt obligations held by the Fund which are not listed or traded on exchanges or for which no reported market exists are ordinarily valued at the valuation obtained from a pricing service provider approved by the Audit Committee.
In any case when a pricing service provider fails to provide a valuation for a debt obligation held by the Fund, the Committee calculates a fair value for the obligation using alternative methods under procedures approved by the Audit Committee. Additionally, in cases when management believes that a valuation obtained from a pricing service provider merits review for significant reasons, the Committee decides whether or not to use the valuation calculated by the pricing service provider or to use an alternative method approved by the Audit Committee to calculate a fair value for the obligation.
Quotations for foreign investments expressed in foreign currency amounts are converted to U.S. dollar equivalents using a foreign exchange quotation from a third party service provider at the time of valuation. Foreign investments held by the Fund may be traded on days and at times when the Fund is not open for business. Consequently, the value of Fund investments may be significantly affected on days when shareholders cannot purchase or sell Fund shares. Futures contracts and other financial and derivative instruments traded on an exchange are valued at the latest published price for the instrument on its primary exchange. Listed options are valued at the last bid price.
Valuation Hierarchy: The Fund categorizes its investments based upon the inputs used in valuing those investments, according to a three-level hierarchy established in guidance from the FASB. Categorization of investments using this hierarchy is intended by the FASB to maximize the use of observable inputs in valuing investments and minimize the use of unobservable inputs by requiring that the most observable inputs be used when available. Observable inputs are those that market participants would use in valuing an investment based on available market information. Unobservable inputs are those that reflect assumptions about the information market participants would use in valuing an investment. An investment’s level within the hierarchy is based on the lowest level input that is deemed significant to the valuation. The methodologies and inputs used to value investments are not necessarily indications of the risk or liquidity associated with those investments.
Various inputs are used in calculating valuations for the Fund’s investments. These inputs are generally summarized according to the three-level hierarchy below:
Level 1: Quoted prices in active markets for identical investments.
Level 2: Other direct or indirect significant observable inputs (including quoted prices for similar investments in active markets and other observable inputs, such as interest rates, prepayment rates, credit risk, etc.).
Level 3: Significant unobservable inputs (including the Committee’s own assumptions in calculating the fair values of investments).
Valuations for debt obligations held by the Fund are typically calculated by pricing service providers approved by the Audit Committee and are generally characterized as Level 2 within the valuation hierarchy.
On days when market volatility thresholds established by the Audit Committee are exceeded, foreign securities for which valuations are obtained from pricing service providers are fair valued. On these days, the foreign securities are characterized as Level 2 within the valuation hierarchy and revert to Level 1 after the threshold is no longer exceeded.
In a limited number of cases the Committee calculates a fair value for investments using broker quotations or other methods approved by the Audit Committee. When the Committee uses a single broker quotation to calculate a fair value for an investment without other significant observable inputs, or if a fair value is calculated using other significant inputs that are considered unobservable, the investment is characterized as Level 3 within the hierarchy. Other significant unobservable inputs used to calculate a fair value in these instances might include an income-based valuation approach which considers discounted anticipated future cash flows from the investment and application of discounts due to the nature or duration of any restrictions on the disposition of the investment.
20 | Semi-Annual Report
Notes to Financial Statements, Continued
Thornburg Global Opportunities Fund | March 31, 2018 (Unaudited)
Valuations based upon the use of inputs from Levels 1, 2 or 3 may not represent the actual price received upon the disposition of an investment, and the Fund may receive a price that is lower than the valuation based upon these inputs when it sells the investment.
The following table displays a summary of the fair value hierarchy measurements of the Fund’s investments as of March 31, 2018. In any instance when valuation inputs from more than one level are used to determine the fair value of a specific investment, the investment is placed in the level of the table based upon the lowest level input that is significant in determining the fair value of the investment:
| | | | | | | | | | | | | | | | | | | | |
| | | FAIR VALUE MEASUREMENTS AT MARCH 31, 2018 |
| | | TOTAL | | LEVEL 1 | | LEVEL 2 | | LEVEL 3 |
Assets | | | | | | | | | | | | | | | | | | | | |
Investments in Securities | | | | | | | | | | | | | | | | | | | | |
Common Stock | | | $ | 2,239,495,228 | | | | $ | 2,239,495,228 | | | | $ | – | | | | $ | – | |
Short Term Investment | | | | 147,033,174 | | | | | 147,033,174 | | | | | – | | | | | – | |
| | | | | |
Total Investments in Securities | | | $ | 2,386,528,402 | | | | $ | 2,386,528,402 | | | | $ | – | | | | $ | – | |
| | | | |
Other Financial Instruments** | | | | | | | | | | | | | | | | | | | | |
Forward Currency Contracts | | | $ | 4,898,919 | | | | $ | – | | | | $ | 4,898,919 | | | | $ | – | |
Spot Currency | | | | 544 | | | | | 544 | | | | | – | | | | | – | |
| | | | | |
Total Other Financial Instruments | | | $ | 4,899,463 | | | | $ | 544 | | | | $ | 4,898,919 | | | | $ | – | |
| | | | |
Liabilities | | | | | | | | | | | | | | | | | | | | |
Other Financial Instruments** | | | | | | | | | | | | | | | | | | | | |
Forward Currency Contracts | | | $ | (3,571,979 | ) | | | $ | – | | | | $ | (3,571,979 | ) | | | $ | – | |
| ** | Other Financial Instruments include investments not reflected in the Schedule of Investments, which may include futures, forwards and swap contracts, which are valued at the unrealized appreciation (depreciation) on the investment. |
In accordance with the guidance prescribed in Accounting Standards Update No. 2011-04, it is the policy of the Fund to recognize transfers between levels and the underlying events which caused the movement. The Fund recognized no transfers between levels for the six months ended March 31, 2018, other than when the Fund exceeded market volatility thresholds for foreign equity investments during the period.
NOTE 4 – INVESTMENT ADVISORY FEE AND OTHER TRANSACTIONS WITH AFFILIATES
Pursuant to an investment advisory agreement, the Advisor serves as the investment advisor and performs services for the Fund for which the fees are payable at the end of each month. Under the investment advisory agreement, the Fund pays the Advisor a management fee based on the daily net assets of the Fund at an annual rate as shown in the following table:
| | | | | |
| Management Fee Schedule |
| DAILY NET ASSETS | | FEE RATE |
| |
Up to $ 500 million | | | | 0.875 | % |
| |
Next $ 500 million | | | | 0.825 | |
| |
Next $ 500 million | | | | 0.775 | |
| |
Next $ 500 million | | | | 0.725 | |
| |
Over $ 2 billion | | | | 0.675 | |
The Fund’s effective management fee for the six months ended March 31, 2018 was 0.774% of the Fund’s average net assets.
The Trust has entered into administrative service agreements with the Advisor, whereby the Advisor will perform certain administrative services related to each class of the Fund’s shares. Until January 31, 2018, the fees were payable at an annual rate of up to 0.125 of 1% per annum of the average daily net assets attributable to each class of shares. As of February 1, 2018, the fees are computed as an annual percentage of the aggregate average daily net assets of all shares classes of all Funds in the Trust as follows:
Semi-Annual Report | 21
Notes to Financial Statements, Continued
Thornburg Global Opportunities Fund | March 31, 2018 (Unaudited)
| | | | | |
| Administration Fee Schedule |
| DAILY NET ASSETS | | FEE RATE |
| |
Up to $20 billion | | | | 0.100 | % |
| |
$20 billion to $40 billion | | | | 0.075 | |
| |
$40 billion to $60 billion | | | | 0.040 | |
| |
Over $60 billion | | | | 0.030 | |
The aggregate fee amount is allocated on a daily basis to each Fund based on net assets and subsequently allocated to each class of shares of the Fund. Total administrative service fees incurred by each class of shares of the Fund for the six months ended March 31, 2018, are set forth in the Statement of Operations.
The Trust has an underwriting agreement with Thornburg Securities Corporation (the “Distributor”), an affiliate of the Advisor, which acts as the distributor of the Fund’s shares. For the six months ended March 31, 2018, the Distributor has advised the Fund that it earned net commissions aggregating $34,538 from the sale of Class A shares, and collected contingent deferred sales charges aggregating $7,552 from redemptions of Class C shares of the Fund.
Pursuant to a service plan under Rule 12b-1 of the Investment Company Act of 1940, the Fund may pay to the Distributor or securities dealers and other financial institutions at the Distributor’s direction an amount not to exceed .25 of 1% per annum of the average daily net assets attributable to Class A, Class C, Class I, Class R3, Class R4, and Class R5 shares of the Fund to obtain various shareholder and distribution related services. For the six months ended March 31, 2018, there were no 12b-1 service plan fees charged for Class I or Class R5 shares. Class R6 shares are not subject to a service plan. The Advisor and Distributor each may pay out of its own resources additional expenses for distribution of the Fund’s shares and shareholder services.
The Trust has also adopted distribution plans pursuant to Rule 12b-1, applicable only to the Fund’s Class C and Class R3 shares, under which the Fund compensates the Distributor for services in promoting the sale of Class C and Class R3 shares of the Fund at an annual rate of up to .75 of 1% per annum of the average daily net assets attributable to Class C shares, and an annual rate of up to .25 of 1% per annum of the average daily net assets attributable to Class R3 shares.
Total fees incurred by each class of shares of the Fund under their respective service and distribution plans for the six months ended March 31, 2018, are set forth in the Statement of Operations.
The Advisor and Distributor have contractually agreed to waive fees and reimburse expenses incurred by the Fund so that actual expenses of certain share classes do not exceed levels as specified in each Fund’s most recent prospectus. The agreement may be terminated by the Fund at any time, but may not be terminated by the Advisor or Distributor before February 1, 2019, unless the Advisor ceases to be the investment advisor to the Fund or the Distributor ceases to be the distributor of the Fund prior to that date. The Advisor and Distributor may recoup amounts waived or reimbursed during the fiscal year if expenses fall below the contractual limit during that year.
For the six months ended March 31, 2018, the Advisor contractually reimbursed certain class specific expenses, administrative fees, and distribution fees of $245 for Class I shares, $20,545 for Class R3 shares, $23,974 for Class R4 shares, $49,333 for Class R5 shares, and $10,137 for Class R6 shares.
Certain officers and Trustees of the Trust are also officers or directors of the Advisor and Distributor. The compensation of the independent Trustees is borne by the Trust. The Trust also pays a portion of the Chief Compliance Officer’s compensation. These amounts are reflected as “Trustee and officer fees” in the Statement of Operations.
The percentage of direct investments in the Fund held by the Trustees, officers of the Trust, and the Advisor is approximately 2.17%.
The Fund may purchase or sell securities from, or to an affiliated fund, provided the affiliation is due solely to having a common investment advisor, common officers, or common trustees, and provided that all such transactions will comply with Rule 17a-7 under the 1940 Act. For the six months ended March 31, 2018, the Fund had no such transactions with affiliated funds.
Shown below are holdings of voting securities of each portfolio company which is considered “affiliated” to the Fund under the Investment Company Act of 1940, including companies for which the Fund’s holding represented 5% or more of the company’s voting securities, and a series of the Thornburg Investment Trust in which the Fund invested for cash management purposes during the period:
22 | Semi-Annual Report
Notes to Financial Statements, Continued
Thornburg Global Opportunities Fund | March 31, 2018 (Unaudited)
| | | | | | | | | | | | | | | | | | | | | | | | | | | | | | | | | | | | | | | | |
| FUND | | MARKET VALUE
9/30/17 | | PURCHASES
AT COST | | SALES
PROCEEDS | | REALIZED
GAIN
(LOSS) | | CHANGE IN
UNREALIZED
APPR./(DEPR.) | | MARKET VALUE
3/31/18 | | DIVIDEND
INCOME | | ROC
ADJUSTMENT |
Thornburg Capital Management Fund | | $193,583,692 | | | $ | 448,952,443 | | | | $ | (495,502,961 | ) | | | $ | – | | | | $ | – | | | | $ | 147,033,174 | | | | $ | 1,327,120 | | | | $ | – | |
NOTE 5 – SHARES OF BENEFICIAL INTEREST
At March 31, 2018, there were an unlimited number of shares with no par value of beneficial interest authorized. Transactions in shares of beneficial interest were as follows:
| | | | | | | | | | | | | | | | |
| | | SIX MONTHS ENDED MARCH 31, 2018 (UNAUDITED) | | | YEAR ENDED SEPTEMBER 30, 2017 (AUDITED) | |
| | | SHARES | | | AMOUNT | | | SHARES | | | AMOUNT | |
Class A Shares | | | | | | | | | | | | | | | | |
Shares sold | | | 1,287,235 | | | $ | 40,648,256 | | | | 3,410,854 | | | $ | 96,747,081 | |
Shares issued to shareholders in
reinvestment of dividends | | | 31,011 | | | | 981,179 | | | | 49,429 | | | | 1,369,463 | |
Shares repurchased | | | (2,589,904 | ) | | | (82,249,403 | ) | | | (6,971,985 | ) | | | (189,139,424 | ) |
| | | | |
| | | | |
Net decrease | | | (1,271,658 | ) | | $ | (40,619,968 | ) | | | (3,511,702 | ) | | $ | (91,022,880 | ) |
| | | | |
Class C Shares | | | | | | | | | | | | | | | | |
Shares sold | | | 864,803 | | | $ | 26,315,315 | | | | 2,099,252 | | | $ | 57,916,957 | |
Shares issued to shareholders in
reinvestment of dividends | | | 6,530 | | | | 199,286 | | | | 5,507 | | | | 140,551 | |
Shares repurchased | | | (1,621,969 | ) | | | (49,428,424 | ) | | | (4,285,695 | ) | | | (114,992,913 | ) |
| | | | |
| | | | |
Net decrease | | | (750,636 | ) | | $ | (22,913,823 | ) | | | (2,180,936 | ) | | $ | (56,935,405 | ) |
| | | | |
Class I Shares | | | | | | | | | | | | | | | | |
Shares sold | | | 9,491,673 | | | $ | 300,963,328 | | | | 20,512,683 | | | $ | 586,229,870 | |
Shares issued to shareholders in
reinvestment of dividends | | | 141,477 | | | | 4,487,657 | | | | 253,500 | | | | 7,177,381 | |
Shares repurchased | | | (9,361,897 | ) | | | (296,194,131 | ) | | | (11,963,671 | ) | | | (332,560,564 | ) |
| | | | |
| | | | |
Net increase | | | 271,253 | | | $ | 9,256,854 | | | | 8,802,512 | | | $ | 260,846,687 | |
| | | | |
Class R3 Shares | | | | | | | | | | | | | | | | |
Shares sold | | | 34,635 | | | $ | 1,086,302 | | | | 130,184 | | | $ | 3,659,868 | |
Shares issued to shareholders in
reinvestment of dividends | | | 403 | | | | 12,620 | | | | 580 | | | | 15,790 | |
Shares repurchased | | | (91,797 | ) | | | (2,849,585 | ) | | | (169,108 | ) | | | (4,651,642 | ) |
| | | | |
| | | | |
Net decrease | | | (56,759 | ) | | $ | (1,750,663 | ) | | | (38,344 | ) | | $ | (975,984 | ) |
| | | | |
Class R4 Shares | | | | | | | | | | | | | | | | |
Shares sold | | | 132,772 | | | $ | 4,164,845 | | | | 515,867 | | | $ | 14,451,431 | |
Shares issued to shareholders in
reinvestment of dividends | | | 1,263 | | | | 39,602 | | | | 2,158 | | | | 59,157 | |
Shares repurchased | | | (175,504 | ) | | | (5,483,245 | ) | | | (471,526 | ) | | | (13,143,425 | ) |
| | | | |
| | | | |
Net increase (decrease) | | | (41,469 | ) | | $ | (1,278,798 | ) | | | 46,499 | | | $ | 1,367,163 | |
| | | | |
Class R5 Shares | | | | | | | | | | | | | | | | |
Shares sold | | | 293,256 | | | $ | 9,322,797 | | | | 852,553 | | | $ | 24,462,244 | |
Shares issued to shareholders in
reinvestment of dividends | | | 7,656 | | | | 243,146 | | | | 16,072 | | | | 453,093 | |
Shares repurchased | | | (278,260 | ) | | | (8,843,227 | ) | | | (684,444 | ) | | | (19,317,252 | ) |
| | | | |
| | | | |
Net increase | | | 22,652 | | | $ | 722,716 | | | | 184,181 | | | $ | 5,598,085 | |
| | | | |
Semi-Annual Report | 23
Notes to Financial Statements, Continued
Thornburg Global Opportunities Fund | March 31, 2018 (Unaudited)
| | | | | | | | | | | | | | | | |
| | | SIX MONTHS ENDED MARCH 31, 2018 (UNAUDITED) | | | YEAR ENDED SEPTEMBER 30, 2017 (AUDITED) | |
| | | SHARES | | | AMOUNT | | | SHARES | | | AMOUNT | |
Class R6 Shares* | | | | | | | | | | | | | | | | |
Shares sold | | | 1,435,946 | | | $ | 44,718,055 | | | | 52,503 | | | $ | 1,613,563 | |
Shares issued to shareholders in
reinvestment of dividends | | | 335 | | | | 10,671 | | | | 46 | | | | 1,432 | |
Shares repurchased | | | (55,823 | ) | | | (1,794,612 | ) | | | (1,962 | ) | | | (60,790 | ) |
| | | | |
Net increase | | | 1,380,458 | | | $ | 42,934,114 | | | | 50,587 | | | $ | 1,554,205 | |
| | | | |
| * | The effective date of this class of shares was April 10, 2017. |
NOTE 6 – INVESTMENT TRANSACTIONS
For the six months ended March 31, 2018, the Fund had purchase and sale transactions of investments (excluding short-term investments) of $606,179,264 and $578,393,810, respectively.
NOTE 7 – DERIVATIVE FINANCIAL INSTRUMENTS WITH OFF-BALANCE SHEET RISK AND FOREIGN INVESTMENT RISK
The Fund may use a variety of derivative financial instruments to hedge or adjust the risks affecting its investment portfolio or to enhance investment returns. Provisions of the FASB Accounting Standards Codification 815-10-50 (“ASC 815”) require certain disclosures. The disclosures are intended to provide users of financial statements with an understanding of the use of derivative instruments by the Fund and how these derivatives affect the financial position, financial performance and cash flows of the Fund. The Fund does not designate any derivative instruments as hedging instruments under ASC 815. During the six months ended March 31, 2018, the Fund’s principal exposure to derivative financial instruments of the type addressed by ASC 815 was investment in foreign exchange contracts. A foreign exchange contract is an agreement between two parties to exchange different currencies at a specified rate of exchange at an agreed upon future date. Foreign exchange contracts involve risks to the Fund, including the risk that a contract’s counterparty will not meet its obligations to the Fund, the risk that a change in a contract’s value may not correlate perfectly with the currency the contract was intended to track, and the risk that the Fund’s Advisor is unable to correctly implement its strategy in using a contract. In any such instance, the Fund may not achieve the intended benefit of entering into a contract, and may experience a loss.
The Fund entered into forward currency contracts during the six months ended March 31, 2018 in the normal course of pursuing its investment objectives, with the objective of purchasing foreign investments or with the intent of reducing the risk to the value of the Fund’s foreign investments from adverse changes in the relationship between the U.S. dollar and foreign currencies. In each case these contracts have been initiated in conjunction with foreign investment transactions. The monthly average value of open forward currency sell contracts for the six months ended March 31, 2018 was $468,755,809.
These contracts are accounted for by the Fund under ASC 815. Unrealized appreciation and depreciation on outstanding contracts are reported in the Fund’s Statement of Assets and Liabilities, as measured by the difference between the forward exchange rates at the reporting date and the forward exchange rates at each contract’s inception date. Net realized gain (loss) on contracts closed during the period, and changes in net unrealized appreciation (depreciation) on outstanding contracts are recognized in the Fund’s Statement of Operations.
The outstanding forward currency contracts table located in the Schedule of Investments which were entered into with State Street Bank and Trust Company (“SSB”), were entered into pursuant to an International Swaps and Derivatives Association (“ISDA”) Master Agreement. Outstanding forward currency contracts which were entered into with Brown Brothers Harriman & Co. (“BBH”) were entered into pursuant to a written agreement with BBH. In the event of a default or termination under the ISDA Master Agreement with SSB or the agreement with BBH, the non-defaulting party has the right to close out all outstanding forward currency contracts between the parties and to net any payment amounts under those contracts, resulting in a single net amount payable by one party to the other.
Because the ISDA Master Agreement with SSB and the agreement with BBH does not result in an offset of reported amounts of financial assets and liabilities in the Fund’s Statement of Assets and Liabilities unless there has been an event of default or termination event under such agreements, the Fund does not net its outstanding forward currency contracts for the purpose of disclosure in the Fund’s Statement of Assets and Liabilities. Instead the Fund recognizes the unrealized appreciation (depreciation) on those forward currency contracts on a gross basis in the Fund’s Statement of Assets and Liabilities.
24 | Semi-Annual Report
Notes to Financial Statements, Continued
Thornburg Global Opportunities Fund | March 31, 2018 (Unaudited)
The unrealized appreciation (depreciation) of the outstanding forward currency contracts recognized in the Fund’s Statement of Assets and Liabilities at March 31, 2018 is disclosed in the following table:
| | | | | | |
| FAIR VALUES OF DERIVATIVE FINANCIAL INSTRUMENTS AT MARCH 31, 2018 | |
| | |
| ASSET DERIVATIVES | | BALANCE SHEET LOCATION | | FAIR VALUE | |
| | |
Foreign exchange contracts | | Assets - Unrealized appreciation
on forward currency contracts | | $ | 4,898,919 | |
|
| FAIR VALUES OF DERIVATIVE FINANCIAL INSTRUMENTS AT MARCH 31, 2018 | |
| | |
| LIABILITY DERIVATIVES | | BALANCE SHEET LOCATION | | FAIR VALUE | |
| | |
Foreign exchange contracts | | Liabilities - Unrealized depreciation
on forward currency contracts | | $ | (3,571,979 | ) |
Because the Fund did not receive or post cash collateral in connection with its currency forward contracts during the period, and because all of the Fund’s outstanding currency forward contracts are with SSB, the net amounts of the Fund’s assets and liabilities which are attributable to those contracts at March 31, 2018 can be determined by offsetting the dollar amounts shown in the preceding table. Based on those amounts, the net amount of the Fund’s assets which is attributable to its outstanding forward currency contracts at March 31, 2018 is $1,778,621 attributable to the Fund’s contracts with BBH, and the net amount of the Fund’s liabilities which is attributable to those contracts at that date is $451,678 attributable to the Fund’s contracts with SSB. The Fund’s forward currency contracts are valued each day, and the net amounts of the Fund’s assets and liabilities which are attributable to those contracts are expected to vary over time.
The net realized gain (loss) from forward currency contracts and the net change in unrealized appreciation (depreciation) on outstanding forward currency contracts recognized in the Fund’s Statement of Operations for the six months ended March 31, 2018 are disclosed in the following tables:
| | | | | | | | |
NET REALIZED GAIN (LOSS) ON DERIVATIVE FINANCIAL INSTRUMENTS
RECOGNIZED IN INCOME FOR THE SIX MONTHS ENDED MARCH 31, 2018 | |
| | |
| | | TOTAL | | | FORWARD CURRENCY CONTRACTS | |
| | |
Foreign exchange contracts | | $ | (18,118,960) | | | $ | (18,118,960) | |
|
NET CHANGE IN UNREALIZED APPRECIATION (DEPRECIATION) OF DERIVATIVE FINANCIAL INSTRUMENTS
RECOGNIZED IN INCOME FOR THE SIX MONTHS ENDED MARCH 31, 2018 | |
| | |
| | | TOTAL | | | FORWARD CURRENCY CONTRACTS | |
| | |
Foreign exchange contracts | | $ | 4,760,901 | | | $ | 4,760,901 | |
OTHER NOTES
Risks: The Fund’s investments subject it to risks including, but not limited to, management risk, market and economic risk, risks affecting specific issuers, liquidity risk, the risks associated with investments in small- and mid-cap companies, non-U.S. issuers (including developing country issuers), real estate investment trusts, credit risk, and interest rate risk. Please see the Fund’s prospectus for a discussion of the risks associated with an investment in the Fund.
Subsequent Events: Fund management believes no events have occurred between March 31, 2018 and the date of issuance of the financial statements that require adjustment to or disclosure in the accompanying financial statements.
Semi-Annual Report | 25
Financial Highlights
Thornburg Global Opportunities Fund
| | | | | | | | | | | | | | | | | | | | | | | | | | | | | | | | | | | | | | | | |
| | | PER SHARE PERFORMANCE (FOR A SHARE OUTSTANDING THROUGHOUT THE PERIOD) |
| | | | | | | | | | | | | | | | | |
UNLESS OTHERWISE NOTED, PERIODS ARE FISCAL YEARS ENDED
SEPTEMBER 30, | | NET ASSET
VALUE,
BEGINNING OF
PERIOD | | NET
INVESTMENT
INCOME
(LOSS)+ | | NET REALIZED &
UNREALIZED GAIN
(LOSS) ON
INVESTMENTS | | TOTAL FROM
INVESTMENT
OPERATIONS | | DIVIDENDS
FROM NET
INVESTMENT
INCOME | | DIVIDENDS
FROM NET
REALIZED
GAINS | | TOTAL
DIVIDENDS | | NET ASSET
VALUE,
END OF PERIOD |
| | | | | | | |
| CLASS A SHARES | | | | | | | | | | | | | | | | | | | | | | | | | | | | | | | | | | | | |
| | | | | | | | |
2018(b)(c) | | | $ | 30.98 | | | | | 0.04 | | | | | (0.92 | ) | | | | (0.88 | ) | | | | (0.07 | ) | | |
| –
|
| | | | (0.07 | ) | | | $ | 30.03 | |
2017(b) | | | $ | 24.90 | | | | | 0.13 | | | | | 6.05 | | | | | 6.18 | | | | | (0.10 | ) | | |
| –
|
| | | | (0.10 | ) | | | $ | 30.98 | |
2016(b) | | | $ | 24.41 | | | | | 0.25 | | | | | 0.38 | | | | | 0.63 | | | | | (0.14 | ) | | |
| –
|
| | | | (0.14 | ) | | | $ | 24.90 | |
2015(b) | | | $ | 23.74 | | | | | (0.11 | ) | | | | 0.78 | | | | | 0.67 | | | | | – | | | |
| –
|
| | | | – | | | | $ | 24.41 | |
2014(b) | | | $ | 19.72 | | | | | (0.03 | ) | | | | 4.13 | | | | | 4.10 | | | | | (0.08 | ) | | |
| –
|
| | | | (0.08 | ) | | | $ | 23.74 | |
2013(b) | | | $ | 15.97 | | | | | 0.11 | | | | | 3.79 | | | | | 3.90 | | | | | (0.15 | ) | | |
| –
|
| | | | (0.15 | ) | | | $ | 19.72 | |
| | | | | | | |
| CLASS C SHARES | | | | | | | | | | | | | | | | | | | | | | | | | | | | | | | | | | | | |
| | | | | | | | |
2018(c) | | | $ | 29.88 | | | | | (0.08 | ) | | | | (0.87 | ) | | | | (0.95 | ) | | | | (0.02 | ) | | |
| –
|
| | | | (0.02 | ) | | | $ | 28.91 | |
2017 | | | $ | 24.13 | | | | | (0.08 | ) | | | | 5.84 | | | | | 5.76 | | | | | (0.01 | ) | | |
| –
|
| | | | (0.01 | ) | | | $ | 29.88 | |
2016 | | | $ | 23.70 | | | | | 0.07 | | | | | 0.36 | | | | | 0.43 | | | | | – | | | |
| –
|
| | | | – | | | | $ | 24.13 | |
2015 | | | $ | 23.23 | | | | | (0.31 | ) | | | | 0.78 | | | | | 0.47 | | | | | – | | | |
| –
|
| | | | – | | | | $ | 23.70 | |
2014 | | | $ | 19.38 | | | | | (0.20 | ) | | | | 4.07 | | | | | 3.87 | | | | | (0.02 | ) | | |
| –
|
| | | | (0.02 | ) | | | $ | 23.23 | |
2013 | | | $ | 15.69 | | | | | (0.03 | ) | | | | 3.72 | | | | | 3.69 | | | | | – | | | |
| –
|
| | | | – | | | | $ | 19.38 | |
| | | | | | | |
| CLASS I SHARES | | | | | | | | | | | | | | | | | | | | | | | | | | | | | | | | | | | | |
| | | | | | | | |
2018(c) | | | $ | 31.06 | | | | | 0.09 | | | | | (0.92 | ) | | | | (0.83 | ) | | | | (0.10 | ) | | |
| –
|
| | | | (0.10 | ) | | | $ | 30.13 | |
2017 | | | $ | 24.96 | | | | | 0.23 | | | | | 6.07 | | | | | 6.30 | | | | | (0.20 | ) | | |
| –
|
| | | | (0.20 | ) | | | $ | 31.06 | |
2016 | | | $ | 24.53 | | | | | 0.34 | | | | | 0.37 | | | | | 0.71 | | | | | (0.28 | ) | | |
| –
|
| | | | (0.28 | ) | | | $ | 24.96 | |
2015 | | | $ | 23.79 | | | | | (0.02 | ) | | | | 0.77 | | | | | 0.75 | | | | | (0.01 | ) | | |
| –
|
| | | | (0.01 | ) | | | $ | 24.53 | |
2014 | | | $ | 19.74 | | | | | 0.06 | | | | | 4.15 | | | | | 4.21 | | | | | (0.16 | ) | | |
| –
|
| | | | (0.16 | ) | | | $ | 23.79 | |
2013 | | | $ | 16.06 | | | | | 0.19 | | | | | 3.80 | | | | | 3.99 | | | | | (0.31 | ) | | |
| –
|
| | | | (0.31 | ) | | | $ | 19.74 | |
| | | | | | | |
| CLASS R3 SHARES | | | | | | | | | | | | | | | | | | | | | | | | | | | | | | | | | | | | |
| | | | | | | | |
2018(c) | | | $ | 30.66 | | | | | – | (e) | | | | (0.90 | ) | | | | (0.90 | ) | | | | (0.06 | ) | | |
| –
|
| | | | (0.06 | ) | | | $ | 29.70 | |
2017 | | | $ | 24.66 | | | | | 0.08 | | | | | 5.99 | | | | | 6.07 | | | | | (0.07 | ) | | |
| –
|
| | | | (0.07 | ) | | | $ | 30.66 | |
2016 | | | $ | 24.18 | | | | | 0.20 | | | | | 0.38 | | | | | 0.58 | | | | | (0.10 | ) | | |
| –
|
| | | | (0.10 | ) | | | $ | 24.66 | |
2015 | | | $ | 23.55 | | | | | (0.15 | ) | | | | 0.78 | | | | | 0.63 | | | | | – | | | |
| –
|
| | | | – | | | | $ | 24.18 | |
2014 | | | $ | 19.55 | | | | | (0.06 | ) | | | | 4.11 | | | | | 4.05 | | | | | (0.05 | ) | | |
| –
|
| | | | (0.05 | ) | | | $ | 23.55 | |
2013 | | | $ | 15.91 | | | | | 0.11 | | | | | 3.74 | | | | | 3.85 | | | | | (0.21 | ) | | |
| –
|
| | | | (0.21 | ) | | | $ | 19.55 | |
| | | | | | | |
| CLASS R4 SHARES | | | | | | | | | | | | | | | | | | | | | | | | | | | | | | | | | | | | |
| | | | | | | | |
2018(c) | | | $ | 30.69 | | | | | (0.01 | ) | | | | (0.85 | ) | | | | (0.86 | ) | | | | (0.10 | ) | | |
| –
|
| | | | (0.10 | ) | | | $ | 29.73 | |
2017 | | | $ | 24.67 | | | | | 0.11 | | | | | 6.00 | | | | | 6.11 | | | | | (0.09 | ) | | |
| –
|
| | | | (0.09 | ) | | | $ | 30.69 | |
2016 | | | $ | 24.22 | | | | | 0.24 | | | | | 0.35 | | | | | 0.59 | | | | | (0.14 | ) | | |
| –
|
| | | | (0.14 | ) | | | $ | 24.67 | |
2015 | | | $ | 23.57 | | | | | (0.13 | ) | | | | 0.78 | | | | | 0.65 | | | | | – | | | |
| –
|
| | | | – | | | | $ | 24.22 | |
2014 | | | $ | 19.59 | | | | | (0.03 | ) | | | | 4.10 | | | | | 4.07 | | | | | (0.09 | ) | | |
| –
|
| | | | (0.09 | ) | | | $ | 23.57 | |
2013 | | | $ | 15.90 | | | | | 0.12 | | | | | 3.76 | | | | | 3.88 | | | | | (0.19 | ) | | |
| –
|
| | | | (0.19 | ) | | | $ | 19.59 | |
| | | | | | | |
| CLASS R5 SHARES | | | | | | | | | | | | | | | | | | | | | | | | | | | | | | | | | | | | |
| | | | | | | | |
2018(c) | | | $ | 31.10 | | | | | 0.09 | | | | | (0.97 | ) | | | | (0.88 | ) | | | | (0.06 | ) | | |
| –
|
| | | | (0.06 | ) | | | $ | 30.16 | |
2017 | | | $ | 24.99 | | | | | 0.22 | | | | | 6.08 | | | | | 6.30 | | | | | (0.19 | ) | | |
| –
|
| | | | (0.19 | ) | | | $ | 31.10 | |
2016 | | | $ | 24.55 | | | | | 0.34 | | | | | 0.37 | | | | | 0.71 | | | | | (0.27 | ) | | |
| –
|
| | | | (0.27 | ) | | | $ | 24.99 | |
2015 | | | $ | 23.81 | | | | | (0.03 | ) | | | | 0.78 | | | | | 0.75 | | | | | (0.01 | ) | | |
| –
|
| | | | (0.01 | ) | | | $ | 24.55 | |
2014 | | | $ | 19.76 | | | | | 0.06 | | | | | 4.15 | | | | | 4.21 | | | | | (0.16 | ) | | |
| –
|
| | | | (0.16 | ) | | | $ | 23.81 | |
2013 | | | $ | 16.07 | | | | | 0.18 | | | | | 3.82 | | | | | 4.00 | | | | | (0.31 | ) | | |
| –
|
| | | | (0.31 | ) | | | $ | 19.76 | |
| | | | | | | |
| CLASS R6 SHARES | | | | | | | | | | | | | | | | | | | | | | | | | | | | | | | | | | | | |
| | | | | | | | |
2018(c) | | | $ | 31.16 | | | | | – | (e) | | | | (0.82 | ) | | | | (0.82 | ) | | | | (0.11 | ) | | |
| –
|
| | | | (0.11 | ) | | | $ | 30.23 | |
2017(f) | | | $ | 28.35 | | | | | 0.11 | | | | | 2.73 | | | | | 2.84 | | | | | (0.03 | ) | | |
| –
|
| | | | (0.03 | ) | | | $ | 31.16 | |
| (a) | Not annualized for periods less than one year. |
| (b) | Sales loads are not reflected in computing total return. |
| (c) | Unaudited Six Month Period Ended March 31. |
| (e) | Net investment income (loss) was less than $0.01 per share. |
| (f) | Effective date of this class of shares was April 10, 2017. |
| (g) | Due to the size of net assets and fixed expenses, ratios may appear disproportionate. |
| + | Based on weighted average shares outstanding. |
See notes to financial statements.
26 | Semi-Annual Report
Financial Highlights, Continued
Thornburg Global Opportunities Fund
| | | | | | | | | | | | | | | | | | | | | | | | | | | | | | |
| RATIOS TO AVERAGE NET ASSETS | | | | | | SUPPLEMENTAL DATA | |
| | | | | | | EXPENSES, AFTER | | | | | | | | | | | | | | | | |
NET INVESTMENT
INCOME (LOSS) (%) | | | EXPENSES, AFTER
EXPENSE
REDUCTIONS (%) | | | EXPENSE
REDUCTIONS AND
NET OF CUSTODY
CREDITS (%) | | | EXPENSES,
BEFORE EXPENSE
REDUCTIONS (%) | | | | | | TOTAL
RETURN (%)(a) | | | PORTFOLIO
TURNOVER
RATE (%)(a) | | | NET ASSETS AT
END OF PERIOD
(THOUSANDS) | |
| | | | | | | |
| | | | | | | | | | | | | | | | | | | | | | | | | | | | | | |
| | | | | | | |
| | 0.23 | (d) | | | 1.28 | (d) | | | 1.28 | (d) | | | 1.28 | (d) | | | | | | | (2.84 | ) | | | 24.73 | | | $ | 390,690 | |
| | 0.46 | | | | 1.33 | | | | 1.33 | | | | 1.33 | | | | | | | | 24.85 | | | | 43.70 | | | $ | 442,522 | |
| | 1.02 | | | | 1.35 | | | | 1.35 | | | | 1.35 | | | | | | | | 2.57 | | | | 37.11 | | | $ | 443,072 | |
| | (0.42 | ) | | | 1.32 | | | | 1.32 | | | | 1.32 | | | | | | | | 2.82 | | | | 45.41 | | | $ | 550,327 | |
| | (0.15 | ) | | | 1.41 | | | | 1.41 | | | | 1.41 | | | | | | | | 20.85 | | | | 60.29 | | | $ | 207,227 | |
| | 0.60 | | | | 1.46 | | | | 1.46 | | | | 1.46 | | | | | | | | 24.50 | | | | 66.12 | | | $ | 96,855 | |
| | | | | | | |
| | | | | | | | | | | | | | | | | | | | | | | | | | | | | | |
| | | | | | | |
| | (0.52 | )(d) | | | 2.03 | (d) | | | 2.03 | (d) | | | 2.03 | (d) | | | | | | | (3.19 | ) | | | 24.73 | | | $ | 345,895 | |
| | (0.30 | ) | | | 2.08 | | | | 2.08 | | | | 2.08 | | | | | | | | 23.88 | | | | 43.70 | | | $ | 380,046 | |
| | 0.29 | | | | 2.09 | | | | 2.09 | | | | 2.09 | | | | | | | | 1.81 | | | | 37.11 | | | $ | 359,426 | |
| | (1.20 | ) | | | 2.10 | | | | 2.10 | | | | 2.10 | | | | | | | | 2.02 | | | | 45.41 | | | $ | 363,615 | |
| | (0.92 | ) | | | 2.17 | | | | 2.17 | | | | 2.17 | | | | | | | | 19.96 | | | | 60.29 | | | $ | 143,506 | |
| | (0.18 | ) | | | 2.22 | | | | 2.22 | | | | 2.22 | | | | | | | | 23.52 | | | | 66.12 | | | $ | 87,808 | |
| | | | | | | |
| | | | | | | | | | | | | | | | | | | | | | | | | | | | | | |
| | | | | | | |
| | 0.56 | (d) | | | 0.94 | (d) | | | 0.94 | (d) | | | 0.94 | (d) | | | | | | | (2.68 | ) | | | 24.73 | | | $ | 1,476,707 | |
| | 0.80 | | | | 0.97 | | | | 0.97 | | | | 0.98 | | | | | | | | 25.31 | | | | 43.70 | | | $ | 1,514,039 | |
| | 1.39 | | | | 0.99 | | | | 0.99 | | | | 0.99 | | | | | | | | 2.91 | | | | 37.11 | | | $ | 996,970 | |
| | (0.08 | ) | | | 0.97 | | | | 0.97 | | | | 0.98 | | | | | | | | 3.17 | | | | 45.41 | | | $ | 1,285,609 | |
| | 0.26 | | | | 0.99 | | | | 0.99 | | | | 1.08 | | | | | | | | 21.39 | | | | 60.29 | | | $ | 453,511 | |
| | 1.07 | | | | 0.99 | | | | 0.99 | | | | 1.11 | | | | | | | | 25.08 | | | | 66.12 | | | $ | 249,283 | |
| | | | | | | |
| | | | | | | | | | | | | | | | | | | | | | | | | | | | | | |
| | | | | | | |
| | 0.01 | (d) | | | 1.50 | (d) | | | 1.50 | (d) | | | 1.86 | (d) | | | | | | | (2.96 | ) | | | 24.73 | | | $ | 9,994 | |
| | 0.28 | | | | 1.50 | | | | 1.50 | | | | 1.97 | | | | | | | | 24.66 | | | | 43.70 | | | $ | 12,059 | |
| | 0.84 | | | | 1.50 | | | | 1.50 | | | | 2.01 | | | | | | | | 2.38 | | | | 37.11 | | | $ | 10,645 | |
| | (0.58 | ) | | | 1.50 | | | | 1.50 | | | | 2.15 | | | | | | | | 2.68 | | | | 45.41 | | | $ | 8,936 | |
| | (0.26 | ) | | | 1.50 | | | | 1.50 | | | | 2.59 | | | | | | | | 20.75 | | | | 60.29 | | | $ | 2,182 | |
| | 0.60 | | | | 1.49 | | | | 1.49 | | | | 3.41 | | | | | | | | 24.37 | | | | 66.12 | | | $ | 1,653 | |
| | | | | | | |
| | | | | | | | | | | | | | | | | | | | | | | | | | | | | | |
| | | | | | | |
| | (0.05 | )(d) | | | 1.40 | (d) | | | 1.40 | (d) | | | 1.58 | (d) | | | | | | | (2.93 | ) | | | 24.73 | | | $ | 25,955 | |
| | 0.38 | | | | 1.40 | | | | 1.40 | | | | 1.65 | | | | | | | | 24.81 | | | | 43.70 | | | $ | 28,061 | |
| | 0.98 | | | | 1.40 | | | | 1.40 | | | | 1.66 | | | | | | | | 2.45 | | | | 37.11 | | | $ | 21,415 | |
| | (0.51 | ) | | | 1.40 | | | | 1.40 | | | | 1.76 | | | | | | | | 2.76 | | | | 45.41 | | | $ | 13,175 | |
| | (0.14 | ) | | | 1.40 | | | | 1.40 | | | | 2.23 | | | | | | | | 20.82 | | | | 60.29 | | | $ | 4,462 | |
| | 0.68 | | | | 1.40 | | | | 1.40 | | | | 2.76 | | | | | | | | 24.57 | | | | 66.12 | | | $ | 2,161 | |
| | | | | | | |
| | | | | | | | | | | | | | | | | | | | | | | | | | | | | | |
| | | | | | | |
| | 0.57 | (d) | | | 0.99 | (d) | | | 0.99 | (d) | | | 1.11 | (d) | | | | | | | (2.73 | ) | | | 24.73 | | | $ | 78,956 | |
| | 0.79 | | | | 0.99 | | | | 0.99 | | | | 1.16 | | | | | | | | 25.29 | | | | 43.70 | | | $ | 80,704 | |
| | 1.38 | | | | 0.99 | | | | 0.99 | | | | 1.07 | | | | | | | | 2.91 | | | | 37.11 | | | $ | 60,252 | |
| | (0.11 | ) | | | 0.98 | | | | 0.98 | | | | 1.02 | | | | | | | | 3.17 | | | | 45.41 | | | $ | 108,654 | |
| | 0.26 | | | | 0.99 | | | | 0.99 | | | | 1.10 | | | | | | | | 21.36 | | | | 60.29 | | | $ | 74,212 | |
| | 1.03 | | | | 0.99 | | | | 0.99 | | | | 1.15 | | | | | | | | 25.13 | | | | 66.12 | | | $ | 49,023 | |
| | | | | | | |
| | | | | | | | | | | | | | | | | | | | | | | | | | | | | | |
| | | | | | | |
| | 0.01 | (d) | | | 0.85 | (d) | | | 0.85 | (d) | | | 1.16 | (d) | | | | | | | (2.65 | ) | | | 24.73 | | | $ | 43,261 | |
| | 0.77 | (d) | | | 0.85 | (d) | | | 0.85 | (d) | | | 13.31 | (d)(g) | | | | | | | 10.02 | | | | 43.70 | | | $ | 1,576 | |
Semi-Annual Report | 27
Expense Example
Thornburg Global Opportunities Fund | March 31, 2018 (Unaudited)
As a shareholder of the Fund, you incur two types of costs:
| | (1) | transaction costs, including |
| | (a) | sales charges (loads) on purchase payments, for Class A shares; |
| | (b) | a deferred sales charge on redemptions of any part or all of a purchase of $1 million of Class A shares within 12 months of purchase; |
| | (c) | a deferred sales charge on redemptions of Class C shares within 12 months of purchase; |
| | (2) | ongoing costs, including management fees; distribution and/or service (12b-1) fees; and other Fund expenses. |
This example is intended to help you understand your ongoing costs (in dollars) of investing in the Fund and to compare these costs with the ongoing costs of investing in other mutual funds.
The example is based on a $1,000 investment beginning on October 1, 2017, and held until March 31, 2018.
ACTUAL EXPENSES
For each class of shares, the first line of the accompanying table provides information about actual account values and actual expenses. You may use the information in this line, together with the amount you invested, to estimate the expenses that you paid over the period. Simply divide your account value by $1,000 (for example, an $8,600 account value divided by $1,000 = 8.6), then multiply the result by the number in the first line for your class of shares under the heading entitled “Expenses Paid During Period” to estimate the expenses you paid on your account during this period.
| | | | | | | | | | | | | | | |
| | | BEGINNING
ACCOUNT VALUE
10/1/17 | | ENDING
ACCOUNT VALUE
3/31/18 | | EXPENSES PAID
DURING PERIOD†
10/1/17–3/31/18 |
| | | |
| CLASS A SHARES | | | | | | | | | | | | | | | |
| | | |
Actual | | | $ | 1,000.00 | | | | $ | 971.60 | | | | $ | 6.29 | |
Hypothetical* | | | $ | 1,000.00 | | | | $ | 1,018.55 | | | | $ | 6.44 | |
| | | |
| CLASS C SHARES | | | | | | | | | | | | | | | |
| | | |
Actual | | | $ | 1,000.00 | | | | $ | 968.10 | | | | $ | 9.96 | |
Hypothetical* | | | $ | 1,000.00 | | | | $ | 1,014.81 | | | | $ | 10.20 | |
| | | |
| CLASS I SHARES | | | | | | | | | | | | | | | |
| | | |
Actual | | | $ | 1,000.00 | | | | $ | 973.20 | | | | $ | 4.62 | |
Hypothetical* | | | $ | 1,000.00 | | | | $ | 1,020.24 | | | | $ | 4.73 | |
| | | |
| CLASS R3 SHARES | | | | | | | | | | | | | | | |
| | | |
Actual | | | $ | 1,000.00 | | | | $ | 970.40 | | | | $ | 7.37 | |
Hypothetical* | | | $ | 1,000.00 | | | | $ | 1,017.45 | | | | $ | 7.54 | |
| | | |
| CLASS R4 SHARES | | | | | | | | | | | | | | | |
| | | |
Actual | | | $ | 1,000.00 | | | | $ | 970.70 | | | | $ | 6.88 | |
Hypothetical* | | | $ | 1,000.00 | | | | $ | 1,017.95 | | | | $ | 7.04 | |
| | | |
| CLASS R5 SHARES | | | | | | | | | | | | | | | |
| | | |
Actual | | | $ | 1,000.00 | | | | $ | 972.70 | | | | $ | 4.87 | |
Hypothetical* | | | $ | 1,000.00 | | | | $ | 1,020.00 | | | | $ | 4.99 | |
| | | |
| CLASS R6 SHARES | | | | | | | | | | | | | | | |
| | | |
Actual | | | $ | 1,000.00 | | | | $ | 973.50 | | | | $ | 4.18 | |
Hypothetical* | | | $ | 1,000.00 | | | | $ | 1,020.69 | | | | $ | 4.28 | |
| † | Expenses are equal to the annualized expense ratio for each class (A: 1.28%; C: 2.03%; I: 0.94%; R3: 1.50%; R4: 1.40%; R5: 0.99%; R6: 0.85%) multiplied by the average account value over the period, multiplied by 182/365 to reflect the one-half year period. |
| * | Hypothetical assumes a rate of return of 5% per year before expenses. |
HYPOTHETICAL EXAMPLE FOR COMPARISON PURPOSES
For each class of shares, the second line of the accompanying table provides information about hypothetical account values and hypothetical expenses based on the Fund’s actual expense ratio and an assumed rate of return of 5% per year before expenses, which is not the Fund’s actual return. The hypothetical account values and expenses may not be used to estimate the actual ending account balance or expenses you paid for the period. You may use this information to compare the ongoing costs of investing in the Fund and other funds. To do so, compare this 5% hypothetical example with the 5% hypothetical examples that appear in the shareholder reports of the other funds.
Please note that the expenses shown in the table are meant to highlight your ongoing costs only and do not reflect any transactional costs, such as sales charges (loads), redemption fees, or exchange fees. Therefore, the second line of the table for each class of shares is useful in comparing ongoing costs only, and will not help you determine the relative total costs of owning different funds. In addition, if these transactional costs were included, your costs would have been higher.
28 | Semi-Annual Report
Other Information
Thornburg Global Opportunities Fund | March 31, 2018 (Unaudited)
PORTFOLIO PROXY VOTING
Policies and Procedures:
The Trust has delegated to Thornburg Investment Management, Inc. (the “Advisor”) voting decisions respecting proxies for the Fund’s voting securities. The Advisor makes voting decisions in accordance with its Proxy Voting Policy and Procedures. A description of the Policy and Procedures is available (i) without charge, upon request, by calling the Advisor toll-free at 1-800-847-0200, (ii) on the Thornburg website at www.thornburg.com, and (iii) on the Securities and Exchange Commission’s website at www.sec.gov.
Information regarding how proxies were voted is available on or before August 31 of each year for the twelve months ending the preceding June 30. This information is available (i) without charge, upon request by calling the Advisor toll-free at 1-800-847-0200, (ii) on the Thornburg website at www.thornburg.com, and (iii) on the Securities and Exchange Commission’s website at www.sec.gov.
AVAILABILITY OF QUARTERLY PORTFOLIO SCHEDULE
The Fund files with the Securities and Exchange Commission schedules of its portfolio holdings on Form N-Q for the first and third quarters of each fiscal year. The Fund’s Forms N-Q are available on the Commission’s website at www.sec.gov, or may be reviewed and copied at the Commission’s Public Reference Room in Washington, D.C. Information on the operation of the Public Reference Room may be obtained by calling 1-800-SEC-0330. The Fund also makes this information available on its website at www.thornburg.com/download or upon request by calling 1-800-847-0200.
Semi-Annual Report | 29
Trustees’ Statement to Shareholders
Readopted September 11, 2017
The Trustees believe current and prospective shareholders should know how we discharge our responsibilities in supervising the Funds’ investment advisor and in reviewing the advisor’s contract for renewal. Since 2005, we have issued a statement which sets out clearly the three principal guidelines that we follow in supervising the Trust’s investment advisor on your behalf. In accordance with our customary practice, in September of this year we again reviewed our statement and concluded we should reissue this statement outlining the principal features of our supervision of the advisor’s performance of investment management services for the Funds.
We begin with the premise that each shareholder selected his or her Fund because its investments are managed by the investment advisor identified in the prospectus and in accordance with the objective and policies described in the prospectus. We realize, as each of you do, that if you believe that your Fund’s stated objective and policies no longer serve your personal investment goals, you can sell your shares and leave the Fund.
Therefore, we believe that our primary supervisory task—our principal obligation to you—is to assess the nature and quality of the advisor’s services, and to confirm that the advisor actively and competently pursues the Fund’s objective, in accordance with the policies set out in the prospectus. To do this, we meet regularly with management to review your Fund’s portfolio and to discuss the advisor’s specific actions and judgments in pursuing the Fund’s objective. We do not substitute our own judgment for the advisor’s decisions in selecting investments; the advisor is paid to exercise its informed judgment on investment decisions, and we seek to confirm, in reviewing the advisor’s performance, that the advisor is doing just that.
Second, we are conscious of costs and the effect that costs have on shareholders’ returns. We try to make sure that your Fund’s fees and costs are reasonable in relationship to the services rendered and that they are generally in line with those charged by other expert investment advisors, consistent with our belief that the Fund’s investors searched for and expect that expertise and attention and have decided to pay a reasonable price for it. We do not put the management contract “out to bid” as a matter of course, and we would not do so unless we had concluded that the advisor materially had failed to pursue the Fund’s objectives in accordance with its policies, or for other equally important reasons. We believe that any other approach would be inconsistent with your interests and contrary to your expectations when you bought shares of the Fund in the first place.
Finally, because we believe that most Thornburg Fund shareholders have invested with a long-term perspective, we try not to focus too much on the fashions of the moment and on short-term performance. The market will not favor any specific investment objective or set of policies at all times and under all economic circumstances. A fund will experience periods of both high and low returns relative to other funds and other investments. Even if one of our Funds is not favored by the market at a particular time, we believe that the advisor is nonetheless obliged to remain true to the Fund’s objective and policies, and we watch to see that it does so.
Trustees of Thornburg Investment Trust
30 | Semi-Annual Report
Thornburg Funds
Thornburg Investment Management is a privately-owned global investment firm that offers a range of solutions for retail and institutional investors. Founded in 1982 and headquartered in Santa Fe, New Mexico, we manage approximately $49 billion (as of March 31, 2018) across U.S. mutual funds, separate accounts for high-net-worth investors, institutional accounts, and UCITS funds for non-U.S. investors.
EQUITY FUNDS
| | ∎ | | Thornburg Investment Income Builder Fund |
| | ∎ | | Thornburg Global Opportunities Fund |
| | ∎ | | Thornburg International Value Fund |
| | ∎ | | Thornburg Better World International Fund |
| | ∎ | | Thornburg International Growth Fund |
| | ∎ | | Thornburg Developing World Fund |
| | ∎ | | Thornburg Core Growth Fund |
FIXED INCOME FUNDS
| | ∎ | | Thornburg Low Duration Income Fund |
| | ∎ | | Thornburg Limited Term U.S. Government Fund |
| | ∎ | | Thornburg Limited Term Income Fund |
| | ∎ | | Thornburg Strategic Income Fund |
| | ∎ | | Thornburg Low Duration Municipal Fund |
| | ∎ | | Thornburg Limited Term Municipal Fund |
| | ∎ | | Thornburg Intermediate Municipal Fund |
| | ∎ | | Thornburg California Limited Term Municipal Fund |
| | ∎ | | Thornburg New Mexico Intermediate Municipal Fund |
| | ∎ | | Thornburg New York Intermediate Municipal Fund |
| | ∎ | | Thornburg Strategic Municipal Income Fund |
ALTERNATIVE FUNDS
| | ∎ | | Thornburg Long/Short Equity Fund |
Before investing, carefully consider the Fund’s investment goals, risks, charges, and expenses. For a prospectus or summary prospectus containing this and other information, contact your financial advisor or visit thornburg.com. Read it carefully before investing.
For additional information, please visit thornburg.com
Thornburg Investment Management, Inc. 2300 North Ridgetop Road, Santa Fe, NM 87506
Semi-Annual Report | 31
| | | | |
| To receive shareholder reports, prospectuses, and proxy statements electronically, go to www.thornburg.com/edelivery. | | | | |
| This Semi-Annual Report is submitted for the general information of shareholders of the Fund. It is not authorized for distribution to prospective investors in the Fund unless preceded or accompanied by an effective prospectus. | |
| | | | |
Investment Advisor: | | Distributor: | | |
Thornburg Investment Management® | | Thornburg Securities Corporation® | | |
800.847.0200 | | 800.847.0200 | | TH1411 |
Semi-Annual Report
March 31, 2018
THORNBURG
DEVELOPING
WORLD FUND
About Thornburg Investment Management
It’s more than what we do.
It’s how we do it.
At Thornburg, we are very different in how we think, invest, and are structured. We believe this difference is what makes us successful in helping individuals reach their long-term financial goals.
Flexible Perspective
Our perspective on investment opportunities is more flexible than most, viewing a wide range of opportunities beyond conventional boundaries to find hidden value.
Collaboration
Collectively, we hone ideas via borderless cross-pollination for better judgment and better results.
Portfolio Construction
Disciplined construction guided more by our convictions than convention.
CONVICTION
Thorough analysis and our relative-value framework lead to conviction in our securities selection.
UNCONVENTIONAL
Active management means we seek the best value for our clients rather than using conventional benchmarks as our starting point.
Structured for Excellence
How we think and how we invest is made possible by how we’re structured.
TEAM APPROACH
FAR FROM THE HERD
ACCESS & TRANSPARENCY
2 | Semi-Annual Report
Thornburg Developing World Fund
Semi-Annual Report | March 31, 2018
Table of Contents
| | | | | | | | | | |
| SHARE CLASS | | NASDAQ SYMBOL | | CUSIP |
| Class A | | THDAX | | | | 885-216-408 | |
| Class C | | THDCX | | | | 885-216-507 | |
| Class I | | THDIX | | | | 885-216-606 | |
| Class R5 | | THDRX | | | | 885-216-846 | |
| Class R6 | | TDWRX | | | | 885-216-838 | |
Class I, R5, and R6 shares may not be available to all investors. Minimum investments for Class I shares may be higher than those for other classes.
Investments carry risks, including possible loss of principal. Additional risks may be associated with investments outside the United States, especially in emerging markets, including currency fluctuations, illiquidity, volatility, and political and economic risks. Investments in small- and mid-capitalization companies may increase the risk of greater price fluctuations. Please see the Fund’s prospectus for a discussion of the risks associated with an investment in the Fund. Investments in the Fund are not FDIC insured, nor are they deposits of or guaranteed by a bank or any other entity.
Funds invested in a smaller number of holdings may expose an investor to greater volatility.
Semi-Annual Report | 3
Letter to Shareholders
Thornburg Developing World Fund | March 31, 2018 (Unaudited)
April 25, 2018
Dear Fellow Shareholder:
The last six months were a tale of two halves in global equity markets. The period started with a grind higher that culminated in an almost euphoric turn upward during the month of January. The euphoria quickly wore off and in late January markets began to swoon, with many of the major indices giving back half or more of the gains. A recovery began in February but failed to hold, losing steam again into the end of March.
Every pundit has a different narrative about the increase in volatility and atrophying prices after such strong performance in 2017, when volatility was near-zero. From our perspective, there’s no sole reason, and we think it’s most likely a combination of various headwinds, including higher interest rates, lofty valuations, burgeoning trade conflicts, and weaker economic data. The good news for long-term investors is that, in our opinion, the market became more attractively valued after the recent pull back.
Thornburg Developing World Fund delivered a return of 6.09% (I shares) in the prior six-month period, which trailed the index return of 8.96%. Most of the underperformance occurred during the final few weeks of the period, as several stock-specific issues took a toll, but they have not impacted our view of fundamental value for those holdings.
Major contributors for the period include Sanlam Limited, Tencent Holdings Ltd., Sberbank Russia OJSC, Itau Unibanco Holding S.A., and Hangzhou Hikvision Digital Technology Co., Ltd.
Shares of Sanlam, a South African Insurance company, rose following the election of Cyril Ramaphosa as President of the African National Congress (ANC) during its party Congress in December of 2017. Investors see Ramaphosa as a market-friendly politician with potential to clean up the system following several corruption accusations against former South African President, Jacob Zuma. A more robust outlook for South Africa’s equity market should benefit Sanlam, as several of its businesses generate revenues based on fees tied to the level of assets under management. Furthermore, if political change sparks an economic recovery, Sanlam would likely experience an acceleration in sales of new products.
Tencent continues to report strong growth in its gaming business, which climbed 42% year-over-year in the most recent quarter. In addition, Tencent’s ad revenue once again grew briskly, driven by higher monetization on each ad impression. Tencent continues to invest in its platform, which should keep driving strong return on investment for its advertising customers in the medium to long term.
Sberbank, the leading banking franchise in Russia, reported robust results during the third and fourth quarters of 2017. Accelerating loan growth combined with falling provisions for doubtful accounts is driving strong earnings growth. The
company’s investor day also shed light on Sberbank’s technology leadership. Lastly, with strong returns on equity and high capital levels, Sberbank communicated to shareholders its commitment to a higher dividend payout ratio. We remain constructive on the long-term prospects for the bank.
With the Brazilian economy showing early signs of improvement, investors have become more constructive on the prospects of Itau Unibanco, a leading private sector bank. Better economic growth in an environment of falling inflation and lower interest rates should boost loan demand in Brazil. Itau Unibanco should also recover some of the market share lost to public sector banks in the last five years. Better economic prospects have led to banks taking less loan loss provisions for potentially troubled credits. Like Sberbank, Itau recently made an effort to clarify its capital return policy, which is important as its provision expenses are expected to fall. We are optimistic about the potential that Itau will pay an attractive and growing dividend over the next several years.
Hikvision shares rose as the company benefited from strong growth in its core surveillance camera business, which was at the top end of its guided range in the most recent quarter.
Meanwhile, the company is also realizing increasing margins through a better overseas mix and growth in its “New Solutions” segment, which includes unique machine vision and artificial intelligence applications.
Major detractors for the period include Baidu, Inc., Bharti Infratel Ltd., China Unicom (Hong Kong) Limited, Emaar Properties (P.J.S.C.) and Kroton Educacional S.A.
Shares of Baidu, the dominant search engine in China, weakened in the fourth quarter after management’s revenue forecast disappointed investors despite recent progress toward a recovery in the core business. Management subsequently clarified that the business was accelerating on a like-for-like basis. Indeed, results in the fourth quarter of 2017 showed that online advertising revenue growth accelerated for the fourth consecutive quarter. But the shares continued to struggle in the first quarter of this year alongside other technology and internet stocks. We believe the share price offers the core search business at compelling value alongside several potentially valuable options in new fields, such as autonomous driving. The overall thesis continues to track with our expectations.
Bharti Infratel is the largest mobile tower operator in India. The shares have recently come under pressure following the merger or bankruptcy of several of their customers, reducing demand for new tower tenancies in the short term. Despite the short-term demand weakness, we remain optimistic about demand for its services as India has become one of the highest consumers of mobile data in the world, yet still has one of the smallest tower bases.
Shares China Unicom, one of three main mobile operators in China, fell after the Chinese regulator announced new restrictions on pricing with respect to roaming. We think the
4 | Semi-Annual Report
Letter to Shareholders, Continued
Thornburg Developing World Fund | March 31, 2018 (Unaudited)
weakness in the shares has provided an attractive point to add to the position considering the limited impact of the pricing adjustments and the progress it’s making in subscriber growth.
Emaar Properties is a leading real estate developer in Dubai. Its shares detracted from performance in the recent period as they gave back some of the gains from the first half of 2017. Investors anticipated that the initial public offering of Emaar Development, the firm’s domestic real estate development business, would result in a large one-time special dividend being paid to shareholders. While the company did distribute a portion of those gains to minorities, management decided that some of the proceeds would be kept within the company to fund ongoing growth initiatives. Some investors were disappointed and sold the shares. We remain constructive on the growth opportunities for several of Emaar Property’s underlying businesses and see the business as attractively valued. We have used the opportunity to add to the position.
Kroton Educacional is one of the leading private education companies in Brazil. The shares were strong during the middle of 2017 thanks to delivery of an internal cost-cutting program, which helped the firm maintain profitability despite sluggish demand. During that period, we significantly reduced our position. Unfortunately, stubbornly high unemployment during the still nascent economic recovery in Brazil has made it difficult for many students who attend school part time while working to
continue their studies. The recent reports have shown higher than normal dropouts and weak student intake, which have weighed on
the shares. We believe that sellers are confusing cyclical and structural pressures, and that enrollment trends will improve.
Looking forward, volatility is higher but valuations are more attractive after the recent pull back. The economic data have improved over the last few years but softened a bit in the last few months. At this point it’s pretty easy to take the view of either a bear or a bull at a high level. We instead turn our focus on company fundamentals, where we have high conviction in our portfolio and believe that despite recent setbacks, our holdings remain undervalued with a path to success.
As always, we appreciate the opportunity to invest alongside you in the Thornburg Developing World Fund.
Sincerely,
Ben Kirby,CFA
Portfolio Manager
Managing Director

Charlie Wilson, PhD
Portfolio Manager
Managing Director
The matters discussed in this report may constitute forward-looking statements made pursuant to the safe harbor provisions of the Securities Litigation Reform Act of 1995. These include any advisor or portfolio manager prediction, assessment, analysis or outlook for individual securities, industries, investment styles, market sectors and/or markets. These statements involve risks and uncertainties. In addition to the general risks described for each fund in its current prospectus, other factors bearing on these reports include the accuracy of the advisor’s or portfolio manager’s forecasts and predictions, the appropriateness of the investment strategies designed by the advisor or portfolio manager and the ability of the advisor or portfolio manager to implement their strategies efficiently and successfully. Any one or more of these factors, as well as other risks affecting the securities markets generally, could cause the actual results of any fund to differ materially as compared to its benchmarks.
The views expressed are subject to change and do not necessarily reflect the views of Thornburg Investment Management, Inc. This information should not be relied upon as a recommendation or investment advice and is not intended to predict the performance of any investment or market.
Performance results of individual share classes will vary based on the fees and expenses associated with each share class, and may be higher or lower than other share classes within the same Fund. Please see Performance Summary for performance results of each share class.
Semi-Annual Report | 5
Performance Summary
Thornburg Developing World Fund | March 31, 2018 (Unaudited)
AVERAGE ANNUAL TOTAL RETURNS
| | | | | | | | | | | | | | | | | | | | |
| | | 1-YR | | 3-YR | | 5-YR | | SINCE
INCEP. |
Class A Shares (Incep: 12/16/09) | | | | | | | | | | | | | | | | | | | | |
Without sales charge | | | | 24.14% | | | | | 6.06% | | | | | 3.46% | | | | | 7.20% | |
| | | | |
With sales charge | | | | 18.57% | | | | | 4.44% | | | | | 2.51% | | | | | 6.61% | |
Class C Shares (Incep: 12/16/09) | | | | | | | | | | | | | | | | | | | | |
Without sales charge | | | | 23.21% | | | | | 5.26% | | | | | 2.67% | | | | | 6.44% | |
| | | | |
With sales charge | | | | 22.21% | | | | | 5.26% | | | | | 2.67% | | | | | 6.44% | |
| | | | |
Class I Shares (Incep: 12/16/09) | | | | 24.63% | | | | | 6.52% | | | | | 3.89% | | | | | 7.73% | |
| | | | |
Class R5 Shares (Incep: 2/1/13) | | | | 24.66% | | | | | 6.54% | | | | | 3.88% | | | | | 4.51% | |
| | | | |
Class R6 Shares (Incep: 2/1/13) | | | | 24.79% | | | | | 6.64% | | | | | 3.98% | | | | | 4.62% | |
| | | | |
MSCI Emerging Markets Index (Since 12/16/09) | | | | 24.93% | | | | | 8.81% | | | | | 4.99% | | | | | 4.70% | |
GROWTH OF A HYPOTHETICAL $10,000 INVESTMENT
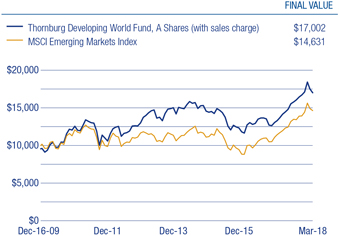
Performance data shown represents past performance and is no guarantee of future results. Investment return and principal value will fluctuate so shares, when redeemed, may be worth more or less than their original cost. Current performance may be lower or higher than quoted. For performance current to the most recent month end, visit thornburg.com or call 800-847-0200. The performance information does not reflect the deduction of taxes that a shareholder would pay on distributions or the redemption of Fund shares. Returns reflect the reinvestment of dividends and capital gains as well as applicable sales charges. Class A shares are sold with a maximum sales charge of 4.50%. Class C shares are subject to a 1% CDSC for the first year only. There is no sales charge for Class I, R5 and R6 shares.
As disclosed in the most recent prospectus, the total annual fund operating expenses before any fee waivers or expense reimbursements are as follows: A shares, 1.56%; C shares, 2.30%; I shares, 1.23%; R5 shares, 1.80%; R6 shares, 1.16%. Thornburg Investment Management and/or Thornburg Securities Corporation have contractually agreed to waive fees and reimburse expenses through at least February 1, 2019, for some of the share classes, resulting in net expense ratios of the following: I shares, 1.09%; R5 shares, 1.09%; R6 shares, 0.99%. For more detailed information on fund expenses and waivers/reimbursements please see the Fund’s prospectus.
Glossary
The MSCI Emerging Markets Index is a free float-adjusted market capitalization index that is designed to measure equity market performance of emerging markets. The MSCI Emerging Markets Index consists of the following 24 emerging market country indexes: Brazil, Chile, China, Colombia, Czech Republic, Egypt, Greece, Hungary, India, Indonesia, Korea, Malaysia, Mexico, Pakistan, Peru, Philippines, Poland, Qatar, Russia, South Africa, Taiwan, Thailand, Turkey and United Arab Emirates.
The performance of any index is not indicative of the performance of any particular investment. Unless otherwise noted, index returns reflect the reinvestment of income dividends and capital gains, if any, but do not reflect fees, brokerage commissions or other expenses of investing. Investors may not make direct investments into any index.
6 | Semi-Annual Report
Fund Summary
Thornburg Developing World Fund | March 31, 2018 (Unaudited)
OBJECTIVES AND STRATEGIES
The Fund seeks long-term capital appreciation. Under normal market conditions the Fund invests at least 80% of its assets in equity securities and debt obligations of developing country issuers. A developing country issuer is a company or sovereign entity that is domiciled or otherwise tied economically to one or more developing countries. The Fund expects that investments in the Fund’s portfolio normally will be weighted in favor of equity securities.
MARKET CAPITALIZATION EXPOSURE
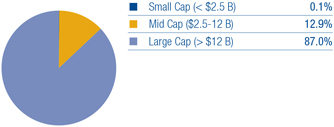
BASKET STRUCTURE
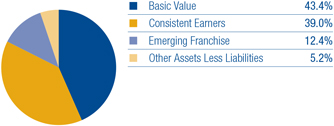
TOP TEN EQUITY HOLDINGS
| | | | | |
| Alibaba Group Holding Ltd. | | | | 6.1% | |
| Tencent Holdings Ltd. | | | | 4.7% | |
| Industrial & Commercial Bank of China Ltd. Class H | | | | 3.5% | |
| Unilever N.V. | | | | 3.3% | |
| Samsung Electronics Co. Ltd. | | | | 3.3% | |
| ICICI Bank Ltd. | | | | 3.3% | |
| Reliance Industries Ltd. | | | | 2.9% | |
| British American Tobacco plc | | | | 2.9% | |
| HDFC Bank Ltd. | | | | 2.9% | |
| Baidu, Inc. | | | | 2.8% | |
SECTOR EXPOSURE
| | | | | |
| Information Technology | | | | 29.9% | |
| Financials | | | | 26.0% | |
| Consumer Discretionary | | | | 7.7% | |
| Consumer Staples | | | | 7.4% | |
| Energy | | | | 6.9% | |
| Telecommunication Services | | | | 5.6% | |
| Real Estate | | | | 4.0% | |
| Materials | | | | 3.7% | |
| Health Care | | | | 2.3% | |
| Industrials | | | | 1.3% | |
| Other Assets Less Liabilities | | | | 5.2% | |
TOP TEN INDUSTRY GROUPS
| | | | | |
| Banks | | | | 20.5% | |
| Software & Services | | | | 18.0% | |
| Energy | | | | 6.9% | |
| Technology Hardware & Equipment | | | | 6.3% | |
| Consumer Services | | | | 5.8% | |
| Semiconductors & Semiconductor Equipment | | | | 5.6% | |
| Telecommunication Services | | | | 5.6% | |
| Insurance | | | | 4.3% | |
| Food, Beverage & Tobacco | | | | 4.1% | |
| Real Estate | | | | 4.0% | |
COUNTRY EXPOSURE*
(percent of equity holdings)
| | | | | |
| China | | | | 31.8% | |
| India | | | | 10.9% | |
| United Kingdom | | | | 8.2% | |
| United States | | | | 7.2% | |
| Brazil | | | | 6.3% | |
| Mexico | | | | 5.6% | |
| Russian Federation | | | | 5.2% | |
| South Korea | | | | 4.7% | |
| Switzerland | | | | 3.9% | |
| Hong Kong | | | | 3.7% | |
| South Africa | | | | 2.8% | |
| Taiwan | | | | 2.3% | |
| United Arab Emirates | | | | 2.0% | |
| Argentina | | | | 1.6% | |
| Indonesia | | | | 1.5% | |
| Philippines | | | | 1.2% | |
| Canada | | | | 1.1% | |
| * | Holdings are classified by country of risk as determined by MSCI and Bloomberg. |
Semi-Annual Report | 7
Schedule of Investments
Thornburg Developing World Fund | March 31, 2018 (Unaudited)
| | | | | | | | | | | | |
| | | | | SHARES/
PRINCIPAL AMOUNT | | VALUE |
| |
| | COMMON STOCK — 94.8% | |
| | | |
| | BANKS — 20.5% | | | | | | | | | | |
| | Banks — 20.5% | | | | | | | | | | |
| | Bank Central Asia Tbk PT | | | | 8,998,010 | | | | $ | 15,228,156 | |
| | BBVA Banco Frances S.A. ADR | | | | 730,819 | | | | | 16,669,981 | |
| | Citigroup, Inc. | | | | 213,439 | | | | | 14,407,133 | |
| | Grupo Financiero Banorte SAB de C.V. | | | | 3,573,926 | | | | | 21,675,527 | |
| | HDFC Bank Ltd. | | | | 609,301 | | | | | 18,020,714 | |
| | HDFC Bank Ltd. ADR | | | | 130,292 | | | | | 12,868,941 | |
| | ICICI Bank Ltd. Sponored ADR | | | | 3,957,172 | | | | | 35,020,972 | |
| | Industrial & Commercial Bank of China Ltd. Class H | | | | 44,165,428 | | | | | 37,873,044 | |
| | Itau Unibanco Holding S.A. ADR | | | | 1,700,466 | | | | | 26,527,270 | |
| | Sberbank of Russia PJSC ADR | | | | 1,189,679 | | | | | 22,187,513 | |
| | | | | | | | | | | | |
| | | | | | | | | | | 220,479,251 | |
| | | | | | | | | | | | |
| | CONSUMER SERVICES — 5.8% | | | | | | | | | | |
| | Diversified Consumer Services — 3.0% | | | | | | | | | | |
| | Kroton Educacional S.A. | | | | 4,167,910 | | | | | 17,169,297 | |
| | TAL Education Group ADR | | | | 396,323 | | | | | 14,699,620 | |
| | Hotels, Restaurants & Leisure — 2.8% | | | | | | | | | | |
| | Galaxy Entertainment Group Ltd. | | | | 1,330,720 | | | | | 12,081,038 | |
| | Yum China Holdings, Inc. | | | | 446,989 | | | | | 18,550,044 | |
| | | | | | | | | | | | |
| | | | | | | | | | | 62,499,999 | |
| | | | | | | | | | | | |
| | DIVERSIFIED FINANCIALS — 1.2% | | | | | | | | | | |
| | Diversified Financial Services — 1.2% | | | | | | | | | | |
| | GT Capital Holdings, Inc. | | | | 555,710 | | | | | 12,450,290 | |
| | | | | | | | | | | | |
| | | | | | | | | | | 12,450,290 | |
| | | | | | | | | | | | |
| | ENERGY — 6.9% | | | | | | | | | | |
| | Energy Equipment & Services — 2.7% | | | | | | | | | | |
| | Halliburton Co. | | | | 626,089 | | | | | 29,388,617 | |
| | Oil, Gas & Consumable Fuels — 4.2% | | | | | | | | | | |
| | LUKOIL PJSC Sponored ADR | | | | 200,981 | | | | | 13,911,905 | |
| | Reliance Industries Ltd. | | | | 2,307,986 | | | | | 31,196,986 | |
| | | | | | | | | | | | |
| | | | | | | | | | | 74,497,508 | |
| | | | | | | | | | | | |
| | FOOD, BEVERAGE & TOBACCO — 4.1% | | | | | | | | | | |
| | Tobacco — 4.1% | | | | | | | | | | |
| | British American Tobacco plc Sponsored ADR | | | | 539,951 | | | | | 31,149,773 | |
| | KT&G Corp. | | | | 140,653 | | | | | 13,195,703 | |
| | | | | | | | | | | | |
| | | | | | | | | | | 44,345,476 | |
| | | | | | | | | | | | |
| | HOUSEHOLD & PERSONAL PRODUCTS — 3.3% | | | | | | | | | | |
| | Personal Products — 3.3% | | | | | | | | | | |
| | Unilever N.V. | | | | 634,336 | | | | | 35,770,207 | |
| | | | | | | | | | | | |
| | | | | | | | | | | 35,770,207 | |
| | | | | | | | | | | | |
| | INSURANCE — 4.3% | | | | | | | | | | |
| | Insurance — 4.3% | | | | | | | | | | |
| | AIA Group Ltd. | | | | 2,994,893 | | | | | 25,338,570 | |
| | Sanlam Ltd. | | | | 2,851,522 | | | | | 20,545,651 | |
| | | | | | | | | | | | |
| | | | | | | | | | | 45,884,221 | |
| | | | | | | | | | | | |
| | MATERIALS — 3.7% | | | | | | | | | | |
| | Metals & Mining — 3.7% | | | | | | | | | | |
| | First Quantum Minerals Ltd. | | | | 775,865 | | | | | 10,894,087 | |
| | Glencore plc | | | | 3,370,247 | | | | | 16,729,288 | |
| | Grupo Mexico SAB de CV Series B Class B | | | | 3,677,923 | | | | | 12,271,882 | |
| | | | | | | | | | | | |
| | | | | | | | | | | 39,895,257 | |
| | | | | | | | | | | | |
| | MEDIA — 0.7% | | | | | | | | | | |
| | Media — 0.7% | | | | | | | | | | |
| | Naspers Ltd. Class N | | | | 32,409 | | | | | 7,916,515 | |
| | | | | | | | | | | | |
| | | | | | | | | | | 7,916,515 | |
| | | | | | | | | | | | |
8 | Semi-Annual Report
Schedule of Investments, Continued
Thornburg Developing World Fund | March 31, 2018 (Unaudited)
| | | | | | | | | | | | |
| | | | | SHARES/
PRINCIPAL AMOUNT | | VALUE |
| | PHARMACEUTICALS, BIOTECHNOLOGY & LIFE SCIENCES — 2.3% | | | | | | | | | | |
| | Pharmaceuticals — 2.3% | | | | | | | | | | |
| a,b,c | | China Animal Healthcare Ltd. | | | | 35,787,582 | | | | $ | 1,459,201 | |
| | Novartis AG Sponored ADR | | | | 282,225 | | | | | 22,817,891 | |
| | | | | | | | | | | | |
| | | | | | | | | | | 24,277,092 | |
| | | | | | | | | | | | |
| | REAL ESTATE — 4.0% | | | | | | | | | | |
| | Equity Real Estate Investment Trusts — 2.1% | | | | | | | | | | |
| | Fibra Uno Administracion S.A. de C.V. | | | | 15,049,063 | | | | | 22,681,206 | |
| | Real Estate Management & Development — 1.9% | | | | | | | | | | |
| | Emaar Properties PJSC | | | | 13,073,756 | | | | | 20,644,365 | |
| | | | | | | | | | | | |
| | | | | | | | | | | 43,325,571 | |
| | | | | | | | | | | | |
| | RETAILING — 1.2% | | | | | | | | | | |
| | Internet & Direct Marketing Retail — 1.2% | | | | | | | | | | |
| c | | Ctrip.com International Ltd. ADR | | | | 277,209 | | | | | 12,923,484 | |
| | | | | | | | | | | | |
| | | | | | | | | | | 12,923,484 | |
| | | | | | | | | | | | |
| | SEMICONDUCTORS & SEMICONDUCTOR EQUIPMENT — 5.6% | | | | | | | | | | |
| | Semiconductors & Semiconductor Equipment — 5.6% | | | | | | | | | | |
| | ams AG | | | | 158,548 | | | | | 16,561,300 | |
| | QUALCOMM, Inc. | | | | 369,799 | | | | | 20,490,563 | |
| | Taiwan Semiconductor Manufacturing Co., Ltd. | | | | 2,790,506 | | | | | 23,352,316 | |
| | | | | | | | | | | | |
| | | | | | | | | | | 60,404,179 | |
| | | | | | | | | | | | |
| | SOFTWARE & SERVICES — 18.0% | | | | | | | | | | |
| | Information Technology Services — 1.9% | | | | | | | | | | |
| | Cielo S.A. | | | | 3,302,977 | | | | | 20,699,569 | |
| | Internet Software & Services — 16.1% | | | | | | | | | | |
| c | | Alibaba Group Holding Ltd. Sponsored ADR | | | | 356,190 | | | | | 65,375,113 | |
| c | | Baidu, Inc. Sponored ADR | | | | 134,361 | | | | | 29,988,032 | |
| c | | Facebook, Inc. Class A | | | | 59,460 | | | | | 9,501,113 | |
| | Tencent Holdings Ltd. | | | | 964,693 | | | | | 50,347,949 | |
| c | | Yandex N.V. Class A | | | | 438,101 | | | | | 17,283,084 | |
| | | | | | | | | | | | |
| | | | | | | | | | | 193,194,860 | |
| | | | | | | | | | | | |
| | TECHNOLOGY HARDWARE & EQUIPMENT — 6.3% | | | | | | | | | | |
| | Electronic Equipment, Instruments & Components — 3.0% | | | | | | | | | | |
| | Hangzhou Hikvision Digital Technology Co. Ltd. Class A | | | | 2,604,153 | | | | | 17,176,971 | |
| | Sunny Optical Technology Group Co. Ltd. | | | | 857,767 | | | | | 15,836,909 | |
| | Technology Hardware, Storage & Peripherals — 3.3% | | | | | | | | | | |
| | Samsung Electronics Co., Ltd. | | | | 15,309 | | | | | 35,216,876 | |
| | | | | | | | | | | | |
| | | | | | | | | | | 68,230,756 | |
| | | | | | | | | | | | |
| | TELECOMMUNICATION SERVICES — 5.6% | | | | | | | | | | |
| | Diversified Telecommunication Services — 3.5% | | | | | | | | | | |
| | Bharti Infratel Ltd. | | | | 2,777,808 | | | | | 14,278,378 | |
| c | | China Unicom Hong Kong Ltd. | | | | 18,242,052 | | | | | 23,011,323 | |
| | Wireless Telecommunication Services — 2.1% | | | | | | | | | | |
| | China Mobile Ltd. | | | | 2,493,966 | | | | | 22,864,096 | |
| | | | | | | | | | | | |
| | | | | | | | | | | 60,153,797 | |
| | | | | | | | | | | | |
| | TRANSPORTATION — 1.3% | | | | | | | | | | |
| | Transportation Infrastructure — 1.3% | | | | | | | | | | |
| | Shanghai International Airport Co. Ltd. Class A | | | | 1,890,357 | | | | | 14,304,544 | |
| | | | | | | | | | | | |
| | | | | | | | | | | 14,304,544 | |
| | | | | | | | | | | | |
| | TOTAL COMMON STOCK (Cost $834,011,128) | | | | | | | | | 1,020,553,007 | |
| | | | | | | | | | | | |
Semi-Annual Report | 9
Schedule of Investments, Continued
Thornburg Developing World Fund | March 31, 2018 (Unaudited)
| | | | | | | | | | | | |
| | | | | SHARES/
PRINCIPAL AMOUNT | | VALUE |
| | SHORT-TERM INVESTMENTS — 4.6% | | | | | | | | | | |
| d | | Thornburg Capital Management Fund | | | | 4,944,975 | | | | $ | 49,449,755 | |
| | | | | | | | | | | | |
| | TOTAL SHORT-TERM INVESTMENTS (Cost $49,449,755) | | | | | | | | | 49,449,755 | |
| | | | | | | | | | | | |
| | | |
| | TOTAL INVESTMENTS — 99.4% (Cost $883,460,883) | | | | | | | | $ | 1,070,002,762 | |
| | | |
| | OTHER ASSETS LESS LIABILITIES — 0.6% | | | | | | | | | 6,377,133 | |
| | | | | | | | | | | | |
| | | |
| | NET ASSETS — 100.0% | | | | | | | | $ | 1,076,379,895 | |
| | | | | | | | | | | | |
Footnote Legend
| b | Security currently fair valued by the Valuation and Pricing Committee using procedures approved by the Trustees’ Audit Committee. |
| d | Investment in Affiliates. |
Portfolio Abbreviations
To simplify the listings of securities, abbreviations are used per the table below:
ADR American Depositary Receipt
See notes to financial statements.
10 | Semi-Annual Report
Statement of Assets and Liabilities
Thornburg Developing World Fund | March 31, 2018 (Unaudited)
| | | | |
ASSETS | | | | |
| |
Investments at value (Note 3) | | | | |
Non-affiliated issuers (cost $834,011,128) | | $ | 1,020,553,007 | |
Non-controlled affiliated issuer (cost $49,449,755) | | | 49,449,755 | |
Cash denominated in foreign currency (cost $518,631) | | | 523,195 | |
Receivable for investments sold | | | 7,771,569 | |
Receivable for fund shares sold | | | 932,848 | |
Dividends receivable | | | 2,833,134 | |
Dividend and interest reclaim receivable | | | 300,030 | |
Prepaid expenses and other assets | | | 58,921 | |
| | | | |
| |
Total Assets | | | 1,082,422,459 | |
| | | | |
| |
LIABILITIES | | | | |
| |
Payable for investments purchased | | | 1,099,958 | |
Payable for fund shares redeemed | | | 1,097,794 | |
Payable to investment advisor and other affiliates (Note 4) | | | 1,027,359 | |
Deferred taxes payable (Note 2) | | | 1,935,864 | |
Accounts payable and accrued expenses | | | 881,507 | |
Dividends payable | | | 82 | |
| | | | |
| |
Total Liabilities | | | 6,042,564 | |
| | | | |
| |
NET ASSETS | | $ | 1,076,379,895 | |
| | | | |
| |
NET ASSETS CONSIST OF | | | | |
| |
Accumulated net investment income | | $ | 1,758,944 | |
Net unrealized appreciation on investments | | | 184,568,040 | |
Accumulated net realized gain (loss) | | | (142,772,098 | ) |
Net capital paid in on shares of beneficial interest | | | 1,032,825,009 | |
| | | | |
| |
| | $ | 1,076,379,895 | |
| | | | |
Semi-Annual Report | 11
Statement of Assets and Liabilities, Continued
Thornburg Developing World Fund | March 31, 2018 (Unaudited)
| | | | |
NET ASSET VALUE | | | | |
| |
Class A Shares: | | | | |
Net asset value and redemption price per share
($ 133,441,135 applicable to 6,346,846 shares of beneficial
interest outstanding - Note 5) | | $ | 21.03 | |
| |
Maximum sales charge, 4.50% of offering price | | | 0.99 | |
| | | | |
| |
Maximum offering price per share | | $ | 22.02 | |
| | | | |
| |
Class C Shares: | | | | |
Net asset value and offering price per share*
($ 105,723,962 applicable to 5,294,415 shares of beneficial
interest outstanding - Note 5) | | $ | 19.97 | |
| | | | |
| |
Class I Shares: | | | | |
Net asset value, offering and redemption price per share
($ 772,384,190 applicable to 36,026,116 shares of beneficial
interest outstanding - Note 5) | | $ | 21.44 | |
| | | | |
| |
Class R5 Shares: | | | | |
Net asset value, offering and redemption price per share
($ 4,563,924 applicable to 213,576 shares of beneficial
interest outstanding - Note 5) | | $ | 21.37 | |
| | | | |
| |
Class R6 Shares: | | | | |
Net asset value, offering and redemption price per share
($ 60,266,684 applicable to 2,809,004 shares of beneficial
interest outstanding - Note 5) | | $ | 21.46 | |
| | | | |
* Redemption price per share is equal to net asset value less any applicable contingent deferred sales charge.
See notes to financial statements.
12 | Semi-Annual Report
Statement of Operations
Thornburg Developing World Fund | Six Months Ended March 31, 2018 (Unaudited)
| | | | |
INVESTMENT INCOME | | | | |
| |
Dividend income | | | | |
Non-affiliated issuers (net of foreign taxes withheld of $984,126) | | $ | 8,224,016 | |
Non-controlled affiliated issuer | | | 404,194 | |
| | | | |
| |
Total Income | | | 8,628,210 | |
| | | | |
| |
EXPENSES | | | | |
| |
Investment advisory fees (Note 4) | | | 5,211,631 | |
Administration fees (Note 4) | | | | |
Class A Shares | | | 75,211 | |
Class C Shares | | | 61,958 | |
Class I Shares | | | 248,662 | |
Class R5 Shares | | | 1,555 | |
Class R6 Shares | | | 10,858 | |
Distribution and service fees (Note 4) | | | | |
Class A Shares | | | 169,440 | |
Class C Shares | | | 556,191 | |
Transfer agent fees | | | | |
Class A Shares | | | 81,746 | |
Class C Shares | | | 72,942 | |
Class I Shares | | | 291,815 | |
Class R5 Shares | | | 7,133 | |
Class R6 Shares | | | 3,916 | |
Registration and filing fees | | | | |
Class A Shares | | | 6,851 | |
Class C Shares | | | 6,623 | |
Class I Shares | | | 9,914 | |
Class R5 Shares | | | 7,492 | |
Class R6 Shares | | | 7,484 | |
Custodian fees (Note 2) | | | 268,785 | |
Professional fees | | | 38,775 | |
Trustee and officer fees (Note 4) | | | 24,731 | |
Other expenses | | | 62,314 | |
| | | | |
| |
Total Expenses | | | 7,226,027 | |
| |
Less: | | | | |
Expenses reimbursed by investment advisor (Note 4) | | | (82,613 | ) |
Investment advisory fees waived by investment advisor (Note 4) | | | (255,297 | ) |
| | | | |
| |
Net Expenses | | | 6,888,117 | |
| | | | |
| |
Net Investment Income | | $ | 1,740,093 | |
| | | | |
| |
REALIZED AND UNREALIZED GAIN (LOSS) | | | | |
| |
Net realized gain (loss) on: | | | | |
Non-affiliated issuer investments | | | 89,760,478 | |
Foreign currency transactions | | | (14,356 | ) |
| | | | |
| | | 89,746,122 | |
| | | | |
| |
Net change in unrealized appreciation (depreciation) on: | | | | |
Non-affiliated issuer investments (net of change in deferred taxes payable of $ 70,518) | | | (28,396,103 | ) |
Foreign currency translations | | | (1,058 | ) |
| | | | |
| | | (28,397,161 | ) |
| | | | |
| |
Net Realized and Unrealized Gain | | | 61,348,961 | |
| | | | |
| |
Net Increase in Net Assets Resulting from Operations | | $ | 63,089,054 | |
| | | | |
See notes to financial statements.
Semi-Annual Report | 13
Statement of Changes in Net Assets
Thornburg Developing World Fund
| | | | | | | | | | |
| | | SIX MONTHS ENDED
MARCH 31, 2018* | | YEAR ENDED
SEPTEMBER 30, 2017 |
INCREASE (DECREASE) IN NET ASSETS FROM | | | | | | | | | | |
| | |
OPERATIONS | | | | | | | | | | |
| | |
Net investment income | | | $ | 1,740,093 | | | | $ | 9,217,721 | |
Net realized gain (loss) on investments and foreign currency transactions | | | | 89,746,122 | | | | | 27,124,927 | |
Net unrealized appreciation (depreciation) on investments, foreign currency translations and deferred taxes | | | | (28,397,161 | ) | | | | 128,774,352 | |
| | | | | |
| | |
Net Increase in Net Assets Resulting from Operations | | | | 63,089,054 | | | | | 165,117,000 | |
| | |
DIVIDENDS TO SHAREHOLDERS | | | | | | | | | | |
| | |
From net investment income | | | | | | | | | | |
Class A Shares | | | | – | | | | | (661,266 | ) |
Class C Shares | | | | – | | | | | (220,121 | ) |
Class I Shares | | | | – | | | | | (6,435,552 | ) |
Class R5 Shares | | | | – | | | | | (47,343 | ) |
Class R6 Shares | | | | – | | | | | (310,277 | ) |
| | |
FUND SHARE TRANSACTIONS (NOTE 5) | | | | | | | | | | |
| | |
Class A Shares | | | | 652,528 | | | | | (58,944,051 | ) |
Class C Shares | | | | (9,601,114 | ) | | | | (40,460,081 | ) |
Class I Shares | | | | (69,269,252 | ) | | | | (177,355,450 | ) |
Class R5 Shares | | | | (1,246,925 | ) | | | | (1,570,384 | ) |
| | | | | |
Class R6 Shares | | | | 30,875,102 | | | | | (26,687,949 | ) |
| | |
Net Increase (Decrease) in Net Assets | | | | 14,499,393 | | | | | (147,575,474 | ) |
| | |
NET ASSETS | | | | | | | | | | |
| | |
Beginning of Period | | | | 1,061,880,502 | | | | | 1,209,455,976 | |
| | | | | |
| | |
End of Period | | | $ | 1,076,379,895 | | | | $ | 1,061,880,502 | |
| | | | | |
| | |
Undistributed net investment income | | | $ | 1,758,944 | | | | $ | 18,851 | |
* Unaudited.
See notes to financial statements.
14 | Semi-Annual Report
Notes to Financial Statements
Thornburg Developing World Fund | March 31, 2018 (Unaudited)
NOTE 1 – ORGANIZATION
Thornburg Developing World Fund (the “Fund”) is a diversified series of Thornburg Investment Trust (the “Trust”). The Fund commenced operations on December 16, 2009. The Trust was organized as a Massachusetts business trust under a Declaration of Trust dated June 3, 1987 and is registered as a diversified, open-end management investment company under the Investment Company Act of 1940, as amended. The Fund is currently one of twenty-one separate series of the Trust. Each series is considered to be a separate entity for financial reporting and tax purposes and bears expenses directly attributable to it. The Fund seeks long-term capital appreciation.
The Fund currently offers five classes of shares of beneficial interest: Class A, Class C, Institutional Class (“Class I”) and Retirement Classes (“Class R5” and “Class R6”). Each class of shares of the Fund represents an interest in the same portfolio of investments, except that (i) Class A shares are sold subject to a front-end sales charge collected at the time the shares are purchased and bear a service fee, (ii) Class C shares are sold at net asset value without a sales charge at the time of purchase, but are subject to a contingent deferred sales charge upon redemption within one year of purchase, and bear both a service fee and a distribution fee, (iii) Class I and Class R5 shares are sold at net asset value without a sales charge at the time of purchase and may be subject to a service fee, (iv) Class R6 shares are sold at net asset value without a sales charge at the time of purchase, and (v) the respective classes may have different reinvestment privileges and conversion rights. Additionally, the Fund may allocate among its classes certain expenses, to the extent allocable to specific classes, including transfer agent fees, government registration fees, certain printing and postage costs, and administrative and legal expenses. Currently, class specific expenses of the Fund are limited to service and distribution fees, administration fees, and certain registration and transfer agent expenses.
The following is a summary of significant accounting policies followed by the Fund in the preparation of its financial statements. The Fund prepares its financial statements in conformity with United States generally accepted accounting principles (“GAAP”), including investment company accounting and reporting guidance in the Financial Accounting Standards Board (the “FASB”) Accounting Standard Codification Topic 946.
NOTE 2 – SIGNIFICANT ACCOUNTING POLICIES
Security Valuation: All investments in securities held by the Fund are valued as described in Note 3.
Allocation of Income, Gains, Losses and Expenses: Net investment income (other than class specific expenses) and realized and unrealized gains and losses are allocated daily to each class of shares based upon the relative net asset value of outstanding shares (or the value of the dividend-eligible shares, as appropriate) of each class of shares at the beginning of the day (after adjusting for the current capital shares activity of the respective class). Expenses common to all Funds are allocated among the Funds comprising the Trust based upon their relative net asset values or other appropriate allocation methods. Operating expenses directly attributable to a specific class are charged against the operating income of that class.
Dividends and Distributions to Shareholders: Dividends and distributions to shareholders, which are determined in accordance with federal income tax regulations and may differ from GAAP, are recorded on the ex-dividend date. Ordinary income distributions, if any, are declared and paid annually. Capital gain distributions, if any, are declared and paid annually and more often if deemed necessary by Thornburg Investment Management, Inc., the Trust’s investment advisor (the “Advisor”). Dividends are paid and are reinvested in additional shares of the Fund at net asset value per share at the close of business on the ex-dividend date, or at the shareholder’s option, paid in cash.
Investment Income: Dividend income is recorded on the ex-dividend date. Certain income from foreign investments is recognized as soon as information is available to the Fund. Interest income is accrued as earned. Premiums and discounts are amortized and accreted, respectively, to call dates or maturity dates using the effective yield method of the respective investments. These amounts are included in Interest income on the Statement of Operations.
Custodian Fees: Custodian fees disclosed in the Statement of Operations may include interest expenses incurred by the Fund on any cash overdrafts of its custodian account during the period. Such cash overdrafts may result from the effects of failed trades in portfolio securities and from cash outflows resulting from unanticipated shareholder redemption activity. The Fund pays interest to its custodian on any such cash overdraft at a rate set periodically at the custodian’s discretion of the overdraft amount in excess of $50,000.
Investment Transactions: Investment transactions are accounted for on a trade date basis. Realized gains and losses from the sale of investments are recorded on an identified cost basis.
Repurchase Agreements: The Fund may invest excess cash in repurchase agreements whereby the Fund purchases investments, which serve as collateral, with an agreement to resell such collateral to the seller at an agreed upon price at the maturity date of the repurchase agreement. Investments pledged as collateral for repurchase agreements are held in custody until maturity of the repurchase agreement. Provisions in the agreements require that the market value of the collateral is at least equal to the repurchase value in the event of default. In the event of default, the Fund has the right to liquidate the collateral and apply the proceeds in satisfaction of the obligation. Under
Semi-Annual Report | 15
Notes to Financial Statements, Continued
Thornburg Developing World Fund | March 31, 2018 (Unaudited)
certain circumstances, in the event of default or bankruptcy by the other party to the agreement, realization and/or retention of the collateral may be subject to legal proceedings.
When-Issued and Delayed Delivery Transactions: The Fund may engage in when-issued or delayed delivery transactions. To the extent the Fund engages in such transactions, it will do so for the purpose of acquiring portfolio investments consistent with the Fund’s investment objectives and not for the purpose of investment leverage or to speculate on interest rate or market changes. At the time the Fund makes a commitment to purchase an investment on a when-issued or delayed delivery basis, the Fund will record the transaction and reflect the value in determining its net asset value. When effecting such transactions, assets of an amount sufficient to make payment for the portfolio investments to be purchased will be segregated on the Fund’s records on the trade date. Investments purchased on a when-issued or delayed delivery basis do not earn interest until the settlement date.
Foreign Currency Translation: Portfolio investments and other assets and liabilities denominated in foreign currencies are translated into U.S. dollars based on the exchange rate of such currencies against the U.S. dollar on the date of valuation. Purchases and sales of investments and income items denominated in foreign currencies are translated into U.S. dollars at the exchange rate in effect on the transaction date. When the Fund purchases or sells foreign investments, it will customarily enter into a foreign exchange contract to minimize foreign exchange risk from the trade date to the settlement date of such transactions. The values of such spot contracts are included in receivable for investments sold and payable for investments purchased on the Statement of Assets and Liabilities.
The Fund does not separately report the effect of changes in foreign exchange rates from changes in market prices on investments held. Such changes are included in net unrealized appreciation (depreciation) from investments.
Reported net realized gains and losses from foreign currency transactions arise due to purchases and sales of foreign currencies, currency gains and losses realized between the trade and settlement dates on investment transactions and the difference between the amounts of dividends, interest, and foreign withholding taxes recorded on the Fund’s books, and the U.S. dollar equivalent of the amounts actually received or paid.
Net change in unrealized appreciation (depreciation) on foreign currency translations arise from changes in the fair value of assets and liabilities, other than investments at period end, resulting from changes in exchange rates.
Guarantees and Indemnifications: Under the Trust’s organizational documents (and under separate agreements with the independent Trustees), its officers and Trustees are provided with an indemnification against certain liabilities arising out of the performance of their duties to the Fund. In the normal course of business the Trust may also enter into contracts with service providers that contain general indemnifications. The Trust’s maximum exposure under these arrangements is unknown. However, based on experience, the Trust expects the risk of loss to be remote.
Use of Estimates: The preparation of financial statements in conformity with GAAP requires management to make estimates and assumptions that affect the reported amounts of assets and liabilities and disclosure of contingent assets and liabilities at the date of the financial statements and the reported amounts of increases (decreases) in net assets from operations during the reporting period. Actual results could differ from those estimates.
Federal Income Taxes: It is the policy of the Trust to comply with the provisions of the Internal Revenue Code applicable to regulated investment companies and to distribute to shareholders substantially all investment company taxable income including net realized gains on investments (if any), and tax exempt income of the Fund. Therefore, no provision for federal income or excise tax is required.
The Fund files income tax returns in United States federal and applicable state jurisdictions. The statute of limitations on the Fund’s tax return filings generally remains open for the three years following a return’s filing date. The Fund has analyzed each uncertain tax position believed to be material in the preparation of the Fund’s financial statements for the six month period ended March 31, 2018, including open tax years, to assess whether it is more likely than not that the position would be sustained upon examination, based on the technical merits of the position. The Fund has not identified any such position for which an asset or liability must be reflected in the Statement of Assets and Liabilities.
At March 31, 2018, information on the tax components of capital was as follows:
| | | | | |
Cost of investments for tax purposes | | | $ | 883,460,883 | |
| | | | | |
Gross unrealized appreciation on a tax basis | | | | 243,572,294 | |
Gross unrealized depreciation on a tax basis | | | | (57,030,415 | ) |
| | | | | |
Net unrealized appreciation (depreciation) on investments (tax basis) | | | $ | 186,541,879 | |
| | | | | |
At March 31, 2018, the Fund had deferred tax basis capital losses occurring subsequent to October 31, 2016 through September 30, 2017 of $8,658,757. For tax purposes, such losses will be recognized in the year ending September 30, 2018.
16 | Semi-Annual Report
Notes to Financial Statements, Continued
Thornburg Developing World Fund | March 31, 2018 (Unaudited)
At March 31, 2018, the Fund had cumulative tax basis capital losses of $223,037,046 (of which $223,037,046 are short-term and $0 are long-term) generated after September 30, 2011, which may be carried forward to offset future capital gains. To the extent such carryforwards are used, capital gain distributions may be reduced to the extent provided by regulations. Such capital loss carryforwards do not expire.
Foreign Withholding Taxes: The Fund is subject to foreign tax withholding imposed by certain foreign countries in which the Fund may invest. Withholding taxes are incurred on certain foreign dividends and are accrued at the time the dividend is recognized based on applicable foreign tax laws. The Fund may file withholding tax reclaims in certain jurisdictions to recover a portion of amounts previously withheld, in view of various considerations, including recent decisions rendered by the courts in those and other jurisdictions. The Fund would expect to record a receivable for such a reclaim based on a variety of factors, including assessment of a jurisdiction’s legal obligation to pay reclaims, the jurisdiction’s administrative practices and payment history, and industry convention. To date the Fund has recorded no such receivable because there is limited precedent for collecting such prior year reclaims and the likelihood of collection remains uncertain.
Deferred Foreign Capital Gain Taxes: The Fund is subject to a tax imposed on net realized gains of securities of certain foreign countries. The Fund records an estimated deferred tax liability for net unrealized gains on these investments as reflected in the accompanying financial statements.
NOTE 3 – SECURITY VALUATION
Valuation of the Fund’s portfolio investment securities is performed in accordance with policies and procedures adopted by and under the oversight of the Trustees.
The Trustees of the Trust have appointed the Advisor to assist the Trustees to obtain market values for portfolio investments, evaluate and monitor professional pricing service providers appointed by the Trustees’ Audit Committee (the “Audit Committee”) to assist in determining fair values for portfolio investments, assist in calculating fair values for portfolio investments in certain circumstances, and to perform other functions in connection with the valuation of investments. The Advisor acts through its Valuation and Pricing Committee (the “Committee”) and other employees of the Advisor. The Committee regularly reviews its own valuation calculations, as well as the valuations, valuation techniques and services furnished by pricing service providers, considers circumstances which may require valuation calculations by the Committee, and reviews previous valuation calculations. The Committee reports to the Audit Committee on the Committee’s activities, the performance of pricing service providers, and other matters relating to valuation of portfolio investments.
In those instances when the Committee assists in calculating a fair value for a portfolio investment, the Committee seeks to determine the price that the Fund would reasonably expect to receive upon a sale of the investment in an orderly transaction between market participants on the valuation date. The Committee customarily utilizes quotations from securities broker dealers in calculating valuations, but also may utilize prices obtained from pricing service providers or other methods approved by the Audit Committee. Because fair values calculated by the Committee are estimates, the calculation of a value for an investment may differ from the price that would be realized by the Fund upon a sale of the investment, and the difference could be material to the Fund’s financial statements. The Committee’s calculation of a fair value for an investment may also differ from the prices obtained by other persons (including other mutual funds) for the investment.
Valuation of Securities: Securities and other portfolio investments which are listed or traded on a United States securities exchange are valued at the last reported sale price on the valuation date. Investments listed or traded on an exchange for which there has been no sale that day are valued at the mean between the last reported bid and asked prices on that valuation date. Portfolio investments reported by NASDAQ are valued at the official closing price on the valuation date. If an investment is traded on more than one exchange, the investment is considered traded on the exchange that is normally the primary market for that investment. Securities and other portfolio investments which are listed or traded on exchanges outside the United States are valued at the last price or the closing price of the investment on the exchange that is normally the primary market for the investment, as of the close of the exchange preceding the Fund’s valuation date. Foreign investments listed or traded on an exchange for which there has been no sale that day are valued at the mean between the last reported bid and asked prices on that valuation date.
In any case when a market quotation is not readily available for a portfolio investment ordinarily valued by market quotation, the Committee calculates a fair value for the investment using alternative methods approved by the Audit Committee. A market quotation is not readily available when the primary market or exchange for the investment is not open for the entire scheduled day of trading. Market quotations for an investment also may not be readily available if developments after the most recent close of the investment’s primary exchange or market, but prior to the close of business on any Fund business day, or an unusual event or significant period of time occurring since the availability of a market quotation, create a serious question concerning the reliability of the most recent market quotation available for the investment. In particular, on days when market volatility thresholds established by the Audit Committee are exceeded, foreign equity investments held by the Fund may be valued using alternative methods. The Committee customarily obtains valuations in these instances from pricing service providers approved by the Audit Committee. Pricing service providers ordinarily calculate valuations using multi-factor models to adjust market prices based upon various inputs, including exchange data, depository receipt prices, futures, index data and other data.
Semi-Annual Report | 17
Notes to Financial Statements, Continued
Thornburg Developing World Fund | March 31, 2018 (Unaudited)
Debt obligations held by the Fund which are not listed or traded on exchanges or for which no reported market exists are ordinarily valued at the valuation obtained from a pricing service provider approved by the Audit Committee.
In any case when a pricing service provider fails to provide a valuation for a debt obligation held by the Fund, the Committee calculates a fair value for the obligation using alternative methods under procedures approved by the Audit Committee. Additionally, in cases when management believes that a valuation obtained from a pricing service provider merits review for significant reasons, the Committee decides whether or not to use the valuation calculated by the pricing service provider or to use an alternative method approved by the Audit Committee to calculate a fair value for the obligation.
Quotations for foreign investments expressed in foreign currency amounts are converted to U.S. dollar equivalents using a foreign exchange quotation from a third party service provider at the time of valuation. Foreign investments held by the Fund may be traded on days and at times when the Fund is not open for business. Consequently, the value of Fund investments may be significantly affected on days when shareholders cannot purchase or sell Fund shares. Futures contracts and other financial and derivative instruments traded on an exchange are valued at the latest published price for the instrument on its primary exchange. Listed options are valued at the last bid price.
Valuation Hierarchy: The Fund categorizes its investments based upon the inputs used in valuing those investments, according to a three-level hierarchy established in guidance from the FASB. Categorization of investments using this hierarchy is intended by the FASB to maximize the use of observable inputs in valuing investments and minimize the use of unobservable inputs by requiring that the most observable inputs be used when available. Observable inputs are those that market participants would use in valuing an investment based on available market information. Unobservable inputs are those that reflect assumptions about the information market participants would use in valuing an investment. An investment’s level within the hierarchy is based on the lowest level input that is deemed significant to the valuation. The methodologies and inputs used to value investments are not necessarily indications of the risk or liquidity associated with those investments.
Various inputs are used in calculating valuations for the Fund’s investments. These inputs are generally summarized according to the three-level hierarchy below:
Level 1: Quoted prices in active markets for identical investments.
Level 2: Other direct or indirect significant observable inputs (including quoted prices for similar investments in active markets and other observable inputs, such as interest rates, prepayment rates, credit risk, etc.).
Level 3: Significant unobservable inputs (including the Committee’s own assumptions in calculating the fair values of investments).
Valuations for debt obligations held by the Fund are typically calculated by pricing service providers approved by the Audit Committee and are generally characterized as Level 2 within the valuation hierarchy.
On days when market volatility thresholds established by the Audit Committee are exceeded, foreign securities for which valuations are obtained from pricing service providers are fair valued. On these days, the foreign securities are characterized as Level 2 within the valuation hierarchy and revert to Level 1 after the threshold is no longer exceeded.
In a limited number of cases the Committee calculates a fair value for investments using broker quotations or other methods approved by the Audit Committee. When the Committee uses a single broker quotation to calculate a fair value for an investment without other significant observable inputs, or if a fair value is calculated using other significant inputs that are considered unobservable, the investment is characterized as Level 3 within the hierarchy. Other significant unobservable inputs used to calculate a fair value in these instances might include an income-based valuation approach which considers discounted anticipated future cash flows from the investment and application of discounts due to the nature or duration of any restrictions on the disposition of the investment.
Valuations based upon the use of inputs from Levels 1, 2 or 3 may not represent the actual price received upon the disposition of an investment, and the Fund may receive a price that is lower than the valuation based upon these inputs when it sells the investment.
The following table displays a summary of the fair value hierarchy measurements of the Fund’s investments as of March 31, 2018. In any instance when valuation inputs from more than one level are used to determine the fair value of a specific investment, the investment is placed in the level of the table based upon the lowest level input that is significant in determining the fair value of the investment:
18 | Semi-Annual Report
Notes to Financial Statements, Continued
Thornburg Developing World Fund | March 31, 2018 (Unaudited)
| | | | | | | | | | | | | | | | | | | | |
| | | FAIR VALUE MEASUREMENTS AT MARCH 31, 2018 |
| | | TOTAL | | LEVEL 1 | | LEVEL 2 | | LEVEL 3 |
Assets | | | | | | | | | | | | | | | | | | | | |
Investments in Securities* | | | | | | | | | | | | | | | | | | | | |
Common Stock(a) | | | $ | 1,020,553,007 | | | | $ | 1,019,093,806 | | | | $ | – | | | | $ | 1,459,201 | |
Short Term Investment | | | | 49,449,755 | | | | | 49,449,755 | | | | | – | | | | | – | |
| | | | | |
Total Investments in Securities | | | $ | 1,070,002,762 | | | | $ | 1,068,543,561 | | | | $ | – | | | | $ | 1,459,201 | (b) |
| | | | |
Other Financial Instruments** | | | | | | | | | | | | | | | | | | | | |
Spot Currency | | | $ | 293 | | | | $ | 293 | | | | $ | – | | | | $ | – | |
| | | | |
Liabilities | | | | | | | | | | | | | | | | | | | | |
Other Financial Instruments** | | | | | | | | | | | | | | | | | | | | |
Spot Currency | | | $ | (91 | ) | | | $ | (91 | ) | | | $ | – | | | | $ | – | |
| (a) | At March 31, 2018, industry classifications for Common Stock in Level 3 consist of $1,459,201 in Pharmaceuticals, Biotechnology & Life Sciences. |
| (b) | In accordance with the guidance prescribed in Accounting Standards Update (“ASU”) No. 2011-04, the following table displays a summary of the valuation techniques and unobservable inputs used to value portfolio securities characterized as Level 3 investments for the period ended at March 31, 2018: |
| * | See Schedule of Investments for a summary of the industry exposure as grouped according to the Global Industry Classification Standard (GICS), which is an industry taxonomy developed by MSCI, Inc. and Standard & Poor’s (S&P). |
| ** | Other Financial Instruments include investments not reflected in the Schedule of Investments, which may include futures, forwards and swap contracts, which are valued at the unrealized appreciation (depreciation) on the investment. |
| | | | | | | | | | |
| | | FAIR VALUE AT
SEPTEMBER 30, 2017 | | | VALUATION TECHNIQUE(S) | | UNOBSERVABLE INPUT | | RANGE
(WEIGHTED AVERAGE) |
| | | | |
Common Stock | | $ | 1,459,201 | | | Discount to valuation | | Fair valued by the Committee due to halt in trading and lack of information and liquidity | | .32 HKD/(N/A) |
In accordance with the guidance prescribed in Accounting Standards Update No. 2011-04, it is the policy of the Fund to recognize transfers between levels and the underlying events which caused the movement. The Fund recognized no transfers between levels for the six months ended March 31, 2018, other than when the Fund exceeded market volatility thresholds for foreign equity investments during the period.
A rollforward of fair value measurements using significant unobservable inputs (Level 3) for the six months ended March 31, 2018 is as follows:
| | | | | | | | | | |
| | | COMMON
STOCK | | TOTAL(c) |
Beginning Balance 9/30/2017 | | | $ | – | | | | $ | – | |
Accrued Discounts (Premiums) | | | | – | | | | | – | |
Net Realized Gain (Loss) | | | | – | | | | | – | |
Gross Purchases | | | | – | | | | | – | |
Gross Sales | | | | – | | | | | – | |
Net Change in Unrealized Appreciation (Depreciation)(a)(b) | | | | 1,459,201 | | | | | 1,459,201 | |
Transfers into Level 3 | | | | – | | | | | – | |
Transfers out of Level 3 | | | | – | | | | | – | |
| | | | | |
Ending Balance 3/31/2018 | | | $ | 1,459,201 | | | | $ | 1,459,201 | |
| (a) | Amount of net change in unrealized appreciation (depreciation) on investments recognized in income is included in the Fund’s Statement of Operations for the six months ended March 31, 2018. |
| (b) | The net change in unrealized appreciation (depreciation) attributable to securities owned at March 31, 2018, which were valued using significant unobservable inputs, was $1,459,201. This is included within net change in unrealized appreciation (depreciation) on investments in the Fund’s the Statement of Operations for the six months ended March 31, 2018. |
| (c) | Level 3 investments represent 0.14% of total net assets at the six months ended March 31, 2018. Significant fluctuations of the unobservable inputs applied to portfolio securities characterized as Level 3 investments could be expected to increase or decrease the fair value of these portfolio securities. |
NOTE 4 – INVESTMENT ADVISORY FEE AND OTHER TRANSACTIONS WITH AFFILIATES
Pursuant to an investment advisory agreement, the Advisor serves as the investment advisor and performs services for the Fund for which the fees are payable at the end of each month. Under the investment advisory agreement, the Fund pays the Advisor a management fee based on the daily net assets of the Fund at an annual rate as shown in the following table:
Semi-Annual Report | 19
Notes to Financial Statements, Continued
Thornburg Developing World Fund | March 31, 2018 (Unaudited)
| | | | | |
| MANAGEMENT FEE SCHEDULE |
| DAILY NET ASSETS | | FEE RATE |
| |
Up to $500 million | | | | 0.975 | % |
| |
Next $500 million | | | | 0.925 | |
| |
Next $500 million | | | | 0.875 | |
| |
Next $500 million | | | | 0.825 | |
| |
Over $2 billion | | | | 0.775 | |
The Fund’s effective management fee for the six months ended March 31, 2018 was 0.943% of the Fund’s average net assets (before applicable management fee waiver of $255,297).
The Trust has entered into administrative service agreements with the Advisor, whereby the Advisor will perform certain administrative services related to each class of the Fund’s shares. Until January 31, 2018, the fees were payable at an annual rate of up to 0.125 of 1% per annum of the average daily net assets attributable to each class of shares. As of February 1, 2018, the fees are computed as an annual percentage of the aggregate average daily net assets of all shares classes of all Funds in the Trust as follows:
| | | | | |
| ADMINISTRATION FEE SCHEDULE |
| DAILY NET ASSETS | | FEE RATE |
| |
Up to $20 billion | | | | 0.100 | % |
| |
$20 billion to $40 billion | | | | 0.075 | |
| |
$40 billion to $60 billion | | | | 0.040 | |
| |
Over $60 billion | | | | 0.030 | |
The aggregate fee amount is allocated on a daily basis to each Fund based on net assets and subsequently allocated to each class of shares of the Fund. Total administrative service fees incurred by each class of shares of the Fund for the six months ended March 31, 2018, are set forth in the Statement of Operations.
The Trust has an underwriting agreement with Thornburg Securities Corporation (the “Distributor”), an affiliate of the Advisor, which acts as the distributor of the Fund’s shares. For the six months ended March 31, 2018, the Distributor has advised the Fund that it earned net commissions aggregating $9,083 from the sale of Class A shares, and collected contingent deferred sales charges aggregating $3,952 from redemptions of Class C shares of the Fund.
Pursuant to a service plan under Rule 12b-1 of the Investment Company Act of 1940, the Fund may pay to the Distributor or securities dealers and other financial institutions at the Distributor’s direction an amount not to exceed .25 of 1% per annum of the average daily net assets attributable to Class A, Class C, Class I, and Class R5 shares of the Fund to obtain various shareholder and distribution related services. For the six months ended March 31, 2018, there were no 12b-1 service plan fees charged for Class I or Class R5 shares. Class R6 shares are not subject to a service plan. The Advisor and Distributor each may pay out of its own resources additional expenses for distribution of the Fund’s shares and shareholder services.
The Trust has also adopted a distribution plan pursuant to Rule 12b-1, applicable only to the Fund’s Class C shares under which the Fund compensates the Distributor for services in promoting the sale of Class C shares of the Fund at an annual rate of up to .75 of 1% per annum of the average daily net assets attributable to Class C shares.
Total fees incurred by each class of shares of the Fund under their respective service and distribution plans for the six months ended March 31, 2018, are set forth in the Statement of Operations.
The Advisor and Distributor have contractually agreed to waive fees and reimburse expenses incurred by the Fund so that actual expenses of certain share classes do not exceed levels as specified in each Fund’s most recent prospectus. The agreement may be terminated by the Fund at any time, but may not be terminated by the Advisor or Distributor before February 1, 2019, unless the Advisor ceases to be the investment advisor to the Fund or the Distributor ceases to be the distributor of the Fund prior to that date. The Advisor and Distributor may recoup amounts waived or reimbursed during the fiscal year if expenses fall below the contractual limit during that year.
For the six months ended March 31, 2018, the Advisor voluntarily waived Fund level investment advisory fees of $255,297. The Advisor contractually reimbursed certain class specific expenses administrative fees, and distribution fees of $53,574 for Class I shares, $12,659 for Class R5 shares, and $16,380 for Class R6 shares.
20 | Semi-Annual Report
Notes to Financial Statements, Continued
Thornburg Developing World Fund | March 31, 2018 (Unaudited)
Certain officers and Trustees of the Trust are also officers or directors of the Advisor and Distributor. The compensation of the independent Trustees is borne by the Trust. The Trust also pays a portion of the Chief Compliance Officer’s compensation. These amounts are reflected as “Trustee and officer fees” in the Statement of Operations.
The percentage of direct investments in the Fund held by the Trustees, officers of the Trust, and the Advisor is approximately 4.10%.
The Fund may purchase or sell securities from, or to an affiliated fund, provided the affiliation is due solely to having a common investment advisor, common officers, or common trustees, and provided that all such transactions will comply with Rule 17a-7 under the 1940 Act. For the six months ended March 31, 2018, the Fund had no such transactions with affiliated funds.
Shown below are holdings of voting securities of each portfolio company which is considered “affiliated” to the Fund under the Investment Company Act of 1940, including companies for which the Fund’s holding represented 5% or more of the company’s voting securities, and a series of the Thornburg Investment Trust in which the Fund invested for cash management purposes during the period:
| | | | | | | | | | | | | | | | | | | | | | | | | | | | | | | | | | | | | | | | |
| FUND | | MARKET VALUE
9/30/17 | | PURCHASES
AT COST | | SALES
PROCEEDS | | REALIZED
GAIN
(LOSS) | | CHANGE IN
UNREALIZED
APPR./(DEPR.) | | MARKET VALUE
3/31/18 | | DIVIDEND
INCOME | | ROC
ADJUSTMENT |
Thornburg Capital Management Fund | | | $ | 49,158,463 | | | | $ | 188,162,233 | | | | $ | (187,870,941 | ) | | | $ | – | | | | $ | – | | | | $ | 49,449,755 | | | | $ | 404,194 | | | | $ | – | |
NOTE 5 – SHARES OF BENEFICIAL INTEREST
At March 31, 2018, there were an unlimited number of shares with no par value of beneficial interest authorized. Transactions in shares of beneficial interest were as follows:
| | | | | | | | | | | | | | | | |
| | | SIX MONTHS ENDED
MARCH 31, 2018 (UNAUDITED) | | | YEAR ENDED
SEPTEMBER 30, 2017 (AUDITED) | |
| | | SHARES | | | AMOUNT | | | SHARES | | | AMOUNT | |
Class A Shares | | | | | | | | | | | | | | | | |
Shares sold | | | 819,333 | | | $ | 17,443,331 | | | | 1,289,759 | | | $ | 22,171,402 | |
Shares issued to shareholders in
reinvestment of dividends | | | – | | | | – | | | | 31,888 | | | | 614,785 | |
Shares repurchased | | | (789,010 | ) | | | (16,790,803 | ) | | | (4,820,106 | ) | | | (81,730,238 | ) |
| | | | |
Net increase (decrease) | | | 30,323 | | | $ | 652,528 | | | | (3,498,459 | ) | | $ | (58,944,051 | ) |
| | | | |
Class C Shares | | | | | | | | | | | | | | | | |
Shares sold | | | 237,675 | | | $ | 4,818,400 | | | | 499,116 | | | $ | 8,103,815 | |
Shares issued to shareholders in
reinvestment of dividends | | | – | | | | – | | | | 11,284 | | | | 208,667 | |
Shares repurchased | | | (712,861 | ) | | | (14,419,514 | ) | | | (2,991,611 | ) | | | (48,772,563 | ) |
| | | | |
Net decrease | | | (475,186 | ) | | $ | (9,601,114 | ) | | | (2,481,211 | ) | | $ | (40,460,081 | ) |
| | | | |
Class I Shares | | | | | | | | | | | | | | | | |
Shares sold | | | 4,014,650 | | | $ | 88,063,414 | | | | 12,552,451 | | | $ | 219,327,001 | |
Shares issued to shareholders in
reinvestment of dividends | | | – | | | | – | | | | 301,037 | | | | 5,820,402 | |
Shares repurchased | | | (7,230,595 | ) | | | (157,332,666 | ) | | | (23,095,483 | ) | | | (402,502,853 | ) |
| | | | |
Net decrease | | | (3,215,945 | ) | | $ | (69,269,252 | ) | | | (10,241,995 | ) | | $ | (177,355,450 | ) |
| | | | |
Class R5 Shares | | | | | | | | | | | | | | | | |
Shares sold | | | 97,969 | | | $ | 2,126,490 | | | | 135,799 | | | $ | 2,404,963 | |
Shares issued to shareholders in
reinvestment of dividends | | | – | | | | – | | | | 2,455 | | | | 47,343 | |
Shares repurchased | | | (157,764 | ) | | | (3,373,415 | ) | | | (225,830 | ) | | | (4,022,690 | ) |
| | | | |
Net decrease | | | (59,795 | ) | | $ | (1,246,925 | ) | | | (87,576 | ) | | $ | (1,570,384 | ) |
| | | | |
Semi-Annual Report | 21
Notes to Financial Statements, Continued
Thornburg Developing World Fund | March 31, 2018 (Unaudited)
| | | | | | | | | | | | | | | | |
| | | SIX MONTHS ENDED
MARCH 31, 2018 (UNAUDITED) | | | YEAR ENDED
SEPTEMBER 30, 2017 (AUDITED) | |
| | | SHARES | | | AMOUNT | | | SHARES | | | AMOUNT | |
Class R6 Shares | | | | | | | | | | | | | | | | |
Shares sold | | | 1,712,725 | | | $ | 37,785,884 | | | | 593,504 | | | $ | 10,364,683 | |
Shares issued to shareholders in
reinvestment of dividends | | | – | | | | – | | | | 16,103 | | | | 307,869 | |
Shares repurchased | | | (321,070 | ) | | | (6,910,782 | ) | | | (2,009,514 | ) | | | (37,360,501 | ) |
| | | | |
Net increase (decrease) | | | 1,391,655 | | | $ | 30,875,102 | | | | (1,399,907 | ) | | $ | (26,687,949 | ) |
| | | | |
NOTE 6 – INVESTMENT TRANSACTIONS
For the six months ended March 31, 2018, the Fund had purchase and sale transactions of investments (excluding short-term investments) of $347,439,338 and $405,772,516, respectively.
NOTE 7 – DERIVATIVE FINANCIAL INSTRUMENTS WITH OFF-BALANCE SHEET RISK AND FOREIGN INVESTMENT RISK
The Fund may use a variety of derivative financial instruments to hedge or adjust the risks affecting its investment portfolio or to enhance investment returns. Provisions of FASB Accounting Standards Codification ASC 815-10-50 (“ASC 815”) require certain disclosures. The disclosures are intended to provide users of financial statements with an understanding of the use of derivative instruments by the Fund and how these derivatives affect the financial position, financial performance and cash flows of the Fund. The Fund does not designate any derivative instruments as hedging instruments under ASC 815. Additionally, the Fund’s risk of loss may exceed the amounts recognized on the Statement of Assets and Liabilities.
During the six months ended March 31, 2018, the Fund did not invest in any derivative financial instruments of the type addressed by ASC 815.
OTHER NOTES
Risks: The Fund’s investments subject it to risks including, but not limited to, management risk, market and economic risk, risks affecting specific issuers, liquidity risk, the risks associated with investments in small- and mid-cap companies and non-U.S. issuers (including developing country issuers), credit risk, and interest rate risk. Please see the Fund’s prospectus for a discussion of the risks associated with an investment in the Fund.
Subsequent Events: Fund management believes no events have occurred between March 31, 2018 and the date of issuance of the financial statements that require adjustment to or disclosure in the accompanying financial statements.
22 | Semi-Annual Report
This page intentionally left blank.
Semi-Annual Report | 23
Financial Highlights
ThornburgDeveloping World Fund
| | | | | | | | | | | | | | | | | | | | | | | | | | | | | | | | | | | | | | | | |
| | | PER SHARE PERFORMANCE (FOR A SHARE OUTSTANDING THROUGHOUT THE PERIOD) |
| | | | | | | | | | | | | | | | | |
UNLESS OTHERWISE
NOTED, PERIODS ARE
FISCAL YEARS ENDED
SEPTEMBER 30, | | NET ASSET
VALUE,
BEGINNING OF PERIOD | | NET
INVESTMENT
INCOME
(LOSS)+ | | NET REALIZED &
UNREALIZED GAIN (LOSS) ON
INVESTMENTS | | TOTAL FROM
INVESTMENT
OPERATIONS | | DIVIDENDS
FROM NET
INVESTMENT
INCOME | | DIVIDENDS
FROM NET
REALIZED
GAINS | | TOTAL
DIVIDENDS | | NET ASSET
VALUE,
END OF PERIOD |
| | | | | | | | |
| CLASS A SHARES | | | | | | | | | | | | | | | | | | | | | | | | | | | | | | | | | | | | | | | | |
| | | | | | | | |
2018(b)(c) | | | $ | 19.86 | | | | | 0.01 | | | | | 1.16 | | | | | 1.17 | | | | | – | | | | | – | | | | | – | | | | $ | 21.03 | |
2017(b) | | | $ | 16.98 | | | | | 0.09 | | | | | 2.89 | | | | | 2.98 | | | | | (0.10 | ) | | | | – | | | | | (0.10 | ) | | | $ | 19.86 | |
2016(b) | | | $ | 15.03 | | | | | 0.04 | | | | | 1.94 | | | | | 1.98 | | | | | (0.03 | ) | | | | – | | | | | (0.03 | ) | | | $ | 16.98 | |
2015(b) | | | $ | 18.61 | | | | | 0.02 | | | | | (3.58 | ) | | | | (3.56 | ) | | | | (0.02 | ) | | | | – | | | | | (0.02 | ) | | | $ | 15.03 | |
2014(b) | | | $ | 17.77 | | | | | 0.03 | | | | | 0.81 | | | | | 0.84 | | | | | – | | | | | – | | | | | – | | | | $ | 18.61 | |
2013(b) | | | $ | 15.71 | | | | | 0.01 | | | | | 2.06 | | | | | 2.07 | | | | | (0.01 | ) | | | | – | | | | | (0.01 | ) | | | $ | 17.77 | |
| | | | | | | | |
| CLASS C SHARES | | | | | | | | | | | | | | | | | | | | | | | | | | | | | | | | | | | | | | | | |
| | | | | | | | |
2018(c) | | | $ | 18.93 | | | | | (0.07 | ) | | | | 1.11 | | | | | 1.04 | | | | | – | | | | | – | | | | | – | | | | $ | 19.97 | |
2017 | | | $ | 16.26 | | | | | (0.03 | ) | | | | 2.74 | | | | | 2.71 | | | | | (0.04 | ) | | | | – | | | | | (0.04 | ) | | | $ | 18.93 | |
2016 | | | $ | 14.48 | | | | | (0.08 | ) | | | | 1.86 | | | | | 1.78 | | | | | – | | | | | – | | | | | – | | | | $ | 16.26 | |
2015 | | | $ | 18.03 | | | | | (0.09 | ) | | | | (3.46 | ) | | | | (3.55 | ) | | | | – | | | | | – | | | | | – | | | | $ | 14.48 | |
2014 | | | $ | 17.34 | | | | | (0.11 | ) | | | | 0.80 | | | | | 0.69 | | | | | – | | | | | – | | | | | – | | | | $ | 18.03 | |
2013 | | | $ | 15.44 | | | | | (0.12 | ) | | | | 2.02 | | | | | 1.90 | | | | | – | | | | | – | | | | | – | | | | $ | 17.34 | |
| | | | | | | | |
| CLASS I SHARES | | | | | | | | | | | | | | | | | | | | | | | | | | | | | | | | | | | | | | | | |
| | | | | | | | |
2018(c) | | | $ | 20.21 | | | | | 0.05 | | | | | 1.18 | | | | | 1.23 | | | | | – | | | | | – | | | | | – | | | | $ | 21.44 | |
2017 | | | $ | 17.26 | | | | | 0.19 | | | | | 2.92 | | | | | 3.11 | | | | | (0.16 | ) | | | | – | | | | | (0.16 | ) | | | $ | 20.21 | |
2016 | | | $ | 15.27 | | | | | 0.11 | | | | | 1.97 | | | | | 2.08 | | | | | (0.09 | ) | | | | – | | | | | (0.09 | ) | | | $ | 17.26 | |
2015 | | | $ | 18.92 | | | | | 0.10 | | | | | (3.65 | ) | | | | (3.55 | ) | | | | (0.10 | ) | | | | – | | | | | (0.10 | ) | | | $ | 15.27 | |
2014 | | | $ | 18.05 | | | | | 0.10 | | | | | 0.84 | | | | | 0.94 | | | | | (0.07 | ) | | | | – | | | | | (0.07 | ) | | | $ | 18.92 | |
2013 | | | $ | 15.96 | | | | | 0.09 | | | | | 2.09 | | | | | 2.18 | | | | | (0.09 | ) | | | | – | | | | | (0.09 | ) | | | $ | 18.05 | |
| | | | | | | | |
| CLASS R5 SHARES | | | | | | | | | | | | | | | | | | | | | | | | | | | | | | | | | | | | | | | | |
| | | | | | | | |
2018(c) | | | $ | 20.14 | | | | | 0.05 | | | | | 1.18 | | | | | 1.23 | | | | | – | | | | | – | | | | | – | | | | $ | 21.37 | |
2017 | | | $ | 17.20 | | | | | 0.18 | | | | | 2.92 | | | | | 3.10 | | | | | (0.16 | ) | | | | – | | | | | (0.16 | ) | | | $ | 20.14 | |
2016 | | | $ | 15.22 | | | | | 0.12 | | | | | 1.96 | | | | | 2.08 | | | | | (0.10 | ) | | | | – | | | | | (0.10 | ) | | | $ | 17.20 | |
2015 | | | $ | 18.86 | | | | | 0.12 | | | | | (3.65 | ) | | | | (3.53 | ) | | | | (0.11 | ) | | | | – | | | | | (0.11 | ) | | | $ | 15.22 | |
2014 | | | $ | 18.04 | | | | | 0.13 | | | | | 0.80 | | | | | 0.93 | | | | | (0.11 | ) | | | | – | | | | | (0.11 | ) | | | $ | 18.86 | |
2013(d) | | | $ | 17.49 | | | | | 0.08 | | | | | 0.47 | | | | | 0.55 | | | | | – | | | | | – | | | | | – | | | | $ | 18.04 | |
| | | | | | | | |
| CLASS R6 SHARES | | | | | | | | | | | | | | | | | | | | | | | | | | | | | | | | | | | | | | | | |
| | | | | | | | |
2018(c) | | | $ | 20.21 | | | | | 0.06 | | | | | 1.19 | | | | | 1.25 | | | | | – | | | | | – | | | | | – | | | | $ | 21.46 | |
2017 | | | $ | 17.25 | | | | | 0.20 | | | | | 2.93 | | | | | 3.13 | | | | | (0.17 | ) | | | | – | | | | | (0.17 | ) | | | $ | 20.21 | |
2016 | | | $ | 15.25 | | | | | 0.13 | | | | | 1.98 | | | | | 2.11 | | | | | (0.11 | ) | | | | – | | | | | (0.11 | ) | | | $ | 17.25 | |
2015 | | | $ | 18.91 | | | | | 0.15 | | | | | (3.68 | ) | | | | (3.53 | ) | | | | (0.13 | ) | | | | – | | | | | (0.13 | ) | | | $ | 15.25 | |
2014 | | | $ | 18.08 | | | | | 0.11 | | | | | 0.84 | | | | | 0.95 | | | | | (0.12 | ) | | | | – | | | | | (0.12 | ) | | | $ | 18.91 | |
2013(d) | | | $ | 17.51 | | | | | 0.04 | | | | | 0.53 | | | | | 0.57 | | | | | – | | | | | – | | | | | – | | | | $ | 18.08 | |
| (a) | Not annualized for periods less than one year. |
| (b) | Sales loads are not reflected in computing total return. |
| (c) | Unaudited Six Month Period Ended March 31. |
| (d) | Effective date of this class of shares was February 1, 2013. |
| (f) | Due to the size of net assets and fixed expenses, ratios may appear disproportionate. |
| + | Based on weighted average shares outstanding. |
See notes to financial statements.
24 | Semi-Annual Report
Financial Highlights, Continued
Thornburg Developing World Fund
| | | | | | | | | | | | | | | | | | | | | | | | | | | | | | |
| RATIOS TO AVERAGE NET ASSETS | | | | | | SUPPLEMENTAL DATA | |
| | | | | | | EXPENSES, AFTER | | | | | | | | | | | | | | | | |
NET INVESTMENT
INCOME (LOSS) (%) | | | EXPENSES, AFTER
EXPENSE
REDUCTIONS (%) | | | EXPENSE
REDUCTIONS AND
NET OF CUSTODY
CREDITS (%) | | | EXPENSES,
BEFORE EXPENSE
REDUCTIONS (%) | | | | | | TOTAL
RETURN (%)(a) | | | PORTFOLIO
TURNOVER
RATE (%)(a) | | | NET ASSETS AT
END OF PERIOD
(THOUSANDS) | |
| | | | | | | |
| | | | | | | | | | | | | | | | | | | | | | | | | | | | | | |
| | | | | | | |
| | 0.09 | | | | 1.47 | | | | 1.47 | | | | 1.51 | | | | | | | | 5.89 | | | | 33.24 | | | $ | 133,441 | |
| | 0.54 | | | | 1.52 | | | | 1.52 | | | | 1.60 | | | | | | | | 17.58 | | | | 77.61 | | | $ | 125,427 | |
| | 0.25 | | | | 1.52 | | | | 1.52 | | | | 1.57 | | | | | | | | 13.20 | | | | 94.68 | | | $ | 166,655 | |
| | 0.14 | | | | 1.53 | | | | 1.53 | | | | 1.53 | | | | | | | | (19.12 | ) | | | 96.74 | | | $ | 207,282 | |
| | 0.15 | | | | 1.45 | | | | 1.45 | | | | 1.45 | | | | | | | | 4.73 | | | | 61.46 | | | $ | 459,121 | |
| | 0.05 | | | | 1.48 | | | | 1.48 | | | | 1.59 | | | | | | | | 13.19 | | | | 61.67 | | | $ | 347,073 | |
| | | | | | | |
| | | | | | | | | | | | | | | | | | | | | | | | | | | | | | |
| | | | | | | |
| | (0.69 | ) | | | 2.23 | | | | 2.23 | | | | 2.27 | | | | | | | | 5.49 | | | | 33.24 | | | $ | 105,724 | |
| | (0.16 | ) | | | 2.26 | | | | 2.26 | | | | 2.34 | | | | | | | | 16.65 | | | | 77.61 | | | $ | 109,227 | |
| | (0.51 | ) | | | 2.29 | | | | 2.29 | | | | 2.34 | | | | | | | | 12.29 | | | | 94.68 | | | $ | 134,129 | |
| | (0.55 | ) | | | 2.27 | | | | 2.27 | | | | 2.27 | | | | | | | | (19.69 | ) | | | 96.74 | | | $ | 154,943 | |
| | (0.62 | ) | | | 2.23 | | | | 2.23 | | | | 2.23 | | | | | | | | 3.98 | | | | 61.46 | | | $ | 232,493 | |
| | (0.71 | ) | | | 2.26 | | | | 2.26 | | | | 2.40 | | | | | | | | 12.31 | | | | 61.67 | | | $ | 106,168 | |
| | | | | | | |
| | | | | | | | | | | | | | | | | | | | | | | | | | | | | | |
| | | | | | | |
| | 0.48 | | | | 1.09 | | | | 1.09 | | | | 1.15 | | | | | | | | 6.09 | | | | 33.24 | | | $ | 772,384 | |
| | 1.05 | | | | 1.07 | | | | 1.07 | | | | 1.20 | | | | | | | | 18.06 | | | | 77.61 | | | $ | 793,069 | |
| | 0.70 | | | | 1.07 | | | | 1.07 | | | | 1.16 | | | | | | | | 13.68 | | | | 94.68 | | | $ | 853,866 | |
| | 0.52 | | | | 1.09 | | | | 1.09 | | | | 1.14 | | | | | | | | (18.75 | ) | | | 96.74 | | | $ | 1,016,898 | |
| | 0.54 | | | | 1.09 | | | | 1.09 | | | | 1.09 | | | | | | | | 5.20 | | | | 61.46 | | | $ | 2,376,420 | |
| | 0.52 | | | | 1.04 | | | | 1.04 | | | | 1.22 | | | | | | | | 13.74 | | | | 61.67 | | | $ | 828,147 | |
| | | | | | | |
| | | | | | | | | | | | | | | | | | | | | | | | | | | | | | |
| | | | | | | |
| | 0.45 | | | | 1.09 | | | | 1.09 | | | | 1.64 | | | | | | | | 6.11 | | | | 33.24 | | | $ | 4,564 | |
| | 1.04 | | | | 1.08 | | | | 1.08 | | | | 1.77 | | | | | | | | 18.06 | | | | 77.61 | | | $ | 5,506 | |
| | 0.74 | | | | 1.08 | | | | 1.08 | | | | 1.75 | | | | | | | | 13.65 | | | | 94.68 | | | $ | 6,208 | |
| | 0.66 | | | | 1.09 | | | | 1.09 | | | | 1.67 | | | | | | | | (18.72 | ) | | | 96.74 | | | $ | 5,363 | |
| | 0.67 | | | | 1.09 | | | | 1.09 | | | | 1.90 | | | | | | | | 5.17 | | | | 61.46 | | | $ | 7,433 | |
| | 0.47 | (e) | | | 1.07 | (e) | | | 1.07 | (e) | | | 17.45 | (e)(f) | | | | | | | 3.14 | | | | 61.67 | | | $ | 697 | |
| | | | | | | |
| | | | | | | | | | | | | | | | | | | | | | | | | | | | | | |
| | | | | | | |
| | 0.53 | | | | 0.99 | | | | 0.99 | | | | 1.15 | | | | | | | | 6.19 | | | | 33.24 | | | $ | 60,267 | |
| | 1.14 | | | | 0.97 | | | | 0.97 | | | | 1.13 | | | | | | | | 18.16 | | | | 77.61 | | | $ | 28,652 | |
| | 0.80 | | | | 0.97 | | | | 0.97 | | | | 1.12 | | | | | | | | 13.81 | | | | 94.68 | | | $ | 48,598 | |
| | 0.84 | | | | 0.99 | | | | 0.99 | | | | 1.10 | | | | | | | | (18.68 | ) | | | 96.74 | | | $ | 21,055 | |
| | 0.57 | | | | 0.99 | | | | 0.99 | | | | 1.10 | | | | | | | | 5.26 | | | | 61.46 | | | $ | 22,727 | |
| | 0.20 | (e) | | | 0.98 | (e) | | | 0.98 | (e) | | | 1.99 | (e) | | | | | | | 3.26 | | | | 61.67 | | | $ | 14,422 | |
Semi-Annual Report | 25
Expense Example
Thornburg Developing World Fund | March 31, 2018 (Unaudited)
As a shareholder of the Fund, you incur two types of costs:
| | (1) | transaction costs, including |
| | (a) | sales charges (loads) on purchase payments, for Class A shares; |
| | (b) | a deferred sales charge on redemptions of any part or all of a purchase of $1 million of Class A shares within 12 months of purchase; |
| | (c) | a deferred sales charge on redemptions of Class C shares within 12 months of purchase; |
| | (2) | ongoing costs, including management fees; distribution and/or service (12b-1) fees; and other Fund expenses. This example is intended to help you understand your ongoing costs (in dollars) of investing in the Fund and to compare these costs with the ongoing costs of investing in other mutual funds |
This example is intended to help you understand your ongoing costs (in dollars) of investing in the Fund and to compare these costs with the ongoing costs of investing in other mutual funds.
The example is based on a $1,000 investment beginning on October 1, 2017, and held until March 31, 2018.
ACTUAL EXPENSES
For each class of shares, the first line of the accompanying table provides information about actual account values and actual expenses. You may use the information in this line, together with the amount you invested, to estimate the expenses that you paid over the period. Simply divide your account value by $1,000 (for example, an $8,600 account value divided by $1,000 = 8.6), then multiply the result by the number in the first line for your class of shares under the heading entitled “Expenses Paid During Period” to estimate the expenses you paid on your account during this period.
| | | | | | | | | | | | | | | |
| | | BEGINNING
ACCOUNT VALUE
10/1/17 | | ENDING
ACCOUNT VALUE
3/31/18 | | EXPENSES PAID
DURING PERIOD†
10/1/17–3/31/18 |
| | | |
| CLASS A SHARES | | | | | | | | | | | | | | | |
| | | |
Actual | | | $ | 1,000.00 | | | | $ | 1,058.90 | | | | $ | 7.55 | |
Hypothetical* | | | $ | 1,000.00 | | | | $ | 1,017.60 | | | | $ | 7.39 | |
| | | |
| CLASS C SHARES | | | | | | | | | | | | | | | |
| | | |
Actual | | | $ | 1,000.00 | | | | $ | 1,054.90 | | | | $ | 11.42 | |
Hypothetical* | | | $ | 1,000.00 | | | | $ | 1,013.81 | | | | $ | 11.20 | |
| | | |
| CLASS I SHARES | | | | | | | | | | | | | | | |
| | | |
Actual | | | $ | 1,000.00 | | | | $ | 1,060.90 | | | | $ | 5.60 | |
Hypothetical* | | | $ | 1,000.00 | | | | $ | 1,019.50 | | | | $ | 5.49 | |
| | | |
| CLASS R5 SHARES | | | | | | | | | | | | | | | |
| | | |
Actual | | | $ | 1,000.00 | | | | $ | 1,061.10 | | | | $ | 5.60 | |
Hypothetical* | | | $ | 1,000.00 | | | | $ | 1,019.50 | | | | $ | 5.49 | |
| | | |
| CLASS R6 SHARES | | | | | | | | | | | | | | | |
| | | |
Actual | | | $ | 1,000.00 | | | | $ | 1,061.90 | | | | $ | 5.09 | |
Hypothetical* | | | $ | 1,000.00 | | | | $ | 1,020.00 | | | | $ | 4.99 | |
| † | Expenses are equal to the annualized expense ratio for each class (A: 1.47%; C: 2.23%; I: 1.09%; R5: 1.09%; R6: 0.99%) multiplied by the average account value over the period, multiplied by 182/365 to reflect the one-half year period. |
| * | Hypothetical assumes a rate of return of 5% per year before expenses. |
HYPOTHETICAL EXAMPLE FOR COMPARISON PURPOSES
For each class of shares, the second line of the accompanying table provides information about hypothetical account values and hypothetical expenses based on the Fund’s actual expense ratio and an assumed rate of return of 5% per year before expenses, which is not the Fund’s actual return. The hypothetical account values and expenses may not be used to estimate the actual ending account balance or expenses you paid for the period. You may use this information to compare the ongoing costs of investing in the Fund and other funds. To do so, compare this 5% hypothetical example with the 5% hypothetical examples that appear in the shareholder reports of the other funds.
Please note that the expenses shown in the table are meant to highlight your ongoing costs only and do not reflect any transactional costs, such as sales charges (loads), redemption fees, or exchange fees. Therefore, the second line of the table for each class of shares is useful in comparing ongoing costs only, and will not help you determine the relative total costs of owning different funds. In addition, if these transactional costs were included, your costs would have been higher.
26 | Semi-Annual Report
Other Information
Thornburg Developing World Fund | March 31, 2018 (Unaudited)
PORTFOLIO PROXY VOTING
Policies and Procedures:
The Trust has delegated to Thornburg Investment Management, Inc. (the “Advisor”) voting decisions respecting proxies for the Fund’s voting securities. The Advisor makes voting decisions in accordance with its Proxy Voting Policy and Procedures. A description of the Policy and Procedures is available (i) without charge, upon request, by calling the Advisor toll-free at 1-800-847-0200, (ii) on the Thornburg website at www.thornburg.com, and (iii) on the Securities and Exchange Commission’s website at www.sec.gov.
Information regarding how proxies were voted is available on or before August 31 of each year for the twelve months ending the preceding June 30. This information is available (i) without charge, upon request by calling the Advisor toll-free at 1-800-847-0200, (ii) on the Thornburg website at www.thornburg.com, and (iii) on the Securities and Exchange Commission’s website at www.sec.gov.
AVAILABILITY OF QUARTERLY PORTFOLIO SCHEDULE
The Fund files with the Securities and Exchange Commission schedules of its portfolio holdings on Form N-Q for the first and third quarters of each fiscal year. The Fund’s Forms N-Q are available on the Commission’s website at www.sec.gov, or may be reviewed and copied at the Commission’s Public Reference Room in Washington, D.C. Information on the operation of the Public Reference Room may be obtained by calling 1-800-SEC-0330. The Fund also makes this information available on its website at www.thornburg.com/download or upon request by calling 1-800-847-0200.
Semi-Annual Report | 27
Trustees’ Statement to Shareholders
Readopted September 11, 2017
The Trustees believe current and prospective shareholders should know how we discharge our responsibilities in supervising the Funds’ investment advisor and in reviewing the advisor’s contract for renewal. Since 2005, we have issued a statement which sets out clearly the three principal guidelines that we follow in supervising the Trust’s investment advisor on your behalf. In accordance with our customary practice, in September of this year we again reviewed our statement and concluded we should reissue this statement outlining the principal features of our supervision of the advisor’s performance of investment management services for the Funds.
We begin with the premise that each shareholder selected his or her Fund because its investments are managed by the investment advisor identified in the prospectus and in accordance with the objective and policies described in the prospectus. We realize, as each of you do, that if you believe that your Fund’s stated objective and policies no longer serve your personal investment goals, you can sell your shares and leave the Fund.
Therefore, we believe that our primary supervisory task—our principal obligation to you—is to assess the nature and quality of the advisor’s services, and to confirm that the advisor actively and competently pursues the Fund’s objective, in accordance with the policies set out in the prospectus. To do this, we meet regularly with management to review your Fund’s portfolio and to discuss the advisor’s specific actions and judgments in pursuing the Fund’s objective. We do not substitute our own judgment for the advisor’s decisions in selecting investments; the advisor is paid to exercise its informed judgment on investment decisions, and we seek to confirm, in reviewing the advisor’s performance, that the advisor is doing just that.
Second, we are conscious of costs and the effect that costs have on shareholders’ returns. We try to make sure that your Fund’s fees and costs are reasonable in relationship to the services rendered and that they are generally in line with those charged by other expert investment advisors, consistent with our belief that the Fund’s investors searched for and expect that expertise and attention and have decided to pay a reasonable price for it. We do not put the management contract “out to bid” as a matter of course, and we would not do so unless we had concluded that the advisor materially had failed to pursue the Fund’s objectives in accordance with its policies, or for other equally important reasons. We believe that any other approach would be inconsistent with your interests and contrary to your expectations when you bought shares of the Fund in the first place.
Finally, because we believe that most Thornburg Fund shareholders have invested with a long-term perspective, we try not to focus too much on the fashions of the moment and on short-term performance. The market will not favor any specific investment objective or set of policies at all times and under all economic circumstances. A fund will experience periods of both high and low returns relative to other funds and other investments. Even if one of our Funds is not favored by the market at a particular time, we believe that the advisor is nonetheless obliged to remain true to the Fund’s objective and policies, and we watch to see that it does so.
Trustees of Thornburg Investment Trust
28 | Semi-Annual Report
Thornburg Funds
Thornburg Investment Management is a privately-owned global investment firm that offers a range of solutions for retail and institutional investors. Founded in 1982 and headquartered in Santa Fe, New Mexico, we manage approximately $49 billion (as of March 31, 2018) across U.S. mutual funds, separate accounts for high-net-worth investors, institutional accounts, and UCITS funds for non-U.S. investors.
EQUITY FUNDS
| | ∎ | | Thornburg Investment Income Builder Fund |
| | ∎ | | Thornburg Global Opportunities Fund |
| | ∎ | | Thornburg International Value Fund |
| | ∎ | | Thornburg Better World International Fund |
| | ∎ | | Thornburg International Growth Fund |
| | ∎ | | Thornburg Developing World Fund |
| | ∎ | | Thornburg Core Growth Fund |
FIXED INCOME FUNDS
| | ∎ | | Thornburg Low Duration Income Fund |
| | ∎ | | Thornburg Limited Term U.S. Government Fund |
| | ∎ | | Thornburg Limited Term Income Fund |
| | ∎ | | Thornburg Strategic Income Fund |
| | ∎ | | Thornburg Low Duration Municipal Fund |
| | ∎ | | Thornburg Limited Term Municipal Fund |
| | ∎ | | Thornburg Intermediate Municipal Fund |
| | ∎ | | Thornburg California Limited Term Municipal Fund |
| | ∎ | | Thornburg New Mexico Intermediate Municipal Fund |
| | ∎ | | Thornburg New York Intermediate Municipal Fund |
| | ∎ | | Thornburg Strategic Municipal Income Fund |
ALTERNATIVE FUNDS
| | ∎ | | Thornburg Long/Short Equity Fund |
Before investing, carefully consider the Fund’s investment goals, risks, charges, and expenses. For a prospectus or summary prospectus containing this and other information, contact your financial advisor or visit thornburg.com. Read it carefully before investing.
For additional information, please visit thornburg.com
Thornburg Investment Management, Inc. 2300 North Ridgetop Road, Santa Fe, NM 87506
Semi-Annual Report | 29
This page intentionally left blank.
30 | Semi-Annual Report
This page intentionally left blank.
Semi-Annual Report | 31
| | | | |
| To receive shareholder reports, prospectuses, and proxy statements electronically, go to www.thornburg.com/edelivery. | | | | |
| This Semi-Annual Report is submitted for the general information of shareholders of the Fund. It is not authorized for distribution to prospective investors in the Fund unless preceded or accompanied by an effective prospectus. | |
| | | | |
Investment Advisor: | | Distributor: | | |
Thornburg Investment Management® | | Thornburg Securities Corporation® | | |
800.847.0200 | | 800.847.0200 | | TH2148 |
Semi-Annual Report
March 31, 2018
THORNBURG
BETTER WORLD
INTERNATIONAL
FUND
About Thornburg Investment Management
It’s more than what we do.
It’s how we do it.
At Thornburg, we are very different in how we think, invest, and are structured. We believe this difference is what makes us successful in helping individuals reach their long-term financial goals.
Flexible Perspective
Our perspective on investment opportunities is more flexible than most, viewing a wide range of opportunities beyond conventional boundaries to find hidden value.
Collaboration
Collectively, we hone ideas via borderless cross-pollination for better judgment and better results.
Portfolio Construction
Disciplined construction guided more by our convictions than convention.
CONVICTION
Thorough analysis and our relative-value framework lead to conviction in our securities selection.
UNCONVENTIONAL
Active management means we seek the best value for our clients rather than using conventional benchmarks as our starting point.
Structured for Excellence
How we think and how we invest is made possible by how we’re structured.
TEAM APPROACH
FAR FROM THE HERD
ACCESS & TRANSPARENCY
2 | Semi-Annual Report
Thornburg Better World International Fund
Semi-Annual Report | March 31, 2018
Table of Contents
| | | | | | | | | | |
| SHARE CLASS | | NASDAQ SYMBOL | | CUSIP |
| | |
| Class A | | TBWAX | | | | 885-216-721 | |
| Class C | | TBWCX | | | | 885-216-713 | |
| Class I | | TBWIX | | | | 885-216-697 | |
Class I shares may not be available to all investors. Minimum investments for Class I shares may be higher than those for other classes.
Investments carry risks, including possible loss of principal. Additional risks may be associated with investments outside the United States, especially in emerging markets, including currency fluctuations, illiquidity, volatility, and political and economic risks. Investments in small- and mid-capitalization companies may increase the risk of greater price fluctuations. Investments in the Fund are not FDIC insured, nor are they bank deposits or guaranteed by a bank or any other entity.
Funds invested in a smaller number of holdings may expose an investor to greater volatility.
Semi-Annual Report | 3
Letter to Shareholders
Thornburg Better World International Fund | March 31, 2018 (Unaudited)
April 13, 2018
Dear Fellow Shareholder:
We are pleased to present the semi-annual report for Thornburg Better World International Fund for the six months ended March 31, 2018. In the October-through-March period, Better World International Fund gained 5.57% (I shares), outperforming the MSCI AC World ex-U.S. Index’s 3.76% return. That brought the since-inception return to 13.03% (I shares), versus 12.95% for the benchmark. While we expect our short-term returns to vary, we aim to deliver superior, risk-adjusted returns over the long run and believe our investment philosophy and process provide a sound framework to add value.
Performance data shown represents past performance and is no guarantee of future results. Investment return and principal value will fluctuate so shares, when redeemed, may be worth more or less than their original cost. Current performance may be lower or higher than quoted. For performance current to the most recent month end, visit thornburg.com or call 800.847.0200.
There is no sales charge for Class I shares. The total annual fund operating expense of Class I shares is 1.65%, as disclosed in the most recent prospectus. Thornburg Investment Management and/or Thornburg Securities Corporation have contractually agreed to waive fees and reimburse expenses through at least February 1, 2019, for some of the share classes, resulting in a net expense ratio of 1.09% for Class I shares.
Thornburg Better World International Fund seeks attractively priced stocks of quality companies that have sustainable business models, compelling growth prospects and, critically, exhibit high “ESG” standards of environmental sensitivity, social responsibility and corporate governance. Through our research and our practical experience of running socially responsible separate accounts for several years prior to launching the Better World International Fund, we have found that companies with durable business models and strong ESG values tend to outperform over time. In our judgment, they also tend to have lower regulatory and legal risks, enhanced marketplace reputations, reduced operating costs and more effective capital allocation policies. These advantages create a positive self-reinforcing cycle to the benefit of clients, employees, and shareholders.
Global equity markets opened the six-month period ended March 31, 2018 boosted by continued optimism surrounding above-trend economic growth, positive leading economic indicators, and robust corporate revenue and earnings growth world-wide. As the calendar year turned, following a strong January, markets swooned as volatility spiked. Trigger points for the initial downturn, ironically, appeared to be firming wage growth in the U.S., a positive data point in isolation, with second-order effects of upward pressure on inflation. That raised pressure on the U.S. Federal Reserve to increase short-term rates and, in turn, resulted in equity market de-rating from a higher discount rate.
Top-performing sectors for the Fund during the six-month period were information technology, financials, and consumer staples. Bottom-performing sectors during the period were consumer discretionary, materials, and utilities. On a regional basis, holdings in Developed North America, the Eurozone, and the Pacific ex-Japan were top contributors to Fund performance, while holdings in the U.K. and EMEA (emerging Europe, the Middle East and Africa) rounded out our detractors.
One question that remains top of mind for our strategy is whether the market is accurately assessing the risks and opportunities of ESG. Are markets properly valuing the future earnings potential of organizations in light of innovations in energy production and consumption, or consumer preferences shifting to natural and organic foods? When business models are changing as a result of innovation and structural changes in multiple industries, how do investors respond? For us, one answer is increased focus on material ESG trends that follow the changing world dynamic.
For example, Deutsche Post has implemented a broad range of efficiency measures for reducing the consumption of fuel, electricity, and kerosene, a large component of costs for the mail and logistics services company. Moreover, it has adopted network optimization measures, such as intelligent route planning, capacity optimization, and intermodal transport concepts, which have also played a large role in reducing fuel use and lowering carbon emissions. These efficiency measures, which play no small role in the profitability of the company, can be easily overlooked by analysts who are less attuned to environmental factors within ESG.
Another example is Mondi plc, which manufactures packaging and business paper. The company appeared on our radar as an industry leader in sustainable forest management. All of Mondi’s managed forests are certified under Forest Stewardship Council standards. The certifications provide us with a high level of confidence in the firm’s responsible land management program. Additionally, Mondi’s efforts in responsible forest management provide its business consumers with responsible sourcing credentials, something increasingly important to the general public. We believe these efforts make for a sustainable moat for the company, increased profitability, and better stock price returns over time.
As mentioned above, Thornburg Better World International Fund seeks to utilize ESG analysis to enhance risk-adjusted returns, while most of the current investment management community does not. We continue to believe that material ESG metrics positively affect investment returns, and we attempt to capitalize on this market inefficiency, with which we can add value for our shareholders. While the last six months is certainly a short period by which to gauge success, we believe that the
4 | Semi-Annual Report
Letter to Shareholders, Continued
Thornburg Better World International Fund | March 31, 2018 (Unaudited)
results speak to the potential of our financials-plus-ESG integration methodology.
Thank you for investing alongside us in Thornburg Better World International Fund.
Sincerely,
| | |
 | |  |
| |
| Jim Gassman, | | Di Zhou,CFA, FRM®, |
| Portfolio Manager | | Portfolio Manager |
| Managing Director | | Managing Director |
The matters discussed in this report may constitute forward-looking statements made pursuant to the safe harbor provisions of the Securities Litigation Reform Act of 1995. These include any advisor or portfolio manager prediction, assessment, analysis or outlook for individual securities, industries, investment styles, market sectors and/or markets. These statements involve risks and uncertainties. In addition to the general risks described for each fund in its current prospectus, other factors bearing on these reports include the accuracy of the advisor’s or portfolio manager’s forecasts and predictions, the appropriateness of the investment strategies designed by the advisor or portfolio manager and the ability of the advisor or portfolio manager to implement their strategies efficiently and successfully. Any one or more of these factors, as well as other risks affecting the securities markets generally, could cause the actual results of any fund to differ materially as compared to its benchmarks.
The views expressed are subject to change and do not necessarily reflect the views of Thornburg Investment Management, Inc. This information should not be relied upon as a recommendation or investment advice and is not intended to predict the performance of any investment or market.
Performance results of individual share classes will vary based on the fees and expenses associated with each share class, and may be higher or lower than other share classes within the same Fund. Please see Performance Summary for performance results of each share class.
Semi-Annual Report | 5
Performance Summary
Thornburg Better World International Fund | March 31, 2018 (Unaudited)
AVERAGE ANNUAL TOTAL RETURNS
| | | | | | | | | | |
| | | 1-YR | | SINCE
INCEP. |
| | |
Class A Shares (Incep: 9/30/15) | | | | | | | | | | |
Without sales charge | | | | 14.02% | | | | | 12.13% | |
| | |
With sales charge | | | | 8.88% | | | | | 10.09% | |
Class C Shares (Incep: 9/30/15) | | | | | | | | | | |
Without sales charge | | | | 13.38% | | | | | 11.50% | |
| | |
With sales charge | | | | 12.38% | | | | | 11.50% | |
| | |
Class I Shares (Incep: 9/30/15) | | | | 14.97% | | | | | 13.03% | |
| | |
MSCI AC World ex-U.S. Index (Since 9/30/15) | | | | 16.53% | | | | | 12.95% | |
GROWTH OF A HYPOTHETICAL $10,000 INVESTMENT
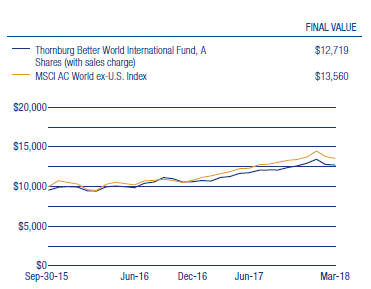
Performance data shown represents past performance and is no guarantee of future results. Investment return and principal value will fluctuate so shares, when redeemed, may be worth more or less than their original cost. Current performance may be lower or higher than quoted. For performance current to the most recent month end, visit thornburg.com or call 800-847-0200. The performance information does not reflect the deduction of taxes that a shareholder would pay on distributions or the redemption of Fund shares. Returns reflect the reinvestment of dividends and capital gains. The maximum sales charge for the Fund’s A shares is 4.50%. C shares are subject to a 1% contingent deferred sales charge (CDSC) for the first year only. There is no sales charge for Class I shares.
As disclosed in the most recent prospectus, the total annual fund operating expenses before any fee waivers or expense reimbursements are as follows: A shares, 3.17%; C shares, 4.44%; I shares, 1.65%. Thornburg Investment Management and/or Thornburg Securities Corporation have contractually agreed to waive fees and reimburse expenses through at least February 1, 2019, for these share classes, resulting in net expense ratios of the following: A shares, 1.83%; C shares, 2.38%; I shares, 1.09%. For more detailed information on fund expenses and waivers/reimbursements please see the Fund’s prospectus.
Glossary
The MSCI All Country (AC) World ex-US Index is a market capitalization weighted index representative of the market structure of 45 developed and emerging market countries in North and South America, Europe, Africa, and the Pacific Rim, excluding securities of United States issuers. Beginning in January 2001, the index is calculated with net dividends reinvested in U.S. dollars.
The performance of any index is not indicative of the performance of any particular investment. Unless otherwise noted, index returns reflect the reinvestment of income dividends and capital gains, if any, but do not reflect fees, brokerage commissions or other expenses of investing. Investors may not make direct investments into any index.
6 | Semi-Annual Report
Fund Summary
Thornburg Better World International Fund | March 31, 2018 (Unaudited)
OBJECTIVES AND STRATEGIES
The Fund seeks long-term capital appreciation.
The Fund invests primarily in a broad range of foreign companies that demonstrate one or more positive environmental, social, and governance (ESG) characteristics that the investment manager identifies as significant. The Fund targets companies of any size or country of origin, and which we believe are high-quality and attractively valued.
MARKET CAPITALIZATION EXPOSURE
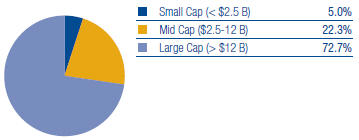
BASKET STRUCTURE
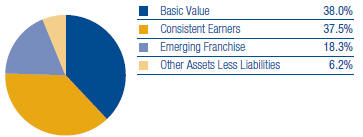
TOP TEN EQUITY HOLDINGS
| | | | | |
| AIA Group Ltd. | | | | 3.6% | |
| Resona Holdings, Inc. | | | | 3.4% | |
| ING Groep N.V. | | | | 3.4% | |
| UBS Group AG | | | | 2.7% | |
| Compass Group plc | | | | 2.6% | |
| CRH plc | | | | 2.6% | |
| Enel S.p.A. | | | | 2.6% | |
| Sony Corp. | | | | 2.6% | |
| Novartis AG | | | | 2.5% | |
| Mondi plc | | | | 2.4% | |
SECTOR EXPOSURE
| | | | | |
| Financials | | | | 22.6% | |
| Industrials | | | | 16.3% | |
| Consumer Discretionary | | | | 14.3% | |
| Information Technology | | | | 10.9% | |
| Consumer Staples | | | | 7.5% | |
| Health Care | | | | 6.3% | |
| Telecommunication Services | | | | 6.0% | |
| Materials | | | | 5.0% | |
| Utilities | | | | 2.6% | |
| Real Estate | | | | 2.3% | |
| Other Assets Less Liabilities | | | | 6.2% | |
TOP TEN INDUSTRY GROUPS
| | | | | |
| Banks | | | | 11.8% | |
| Transportation | | | | 7.7% | |
| Software & Services | | | | 6.7% | |
| Pharmaceuticals, Biotechnology & Life Sciences | | | | 6.3% | |
| Capital Goods | | | | 6.0% | |
| Telecommunication Services | | | | 6.0% | |
| Insurance | | | | 5.8% | |
| Diversified Financials | | | | 5.0% | |
| Materials | | | | 5.0% | |
| Food, Beverage & Tobacco | | | | 4.7% | |
COUNTRY EXPOSURE*
(percent of equity holdings)
| | | | | |
| Japan | | | | 14.2% | |
| United Kingdom | | | | 10.9% | |
| China | | | | 8.4% | |
| Switzerland | | | | 7.7% | |
| Netherlands | | | | 6.9% | |
| Germany | | | | 6.2% | |
| Italy | | | | 5.2% | |
| France | | | | 5.0% | |
| United States | | | | 4.3% | |
| Spain | | | | 4.3% | |
| Canada | | | | 4.2% | |
| Hong Kong | | | | 3.8% | |
| Ireland | | | | 2.8% | |
| Singapore | | | | 2.4% | |
| Colombia | | | | 2.4% | |
| Taiwan | | | | 2.2% | |
| India | | | | 1.9% | |
| Finland | | | | 1.7% | |
| Vietnam | | | | 1.7% | |
| Brazil | | | | 1.4% | |
| Norway | | | | 1.3% | |
| Argentina | | | | 1.1% | |
| * | Holdings are classified by country of risk as determined by MSCI and Bloomberg. |
There is no guarantee that the Fund will meet its investment objectives.
All data is subject to change. Charts may not add up to 100% due to rounding.
Semi-Annual Report | 7
Schedule of Investments
Thornburg Better World International Fund | March 31, 2018 (Unaudited)
| | | | | | | | | | | | |
| | | | | SHARES/
PRINCIPAL AMOUNT | | VALUE |
| | | |
| | COMMON STOCK — 93.8% | | | | | | | | | | |
| | | |
| | AUTOMOBILES & COMPONENTS — 1.8% | | | | | | | | | | |
| | Automobiles — 1.8% | | | | | | | | | | |
| | Subaru Corp. | | | | 36,186 | | | | $ | 1,186,532 | |
| | | | | | | | | | | | |
| | | | | | | | | | | 1,186,532 | |
| | | | | | | | | | | | |
| | BANKS — 11.8% | | | | | | | | | | |
| | Banks — 11.8% | | | | | | | | | | |
| | BBVA Banco Frances S.A. ADR | | | | 29,596 | | | | | 675,085 | |
| | ICICI Bank Ltd. | | | | 280,522 | | | | | 1,199,564 | |
| | ING Groep N.V. | | | | 133,416 | | | | | 2,249,015 | |
| | Resona Holdings, Inc. | | | | 429,457 | | | | | 2,279,970 | |
| | United Overseas Bank Ltd. | | | | 71,405 | | | | | 1,497,645 | |
| | | | | | | | | | | | |
| | | | | | | | | | | 7,901,279 | |
| | | | | | | | | | | | |
| | CAPITAL GOODS — 6.0% | | | | | | | | | | |
| | Electrical Equipment — 1.4% | | | | | | | | | | |
| | Legrand S.A. | | | | 12,043 | | | | | 943,926 | |
| | Machinery — 2.4% | | | | | | | | | | |
| | Weir Group plc | | | | 56,976 | | | | | 1,594,351 | |
| | Trading Companies & Distributors — 2.2% | | | | | | | | | | |
| | Brenntag AG | | | | 25,058 | | | | | 1,489,215 | |
| | | | | | | | | | | | |
| | | | | | | | | | | 4,027,492 | |
| | | | | | | | | | | | |
| | COMMERCIAL & PROFESSIONAL SERVICES — 2.6% | | | | | | | | | | |
| | Professional Services — 2.6% | | | | | | | | | | |
| | Bureau Veritas S.A. | | | | 27,413 | | | | | 712,047 | |
| | RELX PLC | | | | 51,263 | | | | | 1,053,658 | |
| | | | | | | | | | | | |
| | | | | | | | | | | 1,765,705 | |
| | | | | | | | | | | | |
| | CONSUMER DURABLES & APPAREL — 2.6% | | | | | | | | | | |
| | Household Durables — 2.6% | | | | | | | | | | |
| | Sony Corp. | | | | 35,669 | | | | | 1,712,970 | |
| | | | | | | | | | | | |
| | | | | | | | | | | 1,712,970 | |
| | | | | | | | | | | | |
| | CONSUMER SERVICES — 4.0% | | | | | | | | | | |
| | Hotels, Restaurants & Leisure — 4.0% | | | | | | | | | | |
| | Compass Group PLC | | | | 85,790 | | | | | 1,751,890 | |
| a | | GreenTree Hospitality Group Ltd. ADR | | | | 75,000 | | | | | 956,250 | |
| | | | | | | | | | | | |
| | | | | | | | | | | 2,708,140 | |
| | | | | | | | | | | | |
| | DIVERSIFIED FINANCIALS — 5.0% | | | | | | | | | | |
| | Capital Markets — 2.7% | | | | | | | | | | |
| | UBS Group AG | | | | 103,304 | | | | | 1,814,844 | |
| | Diversified Financial Services — 2.3% | | | | | | | | | | |
| | Cerved Information Solutions S.p.A. | | | | 124,885 | | | | | 1,556,623 | |
| | | | | | | | | | | | |
| | | | | | | | | | | 3,371,467 | |
| | | | | | | | | | | | |
| | FOOD, BEVERAGE & TOBACCO — 4.7% | | | | | | | | | | |
| | Food Products — 4.7% | | | | | | | | | | |
| | Grupo Nutresa S.A. | | | | 158,933 | | | | | 1,477,806 | |
| | Vietnam Dairy Products, JSC | | | | 117,110 | | | | | 1,062,793 | |
| | Wessanen | | | | 31,562 | | | | | 631,853 | |
| | | | | | | | | | | | |
| | | | | | | | | | | 3,172,452 | |
| | | | | | | | | | | | |
| | HOUSEHOLD & PERSONAL PRODUCTS — 2.8% | | | | | | | | | | |
| | Household Products — 1.2% | | | | | | | | | | |
| | Reckitt Benckiser Group plc | | | | 9,520 | | | | | 805,935 | |
| | Personal Products — 1.6% | | | | | | | | | | |
| | Kao Corp. | | | | 13,900 | | | | | 1,036,181 | |
| | | | | | | | | | | | |
| | | | | | | | | | | 1,842,116 | |
| | | | | | | | | | | | |
8 | Semi-Annual Report
Schedule of Investments, Continued
Thornburg Better World International Fund | March 31, 2018 (Unaudited)
| | | | | | | | | | | | |
| | | | | SHARES/
PRINCIPAL AMOUNT | | VALUE |
| | INSURANCE — 5.8% | | | | | | | | | | |
| | Insurance — 5.8% | | | | | | | | | | |
| | AIA Group Ltd. | | | | 282,049 | | | | $ | 2,386,301 | |
| | Intact Financial Corp. | | | | 19,581 | | | | | 1,471,368 | |
| | | | | | | | | | | | |
| | | | | | | | | | | 3,857,669 | |
| | | | | | | | | | | | |
| | MATERIALS — 5.0% | | | | | | | | | | |
| | Construction Materials — 2.6% | | | | | | | | | | |
| | CRH PLC | | | | 51,575 | | | | | 1,743,147 | |
| | Paper & Forest Products — 2.4% | | | | | | | | | | |
| | Mondi PLC | | | | 60,429 | | | | | 1,623,574 | |
| | | | | | | | | | | | |
| | | | | | | | | | | 3,366,721 | |
| | | | | | | | | | | | |
| | MEDIA — 3.0% | | | | | | | | | | |
| | Media — 3.0% | | | | | | | | | | |
| | Schibsted ASA Class A | | | | 28,687 | | | | | 801,456 | |
| | Shaw Communications, Inc. Class B | | | | 60,812 | | | | | 1,171,540 | |
| | | | | | | | | | | | |
| | | | | | | | | | | 1,972,996 | |
| | | | | | | | | | | | |
| | PHARMACEUTICALS, BIOTECHNOLOGY & LIFE SCIENCES — 6.3% | | | | | | | | | | |
| | Life Sciences Tools & Services — 1.8% | | | | | | | | | | |
| | Thermo Fisher Scientific, Inc. | | | | 5,789 | | | | | 1,195,197 | |
| | Pharmaceuticals — 4.5% | | | | | | | | | | |
| a | | Galenica AG | | | | 25,634 | | | | | 1,354,098 | |
| | Novartis AG | | | | 20,580 | | | | | 1,663,191 | |
| | | | | | | | | | | | |
| | | | | | | | | | | 4,212,486 | |
| | | | | | | | | | | | |
| | REAL ESTATE — 2.3% | | | | | | | | | | |
| | Equity Real Estate Investment Trusts — 2.3% | | | | | | | | | | |
| | Equinix, Inc. | | | | 3,657 | | | | | 1,529,138 | |
| | | | | | | | | | | | |
| | | | | | | | | | | 1,529,138 | |
| | | | | | | | | | | | |
| | RETAILING — 2.9% | | | | | | | | | | |
| | Internet & Direct Marketing Retail — 1.1% | | | | | | | | | | |
| a | | Ctrip.com International Ltd. ADR | | | | 15,750 | | | | | 734,265 | |
| | Specialty Retail — 1.8% | | | | | | | | | | |
| | Industria de Diseno Textil S.A. | | | | 37,530 | | | | | 1,174,326 | |
| | | | | | | | | | | | |
| | | | | | | | | | | 1,908,591 | |
| | | | | | | | | | | | |
| | SEMICONDUCTORS & SEMICONDUCTOR EQUIPMENT — 4.2% | | | | | | | | | | |
| | Semiconductors & Semiconductor Equipment — 4.2% | | | | | | | | | | |
| | ASML Holding N.V. | | | | 7,431 | | | | | 1,464,327 | |
| | Taiwan Semiconductor Manufacturing Co. Ltd. Sponsored ADR | | | | 31,449 | | | | | 1,376,208 | |
| | | | | | | | | | | | |
| | | | | | | | | | | 2,840,535 | |
| | | | | | | | | | | | |
| | SOFTWARE & SERVICES — 6.7% | | | | | | | | | | |
| | Information Technology Services — 1.3% | | | | | | | | | | |
| | Cielo S.A. | | | | 137,091 | | | | | 859,142 | |
| | Internet Software & Services — 5.4% | | | | | | | | | | |
| a | | Alibaba Group Holding Ltd. Sponsored ADR | | | | 8,021 | | | | | 1,472,174 | |
| | Scout24 AG | | | | 19,325 | | | | | 899,776 | |
| | Tencent Holdings Ltd. | | | | 23,462 | | | | | 1,224,497 | |
| | | | | | | | | | | | |
| | | | | | | | | | | 4,455,589 | |
| | | | | | | | | | | | |
| | TELECOMMUNICATION SERVICES — 6.0% | | | | | | | | | | |
| | Diversified Telecommunication Services — 6.0% | | | | | | | | | | |
| | DNA Oyj | | | | 50,579 | | | | | 1,097,201 | |
| | Nippon Telegraph & Telephone Corp. | | | | 31,671 | | | | | 1,459,060 | |
| | Orange S.A. | | | | 86,200 | | | | | 1,462,103 | |
| | | | | | | | | | | | |
| | | | | | | | | | | 4,018,364 | |
| | | | | | | | | | | | |
| | TRANSPORTATION — 7.7% | | | | | | | | | | |
| | Air Freight & Logistics — 2.3% | | | | | | | | | | |
| | Deutsche Post AG | | | | 34,597 | | | | | 1,512,082 | |
| | Road & Rail — 1.8% | | | | | | | | | | |
| | Kyushu Railway Co. | | | | 39,414 | | | | | 1,222,369 | |
Semi-Annual Report | 9
Schedule of Investments, Continued
Thornburg Better World International Fund | March 31, 2018 (Unaudited)
| | | | | | | | | | | | |
| | | | | SHARES/
PRINCIPAL AMOUNT | | VALUE |
| | Transportation Infrastructure — 3.6% | | | | | | | | | | |
| | Aena SME S.A. | | | | 7,555 | | | | $ | 1,521,298 | |
| | Shanghai International Airport Co. Ltd. Class A | | | | 117,834 | | | | | 891,663 | |
| | | | | | | | | | | | |
| | | | | | | | | | | 5,147,412 | |
| | | | | | | | | | | | |
| | UTILITIES — 2.6% | | | | | | | | | | |
| | Electric Utilities — 2.6% | | | | | | | | | | |
| | Enel S.p.A. | | | | 281,894 | | | | | 1,723,876 | |
| | | | | | | | | | | | |
| | | | | | | | | | | 1,723,876 | |
| | | | | | | | | | | | |
| | TOTAL COMMON STOCK (Cost $56,289,611) | | | | | | | | | 62,721,530 | |
| | | | | | | | | | | | |
| | | |
| | SHORT-TERM INVESTMENTS — 5.4% | | | | | | | | | | |
| b | | Thornburg Capital Management Fund | | | | 364,414 | | | | | 3,644,144 | |
| | | | | | | | | | | | |
| | TOTAL SHORT-TERM INVESTMENTS (Cost $3,644,144) | | | | | | | | | 3,644,144 | |
| | | | | | | | | | | | |
| | | |
| | TOTAL INVESTMENTS — 99.2% (Cost $59,933,755) | | | | | | | | $ | 66,365,674 | |
| | | |
| | OTHER ASSETS LESS LIABILITIES — 0.8% | | | | | | | | | 524,591 | |
| | | | | | | | | | | | |
| | | |
| | NET ASSETS — 100.0% | | | | | | | | $ | 66,890,265 | |
| | | | | | | | | | | | |
Footnote Legend
| b | Investment in Affiliates. |
Portfolio Abbreviations
To simplify the listings of securities, abbreviations are used per the table below:
| | |
| ADR | | American Depositary Receipt |
See notes to financial statements.
10 | Semi-Annual Report
Statement of Assets and Liabilities
Thornburg Better World International Fund | March 31, 2018 (Unaudited)
| | | | |
ASSETS | | | | |
| |
Investments at value (Note 3) | | | | |
Non-affiliated issuers (cost $56,289,611) | | $ | 62,721,530 | |
Non-controlled affiliated issuer (cost $3,644,144) | | | 3,644,144 | |
Cash | | | 4,337 | |
Cash denominated in foreign currency (cost $37,829) | | | 38,041 | |
Receivable for investments sold | | | 756,261 | |
Receivable for fund shares sold | | | 110,131 | |
Dividends receivable | | | 221,494 | |
Dividend and interest reclaim receivable | | | 25,532 | |
Prepaid expenses and other assets | | | 16,852 | |
| | | | |
| |
Total Assets | | | 67,538,322 | |
| | | | |
| |
LIABILITIES | | | | |
| |
Payable for investments purchased | | | 428,697 | |
Payable for fund shares redeemed | | | 3,815 | |
Payable to investment advisor and other affiliates (Note 4) | | | 53,777 | |
Deferred taxes payable (Note 2) | | | 5,308 | |
Accounts payable and accrued expenses | | | 156,460 | |
| | | | |
| |
Total Liabilities | | | 648,057 | |
| | | | |
| |
NET ASSETS | | $ | 66,890,265 | |
| | | | |
| |
NET ASSETS CONSIST OF | | | | |
| |
Undistributed net investment income | | $ | 133,345 | |
Net unrealized appreciation on investments | | | 6,433,632 | |
Accumulated net realized gain (loss) | | | 2,232,063 | |
Net capital paid in on shares of beneficial interest | | | 58,091,225 | |
| | | | |
| |
| | $ | 66,890,265 | |
| | | | |
| |
NET ASSET VALUE | | | | |
| |
Class A Shares: | | | | |
Net asset value and redemption price per share
($7,939,135 applicable to 548,148 shares of beneficial
interest outstanding - Note 5) | | $ | 14.48 | |
| |
Maximum sales charge, 4.50% of offering price | | | 0.68 | |
| | | | |
| |
Maximum offering price per share | | $ | 15.16 | |
| | | | |
| |
Class C Shares: | | | | |
Net asset value and offering price per share*
($2,615,581 applicable to 182,466 shares of beneficial
interest outstanding - Note 5) | | $ | 14.33 | |
| | | | |
| |
Class I Shares: | | | | |
Net asset value, offering and redemption price per share
($56,335,549 applicable to 3,820,500 shares of beneficial
interest outstanding - Note 5) | | $ | 14.75 | |
| | | | |
* Redemption price per share is equal to net asset value less any applicable contingent deferred sales charge.
See notes to financial statements.
Semi-Annual Report | 11
Statement of Operations
Thornburg Better World International Fund | Six Months Ended March 31, 2018 (Unaudited)
| | | | |
INVESTMENT INCOME | | | | |
| |
Dividend income | | | | |
Non-affiliated issuers (net of foreign taxes withheld of $54,289) | | $ | 455,916 | |
Non-controlled affiliated issuer | | | 49,047 | |
| | | | |
| |
Total Income | | | 504,963 | |
| | | | |
| |
EXPENSES | | | | |
| |
Investment advisory fees (Note 4) | | | 362,198 | |
Administration fees (Note 4) | | | | |
Class A Shares | | | 3,996 | |
Class C Shares | | | 1,435 | |
Class I Shares | | | 19,462 | |
Distribution and service fees (Note 4) | | | | |
Class A Shares | | | 9,058 | |
Class C Shares | | | 12,961 | |
Transfer agent fees | | | | |
Class A Shares | | | 16,881 | |
Class C Shares | | | 2,217 | |
Class I Shares | | | 13,600 | |
Registration and filing fees | | | | |
Class A Shares | | | 6,771 | |
Class C Shares | | | 6,771 | |
Class I Shares | | | 6,802 | |
Custodian fees (Note 2) | | | 110,541 | |
Professional fees | | | 30,218 | |
Trustee and officer fees (Note 4) | | | 1,721 | |
Other expenses | | | 10,807 | |
| | | | |
| |
Total Expenses | | | 615,439 | |
| |
Less: | | | | |
Expenses reimbursed by investment advisor (Note 4) | | | (46,070 | ) |
Investment advisory fees waived by investment advisor (Note 4) | | | (121,554 | ) |
| | | | |
| |
Net Expenses | | | 447,815 | |
| | | | |
| |
Net Investment Income | | $ | 57,148 | |
| | | | |
| |
REALIZED AND UNREALIZED GAIN (LOSS) | | | | |
| |
Net realized gain (loss) on: | | | | |
Non-affiliated issuer investments | | | 3,694,338 | |
Foreign currency transactions | | | (24,182 | ) |
| | | | |
| |
| | | 3,670,156 | |
| | | | |
Net change in unrealized appreciation (depreciation) on: | | | | |
Non-affiliated issuer investments (net of change in deferred taxes payable of $33,355) | | | 239,414 | |
Foreign currency translations | | | 712 | |
| | | | |
| |
| | | 240,126 | |
| | | | |
| |
Net Realized and Unrealized Gain | | | 3,910,282 | |
| | | | |
| |
Net Increase in Net Assets Resulting from Operations | | $ | 3,967,430 | |
| | | | |
See notes to financial statements.
12 | Semi-Annual Report
Statements of Changes in Net Assets
Thornburg Better World International Fund
| | | | | | | | | | |
| | | SIX MONTHS ENDED
MARCH 31, 2018* | | YEAR ENDED
SEPTEMBER 30, 2017 |
INCREASE (DECREASE) IN NET ASSETS FROM | | | | | | | | | | |
| | |
OPERATIONS | | | | | | | | | | |
| | |
Net investment income | | | $ | 57,148 | | | | $ | 660,690 | |
Net realized gain (loss) on investments and foreign currency transactions | | | | 3,670,156 | | | | | 606,527 | |
Net unrealized appreciation (depreciation) on investments, foreign currency translations and deferred taxes | | | | 240,126 | | | | | 4,208,343 | |
| | | | | |
| | |
Net Increase in Net Assets Resulting from Operations | | | | 3,967,430 | | | | | 5,475,560 | |
| | |
DIVIDENDS TO SHAREHOLDERS | | | | | | | | | | |
| | |
From net investment income | | | | | | | | | | |
Class A Shares | | | | – | | | | | (49,779 | ) |
Class C Shares | | | | – | | | | | (10,230 | ) |
Class I Shares | | | | – | | | | | (583,812 | ) |
| | |
From realized gains | | | | | | | | | | |
Class A Shares | | | | (169,562 | ) | | | | (177,797 | ) |
Class C Shares | | | | (62,136 | ) | | | | (45,820 | ) |
Class I Shares | | | | (1,613,511 | ) | | | | (1,502,645 | ) |
| | |
FUND SHARE TRANSACTIONS (NOTE 5) | | | | | | | | | | |
| | |
Class A Shares | | | | 1,352,324 | | | | | 4,455,372 | |
Class C Shares | | | | 364,077 | | | | | 1,275,340 | |
Class I Shares | | | | (5,554,186 | ) | | | | 29,500,849 | |
| | | | | |
| | |
Net Increase (Decrease) in Net Assets | | | | (1,715,564 | ) | | | | 38,337,038 | |
| | |
NET ASSETS | | | | | | | | | | |
| | |
Beginning of Period | | | | 68,605,829 | | | | | 30,268,791 | |
| | | | | |
| | |
End of Period | | | $ | 66,890,265 | | | | $ | 68,605,829 | |
| | | | | |
| | |
Undistributed net investment income | | | $ | 133,345 | | | | $ | 76,197 | |
* Unaudited.
See notes to financial statements.
Semi-Annual Report | 13
Notes to Financial Statements
Thornburg Better World International Fund | March 31, 2018 (Unaudited)
NOTE 1 – ORGANIZATION
Thornburg Better World International Fund (the “Fund”) is a diversified series of Thornburg Investment Trust (the “Trust”). The Fund commenced operations on October 1, 2015. The Trust was organized as a Massachusetts business trust under a Declaration of Trust dated June 3, 1987 and is registered as a diversified, open-end management investment company under the Investment Company Act of 1940, as amended. The Fund is currently one of twenty-one separate series of the Trust. Each series is considered to be a separate entity for financial reporting and tax purposes and bears expenses directly attributable to it. The Fund seeks long-term capital appreciation.
The Fund currently offers three classes of shares of beneficial interest: Class A, Class C, and Institutional Class (“Class I”). Each class of shares of the Fund represents an interest in the same portfolio of investments, except that (i) Class A shares are sold subject to a front-end sales charge collected at the time the shares are purchased and bear a service fee, (ii) Class C shares are sold at net asset value without a sales charge at the time of purchase, but are subject to a contingent deferred sales charge upon redemption within one year of purchase, and bear both a service fee and a distribution fee, (iii) Class I shares are sold at net asset value without a sales charge at the time of purchase and may be subject to a service fee, and (iv) the respective classes may have different reinvestment privileges and conversion rights. Additionally, the Fund may allocate among its classes certain expenses, to the extent allocable to specific classes, including transfer agent fees, government registration fees, certain printing and postage costs, and administrative and legal expenses. Currently, class specific expenses of the Fund are limited to service and distribution fees, administration fees, and certain registration and transfer agent expenses.
The following is a summary of significant accounting policies followed by the Fund in the preparation of its financial statements. The Fund prepares its financial statements in conformity with United States generally accepted accounting principles (“GAAP”), including investment company accounting and reporting guidance in the Financial Accounting Standards Board (the “FASB”) Accounting Standard Codification Topic 946.
NOTE 2 – SIGNIFICANT ACCOUNTING POLICIES
Security Valuation: All investments in securities held by the Fund are valued as described in Note 3.
Allocation of Income, Gains, Losses and Expenses: Net investment income (other than class specific expenses) and realized and unrealized gains and losses are allocated daily to each class of shares based upon the relative net asset value of outstanding shares (or the value of the dividend-eligible shares, as appropriate) of each class of shares at the beginning of the day (after adjusting for the current capital shares activity of the respective class). Expenses common to all Funds are allocated among the Funds comprising the Trust based upon their relative net asset values or other appropriate allocation methods. Operating expenses directly attributable to a specific class are charged against the operating income of that class.
Dividends and Distributions to Shareholders: Dividends and distributions to shareholders, which are determined in accordance with federal income tax regulations and may differ from GAAP, are recorded on the ex-dividend date. Ordinary income distributions, if any, are declared and paid annually. Capital gain distributions, if any, are declared and paid annually and more often if deemed necessary by Thornburg Investment Management, Inc., the Trust’s investment advisor (the “Advisor”). Dividends are paid and are reinvested in additional shares of the Fund at net asset value per share at the close of business on the ex-dividend date, or at the shareholder’s option, paid in cash.
Investment Income: Dividend income is recorded on the ex-dividend date. Certain income from foreign investments is recognized as soon as information is available to the Fund. Interest income is accrued as earned. Premiums and discounts are amortized and accreted, respectively, to call dates or maturity dates using the effective yield method of the respective investments. These amounts are included in Interest income on the Statement of Operations.
Custodian Fees: Custodian fees disclosed in the Statement of Operations may include interest expenses incurred by the Fund on any cash overdrafts of its custodian account during the period. Such cash overdrafts may result from the effects of failed trades in portfolio securities and from cash outflows resulting from unanticipated shareholder redemption activity. The Fund pays interest to its custodian on any such cash overdraft at a rate set periodically at the custodian’s discretion of the overdraft amount in excess of $50,000.
Investment Transactions: Investment transactions are accounted for on a trade date basis. Realized gains and losses from the sale of investments are recorded on an identified cost basis.
Repurchase Agreements: The Fund may invest excess cash in repurchase agreements whereby the Fund purchases investments, which serve as collateral, with an agreement to resell such collateral to the seller at an agreed upon price at the maturity date of the repurchase agreement. Investments pledged as collateral for repurchase agreements are held in custody until maturity of the repurchase agreement. Provisions in the agreements require that the market value of the collateral is at least equal to the repurchase value in the event of default. In the event of default, the Fund has the right to liquidate the collateral and apply the proceeds in satisfaction of the obligation. Under
14 | Semi-Annual Report
Notes to Financial Statements, Continued
Thornburg Better World International Fund | March 31, 2018 (Unaudited)
certain circumstances, in the event of default or bankruptcy by the other party to the agreement, realization and/or retention of the collateral may be subject to legal proceedings.
When-Issued and Delayed Delivery Transactions: The Fund may engage in when-issued or delayed delivery transactions. To the extent the Fund engages in such transactions, it will do so for the purpose of acquiring portfolio investments consistent with the Fund’s investment objectives and not for the purpose of investment leverage or to speculate on interest rate or market changes. At the time the Fund makes a commitment to purchase an investment on a when-issued or delayed delivery basis, the Fund will record the transaction and reflect the value in determining its net asset value. When effecting such transactions, assets of an amount sufficient to make payment for the portfolio investments to be purchased will be segregated on the Fund’s records on the trade date. Investments purchased on a when-issued or delayed delivery basis do not earn interest until the settlement date.
Foreign Currency Translation: Portfolio investments and other assets and liabilities denominated in foreign currencies are translated into U.S. dollars based on the exchange rate of such currencies against the U.S. dollar on the date of valuation. Purchases and sales of investments and income items denominated in foreign currencies are translated into U.S. dollars at the exchange rate in effect on the transaction date. When the Fund purchases or sells foreign investments, it will customarily enter into a foreign exchange contract to minimize foreign exchange risk from the trade date to the settlement date of such transactions. The values of such spot contracts are included in receivable for investments sold and payable for investments purchased on the Statement of Assets and Liabilities.
The Fund does not separately report the effect of changes in foreign exchange rates from changes in market prices on investments held. Such changes are included in net unrealized appreciation (depreciation) from investments.
Reported net realized gains and losses from foreign currency transactions arise due to purchases and sales of foreign currencies, currency gains and losses realized between the trade and settlement dates on investment transactions and the difference between the amounts of dividends, interest, and foreign withholding taxes recorded on the Fund’s books, and the U.S. dollar equivalent of the amounts actually received or paid.
Net change in unrealized appreciation (depreciation) on foreign currency translations arise from changes in the fair value of assets and liabilities, other than investments at period end, resulting from changes in exchange rates.
Guarantees and Indemnifications: Under the Trust’s organizational documents (and under separate agreements with the independent Trustees), its officers and Trustees are provided with an indemnification against certain liabilities arising out of the performance of their duties to the Fund. In the normal course of business the Trust may also enter into contracts with service providers that contain general indemnifications. The Trust’s maximum exposure under these arrangements is unknown. However, based on experience, the Trust expects the risk of loss to be remote.
Use of Estimates: The preparation of financial statements in conformity with GAAP requires management to make estimates and assumptions that affect the reported amounts of assets and liabilities and disclosure of contingent assets and liabilities at the date of the financial statements and the reported amounts of increases (decreases) in net assets from operations during the reporting period. Actual results could differ from those estimates.
Federal Income Taxes: It is the policy of the Trust to comply with the provisions of the Internal Revenue Code applicable to regulated investment companies and to distribute to shareholders substantially all investment company taxable income including net realized gains on investments (if any), and tax exempt income of the Fund. Therefore, no provision for federal income or excise tax is required.
The Fund files income tax returns in United States federal and applicable state jurisdictions. The statute of limitations on the Fund’s tax return filings generally remains open for the three years following a return’s filing date. The Fund has analyzed each uncertain tax position believed to be material in the preparation of the Fund’s financial statements for the six month period ended March 31, 2018, including open tax years, to assess whether it is more likely than not that the position would be sustained upon examination, based on the technical merits of the position. The Fund has not identified any such position for which an asset or liability must be reflected in the Statement of Assets and Liabilities.
At March 31, 2018, information on the tax components of capital was as follows:
| | | | | |
Cost of investments for tax purposes | | | $ | 59,933,755 | |
| | | | | |
Gross unrealized appreciation on a tax basis | | | | 7,239,862 | |
Gross unrealized depreciation on a tax basis | | | | (807,943 | ) |
| | | | | |
Net unrealized appreciation (depreciation) on investments (tax basis) | | | $ | 6,431,919 | |
| | | | | |
Foreign Withholding Taxes: The Fund is subject to foreign tax withholding imposed by certain foreign countries in which the Fund may invest. Withholding taxes are incurred on certain foreign dividends and are accrued at the time the dividend is recognized based on
Semi-Annual Report | 15
Notes to Financial Statements, Continued
Thornburg Better World International Fund | March 31, 2018 (Unaudited)
applicable foreign tax laws. The Fund may file withholding tax reclaims in certain jurisdictions to recover a portion of amounts previously withheld, in view of various considerations, including recent decisions rendered by the courts in those and other jurisdictions. The Fund would expect to record a receivable for such a reclaim based on a variety of factors, including assessment of a jurisdiction’s legal obligation to pay reclaims, the jurisdiction’s administrative practices and payment history, and industry convention. To date the Fund has recorded no such receivable because there is limited precedent for collecting such prior year reclaims and the likelihood of collection remains uncertain.
Deferred Foreign Capital Gain Taxes: The Fund is subject to a tax imposed on net realized gains of securities of certain foreign countries. The Fund records an estimated deferred tax liability for net unrealized gains on these investments as reflected in the accompanying financial statements.
NOTE 3 – SECURITY VALUATION
Valuation of the Fund’s portfolio investment securities is performed in accordance with policies and procedures adopted by and under the oversight of the Trustees.
The Trustees of the Trust have appointed the Advisor to assist the Trustees to obtain market values for portfolio investments, evaluate and monitor professional pricing service providers appointed by the Trustees’ Audit Committee (the “Audit Committee”) to assist in determining fair values for portfolio investments, assist in calculating fair values for portfolio investments in certain circumstances, and to perform other functions in connection with the valuation of investments. The Advisor acts through its Valuation and Pricing Committee (the “Committee”) and other employees of the Advisor. The Committee regularly reviews its own valuation calculations, as well as the valuations, valuation techniques and services furnished by pricing service providers, considers circumstances which may require valuation calculations by the Committee, and reviews previous valuation calculations. The Committee reports to the Audit Committee on the Committee’s activities, the performance of pricing service providers, and other matters relating to valuation of portfolio investments.
In those instances when the Committee assists in calculating a fair value for a portfolio investment, the Committee seeks to determine the price that the Fund would reasonably expect to receive upon a sale of the investment in an orderly transaction between market participants on the valuation date. The Committee customarily utilizes quotations from securities broker dealers in calculating valuations, but also may utilize prices obtained from pricing service providers or other methods approved by the Audit Committee. Because fair values calculated by the Committee are estimates, the calculation of a value for an investment may differ from the price that would be realized by the Fund upon a sale of the investment, and the difference could be material to the Fund’s financial statements. The Committee’s calculation of a fair value for an investment may also differ from the prices obtained by other persons (including other mutual funds) for the investment.
Valuation of Securities: Securities and other portfolio investments which are listed or traded on a United States securities exchange are valued at the last reported sale price on the valuation date. Investments listed or traded on an exchange for which there has been no sale that day are valued at the mean between the last reported bid and asked prices on that valuation date. Portfolio investments reported by NASDAQ are valued at the official closing price on the valuation date. If an investment is traded on more than one exchange, the investment is considered traded on the exchange that is normally the primary market for that investment. Securities and other portfolio investments which are listed or traded on exchanges outside the United States are valued at the last price or the closing price of the investment on the exchange that is normally the primary market for the investment, as of the close of the exchange preceding the Fund’s valuation date. Foreign investments listed or traded on an exchange for which there has been no sale that day are valued at the mean between the last reported bid and asked prices on that valuation date.
In any case when a market quotation is not readily available for a portfolio investment ordinarily valued by market quotation, the Committee calculates a fair value for the investment using alternative methods approved by the Audit Committee. A market quotation is not readily available when the primary market or exchange for the investment is not open for the entire scheduled day of trading. Market quotations for an investment also may not be readily available if developments after the most recent close of the investment’s primary exchange or market, but prior to the close of business on any Fund business day, or an unusual event or significant period of time occurring since the availability of a market quotation, create a serious question concerning the reliability of the most recent market quotation available for the investment. In particular, on days when market volatility thresholds established by the Audit Committee are exceeded, foreign equity investments held by the Fund may be valued using alternative methods. The Committee customarily obtains valuations in these instances from pricing service providers approved by the Audit Committee. Pricing service providers ordinarily calculate valuations using multi-factor models to adjust market prices based upon various inputs, including exchange data, depository receipt prices, futures, index data and other data.
Debt obligations held by the Fund which are not listed or traded on exchanges or for which no reported market exists are ordinarily valued at the valuation obtained from a pricing service provider approved by the Audit Committee.
In any case when a pricing service provider fails to provide a valuation for a debt obligation held by the Fund, the Committee calculates a fair value for the obligation using alternative methods under procedures approved by the Audit Committee. Additionally, in cases when management believes that a valuation obtained from a pricing service provider merits review for significant reasons, the Committee decides
16 | Semi-Annual Report
Notes to Financial Statements, Continued
Thornburg Better World International Fund | March 31, 2018 (Unaudited)
whether or not to use the valuation calculated by the pricing service provider or to use an alternative method approved by the Audit Committee to calculate a fair value for the obligation.
Quotations for foreign investments expressed in foreign currency amounts are converted to U.S. dollar equivalents using a foreign exchange quotation from a third party service provider at the time of valuation. Foreign investments held by the Fund may be traded on days and at times when the Fund is not open for business. Consequently, the value of Fund investments may be significantly affected on days when shareholders cannot purchase or sell Fund shares. Futures contracts and other financial and derivative instruments traded on an exchange are valued at the latest published price for the instrument on its primary exchange. Listed options are valued at the last bid price.
Valuation Hierarchy: The Fund categorizes its investments based upon the inputs used in valuing those investments, according to a three-level hierarchy established in guidance from the FASB. Categorization of investments using this hierarchy is intended by the FASB to maximize the use of observable inputs in valuing investments and minimize the use of unobservable inputs by requiring that the most observable inputs be used when available. Observable inputs are those that market participants would use in valuing an investment based on available market information. Unobservable inputs are those that reflect assumptions about the information market participants would use in valuing an investment. An investment’s level within the hierarchy is based on the lowest level input that is deemed significant to the valuation. The methodologies and inputs used to value investments are not necessarily indications of the risk or liquidity associated with those investments.
Various inputs are used in calculating valuations for the Fund’s investments. These inputs are generally summarized according to the three-level hierarchy below:
Level 1: Quoted prices in active markets for identical investments.
Level 2: Other direct or indirect significant observable inputs (including quoted prices for similar investments in active markets and other observable inputs, such as interest rates, prepayment rates, credit risk, etc.).
Level 3: Significant unobservable inputs (including the Committee’s own assumptions in calculating the fair values of investments).
Valuations for debt obligations held by the Fund are typically calculated by pricing service providers approved by the Audit Committee and are generally characterized as Level 2 within the valuation hierarchy.
On days when market volatility thresholds established by the Audit Committee are exceeded, foreign securities for which valuations are obtained from pricing service providers are fair valued. On these days, the foreign securities are characterized as Level 2 within the valuation hierarchy and revert to Level 1 after the threshold is no longer exceeded.
In a limited number of cases the Committee calculates a fair value for investments using broker quotations or other methods approved by the Audit Committee. When the Committee uses a single broker quotation to calculate a fair value for an investment without other significant observable inputs, or if a fair value is calculated using other significant inputs that are considered unobservable, the investment is characterized as Level 3 within the hierarchy. Other significant unobservable inputs used to calculate a fair value in these instances might include an income-based valuation approach which considers discounted anticipated future cash flows from the investment and application of discounts due to the nature or duration of any restrictions on the disposition of the investment.
Valuations based upon the use of inputs from Levels 1, 2 or 3 may not represent the actual price received upon the disposition of an investment, and the Fund may receive a price that is lower than the valuation based upon these inputs when it sells the investment.
The following table displays a summary of the fair value hierarchy measurements of the Fund’s investments as of March 31, 2018. In any instance when valuation inputs from more than one level are used to determine the fair value of a specific investment, the investment is placed in the level of the table based upon the lowest level input that is significant in determining the fair value of the investment:
| | | | | | | | | | | | | | | | | | | | |
| | | FAIR VALUE MEASUREMENTS AT MARCH 31, 2018 |
| | | TOTAL | | LEVEL 1 | | LEVEL 2 | | LEVEL 3 |
Assets | | | | | | | | | | | | | | | | | | | | |
Investments in Securities | | | | | | | | | | | | | | | | | | | | |
Common Stock | | | $ | 62,721,530 | | | | $ | 62,721,530 | | | | $ | – | | | | $ | – | |
Short Term Investment | | | | 3,644,144 | | | | | 3,644,144 | | | | | – | | | | | – | |
| | | | | |
Total Investments in Securities | | | $ | 66,365,674 | | | | $ | 66,365,674 | | | | $ | – | | | | $ | – | |
| | | | |
Other Financial Instruments** | | | | | | | | | | | | | | | | | | | | |
Spot Currency | | | $ | 438 | | | | $ | 438 | | | | $ | – | | | | $ | – | |
Semi-Annaul Report | 17
Notes to Financial Statements, Continued
Thornburg Better World International Fund | March 31, 2018 (Unaudited)
| | | | | | | | | | | | | | | | | | | | |
| | | FAIR VALUE MEASUREMENTS AT MARCH 31, 2018 |
| | | TOTAL | | LEVEL 1 | | LEVEL 2 | | LEVEL 3 |
| | | | |
Liabilities | | | | | | | | | | | | | | | | | | | | |
Other Financial Instruments** | | | | | | | | | | | | | | | | | | | | |
Spot Currency | | | $ | | (15) | | | $ | | (15) | | | $ | – | | | | $ | – | |
| ** | Other Financial Instruments include investments not reflected in the Schedule of Investments, which may include futures, forwards and swap contracts, which are valued at the unrealized appreciation (depreciation) on the investment. |
In accordance with the guidance prescribed in Accounting Standards Update No. 2011-04, it is the policy of the Fund to recognize transfers between levels and the underlying events which caused the movement. The Fund recognized no transfers between levels for the six months ended March 31, 2018, other than when the Fund exceeded market volatility thresholds for foreign equity investments during the period.
NOTE 4 – INVESTMENT ADVISORY FEE AND OTHER TRANSACTIONS WITH AFFILIATES
Pursuant to an investment advisory agreement, the Advisor serves as the investment advisor and performs services for the Fund for which the fees are payable at the end of each month. Under the investment advisory agreement, the Fund pays the Advisor a management fee based on the daily net assets of the Fund at an annual rate as shown in the following table:
| | | | | |
| MANAGEMENT FEE SCHEDULE |
| DAILY NET ASSETS | | FEE RATE |
| |
Up to $500 million | | | | 0.975 | % |
| |
Next $500 million | | | | 0.925 | |
| |
Next $500 million | | | | 0.875 | |
| |
Next $500 million | | | | 0.825 | |
| |
Over $2 billion | | | | 0.775 | |
The Fund’s effective management fee for the six months ended March 31, 2018 was 0.975% of the Fund’s average net assets (before applicable management fee waiver of $121,554).
The Trust has entered into administrative service agreements with the Advisor, whereby the Advisor will perform certain administrative services related to each class of the Fund’s shares. Until January 31, 2018, the fees were payable at an annual rate of up to 0.125 of 1% per annum of the average daily net assets attributable to each class of shares. As of February 1, 2018, the fees are computed as an annual percentage of the aggregate average daily net assets of all shares classes of all Funds in the Trust as follows:
| | | | | |
| ADMINISTRATION FEE SCHEDULE |
| DAILY NET ASSETS | | FEE RATE |
| |
Up to $20 billion | | | | 0.100 | % |
| |
$20 billion to $40 billion | | | | 0.075 | |
| |
$40 billion to $60 billion | | | | 0.040 | |
| |
Over $60 billion | | | | 0.030 | |
The aggregate fee amount is allocated on a daily basis to each Fund based on net assets and subsequently allocated to each class of shares of the Fund. Total administrative service fees incurred by each class of shares of the Fund for the six months ended March 31, 2018, are set forth in the Statement of Operations.
The Trust has an underwriting agreement with Thornburg Securities Corporation (the “Distributor”), an affiliate of the Advisor, which acts as the distributor of the Fund’s shares. For the six months ended March 31, 2018, the Distributor has advised the Fund that it earned net commissions aggregating $3,504 from the sale of Class A shares, and collected contingent deferred sales charges aggregating $44 from redemptions of Class C shares of the Fund.
Pursuant to a service plan under Rule 12b-1 of the Investment Company Act of 1940, the Fund may pay to the Distributor or securities dealers and other financial institutions at the Distributor’s direction an amount not to exceed .25 of 1% per annum of the average daily net assets attributable to Class A, Class C and Class I shares of the Fund to obtain various shareholder and distribution related services. For the six months ended March 31, 2018, there were no 12b-1 service plan fees charged for Class I shares. The Advisor and Distributor each may pay out of its own resources additional expenses for distribution of the Fund’s shares and shareholder services.
18 | Semi-Annual Report
Notes to Financial Statements, Continued
Thornburg Better World International Fund | March 31, 2018 (Unaudited)
The Trust has also adopted a distribution plan pursuant to Rule 12b-1, applicable only to the Fund’s Class C shares under which the Fund compensates the Distributor for services in promoting the sale of Class C shares of the Fund at an annual rate of up to .75 of 1% per annum of the average daily net assets attributable to Class C shares.
Total fees incurred by each class of shares of the Fund under their respective service and distribution plans for the six months ended March 31, 2018, are set forth in the Statement of Operations.
The Advisor and Distributor have contractually agreed to waive fees and reimburse expenses incurred by the Fund so that actual expenses of certain share classes do not exceed levels as specified in each Fund’s most recent prospectus. The agreement may be terminated by the Fund at any time, but may not be terminated by the Advisor or Distributor before February 1, 2019, unless the Advisor ceases to be the investment advisor to the Fund or the Distributor ceases to be the distributor of the Fund prior to that date. The Advisor and Distributor may recoup amounts waived or reimbursed during the fiscal year if expenses fall below the contractual limit during that year.
For the six months ended March 31, 2018, the Advisor voluntarily waived Fund level investment advisory fees of $121,554. For the six months ended March 31, 2018, the Advisor contractually reimbursed certain class specific expenses, administrative fees, and distribution fees of $8,370 for Class A shares, $6,303 for Class C shares, and $31,397 for Class I shares.
Certain officers and Trustees of the Trust are also officers or directors of the Advisor and Distributor. The compensation of the independent Trustees is borne by the Trust. The Trust also pays a portion of the Chief Compliance Officer’s compensation. These amounts are reflected as “Trustee and officer fees” in the Statement of Operations.
The percentage of direct investments in the Fund held by the Trustees, officers of the Trust, and the Advisor is approximately 41.74%.
The Fund may purchase or sell securities from, or to an affiliated fund, provided the affiliation is due solely to having a common investment advisor, common officers, or common trustees, and provided that all such transactions will comply with Rule 17a-7 under the 1940 Act. For the six months ended March 31, 2018, the Fund had no such transactions with affiliated funds.
Shown below are holdings of voting securities of each portfolio company which is considered “affiliated” to the Fund under the Investment Company Act of 1940, including companies for which the Fund’s holding represented 5% or more of the company’s voting securities, and a series of the Thornburg Investment Trust in which the Fund invested for cash management purposes during the period:
| | | | | | | | | | | | | | | | | | | | | | | | | | | | | | | | | | | | | | | | |
| FUND | | MARKET VALUE
9/30/17 | | PURCHASES
AT COST | | SALES
PROCEEDS | | REALIZED
GAIN
(LOSS) | | CHANGE IN
UNREALIZED
APPR./(DEPR.) | | MARKET VALUE
3/31/18 | | DIVIDEND
INCOME | | ROC
ADJUSTMENT |
Thornburg Capital Management Fund | | | $ | 7,738,888 | | | | $ | 28,041,780 | | | | $ | | (32,136,524) | | | $ | – | | | | $ | – | | | | $ | 3,644,144 | | | | $ | 49,047 | | | | $ | – | |
NOTE 5 – SHARES OF BENEFICIAL INTEREST
At March 31, 2018, there were an unlimited number of shares with no par value of beneficial interest authorized. Transactions in shares of beneficial interest were as follows:
| | | | | | | | | | | | | | | | |
| | | SIX MONTHS ENDED
MARCH 31, 2018 (UNAUDITED) | | | YEAR ENDED
SEPTEMBER 30, 2017 (AUDITED) | |
| | | SHARES | | | AMOUNT | | | SHARES | | | AMOUNT | |
Class A Shares | | | | | | | | | | | | | | | | |
Shares sold | | | 99,239 | | | $ | 1,467,601 | | | | 386,475 | | | $ | 5,145,982 | |
Shares issued to shareholders in
reinvestment of dividends | | | 11,866 | | | | 169,052 | | | | 17,306 | | | | 219,209 | |
Shares repurchased | | | (19,490 | ) | | | (284,329 | ) | | | (67,442 | ) | | | (909,819 | ) |
| | | | |
| | | | |
Net increase | | | 91,615 | | | $ | 1,352,324 | | | | 336,339 | | | $ | 4,455,372 | |
| | | | |
Class C Shares | | | | | | | | | | | | | | | | |
Shares sold | | | 36,683 | | | $ | 529,867 | | | | 99,435 | | | $ | 1,303,381 | |
Shares issued to shareholders in
reinvestment of dividends | | | 4,397 | | | | 62,136 | | | | 4,469 | | | | 56,050 | |
Shares repurchased | | | (15,850 | ) | | | (227,926 | ) | | | (6,250 | ) | | | (84,091 | ) |
| | | | |
| | | | |
Net increase | | | 25,230 | | | $ | 364,077 | | | | 97,654 | | | $ | 1,275,340 | |
| | | | |
Semi-Annual Report | 19
Notes to Financial Statements, Continued
Thornburg Better World International Fund | March 31, 2018 (Unaudited)
| | | | | | | | | | | | | | | | |
| | | SIX MONTHS ENDED
MARCH 31, 2018 (UNAUDITED) | | | YEAR ENDED
SEPTEMBER 30, 2017 (AUDITED) | |
| | | SHARES | | | AMOUNT | | | SHARES | | | AMOUNT | |
Class I Shares | | | | | | | | | | | | | | | | |
Shares sold | | | 622,638 | | | $ | 9,233,651 | | | | 2,273,986 | | | $ | 30,676,477 | |
Shares issued to shareholders in
reinvestment of dividends | | | 104,734 | | | | 1,514,453 | | | | 143,963 | | | | 1,848,995 | |
Shares repurchased | | | (1,091,890 | ) | | | (16,302,290 | ) | | | (222,307 | ) | | | (3,024,623 | ) |
| | | | |
| | | | |
Net increase (decrease) | | | (364,518 | ) | | $ | (5,554,186 | ) | | | 2,195,642 | | | $ | 29,500,849 | |
| | | | |
NOTE 6 – INVESTMENT TRANSACTIONS
For the six months ended March 31, 2018, the Fund had purchase and sale transactions of investments (excluding short-term investments) of $45,298,645 and $46,562,280, respectively.
NOTE 7 – DERIVATIVE FINANCIAL INSTRUMENTS WITH OFF-BALANCE SHEET RISK AND FOREIGN INVESTMENT RISK
The Fund may use a variety of derivative financial instruments to hedge or adjust the risks affecting its investment portfolio or to enhance investment returns. Provisions of FASB Accounting Standards Codification ASC 815-10-50 (“ASC 815”) require certain disclosures. The disclosures are intended to provide users of financial statements with an understanding of the use of derivative instruments by the Fund and how these derivatives affect the financial position, financial performance and cash flows of the Fund. The Fund does not designate any derivative instruments as hedging instruments under ASC 815. Additionally, the Fund’s risk of loss may exceed the amounts recognized on the Statement of Assets and Liabilities.
During the six months ended March 31, 2018, the Fund did not invest in any derivative financial instruments of the type addressed by ASC 815.
OTHER NOTES
Risks: The Fund’s investments subject it to risks including, but not limited to, management risk, market and economic risk, risks affecting specific issuers, liquidity risk, the risks associated with investments in small- and mid-cap companies and non-U.S. issuers (including developing country issuers), credit risk, social investing risk, real estate investment trusts, and interest rate risk. Please see the Fund’s prospectus for a discussion of the risks associated with an investment in the Fund.
Subsequent Events: Fund management believes no events have occurred between March 31, 2018 and the date of issuance of the financial statements that require adjustment to or disclosure in the accompanying financial statements.
20 | Semi-Annual Report
This page intentionally left blank.
Semi-Annual Report | 21
Financial Highlights
Thornburg Better World International Fund
| | | | | | | | | | | | | | | | | | | | | | | | | | | | | | | | | | | | | | | | |
| | | PER SHARE PERFORMANCE (FOR A SHARE OUTSTANDING THROUGHOUT THE PERIOD) |
| | | | | | | | | | | | | | | | | |
UNLESS OTHERWISE
NOTED, PERIODS ARE
FISCAL YEARS ENDED
SEPTEMBER 30, | | NET ASSET
VALUE,
BEGINNING OF
PERIOD | | NET
INVESTMENT
INCOME
(LOSS)+ | | NET REALIZED &
UNREALIZED GAIN
(LOSS) ON
INVESTMENTS | | TOTAL FROM
INVESTMENT
OPERATIONS | | DIVIDENDS
FROM NET
INVESTMENT
INCOME | | DIVIDENDS
FROM NET
REALIZED
GAINS | | TOTAL
DIVIDENDS | | NET ASSET
VALUE,
END OF PERIOD |
| | | | | | |
| CLASS A SHARES | | | | | | | | | | | | | | | | | | | | | | | | | | | | | | | |
| | | | | | | | |
2018(b)(c) | | | $ | 14.13 | | | | | (0.03 | ) | | | | 0.45 | | | | | 0.42 | | | | | – | | | | | (0.07 | ) | | | | (0.07 | ) | | | $ | 14.48 | |
2017(b) | | | $ | 13.86 | | | | | 0.09 | | | | | 0.99 | | | | | 1.08 | | | | | (0.12 | ) | | | | (0.69 | ) | | | | (0.81 | ) | | | $ | 14.13 | |
2016(b)(e) | | | $ | 11.94 | | | | | 0.03 | | | | | 2.04 | | | | | 2.07 | | | | | (0.15 | ) | | | | – | | | | | (0.15 | ) | | | $ | 13.86 | |
| | | | | | |
| CLASS C SHARES | | | | | | | | | | | | | | | | | | | | | | | | | | | | | | | |
| | | | | | | | |
2018(c) | | | $ | 14.02 | | | | | (0.07 | ) | | | | 0.45 | | | | | 0.38 | | | | | – | | | | | (0.07 | ) | | | | (0.07 | ) | | | $ | 14.33 | |
2017 | | | $ | 13.79 | | | | | 0.02 | | | | | 0.97 | | | | | 0.99 | | | | | (0.07 | ) | | | | (0.69 | ) | | | | (0.76 | ) | | | $ | 14.02 | |
2016(e) | | | $ | 11.94 | | | | | (0.05 | ) | | | | 2.04 | | | | | 1.99 | | | | | (0.14 | ) | | | | – | | | | | (0.14 | ) | | | $ | 13.79 | |
| | | | | | |
| CLASS I SHARES | | | | | | | | | | | | | | | | | | | | | | | | | | | | | | | |
| | | | | | | | |
2018(c) | | | $ | 14.33 | | | | | 0.02 | | | | | 0.47 | | | | | 0.49 | | | | | – | | | | | (0.07 | ) | | | | (0.07 | ) | | | $ | 14.75 | |
2017 | | | $ | 13.96 | | | | | 0.20 | | | | | 1.02 | | | | | 1.22 | | | | | (0.16 | ) | | | | (0.69 | ) | | | | (0.85 | ) | | | $ | 14.33 | |
2016(e) | | | $ | 11.94 | | | | | 0.10 | | | | | 2.01 | | | | | 2.11 | | | | | (0.09 | ) | | | | – | | | | | (0.09 | ) | | | $ | 13.96 | |
| (a) | Not annualized for periods less than one year. |
| (b) | Sales loads are not reflected in computing total return. |
| (c) | Unaudited Six Month Period Ended March 31. |
| (e) | Fund commenced operations on October 01, 2015. |
| (f) | Due to the size of net assets and fixed expenses, ratios may appear disproportionate. |
| + | Based on weighted average shares outstanding. |
See notes to financial statements.
22 | Semi-Annual Report
Financial Highlights, Continued
Thornburg Better World International Fund
| | | | | | | | | | | | | | | | | | | | | | | | | | | | | | |
| RATIOS TO AVERAGE NET ASSETS | | | | | | SUPPLEMENTAL DATA | |
| | | | | | | EXPENSES, AFTER | | | | | | | | | | | | | | | | |
NET INVESTMENT
INCOME (LOSS) (%) | | | EXPENSES, AFTER
EXPENSE
REDUCTIONS (%) | | | EXPENSE
REDUCTIONS AND
NET OF CUSTODY
CREDITS (%) | | | EXPENSES,
BEFORE EXPENSE
REDUCTIONS (%) | | | | | | TOTAL
RETURN (%)(a) | | | PORTFOLIO
TURNOVER
RATE (%)(a) | | | NET ASSETS AT
END OF PERIOD
(THOUSANDS) | |
| | | | | | | |
| | | | | | | | | | | | | | | | | | | | | | | | | | | | | | |
| | | | | | | |
| | (0.36 | )(d) | | | 1.83 | (d) | | | 1.83 | (d) | | | 2.39 | (d) | | | | | | | 5.15 | | | | 67.96 | | | $ | 7,939 | |
| | 0.64 | | | | 1.79 | | | | 1.79 | | | | 3.21 | | | | | | | | 8.61 | | | | 105.55 | | | $ | 6,450 | |
| | 0.21 | | | | 1.83 | | | | 1.83 | | | | 7.27 | (f) | | | | | | | 16.60 | | | | 180.60 | | | $ | 1,666 | |
| | | | | | | |
| | | | | | | | | | | | | | | | | | | | | | | | | | | | | | |
| | | | | | | |
| | (0.96 | )(d) | | | 2.38 | (d) | | | 2.38 | (d) | | | 3.20 | (d) | | | | | | | 4.90 | | | | 67.96 | | | $ | 2,616 | |
| | 0.18 | | | | 2.32 | | | | 2.32 | | | | 4.48 | | | | | | | | 7.97 | | | | 105.55 | | | $ | 2,205 | |
| | (0.40 | ) | | | 2.38 | | | | 2.38 | | | | 13.13 | (f) | | | | | | | 15.94 | | | | 180.60 | | | $ | 822 | |
| | | | | | | |
| | | | | | | | | | | | | | | | | | | | | | | | | | | | | | |
| | | | | | | |
| | 0.26 | (d) | | | 1.09 | (d) | | | 1.09 | (d) | | | 1.51 | (d) | | | | | | | 5.57 | | | | 67.96 | | | $ | 56,335 | |
| | 1.48 | | | | 0.94 | | | | 0.94 | | | | 1.62 | | | | | | | | 9.58 | | | | 105.55 | | | $ | 59,951 | |
| | 0.76 | | | | 1.09 | | | | 1.09 | | | | 2.28 | | | | | | | | 17.44 | | | | 180.60 | | | $ | 27,781 | |
Semi-Annual Report | 23
Expense Example
Thornburg Better World International Fund | March 31, 2018 (Unaudited)
As a shareholder of the Fund, you incur two types of costs:
| | (1) | transaction costs, including |
| | (a) | sales charges (loads) on purchase payments, for Class A shares; |
| | (b) | a deferred sales charge on redemptions of any part or all of a purchase of $1 million of Class A shares within 12 months of purchase; |
| | (c) | a deferred sales charge on redemptions of Class C shares within 12 months of purchase; |
| | (2) | ongoing costs, including management fees; distribution and/or service (12b-1) fees; and other Fund expenses. |
This example is intended to help you understand your ongoing costs (in dollars) of investing in the Fund and to compare these costs with the ongoing costs of investing in other mutual funds.
The example is based on a $1,000 investment beginning on October 1, 2017, and held until March 31, 2018.
ACTUAL EXPENSES
For each class of shares, the first line of the accompanying table provides information about actual account values and actual expenses. You may use the information in this line, together with the amount you invested, to estimate the expenses that you paid over the period. Simply divide your account value by $1,000 (for example, an $8,600 account value divided by $1,000 = 8.6), then multiply the result by the number in the first line for your class of shares under the heading entitled “Expenses Paid During Period” to estimate the expenses you paid on your account during this period.
| | | | | | | | | | | | | | | |
| | | BEGINNING
ACCOUNT VALUE
10/1/17 | | ENDING
ACCOUNT VALUE
3/31/18 | | EXPENSES PAID
DURING PERIOD†
10/1/17–3/31/18 |
| | | |
| CLASS A SHARES | | | | | | | | | | | | | | | |
| | | |
Actual | | | $ | 1,000.00 | | | | $ | 1,051.50 | | | | $ | 9.36 | |
Hypothetical* | | | $ | 1,000.00 | | | | $ | 1,015.81 | | | | $ | 9.20 | |
| | | |
| CLASS C SHARES | | | | | | | | | | | | | | | |
| | | |
Actual | | | $ | 1,000.00 | | | | $ | 1,049.00 | | | | $ | 12.16 | |
Hypothetical* | | | $ | 1,000.00 | | | | $ | 1,013.06 | | | | $ | 11.94 | |
| | | |
| CLASS I SHARES | | | | | | | | | | | | | | | |
| | | |
Actual | | | $ | 1,000.00 | | | | $ | 1,055.70 | | | | $ | 5.59 | |
Hypothetical* | | | $ | 1,000.00 | | | | $ | 1,019.50 | | | | $ | 5.49 | |
| † | Expenses are equal to the annualized expense ratio for each class (A: 1.83%; C: 2.38%; I: 1.09%) multiplied by the average account value over the period, multiplied by 182/365 to reflect the one-half year period. |
| * | Hypothetical assumes a rate of return of 5% per year before expenses. |
HYPOTHETICAL EXAMPLE FOR COMPARISON PURPOSES
For each class of shares, the second line of the accompanying table provides information about hypothetical account values and hypothetical expenses based on the Fund’s actual expense ratio and an assumed rate of return of 5% per year before expenses, which is not the Fund’s actual return. The hypothetical account values and expenses may not be used to estimate the actual ending account balance or expenses you paid for the period. You may use this information to compare the ongoing costs of investing in the Fund and other funds. To do so, compare this 5% hypothetical example with the 5% hypothetical examples that appear in the shareholder reports of the other funds.
Please note that the expenses shown in the table are meant to highlight your ongoing costs only and do not reflect any transactional costs, such as sales charges (loads), redemption fees, or exchange fees. Therefore, the second line of the table for each class of shares is useful in comparing ongoing costs only, and will not help you determine the relative total costs of owning different funds. In addition, if these transactional costs were included, your costs would have been higher.
24 | Semi-Annual Report
Other Information
Thornburg Better World International Fund | March 31, 2018 (Unaudited)
PORTFOLIO PROXY VOTING
Policies and Procedures:
The Trust has delegated to Thornburg Investment Management, Inc. (the “Advisor”) voting decisions respecting proxies for the Fund’s voting securities. The Advisor makes voting decisions in accordance with its Proxy Voting Policy and Procedures. A description of the Policy and Procedures is available (i) without charge, upon request, by calling the Advisor toll-free at 1-800-847-0200, (ii) on the Thornburg website at www.thornburg.com, and (iii) on the Securities and Exchange Commission’s website at www.sec.gov.
Information regarding how proxies were voted is available on or before August 31 of each year for the twelve months ending the preceding June 30. This information is available (i) without charge, upon request by calling the Advisor toll-free at 1-800-847-0200, (ii) on the Thornburg website at www.thornburg.com, and (iii) on the Securities and Exchange Commission’s website at www.sec.gov.
AVAILABILITY OF QUARTERLY PORTFOLIO SCHEDULE
The Fund files with the Securities and Exchange Commission schedules of its portfolio holdings on Form N-Q for the first and third quarters of each fiscal year. The Fund’s Forms N-Q are available on the Commission’s website at www.sec.gov, or may be reviewed and copied at the Commission’s Public Reference Room in Washington, D.C. Information on the operation of the Public Reference Room may be obtained by calling 1-800-SEC-0330. The Fund also makes this information available on its website at www.thornburg.com/download or upon request by calling 1-800-847-0200.
Semi-Annual Report | 25
Trustees’ Statement to Shareholders
Readopted September 11, 2017
The Trustees believe current and prospective shareholders should know how we discharge our responsibilities in supervising the Funds’ investment advisor and in reviewing the advisor’s contract for renewal. Since 2005, we have issued a statement which sets out clearly the three principal guidelines that we follow in supervising the Trust’s investment advisor on your behalf. In accordance with our customary practice, in September of this year we again reviewed our statement and concluded we should reissue this statement outlining the principal features of our supervision of the advisor’s performance of investment management services for the Funds.
We begin with the premise that each shareholder selected his or her Fund because its investments are managed by the investment advisor identified in the prospectus and in accordance with the objective and policies described in the prospectus. We realize, as each of you do, that if you believe that your Fund’s stated objective and policies no longer serve your personal investment goals, you can sell your shares and leave the Fund.
Therefore, we believe that our primary supervisory task—our principal obligation to you—is to assess the nature and quality of the advisor’s services, and to confirm that the advisor actively and competently pursues the Fund’s objective, in accordance with the policies set out in the prospectus. To do this, we meet regularly with management to review your Fund’s portfolio and to discuss the advisor’s specific actions and judgments in pursuing the Fund’s objective. We do not substitute our own judgment for the advisor’s decisions in selecting investments; the advisor is paid to exercise its informed judgment on investment decisions, and we seek to confirm, in reviewing the advisor’s performance, that the advisor is doing just that.
Second, we are conscious of costs and the effect that costs have on shareholders’ returns. We try to make sure that your Fund’s fees and costs are reasonable in relationship to the services rendered and that they are generally in line with those charged by other expert investment advisors, consistent with our belief that the Fund’s investors searched for and expect that expertise and attention and have decided to pay a reasonable price for it. We do not put the management contract “out to bid” as a matter of course, and we would not do so unless we had concluded that the advisor materially had failed to pursue the Fund’s objectives in accordance with its policies, or for other equally important reasons. We believe that any other approach would be inconsistent with your interests and contrary to your expectations when you bought shares of the Fund in the first place.
Finally, because we believe that most Thornburg Fund shareholders have invested with a long-term perspective, we try not to focus too much on the fashions of the moment and on short-term performance. The market will not favor any specific investment objective or set of policies at all times and under all economic circumstances. A fund will experience periods of both high and low returns relative to other funds and other investments. Even if one of our Funds is not favored by the market at a particular time, we believe that the advisor is nonetheless obliged to remain true to the Fund’s objective and policies, and we watch to see that it does so.
Trustees of Thornburg Investment Trust
26 | Semi-Annual Report
Thornburg Funds
Thornburg Investment Management is a privately-owned global investment firm that offers a range of solutions for retail and institutional investors. Founded in 1982 and headquartered in Santa Fe, New Mexico, we manage approximately $49 billion (as of March 31, 2018) across U.S. mutual funds, separate accounts for high-net-worth investors, institutional accounts, and UCITS funds for non-U.S. investors.
EQUITY FUNDS
| | ∎ | | Thornburg Investment Income Builder Fund |
| | ∎ | | Thornburg Global Opportunities Fund |
| | ∎ | | Thornburg International Value Fund |
| | ∎ | | Thornburg Better World International Fund |
| | ∎ | | Thornburg International Growth Fund |
| | ∎ | | Thornburg Developing World Fund |
| | ∎ | | Thornburg Core Growth Fund |
FIXED INCOME FUNDS
| | ∎ | | Thornburg Low Duration Income Fund |
| | ∎ | | Thornburg Limited Term U.S. Government Fund |
| | ∎ | | Thornburg Limited Term Income Fund |
| | ∎ | | Thornburg Strategic Income Fund |
| | ∎ | | Thornburg Low Duration Municipal Fund |
| | ∎ | | Thornburg Limited Term Municipal Fund |
| | ∎ | | Thornburg Intermediate Municipal Fund |
| | ∎ | | Thornburg California Limited Term Municipal Fund |
| | ∎ | | Thornburg New Mexico Intermediate Municipal Fund |
| | ∎ | | Thornburg New York Intermediate Municipal Fund |
| | ∎ | | Thornburg Strategic Municipal Income Fund |
ALTERNATIVE FUNDS
| | ∎ | | Thornburg Long/Short Equity Fund |
Before investing, carefully consider the Fund’s investment goals, risks, charges, and expenses. For a prospectus or summary prospectus containing this and other information, contact your financial advisor or visit thornburg.com. Read it carefully before investing.
For additional information, please visit thornburg.com
Thornburg Investment Management, Inc. 2300 North Ridgetop Road, Santa Fe, NM 87506
Semi-Annual Report | 27
| | | | |
| To receive shareholder reports, prospectuses, and proxy statements electronically, go to www.thornburg.com/edelivery. | | | | |
| This Semi-Annual Report is submitted for the general information of shareholders of the Fund. It is not authorized for distribution to prospective investors in the Fund unless preceded or accompanied by an effective prospectus. | |
| | | | |
Investment Advisor: | | Distributor: | | |
Thornburg Investment Management® | | Thornburg Securities Corporation® | | |
800.847.0200 | | 800.847.0200 | | TH3645 |
Semi-Annual Report
March 31, 2018
THORNBURG
CAPITAL
MANAGEMENT
FUND
About Thornburg Investment Management
It’s more than what we do.
It’s how we do it.
At Thornburg, we are very different in how we think, invest, and are structured. We believe this difference is what makes us successful in helping individuals reach their long-term financial goals.
Flexible Perspective
Our perspective on investment opportunities is more flexible than most, viewing a wide range of opportunities beyond conventional boundaries to find hidden value.
Collaboration
Collectively, we hone ideas via borderless cross-pollination for better judgment and better results.
Portfolio Construction
Disciplined construction guided more by our convictions than convention.
CONVICTION
Thorough analysis and our relative-value framework lead to conviction in our securities selection.
UNCONVENTIONAL
Active management means we seek the best value for our clients rather than using conventional benchmarks as our starting point.
Structured for Excellence
How we think and how we invest is made possible by how we’re structured.
TEAM APPROACH
FAR FROM THE HERD
ACCESS & TRANSPARENCY
2 | Semi-Annual Report
Thornburg Capital Management Fund
Semi-Annual Report | March 31, 2018
Table of Contents
| | | | | | | | | | |
| SHARE CLASS | | NASDAQ SYMBOL | | CUSIP |
| | |
| Class I | | N/A | | | | 885-216-739 | |
Semi-Annual Report | 3
Performance Summary
Thornburg Capital Management Fund | March 31, 2018 (Unaudited)
AVERAGE ANNUAL TOTAL RETURNS
| | | | | | | | | | |
| | | 1-YR | | SINCE
INCEP. |
| | |
Class I Shares (Incep: 7/31/15) | | | | 1.29% | | | | | 0.79% | |
| | |
FTSE 1-Month T-Bill Index (Since 7/31/15) | | | | 1.04% | | | | | 0.51% | |
30-DAY YIELDS, I SHARES (with sales charge)
| | | | | |
| Annualized Distribution Yield | | | | 1.79% | |
| SEC Yield | | | | 1.85% | |
GROWTH OF A HYPOTHETICAL $10,000 INVESTMENT
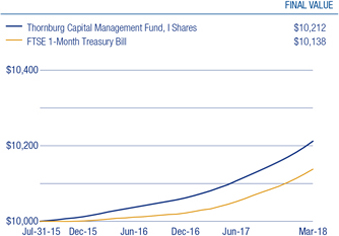
Performance data shown represents past performance and is no guarantee of future results. Investment return and principal value will fluctuate so shares, when redeemed, may be worth more or less than their original cost. Current performance may be lower or higher than quoted. For performance current to the most recent month end, call 800-847-0200. There is no sales charge for class I shares.
Glossary
FTSE One-Month Treasury Bill Index - Measures monthly return equivalents of yield averages that are not marked to market. The One-Month Treasury Bill Index consists of the last one-month Treasury bill issue.
The performance of any index is not indicative of the performance of any particular investment. Unless otherwise noted, index returns reflect the reinvestment of income dividends and capital gains, if any, but do not reflect fees, brokerage commissions or other expenses of investing. Investors may not make direct investments into any index.
Annualized Distribution Yield – The distribution yield reflects actual distributions made to shareholders. The annualized distribution yield is calculated by summing the last 30 days
of income at a given month end and annualizing to a 360-day year. The result is divided by the ending maximum offering price or net asset value.
Short-Term Credit Ratings - A bond credit rating assesses the financial ability of a debt issuer to make timely payments of principal and interest. Short-term obligation ratings of A-1 (the highest), A-2 and A-3 are investment-grade quality. Ratings of B, C and D (the lowest) are considered below investment grade, speculative grade, or junk bonds.
4 | Semi-Annual Report
Fund Summary
Thornburg Capital Management Fund | March 31, 2018 (Unaudited)
PORTFOLIO COMPOSITION
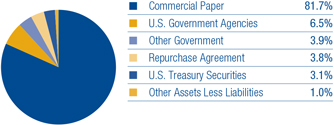
There is no guarantee that the Fund will meet its investment objectives.
All data is subject to change. Charts may not add up to 100% due to rounding.
Semi-Annual Report | 5
Schedule of Investments
Thornburg Capital Management Fund | March 31, 2018 (Unaudited)
| | | | | | | | | | | | |
| | | | | SHARES/
PRINCIPAL AMOUNT | | VALUE |
| | | |
| | SHORT-TERM INVESTMENTS — 99.0% | | | | | | | | | | |
| | | |
| | Alabama Power Co., | | | | | | | | | | |
| a | | 2.150%%, 4/2/2018 | | | $ | 8,755,000 | | | | $ | 8,754,477 | |
| a | | 2.250%%, 4/6/2018 | | | | 7,245,000 | | | | | 7,242,736 | |
| a | | Alphabet, Inc., 1.66%, 4/2/2018 | | | | 15,000,000 | | | | | 14,999,308 | |
| | Ameren Illinois Co., 2.15%, 4/11/2018 | | | | 1,390,000 | | | | | 1,389,170 | |
| a | | Anthem, Inc., 2.25%, 4/6/2018 | | | | 16,000,000 | | | | | 15,995,000 | |
| | Apple, Inc., | | | | | | | | | | |
| a | | 1.650%%, 4/12/2018 | | | | 1,658,000 | | | | | 1,657,164 | |
| a | | 1.730%%, 4/13/2018 | | | | 3,000,000 | | | | | 2,998,270 | |
| a | | 1.760%%, 4/18/2018 | | | | 1,492,000 | | | | | 1,490,760 | |
| a | | 1.800%%, 4/24/2018 | | | | 2,250,000 | | | | | 2,247,413 | |
| a | | Archer Daniels Midland Co., 1.90%, 4/9/2018 | | | | 5,000,000 | | | | | 4,997,889 | |
| | Arizona Public Service Co., 2.15%, 4/2/2018 | | | | 31,000,000 | | | | | 30,998,145 | |
| | Atlantic City Electric, 2.30%, 4/2/2018 | | | | 15,000,000 | | | | | 14,999,042 | |
| | AutoZone, Inc., | | | | | | | | | | |
| a | | 2.000%%, 4/2/2018 | | | | 10,787,000 | | | | | 10,786,401 | |
| a | | 2.280%%, 4/6/2018 | | | | 5,213,000 | | | | | 5,211,349 | |
| a | | AVANGRID, Inc., 2.15%, 4/2/2018 | | | | 15,000,000 | | | | | 14,999,104 | |
| a,b | | B.A.T. International Finance plc, 2.35%, 4/9/2018 | | | | 16,000,000 | | | | | 15,991,644 | |
| | Baltimore Gas and Electric Co., 2.20%, 4/2/2018 | | | | 15,000,000 | | | | | 14,999,083 | |
| | Bank of New York Tri-Party Repurchase Agreement 1.88% dated 3/29/2018 due 4/2/2018, repurchase price $40,008,379 collateralized by 30 corporate debt securities, having an average coupon of 3.70%, a minimum credit rating of BBB-, maturity dates from 9/8/2020 to 6/1/2065, and having an aggregate market value of $42,795,164 at 3/29/2018 | | | | 40,000,000 | | | | | 40,000,000 | |
| a,b | | Bell Canada, 2.02%, 4/2/2018 | | | | 5,000,000 | | | | | 4,999,719 | |
| a | | Berkshire Hathaway Energy, 2.16%, 4/2/2018 | | | | 16,000,000 | | | | | 15,999,040 | |
| a | | Campbell Soup Co., 2.05%, 4/9/2018 | | | | 11,000,000 | | | | | 10,994,989 | |
| | Canadian National Railway Co., | | | | | | | | | | |
| a,b | | 1.750%%, 4/2/2018 | | | | 4,500,000 | | | | | 4,499,781 | |
| a,b | | 1.780%%, 4/2/2018 | | | | 4,000,000 | | | | | 3,999,802 | |
| a,b | | 1.860%%, 4/9/2018 | | | | 4,553,000 | | | | | 4,551,118 | |
| a,b | | 1.920%%, 4/18/2018 | | | | 2,947,000 | | | | | 2,944,328 | |
| a | | Centerpoint Energy, Inc., 2.20%, 4/2/2018 | | | | 15,000,000 | | | | | 14,999,083 | |
| | Cintas Corp., | | | | | | | | | | |
| a | | 2.050%%, 4/2/2018 | | | | 3,000,000 | | | | | 2,999,829 | |
| a | | 2.200%%, 4/2/2018 | | | | 2,850,000 | | | | | 2,849,826 | |
| a | | Conagra Foods, Inc., 1.76%, 4/2/2018 | | | | 10,000,000 | | | | | 9,999,389 | |
| a | | Consolidated Edison, Inc., 2.28%, 4/10/2018 | | | | 7,900,000 | | | | | 7,895,497 | |
| | Delmarva Power & Light, 2.27%, 4/2/2018 | | | | 15,000,000 | | | | | 14,999,054 | |
| a,b | | Diageo Capital plc, 2.26%, 4/2/2018 | | | | 15,000,000 | | | | | 14,999,058 | |
| a | | Dollar General Corp., 2.20%, 4/2/2018 | | | | 15,000,000 | | | | | 14,999,083 | |
| | Dover Corp., | | | | | | | | | | |
| a | | 2.250%%, 4/2/2018 | | | | 8,438,000 | | | | | 8,437,473 | |
| a | | 2.300%%, 4/4/2018 | | | | 7,562,000 | | | | | 7,560,551 | |
| | Dow Chemical Co., 2.25%, 4/3/2018 | | | | 1,300,000 | | | | | 1,299,838 | |
| | Electricite de France S.A., | | | | | | | | | | |
| a,b | | 2.000%%, 4/3/2018 | | | | 13,703,000 | | | | | 13,701,477 | |
| a,b | | 2.230%%, 4/10/2018 | | | | 1,297,000 | | | | | 1,296,277 | |
| | Eli Lilly & Co., | | | | | | | | | | |
| a | | 1.600%%, 4/3/2018 | | | | 13,000,000 | | | | | 12,998,844 | |
| a | | 1.650%%, 4/4/2018 | | | | 3,000,000 | | | | | 2,999,588 | |
| a | | Emerson Electric Co., 1.80%, 4/12/2018 | | | | 12,800,000 | | | | | 12,792,960 | |
| | Federal Home Loan Bank Discount Notes, | | | | | | | | | | |
| | 1.400%%, 4/2/2018 | | | | 13,000,000 | | | | | 12,999,494 | |
| | 1.620%%, 4/5/2018 | | | | 3,862,000 | | | | | 3,861,305 | |
| | 1.620%%, 4/17/2018 | | | | 1,200,000 | | | | | 1,199,136 | |
| | 1.630%%, 4/24/2018 | | | | 2,800,000 | | | | | 2,797,084 | |
| | 1.640%%, 4/20/2018 | | | | 11,000,000 | | | | | 10,990,479 | |
| | 1.650%%, 4/19/2018 | | | | 292,000 | | | | | 291,759 | |
| | 1.680%%, 4/19/2018 | | | | 5,000,000 | | | | | 4,995,800 | |
| | 1.710%%, 4/18/2018 | | | | 3,000,000 | | | | | 2,997,578 | |
6 | Semi-Annual Report
Schedule of Investments, Continued
Thornburg Capital Management Fund | March 31, 2018 (Unaudited)
| | | | | | | | | | | | |
| | | | | SHARES/
PRINCIPAL AMOUNT | | VALUE |
| | General Mills, Inc., | | | | | | | | | | |
| a | | 1.950%%, 4/2/2018 | | | $ | 786,000 | | | | $ | 785,957 | |
| a | | 2.000%%, 4/2/2018 | | | | 5,000,000 | | | | | 4,999,722 | |
| | Hitachi America Capital Ltd., | | | | | | | | | | |
| | 2.150%%, 4/2/2018 | | | | 1,000,000 | | | | | 999,940 | |
| | 2.350%%, 4/11/2018 | | | | 2,704,000 | | | | | 2,702,235 | |
| | 2.400%%, 4/20/2018 | | | | 1,802,000 | | | | | 1,799,718 | |
| | Intel Corp., | | | | | | | | | | |
| a | | 1.700%%, 4/3/2018 | | | | 10,000,000 | | | | | 9,999,056 | |
| a | | 1.840%%, 4/24/2018 | | | | 14,550,000 | | | | | 14,532,896 | |
| | International Bank for Reconstruction & Development Discount Notes, | | | | | | | | | | |
| b | | 1.300%%, 4/2/2018 | | | | 9,000,000 | | | | | 8,999,675 | |
| b | | 1.550%%, 4/2/2018 | | | | 11,000,000 | | | | | 10,999,526 | |
| b | | 1.700%%, 4/6/2018 | | | | 1,000,000 | | | | | 999,764 | |
| b | | 1.750%%, 4/16/2018 | | | | 20,000,000 | | | | | 19,985,417 | |
| a | | Kansas City Power & Light, 2.30%, 4/3/2018 | | | | 6,100,000 | | | | | 6,099,221 | |
| a | | Kentucky Utilities Co., 2.30%, 4/3/2018 | | | | 15,000,000 | | | | | 14,998,083 | |
| a | | Kimberly-Clark Corp., 1.84%, 4/6/2018 | | | | 8,900,000 | | | | | 8,897,726 | |
| a | | Kroger Co., 1.76%, 4/2/2018 | | | | 15,000,000 | | | | | 14,999,083 | |
| | L’oreal USA, Inc., | | | | | | | | | | |
| a | | 1.700%%, 4/4/2018 | | | | 1,000,000 | | | | | 999,858 | |
| a | | 1.850%%, 4/9/2018 | | | | 9,000,000 | | | | | 8,996,300 | |
| a | | Leggett & Platt, 2.25%, 4/9/2018 | | | | 10,835,000 | | | | | 10,829,583 | |
| a | | Louisville Gas & Electric Co., 2.31%, 4/6/2018 | | | | 16,000,000 | | | | | 15,994,867 | |
| a | | McCormick & Co., 1.72%, 4/2/2018 | | | | 7,500,000 | | | | | 7,499,552 | |
| a | | Nestle Capital Corp., 1.65%, 4/4/2018 | | | | 16,000,000 | | | | | 15,997,800 | |
| a | | NextEra Energy Capital Holdings, Inc., 2.36%, 4/16/2018 | | | | 16,000,000 | | | | | 15,984,267 | |
| | Northern Illinois Gas Co., 2.20%, 4/5/2018 | | | | 15,000,000 | | | | | 14,996,333 | |
| | Novartis AG, | | | | | | | | | | |
| a | | 1.680%%, 4/3/2018 | | | | 4,000,000 | | | | | 3,999,627 | |
| a | | 1.860%%, 4/20/2018 | | | | 11,000,000 | | | | | 10,989,202 | |
| | NSTAR Electric Co., 1.70%, 4/5/2018 | | | | 16,000,000 | | | | | 15,996,978 | |
| a | | Oglethorpe Power Corp., 2.41%, 4/16/2018 | | | | 16,000,000 | | | | | 15,983,933 | |
| a | | Pacific Gas & Electric Co., 2.20%, 4/2/2018 | | | | 15,000,000 | | | | | 14,999,083 | |
| | PacifiCorp,, 2.15%, 4/2/2018 | | | | 10,000,000 | | | | | 9,999,403 | |
| | Peoples Gas Light & Coke Co., 2.22%, 4/3/2018 | | | | 15,000,000 | | | | | 14,998,150 | |
| | PepsiCo, Inc., | | | | | | | | | | |
| a | | 1.680%%, 4/2/2018 | | | | 11,000,000 | | | | | 10,999,487 | |
| a | | 1.700%%, 4/2/2018 | | | | 4,000,000 | | | | | 3,999,811 | |
| | Pfizer, Inc., | | | | | | | | | | |
| a | | 1.640%%, 4/3/2018 | | | | 2,400,000 | | | | | 2,399,781 | |
| a | | 1.750%%, 4/13/2018 | | | | 15,000,000 | | | | | 14,991,250 | |
| | Potomac Electric Power Co., 2.27%, 4/2/2018 | | | | 15,000,000 | | | | | 14,999,054 | |
| a | | PPL Electric Utilities Corp., 2.50%, 4/20/2018 | | | | 16,000,000 | | | | | 15,978,889 | |
| | Qualcomm, Inc., | | | | | | | | | | |
| a | | 2.150%%, 4/19/2018 | | | | 2,000,000 | | | | | 1,997,850 | |
| a | | 2.200%%, 4/19/2018 | | | | 13,000,000 | | | | | 12,985,700 | |
| | Reckitt Benckiser Treasury Services plc, | | | | | | | | | | |
| a,b | | 2.200%%, 4/3/2018 | | | | 1,300,000 | | | | | 1,299,841 | |
| a,b | | 2.200%%, 4/4/2018 | | | | 13,700,000 | | | | | 13,697,488 | |
| | Roche Holding, Inc., | | | | | | | | | | |
| a | | 1.610%%, 4/2/2018 | | | | 2,000,000 | | | | | 1,999,911 | |
| a | | 1.780%%, 4/16/2018 | | | | 6,000,000 | | | | | 5,995,550 | |
| a | | Rockwell Automation, Inc., 1.95%, 4/6/2018 | | | | 14,000,000 | | | | | 13,996,208 | |
| a | | Snap-on, Inc., 2.10%, 4/5/2018 | | | | 4,818,000 | | | | | 4,816,876 | |
| | Spectra Energy Partners, | | | | | | | | | | |
| a | | 2.050%%, 4/2/2018 | | | | 6,551,000 | | | | | 6,550,627 | |
| a | | 2.250%%, 4/2/2018 | | | | 1,449,000 | | | | | 1,448,909 | |
| a | | 2.400%%, 4/9/2018 | | | | 8,000,000 | | | | | 7,995,733 | |
| a,b | | Telus Corp., 1.90%, 4/2/2018 | | | | 3,800,000 | | | | | 3,799,799 | |
| | Tennessee Valley Authority Discount Notes, 1.50%, 4/17/2018 | | | | 27,000,000 | | | | | 26,982,000 | |
Semi-Annual Report | 7
Schedule of Investments, Continued
Thornburg Capital Management Fund | March 31, 2018 (Unaudited)
| | | | | | | | | | | | |
| | | | | SHARES/
PRINCIPAL AMOUNT | | VALUE |
| | The Coca-Cola Co., | | | | | | | | | | |
| a | | 1.650%%, 4/6/2018 | | | $ | 7,416,000 | | | | $ | 7,414,301 | |
| a | | 1.750%%, 4/3/2018 | | | | 5,350,000 | | | | | 5,349,480 | |
| a | | The Home Depot, 1.80%, 4/9/2018 | | | | 16,000,000 | | | | | 15,993,600 | |
| a,b | | Tyco Electronics Group S.A., 2.22%, 4/2/2018 | | | | 15,000,000 | | | | | 14,999,075 | |
| a | | Tyson Foods, Inc., 2.22%, 4/4/2018 | | | | 15,000,000 | | | | | 14,997,225 | |
| | Union Electric Co., 2.00%, 4/5/2018 | | | | 1,540,000 | | | | | 1,539,658 | |
| a | | United Parcel Service, Inc., 1.68%, 4/2/2018 | | | | 10,000,000 | | | | | 9,999,533 | |
| | United States Treasury Bill, 1.66%, 4/12/2018 | | | | 32,000,000 | | | | | 31,983,767 | |
| | Wal-Mart Stores, Inc., | | | | | | | | | | |
| a | | 1.730%%, 4/2/2018 | | | | 6,000,000 | | | | | 5,999,712 | |
| a | | 1.850%%, 4/18/2018 | | | | 1,000,000 | | | | | 999,126 | |
| a | | 1.900%%, 4/23/2018 | | | | 8,000,000 | | | | | 7,990,711 | |
| | | | | | | | | | | | |
| | TOTAL SHORT-TERM INVESTMENTS (Cost $1,026,970,101) | | | | | | | | | 1,026,970,101 | |
| | | | | | | | | | | | |
| | | |
| | TOTAL INVESTMENTS — 99.0% (Cost $1,026,970,101) | | | | | | | | $ | 1,026,970,101 | |
| | | |
| | OTHER ASSETS LESS LIABILITIES — 1.0% | | | | | | | | | 10,124,596 | |
| | | | | | | | | | | | |
| | | |
| | NET ASSETS — 100.0% | | | | | | | | $ | 1,037,094,697 | |
| | | | | | | | | | | | |
Footnote Legend
| a | Securities exempt from registration under Rule 144A of the Securities Act of 1933, as amended. These securities are restricted but liquid and may only be resold in the ordinary course of business in transactions exempt from registration, normally to qualified institutional buyers. As of March 31, 2018, the aggregate value of these securities in the Fund’s portfolio was $690,171,516, representing 66.55% of the Fund’s net assets. |
| b | Yankee bond denominated in U.S. dollars and is issued in the U.S. by foreign banks and corporations. |
See notes to financial statements.
8 | Semi-Annual Report
Statement of Assets and Liabilities
Thornburg Capital Management Fund | March 31, 2018 (Unaudited)
| | | | |
ASSETS | | | | |
| |
Investments at value (cost $1,026,970,101) (Note 3) | | $ | 1,026,970,101 | |
Cash | | | 10,162,126 | |
Interest receivable | | | 6,374 | |
Prepaid expenses and other assets | | | 3,731 | |
| | | | |
| |
Total Assets | | | 1,037,142,332 | |
| | | | |
| |
LIABILITIES | | | | |
| |
Accounts payable and accrued expenses | | | 47,554 | |
Dividends payable | | | 81 | |
| | | | |
| |
Total Liabilities | | | 47,635 | |
| | | | |
| |
NET ASSETS | | $ | 1,037,094,697 | |
| | | | |
| |
NET ASSETS CONSIST OF | | | | |
| |
Undistributed net investment income | | $ | 23,695 | |
Net capital paid in on shares of beneficial interest | | | 1,037,071,002 | |
| | | | |
| |
| | $ | 1,037,094,697 | |
| | | | |
| |
NET ASSET VALUE | | | | |
| |
Class I Shares: | | | | |
Net asset value, offering and redemption price per share ($1,037,094,697 applicable to 103,709,470 shares of beneficial interest outstanding - Note 5) | | $ | 10.00 | |
| | | | |
See notes to financial statements.
Semi-Annual Report | 9
Statement of Operations
Thornburg Capital Management Fund | Six Months Ended March 31, 2018 (Unaudited)
| | | | |
INVESTMENT INCOME | | | | |
| |
Interest income | | $ | 7,858,265 | |
| | | | |
| |
EXPENSES | | | | |
| |
Transfer agent fees | | | 2,594 | |
Custodian fees (Note 2) | | | 82,470 | |
Professional fees | | | 14,362 | |
Officer fees | | | 2,880 | |
Other expenses | | | 14,019 | |
| | | | |
| |
Total Expenses | | | 116,325 | |
| | | | |
| |
Net Investment Income | | $ | 7,741,940 | |
| | | | |
See notes to financial statements.
10 | Semi-Annual Report
Statements of Changes in Net Assets
Thornburg Capital Management Fund
| | | | | | | | | | |
| | | SIX MONTHS ENDED
MARCH 31, 2018* | | YEAR ENDED
SEPTEMBER 30, 2017 |
INCREASE (DECREASE) IN NET ASSETS FROM | | | | | | | | | | |
| | |
OPERATIONS | | | | | | | | | | |
| | |
Net investment income | | | $ | 7,741,940 | | | | $ | 9,820,572 | |
| | | | | |
| | |
Net Increase in Net Assets Resulting from Operations | | | | 7,741,940 | | | | | 9,820,572 | |
| | |
DIVIDENDS TO SHAREHOLDERS | | | | | | | | | | |
| | |
From net investment income | | | | | | | | | | |
Class I Shares | | | | (7,741,940 | ) | | | | (9,820,572 | ) |
| | |
FUND SHARE TRANSACTIONS (NOTE 5) | | | | | | | | | | |
Class I Shares | | | | (92,926,138 | ) | | | | (263,515,419 | ) |
| | | | | |
| | |
Net Decrease in Net Assets | | | | (92,926,138 | ) | | | | (263,515,419 | ) |
| | |
NET ASSETS | | | | | | | | | | |
| | |
Beginning of Period | | | | 1,130,020,835 | | | | | 1,393,536,254 | |
| | | | | |
| | |
End of Period | | | $ | 1,037,094,697 | | | | $ | 1,130,020,835 | |
| | | | | |
| | |
Undistributed net investment income | | | $ | 23,695 | | | | $ | 23,695 | |
* Unaudited.
See notes to financial statements.
Semi-Annual Report | 11
Notes to Financial Statements
Thornburg Capital Management Fund | March 31, 2018 (Unaudited)
NOTE 1 – ORGANIZATION
Thornburg Capital Management Fund (the “Fund”) is a non-diversified series of Thornburg Investment Trust (the “Trust”). The Trust was organized as a Massachusetts business trust under a Declaration of Trust dated June 3, 1987 and is registered as a diversified, open-end management investment company under the Investment Company Act of 1940, as amended. The Fund is currently one of twenty-one separate series of the Trust. Each series is considered to be a separate entity for financial reporting and tax purposes and bears expenses directly attributable to it. The Fund’s investment objective is to seek current income consistent with liquidity management and safety of capital.
The Fund currently offers one class of shares of beneficial interest: Institutional Class (“Class I”). This class of shares of the Fund represents all interest in the portfolio of investments. Class I shares are sold at net asset value without a sales charge at the time of purchase and may be subject to a service fee. All expenses are allocated to the class including transfer agent fees, government registration fees, printing and postage costs, and legal expenses.
Shares of the Fund are issued solely in private placement transactions that do not involve any “public offering” within the meaning of Section (4)2 of the 1933 Act. Investments in the Fund may only be made by investment companies, or other persons that are “accredited investors” within the meaning of Regulation D under the 1933 Act. Currently, the Fund’s shares are only sold to certain other series of the Trust. Thornburg Investment Management, Inc., acting as the agent for the other series of the Trust will affect all purchases and sells of shares of the Fund on behalf of any series of the Trust.
The following is a summary of significant accounting policies followed by the Fund in the preparation of its financial statements. The Fund prepares its financial statements in conformity with United States generally accepted accounting principles (“GAAP”), including investment company accounting and reporting guidance in the Financial Accounting Standards Board (the “FASB”) Accounting Standard Codification Topic 946.
NOTE 2 – SIGNIFICANT ACCOUNTING POLICIES
Security Valuation: All investments in securities held by the Fund are valued as described in Note 3.
Allocation of Expenses: Expenses common to all Funds are allocated among the Funds comprising the Trust based upon their relative net asset values or other appropriate allocation methods.
Dividends and Distributions to Shareholders: Dividends and distributions to shareholders, which are determined in accordance with federal income tax regulations and may differ from GAAP, are recorded on the ex-dividend date. Ordinary income distributions, if any, are declared daily and paid monthly. Capital gain distributions, if any, are declared and paid annually and more often if deemed necessary by Thornburg Investment Management, Inc., the Trust’s investment advisor (the “Advisor”). Dividends are paid and are reinvested in additional shares of the Fund at net asset value per share at the close of business on the ex-dividend date, or at the shareholder’s option, paid in cash.
Investment Income: Interest income is accrued as earned. Premiums and discounts are amortized and accreted, respectively, to call dates or maturity dates using the effective yield method of the respective investments. These amounts are included in Interest income on the Statement of Operations.
Custodian Fees: Custodian fees disclosed in the Statement of Operations may include interest expenses incurred by the Fund on any cash overdrafts of its custodian account during the period. Such cash overdrafts may result from the effects of failed trades in portfolio securities and from cash outflows resulting from unanticipated shareholder redemption activity. The Fund pays interest to its custodian on any such cash overdraft at a rate set periodically at the custodian’s discretion of the overdraft amount in excess of $50,000.
Investment Transactions: Investment transactions are accounted for on a trade date basis. Realized gains and losses from the sale of investments are recorded on an identified cost basis.
Repurchase Agreements: The Fund may invest excess cash in repurchase agreements whereby the Fund purchases investments, which serve as collateral, with an agreement to resell such collateral to the seller at an agreed upon price at the maturity date of the repurchase agreement. Investments pledged as collateral for repurchase agreements are held in custody until maturity of the repurchase agreement. Provisions in the agreements require that the market value of the collateral is at least equal to the repurchase value in the event of default. In the event of default, the Fund has the right to liquidate the collateral and apply the proceeds in satisfaction of the obligation. Under certain circumstances, in the event of default or bankruptcy by the other party to the agreement, realization and/or retention of the collateral may be subject to legal proceedings.
When-Issued and Delayed Delivery Transactions: The Fund may engage in when-issued or delayed delivery transactions. To the extent the Fund engages in such transactions, it will do so for the purpose of acquiring portfolio investments consistent with the Fund’s investment
12 | Semi-Annual Report
Notes to Financial Statements, Continued
Thornburg Capital Management Fund | March 31, 2018 (Unaudited)
objectives and not for the purpose of investment leverage or to speculate on interest rate or market changes. At the time the Fund makes a commitment to purchase an investment on a when-issued or delayed delivery basis, the Fund will record the transaction and reflect the value in determining its net asset value. When effecting such transactions, assets of an amount sufficient to make payment for the portfolio investments to be purchased will be segregated on the Fund’s records on the trade date. Investments purchased on a when-issued or delayed delivery basis do not earn interest until the settlement date.
Guarantees and Indemnifications: Under the Trust’s organizational documents (and under separate agreements with the independent Trustees), its officers and Trustees are provided with an indemnification against certain liabilities arising out of the performance of their duties to the Fund. In the normal course of business the Trust may also enter into contracts with service providers that contain general indemnifications. The Trust’s maximum exposure under these arrangements is unknown. However, based on experience, the Trust expects the risk of loss to be remote.
Use of Estimates: The preparation of financial statements in conformity with GAAP requires management to make estimates and assumptions that affect the reported amounts of assets and liabilities and disclosure of contingent assets and liabilities at the date of the financial statements and the reported amounts of increases (decreases) in net assets from operations during the reporting period. Actual results could differ from those estimates.
Federal Income Taxes: It is the policy of the Trust to comply with the provisions of the Internal Revenue Code applicable to regulated investment companies and to distribute to shareholders substantially all investment company taxable income including net realized gains on investments (if any), and tax exempt income of the Fund. Therefore, no provision for federal income or excise tax is required.
The Fund files income tax returns in United States federal and applicable state jurisdictions. The statute of limitations on the Fund’s tax return filings generally remains open for the three years following a return’s filing date. The Fund has analyzed each uncertain tax position believed to be material in the preparation of the Fund’s financial statements for the six month period ended March 31, 2018, including open tax years, to assess whether it is more likely than not that the position would be sustained upon examination, based on the technical merits of the position. The Fund has not identified any such position for which an asset or liability must be reflected in the Statement of Assets and Liabilities.
At March 31, 2018, information on the tax components of capital was as follows:
| | | | | |
Cost of investments for tax purposes | | | $ | 1,026,970,101 | |
| | | | | |
Net unrealized appreciation (depreciation) on investments (tax basis) | | | $ | 0 | |
| | | | | |
There is no unrealized gain (loss) in the Fund at March 31, 2018 due to all securities with less than 60 days to maturity being valued by the amortized cost method.
NOTE 3 – SECURITY VALUATION
Valuation of the Fund’s portfolio investment securities is performed in accordance with policies and procedures adopted by and under the oversight of the Trustees.
The Trustees of the Trust have appointed the Advisor to assist the Trustees to obtain market values for portfolio investments, evaluate and monitor professional pricing service providers appointed by the Trustees’ Audit Committee (the “Audit Committee”) to assist in determining fair values for portfolio investments, assist in calculating fair values for portfolio investments in certain circumstances, and to perform other functions in connection with the valuation of investments. The Advisor acts through its Valuation and Pricing Committee (the “Committee”) and other employees of the Advisor. The Committee regularly reviews its own valuation calculations, as well as the valuations, valuation techniques and services furnished by pricing service providers, considers circumstances which may require valuation calculations by the Committee, and reviews previous valuation calculations. The Committee reports to the Audit Committee on the Committee’s activities, the performance of pricing service providers, and other matters relating to valuation of portfolio investments.
In those instances when the Committee assists in calculating a fair value for a portfolio investment, the Committee seeks to determine the price that the Fund would reasonably expect to receive upon a sale of the investment in an orderly transaction between market participants on the valuation date. The Committee customarily utilizes quotations from securities broker dealers in calculating valuations, but also may utilize prices obtained from pricing service providers or other methods approved by the Audit Committee. Because fair values calculated by the Committee are estimates, the calculation of a value for an investment may differ from the price that would be realized by the Fund upon a sale of the investment, and the difference could be material to the Fund’s financial statements. The Committee’s calculation of a fair value for an investment may also differ from the prices obtained by other persons (including other mutual funds) for the investment.
Semi-Annual Report | 13
Notes to Financial Statements, Continued
Thornburg Capital Management Fund | March 31, 2018 (Unaudited)
Valuation of Securities: Debt obligations held by the Fund which are not listed or traded on exchanges or for which no reported market exists are ordinarily valued at the valuation obtained from a pricing service provider approved by the Audit Committee.
In any case when a pricing service provider fails to provide a valuation for a debt obligation held by the Fund, the Committee calculates a fair value for the obligation using alternative methods under procedures approved by the Audit Committee. Additionally, in cases when management believes that a valuation obtained from a pricing service provider merits review for significant reasons, the Committee decides whether or not to use the valuation calculated by the pricing service provider or to use an alternative method approved by the Audit Committee to calculate a fair value for the obligation.
Valuation Hierarchy: The Fund categorizes its investments based upon the inputs used in valuing those investments, according to a three-level hierarchy established in guidance from the FASB. Categorization of investments using this hierarchy is intended by the FASB to maximize the use of observable inputs in valuing investments and minimize the use of unobservable inputs by requiring that the most observable inputs be used when available. Observable inputs are those that market participants would use in valuing an investment based on available market information. Unobservable inputs are those that reflect assumptions about the information market participants would use in valuing an investment. An investment’s level within the hierarchy is based on the lowest level input that is deemed significant to the valuation. The methodologies and inputs used to value investments are not necessarily indications of the risk or liquidity associated with those investments.
Various inputs are used in calculating valuations for the Fund’s investments. These inputs are generally summarized according to the three-level hierarchy below:
Level 1: Quoted prices in active markets for identical investments.
Level 2: Other direct or indirect significant observable inputs (including quoted prices for similar investments in active markets and other observable inputs, such as interest rates, prepayment rates, credit risk, etc.).
Level 3: Significant unobservable inputs (including the Committee’s own assumptions in calculating the fair values of investments).
Valuations for debt obligations held by the Fund are typically calculated by pricing service providers approved by the Audit Committee and are generally characterized as Level 2 within the valuation hierarchy.
In a limited number of cases the Committee calculates a fair value for investments using broker quotations or other methods approved by the Audit Committee. When the Committee uses a single broker quotation to calculate a fair value for an investment without other significant observable inputs, or if a fair value is calculated using other significant inputs that are considered unobservable, the investment is characterized as Level 3 within the hierarchy. Other significant unobservable inputs used to calculate a fair value in these instances might include an income-based valuation approach which considers discounted anticipated future cash flows from the investment and application of discounts due to the nature or duration of any restrictions on the disposition of the investment.
Valuations based upon the use of inputs from Levels 1, 2 or 3 may not represent the actual price received upon the disposition of an investment, and the Fund may receive a price that is lower than the valuation based upon these inputs when it sells the investment.
The following table displays a summary of the fair value hierarchy measurements of the Fund’s investments as of March 31, 2018. In any instance when valuation inputs from more than one level are used to determine the fair value of a specific investment, the investment is placed in the level of the table based upon the lowest level input that is significant in determining the fair value of the investment:
| | | | | | | | | | | | | | | | | | | | |
| | | FAIR VALUE MEASUREMENTS AT MARCH 31, 2018 |
| | | TOTAL | | LEVEL 1 | | LEVEL 2 | | LEVEL 3 |
Assets | | | | | | | | | | | | | | | | | | | | |
Investments in Securities | | | | | | | | | | | | | | | | | | | | |
Short-Term Investments | | | $ | 1,026,970,101 | | | | $ | – | | | | $ | 1,026,970,101 | | | | $ | – | |
| | | | | |
Total Investments in Securities | | | $ | 1,026,970,101 | | | | $ | – | | | | $ | 1,026,970,101 | | | | $ | – | |
In accordance with the guidance prescribed in Accounting Standards Update No. 2011-04, it is the policy of the Fund to recognize transfers between levels and the underlying events which caused the movement. The Fund recognized no transfers between levels for the six months ended March 31, 2018.
14 | Semi-Annual Report
Notes to Financial Statements, Continued
Thornburg Capital Management Fund | March 31, 2018 (Unaudited)
NOTE 4 – INVESTMENT ADVISORY FEE AND OTHER TRANSACTIONS WITH AFFILIATES
Pursuant to an investment advisory agreement, the Advisor serves as the investment advisor and performs services for the Fund. The Fund does not pay an advisory fee to the Advisor under this agreement.
The Advisor provides certain administrative services to the Fund. No fees are charged for these services.
The Fund may purchase or sell securities from, or to an affiliated fund, provided the affiliation is due solely to having a common investment advisor, common officers, or common trustees, and provided that all such transactions will comply with Rule 17a-7 under the 1940 Act. For the six months ended March 31, 2018, the Fund had no such transactions with affiliated funds.
NOTE 5 – SHARES OF BENEFICIAL INTEREST
At March 31, 2018, there were an unlimited number of shares with no par value of beneficial interest authorized. Transactions in shares of beneficial interest were as follows:
| | | | | | | | | | | | | | | | |
| | | SIX MONTHS ENDED
MARCH 31, 2018 (UNAUDITED) | | | YEAR ENDED
SEPTEMBER 30, 2017 (AUDITED) | |
| | | SHARES | | | AMOUNT | | | SHARES | | | AMOUNT | |
Class I Shares | | | | | | | | | | | | | | | | |
Shares sold | | | 375,886,320 | | | $ | 3,758,863,205 | | | | 876,780,189 | | | $ | 8,767,801,887 | |
Shares issued to shareholders in
reinvestment of dividends | | | 774,194 | | | | 7,741,941 | | | | 982,057 | | | | 9,820,572 | |
Shares repurchased | | | (385,953,128 | ) | | | (3,859,531,284 | ) | | | (904,113,788 | ) | | | (9,041,137,878 | ) |
| | | | |
| | | | |
Net decrease | | | (9,292,614 | ) | | $ | (92,926,138 | ) | | | (26,351,542 | ) | | $ | (263,515,419 | ) |
| | | | |
NOTE 6 – INVESTMENT TRANSACTIONS
For the six months ended March 31, 2018, the Fund had no purchase and sale transactions of investments other than short-term investments.
OTHER NOTES
Risks: The Fund’s investments subject it to risks including, but not limited to, credit risk, interest rate risk, management risk, market and economic risk, foreign investment risk, diversification risk, and liquidity risk. Please see the Fund’s prospectus for a discussion of the risks associated with an investment in the Fund.
Subsequent Events: Fund management believes no events have occurred between March 31, 2018 and the date of issuance of the financial statements that require adjustment to or disclosure in the accompanying financial statements.
Semi-Annual Report | 15
Financial Highlights
Thornburg Capital Management Fund
| | | | | | | | | | | | | | | | | | | | | | | | | | | | | | | | | | | | | | | | |
| | | PER SHARE PERFORMANCE (FOR A SHARE OUTSTANDING THROUGHOUT THE PERIOD) |
| | | | | | | | | | | | | | | | | |
UNLESS OTHERWISE NOTED, PERIODS ARE FISCAL YEARS ENDED
SEPTEMBER 30, | | NET ASSET
VALUE,
BEGINNING OF
PERIOD | | NET
INVESTMENT
INCOME
(LOSS)+ | | NET REALIZED &
UNREALIZED
GAIN (LOSS) ON
INVESTMENTS | | TOTAL FROM
INVESTMENT
OPERATIONS | | DIVIDENDS
FROM NET
INVESTMENT
INCOME | | DIVIDENDS
FROM NET
REALIZED
GAINS | | TOTAL
DIVIDENDS | | NET ASSET
VALUE,
END OF PERIOD |
| | | | | | | |
| CLASS I | | | | | | | | | | | | | | | | | | | | | | | | | | | | | | | | | | | | |
| | | | | | | | |
2018(b)(c) | | | $ | 10.00 | | | | | 0.07 | | | | | – | | | | | 0.07 | | | | | (0.07 | ) | | | | – | | | | | (0.07 | ) | | | $ | 10.00 | |
2017(b) | | | $ | 10.00 | | | | | 0.09 | | | | | – | | | | | 0.09 | | | | | (0.09 | ) | | | | – | | | | | (0.09 | ) | | | $ | 10.00 | |
2016(b) | | | $ | 10.00 | | | | | 0.05 | | | | | – | | | | | 0.05 | | | | | (0.05 | ) | | | | – | | | | | (0.05 | ) | | | $ | 10.00 | |
2015*(b) | | | $ | 10.00 | | | | | – | (f) | | | | – | (g) | | | | – | (h) | | | | – | (i) | | | | – | | | | | – | | | | $ | 10.00 | |
| (a) | Not annualized for periods less than one year. |
| (b) | Sales loads are not reflected in computing total return. |
| (c) | Unaudited Six Month Period Ended March 31. |
| (e) | Portfolio turnover rate equals zero due to no long term investment transactions in the period. |
| (f) | Net investment income (loss) was less than $0.01 per share. |
| (g) | Net realized and unrealized gain (loss) on investments was less than $0.01 per share. |
| (h) | Total from investment operations was less than $0.01 per share. |
| (i) | Dividends from net investment income per share were less than $(0.01). |
| + | Based on weighted average shares outstanding. |
| * | The Fund commenced operations on July 31, 2015. |
See notes to financial statements.
16 | Semi-Annual Report
Financial Highlights, Continued
Thornburg Capital Management Fund
| | | | | | | | | | | | | | | | | | | | | | | | | | | | | | |
| RATIOS TO AVERAGE NET ASSETS | | | | | | SUPPLEMENTAL DATA | |
| | | | | | | EXPENSES, AFTER | | | | | | | | | | | | | | | | |
NET INVESTMENT
INCOME (LOSS) (%) | | | EXPENSES, AFTER
EXPENSE
REDUCTIONS (%) | | | EXPENSE
REDUCTIONS AND
NET OF CUSTODY
CREDITS (%) | | | EXPENSES,
BEFORE EXPENSE
REDUCTIONS (%) | | | | | | TOTAL
RETURN (%)(a) | | | PORTFOLIO
TURNOVER
RATE (%)(a) | | | NET ASSETS AT
END OF PERIOD
(THOUSANDS) | |
| | | | | | | |
| | | | | | | | | | | | | | | | | | | | | | | | | | | | | | |
| | | | | | | |
| | 1.47 | (d) | | | 0.02 | (d) | | | 0.02 | (d) | | | 0.02 | (d) | | | | | | | 0.73 | | | | – | (e) | | $ | 1,037,095 | |
| | 0.89 | | | | 0.03 | | | | 0.03 | | | | 0.03 | | | | | | | | 0.87 | | | | – | (e) | | $ | 1,130,021 | |
| | 0.45 | | | | 0.03 | | | | 0.03 | | | | 0.03 | | | | | | | | 0.45 | | | | – | (e) | | $ | 1,393,536 | |
| | 0.26 | (d) | | | 0.03 | (d) | | | 0.03 | (d) | | | 0.03 | (d) | | | | | | | 0.04 | | | | – | (e) | | $ | 1,772,860 | |
Semi-Annual Report | 17
Expense Example
Thornburg Capital Management Fund | March 31, 2018 (Unaudited)
As a shareholder of the Fund, you incur ongoing costs of investing in the Fund. Because the Fund does not pay any management fee or distribution and/or service (12b-1) fee, the Fund’s ongoing costs are comprised of other Fund expenses. Shareholders of the Fund do not incur any transaction costs.
This example is intended to help you understand your ongoing costs (in dollars) of investing in the Fund and to compare these costs with the ongoing costs of investing in other mutual funds.
The example is based on a $1,000 investment beginning on October 1, 2017, and held until March 31, 2018.
| | | | | | | | | | | | | | | |
| | | BEGINNING
ACCOUNT VALUE
10/1/17 | | ENDING
ACCOUNT VALUE
3/31/18 | | EXPENSES PAID
DURING PERIOD†
10/1/17–3/31/18 |
| | | |
| CLASS I SHARES | | | | | | | | | | | | | | | |
| | | |
Actual | | | $ | 1,000.00 | | | | $ | 1,007.30 | | | | $ | 0.10 | |
Hypothetical* | | | $ | 1,000.00 | | | | $ | 1,024.83 | | | | $ | 0.10 | |
| † | Expenses are equal to the annualized expense ratio for each class (I: 0.02%) multiplied by the average account value over the period, multiplied by 182/365 to reflect the one-half year period. |
| * | Hypothetical assumes a rate of return of 5% per year before expenses. |
ACTUAL EXPENSES
For each class of shares, the first line of the accompanying table provides information about actual account values and actual expenses. You may use the information in this line, together with the amount you invested, to estimate the expenses that you paid over the period. Simply divide your account value by $1,000 (for example, an $8,600 account value divided by $1,000 = 8.6), then multiply the result by the number in the first line for your class of shares under the heading entitled “Expenses Paid During Period” to estimate the expenses you paid on your account during this period.
HYPOTHETICAL EXAMPLE FOR COMPARISON PURPOSES
For each class of shares, the second line of the accompanying table provides information about hypothetical account values and hypothetical expenses based on the Fund’s actual expense ratio and an assumed rate of return of 5% per year before expenses, which is not the Fund’s actual return. The hypothetical account values and expenses may not be used to estimate the actual ending account balance or expenses you paid for the period. You may use this information to compare the ongoing costs of investing in the Fund and other funds. To do so, compare this 5% hypothetical example with the 5% hypothetical examples that appear in the shareholder reports of the other funds.
Please note that the expenses shown in the table are meant to highlight your ongoing costs only and do not reflect any transactional costs, such as sales charges (loads), redemption fees, or exchange fees. Therefore, the second line of the table for each class of shares is useful in comparing ongoing costs only, and will not help you determine the relative total costs of owning different funds. In addition, if these transactional costs were included, your costs would have been higher.
18 | Semi-Annual Report
Other Information
Thornburg Capital Management Fund | March 31, 2018 (Unaudited)
PORTFOLIO PROXY VOTING
Policies and Procedures:
The Trust has delegated to Thornburg Investment Management, Inc. (the “Advisor”) voting decisions respecting proxies for the Fund’s voting securities. The Advisor makes voting decisions in accordance with its Proxy Voting Policy and Procedures. A description of the Policy and Procedures is available (i) without charge, upon request, by calling the Advisor toll-free at 1-800-847-0200, (ii) on the Thornburg website at www.thornburg.com, and (iii) on the Securities and Exchange Commission’s website at www.sec.gov.
Information regarding how proxies were voted is available on or before August 31 of each year for the twelve months ending the preceding June 30. This information is available (i) without charge, upon request by calling the Advisor toll-free at 1-800-847-0200, (ii) on the Thornburg website at www.thornburg.com, and (iii) on the Securities and Exchange Commission’s website at www.sec.gov.
AVAILABILITY OF QUARTERLY PORTFOLIO SCHEDULE
The Fund files with the Securities and Exchange Commission schedules of its portfolio holdings on Form N-Q for the first and third quarters of each fiscal year. The Fund’s Forms N-Q are available on the Commission’s website at www.sec.gov, or may be reviewed and copied at the Commission’s Public Reference Room in Washington, D.C. Information on the operation of the Public Reference Room may be obtained by calling 1-800-SEC-0330. The Fund also makes this information available on its website at www.thornburg.com/download or upon request by calling 1-800-847-0200.
Semi-Annual Report | 19
Trustees’ Statement to Shareholders
Readopted September 11, 2017
The Trustees believe current and prospective shareholders should know how we discharge our responsibilities in supervising the Funds’ investment advisor and in reviewing the advisor’s contract for renewal. Since 2005, we have issued a statement which sets out clearly the three principal guidelines that we follow in supervising the Trust’s investment advisor on your behalf. In accordance with our customary practice, in September of this year we again reviewed our statement and concluded we should reissue this statement outlining the principal features of our supervision of the advisor’s performance of investment management services for the Funds.
We begin with the premise that each shareholder selected his or her Fund because its investments are managed by the investment advisor identified in the prospectus and in accordance with the objective and policies described in the prospectus. We realize, as each of you do, that if you believe that your Fund’s stated objective and policies no longer serve your personal investment goals, you can sell your shares and leave the Fund.
Therefore, we believe that our primary supervisory task—our principal obligation to you—is to assess the nature and quality of the advisor’s services, and to confirm that the advisor actively and competently pursues the Fund’s objective, in accordance with the policies set out in the prospectus. To do this, we meet regularly with management to review your Fund’s portfolio and to discuss the advisor’s specific actions and judgments in pursuing the Fund’s objective. We do not substitute our own judgment for the advisor’s decisions in selecting investments; the advisor is paid to exercise its informed judgment on investment decisions, and we seek to confirm, in reviewing the advisor’s performance, that the advisor is doing just that.
Second, we are conscious of costs and the effect that costs have on shareholders’ returns. We try to make sure that your Fund’s fees and costs are reasonable in relationship to the services rendered and that they are generally in line with those charged by other expert investment advisors, consistent with our belief that the Fund’s investors searched for and expect that expertise and attention and have decided to pay a reasonable price for it. We do not put the management contract “out to bid” as a matter of course, and we would not do so unless we had concluded that the advisor materially had failed to pursue the Fund’s objectives in accordance with its policies, or for other equally important reasons. We believe that any other approach would be inconsistent with your interests and contrary to your expectations when you bought shares of the Fund in the first place.
Finally, because we believe that most Thornburg Fund shareholders have invested with a long-term perspective, we try not to focus too much on the fashions of the moment and on short-term performance. The market will not favor any specific investment objective or set of policies at all times and under all economic circumstances. A fund will experience periods of both high and low returns relative to other funds and other investments. Even if one of our Funds is not favored by the market at a particular time, we believe that the advisor is nonetheless obliged to remain true to the Fund’s objective and policies, and we watch to see that it does so.
Trustees of Thornburg Investment Trust
20 | Semi-Annual Report
Thornburg Funds
Thornburg Investment Management is a privately-owned global investment firm that offers a range of solutions for retail and institutional investors. Founded in 1982 and headquartered in Santa Fe, New Mexico, we manage approximately $49 billion (as of March 31, 2018) across U.S. mutual funds, separate accounts for high-net-worth investors, institutional accounts, and UCITS funds for non-U.S. investors.
EQUITY FUNDS
| | ∎ | | Thornburg Investment Income Builder Fund |
| | ∎ | | Thornburg Global Opportunities Fund |
| | ∎ | | Thornburg International Value Fund |
| | ∎ | | Thornburg Better World International Fund |
| | ∎ | | Thornburg International Growth Fund |
| | ∎ | | Thornburg Developing World Fund |
| | ∎ | | Thornburg Core Growth Fund |
FIXED INCOME FUNDS
| | ∎ | | Thornburg Low Duration Income Fund |
| | ∎ | | Thornburg Limited Term U.S. Government Fund |
| | ∎ | | Thornburg Limited Term Income Fund |
| | ∎ | | Thornburg Strategic Income Fund |
| | ∎ | | Thornburg Low Duration Municipal Fund |
| | ∎ | | Thornburg Limited Term Municipal Fund |
| | ∎ | | Thornburg Intermediate Municipal Fund |
| | ∎ | | Thornburg California Limited Term Municipal Fund |
| | ∎ | | Thornburg New Mexico Intermediate Municipal Fund |
| | ∎ | | Thornburg New York Intermediate Municipal Fund |
| | ∎ | | Thornburg Strategic Municipal Income Fund |
ALTERNATIVE FUNDS
| | ∎ | | Thornburg Long/Short Equity Fund |
Before investing, carefully consider the Fund’s investment goals, risks, charges, and expenses. For a prospectus or summary prospectus containing this and other information, contact your financial advisor or visit thornburg.com. Read it carefully before investing.
For additional information, please visit thornburg.com
Thornburg Investment Management, Inc. 2300 North Ridgetop Road, Santa Fe, NM 87506
Semi-Annual Report | 21
| | | | |
| To receive shareholder reports, prospectuses, and proxy statements electronically, go to www.thornburg.com/edelivery. | | | | |
| This Semi-Annual Report is submitted for the general information of shareholders of the Fund. It is not authorized for distribution to prospective investors in the Fund unless preceded or accompanied by an effective prospectus. | |
| | | | |
Investment Advisor: | | Distributor: | | |
Thornburg Investment Management® | | Thornburg Securities Corporation® | | |
800.847.0200 | | 800.847.0200 | | TH3478 |
Semi-Annual Report
March 31, 2018
THORNBURG
LONG/SHORT
EQUITY FUND
About Thornburg Investment Management
It’s more than what we do.
It’s how we do it.
At Thornburg, we are very different in how we think, invest, and are structured. We believe this difference is what makes us successful in helping individuals reach their long-term financial goals.
Flexible Perspective
Our perspective on investment opportunities is more flexible than most, viewing a wide range of opportunities beyond conventional boundaries to find hidden value.
Collaboration
Collectively, we hone ideas via borderless cross-pollination for better judgment and better results.
Portfolio Construction
Disciplined construction guided more by our convictions than convention.
CONVICTION
Thorough analysis and our relative-value framework lead to conviction in our securities selection.
UNCONVENTIONAL
Active management means we seek the best value for our clients rather than using conventional benchmarks as our starting point.
Structured for Excellence
How we think and how we invest is made possible by how we’re structured.
TEAM APPROACH
FAR FROM THE HERD
ACCESS & TRANSPARENCY
2 | Semi-Annual Report
Thornburg Long/Short Equity Fund
Semi-Annual Report | March 31, 2018
Table of Contents
| | | | | | | | | | |
| SHARE CLASS | | NASDAQ SYMBOL | | CUSIP |
| | |
| Class I | | THLSX | | | | 885-216-689 | |
Investments carry risks, including possible loss of principal. Additional risks may be associated with investments outside the United States, especially in emerging markets, including currency fluctuations, illiquidity, volatility, and political and economic risks.
Investments in small- and mid-capitalization companies may increase the risk of greater price fluctuations. A short position will lose value as the security’s price increases. Theoretically, the loss on a short sale can be unlimited. Investments in derivatives are subject to the risks associated with the securities or other assets underlying the pool of securities, including illiquidity and difficulty in valuation. Non-diversified funds can be more volatile than diversified funds. Investments in the Fund are not FDIC insured, nor are they bank deposits or guaranteed by a bank or any other entity.
Semi-Annual Report | 3
Letter to Shareholders
Thornburg Long/Short Equity Fund | March 31, 2018 (Unaudited)
May 4, 2018
Dear Fellow Shareholder:
Thornburg Long/Short Equity Fund performed well during the semi-annual reporting period ending March 31, 2018. The Fund was up 4.42% vs. a S&P 500 Index return of 5.84%. During the period we averaged 31.7% net exposure. We were able to provide three quarters of the return of the S&P 500 Index with only around 30% of the net equity exposure. Our long book led the way, providing a total return of 9.1% for the period, outpacing the S&P. Our short book lost us money during the period, but was up much less than our long book (+6.2%).
| | | | | | | | | | |
| | | TOTAL RETURN | | AVG. WEIGHT |
| TRAILING AS OF SIX MONTHS (3/31/2018) | | | | | | | | | | |
| Long Book | | | | 9.14% | | | | | 105.26% | |
| Short Book | | | | 6.21% | | | | �� | -73.54% | |
| Fund | | | | 4.42% | | | | | 31.72% | |
| S&P 500 Index | | | | 5.84% | | | | | – | |
| Russell 2000 Index | | | | 3.25% | | | | | – | |
Source: Kiski, Thornburg
If you look at the below chart of our performance relative to the S&P 500 Index you will get a sense for how our return stream looked early in the period, and then later as market volatility picked up. Generally speaking, THLSX was up or down less than the market during the most volatile moments.
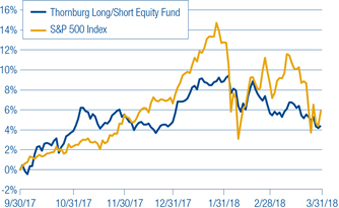
Strength in our relative returns for the period was in part driven by good performance of growth investments in the overall market. Both sides of our book are invested mostly in growthy or Growth at a Reasonable Price (GARP) investments, so both sides are likely to perform better in an environment that flatters growth investors. This occurred during the period, with growth investments, especially large cap growth investments, wildly outpacing value investments. What’s most important for us, then, is whether our long growthy investments outpace our short growthy investments (i.e. how was our stock picking during the
period). We won’t get our stock picking right in every period, but we did during this semi-annual period.
With the return of volatility over the last three months of the period, the most important question we ask ourselves is whether or not the portfolio behaves as we would expect it to given what’s happening in the world around it. We find predicting what’s going to happen in the overall economy much harder than finding great investments (i.e. doing in-depth research work to highlight individual security mispricings - whether longs or shorts). But when we see big shifts in the market, as we did in January, we want to ask ourselves whether we’ve achieved our goal of building a balanced portfolio. So far, so good on that front – the portfolio has performed day-to-day as we generally would have expected given our exposure, despite heightened volatility.
Top contributors to performance during the period were all long positions; Kose, Amazon, Switch, Casa Systems and U.S. Foods.
• Casa Systems, Inc.
Casa is a broadband equipment company that supplies primarily cable companies. Shares of Casa have climbed as they have grown their traditional cable infrastructure business and as excitement has grown about their wireless equipment capabilities.
• KOSÉCorp.
KOSÉ is a Japanese company that manufactures, retails, and exports cosmetics including makeup, skin care, and hair-care products. We have long had a Japanese short investment or two in the portfolio. That has made us all the more interested in Japanese long ideas generated by the team. This investment recommendation from Sean Sun, a portfolio manager of our Thornburg International Growth Fund, was a great investment. Since quarter end, we sold our shares at price target.
• Amazon.com, Inc.
Amazon continued its run as it grows its large ecommerce and cloud computing businesses and begins competing, often effectively, in industry after industry.
• U.S. Foods Holding Corp.
U.S. Foods continued market share gains with independent restaurant customers, improved margins from higher sales of private-label products, and an intentional shift in customer mix towards higher-value independent customers allowed the company to grow operating income at a high single-digit rate.
• Switch, Inc.
Switch, a data-center operator, had a strong trading debut following its October IPO. We sold this investment during the period at price target.
4 | Semi-Annual Report
Letter to Shareholders, Continued
Thornburg Long/Short Equity Fund | March 31, 2018 (Unaudited)
Bottom contributors to performance included long positions ADT and General Electric, and short positions Haemonetics, Grainger and HelloFresh.
• ADT,Inc.
Security monitoring company ADT was brought back to the public markets by its private equity owner Apollo Group. We like the long-term secular growth trend in household security monitoring in the U.S.; ADT’s leadership position in a very fragmented market; its sustained, strong competitive position despite significant cable and telecom provider attempts to gain share; and the predictable nature of a subscription-based revenue model. We don’t like the legacy controversy around this investment, the short investor interest that the company has attracted, management’s decision to disclose less data, nor ADT’s hefty debt load. We worked with the underwriter on the initial public offering (IPO) to help set a price that was well below the original “range,” at which we believed the positives outweighed the negatives. So far that has not been our experience, and the stock broke its IPO price and has traded materially lower since. We are monitoring developments against our initial investment thesis closely.
• General Electric Co.
General Electric is a diversified industrial and financial services conglomerate. The company serves a wide variety of end markets globally, including power and water, aviation, oil and gas, health care, appliances and lighting, energy management, transportation, and finance. During the period, its share price declined on continued disappointment from its power segment and upcoming accounting restatement.
• WW Grainger, Inc.
Our longer-term thesis on Grainger, an industrial supplies distributor, is that company’s margins are secularly challenged due to increased price transparency brought by e-commerce. Apart from being a beneficiary of the tax reform, Grainger’s recent earnings benefited from volume growth driven by a reset in product pricing.
• Haemonetics Corp.
Haemonetics is a medical devices company whose revenues are structurally challenged due to price cuts and increased competition. Strength in the company’s shares during the period can be attributed to bullish expectations on product launches as well as on tax-reform benefits.
• HelloFresh SE
HelloFresh sells meal kits over the internet. We have serious doubts about the long-term growth and margin profile of this company. In the short term, however, the stock has re-rated due to positive sentiment.
As any well-trained economist would report, we see both good and bad in the current economic environment. Trump’s administration seems as unpredictable as ever, though we’ve noticed that ridiculous opening positions have been moderated dramatically over the course of negotiations on many policy fronts. Is President Trump sneaky good at negotiating? Maybe, but we also see risks of some of the tactics backfiring. Further, the ongoing special counsel investigation of Russian interference in the 2016 election and whether the administration was complicit is sure to bring additional moments of uncertainty.
The most recent earnings season, encompassing the first calendar quarter of 2018, is progressing well so far. But any number of risks on the horizon could knock the economy off its strong footing. We will likely remain towards the lower end of our net exposure range of 30-50% for the foreseeable future, dependent, as always, on our stock picking to drive good risk-adjusted returns for the strategy.
Thank you for your trust and confidence.
Sincerely,

Connor Browne,CFA
Portfolio Manager
Managing Director
The matters discussed in this report may constitute forward-looking statements made pursuant to the safe harbor provisions of the Securities Litigation Reform Act of 1995. These include any advisor or portfolio manager prediction, assessment, analysis or outlook for individual securities, industries, investment styles, market sectors and/or markets. These statements involve risks and uncertainties. In addition to the general risks described for each fund in its current prospectus, other factors bearing on these reports include the accuracy of the advisor’s or portfolio manager’s forecasts and predictions, the appropriateness of the investment strategies designed by the advisor or portfolio manager and the ability of the advisor or portfolio manager to implement their strategies efficiently and successfully. Any one or more of these factors, as well as other risks affecting the securities markets generally, could cause the actual results of any fund to differ materially as compared to its benchmarks.
The views expressed are subject to change and do not necessarily reflect the views of Thornburg Investment Management, Inc. This information should not be relied upon as a recommendation or investment advice and is not intended to predict the performance of any investment or market.
Semi-Annual Report | 5
Performance Summary
Thornburg Long/Short Equity Fund | March 31, 2018 (Unaudited)
AVERAGE ANNUAL TOTAL RETURNS
| | | | | | | | | | | | | | | | | | | | | | | | | |
| | | 1-YR | | 3-YR | | 5-YR | | 10-YR | | SINCE
INCEP. |
| | | | | |
Class I Shares (Incep: 12/30/16) | | | | 11.32% | | | | | 5.51% | | | | | 7.96% | | | | | 7.37% | | | | | 7.21% | |
| | | | | |
S&P 500 Index | | | | 13.99% | | | | | 10.78% | | | | | 13.31% | | | | | 9.49% | | | | | 8.93% | |
GROWTH OF A HYPOTHETICAL $10,000 INVESTMENT
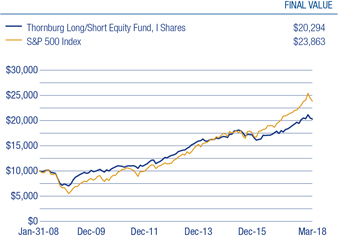
Performance data shown represents past performance and is no guarantee of future results. Investment return and principal value will fluctuate so shares, when redeemed, may be worth more or less than their original cost. Due to the Fund’s relatively small asset base in initial stages, performance was positively impacted by IPOs to a greater degree than it may be in the future. IPO investments are not an integral component of the Fund’s investment process and may not be utilized to the same extent in the future. Current performance may be lower or higher than quoted. For performance current to the most recent month end, visit thornburg.com or call 800-847-0200. The performance information does not reflect the deduction of taxes that a shareholder would pay on distributions or the redemption of Fund shares. Returns reflect the reinvestment of dividends and capital gains. There is no sales charge for Class I shares.
As disclosed in the most recent prospectus, the total annual fund operating expenses before waivers and expense reimbursements are as follows: I shares, 3.81%. Thornburg Investment Management and/or Thornburg Securities Corporation have contractually agreed to waive fees and reimburse expenses through at least February 1, 2019, for some of the share classes, resulting in net expense ratios of the following: I shares, 3.46%. For more detailed information on fund expenses and waivers/reimbursements please see the Fund’s prospectus.
Performance prior to 12/30/2016 is from the predecessor fund, which was managed in a materially equivalent manner to the Thornburg Long/Short Equity Fund. The predecessor fund was not a registered mutual fund and was not subject to the same investment restrictions as the Long/Short Equity Fund. If the predecessor fund had been registered under the 1940 Act, the performance may have been different.
Glossary
The S&P 500 Index is an unmanaged broad measure of the U.S. stock market.
The Russell 2000 Index measures the performance of the small-cap segment of the U.S. equity universe. The Russell 2000 Index is a subset of the Russell 3000 Index including approximately 2,000 of the smallest securities based on a combination of their market cap and current index membership. Source: Frank Russell Company.
The performance of any index is not indicative of the performance of any particular investment. Unless otherwise noted, index returns reflect the reinvestment of income dividends and capital gains, if any, but do not reflect fees, brokerage commissions or other expenses of investing. Investors may not make direct investments into any index.
6 | Semi-Annual Report
Fund Summary
Thornburg Long/Short Equity Fund | March 31, 2018 (Unaudited)
OBJECTIVES AND STRATEGIES
The Fund seeks long-term capital appreciation. There is no guarantee that the Fund will meet its objective.
The Fund pursues its investment goal by investing a significant amount of its assets in long and short positions in a broad range of equity securities. While the Fund normally expects to invest a larger portion of its portfolio in long positions than short positions, the Fund expects to invest a significant portion of its assets in short positions.
SECTOR EXPOSURE
| | | | | |
| Information Technology | | | | 14.2% | |
| Energy | | | | 4.9% | |
| Consumer Discretionary | | | | 4.3% | |
| Consumer Staples | | | | 3.2% | |
| Materials | | | | 2.7% | |
| Health Care | | | | 1.7% | |
| Financials | | | | 0.9% | |
| Real Estate | | | | 0.9% | |
| Industrials | | | | 0.1% | |
| Telecommunication Services | | | | -1.8% | |
| Other Assets Less Liabilities | | | | 70.7% | |
PORTFOLIO EXPOSURE
| | | | | | | | | | |
| | | 1Q18 | | 4Q17 |
| Gross Long | | | | 104.7% | | | | | 106.1% | |
| Gross Short | | | | -73.2% | | | | | -73.6% | |
| Net Equity | | | | 31.5% | | | | | 32.5% | |
ASSETS BY GEOGRAPHY | | | | | | | | | | |
| | | Long | | Short |
| United States | | | | 57.7% | | | | | 42.3% | |
| Ex-U.S | | | | 63.9% | | | | | 36.1% | |
TOP TEN LONG HOLDINGS
| | | | | |
| Gilead Sciences, Inc. | | | | 4.2% | |
| Alkermes plc | | | | 3.9% | |
| US Foods Holding Corp. | | | | 3.8% | |
| PennyMac Mortgage Investment Trust | | | | 3.6% | |
| Starbucks Corp. | | | | 3.4% | |
| Assured Guaranty Ltd. | | | | 3.2% | |
| Alphabet, Inc. | | | | 3.1% | |
| Facebook, Inc. | | | | 3.1% | |
| Oaktree Capital Group, LLC | | | | 3.0% | |
| Fibra Uno Administracion S.A. de C.V. | | | | 3.0% | |
There is no guarantee that the Fund will meet its investment objectives.
All data is subject to change. Charts may not add up to 100% due to rounding.
Semi-Annual Report | 7
Schedule of Investments
Thornburg Long/Short Equity Fund | March 31, 2018 (Unaudited)
| | | | | | | | | | | | |
| | | | | SHARES | | VALUE |
| | | |
| | COMMON STOCK — 101.9% | | | | | | | | | | |
| | | |
| | CAPITAL GOODS — 2.8% | | | | | | | | | | |
| | Machinery — 2.8% | | | | | | | | | | |
| a | | ITT, Inc. | | | | 87,144 | | | | $ | 4,268,313 | |
| | | | | | | | | | | | |
| | | | | | | | | | | 4,268,313 | |
| | | | | | | | | | | | |
| | | |
| | COMMERCIAL & PROFESSIONAL SERVICES — 2.5% | | | | | | | | | | |
| | Commercial Services & Supplies — 2.5% | | | | | | | | | | |
| | ADT, Inc. | | | | 482,819 | | | | | 3,828,755 | |
| | | | | | | | | | | | |
| | | | | | | | | | | 3,828,755 | |
| | | | | | | | | | | | |
| | | |
| | CONSUMER DURABLES & APPAREL — 5.6% | | | | | | | | | | |
| | Household Durables — 2.7% | | | | | | | | | | |
| a,b | | TRI Pointe Group, Inc. | | | | 254,958 | | | | | 4,188,960 | |
| | Leisure Products — 2.9% | | | | | | | | | | |
| a | | Callaway Golf Co. | | | | 266,019 | | | | | 4,352,071 | |
| | | | | | | | | | | | |
| | | | | | | | | | | 8,541,031 | |
| | | | | | | | | | | | |
| | | |
| | CONSUMER SERVICES — 6.0% | | | | | | | | | | |
| | Hotels, Restaurants & Leisure — 6.0% | | | | | | | | | | |
| | Domino’s Pizza Group plc | | | | 840,432 | | | | | 3,897,014 | |
| a | | Starbucks Corp. | | | | 89,338 | | | | | 5,171,777 | |
| | | | | | | | | | | | |
| | | | | | | | | | | 9,068,791 | |
| | | | | | | | | | | | |
| | | |
| | DIVERSIFIED FINANCIALS — 8.3% | | | | | | | | | | |
| | Capital Markets — 4.7% | | | | | | | | | | |
| | Apollo Global Management, LLC, Class A | | | | 86,275 | | | | | 2,555,466 | |
| | Oaktree Capital Group, LLC | | | | 117,742 | | | | | 4,662,583 | |
| | Mortgage Real Estate Investment Trusts — 3.6% | | | | | | | | | | |
| a | | PennyMac Mortgage Investment Trust | | | | 300,948 | | | | | 5,426,092 | |
| | | | | | | | | | | | |
| | | | | | | | | | | 12,644,141 | |
| | | | | | | | | | | | |
| | | |
| | ENERGY — 4.7% | | | | | | | | | | |
| | Oil, Gas & Consumable Fuels — 4.7% | | | | | | | | | | |
| a | | Devon Energy Corp. | | | | 114,005 | | | | | 3,624,219 | |
| | Teekay LNG Partners L.P. | | | | 199,464 | | | | | 3,570,406 | |
| | | | | | | | | | | | |
| | | | | | | | | | | 7,194,625 | |
| | | | | | | | | | | | |
| | | |
| | FOOD & STAPLES RETAILING — 6.3% | | | | | | | | | | |
| | Food & Staples Retailing — 6.3% | | | | | | | | | | |
| a,b | | US Foods Holding Corp. | | | | 177,744 | | | | | 5,824,671 | |
| a | | Walmart, Inc. | | | | 42,759 | | | | | 3,804,268 | |
| | | | | | | | | | | | |
| | | | | | | | | | | 9,628,939 | |
| | | | | | | | | | | | |
| | | |
| | FOOD, BEVERAGE & TOBACCO — 2.9% | | | | | | | | | | |
| | Food Products — 2.9% | | | | | | | | | | |
| b | | Nomad Foods Ltd. | | | | 282,081 | | | | | 4,439,955 | |
| | | | | | | | | | | | |
| | | | | | | | | | | 4,439,955 | |
| | | | | | | | | | | | |
| | | |
| | HEALTHCARE EQUIPMENT & SERVICES — 5.2% | | | | | | | | | | |
| | Health Care Equipment & Supplies — 2.8% | | | | | | | | | | |
| | Medtronic plc | | | | 53,034 | | | | | 4,254,388 | |
| | Health Care Technology — 2.4% | | | | | | | | | | |
| a,b | | Evolent Health, Inc., Class A | | | | 262,249 | | | | | 3,737,048 | |
| | | | | | | | | | | | |
| | | | | | | | | | | 7,991,436 | |
| | | | | | | | | | | | |
| | | |
| | HOUSEHOLD & PERSONAL PRODUCTS — 2.6% | | | | | | | | | | |
| | Personal Products — 2.6% | | | | | | | | | | |
| a | | Kose Corp. | | | | 18,744 | | | | | 3,891,311 | |
| | | | | | | | | | | | |
| | | | | | | | | | | 3,891,311 | |
| | | | | | | | | | | | |
| | | |
| | INSURANCE — 3.2% | | | | | | | | | | |
| | Insurance — 3.2% | | | | | | | | | | |
| a | | Assured Guaranty Ltd. | | | | 136,531 | | | | | 4,942,422 | |
| | | | | | | | | | | | |
| | | | | | | | | | | 4,942,422 | |
| | | | | | | | | | | | |
8 | Semi-Annual Report
Schedule of Investments, Continued
Thornburg Long/Short Equity Fund | March 31, 2018 (Unaudited)
| | | | | | | | | | | | |
| | | | | SHARES | | VALUE |
| | MATERIALS — 3.3% | | | | | | | | | | |
| | Containers & Packaging — 2.8% | | | | | | | | | | |
| | RPC Group plc | | | | 396,006 | | | | $ | 4,295,874 | |
| | Metals & Mining — 0.5% | | | | | | | | | | |
| | Warrior Met Coal, Inc. | | | | 25,700 | | | | | 719,857 | |
| | | | | | | | | | | | |
| | | | | | | | | | | 5,015,731 | |
| | | | | | | | | | | | |
| | PHARMACEUTICALS, BIOTECHNOLOGY & LIFE SCIENCES — 8.1% | | | | | | | | | | |
| | Biotechnology — 8.1% | | | | | | | | | | |
| b | | Alkermes plc | | | | 102,447 | | | | | 5,937,828 | |
| a | | Gilead Sciences, Inc. | | | | 85,406 | | | | | 6,438,758 | |
| | | | | | | | | | | | |
| | | | | | | | | | | 12,376,586 | |
| | | | | | | | | | | | |
| | REAL ESTATE — 3.0% | | | | | | | | | | |
| | Equity Real Estate Investment Trusts — 3.0% | | | | | | | | | | |
| | Fibra Uno Administracion S.A. de C.V. | | | | 3,056,315 | | | | | 4,606,327 | |
| | | | | | | | | | | | |
| | | | | | | | | | | 4,606,327 | |
| | | | | | | | | | | | |
| | RETAILING — 8.5% | | | | | | | | | | |
| | Internet & Direct Marketing Retail — 3.9% | | | | | | | | | | |
| a,b | | Amazon.com, Inc. | | | | 1,546 | | | | | 2,237,588 | |
| a | | Expedia Group, Inc. | | | | 32,950 | | | | | 3,638,009 | |
| | Specialty Retail — 4.6% | | | | | | | | | | |
| b | | CarMax, Inc. | | | | 48,800 | | | | | 3,022,672 | |
| a,b | | O’Reilly Automotive, Inc. | | | | 16,306 | | | | | 4,033,778 | |
| | | | | | | | | | | | |
| | | | | | | | | | | 12,932,047 | |
| | | | | | | | | | | | |
| | SOFTWARE & SERVICES — 13.2% | | | | | | | | | | |
| | Information Technology Services — 1.9% | | | | | | | | | | |
| | Cognizant Technology Solutions Corp., Class A | | | | 35,589 | | | | | 2,864,915 | |
| | Internet Software & Services — 9.7% | | | | | | | | | | |
| a,b | | Alphabet, Inc., Class C | | | | 4,647 | | | | | 4,794,728 | |
| a,b | | Cars.com, Inc. | | | | 136,302 | | | | | 3,861,435 | |
| b | | Facebook, Inc., Class A | | | | 29,730 | | | | | 4,750,557 | |
| b | | iQIYI, Inc. ADR | | | | 87,980 | | | | | 1,368,089 | |
| | Software — 1.6% | | | | | | | | | | |
| | Activision Blizzard, Inc. | | | | 36,193 | | | | | 2,441,580 | |
| | | | | | | | | | | | |
| | | | | | | | | | | 20,081,304 | |
| | | | | | | | | | | | |
| | TECHNOLOGY HARDWARE & EQUIPMENT — 11.1% | | | | | | | | | | |
| | Communications Equipment — 8.9% | | | | | | | | | | |
| a,b | | ARRIS International plc | | | | 158,300 | | | | | 4,206,031 | |
| b | | EchoStar Corp., Class A | | | | 30,347 | | | | | 1,601,411 | |
| b | | Palo Alto Networks, Inc. | | | | 17,630 | | | | | 3,200,198 | |
| a,b | | ViaSat, Inc. | | | | 68,008 | | | | | 4,469,486 | |
| | Technology Hardware, Storage & Peripherals — 2.2% | | | | | | | | | | |
| a,b | | Pure Storage, Inc., Class A | | | | 169,138 | | | | | 3,374,303 | |
| | | | | | | | | | | | |
| | | | | | | | | | | 16,851,429 | |
| | | | | | | | | | | | |
| | TELECOMMUNICATION SERVICES — 2.4% | | | | | | | | | | |
| | Wireless Telecommunication Services — 2.4% | | | | | | | | | | |
| | China Mobile Ltd. | | | | 406,500 | | | | | 3,726,697 | |
| | | | | | | | | | | | |
| | | | | | | | | | | 3,726,697 | |
| | | | | | | | | | | | |
| | TRANSPORTATION — 2.2% | | | | | | | | | | |
| | Air Freight & Logistics — 2.2% | | | | | | | | | | |
| | United Parcel Service, Inc., Class B | | | | 32,323 | | | | | 3,382,925 | |
| | | | | | | | | | | | |
| | | | | | | | | | | 3,382,925 | |
| | | | | | | | | | | | |
| | TOTAL COMMON STOCK (Cost $140,094,491) | | | | | | | | | 155,412,765 | |
| | | | | | | | | | | | |
| | | |
| | TOTAL LONG-TERM INVESTMENTS — 101.9% (Cost $140,094,491) | | | | | | | | | 155,412,765 | |
| | | | | | | | | | | | |
| | SHORT-TERM INVESTMENTS — 30.9% | | | | | | | | | | |
| c | | Thornburg Capital Management Fund | | | | 4,716,896 | | | | | 47,168,960 | |
| | | | | | | | | | | | |
| | TOTAL SHORT-TERM INVESTMENTS (Cost $47,168,960) | | | | | | | | | 47,168,960 | |
| | | | | | | | | | | | |
| | | |
| | LIABILITIES NET OF OTHER ASSETS — (32.8)% | | | | | | | | | (50,016,221 | ) |
| | | | | | | | | | | | |
Semi-Annual Report | 9
Schedule of Investments, Continued
Thornburg Long/Short Equity Fund | March 31, 2018 (Unaudited)
| | | | | | | | | | | | |
| | | | | SHARES | | VALUE |
| | | |
| | COMMON STOCK SOLD SHORT — (72.5)% | | | | | | | | | | |
| | | |
| | AUTOMOBILES & COMPONENTS — (0.9)% | | | | | | | | | | |
| | Auto Components — (0.9)% | | | | | | | | | | |
| | Goodyear Tire & Rubber Co. | | | | (50,287 | ) | | | $ | (1,336,628 | ) |
| | | | | | | | | | | | |
| | | | | | | | | | | (1,336,628 | ) |
| | | | | | | | | | | | |
| | BANKS — (4.3)% | | | | | | | | | | |
| | Banks — (2.1)% | | | | | | | | | | |
| | Westamerica Bancorporation | | | | (55,049 | ) | | | | (3,197,246 | ) |
| | Thrifts & Mortgage Finance — (2.2)% | | | | | | | | | | |
| b | | BofI Holding, Inc. | | | | (83,300 | ) | | | | (3,376,149 | ) |
| | | | | | | | | | | | |
| | | | | | | | | | | (6,573,395 | ) |
| | | | | | | | | | | | |
| | CAPITAL GOODS — (5.4)% | | | | | | | | | | |
| | Machinery — (1.2)% | | | | | | | | | | |
| | Kone OYJ, Class B | | | | (36,604 | ) | | | | (1,825,446 | ) |
| | Trading Companies & Distributors — (4.2)% | | | | | | | | | | |
| | GATX Corp. | | | | (46,700 | ) | | | | (3,198,483 | ) |
| | WW Grainger, Inc. | | | | (11,541 | ) | | | | (3,257,678 | ) |
| | | | | | | | | | | | |
| | | | | | | | | | | (8,281,607 | ) |
| | | | | | | | | | | | |
| | COMMERCIAL & PROFESSIONAL SERVICES — (2.2)% | | | | | | | | | | |
| | Professional Services — (2.2)% | | | | | | | | | | |
| b | | TriNet Group, Inc. | | | | (71,430 | ) | | | | (3,308,638 | ) |
| | | | | | | | | | | | |
| | | | | | | | | | | (3,308,638 | ) |
| | | | | | | | | | | | |
| | CONSUMER SERVICES — (6.0)% | | | | | | | | | | |
| | Diversified Consumer Services — (3.9)% | | | | | | | | | | |
| b | | Chegg, Inc. | | | | (146,306 | ) | | | | (3,022,682 | ) |
| | H&R Block, Inc. | | | | (116,340 | ) | | | | (2,956,199 | ) |
| | Hotels, Restaurants & Leisure — (2.1)% | | | | | | | | | | |
| | Cracker Barrel Old Country Store, Inc. | | | | (20,377 | ) | | | | (3,244,019 | ) |
| | | | | | | | | | | | |
| | | | | | | | | | | (9,222,900 | ) |
| | | | | | | | | | | | |
| | DIVERSIFIED FINANCIALS — (6.6)% | | | | | | | | | | |
| | Capital Markets — (4.5)% | | | | | | | | | | |
| | FactSet Research Systems, Inc. | | | | (16,340 | ) | | | | (3,258,523 | ) |
| | Financial Engines, Inc. | | | | (101,665 | ) | | | | (3,558,275 | ) |
| | Consumer Finance — (2.1)% | | | | | | | | | | |
| b | | Credit Acceptance Corp. | | | | (9,877 | ) | | | | (3,263,459 | ) |
| | | | | | | | | | | | |
| | | | | | | | | | | (10,080,257 | ) |
| | | | | | | | | | | | |
| | FOOD & STAPLES RETAILING — (2.2)% | | | | | | | | | | |
| | Food & Staples Retailing — (2.2)% | | | | | | | | | | |
| | Colruyt S.A. | | | | (60,044 | ) | | | | (3,318,740 | ) |
| | | | | | | | | | | | |
| | | | | | | | | | | (3,318,740 | ) |
| | | | | | | | | | | | |
| | FOOD, BEVERAGE & TOBACCO — (4.3)% | | | | | | | | | | |
| | Food Products — (4.3)% | | | | | | | | | | |
| | Conagra Brands, Inc. | | | | (92,011 | ) | | | | (3,393,366 | ) |
| | Sanderson Farms, Inc. | | | | (26,518 | ) | | | | (3,156,172 | ) |
| | | | | | | | | | | | |
| | | | | | | | | | | (6,549,538 | ) |
| | | | | | | | | | | | |
| | HEALTHCARE EQUIPMENT & SERVICES — (9.6)% | | | | | | | | | | |
| | Health Care Equipment & Supplies — (6.2)% | | | | | | | | | | |
| | DiaSorin S.p.A. | | | | (31,786 | ) | | | | (2,859,019 | ) |
| b | | Haemonetics Corp. | | | | (44,614 | ) | | | | (3,263,960 | ) |
| | ResMed, Inc. | | | | (33,299 | ) | | | | (3,278,953 | ) |
| | Health Care Technology — (3.4)% | | | | | | | | | | |
| | Computer Programs & Systems, Inc. | | | | (110,727 | ) | | | | (3,233,229 | ) |
| b | | Inovalon Holdings, Inc., Class A | | | | (190,710 | ) | | | | (2,021,526 | ) |
| | | | | | | | | | | | |
| | | | | | | | | | | (14,656,687 | ) |
| | | | | | | | | | | | |
| | HOUSEHOLD & PERSONAL PRODUCTS — (2.2)% | | | | | | | | | | |
| | Household Products — (2.2)% | | | | | | | | | | |
| | Church & Dwight Co., Inc. | | | | (67,659 | ) | | | | (3,407,307 | ) |
| | | | | | | | | | | | |
| | | | | | | | | | | (3,407,307 | ) |
| | | | | | | | | | | | |
10 | Semi-Annual Report
Schedule of Investments, Continued
Thornburg Long/Short Equity Fund | March 31, 2018 (Unaudited)
| | | | | | | | | | | | |
| | | | | SHARES | | VALUE |
| | MATERIALS — (0.7)% | | | | | | | | | | |
| | Chemicals — (0.7)% | | | | | | | | | | |
| | Orica Ltd. | | | | (75,756 | ) | | | $ | (1,033,355 | ) |
| | | | | | | | | | | | |
| | | | | | | | | | | (1,033,355 | ) |
| | | | | | | | | | | | |
| | MEDIA — (2.1)% | | | | | | | | | | |
| | Media — (2.1)% | | | | | | | | | | |
| | New York Times Co., Class A | | | | (134,617 | ) | | | | (3,244,270 | ) |
| | | | | | | | | | | | |
| | | | | | | | | | | (3,244,270 | ) |
| | | | | | | | | | | | |
| | PHARMACEUTICALS, BIOTECHNOLOGY & LIFE SCIENCES — (2.2)% | | | | | | | | | | |
| | Pharmaceuticals — (2.2)% | | | | | | | | | | |
| | Shionogi & Co. Ltd. | | | | (66,030 | ) | | | | (3,403,736 | ) |
| | | | | | | | | | | | |
| | | | | | | | | | | (3,403,736 | ) |
| | | | | | | | | | | | |
| | REAL ESTATE — (2.2)% | | | | | | | | | | |
| | Equity Real Estate Investment Trusts — (2.2)% | | | | | | | | | | |
| | Extra Space Storage, Inc. | | | | (38,415 | ) | | | | (3,355,934 | ) |
| | | | | | | | | | | | |
| | | | | | | | | | | (3,355,934 | ) |
| | | | | | | | | | | | |
| | RETAILING — (6.9)% | | | | | | | | | | |
| | Internet & Direct Marketing Retail — (2.6)% | | | | | | | | | | |
| b | | HelloFresh SE | | | | (76,500 | ) | | | | (1,250,039 | ) |
| | PetMed Express, Inc. | | | | (65,764 | ) | | | | (2,745,647 | ) |
| | Specialty Retail — (4.3)% | | | | | | | | | | |
| b | | Dufry AG | | | | (24,809 | ) | | | | (3,247,747 | ) |
| b | | Murphy USA, Inc. | | | | (45,255 | ) | | | | (3,294,564 | ) |
| | | | | | | | | | | | |
| | | | | | | | | | | (10,537,997 | ) |
| | | | | | | | | | | | |
| | SOFTWARE & SERVICES — (10.4)% | | | | | | | | | | |
| | Information Technology Services — (6.2)% | | | | | | | | | | |
| | Paychex, Inc. | | | | (52,857 | ) | | | | (3,255,463 | ) |
| b | | Square, Inc., Class A | | | | (60,629 | ) | | | | (2,982,947 | ) |
| b | | Teradata Corp. | | | | (81,480 | ) | | | | (3,232,311 | ) |
| | Software — (4.2)% | | | | | | | | | | |
| b | | Ellie Mae, Inc. | | | | (34,120 | ) | | | | (3,136,993 | ) |
| | Symantec Corp. | | | | (126,444 | ) | | | | (3,268,577 | ) |
| | | | | | | | | | | | |
| | | | | | | | | | | (15,876,291 | ) |
| | | | | | | | | | | | |
| | TELECOMMUNICATION SERVICES — (4.3)% | | | | | | | | | | |
| | Diversified Telecommunication Services — (4.3)% | | | | | | | | | | |
| | AT&T, Inc. | | | | (90,964 | ) | | | | (3,242,867 | ) |
| | Cogent Communications Holdings, Inc. | | | | (75,670 | ) | | | | (3,284,078 | ) |
| | | | | | | | | | | | |
| | | | | | | | | | | (6,526,945 | ) |
| | | | | | | | | | | | |
| | TOTAL COMMON STOCK SOLD SHORT (Proceeds $102,468,519) | | | | | | | | | (110,714,225 | ) |
| | | | | | | | | | | | |
| | EXCHANGE-TRADED FUNDS SOLD SHORT — (0.5)% | | | | | | | | | | |
| b | | Direxion Daily Developed Markets Bear 3X | | | | (550 | ) | | | | (6,713 | ) |
| b | | Direxion Daily Emerging Markets Bear 3X | | | | (919 | ) | | | | (35,703 | ) |
| b | | Direxion Daily Energy Bear 3X | | | | (535 | ) | | | | (27,113 | ) |
| b | | Direxion Daily Financial Bear 3X | | | | (3,601 | ) | | | | (40,763 | ) |
| b | | Direxion Daily S&P 500 Bear 3X | | | | (266 | ) | | | | (7,836 | ) |
| b | | Direxion Daily Semiconductors Bear 3x | | | | (66 | ) | | | | (796 | ) |
| b | | Direxion Daily Small Cap Bear 3X | | | | (255 | ) | | | | (3,022 | ) |
| b | | iPath S&P 500 VIX Short-Term Futures ETN | | | | (12,835 | ) | | | | (607,224 | ) |
| b | | ProShares UltraPro Short QQQ | | | | (221 | ) | | | | (4,051 | ) |
| | | | | | | | | | | | |
| | TOTAL EXCHANGE-TRADED FUNDS SOLD SHORT (Proceeds $5,561,296) | | | | | | | | | (733,221 | ) |
| | | | | | | | | | | | |
| | TOTAL SECURITIES SOLD SHORT (Proceeds $108,029,815) | | | | | | | | $ | (111,447,446 | ) |
| | | | | | | | | | | | |
| | | |
| | NET ASSETS — 100.0% | | | | | | | | $ | 152,565,504 | |
| | | | | | | | | | | | |
Footnote Legend
| a | All or a portion of the security is pledged as collateral for securities sold short. At March 31, 2018, the value of securities pledged was $68,922,414. An additional $61,093,961 in cash has been segregated for collateral on securities sold short. |
| c | Investment in Affiliates. |
Semi-Annual Report | 11
Schedule of Investments, Continued
Thornburg Long/Short Equity Fund | March 31, 2018 (Unaudited)
Portfolio Abbreviations
To simplify the listings of securities, abbreviations are used per the table below:
| | |
| ADR | | American Depositary Receipt |
See notes to financial statements.
12 | Semi-Annual Report
Statement of Assets and Liabilities
Thornburg Long/Short Equity Fund | March 31, 2018 (Unaudited)
| | | | |
ASSETS | | | | |
| |
Investments at value (Note 3) | | | | |
Non-affiliated issuers (cost $140,094,491) | | $ | 155,412,765 | |
Non-controlled affiliated issuer (cost $47,168,960) | | | 47,168,960 | |
Cash | | | 904,543 | |
Cash segregated as collateral on securities sold short | | | 61,093,961 | |
Receivable for investments sold | | | 4,939,449 | |
Receivable for fund shares sold | | | 245,141 | |
Dividends receivable | | | 222,912 | |
Dividend and interest reclaim receivable | | | 1,500 | |
Prepaid expenses and other assets | | | 21,609 | |
| | | | |
| |
Total Assets | | | 270,010,840 | |
| | | | |
| |
LIABILITIES | | | | |
| |
Securities sold short (proceeds $108,029,815) | | | 111,447,446 | |
Payable for investments purchased | | | 5,678,846 | |
Payable to investment advisor and other affiliates (Note 4) | | | 162,927 | |
Payable for short sale financing | | | 65,510 | |
Accounts payable and accrued expenses | | | 14,324 | |
Dividends payable for short sales | | | 76,283 | |
| | | | |
| |
Total Liabilities | | | 117,445,336 | |
| | | | |
| |
NET ASSETS | | $ | 152,565,504 | |
| | | | |
| |
NET ASSETS CONSIST OF | | | | |
| |
Accumulated net investment loss | | $ | (1,215,747 | ) |
Net unrealized appreciation on investments | | | 11,901,094 | |
Accumulated net realized gain (loss) | | | 3,336,479 | |
Net capital paid in on shares of beneficial interest | | | 138,543,678 | |
| | | | |
| |
| | $ | 152,565,504 | |
| | | | |
| |
NET ASSET VALUE | | | | |
| |
Class I Shares: | | | | |
Net asset value, offering and redemption price per share | | | | |
($152,565,504 applicable to 13,519,760 shares of beneficial interest outstanding - Note 5) | | $ | 11.28 | |
| | | | |
See notes to financial statements.
Semi-Annual Report | 13
Statement of Operations
Thornburg Long/Short Equity Fund | Six Months Ended March 31, 2018 (Unaudited)
| | | | |
INVESTMENT INCOME | | | | |
| |
Dividend income | | | | |
Non-affiliated issuers (net of foreign taxes withheld of $21,554) | | $ | 906,794 | |
Non-controlled affiliated issuer | | | 209,645 | |
| | | | |
| |
Total Income | | | 1,116,439 | |
| | | | |
| |
EXPENSES | | | | |
| |
Investment advisory fees (Note 4) | | | 718,931 | |
Administration fees (Note 4) | | | | |
Class I Shares | | | 36,158 | |
Transfer agent fees | | | | |
Class I Shares | | | 5,238 | |
Registration and filing fees | | | | |
Class I Shares | | | 11,747 | |
Dividend expense on securities sold short | | | 642,294 | |
Short sale financing fees | | | 148,786 | |
Custodian fees (Note 2) | | | 21,907 | |
Professional fees | | | 20,721 | |
Trustee and officer fees (Note 4) | | | 2,407 | |
Other expenses | | | 29,890 | |
| | | | |
| |
Total Expenses | | | 1,638,079 | |
| | | | |
| |
Net Investment Loss | | $ | (521,640 | ) |
| | | | |
| |
REALIZED AND UNREALIZED GAIN (LOSS) | | | | |
Net realized gain (loss) on: | | | | |
Non-affiliated issuer investments | | | | |
Long positions | | | 4,579,183 | |
Short positions | | | 376,248 | |
Foreign currency transactions | | | (1,986 | ) |
| | | | |
| |
| | | 4,953,445 | |
| | | | |
Net change in unrealized appreciation (depreciation) on: | | | | |
Non-affiliated issuer investments | | | | |
Long positions | | | 2,849,719 | |
Short positions | | | (4,505,175 | ) |
Foreign currency translations | | | 451 | |
| | | | |
| |
| | | (1,655,005 | ) |
| | | | |
| |
Net Realized and Unrealized Gain | | | 3,298,440 | |
| | | | |
| |
Net Increase in Net Assets Resulting from Operations | | $ | 2,776,800 | |
| | | | |
See notes to financial statements.
14 | Semi-Annual Report
Statements of Changes in Net Assets
Thornburg Long/Short Equity Fund
| | | | | | | | | | |
| | | SIX MONTHS ENDED
MARCH 31, 2018* | | PERIOD ENDED
SEPTEMBER 30, 2017** |
INCREASE (DECREASE) IN NET ASSETS FROM | | | | | | | | | | |
| | |
OPERATIONS | | | | | | | | | | |
| | |
Net investment loss | | | $ | (521,640 | ) | | | $ | (657,927 | ) |
Net realized gain (loss) on investments and foreign currency transactions | | | | 4,953,445 | | | | | 1,319,263 | |
Net unrealized appreciation (depreciation) on investments and foreign currency translations | | | | (1,655,005 | ) | | | | 4,874,981 | |
| | | | | |
| | |
Net Increase in Net Assets Resulting from Operations | | | | 2,776,800 | | | | | 5,536,317 | |
| | |
DIVIDENDS TO SHAREHOLDERS | | | | | | | | | | |
| | |
From realized gains | | | | | | | | | | |
Class I Shares | | | | (2,992,574 | ) | | | | — | |
| | |
FUND SHARE TRANSACTIONS (NOTE 5) | | | | | | | | | | |
| | |
Class I Shares | | | | 73,042,639 | | | | | 74,202,322 | |
| | | | | |
| | |
Net Increase in Net Assets | | | | 72,826,865 | | | | | 79,738,639 | |
| | |
NET ASSETS | | | | | | | | | | |
| | |
Beginning of Period | | | | 79,738,639 | | | | | — | |
| | | | | |
| | |
End of Period | | | $ | 152,565,504 | | | | $ | 79,738,639 | |
| | | | | |
| | |
Accumulated net investment loss | | | $ | (1,215,747 | ) | | | $ | (694,107 | ) |
| ** | For the audited period from commencement of operations on December 30, 2016 through September 30, 2017 |
See notes to financial statements.
Semi-Annual Report | 15
Statement of Cash Flows
Thornburg Long/Short Equity Fund | Six Months Ended March 31, 2018 (Unaudited)
| | | | |
Cash Flows from Operating Activities: | | | | |
Net change in net assets resulting from operations | | $ | 2,776,800 | |
| |
Adjustments to reconcile net increase in net assets resulting from operations to net cash provided by (used for) operating activities: | | | | |
Purchases of investments in securities | | | (92,230,797 | ) |
Payments to cover securities sold short | | | (20,730,239 | ) |
Proceeds from disposition of investments in securities | | | 28,908,158 | |
Proceeds from securities sold short | | | 68,346,443 | |
Purchases of short term investments, net | | | (29,809,357 | ) |
Net realized (gain) loss: | | | | |
Investment transactions | | | (4,579,183 | ) |
Short sales | | | (376,248 | ) |
Net unrealized (gain) loss: | | | | |
Investments | | | (2,849,719 | ) |
Short sales | | | 4,505,175 | |
| |
Changes in assets and liabilities: | | | | |
(Increase) decrease in assets: | | | | |
Cash segregated as collateral on securities sold short | | | (23,743,188 | ) |
Receivable for investment securities sold | | | (4,910,993 | ) |
Dividend and interest receivable | | | (151,356 | ) |
Increase in receivable for fund shares sold | | | (37,141 | ) |
Other assets | | | 887 | |
Increase (decrease) in liabilities: | | | | |
Payable for investments purchased | | | 5,678,846 | |
Payable for short sale financing | | | 45,932 | |
Payable for dividends on short sales | | | 2,415 | |
Payable to investment adviser | | | 69,612 | |
Accrued expenses and other payables | | | (61,569 | ) |
| | | | |
Net cash used in operating activities | | $ | (69,145,522 | ) |
| | | | |
| |
Cash Flows from Financing Activities: | | | | |
Fund shares sold | | $ | 72,110,739 | |
Fund shares redeemed | | | (1,983,977 | ) |
Fund distributions paid and not reinvested | | | (76,697 | ) |
| | | | |
Net cash received from financing activities | | $ | 70,050,065 | |
| | | | |
Net increase in cash during the period | | $ | 904,543 | |
| |
Cash and foreign currency, beginning of period: | | $ | 0 | |
Cash and foreign currency, end of period: | | $ | 904,543 | |
Non-cash Activities: | | | | |
In-kind contribution | | | 0 | |
Reinvestment of Fund distributions | | | 2,915,877 | |
See notes to financial statements.
16 | Semi-Annual Report
Notes to Financial Statements
Thornburg Long/Short Equity Fund | March 31, 2018 (Unaudited)
NOTE 1 – ORGANIZATION
Thornburg Long/Short Equity Fund (the “Fund”) is a non-diversified series of Thornburg Investment Trust (the “Trust”). The Fund commenced operations on December 30, 2016. The Trust was organized as a Massachusetts business trust under a Declaration of Trust dated June 3, 1987 and is registered as a diversified, open-end management investment company under the Investment Company Act of 1940, as amended. The Fund is currently one of twenty-one separate series of the Trust. Each series is considered to be a separate entity for financial reporting and tax purposes and bears expenses directly attributable to it. The Fund seeks long-term capital appreciation.
Effective December 30, 2016, the assets of Thornburg Partners Fund, L.P., a private investment vehicle for which Thornburg Investment Management, Inc. served as general partner and investment advisor (the “Partnership”), were transferred to the Fund, in exchange for Class I shares of beneficial interest of the Fund, and the Fund assumed certain liabilities of the Partnership. The transaction was structured to qualify as a tax-free transaction under the Internal Revenue Code. The net assets the Fund received from the Partnership in the transaction had a value of $46,625,738 at the time of the transaction. The Partnership received 4,662,574 Class I shares of the Fund, each with a NAV per share of $10.00. Those Class I shares were distributed in pro rata amounts to the partners of the Partnership based on their partner’s capital balance on the effective date of the exchange, and the Partnership subsequently dissolved. The investment policies and restrictions of the Fund are in all material respects equivalent to those of the Partnership, except that the Partnership was not registered as an investment company under the Investment Company Act of 1940 and was not, therefore, subject to certain investment restrictions, diversification requirements, and other restrictions imposed on registered investment companies by the 1940 Act or the Internal Revenue Code of 1986. The Fund’s portfolio management team is the same as the Partnership’s portfolio management team.
The Fund currently offers one class of shares of beneficial interest: Institutional Class (“Class I”). This class of shares of the Fund represents all interest in the portfolio of investments. Class I shares are sold at net asset value without a sales charge at the time of purchase and may be subject to a service fee. All expenses are allocated to the class including transfer agent fees, government registration fees, printing and postage costs, and legal expenses.
The following is a summary of significant accounting policies followed by the Fund in the preparation of its financial statements. The Fund prepares its financial statements in conformity with United States generally accepted accounting principles (“GAAP”), including investment company accounting and reporting guidance in the Financial Accounting Standards Board (the “FASB”) Accounting Standard Codification Topic 946.
NOTE 2 – SIGNIFICANT ACCOUNTING POLICIES
Security Valuation: All investments in securities held by the Fund are valued as described in Note 3.
Restricted Cash: As of March 31, 2018, the Fund has restricted cash in the amount of $61,093,961. The restricted cash represents collateral pledged in relation to short sale securities. The carrying value of the restricted cash approximates fair value.
Allocation of Expenses: Expenses common to all Funds are allocated among the Funds comprising the Trust based upon their relative net asset values or other appropriate allocation methods.
Dividends and Distributions to Shareholders: Dividends and distributions to shareholders, which are determined in accordance with federal income tax regulations and may differ from GAAP, are recorded on the ex-dividend date. Ordinary income distributions, if any, are declared and paid annually. Capital gain distributions, if any, are declared and paid annually and more often if deemed necessary by Thornburg Investment Management, Inc., the Trust’s investment advisor (the “Advisor”). Dividends are paid and are reinvested in additional shares of the Fund at net asset value per share at the close of business on the ex-dividend date, or at the shareholder’s option, paid in cash.
Investment Income: Dividend income is recorded on the ex-dividend date. Certain income from foreign investments is recognized as soon as information is available to the Fund. Interest income is accrued as earned. Premiums and discounts are amortized and accreted, respectively, to call dates or maturity dates using the effective yield method of the respective investments. These amounts are included in Interest income on the Statement of Operations. For securities sold short, the Fund is generally required to pay the lender amounts equal to any dividend or interest which accrues on the borrowed security during the period of the loan. These amounts are included in Dividend expense on securities sold short on the Statement of Operations.
Custodian Fees: Custodian fees disclosed in the Statement of Operations may include interest expenses incurred by the Fund on any cash overdrafts of its custodian account during the period. Such cash overdrafts may result from the effects of failed trades in portfolio securities and from cash outflows resulting from unanticipated shareholder redemption activity. The Fund pays interest to its custodian on any such cash overdraft at a rate set periodically at the custodian’s discretion of the overdraft amount in excess of $50,000.
Investment Transactions: Investment transactions are accounted for on a trade date basis. Realized gains and losses from the sale of investments are recorded on an identified cost basis.
Semi-Annual Report | 17
Notes to Financial Statements, Continued
Thornburg Long/Short Equity Fund | March 31, 2018 (Unaudited)
Short Sales: A short sale involves the sale by the Fund of a security that the Fund does not own. The Fund borrows the security that it intends to sell from a broker or other institution, and at a later date the Fund completes the short sale by purchasing that same security on the open market and delivering it to the lending institution. The Fund may be required to pay a premium, fee, or other amount to the lender in exchange for borrowing the security. These amounts are included in Short sale financing fees on the Statement of Operations. When it enters into a short sale, the Fund seeks to profit on a decline in the price of the security between the date the Fund borrows the security and the date the Fund purchases the security to deliver it to the lender. If, however, the price of the security increases between those dates, or if the price of the security declines by an amount which is not sufficient to cover the expenses of borrowing the security, the Fund will experience a loss. Although the potential for gain as a result of a short sale is limited to the price at which the Fund sold the security short less the cost of borrowing the security, the potential for loss is theoretically unlimited because there is no limit to the cost of replacing the borrowed security. Short sales held by the Fund are fully collateralized by segregated cash or other securities which are denoted on the Schedule of Investments.
Repurchase Agreements: The Fund may invest excess cash in repurchase agreements whereby the Fund purchases investments, which serve as collateral, with an agreement to resell such collateral to the seller at an agreed upon price at the maturity date of the repurchase agreement. Investments pledged as collateral for repurchase agreements are held in custody until maturity of the repurchase agreement. Provisions in the agreements require that the market value of the collateral is at least equal to the repurchase value in the event of default. In the event of default, the Fund has the right to liquidate the collateral and apply the proceeds in satisfaction of the obligation. Under certain circumstances, in the event of default or bankruptcy by the other party to the agreement, realization and/or retention of the collateral may be subject to legal proceedings.
When-Issued and Delayed Delivery Transactions: The Fund may engage in when-issued or delayed delivery transactions. To the extent the Fund engages in such transactions, it will do so for the purpose of acquiring portfolio investments consistent with the Fund’s investment objectives and not for the purpose of investment leverage or to speculate on interest rate or market changes. At the time the Fund makes a commitment to purchase an investment on a when-issued or delayed delivery basis, the Fund will record the transaction and reflect the value in determining its net asset value. When effecting such transactions, assets of an amount sufficient to make payment for the portfolio investments to be purchased will be segregated on the Fund’s records on the trade date. Investments purchased on a when-issued or delayed delivery basis do not earn interest until the settlement date.
Foreign Currency Translation: Portfolio investments and other assets and liabilities denominated in foreign currencies are translated into U.S. dollars based on the exchange rate of such currencies against the U.S. dollar on the date of valuation. Purchases and sales of investments and income items denominated in foreign currencies are translated into U.S. dollars at the exchange rate in effect on the transaction date. When the Fund purchases or sells foreign investments, it will customarily enter into a foreign exchange contract to minimize foreign exchange risk from the trade date to the settlement date of such transactions. The values of such spot contracts are included in receivable for investments sold and payable for investments purchased on the Statement of Assets and Liabilities.
The Fund does not separately report the effect of changes in foreign exchange rates from changes in market prices on investments held. Such changes are included in net unrealized appreciation (depreciation) from investments.
Reported net realized gains and losses from foreign currency transactions arise due to purchases and sales of foreign currencies, currency gains and losses realized between the trade and settlement dates on investment transactions and the difference between the amounts of dividends, interest, and foreign withholding taxes recorded on the Fund’s books, and the U.S. dollar equivalent of the amounts actually received or paid.
Net change in unrealized appreciation (depreciation) on foreign currency translations arise from changes in the fair value of assets and liabilities, other than investments at period end, resulting from changes in exchange rates.
Guarantees and Indemnifications: Under the Trust’s organizational documents (and under separate agreements with the independent Trustees), its officers and Trustees are provided with an indemnification against certain liabilities arising out of the performance of their duties to the Fund. In the normal course of business the Trust may also enter into contracts with service providers that contain general indemnifications. The Trust’s maximum exposure under these arrangements is unknown. However, based on experience, the Trust expects the risk of loss to be remote.
Use of Estimates: The preparation of financial statements in conformity with GAAP requires management to make estimates and assumptions that affect the reported amounts of assets and liabilities and disclosure of contingent assets and liabilities at the date of the financial statements and the reported amounts of increases (decreases) in net assets from operations during the reporting period. Actual results could differ from those estimates.
Federal Income Taxes: It is the policy of the Trust to comply with the provisions of the Internal Revenue Code applicable to regulated investment companies and to distribute to shareholders substantially all investment company taxable income including net realized gains on investments (if any), and tax exempt income of the Fund. Therefore, no provision for federal income or excise tax is required.
18 | Semi-Annual Report
Notes to Financial Statements, Continued
Thornburg Long/Short Equity Fund | March 31, 2018 (Unaudited)
The Fund files income tax returns in United States federal and applicable state jurisdictions. The statute of limitations on the Fund’s tax return filings generally remains open for the three years following a return’s filing date. The Fund has analyzed each uncertain tax position believed to be material in the preparation of the Fund’s financial statements for the six month period ended March 31, 2018, including open tax years, to assess whether it is more likely than not that the position would be sustained upon examination, based on the technical merits of the position. The Fund has not identified any such position for which an asset or liability must be reflected in the Statement of Assets and Liabilities.
At March 31, 2018, information on the tax components of capital was as follows:
| | | | | |
Cost of investments for tax purposes | | | $ | 295,293,266 | |
| | | | | |
Gross unrealized appreciation on a tax basis | | | | 27,388,448 | |
Gross unrealized depreciation on a tax basis | | | | (15,487,805 | ) |
| | | | | |
Net unrealized appreciation (depreciation) on investments (tax basis) | | | $ | 11,900,643 | |
| | | | | |
At March 31, 2018, the Fund had deferred tax basis late-year ordinary losses occurring subsequent to December 31, 2016 through September 30, 2017 of $588,485. For tax purposes, such ordinary losses will be recognized in the year ending September 30, 2018.
Foreign Withholding Taxes: The Fund is subject to foreign tax withholding imposed by certain foreign countries in which the Fund may invest. Withholding taxes are incurred on certain foreign dividends and are accrued at the time the dividend is recognized based on applicable foreign tax laws. The Fund may file withholding tax reclaims in certain jurisdictions to recover a portion of amounts previously withheld, in view of various considerations, including recent decisions rendered by the courts in those and other jurisdictions. The Fund would expect to record a receivable for such a reclaim based on a variety of factors, including assessment of a jurisdiction’s legal obligation to pay reclaims, the jurisdiction’s administrative practices and payment history, and industry convention. To date the Fund has recorded no such receivable because there is limited precedent for collecting such prior year reclaims and the likelihood of collection remains uncertain.
Deferred Foreign Capital Gain Taxes: The Fund is subject to a tax imposed on net realized gains of securities of certain foreign countries. The Fund records an estimated deferred tax liability for net unrealized gains on these investments as reflected in the accompanying financial statements.
NOTE 3 – SECURITY VALUATION
Valuation of the Fund’s portfolio investment securities is performed in accordance with policies and procedures adopted by and under the oversight of the Trustees.
The Trustees of the Trust have appointed the Advisor to assist the Trustees to obtain market values for portfolio investments, evaluate and monitor professional pricing service providers appointed by the Trustees’ Audit Committee (the “Audit Committee”) to assist in determining fair values for portfolio investments, assist in calculating fair values for portfolio investments in certain circumstances, and to perform other functions in connection with the valuation of investments. The Advisor acts through its Valuation and Pricing Committee (the “Committee”) and other employees of the Advisor. The Committee regularly reviews its own valuation calculations, as well as the valuations, valuation techniques and services furnished by pricing service providers, considers circumstances which may require valuation calculations by the Committee, and reviews previous valuation calculations. The Committee reports to the Audit Committee on the Committee’s activities, the performance of pricing service providers, and other matters relating to valuation of portfolio investments.
In those instances when the Committee assists in calculating a fair value for a portfolio investment, the Committee seeks to determine the price that the Fund would reasonably expect to receive upon a sale of the investment in an orderly transaction between market participants on the valuation date. The Committee customarily utilizes quotations from securities broker dealers in calculating valuations, but also may utilize prices obtained from pricing service providers or other methods approved by the Audit Committee. Because fair values calculated by the Committee are estimates, the calculation of a value for an investment may differ from the price that would be realized by the Fund upon a sale of the investment, and the difference could be material to the Fund’s financial statements. The Committee’s calculation of a fair value for an investment may also differ from the prices obtained by other persons (including other mutual funds) for the investment.
Valuation of Securities: Securities and other portfolio investments which are listed or traded on a United States securities exchange are valued at the last reported sale price on the valuation date. Investments listed or traded on an exchange for which there has been no sale that day are valued at the mean between the last reported bid and asked prices on that valuation date. Portfolio investments reported by NASDAQ are valued at the official closing price on the valuation date. If an investment is traded on more than one exchange, the investment is considered traded on the exchange that is normally the primary market for that investment. Securities and other portfolio investments which are listed or traded on exchanges outside the United States are valued at the last price or the closing price of the investment on the exchange that is normally the primary market for the investment, as of the close of the exchange preceding the Fund’s
Semi-Annual Report | 19
Notes to Financial Statements, Continued
Thornburg Long/Short Equity Fund | March 31, 2018 (Unaudited)
valuation date. Foreign investments listed or traded on an exchange for which there has been no sale that day are valued at the mean between the last reported bid and asked prices on that valuation date.
In any case when a market quotation is not readily available for a portfolio investment ordinarily valued by market quotation, the Committee calculates a fair value for the investment using alternative methods approved by the Audit Committee. A market quotation is not readily available when the primary market or exchange for the investment is not open for the entire scheduled day of trading. Market quotations for an investment also may not be readily available if developments after the most recent close of the investment’s primary exchange or market, but prior to the close of business on any Fund business day, or an unusual event or significant period of time occurring since the availability of a market quotation, create a serious question concerning the reliability of the most recent market quotation available for the investment. In particular, on days when market volatility thresholds established by the Audit Committee are exceeded, foreign equity investments held by the Fund may be valued using alternative methods. The Committee customarily obtains valuations in these instances from pricing service providers approved by the Audit Committee. Pricing service providers ordinarily calculate valuations using multi-factor models to adjust market prices based upon various inputs, including exchange data, depository receipt prices, futures, index data and other data.
Debt obligations held by the Fund which are not listed or traded on exchanges or for which no reported market exists are ordinarily valued at the valuation obtained from a pricing service provider approved by the Audit Committee.
In any case when a pricing service provider fails to provide a valuation for a debt obligation held by the Fund, the Committee calculates a fair value for the obligation using alternative methods under procedures approved by the Audit Committee. Additionally, in cases when management believes that a valuation obtained from a pricing service provider merits review for significant reasons, the Committee decides whether or not to use the valuation calculated by the pricing service provider or to use an alternative method approved by the Audit Committee to calculate a fair value for the obligation.
Quotations for foreign investments expressed in foreign currency amounts are converted to U.S. dollar equivalents using a foreign exchange quotation from a third party service provider at the time of valuation. Foreign investments held by the Fund may be traded on days and at times when the Fund is not open for business. Consequently, the value of Fund investments may be significantly affected on days when shareholders cannot purchase or sell Fund shares.
Valuation Hierarchy: The Fund categorizes its investments based upon the inputs used in valuing those investments, according to a three-level hierarchy established in guidance from the FASB. Categorization of investments using this hierarchy is intended by the FASB to maximize the use of observable inputs in valuing investments and minimize the use of unobservable inputs by requiring that the most observable inputs be used when available. Observable inputs are those that market participants would use in valuing an investment based on available market information. Unobservable inputs are those that reflect assumptions about the information market participants would use in valuing an investment. An investment’s level within the hierarchy is based on the lowest level input that is deemed significant to the valuation. The methodologies and inputs used to value investments are not necessarily indications of the risk or liquidity associated with those investments.
Various inputs are used in calculating valuations for the Fund’s investments. These inputs are generally summarized according to the three-level hierarchy below:
Level 1: Quoted prices in active markets for identical investments.
Level 2: Other direct or indirect significant observable inputs (including quoted prices for similar investments in active markets and other observable inputs, such as interest rates, prepayment rates, credit risk, etc.).
Level 3: Significant unobservable inputs (including the Committee’s own assumptions in calculating the fair values of investments).
Valuations for debt obligations held by the Fund are typically calculated by pricing service providers approved by the Audit Committee and are generally characterized as Level 2 within the valuation hierarchy.
On days when market volatility thresholds established by the Audit Committee are exceeded, foreign securities for which valuations are obtained from pricing service providers are fair valued. On these days, the foreign securities are characterized as Level 2 within the valuation hierarchy and revert to Level 1 after the threshold is no longer exceeded.
In a limited number of cases the Committee calculates a fair value for investments using broker quotations or other methods approved by the Audit Committee. When the Committee uses a single broker quotation to calculate a fair value for an investment without other significant observable inputs, or if a fair value is calculated using other significant inputs that are considered unobservable, the investment is characterized as Level 3 within the hierarchy. Other significant unobservable inputs used to calculate a fair value in these instances might include an income-based valuation approach which considers discounted anticipated future cash flows from the investment and application of discounts due to the nature or duration of any restrictions on the disposition of the investment.
20 | Semi-Annual Report
Notes to Financial Statements, Continued
Thornburg Long/Short Equity Fund | March 31, 2018 (Unaudited)
Valuations based upon the use of inputs from Levels 1, 2 or 3 may not represent the actual price received upon the disposition of an investment, and the Fund may receive a price that is lower than the valuation based upon these inputs when it sells the investment.
The following table displays a summary of the fair value hierarchy measurements of the Fund’s investments as of March 31, 2018. In any instance when valuation inputs from more than one level are used to determine the fair value of a specific investment, the investment is placed in the level of the table based upon the lowest level input that is significant in determining the fair value of the investment:
| | | | | | | | | | | | | | | | | | | | |
| | | FAIR VALUE MEASUREMENTS AT MARCH 31, 2018 |
| | | TOTAL | | LEVEL 1 | | LEVEL 2 | | LEVEL 3 |
Assets | | | | | | | | | | | | | | | | | | | | |
Investments in Securities* | | | | | | | | | | | | | | | | | | | | |
Common Stock | | | $ | 155,412,765 | | | | $ | 155,412,765 | | | | $ | – | | | | $ | – | |
Short Term Investment | | | | 47,168,960 | | | | | 47,168,960 | | | | | – | | | | | – | |
| | | | | |
Total Investments in Securities | | | $ | 202,581,725 | | | | $ | 202,581,725 | | | | $ | – | | | | $ | – | |
| | | | |
Liabilities | | | | | | | | | | | | | | | | | | | | |
Investments in Securities Sold Short* | | | | | | | | | | | | | | | | | | | | |
Common Stock | | | $ | (110,714,225 | ) | | | $ | (110,714,225 | ) | | | $ | – | | | | $ | – | |
Exchange-Traded Funds | | | | (733,221 | ) | | | | (733,221 | ) | | | | – | | | | | – | |
| | | | | |
Total Investments in Securities Sold Short | | | $ | (111,447,446 | ) | | | $ | (111,447,446 | ) | | | $ | – | | | | $ | – | |
| | | | |
Liabilities | | | | | | | | | | | | | | | | | | | | |
Other Financial Instruments** | | | | | | | | | | | | | | | | | | | | |
Spot Currency | | | $ | (114 | ) | | | $ | (114 | ) | | | $ | – | | | | $ | – | |
| * | See Schedule of Investments for a summary of the industry exposure as grouped according to the Global Industry Classification Standard (GICS), which is an industry taxonomy developed by MSCI, Inc. and Standard & Poor’s (S&P). |
| ** | Other Financial Instruments include investments not reflected in the Schedule of Investments, which may include futures, forwards and swap contracts, which are valued at the unrealized appreciation (depreciation) on the investment. |
In accordance with the guidance prescribed in Accounting Standards Update No. 2011-04, it is the policy of the Fund to recognize transfers between levels and the underlying events which caused the movement. The Fund recognized no transfers between levels 1 and 2 for the six months ended March 31, 2018, other than when the Fund exceeded market volatility thresholds for foreign equity investments during the period.
NOTE 4 – INVESTMENT ADVISORY FEE AND OTHER TRANSACTIONS WITH AFFILIATES
Pursuant to an investment advisory agreement, the Advisor serves as the investment advisor and performs services for the Fund for which the fees are payable at the end of each month. Under the investment advisory agreement, the Fund pays the Advisor a management fee based on the daily net assets of the Fund at an annual rate as shown in the following table:
| | | | | |
| MANAGEMENT FEE SCHEDULE |
| DAILY NET ASSETS | | FEE RATE |
| |
Up to $500 million | | | | 1.250 | % |
| |
Next $500 million | | | | 1.200 | |
| |
Next $1 billion | | | | 1.150 | |
| |
Over $2 billion | | | | 1.100 | |
The Fund’s effective management fee for the six months ended March 31, 2018 was 1.25% of the Fund’s average net assets.
The Trust has entered into administrative service agreements with the Advisor, whereby the Advisor will perform certain administrative services related to each class of the Fund’s shares. Until January 31, 2018, the fees were payable at an annual rate of 0.05 of 1% per annum of the average daily net assets attributable to each class of shares. As of February 1, 2018, the fees are computed as an annual percentage of the aggregate average daily net assets of all shares classes of all Funds in the Trust as follows:
Semi-Annual Report | 21
Notes to Financial Statements, Continued
Thornburg Long/Short Equity Fund | March 31, 2018 (Unaudited)
| | | | | |
| ADMINISTRATION FEE SCHEDULE |
| DAILY NET ASSETS | | FEE RATE |
| |
Up to $20 billion | | | | 0.100 | % |
| |
$20 billion to $40 billion | | | | 0.075 | |
| |
$40 billion to $60 billion | | | | 0.040 | |
| |
Over $60 billion | | | | 0.030 | |
The aggregate fee amount is allocated on a daily basis to each Fund based on net assets and subsequently allocated to each class of shares of the Fund. Total administrative service fees incurred by each class of shares of the Fund for the six months ended March 31, 2018, are set forth in the Statement of Operations.
The Trust has an underwriting agreement with Thornburg Securities Corporation (the “Distributor”), an affiliate of the Advisor, which acts as the distributor of the Fund’s shares.
The Advisor and Distributor have contractually agreed to waive fees and reimburse expenses incurred by the Fund so that actual expenses do not exceed levels as specified in each Fund’s most recent prospectus. The agreement may be terminated by the Fund at any time, but may not be terminated by the Advisor or Distributor before February 1, 2019, unless the Advisor ceases to be the investment advisor to the Fund or the Distributor ceases to be the distributor of the Fund prior to that date. The Advisor and Distributor may recoup amounts waived or reimbursed during the fiscal year if expenses fall below the contractual limit during that year.
For the six months ended March 31, 2018, the Advisor made no reimbursement of expenses and administrative fees.
Certain officers and Trustees of the Trust are also officers or directors of the Advisor and Distributor. The compensation of the independent Trustees is borne by the Trust. The Trust also pays a portion of the Chief Compliance Officer’s compensation. These amounts are reflected as “Trustee and officer fees” in the Statement of Operations.
The percentage of direct investments in the Fund held by the Trustees, officers of the Trust, and the Advisor is approximately 33.17%.
The Fund may purchase or sell securities from, or to an affiliated fund, provided the affiliation is due solely to having a common investment advisor, common officers, or common trustees, and provided that all such transactions will comply with Rule 17a-7 under the 1940 Act. For the six months ended March 31, 2018, the Fund had no such transactions with affiliated funds.
Shown below are holdings of voting securities of each portfolio company which is considered “affiliated” to the Fund under the Investment Company Act of 1940, including companies for which the Fund’s holding represented 5% or more of the company’s voting securities, and a series of the Thornburg Investment Trust in which the Fund invested for cash management purposes during the period:
| | | | | | | | | | | | | | | | | | | | | | | | | | | | | | | | | | | | | | | | |
| FUND | | MARKET VALUE
9/30/17 | | PURCHASES
AT COST | | SALES
PROCEEDS | | REALIZED
GAIN
(LOSS) | | CHANGE IN
UNREALIZED
APPR./(DEPR.) | | MARKET VALUE
3/31/18 | | DIVIDEND
INCOME | | ROC
ADJUSTMENT |
Thornburg Capital
Management Fund | | | $ | 17,359,603 | | | | $ | 77,004,320 | | | | $ | (47,194,963 | ) | | | $ | – | | | | $ | – | | | | $ | 47,168,960 | | | | $ | 209,645 | | | | $ | – | |
NOTE 5 – SHARES OF BENEFICIAL INTEREST
At March 31, 2018, there were an unlimited number of shares with no par value of beneficial interest authorized. Transactions in shares of beneficial interest were as follows:
| | | | | | | | | | | | | | | | |
| | | SIX MONTHS ENDED
MARCH 31, 2018 (UNAUDITED) | | | PERIOD ENDED
SEPTEMBER 30, 2017 (AUDITED) | |
| | | SHARES | | | AMOUNT | | | SHARES | | | AMOUNT | |
Class I Shares | | | | | | | | | | | | | | | | |
In-kind re-organization | | | – | | | $ | – | | | | 4,662,574 | | | $ | 46,625,738 | |
Shares sold | | | 6,273,425 | | | | 72,110,739 | | | | 2,847,668 | | | | 31,289,733 | |
Shares issued to shareholders in
reinvestment of dividends | | | 257,814 | | | | 2,915,877 | | | | – | | | | – | |
Shares repurchased | | | (172,730 | ) | | | (1,983,977 | ) | | | (348,991 | ) | | | (3,713,149 | ) |
| | | | |
| | | | |
Net increase | | | 6,358,509 | | | $ | 73,042,639 | | | | 7,161,251 | | | $ | 74,202,322 | |
| | | | |
22 | Semi-Annual Report
Notes to Financial Statements, Continued
Thornburg Long/Short Equity Fund | March 31, 2018 (Unaudited)
NOTE 6 – INVESTMENT TRANSACTIONS
For the six months ended March 31, 2018, the Fund had purchase and sale transactions of long investments of $92,230,797 and $28,619,652, respectively, and cover and sale transactions of securities sold short of $20,124,750 and $68,346,443, respectively (excluding short term investments).
NOTE 7 – DERIVATIVE FINANCIAL INSTRUMENTS WITH OFF-BALANCE SHEET RISK AND FOREIGN INVESTMENT RISK
The Fund may use a variety of derivative financial instruments to hedge or adjust the risks affecting its investment portfolio or to enhance investment returns. Provisions of FASB Accounting Standards Codification ASC 815-10-50 (“ASC 815”) require certain disclosures. The disclosures are intended to provide users of financial statements with an understanding of the use of derivative instruments by the Fund and how these derivatives affect the financial position, financial performance and cash flows of the Fund. The Fund does not designate any derivative instruments as hedging instruments under ASC 815. Additionally, the Fund’s risk of loss may exceed the amounts recognized on the Statement of Assets and Liabilities.
During the six months ended March 31, 2018, the Fund did not invest in any derivative financial instruments of the type addressed by ASC 815.
OTHER NOTES
Risks: The Fund’s investments subject it to risks including, but not limited to, management risk, market and economic risk, risks affecting specific issuers, liquidity risk, the risks associated with investments in small- and mid-cap companies and non-U.S. issuers (including developing country issuers), short sale risk, diversification risk, derivatives risk, credit risk, counterparty risk, and interest rate risk. Please see the Fund’s prospectus for a discussion of the risks associated with an investment in the Fund.
Subsequent Events: Fund management believes no events have occurred between March 31, 2018 and the date of issuance of the financial statements that require adjustment to or disclosure in the accompanying financial statements.
Semi-Annual Report | 23
Financial Highlights
Thornburg Long/Short Equity Fund
| | | | | | | | | | | | | | | | | | | | | | | | | | | | | | | | | | | | | | | | |
| | | PER SHARE PERFORMANCE (FOR A SHARE OUTSTANDING THROUGHOUT THE PERIOD) |
| | | | | | | | | | | | | | | | | |
UNLESS OTHERWISE
NOTED, PERIODS ARE
FISCAL YEARS ENDED
SEPTEMBER 30, | | NET ASSET
VALUE,
BEGINNING OF
PERIOD | | NET
INVESTMENT
INCOME
(LOSS)+ | | NET REALIZED &
UNREALIZED GAIN
(LOSS) ON
INVESTMENTS | | TOTAL FROM
INVESTMENT
OPERATIONS | | DIVIDENDS
FROM NET
INVESTMENT
INCOME | | DIVIDENDS
FROM NET
REALIZED
GAINS | | TOTAL
DIVIDENDS | | NET ASSET
VALUE,
END OF PERIOD |
| | | | | | | |
| CLASS I | | | | | | | | | | | | | | | | | | | | | | | | | | | | | | | | | | | | |
| | | | | | | | |
2018(b) | | | $ | 11.13 | | | | | (0.05 | ) | | | | 0.54 | | | | | 0.49 | | | | | – | | | | | (0.34 | ) | | | | (0.34 | ) | | | $ | 11.28 | |
2017* | | | $ | 10.00 | | | | | (0.13 | ) | | | | 1.26 | | | | | 1.13 | | | | | – | | | | | – | | | | | – | | | | $ | 11.13 | |
| (a) | Not annualized for periods less than one year. |
| (b) | Unaudited Six Month Period Ended March 31. |
| (d) | The Fund incurs certain expenses and fees in connection with investments in short positions. If such expenses and fees had not occurred, the Expenses Before Expense Reductions ratio would have been 1.47%. |
| + | Based on weighted average shares outstanding. |
| * | The Fund commenced operations on December 30, 2016. |
See notes to financial statements.
24 | Semi-Annual Report
Financial Highlights, Continued
Thornburg Long/Short Equity Fund
| | | | | | | | | | | | | | | | | | | | | | | | | | | | | | |
| RATIOS TO AVERAGE NET ASSETS | | | | | | SUPPLEMENTAL DATA | |
| | | | | | | EXPENSES, AFTER | | | | | | | | | | | | | | | | |
NET INVESTMENT
INCOME (LOSS) (%) | | | EXPENSES, AFTER
EXPENSE
REDUCTIONS (%) | | | EXPENSE
REDUCTIONS AND
NET OF CUSTODY
CREDITS (%) | | | EXPENSES,
BEFORE EXPENSE
REDUCTIONS (%) | | | | | | TOTAL
RETURN (%)(a) | | | PORTFOLIO
TURNOVER
RATE (%)(a) | | | NET ASSETS AT
END OF PERIOD
(THOUSANDS) | |
| | | | | | | |
| | | | | | | | | | | | | | | | | | | | | | | | | | | | | | |
| | | | | | | |
| | (0.91 | )(c) | | | 1.47 | (c) | | | 1.47 | (c) | | | 2.85 | (c)(d) | | | | | | | 4.42 | | | | 23.34 | | | $ | 152,566 | |
| | (1.56 | )(c) | | | 1.45 | (c) | | | 1.45 | (c) | | | 3.78 | (c) | | | | | | | 11.30 | | | | 61.69 | | | $ | 79,739 | |
Semi-Annual Report | 25
Expense Example
Thornburg Long/Short Equity Fund | March 31, 2018 (Unaudited)
As a shareholder of the Fund, you incur two types of costs:
| | (1) | transaction costs, including |
| | (a) | sales charges (loads) on purchase payments, for Class A shares; |
| | (b) | a deferred sales charge on redemptions of any part or all of a purchase of $1 million of Class A shares within 12 months of purchase; |
| | (c) | a deferred sales charge on redemptions of Class C shares within 12 months of purchase; |
| | (2) | ongoing costs, including management fees; distribution and/or service (12b-1) fees; and other Fund expenses. This example is intended to help you understand your ongoing costs (in dollars) of investing in the Fund and to compare these costs with the ongoing costs of investing in other mutual funds. |
The example is based on a $1,000 investment beginning on October 1, 2017, and held until March 31, 2018.
| | | | | | | | | | | | | | | |
| | | BEGINNING
ACCOUNT VALUE
10/1/17 | | ENDING
ACCOUNT VALUE
3/31/18 | | EXPENSES PAID
DURING PERIOD†
10/1/17–3/31/18 |
| | | |
| CLASS I SHARES | | | | | | | | | | | | | | | |
| | | |
Actual | | | $ | 1,000.00 | | | | $ | 1,044.20 | | | | $ | 14.53 | |
Hypothetical* | | | $ | 1,000.00 | | | | $ | 1,010.72 | | | | $ | 14.29 | |
| † | Expenses are equal to the annualized expense ratio for each class (I: 2.85%) multiplied by the average account value over the period, multiplied by 182/365 to reflect the one-half year period. |
| * | Hypothetical assumes a rate of return of 5% per year before expenses. |
ACTUAL EXPENSES
For each class of shares, the first line of the accompanying table provides information about actual account values and actual expenses. You may use the information in this line, together with the amount you invested, to estimate the expenses that you paid over the period. Simply divide your account value by $1,000 (for example, an $8,600 account value divided by $1,000 = 8.6), then multiply the result by the number in the first line for your class of shares under the heading entitled “Expenses Paid During Period” to estimate the expenses you paid on your account during this period.
HYPOTHETICAL EXAMPLE FOR COMPARISON PURPOSES
For each class of shares, the second line of the accompanying table provides information about hypothetical account values and hypothetical expenses based on the Fund’s actual expense ratio and an assumed rate of return of 5% per year before expenses, which is not the Fund’s actual return. The hypothetical account values and expenses may not be used to estimate the actual ending account balance or expenses you paid for the period. You may use this information to compare the ongoing costs of investing in the Fund and other funds. To do so, compare this 5% hypothetical example with the 5% hypothetical examples that appear in the shareholder reports of the other funds.
Please note that the expenses shown in the table are meant to highlight your ongoing costs only and do not reflect any transactional costs, such as sales charges (loads), redemption fees, or exchange fees. Therefore, the second line of the table for each class of shares is useful in comparing ongoing costs only, and will not help you determine the relative total costs of owning different funds. In addition, if these transactional costs were included, your costs would have been higher.
26 | Semi-Annual Report
Other Information
Thornburg Long/Short Equity Fund | March 31, 2018 (Unaudited)
PORTFOLIO PROXY VOTING
Policies and Procedures:
The Trust has delegated to Thornburg Investment Management, Inc. (the “Advisor”) voting decisions respecting proxies for the Fund’s voting securities. The Advisor makes voting decisions in accordance with its Proxy Voting Policy and Procedures. A description of the Policy and Procedures is available (i) without charge, upon request, by calling the Advisor toll-free at 1-800-847-0200, (ii) on the Thornburg website at www.thornburg.com, and (iii) on the Securities and Exchange Commission’s website at www.sec.gov.
Information regarding how proxies were voted is available on or before August 31 of each year for the twelve months ending the preceding June 30. This information is available (i) without charge, upon request by calling the Advisor toll-free at 1-800-847-0200, (ii) on the Thornburg website at www.thornburg.com, and (iii) on the Securities and Exchange Commission’s website at www.sec.gov.
AVAILABILITY OF QUARTERLY PORTFOLIO SCHEDULE
The Fund files with the Securities and Exchange Commission schedules of its portfolio holdings on Form N-Q for the first and third quarters of each fiscal year. The Fund’s Forms N-Q are available on the Commission’s website at www.sec.gov, or may be reviewed and copied at the Commission’s Public Reference Room in Washington, D.C. Information on the operation of the Public Reference Room may be obtained by calling 1-800-SEC-0330. The Fund also makes this information available on its website at www.thornburg.com/download or upon request by calling 1-800-847-0200.
Semi-Annual Report | 27
Trustees’ Statement to Shareholders
Readopted September 11, 2017
The Trustees believe current and prospective shareholders should know how we discharge our responsibilities in supervising the Funds’ investment advisor and in reviewing the advisor’s contract for renewal. Since 2005, we have issued a statement which sets out clearly the three principal guidelines that we follow in supervising the Trust’s investment advisor on your behalf. In accordance with our customary practice, in September of this year we again reviewed our statement and concluded we should reissue this statement outlining the principal features of our supervision of the advisor’s performance of investment management services for the Funds.
We begin with the premise that each shareholder selected his or her Fund because its investments are managed by the investment advisor identified in the prospectus and in accordance with the objective and policies described in the prospectus. We realize, as each of you do, that if you believe that your Fund’s stated objective and policies no longer serve your personal investment goals, you can sell your shares and leave the Fund.
Therefore, we believe that our primary supervisory task—our principal obligation to you—is to assess the nature and quality of the advisor’s services, and to confirm that the advisor actively and competently pursues the Fund’s objective, in accordance with the policies set out in the prospectus. To do this, we meet regularly with management to review your Fund’s portfolio and to discuss the advisor’s specific actions and judgments in pursuing the Fund’s objective. We do not substitute our own judgment for the advisor’s decisions in selecting investments; the advisor is paid to exercise its informed judgment on investment decisions, and we seek to confirm, in reviewing the advisor’s performance, that the advisor is doing just that.
Second, we are conscious of costs and the effect that costs have on shareholders’ returns. We try to make sure that your Fund’s fees and costs are reasonable in relationship to the services rendered and that they are generally in line with those charged by other expert investment advisors, consistent with our belief that the Fund’s investors searched for and expect that expertise and attention and have decided to pay a reasonable price for it. We do not put the management contract “out to bid” as a matter of course, and we would not do so unless we had concluded that the advisor materially had failed to pursue the Fund’s objectives in accordance with its policies, or for other equally important reasons. We believe that any other approach would be inconsistent with your interests and contrary to your expectations when you bought shares of the Fund in the first place.
Finally, because we believe that most Thornburg Fund shareholders have invested with a long-term perspective, we try not to focus too much on the fashions of the moment and on short-term performance. The market will not favor any specific investment objective or set of policies at all times and under all economic circumstances. A fund will experience periods of both high and low returns relative to other funds and other investments. Even if one of our Funds is not favored by the market at a particular time, we believe that the advisor is nonetheless obliged to remain true to the Fund’s objective and policies, and we watch to see that it does so.
Trustees of Thornburg Investment Trust
28 | Semi-Annual Report
Thornburg Funds
Thornburg Investment Management is a privately-owned global investment firm that offers a range of solutions for retail and institutional investors. Founded in 1982 and headquartered in Santa Fe, New Mexico, we manage approximately $49 billion (as of March 31, 2018) across U.S. mutual funds, separate accounts for high-net-worth investors, institutional accounts, and UCITS funds for non-U.S. investors.
EQUITY FUNDS
| | ∎ | | Thornburg Investment Income Builder Fund |
| | ∎ | | Thornburg Global Opportunities Fund |
| | ∎ | | Thornburg International Value Fund |
| | ∎ | | Thornburg Better World International Fund |
| | ∎ | | Thornburg International Growth Fund |
| | ∎ | | Thornburg Developing World Fund |
| | ∎ | | Thornburg Core Growth Fund |
FIXED INCOME FUNDS
| | ∎ | | Thornburg Low Duration Income Fund |
| | ∎ | | Thornburg Limited Term U.S. Government Fund |
| | ∎ | | Thornburg Limited Term Income Fund |
| | ∎ | | Thornburg Strategic Income Fund |
| | ∎ | | Thornburg Low Duration Municipal Fund |
| | ∎ | | Thornburg Limited Term Municipal Fund |
| | ∎ | | Thornburg Intermediate Municipal Fund |
| | ∎ | | Thornburg California Limited Term Municipal Fund |
| | ∎ | | Thornburg New Mexico Intermediate Municipal Fund |
| | ∎ | | Thornburg New York Intermediate Municipal Fund |
| | ∎ | | Thornburg Strategic Municipal Income Fund |
ALTERNATIVE FUNDS
| | ∎ | | Thornburg Long/Short Equity Fund |
Before investing, carefully consider the Fund’s investment goals, risks, charges, and expenses. For a prospectus or summary prospectus containing this and other information, contact your financial advisor or visit thornburg.com. Read it carefully before investing.
For additional information, please visit thornburg.com
Thornburg Investment Management, Inc. 2300 North Ridgetop Road, Santa Fe, NM 87506
Semi-Annual Report | 29
This page intentionally left blank.
30 | Semi-Annual Report
This page intentionally left blank.
Semi-Annual Report | 31
| | | | |
| To receive shareholder reports, prospectuses, and proxy statements electronically, go to www.thornburg.com/edelivery. | | | | |
| This Semi-Annual Report is submitted for the general information of shareholders of the Fund. It is not authorized for distribution to prospective investors in the Fund unless preceded or accompanied by an effective prospectus. | |
| | | | |
Investment Advisor: | | Distributor: | | |
Thornburg Investment Management® | | Thornburg Securities Corporation® | | |
800.847.0200 | | 800.847.0200 | | TH3932 |
Item 2. Code of Ethics
Not applicable.
Item 3. Audit Committee Financial Expert
Not applicable.
Item 4. Principal Accountant Fees and Services
Not applicable.
Item 5. Audit Committee of Listed Registrants
Not applicable.
Item 6. Schedule of Investments
Filed as part of the reports to shareholders filed under item 1 of this Form.
Item 7. Disclosure of Proxy Voting Policies and Procedures for Closed-End Management Investment Companies
Not applicable.
Item 8. Portfolio Managers of Closed-End Management Investment Companies
Not applicable.
Item 9. Purchases of Equity Securities by Closed-End Management Investment Companies and Affiliated Purchasers.
Not applicable.
Item 10. Submission of Matters to a Vote of Security Holders
The authority to consider candidates recommended by the shareholders in accordance with the Trust’s Procedures for Shareholder Communications is committed to the Governance and Nominating Committee.
Item 11. Controls and Procedures
(a) The principal executive officer and the principal financial officer have concluded that Thornburg Investment Trust’s disclosure controls and procedures provide reasonable assurance that material information relating to Thornburg Investment Trust is made known to them by the appropriate persons, based on their evaluation of these controls and procedures as of a date within 90 days prior to the filing date of this report.
(b) There was no change in Thornburg Investment Trust’s internal control over financial reporting that occurred during the registrant’s second fiscal quarter of the period covered by this report (that is, the registrant’s second fiscal quarter) that has materially affected, or is reasonably likely to materially affect, the registrant’s internal control over financial reporting.
Item 12. Exhibits
| (a) (2) | Certifications pursuant to Rule 30a-2(a) under the Investment Company Act of 1940 (17 CFR 70.30a-2(a)) attached hereto as Exhibit 99.CERT. |
| (b) | Certification pursuant to Section 906 of the Sarbanes-Oxley Act of 2002 and Rule 30a-2(b) under the Investment Company Act of 1940 (17 CFR 70.30a-2(b)) attached hereto as Exhibit 99.906CERT. |
SIGNATURES
Pursuant to the requirements of the Securities Exchange Act of 1934 and the Investment Company Act of 1940, the registrant has duly caused this report to be signed on its behalf by the undersigned, thereunto duly authorized.
Thornburg Investment Trust, in respect of the following Thornburg Funds: Low Duration Municipal Fund, Limited Term Municipal Fund, Intermediate Municipal Fund, Strategic Municipal Income Fund, California Limited Term Municipal Fund, New Mexico Intermediate Municipal Fund, New York Intermediate Municipal Fund, Limited Term U.S. Government Fund, Limited Term Income Fund, Low Duration Income Fund, Strategic Income Fund, Value Fund, International Value Fund, Core Growth Fund, International Growth Fund, Investment Income Builder Fund, Global Opportunities Fund, Developing World Fund, Better World International Fund, Capital Management Fund, and Long/Short Equity Fund.
| | |
| |
| By: | | /s/ Jason H. Brady |
| |
| | Jason H. Brady |
| |
| | President and principal executive officer |
| |
| Date: | | May 24, 2018 |
Pursuant to the requirements of the Securities Exchange Act of 1934 and the Investment Company Act of 1940, this report has been signed below by the following persons on behalf of the registrant and in the capacities and on the dates indicated.
| | |
| |
| By: | | /s/ Jason H. Brady |
| |
| | Jason H. Brady |
| |
| | President and principal executive officer |
| |
| Date: | | May 24, 2018 |
| |
| By: | | /s/ Nimish Bhatt |
| |
| | Nimish Bhatt |
| |
| | Treasurer and principal financial officer |
| |
| Date: | | May 24, 2018 |