UNITED STATES
SECURITIES AND EXCHANGE COMMISSION
Washington, D.C. 20549
FORM N-CSR
CERTIFIED SHAREHOLDER REPORT OF REGISTERED MANAGEMENT INVESTMENT
COMPANIES
Investment Company Act file number 811-05201
Thornburg Investment Trust
(Exact name of registrant as specified in charter)
c/o Thornburg Investment Management, Inc.
2300 North Ridgetop Road, Santa Fe, New Mexico 87506
(Address of principal executive offices) (Zip code)
Garrett Thornburg, 2300 North Ridgetop Road, Santa Fe, New Mexico 87506
(Name and address of agent for service)
Registrant’s telephone number, including area code: 505-984-0200
| | |
| Date of fiscal year end: | | September 30, 2015 |
| |
| Date of reporting period: | | March 31, 2015 |
Item 1. Reports to Stockholders
The following annual reports are attached hereto, in order:
Thornburg Low Duration Municipal Fund
Thornburg Limited Term Municipal Fund
Thornburg Intermediate Municipal Fund
Thornburg Strategic Municipal Income Fund
Thornburg California Limited Term Municipal Fund
Thornburg New Mexico Intermediate Municipal Fund
Thornburg New York Intermediate Municipal Fund
Thornburg Low Duration Income Fund
Thornburg Limited Term Income Funds
Thornburg Strategic Income Fund
Thornburg Value Fund
Thornburg International Value Fund
Thornburg Core Growth Fund
Thornburg International Growth Fund
Thornburg Investment Income Builder Fund
Thornburg Global Opportunities Fund
Thornburg Developing World Fund
FIRM OVERVIEW
THE FIRM
Thornburg Investment Management is a privately owned global investment firm that offers a range of solutions for retail and institutional investors. We are driven by our mission to help our clients reach their long-term financial goals through fundamental research and active portfolio management.
Founded in 1982 and headquartered in Santa Fe, New Mexico, we manage approximately $61 billion (as of March 31, 2015) across seven equity and 11 bond mutual funds, separate accounts for high-net-worth investors and institutional accounts, and five UCITS funds for non-U.S. investors.

CORE INVESTMENT PRINCIPLES
Our focus has always been on maintaining and building the investment expertise to manage Thornburg strategies to a high standard, while adhering to a core set of investment principles:
| | • | | We focus on the fundamentals. We invest according to our view of the fundamental value of an issuer only after performing thorough, bottom-up research. |
| | • | | We think and invest for the long term. We typically make investment decisions based upon an investment thesis we expect to play out over 18 months to several years. We may not always hold a security for several years, but our horizon line is typically a few years out. |
| | • | | We stay flexible. We go where we see value. Our investment mandates are generally broad and flexible, and we exercise as much flexibility as possible within any restrictions. |
| | • | | We collaborate across strategies. We are structured as global generalists. Portfolio managers and analysts do not specialize in sectors, geographies, or even security types, but instead must understand and communicate bottom-up fundamentals across industries, sectors, and borders. |
2 Semi-Annual Report
Semi-Annual Report
Thornburg Low Duration Municipal Fund
March 31, 2015
| | | | | | |
Share Class | | | | NASDAQ Symbol | | CUSIP |
Class A | | | | TLMAX | | 885-216-788 |
Class I | | | | TLMIX | | 885-216-770 |
Minimum investments for Class I shares are higher than those for Class A shares. Class I shares may not be available to all investors.
Investments in the Fund carry risks, including possible loss of principal. Bond funds have the same interest rate, inflation, and credit risks that are associated with the underlying bonds. The value of bonds will fluctuate relative to changes in interest rates, decreasing when interest rates rise. Unlike bonds, bond funds have ongoing fees and expenses. Please see the Fund’s prospectus for a discussion of the risks associated with an investment in the Fund. Investments in the Fund are not FDIC insured, nor are they deposits of or guaranteed by a bank or any other entity.
The laddering strategy does not assure or guarantee better performance and cannot eliminate the risk of investment losses.
Semi-Annual Report 3
LETTER TO SHAREHOLDERS
| | |
Thornburg Low Duration Municipal Fund | | March 31, 2015 (Unaudited) |
April 16, 2015
Dear Fellow Shareholder:
We are pleased to present the semi-annual report for the Thornburg Low Duration Municipal Fund. The net asset value (NAV) of the Class A shares decreased by one cent to $12.33 per share during the six months ended March 31, 2015. If you were with us for the entire period, you received dividends of 0.60 cents per share. Dividends were higher for Class I shares, to account for varying class-specific expenses. The Class A shares underperformed the Fund’s benchmark index, with a negative 0.03% total return (without sales charge) for the six months ended March 31, 2015, compared to the 0.27% total return for the BofA Merrill Lynch 1-3 Year U.S. Municipal Securities Index. The Fund generated 1.85% more price return and 2.15% less income than its benchmark.
Given the Fund’s investment objectives, performance was driven almost exclusively by duration (a measure of interest-rate sensitivity) and yield-curve positioning. The Fund generally invests a significant portion of its assets in variable rate demand notes, which have daily liquidity. In the current low-interest-rate environment, the overallocation to these types of securities hurt the income return of the Fund relative to the benchmark.
The Municipal Market
The municipal market has been something of a roller coaster over the past six months. Much of that volatility revolves around investors’ increased fears of an eventual Federal Reserve rate increase. While those fears aren’t completely unfounded, we believe the typical municipal bond investor is ignoring several other sources of risk present in the market.
First and foremost, it appears that risk is mispriced. At a very high level, we examine two primary sources of risk in the municipal market: duration and credit quality. The hunt for excess yield has bid up the prices of these sources of risk to levels we believe are unsustainable.
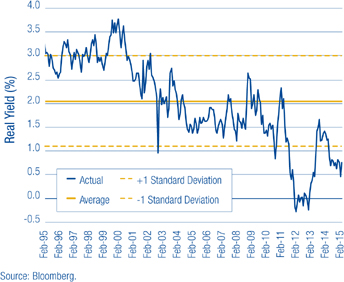
Investors looking for more yield can increase the duration of their purchases. This strategy often makes sense in a period characterized by a steep yield curve. When the curve is sufficiently steep, the incremental yield an investor picks up for buying a bond one year longer may, in fact, provide adequate compensation for the increased interest-rate risk. But through the six months ended March 31, 2015, we believe compensation offered to investors to extend duration was not in line with the added risk. This was particularly true when looking at the overall low level of interest rates in the market. Chart I shows the yield of a AAA rated general obligation bond less the core PCE index (or Personal Consumption Expenditures index, the Federal Reserve’s favored inflation measure). This is the so-called “real yield” an investor receives after inflation; this was and continues to be well below the long-term average.
Chart I 10-Year AAA General Obligation Municipal Bond Real Yield History, Using Core PCE Index
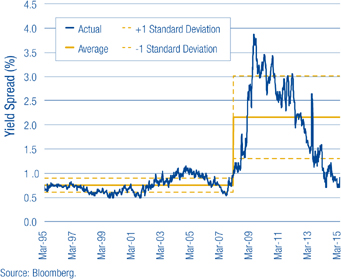
Less risk-averse investors can also decrease the average credit quality of their portfolios in an attempt to generate more income. While this can be a sound strategy in times of wide credit spreads, it fails during periods when credit risk is mispriced. Chart II shows a history of credit spreads, which in this case is the incremental yield an investor picked up from investing in a BBB rated revenue bond versus a AAA rated general obligation bond. Such spreads are as tight as they have been since before the great recession, when municipal bond insurers were thriving and a majority of the market was insured with AAA ratings.
In addition to overpriced risks, investors need to be prepared for continued volatility in the market. We live in a world where the Federal Reserve’s statements are analyzed word for word. The inclusion or deletion of any given word has the potential to send the markets roiling. The increased volatility may be exacerbated in the future by liquidity constraints facing the market, prompted by recent federal regulation. As a result of Dodd-Frank and other regulations, large broker/ dealers will no longer be able to allocate the same amount of capital to the municipal market as they have in the past. Without that support, the market could be rattled more than usual if and when we see large outflows.
4 Semi-Annual Report
LETTER TO SHAREHOLDERS,
CONTINUED
| | |
Thornburg Low Duration Municipal Fund | | March 31, 2015 (Unaudited) |
Chart II Credit-Spread Difference, BBB Rated Revenue v. AAA Rated General Obligation Bonds
Investors need to be aware of all of these risks and ensure they are accounting for them appropriately.
Conclusion
For the past six months, the Thornburg municipal bond team has asked a simple question: “Are we getting paid to take risk?” The answer has been a resounding “no.” As a result, our investors will see a portfolio with a lower duration and a stronger average credit quality, as we overweighted higher-rated credits. We have also increased cash positions to seek to protect against a market liquidity crunch and to strategically take advantage of opportunities should they arise. In short, we believe we have avoided overpriced risk.
Many shareholders may ask themselves “what should I do if interest rates begin to rise?” We continue to stress having confidence in the structure of your portfolio. A portion of your laddered Fund’s bonds mature each year and become available for reinvestment at higher yields; this has the potential to increase income to shareholders. When interest rates do rise, prices will generally decline, but the remaining bonds in the portfolio will move closer to maturity and should, in our opinion, increase in price over time. We advise being patient when interest rates start to rise, and lengthening your anticipated holding period. Remember that higher yields also mean higher income, something investors have been sorely lacking for quite some time!
We will continue to strive to manage your assets to fulfill the Fund’s objectives.
Sincerely,
| | | | |
 | |  | |  |
Christopher Ryon,CFA Portfolio Manager Managing Director | | Josh Gonze Portfolio Manager Managing Director | | Nicholos Venditti Portfolio Manager Managing Director |
The matters discussed in this report may constitute forward-looking statements made pursuant to the safe harbor provisions of the Securities Litigation Reform Act of 1995. These include any advisor or portfolio manager prediction, assessment, analysis or outlook for individual securities, industries, investment styles, market sectors and/or markets. These statements involve risks and uncertainties. In addition to the general risks described for each fund in its current prospectus, other factors bearing on these reports include the accuracy of the advisor’s or portfolio manager’s forecasts and predictions, the appropriateness of the investment strategies designed by the advisor or portfolio manager and the ability of the advisor or portfolio manager to implement their strategies efficiently and successfully. Any one or more of these factors, as well as other risks affecting the securities markets generally, could cause the actual results of any fund to differ materially as compared to its benchmarks.
The views expressed by the portfolio managers reflect their professional opinions and are subject to change. Under no circumstances does the information contained within represent a recommendation to buy or sell any security.
Semi-Annual Report 5
| | |
| PERFORMANCE SUMMARY | | |
| |
Thornburg Low Duration Municipal Fund | | March 31, 2015 (Unaudited) |
Average Annual Total Returns
| | | | | | | | |
| | | 1-Yr | | | Since
Incep. | |
A Shares (Incep: 12/30/13) | | | | | | | | |
Without sales charge | | | 0.30 | % | | | 0.29 | % |
With sales charge | | | -1.22 | % | | | -0.93 | % |
I Shares (Incep: 12/30/13) | | | 0.49 | % | | | 0.48 | % |
30-day Yields, A Shares
(with sales charge)
| | | | |
Annualized Distribution Yield | | | 0.02 | % |
| |
SEC Yield | | | 0.11 | % |
Performance data shown represents past performance and is no guarantee of future results. Investment return and principal value will fluctuate so shares, when redeemed, may be worth more or less than their original cost. Current performance may be lower or higher than quoted. For performance current to the most recent month end, visit thornburg.com or call 800-847-0200. The performance information does not reflect the deduction of taxes that a shareholder would pay on distributions or the redemption of Fund shares. Returns reflect the reinvestment of dividends and capital gains. Class A shares are sold with a maximum sales charge of 1.50%. There is no sales charge for Class I shares.
As disclosed in the most recent prospectus, the total annual fund operating expenses are as follows: A shares, 3.14%; I shares, 1.77%. Thornburg Investment Management and/or Thornburg Securities Corporation have contractually agreed to waive fees and reimburse expenses through at least February 1, 2016, for some of the share classes, resulting in net expense ratios of the following: A shares, 0.70%; I shares, 0.50%. For more detailed information on fund expenses and waivers/reimbursements please see the Fund’s prospectus.
Without fee waivers and expense reimbursements the Annualized Distribution yield would have been negative 2.60%, and the SEC yield would have been negative 2.49%. Unsubsidized yields may be disproportionately negative due to the size of net assets and fixed expenses.
Glossary
BofA Merrill Lynch 1-3 Year Municipal Securities Index – A subset of the BofA Merrill Lynch U.S. Municipal Securities Index including all securities with a remaining term to final maturity less than three years.
Unless otherwise noted, index returns reflect the reinvestment of income dividends and capital gains, if any, but do not reflect fees, brokerage commissions or other expenses of investing. Investors may not make direct investments into any index. The performance of any index is not indicative of the performance of any particular investment.
Alternative Minimum Tax (AMT) – A federal tax aimed at ensuring that high-income individuals, estates, trusts, and corporations pay a minimal level income tax. For individuals, the AMT is calculated by adding tax preference items to regular taxable income.
Annualized Distribution Yield – The distribution yield reflects actual distributions made to shareholders. The annualized distribution yield is calculated by summing the last 30 days of income at a given month end and annualizing to a 360-day year. The result is divided by the ending maximum offering price.
Bond Credit Ratings (Credit Quality) – A bond credit rating assesses the financial ability of a debt issuer to make timely payments of principal and interest. Ratings of AAA (the highest), AA, A, and BBB are investment-grade quality. Ratings of BB, B, CCC, CC, C and D (the lowest) are considered below investment grade, speculative grade, or junk bonds.
Bond Insurers – Individual bonds are sometimes insured by private companies. The insurance guarantees the payment of principal and interest on a bond issue if the issuer defaults. Mutual funds are not insured, even if the underlying bonds are insured.
Credit Spread/Quality Spread – The difference between the yields of securities with different credit qualities.
Duration – A bond’s sensitivity to interest rates. Effective duration incorporates the embedded option features, such as call provisions. Bonds with longer durations experience greater price volatility than bonds with shorter durations.
General Obligation Bond – A municipal bond backed by the credit and “taxing power” of the issuing jurisdiction rather than the revenue from a given project.
Personal Consumption Expenditure (PCE) Index – A broad measure of U.S. inflation that assesses the change in prices of goods and services purchased by consumers throughout the economy. Core PCE excludes the more volatile and seasonal food and energy prices.
Revenue Bond – A bond on which the debt service is payable solely from the revenue generated from the operation of the project being financed or a category of facilities, or from other non-tax sources.
SEC Yield – SEC yield is computed in accordance with SEC standards measuring the net investment income per share over a specified 30-day period expressed as a percentage of the maximum offering price of the Fund’s shares at the end of the period.
Standard Deviation – A measure of the dispersion of a set of data from its mean. The more spread apart the data, the higher the deviation. Values within one standard deviation of the mean represent approximately two-thirds of the data set, assuming a normal distribution.
Yield Curve – A line that plots the interest rates, at a set point in time, of bonds having equal credit quality, but differing maturity dates.
Yield Spread – The difference between yields on differing debt instruments, calculated by deducting the yield of one instrument from another.
6 Semi-Annual Report
| | |
| FUND SUMMARY | | |
| |
Thornburg Low Duration Municipal Fund | | March 31, 2015 (Unaudited) |
OBJECTIVES AND STRATEGIES
The Fund seeks current income exempt from federal income tax, consistent with preservation of capital (may be subject to Alternative Minimum Tax).
This Fund is a laddered portfolio of municipal bonds with a dollar-weighted average duration of normally no more than three years. Laddering involves building a portfolio of bonds with staggered maturities so that a portion of the portfolio matures each year. Cash from maturing bonds, if not needed for other purposes, is invested in bonds with longer maturities at the far end of the ladder. We regard the strategy as a good compromise for managing different types of risk
Portfolio Ladder

Percent of portfolio maturing in each year. Cash includes cash equivalents.
Security Credit Ratings†
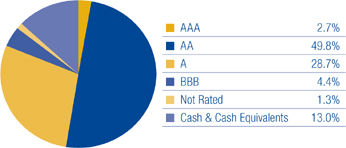
A bond credit rating assesses the financial ability of a debt issuer to make timely payments of principal and interest. Ratings of AAA (the highest), AA, A, and BBB are investment-grade quality. Ratings of BB, B, CCC, CC, C and D (the lowest) are considered below investment grade, speculative grade, or junk bonds. Credit quality ratings for Thornburg’s municipal portfolios used the highest rating available from either Standard & Poor’s or Moody’s Investors Service.
Key Portfolio Attributes
| | | | |
Number of Bonds | | | 109 | |
| |
Effective Duration | | | 1.7 Yrs | |
| |
Average Maturity | | | 1.8 Yrs | |
There is no guarantee that the Fund will meet its investment objectives.
All data is subject to change. Charts may not add up to 100% due to rounding.
Semi-Annual Report 7
| | |
| SCHEDULE OF INVESTMENTS | | |
| |
Thornburg Low Duration Municipal Fund | | March 31, 2015 (Unaudited) |
| | | | | | | | | | |
Issuer-Description | | Credit Rating†
S&P/ Moody’s | | Principal
Amount | | | Value | |
ARIZONA — 1.13% | | | | | | | | | | |
Arizona HFA, 3.00% due 12/1/2016 (Scottsdale Lincoln Hospitals) | | NR/A2 | | $ | 480,000 | | | $ | 498,581 | |
ARKANSAS — 1.19% | | | | | | | | | | |
Board of Trustees of the University of Arkansas, 4.00% due 11/1/2018 (Fayetteville Campus) | | NR/Aa2 | | | 295,000 | | | | 325,149 | |
Jefferson County, 4.00% due 6/1/2015 (Jefferson Regional Medical Center; Insured: AGM) | | AA/NR | | | 200,000 | | | | 201,164 | |
CALIFORNIA — 12.41% | | | | | | | | | | |
Bay Area Toll Authority, 1.00% due 4/1/2047 (San Francisco Bay Area Toll Bridge) | | AA/Aa3 | | | 250,000 | | | | 251,057 | |
California HFFA, 0.07% due 7/1/2016 put 4/1/2015 (Dignity Health; Insured: Natl-Re; LOC: JPMorgan Chase Bank, N.A.) (daily demand notes) | | AAA/Aa1 | | | 200,000 | | | | 200,000 | |
California HFFA, 4.00% due 7/1/2016 (Children’s Hospital Los Angeles; Insured: AGM) | | AA/A2 | | | 200,000 | | | | 207,330 | |
California Statewide Communities Development Authority, 5.25% due 7/1/2017 (St. Joseph Health System; Insured: AGM) | | AA/A1 | | | 100,000 | | | | 109,525 | |
City of Chula Vista, 1.65% due 7/1/2018 (San Diego Gas & Electric Co.) | | A+/Aa2 | | | 1,000,000 | | | | 1,004,100 | |
County of Los Angeles Redevelopment Refunding Authority, 3.00% due 6/1/2016 (Bunker Hill Project) | | A+/NR | | | 305,000 | | | | 314,376 | |
County of Los Angeles Redevelopment Refunding Authority, 3.00% due 12/15/2016 (Covina Revitalization-Redevelopment Project) | | A-/NR | | | 575,000 | | | | 597,126 | |
Jurupa Public Financing Authority, 4.00% due 9/1/2017 | | BBB+/NR | | | 100,000 | | | | 106,581 | |
Murrieta Valley USD GO, 2.00% due 9/1/2016 (Riverside County Educational Facilities; Insured: BAM) | | AA/NR | | | 200,000 | | | | 204,724 | |
Riverside County Public Financing Authority, 4.00% due 9/1/2017 (Hemet Project) | | A+/NR | | | 485,000 | | | | 520,323 | |
a Sacramento City Schools Joint Powers Financing Authority, 3.00% due 3/1/2016 (Rosemont and Luther Burbank High Schools) | | A/NR | | | 665,000 | | | | 678,746 | |
San Diego Redevelopment Agency, 5.00% due 9/1/2016 (Centre City Redevelopment; Insured: AMBAC) | | NR/Baa3 | | | 50,000 | | | | 52,260 | |
a Successor Agency to the Redevelopment Agency of Carson, 4.00% due 10/1/2016 (Carson Merged and Amended Project Area) | | AA-/NR | | | 425,000 | | | | 447,329 | |
Successor Agency to the Redevelopment Agency of the City of Chino, 5.00% due 9/1/2017 (Merged Chino Areas 2001 and 2003 and Central City Redevelopment Projects; Insured: BAM) | | AA/NR | | | 300,000 | | | | 329,658 | |
Successor Agency to the Redevelopment Agency of the Richmond Community, 4.00% due 9/1/2017 (Insured: BAM) | | AA/NR | | | 300,000 | | | | 321,399 | |
Town of Hillsborough COP, 0.10% due 6/1/2035 put 4/1/2015 (Water and Sewer Systems) (daily demand notes) | | AAA/NR | | | 160,000 | | | | 160,000 | |
COLORADO — 2.43% | | | | | | | | | | |
City and County of Denver GO, 3.00% due 8/1/2015 (Civic Facilities and Denver Zoological Gardens Improvements) | | AAA/Aaa | | | 200,000 | | | | 201,924 | |
City of Aurora COP, 3.00% due 12/1/2016 (Aurora Municipal Center) | | AA-/Aa2 | | | 530,000 | | | | 549,960 | |
Regional Transportation District COP, 5.00% due 6/1/2017 (FasTracks Transportation System) | | A/Aa3 | | | 300,000 | | | | 327,495 | |
DISTRICT OF COLUMBIA — 0.47% | | | | | | | | | | |
District of Columbia, 5.00% due 4/1/2016 (National Public Radio) (ETM) | | AA-/Aa3 | | | 200,000 | | | | 209,358 | |
FLORIDA — 6.46% | | | | | | | | | | |
City of Gainesville, 0.03% due 10/1/2042 put 4/1/2015 (Utilities System; LOC: Sumitomo Mitsui Banking) (daily demand notes) | | AA/Aa2 | | | 800,000 | | | | 800,000 | |
County of Osceola, 5.00% due 10/1/2017 (Transportation Capital Improvements; Insured: AMBAC) | | A+/A1 | | | 150,000 | | | | 164,658 | |
Florida Higher Educational Facilities Financing Authority, 5.00% due 4/1/2015 (Nova Southeastern University) | | BBB/Baa1 | | | 200,000 | | | | 200,000 | |
Hillsborough County IDA, 5.65% due 5/15/2018 (Tampa Electric Co.) | | BBB+/A2 | | | 200,000 | | | | 225,522 | |
Orange County School Board COP, 5.00% due 8/1/2018 (Educational Facilities) | | NR/Aa2 | | | 1,000,000 | | | | 1,130,960 | |
Volusia County Educational Facilities Authority, 2.00% due 10/15/2016 (Embry-Riddle Aeronautical University, Inc.) | | NR/Baa1 | | | 105,000 | | | | 107,146 | |
Volusia County Educational Facilities Authority, 3.00% due 10/15/2017 (Embry-Riddle Aeronautical University, Inc.) | | NR/Baa1 | | | 105,000 | | | | 110,198 | |
Volusia County Educational Facilities Authority, 3.00% due 10/15/2018 (Embry-Riddle Aeronautical University, Inc.) | | NR/Baa1 | | | 120,000 | | | | 126,704 | |
GEORGIA — 0.48% | | | | | | | | | | |
City of Atlanta, 5.25% due 12/1/2016 (Atlantic Station Project; Insured: AGM) | | AA/A3 | | | 200,000 | | | | 213,642 | |
ILLINOIS — 7.41% | | | | | | | | | | |
Chicago Park District GO, 5.00% due 1/1/2017 (Capital Improvement Plan; Insured: Natl-Re) | | AA+/A3 | | | 150,000 | | | | 155,289 | |
City of Rockford GO, 3.00% due 12/15/2016 (New Fire Station Construction; Insured: AGM) | | AA/A1 | | | 250,000 | | | | 260,402 | |
Illinois Development Finance Authority, 0.14% due 2/1/2021 put 4/1/2015 (Teachers Academy for Mathematics and Science; LOC: JPMorgan Chase Bank, N.A.) (daily demand notes) | | NR/Aa3 | | | 100,000 | | | | 100,000 | |
Illinois Finance Authority, 5.00% due 11/15/2017 (Rush University Medical Center) | | A+/A1 | | | 1,000,000 | | | | 1,105,530 | |
b Illinois Finance Authority, 5.00% due 8/15/2018 (Silver Cross Hospital and Medical Centers) | | NR/Baa1 | | | 500,000 | | | | 551,465 | |
Illinois Finance Authority, 5.00% due 11/15/2018 (Rush University Medical Center) | | A+/A1 | | | 500,000 | | | | 566,765 | |
Illinois Finance Authority, 4.30% due 6/1/2035 put 6/1/2016 (Peoples Gas Light & Coke Co.; Insured: AMBAC) | | A/Aa3 | | | 200,000 | | | | 208,816 | |
Illinois State Toll Highway Authority, 0.04% due 1/1/2031 put 4/1/2015 (Insured: AGM; SPA: Bank of America, N.A.) (daily demand notes) | | AA/Aa3 | | | 200,000 | | | | 200,000 | |
8 Semi-Annual Report
| | |
| SCHEDULE OF INVESTMENTS, CONTINUED | | |
| |
Thornburg Low Duration Municipal Fund | | March 31, 2015 (Unaudited) |
| | | | | | | | | | |
Issuer-Description | | Credit Rating†
S&P/ Moody’s | | Principal
Amount | | | Value | |
Town of Cicero GO, 5.00% due 1/1/2018 (Cicero and Laramie Development Areas; Insured: AGM) | | AA/A2 | | $ | 125,000 | | | $ | 136,599 | |
INDIANA — 6.60% | | | | | | | | | | |
City of Evansville, 5.00% due 1/1/2018 (Waterworks District; Insured: BAM) | | AA/NR | | | 810,000 | | | | 894,864 | |
Hammond Multi-School Building Corp., 4.00% due 7/15/2017 (Educational Facilities) (State Aid Withholding) | | AA+/NR | | | 300,000 | | | | 321,009 | |
Indiana Finance Authority, 0.03% due 2/1/2037 put 4/1/2015 (Stadium Project; SPA: JPMorgan Chase Bank, N.A.) (daily demand notes) | | AA+/Aa2 | | | 500,000 | | | | 500,000 | |
Indiana State University, 2.00% due 10/1/2015 (Higher Education Facilities) | | NR/A1 | | | 1,000,000 | | | | 1,008,510 | |
University of Southern Indiana, 0.14% due 10/1/2019 put 4/1/2015 (Wellness, Fitness, Recreational Facility; LOC: | | | | | | | | | | |
JPMorgan Chase Bank, N.A.) (daily demand notes) | | A+/Aa3 | | | 200,000 | | | | 200,000 | |
KANSAS — 6.64% | | | | | | | | | | |
Kansas DFA, 5.00% due 12/1/2016 (Department of Commerce Impact Program) | | AA-/A3 | | | 400,000 | | | | 427,692 | |
Kansas DFA, 5.00% due 12/1/2018 (Department of Commerce Impact Program) | | AA-/A3 | | | 1,250,000 | | | | 1,396,687 | |
Topeka Public Building Commission, 5.00% due 6/1/2018 (10th and Jackson Projects; Insured: Natl-Re) | | AA-/A3 | | | 1,000,000 | | | | 1,121,310 | |
LOUISIANA — 2.53% | | | | | | | | | | |
City of New Orleans, 5.00% due 12/1/2017 (Water System Facilities Capital Improvement Program) | | BBB+/NR | | | 100,000 | | | | 109,626 | |
City of New Orleans GO, 2.00% due 12/1/2015 (Drainage System) | | A+/NR | | | 1,000,000 | | | | 1,011,940 | |
MASSACHUSETTS — 1.35% | | | | | | | | | | |
Massachusetts Educational Financing Authority, 5.50% due 1/1/2017 | | AA/NR | | | 275,000 | | | | 296,912 | |
Massachusetts Health & Educational Facilities Authority, 0.03% due 7/1/2044 put 4/1/2015 (Baystate Medical Center; LOC: | | | | | | | | | | |
JPMorgan Chase Bank, N.A.) (daily demand notes) | | AAA/Aa1 | | | 300,000 | | | | 300,000 | |
MICHIGAN — 8.23% | | | | | | | | | | |
Berkley School District GO, 4.00% due 5/1/2018 (Insured: Q-SBLF) | | AA-/NR | | | 1,000,000 | | | | 1,082,930 | |
Charles Stewart Mott Community College GO, 5.00% due 5/1/2018 | | A+/NR | | | 750,000 | | | | 832,642 | |
Goodrich Area School District GO, 5.00% due 5/1/2016 (Insured: AGM/Q-SBLF) | | AA/Aa2 | | | 250,000 | | | | 251,005 | |
Michigan Finance Authority, 5.00% due 5/1/2018 (School District of the City of Detroit; Insured: Q-SBLF) | | AA-/NR | | | 250,000 | | | | 277,173 | |
Michigan State Hospital Finance Authority, 5.00% due 11/15/2015 (Ascension Health) | | AA+/Aa2 | | | 500,000 | | | | 514,725 | |
Michigan State Hospital Finance Authority, 5.00% due 11/15/2016 (Ascension Health) | | AA+/Aa2 | | | 200,000 | | | | 214,268 | |
Michigan State Hospital Finance Authority, 5.75% due 12/1/2034 put 12/1/2015 (Trinity Health) | | AA-/Aa3 | | | 200,000 | | | | 207,294 | |
Northville Public Schools GO, 5.00% due 5/1/2017 (Counties of Wayne, Oakland, Washtenaw Educational Facilities; Insured: Q-SBLF) | | NR/Aa2 | | | 250,000 | | | | 271,255 | |
NEVADA — 1.33% | | | | | | | | | | |
Carson City, 4.00% due 9/1/2016 (Carson Tahoe Regional Healthcare Project) | | BBB+/NR | | | 200,000 | | | | 207,754 | |
City of Reno GO, 5.00% due 6/1/2017 (Fire Protection Projects) | | A-/A1 | | | 200,000 | | | | 218,330 | |
Washoe County School District GO, 5.25% due 6/1/2017 (Educational Facilities; Insured: AGM) | | AA/Aa3 | | | 150,000 | | | | 164,684 | |
NEW HAMPSHIRE — 1.49% | | | | | | | | | | |
New Hampshire Health and Education Facilities Authority, 0.03% due 7/1/2033 put 4/1/2015 (University System of New Hampshire; SPA: Wells Fargo Bank, N.A.) (daily demand notes) | | A+/Aa3 | | | 460,000 | | | | 460,000 | |
New Hampshire Health and Educational Facilities Authority, 0.03% due 7/1/2035 put 4/1/2015 (University System of New Hampshire; SPA: U.S. Bank, N.A.) (daily demand notes) | | A+/Aa3 | | | 200,000 | | | | 200,000 | |
NEW JERSEY — 4.66% | | | | | | | | | | |
Essex County Improvement Authority GO, 4.00% due 10/1/2017 (County Correctional Facility) | | NR/Aa2 | | | 545,000 | | | | 584,562 | |
New Jersey Educational Facilities Authority, 5.00% due 9/1/2016 (Higher Education Capital Improvement; Insured: AGM) | | AA/A2 | | | 300,000 | | | | 305,910 | |
New Jersey Health Care Facilities Financing Authority, 5.00% due 1/1/2018 (Hackensack University Medical Center; Insured: AGM) | | AA/A2 | | | 150,000 | | | | 165,370 | |
New Jersey Transportation Trust Fund Authority, 5.00% due 6/15/2015 (State Transportation System) | | A-/A2 | | | 1,000,000 | | | | 1,009,090 | |
NEW YORK — 7.99% | | | | | | | | | | |
City of New York GO, 0.01% due 8/1/2020 put 4/1/2015 (City Budget Financial Management; LOC: JPMorgan Chase Bank, N.A.) (daily demand notes) | | A+/Aa1 | | | 300,000 | | | | 300,000 | |
Lake Placid Central School District GO, 5.00% due 6/15/2017 (Educational Facilities; Insured: Natl-Re) (State Aid Withholding) | | NR/Aa3 | | | 200,000 | | | | 217,934 | |
Monroe County Industrial Development Corp., 4.00% due 1/15/2018 (Monroe Community College Association; Insured: AGM) | | AA/A2 | | | 200,000 | | | | 213,112 | |
New York City Municipal Water Finance Authority, 0.02% due 6/15/2035 put 4/1/2015 (Water & Sewer System; SPA: Bayerische Landesbank) (daily demand notes) | | AAA/Aa1 | | | 800,000 | | | | 800,000 | |
Semi-Annual Report 9
| | |
| SCHEDULE OF INVESTMENTS, CONTINUED | | |
| |
Thornburg Low Duration Municipal Fund | | March 31, 2015 (Unaudited) |
| | | | | | | | | | | | |
Iissuer-Description | | Credit Rating†
S&P/ Moody’s | | | Principal
Amount | | | Value | |
New York City Municipal Water Finance Authority, 0.03% due 6/15/2050 put 4/1/2015 (Water & Sewer System; SPA: JPMorgan Chase Bank, N.A.) (daily demand notes) | | | AA+/Aa2 | | | $ | 300,000 | | | $ | 300,000 | |
New York City Transitional Finance Authority, 0.03% due 11/1/2022 put 4/1/2015 (World Trade Center Recovery; SPA: Landesbank Hessen-Thuringen) (daily demand notes) | | | AAA/Aa1 | | | | 700,000 | | | | 700,000 | |
New York State Dormitory Authority, 5.00% due 7/1/2015 (NYSARC-Services for Developmentally Disabled) | | | NR/Aa2 | | | | 1,000,000 | | | | 1,011,830 | |
NORTH DAKOTA — 2.64% | | | | | | | | | | | | |
City of Williston GO, 5.00% due 5/1/2017 (Water, Sewer and Street Improvements) | | | A/NR | | | | 200,000 | | | | 216,584 | |
North Dakota Building Authority, 4.25% due 12/1/2015 (Various State Agency Capital Projects; Insured: Natl-Re) | | | AA+/Aa2 | | | | 200,000 | | | | 205,530 | |
North Dakota Housing Finance Agency, 0.85% due 1/1/2017 (Housing Mtg Finance Program) | | | NR/Aa1 | | | | 750,000 | | | | 750,255 | |
OHIO — 1.55% | | | | | | | | | | | | |
City of Cleveland, 3.00% due 10/1/2016 (Public Facilities) | | | AA/A1 | | | | 200,000 | | | | 207,446 | |
County of Franklin, 4.00% due 11/15/2033 put 8/1/2016 (OhioHealth Corp. Hospital Facilities) | | | AA+/Aa2 | | | | 200,000 | | | | 209,148 | |
University of Toledo, 3.50% due 6/1/2016 (Higher Education Facilities) | | | A/A1 | | | | 260,000 | | | | 268,806 | |
OKLAHOMA — 0.69% | | | | | | | | | | | | |
b Oklahoma DFA, 5.00% due 8/15/2018 (INTEGRIS Health) | | | AA-/Aa3 | | | | 270,000 | | | | 304,239 | |
OREGON — 1.80% | | | | | | | | | | | | |
State of Oregon GO, 0.03% due 6/1/2028 put 4/1/2015 (Veterans’ Loan Program; SPA: U.S. Bank, N.A.) (daily demand notes) | | | AA+/Aa1 | | | | 300,000 | | | | 300,000 | |
State of Oregon GO, 0.01% due 12/1/2041 put 4/1/2015 (Veterans’ Loan Program; SPA: U.S. Bank, N.A.) (daily demand notes) | | | AA+/Aa1 | | | | 500,000 | | | | 500,000 | |
PENNSYLVANIA — 6.74% | | | | | | | | | | | | |
Allegheny County Higher Education Building Authority, 5.50% due 3/1/2016 (Duquesne University Project; Insured: AMBAC) | | | NR/NR | | | | 60,000 | | | | 62,221 | |
City of Philadelphia Gas Works, 5.00% due 10/1/2017 (Insured: AMBAC) | | | A-/Baa2 | | | | 200,000 | | | | 217,884 | |
East Allegheny School District GO, 2.00% due 4/1/2017 (Insured: BAM) (State Aid Withholding) | | | AA/Baa1 | | | | 300,000 | | | | 306,078 | |
Hospitals & Higher Education Facilities Authority of Philadelphia, 0.03% due 7/1/2041 put 4/1/2015 (The Children’s Hospital of Philadelphia; SPA: Wells Fargo Bank, N.A.) (daily demand notes) | | | AA/Aa2 | | | | 300,000 | | | | 300,000 | |
Lancaster County Hospital Authority, 5.00% due 11/1/2018 (Masonic Villages Project) | | | A/NR | | | | 1,500,000 | | | | 1,691,610 | |
Pennsylvania Economic Development Financing Authority, 3.375% due 12/1/2040 put 7/1/2015 (Shippingport Project) | | | BBB-/NR | | | | 200,000 | | | | 200,772 | |
Wilson School District GO, 3.00% due 6/1/2017 (State Aid Withholding) | | | AA/NR | | | | 200,000 | | | | 209,424 | |
SOUTH CAROLINA — 1.49% | | | | | | | | | | | | |
City of North Charleston Public Facilities Corp. COP, 5.00% due 10/1/2017 (Convention Center Complex) | | | AA-/NR | | | | 300,000 | | | | 327,291 | |
Piedmont Municipal Power Agency, 5.00% due 1/1/2018 (Catawba Project) | | | AA/A3 | | | | 300,000 | | | | 332,205 | |
TEXAS — 8.02% | | | | | | | | | | | | |
Brazos River Authority, 4.90% due 10/1/2015 (Houston Industries, Inc. Project; Insured: Natl-Re) | | | AA-/A3 | | | | 200,000 | | | | 204,196 | |
City of Houston, 4.00% due 9/1/2017 (Convention & Entertainment Facilities Department ) | | | A-/A2 | | | | 200,000 | | | | 214,434 | |
City of Houston, 4.00% due 9/1/2018 (Convention & Entertainment Facilities Department) | | | A-/A2 | | | | 600,000 | | | | 653,454 | |
Coastal Water Authority, 4.00% due 12/15/2017 (City of Houston Projects) | | | AA/NR | | | | 905,000 | | | | 981,436 | |
Harris County Cultural Education Facilities Finance Corp., 0.01% due 9/1/2031 put 4/1/2015 (Texas Medical Center; LOC: JPMorgan Chase Bank, N.A.) (daily demand notes) | | | AAA/Aa1 | | | | 800,000 | | | | 800,000 | |
Lower Colorado River Authority, 5.00% due 5/15/2015 | | | A/A2 | | | | 200,000 | | | | 201,184 | |
State of Texas GO, 1.50% due 8/31/2015 (Cash Flow Management) | | | SP-1+/Mig1 | | | | 500,000 | | | | 502,980 | |
VIRGINIA — 0.46% | | | | | | | | | | | | |
Fairfax County GO, 4.00% due 10/1/2015 (Public Facilities and Improvements) (State Aid Withholding) | | | AAA/Aaa | | | | 200,000 | | | | 203,878 | |
WASHINGTON — 3.56% | | | | | | | | | | | | |
King County Public Hospital District No. 2 GO, 5.00% due 12/1/2018 (Evergreen Health) | | | NR/Aa3 | | | | 835,000 | | | | 946,748 | |
Ocean Beach School District No. 101 GO, 4.00% due 12/1/2017 (Educational Facilities) | | | NR/A2 | | | | 300,000 | | | | 323,535 | |
Seattle Municipal Light & Power, 5.00% due 2/1/2016 | | | AA/Aa2 | | | | 200,000 | | | | 207,970 | |
Washington Economic DFA, 0.06% due 8/1/2025 put 4/1/2015 (Seadrunar Project; LOC: U.S. Bank, N.A.) (daily demand notes) | | | AA-/NR | | | | 100,000 | | | | 100,000 | |
WEST VIRGINIA — 0.45% | | | | | | | | | | | | |
Mason County, 1.625% due 10/1/2022 put 10/1/2018 (Appalachian Power Company Project) | | | BBB/Baa1 | | | | 200,000 | | | | 200,676 | |
10 Semi-Annual Report
| | |
| SCHEDULE OF INVESTMENTS, CONTINUED | | |
| |
Thornburg Low Duration Municipal Fund | | March 31, 2015 (Unaudited) |
| | | | | | | | | | |
Issuer-Description | | Credit Rating†
S&P/ Moody’s | | Principal
Amount | | | Value | |
WISCONSIN — 0.45% | | | | | | | | | | |
Wisconsin Health & Educational Facilities Authority, 1.25% due 8/15/2025 put 8/15/2017 (Aurora Health Care, Inc.) | | NR/A3 | | $ | 200,000 | | | $ | 201,392 | |
| | | | | | | | | | |
TOTAL INVESTMENTS — 100.65% (Cost $44,637,777) | | | | | | | | $ | 44,631,655 | |
LIABILITIES NET OF OTHER ASSETS — (0.65)% | | | | | | | | | (287,808 | ) |
| | | | | | | | | | |
NET ASSETS — 100.00% | | | | | | | | $ | 44,343,847 | |
| | | | | | | | | | |
Footnote Legend
| † | Credit ratings are unaudited. Rating changes may have occurred subsequent to the reporting period end. Bonds issued with a maturity of one year or less are assigned Moody’s ratings from MIG-1 to MIG-4 and Standard and Poor’s ratings from SP-1+ to SP-3 with MIG-1 and SP-1+ being the strongest ratings. |
| a | Segregated as collateral for a when-issued security. |
Portfolio Abbreviations
To simplify the listings of securities, abbreviations are used per the table below:
| | |
| AGM | | Insured by Assured Guaranty Municipal Corp. |
| AMBAC | | Insured by American Municipal Bond Assurance Corp. |
| BAM | | Insured by Build America Mutual Insurance Co. |
| COP | | Certificates of Participation |
| DFA | | Development Finance Authority |
| ETM | | Escrowed to Maturity |
GO | | General Obligation |
| | |
HFA | | Health Facilities Authority |
HFFA | | Health Facilities Financing Authority |
IDA | | Industrial Development Authority |
Mtg | | Mortgage |
Natl-Re | | Insured by National Public Finance Guarantee Corp. |
Q-SBLF | | Insured by Qualified School Bond Loan Fund |
USD | | Unified School District |
| | |
See notes to financial statements.
Semi-Annual Report 11
| | |
| STATEMENT OF ASSETS AND LIABILITIES | | |
| |
Thornburg Low Duration Municipal Fund | | March 31, 2015 (Unaudited) |
| | | | |
ASSETS | | | | |
Investments at value (cost $44,637,777) (Note 2) | | $ | 44,631,655 | |
Cash | | | 567,953 | |
Receivable for fund shares sold | | | 29,545 | |
Interest receivable | | | 353,984 | |
Prepaid expenses and other assets | | | 25,579 | |
| | | | |
Total Assets | | | 45,608,716 | |
| | | | |
| |
LIABILITIES | | | | |
Payable for investments purchased | | | 852,450 | |
Payable for fund shares redeemed | | | 400,192 | |
Payable to investment advisor and other affiliates (Note 3) | | | 3,334 | |
Accounts payable and accrued expenses | | | 8,725 | |
Dividends payable | | | 168 | |
| | | | |
Total Liabilities | | | 1,264,869 | |
| | | | |
| |
NET ASSETS | | $ | 44,343,847 | |
| | | | |
NET ASSETS CONSIST OF | | | | |
Net unrealized depreciation on investments | | $ | (6,122 | ) |
Accumulated net realized gain (loss) | | | (1,073 | ) |
Net capital paid in on shares of beneficial interest | | | 44,351,042 | |
| | | | |
| | $ | 44,343,847 | |
| | | | |
| |
NET ASSET VALUE | | | | |
Class A Shares: | | | | |
Net asset value and redemption price per share ($3,026,927 applicable to 245,457 shares of beneficial interest outstanding - Note 4) | | $ | 12.33 | |
Maximum sales charge, 1.50% of offering price | | | 0.19 | |
| | | | |
Maximum offering price per share | | $ | 12.52 | |
| | | | |
Class I Shares: | | | | |
Net asset value, offering and redemption price per share ($41,316,920 applicable to 3,350,474 shares of beneficial interest outstanding - Note 4) | | $ | 12.33 | |
| | | | |
See notes to financial statements.
12 Semi-Annual Report
| | |
| STATEMENT OF OPERATIONS | | |
| |
Thornburg Low Duration Municipal Fund | | Six Months Ended March 31, 2015 (Unaudited) |
| | | | |
INVESTMENT INCOME | | | | |
Interest income (net of premium amortized of $309,909) | | $ | 109,399 | |
| | | | |
| |
EXPENSES | | | | |
Investment advisory fees (Note 3) | | | 61,976 | |
Administration fees (Note 3) | | | | |
Class A Shares | | | 1,791 | |
Class I Shares | | | 7,030 | |
Distribution and service fees (Note 3) | | | | |
Class A Shares | | | 2,877 | |
Transfer agent fees | | | | |
Class A Shares | | | 8,261 | |
Class I Shares | | | 4,550 | |
Registration and filing fees | | | | |
Class A Shares | | | 14,271 | |
Class I Shares | | | 14,359 | |
Custodian fees (Note 3) | | | 11,530 | |
Professional fees | | | 24,790 | |
Accounting fees | | | 275 | |
Trustee fees | | | 519 | |
Other expenses | | | 2,947 | |
| | | | |
Total Expenses | | | 155,176 | |
Less: | | | | |
Expenses reimbursed by investment advisor (Note 3) | | | (51,857 | ) |
Investment advisory and other Fund level fees waived by investment advisor (Note 3) | | | (24,553 | ) |
Fees paid indirectly (Note 3) | | | (408 | ) |
| | | | |
Net Expenses | | | 78,358 | |
| | | | |
Net Investment Income | | | 31,041 | |
| | | | |
REALIZED AND UNREALIZED GAIN (LOSS) | | | | |
Net realized gain (loss) on investments | | | (1,073 | ) |
Net change in unrealized appreciation (depreciation) on investments | | | (40,109 | ) |
| | | | |
Net Realized and Unrealized Loss | | | (41,182 | ) |
| | | | |
Net Decrease in Net Assets Resulting from Operations | | $ | (10,141 | ) |
| | | | |
See notes to financial statements.
Semi-Annual Report 13
| | |
| STATEMENTS OF CHANGES IN NET ASSETS | | |
| |
Thornburg Low Duration Municipal Fund | | |
| | | | | | | | |
| | | Six Months Ended
March 31, 2015* | | | Period Ended
September 30, 2014** | |
INCREASE (DECREASE) IN NET ASSETS FROM | | | | | | | | |
| | |
OPERATIONS | | | | | | | | |
Net investment income | | $ | 31,041 | | | $ | 32,677 | |
Net realized gain (loss) on investments | | | (1,073 | ) | | | — | |
Net unrealized appreciation (depreciation) on investments | | | (40,109 | ) | | | 33,987 | |
| | | | | | | | |
| | |
Net Increase (Decrease) in Net Assets Resulting from Operations | | | (10,141 | ) | | | 66,664 | |
| | |
DIVIDENDS TO SHAREHOLDERS | | | | | | | | |
From net investment income | | | | | | | | |
Class A Shares | | | (1,365 | ) | | | (4,035 | ) |
Class I Shares | | | (29,676 | ) | | | (28,642 | ) |
| | |
FUND SHARE TRANSACTIONS (NOTE 4) | | | | | | | | |
Class A Shares | | | 278,240 | | | | 2,744,115 | |
Class I Shares | | | 28,683,473 | | | | 12,645,214 | |
| | | | | | | | |
Net Increase in Net Assets | | | 28,920,531 | | | | 15,423,316 | |
| | |
NET ASSETS | | | | | | | | |
Beginning of Period | | | 15,423,316 | | | | — | |
| | | | | | | | |
| | |
End of Period | | $ | 44,343,847 | | | $ | 15,423,316 | |
| | | | | | | | |
| ** | For the period from commencement of operations on December 30, 2013 through September 30, 2014. |
See notes to financial statements.
14 Semi-Annual Report
| | |
| NOTES TO FINANCIAL STATEMENTS | | |
| |
Thornburg Low Duration Municipal Fund | | March 31, 2015 (Unaudited) |
NOTE 1 – ORGANIZATION
Thornburg Low Duration Municipal Fund (the “Fund”) is a diversified series of Thornburg Investment Trust (the “Trust”). The Trust is organized as a Massachusetts business trust under a Declaration of Trust dated June 3, 1987 and is registered as a diversified, open-end management investment company under the Investment Company Act of 1940, as amended. The Fund is currently one of eighteen separate series of the Trust. Each series is considered to be a separate entity for financial reporting and tax purposes and bears expenses directly attributable to it. The Fund’s investment objective is to seek current income exempt from federal income tax, consistent with preservation of capital.
The Fund currently offers two classes of shares of beneficial interest: Class A and Institutional Class (“Class I”). Each class of shares of the Fund represents an interest in the same portfolio of investments, except that (i) Class A shares are sold subject to a front-end sales charge collected at the time the shares are purchased and bear a service fee, (ii) Class I shares are sold at net asset value without a sales charge at the time of purchase and may be subject to a service fee, and (iii) the respective classes may have different reinvestment privileges and conversion rights. Additionally, the Fund may allocate among its classes certain expenses, to the extent allocable to specific classes, including transfer agent fees, government registration fees, certain printing and postage costs, and administrative and legal expenses. Currently, class specific expenses of the Fund are limited to service and distribution fees, administration fees, and certain registration and transfer agent expenses.
NOTE 2 – SIGNIFICANT ACCOUNTING POLICIES
The following is a summary of significant accounting policies followed by the Fund in the preparation of its financial statements. The Fund is an investment company and prepares its financial statements in conformity with U.S. generally accepted accounting principles (“GAAP”), including the investment company accounting and reporting guidance in the Financial Accounting Standards Board (the “FASB”) Accounting Standard Codification Topic 946. The preparation of financial statements in conformity with GAAP requires management to make estimates and assumptions that affect the reported amounts of assets and liabilities and disclosure of contingent assets and liabilities at the date of the financial statements and the reported amounts of increases (decreases) in net assets from operations during the reporting period. Actual results could differ from those estimates.
Significant accounting policies of the Fund are as follows:
Valuation Policy and Procedures: The Trustees of the Trust (the “Trustees”) have authorized employees of the Fund’s investment advisor, acting as the Valuation and Pricing Committee (the “Committee”), to make certain valuation determinations, subject to oversight and review by the Trustees and the Audit Committee of the Trustees. The Committee and other employees of the Fund’s investment advisor administer and implement the valuation process. The Committee regularly reviews its own fair value decisions, as well as valuations, valuation techniques and services furnished by pricing services, considers circumstances in the markets which may require valuation determinations by the Committee and reviews previous valuation determinations. The Committee also reports on its activities, the performance of the pricing services and other matters to the Trustees and the Audit Committee of the Trustees.
In determining a fair value for a portfolio investment, the Committee seeks to determine the price that the Fund would reasonably expect to receive upon a sale of the investment in an orderly transaction between market participants at the measurement date. Typically, the fair value process employs standing instructions to use quoted prices in active markets or the use of independent pricing services. Less frequently, the Committee may make a fair value determination using other methods. However, because fair value prices are estimated prices, the determination of fair value for an investment may differ from the value that would be realized by the Fund upon a sale of the investment, and that difference could be material to the Fund’s financial statements. The Committee’s determination of fair value for an investment may also differ from the prices obtained by other persons (including other mutual funds) for the investment.
Valuation of Investments: Debt obligations held by the Fund have a primary over-the-counter market and are valued by an independent pricing service approved by the Trustees. The pricing service ordinarily values debt obligations using quoted bid prices and other methods which include consideration of yields or prices of debt obligations of comparable quality, type of issue, coupon, maturity and rating, and indications as to value from dealers and general market conditions.
In any case when a pricing service fails to provide a price for a debt obligation held by the Fund, the Committee determines a fair value for the debt obligation using procedures in accordance with a policy approved by the Trustees, which may include the use of a price obtained from a different independent pricing service. Additionally, in any case when management believes that a price provided by a pricing service for a debt obligation held by the Fund may be unreliable, the Committee decides whether or not to use the pricing service’s valuation or to use an alternative method to determine a fair value for the debt obligation.
Semi-Annual Report 15
| | |
| NOTES TO FINANCIAL STATEMENTS , CONTINUED | | |
| |
Thornburg Low Duration Municipal Fund | | March 31, 2015 (Unaudited) |
Valuation Measurements: The Fund categorizes its investments based upon the inputs used in valuing those investments, according to a three-level hierarchy established by guidance from the FASB. Categorization of investments using this hierarchy is intended by the FASB to maximize the use of observable inputs and minimize the use of unobservable inputs by prioritizing that the most observable input be used when available. Observable inputs are those that market participants would use in valuing an investment based on available market data. Unobservable inputs are those that reflect assumptions about the information market participants would use in valuing an investment. An investment’s level within the hierarchy is based on the lowest level input that is deemed significant to the fair value measurement. The methodologies and relative inputs used to value investments are not necessarily indications of the risk or liquidity associated with investing in those investments.
Various inputs are used in determining the fair value measurement of the Fund’s investments. These inputs are generally summarized according to the three-level hierarchy below:
Level 1: Quoted prices in active markets for identical investments.
Level 2: Other direct or indirect significant observable inputs (including quoted prices for similar investments in active markets and other observable inputs, such as interest rates, prepayment rates, credit risk, etc.).
Level 3: Significant unobservable inputs (including the Committee’s own assumptions in determining the fair value of investments).
Portfolio investments with minimal, if any, market activity are characterized as Level 3 and are valued using significant unobservable inputs, typically including single broker quotes, which may be adjusted or unadjusted, related or comparable investments, last available transactions, and other relevant information. Valuations may also be based upon current market prices of securities that are comparable in coupon, rating, maturity and industry. An income based valuation approach would consider discounted anticipated future cash flows of the investment. Discounts may also be applied due to the nature or duration of any restrictions on the disposition of the investment. Valuations based upon the use of inputs from Levels 1, 2, or 3, may not represent the actual price received upon the disposition of an investment, and the Fund may receive a price that is lower than the valuation when it sells the investment.
The following table displays a summary of the fair value hierarchy measurements of the Fund’s investments as of March 31, 2015. In any instance when valuation inputs from more than one level are used to determine the fair value of a specific investment, the investment is placed in the level of the table based upon the lowest level input that is significant in determining the fair value of the investment:
| | | | | | | | | | | | | | | | |
| | | Fair Value Measurements At March 31, 2015 | |
| | | Total | | | Level 1 | | | Level 2 | | | Level 3 | |
Assets | | | | | | | | | | | | | | | | |
Investments in Securities | | | | | | | | | | | | | | | | |
Municipal Bonds | | $ | 44,631,655 | | | $ | — | | | $ | 44,631,655 | | | $ | — | |
| | | | | | | | | | | | | | | | |
Total Investments in Securities | | $ | 44,631,655 | | | $ | — | | | $ | 44,631,655 | | | $ | — | |
In accordance with the guidance prescribed in Accounting Standards Update No. 2011-04, it is the policy of the Fund to recognize transfers between levels and the underlying events which caused the movement. The Fund recognized no transfers between levels for the six months ended March 31, 2015.
Federal Income Taxes: It is the policy of the Trust to comply with the provisions of the Internal Revenue Code applicable to “regulated investment companies” and to distribute to shareholders substantially all taxable (if any) and tax exempt income of the Fund. Therefore, no provision for federal income tax is required.
Management reviews each uncertain tax position believed to be material to the preparation of the Fund’s financial statements, to assess if it is more likely than not that the position would be sustained upon examination, based upon the technical merits of the position. As of March 31, 2015, management has not identified any such position for which an asset or liability must be reflected in the Statement of Assets and Liabilities. The Fund’s tax returns remain subject to examination for three years after filing.
When-Issued and Delayed Delivery Transactions: The Fund may engage in when-issued or delayed delivery transactions. To the extent the Fund engages in such transactions, it will do so for the purpose of acquiring portfolio investments consistent with the Fund’s investment objectives and not for the purpose of investment leverage or to speculate on interest rate and/or market changes. At the time the Fund makes a commitment to purchase an investment on a when-issued or delayed delivery basis, the Fund will record the transaction and reflect the value in determining its net asset value. When effecting such transactions, assets of an amount sufficient to make payment for the portfolio investments to be purchased will be segregated on the Fund’s records on the trade date. Investments purchased on a when-issued or delayed delivery basis do not earn interest until the settlement date.
Dividends: Net investment income of the Fund is declared daily as a dividend on shares for which the Fund has received payment. Dividends are paid monthly and are reinvested in additional shares of the Fund at net asset value per share at the close of business
16 Semi-Annual Report
| | |
| NOTES TO FINANCIAL STATEMENTS , CONTINUED | | |
| |
Thornburg Low Duration Municipal Fund | | March 31, 2015 (Unaudited) |
on the dividend payment date, or at the shareholder’s option, paid in cash. Net realized capital gains, to the extent available, will be distributed at least annually.
General: Investment transactions are accounted for on a trade date basis. Interest income is accrued as earned. Premiums and discounts on investments purchased are amortized to call dates or maturity dates of the respective investments. Realized gains and losses from the sale of investments are recorded on an identified cost basis. Net investment income (other than class specific expenses) and realized and unrealized gains and losses are allocated daily to each class of shares based upon the relative net asset value of outstanding shares (or the value of the dividend-eligible shares, as appropriate) of each class of shares at the beginning of the day (after adjusting for the current capital shares activity of the respective class). Expenses common to all Funds are allocated among the Funds comprising the Trust based upon their relative net asset values or other appropriate allocation methods.
Guarantees and Indemnifications: Under the Trust’s organizational documents (and under separate agreements with the independent Trustees), its officers and Trustees are indemnified against certain liabilities arising out of the performance of their duties to the Fund. Additionally, in the normal course of business the Trust enters into contracts with service providers that contain general indemnification clauses. The Trust’s maximum exposure under these arrangements is unknown. However, based on experience, the Trust expects the risk of loss to be remote.
NOTE 3 – INVESTMENT ADVISORY FEE AND OTHER TRANSACTIONS WITH AFFILIATES
Pursuant to an investment advisory agreement, Thornburg Investment Management, Inc. (the “Advisor”) serves as the investment advisor and performs services for the Fund for which the fees are payable at the end of each month. For the six months ended March 31, 2015, these fees were payable at annual rates ranging from .40 of 1% to .225 of 1% per annum of the average daily net assets of the Fund depending on the Fund’s asset size. The Trust also has entered into administrative services agreements with the Advisor, whereby the Advisor will perform certain administrative services for the shareholders of each class of the Fund’s shares, and for which fees will be payable at an annual rate of up to .125 of 1% per annum of the average daily net assets attributable to each class of shares.
The Trust has an underwriting agreement with Thornburg Securities Corporation (the “Distributor,” an affiliate of the Advisor), which acts as the distributor of the Fund’s shares. For the six months ended March 31, 2015, the Distributor has advised the Fund that it earned net commissions aggregating $288 from the sale of Class A shares of the Fund.
Pursuant to a service plan under Rule 12b-1 of the Investment Company Act of 1940, the Fund may reimburse to the Advisor an amount not to exceed .20 of 1% per annum of the average daily net assets attributable to each Class of shares of the Fund for payments made by the Advisor to securities dealers and other financial institutions to obtain various shareholder and distribution related services. For the six months ended March 31, 2015, there were no 12b-1 service plan fees charged for Class I shares. The Advisor may pay out of its own resources additional expenses for distribution of the Fund’s shares and shareholder services.
The Advisor and Distributor have contractually agreed to waive fees and reimburse expenses incurred by the Fund so that actual expenses of certain share classes do not exceed levels as specified in the Fund’s most recent prospectus. The agreement may be terminated by the Fund at any time, but may not be terminated by the Advisor or Distributor before February 1, 2016, unless the Advisor ceases to be the investment advisor to the Fund or the Distributor ceases to be the distributor of the Fund prior to that date. The Advisor and Distributor retain the right to be repaid by the Fund for fee waivers and expense reimbursements if expenses fall below the contractual limit prior to the end of the fiscal year.
For the six months ended March 31, 2015, the Advisor contractually reimbursed certain class specific expenses and administrative fees of $25,918 for Class A shares and $25,939 for Class I shares, and voluntarily waived investment advisory fees of $24,553.
The Trust has an agreement with the custodian bank to indirectly pay a portion of the custodian’s fees through credits earned by the Fund’s cash on deposit with the bank. This deposit agreement is an alternative to overnight investments. Custodial fees are adjusted to reflect amounts that would have been paid without this agreement, with a corresponding adjustment reflected as fees paid indirectly in the Statement of Operations. For the six months ended March 31, 2015, fees paid indirectly were $408.
Certain officers and Trustees of the Trust are also officers or directors of the Advisor and Distributor. The compensation of independent Trustees is borne by the Trust.
Semi-Annual Report 17
| | |
| NOTES TO FINANCIAL STATEMENTS, CONTINUED | | |
| |
Thornburg Low Duration Municipal Fund | | March 31, 2015 (Unaudited) |
NOTE 4 – SHARES OF BENEFICIAL INTEREST
At March 31, 2015, there were an unlimited number of shares with no par value of beneficial interest authorized. Transactions in shares of beneficial interest were as follows:
| | | | | | | | | | | | | | | | |
| | | Six Months Ended | | | Period Ended | |
| | | March 31, 2015 (Unaudited) | | | September 30, 2014* (Audited) | |
| | | Shares | | | Amount | | | Shares | | | Amount | |
Class A Shares | | | | | | | | | | | | | | | | |
Shares sold | | | 40,334 | | | $ | 497,520 | | | | 225,443 | | | $ | 2,775,568 | |
Shares issued to shareholders in reinvestment of dividends | | | 109 | | | | 1,345 | | | | 326 | | | | 4,025 | |
Shares repurchased | | | (17,879 | ) | | | (220,625 | ) | | | (2,876 | ) | | | (35,478 | ) |
| | | | | | | | | | | | | | | | |
| | | | |
Net increase (decrease) | | | 22,564 | | | $ | 278,240 | | | | 222,893 | | | $ | 2,744,115 | |
| | | | | | | | | | | | | | | | |
| | | | |
Class I Shares | | | | | | | | | | | | | | | | |
Shares sold | | | 2,606,120 | | | $ | 32,165,226 | | | | 1,087,886 | | | $ | 13,402,490 | |
Shares issued to shareholders in reinvestment of dividends | | | 2,364 | | | | 29,175 | | | | 2,321 | | | | 28,630 | |
Shares repurchased | | | (284,580 | ) | | | (3,510,928 | ) | | | (63,637 | ) | | | (785,906 | ) |
| | | | | | | | | | | | | | | | |
| | | | |
Net increase (decrease) | | | 2,323,904 | | | $ | 28,683,473 | | | | 1,026,570 | | | $ | 12,645,214 | |
| | | | | | | | | | | | | | | | |
| * | Fund commenced operations on December 30, 2013. |
NOTE 5 – INVESTMENT TRANSACTIONS
For the six months ended March 31, 2015, the Fund had purchase and sale transactions of investments (excluding short-term investments) of $25,852,045 and $780,000, respectively.
NOTE 6 – INCOME TAXES
At March 31, 2015, information on the tax components of capital was as follows:
| | | | |
Cost of investments for tax purposes | | $ | 44,637,777 | |
| | | | |
Gross unrealized appreciation on a tax basis | | $ | 61,081 | |
Gross unrealized depreciation on a tax basis | | | (67,203 | ) |
| | | | |
Net unrealized appreciation (depreciation) on investments (tax basis) | | $ | (6,122 | ) |
| | | | |
OTHER NOTES
Risks: The Fund’s investments subject it to risks including, but not limited to, credit risk, interest rate risk, management risk, market and economic risk, and liquidity risk. Please see the Fund’s prospectus for a discussion of the risks associated with an investment in the Fund.
Subsequent Events: Fund management believes no events have occurred between March 31, 2015 and the date of issuance of the financial statements that require adjustment to or disclosure in the accompanying financial statements.
18 Semi-Annual Report
This page intentionally left blank.
Semi-Annual Report 19
| | |
| FINANCIAL HIGHLIGHTS | | |
| |
| Thornburg Low Duration Municipal Fund | | |
| | | | | | | | | | | | | | | | | | | | | | | | | | | | | | | | | | | | | | | | | | | | | | | | | | | | | | | | | | | | |
| | | PER SHARE PERFORMANCE (for a share outstanding throughout the Period)+ | | | RATIOS TO AVERAGE NET ASSETS | | | SUPPLEMENTAL DATA | |
Unless Otherwise
Noted, Periods are
Fiscal Years Ended
Sept. 30, | | Net Asset
Value
Beginning
of Period | | | Net
Investment
Income
(loss) | | | Net
Realized
&
Unrealized
Gain (Loss)
on
Investments | | | Total From
Investment
Operations | | | Dividends
from Net
Investment
Income | | | Dividends
From Net
Realized
Gains | | | Total
Dividends | | | Net
Asset
Value
End
of
Period | | | Net
Investment
Income
(loss)
(%) | | | Expenses,
After
Expense
Reductions
(%) | | | Expenses,
After
Expense
Reductions
and
Net of
Custody
Credits
(%) | | | Expenses,
Before
Expense
Reductions
(%) | | | Total
Return
(%)(a) | | | Portfolio
Turnover
Rate
(%)(a) | | | Net
Assets
at End
of
Period
(thousands) | |
Class A Shares | | | | | | | | | | | | | | | | | | | | | | | | | | | | | | | | | | | | | | | | | | | | | | | | | | | | | |
2015(b)(c) | | $ | 12.34 | | | | 0.01 | | | | (0.01 | ) | | | — | | | | (0.01 | ) | | | — | | | | (0.01 | ) | | $ | 12.33 | | | | 0.10 | (d) | | | 0.64 | (d) | | | 0.64 | (d) | | | 2.61 | (d) | | | (0.03 | ) | | | 4.17 | | | $ | 3,027 | |
2014(c)(e) | | $ | 12.31 | | | | 0.02 | | | | 0.03 | | | | 0.05 | | | | (0.02 | ) | | | — | | | | (0.02 | ) | | $ | 12.34 | | | | 0.20 | (d) | | | 0.66 | (d) | | | 0.65 | (d) | | | 3.14 | (d) | | | 0.40 | | | | 4.54 | | | $ | 2,751 | |
Class I Shares | | | | | | | | | | | | | | | | | | | | | | | | | | | | | | | | | | | | | | | | | | | | | | | | | | | | | |
2015(b) | | $ | 12.34 | | | | 0.01 | | | | — | | | | 0.01 | | | | (0.02 | ) | | | — | | | | (0.02 | ) | | $ | 12.33 | | | | 0.21 | (d) | | | 0.49 | (d) | | | 0.49 | (d) | | | 0.84 | (d) | | | 0.04 | | | | 4.17 | | | $ | 41,317 | |
2014(e) | | $ | 12.31 | | | | 0.04 | | | | 0.03 | | | | 0.07 | | | | (0.04 | ) | | | — | | | | (0.04 | ) | | $ | 12.34 | | | | 0.42 | (d) | | | 0.44 | (d) | | | 0.44 | (d) | | | 1.77 | (d) | | | 0.56 | | | | 4.54 | | | $ | 12,672 | |
| (a) | Not annualized for periods less than one year. |
| (b) | Unaudited Six Month Period Ended March 31. |
| (c) | Sales loads are not reflected in computing total return. |
| (e) | Fund commenced operations on December 30, 2013. |
| + | Based on weighted average shares outstanding, except for Dividends from Net Investment Income and Net Realized Gains, which are actual amounts per share. |
See notes to financial statements.
| | | | |
| 20 Semi-Annual Report | | | | Semi-Annual Report 21 |
| | |
| EXPENSE EXAMPLE | | |
| |
Thornburg Low Duration Municipal Fund | | March 31, 2015 (Unaudited) |
As a shareholder of the Fund, you incur two types of costs:
| | (1) | transaction costs, including |
(a) sales charges (loads) on purchase payments, for Class A shares;
(b) a deferred sales charge on redemptions of any part or all of a purchase of $1 million of Class A shares within 12 months of purchase;
| | (2) | ongoing costs, including management fees; distribution and/or service (12b-1) fees; and other Fund expenses. |
This example is intended to help you understand your ongoing costs (in dollars) of investing in the Fund and to compare these costs with the ongoing costs of investing in other mutual funds.
The example is based on a $1,000 investment beginning on October 1, 2014, and held until March 31, 2015.
| | | | | | | | | | | | |
| | | Beginning
Account Value
10/1/14 | | | Ending
Account Value
3/31/15 | | | Expenses paid
During period†
10/1/14–3/31/15 | |
Class A Shares | | | | | | | | | | | | |
Actual | | $ | 1,000.00 | | | $ | 999.70 | | | $ | 3.19 | |
Hypothetical* | | $ | 1,000.00 | | | $ | 1,021.74 | | | $ | 3.23 | |
Class I Shares | | | | | | | | | | | | |
Actual | | $ | 1,000.00 | | | $ | 1,000.40 | | | $ | 2.45 | |
Hypothetical* | | $ | 1,000.00 | | | $ | 1,022.48 | | | $ | 2.48 | |
| † | Expenses are equal to the annualized expense ratio for each class (A: 0.64%; I: 0.49%) multiplied by the average account value over the period, multiplied by 182/365 to reflect the one-half year period. |
| * | Hypothetical assumes a rate of return of 5% per year before expenses. |
ACTUAL EXPENSES
For each class of shares, the first line of the accompanying table provides information about actual account values and actual expenses. You may use the information in this line, together with the amount you invested, to estimate the expenses that you paid over the period. Simply divide your account value by $1,000 (for example, an $8,600 account value divided by $1,000 = 8.6), then multiply the result by the number in the first line for your class of shares under the heading entitled “Expenses Paid During Period” to estimate the expenses you paid on your account during this period.
HYPOTHETICAL EXAMPLE FOR COMPARISON PURPOSES
For each class of shares, the second line of the accompanying table provides information about hypothetical account values and hypothetical expenses based on the Fund’s actual expense ratio and an assumed rate of return of 5% per year before expenses, which is not the Fund’s actual return. The hypothetical account values and expenses may not be used to estimate the actual ending account balance or expenses you paid for the period. You may use this information to compare the ongoing costs of investing in the Fund and other funds. To do so, compare this 5% hypothetical example with the 5% hypothetical examples that appear in the shareholder reports of the other funds.
Please note that the expenses shown in the table are meant to highlight your ongoing costs only and do not reflect any transactional costs, such as sales charges (loads), redemption fees, or exchange fees. Therefore, the second line of the table for each class of shares is useful in comparing ongoing costs only, and will not help you determine the relative total costs of owning different funds. In addition, if these transactional costs were included, your costs would have been higher.
22 Semi-Annual Report
| | |
| OTHER INFORMATION | | |
| |
Thornburg Low Duration Municipal Fund | | March 31, 2015 (Unaudited) |
PORTFOLIO PROXY VOTING
Policies and Procedures:
The Trust has delegated to Thornburg Investment Management, Inc. (the “Advisor”) voting decisions respecting proxies for the Fund’s voting securities. The Advisor makes voting decisions in accordance with its Proxy Voting Policy. A description of the Policy is available (i) without charge, upon request, by calling the Advisor toll-free at 1-800-847-0200, (ii) on the Thornburg website at www.thornburg. com, and (iii) on the Securities and Exchange Commission’s website at www.sec.gov.
Information regarding how proxies were voted is available on or before August 31 of each year for the twelve months ending the preceding June 30. This information is available (i) without charge, upon request by calling the Advisor toll-free at 1-800-847-0200, (ii) on the Thornburg website at www.thornburg.com, and (iii) on the Securities and Exchange Commission’s website at www.sec.gov.
AVAILABILITY OF QUARTERLY PORTFOLIO SCHEDULE
The Fund files with the Securities and Exchange Commission schedules of its portfolio holdings on Form N-Q for the first and third quarters of each fiscal year. The Fund’s Forms N-Q are available on the Commission’s website at www.sec.gov, or may be reviewed and copied at the Commission’s Public Reference Room in Washington, D.C. Information on the operation of the Public Reference Room may be obtained by calling 1-800-SEC-0330. The Fund also makes this information available on its website at www.thornburg. com/download or upon request by calling 1-800-847-0200.
Semi-Annual Report 23
TRUSTEES’ STATEMENT TO SHAREHOLDERS
Revised and Readopted September 15, 2014
The Trustees believe current and prospective shareholders should know how we discharge our responsibilities in supervising the Funds’ investment advisor and in reviewing the advisor’s contract for renewal. Since 2005, we have issued a statement which sets out clearly the three principal guidelines that we follow in supervising the Trust’s investment advisor on your behalf. In accordance with our customary practice, in September of 2014 we again reviewed our statement and concluded we should reissue this statement outlining the principal features of our supervision of the advisor’s performance of investment management services for the Funds.
We begin with the premise that each shareholder selected his or her Fund because its investments are managed by the investment advisor identified in the prospectus and in accordance with the objective and policies described in the prospectus. We realize, as each of you do, that if you believe that your Fund’s stated objective and policies no longer serve your personal investment goals, you can sell your shares and leave the Fund.
Therefore, we believe that our primary supervisory task—our principal obligation to you—is to assess the nature and quality of the advisor’s services, and to confirm that the advisor actively and competently pursues the Fund’s objective, in accordance with the policies set out in the prospectus. To do this, we meet regularly with management to review your Fund’s portfolio and to discuss the advisor’s specific actions and judgments in pursuing the Fund’s objective. We do not substitute our own judgment for the advisor’s decisions in selecting investments; the advisor is paid to exercise its informed judgment on investment decisions, and we seek to confirm, in reviewing the advisor’s performance, that the advisor is doing just that.
Second, we are conscious of costs and the effect that costs have on shareholders’ returns. We try to make sure that your Fund’s fees and costs are reasonable in relationship to the services rendered and that they are generally in line with those charged by other expert investment advisors, consistent with our belief that the Fund’s investors searched for and expect that expertise and attention and have decided to pay a reasonable price for it. We do not put the management contract “out to bid” as a matter of course, and we would not do so unless we had concluded that the advisor materially had failed to pursue the Fund’s objectives in accordance with its policies, or for other equally important reasons. We believe that any other approach would be inconsistent with your interests and contrary to your expectations when you bought shares of the Fund in the first place.
Finally, because we believe that most Thornburg Fund shareholders have invested with a long-term perspective, we try not to focus too much on the fashions of the moment and on short-term performance. The market will not favor any specific investment objective or set of policies at all times and under all economic circumstances. A fund will experience periods of both high and low returns relative to other funds and other investments. Even if one of our Funds is not favored by the market at a particular time, we believe that the advisor is nonetheless obliged to remain true to the Fund’s objective and policies, and we watch to see that it does so.
Trustees of Thornburg Investment TrustT
24 Semi-Annual Report
This page intentionally left blank.
Semi-Annual Report 25
This page intentionally left blank.
26 Semi-Annual Report
THORNBURG FUND FAMILY
FUNDAMENTAL, BOTTOM-UP EQUITY RESEARCH
We search far and wide for the best stock ideas – within the United States and around the globe. Potential investments that may deserve a deeper look are thoroughly analyzed using both quantitative and qualitative criteria. But the vast majority are discarded. Those that ultimately make it into our highly-selective portfolios are continually monitored to determine whether our investment theses unfold as expected.
| | • | | Thornburg Core Growth Fund |
| | • | | Thornburg International Value Fund |
| | • | | Thornburg International Growth Fund |
| | • | | Thornburg Developing World Fund |
| | • | | Thornburg Investment Income Builder Fund |
| | • | | Thornburg Global Opportunities Fund |
A TRADITION OF DISCIPLINED BOND MANAGEMENT
At Thornburg, the word “disciplined” carries some substance. We don’t make a practice of using shortcuts to enhance yield or total returns. Every strategy is grounded in rigorous, bottom-up credit work. Portfolios are assembled carefully—in the case of our core bond funds, using laddered structures – to mitigate price fluctuation. Position sizes are controlled so that no single bond can have an outsized effect on a portfolio. And as with our equity portfolios, managers enjoy flexibility to seek an optimal risk/reward balance.
| | • | | Thornburg Low Duration Income Fund |
| | • | | Thornburg Limited Term U.S. Government Fund |
| | • | | Thornburg Limited Term Income Fund |
| | • | | Thornburg Strategic Income Fund |
| | • | | Thornburg Low Duration Municipal Fund |
| | • | | Thornburg Limited Term Municipal Fund |
| | • | | Thornburg Intermediate Municipal Fund |
| | • | | Thornburg California Limited Term Municipal Fund |
| | • | | Thornburg New Mexico Intermediate Municipal Fund |
| | • | | Thornburg New York Intermediate Municipal Fund |
| | • | | Thornburg Strategic Municipal Income Fund |
Before investing, carefully consider the Fund’s investment goals, risks, charges, and expenses. For a prospectus or summary prospectus containing this and other information, contact your financial advisor or visit thornburg.com. Read it carefully before investing.
For additional information, please visit thornburg.com
Thornburg Investment Management, Inc. 2300 North Ridgetop Road, Santa Fe, NM 87506
Semi-Annual Report 27

This Semi-Annual Report is submitted for the general information of shareholders of the Fund. It is not authorized for distribution to prospective investors in the Fund unless preceded or accompanied by an effective prospectus.
| | | | |
| Investment Advisor: | | Distributor: | | |
| Thornburg Investment Management® | | Thornburg Securities Corporation® | | |
| 800.847.0200 | | 800.847.0200 | | TH3172 |
Firm Overview
THE FIRM
Thornburg Investment Management is a privately owned global investment firm that offers a range of solutions for retail and institutional investors. We are driven by our mission to help our clients reach their long-term financial goals through fundamental research and active portfolio management.
Founded in 1982 and headquartered in Santa Fe, New Mexico, we manage approximately $61 billion (as of March 31, 2015) across seven equity and 11 bond mutual funds, separate accounts for high-net-worth investors and institutional accounts, and five UCITS funds for non-U.S. investors.

CORE INVESTMENT PRINCIPLES
Our focus has always been on maintaining and building the investment expertise to manage Thornburg strategies to a high standard, while adhering to a core set of investment principles:
| | • | | We focus on the fundamentals. We invest according to our view of the fundamental value of an issuer only after performing thorough, bottom-up research. |
| | • | | We think and invest for the long term. We typically make investment decisions based upon an investment thesis we expect to play out over 18 months to several years. We may not always hold a security for several years, but our horizon line is typically a few years out. |
| | • | | We stay flexible. We go where we see value. Our investment mandates are generally broad and flexible, and we exercise as much flexibility as possible within any restrictions. |
| | • | | We collaborate across strategies. We are structured as global generalists. Portfolio managers and analysts do not specialize in sectors, geographies, or even security types, but instead must understand and communicate bottom-up fundamentals across industries, sectors, and borders. |
2 Semi-Annual Report
Thornburg Limited Term Municipal Fund
Semi-Annual Report | March 31, 2015
| | | | |
Share Class | | NASDAQ Symbol | | CUSIP |
Class A | | LTMFX | | 885-215-459 |
Class C | | LTMCX | | 885-215-442 |
Class I | | LTMIX | | 885-215-434 |
Minimum investments for Class I shares are higher than those for other classes. Class I shares may not be available to all investors.
Investments in the Fund carry risks, including possible loss of principal. Bond funds have the same interest rate, inflation, and credit risks that are associated with the underlying bonds. The value of bonds will fluctuate relative to changes in interest rates, decreasing when interest rates rise. Unlike bonds, bond funds have ongoing fees and expenses. Please see the Fund’s prospectus for a discussion of the risks associated with an investment in the Fund. Investments in the Fund are not FDIC insured, nor are they deposits of or guaranteed by a bank or any other entity.
The laddering strategy does not assure or guarantee better performance and cannot eliminate the risk of investment losses.
Semi-Annual Report 3
LETTER TO SHAREHOLDERS
Thornburg Limited Term Municipal Fund | March 31, 2015 (Unaudited)
April 16, 2015
Dear Fellow Shareholder:
We are pleased to present the semi-annual report for the Thornburg Limited Term Municipal Fund. The net asset value (NAV) of the Class A shares decreased by two cents to $14.56 per share during the six months ended March 31, 2015. If you were with us for the entire period, you received dividends of 11.30 cents per share. If you reinvested your dividends, you received 11.33 cents per share. Dividends were lower for Class C shares and higher for Class I shares, to account for varying class-specific expenses. The Class A shares underperformed the Fund’s benchmark index, with a 0.64% total return (without sales charge) for the six months ended March 31, 2015, compared to the 1.02% total return for the BofA Merrill Lynch 1-10 Year U.S. Municipal Securities Index. The Fund generated 0.97% more price return and 1.35% less income than its benchmark.
Throughout the six-month period, the Fund maintained a lower risk posture on interest rates than its benchmark; its average effective duration (a measure of interest-rate sensitivity) was 3.06 years, compared to 3.76 years for the benchmark. The shorter duration hurt performance by 0.03%. The Fund’s position along the yield curve subtracted 0.02% and sector selection detracted 1.20% of relative performance. Our underweight in high-quality AAA bonds was a contributor, adding 1.61% to performance. Other factors including security selection added 0.61%.
The Municipal Market
The municipal market has been something of a roller coaster over the past six months. Much of that volatility revolves around investors’ increased fears of an eventual Federal Reserve rate increase. While those fears aren’t completely unfounded, we believe the typical municipal bond investor is ignoring several other sources of risk present in the market.
First and foremost, it appears that risk is mispriced. At a very high level, we examine two primary sources of risk in the municipal market: duration and credit quality. The hunt for excess yield has bid up the prices of these sources of risk to levels we believe are unsustainable.
Investors looking for more yield can increase the duration of their purchases. This strategy often makes sense in a period characterized by a steep yield curve. When the curve is sufficiently steep, the incremental yield an investor picks up for buying a bond one year longer may, in fact, provide adequate compensation for the increased interest-rate risk. But through the six months ended March 31, 2015, we believe compensation offered to investors to extend duration was not in line with the added risk. This was particularly true when looking at the overall low level of interest rates in the market. Chart I
Chart I | 10-Year AAA General Obligation Municipal Bond Real Yield History, Using Core PCE Index
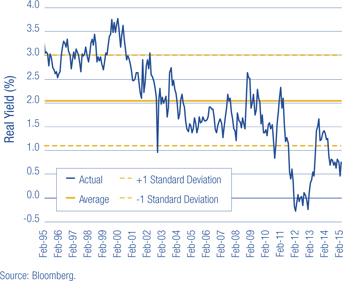
shows the yield of a AAA rated general obligation bond less the core PCE index (or Personal Consumption Expenditures index, the Federal Reserve’s favored inflation measure). This is the so-called “real yield” an investor receives after inflation; this was and continues to be well below the long-term average.
Less risk-averse investors can also decrease the average credit quality of their portfolios in an attempt to generate more income. While this can be a sound strategy in times of wide credit spreads, it fails during periods when credit risk is mispriced. Chart II shows a history of credit spreads, which in this case is the incremental yield an investor picked up from investing in a BBB rated revenue bond versus a AAA rated general obligation bond. Such spreads are as tight as they have been since before the great recession, when municipal bond insurers were thriving and a majority of the market was insured with AAA ratings.
In addition to overpriced risks, investors need to be prepared for continued volatility in the market. We live in a world where the Federal Reserve’s statements are analyzed word for word. The inclusion or deletion of any given word has the potential to send the markets roiling. The increased volatility may be exacerbated in the future by liquidity constraints facing the market, prompted by recent federal regulation. As a result of Dodd-Frank and other regulations, large broker/dealers will no longer be able to allocate the same amount of capital to the municipal market as they have in the past. Without that support, the market could be rattled more than usual if and when we see large outflows.
4 Semi-Annual Report
LETTER TO SHAREHOLDERS,
CONTINUED
Chart II | Credit-Spread Difference, BBB Rated Revenue v. AAA Rated General Obligation Bonds
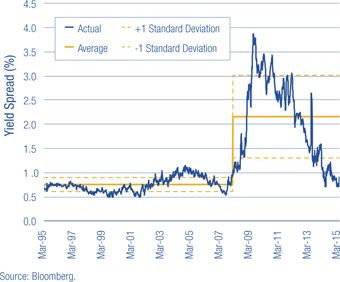
Investors need to be aware of all of these risks and ensure they are accounting for them appropriately.
Conclusion
For the past six months, the Thornburg municipal bond team has asked a simple question: “Are we getting paid to take risk?” The answer has been a resounding “no.” As a result, our investors will see a portfolio with a lower duration and a stronger average credit quality, as we overweighted higher-rated credits. We have also increased cash positions to seek to protect against a market liquidity crunch and to strategically take advantage of opportunities should they arise. In short, we believe we have avoided overpriced risk.
Many shareholders may ask themselves “what should I do if interest rates begin to rise?” We continue to stress having confidence in the structure of your portfolio. A portion of your laddered Fund’s bonds mature each year and become available for reinvestment at higher yields; this has the potential to increase income to shareholders. When interest rates do rise, prices will generally decline, but the remaining bonds in the portfolio will move closer to maturity and should, in our opinion, increase in price over time. We advise being patient when interest rates start to rise, and lengthening your anticipated holding period. Remember that higher yields also mean higher income, something investors have been sorely lacking for quite some time!
We will continue to strive to manage your assets to fulfill the Fund’s objectives.
Sincerely,
| | | | |
 | |  | | 
|
| Christopher Ryon, CFA | | Josh Gonze | | Nicholos Venditti |
| Portfolio Manager | | Portfolio Manager | | Portfolio Manager |
| Managing Director | | Managing Director | | Managing Director |
The matters discussed in this report may constitute forward-looking statements made pursuant to the safe harbor provisions of the Securities Litigation Reform Act of 1995. These include any advisor or portfolio manager prediction, assessment, analysis or outlook for individual securities, industries, investment styles, market sectors and/or markets. These statements involve risks and uncertainties. In addition to the general risks described for each fund in its current prospectus, other factors bearing on these reports include the accuracy of the advisor’s or portfolio manager’s forecasts and predictions, the appropriateness of the investment strategies designed by the advisor or portfolio manager and the ability of the advisor or portfolio manager to implement their strategies efficiently and successfully. Any one or more of these factors, as well as other risks affecting the securities markets generally, could cause the actual results of any fund to differ materially as compared to its benchmarks.
The views expressed by the portfolio managers reflect their professional opinions and are subject to change. Under no circumstances does the information contained within represent a recommendation to buy or sell any security.
Semi-Annual Report 5
PERFORMANCE SUMMARY
Thornburg Limited Term Municipal Fund | March 31, 2015 (Unaudited)
Average Annual Total Returns
| | | | | | | | | | | | | | | | | | | | |
| | | 1-Yr | | | 3-Yr | | | 5-Yr | | | 10-Yr | | | Since
Incep. | |
A Shares (Incep: 9/28/84) | | | | | | | | | | | | | | | | | | | | |
Without sales charge | | | 2.41 | % | | | 1.87 | % | | | 3.02 | % | | | 3.44 | % | | | 5.14 | % |
With sales charge | | | 0.87 | % | | | 1.36 | % | | | 2.71 | % | | | 3.28 | % | | | 5.09 | % |
C Shares (Incep: 9/1/94) | | | | | | | | | | | | | | | | | | | | |
Without sales charge | | | 2.24 | % | | | 1.61 | % | | | 2.75 | % | | | 3.17 | % | | | 3.57 | % |
With sales charge | | | 1.74 | % | | | 1.61 | % | | | 2.75 | % | | | 3.17 | % | | | 3.57 | % |
I Shares (Incep: 7/5/96) | | | 2.74 | % | | | 2.20 | % | | | 3.34 | % | | | 3.78 | % | | | 4.19 | % |
30-Day Yields, A Shares
(with sales charge)
| | | | |
Annualized Distribution Yield | | | 1.40 | % |
SEC Yield | | | 0.56 | % |
Performance data shown represents past performance and is no guarantee of future results. Investment return and principal value will fluctuate so shares, when redeemed, may be worth more or less than their original cost. Current performance may be lower or higher than quoted. For performance current to the most recent month end, visit thornburg.com or call 800-847-0200. The performance information does not reflect the deduction of taxes that a shareholder would pay on distributions or the redemption of Fund shares. Returns reflect the reinvestment of dividends and capital gains. Class A shares are sold with a maximum sales charge of 1.50%. Class C shares include a 0.50% CDSC for the first year only. There is no sales charge for Class I shares.
As disclosed in the most recent prospectus, the total annual fund operating expenses are as follows: A shares, 0.71%; C shares, 0.96%; I shares, 0.40%. For more detailed information on fund expenses and waivers/reimbursements please see the Fund’s prospectus.
Glossary
BofA Merrill Lynch 1-10 Year U.S. Municipal Securities Index – A subset of the BofA Merrill Lynch U.S. Municipal Securities Index including all securities with a remaining term to final maturity less than 10 years.
Unless otherwise noted, index returns reflect the reinvestment of income dividends and capital gains, if any, but do not reflect fees, brokerage commissions or other expenses of investing. Investors may not make direct investments into any index. The performance of any index is not indicative of the performance of any particular investment.
Alternative Minimum Tax (AMT) – A federal tax aimed at ensuring that high-income individuals, estates, trusts, and corporations pay a minimal level income tax. For individuals, the AMT is calculated by adding tax preference items to regular taxable income.
Annualized Distribution Yield – The distribution yield reflects actual distributions made to shareholders. The annualized distribution yield is calculated by summing the last 30 days of income at a given month end and annualizing to a 360-day year. The result is divided by the ending maximum offering price.
Bond Credit Ratings (Credit Quality) – A bond credit rating assesses the financial ability of a debt issuer to make timely payments of principal and interest. Ratings of AAA (the highest), AA, A, and BBB are investment-grade quality. Ratings of BB, B, CCC, CC, C and D (the lowest) are considered below investment grade, speculative grade, or junk bonds.
Bond Insurers – Individual bonds are sometimes insured by private companies. The insurance guarantees the payment of principal and interest on a bond issue if the issuer defaults. Mutual funds are not insured, even if the underlying bonds are insured.
Credit Spread/Quality Spread – The difference between the yields of securities with different credit qualities.
Duration – A bond’s sensitivity to interest rates. Effective duration incorporates the embedded option features, such as call provisions. Bonds with longer durations experience greater price volatility than bonds with shorter durations.
General Obligation Bond – A municipal bond backed by the credit and “taxing power” of the issuing jurisdiction rather than the revenue from a given project.
Personal Consumption Expenditure (PCE) Index – A broad measure of U.S. inflation that assesses the change in prices of goods and services purchased by consumers throughout the economy. Core PCE excludes the more volatile and seasonal food and energy prices.
Revenue Bond – A bond on which the debt service is payable solely from the revenue generated from the operation of the project being financed or a category of facilities, or from other non-tax sources.
SEC Yield – SEC yield is computed in accordance with SEC standards measuring the net investment income per share over a specified 30-day period expressed as a percentage of the maximum offering price of the Fund’s shares at the end of the period.
Standard Deviation – A measure of the dispersion of a set of data from its mean. The more spread apart the data, the higher the deviation. Values within one standard deviation of the mean represent approximately two-thirds of the data set, assuming a normal distribution.
Yield Curve – A line that plots the interest rates, at a set point in time, of bonds having equal credit quality, but differing maturity dates.
Yield Spread – The difference between yields on differing debt instruments, calculated by deducting the yield of one instrument from another.
6 Semi-Annual Report
| | |
| FUND SUMMARY | | |
| |
Thornburg Limited Term Municipal Fund | | March 31, 2015 (Unaudited) |
OBJECTIVES AND STRATEGIES
The Fund’s primary investment objective is to obtain as high a level of current income exempt from federal individual income tax as is consistent, in the view of the Fund’s investment advisor, with preservation of capital (may be subject to Alternative Minimum Tax).
The secondary goal of the Fund is to reduce expected changes in its share price compared to longer intermediate and long-term bond portfolios.
This Fund is a laddered portfolio of municipal bonds with an average maturity of normally less than five years. Laddering involves building a portfolio of bonds with staggered maturities so that a portion of the portfolio matures each year. Cash from maturing bonds, if not needed for other purposes, is invested in bonds with longer maturities at the far end of the ladder. We regard the strategy as a good compromise for managing different types of risk.
LONG TERM STABILITY OF PRINCIPAL
Net Asset Value History of A Shares
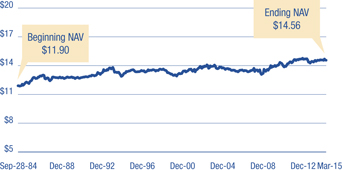
SECURITY CREDIT RATINGS
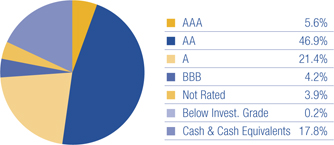
A bond credit rating assesses the financial ability of a debt issuer to make timely payments of principal and interest. Ratings of AAA (the highest), AA, A, and BBB are investment-grade quality. Ratings of BB, B, CCC, CC, C and D (the lowest) are considered below investment grade, speculative grade, or junk bonds. Credit quality ratings for Thornburg’s municipal portfolios used the highest rating available from either Standard & Poor’s or Moody’s Investors Service.
PORTFOLIO LADDER
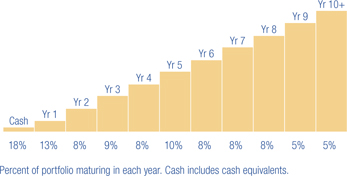
Percent of portfolio maturing in each year. Cash includes cash equivalents.
KEY PORTFOLIO ATTRIBUTES
| | | | |
Number of Bonds | | | 1,929 | |
| |
Effective Duration | | | 3.1 Yrs | |
| |
Average Maturity | | | 3.6 Yrs | |
There is no guarantee that the Fund will meet its investment objectives.
All data is subject to change. Charts may not add up to 100% due to rounding.
Semi-Annual Report 7
| | |
| SCHEDULE OF INVESTMENTS | | |
| |
Thornburg Limited Term Municipal Fund | | March 31, 2015 (Unaudited) |
| | | | | | | | | | |
Issuer-Description | | Credit Rating†
S&P/ Moody’s | | Principal
Amount | | | Value | |
ALABAMA — 1.23% | | | | | | | | | | |
Alabama Public School & College Authority, 5.00% due 5/1/2015 (Education System Capital Improvements) | | NR/Aa1 | | $ | 8,530,000 | | | $ | 8,564,802 | |
Alabama Public School & College Authority, 5.00% due 5/1/2016 (Education System Capital Improvements) | | AA/Aa1 | | | 5,000,000 | | | | 5,256,200 | |
Alabama Public School & College Authority, 5.00% due 6/1/2019 (Education System Capital Improvements) | | AA/Aa1 | | | 4,840,000 | | | | 5,583,085 | |
Alabama Public School & College Authority, 5.00% due 6/1/2019 (Education System Capital Improvements) | | AA/Aa1 | | | 770,000 | | | | 888,218 | |
Alabama Public School & College Authority, 5.00% due 6/1/2020 (Education System Capital Improvements) | | AA/Aa1 | | | 5,085,000 | | | | 5,979,451 | |
Alabama Public School & College Authority, 5.00% due 6/1/2021 (Education System Capital Improvements) | | AA/Aa1 | | | 5,335,000 | | | | 6,378,526 | |
Alabama Public School & College Authority, 5.00% due 6/1/2022 (Education System Capital Improvements) | | AA/Aa1 | | | 5,605,000 | | | | 6,790,794 | |
Alabama Public School & College Authority, 5.00% due 6/1/2023 (Education System Capital Improvements) | | AA/Aa1 | | | 735,000 | | | | 903,219 | |
Alabama State Board of Education, 3.00% due 5/1/2017 (Calhoun Community College) | | NR/A1 | | | 2,070,000 | | | | 2,143,692 | |
Alabama State Board of Education, 3.00% due 5/1/2018 (Calhoun Community College) | | NR/A1 | | | 2,130,000 | | | | 2,221,547 | |
Alabama State Board of Education, 4.00% due 5/1/2019 (Calhoun Community College) | | NR/A1 | | | 2,195,000 | | | | 2,376,483 | |
Alabama State Board of Education, 4.00% due 5/1/2020 (Calhoun Community College) | | NR/A1 | | | 1,000,000 | | | | 1,088,640 | |
Alabama State Board of Education, 4.00% due 5/1/2021 (Calhoun Community College) | | NR/A1 | | | 1,000,000 | | | | 1,084,770 | |
Alabama State Board of Education, 4.00% due 5/1/2022 (Calhoun Community College) | | NR/A1 | | | 1,230,000 | | | | 1,334,944 | |
City of Birmingham GO, 4.00% due 8/1/2015 (Government Services) | | AA/Aa2 | | | 3,005,000 | | | | 3,043,284 | |
City of Birmingham GO, 5.00% due 2/1/2016 (Government Services) | | AA/Aa2 | | | 3,775,000 | | | | 3,921,357 | |
City of Birmingham GO, 4.00% due 8/1/2016 (Government Services) | | AA/Aa2 | | | 3,645,000 | | | | 3,813,362 | |
City of Birmingham GO, 5.00% due 2/1/2017 (Government Services) | | AA/Aa2 | | | 2,045,000 | | | | 2,205,246 | |
City of Birmingham GO, 4.00% due 8/1/2017 (Government Services) | | AA/Aa2 | | | 2,760,000 | | | | 2,958,058 | |
City of Birmingham GO, 5.00% due 2/1/2018 (Government Services) | | AA/Aa2 | | | 2,000,000 | | | | 2,221,000 | |
City of Mobile GO, 4.50% due 8/15/2016 (Senior Center) | | NR/NR | | | 565,000 | | | | 575,532 | |
City of Mobile GO, 5.00% due 2/15/2019 (Capital Improvements) | | A+/Aa2 | | | 2,000,000 | | | | 2,226,640 | |
City of Mobile Industrial Development Board, 1.65% due 6/1/2034 put 3/20/2017 (Alabama Power Company Barry Plant Project) | | A/A1 | | | 6,000,000 | | | | 6,082,740 | |
East Alabama Health Care Authority GO, 5.00% due 9/1/2021 | | A/NR | | | 1,245,000 | | | | 1,442,295 | |
East Alabama Health Care Authority GO, 5.00% due 9/1/2022 | | A/NR | | | 800,000 | | | | 923,728 | |
Montgomery Waterworks and Sanitation, 5.00% due 9/1/2016 | | AAA/Aa1 | | | 2,080,000 | | | | 2,213,973 | |
Montgomery Waterworks and Sanitation, 5.00% due 9/1/2019 | | AAA/Aa1 | | | 3,375,000 | | | | 3,797,854 | |
University of Alabama at Birmingham Hospital, 5.25% due 9/1/2017 | | A+/A1 | | | 2,500,000 | | | | 2,758,075 | |
University of Alabama at Birmingham Hospital, 5.00% due 9/1/2018 | | A+/A1 | | | 1,700,000 | | | | 1,912,738 | |
| | | |
ALASKA — 0.62% | | | | | | | | | | |
Alaska Housing Finance Corp. GO, 5.00% due 12/1/2018 (Insured: Natl-Re) | | AA+/Aa2 | | | 2,000,000 | | | | 2,202,420 | |
Alaska Industrial Development & Export Authority, 5.00% due 4/1/2023 (Greater Fairbanks Community Hospital Foundation) | | A/NR | | | 1,000,000 | | | | 1,179,280 | |
Alaska Industrial Development & Export Authority, 5.00% due 4/1/2024 (Greater Fairbanks Community Hospital Foundation) | | A/NR | | | 1,000,000 | | | | 1,167,630 | |
Alaska Industrial Development & Export Authority GO, 5.00% due 4/1/2015 | | AA+/Aa3 | | | 1,900,000 | | | | 1,900,000 | |
Alaska Industrial Development & Export Authority GO, 5.00% due 4/1/2016 | | AA+/Aa3 | | | 1,100,000 | | | | 1,151,183 | |
Alaska Industrial Development & Export Authority GO, 5.00% due 4/1/2017 | | AA+/Aa3 | | | 3,000,000 | | | | 3,252,660 | |
Alaska Industrial Development & Export Authority GO, 5.00% due 4/1/2018 | | AA+/Aa3 | | | 2,455,000 | | | | 2,737,595 | |
City of Valdez, 5.00% due 1/1/2021 (BP Pipelines (Alaska), Inc. Project) | | A/A2 | | | 3,700,000 | | | | 4,293,443 | |
City of Valdez, 5.00% due 1/1/2021 (BP Pipelines (Alaska), Inc. Project) | | A/A2 | | | 12,000,000 | | | | 13,924,680 | |
North Slope Borough GO, 5.00% due 6/30/2015 (Insured: Natl-Re) | | AA-/Aa2 | | | 3,250,000 | | | | 3,289,715 | |
North Slope Borough GO, 5.00% due 6/30/2017 (Insured: Natl-Re) | | AA-/Aa2 | | | 8,800,000 | | | | 9,653,688 | |
State of Alaska, 5.00% due 10/1/2017 (Alaska International Airports System; Insured: Natl-Re) | | AA-/A1 | | | 1,115,000 | | | | 1,193,139 | |
| | | |
ARIZONA — 2.61% | | | | | | | | | | |
Arizona Board of Regents, 5.00% due 8/1/2020 (University of Arizona SPEED) | | A+/Aa3 | | | 575,000 | | | | 675,941 | |
Arizona Board of Regents, 5.00% due 8/1/2023 (University of Arizona SPEED) | | A+/Aa3 | | | 800,000 | | | | 978,152 | |
Arizona Board of Regents, 5.00% due 8/1/2024 (University of Arizona SPEED) | | A+/Aa3 | | | 550,000 | | | | 678,365 | |
Arizona Board of Regents COP, 5.00% due 7/1/2018 (Arizona State University; Insured: Natl-Re) | | AA-/A1 | | | 1,285,000 | | | | 1,391,552 | |
Arizona Board of Regents COP, 3.00% due 9/1/2018 (Northern Arizona University Projects) | | A/A2 | | | 1,000,000 | | | | 1,055,220 | |
Arizona Board of Regents COP, 5.00% due 7/1/2019 (Arizona State University; Insured: Natl-Re) | | AA-/A1 | | | 3,735,000 | | | | 4,073,354 | |
Arizona Board of Regents COP, 3.00% due 9/1/2019 (Northern Arizona University Projects) | | A/A2 | | | 2,525,000 | | | | 2,667,334 | |
Arizona Board of Regents COP, 5.00% due 9/1/2019 (Arizona State University) | | AA-/A1 | | | 1,085,000 | | | | 1,241,327 | |
Arizona Board of Regents COP, 5.00% due 9/1/2020 (Northern Arizona University Projects) | | A/A2 | | | 1,000,000 | | | | 1,154,360 | |
Arizona Board of Regents COP, 5.00% due 9/1/2020 (Arizona State University) | | AA-/A1 | | | 3,170,000 | | | | 3,681,701 | |
Arizona Board of Regents COP, 5.00% due 9/1/2021 (Arizona State University) | | AA-/A1 | | | 4,020,000 | | | | 4,720,726 | |
Arizona Board of Regents COP, 5.00% due 6/1/2022 (University of Arizona) | | A+/Aa3 | | | 6,080,000 | | | | 7,186,013 | |
Arizona Board of Regents COP, 5.00% due 9/1/2022 (Northern Arizona University Projects) | | A/A2 | | | 2,500,000 | | | | 2,929,875 | |
Arizona Board of Regents COP, 5.00% due 9/1/2022 (Arizona State University) | | AA-/A1 | | | 4,380,000 | | | | 5,190,782 | |
Arizona Board of Regents COP, 5.00% due 9/1/2023 (Northern Arizona University Projects) | | A/A2 | | | 3,325,000 | | | | 3,854,373 | |
Arizona Board of Regents COP, 5.00% due 9/1/2023 (Arizona State University) | | AA-/A1 | | | 5,580,000 | | | | 6,638,972 | |
Arizona HFA, 5.25% due 1/1/2018 (Banner Health) | | AA-/NR | | | 3,500,000 | | | | 3,888,290 | |
Arizona HFA, 5.00% due 7/1/2018 (Dignity Health) | | A/A3 | | | 1,470,000 | | | | 1,638,521 | |
8 Semi-Annual Report
| | |
| SCHEDULE OF INVESTMENTS, CONTINUED | | |
| |
Thornburg Limited Term Municipal Fund | | March 31, 2015 (Unaudited) |
| | | | | | | | | | |
Issuer-Description | | Credit Rating†
S&P/ Moody’s | | Principal
Amount | | | Value | |
Arizona HFA, 5.00% due 7/1/2019 (Dignity Health) | | A/A3 | | $ | 1,365,000 | | | $ | 1,556,127 | |
Arizona HFA, 5.00% due 7/1/2020 (Dignity Health) | | A/A3 | | | 1,290,000 | | | | 1,473,490 | |
Arizona HFA, 5.00% due 12/1/2022 (Scottsdale Lincoln Hospitals) | | NR/A2 | | | 1,600,000 | | | | 1,900,864 | |
Arizona HFA, 5.00% due 12/1/2024 (Scottsdale Lincoln Hospitals) | | NR/A2 | | | 1,500,000 | | | | 1,805,430 | |
Arizona School Facilities Board, 5.00% due 7/1/2016 (State School Land Trust; Insured: AMBAC) | | NR/NR | | | 5,775,000 | | | | 6,084,193 | |
Arizona School Facilities Board, 5.00% due 1/1/2017 pre-refunded 7/1/2015 (State School Improvement) | | AAA/Aaa | | | 1,225,000 | | | | 1,239,688 | |
Arizona School Facilities Board, 5.00% due 7/1/2018 (State School Land Trust; Insured: AMBAC) | | NR/NR | | | 4,040,000 | | | | 4,494,985 | |
Arizona School Facilities Board COP, 5.25% due 9/1/2023 (School Site and Building Projects) | | A+/A1 | | | 1,315,000 | | | | 1,493,564 | |
Arizona Transportation Board, 5.00% due 7/1/2019 | | AA+/Aa2 | | | 3,510,000 | | | | 4,057,806 | |
Arizona Transportation Board, 5.00% due 7/1/2021 | | AA+/Aa2 | | | 7,465,000 | | | | 8,951,729 | |
Arizona Transportation Board, 5.00% due 7/1/2022 | | AA+/Aa2 | | | 5,000,000 | | | | 5,956,400 | |
City of Tucson, 5.00% due 7/1/2022 | | AA+/A1 | | | 2,135,000 | | | | 2,525,726 | |
City of Tucson GO, 3.625% due 7/1/2015 (Insured: Natl-Re) | | AA-/Aa3 | | | 1,750,000 | | | | 1,765,330 | |
City of Yuma Municipal Property Corp., 5.00% due 7/1/2016 (Water and Wastewater System; Insured: Syncora) | | A+/A1 | | | 2,000,000 | | | | 2,109,400 | |
City of Yuma Municipal Property Corp., 5.00% due 7/1/2018 (Water and Wastewater System; Insured: Syncora) | | A+/A1 | | | 2,130,000 | | | | 2,296,247 | |
County of Pinal, 5.00% due 8/1/2025 (Hunt Highway (Phases III-V)) | | AA-/NR | | | 3,000,000 | | | | 3,649,620 | |
Deer Valley USD No. 97 of Maricopa County, 4.00% due 7/1/2015 (2004 School Improvement Project; Insured: AGM) | | NR/Aa2 | | | 1,325,000 | | | | 1,337,707 | |
Glendale IDA, 5.00% due 5/15/2015 (Midwestern University) | | A-/NR | | | 1,000,000 | | | | 1,005,550 | |
Glendale IDA, 5.00% due 5/15/2016 (Midwestern University) | | A-/NR | | | 1,575,000 | | | | 1,649,261 | |
Glendale IDA, 5.00% due 5/15/2017 (Midwestern University) | | A-/NR | | | 1,440,000 | | | | 1,551,974 | |
Maricopa County IDA Health Facilities, 4.125% due 7/1/2015 (Dignity Health) | | A/A3 | | | 1,600,000 | | | | 1,615,568 | |
Maricopa County Public Finance Corp., 5.00% due 7/1/2024 (Insured: AMBAC) | | AA+/Aa1 | | | 1,000,000 | | | | 1,055,640 | |
Mohave County IDA, 7.25% due 5/1/2015 (Mohave Prison LLC) | | BBB+/NR | | | 6,265,000 | | | | 6,287,930 | |
Navajo County PCR, 5.75% due 6/1/2034 put 6/1/2016 (Arizona Public Service Co.) | | A-/A3 | | | 9,700,000 | | | | 10,257,653 | |
Phoenix Union High School District No. 210 of Maricopa County GO, 4.00% due 7/1/2015 (2003 School Improvement Project; Insured: Natl-Re) | | AA/Aa2 | | | 1,500,000 | | | | 1,514,655 | |
Pima County, 5.00% due 7/1/2015 (Ina & Roger Road Wastewater Reclamation Facilities) | | AA-/NR | | | 1,400,000 | | | | 1,417,038 | |
Pima County, 5.00% due 7/1/2016 (Ina & Roger Road Wastewater Reclamation Facilities) | | AA-/NR | | | 2,000,000 | | | | 2,116,920 | |
Pima County, 4.50% due 7/1/2017 (Ina & Roger Road Wastewater Reclamation Facilities; Insured: AGM) | | AA/A2 | | | 5,040,000 | | | | 5,472,684 | |
Pima County, 5.00% due 7/1/2017 (Ina & Roger Road Wastewater Reclamation Facilities) | | AA-/NR | | | 2,750,000 | | | | 3,016,750 | |
Pima County, 3.00% due 7/1/2018 (Ina & Roger Road Wastewater Reclamation Facilities) | | AA-/NR | | | 500,000 | | | | 532,390 | |
Pima County, 5.00% due 7/1/2018 (Ina & Roger Road Wastewater Reclamation Facilities; Insured: AGM) | | AA/A2 | | | 5,000,000 | | | | 5,643,050 | |
Pima County, 5.00% due 7/1/2018 (Ina & Roger Road Wastewater Reclamation Facilities) | | AA-/NR | | | 2,000,000 | | | | 2,257,220 | |
Pima County, 5.00% due 7/1/2018 (Ina & Roger Road Wastewater Reclamation Facilities) | | AA-/NR | | | 700,000 | | | | 790,027 | |
Pima County, 5.00% due 7/1/2020 (Ina & Roger Road Wastewater Reclamation Facilities) | | AA-/NR | | | 500,000 | | | | 588,585 | |
Pima County, 3.00% due 7/1/2021 (Ina & Roger Road Wastewater Reclamation Facilities) | | AA-/NR | | | 1,200,000 | | | | 1,291,032 | |
Pima County, 5.00% due 7/1/2021 (Ina & Roger Road Wastewater Reclamation Facilities) | | AA-/NR | | | 400,000 | | | | 477,564 | |
Pima County, 3.00% due 7/1/2022 (Ina & Roger Road Wastewater Reclamation Facilities) | | AA-/NR | | | 1,325,000 | | | | 1,420,957 | |
Pima County, 5.00% due 7/1/2022 (Ina & Roger Road Wastewater Reclamation Facilities) | | AA-/NR | | | 500,000 | | | | 603,575 | |
a Pima County COP, 5.00% due 12/1/2015 (Sewer System & Fleet Services Facilities Expansion) | | A+/NR | | | 1,250,000 | | | | 1,289,750 | |
Pima County COP, 5.00% due 12/1/2016 (Sewer System & Fleet Services Facilities Expansion) | | A+/NR | | | 600,000 | | | | 643,170 | |
Pima County COP, 5.00% due 12/1/2017 (Sewer System & Fleet Services Facilities Expansion) | | A+/NR | | | 1,395,000 | | | | 1,542,019 | |
Pima County COP, 5.00% due 12/1/2019 (Sewer System & Fleet Services Facilities Expansion) | | A+/NR | | | 500,000 | | | | 575,565 | |
Pima County COP, 5.00% due 12/1/2020 (Sewer System & Fleet Services Facilities Expansion) | | A+/NR | | | 765,000 | | | | 891,990 | |
Pima County COP, 5.00% due 12/1/2021 (Sewer System & Fleet Services Facilities Expansion) | | A+/NR | | | 1,220,000 | | | | 1,433,390 | |
Pima County COP, 5.00% due 12/1/2022 (Sewer System & Fleet Services Facilities Expansion) | | A+/NR | | | 1,275,000 | | | | 1,509,906 | |
Scottsdale IDA, 5.00% due 9/1/2019 (Scottsdale Healthcare) | | NR/A2 | | | 6,885,000 | | | | 7,748,310 | |
State of Arizona Department of Administration, 5.00% due 7/1/2018 (State Lottery; Insured: AGM) | | AA/A1 | | | 8,370,000 | | | | 9,374,986 | |
State of Arizona Department of Administration, 5.00% due 7/1/2020 (State Lottery; Insured: AGM) | | AA/A1 | | | 8,705,000 | | | | 10,125,221 | |
Town of Gilbert Public Facilities Municipal Property Corp., 3.00% due 7/1/2015 | | AA+/Aa2 | | | 1,080,000 | | | | 1,087,636 | |
| | | |
ARKANSAS — 0.45% | | | | | | | | | | |
Arkansas Development Finance Authority, 2.00% due 12/1/2016 (State Dept. of Environmental Quality Project) | | AA-/NR | | | 460,000 | | | | 470,336 | |
Board of Trustees of the University of Arkansas, 2.00% due 9/15/2015 (Fayetteville Campus Athletic Facilities) | | NR/Aa2 | | | 455,000 | | | | 458,877 | |
Board of Trustees of the University of Arkansas, 2.00% due 11/1/2015 (Fayetteville Campus Capital Projects) | | NR/Aa2 | | | 375,000 | | | | 379,080 | |
Board of Trustees of the University of Arkansas, 2.00% due 11/1/2016 (Fayetteville Campus Capital Projects) | | NR/Aa2 | | | 600,000 | | | | 614,904 | |
Board of Trustees of the University of Arkansas, 5.00% due 9/15/2019 pre-refunded 9/15/2016 (Fayetteville Campus Athletic Facilities) | | NR/Aa2 | | | 600,000 | | | | 640,116 | |
Board of Trustees of the University of Arkansas, 3.00% due 11/1/2023 (Fayetteville Campus Athletic Facilities) | | NR/Aa2 | | | 615,000 | | | | 655,590 | |
City of Fort Smith, 3.50% due 10/1/2016 (Water and Sewer System Construction; Insured: AGM) | | AA/NR | | | 1,370,000 | | | | 1,430,814 | |
City of Fort Smith, 3.50% due 10/1/2017 (Water and Sewer System Construction; Insured: AGM) | | AA/NR | | | 1,930,000 | | | | 2,055,740 | |
City of Fort Smith, 4.00% due 10/1/2018 (Water and Sewer System Construction; Insured: AGM) | | AA/NR | | | 1,000,000 | | | | 1,095,140 | |
City of Fort Smith, 4.00% due 10/1/2019 (Water and Sewer System Construction; Insured: AGM) | | AA/NR | | | 1,670,000 | | | | 1,856,372 | |
Independence County PCR, 4.90% due 7/1/2022 (Entergy Mississippi, Inc.; Insured: AMBAC) | | NR/A3 | | | 6,400,000 | | | | 6,449,664 | |
Jefferson County, 4.00% due 6/1/2015 (Jefferson Regional Medical Center; Insured: AGM) | | AA/NR | | | 1,005,000 | | | | 1,010,849 | |
Jefferson County, 4.00% due 6/1/2016 (Jefferson Regional Medical Center; Insured: AGM) | | AA/NR | | | 1,395,000 | | | | 1,443,211 | |
Jefferson County, 4.00% due 6/1/2017 (Jefferson Regional Medical Center; Insured: AGM) | | AA/NR | | | 1,375,000 | | | | 1,446,830 | |
Semi-Annual Report 9
| | |
| SCHEDULE OF INVESTMENTS, CONTINUED | | |
| |
Thornburg Limited Term Municipal Fund | | March 31, 2015 (Unaudited) |
| | | | | | | | | | |
Issuer-Description | | Credit Rating†
S&P/ Moody’s | | Principal
Amount | | | Value | |
Jefferson County, 1.55% due 10/1/2017 (Entergy Arkansas, Inc. Project) | | A-/A3 | | $ | 10,000,000 | | | $ | 10,140,300 | |
Jefferson County, 4.50% due 6/1/2018 (Jefferson Regional Medical Center; Insured: AGM) | | AA/NR | | | 1,495,000 | | | | 1,612,672 | |
Jefferson County, 4.50% due 6/1/2019 (Jefferson Regional Medical Center; Insured: AGM) | | AA/NR | | | 1,580,000 | | | | 1,732,691 | |
| | | |
CALIFORNIA — 7.53% | | | | | | | | | | |
Alameda County COP, 5.00% due 12/1/2017 (Santa Rita Jail; Insured: AMBAC) | | AA/NR | | | 1,220,000 | | | | 1,350,564 | |
Alameda County Joint Powers Authority, 5.00% due 12/1/2021 (Alameda County Medical Center Highland Hospital) | | AA/Aa3 | | | 1,000,000 | | | | 1,202,350 | |
Alameda County Joint Powers Authority, 5.00% due 12/1/2022 (Alameda County Medical Center Highland Hospital) | | AA/Aa3 | | | 2,000,000 | | | | 2,435,680 | |
Alameda County Joint Powers Authority, 5.00% due 12/1/2023 (Alameda County Medical Center Highland Hospital) | | AA/Aa3 | | | 3,200,000 | | | | 3,931,456 | |
Anaheim Public Financing Authority, 0% due 9/1/2022 (Public Improvements Project; Insured: AGM) | | AA/A2 | | | 3,250,000 | | | | 2,712,320 | |
Brentwood Infrastructure, 2.00% due 11/1/2015 (Insured: AGM) | | AA/NR | | | 520,000 | | | | 524,269 | |
Brentwood Infrastructure, 4.00% due 11/1/2016 (Insured: AGM) | | AA/NR | | | 325,000 | | | | 340,795 | |
Brentwood Infrastructure, 5.00% due 11/1/2017 (Insured: AGM) | | AA/NR | | | 965,000 | | | | 1,052,979 | |
Brentwood Infrastructure, 5.25% due 11/1/2018 (Insured: AGM) | | AA/NR | | | 1,020,000 | | | | 1,146,704 | |
Brentwood Infrastructure, 5.25% due 11/1/2019 (Insured: AGM) | | AA/NR | | | 725,000 | | | | 832,358 | |
Cabrillo USD GO, 0% due 8/1/2015 (Educational Facilities; Insured: AMBAC) | | NR/NR | | | 1,000,000 | | | | 998,400 | |
Cabrillo USD GO, 0% due 8/1/2021 (Educational Facilities; Insured: AMBAC) | | NR/NR | | | 1,000,000 | | | | 840,200 | |
California Educational Facilities Authority, 5.00% due 4/1/2017 (Pitzer College) | | NR/A2 | | | 1,460,000 | | | | 1,582,348 | |
California Educational Facilities Authority, 5.00% due 4/1/2021 (Chapman University) | | NR/A2 | | | 4,870,000 | | | | 5,711,098 | |
California HFFA, 5.50% due 2/1/2017 (Community Developmental Disabilities Program; Insured: California Mtg Insurance) | | A+/NR | | | 2,575,000 | | | | 2,807,548 | |
California HFFA, 5.50% due 2/1/2019 (Community Developmental Disabilities Program; Insured: California Mtg Insurance) | | A+/NR | | | 2,865,000 | | | | 3,332,912 | |
California HFFA, 5.75% due 2/1/2020 (Community Developmental Disabilities Program; Insured: California Mtg Insurance) | | A+/NR | | | 1,975,000 | | | | 2,381,751 | |
California HFFA, 5.00% due 3/1/2020 (Dignity Health) | | A/A3 | | | 4,400,000 | | | | 5,159,264 | |
California HFFA, 5.75% due 2/1/2021 (Community Developmental Disabilities Program; Insured: California Mtg Insurance) | | A+/NR | | | 1,695,000 | | | | 2,082,731 | |
California HFFA, 5.00% due 3/1/2021 (Dignity Health) | | A/A3 | | | 3,450,000 | | | | 4,112,641 | |
California HFFA, 5.25% due 3/1/2022 (Dignity Health) | | A/A3 | | | 7,020,000 | | | | 8,398,237 | |
California HFFA, 5.00% due 7/1/2043 put 10/15/2020 (St. Joseph Health System) | | AA-/A1 | | | 5,000,000 | | | | 5,912,800 | |
California State Department of Transportation COP, 5.25% due 3/1/2016 (Insured: Natl-Re) | | AA-/A1 | | | 330,000 | | | | 331,399 | |
California State Department of Water Resources, 5.00% due 5/1/2015 (DWR Power Supply Program) | | AA/Aa2 | | | 5,000,000 | | | | 5,020,550 | |
California State Department of Water Resources, 5.00% due 5/1/2016 (Power Supply Program) | | AA/Aa2 | | | 5,000,000 | | | | 5,259,750 | |
California State Economic Recovery GO, 5.00% due 7/1/2020 pre-refunded 7/1/2019 | | AA+/Aaa | | | 4,200,000 | | | | 4,891,530 | |
California State Housing Finance Agency, 2.50% due 12/1/2017 (One Santa Fe Apartments-Multi Family Housing; Collateralized: GNMA) | | NR/Aa1 | | | 1,725,000 | | | | 1,740,025 | |
California State Public Works Board, 5.00% due 9/1/2016 (Regents of University of California; Insured: Natl-Re) (ETM) | | AA+/Aaa | | | 3,000,000 | | | | 3,198,390 | |
California State Public Works Board, 5.00% due 9/1/2017 (Regents of University of California; Insured: Natl-Re) (ETM) | | AA+/Aaa | | | 3,000,000 | | | | 3,311,310 | |
California State Public Works Board, 5.00% due 11/1/2017 (California State University) | | A/Aa3 | | | 3,000,000 | | | | 3,319,800 | |
California State Public Works Board, 5.00% due 11/1/2018 (California State University) | | A/Aa3 | | | 2,700,000 | | | | 3,070,953 | |
California State Public Works Board, 5.00% due 4/1/2020 (Riverside Campus) | | A/A1 | | | 1,585,000 | | | | 1,854,608 | |
California State Public Works Board, 5.00% due 6/1/2020 (Yuba City Courthouse) | | A/A1 | | | 1,675,000 | | | | 1,967,807 | |
California State Public Works Board, 5.00% due 6/1/2020 (Coalinga State Hospital) | | A/A1 | | | 5,685,000 | | | | 6,678,795 | |
California State Public Works Board, 5.00% due 10/1/2020 (California State University) | | A/A1 | | | 1,000,000 | | | | 1,184,110 | |
California State Public Works Board, 5.00% due 11/1/2020 (Various Capital Projects) | | A/A1 | | | 1,500,000 | | | | 1,779,555 | |
California State Public Works Board, 5.00% due 4/1/2021 (Riverside Campus) | | A/A1 | | | 890,000 | | | | 1,059,260 | |
California State Public Works Board, 5.00% due 6/1/2021 (Yuba City Courthouse) | | A/A1 | | | 1,250,000 | | | | 1,491,937 | |
California State Public Works Board, 5.00% due 6/1/2021 (Coalinga State Hospital) | | A/A1 | | | 5,000,000 | | | | 5,967,750 | |
California State Public Works Board, 5.00% due 10/1/2021 (Various Capital Projects) | | A/A1 | | | 1,000,000 | | | | 1,200,050 | |
California State Public Works Board, 5.00% due 11/1/2021 (Various Capital Projects) | | A/A1 | | | 1,750,000 | | | | 2,102,747 | |
California State Public Works Board, 5.00% due 11/1/2021 (Laboratory Facility and San Diego Courthouse) | | A/A1 | | | 750,000 | | | | 901,177 | |
California State Public Works Board, 5.00% due 4/1/2022 (California School for the Deaf Riverside Campus) | | A/A1 | | | 500,000 | | | | 600,345 | |
California State Public Works Board, 5.00% due 6/1/2022 (Coalinga State Hospital) | | A/A1 | | | 11,555,000 | | | | 13,900,781 | |
California State Public Works Board, 5.00% due 11/1/2022 (Laboratory Facility and San Diego Courthouse) | | A/A1 | | | 10,075,000 | | | | 12,174,428 | |
California State Public Works Board, 5.00% due 6/1/2023 (Yuba City Courthouse) | | A/A1 | | | 1,900,000 | | | | 2,308,177 | |
California State Public Works Board, 5.00% due 11/1/2024 (Laboratory Facility and San Diego Courthouse) | | A/A1 | | | 2,050,000 | | | | 2,485,953 | |
California Statewide Communities Development Authority, 5.00% due 4/1/2019 (Kaiser Foundation Hospitals) | | A+/NR | | | 27,000,000 | | | | 31,041,360 | |
California Statewide Communities Development Authority, 5.00% due 7/1/2020 (Aspire Public Schools; LOC: PCSD Guaranty Pool I, LLC) | | NR/NR | | | 1,825,000 | | | | 1,911,176 | |
Castaic Lake Water Agency COP, 0% due 8/1/2023 (Water System Improvement; Insured: AMBAC) | | AA/NR | | | 10,125,000 | | | | 8,161,762 | |
Castaic USD GO, 0% due 5/1/2018 (Insured: Natl-Re) | | AA-/NR | | | 3,735,000 | | | | 3,331,246 | |
Central Valley Financing Authority, 5.00% due 7/1/2017 (Carson Ice) | | AA-/A1 | | | 600,000 | | | | 656,922 | |
Central Valley Financing Authority, 5.00% due 7/1/2019 (Carson Ice) | | AA-/A1 | | | 1,750,000 | | | | 2,014,495 | |
Chula Vista COP, 5.25% due 3/1/2018 | | AA-/NR | | | 1,170,000 | | | | 1,312,845 | |
Chula Vista COP, 5.25% due 3/1/2019 | | AA-/NR | | | 1,235,000 | | | | 1,421,905 | |
City and County of San Francisco GO, 5.00% due 6/15/2015 (Various Capital Projects) | | AA+/Aa1 | | | 18,385,000 | | | | 18,571,056 | |
10 Semi-Annual Report
| | |
| SCHEDULE OF INVESTMENTS, CONTINUED | | |
| |
Thornburg Limited Term Municipal Fund | | March 31, 2015 (Unaudited) |
| | | | | | | | | | |
Issuer-Description | | Credit Rating†
S&P/ Moody’s | | Principal
Amount | | | Value | |
Clovis USD GO, 0% due 8/1/2019 (Insured: Natl-Re) | | AA/A3 | | $ | 2,685,000 | | | $ | 2,497,936 | |
Community Facilities District No. 86-1 of the Irvine USD, 5.25% due 9/1/2018 (Insured: AGM) | | AA/NR | | | 3,000,000 | | | | 3,380,700 | |
Community Facilities District No. 86-1 of the Irvine USD, 5.25% due 9/1/2019 (Insured: AGM) | | AA/NR | | | 3,000,000 | | | | 3,459,480 | |
County of Los Angeles COP, 0% due 3/1/2017 (Disney Parking Garage and Walt Disney Concert Hall) | | AA/A1 | | | 1,075,000 | | | | 1,057,015 | |
County of Los Angeles COP, 0% due 9/1/2017 (Disney Parking Garage and Walt Disney Concert Hall; Insured: AMBAC) | | AA/A1 | | | 1,200,000 | | | | 1,171,884 | |
County of Los Angeles Redevelopment Refunding Authority, 5.00% due 6/1/2020 (Bunker Hill Project) | | A+/NR | | | 1,730,000 | | | | 2,025,692 | |
County of Los Angeles Redevelopment Refunding Authority, 5.00% due 12/1/2020 (Bunker Hill Project) | | A+/NR | | | 3,805,000 | | | | 4,495,113 | |
County of Los Angeles Redevelopment Refunding Authority, 5.00% due 6/1/2021 (Bunker Hill Project) | | A+/NR | | | 360,000 | | | | 427,126 | |
County of Los Angeles Redevelopment Refunding Authority, 5.00% due 12/1/2021 (Bunker Hill Project) | | A+/NR | | | 5,805,000 | | | | 6,939,703 | |
County of Los Angeles Redevelopment Refunding Authority, 5.00% due 6/1/2022 (Bunker Hill Project) | | A+/NR | | | 1,645,000 | | | | 1,971,944 | |
County of Los Angeles Redevelopment Refunding Authority, 5.00% due 12/1/2022 (Bunker Hill Project) | | A+/NR | | | 5,000,000 | | | | 6,030,200 | |
County of Los Angeles Redevelopment Refunding Authority, 5.00% due 6/1/2023 (Bunker Hill Project) | | A+/NR | | | 450,000 | | | | 544,023 | |
County of Los Angeles Redevelopment Refunding Authority, 5.00% due 12/1/2023 (Bunker Hill Project) | | A+/NR | | | 6,875,000 | | | | 8,360,894 | |
County of Los Angeles Redevelopment Refunding Authority, 5.00% due 6/1/2024 (Bunker Hill Project) | | A+/NR | | | 4,775,000 | | | | 5,804,490 | |
County of Los Angeles Redevelopment Refunding Authority, 5.00% due 12/1/2024 (Bunker Hill Project) | | A+/NR | | | 5,150,000 | | | | 6,296,802 | |
County of Orange Community Facilities District No. 86-1 of the Irvine USD, 5.25% due 9/1/2017 (Educational Facilities; Insured: AGM) | | AA/NR | | | 5,000,000 | | | | 5,491,200 | |
Escondido Union High School District GO, 0% due 11/1/2020 (Insured: Natl-Re) | | AA-/A3 | | | 2,655,000 | | | | 2,323,842 | |
Los Angeles Convention and Exhibition Center Authority, 5.00% due 8/15/2018 | | A+/A1 | | | 2,295,000 | | | | 2,586,649 | |
Los Angeles County Public Works Financing Authority, 5.00% due 8/1/2018 (Multiple Capital Projects) | | AA/A1 | | | 4,000,000 | | | | 4,527,400 | |
Los Angeles County Public Works Financing Authority, 5.00% due 8/1/2019 (Multiple Capital Projects) | | AA/A1 | | | 17,935,000 | | | | 20,782,002 | |
Los Angeles USD COP, 5.00% due 10/1/2017 (Educational Facilities and Information Technology Infrastructure; Insured: AMBAC) | | A+/A1 | | | 2,445,000 | | | | 2,708,302 | |
Los Angeles USD COP, 5.50% due 12/1/2018 (Educational Facilities and Information Technology Infrastructure) | | A+/A1 | | | 4,600,000 | | | | 5,337,886 | |
Los Angeles USD COP, 5.50% due 12/1/2019 (Educational Facilities and Information Technology Infrastructure) | | A+/A1 | | | 7,040,000 | | | | 8,383,795 | |
Los Angeles USD GO, 5.00% due 7/1/2018 pre-refunded 7/1/2017 (Educational Facilities Improvements; Insured: AGM) | | AA/Aa2 | | | 4,000,000 | | | | 4,384,200 | |
Los Angeles USD GO, 5.00% due 7/1/2022 (Educational Facilities and Information Technology Infrastructure) | | AA-/Aa2 | | | 12,260,000 | | | | 15,032,231 | |
Los Angeles USD GO, 5.00% due 7/1/2023 (Educational Facilities and Information Technology Infrastructure) | | AA-/Aa2 | | | 11,950,000 | | | | 14,812,622 | |
Los Angeles USD GO, 5.00% due 7/1/2024 (Educational Facilities and Information Technology Infrastructure) | | AA-/Aa2 | | | 10,640,000 | | | | 13,343,518 | |
Monterey County COP, 5.00% due 8/1/2016 (Insured: AGM) | | AA/A1 | | | 1,435,000 | | | | 1,521,215 | |
Monterey County COP, 5.00% due 8/1/2018 (Insured: AGM) | | AA/A1 | | | 2,260,000 | | | | 2,541,054 | |
Mount San Antonio Community College GO, 0% due 8/1/2017 (Insured: Natl-Re) (ETM) | | AA/Aa2 | | | 5,000,000 | | | | 4,918,750 | |
Needles USD GO, 0% due 8/1/2023 | | AA-/A3 | | | 1,005,000 | | | | 701,189 | |
North City West School Facilities Financing Authority, 5.00% due 9/1/2023 (Carmel Valley Educational Facilities; Insured: AGM) | | AA/NR | | | 4,545,000 | | | | 5,403,369 | |
Northern California Power Agency, 5.00% due 7/1/2017 (Hydroelectric Project) | | A+/A1 | | | 1,000,000 | | | | 1,099,130 | |
Northern California Power Agency, 5.00% due 6/1/2018 (Lodi Energy Center) | | A-/A2 | | | 4,480,000 | | | | 5,056,621 | |
Northern California Power Agency, 5.00% due 7/1/2019 (Hydroelectric Project) | | A+/A1 | | | 1,000,000 | | | | 1,158,780 | |
Northern California Power Agency, 5.00% due 7/1/2020 (Hydroelectric Project) | | A+/A1 | | | 1,325,000 | | | | 1,522,014 | |
Orange County Public Financing Authority, 5.00% due 7/1/2017 (Insured: Natl-Re) | | AA-/Aa3 | | | 1,245,000 | | | | 1,363,412 | |
Palo Alto USD GO, 0% due 8/1/2019 | | AAA/Aa1 | | | 1,000,000 | | | | 936,760 | |
Palomar Community College District GO, 0% due 8/1/2021 | | AA-/Aa2 | | | 2,560,000 | | | | 2,245,581 | |
Redding Electrical Systems COP, 5.00% due 6/1/2020 (Insured: AGM) | | NR/A2 | | | 3,955,000 | | | | 4,459,421 | |
Regents of the University of California, 5.00% due 5/15/2019 (Higher Education Facilities; Insured: AGM) | | AA/Aa2 | | | 4,245,000 | | | | 4,312,453 | |
Rocklin USD GO, 0% due 8/1/2022 (Insured: Natl-Re) | | AA-/Aa2 | | | 3,910,000 | | | | 3,321,545 | |
Sacramento City Financing Authority, 0% due 12/1/2019 (Merged Downtown & Oak Park; Insured: Natl-Re) | | AA-/A3 | | | 2,920,000 | | | | 2,641,841 | |
Sacramento City Financing Authority, 0% due 12/1/2021 (Merged Downtown & Oak Park; Insured: Natl-Re) | | AA-/A3 | | | 1,600,000 | | | | 1,320,480 | |
Sacramento City USD GO, 5.00% due 7/1/2021 (Educational Facilities Improvements) | | A+/A1 | | | 3,265,000 | | | | 3,907,748 | |
Sacramento Cogeneration Authority, 5.00% due 7/1/2017 (Procter & Gamble) | | AA-/A1 | | | 750,000 | | | | 821,153 | |
Sacramento Cogeneration Authority, 5.00% due 7/1/2017 (Insured: AMBAC) | | BBB-/NR | | | 8,290,000 | | | | 8,378,537 | |
Sacramento Municipal Utility District, 5.00% due 7/1/2016 (Cosumnes Project; Insured: Natl-Re) | | AA-/A3 | | | 4,870,000 | | | | 5,125,091 | |
Sacramento Municipal Utility District, 5.00% due 7/1/2019 (Cosumnes Project; Insured: Natl-Re) | | AA-/A3 | | | 5,000,000 | | | | 5,285,150 | |
Sacramento Municipal Utility District, 5.00% due 7/1/2020 (Cosumnes Project; Insured: Natl-Re) | | AA-/A3 | | | 8,675,000 | | | | 9,165,137 | |
San Diego Convention Center Expansion Financing Authority, 5.00% due 4/15/2020 | | AA-/NR | | | 4,000,000 | | | | 4,638,640 | |
San Diego Convention Center Expansion Financing Authority, 5.00% due 4/15/2021 | | AA-/NR | | | 3,000,000 | | | | 3,524,730 | |
San Diego Convention Center Expansion Financing Authority, 5.00% due 4/15/2022 | | AA-/NR | | | 8,000,000 | | | | 9,502,400 | |
San Diego Redevelopment Agency, 4.50% due 9/1/2019 (Centre City Redevelopment; Insured: AMBAC) | | NR/Baa3 | | | 1,240,000 | | | | 1,271,310 | |
San Diego USD GO, 5.50% due 7/1/2020 (Educational System Capital Projects; Insured: Natl-Re) | | AA-/Aa3 | | | 10,000,000 | | | | 12,065,400 | |
San Francisco Bay Area Rapid Transit District, 5.00% due 7/1/2022 (Insured: Natl-Re) | | AA+/Aa2 | | | 1,220,000 | | | | 1,234,445 | |
San Joaquin Delta Community College District GO, 0% due 8/1/2019 (Insured: AGM) | | AA/Aa2 | | | 7,600,000 | | | | 6,939,940 | |
San Jose Redevelopment Agency, 6.00% due 8/1/2015 (Insured: Natl-Re) | | AA-/A3 | | | 2,780,000 | | | | 2,830,262 | |
San Juan USD GO, 0% due 8/1/2015 (Sacramento County Educational Facilities; Insured: AGM) | | AA/Aa2 | | | 760,000 | | | | 759,134 | |
Santa Ana Financing Authority, 6.25% due 7/1/2018 (Police Administration & Holding Facility; Insured: Natl-Re) (ETM) | | AA-/A3 | | | 2,017,500 | | | | 2,351,094 | |
Santa Ana Financing Authority, 6.25% due 7/1/2018 (Police Administration & Holding Facility; Insured: Natl-Re) | | AA-/A3 | | | 2,017,500 | | | | 2,318,935 | |
Santa Ana USD GO, 0% due 8/1/2019 (Insured: Natl-Re) | | AA-/A3 | | | 3,425,000 | | | | 3,170,009 | |
Semi-Annual Report 11
| | |
| SCHEDULE OF INVESTMENTS, CONTINUED | | |
| |
Thornburg Limited Term Municipal Fund | | March 31, 2015 (Unaudited) |
| | | | | | | | | | |
Issuer-Description | | Credit Rating†
S&P/ Moody’s | | Principal
Amount | | | Value | |
Santa Fe Springs Community Development Commission, 0% due 9/1/2024 (Consolidated Redevelopment Project; Insured: Natl-Re) | | AA-/A3 | | $ | 7,000,000 | | | $ | 5,081,720 | |
Solano County COP, 5.00% due 11/15/2017 | | AA-/A1 | | | 1,580,000 | | | | 1,744,130 | |
South San Francisco USD GO, 4.00% due 6/15/2018 (Educational Facilities) | | SP-1+/NR | | | 5,130,000 | | | | 5,622,736 | |
Southeast Resource Recovery Facilities Authority, 5.25% due 12/1/2017 (Insured: AMBAC) | | A+/A2 | | | 2,000,000 | | | | 2,008,280 | |
State of California Economic Recovery GO, 5.00% due 7/1/2018 pre-refunded 7/1/2018 (ETM) | | NR/Aaa | | | 3,105,000 | | | | 3,511,817 | |
State of California Economic Recovery GO, 5.00% due 7/1/2018 | | AA/Aa2 | | | 895,000 | | | | 1,015,342 | |
State of California GO, 4.75% due 4/1/2018 (Various Purposes) | | A+/Aa3 | | | 1,250,000 | | | | 1,392,925 | |
State of California GO, 5.00% due 9/1/2020 (Various Purposes) | | A+/Aa3 | | | 10,000,000 | | | | 11,861,800 | |
State of California GO, 5.00% due 9/1/2021 (Various Purposes) | | A+/Aa3 | | | 5,000,000 | | | | 6,032,650 | |
Tuolumne Wind Project Authority, 5.00% due 1/1/2018 | | AA-/A2 | | | 2,000,000 | | | | 2,217,020 | |
Tuolumne Wind Project Authority, 5.00% due 1/1/2019 | | AA-/A2 | | | 2,000,000 | | | | 2,270,740 | |
Tustin Community Redevelopment Agency, 4.00% due 9/1/2017 (Tustin Redevelopment) | | A/NR | | | 935,000 | | | | 999,076 | |
Tustin Community Redevelopment Agency, 4.00% due 9/1/2019 (Tustin Redevelopment) | | A/NR | | | 1,010,000 | | | | 1,107,960 | |
Tustin Community Redevelopment Agency, 4.00% due 9/1/2020 (Tustin Redevelopment) | | A/NR | | | 1,050,000 | | | | 1,144,836 | |
Ventura County COP, 5.00% due 8/15/2016 | | AA+/Aa3 | | | 1,520,000 | | | | 1,612,720 | |
Ventura County COP, 5.25% due 8/15/2017 | | AA+/Aa3 | | | 1,635,000 | | | | 1,802,784 | |
West Contra Costa USD GO, 0% due 8/1/2022 (Educational Facilities Projects; Insured: AGM) | | AA/Aa3 | | | 4,000,000 | | | | 3,346,680 | |
West Covina Redevelopment Agency, 6.00% due 9/1/2022 (Fashion Plaza) | | AA+/NR | | | 6,180,000 | | | | 7,335,104 | |
| | | |
COLORADO — 2.51% | | | | | | | | | | |
Adams County Platte Valley Medical Center, 5.00% due 8/1/2015 (Brighton Community Hospital Association; Insured: Natl-Re/FHA) (ETM) | | AA-/NR | | | 1,505,000 | | | | 1,528,990 | |
Castle Oaks Metropolitan District GO, 6.125% due 12/1/2035 pre-refunded 12/1/2015 | | NR/NR | | | 1,428,000 | | | | 1,482,450 | |
City & County of Denver Airport System, 5.00% due 11/15/2016 (Insured: Natl-Re) | | AA-/A1 | | | 1,725,000 | | | | 1,849,459 | |
City & County of Denver Airport System, 5.00% due 11/15/2017 (Insured: Natl-Re) | | AA-/A1 | | | 1,000,000 | | | | 1,106,560 | |
City & County of Denver COP, 5.00% due 12/1/2020 (Buell Theatre Property) | | AA+/Aa1 | | | 3,065,000 | | | | 3,617,589 | |
City & County of Denver COP, 5.00% due 12/1/2021 (Buell Theatre Property) | | AA+/Aa1 | | | 3,825,000 | | | | 4,578,410 | |
City & County of Denver COP, 5.00% due 12/1/2023 (Buell Theatre Property) | | AA+/Aa1 | | | 1,720,000 | | | | 2,105,779 | |
City & County of Denver COP, 0.03% due 12/1/2031 put 4/1/2015 (Wellington E. Webb Municipal Office Building; SPA: JPMorgan Chase Bank, N.A.) (daily demand notes) | | AA+/Aa1 | | | 48,425,000 | | | | 48,425,000 | |
City & County of Denver School District No. 1 COP, 4.00% due 12/15/2016 (Eastbridge Elementary and Conservatory Green K-8 Schools) | | NR/Aa3 | | | 350,000 | | | | 369,761 | |
City & County of Denver School District No. 1 COP, 4.00% due 12/15/2019 (Eastbridge Elementary and Conservatory Green K-8 Schools) | | NR/Aa3 | | | 400,000 | | | | 441,628 | |
City & County of Denver School District No. 1 COP, 4.00% due 12/15/2020 (Eastbridge Elementary and Conservatory Green K-8 Schools) | | NR/Aa3 | | | 600,000 | | | | 667,368 | |
City & County of Denver School District No. 1 COP, 5.00% due 12/15/2021 (Eastbridge Elementary and Conservatory Green K-8 Schools) | | NR/Aa3 | | | 1,000,000 | | | | 1,176,820 | |
City & County of Denver School District No. 1 COP, 5.00% due 12/15/2022 (Eastbridge Elementary and Conservatory Green K-8 Schools) | | NR/Aa3 | | | 1,030,000 | | | | 1,224,207 | |
City & County of Denver School District No. 1 COP, 5.00% due 12/15/2023 (Eastbridge Elementary and Conservatory Green K-8 Schools) | | NR/Aa3 | | | 1,180,000 | | | | 1,413,994 | |
City & County of Denver COP, 0.03% due 12/1/2029 put 4/1/2015 (Wellington E. Webb Municipal Office Building; SPA: JPMorgan Chase Bank, N.A.) (daily demand notes) | | AA+/Aa1 | | | 24,730,000 | | | | 24,730,000 | |
City & County of Denver COP, 0.03% due 12/1/2029 put 4/1/2015 (Wellington E. Webb Municipal Office Building; SPA: JPMorgan Chase Bank, N.A.) (daily demand notes) | | AA+/Aa1 | | | 16,610,000 | | | | 16,610,000 | |
City & County of Denver GO, 3.00% due 8/1/2015 (Civic Facilities and Denver Zoological Gardens Improvements) | | AAA/Aaa | | | 720,000 | | | | 726,926 | |
City of Longmont, 6.00% due 5/15/2019 | | AA+/NR | | | 3,215,000 | | | | 3,795,822 | |
Colorado Department of Corrections COP, 5.00% due 3/1/2016 (Colorado Penitentiary II Project) (ETM) | | AA-/Aa2 | | | 2,000,000 | | | | 2,086,680 | |
Colorado Department of Corrections COP, 5.00% due 3/1/2017 (Colorado Penitentiary II Project) (ETM) | | AA-/Aa2 | | | 2,000,000 | | | | 2,167,740 | |
Colorado Department of Corrections COP, 5.00% due 3/1/2018 (Colorado Penitentiary II Project) (ETM) | | AA-/Aa2 | | | 1,590,000 | | | | 1,776,777 | |
Colorado Department of Corrections COP, 5.00% due 3/1/2019 pre-refunded 3/1/2016 (Colorado Penitentiary II Project; Insured: AMBAC) | | AA-/Aa2 | | | 4,930,000 | | | | 5,142,434 | |
Colorado Educational & Cultural Facilities Authority, 5.00% due 6/1/2016 (National Conference of State Legislatures) | | A/A3 | | | 1,475,000 | | | | 1,539,428 | |
Colorado Educational & Cultural Facilities Authority, 5.00% due 6/1/2018 (National Conference of State Legislatures) | | A/A3 | | | 1,625,000 | | | | 1,773,996 | |
Colorado Educational & Cultural Facilities Authority, 5.00% due 6/1/2020 (National Conference of State Legislatures) | | A/A3 | | | 1,805,000 | | | | 2,045,083 | |
Colorado Educational & Cultural Facilities Authority, 5.00% due 6/1/2021 (National Conference of State Legislatures) | | A/A3 | | | 1,000,000 | | | | 1,144,950 | |
Colorado HFA, 5.00% due 11/15/2015 (Adventist Health/Sunbelt Group) | | AA-/Aa2 | | | 2,365,000 | | | | 2,434,909 | |
Colorado HFA, 5.25% due 5/15/2017 (Northern Colorado Medical Center; Insured: AGM) | | AA/NR | | | 1,185,000 | | | | 1,296,627 | |
Colorado HFA, 5.25% due 5/15/2019 (Northern Colorado Medical Center; Insured: AGM) | | AA/NR | | | 2,225,000 | | | | 2,564,379 | |
Colorado HFA, 5.50% due 10/1/2038 put 11/12/2015 (Catholic Health Initiatives) | | A/A2 | | | 1,000,000 | | | | 1,032,090 | |
Denver Convention Center Hotel Authority, 5.25% due 12/1/2021 (Insured: Syncora) | | BBB-/
Baa3 | | | 3,700,000 | | | | 3,929,104 | |
Denver Convention Center Hotel Authority, 5.25% due 12/1/2022 (Insured: Syncora) | | BBB-/
Baa3 | | | 1,100,000 | | | | 1,181,268 | |
Denver West Metropolitan District GO, 5.00% due 12/1/2021 (Insured: AGM) | | AA/NR | | | 2,175,000 | | | | 2,548,056 | |
El Paso County COP, 4.00% due 12/1/2021 (Pikes Peak Regional Development Center) | | AA-/Aa2 | | | 1,000,000 | | | | 1,113,150 | |
El Paso County COP, 5.00% due 12/1/2023 (Pikes Peak Regional Development Center) | | AA-/Aa2 | | | 1,330,000 | | | | 1,586,251 | |
12 Semi-Annual Report
| | |
| SCHEDULE OF INVESTMENTS, CONTINUED | | |
| |
Thornburg Limited Term Municipal Fund | | March 31, 2015 (Unaudited) |
| | | | | | | | | | |
Issuer-Description | | Credit Rating†
S&P/ Moody’s | | Principal
Amount | | | Value | |
El Paso County School District No. 49 Falcon COP, 5.00% due 12/15/2020 | | NR/Aa3 | | $ | 350,000 | | | $ | 410,834 | |
El Paso County School District No. 49 Falcon COP, 5.00% due 12/15/2023 | | NR/Aa3 | | | 945,000 | | | | 1,138,149 | |
El Paso County School District No. 49 Falcon COP, 5.00% due 12/15/2024 | | NR/Aa3 | | | 655,000 | | | | 796,139 | |
Park Creek Metropolitan District, 5.00% due 12/1/2015 (Insured: AGM) | | AA/NR | | | 1,000,000 | | | | 1,028,380 | |
Park Creek Metropolitan District, 5.00% due 12/1/2016 (Insured: AGM) | | AA/NR | | | 1,035,000 | | | | 1,100,629 | |
Park Creek Metropolitan District, 5.00% due 12/1/2017 (Insured: AGM) | | AA/NR | | | 1,525,000 | | | | 1,655,952 | |
Park Creek Metropolitan District, 5.50% due 12/1/2018 (Insured: AGM) | | AA/NR | | | 1,200,000 | | | | 1,350,588 | |
Park Creek Metropolitan District, 5.50% due 12/1/2019 (Insured: AGM) | | AA/NR | | | 1,000,000 | | | | 1,143,010 | |
Regents of the University of Colorado COP, 5.00% due 11/1/2016 (UCDHSC Fitzsimons Academic Facilities) | | AA-/Aa2 | | | 700,000 | | | | 750,029 | |
Regents of the University of Colorado COP, 5.00% due 11/1/2017 (UCDHSC Fitzsimons Academic Facilities) | | AA-/Aa2 | | | 850,000 | | | | 940,916 | |
Regional Transportation District COP, 5.00% due 6/1/2018 (FasTracks Transportation System) | | A/Aa3 | | | 1,750,000 | | | | 1,958,600 | |
Regional Transportation District COP, 5.00% due 6/1/2019 (FasTracks Transportation System) | | A/Aa3 | | | 4,730,000 | | | | 5,396,835 | |
Regional Transportation District COP, 5.00% due 6/1/2020 (FasTracks Transportation System) | | A/Aa3 | | | 3,655,000 | | | | 4,224,632 | |
Regional Transportation District COP, 5.50% due 6/1/2021 (FasTracks Transportation System) | | A/Aa3 | | | 2,370,000 | | | | 2,794,988 | |
Regional Transportation District COP, 5.00% due 6/1/2023 (North Metro Rail Line) | | A/Aa3 | | | 4,000,000 | | | | 4,809,800 | |
Regional Transportation District COP, 5.00% due 6/1/2024 (North Metro Rail Line) | | A/Aa3 | | | 4,000,000 | | | | 4,797,360 | |
| | | |
CONNECTICUT — 0.84% | | | | | | | | | | |
Capital City EDA, 5.00% due 6/15/2015 (Adriaen’s Landing Convention Center; Insured: AGM) | | AA/A2 | | | 1,705,000 | | | | 1,711,991 | |
City of West Haven GO, 4.00% due 8/1/2018 (Insured: AGM) | | AA/A2 | | | 2,080,000 | | | | 2,244,507 | |
Connecticut Housing Finance Authority, 0.03% due 11/15/2036 put 4/1/2015 (Housing Mtg Financing Program; SPA: JPMorgan Chase Bank, N.A.) (daily demand notes) | | AAA/Aaa | | | 4,430,000 | | | | 4,430,000 | |
Connecticut Housing Finance Authority, 0.03% due 5/15/2039 put 4/1/2015 (Housing Mtg Financing Program; SPA: JPMorgan Chase Bank, N.A.) (daily demand notes) | | AAA/Aaa | | | 36,965,000 | | | | 36,965,000 | |
Connecticut Housing Finance Authority, 0.03% due 5/15/2039 put 4/1/2015 (Housing Mtg Finance Program; SPA: JPMorgan Chase Bank, N.A.) (daily demand notes) | | AAA/Aaa | | | 2,970,000 | | | | 2,970,000 | |
State of Connecticut GO, 5.00% due 6/1/2019 pre-refunded 6/1/2016 (General State Capital Projects; Insured: AGM) | | AA/Aa3 | | | 2,865,000 | | | | 3,021,228 | |
State of Connecticut GO Floating Rate Note, 0.79% due 9/15/2018 (General State Capital Projects) | | AA/Aa3 | | | 725,000 | | | | 733,512 | |
State of Connecticut GO Floating Rate Note, 0.67% due 9/15/2024 (Education Capital Projects) | | AA/Aa3 | | | 10,000,000 | | | | 10,081,000 | |
| | | |
DISTRICT OF COLUMBIA — 0.54% | | | | | | | | | | |
District of Columbia, 4.00% due 4/1/2015 (National Public Radio) (ETM) | | AA-/Aa3 | | | 1,000,000 | | | | 1,000,000 | |
District of Columbia, 5.00% due 4/1/2016 (National Public Radio) (ETM) | | AA-/Aa3 | | | 685,000 | | | | 717,051 | |
District of Columbia, 4.00% due 4/1/2017 (National Public Radio) | | AA-/Aa3 | | | 1,830,000 | | | | 1,948,987 | |
District of Columbia, 5.00% due 4/1/2018 (National Public Radio) | | AA-/Aa3 | | | 1,745,000 | | | | 1,947,228 | |
District of Columbia, 5.00% due 4/1/2019 (National Public Radio) | | AA-/Aa3 | | | 805,000 | | | | 918,207 | |
District of Columbia, 5.00% due 4/1/2020 (National Public Radio) | | AA-/Aa3 | | | 1,890,000 | | | | 2,198,845 | |
District of Columbia COP, 5.25% due 1/1/2016 (St. Elizabeth Hospital Lease; Insured: Natl-Re) (ETM) | | AA-/Aa3 | | | 4,700,000 | | | | 4,877,049 | |
District of Columbia COP, 5.00% due 1/1/2018 pre-refunded 1/1/2016 (St. Elizabeth Hospital Lease; Insured: Natl-Re) | | AA-/Aa3 | | | 5,000,000 | | | | 5,179,000 | |
District of Columbia COP, 5.00% due 1/1/2019 pre-refunded 1/1/2016 (St. Elizabeth Hospital Lease; Insured: Natl-Re) | | AA-/Aa3 | | | 5,000,000 | | | | 5,179,000 | |
District of Columbia COP, 4.50% due 1/1/2021 pre-refunded 1/1/2016 (St. Elizabeth Hospital Lease; Insured: Natl-Re) | | AA-/Aa3 | | | 1,100,000 | | | | 1,135,255 | |
District of Columbia GO, 6.00% due 6/1/2018 (Insured: Natl-Re) | | AA/Aa1 | | | 5,000,000 | | | | 5,776,950 | |
District of Columbia GO, 5.25% due 6/1/2020 (Insured: Syncora) | | AA/Aa1 | | | 3,005,000 | | | | 3,579,105 | |
District of Columbia Housing Finance Agency, 5.00% due 7/1/2015 (Housing Authority Modernization Program; Insured: AGM) | | AA/A2 | | | 1,480,000 | | | | 1,496,650 | |
Metropolitan Washington Airports Authority, 0% due 10/1/2016 (Dulles Toll Road; Insured: AGM) | | AA/A3 | | | 4,000,000 | | | | 3,918,880 | |
| | | |
FLORIDA — 7.21% | | | | | | | | | | |
Broward County, 5.00% due 9/1/2017 (Port Facilities) | | A-/A1 | | | 2,820,000 | | | | 3,055,639 | |
Broward County, 4.00% due 10/1/2017 (Airport, Marina & Port Improvements) | | A+/A1 | | | 500,000 | | | | 538,935 | |
Broward County, 5.00% due 10/1/2017 (Airport, Marina & Port Improvements) | | A+/A1 | | | 1,000,000 | | | | 1,102,560 | |
Broward County, 5.50% due 9/1/2018 (Port Facilities) | | A-/A1 | | | 3,500,000 | | | | 3,935,785 | |
Broward County, 4.00% due 10/1/2018 (Airport, Marina & Port Improvements) | | A+/A1 | | | 425,000 | | | | 465,970 | |
Broward County, 5.00% due 10/1/2018 (Airport, Marina & Port Improvements) | | A+/A1 | | | 500,000 | | | | 565,295 | |
Broward County, 5.50% due 9/1/2019 (Port Facilities) | | A-/A1 | | | 2,800,000 | | | | 3,219,412 | |
Broward County, 5.00% due 10/1/2019 (Airport, Marina & Port Improvements) | | A+/A1 | | | 1,000,000 | | | | 1,154,810 | |
Broward County, 4.00% due 10/1/2020 (Airport, Marina & Port Improvements) | | A+/A1 | | | 1,660,000 | | | | 1,852,942 | |
Broward County, 5.00% due 10/1/2020 (Airport, Marina & Port Improvements) | | A+/A1 | | | 2,000,000 | | | | 2,356,360 | |
Broward County School Board COP, 5.25% due 7/1/2015 (Educational Facilities; Insured: AGM) | | AA/A1 | | | 3,035,000 | | | | 3,073,362 | |
Broward County School Board COP, 5.00% due 7/1/2016 (Educational Facilities; Insured: AGM) | | AA/A1 | | | 1,495,000 | | | | 1,581,426 | |
Broward County School Board COP, 5.25% due 7/1/2016 (Educational Facilities; Insured: AGM) | | AA/A1 | | | 7,630,000 | | | | 8,094,896 | |
Broward County School Board COP, 5.25% due 7/1/2016 (Educational Facilities; Insured: AGM) | | AA/A1 | | | 3,715,000 | | | | 3,941,355 | |
Broward County School Board COP, 5.00% due 7/1/2017 (Educational Facilities; Insured: Natl-Re) | | AA-/A1 | | | 1,000,000 | | | | 1,094,640 | |
Broward County School Board COP, 5.00% due 7/1/2021 (Educational Facilities) | | A/A1 | | | 4,000,000 | | | | 4,737,880 | |
Broward County School Board COP, 5.00% due 7/1/2022 (Educational Facilities) | | A/A1 | | | 4,580,000 | | | | 5,475,665 | |
Broward County School Board COP, 5.00% due 7/1/2023 (Educational Facilities) | | A/A1 | | | 3,000,000 | | | | 3,620,520 | |
Broward County School Board COP, 5.00% due 7/1/2023 (Educational Facilities) | | A/A1 | | | 2,000,000 | | | | 2,413,680 | |
Semi-Annual Report 13
| | |
| SCHEDULE OF INVESTMENTS, CONTINUED | | |
| |
Thornburg Limited Term Municipal Fund | | March 31, 2015 (Unaudited) |
| | | | | | | | | | |
Issuer-Description | | Credit Rating†
S&P/ Moody’s | | Principal
Amount | | | Value | |
Broward County School Board COP, 5.00% due 7/1/2024 (Educational Facilities) | | A/NR | | $ | 4,000,000 | | | $ | 4,835,880 | |
Broward County School Board COP, 5.00% due 7/1/2024 (Educational Facilities) | | A/A1 | | | 2,000,000 | | | | 2,417,940 | |
Broward County School Board COP, 5.00% due 7/1/2025 (Educational Facilities) | | A/A1 | | | 7,000,000 | | | | 8,513,540 | |
Broward County School Board COP, 5.00% due 7/1/2025 (Educational Facilities) | | A/A1 | | | 5,000,000 | | | | 6,081,100 | |
Capital Projects Finance Authority, 5.50% due 10/1/2015 (University of Central Florida Apartment Student Housing; Insured: Natl-Re) | | AA-/A3 | | | 2,660,000 | | | | 2,660,931 | |
City of Fort Myers, 5.00% due 12/1/2018 (Gulf Breeze Loan Program; Insured: Natl-Re) | | AA-/Aa3 | | | 2,195,000 | | | | 2,406,620 | |
City of Fort Myers, 5.00% due 10/1/2023 (Utility Systems Capital Projects) | | A/Aa3 | | | 3,360,000 | | | | 3,939,667 | |
City of Gainesville, 0.03% due 10/1/2026 put 4/1/2015 (Utilities System; SPA: Union Bank) (daily demand notes) | | AA/Aa2 | | | 20,800,000 | | | | 20,800,000 | |
City of Hollywood Community Redevelopment Agency, 5.00% due 3/1/2016 (Beach Community Redevelopment Project; Insured: Syncora) | | NR/A3 | | | 2,000,000 | | | | 2,068,380 | |
City of Hollywood Community Redevelopment Agency, 5.00% due 3/1/2017 (Beach Community Redevelopment Project; Insured: Syncora) | | NR/A3 | | | 2,000,000 | | | | 2,124,100 | |
City of Hollywood Community Redevelopment Agency, 5.00% due 3/1/2024 (Beach Community Redevelopment Project; Insured: Syncora) | | NR/A3 | | | 4,850,000 | | | | 5,070,481 | |
City of Jacksonville, 5.00% due 10/1/2017 | | AA-/Aa3 | | | 1,000,000 | | | | 1,104,530 | |
City of Jacksonville, 5.00% due 10/1/2018 | | AA-/Aa3 | | | 1,050,000 | | | | 1,190,784 | |
City of Jacksonville, 5.00% due 10/1/2019 | | AA-/Aa3 | | | 500,000 | | | | 579,415 | |
City of Jacksonville, 5.00% due 10/1/2020 | | AA-/Aa3 | | | 1,000,000 | | | | 1,180,200 | |
City of Jacksonville, 5.00% due 10/1/2023 | | AA-/Aa3 | | | 1,105,000 | | | | 1,342,244 | |
City of Lakeland, 5.00% due 10/1/2016 (Energy System; Insured: AGM) | | AA/Aa3 | | | 9,780,000 | | | | 10,434,478 | |
City of Lakeland, 5.00% due 10/1/2017 (Energy System; Insured: AGM) | | AA/Aa3 | | | 7,105,000 | | | | 7,825,305 | |
City of Lakeland, 5.00% due 10/1/2019 (Energy System; Insured: AGM) | | AA/Aa3 | | | 5,000,000 | | | | 5,771,650 | |
City of Lakeland, 5.00% due 11/15/2019 (Lakeland Regional Health Systems) | | NR/A2 | | | 5,655,000 | | | | 6,376,352 | |
City of Lakeland, 5.00% due 10/1/2020 (Energy System; Insured: AGM) | | AA/Aa3 | | | 1,695,000 | | | | 1,990,184 | |
City of Miami, 5.00% due 1/1/2018 (Street & Sidewalk Improvement Program; Insured: Natl-Re) | | AA-/A2 | | | 1,970,000 | | | | 2,161,740 | |
City of North Miami Beach, 5.00% due 8/1/2017 (North Miami Beach Water Project) | | A+/NR | | | 750,000 | | | | 817,785 | |
City of North Miami Beach, 3.00% due 8/1/2018 (North Miami Beach Water Project) | | A+/NR | | | 1,280,000 | | | | 1,346,509 | |
City of North Miami Beach, 5.00% due 8/1/2019 (North Miami Beach Water Project) | | A+/NR | | | 1,650,000 | | | | 1,876,116 | |
City of North Miami Beach, 5.00% due 8/1/2020 (North Miami Beach Water Project) | | A+/NR | | | 780,000 | | | | 900,393 | |
City of North Miami Beach, 5.00% due 8/1/2021 (North Miami Beach Water Project) | | A+/NR | | | 1,000,000 | | | | 1,168,690 | |
City of Port St. Lucie, 5.00% due 9/1/2015 (Tesoro Special Assessment District; Insured: Natl-Re) | | NR/A1 | | | 250,000 | | | | 254,853 | |
City of Port St. Lucie, 1.70% due 7/1/2016 (Tesoro Special Assessment District) | | NR/A1 | | | 1,075,000 | | | | 1,085,084 | |
City of Port St. Lucie, 1.875% due 7/1/2017 (Tesoro Special Assessment District; Insured: AGM) | | NR/A1 | | | 2,175,000 | | | | 2,197,424 | |
City of Port St. Lucie, 2.00% due 7/1/2018 (Tesoro Special Assessment District; Insured: AGM) | | NR/A1 | | | 2,215,000 | | | | 2,237,305 | |
City of Tampa, 5.00% due 11/15/2016 (BayCare Health System) | | NR/Aa2 | | | 2,855,000 | | | | 3,064,957 | |
City of Tampa, 5.00% due 11/15/2017 (BayCare Health System) | | NR/Aa2 | | | 1,215,000 | | | | 1,345,892 | |
Flagler County School Board COP, 5.00% due 8/1/2015 (Insured: AGM) | | AA/A2 | | | 1,500,000 | | | | 1,522,890 | |
Florida Atlantic University Financing Corp., 5.00% due 7/1/2015 (Innovation Village Capital Improvements) | | A/A1 | | | 2,395,000 | | | | 2,423,333 | |
Florida Atlantic University Financing Corp., 5.00% due 7/1/2016 (Innovation Village Capital Improvements) | | A/A1 | | | 2,275,000 | | | | 2,399,147 | |
Florida Department of Management Services, 5.25% due 9/1/2016 (Insured: AGM) | | AA+/Aa2 | | | 3,500,000 | | | | 3,731,910 | |
Florida Higher Educational Facilities Financing Authority, 5.00% due 4/1/2015 (Nova Southeastern University) | | BBB/Baa1 | | | 2,150,000 | | | | 2,150,000 | |
Florida Higher Educational Facilities Financing Authority, 5.00% due 4/1/2016 (Nova Southeastern University) | | BBB/Baa1 | | | 2,345,000 | | | | 2,435,353 | |
Florida Higher Educational Facilities Financing Authority, 5.25% due 4/1/2017 (Nova Southeastern University) | | BBB/Baa1 | | | 1,325,000 | | | | 1,421,871 | |
Florida Higher Educational Facilities Financing Authority, 5.25% due 4/1/2018 (Nova Southeastern University) | | BBB/Baa1 | | | 2,630,000 | | | | 2,892,237 | |
Florida Higher Educational Facilities Financing Authority, 5.00% due 4/1/2019 (University of Tampa) | | BBB+/NR | | | 1,225,000 | | | | 1,361,122 | |
Florida Higher Educational Facilities Financing Authority, 5.00% due 4/1/2019 (Nova Southeastern University) | | BBB/Baa1 | | | 1,035,000 | | | | 1,150,009 | |
Florida Higher Educational Facilities Financing Authority, 5.50% due 4/1/2019 (Nova Southeastern University) | | BBB/Baa1 | | | 1,705,000 | | | | 1,927,008 | |
Florida Higher Educational Facilities Financing Authority, 5.00% due 4/1/2020 (Nova Southeastern University) | | BBB/Baa1 | | | 1,030,000 | | | | 1,161,953 | |
Florida Higher Educational Facilities Financing Authority, 5.00% due 4/1/2022 (University of Tampa) | | BBB+/NR | | | 620,000 | | | | 712,008 | |
Florida State Board of Governors, 4.00% due 7/1/2020 (University System Capital Improvements) | | AA/Aa2 | | | 4,055,000 | | | | 4,564,957 | |
Florida State Board of Governors, 4.00% due 7/1/2021 (University System Capital Improvements) | | AA/Aa2 | | | 4,215,000 | | | | 4,788,914 | |
Florida State Board of Governors, 4.00% due 7/1/2022 (University System Capital Improvements) | | AA/Aa2 | | | 4,385,000 | | | | 5,017,098 | |
Florida State Department of Children & Families COP, 5.00% due 10/1/2015 | | AA+/NR | | | 925,000 | | | | 945,026 | |
Florida State Department of Transportation GO, 5.00% due 7/1/2018 | | AAA/Aa1 | | | 3,000,000 | | | | 3,304,140 | |
Highlands County HFA, 5.00% due 11/15/2015 (Adventist Health System Sunbelt Group) (ETM) | | AA-/Aa2 | | | 1,000,000 | | | | 1,029,800 | |
Highlands County HFA, 5.00% due 11/15/2016 (Adventist Health System Sunbelt Group) | | AA-/Aa2 | | | 1,000,000 | | | | 1,072,360 | |
Highlands County HFA, 5.00% due 11/15/2017 pre-refunded 11/16/2015 (Adventist Health System Sunbelt Group) | | AA-/Aa2 | | | 1,000,000 | | | | 1,029,390 | |
Highlands County HFA, 5.00% due 11/15/2017 (Adventist Health System Sunbelt Group) | | AA-/Aa2 | | | 3,200,000 | | | | 3,544,736 | |
Highlands County HFA, 5.00% due 11/15/2019 (Adventist Health System Sunbelt Group) | | AA-/Aa2 | | | 3,000,000 | | | | 3,461,340 | |
Highlands County HFA, 5.00% due 11/15/2035 pre-refunded 11/15/2015 (Adventist Health System Sunbelt Group) | | AA-/Aa2 | | | 1,225,000 | | | | 1,260,844 | |
Hillsborough County, 5.00% due 11/1/2016 (Transportation Related Capital Improvements; Insured: AMBAC) | | AA/A1 | | | 1,000,000 | | | | 1,071,800 | |
Hillsborough County, 5.00% due 11/1/2018 (Court Facilities) | | AA/A1 | | | 4,210,000 | | | | 4,752,458 | |
Hillsborough County, 5.00% due 11/1/2019 (Court Facilities) | | AA/A1 | | | 4,420,000 | | | | 5,087,022 | |
Hillsborough County, 5.00% due 11/1/2020 (Court Facilities) | | AA/A1 | | | 4,645,000 | | | | 5,417,603 | |
Hillsborough County, 5.00% due 11/1/2021 (Jail and Storm Water Projects) | | AA/A1 | | | 2,300,000 | | | | 2,706,226 | |
14 Semi-Annual Report
| | |
| SCHEDULE OF INVESTMENTS, CONTINUED | | |
| |
Thornburg Limited Term Municipal Fund | | March 31, 2015 (Unaudited) |
| | | | | | | | | | |
Issuer-Description | | Credit Rating†
S&P/ Moody’s | | Principal
Amount | | | Value | |
Hillsborough County, 5.00% due 11/1/2021 (Court Facilities) | | AA/A1 | | $ | 4,880,000 | | | $ | 5,741,906 | |
Hillsborough County, 5.00% due 11/1/2022 (Jail and Storm Water Projects) | | AA/A1 | | | 3,005,000 | | | | 3,574,207 | |
Hillsborough County IDA, 5.65% due 5/15/2018 (Tampa Electric Co.) | | BBB+/A2 | | | 3,200,000 | | | | 3,608,352 | |
Hillsborough County School Board COP, 5.25% due 7/1/2017 (Educational Facilities; Insured: Natl-Re) | | AA-/Aa2 | | | 1,300,000 | | | | 1,426,880 | |
Jacksonville Economic Development Commission, 6.00% due 9/1/2017 (Florida Proton Therapy Institute) | | NR/NR | | | 2,885,000 | | | | 3,174,567 | |
JEA, 4.00% due 10/1/2016 (Electric System) | | A+/Aa3 | | | 3,540,000 | | | | 3,730,629 | |
JEA, 5.00% due 10/1/2018 (Water and Sewer System) | | AA/Aa2 | | | 1,500,000 | | | | 1,700,850 | |
JEA, 5.00% due 10/1/2023 (Electric System) | | A+/Aa3 | | | 1,395,000 | | | | 1,702,053 | |
JEA, 5.00% due 10/1/2024 (Electric System) | | A+/Aa3 | | | 1,200,000 | | | | 1,453,752 | |
Kissimmee Utility Authority, 5.25% due 10/1/2016 (Electrical Systems; Insured: AGM) | | NR/A1 | | | 1,700,000 | | | | 1,814,546 | |
Lee County School Board COP, 5.00% due 8/1/2023 (School Facilities Improvements) | | A+/Aa3 | | | 1,000,000 | | | | 1,203,810 | |
Lee County School Board COP, 5.00% due 8/1/2024 (School Facilities Improvements) | | A+/Aa3 | | | 2,000,000 | | | | 2,421,120 | |
Manatee County, 5.00% due 10/1/2016 (County Capital Projects) | | NR/Aa2 | | | 1,000,000 | | | | 1,068,090 | |
Manatee County, 5.00% due 10/1/2018 (County Capital Projects) | | NR/Aa2 | | | 2,400,000 | | | | 2,722,248 | |
Manatee County, 5.00% due 10/1/2021 (County Capital Projects) | | NR/Aa2 | | | 2,775,000 | | | | 3,329,195 | |
Marion County Hospital District, 5.00% due 10/1/2015 (Munroe Regional Health Systems) (ETM) | | NR/NR | | | 1,000,000 | | | | 1,024,030 | |
Miami Beach GO, 4.00% due 9/1/2019 | | AA+/Aa2 | | | 2,745,000 | | | | 3,038,358 | |
Miami Beach GO, 5.00% due 9/1/2020 | | AA+/Aa2 | | | 3,720,000 | | | | 4,352,549 | |
Miami Beach GO, 4.00% due 9/1/2021 | | AA+/Aa2 | | | 1,015,000 | | | | 1,142,728 | |
Miami Beach GO, 5.00% due 9/1/2022 | | AA+/Aa2 | | | 1,000,000 | | | | 1,174,970 | |
Miami-Dade County, 0% due 10/1/2015 (Professional Sports Franchise Facilities; Insured: AGM) | | AA/A1 | | | 3,845,000 | | | | 3,831,965 | |
Miami-Dade County, 0% due 10/1/2016 (Professional Sports Franchise Facilities; Insured: AGM) | | AA/A1 | | | 3,535,000 | | | | 3,467,446 | |
Miami-Dade County, 0% due 10/1/2017 (Professional Sports Franchise Facilities; Insured: AGM) | | AA/A1 | | | 2,435,000 | | | | 2,326,009 | |
Miami-Dade County, 0% due 10/1/2018 (Professional Sports Franchise Facilities; Insured: AGM) | | AA/A1 | | | 5,385,000 | | | | 4,988,879 | |
Miami-Dade County, 0% due 10/1/2019 (Professional Sports Franchise Facilities; Insured: AGM) | | AA/A1 | | | 2,170,000 | | | | 1,947,358 | |
Miami-Dade County, 5.00% due 10/1/2025 (Miami International Airport) | | A/A2 | | | 2,500,000 | | | | 3,007,450 | |
Miami-Dade County Educational Facilities Authority GO, 5.00% due 4/1/2016 (University of Miami; Insured: AMBAC) | | A-/A3 | | | 3,000,000 | | | | 3,129,390 | |
Miami-Dade County Expressway Authority, 5.00% due 7/1/2019 (Toll System; Insured: AGM) | | AA/A2 | | | 7,530,000 | | | | 8,604,380 | |
Miami-Dade County Expressway Authority, 5.00% due 7/1/2024 (Toll System) | | A-/A3 | | | 2,000,000 | | | | 2,418,840 | |
Miami-Dade County Expressway Authority, 5.00% due 7/1/2025 (Toll System) | | A-/A3 | | | 2,000,000 | | | | 2,396,900 | |
Miami-Dade County GO, 5.25% due 7/1/2018 (Building Better Communities) | | AA/Aa2 | | | 5,040,000 | | | | 5,714,503 | |
Miami-Dade County School Board COP, 5.00% due 10/1/2015 (Insured: AMBAC) | | A/A1 | | | 1,000,000 | | | | 1,023,980 | |
Miami-Dade County School Board COP, 5.00% due 5/1/2016 (Insured: Natl-Re) | | AA-/A1 | | | 4,065,000 | | | | 4,270,282 | |
Miami-Dade County School Board COP, 5.00% due 10/1/2016 (Insured: AMBAC) | | A/A1 | | | 1,000,000 | | | | 1,067,780 | |
Miami-Dade County School Board COP, 5.00% due 5/1/2022 (Educational Facilities Improvements) | | A/A1 | | | 3,405,000 | | | | 4,022,327 | |
Miami-Dade County School Board COP, 5.00% due 5/1/2023 (Educational Facilities Improvements) | | A/A1 | | | 4,130,000 | | | | 4,924,818 | |
Miami-Dade County School Board COP, 5.00% due 5/1/2024 (Educational Facilities Improvements) | | A/A1 | | | 8,000,000 | | | | 9,594,560 | |
Miami-Dade County School Board COP, 5.00% due 5/1/2031 put 5/1/2024 (Educational Facilities Improvements) | | A/A1 | | | 2,425,000 | | | | 2,849,521 | |
Miami-Dade County School Board COP, 5.00% due 5/1/2032 put 5/1/2016 (Educational Facilities Improvements) | | A/A1 | | | 6,000,000 | | | | 6,283,740 | |
Miami-Dade County School District GO, 5.375% due 8/1/2015 (Insured: AGM) | | AA/Aa3 | | | 5,130,000 | | | | 5,219,005 | |
Orange County HFA, 5.00% due 10/1/2015 (Orlando Health, Inc.) | | A/A3 | | | 500,000 | | | | 511,835 | |
Orange County HFA, 6.25% due 10/1/2016 (Orlando Health, Inc.; Insured:
Natl-Re) | | AA-/A3 | | | 1,585,000 | | | | 1,657,339 | |
Orange County HFA, 5.00% due 10/1/2017 (Orlando Health, Inc.) | | A/A3 | | | 1,980,000 | | | | 2,171,189 | |
Orange County HFA, 5.25% due 10/1/2019 (Orlando Health, Inc.) | | A/A3 | | | 6,050,000 | | | | 6,966,696 | |
Orange County HFA, 6.25% due 10/1/2021 (Orlando Health, Inc.; Insured:
Natl-Re) | | AA-/A3 | | | 1,870,000 | | | | 2,181,299 | |
Orange County HFA, 5.375% due 10/1/2023 (Orlando Health, Inc.) | | A/A3 | | | 4,150,000 | | | | 4,778,351 | |
Orange County School Board COP, 5.00% due 8/1/2019 (Educational Facilities) | | NR/Aa2 | | | 1,000,000 | | | | 1,155,530 | |
Orange County School Board COP, 5.00% due 8/1/2020 (Educational Facilities) | | NR/Aa2 | | | 1,695,000 | | | | 1,996,286 | |
Orange County School Board COP, 5.00% due 8/1/2021 (Educational Facilities) | | NR/Aa2 | | | 2,100,000 | | | | 2,507,211 | |
Orange County School Board COP, 5.00% due 8/1/2022 (Educational Facilities) | | NR/Aa2 | | | 1,825,000 | | | | 2,200,603 | |
Orange County School Board COP, 5.00% due 8/1/2023 (Educational Facilities) | | NR/Aa2 | | | 1,540,000 | | | | 1,875,273 | |
Orange County School Board COP, 5.00% due 8/1/2024 (Educational Facilities) | | NR/Aa2 | | | 1,445,000 | | | | 1,771,440 | |
Orange County School Board COP, 5.00% due 8/1/2025 (Educational Facilities) | | NR/Aa2 | | | 1,190,000 | | | | 1,466,425 | |
Orlando and Orange County Expressway Authority, 8.25% due 7/1/2016 (Insured: Natl-Re/FGIC/IBC) | | AA-/A2 | | | 3,000,000 | | | | 3,288,630 | |
Palm Beach County HFA, 5.00% due 12/1/2020 (Boca Raton Regional Hospital) | | BBB/NR | | | 600,000 | | | | 689,196 | |
Palm Beach County School Board COP, 5.00% due 8/1/2018 (Educational Facilities Master Lease Program) | | NR/Aa3 | | | 800,000 | | | | 900,976 | |
Palm Beach County School Board COP, 4.00% due 8/1/2019 (Educational Facilities Master Lease Program) | | NR/Aa3 | | | 940,000 | | | | 1,039,668 | |
Palm Beach County School Board COP, 5.00% due 8/1/2020 (Educational Facilities Master Lease Program) | | NR/Aa3 | | | 1,090,000 | | | | 1,274,145 | |
Palm Beach County School Board COP, 4.00% due 8/1/2021 (Educational Facilities Master Lease Program) | | NR/Aa3 | | | 3,835,000 | | | | 4,314,989 | |
Palm Beach County School Board COP, 5.00% due 8/1/2022 (Educational Facilities Master Lease Program) | | NR/Aa3 | | | 1,000,000 | | | | 1,194,500 | |
Palm Beach County School Board COP, 5.00% due 8/1/2022 (Educational Facilities Master Lease Program) | | NR/Aa3 | | | 1,660,000 | | | | 1,982,870 | |
Palm Beach County School Board COP, 5.00% due 8/1/2023 (Educational Facilities Master Lease Program) | | NR/Aa3 | | | 1,000,000 | | | | 1,203,810 | |
Palm Beach County School Board COP, 5.00% due 8/1/2023 (Educational Facilities Master Lease Program) | | NR/Aa3 | | | 3,500,000 | | | | 4,213,335 | |
Palm Beach County School Board COP, 5.00% due 8/1/2024 (Educational Facilities Master Lease Program) | | NR/Aa3 | | | 1,000,000 | | | | 1,212,410 | |
Palm Beach County School Board COP, 5.00% due 8/1/2024 (Educational Facilities Master Lease Program) | | NR/Aa3 | | | 3,595,000 | | | | 4,358,614 | |
Semi-Annual Report 15
| | |
| SCHEDULE OF INVESTMENTS, CONTINUED | | |
| |
Thornburg Limited Term Municipal Fund | | March 31, 2015 (Unaudited) |
| | | | | | | | | | |
Issuer-Description | | Credit Rating†
S&P/ Moody’s | | Principal
Amount | | | Value | |
Palm Beach County School Board COP, 5.00% due 8/1/2032 put 8/1/2016 (Educational Facilities Master Lease Program) | | NR/Aa3 | | $ | 1,300,000 | | | $ | 1,376,726 | |
Polk County, 4.00% due 10/1/2020 (Water and Wastewater Utility Systems; Insured: AGM) | | A+/Aa3 | | | 3,100,000 | | | | 3,473,705 | |
Polk County, 3.00% due 10/1/2021 (Water and Wastewater Utility Systems; Insured: AGM) | | A+/Aa3 | | | 3,125,000 | | | | 3,323,906 | |
Polk County, 5.00% due 10/1/2023 (Water and Wastewater Utility Systems) | | A+/Aa3 | | | 1,420,000 | | | | 1,695,409 | |
Putnam County Development Authority PCR, 5.35% due 3/15/2042 put 5/1/2018 (Seminole Project; Insured: AMBAC) | | A-/A3 | | | 10,000,000 | | | | 11,219,100 | |
Putnam County Development Authority PCR, 5.35% due 3/15/2042 put 5/1/2018 (Seminole Project; Insured: AMBAC) | | A-/A3 | | | 4,165,000 | | | | 4,672,755 | |
Reedy Creek Improvement District, 5.00% due 10/1/2017 (Walt Disney World Resort Complex Utility Systems) | | A/A1 | | | 400,000 | | | | 439,560 | |
Reedy Creek Improvement District, 5.00% due 10/1/2018 (Walt Disney World Resort Complex Utility Systems) | | A/A1 | | | 755,000 | | | | 849,028 | |
Reedy Creek Improvement District, 5.00% due 10/1/2021 (Walt Disney World Resort Complex Utility Systems) | | A/A1 | | | 1,200,000 | | | | 1,405,440 | |
a Reedy Creek Improvement District, 5.00% due 10/1/2022 (Walt Disney World Resort Complex Utility Systems) | | A/A1 | | | 625,000 | | | | 736,163 | |
Reedy Creek Improvement District, 5.00% due 6/1/2023 (Buena Vista Drive Corridor Improvements) | | A+/Aa3 | | | 1,940,000 | | | | 2,359,234 | |
Reedy Creek Improvement District, 5.00% due 10/1/2023 (Walt Disney World Resort Complex Utility Systems) | | A/A1 | | | 750,000 | | | | 888,053 | |
School Board of Alachua County COP, 5.00% due 7/1/2022 (Educational Facilities) | | A+/Aa3 | | | 1,600,000 | | | | 1,881,104 | |
School Board of Alachua County COP, 5.00% due 7/1/2023 (Educational Facilities) | | A+/Aa3 | | | 2,250,000 | | | | 2,672,505 | |
School Board of Lake County COP, 5.25% due 6/1/2017 (Insured: AMBAC) | | A/NR | | | 2,000,000 | | | | 2,189,400 | |
School Board of Lake County COP, 5.25% due 6/1/2018 (Insured: AMBAC) | | A/NR | | | 1,475,000 | | | | 1,664,803 | |
South Broward Hospital District, 5.00% due 5/1/2020 (Insured: Natl-Re) | | AA-/Aa3 | | | 7,260,000 | | | | 7,600,567 | |
South Florida Water Management District COP, 5.00% due 10/1/2015 (Everglades Restoration Plan; Insured: AMBAC) | | AA/Aa3 | | | 1,000,000 | | | | 1,022,830 | |
South Florida Water Management District COP, 5.00% due 10/1/2023 (Everglades Restoration Plan; Insured: AMBAC) | | AA/Aa3 | | | 500,000 | | | | 534,155 | |
South Miami HFA, 5.00% due 8/15/2016 (Baptist Health) | | AA/Aa2 | | | 4,985,000 | | | | 5,292,425 | |
South Miami HFA, 5.00% due 8/15/2017 (Baptist Health) | | AA/Aa2 | | | 4,610,000 | | | | 5,067,266 | |
Sunshine State Governmental Financing Commission, 5.00% due 9/1/2021 (Miami-Dade County Program) | | AA-/Aa3 | | | 1,450,000 | | | | 1,716,452 | |
Sunshine State Governmental Financing Commission, 5.00% due 9/1/2021 (Insured: AGM) | | AA/Aa3 | | | 5,000,000 | | | | 5,918,800 | |
Sunshine State Governmental Financing Commission, 5.00% due 9/1/2022 (Miami-Dade County Program) | | AA-/Aa3 | | | 2,000,000 | | | | 2,396,360 | |
Sunshine State Governmental Financing Commission, 5.00% due 9/1/2023 (Miami-Dade County Program) | | AA-/Aa3 | | | 2,100,000 | | | | 2,545,893 | |
Sunshine State Governmental Financing Commission, 5.00% due 9/1/2024 (Miami-Dade County Program) | | AA-/Aa3 | | | 1,725,000 | | | | 2,066,360 | |
Tampa Bay Regional Water Supply Authority, 5.00% due 10/1/2017 | | AA+/Aa1 | | | 5,615,000 | | | | 6,204,856 | |
Tampa Bay Regional Water Supply Authority, 5.00% due 10/1/2018 | | AA+/Aa1 | | | 2,890,000 | | | | 3,280,179 | |
Tampa Bay Regional Water Supply Authority, 5.00% due 10/1/2019 | | AA+/Aa1 | | | 3,000,000 | | | | 3,484,320 | |
Tampa Sports Authority, 5.75% due 10/1/2015 (Tampa Bay Arena; Insured: Natl-Re) | | AA-/A3 | | | 170,000 | | | | 171,727 | |
University of Central Florida Athletics Association, Inc. COP, 5.00% due 10/1/2016 pre-refunded 10/1/2015 (Insured: Natl-Re) | | AA-/A3 | | | 1,640,000 | | | | 1,679,491 | |
Volusia County Educational Facilities Authority, 5.00% due 10/15/2016 (Embry-Riddle Aeronautical University, Inc.; Insured: AGM) | | AA/A2 | | | 2,320,000 | | | | 2,473,955 | |
Volusia County Educational Facilities Authority, 4.00% due 10/15/2017 (Embry-Riddle Aeronautical University, Inc.; Insured: AGM) | | AA/A2 | | | 1,030,000 | | | | 1,106,117 | |
Volusia County Educational Facilities Authority, 5.00% due 10/15/2018 (Embry-Riddle Aeronautical University, Inc.; Insured: AGM) | | AA/A2 | | | 2,075,000 | | | | 2,333,919 | |
Volusia County Educational Facilities Authority, 5.00% due 10/15/2019 (Embry-Riddle Aeronautical University, Inc.; Insured: AGM) | | AA/A2 | | | 2,350,000 | | | | 2,689,458 | |
Volusia County Educational Facilities Authority, 5.00% due 10/15/2023 (Embry-Riddle Aeronautical University, Inc.) | | NR/Baa1 | | | 700,000 | | | | 833,525 | |
Volusia County Educational Facilities Authority, 5.00% due 10/15/2024 (Embry-Riddle Aeronautical University, Inc.) | | NR/Baa1 | | | 650,000 | | | | 779,019 | |
Volusia County Educational Facilities Authority, 5.00% due 10/15/2025 (Embry-Riddle Aeronautical University, Inc.) | | NR/Baa1 | | | 400,000 | | | | 477,972 | |
Volusia County School Board COP, 5.00% due 8/1/2024 (Master Lease Program) | | NR/Aa3 | | | 1,000,000 | | | | 1,207,780 | |
| | | |
GEORGIA — 1.92% | | | | | | | | | | |
Athens-Clarke County Unified Government Development Authority, 3.00% due 6/15/2015 (UGAREF Bolton Commons, LLC) | | NR/Aa2 | | | 3,575,000 | | | | 3,594,555 | |
Athens-Clarke County Unified Government Development Authority, 3.00% due 12/15/2015 (UGAREF Coverdell Building, LLC) | | NR/Aa2 | | | 670,000 | | | | 682,328 | |
Athens-Clarke County Unified Government Development Authority, 3.00% due 6/15/2016 (UGAREF Bolton Commons, LLC) | | NR/Aa2 | | | 300,000 | | | | 308,670 | |
Athens-Clarke County Unified Government Development Authority, 4.00% due 6/15/2017 (UGAREF Bolton Commons, LLC) | | NR/Aa2 | | | 495,000 | | | | 527,764 | |
Athens-Clarke County Unified Government Development Authority, 5.00% due 6/15/2019 (UGAREF Bolton Commons, LLC) | | NR/Aa2 | | | 400,000 | | | | 453,644 | |
Athens-Clarke County Unified Government Development Authority, 4.00% due 6/15/2020 (UGAREF Bolton Commons, LLC) | | NR/Aa2 | | | 395,000 | | | | 435,563 | |
City of Atlanta, 5.50% due 11/1/2015 (Water & Wastewater System; Insured: Natl-Re) | | AA-/Aa3 | | | 4,000,000 | | | | 4,124,480 | |
City of Atlanta, 5.00% due 1/1/2016 (Hartsfield-Jackson Atlanta International Airport) | | NR/A1 | | | 1,495,000 | | | | 1,548,401 | |
City of Atlanta, 5.00% due 11/1/2016 (Water & Wastewater System; Insured: AGM) | | AA/Aa3 | | | 3,215,000 | | | | 3,446,191 | |
City of Atlanta, 5.50% due 11/1/2016 (Water & Wastewater System; Insured: Natl-Re) | | AA-/Aa3 | | | 8,215,000 | | | | 8,870,475 | |
City of Atlanta, 5.25% due 12/1/2016 (Atlantic Station Project; Insured: AGM) | | AA/A3 | | | 3,650,000 | | | | 3,898,966 | |
City of Atlanta, 5.00% due 11/1/2017 (Water & Wastewater System; Insured: AGM) | | AA/Aa3 | | | 4,745,000 | | | | 5,255,135 | |
City of Atlanta, 5.00% due 1/1/2018 (Hartsfield-Jackson Atlanta International Airport) | | NR/A1 | | | 2,100,000 | | | | 2,335,137 | |
City of Atlanta, 5.00% due 1/1/2019 (Hartsfield-Jackson Atlanta International Airport) | | NR/Aa3 | | | 3,145,000 | | | | 3,579,419 | |
16 Semi-Annual Report
| | |
| SCHEDULE OF INVESTMENTS, CONTINUED | | |
| |
Thornburg Limited Term Municipal Fund | | March 31, 2015 (Unaudited) |
| | | | | | | | | | |
Issuer-Description | | Credit Rating†
S&P/ Moody’s | | Principal
Amount | | | Value | |
City of Atlanta, 6.00% due 11/1/2019 (Water & Wastewater System) | | AA-/Aa3 | | $ | 5,650,000 | | | $ | 6,806,159 | |
City of Atlanta, 5.00% due 1/1/2020 (Hartsfield-Jackson Atlanta International Airport) | | NR/A1 | | | 6,000,000 | | | | 6,989,160 | |
City of Atlanta, 5.25% due 1/1/2020 (Hartsfield-Jackson Atlanta International Airport) | | NR/Aa3 | | | 5,000,000 | | | | 5,871,500 | |
City of Atlanta, 5.00% due 1/1/2021 (Hartsfield-Jackson Atlanta International Airport) | | NR/A1 | | | 7,000,000 | | | | 8,147,020 | |
City of Atlanta, 5.50% due 1/1/2021 (Hartsfield-Jackson Atlanta International Airport) | | NR/Aa3 | | | 3,525,000 | | | | 4,247,131 | |
City of Atlanta, 5.00% due 11/1/2021 (Water & Wastewater System) | | AA-/Aa3 | | | 2,500,000 | | | | 3,000,200 | |
City of Atlanta, 5.00% due 11/1/2022 (Water & Wastewater System) | | AA-/Aa3 | | | 1,000,000 | | | | 1,214,260 | |
City of Atlanta, 5.00% due 1/1/2023 (Airport Passenger Facility) | | A+/Aa3 | | | 1,000,000 | | | | 1,204,800 | |
City of Atlanta, 5.00% due 11/1/2023 (Water & Wastewater System) | | AA-/Aa3 | | | 1,130,000 | | | | 1,380,984 | |
City of Atlanta, 5.00% due 1/1/2024 (Airport Passenger Facility) | | A+/A1 | | | 1,350,000 | | | | 1,657,773 | |
City of Atlanta, 5.00% due 11/1/2024 (Water & Wastewater System) | | AA-/Aa3 | | | 1,000,000 | | | | 1,234,060 | |
City of Atlanta, 5.00% due 1/1/2025 (Airport Passenger Facility) | | A+/Aa3 | | | 1,645,000 | | | | 1,986,453 | |
City of Atlanta, 5.00% due 1/1/2025 (Airport Passenger Facility) | | A+/A1 | | | 2,500,000 | | | | 3,014,550 | |
City of Atlanta, 5.00% due 11/1/2025 (Water & Wastewater System) | | AA-/Aa3 | | | 1,000,000 | | | | 1,233,950 | |
Development Authority of Bartow County, 2.70% due 8/1/2043 put 8/23/2018 (Georgia Power Co. Plant Bowen Project) | | A/A3 | | | 6,000,000 | | | | 6,262,200 | |
Fulton County Development Authority, 5.00% due 10/1/2022 (Georgia Tech Athletic Association) | | NR/A2 | | | 4,550,000 | | | | 5,438,569 | |
Fulton County Facilities Corp. COP, 5.00% due 11/1/2017 (Public Purpose Project) | | AA-/Aa3 | | | 8,400,000 | | | | 9,228,072 | |
Fulton County Facilities Corp. COP, 5.00% due 11/1/2019 (Public Purpose Project) | | AA-/Aa3 | | | 6,600,000 | | | | 7,558,188 | |
Georgia Municipal Electric Authority, 6.50% due 1/1/2017 | | A+/A1 | | | 370,000 | | | | 391,538 | |
Gwinnett County Hospital Authority, 5.00% due 7/1/2023 (Gwinnett Hospital System, Inc.; Insured: AGM) | | NR/A2 | | | 5,000,000 | | | | 5,585,400 | |
Gwinnett County School District GO, 4.00% due 10/1/2015 (Educational Capital Building Program) | | AAA/Aaa | | | 10,000,000 | | | | 10,193,900 | |
LaGrange-Troup County Hospital Authority, 5.00% due 7/1/2018 (West Georgia Health Foundation, Inc.) | | A+/Aa2 | | | 2,045,000 | | | | 2,153,590 | |
Main Street Natural Gas, Inc., 5.00% due 3/15/2018 (Georgia Gas) | | A-/Baa2 | | | 5,000,000 | | | | 5,446,700 | |
Municipal Electric Authority of Georgia, 6.60% due 1/1/2018 (Insured: Natl-Re) | | AA-/A1 | | | 1,155,000 | | | | 1,237,398 | |
Valdosta and Lowndes County Hospital Authority, 5.00% due 10/1/2022 (South Medical Center) | | AA-/Aa2 | | | 1,500,000 | | | | 1,777,020 | |
| | | |
GUAM — 0.36% | | | | | | | | | | |
Government of Guam, 5.25% due 12/1/2016 | | BBB+/NR | | | 5,610,000 | | | | 5,979,531 | |
Government of Guam, 5.25% due 12/1/2017 | | BBB+/NR | | | 2,000,000 | | | | 2,201,920 | |
Government of Guam, 5.50% due 12/1/2018 | | BBB+/NR | | | 3,000,000 | | | | 3,401,580 | |
Government of Guam, 5.50% due 12/1/2019 | | BBB+/NR | | | 2,000,000 | | | | 2,317,600 | |
Guam Government Waterworks Authority, 5.25% due 7/1/2020 (Water & Wastewater System Improvements) | | A-/Ba1 | | | 300,000 | | | | 345,288 | |
Guam Government Waterworks Authority, 5.25% due 7/1/2022 (Water & Wastewater System Improvements) | | A-/Ba1 | | | 1,050,000 | | | | 1,236,175 | |
Guam Government Waterworks Authority, 5.25% due 7/1/2023 (Water & Wastewater System Improvements) | | A-/Ba1 | | | 645,000 | | | | 767,479 | |
Guam Power Authority, 5.00% due 10/1/2019 (Electric Power System; Insured: AGM) | | AA/A2 | | | 1,000,000 | | | | 1,151,270 | |
Guam Power Authority, 5.00% due 10/1/2020 (Electric Power System; Insured: AGM) | | AA/A2 | | | 1,500,000 | | | | 1,757,565 | |
Guam Power Authority, 5.00% due 10/1/2022 (Electric Power System; Insured: AGM) | | AA/A2 | | | 6,340,000 | | | | 7,612,121 | |
| | | |
HAWAII — 1.07% | | | | | | | | | | |
City and County of Honolulu GO, 5.00% due 11/1/2019 (Capital Improvement Projects) | | NR/Aa1 | | | 3,620,000 | | | | 4,215,128 | |
City and County of Honolulu GO, 5.00% due 11/1/2020 (Capital Improvement Projects) | | NR/Aa1 | | | 8,265,000 | | | | 9,790,636 | |
City and County of Honolulu GO, 5.00% due 11/1/2021 (Capital Improvement Projects) | | NR/Aa1 | | | 2,770,000 | | | | 3,332,809 | |
City and County of Honolulu GO, 5.00% due 11/1/2022 (Capital Improvement Projects) | | NR/Aa1 | | | 1,750,000 | | | | 2,139,463 | |
City and County of Honolulu GO, 5.00% due 11/1/2022 (Capital Improvement Projects) | | NR/Aa1 | | | 6,695,000 | | | | 8,184,972 | |
State of Hawaii GO, 5.00% due 11/1/2017 (Hawaiian Home Lands Settlement) | | AA/Aa2 | | | 12,000,000 | | | | 13,319,520 | |
State of Hawaii GO, 5.00% due 11/1/2018 (Hawaiian Home Lands Settlement) | | AA/Aa2 | | | 20,000,000 | | | | 22,828,600 | |
State of Hawaii GO, 5.00% due 12/1/2019 (Hawaiian Home Lands Settlement) | | AA/Aa2 | | | 3,000,000 | | | | 3,506,610 | |
State of Hawaii GO, 5.00% due 12/1/2020 (Hawaiian Home Lands Settlement) | | AA/Aa2 | | | 2,500,000 | | | | 2,974,550 | |
State of Hawaii GO, 5.00% due 12/1/2021 (Hawaiian Home Lands Settlement) | | AA/Aa2 | | | 3,000,000 | | | | 3,620,160 | |
State of Hawaii GO, 5.00% due 12/1/2022 (Hawaiian Home Lands Settlement) | | AA/Aa2 | | | 4,000,000 | | | | 4,899,640 | |
| | | |
IDAHO — 0.31% | | | | | | | | | | |
Idaho (HFA), 5.00% due 12/1/2022 (Trinity Health Credit Group) | | AA-/Aa3 | | | 1,000,000 | | | | 1,211,960 | |
Idaho (HFA), 5.00% due 12/1/2023 (Trinity Health Credit Group) | | AA-/Aa3 | | | 2,000,000 | | | | 2,442,400 | |
Idaho (HFA), 5.00% due 12/1/2024 (Trinity Health Credit Group) | | AA-/Aa3 | | | 1,000,000 | | | | 1,229,060 | |
Idaho Housing & Finance Association, 3.00% due 8/15/2015 | | NR/NR | | | 650,000 | | | | 656,818 | |
Twin Falls Urban Renewal Agency, 5.15% due 8/1/2017 | | NR/NR | | | 1,455,000 | | | | 1,462,275 | |
University of Idaho, 5.25% due 4/1/2041 put 4/1/2021 | | A+/Aa3 | | | 13,420,000 | | | | 15,734,011 | |
| | | |
ILLINOIS — 4.57% | | | | | | | | | | |
Board of Education of the City of Chicago GO, 5.00% due 12/1/2018 (School District Capital Improvement Program) (State Aid Withholding) | | A-/Baa3 | | | 3,000,000 | | | | 3,209,190 | |
Board of Education of the City of Chicago GO, 5.00% due 12/1/2019 (School District Capital Improvement Program) (State Aid Withholding) | | A-/Baa3 | | | 2,000,000 | | | | 2,152,840 | |
Board of Education of the City of Chicago GO, 0% due 12/1/2020 (Educational Facilities; Insured: BHAC) | | AA+/Aa1 | | | 12,000,000 | | | | 10,097,160 | |
Semi-Annual Report 17
| | |
| SCHEDULE OF INVESTMENTS, CONTINUED | | |
| |
Thornburg Limited Term Municipal Fund | | March 31, 2015 (Unaudited) |
| | | | | | | | | | |
Issuer-Description | | Credit Rating†
S&P/ Moody’s | | Principal
Amount | | | Value | |
Board of Education of the City of Chicago GO, 5.00% due 12/1/2020 (School District Capital Improvement Program) (State Aid Withholding) | | A-/Baa3 | | $ | 2,500,000 | | | $ | 2,695,875 | |
Chicago Housing Authority, 5.00% due 7/1/2015 (Housing Transformation Capital Program; Insured: AGM) (ETM) | | NR/A2 | | | 8,460,000 | | | | 8,561,435 | |
Chicago Housing Authority, 5.00% due 7/1/2016 (Housing Transformation Capital Program; Insured: AGM) (ETM) | | NR/A2 | | | 2,000,000 | | | | 2,116,400 | |
Chicago Midway International Airport, 5.00% due 1/1/2022 | | A-/A3 | | | 800,000 | | | | 945,272 | |
Chicago Midway International Airport, 5.00% due 1/1/2023 | | A-/A3 | | | 1,900,000 | | | | 2,257,732 | |
Chicago Midway International Airport, 5.00% due 1/1/2024 | | A-/A3 | | | 1,000,000 | | | | 1,195,350 | |
Chicago Park District GO, 5.00% due 1/1/2018 (Park District Capital Improvement Plan) | | AA+/Baa1 | | | 1,150,000 | | | | 1,252,477 | |
Chicago Park District GO, 5.00% due 1/1/2018 (Park District Capital Improvement Plan; Insured: Natl-Re) | | AA+/A3 | | | 700,000 | | | | 724,514 | |
Chicago School Reform Board of Trustees of the Board of Education GO, 5.25% due 12/1/2021 (School District Capital Improvement Program; Insured: Natl-Re) | | AA-/A3 | | | 1,500,000 | | | | 1,674,465 | |
Chicago Transit Authority, 5.25% due 6/1/2017 (Federal Transit Program-Rail Systems; Insured: AGM) | | A/A3 | | | 3,000,000 | | | | 3,241,890 | |
Chicago Transit Authority, 5.50% due 6/1/2018 (Federal Transit Program-Rail Systems; Insured: AGM) | | A/A3 | | | 2,500,000 | | | | 2,788,875 | |
City of Chicago, 5.00% due 11/1/2015 (Water System Extensions & Improvements; Insured: AGM) | | AA/A2 | | | 1,050,000 | | | | 1,079,117 | |
City of Chicago, 4.00% due 1/1/2018 (Wastewater Transmission System) | | AA-/Baa1 | | | 1,475,000 | | | | 1,566,966 | |
City of Chicago, 5.00% due 1/1/2020 (Insured: AGM) | | AAA/A2 | | | 1,320,000 | | | | 1,335,510 | |
City of Chicago, 5.50% due 1/1/2020 (Wastewater Transmission System; Insured: BHAC) | | AA+/Aa1 | | | 1,250,000 | | | | 1,393,863 | |
City of Chicago, 5.00% due 1/1/2021 (Riverwalk Expansion Project; Insured: AGM) | | AA+/Baa2 | | | 1,410,000 | | | | 1,603,311 | |
City of Chicago, 5.00% due 1/1/2023 (Chicago Midway Airport) | | A-/A3 | | | 6,215,000 | | | | 7,385,160 | |
City of Chicago, 5.00% due 1/1/2023 (Riverwalk Expansion Project; Insured: AGM) | | AA+/Baa2 | | | 1,000,000 | | | | 1,157,550 | |
City of Chicago, 5.25% due 1/1/2023 (O’Hare International Airport; Insured: AGM) | | AA/A2 | | | 2,000,000 | | | | 2,072,860 | |
City of Chicago, 5.00% due 1/1/2024 (Chicago Midway Airport) | | A-/A3 | | | 16,060,000 | | | | 18,921,731 | |
City of Chicago Board of Education GO, 5.25% due 12/1/2017 (Chicago School Reform Board; Insured: Natl-Re) | | AA-/A3 | | | 4,100,000 | | | | 4,459,037 | |
City of Chicago Board of Education GO, 5.00% due 12/1/2018 (Insured: Natl-Re) | | AA-/A3 | | | 1,000,000 | | | | 1,092,530 | |
City of Chicago Building Acquisition Certificates GO, 5.40% due 1/1/2018 (Parking Facility Improvements; Insured: AGM) | | AA/A2 | | | 1,620,000 | | | | 1,626,674 | |
City of Chicago GO, 0% due 1/1/2016 (City Colleges; Insured: Natl-Re) | | AA-/A3 | | | 2,670,000 | | | | 2,642,018 | |
City of Chicago GO, 5.44% due 1/1/2018 (Transportation Infrastructure Capital Projects; Insured: Natl-Re) | | AA-/A3 | | | 3,050,000 | | | | 3,183,986 | |
City of Chicago GO, 5.25% due 1/1/2021 (Public Infrastructure and Facility Improvements) | | A+/Baa2 | | | 500,000 | | | | 524,865 | |
City of Chicago O’Hare International Airport, 5.00% due 1/1/2022 (O’Hare Modernization Program) | | A-/A2 | | | 5,835,000 | | | | 6,774,318 | |
City of Mount Vernon GO, 4.00% due 12/15/2019 (Various Municipal Capital Improvements; Insured: AGM) | | AA/A2 | | | 1,000,000 | | | | 1,100,340 | |
City of Mount Vernon GO, 4.00% due 12/15/2020 (Various Municipal Capital Improvements; Insured: AGM) | | AA/A2 | | | 785,000 | | | | 870,447 | |
City of Mount Vernon GO, 4.00% due 12/15/2021 (Various Municipal Capital Improvements; Insured: AGM) | | AA/A2 | | | 1,640,000 | | | | 1,794,357 | |
City of Quincy, 5.00% due 11/15/2016 (Blessing Hospital) | | A-/A3 | | | 1,750,000 | | | | 1,855,035 | |
City of Quincy, 5.00% due 11/15/2017 (Blessing Hospital) | | A-/A3 | | | 500,000 | | | | 543,915 | |
City of Waukegan GO, 5.00% due 12/30/2019 (Lakehurst Redevelopment Project; Insured: AGM) | | NR/A2 | | | 1,935,000 | | | | 2,185,544 | |
City of Waukegan GO, 5.00% due 12/30/2020 (Lakehurst Redevelopment Project; Insured: AGM) | | NR/A2 | | | 1,000,000 | | | | 1,142,900 | |
City of Waukegan GO, 5.00% due 12/30/2021 (Lakehurst Redevelopment Project; Insured: AGM) | | NR/A2 | | | 2,100,000 | | | | 2,419,977 | |
City of Waukegan GO, 5.00% due 12/30/2022 (Lakehurst Redevelopment Project; Insured: AGM) | | NR/A2 | | | 1,000,000 | | | | 1,160,610 | |
Community College District No. 516 GO, 4.50% due 12/15/2020 (Waubonsee Community College) | | NR/Aa1 | | | 1,325,000 | | | | 1,525,022 | |
Community College District No. 516 GO, 5.00% due 12/15/2021 (Waubonsee Community College) | | NR/Aa1 | | | 6,175,000 | | | | 7,377,890 | |
Community Consolidated School District No. 146 GO, 9.00% due 12/1/2016 (Tinley Park; Insured: Natl-Re) | | NR/Aa2 | | | 2,500,000 | | | | 2,721,075 | |
Community Consolidated School District No. 158 GO, 0% due 1/1/2017 (McHenry and Kane Counties; Insured: Natl- Re) (ETM) | | NR/A3 | | | 95,000 | | | | 93,715 | |
Community Consolidated School District No. 158 GO, 0% due 1/1/2017 (McHenry and Kane Counties; Insured: Natl-Re) | | NR/A3 | | | 1,090,000 | | | | 1,054,706 | |
Community Consolidated School District No. 93 GO, 2.00% due 1/1/2017 (Village of Carol Stream) | | AA+/NR | | | 370,000 | | | | 377,959 | |
Community High School District No. 127 GO, 9.00% due 2/1/2016 (Lake County-Grayslake School Bldg.; Insured: AGM) | | AAA/A2 | | | 1,890,000 | | | | 2,016,649 | |
Community High School District No. 127 GO, 9.00% due 2/1/2017 (Lake County-Grayslake School Bldg.; Insured: AGM) | | AAA/A2 | | | 2,025,000 | | | | 2,310,545 | |
Community Unit School District No. 200 GO, 5.25% due 10/1/2023 (DuPage County Educational Facilities; Insured: FSA) | | AA/Aa3 | | | 1,000,000 | | | | 1,160,960 | |
Community Unit School District No. 302 GO, 0% due 2/1/2021 (Kane & DeKalb Counties; Insured: Natl-Re) | | NR/Aa3 | | | 3,165,000 | | | | 2,725,381 | |
Community Unit School District No. 428 GO, 0% due 1/1/2021 (DeKalb County) | | AA-/Aa2 | | | 6,140,000 | | | | 5,319,021 | |
Cook County Community College District No. 508 GO, 5.00% due 12/1/2020 (City Colleges of Chicago) | | AA/NR | | | 720,000 | | | | 840,787 | |
Cook County Community College District No. 508 GO, 5.00% due 12/1/2021 (City Colleges of Chicago) | | AA/NR | | | 1,000,000 | | | | 1,182,510 | |
Cook County Community College District No. 508 GO, 5.00% due 12/1/2022 (City Colleges of Chicago) | | AA/NR | | | 1,250,000 | | | | 1,494,662 | |
Cook County Community College District No. 508 GO, 5.00% due 12/1/2023 (City Colleges of Chicago) | | AA/NR | | | 1,250,000 | | | | 1,510,500 | |
Cook County Township High School District No. 227 GO, 5.00% due 12/1/2018 (Rich Township Educational Facilities; Insured: AGM) | | NR/Aa3 | | | 190,000 | | | | 204,370 | |
County of Cook GO, 5.00% due 11/15/2015 (Capital Improvement Plan; Insured: Natl-Re) | | AA/A1 | | | 2,000,000 | | | | 2,058,200 | |
County of Cook GO, 5.00% due 11/15/2019 (Capital Improvement Plan) | | AA/A1 | | | 3,690,000 | | | | 4,192,947 | |
County of Cook GO, 4.00% due 11/15/2020 (Capital Improvement Plan) | | AA/A1 | | | 925,000 | | | | 1,017,861 | |
County of Cook GO, 5.00% due 11/15/2020 (Capital Improvement Plan) | | AA/A1 | | | 2,000,000 | | | | 2,306,320 | |
County of Cook GO, 5.00% due 11/15/2020 (Capital Improvement Plan) | | AA/A1 | | | 3,590,000 | | | | 4,057,885 | |
County of Cook GO, 4.00% due 11/15/2021 (Capital Improvement Plan) | | AA/A1 | | | 2,000,000 | | | | 2,204,020 | |
18 Semi-Annual Report
| | |
| SCHEDULE OF INVESTMENTS, CONTINUED | | |
| |
Thornburg Limited Term Municipal Fund | | March 31, 2015 (Unaudited) |
| | | | | | | | | | |
Issuer-Description | | Credit Rating†
S&P/ Moody’s | | Principal
Amount | | | Value | |
County of Cook GO, 5.00% due 11/15/2021 (Capital Improvement Plan) | | AA/A1 | | $ | 2,105,000 | | | $ | 2,448,199 | |
County of Cook GO, 5.00% due 11/15/2021 (Capital Improvement Plan) | | AA/A1 | | | 5,000,000 | | | | 5,868,850 | |
County of Cook GO, 4.00% due 11/15/2022 (Capital Improvement Plan) | | AA/A1 | | | 1,000,000 | | | | 1,105,330 | |
County of Cook GO, 5.00% due 11/15/2022 (Capital Improvement Plan) | | AA/A1 | | | 1,500,000 | | | | 1,761,600 | |
County of Winnebago GO, 3.00% due 12/30/2015 (Public Safety) | | NR/Aa2 | | | 1,035,000 | | | | 1,056,311 | |
Forest Preserve District of Cook County GO, 5.00% due 11/15/2021 | | AA/A1 | | | 1,500,000 | | | | 1,757,370 | |
Forest Preserve District of Kane County GO, 5.00% due 12/15/2015 (Insured: Natl-Re) | | AA+/A3 | | | 2,780,000 | | | | 2,872,407 | |
Illinois Educational Facilities Authority, 4.75% due 3/1/2030 put 3/1/2017 (Art Institute of Chicago) | | AA-/NR | | | 3,030,000 | | | | 3,201,801 | |
Illinois Educational Facilities Authority, 5.00% due 3/1/2030 put 3/1/2017 (Art Institute of Chicago) | | NR/A1 | | | 3,000,000 | | | | 3,184,170 | |
Illinois Educational Facilities Authority, 5.25% due 3/1/2034 put 3/1/2018 (Art Institute of Chicago) | | NR/NR | | | 3,500,000 | | | | 3,810,695 | |
Illinois Educational Facilities Authority, 3.40% due 11/1/2036 put 11/1/2017 (Field Museum of Natural History) | | A/NR | | | 1,300,000 | | | | 1,346,462 | |
Illinois Finance Authority, 4.00% due 4/1/2015 (Advocate Health Care) | | AA/Aa2 | | | 3,000,000 | | | | 3,000,000 | |
Illinois Finance Authority, 5.25% due 5/15/2015 (Presence Health) (ETM) | | NR/NR | | | 80,000 | | | | 80,494 | |
Illinois Finance Authority, 5.25% due 5/15/2015 (Presence Health) | | BBB+/Baa2 | | | 920,000 | | | | 924,747 | |
Illinois Finance Authority, 5.00% due 10/1/2015 (DePaul University) | | NR/A2 | | | 1,000,000 | | | | 1,023,540 | |
Illinois Finance Authority, 5.00% due 11/1/2015 (Central DuPage Health) | | AA/Aa2 | | | 5,000,000 | | | | 5,129,250 | |
Illinois Finance Authority, 5.25% due 12/1/2015 (Columbia College) | | BBB+/NR | | | 1,620,000 | | | | 1,664,485 | |
a Illinois Finance Authority, 5.00% due 4/1/2016 (Advocate Health Care) | | AA/Aa2 | | | 1,250,000 | | | | 1,306,625 | |
Illinois Finance Authority, 5.00% due 11/15/2016 (Rush University Medical Center) | | A+/A1 | | | 1,750,000 | | | | 1,876,927 | |
Illinois Finance Authority, 5.00% due 12/1/2016 (Columbia College) | | BBB+/NR | | | 1,710,000 | | | | 1,808,838 | |
Illinois Finance Authority, 5.00% due 11/1/2017 (Rush University Medical Center; Insured: Natl-Re) (ETM) | | AA-/Aaa | | | 1,000,000 | | | | 1,103,440 | |
Illinois Finance Authority, 5.00% due 12/1/2017 (Columbia College) | | BBB+/NR | | | 1,395,000 | | | | 1,502,401 | |
Illinois Finance Authority, 5.50% due 11/1/2018 (Advocate Health Care) | | AA/Aa2 | | | 1,000,000 | | | | 1,134,020 | |
Illinois Finance Authority, 5.25% due 5/1/2019 (Educational Advancement Fund, Inc.) | | NR/Baa3 | | | 4,675,000 | | | | 4,895,613 | |
Illinois Finance Authority, 5.00% due 4/1/2020 (Advocate Health Care) | | AA/Aa2 | | | 1,315,000 | | | | 1,499,508 | |
Illinois Finance Authority, 5.00% due 11/15/2020 (Rush University Medical Center) | | A+/A1 | | | 250,000 | | | | 294,093 | |
Illinois Finance Authority, 5.00% due 11/15/2021 (Rush University Medical Center) | | A+/A1 | | | 250,000 | | | | 296,640 | |
Illinois Finance Authority, 4.00% due 12/1/2021 (Trinity Health) | | AA-/Aa3 | | | 1,000,000 | | | | 1,104,540 | |
Illinois Finance Authority, 5.00% due 11/15/2022 (Rush University Medical Center) | | A+/A1 | | | 250,000 | | | | 298,413 | |
Illinois Finance Authority, 5.00% due 8/1/2023 (Advocate Health Care) | | AA/Aa2 | | | 565,000 | | | | 684,322 | |
Illinois Finance Authority, 5.00% due 11/15/2023 (Rush University Medical Center) | | A+/A1 | | | 1,000,000 | | | | 1,204,970 | |
Illinois Finance Authority, 5.00% due 8/1/2024 (Advocate Health Care) | | AA/Aa2 | | | 800,000 | | | | 971,360 | |
Illinois Finance Authority, 5.00% due 11/15/2024 (Rush University Medical Center) | | A+/A1 | | | 500,000 | | | | 606,785 | |
Illinois Finance Authority, 5.00% due 11/15/2025 (Rush University Medical Center) | | A+/A1 | | | 1,000,000 | | | | 1,212,250 | |
Illinois Finance Authority, 5.00% due 11/1/2030 put 1/15/2020 (Advocate Health Care) | | AA/Aa2 | | | 1,250,000 | | | | 1,442,788 | |
Illinois Finance Authority, 2.625% due 2/1/2033 put 8/1/2015 (Peoples Gas Light & Coke Co.) | | A/Aa3 | | | 9,500,000 | | | | 9,566,595 | |
Illinois Finance Authority, 4.30% due 6/1/2035 put 6/1/2016 (Peoples Gas Light & Coke Co.; Insured: AMBAC) | | A/Aa3 | | | 2,350,000 | | | | 2,453,588 | |
Illinois Toll Highway Authority, 5.00% due 1/1/2023 | | AA-/Aa3 | | | 4,000,000 | | | | 4,822,360 | |
Illinois Toll Highway Authority, 5.00% due 1/1/2024 | | AA-/Aa3 | | | 6,500,000 | | | | 7,900,815 | |
Kane McHenry Cook & DeKalb Counties USD No. 300 GO, 0% due 12/1/2021 (Insured: AMBAC) (ETM) | | NR/Aa3 | | | 765,000 | | | | 683,091 | |
Kane McHenry Cook & DeKalb Counties USD No. 300 GO, 0% due 12/1/2021 (Insured: AMBAC) | | NR/Aa3 | | | 1,235,000 | | | | 1,034,152 | |
Lake County Community High School District No. 127 GO, 7.375% due 2/1/2020 (Grayslake; Insured: Syncora) | | AAA/NR | | | 1,000,000 | | | | 1,255,680 | |
McHenry County Conservation District GO, 5.00% due 2/1/2021 | | AA+/Aa1 | | | 2,325,000 | | | | 2,743,384 | |
McHenry County Conservation District GO, 5.00% due 2/1/2025 | | AA+/Aa1 | | | 2,000,000 | | | | 2,447,740 | |
Metropolitan Pier & Exposition Authority, 0% due 6/15/2016 (McCormick Place Expansion; Insured: Natl-Re) (ETM) | | AA-/NR | | | 3,475,000 | | | | 3,457,764 | |
Metropolitan Pier & Exposition Authority, 0% due 6/15/2016 (McCormick Place Expansion; Insured: Natl-Re) | | AA-/Baa1 | | | 8,245,000 | | | | 8,180,194 | |
Metropolitan Pier & Exposition Authority, 5.00% due 12/15/2020 (McCormick Place Expansion) | | AAA/NR | | | 4,000,000 | | | | 4,652,760 | |
Peoria Tazewell Etc. Counties Community College District No. 514 GO, 4.25% due 12/1/2015 (ETM) | | NR/NR | | | 490,000 | | | | 503,225 | |
Peoria Tazewell Etc. Counties Community College District No. 514 GO, 4.25% due 12/1/2015 | | AA+/Aa2 | | | 1,870,000 | | | | 1,919,518 | |
Railsplitter Tobacco Settlement Authority, 5.00% due 6/1/2019 | | A/NR | | | 22,000,000 | | | | 24,934,800 | |
Railsplitter Tobacco Settlement Authority, 5.125% due 6/1/2019 | | A/NR | | | 6,780,000 | | | | 7,718,420 | |
School District No. 122 GO, 0% due 1/1/2016 (Winnebago County-Harlem-Loves Park; Insured: AGM) | | NR/A2 | | | 2,000,000 | | | | 1,991,620 | |
School District No. 97 GO, 9.00% due 12/1/2018 (Village of Oak Park; Insured: Natl-Re) | | NR/Aa2 | | | 4,000,000 | | | | 5,043,040 | |
Southwestern Illinois Development Authority, 5.125% due 8/15/2016 (Anderson Hospital) | | BBB-/Baa3 | | | 625,000 | | | | 646,506 | |
State of Illinois, 5.00% due 6/15/2016 (Build Illinois Bond Retirement & Interest Fund) | | AAA/NR | | | 3,500,000 | | | | 3,695,160 | |
Town of Cicero Cook County GO, 5.00% due 1/1/2019 (Cicero and Laramie Development Areas; Insured: AGM) | | AA/A2 | | | 2,000,000 | | | | 2,216,440 | |
Town of Cicero Cook County GO, 5.00% due 12/1/2019 (Economic Redevelopment) | | A+/NR | | | 1,070,000 | | | | 1,199,449 | |
Town of Cicero Cook County GO, 5.00% due 1/1/2020 (Cicero and Laramie Development Areas; Insured: AGM) | | AA/A2 | | | 1,250,000 | | | | 1,402,200 | |
Town of Cicero Cook County GO, 5.00% due 1/1/2021 (Cicero and Laramie Development Areas; Insured: AGM) | | AA/A2 | | | 1,250,000 | | | | 1,409,925 | |
Town of Cicero GO, 5.00% due 1/1/2018 (Cicero and Laramie Development Areas; Insured: AGM) | | AA/A2 | | | 2,375,000 | | | | 2,595,376 | |
University of Illinois Board of Trustees COP, 5.00% due 10/1/2019 (Insured: AGM) | | AA/Aa3 | | | 2,000,000 | | | | 2,208,280 | |
Village of Broadview, 5.375% due 7/1/2015 | | NR/NR | | | 1,195,000 | | | | 1,198,035 | |
Village of Downers Grove GO, 3.00% due 1/1/2017 | | AAA/NR | | | 970,000 | | | | 1,004,590 | |
Village of Melrose Park, 5.20% due 7/1/2018 (Insured: Natl-Re) | | AA-/A3 | | | 1,190,000 | | | | 1,204,518 | |
Village of Tinley Park GO, 4.00% due 12/1/2022 | | AA+/NR | | | 625,000 | | | | 703,444 | |
Will County Valley View Community Unit School District No. 365 GO, 0% due 11/1/2018 (Insured: AGM) | | AA/Aa2 | | | 3,370,000 | | | | 3,175,012 | |
Semi-Annual Report 19
| | |
| SCHEDULE OF INVESTMENTS, CONTINUED | | |
| |
Thornburg Limited Term Municipal Fund | | March 31, 2015 (Unaudited) |
| | | | | | | | | | |
Issuer-Description | | Credit Rating†
S&P/ Moody’s | | Principal
Amount | | | Value | |
INDIANA — 4.08% | | | | | | | | | | |
Allen County Jail Building Corp., 5.00% due 10/1/2015 (Insured: Syncora) | | NR/Aa2 | | $ | 760,000 | | | $ | 768,755 | |
Allen County Jail Building Corp., 5.00% due 10/1/2016 (Insured: Syncora) | | NR/Aa2 | | | 1,520,000 | | | | 1,584,463 | |
Allen County Redevelopment District, 5.00% due 11/15/2016 | | NR/A2 | | | 770,000 | | | | 794,917 | |
Avon Community School Building Corp., 5.00% due 7/15/2017 (Insured: AMBAC) (State Aid Withholding) | | A/NR | | | 2,500,000 | | | | 2,726,750 | |
Board of Trustees for the Vincennes University, 3.00% due 6/1/2015 | | NR/Aa3 | | | 1,000,000 | | | | 1,004,410 | |
Board of Trustees for the Vincennes University, 4.00% due 6/1/2018 | | NR/Aa3 | | | 1,000,000 | | | | 1,083,860 | |
Board of Trustees for the Vincennes University, 5.00% due 6/1/2020 | | NR/Aa3 | | | 1,000,000 | | | | 1,164,610 | |
Brownsburg 1999 School Building Corp., 5.00% due 8/1/2017 (Cardinal, Delaware Trail, White Lick Elementary & Brownsburg Junior High Schools; Insured: AGM) (State Aid Withholding) | | AA+/A2 | | | 1,000,000 | | | | 1,015,890 | |
Brownsburg 1999 School Building Corp., 5.00% due 7/15/2018 (Harris Education Center and East Middle School; Insured: AGM) (State Aid Withholding) | | AA+/NR | | | 3,430,000 | | | | 3,477,265 | |
Brownsburg 1999 School Building Corp., 5.00% due 8/1/2018 (Cardinal, Delaware Trail, White Lick Elementary & | | | | | | | | | | |
Brownsburg Junior High Schools; Insured: AGM) (State Aid Withholding) | | AA+/A2 | | | 1,475,000 | | | | 1,498,364 | |
City of Carmel Redevelopment Authority, 4.00% due 8/1/2015 (Road and Intersection Improvements) | | AA+/NR | | | 975,000 | | | | 987,363 | |
City of Carmel Redevelopment Authority, 5.00% due 8/1/2021 (Road and Intersection Improvements) | | AA+/NR | | | 2,405,000 | | | | 2,838,814 | |
City of Carmel Redevelopment Authority, 5.00% due 8/1/2022 (Road and Intersection Improvements) | | AA+/NR | | | 2,510,000 | | | | 2,998,195 | |
City of Carmel Redevelopment District COP, 5.75% due 7/15/2022 (CFP Energy Center, LLC Installment Purchase Agreement) | | NR/NR | | | 3,570,000 | | | | 4,079,617 | |
City of Fort Wayne, 4.25% due 8/1/2015 (Sewer Works Improvements) | | NR/Aa3 | | | 1,780,000 | | | | 1,803,514 | |
City of Fort Wayne, 2.00% due 12/1/2015 (Waterworks Utility Improvements) | | NR/Aa3 | | | 1,145,000 | | | | 1,158,603 | |
City of Fort Wayne, 2.00% due 12/1/2016 (Waterworks Utility Improvements) | | NR/Aa3 | | | 1,160,000 | | | | 1,185,288 | |
City of Fort Wayne, 2.00% due 12/1/2017 (Waterworks Utility Improvements) | | NR/Aa3 | | | 1,175,000 | | | | 1,203,212 | |
City of Whiting, 5.00% due 1/1/2016 (BP Products North America, Inc.) | | A/A2 | | | 5,375,000 | | | | 5,560,760 | |
Clay Multiple School Building Corp., 4.00% due 7/15/2015 (State Aid Withholding) | | AA+/NR | | | 1,000,000 | | | | 1,009,760 | |
Clay Multiple School Building Corp., 5.00% due 7/15/2016 (State Aid Withholding) | | AA+/NR | | | 1,295,000 | | | | 1,363,713 | |
Clay Multiple School Building Corp., 5.00% due 1/15/2017 (State Aid Withholding) | | AA+/NR | | | 1,000,000 | | | | 1,072,050 | |
Crown Point Multi-School Building Corp., 0% due 1/15/2016 (Crown Point Community School Corp.; Insured: Natl-Re) (State Aid Withholding) | | AA+/A3 | | | 5,685,000 | | | | 5,667,888 | |
Duneland School Building Corp., 0% due 2/1/2020 (State Aid Withholding) | | A/NR | | | 2,970,000 | | | | 2,637,687 | |
Duneland School Building Corp., 0% due 8/1/2020 (State Aid Withholding) | | A/NR | | | 3,470,000 | | | | 3,034,550 | |
Duneland School Building Corp., 0% due 2/1/2021 (State Aid Withholding) | | A/NR | | | 2,770,000 | | | | 2,377,131 | |
Duneland School Building Corp., 0% due 8/1/2021 (State Aid Withholding) | | A/NR | | | 3,270,000 | | | | 2,760,207 | |
Evansville Vanderburgh Public Library Leasing Corp., 5.00% due 7/15/2015 (Insured: AMBAC) (ETM) | | A+/NR | | | 510,000 | | | | 517,064 | |
b Hamilton Southeastern Consolidated School Building Corp., 5.00% due 7/15/2021 (First Mortgage; Insured: State Intercept) | | AA+/NR | | | 1,230,000 | | | | 1,456,923 | |
b Hamilton Southeastern Consolidated School Building Corp., 5.00% due 7/15/2022 (First Mortgage; Insured: State Intercept) | | AA+/NR | | | 885,000 | | | | 1,056,602 | |
b Hamilton Southeastern Consolidated School Building Corp., 5.00% due 7/15/2023 (First Mortgage; Insured: State Intercept) | | AA+/NR | | | 570,000 | | | | 685,830 | |
b Hamilton Southeastern Consolidated School Building Corp., 5.00% due 1/15/2024 (First Mortgage; Insured: State Intercept) | | AA+/NR | | | 525,000 | | | | 633,806 | |
Indiana Bond Bank, 5.25% due 10/15/2016 (Special Gas Program) | | NR/A3 | | | 1,545,000 | | | | 1,641,578 | |
Indiana Bond Bank, 5.00% due 10/15/2017 (Special Gas Program) | | NR/A3 | | | 5,000,000 | | | | 5,433,000 | |
Indiana Bond Bank, 5.00% due 8/1/2021 (Columbus Learning Center) | | AA/NR | | | 1,300,000 | | | | 1,523,509 | |
Indiana Finance Authority, 5.00% due 5/1/2015 (Parkview Health Systems) | | A+/A1 | | | 1,500,000 | | | | 1,505,895 | |
Indiana Finance Authority, 4.90% due 1/1/2016 (Indiana Power & Light Co.) | | BBB+/A2 | | | 11,650,000 | | | | 12,038,527 | |
Indiana Finance Authority, 5.00% due 5/1/2016 (Parkview Health Systems) | | A+/A1 | | | 3,090,000 | | | | 3,242,677 | |
Indiana Finance Authority, 5.00% due 7/1/2016 (Forensic & Health Science; Insured: Natl-Re) (ETM) | | AA+/Aa1 | | | 1,030,000 | | | | 1,089,410 | |
Indiana Finance Authority, 5.00% due 9/15/2016 (Marian University Health Sciences) | | BBB-/NR | | | 1,500,000 | | | | 1,542,825 | |
Indiana Finance Authority, 5.00% due 5/1/2017 (Parkview Health Systems) | | A+/A1 | | | 1,000,000 | | | | 1,081,260 | |
Indiana Finance Authority, 5.00% due 9/15/2017 (Marian University Health Sciences) | | BBB-/NR | | | 1,940,000 | | | | 2,026,020 | |
Indiana Finance Authority, 4.00% due 5/1/2018 (Community Health Network) | | A/A2 | | | 2,820,000 | | | | 3,058,628 | |
Indiana Finance Authority, 5.25% due 7/1/2018 (Wabash Correctional Facilities) | | AA+/Aa1 | | | 1,000,000 | | | | 1,132,460 | |
Indiana Finance Authority, 5.25% due 7/1/2018 (Rockville Correctional Facilities) (ETM) | | AA+/Aa1 | | | 2,150,000 | | | | 2,438,487 | |
Indiana Finance Authority, 5.00% due 9/15/2018 (Marian University Health Sciences) | | BBB-/NR | | | 1,790,000 | | | | 1,889,184 | |
Indiana Finance Authority, 5.00% due 11/1/2018 (Indianapolis Airport) | | AA+/Aa2 | | | 2,750,000 | | | | 3,108,462 | |
Indiana Finance Authority, 5.00% due 11/1/2018 (Sisters of St. Francis Health Services, Inc.) | | NR/Aa3 | | | 1,250,000 | | | | 1,407,475 | |
Indiana Finance Authority, 5.00% due 5/1/2019 (Community Health Network) | | A/A2 | | | 1,790,000 | | | | 2,037,754 | |
Indiana Finance Authority, 5.00% due 9/15/2019 (Marian University Health Sciences) | | BBB-/NR | | | 1,250,000 | | | | 1,330,963 | |
Indiana Finance Authority, 5.00% due 3/1/2020 (Indiana University Health System) | | AA-/Aa3 | | | 5,000,000 | | | | 5,810,200 | |
Indiana Finance Authority, 5.00% due 5/1/2020 (Community Health Network) | | A/A2 | | | 860,000 | | | | 996,740 | |
Indiana Finance Authority, 5.00% due 9/15/2020 (Marian University Health Sciences) | | BBB-/NR | | | 2,245,000 | | | | 2,400,534 | |
Indiana Finance Authority, 5.00% due 3/1/2021 (Indiana University Health System) | | AA-/Aa3 | | | 9,880,000 | | | | 11,627,871 | |
Indiana Finance Authority, 5.00% due 5/1/2021 (Community Health Network) | | A/A2 | | | 2,250,000 | | | | 2,638,620 | |
Indiana Finance Authority, 5.00% due 9/15/2021 (Marian University Health Sciences) | | BBB-/NR | | | 2,320,000 | | | | 2,479,384 | |
20 Semi-Annual Report
| | |
| SCHEDULE OF INVESTMENTS, CONTINUED | | |
| |
Thornburg Limited Term Municipal Fund | | March 31, 2015 (Unaudited) |
| | | | | | | | | | |
Issuer-Description | | Credit Rating†
S&P/ Moody’s | | Principal
Amount | | | Value | |
Indiana Finance Authority, 5.00% due 10/1/2021 (CWA Authority, Inc. Wastewater System Project) | | AA/NR | | $ | 500,000 | | | $ | 595,535 | |
Indiana Finance Authority, 5.00% due 3/1/2022 (Indiana University Health System) | | AA-/Aa3 | | | 3,240,000 | | | | 3,789,050 | |
Indiana Finance Authority, 5.00% due 5/1/2022 (Community Health Network) | | A/A2 | | | 1,230,000 | | | | 1,451,818 | |
Indiana Finance Authority, 5.00% due 5/1/2022 (Parkview Regional Medical Center) | | A+/A1 | | | 1,135,000 | | | | 1,327,530 | |
Indiana Finance Authority, 5.00% due 10/1/2023 (CWA Authority, Inc. Wastewater System Project) | | AA/NR | | | 1,000,000 | | | | 1,214,700 | |
Indiana Finance Authority, 5.00% due 10/1/2024 (CWA Authority, Inc. Wastewater System Project) | | AA/NR | | | 500,000 | | | | 612,700 | |
Indiana Finance Authority, 0.03% due 2/1/2037 put 4/1/2015 (Stadium Project; SPA: JPMorgan Chase Bank, N.A.) (daily demand notes) | | AA+/Aa2 | | | 54,050,000 | | | | 54,050,000 | |
Indiana Finance Authority, 0.03% due 2/1/2037 put 4/1/2015 (Stadium Project; SPA: JPMorgan Chase Bank, N.A.) (daily demand notes) | | AA+/Aa2 | | | 57,925,000 | | | | 57,925,000 | |
Indiana HFFA, 5.00% due 10/1/2027 put 6/1/2017 (Ascension Health) | | NR/Aa3 | | | 7,100,000 | | | | 7,748,301 | |
Indianapolis Local Public Improvement Bond Bank, 5.00% due 7/1/2015 (Waterworks System; Insured: Natl-Re) | | AA-/A2 | | | 1,000,000 | | | | 1,011,680 | |
Indianapolis Local Public Improvement Bond Bank, 5.00% due 7/1/2016 (Wishard Complex-Myers Special Care Center Building; Insured: Natl-Re) | | AA+/Aa1 | | | 1,030,000 | | | | 1,042,051 | |
Indianapolis Public Schools Multi-School Building Corp., 5.50% due 7/15/2015 (Insured: Natl-Re) | | AA/A3 | | | 1,690,000 | | | | 1,715,891 | |
Indianapolis Public Schools Multi-School Building Corp., 5.00% due 7/15/2016 (Insured: Natl-Re) | | AA/A3 | | | 5,000,000 | | | | 5,293,150 | |
Knox Middle School Building Corp., 0% due 1/15/2020 (Insured: Natl-Re) (State Aid Withholding) | | AA-/A3 | | | 1,295,000 | | | | 1,151,656 | |
Lake Central Multi-District School Building Corp., 4.00% due 1/15/2019 (Educational Facilities) (State Aid Withholding) | | AA+/A2 | | | 1,000,000 | | | | 1,091,520 | |
Lake Central Multi-District School Building Corp., 5.00% due 7/15/2019 (Educational Facilities) (State Aid Withholding) | | AA+/A2 | | | 1,680,000 | | | | 1,923,449 | |
Lake Central Multi-District School Building Corp., 4.00% due 1/15/2020 (Educational Facilities) (State Aid Withholding) | | AA+/A2 | | | 1,345,000 | | | | 1,482,365 | |
Lake Central Multi-District School Building Corp., 5.00% due 7/15/2020 (Educational Facilities) (State Aid Withholding) | | AA+/A2 | | | 1,170,000 | | | | 1,363,050 | |
Lake Central Multi-District School Building Corp., 4.00% due 1/15/2021 (Educational Facilities) (State Aid Withholding) | | AA+/A2 | | | 1,250,000 | | | | 1,384,125 | |
Lake Central Multi-District School Building Corp., 5.00% due 7/15/2021 (Educational Facilities) (State Aid Withholding) | | AA+/A2 | | | 1,250,000 | | | | 1,472,937 | |
Lake Central Multi-District School Building Corp., 4.00% due 1/15/2022 (Educational Facilities) (State Aid Withholding) | | AA+/A2 | | | 1,455,000 | | | | 1,613,915 | |
Lake Central Multi-District School Building Corp., 5.00% due 7/15/2022 (Educational Facilities) (State Aid Withholding) | | AA+/A2 | | | 1,000,000 | | | | 1,192,410 | |
Madison Schools Lydia Middleton Building Corp., 5.00% due 7/15/2015 (Insured: Natl-Re) (State Aid Withholding) (ETM) | | AA+/A3 | | | 630,000 | | | | 638,593 | |
Metropolitan School District of Pike Township GO, 3.00% due 1/15/2017 (College Park Ancillary Rooms) (State Aid Withholding) | | AA+/NR | | | 2,115,000 | | | | 2,204,126 | |
Mount Vernon of Hancock County Multi-School Building Corp., 5.00% due 7/15/2015 (Insured: Natl-Re) (State Aid Withholding) (ETM) | | AA-/A3 | | | 445,000 | | | | 451,163 | |
Mount Vernon of Hancock County Multi-School Building Corp., 5.00% due 7/15/2015 (Insured: Natl-Re) (State Aid Withholding) | | AA-/A3 | | | 140,000 | | | | 141,889 | |
Noblesville Redevelopment Authority, 5.00% due 8/1/2016 (146th Street Extension A) (ETM) | | AA/NR | | | 1,660,000 | | | | 1,741,108 | |
Perry Township Multischool Building Corp., 4.00% due 1/15/2018 (Educational Facilities) (State Aid Withholding) | | AA+/NR | | | 1,000,000 | | | | 1,077,500 | |
Perry Township Multischool Building Corp., 3.00% due 1/10/2019 (Educational Facilities) (State Aid Withholding) | | AA+/NR | | | 1,000,000 | | | | 1,055,500 | |
Perry Township Multischool Building Corp., 4.00% due 7/10/2019 (Educational Facilities) (State Aid Withholding) | | AA+/NR | | | 1,000,000 | | | | 1,101,520 | |
Perry Township Multischool Building Corp., 5.00% due 7/10/2020 (Educational Facilities) (State Aid Withholding) | | AA+/NR | | | 2,090,000 | | | | 2,454,538 | |
Perry Township Multischool Building Corp., 5.00% due 7/10/2021 (Educational Facilities) (State Aid Withholding) | | AA+/NR | | | 1,000,000 | | | | 1,192,710 | |
Pike Township Multischool Building Corp., 4.00% due 1/15/2017 (Metropolitan School District of Pike Township) (State Aid Withholding) | | AA+/NR | | | 1,080,000 | | | | 1,144,692 | |
South Bend Community School Building Corp., 5.00% due 7/15/2016 (Insured: Natl-Re) (State Aid Withholding) | | AA+/A3 | | | 1,785,000 | | | | 1,891,332 | |
Zionsville Community Schools Building Corp., 5.00% due 7/15/2019 (Insured: AGM) (State Aid Withholding) | | AA/A2 | | | 1,100,000 | | | | 1,272,832 | |
| | | |
IOWA — 0.67% | | | | | | | | | | |
Des Moines Independent Community School District, 4.00% due 6/1/2019 (School Infrastructure; Insured: AGM) | | AA/A2 | | | 3,870,000 | | | | 4,258,742 | |
Des Moines Independent Community School District, 4.00% due 6/1/2020 (School Infrastructure; Insured: AGM) | | AA/A2 | | | 3,990,000 | | | | 4,437,997 | |
Des Moines Independent Community School District, 4.00% due 6/1/2021 (School Infrastructure; Insured: AGM) | | AA/A2 | | | 4,125,000 | | | | 4,579,039 | |
Des Moines Independent Community School District, 4.00% due 6/1/2022 (School Infrastructure; Insured: AGM) | | AA/A2 | | | 2,140,000 | | | | 2,364,208 | |
Iowa Finance Authority, 5.00% due 2/15/2016 (Iowa Health System; Insured: AGM) | | NR/Aa3 | | | 1,600,000 | | | | 1,661,184 | |
Iowa Finance Authority, 5.00% due 8/15/2016 (Iowa Health System; Insured: AGM) | | NR/Aa3 | | | 1,500,000 | | | | 1,587,390 | |
Iowa Finance Authority, 5.00% due 2/15/2017 (Iowa Health System; Insured: AGM) | | NR/Aa3 | | | 1,600,000 | | | | 1,719,568 | |
Iowa Finance Authority, 5.00% due 8/15/2017 (Iowa Health System; Insured: AGM) | | NR/Aa3 | | | 990,000 | | | | 1,082,298 | |
Iowa Finance Authority, 5.00% due 2/15/2018 (Iowa Health System; Insured: AGM) | | NR/Aa3 | | | 1,405,000 | | | | 1,551,190 | |
Iowa Finance Authority, 5.00% due 7/1/2022 (Genesis Health System) | | NR/A1 | | | 1,735,000 | | | | 2,051,880 | |
Iowa Finance Authority, 5.00% due 7/1/2023 (Genesis Health System) | | NR/A1 | | | 2,000,000 | | | | 2,389,540 | |
Iowa Finance Authority, 5.00% due 7/1/2024 (Genesis Health System) | | NR/A1 | | | 2,350,000 | | | | 2,772,013 | |
Iowa Finance Authority, 0.03% due 2/15/2035 put 4/1/2015 (Iowa Health System; LOC: JPMorgan Chase Bank, N.A.) (daily demand notes) | | NR/Aa1 | | | 19,115,000 | | | | 19,115,000 | |
| | | |
KANSAS — 0.12% | | | | | | | | | | |
Kansas DFA, 5.00% due 11/1/2015 (State Capitol, School of Pharmacy and Wildlife & Parks Projects) | | AA-/Aa3 | | | 2,605,000 | | | | 2,678,643 | |
Kansas DFA, 5.00% due 12/1/2020 (New Jobs Training; Insured: BAM) | | AA/NR | | | 1,500,000 | | | | 1,717,680 | |
Wyandotte County-Kansas City Unified Government, 5.00% due 9/1/2022 (Utility Systems Improvement) | | A+/A3 | | | 2,000,000 | | | | 2,389,800 | |
Wyandotte County-Kansas City Unified Government, 5.00% due 9/1/2023 (Utility Systems Improvement) | | A+/A3 | | | 1,000,000 | | | | 1,199,860 | |
Wyandotte County-Kansas City Unified Government, 5.00% due 9/1/2024 (Utility Systems Improvement) | | A+/A3 | | | 600,000 | | | | 724,770 | |
Semi-Annual Report 21
| | |
| SCHEDULE OF INVESTMENTS, CONTINUED | | |
| |
Thornburg Limited Term Municipal Fund | | March 31, 2015 (Unaudited) |
| | | | | | | | | | |
Issuer-Description | | Credit Rating†
S&P/ Moody’s | | Principal
Amount | | | Value | |
KENTUCKY — 0.42% | | | | | | | | | | |
Jefferson County School District Finance Corp., 5.25% due 1/1/2016 (Insured: AGM) | | AA/Aa2 | | $ | 2,145,000 | | | $ | 2,225,309 | |
Kentucky Economic DFA, 0% due 10/1/2019 (Norton Healthcare, Inc.; Insured: Natl-Re) | | AA-/A3 | | | 5,000,000 | | | | 4,467,100 | |
Kentucky Economic DFA, 0% due 10/1/2020 (Norton Healthcare, Inc.; Insured: Natl-Re) | | AA-/A3 | | | 9,600,000 | | | | 8,319,456 | |
Kentucky Economic DFA, 0% due 10/1/2021 (Norton Healthcare, Inc.; Insured: Natl-Re) | | AA-/A3 | | | 2,885,000 | | | | 2,412,235 | |
Kentucky Economic DFA, 0% due 10/1/2023 (Norton Healthcare, Inc.; Insured: Natl-Re) | | AA-/A3 | | | 4,195,000 | | | | 3,213,622 | |
Kentucky Municipal Power Agency, 4.00% due 9/1/2015 (Insured: AGM) | | AA/A2 | | | 2,955,000 | | | | 3,000,270 | |
Lexington-Fayette Urban County Government Public Facilities Corp., 5.00% due 6/1/2022 (Eastern State Hospital) | | A+/Aa3 | | | 6,165,000 | | | | 7,258,979 | |
| | | |
LOUISIANA — 3.09% | | | | | | | | | | |
City of Bossier, 4.00% due 12/1/2018 (Public Improvements; Insured: AGM) | | AA/Aa3 | | | 2,020,000 | | | | 2,215,496 | |
City of Bossier, 4.50% due 12/1/2021 (Public Improvements; Insured: AGM) | | AA/Aa3 | | | 2,240,000 | | | | 2,597,661 | |
City of Lafayette, 4.00% due 11/1/2016 (Utilities System Improvements) | | A+/A1 | | | 1,395,000 | | | | 1,472,715 | |
City of Lafayette, 5.00% due 11/1/2019 (Utilities System Improvements) | | A+/A1 | | | 1,000,000 | | | | 1,157,950 | |
City of New Orleans GO, 5.00% due 10/1/2016 (Audubon Park Aquarium) | | A/NR | | | 2,380,000 | | | | 2,521,729 | |
City of New Orleans GO, 4.00% due 10/1/2018 (Audubon Park Aquarium; Insured: AGM) | | AA/NR | | | 1,110,000 | | | | 1,191,674 | |
City of New Orleans GO, 5.00% due 12/1/2019 (Public Improvements; Insured: AGM) | | A-/A3 | | | 3,080,000 | | | | 3,502,391 | |
City of New Orleans GO, 5.00% due 12/1/2020 (Public Improvements; Insured: AGM) | | A-/A3 | | | 3,250,000 | | | | 3,734,997 | |
City of New Orleans GO, 5.00% due 12/1/2021 (Public Improvements; Insured: AGM) | | A-/A3 | | | 5,700,000 | | | | 6,593,817 | |
City of Shreveport, 5.00% due 12/1/2020 (Water and Sewer System; Insured: BAM) | | AA/A3 | | | 7,770,000 | | | | 9,032,625 | |
City of Shreveport, 5.00% due 12/1/2021 (Water and Sewer System; Insured: BAM) | | AA/A3 | | | 8,185,000 | | | | 9,605,507 | |
City of Shreveport, 5.00% due 12/1/2022 (Water and Sewer System; Insured: BAM) | | AA/A3 | | | 6,460,000 | | | | 7,640,242 | |
City of Shreveport, 5.00% due 12/1/2023 (Water and Sewer System; Insured: BAM) | | AA/A3 | | | 4,245,000 | | | | 5,059,276 | |
City of Shreveport, 5.00% due 12/1/2024 (Water and Sewer System; Insured: BAM) | | AA/A3 | | | 4,490,000 | | | | 5,395,408 | |
Consolidated Sales Tax District A of the Parish of LaFourche, 4.00% due 3/1/2021 (Roads, Bridges & Drainage Works) | | A/NR | | | 1,990,000 | | | | 2,177,737 | |
Consolidated Sales Tax District A of the Parish of LaFourche, 4.00% due 3/1/2022 (Roads, Bridges & Drainage Works) | | A/NR | | | 1,545,000 | | | | 1,687,974 | |
East Baton Rouge Sewerage Commission, 5.00% due 2/1/2018 pre-refunded 2/1/2016 (Wastewater System Improvements; Insured: AGM) | | AA/Aa3 | | | 3,000,000 | | | | 3,118,920 | |
East Baton Rouge Sewerage Commission, 5.00% due 2/1/2023 (Wastewater System Improvements) | | AA-/Aa3 | | | 450,000 | | | | 544,901 | |
East Baton Rouge Sewerage Commission, 5.00% due 2/1/2024 (Wastewater System Improvements) | | AA-/Aa3 | | | 1,000,000 | | | | 1,221,240 | |
East Baton Rouge Sewerage Commission, 5.00% due 2/1/2025 (Wastewater System Improvements) | | AA-/Aa3 | | | 700,000 | | | | 859,460 | |
Ernest N. Morial—New Orleans Exhibition Hall Authority, 5.00% due 7/15/2020 (Convention Center) | | NR/A1 | | | 1,000,000 | | | | 1,166,400 | |
Ernest N. Morial—New Orleans Exhibition Hall Authority, 5.00% due 7/15/2021 (Convention Center) | | NR/A1 | | | 780,000 | | | | 921,640 | |
Ernest N. Morial—New Orleans Exhibition Hall Authority, 5.00% due 7/15/2022 (Convention Center) | | NR/A1 | | | 1,000,000 | | | | 1,196,880 | |
Ernest N. Morial—New Orleans Exhibition Hall Authority, 5.00% due 7/15/2023 (Convention Center) | | NR/A1 | | | 1,000,000 | | | | 1,185,100 | |
Jefferson Sales Tax District Parish of Jefferson, 5.00% due 12/1/2018 (Sewerage Capital Project; Insured: AGM) | | AA/A2 | | | 2,000,000 | | | | 2,273,440 | |
Louisiana Citizens Property Insurance Corp., 5.00% due 6/1/2015 (Insured: AMBAC) | | A-/A3 | | | 10,265,000 | | | | 10,346,607 | |
Louisiana Energy & Power Authority, 5.00% due 1/1/2020 (Rodemacher Unit No. 2 Power) | | A-/A3 | | | 1,000,000 | | | | 1,151,930 | |
Louisiana Energy & Power Authority, 5.00% due 1/1/2021 (Rodemacher Unit No. 2 Power) | | A-/A3 | | | 1,000,000 | | | | 1,166,890 | |
Louisiana Energy & Power Authority, 5.00% due 6/1/2022 (LEPA Unit No. 1 Power; Insured: AGM) | | AA/A2 | | | 1,000,000 | | | | 1,205,420 | |
Louisiana Energy & Power Authority, 5.00% due 1/1/2023 (Rodemacher Unit No. 2 Power) | | A-/A3 | | | 1,415,000 | | | | 1,678,119 | |
Louisiana Energy & Power Authority, 5.00% due 6/1/2023 (LEPA Unit No. 1 Power; Insured: AGM) | | AA/A2 | | | 750,000 | | | | 912,698 | |
Louisiana Local Govt Environmental Facilities & Community Development Authority, 5.00% due 3/1/2016 (Independence Stadium) | | A/NR | | | 1,000,000 | | | | 1,036,900 | |
Louisiana Local Govt Environmental Facilities & Community Development Authority, 4.00% due 10/1/2016 (Town of Vinton Public Power Authority; Insured: AGM) | | AA/NR | | | 1,000,000 | | | | 1,042,790 | |
Louisiana Local Govt Environmental Facilities & Community Development Authority, 5.00% due 3/1/2017 (Independence Stadium) | | A/NR | | | 1,265,000 | | | | 1,350,843 | |
Louisiana Local Govt Environmental Facilities & Community Development Authority, 4.00% due 10/1/2017 (Town of Vinton Public Power Authority; Insured: AGM) | | AA/NR | | | 1,000,000 | | | | 1,060,470 | |
Louisiana Local Govt Environmental Facilities & Community Development Authority, 5.00% due 3/1/2018 (Independence Stadium) | | A/NR | | | 1,000,000 | | | | 1,094,020 | |
Louisiana Local Govt Environmental Facilities & Community Development Authority, 4.50% due 10/1/2018 (Town of Vinton Public Power Authority; Insured: AGM) | | AA/NR | | | 1,000,000 | | | | 1,092,780 | |
Louisiana Local Govt Environmental Facilities & Community Development Authority, 4.00% due 12/1/2018 (Bossier Parish Community College—Campus Facilities, Inc. Project) | | AA-/NR | | | 2,655,000 | | | | 2,901,968 | |
Louisiana Local Govt Environmental Facilities & Community Development Authority, 4.50% due 10/1/2019 (Town of Vinton Public Power Authority; Insured: AGM) | | AA/NR | | | 1,000,000 | | | | 1,105,470 | |
Louisiana Local Govt Environmental Facilities & Community Development Authority, 4.00% due 12/1/2019 (Bossier Parish Community College—Campus Facilities, Inc. Project) | | AA-/NR | | | 1,310,000 | | | | 1,448,100 | |
Louisiana Local Govt Environmental Facilities & Community Development Authority, 5.00% due 12/1/2020 (Bossier Parish Community College—Campus Facilities, Inc. Project) | | AA-/NR | | | 1,200,000 | | | | 1,411,308 | |
Louisiana Offshore Terminal Authority, 5.00% due 10/1/2018 (Deepwater Oil Port-Loop LLC) | | BBB/NR | | | 22,000,000 | | | | 24,345,860 | |
Louisiana Offshore Terminal Authority, 2.125% due 10/1/2037 put 10/1/2015 (Deepwater Oil Port-Loop LLC) | | BBB/A3 | | | 5,000,000 | | | | 5,039,750 | |
Louisiana Offshore Terminal Authority, 2.20% due 10/1/2040 put 10/1/2017 (Deepwater Oil Port-Loop LLC) | | BBB/NR | | | 6,000,000 | | | | 6,100,440 | |
Louisiana Public Facilities Authority, 5.00% due 5/15/2015 (Ochsner Clinic Foundation) | | NR/Baa1 | | | 1,825,000 | | | | 1,833,760 | |
22 Semi-Annual Report
| | |
| SCHEDULE OF INVESTMENTS, CONTINUED | | |
| |
Thornburg Limited Term Municipal Fund | | March 31, 2015 (Unaudited) |
| | | | | | | | | | |
Issuer-Description | | Credit Rating†
S&P/ Moody’s | | Principal
Amount | | | Value | |
Louisiana Public Facilities Authority, 5.75% due 7/1/2015 (Franciscan Missionaries of Our Lady Health System; Insured: AGM) | | AA/A2 | | $ | 1,325,000 | | | $ | 1,341,496 | |
Louisiana Public Facilities Authority, 2.875% due 11/1/2015 (Entergy Gulf States) | | A-/A2 | | | 2,500,000 | | | | 2,535,325 | |
Louisiana Public Facilities Authority, 5.00% due 5/15/2016 (Ochsner Clinic Foundation) | | NR/Baa1 | | | 1,000,000 | | | | 1,040,370 | |
Louisiana Public Facilities Authority, 5.00% due 5/15/2017 (Ochsner Clinic Foundation) | | NR/Baa1 | | | 1,035,000 | | | | 1,105,287 | |
Louisiana Public Facilities Authority, 5.00% due 5/15/2018 (Ochsner Clinic Foundation) | | NR/Baa1 | | | 2,000,000 | | | | 2,138,400 | |
Louisiana Public Facilities Authority, 5.00% due 6/1/2022 (Hurricane Recovery Program) | | NR/Aa3 | | | 2,945,000 | | | | 3,549,962 | |
Louisiana Public Facilities Authority, 5.00% due 6/1/2023 (Hurricane Recovery Program) | | NR/Aa3 | | | 5,000,000 | | | | 6,084,650 | |
Louisiana State Office Facilities Corp., 5.00% due 5/1/2015 (State Capitol) | | NR/Aa3 | | | 2,830,000 | | | | 2,841,263 | |
Louisiana State Office Facilities Corp., 5.00% due 5/1/2016 (State Capitol) | | NR/Aa3 | | | 1,000,000 | | | | 1,048,780 | |
Louisiana State Office Facilities Corp., 5.00% due 5/1/2018 (State Capitol) | | NR/Aa3 | | | 2,500,000 | | | | 2,788,625 | |
Louisiana State Office Facilities Corp., 5.00% due 5/1/2021 (State Capitol) | | NR/Aa3 | | | 4,595,000 | | | | 5,239,127 | |
Parish of LaFourche, 5.00% due 1/1/2019 (Roads, Highways & Bridges) | | AA-/NR | | | 595,000 | | | | 675,307 | |
Parish of LaFourche, 5.00% due 1/1/2022 (Roads, Highways & Bridges) | | AA-/NR | | | 415,000 | | | | 494,680 | |
Parish of LaFourche, 5.00% due 1/1/2023 (Roads, Highways & Bridges) | | AA-/NR | | | 515,000 | | | | 617,619 | |
Parish of Orleans School District GO, 5.00% due 9/1/2016 (Insured: AGM) | | AA/Aa3 | | | 4,500,000 | | | | 4,767,165 | |
Parish of Orleans School District GO, 5.00% due 9/1/2018 (Insured: AGM) | | AA/Aa3 | | | 4,800,000 | | | | 5,357,904 | |
Parish of Orleans School District GO, 5.00% due 9/1/2020 (Insured: AGM) | | AA/Aa3 | | | 3,840,000 | | | | 4,432,013 | |
Parish of Plaquemines Law Enforcement District GO, 5.00% due 9/1/2019 | | A+/NR | | | 1,005,000 | | | | 1,109,419 | |
Parish of Plaquemines Law Enforcement District GO, 5.00% due 9/1/2021 | | A+/NR | | | 1,115,000 | | | | 1,218,639 | |
Parish of St. Charles, 4.00% due 12/1/2040 put 6/1/2022 (Valero Energy Corp. Refinery) | | BBB/Baa2 | | | 14,195,000 | | | | 15,484,474 | |
Parish of St. Tammany Sales Tax District No. 3, 5.00% due 6/1/2017 pre-refunded 6/1/2016 (Public Works, Improvements and Facilities; Insured: CIFG) | | AA-/NR | | | 1,405,000 | | | | 1,496,269 | |
Parish of Terrebonne Hospital Service District No. 1, 4.00% due 4/1/2015 (Terrebonne General Medical Center) | | A+/A2 | | | 575,000 | | | | 575,000 | |
Parish of Terrebonne Hospital Service District No. 1, 4.00% due 4/1/2017 (Terrebonne General Medical Center) | | A+/A2 | | | 1,000,000 | | | | 1,049,180 | |
Parish of Terrebonne Hospital Service District No. 1, 5.00% due 4/1/2018 (Terrebonne General Medical Center) | | A+/A2 | | | 1,000,000 | | | | 1,092,290 | |
Parish of Terrebonne Hospital Service District No. 1, 5.00% due 4/1/2019 (Terrebonne General Medical Center) | | A+/A2 | | | 1,810,000 | | | | 2,014,801 | |
Parish of Terrebonne Hospital Service District No. 1, 5.00% due 4/1/2021 (Terrebonne General Medical Center) | | A+/A2 | | | 2,320,000 | | | | 2,654,405 | |
Regional Transit Authority, 0% due 12/1/2015 (Streetcar Rail Lines; Insured: Natl-Re) | | AA-/NR | | | 1,490,000 | | | | 1,485,083 | |
Regional Transit Authority, 5.00% due 12/1/2017 (Streetcar Rail Lines; Insured: AGM) | | AA/Aa3 | | | 755,000 | | | | 832,501 | |
Regional Transit Authority, 5.00% due 12/1/2019 (Streetcar Rail Lines; Insured: AGM) | | AA/Aa3 | | | 1,000,000 | | | | 1,150,160 | |
Regional Transit Authority, 5.00% due 12/1/2021 (Streetcar Rail Lines; Insured: AGM) | | AA/Aa3 | | | 1,000,000 | | | | 1,154,330 | |
Regional Transit Authority, 5.00% due 12/1/2022 (Streetcar Rail Lines; Insured: AGM) | | AA/Aa3 | | | 1,110,000 | | | | 1,287,789 | |
State of Louisiana GO, 5.00% due 8/1/2017 (Insured: Natl-Re) | | AA/Aa2 | | | 4,000,000 | | | | 4,065,160 | |
| | | |
MAINE — 0.20% | | | | | | | | | | |
Maine Finance Authority, 3.80% due 11/1/2015 (Waste Management, Inc.) | | A-/NR | | | 3,440,000 | | | | 3,513,685 | |
Maine Governmental Facilities Authority, 5.00% due 10/1/2020 (Augusta & Machias Courthouses) | | AA-/Aa3 | | | 1,245,000 | | | | 1,461,817 | |
Maine Governmental Facilities Authority, 5.00% due 10/1/2021 (Augusta & Machias Courthouses) | | AA-/Aa3 | | | 1,315,000 | | | | 1,564,482 | |
Maine Governmental Facilities Authority, 5.00% due 10/1/2022 (Augusta & Machias Courthouses) | | AA-/Aa3 | | | 1,175,000 | | | | 1,415,287 | |
Maine Governmental Facilities Authority, 5.00% due 10/1/2023 (Augusta & Machias Courthouses) | | AA-/Aa3 | | | 1,445,000 | | | | 1,757,741 | |
Maine Health & Higher Educational Facilities Authority, 5.00% due 7/1/2035 pre-refunded 7/1/2015 (Bowdoin College) (State Aid Withholding) | | NR/A1 | | | 5,175,000 | | | | 5,236,893 | |
| | | |
MARYLAND — 0.59% | | | | | | | | | | |
Howard County GO, 5.00% due 8/15/2015 (Consolidated Public Improvements) | | AAA/Aaa | | | 6,000,000 | | | | 6,109,020 | |
Maryland Economic Development Corp., 5.00% due 6/1/2021 (Public Health Laboratory) | | AA+/Aa1 | | | 8,725,000 | | | | 10,414,683 | |
Maryland Economic Development Corp., 4.00% due 6/1/2022 (Public Health Laboratory) | | AA+/Aa1 | | | 8,245,000 | | | | 9,224,671 | |
Montgomery County GO, 4.00% due 11/1/2015 (Consolidated Public Improvements) | | AAA/Aaa | | | 5,160,000 | | | | 5,276,616 | |
State of Maryland GO, 4.00% due 8/1/2015 (Public and Educational Facilities) | | AAA/Aaa | | | 1,000,000 | | | | 1,012,950 | |
Washington Suburban Sanitary District GO, 5.00% due 6/1/2015 (Water and Sewer System Projects) | | AAA/Aaa | | | 11,500,000 | | | | 11,593,840 | |
| | | |
MASSACHUSETTS — 1.18% | | | | | | | | | | |
Berkshire Wind Power Cooperative Corp., 5.00% due 7/1/2017 | | A/NR | | | 2,540,000 | | | | 2,767,838 | |
Berkshire Wind Power Cooperative Corp., 5.00% due 7/1/2018 | | A/NR | | | 2,825,000 | | | | 3,152,700 | |
Berkshire Wind Power Cooperative Corp., 5.00% due 7/1/2019 | | A/NR | | | 2,765,000 | | | | 3,150,939 | |
Berkshire Wind Power Cooperative Corp., 5.00% due 7/1/2020 | | A/NR | | | 2,965,000 | | | | 3,395,785 | |
City of Northampton GO, 5.125% due 10/15/2016 (Insured: Natl-Re) | | NR/Aa2 | | | 1,585,000 | | | | 1,607,333 | |
Massachusetts Development Finance Agency, 3.45% due 12/1/2015 (Carleton-Willard Village) | | A-/NR | | | 590,000 | | | | 596,319 | |
a Massachusetts Development Finance Agency, 5.25% due 10/1/2023 (Simmons College) | | BBB+/Baa1 | | | 595,000 | | | | 700,035 | |
Massachusetts Development Finance Agency, 5.75% due 12/1/2042 pre-refunded 5/1/2019 (Dominion Energy Brayton Point Station Units 1 and 2) | | BBB+/Baa2 | | | 2,000,000 | | | | 2,364,200 | |
Massachusetts Educational Financing Authority, 5.25% due 1/1/2016 | | AA/NR | | | 2,450,000 | | | | 2,536,240 | |
Massachusetts Educational Financing Authority, 5.50% due 1/1/2017 | | AA/NR | | | 1,800,000 | | | | 1,943,424 | |
Massachusetts Educational Financing Authority, 5.50% due 1/1/2018 | | AA/NR | | | 11,170,000 | | | | 12,436,231 | |
Massachusetts Educational Financing Authority, 5.75% due 1/1/2020 | | AA/NR | | | 7,500,000 | | | | 8,775,525 | |
Massachusetts Health & Educational Facilities Authority, 5.00% due 7/1/2015 (UMass Memorial Health Care) | | BBB+/Ba1 | | | 2,625,000 | | | | 2,650,699 | |
Semi-Annual Report 23
| | |
| SCHEDULE OF INVESTMENTS, CONTINUED | | |
| |
Thornburg Limited Term Municipal Fund | | March 31, 2015 (Unaudited) |
| | | | | | | | | | |
Issuer-Description | | Credit Rating†
S&P/ Moody’s | | Principal
Amount | | | Value | |
Massachusetts Health & Educational Facilities Authority, 5.00% due 7/1/2018 (UMass Memorial Health Care) | | BBB+/Ba1 | | $ | 4,290,000 | | | $ | 4,660,399 | |
Massachusetts Health & Educational Facilities Authority, 5.00% due 10/1/2019 (Berkshire Health Systems; Insured: AGM) | | AA/A3 | | | 1,750,000 | | | | 1,786,067 | |
Massachusetts School Building Authority, 5.00% due 8/15/2027 pre-refunded 8/15/2015 (SMART Fund; Insured: Natl-Re) | | AA+/Aa2 | | | 9,350,000 | | | | 9,516,336 | |
Massachusetts School Building Authority, 5.00% due 8/15/2030 pre-refunded 8/15/2015 (SMART Fund; Insured: AGM) | | AA/Aa2 | | | 25,000,000 | | | | 25,444,750 | |
| | | |
MICHIGAN — 3.63% | | | | | | | | | | |
Board of Governors of Wayne State University, 5.00% due 11/15/2022 (Educational Facilities and Equipment) | | AA-/Aa3 | | | 425,000 | | | | 508,003 | |
Board of Governors of Wayne State University, 5.00% due 11/15/2023 (Educational Facilities and Equipment) | | AA-/Aa3 | | | 305,000 | | | | 367,812 | |
Board of Governors of Wayne State University, 5.00% due 11/15/2024 (Educational Facilities and Equipment) | | AA-/Aa3 | | | 515,000 | | | | 623,516 | |
Board of Governors of Wayne State University, 5.00% due 11/15/2025 (Educational Facilities and Equipment) | | AA-/Aa3 | | | 625,000 | | | | 748,500 | |
Byron Center Michigan Public Schools, 4.00% due 5/1/2015 (Insured: Q-SBLF) | | AA-/NR | | | 1,985,000 | | | | 1,991,153 | |
Byron Center Michigan Public Schools, 4.00% due 5/1/2017 (Insured: AGM/Q-SBLF) | | AA/NR | | | 1,305,000 | | | | 1,390,843 | |
Byron Center Michigan Public Schools, 4.00% due 5/1/2018 (Insured: AGM/Q-SBLF) | | AA/NR | | | 1,935,000 | | | | 2,101,391 | |
Byron Center Michigan Public Schools, 4.00% due 5/1/2020 (Insured: AGM/Q-SBLF) | | AA/NR | | | 1,000,000 | | | | 1,117,410 | |
City of Battle Creek County of Calhoun GO, 5.00% due 5/1/2020 (Downtown Development; Insured: AMBAC) | | AA/Aa3 | | | 3,200,000 | | | | 3,519,616 | |
City of Grand Haven, 5.50% due 7/1/2016 (Electric System; Insured: Natl-Re) | | AA-/A3 | | | 3,890,000 | | | | 4,066,022 | |
County of Genesee GO, 3.00% due 11/1/2016 (Water Supply System; Insured: BAM) | | AA/A2 | | | 615,000 | | | | 635,412 | |
County of Genesee GO, 5.00% due 11/1/2022 (Water Supply System; Insured: BAM) | | AA/A2 | | | 600,000 | | | | 692,040 | |
Kalamazoo Hospital Finance Authority, 4.00% due 5/15/2015 (Bronson Methodist Hospital; Insured: AGM) | | NR/A2 | | | 1,735,000 | | | | 1,742,044 | |
Kalamazoo Hospital Finance Authority, 4.00% due 5/15/2016 (Bronson Methodist Hospital; Insured: AGM) | | NR/A2 | | | 1,850,000 | | | | 1,914,694 | |
Kalamazoo Hospital Finance Authority, 4.50% due 5/15/2017 (Bronson Methodist Hospital; Insured: AGM) | | NR/A2 | | | 1,830,000 | | | | 1,962,291 | |
Kalamazoo Hospital Finance Authority, 5.00% due 5/15/2018 (Bronson Methodist Hospital; Insured: AGM) | | AA/A2 | | | 1,520,000 | | | | 1,686,379 | |
Kalamazoo Hospital Finance Authority, 5.00% due 5/15/2018 (Bronson Methodist Hospital; Insured: AGM) | | AA/A2 | | | 2,500,000 | | | | 2,773,650 | |
Kalamazoo Hospital Finance Authority, 5.00% due 5/15/2020 (Bronson Methodist Hospital; Insured: AGM) | | NR/A2 | | | 1,735,000 | | | | 2,015,012 | |
Kalamazoo Hospital Finance Authority, 5.00% due 5/15/2021 (Bronson Methodist Hospital; Insured: AGM) | | NR/A2 | | | 2,350,000 | | | | 2,702,829 | |
Livingston County GO, 4.00% due 5/1/2018 (Howell Public Schools; Insured: Q-SBLF) | | AA-/NR | | | 1,000,000 | | | | 1,083,030 | |
Livingston County GO, 4.00% due 5/1/2020 (Howell Public Schools; Insured: Q-SBLF) | | AA-/NR | | | 1,000,000 | | | | 1,111,890 | |
Livingston County GO, 4.00% due 5/1/2021 (Howell Public Schools; Insured: Q-SBLF) | | AA-/NR | | | 1,000,000 | | | | 1,121,360 | |
Livonia Public Schools School District GO, 4.00% due 5/1/2020 (School Building & Site) | | A/A2 | | | 800,000 | | | | 872,520 | |
Livonia Public Schools School District GO, 5.00% due 5/1/2021 (School Building & Site) | | A/A2 | | | 900,000 | | | | 1,045,737 | |
Michigan Finance Authority, 4.00% due 8/1/2018 (Beaumont Health Credit Group) | | A/A1 | | | 500,000 | | | | 546,320 | |
Michigan Finance Authority, 5.00% due 8/1/2019 (Ypsilanti Community Schools) | | A+/NR | | | 1,150,000 | | | | 1,290,703 | |
Michigan Finance Authority, 5.00% due 8/1/2020 (Ypsilanti Community Schools) | | A+/NR | | | 1,220,000 | | | | 1,389,336 | |
Michigan Finance Authority, 5.00% due 8/1/2021 (Ypsilanti Community Schools) | | A+/NR | | | 1,295,000 | | | | 1,490,610 | |
Michigan Finance Authority, 5.00% due 8/1/2022 (Ypsilanti Community Schools) | | A+/NR | | | 1,375,000 | | | | 1,595,990 | |
Michigan Finance Authority, 5.00% due 12/1/2022 (Trinity Health Credit Group) | | AA-/Aa3 | | | 1,000,000 | | | | 1,200,160 | |
Michigan Finance Authority, 5.00% due 8/1/2023 (Beaumont Health Credit Group) | | A/A1 | | | 3,800,000 | | | | 4,560,380 | |
Michigan Finance Authority, 5.00% due 12/1/2023 (Trinity Health Credit Group) | | AA-/Aa3 | | | 2,500,000 | | | | 3,015,750 | |
Michigan Finance Authority, 5.00% due 8/1/2024 (Beaumont Health Credit Group) | | A/A1 | | | 7,000,000 | | | | 8,431,220 | |
Michigan Finance Authority, 5.00% due 12/1/2024 (Trinity Health Credit Group) | | AA-/Aa3 | | | 1,000,000 | | | | 1,203,150 | |
Michigan Finance Authority, 5.00% due 8/1/2025 (Beaumont Health Credit Group) | | A/A1 | | | 8,000,000 | | | | 9,515,520 | |
Michigan Municipal Bond Authority, 5.00% due 10/1/2020 pre-refunded 10/01/2015 (Clean Water Fund) | | NR/NR | | | 305,000 | | | | 312,329 | |
Michigan Municipal Bond Authority, 5.00% due 10/1/2020 pre-refunded 10/01/2015 (Clean Water Fund) | | NR/NR | | | 165,000 | | | | 168,965 | |
Michigan Municipal Bond Authority, 5.00% due 10/1/2020 (Clean Water Fund) | | AAA/Aaa | | | 35,000 | | | | 35,830 | |
Michigan State Hospital Finance Authority, 5.00% due 7/15/2015 (Oakwood Hospital) | | A/A1 | | | 2,500,000 | | | | 2,532,475 | |
Michigan State Hospital Finance Authority, 5.50% due 11/15/2015 (Henry Ford Health System) | | A-/A3 | | | 2,300,000 | | | | 2,362,008 | |
Michigan State Hospital Finance Authority, 5.00% due 7/15/2016 (Oakwood Hospital) | | A/A1 | | | 1,205,000 | | | | 1,271,203 | |
Michigan State Hospital Finance Authority, 5.00% due 11/15/2016 (Ascension Health) | | AA+/Aa2 | | | 3,330,000 | | | | 3,567,562 | |
Michigan State Hospital Finance Authority, 5.00% due 11/15/2017 (Sparrow Memorial Hospital) | | A+/A1 | | | 1,500,000 | | | | 1,625,700 | |
Michigan State Hospital Finance Authority, 5.50% due 11/15/2017 (Henry Ford Health System) | | A-/A3 | | | 1,530,000 | | | | 1,671,142 | |
Michigan State Hospital Finance Authority, 5.00% due 7/15/2018 pre-refunded 7/15/2017 (Oakwood Hospital) | | A/A1 | | | 1,000,000 | | | | 1,097,460 | |
Michigan State Hospital Finance Authority, 5.50% due 11/15/2018 (Henry Ford Health System) | | A-/A3 | | | 3,500,000 | | | | 3,907,365 | |
Michigan State Hospital Finance Authority, 6.00% due 12/1/2018 (Trinity Health) | | AA-/Aa3 | | | 2,000,000 | | | | 2,327,900 | |
Michigan State Hospital Finance Authority, 5.00% due 7/15/2019 pre-refunded 7/15/2017 (Oakwood Hospital) | | A/A1 | | | 2,000,000 | | | | 2,194,920 | |
Michigan State Hospital Finance Authority, 5.00% due 10/1/2026 put 6/1/2017 (Ascension Health) | | NR/Aa3 | | | 12,140,000 | | | | 13,234,785 | |
Michigan State Hospital Finance Authority, 5.75% due 12/1/2034 put 4/1/2015 (Trinity Health) | | AA-/Aa3 | | | 9,800,000 | | | | 10,157,406 | |
Michigan State Housing Development Authority, 5.00% due 4/1/2016 (Multi-Family Mtg Loan Financing) | | AA/NR | | | 435,000 | | | | 439,916 | |
Michigan State Housing Development Authority, 4.00% due 10/1/2016 (Multi-Family Mtg Loan Financing) | | AA/NR | | | 1,715,000 | | | | 1,797,903 | |
Michigan Strategic Fund, 5.00% due 10/15/2017 (Michigan House of Representatives Facilities; Insured: AGM) | | AA/A1 | | | 2,000,000 | | | | 2,198,680 | |
Michigan Strategic Fund, 5.25% due 10/15/2019 (Michigan House of Representatives Facilities; Insured: AGM) | | AA/A1 | | | 2,550,000 | | | | 2,887,747 | |
Michigan Strategic Fund, 5.25% due 10/15/2020 (Michigan House of Representatives Facilities; Insured: AGM) | | AA/A1 | | | 4,025,000 | | | | 4,552,154 | |
Michigan Strategic Fund, 5.50% due 8/1/2029 put 8/1/2016 (Detroit Edison Co. Exempt Facilities Project) | | A/Aa3 | | | 5,160,000 | | | | 5,444,006 | |
Plymouth-Canton Community Schools GO, 4.00% due 5/1/2018 (Insured: Q-SBLF) | | NR/Aa2 | | | 1,500,000 | | | | 1,624,545 | |
Plymouth-Canton Community Schools GO, 4.00% due 5/1/2019 (Insured: Q-SBLF) | | NR/Aa2 | | | 1,000,000 | | | | 1,098,100 | |
24 Semi-Annual Report
| | |
| SCHEDULE OF INVESTMENTS, CONTINUED | | |
| |
Thornburg Limited Term Municipal Fund | | March 31, 2015 (Unaudited) |
| | | | | | | | | | |
Issuer-Description | | Credit Rating†
S&P/ Moody’s | | Principal
Amount | | | Value | |
Plymouth-Canton Community Schools GO, 5.00% due 5/1/2020 (Insured: Q-SBLF) | | NR/Aa2 | | $ | 1,000,000 | | | $ | 1,160,400 | |
Romeo Community School District GO, 5.00% due 5/1/2018 (Insured: Natl-Re/Q-SBLF) | | AA-/Aa2 | | | 3,050,000 | | | | 3,062,261 | |
Royal Oak Hospital Finance Authority, 5.25% due 8/1/2017 (William Beaumont Hospital) (ETM) | | A/A1 | | | 5,855,000 | | | | 6,468,721 | |
Royal Oak Hospital Finance Authority, 5.00% due 9/1/2020 (William Beaumont Hospital) | | A/A1 | | | 1,200,000 | | | | 1,410,168 | |
Royal Oak Hospital Finance Authority, 5.00% due 9/1/2021 (William Beaumont Hospital) | | A/A1 | | | 2,500,000 | | | | 2,968,250 | |
Royal Oak Hospital Finance Authority, 5.00% due 9/1/2023 (William Beaumont Hospital) | | A/A1 | | | 1,240,000 | | | | 1,489,575 | |
Royal Oak Hospital Finance Authority, 5.00% due 9/1/2024 (William Beaumont Hospital) | | A/A1 | | | 2,000,000 | | | | 2,391,460 | |
School District of the City of Dearborn GO, 3.00% due 5/1/2015 (Insured: Q-SBLF) (State Aid Withholding) | | NR/Aa2 | | | 435,000 | | | | 436,005 | |
School District of the City of Dearborn GO, 3.00% due 5/1/2019 (Insured: Q-SBLF) (State Aid Withholding) | | NR/Aa2 | | | 445,000 | | | | 473,587 | |
School District of the City of Dearborn GO, 4.00% due 5/1/2020 (Insured: Q-SBLF) (State Aid Withholding) | | NR/Aa2 | | | 350,000 | | | | 391,339 | |
School District of the City of Dearborn GO, 4.00% due 5/1/2021 (Insured: Q-SBLF) (State Aid Withholding) | | NR/Aa2 | | | 570,000 | | | | 641,837 | |
School District of the City of Dearborn GO, 4.00% due 5/1/2022 (Insured: Q-SBLF) (State Aid Withholding) | | NR/Aa2 | | | 535,000 | | | | 607,113 | |
School District of the City of Dearborn GO, 4.00% due 5/1/2023 (Insured: Q-SBLF) (State Aid Withholding) | | NR/Aa2 | | | 625,000 | | | | 712,206 | |
School District of the City of Detroit GO, 5.00% due 5/1/2020 (Wayne County School Building & Site; Insured: Q-SBLF) | | AA-/Aa2 | | | 2,200,000 | | | | 2,527,822 | |
School District of the City of Detroit GO, 5.00% due 5/1/2021 (Wayne County School Building & Site; Insured: Q-SBLF) | | AA-/Aa2 | | | 4,000,000 | | | | 4,627,960 | |
School District of the City of Detroit GO, 5.00% due 5/1/2022 (Wayne County School Building & Site; Insured: Q-SBLF) | | AA-/Aa2 | | | 3,000,000 | | | | 3,505,350 | |
Sparta Area Schools, Counties of Kent and Ottawa GO, 4.00% due 5/1/2016 (School Building & Site; Insured: Q-SBLF) | | AA-/NR | | | 1,000,000 | | | | 1,035,260 | |
Sparta Area Schools, Counties of Kent and Ottawa GO, 5.00% due 5/1/2017 (School Building & Site; Insured: Q-SBLF) | | AA-/NR | | | 1,085,000 | | | | 1,172,071 | |
Sparta Area Schools, Counties of Kent and Ottawa GO, 5.00% due 5/1/2018 (School Building & Site; Insured: Q-SBLF) | | AA-/NR | | | 1,285,000 | | | | 1,423,035 | |
Sparta Area Schools, Counties of Kent and Ottawa GO, 5.00% due 5/1/2020 (School Building & Site; Insured: Q-SBLF) | | AA-/NR | | | 1,335,000 | | | | 1,534,396 | |
St. Johns Public Schools GO, 5.00% due 5/1/2021 (Insured: Natl-Re/FGIC/Q-SBLF) | | AA-/Aa3 | | | 1,000,000 | | | | 1,178,580 | |
State Building Authority of the State of Michigan, 5.00% due 10/15/2015 (Higher Education Facilities Program; Insured: AMBAC) | | A+/Aa3 | | | 6,000,000 | | | | 6,154,320 | |
State Building Authority of the State of Michigan, 5.00% due 10/15/2015 (Higher Education Facilities Program) | | A+/Aa3 | | | 4,000,000 | | | | 4,104,280 | |
State Building Authority of the State of Michigan, 5.00% due 10/15/2016 (Higher Education Facilities Program) | | A+/Aa3 | | | 6,305,000 | | | | 6,743,450 | |
State Building Authority of the State of Michigan, 5.50% due 10/15/2017 (Various Correctional Institutions, Higher Education and Other State Facilities) | | A+/Aa3 | | | 4,150,000 | | | | 4,625,880 | |
State Building Authority of the State of Michigan, 5.00% due 10/15/2020 (Higher Education Facilities Program) | | A+/Aa3 | | | 1,000,000 | | | | 1,169,700 | |
State Building Authority of the State of Michigan, 5.00% due 10/15/2021 (Higher Education Facilities Program) | | A+/Aa3 | | | 1,000,000 | | | | 1,182,600 | |
State Building Authority of the State of Michigan, 5.00% due 10/15/2022 (Higher Education Facilities Program) | | A+/Aa3 | | | 3,000,000 | | | | 3,587,400 | |
State Building Authority of the State of Michigan, 5.00% due 10/15/2023 (Higher Education Facilities Program) | | A+/Aa3 | | | 7,715,000 | | | | 9,308,996 | |
Utica Community Schools County of Macomb GO, 4.00% due 5/1/2018 (Technology Infrastructure Improvements; Insured: Q-SBLF) | | AA-/NR | | | 1,725,000 | | | | 1,868,227 | |
Utica Community Schools County of Macomb GO, 4.00% due 5/1/2019 (Technology Infrastructure Improvements; Insured: Q-SBLF) | | AA-/NR | | | 9,925,000 | | | | 10,898,642 | |
Warren Consolidated School District GO, 4.00% due 5/1/2015 (Insured: Q-SBLF) | | AA-/NR | | | 1,000,000 | | | | 1,003,040 | |
Warren Consolidated School District GO, 4.00% due 5/1/2017 (Insured: Q-SBLF) | | AA-/NR | | | 1,035,000 | | | | 1,100,039 | |
Warren Consolidated School District GO, 5.00% due 5/1/2018 (Insured: Q-SBLF) | | AA-/NR | | | 1,000,000 | | | | 1,108,060 | |
Warren Consolidated School District GO, 5.00% due 5/1/2020 (Insured: Q-SBLF) | | AA-/NR | | | 1,000,000 | | | | 1,153,020 | |
Warren Consolidated School District GO, 5.00% due 5/1/2021 (Insured: Q-SBLF) | | AA-/NR | | | 1,000,000 | | | | 1,170,830 | |
Wayne County Airport Authority, 5.00% due 12/1/2017 (Detroit Metropolitan Airport; Insured: Natl-Re) | | AA-/A2 | | | 1,000,000 | | | | 1,101,400 | |
Wayne County Airport Authority, 5.00% due 12/1/2017 (Detroit Metropolitan Airport) | | A/A2 | | | 2,420,000 | | | | 2,665,388 | |
Wayne County Airport Authority, 5.00% due 12/1/2019 (Detroit Metropolitan Airport) | | A/A2 | | | 12,645,000 | | | | 14,506,976 | |
Wayne County Airport Authority, 5.50% due 12/1/2019 (Detroit Metropolitan Airport) | | A/A2 | | | 2,600,000 | | | | 3,040,934 | |
Wayne County Airport Authority, 5.50% due 12/1/2020 (Detroit Metropolitan Airport) | | A/A2 | | | 4,395,000 | | | | 5,242,092 | |
Wayne County Airport Authority, 5.50% due 12/1/2020 (Detroit Metropolitan Airport) | | A/A2 | | | 3,115,000 | | | | 3,715,385 | |
Western Townships Utilities Authority GO, 5.00% due 1/1/2016 (Sewage Disposal System) | | AA/NR | | | 1,670,000 | | | | 1,727,331 | |
Western Townships Utilities Authority GO, 5.00% due 1/1/2017 (Sewage Disposal System) | | AA/NR | | | 1,500,000 | | | | 1,611,975 | |
Western Townships Utilities Authority GO, 5.00% due 1/1/2018 (Sewage Disposal System) | | AA/NR | | | 1,500,000 | | | | 1,658,010 | |
| | | |
MINNESOTA — 1.41% | | | | | | | | | | |
Cities of Minneapolis-St. Paul Metropolitan Airports Commission, 5.00% due 1/1/2017 (Insured: AMBAC) | | AA-/NR | | | 8,005,000 | | | | 8,628,910 | |
City of St. Cloud, 5.00% due 5/1/2015 (CentraCare Health System) | | NR/A1 | | | 1,000,000 | | | | 1,004,020 | |
City of St. Cloud, 5.00% due 5/1/2016 (CentraCare Health System) | | NR/A1 | | | 1,250,000 | | | | 1,311,762 | |
City of St. Cloud, 5.00% due 5/1/2017 (CentraCare Health System) | | NR/A1 | | | 2,920,000 | | | | 3,179,471 | |
City of St. Cloud, 5.00% due 5/1/2017 (CentraCare Health System) | | NR/A1 | | | 1,000,000 | | | | 1,088,860 | |
City of St. Cloud, 5.00% due 5/1/2018 (CentraCare Health System) | | NR/A1 | | | 3,105,000 | �� | | | 3,461,454 | |
City of St. Cloud, 5.00% due 5/1/2019 (CentraCare Health System) | | NR/A1 | | | 3,495,000 | | | | 3,989,193 | |
City of St. Cloud, 5.00% due 5/1/2020 (CentraCare Health System) | | NR/A1 | | | 3,310,000 | | | | 3,850,324 | |
City of St. Paul Housing & Redevelopment Authority, 5.00% due 2/1/2018 (Gillette Children’s Specialty Healthcare Project) | | A-/NR | | | 1,255,000 | | | | 1,364,499 | |
City of St. Paul Housing & Redevelopment Authority, 5.25% due 2/1/2020 (Gillette Children’s Specialty Healthcare Project) | | A-/NR | | | 2,010,000 | | | | 2,247,059 | |
City of St. Paul Housing & Redevelopment Authority, 5.25% due 5/15/2021 (Regions Hospital) | | A/A2 | | | 1,070,000 | | | | 1,134,617 | |
City of St. Paul Housing & Redevelopment Authority, 0.03% due 11/15/2035 put 4/1/2015 (Allina Health System; LOC: JPMorgan Chase Bank, N.A.) (daily demand notes) | | NR/Aa3 | | | 30,215,000 | | | | 30,215,000 | |
County of Clay GO, 3.00% due 4/1/2018 (State-Aid Road Improvements) | | AA/NR | | | 1,225,000 | | | | 1,300,423 | |
Semi-Annual Report 25
| | |
| SCHEDULE OF INVESTMENTS, CONTINUED | | |
| |
Thornburg Limited Term Municipal Fund | | March 31, 2015 (Unaudited) |
| | | | | | | | | | |
Issuer-Description | | Credit Rating†
S&P/ Moody’s | | Principal
Amount | | | Value | |
Le Sueur-Henderson ISD No. 2397 GO, 3.00% due 4/1/2021 (Minnesota School District Credit Enhancement Program) | | AA+/NR | | $ | 1,125,000 | | | $ | 1,207,283 | |
Minnesota Agricultural & Economic Development Board, 5.00% due 2/15/2017 (Essential Health; Insured: AGM) | | AA/NR | | | 2,500,000 | | | | 2,689,250 | |
Northern Municipal Power Agency, 5.00% due 1/1/2019 (Electric System) | | A-/A3 | | | 5,000,000 | | | | 5,672,900 | |
Northern Municipal Power Agency, 5.00% due 1/1/2020 (Electric System) | | A-/A3 | | | 3,500,000 | | | | 4,056,045 | |
Port Authority of the City of St. Paul, 5.00% due 12/1/2017 (Minnesota Andersen Office Building) | | AA/Aa2 | | | 4,945,000 | | | | 5,478,813 | |
Port Authority of the City of St. Paul, 4.00% due 12/1/2018 (Minnesota Freeman Office Building) | | AA/Aa2 | | | 3,925,000 | | | | 4,318,481 | |
Port Authority of the City of St. Paul, 5.00% due 12/1/2019 (Minnesota Freeman Office Building) | | AA/Aa2 | | | 2,000,000 | | | | 2,319,020 | |
Port Authority of the City of St. Paul, 5.00% due 12/1/2020 (Minnesota Freeman Office Building) | | AA/Aa2 | | | 2,675,000 | | | | 3,155,671 | |
a Port Authority of the City of St. Paul, 5.00% due 12/1/2021 (Minnesota Andersen Office Building) | | AA/Aa2 | | | 965,000 | | | | 1,155,076 | |
Port Authority of the City of St. Paul, 5.00% due 12/1/2022 (Minnesota Andersen Office Building) | | AA/Aa2 | | | 1,250,000 | | | | 1,516,175 | |
State of Minnesota GO, 5.00% due 8/1/2015 (Educational and Recreational Facilities Improvements) (ETM) | | NR/NR | | | 165,000 | | | | 167,647 | |
State of Minnesota GO, 5.00% due 8/1/2015 (Educational and Recreational Facilities Improvements) | | AA+/Aa1 | | | 9,835,000 | | | | 9,995,114 | |
| | | |
MISSISSIPPI — 0.42% | | | | | | | | | | |
City of Jackson GO, 5.00% due 10/1/2016 (Insured: AMBAC) | | AA-/Aa2 | | | 1,500,000 | | | | 1,532,700 | |
Lamar County School District GO, 3.00% due 6/1/2016 (Educational and Performing Arts Capital Projects) | | A/NR | | | 1,800,000 | | | | 1,851,588 | |
Lamar County School District GO, 3.50% due 6/1/2017 (Educational and Performing Arts Capital Projects) | | A/NR | | | 1,700,000 | | | | 1,794,979 | |
Medical Center Educational Building, 4.00% due 6/1/2015 (University of Mississippi Medical Center) | | AA-/Aa2 | | | 2,325,000 | | | | 2,339,136 | |
Medical Center Educational Building, 4.00% due 6/1/2016 (University of Mississippi Medical Center) | | AA-/Aa2 | | | 3,300,000 | | | | 3,430,812 | |
Mississippi Development Bank, 4.75% due 7/1/2017 (Canton GO Public Improvement Project) | | NR/NR | | | 880,000 | | | | 911,970 | |
Mississippi Development Bank, 5.00% due 8/1/2018 (Department of Corrections) | | AA-/NR | | | 4,910,000 | | | | 5,498,611 | |
Mississippi Development Bank, 5.00% due 1/1/2020 (MDOT-Harrison County Highway) | | AA-/Aa3 | | | 1,500,000 | | | | 1,745,790 | |
Mississippi Development Bank, 5.00% due 1/1/2020 (MDOT-Madison County Highway) | | AA-/Aa3 | | | 1,000,000 | | | | 1,163,860 | |
Mississippi Development Bank, 5.00% due 1/1/2021 (MDOT-Harrison County Highway) | | AA-/Aa3 | | | 2,500,000 | | | | 2,959,075 | |
Mississippi Development Bank, 5.00% due 1/1/2021 (MDOT-Madison County Highway) | | AA-/Aa3 | | | 2,000,000 | | | | 2,367,260 | |
Mississippi Development Bank, 5.00% due 1/1/2022 (MDOT-Harrison County Highway) | | AA-/Aa3 | | | 1,000,000 | | | | 1,199,700 | |
Mississippi Development Bank, 5.00% due 1/1/2022 (MDOT-Madison County Highway) | | AA-/Aa3 | | | 1,000,000 | | | | 1,199,700 | |
Mississippi Development Bank, 5.00% due 1/1/2023 (MDOT-Harrison County Highway) | | AA-/Aa3 | | | 1,500,000 | | | | 1,814,355 | |
Mississippi Development Bank, 5.00% due 1/1/2023 (MDOT-Madison County Highway) | | AA-/Aa3 | | | 1,250,000 | | | | 1,511,963 | |
| | | |
MISSOURI — 1.24% | | | | | | | | | | |
Cass County COP, 4.00% due 5/1/2015 | | A/NR | | | 1,000,000 | | | | 1,002,820 | |
Cass County COP, 4.00% due 5/1/2018 | | A/NR | | | 2,255,000 | | | | 2,408,295 | |
Cass County COP, 4.50% due 5/1/2019 | | A/NR | | | 1,270,000 | | | | 1,392,149 | |
Cass County COP, 5.00% due 5/1/2020 | | A/NR | | | 2,255,000 | | | | 2,560,575 | |
Cass County COP, 5.00% due 5/1/2021 | | A/NR | | | 1,750,000 | | | | 1,964,760 | |
City of Lee’s Summit GO, 3.00% due 4/1/2015 | | NR/Aa1 | | | 1,275,000 | | | | 1,275,000 | |
Jackson County, 4.00% due 12/1/2016 (Parking Facility Projects) | | NR/Aa3 | | | 500,000 | | | | 528,560 | |
Jackson County, 4.00% due 12/1/2017 (Parking Facility Projects) | | NR/Aa3 | | | 500,000 | | | | 540,420 | |
Jackson County, 4.00% due 12/1/2019 (Parking Facility Projects) | | NR/Aa3 | | | 500,000 | | | | 556,040 | |
Jackson County, 4.00% due 12/1/2021 (Parking Facility Projects) | | NR/Aa3 | | | 1,000,000 | | | | 1,121,730 | |
a Kansas City IDA, 5.00% due 9/1/2018 (Kansas City Redevelopment District) (ETM) | | NR/NR | | | 695,000 | | | | 787,463 | |
Kansas City IDA, 5.00% due 9/1/2018 (Kansas City Redevelopment District) | | AA-/A1 | | | 1,305,000 | | | | 1,462,083 | |
Kansas City Municipal Assistance Corp., 5.00% due 4/15/2018 (Bartle Music Hall and Municipal Auditorium Parking Garage; Insured: Natl-Re) | | AA/A1 | | | 1,000,000 | | | | 1,111,640 | |
Kansas City Municipal Assistance Corp., 0% due 4/15/2021 (H. Roe Bartle Convention Center & Infrastructure Project; Insured: AMBAC) | | AA-/A1 | | | 10,055,000 | | | | 8,750,565 | |
Kansas City Municipal Assistance Corp., 0% due 4/15/2022 (H. Roe Bartle Convention Center & Infrastructure Project; Insured: AMBAC) | | AA-/A1 | | | 5,040,000 | | | | 4,236,422 | |
Missouri Development Finance Board, 4.00% due 6/1/2015 (City of Independence Electric System Projects) | | A/NR | | | 1,000,000 | | | | 1,005,870 | |
Missouri Development Finance Board, 4.00% due 6/1/2016 (City of Independence Electric System Projects) | | A/NR | | | 1,560,000 | | | | 1,617,798 | |
Missouri Development Finance Board, 5.00% due 6/1/2017 (City of Independence Electric System Projects) | | A/NR | | | 1,525,000 | | | | 1,644,057 | |
Missouri Development Finance Board, 5.00% due 6/1/2018 (City of Independence Electric System Projects) | | A/NR | | | 1,705,000 | | | | 1,882,525 | |
Missouri Development Finance Board, 4.00% due 6/1/2019 (City of Independence Electric System Projects) | | A/NR | | | 1,000,000 | | | | 1,080,940 | |
Missouri Development Finance Board, 5.00% due 6/1/2019 (City of Independence Electric System Projects) | | A/NR | | | 1,790,000 | | | | 2,006,143 | |
Missouri Development Finance Board, 4.00% due 6/1/2020 (City of Independence Electric System Projects) | | A/NR | | | 1,265,000 | | | | 1,373,347 | |
Missouri Development Finance Board, 5.00% due 6/1/2020 (City of Independence Electric System Projects) | | A/NR | | | 1,000,000 | | | | 1,134,180 | |
Missouri Development Finance Board, 4.00% due 6/1/2021 (City of Independence Electric System Projects) | | A/NR | | | 2,465,000 | | | | 2,684,631 | |
Missouri Development Finance Board, 4.00% due 6/1/2022 (City of Independence Electric System Projects) | | A/NR | | | 3,155,000 | | | | 3,439,549 | |
Missouri Development Finance Board, 0.03% due 12/1/2033 put 4/1/2015 (The Nelson Gallery Foundation; SPA: Northern Trust Co.) (daily demand notes) | | AAA/Aaa | | | 1,300,000 | | | | 1,300,000 | |
Missouri Health and Educational Facilities Authority, 4.00% due 4/1/2015 (Webster University) | | NR/A2 | | | 2,155,000 | | | | 2,155,000 | |
Missouri Health and Educational Facilities Authority, 4.00% due 4/1/2016 (Webster University) | | NR/A2 | | | 1,685,000 | | | | 1,746,604 | |
Missouri Health and Educational Facilities Authority, 5.00% due 5/15/2017 (Children’s Mercy Hospital) | | A+/NR | | | 1,000,000 | | | | 1,076,830 | |
Missouri Health and Educational Facilities Authority, 5.00% due 5/15/2019 (Children’s Mercy Hospital) | | A+/NR | | | 1,000,000 | | | | 1,124,480 | |
Missouri Health and Educational Facilities Authority, 5.00% due 5/15/2020 (Children’s Mercy Hospital) | | A+/NR | | | 1,000,000 | | | | 1,129,690 | |
26 Semi-Annual Report
| | |
| SCHEDULE OF INVESTMENTS, CONTINUED | | |
| |
Thornburg Limited Term Municipal Fund | | March 31, 2015 (Unaudited) |
| | | | | | | | | | |
Issuer-Description | | Credit Rating†
S&P/ Moody’s | | Principal
Amount | | | Value | |
Missouri Health and Educational Facilities Authority, 0.02% due 9/1/2030 put 4/1/2015 (Washington University; SPA: | | | | | | | | | | |
JPMorgan Chase Bank, N.A.) (daily demand notes) | | AAA/Aaa | | $ | 2,910,000 | | | $ | 2,910,000 | |
a Platte County, 4.00% due 4/1/2017 (Community & Resource Centers) | | NR/A1 | | | 1,500,000 | | | | 1,574,850 | |
Platte County, 4.00% due 4/1/2018 (Community & Resource Centers) | | NR/A1 | | | 2,110,000 | | | | 2,247,551 | |
Platte County, 5.00% due 4/1/2019 (Community & Resource Centers) | | NR/A1 | | | 2,000,000 | | | | 2,227,940 | |
Platte County, 5.00% due 4/1/2021 (Community & Resource Centers) | | NR/A1 | | | 2,440,000 | | | | 2,791,872 | |
Southeast Missouri State University, 4.00% due 4/1/2015 (City of Cape Girardeau Campus System Facilities) | | A/NR | | | 600,000 | | | | 600,000 | |
Southeast Missouri State University, 5.00% due 4/1/2016 (City of Cape Girardeau Campus System Facilities) | | A/NR | | | 750,000 | | | | 783,510 | |
a Southeast Missouri State University, 5.00% due 4/1/2018 (City of Cape Girardeau Campus System Facilities) | | A/NR | | | 1,165,000 | | | | 1,293,802 | |
Southeast Missouri State University, 5.00% due 4/1/2020 (City of Cape Girardeau Campus System Facilities) | | A/NR | | | 2,825,000 | | | | 3,255,417 | |
Special Administrative Board of the Transitional School District of the City of St. Louis GO, 4.00% due 4/1/2019 (State Aid Withholding) | | AA+/NR | | | 1,615,000 | | | | 1,788,096 | |
Special Administrative Board of the Transitional School District of the City of St. Louis GO, 4.00% due 4/1/2020 (State Aid Withholding) | | AA+/NR | | | 1,600,000 | | | | 1,796,928 | |
Special Administrative Board of the Transitional School District of the City of St. Louis GO, 4.00% due 4/1/2021 (State Aid Withholding) | | AA+/NR | | | 2,055,000 | | | | 2,333,000 | |
Special Administrative Board of the Transitional School District of the City of St. Louis GO, 4.00% due 4/1/2022 (State Aid Withholding) | | AA+/NR | | | 3,300,000 | | | | 3,758,700 | |
St. Louis Municipal Finance Corp., 5.00% due 2/15/2016 (City Justice Center) | | A/A1 | | | 2,065,000 | | | | 2,145,576 | |
St. Louis Municipal Finance Corp., 5.00% due 2/15/2017 (City Justice Center) | | A/A1 | | | 2,000,000 | | | | 2,153,140 | |
St. Louis Municipal Finance Corp., 5.00% due 2/15/2018 (City Justice Center) | | A/A1 | | | 3,865,000 | | | | 4,272,023 | |
| | | |
NEVADA — 1.06% | | | | | | | | | | |
Carson City, 4.00% due 9/1/2015 (Carson Tahoe Regional Healthcare Project) | | BBB+/NR | | | 1,000,000 | | | | 1,012,220 | |
Carson City, 4.00% due 9/1/2016 (Carson Tahoe Regional Healthcare Project) | | BBB+/NR | | | 1,045,000 | | | | 1,085,515 | |
Carson City, 5.00% due 9/1/2019 (Carson Tahoe Regional Healthcare Project) | | BBB+/NR | | | 1,000,000 | | | | 1,121,380 | |
Carson City, 5.00% due 9/1/2020 (Carson Tahoe Regional Healthcare Project) | | BBB+/NR | | | 1,000,000 | | | | 1,136,730 | |
Carson City, 5.00% due 9/1/2022 (Carson Tahoe Regional Healthcare Project) | | BBB+/NR | | | 2,450,000 | | | | 2,818,088 | |
City of Las Vegas COP, 5.00% due 9/1/2016 (City Hall) | | AA-/Aa3 | | | 4,000,000 | | | | 4,230,440 | |
City of Las Vegas COP, 5.00% due 9/1/2017 (City Hall) | | AA-/Aa3 | | | 4,300,000 | | | | 4,675,734 | |
City of Las Vegas COP, 5.00% due 9/1/2018 (City Hall) | | AA-/Aa3 | | | 4,000,000 | | | | 4,431,040 | |
City of Las Vegas GO, 7.00% due 4/1/2017 (Performing Arts Center) | | AA/Aa2 | | | 1,825,000 | | | | 2,051,008 | |
City of Las Vegas GO, 7.00% due 4/1/2018 (Performing Arts Center) | | AA/Aa2 | | | 2,095,000 | | | | 2,461,520 | |
City of Reno, 5.25% due 6/1/2016 (Washoe Medical Center; Insured: AGM) | | AA/A2 | | | 1,100,000 | | | | 1,155,506 | |
City of Reno, 5.25% due 6/1/2018 (Washoe Medical Center; Insured: AGM) | | AA/A2 | | | 1,000,000 | | | | 1,115,140 | |
Clark County GO, 5.00% due 11/1/2017 (Southern Nevada Water Authority; Insured: AMBAC) | | AA/Aa1 | | | 1,310,000 | | | | 1,406,914 | |
Clark County Improvement District, 5.00% due 12/1/2015 (Insured: AMBAC) | | BBB+/NR | | | 1,610,000 | | | | 1,647,932 | |
Las Vegas Clark County Library District GO, 5.00% due 1/1/2018 | | AA/Aa2 | | | 6,535,000 | | | | 7,244,113 | |
Las Vegas Clark County Library District GO, 5.00% due 1/1/2019 | | AA/Aa2 | | | 3,000,000 | | | | 3,406,110 | |
Las Vegas Convention & Visitors Authority, 5.25% due 7/1/2015 (Insured: AMBAC) | | A+/A1 | | | 4,845,000 | | | | 4,905,223 | |
Las Vegas Convention & Visitors Authority, 5.00% due 7/1/2019 (Insured: AMBAC) | | A+/A1 | | | 6,000,000 | | | | 6,071,220 | |
Las Vegas Valley Water District GO, 5.00% due 6/1/2016 | | AA+/Aa2 | | | 1,000,000 | | | | 1,054,390 | |
Las Vegas Valley Water District GO, 5.00% due 6/1/2017 | | AA+/Aa2 | | | 1,050,000 | | | | 1,147,618 | |
Las Vegas Valley Water District GO, 5.00% due 6/1/2019 | | AA+/Aa2 | | | 1,000,000 | | | | 1,147,530 | |
Las Vegas Valley Water District GO, 5.00% due 6/1/2020 | | AA+/Aa2 | | | 4,255,000 | | | | 4,976,690 | |
Las Vegas Valley Water District GO, 5.00% due 6/1/2020 | | AA+/Aa2 | | | 5,080,000 | | | | 5,941,619 | |
Las Vegas Valley Water District GO, 5.00% due 6/1/2021 | | AA+/Aa2 | | | 5,000,000 | | | | 5,930,400 | |
State of Nevada GO, 5.00% due 12/1/2021 (Municipal Bond Bank Project Nos. R-9A through R-13F; Insured: AGM) | | AA/Aa2 | | | 1,095,000 | | | | 1,103,782 | |
University and Community College System of Nevada, 5.00% due 7/1/2016 pre-refunded 7/1/2015 (Reno Campus | | | | | | | | | | |
Library Facility; Insured: AGM) | | AA/Aa2 | | | 370,000 | | | | 374,444 | |
Washoe County GO, 5.00% due 7/1/2021 (Reno-Sparks Convention & Visitors Authority) | | AA/Aa2 | | | 1,700,000 | | | | 1,990,598 | |
Washoe County GO, 5.00% due 7/1/2022 (Reno-Sparks Convention & Visitors Authority) | | AA/Aa2 | | | 2,500,000 | | | | 2,941,775 | |
| | | |
NEW HAMPSHIRE — 0.46% | | | | | | | | | | |
New Hampshire Health and Education Facilities Authority, 5.00% due 10/1/2016 (Southern New Hampshire Medical Center) | | A-/NR | | | 1,260,000 | | | | 1,333,093 | |
New Hampshire Health and Education Facilities Authority, 5.00% due 10/1/2017 (Southern New Hampshire Medical Center) | | A-/NR | | | 1,000,000 | | | | 1,088,260 | |
New Hampshire Health and Education Facilities Authority, 0.03% due 6/1/2031 put 4/1/2015 (Dartmouth College; SPA: JPMorgan Chase Bank, N.A.) (daily demand notes) | | AA+/Aa1 | | | 8,500,000 | | | | 8,500,000 | |
New Hampshire Health and Education Facilities Authority, 0.07% due 7/1/2033 put 4/1/2015 (University System of New Hampshire; SPA: Wells Fargo Bank, N.A.) (daily demand notes) | | A+/Aa3 | | | 880,000 | | | | 880,000 | |
New Hampshire Municipal Bond Bank, 5.00% due 8/15/2016 (Insured: Natl-Re) | | AA/Aa3 | | | 2,985,000 | | | | 3,173,801 | |
New Hampshire Municipal Bond Bank, 5.00% due 8/15/2017 (Insured: Natl-Re) | | AA/Aa3 | | | 3,130,000 | | | | 3,444,565 | |
New Hampshire Municipal Bond Bank, 5.25% due 8/15/2020 | | AA/Aa3 | | | 1,000,000 | | | | 1,191,450 | |
New Hampshire Municipal Bond Bank, 5.25% due 8/15/2022 | | AA/Aa3 | | | 2,770,000 | | | | 3,405,853 | |
New Hampshire Turnpike System, 5.00% due 2/1/2016 | | A+/A1 | | | 3,000,000 | | | | 3,118,410 | |
Semi-Annual Report 27
| | |
| SCHEDULE OF INVESTMENTS, CONTINUED | | |
| |
Thornburg Limited Term Municipal Fund | | March 31, 2015 (Unaudited) |
| | | | | | | | | | |
Issuer-Description | | Credit Rating†
S&P/ Moody’s | | Principal
Amount | | | Value | |
New Hampshire Turnpike System, 5.00% due 2/1/2017 | | A+/A1 | | $ | 2,425,000 | | | $ | 2,618,733 | |
New Hampshire Turnpike System, 5.00% due 2/1/2018 | | A+/A1 | | | 1,295,000 | | | | 1,440,791 | |
New Hampshire Turnpike System, 5.00% due 2/1/2020 | | A+/A1 | | | 1,000,000 | | | | 1,162,260 | |
New Hampshire Turnpike System, 5.00% due 2/1/2021 | | A+/A1 | | | 1,260,000 | | | | 1,484,444 | |
State of New Hampshire, 5.00% due 9/1/2015 (I-93 Salem to Manchester Project) | | AA/A2 | | | 825,000 | | | | 841,558 | |
| | | |
NEW JERSEY — 2.20% | | | | | | | | | | |
Burlington County Bridge Commission, 3.00% due 12/1/2015 (County Governmental Loan Program) | | AA/Aa2 | | | 1,245,000 | | | | 1,267,933 | |
Burlington County Bridge Commission, 3.00% due 12/1/2016 (County Governmental Loan Program) | | AA/Aa2 | | | 1,000,000 | | | | 1,040,150 | |
Burlington County Bridge Commission, 5.00% due 12/1/2018 (County Governmental Loan Program) | | AA/Aa2 | | | 1,000,000 | | | | 1,134,920 | |
Camden County Improvement Authority, 5.00% due 7/1/2015 (Cooper Medical School) | | A/A2 | | | 2,990,000 | | | | 3,024,624 | |
Camden County Improvement Authority, 5.00% due 7/1/2016 (Cooper Medical School) | | A/A2 | | | 3,040,000 | | | | 3,205,133 | |
City of Jersey City GO, 4.00% due 8/1/2020 (Qualified General Improvement; Insured: BAM) (State Aid Withholding) | | AA/A1 | | | 2,650,000 | | | | 2,929,045 | |
City of Jersey City GO, 4.00% due 8/1/2021 (Qualified General Improvement; Insured: BAM) (State Aid Withholding) | | AA/A1 | | | 2,805,000 | | | | 3,112,877 | |
City of Jersey City GO, 5.00% due 8/1/2022 (Qualified General Improvement; Insured: BAM) (State Aid Withholding) | | AA/A1 | | | 2,530,000 | | | | 2,984,439 | |
City of Jersey City GO, 5.00% due 8/1/2023 (Qualified General Improvement; Insured: BAM) (State Aid Withholding) | | AA/A1 | | | 2,455,000 | | | | 2,898,201 | |
a City of Paterson, 4.25% due 6/15/2015 (City Capital Projects; Insured: AGM) (State Aid Withholding) (ETM) | | NR/A2 | | | 1,275,000 | | | | 1,285,697 | |
City of Paterson GO, 3.50% due 3/15/2017 (Debt Restructuring & City Capital Projects) (State Aid Withholding) | | NR/A2 | | | 950,000 | | | | 988,523 | |
County of Essex GO, 4.00% due 6/1/2016 | | NR/Aa2 | | | 500,000 | | | | 521,415 | |
County of Hudson COP, 6.25% due 12/1/2016 (Correctional Facility Lease-Purchase; Insured: Natl-Re) | | AA-/A3 | | | 550,000 | | | | 594,011 | |
Essex County Improvement Authority, 5.50% due 10/1/2024 (County Correctional Facilities & Gibraltar Facilities; Insured: Natl-Re) | | NR/Aa2 | | | 5,000,000 | | | | 6,351,050 | |
Gloucester County Improvement Authority, 2.125% due 12/1/2029 put 12/1/2017 (Waste Management, Inc. Project) | | A-/NR | | | 2,000,000 | | | | 2,070,140 | |
Hudson County Improvement Authority, 4.75% due 10/1/2015 (Hudson County Lease Project; Insured: AGM) | | AA/Aa3 | | | 2,000,000 | | | | 2,044,440 | |
Hudson County Improvement Authority, 4.75% due 10/1/2016 (Hudson County Lease Project; Insured: AGM) | | AA/Aa3 | | | 3,155,000 | | | | 3,345,814 | |
Hudson County Improvement Authority, 4.75% due 10/1/2017 (Hudson County Lease Project; Insured: AGM) | | AA/Aa3 | | | 4,065,000 | | | | 4,434,061 | |
Hudson County Improvement Authority, 4.75% due 10/1/2018 (Hudson County Lease Project; Insured: AGM) | | AA/Aa3 | | | 2,000,000 | | | | 2,227,320 | |
Hudson County Improvement Authority, 4.75% due 10/1/2019 (Hudson County Lease Project; Insured: AGM) | | AA/Aa3 | | | 4,390,000 | | | | 4,979,884 | |
Hudson County Improvement Authority, 5.375% due 10/1/2020 (Hudson County Lease Project; Insured: AGM) | | AA/Aa3 | | | 2,020,000 | | | | 2,392,165 | |
Middlesex County Improvement Authority, 5.00% due 9/15/2015 (Parks, Open Space, Playgrounds for Public Recreation) | | AAA/Aa2 | | | 500,000 | | | | 511,045 | |
Monmouth County Improvement Authority, 5.00% due 12/1/2016 (Insured: AMBAC) | | NR/NR | | | 1,000,000 | | | | 1,064,610 | |
New Jersey EDA, 5.00% due 12/15/2016 (School Facilities Construction) | | A-/A2 | | | 10,950,000 | | | | 11,678,613 | |
New Jersey EDA, 5.00% due 9/1/2018 pre-refunded 9/1/2015 (School Facilities Construction; Insured: Natl-Re) | | AA+/A2 | | | 3,000,000 | | | | 3,058,440 | |
New Jersey EDA, 5.50% due 12/15/2019 (School Facilities Construction; Insured: AMBAC) | | A-/A2 | | | 5,525,000 | | | | 6,261,206 | |
New Jersey EDA, 5.00% due 9/1/2020 (School Facilities Construction) | | A-/A2 | | | 500,000 | | | | 559,085 | |
New Jersey EDA, 5.00% due 6/15/2022 (School Facilities Construction) | | A-/A2 | | | 8,000,000 | | | | 9,012,560 | |
New Jersey EDA, 5.00% due 3/1/2023 (School Facilities Construction) | | A-/A2 | | | 8,015,000 | | | | 9,072,900 | |
New Jersey EDA, 5.00% due 6/15/2023 (School Facilities Construction) | | A-/A2 | | | 2,000,000 | | | | 2,267,880 | |
New Jersey EDA, 5.75% due 9/1/2023 (School Facilities Construction) | | A-/A2 | | | 5,505,000 | | | | 6,308,180 | |
New Jersey EDA, 5.00% due 6/15/2024 (School Facilities Construction) | | A-/A2 | | | 4,250,000 | | | | 4,815,718 | |
New Jersey EDA, 5.00% due 3/1/2025 (School Facilities Construction) | | A-/A2 | | | 4,575,000 | | | | 5,081,544 | |
New Jersey EDA, 5.00% due 3/1/2026 (School Facilities Construction) | | A-/A2 | | | 3,000,000 | | | | 3,303,300 | |
New Jersey Educational Facilities Authority, 5.00% due 9/1/2016 (Higher Education Capital Improvement; Insured: AGM) | | AA/A2 | | | 675,000 | | | | 688,298 | |
New Jersey Health Care Facilities Financing Authority, 5.00% due 7/1/2023 (Virtua Health Issue) | | A+/NR | | | 535,000 | | | | 643,642 | |
New Jersey Health Care Facilities Financing Authority, 5.00% due 7/1/2024 (Virtua Health Issue) | | A+/NR | | | 1,000,000 | | | | 1,202,330 | |
New Jersey Higher Educational Assistance Authority, 5.00% due 12/1/2017 | | AA/Aa2 | | | 1,910,000 | | | | 2,100,121 | |
New Jersey Higher Educational Assistance Authority, 5.00% due 12/1/2018 | | AA/Aa2 | | | 3,000,000 | | | | 3,352,050 | |
New Jersey Higher Educational Assistance Authority, 5.25% due 12/1/2019 | | AA/Aa2 | | | 5,650,000 | | | | 6,498,460 | |
New Jersey Transit Corp., 5.00% due 9/15/2021 (Urban Public Transportation Capital Improvement) | | A/A3 | | | 3,395,000 | | | | 3,928,083 | |
New Jersey Transit Corp. COP, 5.00% due 9/15/2019 pre-refunded 9/15/2015 (Multi-Level Rail Cars and Parts; Insured: Natl-Re) | | AA-/A3 | | | 975,000 | | | | 996,401 | |
New Jersey Transportation Trust Fund Authority, 5.00% due 6/15/2019 (State Transportation System) | | A-/A2 | | | 1,000,000 | | | | 1,107,870 | |
New Jersey Transportation Trust Fund Authority, 5.00% due 6/15/2019 pre-refunded 6/15/2015 (State Transportation System; Insured: AGM) | | AA+/NR | | | 1,450,000 | | | | 1,464,268 | |
New Jersey Transportation Trust Fund Authority, 5.00% due 6/15/2020 (State Transportation System) | | A-/A2 | | | 1,000,000 | | | | 1,116,060 | |
New Jersey Transportation Trust Fund Authority, 5.00% due 6/15/2021 (State Transportation System) | | A-/A2 | | | 2,570,000 | | | | 2,875,136 | |
New Jersey Transportation Trust Fund Authority, 5.25% due 12/15/2022 (State Transportation System) | | A-/A2 | | | 2,000,000 | | | | 2,296,180 | |
New Jersey Transportation Trust Fund Authority, 5.25% due 12/15/2023 (State Transportation System; Insured: AMBAC) | | A-/A2 | | | 3,545,000 | | | | 4,097,382 | |
New Jersey Transportation Trust Fund Authority, 5.00% due 6/15/2024 (State Transportation System) | | A-/A2 | | | 1,660,000 | | | | 1,880,963 | |
Ocean Township Municipal Utility Authority, 6.00% due 8/1/2017 (Insured: Natl-Re) | | AA-/A3 | | | 2,065,000 | | | | 2,184,336 | |
Passaic Valley Sewer Commissioners GO, 5.625% due 12/1/2018 (Sewer System) | | NR/A2 | | | 1,210,000 | | | | 1,380,634 | |
Passaic Valley Sewer Commissioners GO, 5.75% due 12/1/2019 (Sewer System) | | NR/A2 | | | 2,000,000 | | | | 2,337,020 | |
Passaic Valley Sewer Commissioners GO, 5.75% due 12/1/2020 (Sewer System) | | NR/A2 | | | 2,800,000 | | | | 3,335,780 | |
Passaic Valley Sewer Commissioners GO, 5.75% due 12/1/2021 (Sewer System) | | NR/A2 | | | 1,000,000 | | | | 1,209,600 | |
28 Semi-Annual Report
| | |
| SCHEDULE OF INVESTMENTS, CONTINUED | | |
| |
Thornburg Limited Term Municipal Fund | | March 31, 2015 (Unaudited) |
| | | | | | | | | | |
Issuer-Description | | Credit Rating†
S&P/ Moody’s | | Principal
Amount | | | Value | |
Township of Plainsboro GO, 4.00% due 5/1/2015 (General Improvement) | | NR/Aa1 | | $ | 1,000,000 | | | $ | 1,003,130 | |
Township of Wayne GO, 2.00% due 2/15/2018 (General Improvements and Water Utility System) | | AA+/Aaa | | | 1,295,000 | | | | 1,330,742 | |
| | | |
NEW MEXICO — 0.87% | | | | | | | | | | |
Albuquerque Bernalillo County Water Utility Authority, 5.00% due 7/1/2016 pre-refunded 7/1/2015 (San Juan-Chama Drinking Water Project; Insured: AMBAC) | | AA+/Aa2 | | | 1,800,000 | | | | 1,821,618 | |
Albuquerque Municipal School District No. 12 GO, 5.00% due 8/1/2019 (Bernalillo and Sandoval Counties School Facilities) (State Aid Withholding) | | AA/Aa1 | | | 2,300,000 | | | | 2,669,150 | |
Albuquerque Municipal School District No. 12 GO, 5.00% due 8/1/2021 pre-refunded 8/1/2016 (Educational Facilities) (State Aid Withholding) | | AA/Aa1 | | | 2,425,000 | | | | 2,575,447 | |
City of Farmington PCR, 1.875% due 6/1/2032 put 9/1/2017 (El Paso Electric Co.-Four Corners Project) | | BBB/Baa1 | | | 3,000,000 | | | | 3,023,940 | |
City of Gallup PCR, 5.00% due 8/15/2016 (Tri-State Generation and Transmission Assoc., Inc.; Insured: AMBAC) | | A/A3 | | | 2,500,000 | | | | 2,539,900 | |
City of Santa Fe, 4.50% due 5/15/2022 (El Castillo Retirement Residences) | | BBB-/NR | | | 2,585,000 | | | | 2,693,389 | |
Incorporated County of Los Alamos, 5.50% due 6/1/2017 | | AA+/A1 | | | 2,365,000 | | | | 2,610,180 | |
Incorporated County of Los Alamos, 5.50% due 6/1/2018 | | AA+/A1 | | | 2,205,000 | | | | 2,507,195 | |
New Mexico Educational Assistance Foundation, 4.00% due 9/1/2017 (Student Loans) | | NR/Aaa | | | 6,000,000 | | | | 6,463,980 | |
New Mexico Educational Assistance Foundation, 5.00% due 12/1/2018 (Student Loans) | | AAA/Aaa | | | 5,000,000 | | | | 5,685,200 | |
New Mexico Educational Assistance Foundation, 5.00% due 12/1/2021 (Student Loans) | | AAA/Aaa | | | 3,000,000 | | | | 3,509,880 | |
New Mexico Finance Authority, 3.00% due 6/15/2015 (State Highway Infrastructure Projects) | | AAA/Aa1 | | | 900,000 | | | | 905,355 | |
Regents of New Mexico State University, 5.00% due 4/1/2020 (Corbett Center Student Union & NMSU Golf Course) | | AA/Aa3 | | | 3,095,000 | | | | 3,624,740 | |
Regents of New Mexico State University, 5.00% due 4/1/2021 (Corbett Center Student Union & NMSU Golf Course) | | AA/Aa3 | | | 1,845,000 | | | | 2,198,797 | |
Regents of New Mexico State University, 5.00% due 4/1/2022 (Corbett Center Student Union & NMSU Golf Course) | | AA/Aa3 | | | 1,250,000 | | | | 1,510,400 | |
Santa Fe Public School District GO, 3.00% due 8/1/2015 (District School Building and Renovation Program) (State Aid Withholding) | | AA/Aa1 | | | 1,000,000 | | | | 1,009,530 | |
State of New Mexico, 5.00% due 7/1/2015 (Statewide Capital Project Funding) | | AA/Aa1 | | | 8,200,000 | | | | 8,300,204 | |
State of New Mexico, 5.00% due 7/1/2016 (Statewide Capital Project Funding) | | AA/Aa1 | | | 10,265,000 | | | | 10,869,096 | |
| | | |
NEW YORK — 10.20% | | | | | | | | | | |
Amherst Development Corp., 5.00% due 10/1/2015 (Student Housing; Insured: AGM) | | AA/A2 | | | 2,035,000 | | | | 2,081,194 | |
City of Long Beach School District GO, 3.50% due 5/1/2022 (Insured: AGM) (State Aid Withholding) | | AA/Aa2 | | | 1,600,000 | | | | 1,721,360 | |
City of New York GO, 5.00% due 8/1/2017 pre-refunded 8/1/2015 (City Budget Financial Management) | | NR/NR | | | 990,000 | | | | 1,005,741 | |
City of New York GO, 5.00% due 8/1/2017 (City Budget Financial Management) | | AA/Aa2 | | | 10,000 | | | | 10,162 | |
City of New York GO, 0.03% due 8/1/2020 put 4/1/2015 (City Budget Financial Management; LOC: JPMorgan Chase Bank, N.A.) (daily demand notes) | | A+/Aa1 | | | 6,600,000 | | | | 6,600,000 | |
City of New York GO, 0.03% due 8/1/2021 put 4/1/2015 (City Budget Financial Management; LOC: JPMorgan Chase Bank, N.A.) (daily demand notes) | | AAA/Aa1 | | | 2,900,000 | | | | 2,900,000 | |
City of New York GO, 5.00% due 8/1/2021 (City Budget Financial Management) | | AA/Aa2 | | | 9,000,000 | | | | 10,711,980 | |
City of New York GO, 5.00% due 8/1/2021 (City Budget Financial Management) | | AA/Aa2 | | | 3,000,000 | | | | 3,570,660 | |
City of New York GO, 5.00% due 8/1/2021 (City Budget Financial Management) | | AA/Aa2 | | | 7,350,000 | | | | 8,748,117 | |
City of New York GO, 5.00% due 8/1/2021 (City Budget Financial Management) | | AA/Aa2 | | | 7,775,000 | | | | 9,253,960 | |
City of New York GO, 5.00% due 8/1/2022 (City Budget Financial Management) | | AA/Aa2 | | | 6,625,000 | | | | 7,919,790 | |
City of New York GO, 5.00% due 8/1/2022 (City Budget Financial Management) | | AA/Aa2 | | | 3,000,000 | | | | 3,586,320 | |
City of New York GO, 5.00% due 8/1/2022 (City Budget Financial Management) | | AA/Aa2 | | | 20,000,000 | | | | 23,908,800 | |
City of New York GO, 5.00% due 8/1/2022 (City Budget Financial Management) | | AA/Aa2 | | | 13,075,000 | | | | 15,630,378 | |
City of New York GO, 5.00% due 8/1/2023 (City Budget Financial Management) | | AA/Aa2 | | | 9,520,000 | | | | 11,554,710 | |
City of New York GO, 5.00% due 8/1/2023 (City Budget Financial Management) | | AA/Aa2 | | | 12,985,000 | | | | 15,760,284 | |
City of New York GO, 0.03% due 10/1/2023 put 4/1/2015 (City Budget Financial Management; LOC: JPMorgan Chase Bank, N.A.) (daily demand notes) | | AAA/Aa1 | | | 2,200,000 | | | | 2,200,000 | |
City of New York GO, 5.00% due 8/1/2024 (City Budget Financial Management) | | AA/Aa2 | | | 40,145,000 | | | | 49,296,053 | |
City of New York GO, 0.01% due 8/1/2035 put 4/1/2015 (Capital Projects) (daily demand notes) | | AA/Aa2 | | | 4,500,000 | | | | 4,500,000 | |
City School District of the City of Rome GO, 5.00% due 6/15/2017 (Insured: Natl-Re) (State Aid Withholding) | | NR/Aa3 | | | 1,635,000 | | | | 1,651,203 | |
Erie County Individual Development Agency, 5.00% due 5/1/2015 (Buffalo School District) (ETM) | | NR/NR | | | 1,395,000 | | | | 1,400,608 | |
Erie County Individual Development Agency, 5.00% due 5/1/2015 (Buffalo School District) | | AA/Aa2 | | | 1,605,000 | | | | 1,611,532 | |
Erie County Individual Development Agency, 5.00% due 5/1/2016 (Buffalo School District) (ETM) | | NR/NR | | | 4,090,000 | | | | 4,299,735 | |
Erie County Individual Development Agency, 5.00% due 5/1/2016 (Buffalo School District) | | AA/Aa2 | | | 4,705,000 | | | | 4,945,049 | |
Erie County Individual Development Agency, 5.00% due 5/1/2017 (Buffalo School District) | | AA/Aa2 | | | 7,265,000 | | | | 7,921,102 | |
Erie County Individual Development Agency, 5.00% due 5/1/2018 (Buffalo School District) | | AA/Aa2 | | | 5,000,000 | | | | 5,613,350 | |
Metropolitan Transportation Authority, 5.00% due 11/15/2020 | | AA-/A2 | | | 12,955,000 | | | | 15,294,155 | |
Metropolitan Transportation Authority, 5.00% due 11/15/2020 | | AA/NR | | | 2,000,000 | | | | 2,373,520 | |
Metropolitan Transportation Authority, 5.00% due 11/15/2021 | | AA-/A2 | | | 24,325,000 | | | | 29,042,104 | |
Monroe County Industrial Development Corp., 5.00% due 6/1/2018 (St. John Fisher College) | | BBB+/NR | | | 1,425,000 | | | | 1,568,255 | |
Monroe County Industrial Development Corp., 5.00% due 6/1/2019 (St. John Fisher College) | | BBB+/NR | | | 1,030,000 | | | | 1,154,373 | |
Monroe County Industrial Development Corp., 5.00% due 6/1/2022 (St. John Fisher College) | | BBB+/NR | | | 2,000,000 | | | | 2,294,240 | |
Nassau County IDA, 5.25% due 3/1/2018 (New York Institute of Technology) | | BBB+/Baa2 | | | 1,260,000 | | | | 1,379,473 | |
Nassau County IDA, 5.25% due 3/1/2020 (New York Institute of Technology) | | BBB+/Baa2 | | | 1,715,000 | | | | 1,945,376 | |
New York City Health and Hospital Corp. GO, 5.00% due 2/15/2019 (Healthcare Facilities Improvements) | | A+/Aa3 | | | 2,700,000 | | | | 3,061,260 | |
New York City Health and Hospital Corp. GO, 5.00% due 2/15/2021 (Healthcare Facilities Improvements) | | A+/Aa3 | | | 2,615,000 | | | | 3,027,961 | |
Semi-Annual Report 29
| | |
| SCHEDULE OF INVESTMENTS, CONTINUED | | |
| |
Thornburg Limited Term Municipal Fund | | March 31, 2015 (Unaudited) |
| | | | | | | | | | |
Issuer-Description | | Credit Rating†
S&P/ Moody’s | | Principal
Amount | | | Value | |
New York City Health and Hospitals Corp. GO, 5.00% due 2/15/2020 (Healthcare Facilities Improvements) | | A+/Aa3 | | $ | 10,000,000 | | | $ | 11,559,600 | |
New York City Housing Development Corp., 0.80% due 11/1/2015 (Multi-Family Housing) | | AA+/Aa2 | | | 1,820,000 | | | | 1,820,728 | |
New York City Municipal Water Finance Authority, 0.02% due 6/15/2035 put 4/1/2015 (Water & Sewer System; SPA: Bayerische Landesbank) (daily demand notes) | | AAA/Aa1 | | | 17,755,000 | | | | 17,755,000 | |
New York City Municipal Water Finance Authority, 0.03% due 6/15/2043 put 4/1/2015 (Water & Sewer System; SPA: JPMorgan Chase Bank, N.A.) (daily demand notes) | | AA+/Aa2 | | | 15,800,000 | | | | 15,800,000 | |
New York City Municipal Water Finance Authority, 0.01% due 6/15/2045 put 4/1/2015 (Water & Sewer System; SPA: CalPERS) (daily demand notes) | | AAA/Aa1 | | | 31,050,000 | | | | 31,050,000 | |
New York City Municipal Water Finance Authority, 0.03% due 6/15/2048 put 4/1/2015 (Water & Sewer System; SPA: Mizuho Bank, Ltd.) (daily demand notes) | | AA+/Aa2 | | | 3,200,000 | | | | 3,200,000 | |
New York City Municipal Water Finance Authority, 0.03% due 6/15/2050 put 4/1/2015 (Water & Sewer System; SPA: JPMorgan Chase Bank, N.A.) (daily demand notes) | | AA+/Aa2 | | | 9,900,000 | | | | 9,900,000 | |
New York City Municipal Water Finance Authority, 0.03% due 6/15/2050 put 4/1/2015 (Water & Sewer System; SPA: JPMorgan Chase Bank, N.A.) (daily demand notes) | | AA+/Aa2 | | | 2,200,000 | | | | 2,200,000 | |
New York City Transitional Finance Authority, 5.00% due 11/1/2015 (City Capital Projects & WTC Recovery Costs) (ETM) | | NR/NR | | | 3,630,000 | | | | 3,731,241 | |
New York City Transitional Finance Authority, 5.00% due 11/1/2015 (City Capital Projects & WTC Recovery Costs) | | AAA/Aa1 | | | 1,370,000 | | | | 1,408,976 | |
New York City Transitional Finance Authority, 5.00% due 7/15/2016 (School Financing Act) (State Aid Withholding) | | AA/Aa2 | | | 3,155,000 | | | | 3,346,225 | |
New York City Transitional Finance Authority, 5.00% due 11/1/2016 (City Capital Projects & WTC Recovery Costs) | | AAA/Aa1 | | | 5,000,000 | | | | 5,368,650 | |
New York City Transitional Finance Authority, 5.00% due 11/1/2016 (City Capital Projects & WTC Recovery Costs) | | AAA/Aa1 | | | 12,680,000 | | | | 13,614,896 | |
New York City Transitional Finance Authority, 5.00% due 11/1/2017 (City Capital Projects & WTC Recovery Costs) | | AAA/Aa1 | | | 1,000,000 | | | | 1,028,710 | |
New York City Transitional Finance Authority, 5.00% due 1/15/2018 (School Financing Act) (State Aid Withholding) | | AA/Aa2 | | | 4,865,000 | | | | 5,404,869 | |
New York City Transitional Finance Authority, 5.00% due 11/1/2018 (City Capital Projects & WTC Recovery Costs) | | AAA/Aa1 | | | 2,000,000 | | | | 2,274,020 | |
New York City Transitional Finance Authority, 5.00% due 11/1/2018 (City Capital Projects & WTC Recovery Costs) | | AAA/Aa1 | | | 1,500,000 | | | | 1,705,515 | |
New York City Transitional Finance Authority, 5.00% due 11/1/2018 (City Capital Projects & WTC Recovery Costs) | | AAA/Aa1 | | | 11,730,000 | | | | 13,337,127 | |
New York City Transitional Finance Authority, 5.00% due 11/1/2018 (City Capital Projects & WTC Recovery Costs) | | AAA/Aa1 | | | 3,075,000 | | | | 3,496,306 | |
New York City Transitional Finance Authority, 5.00% due 11/1/2018 (City Capital Projects & WTC Recovery Costs) | | AAA/Aa1 | | | 1,645,000 | | | | 1,870,381 | |
New York City Transitional Finance Authority, 5.00% due 11/1/2018 (City Capital Projects & WTC Recovery Costs) | | AAA/Aa1 | | | 12,725,000 | | | | 14,468,452 | |
New York City Transitional Finance Authority, 0.03% due 11/1/2036 put 4/1/2015 (City Capital Projects; SPA: JPMorgan Chase Bank, N.A.) (daily demand notes) | | AAA/Aa1 | | | 11,600,000 | | | | 11,600,000 | |
New York City Transitional Finance Authority, 0.01% due 11/1/2042 put 4/1/2015 (School Financing Act; SPA: Barclays Bank plc) (daily demand notes) | | AAA/Aa1 | | | 60,655,000 | | | | 60,655,000 | |
New York State Dormitory Authority, 5.25% due 5/15/2015 (State University of New York Educational Facilities; Insured: Natl-Re/IBC) | | AA/Aa2 | | | 3,580,000 | | | | 3,602,268 | |
New York State Dormitory Authority, 5.25% due 8/15/2015 (Presbyterian Hospital; Insured: AGM/FHA) | | AA/A2 | | | 320,000 | | | | 322,029 | |
New York State Dormitory Authority, 5.50% due 2/15/2017 (Mental Health Services Facilities) | | AA/NR | | | 5,000,000 | | | | 5,460,350 | |
New York State Dormitory Authority, 5.25% due 5/15/2017 (Court Facilities Lease; Insured: AMBAC) | | AA-/Aa2 | | | 4,945,000 | | | | 5,407,506 | |
New York State Dormitory Authority, 5.50% due 2/15/2018 (Mental Health Services Facilities) | | AA/NR | | | 5,280,000 | | | | 5,963,866 | |
New York State Dormitory Authority, 2.25% due 4/1/2018 (School Districts Financing Program) (State Aid Withholding) | | AA+/NR | | | 4,800,000 | | | | 4,969,008 | |
New York State Dormitory Authority, 5.00% due 4/1/2018 (School Districts Financing Program) (State Aid Withholding) | | AA+/NR | | | 325,000 | | | | 363,893 | |
New York State Dormitory Authority, 5.00% due 10/1/2018 (School Districts Financing Program; Insured: AGM) (State Aid Withholding) | | AA/A2 | | | 2,500,000 | | | | 2,836,600 | |
New York State Dormitory Authority, 5.00% due 10/1/2018 (School Districts Financing Program) (State Aid Withholding) | | NR/Aa3 | | | 1,395,000 | | | | 1,582,307 | |
New York State Dormitory Authority, 5.00% due 10/1/2018 (School Districts Financing Program) (State Aid Withholding) | | AA-/NR | | | 2,520,000 | | | | 2,849,087 | |
New York State Dormitory Authority, 5.00% due 4/1/2019 (School Districts Financing Program) (State Aid Withholding) | | AA+/NR | | | 610,000 | | | | 699,755 | |
New York State Dormitory Authority, 5.00% due 7/1/2019 (New York Department of Health Projects; Insured: Natl-Re) | | AA/Aa2 | | | 6,975,000 | | | | 7,002,551 | |
New York State Dormitory Authority, 5.00% due 10/1/2019 (School Districts Financing Program; Insured: AGM) (State Aid Withholding) | | AA/A2 | | | 2,100,000 | | | | 2,437,533 | |
New York State Dormitory Authority, 5.00% due 10/1/2019 (School Districts Financing Program) (State Aid Withholding) | | NR/Aa3 | | | 1,585,000 | | | | 1,838,996 | |
New York State Dormitory Authority, 5.00% due 10/1/2019 (School Districts Financing Program) (State Aid Withholding) | | AA-/NR | | | 2,645,000 | | | | 3,055,716 | |
New York State Dormitory Authority, 5.00% due 12/15/2019 (Metropolitan Transportation Authority Service Contract) | | AAA/Aa1 | | | 60,000,000 | | | | 69,909,600 | |
New York State Dormitory Authority, 5.00% due 4/1/2020 (School Districts Financing Program) (State Aid Withholding) | | AA+/NR | | | 1,000,000 | | | | 1,169,840 | |
New York State Dormitory Authority, 5.00% due 7/1/2020 (NYSARC, Inc. Developmental Disability Programs) | | NR/Aa2 | | | 1,000,000 | | | | 1,157,980 | |
New York State Dormitory Authority, 5.00% due 10/1/2020 (School Districts Financing Program; Insured: AGM) (State Aid Withholding) | | AA/A2 | | | 2,100,000 | | | | 2,479,932 | |
New York State Dormitory Authority, 5.00% due 10/1/2020 (School Districts Financing Program; Insured: AGM) | | AA/NR | | | 1,250,000 | | | | 1,476,150 | |
New York State Dormitory Authority, 5.00% due 10/1/2020 (School Districts Financing Program) (State Aid Withholding) | | NR/Aa3 | | | 1,000,000 | | | | 1,177,020 | |
New York State Dormitory Authority, 5.00% due 10/1/2020 (School Districts Financing Program) (State Aid Withholding) | | AA-/NR | | | 2,775,000 | | | | 3,261,457 | |
New York State Dormitory Authority, 5.00% due 4/1/2021 (School Districts Financing Program) (State Aid Withholding) | | AA+/NR | | | 450,000 | | | | 534,236 | |
New York State Dormitory Authority, 5.00% due 10/1/2021 (School Districts Financing Program; Insured: AGM) | | AA/NR | | | 1,100,000 | | | | 1,316,876 | |
New York State Dormitory Authority, 5.00% due 10/1/2021 (School Districts Financing Program; Insured: AGM) (State Aid Withholding) | | AA/A2 | | | 1,250,000 | | | | 1,496,450 | |
New York State Dormitory Authority, 5.00% due 10/1/2021 (School Districts Financing Program) (State Aid Withholding) | | NR/Aa3 | | | 750,000 | | | | 893,813 | |
New York State Dormitory Authority, 5.00% due 10/1/2022 (School Districts Financing Program; Insured: AGM) | | AA/NR | | | 1,800,000 | | | | 2,177,838 | |
30 Semi-Annual Report
| | |
| SCHEDULE OF INVESTMENTS, CONTINUED | | |
| |
Thornburg Limited Term Municipal Fund | | March 31, 2015 (Unaudited) |
| | | | | | | | | | |
Issuer-Description | | Credit Rating†
S&P/ Moody’s | | Principal
Amount | | | Value | |
New York State Dormitory Authority, 5.00% due 10/1/2022 (School Districts Financing Program) (State Aid Withholding) | | AA+/NR | | $ | 300,000 | | | $ | 362,973 | |
New York State Dormitory Authority, 5.00% due 10/1/2023 (School Districts Financing Program; Insured: AGM) | | AA/NR | | | 2,500,000 | | | | 3,058,975 | |
New York State Dormitory Authority, 5.25% due 10/1/2023 (School Districts Financing Program; Insured: AGM) (State Aid Withholding) | | AA/A1 | | | 2,000,000 | | | | 2,406,160 | |
New York State Dormitory Authority, 5.00% due 10/1/2024 (School Districts Financing Program; Insured: AGM) | | AA/NR | | | 2,000,000 | | | | 2,471,440 | |
New York State Energy Research & Development Authority, 2.25% due 12/1/2015 (New York Electric & Gas Corp.) | | BBB+/A3 | | | 5,000,000 | | | | 5,051,000 | |
New York State Environmental Facilities Corp., 4.00% due 11/15/2017 (Water Pollution Control & Drinking Water Projects) | | AAA/Aaa | | | 2,095,000 | | | | 2,103,589 | |
New York State Environmental Facilities Corp., 4.00% due 11/15/2018 (Water Pollution Control & Drinking Water Projects) | | AAA/Aaa | | | 2,170,000 | | | | 2,177,747 | |
New York State Housing Finance Agency, 0.95% due 5/1/2016 (2012 Affordable Housing Projects; Insured: SONYMA) | | NR/Aa2 | | | 2,700,000 | | | | 2,716,551 | |
New York State Thruway Authority, 5.00% due 4/1/2017 pre-refunded 10/1/2015 (Second General Highway & Bridge Trust; Insured: Natl-Re) | | AA-/A3 | | | 345,000 | | | | 353,290 | |
New York State Thruway Authority, 5.00% due 4/1/2017 (Second General Highway & Bridge Trust; Insured: Natl-Re) | | AA/A3 | | | 2,255,000 | | | | 2,308,985 | |
New York State Thruway Authority, 5.00% due 5/1/2019 (New NY Bridge Project) | | A-/A3 | | | 5,000,000 | | | | 5,718,350 | |
New York State Thruway Authority, 5.00% due 1/1/2020 (Governor Thomas E. Dewey Thruway) | | A/A2 | | | 2,000,000 | | | | 2,324,720 | |
New York State Thruway Authority, 5.00% due 1/1/2021 (Governor Thomas E. Dewey Thruway) | | A/A2 | | | 2,500,000 | | | | 2,960,575 | |
New York State Thruway Authority, 5.00% due 1/1/2022 (Governor Thomas E. Dewey Thruway) | | A/A2 | | | 3,000,000 | | | | 3,582,270 | |
New York State Thruway Authority, 5.00% due 1/1/2024 (Governor Thomas E. Dewey Thruway) | | A/A2 | | | 1,000,000 | | | | 1,220,830 | |
New York State Thruway Authority, 5.00% due 3/15/2024 (Highway, Bridge, Multi-Modal and MTA Projects) | | AAA/Aa1 | | | 18,300,000 | | | | 21,889,728 | |
New York State Thruway Authority, 5.00% due 1/1/2025 (Governor Thomas E. Dewey Thruway) | | A/A2 | | | 2,000,000 | | | | 2,469,160 | |
Patchogue-Medford Union Free School District GO, 4.25% due 10/1/2015 (Insured: MBIA) (State Aid Withholding) | | AA-/A3 | | | 1,000,000 | | | | 1,018,910 | |
Port Authority 148th GO, 5.00% due 8/15/2017 (Insured: AGM) | | AA/Aa3 | | | 4,725,000 | | | | 5,199,815 | |
Port Authority of New York and New Jersey GO, 5.00% due 12/1/2019 (Port Authority Facilities Capital Projects; Insured: AGM) | | AA/Aa3 | | | 1,000,000 | | | | 1,017,950 | |
Suffolk County Economic Development Corp., 5.00% due 7/1/2020 (Catholic Health Services) | | BBB+/Baa1 | | | 5,000,000 | | | | 5,822,550 | |
Suffolk County Economic Development Corp., 5.00% due 7/1/2021 (Catholic Health Services) | | BBB+/Baa1 | | | 5,000,000 | | | | 5,870,750 | |
Suffolk County Economic Development Corp., 5.00% due 7/1/2022 (Catholic Health Services) | | BBB+/Baa1 | | | 5,000,000 | | | | 5,776,950 | |
Suffolk County IDA Civic Facilities GO, 5.25% due 3/1/2019 (New York Institute of Technology) | | BBB+/Baa2 | | | 1,400,000 | | | | 1,415,610 | |
Tobacco Settlement Financing Corp., 5.00% due 6/1/2018 | | AA/NR | | | 3,725,000 | | | | 4,184,702 | |
Triborough Bridge and Tunnel Authority, 5.00% due 11/15/2021 (MTA Bridges & Tunnels) | | AA-/Aa3 | | | 5,140,000 | | | | 6,219,092 | |
United Nations Development Corp., 5.00% due 7/1/2016 (One, Two and Three U.N. Plaza Project) | | NR/A1 | | | 3,400,000 | | | | 3,596,554 | |
United Nations Development Corp., 5.00% due 7/1/2017 (One, Two and Three U.N. Plaza Project) | | NR/A1 | | | 3,000,000 | | | | 3,281,070 | |
United Nations Development Corp., 5.00% due 7/1/2019 (One, Two and Three U.N. Plaza Project) | | NR/A1 | | | 4,000,000 | | | | 4,579,600 | |
West Seneca Central School District GO, 5.00% due 11/15/2022 (Insured: BAM) (State Aid Withholding) | | AA/A1 | | | 1,000,000 | | | | 1,209,340 | |
| | | |
NORTH CAROLINA — 1.73% | | | | | | | | | | |
Catawba County, 4.00% due 10/1/2015 | | AA-/Aa2 | | | 1,620,000 | | | | 1,651,039 | |
Catawba County, 4.00% due 10/1/2016 | | AA-/Aa2 | | | 1,000,000 | | | | 1,053,080 | |
Catawba County, 4.00% due 10/1/2017 | | AA-/Aa2 | | | 1,000,000 | | | | 1,079,300 | |
Charlotte-Mecklenburg Hospital Authority, 5.00% due 1/15/2016 (Carolinas HealthCare System) | | AA-/Aa3 | | | 3,520,000 | | | | 3,647,882 | |
Charlotte-Mecklenburg Hospital Authority, 5.00% due 1/15/2017 (Carolinas HealthCare System) | | AA-/Aa3 | | | 2,000,000 | | | | 2,152,220 | |
Charlotte-Mecklenburg Hospital Authority, 4.00% due 1/15/2019 (Carolinas HealthCare System) | | AA-/Aa3 | | | 600,000 | | | | 658,038 | |
Charlotte-Mecklenburg Hospital Authority, 3.00% due 1/15/2021 (Carolinas HealthCare System) | | AA-/Aa3 | | | 1,595,000 | | | | 1,691,179 | |
Charlotte-Mecklenburg Hospital Authority, 4.00% due 1/15/2022 (Carolinas HealthCare System) | | AA-/Aa3 | | | 845,000 | | | | 947,600 | |
Charlotte-Mecklenburg Hospital Authority, 5.00% due 1/15/2023 (Carolinas HealthCare System) | | AA-/Aa3 | | | 1,400,000 | | | | 1,681,064 | |
Charlotte-Mecklenburg Hospital Authority, 5.00% due 1/15/2024 (Carolinas HealthCare System) | | AA-/Aa3 | | | 2,855,000 | | | | 3,383,660 | |
County of Buncombe, 5.00% due 6/1/2022 (Primary, Middle School & Community College Facilities) | | AA+/Aa2 | | | 1,000,000 | | | | 1,211,560 | |
County of Buncombe, 5.00% due 6/1/2023 (Primary, Middle School & Community College Facilities) | | AA+/Aa2 | | | 750,000 | | | | 921,023 | |
County of Buncombe, 5.00% due 6/1/2024 (Primary, Middle School & Community College Facilities) | | AA+/Aa2 | | | 600,000 | | | | 743,112 | |
County of Dare, 4.00% due 6/1/2016 (Educational Facility Capital Projects) | | AA-/Aa3 | | | 500,000 | | | | 521,095 | |
County of Dare, 4.00% due 6/1/2017 (Educational Facility Capital Projects) | | AA-/Aa3 | | | 400,000 | | | | 427,884 | |
County of Dare, 4.00% due 6/1/2018 (Educational Facility Capital Projects) | | AA-/Aa3 | | | 425,000 | | | | 462,970 | |
County of Dare, 4.00% due 6/1/2019 (Educational Facility Capital Projects) | | AA-/Aa3 | | | 500,000 | | | | 551,470 | |
County of Dare, 4.00% due 6/1/2020 (Educational Facility Capital Projects) | | AA-/Aa3 | | | 765,000 | | | | 852,669 | |
County of Dare, 5.00% due 6/1/2021 (Educational Facility Capital Projects) | | AA-/Aa3 | | | 1,225,000 | | | | 1,451,380 | |
County of Dare, 4.00% due 6/1/2022 (Educational Facility Capital Projects) | | AA-/Aa3 | | | 490,000 | | | | 548,927 | |
County of Dare, 5.00% due 6/1/2024 (Educational Facility Capital Projects) | | AA-/Aa3 | | | 700,000 | | | | 840,357 | |
County of Mecklenburg GO, 4.00% due 8/1/2015 | | AAA/Aaa | | | 3,135,000 | | | | 3,175,598 | |
County of Randolph, 5.00% due 10/1/2020 | | A+/Aa3 | | | 500,000 | | | | 585,280 | |
County of Randolph, 5.00% due 10/1/2021 | | A+/Aa3 | | | 1,065,000 | | | | 1,262,227 | |
County of Randolph, 5.00% due 10/1/2021 | | A+/Aa3 | | | 500,000 | | | | 592,595 | |
County of Randolph, 5.00% due 10/1/2022 | | A+/Aa3 | | | 1,945,000 | | | | 2,333,767 | |
County of Randolph, 5.00% due 10/1/2023 | | A+/Aa3 | | | 550,000 | | | | 666,188 | |
County of Randolph, 5.00% due 10/1/2023 | | A+/Aa3 | | | 400,000 | | | | 484,500 | |
County of Wake, 5.00% due 6/1/2015 (Hammond Road Detention Center) | | AA+/Aa1 | | | 1,135,000 | | | | 1,144,216 | |
Semi-Annual Report 31
| | |
| SCHEDULE OF INVESTMENTS, CONTINUED | | |
| |
Thornburg Limited Term Municipal Fund | | March 31, 2015 (Unaudited) |
| | | | | | | | | | |
Issuer-Description | | Credit Rating†
S&P/ Moody’s | | Principal
Amount | | | Value | |
North Carolina Eastern Municipal Power Agency, 5.00% due 1/1/2016 (Insured: AMBAC) | | A-/NR | | $ | 1,700,000 | | | $ | 1,759,942 | |
North Carolina Eastern Municipal Power Agency, 6.00% due 1/1/2018 (Insured: AMBAC) | | NR/Baa1 | | | 7,500,000 | | | | 8,499,225 | |
North Carolina Eastern Municipal Power Agency, 6.00% due 1/1/2018 (Insured: BHAC/AMBAC) | | AA+/Aa1 | | | 5,965,000 | | | | 6,780,654 | |
North Carolina Eastern Municipal Power Agency, 5.25% due 1/1/2019 (Insured: AGM) | | AA/A3 | | | 3,105,000 | | | | 3,465,615 | |
North Carolina Eastern Municipal Power Agency, 5.00% due 1/1/2021 | | A-/Baa1 | | | 5,000,000 | | | | 5,846,300 | |
North Carolina Eastern Municipal Power Agency, 5.00% due 1/1/2022 | | A-/Baa1 | | | 4,715,000 | | | | 5,584,257 | |
North Carolina Municipal Power Agency, 5.25% due 1/1/2017 (Catawba Electric) | | A/A2 | | | 3,120,000 | | | | 3,372,720 | |
North Carolina Municipal Power Agency, 4.00% due 1/1/2018 (Catawba Electric) | | A/A2 | | | 15,000,000 | | | | 16,230,300 | |
North Carolina Municipal Power Agency, 5.00% due 1/1/2019 (Catawba Electric) | | A/A2 | | | 4,500,000 | | | | 5,107,365 | |
North Carolina Municipal Power Agency, 4.00% due 1/1/2020 (Catawba Electric) | | A/A2 | | | 1,550,000 | | | | 1,724,731 | |
North Carolina Municipal Power Agency, 5.00% due 1/1/2020 (Catawba Electric) | | A/A2 | | | 1,000,000 | | | | 1,158,370 | |
North Carolina Municipal Power Agency, 4.00% due 1/1/2022 (Catawba Electric) | | A/A2 | | | 1,000,000 | | | | 1,128,370 | |
State of North Carolina, 5.00% due 11/1/2019 (State Capital Projects and Correctional Facilities) | | AA+/Aa1 | | | 23,635,000 | | | | 27,474,742 | |
Winston-Salem State University, 4.00% due 4/1/2016 (Student Housing and Student Services Facilities) | | A-/A3 | | | 640,000 | | | | 659,872 | |
Winston-Salem State University, 4.00% due 4/1/2017 (Student Housing and Student Services Facilities) | | A-/A3 | | | 645,000 | | | | 678,624 | |
Winston-Salem State University, 5.00% due 4/1/2019 (Student Housing and Student Services Facilities) | | A-/A3 | | | 815,000 | | | | 903,248 | |
Winston-Salem State University, 5.00% due 4/1/2022 (Student Housing and Student Services Facilities) | | A-/A3 | | | 945,000 | | | | 1,081,675 | |
| | | |
NORTH DAKOTA — 0.06% | | | | | | | | | | |
County of Ward, 4.00% due 4/1/2020 (Insured: AGM) | | AA/A2 | | | 2,445,000 | | | | 2,711,309 | |
a North Dakota Public Finance Authority, 4.00% due 6/1/2017 (City of Fargo Flood Mitigation Projects) | | AA/NR | | | 1,460,000 | | | | 1,563,076 | |
| | | |
OHIO — 3.56% | | | | | | | | | | |
Akron, Bath & Copley Joint Township Hospital District, 5.00% due 11/15/2021 (Children’s Hospital Medical Center) | | NR/A1 | | | 1,000,000 | | | | 1,181,120 | |
Allen County Hospital Facilities, 5.00% due 9/1/2015 (Catholic Healthcare Partners) | | AA-/A1 | | | 10,000,000 | | | | 10,194,100 | |
Allen County Hospital Facilities, 5.00% due 9/1/2016 (Catholic Healthcare Partners) | | AA-/A1 | | | 10,000,000 | | | | 10,609,400 | |
American Municipal Power, Inc., 5.25% due 2/15/2018 (AMP Combined Hydroelectric Projects) | | A/A3 | | | 5,500,000 | | | | 6,146,470 | |
American Municipal Power, Inc., 5.25% due 2/15/2019 (AMP Combined Hydroelectric Projects) | | A/A3 | | | 5,595,000 | | | | 6,408,065 | |
American Municipal Power, Inc., 5.00% due 2/15/2020 (AMP Fremont Energy Center) | | A/A1 | | | 1,865,000 | | | | 2,162,729 | |
American Municipal Power, Inc., 5.00% due 2/15/2021 (AMP Fremont Energy Center) | | A/A1 | | | 1,300,000 | | | | 1,501,019 | |
American Municipal Power, Inc., 5.00% due 2/15/2022 (AMP Fremont Energy Center) | | A/A1 | | | 2,750,000 | | | | 3,273,848 | |
Cincinnati City School District Board of Education GO, 5.25% due 12/1/2023 (Educational Facilities; Insured: Natl-Re) | | AA-/Aa2 | | | 2,690,000 | | | | 3,351,471 | |
City of Akron, 5.00% due 12/1/2021 (Community Learning Centers) | | AA+/NR | | | 4,120,000 | | | | 4,937,202 | |
City of Akron GO, 5.00% due 12/1/2018 pre-refunded 12/1/2015 (Various Municipal Capital Projects; Insured: AMBAC) | | AA+/Aa3 | | | 2,425,000 | | | | 2,502,067 | |
City of Akron GO, 5.00% due 12/1/2019 (Various Municipal Capital Projects) | | AA-/NR | | | 1,685,000 | | | | 1,959,436 | |
City of Cleveland, 3.00% due 10/1/2016 (Public Facilities) | | AA/A1 | | | 690,000 | | | | 715,689 | |
City of Cleveland, 4.00% due 10/1/2018 (Parks & Recreation Facilities) | | AA/A1 | | | 500,000 | | | | 547,930 | |
City of Cleveland, 4.00% due 10/1/2019 (Public Facilities) | | AA/A1 | | | 600,000 | | | | 666,828 | |
City of Cleveland, 4.00% due 10/1/2019 (Parks & Recreation Facilities) | | AA/A1 | | | 520,000 | | | | 577,918 | |
City of Cleveland, 5.00% due 10/1/2020 (Public Facilities) | | AA/A1 | | | 510,000 | | | | 599,403 | |
City of Cleveland, 5.00% due 10/1/2020 (Parks & Recreation Facilities) | | AA/A1 | | | 545,000 | | | | 640,539 | |
City of Cleveland, 5.00% due 10/1/2021 (Parks & Recreation Facilities) | | AA/A1 | | | 570,000 | | | | 678,910 | |
City of Cleveland, 5.00% due 10/1/2022 (Public Facilities) | | AA/A1 | | | 905,000 | | | | 1,087,285 | |
City of Cleveland, 5.00% due 10/1/2022 (Parks & Recreation Facilities) | | AA/A1 | | | 600,000 | | | | 720,852 | |
City of Cleveland, 5.00% due 11/15/2022 (Parks & Recreation Facilities) | | AA/A1 | | | 1,030,000 | | | | 1,239,162 | |
City of Cleveland, 5.00% due 10/1/2023 (Parks & Recreation Facilities) | | AA/A1 | | | 630,000 | | | | 764,171 | |
City of Cleveland, 5.00% due 10/1/2023 (Public Facilities) | | AA/A1 | | | 1,155,000 | | | | 1,400,980 | |
City of Cleveland COP, 5.00% due 11/15/2016 (Cleveland Stadium) | | A/A2 | | | 2,200,000 | | | | 2,351,206 | |
City of Cleveland COP, 4.75% due 11/15/2020 (Cleveland Stadium) | | A/A2 | | | 2,000,000 | | | | 2,267,440 | |
City of Cleveland GO, 5.50% due 10/1/2019 (City Capital Projects; Insured: AMBAC) | | AA/A1 | | | 1,260,000 | | | | 1,483,612 | |
City of Toledo, 5.00% due 11/15/2018 (Water System Improvements) | | AA-/Aa3 | | | 1,175,000 | | | | 1,335,705 | |
City of Toledo, 5.00% due 11/15/2019 (Water System Improvements) | | AA-/Aa3 | | | 2,260,000 | | | | 2,625,645 | |
City of Toledo, 5.00% due 11/15/2020 (Water System Improvements) | | AA-/Aa3 | | | 2,000,000 | | | | 2,363,320 | |
City of Toledo, 5.00% due 11/15/2021 (Water System Improvements) | | AA-/Aa3 | | | 2,000,000 | | | | 2,394,740 | |
City of Toledo, 5.00% due 11/15/2022 (Water System Improvements) | | AA-/Aa3 | | | 3,255,000 | | | | 3,928,427 | |
City of Toledo, 5.00% due 11/15/2023 (Water System Improvements) | | AA-/Aa3 | | | 1,750,000 | | | | 2,109,905 | |
Cleveland Package Facilities, 5.25% due 9/15/2021 (Insured: AGM) (ETM) | | AA/A2 | | | 965,000 | | | | 1,183,331 | |
Cleveland Package Facilities, 5.25% due 9/15/2021 (Insured: AGM) | | AA/A2 | | | 2,035,000 | | | | 2,379,505 | |
Cleveland State University, 5.00% due 6/1/2019 (Campus Capital Projects) | | A+/A1 | | | 1,000,000 | | | | 1,139,820 | |
Cleveland State University, 5.00% due 6/1/2020 (Campus Capital Projects) | | A+/A1 | | | 700,000 | | | | 813,813 | |
Cleveland State University, 5.00% due 6/1/2021 (Campus Capital Projects) | | A+/A1 | | | 1,000,000 | | | | 1,176,870 | |
Cleveland State University, 5.00% due 6/1/2022 (Campus Capital Projects) | | A+/A1 | | | 2,000,000 | | | | 2,377,080 | |
Cleveland-Cuyahoga County Port Authority, 5.00% due 10/1/2019 (Cleveland Museum of Art) | | AA+/NR | | | 2,000,000 | | | | 2,306,780 | |
County of Clermont, 2.00% due 8/1/2016 (Sanitary Sewer System) | | NR/Aa3 | | | 1,325,000 | | | | 1,348,373 | |
County of Clermont, 2.00% due 8/1/2016 (Water System ) | | NR/Aa3 | | | 1,855,000 | | | | 1,887,963 | |
County of Clermont, 4.00% due 8/1/2019 (Sanitary Sewer System) | | NR/Aa3 | | | 1,420,000 | | | | 1,542,858 | |
32 Semi-Annual Report
| | |
| SCHEDULE OF INVESTMENTS, CONTINUED | | |
| |
Thornburg Limited Term Municipal Fund | | March 31, 2015 (Unaudited) |
| | | | | | | | | | |
Issuer-Description | | Credit Rating†
S&P/ Moody’s | | Principal
Amount | | | Value | |
County of Cuyahoga COP, 5.00% due 12/1/2019 (Convention Hotel Project) | | AA-/Aa3 | | $ | 2,585,000 | | | $ | 2,974,430 | |
County of Cuyahoga COP, 5.00% due 12/1/2022 (Convention Hotel Project) | | AA-/Aa3 | | | 9,725,000 | | | | 11,658,816 | |
County of Cuyahoga COP, 5.00% due 12/1/2023 (Convention Hotel Project) | | AA-/Aa3 | | | 5,645,000 | | | | 6,841,119 | |
County of Cuyahoga COP, 5.00% due 12/1/2024 (Convention Hotel Project) | | AA-/Aa3 | | | 11,515,000 | | | | 13,866,824 | |
County of Franklin, 4.00% due 11/15/2033 put 8/1/2016 (OhioHealth Corp. Hospital Facilities) | | AA+/Aa2 | | | 3,235,000 | | | | 3,382,969 | |
Deerfield Township, 5.00% due 12/1/2017 | | NR/A1 | | | 1,000,000 | | | | 1,084,510 | |
Franklin County Convention Facilities Authority, 4.50% due 12/1/2021 (Greater Columbus Convention Center; Insured: AMBAC) | | AA/Aaa | | | 1,000,000 | | | | 1,027,130 | |
Franklin County Convention Facilities Authority, 5.00% due 12/1/2021 (Greater Columbus Convention Center) | | AA/Aaa | | | 1,000,000 | | | | 1,196,970 | |
Franklin County Convention Facilities Authority, 5.00% due 12/1/2022 (Greater Columbus Convention Center) | | AA/Aaa | | | 500,000 | | | | 605,285 | |
Franklin County Convention Facilities Authority, 5.00% due 12/1/2024 (Greater Columbus Convention Center) | | AA/Aaa | | | 1,000,000 | | | | 1,231,090 | |
Garfield Heights City School District GO, 5.375% due 12/15/2016 (School Improvements; Insured: Natl-Re) | | NR/A2 | | | 1,625,000 | | | | 1,743,966 | |
Greater Cleveland Regional Transportation Authority GO, 5.00% due 12/1/2015 (Insured: Natl-Re) | | NR/Aa1 | | | 1,000,000 | | | | 1,030,660 | |
Kent State University, 5.00% due 5/1/2020 (Insured: AGM) | | AA/Aa3 | | | 1,000,000 | | | | 1,150,270 | |
Ohio State Air Quality Development Authority, 5.625% due 6/1/2018 (FirstEnergy Nuclear Generation Corp.) | | BBB-/Baa2 | | | 5,000,000 | | | | 5,569,000 | |
Ohio State Air Quality Development Authority, 5.75% due 6/1/2033 put 12/1/2011 (FirstEnergy Nuclear Generation Corp.) | | BBB-/Baa2 | | | 5,800,000 | | | | 6,085,302 | |
Ohio State Air Quality Development Authority, 3.375% due 1/1/2034 put 7/1/2015 (FirstEnergy Nuclear Generation Corp.) | | BBB-/Baa3 | | | 7,200,000 | | | | 7,243,200 | |
Ohio State Building Authority, 5.00% due 10/1/2015 (Insured: Natl-Re) | | AA/Aa2 | | | 4,600,000 | | | | 4,711,918 | |
Ohio State Building Authority, 5.00% due 10/1/2020 | | AA/Aa2 | | | 1,700,000 | | | | 1,975,060 | |
Ohio State Water Development Authority, 5.875% due 6/1/2033 put 6/1/2016 (FirstEnergy Nuclear Generation Corp.) | | BBB-/Baa2 | | | 5,500,000 | | | | 5,810,585 | |
Ohio State Water Development Authority PCR, 3.625% due 10/1/2033 put 4/1/2020 (FirstEnergy Nuclear Generation Corp.) | | BBB-/Baa3 | | | 2,000,000 | | | | 2,105,140 | |
Ohio State Water Development Authority PCR, 3.375% due 1/1/2034 put 7/1/2015 (FirstEnergy Nuclear Generation Corp.) | | BBB-/Baa3 | | | 24,400,000 | | | | 24,535,420 | |
Penta Career Center COP, 4.00% due 4/1/2017 (School District Facilities Project) | | NR/Aa3 | | | 1,550,000 | | | | 1,643,124 | |
RiverSouth Authority, 5.00% due 12/1/2016 pre-refunded 12/1/2015 (RiverSouth Area Redevelopment) | | AA+/Aa2 | | | 2,380,000 | | | | 2,456,112 | |
RiverSouth Authority, 5.00% due 12/1/2019 (RiverSouth Area Redevelopment) | | AA+/Aa2 | | | 2,500,000 | | | | 2,888,600 | |
State of Ohio, 4.00% due 12/15/2018 (Major New Street Infrastructure Project) | | AA/Aa2 | | | 1,000,000 | | | | 1,106,210 | |
State of Ohio, 4.00% due 12/15/2019 (Major New Street Infrastructure Project) | | AA/Aa2 | | | 1,000,000 | | | | 1,123,270 | |
State of Ohio, 5.00% due 10/1/2020 (Cultural and Sports Capital Facilities) | | AA/Aa2 | | | 3,845,000 | | | | 4,505,225 | |
State of Ohio, 5.00% due 12/15/2020 (Major New Street Infrastructure Project) | | AA/Aa2 | | | 1,000,000 | | | | 1,186,260 | |
State of Ohio, 5.00% due 12/15/2021 (Major New Street Infrastructure Project) | | AA/Aa2 | | | 2,500,000 | | | | 3,000,725 | |
State of Ohio GO, 5.00% due 8/1/2015 (Educational Facilities Projects) | | AA+/Aa1 | | | 5,000,000 | | | | 5,081,500 | |
State of Ohio GO, 5.00% due 8/1/2015 (Higher Education Facility Projects) | | AA+/Aa1 | | | 6,010,000 | | | | 6,107,963 | |
State of Ohio GO, 5.50% due 9/15/2019 (Common Schools Capital Facilities) | | AA+/Aa1 | | | 4,150,000 | | | | 4,906,960 | |
State of Ohio Higher Educational Facility Commission, 5.05% due 7/1/2037 pre-refunded 7/1/2016 (Kenyon College) | | A+/A1 | | | 3,500,000 | | | | 3,705,870 | |
University of Akron Ohio, 5.00% due 1/1/2018 (Insured: AGM) | | AA/A1 | | | 3,415,000 | | | | 3,789,489 | |
Youngstown City School District GO, 3.00% due 12/1/2015 (Educational Facilities) (State Aid Withholding) | | NR/Aa2 | | | 1,000,000 | | | | 1,016,750 | |
Youngstown City School District GO, 3.00% due 12/1/2016 (Educational Facilities) (State Aid Withholding) | | NR/Aa2 | | | 1,440,000 | | | | 1,493,294 | |
Youngstown City School District GO, 4.00% due 12/1/2017 (Educational Facilities) (State Aid Withholding) | | NR/Aa2 | | | 1,480,000 | | | | 1,593,531 | |
Youngstown City School District GO, 4.00% due 12/1/2018 (Educational Facilities) (State Aid Withholding) | | NR/Aa2 | | | 1,545,000 | | | | 1,692,300 | |
Youngstown City School District GO, 4.00% due 12/1/2019 (Educational Facilities) (State Aid Withholding) | | NR/Aa2 | | | 1,605,000 | | | | 1,780,427 | |
Youngstown City School District GO, 4.00% due 12/1/2020 (Educational Facilities) (State Aid Withholding) | | NR/Aa2 | | | 1,670,000 | | | | 1,868,630 | |
Youngstown City School District GO, 4.00% due 12/1/2021 (Educational Facilities) (State Aid Withholding) | | NR/Aa2 | | | 1,735,000 | | | | 1,917,435 | |
Youngstown City School District GO, 4.00% due 12/1/2022 (Educational Facilities) (State Aid Withholding) | | NR/Aa2 | | | 1,805,000 | | | | 1,975,049 | |
Youngstown City School District GO, 4.00% due 12/1/2023 (Educational Facilities) (State Aid Withholding) | | NR/Aa2 | | | 1,700,000 | | | | 1,842,392 | |
| | | |
OKLAHOMA — 2.30% | | | | | | | | | | |
Canadian County Educational Facilities Authority, 4.00% due 9/1/2019 (Mustang Public Schools) | | A+/NR | | | 1,410,000 | | | | 1,534,827 | |
Canadian County Educational Facilities Authority, 4.50% due 9/1/2020 (Mustang Public Schools) | | A+/NR | | | 2,690,000 | | | | 3,017,857 | |
Canadian County Educational Facilities Authority, 4.50% due 9/1/2021 (Mustang Public Schools) | | A+/NR | | | 2,290,000 | | | | 2,587,929 | |
Cleveland County ISD No. 29 GO, 1.50% due 3/1/2017 (Norman School District) | | NR/Aa3 | | | 3,630,000 | | | | 3,685,938 | |
Comanche County Hospital Authority, 5.25% due 7/1/2015 (Insured: Radian) (ETM) | | BBB-/NR | | | 1,340,000 | | | | 1,356,871 | |
Oklahoma County Finance Authority, 3.00% due 9/1/2015 (Western Heights Public Schools) | | A+/NR | | | 375,000 | | | | 379,159 | |
Oklahoma County Finance Authority, 5.00% due 9/1/2016 (Western Heights Public Schools) | | A+/NR | | | 3,000,000 | | | | 3,176,670 | |
Oklahoma County Finance Authority, 5.00% due 9/1/2017 (Western Heights Public Schools) | | A+/NR | | | 4,075,000 | | | | 4,452,549 | |
Oklahoma County Finance Authority, 4.00% due 9/1/2018 (Western Heights Public Schools) | | A+/NR | | | 250,000 | | | | 271,283 | |
Oklahoma County Finance Authority, 5.00% due 9/1/2018 (Western Heights Public Schools) | | A+/NR | | | 2,120,000 | | | | 2,363,418 | |
Oklahoma County Finance Authority, 5.00% due 9/1/2020 (Western Heights Public Schools) | | A+/NR | | | 2,000,000 | | | | 2,316,520 | |
Oklahoma County ISD No. 1 GO, 1.00% due 1/1/2016 | | A+/NR | | | 4,075,000 | | | | 4,096,964 | |
Oklahoma DFA, 5.00% due 8/15/2017 (INTEGRIS Health) (ETM) | | AA-/Aa3 | | | 4,375,000 | | | | 4,820,944 | |
Oklahoma DFA, 5.00% due 8/15/2018 (INTEGRIS Health) (ETM) | | AA-/Aa3 | | | 500,000 | | | | 566,870 | |
b Oklahoma DFA, 5.00% due 8/15/2022 (INTEGRIS Health) | | AA-/Aa3 | | | 1,000,000 | | | | 1,194,100 | |
b Oklahoma DFA, 5.00% due 8/15/2023 (INTEGRIS Health) | | AA-/Aa3 | | | 1,000,000 | | | | 1,206,770 | |
b Oklahoma DFA, 5.00% due 8/15/2024 (INTEGRIS Health) | | AA-/Aa3 | | | 1,225,000 | | | | 1,485,998 | |
Semi-Annual Report 33
| | |
| SCHEDULE OF INVESTMENTS, CONTINUED | | |
| |
Thornburg Limited Term Municipal Fund | | March 31, 2015 (Unaudited) |
| | | | | | | | | | |
Issuer-Description | | Credit Rating†
S&P/ Moody’s | | Principal
Amount | | | Value | |
b Oklahoma DFA, 5.00% due 8/15/2025 (INTEGRIS Health) | | AA-/Aa3 | | $ | 1,000,000 | | | $ | 1,219,350 | |
Oklahoma DFA, 0.03% due 8/15/2033 put 4/1/2015 (INTEGRIS Health; Insured: AGM; SPA: JPMorgan Chase Bank, N.A.) (daily demand notes) | | AA/Aa3 | | | 47,900,000 | | | | 47,900,000 | |
Oklahoma State Industrial Authority, 5.00% due 7/1/2016 (Medical Research Foundation) | | NR/A2 | | | 1,165,000 | | | | 1,225,871 | |
Oklahoma State Industrial Authority, 5.25% due 7/1/2017 (Medical Research Foundation) | | NR/A2 | | | 1,075,000 | | | | 1,172,847 | |
Oklahoma Turnpike Authority, 0.03% due 1/1/2028 put 4/1/2015 (Creek Turnpike and John Kilpatrick Turnpike Systems; SPA: JPMorgan Chase Bank, N.A.) (daily demand notes) | | AA-/Aa3 | | | 62,715,000 | | | | 62,715,000 | |
Tulsa County Industrial Authority, 4.50% due 9/1/2020 (Broken Arrow Public Schools) | | AA-/NR | | | 1,585,000 | | | | 1,816,331 | |
Tulsa County Industrial Authority, 4.50% due 9/1/2021 (Broken Arrow Public Schools) | | AA-/NR | | | 8,775,000 | | | | 10,129,684 | |
Tulsa County ISD No. 3 GO, 2.00% due 4/1/2015 (Broken Arrow School District) | | AA/NR | | | 2,000,000 | | | | 2,000,000 | |
Tulsa County ISD No. 3 GO, 2.00% due 4/1/2016 (Broken Arrow School District) | | AA/NR | | | 1,725,000 | | | | 1,754,601 | |
Tulsa Parking Authority, 3.00% due 7/1/2017 | | AA-/NR | | | 1,470,000 | | | | 1,535,577 | |
| | | |
OREGON — 0.13% | | | | | | | | | | |
Oregon Facilities Authority, 5.00% due 3/15/2016 (Legacy Health System) | | AA-/A1 | | | 1,000,000 | | | | 1,041,420 | |
Oregon Facilities Authority, 4.50% due 3/15/2018 (Legacy Health System) | | AA-/A1 | | | 1,100,000 | | | | 1,196,239 | |
State of Oregon GO, 0.03% due 6/1/2028 put 4/1/2015 (Veterans’ Loan Program; SPA: U.S. Bank, N.A.) (daily demand notes) | | AA+/Aa1 | | | 4,600,000 | | | | 4,600,000 | |
State of Oregon GO, 0.03% due 6/1/2040 put 4/1/2015 (Veterans’ Loan Program; SPA: U.S. Bank, N.A.) (daily demand notes) | | AA+/Aa1 | | | 3,000,000 | | | | 3,000,000 | |
| | | |
PENNSYLVANIA — 3.97% | | | | | | | | | | |
Adams County IDA, 5.00% due 8/15/2016 (Gettysburg College) | | A/A2 | | | 1,250,000 | | | | 1,324,300 | |
Adams County IDA, 5.00% due 8/15/2017 (Gettysburg College) | | A/A2 | | | 1,340,000 | | | | 1,465,679 | |
Adams County IDA, 5.00% due 8/15/2019 (Gettysburg College) | | A/A2 | | | 1,765,000 | | | | 2,017,642 | |
Allegheny County Higher Education Building Authority, 5.00% due 3/1/2020 (Duquesne University of the Holy Spirit) | | A-/A2 | | | 250,000 | | | | 288,948 | |
Allegheny County Higher Education Building Authority, 5.00% due 3/1/2023 (Duquesne University of the Holy Spirit) | | A-/A2 | | | 300,000 | | | | 357,132 | |
Allegheny County Higher Education Building Authority, 5.00% due 3/1/2024 (Duquesne University of the Holy Spirit) | | A-/A2 | | | 500,000 | | | | 598,690 | |
Allegheny County Higher Education Building Authority, 5.00% due 3/1/2025 (Duquesne University of the Holy Spirit) | | A-/A2 | | | 1,145,000 | | | | 1,381,271 | |
Allegheny County Hospital Development Authority, 5.00% due 6/15/2017 (University of Pittsburgh Medical Center) | | A+/Aa3 | | | 3,000,000 | | | | 3,275,670 | |
Allegheny County Hospital Development Authority, 5.00% due 9/1/2017 (University of Pittsburgh Medical Center) | | A+/Aa3 | | | 1,875,000 | | | | 2,064,975 | |
Allegheny County Hospital Development Authority, 5.00% due 5/15/2018 (University of Pittsburgh Medical Center) | | A+/Aa3 | | | 5,915,000 | | | | 6,612,497 | |
Allegheny County Hospital Development Authority, 5.00% due 6/15/2018 (University of Pittsburgh Medical Center) | | A+/Aa3 | | | 3,310,000 | | | | 3,708,623 | |
Allegheny County Hospital Development Authority, 5.00% due 9/1/2018 (University of Pittsburgh Medical Center) | | A+/Aa3 | | | 2,100,000 | | | | 2,366,553 | |
Altoona Area School District GO, 3.25% due 12/1/2016 (Insured: AGM) (State Aid Withholding) | | AA/NR | | | 1,475,000 | | | | 1,536,493 | |
Altoona Area School District GO, 3.00% due 12/1/2022 (Insured: AGM) (State Aid Withholding) | | AA/NR | | | 1,335,000 | | | | 1,399,748 | |
Athens Area School District GO, 2.00% due 4/15/2016 (Insured: AGM) (State Aid Withholding) | | NR/A2 | | | 470,000 | | | | 477,482 | |
Athens Area School District GO, 3.00% due 4/15/2018 (Insured: AGM) (State Aid Withholding) | | NR/A2 | | | 2,600,000 | | | | 2,739,672 | |
Athens Area School District GO, 3.00% due 4/15/2019 (Insured: AGM) (State Aid Withholding) | | NR/A2 | | | 2,680,000 | | | | 2,787,012 | |
Chester County School Authority, 5.00% due 4/1/2016 pre-refunded 10/1/2015 (Intermediate School; Insured: AMBAC) | | A+/NR | | | 1,915,000 | | | | 1,961,017 | |
City of Philadelphia, 5.00% due 6/15/2017 (Water and Wastewater System; Insured: AGM) | | AA/A1 | | | 5,570,000 | | | | 6,094,583 | |
City of Philadelphia, 5.00% due 7/1/2022 pre-refunded 7/1/2015 (Water and Wastewater System; Insured: AGM) | | AA/A1 | | | 1,155,000 | | | | 1,168,906 | |
City of Philadelphia Gas Works, 5.00% due 9/1/2015 (Insured: AGM) | | AA/A2 | | | 3,315,000 | | | | 3,327,862 | |
City of Philadelphia Gas Works, 5.00% due 10/1/2017 (Insured: AMBAC) | | A-/Baa2 | | | 400,000 | | | | 435,768 | |
City of Philadelphia Gas Works, 5.00% due 7/1/2018 (Insured: AGM) | | AA/A2 | | | 1,395,000 | | | | 1,554,449 | |
City of Pittsburgh GO, 5.25% due 9/1/2016 (Insured: AGM) | | AA/A1 | | | 3,030,000 | | | | 3,234,343 | |
City of Pittsburgh GO, 5.25% due 9/1/2017 (Insured: AGM) | | AA/A1 | | | 2,210,000 | | | | 2,364,678 | |
City of Pittsburgh GO, 5.25% due 9/1/2018 pre-refunded 9/1/2016 (Insured: AGM) | | AA/A1 | | | 3,240,000 | | | | 3,462,037 | |
City of Pittsburgh GO, 5.00% due 9/1/2022 (Insured: BAM) | | AA/A1 | | | 1,100,000 | | | | 1,320,231 | |
Commonwealth of Pennsylvania GO, 5.00% due 10/1/2022 | | AA-/Aa3 | | | 575,000 | | | | 614,951 | |
Commonwealth of Pennsylvania State Public School Building Authority, 5.00% due 10/1/2016 (Harrisburg Area Community College Project) | | A/NR | | | 1,390,000 | | | | 1,470,842 | |
Cumberland Valley School District GO, 5.00% due 11/15/2018 (Insured: AGM) (State Aid Withholding) | | NR/Aa3 | | | 3,590,000 | | | | 3,695,941 | |
Economy Borough Municipal Authority, 3.00% due 12/15/2016 (Beaver County Sewer System; Insured: BAM) | | AA/NR | | | 505,000 | | | | 523,821 | |
Economy Borough Municipal Authority, 3.00% due 12/15/2018 (Beaver County Sewer System; Insured: BAM) | | AA/NR | | | 435,000 | | | | 459,243 | |
Economy Borough Municipal Authority, 4.00% due 12/15/2020 (Beaver County Sewer System; Insured: BAM) | | AA/NR | | | 605,000 | | | | 672,234 | |
a Economy Borough Municipal Authority, 4.00% due 12/15/2022 (Beaver County Sewer System; Insured: BAM) | | AA/NR | | | 1,180,000 | | | | 1,317,883 | |
Geisinger Authority, 0.01% due 6/1/2041 put 4/1/2015 (Geisinger Health System; SPA: U.S. Bank, N.A.) (daily demand notes) | | AA/Aa2 | | | 16,300,000 | | | | 16,300,000 | |
Hospitals & Higher Education Facilities Authority of Philadelphia, 0.03% due 2/15/2021 put 4/1/2015 (The Children’s Hospital of Philadelphia; SPA: Wells Fargo Bank, N.A.) (daily demand notes) | | AA/Aa2 | | | 11,515,000 | | | | 11,515,000 | |
Hospitals & Higher Education Facilities Authority of Philadelphia, 0.03% due 7/1/2022 put 4/1/2015 (The Children’s Hospital of Philadelphia; SPA: JPMorgan Chase Bank, N.A.) (daily demand notes) | | AA/Aa2 | | | 6,320,000 | | | | 6,320,000 | |
Hospitals & Higher Education Facilities Authority of Philadelphia, 0.03% due 7/1/2025 put 4/1/2015 (The Children’s Hospital of Philadelphia; SPA: JPMorgan Chase Bank, N.A.) (daily demand notes) | | AA/Aa2 | | | 33,000,000 | | | | 33,000,000 | |
34 Semi-Annual Report
| | |
| SCHEDULE OF INVESTMENTS, CONTINUED | | |
| |
Thornburg Limited Term Municipal Fund | | March 31, 2015 (Unaudited) |
| | | | | | | | | | |
Issuer-Description | | Credit Rating†
S&P/ Moody’s | | Principal
Amount | | | Value | |
Hospitals & Higher Education Facilities Authority of Philadelphia, 0.03% due 7/1/2041 put 4/1/2015 (The Children’s Hospital of Philadelphia; SPA: Wells Fargo Bank, N.A.) (daily demand notes) | | AA/Aa2 | | $ | 10,100,000 | | | $ | 10,100,000 | |
Lancaster County Hospital Authority, 3.00% due 11/1/2016 (Masonic Villages Project) | | A/NR | | | 1,550,000 | | | | 1,602,282 | |
Lancaster County Hospital Authority, 4.00% due 11/1/2017 (Masonic Villages Project) | | A/NR | | | 865,000 | | | | 925,948 | |
Lancaster County Hospital Authority, 5.00% due 11/1/2018 (Masonic Villages Project) | | A/NR | | | 1,105,000 | | | | 1,246,153 | |
Lancaster County Solid Waste Management Authority, 5.00% due 12/15/2023 (Harrisburg Resource Recovery Facility) | | AA-/NR | | | 2,680,000 | | | | 3,195,444 | |
Lancaster County Solid Waste Management Authority, 5.25% due 12/15/2024 (Harrisburg Resource Recovery Facility) | | AA-/NR | | | 4,000,000 | | | | 4,815,200 | |
Monroeville Finance Authority, 5.00% due 2/15/2021 (University of Pittsburgh Medical Center) | | A+/Aa3 | | | 2,400,000 | | | | 2,823,744 | |
Monroeville Finance Authority, 5.00% due 2/15/2022 (University of Pittsburgh Medical Center) | | A+/Aa3 | | | 1,250,000 | | | | 1,487,000 | |
Montgomery County Higher Education & Health Authority, 5.00% due 6/1/2022 (Abington Memorial Hospital) | | A/NR | | | 3,000,000 | | | | 3,507,660 | |
Northampton Borough Municipal Authority, 4.00% due 5/15/2021 (Water System; Insured: AGM) | | NR/A1 | | | 500,000 | | | | 545,615 | |
a Northampton Borough Municipal Authority, 4.00% due 5/15/2022 (Water System; Insured: AGM) | | NR/A1 | | | 1,185,000 | | | | 1,295,300 | |
Northampton Borough Municipal Authority, 3.00% due 5/15/2023 (Water System; Insured: AGM) | | NR/A1 | | | 1,255,000 | | | | 1,286,864 | |
Norwin School District GO, 4.00% due 4/1/2018 (Insured: AGM) (State Aid Withholding) | | AA/A1 | | | 1,835,000 | | | | 1,981,727 | |
Pennsylvania Economic DFA, 5.00% due 7/1/2016 (Pennsylvania Dept. of Labor and Industry) | | AA+/Aaa | | | 10,000,000 | | | | 10,591,100 | |
Pennsylvania Economic DFA, 3.70% due 11/1/2021 put 5/1/2015 (Waste Management, Inc.) | | A-/NR | | | 7,750,000 | | | | 7,773,172 | |
Pennsylvania Economic DFA, 1.75% due 12/1/2033 put 12/1/2015 (Waste Management, Inc.) | | A-/NR | | | 2,000,000 | | | | 2,017,600 | |
Pennsylvania Economic DFA, 3.00% due 12/1/2037 put 9/1/2015 (PPL Energy Supply) | | BB/Ba1 | | | 14,000,000 | | | | 14,090,020 | |
Pennsylvania Higher Educational Facilities Authority, 5.00% due 5/15/2019 (University of Pittsburgh Medical Center) | | A+/Aa3 | | | 5,600,000 | | | | 6,379,688 | |
Pennsylvania Higher Educational Facilities Authority, 5.00% due 5/15/2020 (University of Pittsburgh Medical Center) | | A+/Aa3 | | | 5,100,000 | | | | 5,921,100 | |
Pennsylvania Higher Educational Facilities Authority, 4.00% due 10/1/2022 (Shippensburg University Student Services, Inc. Student Housing) | | BBB-/Baa3 | | | 1,825,000 | | | | 1,894,496 | |
Pennsylvania Higher Educational Facilities Authority, 5.00% due 11/1/2023 (Saint Joseph’s University) | | A-/NR | | | 1,075,000 | | | | 1,232,810 | |
Philadelphia Authority for Industrial Development, 5.00% due 8/1/2020 (Mast Charter School) | | BBB+/NR | | | 605,000 | | | | 638,959 | |
Philadelphia Parking Authority, 5.00% due 9/1/2016 | | A/A1 | | | 1,500,000 | | | | 1,587,300 | |
Philadelphia Parking Authority, 5.00% due 9/1/2017 | | A/A1 | | | 1,020,000 | | | | 1,110,403 | |
Philadelphia School District GO, 4.50% due 9/1/2017 (State Aid Withholding) | | A+/A1 | | | 2,270,000 | | | | 2,457,638 | |
Philadelphia School District GO, 5.00% due 9/1/2019 (State Aid Withholding) | | A+/A1 | | | 18,410,000 | | | | 20,975,433 | |
Philadelphia School District GO, 5.00% due 9/1/2019 (State Aid Withholding) | | A+/A1 | | | 4,210,000 | | | | 4,796,663 | |
Philadelphia School District GO, 5.25% due 9/1/2021 (State Aid Withholding) | | A+/A1 | | | 2,265,000 | | | | 2,595,531 | |
Pittsburgh Water and Sewer Authority, 5.00% due 9/1/2023 | | A/A2 | | | 2,520,000 | | | | 3,040,733 | |
Pittsburgh Water and Sewer Authority, 5.00% due 9/1/2024 | | A/A2 | | | 7,365,000 | | | | 8,870,185 | |
Pittsburgh Water and Sewer Authority, 5.00% due 9/1/2024 | | A/A2 | | | 2,395,000 | | | | 2,884,466 | |
Plum Borough School District GO, 2.00% due 9/15/2015 (Insured: BAM) (State Aid Withholding) | | AA/NR | | | 850,000 | | | | 856,256 | |
Plum Borough School District GO, 3.00% due 9/15/2016 (Insured: BAM) (State Aid Withholding) | | AA/NR | | | 750,000 | | | | 775,260 | |
Plum Borough School District GO, 3.00% due 9/15/2017 (Insured: BAM) (State Aid Withholding) | | AA/NR | | | 240,000 | | | | 251,635 | |
Plum Borough School District GO, 4.00% due 9/15/2018 (Insured: BAM) (State Aid Withholding) | | AA/NR | | | 740,000 | | | | 805,882 | |
Plum Borough School District GO, 4.00% due 9/15/2019 (Insured: BAM) (State Aid Withholding) | | AA/NR | | | 390,000 | | | | 429,320 | |
Plum Borough School District GO, 4.00% due 9/15/2019 (Insured: BAM) (State Aid Withholding) | | AA/NR | | | 395,000 | | | | 434,824 | |
Plum Borough School District GO, 4.00% due 9/15/2019 (Insured: BAM) (State Aid Withholding) | | AA/NR | | | 1,205,000 | | | | 1,326,488 | |
Plum Borough School District GO, 4.00% due 9/15/2020 (Insured: BAM) (State Aid Withholding) | | AA/NR | | | 1,455,000 | | | | 1,615,807 | |
Plum Borough School District GO, 4.00% due 9/15/2021 (Insured: BAM) (State Aid Withholding) | | AA/NR | | | 1,610,000 | | | | 1,794,796 | |
Plum Borough School District GO, 5.00% due 9/15/2022 (Insured: BAM) (State Aid Withholding) | | AA/NR | | | 1,410,000 | | | | 1,671,696 | |
Plum Borough School District GO, 5.00% due 9/15/2023 (Insured: BAM) (State Aid Withholding) | | AA/NR | | | 1,495,000 | | | | 1,779,439 | |
Plum Borough School District GO, 5.00% due 9/15/2023 (Insured: BAM) (State Aid Withholding) | | AA/NR | | | 470,000 | | | | 559,422 | |
Plum Borough School District GO, 5.00% due 9/15/2024 (Insured: BAM) (State Aid Withholding) | | AA/NR | | | 1,885,000 | | | | 2,271,387 | |
School District of Pittsburgh GO, 5.50% due 9/1/2016 (Insured: AGM) (State Aid Withholding) | | AA/Aa3 | | | 4,000,000 | | | | 4,280,320 | |
Wayne County Hospital and HFA, 2.00% due 7/1/2016 (Wayne Memorial Hospital; Insured: AGM) | | AA/NR | | | 500,000 | | | | 509,145 | |
Wayne County Hospital and HFA, 2.00% due 7/1/2017 (Wayne Memorial Hospital; Insured: AGM) | | AA/NR | | | 1,000,000 | | | | 1,024,890 | |
Wayne County Hospital and HFA, 2.00% due 7/1/2018 (Wayne Memorial Hospital; Insured: AGM) | | AA/NR | | | 625,000 | | | | 640,481 | |
Wayne County Hospital and HFA, 3.00% due 7/1/2019 (Wayne Memorial Hospital; Insured: AGM) | | AA/NR | | | 1,185,000 | | | | 1,238,088 | |
West Mifflin Area School District GO, 3.70% due 10/1/2015 (Insured: AGM) (State Aid Withholding) | | AA/A2 | | | 2,210,000 | | | | 2,248,631 | |
| | | |
RHODE ISLAND — 1.62% | | | | | | | | | | |
Rhode Island Clean Water Finance Agency, 5.00% due 10/1/2018 (Public Drinking Water Supply or Treatment Facilities) | | AAA/NR | | | 870,000 | | | | 986,658 | |
Rhode Island Clean Water Finance Agency, 5.00% due 10/1/2019 (Public Drinking Water Supply or Treatment Facilities) | | AAA/NR | | | 1,250,000 | | | | 1,451,213 | |
Rhode Island Clean Water Finance Agency, 5.00% due 10/1/2020 (Public Drinking Water Supply or Treatment Facilities) | | AAA/NR | | | 1,300,000 | | | | 1,541,410 | |
Rhode Island Clean Water Finance Agency, 5.00% due 10/1/2021 (Public Drinking Water Supply or Treatment Facilities) | | AAA/NR | | | 2,000,000 | | | | 2,411,700 | |
Rhode Island Clean Water Finance Agency, 5.00% due 10/1/2022 (Public Drinking Water Supply or Treatment Facilities) | | AAA/NR | | | 2,280,000 | | | | 2,786,593 | |
Rhode Island Clean Water Finance Agency, 5.00% due 10/1/2023 (Public Drinking Water Supply or Treatment Facilities) | | AAA/NR | | | 2,380,000 | | | | 2,938,705 | |
Rhode Island Convention Center Authority, 5.25% due 5/15/2015 (Convention Center and Parking Projects; Insured: Natl-Re) | | AA-/A3 | | | 390,000 | | | | 391,147 | |
Rhode Island Convention Center Authority, 5.00% due 5/15/2018 (Convention Center and Parking Projects) | | AA-/Aa3 | | | 5,615,000 | | | | 6,254,717 | |
Rhode Island Convention Center Authority, 5.00% due 5/15/2019 (Convention Center and Parking Projects) | | AA-/Aa3 | | | 7,310,000 | | | | 8,296,265 | |
Rhode Island Convention Center Authority, 5.00% due 5/15/2020 (Convention Center and Parking Projects) | | AA-/Aa3 | | | 5,890,000 | | | | 6,796,824 | |
Rhode Island Convention Center Authority, 5.00% due 5/15/2021 (Convention Center and Parking Projects; Insured: AGM) | | AA/Aa3 | | | 2,000,000 | | | | 2,011,580 | |
Rhode Island Convention Center Authority, 5.00% due 5/15/2022 (Convention Center and Parking Projects; Insured: AGM) | | AA/Aa3 | | | 125,000 | | | | 125,724 | |
Semi-Annual Report 35
| | |
| SCHEDULE OF INVESTMENTS, CONTINUED | | |
| |
Thornburg Limited Term Municipal Fund | | March 31, 2015 (Unaudited) |
| | | | | | | | | | |
Issuer-Description | | Credit Rating†
S&P/ Moody’s | | Principal
Amount | | | Value | |
Rhode Island Health & Educational Building Corp., 4.00% due 9/15/2015 (University of Rhode Island Auxiliary Enterprise) | | A+/A1 | | $ | 500,000 | | | $ | 508,205 | |
Rhode Island Health & Educational Building Corp., 5.00% due 9/15/2020 (University of Rhode Island Auxiliary Enterprise) | | A+/A1 | | | 750,000 | | | | 870,060 | |
Rhode Island Health & Educational Building Corp., 5.00% due 9/15/2023 (University of Rhode Island Auxiliary Enterprise) | | A+/A1 | | | 1,400,000 | | | | 1,664,012 | |
State of Rhode Island and Providence Plantations COP, 5.00% due 10/1/2015 (Shepard’s Building; Insured: AGM) | | AA/Aa3 | | | 800,000 | | | | 819,096 | |
State of Rhode Island and Providence Plantations COP, 5.00% due 10/1/2019 (Kent County Courthouse) | | AA-/Aa3 | | | 600,000 | | | | 689,352 | |
State of Rhode Island and Providence Plantations COP, 5.00% due 10/1/2019 (Training School Project) | | AA-/Aa3 | | | 1,575,000 | | | | 1,809,549 | |
State of Rhode Island and Providence Plantations COP, 5.00% due 10/1/2020 (Kent County Courthouse) | | AA-/Aa3 | | | 1,375,000 | | | | 1,605,588 | |
State of Rhode Island and Providence Plantations COP, 5.00% due 10/1/2020 (Training School Project) | | AA-/Aa3 | | | 1,405,000 | | | | 1,640,619 | |
State of Rhode Island and Providence Plantations COP, 5.00% due 10/1/2021 (Kent County Courthouse) | | AA-/Aa3 | | | 2,000,000 | | | | 2,361,000 | |
State of Rhode Island and Providence Plantations COP, 5.00% due 10/1/2021 (Training School Project) | | AA-/Aa3 | | | 3,540,000 | | | | 4,178,970 | |
State of Rhode Island and Providence Plantations COP, 5.00% due 4/1/2022 (Energy Conservation Project) | | AA-/Aa3 | | | 2,020,000 | | | | 2,393,054 | |
State of Rhode Island and Providence Plantations COP, 5.00% due 10/1/2022 (Kent County Courthouse) | | AA-/Aa3 | | | 2,100,000 | | | | 2,502,087 | |
State of Rhode Island and Providence Plantations COP, 5.00% due 10/1/2022 (Training School Project) | | AA-/Aa3 | | | 3,620,000 | | | | 4,313,121 | |
State of Rhode Island and Providence Plantations COP, 5.00% due 10/1/2023 (Kent County Courthouse) | | AA-/Aa3 | | | 1,500,000 | | | | 1,800,180 | |
State of Rhode Island and Providence Plantations COP, 5.00% due 10/1/2023 (Training School Project) | | AA-/Aa3 | | | 1,705,000 | | | | 2,046,205 | |
State of Rhode Island and Providence Plantations COP, 5.00% due 11/1/2024 (Information Technology Project) | | AA-/Aa3 | | | 3,010,000 | | | | 3,631,023 | |
State of Rhode Island and Providence Plantations GO, 5.00% due 10/1/2019 (Consolidated Capital Development Loan) | | AA/Aa2 | | | 5,000,000 | | | | 5,832,200 | |
State of Rhode Island and Providence Plantations GO, 5.00% due 8/1/2020 (Consolidated Capital Development Loan) | | AA/Aa2 | | | 8,365,000 | | | | 9,828,791 | |
State of Rhode Island and Providence Plantations GO, 4.00% due 10/15/2020 (Consolidated Capital Development Loan) | | AA/Aa2 | | | 1,200,000 | | | | 1,365,972 | |
State of Rhode Island and Providence Plantations GO, 5.00% due 8/1/2021 (Consolidated Capital Development Loan) | | AA/Aa2 | | | 16,535,000 | | | | 19,722,121 | |
State of Rhode Island and Providence Plantations GO, 4.00% due 10/15/2021 (Consolidated Capital Development Loan) | | AA/Aa2 | | | 1,000,000 | | | | 1,148,310 | |
State of Rhode Island and Providence Plantations GO, 5.00% due 8/1/2022 (Consolidated Capital Development Loan) | | AA/Aa2 | | | 9,825,000 | | | | 11,830,282 | |
State of Rhode Island and Providence Plantations GO, 4.00% due 10/15/2022 (Consolidated Capital Development Loan) | | AA/Aa2 | | | 1,000,000 | | | | 1,155,660 | |
| | | |
SOUTH CAROLINA — 0.49% | | | | | | | | | | |
Berkeley County School District, 5.00% due 12/1/2020 (School Facility Equipment Acquisition) | | AA-/NR | | | 550,000 | | | | 638,094 | |
Berkeley County School District, 5.00% due 12/1/2021 (School Facility Equipment Acquisition) | | AA-/NR | | | 1,000,000 | | | | 1,171,520 | |
Berkeley County School District, 5.00% due 12/1/2024 (School Facility Equipment Acquisition) | | AA-/NR | | | 2,000,000 | | | | 2,382,420 | |
City of North Charleston Public Facilities Corp. COP, 5.00% due 10/1/2016 (Convention Center Complex) | | AA-/NR | | | 1,560,000 | | | | 1,656,392 | |
City of North Charleston Public Facilities Corp. COP, 5.00% due 10/1/2017 (Convention Center Complex) | | AA-/NR | | | 710,000 | | | | 774,589 | |
County of Charleston, 5.00% due 12/1/2022 (South Aviation Ave. Construction) | | AA+/NR | | | 1,810,000 | | | | 2,186,842 | |
County of Charleston, 5.00% due 12/1/2023 (South Aviation Ave. Construction) | | AA+/NR | | | 2,460,000 | | | | 3,005,235 | |
Greenville County School District, 5.50% due 12/1/2016 (Building Equity Sooner for Tomorrow) | | AA/Aa2 | | | 3,500,000 | | | | 3,790,535 | |
Greenwood County, 5.00% due 10/1/2022 (Self Regional Healthcare) | | A+/A1 | | | 1,000,000 | | | | 1,167,490 | |
Greenwood Fifty Facilities School District, 5.00% due 12/1/2015 (Insured: AGM) | | AA/A1 | | | 1,000,000 | | | | 1,030,380 | |
Greenwood Fifty Facilities School District, 5.00% due 12/1/2016 (Insured: AGM) | | AA/A1 | | | 1,000,000 | | | | 1,069,700 | |
Lexington One School Facilities Corp., 5.00% due 12/1/2015 (Lexington County School District No. 1) (ETM) | | NR/Aa3 | | | 1,000,000 | | | | 1,031,980 | |
Piedmont Municipal Power Agency, 5.00% due 1/1/2016 (Electric Generation and Transmission Facilities) | | A-/Baa1 | | | 490,000 | | | | 507,013 | |
Piedmont Municipal Power Agency, 6.75% due 1/1/2019 (Insured: Natl-Re) | | NR/A3 | | | 3,800,000 | | | | 4,518,960 | |
b SCAGO Educational Facilities Corp., 5.00% due 12/1/2021 (School District of Pickens County) | | A/A1 | | | 1,810,000 | | | | 2,137,863 | |
b SCAGO Educational Facilities Corp., 5.00% due 12/1/2022 (School District of Pickens County) | | A/A1 | | | 500,000 | | | | 595,600 | |
b SCAGO Educational Facilities Corp., 5.00% due 12/1/2023 (School District of Pickens County) | | A/A1 | | | 1,000,000 | | | | 1,197,840 | |
b SCAGO Educational Facilities Corp., 5.00% due 12/1/2024 (School District of Pickens County) | | A/A1 | | | 1,010,000 | | | | 1,217,494 | |
b SCAGO Educational Facilities Corp., 5.00% due 12/1/2025 (School District of Pickens County) | | A/A1 | | | 1,000,000 | | | | 1,204,900 | |
South Carolina Jobs Economic Development Authority, 5.00% due 8/15/2015 (CareAlliance Health Services; Insured: AGM) (ETM) | | NR/A2 | | | 3,000,000 | | | | 3,053,730 | |
State of South Carolina GO, 5.00% due 4/1/2015 (Transportation Infrastructure) (State Aid Withholding) | | AA+/Aaa | | | 2,070,000 | | | | 2,070,000 | |
| | | |
SOUTH DAKOTA — 0.35% | | | | | | | | | | |
South Dakota Building Authority, 4.50% due 6/1/2016 (Insured: Natl-Re) (ETM) | | AA/A3 | | | 2,000,000 | | | | 2,097,420 | |
South Dakota Building Authority, 5.00% due 6/1/2022 | | AA/Aa2 | | | 500,000 | | | | 601,595 | |
South Dakota Building Authority, 5.00% due 6/1/2024 | | AA/Aa2 | | | 1,000,000 | | | | 1,209,960 | |
South Dakota Health & Educational Facilities Authority, 5.00% due 9/1/2015 (Regional Health) | | NR/A1 | | | 1,390,000 | | | | 1,417,883 | |
South Dakota Health & Educational Facilities Authority, 5.00% due 11/1/2015 (Sanford Health) | | A+/A1 | | | 1,310,000 | | | | 1,345,724 | |
South Dakota Health & Educational Facilities Authority, 5.00% due 9/1/2016 (Regional Health) | | NR/A1 | | | 1,000,000 | | | | 1,061,370 | |
South Dakota Health & Educational Facilities Authority, 5.00% due 4/1/2017 (Prairie Lakes Health) | | A+/NR | | | 2,215,000 | | | | 2,354,324 | |
South Dakota Health & Educational Facilities Authority, 5.00% due 9/1/2017 (Regional Health) | | NR/A1 | | | 1,100,000 | | | | 1,206,161 | |
South Dakota Health & Educational Facilities Authority, 5.00% due 4/1/2018 (Prairie Lakes Health) | | A+/NR | | | 2,290,000 | | | | 2,475,879 | |
South Dakota Health & Educational Facilities Authority, 5.00% due 9/1/2018 (Regional Health) | | NR/A1 | | | 1,000,000 | | | | 1,124,190 | |
South Dakota Health & Educational Facilities Authority, 5.00% due 9/1/2018 (Regional Health) | | NR/A1 | | | 1,275,000 | | | | 1,433,342 | |
South Dakota Health & Educational Facilities Authority, 5.00% due 4/1/2019 (Prairie Lakes Health) | | A+/NR | | | 2,440,000 | | | | 2,680,609 | |
South Dakota Health & Educational Facilities Authority, 5.00% due 9/1/2020 (Regional Health) | | NR/A1 | | | 1,000,000 | | | | 1,168,350 | |
South Dakota Health & Educational Facilities Authority, 5.00% due 7/1/2021 (Avera Health) | | AA-/A1 | | | 1,670,000 | | | | 1,976,979 | |
South Dakota Housing Development Authority, 4.00% due 11/1/2016 (Single Family Mtg) | | NR/Aa3 | | | 1,040,000 | | | | 1,091,002 | |
36 Semi-Annual Report
| | |
| SCHEDULE OF INVESTMENTS, CONTINUED | | |
| |
Thornburg Limited Term Municipal Fund | | March 31, 2015 (Unaudited) |
| | | | | | | | | | |
Issuer-Description | | Credit Rating†
S&P/ Moody’s | | Principal
Amount | | | Value | |
South Dakota Housing Development Authority, 4.00% due 11/1/2017 (Single Family Mtg) | | NR/Aa3 | | $ | 1,055,000 | | | $ | 1,128,027 | |
South Dakota Housing Development Authority, 4.00% due 11/1/2018 (Single Family Mtg) | | NR/Aa3 | | | 1,165,000 | | | | 1,264,782 | |
| | | |
TENNESSEE — 0.52% | | | | | | | | | | |
Clarksville Natural Gas Acquisition Corp., 5.00% due 12/15/2015 | | NR/Baa2 | | | 3,500,000 | | | | 3,600,905 | |
Clarksville Natural Gas Acquisition Corp., 5.00% due 12/15/2019 | | NR/Baa2 | | | 6,000,000 | | | | 6,764,340 | |
Hallsdale-Powell Utility District, 3.00% due 4/1/2016 | | AA/NR | | | 500,000 | | | | 513,115 | |
Tennessee Energy Acquisition Corp., 5.00% due 9/1/2015 | | A-/Baa1 | | | 3,000,000 | | | | 3,051,150 | |
Tennessee Energy Acquisition Corp., 5.00% due 2/1/2017 | | A-/Baa1 | | | 5,000,000 | | | | 5,341,050 | |
Tennessee Energy Acquisition Corp., 5.25% due 9/1/2017 | | A-/Baa1 | | | 11,000,000 | | | | 12,050,720 | |
Tennessee Energy Acquisition Corp., 5.25% due 9/1/2018 | | A-/Baa1 | | | 5,000,000 | | | | 5,631,050 | |
Tennessee Energy Acquisition Corp., 5.25% due 9/1/2020 | | A-/Baa1 | | | 1,190,000 | | | | 1,365,846 | |
| | | |
TEXAS — 10.29% | | | | | | | | | | |
Austin Community College Public Facilities Corp., 5.25% due 8/1/2017 (Round Rock Campus) | | AA/Aa2 | | | 1,500,000 | | | | 1,652,985 | |
Bexar Metropolitan Water District, 4.50% due 5/1/2021 (Waterworks System; Insured: Natl-Re) | | AA-/A1 | | | 1,200,000 | | | | 1,250,964 | |
Brazos River Authority, 4.90% due 10/1/2015 (Houston Industries, Inc. Project; Insured: Natl-Re) | | AA-/A3 | | | 4,685,000 | | | | 4,783,291 | |
Capital Area Cultural Education Facilities Finance Corp., 5.00% due 4/1/2015 (Roman Catholic Diocese of Austin) | | NR/Baa1 | | | 1,100,000 | | | | 1,100,000 | |
Capital Area Cultural Education Facilities Finance Corp., 5.00% due 4/1/2018 (Roman Catholic Diocese of Austin) | | NR/Baa1 | | | 1,370,000 | | | | 1,504,013 | |
Cities of Dallas and Fort Worth, 5.00% due 11/1/2015 (DFW International Airport Development Plan) | | A+/A2 | | | 3,370,000 | | | | 3,464,326 | |
Cities of Dallas and Fort Worth, 5.25% due 11/1/2023 (DFW International Airport Terminal Renewal & Improvement Program) | | A+/A2 | | | 3,000,000 | | | | 3,614,940 | |
City of Austin, 5.00% due 5/15/2015 (Water and Wastewater System; Insured: AMBAC) | | AA/Aa2 | | | 1,520,000 | | | | 1,529,074 | |
City of Austin, 5.00% due 5/15/2016 (Water and Wastewater System; Insured: Natl-Re) | | AA/Aa2 | | | 1,500,000 | | | | 1,546,140 | |
City of Austin, 5.00% due 11/15/2022 (Water and Wastewater System) | | AA/Aa2 | | | 2,640,000 | | | | 3,196,987 | |
City of Beaumont, 5.00% due 9/1/2023 (Waterworks & Sewer System Improvements; Insured: AGM) | | AA/A2 | | | 5,000,000 | | | | 6,081,600 | |
City of Beaumont, 5.00% due 9/1/2024 (Waterworks & Sewer System Improvements; Insured: AGM) | | AA/A2 | | | 2,500,000 | | | | 3,022,975 | |
City of Brownsville, 5.00% due 9/1/2020 (Water, Wastewater & Electric Utilities Systems) | | A+/A2 | | | 1,500,000 | | | | 1,746,900 | |
City of Brownsville, 5.00% due 9/1/2022 (Water, Wastewater & Electric Utilities Systems) | | A+/A2 | | | 1,520,000 | | | | 1,811,262 | |
City of Brownsville, 5.00% due 9/1/2023 (Water, Wastewater & Electric Utilities Systems) | | A+/A2 | | | 2,380,000 | | | | 2,855,667 | |
City of Bryan, 5.00% due 7/1/2015 (Electric System) | | A+/A2 | | | 1,150,000 | | | | 1,163,605 | |
City of Bryan, 5.00% due 7/1/2019 (Electric System) | | A+/A2 | | | 8,000,000 | | | | 8,630,000 | |
City of Denton GO, 4.00% due 2/15/2016 | | AA/Aa2 | | | 3,535,000 | | | | 3,650,100 | |
City of Denton GO, 5.00% due 2/15/2017 | | AA/Aa2 | | | 3,675,000 | | | | 3,973,961 | |
City of Denton GO, 5.00% due 2/15/2019 | | AA/Aa2 | | | 3,990,000 | | | | 4,557,897 | |
City of Denton GO, 5.00% due 2/15/2020 | | AA/Aa2 | | | 4,195,000 | | | | 4,768,205 | |
City of Houston, 5.00% due 7/1/2015 (Airport System) | | AA-/Aa3 | | | 2,600,000 | | | | 2,631,304 | |
City of Houston, 5.00% due 7/1/2017 (Airport System) | | AA-/Aa3 | | | 1,600,000 | | | | 1,748,032 | |
City of Houston, 5.00% due 7/1/2018 (Airport System) | | AA-/Aa3 | | | 1,000,000 | | | | 1,121,770 | |
City of Houston, 0% due 9/1/2020 (Insured: AGM/AMBAC) | | AA/A2 | | | 3,650,000 | | | | 3,171,667 | |
City of Houston, 5.00% due 9/1/2020 (Convention & Entertainment Facilities) | | A-/A2 | | | 650,000 | | | | 756,139 | |
City of Houston, 5.00% due 9/1/2021 (Convention & Entertainment Facilities) | | A-/A2 | | | 1,500,000 | | | | 1,764,090 | |
City of Houston, 5.00% due 5/15/2022 (Combined Utility System) | | AA/Aa2 | | | 3,000,000 | | | | 3,632,160 | |
City of Houston, 5.00% due 9/1/2022 (Convention & Entertainment Facilities) | | A-/A2 | | | 600,000 | | | | 710,166 | |
City of Houston, 5.00% due 11/15/2022 (Combined Utility System) | | AA/Aa2 | | | 5,000,000 | | | | 6,100,450 | |
City of Houston, 5.00% due 5/15/2023 (Combined Utility System) | | AA/Aa2 | | | 4,445,000 | | | | 5,459,527 | |
City of Houston, 5.00% due 11/15/2023 (Combined Utility System) | | AA/Aa2 | | | 5,000,000 | | | | 6,176,400 | |
City of Houston, 5.00% due 5/15/2024 (Combined Utility System) | | AA/Aa2 | | | 7,250,000 | | | | 8,979,487 | |
City of Houston, 5.00% due 9/1/2024 (Convention & Entertainment Facilities) | | A-/A2 | | | 1,215,000 | | | | 1,457,502 | |
City of Houston, 5.00% due 11/15/2024 (Combined Utility System) | | AA/Aa2 | | | 5,000,000 | | | | 6,244,250 | |
City of Laredo, 5.00% due 3/15/2021 (Sports Venues; Insured: AGM) | | AA/A1 | | | 600,000 | | | | 704,628 | |
City of Laredo, 5.00% due 3/15/2022 (Sports Venues; Insured: AGM) | | AA/A1 | | | 2,000,000 | | | | 2,372,360 | |
City of Laredo, 5.00% due 3/15/2023 (Sports Venues; Insured: AGM) | | AA/A1 | | | 1,500,000 | | | | 1,790,475 | |
City of Laredo, 5.00% due 3/15/2024 (Sports Venues; Insured: AGM) | | AA/A1 | | | 300,000 | | | | 359,730 | |
City of Laredo GO, 5.00% due 2/15/2018 (Streets, Sidewalks, Drainage, Signals, Lighting; Insured: Natl-Re) | | AA/Aa2 | | | 2,000,000 | | | | 2,163,740 | |
City of Olmos Park Higher Education Facilities Corp., 5.00% due 12/1/2020 (University of the Incarnate Word Project) | | NR/A3 | | | 3,620,000 | | | | 4,218,639 | |
City of Olmos Park Higher Education Facilities Corp., 5.00% due 12/1/2021 (University of the Incarnate Word Project) | | NR/A3 | | | 1,000,000 | | | | 1,177,000 | |
City of San Antonio, 5.00% due 2/1/2022 (CPS Energy) | | AA/Aa1 | | | 20,000,000 | | | | 24,155,400 | |
City of San Antonio, 5.25% due 2/1/2024 (CPS Energy) | | AA/Aa1 | | | 7,000,000 | | | | 8,780,310 | |
City of San Antonio Public Facilities Corp., 5.00% due 9/15/2022 (Convention Center Refinancing & Expansion) | | AA+/Aa2 | | | 1,450,000 | | | | 1,744,452 | |
City of Weslaco GO, 5.25% due 2/15/2019 (Waterworks and Sewer System; Insured: Natl-Re) | | AA-/A2 | | | 2,835,000 | | | | 3,029,283 | |
Clifton Higher Education Finance Corp., 5.00% due 8/15/2016 (IDEA Public Schools) | | BBB/NR | | | 225,000 | | | | 236,599 | |
Clifton Higher Education Finance Corp., 5.00% due 8/15/2017 (IDEA Public Schools) | | BBB/NR | | | 315,000 | | | | 341,362 | |
Clifton Higher Education Finance Corp., 5.00% due 8/15/2018 (IDEA Public Schools) | | BBB/NR | | | 325,000 | | | | 360,789 | |
Clifton Higher Education Finance Corp., 5.00% due 8/15/2019 (IDEA Public Schools) | | BBB/NR | | | 445,000 | | | | 504,608 | |
Clifton Higher Education Finance Corp., 5.00% due 8/15/2023 (IDEA Public Schools) | | BBB/NR | | | 1,100,000 | | | | 1,267,046 | |
Collin County GO, 5.00% due 2/15/2016 (Road and Highway Construction) | | AAA/Aaa | | | 1,465,000 | | | | 1,526,178 | |
Semi-Annual Report 37
| | |
| SCHEDULE OF INVESTMENTS, CONTINUED | | |
| |
Thornburg Limited Term Municipal Fund | | March 31, 2015 (Unaudited) |
| | | | | | | | | | |
Issuer-Description | | Credit Rating†
S&P/ Moody’s | | Principal
Amount | | | Value | |
Corpus Christi Business & Job Development Corp., 5.00% due 3/1/2021 (Seawall Project) | | A+/A1 | | $ | 625,000 | | | $ | 727,825 | |
Dallas Convention Center Hotel Development Corp., 0% due 1/1/2018 | | A+/A1 | | | 5,240,000 | | | | 4,936,709 | |
Dallas Convention Center Hotel Development Corp., 5.00% due 1/1/2019 | | A+/A1 | | | 5,200,000 | | | | 5,808,660 | |
Dallas County Utility & Reclamation District, 5.00% due 2/15/2017 (Insured: AMBAC) | | A-/A3 | | | 1,160,000 | | | | 1,252,835 | |
Dallas County Utility & Reclamation District, 5.00% due 2/15/2017 (Insured: AMBAC) | | A-/A3 | | | 1,260,000 | | | | 1,360,838 | |
Dallas County Utility & Reclamation District, 5.00% due 2/15/2018 (Insured: AMBAC) | | A-/A3 | | | 1,935,000 | | | | 2,084,459 | |
Dallas County Utility & Reclamation District, 5.00% due 2/15/2018 (Insured: AMBAC) | | A-/A3 | | | 2,035,000 | | | | 2,192,183 | |
Dallas County Utility & Reclamation District, 5.00% due 2/15/2019 (Insured: AMBAC) | | A-/A3 | | | 2,175,000 | | | | 2,335,819 | |
Decatur ISD GO, 3.00% due 8/15/2015 (Wise County; Guaranty: PSF) | | AAA/NR | | | 1,710,000 | | | | 1,728,331 | |
Grayson County GO, 1.625% due 1/1/2017 (State Highway Toll System) | | AA/Aa2 | | | 1,200,000 | | | | 1,220,532 | |
a Grayson County GO, 4.00% due 1/1/2020 (State Highway Toll System) | | AA/Aa2 | | | 2,000,000 | | | | 2,232,260 | |
Grayson County GO, 5.00% due 1/1/2022 (State Highway Toll System) | | AA/Aa2 | | | 3,000,000 | | | | 3,592,770 | |
Guadalupe-Blanco River Authority PCR, 5.625% due 10/1/2017 (AEP Texas Central Co.) | | BBB/Baa1 | | | 5,000,000 | | | | 5,519,100 | |
Gulf Coast Waste Disposal Authority, 4.00% due 10/1/2016 (Bayport Area Wastewater Treatment System; Insured: AGM) | | AA/A2 | | | 500,000 | | | | 524,690 | |
Gulf Coast Waste Disposal Authority, 4.00% due 10/1/2017 (Bayport Area Wastewater Treatment System; Insured: AGM) | | AA/A2 | | | 800,000 | | | | 858,280 | |
Gulf Coast Waste Disposal Authority, 5.00% due 10/1/2019 (Bayport Area Wastewater Treatment System; Insured: AGM) | | AA/A2 | | | 1,000,000 | | | | 1,142,130 | |
Gulf Coast Waste Disposal Authority, 5.00% due 10/1/2020 (Bayport Area Wastewater Treatment System; Insured: AGM) | | AA/A2 | | | 2,000,000 | | | | 2,311,300 | |
Gulf Coast Waste Disposal Authority, 5.00% due 10/1/2022 (Bayport Area Wastewater Treatment System; Insured: AGM) | | AA/A2 | | | 1,635,000 | | | | 1,919,670 | |
Harris County Cultural Education Facilities Finance Corp., 5.00% due 11/15/2015 (Texas Medical Center Central Heating & Cooling Services Corp.) | | AA/Aa3 | | | 1,450,000 | | | | 1,493,399 | |
Harris County Cultural Education Facilities Finance Corp., 5.00% due 11/15/2018 (Texas Medical Center Central Heating & Cooling Services Corp.) | | AA/Aa3 | | | 1,365,000 | | | | 1,549,480 | |
Harris County Cultural Education Facilities Finance Corp., 5.00% due 11/15/2019 (Texas Medical Center Central Heating & Cooling Services Corp.) | | AA/Aa3 | | | 1,000,000 | | | | 1,160,820 | |
Harris County Cultural Education Facilities Finance Corp., 5.00% due 12/1/2022 (Memorial Hermann Health) | | A+/A1 | | | 200,000 | | | | 240,566 | |
Harris County Cultural Education Facilities Finance Corp., 5.00% due 12/1/2023 (Memorial Hermann Health) | | A+/A1 | | | 400,000 | | | | 485,720 | |
Harris County Cultural Education Facilities Finance Corp., 5.00% due 12/1/2024 (Memorial Hermann Health) | | A+/A1 | | | 3,000,000 | | | | 3,671,160 | |
Harris County GO, 4.00% due 10/1/2015 (County Permanent Improvements) | | AAA/NR | | | 2,995,000 | | | | 3,053,283 | |
Harris County GO, 5.00% due 10/1/2015 (County Permanent Improvements) | | AAA/NR | | | 4,000,000 | | | | 4,097,840 | |
Harris County Health Facilities Development Corp., 5.00% due 7/1/2016 (CHRISTUS Health System; Insured: AGM) | | AA/A1 | | | 6,260,000 | | | | 6,613,001 | |
Harris County Health Facilities Development Corp., 7.00% due 12/1/2027 pre-refunded 12/1/2018 (Memorial Hermann Healthcare System; LOC: JPMorgan Chase Bank, N.A.) | | NR/A1 | | | 1,245,000 | | | | 1,509,899 | |
Harris County Health Facilities Development Corp., 0.03% due 10/1/2041 put 4/1/2015 (Texas Children’s Hospital; SPA: Wells Fargo Bank, N.A.) (daily demand notes) | | AA/Aa2 | | | 56,285,000 | | | | 56,285,000 | |
Harris County Hospital District, 5.00% due 2/15/2017 (Insured: Natl-Re) | | AA-/A2 | | | 1,500,000 | | | | 1,600,365 | |
Harris County-Houston Sports Authority, 5.00% due 11/15/2022 (Insured: AGM) | | AA/A2 | | | 5,410,000 | | | | 6,482,262 | |
Harris County-Houston Sports Authority, 5.00% due 11/15/2023 (Insured: AGM) | | AA/A2 | | | 9,475,000 | | | | 11,411,974 | |
Harris County-Houston Sports Authority, 5.00% due 11/15/2024 (Insured: AGM) | | AA/A2 | | | 7,930,000 | | | | 9,593,397 | |
Hays County GO, 5.00% due 2/15/2022 | | AA/NR | | | 750,000 | | | | 897,315 | |
Hays County GO, 5.00% due 2/15/2023 | | AA/NR | | | 1,500,000 | | | | 1,813,350 | |
Hays County GO, 5.00% due 2/15/2024 | | AA/NR | | | 1,300,000 | | | | 1,580,943 | |
Hays County GO, 5.00% due 2/15/2025 | | AA/NR | | | 500,000 | | | | 612,610 | |
Houston Higher Education Finance Corp., 5.875% due 5/15/2021 (Cosmos Foundation, Inc.) | | BBB/NR | | | 1,865,000 | | | | 2,109,296 | |
Houston ISD GO, 3.00% due 7/15/2015 (Harris County School Buildings) | | AA+/Aaa | | | 2,000,000 | | | | 2,016,680 | |
Houston ISD GO, 1.50% due 6/1/2036 put 6/1/2015 (Harris County School Buildings; Guaranty: PSF) | | AAA/Aaa | | | 10,000,000 | | | | 10,020,900 | |
Houston ISD GO, 2.00% due 6/1/2037 put 6/1/2016 (Harris County School Buildings; Guaranty: PSF) | | AAA/Aaa | | | 10,000,000 | | | | 10,140,400 | |
Hutto ISD GO, 0% due 8/1/2017 pre-refunded 8/1/2016 (Guaranty: PSF) | | AAA/NR | | | 2,170,000 | | | | 2,059,243 | |
Irving ISD GO, 0% due 2/15/2017 pre-refunded 2/15/2016 (Guaranty: PSF) | | NR/Aaa | | | 155,000 | | | | 147,180 | |
Irving ISD GO, 0% due 2/15/2017 (Guaranty: PSF) | | AAA/Aaa | | | 845,000 | | | | 802,632 | |
Kerrville Health Facilities Development Corp., 5.25% due 8/15/2021 (Sid Peterson Memorial Hospital) | | BBB/NR | | | 4,000,000 | | | | 4,092,480 | |
Laredo Community College District GO, 5.00% due 8/1/2019 (School Facilities Improvements) | | AA-/Aa3 | | | 880,000 | | | | 1,015,265 | |
Laredo Community College District GO, 5.00% due 8/1/2020 (School Facilities Improvements) | | AA-/Aa3 | | | 1,360,000 | | | | 1,598,435 | |
Laredo Community College District GO, 5.00% due 8/1/2022 (School Facilities Improvements) | | AA-/Aa3 | | | 655,000 | | | | 789,308 | |
Laredo Community College District GO, 5.00% due 8/1/2023 (School Facilities Improvements) | | AA-/Aa3 | | | 610,000 | | | | 743,322 | |
Laredo Community College District GO, 5.00% due 8/1/2024 (School Facilities Improvements) | | AA-/Aa3 | | | 715,000 | | | | 880,294 | |
Lower Colorado River Authority, 5.875% due 5/15/2016 (Insured: BHAC/FSA) | | NR/Aa1 | | | 2,210,000 | | | | 2,220,431 | |
Lower Colorado River Authority, 5.00% due 5/15/2025 pre-refunded 5/15/2022 | | NR/NR | | | 55,000 | | | | 66,928 | |
Lower Colorado River Authority, 5.00% due 5/15/2025 | | A/A2 | | | 8,020,000 | | | | 9,341,455 | |
Mission Economic Development Corp., 3.75% due 12/1/2018 put 5/1/2015 (Waste Management, Inc.) | | A-/NR | | | 8,500,000 | | | | 8,551,425 | |
New Caney ISD GO, 5.00% due 2/15/2024 (Guaranty: PSF) | | AAA/Aaa | | | 865,000 | | | | 1,047,809 | |
North East ISD GO, 5.00% due 8/1/2016 (Guaranty: PSF) | | AAA/Aaa | | | 2,000,000 | | | | 2,124,680 | |
38 Semi-Annual Report
| | |
| SCHEDULE OF INVESTMENTS, CONTINUED | | |
| |
Thornburg Limited Term Municipal Fund | | March 31, 2015 (Unaudited) |
| | | | | | | | | | |
Issuer-Description | | Credit Rating†
S&P/ Moody’s | | Principal
Amount | | | Value | |
North East ISD GO, 2.00% due 8/1/2043 put 8/1/2015 (Educational Facilities; Guaranty: PSF) | | AAA/Aaa | | $ | 44,745,000 | | | $ | 44,974,542 | |
North Texas University, 5.00% due 4/15/2016 | | NR/Aa2 | | | 2,250,000 | | | | 2,358,652 | |
Northside ISD GO, 2.00% due 6/1/2039 put 6/1/2019 (Educational Facilities; Guaranty: PSF) | | NR/Aaa | | | 2,230,000 | | | | 2,266,840 | |
Nueces River Authority, 5.00% due 7/15/2015 (City of Corpus Christi Lake Texana Project; Insured: AGM) | | AA/Aa3 | | | 1,000,000 | | | | 1,013,880 | |
Pasadena ISD GO, 3.00% due 2/15/2044 put 8/15/2019 (Educational Facilities; Guaranty: PSF) | | AAA/Aaa | | | 8,775,000 | | | | 9,366,523 | |
Sam Rayburn Municipal Power Agency, 5.00% due 10/1/2017 | | BBB+/NR | | | 1,000,000 | | | | 1,097,460 | |
Sam Rayburn Municipal Power Agency, 5.00% due 10/1/2019 | | BBB+/NR | | | 2,565,000 | | | | 2,931,975 | |
Sam Rayburn Municipal Power Agency, 5.00% due 10/1/2020 | | BBB+/NR | | | 1,620,000 | | | | 1,878,795 | |
San Antonio Public Facilities Corp., 5.00% due 9/15/2020 (Convention Center Refinancing & Expansion) | | AA+/Aa2 | | | 915,000 | | | | 1,074,585 | |
San Juan Higher Education Finance Authority, 5.125% due 8/15/2020 (IDEA Public Schools) | | BBB/NR | | | 1,600,000 | | | | 1,775,872 | |
State of Texas GO, 1.50% due 8/31/2015 (Cash Flow Management) | | SP-1+/Mig1 | | | 195,000,000 | | | | 196,162,200 | |
Tarrant County Cultural Education Facilities Finance Corp., 5.00% due 8/15/2016 (Scott & White Memorial Hospital) | | A+/Aa3 | | | 2,280,000 | | | | 2,414,292 | |
Tarrant County Cultural Education Facilities Finance Corp., 5.00% due 8/15/2017 (Scott & White Memorial Hospital) | | A+/Aa3 | | | 2,000,000 | | | | 2,187,440 | |
Tarrant County Cultural Education Facilities Finance Corp., 0.02% due 10/1/2041 put 4/1/2015 (Methodist Hospitals of Dallas; LOC: JPMorgan Chase Bank N.A.) (daily demand notes) | | AAA/Aa1 | | | 62,000,000 | | | | 62,000,000 | |
Texas Municipal Power Agency, 5.00% due 9/1/2017 (Insured: AGM) | | AA/A2 | | | 10,000,000 | | | | 11,002,100 | |
Texas Public Finance Authority, 5.00% due 10/15/2015 (Stephen F. Austin University; Insured: Natl-Re) | | NR/A1 | | | 1,450,000 | | | | 1,486,598 | |
Texas Public Finance Authority, 5.00% due 7/1/2017 pre-refunded 1/1/2016 (Unemployment Compensation) | | AAA/Aaa | | | 15,500,000 | | | | 16,058,465 | |
Texas Transportation Commission, 5.00% due 8/15/2022 (Central Texas Turnpike System) | | BBB+/Baa1 | | | 400,000 | | | | 469,744 | |
Texas Transportation Commission, 5.00% due 8/15/2023 (Central Texas Turnpike System) | | BBB+/Baa1 | | | 730,000 | | | | 863,919 | |
Texas Transportation Commission, 5.00% due 8/15/2024 (Central Texas Turnpike System) | | BBB+/Baa1 | | | 1,000,000 | | | | 1,190,230 | |
Uptown Development Authority, 5.00% due 9/1/2015 (Infrastructure Improvements) | | BBB/NR | | | 1,370,000 | | | | 1,395,482 | |
Uptown Development Authority, 5.00% due 9/1/2017 (Infrastructure Improvements) | | BBB/NR | | | 1,580,000 | | | | 1,716,480 | |
Uptown Development Authority, 5.00% due 9/1/2018 (Infrastructure Improvements) | | BBB/NR | | | 1,870,000 | | | | 2,077,869 | |
Uptown Development Authority, 5.00% due 9/1/2019 (Infrastructure Improvements) | | BBB/NR | | | 1,945,000 | | | | 2,198,900 | |
Walnut Creek Special Utility District, 4.00% due 1/10/2020 (Water System Improvements; Insured: BAM) | | AA/NR | | | 520,000 | | | | 572,510 | |
Walnut Creek Special Utility District, 4.00% due 1/10/2021 (Water System Improvements; Insured: BAM) | | AA/NR | | | 445,000 | | | | 491,160 | |
Walnut Creek Special Utility District, 5.00% due 1/10/2022 (Water System Improvements; Insured: BAM) | | AA/NR | | | 525,000 | | | | 615,111 | |
Walnut Creek Special Utility District, 5.00% due 1/10/2024 (Water System Improvements; Insured: BAM) | | AA/NR | | | 750,000 | | | | 888,983 | |
West Harris County Regional Water Authority, 5.00% due 12/15/2020 (Insured: Natl-Re) | | AA-/A1 | | | 2,140,000 | | | | 2,344,905 | |
| | | |
U.S. VIRGIN ISLANDS — 0.12% | | | | | | | | | | |
Virgin Islands Public Finance Authority, 6.75% due 10/1/2019 (Matching Fund Loan Diageo Project) | | NR/Baa3 | | | 7,690,000 | | | | 8,715,769 | |
| | | |
UTAH — 1.57% | | | | | | | | | | |
City of Murray, 0.02% due 5/15/2036 put 4/1/2015 (IHC Health Services, Inc.) (daily demand notes) | | AA+/Aa1 | | | 20,820,000 | | | | 20,820,000 | |
City of Murray, 0.03% due 5/15/2037 put 4/1/2015 (IHC Health Services, Inc.; SPA: JPMorgan Chase Bank, N.A.) (daily demand notes) | | AA+/Aa1 | | | 38,390,000 | | | | 38,390,000 | |
South Valley Water Reclamation Facility, 5.00% due 8/15/2024 pre-refunded 8/15/2015 (Sewer Treatment Facility Improvements; Insured: AMBAC) | | A+/NR | | | 2,110,000 | | | | 2,147,621 | |
Utah Transit Authority, 5.00% due 6/15/2022 (Integrated Mass Transit System) | | A+/A1 | | | 710,000 | | | | 853,889 | |
Utah Transit Authority, 5.00% due 6/15/2023 (Integrated Mass Transit System) | | A+/A1 | | | 775,000 | | | | 941,625 | |
Utah Transit Authority, 5.00% due 6/15/2024 (Integrated Mass Transit System) | | A+/A1 | | | 825,000 | | | | 1,009,866 | |
Utah Transit Authority, 5.00% due 6/15/2025 (Integrated Mass Transit System) | | A+/A1 | | | 1,235,000 | | | | 1,512,134 | |
Weber County, 0.03% due 2/15/2031 put 4/1/2015 (IHC Health Services, Inc.; SPA: The Bank of New York Mellon) (daily demand notes) | | AA+/Aa1 | | | 29,800,000 | | | | 29,800,000 | |
Weber County, 0.03% due 2/15/2035 put 4/1/2015 (IHC Health Services, Inc.; SPA: Landesbank Hessen-Thuringen) (daily demand notes) | | AA+/Aa1 | | | 20,700,000 | | | | 20,700,000 | |
| | | |
VERMONT — 0.30% | | | | | | | | | | |
Vermont Colleges GO, 4.00% due 7/1/2017 | | A/NR | | | 5,375,000 | | | | 5,616,176 | |
Vermont EDA, 5.00% due 12/15/2020 (Vermont Public Service Corp.) | | NR/NR | | | 14,250,000 | | | | 16,559,498 | |
| | | |
VIRGINIA — 0.30% | | | | | | | | | | |
Fairfax County EDA, 5.00% due 8/1/2016 (Wiehle Avenue Metrorail Station Parking Project) | | AA+/Aa2 | | | 2,600,000 | | | | 2,758,132 | |
Fairfax County GO, 4.00% due 10/1/2015 (Public Facilities and Improvements) (State Aid Withholding) | | AAA/Aaa | | | 5,000,000 | | | | 5,096,950 | |
Fairfax County GO, 5.00% due 10/1/2016 (Public Facilities and Improvements) (State Aid Withholding) | | AAA/Aaa | | | 1,100,000 | | | | 1,176,186 | |
Fairfax County IDA, 4.00% due 5/15/2022 (Inova Health System) | | AA+/Aa2 | | | 5,500,000 | | | | 6,207,465 | |
Fairfax County IDA, 5.00% due 5/15/2022 (Inova Health System) | | AA+/Aa2 | | | 5,000,000 | | | | 6,042,850 | |
Northwestern Regional Jail Authority, 5.00% due 7/1/2033 pre-refunded 7/1/2015 (Community Corrections Center; Insured: Natl-Re) | | AA-/Aa2 | | | 900,000 | | | | 910,764 | |
| | | |
WASHINGTON — 1.99% | | | | | | | | | | |
Bremerton School District No. 100C GO, 0% due 12/1/2015 (Insured: AGM) | | NR/Aa1 | | | 1,270,000 | | | | 1,266,901 | |
Energy Northwest, 5.00% due 7/1/2017 (Bonneville Power Administration Project 3) | | AA-/Aa1 | | | 5,470,000 | | | | 6,000,590 | |
Energy Northwest, 5.00% due 7/1/2017 (Bonneville Power Administration Project 1) | | AA-/Aa1 | | | 5,000,000 | | | | 5,485,000 | |
Energy Northwest, 5.00% due 7/1/2018 (Bonneville Power Administration Project 3) | | AA-/Aa1 | | | 475,000 | | | | 519,987 | |
Semi-Annual Report 39
| | |
| SCHEDULE OF INVESTMENTS, CONTINUED | | |
| |
Thornburg Limited Term Municipal Fund | | March 31, 2015 (Unaudited) |
| | | | | | | | | | |
Issuer-Description | | Credit Rating†
S&P/ Moody’s | | Principal
Amount | | | Value | |
Energy Northwest, 5.00% due 7/1/2018 (Nine Canyon Wind Project
Phase I-III) | | NR/A2 | | $ | 1,000,000 | | | $ | 1,119,390 | |
Energy Northwest, 5.00% due 7/1/2019 (Nine Canyon Wind Project
Phase I-III) | | NR/A2 | | | 2,000,000 | | | | 2,286,240 | |
Energy Northwest, 5.00% due 7/1/2020 (Nine Canyon Wind Project
Phase I-III) | | NR/A2 | | | 2,000,000 | | | | 2,314,860 | |
Energy Northwest, 5.00% due 7/1/2021 (Nine Canyon Wind Project
Phase I-III) | | NR/A2 | | | 2,000,000 | | | | 2,346,380 | |
Energy Northwest, 5.00% due 7/1/2022 (Nine Canyon Wind Project
Phase I-III) | | NR/A2 | | | 1,000,000 | | | | 1,186,680 | |
Energy Northwest, 5.00% due 7/1/2023 (Nine Canyon Wind Project
Phase I-III) | | NR/A2 | | | 1,000,000 | | | | 1,196,850 | |
Energy Northwest, 5.00% due 7/1/2025 (Nine Canyon Wind Project
Phase I-III) | | NR/A2 | | | 850,000 | | | | 1,030,804 | |
King County Federal Way School District No. 210 GO, 4.125% due 12/1/2019 (Insured: Natl-Re) | | AA+/Aa1 | | | 2,000,000 | | | | 2,158,540 | |
Marysville School District No. 25 GO, 4.00% due 12/1/2017 (Snohomish County Educational Facilities) (State Aid Withholding) | | NR/Aa1 | | | 1,000,000 | | | | 1,084,150 | |
Marysville School District No. 25 GO, 4.00% due 12/1/2018 (Snohomish County Educational Facilities) (State Aid Withholding) | | NR/Aa1 | | | 1,100,000 | | | | 1,213,608 | |
Marysville School District No. 25 GO, 5.00% due 12/1/2019 (Snohomish County Educational Facilities) (State Aid Withholding) | | NR/Aa1 | | | 1,390,000 | | | | 1,619,239 | |
Marysville School District No. 25 GO, 5.00% due 12/1/2020 (Snohomish County Educational Facilities) (State Aid Withholding) | | NR/Aa1 | | | 1,625,000 | | | | 1,924,731 | |
Marysville School District No. 25 GO, 5.00% due 12/1/2021 (Snohomish County Educational Facilities) (State Aid Withholding) | | NR/Aa1 | | | 1,750,000 | | | | 2,104,427 | |
Marysville School District No. 25 GO, 5.00% due 12/1/2022 (Snohomish County Educational Facilities) (State Aid Withholding) | | NR/Aa1 | | | 2,620,000 | | | | 3,194,566 | |
Marysville School District No. 25 GO, 5.00% due 12/1/2023 (Snohomish County Educational Facilities) (State Aid Withholding) | | NR/Aa1 | | | 1,700,000 | | | | 2,085,441 | |
Port of Seattle, 5.50% due 9/1/2018 (Insured: Natl-Re) | | AA-/A2 | | | 5,000,000 | | | | 5,721,700 | |
Seattle Municipal Light & Power, 5.00% due 2/1/2016 | | AA/Aa2 | | | 800,000 | | | | 831,880 | |
Seattle Municipal Light & Power, 5.00% due 2/1/2017 | | AA/Aa2 | | | 2,000,000 | | | | 2,161,140 | |
Skagit County Public Hospital District No. 1, 4.00% due 12/1/2016 (Skagit Regional Health) | | NR/Baa2 | | | 1,000,000 | | | | 1,041,820 | |
Skagit County Public Hospital District No. 1, 5.00% due 12/1/2018 (Skagit Regional Health) | | NR/Baa2 | | | 800,000 | | | | 882,776 | |
Skagit County Public Hospital District No. 1, 5.00% due 12/1/2019 (Skagit Regional Health) | | NR/Baa2 | | | 835,000 | | | | 934,315 | |
Skagit County Public Hospital District No. 1, 5.00% due 12/1/2021 (Skagit Regional Health) | | NR/Baa2 | | | 1,160,000 | | | | 1,319,709 | |
Skagit County Public Hospital District No. 1, 5.00% due 12/1/2022 (Skagit Regional Health) | | NR/Baa2 | | | 500,000 | | | | 569,880 | |
Skagit County Public Hospital District No. 1, 5.375% due 12/1/2022 (Skagit Valley Hospital) | | NR/Baa2 | | | 500,000 | | | | 511,130 | |
Skagit County Public Hospital District No. 1, 5.00% due 12/1/2023 (Skagit Regional Health) | | NR/Baa2 | | | 750,000 | | | | 860,453 | |
Skagit County Public Hospital District No. 1 GO, 4.00% due 12/1/2017 (Skagit Regional Health) | | NR/A1 | | | 1,000,000 | | | | 1,077,490 | |
Skagit County Public Hospital District No. 1 GO, 4.00% due 12/1/2018 (Skagit Regional Health) | | NR/A1 | | | 1,270,000 | | | | 1,390,294 | |
Skagit County Public Hospital District No. 1 GO, 5.00% due 12/1/2019 (Skagit Regional Health) | | NR/A1 | | | 1,695,000 | | | | 1,954,199 | |
Skagit County Public Hospital District No. 1 GO, 5.00% due 12/1/2020 (Skagit Regional Health) | | NR/A1 | | | 1,570,000 | | | | 1,837,136 | |
Skagit County Public Hospital District No. 1 GO, 5.00% due 12/1/2021 (Skagit Regional Health) | | NR/A1 | | | 3,135,000 | | | | 3,704,849 | |
Skagit County Public Hospital District No. 1 GO, 5.00% due 12/1/2022 (Skagit Regional Health) | | NR/A1 | | | 3,635,000 | | | | 4,318,525 | |
Skagit County Public Hospital District No. 2 GO, 4.00% due 12/1/2018 (Island Hospital) | | NR/A1 | | | 1,000,000 | | | | 1,092,090 | |
Skagit County Public Hospital District No. 2 GO, 4.00% due 12/1/2019 (Island Hospital) | | NR/A1 | | | 1,000,000 | | | | 1,105,260 | |
Skagit County Public Hospital District No. 2 GO, 4.00% due 12/1/2020 (Island Hospital) | | NR/A1 | | | 1,000,000 | | | | 1,110,860 | |
Skagit County Public Hospital District No. 2 GO, 4.00% due 12/1/2021 (Island Hospital) | | NR/A1 | | | 1,000,000 | | | | 1,111,890 | |
Skagit County Public Hospital District No. 2 GO, 5.00% due 12/1/2022 (Island Hospital) | | NR/A1 | | | 1,700,000 | | | | 2,006,578 | |
State of Washington COP, 5.00% due 7/1/2016 (State Agency Real Property Projects) (State Aid Withholding) | | NR/Aa2 | | | 2,415,000 | | | | 2,556,181 | |
State of Washington COP, 5.00% due 7/1/2017 (State Agency Real Property Projects) (State Aid Withholding) | | NR/Aa2 | | | 2,555,000 | | | | 2,802,835 | |
State of Washington COP, 5.00% due 7/1/2018 (State Agency Real Property Projects) (State Aid Withholding) | | NR/Aa2 | | | 2,670,000 | | | | 3,009,731 | |
State of Washington COP, 5.00% due 7/1/2019 (State and Local Agency Real and Personal Property Projects) (State Aid Withholding) | | NR/Aa2 | | | 1,000,000 | | | | 1,152,930 | |
State of Washington COP, 5.00% due 7/1/2020 (State and Local Agency Real and Personal Property Projects) (State Aid Withholding) | | NR/Aa2 | | | 3,290,000 | | | | 3,861,966 | |
State of Washington COP, 5.00% due 7/1/2021 (State and Local Agency Real and Personal Property Projects) (State Aid Withholding) | | NR/Aa2 | | | 3,125,000 | | | | 3,726,875 | |
State of Washington COP, 5.00% due 7/1/2022 (State and Local Agency Real and Personal Property Projects) (State Aid Withholding) | | NR/Aa2 | | | 3,000,000 | | | | 3,621,450 | |
State of Washington GO, 5.00% due 7/1/2015 (Public Highway, Bridge, Ferry Capital and Operating Costs) | | AA+/Aa1 | | | 5,355,000 | | | | 5,420,438 | |
State of Washington GO, 0% due 1/1/2018 (Stadium and Exhibition Center; Insured: Natl-Re) | | AA+/Aa1 | | | 4,000,000 | | | | 3,884,320 | |
State of Washington GO, 0% due 1/1/2019 (Stadium and Exhibition Center; Insured: Natl-Re) | | AA+/Aa1 | | | 3,000,000 | | | | 2,863,050 | |
State of Washington GO, 0% due 12/1/2019 (Public Highway, Bridge, Ferry Capital and Operating Costs; Insured: Natl-Re) | | AA+/Aa1 | | | 3,030,000 | | | | 2,838,777 | |
State of Washington GO, 5.00% due 7/1/2025 (Motor Vehicle Fuel Tax) | | AA+/Aa1 | | | 10,475,000 | | | | 12,999,684 | |
State of Washington Public Power Supply Systems, 0% due 7/1/2015 (Nuclear Project No. 3; Insured: Natl-Re/IBC) | | AA-/Aa1 | | | 3,000,000 | | | | 2,997,750 | |
Washington Health Care Facilities Authority, 5.00% due 8/15/2015 (Multicare Health Systems) | | AA-/Aa3 | | | 2,000,000 | | | | 2,034,340 | |
Washington Health Care Facilities Authority, 5.00% due 8/15/2016 (Multicare Health Systems) | | AA-/Aa3 | | | 2,075,000 | | | | 2,196,782 | |
Washington Health Care Facilities Authority, 5.00% due 7/1/2017 (Overlake Hospital Medical Center) | | A/A2 | | | 1,245,000 | | | | 1,361,943 | |
Washington Health Care Facilities Authority, 5.00% due 8/15/2017 (Multicare Health Systems) | | AA-/Aa3 | | | 1,000,000 | | | | 1,093,730 | |
Washington Health Care Facilities Authority, 5.25% due 8/1/2018 (Highline Medical Center; Insured: FHA 242) (ETM) | | NR/NR | | | 7,935,000 | | | | 8,620,901 | |
Washington Health Care Facilities Authority, 5.00% due 8/15/2018 (Multicare Health Systems) | | AA-/Aa3 | | | 2,000,000 | | | | 2,234,240 | |
40 Semi-Annual Report
| | |
| SCHEDULE OF INVESTMENTS, CONTINUED | | |
| |
Thornburg Limited Term Municipal Fund | | March 31, 2015 (Unaudited) |
| | | | | | | | | | |
Issuer-Description | | Credit Rating†
S&P/ Moody’s | | Principal
Amount | | | Value | |
Washington Health Care Facilities Authority, 5.00% due 7/1/2019 (Overlake Hospital Medical Center) | | A/A2 | | $ | 1,050,000 | | | $ | 1,206,818 | |
Washington Health Care Facilities Authority, 4.75% due 7/1/2020 (Overlake Hospital Medical Center) | | A/A2 | | | 1,000,000 | | | | 1,120,490 | |
| | | |
WEST VIRGINIA — 0.14% | | | | | | | | | | |
Mason County, 1.625% due 10/1/2022 put 10/1/2018 (Appalachian Power Company Project) | | BBB/Baa1 | | | 3,300,000 | | | | 3,311,154 | |
Monongalia County Building Commission, 5.25% due 7/1/2020 (Monongalia General Hospital) | | A-/NR | | | 3,185,000 | | | | 3,214,270 | |
West Virginia Higher Education Policy Commission, 5.00% due 4/1/2020 (Higher Education Facilities) | | A+/Aa3 | | | 1,000,000 | | | | 1,162,500 | |
West Virginia Higher Education Policy Commission, 5.00% due 4/1/2021 (Higher Education Facilities) | | A+/Aa3 | | | 1,000,000 | | | | 1,179,070 | |
West Virginia Higher Education Policy Commission, 5.00% due 4/1/2022 (Higher Education Facilities) | | A+/Aa3 | | | 1,500,000 | | | | 1,788,840 | |
| | | |
WISCONSIN — 0.82% | | | | | | | | | | |
Fox Valley Technical College District GO, 3.00% due 12/1/2015 (Higher Education Facility Projects) | | NR/Aaa | | | 4,515,000 | | | | 4,601,011 | |
State of Wisconsin, 5.00% due 7/1/2015 (Petroleum Environmental Cleanup Fund Award Program) | | AA/Aa2 | | | 4,000,000 | | | | 4,048,880 | |
Wisconsin Health & Educational Facilities Authority, 5.00% due 7/15/2015 (Aurora Health Care, Inc.) | | NR/A3 | | | 4,100,000 | | | | 4,155,391 | |
Wisconsin Health & Educational Facilities Authority, 5.00% due 7/15/2016 (Aurora Health Care, Inc.) | | NR/A3 | | | 3,695,000 | | | | 3,891,131 | |
Wisconsin Health & Educational Facilities Authority, 5.00% due 4/15/2017 (Aurora Health Care, Inc.) | | NR/A3 | | | 1,295,000 | | | | 1,391,244 | |
Wisconsin Health & Educational Facilities Authority, 5.00% due 7/1/2017 (Agnesian Healthcare, Inc.) | | A-/A3 | | | 1,000,000 | | | | 1,081,760 | |
Wisconsin Health & Educational Facilities Authority, 5.00% due 7/15/2017 (Aurora Health Care, Inc.) | | NR/A3 | | | 5,025,000 | | | | 5,436,095 | |
Wisconsin Health & Educational Facilities Authority, 5.00% due 7/1/2018 (Agnesian Healthcare, Inc.) | | A-/A3 | | | 1,855,000 | | | | 2,051,426 | |
Wisconsin Health & Educational Facilities Authority, 5.00% due 7/1/2019 (Agnesian Healthcare, Inc.) | | A-/A3 | | | 1,000,000 | | | | 1,129,900 | |
Wisconsin Health & Educational Facilities Authority, 5.00% due 7/1/2020 (Agnesian Healthcare, Inc.) | | A-/A3 | | | 2,110,000 | | | | 2,423,947 | |
Wisconsin Health & Educational Facilities Authority, 5.00% due 8/15/2020 (ProHealth Care, Inc.) | | A+/A1 | | | 1,075,000 | | | | 1,256,868 | |
Wisconsin Health & Educational Facilities Authority, 5.00% due 8/15/2021 (ProHealth Care, Inc.) | | A+/A1 | | | 2,575,000 | | | | 3,045,221 | |
Wisconsin Health & Educational Facilities Authority, 5.00% due 8/15/2022 (ProHealth Care, Inc.) | | A+/A1 | | | 1,600,000 | | | | 1,864,896 | |
Wisconsin Health & Educational Facilities Authority, 5.00% due 12/1/2022 (UnityPoint Health) | | NR/Aa3 | | | 1,000,000 | | | | 1,192,360 | |
Wisconsin Health & Educational Facilities Authority, 1.25% due 8/15/2025 put 8/15/2017 (Aurora Health Care, Inc.) | | NR/A3 | | | 1,800,000 | | | | 1,812,528 | |
Wisconsin Health & Educational Facilities Authority, 5.125% due 8/15/2027 put 8/15/2016 (Aurora Health Care, Inc.) | | NR/A3 | | | 4,500,000 | | | | 4,779,135 | |
Wisconsin Health & Educational Facilities Authority, 5.00% due 11/15/2043 put 6/1/2021 (Ascension Health Alliance System) | | AA+/Aa2 | | | 10,000,000 | | | | 11,809,600 | |
WPPI Energy, 5.00% due 7/1/2021 (Power Supply System) | | A/A1 | | | 4,100,000 | | | | 4,880,271 | |
| | | | | | | | | | |
TOTAL INVESTMENTS — 93.87% (Cost $6,708,342,113) | | | | | | | | $ | 6,942,420,970 | |
OTHER ASSETS LESS LIABILITIES — 6.13% | | | | | | | | | 453,129,268 | |
| | | | | | | | | | |
NET ASSETS — 100.00% | | | | | | | | $ | 7,395,550,238 | |
| | | | | | | | | | |
Footnote Legend
| † | Credit ratings are unaudited. Rating changes may have occurred subsequent to the reporting period end. Bonds issued with a maturity of one year or less are assigned Moody’s ratings from MIG-1 to MIG-4 and Standard and Poor’s ratings from SP-1+ to SP-3 with MIG-1 and SP-1+ being the strongest ratings. |
| a | Segregated as collateral for a when-issued security. |
Portfolio Abbreviations
To simplify the listings of securities, abbreviations are used per the table below:
| | |
| AGM | | Insured by Assured Guaranty Municipal Corp. |
| AMBAC | | Insured by American Municipal Bond Assurance Corp. |
| BAM | | Insured by Build America Mutual Insurance Co. |
| BHAC | | Insured by Berkshire Hathaway Assurance Corp. |
| CalPERS | | California Public Employees’ Retirement System |
| CIFG | | Insured by CIFG Assurance North America Inc. |
| COP | | Certificates of Participation |
| DFA | | Development Finance Authority |
| EDA | | Economic Development Authority |
| ETM | | Escrowed to Maturity |
| FGIC | | Insured by Financial Guaranty Insurance Co. |
| FHA | | Insured by Federal Housing Administration |
| FSA | | Insured by Financial Security Assurance Co. |
| GNMA | | Collateralized by Government National Mortgage Association |
| GO | | General Obligation |
| HFA | | Health Facilities Authority |
| | |
| HFFA | | Health Facilities Financing Authority |
| IBC | | Insured Bond Certificate |
| IDA | | Industrial Development Authority |
| ISD | | Independent School District |
| JEA | | Jacksonville Electric Authority |
| MBIA | | Insured by Municipal Bond Investors Assurance |
| Mtg | | Mortgage |
| Natl-Re | | Insured by National Public Finance Guarantee Corp. |
| PCR | | Pollution Control Revenue Bond |
| PSF | | Guaranteed by Permanent School Fund |
| Q-SBLF | | Insured by Qualified School Bond Loan Fund |
| Radian | | Insured by Radian Asset Assurance |
| SONYMA | | State of New York Mortgage Authority |
| Syncora | | Insured by Syncora Guarantee Inc. |
| USD | | Unified School District |
See notes to financial statements.
Semi-Annual Report 41
| | |
| STATEMENT OF ASSETS AND LIABILITIES | | |
| |
Thornburg Limited Term Municipal Fund | | March 31, 2015 (Unaudited) |
| | | | |
ASSETS | | | | |
Investments at value (cost $6,708,342,113) (Note 2) | | $ | 6,942,420,970 | |
Cash | | | 373,279,036 | |
Receivable for investments sold | | | 22,820,981 | |
Receivable for fund shares sold | | | 19,521,232 | |
Interest receivable | | | 72,026,172 | |
Prepaid expenses and other assets | | | 117,635 | |
| | | | |
Total Assets | | | 7,430,186,026 | |
| | | | |
| |
LIABILITIES | | | | |
Payable for investments purchased | | | 20,463,459 | |
Payable for fund shares redeemed | | | 10,253,180 | |
Payable to investment advisor and other affiliates (Note 3) | | | 2,833,643 | |
Accounts payable and accrued expenses | | | 161,810 | |
Dividends payable | | | 923,696 | |
| | | | |
Total Liabilities | | | 34,635,788 | |
| | | | |
| |
NET ASSETS | | $ | 7,395,550,238 | |
| | | | |
NET ASSETS CONSIST OF | | | | |
Distribution in excess of net investment income | | $ | (947,051 | ) |
Net unrealized appreciation on investments | | | 234,078,857 | |
Accumulated net realized gain (loss) | | | (2,486,569 | ) |
Net capital paid in on shares of beneficial interest | | | 7,164,905,001 | |
| | | | |
| | $ | 7,395,550,238 | |
| | | | |
NET ASSET VALUE | | | | |
Class A Shares: | | | | |
Net asset value and redemption price per share ($1,867,239,870 applicable to 128,227,730 shares of beneficial interest outstanding - Note 4) | | $ | 14.56 | |
Maximum sales charge, 1.50% of offering price | | | 0.22 | |
| | | | |
Maximum offering price per share | | $ | 14.78 | |
| | | | |
| |
Class C Shares: | | | | |
Net asset value and offering price per share* ($755,684,964 applicable to 51,799,790 shares of beneficial interest outstanding - Note 4) | | $ | 14.59 | |
| | | | |
| |
Class I Shares: | | | | |
Net asset value, offering and redemption price per share ($4,772,625,404 applicable to 327,701,385 shares of beneficial interest outstanding - Note 4) | | $ | 14.56 | |
| | | | |
| * | Redemption price per share is equal to net asset value less any applicable contingent deferred sales charge. |
See notes to financial statements.
42 Semi-Annual Report
| | |
| STATEMENT OF OPERATIONS | | |
| |
Thornburg Limited Term Municipal Fund | | Six Months Ended March 31, 2015 (Unaudited) |
| | | | |
INVESTMENT INCOME | | | | |
Interest income (net of premium amortized of $43,774,603) | | $ | 81,936,836 | |
| | | | |
| |
EXPENSES | | | | |
Investment advisory fees (Note 3) | | | 9,480,941 | |
Administration fees (Note 3) | | | | |
Class A Shares | | | 1,160,558 | |
Class C Shares | | | 469,661 | |
Class I Shares | | | 1,150,070 | |
Distribution and service fees (Note 3) | | | | |
Class A Shares | | | 2,321,117 | |
Class C Shares | | | 1,879,989 | |
Transfer agent fees | | | | |
Class A Shares | | | 553,290 | |
Class C Shares | | | 163,835 | |
Class I Shares | | | 1,278,710 | |
Registration and filing fees | | | | |
Class A Shares | | | 36,127 | |
Class C Shares | | | 19,346 | |
Class I Shares | | | 59,428 | |
Custodian fees (Note 3) | | | 230,581 | |
Professional fees | | | 55,016 | |
Accounting fees | | | 122,800 | |
Trustee fees | | | 119,905 | |
Other expenses | | | 193,873 | |
| | | | |
Total Expenses | | | 19,295,247 | |
Less: | | | | |
Fees paid indirectly (Note 3) | | | (46,931 | ) |
| | | | |
Net Expenses | | | 19,248,316 | |
| | | | |
Net Investment Income | | | 62,688,520 | |
| | | | |
REALIZED AND UNREALIZED GAIN (LOSS) | | | | |
Net realized gain (loss) on investments | | | (60,602 | ) |
Net change in unrealized appreciation (depreciation) on investments | | | (7,517,313 | ) |
| | | | |
Net Realized and Unrealized Loss | | | (7,577,915 | ) |
| | | | |
Net Increase in Net Assets Resulting from Operations | | $ | 55,110,605 | |
| | | | |
See notes to financial statements.
Semi-Annual Report 43
| | |
| STATEMENTS OF CHANGES IN NET ASSETS | | |
| |
Thornburg Limited Term Municipal Fund | | |
| | | | | | | | |
| | | Six Months Ended
March 31, 2015* | | | Year Ended
September 30, 2014 | |
INCREASE (DECREASE) IN NET ASSETS FROM | | | | | | | | |
| | |
OPERATIONS | | | | | | | | |
Net investment income | | $ | 62,688,520 | | | $ | 128,131,476 | |
Net realized gain (loss) on investments | | | (60,602 | ) | | | (22,996 | ) |
Net unrealized appreciation (depreciation) on investments | | | (7,517,313 | ) | | | 89,178,704 | |
| | | | | | | | |
| | |
Net Increase (Decrease) in Net Assets Resulting from Operations | | | 55,110,605 | | | | 217,287,184 | |
| | |
DIVIDENDS TO SHAREHOLDERS | | | | | | | | |
From net investment income | | | | | | | | |
Class A Shares | | | (14,418,640 | ) | | | (37,884,453 | ) |
Class C Shares | | | (4,949,704 | ) | | | (11,622,218 | ) |
Class I Shares | | | (43,320,176 | ) | | | (78,624,805 | ) |
| | |
FUND SHARE TRANSACTIONS (NOTE 4) | | | | | | | | |
Class A Shares | | | 3,762,878 | | | | (341,940,499 | ) |
Class C Shares | | | 6,776,056 | | | | (55,692,515 | ) |
Class I Shares | | | 360,181,241 | | | | 864,935,978 | |
| | | | | | | | |
Net Increase in Net Assets | | | 363,142,260 | | | | 556,458,672 | |
| | |
NET ASSETS | | | | | | | | |
Beginning of Period | | | 7,032,407,978 | | | | 6,475,949,306 | |
| | | | | | | | |
| | |
End of Period | | $ | 7,395,550,238 | | | $ | 7,032,407,978 | |
| | | | | | | | |
Distribution in excess of net investment income | | $ | (947,051 | ) | | $ | (947,051 | ) |
See notes to financial statements.
44 Semi-Annual Report
| | |
| NOTES TO FINANCIAL STATEMENTS | | |
| |
Thornburg Limited Term Municipal Fund | | March 31, 2015 (Unaudited) |
NOTE 1 – ORGANIZATION
Thornburg Limited Term Municipal Fund (the “Fund”) is a diversified series of Thornburg Investment Trust (the “Trust”). The Trust is organized as a Massachusetts business trust under a Declaration of Trust dated June 3, 1987 and is registered as a diversified, open-end management investment company under the Investment Company Act of 1940, as amended. The Fund is currently one of eighteen separate series of the Trust. Each series is considered to be a separate entity for financial reporting and tax purposes and bears expenses directly attributable to it. The Fund’s primary investment objective is to obtain as high a level of current income exempt from federal individual income taxes as is consistent, in the view of the Fund’s investment advisor, with the preservation of capital. The Fund’s secondary objective is to reduce expected changes in its share price compared to longer intermediate and long-term bond portfolios.
The Fund currently offers three classes of shares of beneficial interest: Class A, Class C, and Institutional Class (“Class I”). Each class of shares of the Fund represents an interest in the same portfolio of investments, except that (i) Class A shares are sold subject to a front-end sales charge collected at the time the shares are purchased and bear a service fee, (ii) Class C shares are sold at net asset value without a sales charge at the time of purchase, but are subject to a contingent deferred sales charge upon redemption within one year of purchase, and bear both a service fee and a distribution fee, (iii) Class I shares are sold at net asset value without a sales charge at the time of purchase and may be subject to a service fee, and (iv) the respective classes may have different reinvestment privileges and conversion rights. Additionally, the Fund may allocate among its classes certain expenses, to the extent allocable to specific classes, including transfer agent fees, government registration fees, certain printing and postage costs, and administrative and legal expenses. Currently, class specific expenses of the Fund are limited to service and distribution fees, administration fees, and certain registration and transfer agent expenses.
NOTE 2 – SIGNIFICANT ACCOUNTING POLICIES
The following is a summary of significant accounting policies followed by the Fund in the preparation of its financial statements. The Fund is an investment company and prepares its financial statements in conformity with U.S. generally accepted accounting principles (“GAAP”), including the investment company accounting and reporting guidance in the Financial Accounting Standards Board (the “FASB”) Accounting Standard Codification Topic 946. The preparation of financial statements in conformity with GAAP requires management to make estimates and assumptions that affect the reported amounts of assets and liabilities and disclosure of contingent assets and liabilities at the date of the financial statements and the reported amounts of increases (decreases) in net assets from operations during the reporting period. Actual results could differ from those estimates.
Significant accounting policies of the Fund are as follows:
Valuation Policy and Procedures: The Trustees of the Trust (the “Trustees”) have authorized employees of the Fund’s investment advisor, acting as the Valuation and Pricing Committee (the “Committee”), to make certain valuation determinations, subject to oversight and review by the Trustees and the Audit Committee of the Trustees. The Committee and other employees of the Fund’s investment advisor administer and implement the valuation process. The Committee regularly reviews its own fair value decisions, as well as valuations, valuation techniques and services furnished by pricing services, considers circumstances in the markets which may require valuation determinations by the Committee and reviews previous valuation determinations. The Committee also reports on its activities, the performance of the pricing services and other matters to the Trustees and the Audit Committee of the Trustees.
In determining a fair value for a portfolio investment, the Committee seeks to determine the price that the Fund would reasonably expect to receive upon a sale of the investment in an orderly transaction between market participants at the measurement date. Typically, the fair value process employs standing instructions to use quoted prices in active markets or the use of independent pricing services. Less frequently, the Committee may make a fair value determination using other methods. However, because fair value prices are estimated prices, the determination of fair value for an investment may differ from the value that would be realized by the Fund upon a sale of the investment, and that difference could be material to the Fund’s financial statements. The Committee’s determination of fair value for an investment may also differ from the prices obtained by other persons (including other mutual funds) for the investment.
Valuation of Investments: Debt obligations held by the Fund have a primary over-the-counter market and are valued by an independent pricing service approved by the Trustees. The pricing service ordinarily values debt obligations using quoted bid prices and other methods which include consideration of yields or prices of debt obligations of comparable quality, type of issue, coupon, maturity and rating, and indications as to value from dealers and general market conditions.
In any case when a pricing service fails to provide a price for a debt obligation held by the Fund, the Committee determines a fair value for the debt obligation using procedures in accordance with a policy approved by the Trustees, which may include the use of a price obtained from a different independent pricing service. Additionally, in any case when management believes that a price provided by a pricing service for a debt obligation held by the Fund may be unreliable, the Committee decides whether or not to use the pricing service’s valuation or to use an alternative method to determine a fair value for the debt obligation.
Semi-Annual Report 45
| | |
| NOTES TO FINANCIAL STATEMENTS, CONTINUED | | |
| |
Thornburg Limited Term Municipal Fund | | March 31, 2015 (Unaudited) |
Valuation Measurements: The Fund categorizes its investments based upon the inputs used in valuing those investments, according to a three-level hierarchy established by guidance from the FASB. Categorization of investments using this hierarchy is intended by the FASB to maximize the use of observable inputs and minimize the use of unobservable inputs by prioritizing that the most observable input be used when available. Observable inputs are those that market participants would use in valuing an investment based on available market data. Unobservable inputs are those that reflect assumptions about the information market participants would use in valuing an investment. An investment’s level within the hierarchy is based on the lowest level input that is deemed significant to the fair value measurement. The methodologies and relative inputs used to value investments are not necessarily indications of the risk or liquidity associated with investing in those investments.
Various inputs are used in determining the fair value measurement of the Fund’s investments. These inputs are generally summarized according to the three-level hierarchy below:
Level 1: Quoted prices in active markets for identical investments.
Level 2: Other direct or indirect significant observable inputs (including quoted prices for similar investments in active markets and other observable inputs, such as interest rates, prepayment rates, credit risk, etc.).
Level 3: Significant unobservable inputs (including the Committee’s own assumptions in determining the fair value of investments).
Portfolio investments with minimal, if any, market activity are characterized as Level 3 and are valued using significant unobservable inputs, typically including single broker quotes, which may be adjusted or unadjusted, related or comparable investments, last available transactions, and other relevant information. Valuations may also be based upon current market prices of securities that are comparable in coupon, rating, maturity and industry. An income based valuation approach would consider discounted anticipated future cash flows of the investment. Discounts may also be applied due to the nature or duration of any restrictions on the disposition of the investment. Valuations based upon the use of inputs from Levels 1, 2, or 3, may not represent the actual price received upon the disposition of an investment, and the Fund may receive a price that is lower than the valuation when it sells the investment.
The following table displays a summary of the fair value hierarchy measurements of the Fund’s investments as of March 31, 2015. In any instance when valuation inputs from more than one level are used to determine the fair value of a specific investment, the investment is placed in the level of the table based upon the lowest level input that is significant in determining the fair value of the investment:
| | | | | | | | | | | | | | | | |
| | | Fair Value Measurements At March 31, 2015 | |
| | | Total | | | Level 1 | | | Level 2 | | | Level 3 | |
Assets | | | | | | | | | | | | | | | | |
Investments in Securities | | | | | | | | | | | | | | | | |
Municipal Bonds | | $ | 6,942,420,970 | | | $ | — | | | $ | 6,942,420,970 | | | $ | — | |
| | | | | | | | | | | | | | | | |
Total Investments in Securities | | $ | 6,942,420,970 | | | $ | — | | | $ | 6,942,420,970 | | | $ | — | |
In accordance with the guidance prescribed in Accounting Standards Update No. 2011-04, it is the policy of the Fund to recognize transfers between levels and the underlying events which caused the movement. The Fund recognized no transfers between levels for the six months ended March 31, 2015.
Federal Income Taxes: It is the policy of the Trust to comply with the provisions of the Internal Revenue Code applicable to “regulated investment companies” and to distribute to shareholders substantially all taxable (if any) and tax exempt income of the Fund. Therefore, no provision for federal income tax is required.
Management reviews each uncertain tax position believed to be material to the preparation of the Fund’s financial statements, to assess if it is more likely than not that the position would be sustained upon examination, based upon the technical merits of the position. As of March 31, 2015, management has not identified any such position for which an asset or liability must be reflected in the Statement of Assets and Liabilities. The Fund’s tax returns remain subject to examination for three years after filing.
When-Issued and Delayed Delivery Transactions: The Fund may engage in when-issued or delayed delivery transactions. To the extent the Fund engages in such transactions, it will do so for the purpose of acquiring portfolio investments consistent with the Fund’s investment objectives and not for the purpose of investment leverage or to speculate on interest rate and/or market changes. At the time the Fund makes a commitment to purchase an investment on a when-issued or delayed delivery basis, the Fund will record the transaction and reflect the value in determining its net asset value. When effecting such transactions, assets of an amount sufficient to make payment for the portfolio investments to be purchased will be segregated on the Fund’s records on the trade date. Investments purchased on a when-issued or delayed delivery basis do not earn interest until the settlement date.
Dividends: Net investment income of the Fund is declared daily as a dividend on shares for which the Fund has received payment. Dividends are paid monthly and are reinvested in additional shares of the Fund at net asset value per share at the close of business
46 Semi-Annual Report
| | |
| NOTES TO FINANCIAL STATEMENTS, CONTINUED | | |
| |
Thornburg Limited Term Municipal Fund | | March 31, 2015 (Unaudited) |
on the dividend payment date, or at the shareholder’s option, paid in cash. Net realized capital gains, to the extent available, will be distributed at least annually.
General: Investment transactions are accounted for on a trade date basis. Interest income is accrued as earned. Premiums and discounts on investments purchased are amortized to call dates or maturity dates of the respective investments. Realized gains and losses from the sale of investments are recorded on an identified cost basis. Net investment income (other than class specific expenses) and realized and unrealized gains and losses are allocated daily to each class of shares based upon the relative net asset value of outstanding shares (or the value of the dividend-eligible shares, as appropriate) of each class of shares at the beginning of the day (after adjusting for the current capital shares activity of the respective class). Expenses common to all Funds are allocated among the Funds comprising the Trust based upon their relative net asset values or other appropriate allocation methods.
Guarantees and Indemnifications: Under the Trust’s organizational documents (and under separate agreements with the independent Trustees), its officers and Trustees are indemnified against certain liabilities arising out of the performance of their duties to the Fund. Additionally, in the normal course of business the Trust enters into contracts with service providers that contain general indemnification clauses. The Trust’s maximum exposure under these arrangements is unknown. However, based on experience, the Trust expects the risk of loss to be remote.
NOTE 3 – INVESTMENT ADVISORY FEE AND OTHER TRANSACTIONS WITH AFFILIATES
Pursuant to an investment advisory agreement, Thornburg Investment Management, Inc. (the “Advisor”) serves as the investment advisor and performs services for the Fund for which the fees are payable at the end of each month. For the six months ended March 31, 2015, these fees were payable at annual rates ranging from .50 of 1% to .225 of 1% per annum of the average daily net assets of the Fund depending on the Fund’s asset size. The Trust also has entered into administrative services agreements with the Advisor, whereby the Advisor will perform certain administrative services for the shareholders of each class of the Fund’s shares, and for which fees will be payable at an annual rate of up to .125 of 1% per annum of the average daily net assets attributable to each class of shares.
The Trust has an underwriting agreement with Thornburg Securities Corporation (the “Distributor,” an affiliate of the Advisor), which acts as the distributor of the Fund’s shares. For the six months ended March 31, 2015, the Distributor has advised the Fund that it earned commissions aggregating $38 from the sale of Class A shares, and collected contingent deferred sales charges aggregating $16,816 from redemptions of Class C shares of the Fund.
Pursuant to a service plan under Rule 12b-1 of the Investment Company Act of 1940, the Fund may reimburse to the Advisor an amount not to exceed .25 of 1% per annum of the average daily net assets attributable to each class of shares of the Fund for payments made by the Advisor to securities dealers and other financial institutions to obtain various shareholder and distribution related services. For the six months ended March 31, 2015, there were no 12b-1 service plan fees charged for Class I shares. The Advisor may pay out of its own resources additional expenses for distribution of the Fund’s shares and shareholder services.
The Trust has also adopted a distribution plan pursuant to Rule 12b-1, applicable only to the Fund’s Class C shares under which the Fund compensates the Distributor for services in promoting the sale of Class C shares of the Fund at an annual rate of up to .25 of 1% per annum of the average daily net assets attributable to Class C shares. Total fees incurred by each class of shares of the Fund under their respective service and distribution plans for the six months ended March 31, 2015, are set forth in the Statement of Operations.
The Trust has an agreement with the custodian bank to indirectly pay a portion of the custodian’s fees through credits earned by the Fund’s cash on deposit with the bank. This deposit agreement is an alternative to overnight investments. Custodial fees are adjusted to reflect amounts that would have been paid without this agreement, with a corresponding adjustment reflected as fees paid indirectly in the Statement of Operations. For the six months ended March 31, 2015, fees paid indirectly were $46,931.
Certain officers and Trustees of the Trust are also officers or directors of the Advisor and Distributor. The compensation of independent Trustees is borne by the Trust.
Semi-Annual Report 47
| | |
| NOTES TO FINANCIAL STATEMENTS, CONTINUED | | |
| |
Thornburg Limited Term Municipal Fund | | March 31, 2015 (Unaudited) |
NOTE 4 – SHARES OF BENEFICIAL INTEREST
At March 31, 2015, there were an unlimited number of shares with no par value of beneficial interest authorized. Transactions in shares of beneficial interest were as follows:
| | | | | | | | | | | | | | | | |
| | | Six Months Ended
March 31, 2015 (Unaudited) | | | Year Ended
September 30, 2014 (Audited) | |
| | | Shares | | | Amount | | | Shares | | | Amount | |
Class A Shares | | | | | | | | | | | | | | | | |
Shares sold | | | 11,225,587 | | | $ | 163,728,273 | | | | 36,108,479 | | | $ | 522,536,121 | |
Shares issued to shareholders in reinvestment of dividends | | | 884,822 | | | | 12,912,091 | | | | 2,381,396 | | | | 34,534,840 | |
Shares repurchased | | | (11,847,258 | ) | | | (172,877,486 | ) | | | (62,000,850 | ) | | | (899,011,460 | ) |
| | | | | | | | | | | | | | | | |
| | | | |
Net increase (decrease) | | | 263,151 | | | $ | 3,762,878 | | | | (23,510,975 | ) | | $ | (341,940,499 | ) |
| | | | | | | | | | | | | | | | |
| | | | |
Class C Shares | | | | | | | | | | | | | | | | |
Shares sold | | | 4,095,853 | | | $ | 59,865,570 | | | | 7,940,555 | | | $ | 115,293,887 | |
Shares issued to shareholders in reinvestment of dividends | | | 288,306 | | | | 4,214,418 | | | | 677,717 | | | | 9,847,834 | |
Shares repurchased | | | (3,920,596 | ) | | | (57,303,932 | ) | | | (12,467,177 | ) | | | (180,834,236 | ) |
| | | | | | | | | | | | | | | | |
| | | | |
Net increase (decrease) | | | 463,563 | | | $ | 6,776,056 | | | | (3,848,905 | ) | | $ | (55,692,515 | ) |
| | | | | | | | | | | | | | | | |
| | | | |
Class I Shares | | | | | | | | | | | | | | | | |
Shares sold | | | 53,471,607 | | | $ | 780,502,120 | | | | 128,853,171 | | | $ | 1,869,230,997 | |
Shares issued to shareholders in reinvestment of dividends | | | 2,698,493 | | | | 39,378,705 | | | | 4,847,211 | | | | 70,339,213 | |
Shares repurchased | | | (31,495,881 | ) | | | (459,699,584 | ) | | | (74,200,163 | ) | | | (1,074,634,232 | ) |
| | | | | | | | | | | | | | | | |
| | | | |
Net increase (decrease) | | | 24,674,219 | | | $ | 360,181,241 | | | | 59,500,219 | | | $ | 864,935,978 | |
| | | | | | | | | | | | | | | | |
NOTE 5 – INVESTMENT TRANSACTIONS
For the six months ended March 31, 2015, the Fund had purchase and sale transactions of investments (excluding short-term investments) of $410,433,230 and $316,498,816, respectively.
NOTE 6 – INCOME TAXES
At March 31, 2015, information on the tax components of capital was as follows:
| | | | |
Cost of investments for tax purposes | | $ | 6,708,342,113 | |
| | | | |
Gross unrealized appreciation on a tax basis | | $ | 236,431,583 | |
Gross unrealized depreciation on a tax basis | | | (2,352,726 | ) |
| | | | |
Net unrealized appreciation (depreciation) on investments (tax basis) | | $ | 234,078,857 | |
| | | | |
At March 31, 2015, the Fund had deferred tax basis capital losses occurring subsequent to October 31, 2013 of $117,573. For tax purposes, such losses will be reflected in the year ending September 30, 2015.
At March 31, 2015, the Fund had cumulative tax basis capital losses of $212,116 (of which $212,116 is short-term and $0 is long-term), generated after September 30, 2011, which may be carried forward to offset future capital gains. To the extent such carryforwards are used, capital gain distributions may be reduced to the extent provided by regulations. Such capital loss carryforwards do not expire but are required to be utilized to offset future gains prior to the utilization of losses that occurred in years prior to the fiscal year ending September 30, 2012, which may expire prior to utilization.
48 Semi-Annual Report
| | |
| NOTES TO FINANCIAL STATEMENTS, CONTINUED | | |
| |
Thornburg Limited Term Municipal Fund | | March 31, 2015 (Unaudited) |
At March 31, 2015, the Fund had cumulative tax basis capital losses, which may be carried forward to offset future capital gains. To the extent such carryforwards are used, capital gain distributions may be reduced to the extent provided by regulations.
Such capital loss carryforwards expire as follows:
| | | | |
2015 | | $ | 1,903,834 | |
2016 | | | 192,444 | |
| | | | |
| | $ | 2,096,278 | |
| | | | |
OTHER NOTES
Risks: The Fund’s investments subject it to risks including, but not limited to, credit risk, interest rate risk, management risk, market and economic risk, and liquidity risk. Please see the Fund’s prospectus for a discussion of the risks associated with an investment in the Fund.
Subsequent Events: Fund management believes no events have occurred between March 31, 2015 and the date of issuance of the financial statements that require adjustment to or disclosure in the accompanying financial statements.
Semi-Annual Report 49
FINANCIAL HIGHLIGHTS
Thornburg Limited Term Municipal Fund
| | | | | | | | | | | | | | | | | | | | | | | | | | | | | | | | | | | | | | | | | | | | | | | | |
| | | PER SHARE PERFORMANCE (for a share outstanding throughout the Period)+ | | RATIOS TO AVERAGE NET ASSETS | | | SUPPLEMENTAL DATA | |
Unless
Otherwise
Noted,
Periods
are
Fiscal
Years
Ended
Sept. 30, | | Net Asset
Value
Beginning
of Period | | | Net
Investment
Income
(Loss) | | Net
Realized
&
Unrealized
Gain (Loss)
on
Investments | | | Total from
Investment
Operations | | Dividends
from Net
Investment
Income | | | Dividends
from Net
Realized
Gains | | Total
Dividends | | | Net
Asset
Value
End
of
Period | | Net
Investment
Income(Loss)
(%) | | | Expenses,
After
Expense
Reductions
(%) | | | Expenses,
After
Expense
Reductions
and
Net of
Custody
Credits
(%) | | | Expenses,
Before
Expense
Reductions
(%) | | | Total
Return
(%)(a) | | Portfolio
Turnover
Rate
(%)(a) | | Net
Assets
at End
of
Period
(Thousands) | |
Class A Shares | | | | | | | | | | | | | | | | | | | | | | | | | | | | | | | | | | | | | | | | | | |
2015(b)(c) | | $ | 14.58 | | | 0.11 | | | (0.02 | ) | | 0.09 | | | (0.11 | ) | | — | | | (0.11 | ) | | $14.56 | | | 1.55 | (d) | | | 0.72 | (d) | | | 0.72 | (d) | | | 0.72 | (d) | | 0.64 | | 5.25 | | $ | 1,867,240 | |
2014(c) | | $ | 14.38 | | | 0.26 | | | 0.20 | | | 0.46 | | | (0.26 | ) | | — | | | (0.26 | ) | | $14.58 | | | 1.78 | | | | 0.72 | | | | 0.71 | | | | 0.72 | | | 3.20 | | 14.46 | | $ | 1,865,213 | |
2013(c) | | $ | 14.70 | | | 0.26 | | | (0.32 | ) | | (0.06) | | | (0.26 | ) | | — | | | (0.26 | ) | | $14.38 | | | 1.81 | | | | 0.71 | | | | 0.71 | | | | 0.71 | | | (0.39) | | 17.47 | | $ | 2,178,317 | |
2012(c) | | $ | 14.39 | | | 0.31 | | | 0.31 | | | 0.62 | | | (0.31 | ) | | — | | | (0.31 | ) | | $14.70 | | | 2.13 | | | | 0.72 | | | | 0.72 | | | | 0.72 | | | 4.36 | | 12.72 | | $ | 2,131,540 | |
2011(c) | | $ | 14.27 | | | 0.36 | | | 0.12 | | | 0.48 | | | (0.36 | ) | | — | | | (0.36 | ) | | $14.39 | | | 2.53 | | | | 0.74 | | | | 0.74 | | | | 0.74 | | | 3.43 | | 16.15 | | $ | 1,649,965 | |
2010(c) | | $ | 14.00 | | | 0.37 | | | 0.28 | | | 0.65 | | | (0.38 | ) | | — | | | (0.38 | ) | | $14.27 | | | 2.66 | | | | 0.78 | | | | 0.78 | | | | 0.78 | | | 4.70 | | 12.57 | | $ | 1,613,582 | |
Class C Shares | | | | | | | | | | | | | | | | | | | | | | | | | | | | | | | | | | | | | | | | | | |
2015(b) | | $ | 14.60 | | | 0.10 | | | (0.01 | ) | | 0.09 | | | (0.10 | ) | | — | | | (0.10 | ) | | $14.59 | | | 1.32 | (d) | | | 0.96 | (d) | | | 0.96 | (d) | | | 0.96 | (d) | | 0.59 | | 5.25 | | $ | 755,685 | |
2014 | | $ | 14.41 | | | 0.22 | | | 0.19 | | | 0.41 | | | (0.22 | ) | | — | | | (0.22 | ) | | $14.60 | | | 1.52 | | | | 0.97 | | | | 0.96 | | | | 0.97 | | | 2.87 | | 14.46 | | $ | 749,648 | |
2013 | | $ | 14.72 | | | 0.23 | | | (0.31 | ) | | (0.08) | | | (0.23 | ) | | — | | | (0.23 | ) | | $14.41 | | | 1.55 | | | | 0.97 | | | | 0.97 | | | | 0.97 | | | (0.58) | | 17.47 | | $ | 795,052 | |
2012 | | $ | 14.41 | | | 0.27 | | | 0.31 | | | 0.58 | | | (0.27 | ) | | — | | | (0.27 | ) | | $14.72 | | | 1.85 | | | | 0.99 | | | | 0.99 | | | | 0.99 | | | 4.08 | | 12.72 | | $ | 777,026 | |
2011 | | $ | 14.30 | | | 0.32 | | | 0.11 | | | 0.43 | | | (0.32 | ) | | — | | | (0.32 | ) | | $14.41 | | | 2.27 | | | | 1.00 | | | | 1.00 | | | | 1.00 | | | 3.08 | | 16.15 | | $ | 525,923 | |
2010 | | $ | 14.02 | | | 0.33 | | | 0.29 | | | 0.62 | | | (0.34 | ) | | — | | | (0.34 | ) | | $14.30 | | | 2.36 | | | | 1.05 | | | | 1.05 | | | | 1.55 | | | 4.48 | | 12.57 | | $ | 481,808 | |
Class I Shares | | | | | | | | | | | | | | | | | | | | | | | | | | | | | | | | | | | | | | | | | | |
2015(b) | | $ | 14.58 | | | 0.14 | | | (0.02 | ) | | 0.12 | | | (0.14 | ) | | — | | | (0.14 | ) | | $14.56 | | | 1.88 | (d) | | | 0.39 | (d) | | | 0.39 | (d) | | | 0.39 | (d) | | 0.80 | | 5.25 | | $ | 4,772,625 | |
2014 | | $ | 14.38 | | | 0.30 | | | 0.20 | | | 0.50 | | | (0.30 | ) | | — | | | (0.30 | ) | | $14.58 | | | 2.09 | | | | 0.40 | | | | 0.40 | | | | 0.40 | | | 3.53 | | 14.46 | | $ | 4,417,547 | |
2013 | | $ | 14.70 | | | 0.31 | | | (0.32 | ) | | (0.01) | | | (0.31 | ) | | — | | | (0.31 | ) | | $14.38 | | | 2.15 | | | | 0.37 | | | | 0.37 | | | | 0.37 | | | (0.05) | | 17.47 | | $ | 3,502,580 | |
2012 | | $ | 14.39 | | | 0.36 | | | 0.31 | | | 0.67 | | | (0.36 | ) | | — | | | (0.36 | ) | | $14.70 | | | 2.46 | | | | 0.39 | | | | 0.39 | | | | 0.39 | | | 4.71 | | 12.72 | | $ | 3,084,872 | |
2011 | | $ | 14.27 | | | 0.41 | | | 0.12 | | | 0.53 | | | (0.41 | ) | | — | | | (0.41 | ) | | $14.39 | | | 2.87 | | | | 0.40 | | | | 0.40 | | | | 0.40 | | | 3.78 | | 16.15 | | $ | 2,228,418 | |
2010 | | $ | 14.00 | | | 0.41 | | | 0.28 | | | 0.69 | | | (0.42 | ) | | — | | | (0.42 | ) | | $14.27 | | | 2.98 | | | | 0.44 | | | | 0.44 | | | | 0.44 | | | 5.04 | | 12.57 | | $ | 1,890,196 | |
| (a) | Not annualized for periods less than one year. |
| (b) | Unaudited Six Month Period Ended March 31. |
| (c) | Sales loads are not reflected in computing total return. |
| + | Based on weighted average shares outstanding, except for Dividends from Net Investment Income and Net Realized Gains, which are actual amounts per share. |
See notes to financial statements.
| | | | |
| 50 Semi-Annual Report | | | | Semi-Annual Report 51 |
| | |
| EXPENSE EXAMPLE | | |
| |
Thornburg Limited Term Municipal Fund | | March 31, 2015 (Unaudited) |
As a shareholder of the Fund, you incur two types of costs:
| | (1) | transaction costs, including |
(a) sales charges (loads) on purchase payments, for Class A shares;
(b) a deferred sales charge on redemptions of any part or all of a purchase of $1 million of Class A shares within 12 months of purchase;
(c) a deferred sales charge on redemptions of Class C shares within 12 months of purchase;
| | (2) | ongoing costs, including management fees; distribution and/or service (12b-1) fees; and other Fund expenses. |
This example is intended to help you understand your ongoing costs (in dollars) of investing in the Fund and to compare these costs with the ongoing costs of investing in other mutual funds.
The example is based on a $1,000 investment beginning on October 1, 2014, and held until March 31, 2015.
| | | | | | | | | | | | |
| | | Beginning
Account Value
10/1/14 | | | Ending
Account Value
3/31/15 | | | Expenses Paid
During Period†
10/1/14–3/31/15 | |
Class A Shares | | | | | | | | | | | | |
Actual | | $ | 1,000.00 | | | $ | 1,006.40 | | | $ | 3.60 | |
Hypothetical* | | $ | 1,000.00 | | | $ | 1,021.34 | | | $ | 3.63 | |
Class C Shares | | | | | | | | | | | | |
Actual | | $ | 1,000.00 | | | $ | 1,005.90 | | | $ | 4.78 | |
Hypothetical* | | $ | 1,000.00 | | | $ | 1,020.17 | | | $ | 4.81 | |
Class I Shares | | | | | | | | | | | | |
Actual | | $ | 1,000.00 | | | $ | 1,008.00 | | | $ | 1.95 | |
Hypothetical* | | $ | 1,000.00 | | | $ | 1,022.99 | | | $ | 1.97 | |
| † | Expenses are equal to the annualized expense ratio for each class (A: 0.72%; C: 0.96%; I: 0.39%) multiplied by the average account value over the period, multiplied by 182/365 to reflect the one-half year period. |
| * | Hypothetical assumes a rate of return of 5% per year before expenses. |
ACTUAL EXPENSES
For each class of shares, the first line of the accompanying table provides information about actual account values and actual expenses. You may use the information in this line, together with the amount you invested, to estimate the expenses that you paid over the period. Simply divide your account value by $1,000 (for example, an $8,600 account value divided by $1,000 = 8.6), then multiply the result by the number in the first line for your class of shares under the heading entitled “Expenses Paid During Period” to estimate the expenses you paid on your account during this period.
HYPOTHETICAL EXAMPLE FOR COMPARISON PURPOSES
For each class of shares, the second line of the accompanying table provides information about hypothetical account values and hypothetical expenses based on the Fund’s actual expense ratio and an assumed rate of return of 5% per year before expenses, which is not the Fund’s actual return. The hypothetical account values and expenses may not be used to estimate the actual ending account balance or expenses you paid for the period. You may use this information to compare the ongoing costs of investing in the Fund and other funds. To do so, compare this 5% hypothetical example with the 5% hypothetical examples that appear in the shareholder reports of the other funds.
Please note that the expenses shown in the table are meant to highlight your ongoing costs only and do not reflect any transactional costs, such as sales charges (loads), redemption fees, or exchange fees. Therefore, the second line of the table for each class of shares is useful in comparing ongoing costs only, and will not help you determine the relative total costs of owning different funds. In addition, if these transactional costs were included, your costs would have been higher.
52 Semi-Annual Report
| | |
| OTHER INFORMATION | | |
| |
Thornburg Limited Term Municipal Fund | | March 31, 2015 (Unaudited) |
PORTFOLIO PROXY VOTING
Policies and Procedures:
The Trust has delegated to Thornburg Investment Management, Inc. (the “Advisor”) voting decisions respecting proxies for the Fund’s voting securities. The Advisor makes voting decisions in accordance with its Proxy Voting Policy. A description of the Policy is available (i) without charge, upon request, by calling the Advisor toll-free at 1-800-847-0200, (ii) on the Thornburg website at www.thornburg.com, and (iii) on the Securities and Exchange Commission’s website at www.sec.gov.
Information regarding how proxies were voted is available on or before August 31 of each year for the twelve months ending the preceding June 30. This information is available (i) without charge, upon request by calling the Advisor toll-free at 1-800-847-0200, (ii) on the Thornburg website at www.thornburg.com, and (iii) on the Securities and Exchange Commission’s website at www.sec.gov.
AVAILABILITY OF QUARTERLY PORTFOLIO SCHEDULE
The Fund files with the Securities and Exchange Commission schedules of its portfolio holdings on Form N-Q for the first and third quarters of each fiscal year. The Fund’s Forms N-Q are available on the Commission’s website at www.sec.gov, or may be reviewed and copied at the Commission’s Public Reference Room in Washington, D.C. Information on the operation of the Public Reference Room may be obtained by calling 1-800-SEC-0330. The Fund also makes this information available on its website at www.thornburg.com/download or upon request by calling 1-800-847-0200.
Semi-Annual Report 53
TRUSTEES’ STATEMENT TO SHAREHOLDERS
Revised and Readopted September 15, 2014
The Trustees believe current and prospective shareholders should know how we discharge our responsibilities in supervising the Funds’ investment advisor and in reviewing the advisor’s contract for renewal. Since 2005, we have issued a statement which sets out clearly the three principal guidelines that we follow in supervising the Trust’s investment advisor on your behalf. In accordance with our customary practice, in September of 2014 we again reviewed our statement and concluded we should reissue this statement outlining the principal features of our supervision of the advisor’s performance of investment management services for the Funds.
We begin with the premise that each shareholder selected his or her Fund because its investments are managed by the investment advisor identified in the prospectus and in accordance with the objective and policies described in the prospectus. We realize, as each of you do, that if you believe that your Fund’s stated objective and policies no longer serve your personal investment goals, you can sell your shares and leave the Fund.
Therefore, we believe that our primary supervisory task—our principal obligation to you—is to assess the nature and quality of the advisor’s services, and to confirm that the advisor actively and competently pursues the Fund’s objective, in accordance with the policies set out in the prospectus. To do this, we meet regularly with management to review your Fund’s portfolio and to discuss the advisor’s specific actions and judgments in pursuing the Fund’s objective. We do not substitute our own judgment for the advisor’s decisions in selecting investments; the advisor is paid to exercise its informed judgment on investment decisions, and we seek to confirm, in reviewing the advisor’s performance, that the advisor is doing just that.
Second, we are conscious of costs and the effect that costs have on shareholders’ returns. We try to make sure that your Fund’s fees and costs are reasonable in relationship to the services rendered and that they are generally in line with those charged by other expert investment advisors, consistent with our belief that the Fund’s investors searched for and expect that expertise and attention and have decided to pay a reasonable price for it. We do not put the management contract “out to bid” as a matter of course, and we would not do so unless we had concluded that the advisor materially had failed to pursue the Fund’s objectives in accordance with its policies, or for other equally important reasons. We believe that any other approach would be inconsistent with your interests and contrary to your expectations when you bought shares of the Fund in the first place.
Finally, because we believe that most Thornburg Fund shareholders have invested with a long-term perspective, we try not to focus too much on the fashions of the moment and on short-term performance. The market will not favor any specific investment objective or set of policies at all times and under all economic circumstances. A fund will experience periods of both high and low returns relative to other funds and other investments. Even if one of our Funds is not favored by the market at a particular time, we believe that the advisor is nonetheless obliged to remain true to the Fund’s objective and policies, and we watch to see that it does so.
Trustees of Thornburg Investment Trust
54 Semi-Annual Report
THORNBURG FUND FAMILY
Fundamental, Bottom-up Equity Research
We search far and wide for the best stock ideas—within the United States and around the globe. Potential investments that may deserve a deeper look are thoroughly analyzed using both quantitative and qualitative criteria. But the vast majority are discarded. Those that ultimately make it into our highly-selective portfolios are continually monitored to determine whether our investment theses unfold as expected.
| | • | | Thornburg Core Growth Fund |
| | • | | Thornburg International Value Fund |
| | • | | Thornburg International Growth Fund |
| | • | | Thornburg Developing World Fund |
| | • | | Thornburg Investment Income Builder Fund |
| | • | | Thornburg Global Opportunities Fund |
A TRADITION OF DISCIPLINED BOND MANAGEMENT
At Thornburg, the word “disciplined” carries some substance. We don’t make a practice of using shortcuts to enhance yield or total returns. Every strategy is grounded in rigorous, bottom-up credit work. Portfolios are assembled carefully—in the case of our core bond funds, using laddered structures—to mitigate price fluctuation. Position sizes are controlled so that no single bond can have an outsized effect on a portfolio. And as with our equity portfolios, managers enjoy flexibility to seek an optimal risk/reward balance.
| | • | | Thornburg Low Duration Income Fund |
| | • | | Thornburg Limited Term U.S. Government Fund |
| | • | | Thornburg Limited Term Income Fund |
| | • | | Thornburg Strategic Income Fund |
| | • | | Thornburg Low Duration Municipal Fund |
| | • | | Thornburg Limited Term Municipal Fund |
| | • | | Thornburg Intermediate Municipal Fund |
| | • | | Thornburg California Limited Term Municipal Fund |
| | • | | Thornburg New Mexico Intermediate Municipal Fund |
| | • | | Thornburg New York Intermediate Municipal Fund |
| | • | | Thornburg Strategic Municipal Income Fund |
Before investing, carefully consider the Fund’s investment goals, risks, charges, and expenses. For a prospectus or summary prospectus containing this and other information, contact your financial advisor or visit thornburg.com. Read it carefully before investing.
For additional information, please visit thornburg.com
Thornburg Investment Management, Inc. 2300 North Ridgetop Road, Santa Fe, NM 87506
Semi-Annual Report 55

This Semi-Annual Report is submitted for the general information of shareholders of the Fund. It is not authorized for distribution to prospective investors in the Fund unless preceded or accompanied by an effective prospectus.
| | | | |
| Investment Advisor: | | Distributor: | | |
| Thornburg Investment Management® | | Thornburg Securities Corporation® | | |
| 800.847.0200 | | 800.847.0200 | | TH1072 |
FIRM OVERVIEW
THE FIRM
Thornburg Investment Management is a privately owned global investment firm that offers a range of solutions for retail and institutional investors. We are driven by our mission to help our clients reach their long-term financial goals through fundamental research and active portfolio management.
Founded in 1982 and headquartered in Santa Fe, New Mexico, we manage approximately $61 billion (as of March 31, 2015) across seven equity and 11 bond mutual funds, separate accounts for high-net-worth investors and institutional accounts, and five UCITS funds for non-U.S. investors.

CORE INVESTMENT PRINCIPLES
Our focus has always been on maintaining and building the investment expertise to manage Thornburg strategies to a high standard, while adhering to a core set of investment principles:
| | • | | We focus on the fundamentals. We invest according to our view of the fundamental value of an issuer only after performing thorough, bottom-up research. |
| | • | | We think and invest for the long term. We typically make investment decisions based upon an investment thesis we expect to play out over 18 months to several years. We may not always hold a security for several years, but our horizon line is typically a few years out. |
| | • | | We stay flexible. We go where we see value. Our investment mandates are generally broad and flexible, and we exercise as much flexibility as possible within any restrictions. |
| | • | | We collaborate across strategies. We are structured as global generalists. Portfolio managers and analysts do not specialize in sectors, geographies, or even security types, but instead must understand and communicate bottom-up fundamentals across industries, sectors, and borders. |
2 Semi-Annual Report
Semi-Annual Report
Thornburg Intermediate Municipal Fund
March 31, 2015
| | | | |
Share Class | | NASDAQ Symbol | | CUSIP |
Class A | | THIMX | | 885-215-202 |
Class C | | THMCX | | 885-215-780 |
Class I | | THMIX | | 885-215-673 |
Minimum investments for Class I shares are higher than those for other classes. Class I shares may not be available to all investors.
Investments in the Fund carry risks, including possible loss of principal. Bond funds have the same interest rate, inflation, and credit risks that are associated with the underlying bonds. The value of bonds will fluctuate relative to changes in interest rates, decreasing when interest rates rise. Unlike bonds, bond funds have ongoing fees and expenses. Please see the Fund’s prospectus for a discussion of the risks associated with an investment in the Fund. Investments in the Fund are not FDIC insured, nor are they deposits of or guaranteed by a bank or any other entity.
The laddering strategy does not assure or guarantee better performance and cannot eliminate the risk of investment losses.
Semi-Annual Report 3
| | |
| LETTER TO SHAREHOLDERS | | |
| |
Thornburg Intermediate Municipal Fund | | March 31, 2015 (Unaudited) |
April 16, 2015
Dear Fellow Shareholder:
We are pleased to present the semi-annual report for the Thornburg Intermediate Municipal Fund. The net asset value (NAV) of the Class A shares increased by five cents to $14.28 per share during the six months ended March 31, 2015. If you were with us for the entire period, you received dividends of 15.13 cents per share. If you reinvested your dividends, you received 15.20 cents per share. Dividends were lower for Class C shares and higher for Class I shares, to account for varying class-specific expenses. The Class A shares underperformed the Fund’s benchmark index, with a 1.42% total return (without sales charge) for the six months ended March 31, 2015, compared to the 1.71% total return for the BofA Merrill Lynch 3-15 Year U.S. Municipal Securities Index. The Fund generated 0.76% more price return and 1.05% less income than its benchmark.
Throughout the six-month period, the Fund maintained a lower risk posture on interest rates than its benchmark; its average effective duration (a measure of interest-rate sensitivity) was 4.67 years, compared to 5.42 years for the benchmark. The shorter duration hurt performance by 0.24%. The Fund’s position along the yield curve added 0.02%, and sector selection contributed 0.31% of relative performance. Credit selection was immaterial to overall performance. Other factors including security selection added 0.67%.
The Municipal Market
The municipal market has been something of a roller coaster over the past six months. Much of that volatility revolves around investors’ increased fears of an eventual Federal Reserve rate increase. While those fears aren’t completely unfounded, we believe the typical municipal investor is ignoring several other sources of risk present in the market.
First and foremost, it appears that risk is mispriced. At a very high level, we examine two primary sources of risk in the municipal market: duration and credit quality. The hunt for excess yield has bid up the prices of these sources of risk to levels we believe are unsustainable.
Investors looking for more yield can increase the duration of their purchases. This strategy often makes sense in a period characterized by a steep yield curve. When the curve is sufficiently steep, the incremental yield an investor picks up for buying a bond one year longer may, in fact, provide adequate compensation for the increased interest-rate risk. But through the six months ended March 31, 2015, we believe compensation offered to investors to extend duration was not in line with the added risk. This was particularly true when looking at the overall low level of interest rates in the market. Chart I shows the yield of a AAA rated general obligation bond less the core PCE index (or Personal Consumption Expenditures index, the Federal Reserve’s favored inflation measure). This is the so-called “real yield” an investor receives after inflation; this was and continues to be well below the long-term average.
Chart I 10-Year AAA General Obligation Municipal Bond Real Yield History, Using Core PCE Index

Less risk-averse investors can also decrease the average credit quality of their portfolios in an attempt to generate more income. While this can be a sound strategy in times of wide credit spreads, it fails during periods when credit risk is mispriced. Chart II shows a history of credit spreads, which in this case is the incremental yield an investor picked up from investing in a BBB rated revenue bond versus a AAA rated general obligation bond. Such spreads are as tight as they have been since before the great recession, when municipal bond insurers were thriving and a majority of the market was insured with AAA ratings.
In addition to overpriced risks, investors need to be prepared for continued volatility in the market. We live in a world where the Federal Reserve’s statements are analyzed word for word. The inclusion or deletion of any given word has the potential to send the markets roiling. The increased volatility may be exacerbated in the future by liquidity constraints facing the market, prompted by recent federal regulation. As a result of Dodd-Frank and other regulations, large broker/dealers will no longer be able to allocate the same amount of capital to the municipal market as they have in the past. Without that support, the market could be rattled more than usual if and when we see large outflows.
4 Semi-Annual Report
| | |
LETTER TO SHAREHOLDERS, CONTINUED | | |
| |
Thornburg Intermediate Municipal Fund | | March 31, 2015 (Unaudited) |
Chart II Credit-Spread Difference, BBB Rated Revenue v. AAA Rated General Obligation Bonds
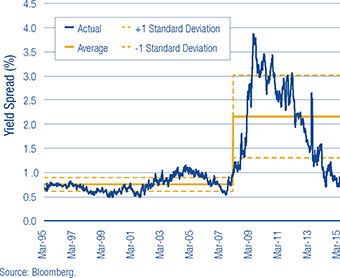
Investors need to be aware of all of these risks and ensure they are accounting for them appropriately.
Conclusion
For the past six months, the Thornburg municipal bond team has asked a simple question: “Are we getting paid to take risk?” The answer has been a resounding “no.” As a result, our investors will see a portfolio with a lower duration and a stronger average credit quality, as we overweighted higher-rated credits. We have also increased cash positions to seek to protect against a market liquidity crunch and to strategically take advantage of opportunities should they arise. In short, we believe we have avoided overpriced risk.
Many shareholders may ask themselves “what should I do if interest rates begin to rise?” We continue to stress having confidence in the structure of your portfolio. A portion of your laddered Fund’s bonds mature each year and become available for reinvestment at higher yields; this has the potential to increase income to shareholders. When interest rates do rise, prices will generally decline, but the remaining bonds in the portfolio will move closer to maturity and should, in our opinion, increase in price over time. We advise being patient when interest rates start to rise, and lengthening your anticipated holding period. Remember that higher yields also mean higher income, something investors have been sorely lacking for quite some time!
We will continue to strive to manage your assets to fulfill the Fund’s objectives.
Sincerely,
| | | | |

Christopher Ryon,CFA Portfolio Manager Managing Director | | 
Josh Gonze Portfolio Manager Managing Director | | 
Nicholos Venditti Portfolio Manager Managing Director |
The matters discussed in this report may constitute forward-looking statements made pursuant to the safe harbor provisions of the Securities Litigation Reform Act of 1995. These include any advisor or portfolio manager prediction, assessment, analysis or outlook for individual securities, industries, investment styles, market sectors and/or markets. These statements involve risks and uncertainties. In addition to the general risks described for each fund in its current prospectus, other factors bearing on these reports include the accuracy of the advisor’s or portfolio manager’s forecasts and predictions, the appropriateness of the investment strategies designed by the advisor or portfolio manager and the ability of the advisor or portfolio manager to implement their strategies efficiently and successfully. Any one or more of these factors, as well as other risks affecting the securities markets generally, could cause the actual results of any fund to differ materially as compared to its benchmarks.
The views expressed by the portfolio managers reflect their professional opinions and are subject to change. Under no circumstances does the information contained within represent a recommendation to buy or sell any security.
Semi-Annual Report 5
| | |
| PERFORMANCE SUMMARY | | |
| |
Thornburg Intermediate Municipal Fund | | March 31, 2015 (Unaudited) |
Average Annual Total Returns
| | | | | | | | | | | | | | | | | | | | |
| | | 1-Yr | | | 3-Yr | | | 5-Yr | | | 10-Yr | | | Since
Incep. | |
A Shares (Incep: 7/22/91) | | | | | | | | | | | | | | | | | | | | |
Without sales charge | | | 4.68 | % | | | 3.33 | % | | | 4.47 | % | | | 4.17 | % | | | 5.06 | % |
With sales charge | | | 2.62 | % | | | 2.64 | % | | | 4.05 | % | | | 3.96 | % | | | 4.97 | % |
C Shares (Incep: 9/1/94) | | | | | | | | | | | | | | | | | | | | |
Without sales charge | | | 4.34 | % | | | 3.00 | % | | | 4.15 | % | | | 3.88 | % | | | 4.22 | % |
With sales charge | | | 3.74 | % | | | 3.00 | % | | | 4.15 | % | | | 3.88 | % | | | 4.22 | % |
I Shares (Incep: 7/5/96) | | | 5.00 | % | | | 3.65 | % | | | 4.79 | % | | | 4.50 | % | | | 4.78 | % |
30-Day Yields, A Shares
(with sales charge)
| | | | |
Annualized Distribution Yield | | | 1.92 | % |
| |
SEC Yield | | | 0.90 | % |
Performance data shown represents past performance and is no guarantee of future results. Investment return and principal value will fluctuate so shares, when redeemed, may be worth more or less than their original cost. Current performance may be lower or higher than quoted. For performance current to the most recent month end, visit thornburg.com or call 800-847-0200. The performance information does not reflect the deduction of taxes that a shareholder would pay on distributions or the redemption of Fund shares. Returns reflect the reinvestment of dividends and capital gains. Class A shares are sold with a maximum sales charge of 2.00%. Class C shares include a 0.60% CDSC for the first year only. There is no sales charge for Class I shares.
As disclosed in the most recent prospectus, the total annual fund operating expenses are as follows: A shares, 0.92%; C shares, 1.29%; I shares, 0.61%. Thornburg Investment Management and/or Thornburg Securities Corporation have contractually agreed to waive fees and reimburse expenses through at least February 1, 2016, for some of the share classes, resulting in net expense ratios of the following: C shares, 1.24%. For more detailed information on fund expenses and waivers/reimbursements please see the Fund’s prospectus.
Glossary
BofA Merrill Lynch 3-15 Year U.S. Municipal Securities Index – A subset of the BofA Merrill Lynch U.S. Municipal Securities Index including all securities with a remaining term to final maturity greater than or equal to 3 years and less than 15 years.
Unless otherwise noted, index returns reflect the reinvestment of income dividends and capital gains, if any, but do not reflect fees, brokerage commissions or other expenses of investing. Investors may not make direct investments into any index. The performance of any index is not indicative of the performance of any particular investment.
Alternative Minimum Tax (AMT) – A federal tax aimed at ensuring that high-income individuals, estates, trusts, and corporations pay a minimal level income tax. For individuals, the AMT is calculated by adding tax preference items to regular taxable income.
Annualized Distribution Yield – The distribution yield reflects actual distributions made to shareholders. The annualized distribution yield is calculated by summing the last 30 days of income at a given month end and annualizing to a 360-day year. The result is divided by the ending maximum offering price.
Bond Credit Ratings (Credit Quality) – A bond credit rating assesses the financial ability of a debt issuer to make timely payments of principal and interest. Ratings of AAA (the highest), AA, A, and BBB are investment-grade quality. Ratings of BB, B, CCC, CC, C and D (the lowest) are considered below investment grade, speculative grade, or junk bonds.
Bond Insurers – Individual bonds are sometimes insured by private companies. The insurance guarantees the payment of principal and interest on a bond issue if the issuer defaults. Mutual funds are not insured, even if the underlying bonds are insured.
Credit Spread/Quality Spread – The difference between the yields of securities with different credit qualities.
Duration – A bond’s sensitivity to interest rates. Effective duration incorporates the embedded option features, such as call provisions. Bonds with longer durations experience greater price volatility than bonds with shorter durations.
General Obligation Bond – A municipal bond backed by the credit and “taxing power” of the issuing jurisdiction rather than the revenue from a given project.
Personal Consumption Expenditure (PCE) Index – A broad measure of U.S. inflation that assesses the change in prices of goods and services purchased by consumers throughout the economy. Core PCE excludes the more volatile and seasonal food and energy prices.
Revenue Bond – A bond on which the debt service is payable solely from the revenue generated from the operation of the project being financed or a category of facilities, or from other non-tax sources.
SEC Yield – SEC yield is computed in accordance with SEC standards measuring the net investment income per share over a specified 30-day period expressed as a percentage of the maximum offering price of the Fund’s shares at the end of the period.
Standard Deviation – A measure of the dispersion of a set of data from its mean. The more spread apart the data, the higher the deviation. Values within one standard deviation of the mean represent approximately two-thirds of the data set, assuming a normal distribution.
Yield Curve – A line that plots the interest rates, at a set point in time, of bonds having equal credit quality, but differing maturity dates.
Yield Spread – The difference between yields on differing debt instruments, calculated by deducting the yield of one instrument from another.
6 Semi-Annual Report
| | |
| FUND SUMMARY | | |
| |
Thornburg Intermediate Municipal Fund | | March 31, 2015 (Unaudited) |
Objectives and Strategies
The Fund’s primary investment goal is to obtain as high a level of current income exempt from federal individual income tax as is consistent, in the view of the Fund’s investment advisor, with preservation of capital (may be subject to Alternative Minimum Tax).
The secondary goal of the Fund is to reduce expected changes in its share price compared to long-term bond portfolios.
This Fund is a laddered portfolio of municipal bonds with an average maturity of normally three to ten years. Laddering involves building a portfolio of bonds with staggered maturities so that a portion of the portfolio matures each year. Cash from maturing bonds, if not needed for other purposes, is invested in bonds with longer maturities at the far end of the ladder. We regard the strategy as a good compromise for managing different types of risk.
Long Term Stability of Principal
Net Asset Value History of A Shares
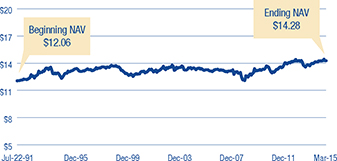
Security Credit Ratings
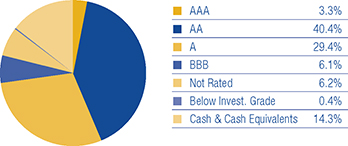
A bond credit rating assesses the financial ability of a debt issuer to make timely payments of principal and interest. Ratings of AAA (the highest), AA, A, and BBB are investment-grade quality. Ratings of BB, B, CCC, CC, C and D (the lowest) are considered below investment grade, speculative grade, or junk bonds. Credit quality ratings for Thornburg’s municipal portfolios used the highest rating available from either Standard & Poor’s or Moody’s Investors Service.
Key Portfolio Attributes
| | | | |
Number of Bonds | | | 507 | |
| |
Effective Duration | | | 4.7 Yrs | |
| |
Average Maturity | | | 7.5 Yrs | |
Portfolio Ladder
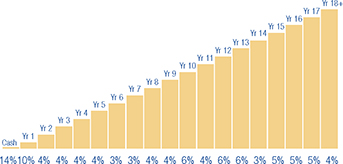
There is no guarantee that the Fund will meet its investment objectives.
All data is subject to change. Charts may not add up to 100% due to rounding.
Semi-Annual Report 7
| | |
| SCHEDULE OF INVESTMENTS | | |
| |
Thornburg Intermediate Municipal Fund | | March 31, 2015 (Unaudited) |
| | | | | | | | | | |
Issuer-Description | | Credit Rating†
S&P/Moody’s | | Principal
Amount | | | Value | |
ALABAMA — 1.78% | | | | | | | | | | |
Alabama Capital Region Solid Waste Disposal Authority, 4.00% due 6/15/2016 (Montgomery Materials Recovery Facility) (AMT) | | AA/NR | | $ | 160,000 | | | $ | 166,277 | |
Alabama Capital Region Solid Waste Disposal Authority, 4.00% due 6/15/2017 (Montgomery Materials Recovery Facility) (AMT) | | AA/NR | | | 750,000 | | | | 796,080 | |
Alabama Capital Region Solid Waste Disposal Authority, 4.00% due 6/15/2019 (Montgomery Materials Recovery Facility) (AMT) | | AA/NR | | | 815,000 | | | | 885,465 | |
Alabama Capital Region Solid Waste Disposal Authority, 5.00% due 6/15/2020 (Montgomery Materials Recovery Facility) (AMT) | | AA/NR | | | 845,000 | | | | 967,128 | |
Alabama Capital Region Solid Waste Disposal Authority, 5.00% due 6/15/2021 (Montgomery Materials Recovery Facility) (AMT) | | AA/NR | | | 890,000 | | | | 1,030,335 | |
Alabama Capital Region Solid Waste Disposal Authority, 5.00% due 6/15/2022 (Montgomery Materials Recovery Facility) (AMT) | | AA/NR | | | 930,000 | | | | 1,082,418 | |
Alabama Capital Region Solid Waste Disposal Authority, 5.00% due 6/15/2023 (Montgomery Materials Recovery Facility) (AMT) | | AA/NR | | | 980,000 | | | | 1,130,988 | |
Alabama Drinking Water Finance Authority, 5.25% due 8/15/2015 (Insured: AMBAC) (ETM) | | NR/NR | | | 1,200,000 | | | | 1,219,908 | |
Alabama Public School & College Authority, 5.00% due 5/1/2016 (Educational Facilities) | | NR/Aa1 | | | 2,000,000 | | | | 2,102,480 | |
Alabama Public School & College Authority, 5.00% due 6/1/2021 (Educational Facilities) | | AA/Aa1 | | | 775,000 | | | | 926,590 | |
Alabama Public School & College Authority, 5.00% due 6/1/2026 (Educational Facilities) | | AA/Aa1 | | | 4,380,000 | | | | 5,224,639 | |
City of Mobile Industrial Development Board, 1.65% due 6/1/2034 put 3/20/2017 (Alabama Power Company Barry Plant Project) | | A/A1 | | | 2,000,000 | | | | 2,027,580 | |
East Alabama Health Care Authority GO, 5.00% due 9/1/2027 (Health Care Facilities Capital Improvements) | | A/NR | | | 1,250,000 | | | | 1,385,575 | |
Montgomery Water Works & Sanitary Sewer Board, 5.00% due 9/1/2017 | | AAA/Aa1 | | | 2,185,000 | | | | 2,407,302 | |
University of Alabama at Birmingham Hospital, 5.25% due 9/1/2025 | | A+/A1 | | | 2,000,000 | | | | 2,235,620 | |
| | | |
ALASKA — 0.22% | | | | | | | | | | |
Alaska Housing Finance Corp. GO, 5.00% due 12/1/2021 (State Capital Project) | | AA+/Aa2 | | | 500,000 | | | | 586,450 | |
City of Valdez, 5.00% due 1/1/2021 (BP Pipelines (Alaska), Inc. Project) | | A/A2 | | | 2,000,000 | | | | 2,320,780 | |
| | | |
ARIZONA — 2.13% | | | | | | | | | | |
Arizona Board of Regents, 5.00% due 8/1/2024 (University of Arizona SPEED) | | A+/Aa3 | | | 1,635,000 | | | | 1,936,331 | |
Arizona Board of Regents, 5.00% due 8/1/2029 (University of Arizona SPEED) | | A+/Aa3 | | | 1,000,000 | | | | 1,175,970 | |
Arizona HFA, 5.00% due 7/1/2017 (Dignity Health) | | A/A3 | | | 1,450,000 | | | | 1,577,687 | |
Arizona HFA, 5.00% due 12/1/2031 (Scottsdale Lincoln Hospitals) | | NR/A2 | | | 2,500,000 | | | | 2,894,025 | |
Arizona State University Energy Management LLC, 5.00% due 7/1/2017 (Tempe Campus Project) | | AA-/A1 | | | 465,000 | | | | 506,817 | |
City of Flagstaff GO, 1.75% due 7/1/2015 (Urban Trail, Street and Utilities Improvements) | | AA/Aa2 | | | 165,000 | | | | 165,655 | |
City of Flagstaff GO, 1.75% due 7/1/2016 (Urban Trail, Street and Utilities Improvements) | | AA/Aa2 | | | 200,000 | | | | 203,414 | |
City of Flagstaff GO, 3.00% due 7/1/2020 (Urban Trail, Street and Utilities Improvements) | | AA/Aa2 | | | 700,000 | | | | 749,161 | |
City of Flagstaff GO, 4.00% due 7/1/2022 (Urban Trail, Street and Utilities Improvements) | | AA/Aa2 | | | 420,000 | | | | 477,187 | |
City of Flagstaff GO, 4.00% due 7/1/2023 (Urban Trail, Street and Utilities Improvements) | | AA/Aa2 | | | 200,000 | | | | 228,566 | |
Mohave County IDA, 7.25% due 5/1/2015 (Mohave Prison LLC) | | BBB+/NR | | | 2,395,000 | | | | 2,403,766 | |
Phoenix Civic Improvement Corp., 5.00% due 7/1/2017 (Insured: Natl-Re) | | AA/Aa3 | | | 1,000,000 | | | | 1,092,280 | |
Pima County IDA, 5.00% due 12/1/2030 (Providence Day School Project) | | BBB+/NR | | | 2,000,000 | | | | 2,155,040 | |
Salt Verde Financial Corp., 5.25% due 12/1/2022 (Salt River Project Agricultural Improvement and Power District) | | A-/Baa2 | | | 2,000,000 | | | | 2,355,520 | |
Salt Verde Financial Corp., 5.25% due 12/1/2028 (Salt River Project Agricultural Improvement and Power District) | | A-/Baa2 | | | 770,000 | | | | 925,579 | |
State of Arizona, 5.00% due 7/1/2019 (Insured: AGM) | | AA/A1 | | | 7,280,000 | | | | 8,331,596 | |
University Medical Center Corp. GO, 5.00% due 7/1/2015 (UMCC Health Care Facilities) (ETM) | | NR/NR | | | 1,000,000 | | | | 1,012,010 | |
| | | |
ARKANSAS — 0.32% | | | | | | | | | | |
Board of Trustees of the University of Arkansas, 5.00% due 11/1/2031 (Fayetteville Campus) | | NR/Aa2 | | | 1,000,000 | | | | 1,181,010 | |
Board of Trustees of the University of Arkansas, 5.00% due 11/1/2032 (Fayetteville Campus) | | NR/Aa2 | | | 655,000 | | | | 770,555 | |
Board of Trustees of the University of Arkansas, 5.00% due 11/1/2033 (Fayetteville Campus) | | NR/Aa2 | | | 1,000,000 | | | | 1,169,110 | |
Board of Trustees of the University of Arkansas, 5.00% due 11/1/2034 (Fayetteville Campus) | | NR/Aa2 | | | 1,000,000 | | | | 1,161,860 | |
| | | |
CALIFORNIA — 6.62% | | | | | | | | | | |
Alameda County Joint Powers Authority, 5.25% due 12/1/2027 (Alameda County Medical Center Highland Hospital) | | AA/Aa3 | | | 1,000,000 | | | | 1,210,810 | |
Alameda County Joint Powers Authority, 5.25% due 12/1/2028 (Alameda County Medical Center Highland Hospital) | | AA/Aa3 | | | 1,150,000 | | | | 1,377,585 | |
Alameda County Joint Powers Authority, 5.25% due 12/1/2029 (Alameda County Medical Center Highland Hospital) | | AA/Aa3 | | | 1,500,000 | | | | 1,792,470 | |
Brentwood Infrastructure Financing Authority, 5.00% due 11/1/2026 (Insured: AGM) | | AA/NR | | | 2,000,000 | | | | 2,240,880 | |
California Educational Facilities Authority, 5.50% due 4/1/2029 (Pitzer College) | | NR/A2 | | | 3,000,000 | | | | 3,491,430 | |
California HFFA, 5.00% due 11/15/2022 (Children’s Hospital Los Angeles) | | BBB+/Baa2 | | | 1,000,000 | | | | 1,141,660 | |
California HFFA, 5.00% due 3/1/2026 (Adventist Health System/West) | | A/NR | | | 3,020,000 | | | | 3,523,434 | |
California HFFA, 5.25% due 3/1/2027 (Dignity Health) | | A/A3 | | | 5,250,000 | | | | 5,978,490 | |
California Infrastructure & Economic Development Bank, 5.75% due 8/15/2029 (King City Joint Union High School District) | | A+/NR | | | 1,500,000 | | | | 1,758,450 | |
California Pollution Control Financing Authority, 5.25% due 6/1/2023 put 12/1/2017 (Solid Waste Disposal-Republic Services, Inc.) (AMT) | | BBB+/Baa3 | | | 2,000,000 | | | | 2,171,720 | |
California State Public Works Board, 5.00% due 6/1/2017 (University of California Multiple Campus Capital Projects; Insured: Natl-Re) (ETM) | | AA+/Aaa | | | 2,000,000 | | | | 2,188,980 | |
California State Public Works Board, 5.00% due 4/1/2028 (Corrections & Rehabilitation and Judicial Council) | | A/A1 | | | 2,500,000 | | | | 2,896,900 | |
California Statewide Community Development Authority, 6.25% due 8/15/2028 (Enloe Medical Center; Insured: California Mtg Insurance) | | A+/NR | | | 1,050,000 | | | | 1,225,014 | |
8 Semi-Annual Report
| | |
| SCHEDULE OF INVESTMENTS, CONTINUED | | |
| |
Thornburg Intermediate Municipal Fund | | March 31, 2015 (Unaudited) |
| | | | | | | | | | |
Issuer-Description | | Credit Rating†
S&P/Moody’s | | Principal
Amount | | | Value | |
California Statewide Community Development Authority, 6.00% due 7/1/2030 (Aspire Public Schools) | | NR/NR | | $ | 7,015,000 | | | $ | 7,564,485 | |
Carson Redevelopment Agency, 6.25% due 10/1/2022 (Redevelopment Project Area No. 1) | | A-/NR | | | 1,620,000 | | | | 1,931,332 | |
Carson Redevelopment Agency, 6.375% due 10/1/2024 (Redevelopment Project Area No. 1) | | A-/NR | | | 1,300,000 | | | | 1,529,008 | |
Chico Redevelopment Agency, 5.00% due 4/1/2030 (Chico Amended & Merged Redevelopment; Insured: AMBAC) | | A+/NR | | | 5,500,000 | | | | 5,694,425 | |
Corona-Norco USD COP, 5.00% due 4/15/2018 (Insured: AGM) | | AA/A1 | | | 1,245,000 | | | | 1,391,350 | |
Corona-Norco USD COP, 5.00% due 4/15/2021 (Insured: AGM) | | AA/A1 | | | 1,000,000 | | | | 1,158,710 | |
Delano Financing Authority, 5.00% due 12/1/2025 (City of Delano Police Station and Woollomes Avenue Bridge) | | A-/NR | | | 2,555,000 | | | | 2,814,358 | |
El Camino Hospital District, 6.25% due 8/15/2017 (Insured: AMBAC) (ETM) | | NR/NR | | | 435,000 | | | | 464,658 | |
Franklin-McKinley School District GO, 5.25% due 8/1/2027 (Insured: Natl-Re) | | NR/A1 | | | 1,000,000 | | | | 1,220,660 | |
Fresno USD GO, 6.00% due 8/1/2026 (Educational Facilities and Improvements; Insured: Natl-Re) | | AA-/A3 | | | 1,165,000 | | | | 1,427,673 | |
Jurupa Public Financing Authority, 5.50% due 9/1/2025 (Eastvale Community Services; Insured: AGM) | | AA/NR | | | 1,195,000 | | | | 1,456,095 | |
Jurupa Public Financing Authority, 5.50% due 9/1/2027 (Eastvale Community Services; Insured: AGM) | | AA/NR | | | 1,335,000 | | | | 1,602,841 | |
Los Angeles Regional Airport Improvement Corp., 5.00% due 1/1/2017 (LAX Fuel Corp.; Insured: AGM) (AMT) | | AA/A2 | | | 1,120,000 | | | | 1,133,261 | |
M-S-R Energy Authority, 6.125% due 11/1/2029 | | A-/NR | | | 2,500,000 | | | | 3,126,875 | |
Mojave USD COP, 0% due 9/1/2021 (Insured: AGM) | | AA/NR | | | 1,095,000 | | | | 878,332 | |
Mojave USD COP, 0% due 9/1/2023 (Insured: AGM) | | AA/NR | | | 1,100,000 | | | | 781,781 | |
North City West School Facilities Financing Authority, 5.00% due 9/1/2024 (Carmel Valley Schools; Insured: AGM) | | AA/NR | | | 1,080,000 | | | | 1,284,779 | |
Redwood City Redevelopment Agency, 0% due 7/15/2023 (Redevelopment Area A-2; Insured: AMBAC) | | A-/NR | | | 2,065,000 | | | | 1,525,498 | |
San Jose Redevelopment Agency, 5.25% due 8/1/2027 (Merged Area Redevelopment Project) | | A/Ba1 | | | 2,400,000 | | | | 2,660,472 | |
San Jose Redevelopment Agency, 5.375% due 8/1/2028 (Merged Area Redevelopment Project) | | A/Ba1 | | | 1,175,000 | | | | 1,307,869 | |
San Mateo Union High School District GO, 0% due 9/1/2019 (Educational Facilities; Insured: Natl-Re) | | AA+/Aa1 | | | 3,000,000 | | | | 2,828,550 | |
Saratoga Union School District GO, 0% due 9/1/2023 (Insured: Natl-Re) | | AA+/Aa2 | | | 900,000 | | | | 723,726 | |
State of California GO, 5.25% due 9/1/2026 (Kindergarten University Facilities) | | A+/Aa3 | | | 5,000,000 | | | | 5,983,900 | |
Tuolumne Wind Project Authority, 5.875% due 1/1/2029 (Tuolumne Co.) | | AA-/A2 | | | 3,000,000 | | | | 3,516,330 | |
Turlock Irrigation District, 5.00% due 1/1/2021 | | AA-/A2 | | | 1,750,000 | | | | 2,015,877 | |
William S. Hart Union High School District GO, 0% due 9/1/2021 (Educational Facilities) | | AA/A2 | | | 800,000 | | | | 688,480 | |
| | | |
COLORADO — 0.91% | | | | | | | | | | |
Denver Convention Center Hotel Authority, 5.25% due 12/1/2023 (Insured: Syncora) | | BBB-/Baa3 | | | 2,530,000 | | | | 2,716,916 | |
Housing Authority of the City and County of Denver, 5.20% due 11/1/2027 (Three Towers Rehabilitation; Insured: AGM) (AMT) | | NR/A2 | | | 1,335,000 | | | | 1,445,712 | |
Housing Authority of the City and County of Denver, 5.20% due 11/1/2027 pre-refunded 11/1/2017 (Three Towers | | | | | | | | | | |
Rehabilitation; Insured: AGM) (AMT) | | NR/Aaa | | | 1,220,000 | | | | 1,354,737 | |
Park Creek Metropolitan District, 5.25% due 12/1/2020 (Insured: AGM) | | AA/NR | | | 1,120,000 | | | | 1,257,704 | |
Regional Transportation District COP, 5.50% due 6/1/2022 (FasTracks Transportation System) | | A/Aa3 | | | 3,000,000 | | | | 3,540,900 | |
Regional Transportation District COP, 5.00% due 6/1/2028 (North Metro Rail Line) | | A/Aa3 | | | 1,550,000 | | | | 1,807,393 | |
| | | |
CONNECTICUT — 0.26% | | | | | | | | | | |
Connecticut Health & Educational Facilities Authority, 5.75% due 7/1/2029 (Ethel Walker School) | | BBB/NR | | | 1,350,000 | | | | 1,439,235 | |
State of Connecticut GO Floating Rate Note, 0.54% due 9/15/2017 (Public Facility Improvements) | | AA/Aa3 | | | 2,000,000 | | | | 2,010,300 | |
| | | |
DELAWARE — 0.05% | | | | | | | | | | |
Delaware Solid Waste Authority, 5.00% due 6/1/2021 (Capital Improvement Program; Insured: Natl-Re) | | AA+/A2 | | | 615,000 | | | | 647,355 | |
| | | |
DISTRICT OF COLUMBIA — 1.17% | | | | | | | | | | |
District of Columbia Association of American Medical Colleges, 5.00% due 2/15/2017 (Insured: AMBAC) (ETM) | | NR/NR | | | 1,000,000 | | | | 1,080,710 | |
District of Columbia COP, 5.00% due 1/1/2020 pre-refunded 1/1/16 (Insured: Natl-Re) | | AA-/Aa3 | | | 3,900,000 | | | | 4,039,620 | |
District of Columbia GO, 6.00% due 6/1/2015 (Insured: Natl-Re) | | AA/Aa1 | | | 3,000,000 | | | | 3,029,130 | |
Metropolitan Airports Authority, 0% due 10/1/2023 (Dulles Toll Road; Insured: AGM) | | AA/A3 | | | 4,890,000 | | | | 3,724,126 | |
Metropolitan Airports Authority, 0% due 10/1/2024 (Dulles Toll Road; Insured: AGM) | | AA/A3 | | | 5,000,000 | | | | 3,608,550 | |
| | | |
FLORIDA — 8.62% | | | | | | | | | | |
Broward County School Board COP, 5.00% due 7/1/2030 (Educational Facilities) | | A/A1 | | | 1,250,000 | | | | 1,457,125 | |
Broward County School Board COP, 5.00% due 7/1/2032 (Educational Facilities) | | A/A1 | | | 2,000,000 | | | | 2,318,080 | |
City of Gainesville, 0.03% due 10/1/2042 put 4/1/2015 (Utilities System; LOC: Sumitomo Mitsui Banking) (daily demand notes) | | NR/NR | | | 25,800,000 | | | | 25,800,000 | |
City of Hollywood Community Redevelopment Agency, 5.00% due 3/1/2021 (Beach Community Redevelopment Project; Insured: Syncora) | | NR/A3 | | | 3,000,000 | | | | 3,163,260 | |
City of Jacksonville, 5.00% due 10/1/2026 (Better Jacksonville Plan) | | A/A1 | | | 2,075,000 | | | | 2,444,454 | |
City of Lakeland, 5.00% due 10/1/2018 (Electric Power System Smart Grid Project; Insured: AGM) | | AA/Aa3 | | | 2,000,000 | | | | 2,259,700 | |
City of Lakeland, 5.25% due 10/1/2027 (Electric Power System Smart Grid Project; Insured: AGM) | | AA/Aa3 | | | 3,680,000 | | | | 4,587,893 | |
City of Lakeland, 5.25% due 10/1/2036 (Electric Power System Smart Grid Project; Insured: AGM) | | AA/Aa3 | | | 2,770,000 | | | | 3,586,956 | |
City of Miami GO, 5.375% due 9/1/2015 (Insured: Natl-Re) | | AA-/A1 | | | 1,000,000 | | | | 1,004,090 | |
Escambia County HFA, 5.95% due 7/1/2020 (Florida Health Care Facility Loan; Insured: AMBAC) | | NR/NR | | | 1,730,000 | | | | 1,845,495 | |
Flagler County School Board COP, 5.00% due 8/1/2020 pre-refunded 8/1/2015 (Insured: AGM) | | AA/A2 | | | 2,560,000 | | | | 2,601,062 | |
Semi-Annual Report 9
| | |
| SCHEDULE OF INVESTMENTS, CONTINUED | | |
| |
Thornburg Intermediate Municipal Fund | | March 31, 2015 (Unaudited) |
| | | | | | | | | | |
Issuer-Description | | Credit Rating†
S&P/Moody’s | | Principal
Amount | | | Value | |
Florida Department of Management Services, 5.00% due 9/1/2018 (Financing or Acquisition of State-Owned Office Buildings; Insured: AMBAC) | | AA+/Aa2 | | $ | 500,000 | | | $ | 515,055 | |
Florida Department of Management Services COP, 3.50% due 8/1/2016 (Correctional Facilities Construction and Improvements; Insured: AGM) | | AA+/Aa2 | | | 500,000 | | | | 520,860 | |
Florida Municipal Loan Council, 5.00% due 10/1/2020 (Insured: Natl-Re) | | AA-/A3 | | | 1,000,000 | | | | 1,071,910 | |
Florida Municipal Loan Council, 5.00% due 10/1/2024 (Insured: Natl-Re) | | AA-/A3 | | | 2,235,000 | | | | 2,370,709 | |
Florida State Department of Children & Families COP, 5.00% due 10/1/2018 (South Florida Evaluation Treatment) | | AA+/NR | | | 2,090,000 | | | | 2,138,760 | |
Florida State Department of Children & Families COP, 5.00% due 10/1/2019 (South Florida Evaluation Treatment) | | AA+/NR | | | 2,255,000 | | | | 2,307,609 | |
Highlands County HFA, 5.00% due 11/15/2019 pre-refunded 11/16/2015 (Adventist Health Hospital) | | AA-/Aa2 | | | 1,100,000 | | | | 1,132,329 | |
Highlands County HFA, 5.00% due 11/15/2019 pre-refunded 11/16/2015 (Adventist Health Hospital) | | AA-/Aa2 | | | 1,750,000 | | | | 1,801,432 | |
Hillsborough County, 5.00% due 3/1/2017 (Water & Wastewater System; Insured: Natl-Re) | | AA-/A1 | | | 5,630,000 | | | | 5,869,725 | |
Lake County School Board COP, 5.00% due 6/1/2026 (School District Facility Projects) | | A/NR | | | 1,210,000 | | | | 1,382,304 | |
Manatee County, 5.00% due 10/1/2015 (Various County Capital Projects) | | NR/Aa2 | | | 500,000 | | | | 512,090 | |
Miami-Dade County Aviation Department, 5.00% due 10/1/2028 | | A/A2 | | | 1,000,000 | | | | 1,170,800 | |
Miami-Dade County Aviation Department, 5.00% due 10/1/2029 | | A/A2 | | | 1,335,000 | | | | 1,556,690 | |
Miami-Dade County Aviation Department, 5.00% due 10/1/2030 | | A/A2 | | | 1,000,000 | | | | 1,158,880 | |
Miami-Dade County Aviation Department, 5.00% due 10/1/2031 | | A/A2 | | | 2,000,000 | | | | 2,308,860 | |
Miami-Dade County Educational Facilities Authority, 5.25% due 4/1/2018 (University of Miami) | | A-/A3 | | | 250,000 | | | | 262,368 | |
Miami-Dade County Educational Facilities Authority, 5.25% due 4/1/2024 (University of Miami; Insured: AMBAC) | | A-/A3 | | | 1,000,000 | | | | 1,218,390 | |
Miami-Dade County GO, 5.00% due 10/1/2023 (Seaport Properties) | | AA/Aa2 | | | 1,040,000 | | | | 1,224,257 | |
Miami-Dade County GO, 6.25% due 7/1/2026 (Building Better Communities) | | AA/Aa2 | | | 2,130,000 | | | | 2,458,978 | |
Miami-Dade County School Board COP, 5.00% due 10/1/2021 (Insured: AMBAC) | | A/A1 | | | 3,035,000 | | | | 3,587,886 | |
Miami-Dade County School Board COP, 5.25% due 5/1/2022 (Insured: AGM) | | AA/A1 | | | 2,600,000 | | | | 2,901,392 | |
a Miami-Dade County School Board COP, 5.00% due 5/1/2030 | | A/A1 | | | 3,250,000 | | | | 3,732,560 | |
Orange County HFA, 6.25% due 10/1/2016 (Orlando Regional Hospital; Insured: Natl-Re) | | AA-/A3 | | | 1,695,000 | | | | 1,772,360 | |
Orange County HFA, 5.125% due 10/1/2026 (Orlando Health, Inc.) | | A/A3 | | | 2,000,000 | | | | 2,247,520 | |
Palm Beach County HFA, 5.00% due 12/1/2025 (Boca Raton Regional Hospital) | | BBB/NR | | | 500,000 | | | | 582,250 | |
Palm Beach County School Board COP, 5.00% due 8/1/2032 put 8/1/2016 | | NR/Aa3 | | | 1,500,000 | | | | 1,588,530 | |
Sarasota County Public Hospital Board, 4.659% due 10/1/2021 (Sarasota Memorial Hospital; Insured: Natl-Re) | | AA-/A1 | | | 2,000,000 | | | | 2,100,000 | |
School Board of Broward County COP, 5.00% due 7/1/2020 pre-refunded 7/1/2016 (Educational Facilities and Equipment; Insured: AGM) | | AA/A1 | | | 1,000,000 | | | | 1,058,460 | |
School Board of Broward County COP, 5.00% due 7/1/2026 (Educational Facilities and Equipment) | | A/A1 | | | 3,000,000 | | | | 3,461,100 | |
School Board of Broward County COP, 5.00% due 7/1/2027 (Educational Facilities and Equipment) | | A/A1 | | | 2,000,000 | | | | 2,287,540 | |
South Miami HFA, 5.00% due 8/15/2022 (Baptist Health Group) | | AA/Aa2 | | | 1,500,000 | | | | 1,646,805 | |
Sunshine State Governmental Finance Commission, 5.00% due 9/1/2028 (Miami-Dade County Program) | | AA-/Aa3 | | | 3,500,000 | | | | 4,069,905 | |
University of Central Florida COP Convocation Corp., 5.00% due 10/1/2019 (Insured: Natl-Re) | | AA-/A3 | | | 1,135,000 | | | | 1,153,342 | |
| | | |
GEORGIA — 1.65% | | | | | | | | | | |
Athens-Clarke County Unified Government Development Authority, 5.00% due 6/15/2024 (UGAREF Bolton Commons, LLC) | | NR/Aa2 | | | 485,000 | | | | 584,149 | |
Athens-Clarke County Unified Government Development Authority, 5.00% due 6/15/2025 (UGAREF Bolton Commons, LLC) | | NR/Aa2 | | | 510,000 | | | | 609,205 | |
Athens-Clarke County Unified Government Development Authority, 5.00% due 6/15/2027 (UGAREF Bolton Commons, LLC) | | NR/Aa2 | | | 735,000 | | | | 861,442 | |
Athens-Clarke County Unified Government Development Authority, 5.00% due 6/15/2028 (UGAREF Bolton Commons, LLC) | | NR/Aa2 | | | 590,000 | | | | 686,294 | |
City of Atlanta, 5.50% due 11/1/2022 (Water & Wastewater System; Insured: Natl-Re) | | AA-/Aa3 | | | 530,000 | | | | 658,127 | |
City of Atlanta, 5.50% due 11/1/2024 (Water & Wastewater System; Insured: AGM) | | AA/Aa3 | | | 5,000,000 | | | | 5,796,350 | |
Clarke County Hospital Authority, 5.00% due 1/1/2023 (Athens Regional Medical Center) | | AA/Aa1 | | | 2,060,000 | | | | 2,436,918 | |
Clarke County Hospital Authority, 5.00% due 1/1/2024 (Athens Regional Medical Center) | | AA/Aa1 | | | 2,310,000 | | | | 2,694,661 | |
Clarke County Hospital Authority, 5.00% due 1/1/2025 (Athens Regional Medical Center) | | AA/Aa1 | | | 525,000 | | | | 607,451 | |
Clarke County Hospital Authority, 5.00% due 1/1/2026 (Athens Regional Medical Center) | | AA/Aa1 | | | 725,000 | | | | 834,961 | |
Development Authority of Fulton County, 5.00% due 10/1/2019 (Georgia Tech Athletic Assoc.) | | NR/A2 | | | 3,000,000 | | | | 3,461,580 | |
Municipal Electric Authority of Georgia, 6.60% due 1/1/2018 (Insured: Natl-Re) | | AA-/A1 | | | 1,170,000 | | | | 1,253,468 | |
Valdosta and Lowndes County Hospital Authority, 5.00% due 10/1/2024 (South Medical Center) | | AA-/Aa2 | | | 1,200,000 | | | | 1,401,276 | |
| | | |
GUAM — 0.67% | | | | | | | | | | |
Guam Power Authority, 5.00% due 10/1/2023 (Electric Power System; Insured: AGM) | | AA/A2 | | | 2,000,000 | | | | 2,390,960 | |
Guam Power Authority, 5.00% due 10/1/2024 (Electric Power System; Insured: AGM) | | AA/A2 | | | 2,000,000 | | | | 2,390,960 | |
Guam Power Authority, 5.00% due 10/1/2025 (Electric Power System; Insured: AGM) | | AA/A2 | | | 2,500,000 | | | | 2,966,350 | |
Guam Waterworks Authority, 5.25% due 7/1/2024 (Water and Wastewater System) | | A-/Ba1 | | | 1,000,000 | | | | 1,177,320 | |
| | | |
HAWAII — 0.98% | | | | | | | | | | |
City and County of Honolulu GO, 5.00% due 7/1/2016 (Insured: Natl-Re) | | NR/Aa1 | | | 1,000,000 | | | | 1,012,040 | |
State of Hawaii GO, 5.00% due 12/1/2027 | | AA/Aa2 | | | 10,000,000 | | | | 11,925,900 | |
| | | |
ILLINOIS — 5.51% | | | | | | | | | | |
Board of Trustees of Southern Illinois University, 5.25% due 4/1/2019 (Housing & Auxiliary Facilities; Insured: Natl-Re) | | AA-/A3 | | | 1,000,000 | | | | 1,129,280 | |
Chicago Housing Authority, 5.00% due 7/1/2018 pre-refunded 7/1/2016 (Low-Income Public Housing Program; Insured: AGM) | | NR/A2 | | | 5,295,000 | | | | 5,593,585 | |
10 Semi-Annual Report
| | |
| SCHEDULE OF INVESTMENTS, CONTINUED | | |
| |
Thornburg Intermediate Municipal Fund | | March 31, 2015 (Unaudited) |
| | | | | | | | | | |
Issuer-description | | Credit Rating†
S&P/Moody’s | | Principal
Amount | | | Value | |
Chicago Transit Authority, 5.00% due 12/1/2018 (Bombardier Transit Rail System) | | AA/A1 | | $ | 1,500,000 | | | $ | 1,684,200 | |
City of Chicago, 5.00% due 1/1/2019 (Midway Airport; Insured: AMBAC) (AMT) | | A-/A3 | | | 1,210,000 | | | | 1,214,767 | |
City of Chicago, 5.75% due 11/1/2030 (Water System; Insured: AMBAC) | | AA+/Aa1 | | | 1,270,000 | | | | 1,611,960 | |
City of Chicago, 5.00% due 1/1/2032 (Midway Airport) | | A-/A3 | | | 4,805,000 | | | | 5,432,869 | |
City of Chicago, 5.00% due 1/1/2033 (Midway Airport) | | A-/A3 | | | 5,000,000 | | | | 5,637,150 | |
City of Chicago, 5.25% due 1/1/2034 (Midway Airport) | | A-/A3 | | | 4,700,000 | | | | 5,321,998 | |
City of Chicago GO, 5.00% due 1/1/2020 (Municipal Facilities Projects; Insured: AMBAC) | | A+/Baa2 | | | 1,000,000 | | | | 1,030,870 | |
City of Chicago GO, 5.00% due 12/1/2022 (Modern Schools Across Chicago Program; Insured: AMBAC) | | A+/Baa2 | | | 415,000 | | | | 431,749 | |
City of Chicago GO, 5.00% due 12/1/2024 (Modern Schools Across Chicago Program; Insured: AMBAC) | | A+/Baa2 | | | 500,000 | | | | 518,715 | |
City of Mount Vernon GO, 4.00% due 12/15/2025 (Various Municipal Capital Improvements; Insured: AGM) | | AA/A2 | | | 1,900,000 | | | | 2,006,400 | |
City of Waukegan GO, 4.00% due 12/30/2015 (Insured: AGM) | | NR/A2 | | | 500,000 | | | | 512,550 | |
City of Waukegan GO, 5.00% due 12/30/2016 (Insured: AGM) | | NR/A2 | | | 1,500,000 | | | | 1,601,130 | |
City of Waukegan GO, 5.00% due 12/30/2017 (Insured: AGM) | | NR/A2 | | | 1,680,000 | | | | 1,835,921 | |
City of Waukegan GO, 5.00% due 12/30/2018 (Insured: AGM) | | NR/A2 | | | 2,000,000 | | | | 2,227,980 | |
Community College District No. 525 GO, 6.25% due 6/1/2024 (Joliet Junior College) | | AA/NR | | | 500,000 | | | | 577,795 | |
Cook County Community College District No. 508 GO, 5.25% due 12/1/2026 (City Colleges of Chicago) | | AA/NR | | | 1,000,000 | | | | 1,197,330 | |
Cook County GO, 5.25% due 11/15/2024 | | AA/A1 | | | 3,000,000 | | | | 3,460,560 | |
Cook County School District No. 104 GO, 0% due 12/1/2022 (Argo Summit Elementary School Facilities; Insured: AGM) (ETM) | | NR/NR | | | 2,000,000 | | | | 1,739,960 | |
DuPage County Community Consolidated School District No. 93 GO, 2.00% due 1/1/2016 (Carol Stream Educational Facilities) (State Aid Withholding) | | AA+/NR | | | 485,000 | | | | 490,767 | |
Forest Preserve District of DuPage County GO, 4.00% due 11/1/2022 (Land Acquisition and Development) | | AAA/NR | | | 750,000 | | | | 857,212 | |
Illinois Educational Facilities Authority, 5.00% due 11/1/2016 (Rush University Medical Center) (ETM) | | AA-/Aaa | | | 1,000,000 | | | | 1,069,270 | |
Illinois Educational Facilities Authority, 5.75% due 11/1/2028 pre-refunded 11/1/2018 (Rush University Medical Center) | | AA-/Aaa | | | 1,000,000 | | | | 1,158,200 | |
Illinois Finance Authority, 5.00% due 11/1/2016 (Central DuPage Health) | | AA/Aa2 | | | 2,000,000 | | | | 2,130,900 | |
Illinois Finance Authority, 5.00% due 11/1/2017 (Central DuPage Health) | | AA/Aa2 | | | 2,000,000 | | | | 2,195,560 | |
Illinois Finance Authority, 5.00% due 8/1/2022 (Bradley University; Insured: Syncora) | | A/NR | | | 1,000,000 | | | | 1,069,300 | |
Illinois Finance Authority, 6.125% due 11/1/2023 pre-refunded 11/1/2018 (Advocate Health Care Network) | | AA/Aa2 | | | 5,175,000 | | | | 6,101,428 | |
b Illinois Finance Authority, 5.00% due 8/15/2024 (Silver Cross Hospital and Medical Centers) | | NR/Baa1 | | | 1,000,000 | | | | 1,144,750 | |
Illinois Finance Authority, 5.00% due 11/15/2033 (Rush University Medical Center) | | A+/A1 | | | 1,000,000 | | | | 1,133,270 | |
Illinois HFA, 5.70% due 2/20/2021 (Midwest Care Center I, Inc.; Collateralized: GNMA) | | NR/Aa1 | | | 500,000 | | | | 502,080 | |
Illinois Toll Highway Authority, 5.00% due 1/1/2021 pre-refunded 7/1/2015 (Congestion-Relief Plan; Insured: AGM) | | AA/Aa3 | | | 350,000 | | | | 354,197 | |
McHenry & Lake Counties Community Consolidated School District No. 15 GO, 0% due 1/1/2017 (Insured: AGM) (ETM) | | NR/Aa2 | | | 45,000 | | | | 44,453 | |
McHenry & Lake Counties Community Consolidated School District No. 15 GO, 0% due 1/1/2017 (Insured: AGM) | | NR/Aa2 | | | 955,000 | | | | 935,537 | |
Metropolitan Pier & Exposition Authority, 5.00% due 12/15/2022 (McCormick Place Expansion Project) | | AAA/NR | | | 1,000,000 | | | | 1,190,040 | |
Niles Park District GO, 2.00% due 12/1/2015 (Parks and Recreation Projects) | | NR/Aa2 | | | 325,000 | | | | 328,442 | |
Niles Park District GO, 2.00% due 12/1/2016 (Parks and Recreation Projects) | | NR/Aa2 | | | 330,000 | | | | 336,706 | |
Niles Park District GO, 3.00% due 12/1/2017 (Parks and Recreation Projects) | | NR/Aa2 | | | 340,000 | | | | 356,742 | |
Niles Park District GO, 3.00% due 12/1/2018 (Parks and Recreation Projects) | | NR/Aa2 | | | 350,000 | | | | 368,718 | |
Niles Park District GO, 3.00% due 12/1/2019 (Parks and Recreation Projects) | | NR/Aa2 | | | 360,000 | | | | 379,138 | |
Niles Park District GO, 3.00% due 12/1/2020 (Parks and Recreation Projects) | | NR/Aa2 | | | 370,000 | | | | 391,519 | |
State of Illinois, 5.00% due 6/15/2018 | | AAA/NR | | | 2,000,000 | | | | 2,245,760 | |
Tazewell County School District GO, 9.00% due 12/1/2024 (Insured: Natl-Re) | | NR/Aa3 | | | 1,205,000 | | | | 1,827,877 | |
Village of Tinley Park GO, 4.00% due 12/1/2021 | | AA+/NR | | | 585,000 | | | | 655,112 | |
Village of Tinley Park GO, 5.00% due 12/1/2024 | | AA+/NR | | | 870,000 | | | | 1,034,961 | |
| | | |
INDIANA — 3.69% | | | | | | | | | | |
Allen County Jail Building Corp., 5.00% due 4/1/2018 (Insured: Syncora) | | NR/Aa2 | | | 2,495,000 | | | | 2,612,066 | |
Allen County Redevelopment District, 5.00% due 11/15/2018 | | NR/A2 | | | 1,560,000 | | | | 1,603,430 | |
Board of Trustees for the Vincennes University, 5.375% due 6/1/2022 | | NR/Aa3 | | | 895,000 | | | | 1,070,769 | |
City of Carmel Redevelopment Authority, 0% due 2/1/2016 (Performing Arts Center) | | AA+/Aa1 | | | 1,730,000 | | | | 1,723,789 | |
City of Carmel Redevelopment Authority, 0% due 2/1/2021 (Performing Arts Center) | | AA+/Aa1 | | | 2,000,000 | | | | 1,778,720 | |
City of Carmel Redevelopment District COP, 6.50% due 7/15/2035 (Performing Arts Center) | | NR/NR | | | 2,730,000 | | | | 3,061,176 | |
City of Petersburg, 5.40% due 8/1/2017 (Indianapolis Power and Light Company; Insured: Natl-Re/IBC) | | AA-/A2 | | | 1,325,000 | | | | 1,456,122 | |
Clay Multi-School Building Corp., 5.00% due 1/15/2018 (State Aid Withholding) | | AA+/NR | | | 1,735,000 | | | | 1,914,260 | |
Fort Wayne Redevelopment Authority, 5.00% due 8/1/2023 pre-refunded 2/1/2017 (Harrison Square; Insured: AGM) | | NR/Aa2 | | | 2,290,000 | | | | 2,474,414 | |
Franklin Township Multi-School Building Corp., 5.00% due 7/10/2017 (Franklin Central High School) (State Aid Withholding) | | AA+/NR | | | 630,000 | | | | 690,757 | |
Hobart Building Corp., 6.50% due 7/15/2019 (Insured: Natl-Re) (State Aid Withholding) | | AA+/A3 | | | 1,000,000 | | | | 1,203,180 | |
Indiana Bond Bank, 5.25% due 10/15/2020 (Natural Gas Utility Improvements) | | NR/A3 | | | 5,340,000 | | | | 6,230,392 | |
Indiana Bond Bank, 5.25% due 4/1/2023 (Hendricks Regional Health Financing Program; Insured: AMBAC) | | AA/NR | | | 2,000,000 | | | | 2,385,400 | |
Indiana Finance Authority, 5.00% due 3/1/2019 (Indiana University Health) | | AA-/Aa3 | | | 5,000,000 | | | | 5,693,400 | |
Indiana Finance Authority, 5.00% due 11/1/2021 (Sisters of St. Francis Health Services, Inc.) | | NR/Aa3 | | | 605,000 | | | | 677,001 | |
Indiana Finance Authority, 5.25% due 9/15/2022 (Marian University) | | BBB-/NR | | | 2,480,000 | | | | 2,682,641 | |
Indiana Finance Authority, 5.25% due 9/15/2023 (Marian University) | | BBB-/NR | | | 2,605,000 | | | | 2,791,674 | |
Indiana Finance Authority, 0.06% due 3/1/2033 put 4/1/2015 (Indiana University Health; LOC: JPMorgan Chase Bank, N.A.) (daily demand notes) | | AAA/Aa1 | | | 325,000 | | | | 325,000 | |
Semi-Annual Report 11
| | |
| SCHEDULE OF INVESTMENTS, CONTINUED | | |
| |
Thornburg Intermediate Municipal Fund | | March 31, 2015 (Unaudited) |
| | | | | | | | | | |
Issuer-Description | | Credit Rating†
S&P/Moody’s | | Principal
Amount | | | Value | |
Indiana Finance Authority, 0.03% due 2/1/2037 put 4/1/2015 (Stadium Project; SPA: JPMorgan Chase Bank) (daily demand notes) | | AA+/Aa2 | | $ | 5,400,000 | | | $ | 5,400,000 | |
Indiana Finance Authority, 4.10% due 11/15/2046 put 11/3/2016 (Ascension Health) | | AA+/Aa2 | | | 1,000,000 | | | | 1,056,280 | |
Noblesville Redevelopment Authority, 5.00% due 8/1/2017 pre-refunded 8/1/2016 (146th Street Extension) | | AA/NR | | | 1,000,000 | | | | 1,060,380 | |
Noblesville Redevelopment Authority, 5.00% due 8/1/2020 pre-refunded 8/1/2016 (146th Street Extension) | | AA/NR | | | 1,000,000 | | | | 1,060,380 | |
| | | |
IOWA — 0.36% | | | | | | | | | | |
Iowa Finance Authority, 5.00% due 2/15/2030 (UnityPoint Health) | | NR/Aa3 | | | 2,250,000 | | | | 2,605,770 | |
Iowa Finance Authority, 5.00% due 2/15/2032 (UnityPoint Health) | | NR/Aa3 | | | 1,850,000 | | | | 2,125,410 | |
| | | |
KANSAS — 0.05% | | | | | | | | | | |
Kansas Development Finance Authority, 5.00% due 6/1/2020 (Wichita State University) | | NR/Aa3 | | | 575,000 | | | | 671,278 | |
| | | |
KENTUCKY — 0.25% | | | | | | | | | | |
Louisville/Jefferson County Metro Government, 5.25% due 10/1/2026 (Norton Suburban Hospital and Kosair Children’s Hospital) | | A-/NR | | | 2,320,000 | | | | 2,663,592 | |
Turnpike Authority of Kentucky, 5.00% due 7/1/2017 pre-refunded 7/1/2015 (Revitalization Projects-Highway Capital Planning; Insured: AMBAC) | | AA+/Aa2 | | | 650,000 | | | | 657,761 | |
| | | |
LOUISIANA — 3.11% | | | | | | | | | | |
City of New Orleans, 6.00% due 6/1/2024 pre-refunded 6/1/2019 (Sewerage System; Insured: AGM) | | AA/A3 | | | 750,000 | | | | 897,218 | |
East Baton Rouge Sewerage Commission, 5.00% due 2/1/2030 | | AA-/Aa3 | | | 1,170,000 | | | | 1,387,667 | |
East Baton Rouge Sewerage Commission, 5.00% due 2/1/2031 | | AA-/Aa3 | | | 2,655,000 | | | | 3,138,927 | |
East Baton Rouge Sewerage Commission, 5.00% due 2/1/2032 | | AA-/Aa3 | | | 3,000,000 | | | | 3,532,710 | |
Law Enforcement District of the Parish of Plaquemines, 5.00% due 9/1/2023 | | A+/NR | | | 1,230,000 | | | | 1,325,915 | |
Law Enforcement District of the Parish of Plaquemines, 5.00% due 9/1/2025 | | A+/NR | | | 1,350,000 | | | | 1,445,674 | |
Law Enforcement District of the Parish of Plaquemines, 5.15% due 9/1/2027 | | A+/NR | | | 1,490,000 | | | | 1,594,166 | |
Law Enforcement District of the Parish of Plaquemines, 5.30% due 9/1/2029 | | A+/NR | | | 1,650,000 | | | | 1,768,420 | |
Louisiana Energy and Power Authority, 5.25% due 6/1/2029 (LEPA Unit No. 1; Insured: AGM) | | AA/A2 | | | 1,000,000 | | | | 1,175,320 | |
Louisiana Energy and Power Authority, 5.25% due 6/1/2030 (LEPA Unit No. 1; Insured: AGM) | | AA/A2 | | | 2,955,000 | | | | 3,463,644 | |
Louisiana Energy and Power Authority, 5.25% due 6/1/2031 (LEPA Unit No. 1; Insured: AGM) | | AA/A2 | | | 2,145,000 | | | | 2,509,114 | |
Louisiana Offshore Terminal Authority, 2.125% due 10/1/2037 put 10/1/2015 (Deepwater Oil Port-Loop LLC) | | BBB/A3 | | | 2,500,000 | | | | 2,519,875 | |
Louisiana Public Facilities Authority, 5.00% due 7/1/2022 (Black & Gold Facilities; Insured: CIFG) | | AA/A3 | | | 1,590,000 | | | | 1,717,709 | |
New Orleans Aviation Board, 5.25% due 1/1/2018 (Insured: AGM) (AMT) | | AA/A2 | | | 1,000,000 | | | | 1,097,790 | |
New Orleans Aviation Board, 5.25% due 1/1/2020 (Insured: AGM) | | AA/A2 | | | 2,000,000 | | | | 2,201,260 | |
New Orleans Regional Transit Authority, 5.00% due 12/1/2023 (Insured: AGM) | | AA/Aa3 | | | 1,000,000 | | | | 1,156,690 | |
New Orleans Regional Transit Authority, 5.00% due 12/1/2024 (Insured: AGM) | | AA/Aa3 | | | 1,000,000 | | | | 1,140,740 | |
Office Facilities Corp., 5.00% due 3/1/2019 (Louisiana State Capitol Complex Program) | | AA-/Aa3 | | | 255,000 | | | | 289,560 | |
Parish of Lafourche, 5.00% due 1/1/2024 (Roads, Highways and Bridges) | | AA-/NR | | | 1,065,000 | | | | 1,277,681 | |
Parish of Lafourche, 5.00% due 1/1/2025 (Roads, Highways and Bridges) | | AA-/NR | | | 2,620,000 | | | | 3,168,418 | |
St. Tammany Parish, 5.00% due 6/1/2019 pre-refunded 6/1/2016 (Insured: CIFG) | | AA-/NR | | | 1,300,000 | | | | 1,384,448 | |
St. Tammany Parish, 5.00% due 6/1/2020 pre-refunded 6/1/2016 (Insured: CIFG) | | AA-/NR | | | 1,000,000 | | | | 1,064,960 | |
State of Louisiana GO, 5.00% due 8/1/2018 (Insured: AGM) | | AAA/Aa3 | | | 300,000 | | | | 304,887 | |
Terrebonne Parish Hospital Service District 1, 5.00% due 4/1/2028 (General Medical Center) | | A+/A2 | | | 1,500,000 | | | | 1,676,730 | |
| | | |
MASSACHUSETTS — 1.16% | | | | | | | | | | |
Commonwealth of Massachusetts GO, 4.00% due 6/1/2015 (Commonwealth Capital Investment Plan) | | AA+/Aa1 | | | 525,000 | | | | 528,428 | |
a Massachusetts Bay Transportation Authority, 5.25% due 7/1/2030 (Transportation Capital Program) | | AAA/Aa1 | | | 1,000,000 | | | | 1,286,490 | |
Massachusetts Development Finance Agency, 5.50% due 10/1/2025 (Simmons College) | | BBB+/Baa1 | | | 460,000 | | | | 544,203 | |
Massachusetts Development Finance Agency, 5.50% due 10/1/2028 (Simmons College) | | BBB+/Baa1 | | | 1,330,000 | | | | 1,537,600 | |
Massachusetts Educational Financing Authority, 5.50% due 1/1/2022 (Higher Education Student Loans) | | AA/NR | | | 1,130,000 | | | | 1,290,144 | |
Massachusetts School Building Authority, 5.00% due 8/15/2030 pre-refunded 8/15/2015 (SMART Fund; Insured: AGM) | | AA/Aa2 | | | 10,000,000 | | | | 10,177,900 | |
| | | |
MICHIGAN — 6.07% | | | | | | | | | | |
Board of Governors of Wayne State University, 5.00% due 11/15/2031 (Educational Facilities and Equipment) | | AA-/Aa3 | | | 1,010,000 | | | | 1,159,510 | |
Brighton Area Schools GO, 5.00% due 5/1/2016 (Livingston County School Building and Site; Insured: Q-SBLF) | | NR/Aa2 | | | 370,000 | | | | 388,297 | |
City of Troy GO, 5.00% due 10/1/2016 (Public Safety Facilities and City Hall) | | AAA/NR | | | 1,060,000 | | | | 1,124,607 | |
City of Troy GO, 5.00% due 11/1/2025 (Downtown Development Authority-Community Center Facilities) | | AAA/NR | | | 300,000 | | | | 361,785 | |
County of Genesee, 5.00% due 11/1/2024 (Water Supply System; Insured: BAM) | | AA/A2 | | | 610,000 | | | | 694,936 | |
County of Genesee, 5.00% due 11/1/2025 (Water Supply System; Insured: BAM) | | AA/A2 | | | 345,000 | | | | 391,365 | |
County of Genesee, 5.25% due 11/1/2026 (Water Supply System; Insured: BAM) | | AA/A2 | | | 900,000 | | | | 1,030,923 | |
County of Genesee, 5.25% due 11/1/2027 (Water Supply System; Insured: BAM) | | AA/A2 | | | 1,375,000 | | | | 1,561,904 | |
County of Genesee, 5.25% due 11/1/2028 (Water Supply System; Insured: BAM) | | AA/A2 | | | 645,000 | | | | 728,773 | |
County of Genesee, 5.00% due 11/1/2029 (Water Supply System; Insured: BAM) | | AA/A2 | | | 1,210,000 | | | | 1,347,601 | |
12 Semi-Annual Report
| | |
| SCHEDULE OF INVESTMENTS, CONTINUED | | |
| |
Thornburg Intermediate Municipal Fund | | March 31, 2015 (Unaudited) |
| | | | | | | | | | |
Issuer-Description | | Credit Rating†
S&P/Moody’s | | Principal
Amount | | | Value | |
County of Genesee, 5.00% due 11/1/2030 (Water Supply System; Insured: BAM) | | AA/A2 | | $ | 1,195,000 | | | $ | 1,327,322 | |
County of Genesee, 5.125% due 11/1/2032 (Water Supply System; Insured: BAM) | | AA/A2 | | | 750,000 | | | | 835,695 | |
Detroit City School District GO, 5.25% due 5/1/2026 (School Building & Site Improvement; Insured: AGM/Q-SBLF) | | AA/Aa2 | | | 3,150,000 | | | | 3,744,216 | |
a Detroit City School District GO, 5.25% due 5/1/2027 (School Building & Site Improvement; Insured: AGM/Q-SBLF) | | AA/Aa2 | | | 1,100,000 | | | | 1,303,467 | |
Kalamazoo Hospital Finance Authority, 5.00% due 5/15/2019 (Bronson Hospital; Insured: AGM) | | AA/A2 | | | 2,000,000 | | | | 2,234,880 | |
Kalamazoo Hospital Finance Authority, 5.00% due 5/15/2022 (Bronson Hospital; Insured: AGM) | | NR/A2 | | | 2,470,000 | | | | 2,816,368 | |
Kalamazoo Hospital Finance Authority, 5.25% due 5/15/2026 (Bronson Hospital) | | NR/A2 | | | 1,285,000 | | | | 1,439,020 | |
Michigan Finance Authority, 5.00% due 4/1/2026 (Government Loan Program) | | A+/NR | | | 1,580,000 | | | | 1,767,356 | |
Michigan Finance Authority, 5.00% due 8/1/2031 (Beaumont Health Credit Group) | | A/A1 | | | 19,080,000 | | | | 21,682,894 | |
Michigan Finance Authority, 5.00% due 8/1/2032 (Beaumont Health Credit Group) | | A/A1 | | | 11,000,000 | | | | 12,472,240 | |
Michigan Public School Academy, 8.00% due 8/1/2035 (Will Carleton Charter School) | | NR/NR | | | 945,000 | | | | 1,014,675 | |
Michigan State Building Authority, 0% due 10/15/2025 (Insured: Natl-Re) | | AA-/Aa3 | | | 5,000,000 | | | | 3,088,300 | |
Michigan State Hospital Finance Authority, 5.00% due 11/15/2024 (Sparrow Health System) | | A+/A1 | | | 2,140,000 | | | | 2,317,599 | |
Michigan State Hospital Finance Authority, 5.00% due 7/15/2025 pre-refunded 7/15/2017 (Oakwood Health System) | | A/A1 | | | 3,000,000 | | | | 3,292,380 | |
Michigan State Hospital Finance Authority, 5.625% due 11/15/2029 (Henry Ford Health System) | | A-/A3 | | | 2,500,000 | | | | 2,855,375 | |
Michigan Strategic Fund, 5.25% due 10/15/2023 (Michigan House of Representatives Facilities; Insured: AGM) | | AA/A1 | | | 1,000,000 | | | | 1,124,700 | |
Royal Oak Hospital Finance Authority, 5.25% due 8/1/2016 (William Beaumont Hospital) (ETM) | | A/A1 | | | 2,000,000 | | | | 2,129,900 | |
Royal Oak Hospital Finance Authority, 8.00% due 9/1/2029 pre-refunded 9/1/2018 (William Beaumont Hospital) | | A/Aaa | | | 2,540,000 | | | | 3,135,046 | |
South Lyon Community Schools GO, 4.00% due 5/1/2019 (School Buildings and Sites; Insured: Natl-Re) | | AA-/Aa2 | | | 450,000 | | | | 466,537 | |
State of Michigan Trunk Line Fund, 5.50% due 11/1/2020 (Insured: AGM) | | AA+/Aa2 | | | 1,500,000 | | | | 1,820,010 | |
Warren Consolidated Schools District GO, 4.00% due 5/1/2018 (School Buildings and Sites; Insured: AGM) | | AA/A2 | | | 750,000 | | | | 776,895 | |
| | | |
MINNESOTA — 0.72% | | | | | | | | | | |
Housing & Redevelopment Authority of the City of St. Paul, 5.25% due 5/15/2020 (HealthPartners Health System) | | A/A2 | | | 1,965,000 | | | | 2,089,365 | |
Minnesota Agriculture & Economic Development Board, 5.50% due 2/15/2025 (Essentia Health; Insured: AGM) | | AA/NR | | | 2,500,000 | | | | 2,894,000 | |
State of Minnesota GO, 5.00% due 8/1/2015 (Educational and Recreational Facilities Improvements) (ETM) | | NR/NR | | | 75,000 | | | | 76,203 | |
State of Minnesota GO, 5.00% due 8/1/2015 (Educational and Recreational Facilities Improvements) | | AA+/Aa1 | | | 4,425,000 | | | | 4,497,039 | |
| | | |
MISSISSIPPI — 0.87% | | | | | | | | | | |
Mississippi Development Bank, 5.00% due 3/1/2018 (Municipal Energy Agency Power Supply; Insured: Syncora) | | NR/Baa1 | | | 1,920,000 | | | | 1,979,635 | |
Mississippi Development Bank, 5.00% due 7/1/2022 (City of Canton Parking Facilities) | | NR/NR | | | 1,935,000 | | | | 2,098,411 | |
Mississippi Development Bank, 5.25% due 8/1/2027 (Department of Corrections) | | AA-/NR | | | 3,415,000 | | | | 3,955,116 | |
Mississippi Development Bank GO, 5.00% due 3/1/2025 (Capital City Convention Center) | | AA-/Aa2 | | | 2,850,000 | | | | 3,451,977 | |
| | | |
MISSOURI — 1.24% | | | | | | | | | | |
Kansas City Metropolitan Community Colleges Building Corp., 5.00% due 7/1/2017 pre-refunded 7/1/2016 (Junior College District; Insured: Natl-Re) | | NR/Aa2 | | | 1,000,000 | | | | 1,058,460 | |
Missouri Development Finance Board, 5.00% due 4/1/2019 (Eastland Center) | | A-/NR | | | 1,000,000 | | | | 1,056,920 | |
Missouri Development Finance Board, 5.00% due 4/1/2021 (Eastland Center) | | A-/NR | | | 2,000,000 | | | | 2,091,680 | |
Missouri Development Finance Board, 5.125% due 4/1/2022 (Eastland Center) | | A-/NR | | | 2,000,000 | | | | 2,191,720 | |
Missouri Health and Educational Facilities Authority, 5.00% due 4/1/2019 (Webster University) | | NR/A2 | | | 2,235,000 | | | | 2,539,943 | |
Missouri Health and Educational Facilities Authority, 5.00% due 4/1/2021 (Webster University) | | NR/A2 | | | 2,520,000 | | | | 2,943,587 | |
Tax Increment Financing Commission of Kansas City, 5.25% due 3/1/2018 (Maincor Project-Public Improvements) (ETM) | | NR/NR | | | 665,000 | | | | 719,171 | |
Tax Increment Financing Commission of Kansas City, 5.00% due 5/1/2022 (Union Hill Redevelopment Project) | | NR/NR | | | 3,570,000 | | | | 3,780,987 | |
| | | |
NEVADA — 0.99% | | | | | | | | | | |
Carson City, 5.00% due 9/1/2027 (Carson Tahoe Regional Medical Center) | | BBB+/NR | | | 2,450,000 | | | | 2,719,108 | |
Washoe County GO, 5.00% due 7/1/2026 (Reno Sparks Convention & Visitors Authority) | | AA/Aa2 | | | 5,000,000 | | | | 5,770,650 | |
Washoe County GO, 5.00% due 7/1/2029 (Reno Sparks Convention & Visitors Authority) | | AA/Aa2 | | | 2,000,000 | | | | 2,290,620 | |
Washoe County GO, 5.00% due 7/1/2032 (Reno Sparks Convention & Visitors Authority) | | AA/Aa2 | | | 2,000,000 | | | | 2,276,960 | |
| | | |
NEW HAMPSHIRE — 2.27% | | | | | | | | | | |
Manchester Housing & Redevelopment Authority, 0% due 1/1/2016 (Insured: Radian/ACA) | | NR/Caa1 | | | 4,990,000 | | | | 4,818,793 | |
New Hampshire Health and Education Facilities Authority, 5.25% due 10/1/2023 (Southern New Hampshire Medical Center) | | A-/NR | | | 1,000,000 | | | | 1,082,120 | |
New Hampshire Health and Education Facilities Authority, 0.03% due 6/1/2031 put 4/1/2015 (Dartmouth College; SPA: JPMorgan Chase Bank, N.A.) (daily demand notes) | | AA+/Aa1 | | | 3,960,000 | | | | 3,960,000 | |
New Hampshire Health and Education Facilities Authority, 0.03% due 7/1/2033 put 4/1/2015 (University System of New Hampshire; SPA: Wells Fargo Bank, N.A. (daily demand notes) | | A+/Aa3 | | | 12,300,000 | | | | 12,300,000 | |
New Hampshire Health and Educational Facilities Authority, 0.03% due 7/1/2035 put 4/1/2015 (University System of New Hampshire; SPA: U.S. Bank, N.A.) (daily demand notes) | | A+/Aa3 | | | 1,010,000 | | | | 1,010,000 | |
New Hampshire Municipal Bond Bank, 5.00% due 8/15/2026 | | AA/Aa3 | | | 1,860,000 | | | | 2,217,790 | |
State of New Hampshire, 5.00% due 2/1/2022 (Turnpike System) | | A+/A1 | | | 2,250,000 | | | | 2,688,412 | |
State of New Hampshire, 5.00% due 2/1/2024 (Turnpike System) | | A+/A1 | | | 1,755,000 | | | | 2,058,229 | |
Semi-Annual Report 13
| | |
| SCHEDULE OF INVESTMENTS, CONTINUED | | |
| |
Thornburg Intermediate Municipal Fund | | March 31, 2015 (Unaudited) |
| | | | | | | | | | |
Issuer-Description | | Credit Rating†
S&P/Moody’s | | Principal
Amount | | | Value | |
NEW JERSEY — 2.44% | | | | | | | | | | |
Burlington County Bridge Commission, 4.00% due 12/1/2017 (County Governmental Loan Program) | | AA/Aa2 | | $ | 850,000 | | | $ | 919,496 | |
Cape May County Industrial Pollution Control Financing Authority, 6.80% due 3/1/2021 (Atlantic City Electric Company; Insured: Natl-Re) | | AA-/A3 | | | 560,000 | | | | 685,994 | |
Essex County Improvement Authority, 5.50% due 10/1/2024 (County Correctional Facilities & Gibraltar Facilities; Insured: Natl-Re) | | NR/Aa2 | | | 2,500,000 | | | | 3,175,525 | |
New Jersey EDA, 5.50% due 9/1/2026 (School Facilities Construction; Insured: AMBAC) | | A-/A2 | | | 3,000,000 | | | | 3,573,060 | |
New Jersey EDA, 5.50% due 9/1/2027 (School Facilities Construction; Insured: Natl-Re) | | AA-/A2 | | | 1,700,000 | | | | 2,075,190 | |
New Jersey EDA, 5.00% due 6/15/2029 (School Facilities Construction) | | A-/A2 | | | 12,890,000 | | | | 14,039,530 | |
New Jersey State Health Care Facilities Financing Authority, 5.00% due 7/1/2027 (Virtua Health) | | A+/NR | | | 2,000,000 | | | | 2,346,080 | |
New Jersey State Health Care Facilities Financing Authority, 5.00% due 7/1/2028 (Virtua Health) | | A+/NR | | | 1,000,000 | | | | 1,167,110 | |
New Jersey Water Supply Authority, 5.00% due 8/1/2019 (Manasquan Reservoir Water Supply System; Insured: Natl-Re) | | AA/Aa3 | | | 635,000 | | | | 645,027 | |
Passaic Valley Sewage Commissioners GO, 5.75% due 12/1/2022 | | NR/A2 | | | 3,000,000 | | | | 3,680,940 | |
| | | |
NEW MEXICO — 0.73% | | | | | | | | | | |
City of Farmington, 4.70% due 9/1/2024 (Arizona Public Service Co.-Four Corners Project) | | A-/A3 | | | 3,000,000 | | | | 3,331,950 | |
City of Las Cruces, 5.00% due 6/1/2030 (NMFA Loan) | | NR/Aa3 | | | 2,040,000 | | | | 2,338,676 | |
New Mexico Hospital Equipment Loan Council, 5.00% due 7/1/2032 (Haverland Carter Lifestyle Group) | | NR/NR | | | 2,130,000 | | | | 2,223,230 | |
Rio Rancho Public School District No. 94, 5.00% due 8/1/2015 (State Aid Withholding) | | NR/Aa1 | | | 1,715,000 | | | | 1,742,629 | |
| | | |
NEW YORK — 7.50% | | | | | | | | | | |
City of New York GO, 5.00% due 8/1/2019 pre-refunded 8/1/2015 (City Budget Financial Management; Insured: Natl-Re) | | AA-/Aa2 | | | 465,000 | | | | 472,412 | |
City of New York GO, 5.00% due 8/1/2019 (City Budget Financial Management; Insured: Natl-Re) | | AA/Aa2 | | | 140,000 | | | | 142,257 | |
City of New York GO, 0.03% due 8/1/2020 put 4/1/2015 (City Budget Financial Management; LOC: JPMorgan Chase Bank, N.A.) (daily demand notes) | | AAA/Aa1 | | | 1,500,000 | | | | 1,500,000 | |
City of New York GO, 0.03% due 8/1/2020 put 4/1/2015 (City Budget Financial Management; LOC: JPMorgan Chase Bank, N.A.) (daily demand notes) | | A+/Aa1 | | | 2,300,000 | | | | 2,300,000 | |
City of New York GO, 0.40% due 8/1/2021 (Capital Projects) | | AA/Aa2 | | | 2,700,000 | | | | 2,700,378 | |
City of New York GO, 5.00% due 8/1/2027 (City Budget Financial Management) | | AA/Aa2 | | | 4,530,000 | | | | 5,376,114 | |
City of New York GO, 5.00% due 8/1/2030 (City Budget Financial Management) | | AA/Aa2 | | | 5,000,000 | | | | 5,879,850 | |
City of New York GO, 5.00% due 8/1/2031 (City Budget Financial Management) | | AA/Aa2 | | | 4,000,000 | | | | 4,678,840 | |
City of New York GO, 0.03% due 1/1/2036 put 4/1/2015 (Gowanus Canal Site; SPA: JPMorgan Chase Bank, N.A) (daily demand notes) | | AA/Aa2 | | | 4,800,000 | | | | 4,800,000 | |
County of Nassau GO, 5.00% due 4/1/2026 (Insured: BAM) | | AA/NR | | | 1,300,000 | | | | 1,534,364 | |
Erie County Industrial Development Agency, 5.00% due 5/1/2019 (City of Buffalo School District) | | AA/Aa2 | | | 3,000,000 | | | | 3,449,940 | |
Erie County Industrial Development Agency, 5.00% due 5/1/2027 (City of Buffalo School District) (State Aid Withholding) | | AA/Aa2 | | | 5,000,000 | | | | 5,947,300 | |
Lake Placid Central School District GO, 5.00% due 6/15/2017 (Educational Facilities; Insured: Natl-Re) (State Aid Withholding) | | NR/Aa3 | | | 305,000 | | | | 332,349 | |
New York City Municipal Water Finance Authority, 0.02% due 6/15/2035 put 4/1/2015 (Water & Sewer System; SPA: Bayerische Landesbank) (daily demand notes) | | AAA/Aa1 | | | 26,000,000 | | | | 26,000,000 | |
New York City Municipal Water Finance Authority, 0.03% due 6/15/2050 put 4/1/2015 (Water & Sewer System; SPA: JPMorgan Chase Bank, N.A.) (daily demand notes) | | AA+/Aa2 | | | 16,000,000 | | | | 16,000,000 | |
New York State Dormitory Authority, 5.625% due 7/1/2016 (City University System) | | AA/Aa2 | | | 710,000 | | | | 737,804 | |
New York State Dormitory Authority, 5.00% due 7/1/2017 (Bishop Henry B. Hucles Nursing Home; Insured: SONYMA) | | NR/Aa1 | | | 850,000 | | | | 893,316 | |
New York State Dormitory Authority, 5.25% due 5/15/2021 (State University Educational Facilities) | | AA/Aa2 | | | 500,000 | | | | 587,560 | |
New York State Dormitory Authority, 5.00% due 7/1/2023 (Miriam Osborn Memorial Home Assoc.) | | NR/NR | | | 2,180,000 | | | | 2,379,535 | |
New York State Dormitory Authority, 5.00% due 12/15/2027 (Metropolitan Transportation Authority & State Urban Development Corp.) | | AAA/Aa1 | | | 2,500,000 | | | | 3,023,725 | |
New York State Thruway Authority, 5.00% due 1/1/2030 (Multi-Year Highway and Bridge Capital Program) | | A/A2 | | | 7,480,000 | | | | 8,756,911 | |
United Nations Development Corp., 5.00% due 7/1/2025 (One, Two and Three U.N. Plaza Project) | | NR/A1 | | | 1,700,000 | | | | 1,927,511 | |
| | | |
NORTH CAROLINA — 0.50% | | | | | | | | | | |
Charlotte-Mecklenburg Hospital Authority, 3.00% due 1/15/2018 (Carolinas HealthCare System) | | AA-/Aa3 | | | 600,000 | | | | 631,704 | |
Charlotte-Mecklenburg Hospital Authority, 5.00% due 1/15/2028 (Carolinas HealthCare System) | | AA-/Aa3 | | | 2,190,000 | | | | 2,528,289 | |
b North Carolina Medical Care Commission, 5.00% due 6/1/2030 (Vidant Health) | | A+/A1 | | | 3,000,000 | | | | 3,465,360 | |
| | | |
NORTH DAKOTA — 0.16% | | | | | | | | | | |
County of Ward, 5.125% due 7/1/2021 (Trinity Health System) | | BBB-/NR | | | 1,000,000 | | | | 1,028,950 | |
North Dakota Building Authority, 4.25% due 12/1/2015 (Various State Agency Capital Projects; Insured: Natl-Re) | | AA+/Aa2 | | | 1,105,000 | | | | 1,135,553 | |
| | | |
OHIO — 5.58% | | | | | | | | | | |
Akron, Bath and Copley Joint Township Hospital District, 5.00% due 11/15/2024 (Children’s Hospital Medical Center of Akron) | | NR/A1 | | | 1,000,000 | | | | 1,162,160 | |
American Municipal Power, Inc., 5.25% due 2/15/2028 (AMP Fremont Energy Center) | | A/A1 | | | 4,000,000 | | | | 4,644,960 | |
14 Semi-Annual Report
| | |
| SCHEDULE OF INVESTMENTS, CONTINUED | | |
| |
Thornburg Intermediate Municipal Fund | | March 31, 2015 (Unaudited) |
| | | | | | | | | | |
Issuer-Description | | Credit Rating†
S&P/Moody’s | | Principal
Amount | | | Value | |
Cincinnati City School District COP, 5.00% due 12/15/2031 (School Improvement Project) | | A+/Aa3 | | $ | 3,075,000 | | | $ | 3,514,202 | |
City of Cleveland, 2.00% due 10/1/2015 (Public Safety, Health and Welfare Facilities) | | AA/A1 | | | 375,000 | | | | 378,353 | |
City of Cleveland, 2.00% due 10/1/2015 (Parks and Recreation Facilities) | | AA/A1 | | | 475,000 | | | | 479,247 | |
City of Cleveland, 3.00% due 10/1/2017 (Parks and Recreation Facilities) | | AA/A1 | | | 490,000 | | | | 515,750 | |
City of Cleveland, 5.00% due 11/15/2027 (Public Facilities Improvements) | | AA/A1 | | | 1,285,000 | | | | 1,508,397 | |
City of Cleveland, 5.00% due 10/1/2028 (Bridges and Roadways) | | AA/A1 | | | 2,420,000 | | | | 2,816,759 | |
City of Cleveland, 5.00% due 11/15/2028 (Public Facilities Improvements) | | AA/A1 | | | 1,000,000 | | | | 1,165,490 | |
City of Cleveland, 5.00% due 10/1/2029 (Bridges and Roadways) | | AA/A1 | | | 100,000 | | | | 115,965 | |
City of Cleveland, 5.00% due 11/15/2029 (Public Facilities Improvements) | | AA/A1 | | | 1,415,000 | | | | 1,643,721 | |
City of Cleveland, 5.00% due 11/15/2030 (Public Facilities Improvements) | | AA/A1 | | | 1,485,000 | | | | 1,717,670 | |
City of Cleveland GO, 5.00% due 12/1/2016 (Various Municipal Capital Improvements) | | AA/A1 | | | 1,000,000 | | | | 1,072,840 | |
City of Cleveland GO, 5.00% due 12/1/2024 (Various Municipal Capital Improvements) | | AA/A1 | | | 1,000,000 | | | | 1,209,260 | |
City of Cleveland GO, 5.00% due 12/1/2026 (Various Municipal Capital Improvements) | | AA/A1 | | | 1,230,000 | | | | 1,467,242 | |
City of Hamilton, 5.25% due 10/1/2017 (Wastewater System; Insured: AGM) | | NR/A1 | | | 1,500,000 | | | | 1,537,605 | |
Cleveland-Cuyahoga County Port Authority, 6.25% due 5/15/2016 (Council for Economic Opportunities in Greater Cleveland; LOC: FifthThird Bank) | | BBB+/NR | | | 410,000 | | | | 410,791 | |
Cleveland-Cuyahoga County Port Authority, 5.00% due 10/1/2021 (Cleveland Museum of Art) | | AA+/NR | | | 1,330,000 | | | | 1,554,570 | |
Cleveland-Cuyahoga County Port Authority, 5.00% due 7/1/2025 (County Administration Offices) | | AA-/Aa2 | | | 1,780,000 | | | | 2,164,872 | |
County of Allen, 5.00% due 5/1/2025 (Catholic Health Partners-Mercy Health West Facility) | | AA-/A1 | | | 4,470,000 | | | | 5,130,800 | |
County of Allen, 5.00% due 5/1/2026 (Catholic Health Partners-Mercy Health West Facility) | | AA-/A1 | | | 3,855,000 | | | | 4,399,056 | |
County of Hamilton, 5.00% due 5/15/2028 (Cincinnati Children’s Hospital Medical Center) | | AA/Aa2 | | | 2,665,000 | | | | 3,141,076 | |
County of Hamilton, 5.00% due 5/15/2029 (Cincinnati Children’s Hospital Medical Center) | | AA/Aa2 | | | 1,000,000 | | | | 1,171,930 | |
County of Hamilton, 5.00% due 5/15/2031 (Cincinnati Children’s Hospital Medical Center) | | AA/Aa2 | | | 4,420,000 | | | | 5,166,892 | |
Deerfield Township, 5.00% due 12/1/2016 | | NR/A1 | | | 1,035,000 | | | | 1,097,793 | |
Deerfield Township, 5.00% due 12/1/2025 | | NR/A1 | | | 1,000,000 | | | | 1,046,140 | |
Lucas County Health Care Facility, 5.00% due 8/15/2021 (Sunset Retirement Community) | | NR/NR | | | 1,400,000 | | | | 1,496,152 | |
Lucas County Health Care Facility, 5.125% due 8/15/2025 (Sunset Retirement Community) | | NR/NR | | | 1,250,000 | | | | 1,378,312 | |
Ohio Air Quality Development Authority, 5.70% due 8/1/2020 (FirstEnergy Nuclear Generation Corp.) | | BBB-/
Baa3 | | | 3,000,000 | | | | 3,476,430 | |
Ohio Air Quality Development Authority, 3.625% due 12/1/2033 put 6/1/2020 (FirstEnergy Nuclear Generation Corp.) | | BBB-/
Baa3 | | | 1,000,000 | | | | 1,045,930 | |
Ohio State Water Development Authority, 5.875% due 6/1/2033 put 6/1/2016 (FirstEnergy Nuclear Generation Corp.) | | BBB-/
Baa2 | | | 1,000,000 | | | | 1,056,470 | |
Ohio State Water Development Authority, 3.375% due 7/1/2033 put 7/1/2015 (FirstEnergy Nuclear Generation Corp.) | | BBB-/
Baa3 | | | 3,000,000 | | | | 3,016,650 | |
State of Ohio GO, 5.00% due 8/1/2015 (Educational Facilities Projects) | | AA+/Aa1 | | | 10,775,000 | | | | 10,950,632 | |
State of Ohio Higher Educational Facility Commission, 5.05% due 7/1/2037 pre-refunded 7/1/2016 (Kenyon College) | | A+/A1 | | | 1,200,000 | | | | 1,270,584 | |
| | | |
OKLAHOMA — 0.67% | | | | | | | | | | |
b Oklahoma DFA, 5.00% due 8/15/2026 (INTEGRIS Health) | | AA-/Aa3 | | | 1,000,000 | | | | 1,201,810 | |
b Oklahoma DFA, 5.00% due 8/15/2027 (INTEGRIS Health) | | AA-/Aa3 | | | 1,000,000 | | | | 1,193,840 | |
Oklahoma State Industries Authority, 5.50% due 7/1/2023 (Oklahoma Medical Research Foundation) | | NR/A2 | | | 3,730,000 | | | | 4,190,729 | |
Oklahoma State Power Authority, 5.00% due 1/1/2018 (Insured: AGM) | | AA/A2 | | | 1,000,000 | | | | 1,107,640 | |
Tulsa County Industrial Authority, 5.00% due 12/15/2024 (St. Francis Health System, Inc.) | | AA+/Aa2 | | | 1,130,000 | | | | 1,211,767 | |
| | | |
PENNSYLVANIA — 5.39% | | | | | | | | | | |
Allegheny County Hospital Development Authority, 5.00% due 5/15/2019 (University of Pittsburgh Medical Center) | | A+/Aa3 | | | 2,500,000 | | | | 2,856,400 | |
Allegheny County IDA, 5.90% due 8/15/2026 (Propel Charter School-McKeesport) | | BBB-/NR | | | 1,035,000 | | | | 1,116,506 | |
a Allegheny County IDA, 6.375% due 8/15/2035 (Propel Charter School-McKeesport) | | BBB-/NR | | | 1,130,000 | | | | 1,237,090 | |
Bethlehem Area School District GO, 5.00% due 10/15/2020 (Educational Facilities; Insured: AGM) (State Aid Withholding) | | AA/NR | | | 475,000 | | | | 530,528 | |
Bradford County IDA, 5.20% due 12/1/2019 (International Paper Company) (AMT) | | BBB/Baa2 | | | 2,620,000 | | | | 2,679,238 | |
Chartiers Valley Industrial & Commercial Development Authority, 5.75% due 12/1/2022 (Asbury Health Center) | | NR/NR | | | 900,000 | | | | 929,205 | |
County of Lehigh GO, 5.00% due 11/15/2016 | | NR/Aa1 | | | 5,725,000 | | | | 6,146,016 | |
Dallastown Area School District GO, 4.00% due 5/1/2021 (State Aid Withholding) | | AA/NR | | | 460,000 | | | | 513,392 | |
Hospitals & Higher Education Facilities Authority of Philadelphia, 0.03% due 7/1/2022 put 4/1/2015 (The Children’s Hospital of Philadelphia; SPA: JPMorgan Chase Bank, N.A.) (daily demand notes) | | AA/Aa2 | | | 2,005,000 | | | | 2,005,000 | |
Hospitals & Higher Education Facilities Authority of Philadelphia, 0.03% due 7/1/2041 put 4/1/2015 (The Children’s Hospital of Philadelphia; SPA: Wells Fargo Bank, N.A.) (daily demand notes) | | AA/Aa2 | | | 3,800,000 | | | | 3,800,000 | |
Lancaster County Solid Waste Management Authority, 5.25% due 12/15/2030 (Acquisition of Susquehanna Resource Management Facility) | | AA-/NR | | | 3,000,000 | | | | 3,471,330 | |
Monroeville Financing Authority, 5.00% due 2/15/2026 (University of Pittsburgh Medical Center) | | A+/Aa3 | | | 3,490,000 | | | | 4,263,908 | |
Pennsylvania Economic DFA, 4.625% due 12/1/2018 (Colver Project; Insured: AMBAC) (AMT) | | BBB-/Ba1 | | | 7,470,000 | | | | 7,640,092 | |
Pennsylvania Higher Education Facilities Authority, 0% due 7/1/2020 (Insured: AMBAC) | | NR/NR | | | 2,032,839 | | | | 1,385,034 | |
Pennsylvania State Public School Building Authority GO, 5.00% due 6/1/2027 (Philadelphia District; Insured: AGM) (State Aid Withholding) | | AA/A1 | | | 5,000,000 | | | | 5,808,250 | |
Pennsylvania Turnpike Commission, 5.35% due 12/1/2030 (PennDOT-Mass Transit Agencies) | | A-/A3 | | | 4,000,000 | | | | 4,280,680 | |
Pittsburgh Water & Sewer Authority, 5.00% due 9/1/2030 (Water and Sewer System; Insured: AGM) | | A/A2 | | | 5,000,000 | | | | 5,766,950 | |
Pittsburgh Water & Sewer Authority, 5.00% due 9/1/2031 (Water and Sewer System; Insured: AGM) | | A/A2 | | | 3,740,000 | | | | 4,298,644 | |
Pittsburgh Water & Sewer Authority, 5.00% due 9/1/2031 (Water and Sewer System; Insured: AGM) | | A/A2 | | | 3,665,000 | | | | 4,212,441 | |
Plum Borough School District GO, 4.00% due 9/15/2020 (Insured: BAM) (State Aid Withholding) | | AA/NR | | | 405,000 | | | | 449,761 | |
Semi-Annual Report 15
| | |
| SCHEDULE OF INVESTMENTS, CONTINUED | | |
| |
Thornburg Intermediate Municipal Fund | | March 31, 2015 (Unaudited) |
| | | | | | | | | | |
Issuer-Description | | Credit Rating†
S&P/Moody’s | | Principal
Amount | | | Value | |
Plum Borough School District GO, 4.00% due 9/15/2017 (Insured: BAM) (State Aid Withholding) | | AA/NR | | $ | 365,000 | | | $ | 391,342 | |
Plum Borough School District GO, 4.00% due 9/15/2018 (Insured: BAM) (State Aid Withholding) | | AA/NR | | | 355,000 | | | | 386,606 | |
Plum Borough School District GO, 4.00% due 9/15/2020 (Insured: BAM) (State Aid Withholding) | | AA/NR | | | 385,000 | | | | 427,550 | |
Plum Borough School District GO, 4.00% due 9/15/2021 (Insured: BAM) (State Aid Withholding) | | AA/NR | | | 425,000 | | | | 473,782 | |
Plum Borough School District GO, 5.00% due 9/15/2021 (Insured: BAM) (State Aid Withholding) | | AA/NR | | | 430,000 | | | | 505,194 | |
School District of Philadelphia GO, 5.00% due 9/1/2018 (School Reform Commission) (State Aid Withholding) | | A+/A1 | | | 5,250,000 | | | | 5,880,682 | |
| | | |
RHODE ISLAND — 0.39% | | | | | | | | | | |
State of Rhode Island and Providence Plantations COP, 5.00% due 10/1/2024 (Training School Project) | | AA-/Aa3 | | | 3,595,000 | | | | 4,318,997 | |
State of Rhode Island and Providence Plantations GO, 4.00% due 10/15/2023 (Consolidated Capital Development Loan) | | AA/Aa2 | | | 800,000 | | | | 912,152 | |
| | | |
SOUTH CAROLINA — 1.43% | | | | | | | | | | |
City of Myrtle Beach, 5.00% due 6/1/2028 (Municipal Sports Complex) | | AA-/A1 | | | 1,000,000 | | | | 1,162,760 | |
City of Myrtle Beach, 5.00% due 6/1/2030 (Municipal Sports Complex) | | AA-/A1 | | | 1,000,000 | | | | 1,148,840 | |
Greenwood Fifty School Facilities, Inc., 5.00% due 12/1/2025 (School District No. 50 Project; Insured: AGM) | | AA/A1 | | | 2,400,000 | | | | 2,651,952 | |
Lexington County Health Services District, Inc., 5.00% due 11/1/2016 (Lexington Medical Center) | | AA-/A1 | | | 250,000 | | | | 267,430 | |
Lexington One School Facilities Corp., 5.00% due 12/1/2019 pre-refunded 12/1/2016 (School District No. 1 Project) | | NR/Aa3 | | | 1,000,000 | | | | 1,075,130 | |
Lexington One School Facilities Corp., 5.25% due 12/1/2021 pre-refunded 12/1/2015 (School District No. 1 Project) | | NR/Aa3 | | | 1,700,000 | | | | 1,757,205 | |
Scago Educational Facilities Corp., 5.00% due 12/1/2017 (Colleton School District; Insured: AGM) | | AA/A3 | | | 1,000,000 | | | | 1,074,760 | |
Scago Educational Facilities Corp., 5.00% due 4/1/2019 pre-refunded 10/1/2015 (Spartanburg School District; Insured: AGM) | | AA/Aa3 | | | 2,740,000 | | | | 2,805,843 | |
Scago Educational Facilities Corp., 5.00% due 4/1/2021 pre-refunded 10/1/2015 (Spartanburg School District; Insured: AGM) | | AA/Aa3 | | | 1,000,000 | | | | 1,024,030 | |
Securing Assets For Education, 5.00% due 12/1/2019 pre-refunded 12/1/2016 (School District of Berkeley County Project) | | AA-/Aa3 | | | 2,000,000 | | | | 2,147,100 | |
South Carolina Housing Finance & Development Authority, 5.30% due 7/1/2023 (AMT) | | NR/Aa1 | | | 805,000 | | | | 833,046 | |
Sumter Two School Facilities, Inc., 5.00% due 12/1/2021 (School District No. 2 Project; Insured: AGM) | | AA/A3 | | | 2,855,000 | | | | 3,063,472 | |
| | | |
SOUTH DAKOTA — 0.28% | | | | | | | | | | |
South Dakota Health & Educational Facilities Authority, 5.00% due 7/1/2023 (Avera Health) | | AA-/A1 | | | 1,575,000 | | | | 1,845,727 | |
South Dakota Health & Educational Facilities Authority, 5.00% due 11/1/2024 (Sanford Health) | | A+/A1 | | | 1,700,000 | | | | 1,927,307 | |
| | | |
TENNESSEE — 0.84% | | | | | | | | | | |
Tennessee Energy Acquisition Corp., 5.00% due 2/1/2023 (Prepaid Gas Purchase Agreement) | | A-/Baa1 | | | 2,500,000 | | | | 2,867,500 | |
Tennessee Energy Acquisition Corp., 5.25% due 9/1/2023 (Prepaid Gas Purchase Agreement) | | A-/Baa1 | | | 7,000,000 | | | | 8,232,000 | |
| | | |
TEXAS — 11.01% | | | | | | | | | | |
Austin Community College District, 5.50% due 8/1/2023 (Round Rock Campus) | | AA/Aa2 | | | 2,180,000 | | | | 2,472,098 | |
Bexar County Health Facilities Development Corp., 5.00% due 7/1/2027 (Army Retirement Residence) | | BBB/NR | | | 1,730,000 | | | | 1,800,065 | |
Bexar Metropolitan Water District, 5.00% due 5/1/2021 (Waterworks System; Insured: Syncora) | | A+/A1 | | | 1,300,000 | | | | 1,413,958 | |
Bexar Metropolitan Water District, 5.00% due 5/1/2022 (Waterworks System; Insured: Syncora) | | A+/A1 | | | 2,300,000 | | | | 2,498,628 | |
Board of Regents of the Texas A&M University System, 5.25% due 5/15/2017 pre-refunded 5/15/2015 (Revenue Financing System and Capital Plan Projects) | | AA+/Aaa | | | 200,000 | | | | 201,240 | |
Cities of Dallas and Fort Worth, 5.00% due 11/1/2015 (DFW International Airport Development Plan) | | A+/A2 | | | 1,000,000 | | | | 1,027,990 | |
City of Arlington GO, 5.00% due 8/15/2019 (Insured: AGM) | | AAA/Aa1 | | | 600,000 | | | | 610,812 | |
City of Dallas, 5.00% due 10/1/2031 pre-refunded 10/1/2015 (Waterworks & Sewer System; Insured: AGM) | | AAA/Aa1 | | | 4,710,000 | | | | 4,822,946 | |
City of Galveston, 5.00% due 9/1/2021 (Galveston Island Convention Center; Insured: AGM) | | NR/A2 | | | 545,000 | | | | 629,960 | |
City of Galveston, 5.00% due 9/1/2024 (Galveston Island Convention Center; Insured: AGM) | | NR/A2 | | | 1,115,000 | | | | 1,318,053 | |
City of Houston, 5.00% due 9/1/2032 (Convention & Entertainment Facilities) | | A-/A2 | | | 3,560,000 | | | | 4,046,332 | |
City of Laredo GO, 5.00% due 8/15/2017 pre-refunded 8/15/2015 (Waterworks and Sewer System; Insured: AMBAC) | | NR/Aa2 | | | 185,000 | | | | 188,313 | |
City of Laredo GO, 5.00% due 8/15/2017 (Waterworks and Sewer System; Insured: AMBAC) | | AA/Aa2 | | | 315,000 | | | | 320,588 | |
City of Pharr Higher Education Finance Authority, 5.75% due 8/15/2024 (IDEA Public Schools) | | BBB/NR | | | 5,050,000 | | | | 5,645,647 | |
City of San Antonio, 5.00% due 7/1/2024 (Airport System Capital Improvements) (AMT) | | A-/A2 | | | 2,065,000 | | | | 2,385,323 | |
City of San Antonio, 5.00% due 7/1/2025 (Airport System Capital Improvements) (AMT) | | A-/A2 | | | 1,160,000 | | | | 1,328,420 | |
City of Texas City Industrial Development Corp., 7.375% due 10/1/2020 (ARCO Pipe Line Co. Project) | | A/A2 | | | 2,705,000 | | | | 3,460,696 | |
Dallas County Utilities & Reclamation District, 5.15% due 2/15/2022 (Insured: AMBAC) | | A-/A3 | | | 3,000,000 | | | | 3,200,610 | |
Grapevine-Colleyville ISD GO, 5.25% due 8/15/2023 (Educational Facilities; Insured: Natl-Re) | | AA/Aa2 | | | 20,000 | | | | 20,375 | |
Grapevine-Colleyville ISD GO, 5.25% due 8/15/2023 pre-refunded 8/15/2015 (Educational Facilities; Insured: Natl-Re) | | AA-/Aa2 | | | 545,000 | | | | 555,268 | |
Harris County Cultural Education Facilities Finance Corp., 5.00% due 12/1/2028 (Memorial Hermann Health System) | | A+/A1 | | | 3,000,000 | | | | 3,547,080 | |
Harris County Health Facilities Development Corp., 0.03% due 10/1/2041 put 4/1/2015 (Texas Children’s Hospital; SPA: Wells Fargo Bank, N.A.) (daily demand notes) | | AA/Aa2 | | | 20,845,000 | | | | 20,845,000 | |
Houston Higher Education Finance Corp., 6.50% due 5/15/2031 (Cosmos Foundation, Inc.) | | BBB/NR | | | 775,000 | | | | 937,696 | |
Kimble County Hospital District GO, 5.00% due 8/15/2017 | | NR/NR | | | 510,000 | | | | 545,853 | |
Kimble County Hospital District GO, 5.00% due 8/15/2018 | | NR/NR | | | 525,000 | | | | 569,929 | |
La Vernia Higher Education Finance Corp., 5.75% due 8/15/2024 (Kipp, Inc.) | | BBB/NR | | | 3,000,000 | | | | 3,360,390 | |
Lower Colorado River Authority, 5.00% due 5/15/2026 pre-refunded 5/15/2022 | | NR/NR | | | 55,000 | | | | 66,928 | |
Lower Colorado River Authority, 5.00% due 5/15/2026 | | A/A2 | | | 9,415,000 | | | | 10,882,234 | |
North Central Texas Health Facilities Development Corp., 5.00% due 8/15/2019 (Children’s Medical Center of Dallas) | | NR/Aa2 | | | 270,000 | | | | 306,626 | |
16 Semi-Annual Report
| | |
| SCHEDULE OF INVESTMENTS, CONTINUED | | |
| |
Thornburg Intermediate Municipal Fund | | March 31, 2015 (Unaudited) |
| | | | | | | | | | |
Issuer-Description | | Credit Rating†
S&P/Moody’s | | Principal
Amount | | | Value | |
North East ISD GO, 2.00% due 8/1/2043 put 8/1/2015 (Educational Facilities; Guaranty: PSF) | | AAA/Aaa | | $ | 7,130,000 | | | $ | 7,166,577 | |
North Texas Tollway Authority, 5.00% due 9/1/2017 (DOT-President George Bush Turnpike Western Extension) | | AA+/NR | | | 450,000 | | | | 495,783 | |
Nueces River Authority, 5.00% due 7/15/2020 (Corpus Christi Lake Texana Water Supply Facilities; Insured: AGM) | | AA/Aa3 | | | 1,000,000 | | | | 1,013,620 | |
San Juan Higher Education Finance Authority, 5.75% due 8/15/2024 (IDEA Public Schools) | | BBB/NR | | | 1,590,000 | | | | 1,817,275 | |
Stafford Economic Development Corp., 6.00% due 9/1/2017 pre-refunded 9/1/2015 (Convention Center-Performing Arts Center Theater Complex; Insured: Natl-Re) | | AA-/A1 | | | 1,775,000 | | | | 1,817,795 | |
State of Texas GO, 1.50% due 8/31/2015 (Cash Flow Management) | | SP-1+/Mig1 | | | 44,500,000 | | | | 44,765,220 | |
Texas Public Finance Authority Charter School Finance Corp., 5.00% due 8/15/2023 pre-refunded 8/15/2017 (IDEA Public Schools; Insured: ACA) | | BBB/NR | | | 3,000,000 | | | | 3,303,540 | |
Texas Public Finance Authority Charter School Finance Corp., 6.00% due 2/15/2030 (Cosmos Foundation, Inc.) | | BBB/NR | | | 1,750,000 | | | | 2,001,615 | |
Texas Public Finance Authority Charter School Finance Corp., 5.00% due 8/15/2030 pre-refunded 8/15/2017 (IDEA Public Schools; Insured: ACA) | | BBB/NR | | | 2,000,000 | | | | 2,202,360 | |
Texas Transportation Commission, 5.00% due 8/15/2025 (Central Texas Turnpike System) | | NR/NR | | | 750,000 | | | | 886,545 | |
Uptown Development Authority, 5.50% due 9/1/2029 (Infrastructure Improvements) | | BBB/NR | | | 1,250,000 | | | | 1,389,262 | |
| | | |
U.S. VIRGIN ISLANDS — 0.43% | | | | | | | | | | |
Virgin Islands Public Finance Authority, 6.625% due 10/1/2029 | | NR/Baa3 | | | 5,000,000 | | | | 5,698,950 | |
| | | |
UTAH — 0.12% | | | | | | | | | | |
City of Herriman, 5.75% due 11/1/2027 (Towne Center Assessment Area) | | AA-/NR | | | 215,000 | | | | 215,953 | |
Local Building Authority of Salt Lake Valley Fire Service Area, 5.25% due 4/1/2020 | | NR/Aa2 | | | 1,250,000 | | | | 1,384,000 | |
| | | |
VIRGINIA — 0.80% | | | | | | | | | | |
County of Hanover IDA, 6.00% due 10/1/2021 (FirstHealth Richmond Memorial Hospital) (ETM) | | AA-/NR | | | 785,000 | | | | 847,926 | |
Fairfax County GO, 4.00% due 10/1/2015 (Public Facilities and Improvements) (State Aid Withholding) | | AAA/Aaa | | | 2,850,000 | | | | 2,905,261 | |
Pittsylvania County GO, 3.00% due 7/15/2017 (Educational Capital Projects) (State Aid Withholding) | | AA-/Aa3 | | | 280,000 | | | | 280,588 | |
Virginia Housing Development Authority GO, 4.85% due 4/1/2019 (Multi-Family Housing Development) (AMT) | | AAA/Aaa | | | 3,100,000 | | | | 3,291,952 | |
Virginia Housing Development Authority GO, 4.85% due 10/1/2019 (Multi-Family Housing Development) (AMT) | | AAA/Aaa | | | 3,100,000 | | | | 3,284,605 | |
| | | |
WASHINGTON — 2.48% | | | | | | | | | | |
City of Seattle, 5.00% due 2/1/2019 (Light and Power Improvements) | | AA/Aa2 | | | 3,000,000 | | | | 3,429,420 | |
King County Public Hospital District No. 2 GO, 5.00% due 12/1/2028 (EvergreenHealth Medical Center) | | NR/Aa3 | | | 1,015,000 | | | | 1,201,039 | |
King County Public Hospital District No. 2 GO, 5.00% due 12/1/2029 (EvergreenHealth Medical Center) | | NR/Aa3 | | | 2,930,000 | | | | 3,445,358 | |
King County Public Hospital District No. 2 GO, 5.00% due 12/1/2030 (EvergreenHealth Medical Center) | | NR/Aa3 | | | 250,000 | | | | 293,740 | |
King County Public Hospital District No. 2 GO, 5.00% due 12/1/2031 (EvergreenHealth Medical Center) | | NR/Aa3 | | | 2,040,000 | | | | 2,383,822 | |
Skagit County Public Hospital District No. 1 GO, 5.125% due 12/1/2015 (Skagit Valley Hospital; Insured: Natl-Re) | | NR/A1 | | | 1,900,000 | | | | 1,958,672 | |
Skagit County Public Hospital District No. 1 GO, 5.00% due 12/1/2025 (Skagit Regional Health) | | NR/A1 | | | 4,860,000 | | | | 5,682,701 | |
Skagit County Public Hospital District No. 1 GO, 5.00% due 12/1/2028 (Skagit Regional Health) | | NR/A1 | | | 3,000,000 | | | | 3,445,740 | |
Skagit County Public Hospital District No. 2 GO, 5.00% due 12/1/2027 (Island Hospital) | | NR/A1 | | | 2,445,000 | | | | 2,783,583 | |
Skagit County Public Hospital District No. 2 GO, 5.00% due 12/1/2028 (Island Hospital) | | NR/A1 | | | 2,195,000 | | | | 2,490,381 | |
Washington Health Care Facilities Authority, 5.25% due 8/15/2024 (Multi-Care Systems; Insured: AGM) | | AA/Aa3 | | | 1,000,000 | | | | 1,125,570 | |
Washington Health Care Facilities Authority, 6.25% due 8/1/2028 pre-refunded 8/1/2018 (Highline Medical Centers; Insured: FHA 242) | | NR/NR | | | 3,985,000 | | | | 4,652,886 | |
| | | |
WEST VIRGINIA — 0.20% | | | | | | | | | | |
State of West Virginia GO, 5.00% due 6/1/2022 (Division of Highways State Road Fund; Insured: Natl-Re) | | AA/Aa1 | | | 1,000,000 | | | | 1,008,040 | |
West Virginia Hospital Finance Authority, 5.00% due 6/1/2020 (United Hospital Center; Insured: AMBAC) | | A/A2 | | | 1,530,000 | | | | 1,593,067 | |
| | | |
WISCONSIN — 1.57% | | | | | | | | | | |
Wisconsin Health & Educational Facilities Authority, 5.00% due 7/1/2021 (Agnesian Healthcare, Inc.) | | A-/A3 | | | 2,170,000 | | | | 2,465,077 | |
Wisconsin Health & Educational Facilities Authority, 5.00% due 8/15/2023 (ProHealth Care, Inc.) | | A+/A1 | | | 1,980,000 | | | | 2,295,671 | |
Wisconsin Health & Educational Facilities Authority, 5.00% due 8/15/2024 (ProHealth Care, Inc.) | | A+/A1 | | | 2,460,000 | | | | 2,840,537 | |
Wisconsin Health & Educational Facilities Authority, 5.50% due 7/1/2025 (Agnesian Healthcare, Inc.) | | A-/A3 | | | 5,000,000 | | | | 5,756,150 | |
Wisconsin Health & Educational Facilities Authority, 5.00% due 8/15/2025 (ProHealth Care, Inc.) | | A+/A1 | | | 3,180,000 | | | | 3,682,822 | |
Wisconsin Health & Educational Facilities Authority, 5.00% due 8/15/2026 (ProHealth Care, Inc.) | | A+/A1 | | | 3,305,000 | | | | 3,809,872 | |
| | | | | | | | | | |
TOTAL INVESTMENTS — 94.19% (Cost $1,180,037,200) | | | | | | | | $ | 1,248,446,834 | |
OTHER ASSETS LESS LIABILITIES — 5.81% | | | | | | | | | 77,032,911 | |
| | | | | | | | | | |
NET ASSETS — 100.00% | | | | | | | | $ | 1,325,479,745 | |
| | | | | | | | | | |
Semi-Annual Report 17
| | |
| SCHEDULE OF INVESTMENTS, CONTINUED | | |
| |
Thornburg Intermediate Municipal Fund | | March 31, 2015 (Unaudited) |
Footnote Legend
| † | Credit ratings are unaudited. Rating changes may have occurred subsequent to the reporting period end. Bonds issued with a maturity of one year or less are assigned Moody’s ratings from MIG-1 to MIG-4 and Standard and Poor’s ratings from SP-1+ to SP-3 with MIG-1 and SP-1+ being the strongest ratings. |
| a | Segregated as collateral for a when-issued security. |
Portfolio Abbreviations
To simplify the listings of securities, abbreviations are used per the table below:
| | |
ACA | | Insured by American Capital Access |
AGM | | Insured by Assured Guaranty Municipal Corp. |
AMBAC | | Insured by American Municipal Bond Assurance Corp. |
AMT | | Alternative Minimum Tax |
BAM | | Insured by Build America Mutual Insurance Co. |
CIFG | | Insured by CIFG Assurance North America Inc. |
COP | | Certificates of Participation |
DFA | | Development Finance Authority |
EDA | | Economic Development Authority |
ETM | | Escrowed to Maturity |
FHA | | Insured by Federal Housing Administration |
GNMA | | Collateralized by Government National Mortgage Association |
GO | | General Obligation |
| | |
HFA | | Health Facilities Authority |
HFFA | | Health Facilities Financing Authority |
IBC | | Insured Bond Certificate |
IDA | | Industrial Development Authority |
ISD | | Independent School District |
Mtg | | Mortgage |
Natl-Re | | Insured by National Public Finance Guarantee Corp. |
PSF | | Guaranteed by Permanent School Fund |
Q-SBLF | | Insured by Qualified School Bond Loan Fund |
Radian | | Insured by Radian Asset Assurance |
SONYMA | | State of New York Mortgage Authority |
Syncora | | Insured by Syncora Guarantee Inc. |
USD | | Unified School District |
See notes to financial statements.
18 Semi-Annual Report
| | |
| STATEMENT OF ASSETS AND LIABILITIES | | |
| |
Thornburg Intermediate Municipal Fund | | March 31, 2015 (Unaudited) |
| | | | |
ASSETS | | | | |
Investments at value (cost $1,180,037,200) (Note 2) | | $ | 1,248,446,834 | |
Cash | | | 67,442,794 | |
Receivable for investments sold | | | 3,671,514 | |
Receivable for fund shares sold | | | 2,575,937 | |
Interest receivable | | | 13,671,845 | |
Prepaid expenses and other assets | | | 34,731 | |
| | | | |
Total Assets | | | 1,335,843,655 | |
| | | | |
| |
LIABILITIES | | | | |
Payable for investments purchased | | | 6,927,660 | |
Payable for fund shares redeemed | | | 2,382,057 | |
Payable to investment advisor and other affiliates (Note 3) | | | 772,750 | |
Accounts payable and accrued expenses | | | 36,736 | |
Dividends payable | | | 244,707 | |
| | | | |
Total Liabilities | | | 10,363,910 | |
| | | | |
| |
NET ASSETS | | $ | 1,325,479,745 | |
| | | | |
NET ASSETS CONSIST OF | | | | |
Distribution in excess of net investment income | | $ | (3,781 | ) |
Net unrealized appreciation on investments | | | 68,409,634 | |
Accumulated net realized gain (loss) | | | 35,553 | |
Net capital paid in on shares of beneficial interest | | | 1,257,038,339 | |
| | | | |
| | $ | 1,325,479,745 | |
| | | | |
NET ASSET VALUE | | | | |
Class A Shares: | | | | |
Net asset value and redemption price per share ($427,613,904 applicable to 29,946,346 shares of beneficial interest outstanding - Note 4) | | $ | 14.28 | |
Maximum sales charge, 2.00% of offering price | | | 0.29 | |
| | | | |
Maximum offering price per share | | $ | 14.57 | |
| | | | |
| |
Class C Shares: | | | | |
Net asset value and offering price per share* ($162,987,833 applicable to 11,399,670 shares of beneficial interest outstanding - Note 4) | | $ | 14.30 | |
| | | | |
| |
Class I Shares: | | | | |
Net asset value, offering and redemption price per share ($734,878,008 applicable to 51,531,753 shares of beneficial interest outstanding - Note 4) | | $ | 14.26 | |
| | | | |
| * | Redemption price per share is equal to net asset value less any applicable contingent deferred sales charge. |
See notes to financial statements.
Semi-Annual Report 19
| | |
| STATEMENT OF OPERATIONS | | |
| |
Thornburg Intermediate Municipal Fund | | Six Months Ended March 31, 2015 (Unaudited) |
| | | | |
INVESTMENT INCOME | | | | |
Interest income (net of premium amortized of $4,837,849) | | $ | 18,986,127 | |
| | | | |
| |
EXPENSES | | | | |
Investment advisory fees (Note 3) | | | 2,876,676 | |
Administration fees (Note 3) | | | | |
Class A Shares | | | 263,173 | |
Class C Shares | | | 100,036 | |
Class I Shares | | | 167,554 | |
Distribution and service fees (Note 3) | | | | |
Class A Shares | | | 526,345 | |
Class C Shares | | | 480,887 | |
Transfer agent fees | | | | |
Class A Shares | | | 93,424 | |
Class C Shares | | | 33,200 | |
Class I Shares | | | 187,498 | |
Registration and filing fees | | | | |
Class A Shares | | | 15,212 | |
Class C Shares | | | 11,522 | |
Class I Shares | | | 22,819 | |
Custodian fees (Note 3) | | | 58,868 | |
Professional fees | | | 25,879 | |
Accounting fees | | | 19,705 | |
Trustee fees | | | 21,225 | |
Other expenses | | | 38,179 | |
| | | | |
Total Expenses | | | 4,942,202 | |
Less: | | | | |
Expenses reimbursed by investment advisor (Note 3) | | | (21,174 | ) |
Fees paid indirectly (Note 3) | | | (8,203 | ) |
| | | | |
Net Expenses | | | 4,912,825 | |
| | | | |
Net Investment Income | | | 14,073,302 | |
| | | | |
REALIZED AND UNREALIZED GAIN (LOSS) | | | | |
Net realized gain (loss) on investments | | | 3,281 | |
Net change in unrealized appreciation (depreciation) on investments | | | 3,477,840 | |
| | | | |
Net Realized and Unrealized Gain | | | 3,481,121 | |
| | | | |
Net Increase in Net Assets Resulting from Operations | | $ | 17,554,423 | |
| | | | |
See notes to financial statements.
20 Semi-Annual Report
| | |
| STATEMENTS OF CHANGES IN NET ASSETS | | |
| |
Thornburg Intermediate Municipal Fund | | |
| | | | | | | | |
| | | Six Months Ended
March 31, 2015* | | | Year Ended
September 30, 2014 | |
INCREASE (DECREASE) IN NET ASSETS FROM | | | | | | | | |
| | |
OPERATIONS | | | | | | | | |
Net investment income | | $ | 14,073,302 | | | $ | 27,643,381 | |
Net realized gain (loss) on investments | | | 3,281 | | | | 778,096 | |
Net unrealized appreciation (depreciation) on investments | | | 3,477,840 | | | | 36,212,520 | |
| | | | | | | | |
| | |
Net Increase (Decrease) in Net Assets Resulting from Operations | | | 17,554,423 | | | | 64,633,997 | |
| | |
DIVIDENDS TO SHAREHOLDERS | | | | | | | | |
From net investment income | | | | | | | | |
Class A Shares | | | (4,469,155 | ) | | | (10,299,388 | ) |
Class C Shares | | | (1,435,928 | ) | | | (3,239,656 | ) |
Class I Shares | | | (8,168,219 | ) | | | (14,104,337 | ) |
| | |
FUND SHARE TRANSACTIONS (NOTE 4) | | | | | | | | |
Class A Shares | | | 8,903,374 | | | | (26,755,780 | ) |
Class C Shares | | | 5,369,948 | | | | (7,732,072 | ) |
Class I Shares | | | 114,950,383 | | | | 151,102,715 | |
| | | | | | | | |
Net Increase in Net Assets | | | 132,704,826 | | | | 153,605,479 | |
| | |
NET ASSETS | | | | | | | | |
Beginning of Period | | | 1,192,774,919 | | | | 1,039,169,440 | |
| | | | | | | | |
| | |
End of Period | | $ | 1,325,479,745 | | | $ | 1,192,774,919 | |
| | | | | | | | |
Distribution in excess of net investment income | | $ | (3,781 | ) | | $ | (3,781 | ) |
See notes to financial statements.
Semi-Annual Report 21
| | |
| NOTES TO FINANCIAL STATEMENTS | | |
| |
Thornburg Intermediate Municipal Fund | | March 31, 2015 (Unaudited) |
NOTE 1 – ORGANIZATION
Thornburg Intermediate Municipal Fund (the “Fund”) is a diversified series of Thornburg Investment Trust (the “Trust”). The Trust is organized as a Massachusetts business trust under a Declaration of Trust dated June 3, 1987 and is registered as a diversified, open-end management investment company under the Investment Company Act of 1940, as amended. The Fund is currently one of eighteen separate series of the Trust. Each series is considered to be a separate entity for financial reporting and tax purposes and bears expenses directly attributable to it. The Fund’s primary investment objective is to obtain as high a level of current income exempt from federal individual income taxes as is consistent, in the view of the Fund’s investment advisor, with the preservation of capital. The Fund’s secondary objective is to reduce expected changes in its share price compared to long-term bond portfolios.
The Fund currently offers three classes of shares of beneficial interest: Class A, Class C, and Institutional Class (“Class I”). Each class of shares of the Fund represents an interest in the same portfolio of investments, except that (i) Class A shares are sold subject to a front-end sales charge collected at the time the shares are purchased and bear a service fee, (ii) Class C shares are sold at net asset value without a sales charge at the time of purchase, but are subject to a contingent deferred sales charge upon redemption within one year of purchase, and bear both a service fee and a distribution fee, (iii) Class I shares are sold at net asset value without a sales charge at the time of purchase and may be subject to a service fee, and (iv) the respective classes may have different reinvestment privileges and conversion rights. Additionally, the Fund may allocate among its classes certain expenses, to the extent allocable to specific classes, including transfer agent fees, government registration fees, certain printing and postage costs, and administrative and legal expenses. Currently, class specific expenses of the Fund are limited to service and distribution fees, administration fees, and certain registration and transfer agent expenses.
NOTE 2 – SIGNIFICANT ACCOUNTING POLICIES
The following is a summary of significant accounting policies followed by the Fund in the preparation of its financial statements. The Fund is an investment company and prepares its financial statements in conformity with U.S. generally accepted accounting principles (“GAAP”), including the investment company accounting and reporting guidance in the Financial Accounting Standards Board (the “FASB”) Accounting Standard Codification Topic 946. The preparation of financial statements in conformity with GAAP requires management to make estimates and assumptions that affect the reported amounts of assets and liabilities and disclosure of contingent assets and liabilities at the date of the financial statements and the reported amounts of increases (decreases) in net assets from operations during the reporting period. Actual results could differ from those estimates.
Significant accounting policies of the Fund are as follows:
Valuation Policy and Procedures: The Trustees of the Trust (the “Trustees”) have authorized employees of the Fund’s investment advisor, acting as the Valuation and Pricing Committee (the “Committee”), to make certain valuation determinations, subject to oversight and review by the Trustees and the Audit Committee of the Trustees. The Committee and other employees of the Fund’s investment advisor administer and implement the valuation process. The Committee regularly reviews its own fair value decisions, as well as valuations, valuation techniques and services furnished by pricing services, considers circumstances in the markets which may require valuation determinations by the Committee and reviews previous valuation determinations. The Committee also reports on its activities, the performance of the pricing services and other matters to the Trustees and the Audit Committee of the Trustees.
In determining a fair value for a portfolio investment, the Committee seeks to determine the price that the Fund would reasonably expect to receive upon a sale of the investment in an orderly transaction between market participants at the measurement date. Typically, the fair value process employs standing instructions to use quoted prices in active markets or the use of independent pricing services. Less frequently, the Committee may make a fair value determination using other methods. However, because fair value prices are estimated prices, the determination of fair value for an investment may differ from the value that would be realized by the Fund upon a sale of the investment, and that difference could be material to the Fund’s financial statements. The Committee’s determination of fair value for an investment may also differ from the prices obtained by other persons (including other mutual funds) for the investment.
Valuation of Investments: Debt obligations held by the Fund have a primary over-the-counter market and are valued by an independent pricing service approved by the Trustees. The pricing service ordinarily values debt obligations using quoted bid prices and other methods which include consideration of yields or prices of debt obligations of comparable quality, type of issue, coupon, maturity and rating, and indications as to value from dealers and general market conditions.
In any case when a pricing service fails to provide a price for a debt obligation held by the Fund, the Committee determines a fair value for the debt obligation using procedures in accordance with a policy approved by the Trustees, which may include the use of a price obtained from a different independent pricing service. Additionally, in any case when management believes that a price provided by a pricing service for a debt obligation held by the Fund may be unreliable, the Committee decides whether or not to use the pricing service’s valuation or to use an alternative method to determine a fair value for the debt obligation.
Valuation Measurements: The Fund categorizes its investments based upon the inputs used in valuing those investments, according to a three-level hierarchy established by guidance from the the FASB. Categorization of investments using this hierarchy is intended by the
22 Semi-Annual Report
| | |
| NOTES TO FINANCIAL STATEMENTS, CONTINUED | | |
| |
Thornburg Intermediate Municipal Fund | | March 31, 2015 (Unaudited) |
FASB to maximize the use of observable inputs and minimize the use of unobservable inputs by prioritizing that the most observable input be used when available. Observable inputs are those that market participants would use in valuing an investment based on available market data. Unobservable inputs are those that reflect assumptions about the information market participants would use in valuing an investment. An investment’s level within the hierarchy is based on the lowest level input that is deemed significant to the fair value measurement. The methodologies and relative inputs used to value investments are not necessarily indications of the risk or liquidity associated with investing in those investments.
Various inputs are used in determining the fair value measurement of the Fund’s investments. These inputs are generally summarized according to the three-level hierarchy below:
Level 1: Quoted prices in active markets for identical investments.
Level 2: Other direct or indirect significant observable inputs (including quoted prices for similar investments in active markets and other observable inputs, such as interest rates, prepayment rates, credit risk, etc.).
Level 3: Significant unobservable inputs (including the Committee’s own assumptions in determining the fair value of investments).
Portfolio investments with minimal, if any, market activity are characterized as Level 3 and are valued using significant unobservable inputs, typically including single broker quotes, which may be adjusted or unadjusted, related or comparable investments, last available transactions, and other relevant information. Valuations may also be based upon current market prices of securities that are comparable in coupon, rating, maturity and industry. An income based valuation approach would consider discounted anticipated future cash flows of the investment. Discounts may also be applied due to the nature or duration of any restrictions on the disposition of the investment. Valuations based upon the use of inputs from Levels 1, 2, or 3, may not represent the actual price received upon the disposition of an investment, and the Fund may receive a price that is lower than the valuation when it sells the investment.
The following table displays a summary of the fair value hierarchy measurements of the Fund’s investments as of March 31, 2015. In any instance when valuation inputs from more than one level are used to determine the fair value of a specific investment, the investment is placed in the level of the table based upon the lowest level input that is significant in determining the fair value of the investment:
| | | | | | | | | | | | | | | | |
| | | Fair Value Measurements at March 31, 2015 | |
| | | Total | | | Level 1 | | | Level 2 | | | Level 3 | |
Assets | | | | | | | | | | | | | | | | |
Investments in Securities | | | | | | | | | | | | | | | | |
Municipal Bonds | | $ | 1,248,446,834 | | | $ | — | | | $ | 1,248,446,834 | | | $ | — | |
| | | | | | | | | | | | | | | | |
Total Investments in Securities | | $ | 1,248,446,834 | | | $ | — | | | $ | 1,248,446,834 | | | $ | — | |
In accordance with the guidance prescribed in Accounting Standards Update No. 2011-04, it is the policy of the Fund to recognize transfers between levels and the underlying events which caused the movement. The Fund recognized no transfers between levels for the six months ended March 31, 2015.
Federal Income Taxes: It is the policy of the Trust to comply with the provisions of the Internal Revenue Code applicable to “regulated investment companies” and to distribute to shareholders substantially all taxable (if any) and tax exempt income of the Fund. Therefore, no provision for federal income tax is required.
Management reviews each uncertain tax position believed to be material to the preparation of the Fund’s financial statements, to assess if it is more likely than not that the position would be sustained upon examination, based upon the technical merits of the position. As of March 31, 2015, management has not identified any such position for which an asset or liability must be reflected in the Statement of Assets and Liabilities. The Fund’s tax returns remain subject to examination for three years after filing.
When-Issued and Delayed Delivery Transactions: The Fund may engage in when-issued or delayed delivery transactions. To the extent the Fund engages in such transactions, it will do so for the purpose of acquiring portfolio investments consistent with the Fund’s investment objectives and not for the purpose of investment leverage or to speculate on interest rate and/or market changes. At the time the Fund makes a commitment to purchase an investment on a when-issued or delayed delivery basis, the Fund will record the transaction and reflect the value in determining its net asset value. When effecting such transactions, assets of an amount sufficient to make payment for the portfolio investments to be purchased will be segregated on the Fund’s records on the trade date. Investments purchased on a when-issued or delayed delivery basis do not earn interest until the settlement date.
Dividends: Net investment income of the Fund is declared daily as a dividend on shares for which the Fund has received payment. Dividends are paid monthly and are reinvested in additional shares of the Fund at net asset value per share at the close of business on the dividend payment date, or at the shareholder’s option, paid in cash. Net realized capital gains, to the extent available, will be distributed at least annually.
Semi-Annual Report 23
| | |
| NOTES TO FINANCIAL STATEMENTS, CONTINUED | | |
| |
Thornburg Intermediate Municipal Fund | | March 31, 2015 (Unaudited) |
General: Investment transactions are accounted for on a trade date basis. Interest income is accrued as earned. Premiums and discounts on investments purchased are amortized to call dates or maturity dates of the respective investments. Realized gains and losses from the sale of investments are recorded on an identified cost basis. Net investment income (other than class specific expenses) and realized and unrealized gains and losses are allocated daily to each class of shares based upon the relative net asset value of outstanding shares (or the value of the dividend-eligible shares, as appropriate) of each class of shares at the beginning of the day (after adjusting for the current capital shares activity of the respective class). Expenses common to all Funds are allocated among the Funds comprising the Trust based upon their relative net asset values or other appropriate allocation methods.
Guarantees and Indemnifications: Under the Trust’s organizational documents (and under separate agreements with the independent Trustees), its officers and Trustees are indemnified against certain liabilities arising out of the performance of their duties to the Fund. Additionally, in the normal course of business the Trust enters into contracts with service providers that contain general indemnification clauses. The Trust’s maximum exposure under these arrangements is unknown. However, based on experience, the Trust expects the risk of loss to be remote.
NOTE 3 – INVESTMENT ADVISORY FEE AND OTHER TRANSACTIONS WITH AFFILIATES
Pursuant to an investment advisory agreement, Thornburg Investment Management, Inc. (the “Advisor”) serves as the investment advisor and performs services for the Fund for which the fees are payable at the end of each month. For the six months ended March 31, 2015, these fees were payable at annual rates ranging from .50 of 1% to .275 of 1% per annum of the average daily net assets of the Fund depending on the Fund’s asset size. The Trust also has entered into administrative services agreements with the Advisor, whereby the Advisor will perform certain administrative services for the shareholders of each class of the Fund’s shares, and for which fees will be payable at an annual rate of up to .125 of 1% per annum of the average daily net assets attributable to each class of shares.
The Trust has an underwriting agreement with Thornburg Securities Corporation (the “Distributor,” an affiliate of the Advisor), which acts as the distributor of the Fund’s shares. For the six months ended March 31, 2015, the Distributor has advised the Fund that it earned net commissions aggregating $3,502 from the sale of Class A shares, and collected contingent deferred sales charges aggregating $3,007 from redemptions of Class C shares of the Fund.
Pursuant to a service plan under Rule 12b-1 of the Investment Company Act of 1940, the Fund may reimburse to the Advisor an amount not to exceed .25 of 1% per annum of the average daily net assets attributable to each class of shares of the Fund for payments made by the Advisor to securities dealers and other financial institutions to obtain various shareholder and distribution related services. For the six months ended March 31, 2015, there were no 12b-1 service plan fees charged for Class I shares. The Advisor may pay out of its own resources additional expenses for distribution of the Fund’s shares and shareholder services.
The Trust has also adopted a distribution plan pursuant to Rule 12b-1, applicable only to the Fund’s Class C shares, under which the Fund compensates the Distributor for services in promoting the sale of Class C shares of the Fund at an annual rate of up to .35 of 1% per annum of the average daily net assets attributable to Class C shares. Total fees incurred by each class of shares of the Fund under their respective service and distribution plans for the six months ended March 31, 2015, are set forth in the Statement of Operations.
The Advisor and Distributor have contractually agreed to waive fees and reimburse expenses incurred by the Fund so that actual expenses of certain share classes do not exceed levels as specified in the Fund’s most recent prospectus. The agreement may be terminated by the Fund at any time, but may not be terminated by the Advisor or Distributor before February 1, 2016, unless the Advisor ceases to be the investment advisor to the Fund or the Distributor ceases to be the distributor of the Fund prior to that date. The Advisor and Distributor retain the right to be repaid by the Fund for fee waivers and expense reimbursements if expenses fall below the contractual limit prior to the end of the fiscal year.
For the six months ended March 31, 2015, the Advisor contractually reimbursed certain class specific expenses and administrative fees of $21,174 for Class C shares.
The Trust has an agreement with the custodian bank to indirectly pay a portion of the custodian’s fees through credits earned by the Fund’s cash on deposit with the bank. This deposit agreement is an alternative to overnight investments. Custodial fees are adjusted to reflect amounts that would have been paid without this agreement, with a corresponding adjustment reflected as fees paid indirectly in the Statement of Operations. For the six months ended March 31, 2015, fees paid indirectly were $8,203.
Certain officers and Trustees of the Trust are also officers or directors of the Advisor and Distributor. The compensation of independent Trustees is borne by the Trust.
24 Semi-Annual Report
| | |
| NOTES TO FINANCIAL STATEMENTS, CONTINUED | | |
| |
Thornburg Intermediate Municipal Fund | | March 31, 2015 (Unaudited) |
NOTE 4 – SHARES OF BENEFICIAL INTEREST
At March 31, 2015, there were an unlimited number of shares with no par value of beneficial interest authorized. Transactions in shares of beneficial interest were as follows:
| | | | | | | | | | | | | | | | |
| | | Six Months Ended
March 31, 2015 (unaudited) | | | Year Ended
September 30, 2014 (Audited) | |
| | | Shares | | | Amount | | | Shares | | | Amount | |
Class A Shares | | | | | | | | | | | | | | | | |
Shares sold | | | 2,435,968 | | | $ | 34,826,462 | | | | 5,171,963 | | | $ | 72,039,550 | |
Shares issued to shareholders in reinvestment of dividends | | | 285,747 | | | | 4,086,342 | | | | 672,690 | | | | 9,418,779 | |
Shares repurchased | | | (2,096,333 | ) | | | (30,009,430 | ) | | | (7,761,608 | ) | | | (108,214,109 | ) |
| | | | | | | | | | | | | | | | |
| | | | |
Net increase (decrease) | | | 625,382 | | | $ | 8,903,374 | | | | (1,916,955 | ) | | $ | (26,755,780 | ) |
| | | | | | | | | | | | | | | | |
| | | | |
Class C Shares | | | | | | | | | | | | | | | | |
Shares sold | | | 1,057,071 | | | $ | 15,129,793 | | | | 1,721,415 | | | $ | 24,111,270 | |
Shares issued to shareholders in reinvestment of dividends | | | 84,600 | | | | 1,211,490 | | | | 195,955 | | | | 2,747,333 | |
Shares repurchased | | | (766,344 | ) | | | (10,971,335 | ) | | | (2,483,360 | ) | | | (34,590,675 | ) |
| | | | | | | | | | | | | | | | |
| | | | |
Net increase (decrease) | | | 375,327 | | | $ | 5,369,948 | | | | (565,990 | ) | | $ | (7,732,072 | ) |
| | | | | | | | | | | | | | | | |
| | | | |
Class I Shares | | | | | | | | | | | | | | | | |
Shares sold | | | 11,811,148 | | | $ | 168,771,244 | | | | 22,132,781 | | | $ | 308,646,550 | |
Shares issued to shareholders in reinvestment of dividends | | | 493,010 | | | | 7,040,660 | | | | 846,289 | | | | 11,848,035 | |
Shares repurchased | | | (4,264,440 | ) | | | (60,861,521 | ) | | | (12,188,664 | ) | | | (169,391,870 | ) |
| | | | | | | | | | | | | | | | |
| | | | |
Net increase (decrease) | | | 8,039,718 | | | $ | 114,950,383 | | | | 10,790,406 | | | $ | 151,102,715 | |
| | | | | | | | | | | | | | | | |
NOTE 5 – INVESTMENT TRANSACTIONS
For the six months ended March 31, 2015, the Fund had purchase and sale transactions of investments (excluding short-term investments) of $95,408,540 and $23,867,150, respectively.
NOTE 6 – INCOME TAXES
At March 31, 2015, information on the tax components of capital was as follows:
| | | | |
Cost of investments for tax purposes | | $ | 1,180,037,200 | |
| | | | |
Gross unrealized appreciation on a tax basis | | $ | 70,088,798 | |
Gross unrealized depreciation on a tax basis | | | (1,679,164 | ) |
| | | | |
Net unrealized appreciation (depreciation)on investments (tax basis) | | $ | 68,409,634 | |
| | | | |
OTHER NOTES
Risks: The Fund’s investments subject it to risks including, but not limited to, credit risk, interest rate risk, management risk, market and economic risk, and liquidity risk. Please see the Fund’s prospectus for a discussion of the risks associated with an investment in the Fund.
Subsequent Events: Fund management believes no events have occurred between March 31, 2015 and the date of issuance of the financial statements that require adjustment to or disclosure in the accompanying financial statements.
Semi-Annual Report 25
FINANCIAL HIGHLIGHTS
Thornburg Intermediate Municipal Fund
| | | | | | | | | | | | | | | | | | | | | | | | | | | | | | | | | | | | | | | | | | | | | | | | | | | | |
| | | PER SHARE PERFORMANCE (for a share outstanding throughout the Period )+ | | RATIOS TO AVERAGE NET ASSETS | | | SUPPLEMENTAL DATA | |
Unless
Otherwise
Noted,
Periods
are
Fiscal
Years
Ended
Sept. 30, | | Net Asset
Value
Beginning
of Period | | | Net
Investment
Income
(Loss) | | Net
Realized
&
Unrealized
Gain (Loss)
On
Investments | | | Total From
Investment
Operations | | | Dividends
From Net
Investment
Income | | | Dividends
From Net
Realized
Gains | | Total
Dividends | | | Net
Asset
Value
End
of
Period | | Net
Investment
Income
(Loss)
(%) | | | Expenses,
After
Expense
Reductions
(%) | | | Expenses,
After
Expense
Reductions
and
Net of
Custody
Credits
(%) | | | Expenses,
Before
Expense
Reductions
(%) | | | Total
Return
(%)(a) | | | Portfolio
Turnover
Rate
(%)(a) | | Net
Assets
at End
of
Period
(thousands) | |
Class A Shares | | | | | | | | | | | | | | | | | | | | | | | | | | | | | | | | | | | | | | | | | | | | | | |
2015(b)(c) | | $ | 14.23 | | | 0.15 | | | 0.05 | | | | 0.20 | | | | (0.15 | ) | | — | | | (0.15 | ) | | $14.28 | | | 2.12 | (d) | | | 0.91 | (d) | | | 0.91 | (d) | | | 0.91 | (d) | | | 1.42 | | | 2.20 | | $ | 427,614 | |
2014(c) | | $ | 13.76 | | | 0.34 | | | 0.47 | | | | 0.81 | | | | (0.34 | ) | | — | | | (0.34 | ) | | $14.23 | | | 2.43 | | | | 0.92 | | | | 0.92 | | | | 0.92 | | | | 5.95 | | | 14.85 | | $ | 417,369 | |
2013(c) | | $ | 14.22 | | | 0.33 | | | (0.46 | ) | | | (0.13 | ) | | | (0.33 | ) | | — | | | (0.33 | ) | | $13.76 | | | 2.37 | | | | 0.92 | | | | 0.92 | | | | 0.92 | | | | (0.91 | ) | | 29.18 | | $ | 429,941 | |
2012(c) | | $ | 13.59 | | | 0.40 | | | 0.63 | | | | 1.03 | | | | (0.40 | ) | | — | | | (0.40 | ) | | $14.22 | | | 2.88 | | | | 0.93 | | | | 0.93 | | | | 0.93 | | | | 7.69 | | | 16.94 | | $ | 456,527 | |
2011(c) | | $ | 13.64 | | | 0.48 | | | (0.05 | ) | | | 0.43 | | | | (0.48 | ) | | — | | | (0.48 | ) | | $13.59 | | | 3.59 | | | | 0.95 | | | | 0.95 | | | | 0.95 | | | | 3.27 | | | 18.33 | | $ | 381,839 | |
2010(c) | | $ | 13.40 | | | 0.49 | | | 0.24 | | | | 0.73 | | | | (0.49 | ) | | — | | | (0.49 | ) | | $13.64 | | | 3.68 | | | | 0.97 | | | | 0.97 | | | | 0.97 | | | | 5.61 | | | 9.87 | | $ | 409,844 | |
Class C Shares | | | | | | | | | | | | | | | | | | | | | | | | | | | | | | | | | | | | | | | | | | | | | | |
2015(b) | | $ | 14.25 | | | 0.13 | | | 0.05 | | | | 0.18 | | | | (0.13 | ) | | — | | | (0.13 | ) | | $14.30 | | | 1.79 | (d) | | | 1.24 | (d) | | | 1.24 | (d) | | | 1.27 | (d) | | | 1.25 | | | 2.20 | | $ | 162,988 | |
2014 | | $ | 13.78 | | | 0.30 | | | 0.47 | | | | 0.77 | | | | (0.30 | ) | | — | | | (0.30 | ) | | $14.25 | | | 2.11 | | | | 1.24 | | | | 1.24 | | | | 1.29 | | | | 5.61 | | | 14.85 | | $ | 157,126 | |
2013 | | $ | 14.24 | | | 0.29 | | | (0.46 | ) | | | (0.17 | ) | | | (0.29 | ) | | — | | | (0.29 | ) | | $13.78 | | | 2.05 | | | | 1.24 | | | | 1.24 | | | | 1.30 | | | | (1.22 | ) | | 29.18 | | $ | 159,727 | |
2012 | | $ | 13.61 | | | 0.36 | | | 0.63 | | | | 0.99 | | | | (0.36 | ) | | — | | | (0.36 | ) | | $14.24 | | | 2.56 | | | | 1.24 | | | | 1.24 | | | | 1.31 | | | | 7.36 | | | 16.94 | | $ | 170,071 | |
2011 | | $ | 13.65 | | | 0.44 | | | (0.04 | ) | | | 0.40 | | | | (0.44 | ) | | — | | | (0.44 | ) | | $13.61 | | | 3.29 | | | | 1.24 | | | | 1.24 | | | | 1.32 | | | | 3.05 | | | 18.33 | | $ | 125,512 | |
2010 | | $ | 13.42 | | | 0.45 | | | 0.24 | | | | 0.69 | | | | (0.46 | ) | | — | | | (0.46 | ) | | $13.65 | | | 3.39 | | | | 1.24 | | | | 1.24 | | | | 1.73 | | | | 5.25 | | | 9.87 | | $ | 128,449 | |
Class I Shares | | | | | | | | | | | | | | | | | | | | | | | | | | | | | | | | | | | | | | | | | | | | | | |
2015(b) | | $ | 14.22 | | | 0.17 | | | 0.04 | | | | 0.21 | | | | (0.17 | ) | | — | | | (0.17 | ) | | $14.26 | | | 2.44 | (d) | | | 0.60 | (d) | | | 0.60 | (d) | | | 0.60 | (d) | | | 1.51 | | | 2.20 | | $ | 734,878 | |
2014 | | $ | 13.75 | | | 0.38 | | | 0.47 | | | | 0.85 | | | | (0.38 | ) | | — | | | (0.38 | ) | | $14.22 | | | 2.73 | | | | 0.62 | | | | 0.61 | | | | 0.62 | | | | 6.28 | | | 14.85 | | $ | 618,280 | |
2013 | | $ | 14.20 | | | 0.38 | | | (0.45 | ) | | | (0.07 | ) | | | (0.38 | ) | | — | | | (0.38 | ) | | $13.75 | | | 2.68 | | | | 0.61 | | | | 0.61 | | | | 0.61 | | | | (0.53 | ) | | 29.18 | | $ | 449,501 | |
2012 | | $ | 13.58 | | | 0.44 | | | 0.63 | | | | 1.07 | | | | (0.45 | ) | | — | | | (0.45 | ) | | $14.20 | | | 3.18 | | | | 0.61 | | | | 0.61 | | | | 0.61 | | | | 7.96 | | | 16.94 | | $ | 365,443 | |
2011 | | $ | 13.62 | | | 0.52 | | | (0.04 | ) | | | 0.48 | | | | (0.52 | ) | | — | | | (0.52 | ) | | $13.58 | | | 3.90 | | | | 0.63 | | | | 0.63 | | | | 0.63 | | | | 3.67 | | | 18.33 | | $ | 232,422 | |
2010 | | $ | 13.39 | | | 0.53 | | | 0.23 | | | | 0.76 | | | | (0.53 | ) | | — | | | (0.53 | ) | | $13.62 | | | 3.99 | | | | 0.65 | | | | 0.65 | | | | 0.65 | | | | 5.87 | | | 9.87 | | $ | 202,859 | |
| (a) | Not annualized for periods less than one year. |
| (b) | Unaudited Six Month Period Ended March 31. |
| (c) | Sales loads are not reflected in computing total return. |
| + | Based on weighted average shares outstanding, except for Dividends from Net Investment Income and Net Realized Gains, which are actual amounts per share. |
See notes to financial statements.
| | | | |
| 26 Semi-Annual Report | | | | Semi-Annual Report 27 |
| | |
| EXPENSE EXAMPLE | | |
| |
Thornburg Intermediate Municipal Fund | | March 31, 2015 (Unaudited) |
As a shareholder of the Fund, you incur two types of costs:
| | (1) | transaction costs, including |
(a) sales charges (loads) on purchase payments, for Class A shares;
(b) a deferred sales charge on redemptions of any part or all of a purchase of $1 million of Class A shares within 12 months of purchase;
(c) a deferred sales charge on redemptions of Class C shares within 12 months of purchase;
| | (2) | ongoing costs, including management fees; distribution and/or service (12b-1) fees; and other Fund expenses. |
This example is intended to help you understand your ongoing costs (in dollars) of investing in the Fund and to compare these costs with the ongoing costs of investing in other mutual funds.
The example is based on a $1,000 investment beginning on October 1, 2014, and held until March 31, 2015.
| | | | | | | | | | | | |
| | | Beginning
Account Value
10/1/14 | | | Ending
Account Value
3/31/15 | | | Expenses Paid
During Period†
10/1/14–3/31/15 | |
Class A Shares | | | | | | | | | | | | |
Actual | | $ | 1,000.00 | | | $ | 1,014.20 | | | $ | 4.58 | |
Hypothetical* | | $ | 1,000.00 | | | $ | 1,020.39 | | | $ | 4.59 | |
Class C Shares | | | | | | | | | | | | |
Actual | | $ | 1,000.00 | | | $ | 1,012.50 | | | $ | 6.23 | |
Hypothetical* | | $ | 1,000.00 | | | $ | 1,015.10 | | | $ | 6.24 | |
Class I Shares | | | | | | | | | | | | |
Actual | | $ | 1,000.00 | | | $ | 1,015.10 | | | $ | 3.00 | |
Hypothetical* | | $ | 1,000.00 | | | $ | 1,021.95 | | | $ | 3.01 | |
| † | Expenses are equal to the annualized expense ratio for each class (A: 0.91%; C: 1.24%; I: 0.60%) multiplied by the average account value over the period, multiplied by 182/365 to reflect the one-half year period. |
| * | Hypothetical assumes a rate of return of 5% per year before expenses. |
ACTUAL EXPENSES
For each class of shares, the first line of the accompanying table provides information about actual account values and actual expenses. You may use the information in this line, together with the amount you invested, to estimate the expenses that you paid over the period. Simply divide your account value by $1,000 (for example, an $8,600 account value divided by $1,000 = 8.6), then multiply the result by the number in the first line for your class of shares under the heading entitled “Expenses Paid During Period” to estimate the expenses you paid on your account during this period.
HYPOTHETICAL EXAMPLE FOR COMPARISON PURPOSES
For each class of shares, the second line of the accompanying table provides information about hypothetical account values and hypothetical expenses based on the Fund’s actual expense ratio and an assumed rate of return of 5% per year before expenses, which is not the Fund’s actual return. The hypothetical account values and expenses may not be used to estimate the actual ending account balance or expenses you paid for the period. You may use this information to compare the ongoing costs of investing in the Fund and other funds. To do so, compare this 5% hypothetical example with the 5% hypothetical examples that appear in the shareholder reports of the other funds.
Please note that the expenses shown in the table are meant to highlight your ongoing costs only and do not reflect any transactional costs, such as sales charges (loads), redemption fees, or exchange fees. Therefore, the second line of the table for each class of shares is useful in comparing ongoing costs only, and will not help you determine the relative total costs of owning different funds. In addition, if these transactional costs were included, your costs would have been higher.
28 Semi-Annual Report
| | |
| OTHER INFORMATION | | |
| |
Thornburg Intermediate Municipal Fund | | March 31, 2015 (Unaudited) |
PORTFOLIO PROXY VOTING
Policies and Procedures:
The Trust has delegated to Thornburg Investment Management, Inc. (the “Advisor”) voting decisions respecting proxies for the Fund’s voting securities. The Advisor makes voting decisions in accordance with its Proxy Voting Policy. A description of the Policy is available (i) without charge, upon request, by calling the Advisor toll-free at 1-800-847-0200, (ii) on the Thornburg website at www.thornburg. com, and (iii) on the Securities and Exchange Commission’s website at www.sec.gov.
Information regarding how proxies were voted is available on or before August 31 of each year for the twelve months ending the preceding June 30. This information is available (i) without charge, upon request by calling the Advisor toll-free at 1-800-847-0200, (ii) on the Thornburg website at www.thornburg.com, and (iii) on the Securities and Exchange Commission’s website at www.sec.gov.
AVAILABILITY OF QUARTERLY PORTFOLIO SCHEDULE
The Fund files with the Securities and Exchange Commission schedules of its portfolio holdings on Form N-Q for the first and third quarters of each fiscal year. The Fund’s Forms N-Q are available on the Commission’s website at www.sec.gov, or may be reviewed and copied at the Commission’s Public Reference Room in Washington, D.C. Information on the operation of the Public Reference Room may be obtained by calling 1-800-SEC-0330. The Fund also makes this information available on its website at www.thornburg. com/download or upon request by calling 1-800-847-0200.
Semi-Annual Report 29
| | |
| TRUSTEES’ STATEMENT TO SHAREHOLDERS | | |
Revised and Readopted September 15, 2014
The Trustees believe current and prospective shareholders should know how we discharge our responsibilities in supervising the Funds’ investment advisor and in reviewing the advisor’s contract for renewal. Since 2005, we have issued a statement which sets out clearly the three principal guidelines that we follow in supervising the Trust’s investment advisor on your behalf. In accordance with our customary practice, in September of 2014 we again reviewed our statement and concluded we should reissue this statement outlining the principal features of our supervision of the advisor’s performance of investment management services for the Funds.
We begin with the premise that each shareholder selected his or her Fund because its investments are managed by the investment advisor identified in the prospectus and in accordance with the objective and policies described in the prospectus. We realize, as each of you do, that if you believe that your Fund’s stated objective and policies no longer serve your personal investment goals, you can sell your shares and leave the Fund.
Therefore, we believe that our primary supervisory task – our principal obligation to you – is to assess the nature and quality of the advisor’s services, and to confirm that the advisor actively and competently pursues the Fund’s objective, in accordance with the policies set out in the prospectus. To do this, we meet regularly with management to review your Fund’s portfolio and to discuss the advisor’s specific actions and judgments in pursuing the Fund’s objective. We do not substitute our own judgment for the advisor’s decisions in selecting investments; the advisor is paid to exercise its informed judgment on investment decisions, and we seek to confirm, in reviewing the advisor’s performance, that the advisor is doing just that.
Second, we are conscious of costs and the effect that costs have on shareholders’ returns. We try to make sure that your Fund’s fees and costs are reasonable in relationship to the services rendered and that they are generally in line with those charged by other expert investment advisors, consistent with our belief that the Fund’s investors searched for and expect that expertise and attention and have decided to pay a reasonable price for it. We do not put the management contract “out to bid” as a matter of course, and we would not do so unless we had concluded that the advisor materially had failed to pursue the Fund’s objectives in accordance with its policies, or for other equally important reasons. We believe that any other approach would be inconsistent with your interests and contrary to your expectations when you bought shares of the Fund in the first place.
Finally, because we believe that most Thornburg Fund shareholders have invested with a long-term perspective, we try not to focus too much on the fashions of the moment and on short-term performance. The market will not favor any specific investment objective or set of policies at all times and under all economic circumstances. A fund will experience periods of both high and low returns relative to other funds and other investments. Even if one of our Funds is not favored by the market at a particular time, we believe that the advisor is nonetheless obliged to remain true to the Fund’s objective and policies, and we watch to see that it does so.
Trustees of Thornburg Investment Trust
30 Semi-Annual Report
THORNBURG FUND FAMILY
FUNDAMENTAL, BOTTOM-UP EQUITY RESEARCH
We search far and wide for the best stock ideas – within the United States and around the globe. Potential investments that may deserve a deeper look are thoroughly analyzed using both quantitative and qualitative criteria. But the vast majority are discarded. Those that ultimately make it into our highly-selective portfolios are continually monitored to determine whether our investment theses unfold as expected.
| | • | | Thornburg Core Growth Fund |
| | • | | Thornburg International Value Fund |
| | • | | Thornburg International Growth Fund |
| | • | | Thornburg Developing World Fund |
| | • | | Thornburg Investment Income Builder Fund |
| | • | | Thornburg Global Opportunities Fund |
A TRADITION OF DISCIPLINED BOND MANAGEMENT
At Thornburg, the word “disciplined” carries some substance. We don’t make a practice of using shortcuts to enhance yield or total returns. Every strategy is grounded in rigorous, bottom-up credit work. Portfolios are assembled carefully—in the case of our core bond funds, using laddered structures – to mitigate price fluctuation. Position sizes are controlled so that no single bond can have an outsized effect on a portfolio. And as with our equity portfolios, managers enjoy flexibility to seek an optimal risk/reward balance.
| | • | | Thornburg Low Duration Income Fund |
| | • | | Thornburg Limited Term U.S. Government Fund |
| | • | | Thornburg Limited Term Income Fund |
| | • | | Thornburg Strategic Income Fund |
| | • | | Thornburg Low Duration Municipal Fund |
| | • | | Thornburg Limited Term Municipal Fund |
| | • | | Thornburg Intermediate Municipal Fund |
| | • | | Thornburg California Limited Term Municipal Fund |
| | • | | Thornburg New Mexico Intermediate Municipal Fund |
| | • | | Thornburg New York Intermediate Municipal Fund |
| | • | | Thornburg Strategic Municipal Income Fund |
Before investing, carefully consider the Fund’s investment goals, risks, charges, and expenses. For a prospectus or summary prospectus containing this and other information, contact your financial advisor or visit thornburg.com. Read it carefully before investing.
For additional information, please visit thornburg.com
Thornburg Investment Management, Inc. 2300 North Ridgetop Road, Santa Fe, NM 87506
Semi-Annual Report 31

This Semi-Annual Report is submitted for the general information of shareholders of the Fund. It is not authorized for distribution to prospective investors in the Fund unless preceded or accompanied by an effective prospectus.
| | | | |
| Investment Advisor: | | Distributor: | | |
| Thornburg Investment Management® | | Thornburg Securities Corporation® | | |
| 800.847.0200 | | 800.847.0200 | | |
| | | | TH172 |
FIRM OVERVIEW
THE FIRM
Thornburg Investment Management is a privately owned global investment firm that offers a range of solutions for retail and institutional investors. We are driven by our mission to help our clients reach their long-term financial goals through fundamental research and active portfolio management.
Founded in 1982 and headquartered in Santa Fe, New Mexico, we manage approximately $61 billion (as of March 31, 2015) across seven equity and 11 bond mutual funds, separate accounts for high-net-worth investors and institutional accounts, and five UCITS funds for non-U.S. investors.

CORE INVESTMENT PRINCIPLES
Our focus has always been on maintaining and building the investment expertise to manage Thornburg strategies to a high standard, while adhering to a core set of investment principles:
| | • | | We focus on the fundamentals. We invest according to our view of the fundamental value of an issuer only after performing thorough, bottom-up research. |
| | • | | We think and invest for the long term. We typically make investment decisions based upon an investment thesis we expect to play out over 18 months to several years. We may not always hold a security for several years, but our horizon line is typically a few years out. |
| | • | | We stay flexible. We go where we see value. Our investment mandates are generally broad and flexible, and we exercise as much flexibility as possible within any restrictions. |
| | • | | We collaborate across strategies. We are structured as global generalists. Portfolio managers and analysts do not specialize in sectors, geographies, or even security types, but instead must understand and communicate bottom-up fundamentals across industries, sectors, and borders. |
2 Semi-Annual Report
Semi-Annual Report
Thornburg Strategic Municipal Income Fund
March 31, 2015
| | | | |
SHARE Class | | NASDAQ Symbol | | CUSIP |
Class A | | TSSAX | | 885-216-101 |
Class C | | TSSCX | | 885-216-200 |
Class I | | TSSIX | | 885-216-309 |
Minimum investments for Class I shares are higher than those for other classes. Class I shares may not be available to all investors.
Investments in the Fund carry risks, including possible loss of principal. Bond funds have the same interest rate, inflation, and credit risks that are associated with the underlying bonds. The value of bonds will fluctuate relative to changes in interest rates, decreasing when interest rates rise. This effect is more pronounced for longer-term bonds. Unlike bonds, bond funds have ongoing fees and expenses. Investments in lower-rated and unrated bonds may be more sensitive to default, downgrades, and market volatility; these investments may also be less liquid than higher-rated bonds. Investments in derivatives are subject to counterparty risk and the risks associated with the securities or other assets underlying the pool of securities, including illiquidity and difficulty in valuation. Please see the Fund’s prospectus for a discussion of the risks associated with an investment in the Fund. Investments in the Fund are not FDIC insured, nor are they deposits of or guaranteed by a bank or any other entity.
Semi-Annual Report 3
| | |
| LETTER TO SHAREHOLDERS | | |
| |
Thornburg Strategic Municipal Income Fund | | March 31, 2015 (Unaudited) |
April 16, 2015
Dear Fellow Shareholder:
We are pleased to present the semi-annual report for the Thornburg Strategic Municipal Income Fund. The net asset value (NAV) of the Class A shares increased by 11 cents to $15.30 per share during the six months ended March 31, 2015. If you were with us for the entire period, you received dividends of 16.86 cents per share. If you reinvested your dividends, you received 16.93 cents per share. Dividends were lower for Class C shares and higher for Class I shares, to account for varying class-specific expenses. The Class A shares underperformed the Fund’s benchmark index, with a 1.92% total return (without sales charge) for the six months ended March 31, 2015, compared to the 2.43% total return for the BofA Merrill Lynch Municipal Master Index. The Fund generated 0.49% more price return and 1.01% less income than its benchmark.
Throughout the six-month period the Fund maintained a lower risk posture on interest rates than its benchmark; its average effective duration was 6.00, years compared to 6.69 years for the benchmark. The shorter duration hurt performance by 0.27%. The Fund’s position along the yield curve subtracted 0.16% and sector selection contributed 0.77% of relative performance. Credit selection added 0.22% to relative performance. Other factors including security selection subtracted 0.07%.
Chart I 10-Year AAA General Obligation Municipal Bond Real Yield History, Using Core PCE Index
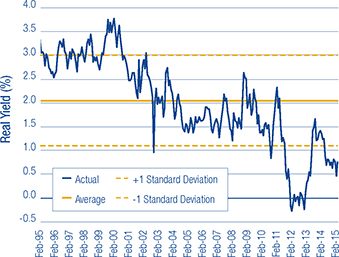
The Municipal Market
The municipal market has been something of a roller coaster over the past six months. Much of that volatility revolves around investors’ increased fears of an eventual Federal Reserve rate increase. While those fears aren’t completely unfounded, we believe the typical municipal bond investor is ignoring several other sources of risk present in the market.
First and foremost, it appears that risk is mispriced. At a very high level, we examine two primary sources of risk in the municipal market: duration and credit quality. The hunt for excess yield has bid up the prices of these sources of risk to levels we believe are unsustainable.
Investors looking for more yield can increase the duration of their purchases. This strategy often makes sense in a period characterized by a steep yield curve. When the curve is sufficiently steep, the incremental yield an investor picks up for buying a bond one year longer may, in fact, provide adequate compensation for the increased interest-rate risk. But through the six months ended March 31, 2015, we believe compensation offered to investors to extend duration was not in line with the added risk. This was particularly true when looking at the overall low level of interest rates in the market. Chart I shows the yield of a AAA rated general obligation bond less the core PCE index (or Personal Consumption Expenditures index, the Federal Reserve’s favored inflation measure). This is the so-called “real yield” an investor receives after inflation; this was and continues to be well below the long-term average.
Less risk-averse investors can also decrease the average credit quality of their portfolios in an attempt to generate more income. While this can be a sound strategy in times of wide credit spreads, it fails during periods when credit risk is mispriced. Chart II shows a history of credit spreads, which in this case is the incremental yield an investor picked up from investing in a BBB rated revenue bond versus a AAA rated general obligation bond. Such spreads are as tight as they have been since before the great recession, when municipal bond insurers were thriving and a majority of the market was insured with AAA ratings.
In addition to overpriced risks, investors need to be prepared for continued volatility in the market. We live in a world where the Federal Reserve’s statements are analyzed word for word. The inclusion or deletion of any given word has the potential to send the markets roiling. The increased volatility may be exacerbated in the future by liquidity constraints facing the market, prompted by recent federal regulation. As a result of Dodd-Frank and other regulations, large broker/dealers will no longer be able to allocate the same amount of capital to the municipal market as they have in the past. Without that support, the market could be rattled more than usual if and when we see large outflows.
Investors need to be aware of all of these risks and ensure they are accounting for them appropriately.
4 Semi-Annual Report
| | |
| LETTER TO SHAREHOLDERS, | | |
| |
CONTINUED | | |
| |
Thornburg Strategic Municipal Income Fund | | March 31, 2015 (Unaudited) |
Chart II Credit-Spread Difference, BBB Rated Revenue v. AAA Rated General Obligation Bonds
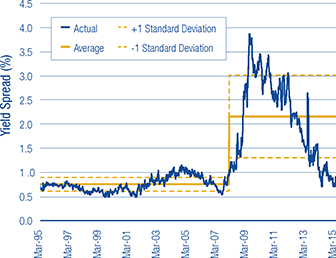
Conclusion
For the past six months, the Thornburg municipal bond team has asked a simple question: “Are we getting paid to take risk?” The answer has been a resounding “no.” As a result, our investors will see a portfolio with a lower duration and a stronger average credit quality, as we overweighted higher-rated credits. We have also increased cash positions to seek to protect against a market liquidity crunch and to strategically take advantage of opportunities should they arise. In short, we believe we have avoided overpriced risk.
Many shareholders may ask themselves “what should I do if interest rates begin to rise?” We continue to stress having confidence in the structure of your portfolio. An increase in rates will allow the portfolio to strategically take advantage of higher-yielding bonds in the most attractive parts of the curve. We advise being patient when interest rates start to rise, and lengthening your anticipated holding period. Remember that higher yields also mean higher income, something investors have been sorely lacking for quite some time!
We will continue to strive to manage your assets to fulfill the Fund’s objectives.
Sincerely,
| | | | |
 | |  | |  |
| Christopher Ryon,CFA | | Josh Gonze | | Nicholos Venditti |
| Portfolio Manager | | Portfolio Manager | | Portfolio Manager |
| Managing Director | | Managing Director | | Managing Director |
The matters discussed in this report may constitute forward-looking statements made pursuant to the safe harbor provisions of the Securities Litigation Reform Act of 1995. These include any advisor or portfolio manager prediction, assessment, analysis or outlook for individual securities, industries, investment styles, market sectors and/or markets. These statements involve risks and uncertainties. In addition to the general risks described for each fund in its current prospectus, other factors bearing on these reports include the accuracy of the advisor’s or portfolio manager’s forecasts and predictions, the appropriateness of the investment strategies designed by the advisor or portfolio manager and the ability of the advisor or portfolio manager to implement their strategies efficiently and successfully. Any one or more of these factors, as well as other risks affecting the securities markets generally, could cause the actual results of any fund to differ materially as compared to its benchmarks.
The views expressed by the portfolio managers reflect their professional opinions and are subject to change. Under no circumstances does the information contained within represent a recommendation to buy or sell any security.
Semi-Annual Report 5
| | |
| PERFORMANCE SUMMARY | | |
| |
Thornburg Strategic Municipal Income Fund | | March 31, 2015 (Unaudited) |
Average Annual Total Returns
| | | | | | | | | | | | | | | | |
| | | 1-Yr | | | 3-Yr | | | 5-Yr | | | Since
Incep. | |
A Shares (Incep: 4/1/09) | | | | | | | | | | | | | | | | |
Without sales charge | | | 6.60 | % | | | 4.49 | % | | | 6.04 | % | | | 8.28 | % |
With sales charge | | | 4.47 | % | | | 3.79 | % | | | 5.61 | % | | | 7.92 | % |
C Shares (Incep: 4/1/09) | | | | | | | | | | | | | | | | |
Without sales charge | | | 6.27 | % | | | 4.18 | % | | | 5.73 | % | | | 7.98 | % |
With sales charge | | | 5.67 | % | | | 4.18 | % | | | 5.73 | % | | | 7.98 | % |
I Shares (Incep: 4/1/09) | | | 6.94 | % | | | 4.84 | % | | | 6.37 | % | | | 8.61 | % |
30-day Yields, A Shares
(with sales charge)
| | | | |
Annualized Distribution Yield | | | 2.05 | % |
SEC Yield | | | 1.16 | % |
Performance data shown represents past performance and is no guarantee of future results. Investment return and principal value will fluctuate so shares, when redeemed, may be worth more or less than their original cost. Current performance may be lower or higher than quoted. For performance current to the most recent month end, visit thornburg.com or call 800-847-0200. The performance information does not reflect the deduction of taxes that a shareholder would pay on distributions or the redemption of Fund shares. Returns reflect the reinvestment of dividends and capital gains. Class A shares are sold with a maximum sales charge of 2.00%. Class C shares include a 0.60% CDSC for the first year only. There is no sales charge for Class I shares.
As disclosed in the most recent prospectus, the total annual fund operating expenses are as follows: A shares, 1.31%; C shares, 1.72%; I shares, 0.93%. Thornburg Investment Management and/or Thornburg Securities Corporation have contractually agreed to waive fees and reimburse expenses through at least February 1, 2016, for some of the share classes, resulting in net expense ratios of the following: A shares, 1.25%; C shares, 1.55%. For more detailed information on fund expenses and waivers/reimbursements please see the Fund’s prospectus.
Without the fee waivers and expense reimbursements described above, the Annualized Distribution yield would have been 2.04%, and the SEC yield would have been 1.15%.
Glossary
BofA Merrill Lynch Municipal Master Index – An index which tracks the performance of the investment-grade U.S. tax-exempt bond market. Qualifying bonds must have at least one year remaining term to maturity, a fixed coupon schedule, and an investment grade rating (based on average of Moody’s, S&P, and Fitch).
Unless otherwise noted, index returns reflect the reinvestment of income dividends and capital gains, if any, but do not reflect fees, brokerage commissions or other expenses of investing. Investors may not make direct investments into any index. The performance of any index is not indicative of the performance of any particular investment.
Alternative Minimum Tax – A federal tax aimed at ensuring that high-income individuals, estates, trusts, and corporations pay a minimal level income tax. For individuals, the AMT is calculated by adding tax preference items to regular taxable income.
Annualized Distribution Yield – The distribution yield reflects actual distributions made to shareholders. The annualized distribution yield is calculated by summing the last 30 days of income at a given month end and annualizing to a 360-day year. The result is divided by the ending maximum offering price.
Bond Credit Ratings (Credit Quality) – A bond credit rating assesses the financial ability of a debt issuer to make timely payments of principal and interest. Ratings of AAA (the highest), AA, A, and BBB are investment-grade quality. Ratings of BB, B, CCC, CC, C and D (the lowest) are considered below investment grade, speculative grade, or junk bonds.
Bond Insurers – Individual bonds are sometimes insured by private companies. The insurance guarantees the payment of principal and interest on a bond issue if the issuer defaults. Mutual funds are not insured, even if the underlying bonds are insured.
Credit Spread/Quality Spread – The difference between the yields of securities with different credit qualities.
Duration – A bond’s sensitivity to interest rates. Effective duration incorporates the embedded option features, such as call provisions. Bonds with longer durations experience greater price volatility than bonds with shorter durations.
General Obligation Bond – A municipal bond backed by the credit and “taxing power” of the issuing jurisdiction rather than the revenue from a given project.
Personal Consumption Expenditure (PCE) Index – A broad measure of U.S. inflation that assesses the change in prices of goods and services purchased by consumers throughout the economy. Core PCE excludes the more volatile and seasonal food and energy prices.
Revenue Bond – A bond on which the debt service is payable solely from the revenue generated from the operation of the project being financed or a category of facilities, or from other non-tax sources.
SEC Yield – SEC yield is computed in accordance with SEC standards measuring the net investment income per share over a specified 30-day period expressed as a percentage of the maximum offering price of the Fund’s shares at the end of the period.
Standard Deviation – A measure of the dispersion of a set of data from its mean. The more spread apart the data, the higher the deviation. Values within one standard deviation of the mean represent approximately two-thirds of the data set, assuming a normal distribution.
Yield Curve – A line that plots the interest rates, at a set point in time, of bonds having equal credit quality, but differing maturity dates.
Yield Spread – The difference between yields on differing debt instruments, calculated by deducting the yield of one instrument from another.
6 Semi-Annual Report
| | |
| FUND SUMMARY | | |
| |
Thornburg Strategic Municipal Income Fund | | March 31, 2015 (Unaudited) |
Objectives and Strategies
The Fund seeks a high level of current income exempt from federal individual income tax (may be subject to Alternative Minimum Tax).
Not more than 50% of the portfolio is invested in bonds rated below investment grade (or of equivalent quality as determined in accordance with the prospectus) at the time of purchase. Also, the portfolio is typically diversified among sectors, issuers, credit qualities, geographic regions, and segments of the yield curve. The flexible nature of the Fund allows the team to adapt the portfolio’s duration and credit quality to our perception of future market conditions.
Key Portfolio Attributes
| | | | |
Number of Bonds | | | 208 | |
Effective Duration | | | 6.0 Yrs | |
Average Maturity | | | 12.2 Yrs | |
Security Credit Ratings
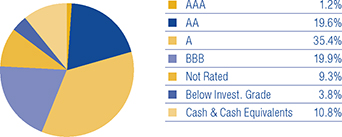
A bond credit rating assesses the financial ability of a debt issuer to make timely payments of principal and interest. Ratings of AAA (the highest), AA, A, and BBB are investment-grade quality. Ratings of BB, B, CCC, CC, C and D (the lowest) are considered below investment grade, speculative grade, or junk bonds. Credit quality ratings for Thornburg’s municipal portfolios used the highest rating available from either Standard & Poor’s or Moody’s Investors Service.
There is no guarantee that the Fund will meet its investment objectives.
All data is subject to change. Charts may not add up to 100% due to rounding.
Semi-Annual Report 7
| | |
| SCHEDULE OF INVESTMENTS | | |
| |
Thornburg Strategic Municipal Income Fund | | March 31, 2015 (Unaudited) |
| | | | | | | | | | |
Issuer-Description | | Credit Rating†
S&P/ Moody’s | | Principal
Amount | | | Value | |
ALABAMA — 0.40% | | | | | | | | | | |
City of Mobile Industrial Development Board, 1.65% due 6/1/2034 put 3/20/2017 (Alabama Power Company Barry Plant Project) | | A/A1 | | $ | 1,000,000 | | | $ | 1,013,790 | |
| | | |
ARIZONA — 1.57% | | | | | | | | | | |
a Arizona HFA, 5.00% due 12/1/2031 (Scottsdale Lincoln Hospitals) | | NR/A2 | | | 2,500,000 | | | | 2,894,025 | |
Pima County IDA, 5.875% due 4/1/2022 (Cambridge Academy) | | NR/NR | | | 335,000 | | | | 338,243 | |
Pima County IDA, 5.125% due 12/1/2040 (Providence Day School) | | BBB+/NR | | | 710,000 | | | | 757,520 | |
| | | |
ARKANSAS — 0.46% | | | | | | | | | | |
University of Arkansas Board of Trustees, 5.00% due 11/1/2036 (Fayetteville Campus) | | NR/Aa2 | | | 1,000,000 | | | | 1,154,670 | |
| | | |
CALIFORNIA — 12.18% | | | | | | | | | | |
ABAG Finance Authority for Nonprofit Corporations, 5.00% due 7/1/2047 (Episcopal Senior Communities) | | NR/NR | | | 1,635,000 | | | | 1,788,559 | |
Benicia USD GO, 0% due 8/1/2026 (Benicia High School; Insured: AGM) | | AA/A2 | | | 830,000 | | | | 571,438 | |
California HFFA, 6.25% due 2/1/2026 (Community Program Developmental Disabilities; Insured: California Mtg Insurance) | | A+/NR | | | 1,500,000 | | | | 1,850,235 | |
California HFFA, 5.00% due 11/15/2034 (Children’s Hospital Los Angeles) | | BBB+/Baa2 | | | 420,000 | | | | 451,912 | |
California Housing Finance Agency, 4.625% due 8/1/2016 (Low-Moderate Income Housing Loans; Insured: FGIC) (AMT) | | A-/A3 | | | 1,175,000 | | | | 1,213,070 | |
California Housing Finance Agency, 4.625% due 8/1/2026 (Low-Moderate Income Housing Loans; Insured: FGIC) (AMT) | | A-/A3 | | | 560,000 | | | | 567,039 | |
California Municipal Finance Authority, 8.50% due 11/1/2039 (Harbor Regional Center) | | NR/A3 | | | 1,000,000 | | | | 1,246,960 | |
California Pollution Control Financing Authority, 5.00% due 11/21/2045 (Poseidon Resources (Channelside) LP Desalination Project) (AMT) | | NR/Baa3 | | | 3,000,000 | | | | 3,259,770 | |
California State Public Works Board, 5.00% due 4/1/2028 (Corrections & Rehabilitation and Judicial Council) | | A/A1 | | | 1,000,000 | | | | 1,158,760 | |
California State Public Works Board, 6.25% due 4/1/2034 (Department of General Services-Offices Renovation) | | A/A1 | | | 100,000 | | | | 119,417 | |
California Statewide Communities Development Authority, 5.00% due 7/1/2020 (Aspire Public Schools; LOC: PCSD Guaranty Pool I, LLC) | | NR/NR | | | 175,000 | | | | 183,264 | |
California Statewide Communities Development Authority, 6.125% due 7/1/2046 (Aspire Public Schools) | | NR/NR | | | 995,000 | | | | 1,070,391 | |
Calipatria USD GO, 0% due 8/1/2025 (Educational Facilities; Insured: ACA) | | NR/NR | | | 2,425,000 | | | | 1,500,105 | |
Carson Redevelopment Agency, 7.00% due 10/1/2036 (Project Area 1) | | A-/NR | | | 500,000 | | | | 592,335 | |
Chico Redevelopment Agency, 5.00% due 4/1/2030 (Chico Amended & Merged Redevelopment; Insured: AMBAC) | | A+/NR | | | 1,500,000 | | | | 1,553,025 | |
City of Moorpark Mobile Home Park, 6.15% due 5/15/2031 (Villa Del Arroyo) | | A/NR | | | 1,000,000 | | | | 1,137,180 | |
City of Palm Springs Financing Authority, 5.25% due 6/1/2027 (Downtown Revitalization Project) | | AA/NR | | | 1,620,000 | | | | 1,888,742 | |
a Corona-Norco USD COP, 5.00% due 4/15/2031 (Insured: AGM) | | AA/A1 | | | 1,750,000 | | | | 1,991,395 | |
County of El Dorado, 5.00% due 9/1/2026 (El Dorado Hills Development-Community Facilities) | | A/NR | | | 630,000 | | | | 722,982 | |
Daly County Housing Development Finance Agency, 5.25% due 12/15/2023 (Franciscan Country Club Mobile Home Park Acquisition) | | A/NR | | | 650,000 | | | | 692,841 | |
Los Angeles County Public Works Financing Authority, 4.00% due 9/1/2015 (Lynwood Regional Justice Center and Central Jail Expansion; Insured: Natl-Re) | | AA-/NR | | | 50,000 | | | | 50,700 | |
Los Angeles County Public Works Financing Authority, 3.625% due 9/1/2016 (Lynwood Regional Justice Center and Central | | | | | | | | | | |
Jail Expansion; Insured: Natl-Re) | | AA-/A3 | | | 200,000 | | | | 207,102 | |
M-S-R Energy Authority, 6.50% due 11/1/2039 | | A-/NR | | | 1,000,000 | | | | 1,379,140 | |
Redwood City Redevelopment Agency, 0% due 7/15/2021 (Redevelopment Project Area 2; Insured: AMBAC) | | A-/NR | | | 1,285,000 | | | | 1,044,769 | |
Riverside Community College District GO, 5.00% due 8/1/2021
pre-refunded 8/1/2015 (Insured: AGM) | | AA/Aa2 | | | 150,000 | | | | 152,391 | |
Riverside County Asset Leasing Corp., 0% due 6/1/2021 (Riverside County Hospital; Insured: Natl-Re) | | AA-/A2 | | | 535,000 | | | | 458,008 | |
San Francisco City & County Redevelopment Financing Authority, 0% due 8/1/2023 (Redevelopment Project; Insured: Natl-Re) | | AA-/A3 | | | 1,025,000 | | | | 801,509 | |
San Francisco City & County Redevelopment Financing Authority, 6.50% due 8/1/2039 (Mission Bay North Redevelopment) | | A-/NR | | | 250,000 | | | | 291,255 | |
San Francisco City & County Redevelopment Financing Authority, 6.75% due 8/1/2041 (Mission Bay North Redevelopment) | | A-/NR | | | 500,000 | | | | 612,650 | |
San Jose Redevelopment Agency, 5.50% due 8/1/2035 (Merged Area Redevelopment) | | A/Ba1 | | | 1,000,000 | | | | 1,111,380 | |
Sonoma County Community Redevelopment Agency, 6.50% due 8/1/2034 (The Springs Redevelopment; Insured: AGM) | | AA/NR | | | 100,000 | | | | 100,481 | |
Southeast Resource Recovery Facilities Authority, 5.25% due 12/1/2016 (Insured: AMBAC) | | A+/A2 | | | 500,000 | | | | 502,075 | |
Union Elementary School District, 0% due 9/1/2027 (Santa Clara County District Schools; Insured: Natl-Re) | | AA+/NR | | | 905,000 | | | | 614,911 | |
| | | |
COLORADO — 2.70% | | | | | | | | | | |
Denver Convention Center Hotel Authority, 5.125% due 12/1/2026 (Insured: Syncora) | | BBB-/Baa3 | | | 2,450,000 | | | | 2,583,035 | |
Denver Convention Center Hotel Authority, 5.00% due 12/1/2030 (Insured: Syncora) | | BBB-/Baa3 | | | 450,000 | | | | 464,085 | |
Denver Convention Center Hotel Authority, 5.00% due 12/1/2035 (Insured: Syncora) | | BBB-/Baa3 | | | 605,000 | | | | 622,327 | |
Eagle River Fire District, 6.625% due 12/1/2024 | | NR/NR | | | 225,000 | | | | 244,258 | |
Eagle River Fire District, 6.875% due 12/1/2030 | | NR/NR | | | 400,000 | | | | 432,044 | |
Public Authority for Colorado Energy, 5.75% due 11/15/2018 (Natural Gas Purchase) | | A-/Baa2 | | | 520,000 | | | | 574,928 | |
Public Authority for Colorado Energy, 6.50% due 11/15/2038 (Natural Gas Purchase) | | A-/Baa2 | | | 260,000 | | | | 357,248 | |
Regional Transportation District COP, 4.50% due 6/1/2016 pre-refunded 6/1/2015 (Transit Vehicles Project; Insured: AMBAC) | | A/Aa3 | | | 350,000 | | | | 352,516 | |
Regional Transportation District COP, 5.375% due 6/1/2031 (FasTracks Transportation System) | | A/Aa3 | | | 500,000 | | | | 577,115 | |
8 Semi-Annual Report
| | |
| SCHEDULE OF INVESTMENTS, CONTINUED | | |
| |
Thornburg Strategic Municipal Income Fund | | March 31, 2015 (Unaudited) |
| | | | | | | | | | |
Issuer-Description | | Credit Rating†
S&P/ Moody’s | | Principal
Amount | | | Value | |
Regional Transportation District COP, 5.00% due 6/1/2044 (FasTracks Transportation System) | | A/Aa3 | | $ | 565,000 | | | $ | 639,292 | |
| | | |
CONNECTICUT — 0.82% | | | | | | | | | | |
Connecticut Health & Educational Facilities Authority, 6.00% due 7/1/2039 (Ethel Walker School) | | BBB/NR | | | 1,000,000 | | | | 1,071,730 | |
State of Connecticut GO Floating Rate Note, 0.54% due 9/15/2017 (Public Facility Improvements) | | AA/Aa3 | | | 1,000,000 | | | | 1,005,150 | |
| | | |
DELAWARE — 0.44% | | | | | | | | | | |
Delaware HFA, 5.00% due 7/1/2021 (Nanticoke Memorial Hospital) | | BBB-/NR | | | 1,000,000 | | | | 1,105,360 | |
| | | |
DISTRICT OF COLUMBIA — 0.37% | | | | | | | | | | |
Metropolitan Washington Airports Authority, 0% due 10/1/2027 (Dulles Toll Road; Insured: AGM) | | AA/A3 | | | 1,500,000 | | | | 932,415 | |
| | | |
FLORIDA — 7.57% | | | | | | | | | | |
City of Gainesville, 0.03% due 10/1/2026 put 4/1/2015 (Utilities System; SPA: Union Bank) (daily demand notes) | | AA/Aa2 | | | 5,500,000 | | | | 5,500,000 | |
City of Hollywood Community Redevelopment Agency, 5.625% due 3/1/2024 (Beach Community Redevelopment Project) | | NR/A3 | | | 315,000 | | | | 315,882 | |
City of Miami GO, 5.00% due 1/1/2017 (Homeland Defense/Neighborhood Capital Improvements) | | A/A2 | | | 1,245,000 | | | | 1,328,241 | |
City of Miami GO, 5.00% due 1/1/2018 (Homeland Defense/Neighborhood Capital Improvements) | | A/A2 | | | 1,790,000 | | | | 1,960,157 | |
Florida Higher Educational Facilities Financing Authority, 5.00% due 4/1/2027 (Nova Southeastern University) | | BBB/Baa1 | | | 1,000,000 | | | | 1,112,270 | |
Miami-Dade County Expressway Authority, 5.00% due 7/1/2022 (Toll System Five-Year Work Program) | | A-/A3 | | | 625,000 | | | | 747,225 | |
Miami-Dade County Expressway Authority, 5.00% due 7/1/2024 (Toll System Five-Year Work Program) | | A-/A3 | | | 625,000 | | | | 760,513 | |
Miami-Dade County School Board COP, 5.00% due 8/1/2027 (District School Facilities and Infrastructure) | | A/A1 | | | 1,100,000 | | | | 1,252,295 | |
Orange County, 0% due 10/1/2016 (County Correctional Facilities and Communications System; Insured: AMBAC) | | NR/NR | | | 410,000 | | | | 401,447 | |
Pinellas County Educational Facilities Authority, 5.25% due 10/1/2030 (Barry University) | | BBB/NR | | | 500,000 | | | | 559,030 | |
Sarasota County Public Hospital Board, 4.659% due 10/1/2021 (Sarasota Memorial Hospital; Insured: Natl-Re) | | AA-/A1 | | | 1,000,000 | | | | 1,050,000 | |
School Board of Marion County COP, 5.25% due 6/1/2022 pre-refunded 6/1/2015 (Educational Facilities; Insured: AMBAC) | | NR/A2 | | | 1,000,000 | | | | 1,008,450 | |
Tampa Sports Authority, 5.75% due 10/1/2020 (Tampa Bay Arena; Insured: Natl-Re) | | AA-/A3 | | | 1,000,000 | | | | 1,119,540 | |
University of Southern Florida Financing Corp. COP, 5.00% due 7/1/2021 (Student Housing & Parking Facilities; Insured: AMBAC) | | A+/A1 | | | 375,000 | | | | 379,451 | |
Volusia County Educational Facilities Authority, 5.00% due 10/15/2030 (Embry-Riddle Aeronautical University, Inc.) | | NR/Baa1 | | | 1,500,000 | | | | 1,710,870 | |
| | | |
GEORGIA — 1.23% | | | | | | | | | | |
City of Atlanta, 6.25% due 11/1/2034 pre-refunded 11/1/2019 (Water and Wastewater Capital Improvement Program) | | AA-/Aa3 | | | 500,000 | | | | 610,175 | |
Development Authority of Fulton County, 5.00% due 10/1/2019 (Georgia Tech Athletic Assoc.) | | NR/A2 | | | 1,000,000 | | | | 1,153,860 | |
Main Street Natural Gas, Inc., 5.00% due 3/15/2018 (Georgia Gas) | | A/A3 | | | 515,000 | | | | 564,409 | |
Main Street Natural Gas, Inc., 5.50% due 9/15/2023 (Georgia Gas) | | A-/Baa2 | | | 350,000 | | | | 418,698 | |
Municipal Gas Authority of Georgia GO, 5.00% due 4/1/2016 (Public Gas Partners, Inc.-Gas Portfolio III Project) | | AA-/A1 | | | 350,000 | | | | 366,412 | |
| | | |
GUAM — 1.82% | | | | | | | | | | |
Guam Government, 5.75% due 12/1/2034 (Layon Solid Waste Disposal Facility) | | BBB+/NR | | | 500,000 | | | | 553,925 | |
Guam Government Department of Education COP, 6.875% due 12/1/2040 (John F. Kennedy High School) | | B+/NR | | | 1,000,000 | | | | 1,125,530 | |
Guam Government GO, 7.00% due 11/15/2039 | | BB-/NR | | | 520,000 | | | | 614,052 | |
Guam Power Authority, 5.00% due 10/1/2027 (Electric Power System; Insured: AGM) | | AA/A2 | | | 1,000,000 | | | | 1,170,940 | |
Guam Waterworks Authority, 5.25% due 7/1/2024 (Water and Wastewater System) | | A-/Ba1 | | | 500,000 | | | | 588,660 | |
Guam Waterworks Authority, 5.00% due 7/1/2028 (Water and Wastewater System) | | A-/Ba1 | | | 500,000 | | | | 570,425 | |
| | | |
ILLINOIS — 6.42% | | | | | | | | | | |
Board of Education of the City of Chicago GO, 5.00% due 12/1/2020 (Education Capital Improvement Program; Insured: AGM) | | AA/A2 | | | 365,000 | | | | 389,130 | |
City of Chicago, 5.00% due 1/1/2031 (Riverwalk Expansion Project; Insured: AGM) | | AA+/A2 | | | 500,000 | | | | 558,080 | |
City of Chicago GO, 5.00% due 1/1/2020 (Insured: AGM) | | AA/A2 | | | 475,000 | | | | 476,876 | |
Cook County GO, 5.25% due 11/15/2033 | | AA/A1 | | | 1,000,000 | | | | 1,114,010 | |
Illinois Finance Authority, 5.00% due 8/1/2029 (Advocate Health Care Network) | | AA/Aa2 | | | 2,195,000 | | | | 2,567,513 | |
b Illinois Finance Authority, 5.00% due 8/15/2035 (Silver Cross Hospital & Medical Centers) | | NR/Baa1 | | | 2,355,000 | | | | 2,591,042 | |
Illinois Finance Authority, 5.75% due 11/15/2037 (OSF Healthcare System) | | A/A3 | | | 330,000 | | | | 361,809 | |
Illinois Finance Authority, 6.00% due 5/15/2039 (OSF Healthcare System) | | A/A3 | | | 1,545,000 | | | | 1,822,142 | |
Kane, Cook, & DuPage Counties School District No. 46 GO, 5.00% due 1/1/2028 | | AA-/NR | | | 1,000,000 | | | | 1,160,380 | |
Kane, Cook, & DuPage Counties School District No. 46 GO, 5.00% due 1/1/2031 | | AA-/NR | | | 2,255,000 | | | | 2,581,051 | |
Metropolitan Pier & Exposition Authority, 5.00% due 6/15/2050 (McCormick Place) | | AAA/
Baa1 | | | 1,500,000 | | | | 1,567,620 | |
Village of Melrose Park GO, 6.75% due 12/15/2016 (Redevelopment Project Costs; Insured: Natl-Re) | | NR/A3 | | | 175,000 | | | | 183,484 | |
Village of Melrose Park GO, 6.75% due 12/15/2021 (Redevelopment Project Costs; Insured: Natl-Re) | | NR/A3 | | | 410,000 | | | | 499,101 | |
Will County School District No. 114 GO, 0% due 12/1/2023 (Educational Facilities; Insured: Natl-Re) | | NR/A3 | | | 570,000 | | | | 410,805 | |
| | | |
INDIANA — 2.21% | | | | | | | | | | |
City of Carmel Redevelopment District COP, 6.50% due 7/15/2035 (Performing Arts Center) | | NR/NR | | | 1,000,000 | | | | 1,121,310 | |
Semi-Annual Report 9
| | |
| SCHEDULE OF INVESTMENTS, CONTINUED | | |
| |
Thornburg Strategic Municipal Income Fund | | March 31, 2015 (Unaudited) |
| | | | | | | | | | |
Issuer-Description | | Credit Rating†
S&P/ Moody’s | | Principal
Amount | | | Value | |
Indiana Finance Authority, 6.00% due 12/1/2019 (U.S. Steel Corp.) | | BB-/B1 | | $ | 3,000,000 | | | $ | 3,365,460 | |
Indiana Finance Authority, 6.375% due 9/15/2041 (Marian University) | | BBB-/NR | | | 1,000,000 | | | | 1,112,000 | |
| | | |
IOWA — 0.71% | | | | | | | | | | |
Iowa Finance Authority, 5.25% due 12/1/2025 (Iowa Fertilizer Company Project) | | BB-/NR | | | 1,615,000 | | | | 1,804,666 | |
| | | |
KANSAS — 1.34% | | | | | | | | | | |
City of Wichita, 5.90% due 12/1/2016 (Brentwood Apartments) | | B/NR | | | 175,000 | | | | 173,619 | |
City of Wichita, 5.85% due 12/1/2025 (Brentwood Apartments) | | B/NR | | | 895,000 | | | | 795,002 | |
Kansas City Community College COP, 3.00% due 4/1/2016 (Higher Education Campus Facilities) | | AA-/NR | | | 150,000 | | | | 153,675 | |
Unified Government of Wyandotte County/Kansas City, 5.00% due 9/1/2031 (Utility System Improvement) | | A+/A3 | | | 1,000,000 | | | | 1,146,200 | |
Unified Government of Wyandotte County/Kansas City, 5.00% due 9/1/2032 (Utility System Improvement) | | A+/A3 | | | 1,000,000 | | | | 1,140,090 | |
| | | |
KENTUCKY — 1.32% | | | | | | | | | | |
County of Owen, 6.25% due 6/1/2039 (Kentucky-American Water Co. Project) | | A-/Baa1 | | | 540,000 | | | | 618,273 | |
Kentucky Economic DFA, 0% due 10/1/2021 (Norton Healthcare, Inc.; Insured: Natl-Re) | | AA-/A3 | | | 715,000 | | | | 597,833 | |
Kentucky Economic DFA, 0% due 10/1/2022 (Norton Healthcare, Inc.; Insured: Natl-Re) | | AA-/A3 | | | 2,650,000 | | | | 2,127,446 | |
| | | |
LOUISIANA — 2.31% | | | | | | | | | | |
City of New Orleans, 5.00% due 12/1/2034 (Water System Facilities Improvement) | | BBB+/NR | | | 400,000 | | | | 449,528 | |
Louisiana Energy and Power Authority, 5.25% due 6/1/2038 (LEPA Unit No. 1; Insured: AGM) | | AA/A2 | | | 2,000,000 | | | | 2,314,300 | |
Louisiana Public Facilities Authority, 5.00% due 7/1/2032 (Black & Gold Facilities; Insured: CIFG) | | AA/A3 | | | 120,000 | | | | 124,727 | |
Louisiana Public Facilities Authority, 5.375% due 5/15/2043 (Ochsner Clinic Foundation) | | NR/Baa1 | | | 500,000 | | | | 523,275 | |
Parish of St. Charles, 4.00% due 12/1/2040 put 6/1/2022 (Valero Energy Corp. Refinery) | | BBB/Baa2 | | | 2,250,000 | | | | 2,454,390 | |
| | | |
MASSACHUSETTS — 0.13% | | | | | | | | | | |
Massachusetts Educational Financing Authority, 6.00% due 1/1/2028 | | AA/NR | | | 300,000 | | | | 319,482 | |
| | | |
MICHIGAN — 9.30% | | | | | | | | | | |
Board of Governors of Wayne State University, 5.00% due 11/15/2033 (Eductional Facilities and Equipment) | | AA-/Aa3 | | | 1,250,000 | | | | 1,426,137 | |
City of Kalamazoo Hospital Finance Authority, 5.00% due 5/15/2036 (Bronson Methodist Hospital) | | NR/A2 | | | 1,000,000 | | | | 1,100,260 | |
City of Kalamazoo Hospital Finance Authority, 5.25% due 5/15/2041 (Bronson Nursing and Rehabilitation Center) | | NR/A2 | | | 1,000,000 | | | | 1,099,700 | |
City of Troy GO, 5.25% due 11/1/2032 (Downtown Development Authority-Community Center Facilities) | | AAA/NR | | | 1,025,000 | | | | 1,223,091 | |
County of Genesee GO, 5.375% due 11/1/2038 (Water Supply System; Insured: BAM) | | AA/A2 | | | 1,000,000 | | | | 1,134,380 | |
Detroit City School District, 5.00% due 5/1/2025 (School Building & Site; Insured: Q-SBLF) | | AA-/Aa2 | | | 1,000,000 | | | | 1,148,310 | |
Detroit City School District GO, 5.25% due 5/1/2027 (School Building & Site; Insured: AGM) | | AA/Aa2 | | | 1,000,000 | | | | 1,184,970 | |
Livonia Public School District GO, 5.00% due 5/1/2036 (School Building & Site) | | AA/A2 | | | 225,000 | | | | 254,153 | |
Michigan Finance Authority, 5.00% due 4/1/2031 (State Dept. of Human Services Office Buildings) | | A+/NR | | | 1,000,000 | | | | 1,087,740 | |
Michigan Finance Authority, 5.00% due 8/1/2032 (Beaumont Health Credit Group) | | A/A1 | | | 6,000,000 | | | | 6,803,040 | |
Michigan Housing Development Authority, 3.375% due 11/1/2016 (AMT) | | AA/NR | | | 655,000 | | | | 662,716 | |
Michigan Public School Academy, 8.00% due 8/1/2035 (Will Carleton Charter School) | | NR/NR | | | 1,035,000 | | | | 1,111,311 | |
Michigan State Hospital Finance Authority, 5.00% due 11/15/2015 (Edward W. Sparrow Hospital Assoc.) | | A+/A1 | | | 200,000 | | | | 205,110 | |
Michigan State Hospital Finance Authority, 5.00% due 7/15/2025
pre-refunded 7/15/2017 (Oakwood Southshore Medical Center) | | A/A1 | | | 650,000 | | | | 713,349 | |
Michigan State Hospital Finance Authority, 5.75% due 11/15/2039 (Henry Ford Health System) | | A-/A3 | | | 1,000,000 | | | | 1,136,790 | |
Michigan Strategic Fund, 7.00% due 5/1/2021 (Detroit Edison Company; Insured: Natl-Re/AMBAC) | | NR/NR | | | 250,000 | | | | 317,600 | |
Wayne County Airport Authority, 5.00% due 12/1/2031 (Detroit Metropolitan Wayne County Airport) | | A/A2 | | | 650,000 | | | | 747,175 | |
Wayne County Airport Authority, 5.00% due 12/1/2033 (Detroit Metropolitan Wayne County Airport) | | A/A2 | | | 825,000 | | | | 942,439 | |
Wayne County Airport Authority, 5.00% due 12/1/2034 (Detroit Metropolitan Wayne County Airport) | | A/A2 | | | 1,140,000 | | | | 1,298,221 | |
| | | |
MINNESOTA — 0.22% | | | | | | | | | | |
St. Paul Housing & Redevelopment Authority, 5.25% due 5/15/2023 | | A/A2 | | | 115,000 | | | | 121,378 | |
Washington County Housing Redevelopment Authority, 5.625% due 6/1/2037 (Birchwood and Woodbury Healthcare Facility Projects) | | NR/NR | | | 415,000 | | | | 426,819 | |
| | | |
MISSISSIPPI — 0.06% | | | | | | | | | | |
Jackson Public School District, 4.00% due 2/1/2018 (District Long Range Capital Expenditure Program; Insured: AGM) (State Aid Withholding) | | NR/Aa3 | | | 140,000 | | | | 141,366 | |
| | | |
MISSOURI — 1.40% | | | | | | | | | | |
Tax Increment Financing Commission of Kansas City, 5.25% due 3/1/2018 (Maincor Project-Public Improvements) (ETM) | | NR/NR | | | 840,000 | | | | 908,427 | |
Tax Increment Financing Commission of Kansas City, 6.00% due 5/1/2030 (Union Hill Redevelopment Project) | | NR/NR | | | 2,505,000 | | | | 2,647,860 | |
10 Semi-Annual Report
| | |
| SCHEDULE OF INVESTMENTS, CONTINUED | | |
| |
Thornburg Strategic Municipal Income Fund | | March 31, 2015 (Unaudited) |
| | | | | | | | | | |
Issuer-Description | | Credit Rating†
S&P/ Moody’s | | Principal
Amount | | | Value | |
NEW HAMPSHIRE — 0.09% | | | | | | | | | | |
New Hampshire Health and Educational Facilities Authority, 0.03% due 7/1/2035 put 4/1/2015 (University System of New Hampshire; SPA: U.S. Bank, N.A.) (daily demand notes) | | A+/Aa3 | | $ | 240,000 | | | $ | 240,000 | |
| | | |
NEW JERSEY — 3.44% | | | | | | | | | | |
Higher Education Student Assistance Authority, 5.75% due 12/1/2039 (NJCLASS Student Loan Program) (AMT) | | A/A2 | | | 750,000 | | | | 822,390 | |
New Jersey EDA, 5.50% due 9/1/2027 (School Facilities Construction; Insured: Natl-Re) | | AA-/A2 | | | 1,000,000 | | | | 1,220,700 | |
New Jersey EDA, 5.00% due 6/15/2029 (School Facilities Construction) | | A-/A2 | | | 2,000,000 | | | | 2,178,360 | |
New Jersey Transit Corp., 5.00% due 9/15/2020 (Federal Transit Administration Section 5307 Urbanized Area Formula Funds) | | A/A3 | | | 1,000,000 | | | | 1,145,240 | |
New Jersey Transportation Trust Fund Authority, 5.00% due 6/15/2042 (Transportation System Improvements) | | A-/A2 | | | 1,000,000 | | | | 1,065,230 | |
Salem County Pollution Control Financing Authority, 5.00% due 12/1/2023 (Chambers Project) (AMT) | | BBB/Baa3 | | | 2,000,000 | | | | 2,282,680 | |
| | | |
NEW MEXICO — 1.47% | | | | | | | | | | |
City of Farmington, 4.70% due 9/1/2024 (Arizona Public Service Co.-Four Corners Project) | | A-/A3 | | | 1,000,000 | | | | 1,110,650 | |
New Mexico Hospital Equipment Loan Council, 5.00% due 7/1/2032 (Haverland Carter Lifestyle Group) | | NR/NR | | | 2,500,000 | | | | 2,609,425 | |
| | | |
NEW YORK — 10.40% | | | | | | | | | | |
City of New York GO, 0.03% due 8/1/2020 put 4/1/2015 (City Budget Financial Management; LOC: JPMorgan Chase Bank, N.A.) (daily demand notes) | | A+/Aa1 | | | 1,500,000 | | | | 1,500,000 | |
City of New York GO, 0.03% due 8/1/2020 put 4/1/2015 (City Budget Financial Management; LOC: JPMorgan Chase Bank, N.A.) (daily demand notes) | | AAA/Aa1 | | | 1,000,000 | | | | 1,000,000 | |
City of New York GO, 5.00% due 8/1/2023 (City Budget Financial Management) | | AA/Aa2 | | | 3,000,000 | | | | 3,641,190 | |
City of New York GO, 5.00% due 8/1/2031 (City Budget Financial Management) | | AA/Aa2 | | | 2,000,000 | | | | 2,339,420 | |
City of Syracuse, 5.00% due 8/1/2017 (City Public and School Building Capital Projects; Insured: AGM) (State Aid Withholding) | | AA/A1 | | | 400,000 | | | | 406,228 | |
New York City Municipal Water Finance Authority, 0.02% due 6/15/2035 put 4/1/2015 (Water & Sewer System; SPA: Bayerische Landesbank) (daily demand notes) | | AAA/Aa1 | | | 12,600,000 | | | | 12,600,000 | |
New York City Municipal Water Finance Authority, 0.03% due 6/15/2050 put 4/1/2015 (Water & Sewer System; SPA: JPMorgan Chase Bank, N.A.) (daily demand notes) | | AA+/Aa2 | | | 4,900,000 | | | | 4,900,000 | |
| | | |
NORTH CAROLINA — 0.85% | | | | | | | | | | |
North Carolina Eastern Municipal Power Agency, 5.00% due 1/1/2020 (Progress Energy Carolinas, Inc. Initial Project Acquisition; Insured: AMBAC) | | A-/NR | | | 410,000 | | | | 424,584 | |
b North Carolina Medical Care Commission, 5.00% due 6/1/2029 (Vidant Health) | | A+/A1 | | | 1,500,000 | | | | 1,741,170 | |
| | | |
OHIO — 2.52% | | | | | | | | | | |
American Municipal Power, Inc., 5.25% due 2/15/2018 (AMP Combined Hydroelectric Projects) | | A/A3 | | | 500,000 | | | | 558,770 | |
City of Akron, 5.00% due 12/1/2031 (Community Learning Centers) | | AA+/NR | | | 625,000 | | | | 718,513 | |
Cleveland-Cuyahoga County Port Authority, 6.25% due 5/15/2016 (Council for Economic Opportunities in Greater Cleveland Project; LOC: FifthThird Bank) | | BBB+/NR | | | 155,000 | | | | 155,299 | |
Cleveland-Cuyahoga County Port Authority, 7.00% due 5/15/2040 (Flats East Development Project; LOC: FifthThird Bank) | | BBB+/NR | | | 990,000 | | | | 1,151,845 | |
Ohio State Air Quality Development Authority, 3.375% due 7/1/2033 put 7/1/2015 (FirstEnergy Nuclear Generation Corp.) | | BBB-/Baa3 | | | 100,000 | | | | 100,600 | |
Ohio State Air Quality Development Authority, 3.625% due 10/1/2033 put 4/1/2020 (FirstEnergy Nuclear Generation Corp.) | | BBB-/Baa3 | | | 1,000,000 | | | | 1,044,570 | |
Ohio State Water Development Authority, 5.875% due 6/1/2033 put 6/1/2016 (FirstEnergy Nuclear Generation Corp.) | | BBB-/Baa2 | | | 1,000,000 | | | | 1,056,470 | |
Ohio State Water Development Authority, 3.375% due 7/1/2033 put 7/1/2015 (FirstEnergy Nuclear Generation Corp.) | | BBB-/Baa3 | | | 1,350,000 | | | | 1,357,492 | |
Wyoming City School District GO, 5.00% due 12/1/2018 (Educational Facilities; Insured: AGM) | | NR/A2 | | | 250,000 | | | | 257,735 | |
| | | |
OREGON — 0.83% | | | | | | | | | | |
State of Oregon GO, 0.03% due 12/1/2041 put 4/1/2015 (Veterans’ Loan Program; SPA: U.S. Bank, N.A.) (daily demand notes) | | AA+/Aa1 | | | 1,100,000 | | | | 1,100,000 | |
Western Generation Agency, 5.00% due 1/1/2016 (Wauna Cogeneration Project; Insured: ACA) | | NR/NR | | | 1,000,000 | | | | 1,012,140 | |
| | | |
PENNSYLVANIA — 5.36% | | | | | | | | | | |
Allegheny County IDA, 6.75% due 8/15/2035 (Propel Charter School) | | BBB-/NR | | | 950,000 | | | | 1,055,697 | |
City of Philadelphia, 5.00% due 6/15/2027 (Philadelphia International and Northeast Philadelphia Airports) (AMT) | | A+/A2 | | | 2,000,000 | | | | 2,230,100 | |
Hospitals & Higher Education Facilities Authority of Philadelphia, 0.03% due 7/1/2041 put 4/1/2015 (The Children’s Hospital of Philadelphia; SPA: Wells Fargo Bank, N.A.) (daily demand notes) | | AA/Aa2 | | | 2,145,000 | | | | 2,145,000 | |
Lancaster County Hospital Authority, 5.00% due 11/1/2019 (Masonic Villages Project) | | A/NR | | | 2,675,000 | | | | 3,078,711 | |
Pennsylvania Economic DFA, 4.625% due 12/1/2018 (Colver Project; Insured: AMBAC) (AMT) | | BBB-/Ba1 | | | 1,800,000 | | | | 1,840,986 | |
Pennsylvania Turnpike Commission, 5.35% due 12/1/2030 (PennDOT-Mass Transit Agencies) | | A-/A3 | | | 2,000,000 | | | | 2,140,340 | |
Philadelphia IDA, 6.00% due 8/1/2035 (Mast Charter School) | | BBB+/NR | | | 1,000,000 | | | | 1,100,680 | |
Semi-Annual Report 11
| | |
| SCHEDULE OF INVESTMENTS, CONTINUED | | |
| |
Thornburg Strategic Municipal Income Fund | | March 31, 2015 (Unaudited) |
| | | | | | | | | | |
Issuer-Description | | Credit Rating†
S&P/ Moody’s | | Principal
Amount | | | Value | |
RHODE ISLAND — 0.31% | | | | | | | | | | |
Housing Authority of the City of Pawtucket, 5.50% due 9/1/2022 (Public Housing Development) | | A+/NR | | $ | 315,000 | | | $ | 377,575 | |
Housing Authority of the City of Pawtucket, 5.50% due 9/1/2024 (Public Housing Development) | | A+/NR | | | 350,000 | | | | 414,746 | |
| | | |
SOUTH DAKOTA — 0.51% | | | | | | | | | | |
South Dakota Health & Educational Facilities Authority, 5.00% due 7/1/2027 (Avera Health) | | AA-/A1 | | | 400,000 | | | | 457,516 | |
South Dakota Health & Educational Facilities Authority, 5.50% due 11/1/2040 (Sanford Health) | | A+/A1 | | | 750,000 | | | | 848,235 | |
| | | |
TENNESSEE — 0.23% | | | | | | | | | | |
Tennessee Energy Acquisition Corp., 5.25% due 9/1/2024 | | A-/Baa1 | | | 500,000 | | | | 589,435 | |
| | | |
TEXAS — 13.88% | | | | | | | | | | |
Austin Convention Enterprises, Inc., 5.25% due 1/1/2024 (Austin Convention Center; Insured: Syncora) | | BBB-/Ba1 | | | 720,000 | | | | 744,581 | |
Austin Convention Enterprises, Inc., 5.00% due 1/1/2034 (Austin Convention Center; Insured: Syncora) | | BBB-/Ba1 | | | 795,000 | | | | 808,666 | |
City of Houston, 5.00% due 9/1/2025 (Convention & Entertainment Facilities Department) | | A-/A2 | | | 1,000,000 | | | | 1,187,040 | |
City of Houston, 5.00% due 9/1/2028 (Convention & Entertainment Facilities Department) | | A-/A2 | | | 325,000 | | | | 375,277 | |
City of Houston, 5.00% due 11/15/2028 (Combined Utility System) | | AA/Aa2 | | | 2,500,000 | | | | 3,007,225 | |
City of Houston, 5.00% due 9/1/2034 (Convention & Entertainment Facilities Department) | | A-/A2 | | | 1,550,000 | | | | 1,748,369 | |
City of Kerrville Health Facilities Development Corp., 5.45% due 8/15/2035 (Sid Peterson Memorial Hospital) | | BBB/NR | | | 2,600,000 | | | | 2,623,946 | |
City of Texas City Industrial Development Corp., 7.375% due 10/1/2020 (ARCO Pipe Line Co. Project) | | A/A2 | | | 1,165,000 | | | | 1,490,466 | |
Commissioners Court of Bexar County, 5.00% due 6/15/2018 pre-refunded 6/15/2015 (County Highway Construction and Maintenance) | | AA+/Aaa | | | 200,000 | | | | 201,982 | |
Harris County-Houston Sports Authority, 5.00% due 11/15/2030 | | A-/A2 | | | 2,000,000 | | | | 2,299,640 | |
Kimble County Hospital District, 6.25% due 8/15/2033 | | NR/NR | | | 500,000 | | | | 572,055 | |
La Vernia Higher Education Finance Corp., 6.25% due 8/15/2039 (Kipp, Inc.) | | BBB/NR | | | 1,000,000 | | | | 1,138,360 | |
Lower Colorado River Authority, 5.00% due 5/15/2026 pre-refunded 5/15/2022 | | NR/NR | | | 20,000 | | | | 24,338 | |
Lower Colorado River Authority, 5.00% due 5/15/2026 | | A/A2 | | | 2,980,000 | | | | 3,444,403 | |
San Antonio Energy Acquisition Public Facilities Corp., 5.50% due 8/1/2021 | | A-/Baa3 | | | 40,000 | | | | 46,859 | |
San Juan Higher Education Finance Authority, 6.70% due 8/15/2040 (IDEA Public Schools) | | BBB/NR | | | 1,000,000 | | | | 1,187,190 | |
State of Texas GO, 1.50% due 8/31/2015 (Cash Flow Management) | | SP-1+/Mig1 | | | 10,000,000 | | | | 10,059,600 | |
Texas Public Finance Authority Charter School Finance Corp., 4.15% due 8/15/2016 (IDEA Public Schools; Insured: ACA) | | BBB/NR | | | 100,000 | | | | 104,016 | |
Texas Public Finance Authority Charter School Finance Corp., 5.00% due 8/15/2023 pre-refunded 8/15/2017 (IDEA Public Schools; Insured: ACA) | | BBB/NR | | | 155,000 | | | | 170,683 | |
Texas Public Finance Authority Charter School Finance Corp., 5.00% due 8/15/2030 pre-refunded 8/15/2017 (IDEA Public Schools; Insured: ACA) | | BBB/NR | | | 1,550,000 | | | | 1,706,829 | |
Texas Public Finance Authority Charter School Finance Corp., 6.20% due 2/15/2040 (Cosmos Foundation, Inc.) | | BBB/NR | | | 1,000,000 | | | | 1,152,820 | |
Texas Transportation Commission, 5.00% due 8/15/2034 (Central Texas Turnpike System) | | BBB+/Baa1 | | | 1,000,000 | | | | 1,113,860 | |
| | | |
U.S. VIRGIN ISLANDS — 0.23% | | | | | | | | | | |
Virgin Islands Public Finance Authority, 6.75% due 10/1/2037 | | NR/Baa3 | | | 500,000 | | | | 572,490 | |
| | | |
UTAH — 0.90% | | | | | | | | | | |
Herriman City, 4.75% due 11/1/2022 (Towne Center Access and Utility Improvements) | | AA-/NR | | | 1,000,000 | | | | 1,120,020 | |
Utah Transit Authority, 5.00% due 6/15/2033 (Integrated Mass Transit System) | | A+/A1 | | | 1,000,000 | | | | 1,160,350 | |
| | | |
VIRGINIA — 1.00% | | | | | | | | | | |
City of Lexington IDA, 5.25% due 1/1/2021 (Kendal at Lexington Residential Care Facility) | | NR/NR | | | 395,000 | | | | 409,955 | |
City of Lexington IDA, 5.375% due 1/1/2022 (Kendal at Lexington Residential Care Facility) | | NR/NR | | | 630,000 | | | | 652,781 | |
City of Lexington IDA, 5.375% due 1/1/2023 (Kendal at Lexington Residential Care Facility) | | NR/NR | | | 425,000 | | | | 439,195 | |
City of Lexington IDA, 5.375% due 1/1/2028 (Kendal at Lexington Residential Care Facility) | | NR/NR | | | 1,000,000 | | | | 1,025,680 | |
| | | |
WASHINGTON — 2.06% | | | | | | | | | | |
Skagit County Public Hospital District No. 1, 5.75% due 12/1/2028 (Skagit Valley Hospital) | | NR/Baa2 | | | 1,510,000 | | | | 1,653,812 | |
Washington Health Care Facilities Authority, 5.70% due 7/1/2038 (Overlake Hospital Medical Center) | | A/A2 | | | 1,000,000 | | | | 1,166,340 | |
Washington Health Care Facilities Authority, 5.75% due 1/1/2045 (Catholic Health Initiatives) | | A/A2 | | | 2,000,000 | | | | 2,391,460 | |
12 Semi-Annual Report
| | |
| SCHEDULE OF INVESTMENTS, CONTINUED | | |
| |
Thornburg Strategic Municipal Income Fund | | March 31, 2015 (Unaudited) |
| | | | | | | | | | | | |
Issuer-Description | | Credit Rating†
S&P/ Moody’s | | | Principal
Amount | | | Value | |
WISCONSIN — 0.40% | | | | | | | | | | | | |
Wisconsin Health & Educational Facilities Authority, 1.25% due 8/15/2025 put 8/15/2017 (Aurora Health Care, Inc.) | | | NR/A3 | | | $ | 1,000,000 | | | $ | 1,006,960 | |
| | | | | | | | | | | | |
TOTAL INVESTMENTS — 99.46% (Cost $234,912,387) | | | | | | | | | | $ | 252,241,630 | |
OTHER ASSETS LESS LIABILITIES — 0.54% | | | | | | | | | | | 1,358,930 | |
| | | | | | | | | | | | |
NET ASSETS — 100.00% | | | | | | | | | | $ | 253,600,560 | |
| | | | | | | | | | | | |
Footnote Legend
| † | Credit ratings are unaudited. Rating changes may have occurred subsequent to the reporting period end. Bonds issued with a maturity of one year or less are assigned Moody’s ratings from MIG-1 to MIG-4 and Standard and Poor’s ratings from SP-1+ to SP-3 with MIG-1 and SP-1+ being the strongest ratings. |
| a | Segregated as collateral for a when-issued security. |
Portfolio Abbreviations
To simplify the listings of securities, abbreviations are used per the table below:
| | |
| ABAG | | Association of Bay Area Governments |
| ACA | | Insured by American Capital Access |
| AGM | | Insured by Assured Guaranty Municipal Corp. |
| AMBAC | | Insured by American Municipal Bond Assurance Corp. |
| AMT | | Alternative Minimum Tax |
| BAM | | Insured by Build America Mutual Insurance Co. |
| CIFG | | Insured by CIFG Assurance North America Inc. |
| COP | | Certificates of Participation |
| DFA | | Development Finance Authority |
| EDA | | Economic Development Authority |
| | |
| ETM | | Escrowed to Maturity |
| FGIC | | Insured by Financial Guaranty Insurance Co. |
| GO | | General Obligation |
| HFA | | Health Facilities Authority |
| HFFA | | Health Facilities Financing Authority |
| IDA | | Industrial Development Authority |
| Mtg | | Mortgage |
| Natl-Re | | Insured by National Public Finance Guarantee Corp. |
| Q-SBLF | | Insured by Qualified School Bond Loan Fund |
| Syncora | | Insured by Syncora Guarantee Inc. |
| USD | | Unified School District |
See notes to financial statements.
Semi-Annual Report 13
| | |
| STATEMENT OF ASSETS AND LIABILITIES | | |
| |
Thornburg Strategic Municipal Income Fund | | March 31, 2015 (Unaudited) |
| | | | |
ASSETS | | | | |
Investments at value (cost $234,912,387) (Note 2) | | $ | 252,241,630 | |
Cash | | | 2,489,792 | |
Receivable for investments sold | | | 35,000 | |
Receivable for fund shares sold | | | 1,020,886 | |
Interest receivable | | | 2,644,538 | |
Prepaid expenses and other assets | | | 49,337 | |
| | | | |
Total Assets | | | 258,481,183 | |
| | | | |
| |
LIABILITIES | | | | |
Payable for investments purchased | | | 4,272,328 | |
Payable for fund shares redeemed | | | 319,196 | |
Payable to investment advisor and other affiliates (Note 3) | | | 202,497 | |
Accounts payable and accrued expenses | | | 34,961 | |
Dividends payable | | | 51,641 | |
| | | | |
Total Liabilities | | | 4,880,623 | |
| | | | |
| |
NET ASSETS | | $ | 253,600,560 | |
| | | | |
NET ASSETS CONSIST OF | | | | |
Undistributed net investment income | | $ | 3,622 | |
Net unrealized appreciation on investments | | | 17,329,243 | |
Accumulated net realized gain (loss) | | | (19,865 | ) |
Net capital paid in on shares of beneficial interest | | | 236,287,560 | |
| | | | |
| | $ | 253,600,560 | |
| | | | |
| |
NET ASSET VALUE | | | | |
Class A Shares: | | | | |
Net asset value and redemption price per share ($66,407,416 applicable to 4,339,578 shares of beneficial interest outstanding - Note 4) | | $ | 15.30 | |
Maximum sales charge, 2.00% of offering price | | | 0.31 | |
| | | | |
Maximum offering price per share | | $ | 15.61 | |
| | | | |
Class C Shares: | | | | |
Net asset value and offering price per share* ($29,079,665 applicable to 1,898,359 shares of beneficial interest outstanding - Note 4) | | $ | 15.32 | |
| | | | |
Class I Shares: | | | | |
Net asset value, offering and redemption price per share ($158,113,479 applicable to 10,322,601 shares of beneficial interest outstanding - Note 4) | | $ | 15.32 | |
| | | | |
| * | Redemption price per share is equal to net asset value less any applicable contingent deferred sales charge. |
See notes to financial statements.
14 Semi-Annual Report
| | |
| STATEMENT OF OPERATIONS | | |
| |
Thornburg Strategic Municipal Income Fund | | Six Months Ended March 31, 2015 (Unaudited) |
| | | | |
INVESTMENT INCOME | | | | |
Dividend income | | $ | 9,153 | |
Interest income (net of premium amortized of $544,332) | | | 4,137,414 | |
| | | | |
Total Income | | | 4,146,567 | |
| | | | |
| |
EXPENSES | | | | |
Investment advisory fees (Note 3) | | | 898,822 | |
Administration fees (Note 3) | | | | |
Class A Shares | | | 40,329 | |
Class C Shares | | | 17,473 | |
Class I Shares | | | 36,800 | |
Distribution and service fees (Note 3) | | | | |
Class A Shares | | | 80,659 | |
Class C Shares | | | 84,029 | |
Transfer agent fees | | | | |
Class A Shares | | | 23,361 | |
Class C Shares | | | 6,852 | |
Class I Shares | | | 34,625 | |
Registration and filing fees | | | | |
Class A Shares | | | 8,342 | |
Class C Shares | | | 10,398 | |
Class I Shares | | | 10,991 | |
Custodian fees (Note 3) | | | 24,083 | |
Professional fees | | | 20,260 | |
Accounting fees | | | 3,032 | |
Trustee fees | | | 4,338 | |
Other expenses | | | 11,198 | |
| | | | |
Total Expenses | | | 1,315,592 | |
Less: | | | | |
Expenses reimbursed by investment advisor (Note 3) | | | (21,953 | ) |
Fees paid indirectly (Note 3) | | | (1,609 | ) |
| | | | |
Net Expenses | | | 1,292,030 | |
| | | | |
Net Investment Income | | | 2,854,537 | |
| | | | |
REALIZED AND UNREALIZED GAIN (LOSS) | | | | |
Net realized gain (loss) on investments | | | (19,596 | ) |
Net change in unrealized appreciation (depreciation) on investments | | | 1,930,172 | |
| | | | |
Net Realized and Unrealized Gain | | | 1,910,576 | |
| | | | |
Net Increase in Net Assets Resulting from Operations | | $ | 4,765,113 | |
| | | | |
See notes to financial statements.
Semi-Annual Report 15
| | |
| STATEMENTS OF CHANGES IN NET ASSETS | | |
| |
Thornburg Strategic Municipal Income Fund | | |
| | | | | | | | |
| | | Six Months Ended
March 31, 2015* | | | Year Ended
September 30, 2014 | |
INCREASE (DECREASE) IN NET ASSETS FROM | | | | | | | | |
| | |
OPERATIONS | | | | | | | | |
Net investment income | | $ | 2,854,537 | | | $ | 5,399,995 | |
Net realized gain (loss) on investments | | | (19,596 | ) | | | 174,212 | |
Net unrealized appreciation (depreciation) on investments | | | 1,930,172 | | | | 10,351,044 | |
| | | | | | | | |
Net Increase (Decrease) in Net Assets Resulting from Operations | | | 4,765,113 | | | | 15,925,251 | |
| | |
DIVIDENDS TO SHAREHOLDERS | | | | | | | | |
From net investment income | | | | | | | | |
Class A Shares | | | (712,878 | ) | | | (1,584,898 | ) |
Class C Shares | | | (266,995 | ) | | | (568,645 | ) |
Class I Shares | | | (1,874,664 | ) | | | (3,246,452 | ) |
From realized gains | | | | | | | | |
Class A Shares | | | (46,826 | ) | | | (189,519 | ) |
Class C Shares | | | (20,477 | ) | | | (79,000 | ) |
Class I Shares | | | (107,131 | ) | | | (342,071 | ) |
| | |
FUND SHARE TRANSACTIONS (NOTE 4) | | | | | | | | |
Class A Shares | | | 4,508,160 | | | | 6,109,965 | |
Class C Shares | | | 2,706,713 | | | | 3,609,685 | |
Class I Shares | | | 19,948,721 | | | | 42,182,323 | |
| | | | | | | | |
Net Increase in Net Assets | | | 28,899,736 | | | | 61,816,639 | |
| | |
NET ASSETS | | | | | | | | |
Beginning of Period | | | 224,700,824 | | | | 162,884,185 | |
| | | | | | | | |
| | |
End of Period | | $ | 253,600,560 | | | $ | 224,700,824 | |
| | | | | | | | |
Undistributed net investment income | | $ | 3,622 | | | $ | 3,622 | |
See notes to financial statements.
16 Semi-Annual Report
| | |
| NOTES TO FINANCIAL STATEMENTS | | |
| |
Thornburg Strategic Municipal Income Fund | | March 31, 2015 (Unaudited) |
NOTE 1 – ORGANIZATION
Thornburg Strategic Municipal Income Fund (the “Fund”) is a diversified series of Thornburg Investment Trust (the “Trust”). The Trust is organized as a Massachusetts business trust under a Declaration of Trust dated June 3, 1987 and is registered as a diversified, open-end management investment company under the Investment Company Act of 1940, as amended. The Fund is currently one of eighteen separate series of the Trust. Each series is considered to be a separate entity for financial reporting and tax purposes and bears expenses directly attributable to it. The Fund’s primary investment objective is to seek a high level of current income exempt from federal individual income tax.
The Fund currently offers three classes of shares of beneficial interest outstanding: Class A, Class C, and Institutional Class (“Class I”). Each class of shares of the Fund represents an interest in the same portfolio of investments, except that (i) Class A shares are sold subject to a front-end sales charge collected at the time the shares are purchased and bear a service fee, (ii) Class C shares are sold at net asset value without a sales charge at the time of purchase, but are subject to a contingent deferred sales charge upon redemption within one year of purchase, and bear both a service fee and a distribution fee, (iii) Class I shares are sold at net asset value without a sales charge at the time of purchase and may be subject to a service fee, and (iv) the respective classes may have different reinvestment privileges and conversion rights. Additionally, the Fund may allocate among its classes certain expenses, to the extent allocable to specific classes, including transfer agent fees, government registration fees, certain printing and postage costs, and administrative and legal expenses. Currently, class specific expenses of the Fund are limited to service and distribution fees, administration fees, and certain registration and transfer agent expenses.
NOTE 2 – SIGNIFICANT ACCOUNTING POLICIES
The following is a summary of significant accounting policies followed by the Fund in the preparation of its financial statements. The Fund is an investment company and prepares its financial statements in conformity with U.S. generally accepted accounting principles (“GAAP”), including the investment company accounting and reporting guidance in the Financial Accounting Standards Board (the “FASB”) Accounting Standard Codification Topic 946. The preparation of financial statements in conformity with GAAP requires management to make estimates and assumptions that affect the reported amounts of assets and liabilities and disclosure of contingent assets and liabilities at the date of the financial statements and the reported amounts of increases (decreases) in net assets from operations during the reporting period. Actual results could differ from those estimates.
Significant accounting policies of the Fund are as follows:
Valuation Policy and Procedures: The Trustees of the Trust (the “Trustees”) have authorized employees of the Fund’s investment advisor, acting as the Valuation and Pricing Committee (the “Committee”), to make certain valuation determinations, subject to oversight and review by the Trustees and the Audit Committee of the Trustees. The Committee and other employees of the Fund’s investment advisor administer and implement the valuation process. The Committee regularly reviews its own fair value decisions, as well as valuations, valuation techniques and services furnished by pricing services, considers circumstances in the markets which may require valuation determinations by the Committee and reviews previous valuation determinations. The Committee also reports on its activities, the performance of the pricing services and other matters to the Trustees and the Audit Committee of the Trustees.
In determining a fair value for a portfolio investment, the Committee seeks to determine the price that the Fund would reasonably expect to receive upon a sale of the investment in an orderly transaction between market participants at the measurement date. Typically, the fair value process employs standing instructions to use quoted prices in active markets or the use of independent pricing services. Less frequently, the Committee may make a fair value determination using other methods. However, because fair value prices are estimated prices, the determination of fair value for an investment may differ from the value that would be realized by the Fund upon a sale of the investment, and that difference could be material to the Fund’s financial statements. The Committee’s determination of fair value for an investment may also differ from the prices obtained by other persons (including other mutual funds) for the investment.
Valuation of Investments: Debt obligations held by the Fund have a primary over-the-counter market and are valued by an independent pricing service approved by the Trustees. The pricing service ordinarily values debt obligations using quoted bid prices and other methods which include consideration of yields or prices of debt obligations of comparable quality, type of issue, coupon, maturity and rating, and indications as to value from dealers and general market conditions.
In any case when a pricing service fails to provide a price for a debt obligation held by the Fund, the Committee determines a fair value for the debt obligation using procedures in accordance with a policy approved by the Trustees, which may include the use of a price obtained from a different independent pricing service. Additionally, in any case when management believes that a price provided by a pricing service for a debt obligation held by the Fund may be unreliable, the Committee decides whether or not to use the pricing service’s valuation or to use an alternative method to determine a fair value for the debt obligation.
Valuation Measurements: The Fund categorizes its investments based upon the inputs used in valuing those investments, according to a three-level hierarchy established by guidance from the FASB. Categorization of investments using this hierarchy is intended by the
Semi-Annual Report 17
| | |
| NOTES TO FINANCIAL STATEMENTS, CONTINUED | | |
| |
Thornburg Strategic Municipal Income Fund | | March 31, 2015 (Unaudited) |
FASB to maximize the use of observable inputs and minimize the use of unobservable inputs by prioritizing that the most observable input be used when available. Observable inputs are those that market participants would use in valuing an investment based on available market data. Unobservable inputs are those that reflect assumptions about the information market participants would use in valuing an investment. An investment’s level within the hierarchy is based on the lowest level input that is deemed significant to the fair value measurement. The methodologies and relative inputs used to value investments are not necessarily indications of the risk or liquidity associated with investing in those investments.
Various inputs are used in determining the fair value measurement of the Fund’s investments. These inputs are generally summarized according to the three-level hierarchy below:
Level 1: Quoted prices in active markets for identical investments.
Level 2: Other direct or indirect significant observable inputs (including quoted prices for similar investments in active markets and other observable inputs, such as interest rates, prepayment rates, credit risk, etc.).
Level 3: Significant unobservable inputs (including the Committee’s own assumptions in determining the fair value of investments).
Portfolio investments with minimal, if any, market activity are characterized as Level 3 and are valued using significant unobservable inputs, typically including single broker quotes, which may be adjusted or unadjusted, related or comparable investments, last available transactions, and other relevant information. Valuations may also be based upon current market prices of securities that are comparable in coupon, rating, maturity and industry. An income based valuation approach would consider discounted anticipated future cash flows of the investment. Discounts may also be applied due to the nature or duration of any restrictions on the disposition of the investment. Valuations based upon the use of inputs from Levels 1, 2, or 3, may not represent the actual price received upon the disposition of an investment, and the Fund may receive a price that is lower than the valuation when it sells the investment.
The following table displays a summary of the fair value hierarchy measurements of the Fund’s investments as of March 31, 2015. In any instance when valuation inputs from more than one level are used to determine the fair value of a specific investment, the investment is placed in the level of the table based upon the lowest level input that is significant in determining the fair value of the investment:
| | | | | | | | | | | | | | | | |
| | | Fair Value Measurements at March 31, 2015 | |
| | | Total | | | Level 1 | | | Level 2 | | | Level 3 | |
Assets | | | | | | | | | | | | | | | | |
Investments in Securities | | | | | | | | | | | | | | | | |
Municipal Bonds | | $ | 252,241,630 | | | $ | — | | | $ | 252,241,630 | | | $ | — | |
| | | | | | | | | | | | | | | | |
Total Investments in Securities | | $ | 252,241,630 | | | $ | — | | | $ | 252,241,630 | | | $ | — | |
In accordance with the guidance prescribed in Accounting Standards Update No. 2011-04, it is the policy of the Fund to recognize transfers between levels and the underlying events which caused the movement. The Fund recognized no transfers between levels for the six months ended March 31, 2015.
Federal Income Taxes: It is the policy of the Trust to comply with the provisions of the Internal Revenue Code applicable to “regulated investment companies” and to distribute to shareholders substantially all taxable (if any) and tax exempt income of the Fund. Therefore, no provision for federal income tax is required.
Management reviews each uncertain tax position believed to be material to the preparation of the Fund’s financial statements, to assess if it is more likely than not that the position would be sustained upon examination, based upon the technical merits of the position. As of March 31, 2015, management has not identified any such position for which an asset or liability must be reflected in the Statement of Assets and Liabilities. The Fund’s tax returns remain subject to examination for three years after filing.
When-Issued and Delayed Delivery Transactions: The Fund may engage in when-issued or delayed delivery transactions. To the extent the Fund engages in such transactions, it will do so for the purpose of acquiring portfolio investments consistent with the Fund’s investment objectives and not for the purpose of investment leverage or to speculate on interest rate and/or market changes. At the time the Fund makes a commitment to purchase an investment on a when-issued or delayed delivery basis, the Fund will record the transaction and reflect the value in determining its net asset value. When effecting such transactions, assets of an amount sufficient to make payment for the portfolio investments to be purchased will be segregated on the Fund’s records on the trade date. Investments purchased on a when-issued or delayed delivery basis do not earn interest until the settlement date.
Dividends: Net investment income of the Fund is declared daily as a dividend on shares for which the Fund has received payment. Dividends are paid monthly and are reinvested in additional shares of the Fund at net asset value per share at the close of business on the dividend payment date, or at the shareholder’s option, paid in cash. Net realized capital gains, to the extent available, will be distributed at least annually.
18 Semi-Annual Report
| | |
| NOTES TO FINANCIAL STATEMENTS, CONTINUED | | |
| |
Thornburg Strategic Municipal Income Fund | | March 31, 2015 (Unaudited) |
General: Investment transactions are accounted for on a trade date basis. Interest income is accrued as earned. Premiums and discounts on investments purchased are amortized to call dates or maturity dates of the respective investments. Realized gains and losses from the sale of investments are recorded on an identified cost basis. Net investment income (other than class specific expenses) and realized and unrealized gains and losses are allocated daily to each class of shares based upon the relative net asset value of outstanding shares (or the value of the dividend-eligible shares, as appropriate) of each class of shares at the beginning of the day (after adjusting for the current capital shares activity of the respective class). Expenses common to all Funds are allocated among the Funds comprising the Trust based upon their relative net asset values or other appropriate allocation methods.
Guarantees and Indemnifications: Under the Trust’s organizational documents (and under separate agreements with the independent Trustees), its officers and Trustees are indemnified against certain liabilities arising out of the performance of their duties to the Fund. Additionally, in the normal course of business the Trust enters into contracts with service providers that contain general indemnification clauses. The Trust’s maximum exposure under these arrangements is unknown. However, based on experience, the Trust expects the risk of loss to be remote.
NOTE 3 – INVESTMENT ADVISORY FEE AND OTHER TRANSACTIONS WITH AFFILIATES
Pursuant to an investment advisory agreement, Thornburg Investment Management, Inc. (the “Advisor”) serves as the investment advisor and performs services for the Fund for which the fees are payable at the end of each month. For the six months ended March 31, 2015, these fees were payable at annual rates ranging from .75 of 1% to .50 of 1% per annum of the average daily net assets of the Fund depending on the Fund’s asset size. The Trust also has entered into administrative services agreements with the Advisor, whereby the Advisor will perform certain administrative services for the shareholders of each class of the Fund’s shares, and for which fees will be payable at an annual rate of up to .125 of 1% per annum of the average daily net assets attributable to each class of shares.
The Trust has an underwriting agreement with Thornburg Securities Corporation (the “Distributor,” an affiliate of the Advisor), which acts as the distributor of the Fund’s shares. For the six months ended March 31, 2015, the Distributor has advised the Fund that it earned net commissions aggregating $305 from the sale of Class A shares, and collected contingent deferred sales charges aggregating $2,140 from redemptions of Class C shares of the Fund.
Pursuant to a service plan under Rule 12b-1 of the Investment Company Act of 1940, the Fund may reimburse to the Advisor an amount not to exceed .25 of 1% per annum of the average daily net assets attributable to each class of shares of the Fund for payments made by the Advisor to securities dealers and other financial institutions to obtain various shareholder and distribution related services. For the six months ended March 31, 2015, there were no 12b-1 service plan fees charged for Class I shares. The Advisor may pay out of its own resources additional expenses for distribution of the Fund’s shares and shareholder services.
The Trust has also adopted a distribution plan pursuant to Rule 12b-1, applicable only to the Fund’s Class C shares, under which the Fund compensates the Distributor for services in promoting the sale of Class C shares of the Fund at an annual rate of up to .35 of 1% per annum of the average daily net assets attributable to Class C shares. Total fees incurred by each class of shares of the Fund under their respective service and distribution plans for the six months ended March 31, 2015, are set forth in the Statement of Operations.
The Advisor and Distributor have contractually agreed to waive fees and reimburse expenses incurred by the Fund so that actual expenses of certain share classes do not exceed levels as specified in the Fund’s most recent prospectus. The agreement may be terminated by the Fund at any time, but may not be terminated by the Advisor or Distributor before February 1, 2016, unless the Advisor ceases to be the investment advisor to the Fund or the Distributor ceases to be the distributor of the Fund prior to that date. The Advisor and Distributor retain the right to be repaid by the Fund for fee waivers and expense reimbursements if expenses fall below the contractual limit prior to the end of the fiscal year.
For the six months ended March 31, 2015, the Advisor contractually reimbursed certain class specific expenses and administrative fees of $7,878 for Class A shares and $14,075 for Class C shares.
The Trust has an agreement with the custodian bank to indirectly pay a portion of the custodian’s fees through credits earned by the Fund’s cash on deposit with the bank. This deposit agreement is an alternative to overnight investments. Custodial fees are adjusted to reflect amounts that would have been paid without this agreement, with a corresponding adjustment reflected as fees paid indirectly in the Statement of Operations. For the six months ended March 31, 2015, fees paid indirectly were $1,609.
Certain officers and Trustees of the Trust are also officers or directors of the Advisor and Distributor. The compensation of independent Trustees is borne by the Trust.
Semi-Annual Report 19
| | |
| NOTES TO FINANCIAL STATEMENTS, CONTINUED | | |
| |
Thornburg Strategic Municipal Income Fund | | March 31, 2015 (Unaudited) |
NOTE 4 – SHARES OF BENEFICIAL INTEREST
At March 31, 2015, there were an unlimited number of shares with no par value of beneficial interest authorized. Transactions in shares of beneficial interest were as follows:
| | | | | | | | | | | | | | | | |
| | | Six Months Ended
March 31, 2015 (Unaudited) | | | Year Ended
September 30, 2014 (Audited) | |
| | | Shares | | | Amount | | | Shares | | | Amount | |
Class A Shares | | | | | | | | | | | | | | | | |
Shares sold | | | 862,077 | | | $ | 13,180,750 | | | | 2,214,705 | | | $ | 32,669,985 | |
Shares issued to shareholders in reinvestment of dividends | | | 47,103 | | | | 720,260 | | | | 115,738 | | | | 1,703,678 | |
Shares repurchased | | | (614,056 | ) | | | (9,392,850 | ) | | | (1,917,594 | ) | | | (28,263,698 | ) |
| | | | | | | | | | | | | | | | |
| | | | |
Net increase (decrease) | | | 295,124 | | | $ | 4,508,160 | | | | 412,849 | | | $ | 6,109,965 | |
| | | | | | | | | | | | | | | | |
| | | | |
Class C Shares | | | | | | | | | | | | | | | | |
Shares sold | | | 322,541 | | | $ | 4,935,911 | | | | 584,844 | | | $ | 8,670,364 | |
Shares issued to shareholders in reinvestment of dividends | | | 16,368 | | | | 250,555 | | | | 39,009 | | | | 573,997 | |
Shares repurchased | | | (161,887 | ) | | | (2,479,753 | ) | | | (383,694 | ) | | | (5,634,676 | ) |
| | | | | | | | | | | | | | | | |
| | | | |
Net increase (decrease) | | | 177,022 | | | $ | 2,706,713 | | | | 240,159 | | | $ | 3,609,685 | |
| | | | | | | | | | | | | | | | |
| | | | |
Class I Shares | | | | | | | | | | | | | | | | |
Shares sold | | | 1,967,849 | | | $ | 30,124,531 | | | | 4,322,972 | | | $ | 64,055,109 | |
Shares issued to shareholders in reinvestment of dividends | | | 117,069 | | | | 1,791,992 | | | | 225,879 | | | | 3,331,595 | |
Shares repurchased | | | (781,955 | ) | | | (11,967,802 | ) | | | (1,724,127 | ) | | | (25,204,381 | ) |
| | | | | | | | | | | | | | | | |
| | | | |
Net increase (decrease) | | | 1,302,963 | | | $ | 19,948,721 | | | | 2,824,724 | | | $ | 42,182,323 | |
| | | | | | | | | | | | | | | | |
NOTE 5 – INVESTMENT TRANSACTIONS
For the six months ended March 31, 2015, the Fund had purchase and sale transactions of investments (excluding short-term investments) of $40,394,806 and $10,047,674, respectively.
NOTE 6 – INCOME TAXES
At March 31, 2015, information on the tax components of capital was as follows:
| | | | |
Cost of investments for tax purposes | | $ | 234,912,387 | |
| | | | |
Gross unrealized appreciation on a tax basis | | $ | 17,622,971 | |
Gross unrealized depreciation on a tax basis | | | (293,728 | ) |
| | | | |
Net unrealized appreciation (depreciation) on investments (tax basis) | | $ | 17,329,243 | |
| | | | |
OTHER NOTES
Risks: The Fund’s investments subject it to risks including, but not limited to, credit risk, interest rate risk, management risk, market and economic risk, and liquidity risk. Please see the Fund’s prospectus for a discussion of the risks associated with an investment in the Fund.
Subsequent Events: Fund management believes no events have occurred between March 31, 2015 and the date of issuance of the financial statements that require adjustment to or disclosure in the accompanying financial statements.
20 Semi-Annual Report
This page intentionally left blank.
Semi-Annual Report 21
| | |
| FINANCIAL HIGHLIGHTS | | |
| |
Thornburg Strategic Municipal Income Fund | | |
| | | | | | | | | | | | | | | | | | | | | | | | | | | | | | | | | | | | | | | | | | | | | | | | | | | | |
| | | PER SHARE PERFORMANCE (for a share outstanding throughout the Period)+ | | RATIOS TO AVERAGE NET ASSETS | | | SUPPLEMENTAL DATA | |
Unless
Otherwise
Noted,
Periods
are
Fiscal
Years
Ended
Sept. 30, | | Net Asset
Value
Beginning
of Period | | | Net
Investment
Income
(Loss) | | Net
Realized
&
Unrealized
Gain (Loss)
on
Investments | | | Total from
Investment
Operations | | | Dividends
from Net
Investment
Income | | | Dividends
from Net
Realized
Gains | | Total
Dividends | | | Net
Asset
Value
End
of
Period | | Net
Investment
Income
(Loss)
(%) | | | Expenses,
After
Expense
Reductions
(%) | | | Expenses,
After
Expense
Reductions
and
Net of
Custody
Credits
(%) | | | Expenses,
Before
Expense
Reductions
(%) | | | Total
Return
(%)(a) | | | Portfolio
Turnover
Rate
(%)(a) | | Net
Assets
at End
of
Period
(Thousands) | |
Class A Shares | | | | | | | | | | | | | | | | | | | | | | | | | | | | | | | | | | | | | | | | | | | |
2015(b)(c) | | $ | 15.19 | | | 0.17 | | | 0.12 | | | | 0.29 | | | | (0.17 | ) | | (0.01) | | | (0.18 | ) | | $15.30 | | | 2.21 | (d) | | | 1.25 | (d) | | | 1.25 | (d) | | | 1.28 | (d) | | | 1.92 | | | 4.90 | | $ | 66,407 | |
2014(b) | | $ | 14.40 | | | 0.41 | | | 0.85 | | | | 1.26 | | | | (0.42 | ) | | (0.05) | | | (0.47 | ) | | $15.19 | | | 2.82 | | | | 1.25 | | | | 1.25 | | | | 1.31 | | | | 8.93 | | | 21.89 | | $ | 61,424 | |
2013(b) | | $ | 15.17 | | | 0.41 | | | (0.74 | ) | | | (0.33 | ) | | | (0.41 | ) | | (0.03) | | | (0.44 | ) | | $14.40 | | | 2.74 | | | | 1.25 | | | | 1.25 | | | | 1.31 | | | | (2.21 | ) | | 37.42 | | $ | 52,278 | |
2012(b) | | $ | 14.06 | | | 0.49 | | | 1.13 | | | | 1.62 | | | | (0.50 | ) | | (0.01) | | | (0.51 | ) | | $15.17 | | | 3.34 | | | | 1.25 | | | | 1.25 | | | | 1.31 | | | | 11.71 | | | 12.52 | | $ | 65,446 | |
2011(b) | | $ | 14.22 | | | 0.59 | | | (0.14 | ) | | | 0.45 | | | | (0.59 | ) | | (0.02) | | | (0.61 | ) | | $14.06 | | | 4.37 | | | | 1.25 | | | | 1.25 | | | | 1.38 | | | | 3.47 | | | 19.45 | | $ | 39,808 | |
2010(b) | | $ | 13.86 | | | 0.60 | | | 0.48 | | | | 1.08 | | | | (0.61 | ) | | (0.11) | | | (0.72 | ) | | $14.22 | | | 4.40 | | | | 1.25 | | | | 1.25 | | | | 1.50 | | | | 8.20 | | | 16.26 | | $ | 28,166 | |
Class C Shares | | | | | | | | | | | | | | | | | | | | | | | | | | | | | | | | | | | | | | | | | | | | | | |
2015(c) | | $ | 15.20 | | | 0.15 | | | 0.13 | | | | 0.28 | | | | (0.15 | ) | | (0.01) | | | (0.16 | ) | | $15.32 | | | 1.91 | (d) | | | 1.55 | (d) | | | 1.55 | (d) | | | 1.65 | (d) | | | 1.83 | | | 4.90 | | $ | 29,080 | |
2014 | | $ | 14.41 | | | 0.37 | | | 0.84 | | | | 1.21 | | | | (0.37 | ) | | (0.05) | | | (0.42 | ) | | $15.20 | | | 2.53 | | | | 1.55 | | | | 1.55 | | | | 1.72 | | | | 8.60 | | | 21.89 | | $ | 26,168 | |
2013 | | $ | 15.18 | | | 0.37 | | | (0.74 | ) | | | (0.37 | ) | | | (0.37 | ) | | (0.03) | | | (0.40 | ) | | $14.41 | | | 2.44 | | | | 1.55 | | | | 1.55 | | | | 1.73 | | | | (2.50 | ) | | 37.42 | | $ | 21,344 | |
2012 | | $ | 14.07 | | | 0.45 | | | 1.12 | | | | 1.57 | | | | (0.45 | ) | | (0.01) | | | (0.46 | ) | | $15.18 | | | 3.04 | | | | 1.55 | | | | 1.55 | | | | 1.78 | | | | 11.38 | | | 12.52 | | $ | 23,521 | |
2011 | | $ | 14.23 | | | 0.55 | | | (0.14 | ) | | | 0.41 | | | | (0.55 | ) | | (0.02) | | | (0.57 | ) | | $14.07 | | | 4.07 | | | | 1.55 | | | | 1.55 | | | | 1.83 | | | | 3.16 | | | 19.45 | | $ | 15,344 | |
2010 | | $ | 13.87 | | | 0.55 | | | 0.49 | | | | 1.04 | | | | (0.57 | ) | | (0.11) | | | (0.68 | ) | | $14.23 | | | 4.05 | | | | 1.55 | | | | 1.55 | | | | 2.36 | | | | 7.88 | | | 16.26 | | $ | 15,261 | |
Class I Shares | | | | | | | | | | | | | | | | | | | | | | | | | | | | | | | | | | | | | | | | | | | | | | |
2015(c) | | $ | 15.20 | | | 0.19 | | | 0.13 | | | | 0.32 | | | | (0.19 | ) | | (0.01) | | | (0.20 | ) | | $15.32 | | | 2.55 | (d) | | | 0.91 | (d) | | | 0.91 | (d) | | | 0.91 | (d) | | | 2.15 | | | 4.90 | | $ | 158,114 | |
2014 | | $ | 14.41 | | | 0.46 | | | 0.85 | | | | 1.31 | | | | (0.47 | ) | | (0.05) | | | (0.52 | ) | | $15.20 | | | 3.12 | | | | 0.94 | | | | 0.93 | | | | 0.94 | | | | 9.27 | | | 21.89 | | $ | 137,109 | |
2013 | | $ | 15.18 | | | 0.45 | | | (0.73 | ) | | | (0.28 | ) | | | (0.46 | ) | | (0.03) | | | (0.49 | ) | | $14.41 | | | 3.04 | | | | 0.95 | | | | 0.95 | | | | 0.96 | | | | (1.92 | ) | | 37.42 | | $ | 89,262 | |
2012 | | $ | 14.07 | | | 0.53 | | | 1.13 | | | | 1.66 | | | | (0.54 | ) | | (0.01) | | | (0.55 | ) | | $15.18 | | | 3.62 | | | | 0.95 | | | | 0.95 | | | | 0.95 | | | | 12.03 | | | 12.52 | | $ | 92,386 | |
2011 | | $ | 14.23 | | | 0.63 | | | (0.14 | ) | | | 0.49 | | | | (0.63 | ) | | (0.02) | | | (0.65 | ) | | $14.07 | | | 4.62 | | | | 0.99 | | | | 0.99 | | | | 1.03 | | | | 3.74 | | | 19.45 | | $ | 54,736 | |
2010 | | $ | 13.87 | | | 0.64 | | | 0.48 | | | | 1.12 | | | | (0.65 | ) | | (0.11) | | | (0.76 | ) | | $14.23 | | | 4.66 | | | | 0.99 | | | | 0.99 | | | | 1.11 | | | | 8.48 | | | 16.26 | | $ | 42,134 | |
| (a) | Not annualized for periods less than one year. |
| (b) | Sales loads are not reflected in computing total return. |
| (c) | Unaudited Six Month Period Ended March 31. |
| + | Based on weighted average shares outstanding, except for Dividends from Net Investment Income and Net Realized Gains, which are actual amounts per share. |
See notes to financial statements.
| | | | |
| 22 Semi-Annual Report | | | | Semi-Annual Report 23 |
| | |
| EXPENSE EXAMPLE | | |
| |
Thornburg Strategic Municipal Income Fund | | March 31, 2015 (Unaudited) |
As a shareholder of the Fund, you incur two types of costs:
| | (1) | transaction costs, including |
(a) sales charges (loads) on purchase payments, for Class A shares;
(b) a deferred sales charge on redemptions of any part or all of a purchase of $1 million of Class A shares within 12 months of purchase;
(c) a deferred sales charge on redemptions of Class C shares within 12 months of purchase;
| | (2) | ongoing costs, including management fees; distribution and/or service (12b-1) fees; and other Fund expenses. |
This example is intended to help you understand your ongoing costs (in dollars) of investing in the Fund and to compare these costs with the ongoing costs of investing in other mutual funds.
The example is based on a $1,000 investment beginning on October 1, 2014, and held until March 31, 2015.
| | | | | | | | | | | | |
| | | Beginning
Account Value
10/1/14 | | | Ending
Account Value
3/31/15 | | | Expenses Paid
During Period†
10/1/14–3/31/15 | |
Class A Shares | | | | | | | | | | | | |
Actual | | $ | 1,000.00 | | | $ | 1,019.20 | | | $ | 6.29 | |
Hypothetical* | | $ | 1,000.00 | | | $ | 1,018.70 | | | $ | 6.29 | |
Class C Shares | | | | | | | | | | | | |
Actual | | $ | 1,000.00 | | | $ | 1,018.30 | | | $ | 7.80 | |
Hypothetical* | | $ | 1,000.00 | | | $ | 1,017.20 | | | $ | 7.80 | |
Class I Shares | | | | | | | | | | | | |
Actual | | $ | 1,000.00 | | | $ | 1,021.50 | | | $ | 4.60 | |
Hypothetical* | | $ | 1,000.00 | | | $ | 1,020.38 | | | $ | 4.60 | |
| † | Expenses are equal to the annualized expense ratio for each class (A: 1.25%; C: 1.55%; I: 0.91%) multiplied by the average account value over the period, multiplied by 182/365 to reflect the one-half year period. |
| * | Hypothetical assumes a rate of return of 5% per year before expenses. |
ACTUAL EXPENSES
For each class of shares, the first line of the accompanying table provides information about actual account values and actual expenses. You may use the information in this line, together with the amount you invested, to estimate the expenses that you paid over the period. Simply divide your account value by $1,000 (for example, an $8,600 account value divided by $1,000 = 8.6), then multiply the result by the number in the first line for your class of shares under the heading entitled “Expenses Paid During Period” to estimate the expenses you paid on your account during this period.
HYPOTHETICAL EXAMPLE FOR COMPARISON PURPOSES
For each class of shares, the second line of the accompanying table provides information about hypothetical account values and hypothetical expenses based on the Fund’s actual expense ratio and an assumed rate of return of 5% per year before expenses, which is not the Fund’s actual return. The hypothetical account values and expenses may not be used to estimate the actual ending account balance or expenses you paid for the period. You may use this information to compare the ongoing costs of investing in the Fund and other funds. To do so, compare this 5% hypothetical example with the 5% hypothetical examples that appear in the shareholder reports of the other funds.
Please note that the expenses shown in the table are meant to highlight your ongoing costs only and do not reflect any transactional costs, such as sales charges (loads), redemption fees, or exchange fees. Therefore, the second line of the table for each class of shares is useful in comparing ongoing costs only, and will not help you determine the relative total costs of owning different funds. In addition, if these transactional costs were included, your costs would have been higher.
24 Semi-Annual Report
| | |
| OTHER INFORMATION | | |
| |
Thornburg Strategic Municipal Income Fund | | March 31, 2015 (Unaudited) |
PORTFOLIO PROXY VOTING
Policies and Procedures:
The Trust has delegated to Thornburg Investment Management, Inc. (the “Advisor”) voting decisions respecting proxies for the Fund’s voting securities. The Advisor makes voting decisions in accordance with its Proxy Voting Policy. A description of the Policy is available (i) without charge, upon request, by calling the Advisor toll-free at 1-800-847-0200, (ii) on the Thornburg website at www.thornburg. com, and (iii) on the Securities and Exchange Commission’s website at www.sec.gov.
Information regarding how proxies were voted is available on or before August 31 of each year for the twelve months ending the preceding June 30. This information is available (i) without charge, upon request by calling the Advisor toll-free at 1-800-847-0200, (ii) on the Thornburg website at www.thornburg.com, and (iii) on the Securities and Exchange Commission’s website at www.sec.gov.
AVAILABILITY OF QUARTERLY PORTFOLIO SCHEDULE
The Fund files with the Securities and Exchange Commission schedules of its portfolio holdings on Form N-Q for the first and third quarters of each fiscal year. The Fund’s Forms N-Q are available on the Commission’s website at www.sec.gov, or may be reviewed and copied at the Commission’s Public Reference Room in Washington, D.C. Information on the operation of the Public Reference Room may be obtained by calling 1-800-SEC-0330. The Fund also makes this information available on its website at www.thornburg. com/download or upon request by calling 1-800-847-0200.
Semi-Annual Report 25
| | |
| TRUSTEES’ STATEMENT TO SHAREHOLDERS | | |
Revised and Readopted September 15, 2014
The Trustees believe current and prospective shareholders should know how we discharge our responsibilities in supervising the Funds’ investment advisor and in reviewing the advisor’s contract for renewal. Since 2005, we have issued a statement which sets out clearly the three principal guidelines that we follow in supervising the Trust’s investment advisor on your behalf. In accordance with our customary practice, in September of 2014 we again reviewed our statement and concluded we should reissue this statement outlining the principal features of our supervision of the advisor’s performance of investment management services for the Funds.
We begin with the premise that each shareholder selected his or her Fund because its investments are managed by the investment advisor identified in the prospectus and in accordance with the objective and policies described in the prospectus. We realize, as each of you do, that if you believe that your Fund’s stated objective and policies no longer serve your personal investment goals, you can sell your shares and leave the Fund.
Therefore, we believe that our primary supervisory task – our principal obligation to you – is to assess the nature and quality of the advisor’s services, and to confirm that the advisor actively and competently pursues the Fund’s objective, in accordance with the policies set out in the prospectus. To do this, we meet regularly with management to review your Fund’s portfolio and to discuss the advisor’s specific actions and judgments in pursuing the Fund’s objective. We do not substitute our own judgment for the advisor’s decisions in selecting investments; the advisor is paid to exercise its informed judgment on investment decisions, and we seek to confirm, in reviewing the advisor’s performance, that the advisor is doing just that.
Second, we are conscious of costs and the effect that costs have on shareholders’ returns. We try to make sure that your Fund’s fees and costs are reasonable in relationship to the services rendered and that they are generally in line with those charged by other expert investment advisors, consistent with our belief that the Fund’s investors searched for and expect that expertise and attention and have decided to pay a reasonable price for it. We do not put the management contract “out to bid” as a matter of course, and we would not do so unless we had concluded that the advisor materially had failed to pursue the Fund’s objectives in accordance with its policies, or for other equally important reasons. We believe that any other approach would be inconsistent with your interests and contrary to your expectations when you bought shares of the Fund in the first place.
Finally, because we believe that most Thornburg Fund shareholders have invested with a long-term perspective, we try not to focus too much on the fashions of the moment and on short-term performance. The market will not favor any specific investment objective or set of policies at all times and under all economic circumstances. A fund will experience periods of both high and low returns relative to other funds and other investments. Even if one of our Funds is not favored by the market at a particular time, we believe that the advisor is nonetheless obliged to remain true to the Fund’s objective and policies, and we watch to see that it does so.
Trustees of Thornburg Investment Trust
26 Semi-Annual Report
THORNBURG FUND FAMILY
FUNDAMENTAL, BOTTOM-UP EQUITY RESEARCH
We search far and wide for the best stock ideas—within the United States and around the globe. Potential investments that may deserve a deeper look are thoroughly analyzed using both quantitative and qualitative criteria. But the vast majority are discarded. Those that ultimately make it into our highly-selective portfolios are continually monitored to determine whether our investment theses unfold as expected.
| | • | | Thornburg Core Growth Fund |
| | • | | Thornburg International Value Fund |
| | • | | Thornburg International Growth Fund |
| | • | | Thornburg Developing World Fund |
| | • | | Thornburg Investment Income Builder Fund |
| | • | | Thornburg Global Opportunities Fund |
A TRADITION OF DISCIPLINED BOND MANAGEMENT
At Thornburg, the word “disciplined” carries some substance. We don’t make a practice of using shortcuts to enhance yield or total returns. Every strategy is grounded in rigorous, bottom-up credit work. Portfolios are assembled carefully—in the case of our core bond funds, using laddered structures—to mitigate price fluctuation. Position sizes are controlled so that no single bond can have an outsized effect on a portfolio. And as with our equity portfolios, managers enjoy flexibility to seek an optimal risk/reward balance.
| | • | | Thornburg Low Duration Income Fund |
| | • | | Thornburg Limited Term U.S. Government Fund |
| | • | | Thornburg Limited Term Income Fund |
| | • | | Thornburg Strategic Income Fund |
| | • | | Thornburg Low Duration Municipal Fund |
| | • | | Thornburg Limited Term Municipal Fund |
| | • | | Thornburg Intermediate Municipal Fund |
| | • | | Thornburg California Limited Term Municipal Fund |
| | • | | Thornburg New Mexico Intermediate Municipal Fund |
| | • | | Thornburg New York Intermediate Municipal Fund |
| | • | | Thornburg Strategic Municipal Income Fund |
Before investing, carefully consider the Fund’s investment goals, risks, charges, and expenses. For a prospectus or summary prospectus containing this and other information, contact your financial advisor or visit thornburg.com. Read it carefully before investing.
For additional information, please visit thornburg.com
Thornburg Investment Management, Inc. 2300 North Ridgetop Road, Santa Fe, NM 87506
Semi-Annual Report 27

This Semi-Annual Report is submitted for the general information of shareholders of the Fund. It is not authorized for distribution to prospective investors in the Fund unless preceded or accompanied by an effective prospectus.
| | | | |
| Investment Advisor: | | Distributor: | | |
| Thornburg Investment Management® | | Thornburg Securities Corporation® | | |
| 800.847.0200 | | 800.847.0200 | | TH1979 |
FIRM OVERVIEW
THE FIRM
Thornburg Investment Management is a privately owned global investment firm that offers a range of solutions for retail and institutional investors. We are driven by our mission to help our clients reach their long-term financial goals through fundamental research and active portfolio management.
Founded in 1982 and headquartered in Santa Fe, New Mexico, we manage approximately $61 billion (as of March 31, 2015) across seven equity and 11 bond mutual funds, separate accounts for high-net-worth investors and institutional accounts, and five UCITS funds for non-U.S. investors.

CORE INVESTMENT PRINCIPLES
Our focus has always been on maintaining and building the investment expertise to manage Thornburg strategies to a high standard, while adhering to a core set of investment principles:
| | • | | We focus on the fundamentals. We invest according to our view of the fundamental value of an issuer only after performing thorough, bottom-up research. |
| | • | | We think and invest for the long term. We typically make investment decisions based upon an investment thesis we expect to play out over 18 months to several years. We may not always hold a security for several years, but our horizon line is typically a few years out. |
| | • | | We stay flexible. We go where we see value. Our investment mandates are generally broad and flexible, and we exercise as much flexibility as possible within any restrictions. |
| | • | | We collaborate across strategies. We are structured as global generalists. Portfolio managers and analysts do not specialize in sectors, geographies, or even security types, but instead must understand and communicate bottom-up fundamentals across industries, sectors, and borders. |
2 Semi-Annual Report
Semi-Annual Report
Thornburg California Limited Term Municipal Fund
March 31, 2015
| | | | |
| Share Class | | NASDAQ Symbol | | CUSIP |
Class A | | LTCAX | | 885-215-426 |
Class C | | LTCCX | | 885-215-418 |
Class I | | LTCIX | | 885-215-392 |
Minimum investments for Class I shares are higher than those for other classes. Class I shares may not be available to all investors.
Investments in the Fund carry risks, including possible loss of principal. Bond funds have the same interest rate, inflation, and credit risks that are associated with the underlying bonds. The value of bonds will fluctuate relative to changes in interest rates, decreasing when interest rates rise. Unlike bonds, bond funds have ongoing fees and expenses. Please see the Fund’s prospectus for a discussion of the risks associated with an investment in the Fund. Investments in the Fund are not FDIC insured, nor are they deposits of or guaranteed by a bank or any other entity.
The laddering strategy does not assure or guarantee better performance and cannot eliminate the risk of investment losses.
Semi-Annual Report 3
LETTER TO SHAREHOLDERS
| | |
Thornburg California Limited Term Municipal Fund | | March 31, 2015 (Unaudited) |
April 16, 2015
Dear Fellow Shareholder:
We are pleased to present the semi-annual report for the Thornburg California Limited Term Municipal Fund. The net asset value (NAV) of the Class A shares increased by three cents to $13.87 per share during the six months ended March 31, 2015. If you were with us for the entire period, you received dividends of 9.75 cents per share. If you reinvested your dividends, you received 9.78 cents per share. Dividends were lower for Class C shares and higher for Class I shares, to account for varying class-specific expenses. The Class A shares underperformed the Fund’s benchmark index, with a 0.92% total return (without sales charge) for the six months ended March 31, 2015, compared to the 1.02% total return for the BofA Merrill Lynch 1-10 Year U.S. Municipal Securities Index. The Fund generated 1.32% more price return and 1.42% less income than its benchmark.
Throughout the six-month period, the Fund maintained a lower risk posture on interest rates than its benchmark; the average effective duration (a measure of interest-rate sensitivity) was 3.45 years, compared to 3.76 years for the benchmark. The shorter duration hurt performance by 0.05%. The Fund’s position along the yield curve added 0.14%, and sector selection subtracted 0.45% of relative performance. Credit selection added 1.01% to relative performance. Other factors including security selection added 0.67%.
The Municipal Market
The municipal market has been something of a roller coaster over the past six months. Much of that volatility revolves around investors’ increased fears of an eventual Federal Reserve rate increase. While those fears aren’t completely unfounded, we believe the typical municipal bond investor is ignoring several other sources of risk present in the market.
First and foremost, it appears that risk is mispriced. At a very high level, we examine two primary sources of risk in the municipal market: duration and credit quality. The hunt for excess yield has bid up the prices of these sources of risk to levels we believe are unsustainable.
Investors looking for more yield can increase the duration of their purchases. This strategy often makes sense in a period characterized by a steep yield curve. When the curve is sufficiently steep, the incremental yield an investor picks up for buying a bond one year longer may, in fact, provide adequate compensation for the increased interest-rate risk. But through the six months ended March 31, 2015, we believe compensation offered to investors to extend duration was not in line with the added risk. This was particularly true when looking at the overall low level of interest rates in the market. Chart I shows the yield of a AAA rated general obligation bond less the core PCE index (or Personal Consumption Expenditures index, the Federal Reserve’s favored inflation measure). This is the so-called “real yield” an investor receives after inflation; this was and continues to be well below the long-term average.
Chart I 10-Year AAA General Obligation Municipal Bond Real Yield History, Using Core PCE Index
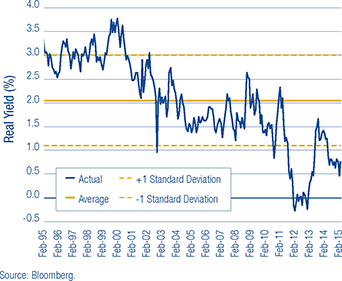
Less risk-averse investors can also decrease the average credit quality of their portfolios in an attempt to generate more income. While this can be a sound strategy in times of wide credit spreads, it fails during periods when credit risk is mispriced. Chart II shows a history of credit spreads, which in this case is the incremental yield an investor picked up from investing in a BBB rated revenue bond versus a AAA rated general obligation bond. Such spreads are as tight as they have been since before the great recession, when municipal bond insurers were thriving and a majority of the market was insured with AAA ratings.
In addition to overpriced risks, investors need to be prepared for continued volatility in the market. We live in a world where the Federal Reserve’s statements are analyzed word for word. The inclusion or deletion of any given word has the potential to send the markets roiling. The increased volatility may be exacerbated in the future by liquidity constraints facing the market, prompted by recent federal regulation. As a result of Dodd-Frank and other regulations, large broker/dealers will no longer be able to allocate the same amount of capital to the municipal market as they have in the past. Without that support, the market could be rattled more than usual if and when we see large outflows.
Investors need to be aware of all of these risks and ensure they are accounting for them appropriately.
4 Semi-Annual Report
LETTER TO SHAREHOLDERS,
CONTINUED
| | |
| |
Thornburg California Limited Term Municipal Fund | | March 31, 2015 (Unaudited) |
Chart II Credit-Spread Difference, BBB Rated Revenue v. AAA Rated General Obligation Bonds
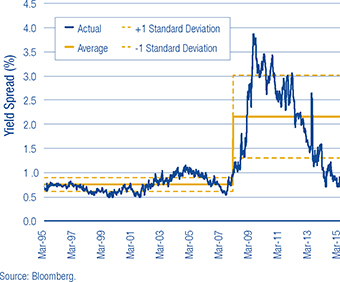
California
Demand for municipal debt in California has been exceptionally high, helping to elevate prices. As a result, many of the mispricing issues we see in the national market exist to an even greater extent in the California market. In general, the credit picture in the state continues to improve. Housing prices have stabilized and are increasing in many areas, leading to stronger fundamentals for most local issuers.
Conclusion
For the past six months, the Thornburg municipal bond team has asked a simple question: “Are we getting paid to take risk?” The answer has been a resounding “no.” As a result, our investors will see a portfolio with a lower duration and a stronger average credit quality, as we overweighted higher-rated credits. We have also increased cash positions to seek to protect against a market liquidity crunch and to strategically take advantage of opportunities should they arise. In short, we believe we have avoided overpriced risk.
Many shareholders may ask themselves “what should I do if interest rates begin to rise?” We continue to stress having confidence in the structure of your portfolio. A portion of your laddered Fund’s bonds mature each year and become available for reinvestment at higher yields; this has the potential to increase income to shareholders. When interest rates do rise, prices will generally decline, but the remaining bonds in the portfolio will move closer to maturity and should, in our opinion, increase in price over time. We advise being patient when interest rates start to rise, and lengthening your anticipated holding period. Remember that higher yields also mean higher income, something investors have been sorely lacking for quite some time!
We will continue to strive to manage your assets to fulfill the Fund’s objectives.
Sincerely,
| | | | |
 | |  | |  |
| Christopher Ryon, CFA | | Josh Gonze | | Nicholos Venditti |
| Portfolio Manager | | Portfolio Manager | | Portfolio Manager |
| Managing Director | | Managing Director | | Managing Director |
The matters discussed in this report may constitute forward-looking statements made pursuant to the safe harbor provisions of the Securities Litigation Reform Act of 1995. These include any advisor or portfolio manager prediction, assessment, analysis or outlook for individual securities, industries, investment styles, market sectors and/or markets. These statements involve risks and uncertainties. In addition to the general risks described for each fund in its current prospectus, other factors bearing on these reports include the accuracy of the advisor’s or portfolio manager’s forecasts and predictions, the appropriateness of the investment strategies designed by the advisor or portfolio manager and the ability of the advisor or portfolio manager to implement their strategies efficiently and successfully. Any one or more of these factors, as well as other risks affecting the securities markets generally, could cause the actual results of any fund to differ materially as compared to its benchmarks.
The views expressed by the portfolio managers reflect their professional opinions and are subject to change. Under no circumstances does the information contained within represent a recommendation to buy or sell any security.
Semi-Annual Report 5
PERFORMANCE SUMMARY
| | |
| |
Thornburg California Limited Term Municipal Fund | | March 31, 2015 (Unaudited) |
Average Annual Total Returns
| | | | | | | | | | | | | | | | |
| | | 1-Yr | | | 5-Yr | | | 10-Yr | | | Since
Incep. | |
A Shares (Incep: 2/19/87) | | | | | | | | | | | | | | | | |
Without sales charge | | | 3.16 | % | | | 3.38 | % | | | 3.53 | % | | | 4.53 | % |
With sales charge | | | 1.59 | % | | | 3.07 | % | | | 3.37 | % | | | 4.47 | % |
C Shares (Incep: 9/1/94) | | | | | | | | | | | | | | | | |
Without sales charge | | | 2.90 | % | | | 3.11 | % | | | 3.27 | % | | | 3.51 | % |
With sales charge | | | 2.39 | % | | | 3.11 | % | | | 3.27 | % | | | 3.51 | % |
I Shares (Incep: 4/1/97) | | | 3.49 | % | | | 3.72 | % | | | 3.88 | % | | | 4.04 | % |
30-Day Yields, A Shares
(with sales charge)
| | | | |
Annualized Distribution Yield | | | 1.28 | % |
| |
SEC Yield | | | 0.43 | % |
Performance data shown represents past performance and is no guarantee of future results. Investment return and principal value will fluctuate so shares, when redeemed, may be worth more or less than their original cost. Current performance may be lower or higher than quoted. For performance current to the most recent month end, visit thornburg.com or call 800-847-0200. The performance information does not reflect the deduction of taxes that a shareholder would pay on distributions or the redemption of Fund shares. Returns reflect the reinvestment of dividends and capital gains. Class A shares are sold with a maximum sales charge of 1.50%. Class C shares include a 0.50% CDSC for the first year only. There is no sales charge for Class I shares.
As disclosed in the most recent prospectus, the total annual fund operating expenses are as follows: A shares, 0.94%; C shares, 1.20%; I shares, 0.62%. For more detailed information on fund expenses and waivers/reimbursements please see the Fund’s prospectus.
Glossary
BofA Merrill Lynch 1-10 Year U.S. Municipal Securities Index – A subset of the BofA Merrill Lynch U.S. Municipal Securities Index including all securities with a remaining term to final maturity less than 10 years.
Unless otherwise noted, index returns reflect the reinvestment of income dividends and capital gains, if any, but do not reflect fees, brokerage commissions or other expenses of investing. Investors may not make direct investments into any index. The performance of any index is not indicative of the performance of any particular investment.
Alternative Minimum Tax – A federal tax aimed at ensuring that high-income individuals, estates, trusts, and corporations pay a minimal level income tax. For individuals, the AMT is calculated by adding tax preference items to regular taxable income.
Annualized Distribution Yield – The distribution yield reflects actual distributions made to shareholders. The annualized distribution yield is calculated by summing the last 30 days of income at a given month end and annualizing to a 360-day year. The result is divided by the ending maximum offering price.
Bond Credit Ratings (Credit Quality) – A bond credit rating assesses the financial ability of a debt issuer to make timely payments of principal and interest. Ratings of AAA (the highest), AA, A, and BBB are investment-grade quality. Ratings of BB, B, CCC, CC, C and D (the lowest) are considered below investment grade, speculative grade, or junk bonds.
Bond Insurers – Individual bonds are sometimes insured by private companies. The insurance guarantees the payment of principal and interest on a bond issue if the issuer defaults. Mutual funds are not insured, even if the underlying bonds are insured.
Credit Spread/Quality Spread – The difference between the yields of securities with different credit qualities.
Duration – A bond’s sensitivity to interest rates. Effective duration incorporates the embedded option features, such as call provisions. Bonds with longer durations experience greater price volatility than bonds with shorter durations.
General Obligation Bond – A municipal bond backed by the credit and “taxing power” of the issuing jurisdiction rather than the revenue from a given project.
Personal Consumption Expenditure (PCE) Index – A broad measure of U.S. inflation that assesses the change in prices of goods and services purchased by consumers throughout the economy. Core PCE excludes the more volatile and seasonal food and energy prices.
Revenue Bond – A bond on which the debt service is payable solely from the revenue generated from the operation of the project being financed or a category of facilities, or from other non-tax sources.
SEC Yield – SEC yield is computed in accordance with SEC standards measuring the net investment income per share over a specified 30-day period expressed as a percentage of the maximum offering price of the Fund’s shares at the end of the period.
Standard Deviation – A measure of the dispersion of a set of data from its mean. The more spread apart the data, the higher the deviation. Values within one standard deviation of the mean represent approximately two-thirds of the data set, assuming a normal distribution.
Yield Curve – A line that plots the interest rates, at a set point in time, of bonds having equal credit quality, but differing maturity dates.
Yield Spread – The difference between yields on differing debt instruments, calculated by deducting the yield of one instrument from another.
6 Semi-Annual Report
FUND SUMMARY
| | |
| |
Thornburg California Limited Term Municipal Fund | | March 31, 2015 (Unaudited) |
Objectives and Strategies
The Fund’s primary investment objective is to obtain as high a level of current income exempt from federal and California state individual income taxes as is consistent, in the view of the Fund’s investment advisor, with preservation of capital.
The secondary goal of the Fund is to reduce expected changes in its share price compared to longer intermediate and long-term bond portfolios.
The Fund offers California investors double tax-free yields (may be subject to Alternative Minimum Tax) in a laddered municipal bond portfolio with an average maturity of normally less than five years. Laddering involves building a portfolio of bonds with staggered maturities so that a portion of the portfolio matures each year. Cash from maturing bonds, if not needed for other purposes, is invested in bonds with longer maturities at the far end of the ladder. We regard this strategy as a good compromise for managing different types of risk.
Long Term Stability of Principal
Net Asset Value History of A Shares
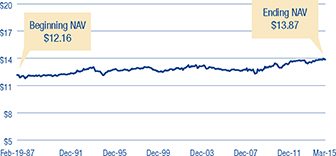
Key Portfolio Attributes
| | | | |
Number of Bonds | | | 347 | |
| |
Effective Duration | | | 3.5 Yrs | |
| |
Average Maturity | | | 4.6 Yrs | |
Security Credit Ratings
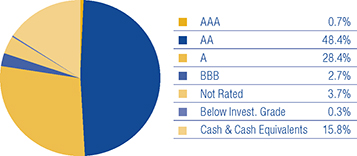
A bond credit rating assesses the financial ability of a debt issuer to make timely payments of principal and interest. Ratings of AAA (the highest), AA, A, and BBB are investment-grade quality. Ratings of BB, B, CCC, CC, C and D (the lowest) are considered below investment grade, speculative grade, or junk bonds. Credit quality ratings for Thornburg’s municipal portfolios used the highest rating available from either Standard & Poor’s or Moody’s Investors Service.
Portfolio Ladder
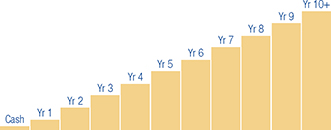
There is no guarantee that the Fund will meet its investment objectives.
All data is subject to change. Charts may not add up to 100% due to rounding.
Semi-Annual Report 7
| | |
| SCHEDULE OF INVESTMENTS | | |
| |
Thornburg California Limited Term Municipal Fund | | March 31, 2015 (Unaudited) |
| | | | | | | | | | |
Issuer-Description | | Credit Rating†
S&P/ Moody’s | | Principal
Amount | | | Value | |
Alameda County COP, 5.625% due 12/1/2016 (Santa Rita Jail; Insured: AMBAC) | | AA/NR | | $ | 1,830,000 | | | $ | 1,982,347 | |
Alameda County Joint Powers Authority, 5.00% due 12/1/2018 (Alameda County Medical Center Highland Hospital) | | AA/Aa3 | | | 400,000 | | | | 455,900 | |
Alameda County Joint Powers Authority, 5.00% due 12/1/2019 (Alameda County Medical Center Highland Hospital) | | AA/Aa3 | | | 750,000 | | | | 873,690 | |
Alameda County Joint Powers Authority, 5.00% due 12/1/2020 (Alameda County Medical Center Highland Hospital) | | AA/Aa3 | | | 725,000 | | | | 859,988 | |
Alameda County Joint Powers Authority, 5.00% due 12/1/2021 (Alameda County Medical Center Highland Hospital) | | AA/Aa3 | | | 1,000,000 | | | | 1,187,300 | |
Alameda County Joint Powers Authority, 5.00% due 12/1/2024 (Alameda County Medical Center Highland Hospital) | | AA/Aa3 | | | 2,500,000 | | | | 3,068,500 | |
Anaheim Public Financing Authority, 5.00% due 10/1/2018 (Electric System Distribution Facilities; Insured: AMBAC) | | NR/NR | | | 780,000 | | | | 795,522 | |
Anaheim Public Financing Authority, 5.00% due 10/1/2020 (Electric System Distribution Facilities; Insured: AMBAC) | | NR/NR | | | 445,000 | | | | 452,925 | |
Anaheim Public Financing Authority, 5.00% due 10/1/2021 (Electric System Distribution Facilities; Insured: AMBAC) | | NR/NR | | | 820,000 | | | | 833,358 | |
Anaheim Public Financing Authority, 0% due 9/1/2022 (Public Improvements Project; Insured: AGM) | | AA/A2 | | | 3,000,000 | | | | 2,503,680 | |
Bay Area Toll Authority, 5.00% due 4/1/2016 (San Francisco Bay Area Toll Bridge) | | AA/Aa3 | | | 2,075,000 | | | | 2,175,741 | |
Bay Area Toll Authority, 0.72% due 4/1/2047 put 10/1/2019 (San Francisco Bay Area Toll Bridge) | | AA/Aa3 | | | 5,000,000 | | | | 5,087,550 | |
Bay Area Toll Authority, 1.50% due 4/1/2047 (San Francisco Bay Area Toll Bridge) | | AA/Aa3 | | | 1,000,000 | | | | 1,012,180 | |
Bay Area Water Supply & Conservation Agency, 2.00% due 10/1/2015 (Regional Water System Improvements) | | AA-/Aa3 | | | 1,000,000 | | | | 1,009,340 | |
Bay Area Water Supply & Conservation Agency, 3.00% due 10/1/2016 (Regional Water System Improvements) | | AA-/Aa3 | | | 3,965,000 | | | | 4,122,054 | |
Bonita USD GO, 5.00% due 8/1/2024 (Educational Facilities) | | AA-/NR | | | 1,000,000 | | | | 1,213,280 | |
Brea Redevelopment Agency, 5.00% due 8/1/2019 (Redevelopment Project AB) | | AA-/NR | | | 2,000,000 | | | | 2,306,800 | |
Brentwood Infrastructure Financing Authority, 3.00% due 9/2/2016 (Residential Single Family Development; Insured: AGM) | | AA/NR | | | 315,000 | | | | 326,268 | |
Brentwood Infrastructure Financing Authority, 4.00% due 9/2/2017 (Residential Single Family Development; Insured: AGM) | | AA/NR | | | 920,000 | | | | 991,052 | |
Brentwood Infrastructure Financing Authority, 5.00% due 9/2/2020 (Residential Single Family Development; Insured: AGM) | | AA/NR | | | 1,760,000 | | | | 2,064,691 | |
Brentwood Infrastructure Financing Authority, 5.00% due 9/2/2021 (Residential Single Family Development; Insured: AGM) | | AA/NR | | | 925,000 | | | | 1,099,325 | |
Brentwood Infrastructure Financing Authority, 5.00% due 9/2/2022 (Residential Single Family Development; Insured: AGM) | | AA/NR | | | 850,000 | | | | 1,021,292 | |
Brentwood Infrastructure Financing Authority, 5.00% due 9/2/2023 (Residential Single Family Development; Insured: AGM) | | AA/NR | | | 2,690,000 | | | | 3,260,495 | |
Calexico USD COP, 6.75% due 9/1/2017 | | A-/NR | | | 2,370,000 | | | | 2,499,118 | |
California Educational Facilities Authority, 5.00% due 4/1/2018 (Pitzer College) | | NR/A2 | | | 1,540,000 | | | | 1,717,023 | |
California Educational Facilities Authority, 0% due 10/1/2019 (Loyola Marymount University; Insured: Natl-Re) | | NR/A2 | | | 2,025,000 | | | | 1,849,473 | |
California Educational Facilities Authority, 5.00% due 4/1/2020 (Pitzer College) | | NR/A2 | | | 1,445,000 | | | | 1,676,980 | |
California Educational Facilities Authority, 5.00% due 4/1/2022 (Chapman University) | | NR/A2 | | | 2,000,000 | | | | 2,378,160 | |
California HFFA, 4.00% due 2/1/2016 (Community Program Developmental Disabilities; Insured: California Mtg Insurance) | | A+/NR | | | 2,475,000 | | | | 2,554,769 | |
California HFFA, 5.50% due 10/1/2017 (Providence Health and Services) | | AA-/Aa3 | | | 1,100,000 | | | | 1,230,471 | |
California HFFA, 5.50% due 2/1/2018 (Community Program Developmental Disabilities; Insured: California Mtg Insurance) | | A+/NR | | | 2,715,000 | | | | 3,063,660 | |
California HFFA, 6.00% due 10/1/2018 (Providence Health and Services) | | AA-/Aa3 | | | 1,000,000 | | | | 1,167,400 | |
California HFFA, 5.00% due 11/15/2018 (Children’s Hospital Los Angeles) | | BBB+/Baa2 | | | 1,235,000 | | | | 1,362,785 | |
California HFFA, 5.10% due 2/1/2019 (Episcopal Home; Insured: California Mtg Insurance) (ETM) | | A+/NR | | | 1,000,000 | | | | 1,094,990 | |
California HFFA, 5.00% due 11/15/2020 (Children’s Hospital Los Angeles) | | BBB+/Baa2 | | | 1,190,000 | | | | 1,348,615 | |
California HFFA, 5.25% due 3/1/2022 (Dignity Health) | | A/A3 | | | 1,000,000 | | | | 1,196,330 | |
California HFFA, 5.125% due 7/1/2022 (Dignity Health) | | A/A3 | | | 1,420,000 | | | | 1,437,395 | |
California HFFA, 1.45% due 8/15/2023 put 3/15/2017 (Lucile Salter Packard Children’s Hospital) | | AA-/Aa3 | | | 3,000,000 | | | | 3,045,570 | |
California HFFA, 5.00% due 11/15/2023 (Children’s Hospital Los Angeles) | | BBB+/Baa2 | | | 1,000,000 | | | | 1,136,160 | |
California HFFA, 5.00% due 7/1/2024 (St. Joseph Health System) | | AA-/A1 | | | 1,000,000 | | | | 1,217,750 | |
California HFFA, 5.00% due 7/1/2034 put 10/18/2022 (St. Joseph Health System) | | AA-/A1 | | | 2,000,000 | | | | 2,435,000 | |
California HFFA, 5.00% due 7/1/2043 put 10/17/2017 (St. Joseph Health System) | | AA-/A1 | | | 3,000,000 | | | | 3,325,170 | |
California HFFA, 5.00% due 7/1/2043 put 10/15/2020 (St. Joseph Health System) | | AA-/A1 | | | 5,000,000 | | | | 5,912,800 | |
California Municipal Finance Authority, 5.00% due 10/1/2021 (Biola University Residential Hall and Parking Structure) | | NR/Baa1 | | | 150,000 | | | | 172,466 | |
California Municipal Finance Authority, 5.00% due 10/1/2022 (Biola University Residential Hall and Parking Structure) | | NR/Baa1 | | | 160,000 | | | | 185,984 | |
California Municipal Finance Authority, 5.00% due 10/1/2023 (Biola University Residential Hall and Parking Structure) | | NR/Baa1 | | | 125,000 | | | | 146,370 | |
California Pollution Control Financing Authority, 5.25% due 6/1/2023 put 12/1/2017 (Solid Waste Disposal-Republic Services, Inc.) (AMT) | | BBB+/Baa3 | | | 2,820,000 | | | | 3,062,125 | |
California Pollution Control Financing Authority, 0.02% due 11/1/2026 put 4/1/2015 (Pacific Gas & Electric Co.; LOC: JPMorgan Chase Bank, N.A.) (daily demand notes) | | AA+/NR | | | 27,800,000 | | | | 27,800,000 | |
California State Department of Transportation COP, 5.25% due 3/1/2016 (Insured: Natl-Re) | | AA-/A1 | | | 660,000 | | | | 662,798 | |
California State Department of Veterans Affairs, 2.75% due 12/1/2018 (Farm and Home Purchase Program) | | AA/Aa3 | | | 1,000,000 | | | | 1,053,210 | |
California State Department of Veterans Affairs, 3.00% due 12/1/2019 (Farm and Home Purchase Program) | | AA/Aa3 | | | 500,000 | | | | 532,780 | |
California State Department of Veterans Affairs GO, 4.40% due 12/1/2022 (Farm and Home Purchase Program) (AMT) | | AA/Aa2 | | | 550,000 | | | | 559,009 | |
California State Department of Water Resources, 5.00% due 5/1/2015 (DWR Power Supply Program) | | AA/Aa2 | | | 3,400,000 | | | | 3,413,974 | |
California State Department of Water Resources, 5.00% due 5/1/2015 (DWR Power Supply Program) | | AA/Aa2 | | | 5,000,000 | | | | 5,020,550 | |
California State Housing Finance Agency, 5.125% due 8/1/2018 (Single Family Housing; Insured: AGM) (AMT) | | AA/A2 | | | 330,000 | | | | 339,715 | |
California State Housing Finance Agency, 3.05% due 12/1/2019 (Multi-Family Housing; Insured: FHA) | | NR/Aa1 | | | 735,000 | | | | 741,262 | |
California State Infrastructure & Economic Development Bank, 5.25% due 8/15/2020 (King City High School) | | A+/NR | | | 1,000,000 | | | | 1,159,110 | |
California State Public Works Board, 5.00% due 11/1/2016 (California State University-J. Paul Leonard & Sutro Library) | | A/Aa3 | | | 1,000,000 | | | | 1,072,120 | |
California State Public Works Board, 5.00% due 6/1/2020 (University of California; Insured: Natl-Re) (ETM) | | AA+/Aaa | | | 1,185,000 | | | | 1,407,685 | |
California State Public Works Board, 5.125% due 3/1/2021 (Various State Participating Agency Capital Projects) | | A/A1 | | | 1,635,000 | | | | 1,902,715 | |
California State Public Works Board, 5.00% due 12/1/2021 (Judicial Council Projects) | | A/A1 | | | 3,100,000 | | | | 3,729,641 | |
California State Public Works Board, 5.00% due 4/1/2022 (California School for the Deaf Riverside Campus) | | A/A1 | | | 565,000 | | | | 678,390 | |
California State Public Works Board, 5.00% due 6/1/2022 (Yuba City Courthouse) | | A/A1 | | | 1,950,000 | | | | 2,345,869 | |
California State Public Works Board, 5.00% due 9/1/2022 (Correctional and Rehabilitation Facilities) | | A/A1 | | | 3,250,000 | | | | 3,920,507 | |
8 Semi-Annual Report
| | |
| SCHEDULE OF INVESTMENTS, CONTINUED | | |
| |
Thornburg California Limited Term Municipal Fund | | March 31, 2015 (Unaudited) |
| | | | | | | | | | |
Issuer-Description | | Credit Rating†
S&P/ Moody’s | | Principal
Amount | | | Value | |
California State Public Works Board, 5.00% due 11/1/2022 (Correctional and Rehabilitation Facilities) | | A/A1 | | $ | 1,500,000 | | | $ | 1,812,570 | |
California State Public Works Board, 5.00% due 12/1/2022 (Judicial Council Projects) | | A/A1 | | | 1,200,000 | | | | 1,420,656 | |
California State Public Works Board, 5.00% due 3/1/2023 (Judicial Council Projects) | | A/A1 | | | 1,400,000 | | | | 1,693,748 | |
California State Public Works Board, 5.00% due 6/1/2023 (Coalinga State Hospital) | | A/A1 | | | 7,200,000 | | | | 8,746,776 | |
California State Public Works Board, 5.00% due 9/1/2023 (Correctional and Rehabilitation Facilities) | | A/A1 | | | 3,600,000 | | | | 4,391,172 | |
California State Public Works Board, 5.00% due 11/1/2023 (Laboratory Facility and San Diego Courthouse) | | A/A1 | | | 3,000,000 | | | | 3,669,000 | |
California State Public Works Board, 5.00% due 3/1/2024 (Judicial Council Projects) | | A/A1 | | | 1,000,000 | | | | 1,200,800 | |
California State Public Works Board, 5.00% due 4/1/2024 (Correctional and Rehabilitation Facilities) | | A/A1 | | | 3,350,000 | | | | 3,990,185 | |
California State Public Works Board, 5.00% due 9/1/2024 (Correctional and Rehabilitation Facilities) | | A/A1 | | | 3,580,000 | | | | 4,411,133 | |
California State Public Works Board, 5.00% due 11/1/2024 (Laboratory Facility and San Diego Courthouse) | | A/A1 | | | 4,000,000 | | | | 4,850,640 | |
California Statewide Communities Development Authority, 5.00% due 4/1/2019 (Kaiser Foundation Hospitals) | | A+/NR | | | 3,715,000 | | | | 4,271,061 | |
California Statewide Communities Development Authority, 5.00% due 7/1/2020 (Aspire Public Schools; LOC: PCSD Guaranty Pool I, LLC) | | NR/NR | | | 1,270,000 | | | | 1,329,969 | |
California Statewide Communities Development Authority, 5.00% due 11/1/2020 (Cottage Health System) | | A+/NR | | | 100,000 | | | | 118,322 | |
California Statewide Communities Development Authority, 4.00% due 11/1/2021 (Cottage Health System) | | A+/NR | | | 150,000 | | | | 170,363 | |
California Statewide Communities Development Authority, 5.00% due 11/1/2022 (Cottage Health System) | | A+/NR | | | 125,000 | | | | 151,179 | |
California Statewide Communities Development Authority, 5.00% due 11/1/2023 (Cottage Health System) | | A+/NR | | | 150,000 | | | | 183,273 | |
California Statewide Communities Development Authority, 5.00% due 11/1/2024 (Cottage Health System) | | A+/NR | | | 200,000 | | | | 244,338 | |
California Statewide Communities Development Authority, 5.00% due 11/1/2025 (Cottage Health System) | | A+/NR | | | 135,000 | | | | 163,620 | |
Calipatria USD GO, 0% due 8/1/2025 (Educational Facilities; Insured: ACA) | | NR/NR | | | 5,000,000 | | | | 3,093,000 | |
Carson Redevelopment Agency, 6.00% due 10/1/2019 (Project Area 1) | | A-/NR | | | 1,050,000 | | | | 1,246,045 | |
Castaic USD GO, 0% due 5/1/2018 (Insured: Natl-Re) | | AA-/NR | | | 1,760,000 | | | | 1,569,744 | |
Central Valley Financing Authority, 5.00% due 7/1/2015 (Carson Ice) | | AA-/A1 | | | 1,000,000 | | | | 1,011,830 | |
Central Valley Financing Authority, 5.25% due 7/1/2020 (Carson Ice) | | AA-/A1 | | | 500,000 | | | | 593,205 | |
Chabot-Las Positas Community College District GO, 0% due 8/1/2018 (Capital Improvements; Insured: AMBAC) | | A+/Aa3 | | | 2,465,000 | | | | 2,222,690 | |
City and County of San Francisco COP, 5.00% due 11/1/2016 (525 Golden Gate Avenue-Public Utilities Commission Office Project) | | AA/Aa3 | | | 200,000 | | | | 214,458 | |
City and County of San Francisco COP, 5.00% due 9/1/2018 (City Office Buildings-Multiple Properties Project; Insured: Natl-Re) | | AA/Aa3 | | | 300,000 | | | | 301,188 | |
City and County of San Francisco COP, 5.00% due 11/1/2022 (525 Golden Gate Avenue-Public Utilities Commission Office Project) | | AA/Aa3 | | | 700,000 | | | | 806,099 | |
City and County of San Francisco Redevelopment Agency, 5.00% due 6/1/2020 (San Francisco Redevelopment Projects; Insured: AGM) | | AA/A1 | | | 1,730,000 | | | | 2,021,384 | |
City of Antioch Public Financing Authority, 5.00% due 5/1/2022 (Municipal Facilities Project) | | AA-/NR | | | 500,000 | | | | 596,555 | |
City of Antioch Public Financing Authority, 5.00% due 5/1/2024 (Municipal Facilities Project) | | AA-/NR | | | 900,000 | | | | 1,092,132 | |
City of Burbank, 5.00% due 6/1/2015 (Burbank Water and Power System) | | AA-/A1 | | | 750,000 | | | | 755,940 | |
City of Burbank, 5.00% due 6/1/2016 (Burbank Water and Power System) | | AA-/A1 | | | 500,000 | | | | 526,720 | |
City of Burbank, 5.00% due 6/1/2017 (Burbank Water and Power System) | | AA-/A1 | | | 1,000,000 | | | | 1,092,180 | |
City of Burbank, 5.00% due 6/1/2018 (Burbank Water and Power System) | | AA-/A1 | | | 360,000 | | | | 404,449 | |
City of Burbank, 5.00% due 6/1/2020 (Burbank Water and Power System) | | AA-/A1 | | | 625,000 | | | | 735,338 | |
City of Chula Vista, 1.65% due 7/1/2018 (San Diego Gas & Electric Co.) | | A+/Aa2 | | | 3,300,000 | | | | 3,313,530 | |
City of Chula Vista COP, 5.25% due 3/1/2020 (Capital Facilities Project) | | AA-/NR | | | 1,300,000 | | | | 1,524,172 | |
City of Chula Vista COP, 5.00% due 10/1/2024 (Police Facility Project) | | AA-/A1 | | | 1,700,000 | | | | 2,055,810 | |
City of Clovis, 5.00% due 3/1/2021 (Water System Facilities; Insured: BAM) | | AA/A2 | | | 550,000 | | | | 645,062 | |
City of Clovis, 5.00% due 3/1/2022 (Water System Facilities; Insured: BAM) | | AA/A2 | | | 720,000 | | | | 853,783 | |
City of Clovis, 5.00% due 3/1/2023 (Water System Facilities; Insured: BAM) | | AA/A2 | | | 1,000,000 | | | | 1,200,030 | |
City of Folsom, 5.00% due 12/1/2016 (Community Facilities District No. 2) | | A+/NR | | | 1,100,000 | | | | 1,175,174 | |
City of Folsom, 5.00% due 12/1/2018 (Community Facilities District No. 2) | | A+/NR | | | 965,000 | | | | 1,081,900 | |
City of Los Angeles Community Facilities District No. 4, 3.00% due 9/1/2015 (Playa Vista - Phase 1) | | BBB/NR | | | 1,270,000 | | | | 1,284,707 | |
City of Los Angeles Community Facilities District No. 4, 4.00% due 9/1/2016 (Playa Vista - Phase 1) | | BBB/NR | | | 650,000 | | | | 681,623 | |
City of Los Angeles Community Facilities District No. 4, 4.00% due 9/1/2017 (Playa Vista - Phase 1) | | BBB/NR | | | 500,000 | | | | 537,080 | |
City of Los Angeles COP, 3.00% due 11/1/2030 put 2/1/2018 (American Academy of Dramatic Arts; LOC: TD Bank, N.A.) | | NR/Aa3 | | | 2,625,000 | | | | 2,708,002 | |
City of Manteca, 3.00% due 12/1/2015 (Wastewater and Sewer System) | | AA-/Aa3 | | | 280,000 | | | | 285,088 | |
City of Manteca, 4.00% due 7/1/2016 (Water Supply System) | | AA-/A1 | | | 300,000 | | | | 313,953 | |
City of Manteca, 3.00% due 12/1/2016 (Wastewater and Sewer System) | | AA-/Aa3 | | | 520,000 | | | | 541,086 | |
City of Manteca, 4.00% due 7/1/2018 (Water Supply System) | | AA-/A1 | | | 550,000 | | | | 602,443 | |
City of Manteca, 4.00% due 12/1/2018 (Wastewater and Sewer System) | | AA-/Aa3 | | | 375,000 | | | | 412,166 | |
City of Manteca, 5.00% due 7/1/2019 (Water Supply System) | | AA-/A1 | | | 400,000 | | | | 461,712 | |
City of Manteca, 5.00% due 7/1/2021 (Water Supply System) | | AA-/A1 | | | 1,000,000 | | | | 1,192,920 | |
City of Manteca, 5.00% due 7/1/2023 (Water Supply System) | | AA-/A1 | | | 650,000 | | | | 776,145 | |
City of Moorpark Mobile Home Park, 4.90% due 5/15/2017 (Villa Del Arroyo) | | A/NR | | | 605,000 | | | | 635,740 | |
City of Porterville COP, 6.30% due 10/1/2018 (Public Service Capital Projects; Insured: AMBAC) | | NR/NR | | | 885,000 | | | | 929,622 | |
City of San Jose Financing Authority, 5.00% due 6/1/2019 (Civic Center Project) | | AA/Aa3 | | | 650,000 | | | | 750,750 | |
City of San Jose Financing Authority, 5.00% due 6/1/2020 (Civic Center Project) | | AA/Aa3 | | | 600,000 | | | | 705,678 | |
City of San Jose Financing Authority, 4.00% due 6/1/2021 (Civic Center Project) | | AA/Aa3 | | | 1,000,000 | | | | 1,132,960 | |
City of San Jose Financing Authority, 5.00% due 6/1/2022 (Civic Center Project) | | AA/Aa3 | | | 745,000 | | | | 900,258 | |
City of San Jose Financing Authority, 5.00% due 6/1/2023 (Civic Center Project) | | AA/Aa3 | | | 1,000,000 | | | | 1,219,800 | |
Semi-Annual Report 9
| | |
| SCHEDULE OF INVESTMENTS, CONTINUED | | |
| |
Thornburg California Limited Term Municipal Fund | | March 31, 2015 (Unaudited) |
| | | | | | | | | | |
Issuer-Description | | Credit Rating†
S&P/ Moody’s | | Principal
Amount | | | Value | |
City of San Jose Financing Authority, 5.00% due 6/1/2024 (Civic Center Project) | | AA/Aa3 | | $ | 750,000 | | | $ | 910,597 | |
City of Torrance, 5.00% due 9/1/2020 (Torrance Memorial Medical Center) | | BBB+/A3 | | | 1,155,000 | | | | 1,337,143 | |
City of Torrance, 6.00% due 6/1/2022 (Torrance Memorial Medical Center) | | BBB+/A3 | | | 2,600,000 | | | | 2,646,020 | |
City of Vallejo, 5.00% due 5/1/2017 (Water Improvement Project; Insured: Natl-Re) | | AA-/A3 | | | 1,240,000 | | | | 1,299,557 | |
Colton Public Financing Authority, 4.00% due 4/1/2017 (Electric Generation Facility Project) | | NR/A2 | | | 530,000 | | | | 564,349 | |
Colton Public Financing Authority, 4.00% due 4/1/2018 (Electric Generation Facility Project) | | NR/A2 | | | 550,000 | | | | 597,713 | |
Colton Public Financing Authority, 4.00% due 4/1/2019 (Electric Generation Facility Project) | | NR/A2 | | | 400,000 | | | | 441,144 | |
Colton Public Financing Authority, 5.00% due 4/1/2020 (Electric Generation Facility Project) | | NR/A2 | | | 410,000 | | | | 477,429 | |
Colton Public Financing Authority, 5.00% due 4/1/2021 (Electric Generation Facility Project) | | NR/A2 | | | 650,000 | | | | 766,701 | |
Colton Public Financing Authority, 5.00% due 4/1/2022 (Electric Generation Facility Project) | | NR/A2 | | | 970,000 | | | | 1,160,285 | |
Community Development Commission of the City of Santa Fe Springs, 5.00% due 9/1/2018 (Redevelopment Project; Insured: Natl-Re) | | AA-/A3 | | | 1,235,000 | | | | 1,347,657 | |
Community Redevelopment Agency of the City of Union City, 4.50% due 10/1/2020 (Redevelopment Project; Insured: AMBAC) | | NR/Ba1 | | | 460,000 | | | | 460,580 | |
Corona-Norco USD GO, 0% due 9/1/2017 (Insured: AGM) | | AA/Aa2 | | | 1,595,000 | | | | 1,559,495 | |
Coronado Community Development Agency, 0% due 9/1/2016 (Insured: AGM) | | AA/A2 | | | 225,000 | | | | 223,308 | |
County of El Dorado Community Facilities District, 5.00% due 9/1/2019 (El Dorado Hills Development) | | A/NR | | | 1,700,000 | | | | 1,936,113 | |
County of Los Angeles Redevelopment Refunding Authority, 5.00% due 6/1/2020 (Bunker Hill Project) | | A+/NR | | | 1,000,000 | | | | 1,170,920 | |
County of Los Angeles Redevelopment Refunding Authority, 5.00% due 6/1/2021 (Bunker Hill Project) | | A+/NR | | | 2,500,000 | | | | 2,966,150 | |
County of Los Angeles Redevelopment Refunding Authority, 5.00% due 6/1/2022 (Bunker Hill Project) | | A+/NR | | | 1,000,000 | | | | 1,198,750 | |
County of Los Angeles Redevelopment Refunding Authority, 5.00% due 6/1/2023 (Bunker Hill Project) | | A+/NR | | | 1,000,000 | | | | 1,208,940 | |
County of Los Angeles Redevelopment Refunding Authority, 5.00% due 6/1/2024 (Bunker Hill Project) | | A+/NR | | | 500,000 | | | | 607,800 | |
County of Monterey COP, 5.25% due 8/1/2021 (Natividad Medical Center; Insured: AGM) | | AA/A1 | | | 3,700,000 | | | | 4,286,598 | |
County of Orange Community Facilities District No. 86-1 of the Irvine USD, 5.25% due 9/1/2017 (Educational Facilities; Insured: AGM) | | AA/NR | | | 250,000 | | | | 274,560 | |
County of Stanislaus, 5.75% due 5/1/2015 (Insured: Natl-Re) | | AA-/A3 | | | 1,815,000 | | | | 1,822,841 | |
Delano Financing Authority, 5.00% due 12/1/2017 (Police Station and Capital Improvements) | | A-/NR | | | 1,085,000 | | | | 1,179,753 | |
Delano Financing Authority, 5.00% due 12/1/2018 (Police Station and Capital Improvements) | | A-/NR | | | 1,135,000 | | | | 1,255,196 | |
Delano Financing Authority, 5.00% due 12/1/2019 (Police Station and Capital Improvements) | | A-/NR | | | 1,195,000 | | | | 1,346,263 | |
Emeryville Redevelopment Agency, 5.00% due 9/1/2022 (Emeryville and Shellmound Park Projects; Insured: AGM) | | AA/NR | | | 2,775,000 | | | | 3,370,265 | |
Emeryville Redevelopment Agency, 5.00% due 9/1/2023 (Emeryville and Shellmound Park Projects; Insured: AGM) | | AA/NR | | | 2,420,000 | | | | 2,966,460 | |
Emeryville Redevelopment Agency, 5.00% due 9/1/2024 (Emeryville and Shellmound Park Projects; Insured: AGM) | | AA/NR | | | 3,900,000 | | | | 4,822,818 | |
Fillmore Public Financing Authority, 5.00% due 5/1/2016 (Water Recycling Financing Project; Insured: CIFG) | | AA/A3 | | | 735,000 | | | | 768,582 | |
Fresno County USD GO, 5.90% due 8/1/2017 (Educational Facilities; Insured: Natl-Re) | | AA-/A3 | | | 590,000 | | | | 658,729 | |
Fresno County USD GO, 5.90% due 8/1/2018 (Educational Facilities; Insured: Natl-Re) | | AA-/A3 | | | 630,000 | | | | 726,636 | |
Fresno County USD GO, 5.90% due 8/1/2019 (Educational Facilities; Insured: Natl-Re) | | AA-/A3 | | | 675,000 | | | | 799,909 | |
Fresno County USD GO, 5.00% due 2/1/2020 (Educational Facilities; Insured: Natl-Re) | | AA-/A3 | | | 2,510,000 | | | | 2,908,814 | |
Fresno County USD GO, 5.90% due 8/1/2020 (Educational Facilities; Insured: Natl-Re) | | AA-/A3 | | | 720,000 | | | | 875,693 | |
Fullerton Public Financing Authority, 5.00% due 9/1/2016 (Insured: AMBAC) | | A/NR | | | 1,775,000 | | | | 1,807,518 | |
Guam Power Authority, 5.00% due 10/1/2021 (Electric Power System; Insured: AGM) | | AA/A2 | | | 1,275,000 | | | | 1,511,971 | |
Hemet USD GO, 4.00% due 8/1/2018 (Insured: AGM) | | AA/NR | | | 1,335,000 | | | | 1,460,343 | |
Irvine Public Facilities & Infrastructure Authority, 3.00% due 9/2/2015 | | BBB+/NR | | | 565,000 | | | | 569,983 | |
Irvine Public Facilities & Infrastructure Authority, 3.00% due 9/2/2016 | | BBB+/NR | | | 1,290,000 | | | | 1,323,411 | |
Jurupa Public Financing Authority, 4.50% due 9/1/2018 (Community Services District-Eastvale Area; Insured: AGM) | | AA/NR | | | 870,000 | | | | 958,723 | |
Jurupa Public Financing Authority, 4.50% due 9/1/2019 (Community Services District-Eastvale Area; Insured: AGM) | | AA/NR | | | 905,000 | | | | 1,014,813 | |
Jurupa Public Financing Authority, 4.50% due 9/1/2020 (Community Services District-Eastvale Area; Insured: AGM) | | AA/NR | | | 945,000 | | | | 1,074,522 | |
Kern High School District GO, 3.00% due 8/1/2015 (Insured: AGM) | | A+/Aa2 | | | 500,000 | | | | 504,665 | |
Kern High School District GO, 4.00% due 8/1/2016 (Insured: AGM) | | A+/Aa2 | | | 500,000 | | | | 524,295 | |
Kern High School District GO, 4.00% due 8/1/2017 (Insured: AGM) | | A+/Aa2 | | | 500,000 | | | | 538,900 | |
Kern High School District GO, 4.00% due 8/1/2018 (Insured: AGM) | | A+/Aa2 | | | 500,000 | | | | 548,900 | |
La Quinta Redevelopment Agency, 5.00% due 9/1/2021 (Redevelopment Project Areas No. 1 and 2) | | A+/NR | | | 1,000,000 | | | | 1,178,690 | |
La Quinta Redevelopment Agency, 5.00% due 9/1/2022 (Redevelopment Project Areas No. 1 and 2) | | A+/NR | | | 2,000,000 | | | | 2,381,240 | |
La Quinta Redevelopment Agency, 5.00% due 9/1/2023 (Redevelopment Project Areas No. 1 and 2) | | A+/NR | | | 1,500,000 | | | | 1,791,375 | |
Lodi Public Financing Authority, 3.00% due 10/1/2016 (City Police Building and Jail) | | A/NR | | | 830,000 | | | | 856,286 | |
Lodi Public Financing Authority, 5.00% due 10/1/2020 (City Police Building and Jail) | | A/NR | | | 965,000 | | | | 1,111,535 | |
Lodi Public Financing Authority, 5.00% due 10/1/2021 (City Police Building and Jail) | | A/NR | | | 1,020,000 | | | | 1,188,239 | |
Lodi Public Financing Authority, 5.00% due 10/1/2022 (City Police Building and Jail) | | A/NR | | | 1,040,000 | | | | 1,210,914 | |
Lodi Public Financing Authority, 5.00% due 10/1/2023 (City Police Building and Jail) | | A/NR | | | 1,120,000 | | | | 1,294,115 | |
Los Alamitos USD GO, 0% due 9/1/2016 (Educational Facilities) (ETM) | | SP-1+/Aa2 | | | 2,000,000 | | | | 1,990,280 | |
Los Angeles Convention & Exhibition Center Authority, 5.00% due 8/15/2016 | | A+/A1 | | | 2,100,000 | | | | 2,230,725 | |
Los Angeles Convention & Exhibition Center Authority, 5.00% due 8/15/2017 | | A+/A1 | | | 1,660,000 | | | | 1,825,286 | |
Los Angeles County Public Works Financing Authority, 4.25% due 6/1/2016 (Calabasas Landfill; Insured: AMBAC) | | AA/A1 | | | 1,000,000 | | | | 1,006,200 | |
Los Angeles County Public Works Financing Authority, 5.00% due 8/1/2018 (Multiple Capital Projects) | | AA/A1 | | | 2,060,000 | | | | 2,331,611 | |
Los Angeles County Schools Regionalized Business Services Corp. COP, 0% due 8/1/2021 (Insured: AMBAC) | | NR/NR | | | 2,135,000 | | | | 1,817,995 | |
Los Angeles Department of Airports, 5.50% due 5/15/2018 (Los Angeles International Airport) (AMT) | | AA/Aa3 | | | 2,000,000 | | | | 2,270,240 | |
10 Semi-Annual Report
| | |
| SCHEDULE OF INVESTMENTS, CONTINUED | | |
| |
Thornburg California Limited Term Municipal Fund | | March 31, 2015 (Unaudited) |
| | | | | | | | | | |
Issuer-Description | | Credit Rating†
S&P/ Moody’s | | Principal
Amount | | | Value | |
Los Angeles Department of Water & Power, 0.01% due 7/1/2034 put 4/1/2015 (Electric Power Plant; SPA: Royal Bank of Canada) (daily demand notes) | | AA-/Aa3 | | $ | 14,000,000 | | | $ | 14,000,000 | |
Los Angeles Municipal Improvement Corp., 5.00% due 11/1/2017 (Capital Improvements) | | A+/A2 | | | 3,235,000 | | | | 3,592,467 | |
Los Angeles Municipal Improvement Corp., 5.00% due 3/1/2018 (Capital Improvements) | | A+/A2 | | | 4,765,000 | | | | 5,330,129 | |
Los Angeles USD COP, 5.00% due 10/1/2015 (Educational Facilities and Information Technology Infrastructure; Insured: AMBAC) | | A+/A1 | | | 2,000,000 | | | | 2,048,720 | |
Los Angeles USD COP, 5.00% due 10/1/2016 (Educational Facilities and Information Technology Infrastructure; Insured: AMBAC) | | A+/A1 | | | 425,000 | | | | 454,903 | |
Los Angeles USD COP, 5.50% due 12/1/2018 (Educational Facilities and Information Technology Infrastructure) | | A+/A1 | | | 2,000,000 | | | | 2,320,820 | |
Los Angeles USD GO, 5.00% due 7/1/2022 (Educational Facilities and Information Technology Infrastructure) | | AA-/Aa2 | | | 2,750,000 | | | | 3,371,830 | |
Los Angeles USD GO, 5.00% due 7/1/2023 (Educational Facilities and Information Technology Infrastructure) | | AA-/Aa2 | | | 3,000,000 | | | | 3,718,650 | |
Los Angeles USD GO, 5.00% due 7/1/2024 (Educational Facilities and Information Technology Infrastructure) | | AA-/Aa2 | | | 3,000,000 | | | | 3,762,270 | |
Lynwood USD GO, 5.00% due 8/1/2023 (Insured: AGM) | | AA/A2 | | | 1,000,000 | | | | 1,222,480 | |
Manteca USD Community Facilities District No. 1989-2, 3.00% due 9/1/2016 (Educational Facilities; Insured: AGM) | | AA/A2 | | | 410,000 | | | | 423,284 | |
Manteca USD Community Facilities District No. 1989-2, 4.00% due 9/1/2018 (Educational Facilities; Insured: AGM) | | AA/A2 | | | 500,000 | | | | 542,680 | |
Manteca USD Community Facilities District No. 1989-2, 4.00% due 9/1/2019 (Educational Facilities; Insured: AGM) | | AA/A2 | | | 870,000 | | | | 957,104 | |
Manteca USD Community Facilities District No. 1989-2, 5.00% due 9/1/2020 (Educational Facilities; Insured: AGM) | | AA/A2 | | | 1,425,000 | | | | 1,656,890 | |
Manteca USD Community Facilities District No. 1989-2, 5.00% due 9/1/2021 (Educational Facilities; Insured: AGM) | | AA/A2 | | | 750,000 | | | | 884,017 | |
Manteca USD Community Facilities District No. 1989-2, 5.00% due 9/1/2023 (Educational Facilities; Insured: AGM) | | AA/A2 | | | 500,000 | | | | 601,480 | |
Mark West Union School District GO, 4.125% due 8/1/2020 (Educational Facilities; Insured: Natl-Re) | | AA/A3 | | | 1,275,000 | | | | 1,278,952 | |
Milpitas Redevelopment Agency, 2.00% due 9/1/2015 (Redevelopment Project Area No. 1) | | AA-/NR | | | 1,000,000 | | | | 1,007,490 | |
Milpitas Redevelopment Agency, 3.00% due 9/1/2016 (Redevelopment Project Area No. 1) | | AA-/NR | | | 1,000,000 | | | | 1,035,860 | |
Milpitas Redevelopment Agency, 4.00% due 9/1/2017 (Redevelopment Project Area No. 1) | | AA-/NR | | | 1,000,000 | | | | 1,077,070 | |
Milpitas Redevelopment Agency, 5.00% due 9/1/2025 (Redevelopment Project Area No. 1) | | AA-/NR | | | 2,300,000 | | | | 2,846,618 | |
Modesto Irrigation District, 5.00% due 7/1/2022 (San Joaquin Valley Electric System) | | A+/A2 | | | 1,000,000 | | | | 1,217,350 | |
Mojave USD COP, 0% due 9/1/2017 (Educational Facilities; Insured: AGM) | | AA/NR | | | 1,045,000 | | | | 1,011,487 | |
Mojave USD COP, 0% due 9/1/2018 (Educational Facilities; Insured: AGM) | | AA/NR | | | 1,095,000 | | | | 1,028,917 | |
Moreno Valley Public Financing Authority, 5.00% due 11/1/2024 (Public Improvements) | | A+/NR | | | 1,455,000 | | | | 1,750,380 | |
Murrieta Valley USD Public Financing Authority GO, 5.00% due 9/1/2023 (Educational Facilities; Insured: BAM) | | AA/NR | | | 1,080,000 | | | | 1,321,693 | |
Natomas USD GO, 5.00% due 8/1/2024 (Insured: BAM) | | AA/A2 | | | 2,425,000 | | | | 2,966,042 | |
North City West School Facilities Financing Authority, 5.00% due 9/1/2021 (Carmel Valley; Insured: AGM) | | AA/NR | | | 2,155,000 | | | | 2,556,239 | |
North City West School Facilities Financing Authority, 5.00% due 9/1/2022 (Carmel Valley; Insured: AGM) | | AA/NR | | | 2,260,000 | | | | 2,715,345 | |
Northern California Power Agency, 4.00% due 7/1/2015 (Hydroelectric Project) | | A+/A1 | | | 500,000 | | | | 504,845 | |
Northern California Power Agency, 5.00% due 7/1/2016 (Hydroelectric Project) | | A+/A1 | | | 500,000 | | | | 529,945 | |
Northern California Power Agency, 5.00% due 7/1/2017 (Hydroelectric Project) | | A+/A1 | | | 100,000 | | | | 109,913 | |
Northern California Power Agency, 5.00% due 7/1/2018 (Hydroelectric Project) | | A+/A1 | | | 1,250,000 | | | | 1,414,200 | |
Northern California Power Agency, 5.00% due 6/1/2019 (Lodi Energy Center) | | A-/A2 | | | 2,340,000 | | | | 2,705,789 | |
Palomar Pomerado Health GO, 0% due 8/1/2019 (Insured: AGM) | | AA/A2 | | | 2,000,000 | | | | 1,840,000 | |
Palomar Pomerado Health GO, 0% due 8/1/2021 (Insured: Natl-Re) | | AA-/A2 | | | 2,850,000 | | | | 2,448,805 | |
Pasadena USD GO, 5.00% due 11/1/2018 pre-refunded 11/1/2015 (Insured: AGM) | | NR/Aa2 | | | 1,200,000 | | | | 1,257,660 | |
Pomona USD GO, 6.10% due 2/1/2020 (Educational Facilities; Insured: Natl-Re) | | AA-/A3 | | | 465,000 | | | | 562,599 | |
Rancho Cucamonga Redevelopment Successor Agency, 5.00% due 9/1/2023 (Insured: AGM) | | AA/NR | | | 1,000,000 | | | | 1,228,410 | |
Rancho Cucamonga Redevelopment Successor Agency, 5.00% due 9/1/2024 (Insured: AGM) | | AA/NR | | | 2,000,000 | | | | 2,479,000 | |
Redding Electrical Systems COP, 5.00% due 6/1/2020 (Insured: AGM) | | NR/A2 | | | 2,500,000 | | | | 2,818,850 | |
Redevelopment Agency of the City of Rialto, 5.00% due 9/1/2023 (Merged Project Area; Insured: BAM) | | AA/NR | | | 550,000 | | | | 663,498 | |
Redevelopment Agency of the City of Rialto, 5.00% due 9/1/2024 (Merged Project Area; Insured: BAM) | | AA/NR | | | 500,000 | | | | 608,970 | |
Redevelopment Agency of the City of San Mateo, 4.00% due 8/1/2020 (Downtown and Shoreline Area Redevelopment Projects; Insured: Syncora) | | A/NR | | | 400,000 | | | | 402,880 | |
Regents of the University of California, 4.00% due 5/15/2017 (Campus Housing and Facilities) | | AA-/Aa3 | | | 1,250,000 | | | | 1,340,950 | |
Ridgecrest Redevelopment Agency, 5.00% due 6/30/2016 (Redevelopment Project) | | A-/NR | | | 1,055,000 | | | | 1,112,170 | |
Ridgecrest Redevelopment Agency, 5.00% due 6/30/2017 (Redevelopment Project) | | A-/NR | | | 1,055,000 | | | | 1,147,418 | |
Ridgecrest Redevelopment Agency, 5.25% due 6/30/2018 (Redevelopment Project) | | A-/NR | | | 1,050,000 | | | | 1,178,709 | |
Ridgecrest Redevelopment Agency, 5.50% due 6/30/2019 (Redevelopment Project) | | A-/NR | | | 1,050,000 | | | | 1,217,128 | |
Ridgecrest Redevelopment Agency, 5.50% due 6/30/2020 (Redevelopment Project) | | A-/NR | | | 1,040,000 | | | | 1,231,953 | |
Riverside County Palm Desert Financing Authority, 6.00% due 5/1/2022 (Palm Desert Sheriff’s Station Facilities) | | AA-/A2 | | | 2,600,000 | | | | 2,972,762 | |
Riverside USD Financing Authority, 2.00% due 9/1/2015 (Educational Facilities; Insured: BAM) | | AA/NR | | | 1,300,000 | | | | 1,309,789 | |
Riverside USD Financing Authority, 3.00% due 9/1/2016 (Educational Facilities; Insured: BAM) | | AA/NR | | | 500,000 | | | | 517,710 | |
Riverside USD Financing Authority, 4.00% due 9/1/2017 (Educational Facilities; Insured: BAM) | | AA/NR | | | 285,000 | | | | 306,327 | |
Riverside USD Financing Authority, 5.00% due 9/1/2019 (Educational Facilities; Insured: BAM) | | AA/NR | | | 950,000 | | | | 1,092,424 | |
Riverside USD Financing Authority, 5.00% due 9/1/2022 (Educational Facilities; Insured: BAM) | | AA/NR | | | 215,000 | | | | 257,555 | |
Riverside USD Financing Authority, 5.00% due 9/1/2024 (Educational Facilities; Insured: BAM) | | AA/NR | | | 680,000 | | | | 822,038 | |
Riverside USD Financing Authority, 5.00% due 9/1/2025 (Educational Facilities; Insured: BAM) | | AA/NR | | | 350,000 | | | | 422,209 | |
Rosemead Community Development Commission, 5.00% due 10/1/2015 (Redevelopment Project Area No. 1; Insured: AMBAC) | | A+/NR | | | 1,015,000 | | | | 1,038,112 | |
Rosemead Community Development Commission, 5.00% due 10/1/2016 (Redevelopment Project Area No. 1; Insured: AMBAC) | | A+/NR | | | 700,000 | | | | 744,562 | |
Semi-Annual Report 11
| | |
| SCHEDULE OF INVESTMENTS, CONTINUED | | |
| |
Thornburg California Limited Term Municipal Fund | | March 31, 2015 (Unaudited) |
| | | | | | | | | | |
Issuer-Description | | Credit Rating†
S&P/ Moody’s | | Principal
Amount | | | Value | |
Roseville Natural Gas Financing Authority, 5.00% due 2/15/2017 | | A-/Baa2 | | $ | 1,390,000 | | | $ | 1,476,541 | |
Sacramento City Schools Joint Power Financing Authority, 5.00% due 3/1/2021 (Sacramento City USD Educational Facility Sublease; Insured: BAM) | | AA/NR | | | 830,000 | | | | 967,390 | |
Sacramento City Schools Joint Power Financing Authority, 5.00% due 3/1/2022 (Sacramento City USD Educational Facility Sublease; Insured: BAM) | | AA/NR | | | 775,000 | | | | 912,454 | |
Sacramento City Schools Joint Power Financing Authority, 5.00% due 3/1/2023 (Sacramento City USD Educational Facility Sublease; Insured: BAM) | | AA/NR | | | 815,000 | | | | 970,420 | |
Sacramento City Schools Joint Power Financing Authority, 5.00% due 3/1/2024 (Sacramento City USD Educational Facility Sublease; Insured: BAM) | | AA/NR | | | 765,000 | | | | 917,464 | |
Sacramento City Schools Joint Power Financing Authority, 5.00% due 3/1/2025 (Sacramento City USD Educational Facility Sublease; Insured: BAM) | | AA/NR | | | 2,175,000 | | | | 2,589,337 | |
Sacramento City USD GO, 2.00% due 7/1/2015 (Educational Facilities Improvements; Insured: AGM) | | AA/NR | | | 100,000 | | | | 100,460 | |
Sacramento City USD GO, 5.00% due 7/1/2018 (Educational Facilities Improvements; Insured: AGM) | | AA/NR | | | 360,000 | | | | 406,548 | |
Sacramento City USD GO, 4.00% due 7/1/2019 (Educational Facilities Improvements) | | A+/A1 | | | 5,455,000 | | | | 6,066,778 | |
Sacramento City USD GO, 5.00% due 7/1/2019 (Educational Facilities Improvements; Insured: AGM) | | AA/NR | | | 635,000 | | | | 734,962 | |
Sacramento City USD GO, 5.00% due 7/1/2020 (Educational Facilities Improvements; Insured: AGM) | | AA/NR | | | 500,000 | | | | 590,660 | |
Sacramento City USD GO, 5.00% due 7/1/2021 (Educational Facilities Improvements; Insured: AGM) | | AA/NR | | | 400,000 | | | | 479,792 | |
Sacramento City USD GO, 5.00% due 7/1/2021 (Educational Facilities Improvements) | | A+/A1 | | | 3,600,000 | | | | 4,308,696 | |
Sacramento City USD GO, 5.00% due 7/1/2022 (Educational Facilities Improvments; Insured: AGM) | | AA/NR | | | 700,000 | | | | 852,145 | |
Sacramento Cogeneration Authority, 5.00% due 7/1/2015 (Procter & Gamble Project) | | AA-/A1 | | | 1,100,000 | | | | 1,113,013 | |
Sacramento Cogeneration Authority, 5.00% due 7/1/2019 (Procter & Gamble Project) | | AA-/A1 | | | 625,000 | | | | 719,463 | |
Sacramento Municipal Utility District, 5.00% due 7/1/2020 (Cosumnes Project; Insured: Natl-Re) | | AA-/A3 | | | 3,000,000 | | | | 3,169,500 | |
Salinas Valley Solid Waste Authority, 5.00% due 8/1/2023 (Insured: AGM) (AMT) | | AA/A2 | | | 1,530,000 | | | | 1,798,484 | |
San Diego Redevelopment Agency, 5.25% due 9/1/2015 (Centre City Redevelopment; Insured: AGM) | | AA/A2 | | | 1,375,000 | | | | 1,380,789 | |
San Diego Redevelopment Agency, 5.00% due 9/1/2018 (Centre City Redevelopment; Insured: AMBAC) | | NR/Baa3 | | | 3,215,000 | | | | 3,344,532 | |
San Diego Redevelopment Agency, 0.01% due 9/1/2019 (Centre City Redevelopment; Insured: AGM) | | AA/A2 | | | 1,910,000 | | | | 1,747,745 | |
San Diego Redevelopment Agency, 5.80% due 11/1/2021 (Horton Plaza) | | A-/Baa3 | | | 2,635,000 | | | | 2,643,116 | |
San Diego USD GO, 5.50% due 7/1/2020 (Educational System Capital Projects; Insured: Natl-Re) | | AA-/Aa3 | | | 1,390,000 | | | | 1,677,091 | |
San Diego USD GO, 5.00% due 7/1/2023 (Educational System Capital Projects) | | AA-/Aa3 | | | 5,000,000 | | | | 6,219,350 | |
San Diego USD GO, 5.00% due 7/1/2024 (Educational System Capital Projects) | | AA-/Aa3 | | | 3,000,000 | | | | 3,719,070 | |
San Francisco Bay Area Rapid Transit District, 5.00% due 7/1/2024 (Insured: Natl-Re) | | AA+/Aa2 | | | 5,675,000 | | | | 5,742,192 | |
San Francisco City and County Airports Commission, 5.00% due 5/1/2024 (San Francisco International Airport; Insured: Natl-Re) | | AA-/A1 | | | 5,000,000 | | | | 5,246,450 | |
San Francisco City and County Redevelopment Agency, 5.00% due 8/1/2019 (San Francisco Redevelopment Projects) | | A+/NR | | | 2,050,000 | | | | 2,366,192 | |
San Francisco City and County Redevelopment Agency, 5.00% due 8/1/2020 (San Francisco Redevelopment Projects) | | A+/NR | | | 1,685,000 | | | | 1,982,841 | |
San Francisco City and County Redevelopment Agency, 5.00% due 8/1/2021 (San Francisco Redevelopment Projects) | | A+/NR | | | 1,000,000 | | | | 1,193,520 | |
San Joaquin Delta Community College District GO, 0% due 8/1/2019 (Insured: AGM) | | AA/Aa2 | | | 5,000,000 | | | | 4,565,750 | |
San Mateo County Joint Powers Financing Authority, 5.00% due 6/15/2017 (Maple Street Correctional Center) | | AA+/Aa2 | | | 750,000 | | | | 823,590 | |
San Mateo County Joint Powers Financing Authority, 5.00% due 7/15/2018 (County Capital Projects) | | AA+/Aa2 | | | 800,000 | | | | 898,560 | |
San Mateo County Joint Powers Financing Authority, 5.00% due 6/15/2021 (Maple Street Correctional Center) | | AA+/Aa2 | | | 410,000 | | | | 493,009 | |
San Mateo County Joint Powers Financing Authority, 5.00% due 6/15/2022 (Maple Street Correctional Center) | | AA+/Aa2 | | | 1,000,000 | | | | 1,221,100 | |
San Mateo County Joint Powers Financing Authority, 5.00% due 6/15/2023 (Maple Street Correctional Center) | | AA+/Aa2 | | | 585,000 | | | | 722,680 | |
San Mateo County Transit District, 4.50% due 6/1/2022 (Transit Services; Insured: Natl-Re) | | AA/Aa2 | | | 400,000 | | | | 402,876 | |
San Mateo Flood Control District COP, 5.25% due 8/1/2017 (Colma Creek; Insured: Natl-Re) | | AA-/A3 | | | 630,000 | | | | 631,852 | |
San Mateo Union High School District GO, 0% due 9/1/2019 (Educational Facilities; Insured: Natl-Re) | | AA+/Aa1 | | | 2,000,000 | | | | 1,885,700 | |
Santa Ana Financing Authority, 6.25% due 7/1/2018 (Police Administration & Holding Facility; Insured: Natl-Re) (ETM) | | AA-/A3 | | | 1,000,000 | | | | 1,165,350 | |
Santa Ana Financing Authority, 6.25% due 7/1/2018 (Police Administration & Holding Facility; Insured: Natl-Re) | | AA-/A3 | | | 1,000,000 | | | | 1,149,410 | |
Santa Ana USD GO, 0.01% due 8/1/2020 (Insured: Natl-Re) | | AA-/A3 | | | 2,035,000 | | | | 1,827,186 | |
Santa Clara County Financing Authority, 4.00% due 5/15/2017 (Multiple Facilities) | | AA+/A1 | | | 1,000,000 | | | | 1,072,320 | |
Santa Monica Community College District GO, 0% due 8/1/2018 pre-refunded 8/1/2015 (College District Capital Improvements; Insured: MBIA) | | AA/Aa2 | | | 1,320,000 | | | | 1,148,849 | |
Semitropic Improvement District, 5.00% due 12/1/2022 (Water Irrigation System; Insured: AGM) | | AA/A2 | | | 400,000 | | | | 481,104 | |
Semitropic Improvement District, 5.00% due 12/1/2023 (Water Irrigation System; Insured: AGM) | | AA/A2 | | | 500,000 | | | | 606,385 | |
Semitropic Improvement District, 5.00% due 12/1/2024 (Water Irrigation System; Insured: AGM) | | AA/A2 | | | 500,000 | | | | 611,420 | |
Semitropic Improvement District, 5.00% due 12/1/2025 (Water Irrigation System; Insured: AGM) | | AA/A2 | | | 1,110,000 | | | | 1,367,975 | |
Solano County COP, 5.00% due 11/15/2016 (Health & Social Services Headquarters) | | AA-/A1 | | | 1,000,000 | | | | 1,070,630 | |
South San Francisco USD GO, 4.00% due 6/15/2018 (Educational Facilities) | | SP-1+/NR | | | 5,000,000 | | | | 5,480,250 | |
Southeast Resource Recovery Facilities Authority, 5.25% due 12/1/2017 (Insured: AMBAC) | | A+/A2 | | | 1,000,000 | | | | 1,004,140 | |
Southeast Resource Recovery Facilities Authority, 5.375% due 12/1/2018 (Insured: AMBAC) (AMT) | | A+/A2 | | | 2,000,000 | | | | 2,008,480 | |
Southern California Public Power Authority, 0% due 7/1/2015 (Multiple Transmission Projects; Insured: Natl-Re) | | AA-/Aa3 | | | 1,500,000 | | | | 1,498,575 | |
Southern California Public Power Authority, 5.15% due 7/1/2015 (Mead-Adelanto Project; Insured: AMBAC) | | NR/Aa3 | | | 450,000 | | | | 454,505 | |
Southern California Public Power Authority, 5.15% due 7/1/2015 (Mead-Phoenix Project; Insured: AMBAC) | | NR/Aa3 | | | 275,000 | | | | 277,753 | |
Southern California Public Power Authority, 5.00% due 7/1/2016 (Southern Transmission Project) | | AA-/NR | | | 2,000,000 | | | | 2,117,960 | |
State of California, 1.50% due 6/22/2015 (Cash Management Plan) | | SP-1+/Mig1 | | | 10,000,000 | | | | 10,032,500 | |
State of California Economic Recovery GO, 5.00% due 7/1/2018 pre-refunded 7/1/2018 (ETM) | | NR/Aaa | | | 2,330,000 | | | | 2,635,277 | |
State of California Economic Recovery GO, 5.00% due 7/1/2018 | | AA/Aa2 | | | 670,000 | | | | 760,088 | |
12 Semi-Annual Report
| | |
| SCHEDULE OF INVESTMENTS, CONTINUED | | |
| |
Thornburg California Limited Term Municipal Fund | | March 31, 2015 (Unaudited) |
| | | | | | | | | | |
Issuer-Description | | Credit Rating†
S&P/ Moody’s | | Principal
Amount | | | Value | |
State of California GO, 4.00% due 8/1/2016 (Kindergarten University Facilities) | | A+/Aa3 | | $ | 500,000 | | | $ | 525,050 | |
State of California GO, 5.00% due 3/1/2017 (Various Capital Projects; Insured: Syncora) | | A+/Aa3 | | | 2,860,000 | | | | 2,986,441 | |
State of California GO, 4.75% due 9/1/2018 (Various Capital Projects; Insured: AGM) | | AA/Aa3 | | | 295,000 | | | | 300,514 | |
State of California GO, 5.00% due 9/1/2020 (Kindergarten University Facilities) | | A+/Aa3 | | | 2,000,000 | | | | 2,372,360 | |
Successor Agency to the City of Riverside Redevelopment Agency, 5.00% due 9/1/2023 | | AA-/NR | | | 1,735,000 | | | | 2,112,814 | |
Successor Agency to the City of Riverside Redevelopment Agency, 5.00% due 9/1/2024 | | AA-/NR | | | 1,250,000 | | | | 1,536,225 | |
Successor Agency to the Richmond County Redevelopment Agency, 5.00% due 9/1/2022 (Insured: BAM) | | AA/NR | | | 400,000 | | | | 476,248 | |
Successor Agency to the Richmond County Redevelopment Agency, 5.00% due 9/1/2023 (Insured: BAM) | | AA/NR | | | 400,000 | | | | 477,700 | |
Successor Agency to the Richmond County Redevelopment Agency, 5.00% due 9/1/2024 (Insured: BAM) | | AA/NR | | | 450,000 | | | | 536,913 | |
Temecula Valley USD Financing Authority, 2.00% due 9/1/2015 (Educational Facilities; Insured: BAM) | | AA/NR | | | 1,305,000 | | | | 1,314,344 | |
Temecula Valley USD Financing Authority, 3.00% due 9/1/2016 (Educational Facilities; Insured: BAM) | | AA/NR | | | 580,000 | | | | 600,544 | |
Temecula Valley USD Financing Authority, 4.00% due 9/1/2017 (Educational Facilities; Insured: BAM) | | AA/NR | | | 400,000 | | | | 430,264 | |
Temecula Valley USD Financing Authority, 5.00% due 9/1/2018 (Educational Facilities; Insured: BAM) | | AA/NR | | | 325,000 | | | | 366,405 | |
Temecula Valley USD Financing Authority, 5.00% due 9/1/2019 (Educational Facilities; Insured: BAM) | | AA/NR | | | 375,000 | | | | 431,220 | |
Temecula Valley USD Financing Authority, 5.00% due 9/1/2020 (Educational Facilities; Insured: BAM) | | AA/NR | | | 400,000 | | | | 468,468 | |
Temecula Valley USD Financing Authority, 5.00% due 9/1/2021 (Educational Facilities; Insured: BAM) | | AA/NR | | | 515,000 | | | | 612,716 | |
Temecula Valley USD Financing Authority, 5.00% due 9/1/2022 (Educational Facilities; Insured: BAM) | | AA/NR | | | 275,000 | | | | 329,849 | |
Temecula Valley USD Financing Authority, 5.00% due 9/1/2023 (Educational Facilities; Insured: BAM) | | AA/NR | | | 300,000 | | | | 363,015 | |
Temecula Valley USD Financing Authority, 5.00% due 9/1/2024 (Educational Facilities; Insured: BAM) | | AA/NR | | | 300,000 | | | | 365,478 | |
Temecula Valley USD Financing Authority, 5.00% due 9/1/2025 (Educational Facilities; Insured: BAM) | | AA/NR | | | 300,000 | | | | 364,524 | |
Tuolumne Wind Project Authority, 5.00% due 1/1/2018 | | AA-/A2 | | | 1,690,000 | | | | 1,873,382 | |
Turlock Irrigation District, 5.00% due 1/1/2019 | | AA-/A2 | | | 1,000,000 | | | | 1,139,310 | |
Ukiah USD GO, 0% due 8/1/2019 (Insured: Natl-Re) | | AA-/A1 | | | 2,000,000 | | | | 1,858,280 | |
Upper Lake Union High School District GO, 0% due 8/1/2020 (Insured: Natl-Re) | | NR/A3 | | | 1,050,000 | | | | 874,755 | |
Ventura County Public Financing Authority, 5.00% due 11/1/2023 (Office Building Purchase and Improvements) | | AA+/Aa3 | | | 500,000 | | | | 608,360 | |
Ventura County Public Financing Authority, 5.00% due 11/1/2024 (Office Building Purchase and Improvements) | | AA+/Aa3 | | | 1,060,000 | | | | 1,288,494 | |
Virgin Islands Public Finance Authority, 5.00% due 10/1/2017 | | BBB-/Baa2 | | | 1,440,000 | | | | 1,544,818 | |
Vista Redevelopment Agency, 5.00% due 9/1/2019 (Vista Redevelopment Project; Insured: AGM) | | AA/NR | | | 300,000 | | | | 346,089 | |
Vista Redevelopment Agency, 5.00% due 9/1/2020 (Vista Redevelopment Project; Insured: AGM) | | AA/NR | | | 275,000 | | | | 322,801 | |
Vista Redevelopment Agency, 5.00% due 9/1/2021 (Vista Redevelopment Project; Insured: AGM) | | AA/NR | | | 265,000 | | | | 316,283 | |
Vista Redevelopment Agency, 5.00% due 9/1/2022 (Vista Redevelopment Project; Insured: AGM) | | AA/NR | | | 335,000 | | | | 403,688 | |
Vista Redevelopment Agency, 5.00% due 9/1/2023 (Vista Redevelopment Project; Insured: AGM) | | AA/NR | | | 400,000 | | | | 486,300 | |
Walnut Improvement Agency, 4.00% due 3/1/2016 (City of Walnut Improvement Plan; Insured: BAM) | | AA/NR | | | 500,000 | | | | 515,550 | |
Walnut Improvement Agency, 4.00% due 3/1/2017 (City of Walnut Improvement Plan; Insured: BAM) | | AA/NR | | | 1,000,000 | | | | 1,057,150 | |
Walnut Improvement Agency, 4.00% due 3/1/2018 (City of Walnut Improvement Plan; Insured: BAM) | | AA/NR | | | 1,000,000 | | | | 1,076,650 | |
Walnut Improvement Agency, 5.00% due 3/1/2019 (City of Walnut Improvement Plan; Insured: BAM) | | AA/NR | | | 400,000 | | | | 452,032 | |
Washington USD Yolo County COP, 5.00% due 8/1/2017 (West Sacramento High School; Insured: AMBAC) | | A/NR | | | 725,000 | | | | 799,117 | |
Washington USD Yolo County COP, 5.00% due 8/1/2021 (West Sacramento High School; Insured: AMBAC) | | A/NR | | | 910,000 | | | | 984,975 | |
Washington USD Yolo County COP, 5.00% due 8/1/2022 (West Sacramento High School; Insured: AMBAC) | | A/NR | | | 2,010,000 | | | | 2,175,604 | |
Westminster Redevelopment Agency, 5.00% due 8/1/2024 (Commercial Redevelopment Project No. 1; Insured: AGM) | | AA/A3 | | | 1,205,000 | | | | 1,336,069 | |
| | | | | | | | | | |
TOTAL INVESTMENTS — 89.98% (Cost $545,728,133) | | | | | | | | $ | 569,820,091 | |
OTHER ASSETS LESS LIABILITIES — 10.02% | | | | | | | | | 63,454,671 | |
| | | | | | | | | | |
NET ASSETS — 100.00% | | | | | | | | $ | 633,274,762 | |
| | | | | | | | | | |
Footnote Legend
| † | Credit ratings are unaudited. Rating changes may have occurred subsequent to the reporting period end. Bonds issued with a maturity of one year or less are assigned Moody’s ratings from MIG-1 to MIG-4 and Standard and Poor’s ratings from SP-1+ to SP-3 with MIG-1 and SP-1+ being the strongest ratings. |
Portfolio Abbreviations
To simplify the listings of securities, abbreviations are used per the table below:
| | |
| ACA | | Insured by American Capital Access |
| AGM | | Insured by Assured Guaranty Municipal Corp. |
| AMBAC | | Insured by American Municipal Bond Assurance Corp. |
| AMT | | Alternative Minimum Tax |
| BAM | | Insured by Build America Mutual Insurance Co. |
| CIFG | | Insured by CIFG Assurance North America Inc. |
| COP | | Certificates of Participation |
| ETM | | Escrowed to Maturity |
| | |
| FHA | | Insured by Federal Housing Administration |
| GO | | General Obligation |
| HFFA | | Health Facilities Financing Authority |
| MBIA | | Insured by Municipal Bond Investors Assurance |
| Mtg | | Mortgage |
| Natl-Re | | Insured by National Public Finance Guarantee Corp. |
| Syncora | | Insured by Syncora Guarantee Inc. |
| USD | | Unified School District |
See notes to financial statements.
Semi-Annual Report 13
| | |
| STATEMENT OF ASSETS AND LIABILITIES | | |
| |
Thornburg California Limited Term Municipal Fund | | March 31, 2015 (Unaudited) |
| | | | |
ASSETS | | | | |
Investments at value (cost $545,728,133) (Note 2) | | $ | 569,820,091 | |
Cash | | | 56,333,756 | |
Receivable for investments sold | | | 940,668 | |
Receivable for fund shares sold | | | 2,660,473 | |
Interest receivable | | | 5,232,405 | |
| | | | |
Total Assets | | | 634,987,393 | |
| | | | |
| |
LIABILITIES | | | | |
Payable for fund shares redeemed | | | 1,131,774 | |
Payable to investment advisor and other affiliates (Note 3) | | | 359,624 | |
Accounts payable and accrued expenses | | | 19,594 | |
Dividends payable | | | 201,639 | |
| | | | |
Total Liabilities | | | 1,712,631 | |
| | | | |
| |
NET ASSETS | | $ | 633,274,762 | |
| | | | |
NET ASSETS CONSIST OF | | | | |
Undistributed net investment income | | $ | 2,404 | |
Net unrealized appreciation on investments | | | 24,091,958 | |
Accumulated net realized gain (loss) | | | (51,285 | ) |
Net capital paid in on shares of beneficial interest | | | 609,231,685 | |
| | | | |
| | $ | 633,274,762 | |
| | | | |
NET ASSET VALUE | | | | |
Class A Shares: | | | | |
Net asset value and redemption price per share ($172,308,011 applicable to 12,422,879 shares of beneficial interest outstanding - Note 4) | | $ | 13.87 | |
Maximum sales charge, 1.50% of offering price | | | 0.21 | |
| | | | |
Maximum offering price per share | | $ | 14.08 | |
| | | | |
| |
Class C Shares: | | | | |
Net asset value and offering price per share* ($65,047,338 applicable to 4,685,856 shares of beneficial interest outstanding - Note 4) | | $ | 13.88 | |
| | | | |
| |
Class I Shares: | | | | |
Net asset value, offering and redemption price per share ($395,919,413 applicable to 28,517,072 shares of beneficial interest outstanding - Note 4) | | $ | 13.88 | |
| | | | |
| * | Redemption price per share is equal to net asset value less any applicable contingent deferred sales charge. |
See notes to financial statements.
14 Semi-Annual Report
| | |
| STATEMENT OF OPERATIONS | | |
| |
Thornburg California Limited Term Municipal Fund | | Six Months Ended March 31, 2015 (Unaudited) |
| | | | |
INVESTMENT INCOME | | | | |
Interest income (net of premium amortized of $3,426,395) | | $ | 7,109,709 | |
| | | | |
| |
EXPENSES | | | | |
Investment advisory fees (Note 3) | | | 1,462,508 | |
Administration fees (Note 3) | | | | |
Class A Shares | | | 103,192 | |
Class C Shares | | | 39,673 | |
Class I Shares | | | 94,503 | |
Distribution and service fees (Note 3) | | | | |
Class A Shares | | | 206,385 | |
Class C Shares | | | 159,005 | |
Transfer agent fees | | | | |
Class A Shares | | | 36,130 | |
Class C Shares | | | 13,306 | |
Class I Shares | | | 84,940 | |
Registration and filing fees | | | | |
Class A Shares | | | 1,820 | |
Class C Shares | | | 1,820 | |
Class I Shares | | | 1,820 | |
Custodian fees (Note 3) | | | 40,701 | |
Professional fees | | | 23,619 | |
Accounting fees | | | 10,123 | |
Trustee fees | | | 10,779 | |
Other expenses | | | 13,028 | |
| | | | |
Total Expenses | | | 2,303,352 | |
Less: | | | | |
Fees paid indirectly (Note 3) | | | (3,451 | ) |
| | | | |
Net Expenses | | | 2,299,901 | |
| | | | |
Net Investment Income | | | 4,809,808 | |
| | | | |
REALIZED AND UNREALIZED GAIN (LOSS) | | | | |
Net realized gain (loss) on investments | | | 52,403 | |
Net change in unrealized appreciation (depreciation) on investments | | | 1,357,861 | |
| | | | |
Net Realized and Unrealized Gain | | | 1,410,264 | |
| | | | |
Net Increase in Net Assets Resulting from Operations | | $ | 6,220,072 | |
| | | | |
See notes to financial statements.
Semi-Annual Report 15
| | |
| STATEMENT OF CHANGES IN NET ASSETS | | |
| |
Thornburg California Limited Term Municipal Fund | | |
| | | | | | | | |
| | | Six Months Ended | | | Year Ended | |
| | | March 31, 2015* | | | September 30, 2014 | |
INCREASE (DECREASE) IN NET ASSETS FROM | | | | | | | | |
| | |
OPERATIONS | | | | | | | | |
Net investment income | | $ | 4,809,808 | | | $ | 9,465,710 | |
Net realized gain (loss) on investments | | | 52,403 | | | | (13,106 | ) |
Net unrealized appreciation (depreciation) on investments | | | 1,357,861 | | | | 11,340,158 | |
| | | | | | | | |
| | |
Net Increase (Decrease) in Net Assets Resulting from Operations | | | 6,220,072 | | | | 20,792,762 | |
| | |
DIVIDENDS TO SHAREHOLDERS | | | | | | | | |
From net investment income | | | | | | | | |
Class A Shares | | | (1,163,966 | ) | | | (2,723,413 | ) |
Class C Shares | | | (367,367 | ) | | | (844,479 | ) |
Class I Shares | | | (3,278,475 | ) | | | (5,897,818 | ) |
| | |
FUND SHARE TRANSACTIONS (NOTE 4) | | | | | | | | |
Class A Shares | | | 11,782,374 | | | | (2,493,202 | ) |
Class C Shares | | | 2,045,869 | | | | 1,968,650 | |
Class I Shares | | | 34,011,669 | | | | 99,709,790 | |
| | | | | | | | |
Net Increase in Net Assets | | | 49,250,176 | | | | 110,512,290 | |
| | |
NET ASSETS | | | | | | | | |
Beginning of Period | | | 584,024,586 | | | | 473,512,296 | |
| | | | | | | | |
| | |
End of Period | | $ | 633,274,762 | | | $ | 584,024,586 | |
| | | | | | | | |
Undistributed net investment income | | $ | 2,404 | | | $ | 2,404 | |
See notes to financial statements.
16 Semi-Annual Report
| | |
| NOTES TO FINANCIAL STATEMENTS | | |
| |
Thornburg California Limited Term Municipal Fund | | March 31, 2015 (Unaudited) |
NOTE 1 – ORGANIZATION
Thornburg California Limited Term Municipal Fund (the “Fund”) is a diversified series of Thornburg Investment Trust (the “Trust”). The Trust is organized as a Massachusetts business trust under a Declaration of Trust dated June 3, 1987 and is registered as a diversified, open-end management investment company under the Investment Company Act of 1940, as amended. The Fund is currently one of eighteen separate series of the Trust. Each series is considered to be a separate entity for financial reporting and tax purposes and bears expenses directly attributable to it. The Fund’s primary investment objective is to obtain as high a level of current income exempt from federal and California state individual income tax as is consistent, in the view of the Fund’s investment advisor, with the preservation of capital. The Fund’s secondary objective is to reduce expected changes in its share price compared to longer intermediate and long-term bond portfolios.
The Fund currently offers three classes of shares of beneficial interest: Class A, Class C, and Institutional Class (“Class I”). Each class of shares of the Fund represents an interest in the same portfolio of investments, except that (i) Class A shares are sold subject to a front-end sales charge collected at the time the shares are purchased and bear a service fee, (ii) Class C shares are sold at net asset value without a sales charge at the time of purchase, but are subject to a contingent deferred sales charge upon redemption within one year of purchase, and bear both a service fee and a distribution fee, (iii) Class I shares are sold at net asset value without a sales charge at the time of purchase and may be subject to a service fee, and (iv) the respective classes may have different reinvestment privileges and conversion rights. Additionally, the Fund may allocate among its classes certain expenses, to the extent allocable to specific classes, including transfer agent fees, government registration fees, certain printing and postage costs, and administrative and legal expenses. Currently, class specific expenses of the Fund are limited to service and distribution fees, administration fees, and certain registration and transfer agent expenses.
NOTE 2 – SIGNIFICANT ACCOUNTING POLICIES
The following is a summary of significant accounting policies followed by the Fund in the preparation of its financial statements. The Fund is an investment company and prepares its financial statements in conformity with U.S. generally accepted accounting principles (“GAAP”), including the investment company accounting and reporting guidance in the Financial Accounting Standards Board (the “FASB”) Accounting Standard Codification Topic 946. The preparation of financial statements in conformity with GAAP requires management to make estimates and assumptions that affect the reported amounts of assets and liabilities and disclosure of contingent assets and liabilities at the date of the financial statements and the reported amounts of increases (decreases) in net assets from operations during the reporting period. Actual results could differ from those estimates.
Significant accounting policies of the Fund are as follows:
Valuation Policy and Procedures: The Trustees of the Trust (the “Trustees”) have authorized employees of the Fund’s investment advisor, acting as the Valuation and Pricing Committee (the “Committee”), to make certain valuation determinations, subject to oversight and review by the Trustees and the Audit Committee of the Trustees. The Committee and other employees of the Fund’s investment advisor administer and implement the valuation process. The Committee regularly reviews its own fair value decisions, as well as valuations, valuation techniques and services furnished by pricing services, considers circumstances in the markets which may require valuation determinations by the Committee and reviews previous valuation determinations. The Committee also reports on its activities, the performance of the pricing services and other matters to the Trustees and the Audit Committee of the Trustees.
In determining a fair value for a portfolio investment, the Committee seeks to determine the price that the Fund would reasonably expect to receive upon a sale of the investment in an orderly transaction between market participants at the measurement date. Typically, the fair value process employs standing instructions to use quoted prices in active markets or the use of independent pricing services. Less frequently, the Committee may make a fair value determination using other methods. However, because fair value prices are estimated prices, the determination of fair value for an investment may differ from the value that would be realized by the Fund upon a sale of the investment, and that difference could be material to the Fund’s financial statements. The Committee’s determination of fair value for an investment may also differ from the prices obtained by other persons (including other mutual funds) for the investment.
Valuation of Investments: Debt obligations held by the Fund have a primary over-the-counter market and are valued by an independent pricing service approved by the Trustees. The pricing service ordinarily values debt obligations using quoted bid prices and other methods which include consideration of yields or prices of debt obligations of comparable quality, type of issue, coupon, maturity and rating, and indications as to value from dealers and general market conditions.
In any case when a pricing service fails to provide a price for a debt obligation held by the Fund, the Committee determines a fair value for the debt obligation using procedures in accordance with a policy approved by the Trustees, which may include the use of a price obtained from a different independent pricing service. Additionally, in any case when management believes that a price provided by a pricing service for a debt obligation held by the Fund may be unreliable, the Committee decides whether or not to use the pricing service’s valuation or to use an alternative method to determine a fair value for the debt obligation.
Semi-Annual Report 17
| | |
| NOTES TO FINANCIAL STATEMENTS, CONTINUED | | |
| |
Thornburg California Limited Term Municipal Fund | | March 31, 2015 (Unaudited) |
Valuation Measurements: The Fund categorizes its investments based upon the inputs used in valuing those investments, according to a three-level hierarchy established by guidance from the the FASB. Categorization of investments using this hierarchy is intended by the FASB to maximize the use of observable inputs and minimize the use of unobservable inputs by prioritizing that the most observable input be used when available. Observable inputs are those that market participants would use in valuing an investment based on available market data. Unobservable inputs are those that reflect assumptions about the information market participants would use in valuing an investment. An investment’s level within the hierarchy is based on the lowest level input that is deemed significant to the fair value measurement. The methodologies and relative inputs used to value investments are not necessarily indications of the risk or liquidity associated with investing in those investments.
Various inputs are used in determining the fair value measurement of the Fund’s investments. These inputs are generally summarized according to the three-level hierarchy below:
Level 1: Quoted prices in active markets for identical investments.
Level 2: Other direct or indirect significant observable inputs (including quoted prices for similar investments in active markets and other observable inputs, such as interest rates, prepayment rates, credit risk, etc.).
Level 3: Significant unobservable inputs (including the Committee’s own assumptions in determining the fair value of investments).
Portfolio investments with minimal, if any, market activity are characterized as Level 3 and are valued using significant unobservable inputs, typically including single broker quotes, which may be adjusted or unadjusted, related or comparable investments, last available transactions, and other relevant information. Valuations may also be based upon current market prices of securities that are comparable in coupon, rating, maturity and industry. An income based valuation approach would consider discounted anticipated future cash flows of the investment. Discounts may also be applied due to the nature or duration of any restrictions on the disposition of the investment. Valuations based upon the use of inputs from Levels 1, 2, or 3, may not represent the actual price received upon the disposition of an investment, and the Fund may receive a price that is lower than the valuation when it sells the investment.
The following table displays a summary of the fair value hierarchy measurements of the Fund’s investments as of March 31, 2015. In any instance when valuation inputs from more than one level are used to determine the fair value of a specific investment, the investment is placed in the level of the table based upon the lowest level input that is significant in determining the fair value of the investment:
| | | | | | | | | | | | | | | | |
| | | Fair Value Measurements at March 31, 2015 | |
| | | Total | | | Level 1 | | | Level 2 | | | Level 3 | |
Assets | | | | | | | | | | | | | | | | |
Investments in Securities | | | | | | | | | | | | | | | | |
Municipal Bonds | | $ | 569,820,091 | | | $ | — | | | $ | 569,820,091 | | | $ | — | |
| | | | | | | | | | | | | | | | |
Total Investments in Securities | | $ | 569,820,091 | | | $ | — | | | $ | 569,820,091 | | | $ | — | |
In accordance with the guidance prescribed in Accounting Standards Update No. 2011-04, it is the policy of the Fund to recognize transfers between levels and the underlying events which caused the movement. The Fund recognized no transfers between levels for the six months ended March 31, 2015.
Federal Income Taxes: It is the policy of the Trust to comply with the provisions of the Internal Revenue Code applicable to “regulated investment companies” and to distribute to shareholders substantially all taxable (if any) and tax exempt income of the Fund. Therefore, no provision for federal income tax is required.
Management reviews each uncertain tax position believed to be material to the preparation of the Fund’s financial statements, to assess if it is more likely than not that the position would be sustained upon examination, based upon the technical merits of the position. As of March 31, 2015, management has not identified any such position for which an asset or liability must be reflected in the Statement of Assets and Liabilities. The Fund’s tax returns remain subject to examination for three years after filing.
When-Issued and Delayed Delivery Transactions: The Fund may engage in when-issued or delayed delivery transactions. To the extent the Fund engages in such transactions, it will do so for the purpose of acquiring portfolio investments consistent with the Fund’s investment objectives and not for the purpose of investment leverage or to speculate on interest rate and/or market changes. At the time the Fund makes a commitment to purchase an investment on a when-issued or delayed delivery basis, the Fund will record the transaction and reflect the value in determining its net asset value. When effecting such transactions, assets of an amount sufficient to make payment for the portfolio investments to be purchased will be segregated on the Fund’s records on the trade date. Investments purchased on a when-issued or delayed delivery basis do not earn interest until the settlement date.
Dividends: Net investment income of the Fund is declared daily as a dividend on shares for which the Fund has received payment. Dividends are paid monthly and are reinvested in additional shares of the Fund at net asset value per share at the close of business
18 Semi-Annual Report
| | |
| NOTES TO FINANCIAL STATEMENTS, CONTINUED | | |
| |
Thornburg California Limited Term Municipal Fund | | March 31, 2015 (Unaudited) |
on the dividend payment date, or at the shareholder’s option, paid in cash. Net realized capital gains, to the extent available, will be distributed at least annually.
General: Investment transactions are accounted for on a trade date basis. Interest income is accrued as earned. Premiums and discounts on investments purchased are amortized to call dates or maturity dates of the respective investments. Realized gains and losses from the sale of investments are recorded on an identified cost basis. Net investment income (other than class specific expenses) and realized and unrealized gains and losses are allocated daily to each class of shares based upon the relative net asset value of outstanding shares (or the value of the dividend-eligible shares, as appropriate) of each class of shares at the beginning of the day (after adjusting for the current capital shares activity of the respective class). Expenses common to all Funds are allocated among the Funds comprising the Trust based upon their relative net asset values or other appropriate allocation methods.
Guarantees and Indemnifications: Under the Trust’s organizational documents (and under separate agreements with the independent Trustees), its officers and Trustees are indemnified against certain liabilities arising out of the performance of their duties to the Fund. Additionally, in the normal course of business the Trust enters into contracts with service providers that contain general indemnification clauses. The Trust’s maximum exposure under these arrangements is unknown. However, based on experience, the Trust expects the risk of loss to be remote.
NOTE 3 – INVESTMENT ADVISORY FEE AND OTHER TRANSACTIONS WITH AFFILIATES
Pursuant to an investment advisory agreement, Thornburg Investment Management, Inc. (the “Advisor”) serves as the investment advisor and performs services for the Fund for which the fees are payable at the end of each month. For the six months ended March 31, 2015, these fees were payable at annual rates ranging from .50 of 1% to .225 of 1% per annum of the average daily net assets of the Fund depending on the Fund’s asset size. The Trust also has entered into administrative services agreements with the Advisor, whereby the Advisor will perform certain administrative services for the shareholders of each class of the Fund’s shares, and for which fees will be payable at an annual rate of up to .125 of 1% per annum of the average daily net assets attributable to each class of shares.
The Trust has an underwriting agreement with Thornburg Securities Corporation (the “Distributor,” an affiliate of the Advisor), which acts as the distributor of the Fund’s shares. For the six months ended March 31, 2015, the Distributor has advised the Fund that it earned net commissions of $1,192 from the sale of Class A shares, and collected contingent deferred sales charges aggregating $5,083 from redemptions of Class C shares of the Fund.
Pursuant to a service plan under Rule 12b-1 of the Investment Company Act of 1940, the Fund may reimburse to the Advisor an amount not to exceed .25 of 1% per annum of the average daily net assets attributable to each class of shares of the Fund for payments made by the Advisor to securities dealers and other financial institutions to obtain various shareholder and distribution related services. For the six months ended March 31, 2015, there were no 12b-1 service plan fees charged for Class I shares. The Advisor may pay out of its own resources additional expenses for distribution of the Fund’s shares and shareholder services.
The Trust has also adopted a distribution plan pursuant to Rule 12b-1, applicable only to the Fund’s Class C shares, under which the Fund compensates the Distributor for services in promoting the sale of Class C shares of the Fund at an annual rate of up to .25 of 1% per annum of the average daily net assets attributable to Class C shares. Total fees incurred by each class of shares of the Fund under their respective service and distribution plans for the six months ended March 31, 2015, are set forth in the Statement of Operations.
The Trust has an agreement with the custodian bank to indirectly pay a portion of the custodian’s fees through credits earned by the Fund’s cash on deposit with the bank. This deposit agreement is an alternative to overnight investments. Custodial fees are adjusted to reflect amounts that would have been paid without this agreement, with a corresponding adjustment reflected as fees paid indirectly in the Statement of Operations. For the six months ended March 31, 2015, fees paid indirectly were $3,451.
Certain officers and Trustees of the Trust are also officers or directors of the Advisor and Distributor. The compensation of independent Trustees is borne by the Trust.
Semi-Annual Report 19
| | |
| NOTES TO FINANCIAL STATEMENTS, CONTINUED | | |
| |
Thornburg California Limited Term Municipal Fund | | March 31, 2015 (Unaudited) |
NOTE 4 – SHARES OF BENEFICIAL INTEREST
At March 31, 2015, there were an unlimited number of shares with no par value of beneficial interest authorized. Transactions in shares of beneficial interest were as follows:
| | | | | | | | | | | | | | | | |
| | | Six Months Ended
March 31, 2015 (Unaudited) | | | Year Ended
September 30, 2014 (Audited) | |
| | | Shares | | | Amount | | | Shares | | | Amount | |
Class A Shares | | | | | | | | | | | | | | | | |
Shares sold | | | 1,561,317 | | | $ | 21,663,598 | | | | 4,298,157 | | | $ | 58,771,859 | |
Shares issued to shareholders in reinvestment of dividends | | | 70,375 | | | | 976,731 | | | | 166,312 | | | | 2,280,039 | |
Shares repurchased | | | (782,322 | ) | | | (10,857,955 | ) | | | (4,639,726 | ) | | | (63,545,100 | ) |
| | | | | | | | | | | | | | | | |
| | | | |
Net increase (decrease) | | | 849,370 | | | $ | 11,782,374 | | | | (175,257 | ) | | $ | (2,493,202 | ) |
| | | | | | | | | | | | | | | | |
| | | | |
Class C Shares | | | | | | | | | | | | | | | | |
Shares sold | | | 474,770 | | | $ | 6,596,577 | | | | 987,026 | | | $ | 13,537,477 | |
Shares issued to shareholders in reinvestment of dividends | | | 20,725 | | | | 287,872 | | | | 47,999 | | | | 658,735 | |
Shares repurchased | | | (348,427 | ) | | | (4,838,580 | ) | | | (893,839 | ) | | | (12,227,562 | ) |
| | | | | | | | | | | | | | | | |
| | | | |
Net increase (decrease) | | | 147,068 | | | $ | 2,045,869 | | | | 141,186 | | | $ | 1,968,650 | |
| | | | | | | | | | | | | | | | |
| | | | |
Class I Shares | | | | | | | | | | | | | | | | |
Shares sold | | | 5,791,568 | | | $ | 80,425,393 | | | | 12,907,105 | | | $ | 177,105,776 | |
Shares issued to shareholders in reinvestment of dividends | | | 167,620 | | | | 2,328,378 | | | | 288,996 | | | | 3,969,249 | |
Shares repurchased | | | (3,506,162 | ) | | | (48,742,102 | ) | | | (5,939,982 | ) | | | (81,365,235 | ) |
| | | | | | | | | | | | | | | | |
| | | | |
Net increase (decrease) | | | 2,453,026 | | | $ | 34,011,669 | | | | 7,256,119 | | | $ | 99,709,790 | |
| | | | | | | | | | | | | | | | |
NOTE 5 – INVESTMENT TRANSACTIONS
For the six months ended March 31, 2015, the Fund had purchase and sale transactions of investments (excluding short-term investments) of $53,560,420 and $23,416,721, respectively.
NOTE 6 – INCOME TAXES
At March 31, 2015, information on the tax components of capital was as follows:
| | | | |
Cost of investments for tax purposes | | $ | 545,728,133 | |
| | | | |
Gross unrealized appreciation on a tax basis | | $ | 24,365,520 | |
Gross unrealized depreciation on a tax basis | | | (273,562 | ) |
| | | | |
Net unrealized appreciation (depreciation) on investments (tax basis) | | $ | 24,091,958 | |
| | | | |
At March 31, 2015, the Fund had deferred tax basis capital losses occurring subsequent to October 31, 2013 of $13,507. For tax purposes, such losses will be reflected in the year ending September 30, 2015.
At March 31, 2015, the Fund had cumulative tax basis capital losses of $90,182 (of which $30,538 is short-term and $59,644 is long-term), generated after September 30, 2011, which may be carried forward to offset future capital gains. To the extent such carryfor-wards are used, capital gain distributions may be reduced to the extent provided by regulations. Such capital loss carryforwards do not expire.
20 Semi-Annual Report
| | |
| NOTES TO FINANCIAL STATEMENTS, CONTINUED | | |
| |
Thornburg California Limited Term Municipal Fund | | March 31, 2015 (Unaudited) |
OTHER NOTES
Risks: The Fund’s investments subject it to risks including, but not limited to, credit risk, interest rate risk, management risk, market and economic risk, liquidity risk, and the risks of investing primarily in the obligations of a single state. Please see the Fund’s prospectus for a discussion of the risks associated with an investment in the Fund.
Subsequent Events: Fund management believes no events have occurred between March 31, 2015 and the date of issuance of the financial statements that require adjustment to or disclosure in the accompanying financial statements.
Semi-Annual Report 21
FINANCIAL HIGHLIGHTS
Thornburg California Limited Term Municipal Fund
| | | | | | | | | | | | | | | | | | | | | | | | | | | | | | | | | | | | | | | | | | | | | | | | | | | | | | | | | | | | |
| | | PER SHARE PERFORMANCE (for a share outstanding throughout the Period)+ | | | RATIOS TO AVERAGE NET ASSETS | | | SUPPLEMENTAL DATA | |
Unless
Otherwise
Noted,
Periods
are
Fiscal
Years
Ended
Sept. 30, | | Net Asset
Value
Beginning
of
Period | | | Net
Investment
Income
(Loss) | | | Net
Realized &
Unrealized
Gain (Loss)
on
Investments | | | Total from
Investment
Operations | | | Dividends
from Net
Investment
Income | | | Dividends
from Net
Realized
Gains | | | Total
Dividends | | | Net
Asset
Value
End
of
Period | | | Net
Investment
Income
(Loss) (%) | | | Expenses,
After
Expense
Reductions
(%) | | | Expenses,
After
Expense
Reductions
and Net of
Custody
Credits
(%) | | | Expenses,
Before
Expense
Reductions
(%) | | | Total
Return
(%)(a) | | | Portfolio
Turnover
Rate
(%)(a) | | | Net Assets
at End of
Period
(Thousands) | |
Class A Shares | | | | | | | | | | | | | | | | | | | | | | | | | | | | | | | | | | | | | | | | | | | | | | | | | | | | | |
2015(b)(c) | | $ | 13.84 | | | | 0.10 | | | | 0.03 | | | | 0.13 | | | | (0.10 | ) | | | — | | | | (0.10 | ) | | $ | 13.87 | | | | 1.41 | (d) | | | 0.94 | (d) | | | 0.93 | (d) | | | 0.94 | (d) | | | 0.92 | | | | 4.59 | | | $ | 172,308 | |
2014(c) | | $ | 13.54 | | | | 0.23 | | | | 0.30 | | | | 0.53 | | | | (0.23 | ) | | | — | | | | (0.23 | ) | | $ | 13.84 | | | | 1.67 | | | | 0.95 | | | | 0.94 | | | | 0.95 | | | | 3.93 | | | | 16.85 | | | $ | 160,151 | |
2013(c) | | $ | 13.75 | | | | 0.24 | | | | (0.20 | ) | | | 0.04 | | | | (0.24 | ) | | | (0.01 | ) | | | (0.25 | ) | | $ | 13.54 | | | | 1.75 | | | | 0.94 | | | | 0.94 | | | | 0.94 | | | | 0.28 | | | | 17.57 | | | $ | 159,058 | |
2012(c) | | $ | 13.41 | | | | 0.29 | | | | 0.34 | | | | 0.63 | | | | (0.29 | ) | | | — | | | | (0.29 | ) | | $ | 13.75 | | | | 2.15 | | | | 0.95 | | | | 0.95 | | | | 0.95 | | | | 4.78 | | | | 13.06 | | | $ | 150,155 | |
2011(c) | | $ | 13.38 | | | | 0.36 | | | | 0.03 | | | | 0.39 | | | | (0.36 | ) | | | — | | | | (0.36 | ) | | $ | 13.41 | | | | 2.71 | | | | 0.96 | | | | 0.96 | | | | 0.96 | | | | 2.98 | | | | 13.33 | | | $ | 123,910 | |
2010(c) | | $ | 13.09 | | | | 0.39 | | | | 0.29 | | | | 0.68 | | | | (0.39 | ) | | | — | | | | (0.39 | ) | | $ | 13.38 | | | | 2.94 | | | | 0.97 | | | | 0.97 | | | | 0.97 | | | | 5.29 | | | | 13.69 | | | $ | 114,813 | |
Class C Shares | | | | | | | | | | | | | | | | | | | | | | | | | | | | | | | | | | | | | | | | | | | | | | | | | | | | | |
2015(b) | | $ | 13.85 | | | | 0.08 | | | | 0.03 | | | | 0.11 | | | | (0.08 | ) | | | — | | | | (0.08 | ) | | $ | 13.88 | | | | 1.16 | (d) | | | 1.19 | (d) | | | 1.19 | (d) | | | 1.19 | (d) | | | 0.80 | | | | 4.59 | | | $ | 65,047 | |
2014 | | $ | 13.55 | | | | 0.19 | | | | 0.30 | | | | 0.49 | | | | (0.19 | ) | | | — | | | | (0.19 | ) | | $ | 13.85 | | | | 1.41 | | | | 1.21 | | | | 1.20 | | | | 1.21 | | | | 3.66 | | | | 16.85 | | | $ | 62,858 | |
2013 | | $ | 13.76 | | | | 0.20 | | | | (0.20 | ) | | | — | | | | (0.20 | ) | | | (0.01 | ) | | | (0.21 | ) | | $ | 13.55 | | | | 1.48 | | | | 1.21 | | | | 1.21 | | | | 1.21 | | | | 0.02 | | | | 17.57 | | | $ | 59,585 | |
2012 | | $ | 13.42 | | | | 0.26 | | | | 0.34 | | | | 0.60 | | | | (0.26 | ) | | | — | | | | (0.26 | ) | | $ | 13.76 | | | | 1.88 | | | | 1.22 | | | | 1.22 | | | | 1.22 | | | | 4.49 | | | | 13.06 | | | $ | 59,563 | |
2011 | | $ | 13.40 | | | | 0.32 | | | | 0.02 | | | | 0.34 | | | | (0.32 | ) | | | — | | | | (0.32 | ) | | $ | 13.42 | | | | 2.45 | | | | 1.22 | | | | 1.22 | | | | 1.22 | | | | 2.63 | | | | 13.33 | | | $ | 45,897 | |
2010 | | $ | 13.10 | | | | 0.35 | | | | 0.30 | | | | 0.65 | | | | (0.35 | ) | | | — | | | | (0.35 | ) | | $ | 13.40 | | | | 2.67 | | | | 1.23 | | | | 1.23 | | | | 1.74 | | | | 5.09 | | | | 13.69 | | | $ | 42,039 | |
Class I Shares | | | | | | | | | | | | | | | | | | | | | | | | | | | | | | | | | | | | | | | | | | | | | | | | | | | | | |
2015(b) | | $ | 13.85 | | | | 0.12 | | | | 0.03 | | | | 0.15 | | | | (0.12 | ) | | | — | | | | (0.12 | ) | | $ | 13.88 | | | | 1.73 | (d) | | | 0.61 | (d) | | | 0.61 | (d) | | | 0.61 | (d) | | | 1.09 | | | | 4.59 | | | $ | 395,920 | |
2014 | | $ | 13.55 | | | | 0.27 | | | | 0.30 | | | | 0.57 | | | | (0.27 | ) | | | — | | | | (0.27 | ) | | $ | 13.85 | | | | 1.99 | | | | 0.62 | | | | 0.62 | | | | 0.62 | | | | 4.27 | | | | 16.85 | | | $ | 361,015 | |
2013 | | $ | 13.76 | | | | 0.28 | | | | (0.19 | ) | | | 0.09 | | | | (0.29 | ) | | | (0.01 | ) | | | (0.30 | ) | | $ | 13.55 | | | | 2.08 | | | | 0.61 | | | | 0.61 | | | | 0.61 | | | | 0.62 | | | | 17.57 | | | $ | 254,869 | |
2012 | | $ | 13.42 | | | | 0.33 | | | | 0.35 | | | | 0.68 | | | | (0.34 | ) | | | — | | | | (0.34 | ) | | $ | 13.76 | | | | 2.46 | | | | 0.62 | | | | 0.62 | | | | 0.62 | | | | 5.12 | | | | 13.06 | | | $ | 196,071 | |
2011 | | $ | 13.40 | | | | 0.40 | | | | 0.02 | | | | 0.42 | | | | (0.40 | ) | | | — | | | | (0.40 | ) | | $ | 13.42 | | | | 3.03 | | | | 0.63 | | | | 0.62 | | | | 0.63 | | | | 3.24 | | | | 13.33 | | | $ | 120,693 | |
2010 | | $ | 13.10 | | | | 0.43 | | | | 0.30 | | | | 0.73 | | | | (0.43 | ) | | | — | | | | (0.43 | ) | | $ | 13.40 | | | | 3.27 | | | | 0.63 | | | | 0.63 | | | | 0.63 | | | | 5.72 | | | | 13.69 | | | $ | 78,948 | |
| (a) | Not annualized for periods less than one year. |
| (b) | Unaudited Six Month Period Ended March 31. |
| (c) | Sales loads are not reflected in computing total return. |
| + | Based on weighted average shares outstanding, except for Dividends from Net Investment Income and Net Realized Gains, which are actual amounts per share. |
See notes to financial statements.
| | | | |
| 22 Semi-Annual Report | | | | Semi-Annual Report 23 |
| | |
| EXPENSE EXAMPLE | | |
| |
Thornburg California Limited Term Municipal Fund | | March 31, 2015 (Unaudited) |
As a shareholder of the Fund, you incur two types of costs:
| | (1) | transaction costs, including |
(a) sales charges (loads) on purchase payments, for Class A shares;
(b) a deferred sales charge on redemptions of any part or all of a purchase of $1 million of Class A shares within 12 months of purchase;
(c) a deferred sales charge on redemptions of Class C shares within 12 months of purchase;
| | (2) | ongoing costs, including management fees; distribution and/or service (12b-1) fees; and other Fund expenses. |
This example is intended to help you understand your ongoing costs (in dollars) of investing in the Fund and to compare these costs with the ongoing costs of investing in other mutual funds.
The example is based on a $1,000 investment beginning on October 1, 2014, and held until March 31, 2015.
| | | | | | | | | | | | |
| | | Beginning
Account Value
10/1/14 | | | Ending
Account Value
3/31/15 | | | Expenses Paid
During Period†
10/1/14–3/31/15 | |
Class A Shares | | | | | | | | | | | | |
Actual | | $ | 1,000.00 | | | $ | 1,009.20 | | | $ | 4.68 | |
Hypothetical* | | $ | 1,000.00 | | | $ | 1,020.27 | | | $ | 4.71 | |
Class C Shares | | | | | | | | | | | | |
Actual | | $ | 1,000.00 | | | $ | 1,008.00 | | | $ | 5.94 | |
Hypothetical* | | $ | 1,000.00 | | | $ | 1,019.01 | | | $ | 5.98 | |
Class I Shares | | | | | | | | | | | | |
Actual | | $ | 1,000.00 | | | $ | 1,010.90 | | | $ | 3.05 | |
Hypothetical* | | $ | 1,000.00 | | | $ | 1,021.89 | | | $ | 3.07 | |
| † | Expenses are equal to the annualized expense ratio for each class (A: 0.93%; C: 1.19%; I: 0.61%) multiplied by the average account value over the period, multiplied by 182/365 to reflect the one-half year period. |
| * | Hypothetical assumes a rate of return of 5% per year before expenses. |
ACTUAL EXPENSES
For each class of shares, the first line of the accompanying table provides information about actual account values and actual expenses. You may use the information in this line, together with the amount you invested, to estimate the expenses that you paid over the period. Simply divide your account value by $1,000 (for example, an $8,600 account value divided by $1,000 = 8.6), then multiply the result by the number in the first line for your class of shares under the heading entitled “Expenses Paid During Period” to estimate the expenses you paid on your account during this period.
HYPOTHETICAL EXAMPLE FOR COMPARISON PURPOSES
For each class of shares, the second line of the accompanying table provides information about hypothetical account values and hypothetical expenses based on the Fund’s actual expense ratio and an assumed rate of return of 5% per year before expenses, which is not the Fund’s actual return. The hypothetical account values and expenses may not be used to estimate the actual ending account balance or expenses you paid for the period. You may use this information to compare the ongoing costs of investing in the Fund and other funds. To do so, compare this 5% hypothetical example with the 5% hypothetical examples that appear in the shareholder reports of the other funds.
Please note that the expenses shown in the table are meant to highlight your ongoing costs only and do not reflect any transactional costs, such as sales charges (loads), redemption fees, or exchange fees. Therefore, the second line of the table for each class of shares is useful in comparing ongoing costs only, and will not help you determine the relative total costs of owning different funds. In addition, if these transactional costs were included, your costs would have been higher.
24 Semi-Annual Report
OTHER INFORMATION
| | |
Thornburg California Limited Term Municipal Fund | | March 31, 2015 (Unaudited) |
PORTFOLIO PROXY VOTING
Policies and Procedures:
The Trust has delegated to Thornburg Investment Management, Inc. (the “Advisor”) voting decisions respecting proxies for the Fund’s voting securities. The Advisor makes voting decisions in accordance with its Proxy Voting Policy. A description of the Policy is available (i) without charge, upon request, by calling the Advisor toll-free at 1-800-847-0200, (ii) on the Thornburg website at www.thornburg. com, and (iii) on the Securities and Exchange Commission’s website at www.sec.gov.
Information regarding how proxies were voted is available on or before August 31 of each year for the twelve months ending the preceding June 30. This information is available (i) without charge, upon request by calling the Advisor toll-free at 1-800-847-0200, (ii) on the Thornburg website at www.thornburg.com, and (iii) on the Securities and Exchange Commission’s website at www.sec.gov.
AVAILABILITY OF QUARTERLY PORTFOLIO SCHEDULE
The Fund files with the Securities and Exchange Commission schedules of its portfolio holdings on Form N-Q for the first and third quarters of each fiscal year. The Fund’s Forms N-Q are available on the Commission’s website at www.sec.gov, or may be reviewed and copied at the Commission’s Public Reference Room in Washington, D.C. Information on the operation of the Public Reference Room may be obtained by calling 1-800-SEC-0330. The Fund also makes this information available on its website at www.thornburg. com/download or upon request by calling 1-800-847-0200.
Semi-Annual Report 25
TRUSTEES’ STATEMENT TO SHAREHOLDERS
Revised and Readopted September 15, 2014
The Trustees believe current and prospective shareholders should know how we discharge our responsibilities in supervising the Funds’ investment advisor and in reviewing the advisor’s contract for renewal. Since 2005, we have issued a statement which sets out clearly the three principal guidelines that we follow in supervising the Trust’s investment advisor on your behalf. In accordance with our customary practice, in September of 2014 we again reviewed our statement and concluded we should reissue this statement outlining the principal features of our supervision of the advisor’s performance of investment management services for the Funds.
We begin with the premise that each shareholder selected his or her Fund because its investments are managed by the investment advisor identified in the prospectus and in accordance with the objective and policies described in the prospectus. We realize, as each of you do, that if you believe that your Fund’s stated objective and policies no longer serve your personal investment goals, you can sell your shares and leave the Fund.
Therefore, we believe that our primary supervisory task—our principal obligation to you—is to assess the nature and quality of the advisor’s services, and to confirm that the advisor actively and competently pursues the Fund’s objective, in accordance with the policies set out in the prospectus. To do this, we meet regularly with management to review your Fund’s portfolio and to discuss the advisor’s specific actions and judgments in pursuing the Fund’s objective. We do not substitute our own judgment for the advisor’s decisions in selecting investments; the advisor is paid to exercise its informed judgment on investment decisions, and we seek to confirm, in reviewing the advisor’s performance, that the advisor is doing just that.
Second, we are conscious of costs and the effect that costs have on shareholders’ returns. We try to make sure that your Fund’s fees and costs are reasonable in relationship to the services rendered and that they are generally in line with those charged by other expert investment advisors, consistent with our belief that the Fund’s investors searched for and expect that expertise and attention and have decided to pay a reasonable price for it. We do not put the management contract “out to bid” as a matter of course, and we would not do so unless we had concluded that the advisor materially had failed to pursue the Fund’s objectives in accordance with its policies, or for other equally important reasons. We believe that any other approach would be inconsistent with your interests and contrary to your expectations when you bought shares of the Fund in the first place.
Finally, because we believe that most Thornburg Fund shareholders have invested with a long-term perspective, we try not to focus too much on the fashions of the moment and on short-term performance. The market will not favor any specific investment objective or set of policies at all times and under all economic circumstances. A fund will experience periods of both high and low returns relative to other funds and other investments. Even if one of our Funds is not favored by the market at a particular time, we believe that the advisor is nonetheless obliged to remain true to the Fund’s objective and policies, and we watch to see that it does so.
Trustees of Thornburg Investment Trust
26 Semi-Annual Report
THORNBURG FUND FAMILY
FUNDAMENTAL, BOTTOM-UP EQUITY RESEARCH
We search far and wide for the best stock ideas—within the United States and around the globe. Potential investments that may deserve a deeper look are thoroughly analyzed using both quantitative and qualitative criteria. But the vast majority are discarded. Those that ultimately make it into our highly-selective portfolios are continually monitored to determine whether our investment theses unfold as expected.
| | • | | Thornburg Core Growth Fund |
| | • | | Thornburg International Value Fund |
| | • | | Thornburg International Growth Fund |
| | • | | Thornburg Developing World Fund |
| | • | | Thornburg Investment Income Builder Fund |
| | • | | Thornburg Global Opportunities Fund |
A TRADITION OF DISCIPLINED BOND MANAGEMENT
At Thornburg, the word “disciplined” carries some substance. We don’t make a practice of using shortcuts to enhance yield or total returns. Every strategy is grounded in rigorous, bottom-up credit work. Portfolios are assembled carefully—in the case of our core bond funds, using laddered structures—to mitigate price fluctuation. Position sizes are controlled so that no single bond can have an outsized effect on a portfolio. And as with our equity portfolios, managers enjoy flexibility to seek an optimal risk/reward balance.
| | • | | Thornburg Low Duration Income Fund |
| | • | | Thornburg Limited Term U.S. Government Fund |
| | • | | Thornburg Limited Term Income Fund |
| | • | | Thornburg Strategic Income Fund |
| | • | | Thornburg Low Duration Municipal Fund |
| | • | | Thornburg Limited Term Municipal Fund |
| | • | | Thornburg Intermediate Municipal Fund |
| | • | | Thornburg California Limited Term Municipal Fund |
| | • | | Thornburg New Mexico Intermediate Municipal Fund |
| | • | | Thornburg New York Intermediate Municipal Fund |
| | • | | Thornburg Strategic Municipal Income Fund |
Before investing, carefully consider the Fund’s investment goals, risks, charges, and expenses. For a prospectus or summary prospectus containing this and other information, contact your financial advisor or visit thornburg.com. Read it carefully before investing.
For additional information, please visit thornburg.com
Thornburg Investment Management, Inc. 2300 North Ridgetop Road, Santa Fe, NM 87506
Semi-Annual Report 27

This Semi-Annual Report is submitted for the general information of shareholders of the Fund. It is not authorized for distribution to prospective investors in the Fund unless preceded or accompanied by an effective prospectus.
| | | | |
| Investment Advisor: | | Distributor: | | |
| Thornburg Investment Management® | | Thornburg Securities Corporation® | | |
| 800.847.0200 | | 800.847.0200 | | TH1070 |
Firm Overview
THE FIRM
Thornburg Investment Management is a privately owned global investment firm that offers a range of solutions for retail and institutional investors. We are driven by our mission to help our clients reach their long-term financial goals through fundamental research and active portfolio management.
Founded in 1982 and headquartered in Santa Fe, New Mexico, we manage approximately $61 billion (as of March 31, 2015) across seven equity and 11 bond mutual funds, separate accounts for high-net-worth investors and institutional accounts, and five UCITS funds for non-U.S. investors.

CORE INVESTMENT PRINCIPLES
Our focus has always been on maintaining and building the investment expertise to manage Thornburg strategies to a high standard, while adhering to a core set of investment principles:
| | • | | We focus on the fundamentals. We invest according to our view of the fundamental value of an issuer only after performing thorough, bottom-up research. |
| | • | | We think and invest for the long term. We typically make investment decisions based upon an investment thesis we expect to play out over 18 months to several years. We may not always hold a security for several years, but our horizon line is typically a few years out. |
| | • | | We stay flexible. We go where we see value. Our investment mandates are generally broad and flexible, and we exercise as much flexibility as possible within any restrictions. |
| | • | | We collaborate across strategies. We are structured as global generalists. Portfolio managers and analysts do not specialize in sectors, geographies, or even security types, but instead must understand and communicate bottom-up fundamentals across industries, sectors, and borders. |
2 Semi-Annual Report
Semi-Annual Report
Thornburg New Mexico Intermediate Municipal Fund
March 31, 2015
| | | | | | |
SHARE CLASS | | NASDAQ SYMBOL | | CUSIP | |
Class A | | THNMX | | | 885-215-301 | |
Class D | | THNDX | | | 885-215-624 | |
Class I | | THNIX | | | 885-215-285 | |
Minimum investments for Class I shares are higher than those for other classes. Class I shares may not be available to all investors.
Investments in the Fund carry risks, including possible loss of principal. Bond funds have the same interest rate, inflation, and credit risks that are associated with the underlying bonds. The value of bonds will fluctuate relative to changes in interest rates, decreasing when interest rates rise. Unlike bonds, bond funds have ongoing fees and expenses. Please see the Fund’s prospectus for a discussion of the risks associated with an investment in the Fund. Investments in the Fund are not FDIC insured, nor are they deposits of or guaranteed by a bank or any other entity.
The laddering strategy does not assure or guarantee better performance and cannot eliminate the risk of investment losses.
Semi-Annual Report 3
LETTER TO SHAREHOLDERS
| | |
Thornburg New Mexico Intermediate Municipal Fund | | March 31, 2015 (Unaudited) |
April 16, 2015
Dear Fellow Shareholder:
We are pleased to present the semi-annual report for the Thornburg New Mexico Intermediate Municipal Fund. The net asset value (NAV) of the Class A shares increased by five cents to $13.65 per share during the six months ended March 31, 2015. If you were with us for the entire period, you received dividends of 18.21 cents per share. If you reinvested your dividends, you received 18.31 cents per share. Dividends were lower for Class D shares and higher for Class I shares, to account for varying class-specific expenses. The Class A shares equaled the Fund’s benchmark index, with a 1.71% total return (without sales charge) for the six months ended March 31, 2015, and a 1.71% total return for the BofA Merrill Lynch 3-15 Year U.S. Municipal Securities Index. The Fund generated 0.77% more price return and 0.77% less income than its benchmark.
Throughout the six-month period, the Fund maintained a lower risk posture on interest rates than its benchmark; the average effective duration (a measure of interest-rate sensitivity) was 4.47 years, compared to 5.42 years for the benchmark. The shorter duration hurt performance by 0.06%. The Fund’s position along the yield curve added 0.24% and sector selection added an additional 0.34% of relative performance. Credit subtracted 0.21% of relative performance. Other factors, including security selection added 0.46%.
The Municipal Market
The municipal market has been something of a roller coaster over the past six months. Much of that volatility revolves around investors’ increased fears of an eventual Federal Reserve rate increase. While those fears aren’t completely unfounded, we believe the typical municipal bond investor is ignoring several other sources of risk present in the market.
First and foremost, it appears that risk is mispriced. At a very high level, we examine two primary sources of risk in the municipal market: duration and credit quality. The hunt for excess yield has bid up the prices of these sources of risk to levels we believe are unsustainable.
Investors looking for more yield can increase the duration of their purchases. This strategy often makes sense in a period characterized by a steep yield curve. When the curve is sufficiently steep, the incremental yield an investor picks up for buying a bond one year longer may, in fact, provide adequate compensation for the increased interest-rate risk. But through the six months ended March 31, 2015, we believe compensation offered to investors to extend duration was not in line with
Chart I | 10-Year AAA General Obligation Municipal Bond Real Yield History, Using Core PCE Index
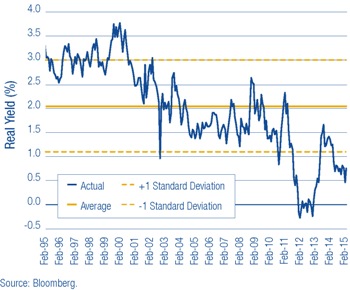
the added risk. This was particularly true when looking at the overall low level of interest rates in the market. Chart I shows the yield of a AAA rated general obligation bond less the core PCE index (or Personal Consumption Expenditures index, the Federal Reserve’s favored inflation measure). This is the so-called “real yield” an investor receives after inflation; this was and continues to be well below the long-term average.
Less risk-averse investors can also decrease the average credit quality of their portfolios in an attempt to generate more income. While this can be a sound strategy in times of wide credit spreads, it fails during periods when credit risk is mispriced. Chart II shows a history of credit spreads, which in this case is the incremental yield an investor picked up from investing in a BBB rated revenue bond versus a AAA rated general obligation bond. Such spreads are as tight as they have been since before the great recession, when municipal bond insurers were thriving and a majority of the market was insured with AAA ratings.
In addition to overpriced risks, investors need to be prepared for continued volatility in the market. We live in a world where the Federal Reserve’s statements are analyzed word for word. The inclusion or deletion of any given word has the potential to send the markets roiling. The increased volatility may be exacerbated in the future by liquidity constraints facing the market, prompted by recent federal regulation. As a result of Dodd-Frank and other regulations, large broker/dealers will no longer be able to allocate the same amount of capital to the municipal market as they have in the past. Without that sup-
4 Semi-Annual Report
Chart II | Credit-Spread Difference, BBB Rated Revenue v. AAA Rated General Obligation Bonds
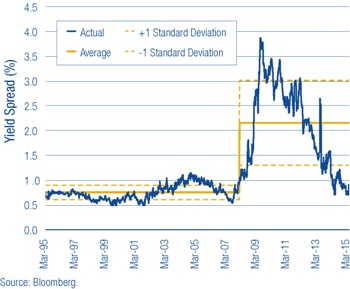
port, the market could be rattled more than usual if and when we see large outflows.
Investors need to be aware of all of these risks and ensure they are accounting for them appropriately.
New Mexico
New Mexico’s economy has suffered as a result of the dramatic decline in energy prices. New Mexico is heavily dependent on the energy sector to boost tax receipts both at the state and local level. While the downturn has not affected bond prices to date, a prolonged period of low prices could begin to adversely affect credit fundamentals.
Conclusion
For the past six months, the Thornburg municipal bond team has asked a simple question: “Are we getting paid to take risk?” The answer has been a resounding “no.” As a result, our investors will see a portfolio with a lower duration and a stronger average credit quality, as we overweighted higher-rated credits. We have also increased cash positions to seek to protect against a market liquidity crunch and to strategically take advantage of opportunities should they arise. In short, we believe we have avoided overpriced risk.
Many shareholders may ask themselves “what should I do if interest rates begin to rise?” We continue to stress having confidence in the structure of your portfolio. A portion of your laddered Fund’s bonds mature each year and become available for reinvestment at higher yields; this has the potential to increase income to shareholders. When interest rates do rise, prices will generally decline, but the remaining bonds in the portfolio will move closer to maturity and should, in our opinion, increase in price over time. We advise being patient when interest rates start to rise, and lengthening your anticipated holding period. Remember that higher yields also mean higher income, something investors have been sorely lacking for quite some time!
We will continue to strive to manage your assets to fulfill the Fund’s objectives.
Sincerely,
| | | | |
 | |  | |  |
| Christopher Ryon, CFA | | Josh Gonze | | Nicholos Venditti |
| Portfolio Manager | | Portfolio Manager | | Portfolio Manager |
| Managing Director | | Managing Director | | Managing Director |
The matters discussed in this report may constitute forward-looking statements made pursuant to the safe harbor provisions of the Securities Litigation Reform Act of 1995. These include any advisor or portfolio manager prediction, assessment, analysis or outlook for individual securities, industries, investment styles, market sectors and/or markets. These statements involve risks and uncertainties. In addition to the general risks described for each fund in its current prospectus, other factors bearing on these reports include the accuracy of the advisor’s or portfolio manager’s forecasts and predictions, the appropriateness of the investment strategies designed by the advisor or portfolio manager and the ability of the advisor or portfolio manager to implement their strategies efficiently and successfully. Any one or more of these factors, as well as other risks affecting the securities markets generally, could cause the actual results of any fund to differ materially as compared to its benchmarks.
The views expressed by the portfolio managers reflect their professional opinions and are subject to change. Under no circumstances does the information contained within represent a recommendation to buy or sell any security.
Semi-Annual Report 5
PERFORMANCE SUMMARY
| | |
| |
Thornburg New Mexico Intermediate Municipal Fund | | March 31, 2015 (Unaudited) |
Average Annual Total Returns
| | | | | | | | | | | | | | | | | | | | |
| | | 1-Yr | | | 3-Yr | | | 5-Yr | | | 10-Yr | | | Since
Incep. | |
A Shares (Incep: 6/18/91) | | | | | | | | | | | | | | | | | | | | |
Without sales charge | | | 4.46 | % | | | 2.55 | % | | | 3.31 | % | | | 3.64 | % | | | 4.62 | % |
With sales charge | | | 2.41 | % | | | 1.87 | % | | | 2.90 | % | | | 3.43 | % | | | 4.53 | % |
D Shares (Incep: 6/1/99) | | | 4.20 | % | | | 2.26 | % | | | 3.05 | % | | | 3.37 | % | | | 3.53 | % |
I Shares (Incep: 2/1/07) | | | 4.80 | % | | | 2.89 | % | | | 3.66 | % | | | — | | | | 4.11 | % |
30-Day Yields, A Shares
(with sales charge)
| | | | |
Annualized Distribution Yield | | | 2.39 | % |
| |
SEC Yield | | | 0.87 | % |
Performance data shown represents past performance and is no guarantee of future results. Investment return and principal value will fluctuate so shares, when redeemed, may be worth more or less than their original cost. Current performance may be lower or higher than quoted. For performance current to the most recent month end, visit thornburg.com or call 800-847-0200. The performance information does not reflect the deduction of taxes that a shareholder would pay on distributions or the redemption of Fund shares. Returns reflect the reinvestment of dividends and capital gains. Class A shares are sold with a maximum sales charge of 2.00%. There is no sales charge for Class D and Class I shares.
As disclosed in the most recent prospectus, the total annual fund operating expenses are as follows: A shares, 0.97%; D shares, 1.23%; I shares, 0.64%. For more detailed information on fund expenses and waivers/reimbursements please see the Fund’s prospectus.
Glossary
BofA Merrill Lynch 3-15 Year U.S. Municipal Securities Index – A subset of the BofA Merrill Lynch U.S. Municipal Securities Index including all securities with a remaining term to final maturity greater than or equal to 3 years and less than 15 years.
Unless otherwise noted, index returns reflect the reinvestment of income dividends and capital gains, if any, but do not reflect fees, brokerage commissions or other expenses of investing. Investors may not make direct investments into any index. The performance of any index is not indicative of the performance of any particular investment.
Alternative Minimum Tax (AMT) – A federal tax aimed at ensuring that high-income individuals, estates, trusts, and corporations pay a minimal level income tax. For individuals, the AMT is calculated by adding tax preference items to regular taxable income.
Annualized Distribution Yield – The distribution yield reflects actual distributions made to shareholders. The annualized distribution yield is calculated by summing the last 30 days of income at a given month end and annualizing to a 360-day year. The result is divided by the ending maximum offering price.
Bond Credit Ratings (Credit Quality) – A bond credit rating assesses the financial ability of a debt issuer to make timely payments of principal and interest. Ratings of AAA (the highest), AA, A, and BBB are investment-grade quality. Ratings of BB, B, CCC, CC, C and D (the lowest) are considered below investment grade, speculative grade, or junk bonds.
Bond Insurers – Individual bonds are sometimes insured by private companies. The insurance guarantees the payment of principal and interest on a bond issue if the issuer defaults. Mutual funds are not insured, even if the underlying bonds are insured.
Credit Spread/Quality Spread – The difference between the yields of securities with different credit qualities.
Duration – A bond’s sensitivity to interest rates. Effective duration incorporates the embedded option features, such as call provisions. Bonds with longer durations experience greater price volatility than bonds with shorter durations.
General Obligation Bond – A municipal bond backed by the credit and “taxing power” of the issuing jurisdiction rather than the revenue from a given project.
Personal Consumption Expenditure (PCE) Index – A broad measure of U.S. inflation that assesses the change in prices of goods and services purchased by consumers throughout the economy. Core PCE excludes the more volatile and seasonal food and energy prices.
Revenue Bond – A bond on which the debt service is payable solely from the revenue generated from the operation of the project being financed or a category of facilities, or from other non-tax sources.
SEC Yield – SEC yield is computed in accordance with SEC standards measuring the net investment income per share over a specified 30-day period expressed as a percentage of the maximum offering price of the Fund’s shares at the end of the period.
Standard Deviation – A measure of the dispersion of a set of data from its mean. The more spread apart the data, the higher the deviation. Values within one standard deviation of the mean represent approximately two-thirds of the data set, assuming a normal distribution.
Yield Curve – A line that plots the interest rates, at a set point in time, of bonds having equal credit quality, but differing maturity dates.
Yield Spread – The difference between yields on differing debt instruments, calculated by deducting the yield of one instrument from another.
6 Semi-Annual Report
FUND SUMMARY
| | |
| |
Thornburg New Mexico Intermediate Municipal Fund | | March 31, 2015 (Unaudited) |
Objectives and Strategies
The Fund’s primary investment objective is to obtain as high a level of current income exempt from federal and New Mexico state individual income taxes as is consistent, in the view of the investment advisor, with preservation of capital.
The secondary goal of the Fund is to reduce expected changes in its share price compared to long-term bond portfolios.
This Fund offers New Mexico investors double tax-free yields (may be subject to Alternative Minimum Tax) in a laddered municipal bond portfolio with an average maturity of normally three to ten years. Laddering involves building a portfolio of bonds with staggered maturities so that a portion of the portfolio matures each year. Cash from maturing bonds, if not needed for other purposes, is invested in bonds with longer maturities at the far end of the ladder. We regard the strategy as a good compromise for managing different types of risk.
Key Portfolio Attributes
| | | | |
Number of Bonds | | | 125 | |
| |
Effective Duration | | | 4.5 Yrs | |
| |
Average Maturity | | | 8.1 Yrs | |
Long Term Stability of Principal
Net Asset Value History of A Shares
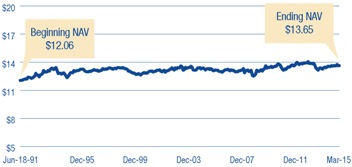
Security Credit Ratings
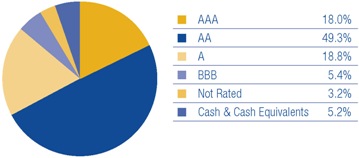
A bond credit rating assesses the financial ability of a debt issuer to make timely payments of principal and interest. Ratings of AAA (the highest), AA, A, and BBB are investment-grade quality. Ratings of BB, B, CCC, CC, C and D (the lowest) are considered below investment grade, speculative grade, or junk bonds. Credit quality ratings for Thornburg’s municipal portfolios used the highest rating available from either Standard & Poor’s or Moody’s Investors Service.
Portfolio Ladder
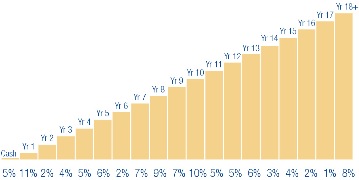
Percent of portfolio maturing in each year. Cash includes cash equivalents.
There is no guarantee that the Fund will meet its investment objectives.
All data is subject to change. Charts may not add up to 100% due to rounding.
Semi-Annual Report 7
| | |
| SCHEDULE OF INVESTMENTS | | |
| |
Thornburg New Mexico Intermediate Municipal Fund | | March 31, 2015 (Unaudited) |
| | | | | | | | | | |
Issuer-Description | | Credit Rating†
S&P/Moody’s | | Principal
Amount | | | Value | |
Albuquerque Bernalillo County Water Utility Authority, 5.00% due 7/1/2021 pre-refunded 7/1/2019 (New Mexico Utilities, Inc. Water System) | | AA+/Aa2 | | $ | 1,760,000 | | | $ | 2,036,267 | |
Albuquerque Bernalillo County Water Utility Authority, 5.50% due 7/1/2025 pre-refunded 7/1/2019 (New Mexico Utilities, Inc. Water System) | | AA+/Aa2 | | | 1,000,000 | | | | 1,177,630 | |
Albuquerque Bernalillo County Water Utility Authority, 5.00% due 7/1/2026 (2005 NMFA Loan and Joint Water and Sewer System Improvements) | | AA+/Aa2 | | | 2,000,000 | | | | 2,445,720 | |
Albuquerque Bernalillo County Water Utility Authority, 5.00% due 7/1/2026 pre-refunded 7/1/2016 (San Juan-Chama Drinking Water Project; Insured: AMBAC) | | AA+/Aa2 | | | 500,000 | | | | 529,230 | |
Albuquerque Bernalillo County Water Utility Authority, 5.00% due 7/1/2026 pre-refunded 7/1/2018 (San Juan-Chama Drinking Water Project) | | AA+/Aa2 | | | 1,420,000 | | | | 1,602,626 | |
a Albuquerque Bernalillo County Water Utility Authority, 5.00% due 7/1/2031 (2007 NMFA Loan and Joint Water and Sewer System Improvements) | | AA+/Aa2 | | | 500,000 | | | | 599,375 | |
a Albuquerque Bernalillo County Water Utility Authority, 5.00% due 7/1/2032 (2007 NMFA Loan and Joint Water and Sewer System Improvements) | | AA+/Aa2 | | | 1,000,000 | | | | 1,194,810 | |
Albuquerque Municipal School District No. 12 GO, 5.00% due 8/1/2019 (Bernalillo and Sandoval Counties School Facilities) (State Aid Withholding) | | AA/Aa1 | | | 3,585,000 | | | | 4,160,392 | |
Albuquerque Municipal School District No. 12 GO, 4.00% due 8/1/2029 (Bernalillo and Sandoval Counties School Facilities) (State Aid Withholding) | | AA/Aa1 | | | 1,300,000 | | | | 1,408,147 | |
Bernalillo County GRT, 5.00% due 4/1/2021 (Government Services; Insured: Natl-Re) | | AAA/Aa2 | | | 3,000,000 | | | | 3,382,200 | |
Bernalillo County GRT, 5.25% due 10/1/2022 (Government Services; Insured: AMBAC) | | AAA/Aa2 | | | 3,170,000 | | | | 3,932,195 | |
Bernalillo County GRT, 5.25% due 10/1/2023 (Government Services; Insured: AMBAC) | | AAA/Aa2 | | | 1,275,000 | | | | 1,601,680 | |
Bernalillo County GRT, 5.25% due 10/1/2025 (Government Services; Insured: AMBAC) | | AAA/Aa2 | | | 3,850,000 | | | | 4,770,227 | |
Bernalillo County GRT, 5.25% due 4/1/2027 (Government Services) | | AAA/Aa2 | | | 300,000 | | | | 368,679 | |
Bernalillo County GRT, 5.70% due 4/1/2027 (Government Services) | | AAA/Aa2 | | | 3,000,000 | | | | 3,807,180 | |
Bernalillo County GRT, 5.70% due 4/1/2027 (Government Services; Insured: Natl-Re) | | AAA/Aa2 | | | 815,000 | | | | 1,034,284 | |
Central New Mexico Community College GO, 5.00% due 8/15/2020 (Campus Buildings Acquisition & Improvements) | | AA+/Aa1 | | | 1,375,000 | | | | 1,629,169 | |
Central New Mexico Community College GO, 5.00% due 8/15/2021 (Campus Buildings Acquisition & Improvements) | | AA+/Aa1 | | | 1,435,000 | | | | 1,729,864 | |
b Central New Mexico Community College GO, 5.00% due 8/15/2022 (Campus Buildings Acquisition & Improvements) | | AA+/Aa1 | | | 1,100,000 | | | | 1,345,531 | |
Central New Mexico Community College GO, 4.00% due 8/15/2023 (Campus Buildings Acquisition & Improvements) | | AA+/Aa1 | | | 1,920,000 | | | | 2,144,890 | |
Cibola County, 3.00% due 6/1/2015 (County Building Improvements) | | NR/A2 | | | 290,000 | | | | 291,349 | |
Cibola County, 3.00% due 6/1/2015 (County Building Improvements) | | NR/A2 | | | 145,000 | | | | 145,674 | |
Cibola County, 3.00% due 6/1/2016 (County Building Improvements) | | NR/A2 | | | 185,000 | | | | 190,607 | |
Cibola County, 3.00% due 6/1/2016 (County Building Improvements) | | NR/NR | | | 245,000 | | | | 252,426 | |
Cibola County, 5.00% due 6/1/2025 (County Building Improvements) | | NR/A2 | | | 360,000 | | | | 433,206 | |
Cibola County, 5.00% due 6/1/2025 (County Building Improvements) | | NR/NR | | | 355,000 | | | | 427,189 | |
City of Albuquerque GRT, 5.00% due 7/1/2021 | | AAA/Aa2 | | | 1,340,000 | | | | 1,536,350 | |
City of Albuquerque GRT, 5.00% due 7/1/2021 | | AAA/Aa2 | | | 3,000,000 | | | | 3,439,590 | |
City of Albuquerque GRT, 5.00% due 7/1/2025 (I-25/Paseo del Norte Interchange) | | AAA/Aa2 | | | 540,000 | | | | 656,910 | |
City of Albuquerque GRT, 5.00% due 7/1/2027 (I-25/Paseo del Norte Interchange) | | AAA/Aa2 | | | 555,000 | | | | 665,395 | |
City of Farmington, 5.00% due 6/1/2017 (San Juan Regional Medical Center) | | NR/A3 | | | 1,035,000 | | | | 1,107,502 | |
City of Farmington, 5.125% due 6/1/2018 (San Juan Regional Medical Center) | | NR/A3 | | | 570,000 | | | | 572,120 | |
City of Farmington, 5.125% due 6/1/2019 (San Juan Regional Medical Center) | | NR/A3 | | | 645,000 | | | | 647,277 | |
City of Farmington, 5.00% due 6/1/2022 (San Juan Regional Medical Center) | | NR/A3 | | | 2,825,000 | | | | 3,030,999 | |
City of Farmington, 4.70% due 9/1/2024 (Arizona Public Service Co.-Four Corners Project) | | A-/A3 | | | 4,000,000 | | | | 4,442,600 | |
City of Farmington PCR, 4.70% due 5/1/2024 (Arizona Public Service Co.-Four Corners Project) | | A-/A3 | | | 965,000 | | | | 1,073,389 | |
City of Gallup PCR, 5.00% due 8/15/2017 (Tri-State Generation & Transmission Assoc., Inc. Project; Insured: AMBAC) | | A/A3 | | | 3,540,000 | | | | 3,589,949 | |
City of Las Cruces, 4.00% due 6/1/2021 (Joint Utility System) | | NR/Aa2 | | | 100,000 | | | | 113,783 | |
City of Las Cruces, 4.00% due 6/1/2022 (Joint Utility System) | | NR/Aa2 | | | 670,000 | | | | 767,920 | |
City of Las Cruces, 4.00% due 6/1/2023 (Joint Utility System) | | NR/Aa2 | | | 695,000 | | | | 802,412 | |
City of Las Cruces, 4.00% due 6/1/2025 (Joint Utility System) | | NR/Aa2 | | | 750,000 | | | | 868,125 | |
City of Las Cruces, 5.00% due 6/1/2030 (NMFA Loan) | | NR/Aa3 | | | 2,000,000 | | | | 2,292,820 | |
City of Las Cruces GRT, 5.00% due 6/1/2021 (NMFA Loan) | | NR/Aa3 | | | 730,000 | | | | 844,719 | |
City of Las Cruces GRT, 5.00% due 6/1/2022 (NMFA Loan) | | NR/Aa3 | | | 765,000 | | | | 891,133 | |
City of Las Cruces GRT, 5.00% due 6/1/2023 (NMFA Loan) | | NR/Aa3 | | | 800,000 | | | | 929,568 | |
City of Las Cruces GRT, 5.00% due 6/1/2024 (NMFA Loan) | | NR/Aa3 | | | 840,000 | | | | 973,342 | |
City of Las Cruces GRT, 5.00% due 6/1/2037 (NMFA Loan) | | NR/Aa3 | | | 5,000,000 | | | | 5,677,450 | |
City of Rio Rancho GRT, 5.00% due 6/1/2016 pre-refunded 6/1/2015 (Public Service Facility Projects; Insured: Natl-Re) | | AA-/Aa3 | | | 555,000 | | | | 559,434 | |
City of Rio Rancho GRT, 5.00% due 6/1/2022 pre-refunded 6/1/2015 (Public Service Facility Projects; Insured: Natl-Re) | | AA-/Aa3 | | | 1,000,000 | | | | 1,007,990 | |
City of Santa Fe, 4.50% due 5/15/2027 (El Castillo Retirement Residences) | | BBB-/NR | | | 3,275,000 | | | | 3,401,251 | |
City of Santa Fe, 5.00% due 5/15/2034 (El Castillo Retirement Residences) | | BBB-/NR | | | 1,465,000 | | | | 1,520,890 | |
Colfax County GRT, 5.00% due 9/1/2019 (Government Center Facility) | | A-/NR | | | 570,000 | | | | 630,984 | |
Colfax County GRT, 5.50% due 9/1/2029 (Government Center Facility) | | A-/NR | | | 2,510,000 | | | | 2,751,362 | |
b County of Los Alamos GRT, 5.75% due 6/1/2016 (Public Facilities Projects) | | AA+/A1 | | | 1,315,000 | | | | 1,397,385 | |
County of Los Alamos GRT, 5.625% due 6/1/2023 pre-refunded 6/1/2018 (Public Facilities Projects) | | AA+/A1 | | | 1,000,000 | | | | 1,145,650 | |
County of Los Alamos GRT, 5.75% due 6/1/2024 pre-refunded 6/1/2018 (Public Facilities Projects) | | AA+/A1 | | | 3,000,000 | | | | 3,448,620 | |
County of Los Alamos GRT, 5.75% due 6/1/2025 pre-refunded 6/1/2018 (Public Facilities Projects) | | AA+/A1 | | | 1,000,000 | | | | 1,149,540 | |
8 Semi-Annual Report
| | |
| SCHEDULE OF INVESTMENTS, CONTINUED | | |
| |
Thornburg New Mexico Intermediate Municipal Fund | | March 31, 2015 (Unaudited) |
| | | | | | | | | | |
Issuer-Description | | Credit Rating†
S&P/ Moody’s | | Principal
Amount | | | Value | |
County of Taos GRT, 3.00% due 4/1/2018 (County Educational Improvements; Insured: BAM) | | AA/NR | | $ | 1,000,000 | | | $ | 1,037,280 | |
Government of Guam, 5.375% due 12/1/2024 | | BBB+/NR | | | 2,000,000 | | | | 2,231,780 | |
Grant County, 5.50% due 7/1/2020 (State Dept. of Health-Ft. Bayard Project) | | AA/Aa1 | | | 1,565,000 | | | | 1,769,530 | |
Grant County, 5.50% due 7/1/2021 (State Dept. of Health-Ft. Bayard Project) | | AA/Aa1 | | | 1,655,000 | | | | 1,871,292 | |
Grant County, 5.50% due 7/1/2022 (State Dept. of Health-Ft. Bayard Project) | | AA/Aa1 | | | 1,745,000 | | | | 1,973,054 | |
Guam Power Authority, 5.00% due 10/1/2026 (Electric Power System; Insured: AGM) | | AA/A2 | | | 2,000,000 | | | | 2,359,100 | |
Las Cruces School District No. 2 GO, 2.00% due 8/1/2018 (New Mexico SD Credit Enhancement Program) (State Aid Withholding) | | NR/Aa1 | | | 630,000 | | | | 649,889 | |
New Mexico Educational Assistance Foundation, 4.10% due 9/1/2015 (Student Loans; LOC: Royal Bank of Canada) (AMT) | | NR/Aaa | | | 2,000,000 | | | | 2,028,460 | |
b New Mexico Educational Assistance Foundation, 4.00% due 9/1/2016 (Student Loans) | | NR/Aaa | | | 690,000 | | | | 724,880 | |
New Mexico Educational Assistance Foundation, 4.00% due 9/1/2017 (Student Loans) | | NR/Aaa | | | 1,150,000 | | | | 1,238,929 | |
New Mexico Educational Assistance Foundation, 5.00% due 12/1/2019 (Student Loans) | | AAA/Aaa | | | 1,000,000 | | | | 1,161,390 | |
New Mexico Educational Assistance Foundation, 5.00% due 12/1/2022 (Student Loans) | | AAA/Aaa | | | 3,000,000 | | | | 3,483,990 | |
New Mexico Finance Authority, 5.00% due 6/15/2018 (Bernalillo County Metropolitan Court; Insured: AMBAC) | | NR/Aa2 | | | 2,915,000 | | | | 2,942,838 | |
New Mexico Finance Authority, 5.00% due 6/15/2019 (UNM Health Sciences Center; Insured: Natl-Re) | | NR/Aa2 | | | 1,215,000 | | | | 1,226,834 | |
New Mexico Finance Authority, 5.00% due 6/1/2020 (The Public Project Revolving Fund Program; Insured: AMBAC) | | AAA/Aa1 | | | 365,000 | | | | 384,805 | |
New Mexico Finance Authority, 5.00% due 6/15/2022 (The Public Project Revolving Fund Program; Insured: Natl-Re) | | AA+/Aa2 | | | 1,300,000 | | | | 1,414,803 | |
New Mexico Finance Authority, 5.00% due 6/1/2024 (The Public Project Revolving Fund Program) | | AAA/Aa1 | | | 4,185,000 | | | | 5,226,688 | |
New Mexico Finance Authority, 5.00% due 6/15/2024 (The Public Project Revolving Fund Program; Insured: Natl-Re) | | AA+/Aa2 | | | 7,000,000 | | | | 7,618,170 | |
New Mexico Finance Authority, 5.00% due 6/15/2026 (State Highway Infrastructure) | | AA/Aa2 | | | 1,220,000 | | | | 1,492,048 | |
New Mexico Finance Authority, 5.00% due 6/15/2027 (State Highway Infrastructure) | | AA/Aa2 | | | 1,195,000 | | | | 1,449,917 | |
a New Mexico Finance Authority, 5.00% due 6/15/2031 (The Public Project Revolving Fund Program) | | AA+/Aa2 | | | 1,000,000 | | | | 1,187,240 | |
New Mexico Hospital Equipment Loan Council, 5.00% due 7/1/2017 pre-refunded 7/1/2015 (St. Vincent Hospital; Insured: Radian) | | NR/NR | | | 1,730,000 | | | | 1,749,757 | |
New Mexico Hospital Equipment Loan Council, 5.00% due 7/1/2019 pre-refunded 7/1/2015 (St. Vincent Hospital; Insured: Radian) | | NR/NR | | | 1,000,000 | | | | 1,011,420 | |
New Mexico Hospital Equipment Loan Council, 5.00% due 7/1/2021 pre-refunded 7/1/2015 (St. Vincent Hospital; Insured: Radian) | | NR/NR | | | 1,185,000 | | | | 1,198,533 | |
New Mexico Hospital Equipment Loan Council, 6.00% due 8/1/2023 (Presbyterian Healthcare Services) | | AA/Aa3 | | | 6,000,000 | | | | 6,875,940 | |
New Mexico Hospital Equipment Loan Council, 5.25% due 7/1/2025 pre-refunded 7/1/2015 (St. Vincent Hospital; Insured: Radian) | | NR/NR | | | 1,000,000 | | | | 1,012,050 | |
New Mexico Hospital Equipment Loan Council, 5.00% due 7/1/2032 (Haverland Carter Lifestyle Group) | | NR/NR | | | 2,000,000 | | | | 2,087,540 | |
New Mexico Hospital Equipment Loan Council, 5.00% due 8/1/2039 (Presbyterian Healthcare Services) | | AA/Aa3 | | | 3,000,000 | | | | 3,333,480 | |
New Mexico Housing Authority, 5.30% due 12/1/2022 (El Paseo Apartments; Insured: AMBAC) (AMT) | | NR/NR | | | 670,000 | | | | 670,496 | |
New Mexico Institute of Mining and Technology, 5.00% due 7/1/2015 | | A+/A1 | | | 490,000 | | | | 495,571 | |
New Mexico Institute of Mining and Technology, 5.00% due 7/1/2020 | | A+/A1 | | | 590,000 | | | | 676,518 | |
New Mexico Institute of Mining and Technology, 5.00% due 7/1/2023 | | A+/A1 | | | 685,000 | | | | 776,297 | |
New Mexico Institute of Mining and Technology, 5.00% due 7/1/2024 | | A+/A1 | | | 525,000 | | | | 607,068 | |
New Mexico Institute of Mining and Technology, 5.00% due 7/1/2025 | | A+/A1 | | | 505,000 | | | | 579,351 | |
New Mexico Institute of Mining and Technology, 5.00% due 7/1/2028 | | A+/A1 | | | 1,500,000 | | | | 1,687,500 | |
New Mexico MFA, 5.25% due 7/1/2023 (HERO SFM Loan Program; Collateralized: GNMA/FNMA/FHLMC) (AMT) | | AA+/NR | | | 410,000 | | | | 432,546 | |
New Mexico MFA, 5.375% due 7/1/2023 (Saver SFM Loan Program; Collateralized: GNMA/FNMA/FHLMC) (AMT) | | AA+/NR | | | 300,000 | | | | 302,157 | |
New Mexico MFA, 4.625% due 3/1/2028 (NIBP SFM Loan Program; Collateralized: GNMA/FNMA/FHLMC) | | AA+/NR | | | 1,370,000 | | | | 1,473,202 | |
New Mexico MFA, 5.50% due 7/1/2028 (HERO SFM Loan Program; Collateralized: GNMA/FNMA/FHLMC) (AMT) | | AA+/NR | | | 900,000 | | | | 943,020 | |
New Mexico MFA, 5.60% due 7/1/2028 (Saver SFM Loan Program; Collateralized: GNMA/FNMA/FHLMC) (AMT) | | AA+/NR | | | 270,000 | | | | 284,270 | |
New Mexico MFA, 5.40% due 9/1/2029 (Saver SFM Loan Program; Collateralized: GNMA/FNMA/FHLMC) | | AA+/NR | | | 495,000 | | | | 530,813 | |
Regents of the University of New Mexico, 5.00% due 6/1/2015 (Campus Improvements; Insured: AMBAC) (ETM) | | AA/Aa2 | | | 1,590,000 | | | | 1,602,752 | |
Regents of the University of New Mexico, 5.00% due 1/1/2016 (Children’s Hospital and Critical Care Pavilion; Insured: AGM/FHA) | | AA/A2 | | | 2,920,000 | | | | 2,931,943 | |
Regents of the University of New Mexico, 5.00% due 1/1/2018 (Children’s Hospital and Critical Care Pavilion; Insured: AGM/FHA) | | AA/A2 | | | 2,000,000 | | | | 2,030,160 | |
Regents of the University of New Mexico, 5.00% due 1/1/2019 (Children’s Hospital and Critical Care Pavilion; Insured: AGM/FHA) | | AA/A2 | | | 3,000,000 | | | | 3,045,240 | |
Regents of the University of New Mexico, 5.00% due 7/1/2019 (Children’s Hospital and Critical Care Pavilion; Insured: AGM/FHA) | | AA/A2 | | | 3,000,000 | | | | 3,045,240 | |
Regents of the University of New Mexico, 5.00% due 1/1/2020 (Children’s Hospital and Critical Care Pavilion; Insured: AGM/FHA) | | AA/A2 | | | 2,310,000 | | | | 2,344,835 | |
Regents of the University of New Mexico, 5.00% due 7/1/2020 (Children’s Hospital and Critical Care Pavilion; Insured: AGM/FHA) | | AA/A2 | | | 500,000 | | | | 507,540 | |
Regents of the University of New Mexico, 6.00% due 6/1/2021 (Campus Buildings Acquisition & Improvements) | | AA/Aa2 | | | 495,000 | | | | 561,058 | |
San Juan County, 3.00% due 6/15/2016 (County Capital Improvements) | | A+/A2 | | | 410,000 | | | | 422,595 | |
San Juan County, 4.00% due 6/15/2017 (County Capital Improvements) | | A+/A2 | | | 500,000 | | | | 534,355 | |
San Juan County, 5.00% due 6/15/2028 (County Capital Improvements) | | A+/A1 | | | 1,280,000 | | | | 1,489,818 | |
San Juan County, 5.00% due 6/15/2030 (County Capital Improvements) | | A+/A1 | | | 1,365,000 | | | | 1,573,627 | |
Sandoval County, 4.00% due 6/1/2015 (Intel Corp.) (ETM) | | A+/NR | | | 215,000 | | | | 216,355 | |
Sandoval County, 5.00% due 6/1/2020 pre-refunded 6/1/2015 (Intel Corp.) | | A+/NR | | | 6,440,000 | | | | 6,491,520 | |
Santa Fe County, 5.00% due 2/1/2018 (County Correctional System; Insured: AGM) | | AA/A2 | | | 580,000 | | | | 616,192 | |
Santa Fe County, 6.00% due 2/1/2027 (County Correctional System; Insured: AGM) | | AA/A2 | | | 1,520,000 | | | | 1,865,238 | |
Santa Fe County GO, 4.00% due 7/1/2019 (County Road and Water System Improvement Projects; Insured: Natl-Re) | | NR/Aaa | | | 750,000 | | | | 782,850 | |
Santa Fe County GRT, 5.00% due 6/1/2025 (County Courthouse and Other Public Facilities) | | AA+/Aa2 | | | 1,400,000 | | | | 1,563,646 | |
Santa Fe County GRT, 5.00% due 6/1/2026 (County Courthouse and Other Public Facilities) | | AA+/Aa2 | | | 1,535,000 | | | | 1,699,767 | |
Santa Fe Public School District GO, 5.00% due 8/1/2022 (Santa Fe County School Facilities) (State Aid Withholding) | | AA/Aa1 | | | 2,205,000 | | | | 2,695,436 | |
Semi-Annual Report 9
| | |
| SCHEDULE OF INVESTMENTS, CONTINUED | | |
| |
Thornburg New Mexico Intermediate Municipal Fund | | March 31, 2015 (Unaudited) |
| | | | | | | | | | |
Issuer-Description | | Credit Rating†
S&P/ Moody’s | | Principal
Amount | | | Value | |
Taos Municipal School District No. 1 GO, 5.00% due 9/1/2016 (Taos County School Facilities) (State Aid Withholding) | | NR/Aa1 | | $ | 200,000 | | | $ | 213,068 | |
Town of Silver City GRT, 4.00% due 6/1/2029 (Public Facility Capital Projects) | | A+/NR | | | 1,000,000 | | | | 1,065,170 | |
Town of Silver City GRT, 4.25% due 6/1/2032 (Public Facility Capital Projects) | | A+/NR | | | 1,050,000 | | | | 1,120,308 | |
Ventana West Public Improvement District, 6.625% due 8/1/2023 | | NR/NR | | | 1,635,000 | | | | 1,638,433 | |
Village of Los Ranchos de Albuquerque, 4.50% due 9/1/2040 (Albuquerque Academy) | | A/NR | | | 3,000,000 | | | | 3,172,590 | |
Virgin Islands Public Finance Authority, 6.625% due 10/1/2029 | | NR/Baa3 | | | 2,500,000 | | | | 2,849,475 | |
Zuni Public School District, 5.00% due 8/1/2028 (Teacher Housing Projects) | | A/NR | | | 1,600,000 | | | | 1,776,736 | |
| | | | | | | | | | |
TOTAL INVESTMENTS — 93.78% (Cost $199,917,738) | | | | | | | | $ | 212,633,399 | |
OTHER ASSETS LESS LIABILITIES — 6.22% | | | | | | | | | 14,112,571 | |
| | | | | | | | | | |
NET ASSETS — 100.00% | | | | | | | | $ | 226,745,970 | |
| | | | | | | | | | |
Footnote Legend
| † | Credit ratings are unaudited. Rating changes may have occurred subsequent to the reporting period end. Bonds issued with a maturity of one year or less are assigned Moody’s ratings from MIG-1 to MIG-4 and Standard and Poor’s ratings from SP-1+ to SP-3 with MIG-1 and SP-1+ being the strongest ratings. |
| b | Segregated as collateral for a when-issued security. |
Portfolio Abbreviations
To simplify the listings of securities, abbreviations are used per the table below:
| | |
| AGM | | Insured by Assured Guaranty Municipal Corp. |
| AMBAC | | Insured by American Municipal Bond Assurance Corp. |
| AMT | | Alternative Minimum Tax |
| BAM | | Insured by Build America Mutual Insurance Co. |
| ETM | | Escrowed to Maturity |
| FHA | | Insured by Federal Housing Administration |
| FHLMC | | Insured by Federal Home Loan Mortgage Corp. |
| FNMA | | Collateralized by Federal National Mortgage Association |
| | |
| GNMA | | Collateralized by Government National Mortgage Association |
| GO | | General Obligation |
| GRT | | Gross Receipts Tax |
| MFA | | Mortgage Finance Authority |
| Natl-Re | | Insured by National Public Finance Guarantee Corp. |
| PCR | | Pollution Control Revenue Bond |
| Radian | | Insured by Radian Asset Assurance |
See notes to financial statements.
10 Semi-Annual Report
| | |
| STATEMENT OF ASSETS AND LIABILITIES | | |
| |
Thornburg New Mexico Intermediate Municipal Fund | | March 31, 2015 (Unaudited) |
| | | | |
ASSETS | | | | |
Investments at value (cost $199,917,738) (Note 2) | | $ | 212,633,399 | |
Cash | | | 14,837,869 | |
Receivable for fund shares sold | | | 287,442 | |
Interest receivable | | | 2,700,136 | |
| | | | |
Total Assets | | | 230,458,846 | |
| | | | |
LIABILITIES | | | | |
Payable for investments purchased | | | 2,964,220 | |
Payable for fund shares redeemed | | | 505,343 | |
Payable to investment advisor and other affiliates (Note 3) | | | 159,288 | |
Accounts payable and accrued expenses | | | 39,912 | |
Dividends payable | | | 44,113 | |
| | | | |
Total Liabilities | | | 3,712,876 | |
| | | | |
NET ASSETS | | $ | 226,745,970 | |
| | | | |
NET ASSETS CONSIST OF | | | | |
Distribution in excess of net investment income | | $ | (25,896 | ) |
Net unrealized appreciation on investments | | | 12,715,661 | |
Accumulated net realized gain (loss) | | | (1,141,712 | ) |
Net capital paid in on shares of beneficial interest | | | 215,197,917 | |
| | | | |
| | $ | 226,745,970 | |
| | | | |
NET ASSET VALUE | | | | |
Class A Shares: | | | | |
Net asset value and redemption price per share ($140,887,877 applicable to 10,324,677 shares of beneficial interest outstanding - Note 4) | | $ | 13.65 | |
Maximum sales charge, 2.00% of offering price | | | 0.28 | |
| | | | |
Maximum offering price per share | | $ | 13.93 | |
| | | | |
| |
Class D Shares: | | | | |
Net asset value, offering and redemption price per share ($30,311,992 applicable to 2,220,289 shares of beneficial interest outstanding - Note 4) | | $ | 13.65 | |
| | | | |
| |
Class I Shares: | | | | |
Net asset value, offering and redemption price per share ($55,546,101 applicable to 4,072,587 shares of beneficial interest outstanding - Note 4) | | $ | 13.64 | |
| | | | |
See notes to financial statements.
Semi-Annual Report 11
| | |
| STATEMENT OF OPERATIONS | | |
| |
Thornburg New Mexico Intermediate Municipal Fund | | Six Months Ended March 31, 2015 (Unaudited) |
| | | | |
INVESTMENT INCOME | | | | |
Interest income (net of premium amortized of $668,668) | | $ | 3,998,496 | |
| | | | |
| |
EXPENSES | | | | |
Investment advisory fees (Note 3) | | | 549,276 | |
Administration fees (Note 3) | | | | |
Class A Shares | | | 88,999 | |
Class D Shares | | | 18,200 | |
Class I Shares | | | 12,048 | |
Distribution and service fees (Note 3) | | | | |
Class A Shares | | | 177,999 | |
Class D Shares | | | 72,527 | |
Transfer agent fees | | | | |
Class A Shares | | | 29,217 | |
Class D Shares | | | 4,788 | |
Class I Shares | | | 9,136 | |
Registration and filing fees | | | | |
Class A Shares | | | 1,820 | |
Class D Shares | | | 1,820 | |
Class I Shares | | | 1,820 | |
Custodian fees (Note 3) | | | 21,835 | |
Professional fees | | | 20,597 | |
Accounting fees | | | 3,640 | |
Trustee fees | | | 3,821 | |
Other expenses | | | 7,223 | |
| | | | |
Total Expenses | | | 1,024,766 | |
Less: | | | | |
Fees paid indirectly (Note 3) | | | (2,083 | ) |
| | | | |
Net Expenses | | | 1,022,683 | |
| | | | |
Net Investment Income | | | 2,975,813 | |
| | | | |
REALIZED AND UNREALIZED GAIN (LOSS) | | | | |
Net realized gain (loss) on investments | | | (5,403 | ) |
Net change in unrealized appreciation (depreciation) on investments | | | 756,734 | |
| | | | |
Net Realized and Unrealized Gain | | | 751,331 | |
| | | | |
Net Increase in Net Assets Resulting from Operations | | $ | 3,727,144 | |
| | | | |
See notes to financial statements.
12 Semi-Annual Report
| | |
| STATEMENT OF CHANGES IN NET ASSETS | | |
| |
Thornburg New Mexico Intermediate Municipal Fund | | |
| | | | | | | | |
| | | Six Months Ended
March 31, 2015* | | | Year Ended
September 30, 2014 | |
INCREASE (DECREASE) IN NET ASSETS FROM | | | | | | | | |
| | |
OPERATIONS | | | | | | | | |
Net investment income | | $ | 2,975,813 | | | $ | 6,002,378 | |
Net realized gain (loss) on investments | | | (5,403 | ) | | | (113,232 | ) |
Net unrealized appreciation (depreciation) on investments | | | 756,734 | | | | 3,934,421 | |
| | | | | | | | |
| | |
Net Increase (Decrease) in Net Assets Resulting from Operations | | | 3,727,144 | | | | 9,823,567 | |
| | |
DIVIDENDS TO SHAREHOLDERS | | | | | | | | |
From net investment income | | | | | | | | |
Class A Shares | | | (1,905,400 | ) | | | (4,318,586 | ) |
Class D Shares | | | (352,870 | ) | | | (741,974 | ) |
Class I Shares | | | (717,543 | ) | | | (941,818 | ) |
| | |
FUND SHARE TRANSACTIONS (NOTE 4) | | | | | | | | |
Class A Shares | | | (3,598,728 | ) | | | (17,279,143 | ) |
Class D Shares | | | 1,774,537 | | | | (943,388 | ) |
Class I Shares | | | 18,007,135 | | | | 11,265,574 | |
| | | | | | | | |
Net Increase (Decrease) in Net Assets | | | 16,934,275 | | | | (3,135,768 | ) |
| | |
NET ASSETS | | | | | | | | |
Beginning of Period | | | 209,811,695 | | | | 212,947,463 | |
| | | | | | | | |
| | |
End of Period | | $ | 226,745,970 | | | $ | 209,811,695 | |
| | | | | | | | |
| | |
Distribution in excess of net investment income | | $ | (25,896 | ) | | $ | (25,896 | ) |
See notes to financial statements.
Semi-Annual Report 13
| | |
| NOTES TO FINANCIAL STATEMENTS | | |
| |
Thornburg New Mexico Intermediate Municipal Fund | | March 31, 2015 (Unaudited) |
NOTE 1 – ORGANIZATION
Thornburg New Mexico Intermediate Municipal Fund (the “Fund”) is a non-diversified series of Thornburg Investment Trust (the “Trust”). The Trust is organized as a Massachusetts business trust under a Declaration of Trust dated June 3, 1987 and is registered as a diversified, open-end management investment company under the Investment Company Act of 1940, as amended. The Fund is currently one of eighteen separate series of the Trust. Each series is considered to be a separate entity for financial reporting and tax purposes and bears expenses directly attributable to it. The Fund’s primary investment objective is to obtain as high a level of current income exempt from federal and New Mexico state individual income tax as is consistent, in the view of the Fund’s investment advisor, with the preservation of capital. The Fund’s secondary objective is to reduce expected changes in its share price compared to long-term bond portfolios.
The Fund currently offers three classes of shares of beneficial interest: Class A, Class D, and Institutional Class (“Class I”). Each class of shares of the Fund represents an interest in the same portfolio of investments, except that (i) Class A shares are sold subject to a front-end sales charge collected at the time the shares are purchased and bear a service fee, (ii) Class D shares are sold at net asset value without a sales charge at the time of purchase or redemption, and bear both a service fee and a distribution fee, (iii) Class I shares are sold at net asset value without a sales charge at the time of purchase and may be subject to a service fee, and (iv) the respective classes may have different reinvestment privileges and conversion rights. Additionally, the Fund may allocate among its classes certain expenses, to the extent allocable to specific classes, including transfer agent fees, government registration fees, certain printing and postage costs, and administrative and legal expenses. Currently, class specific expenses of the Fund are limited to service and distribution fees, administration fees, and certain registration and transfer agent expenses.
NOTE 2 – SIGNIFICANT ACCOUNTING POLICIES
The following is a summary of significant accounting policies followed by the Fund in the preparation of its financial statements. The Fund is an investment company and prepares its financial statements in conformity with U.S. generally accepted accounting principles (“GAAP”), including the investment company accounting and reporting guidance in the Financial Accounting Standards Board (the “FASB”) Accounting Standard Codification Topic 946. The preparation of financial statements in conformity with GAAP requires management to make estimates and assumptions that affect the reported amounts of assets and liabilities and disclosure of contingent assets and liabilities at the date of the financial statements and the reported amounts of increases (decreases) in net assets from operations during the reporting period. Actual results could differ from those estimates.
Significant accounting policies of the Fund are as follows:
Valuation Policy and Procedures: The Trustees of the Trust (the “Trustees”) have authorized employees of the Fund’s investment advisor, acting as the Valuation and Pricing Committee (the “Committee”), to make certain valuation determinations, subject to oversight and review by the Trustees and the Audit Committee of the Trustees. The Committee and other employees of the Fund’s investment advisor administer and implement the valuation process. The Committee regularly reviews its own fair value decisions, as well as valuations, valuation techniques and services furnished by pricing services, considers circumstances in the markets which may require valuation determinations by the Committee and reviews previous valuation determinations. The Committee also reports on its activities, the performance of the pricing services and other matters to the Trustees and the Audit Committee of the Trustees.
In determining a fair value for a portfolio investment, the Committee seeks to determine the price that the Fund would reasonably expect to receive upon a sale of the investment in an orderly transaction between market participants at the measurement date. Typically, the fair value process employs standing instructions to use quoted prices in active markets or the use of independent pricing services. Less frequently, the Committee may make a fair value determination using other methods. However, because fair value prices are estimated prices, the determination of fair value for an investment may differ from the value that would be realized by the Fund upon a sale of the investment, and that difference could be material to the Fund’s financial statements. The Committee’s determination of fair value for an investment may also differ from the prices obtained by other persons (including other mutual funds) for the investment.
Valuation of Investments: Debt obligations held by the Fund have a primary over-the-counter market and are valued by an independent pricing service approved by the Trustees. The pricing service ordinarily values debt obligations using quoted bid prices and other methods which include consideration of yields or prices of debt obligations of comparable quality, type of issue, coupon, maturity and rating, and indications as to value from dealers and general market conditions.
In any case when a pricing service fails to provide a price for a debt obligation held by the Fund, the Committee determines a fair value for the debt obligation using procedures in accordance with a policy approved by the Trustees, which may include the use of a price obtained from a different independent pricing service. Additionally, in any case when management believes that a price provided by a pricing service for a debt obligation held by the Fund may be unreliable, the Committee decides whether or not to use the pricing service’s valuation or to use an alternative method to determine a fair value for the debt obligation.
Valuation Measurements: The Fund categorizes its investments based upon the inputs used in valuing those investments, according to a three-level hierarchy established by guidance from the the FASB. Categorization of investments using this hierarchy is intended by the FASB to maximize the use of observable inputs and minimize the use of unobservable inputs by prioritizing that the most observable
14 Semi-Annual Report
| | |
| NOTES TO FINANCIAL STATEMENTS, CONTINUED | | |
| |
Thornburg New Mexico Intermediate Municipal Fund | | March 31, 2015 (Unaudited) |
input be used when available. Observable inputs are those that market participants would use in valuing an investment based on available market data. Unobservable inputs are those that reflect assumptions about the information market participants would use in valuing an investment. An investment’s level within the hierarchy is based on the lowest level input that is deemed significant to the fair value measurement. The methodologies and relative inputs used to value investments are not necessarily indications of the risk or liquidity associated with investing in those investments.
Various inputs are used in determining the fair value measurement of the Fund’s investments. These inputs are generally summarized according to the three-level hierarchy below:
Level 1: Quoted prices in active markets for identical investments.
Level 2: Other direct or indirect significant observable inputs (including quoted prices for similar investments in active markets and other observable inputs, such as interest rates, prepayment rates, credit risk, etc.).
Level 3: Significant unobservable inputs (including the Committee’s own assumptions in determining the fair value of investments).
Portfolio investments with minimal, if any, market activity are characterized as Level 3 and are valued using significant unobservable inputs, typically including single broker quotes, which may be adjusted or unadjusted, related or comparable investments, last available transactions, and other relevant information. Valuations may also be based upon current market prices of securities that are comparable in coupon, rating, maturity and industry. An income based valuation approach would consider discounted anticipated future cash flows of the investment. Discounts may also be applied due to the nature or duration of any restrictions on the disposition of the investment. Valuations based upon the use of inputs from Levels 1, 2, or 3, may not represent the actual price received upon the disposition of an investment, and the Fund may receive a price that is lower than the valuation when it sells the investment.
The following table displays a summary of the fair value hierarchy measurements of the Fund’s investments as of March 31, 2015. In any instance when valuation inputs from more than one level are used to determine the fair value of a specific investment, the investment is placed in the level of the table based upon the lowest level input that is significant in determining the fair value of the investment:
| | | | | | | | | | | | | | | | |
| | | Fair Value Measurements at March 31, 2015 | |
| | | Total | | | Level 1 | | | Level 2 | | | Level 3 | |
Assets | | | | | | | | | | | | | | | | |
Investments in Securities | | | | | | | | | | | | | | | | |
Municipal Bonds | | $ | 212,633,399 | | | $ | — | | | $ | 212,633,399 | | | $ | — | |
| | | | | | | | | | | | | | | | |
Total Investments in Securities | | $ | 212,633,399 | | | $ | — | | | $ | 212,633,399 | | | $ | — | |
In accordance with the guidance prescribed in Accounting Standards Update No. 2011-04, it is the policy of the Fund to recognize transfers between levels and the underlying events which caused the movement. The Fund recognized no transfers between levels for the six months ended March 31, 2015.
Federal Income Taxes: It is the policy of the Trust to comply with the provisions of the Internal Revenue Code applicable to “regulated investment companies” and to distribute to shareholders substantially all taxable (if any) and tax exempt income of the Fund. Therefore, no provision for federal income tax is required.
Management reviews each uncertain tax position believed to be material to the preparation of the Fund’s financial statements, to assess if it is more likely than not that the position would be sustained upon examination, based upon the technical merits of the position. As of March 31, 2015, management has not identified any such position for which an asset or liability must be reflected in the Statement of Assets and Liabilities. The Fund’s tax returns remain subject to examination for three years after filing.
When-Issued and Delayed Delivery Transactions: The Fund may engage in when-issued or delayed delivery transactions. To the extent the Fund engages in such transactions, it will do so for the purpose of acquiring portfolio investments consistent with the Fund’s investment objectives and not for the purpose of investment leverage or to speculate on interest rate and/or market changes. At the time the Fund makes a commitment to purchase an investment on a when-issued or delayed delivery basis, the Fund will record the transaction and reflect the value in determining its net asset value. When effecting such transactions, assets of an amount sufficient to make payment for the portfolio investments to be purchased will be segregated on the Fund’s records on the trade date. Investments purchased on a when-issued or delayed delivery basis do not earn interest until the settlement date.
Dividends: Net investment income of the Fund is declared daily as a dividend on shares for which the Fund has received payment. Dividends are paid monthly and are reinvested in additional shares of the Fund at net asset value per share at the close of business on the dividend payment date, or at the shareholder’s option, paid in cash. Net realized capital gains, to the extent available, will be distributed at least annually.
General: Investment transactions are accounted for on a trade date basis. Interest income is accrued as earned. Premiums and discounts on investments purchased are amortized to call dates or maturity dates of the respective investments. Realized gains and losses
Semi-Annual Report 15
| | |
| NOTES TO FINANCIAL STATEMENTS, CONTINUED | | |
| |
Thornburg New Mexico Intermediate Municipal Fund | | March 31, 2015 (Unaudited) |
from the sale of investments are recorded on an identified cost basis. Net investment income (other than class specific expenses) and realized and unrealized gains and losses are allocated daily to each class of shares based upon the relative net asset value of outstanding shares (or the value of the dividend-eligible shares, as appropriate) of each class of shares at the beginning of the day (after adjusting for the current capital shares activity of the respective class). Expenses common to all Funds are allocated among the Funds comprising the Trust based upon their relative net asset values or other appropriate allocation methods.
Guarantees and Indemnifications: Under the Trust’s organizational documents (and under separate agreements with the independent Trustees), its officers and Trustees are indemnified against certain liabilities arising out of the performance of their duties to the Fund. Additionally, in the normal course of business the Trust enters into contracts with service providers that contain general indemnification clauses. The Trust’s maximum exposure under these arrangements is unknown. However, based on experience, the Trust expects the risk of loss to be remote.
NOTE 3 – INVESTMENT ADVISORY FEE AND OTHER TRANSACTIONS WITH AFFILIATES
Pursuant to an investment advisory agreement, Thornburg Investment Management, Inc. (the “Advisor”) serves as the investment advisor and performs services for the Fund for which the fees are payable at the end of each month. For the six months ended March 31, 2015, these fees were payable at annual rates ranging from .50 of 1% to .275 of 1% per annum of the average daily net assets of the Fund depending on the Fund’s asset size. The Trust also has entered into administrative services agreements with the Advisor, whereby the Advisor will perform certain administrative services for the shareholders of each class of the Fund’s shares, and for which fees will be payable at an annual rate of up to .125 of 1% per annum of the average daily net assets attributable to each class of shares.
The Trust has an underwriting agreement with Thornburg Securities Corporation (the “Distributor,” an affiliate of the Advisor), which acts as the distributor of the Fund’s shares. For the six months ended March 31, 2015, the Distributor has advised the Fund that it earned net commissions aggregating $1,096 from the sale of Class A shares.
Pursuant to a service plan under Rule 12b-1 of the Investment Company Act of 1940, the Fund may reimburse to the Advisor an amount not to exceed .25 of 1% per annum of the average daily net assets attributable to each class of shares of the Fund for payments made by the Advisor to securities dealers and other financial institutions to obtain various shareholder and distribution related services. For the six months ended March 31, 2015, there were no 12b-1 service plan fees charged for Class I shares. The Advisor may pay out of its own resources additional expenses for distribution of the Fund’s shares and shareholder services.
The Trust has also adopted a distribution plan pursuant to Rule 12b-1, applicable only to the Fund’s Class D shares, under which the Fund compensates the Distributor for services in promoting the sale of Class D shares of the Fund at an annual rate of up to .25 of 1% per annum of the average daily net assets attributable to Class D shares. Total fees incurred by each class of shares of the Fund under their respective service and distribution plans for the six months ended March 31, 2015, are set forth in the Statement of Operations.
The Trust has an agreement with the custodian bank to indirectly pay a portion of the custodian’s fees through credits earned by the Fund’s cash on deposit with the bank. This deposit agreement is an alternative to overnight investments. Custodial fees are adjusted to reflect amounts that would have been paid without this agreement, with a corresponding adjustment reflected as fees paid indirectly in the Statement of Operations. For the six months ended March 31, 2015, fees paid indirectly were $2,083.
Certain officers and Trustees of the Trust are also officers or directors of the Advisor and Distributor. The compensation of independent Trustees is borne by the Trust.
NOTE 4 – SHARES OF BENEFICIAL INTEREST
At March 31, 2015, there were an unlimited number of shares with no par value of beneficial interest authorized. Transactions in shares of beneficial interest were as follows:
| | | | | | | | | | | | | | | | |
| | | Six Months Ended
March 31, 2015 (Unaudited) | | | Year Ended
September 30, 2014 (Audited) | |
| | | Shares | | | Amount | | | Shares | | | Amount | |
Class A Shares | | | | | | | | | | | | | | | | |
Shares sold | | | 302,067 | | | $ | 4,121,072 | | | | 597,314 | | | $ | 8,041,850 | |
Shares issued to shareholders in reinvestment of dividends | | | 120,571 | | | | 1,647,011 | | | | 278,451 | | | | 3,754,060 | |
Shares repurchased | | | (686,256 | ) | | | (9,366,811 | ) | | | (2,159,552 | ) | | | (29,075,053 | ) |
| | | | | | | | | | | | | | | | |
Net increase (decrease) | | | (263,618 | ) | | $ | (3,598,728 | ) | | | (1,283,787 | ) | | $ | (17,279,143 | ) |
| | | | | | | | | | | | | | | | |
16 Semi-Annual Report
| | |
| NOTES TO FINANCIAL STATEMENTS, CONTINUED | | |
| |
Thornburg New Mexico Intermediate Municipal Fund | | March 31, 2015 (Unaudited) |
| | | | | | | | | | | | | | | | |
| | | Six Months Ended
March 31, 2015 (Unaudited) | | | Year Ended
September 30, 2014 (Audited) | |
| | | Shares | | | Amount | | | Shares | | | Amount | |
Class D Shares | | | | | | | | | | | | | | | | |
Shares sold | | | 200,006 | | | $ | 2,727,788 | | | | 209,729 | | | $ | 2,824,940 | |
Shares issued to shareholders in reinvestment of dividends | | | 25,590 | | | | 349,610 | | | | 54,490 | | | | 735,025 | |
Shares repurchased | | | (95,377 | ) | | | (1,302,861 | ) | | | (334,633 | ) | | | (4,503,353 | ) |
| | | | | | | | | | | | | | | | |
| | | | |
Net increase (decrease) | | | 130,219 | | | $ | 1,774,537 | | | | (70,414 | ) | | $ | (943,388 | ) |
| | | | | | | | | | | | | | | | |
| | | | |
Class I Shares | | | | | | | | | | | | | | | | |
Shares sold | | | 1,452,557 | | | $ | 19,775,744 | | | | 1,102,218 | | | $ | 14,871,619 | |
Shares issued to shareholders in reinvestment of dividends | | | 48,434 | | | | 661,283 | | | | 61,670 | | | | 831,948 | |
Shares repurchased | | | (178,296 | ) | | | (2,429,892 | ) | | | (331,495 | ) | | | (4,437,993 | ) |
| | | | | | | | | | | | | | | | |
Net increase (decrease) | | | 1,322,695 | | | $ | 18,007,135 | | | | 832,393 | | | $ | 11,265,574 | |
| | | | | | | | | | | | | | | | |
NOTE 5 – INVESTMENT TRANSACTIONS
For the six months ended March 31, 2015, the Fund had purchase and sale transactions of investments (excluding short-term investments) of $11,839,741 and $3,310,000, respectively.
NOTE 6 – INCOME TAXES
At March 31, 2015, information on the tax components of capital was as follows:
| | | | |
Cost of investments for tax purposes | | $ | 199,917,738 | |
| | | | |
Gross unrealized appreciation on a tax basis | | $ | 12,841,810 | |
Gross unrealized depreciation on a tax basis | | | (126,149 | ) |
| | | | |
Net unrealized appreciation (depreciation) on investments (tax basis) | | $ | 12,715,661 | |
| | | | |
At March 31, 2015, the Fund had deferred tax basis capital losses occurring subsequent to October 31, 2013 of $113,055. For tax purposes, such losses will be reflected in the year ending September 30, 2015.
At March 31, 2015, the Fund had cumulative tax basis capital losses of $1,023,254 (of which $87,413 is short-term and $935,841 is long-term), generated after September 30, 2011, which may be carried forward to offset future capital gains. To the extent such carry-forwards are used, capital gain distributions may be reduced to the extent provided by regulations. Such capital loss carryforwards do not expire.
OTHER NOTES
Risks: The Fund’s investments subject it to risks including, but not limited to, credit risk, interest rate risk, management risk, market and economic risk, liquidity risk, diversification risk, and the risks of investing primarily in the obligations of a single state. Please see the Fund’s prospectus for a discussion of the risks associated with an investment in the Fund.
Subsequent Events: Fund management believes no events have occurred between March 31, 2015 and the date of issuance of the financial statements that require adjustment to or disclosure in the accompanying financial statements.
Semi-Annual Report 17
FINANCIAL HIGHLIGHTS
Thornburg New Mexico Intermediate Municipal Fund
| | | | | | | | | | | | | | | | | | | | | | | | | | | | | | | | | | | | | | | | | | | | | | | | | | | | | | | | | | | | |
| | | PER SHARE PERFORMANCE (for a share outstanding throughout the Period)+ | | | RATIOS TO AVERAGE NET ASSETS | | | SUPPLEMENTAL DATA | |
Unless
Otherwise
Noted,
Periods
are Fiscal
Years
Ended
Sept. 30, | | Net Asset
Value
Beginning
of Period | | | Net
Investment
Income
(Loss) | | | Net
Realized
&
Unrealized
Gain (Loss)
on
Investments | | | Total from
Investment
Operations | | | Dividends
from Net
Investment
Income | | | Dividends
from Net
Realized
Gains | | | Total
Dividends | | | Net
Asset
Value
End
of
Period | | | Net
Investment
Income
(Loss)
(%) | | | Expenses,
After
Expense
Reductions
(%) | | | Expenses,
After
Expense
Reductions
and
Net of
Custody
Credits
(%) | | | Expenses,
Before
Expense
Reductions
(%) | | | Total
Return
(%)(a) | | | Portfolio
Turnover
Rate
(%)(a) | | | Net
Assets
at End
of
Period
(Thousands) | |
Class A Shares | | | | | | | | | | | | | | | | | | | | | | | | | | | | | | | | | | | | | | | | | | | | | | | | | | | | | |
2015(b)(c) | | $ | 13.60 | | | | 0.18 | | | | 0.05 | | | | 0.23 | | | | (0.18 | ) | | | — | | | | (0.18 | ) | | $ | 13.65 | | | | 2.68 | (d) | | | 0.97 | (d) | | | 0.97 | (d) | | | 0.97 | (d) | | | 1.71 | | | | 1.61 | | | $ | 140,888 | |
2014(c) | | $ | 13.35 | | | | 0.39 | | | | 0.25 | | | | 0.64 | | | | (0.39 | ) | | | — | | | | (0.39 | ) | | $ | 13.60 | | | | 2.87 | | | | 0.97 | | | | 0.97 | | | | 0.97 | | | | 4.83 | | | | 10.79 | | | $ | 143,994 | |
2013(c) | | $ | 13.95 | | | | 0.38 | | | | (0.60 | ) | | | (0.22 | ) | | | (0.38 | ) | | | — | | | | (0.38 | ) | | $ | 13.35 | | | | 2.76 | | | | 0.96 | | | | 0.95 | | | | 0.96 | | | | (1.61 | ) | | | 11.78 | | | $ | 148,499 | |
2012(c) | | $ | 13.72 | | | | 0.41 | | | | 0.24 | | | | 0.65 | | | | (0.41 | ) | | | (0.01 | ) | | | (0.42 | ) | | $ | 13.95 | | | | 2.95 | | | | 0.95 | | | | 0.95 | | | | 0.95 | | | | 4.80 | | | | 11.66 | | | $ | 187,578 | |
2011(c) | | $ | 13.78 | | | | 0.44 | | | | (0.05 | ) | | | 0.39 | | | | (0.44 | ) | | | (0.01 | ) | | | (0.45 | ) | | $ | 13.72 | | | | 3.23 | | | | 0.96 | | | | 0.96 | | | | 0.96 | | | | 2.93 | | | | 10.64 | | | $ | 185,208 | |
2010(c) | | $ | 13.63 | | | | 0.43 | | | | 0.15 | | | | 0.58 | | | | (0.43 | ) | | | — | | | | (0.43 | ) | | $ | 13.78 | | | | 3.19 | | | | 0.96 | | | | 0.96 | | | | 0.96 | | | | 4.38 | | | | 7.70 | | | $ | 202,870 | |
Class D Shares | | | | | | | | | | | | | | | | | | | | | | | | | | | | | | | | | | | | | | | | | | | | | | | | | | | | | |
2015(b) | | $ | 13.61 | | | | 0.16 | | | | 0.05 | | | | 0.21 | | | | (0.17 | ) | | | — | | | | (0.17 | ) | | $ | 13.65 | | | | 2.42 | (d) | | | 1.22 | (d) | | | 1.22 | (d) | | | 1.22 | (d) | | | 1.51 | | | | 1.61 | | | $ | 30,312 | |
2014 | | $ | 13.36 | | | | 0.35 | | | | 0.25 | | | | 0.60 | | | | (0.35 | ) | | | — | | | | (0.35 | ) | | $ | 13.61 | | | | 2.60 | | | | 1.23 | | | | 1.23 | | | | 1.23 | | | | 4.55 | | | | 10.79 | | | $ | 28,438 | |
2013 | | $ | 13.96 | | | | 0.34 | | | | (0.59 | ) | | | (0.25 | ) | | | (0.35 | ) | | | — | | | | (0.35 | ) | | $ | 13.36 | | | | 2.51 | | | | 1.21 | | | | 1.21 | | | | 1.22 | | | | (1.85 | ) | | | 11.78 | | | $ | 28,858 | |
2012 | | $ | 13.72 | | | | 0.37 | | | | 0.26 | | | | 0.63 | | | | (0.38 | ) | | | (0.01 | ) | | | (0.39 | ) | | $ | 13.96 | | | | 2.71 | | | | 1.18 | | | | 1.18 | | | | 1.22 | | | | 4.62 | | | | 11.66 | | | $ | 31,984 | |
2011 | | $ | 13.78 | | | | 0.40 | | | | (0.05 | ) | | | 0.35 | | | | (0.40 | ) | | | (0.01 | ) | | | (0.41 | ) | | $ | 13.72 | | | | 2.97 | | | | 1.22 | | | | 1.21 | | | | 1.22 | | | | 2.66 | | | | 10.64 | | | $ | 24,228 | |
2010 | | $ | 13.63 | | | | 0.28 | | | | 0.27 | | | | 0.55 | | | | (0.40 | ) | | | — | | | | (0.40 | ) | | $ | 13.78 | | | | 2.92 | | | | 1.22 | | | | 1.22 | | | | 1.71 | | | | 4.11 | | | | 7.70 | | | $ | 24,068 | |
Class I Shares | | | | | | | | | | | | | | | | | | | | | | | | | | | | | | | | | | | | | | | | | | | | | | | | | | | | | |
2015(b) | | $ | 13.59 | | | | 0.20 | | | | 0.05 | | | | 0.25 | | | | (0.20 | ) | | | — | | | | (0.20 | ) | | $ | 13.64 | | | | 2.98 | (d) | | | 0.65 | (d) | | | 0.65 | (d) | | | 0.65 | (d) | | | 1.88 | | | | 1.61 | | | $ | 55,546 | |
2014 | | $ | 13.35 | | | | 0.43 | | | | 0.24 | | | | 0.67 | | | | (0.43 | ) | | | — | | | | (0.43 | ) | | $ | 13.59 | | | | 3.19 | | | | 0.65 | | | | 0.64 | | | | 0.65 | | | | 5.09 | | | | 10.79 | | | $ | 37,380 | |
2013 | | $ | 13.95 | | | | 0.43 | | | | (0.61 | ) | | | (0.18 | ) | | | (0.42 | ) | | | — | | | | (0.42 | ) | | $ | 13.35 | | | | 3.09 | | | | 0.61 | | | | 0.61 | | | | 0.61 | | | | (1.29 | ) | | | 11.78 | | | $ | 25,590 | |
2012 | | $ | 13.71 | | | | 0.46 | | | | 0.25 | | | | 0.71 | | | | (0.46 | ) | | | (0.01 | ) | | | (0.47 | ) | | $ | 13.95 | | | | 3.30 | | | | 0.61 | | | | 0.61 | | | | 0.61 | | | | 5.24 | | | | 11.66 | | | $ | 38,099 | |
2011 | | $ | 13.77 | | | | 0.48 | | | | (0.05 | ) | | | 0.43 | | | | (0.48 | ) | | | (0.01 | ) | | | (0.49 | ) | | $ | 13.71 | | | | 3.57 | | | | 0.62 | | | | 0.61 | | | | 0.62 | | | | 3.28 | | | | 10.64 | | | $ | 41,645 | |
2010 | | $ | 13.62 | | | | 0.67 | | | | (0.04 | ) | | | 0.63 | | | | (0.48 | ) | | | — | | | | (0.48 | ) | | $ | 13.77 | | | | 3.53 | | | | 0.61 | | | | 0.61 | | | | 0.61 | | | | 4.74 | | | | 7.70 | | | $ | 26,971 | |
| (a) | Not annualized for periods less than one year. |
| (b) | Unaudited Six Month Period Ended March 31. |
| (c) | Sales loads are not reflected in computing total return. |
| + | Based on weighted average shares outstanding, except for Dividends from Net Investment Income and Net Realized Gains, which are actual amounts per share. |
See notes to financial statements.
| | | | |
| 18 Semi-Annual Report | | | | Semi-Annual Report 19 |
| | |
| EXPENSE EXAMPLE | | |
| |
Thornburg New Mexico Intermediate Municipal Fund | | March 31, 2015 (Unaudited) |
As a shareholder of the Fund, you incur two types of costs:
| | (1) | transaction costs, including |
(a) sales charges (loads) on purchase payments, for Class A shares;
(b) a deferred sales charge on redemptions of any part or all of a purchase of $1 million of Class A shares within 12 months of purchase;
| | (2) | ongoing costs, including management fees; distribution and/or service (12b-1) fees; and other Fund expenses. |
This example is intended to help you understand your ongoing costs (in dollars) of investing in the Fund and to compare these costs with the ongoing costs of investing in other mutual funds.
The example is based on a $1,000 investment beginning on October 1, 2014, and held until March 31, 2015.
| | | | | | | | | | | | |
| | | Beginning
Account Value
10/1/14 | | | Ending
Account Value
3/31/15 | | | Expenses Paid
During Period†
10/1/14–3/31/15 | |
CLASS A SHARES | | | | | | | | | | | | |
Actual | | $ | 1,000.00 | | | $ | 1,017.10 | | | $ | 4.87 | |
Hypothetical* | | $ | 1,000.00 | | | $ | 1,020.10 | | | $ | 4.88 | |
CLASS D SHARES | | | | | | | | | | | | |
Actual | | $ | 1,000.00 | | | $ | 1,015.10 | | | $ | 6.12 | |
Hypothetical* | | $ | 1,000.00 | | | $ | 1,018.85 | | | $ | 6.13 | |
CLASS I SHARES | | | | | | | | | | | | |
Actual | | $ | 1,000.00 | | | $ | 1,018.80 | | | $ | 3.25 | |
Hypothetical* | | $ | 1,000.00 | | | $ | 1,021.72 | | | $ | 3.25 | |
| † | Expenses are equal to the annualized expense ratio for each class (A: 0.97%; D: 1.22%; I: 0.64%) multiplied by the average account value over the period, multiplied by 182/365 to reflect the one-half year period. |
| * | Hypothetical assumes a rate of return of 5% per year before expenses. |
ACTUAL EXPENSES
For each class of shares, the first line of the accompanying table provides information about actual account values and actual expenses. You may use the information in this line, together with the amount you invested, to estimate the expenses that you paid over the period. Simply divide your account value by $1,000 (for example, an $8,600 account value divided by $1,000 = 8.6), then multiply the result by the number in the first line for your class of shares under the heading entitled “Expenses Paid During Period” to estimate the expenses you paid on your account during this period.
HYPOTHETICAL EXAMPLE FOR COMPARISON PURPOSES
For each class of shares, the second line of the accompanying table provides information about hypothetical account values and hypothetical expenses based on the Fund’s actual expense ratio and an assumed rate of return of 5% per year before expenses, which is not the Fund’s actual return. The hypothetical account values and expenses may not be used to estimate the actual ending account balance or expenses you paid for the period. You may use this information to compare the ongoing costs of investing in the Fund and other funds. To do so, compare this 5% hypothetical example with the 5% hypothetical examples that appear in the shareholder reports of the other funds.
Please note that the expenses shown in the table are meant to highlight your ongoing costs only and do not reflect any transactional costs, such as sales charges (loads), redemption fees, or exchange fees. Therefore, the second line of the table for each class of shares is useful in comparing ongoing costs only, and will not help you determine the relative total costs of owning different funds. In addition, if these transactional costs were included, your costs would have been higher.
20 Semi-Annual Report
OTHER INFORMATION
| | |
Thornburg New Mexico Intermediate Municipal Fund | | March 31, 2015 (Unaudited) |
PORTFOLIO PROXY VOTING
Policies and Procedures:
The Trust has delegated to Thornburg Investment Management, Inc. (the “Advisor”) voting decisions respecting proxies for the Fund’s voting securities. The Advisor makes voting decisions in accordance with its Proxy Voting Policy. A description of the Policy is available (i) without charge, upon request, by calling the Advisor toll-free at 1-800-847-0200, (ii) on the Thornburg website at www.thornburg. com, and (iii) on the Securities and Exchange Commission’s website at www.sec.gov.
Information regarding how proxies were voted is available on or before August 31 of each year for the twelve months ending the preceding June 30. This information is available (i) without charge, upon request by calling the Advisor toll-free at 1-800-847-0200, (ii) on the Thornburg website at www.thornburg.com, and (iii) on the Securities and Exchange Commission’s website at www.sec.gov.
AVAILABILITY OF QUARTERLY PORTFOLIO SCHEDULE
The Fund files with the Securities and Exchange Commission schedules of its portfolio holdings on Form N-Q for the first and third quarters of each fiscal year. The Fund’s Forms N-Q are available on the Commission’s website at www.sec.gov, or may be reviewed and copied at the Commission’s Public Reference Room in Washington, D.C. Information on the operation of the Public Reference Room may be obtained by calling 1-800-SEC-0330. The Fund also makes this information available on its website at www.thornburg. com/download or upon request by calling 1-800-847-0200.
Semi-Annual Report 21
TRUSTEES’ STATEMENT TO SHAREHOLDERS
Revised and Readopted September 15, 2014
The Trustees believe current and prospective shareholders should know how we discharge our responsibilities in supervising the Funds’ investment advisor and in reviewing the advisor’s contract for renewal. Since 2005, we have issued a statement which sets out clearly the three principal guidelines that we follow in supervising the Trust’s investment advisor on your behalf. In accordance with our customary practice, in September of 2014 we again reviewed our statement and concluded we should reissue this statement outlining the principal features of our supervision of the advisor’s performance of investment management services for the Funds.
We begin with the premise that each shareholder selected his or her Fund because its investments are managed by the investment advisor identified in the prospectus and in accordance with the objective and policies described in the prospectus. We realize, as each of you do, that if you believe that your Fund’s stated objective and policies no longer serve your personal investment goals, you can sell your shares and leave the Fund.
Therefore, we believe that our primary supervisory task—our principal obligation to you—is to assess the nature and quality of the advisor’s services, and to confirm that the advisor actively and competently pursues the Fund’s objective, in accordance with the policies set out in the prospectus. To do this, we meet regularly with management to review your Fund’s portfolio and to discuss the advisor’s specific actions and judgments in pursuing the Fund’s objective. We do not substitute our own judgment for the advisor’s decisions in selecting investments; the advisor is paid to exercise its informed judgment on investment decisions, and we seek to confirm, in reviewing the advisor’s performance, that the advisor is doing just that.
Second, we are conscious of costs and the effect that costs have on shareholders’ returns. We try to make sure that your Fund’s fees and costs are reasonable in relationship to the services rendered and that they are generally in line with those charged by other expert investment advisors, consistent with our belief that the Fund’s investors searched for and expect that expertise and attention and have decided to pay a reasonable price for it. We do not put the management contract “out to bid” as a matter of course, and we would not do so unless we had concluded that the advisor materially had failed to pursue the Fund’s objectives in accordance with its policies, or for other equally important reasons. We believe that any other approach would be inconsistent with your interests and contrary to your expectations when you bought shares of the Fund in the first place.
Finally, because we believe that most Thornburg Fund shareholders have invested with a long-term perspective, we try not to focus too much on the fashions of the moment and on short-term performance. The market will not favor any specific investment objective or set of policies at all times and under all economic circumstances. A fund will experience periods of both high and low returns relative to other funds and other investments. Even if one of our Funds is not favored by the market at a particular time, we believe that the advisor is nonetheless obliged to remain true to the Fund’s objective and policies, and we watch to see that it does so.
Trustees of Thornburg Investment Trust
22 Semi-Annual Report
THORNBURG FUND FAMILY
FUNDAMENTAL, BOTTOM-UP EQUITY RESEARCH
We search far and wide for the best stock ideas—within the United States and around the globe. Potential investments that may deserve a deeper look are thoroughly analyzed using both quantitative and qualitative criteria. But the vast majority are discarded. Those that ultimately make it into our highly-selective portfolios are continually monitored to determine whether our investment theses unfold as expected.
| | • | | Thornburg Core Growth Fund |
| | • | | Thornburg International Value Fund |
| | • | | Thornburg International Growth Fund |
| | • | | Thornburg Developing World Fund |
| | • | | Thornburg Investment Income Builder Fund |
| | • | | Thornburg Global Opportunities Fund |
A TRADITION OF DISCIPLINED BOND MANAGEMENT
At Thornburg, the word “disciplined” carries some substance. We don’t make a practice of using shortcuts to enhance yield or total returns. Every strategy is grounded in rigorous, bottom-up credit work. Portfolios are assembled carefully—in the case of our core bond funds, using laddered structures—to mitigate price fluctuation. Position sizes are controlled so that no single bond can have an outsized effect on a portfolio. And as with our equity portfolios, managers enjoy flexibility to seek an optimal risk/reward balance.
| | • | | Thornburg Low Duration Income Fund |
| | • | | Thornburg Limited Term U.S. Government Fund |
| | • | | Thornburg Limited Term Income Fund |
| | • | | Thornburg Strategic Income Fund |
| | • | | Thornburg Low Duration Municipal Fund |
| | • | | Thornburg Limited Term Municipal Fund |
| | • | | Thornburg Intermediate Municipal Fund |
| | • | | Thornburg California Limited Term Municipal Fund |
| | • | | Thornburg New Mexico Intermediate Municipal Fund |
| | • | | Thornburg New York Intermediate Municipal Fund |
| | • | | Thornburg Strategic Municipal Income Fund |
Before investing, carefully consider the Fund’s investment goals, risks, charges, and expenses. For a prospectus or summary prospectus containing this and other information, contact your financial advisor or visit thornburg.com. Read it carefully before investing.
For additional information, please visit thornburg.com
Thornburg Investment Management, Inc. 2300 North Ridgetop Road, Santa Fe, NM 87506
Semi-Annual Report 23

This Semi-Annual Report is submitted for the general information of shareholders of the Fund. It is not authorized for distribution to prospective investors in the Fund unless preceded or accompanied by an effective prospectus.
| | | | |
| Investment Advisor: | | Distributor: | | |
| Thornburg Investment Management® | | Thornburg Securities Corporation® | | |
| 800.847.0200 | | 800.847.0200 | | TH178 |
Firm & Philosophy
THE FIRM
Thornburg Investment Management is a privately owned global investment firm that offers a range of solutions for retail and institutional investors. We are driven by our mission to help our clients reach their long-term financial goals through fundamental research and active portfolio management.
Founded in 1982 and headquartered in Santa Fe, New Mexico, we manage approximately $61 billion (as of March 31, 2015) across seven equity and 11 bond mutual funds, separate accounts for high-net-worth investors and institutional accounts, and five UCITS funds for non-U.S. investors.

CORE INVESTMENT PRINCIPLES
Our focus has always been on maintaining and building the investment expertise to manage Thornburg strategies to a high standard, while adhering to a core set of investment principles:
| | • | | We focus on the fundamentals. We invest according to our view of the fundamental value of an issuer only after performing thorough, bottom-up research. |
| | • | | We think and invest for the long term. We typically make investment decisions based upon an investment thesis we expect to play out over 18 months to several years. We may not always hold a security for several years, but our horizon line is typically a few years out. |
| | • | | We stay flexible. We go where we see value. Our investment mandates are generally broad and flexible, and we exercise as much flexibility as possible within any restrictions. |
| | • | | We collaborate across strategies. We are structured as global generalists. Portfolio managers and analysts do not specialize in sectors, geographies, or even security types, but instead must understand and communicate bottom-up fundamentals across industries, sectors, and borders. |
2 Semi-Annual Report
Semi-Annual Report
Thornburg New York Intermediate Municipal Fund
March 31, 2015
| | | | | | |
| SHARE CLASS | | NASDAQ SYMBOL | | CUSIP | |
Class A | | THNYX | | | 885-215-665 | |
Class I | | TNYIX | | | 885-216-705 | |
Minimum investments for Class I shares are higher than those for Class A. Class I shares may not be available to all investors.
Investments in the Fund carry risks, including possible loss of principal. Bond funds have the same interest rate, inflation, and credit risks that are associated with the underlying bonds. The value of bonds will fluctuate relative to changes in interest rates, decreasing when interest rates rise. Unlike bonds, bond funds have ongoing fees and expenses. Please see the Fund’s prospectus for a discussion of the risks associated with an investment in the Fund. Investments in the Fund are not FDIC insured, nor are they deposits of or guaranteed by a bank or any other entity.
The laddering strategy does not assure or guarantee better performance and cannot eliminate the risk of investment losses.
Semi-Annual Report 3
LETTER TO SHAREHOLDERS
| | |
Thornburg New York Intermediate Municipal Fund | | March 31, 2015 (Unaudited) |
April 16, 2015
Dear Fellow Shareholder:
We are pleased to present the semi-annual report for the Thornburg New York Intermediate Municipal Fund. The net asset value (NAV) of the Class A shares increased by five cents to $13.27 per share during the six months ended March 31, 2015. If you were with us for the entire period, you received dividends of 14.44 cents per share. If you reinvested your dividends, you received 14.50 cents per share. Dividends were higher for Class I shares, to account for varying class-specific expenses. The Class A shares underperformed the Fund’s benchmark index, with a 1.47% total return (without sales charge) for the six months ended March 31, 2015, compared to the 1.71% total return for the BofA Merrill Lynch 3-15 Year U.S. Municipal Securities Index. The Fund generated 0.78% more price return and 1.02% less income than its benchmark.
Throughout the six-month period, the Fund maintained a lower risk posture on interest rates than its benchmark; the average effective duration (a measure of interest-rate sensitivity) was 5.20 years, compared to 5.42 years for the benchmark. The shorter duration hurt performance by 0.21%. The Fund’s position along the yield curve added 0.05% and sector selection contributed 0.63% of relative performance. Credit selection subtracted 0.35% from relative performance. Other factors, including security selection added 0.66%.
The Municipal Market
The municipal market has been something of a roller coaster over the past six months. Much of that volatility revolves around investors’ increased fears of an eventual Federal Reserve rate increase. While those fears aren’t completely unfounded, we believe the typical municipal bond investor is ignoring several other sources of risk present in the market.
First and foremost, it appears that risk is mispriced. At a very high level, we examine two primary sources of risk in the municipal market: duration and credit quality. The hunt for excess yield has bid up the prices of these sources of risk to levels we believe are unsustainable.
Investors looking for more yield can increase the duration of their purchases. This strategy often makes sense in a period characterized by a steep yield curve. When the curve is sufficiently steep, the incremental yield an investor picks up for buying a bond one year longer may, in fact, provide adequate compensation for the increased interest-rate risk. But through the six months ended March 31, 2015, we believe compensation offered to investors to extend duration was not in line with the added risk. This was particularly true when looking at the overall low level of interest rates in the market. Chart I shows the yield of a AAA rated general obligation bond less the core PCE index (or Personal Consumption Expenditures index, the Federal Reserve’s favored inflation measure). This is the so-called “real yield” an investor receives after inflation; this was and continues to be well below the long-term average.
Chart I 10-Year AAA General Obligation Municipal Bond Real Yield History, Using Core PCE Index
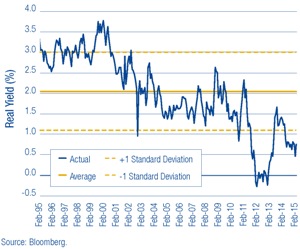
Less risk-averse investors can also decrease the average credit quality of their portfolios in an attempt to generate more income. While this can be a sound strategy in times of wide credit spreads, it fails during periods when credit risk is mispriced. Chart II shows a history of credit spreads, which in this case is the incremental yield an investor picked up from investing in a BBB rated revenue bond versus a AAA rated general obligation bond. Such spreads are as tight as they have been since before the great recession, when municipal bond insurers were thriving and a majority of the market was insured with AAA ratings.
In addition to overpriced risks, investors need to be prepared for continued volatility in the market. We live in a world where the Federal Reserve’s statements are analyzed word for word. The inclusion or deletion of any given word has the potential to send the markets roiling. The increased volatility may be exacerbated in the future by liquidity constraints facing the market, prompted by recent federal regulation. As a result of Dodd-Frank and other regulations, large broker/dealers will no longer be able to allocate the same amount of capital to the municipal market as they have in the past. Without that
4 Semi-Annual Report
LETTER TO SHAREHOLDERS,
CONTINUED
| | |
| |
Thornburg New York Intermediate Municipal Fund | | March 31, 2015 (Unaudited) |
Chart II Credit-Spread Difference, BBB Rated Revenue v. AAA Rated General Obligation Bonds
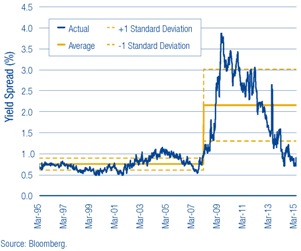
support, the market could be rattled more than usual if and when we see large outflows.
Investors need to be aware of all of these risks and ensure they are accounting for them appropriately.
New York
Demand for municipal debt in New York has been exceptionally high, helping to elevate prices. As a result, many of the mispricing issues we see in the national market exist to an even greater extent in the New York market. In general, the credit picture in the state continues to improve. Housing prices, particularly in New York City, are increasing, leading to stronger fundamentals for most local issuers.
Conclusion
For the past six months, the Thornburg municipal bond team has asked a simple question: “Are we getting paid to take risk?” The answer has been a resounding “no.” As a result, our investors will see a portfolio with a lower duration and a stronger average credit quality, as we overweighted higher-rated credits. We have also increased cash positions to seek to protect against a market liquidity crunch and to strategically take advantage of opportunities should they arise. In short, we believe we have avoided overpriced risk.
Many shareholders may ask themselves “what should I do if interest rates begin to rise?” We continue to stress having confidence in the structure of your portfolio. A portion of your laddered Fund’s bonds mature each year and become available for reinvestment at higher yields; this has the potential to increase income to shareholders. When interest rates do rise, prices will generally decline, but the remaining bonds in the portfolio will move closer to maturity and should, in our opinion, increase in price over time. We advise being patient when interest rates start to rise, and lengthening your anticipated holding period. Remember that higher yields also mean higher income, something investors have been sorely lacking for quite some time!
We will continue to strive to manage your assets to fulfill the Fund’s objectives.
Sincerely,
| | | | |
 | |  | |  |
| Christopher Ryon, CFA | | Josh Gonze | | Nicholos Venditti |
| Portfolio Manager | | Portfolio Manager | | Portfolio Manager |
| Managing Director | | Managing Director | | Managing Director |
The matters discussed in this report may constitute forward-looking statements made pursuant to the safe harbor provisions of the Securities Litigation Reform Act of 1995. These include any advisor or portfolio manager prediction, assessment, analysis or outlook for individual securities, industries, investment styles, market sectors and/or markets. These statements involve risks and uncertainties. In addition to the general risks described for each fund in its current prospectus, other factors bearing on these reports include the accuracy of the advisor’s or portfolio manager’s forecasts and predictions, the appropriateness of the investment strategies designed by the advisor or portfolio manager and the ability of the advisor or portfolio manager to implement their strategies efficiently and successfully. Any one or more of these factors, as well as other risks affecting the securities markets generally, could cause the actual results of any fund to differ materially as compared to its benchmarks.
The views expressed by the portfolio managers reflect their professional opinions and are subject to change. Under no circumstances does the information contained within represent a recommendation to buy or sell any security.
Semi-Annual Report 5
PERFORMANCE SUMMARY
| | | | |
| |
Thornburg New York Intermediate Municipal Fund | | | March 31, 2015 (Unaudited) | |
AVERAGE ANNUAL TOTAL RETURNS
| | | | | | | | | | | | | | | | | | | | |
| | | 1-YR | | | 3-YR | | | 5-YR | | | 10-YR | | | SINCE
INCEP. | |
A Shares (Incep: 9/5/97) | | | | | | | | | | | | | | | | | | | | |
Without sales charge | | | 4.48 | % | | | 2.85 | % | | | 4.04 | % | | | 3.90 | % | | | 4.15 | % |
With sales charge | | | 2.43 | % | | | 2.15 | % | | | 3.62 | % | | | 3.70 | % | | | 4.03 | % |
I Shares (Incep: 2/1/10) | | | 4.82 | % | | | 3.18 | % | | | 4.37 | % | | | — | | | | 4.35 | % |
30-DAY YIELDS, A SHARES
(with sales charge)
| | | | |
Annualized Distribution Yield | | | 2.01 | % |
| |
SEC Yield | | | 0.76 | % |
Performance data shown represents past performance and is no guarantee of future results. Investment return and principal value will fluctuate so shares, when redeemed, may be worth more or less than their original cost. Current performance may be lower or higher than quoted. For performance current to the most recent month end, visit thornburg.com or call 800-847-0200. The performance information does not reflect the deduction of taxes that a shareholder would pay on distributions or the redemption of Fund shares. Returns reflect the reinvestment of dividends and capital gains. Class A shares are sold with a maximum sales charge of 2.00%. There is no sales charge for Class I shares.
As disclosed in the most recent prospectus, the total annual fund operating expenses are as follows: A shares, 1.05%; I shares, 0.73%. Thornburg Investment Management and/or Thornburg Securities Corporation have contractually agreed to waive fees and reimburse expenses through at least February 1, 2016, for some of the share classes, resulting in net expense ratios of the following: A shares, 0.99%; I shares, 0.67%. For more detailed information on fund expenses and waivers/reimbursements please see the Fund’s prospectus.
Without the fee waivers and expense reimbursements described above the Annualized Distribution yield would have been 1.92%, and the SEC yield would have been 0.67%.
Glossary
BofA Merrill Lynch 3-15 Year U.S. Municipal Securities Index – A subset of the BofA Merrill Lynch U.S. Municipal Securities Index including all securities with a remaining term to final maturity greater than or equal to 3 years and less than 15 years.
Unless otherwise noted, index returns reflect the reinvestment of income dividends and capital gains, if any, but do not reflect fees, brokerage commissions or other expenses of investing. Investors may not make direct investments into any index. The performance of any index is not indicative of the performance of any particular investment.
Alternative Minimum Tax – A federal tax aimed at ensuring that high-income individuals, estates, trusts, and corporations pay a minimal level income tax. For individuals, the AMT is calculated by adding tax preference items to regular taxable income.
Annualized Distribution Yield – The distribution yield reflects actual distributions made to shareholders. The annualized distribution yield is calculated by summing the last 30 days of income at a given month end and annualizing to a 360-day year. The result is divided by the ending maximum offering price.
Bond Credit Ratings (Credit Quality) – A bond credit rating assesses the financial ability of a debt issuer to make timely payments of principal and interest. Ratings of AAA (the highest), AA, A, and BBB are investment-grade quality. Ratings of BB, B, CCC, CC, C and D (the lowest) are considered below investment grade, speculative grade, or junk bonds.
Bond Insurers – Individual bonds are sometimes insured by private companies. The insurance guarantees the payment of principal and interest on a bond issue if the issuer defaults. Mutual funds are not insured, even if the underlying bonds are insured.
Credit Spread/Quality Spread – The difference between the yields of securities with different credit qualities.
Duration – A bond’s sensitivity to interest rates. Effective duration incorporates the embedded option features, such as call provisions. Bonds with longer durations experience greater price volatility than bonds with shorter durations.
General Obligation Bond – A municipal bond backed by the credit and “taxing power” of the issuing jurisdiction rather than the revenue from a given project.
Personal Consumption Expenditure (PCE) Index – A broad measure of U.S. inflation that assesses the change in prices of goods and services purchased by consumers throughout the economy. Core PCE excludes the more volatile and seasonal food and energy prices.
Revenue Bond – A bond on which the debt service is payable solely from the revenue generated from the operation of the project being financed or a category of facilities, or from other non-tax sources.
SEC Yield – SEC yield is computed in accordance with SEC standards measuring the net investment income per share over a specified 30-day period expressed as a percentage of the maximum offering price of the Fund’s shares at the end of the period.
Standard Deviation – A measure of the dispersion of a set of data from its mean. The more spread apart the data, the higher the deviation. Values within one standard deviation of the mean represent approximately two-thirds of the data set, assuming a normal distribution.
Yield Curve – A line that plots the interest rates, at a set point in time, of bonds having equal credit quality, but differing maturity dates.
Yield Spread – The difference between yields on differing debt instruments, calculated by deducting the yield of one instrument from another.
6 Semi-Annual Report
Fund Summary
| | |
| |
Thornburg New York Intermediate Municipal Fund | | March 31, 2015 (Unaudited) |
Objectives and Strategies
The Fund’s primary investment objective is to obtain as high a level of current income exempt from federal, New York State and New York City individual income taxes as is consistent, in the view of the Fund’s investment advisor, with preservation of capital.
The secondary goal of the Fund is to reduce expected changes in its share price compared to long-term bond portfolios.
The Fund offers New York investors double (or for New York City residents triple) tax-free yields in a laddered municipal bond portfolio with an average maturity of normally three to ten years (may be subject to Alternative Minimum Tax). Laddering involves building a portfolio of bonds with staggered maturities so that a portion of the portfolio matures each year. Cash from maturing bonds, if not needed for other purposes, is invested in bonds with longer maturities at the far end of the ladder. We regard the strategy as a good compromise for managing different types of risk.
Key Portfolio Attributes
| | | | |
Number of Bonds | | | 79 | |
| |
Effective Duration | | | 5.2 Yrs | |
| |
Average Maturity | | | 8.5 Yrs | |
Long Term Stability of Principal
Net Asset Value History of A Shares
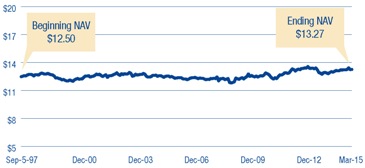
Security Credit Ratings
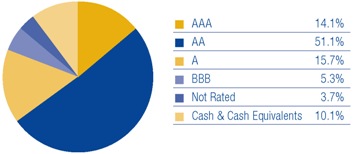
A bond credit rating assesses the financial ability of a debt issuer to make timely payments of principal and interest. Ratings of AAA (the highest), AA, A, and BBB are investment-grade quality. Ratings of BB, B, CCC, CC, C and D (the lowest) are considered below investment grade, speculative grade, or junk bonds. Credit quality ratings for Thornburg’s municipal portfolios used the highest rating available from either Standard & Poor’s or Moody’s Investors Service.
Portfolio Ladder
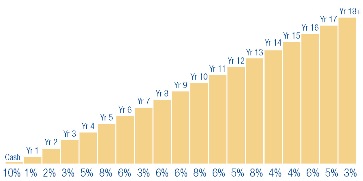
Percent of portfolio maturing in each year. Cash includes cash equivalents.
There is no guarantee that the Fund will meet its investment objectives.
All data is subject to change. Charts may not add up to 100% due to rounding.
Semi-Annual Report 7
| | |
| SCHEDULE OF INVESTMENTS | | |
| |
Thornburg New York Intermediate Municipal Fund | | March 31, 2015 (Unaudited) |
| | | | | | | | | | |
Issuer-Description | | Credit Rating†
S&P/ Moody’s | | Principal
Amount | | | Value | |
City of New York GO, 5.00% due 6/1/2019 pre-refunded 6/1/2016 (City Budget Financial Management; Insured: AGM) | | AA/Aa2 | | $ | 255,000 | | | $ | 269,022 | |
City of New York GO, 5.00% due 8/1/2019 (City Budget Financial Management) | | AA/Aa2 | | | 1,000,000 | | | | 1,150,820 | |
City of New York GO, 0.03% due 8/1/2020 put 4/1/2015 (City Budget Financial Management; LOC: JPMorgan Chase Bank, N.A.) (daily demand notes) | | AAA/Aa1 | | | 300,000 | | | | 300,000 | |
City of New York GO, 0.03% due 8/1/2021 put 4/1/2015 (City Budget Financial Management; LOC: JPMorgan Chase Bank N.A) (daily demand notes) | | A+/Aa1 | | | 300,000 | | | | 300,000 | |
City of New York GO, 5.00% due 8/1/2023 (City Budget Financial Management) | | AA/Aa2 | | | 1,000,000 | | | | 1,213,730 | |
City of New York GO, 5.00% due 8/1/2025 (City Budget Financial Management) | | AA/Aa2 | | | 400,000 | | | | 439,816 | |
City of New York GO, 5.00% due 8/1/2030 (City Budget Financial Management) | | AA/Aa2 | | | 1,000,000 | | | | 1,167,660 | |
County of Nassau GO, 5.00% due 4/1/2026 (Insured: BAM) | | AA/NR | | | 1,000,000 | | | | 1,180,280 | |
Dutchess County Local Development Corp., 5.00% due 7/1/2021 (Health Quest Systems, Inc.; Insured: AGM) | | AA/A2 | | | 535,000 | | | | 618,075 | |
Dutchess County Local Development Corp., 5.00% due 7/1/2022 (Health Quest Systems, Inc.; Insured: AGM) | | AA/A2 | | | 510,000 | | | | 583,287 | |
Erie County Industrial Development Agency, 5.25% due 5/1/2025 (Buffalo City School District) | | AA/Aa2 | | | 1,000,000 | | | | 1,139,590 | |
Government of Guam, 5.375% due 12/1/2024 | | BBB+/NR | | | 1,000,000 | | | | 1,115,890 | |
Guam Waterworks Authority, 5.00% due 7/1/2028 (Water and Wastewater System) | | A-/Ba1 | | | 500,000 | | | | 570,425 | |
Hempstead Town Local Development Corp., 5.00% due 7/1/2028 (Hofstra University) | | A/A3 | | | 500,000 | | | | 562,500 | |
Long Island Power Authority, 5.25% due 9/1/2029 | | A-/Baa1 | | | 645,000 | | | | 796,730 | |
Monroe County Industrial Development Corp., 4.00% due 6/1/2016 (St. John Fisher College) | | BBB+/NR | | | 880,000 | | | | 911,038 | |
Monroe County Industrial Development Corp., 5.00% due 1/15/2028 (Monroe Community College Association, Inc.; Insured: AGM) | | AA/A2 | | | 250,000 | | | | 283,763 | |
Monroe County Industrial Development Corp., 5.00% due 1/15/2029 (Monroe Community College Association, Inc.; Insured: AGM) | | AA/A2 | | | 300,000 | | | | 337,644 | |
Nassau County IDA, 4.75% due 3/1/2026 (New York Institute of Technology) | | BBB+/Baa2 | | | 1,000,000 | | | | 1,064,830 | |
Nassau County Sewer & Storm Water Finance Authority, 5.00% due 10/1/2021 (Sewerage and Storm Water Resource Facilities) | | AAA/Aa3 | | | 275,000 | | | | 331,986 | |
Nassau County Sewer & Storm Water Finance Authority, 5.00% due 10/1/2028 (Sewerage and Storm Water Resource Facilities) | | AAA/Aa3 | | | 400,000 | | | | 483,908 | |
Nassau County Sewer & Storm Water Finance Authority, 5.00% due 10/1/2031 (Sewerage and Storm Water Resource Facilities) | | AAA/Aa3 | | | 1,000,000 | | | | 1,190,670 | |
New York City Health and Hospitals Corp. GO, 5.00% due 2/15/2020 (Healthcare Facilities Improvements) | | A+/Aa3 | | | 770,000 | | | | 890,089 | |
New York City Health and Hospitals Corp. GO, 5.00% due 2/15/2025 (Healthcare Facilities Improvements) | | A+/Aa3 | | | 1,000,000 | | | | 1,136,040 | |
New York City Metropolitan Transportation Authority, 6.25% due 11/15/2023 | | AA-/A2 | | | 1,000,000 | | | | 1,185,510 | |
New York City Municipal Water Finance Authority, 5.00% due 6/15/2032 (Water and Sewer System) | | AA+/Aa2 | | | 1,000,000 | | | | 1,186,270 | |
New York City Municipal Water Finance Authority, 0.02% due 6/15/2035 put 4/1/2015 (Water & Sewer System; SPA: Bayerische Landesbank) (daily demand notes) | | AAA/Aa1 | | | 3,800,000 | | | | 3,800,000 | |
New York City Municipal Water Finance Authority, 0.03% due 6/15/2043 put 4/1/2015 (Water & Sewer System; SPA: JPMorgan Chase Bank, N.A.) (daily demand notes) | | AA+/Aa2 | | | 500,000 | | | | 500,000 | |
New York City Transitional Finance Authority, 5.00% due 1/15/2020 (World Trade Center Recovery) (State Aid Withholding) | | AA/Aa2 | | | 1,000,000 | | | | 1,142,060 | |
New York City Transitional Finance Authority, 5.00% due 11/1/2020 (World Trade Center Recovery) | | AAA/Aaa | | | 1,000,000 | | | | 1,028,490 | |
New York City Trust for Cultural Resources, 5.25% due 12/1/2018 (Lincoln Center for the Performing Arts) | | A+/A2 | | | 175,000 | | | | 199,297 | |
New York Convention Center Development Corp., 5.00% due 11/15/2017 (Jacob K. Javits Convention Center: AMBAC) | | NR/A1 | | | 1,000,000 | | | | 1,028,970 | |
New York Municipal Bond Bank Agency, 5.00% due 4/15/2018 (Insured: AGM) | | AA/A2 | | | 1,000,000 | | | | 1,111,820 | |
New York State Dormitory Authority, 5.00% due 10/1/2023 (School District Financing Program; Insured: AGM) (State Aid Withholding) | | AA/A2 | | | 400,000 | | | | 442,496 | |
New York State Dormitory Authority, 5.00% due 7/1/2016 (Bishop Henry B. Hucles Nursing Home; Insured: SONYMA) | | NR/Aa1 | | | 600,000 | | | | 633,912 | |
New York State Dormitory Authority, 5.00% due 10/1/2018 (School District Financing Program; Insured: AGM) | | AA/Aa3 | | | 1,000,000 | | | | 1,084,830 | |
New York State Dormitory Authority, 5.25% due 10/1/2018 (School District Financing Program; Insured: AGM) | | AA/Aa3 | | | 775,000 | | | | 885,980 | |
New York State Dormitory Authority, 5.00% due 7/1/2020 (NYSARC, Inc. Developmental Disability Programs) | | NR/Aa2 | | | 1,175,000 | | | | 1,360,626 | |
New York State Dormitory Authority, 4.00% due 10/1/2020 (School District Financing Program; Insured: AGM) (State Aid Withholding) | | AA/A1 | | | 325,000 | | | | 364,725 | |
New York State Dormitory Authority, 5.00% due 7/1/2021 (State University of New York; Insured: Natl-Re) | | AA-/NR | | | 300,000 | | | | 303,564 | |
New York State Dormitory Authority, 5.25% due 7/1/2022 (St. John’s University; Insured: Natl-Re) | | AA-/A3 | | | 1,000,000 | | | | 1,213,060 | |
New York State Dormitory Authority, 5.00% due 1/15/2023 (Municipal Health Facilities) | | AA-/Aa3 | | | 1,000,000 | | | | 1,112,990 | |
New York State Dormitory Authority, 5.00% due 10/1/2023 (School District Financing Program) (State Aid Withholding) | | AA-/NR | | | 575,000 | | | | 696,469 | |
New York State Dormitory Authority, 5.00% due 7/1/2024 (Bishop Henry B. Hucles Nursing Home; Insured: SONYMA) | | NR/Aa1 | | | 1,000,000 | | | | 1,031,040 | |
New York State Dormitory Authority, 5.00% due 7/1/2024 (Miriam Osborn Memorial Home Assoc.) | | NR/NR | | | 1,540,000 | | | | 1,685,145 | |
New York State Dormitory Authority, 5.00% due 10/1/2024 (School District Financing Program; Insured: AGM) (State Aid Withholding) | | AA/Aa3 | | | 1,000,000 | | | | 1,179,830 | |
New York State Dormitory Authority, 5.00% due 7/1/2025 (Miriam Osborn Memorial Home Assoc.) | | NR/NR | | | 1,105,000 | | | | 1,199,190 | |
New York State Dormitory Authority, 5.00% due 7/1/2027 (Interagency Council Pooled Loan Program) | | NR/Aa2 | | | 1,000,000 | | | | 1,111,800 | |
New York State Dormitory Authority, 5.00% due 7/1/2027 (Columbia University Teachers College) | | A+/A1 | | | 750,000 | | | | 870,637 | |
New York State Dormitory Authority, 5.25% due 7/1/2027 (Health Quest Systems; Insured: AGM) | | AA/A3 | | | 500,000 | | | | 544,550 | |
New York State Dormitory Authority, 5.00% due 12/15/2027 (Metropolitan Transportation Authority & State Urban Development Corp.) | | AAA/Aa1 | | | 2,500,000 | | | | 3,023,725 | |
New York State Dormitory Authority, 5.00% due 10/1/2028 (School District Financing Program; Insured: AGM) | | AA/NR | | | 200,000 | | | | 237,442 | |
New York State Dormitory Authority, 5.25% due 5/1/2030 (North Shore Long Island Jewish Medical) | | A-/A3 | | | 1,000,000 | | | | 1,121,800 | |
8 Semi-Annual Report
| | |
| SCHEDULE OF INVESTMENTS, CONTINUED | | |
| |
Thornburg New York Intermediate Municipal Fund | | March 31, 2015 (Unaudited) |
| | | | | | | | | | |
Issuer-Description | | Credit Rating†
S&P/ Moody’s | | Principal
Amount | | | Value | |
New York State Dormitory Authority, 5.00% due 7/1/2034 (Pratt Institute) | | NR/A3 | | $ | 1,000,000 | | | $ | 1,146,540 | |
New York State Energy Research & Development Authority, 2.25% due 12/1/2015 (New York Electric & Gas Corp.) | | BBB+/A3 | | | 1,000,000 | | | | 1,010,200 | |
New York State Thruway Authority, 5.00% due 4/1/2018 pre-refunded 10/1/2015 (Multi-Year Highway and Bridge Capital Program; Insured: AMBAC) | | NR/NR | | | 60,000 | | | | 61,442 | |
New York State Thruway Authority, 5.00% due 4/1/2018 (Multi-Year Highway and Bridge Capital Program; Insured: AMBAC) | | AA/NR | | | 385,000 | | | | 394,217 | |
New York State Thruway Authority, 5.00% due 4/1/2019 (Multi-Year Highway and Bridge Capital Program; Insured: AMBAC) | | AA/A2 | | | 235,000 | | | | 240,595 | |
New York State Thruway Authority, 5.00% due 5/1/2019 (New NY Bridge Project) | | A-/A3 | | | 2,000,000 | | | | 2,287,340 | |
New York State Thruway Authority, 5.00% due 4/1/2022 (Multi-Year Highway and Bridge Capital Program) | | AA/NR | | | 1,000,000 | | | | 1,102,990 | |
New York State Thruway Authority, 5.00% due 1/1/2028 (Multi-Year Highway and Bridge Capital Program) | | A/A2 | | | 500,000 | | | | 595,620 | |
New York State Urban Development Corp., 5.25% due 1/1/2021 | | AA/NR | | | 1,000,000 | | | | 1,147,660 | |
Onondaga Civic Development Corp., 5.00% due 7/1/2021 (Le Moyne College) | | NR/Baa2 | | | 1,000,000 | | | | 1,105,410 | |
Onondaga Civic Development Corp., 5.50% due 12/1/2031 (Upstate Properties Development) | | A+/NR | | | 1,000,000 | | | | 1,157,190 | |
Port Authority New York & New Jersey, 5.00% due 8/15/2022 (Insured: AGM) | | AA/Aa3 | | | 1,000,000 | | | | 1,102,010 | |
Sales Tax Asset Receivable Corp., 5.00% due 10/15/2029 (New York Local Government Assistance Corp.) | | AAA/Aa1 | | | 250,000 | | | | 304,883 | |
Sales Tax Asset Receivable Corp., 5.00% due 10/15/2030 (New York Local Government Assistance Corp.) | | AAA/Aa1 | | | 1,000,000 | | | | 1,212,880 | |
Sales Tax Asset Receivable Corp., 5.00% due 10/15/2031 (New York Local Government Assistance Corp.) | | AAA/Aa1 | | | 1,000,000 | | | | 1,205,340 | |
Syracuse Industrial Development Agency, 5.25% due 5/1/2026 (Syracuse City School District) | | AA-/Aa2 | | | 2,150,000 | | | | 2,505,029 | |
Town of Amherst Development Corp., 5.00% due 10/1/2020 (University at Buffalo Foundation Facility-Student Housing; Insured: AGM) | | AA/A2 | | | 1,000,000 | | | | 1,159,040 | |
Town of Babylon GO, 5.00% due 9/1/2015 (Insured: AMBAC) | | NR/NR | | | 25,000 | | | | 25,101 | |
Triborough Bridge & Tunnel Authority GO, 5.00% due 11/15/2025 pre-refunded 11/15/2017 (MTA Bridges and Tunnels) | | AA-/Aa3 | | | 1,410,000 | | | | 1,566,862 | |
Triborough Bridge & Tunnel Authority GO, 5.00% due 11/15/2028 (MTA Bridges and Tunnels) | | AA-/Aa3 | | | 1,000,000 | | | | 1,207,870 | |
Triborough Bridge & Tunnel Authority GO, 5.00% due 11/15/2029 (MTA Bridges and Tunnels) | | AA-/Aa3 | | | 1,000,000 | | | | 1,195,560 | |
United Nations Development Corp., 5.00% due 7/1/2019 (One, Two and Three U.N. Plaza Project) | | NR/A1 | | | 230,000 | | | | 263,327 | |
United Nations Development Corp., 5.00% due 7/1/2025 (One, Two and Three U.N. Plaza Project) | | NR/A1 | | | 710,000 | | | | 805,019 | |
Utility Debt Securitization Authority, 5.00% due 12/15/2029 (Long Island Power Authority-Electric Service) | | AAA/Aaa | | | 1,000,000 | | | | 1,197,050 | |
Utility Debt Securitization Authority, 5.00% due 12/15/2030 (Long Island Power Authority-Electric Service) | | AAA/Aaa | | | 1,000,000 | | | | 1,191,870 | |
West Seneca Central School District GO, 5.00% due 11/15/2023 (Facilities Improvements; Insured: BAM) (State Aid Withholding) | | AA/A1 | | | 1,300,000 | | | | 1,589,302 | |
| | | | | | | | | | |
TOTAL INVESTMENTS — 94.76% (Cost $71,288,932) | | | | | | | | $ | 76,104,368 | |
OTHER ASSETS LESS LIABILITIES — 5.24% | | | | | | | | | 4,210,326 | |
| | | | | | | | | | |
NET ASSETS — 100.00% | | | | | | | | $ | 80,314,694 | |
| | | | | | | | | | |
Footnote Legend
| † | Credit ratings are unaudited. Rating changes may have occurred subsequent to the reporting period end. Bonds issued with a maturity of one year or less are assigned Moody’s ratings from MIG-1 to MIG-4 and Standard and Poor’s ratings from SP-1+ to SP-3 with MIG-1 and SP-1+ being the strongest ratings. |
Portfolio Abbreviations
To simplify the listings of securities, abbreviations are used per the table below:
| | |
| AGM | | Insured by Assured Guaranty Municipal Corp. |
| AMBAC | | Insured by American Municipal Bond Assurance Corp. |
| BAM | | Insured by Build America Mutual Insurance Co. |
| GO | | General Obligation |
| | |
| IDA | | Industrial Development Authority |
| Natl-Re | | Insured by National Public Finance Guarantee Corp. |
| SONYMA | | State of New York Mortgage Authority |
See notes to financial statements.
Semi-Annual Report 9
| | |
| STATEMENT OF ASSETS AND LIABILITIES | | |
| |
Thornburg New York Intermediate Municipal Fund | | March 31, 2015 (Unaudited) |
| | | | |
ASSETS | | | | |
Investments at value (cost $71,288,932) (Note 2) | | $ | 76,104,368 | |
Cash | | | 3,210,128 | |
Receivable for fund shares sold | | | 206,413 | |
Interest receivable | | | 981,007 | |
| | | | |
Total Assets | | | 80,501,916 | |
| | | | |
| |
LIABILITIES | | | | |
Payable for fund shares redeemed | | | 89,553 | |
Payable to investment advisor and other affiliates (Note 3) | | | 45,723 | |
Accounts payable and accrued expenses | | | 31,276 | |
Dividends payable | | | 20,670 | |
| | | | |
Total Liabilities | | | 187,222 | |
| | | | |
| |
NET ASSETS | | $ | 80,314,694 | |
| | | | |
NET ASSETS CONSIST OF | | | | |
Distribution in excess of net investment income | | $ | (16,847 | ) |
Net unrealized appreciation on investments | | | 4,815,436 | |
Accumulated net realized gain (loss) | | | (438,069 | ) |
Net capital paid in on shares of beneficial interest | | | 75,954,174 | |
| | | | |
| | $ | 80,314,694 | |
| | | | |
| |
NET ASSET VALUE | | | | |
Class A Shares: | | | | |
Net asset value and redemption price per share ($52,070,752 applicable to 3,923,236 shares of beneficial interest outstanding - Note 4) | | $ | 13.27 | |
Maximum sales charge, 2.00% of offering price | | | 0.27 | |
| | | | |
Maximum offering price per share | | $ | 13.54 | |
| | | | |
| |
Class I Shares: | | | | |
Net asset value, offering and redemption price per share ($28,243,942 applicable to 2,128,007 shares of beneficial interest outstanding - Note 4) | | $ | 13.27 | |
| | | | |
See notes to financial statements.
10 Semi-Annual Report
| | |
| STATEMENT OF OPERATIONS | | |
| |
Thornburg New York Intermediate Municipal Fund | | Six Months Ended March 31, 2015 (Unaudited) |
| | | | |
INVESTMENT INCOME | | | | |
Interest income (net of premium amortized of $297,659) | | $ | 1,253,215 | |
| | | | |
| |
EXPENSES | | | | |
Investment advisory fees (Note 3) | | | 197,642 | |
Administration fees (Note 3) | | | | |
Class A Shares | | | 33,287 | |
Class I Shares | | | 6,449 | |
Distribution and service fees (Note 3) | | | | |
Class A Shares | | | 66,575 | |
Transfer agent fees | | | | |
Class A Shares | | | 17,092 | |
Class I Shares | | | 8,689 | |
Registration and filing fees | | | | |
Class A Shares | | | 6,192 | |
Custodian fees (Note 3) | | | 13,032 | |
Professional fees | | | 20,656 | |
Accounting fees | | | 1,272 | |
Trustee fees | | | 1,640 | |
Other expenses | | | 4,377 | |
| | | | |
Total Expenses | | | 376,903 | |
Less: | | | | |
Expenses reimbursed by investment advisor (Note 3) | | | (26,717 | ) |
Fees paid indirectly (Note 3) | | | (259 | ) |
| | | | |
Net Expenses | | | 349,927 | |
| | | | |
Net Investment Income | | | 903,288 | |
| | | | |
REALIZED AND UNREALIZED GAIN (LOSS) | | | | |
Net realized gain (loss) on investments | | | (10,166 | ) |
Net change in unrealized appreciation (depreciation) on investments | | | 340,767 | |
| | | | |
Net Realized and Unrealized Gain | | | 330,601 | |
| | | | |
Net Increase in Net Assets Resulting from Operations | | $ | 1,233,889 | |
| | | | |
See notes to financial statements.
Semi-Annual Report 11
| | |
| STATEMENTS OF CHANGES IN NET ASSETS | | |
| |
Thornburg New York Intermediate Municipal Fund | | |
| | | | | | | | |
| | | Six Months Ended
March 31, 2015* | | | Year Ended
September 30, 2014 | |
INCREASE (DECREASE) IN NET ASSETS FROM | | | | | | | | |
| | |
OPERATIONS | | | | | | | | |
Net investment income | | $ | 903,288 | | | $ | 1,691,774 | |
Net realized gain (loss) on investments | | | (10,166 | ) | | | (249,977 | ) |
Net unrealized appreciation (depreciation) on investments | | | 340,767 | | | | 1,999,926 | |
| | | | | | | | |
Net Increase (Decrease) in Net Assets Resulting from Operations | | | 1,233,889 | | | | 3,441,723 | |
| | |
DIVIDENDS TO SHAREHOLDERS | | | | | | | | |
From net investment income | | | | | | | | |
Class A Shares | | | (580,387 | ) | | | (1,289,806 | ) |
Class I Shares | | | (322,901 | ) | | | (401,968 | ) |
| | |
FUND SHARE TRANSACTIONS (NOTE 4) | | | | | | | | |
Class A Shares | | | (2,464,988 | ) | | | (1,094,618 | ) |
Class I Shares | | | 4,226,475 | | | | 16,446,386 | |
| | | | | | | | |
Net Increase in Net Assets | | | 2,092,088 | | | | 17,101,717 | |
| | |
NET ASSETS | | | | | | | | |
Beginning of Period | | | 78,222,606 | | | | 61,120,889 | |
| | | | | | | | |
| | |
End of Period | | $ | 80,314,694 | | | $ | 78,222,606 | |
| | | | | | | | |
Distribution in excess of net investment income | | $ | (16,847 | ) | | $ | (16,847 | ) |
See notes to financial statements.
12 Semi-Annual Report
| | |
| NOTES TO FINANCIAL STATEMENTS | | |
| |
Thornburg New York Intermediate Municipal Fund | | March 31, 2015 (Unaudited) |
NOTE 1 – ORGANIZATION
Thornburg New York Intermediate Municipal Fund (the “Fund”) is a non-diversified series of Thornburg Investment Trust (the “Trust”). The Trust is organized as a Massachusetts business trust under a Declaration of Trust dated June 3, 1987 and is registered as a diversified, open-end management investment company under the Investment Company Act of 1940, as amended. The Fund is currently one of eighteen separate series of the Trust. Each series is considered to be a separate entity for financial reporting and tax purposes and bears expenses directly attributable to it. The Fund’s primary investment objective is to obtain as high a level of current income exempt from federal, New York State, and New York City individual income tax as is consistent, in the view of the Fund’s investment advisor, with the preservation of capital. The Fund’s secondary objective is to reduce expected changes in its share price compared to long-term bond portfolios. The Fund will invest primarily in municipal obligations within the state of New York.
The Fund currently offers two classes of shares of beneficial interest: Class A and Institutional Class (“Class I”) shares. Each class of shares of the Fund represents an interest in the same portfolio of investments, except that (i) Class A shares are sold subject to a front-end sales charge collected at the time the shares are purchased and bear a service fee and (ii) Class I shares are sold at net asset value without a sales charge at the time of purchase and may be subject to a service fee, and (iii) the respective classes may have different reinvestment privileges and conversion rights. Additionally, the Fund may allocate among its classes certain expenses, to the extent allocable to specific classes, including transfer agent fees, government registration fees, certain printing and postage costs, and administrative and legal expenses. Currently, class specific expenses of the Fund are limited to service and distribution fees, administration fees, and certain registration and transfer agent expenses.
NOTE 2 – SIGNIFICANT ACCOUNTING POLICIES
The following is a summary of significant accounting policies followed by the Fund in the preparation of its financial statements. The Fund is an investment company and prepares its financial statements in conformity with U.S. generally accepted accounting principles (“GAAP”), including the investment company accounting and reporting guidance in the Financial Accounting Standards Board (the “FASB”) Accounting Standard Codification Topic 946. The preparation of financial statements in conformity with GAAP requires management to make estimates and assumptions that affect the reported amounts of assets and liabilities and disclosure of contingent assets and liabilities at the date of the financial statements and the reported amounts of increases (decreases) in net assets from operations during the reporting period. Actual results could differ from those estimates.
Significant accounting policies of the Fund are as follows:
Valuation Policy and Procedures: The Trustees of the Trust (the “Trustees”) have authorized employees of the Fund’s investment advisor, acting as the Valuation and Pricing Committee (the “Committee”), to make certain valuation determinations, subject to oversight and review by the Trustees and the Audit Committee of the Trustees. The Committee and other employees of the Fund’s investment advisor administer and implement the valuation process. The Committee regularly reviews its own fair value decisions, as well as valuations, valuation techniques and services furnished by pricing services, considers circumstances in the markets which may require valuation determinations by the Committee and reviews previous valuation determinations. The Committee also reports on its activities, the performance of the pricing services and other matters to the Trustees and the Audit Committee of the Trustees.
In determining a fair value for a portfolio investment, the Committee seeks to determine the price that the Fund would reasonably expect to receive upon a sale of the investment in an orderly transaction between market participants at the measurement date. Typically, the fair value process employs standing instructions to use quoted prices in active markets or the use of independent pricing services. Less frequently, the Committee may make a fair value determination using other methods. However, because fair value prices are estimated prices, the determination of fair value for an investment may differ from the value that would be realized by the Fund upon a sale of the investment, and that difference could be material to the Fund’s financial statements. The Committee’s determination of fair value for an investment may also differ from the prices obtained by other persons (including other mutual funds) for the investment.
Valuation of Investments: Debt obligations held by the Fund have a primary over-the-counter market and are valued by an independent pricing service approved by the Trustees. The pricing service ordinarily values debt obligations using quoted bid prices and other methods which include consideration of yields or prices of debt obligations of comparable quality, type of issue, coupon, maturity and rating, and indications as to value from dealers and general market conditions.
In any case when a pricing service fails to provide a price for a debt obligation held by the Fund, the Committee determines a fair value for the debt obligation using procedures in accordance with a policy approved by the Trustees, which may include the use of a price obtained from a different independent pricing service. Additionally, in any case when management believes that a price provided by a pricing service for a debt obligation held by the Fund may be unreliable, the Committee decides whether or not to use the pricing service’s valuation or to use an alternative method to determine a fair value for the debt obligation.
Semi-Annual Report 13
| | |
| NOTES TO FINANCIAL STATEMENTS, CONTINUED | | |
| |
Thornburg New York Intermediate Municipal Fund | | March 31, 2015 (Unaudited) |
Valuation Measurements: The Fund categorizes its investments based upon the inputs used in valuing those investments, according to a three-level hierarchy established by guidance from the the FASB. Categorization of investments using this hierarchy is intended by the FASB to maximize the use of observable inputs and minimize the use of unobservable inputs by prioritizing that the most observable input be used when available. Observable inputs are those that market participants would use in valuing an investment based on available market data. Unobservable inputs are those that reflect assumptions about the information market participants would use in valuing an investment. An investment’s level within the hierarchy is based on the lowest level input that is deemed significant to the fair value measurement. The methodologies and relative inputs used to value investments are not necessarily indications of the risk or liquidity associated with investing in those investments.
Various inputs are used in determining the fair value measurement of the Fund’s investments. These inputs are generally summarized according to the three-level hierarchy below:
Level 1: Quoted prices in active markets for identical investments.
Level 2: Other direct or indirect significant observable inputs (including quoted prices for similar investments in active markets and other observable inputs, such as interest rates, prepayment rates, credit risk, etc.).
Level 3: Significant unobservable inputs (including the Committee’s own assumptions in determining the fair value of investments).
Portfolio investments with minimal, if any, market activity are characterized as Level 3 and are valued using significant unobservable inputs, typically including single broker quotes, which may be adjusted or unadjusted, related or comparable investments, last available transactions, and other relevant information. Valuations may also be based upon current market prices of securities that are comparable in coupon, rating, maturity and industry. An income based valuation approach would consider discounted anticipated future cash flows of the investment. Discounts may also be applied due to the nature or duration of any restrictions on the disposition of the investment. Valuations based upon the use of inputs from Levels 1, 2, or 3, may not represent the actual price received upon the disposition of an investment, and the Fund may receive a price that is lower than the valuation when it sells the investment.
The following table displays a summary of the fair value hierarchy measurements of the Fund’s investments as of March 31, 2015. In any instance when valuation inputs from more than one level are used to determine the fair value of a specific investment, the investment is placed in the level of the table based upon the lowest level input that is significant in determining the fair value of the investment:
| | | | | | | | | | | | | | | | |
| | | Fair Value Measurements at March 31, 2015 | |
| | | Total | | | Level 1 | | | Level 2 | | | Level 3 | |
Assets | | | | | | | | | | | | | | | | |
Investments in Securities | | | | | | | | | | | | | | | | |
Municipal Bonds | | $ | 76,104,368 | | | $ | — | | | $ | 76,104,368 | | | $ | — | |
| | | | | | | | | | | | | | | | |
Total Investments in Securities | | $ | 76,104,368 | | | $ | — | | | $ | 76,104,368 | | | $ | — | |
In accordance with the guidance prescribed in Accounting Standards Update No. 2011-04, it is the policy of the Fund to recognize transfers between levels and the underlying events which caused the movement. The Fund recognized no transfers between levels for the six months ended March 31, 2015.
Federal Income Taxes: It is the policy of the Trust to comply with the provisions of the Internal Revenue Code applicable to “regulated investment companies” and to distribute to shareholders substantially all taxable (if any) and tax exempt income of the Fund. Therefore, no provision for federal income tax is required.
Management reviews each uncertain tax position believed to be material to the preparation of the Fund’s financial statements, to assess if it is more likely than not that the position would be sustained upon examination, based upon the technical merits of the position. As of March 31, 2015, management has not identified any such position for which an asset or liability must be reflected in the Statement of Assets and Liabilities. The Fund’s tax returns remain subject to examination for three years after filing.
When-Issued and Delayed Delivery Transactions: The Fund may engage in when-issued or delayed delivery transactions. To the extent the Fund engages in such transactions, it will do so for the purpose of acquiring portfolio investments consistent with the Fund’s investment objectives and not for the purpose of investment leverage or to speculate on interest rate and/or market changes. At the time the Fund makes a commitment to purchase an investment on a when-issued or delayed delivery basis, the Fund will record the transaction and reflect the value in determining its net asset value. When effecting such transactions, assets of an amount sufficient to make payment for the portfolio investments to be purchased will be segregated on the Fund’s records on the trade date. Investments purchased on a when-issued or delayed delivery basis do not earn interest until the settlement date.
Dividends: Net investment income of the Fund is declared daily as a dividend on shares for which the Fund has received payment. Dividends are paid monthly and are reinvested in additional shares of the Fund at net asset value per share at the close of business
14 Semi-Annual Report
| | |
| NOTES TO FINANCIAL STATEMENTS, CONTINUED | | |
| |
Thornburg New York Intermediate Municipal Fund | | March 31, 2015 (Unaudited) |
on the dividend payment date, or at the shareholder’s option, paid in cash. Net realized capital gains, to the extent available, will be distributed at least annually.
General: Investment transactions are accounted for on a trade date basis. Interest income is accrued as earned. Premiums and discounts on investments purchased are amortized to call dates or maturity dates of the respective investments. Realized gains and losses from the sale of investments are recorded on an identified cost basis. Net investment income (other than class specific expenses) and realized and unrealized gains and losses are allocated daily to each class of shares based upon the relative net asset value of outstanding shares (or the value of the dividend-eligible shares, as appropriate) of each class of shares at the beginning of the day (after adjusting for the current capital shares activity of the respective class). Expenses common to all Funds are allocated among the Funds comprising the Trust based upon their relative net asset values or other appropriate allocation methods.
Guarantees and Indemnifications: Under the Trust’s organizational documents (and under separate agreements with the independent Trustees), its officers and Trustees are indemnified against certain liabilities arising out of the performance of their duties to the Fund. Additionally, in the normal course of business the Trust enters into contracts with service providers that contain general indemnification clauses. The Trust’s maximum exposure under these arrangements is unknown. However, based on experience, the Trust expects the risk of loss to be remote.
NOTE 3 – INVESTMENT ADVISORY FEE AND OTHER TRANSACTIONS WITH AFFILIATES
Pursuant to an investment advisory agreement, Thornburg Investment Management, Inc. (the “Advisor”) serves as the investment advisor and performs services for the Fund for which the fees are payable at the end of each month. For the six months ended March 31, 2015, these fees were payable at annual rates ranging from .50 of 1% to .275 of 1% per annum of the average daily net assets of the Fund depending on the Fund’s asset size. The Trust also has entered into administrative services agreements with the Advisor, whereby the Advisor will perform certain administrative services for the shareholders of each class of the fund shares, and for which fees will be payable at an annual rate of up to .125 of 1% per annum of the average daily net assets attributable to each class of shares.
The Trust has an underwriting agreement with Thornburg Securities Corporation (the “Distributor,” an affiliate of the Advisor), which acts as the distributor of the Fund’s shares. For the six months ended March 31, 2015, the Distributor has advised the Fund that it earned no commissions from the sale of Class A shares.
Pursuant to a service plan under Rule 12b-1 of the Investment Company Act of 1940, the Fund may reimburse to the Advisor an amount not to exceed .25 of 1% per annum of the average daily net assets attributable to each class of shares of the Fund for payments made by the Advisor to securities dealers and other financial institutions to obtain various shareholder and distribution related services. For the six months ended March 31, 2015, there were no 12b-1 service plan fees charged for Class I shares. The Advisor may pay out of its own resources additional expenses for distribution of the Fund’s shares and shareholder services.
The Advisor and Distributor have contractually agreed to waive fees and reimburse expenses incurred by the Fund so that actual expenses of certain share classes do not exceed levels as specified in the Fund’s most recent prospectus. The agreement may be terminated by the Fund at any time, but may not be terminated by the Advisor or Distributor before February 1, 2016, unless the Advisor ceases to be the investment advisor to the Fund or the Distributor ceases to be the distributor of the Fund prior to that date. The Advisor and Distributor retain the right to be repaid by the Fund for fee waivers and expense reimbursements if expenses fall below the contractual limit prior to the end of the fiscal year.
For the six months ended March 31, 2015, the Advisor contractually reimbursed certain class specific expenses and administrative fees of $20,084 for Class A shares and $6,633 for Class I shares.
The Trust has an agreement with the custodian bank to indirectly pay a portion of the custodian’s fees through credits earned by the Fund’s cash on deposit with the bank. This deposit agreement is an alternative to overnight investments. Custodial fees are adjusted to reflect amounts that would have been paid without this agreement, with a corresponding adjustment reflected as fees paid indirectly in the Statement of Operations. For the six months ended March 31, 2015, fees paid indirectly were $259.
Certain officers and Trustees of the Trust are also officers or directors of the Advisor and Distributor. The compensation of independent Trustees is borne by the Trust.
Semi-Annual Report 15
| | |
| NOTES TO FINANCIAL STATEMENTS, CONTINUED | | |
| |
Thornburg New York Intermediate Municipal Fund | | March 31, 2015 (Unaudited) |
NOTE 4 – SHARES OF BENEFICIAL INTEREST
At March 31, 2015, there were an unlimited number of shares with no par value of beneficial interest authorized. Transactions in shares of beneficial interest were as follows:
| | | | | | | | | | | | | | | | |
| | | Six Months Ended
March 31, 2015 (Unaudited) | | | Year Ended
September 30, 2014 (Audited) | |
| | | Shares | | | Amount | | | Shares | | | Amount | |
Class A Shares | | | | | | | | | | | | | | | | |
Shares sold | | | 218,060 | | | $ | 2,893,751 | | | | 1,643,317 | | | $ | 21,214,647 | |
Shares issued to shareholders in reinvestment of dividends | | | 34,688 | | | | 460,851 | | | | 80,732 | | | | 1,052,930 | |
Shares repurchased | | | (437,793 | ) | | | (5,819,590 | ) | | | (1,797,961 | ) | | | (23,362,195 | ) |
| | | | | | | | | | | | | | | | |
| | | | |
Net increase (decrease) | | | (185,045 | ) | | $ | (2,464,988 | ) | | | (73,912 | ) | | $ | (1,094,618 | ) |
| | | | | | | | | | | | | | | | |
| | | | |
Class I Shares | | | | | | | | | | | | | | | | |
Shares sold | | | 467,901 | | | $ | 6,215,513 | | | | 1,745,619 | | | $ | 22,738,797 | |
Shares issued to shareholders in reinvestment of dividends | | | 24,160 | | | | 321,013 | | | | 29,671 | | | | 388,253 | |
Shares repurchased | | | (173,907 | ) | | | (2,310,051 | ) | | | (511,478 | ) | | | (6,680,664 | ) |
| | | | | | | | | | | | | | | | |
| | | | |
Net increase (decrease) | | | 318,154 | | | $ | 4,226,475 | | | | 1,263,812 | | | $ | 16,446,386 | |
| | | | | | | | | | | | | | | | |
NOTE 5 – INVESTMENT TRANSACTIONS
For the six months ended March 31, 2015, the Fund had purchase and sale transactions of investments (excluding short-term investments) of $5,893,046 and $4,453,278, respectively.
NOTE 6 – INCOME TAXES
At March 31, 2015, information on the tax components of capital was as follows:
| | | | |
Cost of investments for tax purposes | | $ | 71,288,932 | |
| | | | |
Gross unrealized appreciation on a tax basis | | $ | 4,853,142 | |
Gross unrealized depreciation on a tax basis | | | (37,706 | ) |
| | | | |
Net unrealized appreciation (depreciation) on investments (tax basis) | | $ | 4,815,436 | |
| | | | |
At March 31, 2015, the Fund had deferred tax basis capital losses occurring subsequent to October 31, 2013 of $249,977. For tax purposes, such losses will be reflected in the year ending September 30, 2015.
At March 31, 2015, the Fund had cumulative tax basis capital losses of $177,925 (of which $127,505 is short-term and $50,420 is long-term), generated after September 30, 2011, which may be carried forward to offset future capital gains. To the extent such carry-forwards are used, capital gain distributions may be reduced to the extent provided by regulations. Such capital loss carryforwards do not expire.
OTHER NOTES
Risks: The Fund’s investments subject it to risks including, but not limited to, credit risk, interest rate risk, management risk, market and economic risk, liquidity risk, and the risks of investing primarily in the obligations of a single state. Please see the Fund’s prospectus for a discussion of the risks associated with an investment in the Fund.
Subsequent Events: Fund management believes no events have occurred between March 31, 2015 and the date of issuance of the financial statements that require adjustment to or disclosure in the accompanying financial statements.
16 Semi-Annual Report
This page intentionally left blank.
Semi-Annual Report 17
FINANCIAL HIGHLIGHTS
Thornburg New York Intermediate Municipal Fund
| | | | | | | | | | | | | | | | | | | | | | | | | | | | | | | | | | | | | | | | | | | | | | | | |
| | | PER SHARE PERFORMANCE (for a share outstanding throughout the Period)+ | | RATIOS TO AVERAGE NET ASSETS | | | SUPPLEMENTAL DATA | |
Unless Otherwise Noted, Periods are Fiscal Years Ended Sept. 30, | | Net Asset
Value
Beginning
of Period | | | Net Investment Income (Loss) | | Net
Realized
&
Unrealized
Gain (Loss)
on
Investments | | | Total from Investment Operations | | Dividends
from Net
Investment
Income | | | Dividends from Net Realized Gains | | Total
Dividends | | | Net Asset Value End of Period | | Net
Investment
Income
(Loss)
(%) | | | Expenses,
After
Expense
Reductions
(%) | | | Expenses,
After
Expense
Reductions
and
Net of
Custody
Credits
(%) | | | Expenses,
Before
Expense
Reductions
(%) | | | Total Return (%)(a) | | Portfolio
Turnover
Rate
(%)(a) | | Net
Assets
at End
of
Period
(Thousands) | |
CLASS A SHARES | | | | | | | | | | | | | | | | | | | | | | | | | | | | | | | | | | | | | | | |
2015(b)(c) | | $ | 13.22 | | | 0.14 | | | 0.05 | | | 0.19 | | | (0.14 | ) | | — | | | (0.14 | ) | | $13.27 | | | 2.18 | (d) | | | 0.99 | (d) | | | 0.99 | (d) | | | 1.07 | (d) | | 1.47 | | 6.29 | | $ | 52,071 | |
2014(c) | | $ | 12.93 | | | 0.30 | | | 0.29 | | | 0.59 | | | (0.30 | ) | | — | | | (0.30 | ) | | $13.22 | | | 2.27 | | | | 0.99 | | | | 0.99 | | | | 1.05 | | | 4.59 | | 14.12 | | $ | 54,301 | |
2013(c) | | $ | 13.44 | | | 0.34 | | | (0.51 | ) | | (0.17) | | | (0.34 | ) | | — | | | (0.34 | ) | | $12.93 | | | 2.54 | | | | 0.99 | | | | 0.99 | | | | 1.05 | | | (1.32) | | 11.31 | | $ | 54,061 | |
2012(c) | | $ | 12.93 | | | 0.37 | | | 0.51 | | | 0.88 | | | (0.37 | ) | | — | | | (0.37 | ) | | $13.44 | | | 2.80 | | | | 0.99 | | | | 0.99 | | | | 1.05 | | | 6.90 | | 13.37 | | $ | 55,862 | |
2011(c) | | $ | 12.82 | | | 0.41 | | | 0.11 | | | 0.52 | | | (0.41 | ) | | — | | | (0.41 | ) | | $12.93 | | | 3.26 | | | | 0.99 | | | | 0.99 | | | | 1.07 | | | 4.20 | | 26.39 | | $ | 45,551 | |
2010(c) | | $ | 12.79 | | | 0.42 | | | 0.04 | | | 0.46 | | | (0.43 | ) | | — | | | (0.43 | ) | | $12.82 | | | 3.38 | | | | 0.99 | | | | 0.99 | | | | 1.07 | | | 3.68 | | 11.79 | | $ | 48,203 | |
CLASS I SHARES | | | | | | | | | | | | | | | | | | | | | | | | | | | | | | | | | | | | | | | |
2015(b) | | $ | 13.22 | | | 0.17 | | | 0.05 | | | 0.22 | | | (0.17 | ) | | — | | | (0.17 | ) | | $13.27 | | | 2.50 | (d) | | | 0.67 | (d) | | | 0.67 | (d) | | | 0.72 | (d) | | 1.64 | | 6.29 | | $ | 28,244 | |
2014 | | $ | 12.93 | | | 0.33 | | | 0.30 | | | 0.63 | | | (0.34 | ) | | — | | | (0.34 | ) | | $13.22 | | | 2.57 | | | | 0.67 | | | | 0.67 | | | | 0.73 | | | 4.93 | | 14.12 | | $ | 23,922 | |
2013 | | $ | 13.44 | | | 0.38 | | | (0.51 | ) | | (0.13) | | | (0.38 | ) | | — | | | (0.38 | ) | | $12.93 | | | 2.86 | | | | 0.67 | | | | 0.67 | | | | 0.74 | | | (1.00) | | 11.31 | | $ | 7,060 | |
2012 | | $ | 12.92 | | | 0.41 | | | 0.52 | | | 0.93 | | | (0.41 | ) | | — | | | (0.41 | ) | | $13.44 | | | 3.12 | | | | 0.67 | | | | 0.67 | | | | 0.77 | | | 7.33 | | 13.37 | | $ | 4,707 | |
2011 | | $ | 12.82 | | | 0.45 | | | 0.10 | | | 0.55 | | | (0.45 | ) | | — | | | (0.45 | ) | | $12.92 | | | 3.54 | | | | 0.67 | | | | 0.67 | | | | 0.71 | | | 4.45 | | 26.39 | | $ | 3,514 | |
2010(e) | | $ | 12.48 | | | 0.29 | | | 0.35 | | | 0.64 | | | (0.30 | ) | | — | | | (0.30 | ) | | $12.82 | | | 3.53 | (d) | | | 0.67 | (d) | | | 0.67 | (d) | | | 1.32 | (d) | | 5.22 | | 11.79 | | $ | 1,772 | |
| (a) | Not annualized for periods less than one year. |
| (b) | Unaudited Six Month Period Ended March 31. |
| (c) | Sales loads are not reflected in computing total return. |
| (e) | Effective date of this class of shares was February 1, 2010. |
| + | Based on weighted average shares outstanding, except for Dividends from Net Investment Income and Net Realized Gains, which are actual amounts per share. |
See notes to financial statements.
| | | | |
| 18 Semi-Annual Report | | | | Semi-Annual Report 19 |
| | |
| EXPENSE EXAMPLE | | |
| |
Thornburg New York Intermediate Municipal Fund | | March 31, 2015 (Unaudited) |
As a shareholder of the Fund, you incur two types of costs:
| | (1) | transaction costs, including |
(a) sales charges (loads) on purchase payments, for Class A shares;
(b) a deferred sales charge on redemptions of any part or all of a purchase of $1 million of Class A shares within 12 months of purchase;
| | (2) | ongoing costs, including management fees; distribution and/or service (12b-1) fees; and other Fund expenses. |
This example is intended to help you understand your ongoing costs (in dollars) of investing in the Fund and to compare these costs with the ongoing costs of investing in other mutual funds.
The example is based on a $1,000 investment beginning on October 1, 2014, and held until March 31, 2015.
| | | | | | | | | | | | |
| | | Beginning
Account Value
10/1/14 | | | Ending
Account Value
3/31/15 | | | Expenses paid
During period†
10/1/14–3/31/15 | |
Class A Shares | | | | | | | | | | | | |
Actual | | $ | 1,000.00 | | | $ | 1,014.70 | | | $ | 4.97 | |
Hypothetical* | | $ | 1,000.00 | | | $ | 1,020.00 | | | $ | 4.99 | |
Class I Shares | | | | | | | | | | | | |
Actual | | $ | 1,000.00 | | | $ | 1,016.40 | | | $ | 3.36 | |
Hypothetical* | | $ | 1,000.00 | | | $ | 1,021.60 | | | $ | 3.37 | |
| † | Expenses are equal to the annualized expense ratio for each class (A: 0.99%; I: 0.67%) multiplied by the average account value over the period, multiplied by 182/365 to reflect the one-half year period. |
| * | Hypothetical assumes a rate of return of 5% per year before expenses. |
ACTUAL EXPENSES
For each class of shares, the first line of the accompanying table provides information about actual account values and actual expenses. You may use the information in this line, together with the amount you invested, to estimate the expenses that you paid over the period. Simply divide your account value by $1,000 (for example, an $8,600 account value divided by $1,000 = 8.6), then multiply the result by the number in the first line for your class of shares under the heading entitled “Expenses Paid During Period” to estimate the expenses you paid on your account during this period.
HYPOTHETICAL EXAMPLE FOR COMPARISON PURPOSES
For each class of shares, the second line of the accompanying table provides information about hypothetical account values and hypothetical expenses based on the Fund’s actual expense ratio and an assumed rate of return of 5% per year before expenses, which is not the Fund’s actual return. The hypothetical account values and expenses may not be used to estimate the actual ending account balance or expenses you paid for the period. You may use this information to compare the ongoing costs of investing in the Fund and other funds. To do so, compare this 5% hypothetical example with the 5% hypothetical examples that appear in the shareholder reports of the other funds.
Please note that the expenses shown in the table are meant to highlight your ongoing costs only and do not reflect any transactional costs, such as sales charges (loads), redemption fees, or exchange fees. Therefore, the second line of the table for each class of shares is useful in comparing ongoing costs only, and will not help you determine the relative total costs of owning different funds. In addition, if these transactional costs were included, your costs would have been higher.
20 Semi-Annual Report
| | |
| OTHER INFORMATION | | |
| |
Thornburg New York Intermediate Municipal Fund | | March 31, 2015 (Unaudited) |
PORTFOLIO PROXY VOTING
Policies and Procedures:
The Trust has delegated to Thornburg Investment Management, Inc. (the “Advisor”) voting decisions respecting proxies for the Fund’s voting securities. The Advisor makes voting decisions in accordance with its Proxy Voting Policy. A description of the Policy is available (i) without charge, upon request, by calling the Advisor toll-free at 1-800-847-0200, (ii) on the Thornburg website at www.thornburg. com, and (iii) on the Securities and Exchange Commission’s website at www.sec.gov.
Information regarding how proxies were voted is available on or before August 31 of each year for the twelve months ending the preceding June 30. This information is available (i) without charge, upon request by calling the Advisor toll-free at 1-800-847-0200, (ii) on the Thornburg website at www.thornburg.com, and (iii) on the Securities and Exchange Commission’s website at www.sec.gov.
AVAILABILITY OF QUARTERLY PORTFOLIO SCHEDULE
The Fund files with the Securities and Exchange Commission schedules of its portfolio holdings on Form N-Q for the first and third quarters of each fiscal year. The Fund’s Forms N-Q are available on the Commission’s website at www.sec.gov, or may be reviewed and copied at the Commission’s Public Reference Room in Washington, D.C. Information on the operation of the Public Reference Room may be obtained by calling 1-800-SEC-0330. The Fund also makes this information available on its website at www.thornburg. com/download or upon request by calling 1-800-847-0200.
Semi-Annual Report 21
TRUSTEES’ STATEMENT TO SHAREHOLDERS
Revised and Readopted September 15, 2014
The Trustees believe current and prospective shareholders should know how we discharge our responsibilities in supervising the Funds’ investment advisor and in reviewing the advisor’s contract for renewal. Since 2005, we have issued a statement which sets out clearly the three principal guidelines that we follow in supervising the Trust’s investment advisor on your behalf. In accordance with our customary practice, in September of 2014 we again reviewed our statement and concluded we should reissue this statement outlining the principal features of our supervision of the advisor’s performance of investment management services for the Funds.
We begin with the premise that each shareholder selected his or her Fund because its investments are managed by the investment advisor identified in the prospectus and in accordance with the objective and policies described in the prospectus. We realize, as each of you do, that if you believe that your Fund’s stated objective and policies no longer serve your personal investment goals, you can sell your shares and leave the Fund.
Therefore, we believe that our primary supervisory task – our principal obligation to you – is to assess the nature and quality of the advisor’s services, and to confirm that the advisor actively and competently pursues the Fund’s objective, in accordance with the policies set out in the prospectus. To do this, we meet regularly with management to review your Fund’s portfolio and to discuss the advisor’s specific actions and judgments in pursuing the Fund’s objective. We do not substitute our own judgment for the advisor’s decisions in selecting investments; the advisor is paid to exercise its informed judgment on investment decisions, and we seek to confirm, in reviewing the advisor’s performance, that the advisor is doing just that.
Second, we are conscious of costs and the effect that costs have on shareholders’ returns. We try to make sure that your Fund’s fees and costs are reasonable in relationship to the services rendered and that they are generally in line with those charged by other expert investment advisors, consistent with our belief that the Fund’s investors searched for and expect that expertise and attention and have decided to pay a reasonable price for it. We do not put the management contract “out to bid” as a matter of course, and we would not do so unless we had concluded that the advisor materially had failed to pursue the Fund’s objectives in accordance with its policies, or for other equally important reasons. We believe that any other approach would be inconsistent with your interests and contrary to your expectations when you bought shares of the Fund in the first place.
Finally, because we believe that most Thornburg Fund shareholders have invested with a long-term perspective, we try not to focus too much on the fashions of the moment and on short-term performance. The market will not favor any specific investment objective or set of policies at all times and under all economic circumstances. A fund will experience periods of both high and low returns relative to other funds and other investments. Even if one of our Funds is not favored by the market at a particular time, we believe that the advisor is nonetheless obliged to remain true to the Fund’s objective and policies, and we watch to see that it does so.
Trustees of Thornburg Investment Trust
22 Semi-Annual Report
THORNBURG FUND FAMILY
FUNDAMENTAL, BOTTOM-UP EQUITY RESEARCH
We search far and wide for the best stock ideas—within the United States and around the globe. Potential investments that may deserve a deeper look are thoroughly analyzed using both quantitative and qualitative criteria. But the vast majority are discarded. Those that ultimately make it into our highly-selective portfolios are continually monitored to determine whether our investment theses unfold as expected.
| | • | | Thornburg Core Growth Fund |
| | • | | Thornburg International Value Fund |
| | • | | Thornburg International Growth Fund |
| | • | | Thornburg Developing World Fund |
| | • | | Thornburg Investment Income Builder Fund |
| | • | | Thornburg Global Opportunities Fund |
A TRADITION OF DISCIPLINED BOND MANAGEMENT
At Thornburg, the word “disciplined” carries some substance. We don’t make a practice of using shortcuts to enhance yield or total returns. Every strategy is grounded in rigorous, bottom-up credit work. Portfolios are assembled carefully—in the case of our core bond funds, using laddered structures—to mitigate price fluctuation. Position sizes are controlled so that no single bond can have an outsized effect on a portfolio. And as with our equity portfolios, managers enjoy flexibility to seek an optimal risk/reward balance.
| | • | | Thornburg Low Duration Income Fund |
| | • | | Thornburg Limited Term U.S. Government Fund |
| | • | | Thornburg Limited Term Income Fund |
| | • | | Thornburg Strategic Income Fund |
| | • | | Thornburg Low Duration Municipal Fund |
| | • | | Thornburg Limited Term Municipal Fund |
| | • | | Thornburg Intermediate Municipal Fund |
| | • | | Thornburg California Limited Term Municipal Fund |
| | • | | Thornburg New Mexico Intermediate Municipal Fund |
| | • | | Thornburg New York Intermediate Municipal Fund |
| | • | | Thornburg Strategic Municipal Income Fund |
Before investing, carefully consider the Fund’s investment goals, risks, charges, and expenses. For a prospectus or summary prospectus containing this and other information, contact your financial advisor or visit thornburg.com. Read it carefully before investing.
For additional information, please visit thornburg.com
Thornburg Investment Management, Inc. 2300 North Ridgetop Road, Santa Fe, NM 87506
Semi-Annual Report 23

This Semi-Annual Report is submitted for the general information of shareholders of the Fund. It is not authorized for distribution to prospective investors in the Fund unless preceded or accompanied by an effective prospectus.
| | | | |
| Investment Advisor: | | Distributor: | | |
| Thornburg Investment Management® | | Thornburg Securities Corporation® | | |
| 800.847.0200 | | 800.847.0200 | | TH1069 |
FIRM OVERVIEW
THE FIRM
Thornburg Investment Management is a privately owned global investment firm that offers a range of solutions for retail and institutional investors. We are driven by our mission to help our clients reach their long-term financial goals through fundamental research and active portfolio management.
Founded in 1982 and headquartered in Santa Fe, New Mexico, we manage approximately $61 billion (as of March 31, 2015) across seven equity and 11 bond mutual funds, separate accounts for high-net-worth investors and institutional accounts, and five UCITS funds for non-U.S. investors.

CORE INVESTMENT PRINCIPLES
Our focus has always been on maintaining and building the investment expertise to manage Thornburg strategies to a high standard, while adhering to a core set of investment principles:
| | • | | We focus on the fundamentals. We invest according to our view of the fundamental value of an issuer only after performing thorough, bottom-up research. |
| | • | | We think and invest for the long term. We typically make investment decisions based upon an investment thesis we expect to play out over 18 months to several years. We may not always hold a security for several years, but our horizon line is typically a few years out. |
| | • | | We stay flexible. We go where we see value. Our investment mandates are generally broad and flexible, and we exercise as much flexibility as possible within any restrictions. |
| | • | | We collaborate across strategies. We are structured as global generalists. Portfolio managers and analysts do not specialize in sectors, geographies, or even security types, but instead must understand and communicate bottom-up fundamentals across industries, sectors, and borders. |
2 Semi-Annual Report
| | |
| Semi-Annual Report |
| |
| Thornburg Low Duration Income Fund | | |
| March 31, 2015 | | |
| |
| | |
| | | | |
| Share Class | | NASDAQ Symbol | | CUSIP |
Class A | | TLDAX | | 885-216-812 |
Class I | | TLDIX | | 885-216-796 |
Minimum investments for Class I shares are higher than those for other classes. Class I shares may not be available to all investors.
Investments in the Fund carry risks, including possible loss of principal. Bond funds have the same interest rate, inflation, and credit risks that are associated with the underlying bonds. The value of bonds will fluctuate relative to changes in interest rates, decreasing when interest rates rise. Unlike bonds, bond funds have ongoing fees and expenses. Please see the Fund’s prospectus for a discussion of the risks associated with an investment in the Fund. Investments in the Fund are not FDIC insured, nor are they deposits of or guaranteed by a bank or any other entity.
The laddering strategy does not assure or guarantee better performance and cannot eliminate the risk of investment losses.
Semi-Annual Report 3
| | |
| LETTER TO SHAREHOLDERS | | |
| |
Thornburg Low Duration Income Fund | | March 31, 2015 (Unaudited) |
April 10, 2015
Dear Fellow Shareholder:
We are pleased to present the semi-annual report for the Thornburg Low Duration Income Fund for the six months ended March 31, 2015. The net asset value (NAV) of a Class A share of the Thornburg Low Duration Income Fund increased two cents in the period to $12.40. If you were invested for the entire period you received dividends of 4.36 cents per share. Dividends per share were higher for Class I shares to account for varying class-specific expenses.
Combining income and change in price, Class A shares of the Thornburg Low Duration Income Fund produced a total return of 0.51% (without sales charge) over the six-month period. The Barclays U.S. 1–3 Year Aggregate Bond Index produced a total return of 0.77% over the same period. The Barclays index reflects no deduction for fees, expenses, or taxes. The average return for the Lipper Short Investment-Grade Debt Funds category was 0.65%.
Market Impact
The six-month period ended March 31, 2015, was relatively eventful. The Federal Reserve officially ended their quantitative easing (QE) program and has signaled that an eventual interest-rate hike is forthcoming. While U.S. Federal Reserve officials are busy attempting to engineer an unwind of zero interest rate policy, excess liquidity, and explicitly supporting particular areas of the fixed income market, European officials have moved in the opposite direction with an official announcement of their own quantitative easing program in January 2015. It is hard to get excited about U.S. rates considering the 10-year U.S. Treasury yield sat at 1.94% as of March 31, 2015. However, quantitative easing by the European Central Bank (ECB), in conjunction with low official policy rates and subdued inflation, caused rates on a significant portion of European sovereign bonds to move into negative territory during the period. This means investors purchasing high-quality European sovereign debt are now paying European central banks for the privilege of holding their money.
Despite the signal that the U.S. economy is on firmer footing and eventual rate hikes are likely to commence prior to the end of 2015, rates in the United States fell across most of the yield curve with only the very front end of the curve rising during the six months ended March 31, 2015. Our belief going into the period was that investors were poorly compensated for holding significant exposure to longer-term rates, so the Fund was positioned shorter on the yield curve and thus did not benefit as much as rates continued to fall in the longer end. The perceived disparity between U.S. and other global rate cycles caused the dollar to rally against nearly every other major global currency across the six-month period. A multitude of factors, including lower global growth along with the ‘supply revolution’ from U.S. shale caused oil to fall significantly throughout the period. West Texas Intermediate Crude oil ended the year at $53.27, and stood at $47.60 as of March 31, 2015. In sympathy with the general “risk-off” move, credit spreads on BBB rated five-year corporate bonds rose by 20 basis points during the six months ended March 31, 2015. Much of this move was in direct response to the fall in oil prices, with sectors less exposed to that decline performing better through the period. The Thornburg Low Duration Income Fund’s move up in quality throughout 2014 was rewarded. However, the Fund remained more exposed to broad credit than did the index.
A Cautious Outlook
As we look forward, we are cautious concerning the eventual normalization of Federal Reserve monetary policy and the impact this may have on longer-term rates, credit spreads, and markets more broadly. Federal Reserve officials have conveyed to the market that the unwind in rates is likely to be gradual and take place over a medium-term time horizon. Additionally, while the Federal Reserve remains “data dependent,” the intention of their first rate hike has already been communicated to markets. For these two reasons, we are hopeful that the normalization of rates will cause minimal market disruption. However, as stewards of your capital, we have felt it prudent to take the necessary precautions in the Thornburg Low Duration Income Fund to prepare for a potentially more volatile period ahead. Given the Fund’s lower duration and laddered portfolio structure, investors could benefit from a gradual pace of normalization to higher long-term yields.
As we have said in the past, when we believe fixed income investors are well compensated for assuming additional risk, we will position the portfolio to seek additional return. However, in times like this where term premiums in global rates are low and the all-in compensation (yield) for holding any given risk remains subdued, we employ the opposite strategy, seeking to pare back risk in most all forms. This has recently meant a continued shortening of duration relative to the benchmarks and longer-term neutral positioning for the Fund. Additionally, our caution has also meant a continued move up in quality, both in terms of credit and liquidity. The Fund now holds a higher cash and cash equivalents balance,
4 Semi-Annual Report
| | |
LETTER TO SHAREHOLDERS, CONTINUED | | |
| |
Thornburg Low Duration Income Fund | | March 31, 2015 (Unaudited) |
which we view as defensive as well as opportunistic. This capital can be deployed in periods of rising volatility to acquire quality assets where we believe the risk/reward tradeoff is skewed in our favor.
The Fund remains a laddered portfolio, a staple structure of Thornburg’s core fixed income funds for more than 30 years. Laddering balances duration and yield in a manner intended to provide attractive risk-adjusted returns over time. With an expected start to normalization of Federal Reserve policy, an eventual rise in the yield curve, and global imbalances exerting pressure on economies worldwide, we do not expect significant price increases in high-quality fixed income. Additionally, it is likely that investors should be ready for an elevated level of volatility across many asset classes, high-quality fixed income included. We have taken many measures to help shield investors from this volatility, but the Fund is likely to be affected as these events develop. Nevertheless, we believe the Fund is well positioned to achieve its longer-term goals of price stability and a reasonably attractive income stream, no matter what environment we may be entering. For investors with an appropriate medium-term investment horizon, we believe the Fund remains an appropriate vehicle for investors seeking low duration core bond investments.
Thank you very much for investing in the Fund.
Sincerely,
| | | | |
 | |  | |  |
| Jason H. Brady, CFA | | Lon R. Erickson, CFA | | Jeff Klingelhofer, CFA |
| Portfolio Manager | | Portfolio Manager | | Portfolio Manager |
| Managing Director | | Managing Director | | Managing Director |
The matters discussed in this report may constitute forward-looking statements made pursuant to the safe harbor provisions of the Securities Litigation Reform Act of 1995. These include any advisor or portfolio manager prediction, assessment, analysis or outlook for individual securities, industries, investment styles, market sectors and/or markets. These statements involve risks and uncertainties. In addition to the general risks described for each fund in its current prospectus, other factors bearing on these reports include the accuracy of the advisor’s or portfolio manager’s forecasts and predictions, the appropriateness of the investment strategies designed by the advisor or portfolio manager and the ability of the advisor or portfolio manager to implement their strategies efficiently and successfully. Any one or more of these factors, as well as other risks affecting the securities markets generally, could cause the actual results of any fund to differ materially as compared to its benchmarks.
The views expressed by the portfolio managers reflect their professional opinions and are subject to change. Under no circumstances does the information contained within represent a recommendation to buy or sell any security.
Semi-Annual Report 5
| | |
| PERFORMANCE SUMMARY | | |
| |
Thornburg Low Duration Income Fund | | March 31, 2015 (Unaudited) |
Average Annual Total Returns
| | | | | | | | |
| | | 1-Yr | | | Since
Incep. | |
A Shares (Incep: 12/30/13) | | | | | | | | |
Without sales charge | | | 1.15 | % | | | 1.48 | % |
With sales charge | | | -0.38 | % | | | 0.24 | % |
I Shares (Incep: 12/30/13) | | | 1.35 | % | | | 1.68 | % |
30-Day Yields, a Shares
(with sales charge)
| | | | |
Annualized Distribution Yield | | | 0.64 | % |
| |
SEC Yield | | | 0.59 | % |
Performance data shown represents past performance and is no guarantee of future results. Investment return and principal value will fluctuate so shares, when redeemed, may be worth more or less than their original cost. Current performance may be lower or higher than quoted. For performance current to the most recent month end, visit thornburg.com or call 800.847.0200. The performance information does not reflect the deduction of taxes that a shareholder would pay on distributions or the redemption of Fund shares. Returns reflect the reinvestment of dividends and capital gains. The maximum sales charge for the Fund’s Class A shares is 1.50%. There is no sales charge for Class I shares.
As disclosed in the most recent prospectus, the total annual fund operating expenses are as follows: A shares, 3.14%; I shares, 3.19%. Thornburg Investment Management and/or Thornburg Securities Corporation have contractually agreed to waive fees and reimburse expenses through at least February 1, 2016, for some of the share classes, resulting in net expense ratios of the following: A shares, 0.70%; I shares, 0.50%. For more detailed information on fund expenses and waivers/reimbursements please see the Fund’s prospectus.
Without the fee waivers and expense reimbursements described above the Annualized Distribution yield would have been negative 1.03%, and the SEC yield would have been negative 1.08%. Unsubsidized yields may be disproportionately negative due to the size of net assets and fixed expenses.
Glossary
Barclays U.S. 1–3 Yr Aggregate Bond Index – Index that measures the investment grade, U.S. dollar-denominated, fixed-rate taxable bond market with maturities between 1 and 3 years, including Treasuries, government-related and corporate securities, MBS (agency fixed-rate and hybrid ARM passthroughs), ABS, and CMBS.
Unless otherwise noted, index returns reflect the reinvestment of income dividends and capital gains, if any, but do not reflect fees, brokerage commissions or other expenses of investing. Investors may not make direct investments into any index. The performance of any index is not indicative of the performance of any particular investment.
Annualized Distribution Yield – The distribution yield reflects actual distributions made to shareholders. The annualized distribution yield is calculated by summing the last 30 days of income at a given month end and annualizing to a 360-day year. The result is divided by the ending maximum offering price.
Basis Point (bp) – A unit equal to 1/100th of 1%. 1% = 100 basis points (bps).
Credit Rating – A rating that assesses the financial ability of a debt issuer to make timely payments of principal and interest. Ratings of AAA (the highest), AA, A, and BBB are investment-grade quality. Ratings of BB, B, CCC, CC, C and D (the lowest) are considered below investment grade, speculative grade, or junk bonds.
Credit Spread/Quality Spread – The difference between the yields of securities with different credit qualities.
Duration – A bond’s sensitivity to interest rates. Effective duration incorporates the embedded option features, such as call provisions. Bonds with longer durations experience greater price volatility than bonds with shorter durations.
Laddering – Involves building a portfolio of bonds with staggered maturities so that a portion matures each year. Money that comes in from maturing bonds is typically invested in bonds with longer maturities at the far end of the portfolio.
Lipper Short Investment-Grade Debt Funds – Funds that invest primarily in investment-grade debt issues (rated in the top four grades) with dollar-weighted average maturities of less than three years.
Quantitative Easing (QE) – An unconventional monetary policy in which a central bank purchases financial assets from the market in order to lower interest rates and increase the money supply.
SEC Yield – SEC yield is computed in accordance with SEC standards measuring the net investment income per share over a specified 30-day period expressed as a percentage of the maximum offering price of the Fund’s shares at the end of the period.
Sovereign Debt – Government debt that has been issued in a foreign currency.
Term Premium – The excess yield that investors require to commit to holding a long-term bond instead of a series of shorter-term bonds.
West Texas Intermediate (WTI) Crude Oil – The benchmark for oil prices in the United States. WTI crude is a light sweet crude oil with low sulfur content that is often processed into gasoline on the American east coast and then piped across the country for consumption.
Yield Curve – A line that plots the interest rates, at a set point in time, of bonds having equal credit quality, but differing maturity dates.
6 Semi-Annual Report
| | |
| FUND SUMMARY | | |
| |
Thornburg Low Duration Income Fund | | March 31, 2015 (Unaudited) |
OBJECTIVES AND STRATEGIES
The Fund’s objective is to seek current income, consistent with preservation of capital. The Fund aims to reduce changes in its share value compared to longer duration fixed income portfolios by maintaining a laddered portfolio of investments with a dollar-weighted average duration of normally no more than three years.
Portfolio Ladder
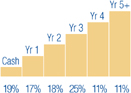
Percent of portfolio maturing in each year. Cash includes cash equivalents.
Security Credit Ratings
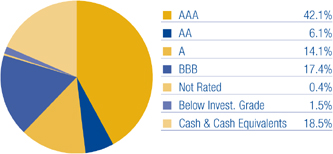
We have used ratings from Moody’s Investors Service. Where Moody’s ratings are not available, we have used Standard & Poor’s ratings. Where neither rating is available, we have used ratings from other rating agencies.
Key Portfolio Attributes
| | | | |
Number of Bonds | | | 100 | |
| |
Effective Duration | | | 1.4 Yrs | |
| |
Average Maturity | | | 1.8 Yrs | |
There is no guarantee that the Fund will meet its investment objectives.
All data is subject to change. Charts may not add up to 100% due to rounding.
Semi-Annual Report 7
| | |
| SCHEDULE OF INVESTMENTS | | |
| |
Thornburg Low Duration Income Fund | | March 31, 2015 (Unaudited) |
| | | | | | | | | | |
ISSUER-DESCRIPTION | | Credit Rating†
S&P/ Moody’s | | Principal
Amount | | | Value | |
U.S. TREASURY SECURITIES — 20.42% | | | | | | | | | | |
United States Treasury Notes, 0.25% due 7/15/2015 | | NR/Aaa | | $ | 635,000 | | | $ | 635,325 | |
United States Treasury Notes, 0.25% due 10/31/2015 | | NR/Aaa | | | 100,000 | | | | 100,045 | |
United States Treasury Notes, 0.25% due 12/31/2015 | | NR/Aaa | | | 100,000 | | | | 100,012 | |
United States Treasury Notes, 0.375% due 4/30/2016 | | NR/Aaa | | | 100,000 | | | | 100,055 | |
United States Treasury Notes, 0.375% due 5/31/2016 | | NR/Aaa | | | 565,000 | | | | 565,177 | |
United States Treasury Notes, 0.50% due 6/15/2016 | | NR/Aaa | | | 100,000 | | | | 100,164 | |
United States Treasury Notes, 0.625% due 12/15/2016 | | NR/Aaa | | | 100,000 | | | | 100,215 | |
United States Treasury Notes, 2.75% due 5/31/2017 | | NR/Aaa | | | 100,000 | | | | 104,541 | |
United States Treasury Notes, 0.875% due 6/15/2017 | | NR/Aaa | | | 100,000 | | | | 100,527 | |
United States Treasury Notes, 0.50% due 7/31/2017 | | NR/Aaa | | | 400,000 | | | | 398,469 | |
United States Treasury Notes, 0.75% due 12/31/2017 | | NR/Aaa | | | 300,000 | | | | 299,370 | |
United States Treasury Notes, 1.125% due 12/31/2019 | | NR/Aaa | | | 100,000 | | | | 99,005 | |
| | | | | | | | | | |
TOTAL U.S. TREASURY SECURITIES (Cost $2,692,631) | | | | | | | | | 2,702,905 | |
| | | | | | | | | | |
U.S. GOVERNMENT AGENCIES — 1.88% | | | | | | | | | | |
Export Leasing (2009), LLC, (Guaranty: Export-Import Bank of the United States), 1.859% due 8/28/2021 | | NR/NR | | | 84,604 | | | | 85,176 | |
a Micron Semiconductor Ltd., (Guaranty: Export-Import Bank of the United States), 1.258% due 1/15/2019 | | NR/NR | | | 80,000 | | | | 79,829 | |
Small Business Administration Participation Certificates, Series 2005-20K Class 1, 5.36% due 11/1/2025 | | NR/NR | | | 75,968 | | | | 83,478 | |
| | | | | | | | | | |
TOTAL U.S. GOVERNMENT AGENCIES (Cost $246,137) | | | | | | | | | 248,483 | |
| | | | | | | | | | |
OTHER GOVERNMENT — 1.54% | | | | | | | | | | |
a Corp Andina de Fomento, 3.75% due 1/15/2016 | | AA-/Aa3 | | | 100,000 | | | | 102,486 | |
a,b Turks and Caicos Islands, 3.20% due 2/22/2016 | | AAA/NR | | | 100,000 | | | | 102,068 | |
| | | | | | | | | | |
TOTAL OTHER GOVERNMENT (Cost $203,505) | | | | | | | | | 204,554 | |
| | | | | | | | | | |
MORTGAGE BACKED — 0.75% | | | | | | | | | | |
Federal Home Loan Mtg Corp., CMO Series K716 Class A1, 2.415% due 1/25/2021 | | NR/Aaa | | | 96,779 | | | | 99,665 | |
| | | | | | | | | | |
TOTAL MORTGAGE BACKED (Cost $98,547) | | | | | | | | | 99,665 | |
| | | | | | | | | | |
ASSET BACKED SECURITIES — 21.87% | | | | | | | | | | |
ADVANCE RECEIVABLES — 2.25% | | | | | | | | | | |
b HLSS Servicer Advance Receivables Trust, Series 2013-T5 Class AT5, 1.979% due 8/15/2046 | | AAA/NR | | | 100,000 | | | | 99,225 | |
b HLSS Servicer Advance Receivables Trust, Series 2013-T7 Class A7, 1.981% due 11/15/2046 | | AAA/NR | | | 100,000 | | | | 99,110 | |
b HLSS Servicer Advance Receivables Trust, Series 2014-T2 Class AT2, 2.217% due 1/15/2047 | | AAA/NR | | | 100,000 | | | | 99,107 | |
| | | | | | | | | | |
| | | | | | | | | 297,442 | |
| | | | | | | | | | |
AUTO RECEIVABLES — 4.88% | | | | | | | | | | |
b Avis Budget Rental Car Funding AESOP, LLC, Series 2012-3A Class A, 2.10% due 3/20/2019 | | NR/Aaa | | | 100,000 | | | | 101,228 | |
b Exeter Automobile Receivables Trust, Series 2014-1A Class A, 1.29% due 5/15/2018 | | AA/NR | | | 42,272 | | | | 42,354 | |
b Ford Credit Auto Owner Trust, Series 2015-1 Class A, 2.12% due 7/15/2026 | | AAA/NR | | | 100,000 | | | | 100,524 | |
b GM Financial Automobile Leasing Trust, Series 2014-2A Class A4, 1.62% due 2/20/2018 | | NR/Aaa | | | 100,000 | | | | 100,525 | |
b OSCAR US Funding Trust, Series 2014-1A Class A3, 1.72% due 4/15/2019 | | AAA/Aaa | | | 100,000 | | | | 100,648 | |
Santander Drive Auto Receivables Trust, Series 2013-2 Class B, 1.33% due 3/15/2018 | | AA/Aaa | | | 100,000 | | | | 100,239 | |
World Omni Auto Receivables Trust, Series 2014-B Class A4, 1.68% due 12/15/2020 | | AAA/NR | | | 100,000 | | | | 100,577 | |
| | | | | | | | | | |
| | | | | | | | | 646,095 | |
| | | | | | | | | | |
COMMERCIAL MTG TRUST — 5.37% | | | | | | | | | | |
b BAMLL-DB Trust, Series 2012-OSI Class A2FX, 3.352% due 4/13/2029 | | NR/Aaa | | | 99,953 | | | | 102,689 | |
b DBUBS Mtg Trust CMO, Series 2011-LC1A Class A1, 3.742% due 11/10/2046 | | NR/Aaa | | | 88,458 | | | | 89,972 | |
b DBUBS Mtg Trust CMO, Series 2011-LC2A Class A1FL, 1.528% due 7/12/2044 | | NR/Aaa | | | 63,941 | | | | 64,936 | |
b FREMF Mtg Trust, Series 2013-KF02 Class B Floating Rate Note, 2.833% due 12/25/2045 | | NR/Baa3 | | | 57,944 | | | | 59,024 | |
b GAHR Commercial Mtg Trust, Series 2015-NRF Class BFX, 3.382% due 12/15/2019 | | AA-/NR | | | 100,000 | | | | 102,374 | |
b JPMorgan Chase Commercial Mtg, Series 2013-JWRZ Class B Floating Rate Note, 1.325% due 4/15/2030 | | AA-/Aa3 | | | 100,000 | | | | 99,989 | |
b JPMorgan Chase Commercial Mtg, Series 2014-BXH Class A Floating Rate Note, 1.075% due 4/15/2027 | | AAA/NR | | | 100,000 | | | | 99,803 | |
WFRBS Commercial Mtg Trust, Series 2014-C22 Class A1, 1.479% due 9/15/2057 | | NR/Aaa | | | 92,622 | | | | 92,905 | |
| | | | | | | | | | |
| | | | | | | | | 711,692 | |
| | | | | | | | �� | | |
CREDIT CARD — 0.76% | | | | | | | | | | |
Synchrony Credit Card Master Note Trust, Series 2014-1 Class A, 1.61% due 11/15/2020 | | AAA/Aaa | | | 100,000 | | | | 100,527 | |
| | | | | | | | | | |
| | | | | | | | | 100,527 | |
| | | | | | | | | | |
8 Semi-Annual Report
| | |
| SCHEDULE OF INVESTMENTS, CONTINUED | | |
| |
Thornburg Low Duration Income Fund | | March 31, 2015 (Unaudited) |
| | | | | | | | | | |
Issuer-Description | | Credit Rating†
S&P/ Moody’s | | Principal
Amount | | | Value | |
OTHER ASSET BACKED — 5.96% | | | | | | | | | | |
b Alterna Funding I, LLC, Series 2014-1A, 1.639% due 2/15/2021 | | NR/NR | | $ | 80,307 | | | $ | 80,407 | |
b Ascentium Equipment Receivables, LLC, Series 2015-1A Class B, 2.36% due 6/10/2021 | | NR/Aa3 | | | 50,000 | | | | 50,206 | |
b CLI Funding, LLC, Series 2014-1A Class A, 3.29% due 6/18/2029 | | A/NR | | | 92,384 | | | | 93,165 | |
b Navistar Financial Dealer Note Master Owner Trust II, Series 2014-1 Class A Floating Rate Note, 0.921% due 10/25/2019 | | NR/Aaa | | | 100,000 | | | | 100,000 | |
b PFS Financing Corp., Series 2013-AA Class A Floating Rate Note, 0.725% due 2/15/2018 | | AAA/Aaa | | | 100,000 | | | | 99,907 | |
b PFS Tax Lien Trust, Series 2014-1, 1.44% due 5/15/2029 | | AAA/NR | | | 72,852 | | | | 73,016 | |
b SBA Tower Trust, Series 2012-1 Class C, 2.933% due 12/15/2042 | | NR/A2 | | | 100,000 | | | | 101,190 | |
b SBA Tower Trust, Series 2014-1A Class C, 2.898% due 10/15/2044 | | NR/A2 | | | 100,000 | | | | 101,215 | |
b Sierra Receivables Funding Co., LLC, Series 2012-1A Class A, 2.84% due 11/20/2028 | | A+/NR | | | 33,135 | | | | 33,543 | |
b Sierra Receivables Funding Co., LLC, Series 2014-1A Class A, 2.07% due 3/20/2030 | | A/NR | | | 56,825 | | | | 56,720 | |
| | | | | | | | | | |
| | | | | | | | | 789,369 | |
| | | | | | | | | | |
STUDENT LOAN — 2.65% | | | | | | | | | | |
b Navient Student Loan Trust, Series 2015-AA Class A1, 0.717% due 12/15/2021 | | NR/Aaa | | | 82,647 | | | | 82,587 | |
b Pennsylvania Higher Education Assistance Agency, Series 2012-1A Class A1 Floating Rate Note, 0.724% due 5/25/2027 | | AA+/NR | | | 80,448 | | | | 80,881 | |
b SLM Student Loan Trust, Series 2011-A Class A3 Floating Rate Note, 2.667% due 1/15/2043 | | AAA/Aaa | | | 100,000 | | | | 105,796 | |
SLM Student Loan Trust, Series 2013- 4 Class A Floating Rate Note, 0.724% due 6/25/2027 | | NR/Aaa | | | 81,390 | | | | 81,423 | |
| | | | | | | | | | |
| | | | | | | | | 350,687 | |
| | | | | | | | | | |
TOTAL ASSET BACKED SECURITIES (Cost $2,891,314) | | | | | | | | | 2,895,812 | |
| | | | | | | | | | |
CORPORATE BONDS — 30.26% | | | | | | | | | | |
AUTOMOBILES & COMPONENTS — 1.91% | | | | | | | | | | |
Automobiles — 1.91% | | | | | | | | | | |
b Hyundai Capital America, 2.00% due 3/19/2018 | | A-/Baa1 | | | 50,000 | | | | 50,801 | |
a,b Hyundai Capital Services, Inc., 6.00% due 5/5/2015 | | A-/Baa1 | | | 100,000 | | | | 100,382 | |
b Nissan Motor Acceptance Corp., 1.95% due 9/12/2017 | | A-/A3 | | | 100,000 | | | | 101,593 | |
| | | | | | | | | | |
| | | | | | | | | 252,776 | |
| | | | | | | | | | |
BANKS — 2.94% | | | | | | | | | | |
Banks — 2.11% | | | | | | | | | | |
Bank of America Corp. Floating Rate Note, 1.293% due 1/15/2019 | | A-/Baa2 | | | 100,000 | | | | 101,369 | |
Citigroup, Inc., 2.50% due 7/29/2019 | | A-/Baa2 | | | 75,000 | | | | 76,069 | |
a,b Standard Chartered plc, 3.20% due 5/12/2016 | | A-/A2 | | | 100,000 | | | | 102,235 | |
Thrifts & Mortgage Finance — 0.83% | | | | | | | | | | |
a,b Northern Rock Covered Bond LLP, 5.625% due 6/22/2017 | | AAA/Aaa | | | 100,000 | | | | 109,391 | |
| | | | | | | | | | |
| | | | | | | | | 389,064 | |
| | | | | | | | | | |
CAPITAL GOODS — 1.50% | | | | | | | | | | |
Construction & Engineering — 0.74% | | | | | | | | | | |
URS Corp., 3.85% due 4/1/2017 | | BB-/NR | | | 100,000 | | | | 98,625 | |
Machinery — 0.76% | | | | | | | | | | |
a,b Volvo Treasury AB, 5.95% due 4/1/2015 | | BBB/NR | | | 100,000 | | | | 100,000 | |
| | | | | | | | | | |
| | | | | | | | | 198,625 | |
| | | | | | | | | | |
COMMERCIAL & PROFESSIONAL SERVICES — 0.77% | | | | | | | | | | |
Commercial Services & Supplies — 0.77% | | | | | | | | | | |
Cintas Corp. No. 2, 2.85% due 6/1/2016 | | BBB+/A2 | | | 100,000 | | | | 102,331 | |
| | | | | | | | | | |
| | | | | | | | | 102,331 | |
| | | | | | | | | | |
CONSUMER SERVICES — 0.81% | | | | | | | | | | |
Diversified Consumer Services — 0.81% | | | | | | | | | | |
George Washington University, 4.411% due 9/15/2017 | | A+/A1 | | | 100,000 | | | | 107,184 | |
| | | | | | | | | | |
| | | | | | | | | 107,184 | |
| | | | | | | | | | |
DIVERSIFIED FINANCIALS — 4.40% | | | | | | | | | | |
Capital Markets — 3.25% | | | | | | | | | | |
a Deutsche Bank AG London, 2.50% due 2/13/2019 | | A/A3 | | | 75,000 | | | | 76,130 | |
Goldman Sachs Group, Inc. Floating Rate Note, 1.357% due 11/15/2018 | | A-/Baa1 | | | 100,000 | | | | 101,092 | |
Legg Mason, Inc., 2.70% due 7/15/2019 | | BBB/Baa1 | | | 100,000 | | | | 101,857 | |
a,b Macquarie Bank Ltd., 3.45% due 7/27/2015 | | A/A2 | | | 100,000 | | | | 100,865 | |
Morgan Stanley, 1.875% due 1/5/2018 | | A-/Baa2 | | | 50,000 | | | | 50,342 | |
Semi-Annual Report 9
| | |
| SCHEDULE OF INVESTMENTS, CONTINUED | | |
| |
Thornburg Low Duration Income Fund | | March 31, 2015 (Unaudited) |
| | | | | | | | | | |
Issuer-Description | | Credit Rating†
S&P/ Moody’s | | Principal
Amount | | | Value | |
Consumer Finance — 0.76% | | | | | | | | | | |
Synchrony Financial, 1.875% due 8/15/2017 | | BBB-/NR | | $ | 50,000 | | | $ | 50,041 | |
Synchrony Financial, 3.00% due 8/15/2019 | | BBB-/NR | | | 50,000 | | | | 51,085 | |
Diversified Financial Services — 0.39% | | | | | | | | | | |
Moody’s Corp., 2.75% due 7/15/2019 | | BBB+/NR | | | 50,000 | | | | 51,112 | |
| | | | | | | | | | |
| | | | | | | | | 582,524 | |
| | | | | | | | | | |
ENERGY — 1.45% | | | | | | | | | | |
Oil, Gas & Consumable Fuels — 1.45% | | | | | | | | | | |
a,b Delek & Avner Tamar Bond Ltd., 2.803% due 12/30/2016 | | BBB-/Baa3 | | | 100,000 | | | | 99,902 | |
a Petrobras Global Finance B.V. Floating Rate Note, 2.631% due 3/17/2017 | | BBB-/Ba2 | | | 100,000 | | | | 91,990 | |
| | | | | | | | | | |
| | | | | | | | | 191,892 | |
| | | | | | | | | | |
FOOD & STAPLES RETAILING — 0.56% | | | | | | | | | | |
Food & Staples Retailing — 0.56% | | | | | | | | | | |
Smith’s 1994-A3 Pass Through Trust, 9.20% due 7/2/2018 | | BBB/A3 | | | 65,655 | | | | 74,574 | |
| | | | | | | | | | |
| | | | | | | | | 74,574 | |
| | | | | | | | | | |
FOOD, BEVERAGE & TOBACCO — 3.05% | | | | | | | | | | |
Beverages — 0.77% | | | | | | | | | | |
a Coca Cola HBC Finance B.V., 5.50% due 9/17/2015 | | BBB/Baa1 | | | 100,000 | | | | 102,219 | |
Food Products — 1.51% | | | | | | | | | | |
General Mills, Inc., 1.40% due 10/20/2017 | | BBB+/A3 | | | 50,000 | | | | 50,130 | |
General Mills, Inc., 2.20% due 10/21/2019 | | BBB+/A3 | | | 50,000 | | | | 50,419 | |
Ingredion, Inc., 1.80% due 9/25/2017 | | BBB/Baa2 | | | 100,000 | | | | 99,992 | |
Tobacco — 0.77% | | | | | | | | | | |
Altria Group, Inc., 2.625% due 1/14/2020 | | BBB+/Baa1 | | | 100,000 | | | | 101,604 | |
| | | | | | | | | | |
| | | | | | | | | 404,364 | |
| | | | | | | | | | |
HEALTH CARE EQUIPMENT & SERVICES — 0.76% | | | | | | | | | | |
Health Care Providers & Services — 0.76% | | | | | | | | | | |
Catholic Health Initiatives, 1.60% due 11/1/2017 | | A/NR | | | 100,000 | | | | 100,293 | |
| | | | | | | | | | |
| | | | | | | | | 100,293 | |
| | | | | | | | | | |
INSURANCE — 1.53% | | | | | | | | | | |
Insurance — 1.53% | | | | | | | | | | |
b Principal Life Global Funding II, 1.50% due 9/11/2017 | | A+/A1 | | | 50,000 | | | | 50,217 | |
b Principal Life Global Funding II, 2.375% due 9/11/2019 | | A+/A1 | | | 50,000 | | | | 50,577 | |
b Reliance Standard Life Insurance Co., 2.50% due 4/24/2019 | | A+/A2 | | | 100,000 | | | | 101,366 | |
| | | | | | | | | | |
| | | | | | | | | 202,160 | |
| | | | | | | | | | |
MATERIALS — 0.76% | | | | | | | | | | |
Metals & Mining — 0.76% | | | | | | | | | | |
b Glencore Funding, LLC Floating Rate Note, 1.613% due 1/15/2019 | | BBB/Baa2 | | | 100,000 | | | | 100,036 | |
| | | | | | | | | | |
| | | | | | | | | 100,036 | |
| | | | | | | | | | |
PHARMACEUTICALS, BIOTECHNOLOGY & LIFE SCIENCES — 0.92% | | | | | | | | | | |
Pharmaceuticals — 0.92% | | | | | | | | | | |
a Actavis Funding SCS, 2.35% due 3/12/2018 | | BBB-/Baa3 | | | 60,000 | | | | 60,811 | |
a Actavis Funding SCS Floating Rate Note, 1.523% due 3/12/2020 | | BBB-/Baa3 | | | 60,000 | | | | 60,815 | |
| | | | | | | | | | |
| | | | | | | | | 121,626 | |
| | | | | | | | | | |
REAL ESTATE — 0.76% | | | | | | | | | | |
Real Estate Investment Trusts — 0.76% | | | | | | | | | | |
Select Income REIT, 2.85% due 2/1/2018 | | BBB-/Baa2 | | | 100,000 | | | | 100,857 | |
| | | | | | | | | | |
| | | | | | | | | 100,857 | |
| | | | | | | | | | |
SOFTWARE & SERVICES — 0.76% | | | | | | | | | | |
Information Technology Services — 0.76% | | | | | | | | | | |
Total System Services, Inc., 2.375% due 6/1/2018 | | BBB+/Baa3 | | | 100,000 | | | | 100,578 | |
| | | | | | | | | | |
| | | | | | | | | 100,578 | |
| | | | | | | | | | |
10 Semi-Annual Report
| | |
| SCHEDULE OF INVESTMENTS, CONTINUED | | |
| |
Thornburg Low Duration Income Fund | | March 31, 2015 (Unaudited) |
| | | | | | | | | | |
Issuer-Description | | Credit Rating†
S&P/ Moody’s | | Principal
Amount | | | Value | |
TECHNOLOGY HARDWARE & EQUIPMENT — 0.76% | | | | | | | | | | |
Communications Equipment — 0.76% | | | | | | | | | | |
Juniper Networks, Inc., 3.30% due 6/15/2020 | | BBB/Baa2 | | $ | 100,000 | | | $ | 101,197 | |
| | | | | | | | | | |
| | | | | | | | | 101,197 | |
| | | | | | | | | | |
TELECOMMUNICATION SERVICES — 3.15% | | | | | | | | | | |
Diversified Telecommunication Services — 2.36% | | | | | | | | | | |
AT&T, Inc. Floating Rate Note, 1.171% due 11/27/2018 | | BBB+/Baa1 | | | 100,000 | | | | 101,320 | |
a Telefonica Emisiones SAU, 6.421% due 6/20/2016 | | BBB/Baa2 | | | 100,000 | | | | 106,254 | |
Verizon Communications, Inc. Floating Rate Note, 2.021% due 9/14/2018 | | BBB+/Baa1 | | | 100,000 | | | | 104,303 | |
Wireless Telecommunication Services — 0.79% | | | | | | | | | | |
b Crown Castle Towers, LLC, 5.495% due 1/15/2037 | | NR/A2 | | | 100,000 | | | | 104,881 | |
| | | | | | | | | | |
| | | | | | | | | 416,758 | |
| | | | | | | | | | |
TRANSPORTATION — 1.18% | | | | | | | | | | |
Air Freight & Logistics — 0.42% | | | | | | | | | | |
b FedEx Corp. 2012 Pass Through Trust, 2.625% due 1/15/2018 | | BBB/A3 | | | 54,527 | | | | 55,659 | |
Road & Rail — 0.76% | | | | | | | | | | |
a,b Asciano Finance Ltd., 3.125% due 9/23/2015 | | BBB/Baa2 | | | 100,000 | | | | 100,835 | |
| | | | | | | | | | |
| | | | | | | | | 156,494 | |
| | | | | | | | | | |
UTILITIES — 2.29% | | | | | | | | | | |
Electric Utilities — 0.77% | | | | | | | | | | |
a,b Electricite de France S.A., 2.15% due 1/22/2019 | | A+/Aa3 | | | 100,000 | | | | 101,307 | |
Gas Utilities — 0.75% | | | | | | | | | | |
The Laclede Group, Inc. Floating Rate Note, 1.007% due 8/15/2017 | | BBB+/Baa2 | | | 100,000 | | | | 99,878 | |
Multi-Utilities — 0.77% | | | | | | | | | | |
Dominion Gas Holdings, LLC, 2.50% due 12/15/2019 | | A-/A2 | | | 100,000 | | | | 101,931 | |
| | | | | | | | | | |
| | | | | | | | | 303,116 | |
| | | | | | | | | | |
TOTAL CORPORATE BONDS (Cost $3,985,719) | | | | | | | | | 4,006,449 | |
| | | | | | | | | | |
| | | |
CONVERTIBLE BONDS — 0.36% | | | | | | | | | | |
REAL ESTATE — 0.36% | | | | | | | | | | |
Real Estate Investment Trusts — 0.36% | | | | | | | | | | |
b IAS Operating Partnership LP, 5.00% due 3/15/2018 | | NR/NR | | | 50,000 | | | | 48,125 | |
| | | | | | | | | | |
TOTAL CONVERTIBLE BONDS (Cost $47,000) | | | | | | | | | 48,125 | |
| | | | | | | | | | |
| | | |
MUNICIPAL BONDS — 3.43% | | | | | | | | | | |
JobsOhio Beverage System, 2.217% due 1/1/2019 (State Liquor Enterprise) | | AA/Aa3 | | | 100,000 | | | | 102,126 | |
Louisiana Local Government Environmental Facilities and Community Development Authority, 1.66% due 2/1/2022 (Louisiana Utilities Restoration) | | AAA/Aaa | | | 100,000 | | | | 100,706 | |
Massachusetts Housing Finance Agency, 1.45% due 12/1/2015 (Multi-Family Residential Development) | | A+/Aa3 | | | 100,000 | | | | 100,116 | |
Sandoval County New Mexico, 1.452% due 6/1/2017 | | A+/NR | | | 100,000 | | | | 100,722 | |
State of New York Mortgage Agency, 0.52% due 4/1/2015 | | NR/Aa1 | | | 50,000 | | | | 50,000 | |
| | | | | | | | | | |
TOTAL MUNICIPAL BONDS (Cost $446,601) | | | | | | | | | 453,670 | |
| | | | | | | | | | |
TOTAL INVESTMENTS — 80.51% (Cost $10,611,454) | | | | | | $ | 10,659,663 | |
OTHER ASSETS LESS LIABILITIES — 19.49% | | | | | | | 2,580,040 | |
| | | | | | | | | | |
NET ASSETS — 100.00% | | | | | | $ | 13,239,703 | |
| | | | | | | | | | |
Semi-Annual Report 11
| | |
| SCHEDULE OF INVESTMENTS, CONTINUED | | |
| |
Thornburg Low Duration Income Fund | | March 31, 2015 (Unaudited) |
Footnote Legend
| † | Credit ratings are unaudited. Rating changes may have occurred subsequent to the reporting period end. Bonds issued with a maturity of one year or less are assigned Moody’s ratings from MIG-1 to MIG-4 and Standard and Poor’s ratings from SP-1+ to SP-3 with MIG-1 and SP-1+ being the strongest ratings. |
| a | Yankee Bond - Denominated in U.S. dollars and is issued in the U.S. by foreign banks and corporations. |
| b | Securities exempt from registration under Rule 144A of the Securities Act of 1933, as amended. These securities may only be resold in the ordinary course of business in transactions exempt from registration, normally to qualified institutional buyers. As of March 31, 2015, the aggregate value of these securities in the Fund’s portfolio was $4,000,381, representing 30.22% of the Fund’s net assets. |
Portfolio Abbreviations
To simplify the listings of securities, abbreviations are used per the table below:
| | | | | | |
| CMO | | Collateralized Mortgage Obligation | | | | |
| Mtg | | Mortgage | | | | |
| REIT | | Real Estate Investment Trust | | | | |
| SBA | | Small Business Administration | | | | |
See notes to financial statements.
12 Semi-Annual Report
| | |
| STATEMENT OF ASSETS AND LIABILITIES | | |
| |
Thornburg Low Duration Income Fund | | March 31, 2015 (Unaudited) |
| | | | |
ASSETS | | | | |
Investments at value (cost $10,611,454) (Note 2) | | $ | 10,659,663 | |
Cash | | | 2,470,792 | |
Receivable for fund shares sold | | | 113,736 | |
Receivable from investment advisor | | | 8,457 | |
Interest receivable | | | 39,612 | |
Prepaid expenses and other assets | | | 25,491 | |
| | | | |
Total Assets | | | 13,317,751 | |
| | | | |
| |
LIABILITIES | | | | |
Payable for investments purchased | | | 64,928 | |
Payable for fund shares redeemed | | | 572 | |
Accounts payable and accrued expenses | | | 11,024 | |
Dividends payable | | | 1,524 | |
| | | | |
Total Liabilities | | | 78,048 | |
| | | | |
| |
NET ASSETS | | $ | 13,239,703 | |
| | | | |
NET ASSETS CONSIST OF | | | | |
Undistributed net investment income | | $ | 1,386 | |
Net unrealized appreciation on investments | | | 48,209 | |
Accumulated net realized gain (loss) | | | (190 | ) |
Net capital paid in on shares of beneficial interest | | | 13,190,298 | |
| | | | |
| | $ | 13,239,703 | |
| | | | |
| |
NET ASSET VALUE | | | | |
Class A Shares: | | | | |
Net asset value and redemption price per share ($8,844,597 applicable to 713,188 shares of beneficial interest outstanding - Note 4) | | $ | 12.40 | |
Maximum sales charge, 1.50% of offering price | | | 0.19 | |
| | | | |
Maximum offering price per share | | $ | 12.59 | |
| | | | |
| |
Class I Shares: | | | | |
Net asset value, offering and redemption price per share ($4,395,106 applicable to 354,389 shares of beneficial interest outstanding - Note 4) | | $ | 12.40 | |
| | | | |
See notes to financial statements.
Semi-Annual Report 13
| | |
| STATEMENT OF OPERATIONS | | |
| |
Thornburg Low Duration Income Fund | | Six Months Ended March 31, 2015 (Unaudited) |
| | | | |
INVESTMENT INCOME | | | | |
Interest income (net of premium amortized of $23,572) | | $ | 83,012 | |
| | | | |
| |
EXPENSES | | | | |
Investment advisory fees (Note 3) | | | 23,631 | |
Administration fees (Note 3) | | | | |
Class A Shares | | | 4,831 | |
Class I Shares | | | 1,022 | |
Distribution and service fees (Note 3) | | | | |
Class A Shares | | | 7,766 | |
Transfer agent fees | | | | |
Class A Shares | | | 9,203 | |
Class I Shares | | | 1,187 | |
Registration and filing fees | | | | |
Class A Shares | | | 14,548 | |
Class I Shares | | | 14,605 | |
Custodian fees (Note 3) | | | 13,343 | |
Professional fees | | | 26,225 | |
Accounting fees | | | 132 | |
Trustee fees | | | 245 | |
Other expenses | | | 1,958 | |
| | | | |
Total Expenses | | | 118,696 | |
Less: | | | | |
Expenses reimbursed by investment advisor (Note 3) | | | (45,437 | ) |
Investment Advisory and other Fund level fees waived by Investment Advisor (Note 3) | | | (35,648 | ) |
Fees paid indirectly (Note 3) | | | (343 | ) |
| | | | |
Net Expenses | | | 37,268 | |
| | | | |
Net Investment Income | | | 45,744 | |
| | | | |
REALIZED AND UNREALIZED GAIN (LOSS) | | | | |
Net realized gain (loss) on investments | | | 674 | |
Net change in unrealized appreciation (depreciation) on investments | | | 22,812 | |
| | | | |
Net Realized and Unrealized Gain | | | 23,486 | |
| | | | |
Net Increase in Net Assets Resulting from Operations | | $ | 69,230 | |
| | | | |
See notes to financial statements.
14 Semi-Annual Report
| | |
| STATEMENT OF CHANGES IN NET ASSETS | | |
| |
Thornburg Low Duration Income Fund | | |
| | | | | | | | |
| | | Six Months Ended
March 31, 2015* | | | Period Ended
September 30, 2014** | |
INCREASE (DECREASE) IN NET ASSETS FROM | | | | | | | | |
| | |
OPERATIONS | | | | | | | | |
Net investment income | | $ | 45,744 | | | $ | 57,563 | |
Net realized gain (loss) on investments | | | 674 | | | | 522 | |
Net unrealized appreciation (depreciation) on investments | | | 22,812 | | | | 25,397 | |
| | | | | | | | |
| | |
Net Increase (Decrease) in Net Assets Resulting from Operations | | | 69,230 | | | | 83,482 | |
| | |
DIVIDENDS TO SHAREHOLDERS | | | | | | | | |
From net investment income | | | | | | | | |
Class A Shares | | | (27,230 | ) | | | (28,921 | ) |
Class I Shares | | | (18,514 | ) | | | (28,642 | ) |
| | |
FUND SHARE TRANSACTIONS (NOTE 4) | | | | | | | | |
Class A Shares | | | 2,150,924 | | | | 6,667,167 | |
Class I Shares | | | 689,054 | | | | 3,683,153 | |
| | | | | | | | |
| | |
Net Increase in Net Assets | | | 2,863,464 | | | | 10,376,239 | |
| | |
NET ASSETS | | | | | | | | |
Beginning of Period | | | 10,376,239 | | | | — | |
| | | | | | | | |
| | |
End of Period | | $ | 13,239,703 | | | $ | 10,376,239 | |
| | | | | | | | |
| | |
Undistributed net investment income | | $ | 1,386 | | | $ | 1,386 | |
| ** | For the period from commencement of operations on December 30, 2013 through September 30, 2014. |
See notes to financial statements.
Semi-Annual Report 15
| | |
| NOTES TO FINANCIAL STATEMENTS | | |
| |
Thornburg Low Duration Income Fund | | March 31, 2015 (Unaudited) |
NOTE 1 – ORGANIZATION
Thornburg Low Duration Income Fund (the “Fund”) is a diversified series of Thornburg Investment Trust (the “Trust”). The Trust is organized as a Massachusetts business trust under a Declaration of Trust dated June 3, 1987 and is registered as a diversified, open-end management investment company under the Investment Company Act of 1940, as amended. The Fund is currently one of eighteen separate series of the Trust. Each series is considered to be a separate entity for financial reporting and tax purposes and bears expenses directly attributable to it. The Fund’s investment objective is to seek current income, consistent with preservation of capital.
The Fund currently offers two classes of shares of beneficial interest: Class A and Institutional Class (“Class I”). Each class of shares of the Fund represents an interest in the same portfolio of investments, except that (i) Class A shares are sold subject to a front-end sales charge collected at the time the shares are purchased and bear a service fee, (ii) Class I shares are sold at net asset value without a sales charge at the time of purchase and may be subject to a service fee, and (iii) the respective classes may have different reinvestment privileges and conversion rights. Additionally, the Fund may allocate among its classes certain expenses, to the extent allocable to specific classes, including transfer agent fees, government registration fees, certain printing and postage costs, and administrative and legal expenses. Currently, class specific expenses of the Fund are limited to service and distribution fees, administration fees, and certain registration and transfer agent expenses.
NOTE 2 – SIGNIFICANT ACCOUNTING POLICIES
The following is a summary of significant accounting policies followed by the Fund in the preparation of its financial statements. The Fund is an investment company and prepares its financial statements in conformity with U.S. generally accepted accounting principles (“GAAP”), including the investment company accounting and reporting guidance in the Financial Accounting Standards Board (the “FASB”) Accounting Standard Codification Topic 946. The preparation of financial statements in conformity with GAAP requires management to make estimates and assumptions that affect the reported amounts of assets and liabilities and disclosure of contingent assets and liabilities at the date of the financial statements and the reported amounts of increases (decreases) in net assets from operations during the reporting period. Actual results could differ from those estimates.
Significant accounting policies of the Fund are as follows:
Valuation Policy and Procedures: The Trustees of the Trust (the “Trustees”) have authorized employees of the Fund’s investment advisor, acting as the Valuation and Pricing Committee (the “Committee”), to make certain valuation determinations, subject to oversight and review by the Trustees and the Audit Committee of the Trustees. The Committee and other employees of the Fund’s investment advisor administer and implement the valuation process. The Committee regularly reviews its own fair value decisions, as well as valuations, valuation techniques and services furnished by pricing services, considers circumstances in the markets which may require valuation determinations by the Committee and reviews previous valuation determinations. The Committee also reports on its activities, the performance of the pricing services and other matters to the Trustees and the Audit Committee of the Trustees.
In determining a fair value for a portfolio investment, the Committee seeks to determine the price that the Fund would reasonably expect to receive upon a sale of the investment in an orderly transaction between market participants at the measurement date. Typically, the fair value process employs standing instructions to use quoted prices in active markets or the use of independent pricing services. Less frequently, the Committee may make a fair value determination using other methods. However, because fair value prices are estimated prices, the determination of fair value for an investment may differ from the value that would be realized by the Fund upon a sale of the investment, and that difference could be material to the Fund’s financial statements. The Committee’s determination of fair value for an investment may also differ from the prices obtained by other persons (including other mutual funds) for the investment.
Valuation of Investments: Debt obligations held by the Fund have a primary over-the-counter market and are valued by an independent pricing service approved by the Trustees. The pricing service ordinarily values debt obligations using quoted bid prices and other methods which include consideration of yields or prices of debt obligations of comparable quality, type of issue, coupon, maturity and rating, and indications as to value from dealers and general market conditions.
In any case when a pricing service fails to provide a price for a debt obligation held by the Fund, the Committee determines a fair value for the debt obligation using procedures in accordance with a policy approved by the Trustees, which may include the use of a price obtained from a different independent pricing service. Additionally, in any case when management believes that a price provided by a pricing service for a debt obligation held by the Fund may be unreliable, the Committee decides whether or not to use the pricing service’s valuation or to use an alternative method to determine a fair value for the debt obligation.
Valuation Measurements: The Fund categorizes its investments based upon the inputs used in valuing those investments, according to a three-level hierarchy established by guidance from the the FASB. Categorization of investments using this hierarchy is intended by the FASB to maximize the use of observable inputs and minimize the use of unobservable inputs by prioritizing that the most observable input be used when available. Observable inputs are those that market participants would use in valuing an investment based on avail-
16 Semi-Annual Report
| | |
| NOTES TO FINANCIAL STATEMENTS, CONTINUED | | |
| |
Thornburg Low Duration Income Fund | | March 31, 2015 (Unaudited) |
able market data. Unobservable inputs are those that reflect assumptions about the information market participants would use in valuing an investment. An investment’s level within the hierarchy is based on the lowest level input that is deemed significant to the fair value measurement. The methodologies and relative inputs used to value investments are not necessarily indications of the risk or liquidity associated with investing in those investments.
Various inputs are used in determining the fair value measurement of the Fund’s investments. These inputs are generally summarized according to the three-level hierarchy below:
Level 1: Quoted prices in active markets for identical investments.
Level 2: Other direct or indirect significant observable inputs (including quoted prices for similar investments in active markets and other observable inputs, such as interest rates, prepayment rates, credit risk, etc.).
Level 3: Significant unobservable inputs (including the Committee’s own assumptions in determining the fair value of investments).
Portfolio investments with minimal, if any, market activity are characterized as Level 3 and are valued using significant unobservable inputs, typically including single broker quotes, which may be adjusted or unadjusted, related or comparable investments, last available transactions, and other relevant information. Valuations may also be based upon current market prices of securities that are comparable in coupon, rating, maturity and industry. An income based valuation approach would consider discounted anticipated future cash flows of the investment. Discounts may also be applied due to the nature or duration of any restrictions on the disposition of the investment. Valuations based upon the use of inputs from Levels 1, 2, or 3, may not represent the actual price received upon the disposition of an investment, and the Fund may receive a price that is lower than the valuation when it sells the investment.
The following table displays a summary of the fair value hierarchy measurements of the Fund’s investments as of March 31, 2015. In any instance when valuation inputs from more than one level are used to determine the fair value of a specific investment, the investment is placed in the level of the table based upon the lowest level input that is significant in determining the fair value of the investment:
| | | | | | | | | | | | | | | | |
| | | Fair Value Measurements at March 31, 2015 | |
| | | Total | | | Level 1 | | | Level 2 | | | Level 3 | |
Assets | | | | | | | | | | | | | | | | |
Investments in Securities | | | | | | | | | | | | | | | | |
U.S. Treasury Securities | | $ | 2,702,905 | | | $ | 2,702,905 | | | $ | — | | | $ | — | |
U.S. Government Agencies | | | 248,483 | | | | — | | | | 248,483 | | | | — | |
Other Government | | | 204,554 | | | | — | | | | 204,554 | | | | — | |
Mortgage Backed | | | 99,665 | | | | — | | | | 99,665 | | | | — | |
Asset Backed Securities | | | 2,895,812 | | | | — | | | | 2,895,812 | | | | — | |
Corporate Bonds | | | 4,006,449 | | | | — | | | | 4,006,449 | | | | — | |
Convertible Bonds | | | 48,125 | | | | — | | | | 48,125 | | | | — | |
Municipal Bonds | | | 453,670 | | | | — | | | | 453,670 | | | | — | |
| | | | | | | | | | | | | | | | |
Total Investments in Securities | | $ | 10,659,663 | | | $ | 2,702,905 | | | $ | 7,956,758 | | | $ | — | |
In accordance with the guidance prescribed in Accounting Standards Update No. 2011-04, it is the policy of the Fund to recognize transfers between levels and the underlying events which caused the movement. The Fund recognized no transfers between levels for the six months ended March 31, 2015.
Semi-Annual Report 17
| | |
| NOTES TO FINANCIAL STATEMENTS, CONTINUED | | |
| |
Thornburg Low Duration Income Fund | | March 31, 2015 (Unaudited) |
A rollforward of fair value measurements using significant unobservable inputs (Level 3) for the six months ended March 31, 2015 is as follows:
| | | | | | | | |
| | | Asset Backed
Securities | | | Total | |
Beginning Balance 9/30/2014 | | $ | 100,000 | | | $ | 100,000 | |
Accrued Discounts (Premiums) | | | (179 | ) | | | (179 | ) |
Net Realized Gain (Loss)(a) | | | 179 | | | | 179 | |
Gross Purchases | | | — | | | | — | |
Gross Sales | | | 100,000 | | | | 100,000 | |
Net Change in Unrealized | | | | | | | | |
Appreciation (Depreciation) | | | — | | | | — | |
Transfers into Level 3 | | | — | | | | — | |
Transfers out of Level 3 | | | — | | | | — | |
| | | | | | | | |
Ending Balance 3/31/2015 | | $ | — | | | $ | — | |
| (a) | Amount of Net Realized Gain (Loss) recognized in the net increase in net assets resulting from operations is included in the Fund’s Statement of Operations for the six months ended March 31, 2015. |
Federal Income Taxes: It is the policy of the Trust to comply with the provisions of the Internal Revenue Code applicable to “regulated investment companies” and to distribute to shareholders substantially all taxable income, including any net realized gain on investments of the Fund. Therefore, no provision for federal income taxes is required.
Management reviews each uncertain tax position believed to be material to the preparation of the Fund’s financial statements, to assess if it is more likely than not that the position would be sustained upon examination, based upon the technical merits of the position. As of March 31, 2015, management has not identified any such position for which an asset or liability must be reflected in the Statement of Assets and Liabilities. The Fund’s tax returns remain subject to examination for three years after filing.
When-Issued and Delayed Delivery Transactions: The Fund may engage in when-issued or delayed delivery transactions. To the extent the Fund engages in such transactions, it will do so for the purpose of acquiring portfolio investments consistent with the Fund’s investment objectives and not for the purpose of investment leverage or to speculate on interest rate and/or market changes. At the time the Fund makes a commitment to purchase an investment on a when-issued or delayed delivery basis, the Fund will record the transaction and reflect the value in determining its net asset value. When effecting such transactions, assets of an amount sufficient to make payment for the portfolio investments to be purchased will be segregated on the Fund’s records on the trade date. Investments purchased on a when-issued or delayed delivery basis do not earn interest until the settlement date.
Dividends: Net investment income of the Fund is declared daily as a dividend on shares for which the Fund has received payment. Dividends are paid monthly and are reinvested in additional shares of the Fund at net asset value per share at the close of business on the dividend payment date, or at the shareholder’s option, paid in cash. Net realized capital gains, to the extent available, will be distributed at least annually.
Repurchase Agreements: The Fund may invest excess cash in repurchase agreements whereby the Fund purchases investments, which serve as collateral, with an agreement to resell such collateral to the seller at an agreed upon price at the maturity date of the repurchase agreement. Investments pledged as collateral for repurchase agreements are held in custody until maturity of the repurchase agreement. Provisions in the agreements require that the market value of the collateral is at least equal to the repurchase value in the event of default. In the event of default, the Fund has the right to liquidate the collateral and apply the proceeds in satisfaction of the obligation. Under certain circumstances, in the event of default or bankruptcy by the other party to the agreement, realization and/or retention of the collateral may be subject to legal proceedings.
General: Investment transactions are accounted for on a trade date basis. Interest income is accrued as earned. Premiums and discounts on securities purchased are amortized over the life of the respective securities. Realized gains and losses from the sale of securities are recorded on an identified cost basis. The Funds invest in various mortgage-backed securities. Such securities pay interest and a portion of principal each month, which is then available for investment in securities at prevailing prices. Paydown gains and losses on these securities are included in interest income. Net investment income (other than class specific expenses) and realized and unrealized gains and losses are allocated daily to each class of shares based upon the relative net asset value of outstanding shares (or the value of the dividend-eligible shares, as appropriate) of each class of shares at the beginning of the day (after adjusting for the current share activity of the respective class). Expenses common to all Funds are allocated among the Funds comprising the Trust based upon their relative net asset values or other appropriate allocation methods.
18 Semi-Annual Report
| | |
| NOTES TO FINANCIAL STATEMENTS, CONTINUED | | |
| |
Thornburg Low Duration Income Fund | | March 31, 2015 (Unaudited) |
Guarantees and Indemnifications: Under the Trust’s organizational documents (and under separate agreements with the independent Trustees), its officers and Trustees are indemnified against certain liabilities arising out of the performance of their duties to the Fund. Additionally, in the normal course of business the Trust enters into contracts with service providers that contain general indemnification clauses. The Trust’s maximum exposure under these arrangements is unknown. However, based on experience, the Trust expects the risk of loss to be remote.
NOTE 3 – INVESTMENT ADVISORY FEE AND OTHER TRANSACTIONS WITH AFFILIATES
Pursuant to an investment advisory agreement, Thornburg Investment Management, Inc. (the “Advisor”) serves as the investment advisor and performs services for the Fund for which the fees are payable at the end of each month. For the six months ended March 31, 2015, these fees were payable at annual rates ranging from .40 of 1% to .225 of 1% per annum of the average daily net assets of the Fund depending on the Fund’s asset size. The Trust also has entered into administrative services agreements with the Advisor, whereby the Advisor will perform certain administrative services for the shareholders of each class of the Fund’s shares, and for which fees will be payable at an annual rate of up to .125 of 1% per annum of the average daily net assets attributable to each class of shares.
The Trust has an underwriting agreement with Thornburg Securities Corporation (the “Distributor,” an affiliate of the Advisor), which acts as the distributor of the Fund’s shares. For the six months ended March 31, 2015, the Distributor has advised the Fund that it earned net commissions aggregating $391 from the sale of Class A shares of the Fund.
Pursuant to a service plan under Rule 12b-1 of the Investment Company Act of 1940, the Fund may reimburse to the Advisor an amount not to exceed .20 of 1% per annum of the average daily net assets attributable to each Class of shares of the Fund for payments made by the Advisor to securities dealers and other financial institutions to obtain various shareholder and distribution related services. For the six months ended March 31, 2015, there were no 12b-1 service plan fees charged for Class I shares. The Advisor may pay out of its own resources additional expenses for distribution of the Fund’s shares and shareholder services.
The Advisor and Distributor have contractually agreed to waive fees and reimburse expenses incurred by the Fund so that actual expenses of certain share classes do not exceed levels as specified in the Fund’s most recent prospectus. The agreement may be terminated by the Fund at any time, but may not be terminated by the Advisor or Distributor before February 1, 2016, unless the Advisor ceases to be the investment advisor to the Fund or the Distributor ceases to be the distributor of the Fund prior to that date. The Advisor and Distributor retain the right to be repaid by the Fund for fee waivers and expense reimbursements if expenses fall below the contractual limit prior to the end of the fiscal year.
For the six months ended March 31, 2015, the Advisor contractually reimbursed certain class specific expenses and administrative fees of $28,623 for Class A shares and $16,814 for Class I shares, and voluntarily waived investment advisory fees of $35,648.
The Trust has an agreement with the custodian bank to indirectly pay a portion of the custodian’s fees through credits earned by the Fund’s cash on deposit with the bank. This deposit agreement is an alternative to overnight investments. Custodial fees are adjusted to reflect amounts that would have been paid without this agreement, with a corresponding adjustment reflected as fees paid indirectly in the Statement of Operations. For the six months ended March 31, 2015, fees paid indirectly were $343.
Certain officers and Trustees of the Trust are also officers or directors of the Advisor and Distributor. The compensation of independent Trustees is borne by the Trust.
Semi-Annual Report 19
| | |
| NOTES TO FINANCIAL STATEMENTS, CONTINUED | | |
| |
Thornburg Low Duration Income Fund | | March 31, 2015 (Unaudited) |
NOTE 4 – SHARES OF BENEFICIAL INTEREST
At March 31, 2015, there were an unlimited number of shares with no par value of beneficial interest authorized. Transactions in shares of beneficial interest were as follows:
| | | | | | | | | | | | | | | | |
| | | Six Months Ended
March 31, 2015 (Unaudited) | | | Period Ended
September 30, 2014* (Audited) | |
| | | Shares | | | Amount | | | Shares | | | Amount | |
Class A Shares | | | | | | | | | | | | | | | | |
Shares sold | | | 221,385 | | | $ | 2,742,631 | | | | 548,858 | | | $ | 6,781,755 | |
Shares issued to shareholders in reinvestment of dividends | | | 1,722 | | | | 21,330 | | | | 2,224 | | | | 27,529 | |
Shares repurchased | | | (49,520 | ) | | | (613,037 | ) | | | (11,481 | ) | | | (142,117 | ) |
| | | | | | | | | | | | | | | | |
| | | | |
Net increase (decrease) | | | 173,587 | | | $ | 2,150,924 | | | | 539,601 | | | $ | 6,667,167 | |
| | | | | | | | | | | | | | | | |
| | | | |
Class I Shares | | | | | | | | | | | | | | | | |
Shares sold | | | 69,994 | | | $ | 867,460 | | | | 342,617 | | | $ | 4,225,814 | |
Shares issued to shareholders in reinvestment of dividends | | | 1,419 | | | | 17,579 | | | | 2,304 | | | | 28,523 | |
Shares repurchased | | | (15,815 | ) | | | (195,985 | ) | | | (46,130 | ) | | | (571,184 | ) |
| | | | | | | | | | | | | | | | |
| | | | |
Net increase (decrease) | | | 55,598 | | | $ | 689,054 | | | | 298,791 | | | $ | 3,683,153 | |
| | | | | | | | | | | | | | | | |
| * | Fund commenced operations on December 30, 2013. |
NOTE 5 – INVESTMENT TRANSACTIONS
For the six months ended March 31, 2015, the Fund had purchase and sale transactions of investments (excluding short-term investments and U. S. Government obligations) of $1,942,431 and $540,174, respectively.
NOTE 6 – INCOME TAXES
At March 31, 2015, information on the tax components of capital was as follows:
| | | | |
Cost of investments for tax purposes | | $ | 10,611,454 | |
| | | | |
Gross unrealized appreciation on a tax basis | | $ | 69,502 | |
Gross unrealized depreciation on a tax basis | | | (21,293 | ) |
| | | | |
Net unrealized appreciation (depreciation)on investments (tax basis) | | $ | 48,209 | |
| | | | |
At March 31, 2015, the Fund had cumulative tax basis capital losses of $864 (of which $864 is short-term and $0 is long-term), generated after September 30, 2011, which may be carried forward to offset future capital gains. To the extent such carryforwards are used, capital gain distributions may be reduced to the extent provided by regulations. Such capital loss carryforwards do not expire.
OTHER NOTES
Risks: The Fund’s investments subject it to risks including, but not limited to, credit risk, interest rate risk, prepayment risk, management risk, market and economic risk, liquidity risk, risks affecting specific issuers, and the risks associated with investments in non-U.S. issuers. Please see the Fund’s prospectus for a discussion of the risks associated with an investment in the Fund.
Subsequent Events: Fund management believes no events have occurred between March 31, 2015 and the date of issuance of the financial statements that require adjustment to or disclosure in the accompanying financial statements.
20 Semi-Annual Report
This page intentionally left blank.
Semi-Annual Report 21
FINANCIAL HIGHLIGHTS
Thornburg Low Duration Income Fund
| | | | | | | | | | | | | | | | | | | | | | | | | | | | | | | | | | | | | | | | | | | | | | | | | | | | | | | | | | | | |
| | | PER SHARE PERFORMANCE (for a share outstanding throughout the Period)+ | | | RATIOS TO AVERAGE NET ASSETS | | | SUPPLEMENTAL DATA | |
Unless Otherwise Noted, Periods are Fiscal Years Ended Sept. 30, | | Net Asset
Value
Beginning
of Period | | | Net
Investment
Income
(Loss) | | | Net
Realized
&
Unrealized
Gain (Loss)
on
Investments | | | Total from
Investment
Operations | | | Dividends
from Net
Investment
Income | | | Dividends
from Net
Realized
Gains | | | Total
Dividends | | | Net
Asset
Value
End
of
Period | | | Net
Investment
Income
(Loss)
(%) | | | Expenses,
After
Expense
Reductions
(%) | | | Expenses,
After
Expense
Reductions
and
net of
Custody
Credits
(%) | | | Expenses,
Before
Expense
Reductions
(%) | | | Total
Return
(%)(a) | | | Portfolio
Turnover
Rate
(%)(a) | | | Net
Assets
at End
of
Period
(Thousands) | |
Class A Shares | | | | | | | | | | | | | | | | | | | | | | | | | | | | | | | | | | | | | | | | | | | | | | | | | | | | | | | | | | | | |
2015(b)(c) | | $ | 12.38 | | | | 0.04 | | | | 0.02 | | | | 0.06 | | | | (0.04 | ) | | | — | | | | (0.04 | ) | | $ | 12.40 | | | | 0.70 | (d) | | | 0.71 | (d) | | | 0.70 | (d) | | | 2.05 | (d) | | | 0.51 | | | | 6.55 | | | $ | 8,845 | |
2014(c)(e) | | $ | 12.31 | | | | 0.08 | | | | 0.08 | | | | 0.16 | | | | (0.09 | ) | | | — | | | | (0.09 | ) | | $ | 12.38 | | | | 0.92 | (d) | | | 0.62 | (d) | | | 0.61 | (d) | | | 3.14 | (d) | | | 1.33 | | | | 23.70 | | | $ | 6,678 | |
Class I Shares | | | | | | | | | | | | | | | | | | | | | | | | | | | | | | | | | | | | | | | | | | | | | | | | | | | | | | | | | | | | |
2015(b) | | $ | 12.38 | | | | 0.06 | | | | 0.02 | | | | 0.08 | | | | (0.06 | ) | | | — | | | | (0.06 | ) | | $ | 12.40 | | | | 0.91 | (d) | | | 0.51 | (d) | | | 0.50 | (d) | | | 1.93 | (d) | | | 0.61 | | | | 6.55 | | | $ | 4,395 | |
2014(e) | | $ | 12.31 | | | | 0.11 | | | | 0.07 | | | | 0.18 | | | | (0.11 | ) | | | — | | | | (0.11 | ) | | $ | 12.38 | | | | 1.19 | (d) | | | 0.41 | (d) | | | 0.41 | (d) | | | 3.19 | (d) | | | 1.48 | | | | 23.70 | | | $ | 3,698 | |
| (a) | Not annualized for periods less than one year. |
| (b) | Unaudited Six Month Period Ended March 31. |
| (c) | Sales loads are not reflected in computing total return. |
| (e) | Fund commenced operations on December 30, 2013. |
| + | Based on weighted average shares outstanding, except for Dividends from Net Investment Income and Net Realized Gains, which are actual amounts per share. |
See notes to financial statements.
| | | | |
| 22 Semi-Annual Report | | | | Semi-Annual Report 23 |
| | |
| EXPENSE EXAMPLE | | |
| |
Thornburg Low Duration Income Fund | | March 31, 2015 (Unaudited) |
As a shareholder of the Fund, you incur two types of costs:
| | (1) | transaction costs, including |
(a) sales charges (loads) on purchase payments, for Class A shares;
(b) a deferred sales charge on redemptions of any part or all of a purchase of $1 million of Class A shares within 12 months of purchase;
| | (2) | ongoing costs, including management fees; distribution and/ or service (12b-1) fees; and other Fund expenses. |
This example is intended to help you understand your ongoing costs (in dollars) of investing in the Fund and to compare these costs with the ongoing costs of investing in other mutual funds.
The example is based on a $1,000 investment beginning on October 1, 2014, and held until March 31, 2015.
| | | | | | | | | | | | |
| | | Beginning
Account Value
10/1/14 | | | Ending
Account Value
3/31/15 | | | Expenses Paid
During Period†
10/1/14–3/31/15 | |
Class A Shares | | | | | | | | | | | | |
Actual | | $ | 1,000.00 | | | $ | 1,005.10 | | | $ | 3.50 | |
Hypothetical* | | $ | 1,000.00 | | | $ | 1,021.44 | | | $ | 3.53 | |
Class I Shares | | | | | | | | | | | | |
Actual | | $ | 1,000.00 | | | $ | 1,006.10 | | | $ | 2.50 | |
Hypothetical* | | $ | 1,000.00 | | | $ | 1,022.44 | | | $ | 2.52 | |
| † | Expenses are equal to the annualized expense ratio for each class (A: 0.70%; I: 0.50%) multiplied by the average account value over the period, multiplied by 182/365 to reflect the one-half year period. |
| * | Hypothetical assumes a rate of return of 5% per year before expenses. |
ACTUAL EXPENSES
For each class of shares, the first line of the accompanying table provides information about actual account values and actual expenses. You may use the information in this line, together with the amount you invested, to estimate the expenses that you paid over the period. Simply divide your account value by $1,000 (for example, an $8,600 account value divided by $1,000 = 8.6), then multiply the result by the number in the first line for your class of shares under the heading entitled “Expenses Paid During Period” to estimate the expenses you paid on your account during this period.
HYPOTHETICAL EXAMPLE FOR COMPARISON PURPOSES
For each class of shares, the second line of the accompanying table provides information about hypothetical account values and hypothetical expenses based on the Fund’s actual expense ratio and an assumed rate of return of 5% per year before expenses, which is not the Fund’s actual return. The hypothetical account values and expenses may not be used to estimate the actual ending account balance or expenses you paid for the period. You may use this information to compare the ongoing costs of investing in the Fund and other funds. To do so, compare this 5% hypothetical example with the 5% hypothetical examples that appear in the shareholder reports of the other funds.
Please note that the expenses shown in the table are meant to highlight your ongoing costs only and do not reflect any transactional costs, such as sales charges (loads), redemption fees, or exchange fees. Therefore, the second line of the table for each class of shares is useful in comparing ongoing costs only, and will not help you determine the relative total costs of owning different funds. In addition, if these transactional costs were included, your costs would have been higher.
24 Semi-Annual Report
| | |
| OTHER INFORMATION | | |
| |
Thornburg Low Duration Income Fund | | March 31, 2015 (Unaudited) |
PORTFOLIO PROXY VOTING
Policies and Procedures:
The Trust has delegated to Thornburg Investment Management, Inc. (the “Advisor”) voting decisions respecting proxies for the Fund’s voting securities. The Advisor makes voting decisions in accordance with its Proxy Voting Policy. A description of the Policy is available (i) without charge, upon request, by calling the Advisor toll-free at 1-800-847-0200, (ii) on the Thornburg website at www.thornburg. com, and (iii) on the Securities and Exchange Commission’s website at www.sec.gov.
Information regarding how proxies were voted is available on or before August 31 of each year for the twelve months ending the preceding June 30. This information is available (i) without charge, upon request by calling the Advisor toll-free at 1-800-847-0200, (ii) on the Thornburg website at www.thornburg.com, and (iii) on the Securities and Exchange Commission’s website at www.sec.gov.
AVAILABILITY OF QUARTERLY PORTFOLIO SCHEDULE
The Fund files with the Securities and Exchange Commission schedules of its portfolio holdings on Form N-Q for the first and third quarters of each fiscal year. The Fund’s Forms N-Q are available on the Commission’s website at www.sec.gov, or may be reviewed and copied at the Commission’s Public Reference Room in Washington, D.C. Information on the operation of the Public Reference Room may be obtained by calling 1-800-SEC-0330. The Fund also makes this information available on its website at www.thornburg. com/download or upon request by calling 1-800-847-0200.
Semi-Annual Report 25
TRUSTEES’ STATEMENT TO SHAREHOLDERS
Revised and Readopted September 15, 2014
The Trustees believe current and prospective shareholders should know how we discharge our responsibilities in supervising the Funds’ investment advisor and in reviewing the advisor’s contract for renewal. Since 2005, we have issued a statement which sets out clearly the three principal guidelines that we follow in supervising the Trust’s investment advisor on your behalf. In accordance with our customary practice, in September of 2014 we again reviewed our statement and concluded we should reissue this statement outlining the principal features of our supervision of the advisor’s performance of investment management services for the Funds.
We begin with the premise that each shareholder selected his or her Fund because its investments are managed by the investment advisor identified in the prospectus and in accordance with the objective and policies described in the prospectus. We realize, as each of you do, that if you believe that your Fund’s stated objective and policies no longer serve your personal investment goals, you can sell your shares and leave the Fund.
Therefore, we believe that our primary supervisory task – our principal obligation to you – is to assess the nature and quality of the advisor’s services, and to confirm that the advisor actively and competently pursues the Fund’s objective, in accordance with the policies set out in the prospectus. To do this, we meet regularly with management to review your Fund’s portfolio and to discuss the advisor’s specific actions and judgments in pursuing the Fund’s objective. We do not substitute our own judgment for the advisor’s decisions in selecting investments; the advisor is paid to exercise its informed judgment on investment decisions, and we seek to confirm, in reviewing the advisor’s performance, that the advisor is doing just that.
Second, we are conscious of costs and the effect that costs have on shareholders’ returns. We try to make sure that your Fund’s fees and costs are reasonable in relationship to the services rendered and that they are generally in line with those charged by other expert investment advisors, consistent with our belief that the Fund’s investors searched for and expect that expertise and attention and have decided to pay a reasonable price for it. We do not put the management contract “out to bid” as a matter of course, and we would not do so unless we had concluded that the advisor materially had failed to pursue the Fund’s objectives in accordance with its policies, or for other equally important reasons. We believe that any other approach would be inconsistent with your interests and contrary to your expectations when you bought shares of the Fund in the first place.
Finally, because we believe that most Thornburg Fund shareholders have invested with a long-term perspective, we try not to focus too much on the fashions of the moment and on short-term performance. The market will not favor any specific investment objective or set of policies at all times and under all economic circumstances. A fund will experience periods of both high and low returns relative to other funds and other investments. Even if one of our Funds is not favored by the market at a particular time, we believe that the advisor is nonetheless obliged to remain true to the Fund’s objective and policies, and we watch to see that it does so.
Trustees of Thornburg Investment Trust
26 Semi-Annual Report
THORNBURG FUND FAMILY
FUNDAMENTAL, BOTTOM-UP EQUITY RESEARCH
We search far and wide for the best stock ideas – within the United States and around the globe. Potential investments that may deserve a deeper look are thoroughly analyzed using both quantitative and qualitative criteria. But the vast majority are discarded. Those that ultimately make it into our highly-selective portfolios are continually monitored to determine whether our investment theses unfold as expected.
| | • | | Thornburg Core Growth Fund |
| | • | | Thornburg International Value Fund |
| | • | | Thornburg International Growth Fund |
| | • | | Thornburg Developing World Fund |
| | • | | Thornburg Investment Income Builder Fund |
| | • | | Thornburg Global Opportunities Fund |
A TRADITION OF DISCIPLINED BOND MANAGEMENT
At Thornburg, the word “disciplined” carries some substance. We don’t make a practice of using shortcuts to enhance yield or total returns. Every strategy is grounded in rigorous, bottom-up credit work. Portfolios are assembled carefully – in the case of our core bond funds, using laddered structures – to mitigate price fluctuation. Position sizes are controlled so that no single bond can have an outsized effect on a portfolio. And as with our equity portfolios, managers enjoy flexibility to seek an optimal risk/reward balance.
| | • | | Thornburg Low Duration Income Fund |
| | • | | Thornburg Limited Term U.S. Government Fund |
| | • | | Thornburg Limited Term Income Fund |
| | • | | Thornburg Strategic Income Fund |
| | • | | Thornburg Low Duration Municipal Fund |
| | • | | Thornburg Limited Term Municipal Fund |
| | • | | Thornburg Intermediate Municipal Fund |
| | • | | Thornburg California Limited Term Municipal Fund |
| | • | | Thornburg New Mexico Intermediate Municipal Fund |
| | • | | Thornburg New York Intermediate Municipal Fund |
| | • | | Thornburg Strategic Municipal Income Fund |
Before investing, carefully consider the Fund’s investment goals, risks, charges, and expenses. For a prospectus or summary prospectus containing this and other information, contact your financial advisor or visit thornburg.com. Read it carefully before investing.
For additional information, please visit thornburg.com
Thornburg Investment Management, Inc. 2300 North Ridgetop Road, Santa Fe, NM 87506
Semi-Annual Report 27

This Semi-Annual Report is submitted for the general information of shareholders of the Fund. It is not authorized for distribution to prospective investors in the Fund unless preceded or accompanied by an effective prospectus.
| | | | |
| Investment Advisor: | | Distributor: | | |
| Thornburg Investment Management® | | Thornburg Securities Corporation® | | |
| 800.847.0200 | | 800.847.0200 | | TH3171 |
FIRM OVERVIEW
THE FIRM
Thornburg Investment Management is a privately owned global investment firm that offers a range of solutions for retail and institutional investors. We are driven by our mission to help our clients reach their long-term financial goals through fundamental research and active portfolio management.
Founded in 1982 and headquartered in Santa Fe, New Mexico, we manage approximately $61 billion (as of March 31, 2015) across seven equity and 11 bond mutual funds, separate accounts for high-net-worth investors and institutional accounts, and five UCITS funds for non-U.S. investors.

CORE INVESTMENT PRINCIPLES
Our focus has always been on maintaining and building the investment expertise to manage Thornburg strategies to a high standard, while adhering to a core set of investment principles:
| | • | | We focus on the fundamentals. We invest according to our view of the fundamental value of an issuer only after performing thorough, bottom-up research. |
| | • | | We think and invest for the long term. We typically make investment decisions based upon an investment thesis we expect to play out over 18 months to several years. We may not always hold a security for several years, but our horizon line is typically a few years out. |
| | • | | We stay flexible. We go where we see value. Our investment mandates are generally broad and flexible, and we exercise as much flexibility as possible within any restrictions. |
| | • | | We collaborate across strategies. We are structured as global generalists. Portfolio managers and analysts do not specialize in sectors, geographies, or even security types, but instead must understand and communicate bottom-up fundamentals across industries, sectors, and borders. |
2 Semi-Annual Report
Semi-Annual Report
Thornburg Limited Term Income Funds
March 31, 2015
| | | | |
Limited Term U.S. Government Fund | | NASDAQ Symbols | | CUSIPS |
Class A | | LTUSX | | 885-215-103 |
Class B | | LTUBX | | 885-215-848 |
Class C | | LTUCX | | 885-215-830 |
Class I | | LTUIX | | 885-215-699 |
Class R3 | | LTURX | | 885-215-491 |
Class R4 | | LTUGX | | 885-216-747 |
Class R5 | | LTGRX | | 885-216-861 |
| | |
Limited Term Income Fund | | | | |
Class A | | THIFX | | 885-215-509 |
Class C | | THICX | | 885-215-764 |
Class I | | THIIX | | 885-215-681 |
Class R3 | | THIRX | | 885-215-483 |
Class R4 | | THRIX | | 885-216-762 |
Class R5 | | THRRX | | 885-216-853 |
Class I, R3, R4, R5 shares may not be available to all investors. Minimum investments for Class I shares may be higher than those for other classes.
Investments in the Funds carry risks, including possible loss of principal. Bond funds have the same interest rate, inflation, and credit risks that are associated with the underlying bonds. The value of a bond will fluctuate relative to changes in interest rates, decreasing when interest rates rise. Unlike bonds, bond funds have ongoing fees and expenses. Funds invested in mortgage backed securities may bear additional risk. Please see each Fund’s prospectus for a discussion of the risks associated with an investment in either Fund. Investments in the Funds are not FDIC insured, nor are they deposits of or guaranteed by a bank or any other entity.
The laddering strategy does not assure or guarantee better performance and cannot eliminate the risk of investment losses.
Semi-Annual Report 3
| | |
| LETTER TO SHAREHOLDERS | | |
| |
Thornburg Limited Term Income Funds | | March 31, 2015 (Unaudited) |
April 10, 2015
Dear Fellow Shareholder:
We are pleased to present the semi-annual report for the Thornburg Limited Term U.S. Government Fund and the Thornburg Limited Term Income Fund for the six months ended March 31, 2015. The net asset value (NAV) of a Class A share of the Limited Term U.S. Government Fund increased six cents in the period to $13.33, and if you were invested for the entire period you received dividends of 10.42 cents per share. If you reinvested your dividends, you received 10.44 cents per share. The NAV of a Class A share of the Thornburg Limited Term Income Fund decreased two cents in the period to $13.47. If you were invested for the entire period, you received dividends of 13.69 cents per share. If you reinvested your dividends, you received 13.74 cents per share. Dividends per share varied for other share classes to account for varying class-specific expenses.
Combining income and change in price, Class A shares of the Thornburg Limited Term U.S. Government Fund produced a total return of 1.24% (without sales charge) over the six-month period. The Barclays Intermediate Government Bond Index produced a total return of 2.21% over the same period. The average return for the Lipper Short-Intermediate U.S. Government category was 1.38%. Class A shares of the Thornburg Limited Term Income Fund produced a total return of 1.40% (without sales charge) over the six-month period ending March 31, 2015. The Barclays Intermediate Government/Credit Bond Index produced a 2.35% total return over the same time period. The average return for the Lipper Short-Intermediate Investment Grade Debt category was 1.36%. The indices reflect no deduction for fees, expenses, or taxes.
Market Impact
The six-month period ended March 31, 2015, was relatively eventful. The Federal Reserve officially ended their quantitative easing (QE) program and has signaled that an eventual interest-rate hike is forthcoming. While U.S. Federal Reserve officials are busy attempting to engineer an unwind of zero interest rate policy, excess liquidity, and explicitly supporting particular areas of the fixed income market, European officials have moved in the opposite direction with an official announcement of their own quantitative easing program in January 2015. It is hard to get excited about U.S. rates considering the 10-year U.S. Treasury yield sat at 1.92% as of March 31, 2015. However, quantitative easing by the European Central Bank (ECB), in conjunction with low official policy rates and subdued inflation, caused rates on a significant portion of European sovereign bonds to move into negative territory during the period. This means investors purchasing high-quality European sovereign debt are now paying European central banks for the privilege of holding their money.
Despite the signal that the U.S. economy is on firmer footing and eventual rate hikes are likely to commence prior to the end of 2015, rates in the United States fell across most of the yield curve with only the very front end of the curve rising during the six months ended March 31, 2015. Our belief going into the period was that investors were poorly compensated for holding significant exposure to longer-term rates, so the Funds were positioned shorter on the yield curve and thus did not benefit as much as rates continued to fall in the longer end. The perceived disparity between U.S. and other global rate cycles caused the dollar to rally against nearly every other major global currency across the six-month period. A multitude of factors, including lower global growth along with the ‘supply revolution’ from U.S. shale caused oil to fall significantly throughout the period. West Texas Intermediate Crude oil ended the year at $53.27, and stood at $47.60 as of March 31, 2015. In sympathy with the general “risk-off” move, credit spreads on BBB rated five-year corporate bonds rose by 20 basis points during the six months ended March 31, 2015. Much of this move was in direct response to the fall in oil prices, with sectors less exposed to that decline performing better through the period. The Thornburg Limited Term Income Fund’s move up in quality throughout 2014 was rewarded. However, the Fund remained more exposed to broad credit than did the index.
A Cautious Outlook
As we look forward, we are cautious concerning the eventual normalization of Federal Reserve monetary policy and the impact this may have on longer-term rates, credit spreads, and markets more broadly. Federal Reserve officials have conveyed to the market that the unwind in rates is likely to be gradual and take place over a medium-term time horizon. Additionally, while the Federal Reserve remains “data dependent,” the intention of their first rate hike has already been communicated to markets. For these two reasons, we are hopeful that the normalization of rates will cause minimal market disruption. However, as stewards of your capital, we have felt it prudent to take the necessary precautions in both the Thornburg Limited Term U.S. Government Fund and Thornburg Limited Term Income Fund to prepare for a potentially more volatile period ahead. Given the Funds’ lower durations and laddered portfolio structure, investors
4 Semi-Annual Report
| | |
| LETTER TO SHAREHOLDERS, CONTINUED | | |
| |
Thornburg Limited Term Income Funds | | March 31, 2015 (Unaudited) |
could benefit from a gradual pace of normalization to higher long-term yields.
As we have said in the past, when we believe fixed income investors are well compensated for assuming additional risk, we will position each portfolio to seek additional return. However, in times like this where term premiums in global rates are low and the all-in compensation (yield) for holding any given risk remains subdued, we employ the opposite strategy, seeking to pare back risk in most all forms. This has recently meant a continued shortening of duration relative to the benchmarks and longer-term neutral positioning for each Fund. Additionally, our caution has also meant a continued move up in quality, both in terms of credit and liquidity. Both Funds now hold a higher cash and cash equivalents balance, which we view as defensive as well as opportunistic. This capital can be deployed in periods of rising volatility to acquire quality assets where we believe the risk/reward tradeoff is skewed in our favor.
Both Funds are laddered portfolios, a staple structure of Thornburg’s core fixed income funds for more than 30 years. Laddering balances duration and yield in a manner intended to provide attractive risk-adjusted returns over time. With an expected start to normalization of Federal Reserve policy, an eventual rise in the yield curve, and global imbalances exerting pressure on economies worldwide, we do not expect significant price increases in high-quality fixed income. Additionally, it is likely that investors should be ready for an elevated level of volatility across many asset classes, high-quality fixed income included. We have taken many measures to help shield investors from this volatility, but the Funds are likely to be affected as these events develop. Nevertheless, we believe your Funds are well positioned to achieve their longer-term goals of price stability and a reasonably attractive income stream, no matter what environment we may be entering. For investors with an appropriate medium-term investment horizon we believe both Funds remain appropriate vehicles for investors seeking core bond investments.
Thank you very much for investing in the Funds.
Sincerely,
| | | | |

Jason H. Brady,CFA Portfolio Manager Managing Director | | 
Lon R. Erickson,CFA Portfolio Manager Managing Director | | 
Jeff Klingelhofer,CFA Portfolio Manager Managing Director |
The matters discussed in this report may constitute forward-looking statements made pursuant to the safe harbor provisions of the Securities Litigation Reform Act of 1995. These include any advisor or portfolio manager prediction, assessment, analysis or outlook for individual securities, industries, investment styles, market sectors and/or markets. These statements involve risks and uncertainties. In addition to the general risks described for each fund in its current prospectus, other factors bearing on these reports include the accuracy of the advisor’s or portfolio manager’s forecasts and predictions, the appropriateness of the investment strategies designed by the advisor or portfolio manager and the ability of the advisor or portfolio manager to implement their strategies efficiently and successfully. Any one or more of these factors, as well as other risks affecting the securities markets generally, could cause the actual results of any fund to differ materially as compared to its benchmarks.
The views expressed by the portfolio managers reflect their professional opinions and are subject to change. Under no circumstances does the information contained within represent a recommendation to buy or sell any security.
Semi-Annual Report 5
| | |
| PERFORMANCE SUMMARY | | |
| |
Thornburg Limited Term Income Funds | | March 31, 2015 (Unaudited) |
Average Annual Total Returns
| | | | | | | | | | | | | | | | | | | | |
| | | 1-Yr | | | 3-Yr | | | 5-Yr | | | 10-Yr | | | Since
Incep. | |
LIMITED TERM U.S. GOVERNMENT FUND | | | | | | | | | | | | | | | | | | | | |
A Shares (Incep: 11/16/87) | | | | | | | | | | | | | | | | | | | | |
Without sales charge | | | 2.16 | % | | | 0.92 | % | | | 1.87 | % | | | 3.26 | % | | | 5.21 | % |
With sales charge | | | 0.64 | % | | | 0.41 | % | | | 1.56 | % | | | 3.11 | % | | | 5.15 | % |
B Shares (Incep: 11/1/02) | | | | | | | | | | | | | | | | | | | | |
Without sales charge | | | 0.78 | % | | | -0.47 | % | | | 0.51 | % | | | 2.17 | % | | | 2.18 | % |
With sales charge | | | -4.22 | % | | | -1.62 | % | | | 0.12 | % | | | 2.17 | % | | | 2.18 | % |
C Shares (Incep: 9/1/94) | | | | | | | | | | | | | | | | | | | | |
Without sales charge | | | 1.88 | % | | | 0.63 | % | | | 1.59 | % | | | 2.98 | % | | | 4.13 | % |
With sales charge | | | 1.38 | % | | | 0.63 | % | | | 1.59 | % | | | 2.98 | % | | | 4.13 | % |
I Shares (Incep: 7/5/96) | | | 2.46 | % | | | 1.24 | % | | | 2.20 | % | | | 3.59 | % | | | 4.63 | % |
R3 Shares (Incep: 7/1/03) | | | 2.09 | % | | | 0.84 | % | | | 1.78 | % | | | 3.21 | % | | | 2.80 | % |
R4 Shares (Incep: 2/1/14) | | | 2.17 | % | | | — | | | | — | | | | — | | | | 1.73 | % |
R5 Shares (Incep: 5/1/12) | | | 2.50 | % | | | — | | | | — | | | | — | | | | 1.06 | % |
LIMITED TERM INCOME FUND | | | | | | | | | | | | | | | | | | | | |
A Shares (Incep: 10/1/92) | | | | | | | | | | | | | | | | | | | | |
Without sales charge | | | 3.02 | % | | | 3.17 | % | | | 4.21 | % | | | 4.65 | % | | | 5.34 | % |
With sales charge | | | 1.51 | % | | | 2.66 | % | | | 3.89 | % | | | 4.49 | % | | | 5.26 | % |
C Shares (Incep: 9/1/94) | | | | | | | | | | | | | | | | | | | | |
Without sales charge | | | 2.79 | % | | | 2.94 | % | | | 3.96 | % | | | 4.40 | % | | | 5.04 | % |
With sales charge | | | 2.29 | % | | | 2.94 | % | | | 3.96 | % | | | 4.40 | % | | | 5.04 | % |
I Shares (Incep: 7/5/96) | | | 3.38 | % | | | 3.54 | % | | | 4.57 | % | | | 5.01 | % | | | 5.59 | % |
R3 Shares (Incep: 7/1/03) | | | 2.91 | % | | | 3.07 | % | | | 4.15 | % | | | 4.62 | % | | | 4.14 | % |
R4 Shares (Incep: 2/1/14) | | | 2.91 | % | | | — | | | | — | | | | — | | | | 2.77 | % |
R5 Shares (Incep: 5/1/12) | | | 3.28 | % | | | — | | | | — | | | | — | | | | 3.26 | % |
30-Day Yields
(with sales charge)
Thornburg Limited Term U.S. Government Fund, A Shares
| | | | |
Annualized Distribution Yield | | | 1.14 | % |
| |
SEC Yield | | | 0.47 | % |
Thornburg Limited Term Income Fund, A Shares
| | | | |
Annualized Distribution Yield | | | 1.99 | % |
| |
SEC Yield | | | 1.52 | % |
Performance data shown represents past performance and is no guarantee of future results. Investment return and principal value will fluctuate so shares, when redeemed, may be worth more or less than their original cost. Current performance may be lower or higher than quoted. For performance current to the most recent month end, visit thornburg.com or call 800-847-0200. The performance information does not reflect the deduction of taxes that a shareholder would pay on distributions or the redemption of Fund shares. Returns reflect the reinvestment of dividends and capital gains. Class A shares are sold with a maximum sales charge of 1.50%. Class B shares carry a contingent deferred sales charge (CDSC) that declines from 5.00% to 0% depending upon the period of time the shares are held. Class B shares will automatically convert to Class A shares on a quarterly basis approximately eight years after purchase. Class C shares include a 0.50% CDSC for the first year only. There is no sales charge for Class I, Class R3, Class R4, and Class R5 shares.
As disclosed in the most recent prospectus, the total annual fund operating expenses are as follows: Limited Term U.S. Government Fund A shares, 0.93%; B shares, 3.60%; C shares, 1.19%; I shares, 0.61%; R3 shares, 1.31%; R4 shares, 1.13%; R5 shares 2.87%; and Limited Term Income Fund A shares, 0.89%; C shares, 1.11%; I shares, 0.54%; R3 shares, 1.12%; R4 shares, 1.17%; R5 shares 0.72%. Thornburg Investment Management and/or Thornburg Securities Corporation have contractually agreed to waive fees and reimburse expenses through at least February 1, 2016, for some of the share classes, resulting in net expense ratios of the following: For Limited Term U.S. Government Fund B shares, 2.50%; R3 shares, 0.99%; R4 shares, 0.99%; R5 shares, 0.67%. Limited Term Income Fund R3 shares, 0.99%; R3 shares, 0.99%; R5 shares, 0.67%. For more detailed information on fund expenses and waivers/reimbursements please see the Fund’s prospectus.
Glossary
Barclays Intermediate Government Bond Index – An unmanaged, market-weighted index generally representative of all public obligations of the U.S. Government, its agencies and instrumentalities having maturities from one up to ten years.
Barclays Intermediate Government/Credit Bond Index – An unmanaged, market-weighted index generally representative of intermediate government and investment-grade corporate debt securities having maturities from one up to ten years.
Unless otherwise noted, index returns reflect the reinvestment of income dividends and capital gains, if any, but do not reflect fees, brokerage commissions or other expenses of investing. Investors may not make direct investments into any index. The performance of any index is not indicative of the performance of any particular investment.
Annualized Distribution Yield – The distribution yield reflects actual distributions made to shareholders. The annualized distribution yield is calculated by summing the last 30 days of income at a given month end and annualizing to a 360-day year. The result is divided by the ending maximum offering price or net asset value.
Basis Point (bp) – A unit equal to 1/100th of 1%. 1% = 100 basis points (bps).
Credit Rating – A rating that assesses the financial ability of a debt issuer to make timely payments of principal and interest. Ratings of AAA (the highest), AA, A, and BBB are investment-grade quality. Ratings of BB, B, CCC, CC, C and D (the lowest) are considered below investment grade, speculative grade, or junk bonds.
Credit Spread/Quality Spread – The difference between the yields of securities with different credit qualities.
Duration – A bond’s sensitivity to interest rates. Effective duration incorporates the embedded option features, such as call provisions. Bonds with longer durations experience greater price volatility than bonds with shorter durations.
Laddering – Laddering involves building a portfolio of bonds with staggered maturities so that a portion matures each year. Money that comes in from maturing bonds is typically invested in bonds with longer maturities at the far end of the portfolio.
Lipper Short Investment Grade Debt Funds – Funds that invest primarily in investment-grade debt issues (rated in the top four grades) with dollar-weighted average maturities of less than three years.
Lipper Short-Intermediate U.S. Government Funds – Funds that invest primarily in securities issued or guaranteed by the U.S. government, its agencies, or its instrumentalities, with dollar-weighted average maturities of one to five years.
Quantitative Easing (QE) – An unconventional monetary policy in which a central bank purchases financial assets from the market in order to lower interest rates and increase the money supply.
SEC Yield – SEC yield is computed in accordance with SEC standards measuring the net investment income per share over a specified 30-day period expressed as a percentage of the maximum offering price of the Fund’s shares at the end of the period.
Sovereign debt – Government debt that has been issued in a foreign currency.
Term Premium – The excess yield that investors require to commit to holding a long-term bond instead of a series of shorter-term bonds.
West Texas Intermediate (WTI) Crude Oil – The benchmark for oil prices in the United States. WTI crude is a light sweet crude oil with low sulfur content that is often processed into gasoline on the American east coast and then piped across the country for consumption.
Yield Curve – A line that plots the interest rates, at a set point in time, of bonds having equal credit quality, but differing maturity dates.
6 Semi-Annual Report
| | |
| FUND SUMMARY | | |
| |
Thornburg Limited Term U.S. Government Fund | | March 31, 2015 (Unaudited) |
Objectives and Strategies
The Fund’s primary objective is to obtain as high a level of current income as is consistent, in the view of the Fund’s investment advisor, with the preservation of capital. As a secondary goal, the Fund seeks to reduce changes in its share price compared to longer term portfolios.
This Fund is a laddered portfolio primarily composed of short/ intermediate debt obligations at least 80% of which are issued by the U.S. Government, its agencies, or its instrumentalities, with an average maturity of normally less than five years.
Long Term Stability of Principal
Net Asset Value History of A Shares
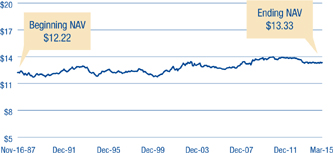
Key Portfolio Attributes
| | | | |
Number of Bonds | | | 137 | |
| |
Effective Duration | | | 2.3 Yrs | |
| |
Average Maturity | | | 3.0 Yrs | |
Types of Holdings
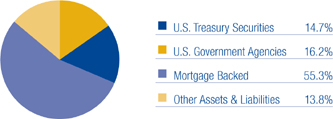
Portfolio Ladder

There is no guarantee that the Fund will meet its investment objectives.
All data is subject to change. Charts may not add up to 100% due to rounding.
Semi-Annual Report 7
| | |
| FUND SUMMARY | | |
| |
Thornburg Limited Term Income Fund | | March 31, 2015 (Unaudited) |
Objectives and Strategies
The Fund’s primary objective is to obtain as high a level of current income as is consistent, in the view of the Fund’s investment advisor, with the preservation of capital. As a secondary goal, the Fund seeks to reduce changes in its share price compared to longer term portfolios.
This Fund is a laddered portfolio primarily composed of short/ intermediate debt obligations which are investment grade or judged by the advisor to be of equivalent quality, with an average maturity of normally less than five years.
Long-term Stability of Principal
Net Asset Value History of A Shares
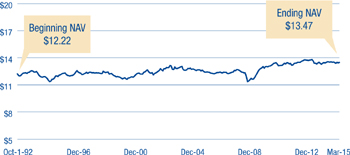
Key Portfolio Attributes
| | | | |
Number of Bonds | | | 493 | |
| |
Effective Duration | | | 2.9 Yrs | |
| |
Average Maturity | | | 3.9 Yrs | |
Security Credit Ratings
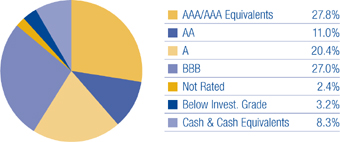
Credit quality ratings for Thornburg’s global fixed income portfolios used ratings from Moody’s Investors Service. Where Moody’s ratings are not available, we have used Standard & Poor’s ratings. Where neither rating is available, we have used ratings from other rating agencies.
Portfolio Ladder
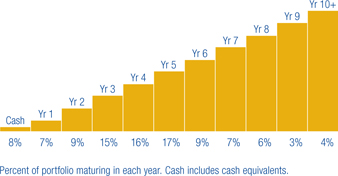
There is no guarantee that the Fund will meet its investment objectives.
All data is subject to change. Charts may not add up to 100% due to rounding.
8 Semi-Annual Report
| | |
| SCHEDULE OF INVESTMENTS | | |
| |
Thornburg Limited Term U.S. Government Fund | | March 31, 2015 (Unaudited) |
| | | | | | | | |
Issuer-Description | | Principal
Amount | | | Value | |
U.S. TREASURY SECURITIES — 14.68% | | | | | | | | |
United States Treasury Notes, 1.375%, 11/30/2015 | | $ | 2,500,000 | | | $ | 2,519,385 | |
United States Treasury Notes, 2.625%, 2/29/2016 | | | 2,000,000 | | | | 2,042,666 | |
United States Treasury Notes, 4.875%, 8/15/2016 | | | 5,000,000 | | | | 5,306,128 | |
United States Treasury Notes, 4.625%, 2/15/2017 | | | 4,000,000 | | | | 4,304,824 | |
United States Treasury Notes, 2.25%, 11/30/2017 | | | 3,500,000 | | | | 3,634,224 | |
United States Treasury Notes, 2.625%, 1/31/2018 | | | 6,700,000 | | | | 7,030,878 | |
United States Treasury Notes, 3.625%, 2/15/2020 | | | 1,000,000 | | | | 1,107,520 | |
United States Treasury Notes, 1.375%, 2/29/2020 | | | 2,500,000 | | | | 2,500,293 | |
United States Treasury Notes Inflationary Index, 1.875%, 7/15/2015 | | | 4,806,800 | | | | 4,881,170 | |
United States Treasury Notes Inflationary Index, 2.00%, 1/15/2016 | | | 5,888,400 | | | | 6,037,080 | |
| | | | | | | | |
TOTAL U.S. TREASURY SECURITIES (Cost $38,254,491) | | | | | | | 39,364,168 | |
| | | | | | | | |
| | |
U.S. GOVERNMENT AGENCIES — 16.22% | | | | | | | | |
Federal Home Loan Bank, 5.00%, 12/8/2017 | | | 3,000,000 | | | | 3,329,423 | |
Federal Home Loan Bank Step Up Coupon, 1.75%, 10/25/2022 | | | 3,700,000 | | | | 3,679,043 | |
Federal Home Loan Mtg Corp., 4.875%, 6/13/2018 | | | 3,000,000 | | | | 3,364,224 | |
Mtg-Linked Amortizing Notes, Series 2012-1 Class A10, 2.06%, 1/15/2022 | | | 788,952 | | | | 803,157 | |
New Valley Generation I, Tennessee Valley Authority, 7.299%, 3/15/2019 | | | 1,697,226 | | | | 1,906,029 | |
a Petroleos Mexicanos, (Guaranty: Export-Import Bank of the United States), 1.70%, 12/20/2022 | | | 2,480,000 | | | | 2,468,279 | |
Private Export Funding Corp., (Guaranty: Export-Import Bank of the United States), 5.45%, 9/15/2017 | | | 3,000,000 | | | | 3,326,460 | |
Small Business Administration Participation Certificates, Series 2001-20D Class 1, 6.35%, 4/1/2021 | | | 1,511,350 | | | | 1,638,034 | |
Small Business Administration Participation Certificates, Series 2001-20F Class 1, 6.44%, 6/1/2021 | | | 883,803 | | | | 959,635 | |
Small Business Administration Participation Certificates, Series 2002-20A Class 1, 6.14%, 1/1/2022 | | | 556,601 | | | | 602,262 | |
Small Business Administration Participation Certificates, Series 2002-20K Class 1, 5.08%, 11/1/2022 | | | 591,070 | | | | 635,659 | |
Small Business Administration Participation Certificates, Series 2005-20H Class 1, 5.11%, 8/1/2025 | | | 501,919 | | | | 546,578 | |
Small Business Administration Participation Certificates, Series 2007-20D Class 1, 5.32%, 4/1/2027 | | | 1,103,317 | | | | 1,227,176 | |
Small Business Administration Participation Certificates, Series 2007-20F Class 1, 5.71%, 6/1/2027 | | | 621,155 | | | | 701,092 | |
Small Business Administration Participation Certificates, Series 2007-20I Class 1, 5.56%, 9/1/2027 | | | 2,053,511 | | | | 2,320,613 | |
Small Business Administration Participation Certificates, Series 2007-20K Class 1, 5.51%, 11/1/2027 | | | 1,230,435 | | | | 1,387,446 | |
Small Business Administration Participation Certificates, Series 2008-20G Class 1, 5.87%, 7/1/2028 | | | 3,091,274 | | | | 3,507,640 | |
Small Business Administration Participation Certificates, Series 2011-20G Class 1, 3.74%, 7/1/2031 | | | 2,948,311 | | | | 3,169,873 | |
Small Business Administration Participation Certificates, Series 2011-20K Class 1, 2.87%, 11/1/2031 | | | 3,208,612 | | | | 3,311,211 | |
b,c U.S. Department of Transportation, 5.594%, 12/7/2021 | | | 2,050,513 | | | | 2,255,564 | |
Union 13 Leasing LLC, (Guaranty: Export-Import Bank of the United States), 1.87%, 6/28/2024 | | | 2,372,252 | | | | 2,360,593 | |
| | | | | | | | |
TOTAL U.S. GOVERNMENT AGENCIES (Cost $41,762,634) | | | | | | | 43,499,991 | |
| | | | | | | | |
| | |
MORTGAGE BACKED — 55.30% | | | | | | | | |
Federal Home Loan Mtg Corp., CMO Series 1321 Class TE, 7.00%, 8/15/2022 | | | 197,381 | | | | 216,653 | |
Federal Home Loan Mtg Corp., CMO Series 2420 Class MC, 6.00%, 2/15/2017 | | | 83,332 | | | | 86,571 | |
Federal Home Loan Mtg Corp., CMO Series 2527 Class BP, 5.00%, 11/15/2017 | | | 251,661 | | | | 262,958 | |
Federal Home Loan Mtg Corp., CMO Series 2529 Class MB, 5.00%, 11/15/2017 | | | 266,325 | | | | 277,091 | |
Federal Home Loan Mtg Corp., CMO Series 2553 Class GB, 5.00%, 1/15/2018 | | | 207,578 | | | | 217,314 | |
Federal Home Loan Mtg Corp., CMO Series 2558 Class BD, 5.00%, 1/15/2018 | | | 907,944 | | | | 950,771 | |
Federal Home Loan Mtg Corp., CMO Series 2622 Class PE, 4.50%, 5/15/2018 | | | 485,211 | | | | 507,811 | |
Federal Home Loan Mtg Corp., CMO Series 2641 Class WE, 4.50%, 1/15/2033 | | | 111,020 | | | | 116,120 | |
Federal Home Loan Mtg Corp., CMO Series 2642 Class JE, 5.00%, 9/15/2032 | | | 673,180 | | | | 694,218 | |
Federal Home Loan Mtg Corp., CMO Series 2649 Class QH, 4.50%, 7/15/2018 | | | 251,125 | | | | 263,556 | |
Federal Home Loan Mtg Corp., CMO Series 2692 Class QD, 5.00%, 12/15/2022 | | | 54,368 | | | | 54,586 | |
Federal Home Loan Mtg Corp., CMO Series 2814 Class GB, 5.00%, 6/15/2019 | | | 70,198 | | | | 71,752 | |
Federal Home Loan Mtg Corp., CMO Series 2827 Class BU, 3.50%, 7/15/2019 | | | 848,852 | | | | 882,832 | |
Federal Home Loan Mtg Corp., CMO Series 3291 Class BY, 4.50%, 3/15/2022 | | | 1,504,568 | | | | 1,604,292 | |
Federal Home Loan Mtg Corp., CMO Series 3480 Class VA, 6.00%, 6/15/2019 | | | 76,085 | | | | 76,093 | |
Federal Home Loan Mtg Corp., CMO Series 3589 Class CA, 4.00%, 10/15/2021 | | | 274,105 | | | | 283,378 | |
Federal Home Loan Mtg Corp., CMO Series 3640 Class EL, 4.00%, 3/15/2020 | | | 983,711 | | | | 1,033,388 | |
Federal Home Loan Mtg Corp., CMO Series 3704 Class DC, 4.00%, 11/15/2036 | | | 689,132 | | | | 750,914 | |
Federal Home Loan Mtg Corp., CMO Series 3867 Class VA, 4.50%, 3/15/2024 | | | 2,172,520 | | | | 2,422,219 | |
Federal Home Loan Mtg Corp., CMO Series 3922 Class PQ, 2.00%, 4/15/2041 | | | 1,780,583 | | | | 1,802,731 | |
Federal Home Loan Mtg Corp., CMO Series 4050 Class MV, 3.50%, 8/15/2023 | | | 2,744,123 | | | | 2,942,008 | |
Federal Home Loan Mtg Corp., CMO Series 4097 Class TE, 1.75%, 5/15/2039 | | | 3,119,971 | | | | 3,086,854 | |
Federal Home Loan Mtg Corp., CMO Series 4120 Class TC, 1.50%, 10/15/2027 | | | 3,648,014 | | | | 3,613,675 | |
Federal Home Loan Mtg Corp., CMO Series 4120 Class UE, 2.00%, 10/15/2027 | | | 3,695,289 | | | | 3,732,562 | |
Federal Home Loan Mtg Corp., CMO Series K018 Class A1, 1.781%, 10/25/2020 | | | 1,889,247 | | | | 1,908,784 | |
Federal Home Loan Mtg Corp., CMO Series K035 Class A1, 2.615%, 3/25/2023 | | | 3,687,151 | | | | 3,818,002 | |
Semi-Annual Report 9
| | |
| SCHEDULE OF INVESTMENTS, CONTINUED | | |
| |
Thornburg Limited Term U.S. Government Fund | | March 31, 2015 (Unaudited) |
| | | | | | | | |
Issuer-Description | | Principal
Amount | | | Value | |
Federal Home Loan Mtg Corp., CMO Series K037 Class A1, 2.592%, 4/25/2023 | | $ | 1,879,931 | | | $ | 1,943,110 | |
Federal Home Loan Mtg Corp., CMO Series K038 Class A1, 2.604%, 10/25/2023 | | | 5,775,519 | | | | 5,970,450 | |
Federal Home Loan Mtg Corp., CMO Series K039 Class A1, 2.683%, 12/25/2023 | | | 2,574,472 | | | | 2,670,357 | |
Federal Home Loan Mtg Corp., CMO Series K042 Class A1, 2.267%, 6/25/2024 | | | 2,360,949 | | | | 2,383,930 | |
Federal Home Loan Mtg Corp., CMO Series K709 Class A2, 2.086%, 3/25/2019 | | | 3,000,000 | | | | 3,065,717 | |
Federal Home Loan Mtg Corp., CMO Series K716 Class A1, 2.413%, 1/25/2021 | | | 1,935,582 | | | | 1,993,294 | |
Federal Home Loan Mtg Corp., Pool AK6768, 3.00%, 3/1/2027 | | | 2,909,025 | | | | 3,054,817 | |
Federal Home Loan Mtg Corp., Pool B14155, 3.50%, 5/1/2019 | | | 213,919 | | | | 227,172 | |
Federal Home Loan Mtg Corp., Pool D37120, 7.00%, 7/1/2023 | | | 3,408 | | | | 3,863 | |
Federal Home Loan Mtg Corp., Pool D98887, 3.50%, 1/1/2032 | | | 1,933,673 | | | | 2,049,316 | |
Federal Home Loan Mtg Corp., Pool E96575, 4.50%, 6/1/2018 | | | 478,164 | | | | 500,167 | |
Federal Home Loan Mtg Corp., Pool G12079, 4.50%, 4/1/2019 | | | 504,440 | | | | 529,471 | |
Federal Home Loan Mtg Corp., Pool G12140, 4.00%, 2/1/2020 | | | 138,637 | | | | 146,230 | |
Federal Home Loan Mtg Corp., Pool G13804, 5.00%, 3/1/2025 | | | 799,573 | | | | 871,935 | |
Federal Home Loan Mtg Corp., Pool J11371, 4.50%, 12/1/2024 | | | 825,761 | | | | 885,951 | |
Federal Home Loan Mtg Corp., Pool J13583, 3.50%, 11/1/2025 | | | 1,331,047 | | | | 1,421,412 | |
Federal Home Loan Mtg Corp., Pool J14888, 3.50%, 4/1/2026 | | | 1,320,273 | | | | 1,403,719 | |
Federal Home Loan Mtg Corp., REMIC Series 4072 Class VA, 3.50%, 10/15/2023 | | | 2,391,008 | | | | 2,561,243 | |
Federal National Mtg Assoc., CMO Series 1993-32 Class H, 6.00%, 3/25/2023 | | | 23,718 | | | | 26,132 | |
Federal National Mtg Assoc., CMO Series 2003-15 Class CY, 5.00%, 3/25/2018 | | | 165,564 | | | | 173,307 | |
Federal National Mtg Assoc., CMO Series 2003-4 Class PE, 5.00%, 2/25/2018 | | | 432,907 | | | | 454,094 | |
Federal National Mtg Assoc., CMO Series 2003-49 Class YD, 5.50%, 6/25/2023 | | | 144,604 | | | | 146,809 | |
Federal National Mtg Assoc., CMO Series 2003-9 Class DB, 5.00%, 2/25/2018 | | | 195,575 | | | | 204,750 | |
Federal National Mtg Assoc., CMO Series 2004-33 Class MW, 4.50%, 1/25/2030 | | | 179,389 | | | | 180,752 | |
Federal National Mtg Assoc., CMO Series 2009-17 Class AH, 1.341%, 3/25/2039 | | | 503,375 | | | | 451,822 | |
Federal National Mtg Assoc., CMO Series 2009-49 Class KA, 5.00%, 2/25/2024 | | | 119,686 | | | | 123,738 | |
Federal National Mtg Assoc., CMO Series 2009-52 Class AJ, 4.00%, 7/25/2024 | | | 412,080 | | | | 432,840 | |
Federal National Mtg Assoc., CMO Series 2009-70 Class NK, 4.50%, 8/25/2019 | | | 230,119 | | | | 240,880 | |
Federal National Mtg Assoc., CMO Series 2009-78 Class A, 4.50%, 8/25/2019 | | | 324,864 | | | | 341,010 | |
Federal National Mtg Assoc., CMO Series 2010-46 Class VM, 5.00%, 5/25/2021 | | | 158,630 | | | | 159,113 | |
Federal National Mtg Assoc., CMO Series 2010-6 Class VA, 5.00%, 2/25/2021 | | | 2,045,239 | | | | 2,071,844 | |
Federal National Mtg Assoc., CMO Series 2010-69 Class EJ, 2.50%, 7/25/2024 | | | 78,437 | | | | 78,897 | |
Federal National Mtg Assoc., CMO Series 2011-103 Class VA, 4.00%, 12/25/2022 | | | 2,194,459 | | | | 2,305,854 | |
Federal National Mtg Assoc., CMO Series 2011-110 Class JV, 4.00%, 1/25/2023 | | | 2,451,679 | | | | 2,580,720 | |
Federal National Mtg Assoc., CMO Series 2011-118 Class V, 4.00%, 10/25/2029 | | | 2,654,694 | | | | 2,739,196 | |
Federal National Mtg Assoc., CMO Series 2011-124 Class QA, 2.00%, 12/25/2041 | | | 3,366,926 | | | | 3,255,939 | |
Federal National Mtg Assoc., CMO Series 2011-45 Class VA, 4.00%, 3/25/2024 | | | 2,987,900 | | | | 3,251,380 | |
Federal National Mtg Assoc., CMO Series 2011-63 Class MV, 3.50%, 7/25/2024 | | | 3,021,455 | | | | 3,233,615 | |
Federal National Mtg Assoc., CMO Series 2011-70 Class CA, 3.00%, 8/25/2026 | | | 5,475,549 | | | | 5,543,748 | |
Federal National Mtg Assoc., CMO Series 2011-72 Class KV, 3.50%, 11/25/2022 | | | 1,709,574 | | | | 1,816,463 | |
Federal National Mtg Assoc., CMO Series 2012-36 Class CV, 4.00%, 6/25/2023 | | | 3,087,982 | | | | 3,321,170 | |
Federal National Mtg Assoc., Pool 044003, 8.00%, 6/1/2017 | | | 1,569 | | | | 1,655 | |
Federal National Mtg Assoc., Pool 076388, 9.25%, 9/1/2018 | | | 7,699 | | | | 8,151 | |
Federal National Mtg Assoc., Pool 252648, 6.50%, 5/1/2022 | | | 33,488 | | | | 37,485 | |
Federal National Mtg Assoc., Pool 342947, 7.25%, 4/1/2024 | | | 74,049 | | | | 84,711 | |
Federal National Mtg Assoc., Pool 443909, 6.50%, 9/1/2018 | | | 15,977 | | | | 17,148 | |
Federal National Mtg Assoc., Pool 555207, 7.00%, 11/1/2017 | | | 2,813 | | | | 3,036 | |
Federal National Mtg Assoc., Pool 726308, 4.00%, 7/1/2018 | | | 283,307 | | | | 299,353 | |
Federal National Mtg Assoc., Pool 889906, 4.00%, 7/1/2023 | | | 306,394 | | | | 327,196 | |
Federal National Mtg Assoc., Pool 895572, 2.445%, 6/1/2036 | | | 398,390 | | | | 426,029 | |
Federal National Mtg Assoc., Pool 930986, 4.50%, 4/1/2019 | | | 526,424 | | | | 551,430 | |
Federal National Mtg Assoc., Pool AA2870, 4.00%, 3/1/2024 | | | 779,850 | | | | 833,769 | |
Federal National Mtg Assoc., Pool AB7997, 2.50%, 2/1/2023 | | | 1,584,557 | | | | 1,643,173 | |
Federal National Mtg Assoc., Pool AD8191, 4.00%, 9/1/2025 | | | 1,213,870 | | | | 1,301,591 | |
Federal National Mtg Assoc., Pool AJ1752, 3.50%, 9/1/2026 | | | 2,945,193 | | | | 3,144,684 | |
Federal National Mtg Assoc., Pool AK6518, 3.00%, 3/1/2027 | | | 2,856,734 | | | | 3,013,296 | |
Federal National Mtg Assoc., Pool MA0045, 4.00%, 4/1/2019 | | | 363,674 | | | | 384,273 | |
Federal National Mtg Assoc., Pool MA0071, 4.50%, 5/1/2019 | | | 255,065 | | | | 267,180 | |
Federal National Mtg Assoc., Pool MA0125, 4.50%, 7/1/2019 | | | 215,943 | | | | 226,200 | |
Federal National Mtg Assoc., Pool MA0380, 4.00%, 4/1/2020 | | | 541,213 | | | | 571,868 | |
Federal National Mtg Assoc., Pool MA1582, 3.50%, 9/1/2043 | | | 5,535,081 | | | | 5,864,375 | |
Federal National Mtg Assoc., Pool MA1585, 2.00%, 9/1/2023 | | | 3,170,833 | | | | 3,220,873 | |
Federal National Mtg Assoc., Pool MA1625, 3.00%, 10/1/2023 | | | 3,791,810 | | | | 3,988,954 | |
Government National Mtg Assoc., CMO Series 2004-45 Class C, 4.904%, 10/16/2033 | | | 174,623 | | | | 175,920 | |
Government National Mtg Assoc., CMO Series 2005-67 Class C, 4.907%, 3/16/2035 | | | 177,702 | | | | 180,667 | |
Government National Mtg Assoc., CMO Series 2009-92 Class VA, 5.00%, 10/20/2020 | | | 902,770 | | | | 934,419 | |
10 Semi-Annual Report
| | |
| SCHEDULE OF INVESTMENTS, CONTINUED | | |
| |
Thornburg Limited Term U.S. Government Fund | | March 31, 2015 (Unaudited) |
| | | | | | | | |
Issuer-Description | | Principal
Amount | | | Value | |
Government National Mtg Assoc., CMO Series 2010-160 Class VY, 4.50%, 1/20/2022 | | $ | 672,287 | | | $ | 739,960 | |
Government National Mtg Assoc., Pool 000623, 8.00%, 9/20/2016 | | | 1,711 | | | | 1,775 | |
Government National Mtg Assoc., Pool 003550, 5.00%, 5/20/2019 | | | 240,750 | | | | 254,403 | |
Government National Mtg Assoc., Pool 714631, 5.691%, 10/20/2059 | | | 1,070,704 | | | | 1,127,498 | |
Government National Mtg Assoc., Pool 721652, 5.044%, 5/20/2061 | | | 3,965,095 | | | | 4,294,610 | |
Government National Mtg Assoc., Pool 751388, 5.307%, 1/20/2061 | | | 2,837,696 | | | | 3,119,025 | |
Government National Mtg Assoc., Pool 751392, 5.00%, 2/20/2061 | | | 4,838,128 | | | | 5,474,434 | |
Government National Mtg Assoc., Pool 757313, 4.307%, 12/20/2060 | | | 5,533,412 | | | | 5,818,593 | |
Government National Mtg Assoc., Pool 894205, 3.00%, 8/20/2039 | | | 812,414 | | | | 844,585 | |
Government National Mtg Assoc., Pool MA0100, 2.50%, 5/20/2042 | | | 2,491,106 | | | | 2,589,883 | |
| | | | | | | | |
TOTAL MORTGAGE BACKED (Cost $146,461,117) | | | | | | | 148,265,562 | |
| | | | | | | | |
| | |
SHORT TERM INVESTMENTS — 4.85% | | | | | | | | |
Bank of New York Tri-Party Repurchase Agreement 0.15% dated 3/31/2015 due 4/1/2015, repurchase price $13,000,054 collateralized by 31 U.S. Government debt securities, having an average coupon of 3.68%, a minimum credit rating of BBB-, maturity dates from 9/15/2018 to 8/15/2043, and having an aggregate market value of $13,231,023 at 3/31/2015 | | | 13,000,000 | | | | 13,000,000 | |
| | | | | | | | |
TOTAL SHORT TERM INVESTMENTS (Cost $13,000,000) | | | | | | | 13,000,000 | |
| | | | | | | | |
TOTAL INVESTMENTS — 91.05% (Cost $239,478,242) | | | | | | $ | 244,129,721 | |
OTHER ASSETS LESS LIABILITIES — 8.95% | | | | | | | 23,996,483 | |
| | | | | | | | |
NET ASSETS — 100.00% | | | | | | $ | 268,126,204 | |
| | | | | | | | |
Footnote Legend
| a | Yankee Bond - Denominated in U.S. dollars and is issued in the U.S. by foreign banks and corporations. |
| b | Security currently fair valued by the Valuation and Pricing Committee using procedures approved by the Trustees. |
| c | Securities exempt from registration under Rule 144A of the Securities Act of 1933, as amended. These securities may only be resold in the ordinary course of business in transactions exempt from registration, normally to qualified institutional buyers. As of March 31, 2015, the aggregate value of these securities in the Fund’s portfolio was $2,255,564, representing 0.84% of the Fund’s net assets. |
Portfolio Abbreviations
To simplify the listings of securities, abbreviations are used per the table below:
| | |
| CMO | | Collateralized Mortgage Obligation |
| Mtg | | Mortgage |
| REMIC | | Real Estate Mortgage Investment Conduit |
| VA | | Veterans Affairs |
See notes to financial statements.
Semi-Annual Report 11
| | |
| SCHEDULE OF INVESTMENTS | | |
| |
Thornburg Limited Term Income Fund | | March 31, 2015 (Unaudited) |
| | | | | | | | | | |
Issuer-Description | | Credit Rating†
S&P/ Moody’s | | Principal
Amount | | | Value | |
U.S. TREASURY SECURITIES — 1.84% | | | | | | | | | | |
United States Treasury Notes, 5.125% due 5/15/2016 | | NR/Aaa | | $ | 1,000,000 | | | $ | 1,053,320 | |
United States Treasury Notes, 4.875% due 8/15/2016 | | NR/Aaa | | | 2,000,000 | | | | 2,122,451 | |
United States Treasury Notes, 3.00% due 2/28/2017 | | NR/Aaa | | | 2,000,000 | | | | 2,093,164 | |
United States Treasury Notes, 0.875% due 6/15/2017 | | NR/Aaa | | | 14,900,000 | | | | 14,978,574 | |
United States Treasury Notes, 1.625% due 3/31/2019 | | NR/Aaa | | | 15,000,000 | | | | 15,249,609 | |
United States Treasury Notes, 1.50% due 5/31/2019 | | NR/Aaa | | | 10,000,000 | | | | 10,106,641 | |
United States Treasury Notes, 1.125% due 12/31/2019 | | NR/Aaa | | | 14,900,000 | | | | 14,751,727 | |
United States Treasury Notes, 1.375% due 5/31/2020 | | NR/Aaa | | | 5,000,000 | | | | 4,989,600 | |
| | | | | | | | | | |
TOTAL U.S. TREASURY SECURITIES (Cost $64,067,866) | | | | | | | | | 65,345,086 | |
| | | | | | | | | | |
| | | |
U.S. GOVERNMENT AGENCIES — 8.09% | | | | | | | | | | |
a Agribank FCB, 9.125% due 7/15/2019 | | A-/NR | | | 14,185,000 | | | | 18,102,883 | |
Alex Alpha, LLC, (Guaranty: Export-Import Bank of the United States), 1.617% due 8/15/2024 | | NR/NR | | | 4,130,435 | | | | 4,067,640 | |
Altitude Investments 12, LLC, (Guaranty: Export-Import Bank of the United States), 2.454% due 12/9/2025 | | NR/NR | | | 6,378,647 | | | | 6,508,025 | |
a CoBank ACB Floating Rate Note (Farm Credit Banks), 0.871% due 6/15/2022 | | A-/NR | | | 26,200,000 | | | | 24,643,301 | |
b Durrah MSN 35603, (Guaranty: Export-Import Bank of the United States), 1.684% due 1/22/2025 | | NR/NR | | | 12,683,346 | | | | 12,492,627 | |
DY8 Leasing, LLC, (Guaranty: Export-Import Bank of the United States), 2.627% due 4/29/2026 | | NR/NR | | | 4,804,688 | | | | 4,946,834 | |
Export Leasing (2009), LLC, (Guaranty: Export-Import Bank of the United States), 1.859% due 8/28/2021 | | NR/NR | | | 5,837,707 | | | | 5,877,164 | |
Federal Home Loan Bank Step Up Coupon, 1.75% due 10/25/2022 | | AA+/Aaa | | | 16,000,000 | | | | 15,909,374 | |
b,c Gate Capital Cayman One Ltd., (Guaranty: Export-Import Bank of the United States), 1.839% due 3/27/2021 | | NR/NR | | | 9,736,726 | | | | 9,843,829 | |
Helios Leasing I, LLC, (Guaranty: Export-Import Bank of the United States), 1.562% due 9/28/2024 | | NR/NR | | | 4,845,839 | | | | 4,747,875 | |
b Micron Semiconductor Ltd., (Guaranty: Export-Import Bank of the United States), 1.258% due 1/15/2019 | | NR/NR | | | 3,440,000 | | | | 3,432,628 | |
b MSN 41079 and 41084 Ltd., (Guaranty: Export-Import Bank of the United States), 1.717% due 7/13/2024 | | NR/NR | | | 9,714,319 | | | | 9,602,857 | |
Mtg-Linked Amortizing Notes, Series 2012-1 Class A10, 2.06% due 1/15/2022 | | AA+/NR | | | 1,084,810 | | | | 1,104,341 | |
b Petroleos Mexicanos, (Guaranty: Export-Import Bank of the United States), 1.70% due 12/20/2022 | | NR/NR | | | 4,800,000 | | | | 4,777,315 | |
Private Export Funding Corp., (Guaranty: Export-Import Bank of the United States), 5.45% due 9/15/2017 | | A+/Aaa | | | 3,000,000 | | | | 3,326,460 | |
Private Export Funding Corp., (Guaranty: Export-Import Bank of the United States), 3.55% due 1/15/2024 | | A+/Aaa | | | 10,000,000 | | | | 10,848,940 | |
Sandalwood 2013, LLC, (Guaranty: Export-Import Bank of the United States), 2.821% due 2/12/2026 | | NR/NR | | | 6,474,932 | | | | 6,732,039 | |
Santa Rosa Leasing, LLC, (Guaranty: Export-Import Bank of the United States), 1.693% due 8/15/2024 | | NR/NR | | | 4,836,146 | | | | 4,777,039 | |
Santa Rosa Leasing, LLC, (Guaranty: Export-Import Bank of the United States), 1.472% due 11/3/2024 | | NR/NR | | | 13,231,189 | | | | 12,908,612 | |
Small Business Administration Participation Certificates, Series 2001-20J Class 1, 5.76% due 10/1/2021 | | NR/NR | | | 530,233 | | | | 571,354 | |
Small Business Administration Participation Certificates, Series 2008-20D Class 1, 5.37% due 4/1/2028 | | NR/NR | | | 1,825,065 | | | | 2,047,558 | |
Small Business Administration Participation Certificates, Series 2009-20E Class 1, 4.43% due 5/1/2029 | | NR/NR | | | 1,452,737 | | | | 1,598,844 | |
Small Business Administration Participation Certificates, Series 2009-20K Class 1, 4.09% due 11/1/2029 | | NR/NR | | | 8,633,827 | | | | 9,329,593 | |
Small Business Administration Participation Certificates, Series 2011-20E Class 1, 3.79% due 5/1/2031 | | NR/NR | | | 11,506,019 | | | | 12,389,796 | |
Small Business Administration Participation Certificates, Series 2011-20F Class 1, 3.67% due 6/1/2031 | | NR/NR | | | 1,892,408 | | | | 2,021,435 | |
Small Business Administration Participation Certificates, Series 2011-20G Class 1, 3.74% due 7/1/2031 | | NR/NR | | | 11,793,242 | | | | 12,679,490 | |
Small Business Administration Participation Certificates, Series 2011-20I Class 1, 2.85% due 9/1/2031 | | NR/NR | | | 16,044,021 | | | | 16,521,145 | |
Small Business Administration Participation Certificates, Series 2011-20K Class 1, 2.87% due 11/1/2031 | | NR/NR | | | 12,489,521 | | | | 12,888,889 | |
Small Business Administration Participation Certificates, Series 2012-20D Class 1, 2.67% due 4/1/2032 | | NR/NR | | | 12,578,601 | | | | 12,817,441 | |
Small Business Administration Participation Certificates, Series 2012-20J Class 1, 2.18% due 10/1/2032 | | NR/NR | | | 9,729,583 | | | | 9,657,908 | |
Small Business Administration Participation Certificates, Series 2012-20K Class 1, 2.09% due 11/1/2032 | | NR/NR | | | 5,835,159 | | | | 5,769,849 | |
Southaven Combined Cycle Generation LLC (Tennessee Valley Authority), 3.846% due 8/15/2033 | | AA-/Aaa | | | 5,850,222 | | | | 6,298,238 | |
a,c U.S. Department of Transportation, 5.594% due 12/7/2021 | | NR/NR | | | 1,879,637 | | | | 2,067,600 | |
a,c U.S. Department of Transportation, 6.001% due 12/7/2021 | | NR/NR | | | 3,000,000 | | | | 3,435,000 | |
Union 13 Leasing LLC, (Guaranty: Export-Import Bank of the United States), 1.682% due 12/19/2024 | | NR/NR | | | 12,396,190 | | | | 12,204,111 | |
| | | | | | | | | | |
TOTAL U.S. GOVERNMENT AGENCIES (Cost $284,167,445) | | | | | | | | | 286,948,034 | |
| | | | | | | | | | |
| | | |
OTHER GOVERNMENT — 2.93% | | | | | | | | | | |
a,b Carpintero Finance Ltd., (Guaranty: Export Credits Guarantee Department of the United Kingdom), 2.004% due 9/18/2024 | | NR/NR | | | 9,284,969 | | | | 9,290,521 | |
a,b,c Carpintero Finance Ltd., (Guaranty: Export Credits Guarantee Department of the United Kingdom), 2.581% due 11/11/2024 | | NR/NR | | | 13,005,803 | | | | 13,005,803 | |
b Corp Andina de Fomento, 3.75% due 1/15/2016 | | AA-/Aa3 | | | 10,900,000 | | | | 11,170,963 | |
a,b Eurasian Development Bank, 5.00% due 9/26/2020 | | BBB/Baa1 | | | 8,000,000 | | | | 7,560,000 | |
a,b Government of Bermuda, 5.603% due 7/20/2020 | | AA-/A1 | | | 3,000,000 | | | | 3,315,000 | |
a,b Government of Bermuda, 4.138% due 1/3/2023 | | AA-/A1 | | | 4,000,000 | | | | 3,970,000 | |
a,b,c Khadrawy Ltd., (Guaranty: Export Credit Guarantee Department), 2.471% due 3/31/2025 | | NR/NR | | | 6,000,000 | | | | 6,000,000 | |
a,b Korea National Oil Corp., 2.75% due 1/23/2019 | | A+/Aa3 | | | 5,000,000 | | | | 5,125,850 | |
b North American Development Bank, 4.375% due 2/11/2020 | | NR/Aa1 | | | 15,500,000 | | | | 17,176,697 | |
a,b Seven and Seven Ltd. Floating Rate Note, (Guaranty: Export-Import Bank of Korea), 1.404% due 9/11/2019 | | NR/NR | | | 20,070,000 | | | | 20,048,706 | |
12 Semi-Annual Report
| | |
| SCHEDULE OF INVESTMENTS, CONTINUED | | |
| |
Thornburg Limited Term Income Fund | | March 31, 2015 (Unaudited) |
| | | | | | | | | | |
Issuer-Description | | Credit Rating†
S&P/ Moody’s | | Principal
Amount | | | Value | |
a,b State of Qatar, 3.125% due 1/20/2017 | | AA/Aa2 | | $ | 4,000,000 | | | $ | 4,150,000 | |
a,b Turks and Caicos Islands, 3.20% due 2/22/2016 | | AAA/NR | | | 2,930,000 | | | | 2,990,592 | |
| | | | | | | | | | |
TOTAL OTHER GOVERNMENT (Cost $103,137,404) | | | | | | | | | 103,804,132 | |
| | | | | | | | | | |
| | | |
MORTGAGE BACKED — 5.54% | | | | | | | | | | |
Federal Home Loan Mtg Corp., CMO Interest Only Series K008 Class X1, 1.652% due 6/25/2020 | | NR/NR | | | 37,715,379 | | | | 2,463,523 | |
Federal Home Loan Mtg Corp., CMO Interest Only Series K710 Class X1, 1.777% due 5/25/2019 | | NR/NR | | | 48,911,401 | | | | 3,048,476 | |
Federal Home Loan Mtg Corp., CMO Series 2528 Class HN, 5.00% due 11/15/2017 | | NR/NR | | | 160,278 | | | | 167,540 | |
Federal Home Loan Mtg Corp., CMO Series 2627 Class GY, 4.50% due 6/15/2018 | | NR/NR | | | 960,037 | | | | 1,004,815 | |
Federal Home Loan Mtg Corp., CMO Series 2628 Class AB, 4.50% due 6/15/2018 | | NR/NR | | | 231,062 | | | | 239,547 | |
Federal Home Loan Mtg Corp., CMO Series 2682 Class JG, 4.50% due 10/15/2023 | | NR/NR | | | 1,088,239 | | | | 1,160,900 | |
Federal Home Loan Mtg Corp., CMO Series 2814 Class GB, 5.00% due 6/15/2019 | | NR/NR | | | 70,198 | | | | 71,752 | |
Federal Home Loan Mtg Corp., CMO Series 2827 Class BU, 3.50% due 7/15/2019 | | NR/NR | | | 1,018,623 | | | | 1,059,399 | |
Federal Home Loan Mtg Corp., CMO Series 3195 Class PD, 6.50% due 7/15/2036 | | NR/NR | | | 1,717,380 | | | | 1,921,078 | |
Federal Home Loan Mtg Corp., CMO Series 3291 Class BY, 4.50% due 3/15/2022 | | NR/NR | | | 2,006,091 | | | | 2,139,056 | |
Federal Home Loan Mtg Corp., CMO Series 3504 Class PC, 4.00% due 1/15/2039 | | NR/NR | | | 209,179 | | | | 219,718 | |
Federal Home Loan Mtg Corp., CMO Series 3589 Class CA, 4.00% due 10/15/2021 | | NR/NR | | | 411,157 | | | | 425,067 | |
Federal Home Loan Mtg Corp., CMO Series 3919 Class VB, 4.00% due 8/15/2024 | | NR/NR | | | 4,661,825 | | | | 5,131,694 | |
Federal Home Loan Mtg Corp., CMO Series 3922 Class PQ, 2.00% due 4/15/2041 | | NR/NR | | | 2,670,874 | | | | 2,704,096 | |
Federal Home Loan Mtg Corp., CMO Series 4050 Class MV, 3.50% due 8/15/2023 | | NR/NR | | | 3,135,244 | | | | 3,361,334 | |
Federal Home Loan Mtg Corp., CMO Series 4079 Class WV, 3.50% due 3/15/2027 | | NR/NR | | | 3,240,584 | | | | 3,452,842 | |
Federal Home Loan Mtg Corp., CMO Series 4097 Class TE, 1.75% due 5/15/2039 | | NR/NR | | | 9,359,912 | | | | 9,260,561 | |
Federal Home Loan Mtg Corp., CMO Series 4120 Class TC, 1.50% due 10/15/2027 | | NR/NR | | | 4,736,977 | | | | 4,692,388 | |
Federal Home Loan Mtg Corp., CMO Series K038 Class A1, 2.604% due 10/25/2023 | | NR/NR | | | 13,476,212 | | | | 13,931,050 | |
Federal Home Loan Mtg Corp., CMO Series K039 Class A1, 2.683% due 12/25/2023 | | NR/NR | | | 6,800,493 | | | | 7,053,773 | |
Federal Home Loan Mtg Corp., CMO Series K716 Class A1, 2.413% due 1/25/2021 | | NR/Aaa | | | 5,951,916 | | | | 6,129,380 | |
Federal Home Loan Mtg Corp., Pool D98887, 3.50% due 1/1/2032 | | NR/NR | | | 6,472,963 | | | | 6,860,076 | |
Federal Home Loan Mtg Corp., Pool J17504, 3.00% due 12/1/2026 | | NR/NR | | | 3,016,543 | | | | 3,183,395 | |
Federal Home Loan Mtg Corp., REMIC Series 3838 Class GV, 4.00% due 3/15/2024 | | NR/NR | | | 9,126,140 | | | | 9,945,278 | |
Federal Home Loan Mtg Corp., REMIC Series 4072 Class VA, 3.50% due 10/15/2023 | | NR/NR | | | 2,406,010 | | | | 2,577,313 | |
Federal National Mtg Assoc., CMO Series 2003-4 Class PE, 5.00% due 2/25/2018 | | NR/NR | | | 436,251 | | | | 457,602 | |
Federal National Mtg Assoc., CMO Series 2003-74 Class KN, 4.50% due 8/25/2018 | | NR/NR | | | 192,286 | | | | 200,192 | |
Federal National Mtg Assoc., CMO Series 2004-33 Class MW, 4.50% due 1/25/2030 | | NR/NR | | | 185,767 | | | | 187,178 | |
Federal National Mtg Assoc., CMO Series 2005-48 Class AR, 5.50% due 2/25/2035 | | NR/NR | | | 492,206 | | | | 532,805 | |
Federal National Mtg Assoc., CMO Series 2007-42 Class PA, 5.50% due 4/25/2037 | | NR/NR | | | 679,961 | | | | 733,455 | |
Federal National Mtg Assoc., CMO Series 2009-17 Class AH, 1.341% due 3/25/2039 | | NR/NR | | | 838,958 | | | | 753,037 | |
Federal National Mtg Assoc., CMO Series 2009-49 Class KA, 5.00% due 2/25/2024 | | NR/NR | | | 279,268 | | | | 288,722 | |
Federal National Mtg Assoc., CMO Series 2009-5 Class A, 4.50% due 12/25/2023 | | NR/NR | | | 1,013,590 | | | | 1,064,497 | |
Federal National Mtg Assoc., CMO Series 2009-52 Class AJ, 4.00% due 7/25/2024 | | NR/NR | | | 686,799 | | | | 721,400 | |
Federal National Mtg Assoc., CMO Series 2009-65 Class GA, 4.50% due 11/25/2023 | | NR/NR | | | 99,797 | | | | 101,397 | |
Federal National Mtg Assoc., CMO Series 2009-70 Class NK, 4.50% due 8/25/2019 | | NR/NR | | | 575,297 | | | | 602,200 | |
Federal National Mtg Assoc., CMO Series 2011-103 Class VA, 4.00% due 12/25/2022 | | NR/NR | | | 2,173,977 | | | | 2,284,333 | |
Federal National Mtg Assoc., CMO Series 2011-15 Class VA, 4.00% due 4/25/2022 | | NR/NR | | | 1,362,870 | | | | 1,463,199 | |
Federal National Mtg Assoc., CMO Series 2011-89 Class VA, 4.00% due 9/25/2023 | | NR/NR | | | 3,348,778 | | | | 3,374,194 | |
Federal National Mtg Assoc., CMO Series 2012-129 Class LA, 3.50% due 12/25/2042 | | NR/NR | | | 12,933,355 | | | | 13,607,133 | |
Federal National Mtg Assoc., CMO Series 2012-36 Class CV, 4.00% due 6/25/2023 | | NR/NR | | | 2,817,012 | | | | 3,029,738 | |
Federal National Mtg Assoc., Pool 357384, 4.50% due 5/1/2018 | | NR/NR | | | 139,190 | | | | 145,801 | |
Federal National Mtg Assoc., Pool 897936, 5.50% due 8/1/2021 | | NR/NR | | | 801,589 | | | | 870,731 | |
Federal National Mtg Assoc., Pool AB7997, 2.50% due 2/1/2023 | | NR/NR | | | 8,626,660 | | | | 8,945,779 | |
Federal National Mtg Assoc., Pool AK6518, 3.00% due 3/1/2027 | | NR/NR | | | 3,984,780 | | | | 4,203,164 | |
Federal National Mtg Assoc., Pool MA1278, 2.50% due 12/1/2022 | | NR/NR | | | 10,478,642 | | | | 10,866,270 | |
Federal National Mtg Assoc., Pool MA1585, 2.00% due 9/1/2023 | | NR/NR | | | 12,009,531 | | | | 12,199,055 | |
Federal National Mtg Assoc., Pool MA1691, 3.00% due 12/1/2023 | | NR/NR | | | 11,375,054 | | | | 11,966,468 | |
Government National Mtg Assoc., CMO Series 2009-35 Class KV, 4.50% due 6/20/2020 | | NR/NR | | | 1,357,156 | | | | 1,369,327 | |
Government National Mtg Assoc., CMO Series 2009-68 Class DP, 4.50% due 11/16/2038 | | NR/NR | | | 665,107 | | | | 715,438 | |
Government National Mtg Assoc., Pool 003007, 8.50% due 11/20/2015 | | NR/NR | | | 1,082 | | | | 1,088 | |
Government National Mtg Assoc., Pool 714631, 5.691% due 10/20/2059 | | NR/NR | | | 2,890,900 | | | | 3,044,245 | |
Government National Mtg Assoc., Pool 721652, 5.044% due 5/20/2061 | | NR/NR | | | 5,780,928 | | | | 6,261,346 | |
Government National Mtg Assoc., Pool 731491, 5.156% due 12/20/2060 | | NR/NR | | | 3,578,480 | | | | 3,922,866 | |
Government National Mtg Assoc., Pool 751388, 5.307% due 1/20/2061 | | NR/NR | | | 4,459,237 | | | | 4,901,326 | |
Government National Mtg Assoc., Pool 783299, 4.50% due 2/15/2022 | | NR/NR | | | 2,870,195 | | | | 3,015,921 | |
Government National Mtg Assoc., Pool 827148, 1.625% due 2/20/2024 | | NR/NR | | | 22,712 | | | | 23,223 | |
Semi-Annual Report 13
| | |
| SCHEDULE OF INVESTMENTS, CONTINUED | | |
| |
Thornburg Limited Term Income Fund | | March 31, 2015 (Unaudited) |
| | | | | | | | | | |
Issuer-Description | | Credit Rating†
S&P/ Moody’s | | Principal
Amount | | | Value | |
Government National Mtg Assoc., Pool MA0100, 2.50% due 5/20/2042 | | NR/NR | | $ | 2,516,269 | | | $ | 2,616,044 | |
| | | | | | | | | | |
TOTAL MORTGAGE BACKED (Cost $194,193,893) | | | | | | | | | 196,673,225 | |
| | | | | | | | | | |
| | | |
ASSET BACKED SECURITIES — 19.20% | | | | | | | | | | |
ADVANCE RECEIVABLES — 1.84% | | | | | | | | | | |
a HLSS Servicer Advance Receivables Trust, Series 2013-T1 Class A2, 1.495% due 1/16/2046 | | AAA/NR | | | 5,000,000 | | | | 4,984,585 | |
a HLSS Servicer Advance Receivables Trust, Series 2013-T1 Class A3, 2.289% due 1/15/2048 | | AAA/NR | | | 10,000,000 | | | | 9,831,000 | |
a HLSS Servicer Advance Receivables Trust, Series 2013-T3 Class A3, 1.793% due 5/15/2046 | | AAA/NR | | | 8,500,000 | | | | 8,361,170 | |
a HLSS Servicer Advance Receivables Trust, Series 2013-T5 Class AT5, 1.979% due 8/15/2046 | | AAA/NR | | | 10,500,000 | | | | 10,418,698 | |
a HLSS Servicer Advance Receivables Trust, Series 2013-T7 Class A7, 1.981% due 11/15/2046 | | AAA/NR | | | 19,900,000 | | | | 19,722,890 | |
a HLSS Servicer Advance Receivables Trust, Series 2014-T2 Class AT2, 2.217% due 1/15/2047 | | AAA/NR | | | 11,900,000 | | | | 11,793,697 | |
| | | | | | | | | | |
| | | | | | | | | 65,112,040 | |
| | | | | | | | | | |
| | | |
AUTO RECEIVABLES — 3.15% | | | | | | | | | | |
a Avis Budget Rental Car Funding AESOP LLC, Series 2012-3A Class A, 2.10% due 3/20/2019 | | NR/Aaa | | | 10,200,000 | | | | 10,325,262 | |
a CFC, LLC, Series 2013-1A Class A, 1.65% due 7/17/2017 | | NR/Aa3 | | | 185,643 | | | | 185,763 | |
a Exeter Automobile Receivables Trust, Series 2014-1A Class A, 1.29% due 5/15/2018 | | AA/NR | | | 3,128,125 | | | | 3,134,167 | |
Ford Credit Auto Owner Trust, Series 2013-C Class A4, 1.25% due 10/15/2018 | | AAA/NR | | | 1,200,000 | | | | 1,205,484 | |
a Ford Credit Auto Owner Trust, Series 2014-2 Class A, 2.31% due 4/15/2026 | | NR/Aaa | | | 18,000,000 | | | | 18,268,861 | |
a Ford Credit Auto Owner Trust, Series 2015-1 Class A, 2.12% due 7/15/2026 | | AAA/NR | | | 9,900,000 | | | | 9,951,852 | |
a GM Financial Automobile Leasing Trust, Series 2014-2A Class A4, 1.62% due 2/20/2018 | | NR/Aaa | | | 13,400,000 | | | | 13,470,338 | |
a Hertz Vehicle Financing, LLC, Series 2013-1A Class A2, 1.83% due 8/25/2019 | | NR/Aaa | | | 10,000,000 | | | | 9,948,024 | |
a OSCAR US Funding Trust, Series 2014-1A Class A3, 1.72% due 4/15/2019 | | AAA/Aaa | | | 9,900,000 | | | | 9,964,132 | |
a,c OSCAR US Funding Trust, Series 2015-1A Class A2A, 1.30% due 2/15/2018 | | AAA/Aaa | | | 15,000,000 | | | | 14,999,205 | |
Santander Drive Auto Receivables Trust, Series 2013-2 Class B, 1.33% due 3/15/2018 | | AA/Aaa | | | 7,835,000 | | | | 7,853,770 | |
Santander Drive Auto Receivables Trust, Series 2013-4 Class B, 2.16% due 1/15/2020 | | AA/Aaa | | | 4,000,000 | | | | 4,035,056 | |
World Omni Auto Receivables Trust, Series 2014-B Class A4, 1.68% due 12/15/2020 | | AAA/NR | | | 8,400,000 | | | | 8,448,467 | |
| | | | | | | | | | |
| | | | | | | | | 111,790,381 | |
| | | | | | | | | | |
| | | |
COMMERCIAL MTG TRUST — 5.25% | | | | | | | | | | |
a BAMLL-DB Trust, Series 2012-OSI Class A2FX, 3.352% due 4/13/2029 | | NR/Aaa | | | 14,893,068 | | | | 15,300,694 | |
Banc of America Commercial Mtg Inc., Series 2006-6 Class A3, 5.369% due 10/10/2045 | | AAA/Aaa | | | 3,000,000 | | | | 3,040,664 | |
a Bayview Commercial Asset Trust, Series 2004-3 Class A2 Floating Rate Note, 0.594% due 1/25/2035 | | NR/Aa2 | | | 3,703,748 | | | | 3,420,427 | |
a BHMS Mtg Trust, Series 2014-ATLS Class AFL Floating Rate Note, 1.672% due 7/5/2033 | | NR/NR | | | 10,000,000 | | | | 9,988,826 | |
a CFCRE Commercial Mtg Trust, Series 2011-C1 Class A4, 4.961% due 4/15/2044 | | NR/Aaa | | | 11,877,000 | | | | 13,435,697 | |
Citigroup Commercial Mtg Trust, Series 2004-HYB2 Class B1, 2.641% due 3/25/2034 | | CCC/Caa2 | | | 290,143 | | | | 236,450 | |
a COMM Mtg Trust, Series 2012-MVP Class A Floating Rate Note, 2.116% due 11/17/2026 | | AAA/NR | | | 6,332,785 | | | | 6,390,375 | |
Credit Suisse Commercial Mtg Capital Certificates, Series 2007-C2 Class A2, 5.448% due 1/15/2049 | | AAA/Aaa | | | 8,184 | | | | 8,190 | |
a DBUBS Mtg Trust CMO, Series 2011-LC1A Class A1, 3.742% due 11/10/2046 | | NR/Aaa | | | 4,776,747 | | | | 4,858,477 | |
a DBUBS Mtg Trust CMO, Series 2011-LC2A Class A1FL, 1.528% due 7/12/2044 | | NR/Aaa | | | 6,282,181 | | | | 6,379,921 | |
a Extended Stay America Trust, Series 2013-ESH7 Class B7, 3.604% due 12/5/2031 | | AA-/NR | | | 11,380,000 | | | | 11,846,967 | |
a FREMF Mtg Trust, Series 2012-KF01 Class B Floating Rate Note, 2.776% due 10/25/2044 | | NR/A1 | | | 4,000,000 | | | | 4,044,110 | |
a FREMF Mtg Trust, Series 2013-KF02 Class B Floating Rate Note, 3.174% due 12/25/2045 | | NR/Baa3 | | | 3,331,802 | | | | 3,393,856 | |
a GAHR Commercial Mtg Trust, Series 2015-NRF Class BFX, 3.382% due 12/15/2019 | | AA-/NR | | | 19,900,000 | | | | 20,372,404 | |
a Hilton USA Trust, Series 2013-HLT Class BFX, 3.367% due 11/5/2030 | | AA-/Aa3 | | | 18,500,000 | | | | 18,764,639 | |
a JPMorgan Chase Commercial Mtg, Series 2013-JWRZ Class B Floating Rate Note, 1.325% due 4/15/2030 | | AA-/Aa3 | | | 14,900,000 | | | | 14,898,431 | |
a JPMorgan Chase Commercial Mtg, Series 2014-BXH Class A Floating Rate Note, 1.075% due 4/15/2027 | | AAA/NR | | | 19,900,000 | | | | 19,860,855 | |
a Madison Avenue Trust, Series 2013-650M Class A, 3.843% due 10/12/2032 | | NR/Aaa | | | 6,000,000 | | | | 6,456,480 | |
a Morgan Stanley Re-REMIC Trust, Series 2009-GG10 Class A4A, 5.796% due 8/12/2045 | | NR/Aaa | | | 2,435,829 | | | | 2,607,728 | |
a Wells Fargo Commercial Mtg Trust, Series 2013-120B Class A, 2.71% due 3/18/2028 | | AAA/NR | | | 15,000,000 | | | | 15,215,936 | |
WFRBS Commercial Mtg Trust, Series 2014-C22 Class A1, 1.479% due 9/15/2057 | | NR/Aaa | | | 5,686,966 | | | | 5,704,372 | |
| | | | | | | | | | |
| | | | | | | | | 186,225,499 | |
| | | | | | | | | | |
| | | |
CREDIT CARD — 0.70% | | | | | | | | | | |
Synchrony Credit Card Master Note Trust, Series 2014-1 Class A, 1.61% due 11/15/2020 | | AAA/Aaa | | | 14,613,000 | | | | 14,690,005 | |
a,b Turquoise Card Backed Securities plc, Series 2012-1A Class A Floating Rate Note, 0.975% due 6/17/2019 | | NR/Aaa | | | 10,000,000 | | | | 10,071,010 | |
| | | | | | | | | | |
| | | | | | | | | 24,761,015 | |
| | | | | | | | | | |
| | | |
OTHER ASSET BACKED — 5.93% | | | | | | | | | | |
a 321 Henderson Receivables, LLC, Series 2014-1A Class A, 3.96% due 3/15/2063 | | NR/Aaa | | | 6,318,806 | | | | 6,773,549 | |
a Alterna Funding I, LLC, Series 2014-1A, 1.639% due 2/15/2021 | | NR/NR | | | 5,541,179 | | | | 5,548,106 | |
Appalachian Consumer Rate Relief Funding LLC, Series 2013-1 Class A1, 2.008% due 2/1/2024 | | AAA/Aaa | | | 13,529,637 | | | | 13,646,493 | |
a Ascentium Equipment Receivables, LLC, Series 2012-1A Class A, 1.83% due 9/15/2019 | | NR/NR | | | 96,639 | | | | 96,643 | |
a Ascentium Equipment Receivables, LLC, Series 2015-1A Class B, 2.26% due 6/10/2021 | | NR/Aa3 | | | 5,920,000 | | | | 5,944,386 | |
a CLI Funding V LLC, Series 2014-2A Class A, 3.38% due 10/18/2029 | | A/NR | | | 9,583,333 | | | | 9,691,847 | |
a,b Cronos Containers Program Ltd., Series 2013-1A Class A, 3.08% due 4/18/2028 | | A+/NR | | | 8,083,333 | | | | 8,104,554 | |
a Dominos Pizza Master Issuer, LLC, Series 2012-1A Class A2, 5.216% due 1/25/2042 | | BBB+/Baa1 | | | 12,435,638 | | | | 13,017,294 | |
14 Semi-Annual Report
| | |
| SCHEDULE OF INVESTMENTS, CONTINUED | | |
| |
Thornburg Limited Term Income Fund | | March 31, 2015 (Unaudited) |
| | | | | | | | | | |
Issuer-Description | | Credit Rating†
S&P/ Moody’s | | Principal
Amount | | | Value | |
a Fairway Outdoor Funding, LLC, Series 2012-1A Class A2, 4.212% due 10/15/2042 | | NR/NR | | $ | 6,527,711 | | | $ | 6,544,044 | |
a,c GTP Cellular Sites, LLC, 3.721% due 3/15/2042 | | NR/NR | | | 9,249,626 | | | | 9,554,864 | |
a Navistar Financial Dealer Note Master Owner Trust II, Series 2014-1 Class A Floating Rate Note, 0.924% due 10/25/2019 | | NR/Aaa | | | 17,730,000 | | | | 17,730,053 | |
a Navitas Equipment Receivables, LLC, Series 2015-1 Class A2, 2.12% due 11/15/2018 | | NR/A3 | | | 11,500,000 | | | | 11,498,487 | |
Northwest Airlines, Inc., 7.027% due 5/1/2021 | | A/Baa1 | | | 4,292,933 | | | | 4,976,798 | |
a,c Northwind Holdings, LLC, Series 2007-1A Class A1 Floating Rate Note, 1.014% due 12/1/2037 | | A/Baa1 | | | 3,231,318 | | | | 2,997,047 | |
a PFS Financing Corp., Series 2013-AA Class A Floating Rate Note, 0.725% due 2/15/2018 | | AAA/Aaa | | | 9,345,000 | | | | 9,336,348 | |
a PFS Financing Corp., Series 2014-BA Class A Floating Rate Note, 0.775% due 10/15/2019 | | AAA/Aaa | | | 6,000,000 | | | | 5,997,225 | |
a PFS Tax Lien Trust, Series 2014-1, 1.44% due 5/15/2029 | | AAA/NR | | | 3,569,752 | | | | 3,577,763 | |
a SBA Tower Trust, Series 2010-2 Class C, 5.101% due 4/15/2042 | | NR/A2 | | | 4,605,000 | | | | 4,816,300 | |
a SBA Tower Trust, Series 2012-1 Class C, 2.933% due 12/15/2042 | | NR/A2 | | | 1,548,000 | | | | 1,566,420 | |
a SBA Tower Trust, Series 2014-1A Class C, 2.898% due 10/15/2044 | | NR/A2 | | | 17,900,000 | | | | 18,117,556 | |
a Sierra Receivables Funding Co., LLC, Series 2012-1A Class A, 2.84% due 11/20/2028 | | A+/NR | | | 2,175,847 | | | | 2,202,624 | |
a Sierra Receivables Funding Co., LLC, Series 2012-2A Class A, 2.05% due 6/20/2031 | | A/NR | | | 4,512,157 | | | | 4,500,776 | |
a Sierra Receivables Funding Co., LLC, Series 2014-1A Class A, 2.07% due 3/20/2030 | | A/NR | | | 9,546,618 | | | | 9,528,920 | |
a Sierra Receivables Funding Co., LLC, Series 2015-1A Class A, 2.40% due 3/22/2032 | | A/NR | | | 11,000,000 | | | | 10,997,732 | |
a Sonic Capital, LLC, Series 2011-1A Class A2, 5.438% due 5/20/2041 | | BBB/Baa2 | | | 4,424,800 | | | | 4,678,029 | |
a Springleaf Funding Trust, Series 2015-AA Class A, 3.16% due 11/15/2024 | | A+/NR | | | 13,000,000 | | | | 13,020,046 | |
a,b Trafigura Securitisation Finance plc, Series 2012-1A Class A Floating Rate Note, 2.575% due 10/15/2015 | | AAA/Aaa | | | 6,000,000 | | | | 6,002,173 | |
| | | | | | | | | | |
| | | | | | | | | 210,466,077 | |
| | | | | | | | | | |
| | | |
RESIDENTIAL MTG TRUST — 0.90% | | | | | | | | | | |
Banc of America Mtg Securities, Inc., Series 2004-4 Class 1A2, 5.50% due 5/25/2034 | | A+/NR | | | 101,258 | | | | 101,309 | |
a Citigroup Mtg Loan Trust, Inc., Series 2014-A Class A, 4.00% due 1/25/2035 | | AA/NR | | | 7,016,826 | | | | 7,247,723 | |
Countrywide Home Loan, Series 2004-HYB2 Class 1A, 2.596% due 7/20/2034 | | A/B1 | | | 361,446 | | | | 365,943 | |
a,c FDIC Trust, Series 2013-R1 Class A, 1.15% due 3/25/2033 | | NR/NR | | | 4,594,890 | | | | 4,530,561 | |
Merrill Lynch Mtg Investors Trust, Series 2003-E Class B3, 2.424% due 10/25/2028 | | CCC/Caa2 | | | 975,968 | | | | 261,912 | |
Merrill Lynch Mtg Investors Trust, Series 2004-A4 Class M1, 2.463% due 8/25/2034 | | CCC/NR | | | 722,121 | | | | 663,732 | |
Option One Mtg Loan Trust, Series 2005-5 Class A3 Floating Rate Note, 0.384% due 12/25/2035 | | AA+/Baa2 | | | 891,416 | | | | 874,774 | |
Popular ABS Mtg Pass-Through Trust, Series 2005-4 Class AF5, 5.537% due 9/25/2035 | | BB+/A1 | | | 3,384,476 | | | | 3,451,387 | |
Residential Asset Mtg Products, Inc., Series 2003-SL1 Class A31, 7.125% due 4/25/2031 | | AA+/NR | | | 1,648,924 | | | | 1,738,249 | |
a Shellpoint Asset Funding Trust, Series 2013-1 Class A1, 3.75% due 7/25/2043 | | AAA/NR | | | 9,427,784 | | | | 9,724,101 | |
Structured Asset Securities Corp., Series 2003-9A Class 2A2, 2.353% due 3/25/2033 | | AA+/Ba1 | | �� | 2,012,113 | | | | 1,995,254 | |
Structured Asset Securities Corp., Series 2004-3 Class 3A1, 5.50% due 3/25/2019 | | A+/Ba2 | | | 455,113 | | | | 460,411 | |
Washington Mutual Mtg, Series 2003-S13 Class 21A1, 4.50% due 12/25/2018 | | A+/NR | | | 410,806 | | | | 410,468 | |
Wells Fargo Asset Securities Corp., Series 2005-AR1 Class 1B1, 2.622% due 2/25/2035 | | D/C | | | 529,919 | | | | 186,761 | |
| | | | | | | | | | |
| | | | | | | | | 32,012,585 | |
| | | | | | | | | | |
STUDENT LOAN — 1.43% | | | | | | | | | | |
Navient Student Loan Trust, Series 2014-1 Class A3 Floating Rate Note, 0.684% due 6/25/2031 | | NR/Aaa | | | 6,750,000 | | | | 6,711,863 | |
a Navient Student Loan Trust, Series 2015-AA Class A2B Floating Rate Note, 1.403% due 12/15/2028 | | NR/Aaa | | | 7,000,000 | | | | 7,007,668 | |
a Nelnet Student Loan Trust, Series 2013-1A Class A Floating Rate Note, 0.774% due 6/25/2041 | | NR/Aaa | | | 11,241,707 | | | | 11,248,927 | |
a Pennsylvania Higher Education Assistance Agency, Series 2012-1A Class A1 Floating Rate Note, 0.724% due 5/25/2027 | | AA+/NR | | | 4,424,654 | | | | 4,448,471 | |
SLM Student Loan Trust, Series 2003-C Class A2 Floating Rate Note, 0.661% due 9/15/2020 | | A-/Aaa | | | 1,709,540 | | | | 1,699,215 | |
a SLM Student Loan Trust, Series 2011-A Class A3 Floating Rate Note, 2.675% due 1/15/2043 | | AAA/Aaa | | | 13,650,000 | | | | 14,441,071 | |
a SLM Student Loan Trust, Series 2011-B Class A2, 3.74% due 2/15/2029 | | AAA/Aaa | | | 5,000,000 | | | | 5,291,646 | |
| | | | | | | | | | |
| | | | | | | | | 50,848,861 | |
| | | | | | | | | | |
TOTAL ASSET BACKED SECURITIES (Cost $678,196,770) | | | | | | | | | 681,216,458 | |
| | | | | | | | | | |
| | | |
CORPORATE BONDS — 47.93% | | | | | | | | | | |
AUTOMOBILES & COMPONENTS — 1.36% | | | | | | | | | | |
Automobiles — 1.36% | | | | | | | | | | |
a American Honda Finance Corp., 2.60% due 9/20/2016 | | A+/A1 | | | 5,000,000 | | | | 5,131,065 | |
a American Honda Finance Corp., 1.00% due 8/11/2015 | | A+/A1 | | | 3,000,000 | | | | 3,006,858 | |
a Daimler Finance North America, LLC, 1.25% due 1/11/2016 | | A-/A3 | | | 7,000,000 | | | | 7,025,900 | |
a Hyundai Capital America, 2.00% due 3/19/2018 | | A-/Baa1 | | | 4,950,000 | | | | 5,029,294 | |
a,b Hyundai Capital Services, Inc., 6.00% due 5/5/2015 | | A-/Baa1 | | | 7,900,000 | | | | 7,930,138 | |
a,b Hyundai Capital Services, Inc. Floating Rate Note, 1.07% due 3/18/2017 | | A-/Baa1 | | | 5,000,000 | | | | 5,006,310 | |
a Nissan Motor Acceptance Corp., 1.95% due 9/12/2017 | | A-/A3 | | | 14,900,000 | | | | 15,137,402 | |
| | | | | | | | | | |
| | | | | | | | | 48,266,967 | |
| | | | | | | | | | |
| | | |
BANKS — 7.16% | | | | | | | | | | |
Banks — 6.55% | | | | | | | | | | |
a,b ANZ National International Ltd., 3.125% due 8/10/2015 | | AA-/Aa3 | | | 4,000,000 | | | | 4,037,620 | |
a,b Banco BTG Pactual SA/Cayman Islands N.A., 4.00% due 1/16/2020 | | NR/Baa3 | | | 7,000,000 | | | | 6,384,000 | |
a,b Banco Latinoamericano de Comercio Exterior, S.A., 3.75% due 4/4/2017 | | BBB/NR | | | 4,000,000 | | | | 4,110,000 | |
Semi-Annual Report 15
| | |
| SCHEDULE OF INVESTMENTS, CONTINUED | | |
| |
Thornburg Limited Term Income Fund | | March 31, 2015 (Unaudited) |
| | | | | | | | | | |
Issuer-Description | | Credit Rating†
S&P/ Moody’s | | Principal
Amount | | | Value | |
a,b Banco Santander Chile Floating Rate Note, 2.139% due 6/7/2018 | | A/Aa3 | | $ | 21,000,000 | | | $ | 21,378,000 | |
Bank of America Corp. Floating Rate Note, 1.293% due 1/15/2019 | | A-/Baa2 | | | 4,225,000 | | | | 4,282,840 | |
Bank of America Corp. Floating Rate Note, 1.125% due 4/1/2019 | | A-/Baa2 | | | 8,000,000 | | | | 8,046,840 | |
a,b Bank of China Hong Kong, 3.75% due 11/8/2016 | | A+/Aa3 | | | 4,000,000 | | | | 4,140,572 | |
a,b Barclays Bank plc, 2.50% due 9/21/2015 | | AAA/Aaa | | | 14,650,000 | | | | 14,800,953 | |
a,b Caixa Economica Federal, 4.50% due 10/3/2018 | | BBB-/Baa2 | | | 11,525,000 | | | | 11,307,177 | |
Citigroup, Inc., 2.50% due 7/29/2019 | | A-/Baa2 | | | 2,925,000 | | | | 2,966,705 | |
a,b Danske Bank A/S, 3.75% due 4/1/2015 | | A/NR | | | 4,000,000 | | | | 4,000,000 | |
a,b DNB Bank ASA, 3.20% due 4/3/2017 | | A+/A1 | | | 10,000,000 | | | | 10,361,130 | |
Fifth Third Bank, 2.875% due 10/1/2021 | | A-/A3 | | | 11,600,000 | | | | 11,757,296 | |
First Tennessee Bank, 2.95% due 12/1/2019 | | NR/NR | | | 7,000,000 | | | | 7,099,771 | |
a,b HSBC Bank plc, 3.50% due 6/28/2015 | | AA-/Aa3 | | | 2,000,000 | | | | 2,014,520 | |
Manufacturers & Traders Trust Co., 2.30% due 1/30/2019 | | A/A2 | | | 10,000,000 | | | | 10,155,830 | |
a,b Mitsubishi UFJ Trust and Banking Corp., 1.60% due 10/16/2017 | | A+/A1 | | | 5,000,000 | | | | 4,995,805 | |
a,b Mitsubishi UFJ Trust and Banking Corp., 2.45% due 10/16/2019 | | A+/A1 | | | 7,000,000 | | | | 7,079,275 | |
a,b Mizuho Bank, Ltd., 2.45% due 4/16/2019 | | A+/A1 | | | 7,000,000 | | | | 7,091,203 | |
National City Bank Floating Rate Note, 0.634% due 6/7/2017 | | A-/A3 | | | 4,000,000 | | | | 3,980,432 | |
a,b Oversea-Chinese Banking Corp. Ltd., 3.15% due 3/11/2023 | | A+/Aa3 | | | 29,650,000 | | | | 30,225,477 | |
b Royal Bank of Scotland Group plc, 9.50% due 3/16/2022 | | BB+/NR | | | 12,000,000 | | | | 13,533,552 | |
a,b Sberbank of Russia, 5.50% due 2/26/2024 | | NR/NR | | | 10,640,000 | | | | 8,174,180 | |
a,c Sovereign Bank, 12.18% due 6/30/2020 | | BBB/A2 | | | 2,960,202 | | | | 4,070,278 | |
a,b Standard Chartered plc, 3.20% due 5/12/2016 | | A-/A2 | | | 4,900,000 | | | | 5,009,486 | |
U.S. Bank National Association, 2.125% due 10/28/2019 | | AA-/Aa3 | | | 9,600,000 | | | | 9,724,646 | |
Wells Fargo Bank N.A., 0.467% due 5/16/2016 | | A+/A1 | | | 4,629,000 | | | | 4,618,673 | |
b Westpac Banking Corp., 3.00% due 8/4/2015 | | AA-/Aa2 | | | 2,000,000 | | | | 2,017,274 | |
a,b Westpac Banking Corp. Floating Rate Note, 1.057% due 7/17/2015 | | NR/Aaa | | | 5,000,000 | | | | 5,010,455 | |
Thrifts & Mortgage Finance — 0.61% | | | | | | | | | | |
a,b Northern Rock Covered Bond LLP, 5.625% due 6/22/2017 | | AAA/Aaa | | | 19,900,000 | | | | 21,768,849 | |
| | | | | | | | | | |
| | | | | | | | | 254,142,839 | |
| | | | | | | | | | |
| | | |
CAPITAL GOODS — 1.68% | | | | | | | | | | |
Aerospace & Defense — 0.35% | | | | | | | | | | |
Exelis, Inc., 5.55% due 10/1/2021 | | BBB-/Ba1 | | | 11,338,000 | | | | 12,522,719 | |
Construction & Engineering — 0.25% | | | | | | | | | | |
URS Corp., 3.85% due 4/1/2017 | | BB-/NR | | | 8,895,000 | | | | 8,772,694 | |
Industrial Conglomerates — 0.24% | | | | | | | | | | |
a,b Hutchison Whampoa Ltd., 3.50% due 1/13/2017 | | A-/A3 | | | 5,000,000 | | | | 5,170,700 | |
a,b Smiths Group plc, 7.20% due 5/15/2019 | | BBB+/Baa2 | | | 3,000,000 | | | | 3,486,114 | |
Machinery — 0.52% | | | | | | | | | | |
Aeroquip Vickers, Inc., 6.875% due 4/9/2018 | | A-/NR | | | 1,500,000 | | | | 1,657,183 | |
Ingersoll Rand Co., 6.391% due 11/15/2027 | | BBB/Baa2 | | | 3,000,000 | | | | 3,654,936 | |
a,b Volvo Treasury AB, 5.95% due 4/1/2015 | | BBB/NR | | | 13,000,000 | | | | 13,000,000 | |
Trading Companies & Distributors — 0.32% | | | | | | | | | | |
a Aviation Capital Group Corp., 6.75% due 4/6/2021 | | BBB-/NR | | | 6,000,000 | | | | 6,828,246 | |
a Aviation Capital Group Corp., 7.125% due 10/15/2020 | | BBB-/NR | | | 3,912,000 | | | | 4,542,028 | |
| | | | | | | | | | |
| | | | | | | | | 59,634,620 | |
| | | | | | | | | | |
| | | |
CONSUMER DURABLES & APPAREL — 0.27% | | | | | | | | | | |
Household Durables — 0.20% | | | | | | | | | | |
Leggett & Platt, Inc., 3.80% due 11/15/2024 | | BBB+/Baa1 | | | 7,000,000 | | | | 7,274,554 | |
Textiles, Apparel & Luxury Goods — 0.07% | | | | | | | | | | |
Nike, Inc., 5.15% due 10/15/2015 | | AA-/A1 | | | 2,315,000 | | | | 2,372,069 | |
| | | | | | | | | | |
| | | | | | | | | 9,646,623 | |
| | | | | | | | | | |
| | | |
CONSUMER SERVICES — 0.60% | | | | | | | | | | |
Diversified Consumer Services — 0.45% | | | | | | | | | | |
George Washington University, 4.411% due 9/15/2017 | | A+/A1 | | | 1,650,000 | | | | 1,768,536 | |
Rensselaer Polytechnic I, 5.60% due 9/1/2020 | | A-/A3 | | | 10,925,000 | | | | 12,613,393 | |
University of Chicago, 3.065% due 10/1/2024 | | AA/Aa2 | | | 1,611,000 | | | | 1,650,441 | |
Hotels, Restaurants & Leisure — 0.15% | | | | | | | | | | |
Marriott International, Inc., 3.125% due 10/15/2021 | | BBB/Baa2 | | | 5,000,000 | | | | 5,146,330 | |
| | | | | | | | | | |
| | | | | | | | | 21,178,700 | |
| | | | | | | | | | |
16 Semi-Annual Report
| | |
| SCHEDULE OF INVESTMENTS, CONTINUED | | |
| |
Thornburg Limited Term Income Fund | | March 31, 2015 (Unaudited) |
| | | | | | | | | | |
Issuer-Description | | Credit Rating†
S&P/ Moody’s | | Principal
Amount | | | Value | |
DIVERSIFIED FINANCIALS — 7.85% | | | | | | | | | | |
Capital Markets — 4.40% | | | | | | | | | | |
Ares Capital Corp., 4.875% due 11/30/2018 | | BBB/NR | | $ | 18,000,000 | | | $ | 18,923,454 | |
a Ares Finance Co., LLC, 4.00% due 10/8/2024 | | A-/NR | | | 5,000,000 | | | | 4,918,115 | |
a,b BTG Investments LP, 4.50% due 4/17/2018 | | NR/NR | | | 20,000,000 | | | | 18,450,000 | |
b Credit Suisse Group AG - New York, 3.00% due 10/29/2021 | | A/A1 | | | 10,000,000 | | | | 10,192,500 | |
b Credit Suisse Group AG - New York, 1.75% due 1/29/2018 | | A/A1 | | | 9,325,000 | | | | 9,353,329 | |
b Deutsche Bank AG London, 2.50% due 2/13/2019 | | A/A3 | | | 8,600,000 | | | | 8,729,533 | |
FS Investment Corp., 4.00% due 7/15/2019 | | BBB/NR | | | 12,000,000 | | | | 12,192,504 | |
Goldman Sachs Group, Inc. Floating Rate Note, 1.357% due 11/15/2018 | | A-/Baa1 | | | 14,900,000 | | | | 15,062,738 | |
Goldman Sachs Group, Inc. Floating Rate Note, 1.277% due 10/23/2019 | | A-/Baa1 | | | 14,545,000 | | | | 14,667,091 | |
a,b IPIC GMTN Ltd., 3.75% due 3/1/2017 | | AA/Aa2 | | | 3,000,000 | | | | 3,127,500 | |
a,b IPIC GMTN Ltd., 5.50% due 3/1/2022 | | AA/Aa2 | | | 3,500,000 | | | | 4,090,625 | |
a,b IPIC GMTN Ltd., 3.125% due 11/15/2015 | | AA/Aa2 | | | 1,000,000 | | | | 1,014,140 | |
a,b IPIC GMTN Ltd., 5.00% due 11/15/2020 | | AA/Aa2 | | | 1,000,000 | | | | 1,126,250 | |
Legg Mason, Inc., 2.70% due 7/15/2019 | | BBB/Baa1 | | | 1,660,000 | | | | 1,690,836 | |
a,b Macquarie Bank Ltd., 3.45% due 7/27/2015 | | A/A2 | | | 1,900,000 | | | | 1,916,435 | |
a,b Macquarie Bank Ltd., 1.60% due 10/27/2017 | | A/A2 | | | 5,000,000 | | | | 4,997,675 | |
a,b Macquarie Bank Ltd., 2.60% due 6/24/2019 | | A/A2 | | | 3,000,000 | | | | 3,042,474 | |
Merrill Lynch & Co., 0.805% due 5/2/2017 | | BBB+/Baa3 | | | 2,500,000 | | | | 2,479,475 | |
Morgan Stanley, 1.875% due 1/5/2018 | | A-/Baa2 | | | 4,950,000 | | | | 4,983,868 | |
TD Ameritrade Holding Corp., 2.95% due 4/1/2022 | | A/A3 | | | 2,550,000 | | | | 2,592,679 | |
b UBS AG Stamford, 1.80% due 3/26/2018 | | A/NR | | | 3,000,000 | | | | 3,008,325 | |
b UBS AG Stamford, 2.375% due 8/14/2019 | | A/A2 | | | 9,500,000 | | | | 9,575,763 | |
| | | |
Consumer Finance - 1.31% | | | | | | | | | | |
American Express Credit Co., 2.80% due 9/19/2016 | | A-/A2 | | | 8,000,000 | | | | 8,224,856 | |
Capital One Bank (USA), N.A., 2.30% due 6/5/2019 | | BBB+/A3 | | | 3,000,000 | | | | 3,005,688 | |
Capital One Bank (USA), N.A., 2.95% due 7/23/2021 | | BBB+/A3 | | | 10,000,000 | | | | 10,142,920 | |
a,b Cie Financement Foncier, 2.50% due 9/16/2015 | | AAA/Aaa | | | 6,000,000 | | | | 6,054,060 | |
Synchrony Financial, 1.875% due 8/15/2017 | | BBB-/NR | | | 950,000 | | | | 950,768 | |
Synchrony Financial, 3.00% due 8/15/2019 | | BBB-/NR | | | 1,950,000 | | | | 1,992,329 | |
Synchrony Financial, 3.75% due 8/15/2021 | | BBB-/NR | | | 2,000,000 | | | | 2,074,008 | |
Western Union Co., 3.35% due 5/22/2019 | | BBB/Baa2 | | | 11,350,000 | | | | 11,804,999 | |
Western Union Co., 3.65% due 8/22/2018 | | BBB/Baa2 | | | 2,000,000 | | | | 2,100,288 | |
| | | |
Diversified Financial Services — 2.14% | | | | | | | | | | |
b Barclays Bank plc, 2.50% due 2/20/2019 | | A/A2 | | | 3,000,000 | | | | 3,061,020 | |
a CME Group Index Services, 4.40% due 3/15/2018 | | AA-/Aa3 | | | 4,530,000 | | | | 4,965,143 | |
General Electric Capital Corp. Floating Rate Note, 0.42% due 12/28/2018 | | AA+/A1 | | | 4,850,000 | | | | 4,779,481 | |
General Electric Capital Corp. Floating Rate Note, 1.271% due 3/15/2023 | | AA+/A1 | | | 7,725,000 | | | | 7,824,266 | |
JPMorgan Chase Bank N.A. Floating Rate Note, 0.60% due 6/13/2016 | | A/A2 | | | 16,875,000 | | | | 16,829,421 | |
Moody’s Corp., 4.875% due 2/15/2024 | | BBB+/NR | | | 17,000,000 | | | | 18,931,982 | |
Moody’s Corp., 2.75% due 7/15/2019 | | BBB+/NR | | | 4,875,000 | | | | 4,983,386 | |
a,b Mubadala GE Capital Ltd., 3.00% due 11/10/2019 | | NR/Baa2 | | | 4,000,000 | | | | 3,988,656 | |
National Rural Utilities CFC, 10.375% due 11/1/2018 | | A/A1 | | | 2,000,000 | | | | 2,591,264 | |
a USAA Capital Corp., 2.25% due 12/13/2016 | | AA+/Aa1 | | | 8,000,000 | | | | 8,189,016 | |
| | | | | | | | | | |
| | | | | | | | | 278,628,860 | |
| | | | | | | | | | |
| | | |
ENERGY — 5.07% | | | | | | | | | | |
Energy Equipment & Services — 0.49% | | | | | | | | | | |
b Ensco plc, 4.70% due 3/15/2021 | | BBB+/Baa1 | | | 5,000,000 | | | | 5,053,640 | |
Oceaneering International, Inc., 4.65% due 11/15/2024 | | BBB/Baa2 | | | 10,000,000 | | | | 10,110,350 | |
a,b Schahin II Finance Co. (SPV) Ltd., 5.875% due 9/25/2023 | | B+/B1 | | | 4,082,733 | | | | 2,468,012 | |
| | | |
Oil, Gas & Consumable Fuels — 4.58% | | | | | | | | | | |
a,b BG Energy Capital plc, 2.875% due 10/15/2016 | | A-/A2 | | | 5,000,000 | | | | 5,134,195 | |
Buckeye Partners LP, 4.15% due 7/1/2023 | | BBB-/Baa3 | | | 7,000,000 | | | | 6,923,028 | |
a,b CNPC General Capital Ltd., 2.75% due 4/19/2017 | | A+/A1 | | | 5,000,000 | | | | 5,088,585 | |
a,b CNPC General Capital Ltd., 2.75% due 5/14/2019 | | A+/A1 | | | 5,000,000 | | | | 5,029,135 | |
a,b CNPC General Capital Ltd., 1.45% due 4/16/2016 | | A+/A1 | | | 3,000,000 | | | | 2,999,109 | |
a,b CNPC General Capital Ltd. Floating Rate Note, 1.157% due 5/14/2017 | | A+/A1 | | | 5,000,000 | | | | 5,006,985 | |
Energen Corp., 4.625% due 9/1/2021 | | BB/Ba2 | | | 10,000,000 | | | | 9,408,550 | |
a Florida Gas Transmission Co., LLC, 4.00% due 7/15/2015 | | BBB/Baa2 | | | 2,000,000 | | | | 2,016,250 | |
a,b Gazprom, 4.95% due 5/23/2016 | | BB+/Ba1 | | | 4,000,000 | | | | 4,037,448 | |
a,b Gazprom Neft OAO, 6.00% due 11/27/2023 | | BB+/Ba1 | | | 7,000,000 | | | | 6,037,500 | |
Gulf South Pipeline Co. LP, 4.00% due 6/15/2022 | | BBB-/Baa2 | | | 13,690,000 | | | | 13,216,176 | |
Semi-Annual Report 17
| | |
| SCHEDULE OF INVESTMENTS, CONTINUED | | |
| |
Thornburg Limited Term Income Fund | | March 31, 2015 (Unaudited) |
| | | | | | | | | | |
Issuer-Description | | Credit Rating†
S&P/ Moody’s | | Principal
Amount | | | Value | |
a,b Harvest Operations Corp., 2.125% due 5/14/2018 | | A+/Aa3 | | $ | 7,000,000 | | | $ | 7,032,739 | |
a,b Korea National Oil Corp., 4.00% due 10/27/2016 | | A+/Aa3 | | | 2,000,000 | | | | 2,080,588 | |
a Northern Natural Gas Co., 5.75% due 7/15/2018 | | A-/A2 | | | 50,000 | | | | 56,434 | |
NuStar Logistics LP, 4.75% due 2/1/2022 | | BB+/Ba1 | | | 5,000,000 | | | | 4,800,000 | |
a,b Odebrecht Offshore Drilling Finance Ltd., 6.75% due 10/1/2022 | | B+/B2 | | | 18,602,000 | | | | 14,457,474 | |
b Petrobras Global Finance B.V. Floating Rate Note, 2.631% due 3/17/2017 | | BBB-/Ba2 | | | 5,750,000 | | | | 5,289,425 | |
b Petroleos Mexicanos Floating Rate Note, 2.277% due 7/18/2018 | | BBB+/A3 | | | 10,000,000 | | | | 10,235,000 | |
b Sasol Financing International plc, 4.50% due 11/14/2022 | | BBB/Baa1 | | | 4,000,000 | | | | 3,970,000 | |
a Semco Energy, Inc., 5.15% due 4/21/2020 | | A-/A2 | | | 3,000,000 | | | | 3,406,521 | |
a,b Sinopec Capital (2013) Ltd., 1.875% due 4/24/2018 | | AA-/Aa3 | | | 20,000,000 | | | | 19,877,700 | |
a,b Sinopec Group Overseas Development Ltd., 2.75% due 5/17/2017 | | AA-/Aa3 | | | 6,000,000 | | | | 6,111,492 | |
a Texas Gas Transmission, LLC, 4.50% due 2/1/2021 | | BBB-/Baa2 | | | 4,480,000 | | | | 4,650,276 | |
Williams Partners LP, 4.50% due 11/15/2023 | | BBB/Baa2 | | | 15,000,000 | | | | 15,553,050 | |
| | | | | | | | | | |
| | | | | | | | | 180,049,662 | |
| | | | | | | | | | |
| | | |
FOOD, BEVERAGE & TOBACCO — 1.82% | | | | | | | | | | |
Beverages — 0.49% | | | | | | | | | | |
Coca Cola Enterprises, Inc., 5.71% due 3/18/2037 | | AA/NR | | | 3,380,000 | | | | 4,083,544 | |
b Coca Cola HBC Finance B.V., 5.50% due 9/17/2015 | | BBB/Baa1 | | | 7,885,000 | | | | 8,060,007 | |
a,b Coca Cola Icecek Uretim A.S., 4.75% due 10/1/2018 | | NR/Baa3 | | | 5,000,000 | | | | 5,268,395 | |
| | | |
Food Products — 0.61% | | | | | | | | | | |
Corn Products International, Inc., 3.20% due 11/1/2015 | | BBB/Baa2 | | | 1,000,000 | | | | 1,012,275 | |
General Mills, Inc., 1.40% due 10/20/2017 | | BBB+/A3 | | | 4,600,000 | | | | 4,611,955 | |
General Mills, Inc., 2.20% due 10/21/2019 | | BBB+/A3 | | | 3,950,000 | | | | 3,983,109 | |
Ingredion, Inc., 1.80% due 9/25/2017 | | BBB/Baa2 | | | 12,150,000 | | | | 12,148,967 | |
| | | |
Tobacco — 0.72% | | | | | | | | | | |
Altria Group, Inc., 2.625% due 1/14/2020 | | BBB+/Baa1 | | | 4,900,000 | | | | 4,978,591 | |
a,b B.A.T. International Finance plc, 2.125% due 6/7/2017 | | A-/A3 | | | 8,000,000 | | | | 8,130,920 | |
Lorillard Tobacco Co., 3.75% due 5/20/2023 | | BBB-/Baa2 | | | 6,230,000 | | | | 6,343,156 | |
Lorillard Tobacco Co., 6.875% due 5/1/2020 | | BBB-/Baa2 | | | 5,000,000 | | | | 5,959,415 | |
| | | | | | | | | | |
| | | | | | | | | 64,580,334 | |
| | | | | | | | | | |
| | | |
HEALTH CARE EQUIPMENT & SERVICES — 0.53% | | | | | | | | | | |
Health Care Providers & Services — 0.53% | | | | | | | | | | |
Catholic Health Initiatives, 2.95% due 11/1/2022 | | A/A2 | | | 7,000,000 | | | | 6,962,648 | |
Catholic Health Initiatives, 1.60% due 11/1/2017 | | A/NR | | | 1,900,000 | | | | 1,905,561 | |
Wellpoint, Inc., 2.25% due 8/15/2019 | | A-/Baa2 | | | 10,000,000 | | | | 10,045,040 | |
| | | | | | | | | | |
| | | | | | | | | 18,913,249 | |
| | | | | | | | | | |
| | | |
HOUSEHOLD & PERSONAL PRODUCTS — 0.15% | | | | | | | | | | |
Household Products — 0.15% | | | | | | | | | | |
Energizer Holdings, Inc., 4.70% due 5/24/2022 | | BBB-/Baa3 | | | 2,000,000 | | | | 2,064,828 | |
a,b Kimberly-Clark de Mexico, 3.80% due 4/8/2024 | | A-/NR | | | 3,000,000 | | | | 3,154,140 | |
| | | | | | | | | | |
| | | | | | | | | 5,218,968 | |
| | | | | | | | | | |
| | | |
INSURANCE — 3.69% | | | | | | | | | | |
Insurance — 3.69% | | | | | | | | | | |
Aflac, Inc., 3.625% due 11/15/2024 | | A/A3 | | | 5,000,000 | | | | 5,240,215 | |
a Forethought Financial Group, Inc., 8.625% due 4/15/2021 | | BBB-/Ba1 | | | 2,600,000 | | | | 3,054,394 | |
Hanover Insurance Group, Inc., 6.375% due 6/15/2021 | | BBB/Baa3 | | | 2,480,000 | | | | 2,913,886 | |
Infinity Property & Casualty Corp., 5.00% due 9/19/2022 | | BBB/Baa2 | | | 3,000,000 | | | | 3,252,108 | |
Kemper Corp., 4.35% due 2/15/2025 | | BBB-/Baa3 | | | 15,000,000 | | | | 15,350,310 | |
a,b,c Lancashire Holdings Ltd., 5.70% due 10/1/2022 | | BBB/Baa2 | | | 10,000,000 | | | | 11,050,000 | |
a MassMutual Global Funding, LLC, 2.00% due 4/5/2017 | | AA+/Aa2 | | | 8,000,000 | | | | 8,121,568 | |
a MetLife Institutional Funding II, 1.625% due 4/2/2015 | | AA-/Aa3 | | | 5,000,000 | | | | 5,000,000 | |
a Metropolitan Life Global Funding I, 1.70% due 6/29/2015 | | AA-/Aa3 | | | 4,000,000 | | | | 4,012,400 | |
b Montpelier Re Holdings Ltd., 4.70% due 10/15/2022 | | BBB/NR | | | 5,000,000 | | | | 5,272,240 | |
a Pricoa Global Funding 1, 1.35% due 8/18/2017 | | AA-/A1 | | | 10,000,000 | | | | 9,993,030 | |
a,d Principal Life Global Funding II, 2.20% due 4/8/2020 | | NR/NR | | | 7,000,000 | | | | 6,990,760 | |
a Principal Life Global Funding II, 1.00% due 12/11/2015 | | A+/A1 | | | 7,000,000 | | | | 7,023,779 | |
a Principal Life Global Funding II, 1.50% due 9/11/2017 | | A+/A1 | | | 6,950,000 | | | | 6,980,149 | |
18 Semi-Annual Report
| | |
| SCHEDULE OF INVESTMENTS, CONTINUED | | |
| |
Thornburg Limited Term Income Fund | | March 31, 2015 (Unaudited) |
| | | | | | | | | | |
Issuer-Description | | Credit Rating†
S&P/ Moody’s | | Principal
Amount | | | Value | |
a Principal Life Global Funding II, 2.375% due 9/11/2019 | | A+/A1 | | $ | 2,450,000 | | | $ | 2,478,263 | |
a Prudential Covered Trust Co., 2.997% due 9/30/2015 | | A/Baa1 | | | 2,100,000 | | | | 2,120,811 | |
a Reliance Standard Life Insurance Co., 2.50% due 1/15/2020 | | A+/A2 | | | 15,000,000 | | | | 15,109,710 | |
a Reliance Standard Life Insurance Co., 2.50% due 4/24/2019 | | A+/A2 | | | 9,900,000 | | | | 10,035,284 | |
a,b White Mountains Re Group Ltd., 6.375% due 3/20/2017 | | BBB/Baa3 | | | 6,335,000 | | | | 6,845,702 | |
| | | | | | | | | | |
| | | | | | | | | 130,844,609 | |
| | | | | | | | | | |
| | | |
MATERIALS — 2.80% | | | | | | | | | | |
Chemicals — 0.64% | | | | | | | | | | |
a Incitec Pivot Finance, LLC, 6.00% due 12/10/2019 | | BBB/Baa3 | | | 4,538,000 | | | | 5,101,098 | |
a,b Incitec Pivot Ltd., 4.00% due 12/7/2015 | | BBB/Baa3 | | | 4,325,000 | | | | 4,406,085 | |
a,b Office Cherifien des Phosphates, 5.625% due 4/25/2024 | | BBB-/NR | | | 12,010,000 | | | | 13,060,875 | |
| | | |
Construction Materials — 0.02% | | | | | | | | | | |
CRH America, Inc., 8.125% due 7/15/2018 | | BBB+/Baa2 | | | 650,000 | | | | 774,113 | |
| | | |
Metals & Mining — 2.14% | | | | | | | | | | |
a,b Anglo American Capital plc, 2.625% due 9/27/2017 | | BBB/Baa2 | | | 9,700,000 | | | | 9,829,708 | |
b Anglogold Holdings plc, 5.125% due 8/1/2022 | | BB+/Baa3 | | | 7,000,000 | | | | 6,597,612 | |
b Anglogold Holdings plc, 5.375% due 4/15/2020 | | BB+/Baa3 | | | 9,100,000 | | | | 9,000,764 | |
b ArcelorMittal, 5.25% due 2/25/2017 | | BB/Ba1 | | | 3,000,000 | | | | 3,120,000 | |
b ArcelorMittal, 4.50% due 8/5/2015 | | BB/Ba1 | | | 3,000,000 | | | | 3,022,500 | |
a Glencore Funding, LLC Floating Rate Note, 1.613% due 1/15/2019 | | BBB/Baa2 | | | 17,600,000 | | | | 17,606,354 | |
b Kinross Gold Corp., 3.625% due 9/1/2016 | | BBB-/Ba1 | | | 7,000,000 | | | | 6,931,932 | |
a,b Newcrest Finance Property Ltd., 4.20% due 10/1/2022 | | BBB-/Baa3 | | | 10,459,000 | | | | 9,842,411 | |
a,b Samarco Mineracao S.A., 4.125% due 11/1/2022 | | BBB-/NR | | | 5,000,000 | | | | 4,500,000 | |
a,b Xstrata Finance Canada Ltd., 4.95% due 11/15/2021 | | BBB/Baa2 | | | 5,000,000 | | | | 5,402,280 | |
| | | | | | | | | | |
| | | | | | | | | 99,195,732 | |
| | | | | | | | | | |
| | | |
MEDIA — 0.47% | | | | | | | | | | |
Media — 0.47% | | | | | | | | | | |
DirecTV Holdings, LLC/Financing Co., Inc., 4.45% due 4/1/2024 | | BBB/Baa2 | | | 10,000,000 | | | | 10,679,910 | |
The Washington Post Co., 7.25% due 2/1/2019 | | BBB/Baa3 | | | 5,000,000 | | | | 5,653,350 | |
Time Warner Cable, Inc., 8.05% due 1/15/2016 | | BBB/Baa2 | | | 200,000 | | | | 210,824 | |
| | | | | | | | | | |
| | | | | | | | | 16,544,084 | |
| | | | | | | | | | |
| | |
PHARMACEUTICALS, BIOTECHNOLOGY & LIFE SCIENCES — 0.48% | | | | | | | | |
Biotechnology — 0.09% | | | | | | | | | | |
Genzyme Corp., 3.625% due 6/15/2015 | | AA/A1 | | | 3,000,000 | | | | 3,018,759 | |
| | | |
Pharmaceuticals — 0.39% | | | | | | | | | | |
b Actavis Funding SCS, 3.45% due 3/15/2022 | | BBB-/Baa3 | | | 5,000,000 | | | | 5,121,385 | |
b Actavis Funding SCS, 1.85% due 3/1/2017 | | BBB-/Baa3 | | | 2,000,000 | | | | 2,014,428 | |
b Actavis Funding SCS, 2.35% due 3/12/2018 | | BBB-/Baa3 | | | 1,720,000 | | | | 1,743,261 | |
b Actavis Funding SCS Floating Rate Note, 1.523% due 3/12/2020 | | BBB-/Baa3 | | | 4,940,000 | | | | 5,007,090 | |
| | | | | | | | | | |
| | | | | | | | | 16,904,923 | |
| | | | | | | | | | |
| | | |
REAL ESTATE — 1.42% | | | | | | | | | | |
Real Estate Investment Trusts — 1.04% | | | | | | | | | | |
Alexandria Real Estate Equities, Inc., 3.90% due 6/15/2023 | | BBB-/Baa2 | | | 11,700,000 | | | | 12,080,016 | |
Commonwealth REIT (HRPT Properties), 6.25% due 6/15/2017 | | BBB-/Baa3 | | | 4,000,000 | | | | 4,284,468 | |
Washington REIT, 4.95% due 10/1/2020 | | BBB/Baa2 | | | 19,100,000 | | | | 20,747,719 | |
| | | |
Real Estate Management & Development — 0.38% | | | | | | | | | | |
a,b Deutsche Annington Finance B.V., 3.20% due 10/2/2017 | | BBB+/NR | | | 10,000,000 | | | | 10,293,080 | |
Jones Lang LaSalle, Inc., 4.40% due 11/15/2022 | | BBB/Baa2 | | | 3,000,000 | | | | 3,155,502 | |
| | | | | | | | | | |
| | | | | | | | | 50,560,785 | |
| | | | | | | | | | |
| | | |
RETAILING — 0.88% | | | | | | | | | | |
Multiline Retail — 0.69% | | | | | | | | | | |
Family Dollar Stores, Inc., 5.00% due 2/1/2021 | | BBB-/Baa3 | | | 23,225,000 | | | | 24,424,363 | |
| | | |
Specialty Retail — 0.19% | | | | | | | | | | |
Advance Auto Parts, Inc., 4.50% due 1/15/2022 | | BBB-/Baa3 | | | 6,400,000 | | | | 6,873,043 | |
| | | | | | | | | | |
| | | | | | | | | 31,297,406 | |
| | | | | | | | | | |
Semi-Annual Report 19
| | |
| SCHEDULE OF INVESTMENTS, CONTINUED | | |
| |
Thornburg Limited Term Income Fund | | March 31, 2015 (Unaudited) |
| | | | | | | | | | |
Issuer-Description | | Credit Rating†
S&P/ Moody’s | | Principal
Amount | | | Value | |
SOFTWARE & SERVICES — 1.63% | | | | | | | | | | |
Information Technology Services — 1.03% | | | | | | | | | | |
Broadridge Financial Solutions, Inc., 3.95% due 9/1/2020 | | BBB+/Baa1 | | $ | 8,000,000 | | | $ | 8,472,392 | |
a CDK Global, Inc., 3.30% due 10/15/2019 | | BBB-/Baa3 | | | 5,000,000 | | | | 5,041,060 | |
SAIC, Inc., 4.45% due 12/1/2020 | | BBB-/Ba1 | | | 2,000,000 | | | | 1,990,836 | |
Total System Services, Inc., 2.375% due 6/1/2018 | | BBB+/Baa3 | | | 20,915,000 | | | | 21,035,931 | |
| | | |
Internet Software & Services — 0.51% | | | | | | | | | | |
Lender Processing Services, Inc./Black Knight Lending Solutions, Inc., 5.75% due 4/15/2023 | | BBB/Baa3 | | | 12,469,000 | | | | 13,211,903 | |
a,b Tencent Holdings Ltd., 2.00% due 5/2/2017 | | A-/A2 | | | 5,000,000 | | | | 5,024,350 | |
| | | |
Software — 0.09% | | | | | | | | | | |
CA Technologies, Inc., 2.875% due 8/15/2018 | | BBB+/Baa2 | | | 2,925,000 | | | | 2,999,181 | |
| | | | | | | | | | |
| | | | | | | | | 57,775,653 | |
| | | | | | | | | | |
| | | |
TECHNOLOGY HARDWARE & EQUIPMENT — 1.70% | | | | | | | | | | |
Communications Equipment — 0.57% | | | | | | | | | | |
b Ericsson LM, 4.125% due 5/15/2022 | | BBB+/Baa1 | | | 14,300,000 | | | | 15,342,298 | |
Juniper Networks, Inc., 3.30% due 6/15/2020 | | BBB/Baa2 | | | 4,825,000 | | | | 4,882,741 | |
Computers & Peripherals — 0.42% | | | | | | | | | | |
Hewlett-Packard Co., 3.30% due 12/9/2016 | | BBB+/Baa1 | | | 2,000,000 | | | | 2,068,098 | |
Lexmark International, Inc., 5.125% due 3/15/2020 | | BBB-/Baa3 | | | 12,000,000 | | | | 12,866,256 | |
Electronic Equipment, Instruments & Components — 0.71% | | | | | | | | | | |
Ingram Micro, Inc., 4.95% due 12/15/2024 | | BBB-/Baa3 | | | 7,000,000 | | | | 7,251,335 | |
Trimble Navigation, Ltd., 4.75% due 12/1/2024 | | BBB-/Baa2 | | | 17,000,000 | | | | 17,923,678 | |
| | | | | | | | | | |
| | | | | | | | | 60,334,406 | |
| | | | | | | | | | |
| | | |
TELECOMMUNICATION SERVICES — 2.04% | | | | | | | | | | |
Diversified Telecommunication Services — 1.27% | | | | | | | | | | |
AT&T, Inc. Floating Rate Note, 1.171% due 11/27/2018 | | BBB+/Baa1 | | | 16,250,000 | | | | 16,464,500 | |
a Hidden Ridge Facility, 5.65% due 1/1/2022 | | NR/Baa2 | | | 3,280,660 | | | | 3,486,164 | |
Michigan Bell Telephone Co., 7.85% due 1/15/2022 | | BBB+/NR | | | 3,000,000 | | | | 3,709,362 | |
a,b Qtel International Finance Ltd., 3.375% due 10/14/2016 | | A-/A2 | | | 500,000 | | | | 513,755 | |
Qwest Corp., 6.75% due 12/1/2021 | | BBB-/Baa3 | | | 3,000,000 | | | | 3,438,750 | |
b Telefonica Emisiones SAU, 6.421% due 6/20/2016 | | BBB/Baa2 | | | 9,900,000 | | | | 10,519,156 | |
Verizon Communications, Inc., 2.625% due 2/21/2020 | | BBB+/Baa1 | | | 4,997,000 | | | | 5,083,748 | |
Verizon Communications, Inc. Floating Rate Note, 2.021% due 9/14/2018 | | BBB+/Baa1 | | | 1,825,000 | | | | 1,903,526 | |
| | | |
Wireless Telecommunication Services — 0.77% | | | | | | | | | | |
a Crown Castle Towers, LLC, 5.495% due 1/15/2037 | | NR/A2 | | | 8,120,000 | | | | 8,516,305 | |
a Crown Castle Towers, LLC, 6.113% due 1/15/2040 | | NR/A2 | | | 4,395,000 | | | | 5,013,728 | |
a Unison Ground Lease Funding, LLC, 6.392% due 4/15/2040 | | NR/NR | | | 9,640,000 | | | | 11,126,025 | |
a Unison Ground Lease Funding, LLC, 5.349% due 4/15/2040 | | NR/NR | | | 2,470,000 | | | | 2,612,618 | |
| | | | | | | | | | |
| | | | | | | | | 72,387,637 | |
| | | | | | | | | | |
| | | |
TRANSPORTATION — 1.80% | | | | | | | | | | |
Air Freight & Logistics — 0.06% | | | | | | | | | | |
FedEx Corp., 8.76% due 5/22/2015 | | BBB/A3 | | | 23,733 | | | | 24,030 | |
a FedEx Corp. 2012 Pass Through Trust, 2.625% due 1/15/2018 | | BBB/A3 | | | 2,126,556 | | | | 2,170,721 | |
| | | |
Airlines — 0.60% | | | | | | | | | | |
American Airlines, 4.95% due 7/15/2024 | | A-/NR | | | 6,669,143 | | | | 7,302,712 | |
a,b BAA Funding Ltd., 2.50% due 6/25/2017 | | A-/NR | | | 5,000,000 | | | | 5,016,850 | |
US Airways, 6.25% due 10/22/2024 | | A-/Baa1 | | | 5,815,396 | | | | 6,600,474 | |
a,b Virgin Australia, 5.00% due 4/23/2025 | | NR/Baa1 | | | 2,147,630 | | | | 2,260,380 | |
| | | |
Road & Rail — 1.14% | | | | | | | | | | |
a,b Asciano Finance Ltd., 3.125% due 9/23/2015 | | BBB/Baa2 | | | 2,900,000 | | | | 2,924,209 | |
a,b Asciano Finance Ltd., 5.00% due 4/7/2018 | | BBB/Baa2 | | | 2,000,000 | | | | 2,150,672 | |
a,b LeasePlan Corp. NV, 2.50% due 5/16/2018 | | BBB+/Baa2 | | | 10,000,000 | | | | 10,112,570 | |
a Penske Truck Leasing Co., LP/PTL Finance Corp., 3.375% due 2/1/2022 | | BBB-/Baa3 | | | 20,000,000 | | | | 19,993,840 | |
a TTX Co., 3.60% due 1/15/2025 | | A+/Baa1 | | | 5,000,000 | | | | 5,187,965 | |
| | | | | | | | | | |
| | | | | | | | | 63,744,423 | |
| | | | | | | | | | |
20 Semi-Annual Report
| | |
| SCHEDULE OF INVESTMENTS, CONTINUED | | |
| |
Thornburg Limited Term Income Fund | | March 31, 2015 (Unaudited) |
| | | | | | | | | | |
Issuer-Description | | Credit Rating†
S&P/ Moody’s | | Principal
Amount | | | Value | |
UTILITIES — 4.53% | | | | | | | | | | |
Electric Utilities — 2.70% | | | | | | | | | | |
a,b Electricite de France S.A., 2.15% due 1/22/2019 | | A+/Aa3 | | $ | 4,900,000 | | | $ | 4,964,062 | |
a,b Enel Finance International S.A., 6.25% due 9/15/2017 | | BBB/Baa2 | | | 9,500,000 | | | | 10,573,158 | |
Entergy Louisiana, LLC, 4.80% due 5/1/2021 | | A-/A2 | | | 4,300,000 | | | | 4,845,743 | |
Entergy Texas, Inc., 7.125% due 2/1/2019 | | A-/Baa1 | | | 2,000,000 | | | | 2,379,356 | |
Entergy Texas, Inc., 3.60% due 6/1/2015 | | A-/Baa1 | | | 3,000,000 | | | | 3,010,317 | |
Idaho Power Corp., 6.025% due 7/15/2018 | | A-/A1 | | | 1,000,000 | | | | 1,127,011 | |
a,b Korea Western Power Co., Ltd., 2.875% due 10/10/2018 | | A+/Aa3 | | | 10,000,000 | | | | 10,241,290 | |
a Monongahela Power Co., 4.10% due 4/15/2024 | | BBB+/A3 | | | 5,000,000 | | | | 5,440,575 | |
a Monongahela Power Co., 5.70% due 3/15/2017 | | BBB+/A3 | | | 4,785,000 | | | | 5,159,819 | |
Public Service Co. of New Mexico, 5.35% due 10/1/2021 | | BBB/Baa2 | | | 3,000,000 | | | | 3,324,507 | |
a Rochester Gas & Electric, 5.90% due 7/15/2019 | | A/A2 | | | 11,732,000 | | | | 13,373,084 | |
a,b State Grid Overseas Investment (2014) Ltd., 2.75% due 5/7/2019 | | AA-/Aa3 | | | 9,000,000 | | | | 9,170,352 | |
a Steelriver Transmission Co., LLC, 4.71% due 6/30/2017 | | NR/Baa2 | | | 3,226,245 | | | | 3,375,462 | |
Toledo Edison Co., 7.25% due 5/1/2020 | | BBB/Baa1 | | | 167,000 | | | | 201,952 | |
a,b Transelec S.A., 4.25% due 1/14/2025 | | BBB/Baa1 | | | 6,000,000 | | | | 6,120,714 | |
UIL Holdings Corp., 4.625% due 10/1/2020 | | BBB-/Baa2 | | | 11,660,000 | | | | 12,592,975 | |
| | | |
Gas Utilities — 0.80% | | | | | | | | | | |
a,b APT Pipelines Ltd., 3.875% due 10/11/2022 | | BBB/Baa2 | | | 5,500,000 | | | | 5,570,103 | |
a Southern Star Central Gas Pipeline, Inc., 6.00% due 6/1/2016 | | BBB-/Baa3 | | | 5,715,000 | | | | 5,970,095 | |
The Laclede Group, Inc. Floating Rate Note, 1.007% due 8/15/2017 | | BBB+/Baa2 | | | 16,900,000 | | | | 16,879,449 | |
| | | |
Independent Power & Renewable Electricity Producers — 0.22% | | | | | | | | | | |
a Midland Cogeneration Venture, 6.00% due 3/15/2025 | | BBB-/NR | | | 7,032,576 | | | | 7,706,613 | |
| | | |
Multi-Utilities — 0.81% | | | | | | | | | | |
Dominion Gas Holdings, LLC, 2.50% due 12/15/2019 | | A-/A2 | | | 3,900,000 | | | | 3,975,293 | |
a Enable Oklahoma Intrastate Transmission, LLC, 6.25% due 3/15/2020 | | BBB-/Baa3 | | | 3,640,000 | | | | 4,132,609 | |
a,b Korea Hydro & Nuclear Power Co. Ltd., 2.875% due 10/2/2018 | | A+/Aa3 | | | 7,000,000 | | | | 7,214,543 | |
a Niagara Mohawk Power Corp., 4.881% due 8/15/2019 | | A-/A2 | | | 10,000,000 | | | | 11,196,800 | |
SCANA Corp., 4.125% due 2/1/2022 | | BBB/Baa3 | | | 2,000,000 | | | | 2,102,642 | |
| | | | | | | | | | |
| | | | | | | | | 160,648,524 | |
| | | | | | | | | | |
TOTAL CORPORATE BONDS (Cost $1,666,723,426) | | | | | | | | | 1,700,499,004 | |
| | | | | | | | | | |
| | | |
CONVERTIBLE BONDS — 0.54% | | | | | | | | | | |
| | | |
REAL ESTATE — 0.54% | | | | | | | | | | |
Real Estate Investment Trusts — 0.54% | | | | | | | | | | |
a IAS Operating Partnership LP, 5.00% due 3/15/2018 | | NR/NR | | | 19,950,000 | | | | 19,201,875 | |
| | | | | | | | | | |
TOTAL CONVERTIBLE BONDS (Cost $19,950,000) | | | | | | | | | 19,201,875 | |
| | | | | | | | | | |
| | | |
MUNICIPAL BONDS — 4.56% | | | | | | | | | | |
American Municipal Power Ohio, Inc., 5.072% due 2/15/2018 (Meldahl Hydroelectric) | | A/A3 | | | 5,000,000 | | | | 5,452,200 | |
Anaheim California Public Financing Authority, 5.316% due 9/1/2017 (Anaheim Public Improvements; Insured: Natl-Re/FGIC) | | AA-/A1 | | | 1,440,000 | | | | 1,497,240 | |
Anaheim California Public Financing Authority, 5.486% due 9/1/2020 (Anaheim Public Improvements; Insured: Natl-Re) | | AA-/A1 | | | 3,270,000 | | | | 3,487,586 | |
Brentwood California Infrastructure Financing Authority, 6.16% due 10/1/2019 (Civic Center) | | AA/NR | | | 2,110,000 | | | | 2,378,139 | |
California Health Facilities Financing Authority, 6.76% due 2/1/2019 (Community Program for Persons with Developmental | | | | | | | | | | |
Disabilities) | | A+/NR | | | 3,905,000 | | | | 4,425,458 | |
California School Finance Authority, 5.041% due 7/1/2020 (LOC: City National Bank) | | AA+/NR | | | 4,000,000 | | | | 4,499,120 | |
Camden County Improvement Authority, 5.47% due 7/1/2018 (Cooper Medical School of Rowan University) | | A/A2 | | | 2,140,000 | | | | 2,375,314 | |
Camden County Improvement Authority, 5.62% due 7/1/2019 (Cooper Medical School of Rowan University) | | A/A2 | | | 3,025,000 | | | | 3,408,388 | |
Carson Redevelopment Agency, 4.511% due 10/1/2016 (Low and Moderate Income Housing) | | A-/NR | | | 2,695,000 | | | | 2,754,155 | |
e City and County of San Francisco Redevelopment Financing Authority, 8.00% due 8/1/2019 (San Francisco Redevelopment | | | | | | | | | | |
Projects) | | AA-/Ba1 | | | 6,500,000 | | | | 7,504,900 | |
City of Fort Collins, Colorado Electric Utility Enterprise, 4.92% due 12/1/2020 (Fort Collins Smart Grid) | | AA-/NR | | | 2,250,000 | | | | 2,466,765 | |
City of North Little Rock, Arkansas, 3.562% due 7/1/2022 (Electric System; Insured: AGM) | | AA/NR | | | 8,185,000 | | | | 8,193,431 | |
City of Riverside, California, 5.61% due 8/1/2017 (City Sewer System) | | A/A1 | | | 2,000,000 | | | | 2,183,540 | |
Connecticut Housing Finance Authority, 5.071% due 11/15/2019 (Housing Mtg Finance Program) | | AAA/Aaa | | | 2,470,000 | | | | 2,469,506 | |
Denver Public Schools COP, 2.018% due 12/15/2019 (School District No. 1 Educational Facilities) | | NR/Aa3 | | | 3,000,000 | | | | 3,038,670 | |
Florida Hurricane Catastrophe Fund Finance Corp., 1.298% due 7/1/2016 (Reimbursement Contracts for Covered Event | | | | | | | | | | |
Losses) | | AA-/Aa3 | | | 7,500,000 | | | | 7,546,350 | |
Florida State Board of Education, 3.60% due 6/1/2015 (Public Education Capital Outlay) | | AAA/Aa1 | | | 3,000,000 | | | | 3,016,830 | |
Illinois Finance Authority, 5.629% due 7/1/2016 (Theory and Computing Sciences Building; Insured: Syncora) | | AA-/NR | | | 755,000 | | | | 778,949 | |
JobsOhio Beverage System, 2.217% due 1/1/2019 (State Liquor Enterprise) | | AA/Aa3 | | | 11,245,000 | | | | 11,484,069 | |
Semi-Annual Report 21
| | |
| SCHEDULE OF INVESTMENTS, CONTINUED | | |
| |
Thornburg Limited Term Income Fund | | March 31, 2015 (Unaudited) |
| | | | | | | | | | |
Issuer-Description | | Credit Rating†
S&P/ Moody’s | | Principal
Amount | | | Value | |
Kentucky Asset/Liability Commission, 2.099% due 4/1/2019 (Commonwealth of Kentucky and Teachers’ Retirement System | | | | | | | | | | |
Funding Obligations) | | A+/Aa3 | | $ | 3,000,000 | | | $ | 3,022,980 | |
Los Angeles County California Public Works Financing Authority, 5.591% due 8/1/2020 (Los Angeles County & USC | | | | | | | | | | |
Medical Center Projects) | | AA/A1 | | | 3,000,000 | | | | 3,465,060 | |
Louisiana Local Government Environmental Facilities and Community Development Authority, 1.66% due 2/1/2022 | | | | | | | | | | |
(Louisiana Utilities Restoration) | | AAA/Aaa | | | 8,350,000 | | | | 8,408,951 | |
Louisiana Public Facilities Authority, 5.72% due 7/1/2015 (Black & Gold Facilities Project; Insured: CIFG) | | AA/A3 | | | 300,000 | | | | 303,489 | |
Massachusetts Housing Finance Agency, 1.45% due 12/1/2015 (Multi-Family Residential Development) | | A+/Aa3 | | | 8,550,000 | | | | 8,559,918 | |
a Midwest Family Housing, 5.168% due 7/1/2016 (Insured: CIFG) | | AA-/Baa1 | | | 392,000 | | | | 404,314 | |
Municipal Improvement Corp. of Los Angeles, 6.165% due 11/1/2020 (Recovery Zone Economic Development) | | A+/A2 | | | 10,000,000 | | | | 11,005,900 | |
New York City Transitional Finance Authority, 4.075% due 11/1/2020 (World Trade Center Recovery) | | AAA/Aa1 | | | 2,500,000 | | | | 2,721,650 | |
Oakland California Redevelopment Agency, 8.00% due 9/1/2016 (Central District Redevelopment Project) | | A-/NR | | | 4,200,000 | | | | 4,547,046 | |
Oklahoma Development Finance Authority, 8.00% due 5/1/2020 (Cleveland County Industrial Authority (CCIA) - Hitachi | | | | | | | | | | |
Norman, Oklahoma Project) | | NR/NR | | | 5,640,000 | | | | 5,798,371 | |
Orleans Parish School Board GO, 4.40% due 2/1/2021 (Educational Facilities Improvements; Insured: AGM) | | AA/A2 | | | 10,000,000 | | | | 10,939,300 | |
Redevelopment Agency of the City of Redlands, 5.818% due 8/1/2022 (Redlands Redevelopment Project; Insured: AMBAC) | | A-/NR | | | 1,895,000 | | | | 2,016,261 | |
Redevelopment Agency of the County of San Benardino, 7.135% due 9/1/2020 (San Sevaine Redevelopment Project) | | BBB/NR | | | 1,470,000 | | | | 1,609,106 | |
Rutgers State University GO, 2.342% due 5/1/2019 (New Brunswick, Newark and Camden Campus Facilities ) | | AA-/Aa3 | | | 3,485,000 | | | | 3,526,576 | |
Rutgers State University GO, 3.028% due 5/1/2021 (New Brunswick, Newark and Camden Campus Facilities) | | AA-/Aa3 | | | 1,500,000 | | | | 1,541,565 | |
Sandoval County New Mexico, 1.452% due 6/1/2017 | | A+/NR | | | 1,000,000 | | | | 1,007,220 | |
Tampa-Hillsborough County Florida Expressway Authority, 2.22% due 7/1/2018 (Electronic Tolling Program) | | A/A3 | | | 2,000,000 | | | | 2,023,840 | |
Tampa-Hillsborough County Florida Expressway Authority, 2.49% due 7/1/2019 (Electronic Tolling Program) | | A/A3 | | | 2,500,000 | | | | 2,515,050 | |
Tampa-Hillsborough County Florida Expressway Authority, 2.84% due 7/1/2020 (Electronic Tolling Program) | | A/A3 | | | 1,750,000 | | | | 1,781,658 | |
Wallenpaupack Area School District GO, 3.80% due 9/1/2019 (Pike and Wayne Counties Educational Facilities) (State Aid | | | | | | | | | | |
Withholding) | | AA/NR | | | 3,000,000 | | | | 3,074,340 | |
Wallenpaupack Area School District GO, 4.00% due 9/1/2020 (Pike and Wayne Counties Educational Facilities) (State Aid | | | | | | | | | | |
Withholding) | | AA/NR | | | 2,750,000 | | | | 2,821,335 | |
Wisconsin Health & Educational Facilities Authority, 7.08% due 6/1/2016 (Richland Hospital) | | NR/NR | | | 535,000 | | | | 535,048 | |
Yuba Levee Financing Authority, 6.375% due 9/1/2021 (Yuba County Levee Financing Project) | | AA/NR | | | 1,000,000 | | | | 1,094,820 | |
| | | | | | | | | | |
TOTAL MUNICIPAL BONDS (Cost $153,482,778) | | | | | | | | | 161,684,408 | |
| | | | | | | | | | |
| | | |
LOAN PARTICIPATIONS — 0.42% | | | | | | | | | | |
MATERIALS — 0.42% | | | | | | | | | | |
Metals and Mining — 0.42% | | | | | | | | | | |
Freeport-McMoRan Copper & Gold, Inc., 1.93%, due 5/31/2018 | | NR/NR | | | 15,250,000 | | | | 15,002,188 | |
| | | | | | | | | | |
TOTAL OTHER SECURITIES (Cost $15,193,867) | | | | | | | | | 15,002,188 | |
| | | | | | | | | | |
SHORT TERM INVESTMENTS — 5.70% | | | | | | | | | | |
Bank of New York Tri-Party Repurchase Agreement 0.23% dated 3/31/2015 due 4/1/2015, repurchase price $100,000 639 collateralized by 12 U.S. Government debt securities and 48 corporate debt securities, having an average coupon of 4.07%, a minimum credit rating of BBB-, maturity dates from 3/1/2016 to 8/21/2054, and having an aggregate market value of $106,342,364 at 3/31/2015 | | NR/NR | | | 100,000,000 | | | | 100,000,000 | |
Bayer Corp., 0.45% due 4/1/2015 | | NR/NR | | | 6,500,000 | | | | 6,500,000 | |
Consolidated Edison, Inc., 0.30% due 4/2/2015 | | NR/NR | | | 16,800,000 | | | | 16,799,860 | |
Diageo Capital plc, 0.53% due 4/2/2015 | | NR/NR | | | 26,128,000 | | | | 26,127,616 | |
Intercontinental Exchange, Inc., 0.16% due 4/6/2015 | | NR/NR | | | 8,179,000 | | | | 8,178,818 | |
Kansas City Power & Light Co., 0.50% due 4/6/2015 | | NR/NR | | | 14,000,000 | | | | 13,999,028 | |
Kentucky Utilities Co., 0.54% due 4/1/2015 | | NR/NR | | | 6,000,000 | | | | 6,000,000 | |
St. Jude Medical, Inc., 0.22% due 4/1/2015 | | NR/NR | | | 24,400,000 | | | | 24,400,000 | |
| | | | | | | | | | |
TOTAL SHORT TERM INVESTMENTS (Cost $202,005,322) | | | | | | | | | 202,005,322 | |
| | | | | | | | | | |
TOTAL INVESTMENTS — 96.75% (Cost $3,381,118,771) | | | | | | | | $ | 3,432,379,732 | |
OTHER ASSETS LESS LIABILITIES — 3.25% | | | | | | | | | 115,415,342 | |
| | | | | | | | | | |
NET ASSETS — 100.00% | | | | | | | | $ | 3,547,795,074 | |
| | | | | | | | | | |
22 Semi-Annual Report
| | |
| SCHEDULE OF INVESTMENTS, CONTINUED | | |
| |
Thornburg Limited Term Income Fund | | March 31, 2015 (Unaudited) |
Footnote Legend
| † | Credit ratings are unaudited. Rating changes may have occurred subsequent to the reporting period end. Bonds issued with a maturity of one year or less are assigned Moody’s ratings from MIG-1 to MIG-4 and Standard and Poor’s ratings from SP-1+ to SP-3 with MIG-1 and SP-1+ being the strongest ratings. |
| a | Securities exempt from registration under Rule 144A of the Securities Act of 1933, as amended. These securities may only be resold in the ordinary course of business in transactions exempt from registration, normally to qualified institutional buyers. As of March 31, 2015, the aggregate value of these securities in the Fund’s portfolio was $1,557,156,132, representing 43.89% of the Fund’s net assets. |
| b | Yankee Bond - Denominated in U.S. dollars and is issued in the U.S. by foreign banks and corporations. |
| c | Security currently fair valued by the Valuation and Pricing Committee using procedures approved by the Trustees. |
| e | Segregated as collateral for a when-issued security. |
Portfolio Abbreviations
To simplify the listings of securities, abbreviations are used per the table below:
| | |
| AGM | | Insured by Assured Guaranty Municipal Corp. |
| AMBAC | | Insured by American Municipal Bond Assurance Corp. |
| CIFG | | Insured by CIFG Assurance North America Inc. |
| CMO | | Collateralized Mortgage Obligation |
| COP | | Certificates of Participation |
| FCB | | Farm Credit Bank |
| FGIC | | Insured by Financial Guaranty Insurance Co. |
| GO | | General Obligation |
| Mtg | | Mortgage |
| Natl-Re | | Insured by National Public Finance Guarantee Corp. |
| REIT | | Real Estate Investment Trust |
| REMIC | | Real Estate Mortgage Investment Conduit |
| SBA | | Small Business Administration |
| SPV | | Special Purpose Vehicle |
| Syncora | | Insured by Syncora Guarantee Inc. |
| VA | | Veterans Affairs |
See notes to financial statements.
Semi-Annual Report 23
| | |
| STATEMENTS OF ASSETS AND LIABILITIES | | |
| |
Thornburg Limited Term Income Funds | | March 31, 2015 (Unaudited) |
| | | | | | | | |
| | | Thornburg | | | Thornburg | |
| | | Limited Term U.S. | | | Limited Term | |
| | | Government Fund | | | Income Fund | |
ASSETS | | | | | | | | |
Investments at value (cost $239,478,242 and $3,381,118,771) (Note 2) | | $ | 244,129,721 | | | $ | 3,432,379,732 | |
Cash | | | 23,162,252 | | | | 102,254,357 | |
Receivable for investments sold | | | — | | | | 1,065,000 | |
Receivable for fund shares sold | | | 643,592 | | | | 12,151,657 | |
Dividend and interest reclaim receivable | | | — | | | | 54,170 | |
Interest receivable | | | 1,041,519 | | | | 22,225,279 | |
Prepaid expenses and other assets | | | 53,273 | | | | 108,434 | |
| | | | | | | | |
Total Assets | | | 269,030,357 | | | | 3,570,238,629 | |
| | | | | | | | |
| | |
LIABILITIES | | | | | | | | |
Payable for investments purchased | | | — | | | | 12,395,996 | |
Payable for fund shares redeemed | | | 528,018 | | | | 6,947,042 | |
Payable to investment advisor and other affiliates (Note 3) | | | 149,173 | | | | 1,834,512 | |
Accounts payable and accrued expenses | | | 156,931 | | | | 389,166 | |
Dividends payable | | | 70,031 | | | | 876,839 | |
| | | | | | | | |
Total Liabilities | | | 904,153 | | | | 22,443,555 | |
| | | | | | | | |
| | |
NET ASSETS | | $ | 268,126,204 | | | $ | 3,547,795,074 | |
| | | | | | | | |
NET ASSETS CONSIST OF | | | | | | | | |
Distribution in excess of net investment income | | $ | (602,138 | ) | | $ | (1,491,972 | ) |
Net unrealized appreciation on investments | | | 4,651,921 | | | | 51,261,104 | |
Accumulated net realized gain (loss) | | | (7,553,470 | ) | | | 660,998 | |
Net capital paid in on shares of beneficial interest | | | 271,629,891 | | | | 3,497,364,944 | |
| | | | | | | | |
| | $ | 268,126,204 | | | $ | 3,547,795,074 | |
| | | | | | | | |
24 Semi-Annual Report
| | |
| STATEMENTS OF ASSETS AND LIABILITIES, CONTINUED | | |
| |
Thornburg Limited Term Income Funds | | March 31, 2015 (Unaudited) |
| | | | | | | | |
| | | Thornburg | | | Thornburg | |
| | | Limited Term U.S. | | | Limited Term | |
| | | Government Fund | | | Income Fund | |
NET ASSET VALUE | | | | | | | | |
Class A Shares: | | | | | | | | |
Net asset value and redemption price per share ($127,760,852 and $966,309,552 applicable to 9,582,566 and 71,753,033 shares of beneficial interest outstanding – Note 4) | | $ | 13.33 | | | $ | 13.47 | |
Maximum sales charge, 1.50% of offering price | | | 0.20 | | | | 0.21 | |
| | | | | | | | |
Maximum offering price per share | | $ | 13.53 | | | $ | 13.68 | |
| | | | | | | | |
| | |
Class B Shares: | | | | | | | | |
Net asset value per share* ($455,702 applicable to 34,254 shares of beneficial interest outstanding – Note 4) | | $ | 13.30 | | | $ | — | |
| | | | | | | | |
| | |
Class C Shares: | | | | | | | | |
Net asset value and offering price per share* ($47,917,552 and $616,200,366 applicable to 3,572,329 and 45,829,884 shares of beneficial interest outstanding – Note 4) | | $ | 13.41 | | | $ | 13.45 | |
| | | | | | | | |
| | |
Class I Shares: | | | | | | | | |
Net asset value, offering and redemption price per share ($76,606,372 and $1,810,429,394 applicable to 5,745,772 and 134,411,468 shares of beneficial interest outstanding – Note 4) | | $ | 13.33 | | | $ | 13.47 | |
| | | | | | | | |
| | |
Class R3 Shares: | | | | | | | | |
Net asset value, offering and redemption price per share ($13,079,200 and $130,035,550 applicable to 980,370 and 9,648,512 shares of beneficial interest outstanding – Note 4) | | $ | 13.34 | | | $ | 13.48 | |
| | | | | | | | |
| | |
Class R4 Shares: | | | | | | | | |
Net asset value, offering and redemption price per share ($15,296 and $2,034,827 applicable to 1,148 and 151,179 shares of beneficial interest outstanding – Note 4) | | $ | 13.33 | | | $ | 13.46 | |
| | | | | | | | |
| | |
Class R5 Shares: | | | | | | | | |
Net asset value, offering and redemption price per share ($2,291,230 and $22,785,385 applicable to 171,811 and 1,691,984 shares of beneficial interest outstanding – Note 4) | | $ | 13.34 | | | $ | 13.47 | |
| | | | | | | | |
| * | Redemption price per share is equal to net asset value less any applicable contingent deferred sales charge. |
See notes to financial statements.
Semi-Annual Report 25
| | |
| STATEMENTS OF OPERATIONS | | |
| |
Thornburg Limited Term Income Funds | | Six Months Ended March 31, 2015 (Unaudited) |
| | | | | | | | |
| | | Thornburg | | | Thornburg | |
| | | Limited Term U.S. | | | Limited Term | |
| | | Government Fund | | | Income Fund | |
INVESTMENT INCOME | | | | | | | | |
Interest income (net of premium amortized of $437,171 and $3,420,753 and net of paydown losses of $752,433 and $1,118,156, respectively) | | $ | 2,662,766 | | | $ | 47,880,896 | |
| | | | | | | | |
| | |
EXPENSES | | | | | | | | |
Investment advisory fees (Note 3) | | | 500,877 | | | | 6,148,161 | |
Administration fees (Note 3) | | | | | | | | |
Class A Shares | | | 81,429 | | | | 583,397 | |
Class B Shares | | | 321 | | | | — | |
Class C Shares | | | 31,218 | | | | 378,959 | |
Class I Shares | | | 17,742 | | | | 423,718 | |
Class R3 Shares | | | 8,366 | | | | 79,584 | |
Class R4 Shares | | | 9 | | | | 801 | |
Class R5 Shares | | | 504 | | | | 5,053 | |
Distribution and service fees (Note 3) | | | | | | | | |
Class A Shares | | | 162,858 | | | | 1,166,794 | |
Class B Shares | | | 2,552 | | | | — | |
Class C Shares | | | 124,663 | | | | 1,518,467 | |
Class R3 Shares | | | 33,455 | | | | 318,425 | |
Class R4 Shares | | | 19 | | | | 1,622 | |
Transfer agent fees | | | | | | | | |
Class A Shares | | | 56,320 | | | | 447,960 | |
Class B Shares | | | 1,707 | | | | — | |
Class C Shares | | | 24,486 | | | | 208,310 | |
Class I Shares | | | 32,820 | | | | 529,955 | |
Class R3 Shares | | | 9,352 | | | | 39,410 | |
Class R4 Shares | | | 1,181 | | | | 821 | |
Class R5 Shares | | | 3,635 | | | | 10,793 | |
Registration and filing fees | | | | | | | | |
Class A Shares | | | 9,256 | | | | 24,476 | |
Class B Shares | | | 7,992 | | | | — | |
Class C Shares | | | 9,265 | | | | 17,070 | |
Class I Shares | | | 11,689 | | | | 40,181 | |
Class R3 Shares | | | 8,809 | | | | 10,161 | |
Class R4 Shares | | | 4,518 | | | | 5,136 | |
Class R5 Shares | | | 11,344 | | | | 11,681 | |
Custodian fees (Note 3) | | | 43,664 | | | | 175,393 | |
Professional fees | | | 27,250 | | | | 57,328 | |
Accounting fees | | | 3,793 | | | | 54,600 | |
Trustee fees | | | 4,856 | | | | 56,550 | |
Other expenses | | | 14,484 | | | | 129,180 | |
| | | | | | | | |
Total Expenses | | | 1,250,434 | | | | 12,443,986 | |
Less: | | | | | | | | |
Expenses reimbursed by investment advisor (Note 3) | | | (51,234 | ) | | | (73,515 | ) |
Fees paid indirectly (Note 3) | | | (2,909 | ) | | | (4,683 | ) |
| | | | | | | | |
Net Expenses | | | 1,196,291 | | | | 12,365,788 | |
| | | | | | | | |
Net Investment Income | | $ | 1,466,475 | | | $ | 35,515,108 | |
| | | | | | | | |
26 Semi-Annual Report
| | |
| STATEMENTS OF OPERATIONS, CONTINUED | | |
| |
Thornburg Limited Term Income Funds | | Six Months Ended March 31, 2015 (Unaudited) |
| | | | | | | | |
| | | Thornburg | | | Thornburg | |
| | | Limited Term U.S. | | | Limited Term | |
| | | Government Fund | | | Income Fund | |
REALIZED AND UNREALIZED GAIN (LOSS) | | | | | | | | |
Net realized gain (loss) on investments | | $ | 21,249 | | | $ | 1,016,957 | |
Net change in unrealized appreciation (depreciation) on investments | | | 1,874,938 | | | | 12,864,523 | |
| | | | | | | | |
Net Realized and Unrealized Gain | | | 1,896,187 | | | | 13,881,480 | |
| | | | | | | | |
Net Increase in Net Assets Resulting from Operations | | $ | 3,362,662 | | | $ | 49,396,588 | |
| | | | | | | | |
See notes to financial statements.
Semi-Annual Report 27
STATEMENTS OF CHANGES IN NET ASSETS
Thornburg Limited Term U.S. Government Fund
| | | | | | | | |
| | | Six Months Ended | | | Year Ended | |
| | | March 31, 2015* | | | September 30, 2014 | |
INCREASE (DECREASE) IN NET ASSETS FROM | | | | | | | | |
| | |
OPERATIONS | | | | | | | | |
Net investment income | | $ | 1,466,475 | | | $ | 4,111,583 | |
Net realized gain (loss) on investments | | | 21,249 | | | | (263,393 | ) |
Net unrealized appreciation (depreciation) on investments | | | 1,874,938 | | | | (219,886 | ) |
| | | | | | | | |
| | |
Net Increase (Decrease) in Net Assets Resulting from Operations | | | 3,362,662 | | | | 3,628,304 | |
| | |
DIVIDENDS TO SHAREHOLDERS | | | | | | | | |
From net investment income | | | | | | | | |
Class A Shares | | | (1,028,212 | ) | | | (2,819,935 | ) |
Class B Shares | | | (1,101 | ) | | | (4,853 | ) |
Class C Shares | | | (324,337 | ) | | | (1,014,665 | ) |
Class I Shares | | | (660,362 | ) | | | (1,533,758 | ) |
Class R3 Shares | | | (100,799 | ) | | | (280,108 | ) |
Class R4 Shares | | | (114 | ) | | | (219 | ) |
Class R5 Shares | | | (18,050 | ) | | | (22,390 | ) |
| | |
FUND SHARE TRANSACTIONS (NOTE 4) | | | | | | | | |
Class A Shares | | | (5,763,629 | ) | | | (25,279,558 | ) |
Class B Shares | | | (261,458 | ) | | | (663,906 | ) |
Class C Shares | | | (3,309,941 | ) | | | (22,460,082 | ) |
Class I Shares | | | 6,979,366 | | | | (3,849,985 | ) |
Class R3 Shares | | | (733,648 | ) | | | (1,502,345 | ) |
Class R4 Shares | | | 114 | | | | 15,217 | |
Class R5 Shares | | | 423,405 | | | | 989,013 | |
| | | | | | | | |
Net Decrease in Net Assets | | | (1,436,104 | ) | | | (54,799,270 | ) |
| | |
NET ASSETS | | | | | | | | |
Beginning of Period | | | 269,562,308 | | | | 324,361,578 | |
| | | | | | | | |
| | |
End of Period | | $ | 268,126,204 | | | $ | 269,562,308 | |
| | | | | | | | |
Undistributed (distribution in excess of) net investment income | | $ | (602,138 | ) | | $ | 64,362 | |
See notes to financial statements.
28 Semi-Annual Report
STATEMENTS OF CHANGES IN NET ASSETS
Thornburg Limited Term Income Fund
| | | | | | | | |
| | | Six Months Ended | | | Year Ended | |
| | | March 31, 2015* | | | September 30, 2014 | |
INCREASE (DECREASE) IN NET ASSETS FROM | | | | | | | | |
| | |
OPERATIONS | | | | | | | | |
Net investment income | | $ | 35,515,108 | | | $ | 68,224,679 | |
Net realized gain (loss) on investments | | | 1,016,957 | | | | 22,349,977 | |
Net unrealized appreciation (depreciation) on investments | | | 12,864,523 | | | | 19,198,183 | |
| | | | | | | | |
| | |
Net Increase (Decrease) in Net Assets Resulting from Operations | | | 49,396,588 | | | | 109,772,839 | |
| | |
DIVIDENDS TO SHAREHOLDERS | | | | | | | | |
From net investment income | | | | | | | | |
Class A Shares | | | (9,531,316 | ) | | | (20,844,311 | ) |
Class C Shares | | | (5,509,883 | ) | | | (11,944,153 | ) |
Class I Shares | | | (20,358,972 | ) | | | (34,874,369 | ) |
Class R3 Shares | | | (1,221,662 | ) | | | (2,227,898 | ) |
Class R4 Shares | | | (12,616 | ) | | | (219 | ) |
Class R5 Shares | | | (230,659 | ) | | | (295,723 | ) |
From realized gains | | | | | | | | |
Class A Shares | | | (4,830,351 | ) | | | (8,162,458 | ) |
Class C Shares | | | (3,183,519 | ) | | | (5,067,874 | ) |
Class I Shares | | | (8,807,696 | ) | | | (10,507,616 | ) |
Class R3 Shares | | | (673,050 | ) | | | (758,459 | ) |
Class R4 Shares | | | (477 | ) | | | — | |
Class R5 Shares | | | (93,460 | ) | | | (61,655 | ) |
| | |
FUND SHARE TRANSACTIONS (NOTE 4) | | | | | | | | |
Class A Shares | | | 60,903,338 | | | | (127,630,504 | ) |
Class C Shares | | | 23,473,044 | | | | (42,344,263 | ) |
Class I Shares | | | 234,861,647 | | | | 311,080,157 | |
Class R3 Shares | | | 10,232,673 | | | | 37,870,291 | |
Class R4 Shares | | | 1,983,031 | | | | 46,653 | |
Class R5 Shares | | | 5,979,852 | | | | 8,559,767 | |
| | | | | | | | |
Net Increase in Net Assets | | | 332,376,512 | | | | 202,610,205 | |
| | |
NET ASSETS | | | | | | | | |
Beginning of Period | | | 3,215,418,562 | | | | 3,012,808,357 | |
| | | | | | | | |
| | |
End of Period | | $ | 3,547,795,074 | | | $ | 3,215,418,562 | |
| | | | | | | | |
Distribution in excess of net investment income | | $ | (1,491,972 | ) | | $ | (141,972 | ) |
See notes to financial statements.
Semi-Annual Report 29
| | |
| NOTES TO FINANCIAL STATEMENTS | | |
| |
Thornburg Limited Term Income Funds | | March 31, 2015 (Unaudited) |
NOTE 1 – ORGANIZATION
Thornburg Limited Term U.S. Government Fund (the “Government Fund”) and Thornburg Limited Term Income Fund (the “Income Fund”), collectively the “Funds,” are diversified series of Thornburg Investment Trust (the “Trust”). The Trust is organized as a Massachusetts business trust under a Declaration of Trust dated June 3, 1987 and is registered as a diversified, open-end management investment company under the Investment Company Act of 1940, as amended. The Funds are currently two of eighteen separate series of the Trust. Each series is considered to be a separate entity for financial reporting and tax purposes and bears expenses directly attributable to it. The Funds’ primary objectives are to obtain as high a level of current income as is consistent, in the view of the Funds’ investment advisor, with the safety of capital. As a secondary objective, the Funds seek to reduce changes in their share prices compared to longer term portfolios.
The Government Fund currently has seven classes of shares of beneficial interest: Class A, Class B, Class C, Institutional Class (“Class I”), and Retirement Classes (“Class R3,” “Class R4,” and “Class R5”). The Fund no longer offers Class B shares for sale. The Income Fund currently offers six classes of shares of beneficial interest outstanding, Class A, Class C, Institutional Class (“Class I”), and Retirement Classes (“Class R3,” “Class R4,” and “Class R5”). Each class of shares of the Funds represents an interest in the same portfolio of investments, except that (i) Class A shares are sold subject to a front-end sales charge collected at the time the shares are purchased and bear a service fee, (ii) Class B shares were sold at net asset value without a sales charge at the time of purchase, but are subject to a contingent deferred sales charge upon redemption and bear both a service fee and distribution fee, (iii) Class C shares are sold at net asset value without a sales charge at the time of purchase, but are subject to a contingent deferred sales charge upon redemption within one year of purchase, and bear both a service fee and a distribution fee, (iv) Class I shares are sold at net asset value without a sales charge at the time of purchase and may be subject to a service fee, (v) Class R3 shares are sold at net asset value without a sales charge, but bear both a service fee and a distribution fee, (vi) Class R4 shares are sold at net asset value without a sales charge at the time of purchase but bear a service fee, (vii) Class R5 shares are sold at net asset value without a sales charge at the time of purchase and may be subject to a service fee, and (viii) the respective classes may have different reinvestment privileges and conversion rights. Additionally, each Fund may allocate among its classes certain expenses, to the extent allocable to specific classes, including transfer agent fees, government registration fees, certain printing and postage costs, and administrative and legal expenses. Currently, class specific expenses of the Funds are limited to distribution and service fees, administration fees, and certain registration and transfer agent expenses. Class B shares of the Government Fund outstanding for eight years will convert to Class A shares of the Government Fund.
NOTE 2 – SIGNIFICANT ACCOUNTING POLICIES
The following is a summary of significant accounting policies followed by each Fund in the preparation of its financial statements. Each Fund is an investment company and prepares its financial statements in conformity with U.S. generally accepted accounting principles (“GAAP”), including the investment company accounting and reporting guidance in the Financial Accounting Standards Board (the “FASB”) Accounting Standard Codification Topic 946. The preparation of financial statements in conformity with GAAP requires management to make estimates and assumptions that affect the reported amounts of assets and liabilities and disclosure of contingent assets and liabilities at the date of the financial statements and the reported amounts of increases (decreases) in net assets from operations during the reporting period. Actual results could differ from those estimates.
Significant accounting policies of the Funds are as follows:
Valuation Policy and Procedures: The Trustees of the Trust (the “Trustees”) have authorized employees of the Funds’ investment advisor, acting as the Valuation and Pricing Committee (the “Committee”), to make certain valuation determinations, subject to oversight and review by the Trustees and the Audit Committee of the Trustees. The Committee and other employees of the Funds’ investment advisor administer and implement the valuation process. The Committee regularly reviews its own fair value decisions, as well as valuations, valuation techniques and services furnished by pricing services, considers circumstances in the markets which may require valuation determinations by the Committee and reviews previous valuation determinations. The Committee also reports on its activities, the performance of the pricing services and other matters to the Trustees and the Audit Committee of the Trustees.
In determining a fair value for a portfolio investment, the Committee seeks to determine the price that the Funds would reasonably expect to receive upon a sale of the investment in an orderly transaction between market participants at the measurement date. Typically, the fair value process employs standing instructions to use quoted prices in active markets or the use of independent pricing services. Less frequently, the Committee may make a fair value determination using other methods. However, because fair value prices are estimated prices, the determination of fair value for an investment may differ from the value that would be realized by the Funds upon a sale of the investment, and that difference could be material to the Funds’ financial statements. The Committee’s determination of fair value for an investment may also differ from the prices obtained by other persons (including other mutual funds) for the investment.
Valuation of Investments: Debt obligations held by the Funds have a primary over-the-counter market and are valued by an independent pricing service approved by the Trustees. The pricing service ordinarily values debt obligations using quoted bid prices and other
30 Semi-Annual Report
| | |
| NOTES TO FINANCIAL STATEMENTS, CONTINUED | | |
| |
Thornburg Limited Term Income Funds | | March 31, 2015 (Unaudited) |
methods, which include consideration of yields or prices of debt obligations of comparable quality, type of issue, coupon, maturity and rating, and indications as to value from dealers and general market conditions.
In any case when a pricing service fails to provide a price for a debt obligation held by the Funds, the Committee determines a fair value for the debt obligation using procedures in accordance with a policy approved by the Trustees, which may include the use of a price obtained from a different independent pricing service. Additionally, in any case when management believes that a price provided by a pricing service for a debt obligation held by the Funds may be unreliable, the Committee decides whether or not to use the pricing service’s valuation or to use an alternative method to determine a fair value for the debt obligation.
Valuation Measurements: The Funds categorize their investments based upon the inputs used in valuing those investments, according to a three-level hierarchy established by guidance from the FASB. Categorization of investments using this hierarchy is intended by the FASB to maximize the use of observable valuation inputs and minimize the use of unobservable inputs by prioritizing that the most observable input be used when available. Observable inputs are those that market participants would use in valuing an investment based on available market data. Unobservable inputs are those that reflect the Funds’ assumptions about the information market participants would use in valuing an investment. An investment’s level within the hierarchy is based on the lowest level of any input that is deemed significant to the asset or liability’s fair value measurement. The inputs or methodologies used to value investments are not necessarily indications of the risk or liquidity associated with investing in those investments.
Various inputs are used in determining the fair value measurement of the Funds’ investments. These inputs are summarized according to the three-level hierarchy listed below:
Level 1: Quoted prices in active markets for identical investments.
Level 2: Other direct or indirect significant observable (including quoted prices for similar investments in active markets and other observable inputs, such as interest rates, prepayment rates, credit risk, etc.).
Level 3: Significant unobservable inputs, (including the Committee’s own assumptions in determining the fair value of investments).
Portfolio investments with minimal, if any, market activity are characterized as Level 3 and are valued using significant unobservable inputs, typically including single broker quotes, which may be adjusted or unadjusted, related or comparable investments, last available transactions, and other relevant information. Valuations may also be based upon current market prices of securities that are comparable in coupon, rating, maturity and industry. An income based valuation approach would consider discounted anticipated future cash flows of the investment. Discounts may also be applied due to the nature or duration of any restrictions on the disposition of the investment. Valuations based upon the use of inputs from Levels 1, 2, or 3, may not represent the actual price received upon the disposition of an investment, and a Fund may receive a price that is lower than the valuation when it sells the investment.
GOVERNMENT FUND
The following table displays a summary of the fair value hierarchy measurements of the Government Fund’s net investments as of March 31, 2015. In any instance when valuation inputs from more than one level are used to determine the fair value of a specific investment, the investment is placed in the level of the table based upon the lowest level input that is significant in determining the fair value of the investment:
| | | | | | | | | | | | | | | | |
| | | Fair Value Measurements at March 31, 2015 | |
| | | Total | | | Level 1 | | | Level 2 | | | Level 3(a) | |
Assets | | | | | | | | | | | | | | | | |
Investments in Securities | | | | | | | | | | | | | | | | |
U.S. Treasury Securities | | $ | 39,364,168 | | | $ | 39,364,168 | | | $ | — | | | $ | — | |
U.S. Government Agencies | | | 43,499,991 | | | | — | | | | 41,244,427 | | | | 2,255,564 | |
Mortgage Backed | | | 148,265,562 | | | | — | | | | 148,265,562 | | | | — | |
Short Term Investments | | | 13,000,000 | | | | — | | | | 13,000,000 | | | | — | |
| | | | | | | | | | | | | | | | |
Total Investments in Securities | | $ | 244,129,721 | | | $ | 39,364,168 | | | $ | 202,509,989 | | | $ | 2,255,564 | |
| (a) | In accordance with the guidance prescribed in Accounting Standards Update (“ASU”) No. 2011-04, a portfolio security characterized as a Level 3 investment representing $2,255,564 market value in U.S. Government Agencies was fair valued by the Committee based upon current market prices/yield of comparable securities using a yield of 2.7479%. |
In accordance with the guidance prescribed in ASU No. 2011-04, it is the policy of the Fund to recognize transfers between levels and those underlying events which caused the movement. The Fund recognized no transfers between Levels 1 and 2 for the six months ended March 31, 2015.
Semi-Annual Report 31
| | |
| NOTES TO FINANCIAL STATEMENTS, CONTINUED | | |
| |
Thornburg Limited Term Income Funds | | March 31, 2015 (Unaudited) |
GOVERNMENT FUND (Continued)
A rollforward of fair value measurements using significant unobservable inputs (Level 3) for the six months ended March 31, 2015 is as follows:
| | | | | | | | |
| | | U.S. Government Agencies | | | Total(d) | |
Beginning Balance 9/30/2014 | | $ | 2,356,134 | | | $ | 2,356,134 | |
Accrued Discounts (Premiums) | | | 1,431 | | | | 1,431 | |
Net Realized Gain (Loss)(a) | | | 1,180 | | | | 1,180 | |
Gross Purchases | | | — | | | | — | |
Gross Sales | | | (101,207 | ) | | | (101,207 | ) |
Net Change in Unrealized Appreciation (Depreciation)(b)(c) | | | (1,974 | ) | | | (1,974 | ) |
Transfers into Level 3 | | | — | | | | — | |
Transfers out of Level 3 | | | — | | | | — | |
| | | | | | | | |
Ending Balance 3/31/2015 | | $ | 2,255,564 | | | $ | 2,255,564 | |
| (a) | Amount of Net Realized Gain (Loss) recognized in the net increase in net assets resulting from operations is included in the Fund’s Statement of Operations for the six months ended March 31, 2015. |
| (b) | Amount of Net Change in Unrealized Appreciation (Depreciation) recognized in the net increase in net assets resulting from operations is included in the Fund’s Statement of Operations for the six months ended March 31, 2015. |
| (c) | The Net Change in Unrealized Appreciation (Depreciation) attributable to securities owned at March 31, 2015, which were valued using significant unobservable inputs was $(1,974). This is included within net change in unrealized appreciation (depreciation) on investments within the Statement of Operations. |
| (d) | Level 3 investments represent 0.84% of total Net Assets at the six months ended March 31, 2015. Significant fluctuations of the unobservable inputs applied to portfolio investments characterized as Level 3 could be expected to increase or decrease the fair value of these portfolio investments. |
INCOME FUND
The following table displays a summary of the fair value hierarchy measurements of the Income Fund’s net investments as of March 31, 2015. In any instance when valuation inputs from more than one level are used to determine the fair value of a specific investment, the investment is placed in the level of the table based upon the lowest level input that is significant in determining the fair value of the investment:
| | | | | | | | | | | | | | | | |
| | | Fair Value Measurements At March 31, 2015 | |
| | | Total | | | Level 1 | | | Level 2 | | | Level 3(a) | |
Assets | | | | | | | | | | | | | | | | |
Investments in Securities | | | | | | | | | | | | | | | | |
U.S. Treasury Securities | | $ | 65,345,086 | | | $ | 65,345,086 | | | $ | — | | | $ | — | |
U.S. Government Agencies | | | 286,948,034 | | | | — | | | | 281,445,434 | | | | 5,502,600 | |
Other Government | | | 103,804,132 | | | | — | | | | 90,798,329 | | | | 13,005,803 | |
Mortgage Backed | | | 196,673,225 | | | | — | | | | 196,673,225 | | | | — | |
Asset Backed Securities | | | 681,216,458 | | | | — | | | | 673,688,850 | | | | 7,527,608 | |
Corporate Bonds | | | 1,700,499,004 | | | | — | | | | 1,700,499,004 | | | | — | |
Convertible Bonds | | | 19,201,875 | | | | — | | | | 19,201,875 | | | | — | |
Municipal Bonds | | | 161,684,408 | | | | — | | | | 161,684,408 | | | | — | |
Loan Participations | | | 15,002,188 | | | | — | | | | 15,002,188 | | | | — | |
Short Term Investments | | | 202,005,322 | | | | — | | | | 202,005,322 | | | | — | |
| | | | | | | | | | | | | | | | |
Total Investments in Securities | | $ | 3,432,379,732 | | | $ | 65,345,086 | | | $ | 3,340,998,635 | | | $ | 26,036,011 | |
| (a) | In accordance with the guidance prescribed in Accounting Standards Update (“ASU”) No. 2011-04, unadjusted broker quotes were applied to portfolio securities characterized as Level 3 investments totaling $2,997,047 in market value at March 31, 2015. The following table displays a summary of the valuation techniques and unobservable inputs used to value portfolio securities characterized as Level 3 investments where no unadjusted broker quotes were available at March 31, 2015. |
32 Semi-Annual Report
| | |
| NOTES TO FINANCIAL STATEMENTS, CONTINUED | | |
| |
Thornburg Limited Term Income Funds | | March 31, 2015 (Unaudited) |
INCOME FUND (Continued)
| | | | | | | | | | |
| | | Fair Value at
March 31,
2015 | | | Valuation
Technique(s) | | Unobservable
Input | | Range
(weighted Average) |
U.S. Government | | $ | 5,502,600 | | | Market comparable | | Yields of | | 2.75% – 3.59% (3.17%) |
| | | | | | securities yield method | | comparable securities | | |
Other Government | | | 13,005,803 | | | Discounted cash flows | | Third party vendor projection | | 2.60% (N/A) |
| | | | | | | | of discounted cash flows | | |
Asset Backed Securities | | | 4,530,561 | | | Discounted cash flows | | Third party vendor projection | | 1.70% (N/A) |
| | | | | | | | of discounted cash flows | | |
| | | | | | | | | | |
Total | | $ | 23,038,964 | | | | | | | |
In accordance with the guidance prescribed in ASU No. 2011-04, it is the policy of the Fund to recognize transfers between levels and those underlying events which caused the movement. The Fund recognized no transfers between Levels 1 and 2 for the six months ended March 31, 2015.
A rollforward of fair value measurements using significant unobservable inputs (Level 3) for the six months ended March 31, 2015 is as follows:
| | | | | | | | | | | | | | | | |
| | | Asset Backed
Securities | | | Corporate Bonds | | | U.S. and Other
Government | | | Total(d) | |
Beginning Balance 9/30/2014 | | $ | 22,153,810 | | | $ | 4,105,650 | | | $ | 19,329,101 | | | $ | 45,588,561 | |
Accrued Discounts (Premiums) | | | 10,746 | | | | 740 | | | | (17,478 | ) | | | (5,992 | ) |
Net Realized Gain (Loss)(a) | | | 44,585 | | | | 9,739 | | | | 1,083 | | | | 55,407 | |
Gross Purchases | | | — | | | | — | | | | — | | | | — | |
Gross Sales | | | (14,750,573 | ) | | | (579,359 | ) | | | (672,159 | ) | | | (16,002,091 | ) |
Net Change in Unrealized Appreciation (Depreciation)(b)(e) | | | 69,040 | | | | (14,100 | ) | | | (132,144 | ) | | | (77,204 | ) |
Transfers into Level 3(c) | | | — | | | | — | | | | — | | | | — | |
Transfers out of Level 3(c) | | | — | | | | (3,522,670 | ) | | | — | | | | (3,522,670 | ) |
| | | | | | | | | | | | | | | | |
Ending Balance 3/31/2015 | | $ | 7,527,608 | | | $ | — | | | $ | 18,508,403 | | | $ | 26,036,011 | |
| (a) | Amount of Net Realized Gain (Loss) recognized in the net increase in net assets resulting from operations is included in the Fund’s Statement of Operations for the six months ended March 31, 2015. |
| (b) | Amount of Net Change in Unrealized Appreciation (Depreciation) recognized in the net increase in net assets resulting from operations is included in the Fund’s Statement of Operations for the six months ended March 31, 2015. |
| (c) | Transfers into or out of Level 3 were out of or into Level 2, and were due to changes in other significant observable inputs available during the six months ended March 31, 2015. Transfers into or out of Level 3 are based on the beginning market value of the period in which they occurred. |
| (d) | Level 3 investments represent 0.74% of total Net Assets at the six months ended March 31, 2015. Significant fluctuations of the unobservable inputs applied to portfolio investments characterized as Level 3 could be expected to increase or decrease the fair value of these portfolio investments. |
| (e) | The Net Change in Unrealized Appreciation (Depreciation) attributable to securities owned at March 31, 2015, which were valued using significant unobservable inputs was negative $128,401. This is included within net change in unrealized appreciation (depreciation) on investments within the Statement of Operations. |
Federal Income Taxes: It is the policy of the Trust to comply with the provisions of the Internal Revenue Code applicable to “regulated investment companies” and to distribute to shareholders substantially all taxable income, including any net realized gain on investments of the Funds. Therefore, no provision for federal income taxes is required.
Management reviews each uncertain tax position believed to be material to the preparation of each Fund’s financial statements, to assess if it is more likely than not that the position would be sustained upon examination, based upon the technical merits of the position. As of March 31, 2015, management has not identified any such position for which an asset or liability must be reflected in the Statements of Assets and Liabilities. The Funds’ tax returns remain subject to examination for three years after filing.
When-Issued and Delayed Delivery Transactions: The Funds may engage in when-issued or delayed delivery transactions. To the extent a Fund engages in such transactions, it will do so for the purpose of acquiring portfolio securities consistent with the Fund’s investment objectives and not for the purpose of investment leverage or to speculate on interest rate and/or market changes. At the time a Fund makes a commitment to purchase a security on a when-issued or delayed delivery basis, the Fund will record the transaction and
Semi-Annual Report 33
| | |
| NOTES TO FINANCIAL STATEMENTS, CONTINUED | | |
| |
Thornburg Limited Term Income Funds | | March 31, 2015 (Unaudited) |
reflect the value in determining the Fund’s net asset value. When effecting such transactions, assets of an amount sufficient to make payment for the portfolio securities to be purchased will be segregated on the Fund’s records at the trade date. Securities purchased on a when-issued or delayed delivery basis do not earn interest until the settlement date.
Dividends: Net investment income of the Funds is declared daily as a dividend on shares for which the Funds have received payment. Dividends are paid monthly and are reinvested in additional shares of the Funds at net asset value per share at the close of business on the dividend payment date, or at the shareholder’s option, paid in cash. Net realized capital gains, to the extent available, will be distributed at least annually.
Repurchase Agreements: The Funds may invest excess cash in repurchase agreements whereby the Funds purchase investments, which serve as collateral, with an agreement to resell such collateral to the seller at an agreed upon price at the maturity date of the repurchase agreement. Investments pledged as collateral for repurchase agreements are held in custody until maturity of the repurchase agreement. Provisions in the agreements require that the market value of the collateral is at least equal to the repurchase value in the event of default. In the event of default, the Funds have the right to liquidate the collateral and apply the proceeds in satisfaction of the obligation. Under certain circumstances, in the event of default or bankruptcy by the other party to the agreement, realization and/ or retention of the collateral may be subject to legal proceedings.
General: Investment transactions are accounted for on a trade date basis. Interest income is accrued as earned. Premiums and discounts on securities purchased are amortized over the life of the respective securities. Realized gains and losses from the sale of securities are recorded on an identified cost basis. The Funds invest in various mortgage-backed securities. Such securities pay interest and a portion of principal each month, which is then available for investment in securities at prevailing prices. Paydown gains and losses on these securities are included in interest income. Net investment income (other than class specific expenses) and realized and unrealized gains and losses are allocated daily to each class of shares based upon the relative net asset value of outstanding shares (or the value of the dividend-eligible shares, as appropriate) of each class of shares at the beginning of the day (after adjusting for the current share activity of the respective class). Expenses common to all Funds are allocated among the Funds comprising the Trust based upon their relative net asset values or other appropriate allocation methods.
Foreign Currency Translation: With respect to the Income Fund, portfolio securities and other assets and liabilities denominated in foreign currencies are translated into U.S. dollars based on the rate of exchange of such currencies against U.S. dollars on the date of valuation. Purchases and sales of portfolio securities and interest denominated in foreign currencies are translated into U.S. dollar amounts on the respective dates of such transactions. Such spot contracts are included in receivable for investments sold and payable for investments purchased on the Statement of Assets and Liabilities.
The Income Fund does not isolate that portion of the results of operations resulting from changes in foreign exchange rates on investments from the fluctuations arising from changes in market prices of securities held. Such fluctuations are included with the net realized and unrealized gain or loss from investments.
Reported net realized foreign exchange gains or losses arise from sales of foreign currencies, currency gains or losses realized between the trade and settlement dates on securities transactions, and the difference between the amount of interest recorded on the Income Fund’s books and the U.S. dollar equivalent of the amounts actually received or paid.
Guarantees and Indemnifications: Under the Trust’s organizational documents, its officers and Trustees are indemnified against certain liabilities arising out of the performance of their duties to the Funds. Additionally, in the normal course of business the Trust enters into contracts with service providers that contain general indemnification clauses. The Trust’s maximum exposure under these arrangements is unknown. However, based on experience, the Trust expects the risk of loss to be remote.
NOTE 3 – INVESTMENT ADVISORY FEE AND OTHER TRANSACTIONS WITH AFFILIATES
Pursuant to an investment advisory agreement, Thornburg Investment Management, Inc. (the “Advisor”) serves as the investment advisor and performs services for the Funds for which the fees are payable at the end of each month. For the six months ended March 31, 2015, these fees were payable at annual rates ranging from .375 of 1% to .275 of 1% per annum of the average daily net assets of the Government Fund and .50 of 1% to .275 of 1% per annum of the average daily net assets of the Income Fund depending on each Fund’s asset size. The Trust also has entered into administrative services agreements with the Advisor, whereby the Advisor will perform certain administrative services for the shareholders of each class of each Fund’s shares, and for which fees will be payable at an annual rate of up to .125 of 1% per annum of the average daily net assets attributable to Class A, Class B, Class C, Class R3, and Class R4 shares, and up to .05 of 1% per annum of the average daily net assets attributable to Class I and Class R5 shares.
The Trust has an underwriting agreement with Thornburg Securities Corporation (the “Distributor,” an affiliate of the Advisor), which acts as the distributor of each Fund’s shares. For the six months ended March 31, 2015, the Distributor has advised the Funds that they earned no net commissions from the sale of Class A shares of the Government Fund and earned $4,144 from the sale of Class
34 Semi-Annual Report
| | |
| NOTES TO FINANCIAL STATEMENTS, CONTINUED | | |
| |
Thornburg Limited Term Income Funds | | March 31, 2015 (Unaudited) |
A shares of the Income Fund, and collected contingent deferred sales charges aggregating $1,063 and $22,611 from redemptions of Class C shares of the Government Fund and Income Fund, respectively.
Pursuant to a service plan under Rule 12b-1 of the Investment Company Act of 1940, the Funds may reimburse to the Advisor an amount not to exceed .25 of 1% per annum of the average daily net assets attributable to the applicable Class A, Class B, Class C, Class I, Class R3, and Class R4 shares of the Funds for payments made by the Advisor to securities dealers and other financial institutions to obtain various shareholder and distribution related services. For the six months ended March 31, 2015, there were no 12b-1 service plan fees charged for Class I or Class R5 shares. The Advisor may pay out of its own resources additional expenses for distribution of each Fund’s shares and shareholder services.
The Trust has also adopted distribution plans pursuant to Rule 12b-1, applicable to each Fund’s Class C and Class R3 shares, and also applicable to Government Fund’s Class B shares, under which the Funds compensate the Distributor for services in promoting the sale of Class B, C, and R3 shares of the Funds at an annual rate of up to .75 of 1% per annum of the average daily net assets attributable to Class B shares, and an annual rate of up to .25 of 1% per annum of the average daily net assets attributable to Class C and Class R3 shares. Total fees incurred by each class of shares of the Funds under their respective service and distribution plans for the six months ended March 31, 2015, are set forth in the Statements of Operations.
The Advisor and Distributor have contractually agreed to waive fees and reimburse expenses incurred by the Funds so that actual expenses of certain share classes do not exceed levels as specified in each Fund’s most recent prospectus. The agreement may be terminated by the Funds at any time, but may not be terminated by the Advisor or Distributor before February 1, 2016, unless the Advisor ceases to be the investment advisor to the Funds or the Distributor ceases to be the distributor of the Funds prior to that date. The Advisor and Distributor retain the right to be repaid by the Funds for fee waivers and expense reimbursements if expenses fall below the contractual limit prior to the end of the fiscal year.
For the six months ended March 31, 2015, the Advisor contractually reimbursed certain class specific expenses and administrative fees of $8,293 for the Class B shares, $657 for the Class C shares, $23,391 for the Class R3 shares, $5,687 for the Class R4 shares, and $13,206 for the Class R5 shares of the Government Fund and $66,294 for the Class R3 shares, $4,533 for the Class R4 shares, and $2,688 for the Class R5 shares of the Income Fund.
The Trust has an agreement with the custodian bank to indirectly pay a portion of the custodian’s fees through credits earned by each Fund’s cash on deposit with the bank. This deposit agreement is an alternative to overnight investments. Custodial fees are adjusted to reflect amounts that would have been paid without this agreement, with a corresponding adjustment reflected as fees paid indirectly in the Statements of Operations. For the six months ended March 31, 2015, fees paid indirectly were $2,909 for the Government Fund and $4,683 for the Income Fund.
Certain officers and Trustees of the Trust are also officers or directors of the Advisor and Distributor. The compensation of independent Trustees is borne by the Trust.
NOTE 4 – SHARES OF BENEFICIAL INTEREST
At March 31, 2015, there were an unlimited number of shares with no par value of beneficial interest authorized. Transactions in shares of beneficial interest were as follows:
GOVERNMENT FUND
| | | | | | | | | | | | | | | | |
| | | Six Months Ended | | | Year Ended | |
| | | March 31, 2015 (Unaudited) | | | September 30, 2014 (Audited) | |
| | | Shares | | | Amount | | | Shares | | | Amount | |
Class A Shares | | | | | | | | | | | | | | | | |
Shares sold | | | 1,137,525 | | | $ | 15,134,746 | | | | 1,714,063 | | | $ | 22,865,234 | |
Shares issued to shareholders in reinvestment of dividends | | | 56,747 | | | | 755,703 | | | | 156,283 | | | | 2,082,416 | |
Shares repurchased | | | (1,626,836 | ) | | | (21,654,078 | ) | | | (3,769,364 | ) | | | (50,227,208 | ) |
| | | | | | | | | | | | | | | | |
| | | | |
Net increase (decrease) | | | (432,564 | ) | | $ | (5,763,629 | ) | | | (1,899,018 | ) | | $ | (25,279,558 | ) |
| | | | | | | | | | | | | | | | |
Semi-Annual Report 35
| | |
| NOTES TO FINANCIAL STATEMENTS, CONTINUED | | |
| |
Thornburg Limited Term Income Funds | | March 31, 2015 (Unaudited) |
GOVERNMENT FUND (Continued)
| | | | | | | | | | | | | | | | |
| | | Six Months Ended | | | Year Ended | |
| | | March 31, 2015 (Unaudited) | | | September 30, 2014 (Audited) | |
| | | Shares | | | Amount | | | Shares | | | Amount | |
Class B Shares | | | | | | | | | | | | | | | | |
Shares sold | | | — | | | $ | — | | | | 18,991 | | | $ | 252,210 | |
Shares issued to shareholders in reinvestment of dividends | | | 80 | | | | 1,064 | | | | 355 | | | | 4,713 | |
Shares repurchased | | | (19,733 | ) | | | (262,522 | ) | | | (69,262 | ) | | | (920,829 | ) |
| | | | | | | | | | | | | | | | |
| | | | |
Net increase (decrease) | | | (19,653 | ) | | $ | (261,458 | ) | | | (49,916 | ) | | $ | (663,906 | ) |
| | | | | | | | | | | | | | | | |
| | | | |
Class C Shares | | | | | | | | | | | | | | | | |
Shares sold | | | 244,578 | | | $ | 3,280,555 | | | | 336,942 | | | $ | 4,519,939 | |
Shares issued to shareholders in reinvestment of dividends | | | 21,221 | | | | 284,314 | | | | 65,687 | | | | 880,540 | |
Shares repurchased | | | (513,211 | ) | | | (6,874,810 | ) | | | (2,077,467 | ) | | | (27,860,561 | ) |
| | | | | | | | | | | | | | | | |
| | | | |
Net increase (decrease) | | | (247,412 | ) | | $ | (3,309,941 | ) | | | (1,674,838 | ) | | $ | (22,460,082 | ) |
| | | | | | | | | | | | | | | | |
| | | | |
Class I Shares | | | | | | | | | | | | | | | | |
Shares sold | | | 1,246,655 | | | $ | 16,605,801 | | | | 1,813,462 | | | $ | 24,164,635 | |
Shares issued to shareholders in reinvestment of dividends | | | 41,182 | | | | 548,454 | | | | 97,347 | | | | 1,297,025 | |
Shares repurchased | | | (764,520 | ) | | | (10,174,889 | ) | | | (2,199,111 | ) | | | (29,311,645 | ) |
| | | | | | | | | | | | | | | | |
| | | | |
Net increase (decrease) | | | 523,317 | | | $ | 6,979,366 | | | | (288,302 | ) | | $ | (3,849,985 | ) |
| | | | | | | | | | | | | | | | |
| | | | |
Class R3 Shares | | | | | | | | | | | | | | | | |
Shares sold | | | 159,747 | | | $ | 2,127,435 | | | | 375,179 | | | $ | 5,003,670 | |
Shares issued to shareholders in reinvestment of dividends | | | 6,890 | | | | 91,811 | | | | 19,348 | | | | 257,965 | |
Shares repurchased | | | (221,535 | ) | | | (2,952,894 | ) | | | (507,115 | ) | | | (6,763,980 | ) |
| | | | | | | | | | | | | | | | |
| | | | |
Net increase (decrease) | | | (54,898 | ) | | $ | (733,648 | ) | | | (112,588 | ) | | $ | (1,502,345 | ) |
| | | | | | | | | | | | | | | | |
| | | | |
Class R4 Shares | | | | | | | | | | | | | | | | |
Shares sold | | | — | | | $ | — | | | | 1,142 | | | $ | 15,250 | |
Shares issued to shareholders in reinvestment of dividends | | | 9 | | | | 114 | | | | 16 | | | | 219 | |
Shares repurchased | | | — | | | | — | | | | (19 | ) | | | (252 | ) |
| | | | | | | | | | | | | | | | |
| | | | |
Net increase (decrease) | | | 9 | | | $ | 114 | | | | 1,139 | | | $ | 15,217 | |
| | | | | | | | | | | | | | | | |
| | | | |
Class R5 Shares | | | | | | | | | | | | | | | | |
Shares sold | | | 49,882 | | | $ | 664,119 | | | | 161,398 | | | $ | 2,151,422 | |
Shares issued to shareholders in reinvestment of dividends | | | 150 | | | | 1,991 | | | | 817 | | | | 10,878 | |
Shares repurchased | | | (18,233 | ) | | | (242,705 | ) | | | (88,161 | ) | | | (1,173,287 | ) |
| | | | | | | | | | | | | | | | |
| | | | |
Net increase (decrease) | | | 31,799 | | | $ | 423,405 | | | | 74,054 | | | $ | 989,013 | |
| | | | | | | | | | | | | | | | |
36 Semi-Annual Report
| | |
| NOTES TO FINANCIAL STATEMENTS, CONTINUED | | |
| |
Thornburg Limited Term Income Funds | | March 31, 2015 (Unaudited) |
INCOME FUND
| | | | | | | | | | | | | | | | |
| | | Six Months Ended | | | Year Ended | |
| | | March 31, 2015 (Unaudited) | | | September 30, 2014 (Audited) | |
| | | Shares | | | Amount | | | Shares | | | Amount | |
| | | | |
Class A Shares | | | | | | | | | | | | | | | | |
Shares sold | | | 13,882,855 | | | $ | 186,818,408 | | | | 20,658,936 | | | $ | 278,069,724 | |
Shares issued to shareholders in reinvestment of dividends | | | 948,991 | | | | 12,762,800 | | | | 1,935,680 | | | | 25,992,765 | |
Shares repurchased | | | (10,304,178 | ) | | | (138,677,870 | ) | | | (32,121,123 | ) | | | (431,692,993 | ) |
| | | | | | | | | | | | | | | | |
| | | | |
Net increase (decrease) | | | 4,527,668 | | | $ | 60,903,338 | | | | (9,526,507 | ) | | $ | (127,630,504 | ) |
| | | | | | | | | | | | | | | | |
| | | | |
Class C Shares | | | | | | | | | | | | | | | | |
Shares sold | | | 6,003,490 | | | $ | 80,701,133 | | | | 8,103,867 | | | $ | 108,884,838 | |
Shares issued to shareholders in reinvestment of dividends | | | 574,527 | | | | 7,712,715 | | | | 1,113,293 | | | | 14,926,284 | |
Shares repurchased | | | (4,834,123 | ) | | | (64,940,804 | ) | | | (12,383,560 | ) | | | (166,155,385 | ) |
| | | | | | | | | | | | | | | | |
| | | | |
Net increase (decrease) | | | 1,743,894 | | | $ | 23,473,044 | | | | (3,166,400 | ) | | $ | (42,344,263 | ) |
| | | | | | | | | | | | | | | | |
| | | | |
Class I Shares | | | | | | | | | | | | | | | | |
Shares sold | | | 36,221,692 | | | $ | 487,588,045 | | | | 53,437,378 | | | $ | 719,454,550 | |
Shares issued to shareholders in reinvestment of dividends | | | 1,869,368 | | | | 25,142,751 | | | | 2,874,558 | | | | 38,631,611 | |
Shares repurchased | | | (20,669,318 | ) | | | (277,869,149 | ) | | | (33,255,810 | ) | | | (447,006,004 | ) |
| | | | | | | | | | | | | | | | |
| | | | |
Net increase (decrease) | | | 17,421,742 | | | $ | 234,861,647 | | | | 23,056,126 | | | $ | 311,080,157 | |
| | | | | | | | | | | | | | | | |
| | | | |
Class R3 Shares | | | | | | | | | | | | | | | | |
Shares sold | | | 2,418,117 | | | $ | 32,585,875 | | | | 5,189,231 | | | $ | 69,801,833 | |
Shares issued to shareholders in reinvestment of dividends | | | 135,677 | | | | 1,826,003 | | | | 214,137 | | | | 2,879,405 | |
Shares repurchased | | | (1,796,870 | ) | | | (24,179,205 | ) | | | (2,588,440 | ) | | | (34,810,947 | ) |
| | | | | | | | | | | | | | | | |
| | | | |
Net increase (decrease) | | | 756,924 | | | $ | 10,232,673 | | | | 2,814,928 | | | $ | 37,870,291 | |
| | | | | | | | | | | | | | | | |
| | | | |
Class R4 Shares | | | | | | | | | | | | | | | | |
Shares sold | | | 167,138 | | | $ | 2,243,512 | | | | 3,467 | | | $ | 46,690 | |
Shares issued to shareholders in reinvestment of dividends | | | 95 | | | | 1,280 | | | | 16 | | | | 218 | |
Shares repurchased | | | (19,518 | ) | | | (261,761 | ) | | | (19 | ) | | | (255 | ) |
| | | | | | | | | | | | | | | | |
| | | | |
Net increase (decrease) | | | 147,715 | | | $ | 1,983,031 | | | | 3,464 | | | $ | 46,653 | |
| | | | | | | | | | | | | | | | |
| | | | |
Class R5 Shares | | | | | | | | | | | | | | | | |
Shares sold | | | 847,929 | | | $ | 11,393,010 | | | | 913,728 | | | $ | 12,254,923 | |
Shares issued to shareholders in reinvestment of dividends | | | 23,829 | | | | 320,504 | | | | 26,437 | | | | 355,574 | |
Shares repurchased | | | (427,232 | ) | | | (5,733,662 | ) | | | (301,211 | ) | | | (4,050,730 | ) |
| | | | | | | | | | | | | | | | |
| | | | |
Net increase (decrease) | | | 444,526 | | | $ | 5,979,852 | | | | 638,954 | | | $ | 8,559,767 | |
| | | | | | | | | | | | | | | | |
Semi-Annual Report 37
| | |
| NOTES TO FINANCIAL STATEMENTS, CONTINUED | | |
| |
Thornburg Limited Term Income Funds | | March 31, 2015 (Unaudited) |
NOTE 5 – INVESTMENT TRANSACTIONS
For the six months ended March 31, 2015, the Government Fund had purchase and sale transactions of investments (excluding short-term investments) of $13,927,815 and $10,024,498, respectively, while the Income Fund had purchase and sale transactions of investments (excluding short-term investments and U.S. Government obligations) of $554,834,831 and $152,006,114, respectively.
NOTE 6 – INCOME TAXES
At March 31, 2015, information on the tax components of capital was as follows:
| | | | | | | | |
| | | Government Fund | | | Income Fund | |
Cost of investments for tax purposes | | $ | 239,478,242 | | | $ | 3,381,118,771 | |
| | | | | | | | |
Gross unrealized appreciation on a tax basis | | $ | 5,539,885 | | | $ | 72,844,100 | |
Gross unrealized depreciation on a tax basis | | | (888,406 | ) | | | (21,583,139 | ) |
| | | | | | | | |
Net unrealized appreciation (depreciation) on investments (tax basis) | | $ | 4,651,479 | | | $ | 51,260,961 | |
| | | | | | | | |
At March 31, 2015, the Government Fund had deferred tax basis capital losses occurring subsequent to October 31, 2013 of $1,820,325. For tax purposes, such losses will be reflected in the year ending September 30, 2015.
At March 31, 2015, the Government Fund had cumulative tax basis capital losses of $5,630,929 (of which $2,155,138 is short-term and $3,475,791 is long-term), generated after September 30, 2011, which may be carried forward to offset future capital gains. To the extent such carryforwards are used, capital gain distributions may be reduced to the extent provided by regulations. Such capital loss carryforwards do not expire but are required to be utilized to offset future gains prior to the utilization of losses that occurred in years prior to the fiscal year ending September 30, 2012, which may expire prior to utilization.
At March 31, 2015, the Government Fund had tax basis capital losses generated prior to October 1, 2011, which may be carried forward to offset future capital gains. To the extent such carryforwards are used, capital gain distributions may be reduced to the extent provided by regulations. Such capital loss carryforwards expire as follows:
| | | | |
2018 | | $ | 17,316 | |
2019 | | | 106,151 | |
| | | | |
| | $ | 123,467 | |
| | | | |
OTHER NOTES
Risks: Each Fund’s investments subject it to risks including, but not limited to, credit risk, interest rate risk, prepayment risk, management risk, market and economic risk, liquidity risk and, in the case of Income Fund, the risks associated with investments in non-U.S. issuers. Please see the Funds’ prospectus for a discussion of the risks associated with an investment in the Funds.
Subsequent Events: Fund management believes no events have occurred between March 31, 2015 and the date of issuance of the financial statements that require adjustment to or disclosure in the accompanying financial statements.
38 Semi-Annual Report
This page intentionally left blank.
Semi-Annual Report 39
FINANCIAL HIGHLIGHTS
Thornburg Limited Term U.S. Government Fund
| | | | | | | | | | | | | | | | | | | | | | | | | | | | | | | | | | | | | | | | | | | | | | | | |
| | | PER SHARE PERFORMANCE (for a share outstanding throughout the Period)+ | | RATIOS TO AVERAGE NET ASSETS | | | SUPPLEMENTAL DATA | |
Unless Otherwise Noted, Periods are Fiscal Years Ended Sept. 30, | | Net Asset
Value
Beginning
of Period | | | Net
Investment
Income (Loss) | | Net
Realized
&
Unrealized
Gain (Loss)
on
Investments | | | Total from
Investment
Operations | | Dividends
from Net
Investment
Income | | | Dividends
from Net
Realized
Gains | | Total
Dividends | | | Net
Asset
Value
End
of
Period | | Net
Investment
Income
(Loss)
(%) | | | Expenses,
After
Expense
Reductions
(%) | | | Expenses,
After
Expense
Reductions
and
Net of
Custody
Credits
(%) | | | Expenses,
Before
Expense
Reductions
(%) | | | Total
Return (%)(a) | | Portfolio
Turnover
Rate (%)(a) | | Net
Assets
at End
of
Period
(Thousands) | |
Class A Shares | | | | | | | | | | | | | | | | | | | | | | | | | | | | | | | | | | | | | | | | | | |
2015(b)(c) | | $ | 13.27 | | | 0.07 | | | 0.09 | | | 0.16 | | | (0.10 | ) | | — | | | (0.10 | ) | | $13.33 | | | 1.08 | (d) | | | 0.92 | (d) | | | 0.92 | (d) | | | 0.92 | (d) | | 1.24 | | 4.22 | | $ | 127,761 | |
2014(b) | | $ | 13.36 | | | 0.19 | | | (0.02 | ) | | 0.17 | | | (0.26 | ) | | — | | | (0.26 | ) | | $13.27 | | | 1.41 | | | | 0.93 | | | | 0.93 | | | | 0.94 | | | 1.30 | | 8.14 | | $ | 132,916 | |
2013(b) | | $ | 13.86 | | | 0.20 | | | (0.39 | ) | | (0.19) | | | (0.31 | ) | | — | | | (0.31 | ) | | $13.36 | | | 1.45 | | | | 0.89 | | | | 0.89 | | | | 0.89 | | | (1.38) | | 12.18 | | $ | 159,225 | |
2012(b) | | $ | 13.90 | | | 0.25 | | | 0.06 | | | 0.31 | | | (0.35 | ) | | — | | | (0.35 | ) | | $13.86 | | | 1.79 | | | | 0.89 | | | | 0.89 | | | | 0.89 | | | 2.29 | | 9.89 | | $ | 214,749 | |
2011(b) | | $ | 13.94 | | | 0.33 | | | 0.03 | | | 0.36 | | | (0.40 | ) | | — | | | (0.40 | ) | | $13.90 | | | 2.42 | | | | 0.90 | | | | 0.89 | | | | 0.90 | | | 2.66 | | 14.62 | | $ | 202,910 | |
2010(b) | | $ | 13.78 | | | 0.39 | | | 0.80 | | | 1.19 | | | (0.41 | ) | | (0.62) | | | (1.03 | ) | | $13.94 | | | 2.81 | | | | 0.93 | | | | 0.92 | | | | 0.93 | | | 4.69 | | 16.01 | | $ | 189,465 | |
Class B Shares | | | | | | | | | | | | | | | | | | | | | | | | | | | | | | | | | | | | | | | | | | |
2015(c) | | $ | 13.24 | | | (0.01) | | | 0.10 | | | 0.09 | | | (0.03 | ) | | — | | | (0.03 | ) | | $13.30 | | | (0.10 | )(d) | | | 2.11 | (d) | | | 2.11 | (d) | | | 5.34 | (d) | | 0.66 | | 4.22 | | $ | 456 | |
2014 | | $ | 13.33 | | | (0.01) | | | (0.02 | ) | | (0.03) | | | (0.06 | ) | | — | | | (0.06 | ) | | $13.24 | | | (0.06 | ) | | | 2.40 | | | | 2.40 | | | | 3.60 | | | (0.19) | | 8.14 | | $ | 714 | |
2013 | | $ | 13.83 | | | 0.01 | | | (0.39 | ) | | (0.38) | | | (0.12 | ) | | — | | | (0.12 | ) | | $13.33 | | | 0.07 | | | | 2.29 | | | | 2.29 | | | | 2.57 | | | (2.75) | | 12.18 | | $ | 1,384 | |
2012 | | $ | 13.87 | | | 0.06 | | | 0.06 | | | 0.12 | | | (0.16 | ) | | — | | | (0.16 | ) | | $13.83 | | | 0.42 | | | | 2.26 | | | | 2.25 | | | | 2.26 | | | 0.90 | | 9.89 | | $ | 3,452 | |
2011 | | $ | 13.91 | | | 0.16 | | | 0.02 | | | 0.18 | | | (0.22 | ) | | — | | | (0.22 | ) | | $13.87 | | | 1.13 | | | | 2.20 | | | | 2.19 | | | | 2.20 | | | 1.33 | | 14.62 | | $ | 4,368 | |
2010 | | $ | 13.75 | | | 0.23 | | | 0.80 | | | 1.03 | | | (0.25 | ) | | (0.62) | | | (0.87 | ) | | $13.91 | | | 1.65 | | | | 2.11 | | | | 2.11 | | | | 2.11 | | | 3.46 | | 16.01 | | $ | 5,215 | |
Class C Shares | | | | | | | | | | | | | | | | | | | | | | | | | | | | | | | | | | | | | | | | | | |
2015(c) | | $ | 13.35 | | | 0.05 | | | 0.10 | | | 0.15 | | | (0.09 | ) | | — | | | (0.09 | ) | | $13.41 | | | 0.80 | (d) | | | 1.20 | (d) | | | 1.20 | (d) | | | 1.20 | (d) | | 1.10 | | 4.22 | | $ | 47,918 | |
2014 | | $ | 13.45 | | | 0.15 | | | (0.02 | ) | | 0.13 | | | (0.23 | ) | | — | | | (0.23 | ) | | $13.35 | | | 1.14 | | | | 1.19 | | | | 1.19 | | | | 1.20 | | | 0.96 | | 8.14 | | $ | 51,001 | |
2013 | | $ | 13.94 | | | 0.16 | | | (0.37 | ) | | (0.21) | | | (0.28 | ) | | — | | | (0.28 | ) | | $13.45 | | | 1.17 | | | | 1.17 | | | | 1.17 | | | | 1.17 | | | (1.56) | | 12.18 | | $ | 73,877 | |
2012 | | $ | 13.98 | | | 0.21 | | | 0.07 | | | 0.28 | | | (0.32 | ) | | — | | | (0.32 | ) | | $13.94 | | | 1.51 | | | | 1.17 | | | | 1.17 | | | | 1.17 | | | 2.01 | | 9.89 | | $ | 102,790 | |
2011 | | $ | 14.03 | | | 0.30 | | | 0.02 | | | 0.32 | | | (0.37 | ) | | — | | | (0.37 | ) | | $13.98 | | | 2.15 | | | | 1.17 | | | | 1.16 | | | | 1.17 | | | 2.31 | | 14.62 | | $ | 100,212 | |
2010 | | $ | 13.87 | | | 0.35 | | | 0.81 | | | 1.16 | | | (0.38 | ) | | (0.62) | | | (1.00 | ) | | $14.03 | | | 2.53 | | | | 1.21 | | | | 1.20 | | | | 1.71 | | | 4.39 | | 16.01 | | $ | 99,430 | |
Class I Shares | | | | | | | | | | | | | | | | | | | | | | | | | | | | | | | | | | | | | | | | | | |
2015(c) | | $ | 13.27 | | | 0.09 | | | 0.09 | | | 0.18 | | | (0.12 | ) | | — | | | (0.12 | ) | | $13.33 | | | 1.37 | (d) | | | 0.62 | (d) | | | 0.62 | (d) | | | 0.62 | (d) | | 1.39 | | 4.22 | | $ | 76,606 | |
2014 | | $ | 13.36 | | | 0.23 | | | (0.02 | ) | | 0.21 | | | (0.30 | ) | | — | | | (0.30 | ) | | $13.27 | | | 1.73 | | | | 0.61 | | | | 0.61 | | | | 0.61 | | | 1.62 | | 8.14 | | $ | 69,309 | |
2013 | | $ | 13.86 | | | 0.24 | | | (0.38 | ) | | (0.14) | | | (0.36 | ) | | — | | | (0.36 | ) | | $13.36 | | | 1.78 | | | | 0.56 | | | | 0.56 | | | | 0.56 | | | (1.05) | | 12.18 | | $ | 73,645 | |
2012 | | $ | 13.90 | | | 0.29 | | | 0.07 | | | 0.36 | | | (0.40 | ) | | — | | | (0.40 | ) | | $13.86 | | | 2.12 | | | | 0.56 | | | | 0.55 | | | | 0.56 | | | 2.63 | | 9.89 | | $ | 98,112 | |
2011 | | $ | 13.94 | | | 0.37 | | | 0.04 | | | 0.41 | | | (0.45 | ) | | — | | | (0.45 | ) | | $13.90 | | | 2.71 | | | | 0.57 | | | | 0.57 | | | | 0.57 | | | 2.99 | | 14.62 | | $ | 82,994 | |
2010 | | $ | 13.78 | | | 0.42 | | | 0.82 | | | 1.24 | | | (0.46 | ) | | (0.62) | | | (1.08 | ) | | $13.94 | | | 3.09 | | | | 0.60 | | | | 0.59 | | | | 0.60 | | | 5.03 | | 16.01 | | $ | 55,398 | |
Class R3 Shares | | | | | | | | | | | | | | | | | | | | | | | | | | | | | | | | | | | | | | | | | | |
2015(c) | | $ | 13.28 | | | 0.07 | | | 0.09 | | | 0.16 | | | (0.10 | ) | | — | | | (0.10 | ) | | $13.34 | | | 1.01 | (d) | | | 0.99 | (d) | | | 0.99 | (d) | | | 1.34 | (d) | | 1.20 | | 4.22 | | $ | 13,079 | |
2014 | | $ | 13.37 | | | 0.18 | | | (0.02 | ) | | 0.16 | | | (0.25 | ) | | — | | | (0.25 | ) | | $13.28 | | | 1.35 | | | | 0.99 | | | | 0.99 | | | | 1.31 | | | 1.23 | | 8.14 | | $ | 13,748 | |
2013 | | $ | 13.87 | | | 0.18 | | | (0.38 | ) | | (0.20) | | | (0.30 | ) | | — | | | (0.30 | ) | | $13.37 | | | 1.35 | | | | 0.99 | | | | 0.99 | | | | 1.27 | | | (1.47) | | 12.18 | | $ | 15,350 | |
2012 | | $ | 13.91 | | | 0.23 | | | 0.07 | | | 0.30 | | | (0.34 | ) | | — | | | (0.34 | ) | | $13.87 | | | 1.69 | | | | 1.00 | | | | 0.99 | | | | 1.29 | | | 2.19 | | 9.89 | | $ | 15,486 | |
2011 | | $ | 13.95 | | | 0.32 | | | 0.03 | | | 0.35 | | | (0.39 | ) | | — | | | (0.39 | ) | | $13.91 | | | 2.33 | | | | 1.00 | | | | 0.99 | | | | 1.32 | | | 2.56 | | 14.62 | | $ | 12,749 | |
2010 | | $ | 13.79 | | | 0.38 | | | 0.80 | | | 1.18 | | | (0.40 | ) | | (0.62) | | | (1.02 | ) | | $13.95 | | | 2.73 | | | | 0.99 | | | | 0.99 | | | | 1.31 | | | 4.62 | | 16.01 | | $ | 12,631 | |
Class R4 Shares | | | | | | | | | | | | | | | | | | | | | | | | | | | | | | | | | | | | | | | | | | |
2015(c) | | $ | 13.27 | | | 0.07 | | | 0.09 | | | 0.16 | | | (0.10 | ) | | — | | | (0.10 | ) | | $13.33 | | | 1.00 | (d) | | | 0.99 | (d) | | | 0.98 | (d) | | | 75.96 | (d)(f) | | 1.21 | | 4.22 | | $ | 15 | |
2014(e) | | $ | 13.36 | | | 0.14 | | | (0.03 | ) | | 0.11 | | | (0.20 | ) | | — | | | (0.20 | ) | | $13.27 | | | 1.57 | (d) | | | 0.99 | (d) | | | 0.99 | (d) | | | 64.66 | (d)(f) | | 0.78 | | 8.14 | | $ | 15 | |
Class R5 Shares | | | | | | | | | | | | | | | | | | | | | | | | | | | | | | | | | | | | | | | | | | |
2015(c) | | $ | 13.27 | | | 0.09 | | | 0.10 | | | 0.19 | | | (0.12 | ) | | — | | | (0.12 | ) | | $13.34 | | | 1.31 | (d) | | | 0.67 | (d) | | | 0.67 | (d) | | | 1.98 | (d) | | 1.44 | | 4.22 | | $ | 2,291 | |
2014 | | $ | 13.36 | | | 0.21 | | | — | (g) | | 0.21 | | | (0.30 | ) | | — | | | (0.30 | ) | | $13.27 | | | 1.59 | | | | 0.67 | | | | 0.67 | | | | 2.87 | | | 1.56 | | 8.14 | | $ | 1,859 | |
2013 | | $ | 13.85 | | | 0.24 | | | (0.39 | ) | | (0.15) | | | (0.34 | ) | | — | | | (0.34 | ) | | $13.36 | | | 1.83 | | | | 0.67 | | | | 0.67 | | | | 7.28 | (f) | | (1.09) | | 12.18 | | $ | 881 | |
2012(h) | | $ | 13.84 | | | 0.10 | | | 0.07 | | | 0.17 | | | (0.16 | ) | | — | | | (0.16 | ) | | $13.85 | | | 1.87 | (d) | | | 0.68 | (d) | | | 0.67 | (d) | | | 44.86 | (d)(f) | | 1.20 | | 9.89 | | $ | 299 | |
| (a) | Not annualized for periods less than one year. |
| (b) | Sales loads are not reflected in computing total return. |
| (c) | Unaudited Six Month Period Ended March 31. |
| (e) | Effective date of this class of shares was February 1, 2014. |
| (f) | Due to the size of net assets and fixed expenses, ratios may appear disproportionate. |
| (g) | Net Realized & Unrealized Gain (Loss) on Investments was less than $0.01 per share. |
| (h) | Effective date of this class of shares was May 1, 2012. |
| + | Based on weighted average shares outstanding, except for Dividends from Net Investment Income and Net Realized Gains, which are actual amounts per share. |
See notes to financial statements.
| | |
| 40 Semi-Annual Report | | Semi-Annual Report 41 |
FINANCIAL HIGHLIGHTS
Thornburg Limited Term Income Fund
| | | | | | | | | | | | | | | | | | | | | | | | | | | | | | | | | | | | | | | | | | | | | | | | |
| | | PER SHARE PERFORMANCE (for a share outstanding throughout the Period)+ | | RATIOS TO AVERAGE NET ASSETS | | | SUPPLEMENTAL DATA | |
Unless
Otherwise
Noted,
Periods are Fiscal
Years
Ended
Sept. 30, | | Net Asset
Value
Beginning
of Period | | | Net
Investment
Income (Loss) | | Net
Realized
&
Unrealized
Gain (Loss)
on
Investments | | | Total from
Investment
Operations | | Dividends
from Net
Investment
Income | | | Dividends
from Net
Realized
Gains | | Total
Dividends | | | Net Asset Value End of Period | | Net
Investment
Income(Loss)
(%) | | | Expenses,
After Expense
Reductions(%) | | | Expenses,
After
Expense
Reductions
and
Net of
Custody
Credits(%) | | | Expenses,
Before
Expense
Reductions
(%) | | | Total
Return (%)(a) | | Portfolio
Turnover
Rate (%)(a) | | Net
Assets
at End
of
Period
(Thousands) | |
Class A Shares | | | | | | | | | | | | | | | | | | | | | | | | | | | | | | | | | | | | | | | | | | |
2015(b)(c) | | $ | 13.49 | | | 0.13 | | | 0.06 | | | 0.19 | | | (0.14 | ) | | (0.07) | | | (0.21 | ) | | $13.47 | | | 1.96 | (d) | | | 0.87 | (d) | | | 0.87 | (d) | | | 0.87 | (d) | | 1.40 | | 5.49 | | $ | 966,310 | |
2014(b) | | $ | 13.42 | | | 0.29 | | | 0.19 | | | 0.48 | | | (0.30 | ) | | (0.11) | | | (0.41 | ) | | $13.49 | | | 2.15 | | | | 0.89 | | | | 0.89 | | | | 0.89 | | | 3.61 | | 29.41 | | $ | 906,708 | |
2013(b) | | $ | 13.72 | | | 0.32 | | | (0.22 | ) | | 0.10 | | | (0.34 | ) | | (0.06) | | | (0.40 | ) | | $13.42 | | | 2.33 | | | | 0.88 | | | | 0.88 | | | | 0.88 | | | 0.69 | | 36.66 | | $ | 1,029,692 | |
2012(b) | | $ | 13.32 | | | 0.39 | | | 0.52 | | | 0.91 | | | (0.42 | ) | | (0.09) | | | (0.51 | ) | | $13.72 | | | 2.94 | | | | 0.93 | | | | 0.93 | | | | 0.93 | | | 7.04 | | 23.72 | | $ | 1,049,044 | |
2011(b) | | $ | 13.41 | | | 0.46 | | | (0.04 | ) | | 0.42 | | | (0.47 | ) | | (0.04) | | | (0.51 | ) | | $13.32 | | | 3.44 | | | | 0.98 | | | | 0.97 | | | | 0.98 | | | 3.19 | | 24.86 | | $ | 578,731 | |
2010(b) | | $ | 12.81 | | | 0.51 | | | 0.61 | | | 1.12 | | | (0.52 | ) | | — | | | (0.52 | ) | | $13.41 | | | 3.88 | | | | 0.99 | | | | 0.99 | | | | 1.01 | | | 8.91 | | 16.35 | | $ | 459,532 | |
Class C Shares | | | | | | | | | | | | | | | | | | | | | | | | | | | | | | | | | | | | | | | | | | |
2015(c) | | $ | 13.47 | | | 0.12 | | | 0.05 | | | 0.17 | | | (0.12 | ) | | (0.07) | | | (0.19 | ) | | $13.45 | | | 1.74 | (d) | | | 1.09 | (d) | | | 1.09 | (d) | | | 1.09 | (d) | | 1.29 | | 5.49 | | $ | 616,200 | |
2014 | | $ | 13.39 | | | 0.26 | | | 0.20 | | | 0.46 | | | (0.27 | ) | | (0.11) | | | (0.38 | ) | | $13.47 | | | 1.92 | | | | 1.11 | | | | 1.11 | | | | 1.11 | | | 3.46 | | 29.41 | | $ | 593,658 | |
2013 | | $ | 13.70 | | | 0.28 | | | (0.23 | ) | | 0.05 | | | (0.30 | ) | | (0.06) | | | (0.36 | ) | | $13.39 | | | 2.09 | | | | 1.12 | | | | 1.12 | | | | 1.12 | | | 0.38 | | 36.66 | | $ | 632,918 | |
2012 | | $ | 13.30 | | | 0.36 | | | 0.52 | | | 0.88 | | | (0.39 | ) | | (0.09) | | | (0.48 | ) | | $13.70 | | | 2.70 | | | | 1.18 | | | | 1.18 | | | | 1.18 | | | 6.78 | | 23.72 | | $ | 604,314 | |
2011 | | $ | 13.39 | | | 0.42 | | | (0.04 | ) | | 0.38 | | | (0.43 | ) | | (0.04) | | | (0.47 | ) | | $13.30 | | | 3.19 | | | | 1.22 | | | | 1.22 | | | | 1.23 | | | 2.93 | | 24.86 | | $ | 366,822 | |
2010 | | $ | 12.79 | | | 0.47 | | | 0.61 | | | 1.08 | | | (0.48 | ) | | — | | | (0.48 | ) | | $13.39 | | | 3.62 | | | | 1.24 | | | | 1.24 | | | | 1.77 | | | 8.64 | | 16.35 | | $ | 257,869 | |
Class I Shares | | | | | | | | | | | | | | | | | | | | | | | | | | | | | | | | | | | | | | | | | | |
2015(c) | | $ | 13.49 | | | 0.16 | | | 0.05 | | | 0.21 | | | (0.16 | ) | | (0.07) | | | (0.23 | ) | | $13.47 | | | 2.32 | (d) | | | 0.51 | (d) | | | 0.51 | (d) | | | 0.51 | (d) | | 1.59 | | 5.49 | | $ | 1,810,429 | |
2014 | | $ | 13.42 | | | 0.33 | | | 0.20 | | | 0.53 | | | (0.35 | ) | | (0.11) | | | (0.46 | ) | | $13.49 | | | 2.49 | | | | 0.54 | | | | 0.54 | | | | 0.54 | | | 3.98 | | 29.41 | | $ | 1,578,168 | |
2013 | | $ | 13.73 | | | 0.36 | | | (0.23 | ) | | 0.13 | | | (0.38 | ) | | (0.06) | | | (0.44 | ) | | $13.42 | | | 2.68 | | | | 0.53 | | | | 0.53 | | | | 0.53 | | | 0.08 | | 36.66 | | $ | 1,260,449 | |
2012 | | $ | 13.32 | | | 0.44 | | | 0.53 | | | 0.97 | | | (0.47 | ) | | (0.09) | | | (0.56 | ) | | $13.73 | | | 3.27 | | | | 0.58 | | | | 0.58 | | | | 0.58 | | | 7.49 | | 23.72 | | $ | 1,012,430 | |
2011 | | $ | 13.41 | | | 0.50 | | | (0.04 | ) | | 0.46 | | | (0.51 | ) | | (0.04) | | | (0.55 | ) | | $13.32 | | | 3.79 | | | | 0.63 | | | | 0.63 | | | | 0.63 | | | 3.55 | | 24.86 | | $ | 448,669 | |
2010 | | $ | 12.82 | | | 0.55 | | | 0.60 | | | 1.15 | | | (0.56 | ) | | — | | | (0.56 | ) | | $13.41 | | | 4.22 | | | | 0.64 | | | | 0.64 | | | | 0.64 | | | 9.20 | | 16.35 | | $ | 295,433 | |
Class R3 Shares | | | | | | | | | | | | | | | | | | | | | | | | | | | | | | | | | | | | | | | | | | |
2015(c) | | $ | 13.50 | | | 0.12 | | | 0.06 | | | 0.18 | | | (0.13 | ) | | (0.07) | | | (0.20 | ) | | $13.48 | | | 1.84 | (d) | | | 0.99 | (d) | | | 0.99 | (d) | | | 1.09 | (d) | | 1.34 | | 5.49 | | $ | 130,036 | |
2014 | | $ | 13.43 | | | 0.27 | | | 0.19 | | | 0.46 | | | (0.28 | ) | | (0.11) | | | (0.39 | ) | | $13.50 | | | 2.04 | | | | 0.99 | | | | 0.99 | | | | 1.12 | | | 3.51 | | 29.41 | | $ | 120,013 | |
2013 | | $ | 13.73 | | | 0.30 | | | (0.22 | ) | | 0.08 | | | (0.32 | ) | | (0.06) | | | (0.38 | ) | | $13.43 | | | 2.22 | | | | 0.99 | | | | 0.99 | | | | 1.14 | | | 0.59 | | 36.66 | | $ | 81,585 | |
2012 | | $ | 13.33 | | | 0.39 | | | 0.52 | | | 0.91 | | | (0.42 | ) | | (0.09) | | | (0.51 | ) | | $13.73 | | | 2.88 | | | | 0.99 | | | | 0.99 | | | | 1.19 | | | 6.97 | | 23.72 | | $ | 73,373 | |
2011 | | $ | 13.42 | | | 0.45 | | | (0.03 | ) | | 0.42 | | | (0.47 | ) | | (0.04) | | | (0.51 | ) | | $13.33 | | | 3.42 | | | | 0.99 | | | | 0.99 | | | | 1.29 | | | 3.17 | | 24.86 | | $ | 30,022 | |
2010 | | $ | 12.82 | | | 0.51 | | | 0.61 | | | 1.12 | | | (0.52 | ) | | — | | | (0.52 | ) | | $13.42 | | | 3.89 | | | | 0.99 | | | | 0.99 | | | | 1.35 | | | 8.90 | | 16.35 | | $ | 18,767 | |
Class R4 Shares | | | | | | | | | | | | | | | | | | | | | | | | | | | | | | | | | | | | | | | | | | |
2015(c) | | $ | 13.48 | | | 0.12 | | | 0.06 | | | 0.18 | | | (0.13 | ) | | (0.07) | | | (0.20 | ) | | $13.46 | | | 1.85 | (d) | | | 0.99 | (d) | | | 0.99 | (d) | | | 1.70 | (d) | | 1.34 | | 5.49 | | $ | 2,035 | |
2014(e) | | $ | 13.42 | | | 0.18 | | | 0.07 | | | 0.25 | | | (0.19 | ) | | — | | | (0.19 | ) | | $13.48 | | | 1.99 | (d) | | | 0.99 | (d) | | | 0.99 | (d) | | | 61.75 | (d)(g) | | 1.84 | | 29.41 | | $ | 47 | |
Class R5 Shares | | | | | | | | | | | | | | | | | | | | | | | | | | | | | | | | | | | | | | | | | | |
2015(c) | | $ | 13.49 | | | 0.15 | | | 0.05 | | | 0.20 | | | (0.15 | ) | | (0.07) | | | (0.22 | ) | | $13.47 | | | 2.20 | (d) | | | 0.64 | (d) | | | 0.64 | (d) | | | 0.66 | (d) | | 1.52 | | 5.49 | | $ | 22,785 | |
2014 | | $ | 13.42 | | | 0.32 | | | 0.19 | | | 0.51 | | | (0.33 | ) | | (0.11) | | | (0.44 | ) | | $13.49 | | | 2.38 | | | | 0.64 | | | | 0.64 | | | | 0.72 | | | 3.86 | | 29.41 | | $ | 16,825 | |
2013 | | $ | 13.72 | | | 0.34 | | | (0.21 | ) | | 0.13 | | | (0.37 | ) | | (0.06) | | | (0.43 | ) | | $13.42 | | | 2.52 | | | | 0.65 | | | | 0.65 | | | | 1.01 | | | 0.92 | | 36.66 | | $ | 8,164 | |
2012(f) | | $ | 13.47 | | | 0.16 | | | 0.27 | | | 0.43 | | | (0.18 | ) | | — | | | (0.18 | ) | | $13.72 | | | 2.96 | (d) | | | 0.67 | (d) | | | 0.67 | (d) | | | 25.61 | (d)(g) | | 3.19 | | 23.72 | | $ | 1,322 | |
| (a) | Not annualized for periods less than one year. |
| (b) | Sales loads are not reflected in computing total return. |
| (c) | Unaudited Six Month Period Ended March 31. |
| (e) | Effective date of this class of shares was February 1, 2014. |
| (f) | Effective date of this class of shares was May 1, 2012. |
| (g) | Due to the size of net assets and fixed expenses, ratios may appear disproportionate. |
| + | Based on weighted average shares outstanding, except for Dividends from Net Investment Income and Net Realized Gains, which are actual amounts per share. |
See notes to financial statements.
| | |
| 42 Semi-Annual Report | | Semi-Annual Report 43 |
| | |
| EXPENSE EXAMPLES | | |
| |
Thornburg Limited Term Income Funds | | March 31, 2015 (Unaudited) |
As a shareholder of the Fund, you incur two types of costs:
| | (1) | transaction costs, including |
(a) sales charges (loads) on purchase payments, for Class A shares;
(b) a deferred sales charge on redemptions of any part or all of a purchase of $1 million of Class A shares within 12 months of purchase;
(c) a deferred sales charge on redemptions of Class B shares within eight years of purchase;
(d) a deferred sales charge on redemptions of Class C shares within 12 months of purchase;
| | (2) | ongoing costs, including management fees; distribution and/or service (12b-1) fees; and other Fund expenses. |
This example is intended to help you understand your ongoing costs (in dollars) of investing in the Fund and to compare these costs with the ongoing costs of investing in other mutual funds.
The example is based on a $1,000 investment beginning on October 1, 2014, and held until March 31, 2015.
ACTUAL EXPENSES
For each class of shares, the first line of the accompanying table provides information about actual account values and actual expenses. You may use the information in this line, together with the amount you invested, to estimate the expenses that you paid over the period. Simply divide your account value by $1,000 (for example, an $8,600 account value divided by $1,000 = 8.6), then multiply the result by the number in the first line for your class of shares under the heading entitled “Expenses Paid During Period” to estimate the expenses you paid on your account during this period.
HYPOTHETICAL EXAMPLE FOR COMPARISON PURPOSES
For each class of shares, the second line of the accompanying table provides information about hypothetical account values and hypothetical expenses based on the Fund’s actual expense ratio and an assumed rate of return of 5% per year before expenses, which is not the Fund’s actual return. The hypothetical account values and expenses may not be used to estimate the actual ending account balance or expenses you paid for the period. You may use this information to compare the ongoing costs of investing in the Fund and other funds. To do so, compare this 5% hypothetical example with the 5% hypothetical examples that appear in the shareholder reports of the other funds.
Please note that the expenses shown in the table are meant to highlight your ongoing costs only and do not reflect any transactional costs, such as sales charges (loads), redemption fees, or exchange fees. Therefore, the second line of the table for each class of shares is useful in comparing ongoing costs only, and will not help you determine the relative total costs of owning different funds. In addition, if these transactional costs were included, your costs would have been higher.
| | | | | | | | | | | | |
| | | Beginning
Account Value
10/1/14 | | | Ending
Account Value
3/31/15 | | | Expenses Paid
During Period†
10/1/14–3/31/15 | |
Limited Term U.S. Government Fund | | | | | | | | | | | | |
Class A Shares | | | | | | | | | | | | |
Actual | | $ | 1,000.00 | | | $ | 1,012.40 | | | $ | 4.61 | |
Hypothetical* | | $ | 1,000.00 | | | $ | 1,020.35 | | | $ | 4.63 | |
Class B Shares | | | | | | | | | | | | |
Actual | | $ | 1,000.00 | | | $ | 1,006.60 | | | $ | 10.55 | |
Hypothetical* | | $ | 1,000.00 | | | $ | 1,014.42 | | | $ | 10.59 | |
Class C Shares | | | | | | | | | | | | |
Actual | | $ | 1,000.00 | | | $ | 1,011.00 | | | $ | 6.02 | |
Hypothetical* | | $ | 1,000.00 | | | $ | 1,018.95 | | | $ | 6.04 | |
Class I Shares | | | | | | | | | | | | |
Actual | | $ | 1,000.00 | | | $ | 1,013.90 | | | $ | 3.11 | |
Hypothetical* | | $ | 1,000.00 | | | $ | 1,021.85 | | | $ | 3.12 | |
Class R3 Shares | | | | | | | | | | | | |
Actual | | $ | 1,000.00 | | | $ | 1,012.00 | | | $ | 4.97 | |
Hypothetical* | | $ | 1,000.00 | | | $ | 1,020.00 | | | $ | 4.99 | |
Class R4 Shares | | | | | | | | | | | | |
Actual | | $ | 1,000.00 | | | $ | 1,012.10 | | | $ | 4.94 | |
Hypothetical* | | $ | 1,000.00 | | | $ | 1,020.02 | | | $ | 4.96 | |
Class R5 Shares | | | | | | | | | | | | |
Actual | | $ | 1,000.00 | | | $ | 1,014.40 | | | $ | 3.36 | |
Hypothetical* | | $ | 1,000.00 | | | $ | 1,021.60 | | | $ | 3.37 | |
| | | |
Limited Term Income Fund | | | | | | | | | | | | |
Class A Shares | | | | | | | | | | | | |
Actual | | $ | 1,000.00 | | | $ | 1,014.00 | | | $ | 4.36 | |
Hypothetical* | | $ | 1,000.00 | | | $ | 1,020.61 | | | $ | 4.37 | |
Class C Shares | | | | | | | | | | | | |
Actual | | $ | 1,000.00 | | | $ | 1,012.90 | | | $ | 5.48 | |
Hypothetical* | | $ | 1,000.00 | | | $ | 1,019.49 | | | $ | 5.49 | |
Class I Shares | | | | | | | | | | | | |
Actual | | $ | 1,000.00 | | | $ | 1,015.90 | | | $ | 2.56 | |
Hypothetical* | | $ | 1,000.00 | | | $ | 1,022.40 | | | $ | 2.56 | |
Class R3 Shares | | | | | | | | | | | | |
Actual | | $ | 1,000.00 | | | $ | 1,013.40 | | | $ | 4.97 | |
Hypothetical* | | $ | 1,000.00 | | | $ | 1,020.00 | | | $ | 4.99 | |
Class R4 Shares | | | | | | | | | | | | |
Actual | | $ | 1,000.00 | | | $ | 1,013.40 | | | $ | 4.97 | |
Hypothetical* | | $ | 1,000.00 | | | $ | 1,020.00 | | | $ | 4.99 | |
Class R5 Shares | | | | | | | | | | | | |
Actual | | $ | 1,000.00 | | | $ | 1,015.20 | | | $ | 3.20 | |
Hypothetical* | | $ | 1,000.00 | | | $ | 1,021.76 | | | $ | 3.21 | |
| † | Thornburg Limited Term U.S. Government Fund expenses are equal to the annualized expense ratio for each class (A: 0.92%; B: 2.11%; C: 1.20%; I: 0.62%; R3: 0.99% R4: 0.98% R5: 0.67%) multiplied by the average account value over the period, multiplied by 182/365 to reflect the one-half year period. |
| † | Thornburg Limited Term Income Fund expenses are equal to the annualized expense ratio for each class (A: 0.87%; C: 1.09%; I: 0.51%; R3: 0.99% R4: 0.99% R5: 0.64%) multiplied by the average account value over the period, multiplied by 182/365 to reflect the one-half year period. |
| * | Hypothetical assumes a rate of return of 5% per year before expenses. |
44 Semi-Annual Report
| | |
| OTHER INFORMATION | | |
| |
Thornburg Limited Term Income Funds | | March 31, 2015 (Unaudited) |
PORTFOLIO PROXY VOTING
Policies and Procedures:
The Trust has delegated to Thornburg Investment Management, Inc. (the “Advisor”) voting decisions respecting proxies for each of the Fund’s voting securities. The Advisor makes voting decisions in accordance with its Proxy Voting Policy. A description of the Policy is available (i) without charge, upon request, by calling the Advisor toll-free at 1-800-847-0200, (ii) on the Thornburg website at www. thornburg.com, and (iii) on the Securities and Exchange Commission’s website at www.sec.gov.
Information regarding how proxies were voted is available on or before August 31 of each year for the twelve months ending the preceding June 30. This information is available (i) without charge, upon request by calling the Advisor toll-free at 1-800-847-0200, (ii) on the Thornburg website at www.thornburg.com, and (iii) on the Securities and Exchange Commission’s website at www.sec.gov.
AVAILABILITY OF QUARTERLY PORTFOLIO SCHEDULE
The Funds file with the Securities and Exchange Commission schedules of their portfolio holdings on Form N-Q for the first and third quarters of each fiscal year. The Funds’ Forms N-Q are available on the Commission’s website at www.sec.gov, or may be reviewed and copied at the Commission’s Public Reference Room in Washington, D.C. Information on the operation of the Public Reference Room may be obtained by calling 1-800-SEC-0330. The Funds also make this information available on their website at www.thornburg. com/download or upon request by calling 1-800-847-0200.
Semi-Annual Report 45
TRUSTEES’ STATEMENT TO SHAREHOLDERS
Revised and Readopted September 15, 2014
The Trustees believe current and prospective shareholders should know how we discharge our responsibilities in supervising the Funds’ investment advisor and in reviewing the advisor’s contract for renewal. Since 2005, we have issued a statement which sets out clearly the three principal guidelines that we follow in supervising the Trust’s investment advisor on your behalf. In accordance with our customary practice, in September of 2014 we again reviewed our statement and concluded we should reissue this statement outlining the principal features of our supervision of the advisor’s performance of investment management services for the Funds.
We begin with the premise that each shareholder selected his or her Fund because its investments are managed by the investment advisor identified in the prospectus and in accordance with the objective and policies described in the prospectus. We realize, as each of you do, that if you believe that your Fund’s stated objective and policies no longer serve your personal investment goals, you can sell your shares and leave the Fund.
Therefore, we believe that our primary supervisory task—our principal obligation to you—is to assess the nature and quality of the advisor’s services, and to confirm that the advisor actively and competently pursues the Fund’s objective, in accordance with the policies set out in the prospectus. To do this, we meet regularly with management to review your Fund’s portfolio and to discuss the advisor’s specific actions and judgments in pursuing the Fund’s objective. We do not substitute our own judgment for the advisor’s decisions in selecting investments; the advisor is paid to exercise its informed judgment on investment decisions, and we seek to confirm, in reviewing the advisor’s performance, that the advisor is doing just that.
Second, we are conscious of costs and the effect that costs have on shareholders’ returns. We try to make sure that your Fund’s fees and costs are reasonable in relationship to the services rendered and that they are generally in line with those charged by other expert investment advisors, consistent with our belief that the Fund’s investors searched for and expect that expertise and attention and have decided to pay a reasonable price for it. We do not put the management contract “out to bid” as a matter of course, and we would not do so unless we had concluded that the advisor materially had failed to pursue the Fund’s objectives in accordance with its policies, or for other equally important reasons. We believe that any other approach would be inconsistent with your interests and contrary to your expectations when you bought shares of the Fund in the first place.
Finally, because we believe that most Thornburg Fund shareholders have invested with a long-term perspective, we try not to focus too much on the fashions of the moment and on short-term performance. The market will not favor any specific investment objective or set of policies at all times and under all economic circumstances. A fund will experience periods of both high and low returns relative to other funds and other investments. Even if one of our Funds is not favored by the market at a particular time, we believe that the advisor is nonetheless obliged to remain true to the Fund’s objective and policies, and we watch to see that it does so.
Trustees of Thornburg Investment Trust
46 Semi-Annual Report
THORNBURG FUND FAMILY
FUNDAMENTAL, BOTTOM-UP EQUITY RESEARCH
We search far and wide for the best stock ideas—within the United States and around the globe. Potential investments that may deserve a deeper look are thoroughly analyzed using both quantitative and qualitative criteria. But the vast majority are discarded. Those that ultimately make it into our highly-selective portfolios are continually monitored to determine whether our investment theses unfold as expected.
| | • | | Thornburg Core Growth Fund |
| | • | | Thornburg International Value Fund |
| | • | | Thornburg International Growth Fund |
| | • | | Thornburg Developing World Fund |
| | • | | Thornburg Investment Income Builder Fund |
| | • | | Thornburg Global Opportunities Fund |
A TRADITION OF DISCIPLINED BOND MANAGEMENT
At Thornburg, the word “disciplined” carries some substance. We don’t make a practice of using shortcuts to enhance yield or total returns. Every strategy is grounded in rigorous, bottom-up credit work. Portfolios are assembled carefully—in the case of our core bond funds, using laddered structures—to mitigate price fluctuation. Position sizes are controlled so that no single bond can have an outsized effect on a portfolio. And as with our equity portfolios, managers enjoy flexibility to seek an optimal risk/reward balance.
| | • | | Thornburg Low Duration Income Fund |
| | • | | Thornburg Limited Term U.S. Government Fund |
| | • | | Thornburg Limited Term Income Fund |
| | • | | Thornburg Strategic Income Fund |
| | • | | Thornburg Low Duration Municipal Fund |
| | • | | Thornburg Limited Term Municipal Fund |
| | • | | Thornburg Intermediate Municipal Fund |
| | • | | Thornburg California Limited Term Municipal Fund |
| | • | | Thornburg New Mexico Intermediate Municipal Fund |
| | • | | Thornburg New York Intermediate Municipal Fund |
| | • | | Thornburg Strategic Municipal Income Fund |
Before investing, carefully consider the Fund’s investment goals, risks, charges, and expenses. For a prospectus or summary prospectus containing this and other information, contact your financial advisor or visit thornburg.com. Read it carefully before investing.
For additional information, please visit thornburg.com
Thornburg Investment Management, Inc. 2300 North Ridgetop Road, Santa Fe, NM 87506
Semi-Annual Report 47

This Semi-Annual Report is submitted for the general information of shareholders of the Fund. It is not authorized for distribution to prospective investors in the Fund unless preceded or accompanied by an effective prospectus.
| | | | |
| Investment Advisor: | | Distributor: | | |
| Thornburg Investment Management® | | Thornburg Securities Corporation® | | |
| 800.847.0200 | | 800.847.0200 | | TH174 |
Thornburg Strategic Income Fund
Semi-Annual Report | March 31, 2015
FIRM OVERVIEW
THE FIRM
Thornburg Investment Management is a privately owned global investment firm that offers a range of solutions for retail and institutional investors. We are driven by our mission to help our clients reach their long-term financial goals through fundamental research and active portfolio management.
Founded in 1982 and headquartered in Santa Fe, New Mexico, we manage approximately $61 billion (as of March 31, 2015) across seven equity and 11 bond mutual funds, separate accounts for high-net-worth investors and institutional accounts, and five UCITS funds for non-U.S. investors.

CORE INVESTMENT PRINCIPLES
Our focus has always been on maintaining and building the investment expertise to manage Thornburg strategies to a high standard, while adhering to a core set of investment principles:
| | • | | We focus on the fundamentals. We invest according to our view of the fundamental value of an issuer only after performing thorough, bottom-up research. |
| | • | | We think and invest for the long term. We typically make investment decisions based upon an investment thesis we expect to play out over 18 months to several years. We may not always hold a security for several years, but our horizon line is typically a few years out. |
| | • | | We stay flexible. We go where we see value. Our investment mandates are generally broad and flexible, and we exercise as much flexibility as possible within any restrictions. |
| | • | | We collaborate across strategies. We are structured as global generalists. Portfolio managers and analysts do not specialize in sectors, geographies, or even security types, but instead must understand and communicate bottom-up fundamentals across industries, sectors, and borders. |
2 Semi-Annual Report
Semi-Annual Report
Thornburg Strategic Income Fund
March 31, 2015
| | | | |
Share Class | | NASDAQ Symbol | | CUSIP |
Class A | | TSIAX | | 885-215-228 |
Class C | | TSICX | | 885-215-210 |
Class I | | TSIIX | | 885-215-194 |
Class R3 | | TSIRX | | 885-216-887 |
Class R4 | | TSRIX | | 885-216-754 |
Class R5 | | TSRRX | | 885-216-879 |
Class I, R3, R4, and R5 shares may not be available to all investors. Minimum investments for Class I shares may be higher than those for other classes.
Investments in the Fund carry risks, including possible loss of principal. Bond funds have the same interest rate, inflation, and credit risks that are associated with the underlying bonds. The value of bonds will fluctuate relative to changes in interest rates, decreasing when interest rates rise. Unlike bonds, bond funds have ongoing fees and expenses. Funds invested in mortgage-backed securities may bear additional risk. Investments in lower-rated and unrated bonds may be more sensitive to default, downgrades, and market volatility; these investments may also be less liquid than higher-rated bonds. Investments in structured finance arrangements and other types of derivatives are subject to the risks associated with the securities or other assets underlying the pool of securities including illiquidity and difficulty in valuation. Investments in equity securities are subject to additional risks, such as greater market fluctuations. Additional risks may be associated with investments outside the United States, especially in emerging markets, including currency fluctuations, illiquidity, volatility, and political and economic risks. Please see the Fund’s prospectus for a discussion of the risks associated with an investment in the Fund. Investments in the Fund are not FDIC insured, nor are they deposits of or guaranteed by a bank or any other entity.
Semi-Annual Report 3
| | |
| LETTER TO SHAREHOLDERS | | |
| |
Thornburg Strategic Income Fund | | March 31, 2015 (Unaudited) |
April 15, 2015
Dear Fellow Shareholder:
We are pleased to present the semi-annual report for the Thornburg Strategic Income Fund for the six months ended March 31, 2015. The net asset value (NAV) of a Class A share of the Thornburg Strategic Income Fund decreased 48 cents in the period to $11.70. If you were invested for the entire period, you received dividends of 22.5 cents per share. If you reinvested your dividends, you received 22.7 cents per share. Dividends per share varied for other share classes to account for class-specific expenses.
Combining income and change in price, Class A shares of the Thornburg Strategic Income Fund produced a total return of negative 0.87% (without sales charge) over the six-month period. A blended index of 80% Barclays U.S. Aggregate Bond Index and 20% MSCI World Index produced a 3.47% total return over the same time period. The Barclays U.S. Universal Bond Index produced a return of 3.09%, while the Barclays U.S. Corporate High-Yield Index produced a 1.50% total return over the same time period. These indices reflect no deduction for fees, expenses, or taxes.
Market Impact
The six-month period ended March 31, 2015, was relatively eventful. While the Federal Reserve has officially ended its quantitative easing (QE) program, the European Central Bank (ECB) announced their foray into QE in mid January. Federal Reserve officials have signaled their belief that inflation and growth conditions will continue to move toward policy goals and that the risks of continued zero monetary policy rates could begin to outweigh the reward and have signaled their intention to begin the path toward a gradual normalization prior to the end of 2015. The potential divergence between monetary policies, along with global growth pressures more broadly caused the U.S. dollar to rally significantly over the time period in a flight to quality bid for U.S. assets. The U.S. dollar appreciated 18% relative to the euro over the six months ended March 31, 2015. A significant portion of the European sovereign bond complex moved into negative territory on the back of growth and deflation scares in addition to the prospect of significant asset purchases from the ECB. At the start of the six-month period, the German five-year Bund was yielding 0.15%—certainly not significant but a positive nominal return. As of March 31, 2015, that same security was yielding negative 0.10%, thus guaranteeing a loss for the privilege of loaning your money for five years to the German government. We have to question the state of the world when central banks deploy negative policy rates and bonds trade with negative yields.
While global central bank policies diverged, so too have returns on global assets. The high-quality portion of the U.S. markets performed well, with the Barclays Intermediate U.S. Aggregate Bond Index price return (portion of total return excluding income) up 1.27% over the period. Contrast this with the price return of the Barclays U.S. Corporate High Yield Index at negative 1.82%, while the total return (price appreciation plus interest income) was positive 1.50%. This highlights two very important points to keep in mind as we discuss the current environment for the Thornburg Strategic Income Fund and its relative performance. First, various asset classes often display significantly different performance trends and correlations. And second, income is often a very important driver of total return performance and more importantly a buffer to risk within a fixed income portfolio. Given the asymmetric returns in fixed income, an investor’s upside is most often capped at return of par plus the contractual interest across the holding period. However, the downside case can be complete capital loss. This means that in any rate and economic environment, an investor must always question if the all-in return potential is attractive enough compensation to bear the risk of principal impairment.
Since the Fund’s inception in late 2007, we have been navigating an environment of high volatility in global financial markets. We believe that our global generalist approach to investing is the best approach to allow the team to navigate the turbulent and changing market environments while meeting the goals of the Fund: a high level of current income and some long-term capital appreciation. Additionally, every decision we make as portfolio managers exists within the context of balancing risk and reward. The previous six months has been a challenging environment for this Fund on a short-term basis. Given the decline in oil prices, a few names exposed to the sector within the portfolio were significantly challenged. Additionally, any non-U.S. dollar position was hurt amidst the significant decline of most every other major global currency relative to the U.S. dollar. Both direct and indirect exposure to the oil sector and non-U.S. dollar positions were limited portions of the portfolio, but large moves in small portions of the portfolio can and did create significant price impact at the portfolio level. However, the unconstrained nature of the Thornburg Strategic Income Fund along with an opportunistic approach to sourcing investments has meant that the current volatility has presented opportunities to find attractive investments at now lower prices. These opportunities are at the company level, and not across the universe as a whole. We will admit that timing can be difficult, but across market cycles we continue to believe the Thornburg Strategic Income Fund is well positioned to benefit from the recent volatility.
4 Semi-Annual Report
| | |
LETTER TO SHAREHOLDERS, CONTINUED | | |
| |
Thornburg Strategic Income Fund | | March 31, 2015 (Unaudited) |
A Cautious Outlook
As we look forward we are cautious about the eventual normalization of Federal Reserve monetary policy and the impact this may have on longer-term rates, credit spreads and markets more broadly. Federal Reserve officials have conveyed to the market that the unwind in rates is likely to be gradual and take place over a medium-term time horizon. Additionally, while the Federal Reserve remains ‘data dependent,’ the intention of their first rate hike has already been communicated to markets. For these two reasons we are hopeful that the normalization of rates will cause minimal market disruption. However, as stewards of your capital, we have felt it prudent to take the necessary precautions at the portfolio level to prepare for a potentially more volatile period ahead.
As we have said in the past, when we believe fixed income investors are well compensated to assume additional risk, we will position each portfolio to seek additional return. However, in times like this where term premiums in rates are low, credit spreads across sectors remain low relative to history, and the all-in compensation (yield) for holding any given risk remains subdued, we employ the opposite strategy: seeking to pare back risk. This has meant a continued move to lower the Fund’s exposure to potentially rising rates. Additionally, this has meant a continued move up in quality, both in terms of credit and liquidity. The Thornburg Strategic Income Fund now holds a higher cash and cash equivalent balance, which we view as both defensive and opportunistic. Historically, this higher cash balance has allowed us to deploy capital in periods of rising volatility to acquire quality assets where we believe the risk/reward trade-off is skewed in our favor.
With an expected start to normalization of Federal Reserve policy, an eventual rise in the yield curve, and global imbalances exerting pressure on economies worldwide, we do not expect significant price increases in high-quality fixed income. Additionally, it is likely that investors should be ready for an elevated level of volatility across many asset classes. And while we have taken many measures to help shield investors from this volatility, the Fund is likely to be affected as these events develop. However, for investors willing to take a medium-term view, these periods of increased volatility combined with Thornburg’s global generalist approach and the relatively unconstrained mandate of the Thornburg Strategic Income Fund should give us a more attractive opportunity set going forward. Nevertheless, we believe your Fund is well positioned to achieve its longer-term goals of a high current level of income and some long-term capital appreciation.
Sincerely,
| | | | |

Jason H. Brady,CFA Portfolio Manager Managing Director | | 
Lon R. Erickson,CFA Portfolio Manager Managing Director | | 
Jeff Klingelhofer,CFA Portfolio Manager Managing Director |
The matters discussed in this report may constitute forward-looking statements made pursuant to the safe harbor provisions of the Securities Litigation Reform Act of 1995. These include any advisor or portfolio manager prediction, assessment, analysis or outlook for individual securities, industries, investment styles, market sectors and/or markets. These statements involve risks and uncertainties. In addition to the general risks described for each fund in its current prospectus, other factors bearing on these reports include the accuracy of the advisor’s or portfolio manager’s forecasts and predictions, the appropriateness of the investment strategies designed by the advisor or portfolio manager and the ability of the advisor or portfolio manager to implement their strategies efficiently and successfully. Any one or more of these factors, as well as other risks affecting the securities markets generally, could cause the actual results of any fund to differ materially as compared to its benchmarks.
The views expressed by the portfolio managers reflect their professional opinions and are subject to change. Under no circumstances does the information contained within represent a recommendation to buy or sell any security.
Semi-Annual Report 5
| | |
| PERFORMANCE SUMMARY | | |
| |
Thornburg Strategic Income Fund | | March 31, 2015 (Unaudited) |
Average Annual Total Returns
| | | | | | | | | | | | | | | | |
| | | 1-Yr | | | 3-Yr | | | 5-Yr | | | Since
Incep. | |
Class A Shares (Incep: 12/19/07) | | | | | | | | | | | | | | | | |
Without sales charge | | | 1.33 | % | | | 5.69 | % | | | 7.01 | % | | | 7.23 | % |
With sales charge | | | -3.21 | % | | | 4.07 | % | | | 6.02 | % | | | 6.56 | % |
Class C Shares (Incep: 12/19/07) | | | | | | | | | | | | | | | | |
Without sales charge | | | 0.74 | % | | | 5.13 | % | | | 6.42 | % | | | 6.63 | % |
With sales charge | | | -0.23 | % | | | 5.13 | % | | | 6.42 | % | | | 6.63 | % |
Class I Shares (Incep: 12/19/07) | | | 1.66 | % | | | 6.06 | % | | | 7.35 | % | | | 7.56 | % |
Class R3 Shares (Incep: 5/1/12) | | | 1.12 | % | | | — | | | | — | | | | 5.54 | % |
Class R4 Shares (Incep: 2/1/14) | | | 1.29 | % | | | — | | | | — | | | | 2.90 | % |
Class R5 Shares (Incep: 5/1/12) | | | 1.55 | % | | | — | | | | — | | | | 5.85 | % |
Barclays U.S. Universal Index (Since 12/19/07) | | | 5.32 | % | | | 3.49 | % | | | 4.75 | % | | | 5.09 | % |
Blended Index (Since 12/19/07) | | | 5.85 | % | | | 4.97 | % | | | 5.70 | % | | | 4.93 | % |
Performance data shown represents past performance and is no guarantee of future results. Investment return and principal value will fluctuate so shares, when redeemed, may be worth more or less than their original cost. Current performance may be lower or higher than quoted. For performance current to the most recent month end, visit thornburg.com or call 800-847-0200. The performance information does not reflect the deduction of taxes that a shareholder would pay on distributions or the redemption of Fund shares. Returns reflect the reinvestment of dividends and capital gains. Class A shares are sold with a maximum sales charge of 4.50%. Class C shares are subject to a 1% CDSC for the first year only. There is no sales charge for Class I, R3, R4, and R5 shares.
Growth of A Hypothetical $10,000 Investment
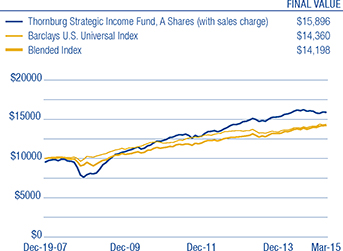
30-Day Yields, A Shares
(with sales charge)
| | | | |
SEC Yield | | | 5.57 | % |
| |
Annualized Distribution Yield | | | 3.79 | % |
As disclosed in the most recent prospectus, the total annual fund operating expenses are as follows: A shares, 1.22%; C shares, 1.98%; I shares, 0.90%; R3 shares, 3.10%; R4 shares, 1.50%; R5 shares, 2.11%. Thornburg Investment Management and/or Thornburg Securities Corporation have contractually agreed to waive fees and reimburse expenses through at least February 1, 2016, for some of the share classes, resulting in net expense ratios of the following: C shares, 1.80%; R3 shares, 1.25%; R4 shares, 1.25%; R5 shares, 0.99%. For more detailed information on fund expenses and waivers/reimbursements please see the Fund’s prospectus.
Glossary
Barclays Intermediate U.S. Aggregate Bond Index – This index measures the investment grade, U.S. dollar-denominated, fixed-rate taxable bond market with maturities between one and ten years. The index includes Treasuries, government-related and corporate securities, MBS (agency fixed-rate and hybrid ARM pass-throughs), ABS and CMBS (agency and non-agency).
Barclays U.S. Aggregate Bond Index – This index is composed of approximately 8,000 publicly traded bonds including U.S. government, mortgage-backed, corporate and Yankee bonds. The index is weighted by the market value of the bonds included in the index.
Barclays U.S. Corporate High-Yield Index – This index measures the market of USD-denominated, non-investment grade, fixed-rate, taxable corporate bonds. Securities are classified as high yield if the middle rating of Moody’s, Fitch, and S&P is Ba1/BB+/BB+ or below. The index excludes emerging market debt.
Barclays U.S. Universal Bond Index – This index represents the union of the U.S. Aggregate Index, U.S. Corporate High-Yield, Investment Grade 144A Index, Eurodollar Index, U.S. Emerging Markets Index, and the non-ERISA eligible portion of the CMBS Index. The index covers USD denominated, taxable bonds that are rated either investment-grade or below investment-grade.
Blended Index – Thornburg Strategic Income Fund’s Blended Index is composed of 80% Barclays U.S. Aggregate Bond Index and 20% MSCI World Index, rebalanced monthly.
MSCI World Index – This index is an unmanaged market-weighted index that consists of securities traded in 23 of the world’s most developed countries. Securities are listed on exchanges in the U.S., Europe, Canada, Australia, New Zealand, and the Far East. The index is calculated with net dividends reinvested, in U.S. dollars.
Unless otherwise noted, index returns reflect the reinvestment of income dividends and capital gains, if any, but do not reflect fees, brokerage commissions or other expenses of investing. Investors may not make direct investments into any index. The performance of any index is not indicative of the performance of any particular investment.
Annualized Distribution Yield – The distribution yield reflects actual distributions made to shareholders. The Annualized distribution yield is calculated by summing the last 30 days of income at a given month end and annualizing to a 360-day year. The result is divided by the ending maximum offering price or net asset value.
Credit Spread/Quality Spread – The difference between the yields of securities with different credit qualities.
Quantitative Easing (QE) – An unconventional monetary policy in which a central bank purchases financial assets from the market in order to lower interest rates and increase the money supply.
SEC Yield – SEC Yield is computed in accordance with SEC standards measuring the net investment income per share over a specified 30-day period expressed as a percentage of the maximum offering price of the Fund’s shares at the end of the period.
Term Premium – The excess yield that investors require to commit to holding a long-term bond instead of a series of shorter-term bonds.
Yield Curve – A line that plots the interest rates, at a set point in time, of bonds having equal credit quality, but differing maturity dates.
6 Semi-Annual Report
| | |
| FUND SUMMARY | | |
| |
Thornburg Strategic Income Fund | | March 31, 2015 (Unaudited) |
Objectives and Strategies
The Fund’s primary investment goal is to seek a high level of current income. The Fund’s secondary investment goal is some long-term capital appreciation.
The Fund pursues its investment goals by investing in a broad range of income producing investments from throughout the world, primarily including debt obligations and income producing stocks. The Fund expects, under normal conditions, to invest a majority of its assets in debt obligations, but the relative proportions of the Fund’s investments in debt obligations and in income producing stocks can be expected to vary over time.
Portfolio Composition
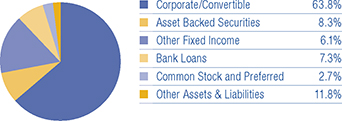
Fixed Income Credit Quality*
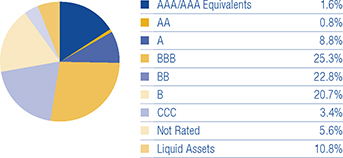
| * | Excludes equity securities. |
A bond credit rating assesses the financial ability of a debt issuer to make timely payments of principal and interest. Ratings of AAA (the highest), AA, A, and BBB are investment-grade quality. Ratings of BB, B, CCC, CC, C and D (the lowest) are considered below investment grade, speculative grade, or junk bonds. We have used ratings from Moody’s Investors Service. Where Moody’s ratings are not available, we have used Standard & Poor’s ratings. Where neither rating is available, we have used ratings from other rating agencies.
Top Ten Industry Groups
| | | | |
Energy | | | 10.0 | % |
Diversified Financials | | | 8.5 | % |
Materials | | | 6.2 | % |
Capital Goods | | | 5.9 | % |
Telecommunication Services | | | 5.2 | % |
Commercial & Professional Services | | | 3.7 | % |
Banks | | | 3.5 | % |
Food, Beverage & Tobacco | | | 3.2 | % |
Retail | | | 3.1 | % |
Transportation | | | 3.0 | % |
Country Exposure**
| | | | |
United States | | | 58.7 | % |
Mexico | | | 3.4 | % |
Brazil | | | 3.0 | % |
Canada | | | 2.3 | % |
United Kingdom | | | 2.2 | % |
Netherlands | | | 2.2 | % |
Australia | | | 1.7 | % |
Cayman Islands | | | 1.6 | % |
Ireland | | | 1.2 | % |
Russia | | | 1.2 | % |
Spain | | | 1.1 | % |
Sweden | | | 1.0 | % |
Luxembourg | | | 0.8 | % |
Israel | | | 0.6 | % |
Czech Republic | | | 0.6 | % |
Aruba | | | 0.6 | % |
New Zealand | | | 0.6 | % |
France | | | 0.5 | % |
South Korea | | | 0.4 | % |
South Africa | | | 0.4 | % |
Japan | | | 0.4 | % |
Romania | | | 0.3 | % |
Barbados | | | 0.3 | % |
Jamaica | | | 0.3 | % |
Switzerland | | | 0.3 | % |
Mauritus | | | 0.3 | % |
Chile | | | 0.3 | % |
Nigeria | | | 0.3 | % |
Norway | | | 0.3 | % |
Germany | | | 0.3 | % |
Italy | | | 0.2 | % |
Panama | | | 0.2 | % |
Argentina | | | 0.2 | % |
Indonesia | | | 0.1 | % |
Hong Kong | | | 0.1 | % |
Other Assets & Liabilities | | | 11.8 | % |
| ** | The country assignment of each holding is determined by the Fund’s Advisor based on various factors, including the location of the issuer’s head office, the issuer’s jurisdiction of incorporation and the country from which a majority of the issuer’s revenue is derived. |
There is no guarantee that the Fund will meet its investment objectives.
All portfolio information is subject to change. Charts may not add up to 100% due to rounding.
Semi-Annual Report 7
| | |
| SCHEDULE OF INVESTMENTS | | |
| |
Thornburg Strategic Income Fund | | March 31, 2015 (Unaudited) |
| | | | | | | | |
| | | Shares/
Principal Amount | | | Value | |
COMMON STOCK — 1.23% | | | | | | | | |
ENERGY — 0.67% | | | | | | | | |
Oil, Gas & Consumable Fuels — 0.67% | | | | | | | | |
Eni S.p.A. | | | 147,400 | | | $ | 2,556,474 | |
a,b Halcon Resources Corp. | | | 45,314 | | | | 69,784 | |
Linn Co., LLC | | | 167,800 | | | | 1,605,846 | |
c ROMGAZ SA-GDR | | | 531,954 | | | | 4,601,402 | |
a,b TPT Acquisition, Inc. | | | 20,480 | | | | 0 | |
| | | | | | | | |
| | | | | | | 8,833,506 | |
| | | | | | | | |
MATERIALS — 0.00% | | | | | | | | |
Metals & Mining — 0.00% | | | | | | | | |
b Jaguar Mining, Inc. | | | 144,927 | | | | 34,783 | |
| | | | | | | | |
| | | | | | | 34,783 | |
| | | | | | | | |
REAL ESTATE — 0.40% | | | | | | | | |
Real Estate Investment Trusts — 0.40% | | | | | | | | |
Annaly Capital Management, Inc. | | | 212,700 | | | | 2,212,080 | |
Capstead Mortgage Corp. | | | 259,027 | | | | 3,048,748 | |
| | | | | | | | |
| | | | | | | 5,260,828 | |
| | | | | | | | |
RETAILING — 0.16% | | | | | | | | |
Internet & Catalog Retail — 0.16% | | | | | | | | |
Trade Me Ltd. | | | 748,335 | | | | 2,074,688 | |
| | | | | | | | |
| | | | | | | 2,074,688 | |
| | | | | | | | |
TOTAL COMMON STOCK (Cost $26,164,123) | | | | | | | 16,203,805 | |
| | | | | | | | |
| | |
PREFERRED STOCK — 1.48% | | | | | | | | |
BANKS — 0.31% | | | | | | | | |
Banks — 0.31% | | | | | | | | |
First Niagara Financial Group Pfd, 8.625% | | | 17,732 | | | | 488,339 | |
GMAC Capital Trust I Pfd, 8.125% | | | 140,000 | | | | 3,675,000 | |
| | | | | | | | |
| | | | | | | 4,163,339 | |
| | | | | | | | |
ENERGY — 0.10% | | | | | | | | |
Oil, Gas & Consumable Fuels — 0.10% | | | | | | | | |
Halcon Resources Corp. Pfd, 5.75% | | | 4,441 | | | | 1,332,300 | |
| | | | | | | | |
| | | | | | | 1,332,300 | |
| | | | | | | | |
MISCELLANEOUS — 0.80% | | | | | | | | |
U.S. Government Agencies — 0.80% | | | | | | | | |
Farm Credit Bank of Texas Pfd, 10.00% | | | 1,000 | | | | 1,247,188 | |
c Cobank, ACB Pfd, 6.25% | | | 50,000 | | | | 5,111,000 | |
c AgriBank, FCB Pfd, 6.875% | | | 40,000 | | | | 4,160,000 | |
| | | | | | | | |
| | | | | | | 10,518,188 | |
| | | | | | | | |
REAL ESTATE — 0.05% | | | | | | | | |
Real Estate Investment Trusts — 0.05% | | | | | | | | |
American Realty Capital Properties, Inc. Pfd, 6.70% | | | 25,857 | | | | 610,225 | |
| | | | | | | | |
| | | | | | | 610,225 | |
| | | | | | | | |
TELECOMMUNICATION SERVICES — 0.22% | | | | | | | | |
Wireless Telecommunication Services — 0.22% | | | | | | | | |
c Centaur Funding Corp. Pfd, 9.08% | | | 2,330 | | | | 2,893,569 | |
| | | | | | | | |
| | | | | | | 2,893,569 | |
| | | | | | | | |
TOTAL PREFERRED STOCK (Cost $21,098,556) | | | | | | | 19,517,621 | |
| | | | | | | | |
| | |
ASSET BACKED SECURITIES — 8.28% | | | | | | | | |
COMMERCIAL MTG TRUST — 1.25% | | | | | | | | |
a,c Capital Automotive REIT, Series 2012-1A Class A, 4.70%, 7/15/2042 | | $ | 2,882,081 | | | | 2,977,190 | |
Citigroup Commercial Mtg Trust, Series 2004-HYB2 Class B1, 2.641%, 3/25/2034 | | | 130,695 | | | | 106,509 | |
c CVS Pass-Through Trust, 9.35%, 1/10/2023 | | | 4,605,000 | | | | 5,559,851 | |
c FREMF Mtg Trust, Series 2012-KF01 Class B Floating Rate Note, 2.771%, 10/25/2044 | | | 2,000,000 | | | | 2,022,055 | |
c FREMF Mtg Trust, Series 2013-KF02 Class B Floating Rate Note, 2.833%, 12/25/2045 | | | 1,738,331 | | | | 1,770,708 | |
c JPMorgan Chase Commercial Mtg Trust, Series 2013-JWRZ Class D Floating Rate Note, 3.165%, 4/15/2030 | | | 4,000,000 | | | | 4,000,364 | |
| | | | | | | | |
| | | | | | | 16,436,677 | |
| | | | | | | | |
8 Semi-Annual Report
| | |
| SCHEDULE OF INVESTMENTS, CONTINUED | | |
| |
Thornburg Strategic Income Fund | | March 31, 2015 (Unaudited) |
| | | | | | | | |
| | | Shares/
Principal Amount | | | Value | |
OTHER ASSET BACKED — 4.48% | | | | | | | | |
a,c Aircraft Certificate Owner Trust, Series 2003-1A Class E, 7.001%, 9/20/2022 | | $ | 4,433,859 | | | $ | 4,744,230 | |
c American Credit Acceptance, Series 2014-2 Class B, 2.26%, 3/10/2020 | | | 6,850,000 | | | | 6,862,425 | |
c CLI Funding, LLC, Series 2014-1A Class A, 3.29%, 6/18/2029 | | | 4,526,818 | | | | 4,565,082 | |
a,c Concord Funding Co., LLC, Series 2012-2 Class B, 4.145%, 1/15/2017 | | | 4,000,000 | | | | 4,028,000 | |
c Dominos Pizza Master Issuer, LLC, Series 2012-1A Class A2, 5.216%, 1/25/2042 | | | 9,710,813 | | | | 10,165,020 | |
c Fairway Outdoor Funding, LLC, Series 2012-1 Class B, 8.835%, 10/15/2042 | | | 3,000,000 | | | | 3,186,137 | |
c,d Global SC Finance SRL, Series 2014-1A Class A1, 3.19%, 7/17/2029 | | | 4,433,333 | | | | 4,446,275 | |
c JPR Royalty, LLC, 14.00%, 9/1/2020 | | | 2,000,000 | | | | 1,000,000 | |
a,c Northwind Holdings, LLC, Series 2007-1A Class A1 Floating Rate Note, 1.014%, 12/1/2037 | | | 923,234 | | | | 856,299 | |
a,c Progreso Receivables Funding LLC, Series 2015-A Class A, 3.625%, 2/8/2020 | | | 10,025,000 | | | | 10,025,000 | |
c SolarCity LMC, LLC, Series 2013-1 Class A, 4.80%, 11/20/2038 | | | 3,412,036 | | | | 3,620,487 | |
c SolarCity LMC, LLC, Series 2014-1 Class A, 4.59%, 4/20/2044 | | | 3,382,385 | | | | 3,551,457 | |
c,d Trafigura Securitisation Finance plc, Series 2012-1A Class B, 4.175%, 10/15/2015 | | | 2,000,000 | | | | 2,000,575 | |
| | | | | | | | |
| | | | | | | 59,050,987 | |
| | | | | | | | |
RESIDENTIAL MTG TRUST — 2.26% | | | | | | | | |
Banc of America Funding Corp., Series 2006-I Class SB1, 2.26%, 12/20/2036 | | | 817,196 | | | | 290,104 | |
Bear Stearns ARM Mtg, Series 2003-6 Class 2B-1, 2.586%, 8/25/2033 | | | 281,162 | | | | 279,159 | |
c CIT Mtg Loan Trust, Series 2007-1 Class 2A2, 1.424%, 10/25/2037 | | | 501,597 | | | | 500,933 | |
c Citigroup Mtg Loan Trust, Inc., Series 2014-A Class A, 4.00%, 1/25/2035 | | | 5,402,956 | | | | 5,580,747 | |
Countrywide, Series 2005-11 Class AF3, 4.778%, 2/25/2036 | | | 572,534 | | | | 579,474 | |
c CS First Boston Mtg Securities Co., Series 2005-CF1 Class M1, 0.871%, 3/25/2045 | | | 1,751,819 | | | | 1,659,063 | |
FBR Securitization Trust, Series 2005-2 Class M1, 0.891%, 9/25/2035 | | | 2,868,726 | | | | 2,844,600 | |
JPMorgan Mtg Acquisition Corp., Series 2006-CH1 Class A4, 0.311%, 7/25/2036 | | | 833,853 | | | | 821,861 | |
Merrill Lynch Mtg Investors Trust, Series 2004-A4 Class M1, 2.463%, 8/25/2034 | | | 288,848 | | | | 265,493 | |
Morgan Stanley Capital, Inc., Series 2005-HE7 Class A2C, 0.491%, 11/25/2035 | | | 955,325 | | | | 939,488 | |
New Century Home Equity Loan Trust, Series 2005-2 Class M1, 0.604%, 6/25/2035 | | | 1,609,660 | | | | 1,586,948 | |
Park Place Securities, Inc., Series 2004-MHQ1 Class M2, 1.299%, 12/25/2034 | | | 2,001,847 | | | | 1,998,750 | |
Residential Asset Securities Corp., Series 2006-KS4 Class A3, 0.324%, 6/25/2036 | | | 215,478 | | | | 214,916 | |
a,c SHAP, Series 2013-RM1 Class A, 4.00%, 5/26/2053 | | | 3,464,728 | | | | 3,433,546 | |
Structured Asset Securities Corp., Series 2004-20 Class 7A1, 5.25%, 11/25/2034 | | | 873,879 | | | | 890,369 | |
c TAL Advantage, LLC, Series 2014-1A Class A, 3.51%, 2/22/2039 | | | 7,802,083 | | | | 7,927,404 | |
Wells Fargo Asset Securities Corp., Series 2005-AR1 Class 1B1, 2.622%, 2/25/2035 | | | 211,968 | | | | 74,704 | |
| | | | | | | | |
| | | | | | | 29,887,559 | |
| | | | | | | | |
STUDENT LOAN — 0.29% | | | | | | | | |
Access Group, Inc., Series 2005-A Class A3, 0.656%, 7/25/2034 | | | 4,000,000 | | | | 3,816,586 | |
| | | | | | | | |
| | | | | | | 3,816,586 | |
| | | | | | | | |
TOTAL ASSET BACKED SECURITIES (Cost $106,770,472) | | | | | | | 109,191,809 | |
| | | | | | | | |
| | |
CORPORATE BONDS — 60.74% | | | | | | | | |
AUTOMOBILES & COMPONENTS — 0.13% | | | | | | | | |
Auto Components — 0.13% | | | | | | | | |
c,d Nexteer Automotive Group Ltd., 5.875%, 11/15/2021 | | | 1,700,000 | | | | 1,742,500 | |
| | | | | | | | |
| | | | | | | 1,742,500 | |
| | | | | | | | |
BANKS — 3.17% | | | | | | | | |
Banks — 3.17% | | | | | | | | |
c Banco Santander Brasil S.A. (BRL), 8.00%, 3/18/2016 | | | 5,300,000 | | | | 1,560,997 | |
c,d Banco Santander Chile Floating Rate Note, 2.139%, 6/7/2018 | | | 4,000,000 | | | | 4,072,000 | |
Bank of America Corp., 4.20%, 8/26/2024 | | | 3,200,000 | | | | 3,310,611 | |
c,d Caixa Economica Federal, 4.50%, 10/3/2018 | | | 6,475,000 | | | | 6,352,622 | |
DEPFA Bank plc (EUR), 0.782%, 12/15/2015 | | | 5,800,000 | | | | 6,080,541 | |
b,c,d,e Islandsbanki, 4.41%, 10/15/2008 | | | 60,000 | | | | 16,800 | |
c,d Mizuho Financial Group, 4.60%, 3/27/2024 | | | 5,000,000 | | | | 5,368,930 | |
National City Bank Floating Rate Note, 0.634%, 6/7/2017 | | | 1,000,000 | | | | 995,108 | |
d Royal Bank of Scotland Group plc, 6.125%, 12/15/2022 | | | 2,000,000 | | | | 2,252,192 | |
d Royal Bank of Scotland Group plc, 9.50%, 3/16/2022 | | | 2,000,000 | | | | 2,255,592 | |
c,d Sberbank of Russia, 5.50%, 2/26/2024 | | | 7,200,000 | | | | 5,531,400 | |
c,d Zenith Bank plc, 6.25%, 4/22/2019 | | | 4,400,000 | | | | 4,026,000 | |
| | | | | | | | |
| | | | | | | 41,822,793 | |
| | | | | | | | |
CAPITAL GOODS — 5.87% | | | | | | | | |
Construction & Engineering — 2.66% | | | | | | | | |
c,d Abengoa Finance, S.A.U., 7.75%, 2/1/2020 | | | 2,696,000 | | | | 2,588,160 | |
c,d Abengoa Greenfield, S.A., 6.50%, 10/1/2019 | | | 6,400,000 | | | | 5,888,000 | |
c AECOM Technology Corp., 5.875%, 10/15/2024 | | | 4,835,000 | | | | 5,076,750 | |
c,d Ausdrill Finance Property Ltd., 6.875%, 11/1/2019 | | | 6,750,000 | | | | 5,096,250 | |
Semi-Annual Report 9
| | |
| SCHEDULE OF INVESTMENTS, CONTINUED | | |
| |
Thornburg Strategic Income Fund | | March 31, 2015 (Unaudited) |
| | | | | | | | |
| | | Shares/
Principal Amount | | | Value | |
URS Corp., 3.85%, 4/1/2017 | | $ | 11,190,000 | | | $ | 11,036,137 | |
c Zachry Holdings, Inc., 7.50%, 2/1/2020 | | | 5,725,000 | | | | 5,438,750 | |
Industrial Conglomerates — 0.34% | | | | | | | | |
Otter Tail Corp., 9.00%, 12/15/2016 | | | 4,000,000 | | | | 4,478,588 | |
Machinery — 0.06% | | | | | | | | |
c Waterjet Holdings, Inc., 7.625%, 2/1/2020 | | | 750,000 | | | | 789,375 | |
Trading Companies & Distributors — 2.81% | | | | | | | | |
c Aviation Capital Group Corp., 6.75%, 4/6/2021 | | | 11,500,000 | | | | 13,087,472 | |
c Aviation Capital Group Corp., 7.125%, 10/15/2020 | | | 1,881,000 | | | | 2,183,935 | |
d Fly Leasing Ltd., 6.75%, 12/15/2020 | | | 7,500,000 | | | | 7,659,375 | |
c International Lease Finance Corp., 7.125%, 9/1/2018 | | | 8,000,000 | | | | 8,980,000 | |
c Wajax Corp. (CAD), 6.125%, 10/23/2020 | | | 6,510,000 | | | | 5,140,975 | |
| | | | | | | | |
| | | | | | | 77,443,767 | |
| | | | | | | | |
COMMERCIAL & PROFESSIONAL SERVICES — 2.62% | | | | | | | | |
Commercial Services & Supplies — 1.98% | | | | | | | | |
ADT Corp., 5.25%, 3/15/2020 | | | 8,155,000 | | | | 8,440,425 | |
c GFL Environmental Corp. (CAD), 7.50%, 6/18/2018 | | | 5,460,000 | | | | 4,192,589 | |
Iron Mountain, Inc., 6.00%, 8/15/2023 | | | 3,000,000 | | | | 3,157,500 | |
c Multi-Color Corp., 6.125%, 12/1/2022 | | | 1,635,000 | | | | 1,700,400 | |
RR Donnelley & Sons Co., 7.875%, 3/15/2021 | | | 3,000,000 | | | | 3,432,000 | |
RR Donnelley & Sons Co., 8.875%, 4/15/2021 | | | 4,500,000 | | | | 5,152,500 | |
Professional Services — 0.64% | | | | | | | | |
c IHS, Inc., 5.00%, 11/1/2022 | | | 1,220,000 | | | | 1,225,368 | |
c Nielsen Finance, LLC, 5.00%, 4/15/2022 | | | 7,200,000 | | | | 7,245,000 | |
| | | | | | | | |
| | | | | | | 34,545,782 | |
| | | | | | | | |
COMMERCIAL SERVICES & SUPPLIES — 0.31% | | | | | | | | |
Diversified Support Services — 0.31% | | | | | | | | |
a Lavare Holding AB (SEK), 5.264%, 4/4/2019 | | | 35,000,000 | | | | 4,043,706 | |
| | | | | | | | |
| | | | | | | 4,043,706 | |
| | | | | | | | |
CONSUMER SERVICES — 1.83% | | | | | | | | |
Hotels, Restaurants & Leisure — 1.83% | | | | | | | | |
Aramark Services, Inc., 5.75%, 3/15/2020 | | | 8,720,000 | | | | 9,112,400 | |
c,d Arcos Dorados Holdings, Inc., 6.625%, 9/27/2023 | | | 9,000,000 | | | | 8,550,000 | |
c Arcos Dorados Holdings, Inc. (BRL), 10.25%, 7/13/2016 | | | 8,000,000 | | | | 2,255,957 | |
c Nathan’s Famous, Inc., 10.00%, 3/15/2020 | | | 4,000,000 | | | | 4,200,000 | |
| | | | | | | | |
| | | | | | | 24,118,357 | |
| | | | | | | | |
DIVERSIFIED FINANCIALS — 6.37% | | | | | | | | |
Capital Markets — 2.84% | | | | | | | | |
Ares Capital Corp., 4.875%, 11/30/2018 | | | 7,000,000 | | | | 7,359,121 | |
c Ares Finance Co., LLC, 4.00%, 10/8/2024 | | | 4,025,000 | | | | 3,959,083 | |
c,d BTG Investments LP, 4.50%, 4/17/2018 | | | 5,000,000 | | | | 4,612,500 | |
FS Investment Corp., 4.00%, 7/15/2019 | | | 6,286,000 | | | | 6,386,840 | |
Goldman Sachs Group, Inc. Floating Rate Note, 1.277%, 10/23/2019 | | | 11,760,000 | | | | 11,858,713 | |
Merrill Lynch & Co., 0.805%, 5/2/2017 | | | 2,500,000 | | | | 2,479,475 | |
Oppenheimer Holdings, Inc., 8.75%, 4/15/2018 | | | 775,000 | | | | 812,975 | |
Consumer Finance — 1.60% | | | | | | | | |
Ally Financial, Inc., 4.75%, 9/10/2018 | | | 4,000,000 | | | | 4,115,000 | |
Capital One Bank (USA), N.A., 2.95%, 7/23/2021 | | | 3,800,000 | | | | 3,854,309 | |
c,e Cash Store Financial (CAD), 0%, 1/31/2017 | | | 1,700,000 | | | | 265,426 | |
First Cash Financial Services, Inc., 6.75%, 4/1/2021 | | | 9,300,000 | | | | 9,579,000 | |
c Lowell Group Financing plc (GBP), 10.75%, 4/1/2019 | | | 2,000,000 | | | | 3,218,978 | |
Diversified Financial Services — 1.93% | | | | | | | | |
c,d CFG Holdings Ltd./CFG Finance, LLC, 11.50%, 11/15/2019 | | | 7,000,000 | | | | 7,052,500 | |
c Citicorp, 8.04%, 12/15/2019 | | | 250,000 | | | | 306,889 | |
JPMorgan Chase & Co., 6.75%, 1/29/2049 | | | 7,500,000 | | | | 8,137,500 | |
KFW (BRL), 5.375%, 9/14/2015 | | | 12,000,000 | | | | 3,653,673 | |
c MSCI, Inc., 5.25%, 11/15/2024 | | | 1,625,000 | | | | 1,679,844 | |
c TMX Finance, LLC/Titlemax Finance, 8.50%, 9/15/2018 | | | 6,550,000 | | | | 4,650,500 | |
| | | | | | | | |
| | | | | | | 83,982,326 | |
| | | | | | | | |
ENERGY — 9.09% | | | | | | | | |
Energy Equipment & Services — 1.64% | | | | | | | | |
c,d Anton Oilfield Services Group, 7.50%, 11/6/2018 | | | 7,000,000 | | | | 4,385,500 | |
c Compressco Partners, L.P., 7.25%, 8/15/2022 | | | 4,800,000 | | | | 4,176,000 | |
10 Semi-Annual Report
| | |
| SCHEDULE OF INVESTMENTS, CONTINUED | | |
| |
Thornburg Strategic Income Fund | | March 31, 2015 (Unaudited) |
| | | | | | | | |
| | | Shares/
Principal Amount | | | Value | |
c Helmerich & Payne International Drilling Co., 4.65%, 3/15/2025 | | $ | 2,405,000 | | | $ | 2,490,652 | |
Oceaneering International, Inc., 4.65%, 11/15/2024 | | | 4,075,000 | | | | 4,119,967 | |
c,d Schahin II Finance Co. (SPV) Ltd., 5.875%, 9/25/2023 | | | 10,684,600 | | | | 6,458,841 | |
Oil, Gas & Consumable Fuels — 7.45% | | | | | | | | |
Atlas Energy Holdings Operating Co., LLC, 7.75%, 1/15/2021 | | | 3,000,000 | | | | 2,040,000 | |
c Citgo Petroleum Corp., 6.25%, 8/15/2022 | | | 1,450,000 | | | | 1,406,500 | |
c,d Delek & Avner Tamar Bond Ltd., 3.839%, 12/30/2018 | | | 2,250,000 | | | | 2,251,764 | |
c,d Delek & Avner Tamar Bond Ltd., 2.803%, 12/30/2016 | | | 6,145,000 | | | | 6,138,984 | |
Energy Transfer Partners LP, 3.272%, 11/1/2066 | | | 1,200,000 | | | | 1,056,000 | |
Enterprise Products Operating LP, 7.034%, 1/15/2068 | | | 1,400,000 | | | | 1,513,574 | |
Gastar Exploration USA, Inc., 8.625%, 5/15/2018 | | | 2,271,000 | | | | 2,112,030 | |
c,d Gazprom Neft OAO, 6.00%, 11/27/2023 | | | 3,000,000 | | | | 2,587,500 | |
c Global Partners LP/GLP Finance Corp., 6.25%, 7/15/2022 | | | 5,975,000 | | | | 5,885,375 | |
Gulf South Pipeline Co. LP, 4.00%, 6/15/2022 | | | 4,860,000 | | | | 4,691,791 | |
c Kinder Morgan (Delaware), Inc., 5.00%, 2/15/2021 | | | 7,791,000 | | | | 8,327,052 | |
c Linc Energy, 12.50%, 10/31/2017 | | | 6,185,000 | | | | 1,422,550 | |
c Linc Energy, 9.625%, 10/31/2017 | | | 1,324,000 | | | | 1,198,220 | |
NGL Energy Partners LP, 6.875%, 10/15/2021 | | | 6,000,000 | | | | 6,270,000 | |
Northern Tier Energy, LLC, 7.125%, 11/15/2020 | | | 6,450,000 | | | | 6,622,924 | |
c,d Odebrecht Offshore Drilling Finance Ltd., 6.75%, 10/1/2022 | | | 8,138,375 | | | | 6,325,145 | |
d Petrobras Global Finance B.V., 3.00%, 1/15/2019 | | | 1,000,000 | | | | 863,320 | |
d Petrobras Global Finance B.V. Floating Rate Note, 2.631%, 3/17/2017 | | | 3,650,000 | | | | 3,357,635 | |
Plains All American Pipeline LP, 8.75%, 5/1/2019 | | | 1,000,000 | | | | 1,246,422 | |
c,d QGOG Atlantic/Alaskan Rigs Ltd., 5.25%, 7/30/2019 | | | 1,433,430 | | | | 1,241,350 | |
a RAAM Global Energy Co., 12.50%, 10/1/2015 | | | 2,000,000 | | | | 765,000 | |
c Rockies Express Pipeline, LLC, 3.90%, 4/15/2015 | | | 2,000,000 | | | | 1,998,750 | |
c Rockies Express Pipeline, LLC, 6.85%, 7/15/2018 | | | 2,000,000 | | | | 2,160,000 | |
Summit Midstream Holdings, LLC, 5.50%, 8/15/2022 | | | 8,360,000 | | | | 7,921,100 | |
Tennessee Gas Pipeline Co., 8.00%, 2/1/2016 | | | 1,000,000 | | | | 1,051,597 | |
Tesoro Logistics LP, 6.125%, 10/15/2021 | | | 2,000,000 | | | | 2,060,000 | |
c,d Tullow Oil plc, 6.25%, 4/15/2022 | | | 11,500,000 | | | | 9,947,500 | |
Williams Partners LP, 4.50%, 11/15/2023 | | | 5,600,000 | | | | 5,806,472 | |
| | | | | | | | |
| | | | | | | 119,899,515 | |
| | | | | | | | |
FOOD & STAPLES RETAILING — 1.32% | | | | | | | | |
Food & Staples Retailing — 1.32% | | | | | | | | |
c Bakkavor Finance 2 plc (GBP), 8.75%, 6/15/2020 | | | 7,275,000 | | | | 11,816,950 | |
c C&S Group Enterprises, LLC, 5.375%, 7/15/2022 | | | 5,800,000 | | | | 5,669,500 | |
| | | | | | | | |
| | | | | | | 17,486,450 | |
| | | | | | | | |
FOOD, BEVERAGE & TOBACCO — 2.09% | | | | | | | | |
Beverages — 0.49% | | | | | | | | |
Ambev International Finance Co., Ltd. (BRL), 9.50%, 7/24/2017 | | | 2,000,000 | | | | 600,022 | |
Anheuser-Busch InBev (BRL), 9.75%, 11/17/2015 | | | 2,000,000 | | | | 616,002 | |
c,d Central America Bottling Corp., 6.75%, 2/9/2022 | | | 5,000,000 | | | | 5,256,250 | |
Food Products — 1.60% | | | | | | | | |
c,d Barry Callebaut Services NV, 5.50%, 6/15/2023 | | | 4,000,000 | | | | 4,254,000 | |
c,d BRF S.A., 4.75%, 5/22/2024 | | | 4,650,000 | | | | 4,522,125 | |
Bunge Limited Finance Corp., 5.10%, 7/15/2015 | | | 321,000 | | | | 324,747 | |
c,d Comfeed Finance B.V., 6.00%, 5/2/2018 | | | 2,000,000 | | | | 1,832,210 | |
c Dean Foods Co., 6.50%, 3/15/2023 | | | 6,330,000 | | | | 6,361,650 | |
c Southern States Cooperative, Inc., 10.00%, 8/15/2021 | | | 4,000,000 | | | | 3,780,000 | |
| | | | | | | | |
| | | | | | | 27,547,006 | |
| | | | | | | | |
HEALTH CARE EQUIPMENT & SERVICES — 2.15% | | | | | | | | |
Health Care Equipment & Supplies — 0.13% | | | | | | | | |
c Teleflex, Inc., 5.25%, 6/15/2024 | | | 1,715,000 | | | | 1,749,300 | |
Health Care Providers & Services — 1.20% | | | | | | | | |
c Covenant Surgical Partners, Inc., 8.75%, 8/1/2019 | | | 5,990,000 | | | | 6,019,950 | |
DaVita Healthcare Partners, 5.125%, 7/15/2024 | | | 5,975,000 | | | | 6,094,500 | |
Tenet Healthcare Corp., 6.00%, 10/1/2020 | | | 3,500,000 | | | | 3,710,000 | |
Health Care Services — 0.82% | | | | | | | | |
d Catamaran Corp., 4.75%, 3/15/2021 | | | 9,715,000 | | | | 10,795,794 | |
| | | | | | | | |
| | | | | | | 28,369,544 | |
| | | | | | | | |
Semi-Annual Report 11
| | |
| SCHEDULE OF INVESTMENTS, CONTINUED | | |
| |
Thornburg Strategic Income Fund | | March 31, 2015 (Unaudited) |
| | | | | | | | |
| | | Shares/
Principal Amount | | | Value | |
INSURANCE — 1.58% | | | | | | | | |
Insurance — 1.58% | | | | | | | | |
ELM B.V. (AUD), 3.985%, 4/29/2049 | | $ | 1,000,000 | | | $ | 750,806 | |
ELM B.V. (AUD), 7.635%, 12/29/2049 | | | 1,000,000 | | | | 815,103 | |
c Forethought Financial Group, Inc., 8.625%, 4/15/2021 | | | 1,330,000 | | | | 1,562,440 | |
Genworth Holdings, Inc., 4.90%, 8/15/2023 | | | 6,000,000 | | | | 5,130,000 | |
Kemper Corp., 4.35%, 2/15/2025 | | | 3,950,000 | | | | 4,042,248 | |
a,c,d Lancashire Holdings Ltd., 5.70%, 10/1/2022 | | | 4,900,000 | | | | 5,414,500 | |
c National Life Insurance of Vermont, 10.50%, 9/15/2039 | | | 1,000,000 | | | | 1,621,547 | |
c ZFS Finance USA Trust II, 6.45%, 12/15/2065 | | | 1,460,000 | | | | 1,533,000 | |
| | | | | | | | |
| | | | | | | 20,869,644 | |
| | | | | | | | |
MATERIALS — 5.42% | | | | | | | | |
Chemicals — 1.61% | | | | | | | | |
c,d Consolidated Energy Finance S.A., 6.75%, 10/15/2019 | | | 6,100,000 | | | | 6,145,750 | |
c Iracore International Holdings, Inc., 9.50%, 6/1/2018 | | | 3,250,000 | | | | 1,885,000 | |
c,d Kissner Milling Co., Ltd., 7.25%, 6/1/2019 | | | 2,300,000 | | | | 2,374,750 | |
c,d Office Cherifien des Phosphates, 5.625%, 4/25/2024 | | | 10,000,000 | | | | 10,875,000 | |
Construction Materials — 0.57% | | | | | | | | |
c,d Cimpor Financial Operations B.V., 5.75%, 7/17/2024 | | | 7,770,000 | | | | 6,449,100 | |
Wesco Distribution, Inc., 5.375%, 12/15/2021 | | | 1,000,000 | | | | 1,017,500 | |
Metals & Mining — 2.78% | | | | | | | | |
d Anglogold Holdings, 8.50%, 7/30/2020 | | | 5,000,000 | | | | 5,373,750 | |
Coeur d’Alene Mines Corp., 7.875%, 2/1/2021 | | | 3,138,000 | | | | 2,675,145 | |
c Compass Minerals International, Inc., 4.875%, 7/15/2024 | | | 1,525,000 | | | | 1,528,813 | |
c Glencore Funding, LLC Floating Rate Note, 1.613%, 1/15/2019 | | | 11,000,000 | | | | 11,003,971 | |
c,d Newcrest Finance Property Ltd., 4.20%, 10/1/2022 | | | 7,000,000 | | | | 6,587,329 | |
d Rio Tinto Alcan, Inc., 5.00%, 6/1/2015 | | | 50,000 | | | | 50,324 | |
c,d Samarco Mineracao S.A., 4.125%, 11/1/2022 | | | 10,500,000 | | | | 9,450,000 | |
Paper & Forest Products — 0.46% | | | | | | | | |
c Neenah Paper, Inc., 5.25%, 5/15/2021 | | | 6,000,000 | | | | 6,030,000 | |
| | | | | | | | |
| | | | | | | 71,446,432 | |
| | | | | | | | |
MEDIA — 0.92% | | | | | | | | |
Media — 0.92% | | | | | | | | |
c,d Numericable Group S.A., 4.875%, 5/15/2019 | | | 3,100,000 | | | | 3,084,500 | |
c,d Numericable Group S.A., 6.00%, 5/15/2022 | | | 3,875,000 | | | | 3,923,438 | |
The Washington Post Co., 7.25%, 2/1/2019 | | | 500,000 | | | | 565,335 | |
c,d Virgin Media, Inc., 5.375%, 4/15/2021 | | | 4,316,000 | | | | 4,526,405 | |
| | | | | | | | |
| | | | | | | 12,099,678 | |
| | | | | | | | |
PHARMACEUTICALS, BIOTECHNOLOGY & LIFE SCIENCES — 0.40% | | | | | | | | |
Pharmaceuticals — 0.40% | | | | | | | | |
a,c Atlas U.S. Royalty, LLC, 12.25%, 3/15/2027 | | | 5,450,000 | | | | 5,302,850 | |
| | | | | | | | |
| | | | | | | 5,302,850 | |
| | | | | | | | |
REAL ESTATE — 0.98% | | | | | | | | |
Real Estate Investment Trusts — 0.98% | | | | | | | | |
EPR Properties, 5.25%, 7/15/2023 | | | 5,000,000 | | | | 5,397,130 | |
OUTFRONT Media Capital, LLC, 5.25%, 2/15/2022 | | | 3,220,000 | | | | 3,372,950 | |
OUTFRONT Media Capital, LLC, 5.875%, 3/15/2025 | | | 700,000 | | | | 740,250 | |
Retail Opportunity Investments Corp., 5.00%, 12/15/2023 | | | 1,500,000 | | | | 1,640,353 | |
Select Income REIT, 2.85%, 2/1/2018 | | | 1,720,000 | | | | 1,734,732 | |
| | | | | | | | |
| | | | | | | 12,885,415 | |
| | | | | | | | |
RETAILING — 2.06% | | | | | | | | |
Distributors — 0.46% | | | | | | | | |
LKQ Corp., Inc., 4.75%, 5/15/2023 | | | 6,254,000 | | | | 6,128,920 | |
Internet & Catalog Retail — 0.58% | | | | | | | | |
QVC, Inc., 4.45%, 2/15/2025 | | | 7,567,000 | | | | 7,617,434 | |
Multiline Retail — 0.57% | | | | | | | | |
c Family Tree Escrow, LLC, 5.75%, 3/1/2023 | | | 1,540,000 | | | | 1,620,850 | |
c Family Tree Escrow, LLC, 5.25%, 3/1/2020 | | | 745,000 | | | | 780,387 | |
c,d Grupo Famsa S.A.B. de C.V., 7.25%, 6/1/2020 | | | 5,550,000 | | | | 5,077,140 | |
Specialty Retail — 0.82% | | | | | | | | |
Coinstar, Inc., 6.00%, 3/15/2019 | | | 5,000,000 | | | | 4,850,000 | |
c Outerwall, Inc., 5.875%, 6/15/2021 | | | 6,675,000 | | | | 6,024,188 | |
| | | | | | | | |
| | | | | | | 32,098,919 | |
| | | | | | | | |
12 Semi-Annual Report
| | |
| SCHEDULE OF INVESTMENTS, CONTINUED | | |
| |
Thornburg Strategic Income Fund | | March 31, 2015 (Unaudited) |
| | | | | | | | |
| | | Shares/
Principal Amount | | | Value | |
SEMICONDUCTORS & SEMICONDUCTOR EQUIPMENT — 0.18% | | | | | | | | |
Semiconductors & Semiconductor Equipment — 0.18% | | | | | | | | |
c,d Sensata Technologies B.V., 5.00%, 10/1/2025 | | $ | 2,400,000 | | | $ | 2,433,000 | |
| | | | | | | | |
| | | | | | | 2,433,000 | |
| | | | | | | | |
SOFTWARE & SERVICES — 1.91% | | | | | | | | |
Information Technology Services — 1.15% | | | | | | | | |
iGATE Corp., 4.75%, 4/15/2019 | | | 7,775,000 | | | | 7,823,594 | |
Neustar, Inc., 4.50%, 1/15/2023 | | | 8,660,000 | | | | 7,404,300 | |
Internet Software & Services — 0.69% | | | | | | | | |
Lender Processing Services, Inc./Black Knight Lending Solutions, Inc., 5.75%, 4/15/2023 | | | 7,500,000 | | | | 7,946,850 | |
c Verisign, Inc., 5.25%, 4/1/2025 | | | 1,200,000 | | | | 1,224,000 | |
Software — 0.07% | | | | | | | | |
c Audatex North America, Inc., 6.00%, 6/15/2021 | | | 815,000 | | | | 861,862 | |
| | | | | | | | |
| | | | | | | 25,260,606 | |
| | | | | | | | |
TECHNOLOGY HARDWARE & EQUIPMENT — 2.11% | | | | | | | | |
Computers & Peripherals — 0.25% | | | | | | | | |
Lexmark International, Inc., 5.125%, 3/15/2020 | | | 3,000,000 | | | | 3,216,564 | |
Electronic Equipment, Instruments & Components — 1.86% | | | | | | | | |
Anixter, Inc., 5.125%, 10/1/2021 | | | 6,450,000 | | | | 6,627,375 | |
CDW, LLC/CDW Finance Corp., 6.00%, 8/15/2022 | | | 7,950,000 | | | | 8,533,928 | |
Ingram Micro, Inc., 4.95%, 12/15/2024 | | | 2,440,000 | | | | 2,527,608 | |
Trimble Navigation, Ltd., 4.75%, 12/1/2024 | | | 6,525,000 | | | | 6,879,529 | |
| | | | | | | | |
| | | | | | | 27,785,004 | |
| | | | | | | | |
TELECOMMUNICATION SERVICES — 4.97% | | | | | | | | |
Diversified Telecommunication Services — 1.98% | | | | | | | | |
c,d Digicel Ltd., 6.00%, 4/15/2021 | | | 4,610,000 | | | | 4,379,500 | |
c GTP Acquisition Partners I, LLC, 4.704%, 5/15/2043 | | | 4,750,000 | | | | 4,860,157 | |
Level 3 Communications, Inc., 8.875%, 6/1/2019 | | | 1,000,000 | | | | 1,052,500 | |
d Telefonica Emisiones SAU, 3.992%, 2/16/2016 | | | 1,000,000 | | | | 1,025,454 | |
d Telefonica Emisiones SAU, 5.134%, 4/27/2020 | | | 1,000,000 | | | | 1,128,738 | |
d Telefonica Emisiones SAU, 6.221%, 7/3/2017 | | | 2,000,000 | | | | 2,208,296 | |
d Telefonica Emisiones SAU, 6.421%, 6/20/2016 | | | 1,000,000 | | | | 1,062,541 | |
c,d Videotron Ltd. Co., 5.375%, 6/15/2024 | | | 10,050,000 | | | | 10,351,500 | |
Wireless Telecommunication Services — 2.99% | | | | | | | | |
America Movil Sab de CV (MXN), 6.45%, 12/5/2022 | | | 120,000,000 | | | | 7,583,047 | |
c,d Bharti Airtel International, 5.125%, 3/11/2023 | | | 6,000,000 | | | | 6,484,638 | |
c,d Millicom International Cellular S.A., 6.00%, 3/15/2025 | | | 3,178,000 | | | | 3,166,083 | |
c,d MTN International (Mauritius) Ltd., 4.755%, 11/11/2024 | | | 4,125,000 | | | | 4,143,562 | |
c,d MTS International Funding Ltd., 5.00%, 5/30/2023 | | | 6,000,000 | | | | 5,058,000 | |
c,d VimpelCom (UBS SA), 8.25%, 5/23/2016 | | | 500,000 | | | | 522,205 | |
c,d VimpelCom Holdings B.V., 7.504%, 3/1/2022 | | | 2,000,000 | | | | 1,897,500 | |
c WCP Issuer, LLC, 7.143%, 8/15/2043 | | | 6,000,000 | | | | 6,300,000 | |
c WCP Wireless Site Fund, 6.829%, 11/15/2040 | | | 4,240,000 | | | | 4,323,545 | |
| | | | | | | | |
| | | | | | | 65,547,266 | |
| | | | | | | | |
TRANSPORTATION — 2.79% | | | | | | | | |
Airlines — 2.46% | | | | | | | | |
American Airlines, 4.95%, 7/15/2024 | | | 2,747,518 | | | | 3,008,533 | |
c American Airlines, 5.60%, 1/15/2022 | | | 13,650,133 | | | | 14,264,389 | |
Continental Airlines, 9.798%, 10/1/2022 | | | 6,311,945 | | | | 7,132,498 | |
US Airways, 7.076%, 9/20/2022 | | | 1,773,982 | | | | 1,951,380 | |
US Airways, 5.90%, 4/1/2026 | | | 1,788,628 | | | | 2,043,507 | |
US Airways, 6.25%, 10/22/2024 | | | 1,548,089 | | | | 1,757,081 | |
c,d Virgin Australia, 5.00%, 4/23/2025 | | | 2,147,630 | | | | 2,260,380 | |
Marine — 0.33% | | | | | | | | |
c,d Stena International SA, 5.75%, 3/1/2024 | | | 4,650,000 | | | | 4,417,500 | |
| | | | | | | | |
| | | | | | | 36,835,268 | |
| | | | | | | | |
UTILITIES — 2.10% | | | | | | | | |
Electric Utilities — 1.05% | | | | | | | | |
Alabama Power Capital Trust V, 3.355%, 10/1/2042 | | | 700,000 | | | | 655,071 | |
c Duquesne Light Holdings, Inc., 6.40%, 9/15/2020 | | | 2,000,000 | | | | 2,373,046 | |
c,d Enel Finance International S.A., 6.25%, 9/15/2017 | | | 1,500,000 | | | | 1,669,446 | |
PNM Resources, Inc., 9.25%, 5/15/2015 | | | 3,879,000 | | | | 3,913,108 | |
Puget Energy, Inc., 5.625%, 7/15/2022 | | | 2,500,000 | | | | 2,908,323 | |
Semi-Annual Report 13
| | |
| SCHEDULE OF INVESTMENTS, CONTINUED | | |
| |
Thornburg Strategic Income Fund | | March 31, 2015 (Unaudited) |
| | | | | | | | |
| | | Shares/
Principal Amount | | | Value | |
Puget Energy, Inc., 6.50%, 12/15/2020 | | $ | 2,000,000 | | | $ | 2,404,298 | |
Gas Utilities — 0.26% | | | | | | | | |
c Source Gas, LLC., 5.90%, 4/1/2017 | | | 1,250,000 | | | | 1,335,331 | |
c Southern Star Central Gas Pipeline, Inc., 6.00%, 6/1/2016 | | | 2,000,000 | | | | 2,089,272 | |
Independent Power & Renewable Electricity Producers — 0.35% | | | | | | | | |
Ipalco Enterprises, Inc., 5.00%, 5/1/2018 | | | 2,500,000 | | | | 2,650,000 | |
c Midland Cogeneration Venture, 6.00%, 3/15/2025 | | | 1,758,144 | | | | 1,926,653 | |
Multi-Utilities — 0.44% | | | | | | | | |
CMS Energy Corp., 8.75%, 6/15/2019 | | | 2,000,000 | | | | 2,528,832 | |
c Topaz Solar Farms, LLC, 4.875%, 9/30/2039 | | | 3,000,000 | | | | 3,306,294 | |
| | | | | | | | |
| | | | | | | 27,759,674 | |
| | | | | | | | |
TOTAL CORPORATE BONDS (Cost $823,662,334) | | | | | | | 801,325,502 | |
| | | | | | | | |
| | |
CONVERTIBLE BONDS — 3.06% | | | | | | | | |
DIVERSIFIED FINANCIALS — 0.63% | | | | | | | | |
Capital Markets — 0.32% | | | | | | | | |
Apollo Investment Corp., 5.75%, 1/15/2016 | | | 4,100,000 | | | | 4,174,312 | |
Consumer Finance — 0.31% | | | | | | | | |
c EZCORP, Inc., 2.125%, 6/15/2019 | | | 4,867,000 | | | | 4,124,783 | |
| | | | | | | | |
| | | | | | | 8,299,095 | |
| | | | | | | | |
FOOD, BEVERAGE & TOBACCO — 0.60% | | | | | | | | |
Tobacco — 0.60% | | | | | | | | |
Vector Group Ltd., 1.75%, 4/15/2020 | | | 7,460,000 | | | | 7,991,525 | |
| | | | | | | | |
| | | | | | | 7,991,525 | |
| | | | | | | | |
MEDIA — 1.17% | | | | | | | | |
Media — 1.17% | | | | | | | | |
d Central European Media Enterprises Ltd., 5.00%, 11/15/2015 | | | 8,130,000 | | | | 8,145,244 | |
Comcast Holdings Corp., 2.00%, 10/15/2029 | | | 15,500,000 | | | | 7,269,500 | |
| | | | | | | | |
| | | | | | | 15,414,744 | |
| | | | | | | | |
REAL ESTATE — 0.65% | | | | | | | | |
Real Estate Investment Trusts — 0.65% | | | | | | | | |
American Realty Capital Properties, Inc., 3.00%, 8/1/2018 | | | 3,890,000 | | | | 3,787,887 | |
c IAS Operating Partnership LP, 5.00%, 3/15/2018 | | | 5,040,000 | | | | 4,851,000 | |
| | | | | | | | |
| | | | | | | 8,638,887 | |
| | | | | | | | |
TELECOMMUNICATION SERVICES — 0.01% | | | | | | | | |
Diversified Telecommunication Services — 0.01% | | | | | | | | |
Alaska Communication Systems Group, Inc., 6.25%, 5/1/2018 | | | 69,000 | | | | 67,318 | |
| | | | | | | | |
| | | | | | | 67,318 | |
| | | | | | | | |
TOTAL CONVERTIBLE BONDS (Cost $40,881,402) | | | | | | | 40,411,569 | |
| | | | | | | | |
| | |
WARRANTS — 0.01% | | | | | | | | |
PHARMACEUTICALS, BIOTECHNOLOGY & LIFE SCIENCES — 0.01% | | | | | | | | |
Pharmaceuticals — 0.01% | | | | | | | | |
b Alexza Pharmaceuticals, Inc. | | | 41,863 | | | | 86,656 | |
| | | | | | | | |
TOTAL WARRANTS (Cost $213,640) | | | | | | | 86,656 | |
| | | | | | | | |
| | |
MUNICIPAL BONDS — 0.70% | | | | | | | | |
California Health Facilities Financing Authority (Developmental Disabilities), 7.875%, 2/1/2026 | | | 1,940,000 | | | | 2,273,564 | |
c Midwest Family Housing, 5.168%, 7/1/2016 | | | 255,000 | | | | 263,011 | |
Municipal Improvement Corp. of Los Angeles (Recovery Zone Economic Development), 6.165%, 11/1/2020 | | | 1,885,000 | | | | 2,074,612 | |
Oakland California Redevelopment Agency, 8.00%, 9/1/2016 | | | 1,000,000 | | | | 1,082,630 | |
Oklahoma Development Finance Authority, 8.00%, 5/1/2020 | | | 995,000 | | | | 1,022,940 | |
San Bernardino County California Redevelopment Agency (San Sevaine), 8.45%, 9/1/2030 | | | 2,000,000 | | | | 2,315,540 | |
Wisconsin Health & Educational Facilities Authority (Richland Hospital), 7.08%, 6/1/2016 | | | 150,000 | | | | 150,013 | |
| | | | | | | | |
TOTAL MUNICIPAL BONDS (Cost $8,148,442) | | | | | | | 9,182,310 | |
| | | | | | | | |
| | |
U.S. GOVERNMENT AGENCIES — 0.91% | | | | | | | | |
c CoBank ACB Floating Rate Note (Farm Credit Banks), 0.871%, 6/15/2022 | | | 12,700,000 | | | | 11,945,417 | |
| | | | | | | | |
TOTAL U.S. GOVERNMENT AGENCIES (Cost $12,108,533) | | | | | | | 11,945,417 | |
| | | | | | | | |
14 Semi-Annual Report
| | |
| SCHEDULE OF INVESTMENTS, CONTINUED | | |
| |
Thornburg Strategic Income Fund | | March 31, 2015 (Unaudited) |
| | | | | | | | |
| | | Shares/
Principal Amount | | | Value | |
OTHER GOVERNMENT — 4.44% | | | | | | | | |
Australian Government (AUD), 2.75%, 4/21/2024 | | $ | 8,200,000 | | | $ | 6,487,482 | |
BK Nederlandse Gemeenten N.V. (NOK), 4.00%, 5/15/2015 | | | 5,000,000 | | | | 622,156 | |
c,d Eurasian Development Bank, 5.00%, 9/26/2020 | | | 2,000,000 | | | | 1,890,000 | |
Federative Republic of Brazil (BRL), 12.50%, 1/5/2016 | | | 3,475,000 | | | | 1,090,990 | |
c,d Government of Aruba, 4.625%, 9/14/2023 | | | 7,700,000 | | | �� | 7,671,125 | |
Mexican Bonos (MXN), 5.00%, 6/15/2017 | | | 130,000,000 | | | | 8,688,911 | |
Mexico Bonos de Desarrollo (MXN), 4.75%, 6/14/2018 | | | 275,000,000 | | | | 18,038,042 | |
New Zealand Government (NZD), 6.00%, 4/15/2015 | | | 7,250,000 | | | | 5,425,465 | |
Norwegian Government (NOK), 4.25%, 5/19/2017 | | | 25,000,000 | | | | 3,323,423 | |
c,d Seven and Seven Ltd. Floating Rate Note, (Guaranty: Export-Import Bank of Korea), 1.404%, 9/11/2019 | | | 5,400,000 | | | | 5,394,270 | |
| | | | | | | | |
TOTAL OTHER GOVERNMENT (Cost $63,804,373) | | | | | | | 58,631,864 | |
| | | | | | | | |
| | |
MORTGAGE BACKED — 0.04% | | | | | | | | |
Federal National Mtg Assoc., CMO Series 1994-37 Class L, 6.50%, 3/25/2024 | | | 4,023 | | | | 4,504 | |
a Reilly FHA 1997-A Mtg, 6.896%, 7/1/2020 | | | 558,434 | | | | 575,405 | |
| | | | | | | | |
TOTAL MORTGAGE BACKED (Cost $575,816) | | | | | | | 579,909 | |
| | | | | | | | |
| | |
LOAN PARTICIPATIONS — 7.29% | | | | | | | | |
COMMERCIAL & PROFESSIONAL SERVICES — 1.11% | | | | | | | | |
Professional Services — 1.11% | | | | | | | | |
Extreme Reach, Inc., 6.75%, 2/7/2020 | | | 5,031,000 | | | | 5,056,155 | |
Affinion Group, Inc., 6.75%, 4/30/2018 | | | 3,979,899 | | | | 3,768,965 | |
Academi Holdings, LLC, 11.00%, 7/24/2020 | | | 6,000,000 | | | | 5,880,000 | |
| | | | | | | | |
| | | | | | | 14,705,120 | |
| | | | | | | | |
CONSUMER DURABLES & APPAREL — 0.32% | | | | | | | | |
Leisure Equipment & Products — 0.15% | | | | | | | | |
Topps Co, Inc., 7.25%, 10/2/2018 | | | 1,975,000 | | | | 1,942,906 | |
Textiles, Apparel & Luxury Goods — 0.17% | | | | | | | | |
5.11, Inc., 6.00%, 2/28/2020 | | | 2,227,500 | | | | 2,224,716 | |
| | | | | | | | |
| | | | | | | 4,167,622 | |
| | | | | | | | |
CONSUMER SERVICES — 0.72% | | | | | | | | |
Diversified Consumer Services — 0.49% | | | | | | | | |
Laureate Education, Inc., 5.00%, 6/15/2018 | | | 6,950,742 | | | | 6,487,336 | |
Hotels, Restaurants & Leisure — 0.23% | | | | | | | | |
a Private Restaurants Properties, Inc., 9.00%, 4/10/2017 | | | 2,905,329 | | | | 2,957,625 | |
| | | | | | | | |
| | | | | | | 9,444,961 | |
| | | | | | | | |
DIVERSIFIED FINANCIALS — 1.44% | | | | | | | | |
Diversified Financial Services — 1.44% | | | | | | | | |
NCP Finance LP, 11.00%, 9/25/2018 | | | 4,233,193 | | | | 4,180,278 | |
Abg Intermediate Holdings 2, LLC, 9.00%, 5/27/2022 | | | 10,100,000 | | | | 10,074,750 | |
d Stena International S.A., 4.00%, 3/3/2021 | | | 5,316,300 | | | | 4,754,792 | |
| | | | | | | | |
| | | | | | | 19,009,820 | |
| | | | | | | | |
ENERGY — 0.19% | | | | | | | | |
Oil, Gas & Consumable Fuels — 0.19% | | | | | | | | |
Citgo Holding, Inc., 9.50%, 5/12/2018 | | | 2,493,750 | | | | 2,479,211 | |
| | | | | | | | |
| | | | | | | 2,479,211 | |
| | | | | | | | |
FOOD, BEVERAGE & TOBACCO — 0.55% | | | | | | | | |
Tobacco — 0.55% | | | | | | | | |
North Atlantic Trading Co., Inc., 7.75%-8.75%, 1/13/2020 | | | 7,409,007 | | | | 7,297,872 | |
| | | | | | | | |
| | | | | | | 7,297,872 | |
| | | | | | | | |
MATERIALS — 0.73% | | | | | | | | |
Chemicals — 0.73% | | | | | | | | |
OCI Beaumont, LLC, 5.50%, 8/20/2019 | | | 4,598,308 | | | | 4,615,551 | |
PeroxyChem, LLC, 7.50%-8.75%, 2/28/2020 | | | 4,950,000 | | | | 4,950,000 | |
| | | | | | | | |
| | | | | | | 9,565,551 | |
| | | | | | | | |
MEDIA — 0.65% | | | | | | | | |
Media — 0.65% | | | | | | | | |
a,d Mood Media Corp., 7.00%, 5/1/2019 | | | 8,729,393 | | | | 8,572,264 | |
| | | | | | | | |
| | | | | | | 8,572,264 | |
| | | | | | | | |
Semi-Annual Report 15
| | |
| SCHEDULE OF INVESTMENTS, CONTINUED | | |
| |
Thornburg Strategic Income Fund | | March 31, 2015 (Unaudited) |
| | | | | | | | |
| | | Shares/
Principal Amount | | | Value | |
REAL ESTATE — 0.43% | | | | | | | | |
Real Estate Management & Development — 0.43% | | | | | | | | |
DTZ U.S. Borrower, LLC, 9.25%, 11/4/2022 | | $ | 5,690,000 | | | $ | 5,718,450 | |
| | | | | | | | |
| | | | | | | 5,718,450 | |
| | | | | | | | |
RETAILING — 0.51% | | | | | | | | |
Specialty Retail — 0.51% | | | | | | | | |
NBTY, Inc., 3.50%, 10/1/2017 | | | 4,000,000 | | | | 3,945,000 | |
Rue21, Inc., 5.63%, 10/9/2020 | | | 3,094,463 | | | | 2,755,620 | |
| | | | | | | | |
| | | | | | | 6,700,620 | |
| | | | | | | | |
SOFTWARE & SERVICES — 0.46% | | | | | | | | |
Information Technology Services — 0.46% | | | | | | | | |
a,f Valores Corporativos Softtek, S.A. de C.V., 3.38%-6.93%, 8/27/2019 | | | 6,181,818 | | | | 6,120,000 | |
| | | | | | | | |
| | | | | | | 6,120,000 | |
| | | | | | | | |
TRANSPORTATION — 0.18% | | | | | | | | |
Airlines — 0.18% | | | | | | | | |
a,d ET Two LLC, 10.00%, 9/30/2019 | | | 395,224 | | | | 395,224 | |
a,d Synergy Aerospace Corp., 6.50%, 3/3/2015 | | | 1,641,533 | | | | 1,639,891 | |
a,d ET Three LLC, 10.00%, 9/30/2019 | | | 395,224 | | | | 395,224 | |
| | | | | | | | |
| | | | | | | 2,430,339 | |
| | | | | | | | |
TOTAL LOAN PARTICIPATIONS (Cost $96,519,339) | | | | | | | 96,211,830 | |
| | | | | | | | |
| | |
SHORT TERM INVESTMENTS — 10.01% | | | | | | | | |
Ameren Corp., 0.45%, 4/1/2015 | | | 19,000,000 | | | | 19,000,000 | |
Bank of New York Tri-Party Repurchase Agreement 0.23% dated 3/31/2015 due 4/1/2015, repurchase price $18,000,115 | | | | | | | | |
collateralized by 6 U.S. Government debt securities and 13 corporate debt securities, having an average coupon of 4.18%, | | | | | | | | |
a minimum credit rating of BBB-, maturity dates from 8/15/2015 to 2/1/2044, and having an aggregate market value of | | | | | | | | |
$18,905,698 at 3/31/2015 | | | 18,000,000 | | | | 18,000,000 | |
CenterPoint Energy, Inc., 0.60%, 4/1/2015 | | | 19,000,000 | | | | 19,000,000 | |
Delmarva Power & Light Co., 0.45%, 4/1/2015 | | | 19,000,000 | | | | 19,000,000 | |
Johnson Controls, Inc., 0.50%, 4/6/2015 | | | 19,000,000 | | | | 18,998,680 | |
Kansas City Power & Light Co., 0.50%, 4/6/2015 | | | 19,000,000 | | | | 18,998,681 | |
Union Electric Co., 0.55%, 4/1/2015 | | | 19,000,000 | | | | 19,000,000 | |
| | | | | | | | |
TOTAL SHORT TERM INVESTMENTS (Cost $131,997,361) | | | | | | | 131,997,361 | |
| | | | | | | | |
TOTAL INVESTMENTS — 98.19% (Cost $1,331,944,391) | | | | | | $ | 1,295,285,653 | |
OTHER ASSETS LESS LIABILITIES — 1.81% | | | | | | | 23,876,742 | |
| | | | | | | | |
NET ASSETS — 100.00% | | | | | | $ | 1,319,162,395 | |
| | | | | | | | |
Footnote Legend
| a | Security currently fair valued by the Valuation and Pricing Committee using procedures approved by the Trustees. |
| c | Securities exempt from registration under Rule 144A of the Securities Act of 1933, as amended. These securities may only be resold in the ordinary course of business in transactions exempt from registration, normally to qualified institutional buyers. As of March 31, 2015, the aggregate value of these securities in the Fund’s portfolio was $597,556,812, representing 45.3% of the Fund’s net assets. |
| d | Yankee Bond - Denominated in U.S. dollars and is issued in the U.S. by foreign banks and corporations. |
| f | Loan facility with an unfunded liability of $1,181,182 (see Note 2). |
Portfolio Abbreviations
To simplify the listings of securities, abbreviations are used per the table below:
| | |
| ARM | | Adjustable Rate Mortgage |
| AUD | | Denominated in Australian Dollars |
| BRL | | Denominated in Brazilian Real |
| CAD | | Denominated in Canadian Dollars |
| CHL | | Denominated in Chilean Peso |
| CMO | | Collateralized Mortgage Obligation |
| EUR | | Denominated in Euros |
| FCB | | Farm Credit Bank |
| FHA | | Insured by Federal Housing Administration |
| GBP | | Denominated in Great Britain Pounds |
| Mtg | | Mortgage |
| MTN | | Medium-Term Note |
| | |
| MXN | | Denominated in Mexican Pesos |
| NOK | | Denominated in Norwegian Kroner |
| Pfd | | Preferred Stock |
| REIT | | Real Estate Investment Trust |
| SEK | | Denominated in Swedish Kronor |
| SPV | | Special Purpose Vehicle |
See notes to financial statements.
16 Semi-Annual Report
This page intentionally left blank.
Semi-Annual Report 17
| | |
| STATEMENT OF ASSETS AND LIABILITIES | | |
| |
Thornburg Strategic Income Fund | | March 31, 2015 (Unaudited) |
| | | | |
ASSETS | | | | |
Investments at value (cost $1,331,944,391) (Note 2) | | $ | 1,295,285,653 | |
Cash | | | 9,504,093 | |
Receivable for investments sold | | | 1,155,662 | |
Receivable for fund shares sold | | | 4,058,244 | |
Unrealized appreciation on forward currency contracts (Note 7) | | | 942,164 | |
Dividends receivable | | | 283,264 | |
Dividend and interest reclaim receivable | | | 50,345 | |
Interest receivable | | | 15,811,370 | |
Prepaid expenses and other assets | | | 63,096 | |
| | | | |
Total Assets | | | 1,327,153,891 | |
| | | | |
| |
LIABILITIES | | | | |
Payable for investments purchased | | | 1,649,417 | |
Payable for fund shares redeemed | | | 4,181,809 | |
Unrealized depreciation on forward currency contracts (Note 7) | | | 172,977 | |
Payable to investment advisor and other affiliates (Note 3) | | | 1,203,372 | |
Accounts payable and accrued expenses | | | 123,765 | |
Dividends payable | | | 660,156 | |
| | | | |
Total Liabilities | | | 7,991,496 | |
| | | | |
| |
NET ASSETS | | $ | 1,319,162,395 | |
| | | | |
NET ASSETS CONSIST OF | | | | |
Undistributed net investment income | | $ | 367,445 | |
Net unrealized depreciation on investments | | | (36,025,500 | ) |
Accumulated net realized gain (loss) | | | 2,998,269 | |
Net capital paid in on shares of beneficial interest | | | 1,351,822,181 | |
| | | | |
| | $ | 1,319,162,395 | |
| | | | |
18 Semi-Annual Report
| | |
| STATEMENT OF ASSETS AND LIABILITIES, CONTINUED | | |
| |
Thornburg Strategic Income Fund | | March 31, 2015 (Unaudited) |
| | | | |
NET ASSET VALUE | | | | |
Class A Shares: | | | | |
Net asset value and redemption price per share ($382,370,929 applicable to 32,673,312 shares of beneficial interest outstanding - Note 4) | | $ | 11.70 | |
Maximum sales charge, 4.50% of offering price | | | 0.55 | |
| | | | |
Maximum offering price per share | | $ | 12.25 | |
| | | | |
| |
Class C Shares: | | | | |
Net asset value and offering price per share* ($340,169,049 applicable to 29,110,349 shares of beneficial interest outstanding - Note 4) | | $ | 11.69 | |
| | | | |
| |
Class I Shares: | | | | |
Net asset value, offering and redemption price per share ($586,752,973 applicable to 50,250,994 shares of beneficial interest outstanding - Note 4) | | $ | 11.68 | |
| | | | |
| |
Class R3 Shares: | | | | |
Net asset value, offering and redemption price per share ($2,407,765 applicable to 205,884 shares of beneficial interest outstanding - Note 4) | | $ | 11.69 | |
| | | | |
| |
Class R4 Shares: | | | | |
Net asset value, offering and redemption price per share ($2,070,982 applicable to 177,049 shares of beneficial interest outstanding - Note 4) | | $ | 11.70 | |
| | | | |
| |
Class R5 Shares: | | | | |
Net asset value, offering and redemption price per share ($5,390,697 applicable to 461,769 shares of beneficial interest outstanding - Note 4) | | $ | 11.67 | |
| | | | |
| * | Redemption price per share is equal to net asset value less any applicable contingent deferred sales charge. |
See notes to financial statements.
Semi-Annual Report 19
| | |
| STATEMENT OF OPERATIONS | | |
| |
Thornburg Strategic Income Fund | | Six Months Ended March 31, 2015 (Unaudited) |
| | | | |
INVESTMENT INCOME | | | | |
Dividend income (net of foreign taxes withheld of $7,337) | | $ | 1,490,717 | |
Interest income (net of premium amortized of $1,041,511) | | | 32,592,395 | |
| | | | |
Total Income | | | 34,083,112 | |
| | | | |
| |
EXPENSES | | | | |
Investment advisory fees (Note 3) | | | 4,568,856 | |
Administration fees (Note 3) | | | | |
Class A Shares | | | 244,355 | |
Class C Shares | | | 217,151 | |
Class I Shares | | | 144,043 | |
Class R3 Shares | | | 2,150 | |
Class R4 Shares | | | 463 | |
Class R5 Shares | | | 914 | |
Distribution and service fees (Note 3) | | | | |
Class A Shares | | | 489,436 | |
Class C Shares | | | 1,739,998 | |
Class R3 Shares | | | 8,612 | |
Class R4 Shares | | | 943 | |
Transfer agent fees | | | | |
Class A Shares | | | 160,318 | |
Class C Shares | | | 116,880 | |
Class I Shares | | | 180,811 | |
Class R3 Shares | | | 1,628 | |
Class R4 Shares | | | 945 | |
Class R5 Shares | | | 2,502 | |
Registration and filing fees | | | | |
Class A Shares | | | 22,798 | |
Class C Shares | | | 15,935 | |
Class I Shares | | | 20,301 | |
Class R3 Shares | | | 11,872 | |
Class R4 Shares | | | 4,412 | |
Class R5 Shares | | | 11,895 | |
Custodian fees (Note 3) | | | 135,284 | |
Professional fees | | | 52,577 | |
Accounting fees | | | 21,715 | |
Trustee fees | | | 20,590 | |
Other expenses | | | 70,083 | |
| | | | |
Total Expenses | | | 8,267,467 | |
Less: | | | | |
Expenses reimbursed by investment advisor (Note 3) | | | (272,933 | ) |
Fees paid indirectly (Note 3) | | | (1,189 | ) |
| | | | |
Net Expenses | | | 7,993,345 | |
| | | | |
Net Investment Income | | $ | 26,089,767 | |
| | | | |
20 Semi-Annual Report
| | |
| STATEMENT OF OPERATIONS, CONTINUED | | |
| |
Thornburg Strategic Income Fund | | Six Months Ended March 31, 2015 (Unaudited) |
| | | | |
REALIZED AND UNREALIZED GAIN (LOSS) | | | | |
Net realized gain (loss) from: | | | | |
Investments | | $ | 1,971,177 | |
Forward currency contracts (Note 7) | | | 2,767,898 | |
Foreign currency transactions | | | (328,276 | ) |
| | | | |
| | | 4,410,799 | |
| | | | |
Net change in unrealized appreciation (depreciation) on: | | | | |
Investments | | | (41,919,359 | ) |
Foreign currency translations | | | (96,361 | ) |
Forward currency contracts (Note 7) | | | (469,432 | ) |
| | | | |
| | | (42,485,152 | ) |
| | | | |
Net Realized and Unrealized Loss | | | (38,074,353 | ) |
| | | | |
Net Decrease in Net Assets Resulting from Operations | | $ | (11,984,586 | ) |
| | | | |
See notes to financial statements.
Semi-Annual Report 21
| | |
| STATEMENTS OF CHANGES IN NET ASSETS | | |
| |
Thornburg Strategic Income Fund | | |
| | | | | | | | |
| | | Six Months Ended | | | Year Ended | |
| | | March 31, 2015* | | | September 30, 2014 | |
INCREASE (DECREASE) IN NET ASSETS FROM | | | | | | | | |
| | |
OPERATIONS | | | | | | | | |
Net investment income | | $ | 26,089,767 | | | $ | 42,473,247 | |
Net realized gain (loss) from investments, forward currency contracts, and foreign currency transactions | | | 4,410,799 | | | | 18,703,755 | |
Net unrealized appreciation (depreciation) on investments, forward currency contracts, and foreign currency translations | | | (42,485,152 | ) | | | (2,265,395 | ) |
| | | | | | | | |
| | |
Net Increase (Decrease) in Net Assets Resulting from Operations | | | (11,984,586 | ) | | | 58,911,607 | |
| | |
DIVIDENDS TO SHAREHOLDERS | | | | | | | | |
From net investment income | | | | | | | | |
Class A Shares | | | (7,446,329 | ) | | | (14,111,314 | ) |
Class C Shares | | | (5,579,793 | ) | | | (10,955,909 | ) |
Class I Shares | | | (11,989,534 | ) | | | (17,925,535 | ) |
Class R3 Shares | | | (64,977 | ) | | | (56,962 | ) |
Class R4 Shares | | | (15,312 | ) | | | (423 | ) |
Class R5 Shares | | | (74,654 | ) | | | (85,256 | ) |
From realized gains | | | | | | | | |
Class A Shares | | | (4,909,559 | ) | | | (5,900,030 | ) |
Class C Shares | | | (4,451,217 | ) | | | (5,473,946 | ) |
Class I Shares | | | (7,233,973 | ) | | | (5,939,705 | ) |
Class R3 Shares | | | (42,240 | ) | | | (2,935 | ) |
Class R4 Shares | | | (514 | ) | | | — | |
Class R5 Shares | | | (39,105 | ) | | | (19,145 | ) |
| | |
FUND SHARE TRANSACTIONS (NOTE 4) | | | | | | | | |
Class A Shares | | | 5,661,064 | | | | 141,841,186 | |
Class C Shares | | | 6,112,766 | | | | 111,635,825 | |
Class I Shares | | | 57,966,612 | | | | 306,584,478 | |
Class R3 Shares | | | (503,402 | ) | | | 2,887,855 | |
Class R4 Shares | | | 2,055,619 | | | | 15,412 | |
Class R5 Shares | | | 2,951,271 | | | | 2,547,850 | |
| | | | | | | | |
Net Increase in Net Assets | | | 20,412,137 | | | | 563,953,053 | |
| | |
NET ASSETS | | | | | | | | |
Beginning of Period | | | 1,298,750,258 | | | | 734,797,205 | |
| | | | | | | | |
| | |
End of Period | | $ | 1,319,162,395 | | | $ | 1,298,750,258 | |
| | | | | | | | |
Undistributed (distribution in excess of) net investment income | | $ | 367,445 | | | $ | (551,723 | ) |
See notes to financial statements.
22 Semi-Annual Report
| | |
| NOTES TO FINANCIAL STATEMENTS | | |
| |
Thornburg Strategic Income Fund | | March 31, 2015 (Unaudited) |
NOTE 1 – ORGANIZATION
Thornburg Strategic Income Fund, hereinafter referred to as (the “Fund)” is a diversified series of Thornburg Investment Trust (the “Trust”). The Fund commenced operations on December 19, 2007. The Trust was organized as a Massachusetts business trust under a Declaration of Trust dated June 3, 1987 and is registered as a diversified, open-end management investment company under the Investment Company Act of 1940, as amended. The Fund is currently one of eighteen separate series of the Trust. Each series is considered to be a separate entity for financial reporting and tax purposes and bears expenses directly attributable to it. The Fund’s primary investment goal is to seek a high level of current income. The Fund’s secondary investment goal is some long-term capital appreciation.
The Fund currently offers six classes of shares of beneficial interest: Class A, Class C, Institutional Class (“Class I”) and Retirement Classes (“Class R3”, “Class R4”, and “Class R5”). Each class of shares of the Fund represents an interest in the same portfolio of investments, except that (i) Class A shares are sold subject to a front-end sales charge collected at the time the shares are purchased and bear a service fee, (ii) Class C shares are sold at net asset value without a sales charge at the time of purchase, but are subject to a contingent deferred sales charge upon redemption within one year of purchase, and bear both a service fee and a distribution fee, (iii) Class I shares are sold at net asset value without a sales charge at the time of purchase and may be subject to a service fee, (iv) Class R3 shares are sold at net asset value without a sales charge at the time of purchase, but bear both a service fee and distribution fee, (v) Class R4 shares are sold at net asset value without a sales charge at the time of purchase, but bear a service fee, (vi) Class R5 shares are sold at net asset value without a sales charge at the time of purchase and may be subject to a service fee, and (vii) the respective classes may have different reinvestment privileges and conversion rights. Additionally, the Fund may allocate among its classes certain expenses, to the extent allocable to specific classes, including transfer agent fees, government registration fees, certain printing and postage costs, and administrative and legal expenses. Currently, class specific expenses of the Fund are limited to service and distribution fees, administration fees, and certain registration and transfer agent expenses.
NOTE 2 – SIGNIFICANT ACCOUNTING POLICIES
The following is a summary of significant accounting policies followed by the Fund in the preparation of its financial statements. The Fund is an investment company and prepares its financial statements in conformity with U.S. generally accepted accounting principles (“GAAP”), including the investment company accounting and reporting guidance in the Financial Accounting Standards Board (the “FASB”) Accounting Standard Codification Topic 946. The preparation of financial statements in conformity with GAAP requires management to make estimates and assumptions that affect the reported amounts of assets and liabilities and disclosure of contingent assets and liabilities at the date of the financial statements and the reported amounts of increases (decreases) in net assets from operations during the reporting period. Actual results could differ from those estimates.
Significant accounting policies of the Fund are as follows:
Valuation Policy and Procedures: The Trustees of the Trust (the “Trustees”) have authorized employees of the Fund’s investment advisor, acting as the Valuation and Pricing Committee (the “Committee”), to make certain valuation determinations, subject to oversight and review by the Trustees and the Audit Committee of the Trustees. The Committee and other employees of the Fund’s investment advisor administer and implement the valuation process. The Committee regularly reviews its own fair value decisions, as well as valuations, valuation techniques and services furnished by pricing services, considers circumstances in the markets which may require valuation determinations by the Committee and reviews previous valuation determinations. The Committee also reports on its activities, the performance of the pricing services and other matters to the Trustees and the Audit Committee of the Trustees.
In determining a fair value for a portfolio investment, the Committee seeks to determine the price that the Fund would reasonably expect to receive upon a sale of the investment in an orderly transaction between market participants at the measurement date. Typically, the fair value process employs standing instructions to use quoted prices in active markets or the use of independent pricing services. Less frequently, the Committee may make a fair value determination using other methods. However, because fair value prices are estimated prices, the determination of fair value for an investment may differ from the value that would be realized by the Fund upon a sale of the investment, and that difference could be material to the Fund’s financial statements. The Committee’s determination of fair value for an investment may also differ from the prices obtained by other persons (including other mutual funds) for the investment.
Valuation of Investments: Portfolio investments listed or traded on a national securities exchange are valued on the valuation date at the last reported trade price on the exchange that is the primary market for the investment. Portfolio investments reported by NASDAQ are valued at the NASDAQ official closing price. Portfolio investments traded on an exchange for which there has been no trade that day and other equity investments traded in the over-the-counter market are valued at the mean between the last reported bid and ask prices. Any foreign investment traded on exchanges outside the United States is valued at the price of the investment on the exchange that is normally the investment’s primary market, as of the close of that exchange preceding the time of the Fund’s valuation measurement date.
Semi-Annual Report 23
| | |
| NOTES TO FINANCIAL STATEMENTS, CONTINUED | | |
| |
Thornburg Strategic Income Fund | | March 31, 2015 (Unaudited) |
In any case when the market value of an equity investment held by the Fund is not readily available, a determination of a fair value for the investment is made by the Committee. The Committee’s determinations are made using procedures in accordance with a policy approved by the Trustees, which may include the use of a price obtained from an independent pricing service. The pricing service ordinarily values equity investments in these instances using multi-factor models to adjust market prices based upon various inputs, including exchange data, depositary receipt prices, futures, index data and other data. An investment’s market value is deemed not readily available whenever the exchange or market on which the investment is primarily traded is closed for the entire scheduled day of trading. Additionally, an investment’s market value may be deemed not readily available under other circumstances identified by the Trustees, including when developments occurring after the most recent close of the investment’s primary exchange or market, but before the most recent close of trading in Fund shares, or an unusual event or significant period of time occurring since the availability of a market quotation, create a question about the reliability of the investment’s market value. For example, on days when market volatility thresholds pre-determined by the Trustees are exceeded, foreign equity investments held by the Fund may be valued using synthetic pricing obtained from an independent pricing service approved by the Trustees, subject to the ability of the Committee to determine in any such instance to utilize market closing prices if the Committee considers closing prices to be more reliable.
Debt obligations held by the Fund have a primary over-the-counter market and are valued by an independent pricing service approved by the Trustees. The pricing service ordinarily values debt obligations using quoted bid prices and other methods, which include consideration of yields or prices of debt obligations of comparable quality, type of issue, coupon, maturity and rating, and indications as to value from dealers and general market conditions.
In any case when a pricing service fails to provide a price for a debt obligation held by the Fund, the Committee determines a fair value for the debt obligation using procedures in accordance with a policy approved by the Trustees, which may include the use of a price obtained from a different independent pricing service. Additionally, in any case when management believes that a price provided by a pricing service for a debt obligation held by the Fund may be unreliable, the Committee decides whether or not to use the pricing service’s valuation or to use an alternative method to determine a fair value for the debt obligation.
Quotations in foreign currencies for foreign portfolio investments are converted to U.S. dollar equivalents using the foreign exchange quotation in effect at the time of valuation.
Valuation Measurements: The Fund categorizes its investments based upon the inputs used in valuing those investments, according to a three-level hierarchy established by guidance from the FASB. Categorization of investments using this hierarchy is intended by the FASB to maximize the use of observable inputs and minimize the use of unobservable inputs by prioritizing that the most observable input be used when available. Observable inputs are those that market participants would use in valuing an investment based on available market data. Unobservable inputs are those that reflect assumptions about the information market participants would use in valuing an investment. An investment’s level within the hierarchy is based on the lowest level input that is deemed significant to the fair value measurement. The methodologies and relative inputs used to value investments are not necessarily indications of the risk or liquidity associated with investing in those investments.
Various inputs are used in determining the fair value measurement of the Fund’s investments. These inputs are generally summarized according to the three-level hierarchy below:
Level 1: Quoted prices in active markets for identical investments.
Level 2: Other direct or indirect significant observable inputs (including quoted prices for similar investments in active markets and other observable inputs, such as interest rates, prepayment rates, credit risk, etc.).
When market volatility thresholds are exceeded, foreign equity investments may be fair valued according to other significant observable inputs rather than quoted market prices. The affected investments will be characterized as Level 2 within the valuation hierarchy and revert to Level 1 after the threshold is no longer exceeded.
Level 3: Significant unobservable inputs (including the Committee’s own assumptions in determining the fair value of investments).
Portfolio investments with minimal, if any, market activity are characterized as Level 3 and are valued using significant unobservable inputs, typically including single broker quotes, which may be adjusted or unadjusted, related or comparable investments, last available transactions, and other relevant information. Valuations may also be based upon current market prices of securities that are comparable in coupon, rating, maturity and industry. An income based valuation approach would consider discounted anticipated future cash flows of the investment. Discounts may also be applied due to the nature or duration of any restrictions on the disposition of the investment. Valuations based upon the use of inputs from Levels 1, 2, or 3, may not represent the actual price received upon the disposition of an investment, and the Fund may receive a price that is lower than the valuation when it sells the investment.
The following table displays a summary of the fair value hierarchy measurements of the Fund’s investments as of March 31, 2015. In any instance when valuation inputs from more than one level are used to determine the fair value of a specific investment, the investment is placed in the level of the table based upon the lowest level input that is significant in determining the fair value of the investment:
24 Semi-Annual Report
| | |
| NOTES TO FINANCIAL STATEMENTS, CONTINUED | | |
| |
Thornburg Strategic Income Fund | | March 31, 2015 (Unaudited) |
| | | | | | | | | | | | | | | | |
| | | Fair Value Measurements at March 31, 2015 | |
| | | Total | | | Level 1 | | | Level 2 | | | Level 3(b) | |
Assets | | | | | | | | | | | | | | | | |
Investments in Securities* | | | | | | | | | | | | | | | | |
Common Stock | | $ | 16,203,805 | | | $ | 11,532,619 | | | $ | 4,671,186 | | | $ | — | |
Preferred Stock (a) | | | 19,517,621 | | | | 8,933,564 | | | | 10,584,057 | | | | — | |
Asset Backed Securities | | | 109,191,809 | | | | — | | | | 86,104,734 | | | | 23,087,075 | |
Corporate Bonds | | | 801,325,502 | | | | — | | | | 791,978,946 | | | | 9,346,556 | |
Convertible Bonds | | | 40,411,569 | | | | — | | | | 40,411,569 | | | | — | |
Warrants | | | 86,656 | | | | — | | | | 86,656 | | | | — | |
Municipal Bonds | | | 9,182,310 | | | | — | | | | 9,182,310 | | | | — | |
U.S. Government Agencies | | | 11,945,417 | | | | — | | | | 11,945,417 | | | | — | |
Other Government | | | 58,631,864 | | | | — | | | | 58,631,864 | | | | — | |
Mortgage Backed | | | 579,909 | | | | — | | | | 4,504 | | | | 575,405 | |
Loan Participations | | | 96,211,830 | | | | — | | | | 76,131,602 | | | | 20,080,228 | |
Short Term Investments | | | 131,997,361 | | | | — | | | | 131,997,361 | | | | — | |
| | | | | | | | | | | | | | | | |
Total Investments in Securities | | $ | 1,295,285,653 | | | $ | 20,466,183 | | | $ | 1,221,730,206 | | | $ | 53,089,264 | |
Other Financial Instruments** | | | | | | | | | | | | | | | | |
Forward Currency Contracts | | $ | 942,164 | | | $ | — | | | $ | 942,164 | | | $ | — | |
Liabilities | | | | | | | | | | | | | | | | |
Other Financial Instruments** | | | | | | | | | | | | | | | | |
Forward Currency Contracts | | $ | (172,977 | ) | | $ | — | | | $ | (172,977 | ) | | $ | — | |
| * | See Schedule of Investments for a summary of the industry exposure as grouped according to the Global Industry Classification Standard (GICS), which is an industry taxonomy developed by MSCI, Inc. and Standard & Poor’s (S&P). |
| ** | Other Financial Instruments include investments not reflected in the Schedule of Investments, which may include futures, forwards and swap contracts, which are valued at the unrealized appreciation (depreciation) on the investment. |
| (a) | At March 31, 2015, industry classifications for Preferred Stock in Level 2 consisted of $1,332,300 in Energy, $6,358,188 in Miscellaneous, and $2,893,569 in Telecommunication Services. |
| (b) | In accordance with the guidance prescribed in Accounting Standards update (“ASU”) No. 2011-04, unadjusted broker quotes were applied to portfolio securities characterized as Level 3 investments totaling $21,745,529 in market value at March 31, 2015. The following table displays a summary of the valuation techniques and unobservable inputs used to value portfolio securities characterized as Level 3 investments, where no unadjusted broker quotes were available at March 31, 2015. |
| | | | | | | | | | |
| | | Fair Value at | | | Valuation | | Unobservable | | Range |
| | | March 31, 2015 | | | Technique(s) | | Input | | (Weighted Average) |
Common Stock | | $ | 0 | | | Terms of plan reorganization | | Discount to zero for lack of
marketability and
company sustainability in
question | | N/A (N/A) |
Corporate Bonds | | | 9,346,556 | | | Discounted cash flows | | Third party vendor
projection of discounted
cash flows | | 5.70% - 13.50% (9.60%) |
Mortgage Backed | | | 575,405 | | | Yield method | | Yield | | 5.0% (N/A) |
Loan Participations | | | 13,960,228 | | | Discounted cash flows | | Third party vendor
projection of discounted
cash flows | | 8.30% - 10.00% (9.22%) |
Asset Backed Securities | | | 7,461,546 | | | Discounted cash flows | | Third party vendor
projection of discounted
cash flows | | 3.80% - 4.50% (4.15%) |
| | | | | | | | | | |
Total | | $ | 31,343,735 | | | | | | | |
In accordance with the guidance prescribed in ASU No. 2011-04, it is the policy of the Fund to recognize transfers between levels and those underlying events which caused the movement. The Fund recognized no transfers between Levels 1 and 2 for the six months ended March 31, 2015, other than when the Fund exceeded market volatility thresholds for foreign equity investments during the period.
Semi-Annual Report 25
| | |
| NOTES TO FINANCIAL STATEMENTS, CONTINUED | | |
| |
Thornburg Strategic Income Fund | | March 31, 2015 (Unaudited) |
A rollforward of fair value measurements using significant unobservable inputs (Level 3) for the six months ended March 31, 2015 is as follows:
| | | | | | | | | | | | | | | | | | | | | | | | |
| | | Asset Backed
Securities | | | Common
Stock | | | Corporate
Bonds | | | Mortgage
Backed | | | Other
Securities | | | Total(d) | |
Beginning Balance 9/30/2014 | | $ | 27,741,284 | | | $ | — | | | $ | 16,651,104 | | | $ | 806,724 | | | $ | 17,446,134 | | | $ | 62,645,246 | |
Accrued Discounts (Premiums) | | | 6,018 | | | | — | | | | 21,908 | | | | (1,201 | ) | | | 21,321 | | | | 48,046 | |
Net Realized Gain (Loss)(a) | | | 49,473 | | | | — | | | | (281,008 | ) | | | (5,849 | ) | | | (209 | ) | | | (237,593 | ) |
Gross Purchases | | | 10,025,000 | | | | — | | | | — | | | | — | | | | 2,431,980 | | | | 12,456,980 | |
Gross Sales | | | (14,942,593 | ) | | | — | | | | (6,300,082 | ) | | | (232,472 | ) | | | (8,262,446 | ) | | | (29,737,593 | ) |
Net Change in Unrealized Appreciation (Depreciation)(b)(e) | | | 207,893 | | | | — | | | | (745,366 | ) | | | 8,203 | | | | (330,033 | ) | | | (859,303 | ) |
Transfers into Level 3(c) | | | — | | | | — | | | | — | | | | — | | | | 8,773,481 | | | | 8,773,481 | |
Transfers out of Level 3(c) | | | — | | | | — | | | | — | | | | — | | | | — | | | | — | |
| | | | | | | | | | | | | | | | | | | | | | | | |
Ending Balance 3/31/2015 | | $ | 23,087,075 | | | $ | — | | | $ | 9,346,556 | | | $ | 575,405 | | | $ | 20,080,228 | | | $ | 53,089,264 | |
| (a) | Amount of Net Realized Gain (Loss) recognized in the net increase in net assets resulting from operations is included in the Fund’s Statement of Operations for the six months ended March 31, 2015. |
| (b) | Amount of Net Change in Unrealized Appreciation (Depreciation) recognized in the net increase in net assets resulting from operations is included in the Fund’s Statement of Operations for the six months ended March 31, 2015. |
| (c) | Transfers into or out of Level 3 were out of or into Level 2, and were due to changes in other significant observable inputs available during the six months ended March 31, 2015. Transfers into or out of Level 3 are based on the beginning market value of the period in which they occurred. |
| (d) | Level 3 investments represent 4.02% of total Net Assets at March 31, 2015. Significant fluctuations of the unobservable inputs applied to portfolio investments characterized as Level 3 could be expected to increase or decrease the fair value of these portfolio investments. |
| (e) | The Net Change in Unrealized Appreciation (Depreciation) attributable to securities owned at March 31, 2015, which were valued using significant unobservable inputs was $(992,053). This is included within net change in unrealized appreciation (depreciation) on investments within the Statement of Operations. |
Foreign Currency Translation: Portfolio investments and other assets and liabilities denominated in foreign currencies are translated into U.S. dollars based on the exchange rate of such currencies against the U.S. dollar on the date of valuation. Purchases and sales of investments and income items denominated in foreign currencies are translated into U.S. dollars at the exchange rate in effect on the transaction date. When the Fund purchases or sells foreign investments, it will customarily enter into a foreign exchange contract to minimize foreign exchange risk from the trade date to the settlement date of such transactions. The values of such spot contracts are included in receivable for investments sold and payable for investments purchased on the Statement of Assets and Liabilities.
The Fund does not separately report the effect of changes in foreign exchange rates from changes in market prices on investments held. Such changes are included in net unrealized appreciation or depreciation from investments.
Reported net realized gains or losses from foreign currency transactions arise due to purchases and sales of foreign currencies, currency gains or losses realized between the trade and settlement dates on investment transactions and the difference between the amounts of dividends, interest, and foreign withholding taxes recorded on the Fund’s books, and the U.S. dollar equivalent of the amounts actually received or paid.
Net change in unrealized appreciation and depreciation on foreign currency translations arise from changes in the fair value of assets and liabilities, other than investments at fiscal period end, resulting from changes in exchange rates.
Foreign Withholding Taxes: The Fund is subject to foreign tax withholding imposed by certain foreign countries in which the Fund may invest. Withholding taxes are incurred on certain foreign dividends and are accrued at the time the dividend is recognized based on applicable foreign tax law. The Fund files withholding tax reclaims in certain jurisdictions to recover a portion of amounts previously withheld, in view of various considerations, including recent decisions rendered by the courts in those and other jurisdictions. The Fund would expect to record a receivable for such a reclaim based on a variety of factors, including assessments of a jurisdiction’s legal obligation to pay reclaims, the jurisdiction’s administrative practices and payment history, and industry convention. To date the Fund has recorded no such receivable because there is no precedent for collecting such prior year reclaims and the likelihood of collection remains uncertain.
Deferred Foreign Capital Gain Taxes: The Fund is subject to a tax imposed on net realized gains of securities of certain foreign countries. The Fund records an estimated deferred tax liability for net unrealized gains on these investments as reflected in the accompanying financial statements.
26 Semi-Annual Report
| | |
| NOTES TO FINANCIAL STATEMENTS, CONTINUED | | |
| |
Thornburg Strategic Income Fund | | March 31, 2015 (Unaudited) |
Federal Income Taxes: It is the policy of the Trust to comply with the provisions of the Internal Revenue Code applicable to “regulated investment companies” and to distribute to shareholders substantially all taxable income, including any net realized gain on investments of the Fund. Therefore, no provision for federal income taxes is required.
Management reviews each uncertain tax position believed to be material to the preparation of the Fund’s financial statements, to assess if it is more likely than not that the position would be sustained upon examination, based upon the technical merits of the position. As of March 31, 2015, management has not identified any such position for which an asset or liability must be reflected in the Statement of Assets and Liabilities. The Fund’s tax returns remain subject to examination for three years after filing.
When-Issued and Delayed Delivery Transactions: The Fund may engage in when-issued or delayed delivery transactions. To the extent the Fund engages in such transactions, it will do so for the purpose of acquiring portfolio investments consistent with the Fund’s investment objectives and not for the purpose of investment leverage or to speculate on interest rate and/or market changes. At the time the Fund makes a commitment to purchase an investment on a when-issued or delayed delivery basis, the Fund will record the transaction and reflect the value in determining its net asset value. When effecting such transactions, assets of an amount sufficient to make payment for the portfolio investments to be purchased will be segregated on the Fund’s records on the trade date. Investments purchased on a when-issued or delayed delivery basis do not earn interest until the settlement date.
Dividends: Dividends to shareholders, if any, are generally paid monthly and are reinvested in additional shares of the Fund at net asset value per share at the close of business on the dividend payment date or, at the shareholder’s option, paid in cash. Net realized capital gains, to the extent available, will be distributed at least annually. Distributions to shareholders are based on income tax regulations and therefore, their characteristics may differ for financial statement and tax purposes.
Repurchase Agreements: The Fund may invest excess cash in repurchase agreements whereby the Fund purchases investments, which serve as collateral, with an agreement to resell such collateral to the seller at an agreed upon price at the maturity date of the repurchase agreement. Investments pledged as collateral for repurchase agreements are held in custody until maturity of the repurchase agreement. Provisions in the agreements require that the market value of the collateral is at least equal to the repurchase value in the event of default. In the event of default, the Fund has the right to liquidate the collateral and apply the proceeds in satisfaction of the obligation. Under certain circumstances, in the event of default or bankruptcy by the other party to the agreement, realization and/or retention of the collateral may be subject to legal proceedings.
Unfunded Loan Commitments: The Fund has entered into a loan commitment with Valores Corporativos Softek. At March 31, 2015, $6,181,818 of the $8,000,000 par commitment had been funded and maturity date is August 27, 2019.
Bridge Participation Commitments: On March 27, 2015, the Fund executed a Bridge Participation Commitment Letter to JPMorgan Chase Bank N.A. The Fund has committed to provide for up to $4,000,000 in aggregate principal. The termination date for this commitment is July 15, 2015. No amount of this commitment is funded and the commitment is not reflected in the Fund’s Statement of Assets and Liabilities.
General: Investment transactions are accounted for on a trade date basis. Interest income is accrued as earned and dividend income is recorded on the ex-dividend date. Certain income from foreign investments is recognized as soon as information is available to the Fund. Realized gains and losses from the sale of investments are recorded on an identified cost basis. Net investment income (other than class specific expenses) and realized and unrealized gains and losses are allocated daily to each class of shares based upon the relative net asset value of outstanding shares of each class of shares at the beginning of the day (after adjusting for the current share activity of the respective class). Expenses common to all Funds are allocated among the Funds comprising the Trust based upon their relative net asset values or other appropriate allocation methods.
Guarantees and Indemnifications: Under the Trust’s organizational documents (and under separate agreements with the independent Trustees), its officers and Trustees are indemnified against certain liabilities arising out of the performance of their duties to the Fund. Additionally, in the normal course of business the Trust enters into contracts with service providers that contain general indemnification clauses. The Trust’s maximum exposure under these arrangements is unknown. However, based on experience, the Trust expects the risk of loss to be remote.
NOTE 3 – INVESTMENT ADVISORY FEE AND OTHER TRANSACTIONS WITH AFFILIATES
Pursuant to an investment advisory agreement, Thornburg Investment Management, Inc. (the “Advisor”) serves as the investment advisor and performs services for the Fund for which the fees are payable at the end of each month. For the six months ended March 31, 2015, these fees were payable at annual rates ranging from .75 of 1% to .50 of 1% per annum of the average daily net assets of the Fund depending on the Fund’s asset size. The Trust also has entered into administrative services agreements with the Advisor, whereby the Advisor will perform certain administrative services for the shareholders of each class of the Fund’s shares, and for which fees will be payable at an annual rate of up to .125 of 1% per annum of the average daily net assets attributable to each class of shares.
Semi-Annual Report 27
| | |
| NOTES TO FINANCIAL STATEMENTS, CONTINUED | | |
| |
Thornburg Strategic Income Fund | | March 31, 2015 (Unaudited) |
The Trust has an underwriting agreement with Thornburg Securities Corporation (the “Distributor,” an affiliate of the Advisor), which acts as the distributor of the Fund’s shares. For the six months ended March 31, 2015, the Distributor has advised the Fund that it earned commissions aggregating $73,208 from the sale of Class A shares, and collected contingent deferred sales charges aggregating $36,358 from redemptions of Class C shares of the Fund.
Pursuant to a service plan under Rule 12b-1 of the Investment Company Act of 1940, the Fund may reimburse to the Advisor an amount not to exceed .25 of 1% per annum of the average daily net assets attributable to each class of shares of the Fund for payments made by the Advisor to securities dealers and other financial institutions to obtain various shareholder and distribution related services. For the six months ended March 31, 2015, there were no 12b-1 service plan fees charged for Class I shares. The Advisor may pay out of its own resources additional expenses for distribution of the Fund’s shares and shareholder services.
The Trust has also adopted a distribution plan pursuant to Rule 12b-1, applicable only to the Fund’s Class C shares, under which the Fund compensates the Distributor for services in promoting the sale of Class C and Class R3 shares of the Fund at an annual rate of up to .75 of 1% per annum of the average daily net assets attributable to Class C shares and an annual rate of .25 of 1% of the average daily net assets attributable to Class R3 shares. Total fees incurred by each class of shares of the Fund under their respective service and distribution plans for the six months ended March 31, 2015, are set forth in the Statement of Operations.
The Advisor and Distributor have contractually agreed to waive fees and reimburse expenses incurred by the Fund so that actual expenses of certain share classes do not exceed levels as specified in the Fund’s most recent prospectuses. The agreement may be terminated by the Fund at any time, but may not be terminated by the Advisor or Distributor before February 1, 2016, unless the Advisor ceases to be the investment advisor to the Fund or the Distributor ceases to be the distributor of the Fund prior to that date. The Advisor and Distributor retain the right to be repaid by the Fund for fee waivers and expense reimbursements if expenses fall below the contractual limit prior to the end of the fiscal year.
For the six months ended March 31, 2015, the Advisor contractually reimbursed certain class specific expenses, administrative fees, and distribution fees of $241,957 for Class C shares, $15,425 for Class R3 shares, $4,869 for Class R4 shares, and $10,682 for Class R5 shares.
The Trust has an agreement with the custodian bank to indirectly pay a portion of the custodian’s fees through credits earned by the Fund’s cash on deposit with the bank. This deposit agreement is an alternative to overnight investments. Custodial fees are adjusted to reflect amounts that would have been paid without this agreement, with a corresponding adjustment reflected as fees paid indirectly in the Statement of Operations. For the six months ended March 31, 2015, fees paid indirectly were $1,189.
Certain officers and Trustees of the Trust are also officers or directors of the Advisor and Distributor. The compensation of independent Trustees is borne by the Trust.
NOTE 4 – SHARES OF BENEFICIAL INTEREST
At March 31, 2015, there were an unlimited number of shares with no par value of beneficial interest authorized. Transactions in shares of beneficial interest were as follows:
| | | | | | | | | | | | | | | | |
| | | Six Months Ended
March 31, 2015 (Unaudited) | | | Year Ended
September 30, 2014 (Audited) | |
| | | Shares | | | Amount | | | Shares | | | Amount | |
Class A Shares | | | | | | | | | | | | | | | | |
Shares sold | | | 6,050,275 | | | $ | 71,995,975 | | | | 18,515,650 | | | $ | 225,983,883 | |
Shares issued to shareholders in reinvestment of dividends | | | 953,168 | | | | 11,314,330 | | | | 1,512,030 | | | | 18,371,710 | |
Shares repurchased | | | (6,551,487 | ) | | | (77,649,241 | ) | | | (8,402,986 | ) | | | (102,514,407 | ) |
| | | | | | | | | | | | | | | | |
| | | | |
Net increase (decrease) | | | 451,956 | | | $ | 5,661,064 | | | | 11,624,694 | | | $ | 141,841,186 | |
| | | | | | | | | | | | | | | | |
| | | | |
Class C Shares | | | | | | | | | | | | | | | | |
Shares sold | | | 3,987,463 | | | $ | 47,437,765 | | | | 12,164,015 | | | $ | 148,392,875 | |
Shares issued to shareholders in reinvestment of dividends | | | 717,831 | | | | 8,511,380 | | | | 1,169,485 | | | | 14,180,200 | |
Shares repurchased | | | (4,224,931 | ) | | | (49,836,379 | ) | | | (4,185,267 | ) | | | (50,937,250 | ) |
| | | | | | | | | | | | | | | | |
| | | | |
Net increase (decrease) | | | 480,363 | | | $ | 6,112,766 | | | | 9,148,233 | | | $ | 111,635,825 | |
| | | | | | | | | | | | | | | | |
28 Semi-Annual Report
| | |
| NOTES TO FINANCIAL STATEMENTS, CONTINUED | | |
| |
Thornburg Strategic Income Fund | | March 31, 2015 (Unaudited) |
| | | | | | | | | | | | | | | | |
| | | Six Months Ended
March 31, 2015 (Unaudited) | | | Year Ended
September 30, 2014 (Audited) | |
| | | Shares | | | Amount | | | Shares | | | Amount | |
| | | | |
Class I Shares | | | | | | | | | | | | | | | | |
Shares sold | | | 14,329,204 | | | $ | 169,779,636 | | | | 31,367,129 | | | $ | 382,209,495 | |
Shares issued to shareholders in reinvestment of dividends | | | 1,324,048 | | | | 15,675,053 | | | | 1,530,876 | | | | 18,590,355 | |
Shares repurchased | | | (10,821,482 | ) | | | (127,488,077 | ) | | | (7,726,042 | ) | | | (94,215,372 | ) |
| | | | | | | | | | | | | | | | |
| | | | |
Net increase (decrease) | | | 4,831,770 | | | $ | 57,966,612 | | | | 25,171,963 | | | $ | 306,584,478 | |
| | | | | | | | | | | | | | | | |
| | | | |
Class R3 Shares | | | | | | | | | | | | | | | | |
Shares sold | | | 69,498 | | | $ | 830,795 | | | | 252,491 | | | $ | 3,086,494 | |
Shares issued to shareholders in reinvestment of dividends | | | 8,309 | | | | 98,532 | | | | 4,631 | | | | 56,871 | |
Shares repurchased | | | (122,305 | ) | | | (1,432,729 | ) | | | (20,759 | ) | | | (255,510 | ) |
| | | | | | | | | | | | | | | | |
| | | | |
Net increase (decrease) | | | (44,498 | ) | | $ | (503,402 | ) | | | 236,363 | | | $ | 2,887,855 | |
| | | | | | | | | | | | | | | | |
| | | | |
Class R4 Shares | | | | | | | | | | | | | | | | |
Shares sold | | | 177,914 | | | $ | 2,080,680 | | | | 1,271 | | | $ | 15,250 | |
Shares issued to shareholders in reinvestment of dividends | | | 849 | | | | 9,962 | | | | 35 | | | | 423 | |
Shares repurchased | | | (2,999 | ) | | | (35,023 | ) | | | (21 | ) | | | (261 | ) |
| | | | | | | | | | | | | | | | |
| | | | |
Net increase (decrease) | | | 175,764 | | | $ | 2,055,619 | | | | 1,285 | | | $ | 15,412 | |
| | | | | | | | | | | | | | | | |
| | | | |
Class R5 Shares | | | | | | | | | | | | | | | | |
Shares sold | | | 284,452 | | | $ | 3,349,763 | | | | 226,485 | | | $ | 2,747,416 | |
Shares issued to shareholders in reinvestment of dividends | | | 8,792 | | | | 104,029 | | | | 8,572 | | | | 104,180 | |
Shares repurchased | | | (42,550 | ) | | | (502,521 | ) | | | (24,914 | ) | | | (303,746 | ) |
| | | | | | | | | | | | | | | | |
| | | | |
Net increase (decrease) | | | 250,694 | | | $ | 2,951,271 | | | | 210,143 | | | $ | 2,547,850 | |
| | | | | | | | | | | | | | | | |
NOTE 5 – INVESTMENT TRANSACTIONS
For the six months ended March 31, 2015, the Fund had purchase and sale transactions of investments (excluding short-term investments and U. S. Government obligations) of $302,586,867 and $188,001,159, respectively.
NOTE 6 – INCOME TAXES
At March 31, 2015, information on the tax components of capital was as follows:
| | | | |
Cost of investments for tax purposes | | $ | 1,331,944,391 | |
| | | | |
Gross unrealized appreciation on a tax basis | | $ | 31,639,134 | |
Gross unrealized depreciation on a tax basis | | | (68,297,872 | ) |
| | | | |
Net unrealized appreciation (depreciation) on investments (tax basis) | | $ | (36,658,738 | ) |
| | | | |
NOTE 7 – DERIVATIVE FINANCIAL INSTRUMENTS WITH OFF-BALANCE SHEET RISK AND FOREIGN INVESTMENT RISK
The Fund may use a variety of derivative financial instruments to hedge or adjust the risks affecting its investment portfolio or to enhance investment returns. Provisions of FASB Accounting Standards Codification 815-10-50 (“ASC 815”), require certain disclosures. The disclosures are intended to provide users of financial statements with an understanding of the use of derivative instruments by the Fund and how these derivatives affect the financial position, financial performance and cash flows of the Fund. The Fund does not designate any derivative instruments as hedging instruments under ASC 815. During the six months ended March 31, 2015, the Fund’s principal exposure to derivative financial instruments of the type addressed by ASC 815 was investment in foreign exchange contracts. A foreign exchange contract is an agreement between two parties to exchange different currencies at a specified rate of exchange
Semi-Annual Report 29
| | |
| NOTES TO FINANCIAL STATEMENTS, CONTINUED | | |
| |
Thornburg Strategic Income Fund | | March 31, 2015 (Unaudited) |
at an agreed upon future date. Foreign exchange contracts involve risks to the Fund, including the risk that a contract’s counterparty will not meet its obligations to the Fund, the risk that a change in a contract’s value may not correlate perfectly with the currency the contract was intended to track, and the risk that the advisor is unable to correctly implement its strategy in using a contract. In any such instance, the Fund may not achieve the intended benefit of entering into a contract, and may experience a loss. Additionally, the Fund’s risk of loss may exceed the amounts recognized on the Statement of Assets and Liabilities.
The Fund entered into forward currency contracts during the six months ended March 31, 2015 in the normal course of pursuing its investment objectives, with the objective of reducing the risk to the value of the Fund’s foreign investments from adverse changes in the relationship between the U.S. dollar and foreign currencies. In each case these contracts have been initiated in conjunction with foreign investment transactions.
These contracts are accounted for by the Fund under ASC 815. Unrealized appreciation and depreciation on outstanding contracts are reported in the Fund’s Statement of Assets and Liabilities, as measured by the difference between the forward exchange rates at the reporting date and the forward exchange rates at each contract’s inception date. Net realized gain (loss) on contracts closed during the period, and changes in net unrealized appreciation (depreciation) on outstanding contracts are recognized in the Fund’s Statement of Operations. The average value of open sell currency contracts for the six months ended March 31, 2015 was $22,273,262. Open buy currency contracts are entered into for the purpose of closing open sell currency contracts and the values are dependent upon the values of the open sell currency contracts to which they relate.
The following table displays the outstanding forward currency contracts at March 31, 2015:
| | | | | | | | | | | | | | | | | | | | | | | | |
| | | Outstanding Forward Currency Contracts to Buy or Sell at March 31, 2015 | |
Contract Description | | Buy/Sell | | | Contract
Amount | | | Contract
Value Date | | | Value Usd | | | Unrealized
Appreciation | | | Unrealized
Depreciation | |
Euro | | | Sell | | | | 7,958,500 | | | | 8/17/2015 | | | | 8,574,843 | | | $ | 530,238 | | | $ | — | |
Great Britain Pound | | | Sell | | | | 5,135,600 | | | | 6/11/2015 | | | | 7,614,503 | | | | 411,926 | | | | — | |
Great Britain Pound | | | Buy | | | | 5,135,600 | | | | 6/11/2015 | | | | 7,614,503 | | | | — | | | | (172,977 | ) |
| | | | | | | | | | | | | | | | | | | | | | | | |
Total | | | | | | | | | | | | | | | | | | $ | 942,164 | | | $ | (172,977 | ) |
| | | | | | | | | | | | | | | | | | | | | | | | |
Net unrealized appreciation (depreciation) | | | | | | | | | | | | | | | | | | $ | 769,187 | | | | | |
| | | | | | | | | | | | | | | | | | | | | | | | |
Certain forward currency contracts were entered into with State Street Bank and Trust Company (“SSB”) pursuant to an International Swaps and Derivatives Association (“ISDA”) Master Agreement. In the event of a default or termination under the ISDA Master Agreement with SSB, the non-defaulting party has the right to close out all outstanding forward currency contracts between the parties and to net any payment amounts under those contracts, resulting in a single net amount payable by one party to the other. Because the ISDA Master Agreement with SSB does not result in an offset of reported amounts of financial assets and financial liabilities in the Fund’s Statement of Assets and Liabilities unless there has been an event of default or termination event under that agreement, the Fund does not net its outstanding forward currency contracts for purposes of the disclosure in the Fund’s Statement of Assets and Liabilities. Instead the Fund recognizes the unrealized appreciation or depreciation on those forward currency contracts on a gross basis in the Fund’s Statement of Assets and Liabilities. At March 31, 2015, those recognized amounts are disclosed in the following table:
| | | | | | |
Fair Values of Derivative Financial Instruments at March 31, 2015 | |
| Asset Derivatives | | Balance Sheet Location | | Fair Value | |
Foreign exchange contracts | | Assets - Unrealized appreciation on forward currency contracts | | $ | 942,164 | |
| | |
| Liability Derivatives | | Balance Sheet Location | | Fair Value | |
Foreign exchange contracts | | Liabilities - Unrealized depreciation on forward currency contracts | | $ | (172,977 | ) |
Because the Fund does not currently receive or post cash collateral in connection with its currency forward contracts, and because all of the Fund’s outstanding currency forward contracts are with State Street Bank and Trust Company, the net amounts of the Fund’s assets and liabilities which are attributable to those contracts at March 31, 2015 can be determined by offsetting the dollar amounts shown in the preceding table. Based on those amounts, the net amount of the Fund’s assets which is attributable to its outstanding forward currency contracts at March 31, 2015 is $769,187, and the net amount of the Fund’s liabilities which is attributable to those contracts at that date is $0. The Fund’s forward currency contracts are valued each day, and the net amounts of the Fund’s assets and liabilities which are attributable to those contracts are expected to vary over time.
30 Semi-Annual Report
| | |
| NOTES TO FINANCIAL STATEMENTS, CONTINUED | | |
| |
Thornburg Strategic Income Fund | | March 31, 2015 (Unaudited) |
The net realized gain (loss) from forward currency contracts and the net change in unrealized appreciation (depreciation) on outstanding forward currency contracts recognized in the Fund’s Statement of Operations for the six months ended March 31, 2015 are disclosed in the following tables:
| | | | | | | | | | |
Net Realized Gain (Loss) from Derivative Financial Instruments | |
Recognized in Income for the Six Months Ended March 31, 2015 | |
| | | Total | | | | | Forward Currency Contracts | |
Foreign exchange contracts | | $ | 2,767,898 | | | | | $ | 2,767,898 | |
|
Net Change in Unrealized Appreciation (Depreciation) on Derivative Financial Instruments Recognized in Income for the Six Months Ended March 31, 2015 | |
| | | Total | | | | | Forward Currency Contracts | |
Foreign exchange contracts | | $ | (469,432 | ) | | | | $ | (469,432 | ) |
OTHER NOTES
Risks: The Fund’s investments subject it to risks including, but not limited to, credit risk, interest rate risk, prepayment risk, management risk, market and economic risk, liquidity risk, risks affecting specific issuers, and the risks associated with investments in derivative instruments, small- and mid-cap companies, non-U.S. issuers, real estate investment trusts, below investment grade debt obligations, and structured finance arrangements. Please see the Fund’s prospectus for a discussion of the risks associated with an investment in the Fund.
Subsequent Events: Fund management believes no events have occurred between March 31, 2015 and the date of issuance of the financial statements that require adjustment to or disclosure in the accompanying financial statements.
Semi-Annual Report 31
FINANCIAL HIGHLIGHTS
Thornburg Strategic Income Fund
| | | | | | | | | | | | | | | | | | | | | | | | | | | | | | | | | | | | | | | | | | | | | | | | | | | | | | |
| | | PER SHARE PERFORMANCE (for A Share outstanding throughout the
period)+ | | | RATIOS TO AVERAGE NET ASSETS | | | SUPPLEMENTAL DATA | |
Unless Otherwise Noted, Periods are Fiscal Years Ended Sept. 30, | | Net Asset
Value
Beginning
of
Period | | | Net
Investment
Income
(Loss) | | Net
Realized
&
Unrealized
Gain
(Loss)
on
Investments | | | Total
From
Investment
Operations | | | Dividends
From
Net
Investment
Income | | | Dividends
From Net
Realized
Gains | | Total
Dividends | | | Net
Asset
Value
End
of
Period | | | Net
Investment
Income
(Loss)
(%) | | | Expenses,
After
Expense
Reductions
(%) | | | Expenses,
After
Expense
Reductions
and
Net of
Custody
Credits
(%) | | | Expenses,
Before
Expense
Reductions
(%) | | | Total
Return
(%)(a) | | | Portfolio
Turnover Rate
(%)(a) | | Net
Assets
at
End
of
period
(thousands) | |
Class A Shares | | | | | | | | | | | | | | | | | | | | | | | | | | | | | | | | | | | | | | | | | | | | | | | | |
2015(b)(c) | | $ | 12.18 | | | 0.23 | | | (0.33 | ) | | | (0.10 | ) | | | (0.23 | ) | | (0.15) | | | (0.38 | ) | | $ | 11.70 | | | | 3.95 | (d) | | | 1.21 | (d) | | | 1.21 | (d) | | | 1.21 | (d) | | | (0.87 | ) | | 17.52 | | $ | 382,371 | |
2014(c) | | $ | 12.19 | | | 0.52 | | | 0.28 | | | | 0.80 | | | | (0.54 | ) | | (0.27) | | | (0.81 | ) | | $ | 12.18 | | | | 4.30 | | | | 1.22 | | | | 1.22 | | | | 1.24 | | | | 6.79 | | | 51.20 | | $ | 392,604 | |
2013(c) | | $ | 12.28 | | | 0.67 | | | 0.03 | | | | 0.70 | | | | (0.65 | ) | | (0.14) | | | (0.79 | ) | | $ | 12.19 | | | | 5.44 | | | | 1.25 | | | | 1.25 | | | | 1.27 | | | | 5.79 | | | 76.47 | | $ | 251,106 | |
2012(c) | | $ | 11.86 | | | 0.71 | | | 0.73 | | | | 1.44 | | | | (0.74 | ) | | (0.28) | | | (1.02 | ) | | $ | 12.28 | | | | 5.97 | | | | 1.25 | | | | 1.25 | | | | 1.31 | | | | 12.73 | | | 34.54 | | $ | 199,770 | |
2011(c) | | $ | 12.35 | | | 0.79 | | | (0.21 | ) | | | 0.58 | | | | (0.79 | ) | | (0.28) | | | (1.07 | ) | | $ | 11.86 | | | | 6.47 | | | | 1.20 | | | | 1.20 | | | | 1.32 | | | | 4.78 | | | 48.09 | | $ | 115,704 | |
2010(c) | | $ | 11.63 | | | 0.81 | | | 0.77 | | | | 1.58 | | | | (0.81 | ) | | (0.05) | | | (0.86 | ) | | $ | 12.35 | | | | 6.86 | | | | 1.25 | | | | 1.25 | | | | 1.35 | | | | 14.07 | | | 38.87 | | $ | 83,822 | |
Class C Shares | | | | | | | | | | | | | | | | | | | | | | | | | | | | | | | | | | | | | | | | | | | | | | | | |
2015(b) | | $ | 12.17 | | | 0.20 | | | (0.34 | ) | | | (0.14 | ) | | | (0.19 | ) | | (0.15) | | | (0.34 | ) | | $ | 11.69 | | | | 3.35 | (d) | | | 1.80 | (d) | | | 1.80 | (d) | | | 1.94 | (d) | | | (1.16 | ) | | 17.52 | | $ | 340,169 | |
2014 | | $ | 12.17 | | | 0.45 | | | 0.29 | | | | 0.74 | | | | (0.47 | ) | | (0.27) | | | (0.74 | ) | | $ | 12.17 | | | | 3.73 | | | | 1.80 | | | | 1.80 | | | | 1.98 | | | | 6.27 | | | 51.20 | | $ | 348,334 | |
2013 | | $ | 12.26 | | | 0.60 | | | 0.03 | | | | 0.63 | | | | (0.58 | ) | | (0.14) | | | (0.72 | ) | | $ | 12.17 | | | | 4.88 | | | | 1.80 | | | | 1.80 | | | | 2.02 | | | | 5.21 | | | 76.47 | | $ | 237,177 | |
2012 | | $ | 11.84 | | | 0.64 | | | 0.73 | | | | 1.37 | | | | (0.67 | ) | | (0.28) | | | (0.95 | ) | | $ | 12.26 | | | | 5.42 | | | | 1.79 | | | | 1.79 | | | | 2.05 | | | | 12.15 | | | 34.54 | | $ | 188,782 | |
2011 | | $ | 12.34 | | | 0.72 | | | (0.22 | ) | | | 0.50 | | | | (0.72 | ) | | (0.28) | | | (1.00 | ) | | $ | 11.84 | | | | 5.86 | | | | 1.80 | | | | 1.80 | | | | 2.07 | | | | 4.11 | | | 48.09 | | $ | 106,684 | |
2010 | | $ | 11.62 | | | 0.75 | | | 0.77 | | | | 1.52 | | | | (0.75 | ) | | (0.05) | | | (0.80 | ) | | $ | 12.34 | | | | 6.31 | | | | 1.80 | | | | 1.80 | | | | 2.12 | | | | 13.48 | | | 38.87 | | $ | 81,841 | |
Class I Shares | | | | | | | | | | | | | | | | | | | | | | | | | | | | | | | | | | | | | | | | | | | | | | | | |
2015(b) | | $ | 12.16 | | | 0.25 | | | (0.33 | ) | | | (0.08 | ) | | | (0.25 | ) | | (0.15) | | | (0.40 | ) | | $ | 11.68 | | | | 4.30 | (d) | | | 0.86 | (d) | | | 0.86 | (d) | | | 0.86 | (d) | | | (0.70 | ) | | 17.52 | | $ | 586,753 | |
2014 | | $ | 12.17 | | | 0.56 | | | 0.28 | | | | 0.84 | | | | (0.58 | ) | | (0.27) | | | (0.85 | ) | | $ | 12.16 | | | | 4.60 | | | | 0.90 | | | | 0.90 | | | | 0.90 | | | | 7.15 | | | 51.20 | | $ | 552,182 | |
2013 | | $ | 12.25 | | | 0.70 | | | 0.04 | | | | 0.74 | | | | (0.68 | ) | | (0.14) | | | (0.82 | ) | | $ | 12.17 | | | | 5.75 | | | | 0.94 | | | | 0.94 | | | | 0.94 | | | | 6.21 | | | 76.47 | | $ | 246,332 | |
2012 | | $ | 11.83 | | | 0.74 | | | 0.73 | | | | 1.47 | | | | (0.77 | ) | | (0.28) | | | (1.05 | ) | | $ | 12.25 | | | | 6.27 | | | | 0.96 | | | | 0.96 | | | | 0.97 | | | | 13.06 | | | 34.54 | | $ | 191,090 | |
2011 | | $ | 12.35 | | | 0.83 | | | (0.20 | ) | | | 0.63 | | | | (0.87 | ) | | (0.28) | | | (1.15 | ) | | $ | 11.83 | | | | 6.71 | | | | 0.97 | | | | 0.97 | | | | 0.98 | | | | 5.16 | | | 48.09 | | $ | 99,594 | |
2010 | | $ | 11.64 | | | 0.85 | | | 0.75 | | | | 1.60 | | | | (0.84 | ) | | (0.05) | | | (0.89 | ) | | $ | 12.35 | | | | 7.13 | | | | 0.98 | | | | 0.98 | | | | 1.00 | | | | 14.27 | | | 38.87 | | $ | 73,011 | |
Class R3 Shares | | | | | | | | | | | | | | | | | | | | | | | | | | | | | | | | | | | | | | | | | | | | | | | | |
2015(b) | | $ | 12.18 | | | 0.23 | | | (0.35 | ) | | | (0.12 | ) | | | (0.22 | ) | | (0.15) | | | (0.37 | ) | | $ | 11.69 | | | | 3.91 | (d) | | | 1.25 | (d) | | | 1.25 | (d) | | | 2.15 | (d) | | | (0.98 | ) | | 17.52 | | $ | 2,408 | |
2014 | | $ | 12.19 | | | 0.49 | | | 0.31 | | | | 0.80 | | | | (0.54 | ) | | (0.27) | | | (0.81 | ) | | $ | 12.18 | | | | 4.10 | | | | 1.25 | | | | 1.25 | | | | 3.10 | | | | 6.76 | | | 51.20 | | $ | 3,049 | |
2013 | | $ | 12.28 | | | 0.63 | | | 0.06 | | | | 0.69 | | | | (0.64 | ) | | (0.14) | | | (0.78 | ) | | $ | 12.19 | | | | 5.19 | | | | 1.25 | | | | 1.25 | | | | 32.64 | (e) | | | 5.78 | | | 76.47 | | $ | 171 | |
2012(f) | | $ | 12.03 | | | 0.30 | | | 0.25 | | | | 0.55 | | | | (0.30 | ) | | — | | | (0.30 | ) | | $ | 12.28 | | | | 5.93 | (d) | | | 1.22 | (d) | | | 1.22 | (d) | | | 373.07 | (d)(e) | | | 4.63 | | | 34.54 | | $ | 11 | |
Class R4 Shares | | | | | | | | | | | | | | | | | | | | | | | | | | | | | | | | | | | | | | | | | | | | | | | | |
2015(b) | | $ | 12.18 | | | 0.24 | | | (0.35 | ) | | | (0.11 | ) | | | (0.22 | ) | | (0.15) | | | (0.37 | ) | | $ | 11.70 | | | | 4.17 | (d) | | | 1.25 | (d) | | | 1.25 | (d) | | | 2.56 | (d) | | | (0.89 | ) | | 17.52 | | $ | 2,071 | |
2014(g) | | $ | 12.00 | | | 0.35 | | | 0.17 | | | | 0.52 | | | | (0.34 | ) | | — | | | (0.34 | ) | | $ | 12.18 | | | | 4.25 | (d) | | | 1.25 | (d) | | | 1.25 | (d) | | | 60.66 | (d)(e) | | | 4.29 | | | 51.20 | | $ | 16 | |
Class R5 Shares | | | | | | | | | | | | | | | | | | | | | | | | | | | | | | | | | | | | | | | | | | | | | | | | |
2015(b) | | $ | 12.15 | | | 0.25 | | | (0.34 | ) | | | (0.09 | ) | | | (0.24 | ) | | (0.15) | | | (0.39 | ) | | $ | 11.67 | | | | 4.21 | (d) | | | 0.99 | (d) | | | 0.99 | (d) | | | 1.57 | (d) | | | (0.77 | ) | | 17.52 | | $ | 5,390 | |
2014 | | $ | 12.16 | | | 0.55 | | | 0.28 | | | | 0.83 | | | | (0.57 | ) | | (0.27) | | | (0.84 | ) | | $ | 12.15 | | | | 4.51 | | | | 0.99 | | | | 0.99 | | | | 2.11 | | | | 7.05 | | | 51.20 | | $ | 2,565 | |
2013 | | $ | 12.25 | | | 0.70 | | | 0.03 | | | | 0.73 | | | | (0.68 | ) | | (0.14) | | | (0.82 | ) | | $ | 12.16 | | | | 5.68 | | | | 0.99 | | | | 0.99 | | | | 227.33 | (e) | | | 6.07 | | | 76.47 | | $ | 11 | |
2012(f) | | $ | 12.00 | | | 0.31 | | | 0.25 | | | | 0.56 | | | | (0.31 | ) | | — | | | (0.31 | ) | | $ | 12.25 | | | | 6.22 | (d) | | | 0.97 | (d) | | | 0.97 | (d) | | | 372.35 | (d)(e) | | | 4.75 | | | 34.54 | | $ | 11 | |
| (a) | Not annualized for periods less than one year. |
| (b) | Unaudited Six Month Period Ended March 31. |
| (c) | Sales loads are not reflected in computing total return. |
| (e) | Due to the size of net assets and fixed expenses, ratios may appear disproportionate. |
| (f) | Effective date of this class of shares was May 1, 2012. |
| (g) | Effective date of this class of shares was February 1, 2014. |
| + | Based on weighted average shares outstanding, except for Dividends from Net Investment Income and Net Realized Gains, which are actual amounts per share. |
See notes to financial statements.
| | | | |
| 32 Semi-Annual Report | | | | Semi-Annual Report 33 |
| | |
| EXPENSE EXAMPLE | | |
| |
Thornburg Strategic Income Fund | | March 31, 2015 (Unaudited) |
As a shareholder of the Fund, you incur two types of costs:
| | (1) | transaction costs, including |
(a) sales charges (loads) on purchase payments, for Class A shares;
(b) a deferred sales charge on redemptions of any part or all of a purchase of $1 million of Class A shares within 12 months of purchase;
(c) a deferred sales charge on redemptions of Class C shares within 12 months of purchase;
| | (2) | ongoing costs, including management fees; distribution and/or service (12b-1) fees; and other Fund expenses. |
This example is intended to help you understand your ongoing costs (in dollars) of investing in the Fund and to compare these costs with the ongoing costs of investing in other mutual funds.
The example is based on a $1,000 investment beginning on October 1, 2014, and held until March 31, 2015.
| | | | | | | | | | | | |
| | | Beginning
Account Value
10/1/14 | | | Ending
Account Value
3/31/15 | | | Expenses Paid
During Period†
10/1/14–3/31/15 | |
Class A Shares | | | | | | | | | | | | |
Actual | | $ | 1,000.00 | | | $ | 991.30 | | | $ | 5.98 | |
Hypothetical* | | $ | 1,000.00 | | | $ | 1,018.92 | | | $ | 6.07 | |
Class C Shares | | | | | | | | | | | | |
Actual | | $ | 1,000.00 | | | $ | 988.40 | | | $ | 8.92 | |
Hypothetical* | | $ | 1,000.00 | | | $ | 1,015.96 | | | $ | 9.05 | |
Class I Shares | | | | | | | | | | | | |
Actual | | $ | 1,000.00 | | | $ | 993.00 | | | $ | 4.25 | |
Hypothetical* | | $ | 1,000.00 | | | $ | 1,020.66 | | | $ | 4.31 | |
Class R3 Shares | | | | | | | | | | | | |
Actual | | $ | 1,000.00 | | | $ | 990.20 | | | $ | 6.20 | |
Hypothetical* | | $ | 1,000.00 | | | $ | 1,018.70 | | | $ | 6.29 | |
Class R4 Shares | | | | | | | | | | | | |
Actual | | $ | 1,000.00 | | | $ | 991.10 | | | $ | 6.21 | |
Hypothetical* | | $ | 1,000.00 | | | $ | 1,018.70 | | | $ | 6.29 | |
Class R5 Shares | | | | | | | | | | | | |
Actual | | $ | 1,000.00 | | | $ | 992.30 | | | $ | 4.92 | |
Hypothetical* | | $ | 1,000.00 | | | $ | 1,020.00 | | | $ | 4.99 | |
| † | Expenses are equal to the annualized expense ratio for each class (A: 1.21%; C: 1.80%; I: 0.86% R3: 1.25% R4: 1.25% R5: 0.99%) multiplied by the average account value over the period, multiplied by 182/365 to reflect the one-half year period. |
| * | Hypothetical assumes a rate of return of 5% per year before expenses. |
ACTUAL EXPENSES
For each class of shares, the first line of the accompanying table provides information about actual account values and actual expenses. You may use the information in this line, together with the amount you invested, to estimate the expenses that you paid over the period. Simply divide your account value by $1,000 (for example, an $8,600 account value divided by $1,000 = 8.6), then multiply the result by the number in the first line for your class of shares under the heading entitled “Expenses Paid During Period” to estimate the expenses you paid on your account during this period.
HYPOTHETICAL EXAMPLE FOR COMPARISON PURPOSES
For each class of shares, the second line of the accompanying table provides information about hypothetical account values and hypothetical expenses based on the Fund’s actual expense ratio and an assumed rate of return of 5% per year before expenses, which is not the Fund’s actual return. The hypothetical account values and expenses may not be used to estimate the actual ending account balance or expenses you paid for the period. You may use this information to compare the ongoing costs of investing in the Fund and other funds. To do so, compare this 5% hypothetical example with the 5% hypothetical examples that appear in the shareholder reports of the other funds.
Please note that the expenses shown in the table are meant to highlight your ongoing costs only and do not reflect any transactional costs, such as sales charges (loads), redemption fees, or exchange fees. Therefore, the second line of the table for each class of shares is useful in comparing ongoing costs only, and will not help you determine the relative total costs of owning different funds. In addition, if these transactional costs were included, your costs would have been higher.
34 Semi-Annual Report
| | |
| OTHER INFORMATION | | |
| |
Thornburg Strategic Income Fund | | March 31, 2015 (Unaudited) |
PORTFOLIO PROXY VOTING
Policies and Procedures:
The Trust has delegated to Thornburg Investment Management, Inc. (the “Advisor”) voting decisions respecting proxies for the Fund’s voting securities. The Advisor makes voting decisions in accordance with its Proxy Voting Policy and Procedures. A description of the Policy and Procedures is available (i) without charge, upon request, by calling the Advisor toll-free at 1-800-847-0200, (ii) on the Thornburg website at www.thornburg.com, and (iii) on the Securities and Exchange Commission’s website at www.sec.gov.
Information regarding how proxies were voted is available on or before August 31 of each year for the twelve months ending the preceding June 30. This information is available (i) without charge, upon request by calling the Advisor toll-free at 1-800-847-0200, (ii) on the Thornburg website at www.thornburg.com, and (iii) on the Securities and Exchange Commission’s website at www.sec.gov.
AVAILABILITY OF QUARTERLY PORTFOLIO SCHEDULE
The Fund files with the Securities and Exchange Commission schedules of its portfolio holdings on Form N-Q for the first and third quarters of each fiscal year. The Fund’s Forms N-Q are available on the Commission’s website at www.sec.gov, or may be reviewed and copied at the Commission’s Public Reference Room in Washington, D.C. Information on the operation of the Public Reference Room may be obtained by calling 1-800-SEC-0330. The Fund also makes this information available on its website at www.thornburg. com/download or upon request by calling 1-800-847-0200.
Semi-Annual Report 35
| | |
| TRUSTEES’ STATEMENT TO SHAREHOLDERS | | |
Revised and Readopted September 15, 2014
The Trustees believe current and prospective shareholders should know how we discharge our responsibilities in supervising the Funds’ investment advisor and in reviewing the advisor’s contract for renewal. Since 2005, we have issued a statement which sets out clearly the three principal guidelines that we follow in supervising the Trust’s investment advisor on your behalf. In accordance with our customary practice, in September of 2014 we again reviewed our statement and concluded we should reissue this statement outlining the principal features of our supervision of the advisor’s performance of investment management services for the Funds.
We begin with the premise that each shareholder selected his or her Fund because its investments are managed by the investment advisor identified in the prospectus and in accordance with the objective and policies described in the prospectus. We realize, as each of you do, that if you believe that your Fund’s stated objective and policies no longer serve your personal investment goals, you can sell your shares and leave the Fund.
Therefore, we believe that our primary supervisory task—our principal obligation to you—is to assess the nature and quality of the advisor’s services, and to confirm that the advisor actively and competently pursues the Fund’s objective, in accordance with the policies set out in the prospectus. To do this, we meet regularly with management to review your Fund’s portfolio and to discuss the advisor’s specific actions and judgments in pursuing the Fund’s objective. We do not substitute our own judgment for the advisor’s decisions in selecting investments; the advisor is paid to exercise its informed judgment on investment decisions, and we seek to confirm, in reviewing the advisor’s performance, that the advisor is doing just that.
Second, we are conscious of costs and the effect that costs have on shareholders’ returns. We try to make sure that your Fund’s fees and costs are reasonable in relationship to the services rendered and that they are generally in line with those charged by other expert investment advisors, consistent with our belief that the Fund’s investors searched for and expect that expertise and attention and have decided to pay a reasonable price for it. We do not put the management contract “out to bid” as a matter of course, and we would not do so unless we had concluded that the advisor materially had failed to pursue the Fund’s objectives in accordance with its policies, or for other equally important reasons. We believe that any other approach would be inconsistent with your interests and contrary to your expectations when you bought shares of the Fund in the first place.
Finally, because we believe that most Thornburg Fund shareholders have invested with a long-term perspective, we try not to focus too much on the fashions of the moment and on short-term performance. The market will not favor any specific investment objective or set of policies at all times and under all economic circumstances. A fund will experience periods of both high and low returns relative to other funds and other investments. Even if one of our Funds is not favored by the market at a particular time, we believe that the advisor is nonetheless obliged to remain true to the Fund’s objective and policies, and we watch to see that it does so.
Trustees of Thornburg Investment Trust
36 Semi-Annual Report
THORNBURG FUND FAMILY
FUNDAMENTAL, BOTTOM-UP EQUITY RESEARCH
We search far and wide for the best stock ideas – within the United States and around the globe. Potential investments that may deserve a deeper look are thoroughly analyzed using both quantitative and qualitative criteria. But the vast majority are discarded. Those that ultimately make it into our highly-selective portfolios are continually monitored to determine whether our investment theses unfold as expected.
| | • | | Thornburg Core Growth Fund |
| | • | | Thornburg International Value Fund |
| | • | | Thornburg International Growth Fund |
| | • | | Thornburg Developing World Fund |
| | • | | Thornburg Investment Income Builder Fund |
| | • | | Thornburg Global Opportunities Fund |
A TRADITION OF DISCIPLINED BOND MANAGEMENT
At Thornburg, the word “disciplined” carries some substance. We don’t make a practice of using shortcuts to enhance yield or total returns. Every strategy is grounded in rigorous, bottom-up credit work. Portfolios are assembled carefully – in the case of our core bond funds, using laddered structures – to mitigate price fluctuation. Position sizes are controlled so that no single bond can have an outsized effect on a portfolio. And as with our equity portfolios, managers enjoy flexibility to seek an optimal risk/reward balance.
| | • | | Thornburg Low Duration Income Fund |
| | • | | Thornburg Limited Term U.S. Government Fund |
| | • | | Thornburg Limited Term Income Fund |
| | • | | Thornburg Strategic Income Fund |
| | • | | Thornburg Low Duration Municipal Fund |
| | • | | Thornburg Limited Term Municipal Fund |
| | • | | Thornburg Intermediate Municipal Fund |
| | • | | Thornburg California Limited Term Municipal Fund |
| | • | | Thornburg New Mexico Intermediate Municipal Fund |
| | • | | Thornburg New York Intermediate Municipal Fund |
| | • | | Thornburg Strategic Municipal Income Fund |
Before investing, carefully consider the Fund’s investment goals, risks, charges, and expenses. For a prospectus or summary prospectus containing this and other information, contact your financial advisor or visit thornburg.com. Read it carefully before investing.
For additional information, please visit thornburg.com
Thornburg Investment Management, Inc. 2300 North Ridgetop Road, Santa Fe, NM 87506
Semi-Annual Report 37
This page intentionally left blank.
38 Semi-Annual Report
This page intentionally left blank.
Semi-Annual Report 39
This Semi-Annual Report is submitted for the general information of shareholders of the Fund. It is not authorized for distribution to prospective investors in the Fund unless preceded or accompanied by an effective prospectus.
| | | | |
| Investment Advisor: | | Distributor: | | |
| Thornburg Investment Management® | | Thornburg Securities Corporation® | | |
| 800.847.0200 | | 800.847.0200 | | TH1663 |
FIRM OVERVIEW
THE FIRM
Thornburg Investment Management is a privately owned global investment firm that offers a range of solutions for retail and institutional investors. We are driven by our mission to help our clients reach their long-term financial goals through fundamental research and active portfolio management.
Founded in 1982 and headquartered in Santa Fe, New Mexico, we manage approximately $61 billion (as of March 31, 2015) across seven equity and 11 bond mutual funds, separate accounts for high-net-worth investors and institutional accounts, and five UCITS funds for non-U.S. investors.

CORE INVESTMENT PRINCIPLES
Our focus has always been on maintaining and building the investment expertise to manage Thornburg strategies to a high standard, while adhering to a core set of investment principles:
| | • | | We focus on the fundamentals. We invest according to our view of the fundamental value of an issuer only after performing thorough, bottom-up research. |
| | • | | We think and invest for the long term. We typically make investment decisions based upon an investment thesis we expect to play out over 18 months to several years. We may not always hold a security for several years, but our horizon line is typically a few years out. |
| | • | | We stay flexible. We go where we see value. Our investment mandates are generally broad and flexible, and we exercise as much flexibility as possible within any restrictions. |
| | • | | We collaborate across strategies. We are structured as global generalists. Portfolio managers and analysts do not specialize in sectors, geographies, or even security types, but instead must understand and communicate bottom-up fundamentals across industries, sectors, and borders. |
2 Semi-Annual Report
Semi-Annual Report
Thornburg Value Fund
March 31, 2015
| | | | |
Share Class | | NASDAQ Symbol | | CUSIP |
Class A | | TVAFX | | 885-215-731 |
Class B | | TVBFX | | 885-215-590 |
Class C | | TVCFX | | 885-215-715 |
Class I | | TVIFX | | 885-215-632 |
Class R3 | | TVRFX | | 885-215-533 |
Class R4 | | TVIRX | | 885-215-277 |
Class R5 | | TVRRX | | 885-215-376 |
Class I, R3, R4, and R5 shares may not be available to all investors. Minimum investments for Class I shares may be higher than those for other classes. Class B shares are no longer offered.
Investments in the Fund carry risks, including possible loss of principal. Additional risks may be associated with investments outside the United States, especially in emerging markets, including currency fluctuations, illiquidity, volatility, and political and economic risks. Investments in small capitalization companies may increase the risk of greater price fluctuations. Please see the Fund’s prospectus for a discussion of the risks associated with an investment in the Fund. Investments in the Fund are not FDIC insured, nor are they deposits of or guaranteed by a bank or any other entity.
Semi-Annual Report 3
| | |
| LETTER TO SHAREHOLDERS | | |
| |
Thornburg Value Fund | | March 31, 2015 (Unaudited) |
April 15, 2015
Dear Fellow Shareholders:
We’re pleased to write that for the six-month period ended March 31, 2015, the Thornburg Value Fund (Class A shares without sales charge) outperformed the benchmark S&P 500 Index, returning 7.90%, versus the index’s 5.93%. This October, the Fund will celebrate its 20th anniversary (hard for us to believe!). Overall, the Fund has had a strong track record since inception, with a cumulative gain of 548% against an S&P 500 Index gain of 412% over that same time period. That said, the Fund has not performed as competitively over each and every period.
In particular, you may remember that we experienced about a year and a half of weak relative performance between December 31, 2010 and June 30, 2012, during the aftermath of the financial crisis. One of the things that characterized that rough patch was increased volatility: for the life of the Fund up to that point, raw beta (calculated weekly) had been 0.94. During that same extended period (October 2, 1995 through December 31, 2010), the portfolio returned 9.9% on an annual basis, versus 7.1% for the S&P 500. For that long stretch, the Fund outperformed the market, with lower volatility. During the year and a half of underperformance, volatility jumped, beta was at 1.22 and annualized total return was a negative 8.9% versus the S&P 500’s positive 7.7%.
We took action to correct course. We bolstered the consistent earner characteristics of the portfolio and took other actions to reduce volatility. Since then, beta has returned to near its historic average. Returns are also competitive. For the up-market period since June 30, 2012, the Fund has returned 23.1% on an average annual basis, while the index has returned 18.9%. So your portfolio has outperformed the broader market, with less volatility, during one of the strongest rally periods in recent memory. We believe our efforts at risk management have paid off—that we have positioned the portfolio to have the potential to outperform through good stock selection, should the market continue to march higher—while exposing shareholders to less downside risk during a correction.
Contributors and Detractors
Over the first six months of the Fund’s fiscal year, our allocation decisions between sectors and our stock selection added performance relative to the index. Our overweight exposures within the health care and consumer discretionary sectors both helped, as these were the best performing sectors in the S&P 500 during the period. Our high average cash level was a drag on performance, while our currency hedges against our international equity investments helped. Our stock selection was best in the consumer discretionary, telecommunication services, and financial sectors, while we were less successful picking stocks in the energy sector during the period. The biggest, most defensive energy companies in the S&P 500 outperformed our energy holdings as oil prices declined.
Table I Value Fund Historical Performance Statistics
| | | | | | | | | | | | |
| | | 10/2/95–
12/31/10 | | | 12/31/10–
6/30/12 | | | 6/30/12–
3/31/15 | |
Value Fund Beta (weekly) | | | 0.94 | | | | 1.22 | | | | 0.95 | |
Value Fund Total Return, Annualized (A Shares without sales charge) | | | 9.9 | % | | | -8.9 | % | | | 23.1 | % |
S&P 500 Total Return, Annualized | | | 7.1 | % | | | 7.7 | % | | | 18.9 | % |
Value Fund Total Return, Cumulative (A Shares without sales charge) | | | 320.3 | % | | | -12.9 | % | | | 77.0 | % |
S&P 500 Total Return, Cumulative | | | 184.3 | % | | | 11.8 | % | | | 61.0 | % |
Source: Thornburg, Bloomberg, and Confluence
Performance data shown represents past performance and is no guarantee of future results. Investment return and principal value will fluctuate so shares, when redeemed, may be worth more or less than their original cost. Current performance may be lower or higher than quoted. For performance current to the most recent month end, visit thornburg.com or call 800.847.0200.
The maximum sales charge for Class A shares is 4.50%. The total annual fund operating expense of Class A shares is 1.37%, as disclosed in the most recent prospectus. If the sales charge had been deducted, returns would be lower.
Top individual contributors for the period were Phibro Animal Health, Express Scripts, Target, Zayo Group and Zoetis.
Phibro is a family-owned animal health business based in Teaneck, New Jersey. Its management team has executed well since we initiated our position in early 2014. The animal health space has further garnered interest following activist involvement in market leader Zoetis.
Express Scripts is the country’s largest pharmacy benefit manager (PBM). PBMs stand between individuals and their doctors, and the health plans that cover the spending on drugs. When PBMs execute well, they can be a significant force for controlling healthcare spending inflation. Moving patients from branded to generic drugs with the same chemical makeup is an example of the role Express Scripts can play in the healthcare system. Following Express Scripts’ merger with Medco, customer retention had weakened a bit. This led the stock to a compelling valuation level ahead of our purchase. The discount has decreased somewhat as the company has continued to prove out its role in saving the system money, while the possibility of further consolidation has generated additional interest in the company.
In the wake of the credit card data breach of late 2013 and a misguided, and very aggressive launch in Canada, Target stock
4 Semi-Annual Report
LETTER TO SHAREHOLDERS,
CONTINUED
| | |
Thornburg Value Fund | | March 31, 2015 (Unaudited) |
was trading very cheap relative to our calculation of intrinsic value. Our work showed that the brand was still relevant, that even in a bad case they could shut down Canadian operations and exit at a reasonable cost, and that store-level performance should improve. Happily for the Fund, our work proved correct and this out-of-favor investment has become much more in vogue.
Zayo is a bandwidth infrastructure provider that had its initial public offering (IPO) during the period. The IPO presented a compelling opportunity to invest in this company at a big discount. Demand continues to grow for their services as each of us consumes increasing amounts of data. We believe that Zayo’s dark fiber business, in particular, should generate consistent and predictable revenue and cash flow growth over the next few years.
Zoetis, the world’s largest animal health company, was a strong performer during the period as well. We bought Zoetis as it was spun off from Pfizer in early 2013. More recently, activist investor Bill Ackman initiated a position that has helped the company garner more attention and a higher valuation in the marketplace.
The biggest detractors to portfolio returns were from companies whose fundamentals are tied to the price of oil. During the period, the price of Brent crude oil fell about 40%.
Weatherford International is an oilfield services company that helps energy producers extract oil and gas from the ground. When oil prices decline, energy producers reduce exploration and production activity. The number of drilling rigs in operation is an indication of overall level of activity. Since oil prices started to decline, U.S. onshore drilling rigs have declined by about 45%. This decline in activity will impact near-term revenue and earnings for Weatherford.
Inpex, Total, and Bankers Petroleum are all oil and gas producers, with revenues closely tied to oil prices. The near-term earnings for these companies will fall as a result of lower oil prices. After the big drop in oil, oil production has become much less profitable; many producers are slowing production activity. The market is currently working through the process of figuring out the marginal cost of production. Over the coming months, it is reasonable to expect some volatility in oil prices and stocks linked to oil.
Mastec is an engineering and construction company, which builds oil and gas pipelines, energy transmission lines, and communication infrastructure—both wireline and wireless. Mastec has had a couple of issues of late. First: like the other underperformers discussed above, Mastec’s pipeline business is linked to oil production. If less oil is produced in the United States, fewer pipelines will be needed. Second: within its communications business, AT&T has signaled it will be reducing capital expenditures. AT&T is an important customer of Mastec and reduced spending by AT&T will impact Mastec.
Market Environment
As we look forward, we view the environment for U.S. equities as constructive. Recovery has slowly taken hold, and inflation pressure remains under control in large part due to the strong dollar. We expect the rapid decline in oil prices to have a net positive impact on the U.S. economy, as consumers who buy gas are a larger economic driver than the oil and gas companies that produce it. That said, it is not lost on us that we’ve seen six years in a row of positive stock market returns and that parts of the U.S. equity market look overvalued, and in our experience, recessions often happen when we least expect them. But since we think our skills lie in the active investment of capital in businesses, rather than predicting the economy, we hope that we’ve positioned the portfolio to have the opportunity to outperform, no matter what the future holds.
Thank you for your continued trust and confidence.
Sincerely,
| | |
 | |  |
| Connor Browne,CFA | | Robert MacDonald,CFA |
| Portfolio Manager | | Portfolio Manager |
| Managing Director | | Managing Director |
The matters discussed in this report may constitute forward-looking statements made pursuant to the safe harbor provisions of the Securities Litigation Reform Act of 1995. These include any advisor or portfolio manager prediction, assessment, analysis or outlook for individual securities, industries, investment styles, market sectors and/or markets. These statements involve risks and uncertainties. In addition to the general risks described for each fund in its current prospectus, other factors bearing on these reports include the accuracy of the advisor’s or portfolio manager’s forecasts and predictions, the appropriateness of the investment strategies designed by the advisor or portfolio manager and the ability of the advisor or portfolio manager to implement their strategies efficiently and successfully. Any one or more of these factors, as well as other risks affecting the securities markets generally, could cause the actual results of any fund to differ materially as compared to its benchmarks.
The views expressed by the portfolio managers reflect their professional opinions and are subject to change. Under no circumstances does the information contained within represent a recommendation to buy or sell any security.
Semi-Annual Report 5
| | |
| PERFORMANCE SUMMARY | | |
| |
Thornburg Value Fund | | March 31, 2015 (Unaudited) |
AVERAGE ANNUAL TOTAL RETURNS
| | | | | | | | | | | | | | | | | | | | |
| | | 1-Yr | | | 3-Yr | | | 5-Yr | | | 10-Yr | | | Since
Incep. | |
Class A Shares (Incep: 10/2/95) | | | | | | | | | | | | | | | | | | | | |
Without sales charge | | | 12.53 | % | | | 15.32 | % | | | 9.93 | % | | | 7.49 | % | | | 10.06 | % |
With sales charge | | | 7.47 | % | | | 13.57 | % | | | 8.92 | % | | | 6.99 | % | | | 9.80 | % |
Class B Shares (Incep: 4/3/00) | | | | | | | | | | | | | | | | | | | | |
Without sales charge | | | 11.43 | % | | | 14.20 | % | | | 8.88 | % | | | 6.75 | % | | | 4.15 | % |
With sales charge | | | 6.43 | % | | | 13.30 | % | | | 8.59 | % | | | 6.75 | % | | | 4.15 | % |
Class C Shares (Incep: 10/2/95) | | | | | | | | | | | | | | | | | | | | |
Without sales charge | | | 11.70 | % | | | 14.44 | % | | | 9.09 | % | | | 6.67 | % | | | 9.21 | % |
With sales charge | | | 10.70 | % | | | 14.44 | % | | | 9.09 | % | | | 6.67 | % | | | 9.21 | % |
Class I Shares (Incep: 11/2/98) | | | 12.95 | % | | | 15.78 | % | | | 10.36 | % | | | 7.90 | % | | | 7.56 | % |
Class R3 Shares (Incep: 7/1/03) | | | 12.55 | % | | | 15.35 | % | | | 9.92 | % | | | 7.46 | % | | | 7.88 | % |
Class R4 Shares (Incep: 2/1/07) | | | 12.67 | % | | | 15.47 | % | | | 10.04 | % | | | — | | | | 4.75 | % |
Class R5 Shares (Incep: 2/1/05) | | | 12.97 | % | | | 15.77 | % | | | 10.32 | % | | | 7.86 | % | | | 7.76 | % |
S&P 500 Index (Since 10/2/95) | | | 12.73 | % | | | 16.11 | % | | | 14.47 | % | | | 8.01 | % | | | 8.73 | % |
GROWTH OF A HYPOTHETICAL $10,000 INVESTMENT
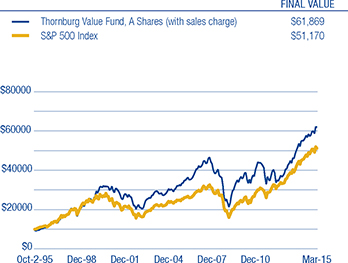
Performance data shown represents past performance and is no guarantee of future results. Investment return and principal value will fluctuate so shares, when redeemed, may be worth more or less than their original cost. Current performance may be lower or higher than quoted. For performance current to the most recent month end, visit thornburg.com or call 800-847-0200. The performance information does not reflect the deduction of taxes that a shareholder would pay on distributions or the redemption of Fund shares. Returns reflect the reinvestment of dividends and capital gains. Class A shares are sold with a maximum sales charge of 4.50%. Class B shares carry a contingent deferred sales charge (CDSC), if redeemed within a year, of 5.00%; within two years, 4.25%; within three years, 3.50%; within four years, 2.75%; within five years, 2.00%; within six years, 1.25%, within seven years, 0.50%. There is no charge for redemption within the eighth year. Class C shares are subject to a 1% CDSC for the first year only. There is no sales charge for Class I, R3, R4, and R5 shares.
As disclosed in the most recent prospectus, the total annual fund operating expenses are as follows: A shares, 1.37%; B shares, 2.55%; C shares, 2.14%; I shares, 1.06%; R3 shares, 1.77%; R4 shares, 1.69%; R5 shares, 1.42%. Thornburg Investment Management and/or Thornburg Securities Corporation have contractually agreed to waive fees and reimburse expenses through at least February 1, 2016, for some of the share classes, resulting in net expense ratios of the following: B shares, 2.38%; I shares, 0.99%; R3 shares, 1.35%; R4 shares, 1.25%; R5 shares, 0.99%. For more detailed information on fund expenses and waivers/reimbursements please see the Fund’s prospectus.
From time to time, the Fund may invest in shares of companies through initial public offerings (IPOs). IPOs have the potential to produce substantial gains for the Fund. There is no assurance that the Fund will have continued access to profitable IPOs and, as the Fund’s assets grow, the impact of IPO investments may decline. Therefore, investors should not rely on these past gains as an indication of future performance.
Glossary
S&P 500 Index – The S&P 500 Index is a broad measure of the U.S. stock market.
Unless otherwise noted, index returns reflect the reinvestment of income dividends and capital gains, if any, but do not reflect fees, brokerage commissions or other expenses of investing. Investors may not make direct investments into any index. The performance of any index is not indicative of the performance of any particular investment.
Beta – A measure of market-related risk. Less than one means the portfolio is less volatile than the index, while greater than one indicates more volatility than the index.
Brent Crude Oil – An international benchmark for oil prices, accounting for roughly two-thirds of the global oil trade. Brent is a sweet crude oil from the North Sea suitable for production of gasoline and middle distillates such as kerosene and diesel.
6 Semi-Annual Report
| | |
| FUND SUMMARY | | |
| |
Thornburg Value Fund | | March 31, 2015 (Unaudited) |
OBJECTIVES AND STRATEGIES
The Fund seeks long-term capital appreciation by investing in equity and debt securities of all types. As a secondary consideration, the Fund also seeks some current income.
The Fund expects to invest primarily in domestic equity securities (primarily common stocks) selected on a value basis. However, the Fund may own a variety of securities, including foreign equity securities, partnership interests, and foreign and domestic debt obligations which, in the opinion of the Fund’s investment advisor, offer prospects for meeting the Fund’s investment goals.
MARKET CAPITALIZATION EXPOSURE
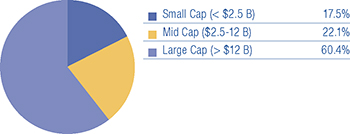
BASKET STRUCTURE
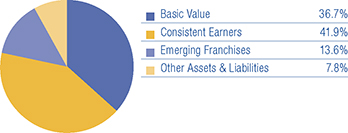
TOP TEN EQUITY HOLDINGS
| | | | |
Thermo Fisher Scientific, Inc. | | | 4.2 | % |
Gilead Sciences, Inc. | | | 3.4 | % |
JPMorgan Chase & Co. | | | 3.2 | % |
Express Scripts Holding Company | | | 3.0 | % |
Target Corp. | | | 2.6 | % |
Mondelez International, Inc. | | | 2.5 | % |
Zayo Group Holdings, Inc. | | | 2.5 | % |
Phibro Animal Health Corp. | | | 2.5 | % |
IMS Health Holdings, Inc. | | | 2.5 | % |
Citizens Financial Group, Inc. | | | 2.4 | % |
There is no guarantee that the Fund will meet its investment objectives.
All portfolio information is subject to change.
SECTOR EXPOSURE
| | | | |
Health Care | | | 21.1 | % |
Financials | | | 15.6 | % |
Consumer Discretionary | | | 14.9 | % |
Industrials | | | 9.9 | % |
Consumer Staples | | | 6.9 | % |
Energy | | | 6.7 | % |
Telecommunication Services | | | 6.3 | % |
Information Technology | | | 5.6 | % |
Utilities | | | 3.0 | % |
Materials | | | 2.2 | % |
Other Assets & Liabilities | | | 7.8 | % |
TOP TEN INDUSTRY GROUPS
| | | | |
Pharmaceuticals, Biotechnology & Life Sciences | | | 15.6 | % |
Banks | | | 8.9 | % |
Retailing | | | 7.6 | % |
Energy | | | 6.7 | % |
Telecommunication Services | | | 6.3 | % |
Food, Beverage & Tobacco | | | 6.0 | % |
Health Care Equipment & Services | | | 5.5 | % |
Diversified Financials | | | 4.9 | % |
Commercial & Professional Services | | | 4.7 | % |
Consumer Services | | | 4.6 | % |
Semi-Annual Report 7
| | |
| SCHEDULE OF INVESTMENTS | | |
| |
Thornburg Value Fund | | March 31, 2015 (Unaudited) |
| | | | | | | | |
| | | Shares/ | | | | |
| | | Principal Amount | | | Value | |
COMMON STOCK — 92.19% | | | | | | | | |
| | |
BANKS — 8.85% | | | | | | | | |
Banks — 6.78% | | | | | | | | |
Citigroup, Inc. | | | 214,400 | | | $ | 11,045,888 | |
Citizens Financial Group, Inc. | | | 1,016,315 | | | | 24,523,681 | |
JPMorgan Chase & Co. | | | 539,040 | | | | 32,655,043 | |
Thrifts & Mortgage Finance — 2.07% | | | | | | | | |
a Essent Group Ltd. | | | 870,850 | | | | 20,822,024 | |
| | | | | | | | |
| | | | | | | 89,046,636 | |
| | | | | | | | |
| | |
CAPITAL GOODS — 3.97% | | | | | | | | |
Building Products — 1.04% | | | | | | | | |
a Continental Building Products, Inc. | | | 463,500 | | | | 10,470,465 | |
Construction & Engineering — 0.71% | | | | | | | | |
a Mastec, Inc. | | | 371,176 | | | | 7,163,697 | |
Machinery — 1.42% | | | | | | | | |
Allison Transmission Holdings, Inc. | | | 447,769 | | | | 14,301,742 | |
Trading Companies & Distributors — 0.80% | | | | | | | | |
Fly Leasing Ltd. ADR | | | 548,242 | | | | 7,982,403 | |
| | | | | | | | |
| | | | | | | 39,918,307 | |
| | | | | | | | |
| | |
COMMERCIAL & PROFESSIONAL SERVICES — 4.66% | | | | | | | | |
Commercial Services & Supplies — 2.93% | | | | | | | | |
Covanta Holding Corp. | | | 704,400 | | | | 15,799,692 | |
Rentokil Initial plc | | | 6,737,268 | | | | 13,661,885 | |
Professional Services — 1.73% | | | | | | | | |
Nielsen Holdings N.V. | | | 390,249 | | | | 17,393,398 | |
| | | | | | | | |
| | | | | | | 46,854,975 | |
| | | | | | | | |
| | |
CONSUMER DURABLES & APPAREL — 2.68% | | | | | | | | |
Household Durables — 2.68% | | | | | | | | |
a Helen of Troy Ltd. | | | 74,297 | | | | 6,054,463 | |
a TRI Pointe Homes, Inc. | | | 1,354,071 | | | | 20,893,315 | |
| | | | | | | | |
| | | | | | | 26,947,778 | |
| | | | | | | | |
| | |
CONSUMER SERVICES — 4.60% | | | | | | | | |
Diversified Consumer Services — 1.06% | | | | | | | | |
a Nord Anglia Education, Inc. | | | 470,561 | | | | 10,691,146 | |
Hotels, Restaurants & Leisure — 3.54% | | | | | | | | |
Aramark Holdings Corp. | | | 728,948 | | | | 23,056,625 | |
Starbucks Corp. | | | 132,357 | | | | 12,534,208 | |
| | | | | | | | |
| | | | | | | 46,281,979 | |
| | | | | | | | |
| | |
DIVERSIFIED FINANCIALS — 4.93% | | | | | | | | |
Capital Markets — 3.96% | | | | | | | | |
Charles Schwab Corp. | | | 376,989 | | | | 11,475,545 | |
Oaktree Capital Group LLC | | | 267,228 | | | | 13,804,998 | |
The Blackstone Group LP | | | 373,303 | | | | 14,517,754 | |
Consumer Finance — 0.97% | | | | | | | | |
American Express Co. | | | 125,349 | | | | 9,792,264 | |
| | | | | | | | |
| | | | | | | 49,590,561 | |
| | | | | | | | |
| | |
ENERGY — 6.72% | | | | | | | | |
Energy Equipment & Services — 2.80% | | | | | | | | |
Frank’s International N.V. | | | 561,091 | | | | 10,492,402 | |
a Weatherford International Ltd. | | | 1,431,466 | | | | 17,607,032 | |
Oil, Gas & Consumable Fuels — 3.92% | | | | | | | | |
a Bankers Petroleum Ltd. | | | 1,129,987 | | | | 2,417,800 | |
Chevron Corp. | | | 165,800 | | | | 17,405,684 | |
INPEX Corp. | | | 692,941 | | | | 7,658,259 | |
Total SA | | | 240,800 | | | | 11,981,536 | |
| | | | | | | | |
| | | | | | | 67,562,713 | |
| | | | | | | | |
8 Semi-Annual Report
| | |
| SCHEDULE OF INVESTMENTS, CONTINUED | | |
| |
Thornburg Value Fund | | March 31, 2015 (Unaudited) |
| | | | | | | | |
| | | Shares/
Principal Amount | | | Value | |
FOOD & STAPLES RETAILING — 0.90% | | | | | | | | |
Food & Staples Retailing — 0.90% | | | | | | | | |
Walgreens Boots Alliance, Inc. | | | 106,602 | | | $ | 9,027,057 | |
| | | | | | | | |
| | | | | | | 9,027,057 | |
| | | | | | | | |
| | |
FOOD, BEVERAGE & TOBACCO — 5.96% | | | | | | | | |
Beverages — 1.09% | | | | | | | | |
Kweichow Moutai Co., Ltd. | | | 346,275 | | | | 10,935,735 | |
Food Products — 4.87% | | | | | | | | |
Mead Johnson Nutrition Co. | | | 233,873 | | | | 23,511,253 | |
Mondelez International, Inc. | | | 706,774 | | | | 25,507,473 | |
| | | | | | | | |
| | | | | | | 59,954,461 | |
| | | | | | | | |
| | |
HEALTH CARE EQUIPMENT & SERVICES — 5.47% | | | | | | | | |
Health Care Providers & Services — 3.02% | | | | | | | | |
a Express Scripts Holding Company | | | 350,156 | | | | 30,383,036 | |
Health Care Technology — 2.45% | | | | | | | | |
a IMS Health Holdings, Inc. | | | 910,659 | | | | 24,651,539 | |
| | | | | | | | |
| | | | | | | 55,034,575 | |
| | | | | | | | |
| | |
MATERIALS — 2.25% | | | | | | | | |
Chemicals — 1.32% | | | | | | | | |
Orion Engineered Carbons S.A. | | | 737,154 | | | | 13,268,772 | |
Metals & Mining — 0.93% | | | | | | | | |
a Horsehead Holding Corp. | | | 738,902 | | | | 9,354,499 | |
| | | | | | | | |
| | | | | | | 22,623,271 | |
| | | | | | | | |
| | |
PHARMACEUTICALS, BIOTECHNOLOGY & LIFE SCIENCES — 15.57% | | | | | | | | |
Biotechnology — 5.31% | | | | | | | | |
Actelion Ltd. | | | 84,430 | | | | 9,782,690 | |
a Gilead Sciences, Inc. | | | 344,235 | | | | 33,779,780 | |
a Seattle Genetics, Inc. | | | 278,996 | | | | 9,862,509 | |
Life Sciences Tools & Services — 4.22% | | | | | | | | |
Thermo Fisher Scientific, Inc. | | | 316,072 | | | | 42,461,113 | |
Pharmaceuticals — 6.04% | | | | | | | | |
GlaxoSmithKline plc | | | 753,585 | | | | 17,282,239 | |
Phibro Animal Health Corp. | | | 699,363 | | | | 24,764,444 | |
Zoetis, Inc. | | | 403,094 | | | | 18,659,221 | |
| | | | | | | | |
| | | | | | | 156,591,996 | |
| | | | | | | | |
| | |
REAL ESTATE — 1.81% | | | | | | | | |
Real Estate Investment Trusts — 1.81% | | | | | | | | |
Invesco Mortgage Capital, Inc. | | | 552,111 | | | | 8,574,284 | |
Two Harbors Investment Corp. | | | 903,307 | | | | 9,593,120 | |
| | | | | | | | |
| | | | | | | 18,167,404 | |
| | | | | | | | |
| | |
RETAILING — 7.63% | | | | | | | | |
Internet & Catalog Retail — 3.70% | | | | | | | | |
a Amazon.com, Inc. | | | 55,378 | | | | 20,606,154 | |
a Netflix, Inc. | | | 39,797 | | | | 16,583,012 | |
Multiline Retail — 2.58% | | | | | | | | |
Target Corp. | | | 316,616 | | | | 25,984,675 | |
Specialty Retail — 1.35% | | | | | | | | |
a AutoZone, Inc. | | | 19,959 | | | | 13,615,231 | |
| | | | | | | | |
| | | | | | | 76,789,072 | |
| | | | | | | | |
| | |
SEMICONDUCTORS & SEMICONDUCTOR EQUIPMENT — 0.43% | | | | | | | | |
Semiconductors & Semiconductor Equipment — 0.43% | | | 158,790 | | | | 4,307,973 | |
| | | | | | | | |
a Micron Technology, Inc. | | | | | | | 4,307,973 | |
| | | | | | | | |
Semi-Annual Report 9
| | |
| SCHEDULE OF INVESTMENTS, CONTINUED | | |
| |
Thornburg Value Fund | | March 31, 2015 (Unaudited) |
| | | | | | | | |
| | | Shares/
Principal Amount | | | Value | |
SOFTWARE & SERVICES — 4.20% | | | | | | | | |
Internet Software & Services — 2.44% | | | | | | | | |
a Google, Inc. Class C | | | 34,377 | | | $ | 18,838,596 | |
a Marin Software, Inc. | | | 908,014 | | | | 5,711,408 | |
Software — 1.76% | | | | | | | | |
Activision Blizzard, Inc. | | | 778,400 | | | | 17,689,140 | |
| | | | | | | | |
| | | | | | | 42,239,144 | |
| | | | | | | | |
| | |
TECHNOLOGY HARDWARE & EQUIPMENT — 1.01% | | | | | | | | |
Electronic Equipment, Instruments & Components — 1.01% | | | | | | | | |
CDW Corp. | | | 273,801 | | | | 10,196,349 | |
| | | | | | | | |
| | | | | | | 10,196,349 | |
| | | | | | | | |
| | |
TELECOMMUNICATION SERVICES — 6.29% | | | | | | | | |
Diversified Telecommunication Services — 2.52% | | | 909,262 | | | | 25,422,966 | |
a Zayo Group Holdings, Inc. | | | | | | | | |
Wireless Telecommunication Services — 3.77% | | | | | | | | |
China Mobile Ltd. | | | 1,490,797 | | | | 19,421,810 | |
SoftBank Corp. | | | 317,457 | | | | 18,475,423 | |
| | | | | | | | |
| | | | | | | 63,320,199 | |
| | | | | | | | |
| | |
TRANSPORTATION — 1.26% | | | | | | | | |
Airlines — 1.26% | | | | | | | | |
American Airlines Group, Inc. | | | 239,910 | | | | 12,662,450 | |
| | | | | | | | |
| | | | | | | 12,662,450 | |
| | | | | | | | |
| | |
UTILITIES — 3.00% | | | | | | | | |
Electric Utilities — 1.90% | | | | | | | | |
ITC Holdings Corp. | | | 510,045 | | | | 19,090,984 | |
Independent Power & Renewable Electricity Producers — 1.10% | | | | | | | | |
a Dynegy, Inc. | | | 351,401 | | | | 11,044,534 | |
| | | | | | | | |
| | | | | | | 30,135,518 | |
| | | | | | | | |
TOTAL COMMON STOCK (Cost $729,803,244) | | | | | | | 927,252,418 | |
| | | | | | | | |
SHORT TERM INVESTMENTS — 7.85% | | | | | | | | |
Apache Corp., 0.50%, 4/6/2015 | | $ | 15,000,000 | | | | 14,998,958 | |
Atlantic City Electric Co., 0.45%, 4/1/2015 | | | 15,000,000 | | | | 15,000,000 | |
Bank of New York Tri-Party Repurchase Agreement 0.23% dated 3/31/2015 due 4/1/2015, repurchase price $14,000,089 collateralized by 1 U.S. Government debt security and 22 corporate debt securities, having an average coupon of 4.50%, a minimum credit rating of BBB-, maturity dates from 8/15/2015 to 1/1/2045, and having an aggregate market value of $14,989,700 at 3/31/2015 | | | 14,000,000 | | | | 14,000,000 | |
Marriott International, Inc., 0.30%, 4/1/2015 | | | 15,000,000 | | | | 15,000,000 | |
Spectra Energy Partners, 0.45%, 4/1/2015 | | | 6,000,000 | | | | 6,000,000 | |
Union Electric Co., 0.50%, 4/2/2015 | | | 14,000,000 | | | | 13,999,806 | |
| | | | | | | | |
TOTAL SHORT TERM INVESTMENTS (Cost $78,998,764) | | | | | | | 78,998,764 | |
| | | | | | | | |
TOTAL INVESTMENTS — 100.04% (Cost $808,802,008) | | | | | | $ | 1,006,251,182 | |
LIABILITIES NET OF OTHER ASSETS — (0.04)% | | | | | | | (426,329 | ) |
| | | | | | | | |
NET ASSETS — 100.00% | | | | | | $ | 1,005,824,853 | |
| | | | | | | | |
Footnote Legend
Portfolio Abbreviations
To simplify the listings of securities, abbreviations are used per the table below:
| | |
| ADR | | American Depositary Receipt |
See notes to financial statements.
10 Semi-Annual Report
This page intentionally left blank.
Semi-Annual Report 11
| | |
| STATEMENT OF ASSETS AND LIABILITIES | | |
| |
Thornburg Value Fund | | March 31, 2015 (Unaudited) |
| | | | |
ASSETS | | | | |
Investments at value (cost $808,802,008) (Note 2) | | $ | 1,006,251,182 | |
Cash | | | 477,785 | |
Receivable for investments sold | | | 11,908,516 | |
Receivable for fund shares sold | | | 281,915 | |
Unrealized appreciation on forward currency contracts (Note 7) | | | 2,128,412 | |
Dividends receivable | | | 1,458,123 | |
Dividend and interest reclaim receivable | | | 344,599 | |
Interest receivable | | | 89 | |
Prepaid expenses and other assets | | | 58,815 | |
| | | | |
Total Assets | | | 1,022,909,436 | |
| | | | |
| |
LIABILITIES | | | | |
Payable for investments purchased | | | 14,058,687 | |
Payable for fund shares redeemed | | | 1,305,928 | |
Unrealized depreciation on forward currency contracts (Note 7) | | | 303,396 | |
Payable to investment advisor and other affiliates (Note 3) | | | 1,045,956 | |
Accounts payable and accrued expenses | | | 370,616 | |
| | | | |
Total Liabilities | | | 17,084,583 | |
| | | | |
| |
NET ASSETS | | $ | 1,005,824,853 | |
| | | | |
NET ASSETS CONSIST OF | | | | |
Distribution in excess of net investment income | | $ | (1,231,943 | ) |
Net unrealized appreciation on investments | | | 199,243,391 | |
Accumulated net realized gain (loss) | | | (474,136,579 | ) |
Net capital paid in on shares of beneficial interest | | | 1,281,949,984 | |
| | | | |
| | $ | 1,005,824,853 | |
| | | | |
12 Semi-Annual Report
| | |
| STATEMENT OF ASSETS AND LIABILITIES, CONTINUED | | |
| |
Thornburg Value Fund | | March 31, 2015 (Unaudited) |
| | | | |
| |
NET ASSET VALUE | | | | |
Class A Shares: | | | | |
Net asset value and redemption price per share ($409,405,964 applicable to 7,893,339 shares of beneficial interest outstanding - Note 4) | | $ | 51.87 | |
Maximum sales charge, 4.50% of offering price | | | 2.44 | |
| | | | |
Maximum offering price per share | | $ | 54.31 | |
| | | | |
| |
Class B Shares: | | | | |
Net asset value per share* ($3,340,213 applicable to 70,640 shares of beneficial interest outstanding - Note 4) | | $ | 47.29 | |
| | | | |
| |
Class C Shares: | | | | |
Net asset value and offering price per share* ($183,982,528 applicable to 3,807,761 shares of beneficial interest outstanding - Note 4) | | $ | 48.32 | |
| | | | |
| |
Class I Shares: | | | | |
Net asset value, offering and redemption price per share ($300,126,820 applicable to 5,641,098 shares of beneficial interest outstanding - Note 4) | | $ | 53.20 | |
| | | | |
| |
Class R3 Shares: | | | | |
Net asset value, offering and redemption price per share ($70,347,458 applicable to 1,364,860 shares of beneficial interest outstanding - Note 4) | | $ | 51.54 | |
| | | | |
| |
Class R4 Shares: | | | | |
Net asset value, offering and redemption price per share ($10,993,741 applicable to 211,251 shares of beneficial interest outstanding - Note 4) | | $ | 52.04 | |
| | | | |
| |
Class R5 Shares: | | | | |
Net asset value, offering and redemption price per share ($27,628,129 applicable to 520,060 shares of beneficial interest outstanding - Note 4) | | $ | 53.12 | |
| | | | |
| * | Redemption price per share is equal to net asset value less any applicable contingent deferred sales charge. |
See notes to financial statements.
Semi-Annual Report 13
| | |
| STATEMENT OF OPERATIONS | | |
| |
Thornburg Value Fund | | Six Months Ended March 31, 2015 (Unaudited) |
| | | | |
INVESTMENT INCOME | | | | |
Dividend income (net of foreign taxes withheld of $208,171) | | $ | 7,110,085 | |
Interest income | | | 136,506 | |
| | | | |
Total Income | | | 7,246,591 | |
| | | | |
| |
EXPENSES | | | | |
Investment advisory fees (Note 3) | | | 4,209,611 | |
Administration fees (Note 3) | | | | |
Class A Shares | | | 249,918 | |
Class B Shares | | | 2,316 | |
Class C Shares | | | 111,660 | |
Class I Shares | | | 73,894 | |
Class R3 Shares | | | 44,839 | |
Class R4 Shares | | | 7,280 | |
Class R5 Shares | | | 7,334 | |
Distribution and service fees (Note 3) | | | | |
Class A Shares | | | 499,756 | |
Class B Shares | | | 18,533 | |
Class C Shares | | | 894,337 | |
Class R3 Shares | | | 179,348 | |
Class R4 Shares | | | 13,958 | |
Transfer agent fees | | | | |
Class A Shares | | | 215,275 | |
Class B Shares | | | 4,835 | |
Class C Shares | | | 92,580 | |
Class I Shares | | | 171,970 | |
Class R3 Shares | | | 85,175 | |
Class R4 Shares | | | 15,095 | |
Class R5 Shares | | | 31,871 | |
Registration and filing fees | | | | |
Class A Shares | | | 10,106 | |
Class B Shares | | | 8,132 | |
Class C Shares | | | 9,565 | |
Class I Shares | | | 15,228 | |
Class R3 Shares | | | 9,253 | |
Class R4 Shares | | | 3,382 | |
Class R5 Shares | | | 5,424 | |
Custodian fees (Note 3) | | | 72,080 | |
Professional fees | | | 24,208 | |
Accounting fees | | | 16,381 | |
Trustee fees | | | 17,612 | |
Other expenses | | | 29,310 | |
| | | | |
Total Expenses | | | 7,150,266 | |
Less: | | | | |
Expenses reimbursed by investment advisor (Note 3) | | | (307,112 | ) |
Fees paid indirectly (Note 3) | | | (230 | ) |
| | | | |
Net Expenses | | | 6,842,924 | |
| | | | |
Net Investment Income | | $ | 403,667 | |
| | | | |
14 Semi-Annual Report
| | |
| STATEMENT OF OPERATIONS, CONTINUED | | |
| |
Thornburg Value Fund | | Six Months Ended March 31, 2015 (Unaudited) |
| | | | |
REALIZED AND UNREALIZED GAIN (LOSS) | | | | |
Net realized gain (loss) from: | | | | |
Investments | | $ | 62,451,465 | |
Forward currency contracts (Note 7) | | | 4,695,375 | |
Foreign currency transactions | | | 49,033 | |
| | | | |
| | | 67,195,873 | |
| | | | |
Net change in unrealized appreciation (depreciation) on: | | | | |
Investments | | | 9,388,762 | |
Foreign currency translations | | | (6,107 | ) |
Forward currency contracts (Note 7) | | | (1,437,873 | ) |
| | | | |
| | | 7,944,782 | |
| | | | |
Net Realized and Unrealized Gain | | | 75,140,655 | |
| | | | |
Net Increase in Net Assets Resulting from Operations | | $ | 75,544,322 | |
| | | | |
See notes to financial statements.
Semi-Annual Report 15
| | |
| STATEMENTS OF CHANGES IN NET ASSETS | | |
| |
Thornburg Value Fund | | |
| | | | | | | | |
| | | Six Months Ended
March 31, 2015* | | | Year Ended
September 30, 2014 | |
INCREASE (DECREASE) IN NET ASSETS FROM | | | | | | | | |
| | |
OPERATIONS | | | | | | | | |
Net investment income | | $ | 403,667 | | | $ | 2,043,450 | |
Net realized gain (loss) from investments, forward currency contracts, and foreign currency transactions | | | 67,195,873 | | | | 215,008,674 | |
Net unrealized appreciation (depreciation) on investments, forward currency contracts, and foreign currency translations | | | 7,944,782 | | | | (45,433,482 | ) |
| | | | | | | | |
| | |
Net Increase (Decrease) in Net Assets Resulting from Operations | | | 75,544,322 | | | | 171,618,642 | |
| | |
DIVIDENDS TO SHAREHOLDERS | | | | | | | | |
From net investment income | | | | | | | | |
Class A Shares | | | (149,783 | ) | | | (2,231,878 | ) |
Class I Shares | | | (385,447 | ) | | | (3,575,743 | ) |
Class R3 Shares | | | (31,715 | ) | | | (406,915 | ) |
Class R4 Shares | | | (8,095 | ) | | | (56,789 | ) |
Class R5 Shares | | | (39,382 | ) | | | (413,785 | ) |
| | |
FUND SHARE TRANSACTIONS (NOTE 4) | | | | | | | | |
Class A Shares | | | (16,132,696 | ) | | | (73,662,024 | ) |
Class B Shares | | | (898,063 | ) | | | (4,547,295 | ) |
Class C Shares | | | (4,493,093 | ) | | | (19,769,894 | ) |
Class I Shares | | | (22,201,733 | ) | | | (18,265,855 | ) |
Class R3 Shares | | | (9,683,430 | ) | | | (19,341,373 | ) |
Class R4 Shares | | | (1,248,675 | ) | | | (4,192,893 | ) |
Class R5 Shares | | | (5,285,821 | ) | | | (22,564,831 | ) |
| | | | | | | | |
Net Increase in Net Assets | | | 14,986,389 | | | | 2,589,367 | |
| | |
NET ASSETS | | | | | | | | |
Beginning of Period | | | 990,838,464 | | | | 988,249,097 | �� |
| | | | | | | | |
| | |
End of Period | | $ | 1,005,824,853 | | | $ | 990,838,464 | |
| | | | | | | | |
Distribution in excess of net investment income | | $ | (1,231,943 | ) | | $ | (1,021,188 | ) |
See notes to financial statements.
16 Semi-Annual Report
| | |
| NOTES TO FINANCIAL STATEMENTS | | |
| |
Thornburg Value Fund | | March 31, 2015 (Unaudited) |
NOTE 1 – ORGANIZATION
Thornburg Value Fund, hereinafter referred to as (the “Fund)” is a diversified series of Thornburg Investment Trust (the “Trust”). The Trust is organized as a Massachusetts business trust under a Declaration of Trust dated June 3, 1987 and is registered as a diversified, open-end management investment company under the Investment Company Act of 1940, as amended. The Fund is currently one of eighteen separate series of the Trust. Each series is considered to be a separate entity for financial reporting and tax purposes and bears expenses directly attributable to it. The Fund seeks long-term capital appreciation by investing in equity and debt securities of all types. As a secondary objective, the Fund also seeks some current income.
The Fund currently has seven classes of shares of beneficial interest: Class A, Class B, Class C, Institutional Class (“Class I”), and Retirement Classes (“Class R3,” “Class R4,” and “Class R5”). The Fund no longer offers Class B shares for sale. Each class of shares of the Fund represents an interest in the same portfolio of investments, except that (i) Class A shares are sold subject to a front-end sales charge collected at the time the shares are purchased and bear a service fee, (ii) Class B shares were sold at net asset value without a sales charge at the time of purchase, but are subject to a contingent deferred sales charge upon redemption and bear both a service fee and distribution fee, (iii) Class C shares are sold at net asset value without a sales charge at the time of purchase, but are subject to a contingent deferred sales charge upon redemption within one year of purchase, and bear both a service fee and a distribution fee, (iv) Class I shares are sold at net asset value without a sales charge at the time of purchase and may be subject to a service fee, (v) Class R3 shares are sold at net asset value without a sales charge at the time of purchase, but bear both a service fee and distribution fee, (vi) Class R4 shares are sold at net asset value without a sales charge at the time of purchase, but bear a service fee, (vii) Class R5 shares are sold at net asset value without a sales charge at the time of purchase and may be subject to a service fee, and (viii) the respective classes may have different reinvestment privileges and conversion rights. Additionally, the Fund may allocate among its classes certain expenses, to the extent allocable to specific classes, including transfer agent fees, government registration fees, certain printing and postage costs, and administrative and legal expenses. Currently, class specific expenses of the Fund are limited to service and distribution fees, administration fees, and certain registration and transfer agent expenses. Class B shares of the Fund outstanding for eight years will convert to Class A shares of the Fund.
NOTE 2 – SIGNIFICANT ACCOUNTING POLICIES
The following is a summary of significant accounting policies followed by the Fund in the preparation of its financial statements. The Fund is an investment company and prepares its financial statements in conformity with U.S. generally accepted accounting principles (“GAAP”), including the investment company accounting and reporting guidance in the Financial Accounting Standards Board (the “FASB”) Accounting Standard Codification Topic 946. The preparation of financial statements in conformity with GAAP requires management to make estimates and assumptions that affect the reported amounts of assets and liabilities and disclosure of contingent assets and liabilities at the date of the financial statements and the reported amounts of increases (decreases) in net assets from operations during the reporting period. Actual results could differ from those estimates.
Significant accounting policies of the Fund are as follows:
Valuation Policy and Procedures: The Trustees of the Trust (the “Trustees”) have authorized employees of the Fund’s investment advisor, acting as the Valuation and Pricing Committee (the “Committee”), to make certain valuation determinations, subject to oversight and review by the Trustees and the Audit Committee of the Trustees. The Committee and other employees of the Fund’s investment advisor administer and implement the valuation process. The Committee regularly reviews its own fair value decisions, as well as valuations, valuation techniques and services furnished by pricing services, considers circumstances in the markets which may require valuation determinations by the Committee and reviews previous valuation determinations. The Committee also reports on its activities, the performance of the pricing services and other matters to the Trustees and the Audit Committee of the Trustees.
In determining a fair value for a portfolio investment, the Committee seeks to determine the price that the Fund would reasonably expect to receive upon a sale of the investment in an orderly transaction between market participants at the measurement date. Typically, the fair value process employs standing instructions to use quoted prices in active markets or the use of independent pricing services. Less frequently, the Committee may make a fair value determination using other methods. However, because fair value prices are estimated prices, the determination of fair value for an investment may differ from the value that would be realized by the Fund upon a sale of the investment, and that difference could be material to the Fund’s financial statements. The Committee’s determination of fair value for an investment may also differ from the prices obtained by other persons (including other mutual funds) for the investment.
Valuation of Investments: Portfolio investments listed or traded on a national securities exchange are valued on the valuation date at the last reported trade price on the exchange that is the primary market for the investment. Portfolio investments reported by NASDAQ are valued at the NASDAQ official closing price. Portfolio investments traded on an exchange for which there has been no trade that day and other equity investments traded in the over-the-counter market are valued at the mean between the last reported bid and ask prices. Any foreign investment traded on exchanges outside the United States is valued at the price of the investment on the exchange that is normally the investment’s primary market, as of the close of that exchange preceding the time of the Fund’s valuation measurement date.
Semi-Annual Report 17
| | |
| NOTES TO FINANCIAL STATEMENTS, CONTINUED | | |
| |
Thornburg Value Fund | | March 31, 2015 (Unaudited) |
In any case when the market value of an equity investment held by the Fund is not readily available, a determination of a fair value for the investment is made by the Committee. The Committee’s determinations are made using procedures in accordance with a policy approved by the Trustees, which may include the use of a price obtained from an independent pricing service. The pricing service ordinarily values equity investments in these instances using multi-factor models to adjust market prices based upon various inputs, including exchange data, depositary receipt prices, futures, index data and other data. An investment’s market value is deemed not readily available whenever the exchange or market on which the investment is primarily traded is closed for the entire scheduled day of trading. Additionally, an investment’s market value may be deemed not readily available under other circumstances identified by the Trustees, including when developments occurring after the most recent close of the investment’s primary exchange or market, but before the most recent close of trading in Fund shares, or an unusual event or significant period of time occurring since the availability of a market quotation, create a question about the reliability of the investment’s market value. For example, on days when market volatility thresholds pre-determined by the Trustees are exceeded, foreign equity investments held by the Fund may be valued using synthetic pricing obtained from an independent pricing service approved by the Trustees, subject to the ability of the Committee to determine in any such instance to utilize market closing prices if the Committee considers closing prices to be more reliable.
Debt obligations held by the Fund have a primary over-the-counter market and are valued by an independent pricing service approved by the Trustees. The pricing service ordinarily values debt obligations using quoted bid prices and other methods, which include consideration of yields or prices of debt obligations of comparable quality, type of issue, coupon, maturity and rating, and indications as to value from dealers and general market conditions.
In any case when a pricing service fails to provide a price for a debt obligation held by the Fund, the Committee determines a fair value for the debt obligation using procedures in accordance with a policy approved by the Trustees, which may include the use of a price obtained from a different independent pricing service. Additionally, in any case when management believes that a price provided by a pricing service for a debt obligation held by the Fund may be unreliable, the Committee decides whether or not to use the pricing service’s valuation or to use an alternative method to determine a fair value for the debt obligation.
Quotations in foreign currencies for foreign portfolio investments are converted to U.S. dollar equivalents using the foreign exchange quotation in effect at the time of valuation.
Valuation Measurements: The Fund categorizes its investments based upon the inputs used in valuing those investments, according to a three-level hierarchy established by guidance from the FASB. Categorization of investments using this hierarchy is intended by the FASB to maximize the use of observable inputs and minimize the use of unobservable inputs by prioritizing that the most observable input be used when available. Observable inputs are those that market participants would use in valuing an investment based on available market data. Unobservable inputs are those that reflect assumptions about the information market participants would use in valuing an investment. An investment’s level within the hierarchy is based on the lowest level input that is deemed significant to the fair value measurement. The methodologies and relative inputs used to value investments are not necessarily indications of the risk or liquidity associated with investing in those investments.
Various inputs are used in determining the fair value measurement of the Fund’s investments. These inputs are generally summarized according to the three-level hierarchy below:
Level 1: Quoted prices in active markets for identical investments.
Level 2: Other direct or indirect significant observable inputs (including quoted prices for similar investments in active markets and other observable inputs, such as interest rates, prepayment rates, credit risk, etc.).
When market volatility thresholds are exceeded, foreign equity investments may be fair valued according to other significant observable inputs rather than quoted market prices. The affected investments will be characterized as Level 2 within the valuation hierarchy and revert to Level 1 after the threshold is no longer exceeded.
Level 3: Significant unobservable inputs (including the Committee’s own assumptions in determining the fair value of investments).
Portfolio investments with minimal, if any, market activity are characterized as Level 3 and are valued using significant unobservable inputs, typically including single broker quotes, which may be adjusted or unadjusted, related or comparable investments, last available transactions, and other relevant information. Valuations may also be based upon current market prices of securities that are comparable in coupon, rating, maturity and industry. An income based valuation approach would consider discounted anticipated future cash flows of the investment. Discounts may also be applied due to the nature or duration of any restrictions on the disposition of the investment. Valuations based upon the use of inputs from Levels 1, 2, or 3, may not represent the actual price received upon the disposition of an investment, and the Fund may receive a price that is lower than the valuation when it sells the investment.
The following table displays a summary of the fair value hierarchy measurements of the Fund’s investments as of March 31, 2015. In any instance when valuation inputs from more than one level are used to determine the fair value of a specific investment, the investment is placed in the level of the table based upon the lowest level input that is significant in determining the fair value of the investment:
18 Semi-Annual Report
| | |
| NOTES TO FINANCIAL STATEMENTS, CONTINUED | | |
| |
Thornburg Value Fund | | March 31, 2015 (Unaudited) |
| | | | | | | | | | | | | | | | |
| | | Fair Value Measurements at March 31, 2015 | |
| | | Total | | | Level 1 | | | Level 2 | | | Level 3 | |
Assets | | | | | | | | | | | | | | | | |
Investments in Securities* | | | | | | | | | | | | | | | | |
Common Stock | | $ | 927,252,418 | | | $ | 927,252,418 | | | $ | — | | | $ | — | |
Short Term Investments | | | 78,998,764 | | | | — | | | | 78,998,764 | | | | — | |
| | | | | | | | | | | | | | | | |
Total Investments in Securities | | $ | 1,006,251,182 | | | $ | 927,252,418 | | | $ | 78,998,764 | | | $ | — | |
Other Financial Instruments** | | | | | | | | | | | | | | | | |
Forward Currency Contracts | | $ | 2,128,412 | | | $ | — | | | $ | 2,128,412 | | | $ | — | |
Liabilities | | | | | | | | | | | | | | | | |
Other Financial Instruments** | | | | | | | | | | | | | | | | |
Forward Currency Contracts | | $ | (303,396 | ) | | $ | — | | | $ | (303,396 | ) | | $ | — | |
Spot Currency | | $ | (2,333 | ) | | $ | (2,333 | ) | | $ | — | | | $ | — | |
| * | See Schedule of Investments for a summary of the industry exposure as grouped according to the Global Industry Classification Standard (GICS), which is an industry taxonomy developed by MSCI, Inc. and Standard & Poor’s (S&P). |
| ** | Other Financial Instruments include investments not reflected in the Schedule of Investments, which may include futures, forwards and swap contracts, which are valued at the unrealized appreciation (depreciation) on the investment. |
In accordance with the guidance prescribed in Accounting Standards Update No. 2011-04, it is the policy of the Fund to recognize transfers between levels and the underlying events which caused the movement. The Fund recognized no transfers between levels for the six months ended March 31, 2015, other than when the Fund exceeded market volatility thresholds for foreign equity investments during the period.
Foreign Withholding Taxes: The Fund is subject to foreign tax withholding imposed by certain foreign countries in which the Fund may invest. Withholding taxes are incurred on certain foreign dividends and are accrued at the time the dividend is recognized based on applicable foreign tax law. The Fund files withholding tax reclaims in certain jurisdictions to recover a portion of amounts previously withheld, in view of various considerations, including recent decisions rendered by the courts in those and other jurisdictions. The Fund would expect to record a receivable for such a reclaim based on a variety of factors, including assessments of a jurisdiction’s legal obligation to pay reclaims, the jurisdiction’s administrative practices and payment history, and industry convention. To date the Fund has recorded no such receivable because there is no precedent for collecting such prior year reclaims and the likelihood of collection remains uncertain.
Deferred Foreign Capital Gain Taxes: The Fund is subject to a tax imposed on net realized gains of securities of certain foreign countries. The Fund records an estimated deferred tax liability for net unrealized gains on these investments as reflected in the accompanying financial statements.
Federal Income Taxes: It is the policy of the Trust to comply with the provisions of the Internal Revenue Code applicable to “regulated investment companies” and to distribute to shareholders substantially all taxable income, including any net realized gain on investments of the Fund. Therefore, no provision for federal income taxes is required.
Management reviews each uncertain tax position believed to be material to the preparation of the Fund’s financial statements, to assess if it is more likely than not that the position would be sustained upon examination, based upon the technical merits of the position. As of March 31, 2015, management has not identified any such position for which an asset or liability must be reflected in the Statement of Assets and Liabilities. The Fund’s tax returns remain subject to examination for three years after filing.
Foreign Currency Translation: Portfolio investments and other assets and liabilities denominated in foreign currencies are translated into U.S. dollars based on the exchange rate of such currencies against the U.S. dollar on the date of valuation. Purchases and sales of investments and income items denominated in foreign currencies are translated into U.S. dollars at the exchange rate in effect on the transaction date. When the Fund purchases or sells foreign investments, it will customarily enter into a foreign exchange contract to minimize foreign exchange risk from the trade date to the settlement date of such transactions. The values of such spot contracts are included in receivable for investments sold and payable for investments purchased on the Statement of Assets and Liabilities.
The Fund does not separately report the effect of changes in foreign exchange rates from changes in market prices on investments held. Such changes are included in net unrealized appreciation or depreciation from investments.
Reported net realized gains or losses from foreign currency transactions arise due to purchases and sales of foreign currencies, currency gains or losses realized between the trade and settlement dates on investment transactions and the difference between
Semi-Annual Report 19
| | |
| NOTES TO FINANCIAL STATEMENTS, CONTINUED | | |
| |
Thornburg Value Fund | | March 31, 2015 (Unaudited) |
the amounts of dividends, interest, and foreign withholding taxes recorded on the Fund’s books, and the U.S. dollar equivalent of the amounts actually received or paid.
Net change in unrealized appreciation and depreciation on foreign currency translations arise from changes in the fair value of assets and liabilities, other than investments at fiscal period end, resulting from changes in exchange rates.
When-Issued and Delayed Delivery Transactions: The Fund may engage in when-issued or delayed delivery transactions. To the extent the Fund engages in such transactions, it will do so for the purpose of acquiring portfolio investments consistent with the Fund’s investment objectives and not for the purpose of investment leverage or to speculate on interest rate and/or market changes. At the time the Fund makes a commitment to purchase an investment on a when-issued or delayed delivery basis, the Fund will record the transaction and reflect the value in determining its net asset value. When effecting such transactions, assets of an amount sufficient to make payment for the portfolio investments to be purchased will be segregated on the Fund’s records on the trade date. Investments purchased on a when-issued or delayed delivery basis do not earn interest until the settlement date.
Dividends: Dividends to shareholders, if any, are generally paid quarterly and are reinvested in additional shares of the Fund at net asset value per share at the close of business on the dividend payment date or, at the shareholder’s option, paid in cash. Net realized capital gains, to the extent available, will be distributed at least annually. Distributions to shareholders are based on income tax regulations and therefore, their characteristics may differ for financial statement and tax purposes.
Repurchase Agreements: The Fund may invest excess cash in repurchase agreements whereby the Fund purchases investments, which serve as collateral, with an agreement to resell such collateral to the seller at an agreed upon price at the maturity date of the repurchase agreement. Investments pledged as collateral for repurchase agreements are held in custody until maturity of the repurchase agreement. Provisions in the agreements require that the market value of the collateral is at least equal to the repurchase value in the event of default. In the event of default, the Fund has the right to liquidate the collateral and apply the proceeds in satisfaction of the obligation. Under certain circumstances, in the event of default or bankruptcy by the other party to the agreement, realization and/ or retention of the collateral may be subject to legal proceedings.
General: Investment transactions are accounted for on a trade date basis. Interest income is accrued as earned and dividend income is recorded on the ex-dividend date. Certain income from foreign investments is recognized as soon as information is available to the Fund. Realized gains and losses from the sale of investments are recorded on an identified cost basis. Net investment income (other than class specific expenses) and realized and unrealized gains and losses are allocated daily to each class of shares based upon the relative net asset value of outstanding shares of each class of shares at the beginning of the day (after adjusting for the current share activity of the respective class). Expenses common to all Funds are allocated among the Funds comprising the Trust based upon their relative net asset values or other appropriate allocation methods.
Guarantees and Indemnifications: Under the Trust’s organizational documents (and under separate agreements with the independent Trustees), its officers and Trustees are indemnified against certain liabilities arising out of the performance of their duties to the Fund. Additionally, in the normal course of business the Trust enters into contracts with service providers that contain general indemnification clauses. The Trust’s maximum exposure under these arrangements is unknown. However, based on experience, the Trust expects the risk of loss to be remote.
NOTE 3 – INVESTMENT ADVISORY FEE AND OTHER TRANSACTIONS WITH AFFILIATES
Pursuant to an investment advisory agreement, Thornburg Investment Management, Inc. (the “Advisor”) serves as the investment advisor and performs services for the Fund for which the fees are payable at the end of each month. For the six months ended March 31, 2015, these fees were payable at annual rates ranging from .875 of 1% to .675 of 1% per annum of the average daily net assets of the Fund depending on the Fund’s asset size. The Trust also has entered into administrative services agreements with the Advisor, whereby the Advisor will perform certain administrative services for the shareholders of each class of the Fund’s shares, and for which fees will be payable at an annual rate of up to .125 of 1% per annum of the average daily net assets attributable to each class of shares.
The Trust has an underwriting agreement with Thornburg Securities Corporation (the “Distributor,” an affiliate of the Advisor), which acts as the distributor of the Fund’s shares. For the six months ended March 31, 2015, the Distributor has advised the Fund that it earned net commissions aggregating $10,372 from the sale of Class A shares, and collected contingent deferred sales charges aggregating $2,131 from redemptions of Class C shares of the Fund.
Pursuant to a service plan under Rule 12b-1 of the Investment Company Act of 1940, the Fund may reimburse to the Advisor an amount not to exceed .25 of 1% per annum of the average daily net assets attributable to each class of shares of the Fund for payments made by the Advisor to securities dealers and other financial institutions to obtain various shareholder and distribution related services. For the six months ended March 31, 2015, there were no 12b-1 service plan fees charged for Class I and R5 shares. The Advisor may pay out of its own resources additional expenses for distribution of the Fund’s shares and shareholder services.
20 Semi-Annual Report
| | |
| NOTES TO FINANCIAL STATEMENTS, CONTINUED | | |
| |
Thornburg Value Fund | | March 31, 2015 (Unaudited) |
The Trust has also adopted distribution plans pursuant to Rule 12b-1, applicable only to the Fund’s Class B, Class C, and Class R3 shares, under which the Fund compensates the Distributor for services in promoting the sale of Class B, Class C, and Class R3 shares of the Fund at an annual rate of up to .75 of 1% per annum of the average daily net assets attributable to Class B and Class C shares, and an annual rate of up to .25 of 1% per annum of the average daily net assets attributable to Class R3 shares. Total fees incurred by each class of shares of the Fund under their respective service and distribution plans for the six months ended March 31, 2015, are set forth in the Statement of Operations.
The Advisor and Distributor have contractually agreed to waive fees and reimburse expenses incurred by the Fund so that actual expenses of certain share classes do not exceed levels as specified in the Fund’s most recent prospectuses. The agreement may be terminated by the Fund at any time, but may not be terminated by the Advisor or Distributor before February 1, 2016, unless the Advisor ceases to be the investment advisor to the Fund or the Distributor ceases to be the distributor of the Fund prior to that date. The Advisor and Distributor retain the right to be repaid by the Fund for fee waivers and expense reimbursements if expenses fall below the contractual limit prior to the end of the fiscal year.
For the six months ended March 31, 2015, the Advisor contractually reimbursed certain class specific expenses, administrative fees, and distribution fees of $6,070 for Class B shares, $101,746 for Class I shares, $150,853 for Class R3 shares, $18,710 for Class R4 Shares, and $29,733 for Class R5 shares.
The Trust has an agreement with the custodian bank to indirectly pay a portion of the custodian’s fees through credits earned by the Fund’s cash on deposit with the bank. This deposit agreement is an alternative to overnight investments. Custodial fees are adjusted to reflect amounts that would have been paid without this agreement, with a corresponding adjustment reflected as fees paid indirectly in the Statement of Operations. For the six months ended March 31, 2015, fees paid indirectly were $230.
Certain officers and Trustees of the Trust are also officers or directors of the Advisor and Distributor. The compensation of independent Trustees is borne by the Trust.
NOTE 4 – SHARES OF BENEFICIAL INTEREST
At March 31, 2015, there were an unlimited number of shares with no par value of beneficial interest authorized. Transactions in shares of beneficial interest were as follows:
| | | | | | | | | | | | | | | | |
| | | Six Months Ended
March 31, 2015 (Unaudited) | | | Year Ended
September 30, 2014 (Audited) | |
| | | Shares | | | Amount | | | Shares | | | Amount | |
Class A Shares | | | | | | | | | | | | | | | | |
Shares sold | | | 299,988 | | | $ | 14,914,959 | | | | 730,300 | | | $ | 32,369,874 | |
Shares issued to shareholders in reinvestment of dividends | | | 2,867 | | | | 143,603 | | | | 44,964 | | | | 2,140,804 | |
Shares repurchased | | | (627,406 | ) | | | (31,191,258 | ) | | | (2,359,346 | ) | | | (108,172,702 | ) |
| | | | | | | | | | | | | | | | |
| | | | |
Net increase (decrease) | | | (324,551 | ) | | $ | (16,132,696 | ) | | | (1,584,082 | ) | | $ | (73,662,024 | ) |
| | | | | | | | | | | | | | | | |
| | | | |
Class B Shares | | | | | | | | | | | | | | | | |
Shares sold | | | 6,493 | | | $ | 288,806 | | | | 5,477 | | | $ | 229,285 | |
Shares issued to shareholders in reinvestment of dividends | | | — | | | | — | | | | — | | | | — | |
Shares repurchased | | | (26,075 | ) | | | (1,186,869 | ) | | | (113,589 | ) | | | (4,776,580 | ) |
| | | | | | | | | | | | | | | | |
| | | | |
Net increase (decrease) | | | (19,582 | ) | | $ | (898,063 | ) | | | (108,112 | ) | | $ | (4,547,295 | ) |
| | | | | | | | | | | | | | | | |
| | | | |
Class C Shares | | | | | | | | | | | | | | | | |
Shares sold | | | 190,895 | | | $ | 8,813,142 | | | | 186,376 | | | $ | 7,896,358 | |
Shares issued to shareholders in reinvestment of dividends | | | — | | | | — | | | | — | | | | — | |
Shares repurchased | | | (287,113 | ) | | | (13,306,235 | ) | | | (646,930 | ) | | | (27,666,252 | ) |
| | | | | | | | | | | | | | | | |
| | | | |
Net increase (decrease) | | | (96,218 | ) | | $ | (4,493,093 | ) | | | (460,554 | ) | | $ | (19,769,894 | ) |
| | | | | | | | | | | | | | | | |
Semi-Annual Report 21
| | |
| NOTES TO FINANCIAL STATEMENTS, CONTINUED | | |
| |
Thornburg Value Fund | | March 31, 2015 (Unaudited) |
| | | | | | | | | | | | | | | | |
| | | Six Months Ended
March 31, 2015 (Unaudited) | | | Year Ended
September 30, 2014 (Audited) | |
| | | Shares | | | Amount | | | Shares | | | Amount | |
Class I Shares | | | | | | | | | | | | | | | | |
Shares sold | | | 214,046 | | | $ | 10,927,689 | | | | 947,805 | | | $ | 45,196,302 | |
Shares issued to shareholders in reinvestment of dividends | | | 7,300 | | | | 374,639 | | | | 71,848 | | | | 3,462,876 | |
Shares repurchased | | | (658,689 | ) | | | (33,504,061 | ) | | | (1,434,646 | ) | | | (66,925,033 | ) |
| | | | | | | | | | | | | | | | |
| | | | |
Net increase (decrease) | | | (437,343 | ) | | $ | (22,201,733 | ) | | | (414,993 | ) | | $ | (18,265,855 | ) |
| | | | | | | | | | | | | | | | |
| | | | |
Class R3 Shares | | | | | | | | | | | | | | | | |
Shares sold | | | 108,772 | | | $ | 5,335,434 | | | | 248,804 | | | $ | 11,260,106 | |
Shares issued to shareholders in reinvestment of dividends | | | 620 | | | | 30,881 | | | | 8,348 | | | | 397,261 | |
Shares repurchased | | | (305,127 | ) | | | (15,049,745 | ) | | | (685,352 | ) | | | (30,998,740 | ) |
| | | | | | | | | | | | | | | | |
| | | | |
Net increase (decrease) | | | (195,735 | ) | | $ | (9,683,430 | ) | | | (428,200 | ) | | $ | (19,341,373 | ) |
| | | | | | | | | | | | | | | | |
| | | | |
Class R4 Shares | | | | | | | | | | | | | | | | |
Shares sold | | | 36,478 | | | $ | 1,784,051 | | | | 50,333 | | | $ | 2,278,220 | |
Shares issued to shareholders in reinvestment of dividends | | | 126 | | | | 6,316 | | | | 920 | | | | 44,944 | |
Shares repurchased | | | (60,226 | ) | | | (3,039,042 | ) | | | (142,648 | ) | | | (6,516,057 | ) |
| | | | | | | | | | | | | | | | |
| | | | |
Net increase (decrease) | | | (23,622 | ) | | $ | (1,248,675 | ) | | | (91,395 | ) | | $ | (4,192,893 | ) |
| | | | | | | | | | | | | | | | |
| | | | |
Class R5 Shares | | | | | | | | | | | | | | | | |
Shares sold | | | 40,584 | | | $ | 2,061,135 | | | | 111,612 | | | $ | 5,242,431 | |
Shares issued to shareholders in reinvestment of dividends | | | 677 | | | | 34,703 | | | | 7,886 | | | | 376,859 | |
Shares repurchased | | | (144,573 | ) | | | (7,381,659 | ) | | | (619,985 | ) | | | (28,184,121 | ) |
| | | | | | | | | | | | | | | | |
| | | | |
Net increase (decrease) | | | (103,312 | ) | | $ | (5,285,821 | ) | | | (500,487 | ) | | $ | (22,564,831 | ) |
| | | | | | | | | | | | | | | | |
NOTE 5 – INVESTMENT TRANSACTIONS
For the six months ended March 31, 2015, the Fund had purchase and sale transactions of investments (excluding short-term investments) of $204,561,395 and $290,448,913, respectively.
NOTE 6 – INCOME TAXES
At March 31, 2015, information on the tax components of capital was as follows:
| | | | |
Cost of investments for tax purposes | | $ | 809,459,986 | |
| | | | |
Gross unrealized appreciation on a tax basis | | $ | 226,155,148 | |
Gross unrealized depreciation on a tax basis | | | (29,363,952 | ) |
| | | | |
Net unrealized appreciation (depreciation) on investments (tax basis) | | $ | 196,791,196 | |
| | | | |
At March 31, 2015, the Fund had cumulative tax basis capital losses of $88,973,265 (of which $88,973,265 is short-term and $0 is long-term) generated after September 30, 2011, which may be carried forward to offset future capital gains. To the extent such carry-forwards are used, capital gain distributions may be reduced to the extent provided by regulations. Such capital loss carryforwards do not expire but are required to be utilized to offset future gains prior to the utilization of losses that occurred in years prior to the fiscal year ending September 30, 2012, which may expire prior to utilization.
22 Semi-Annual Report
| | |
| NOTES TO FINANCIAL STATEMENTS, CONTINUED | | |
| |
Thornburg Value Fund | | March 31, 2015 (Unaudited) |
At March 31, 2015, the Fund had cumulative tax basis capital losses generated prior to October 1, 2011, which may be carried forward to offset future capital gains. To the extent such carryforwards are used, capital gain distributions may be reduced to the extent provided by regulations.
Such capital loss carryforwards expire as follows:
| | | | |
2017 | | $ | 204,425,697 | |
2018 | | | 242,353,997 | |
| | | | |
| | $ | 446,779,694 | |
| | | | |
NOTE 7 – DERIVATIVE FINANCIAL INSTRUMENTS WITH OFF-BALANCE SHEET RISK AND FOREIGN INVESTMENT RISK
The Fund may use a variety of derivative financial instruments to hedge or adjust the risks affecting its investment portfolio or to enhance investment returns. Provisions of FASB Accounting Standards Codification 815-10-50 (“ASC 815”), require certain disclosures. The disclosures are intended to provide users of financial statements with an understanding of the use of derivative instruments by the Fund and how these derivatives affect the financial position, financial performance and cash flows of the Fund. The Fund does not designate any derivative instruments as hedging instruments under ASC 815. During the six months ended March 31, 2015, the Fund’s principal exposure to derivative financial instruments of the type addressed by ASC 815 was investment in foreign exchange contracts. A foreign exchange contract is an agreement between two parties to exchange different currencies at a specified rate of exchange at an agreed upon future date. Foreign exchange contracts involve risks to the Fund, including the risk that a contract’s counterparty will not meet its obligations to the Fund, the risk that a change in a contract’s value may not correlate perfectly with the currency the contract was intended to track, and the risk that the advisor is unable to correctly implement its strategy in using a contract. In any such instance, the Fund may not achieve the intended benefit of entering into a contract, and may experience a loss. Additionally, the Fund’s risk of loss may exceed the amounts recognized on the Statement of Assets and Liabilities.
The Fund entered into forward currency contracts during the six months ended March 31, 2015 in the normal course of pursuing its investment objectives, with the objective of reducing the risk to the value of the Fund’s foreign investments from adverse changes in the relationship between the U.S. dollar and foreign currencies. In each case these contracts have been initiated in conjunction with foreign investment transactions.
These contracts are accounted for by the Fund under ASC 815. Unrealized appreciation and depreciation on outstanding contracts are reported in the Fund’s Statement of Assets and Liabilities, as measured by the difference between the forward exchange rates at the reporting date and the forward exchange rates at each contract’s inception date. Net realized gain (loss) on contracts closed during the period, and changes in net unrealized appreciation (depreciation) on outstanding contracts are recognized in the Fund’s Statement of Operations. The average value of open sell currency contracts for the six months ended March 31, 2015 was $52,061,573. Open buy currency contracts are entered into for the purpose of closing open sell currency contracts and the values are dependent upon the values of the open sell currency contracts to which they relate.
The following table displays the outstanding forward currency contracts at March 31, 2015:
| | | | | | | | | | | | | | | | | | | | | | | | |
| | | Outstanding Forward Currency Contracts To Buy Or Sell At March 31, 2015 | |
Contract Description | | Buy/Sell | | | Contract
Amount | | | Contract
Value Date | | | Value USD | | | Unrealized
Appreciation | | | Unrealized
Depreciation | |
Euro | | | Sell | | | | 11,666,800 | | | | 05/29/2015 | | | | 12,554,204 | | | $ | 1,959,411 | | | $ | — | |
Euro | | | Buy | | | | 1,791,600 | | | | 05/29/2015 | | | | 1,927,873 | | | | — | | | | (303,396 | ) |
Japanese Yen | | | Sell | | | | 2,197,981,300 | | | | 08/25/2015 | | | | 18,366,957 | | | | 166,863 | | | | — | |
Japanese Yen | | | Buy | | | | 550,920,900 | | | | 08/25/2015 | | | | 4,603,652 | | | | 2,138 | | | | — | |
| | | | | | | | | | | | | | | | | | | | | | | | |
Total | | | | | | | | | | | | | | | | | | $ | 2,128,412 | | | $ | (303,396 | ) |
| | | | | | | | | | | | | | | | | | | | | | | | |
Net unrealized appreciation (depreciation) | | | | | | | | | | | $ | 1,825,016 | | | | | |
| | | | | | | | | | | | | | | | | | | | | | | | |
Certain forward currency contracts were entered into with State Street Bank and Trust Company (“SSB”) pursuant to an International Swaps and Derivatives Association (“ISDA”) Master Agreement. In the event of a default or termination under the ISDA Master Agreement with SSB, the non-defaulting party has the right to close out all outstanding forward currency contracts between the parties
Semi-Annual Report 23
| | |
| NOTES TO FINANCIAL STATEMENTS, CONTINUED | | |
| |
Thornburg Value Fund | | March 31, 2015 (Unaudited) |
and to net any payment amounts under those contracts, resulting in a single net amount payable by one party to the other. Because the ISDA Master Agreement with SSB does not result in an offset of reported amounts of financial assets and financial liabilities in the Fund’s Statement of Assets and Liabilities unless there has been an event of default or termination event under that agreement, the Fund does not net its outstanding forward currency contracts for purposes of the disclosure in the Fund’s Statement of Assets and Liabilities. Instead the Fund recognizes the unrealized appreciation or depreciation on those forward currency contracts on a gross basis in the Fund’s Statement of Assets and Liabilities. At March 31, 2015, those recognized amounts are disclosed in the following table:
| | | | |
Fair Values Of Derivative Financial Instruments At March 31, 2015 |
Asset Derivatives | | Balance Sheet Location | | Fair Value |
Foreign exchange contracts | | Assets - Unrealized appreciation on forward currency contracts | | $2,128,412 |
| | |
Liability Derivatives | | Balance Sheet Location | | Fair Value |
Foreign exchange contracts | | Liabilities - Unrealized depreciation on forward currency contracts | | $(303,396) |
Because the Fund does not currently receive or post cash collateral in connection with its currency forward contracts, and because all of the Fund’s outstanding currency forward contracts are with State Street Bank and Trust Company, the net amounts of the Fund’s assets and liabilities which are attributable to those contracts at March 31, 2015 can be determined by offsetting the dollar amounts shown in the preceding table. Based on those amounts, the net amount of the Fund’s assets which is attributable to its outstanding forward currency contracts at March 31, 2015 is $1,825,016, and the net amount of the Fund’s liabilities which is attributable to those contracts at that date is $0. The Fund’s forward currency contracts are valued each day, and the net amounts of the Fund’s assets and liabilities which are attributable to those contracts are expected to vary over time.
The net realized gain (loss) from forward currency contracts and the net change in unrealized appreciation (depreciation) on outstanding forward currency contracts recognized in the Fund’s Statement of Operations for the six months ended March 31, 2015 are disclosed in the following tables:
| | | | |
Net Realized Gain (loss) From Derivative Financial Instruments
Recognized In Income For The Six Months Ended March 31, 2015 |
| | | Total | | Forward Currency Contracts |
Foreign exchange contracts | | $ 4,695,375 | | $ 4,695,375 |
|
Net Change In Unrealized Appreciation (depreciation) On Derivative Financial Instruments Recognized In Income For The Six Months Ended March 31, 2015 |
| | | Total | | Forward Currency Contracts |
Foreign exchange contracts | | $ (1,437,873) | | $ (1,437,873) |
OTHER NOTES
Risks: The Fund’s investments subject it to risks including, but not limited to, management risk, market and economic risk, risks affecting specific issuers, liquidity risk, the risks associated with investments in small- and mid-cap companies and non-U.S. issuers, credit risk, and interest rate risk. Please see the Fund’s prospectus for a discussion of the risks associated with an investment in the Fund.
Subsequent Events: Fund management believes no events have occurred between March 31, 2015 and the date of issuance of the financial statements that require adjustment to or disclosure in the accompanying financial statements.
24 Semi-Annual Report
This page intentionally left blank.
Semi-Annual Report 25
FINANCIAL HIGHLIGHTS
Thornburg Value Fund
| | | | | | | | | | | | | | | | | | | | | | | | | | | | | | | | | | | | | | | | | | | | | | | | |
| | | PER SHARE PERFORMANCE (for a share outstanding throughout the Period)+ | | RATIOS TO AVERAGE NET ASSETS | | | SUPPLEMENTAL DATA | |
Unless
Otherwise
Noted,
Periods
are
Fiscal
Years
Ended
Sept. 30, | | Net Asset
Value
Beginning
of Period | | | Net
Investment
Income
(Loss) | | Net
Realized
&
Unrealized
Gain (Loss)
on
Investments | | | Total from
Investment
Operations | | Dividends
from Net
Investment
Income | | | Dividends
from Net
Realized
Gains | | Total
Dividends | | | Net
Asset
Value
End
of
Period | | Net
Investment
Income
(Loss) (%) | | | Expenses,
After Expense
Reductions
(%) | | | Expenses,
After
Expense
Reductions
and
Net of
Custody
Credits
(%) | | | Expenses,
Before
Expense
Reductions
(%) | | | Total
Return
(%)(a) | | Portfolio
Turnover
Rate
(%)(a) | | Net
Assets
at End
of
Period
(Thousands) | |
CLASS A SHARES | | | | | | | | | | | | | | | | | | | | | | | | | | | | | | | | | | | | | | | | | | |
2015(b)(c) | | $ | 48.09 | | | 0.02 | | | 3.78 | | | 3.80 | | | (0.02 | ) | | — | | | (0.02 | ) | | $51.87 | | | 0.09(d) | | | | 1.37 | (d) | | | 1.37 | (d) | | | 1.37 | (d) | | 7.90 | | 22.28 | | $ | 409,406 | |
2014(b) | | $ | 40.84 | | | 0.10 | | | 7.41 | | | 7.51 | | | (0.26 | ) | | — | | | (0.26 | ) | | $48.09 | | | 0.22 | | | | 1.37 | | | | 1.37 | | | | 1.37 | | | 18.40 | | 72.43 | | $ | 395,216 | |
2013(b) | | $ | 31.51 | | | 0.08 | | | 9.25 | | | 9.33 | | | — | | | — | | | — | | | $40.84 | | | 0.23 | | | | 1.40 | | | | 1.40 | | | | 1.40 | | | 29.61 | | 61.50 | | $ | 400,275 | |
2012(b) | | $ | 27.71 | | | (0.10) | | | 3.90 | | | 3.80 | | | — | | | — | | | — | | | $31.51 | | | (0.32) | | | | 1.32 | | | | 1.32 | | | | 1.32 | | | 13.71 | | 54.16 | | $ | 470,120 | |
2011(b) | | $ | 30.44 | | | (0.03) | | | (2.70 | ) | | (2.73) | | | — | | | — | | | — | | | $27.71 | | | (0.10) | | | | 1.28 | | | | 1.28 | | | | 1.28 | | | (8.97) | | 64.14 | | $ | 825,700 | |
2010(b) | | $ | 29.66 | | | 0.20 | | | 0.76 | | | 0.96 | | | (0.18 | ) | | — | | | (0.18 | ) | | $30.44 | | | 0.65 | | | | 1.31 | | | | 1.31 | | | | 1.31 | | | 3.21 | | 72.75 | | $ | 1,131,594 | |
CLASS B SHARES | | | | | | | | | | | | | | | | | | | | | | | | | | | | | | | | | | | | | | | | | | |
2015(c) | | $ | 44.05 | | | (0.21) | | | 3.45 | | | 3.24 | | | — | | | — | | | — | | | $47.29 | | | (0.93)(d) | | | | 2.38 | (d) | | | 2.38 | (d) | | | 2.71 | (d) | | 7.33 | | 22.28 | | $ | 3,340 | |
2014 | | $ | 37.55 | | | (0.31) | | | 6.81 | | | 6.50 | | | — | | | — | | | — | | | $44.05 | | | (0.74) | | | | 2.32 | | | | 2.32 | | | | 2.55 | | | 17.31 | | 72.43 | | $ | 3,974 | |
2013 | | $ | 29.25 | | | (0.24) | | | 8.54 | | | 8.30 | | | — | | | — | | | — | | | $37.55 | | | (0.74) | | | | 2.37 | | | | 2.37 | | | | 2.47 | | | 28.38 | | 61.50 | | $ | 7,448 | |
2012 | | $ | 25.99 | | | (0.38) | | | 3.64 | | | 3.26 | | | — | | | — | | | — | | | $29.25 | | | (1.33) | | | | 2.34 | | | | 2.34 | | | | 2.36 | | | 12.53 | | 54.16 | | $ | 9,344 | |
2011 | | $ | 28.81 | | | (0.33) | | | (2.49 | ) | | (2.82) | | | — | | | — | | | — | | | $25.99 | | | (1.03) | | | | 2.19 | | | | 2.19 | | | | 2.19 | | | (9.79) | | 64.14 | | $ | 13,616 | |
2010 | | $ | 28.21 | | | (0.04) | | | 0.69 | | | 0.65 | | | (0.05 | ) | | — | | | (0.05 | ) | | $28.81 | | | (0.13) | | | | 2.18 | | | | 2.18 | | | | 2.18 | | | 2.29 | | 72.75 | | $ | 22,036 | |
CLASS C SHARES | | | | | | | | | | | | | | | | | | | | | | | | | | | | | | | | | | | | | | | | | | |
2015(c) | | $ | 44.95 | | | (0.15) | | | 3.52 | | | 3.37 | | | — | | | — | | | — | | | $48.32 | | | (0.66)(d) | | | | 2.12 | (d) | | | 2.12 | (d) | | | 2.12 | (d) | | 7.50 | | 22.28 | | $ | 183,983 | |
2014 | | $ | 38.26 | | | (0.24) | | | 6.93 | | | 6.69 | | | — | | | — | | | — | | | $44.95 | | | (0.55) | | | | 2.14 | | | | 2.14 | | | | 2.14 | | | 17.49 | | 72.43 | | $ | 175,495 | |
2013 | | $ | 29.75 | | | (0.18) | | | 8.69 | | | 8.51 | | | — | | | — | | | — | | | $38.26 | | | (0.55) | | | | 2.18 | | | | 2.18 | | | | 2.18 | | | 28.60 | | 61.50 | | $ | 166,971 | |
2012 | | $ | 26.36 | | | (0.32) | | | 3.71 | | | 3.39 | | | — | | | — | | | — | | | $29.75 | | | (1.09) | | | | 2.09 | | | | 2.09 | | | | 2.09 | | | 12.86 | | 54.16 | | $ | 185,286 | |
2011 | | $ | 29.18 | | | (0.28) | | | (2.54 | ) | | (2.82) | | | — | | | — | | | — | | | $26.36 | | | (0.85) | | | | 2.03 | | | | 2.03 | | | | 2.03 | | | (9.66) | | 64.14 | | $ | 253,065 | |
2010 | | $ | 28.55 | | | (0.03) | | | 0.73 | | | 0.70 | | | (0.07 | ) | | — | | | (0.07 | ) | | $29.18 | | | (0.09) | | | | 2.06 | | | | 2.06 | | | | 2.06 | | | 2.43 | | 72.75 | | $ | 329,761 | |
CLASS I SHARES | | | | | | | | | | | | | | | | | | | | | | | | | | | | | | | | | | | | | | | | | | |
2015(c) | | $ | 49.28 | | | 0.12 | | | 3.87 | | | 3.99 | | | (0.07 | ) | | — | | | (0.07 | ) | | $53.20 | | | 0.47(d) | | | | 0.99 | (d) | | | 0.99 | (d) | | | 1.06 | (d) | | 8.09 | | 22.28 | | $ | 300,127 | |
2014 | | $ | 41.96 | | | 0.28 | | | 7.62 | | | 7.90 | | | (0.58 | ) | | — | | | (0.58 | ) | | $49.28 | | | 0.60 | | | | 0.99 | | | | 0.99 | | | | 1.06 | | | 18.86 | | 72.43 | | $ | 299,568 | |
2013 | | $ | 32.24 | | | 0.20 | | | 9.52 | | | 9.72 | | | — | | | — | | | — | | | $41.96 | | | 0.59 | | | | 0.98 | | | | 0.98 | | | | 1.01 | | | 30.15 | | 61.50 | | $ | 272,468 | |
2012 | | $ | 28.26 | | | 0.02 | | | 3.99 | | | 4.01 | | | (0.03 | ) | | — | | | (0.03 | ) | | $32.24 | | | 0.07 | | | | 0.93 | | | | 0.93 | | | | 0.93 | | | 14.18 | | 54.16 | | $ | 1,104,163 | |
2011 | | $ | 30.95 | | | 0.09 | | | (2.76 | ) | | (2.67) | | | (0.02 | ) | | — | | | (0.02 | ) | | $28.26 | | | 0.27 | | | | 0.91 | | | | 0.91 | | | | 0.91 | | | (8.65) | | 64.14 | | $ | 1,968,181 | |
2010 | | $ | 30.15 | | | 0.30 | | | 0.80 | | | 1.10 | | | (0.30 | ) | | — | | | (0.30 | ) | | $30.95 | | | 0.97 | | | | 0.94 | | | | 0.94 | | | | 0.94 | | | 3.62 | | 72.75 | | $ | 2,087,380 | |
CLASS R3 SHARES | | | | | | | | | | | | | | | | | | | | | | | | | | | | | | | | | | | | | | | | | | |
2015(c) | | $ | 47.79 | | | 0.03 | | | 3.74 | | | 3.77 | | | (0.02 | ) | | — | | | (0.02 | ) | | $51.54 | | | 0.11(d) | | | | 1.35 | (d) | | | 1.35 | (d) | | | 1.77 | (d) | | 7.89 | | 22.28 | | $ | 70,347 | |
2014 | | $ | 40.56 | | | 0.11 | | | 7.37 | | | 7.48 | | | (0.25 | ) | | — | | | (0.25 | ) | | $47.79 | | | 0.23 | | | | 1.35 | | | | 1.35 | | | | 1.77 | | | 18.45 | | 72.43 | | $ | 74,579 | |
2013 | | $ | 31.28 | | | 0.10 | | | 9.18 | | | 9.28 | | | — | | | — | | | — | | | $40.56 | | | 0.29 | | | | 1.34 | | | | 1.34 | | | | 1.78 | | | 29.67 | | 61.50 | | $ | 80,671 | |
2012 | | $ | 27.51 | | | (0.10) | | | 3.87 | | | 3.77 | | | — | | | — | | | — | | | $31.28 | | | (0.34) | | | | 1.35 | | | | 1.35 | | | | 1.66 | | | 13.70 | | 54.16 | | $ | 131,013 | |
2011 | | $ | 30.24 | | | (0.06) | | | (2.67 | ) | | (2.73) | | | — | | | — | | | — | | | $27.51 | | | (0.17) | | | | 1.35 | | | | 1.35 | | | | 1.64 | | | (9.03) | | 64.14 | | $ | 169,234 | |
2010 | | $ | 29.48 | | | 0.17 | | | 0.76 | | | 0.93 | | | (0.17 | ) | | — | | | (0.17 | ) | | $30.24 | | | 0.57 | | | | 1.35 | | | | 1.35 | | | | 1.66 | | | 3.14 | | 72.75 | | $ | 200,362 | |
CLASS R4 SHARES | | | | | | | | | | | | | | | | | | | | | | | | | | | | | | | | | | | | | | | | | | |
2015(c) | | $ | 48.24 | | | 0.05 | | | 3.78 | | | 3.83 | | | (0.03 | ) | | — | | | (0.03 | ) | | $52.04 | | | 0.21(d) | | | | 1.24 | (d) | | | 1.24 | (d) | | | 1.56 | (d) | | 7.95 | | 22.28 | | $ | 10,994 | |
2014 | | $ | 40.89 | | | 0.16 | | | 7.43 | | | 7.59 | | | (0.24 | ) | | — | | | (0.24 | ) | | $48.24 | | | 0.36 | | | | 1.24 | | | | 1.24 | | | | 1.69 | | | 18.56 | | 72.43 | | $ | 11,330 | |
2013 | | $ | 31.50 | | | 0.13 | | | 9.26 | | | 9.39 | | | — | | | — | | | — | | | $40.89 | | | 0.39 | | | | 1.25 | | | | 1.25 | | | | 1.67 | | | 29.81 | | 61.50 | | $ | 13,340 | |
2012 | | $ | 27.68 | | | (0.07) | | | 3.89 | | | 3.82 | | | — | | | — | | | — | | | $31.50 | | | (0.24) | | | | 1.25 | | | | 1.25 | | | | 1.50 | | | 13.80 | | 54.16 | | $ | 45,989 | |
2011 | | $ | 30.39 | | | (0.02) | | | (2.69 | ) | | (2.71) | | | — | | | — | | | — | | | $27.68 | | | (0.06) | | | | 1.25 | | | | 1.25 | | | | 1.47 | | | (8.92) | | 64.14 | | $ | 51,900 | |
2010 | | $ | 29.62 | | | 0.19 | | | 0.78 | | | 0.97 | | | (0.20 | ) | | — | | | (0.20 | ) | | $30.39 | | | 0.63 | | | | 1.25 | | | | 1.25 | | | | 1.49 | | | 3.25 | | 72.75 | | $ | 54,461 | |
CLASS R5 SHARES | | | | | | | | | | | | | | | | | | | | | | | | | | | | | | | | | | | | | | | | | | |
2015(c) | | $ | 49.21 | | | 0.12 | | | 3.86 | | | 3.98 | | | (0.07 | ) | | — | | | (0.07 | ) | | $53.12 | | | 0.47(d) | | | | 0.98 | (d) | | | 0.98 | (d) | | | 1.19 | (d) | | 8.09 | | 22.28 | | $ | 27,628 | |
2014 | | $ | 41.89 | | | 0.28 | | | 7.61 | | | 7.89 | | | (0.57 | ) | | — | | | (0.57 | ) | | $49.21 | | | 0.59 | | | | 0.98 | | | | 0.98 | | | | 1.42 | | | 18.88 | | 72.43 | | $ | 30,676 | |
2013 | | $ | 32.19 | | | 0.22 | | | 9.48 | | | 9.70 | | | — | | | — | | | — | | | $41.89 | | | 0.63 | | | | 0.99 | | | | 0.99 | | | | 1.37 | | | 30.13 | | 61.50 | | $ | 47,076 | |
2012 | | $ | 28.22 | | | — (e) | | | 3.98 | | | 3.98 | | | (0.01 | ) | | — | | | (0.01 | ) | | $32.19 | | | –(f) | | | | 0.99 | | | | 0.99 | | | | 1.17 | | | 14.10 | | 54.16 | | $ | 129,995 | |
2011 | | $ | 30.92 | | | 0.07 | | | (2.76 | ) | | (2.69) | | | (0.01 | ) | | — | | | (0.01 | ) | | $28.22 | | | 0.20 | | | | 0.98 | | | | 0.99 | | | | 1.09 | | | (8.70) | | 64.14 | | $ | 215,364 | |
2010 | | $ | 30.13 | | | 0.28 | | | 0.79 | | | 1.07 | | | (0.28 | ) | | — | | | (0.28 | ) | | $30.92 | | | 0.91 | | | | 0.99 | | | | 0.99 | | | | 1.12 | | | 3.54 | | 72.75 | | $ | 228,768 | |
| (a) | Not annualized for periods less than one year. |
| (b) | Sales loads are not reflected in computing total return. |
| (c) | Unaudited Six Month Period Ended March 31. |
| (e) | Net Investment Income (Loss) was less than $0.01 per share. |
| (f) | Net Investment Income (Loss) was less than 0.01%. |
| + | Based on weighted average shares outstanding, except for Dividends from Net Investment Income and Net Realized Gains, which are actual amounts per share. |
See notes to financial statements.
| | | | |
| 26 Semi-Annual Report | | | | Semi-Annual Report 27 |
| | |
| EXPENSE EXAMPLE | | |
| |
Thornburg Value Fund | | March 31, 2015 (Unaudited) |
As a shareholder of the Fund, you incur two types of costs:
| | (1) | transaction costs, including |
(a) sales charges (loads) on purchase payments for Class A shares;
(b) a deferred sales charge on redemptions of any part or all of a purchase of $1 million of Class A shares within 12 months of purchase;
(c) a deferred sales charge on redemptions of Class B shares within eight years of purchase;
(d) a deferred sales charge on redemptions of Class C shares within 12 months of purchase;
| | (2) | ongoing costs, including management fees; distribution and/or service (12b-1) fees; and other Fund expenses. |
This example is intended to help you understand your ongoing costs (in dollars) of investing in the Fund and to compare these costs with the ongoing costs of investing in other mutual funds.
The example is based on a $1,000 investment beginning on October 1, 2014, and held until March 31, 2015.
ACTUAL EXPENSES
For each class of shares, the first line of the accompanying table provides information about actual account values and actual expenses. You may use the information in this line, together with the amount you invested, to estimate the expenses that you paid over the period. Simply divide your account value by $1,000 (for example, an $8,600 account value divided by $1,000 = 8.6), then multiply the result by the number in the first line for your class of shares under the heading entitled “Expenses Paid During Period” to estimate the expenses you paid on your account during this period.
HYPOTHETICAL EXAMPLE FOR COMPARISON PURPOSES
For each class of shares, the second line of the accompanying table provides information about hypothetical account values and hypothetical expenses based on the Fund’s actual expense ratio and an assumed rate of return of 5% per year before expenses, which is not the Fund’s actual return. The hypothetical account values and expenses may not be used to estimate the actual ending account balance or expenses you paid for the period. You may use this information to compare the ongoing costs of investing in the Fund and other funds. To do so, compare this 5% hypothetical example with the 5% hypothetical examples that appear in the shareholder reports of the other funds.
Please note that the expenses shown in the table are meant to highlight your ongoing costs only and do not reflect any transactional costs, such as sales charges (loads), redemption fees, or exchange fees. Therefore, the second line of the table for each class of shares is useful in comparing ongoing costs only, and will not help you determine the relative total costs of owning different funds. In addition, if these transactional costs were included, your costs would have been higher.
| | | | | | | | | | | | |
| | | Beginning
Account Value
10/1/14 | | | Ending
Account Value
3/31/15 | | | Expenses Paid
During Period†
10/1/14–3/31/15 | |
CLASS A SHARES | | | | | | | | | | | | |
Actual | | $ | 1,000.00 | | | $ | 1,079.00 | | | $ | 7.10 | |
Hypothetical* | | $ | 1,000.00 | | | $ | 1,018.10 | | | $ | 6.89 | |
CLASS B SHARES | | | | | | | | | | | | |
Actual | | $ | 1,000.00 | | | $ | 1,073.30 | | | $ | 12.30 | |
Hypothetical* | | $ | 1,000.00 | | | $ | 1,013.06 | | | $ | 11.94 | |
CLASS C SHARES | | | | | | | | | | | | |
Actual | | $ | 1,000.00 | | | $ | 1,075.00 | | | $ | 10.98 | |
Hypothetical* | | $ | 1,000.00 | | | $ | 1,014.35 | | | $ | 10.66 | |
CLASS I SHARES | | | | | | | | | | | | |
Actual | | $ | 1,000.00 | | | $ | 1,080.90 | | | $ | 5.14 | |
Hypothetical* | | $ | 1,000.00 | | | $ | 1,020.00 | | | $ | 4.99 | |
CLASS R3 SHARES | | | | | | | | | | | | |
Actual | | $ | 1,000.00 | | | $ | 1,078.90 | | | $ | 7.00 | |
Hypothetical* | | $ | 1,000.00 | | | $ | 1,018.20 | | | $ | 6.79 | |
CLASS R4 SHARES | | | | | | | | | | | | |
Actual | | $ | 1,000.00 | | | $ | 1,079.50 | | | $ | 6.44 | |
Hypothetical* | | $ | 1,000.00 | | | $ | 1,018.73 | | | $ | 6.26 | |
CLASS R5 SHARES | | | | | | | | | | | | |
Actual | | $ | 1,000.00 | | | $ | 1,080.90 | | | $ | 5.10 | |
Hypothetical* | | $ | 1,000.00 | | | $ | 1,020.03 | | | $ | 4.96 | |
| † | Expenses are equal to the annualized expense ratio for each class (A: 1.37%; B: 2.38%; C: 2.12%; I: 0.99%; R3: 1.35%; R4: 1.24%; R5: 0.98%) multiplied by the average account value over the period, multiplied by 182/365 to reflect the one-half year period. |
| * | Hypothetical assumes a rate of return of 5% per year before expenses. |
28 Semi-Annual Report
| | |
| OTHER INFORMATION | | |
| |
Thornburg Value Fund | | March 31, 2015 (Unaudited) |
PORTFOLIO PROXY VOTING
Policies and Procedures:
The Trust has delegated to Thornburg Investment Management, Inc. (the “Advisor”) voting decisions respecting proxies for the Fund’s voting securities. The Advisor makes voting decisions in accordance with its Proxy Voting Policy and Procedures. A description of the Policy and Procedures is available (i) without charge, upon request, by calling the Advisor toll-free at 1-800-847-0200, (ii) on the Thornburg website at www.thornburg.com, and (iii) on the Securities and Exchange Commission’s website at www.sec.gov.
Information regarding how proxies were voted is available on or before August 31 of each year for the twelve months ending the preceding June 30. This information is available (i) without charge, upon request by calling the Advisor toll-free at 1-800-847-0200, (ii) on the Thornburg website at www.thornburg.com, and (iii) on the Securities and Exchange Commission’s website at www.sec.gov.
AVAILABILITY OF QUARTERLY PORTFOLIO SCHEDULE
The Fund files with the Securities and Exchange Commission schedules of its portfolio holdings on Form N-Q for the first and third quarters of each fiscal year. The Fund’s Forms N-Q are available on the Commission’s website at www.sec.gov, or may be reviewed and copied at the Commission’s Public Reference Room in Washington, D.C. Information on the operation of the Public Reference Room may be obtained by calling 1-800-SEC-0330. The Fund also makes this information available on its website at www.thornburg. com/download or upon request by calling 1-800-847-0200.
Semi-Annual Report 29
TRUSTEES’ STATEMENT TO SHAREHOLDERS
Revised and Readopted September 15, 2014
The Trustees believe current and prospective shareholders should know how we discharge our responsibilities in supervising the Funds’ investment advisor and in reviewing the advisor’s contract for renewal. Since 2005, we have issued a statement which sets out clearly the three principal guidelines that we follow in supervising the Trust’s investment advisor on your behalf. In accordance with our customary practice, in September of 2014 we again reviewed our statement and concluded we should reissue this statement outlining the principal features of our supervision of the advisor’s performance of investment management services for the Funds.
We begin with the premise that each shareholder selected his or her Fund because its investments are managed by the investment advisor identified in the prospectus and in accordance with the objective and policies described in the prospectus. We realize, as each of you do, that if you believe that your Fund’s stated objective and policies no longer serve your personal investment goals, you can sell your shares and leave the Fund.
Therefore, we believe that our primary supervisory task—our principal obligation to you – is to assess the nature and quality of the advisor’s services, and to confirm that the advisor actively and competently pursues the Fund’s objective, in accordance with the policies set out in the prospectus. To do this, we meet regularly with management to review your Fund’s portfolio and to discuss the advisor’s specific actions and judgments in pursuing the Fund’s objective. We do not substitute our own judgment for the advisor’s decisions in selecting investments; the advisor is paid to exercise its informed judgment on investment decisions, and we seek to confirm, in reviewing the advisor’s performance, that the advisor is doing just that.
Second, we are conscious of costs and the effect that costs have on shareholders’ returns. We try to make sure that your Fund’s fees and costs are reasonable in relationship to the services rendered and that they are generally in line with those charged by other expert investment advisors, consistent with our belief that the Fund’s investors searched for and expect that expertise and attention and have decided to pay a reasonable price for it. We do not put the management contract “out to bid” as a matter of course, and we would not do so unless we had concluded that the advisor materially had failed to pursue the Fund’s objectives in accordance with its policies, or for other equally important reasons. We believe that any other approach would be inconsistent with your interests and contrary to your expectations when you bought shares of the Fund in the first place.
Finally, because we believe that most Thornburg Fund shareholders have invested with a long-term perspective, we try not to focus too much on the fashions of the moment and on short-term performance. The market will not favor any specific investment objective or set of policies at all times and under all economic circumstances. A fund will experience periods of both high and low returns relative to other funds and other investments. Even if one of our Funds is not favored by the market at a particular time, we believe that the advisor is nonetheless obliged to remain true to the Fund’s objective and policies, and we watch to see that it does so.
Trustees of Thornburg Investment Trust
30 Semi-Annual Report.
THORNBURG FUND FAMILY
FUNDAMENTAL, BOTTOM-UP EQUITY RESEARCH
We search far and wide for the best stock ideas—within the United States and around the globe. Potential investments that may deserve a deeper look are thoroughly analyzed using both quantitative and qualitative criteria. But the vast majority are discarded. Those that ultimately make it into our highly-selective portfolios are continually monitored to determine whether our investment theses unfold as expected.
| | • | | Thornburg Core Growth Fund |
| | • | | Thornburg International Value Fund |
| | • | | Thornburg International Growth Fund |
| | • | | Thornburg Developing World Fund |
| | • | | Thornburg Investment Income Builder Fund |
| | • | | Thornburg Global Opportunities Fund |
A TRADITION OF DISCIPLINED BOND MANAGEMENT
At Thornburg, the word “disciplined” carries some substance. We don’t make a practice of using shortcuts to enhance yield or total returns. Every strategy is grounded in rigorous, bottom-up credit work. Portfolios are assembled carefully—in the case of our core bond funds, using laddered structures—to mitigate price fluctuation. Position sizes are controlled so that no single bond can have an outsized effect on a portfolio. And as with our equity portfolios, managers enjoy flexibility to seek an optimal risk/reward balance.
| | • | | Thornburg Low Duration Income Fund |
| | • | | Thornburg Limited Term U.S. Government Fund |
| | • | | Thornburg Limited Term Income Fund |
| | • | | Thornburg Strategic Income Fund |
| | • | | Thornburg Low Duration Municipal Fund |
| | • | | Thornburg Limited Term Municipal Fund |
| | • | | Thornburg Intermediate Municipal Fund |
| | • | | Thornburg California Limited Term Municipal Fund |
| | • | | Thornburg New Mexico Intermediate Municipal Fund |
| | • | | Thornburg New York Intermediate Municipal Fund |
| | • | | Thornburg Strategic Municipal Income Fund |
Before investing, carefully consider the Fund’s investment goals, risks, charges, and expenses. For a prospectus or summary prospectus containing this and other information, contact your financial advisor or visit thornburg.com. Read it carefully before investing.
For additional information, please visit thornburg.com
Thornburg Investment Management, Inc. 2300 North Ridgetop Road, Santa Fe, NM 87506
Semi-Annual Report 31

This Semi-Annual Report is submitted for the general information of shareholders of the Fund. It is not authorized for distribution to prospective investors in the Fund unless preceded or accompanied by an effective prospectus.
| | | | |
| Investment Advisor: | | Distributor: | | |
| Thornburg Investment Management® | | Thornburg Securities Corporation® | | |
| 800.847.0200 | | 800.847.0200 | | TH170 |
FIRM OVERVIEW
THE FIRM
Thornburg Investment Management is a privately owned global investment firm that offers a range of solutions for retail and institutional investors. We are driven by our mission to help our clients reach their long-term financial goals through fundamental research and active portfolio management.
Founded in 1982 and headquartered in Santa Fe, New Mexico, we manage approximately $61 billion (as of March 31, 2015) across seven equity and 11 bond mutual funds, separate accounts for high-net-worth investors and institutional accounts, and five UCITS funds for non-U.S. investors.

CORE INVESTMENT PRINCIPLES
Our focus has always been on maintaining and building the investment expertise to manage Thornburg strategies to a high standard, while adhering to a core set of investment principles:
| | • | | We focus on the fundamentals. We invest according to our view of the fundamental value of an issuer only after performing thorough, bottom-up research. |
| | • | | We think and invest for the long term. We typically make investment decisions based upon an investment thesis we expect to play out over 18 months to several years. We may not always hold a security for several years, but our horizon line is typically a few years out. |
| | • | | We stay flexible. We go where we see value. Our investment mandates are generally broad and flexible, and we exercise as much flexibility as possible within any restrictions. |
| | • | | We collaborate across strategies. We are structured as global generalists. Portfolio managers and analysts do not specialize in sectors, geographies, or even security types, but instead must understand and communicate bottom-up fundamentals across industries, sectors, and borders. |
2 Semi-Annual Report
Semi-Annual Report
Thornburg International Value Fund
March 31, 2015
| | | | |
Share Class | | NASDAQ Symbol | | CUSIP |
Class A | | TGVAX | | 885-215-657 |
Class B | | THGBX | | 885-215-616 |
Class C | | THGCX | | 885-215-640 |
Class I | | TGVIX | | 885-215-566 |
Class R3 | | TGVRX | | 885-215-525 |
Class R4 | | THVRX | | 885-215-269 |
Class R5 | | TIVRX | | 885-215-368 |
Class R6 | | TGIRX | | 885-216-804 |
Class I, R3, R4, R5, and R6 shares may not be available to all investors. Minimum investments for Class I shares may be higher than those for other classes. Class B shares are no longer offered.
Investments in the Fund carry risks, including possible loss of principal. Additional risks may be associated with investments outside the United States, especially in emerging markets, including currency fluctuations, illiquidity, volatility, and political and economic risks. Investments in small capitalization companies may increase the risk of declines in value and greater price fluctuations. Please see the Fund’s prospectus for a discussion of the risks associated with an investment in the Fund. Investments in the Fund are not FDIC insured, nor are they deposits of or guaranteed by a bank or any other entity.
Funds invested in a limited number of holdings may expose an investor to greater volatility.
Diversification does not assure or guarantee better performance and cannot eliminate the risk of investment losses.
Semi-Annual Report 3
| | |
| LETTER TO SHAREHOLDERS | | |
| |
Thornburg International Value Fund | | March 31, 2015 (Unaudited) |
April 17, 2015
Dear Fellow Shareholder:
This letter highlights the Thornburg International Value Fund’s investment activities and results for the six months ended March 31, 2015. It includes our views on the investment landscape, which has changed rather markedly in recent quarters. We also point out that a year has now passed since we streamlined the Fund’s management by reducing the number of portfolio managers to two. The purpose was to facilitate timely and effective decision-making. In the wake of the change, portfolio turnover increased, while the number of holdings decreased about 20% to 54 stocks at the end of the period. Position management—taking profits on strongly performing stocks and reallocating the proceeds into stocks that we perceived to have more upside—became more productive, even as the turnover ratio rose just a few points to 37% at September 30, 2014. The changes started to bear fruit appreciably in the third quarter of last year and continued to do so through the first half of the current fiscal year.
For the six months ended March 31, 2015, the Thornburg International Value Fund returned 5.53% for Class A shares, versus a 0.52% loss for the MSCI All Country World ex-U.S. Index and a 1.13% gain for the MSCI EAFE Index.
Morningstar ranked the Fund’s Class A share performance in the top 8% of its category over the year ended March 31, 2015. We credit the outperformance, both recently and since the inception of the Fund, to our bottom-up stock selection. But our active management of currency risk has also played a helpful, if secondary role in what has been a particularly volatile time for foreign exchange markets.
Table I International Value Fund
Percent Rank in Morningstar Foreign Large Growth Category
| | | | | | | | | | | | |
| | | 1-Yr | | | 5-Yr | | | 10-Yr | |
Class A | | | 8 | % | | | 77 | % | | | 30 | % |
Funds in Category | | | 339 | | | | 277 | | | | 175 | |
Based on total returns, without sales charge, as of March 31, 2015. Past performance is no guarantee of future results.
As noted, we run a relatively focused portfolio, currently consisting of roughly four-and-a-half-dozen stocks. Reflecting our conviction, each one has a meaningful weight in the portfolio, unless we are building or exiting a position. A focused, but diversified portfolio of well-researched stocks can enhance both risk management and return potential to a greater degree than the benchmarks might, in our judgment. The MSCI EAFE Index contained 910 constituents at the end of March, while the MSCI AC World ex-U.S. Index was laden with 1,841 constituents. Such high numbers of constituents doubtless contain material portions of underperformers, which dilute contributions from outperforming index members. While we also had our underperformers during the period, they were fewer in number than the outperformers, and their detraction from the portfolio’s performance was meaningfully outweighed by the contributions of the winners.
Contributors and Detractors
A number of our largest holdings did well during the period. Our top contributor in the period was Sony, which is executing well on its strategy to focus on its core device and entertainment divisions while moving to shed its unprofitable business units. It was followed by NXP Semiconductors, a leading European manufacturer of semiconductors used in a variety of electronic devices, including smartphones and near-field communications devices. NXP also announced plans to acquire Freescale Semiconductor for a total equity value of $11.8 billion. The merger should result in meaningful cost synergies and higher confidence in long-term sustainable growth. The combined company will be the leading franchise in MCUs (micro control units) for the automotive industry with strong cash-generating ability, helping to diversify from mobile communications exposure.
Another major contributor was Toyota, which benefitted from strong vehicle sales globally and a weaker yen. Tencent, a Chinese internet portal and mobile-device service company, posted better-than-expected earnings, in part on advertising monetization of its WeChat messaging platform, and Tenpay (one-stop online payment platform) user growth. China Mobile, meanwhile, logged robust subscriber growth, increasing mobile data usage, and an incipient decline in the pace of capital spending, the latter generally perceived as a plus in the generation of cash flow for shareholder-friendly activities—such as dividend increases.
Among our bottom performers in the period was Japanese financial Sumitomo Trust, which weakened as the reallocation of Japanese wealth into higher-margin products and higher fee transactions fell short of expectations. Spanish banks Banco Popular and BBVA also detracted from performance. Banco Popular suffered from continuing concerns with provisioning for poorly performing real estate loans as well as little improvement in margins in the small- and mid-sized business segment, despite a pickup in economic activity in Spain. BBVA traded off on worries about its units in Mexico, where lower oil prices have hurt the government’s budget and the currency, and Turkey, where the lira has also been under pressure.
Our other two main detractors were energy firms, Royal Dutch Shell (RDS) and BG Group plc (BG). Similar to energy names across the board, both have been undercut by lower oil and gas prices. At some point, we believe oil prices will rebound as higher-cost producers are sidelined and
4 Semi-Annual Report
| | |
| LETTER TO SHAREHOLDERS, | | |
| |
CONTINUED | | |
| |
Thornburg International Value Fund | | March 31, 2015 (Unaudited) |
economic growth picks up in the United States, Europe, and emerging markets, lifting global fuel and feedstock demand. In the meantime, RDS’s refining division provides a natural hedge against lower oil prices. It’s also worth noting that our energy positions provided nice dividend yields during the period. Also, as of this writing, RDS has made a $70 billion buyout offer for BG, lifting BG’s share price some 25% in next-day trading.
Market Environment
Market consensus going into 2015 appeared split between those who continued to favor U.S. stocks and those forecasting better performance in overseas equities. The former pointed to gathering steam in the world’s largest economy, with falling unemployment, better corporate and consumer balance sheets, and still-low interest rates and low inflation continuing to support U.S. equity multiples that were on the high side of historical averages. They also noted lackluster growth in Europe, Japan, and emerging markets, along with subpar or inconsistent returns in recent years. The other camp argued—so far correctly—that the upside potential of overseas equities was greater, and pointed to their more attractive valuations. Significantly, monetary authorities in Europe, Japan, China, and many other emerging markets were already engaging in monetary stimulus, whereas the U.S. Federal Reserve (the Fed) had wrapped up its asset-purchase program in late 2014 and was signaling that key interest-rate hikes were likely in the second half of this year.
The bifurcation in monetary policies of the Fed and its major peers has, of course, had a significant impact on markets, including currency markets. Alongside the sharp strengthening of the dollar, credit markets exhibit rock-bottom and even negative sovereign yields in most of Europe, while prices on commodities, from oil to base metals to agricultural products, are weighed down by the strong dollar. Emerging markets, which usually get hit from the mere specter of higher U.S. interest rates drawing portfolio flows away, have also struggled with slowing economic growth.
The divergence in global monetary policy is, of course, of interest to us and virtually all security market participants. While we pick stocks by virtue of fundamental analysis, we also factor in our evaluation the operating environments, end markets, and other macro factors, like potential currency changes. When it is cost effective and makes sense, we may employ foreign exchange hedges in an effort to mitigate exposure to weak overseas currencies and capture local market returns for our dollar-based investors. We may also favor exposure to quality companies in countries whose currencies are dollar-linked, such as China and Hong Kong. This approach has benefitted the Thornburg International Value Fund, and distinguished it as well: while many U.S. international equity mutual funds by prospectus may hedge foreign exchange risks, few in practice do so. The reasons why no doubt vary, but perhaps it���s worth noting that the category benchmarks represent dollar-based returns.
A strong dollar and weak local currencies generally help foreign companies which have overseas-based revenue. Both their relative costs and export competitiveness improve. The negative or historically low yields in a number of overseas markets as a result of monetary stimulus also tend to support risk assets, and, policy makers there hope, economic growth. That may be why, for instance, the total return of the euro-denominated STOXX Europe 600 Index from January 1st to April 1, 2015 was 17%, while the S&P 500 Index was up 1%. To reiterate: we seek local market returns and only hedge foreign exchange risks to facilitate securing them, and only when we deem it sensible and cost-effective.
We continue to seek strong franchises with bright prospects at attractive share prices, and are enthusiastic about the opportunities that can be found internationally, from Europe to Japan, China, and other select emerging markets. Though our portfolio consists of a relatively limited number of holdings, it is also diversified across company types we classify as Basic Value, Consistent Earners, and Emerging Franchises. We believe this complement to industry and country diversification provides an opportunity for effective risk-reward trade-off in our portfolio results.
We thank you for investing alongside us in the Thornburg International Value Fund.
Sincerely,
| | | | |
 | |  | | |
| William V. Fries,CFA | | Lei Wang,CFA | | |
| Portfolio Manager | | Portfolio Manager | | |
| Managing Director | | Managing Director | | |
The matters discussed in this report may constitute forward-looking statements made pursuant to the safe harbor provisions of the Securities Litigation Reform Act of 1995. These include any advisor or portfolio manager prediction, assessment, analysis or outlook for individual securities, industries, investment styles, market sectors and/or markets. These statements involve risks and uncertainties. In addition to the general risks described for each fund in its current prospectus, other factors bearing on these reports include the accuracy of the advisor’s or portfolio manager’s forecasts and predictions, the appropriateness of the investment strategies designed by the advisor or portfolio manager and the ability of the advisor or portfolio manager to implement their strategies efficiently and successfully. Any one or more of these factors, as well as other risks affecting the securities markets generally, could cause the actual results of any fund to differ materially as compared to its benchmarks.
The views expressed by the portfolio managers reflect their professional opinions and are subject to change. Under no circumstances does the information contained within represent a recommendation to buy or sell any security.
Semi-Annual Report 5
| | |
| PERFORMANCE SUMMARY | | |
| |
Thornburg International Value Fund | | March 31, 2015 (Unaudited) |
Average Annual Total Returns
| | | | | | | | | | | | | | | | | | | | |
| | | 1-Yr | | | 3-Yr | | | 5-Yr | | | 10-Yr | | | Since
Incep. | |
Class A Shares (Incep: 5/28/98) | | | | | | | | | | | | | | | | | | | | |
Without sales charge | | | 6.15 | % | | | 6.59 | % | | | 5.44 | % | | | 6.70 | % | | | 8.05 | % |
With sales charge | | | 1.37 | % | | | 4.96 | % | | | 4.47 | % | | | 6.21 | % | | | 7.76 | % |
Class B Shares (Incep: 4/3/00) | | | | | | | | | | | | | | | | | | | | |
Without sales charge | | | 5.17 | % | | | 5.67 | % | | | 4.55 | % | | | 6.03 | % | | | 5.58 | % |
With sales charge | | | 0.40 | % | | | 4.61 | % | | | 4.21 | % | | | 6.03 | % | | | 5.58 | % |
Class C Shares (Incep: 5/28/98) | | | | | | | | | | | | | | | | | | | | |
Without sales charge | | | 5.35 | % | | | 5.80 | % | | | 4.66 | % | | | 5.93 | % | | | 7.20 | % |
With sales charge | | | 4.40 | % | | | 5.80 | % | | | 4.66 | % | | | 5.93 | % | | | 7.20 | % |
Class I Shares (Incep: 3/30/01) | | | 6.49 | % | | | 7.00 | % | | | 5.85 | % | | | 7.13 | % | | | 7.80 | % |
Class R3 Shares (Incep: 7/1/03) | | | 5.93 | % | | | 6.38 | % | | | 5.24 | % | | | 6.54 | % | | | 9.34 | % |
Class R4 Shares (Incep: 2/1/07) | | | 6.13 | % | | | 6.60 | % | | | 5.46 | % | | | — | | | | 3.09 | % |
Class R5 Shares (Incep: 2/1/05) | | | 6.42 | % | | | 6.89 | % | | | 5.74 | % | | | 7.05 | % | | | 7.13 | % |
Class R6 Shares (Incep: 5/1/12) | | | 6.70 | % | | | — | | | | — | | | | — | | | | 7.48 | % |
MSCI AC World ex-U.S. Index (Since 5/28/98) | | | -0.57 | % | | | 6.89 | % | | | 5.29 | % | | | 5.93 | % | | | 5.18 | % |
MSCI EAFE Index (Since 5/28/98) | | | -0.92 | % | | | 9.02 | % | | | 6.16 | % | | | 4.95 | % | | | 4.24 | % |
Growth of a Hypothetical $10,000 Investment
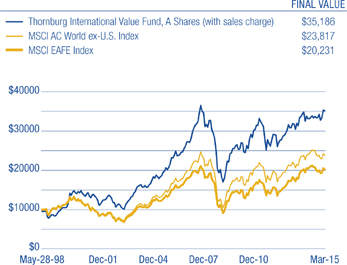
Performance data shown represents past performance and is no guarantee of future results. Investment return and principal value will fluctuate so shares, when redeemed, may be worth more or less than their original cost. Current performance may be lower or higher than quoted. For performance current to the most recent month end, visit thornburg.com or call 800-847-0200. The performance information does not reflect the deduction of taxes that a shareholder would pay on distributions or the redemption of Fund shares. Returns reflect the reinvestment of dividends and capital gains. Class A shares are sold with a maximum sales charge of 4.50%. B shares carry a contingent deferred sales charge (CDSC), if redeemed within a year, of 5.00%; within two years, 4.25%; within three years, 3.50%; within four years, 2.75%; within five years, 2.00%; within six years, 1.25%, within seven years, 0.50%. There is no charge for redemption within the eighth year. Class C shares are subject to a 1% CDSC for the first year only. There is no sales charge for Class I, R3, R4, R5 and R6 shares.
As disclosed in the most recent prospectus, the total annual fund operating expenses are as follows: A shares, 1.26%; B shares, 2.13%; C shares, 1.99%; I shares, 0.88%; R3 shares, 1.61%; R4 shares, 1.49%; R5 shares, 1.12%; R6 shares, 0.73%. Thornburg Investment Management and/or Thornburg Securities Corporation have contractually agreed to waive fees and reimburse expenses through at least February 1, 2016, for some of the share classes, resulting in net expense ratios of the following: R3 shares, 1.45%; R4 shares, 1.25%; R5 shares, 0.99%. For more detailed information on fund expenses and waivers/reimbursements please see the Fund’s prospectus.
Glossary
MSCI All Country (AC) World ex-US Index – A market capitalization weighted index representative of the market structure of 45 developed and emerging market countries in North and South America, Europe, Africa, and the Pacific Rim, excluding securities of United States’ issuers. The index is calculated with gross dividends reinvested in U.S. dollars.
MSCI EAFE (Europe, Australasia, Far East) Index – An unmanaged, market capitalization weighted index that is a common benchmark for international portfolio performance. The index is calculated with net dividends reinvested in U.S. dollars.
S&P 500 Index – An unmanaged broad measure of the U.S. stock market.
STOXX Europe 600 Index – This index represents large-, mid- and small-capitalization companies across 18 countries of the European region: Austria, Belgium, Czech Republic, Denmark, Finland, France, Germany, Greece, Ireland, Italy, Luxembourg, the Netherlands, Norway, Portugal, Spain, Sweden, Switzerland and the United Kingdom.
Unless otherwise noted, index returns reflect the reinvestment of income dividends and capital gains, if any, but do not reflect fees, brokerage commissions or other expenses of investing. Investors may not make direct investments into any index. The performance of any index is not indicative of the performance of any particular investment.
Multiple – A valuation multiple reflects an investment’s market value relative to some key metric. Price to earnings ratio (P/E) is a commonly used multiple. It’s calculated by dividing a stock’s price by the company’s earnings per share.
6 Semi-Annual Report
| | |
| FUND SUMMARY | | |
| |
Thornburg International Value Fund | | March 31, 2015 (Unaudited) |
OBJECTIVES AND STRATEGIES
The Fund seeks long-term capital appreciation by investing in equity and debt securities of all types. As a secondary consideration, the Fund also seeks some current income.
The Fund invests primarily in foreign securities or depositary receipts of foreign securities. The Fund may invest in developing countries.
Market Capitalization Exposure
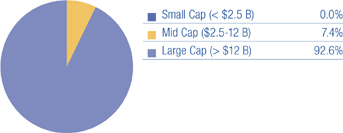
Basket Structure
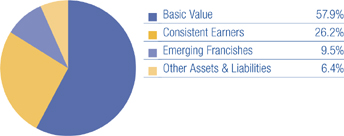
Top Ten Equity Holdings
| | | | |
UBS Group AG | | | 3.9 | % |
Sony Corp. | | | 3.8 | % |
NXP Semiconductors N.V. | | | 3.6 | % |
Nippon Telegraph & Telephone Corp. | | | 3.4 | % |
Hong Kong Exchanges & Clearing Ltd. | | | 3.2 | % |
Roche Holding AG | | | 3.2 | % |
Novartis AG | | | 3.1 | % |
Compagnie de Saint-Gobain | | | 3.1 | % |
Intesa Sanpaolo S.p.A. | | | 3.1 | % |
Toyota Motor Corp. | | | 3.1 | % |
There is no guarantee that the Fund will meet its investment objectives.
All portfolio information is subject to change. Charts may not add up to 100% due to rounding.
Sector Exposure
| | | | |
Financials | | | 24.8 | % |
Consumer Discretionary | | | 12.8 | % |
Information Technology | | | 12.7 | % |
Health Care | | | 12.2 | % |
Telecommunication Services | | | 10.8 | % |
Industrials | | | 8.8 | % |
Energy | | | 6.9 | % |
Utilities | | | 2.8 | % |
Materials | | | 1.3 | % |
Consumer Staples | | | 0.6 | % |
Other Assets & Liabilities | | | 6.4 | % |
Top Ten Industry Groups
| | | | |
Pharmaceuticals, Biotechnology & Life Sciences | | | 12.2 | % |
Diversified Financials | | | 11.3 | % |
Banks | | | 10.9 | % |
Telecommunication Services | | | 10.8 | % |
Energy | | | 6.9 | % |
Capital Goods | | | 6.9 | % |
Software & Services | | | 6.3 | % |
Semiconductors & Semiconductor Equipment | | | 6.1 | % |
Automobiles & Components | | | 5.7 | % |
Consumer Durables & Apparel | | | 3.8 | % |
Semi-Annual Report 7
| | |
| FUND SUMMARY, | | |
| |
CONTINUED | | |
| |
Thornburg International Value Fund | | March 31, 2015 (Unaudited) |
Country Exposure*
(percent of equity holdings)
| | | | |
United Kingdom | | | 16.3 | % |
Japan | | | 13.7 | % |
China | | | 11.6 | % |
Switzerland | | | 10.9 | % |
Netherlands | | | 10.1 | % |
France | | | 9.6 | % |
Spain | | | 4.2 | % |
Hong Kong | | | 3.4 | % |
Italy | | | 3.3 | % |
United States | | | 3.3 | % |
Germany | | | 2.6 | % |
Denmark | | | 2.5 | % |
Mexico | | | 2.0 | % |
Ireland | | | 1.9 | % |
Taiwan | | | 1.6 | % |
South Korea | | | 1.0 | % |
Brazil | | | 0.9 | % |
Canada | | | 0.6 | % |
Israel | | | 0.3 | % |
India | | | 0.2 | % |
| * | The country assignment of each equity holding is determined by the Fund’s Advisor based on various factors, including the location of the issuer’s head office, the issuer’s jurisdiction of incorporation and the country from which a majority of the issuer’s revenue is derived. |
8 Semi-Annual Report
| | |
| SCHEDULE OF INVESTMENTS | | |
| |
Thornburg International Value Fund | | March 31, 2015 (Unaudited) |
| | | | | | | | |
| | | Shares/
Principal Amount | | | Value | |
| | |
COMMON STOCK — 93.65% | | | | | | | | |
| | |
AUTOMOBILES & COMPONENTS — 5.67% | | | | | | | | |
Automobiles — 5.67% | | | | | | | | |
Bayerische Motoren Werke AG | | | 1,431,627 | | | $ | 179,258,168 | |
SAIC Motor Corp., Ltd. | | | 27,844,916 | | | | 111,566,507 | |
Toyota Motor Corp. | | | 4,853,375 | | | | 339,232,439 | |
| | | | | | | | |
| | | | | | | 630,057,114 | |
| | | | | | | | |
| | |
BANKS — 10.86% | | | | | | | | |
Banks — 10.86% | | | | | | | | |
Banco Popular Espanol, S.A. | | | 40,227,640 | | | | 197,155,300 | |
ICICI Bank Ltd. ADR | | | 2,497,605 | | | | 25,875,188 | |
a ING Groep N.V. | | | 22,746,085 | | | | 333,725,796 | |
Intesa Sanpaolo S.p.A. | | | 100,077,893 | | | | 340,689,417 | |
Itau Unibanco Holding SA ADR | | | 2,825,420 | | | | 31,249,145 | |
Standard Chartered plc | | | 8,727,368 | | | | 141,566,454 | |
Sumitomo Mitsui Trust Holdings, Inc. | | | 32,917,084 | | | | 135,993,789 | |
| | | | | | | | |
| | | | | | | 1,206,255,089 | |
| | | | | | | | |
| | |
CAPITAL GOODS — 6.95% | | | | | | | | |
Building Products — 3.08% | | | | | | | | |
Compagnie de Saint-Gobain | | | 7,777,952 | | | | 342,014,919 | |
| | |
Construction & Engineering — 2.88% | | | | | | | | |
Vinci S.A. | | | 5,588,358 | | | | 319,852,880 | |
| | |
Electrical Equipment — 0.37% | | | | | | | | |
Schneider Electric SE | | | 524,557 | | | | 40,807,577 | |
| | |
Trading Companies & Distributors — 0.62% | | | | | | | | |
a AerCap Holdings N.V. | | | 1,575,919 | | | | 68,788,864 | |
| | | | | | | | |
| | | | | | | 771,464,240 | |
| | | | | | | | |
| | |
CONSUMER DURABLES & APPAREL — 3.83% | | | | | | | | |
Household Durables — 3.83% | | | | | | | | |
a Sony Corp. | | | 16,013,485 | | | | 425,922,518 | |
| | | | | | | | |
| | | | | | | 425,922,518 | |
| | | | | | | | |
| | |
DIVERSIFIED FINANCIALS — 11.30% | | | | | | | | |
Capital Markets — 3.90% | | | | | | | | |
UBS Group AG | | | 22,999,646 | | | | 433,580,484 | |
| | |
Diversified Financial Services — 7.40% | | | | | | | | |
CME Group, Inc. | | | 1,781,870 | | | | 168,760,908 | |
Deutsche Boerse AG | | | 1,162,132 | | | | 95,043,268 | |
Hong Kong Exchanges & Clearing Ltd. | | | 14,438,723 | | | | 353,674,356 | |
Japan Exchange Group, Inc. | | | 5,076,390 | | | | 147,506,726 | |
London Stock Exchange Group plc | | | 1,552,301 | | | | 56,622,983 | |
| | | | | | | | |
| | | | | | | 1,255,188,725 | |
| | | | | | | | |
| | |
ENERGY — 6.95% | | | | | | | | |
Oil, Gas & Consumable Fuels — 6.95% | | | | | | | | |
BG Group plc | | | 16,291,757 | | | | 200,346,026 | |
Canadian Natural Resources Ltd. | | | 919,301 | | | | 28,231,734 | |
Royal Dutch Shell plc ADR | | | 4,064,188 | | | | 242,428,814 | |
Total SA | | | 6,045,648 | | | | 300,814,568 | |
| | | | | | | | |
| | | | | | | 771,821,142 | |
| | | | | | | | |
| | |
FOOD, BEVERAGE & TOBACCO — 0.56% | | | | | | | | |
Beverages — 0.56% | | | | | | | | |
Kweichow Moutai Co., Ltd. | | | 1,952,595 | | | | 61,665,039 | |
| | | | | | | | |
| | | | | | | 61,665,039 | |
| | | | | | | | |
| | |
INSURANCE — 2.59% | | | | | | | | |
Insurance — 2.59% | | | | | | | | |
Aviva plc | | | 35,945,258 | | | | 287,934,459 | |
| | | | | | | | |
| | | | | | | 287,934,459 | |
| | | | | | | | |
| | |
MATERIALS — 1.28% | | | | | | | | |
Metals & Mining — 1.28% | | | | | | | | |
Rio Tinto plc | | | 3,471,397 | | | | 142,743,318 | |
| | | | | | | | |
| | | | | | | 142,743,318 | |
| | | | | | | | |
Semi-Annual Report 9
| | |
| SCHEDULE OF INVESTMENTS, CONTINUED | | |
| |
Thornburg International Value Fund | | March 31, 2015 (Unaudited) |
| | | | | | | | |
| | | Shares/
Principal Amount | | | Value | |
MEDIA — 3.32% | | | | | | | | |
Media — 3.32% | | | | | | | | |
a Grupo Televisa, S.A.B. | | | 1,604,411 | | | $ | 52,961,607 | |
a Liberty Global plc | | | 6,336,793 | | | | 315,635,659 | |
| | | | | | | | |
| | | | | | | 368,597,266 | |
| | | | | | | | |
| |
PHARMACEUTICALS, BIOTECHNOLOGY & LIFE SCIENCES — 12.15% | | | | | |
Biotechnology — 1.71% | | | | | | | | |
a Gilead Sciences, Inc. | | | 1,051,551 | | | | 103,188,700 | |
Grifols, S.A. | | | 2,010,347 | | | | 86,421,817 | |
| | |
Pharmaceuticals — 10.44% | | | | | | | | |
Novartis AG | | | 3,486,162 | | | | 344,921,256 | |
Novo Nordisk A/S | | | 4,933,342 | | | | 264,109,320 | |
Perrigo Co. plc | | | 1,209,448 | | | | 200,224,116 | |
Roche Holding AG | | | 1,272,142 | | | | 350,958,294 | |
| | | | | | | | |
| | | | | | | 1,349,823,503 | |
| | | | | | | | |
| |
SEMICONDUCTORS & SEMICONDUCTOR EQUIPMENT — 6.11% | | | | | |
Semiconductors & Semiconductor Equipment — 6.11% | | | | | | | | |
ARM Holdings plc | | | 2,430,947 | | | | 39,847,038 | |
a Micron Technology, Inc. | | | 2,672,993 | | | | 72,518,300 | |
a NXP Semiconductors N.V. | | | 4,010,009 | | | | 402,444,503 | |
Taiwan Semiconductor Manufacturing Co., Ltd. ADR | | | 6,962,774 | | | | 163,485,934 | |
| | | | | | | | |
| | | | | | | 678,295,775 | |
| | | | | | | | |
| | |
SOFTWARE & SERVICES — 6.32% | | | | | | | | |
Information Technology Services — 1.35% | | | | | | | | |
Amadeus IT Holding SA | | | 3,492,852 | | | | 150,077,382 | |
| | |
Internet Software & Services — 4.97% | | | | | | | | |
a Alibaba Group Holding Ltd. ADR | | | 1,675,015 | | | | 139,428,249 | |
a Baidu, Inc. ADR | | | 1,090,009 | | | | 227,157,875 | |
Tencent Holdings Ltd. | | | 9,724,481 | | | | 184,764,700 | |
| | | | | | | | |
| | | | | | | 701,428,206 | |
| | | | | | | | |
| | |
TECHNOLOGY HARDWARE & EQUIPMENT — 0.27% | | | | | | | | |
Technology, Hardware, Storage & Peripherals — 0.27% | | | | | | | | |
a Stratasys Ltd. | | | 559,518 | | | | 29,531,360 | |
| | | | | | | | |
| | | | | | | 29,531,360 | |
| | | | | | | | |
| | |
TELECOMMUNICATION SERVICES — 10.83% | | | | | | | | |
Diversified Telecommunication Services — 3.91% | | | | | | | | |
Nippon Telegraph & Telephone Corp. | | | 6,063,945 | | | | 373,994,256 | |
Telefonica Brasil SA ADR | | | 3,935,806 | | | | 60,178,474 | |
| | |
Wireless Telecommunication Services — 6.92% | | | | | | | | |
America Movil SAB de C.V. ADR | | | 7,797,415 | | | | 159,535,111 | |
China Mobile Ltd. | | | 23,440,423 | | | | 305,377,222 | |
Vodafone Group plc ADR | | | 9,278,755 | | | | 303,229,714 | |
| | | | | | | | |
| | | | | | | 1,202,314,777 | |
| | | | | | | | |
| | |
TRANSPORTATION — 1.86% | | | | | | | | |
Road & Rail — 0.27% | | | | | | | | |
Canadian National Railway Co. | | | 454,773 | | | | 30,455,842 | |
| | |
Transportation Infrastructure — 1.59% | | | | | | | | |
Shanghai International Air Co., Ltd. | | | 45,232,267 | | | | 176,052,423 | |
| | | | | | | | |
| | | | | | | 206,508,265 | |
| | | | | | | | |
| | |
UTILITIES — 2.80% | | | | | | | | |
Electric Utilities — 0.92% | | | | | | | | |
Korea Electric Power Corp. | | | 2,466,118 | | | | 102,250,149 | |
| | |
Multi-Utilities — 1.88% | | | | | | | | |
National Grid plc | | | 16,291,057 | | | | 208,964,735 | |
| | | | | | | | |
| | | | | | | 311,214,884 | |
| | | | | | | | |
TOTAL COMMON STOCK (Cost $8,874,794,703) | | | | | | | 10,400,765,680 | |
| | | | | | | | |
10 Semi-Annual Report
| | |
| SCHEDULE OF INVESTMENTS, CONTINUED | | |
| |
Thornburg International Value Fund | | March 31, 2015 (Unaudited) |
| | | | | | | | |
| | | Shares/
Principal Amount | | | Value | |
SHORT TERM INVESTMENTS — 1.56% | | | | | | | | |
Arizona Public Service Co., 0.30%, 4/1/2015 | | $ | 30,000,000 | | | $ | 30,000,000 | |
Atlantic City Electric Co., 0.45%, 4/1/2015 | | | 28,300,000 | | | | 28,300,000 | |
Bank of New York Tri-Party Repurchase Agreement 0.23% dated 3/31/2015 due 4/1/2015, repurchase price $19,000,121 collateralized by 24 corporate debt securities, having an average coupon of 4.85%, a minimum credit rating of BBB-, maturity dates from 8/15/2015 to 3/15/2044, and having an aggregate market value of $20,338,770 at 3/31/2015 | | | 19,000,000 | | | | 19,000,000 | |
Marriott International, Inc., 0.30%, 4/1/2015 | | | 50,000,000 | | | | 50,000,000 | |
Pacific Gas & Electric Co., 0.37%, 4/1/2015 | | | 20,000,000 | | | | 20,000,000 | |
Spectra Energy Partners, 0.45%, 4/1/2015 | | | 26,500,000 | | | | 26,500,000 | |
| | | | | | | | |
TOTAL SHORT TERM INVESTMENTS (Cost $173,800,000) | | | | | | | 173,800,000 | |
| | | | | | | | |
TOTAL INVESTMENTS — 95.21% (Cost $9,048,594,703) | | | | | | $ | 10,574,565,680 | |
OTHER ASSETS LESS LIABILITIES — 4.79% | | | | | | | 531,936,100 | |
| | | | | | | | |
NET ASSETS — 100.00% | | | | | | $ | 11,106,501,780 | |
| | | | | | | | |
Footnote Legend
Portfolio Abbreviations
To simplify the listings of securities, abbreviations are used per the table below:
| | |
| ADR | | American Depositary Receipt |
See notes to financial statements.
Semi-Annual Report 11
| | |
| STATEMENT OF ASSETS AND LIABILITIES | | |
| |
Thornburg International Value Fund | | March 31, 2015 (Unaudited) |
| | | | |
ASSETS | | | | |
Investments at value (cost $9,048,594,703) (Note 2) | | $ | 10,574,565,680 | |
Cash | | | 84,520,678 | |
Cash denominated in foreign currency (cost $2,837,684) | | | 2,806,920 | |
Receivable for investments sold | | | 163,829,364 | |
Receivable for fund shares sold | | | 9,247,575 | |
Unrealized appreciation on forward currency contracts (Note 7) | | | 422,687,020 | |
Dividends receivable | | | 24,730,489 | |
Dividend and interest reclaim receivable | | | 36,284,106 | |
Interest receivable | | | 121 | |
Prepaid expenses and other assets | | | 279,353 | |
| | | | |
Total Assets | | | 11,318,951,306 | |
| | | | |
| |
LIABILITIES | | | | |
Payable for investments purchased | | | 40,829,869 | |
Payable for fund shares redeemed | | | 57,361,860 | |
Unrealized depreciation on forward currency contracts (Note 7) | | | 97,523,822 | |
Payable to investment advisor and other affiliates (Note 3) | | | 8,296,484 | |
Accounts payable and accrued expenses | | | 8,437,491 | |
| | | | |
Total Liabilities | | | 212,449,526 | |
| | | | |
| |
NET ASSETS | | $ | 11,106,501,780 | |
| | | | |
NET ASSETS CONSIST OF | | | | |
Undistributed net investment income | | $ | 27,334,451 | |
Net unrealized appreciation on investments | | | 1,848,963,982 | |
Accumulated net realized gain (loss) | | | 1,072,823,028 | |
Net capital paid in on shares of beneficial interest | | | 8,157,380,319 | |
| | | | |
| | $ | 11,106,501,780 | |
| | | | |
12 Semi-Annual Report
| | |
| STATEMENT OF ASSETS AND LIABILITIES, CONTINUED |
| |
Thornburg International Value Fund | | March 31, 2015 (Unaudited) |
| | | | |
NET ASSET VALUE | | | | |
Class A Shares: | | | | |
Net asset value and redemption price per share ($1,541,325,120 applicable to 53,451,372 shares of beneficial interest outstanding - Note 4) | | $ | 28.84 | |
Maximum sales charge, 4.50% of offering price | | | 1.36 | |
| | | | |
Maximum offering price per share | | $ | 30.20 | |
| | | | |
| |
Class B Shares: | | | | |
Net asset value per share* ($11,350,348 applicable to 429,168 shares of beneficial interest outstanding - Note 4) | | $ | 26.45 | |
| | | | |
| |
Class C Shares: | | | | |
Net asset value and offering price per share* ($771,787,417 applicable to 28,946,104 shares of beneficial interest outstanding - Note 4) | | $ | 26.66 | |
| | | | |
| |
Class I Shares: | | | | |
Net asset value, offering and redemption price per share ($6,357,209,736 applicable to 215,666,718 shares of beneficial interest outstanding - Note 4) | | $ | 29.48 | |
| | | | |
| |
Class R3 Shares: | | | | |
Net asset value, offering and redemption price per share ($589,254,893 applicable to 20,436,407 shares of beneficial interest outstanding - Note 4) | | $ | 28.83 | |
| | | | |
| |
Class R4 Shares: | | | | |
Net asset value, offering and redemption price per share ($436,487,573 applicable to 15,224,853 shares of beneficial interest outstanding - Note 4) | | $ | 28.67 | |
| | | | |
| |
Class R5 Shares: | | | | |
Net asset value, offering and redemption price per share ($912,972,189 applicable to 31,003,391 shares of beneficial interest outstanding - Note 4) | | $ | 29.45 | |
| | | | |
| |
Class R6 Shares: | | | | |
Net asset value, offering and redemption price per share ($486,114,504 applicable to 16,527,888 shares of beneficial interest outstanding - Note 4) | | $ | 29.41 | |
| | | | |
| * | Redemption price per share is equal to net asset value less any applicable contingent deferred sales charge. |
See notes to financial statements.
Semi-Annual Report 13
| | |
| STATEMENT OF OPERATIONS | | |
| |
Thornburg International Value Fund | | Six Months Ended March 31, 2015 (Unaudited) |
| | | | |
INVESTMENT INCOME | | | | |
Dividend income (net of foreign taxes withheld of $12,608,251) | | $ | 109,843,160 | |
Interest income | | | 601,233 | |
| | | | |
Total Income | | | 110,444,393 | |
| | | | |
| |
EXPENSES | | | | |
Investment advisory fees (Note 3) | | | 44,477,397 | |
Administration fees (Note 3) | | | | |
Class A Shares | | | 1,174,789 | |
Class B Shares | | | 8,252 | |
Class C Shares | | | 499,338 | |
Class I Shares | | | 1,715,098 | |
Class R3 Shares | | | 402,380 | |
Class R4 Shares | | | 326,455 | |
Class R5 Shares | | | 356,316 | |
Distribution and service fees (Note 3) | | | | |
Class A Shares | | | 2,349,578 | |
Class B Shares | | | 66,003 | |
Class C Shares | | | 3,991,243 | |
Class R3 Shares | | | 1,606,658 | |
Class R4 Shares | | | 651,014 | |
Transfer agent fees | | | | |
Class A Shares | | | 1,781,100 | |
Class B Shares | | | 16,134 | |
Class C Shares | | | 506,775 | |
Class I Shares | | | 4,445,800 | |
Class R3 Shares | | | 788,370 | |
Class R4 Shares | | | 1,058,927 | |
Class R5 Shares | | | 3,157,949 | |
Class R6 Shares | | | 3,398 | |
Registration and filing fees | | | | |
Class A Shares | | | 18,486 | |
Class B Shares | | | 8,729 | |
Class C Shares | | | 14,715 | |
Class I Shares | | | 63,389 | |
Class R3 Shares | | | 12,884 | |
Class R4 Shares | | | 18,322 | |
Class R5 Shares | | | 16,660 | |
Class R6 Shares | | | 25,393 | |
Custodian fees (Note 3) | | | 894,753 | |
Professional fees | | | 109,485 | |
Accounting fees | | | 318,100 | |
Trustee fees | | | 331,300 | |
Other expenses | | | 811,505 | |
| | | | |
Total Expenses | | | 72,026,695 | |
Less: | | | | |
Expenses reimbursed by investment advisor (Note 3) | | | (2,908,684 | ) |
Fees paid indirectly (Note 3) | | | (19,853 | ) |
| | | | |
Net Expenses | | | 69,098,158 | |
| | | | |
Net Investment Income | | $ | 41,346,235 | |
| | | | |
14 Semi-Annual Report
| | |
| STATEMENT OF OPERATIONS, CONTINUED | | |
| |
Thornburg International Value Fund | | Six Months Ended March 31, 2015 (Unaudited) |
| | | | |
REALIZED AND UNREALIZED GAIN (LOSS) | | | | |
Net realized gain (loss) from: | | | | |
Investments | | $ | 1,117,501,082 | |
Forward currency contracts (Note 7) | | | 333,225,252 | |
Foreign currency transactions | | | (3,583,553 | ) |
| | | | |
| | | 1,447,142,781 | |
| | | | |
Net change in unrealized appreciation (depreciation) on: | | | | |
Investments | | | (950,457,181 | ) |
Foreign currency translations | | | (485,487 | ) |
Forward currency contracts (Note 7) | | | 64,291,311 | |
| | | | |
| | | (886,651,357 | ) |
| | | | |
Net Realized and Unrealized Gain | | | 560,491,424 | |
| | | | |
Net Increase in Net Assets Resulting from Operations | | $ | 601,837,659 | |
| | | | |
See notes to financial statements.
Semi-Annual Report 15
| | |
| STATEMENT OF CHANGES IN NET ASSETS | | |
| |
Thornburg International Value Fund | | |
| | | | | | | | |
| | | Six Months Ended
March 31, 2015* | | | Year Ended
September 30, 2014 | |
INCREASE (DECREASE) IN NET ASSETS FROM | | | | | | | | |
| | |
OPERATIONS | | | | | | | | |
Net investment income | | $ | 41,346,235 | | | $ | 213,013,596 | |
Net realized gain (loss) from investments, forward currency contracts, and foreign currency transactions | | | 1,447,142,781 | | | | 4,316,041,133 | |
Net unrealized appreciation (depreciation) on investments, forward currency contracts, and foreign currency translations | | | (886,651,357 | ) | | | (4,454,707,186 | ) |
| | | | | | | | |
| | |
Net Increase (Decrease) in Net Assets Resulting from Operations | | | 601,837,659 | | | | 74,347,543 | |
| | |
DIVIDENDS TO SHAREHOLDERS | | | | | | | | |
From net investment income | | | | | | | | |
Class A Shares | | | (1,253,947 | ) | | | (24,836,500 | ) |
Class B Shares | | | — | | | | (41,872 | ) |
Class C Shares | | | — | | | | (2,410,852 | ) |
Class I Shares | | | (13,005,721 | ) | | | (122,938,549 | ) |
Class R3 Shares | | | (376,278 | ) | | | (5,130,641 | ) |
Class R4 Shares | | | (524,411 | ) | | | (7,356,292 | ) |
Class R5 Shares | | | (2,440,269 | ) | | | (32,599,485 | ) |
Class R6 Shares | | | (1,612,728 | ) | | | (19,861,092 | ) |
From realized gains | | | | | | | | |
Class A Shares | | | (166,562,573 | ) | | | — | |
Class B Shares | | | (1,316,453 | ) | | | — | |
Class C Shares | | | (75,585,562 | ) | | | — | |
Class I Shares | | | (617,568,803 | ) | | | — | |
Class R3 Shares | | | (57,375,341 | ) | | | — | |
Class R4 Shares | | | (46,567,679 | ) | | | — | |
Class R5 Shares | | | (145,792,152 | ) | | | — | |
Class R6 Shares | | | (62,251,716 | ) | | | — | |
FUND SHARE TRANSACTIONS (NOTE 4) | | | | | | | | |
Class A Shares | | | (973,371,996 | ) | | | (2,591,843,528 | ) |
Class B Shares | | | (4,186,470 | ) | | | (17,031,740 | ) |
Class C Shares | | | (65,009,849 | ) | | | (296,649,398 | ) |
Class I Shares | | | (1,110,049,174 | ) | | | (6,778,761,004 | ) |
Class R3 Shares | | | (138,162,517 | ) | | | (392,504,894 | ) |
Class R4 Shares | | | (260,498,771 | ) | | | (616,127,795 | ) |
Class R5 Shares | | | (1,160,637,320 | ) | | | (2,191,585,826 | ) |
Class R6 Shares | | | (353,143,873 | ) | | | (460,324,600 | ) |
| | | | | | | | |
Net Decrease in Net Assets | | | (4,655,455,944 | ) | | | (13,485,656,525 | ) |
| | |
NET ASSETS | | | | | | | | |
Beginning of Period | | | 15,761,957,724 | | | | 29,247,614,249 | |
| | | | | | | | |
| | |
End of Period | | $ | 11,106,501,780 | | | $ | 15,761,957,724 | |
| | | | | | | | |
Undistributed net investment income | | $ | 27,334,451 | | | $ | 5,201,570 | |
See notes to financial statements.
16 Semi-Annual Report
| | |
| NOTES TO FINANCIAL STATEMENTS | | |
| |
Thornburg International Value Fund | | March 31, 2015 (Unaudited) |
NOTE 1 – ORGANIZATION
Thornburg International Value Fund, hereinafter referred to as (the “Fund)” is a diversified series of Thornburg Investment Trust (the “Trust”). The Trust was organized as a Massachusetts business trust under a Declaration of Trust dated June 3, 1987 and is registered as a diversified, open-end management investment company under the Investment Company Act of 1940, as amended. The Fund is currently one of eighteen separate series of the Trust. Each series is considered to be a separate entity for financial reporting and tax purposes and bears expenses directly attributable to it. The Fund seeks long-term capital appreciation by investing in equity and debt securities of all types. As a secondary objective, the Fund also seeks some current income.
The Fund currently has eight classes of shares of beneficial interest: Class A, Class B, Class C, Institutional Class (“Class I”), and Retirement Classes (“Class R3,” “Class R4,” “Class R5,” and “Class R6”). The Fund no longer offers Class B shares for sale. Each class of shares of the Fund represents an interest in the same portfolio of investments, except that (i) Class A shares are sold subject to a front-end sales charge collected at the time the shares are purchased and bear a service fee, (ii) Class B shares were sold at net asset value without a sales charge at the time of purchase, but are subject to a contingent deferred sales charge upon redemption and bear both a service fee and distribution fee, (iii) Class C shares are sold at net asset value without a sales charge at the time of purchase, but are subject to a contingent deferred sales charge upon redemption within one year of purchase, and bear both a service fee and a distribution fee, (iv) Class I and Class R5 shares are sold at net asset value without a sales charge at the time of purchase and may be subject to a service fee, (v) Class R3 shares are sold at net asset value without a sales charge at the time of purchase, but bear both a service fee and distribution fee, (vi) Class R4 shares are sold at net asset value without a sales charge at the time of purchase, but bear a service fee, (vii) Class R6 shares are sold at net asset value without a sales charge at the time of purchase, and (viii) the respective classes may have different reinvestment privileges and conversion rights. Additionally, the Fund may allocate among its classes certain expenses, to the extent allocable to specific classes, including transfer agent fees, government registration fees, certain printing and postage costs, and administrative and legal expenses. Currently, class specific expenses of the Fund are limited to service and distribution fees, administration fees, and certain registration and transfer agent expenses. Class B shares of the Fund outstanding for eight years will convert to Class A shares of the Fund.
NOTE 2 – SIGNIFICANT ACCOUNTING POLICIES
The following is a summary of significant accounting policies followed by the Fund in the preparation of its financial statements. The Fund is an investment company and prepares its financial statements in conformity with U.S. generally accepted accounting principles (“GAAP”), including the investment company accounting and reporting guidance in the Financial Accounting Standards Board (the “FASB”) Accounting Standard Codification Topic 946. The preparation of financial statements in conformity with GAAP requires management to make estimates and assumptions that affect the reported amounts of assets and liabilities and disclosure of contingent assets and liabilities at the date of the financial statements and the reported amounts of increases (decreases) in net assets from operations during the reporting period. Actual results could differ from those estimates.
Significant accounting policies of the Fund are as follows:
Valuation Policy and Procedures: The Trustees of the Trust (the “Trustees”) have authorized employees of the Fund’s investment advisor, acting as the Valuation and Pricing Committee (the “Committee”), to make certain valuation determinations, subject to oversight and review by the Trustees and the Audit Committee of the Trustees. The Committee and other employees of the Fund’s investment advisor administer and implement the valuation process. The Committee regularly reviews its own fair value decisions, as well as valuations, valuation techniques and services furnished by pricing services, considers circumstances in the markets which may require valuation determinations by the Committee and reviews previous valuation determinations. The Committee also reports on its activities, the performance of the pricing services and other matters to the Trustees and the Audit Committee of the Trustees.
In determining a fair value for a portfolio investment, the Committee seeks to determine the price that the Fund would reasonably expect to receive upon a sale of the investment in an orderly transaction between market participants at the measurement date. Typically, the fair value process employs standing instructions to use quoted prices in active markets or the use of independent pricing services. Less frequently, the Committee may make a fair value determination using other methods. However, because fair value prices are estimated prices, the determination of fair value for an investment may differ from the value that would be realized by the Fund upon a sale of the investment, and that difference could be material to the Fund’s financial statements. The Committee’s determination of fair value for an investment may also differ from the prices obtained by other persons (including other mutual funds) for the investment.
Valuation of Investments: Portfolio investments listed or traded on a national securities exchange are valued on the valuation date at the last reported trade price on the exchange that is the primary market for the investment. Portfolio investments reported by NASDAQ are valued at the NASDAQ official closing price. Portfolio investments traded on an exchange for which there has been no trade that day and other equity investments traded in the over-the-counter market are valued at the mean between the last reported bid and ask prices. Any foreign investment traded on exchanges outside the United States is valued at the price of the investment on the exchange that is normally the investment’s primary market, as of the close of that exchange preceding the time of the Fund’s valuation measurement date.
Semi-Annual Report 17
| | |
| NOTES TO FINANCIAL STATEMENTS, CONTINUED | | |
| |
Thornburg International Value Fund | | March 31, 2015 (Unaudited) |
In any case when the market value of an equity investment held by the Fund is not readily available, a determination of a fair value for the investment is made by the Committee. The Committee’s determinations are made using procedures in accordance with a policy approved by the Trustees, which may include the use of a price obtained from an independent pricing service. The pricing service ordinarily values equity investments in these instances using multi-factor models to adjust market prices based upon various inputs, including exchange data, depositary receipt prices, futures, index data and other data. An investment’s market value is deemed not readily available whenever the exchange or market on which the investment is primarily traded is closed for the entire scheduled day of trading. Additionally, an investment’s market value may be deemed not readily available under other circumstances identified by the Trustees, including when developments occurring after the most recent close of the investment’s primary exchange or market, but before the most recent close of trading in Fund shares, or an unusual event or significant period of time occurring since the availability of a market quotation, create a question about the reliability of the investment’s market value. For example, on days when market volatility thresholds pre-determined by the Trustees are exceeded, foreign equity investments held by the Fund may be valued using synthetic pricing obtained from an independent pricing service approved by the Trustees, subject to the ability of the Committee to determine in any such instance to utilize market closing prices if the Committee considers closing prices to be more reliable.
Debt obligations held by the Fund have a primary over-the-counter market and are valued by an independent pricing service approved by the Trustees. The pricing service ordinarily values debt obligations using quoted bid prices and other methods, which include consideration of yields or prices of debt obligations of comparable quality, type of issue, coupon, maturity and rating, and indications as to value from dealers and general market conditions.
In any case when a pricing service fails to provide a price for a debt obligation held by the Fund, the Committee determines a fair value for the debt obligation using procedures in accordance with a policy approved by the Trustees, which may include the use of a price obtained from a different independent pricing service. Additionally, in any case when management believes that a price provided by a pricing service for a debt obligation held by the Fund may be unreliable, the Committee decides whether or not to use the pricing service’s valuation or to use an alternative method to determine a fair value for the debt obligation.
Quotations in foreign currencies for foreign portfolio investments are converted to U.S. dollar equivalents using the foreign exchange quotation in effect at the time of valuation.
Valuation Measurements: The Fund categorizes its investments based upon the inputs used in valuing those investments, according to a three-level hierarchy established by guidance from the FASB. Categorization of investments using this hierarchy is intended by the FASB to maximize the use of observable inputs and minimize the use of unobservable inputs by prioritizing that the most observable input be used when available. Observable inputs are those that market participants would use in valuing an investment based on available market data. Unobservable inputs are those that reflect assumptions about the information market participants would use in valuing an investment. An investment’s level within the hierarchy is based on the lowest level input that is deemed significant to the fair value measurement. The methodologies and relative inputs used to value investments are not necessarily indications of the risk or liquidity associated with investing in those investments.
Various inputs are used in determining the fair value measurement of the Fund’s investments. These inputs are generally summarized according to the three-level hierarchy below:
Level 1: Quoted prices in active markets for identical investments.
Level 2: Other direct or indirect significant observable inputs (including quoted prices for similar investments in active markets and other observable inputs, such as interest rates, prepayment rates, credit risk, etc.).
When market volatility thresholds are exceeded, foreign equity investments may be fair valued according to other significant observable inputs rather than quoted market prices. The affected investments will be characterized as Level 2 within the valuation hierarchy and revert to Level 1 after the threshold is no longer exceeded.
Level 3: Significant unobservable inputs (including the Committee’s own assumptions in determining the fair value of investments).
Portfolio investments with minimal, if any, market activity are characterized as Level 3 and are valued using significant unobservable inputs, typically including single broker quotes, which may be adjusted or unadjusted, related or comparable investments, last available transactions, and other relevant information. Valuations may also be based upon current market prices of securities that are comparable in coupon, rating, maturity and industry. An income based valuation approach would consider discounted anticipated future cash flows of the investment. Discounts may also be applied due to the nature or duration of any restrictions on the disposition of the investment. Valuations based upon the use of inputs from Levels 1, 2, or 3, may not represent the actual price received upon the disposition of an investment, and the Fund may receive a price that is lower than the valuation when it sells the investment.
The following table displays a summary of the fair value hierarchy measurements of the Fund’s investments as of March 31, 2015. In any instance when valuation inputs from more than one level are used to determine the fair value of a specific investment, the investment is placed in the level of the table based upon the lowest level input that is significant in determining the fair value of the investment:
18 Semi-Annual Report
| | |
| NOTES TO FINANCIAL STATEMENTS, CONTINUED | | |
| |
Thornburg International Value Fund | | March 31, 2015 (Unaudited) |
| | | | | | | | | | | | | | | | |
| | | Fair Value Measurements at March 31, 2015 | |
| | | Total | | | Level 1 | | | Level 2 | | | Level 3 | |
Assets | | | | | | | | | | | | | | | | |
Investments in Securities* | | | | | | | | | | | | | | | | |
Common Stock | | $ | 10,400,765,680 | | | $ | 10,400,765,680 | | | $ | — | | | $ | — | |
Short Term Investments | | | 173,800,000 | | | | — | | | | 173,800,000 | | | | — | |
| | | | | | | | | | | | | | | | |
Total Investments in Securities | | $ | 10,574,565,680 | | | $ | 10,400,765,680 | | | $ | 173,800,000 | | | $ | — | |
| | | | |
Other Financial Instruments** | | | | | | | | | | | | | | | | |
Forward Currency Contracts | | $ | 422,687,020 | | | $ | — | | | $ | 422,687,020 | | | $ | — | |
Spot Currency | | $ | 30,005 | | | $ | 30,005 | | | $ | — | | | $ | — | |
| | | | |
Liabilities | | | | | | | | | | | | | | | | |
Other Financial Instruments** | | | | | | | | | | | | | | | | |
Forward Currency Contracts | | $ | (97,523,822 | ) | | $ | — | | | $ | (97,523,822 | ) | | $ | — | |
Spot Currency | | $ | (56,454 | ) | | $ | (56,454 | ) | | $ | — | | | $ | — | |
| * | See Schedule of Investments for a summary of the industry exposure as grouped according to the Global Industry Classification Standard (GICS), which is an industry taxonomy developed by MSCI, Inc. and Standard & Poor’s (S&P). |
| ** | Other Financial Instruments include investments not reflected in the Schedule of Investments, which may include futures, forwards and swap contracts, which are valued at the unrealized appreciation (depreciation) on the investment. |
In accordance with the guidance prescribed in Accounting Standards Update No. 2011-04, it is the policy of the Fund to recognize transfers between levels and the underlying events which caused the movement. The Fund recognized no transfers between levels for the six months ended March 31, 2015, other than when the Fund exceeded market volatility thresholds for foreign equity investments during the period.
Foreign Currency Translation: Portfolio investments and other assets and liabilities denominated in foreign currencies are translated into U.S. dollars based on the exchange rate of such currencies against the U.S. dollar on the date of valuation. Purchases and sales of investments and income items denominated in foreign currencies are translated into U.S. dollars at the exchange rate in effect on the transaction date. When the Fund purchases or sells foreign investments, it will customarily enter into a foreign exchange contract to minimize foreign exchange risk from the trade date to the settlement date of such transactions. The values of such spot contracts are included in receivable for investments sold and payable for investments purchased on the Statement of Assets and Liabilities.
The Fund does not separately report the effect of changes in foreign exchange rates from changes in market prices on investments held. Such changes are included in net unrealized appreciation or depreciation from investments.
Reported net realized gains or losses from foreign currency transactions arise due to purchases and sales of foreign currencies, currency gains or losses realized between the trade and settlement dates on investment transactions and the difference between the amounts of dividends, interest, and foreign withholding taxes recorded on the Fund’s books, and the U.S. dollar equivalent of the amounts actually received or paid.
Net change in unrealized appreciation and depreciation on foreign currency translations arise from changes in the fair value of assets and liabilities, other than investments at fiscal period end, resulting from changes in exchange rates.
Foreign Withholding Taxes: The Fund is subject to foreign tax withholding imposed by certain foreign countries in which the Fund may invest. Withholding taxes are incurred on certain foreign dividends and are accrued at the time the dividend is recognized based on applicable foreign tax law. The Fund files withholding tax reclaims in certain jurisdictions to recover a portion of amounts previously withheld, in view of various considerations, including recent decisions rendered by the courts in those and other jurisdictions. The Fund would expect to record a receivable for such a reclaim based on a variety of factors, including assessments of a jurisdiction’s legal obligation to pay reclaims, the jurisdiction’s administrative practices and payment history, and industry convention. To date the Fund has recorded no such receivable because there is no precedent for collecting such prior year reclaims and the likelihood of collection remains uncertain.
Deferred Foreign Capital Gain Taxes: The Fund is subject to a tax imposed on net realized gains of securities of certain foreign countries. The Fund records an estimated deferred tax liability for net unrealized gains on these investments as reflected in the accompanying financial statements.
Federal Income Taxes: It is the policy of the Trust to comply with the provisions of the Internal Revenue Code applicable to “regulated investment companies” and to distribute to shareholders substantially all taxable income, including any net realized gain on investments of the Fund. Therefore, no provision for federal income taxes is required.
Semi-Annual Report 19
| | |
| NOTES TO FINANCIAL STATEMENTS, CONTINUED | | |
| |
Thornburg International Value Fund | | March 31, 2015 (Unaudited) |
Management reviews each uncertain tax position believed to be material to the preparation of the Fund’s financial statements, to assess if it is more likely than not that the position would be sustained upon examination, based upon the technical merits of the position. As of March 31, 2015, management has not identified any such position for which an asset or liability must be reflected in the Statement of Assets and Liabilities. The Fund’s tax returns remain subject to examination for three years after filing.
When-Issued and Delayed Delivery Transactions: The Fund may engage in when-issued or delayed delivery transactions. To the extent the Fund engages in such transactions, it will do so for the purpose of acquiring portfolio investments consistent with the Fund’s investment objectives and not for the purpose of investment leverage or to speculate on interest rate and/or market changes. At the time the Fund makes a commitment to purchase an investment on a when-issued or delayed delivery basis, the Fund will record the transaction and reflect the value in determining its net asset value. When effecting such transactions, assets of an amount sufficient to make payment for the portfolio investments to be purchased will be segregated on the Fund’s records on the trade date. Investments purchased on a when-issued or delayed delivery basis do not earn interest until the settlement date.
Dividends: Dividends to shareholders, if any, are generally paid quarterly and are reinvested in additional shares of the Fund at net asset value per share at the close of business on the dividend payment date or, at the shareholder’s option, paid in cash. Net realized capital gains, to the extent available, will be distributed at least annually. Distributions to shareholders are based on income tax regulations and therefore, their characteristics may differ for financial statement and tax purposes.
Repurchase Agreements: The Fund may invest excess cash in repurchase agreements whereby the Fund purchases investments, which serve as collateral, with an agreement to resell such collateral to the seller at an agreed upon price at the maturity date of the repurchase agreement. Investments pledged as collateral for repurchase agreements are held in custody until maturity of the repurchase agreement. Provisions in the agreements require that the market value of the collateral is at least equal to the repurchase value in the event of default. In the event of default, the Fund has the right to liquidate the collateral and apply the proceeds in satisfaction of the obligation. Under certain circumstances, in the event of default or bankruptcy by the other party to the agreement, realization and/or retention of the collateral may be subject to legal proceedings.
General: Investment transactions are accounted for on a trade date basis. Interest income is accrued as earned and dividend income is recorded on the ex-dividend date. Certain income from foreign investments is recognized as soon as information is available to the Fund. Realized gains and losses from the sale of investments are recorded on an identified cost basis. Net investment income (other than class specific expenses) and realized and unrealized gains and losses are allocated daily to each class of shares based upon the relative net asset value of outstanding shares of each class of shares at the beginning of the day (after adjusting for the current share activity of the respective class). Expenses common to all Funds are allocated among the Funds comprising the Trust based upon their relative net asset values or other appropriate allocation methods.
Guarantees and Indemnifications: Under the Trust’s organizational documents (and under separate agreements with the independent Trustees), its officers and Trustees are indemnified against certain liabilities arising out of the performance of their duties to the Fund. Additionally, in the normal course of business the Trust enters into contracts with service providers that contain general indemnification clauses. The Trust’s maximum exposure under these arrangements is unknown. However, based on experience, the Trust expects the risk of loss to be remote.
NOTE 3 – INVESTMENT ADVISORY FEE AND OTHER TRANSACTIONS WITH AFFILIATES
Pursuant to an investment advisory agreement, Thornburg Investment Management, Inc. (the “Advisor”) serves as the investment advisor and performs services for the Fund for which the fees are payable at the end of each month. For the six months ended March 31, 2015, these fees were payable at annual rates ranging from .875 of 1% to .675 of 1% per annum of the average daily net assets of the Fund depending on the Fund’s asset size. The Trust also has entered into administrative services agreements with the Advisor, whereby the Advisor will perform certain administrative services for the shareholders of each class of the Fund’s shares (except for Class R6 shares, which do not have an administrative services agreement) and for which fees will be payable at an annual rate of up to .125 of 1% per annum of the average daily net assets attributable to each class of shares.
The Trust has an underwriting agreement with Thornburg Securities Corporation (the “Distributor,” an affiliate of the Advisor), which acts as the distributor of the Fund’s shares. For the six months ended March 31, 2015, the Distributor has advised the Fund that it earned net commissions aggregating $20,915 from the sale of Class A shares, and collected contingent deferred sales charges aggregating $17,746 from redemptions of Class C shares of the Fund.
Pursuant to a service plan under Rule 12b-1 of the Investment Company Act of 1940, the Fund may reimburse to the Advisor an amount not to exceed .25 of 1% per annum of the average daily net assets attributable to each class of shares of the Fund (except for Class R6 shares, which do not have a Rule 12b-1 service plan) for payments made by the Advisor to securities dealers and other financial institutions to obtain various shareholder and distribution related services. For the six months ended March 31, 2015, there were no 12b-1 service plan fees charged for Class I and R5 shares. The Advisor may pay out of its own resources additional expenses for distribution of the Fund’s shares and shareholder services.
20 Semi-Annual Report
| | |
| NOTES TO FINANCIAL STATEMENTS, CONTINUED | | |
| |
Thornburg International Value Fund | | March 31, 2015 (Unaudited) |
The Trust has also adopted distribution plans pursuant to Rule 12b-1, applicable only to the Fund’s Class B, Class C, and Class R3 shares, under which the Fund compensates the Distributor for services in promoting the sale of Class B, Class C, and Class R3 shares of the Fund at an annual rate of up to .75 of 1% per annum of the average daily net assets attributable to Class B and Class C shares, and an annual rate of up to .25 of 1% per annum of the average daily net assets attributable to Class R3 shares. Total fees incurred by each class of shares of the Fund under their respective service and distribution plans for the six months ended March 31, 2015, are set forth in the Statement of Operations.
The Advisor and Distributor have contractually agreed to waive fees and reimburse expenses incurred by the Fund so that actual expenses of certain share classes do not exceed levels as specified in the Fund’s most recent prospectuses. The agreement may be terminated by the Fund at any time, but may not be terminated by the Advisor or Distributor before February 1, 2016, unless the Advisor ceases to be the investment advisor to the Fund or the Distributor ceases to be the distributor of the Fund prior to that date. The Advisor and Distributor retain the right to be repaid by the Fund for fee waivers and expense reimbursements if expenses fall below the contractual limit prior to the end of the fiscal year.
For the six months ended March 31, 2015, the Advisor contractually reimbursed certain class specific expenses, administrative fees, and distribution fees of $500,578 for Class R3 shares, $705,384 for Class R4 shares, and $1,702,722 for Class R5 shares.
The Trust has an agreement with the custodian bank to indirectly pay a portion of the custodian’s fees through credits earned by the Fund’s cash on deposit with the bank. This deposit agreement is an alternative to overnight investments. Custodial fees are adjusted to reflect amounts that would have been paid without this agreement, with a corresponding adjustment reflected as fees paid indirectly in the Statement of Operations. For the six months ended March 31, 2015, fees paid indirectly were $19,853.
Certain officers and Trustees of the Trust are also officers or directors of the Advisor and Distributor. The compensation of independent Trustees is borne by the Trust.
NOTE 4 – SHARES OF BENEFICIAL INTEREST
At March 31, 2015, there were an unlimited number of shares with no par value of beneficial interest authorized. Transactions in shares of beneficial interest were as follows:
| | | | | | | | | | | | | | | | |
| | | Six Months Ended | | | Year Ended | |
| | | March 31, 2015 (Unaudited) | | | September 30, 2014 (Audited) | |
| | | Shares | | | Amount | | | Shares | | | Amount | |
Class A Shares | | | | | | | | | | | | | | | | |
Shares sold | | | 3,856,885 | | | $ | 108,421,703 | | | | 17,448,628 | | | $ | 527,252,760 | |
Shares issued to shareholders in reinvestment of dividends | | | 5,484,551 | | | | 151,685,839 | | | | 751,233 | | | | 22,755,421 | |
Shares repurchased | | | (43,068,055 | ) | | | (1,233,479,538 | ) | | | (104,116,072 | ) | | | (3,141,851,709 | ) |
| | | | | | | | | | | | | | | | |
| | | | |
Net increase (decrease) | | | (33,726,619 | ) | | $ | (973,371,996 | ) | | | (85,916,211 | ) | | $ | (2,591,843,528 | ) |
| | | | | | | | | | | | | | | | |
| | | | |
Class B Shares | | | | | | | | | | | | | | | | |
Shares sold | | | 11,376 | | | $ | 289,780 | | | | 2,583 | | | $ | 72,727 | |
Shares issued to shareholders in reinvestment of dividends | | | 38,239 | | | | 972,791 | | | | 1,079 | | | | 30,247 | |
Shares repurchased | | | (208,827 | ) | | | (5,449,041 | ) | | | (612,869 | ) | | | (17,134,714 | ) |
| | | | | | | | | | | | | | | | |
| | | | |
Net increase (decrease) | | | (159,212 | ) | | $ | (4,186,470 | ) | | | (609,207 | ) | | $ | (17,031,740 | ) |
| | | | | | | | | | | | | | | | |
| | | | |
Class C Shares | | | | | | | | | | | | | | | | |
Shares sold | | | 1,213,767 | | | $ | 31,357,477 | | | | 1,825,885 | | | $ | 51,520,849 | |
Shares issued to shareholders in reinvestment of dividends | | | 2,242,939 | | | | 57,464,092 | | | | 64,864 | | | | 1,829,821 | |
Shares repurchased | | | (5,899,080 | ) | | | (153,831,418 | ) | | | (12,442,806 | ) | | | (350,000,068 | ) |
| | | | | | | | | | | | | | | | |
| | | | |
Net increase (decrease) | | | (2,442,374 | ) | | $ | (65,009,849 | ) | | | (10,552,057 | ) | | $ | (296,649,398 | ) |
| | | | | | | | | | | | | | | | |
Semi-Annual Report 21
| | |
| NOTES TO FINANCIAL STATEMENTS, CONTINUED | | |
| |
Thornburg International Value Fund | | March 31, 2015 (Unaudited) |
| | | | | | | | | | | | | | | | |
| | | Six Months Ended | | | Year Ended | |
| | | March 31, 2015 (Unaudited) | | | September 30, 2014 (Audited) | |
| | | Shares | | | Amount | | | Shares | | | Amount | |
Class I Shares | | | | | | | | | | | | | | | | |
Shares sold | | | 31,215,750 | | | $ | 919,386,182 | | | | 103,474,293 | | | $ | 3,194,619,827 | |
Shares issued to shareholders in reinvestment of dividends | | | 19,520,515 | | | | 551,665,079 | | | | 3,353,409 | | | | 103,806,502 | |
Shares repurchased | | | (89,693,278 | ) | | | (2,581,100,435 | ) | | | (326,972,110 | ) | | | (10,077,187,333 | ) |
| | | | | | | | | | | | | | | | |
| | | | |
Net increase (decrease) | | | (38,957,013 | ) | | $ | (1,110,049,174 | ) | | | (220,144,408 | ) | | $ | (6,778,761,004 | ) |
| | | | | | | | | | | | | | | | |
| | | | |
Class R3 Shares | | | | | | | | | | | | | | | | |
Shares sold | | | 2,062,429 | | | $ | 57,777,361 | | | | 5,588,730 | | | $ | 168,961,744 | |
Shares issued to shareholders in reinvestment of dividends | | | 1,956,418 | | | | 54,128,798 | | | | 158,988 | | | | 4,816,635 | |
Shares repurchased | | | (8,836,932 | ) | | | (250,068,676 | ) | | | (18,738,646 | ) | | | (566,283,273 | ) |
| | | | | | | | | | | | | | | | |
| | | | |
Net increase (decrease) | | | (4,818,085 | ) | | $ | (138,162,517 | ) | | | (12,990,928 | ) | | $ | (392,504,894 | ) |
| | | | | | | | | | | | | | | | |
| | | | |
Class R4 Shares | | | | | | | | | | | | | | | | |
Shares sold | | | 2,468,321 | | | $ | 68,776,080 | | | | 8,521,096 | | | $ | 256,157,143 | |
Shares issued to shareholders in reinvestment of dividends | | | 1,327,755 | | | | 36,520,360 | | | | 183,905 | | | | 5,543,050 | |
Shares repurchased | | | (12,900,822 | ) | | | (365,795,211 | ) | | | (29,175,509 | ) | | | (877,827,988 | ) |
| | | | | | | | | | | | | | | | |
| | | | |
Net increase (decrease) | | | (9,104,746 | ) | | $ | (260,498,771 | ) | | | (20,470,508 | ) | | $ | (616,127,795 | ) |
| | | | | | | | | | | | | | | | |
| | | | |
Class R5 Shares | | | | | | | | | | | | | | | | |
Shares sold | | | 5,741,042 | | | $ | 162,428,210 | | | | 19,469,855 | | | $ | 600,262,418 | |
Shares issued to shareholders in reinvestment of dividends | | | 4,976,228 | | | | 140,492,698 | | | | 989,545 | | | | 30,588,240 | |
Shares repurchased | | | (51,127,558 | ) | | | (1,463,558,228 | ) | | | (91,535,480 | ) | | | (2,822,436,484 | ) |
| | | | | | | | | | | | | | | | |
| | | | |
Net increase (decrease) | | | (40,410,288 | ) | | $ | (1,160,637,320 | ) | | | (71,076,080 | ) | | $ | (2,191,585,826 | ) |
| | | | | | | | | | | | | | | | |
| | | | |
Class R6 Shares | | | | | | | | | | | | | | | | |
Shares sold | | | 3,112,552 | | | $ | 89,383,362 | | | | 20,980,274 | | | $ | 647,021,016 | |
Shares issued to shareholders in reinvestment of dividends | | | 2,264,383 | | | | 63,852,152 | | | | 642,244 | | | | 19,836,878 | |
Shares repurchased | | | (17,586,568 | ) | | | (506,379,387 | ) | | | (36,713,336 | ) | | | (1,127,182,494 | ) |
| | | | | | | | | | | | | | | | |
| | | | |
Net increase (decrease) | | | (12,209,633 | ) | | $ | (353,143,873 | ) | | | (15,090,818 | ) | | $ | (460,324,600 | ) |
| | | | | | | | | | | | | | | | |
NOTE 5 – INVESTMENT TRANSACTIONS
For the six months ended March 31, 2015, the Fund had purchase and sale transactions of investments (excluding short-term investments) of $3,287,012,155 and $7,740,519,200, respectively.
NOTE 6 – INCOME TAXES
At March 31, 2015, information on the tax components of capital was as follows:
| | | | |
Cost of investments for tax purposes | | $ | 9,048,594,703 | |
| | | | |
Gross unrealized appreciation on a tax basis | | $ | 2,063,487,306 | |
Gross unrealized depreciation on a tax basis | | | (537,516,329 | ) |
| | | | |
Net unrealized appreciation (depreciation) on investments (tax basis) | | $ | 1,525,970,977 | |
| | | | |
22 Semi-Annual Report
| | |
| NOTES TO FINANCIAL STATEMENTS, CONTINUED | | |
| |
Thornburg International Value Fund | | March 31, 2015 (Unaudited) |
NOTE 7 — DERIVATIVE FINANCIAL INSTRUMENTS WITH OFF-BALANCE SHEET RISK AND FOREIGN INVESTMENT RISK
The Fund may use a variety of derivative financial instruments to hedge or adjust the risks affecting its investment portfolio or to enhance investment returns. Provisions of FASB Accounting Standards Codification 815-10-50 (“ASC 815”), require certain disclosures. The disclosures are intended to provide users of financial statements with an understanding of the use of derivative instruments by the Fund and how these derivatives affect the financial position, financial performance and cash flows of the Fund. The Fund does not designate any derivative instruments as hedging instruments under ASC 815. During the six months ended March 31, 2015, the Fund’s principal exposure to derivative financial instruments of the type addressed by ASC 815 was investment in foreign exchange contracts. A foreign exchange contract is an agreement between two parties to exchange different currencies at a specified rate of exchange at an agreed upon future date. Foreign exchange contracts involve risks to the Fund, including the risk that a contract’s counterparty will not meet its obligations to the Fund, the risk that a change in a contract’s value may not correlate perfectly with the currency the contract was intended to track, and the risk that the advisor is unable to correctly implement its strategy in using a contract. In any such instance, the Fund may not achieve the intended benefit of entering into a contract, and may experience a loss. Additionally, the Fund’s risk of loss may exceed the amounts recognized on the Statement of Assets and Liabilities.
The Fund entered into forward currency contracts during the six months ended March 31, 2015 in the normal course of pursuing its investment objectives, with the objective of reducing the risk to the value of the Fund’s foreign investments from adverse changes in the relationship between the U.S. dollar and foreign currencies. In each case these contracts have been initiated in conjunction with foreign investment transactions.
These contracts are accounted for by the Fund under ASC 815. Unrealized appreciation and depreciation on outstanding contracts are reported in the Fund’s Statement of Assets and Liabilities, as measured by the difference between the forward exchange rates at the reporting date and the forward exchange rates at each contract’s inception date. Net realized gain (loss) on contracts closed during the period, and changes in net unrealized appreciation (depreciation) on outstanding contracts are recognized in the Fund’s Statement of Operations. The average value of open sell currency contracts for the six months ended March 31, 2015 was $4,477,204,536. Open buy currency contracts are entered into for the purpose of closing open sell currency contracts and the values are dependent upon the values of the open sell currency contracts to which they relate.
The following table displays the outstanding forward currency contracts at March 31, 2015:
| | | | | | | | | | | | | | | | | | | | | | | | |
| | | Outstanding Forward Currency Contracts to Buy or Sell at March 31, 2015 | |
Contract Description | | Buy/Sell | | | Contract
Amount | | | Contract
Value Date | | | Value USD | | | Unrealized
Appreciation | | | Unrealized
Depreciation | |
Euro | | | Sell | | | | 1,461,814,600 | | | | 04/28/2015 | | | | 1,572,351,608 | | | $ | 283,962,898 | | | $ | — | |
Euro | | | Buy | | | | 192,983,700 | | | | 04/28/2015 | | | | 207,576,413 | | | | — | | | | (2,169,852 | ) |
Euro | | | Buy | | | | 274,574,900 | | | | 04/28/2015 | | | | 295,337,237 | | | | — | | | | (2,585,315 | ) |
Euro | | | Buy | | | | 185,479,200 | | | | 04/28/2015 | | | | 199,504,450 | | | | — | | | | (10,926,339 | ) |
Euro | | | Buy | | | | 493,690,500 | | | | 04/28/2015 | | | | 531,021,548 | | | | — | | | | (29,630,663 | ) |
Japanese Yen | | | Sell | | | | 155,973,836,900 | | | | 04/02/2015 | | | | 1,300,486,404 | | | | 125,090,886 | | | | — | |
Japanese Yen | | | Sell | | | | 27,062,472,600 | | | | 04/02/2015 | | | | 225,642,828 | | | | 13,053,832 | | | | — | |
Japanese Yen | | | Buy | | | | 28,158,103,400 | | | | 04/02/2015 | | | | 234,778,033 | | | | 538,067 | | | | — | |
Japanese Yen | | | Buy | | | | 17,493,385,300 | | | | 04/02/2015 | | | | 145,857,217 | | | | 41,337 | | | | — | |
Japanese Yen | | | Buy | | | | 43,956,717,500 | | | | 04/02/2015 | | | | 366,504,502 | | | | — | | | | (1,303,359 | ) |
Japanese Yen | | | Sell | | | | 25,093,093,800 | | | | 04/02/2015 | | | | 209,222,444 | | | | — | | | | (2,328,985 | ) |
Japanese Yen | | | Buy | | | | 32,243,760,300 | | | | 04/02/2015 | | | | 268,843,626 | | | | — | | | | (5,744,053 | ) |
Japanese Yen | | | Buy | | | | 45,996,484,000 | | | | 04/02/2015 | | | | 383,511,769 | | | | — | | | | (8,506,671 | ) |
Japanese Yen | | | Buy | | | | 40,280,952,800 | | | | 04/02/2015 | | | | 335,856,529 | | | | — | | | | (34,328,585 | ) |
| | | | | | | | | | | | | | | | | | | | | | | | |
Total | | | | | | | | | | | | | | | | | | $ | 422,687,020 | | | $ | (97,523,822 | ) |
| | | | | | | | | | | | | | | | | | | | | | | | |
Net unrealized appreciation (depreciation) | | | $ | 325,163,198 | | | | | |
| | | | | | | | | | | | | | | | | | | | | | | | |
Certain forward currency contracts were entered into with State Street Bank and Trust Company (“SSB”) pursuant to an International Swaps and Derivatives Association (“ISDA”) Master Agreement. In the event of a default or termination under the ISDA Master Agreement with SSB, the non-defaulting party has the right to close out all outstanding forward currency contracts between the parties and to net any payment amounts under those contracts, resulting in a single net amount payable by one party to the other. Because the ISDA Master Agreement with SSB does not result in an offset of reported amounts of financial assets and financial liabilities in the Fund’s Statement of Assets and Liabilities unless there has been an event of default or termination event under that agreement, the
Semi-Annual Report 23
| | |
| NOTES TO FINANCIAL STATEMENTS, CONTINUED | | |
| |
Thornburg International Value Fund | | March 31, 2015 (Unaudited) |
Fund does not net its outstanding forward currency contracts for purposes of the disclosure in the Fund’s Statement of Assets and Liabilities. Instead the Fund recognizes the unrealized appreciation or depreciation on those forward currency contracts on a gross basis in the Fund’s Statement of Assets and Liabilities. At March 31, 2015, those recognized amounts are disclosed in the following table:
| | | | | | |
Fair Values of Derivative Financial Instruments at March 31, 2015 | |
| Asset Derivatives | | Balance Sheet Location | | Fair Value | |
Foreign exchange contracts | | Assets - Unrealized appreciation on forward currency contracts | | $ | 422,687,020 | |
| | |
| Liability Derivatives | | Balance Sheet Location | | Fair Value | |
Foreign exchange contracts | | Liabilities - Unrealized depreciation on forward currency contracts | | $ | (97,523,822 | ) |
Because the Fund does not currently receive or post cash collateral in connection with its currency forward contracts, and because all of the Fund’s outstanding currency forward contracts are with State Street Bank and Trust Company, the net amounts of the Fund’s assets and liabilities which are attributable to those contracts at March 31, 2015 can be determined by offsetting the dollar amounts shown in the preceding table. Based on those amounts, the net amount of the Fund’s assets which is attributable to its outstanding forward currency contracts at March 31, 2015 is $325,163,198, and the net amount of the Fund’s liabilities which is attributable to those contracts at that date is $0. The Fund’s forward currency contracts are valued each day, and the net amounts of the Fund’s assets and liabilities which are attributable to those contracts are expected to vary over time.
The net realized gain (loss) from forward currency contracts and the net change in unrealized appreciation (depreciation) on outstanding forward currency contracts recognized in the Fund’s Statement of Operations for the six months ended March 31, 2015 are disclosed in the following tables:
| | | | | | | | | | |
Net Realized Gain (loss) from Derivative Financial Instruments Recognized in Income for the Six Months Ended March 31, 2015 | |
| | | Total | | | | | Forward Currency Contracts | |
Foreign exchange contracts | | $ | 333,225,252 | | | | | $ | 333,225,252 | |
|
Net Change in Unrealized Appreciation (depreciation) on Derivative Financial Instruments Recognized in Income for the Six Months Ended March 31, 2015 | |
| | | Total | | | | | Forward Currency Contracts | |
Foreign exchange contracts | | $ | 64,291,311 | | | | | $ | 64,291,311 | |
OTHER NOTES
Risks: The Fund’s investments subject it to risks including, but not limited to, management risk, market and economic risk, risks affecting specific issuers, liquidity risk, the risks associated with investments in small- and mid-cap companies and non-U.S. issuers, credit risk, and interest rate risk. Please see the Fund’s prospectus for a discussion of the risks associated with an investment in the Fund.
Subsequent Events: Fund management believes no events have occurred between March 31, 2015 and the date of issuance of the financial statements that require adjustment to or disclosure in the accompanying financial statements.
24 Semi-Annual Report
This page intentionally left blank.
Semi-Annual Report 25
FINANCIAL HIGHLIGHTS
Thornburg International Value Fund
| | | | | | | | | | | | | | | | | | | | | | | | | | | | | | | | | | | | | | | | | | | | | | | | | | |
| | | PER SHARE PERFORMANCE (for a share outstanding throughout the period)+ | | RATIOS TO AVERAGE NET ASSETS | | | SUPPLEMENTAL DATA | |
Unless
Otherwise
Noted,
Periods
are
Fiscal
Years
Ended
Sept. 30, | | Net Asset
Value
Beginning
of Period | | | Net Investment Income
(Loss) | | Net
Realized
&
Unrealized
Gain (Loss)
on
Investments | | | Total from
Investment
Operations | | | Dividends
from Net
Investment
Income | | | Dividends
from Net Realized Gains | | Total
Dividends | | | Net
Asset Value End
of
Period | | Net
Investment
Income
(Loss)
(%) | | | Expenses,
After
Expense
Reductions
(%) | | | Expenses,
After
Expense
Reductions
and Net of
Custody
Credits
(%) | | | Expenses,
Before
Expense
Reductions
(%) | | | Total
Return
(%)(a) | | Portfolio
Turnover
Rate
(%)(a) | | Net
Assets
at End
of
Period
(Thousands) | |
Class A Shares | | | | | | | | | | | | | | | | | | | | | | | | | | | | | | | | | | | | | | | | | | | | |
2015(b)(c) | | $ | 29.84 | | | 0.05 | | | 1.49 | | | | 1.54 | | | | (0.02 | ) | | (2.52) | | | (2.54 | ) | | $28.84 | | | 0.37 | (d) | | | 1.30 | (d) | | | 1.30 | (d) | | | 1.30 | (d) | | 5.53 | | 26.80 | | $ | 1,541,325 | |
2014(c) | | $ | 30.12 | | | 0.19 | | | (0.23 | ) | | | (0.04 | ) | | | (0.24 | ) | | — | | | (0.24 | ) | | $29.84 | | | 0.63 | | | | 1.26 | | | | 1.26 | | | | 1.26 | | | (0.14) | | 37.25 | | $ | 2,601,689 | |
2013(c) | | $ | 26.08 | | | 0.26 | | | 4.02 | | | | 4.28 | | | | (0.24 | ) | | — | | | (0.24 | ) | | $30.12 | | | 0.92 | | | | 1.25 | | | | 1.25 | | | | 1.25 | | | 16.49 | | 34.67 | | $ | 5,212,813 | |
2012(c) | | $ | 23.14 | | | 0.28 | | | 2.95 | | | | 3.23 | | | | (0.29 | ) | | — | | | (0.29 | ) | | $26.08 | | | 1.09 | | | | 1.29 | | | | 1.29 | | | | 1.29 | | | 14.02 | | 17.86 | | $ | 5,429,316 | |
2011(c) | | $ | 26.00 | | | 0.30 | | | (2.89 | ) | | | (2.59 | ) | | | (0.27 | ) | | — | | | (0.27 | ) | | $23.14 | | | 1.06 | | | | 1.25 | | | | 1.25 | | | | 1.25 | | | (10.10) | | 20.78 | | $ | 5,932,896 | |
2010(c) | | $ | 23.91 | | | 0.18 | | | 2.07 | | | | 2.25 | | | | (0.16 | ) | | — | | | (0.16 | ) | | $26.00 | | | 0.72 | | | | 1.33 | | | | 1.33 | | | | 1.33 | | | 9.43 | | 22.26 | | $ | 6,704,550 | |
Class B Shares | | | | | | | | | | | | | | | | | | | | | | | | | | | | | | | | | | | | | | | | | | | | |
2015(b) | | $ | 27.68 | | | (0.07) | | | 1.36 | | | | 1.29 | | | | — | | | (2.52) | | | (2.52 | ) | | $26.45 | | | (0.52 | )(d) | | | 2.23 | (d) | | | 2.23 | (d) | | | 2.23 | (d) | | 5.02 | | 26.80 | | $ | 11,350 | |
2014 | | $ | 28.02 | | | (0.07) | | | (0.20 | ) | | | (0.27 | ) | | | (0.07 | ) | | — | | | (0.07 | ) | | $27.68 | | | (0.24 | ) | | | 2.13 | | | | 2.13 | | | | 2.13 | | | (0.96) | | 37.25 | | $ | 16,288 | |
2013 | | $ | 24.37 | | | 0.01 | | | 3.74 | | | | 3.75 | | | | (0.10 | ) | | — | | | (0.10 | ) | | $28.02 | | | 0.02 | | | | 2.10 | | | | 2.10 | | | | 2.10 | | | 15.45 | | 34.67 | | $ | 33,562 | |
2012 | | $ | 21.67 | | | 0.06 | | | 2.77 | | | | 2.83 | | | | (0.13 | ) | | — | | | (0.13 | ) | | $24.37 | | | 0.26 | | | | 2.09 | | | | 2.09 | | | | 2.09 | | | 13.07 | | 17.86 | | $ | 44,009 | |
2011 | | $ | 24.43 | | | 0.05 | | | (2.67 | ) | | | (2.62 | ) | | | (0.14 | ) | | — | | | (0.14 | ) | | $21.67 | | | 0.21 | | | | 2.06 | | | | 2.06 | | | | 2.06 | | | (10.80) | | 20.78 | | $ | 56,002 | |
2010 | | $ | 22.56 | | | (0.02) | | | 1.95 | | | | 1.93 | | | | (0.06 | ) | | — | | | (0.06 | ) | | $24.43 | | | (0.10 | ) | | | 2.10 | | | | 2.10 | | | | 2.10 | | | 8.59 | | 22.26 | | $ | 74,083 | |
Class C Shares | | | | | | | | | | | | | | | | | | | | | | | | | | | | | | | | | | | | | | | | | | | | |
2015(b) | | $ | 27.86 | | | (0.03) | | | 1.35 | | | | 1.32 | | | | — | | | (2.52) | | | (2.52 | ) | | $26.66 | | | (0.21 | )(d) | | | 1.99 | (d) | | | 1.99 | (d) | | | 1.99 | (d) | | 5.11 | | 26.80 | | $ | 771,787 | |
2014 | | $ | 28.17 | | | — | | | (0.23 | ) | | | (0.23 | ) | | | (0.08 | ) | | — | | | (0.08 | ) | | $27.86 | | | — | | | | 1.99 | | | | 1.99 | | | | 1.99 | | | (0.83) | | 37.25 | | $ | 874,358 | |
2013 | | $ | 24.48 | | | 0.04 | | | 3.77 | | | | 3.81 | | | | (0.12 | ) | | — | | | (0.12 | ) | | $28.17 | | | 0.15 | | | | 2.01 | | | | 2.01 | | | | 2.01 | | | 15.62 | | 34.67 | | $ | 1,181,438 | |
2012 | | $ | 21.77 | | | 0.08 | | | 2.77 | | | | 2.85 | | | | (0.14 | ) | | — | | | (0.14 | ) | | $24.48 | | | 0.35 | | | | 2.03 | | | | 2.03 | | | | 2.03 | | | 13.14 | | 17.86 | | $ | 1,254,732 | |
2011 | | $ | 24.54 | | | 0.08 | | | (2.70 | ) | | | (2.62 | ) | | | (0.15 | ) | | — | | | (0.15 | ) | | $21.77 | | | 0.31 | | | | 1.99 | | | | 1.99 | | | | 1.99 | | | (10.78) | | 20.78 | | $ | 1,391,173 | |
2010 | | $ | 22.65 | | | (0.01) | | | 1.97 | | | | 1.96 | | | | (0.07 | ) | | — | | | (0.07 | ) | | $24.54 | | | (0.03 | ) | | | 2.06 | | | | 2.06 | | | | 2.06 | | | 8.67 | | 22.26 | | $ | 1,643,753 | |
Class I Shares | | | | | | | | | | | | | | | | | | | | | | | | | | | | | | | | | | | | | | | | | | | | |
2015(b) | | $ | 30.43 | | | 0.12 | | | 1.50 | | | | 1.62 | | | | (0.05 | ) | | (2.52) | | | (2.57 | ) | | $29.48 | | | 0.85 | (d) | | | 0.91 | (d) | | | 0.91 | (d) | | | 0.91 | (d) | | 5.72 | | 26.80 | | $ | 6,357,210 | |
2014 | | $ | 30.76 | | | 0.33 | | | (0.25 | ) | | | 0.08 | | | | (0.41 | ) | | — | | | (0.41 | ) | | $30.43 | | | 1.05 | | | | 0.88 | | | | 0.88 | | | | 0.88 | | | 0.23 | | 37.25 | | $ | 7,748,950 | |
2013 | | $ | 26.66 | | | 0.38 | | | 4.10 | | | | 4.48 | | | | (0.38 | ) | | — | | | (0.38 | ) | | $30.76 | | | 1.34 | | | | 0.86 | | | | 0.86 | | | | 0.86 | | | 16.94 | | 34.67 | | $ | 14,601,876 | |
2012 | | $ | 23.65 | | | 0.40 | | | 3.00 | | | | 3.40 | | | | (0.39 | ) | | — | | | (0.39 | ) | | $26.66 | | | 1.53 | | | | 0.88 | | | | 0.88 | | | | 0.88 | | | 14.47 | | 17.86 | | $ | 12,505,553 | |
2011 | | $ | 26.57 | | | 0.41 | | | (2.96 | ) | | | (2.55 | ) | | | (0.37 | ) | | — | | | (0.37 | ) | | $23.65 | | | 1.45 | | | | 0.88 | | | | 0.88 | | | | 0.88 | | | (9.77) | | 20.78 | | $ | 10,942,112 | |
2010 | | $ | 24.42 | | | 0.29 | | | 2.11 | | | | 2.40 | | | | (0.25 | ) | | — | | | (0.25 | ) | | $26.57 | | | 1.17 | | | | 0.92 | | | | 0.92 | | | | 0.92 | | | 9.90 | | 22.26 | | $ | 9,693,445 | |
Class R3 Shares | | | | | | | | | | | | | | | | | | | | | | | | | | | | | | | | | | | | | | | | | | | | |
2015(b) | | $ | 29.86 | | | 0.04 | | | 1.47 | | | | 1.51 | | | | (0.02 | ) | | (2.52) | | | (2.54 | ) | | $28.83 | | | 0.30 | (d) | | | 1.45 | (d) | | | 1.45 | (d) | | | 1.61 | (d) | | 5.41 | | 26.80 | | $ | 589,255 | |
2014 | | $ | 30.14 | | | 0.15 | | | (0.24 | ) | | | (0.09 | ) | | | (0.19 | ) | | — | | | (0.19 | ) | | $29.86 | | | 0.51 | | | | 1.45 | | | | 1.45 | | | | 1.61 | | | (0.30) | | 37.25 | | $ | 754,139 | |
2013 | | $ | 26.11 | | | 0.20 | | | 4.02 | | | | 4.22 | | | | (0.19 | ) | | — | | | (0.19 | ) | | $30.14 | | | 0.71 | | | | 1.45 | | | | 1.45 | | | | 1.57 | | | 16.23 | | 34.67 | | $ | 1,152,795 | |
2012 | | $ | 23.17 | | | 0.24 | | | 2.95 | | | | 3.19 | | | | (0.25 | ) | | — | | | (0.25 | ) | | $26.11 | | | 0.95 | | | | 1.45 | | | | 1.45 | | | | 1.60 | | | 13.82 | | 17.86 | | $ | 1,323,765 | |
2011 | | $ | 26.04 | | | 0.24 | | | (2.89 | ) | | | (2.65 | ) | | | (0.22 | ) | | — | | | (0.22 | ) | | $23.17 | | | 0.86 | | | | 1.45 | | | | 1.45 | | | | 1.58 | | | (10.27) | | 20.78 | | $ | 1,270,000 | |
2010 | | $ | 23.96 | | | 0.15 | | | 2.07 | | | | 2.22 | | | | (0.14 | ) | | — | | | (0.14 | ) | | $26.04 | | | 0.61 | | | | 1.45 | | | | 1.45 | | | | 1.63 | | | 9.30 | | 22.26 | | $ | 1,311,041 | |
Class R4 Shares | | | | | | | | | | | | | | | | | | | | | | | | | | | | | | | | | | | | | | | | | | | | |
2015(b) | | $ | 29.69 | | | 0.06 | | | 1.47 | | | | 1.53 | | | | (0.03 | ) | | (2.52) | | | (2.55 | ) | | $28.67 | | | 0.44 | (d) | | | 1.25 | (d) | | | 1.25 | (d) | | | 1.52 | (d) | | 5.52 | | 26.80 | | $ | 436,488 | |
2014 | | $ | 29.98 | | | 0.21 | | | (0.24 | ) | | | (0.03 | ) | | | (0.26 | ) | | — | | | (0.26 | ) | | $29.69 | | | 0.70 | | | | 1.25 | | | | 1.25 | | | | 1.49 | | | (0.12) | | 37.25 | | $ | 722,349 | |
2013 | | $ | 25.96 | | | 0.25 | | | 4.01 | | | | 4.26 | | | | (0.24 | ) | | — | | | (0.24 | ) | | $29.98 | | | 0.91 | | | | 1.25 | | | | 1.25 | | | | 1.38 | | | 16.49 | | 34.67 | | $ | 1,342,883 | |
2012 | | $ | 23.04 | | | 0.29 | | | 2.93 | | | | 3.22 | | | | (0.30 | ) | | — | | | (0.30 | ) | | $25.96 | | | 1.16 | | | | 1.25 | | | | 1.25 | | | | 1.45 | | | 14.05 | | 17.86 | | $ | 1,495,958 | |
2011 | | $ | 25.90 | | | 0.31 | | | (2.89 | ) | | | (2.58 | ) | | | (0.28 | ) | | — | | | (0.28 | ) | | $23.04 | | | 1.12 | | | | 1.25 | | | | 1.25 | | | | 1.41 | | | (10.11) | | 20.78 | | $ | 1,296,493 | |
2010 | | $ | 23.82 | | | 0.21 | | | 2.05 | | | | 2.26 | | | | (0.18 | ) | | — | | | (0.18 | ) | | $25.90 | | | 0.85 | | | | 1.25 | | | | 1.25 | | | | 1.49 | | | 9.53 | | 22.26 | | $ | 872,122 | |
Class R5 Shares | | | | | | | | | | | | | | | | | | | | | | | | | | | | | | | | | | | | | | | | | | | | |
2015(b) | | $ | 30.41 | | | 0.09 | | | 1.52 | | | | 1.61 | | | | (0.05 | ) | | (2.52) | | | (2.57 | ) | | $29.45 | | | 0.62 | (d) | | | 0.99 | (d) | | | 0.99 | (d) | | | 1.23 | (d) | | 5.66 | | 26.80 | | $ | 912,972 | |
2014 | | $ | 30.71 | | | 0.30 | | | (0.24 | ) | | | 0.06 | | | | (0.36 | ) | | — | | | (0.36 | ) | | $30.41 | | | 0.97 | | | | 0.99 | | | | 0.99 | | | | 1.12 | | | 0.17 | | 37.25 | | $ | 2,171,673 | |
2013 | | $ | 26.61 | | | 0.34 | | | 4.10 | | | | 4.44 | | | | (0.34 | ) | | — | | | (0.34 | ) | | $30.71 | | | 1.20 | | | | 0.96 | | | | 0.96 | | | | 1.00 | | | 16.80 | | 34.67 | | $ | 4,376,567 | |
2012 | | $ | 23.61 | | | 0.37 | | | 3.00 | | | | 3.37 | | | | (0.37 | ) | | — | | | (0.37 | ) | | $26.61 | | | 1.44 | | | | 0.99 | | | | 0.99 | | | | 1.06 | | | 14.33 | | 17.86 | | $ | 4,512,144 | |
2011 | | $ | 26.53 | | | 0.40 | | | (2.98 | ) | | | (2.58 | ) | | | (0.34 | ) | | — | | | (0.34 | ) | | $23.61 | | | 1.39 | | | | 0.99 | | | | 0.99 | | | | 1.04 | | | (9.88) | | 20.78 | | $ | 3,709,978 | |
2010 | | $ | 24.38 | | | 0.28 | | | 2.11 | | | | 2.39 | | | | (0.24 | ) | | — | | | (0.24 | ) | | $26.53 | | | 1.11 | | | | 0.99 | | | | 0.99 | | | | 1.08 | | | 9.86 | | 22.26 | | $ | 2,462,021 | |
Class R6 Shares | | | | | | | | | | | | | | | | | | | | | | | | | | | | | | | | | | | | | | | | | | | | |
2015(b) | | $ | 30.36 | | | 0.13 | | | 1.51 | | | | 1.64 | | | | (0.07 | ) | | (2.52) | | | (2.59 | ) | | $29.41 | | | 0.92 | (d) | | | 0.74 | (d) | | | 0.74 | (d) | | | 0.74 | (d) | | 5.78 | | 26.80 | | $ | 486,115 | |
2014 | | $ | 30.70 | | | 0.40 | | | (0.26 | ) | | | 0.14 | | | | (0.48 | ) | | — | | | (0.48 | ) | | $30.36 | | | 1.28 | | | | 0.73 | | | | 0.73 | | | | 0.73 | | | 0.42 | | 37.25 | | $ | 872,512 | |
2013 | | $ | 26.62 | | | 0.46 | | | 4.05 | | | | 4.51 | | | | (0.43 | ) | | — | | | (0.43 | ) | | $30.70 | | | 1.59 | | | | 0.74 | | | | 0.74 | | | | 0.74 | | | 17.07 | | 34.67 | | $ | 1,345,680 | |
2012(e) | | $ | 27.14 | | | 0.15 | | | (0.38 | ) | | | (0.23 | ) | | | (0.29 | ) | | — | | | (0.29 | ) | | $26.62 | | | 1.35 | (d) | | | 0.76 | (d) | | | 0.76 | (d) | | | 0.76 | (d) | | (0.77) | | 17.86 | | $ | 478,078 | |
| (a) | Not annualized for periods less than one year. |
| (b) | Unaudited Six Month Period Ended March 31. |
| (c) | Sales loads are not reflected in computing total return. |
| (e) | Effective date of this class of shares was May 1, 2012. |
| + | Based on weighted average shares outstanding, except for Dividends from Net Investment Income and Net Realized Gains, which are actual amounts per share. |
See notes to financial statements.
| | | | |
| 26 Semi-Annual Report | | | | Semi-Annual Report 27 |
| | |
| EXPENSE EXAMPLE | | |
| |
Thornburg International Value Fund | | March 31, 2015 (Unaudited) |
As a shareholder of the Fund, you incur two types of costs:
| | (1) | transaction costs, including |
(a) sales charges (loads) on purchase payments for Class A shares;
(b) a deferred sales charge on redemptions of any part or all of a purchase of $1 million of Class A shares within 12 months of purchase;
(c) a deferred sales charge on redemptions of Class B shares within eight years of purchase;
(d) a deferred sales charge on redemptions of Class C shares within 12 months of purchase;
| | (2) | ongoing costs, including management fees; distribution and/or service (12b-1) fees; and other Fund expenses. |
This example is intended to help you understand your ongoing costs (in dollars) of investing in the Fund and to compare these costs with the ongoing costs of investing in other mutual funds.
The example is based on a $1,000 investment beginning on October 1, 2014, and held until March 31, 2015.
ACTUAL EXPENSES
For each class of shares, the first line of the accompanying table provides information about actual account values and actual expenses. You may use the information in this line, together with the amount you invested, to estimate the expenses that you paid over the period. Simply divide your account value by $1,000 (for example, an $8,600 account value divided by $1,000 = 8.6), then multiply the result by the number in the first line for your class of shares under the heading entitled “Expenses Paid During Period” to estimate the expenses you paid on your account during this period.
| | | | | | | | | | | | |
| | | Beginning
Account Value
10/1/14 | | | Ending
Account Value
3/31/15 | | | Expenses paid
During period†
10/1/14-3/31/15 | |
Class A Shares | | | | | | | | | | | | |
Actual | | $ | 1,000.00 | | | $ | 1,055.30 | | | $ | 6.66 | |
Hypothetical* | | $ | 1,000.00 | | | $ | 1,018.45 | | | $ | 6.54 | |
Class B Shares | | | | | | | | | | | | |
Actual | | $ | 1,000.00 | | | $ | 1,050.20 | | | $ | 11.42 | |
Hypothetical* | | $ | 1,000.00 | | | $ | 1,013.79 | | | $ | 11.22 | |
Class C Shares | | | | | | | | | | | | |
Actual | | $ | 1,000.00 | | | $ | 1,051.10 | | | $ | 10.16 | |
Hypothetical* | | $ | 1,000.00 | | | $ | 1,015.02 | | | $ | 9.98 | |
Class I Shares | | | | | | | | | | | | |
Actual | | $ | 1,000.00 | | | $ | 1,057.20 | | | $ | 4.69 | |
Hypothetical* | | $ | 1,000.00 | | | $ | 1,020.37 | | | $ | 4.60 | |
Class R3 Shares | | | | | | | | | | | | |
Actual | | $ | 1,000.00 | | | $ | 1,054.10 | | | $ | 7.43 | |
Hypothetical* | | $ | 1,000.00 | | | $ | 1,017.70 | | | $ | 7.29 | |
Class R4 Shares | | | | | | | | | | | | |
Actual | | $ | 1,000.00 | | | $ | 1,055.20 | | | $ | 6.40 | |
Hypothetical* | | $ | 1,000.00 | | | $ | 1,018.70 | | | $ | 6.29 | |
Class R5 Shares | | | | | | | | | | | | |
Actual | | $ | 1,000.00 | | | $ | 1,056.60 | | | $ | 5.08 | |
Hypothetical* | | $ | 1,000.00 | | | $ | 1,020.00 | | | $ | 4.99 | |
Class R6 Shares | | | | | | | | | | | | |
Actual | | $ | 1,000.00 | | | $ | 1,057.80 | | | $ | 3.80 | |
Hypothetical* | | $ | 1,000.00 | | | $ | 1,021.23 | | | $ | 3.74 | |
| † | Expenses are equal to the annualized expense ratio for each class (A: 1.30%; B: 2.23%; C: 1.99%; I: 0.91%; R3: 1.45%; R4: 1.25%; R5: 0.99%; R6: 0.74%) multiplied by the average account value over the period, multiplied by 182/365 to reflect the one-half year period. |
| * | Hypothetical assumes a rate of return of 5% per year before expenses. |
HYPOTHETICAL EXAMPLE FOR COMPARISON PURPOSES
For each class of shares, the second line of the accompanying table provides information about hypothetical account values and hypothetical expenses based on the Fund’s actual expense ratio and an assumed rate of return of 5% per year before expenses, which is not the Fund’s actual return. The hypothetical account values and expenses may not be used to estimate the actual ending account balance or expenses you paid for the period. You may use this information to compare the ongoing costs of investing in the Fund and other funds. To do so, compare this 5% hypothetical example with the 5% hypothetical examples that appear in the shareholder reports of the other funds.
Please note that the expenses shown in the table are meant to highlight your ongoing costs only and do not reflect any transactional costs, such as sales charges (loads), redemption fees, or exchange fees. Therefore, the second line of the table for each class of shares is useful in comparing ongoing costs only, and will not help you determine the relative total costs of owning different funds. In addition, if these transactional costs were included, your costs would have been higher.
28 Semi-Annual Report
| | |
| OTHER INFORMATION | | |
| |
Thornburg International Value Fund | | March 31, 2015 (Unaudited) |
PORTFOLIO PROXY VOTING
Policies and Procedures:
The Trust has delegated to Thornburg Investment Management, Inc. (the “Advisor”) voting decisions respecting proxies for the Fund’s voting securities. The Advisor makes voting decisions in accordance with its Proxy Voting Policy and Procedures. A description of the Policy and Procedures is available (i) without charge, upon request, by calling the Advisor toll-free at 1-800-847-0200, (ii) on the Thornburg website at www.thornburg.com, and (iii) on the Securities and Exchange Commission’s website at www.sec.gov.
Information regarding how proxies were voted is available on or before August 31 of each year for the twelve months ending the preceding June 30. This information is available (i) without charge, upon request by calling the Advisor toll-free at 1-800-847-0200, (ii) on the Thornburg website at www.thornburg.com, and (iii) on the Securities and Exchange Commission’s website at www.sec.gov.
AVAILABILITY OF QUARTERLY PORTFOLIO SCHEDULE
The Fund files with the Securities and Exchange Commission schedules of its portfolio holdings on Form N-Q for the first and third quarters of each fiscal year. The Fund’s Forms N-Q are available on the Commission’s website at www.sec.gov, or may be reviewed and copied at the Commission’s Public Reference Room in Washington, D.C. Information on the operation of the Public Reference Room may be obtained by calling 1-800-SEC-0330. The Fund also makes this information available on its website at www.thornburg. com/download or upon request by calling 1-800-847-0200.
Semi-Annual Report 29
TRUSTEES’ STATEMENT TO SHAREHOLDERS
Revised and Readopted September 15, 2014
The Trustees believe current and prospective shareholders should know how we discharge our responsibilities in supervising the Funds’ investment advisor and in reviewing the advisor’s contract for renewal. Since 2005, we have issued a statement which sets out clearly the three principal guidelines that we follow in supervising the Trust’s investment advisor on your behalf. In accordance with our customary practice, in September of 2014 we again reviewed our statement and concluded we should reissue this statement outlining the principal features of our supervision of the advisor’s performance of investment management services for the Funds.
We begin with the premise that each shareholder selected his or her Fund because its investments are managed by the investment advisor identified in the prospectus and in accordance with the objective and policies described in the prospectus. We realize, as each of you do, that if you believe that your Fund’s stated objective and policies no longer serve your personal investment goals, you can sell your shares and leave the Fund.
Therefore, we believe that our primary supervisory task – our principal obligation to you—is to assess the nature and quality of the advisor’s services, and to confirm that the advisor actively and competently pursues the Fund’s objective, in accordance with the policies set out in the prospectus. To do this, we meet regularly with management to review your Fund’s portfolio and to discuss the advisor’s specific actions and judgments in pursuing the Fund’s objective. We do not substitute our own judgment for the advisor’s decisions in selecting investments; the advisor is paid to exercise its informed judgment on investment decisions, and we seek to confirm, in reviewing the advisor’s performance, that the advisor is doing just that.
Second, we are conscious of costs and the effect that costs have on shareholders’ returns. We try to make sure that your Fund’s fees and costs are reasonable in relationship to the services rendered and that they are generally in line with those charged by other expert investment advisors, consistent with our belief that the Fund’s investors searched for and expect that expertise and attention and have decided to pay a reasonable price for it. We do not put the management contract “out to bid” as a matter of course, and we would not do so unless we had concluded that the advisor materially had failed to pursue the Fund’s objectives in accordance with its policies, or for other equally important reasons. We believe that any other approach would be inconsistent with your interests and contrary to your expectations when you bought shares of the Fund in the first place.
Finally, because we believe that most Thornburg Fund shareholders have invested with a long-term perspective, we try not to focus too much on the fashions of the moment and on short-term performance. The market will not favor any specific investment objective or set of policies at all times and under all economic circumstances. A fund will experience periods of both high and low returns relative to other funds and other investments. Even if one of our Funds is not favored by the market at a particular time, we believe that the advisor is nonetheless obliged to remain true to the Fund’s objective and policies, and we watch to see that it does so.
Trustees of Thornburg Investment Trust
30 Semi-Annual Report
THORNBURG FUND FAMILY
FUNDAMENTAL, BOTTOM-UP EQUITY RESEARCH
We search far and wide for the best stock ideas—within the United States and around the globe. Potential investments that may deserve a deeper look are thoroughly analyzed using both quantitative and qualitative criteria. But the vast majority are discarded. Those that ultimately make it into our highly-selective portfolios are continually monitored to determine whether our investment theses unfold as expected.
| | • | | Thornburg Core Growth Fund |
| | • | | Thornburg International Value Fund |
| | • | | Thornburg International Growth Fund |
| | • | | Thornburg Developing World Fund |
| | • | | Thornburg Investment Income Builder Fund |
| | • | | Thornburg Global Opportunities Fund |
A TRADITION OF DISCIPLINED BOND MANAGEMENT
At Thornburg, the word “disciplined” carries some substance. We don’t make a practice of using shortcuts to enhance yield or total returns. Every strategy is grounded in rigorous, bottom-up credit work. Portfolios are assembled carefully—in the case of our core bond funds, using laddered structures—to mitigate price fluctuation. Position sizes are controlled so that no single bond can have an outsized effect on a portfolio. And as with our equity portfolios, managers enjoy flexibility to seek an optimal risk/reward balance.
| | • | | Thornburg Low Duration Income Fund |
| | • | | Thornburg Limited Term U.S. Government Fund |
| | • | | Thornburg Limited Term Income Fund |
| | • | | Thornburg Strategic Income Fund |
| | • | | Thornburg Low Duration Municipal Fund |
| | • | | Thornburg Limited Term Municipal Fund |
| | • | | Thornburg Intermediate Municipal Fund |
| | • | | Thornburg California Limited Term Municipal Fund |
| | • | | Thornburg New Mexico Intermediate Municipal Fund |
| | • | | Thornburg New York Intermediate Municipal Fund |
| | • | | Thornburg Strategic Municipal Income Fund |
Before investing, carefully consider the Fund’s investment goals, risks, charges, and expenses. For a prospectus or summary prospectus containing this and other information, contact your financial advisor or visit thornburg.com. Read it carefully before investing.
For additional information, please visit thornburg.com
Thornburg Investment Management, Inc. 2300 North Ridgetop Road, Santa Fe, NM 87506
Semi-Annual Report 31
This Semi-Annual Report is submitted for the general information of shareholders of the Fund. It is not authorized for distribution to prospective investors in the Fund unless preceded or accompanied by an effective prospectus.
| | | | |
| Investment Advisor: | | Distributor: | | |
| Thornburg Investment Management® | | Thornburg Securities Corporation® | | |
| 800.847.0200 | | 800.847.0200 | | TH176 |
FIRM OVERVIEW
THE FIRM
Thornburg Investment Management is a privately owned global investment firm that offers a range of solutions for retail and institutional investors. We are driven by our mission to help our clients reach their long-term financial goals through fundamental research and active portfolio management.
Founded in 1982 and headquartered in Santa Fe, New Mexico, we manage approximately $61 billion (as of March 31, 2015) across seven equity and 11 bond mutual funds, separate accounts for high-net-worth investors and institutional accounts, and five UCITS funds for non-U.S. investors.

CORE INVESTMENT PRINCIPLES
Our focus has always been on maintaining and building the investment expertise to manage Thornburg strategies to a high standard, while adhering to a core set of investment principles:
| | • | | We focus on the fundamentals. We invest according to our view of the fundamental value of an issuer only after performing thorough, bottom-up research. |
| | • | | We think and invest for the long term. We typically make investment decisions based upon an investment thesis we expect to play out over 18 months to several years. We may not always hold a security for several years, but our horizon line is typically a few years out. |
| | • | | We stay flexible. We go where we see value. Our investment mandates are generally broad and flexible, and we exercise as much flexibility as possible within any restrictions. |
| | • | | We collaborate across strategies. We are structured as global generalists. Portfolio managers and analysts do not specialize in sectors, geographies, or even security types, but instead must understand and communicate bottom-up fundamentals across industries, sectors, and borders. |
2 Semi-Annual Report
Semi-Annual Report
Thornburg Core Growth Fund
March 31, 2015
| | | | |
SHARE Class | | NASDAQ Symbol | | CUSIP |
Class A | | THCGX | | 885-215-582 |
Class C | | TCGCX | | 885-215-574 |
Class I | | THIGX | | 885-215-475 |
Class R3 | | THCRX | | 885-215-517 |
Class R4 | | TCGRX | | 885-215-251 |
Class R5 | | THGRX | | 885-215-350 |
Class I, R3, R4, and R5 shares may not be available to all investors. Minimum investments for Class I shares may be higher than those for other classes.
Investments in the Fund carry risks, including possible loss of principal. Additional risks may be associated with investments outside the United States, especially in emerging markets, including currency fluctuations, illiquidity, volatility, and political and economic risks. Investments in small capitalization companies may increase the risk of greater price fluctuations. Please see the Fund’s prospectus for a discussion of the risks associated with an investment in the Fund. Investments in the Fund are not FDIC insured, nor are they deposits of or guaranteed by a bank or any other entity.
Semi-Annual Report 3
| | |
| LETTER TO SHAREHOLDERS | | |
| |
Thornburg Core Growth Fund | | March 31, 2015 (Unaudited) |
April 17, 2015
Dear Fellow Shareholder:
For the six-month period ended March 31, 2015, the Thornburg Core Growth Fund returned 7.11% for the Class A shares (without sales charge), underperforming its benchmark, the Russell 3000 Growth Index, which returned 9.43%. On March 31, 2015, the net asset value (NAV) of the Class A shares was $28.32, up from $26.44 at September 30, 2014.
The six-month period was notable for the heightened volatility. October featured a market correction of nearly 10%, followed by a sharp reversal to new highs. Oil continued its collapse, dropping 50% in the first three months of the period and then stabilizing around $50 a barrel. Health care stocks continued to lead the market, as they did during the fiscal year ended September 30, 2014.
Performance was mixed for the Core Growth Fund. We were encouraged by the strong performance of some long-term holdings that had lagged in 2014, such as Visa, Amazon and WisdomTree Investments. We also had some success with stocks that were new to the portfolio, including Acuity Brands, Vantiv and Gentex. Unfortunately, a handful of notable misses such as Stratasys, Yelp, and MGM Resorts kept us from outperforming the Fund’s benchmark.
On a sector basis, health care was our biggest positive contributor to performance. Industrials and consumer staples were also strong for the Fund, with stock selection driving the difference between the Fund and market returns. Information technology and consumer discretionary were our weakest performing sectors relative to the benchmark.
Contributors and Detractors
Top contributors to performance included WisdomTree Investments, Monster Beverage, Catamaran, Visa, and Fleetmatics.
WisdomTree Investments is a provider of enhanced exchange traded funds (ETFs). ETFs have gained popularity thanks to a number of characteristics, including low fees, the ability to trade throughout the day, and the ability to sell short. In addition, WisdomTree offers a range of currency hedged international ETFs, which have gained popularity and inflows alongside the strength in the U.S. dollar.
Coca-Cola recently bought a strategic stake in Monster Beverage, driving the stock higher. Since the deal was announced it is slowly becoming clear how powerful it will be to plug Monster’s products into Coca-Cola’s global distribution system. Standalone, Monster also reported a strong quarter with good improvement to its international operations.
Catamaran is a pharmaceutical benefits manager. During the quarter, Catamaran was acquired by United Health Group at a 25% premium to their previous closing price. We have since exited the position and put the proceeds to work in new opportunities.
Solid quarterly results combined with an attractive valuation were the catalysts for Visa’s stock to appreciate more than 20% during the period. We have been long-term holders of Visa and continue to view their business and growth prospects very positively.
Fleetmatics is a provider of fleet management solutions delivered as software and sold on a subscription basis. After a period of investing in the business to expand product lines and geographic coverage, Fleetmatics has started to reap the benefits, sustaining revenue growth rates and delivering margin expansion to report earnings above expectations over the last couple of quarters.
The top detractors to performance were Stratasys, Oasis Petroleum, Whiting Petroleum, Yelp, and MGM Resorts.
Stratasys is a leading 3D printer manufacturer. Shares decreased significantly in the period due to problems with the company’s MakerBot product line and a change in strategy by the company to invest more in sales, marketing, and product development. As a fast-growing leader in an emerging industry with an attractive razor-blade business model, there was potential for Stratasys to grow very strongly as they sold more high-margin printer materials to an expanding base of printer owners. However, we have sold out of the position as the company’s guidance indicates profit margins will contract due to the increased investments, potentially signaling increased competition.
Oasis is an oil producer located in the Bakken region (primarily located in North Dakota). It is an oil-rich play with fast production growth. Worrisome comments out of the Organization of Petroleum Exporting Countries (basically not cutting oil production despite a slowdown in demand) have caused the price of oil to decline rapidly since September 30, 2014, (from $90 down to $50 a barrel). This has hurt the whole energy space, but Oasis more so due to its aggressive production growth nature.
Whiting is an oil producer and performed poorly for the same reasons as Oasis.
We sold both Whiting and Oasis to make room for Concho, an oil and gas producer with a stronger balance sheet, and Helmerich & Payne, a high-end drilling services firm with a geographically diversified client base and healthy balance sheet. We believe both Concho and Helmerich & Payne are well positioned to weather the cyclical downturn in oil prices and to grow as the cycle turns.
Yelp operates the leading user review/local search site on the internet. Although growth remains robust, lower-than-expected traffic and higher-than-anticipated marketing expenditure have weighed on the stock.
4 Semi-Annual Report
| | |
| LETTER TO SHAREHOLDERS, | | |
| |
CONTINUED | | |
| |
Thornburg Core Growth Fund | | March 31, 2015 (Unaudited) |
MGM Resorts has continued to be hit by heavy negative news surrounding Beijing’s anti-corruption campaign and stepped-up regulation weighing on casino resorts in Macau. The political uncertainty drove the stock down to levels at which the company’s leverage was going to become more of a factor. We exited the position.
Market Outlook
Market volatility may persist over the course of the year. Consensus economic forecasts have the U.S. expanding 3% or more in 2015, after growing a rather modest 2.4% last year. While certainly positive for growth stocks, it also bolsters expectations that the U.S. Federal Reserve will begin raising interest rates later this year. That could make for choppy markets in the months ahead. As always, we believe the best way to navigate dynamic markets is by seeking promising growth companies with solid business models and good long-term fundamentals at attractive valuations.
Thank you for investing alongside us in the Core Growth Fund.
Sincerely,
| | | | |
 | |  | | |
| Greg Dunn | | Tim Cunningham,CFA | | |
| Managing Director | | Managing Director | | |
| Portfolio Manager | | Portfolio Manager | | |
The matters discussed in this report may constitute forward-looking statements made pursuant to the safe harbor provisions of the Securities Litigation Reform Act of 1995. These include any advisor or portfolio manager prediction, assessment, analysis or outlook for individual securities, industries, investment styles, market sectors and/or markets. These statements involve risks and uncertainties. In addition to the general risks described for each fund in its current prospectus, other factors bearing on these reports include the accuracy of the advisor’s or portfolio manager’s forecasts and predictions, the appropriateness of the investment strategies designed by the advisor or portfolio manager and the ability of the advisor or portfolio manager to implement their strategies efficiently and successfully. Any one or more of these factors, as well as other risks affecting the securities markets generally, could cause the actual results of any fund to differ materially as compared to its benchmarks.
The views expressed by the portfolio managers reflect their professional opinions and are subject to change. Under no circumstances does the information contained within represent a recommendation to buy or sell any security.
Semi-Annual Report 5
| | |
| PERFORMANCE SUMMARY | | |
| |
Thornburg Core Growth Fund | | March 31, 2015 (Unaudited) |
Average Annual Total Returns
| | | | | | | | | | | | | | | | | | | | |
| | | 1-Yr | | | 3-Yr | | | 5-Yr | | | 10-Yr | | | Since
Incep. | |
Class A Shares (Incep: 12/27/00) | | | | | | | | | | | | | | | | | | | | |
Without sales charge | | | 6.23 | % | | | 14.84 | % | | | 14.48 | % | | | 8.96 | % | | | 6.37 | % |
With sales charge | | | 1.43 | % | | | 13.09 | % | | | 13.43 | % | | | 8.46 | % | | | 6.03 | % |
Class C Shares (Incep: 12/27/00) | | | | | | | | | | | | | | | | | | | | |
Without sales charge | | | 5.42 | % | | | 13.99 | % | | | 13.64 | % | | | 8.15 | % | | | 5.53 | % |
With sales charge | | | 4.42 | % | | | 13.99 | % | | | 13.64 | % | | | 8.15 | % | | | 5.53 | % |
Class I Shares (Incep: 11/3/03) | | | 6.66 | % | | | 15.34 | % | | | 15.01 | % | | | 9.47 | % | | | 9.45 | % |
Class R3 Shares (Incep: 7/1/03) | | | 6.12 | % | | | 14.74 | % | | | 14.43 | % | | | 8.90 | % | | | 9.79 | % |
Class R4 Shares (Incep: 2/1/07) | | | 6.20 | % | | | 14.86 | % | | | 14.54 | % | | | — | | | | 5.14 | % |
Class R5 Shares (Incep: 10/3/05) | | | 6.67 | % | | | 15.35 | % | | | 15.02 | % | | | — | | | | 8.18 | % |
Russell 3K G (Since 12/27/00) | | | 15.76 | % | | | 16.45 | % | | | 15.71 | % | | | 9.41 | % | | | 4.51 | % |
Growth of a Hypothetical $10,000 Investment
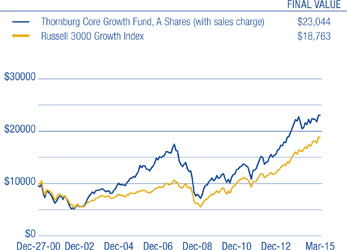
Performance data shown represents past performance and is no guarantee of future results. Investment return and principal value will fluctuate so shares, when redeemed, may be worth more or less than their original cost. Current performance may be lower or higher than quoted. For performance current to the most recent month end, visit thornburg.com or call 800-847-0200. The performance information does not reflect the deduction of taxes that a shareholder would pay on distributions or the redemption of Fund shares. Returns reflect the reinvestment of dividends and capital gains. Class A shares are sold with a maximum sales charge of 4.50%. Class C shares are subject to a 1% CDSC for the first year only. There is no sales charge for Class I, R3, R4, and R5 shares.
As disclosed in the most recent prospectus, the total annual fund operating expenses are as follows: A shares, 1.40%; C shares, 2.14%; I shares, 1.03%; R3 shares, 1.80%; R4 shares, 1.77%; R5 shares, 1.28%. Thornburg Investment Management and/or Thornburg Securities Corporation have contractually agreed to waive fees and reimburse expenses through at least February 1, 2016, for some of the share classes, resulting in net expense ratios of the following: I shares, 0.99%; R3 shares, 1.50%; R4 shares, 1.40%; R5 shares, 0.99%. For more detailed information on fund expenses and waivers/reimbursements please see the Fund’s prospectus.
Glossary
Russell 3000 Growth Index (Russell 3K G) – An unmanaged index comprised of those Russell 3000 companies with higher price-to-book ratios and higher forecasted growth values.
Unless otherwise noted, index returns reflect the reinvestment of income dividends and capital gains, if any, but do not reflect fees, brokerage commissions or other expenses of investing. Investors may not make direct investments into any index. The performance of any index is not indicative of the performance of any particular investment.
Short Selling – The sale of a security that is not owned by the seller, or that the seller has borrowed. Short sellers believe that a security’s price will decline, enabling it to be bought back at a lower price to make a profit. Short selling may be prompted by speculation, or by the desire to hedge the downside risk of a long position in the same security or a related one. Since the risk of loss on a short sale is theoretically infinite, short selling should only be used by experienced traders who are familiar with its risks.
Razor Blade Model – Refers to any business practice in which a company offers a onetime product, usually at little or no cost, that is complemented by another product for which the consumer is required to make repeated purchases.
6 Semi-Annual Report
| | |
| FUND SUMMARY | | |
| |
Thornburg Core Growth Fund | | March 31, 2015 (Unaudited) |
OBJECTIVES AND STRATEGIES
The Fund seeks long-term growth of capital by investing in equity securities selected for their growth potential.
The Fund expects to invest primarily in domestic equity securities (primarily common stocks) selected for their growth potential. However, the Fund may own a variety of securities, including foreign equity securities, partnership interests, and domestic and foreign debt obligations. The Fund may also invest in developing countries.
Market Capitalization Exposure
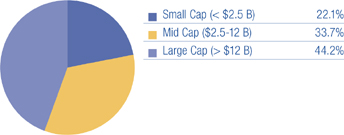
Basket Structure
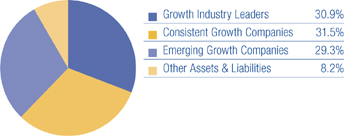
Top Ten Equity Holdings
| | | | |
Google, Inc. | | | 2.9 | % |
Amazon.com, Inc. | | | 2.8 | % |
Affiliated Managers Group, Inc. | | | 2.8 | % |
Nielsen Holdings N.V. | | | 2.8 | % |
Solera Holdings, Inc. | | | 2.8 | % |
Zillow, Inc. | | | 2.7 | % |
Visa, Inc. | | | 2.7 | % |
LKQ Corp. | | | 2.6 | % |
Charles Schwab Corp. | | | 2.5 | % |
Vantiv, Inc. | | | 2.3 | % |
There is no guarantee that the Fund will meet its investment objectives.
All portfolio information is subject to change. Charts may not add up to 100% due to rounding.
Sector Exposure
| | | | |
Information Technology | | | 31.4 | % |
Consumer Discretionary | | | 15.8 | % |
Industrials | | | 14.2 | % |
Health Care | | | 14.2 | % |
Financials | | | 10.7 | % |
Consumer Staples | | | 3.5 | % |
Energy | | | 2.0 | % |
Other Assets & Liabilities | | | 8.2 | % |
Top Ten Industry Groups
| | | | |
Software & Services | | | 27.7 | % |
Diversified Financials | | | 10.7 | % |
Commercial & Professional Services | | | 10.6 | % |
Pharmaceuticals, Biotechnology & Life Sciences | | | 9.8 | % |
Retailing | | | 9.3 | % |
Health Care Equipment & Services | | | 4.4 | % |
Consumer Services | | | 3.8 | % |
Technology Hardware & Equipment | | | 3.8 | % |
Capital Goods | | | 3.6 | % |
Energy | | | 2.0 | % |
Country Exposure*
(percent of equity holdings)
| | | | |
United States | | | 90.1 | % |
Ireland | | | 6.6 | % |
United Kingdom | | | 2.2 | % |
Canada | | | 1.1 | % |
| * | The country assignment of each equity holding is determined by the Fund’s Advisor based on various factors, including the location of the issuer’s head office, the issuer’s jurisdiction of incorporation and the country from which a majority of the issuer’s revenue is derived. |
Semi-Annual Report 7
| | |
| SCHEDULE OF INVESTMENTS | | |
| |
Thornburg Core Growth Fund | | March 31, 2015 (Unaudited) |
| | | | | | | | |
| | | Shares/ | | | | |
| | | Principal Amount | | | Value | |
COMMON STOCK — 91.80% | | | | | | | | |
| | |
AUTOMOBILES & COMPONENTS — 1.34% | | | | | | | | |
Auto Components — 1.34% | | | | | | | | |
Gentex Corp. | | | 651,079 | | | $ | 11,914,746 | |
| | | | | | | | |
| | | | | | | 11,914,746 | |
| | | | | | | | |
CAPITAL GOODS — 3.64% | | | | | | | | |
Electrical Equipment — 1.82% | | | | | | | | |
Acuity Brands, Inc. | | | 96,435 | | | | 16,216,510 | |
| | |
Machinery — 1.82% | | | | | | | | |
a Proto Labs, Inc. | | | 232,841 | | | | 16,298,870 | |
| | | | | | | | |
| | | | | | | 32,515,380 | |
| | | | | | | | |
COMMERCIAL & PROFESSIONAL SERVICES — 10.54% | | | | | | | | |
Commercial Services & Supplies — 1.56% | | | | | | | | |
a Stericycle, Inc. | | | 99,209 | | | | 13,931,920 | |
| | |
Professional Services — 8.98% | | | | | | | | |
Experian plc | | | 1,093,219 | | | | 18,114,178 | |
Nielsen Holdings N.V. | | | 565,008 | | | | 25,182,406 | |
a The Advisory Board Co. | | | 356,581 | | | | 18,998,636 | |
a Verisk Analytics, Inc. | | | 249,871 | | | | 17,840,789 | |
| | | | | | | | |
| | | | | | | 94,067,929 | |
| | | | | | | | |
CONSUMER SERVICES — 3.83% | | | | | | | | |
Diversified Consumer Services — 1.76% | | | | | | | | |
a LifeLock, Inc. | | | 1,113,730 | | | | 15,714,730 | |
| | |
Hotels, Restaurants & Leisure — 2.07% | | | | | | | | |
Las Vegas Sands Corp. | | | 336,033 | | | | 18,495,257 | |
| | | | | | | | |
| | | | | | | 34,209,987 | |
| | | | | | | | |
DIVERSIFIED FINANCIALS — 10.71% | | | | | | | | |
Capital Markets — 6.67% | | | | | | | | |
a Affiliated Managers Group, Inc. | | | 117,278 | | | | 25,188,969 | |
Charles Schwab Corp. | | | 734,978 | | | | 22,372,730 | |
WisdomTree Investments, Inc. | | | 560,318 | | | | 12,024,424 | |
| | |
Consumer Finance — 4.04% | | | | | | | | |
American Express Co. | | | 223,700 | | | | 17,475,444 | |
Cash America International, Inc. | | | 797,737 | | | | 18,587,272 | |
| | | | | | | | |
| | | | | | | 95,648,839 | |
| | | | | | | | |
ENERGY — 2.03% | | | | | | | | |
Energy Equipment & Services — 1.00% | | | | | | | | |
Helmerich & Payne, Inc. | | | 131,275 | | | | 8,935,889 | |
| | |
Oil, Gas & Consumable Fuels — 1.03% | | | | | | | | |
a Concho Resources, Inc. | | | 79,062 | | | | 9,164,867 | |
| | | | | | | | |
| | | | | | | 18,100,756 | |
| | | | | | | | |
FOOD & STAPLES RETAILING — 1.55% | | | | | | | | |
Food & Staples Retailing — 1.55% | | | | | | | | |
a Diplomat Pharmacy, Inc. | | | 94,540 | | | | 3,269,193 | |
a Sprouts Farmers Market, Inc. | | | 298,732 | | | | 10,524,328 | |
| | | | | | | | |
| | | | | | | 13,793,521 | |
| | | | | | | | |
FOOD, BEVERAGE & TOBACCO — 1.94% | | | | | | | | |
Beverages — 1.94% | | | | | | | | |
a Monster Beverage Corp. | | | 125,174 | | | | 17,323,456 | |
| | | | | | | | |
| | | | | | | 17,323,456 | |
| | | | | | | | |
HEALTH CARE EQUIPMENT & SERVICES — 4.36% | | | | | | | | |
Health Care Equipment & Supplies — 3.30% | | | | | | | | |
a Cardiovascular Systems, Inc. | | | 299,900 | | | | 11,708,096 | |
a Inogen, Inc. | | | 279,971 | | | | 8,956,272 | |
a Novadaq Technologies, Inc. | | | 540,519 | | | | 8,778,029 | |
| | |
Health Care Technology — 1.06% | | | | | | | | |
a Inovalon Holdings, Inc. | | | 313,000 | | | | 9,455,730 | |
| | | | | | | | |
| | | | | | | 38,898,127 | |
| | | | | | | | |
MEDIA — 1.30% | | | | | | | | |
Media — 1.30% | | | | | | | | |
a Sirius XM Holdings, Inc. | | | 3,046,300 | | | | 11,636,866 | |
| | | | | | | | |
| | | | | | | 11,636,866 | |
| | | | | | | | |
PHARMACEUTICALS, BIOTECHNOLOGY & LIFE SCIENCES — 9.81% | | | | | | | | |
Biotechnology — 5.85% | | | | | | | | |
a Alexion Pharmaceuticals, Inc. | | | 118,850 | | | | 20,596,705 | |
8 Semi-Annual Report
| | |
| SCHEDULE OF INVESTMENTS, CONTINUED | | |
| |
Thornburg Core Growth Fund | | March 31, 2015 (Unaudited) |
| | | | | | | | |
| | | Shares/ | | | | |
| | | Principal Amount | | | Value | |
a Biogen Idec, Inc. | | | 42,695 | | | $ | 18,027,537 | |
a Gilead Sciences, Inc. | | | 138,675 | | | | 13,608,178 | |
| | |
Pharmaceuticals — 3.96% | | | | | | | | |
a Actavis plc | | | 59,693 | | | | 17,765,830 | |
Perrigo Co. plc | | | 106,414 | | | | 17,616,838 | |
| | | | | | | | |
| | | | | | | 87,615,088 | |
| | | | | | | | |
RETAILING — 9.31% | | | | | | | | |
Distributors — 2.64% | | | | | | | | |
a LKQ Corp. | | | 922,571 | | | | 23,580,915 | |
| | |
Internet & Catalog Retail — 4.72% | | | | | | | | |
a Amazon.com, Inc. | | | 68,355 | | | | 25,434,895 | |
a priceline.com, Inc. | | | 14,352 | | | | 16,707,881 | |
| | |
Specialty Retail — 1.95% | | | | | | | | |
a Container Store Group, Inc. | | | 224,241 | | | | 4,271,791 | |
a Five Below, Inc. | | | 369,565 | | | | 13,145,427 | |
| | | | | | | | |
| | | | | | | 83,140,909 | |
| | | | | | | | |
SOFTWARE & SERVICES — 27.70% | | | | | | | | |
Information Technology Services — 5.05% | | | | | | | | |
a Vantiv, Inc. | | | 551,963 | | | | 20,809,005 | |
Visa, Inc. | | | 371,728 | | | | 24,314,729 | |
| | |
Internet Software & Services — 13.25% | | | | | | | | |
a Facebook, Inc. | | | 173,500 | | | | 14,264,303 | |
a Google, Inc. Class A | | | 19,376 | | | | 10,747,867 | |
a Google, Inc. Class C | | | 26,822 | | | | 14,698,456 | |
a LinkedIn Corp. | | | 54,198 | | | | 13,541,912 | |
a Shutterstock, Inc. | | | 252,323 | | | | 17,327,021 | |
a Web.com Group, Inc. | | | 371,520 | | | | 7,040,304 | |
a Yelp, Inc. | | | 343,268 | | | | 16,253,740 | |
a Zillow, Inc. | | | 243,178 | | | | 24,390,753 | |
| | |
Software — 9.40% | | | | | | | | |
a ANSYS, Inc. | | | 159,000 | | | | 14,022,210 | |
a Fleetmatics Group plc | | | 422,579 | | | | 18,952,668 | |
Solera Holdings, Inc. | | | 479,272 | | | | 24,759,191 | |
a Splunk, Inc. | | | 149,531 | | | | 8,852,235 | |
a Workday, Inc. | | | 205,294 | | | | 17,328,867 | |
| | | | | | | | |
| | | | | | | 247,303,261 | |
| | | | | | | | |
TECHNOLOGY HARDWARE & EQUIPMENT — 3.74% | | | | | | | | |
Communications Equipment — 2.67% | | | | | | | | |
a CalAmp Corp. | | | 537,984 | | | | 8,709,961 | |
Qualcomm, Inc. | | | 218,655 | | | | 15,161,538 | |
| | |
Electronic Equipment, Instruments & Components — 1.07% | | | | | | | | |
a IPG Photonics Corp. | | | 102,849 | | | | 9,534,102 | |
| | | | | | | | |
| | | | | | | 33,405,601 | |
| | | | | | | | |
TOTAL COMMON STOCK (Cost $633,367,370) | | | | | | | 819,574,466 | |
| | | | | | | | |
| | |
SHORT TERM INVESTMENTS — 6.83% | | | | | | | | |
Bank of New York Tri-Party Repurchase Agreement 0.23% dated 3/31/2015 due 4/1/2015, repurchase price $12,000,077 collateralized by 2 U.S. Government debt securities and 14 corporate debt securities, having an average coupon of 3.90%, a minimum credit rating of BBB-, maturity dates from 4/1/2015 to 3/1/2045, and having an aggregate market value of $12,661,260 at 3/31/2015 | | | $12,000,000 | | | | 12,000,000 | |
Eversource Energy, 0.48%, 4/7/2015 | | | 13,000,000 | | | | 12,998,960 | |
J.M. Smucker Co., 0.40%, 4/1/2015 | | | 13,000,000 | | | | 13,000,000 | |
Kansas City Power & Light Co., 0.50%, 4/6/2015 | | | 13,000,000 | | | | 12,999,097 | |
Marriott International, Inc., 0.30%, 4/1/2015 | | | 10,000,000 | | | | 10,000,000 | |
| | | | | | | | |
TOTAL SHORT TERM INVESTMENTS (Cost $60,998,057) | | | | | | | 60,998,057 | |
| | | | | | | | |
TOTAL INVESTMENTS — 98.63% (Cost $694,365,427) | | | $ | 880,572,523 | |
OTHER ASSETS LESS LIABILITIES — 1.37% | | | | 12,267,838 | |
| | | | | | | | |
NET ASSETS — 100.00% | | | $ | 892,840,361 | |
| | | | | | | | |
Footnote Legend
See notes to financial statements.
Semi-Annual Report 9
| | |
| STATEMENT OF ASSETS AND LIABILITIES | | |
| |
Thornburg Core Growth Fund | | March 31, 2015 (Unaudited) |
| | | | |
ASSETS | | | | |
Investments at value (cost $694,365,427) (Note 2) | | $ | 880,572,523 | |
Cash | | | 856,445 | |
Receivable for investments sold | | | 26,995,752 | |
Receivable for fund shares sold | | | 522,970 | |
Dividends receivable | | | 58,162 | |
Interest receivable | | | 77 | |
Prepaid expenses and other assets | | | 48,393 | |
| | | | |
Total Assets | | | 909,054,322 | |
| | | | |
| |
LIABILITIES | | | | |
Payable for investments purchased | | | 13,577,521 | |
Payable for fund shares redeemed | | | 1,465,474 | |
Payable to investment advisor and other affiliates (Note 3) | | | 947,954 | |
Accounts payable and accrued expenses | | | 223,012 | |
| | | | |
Total Liabilities | | | 16,213,961 | |
| | | | |
| |
NET ASSETS | | $ | 892,840,361 | |
| | | | |
NET ASSETS CONSIST OF | | | | |
Net investment loss | | $ | (12,161,930 | ) |
Net unrealized appreciation on investments | | | 186,207,096 | |
Accumulated net realized gain (loss) | | | (284,912,763 | ) |
Net capital paid in on shares of beneficial interest | | | 1,003,707,958 | |
| | | | |
| | $ | 892,840,361 | |
| | | | |
10 Semi-Annual Report
| | |
| STATEMENT OF ASSETS AND LIABILITIES, CONTINUED |
| |
Thornburg Core Growth Fund | | March 31, 2015 (Unaudited) |
| | | | |
NET ASSET VALUE | | | | |
Class A Shares: | | | | |
Net asset value and redemption price per share ($272,007,602 applicable to 9,604,212 shares of beneficial interest outstanding - Note 4) | | $ | 28.32 | |
Maximum sales charge, 4.50% of offering price | | | 1.33 | |
| | | | |
Maximum offering price per share | | $ | 29.65 | |
| | | | |
| |
Class C Shares: | | | | |
Net asset value and offering price per share* ($202,210,592 applicable to 7,998,473 shares of beneficial interest outstanding - Note 4) | | $ | 25.28 | |
| | | | |
| |
Class I Shares: | | | | |
Net asset value, offering and redemption price per share ($264,332,299 applicable to 8,827,442 shares of beneficial interest outstanding - Note 4) | | $ | 29.94 | |
| | | | |
| |
Class R3 Shares: | | | | |
Net asset value, offering and redemption price per share ($85,847,067 applicable to 3,038,433 shares of beneficial interest outstanding - Note 4) | | $ | 28.25 | |
| | | | |
| |
Class R4 Shares: | | | | |
Net asset value, offering and redemption price per share ($10,525,645 applicable to 370,178 shares of beneficial interest outstanding - Note 4) | | $ | 28.43 | |
| | | | |
| |
Class R5 Shares: | | | | |
Net asset value, offering and redemption price per share ($57,917,156 applicable to 1,936,208 shares of beneficial interest outstanding - Note 4) | | $ | 29.91 | |
| | | | |
| * | Redemption price per share is equal to net asset value less any applicable contingent deferred sales charge. |
See notes to financial statements.
Semi-Annual Report 11
| | |
| STATEMENT OF OPERATIONS | | |
| |
Thornburg Core Growth Fund | | Six Months Ended March 31, 2015 (Unaudited) |
| | | | |
INVESTMENT INCOME | | | | |
Dividend income (net of foreign taxes withheld of $15,139) | | $ | 1,677,683 | |
Interest income | | | 122,792 | |
| | | | |
Total Income | | | 1,800,475 | |
| | | | |
| |
EXPENSES | | | | |
Investment advisory fees (Note 3) | | | 3,795,236 | |
Administration fees (Note 3) | | | | |
Class A Shares | | | 170,138 | |
Class C Shares | | | 125,579 | |
Class I Shares | | | 64,548 | |
Class R3 Shares | | | 55,065 | |
Class R4 Shares | | | 6,784 | |
Class R5 Shares | | | 14,885 | |
Distribution and service fees (Note 3) | | | | |
Class A Shares | | | 339,806 | |
Class C Shares | | | 1,005,070 | |
Class R3 Shares | | | 219,698 | |
Class R4 Shares | | | 13,472 | |
Transfer agent fees | | | | |
Class A Shares | | | 160,865 | |
Class C Shares | | | 103,752 | |
Class I Shares | | | 104,820 | |
Class R3 Shares | | | 93,493 | |
Class R4 Shares | | | 16,217 | |
Class R5 Shares | | | 77,566 | |
Registration and filing fees | | | | |
Class A Shares | | | 1,820 | |
Class C Shares | | | 10,167 | |
Class I Shares | | | 14,271 | |
Class R3 Shares | | | 10,998 | |
Class R4 Shares | | | 10,074 | |
Class R5 Shares | | | 9,637 | |
Custodian fees (Note 3) | | | 60,215 | |
Professional fees | | | 18,852 | |
Accounting fees | | | 16,287 | |
Trustee fees | | | 19,086 | |
Other expenses | | | 57,133 | |
| | | | |
Total Expenses | | | 6,595,534 | |
Less: | | | | |
Expenses reimbursed by investment advisor (Note 3) | | | (259,400 | ) |
Fees paid indirectly (Note 3) | | | (335 | ) |
| | | | |
Net Expenses | | | 6,335,799 | |
| | | | |
Net Investment Loss | | $ | (4,535,324 | ) |
| | | | |
12 Semi-Annual Report
| | |
| STATEMENT OF OPERATIONS, CONTINUED | | |
| |
Thornburg Core Growth Fund | | Six Months Ended March 31, 2015 (Unaudited) |
| | | | |
REALIZED AND UNREALIZED GAIN (LOSS) | | | | |
Net realized gain (loss) from: | | | | |
Investments | | $ | 47,643,776 | |
Foreign currency transactions | | | (5,022 | ) |
| | | | |
| | | 47,638,754 | |
| | | | |
Net change in unrealized appreciation (depreciation) on: | | | | |
Investments | | | 18,314,783 | |
| | | | |
Net Realized and Unrealized Gain | | | 65,953,537 | |
| | | | |
Net Increase in Net Assets Resulting from Operations | | $ | 61,418,213 | |
| | | | |
See notes to financial statements.
Semi-Annual Report 13
| | |
| STATEMENTS OF CHANGES IN NET ASSETS | | |
| |
Thornburg Core Growth Fund | | |
| | | | | | | | |
| | | Six Months Ended | | | Year Ended | |
| | | March 31, 2015* | | | September 30, 2014 | |
INCREASE (DECREASE) IN NET ASSETS FROM | | | | | | | | |
| | |
OPERATIONS | | | | | | | | |
Net investment loss | | $ | (4,535,324 | ) | | $ | (10,129,703 | ) |
Net realized gain (loss) from investments and foreign currency transactions | | | 47,638,754 | | | | 140,640,435 | |
Net unrealized appreciation (depreciation) on investments | | | 18,314,783 | | | | (63,137,038 | ) |
| | | | | | | | |
Net Increase (Decrease) in Net Assets Resulting from Operations | | | 61,418,213 | | | | 67,373,694 | |
| | |
FUND SHARE TRANSACTIONS (NOTE 4) | | | | | | | | |
Class A Shares | | | (23,891,200 | ) | | | (25,983,897 | ) |
Class C Shares | | | (11,585,287 | ) | | | 3,863,171 | |
Class I Shares | | | (5,321,410 | ) | | | 43,839,713 | |
Class R3 Shares | | | (10,879,035 | ) | | | (12,906,695 | ) |
Class R4 Shares | | | (1,515,965 | ) | | | 71,357 | |
Class R5 Shares | | | (8,182,027 | ) | | | (5,268,662 | ) |
| | | | | | | | |
Net Increase in Net Assets | | | 43,289 | | | | 70,988,681 | |
| | |
NET ASSETS | | | | | | | | |
Beginning of Period | | | 892,797,072 | | | | 821,808,391 | |
| | | | | | | | |
| | |
End of Period | | $ | 892,840,361 | | | $ | 892,797,072 | |
| | | | | | | | |
See notes to financial statements.
14 Semi-Annual Report
| | |
| NOTES TO FINANCIAL STATEMENTS | | |
| |
Thornburg Core Growth Fund | | March 31, 2015 (Unaudited) |
NOTE 1 – ORGANIZATION
Thornburg Core Growth Fund, hereinafter referred to as (the “Fund)” is a diversified series of Thornburg Investment Trust (the “Trust”). The Trust was organized as a Massachusetts business trust under a Declaration of Trust dated June 3, 1987 and is registered as a diversified, open-end management investment company under the Investment Company Act of 1940, as amended. The Fund is currently one of eighteen separate series of the Trust. Each series is considered to be a separate entity for financial reporting and tax purposes and bears expenses directly attributable to it. The Fund seeks long-term capital appreciation by investing in equity securities selected for their growth potential.
The Fund currently offers six classes of shares of beneficial interest: Class A, Class C, Institutional Class (“Class I”), and Retirement Classes (“Class R3,” “Class R4,” and “Class R5”). Each class of shares of the Fund represents an interest in the same portfolio of investments, except that (i) Class A shares are sold subject to a front-end sales charge collected at the time the shares are purchased and bear a service fee, (ii) Class C shares are sold at net asset value without a sales charge at the time of purchase, but are subject to a contingent deferred sales charge upon redemption within one year of purchase, and bear both a service fee and a distribution fee, (iii) Class I shares are sold at net asset value without a sales charge at the time of purchase and may be subject to a service fee, (iv) Class R3 shares are sold at net asset value without a sales charge at the time of purchase, but bear both a service fee and distribution fee, (v) Class R4 shares are sold at net asset value without sales charge at the time of purchase, but bear a service fee, (vi) Class R5 shares are sold at net asset value without a sales charge at the time of purchase and may bear a service fee, and (vii) the respective classes may have different reinvestment privileges and conversion rights. Additionally, the Fund may allocate among its classes certain expenses, to the extent allocable to specific classes, including transfer agent fees, government registration fees, certain printing and postage costs, and administrative and legal expenses. Currently, class specific expenses of the Fund are limited to service and distribution fees, administration fees, and certain registration and transfer agent expenses.
NOTE 2 – SIGNIFICANT ACCOUNTING POLICIES
The following is a summary of significant accounting policies followed by the Fund in the preparation of its financial statements. The Fund is an investment company and prepares its financial statements in conformity with U.S. generally accepted accounting principles (“GAAP”), including the investment company accounting and reporting guidance in the Financial Accounting Standards Board (the “FASB”) Accounting Standard Codification Topic 946. The preparation of financial statements in conformity with GAAP requires management to make estimates and assumptions that affect the reported amounts of assets and liabilities and disclosure of contingent assets and liabilities at the date of the financial statements and the reported amounts of increases (decreases) in net assets from operations during the reporting period. Actual results could differ from those estimates.
Significant accounting policies of the Fund are as follows:
Valuation Policy and Procedures: The Trustees of the Trust (the “Trustees”) have authorized employees of the Fund’s investment advisor, acting as the Valuation and Pricing Committee (the “Committee”), to make certain valuation determinations, subject to oversight and review by the Trustees and the Audit Committee of the Trustees. The Committee and other employees of the Fund’s investment advisor administer and implement the valuation process. The Committee regularly reviews its own fair value decisions, as well as valuations, valuation techniques and services furnished by pricing services, considers circumstances in the markets which may require valuation determinations by the Committee and reviews previous valuation determinations. The Committee also reports on its activities, the performance of the pricing services and other matters to the Trustees and the Audit Committee of the Trustees.
In determining a fair value for a portfolio investment, the Committee seeks to determine the price that the Fund would reasonably expect to receive upon a sale of the investment in an orderly transaction between market participants at the measurement date. Typically, the fair value process employs standing instructions to use quoted prices in active markets or the use of independent pricing services. Less frequently, the Committee may make a fair value determination using other methods. However, because fair value prices are estimated prices, the determination of fair value for an investment may differ from the value that would be realized by the Fund upon a sale of the investment, and that difference could be material to the Fund’s financial statements. The Committee’s determination of fair value for an investment may also differ from the prices obtained by other persons (including other mutual funds) for the investment.
Valuation of Investments: Portfolio investments listed or traded on a national securities exchange are valued on the valuation date at the last reported trade price on the exchange that is the primary market for the investment. Portfolio investments reported by NASDAQ are valued at the NASDAQ official closing price. Portfolio investments traded on an exchange for which there has been no trade that day and other equity investments traded in the over-the-counter market are valued at the mean between the last reported bid and ask prices. Any foreign investment traded on exchanges outside the United States is valued at the price of the investment on the exchange that is normally the investment’s primary market, as of the close of that exchange preceding the time of the Fund’s valuation measurement date.
In any case when the market value of an equity investment held by the Fund is not readily available, a determination of a fair value for the investment is made by the Committee. The Committee’s determinations are made using procedures in accordance with a policy
Semi-Annual Report 15
| | |
| NOTES TO FINANCIAL STATEMENTS, CONTINUED | | |
| |
Thornburg Core Growth Fund | | March 31, 2015 (Unaudited) |
approved by the Trustees, which may include the use of a price obtained from an independent pricing service. The pricing service ordinarily values equity investments in these instances using multi-factor models to adjust market prices based upon various inputs, including exchange data, depositary receipt prices, futures, index data and other data. An investment’s market value is deemed not readily available whenever the exchange or market on which the investment is primarily traded is closed for the entire scheduled day of trading. Additionally, an investment’s market value may be deemed not readily available under other circumstances identified by the Trustees, including when developments occurring after the most recent close of the investment’s primary exchange or market, but before the most recent close of trading in Fund shares, or an unusual event or significant period of time occurring since the availability of a market quotation, create a question about the reliability of the investment’s market value. For example, on days when market volatility thresholds pre-determined by the Trustees are exceeded, foreign equity investments held by the Fund may be valued using synthetic pricing obtained from an independent pricing service approved by the Trustees, subject to the ability of the Committee to determine in any such instance to utilize market closing prices if the Committee considers closing prices to be more reliable.
Debt obligations held by the Fund have a primary over-the-counter market and are valued by an independent pricing service approved by the Trustees. The pricing service ordinarily values debt obligations using quoted bid prices and other methods, which include consideration of yields or prices of debt obligations of comparable quality, type of issue, coupon, maturity and rating, and indications as to value from dealers and general market conditions.
In any case when a pricing service fails to provide a price for a debt obligation held by the Fund, the Committee determines a fair value for the debt obligation using procedures in accordance with a policy approved by the Trustees, which may include the use of a price obtained from a different independent pricing service. Additionally, in any case when management believes that a price provided by a pricing service for a debt obligation held by the Fund may be unreliable, the Committee decides whether or not to use the pricing service’s valuation or to use an alternative method to determine a fair value for the debt obligation.
Quotations in foreign currencies for foreign portfolio investments are converted to U.S. dollar equivalents using the foreign exchange quotation in effect at the time of valuation.
Valuation Measurements: The Fund categorizes its investments based upon the inputs used in valuing those investments, according to a three-level hierarchy established by guidance from the FASB. Categorization of investments using this hierarchy is intended by the FASB to maximize the use of observable inputs and minimize the use of unobservable inputs by prioritizing that the most observable input be used when available. Observable inputs are those that market participants would use in valuing an investment based on available market data. Unobservable inputs are those that reflect assumptions about the information market participants would use in valuing an investment. An investment’s level within the hierarchy is based on the lowest level input that is deemed significant to the fair value measurement. The methodologies and relative inputs used to value investments are not necessarily indications of the risk or liquidity associated with investing in those investments.
Various inputs are used in determining the fair value measurement of the Fund’s investments. These inputs are generally summarized according to the three-level hierarchy below:
Level 1: Quoted prices in active markets for identical investments.
Level 2: Other direct or indirect significant observable inputs (including quoted prices for similar investments in active markets and other observable inputs, such as interest rates, prepayment rates, credit risk, etc.).
When market volatility thresholds are exceeded, foreign equity investments may be fair valued according to other significant observable inputs rather than quoted market prices. The affected investments will be characterized as Level 2 within the valuation hierarchy and revert to Level 1 after the threshold is no longer exceeded.
Level 3: Significant unobservable inputs (including the Committee’s own assumptions in determining the fair value of investments).
Portfolio investments with minimal, if any, market activity are characterized as Level 3 and are valued using significant unobservable inputs, typically including single broker quotes, which may be adjusted or unadjusted, related or comparable investments, last available transactions, and other relevant information. Valuations may also be based upon current market prices of securities that are comparable in coupon, rating, maturity and industry. An income based valuation approach would consider discounted anticipated future cash flows of the investment. Discounts may also be applied due to the nature or duration of any restrictions on the disposition of the investment. Valuations based upon the use of inputs from Levels 1, 2, or 3, may not represent the actual price received upon the disposition of an investment, and the Fund may receive a price that is lower than the valuation when it sells the investment.
The following table displays a summary of the fair value hierarchy measurements of the Fund’s investments as of March 31, 2015. In any instance when valuation inputs from more than one level are used to determine the fair value of a specific investment, the investment is placed in the level of the table based upon the lowest level input that is significant in determining the fair value of the investment:
16 Semi-Annual Report
| | |
| NOTES TO FINANCIAL STATEMENTS, CONTINUED | | |
| |
Thornburg Core Growth Fund | | March 31, 2015 (Unaudited) |
| | | | | | | | | | | | | | | | |
| | | Fair Value Measurements at March 31, 2015 | |
| | | Total | | | Level 1 | | | Level 2 | | | Level 3 | |
Assets | | | | | | | | | | | | | | | | |
Investments in Securities* | | | | | | | | | | | | | | | | |
Common Stock | | $ | 819,574,466 | | | $ | 819,574,466 | | | $ | — | | | $ | — | |
Short Term Investments | | | 60,998,057 | | | | — | | | | 60,998,057 | | | | — | |
Total Investments in Securities | | $ | 880,572,523 | | | $ | 819,574,466 | | | $ | 60,998,057 | | | $ | — | |
| * | See Schedule of Investments for a summary of the industry exposure as grouped according to the Global Industry Classification Standard (GICS), which is an industry taxonomy developed by MSCI, Inc. and Standard & Poor’s (S&P). |
In accordance with the guidance prescribed in Accounting Standards Update No. 2011-04, it is the policy of the Fund to recognize transfers between levels and the underlying events which caused the movement. The Fund recognized no transfers between levels for the six months ended March 31, 2015, other than when the Fund exceeded market volatility thresholds for foreign equity investments during the period.
Foreign Currency Translation: Portfolio investments and other assets and liabilities denominated in foreign currencies are translated into U.S. dollars based on the exchange rate of such currencies against the U.S. dollar on the date of valuation. Purchases and sales of investments and income items denominated in foreign currencies are translated into U.S. dollars at the exchange rate in effect on the transaction date. When the Fund purchases or sells foreign investments, it will customarily enter into a foreign exchange contract to minimize foreign exchange risk from the trade date to the settlement date of such transactions. The values of such spot contracts are included in receivable for investments sold and payable for investments purchased on the Statement of Assets and Liabilities.
The Fund does not separately report the effect of changes in foreign exchange rates from changes in market prices on investments held. Such changes are included in net unrealized appreciation or depreciation from investments.
Reported net realized gains or losses from foreign currency transactions arise due to purchases and sales of foreign currencies, currency gains or losses realized between the trade and settlement dates on investment transactions and the difference between the amounts of dividends, interest, and foreign withholding taxes recorded on the Fund’s books, and the U.S. dollar equivalent of the amounts actually received or paid.
Net change in unrealized appreciation and depreciation on foreign currency translations arise from changes in the fair value of assets and liabilities, other than investments at fiscal period end, resulting from changes in exchange rates.
Foreign Withholding Taxes: The Fund is subject to foreign tax withholding imposed by certain foreign countries in which the Fund may invest. Withholding taxes are incurred on certain foreign dividends and are accrued at the time the dividend is recognized based on applicable foreign tax laws. The Fund files withholding tax reclaims in certain jurisdictions to recover a portion of amounts previously withheld based on applicable laws and regulations, and industry convention.
Deferred Foreign Capital Gain Taxes: The Fund is subject to a tax imposed on net realized gains of securities of certain foreign countries. The Fund records an estimated deferred tax liability for net unrealized gains on these investments as reflected in the accompanying financial statements.
Federal Income Taxes: It is the policy of the Trust to comply with the provisions of the Internal Revenue Code applicable to “regulated investment companies” and to distribute to shareholders substantially all taxable income, including any net realized gain on investments of the Fund. Therefore, no provision for federal income taxes is required.
Management reviews each uncertain tax position believed to be material to the preparation of the Fund’s financial statements, to assess if it is more likely than not that the position would be sustained upon examination, based upon the technical merits of the position. As of March 31, 2015, management has not identified any such position for which an asset or liability must be reflected in the Statement of Assets and Liabilities. The Fund’s tax returns remain subject to examination for three years after filing.
When-Issued and Delayed Delivery Transactions: The Fund may engage in when-issued or delayed delivery transactions. To the extent the Fund engages in such transactions, it will do so for the purpose of acquiring portfolio investments consistent with the Fund’s investment objectives and not for the purpose of investment leverage or to speculate on interest rate and/or market changes. At the time the Fund makes a commitment to purchase an investment on a when-issued or delayed delivery basis, the Fund will record the transaction and reflect the value in determining its net asset value. When effecting such transactions, assets of an amount sufficient to make payment for the portfolio investments to be purchased will be segregated on the Fund’s records on the trade date. Investments purchased on a when-issued or delayed delivery basis do not earn interest until the settlement date.
Dividends: Dividends to shareholders, if any, are generally paid quarterly and are reinvested in additional shares of the Fund at net asset value per share at the close of business on the dividend payment date or, at the shareholder’s option, paid in cash. Net realized capital
Semi-Annual Report 17
| | |
| NOTES TO FINANCIAL STATEMENTS, CONTINUED | | |
| |
Thornburg Core Growth Fund | | March 31, 2015 (Unaudited) |
gains, to the extent available, will be distributed at least annually. Distributions to shareholders are based on income tax regulations and therefore, their characteristics may differ for financial statement and tax purposes.
Repurchase Agreements: The Fund may invest excess cash in repurchase agreements whereby the Fund purchases investments, which serve as collateral, with an agreement to resell such collateral to the seller at an agreed upon price at the maturity date of the repurchase agreement. Investments pledged as collateral for repurchase agreements are held in custody until maturity of the repurchase agreement. Provisions in the agreements require that the market value of the collateral is at least equal to the repurchase value in the event of default. In the event of default, the Fund has the right to liquidate the collateral and apply the proceeds in satisfaction of the obligation. Under certain circumstances, in the event of default or bankruptcy by the other party to the agreement, realization and/or retention of the collateral may be subject to legal proceedings.
General: Investment transactions are accounted for on a trade date basis. Interest income is accrued as earned and dividend income is recorded on the ex-dividend date. Certain income from foreign investments is recognized as soon as information is available to the Fund. Realized gains and losses from the sale of investments are recorded on an identified cost basis. Net investment income (other than class specific expenses) and realized and unrealized gains and losses are allocated daily to each class of shares based upon the relative net asset value of outstanding shares of each class of shares at the beginning of the day (after adjusting for the current share activity of the respective class). Expenses common to all Funds are allocated among the Funds comprising the Trust based upon their relative net asset values or other appropriate allocation methods.
Guarantees and Indemnifications: Under the Trust’s organizational documents (and under separate agreements with the independent Trustees), its officers and Trustees are indemnified against certain liabilities arising out of the performance of their duties to the Fund. Additionally, in the normal course of business the Trust enters into contracts with service providers that contain general indemnification clauses. The Trust’s maximum exposure under these arrangements is unknown. However, based on experience, the Trust expects the risk of loss to be remote.
NOTE 3 – INVESTMENT ADVISORY FEE AND OTHER TRANSACTIONS WITH AFFILIATES
Pursuant to an investment advisory agreement, Thornburg Investment Management, Inc. (the “Advisor”) serves as the investment advisor and performs services for the Fund for which the fees are payable at the end of each month. For the six months ended March 31, 2015, these fees were payable at annual rates ranging from .875 of 1% to .675 of 1% per annum of the average daily net assets of the Fund depending on the Fund’s asset size. The Trust also has entered into administrative services agreements with the Advisor, whereby the Advisor will perform certain administrative services for the shareholders of each class of the Fund’s shares, and for which fees will be payable at an annual rate of up to .125 of 1% per annum of the average daily net assets attributable to each class of shares.
The Trust has an underwriting agreement with Thornburg Securities Corporation (the “Distributor,” an affiliate of the Advisor), which acts as the distributor of the Fund’s shares. For the six months ended March 31, 2015, the Distributor has advised the Fund that it earned commissions aggregating $11,939 from the sale of Class A shares, and collected contingent deferred sales charges aggregating $9,337 from redemptions of Class C shares of the Fund.
Pursuant to a service plan under Rule 12b-1 of the Investment Company Act of 1940, the Fund may reimburse to the Advisor an amount not to exceed .25 of 1% per annum of the average daily net assets attributable to each class of shares of the Fund for payments made by the Advisor to securities dealers and other financial institutions to obtain various shareholder and distribution related services. For the six months ended March 31, 2015, there were no 12b-1 service plan fees charged for Class I and R5 shares. The Advisor may pay out of its own resources additional expenses for distribution of the Fund’s shares and shareholder services.
The Trust has also adopted distribution plans pursuant to Rule 12b-1, applicable only to the Fund’s Class C and Class R3 shares, under which the Fund compensates the Distributor for services in promoting the sale of Class C and Class R3 shares of the Fund at an annual rate of up to .75 of 1% per annum of the average daily net assets attributable to Class C shares, and an annual rate of up to .25 of 1% per annum of the average daily net assets attributable to Class R3 shares. Total fees incurred by each class of shares of the Fund under their respective service and distribution plans for the six months ended March 31, 2015, are set forth in the Statement of Operations.
The Advisor and Distributor have contractually agreed to waive fees and reimburse expenses incurred by the Fund so that actual expenses of certain share classes do not exceed levels as specified in the Fund’s most recent prospectuses. The agreement may be terminated by the Fund at any time, but may not be terminated by the Advisor or Distributor before February 1, 2016, unless the Advisor ceases to be the investment advisor to the Fund or the Distributor ceases to be the distributor of the Fund prior to that date. The Advisor and Distributor retain the right to be repaid by the Fund for fee waivers and expense reimbursements if expenses fall below the contractual limit prior to the end of the fiscal year.
For the six months ended March 31, 2015, the Advisor contractually reimbursed certain class specific expenses, administrative fees, and distribution fees of $56,493 for Class I shares, $111,191 for Class R3 shares, $18,951 for Class R4 shares, and $72,765 for Class R5 shares.
18 Semi-Annual Report
| | |
| NOTES TO FINANCIAL STATEMENTS, CONTINUED | | |
| |
Thornburg Core Growth Fund | | March 31, 2015 (Unaudited) |
The Trust has an agreement with the custodian bank to indirectly pay a portion of the custodian’s fees through credits earned by the Fund’s cash on deposit with the bank. This deposit agreement is an alternative to overnight investments. Custodial fees are adjusted to reflect amounts that would have been paid without this agreement, with a corresponding adjustment reflected as fees paid indirectly in the Statement of Operations. For the six months ended March 31, 2015, fees paid indirectly were $335.
Certain officers and Trustees of the Trust are also officers or directors of the Advisor and Distributor. The compensation of independent Trustees is borne by the Trust.
NOTE 4 – SHARES OF BENEFICIAL INTEREST
At March 31, 2015, there were an unlimited number of shares with no par value of beneficial interest authorized. Transactions in shares of beneficial interest were as follows:
| | | | | | | | | | | | | | | | |
| | | Six Months Ended
March 31, 2015 (Unaudited) | | | Year Ended
September 30, 2014 (Audited) | |
| | | Shares | | | Amount | | | Shares | | | Amount | |
Class A Shares | | | | | | | | | | | | | | | | |
Shares sold | | | 307,968 | | | $ | 8,352,176 | | | | 2,726,720 | | | $ | 72,039,092 | |
Shares issued to shareholders in reinvestment of dividends | | | — | | | | — | | | | — | | | | — | |
Shares repurchased | | | (1,185,237 | ) | | | (32,243,376 | ) | | | (3,724,292 | ) | | | (98,022,989 | ) |
| | | | | | | | | | | | | | | | |
| | | | |
Net increase (decrease) | | | (877,269 | ) | | $ | (23,891,200 | ) | | | (997,572 | ) | | $ | (25,983,897 | ) |
| | | | | | | | | | | | | | | | |
| | | | |
Class C Shares | | | | | | | | | | | | | | | | |
Shares sold | | | 274,370 | | | $ | 6,647,994 | | | | 1,473,844 | | | $ | 35,295,012 | |
Shares issued to shareholders in reinvestment of dividends | | | — | | | | — | | | | — | | | | — | |
Shares repurchased | | | (747,455 | ) | | | (18,233,281 | ) | | | (1,329,377 | ) | | | (31,431,841 | ) |
| | | | | | | | | | | | | | | | |
| | | | |
Net increase (decrease) | | | (473,085 | ) | | $ | (11,585,287 | ) | | | 144,467 | | | $ | 3,863,171 | |
| | | | | | | | | | | | | | | | |
Class I Shares | | | | | | | | | | | | | | | | |
Shares sold | | | 1,052,030 | | | $ | 29,921,356 | | | | 4,103,740 | | | $ | 115,390,413 | |
Shares issued to shareholders in reinvestment of dividends | | | — | | | | — | | | | — | | | | — | |
Shares repurchased | | | (1,226,476 | ) | | | (35,242,766 | ) | | | (2,581,075 | ) | | | (71,550,700 | ) |
| | | | | | | | | | | | | | | | |
| | | | |
Net increase (decrease) | | | (174,446 | ) | | $ | (5,321,410 | ) | | | 1,522,665 | | | $ | 43,839,713 | |
| | | | | | | | | | | | | | | | |
| | | | |
Class R3 Shares | | | | | | | | | | | | | | | | |
Shares sold | | | 208,617 | | | $ | 5,676,680 | | | | 1,118,230 | | | $ | 29,400,891 | |
Shares issued to shareholders in reinvestment of dividends | | | — | | | | — | | | | — | | | | — | |
Shares repurchased | | | (610,618 | ) | | | (16,555,715 | ) | | | (1,605,481 | ) | | | (42,307,586 | ) |
| | | | | | | | | | | | | | | | |
| | | | |
Net increase (decrease) | | | (402,001 | ) | | $ | (10,879,035 | ) | | | (487,251 | ) | | $ | (12,906,695 | ) |
| | | | | | | | | | | | | | | | |
| | | | |
Class R4 Shares | | | | | | | | | | | | | | | | |
Shares sold | | | 75,829 | | | $ | 2,041,742 | | | | 206,135 | | | $ | 5,433,989 | |
Shares issued to shareholders in reinvestment of dividends | | | — | | | | — | | | | — | | | | — | |
Shares repurchased | | | (131,578 | ) | | | (3,557,707 | ) | | | (200,662 | ) | | | (5,362,632 | ) |
| | | | | | | | | | | | | | | | |
| | | | |
Net increase (decrease) | | | (55,749 | ) | | $ | (1,515,965 | ) | | | 5,473 | | | $ | 71,357 | |
| | | | | | | | | | | | | | | | |
| | | | |
Class R5 Shares | | | | | | | | | | | | | | | | |
Shares sold | | | 200,200 | | | $ | 5,715,758 | | | | 821,533 | | | $ | 22,904,484 | |
Shares issued to shareholders in reinvestment of dividends | | | — | | | | — | | | | — | | | | — | |
Shares repurchased | | | (482,308 | ) | | | (13,897,785 | ) | | | (1,034,831 | ) | | | (28,173,146 | ) |
| | | | | | | | | | | | | | | | |
| | | | |
Net increase (decrease) | | | (282,108 | ) | | $ | (8,182,027 | ) | | | (213,298 | ) | | $ | (5,268,662 | ) |
| | | | | | | | | | | | | | | | |
Semi-Annual Report 19
| | |
| NOTES TO FINANCIAL STATEMENTS, CONTINUED | | |
| |
Thornburg Core Growth Fund | | March 31, 2015 (Unaudited) |
NOTE 5 – INVESTMENT TRANSACTIONS
For the six months ended March 31, 2015, the Fund had purchase and sale transactions of investments (excluding short-term investments) of $410,378,935 and $468,549,329, respectively.
NOTE 6 – INCOME TAXES
At March 31, 2015, information on the tax components of capital was as follows:
| | | | |
Cost of investments for tax purposes | | $ | 694,365,427 | |
| | | | |
Gross unrealized appreciation on a tax basis | | $ | 203,197,989 | |
Gross unrealized depreciation on a tax basis | | | (16,990,893 | ) |
| | | | |
Net unrealized appreciation (depreciation) on investments (tax basis) | | $ | 186,207,096 | |
| | | | |
At March 31, 2015, the Fund had deferred tax basis late-year ordinary investment losses of $7,626,606. For tax purposes, such losses will be reflected in the year ending September 30, 2015.
At March 31, 2015, the Fund had cumulative tax basis capital losses generated prior to October 1, 2011, which may be carried forward to offset future capital gains. To the extent such carryforwards are used, capital gain distributions may be reduced to the extent provided by regulations.
Such capital loss carryforwards expire as follows:
| | | | |
2017 | | $ | 78,659,907 | |
2018 | | | 253,358,410 | |
| | | | |
| | $ | 332,018,317 | |
| | | | |
NOTE 7 – DERIVATIVE FINANCIAL INSTRUMENTS WITH OFF-BALANCE SHEET RISK AND FOREIGN INVESTMENT RISK
The Fund may use a variety of derivative financial instruments to hedge or adjust the risks affecting its investment portfolio or to enhance investment returns. Provisions of FASB Accounting Standards Codification ASC 815-10-50 (“ASC 815”), require certain disclosures. The disclosures are intended to provide users of financial statements with an understanding of the use of derivative instruments by the Fund and how these derivatives affect the financial position, financial performance and cash flows of the Fund. The Fund does not designate any derivative instruments as hedging instruments under ASC 815. Additionally, the Fund’s risk of loss may exceed the amounts recognized on the Statement of Assets and Liabilities.
During the six months ended March 31, 2015, the Fund did not invest in any derivative financial instruments of the type addressed by ASC 815.
OTHER NOTES
Risks: The Fund’s investments subject it to risks including, but not limited to, management risk, market and economic risk, risks affecting specific issuers, liquidity risk, the risks associated with investments in small- and mid-cap companies and non-U.S. issuers, credit risk, and interest rate risk. Please see the Fund’s prospectus for a discussion of the risks associated with an investment in the Fund.
Subsequent Events: Fund management believes no events have occurred between March 31, 2015 and the date of issuance of the financial statements that require adjustment to or disclosure in the accompanying financial statements.
20 Semi-Annual Report
This page intentionally left blank.
Semi-Annual Report 21
FINANCIAL HIGHLIGHTS
Thornburg Core Growth Fund
| | | | | | | | | | | | | | | | | | | | | | | | | | | | | | | | | | | | | | | | | | | | | | | | |
| | | PER SHARE PERFORMANCE (for a share outstanding throughout the Period)+ | | RATIOS TO AVERAGE NET ASSETS | | | SUPPLEMENTAL DATA | |
Unless Otherwise Noted,
Periods
are
Fiscal
Years Ended
Sept.
30, | | Net Asset
Value
Beginning
of Period | | | Net
Investment
Income (Loss) | | Net
Realized
&
Unrealized
Gain (Loss)
on
Investments | | | Total from
Investment
Operations | | Dividends
from Net
Investment
Income | | | Dividends
from Net
Realized
Gains | | Total
Dividends | | | Net Asset Value End of Period | | Net
Investment
Income
(Loss)
(%) | | | Expenses,
After
Expense
Reductions
(%) | | | Expenses,
After
Expense
Reductions
and
Net of
Custody
Credits
(%) | | | Expenses,
Before
Expense
Reductions
(%) | | | Total
Return
(%)(a) | | Portfolio
Turnover
Rate (%)(a) | | Net
Assets
at End
of
Period
(Thousands) | |
Class A Shares | | | | | | | | | | | | | | | | | | | | | | | | | | | | | | | | | | | | | | | | | | |
2015(b)(c) | | $ | 26.44 | | | (0.13) | | | 2.01 | | | 1.88 | | | — | | | — | | | — | | | $28.32 | | | (0.98 | )(d) | | | 1.39 | (d) | | | 1.39 | (d) | | | 1.39 | (d) | | 7.11 | | 49.74 | | $ | 272,008 | |
2014(c) | | $ | 24.35 | | | (0.28) | | | 2.37 | | | 2.09 | | | — | | | — | | | — | | | $26.44 | | | (1.06 | ) | | | 1.40 | | | | 1.40 | | | | 1.40 | | | 8.58 | | 100.62 | | $ | 277,099 | |
2013(c) | | $ | 19.11 | | | (0.21) | | | 5.45 | | | 5.24 | | | — | | | — | | | — | | | $24.35 | | | (1.01 | ) | | | 1.45 | | | | 1.45 | | | | 1.45 | | | 27.42 | | 91.92 | | $ | 279,483 | |
2012(c) | | $ | 13.33 | | | (0.17) | | | 5.95 | | | 5.78 | | | — | | | — | | | — | | | $19.11 | | | (1.02 | ) | | | 1.48 | | | | 1.49 | | | | 1.48 | | | 43.36 | | 122.93 | | $ | 225,945 | |
2011(c) | | $ | 13.81 | | | (0.15) | | | (0.33 | ) | | (0.48) | | | — | | | — | | | — | | | $13.33 | | | (0.96 | ) | | | 1.45 | | | | 1.45 | | | | 1.45 | | | (3.48) | | 80.53 | | $ | 208,135 | |
2010(c) | | $ | 13.61 | | | (0.15) | | | 0.35 | | | 0.20 | | | — | | | — | | | — | | | $13.81 | | | (1.09 | ) | | | 1.48 | | | | 1.48 | | | | 1.48 | | | 1.47 | | 75.06 | | $ | 372,954 | |
Class C Shares | | | | | | | | | | | | | | | | | | | | | | | | | | | | | | | | | | | | | | | | | | |
2015(b) | | $ | 23.69 | | | (0.21) | | | 1.80 | | | 1.59 | | | — | | | — | | | — | | | $25.28 | | | (1.73 | )(d) | | | 2.13 | (d) | | | 2.13 | (d) | | | 2.13 | (d) | | 6.71 | | 49.74 | | $ | 202,210 | |
2014 | | $ | 21.98 | | | (0.43) | | | 2.14 | | | 1.71 | | | — | | | — | | | — | | | $23.69 | | | (1.81 | ) | | | 2.14 | | | | 2.14 | | | | 2.14 | | | 7.78 | | 100.62 | | $ | 200,664 | |
2013 | | $ | 17.38 | | | (0.34) | | | 4.94 | | | 4.60 | | | — | | | — | | | — | | | $21.98 | | | (1.76 | ) | | | 2.20 | | | | 2.20 | | | | 2.20 | | | 26.47 | | 91.92 | | $ | 182,999 | |
2012 | | $ | 12.22 | | | (0.28) | | | 5.44 | | | 5.16 | | | — | | | — | | | — | | | $17.38 | | | (1.79 | ) | | | 2.25 | | | | 2.25 | | | | 2.25 | | | 42.23 | | 122.93 | | $ | 156,597 | |
2011 | | $ | 12.75 | | | (0.24) | | | (0.29 | ) | | (0.53) | | | — | | | — | | | — | | | $12.22 | | | (1.71 | ) | | | 2.20 | | | | 2.20 | | | | 2.20 | | | (4.16) | | 80.53 | | $ | 137,799 | |
2010 | | $ | 12.66 | | | (0.23) | | | 0.32 | | | 0.09 | | | — | | | — | | | — | | | $12.75 | | | (1.84 | ) | | | 2.23 | | | | 2.23 | | | | 2.23 | | | 0.71 | | 75.06 | | $ | 215,413 | |
Class I Shares | | | | | | | | | | | | | | | | | | | | | | | | | | | | | | | | | | | | | | | | | | |
2015(b) | | $ | 27.90 | | | (0.08) | | | 2.12 | | | 2.04 | | | — | | | — | | | — | | | $29.94 | | | (0.58 | )(d) | | | 0.99 | (d) | | | 0.99 | (d) | | | 1.03 | (d) | | 7.31 | | 49.74 | | $ | 264,332 | |
2014 | | $ | 25.59 | | | (0.18) | | | 2.49 | | | 2.31 | | | — | | | — | | | — | | | $27.90 | | | (0.65 | ) | | | 0.99 | | | | 0.99 | | | | 1.03 | | | 9.03 | | 100.62 | | $ | 251,122 | |
2013 | | $ | 19.99 | | | (0.12) | | | 5.72 | | | 5.60 | | | — | | | — | | | — | | | $25.59 | | | (0.55 | ) | | | 0.99 | | | | 0.99 | | | | 1.02 | | | 28.01 | | 91.92 | | $ | 191,358 | |
2012 | | $ | 13.88 | | | (0.09) | | | 6.20 | | | 6.11 | | | — | | | — | | | — | | | $19.99 | | | (0.52 | ) | | | 0.99 | | | | 0.99 | | | | 1.08 | | | 44.02 | | 122.93 | | $ | 116,567 | |
2011 | | $ | 14.31 | | | (0.08) | | | (0.35 | ) | | (0.43) | | | — | | | — | | | — | | | $13.88 | | | (0.49 | ) | | | 0.99 | | | | 0.99 | | | | 1.07 | | | (3.00) | | 80.53 | | $ | 114,679 | |
2010 | | $ | 14.04 | | | (0.09) | | | 0.36 | | | 0.27 | | | — | | | — | | | — | | | $14.31 | | | (0.60 | ) | | | 0.99 | | | | 0.99 | | | | 1.08 | | | 1.92 | | 75.06 | | $ | 172,126 | |
Class R3 Shares | | | | | | | | | | | | | | | | | | | | | | | | | | | | | | | | | | | | | | | | | | |
2015(b) | | $ | 26.39 | | | (0.15) | | | 2.01 | | | 1.86 | | | — | | | — | | | — | | | $28.25 | | | (1.10 | )(d) | | | 1.50 | (d) | | | 1.50 | (d) | | | 1.75 | (d) | | 7.05 | | 49.74 | | $ | 85,847 | |
2014 | | $ | 24.33 | | | (0.31) | | | 2.37 | | | 2.06 | | | — | | | — | | | — | | | $26.39 | | | (1.16 | ) | | | 1.50 | | | | 1.50 | | | | 1.80 | | | 8.47 | | 100.62 | | $ | 90,788 | |
2013 | | $ | 19.11 | | | (0.22) | | | 5.44 | | | 5.22 | | | — | | | — | | | — | | | $24.33 | | | (1.06 | ) | | | 1.50 | | | | 1.50 | | | | 1.79 | | | 27.32 | | 91.92 | | $ | 95,545 | |
2012 | | $ | 13.33 | | | (0.18) | | | 5.96 | | | 5.78 | | | — | | | — | | | — | | | $19.11 | | | (1.04 | ) | | | 1.50 | | | | 1.50 | | | | 1.80 | | | 43.36 | | 122.93 | | $ | 106,353 | |
2011 | | $ | 13.82 | | | (0.16) | | | (0.33 | ) | | (0.49) | | | — | | | — | | | — | | | $13.33 | | | (1.01 | ) | | | 1.50 | | | | 1.50 | | | | 1.77 | | | (3.55) | | 80.53 | | $ | 109,127 | |
2010 | | $ | 13.62 | | | (0.15) | | | 0.35 | | | 0.20 | | | — | | | — | | | — | | | $13.82 | | | (1.11 | ) | | | 1.50 | | | | 1.50 | | | | 1.79 | | | 1.47 | | 75.06 | | $ | 212,360 | |
Class R4 Shares | | | | | | | | | | | | | | | | | | | | | | | | | | | | | | | | | | | | | | | | | | |
2015(b) | | $ | 26.54 | | | (0.14) | | | 2.03 | | | 1.89 | | | — | | | — | | | — | | | $28.43 | | | (1.00 | )(d) | | | 1.40 | (d) | | | 1.40 | (d) | | | 1.75 | (d) | | 7.12 | | 49.74 | | $ | 10,526 | |
2014 | | $ | 24.44 | | | (0.28) | | | 2.38 | | | 2.10 | | | — | | | — | | | — | | | $26.54 | | | (1.06 | ) | | | 1.40 | (d) | | | 1.40 | | | | 1.77 | | | 8.59 | | 100.62 | | $ | 11,306 | |
2013 | | $ | 19.18 | | | (0.20) | | | 5.46 | | | 5.26 | | | — | | | — | | | — | | | $24.44 | | | (0.96 | ) | | | 1.40 | (d) | | | 1.40 | | | | 1.79 | | | 27.42 | | 91.92 | | $ | 10,277 | |
2012 | | $ | 13.37 | | | (0.16) | | | 5.97 | | | 5.81 | | | — | | | — | | | — | | | $19.18 | | | (0.93 | ) | | | 1.40 | (d) | | | 1.40 | | | | 1.78 | | | 43.46 | | 122.93 | | $ | 9,344 | |
2011 | | $ | 13.84 | | | (0.14) | | | (0.33 | ) | | (0.47) | | | — | | | — | | | — | | | $13.37 | | | (0.91 | ) | | | 1.40 | (d) | | | 1.40 | | | | 1.76 | | | (3.40) | | 80.53 | | $ | 10,423 | |
2010 | | $ | 13.63 | | | (0.14) | | | 0.35 | | | 0.21 | | | — | | | — | | | — | | | $13.84 | | | (1.01 | ) | | | 1.40 | (d) | | | 1.40 | | | | 1.73 | | | 1.54 | | 75.06 | | $ | 24,968 | |
Class R5 Shares | | | | | | | | | | | | | | | | | | | | | | | | | | | | | | | | | | | | | | | | | | |
2015(b) | | $ | 27.87 | | | (0.08) | | | 2.12 | | | 2.04 | | | — | | | — | | | — | | | $29.91 | | | (0.59 | )(d) | | | 0.99 | (d) | | | 0.99 | (d) | | | 1.23 | (d) | | 7.32 | | 49.74 | | $ | 57,917 | |
2014 | | $ | 25.56 | | | (0.18) | | | 2.49 | | | 2.31 | | | — | | | — | | | — | | | $27.87 | | | (0.65 | ) | | | 0.99 | | | | 0.99 | | | | 1.28 | | | 9.04 | | 100.62 | | $ | 61,818 | |
2013 | | $ | 19.97 | | | (0.12) | | | 5.71 | | | 5.59 | | | — | | | — | | | — | | | $25.56 | | | (0.55 | ) | | | 0.99 | | | | 0.99 | | | | 1.12 | | | 27.99 | | 91.92 | | $ | 62,146 | |
2012 | | $ | 13.86 | | | (0.09) | | | 6.20 | | | 6.11 | | | — | | | — | | | — | | | $19.97 | | | (0.52 | ) | | | 0.98 | | | | 0.99 | | | | 1.32 | | | 44.08 | | 122.93 | | $ | 61,411 | |
2011 | | $ | 14.30 | | | (0.08) | | | (0.36 | ) | | (0.44) | | | — | | | — | | | — | | | $13.86 | | | (0.51 | ) | | | 0.99 | | | | 0.99 | | | | 1.22 | | | (3.08) | | 80.53 | | $ | 66,901 | |
2010 | | $ | 14.02 | | | (0.08) | | | 0.36 | | | 0.28 | | | — | | | — | | | — | | | $14.30 | | | (0.60 | ) | | | 0.99 | | | | 0.99 | | | | 1.18 | | | 2.00 | | 75.06 | | $ | 324,963 | |
| (a) | Not annualized for periods less than one year. |
| (b) | Unaudited Six Month Period Ended March 31. |
| (c) | Sales loads are not reflected in computing total return. |
| + | Based on weighted average shares outstanding, except for Dividends from Net Investment Income and Net Realized Gains, which are actual amounts per share. |
See notes to financial statements.
| | | | |
| 22 Semi-Annual Report | | | | Semi-Annual Report 23 |
| | |
| EXPENSE EXAMPLE | | |
| |
Thornburg Core Growth Fund | | March 31, 2015 (Unaudited) |
As a shareholder of the Fund, you incur two types of costs:
| | (1) | transaction costs, including |
(a) sales charges (loads) on purchase payments, for Class A shares;
(b) a deferred sales charge on redemptions of any part or all of a purchase of $1 million of Class A shares within 12 months of purchase;
(c) a deferred sales charge on redemptions of Class C shares within 12 months of purchase;
| | (2) | ongoing costs, including management fees; distribution and/or service (12b-1) fees; and other Fund expenses. |
This example is intended to help you understand your ongoing costs (in dollars) of investing in the Fund and to compare these costs with the ongoing costs of investing in other mutual funds.
The example is based on a $1,000 investment beginning on October 1, 2014, and held until March 31, 2015.
ACTUAL EXPENSES
For each class of shares, the first line of the accompanying table provides information about actual account values and actual expenses. You may use the information in this line, together with the amount you invested, to estimate the expenses that you paid over the period. Simply divide your account value by $1,000 (for example, an $8,600 account value divided by $1,000 = 8.6), then multiply the result by the number in the first line for your class of shares under the heading entitled “Expenses Paid During Period” to estimate the expenses you paid on your account during this period.
| | | | | | | | | | | | |
| | | Beginning
Account Value
10/1/14 | | | Ending
Account Value
3/31/15 | | | Expenses Paid
During Period†
10/1/14–3/31/15 | |
Class A Shares | | | | | | | | | | | | |
Actual | | $ | 1,000.00 | | | $ | 1,071.10 | | | $ | 7.16 | |
Hypothetical* | | $ | 1,000.00 | | | $ | 1,018.02 | | | $ | 6.97 | |
Class C Shares | | | | | | | | | | | | |
Actual | | $ | 1,000.00 | | | $ | 1,067.10 | | | $ | 10.98 | |
Hypothetical* | | $ | 1,000.00 | | | $ | 1,014.31 | | | $ | 10.70 | |
Class I Shares | | | | | | | | | | | | |
Actual | | $ | 1,000.00 | | | $ | 1,073.10 | | | $ | 5.12 | |
Hypothetical* | | $ | 1,000.00 | | | $ | 1,020.00 | | | $ | 4.99 | |
Class R3 Shares | | | | | | | | | | | | |
Actual | | $ | 1,000.00 | | | $ | 1,070.50 | | | $ | 7.74 | |
Hypothetical* | | $ | 1,000.00 | | | $ | 1,017.45 | | | $ | 7.54 | |
Class R4 Shares | | | | | | | | | | | | |
Actual | | $ | 1,000.00 | | | $ | 1,071.20 | | | $ | 7.23 | |
Hypothetical* | | $ | 1,000.00 | | | $ | 1,017.95 | | | $ | 7.04 | |
Class R5 Shares | | | | | | | | | | | | |
Actual | | $ | 1,000.00 | | | $ | 1,073.20 | | | $ | 5.12 | |
Hypothetical* | | $ | 1,000.00 | | | $ | 1,020.00 | | | $ | 4.99 | |
| † | Expenses are equal to the annualized expense ratio for each class (A: 1.39%; C: 2.13%; I: 0.99%; R3: 1.50%; R4: 1.40%; R5: 0.99%) multiplied by the average account value over the period, multiplied by 182/365 to reflect the one-half year period. |
| * | Hypothetical assumes a rate of return of 5% per year before expenses. |
HYPOTHETICAL EXAMPLE FOR COMPARISON PURPOSES
For each class of shares, the second line of the accompanying table provides information about hypothetical account values and hypothetical expenses based on the Fund’s actual expense ratio and an assumed rate of return of 5% per year before expenses, which is not the Fund’s actual return. The hypothetical account values and expenses may not be used to estimate the actual ending account balance or expenses you paid for the period. You may use this information to compare the ongoing costs of investing in the Fund and other funds. To do so, compare this 5% hypothetical example with the 5% hypothetical examples that appear in the shareholder reports of the other funds.
Please note that the expenses shown in the table are meant to highlight your ongoing costs only and do not reflect any transactional costs, such as sales charges (loads), redemption fees, or exchange fees. Therefore, the second line of the table for each class of shares is useful in comparing ongoing costs only, and will not help you determine the relative total costs of owning different funds. In addition, if these transactional costs were included, your costs would have been higher.
24 Semi-Annual Report
| | |
| OTHER INFORMATION | | |
| |
Thornburg Core Growth Fund | | March 31, 2015 (Unaudited) |
PORTFOLIO PROXY VOTING
Policies and Procedures:
The Trust has delegated to Thornburg Investment Management, Inc. (the “Advisor”) voting decisions respecting proxies for the Fund’s voting securities. The Advisor makes voting decisions in accordance with its Proxy Voting Policy and Procedures. A description of the Policy and Procedures is available (i) without charge, upon request, by calling the Advisor toll-free at 1-800-847-0200, (ii) on the Thornburg website at www.thornburg.com, and (iii) on the Securities and Exchange Commission’s website at www.sec.gov.
Information regarding how proxies were voted is available on or before August 31 of each year for the twelve months ending the preceding June 30. This information is available (i) without charge, upon request by calling the Advisor toll-free at 1-800-847-0200, (ii) on the Thornburg website at www.thornburg.com, and (iii) on the Securities and Exchange Commission’s website at www.sec.gov.
AVAILABILITY OF QUARTERLY PORTFOLIO SCHEDULE
The Fund files with the Securities and Exchange Commission schedules of its portfolio holdings on Form N-Q for the first and third quarters of each fiscal year. The Fund’s Forms N-Q are available on the Commission’s website at www.sec.gov, or may be reviewed and copied at the Commission’s Public Reference Room in Washington, D.C. Information on the operation of the Public Reference Room may be obtained by calling 1-800-SEC-0330. The Fund also makes this information available on its website at www.thornburg. com/download or upon request by calling 1-800-847-0200.
Semi-Annual Report 25
TRUSTEES’ STATEMENT TO SHAREHOLDERS
Revised and Readopted September 15, 2014
The Trustees believe current and prospective shareholders should know how we discharge our responsibilities in supervising the Funds’ investment advisor and in reviewing the advisor’s contract for renewal. Since 2005, we have issued a statement which sets out clearly the three principal guidelines that we follow in supervising the Trust’s investment advisor on your behalf. In accordance with our customary practice, in September of 2014 we again reviewed our statement and concluded we should reissue this statement outlining the principal features of our supervision of the advisor’s performance of investment management services for the Funds.
We begin with the premise that each shareholder selected his or her Fund because its investments are managed by the investment advisor identified in the prospectus and in accordance with the objective and policies described in the prospectus. We realize, as each of you do, that if you believe that your Fund’s stated objective and policies no longer serve your personal investment goals, you can sell your shares and leave the Fund.
Therefore, we believe that our primary supervisory task—our principal obligation to you—is to assess the nature and quality of the advisor’s services, and to confirm that the advisor actively and competently pursues the Fund’s objective, in accordance with the policies set out in the prospectus. To do this, we meet regularly with management to review your Fund’s portfolio and to discuss the advisor’s specific actions and judgments in pursuing the Fund’s objective. We do not substitute our own judgment for the advisor’s decisions in selecting investments; the advisor is paid to exercise its informed judgment on investment decisions, and we seek to confirm, in reviewing the advisor’s performance, that the advisor is doing just that.
Second, we are conscious of costs and the effect that costs have on shareholders’ returns. We try to make sure that your Fund’s fees and costs are reasonable in relationship to the services rendered and that they are generally in line with those charged by other expert investment advisors, consistent with our belief that the Fund’s investors searched for and expect that expertise and attention and have decided to pay a reasonable price for it. We do not put the management contract “out to bid” as a matter of course, and we would not do so unless we had concluded that the advisor materially had failed to pursue the Fund’s objectives in accordance with its policies, or for other equally important reasons. We believe that any other approach would be inconsistent with your interests and contrary to your expectations when you bought shares of the Fund in the first place.
Finally, because we believe that most Thornburg Fund shareholders have invested with a long-term perspective, we try not to focus too much on the fashions of the moment and on short-term performance. The market will not favor any specific investment objective or set of policies at all times and under all economic circumstances. A fund will experience periods of both high and low returns relative to other funds and other investments. Even if one of our Funds is not favored by the market at a particular time, we believe that the advisor is nonetheless obliged to remain true to the Fund’s objective and policies, and we watch to see that it does so.
Trustees of Thornburg Investment Trust
26 Semi-Annual Report
THORNBURG FUND FAMILY
FUNDAMENTAL, BOTTOM-UP EQUITY RESEARCH
We search far and wide for the best stock ideas—within the United States and around the globe. Potential investments that may deserve a deeper look are thoroughly analyzed using both quantitative and qualitative criteria. But the vast majority are discarded. Those that ultimately make it into our highly-selective portfolios are continually monitored to determine whether our investment theses unfold as expected.
| | • | | Thornburg Core Growth Fund |
| | • | | Thornburg International Value Fund |
| | • | | Thornburg International Growth Fund |
| | • | | Thornburg Developing World Fund |
| | • | | Thornburg Investment Income Builder Fund |
| | • | | Thornburg Global Opportunities Fund |
A TRADITION OF DISCIPLINED BOND MANAGEMENT
At Thornburg, the word “disciplined” carries some substance. We don’t make a practice of using shortcuts to enhance yield or total returns. Every strategy is grounded in rigorous, bottom-up credit work. Portfolios are assembled carefully—in the case of our core bond funds, using laddered structures—to mitigate price fluctuation. Position sizes are controlled so that no single bond can have an outsized effect on a portfolio. And as with our equity portfolios, managers enjoy flexibility to seek an optimal risk/reward balance.
| | • | | Thornburg Low Duration Income Fund |
| | • | | Thornburg Limited Term U.S. Government Fund |
| | • | | Thornburg Limited Term Income Fund |
| | • | | Thornburg Strategic Income Fund |
| | • | | Thornburg Low Duration Municipal Fund |
| | • | | Thornburg Limited Term Municipal Fund |
| | • | | Thornburg Intermediate Municipal Fund |
| | • | | Thornburg California Limited Term Municipal Fund |
| | • | | Thornburg New Mexico Intermediate Municipal Fund |
| | • | | Thornburg New York Intermediate Municipal Fund |
| | • | | Thornburg Strategic Municipal Income Fund |
Before investing, carefully consider the Fund’s investment goals, risks, charges, and expenses. For a prospectus or summary prospectus containing this and other information, contact your financial advisor or visit thornburg.com. Read it carefully before investing.
For additional information, please visit thornburg.com
Thornburg Investment Management, Inc. 2300 North Ridgetop Road, Santa Fe, NM 87506
Semi-Annual Report 27

This Semi-Annual Report is submitted for the general information of shareholders of the Fund. It is not authorized for distribution to prospective investors in the Fund unless preceded or accompanied by an effective prospectus.
| | | | |
| Investment Advisor: | | Distributor: | | |
| Thornburg Investment Management® | | Thornburg Securities Corporation® | | |
| 800.847.0200 | | 800.847.0200 | | TH180 |
FIRM OVERVIEW
THE FIRM
Thornburg Investment Management is a privately owned global investment firm that offers a range of solutions for retail and institutional investors. We are driven by our mission to help our clients reach their long-term financial goals through fundamental research and active portfolio management.
Founded in 1982 and headquartered in Santa Fe, New Mexico, we manage approximately $61 billion (as of March 31, 2015) across seven equity and 11 bond mutual funds, separate accounts for high-net-worth investors and institutional accounts, and five UCITS funds for non-U.S. investors.

CORE INVESTMENT PRINCIPLES
Our focus has always been on maintaining and building the investment expertise to manage Thornburg strategies to a high standard, while adhering to a core set of investment principles:
| | • | | We focus on the fundamentals. We invest according to our view of the fundamental value of an issuer only after performing thorough, bottom-up research. |
| | • | | We think and invest for the long term. We typically make investment decisions based upon an investment thesis we expect to play out over 18 months to several years. We may not always hold a security for several years, but our horizon line is typically a few years out. |
| | • | | We stay flexible. We go where we see value. Our investment mandates are generally broad and flexible, and we exercise as much flexibility as possible within any restrictions. |
| | • | | We collaborate across strategies. We are structured as global generalists. Portfolio managers and analysts do not specialize in sectors, geographies, or even security types, but instead must understand and communicate bottom-up fundamentals across industries, sectors, and borders. |
2 Semi-Annual Report
Semi-Annual Report
Thornburg International Growth Fund
March 31, 2015
| | | | |
Share Class | | NASDAQ Symbol | | CUSIP |
Class A | | TIGAX | | 885-215-319 |
Class C | | TIGCX | | 885-215-293 |
Class I | | TINGX | | 885-215-244 |
Class R3 | | TIGVX | | 885-215-178 |
Class R4 | | TINVX | | 885-215-160 |
Class R5 | | TINFX | | 885-215-152 |
Class R6 | | THGIX | | 885-216-820 |
Class I, R3, R4, R5, and R6 shares may not be available to all investors. Minimum investments for Class I shares may be higher than those for other classes.
Investments in the Fund carry risks, including possible loss of principal. Additional risks may be associated with investments outside the United States, especially in emerging markets, including currency fluctuations, illiquidity, volatility, and political and economic risks. Investments in small capitalization companies may increase the risk of greater price fluctuations. Please see the Fund’s prospectus for a discussion of the risks associated with an investment in the Fund. Investments in the Fund are not FDIC insured, nor are they deposits of or guaranteed by a bank or any other entity.
Semi-Annual Report 3
| | |
| LETTER TO SHAREHOLDERS | | |
| |
Thornburg International Growth Fund | | March 31, 2015 (Unaudited) |
April 20, 2015
Dear Fellow Shareholder:
For the six-month period ended March 31, 2015, the Thornburg International Growth Fund returned 4.11% for the Class A shares (without sales charge), outperforming the benchmark MSCI All Country World ex-U.S. Growth Index, which returned 2.37%. On March 31, 2015, the net asset value (NAV) of the Class A shares was $18.88.
We are pleased that the Thornburg International Growth Fund received another Lipper Fund Award, with the Fund’s Class I shares recognized as Lipper’s Best International Multi-Cap Growth Fund over the five-year period ended November 30, 2014, based on risk-adjusted returns. This brings the total number of Lipper Awards to five since the Fund’s February 2007 inception.
Market Environment
Equity markets were broadly strong during the period. Easy monetary policy and accommodative central banks continue to create a generally favorable environment for stocks. During the period we had the notable addition of the European Central Bank, which launched an aggressive bond-buying program (known as quantitative easing) in a better-late-than-never attempt to stimulate the European economy. It certainly stimulated European stock markets, which surged higher.
Despite the run in stock prices it was not all good news for U.S. dollar-based investors. While the U.S. economic recovery has been slower than many would like, the U.S. economy has nonetheless improved significantly since the Great Recession. We now face the end of monetary stimulus and the prospect of higher interest rates, a byproduct of which is a stronger U.S. dollar. This means that the value of investments overseas is reduced when translated back to dollars. This coincides with easy money and lower rates in many regions around the world, exacerbating the move in the U.S. dollar. During the period, we were partially hedged on the euro, pound, and yen and have reduced all after the large move in the U.S. dollar.
Also of note, the price of oil collapsed during the period. The Organization of Petroleum Exporting Countries (OPEC), and particularly swing-producer Saudi Arabia, were no longer willing to cut production to support higher oil prices. Falling prices drive out higher marginal-cost producers, mainly onshore North American production. Lower oil prices put additional money into consumers’ pockets; money saved while filling gas tanks and heating homes. It can now be spent elsewhere. On a country level it creates winners and losers. Oil exporters generally suffer while oil importers benefit. Similarly, on a stock level you have to sort through company by company to determine the exposure and the effect.
Contributors and Detractors
Top performers in the six months ended March 31, 2015 include Valeant Pharmaceuticals, Constellation Software, Catamaran, Rightmove, and ASOS.
Valeant is a multi-national specialty pharmaceutical company based in Montreal, Canada. Valeant develops, manufactures and markets a broad range of pharmaceutical products primarily in the areas of eye health, dermatology, branded generics and over-the-counter (OTC) drugs. Valeant has a unique operating philosophy for a pharmaceutical company, whereby it is more focused on the management and operational side of the equation rather than the R&D side. Valeant doesn’t focus on R&D, which of late has been a less efficient allocation of shareholder capital. Rather, it focuses on acquiring undermanaged businesses and products and driving operational efficiencies through cost cutting and revenue optimization. This results in a company that is very similar to a private-equity company in its approach to the pharmaceutical industry. We believe that the pharmaceutical industry represents a huge opportunity for driving additional value through operational skill, as it is rather fragmented and not efficiently managed for shareholder interests. During the period, Valeant reported financial results, provided full year guidance that exceeded street expectations, and showed strong double-digit organic growth. In February, it also announced its intention to acquire Salix Pharmaceuticals.
Constellation Software is a combination of a large number of small, diverse software companies mainly built via acquisition. It targets mission-critical software providers, but often with small addressable markets. Typically these companies are too small for larger software companies or private-equity investors to be interested in, leaving the founders with no exit strategy other than to sell to Constellation at an attractive valuation. Given the diversification, Constellation tends to deliver steady growth.
Catamaran is a pharmaceutical benefits manager. During the period, Catamaran was acquired by United Health Group at a 25% premium to their previous closing price. We have since exited the position and put the proceeds to work in new opportunities.
Rightmove is an online real estate portal in the United Kingdom. The stock had been weak after a new competitor entered the market. Rightmove’s stock bounced after it became clear that the new competitor would have only a minor impact on Rightmove’s business. We continue to believe that Rightmove is and will be the dominant real estate website in the United Kingdom.
ASOS is a U.K.-based online retailer of fashion apparel and accessories targeting fashion forward twenty-something year old shoppers. ASOS.com is one of the most popular online
4 Semi-Annual Report
| | |
LETTER TO SHAREHOLDERS, CONTINUED | | |
| |
Thornburg International Growth Fund | | March 31, 2015 (Unaudited) |
fashion sites in the world, with millions of visitors each day. After a series of missteps in 2014, ASOS has recently reported a set of results that show a stabilizing growth trajectory in the business. Although the recent sales growth rate is slower than we have historically seen from ASOS, it is a sharp improvement from 8% in the 4th quarter of 2014. With relatively easy comparisons on the horizon, we should continue to see an acceleration of ASOS’s sales growth rate in the upcoming quarters.
The top detractors during the period included Stratasys, boohoo.com, Legacy Oil & Gas, Yandex, and Galaxy Entertainment Group.
Stratasys is a leading 3D printer manufacturer. Shares decreased significantly in the period due to problems with the company’s MakerBot product line and a change in strategy by the company to invest more in sales, marketing, and product development. As a fast-growing leader in an emerging industry with an attractive razor-blade business model, there was potential for Stratasys to grow very strongly as they sold more high-margin printer materials to an expanding base of printer owners. However, we have sold out of the position as the company’s guidance indicates profit margins will contract due to the increased investments, potentially signaling increased competition.
U.K.-based boohoo.com is an online fashion retailer focused on fashion forward 16–24 year olds, offering exclusive yet affordable apparel. The company sells clothing that is entirely its own label and its supply chain expertise allows it to have really short lead times, in some cases just six weeks from design to product. In early January, boohoo announced that sales growth and profitability were materially lower than street expectations. The company grew sales robustly in the period, but still fell short of market expectations. Relative to other e-commerce names such as ASOS and Zalando, this was a lower quality and lower conviction name for us, so we sold it due to the fundamental deterioration.
Legacy Oil is a Canadian oil producer located in the Bakken region (on the Canadian side of North Dakota). It is an oil-rich play with fast production growth. OPEC comments on maintaining the group’s production have caused the price of oil to decline rapidly since September 2014 (from $90 down to $50). This has hurt the whole energy space, but Legacy more so due to its aggressive production growth nature.
Yandex is Russia’s largest internet search engine (much like Google in the United States). Sanctions on Russia have investors worried that advertising budgets may slow down. Additionally, the ruble devaluation during the period is likely to impact earnings in the short to medium term.
Galaxy is a casino developer and operator with properties in Macau, where names were under pressure as a result of a cyclical slow down in Chinese gaming driven by a slowing macro environment in China and an anti-corruption campaign against high net worth individuals. While there are continued pressures in the short term, Galaxy has performed well, gaining market share in this tough environment.
It is interesting to note that three of the five top contributing stocks suffered recent periods of significant underperformance: Rightmove, the online U.K. real estate portal; Catamaran, the pharmacy benefit manager; and ASOS, the online apparel retailer. These three stocks serve as a good reminder to remain focused on the longer-term fundamentals rather than the market volatility and shifts in short-term sentiment.
Thank you for investing alongside us in the Thornburg International Growth Fund.
| | |
| Sincerely, | | |
 | |  |
| Greg Dunn | | Tim Cunningham,CFA |
| Managing Director | | Managing Director |
| Portfolio Manager | | Portfolio Manager |
The matters discussed in this report may constitute forward-looking statements made pursuant to the safe harbor provisions of the Securities Litigation Reform Act of 1995. These include any advisor or portfolio manager prediction, assessment, analysis or outlook for individual securities, industries, investment styles, market sectors and/or markets. These statements involve risks and uncertainties. In addition to the general risks described for each fund in its current prospectus, other factors bearing on these reports include the accuracy of the advisor’s or portfolio manager’s forecasts and predictions, the appropriateness of the investment strategies designed by the advisor or portfolio manager and the ability of the advisor or portfolio manager to implement their strategies efficiently and successfully. Any one or more of these factors, as well as other risks affecting the securities markets generally, could cause the actual results of any fund to differ materially as compared to its benchmarks.
The views expressed by the portfolio managers reflect their professional opinions and are subject to change. Under no circumstances does the information contained within represent a recommendation to buy or sell any security.
Semi-Annual Report 5
| | |
| PERFORMANCE SUMMARY | | |
| |
Thornburg International Growth Fund | | March 31, 2015 (Unaudited) |
Average Annual Total Returns
| | | | | | | | | | | | | | | | |
| | | 1 Yr | | | 3 Yrs | | | 5 Yrs | | | Since
Incep. | |
Class A Shares (Incep: 2/1/07) | | | | | | | | | | | | | | | | |
Without sales charge | | | -3.19 | % | | | 9.55 | % | | | 12.12 | % | | | 7.45 | % |
With sales charge | | | -7.56 | % | | | 7.88 | % | | | 11.10 | % | | | 6.84 | % |
Class C Shares (Incep: 2/1/07) | | | | | | | | | | | | | | | | |
Without sales charge | | | -3.86 | % | | | 8.73 | % | | | 11.27 | % | | | 6.71 | % |
With sales charge | | | -4.77 | % | | | 8.73 | % | | | 11.27 | % | | | 6.71 | % |
Class I Shares (Incep: 2/1/07) | | | -2.76 | % | | | 10.01 | % | | | 12.65 | % | | | 8.02 | % |
Class R3 Shares (Incep: 2/1/08) | | | -3.26 | % | | | 9.45 | % | | | 12.07 | % | | | 5.87 | % |
Class R4 Shares (Incep: 2/1/08) | | | -3.16 | % | | | 9.58 | % | | | 12.20 | % | | | 5.98 | % |
Class R5 Shares (Incep: 2/1/08) | | | -2.78 | % | | | 9.99 | % | | | 12.64 | % | | | 6.40 | % |
Class R6 Shares (Incep: 2/1/13) | | | -2.70 | % | | | — | | | | — | | | | 8.89 | % |
MSCI AC World ex-U.S. Growth Index (Since 2/1/07) | | | 1.71 | % | | | 7.14 | % | | | 5.75 | % | | | 2.36 | % |
Growth of a Hypothetical $10,000 Investment
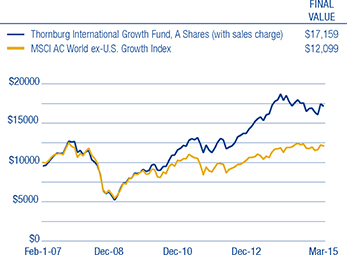
Performance data shown represents past performance and is no guarantee of future results. Investment return and principal value will fluctuate so shares, when redeemed, may be worth more or less than their original cost. Current performance may be lower or higher than quoted. For performance current to the most recent month end, visit thornburg.com or call 800-847-0200. The performance information does not reflect the deduction of taxes that a shareholder would pay on distributions or the redemption of Fund shares. Returns reflect the reinvestment of dividends and capital gains. Class A shares are sold with a maximum sales charge of 4.50%. Class C shares are subject to a 1% CDSC for the first year only. There is no sales charge for Class I, R3, R4, R5, and R6 shares.
As disclosed in the most recent prospectus, the total annual fund operating expenses are as follows: A shares, 1.33%; C shares, 2.09%; I shares, 0.98%; R3 shares, 1.86%; R4 shares, 1.63%; R5 shares, 1.18%; R6 shares, 1.34%. Thornburg Investment Management and/or Thornburg Securities Corporation have contractually agreed to waive fees and reimburse expenses through at least February 1, 2016, for some of the share classes, resulting in net expense ratios of the following: R3 shares, 1.50%; R4 shares, 1.40%; R5 shares, 0.99%; R6 shares, 0.89%. For more detailed information on fund expenses and waivers/reimbursements please see the Fund’s prospectus.
From time to time, the Fund may invest in shares of companies through initial public offerings (IPOs). IPOs have the potential to produce substantial gains for the Fund. There is no assurance that the Fund will have continued access to profitable IPOs and, as the Fund’s assets grow, the impact of IPO investments may decline. Therefore, investors should not rely on these past gains as an indication of future performance.
BEST INTERNATIONAL MULTI-CAP GROWTH FUND
| | | | |
| 2015 – | | Class I shares for the five-year period ended 11/30/14, among 300 funds. | |  |
| 2014 – | | Class I shares for the three-year period ended 11/30/13, among 312 funds. Class I shares for the five-year period ended 11/30/13, among 276 funds. | |
| 2013 – | | Class I shares for the three-year period ended 11/30/12, among 264 funds. Class I shares for the five-year period ended 11/30/12, among 205 funds. | |
Lipper Fund Awards are granted annually to the fund in each Lipper classification that consistently delivered the strongest risk-adjusted performance (calculated with dividends reinvested and without sales charges). Thornburg did not win the awards for any other time periods.
Glossary
MSCI All Country (AC) World ex-U.S. Growth Index – A market capitalization weighted index that includes growth companies in developed and emerging markets throughout the world, excluding the United States.
Unless otherwise noted, index returns reflect the reinvestment of income dividends and capital gains, if any, but do not reflect fees, brokerage commissions or other expenses of investing. Investors may not make direct investments into any index. The performance of any index is not indicative of the performance of any particular investment.
Private Equity – Equity shares that are not traded on a public exchange.
Quantitative Easing (QE) – An unconventional monetary policy in which a central bank purchases financial assets from the market in order to lower interest rates and increase the money supply.
6 Semi-Annual Report
| | |
| FUND SUMMARY | | |
| |
Thornburg International Growth Fund | | March 31, 2015 (Unaudited) |
OBJECTIVES AND STRATEGIES
The Fund seeks long-term growth of capital by investing in equity securities selected for their growth potential.
The Fund normally invests at least 75% of its assets in foreign securities or depositary receipts of foreign securities. However, the Fund may own a variety of securities, including domestic equity securities, partnership interests, and debt obligations. The Fund may also invest in developing countries and in smaller companies with market capitalizations of less than $500 million.
Market Capitalization Exposure
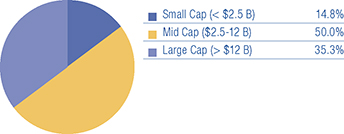
Basket Structure
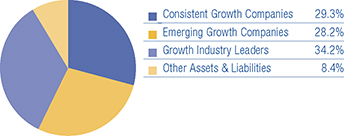
Top Ten Equity Holdings
| | | | |
Optimal Payments plc | | | 3.1 | % |
MasterCard, Inc. | | | 2.9 | % |
Nielsen Holdings N.V. | | | 2.8 | % |
Solera Holdings, Inc. | | | 2.8 | % |
Hargreaves Lansdown plc | | | 2.8 | % |
priceline.com, Inc. | | | 2.6 | % |
Valeant Pharmaceuticals International, Inc. | | | 2.5 | % |
Rightmove plc | | | 2.5 | % |
Partners Group Holding AG | | | 2.4 | % |
Wal-Mart de Mexico SAB de C.V. | | | 2.4 | % |
There is no guarantee that the Fund will meet its investment objectives.
All portfolio information is subject to change. Charts may not add up to 100% due to rounding.
| | | | |
| Sector Exposure | |
| |
Information Technology | | | 27.9 | % |
Financials | | | 16.1 | % |
Consumer Discretionary | | | 15.5 | % |
Industrials | | | 15.4 | % |
Health Care | | | 8.9 | % |
Consumer Staples | | | 5.7 | % |
Energy | | | 2.1 | % |
Other Assets & Liabilities | | | 8.4 | % |
|
| Top Ten Industry Groups | |
| |
Software & Services | | | 20.9 | % |
Diversified Financials | | | 12.5 | % |
Commercial & Professional Services | | | 9.7 | % |
Pharmaceuticals, Biotechnology & Life Sciences | | | 8.9 | % |
Technology Hardware & Equipment | | | 5.4 | % |
Consumer Services | | | 4.8 | % |
Retailing | | | 4.2 | % |
Capital Goods | | | 3.9 | % |
Media | | | 3.7 | % |
Food, Beverage & Tobacco | | | 3.3 | % |
|
| Country Exposure* | |
| (percent of equity holdings) | |
| |
United Kingdom | | | 28.3 | % |
United States | | | 13.8 | % |
Canada | | | 10.0 | % |
France | | | 7.8 | % |
China | | | 5.6 | % |
Japan | | | 4.0 | % |
Sweden | | | 4.0 | % |
Australia | | | 2.8 | % |
Switzerland | | | 2.7 | % |
Mexico | | | 2.6 | % |
Germany | | | 2.5 | % |
Spain | | | 2.2 | % |
Ireland | | | 2.1 | % |
India | | | 2.0 | % |
Panama | | | 2.0 | % |
Brazil | | | 1.8 | % |
Hong Kong | | | 1.8 | % |
Turkey | | | 1.7 | % |
Taiwan | | | 1.2 | % |
Russia | | | 1.1 | % |
| * | The country assignment of each equity holding is determined by the Fund’s Advisor based on various factors, including the location of the issuer’s head office, the issuer’s jurisdiction of incorporation and the country from which a majority of the issuer’s revenue is derived. |
Semi-Annual Report 7
SCHEDULE OF INVESTMENTS
| | |
| |
Thornburg International Growth Fund | | March 31, 2015 (Unaudited) |
| | | | | | | | |
| | | Shares/ | | | | |
| | | Principal Amount | | | Value | |
COMMON STOCK — 91.65% | | | | | | | | |
| | |
CAPITAL GOODS — 3.89% | | | | | | | | |
Electrical Equipment — 1.53% | | | | | | | | |
Schneider Electric SE | | | 311,103 | | | $ | 24,202,059 | |
Machinery — 2.36% | | | | | | | | |
a Arcam AB | | | 880,372 | | | | 16,151,457 | |
GEA Group AG | | | 438,819 | | | | 21,251,686 | |
| | | | | | | | |
| | | | | | | 61,605,202 | |
| | | | | | | | |
| | |
COMMERCIAL & PROFESSIONAL SERVICES — 9.66% | | | | | | | | |
Commercial Services & Supplies — 2.56% | | | | | | | | |
Edenred | | | 1,225,836 | | | | 30,599,240 | |
Mineral Resources Ltd. | | | 1,919,341 | | | | 9,867,596 | |
Professional Services — 7.10% | | | | | | | | |
Experian plc | | | 1,860,492 | | | | 30,827,567 | |
Intertek Group plc | | | 984,577 | | | | 36,483,828 | |
Nielsen Holdings N.V. | | | 1,011,119 | | | | 45,065,574 | |
| | | | | | | | |
| | | | | | | 152,843,805 | |
| | | | | | | | |
| | |
CONSUMER DURABLES & APPAREL — 2.74% | | | | | | | | |
Textiles, Apparel & Luxury Goods — 2.74% | | | | | | | | |
Eclat Textile Co. Ltd. | | | 1,297,015 | | | | 17,057,260 | |
Gildan Activewear, Inc. | | | 890,632 | | | | 26,291,457 | |
| | | | | | | | |
| | | | | | | 43,348,717 | |
| | | | | | | | |
| | |
CONSUMER SERVICES — 4.82% | | | | | | | | |
Hotels, Restaurants & Leisure — 4.82% | | | | | | | | |
Domino’s Pizza Group plc | | | 2,152,973 | | | | 24,767,300 | |
Galaxy Entertainment Group Ltd. | | | 5,715,069 | | | | 25,948,602 | |
Sands China Ltd. | | | 6,152,415 | | | | 25,513,875 | |
| | | | | | | | |
| | | | | | | 76,229,777 | |
| | | | | | | | |
| | |
DIVERSIFIED FINANCIALS — 12.55% | | | | | | | | |
Capital Markets — 9.40% | | | | | | | | |
Hargreaves Lansdown plc | | | 2,589,740 | | | | 44,255,466 | |
Nomura Holdings, Inc. | | | 5,171,910 | | | | 30,453,186 | |
Partners Group Holding AG | | | 128,442 | | | | 38,395,144 | |
Schroders plc | | | 748,655 | | | | 35,537,755 | |
Consumer Finance — 1.47% | | | | | | | | |
a First Cash Financial Services, Inc. | | | 500,959 | | | | 23,304,613 | |
Diversified Financial Services — 1.68% | | | | | | | | |
BM&F Bovespa SA | | | 7,603,503 | | | | 26,587,424 | |
| | | | | | | | |
| | | | | | | 198,533,588 | |
| | | | | | | | |
| | |
ENERGY — 2.10% | | | | | | | | |
Oil, Gas & Consumable Fuels — 2.10% | | | | | | | | |
Canadian Oil Sands Ltd. | | | 2,203,700 | | | | 17,138,246 | |
a Lundin Petroleum AB | | | 1,175,928 | | | | 16,125,717 | |
| | | | | | | | |
| | | | | | | 33,263,963 | |
| | | | | | | | |
| | |
FOOD & STAPLES RETAILING — 2.41% | | | | | | | | |
Food & Staples Retailing — 2.41% | | | | | | | | |
Wal-Mart de Mexico SAB de C.V. | | | 15,332,556 | | | | 38,206,999 | |
| | | | | | | | |
| | | | | | | 38,206,999 | |
| | | | | | | | |
| | |
FOOD, BEVERAGE & TOBACCO — 3.32% | | | | | | | | |
Beverages — 1.52% | | | | | | | | |
Coca Cola Icecek AS | | | 1,415,983 | | | | 23,946,151 | |
Tobacco — 1.80% | | | | | | | | |
ITC Ltd. | | | 5,480,501 | | | | 28,505,392 | |
| | | | | | | | |
| | | | | | | 52,451,543 | |
| | | | | | | | |
| | |
INSURANCE — 1.75% | | | | | | | | |
Insurance — 1.75% | | | | | | | | |
St. James’s Place plc | | | 2,000,600 | | | | 27,733,064 | |
| | | | | | | | |
| | | | | | | 27,733,064 | |
| | | | | | | | |
| | |
MEDIA — 3.67% | | | | | | | | |
Media — 3.67% | | | | | | | | |
REA Group Ltd. | | | 508,290 | | | | 18,691,075 | |
Rightmove plc | | | 884,175 | | | | 39,308,209 | |
| | | | | | | | |
| | | | | | | 57,999,284 | |
| | | | | | | | |
8 Semi-Annual Report
| | |
| SCHEDULE OF INVESTMENTS, CONTINUED | | |
| |
Thornburg International Growth Fund | | March 31, 2015 (Unaudited) |
| | | | | | | | |
| | | Shares/ | | | | |
| | | Principal Amount | | | Value | |
PHARMACEUTICALS, BIOTECHNOLOGY & LIFE SCIENCES — 8.91% | | | | | | | | |
Biotechnology — 3.05% | | | | | | | | |
Abcam plc | | | 2,249,126 | | | $ | 16,197,996 | |
Grifols, S.A. | | | 747,061 | | | | 32,115,038 | |
Life Sciences Tools & Services — 1.46% | | | | | | | | |
Eurofins Scientific | | | 85,888 | | | | 23,157,038 | |
Pharmaceuticals — 4.40% | | | | | | | | |
Perrigo Co. plc | | | 181,764 | | | | 30,091,030 | |
a Valeant Pharmaceuticals International, Inc. | | | 198,890 | | | | 39,503,532 | |
| | | | | | | | |
| | | | | | | 141,064,634 | |
| | | | | | | | |
| | |
REAL ESTATE — 1.83% | | | | | | | | |
Real Estate Management & Development — 1.83% | | | | | | | | |
Foxtons Group plc | | | 9,484,915 | | | | 28,878,517 | |
| | | | | | | | |
| | | | | | | 28,878,517 | |
| | | | | | | | |
| | |
RETAILING — 4.24% | | | | | | | | |
Internet & Catalog Retail — 4.24% | | | | | | | | |
a ASOS plc | | | 470,782 | | | | 25,343,412 | |
a priceline.com, Inc. | | | 35,905 | | | | 41,798,806 | |
| | | | | | | | |
| | | | | | | 67,142,218 | |
| | | | | | | | |
| | |
SEMICONDUCTORS & SEMICONDUCTOR EQUIPMENT — 1.58% | | | | | | | | |
Semiconductors & Semiconductor Equipment — 1.58% | | | | | | | | |
ARM Holdings plc | | | 1,527,423 | | | | 25,036,861 | |
| | | | | | | | |
| | | | | | | 25,036,861 | |
| | | | | | | | |
| | |
SOFTWARE & SERVICES — 20.94% | | | | | | | | |
Information Technology Services — 7.52% | | | | | | | | |
MasterCard, Inc. | | | 522,368 | | | | 45,127,371 | |
a Optimal Payments plc | | | 6,170,585 | | | | 48,330,194 | |
QIWI plc ADR | | | 416,458 | | | | 10,003,321 | |
Wirecard AG | | | 365,508 | | | | 15,468,976 | |
Internet Software & Services — 8.22% | | | | | | | | |
a Alibaba Group Holding Ltd. ADR | | | 283,016 | | | | 23,558,252 | |
a Auto Trader Group plc | | | 7,394,117 | | | | 27,613,031 | |
a Baidu, Inc. ADR | | | 154,680 | | | | 32,235,312 | |
carsales.com Ltd. | | | 1,575,524 | | | | 12,395,978 | |
Kakaku.com, Inc. | | | 1,672,202 | | | | 27,857,252 | |
a Yandex NV | | | 423,926 | | | | 6,428,838 | |
Software — 5.20% | | | | | | | | |
Constellation Software, Inc. | | | 110,101 | | | | 38,054,411 | |
Solera Holdings, Inc. | | | 857,690 | | | | 44,308,265 | |
| | | | | | | | |
| | | | | | | 331,381,201 | |
| | | | | | | | |
| | |
TECHNOLOGY HARDWARE & EQUIPMENT — 5.38% | | | | | | | | |
Electronic Equipment, Instruments & Components — 5.38% | | | | | | | | |
a Avigilon Corp. | | | 1,455,040 | | | | 24,205,671 | |
Hexagon AB | | | 708,990 | | | | 25,240,658 | |
Ingenico S.A. | | | 325,101 | | | | 35,760,495 | |
| | | | | | | | |
| | | | | | | 85,206,824 | |
| | | | | | | | |
| | |
TRANSPORTATION — 1.86% | | | | | | | | |
Airlines — 1.86% | | | | | | | | |
Copa Holdings SA | | | 290,765 | | | | 29,358,542 | |
| | | | | | | | |
| | | | | | | 29,358,542 | |
| | | | | | | | |
TOTAL COMMON STOCK (Cost $1,318,735,116) | | | | | | | 1,450,284,739 | |
| | | | | | | | |
Semi-Annual Report 9
| | |
| SCHEDULE OF INVESTMENTS, CONTINUED | | |
| |
Thornburg International Growth Fund | | March 31, 2015 (Unaudited) |
| | | | | | | | |
| | | Shares/ | | | | |
| | | Principal Amount | | | Value | |
SHORT TERM INVESTMENTS — 6.04% | | | | | | | | |
Bank of New York Tri-Party Repurchase Agreement 0.23% dated 3/31/2015 due 4/1/2015, repurchase price $18,000,115 collateralized by 7 U.S. Government debt securities and 9 corporate debt securities, having an average coupon of 4.14%,a minimum credit rating of BBB-, maturity dates from 8/15/2015 to 1/1/2045, and having an aggregate market value of $19,036,915 at 3/31/2015 | | $ | 18,000,000 | | | $ | 18,000,000 | |
CenterPoint Energy, Inc., 0.60%, 4/1/2015 | | | 23,000,000 | | | | 23,000,000 | |
J.M. Smucker Co., 0.40%, 4/1/2015 | | | 17,623,000 | | | | 17,623,000 | |
Kroger Co., 0.40%, 4/7/2015 | | | 23,000,000 | | | | 22,998,467 | |
Public Service Co. of Colorado, 0.50%, 4/7/2015 | | | 14,000,000 | | | | 13,998,833 | |
| | | | | | | | |
TOTAL SHORT TERM INVESTMENTS (Cost $95,620,300) | | | | | | | 95,620,300 | |
| | | | | | | | |
TOTAL INVESTMENTS — 97.69% (Cost $1,414,355,416) | | | | | | $ | 1,545,905,039 | |
OTHER ASSETS LESS LIABILITIES — 2.31% | | | | | | | 36,582,441 | |
| | | | | | | | |
NET ASSETS — 100.00% | | | | | | $ | 1,582,487,480 | |
| | | | | | | | |
Footnote Legend
Portfolio Abbreviations
To simplify the listings of securities, abbreviations are used per the table below:
| | |
| ADR | | American Depositary Receipt |
See notes to financial statements.
10 Semi-Annual Report
This page intentionally left blank.
Semi-Annual Report 11
| | |
| STATEMENT OF ASSETS AND LIABILITIES | | |
| |
Thornburg International Growth Fund | | March 31, 2015 (Unaudited) |
| | | | |
ASSETS | | | | |
Investments at value (cost $1,414,355,416) (Note 2) | | $ | 1,545,905,039 | |
Cash | | | 16,365,770 | |
Cash denominated in foreign currency (cost $2,376,171) | | | 2,376,171 | |
Receivable for investments sold | | | 50,370,002 | |
Receivable for fund shares sold | | | 3,297,006 | |
Unrealized appreciation on forward currency contracts (Note 7) | | | 4,832,927 | |
Dividends receivable | | | 2,111,456 | |
Dividend and interest reclaim receivable | | | 525,107 | |
Interest receivable | | | 115 | |
Prepaid expenses and other assets | | | 184,575 | |
| | | | |
Total Assets | | | 1,625,968,168 | |
| | | | |
| |
LIABILITIES | | | | |
Payable for investments purchased | | | 33,421,672 | |
Payable for fund shares redeemed | | | 5,515,089 | |
Unrealized depreciation on forward currency contracts (Note 7) | | | 3,002,682 | |
Payable to investment advisor and other affiliates (Note 3) | | | 1,213,527 | |
Accounts payable and accrued expenses | | | 326,401 | |
Dividends payable | | | 1,317 | |
| | | | |
Total Liabilities | | | 43,480,688 | |
| | | | |
| |
NET ASSETS | | $ | 1,582,487,480 | |
| | | | |
NET ASSETS CONSIST OF | | | | |
Distribution in excess of net investment income | | $ | (2,299,813 | ) |
Net unrealized appreciation on investments | | | 133,315,775 | |
Accumulated net realized gain (loss) | | | (30,990,357 | ) |
Net capital paid in on shares of beneficial interest | | | 1,482,461,875 | |
| | | | |
| | $ | 1,582,487,480 | |
| | | | |
12 Semi-Annual Report
| | |
| STATEMENT OF ASSETS AND LIABILITIES, CONTINUED | | |
| |
Thornburg International Growth Fund | | March 31, 2015 (Unaudited) |
| | | | |
| |
NET ASSET VALUE | | | | |
Class A Shares: | | | | |
Net asset value and redemption price per share ($256,809,844 applicable to 13,602,781 shares of beneficial interest outstanding - Note 4) | | $ | 18.88 | |
Maximum sales charge, 4.50% of offering price | | | 0.89 | |
| | | | |
Maximum offering price per share | | $ | 19.77 | |
| | | | |
| |
Class C Shares: | | | | |
Net asset value and offering price per share* ($120,227,293 applicable to 6,626,452 shares of beneficial interest outstanding - Note 4) | | $ | 18.14 | |
| | | | |
| |
Class I Shares: | | | | |
Net asset value, offering and redemption price per share ($1,069,937,526 applicable to 55,323,581 shares of beneficial interest outstanding - Note 4) | | $ | 19.34 | |
| | | | |
| |
Class R3 Shares: | | | | |
Net asset value, offering and redemption price per share ($23,066,778 applicable to 1,229,476 shares of beneficial interest outstanding - Note 4) | | $ | 18.76 | |
| | | | |
| |
Class R4 Shares: | | | | |
Net asset value, offering and redemption price per share ($39,821,268 applicable to 2,120,952 shares of beneficial interest outstanding - Note 4) | | $ | 18.78 | |
| | | | |
| |
Class R5 Shares: | | | | |
Net asset value, offering and redemption price per share ($67,078,560 applicable to 3,459,762 shares of beneficial interest outstanding - Note 4) | | $ | 19.39 | |
| | | | |
| |
Class R6 Shares: | | | | |
Net asset value, offering and redemption price per share ($5,546,211 applicable to 285,386 shares of beneficial interest outstanding - Note 4) | | $ | 19.43 | |
| | | | |
| * | Redemption price per share is equal to net asset value less any applicable contingent deferred sales charge. |
See notes to financial statements.
Semi-Annual Report 13
STATEMENT OF OPERATIONS
| | |
| |
Thornburg International Growth Fund | | Six Months Ended March 31, 2015 (Unaudited) |
| | | | |
INVESTMENT INCOME | | | | |
Dividend income (net of foreign taxes withheld of $217,276) | | $ | 7,380,632 | |
Interest income | | | 135,850 | |
| | | | |
Total Income | | | 7,516,482 | |
| | | | |
| |
EXPENSES | | | | |
Investment advisory fees (Note 3) | | | 6,868,995 | |
Administration fees (Note 3) | | | | |
Class A Shares | | | 198,631 | |
Class C Shares | | | 79,619 | |
Class I Shares | | | 277,578 | |
Class R3 Shares | | | 14,127 | |
Class R4 Shares | | | 24,024 | |
Class R5 Shares | | | 16,942 | |
Distribution and service fees (Note 3) | | | | |
Class A Shares | | | 397,261 | |
Class C Shares | | | 635,773 | |
Class R3 Shares | | | 56,079 | |
Class R4 Shares | | | 47,998 | |
Transfer agent fees | | | | |
Class A Shares | | | 271,175 | |
Class C Shares | | | 72,796 | |
Class I Shares | | | 466,205 | |
Class R3 Shares | | | 33,447 | |
Class R4 Shares | | | 56,976 | |
Class R5 Shares | | | 83,765 | |
Class R6 Shares | | | 910 | |
Registration and filing fees | | | | |
Class A Shares | | | 17,084 | |
Class C Shares | | | 1,820 | |
Class I Shares | | | 29,621 | |
Class R3 Shares | | | 8,721 | |
Class R4 Shares | | | 8,813 | |
Class R5 Shares | | | 9,409 | |
Class R6 Shares | | | 10,599 | |
Custodian fees (Note 3) | | | 208,155 | |
Professional fees | | | 34,429 | |
Accounting fees | | | 40,215 | |
Trustee fees | | | 38,300 | |
Other expenses | | | 93,552 | |
| | | | |
Total Expenses | | | 10,103,019 | |
Less: | | | | |
Expenses reimbursed by investment advisor (Note 3) | | | (255,160 | ) |
Fees paid indirectly (Note 3) | | | (605 | ) |
| | | | |
Net Expenses | | | 9,847,254 | |
| | | | |
Net Investment Loss | | $ | (2,330,772 | ) |
| | | | |
14 Semi-Annual Report
| | |
| STATEMENT OF OPERATIONS, CONTINUED | | |
| |
Thornburg International Growth Fund | | Six Months Ended March 31, 2015 (Unaudited) |
| | | | |
REALIZED AND UNREALIZED GAIN (LOSS) | | | | |
Net realized gain (loss) from: | | | | |
Investments | | $ | (464,292 | ) |
Forward currency contracts (Note 7) | | | 27,235,927 | |
Foreign currency transactions | | | (232,427 | ) |
| | | | |
| | | 26,539,208 | |
| | | | |
Net change in unrealized appreciation (depreciation) on: | | | | |
Investments (net of change in deferred taxes payable of $ 389,723) | | | 47,875,269 | |
Foreign currency translations | | | 36,207 | |
Forward currency contracts (Note 7) | | | (9,344,458 | ) |
| | | | |
| | | 38,567,018 | |
| | | | |
Net Realized and Unrealized Gain | | | 65,106,226 | |
| | | | |
Net Increase in Net Assets Resulting from Operations | | $ | 62,775,454 | |
| | | | |
See notes to financial statements.
Semi-Annual Report 15
STATEMENTS OF CHANGES IN NET ASSETS
Thornburg International Growth Fund
| | | | | | | | |
| | | Six Months Ended | | | Year Ended | |
| | | March 31, 2015* | | | September 30, 2014 | |
INCREASE (DECREASE) IN NET ASSETS FROM | | | | | | | | |
| | |
OPERATIONS | | | | | | | | |
Net investment income (loss) | | $ | (2,330,772 | ) | | $ | 5,013,784 | |
Net realized gain (loss) from investments, forward currency contracts, and foreign currency transactions | | | 26,539,208 | | | | 66,096,987 | |
Net unrealized appreciation (depreciation) on investments, forward currency contracts, foreign currency translations, and deferred taxes | | | 38,567,018 | | | | (194,644,609 | ) |
| | | | | | | | |
| | |
Net Increase (Decrease) in Net Assets Resulting from Operations | | | 62,775,454 | | | | (123,533,838 | ) |
| | |
DIVIDENDS TO SHAREHOLDERS | | | | | | | | |
From net investment income | | | | | | | | |
Class I Shares | | | (283,766 | ) | | | (4,077,687 | ) |
Class R5 Shares | | | (15,462 | ) | | | (236,274 | ) |
Class R6 Shares | | | (2,115 | ) | | | (16,448 | ) |
From realized gains | | | | | | | | |
Class A Shares | | | (15,965,821 | ) | | | (17,999,580 | ) |
Class C Shares | | | (7,113,275 | ) | | | (3,700,916 | ) |
Class I Shares | | | (60,990,387 | ) | | | (22,590,256 | ) |
Class R3 Shares | | | (1,180,199 | ) | | | (398,754 | ) |
Class R4 Shares | | | (1,967,801 | ) | | | (774,775 | ) |
Class R5 Shares | | | (3,451,556 | ) | | | (1,254,132 | ) |
Class R6 Shares | | | (216,084 | ) | | | (76,351 | ) |
| | |
FUND SHARE TRANSACTIONS (NOTE 4) | | | | | | | | |
Class A Shares | | | (246,702,331 | ) | | | (23,243,109 | ) |
Class C Shares | | | (23,252,823 | ) | | | 43,629,520 | |
Class I Shares | | | (81,465,454 | ) | | | 533,515,434 | |
Class R3 Shares | | | 606,726 | | | | 10,404,825 | |
Class R4 Shares | | | 1,598,460 | | | | 15,436,358 | |
Class R5 Shares | | | (1,499,882 | ) | | | 32,771,453 | |
Class R6 Shares | | | 1,657,933 | | | | 1,732,060 | |
| | | | | | | | |
Net Increase (Decrease) in Net Assets | | | (377,468,383 | ) | | | 439,587,530 | |
| | |
NET ASSETS | | | | | | | | |
Beginning of Period | | | 1,959,955,863 | | | | 1,520,368,333 | |
| | | | | | | | |
| | |
End of Period | | $ | 1,582,487,480 | | | $ | 1,959,955,863 | |
| | | | | | | | |
Undistributed (distribution in excess of) net investment income | | $ | (2,299,813 | ) | | $ | 332,302 | |
See notes to financial statements.
16 Semi-Annual Report
| | |
| NOTES TO FINANCIAL STATEMENTS | | |
| |
Thornburg International Growth Fund | | March 31, 2015 (Unaudited) |
NOTE 1 – ORGANIZATION
Thornburg International Growth Fund, hereinafter referred to as (the “Fund)” is a diversified series of Thornburg Investment Trust (the “Trust”). The Fund commenced operations on February 1, 2007. The Trust was organized as a Massachusetts business trust under a Declaration of Trust dated June 3, 1987 and is registered as a diversified, open-end management investment company under the Investment Company Act of 1940, as amended. The Fund is currently one of eighteen separate series of the Trust. Each series is considered to be a separate entity for financial reporting and tax purposes and bears expenses directly attributable to it. The Fund seeks long-term capital appreciation by investing in equity securities selected for their growth potential.
The Fund currently offers seven classes of shares of beneficial interest: Class A, Class C, Institutional Class (“Class I”), and Retirement Classes (“Class R3,” “Class R4,” “Class R5,” and “Class R6”). Each class of shares of the Fund represents an interest in the same portfolio of investments, except that (i) Class A shares are sold subject to a front-end sales charge collected at the time the shares are purchased and bear a service fee, (ii) Class C shares are sold at net asset value without a sales charge at the time of purchase, but are subject to a contingent deferred sales charge upon redemption within one year of purchase, and bear both a service fee and a distribution fee, (iii) Class I and Class R5 shares are sold at net asset value without a sales charge at the time of purchase and may be subject to a service fee, (iv) Class R3 shares are sold at net asset value without a sales charge at the time of purchase, but bear both a service fee and distribution fee, (v) Class R4 shares are sold at net asset value without a sales charge at the time of purchase, but bear a service fee, (vi) Class R6 shares are sold at net asset value without a sales charge at the time of purchase, and (vii) the respective classes may have different reinvestment privileges and conversion rights. Additionally, the Fund may allocate among its classes certain expenses, to the extent allocable to specific classes, including transfer agent fees, government registration fees, certain printing and postage costs, and administrative and legal expenses. Currently, class specific expenses of the Fund are limited to service and distribution fees, administration fees, and certain registration and transfer agent expenses.
NOTE 2 – SIGNIFICANT ACCOUNTING POLICIES
The following is a summary of significant accounting policies followed by the Fund in the preparation of its financial statements. The Fund is an investment company and prepares its financial statements in conformity with U.S. generally accepted accounting principles (“GAAP”), including the investment company accounting and reporting guidance in the Financial Accounting Standards Board (the “FASB”) Accounting Standard Codification Topic 946. The preparation of financial statements in conformity with GAAP requires management to make estimates and assumptions that affect the reported amounts of assets and liabilities and disclosure of contingent assets and liabilities at the date of the financial statements and the reported amounts of increases (decreases) in net assets from operations during the reporting period. Actual results could differ from those estimates.
Significant accounting policies of the Fund are as follows:
Valuation Policy and Procedures: The Trustees of the Trust (the “Trustees”) have authorized employees of the Fund’s investment advisor, acting as the Valuation and Pricing Committee (the “Committee”), to make certain valuation determinations, subject to oversight and review by the Trustees and the Audit Committee of the Trustees. The Committee and other employees of the Fund’s investment advisor administer and implement the valuation process. The Committee regularly reviews its own fair value decisions, as well as valuations, valuation techniques and services furnished by pricing services, considers circumstances in the markets which may require valuation determinations by the Committee and reviews previous valuation determinations. The Committee also reports on its activities, the performance of the pricing services and other matters to the Trustees and the Audit Committee of the Trustees.
In determining a fair value for a portfolio investment, the Committee seeks to determine the price that the Fund would reasonably expect to receive upon a sale of the investment in an orderly transaction between market participants at the measurement date. Typically, the fair value process employs standing instructions to use quoted prices in active markets or the use of independent pricing services. Less frequently, the Committee may make a fair value determination using other methods. However, because fair value prices are estimated prices, the determination of fair value for an investment may differ from the value that would be realized by the Fund upon a sale of the investment, and that difference could be material to the Fund’s financial statements. The Committee’s determination of fair value for an investment may also differ from the prices obtained by other persons (including other mutual funds) for the investment.
Valuation of Investments: Portfolio investments listed or traded on a national securities exchange are valued on the valuation date at the last reported trade price on the exchange that is the primary market for the investment. Portfolio investments reported by NASDAQ are valued at the NASDAQ official closing price. Portfolio investments traded on an exchange for which there has been no trade that day and other equity investments traded in the over-the-counter market are valued at the mean between the last reported bid and ask prices. Any foreign investment traded on exchanges outside the United States is valued at the price of the investment on the exchange that is normally the investment’s primary market, as of the close of that exchange preceding the time of the Fund’s valuation measurement date.
In any case when the market value of an equity investment held by the Fund is not readily available, a determination of a fair value for the investment is made by the Committee. The Committee’s determinations are made using procedures in accordance with a policy
Semi-Annual Report 17
| | |
| NOTES TO FINANCIAL STATEMENTS, CONTINUED | | |
| |
Thornburg International Growth Fund | | March 31, 2015 (Unaudited) |
approved by the Trustees, which may include the use of a price obtained from an independent pricing service. The pricing service ordinarily values equity investments in these instances using multi-factor models to adjust market prices based upon various inputs, including exchange data, depositary receipt prices, futures, index data and other data. An investment’s market value is deemed not readily available whenever the exchange or market on which the investment is primarily traded is closed for the entire scheduled day of trading. Additionally, an investment’s market value may be deemed not readily available under other circumstances identified by the Trustees, including when developments occurring after the most recent close of the investment’s primary exchange or market, but before the most recent close of trading in Fund shares, or an unusual event or significant period of time occurring since the availability of a market quotation, create a question about the reliability of the investment’s market value. For example, on days when market volatility thresholds pre-determined by the Trustees are exceeded, foreign equity investments held by the Fund may be valued using synthetic pricing obtained from an independent pricing service approved by the Trustees, subject to the ability of the Committee to determine in any such instance to utilize market closing prices if the Committee considers closing prices to be more reliable.
Debt obligations held by the Fund have a primary over-the-counter market and are valued by an independent pricing service approved by the Trustees. The pricing service ordinarily values debt obligations using quoted bid prices and other methods, which include consideration of yields or prices of debt obligations of comparable quality, type of issue, coupon, maturity and rating, and indications as to value from dealers and general market conditions.
In any case when a pricing service fails to provide a price for a debt obligation held by the Fund, the Committee determines a fair value for the debt obligation using procedures in accordance with a policy approved by the Trustees, which may include the use of a price obtained from a different independent pricing service. Additionally, in any case when management believes that a price provided by a pricing service for a debt obligation held by the Fund may be unreliable, the Committee decides whether or not to use the pricing service’s valuation or to use an alternative method to determine a fair value for the debt obligation.
Quotations in foreign currencies for foreign portfolio investments are converted to U.S. dollar equivalents using the foreign exchange quotation in effect at the time of valuation.
Valuation Measurements: The Fund categorizes its investments based upon the inputs used in valuing those investments, according to a three-level hierarchy established by guidance from the FASB. Categorization of investments using this hierarchy is intended by the FASB to maximize the use of observable inputs and minimize the use of unobservable inputs by prioritizing that the most observable input be used when available. Observable inputs are those that market participants would use in valuing an investment based on available market data. Unobservable inputs are those that reflect assumptions about the information market participants would use in valuing an investment. An investment’s level within the hierarchy is based on the lowest level input that is deemed significant to the fair value measurement. The methodologies and relative inputs used to value investments are not necessarily indications of the risk or liquidity associated with investing in those investments.
Various inputs are used in determining the fair value measurement of the Fund’s investments. These inputs are generally summarized according to the three-level hierarchy below:
Level 1: Quoted prices in active markets for identical investments.
Level 2: Other direct or indirect significant observable inputs (including quoted prices for similar investments in active markets and other observable inputs, such as interest rates, prepayment rates, credit risk, etc.).
When market volatility thresholds are exceeded, foreign equity investments may be fair valued according to other significant observable inputs rather than quoted market prices. The affected investments will be characterized as Level 2 within the valuation hierarchy and revert to Level 1 after the threshold is no longer exceeded.
Level 3: Significant unobservable inputs (including the Committee’s own assumptions in determining the fair value of investments).
Portfolio investments with minimal, if any, market activity are characterized as Level 3 and are valued using significant unobservable inputs, typically including single broker quotes, which may be adjusted or unadjusted, related or comparable investments, last available transactions, and other relevant information. Valuations may also be based upon current market prices of securities that are comparable in coupon, rating, maturity and industry. An income based valuation approach would consider discounted anticipated future cash flows of the investment. Discounts may also be applied due to the nature or duration of any restrictions on the disposition of the investment. Valuations based upon the use of inputs from Levels 1, 2, or 3, may not represent the actual price received upon the disposition of an investment, and the Fund may receive a price that is lower than the valuation when it sells the investment.
The following table displays a summary of the fair value hierarchy measurements of the Fund’s investments as of March 31, 2015. In any instance when valuation inputs from more than one level are used to determine the fair value of a specific investment, the investment is placed in the level of the table based upon the lowest level input that is significant in determining the fair value of the investment:
18 Semi-Annual Report
| | |
| NOTES TO FINANCIAL STATEMENTS, CONTINUED | | |
| |
Thornburg International Growth Fund | | March 31, 2015 (Unaudited) |
| | | | | | | | | | | | | | | | |
| | | Fair Value Measurements at March 31, 2015 | |
| | | Total | | | Level 1 | | | Level 2 | | | Level 3 | |
Assets | | | | | | | | | | | | | | | | |
Investments in Securities* | | | | | | | | | | | | | | | | |
Common Stock | | $ | 1,450,284,739 | | | $ | 1,450,284,739 | | | $ | — | | | $ | — | |
Short Term Investments | | | 95,620,300 | | | | — | | | | 95,620,300 | | | | — | |
| | | | | | | | | | | | | | | | |
Total Investments in Securities | | $ | 1,545,905,039 | | | $ | 1,450,284,739 | | | $ | 95,620,300 | | | $ | — | |
Other Financial Instruments** | | | | | | | | | | | | | | | | |
Forward Currency Contracts | | $ | 4,832,927 | | | $ | — | | | $ | 4,832,927 | | | $ | — | |
Liabilities | | | | | | | | | | | | | | | | |
Other Financial Instruments** | | | | | | | | | | | | | | | | |
Forward Currency Contracts | | $ | (3,002,682 | ) | | $ | — | | | $ | (3,002,682 | ) | | $ | — | |
Spot Currency | | $ | (20,665 | ) | | $ | (20,665 | ) | | $ | — | | | $ | — | |
| * | See Schedule of Investments for a summary of the industry exposure as grouped according to the Global Industry Classification Standard (GICS), which is an industry taxonomy developed by MSCI, Inc. and Standard & Poor’s (S&P). |
| ** | Other Financial Instruments include investments not reflected in the Schedule of Investments, which may include futures, forwards and swap contracts, which are valued at the unrealized appreciation (depreciation) on the investment. |
In accordance with the guidance prescribed in Accounting Standards Update No. 2011-04, it is the policy of the Fund to recognize transfers between levels and the underlying events which caused the movement. The Fund recognized no transfers between levels for the six months ended March 31, 2015, other than when the Fund exceeded market volatility thresholds for foreign equity investments during the period.
Foreign Currency Translation: Portfolio investments and other assets and liabilities denominated in foreign currencies are translated into U.S. dollars based on the exchange rate of such currencies against the U.S. dollar on the date of valuation. Purchases and sales of investments and income items denominated in foreign currencies are translated into U.S. dollars at the exchange rate in effect on the transaction date. When the Fund purchases or sells foreign investments, it will customarily enter into a foreign exchange contract to minimize foreign exchange risk from the trade date to the settlement date of such transactions. The values of such spot contracts are included in receivable for investments sold and payable for investments purchased on the Statement of Assets and Liabilities.
The Fund does not separately report the effect of changes in foreign exchange rates from changes in market prices on investments held. Such changes are included in net unrealized appreciation or depreciation from investments.
Reported net realized gains or losses from foreign currency transactions arise due to purchases and sales of foreign currencies, currency gains or losses realized between the trade and settlement dates on investment transactions and the difference between the amounts of dividends, interest, and foreign withholding taxes recorded on the Fund’s books, and the U.S. dollar equivalent of the amounts actually received or paid.
Net change in unrealized appreciation and depreciation on foreign currency translations arise from changes in the fair value of assets and liabilities, other than investments at fiscal period end, resulting from changes in exchange rates.
Foreign Withholding Taxes: The Fund is subject to foreign tax withholding imposed by certain foreign countries in which the Fund may invest. Withholding taxes are incurred on certain foreign dividends and are accrued at the time the dividend is recognized based on applicable foreign tax law. The Fund files withholding tax reclaims in certain jurisdictions to recover a portion of amounts previously withheld, in view of various considerations, including recent decisions rendered by the courts in those and other jurisdictions. The Fund would expect to record a receivable for such a reclaim based on a variety of factors, including assessments of a jurisdiction’s legal obligation to pay reclaims, the jurisdiction’s administrative practices and payment history, and industry convention. To date the Fund has recorded no such receivable because there is no precedent for collecting such prior year reclaims and the likelihood of collection remains uncertain.
Deferred Foreign Capital Gain Taxes: The Fund is subject to a tax imposed on net realized gains of securities of certain foreign countries. The Fund records an estimated deferred tax liability for net unrealized gains on these investments as reflected in the accompanying financial statements.
Federal Income Taxes: It is the policy of the Trust to comply with the provisions of the Internal Revenue Code applicable to “regulated investment companies” and to distribute to shareholders substantially all taxable income, including any net realized gain on investments of the Fund. Therefore, no provision for federal income taxes is required.
Semi-Annual Report 19
| | |
| NOTES TO FINANCIAL STATEMENTS, CONTINUED | | |
| |
Thornburg International Growth Fund | | March 31, 2015 (Unaudited) |
Management reviews each uncertain tax position believed to be material to the preparation of the Fund’s financial statements, to assess if it is more likely than not that the position would be sustained upon examination, based upon the technical merits of the position. As of March 31, 2015, management has not identified any such position for which an asset or liability must be reflected in the Statement of Assets and Liabilities. The Fund’s tax returns remain subject to examination for three years after filing.
When-Issued and Delayed Delivery Transactions: The Fund may engage in when-issued or delayed delivery transactions. To the extent the Fund engages in such transactions, it will do so for the purpose of acquiring portfolio investments consistent with the Fund’s investment objectives and not for the purpose of investment leverage or to speculate on interest rate and/or market changes. At the time the Fund makes a commitment to purchase an investment on a when-issued or delayed delivery basis, the Fund will record the transaction and reflect the value in determining its net asset value. When effecting such transactions, assets of an amount sufficient to make payment for the portfolio investments to be purchased will be segregated on the Fund’s records on the trade date. Investments purchased on a when-issued or delayed delivery basis do not earn interest until the settlement date.
Dividends: Dividends to shareholders, if any, are generally paid quarterly and are reinvested in additional shares of the Fund at net asset value per share at the close of business on the dividend payment date or, at the shareholder’s option, paid in cash. Net realized capital gains, to the extent available, will be distributed at least annually. Distributions to shareholders are based on income tax regulations and therefore, their characteristics may differ for financial statement and tax purposes.
Repurchase Agreements: The Fund may invest excess cash in repurchase agreements whereby the Fund purchases investments, which serve as collateral, with an agreement to resell such collateral to the seller at an agreed upon price at the maturity date of the repurchase agreement. Investments pledged as collateral for repurchase agreements are held in custody until maturity of the repurchase agreement. Provisions in the agreements require that the market value of the collateral is at least equal to the repurchase value in the event of default. In the event of default, the Fund has the right to liquidate the collateral and apply the proceeds in satisfaction of the obligation. Under certain circumstances, in the event of default or bankruptcy by the other party to the agreement, realization and/or retention of the collateral may be subject to legal proceedings.
General: Investment transactions are accounted for on a trade date basis. Interest income is accrued as earned and dividend income is recorded on the ex-dividend date. Certain income from foreign investments is recognized as soon as information is available to the Fund. Realized gains and losses from the sale of investments are recorded on an identified cost basis. Net investment income (other than class specific expenses) and realized and unrealized gains and losses are allocated daily to each class of shares based upon the relative net asset value of outstanding shares of each class of shares at the beginning of the day (after adjusting for the current share activity of the respective class). Expenses common to all Funds are allocated among the Funds comprising the Trust based upon their relative net asset values or other appropriate allocation methods.
Guarantees and Indemnifications: Under the Trust’s organizational documents (and under separate agreements with the independent Trustees), its officers and Trustees are indemnified against certain liabilities arising out of the performance of their duties to the Fund. Additionally, in the normal course of business the Trust enters into contracts with service providers that contain general indemnification clauses. The Trust’s maximum exposure under these arrangements is unknown. However, based on experience, the Trust expects the risk of loss to be remote.
NOTE 3 – INVESTMENT ADVISORY FEE AND OTHER TRANSACTIONS WITH AFFILIATES
Pursuant to an investment advisory agreement, Thornburg Investment Management, Inc. (the “Advisor”) serves as the investment advisor and performs services for the Fund for which the fees are payable at the end of each month. For the six months ended March 31, 2015, these fees were payable at annual rates ranging from .875 of 1% to .675 of 1% per annum of the average daily net assets of the Fund depending on the Fund’s asset size. The Trust has also entered into administrative services agreements with the Advisor, whereby the Advisor will perform certain administrative services for the shareholders of each class of the Fund’s shares (except for Class R6 shares, which do not have an administrative services agreement) and for which fees will be payable at an annual rate of up to .125 of 1% per annum of the average daily net assets attributable to each class of shares.
The Trust has an underwriting agreement with Thornburg Securities Corporation (the “Distributor,” an affiliate of the Advisor), which acts as the distributor of the Fund’s shares. For the six months ended March 31, 2015, the Distributor has advised the Fund that it earned commissions aggregating $9,317 from the sale of Class A shares, and collected contingent deferred sales charges aggregating $45,603 from redemptions of Class C shares of the Fund.
Pursuant to a service plan under Rule 12b-1 of the Investment Company Act of 1940, the Fund may reimburse to the Advisor an amount not to exceed .25 of 1% per annum of the average daily net assets attributable to each class of shares of the Fund (except for Class R6 shares, which do not have a Rule 12b-1 service plan) for payments made by the Advisor to securities dealers and other financial institutions to obtain various shareholder and distribution related services. For the six months ended March 31, 2015, there were no 12b-1 service plan fees charged for Class I and R5 shares. The Advisor may pay out of its own resources additional expenses for distribution of the Fund’s shares and shareholder services.
20 Semi-Annual Report
| | |
| NOTES TO FINANCIAL STATEMENTS, CONTINUED | | |
| |
Thornburg International Growth Fund | | March 31, 2015 (Unaudited) |
The Trust has also adopted distribution plans pursuant to Rule 12b-1, applicable only to the Fund’s Class C and Class R3 shares, under which the Fund compensates the Distributor for services in promoting the sale of Class C and Class R3 shares of the Fund at an annual rate of up to .75 of 1% per annum of the average daily net assets attributable to Class C shares, and an annual rate of up to .25 of 1% per annum of the average daily net assets attributable to Class R3 shares. Total fees incurred by each class of shares of the Fund under their respective service and distribution plans for the six months ended March 31, 2015, are set forth in the Statement of Operations.
The Advisor and Distributor have contractually agreed to waive fees and reimburse expenses incurred by the Fund so that actual expenses of certain share classes do not exceed levels as specified in the Fund’s most recent prospectuses. The agreement may be terminated by the Fund at any time, but may not be terminated by the Advisor or Distributor before February 1, 2016, unless the Advisor ceases to be the investment advisor to the Fund or the Distributor ceases to be the distributor of the Fund prior to that date. The Advisor and Distributor retain the right to be repaid by the Fund for fee waivers and expense reimbursements if expenses fall below the contractual limit prior to the end of the fiscal year.
For the six months ended March 31, 2015, the Advisor contractually reimbursed certain class specific expenses, administrative fees, and distribution fees of $102,088 for Class I shares, $40,545 for Class R3 shares, $34,578 for Class R4 shares, $67,016 for Class R5 shares, and $10,933 for Class R6 shares.
The Trust has an agreement with the custodian bank to indirectly pay a portion of the custodian’s fees through credits earned by the Fund’s cash on deposit with the bank. This deposit agreement is an alternative to overnight investments. Custodial fees are adjusted to reflect amounts that would have been paid without this agreement, with a corresponding adjustment reflected as fees paid indirectly in the Statement of Operations. For the six months ended March 31, 2015, fees paid indirectly were $605.
Certain officers and Trustees of the Trust are also officers or directors of the Advisor and Distributor. The compensation of independent Trustees is borne by the Trust.
NOTE 4 – SHARES OF BENEFICIAL INTEREST
At March 31, 2015, there were an unlimited number of shares with no par value of beneficial interest authorized. Transactions in shares of beneficial interest were as follows:
| | | | | | | | | | | | | | | | |
| | | Six Months Ended | | | Year Ended | |
| | | March 31, 2015 (unaudited) | | | September 30, 2014 (audited) | |
| | | Shares | | | Amount | | | Shares | | | Amount | |
Class A Shares | | | | | | | | | | | | | | | | |
Shares sold | | | 1,394,786 | | | $ | 25,802,492 | | | | 19,478,383 | | | $ | 406,362,238 | |
Shares issued to shareholders in reinvestment of dividends | | | 805,337 | | | | 14,850,417 | | | | 810,018 | | | | 16,767,379 | |
Shares repurchased | | | (15,197,780 | ) | | | (287,355,240 | ) | | | (21,931,930 | ) | | | (446,372,726 | ) |
| | | | | | | | | | | | | | | | |
| | | | |
Net increase (decrease) | | | (12,997,657 | ) | | $ | (246,702,331 | ) | | | (1,643,529 | ) | | $ | (23,243,109 | ) |
| | | | | | | | | | | | | | | | |
| | | | |
Class C Shares | | | | | | | | | | | | | | | | |
Shares sold | | | 510,072 | | | $ | 9,040,178 | | | | 3,773,764 | | | $ | 76,464,884 | |
Shares issued to shareholders in reinvestment of dividends | | | 348,284 | | | | 6,189,006 | | | | 158,203 | | | | 3,184,629 | |
Shares repurchased | | | (2,165,172 | ) | | | (38,482,007 | ) | | | (1,817,777 | ) | | | (36,019,993 | ) |
| | | | | | | | | | | | | | | | |
| | | | |
Net increase (decrease) | | | (1,306,816 | ) | | $ | (23,252,823 | ) | | | 2,114,190 | | | $ | 43,629,520 | |
| | | | | | | | | | | | | | | | |
| | | | |
Class I Shares | | | | | | | | | | | | | | | | |
Shares sold | | | 18,121,919 | | | $ | 347,744,087 | | | | 44,346,455 | | | $ | 939,821,434 | |
Shares issued to shareholders in reinvestment of dividends | | | 2,975,423 | | | | 56,140,792 | | | | 1,114,267 | | | | 23,322,178 | |
Shares repurchased | | | (25,807,236 | ) | | | (485,350,333 | ) | | | (20,611,781 | ) | | | (429,628,178 | ) |
| | | | | | | | | | | | | | | | |
| | | | |
Net increase (decrease) | | | (4,709,894 | ) | | $ | (81,465,454 | ) | | | 24,848,941 | | | $ | 533,515,434 | |
| | | | | | | | | | | | | | | | |
Semi-Annual Report 21
| | |
| NOTES TO FINANCIAL STATEMENTS, CONTINUED | | |
| |
Thornburg International Growth Fund | | March 31, 2015 (Unaudited) |
| | | | | | | | | | | | | | | | |
| | | Six Months Ended | | | Year Ended | |
| | | March 31, 2015 (unaudited) | | | September 30, 2014 (audited) | |
| | | Shares | | | Amount | | | Shares | | | Amount | |
| | | | |
Class R3 Shares | | | | | | | | | | | | | | | | |
Shares sold | | | 216,437 | | | $ | 3,976,347 | | | | 869,661 | | | $ | 17,646,641 | |
Shares issued to shareholders in reinvestment of dividends | | | 57,359 | | | | 1,051,381 | | | | 15,665 | | | | 323,012 | |
Shares repurchased | | | (241,434 | ) | | | (4,421,002 | ) | | | (371,512 | ) | | | (7,564,828 | ) |
| | | | | | | | | | | | | | | | |
| | | | |
Net increase (decrease) | | | 32,362 | | | $ | 606,726 | | | | 513,814 | | | $ | 10,404,825 | |
| | | | | | | | | | | | | | | | |
| | | | |
Class R4 Shares | | | | | | | | | | | | | | | | |
Shares sold | | | 341,992 | | | $ | 6,280,090 | | | | 1,507,249 | | | $ | 31,205,477 | |
Shares issued to shareholders in reinvestment of dividends | | | 76,524 | | | | 1,403,461 | | | | 27,047 | | | | 557,168 | |
Shares repurchased | | | (327,940 | ) | | | (6,085,091 | ) | | | (797,079 | ) | | | (16,326,287 | ) |
| | | | | | | | | | | | | | | | |
| | | | |
Net increase (decrease) | | | 90,576 | | | $ | 1,598,460 | | | | 737,217 | | | $ | 15,436,358 | |
| | | | | | | | | | | | | | | | |
| | | | |
Class R5 Shares | | | | | | | | | | | | | | | | |
Shares sold | | | 464,999 | | | $ | 8,780,668 | | | | 2,818,225 | | | $ | 60,515,504 | |
Shares issued to shareholders in reinvestment of dividends | | | 183,235 | | | | 3,466,477 | | | | 70,939 | | | | 1,488,221 | |
Shares repurchased | | | (728,418 | ) | | | (13,747,027 | ) | | | (1,405,797 | ) | | | (29,232,272 | ) |
| | | | | | | | | | | | | | | | |
| | | | |
Net increase (decrease) | | | (80,184 | ) | | $ | (1,499,882 | ) | | | 1,483,367 | | | $ | 32,771,453 | |
| | | | | | | | | | | | | | | | |
| | | | |
Class R6 Shares | | | | | | | | | | | | | | | | |
Shares sold | | | 127,806 | | | $ | 2,487,039 | | | | 138,776 | | | $ | 2,965,917 | |
Shares issued to shareholders in reinvestment of dividends | | | 11,511 | | | | 218,199 | | | | 4,421 | | | | 92,799 | |
Shares repurchased | | | (55,504 | ) | | | (1,047,305 | ) | | | (62,896 | ) | | | (1,326,656 | ) |
| | | | | | | | | | | | | | | | |
| | | | |
Net increase (decrease) | | | 83,813 | | | $ | 1,657,933 | | | | 80,301 | | | $ | 1,732,060 | |
| | | | | | | | | | | | | | | | |
NOTE 5 – INVESTMENT TRANSACTIONS
For the six months ended March 31, 2015, the Fund had purchase and sale transactions of investments (excluding short-term investments) of $659,369,798 and $1,118,421,243, respectively.
NOTE 6 – INCOME TAXES
At March 31, 2015, information on the tax components of capital was as follows:
| | | | |
Cost of investments for tax purposes | | $ | 1,414,355,416 | |
| | | | |
Gross unrealized appreciation on a tax basis | | $ | 231,792,154 | |
Gross unrealized depreciation on a tax basis | | | (100,242,531 | ) |
| | | | |
Net unrealized appreciation (depreciation) on investments (tax basis) | | $ | 131,549,623 | |
| | | | |
At March 31, 2015, the Fund had deferred tax basis capital losses occurring subsequent to October 31, 2013 of $39,761,517. For tax purposes, such losses will be reflected in the year ending September 30, 2015.
22 Semi-Annual Report
| | |
| NOTES TO FINANCIAL STATEMENTS, CONTINUED | | |
| |
Thornburg International Growth Fund | | March 31, 2015 (Unaudited) |
NOTE 7 – DERIVATIVE FINANCIAL INSTRUMENTS WITH OFF-BALANCE SHEET RISK AND FOREIGN INVESTMENT RISK
The Fund may use a variety of derivative financial instruments to hedge or adjust the risks affecting its investment portfolio or to enhance investment returns. Provisions of FASB Accounting Standards Codification 815-10-50 (“ASC 815”), require certain disclosures. The disclosures are intended to provide users of financial statements with an understanding of the use of derivative instruments by the Fund and how these derivatives affect the financial position, financial performance and cash flows of the Fund. The Fund does not designate any derivative instruments as hedging instruments under ASC 815. During the six months ended March 31, 2015, the Fund’s principal exposure to derivative financial instruments of the type addressed by ASC 815 was investment in foreign exchange contracts. A foreign exchange contract is an agreement between two parties to exchange different currencies at a specified rate of exchange at an agreed upon future date. Foreign exchange contracts involve risks to the Fund, including the risk that a contract’s counterparty will not meet its obligations to the Fund, the risk that a change in a contract’s value may not correlate perfectly with the currency the contract was intended to track, and the risk that the advisor is unable to correctly implement its strategy in using a contract. In any such instance, the Fund may not achieve the intended benefit of entering into a contract, and may experience a loss. Additionally, the Fund’s risk of loss may exceed the amounts recognized on the Statement of Assets and Liabilities.
The Fund entered into forward currency contracts during the six months ended March 31, 2015 in the normal course of pursuing its investment objectives, with the objective of reducing the risk to the value of the Fund’s foreign investments from adverse changes in the relationship between the U.S. dollar and foreign currencies. In each case these contracts have been initiated in conjunction with foreign investment transactions.
These contracts are accounted for by the Fund under ASC 815. Unrealized appreciation and depreciation on outstanding contracts are reported in the Fund’s Statement of Assets and Liabilities, as measured by the difference between the forward exchange rates at the reporting date and the forward exchange rates at each contract’s inception date. Net realized gain (loss) on contracts closed during the period, and changes in net unrealized appreciation (depreciation) on outstanding contracts are recognized in the Fund’s Statement of Operations. The average value of open sell currency contracts for the six months ended March 31, 2015 was $225,728,618. Open buy currency contracts are entered into for the purpose of closing open sell currency contracts and the values are dependent upon the values of the open sell currency contracts to which they relate.
The following table displays the outstanding forward currency contracts at March 31, 2015:
| | | | | | | | | | | | | | | | | | | | | | | | |
| | | Outstanding Forward Currency Contracts to Buy or Sell at March 31, 2015 | |
Contract Description | | Buy/Sell | | | Contract
Amount | | | Contract
Value Date | | | Value
USD | | | Unrealized
Appreciation | | | Unrealized
Depreciation | |
Euro | | | Sell | | | | 41,545,100 | | | | 9/11/2015 | | | | 44,781,408 | | | $ | 481,148 | | | $ | — | |
Great Britain Pound | | | Sell | | | | 63,514,900 | | | | 7/22/2015 | | | | 94,149,624 | | | | 2,207,560 | | | | — | |
Great Britain Pound | | | Buy | | | | 24,642,400 | | | | 7/22/2015 | | | | 36,528,007 | | | | — | | | | (445,844 | ) |
Great Britain Pound | | | Buy | | | | 38,872,500 | | | | 7/22/2015 | | | | 57,621,618 | | | | — | | | | (2,207,436 | ) |
Japanese Yen | | | Sell | | | | 8,239,226,400 | | | | 5/20/2015 | | | | 68,741,822 | | | | 2,144,219 | | | | — | |
Japanese Yen | | | Buy | | | | 2,386,687,800 | | | | 5/20/2015 | | | | 19,912,703 | | | | — | | | | (155,471 | ) |
Japanese Yen | | | Buy | | | | 2,069,040,500 | | | | 5/20/2015 | | | | 17,262,496 | | | | — | | | | (193,931 | ) |
| | | | | | | | | | | | | | | | | | | | | | | | |
Total | | | | | | | | | | | | | | | | | | $ | 4,832,927 | | | $ | (3,002,682 | ) |
| | | | | | | | | | | | | | | | | | | | | | | | |
Net unrealized appreciation (depreciation) | | | | | | | | | | | $ | 1,830,245 | | | | | |
| | | | | | | | | | | | | | | | | | | | | | | | |
Semi-Annual Report 23
| | |
| NOTES TO FINANCIAL STATEMENTS, CONTINUED | | |
| |
Thornburg International Growth Fund | | March 31, 2015 (Unaudited) |
Certain forward currency contracts were entered into with State Street Bank and Trust Company (“SSB”) pursuant to an International Swaps and Derivatives Association (“ISDA”) Master Agreement. In the event of a default or termination under the ISDA Master Agreement with SSB, the non-defaulting party has the right to close out all outstanding forward currency contracts between the parties and to net any payment amounts under those contracts, resulting in a single net amount payable by one party to the other. Because the ISDA Master Agreement with SSB does not result in an offset of reported amounts of financial assets and financial liabilities in the Fund’s Statement of Assets and Liabilities unless there has been an event of default or termination event under that agreement, the Fund does not net its outstanding forward currency contracts for purposes of the disclosure in the Fund’s Statement of Assets and Liabilities. Instead the Fund recognizes the unrealized appreciation or depreciation on those forward currency contracts on a gross basis in the Fund’s Statement of Assets and Liabilities. At March 31, 2015, those recognized amounts are disclosed in the following table:
| | | | | | |
Fair Values of Derivative Financial Instruments at March 31, 2015 | |
| Asset Derivatives | | Balance Sheet Location | | Fair Value | |
Foreign exchange contracts | | Assets - Unrealized appreciation on forward currency contracts | | $ | 4,832,927 | |
| | |
| Liability Derivatives | | Balance Sheet Location | | Fair Value | |
Foreign exchange contracts | | Liabilities - Unrealized depreciation on forward currency contracts | | $ | (3,002,682 | ) |
Because the Fund does not currently receive or post cash collateral in connection with its currency forward contracts, and because all of the Fund’s outstanding currency forward contracts are with State Street Bank and Trust Company, the net amounts of the Fund’s assets and liabilities which are attributable to those contracts at March 31, 2015 can be determined by offsetting the dollar amounts shown in the preceding table. Based on those amounts, the net amount of the Fund’s assets which is attributable to its outstanding forward currency contracts at March 31, 2015 is $1,830,245, and the net amount of the Fund’s liabilities which is attributable to those contracts at that date is $0. The Fund’s forward currency contracts are valued each day, and the net amounts of the Fund’s assets and liabilities which are attributable to those contracts are expected to vary over time.
The net realized gain (loss) from forward currency contracts and the net change in unrealized appreciation (depreciation) on outstanding forward currency contracts recognized in the Fund’s Statement of Operations for the six months ended March 31, 2015 are disclosed in the following tables:
| | | | | | | | | | |
Net Realized Gain (loss) from Derivative Financial Instruments Recognized in Income for the Six Months Ended March 31, 2015 | |
| | | Total | | | | | Forward Currency Contracts | |
Foreign exchange contracts | | $ | 27,235,927 | | | | | $ | 27,235,927 | |
|
Net Change in Unrealized Appreciation (depreciation) on Derivative Financial Instruments Recognized in Income for the Six Months Ended March 31, 2015 | |
| | | Total | | | | | Forward Currency Contracts | |
Foreign exchange contracts | | $ | (9,344,458 | ) | | | | $ | (9,344,458 | ) |
OTHER NOTES
Risks: The Fund’s investments subject it to risks including, but not limited to, management risk, market and economic risk, risks affecting specific issuers, liquidity risk, the risks associated with investments in small- and mid-cap companies and non-U.S. issuers, credit risk, and interest rate risk. Please see the Fund’s prospectus for a discussion of the risks associated with an investment in the Fund.
Subsequent Events: Fund management believes no events have occurred between March 31, 2015 and the date of issuance of the financial statements that require adjustment to or disclosure in the accompanying financial statements.
24 Semi-Annual Report
This page intentionally left blank.
Semi-Annual Report 25
FINANCIAL HIGHLIGHTS
Thornburg International Growth Fund
| | | | | | | | | | | | | | | | | | | | | | | | | | | | | | | | | | | | | | | | | | | | | | | | | | | | | | | | | | | | |
| | | PER SHARE PERFORMANCE (for a share outstanding throughout the Period )+ | | | RATIOS TO AVERAGE NET ASSETS | | | SUPPLEMENTAL DATA | |
Unless Otherwise Noted,
Periods are Fiscal Years Ended Sept. 30, | | Net Asset
Value
Beginning
of Period | | | Net
Investment
Income
(Loss) | | | Net
Realized
&
Unrealized
Gain
(Loss)
on
Investments | | | Total from
Investment
Operations | | | Dividends
from Net
Investment
Income | | | Dividends
from Net
Realized
Gains | | | Total
Dividends | | | Net
Asset
Value
End
of
Period | | | Net
Investment
Income(Loss)
(%) | | | Expenses,
After
Expense
Reductions(%) | | | Expenses,
After
Expense
Reductions
and
Net of
Custody
Credits(%) | | | Expenses,
Before
Expense
Reductions
(%) | | | Total
Return
(%)(a) | | | Portfolio
Turnover
Rate
(%) | | | Net
Assets
at End
of
Period
(Thousands) | |
Class A Shares | | | | | | | | | | | | | | | | | | | | | | | | | | | | | | | | | | | | | | | | | | | | | | | | | | | | | |
2015(b)(c) | | $ | 19.10 | | | | (0.05 | ) | | | 0.81 | | | | 0.76 | | | | — | | | | (0.98 | ) | | | (0.98 | ) | | $ | 18.88 | | | | (0.55 | )(d) | | | 1.42 | (d) | | | 1.42 | (d) | | | 1.42 | (d) | | | 4.11 | | | | 40.46 | | | $ | 256,810 | |
2014(b) | | $ | 20.54 | | | | 0.02 | | | | (0.89 | ) | | | (0.87 | ) | | | — | | | | (0.57 | ) | | | (0.57 | ) | | $ | 19.10 | | | | 0.07 | | | | 1.33 | | | | 1.33 | | | | 1.33 | | | | (4.46 | ) | | | 106.18 | | | $ | 508,044 | |
2013(b) | | $ | 15.78 | | | | (0.01 | ) | | | 4.77 | | | | 4.76 | | | | — | | | | — | | | | — | | | $ | 20.54 | | | | (0.06 | ) | | | 1.41 | | | | 1.41 | | | | 1.42 | | | | 30.16 | | | | 89.17 | | | $ | 580,194 | |
2012(b) | | $ | 13.37 | | | | (0.06 | ) | | | 2.47 | | | | 2.41 | | | | — | (e) | | | — | | | | — | | | $ | 15.78 | | | | (0.41 | ) | | | 1.51 | | | | 1.51 | | | | 1.52 | | | | 18.03 | | | | 95.17 | | | $ | 255,725 | |
2011(b) | | $ | 12.25 | | | | 0.03 | | | | 1.13 | | | | 1.16 | | | | (0.04 | ) | | | — | | | | (0.04 | ) | | $ | 13.37 | | | | 0.19 | | | | 1.51 | | | | 1.50 | | | | 1.54 | | | | 9.43 | | | | 142.59 | | | $ | 104,918 | |
2010(b) | | $ | 10.36 | | | | — | (f) | | | 1.94 | | | | 1.94 | | | | (0.05 | ) | | | — | | | | (0.05 | ) | | $ | 12.25 | | | | (0.02 | ) | | | 1.61 | | | | 1.60 | | | | 1.70 | | | | 18.82 | | | | 128.86 | | | $ | 36,527 | |
Class C Shares | | | | | | | | | | | | | | | | | | | | | | | | | | | | | | | | | | | | | | | | | | | | | | | | | | | | | |
2015(c) | | $ | 18.45 | | | | (0.11 | ) | | | 0.78 | | | | 0.67 | | | | — | | | | (0.98 | ) | | | (0.98 | ) | | $ | 18.14 | | | | (1.21 | )(d) | | | 2.10 | (d) | | | 2.10 | (d) | | | 2.10 | (d) | | | 3.75 | | | | 40.46 | | | $ | 120,227 | |
2014 | | $ | 20.01 | | | | (0.13 | ) | | | (0.86 | ) | | | (0.99 | ) | | | — | | | | (0.57 | ) | | | (0.57 | ) | | $ | 18.45 | | | | (0.65 | ) | | | 2.09 | | | | 2.09 | | | | 2.09 | | | | (5.19 | ) | | | 106.18 | | | $ | 146,399 | |
2013 | | $ | 15.49 | | | | (0.14 | ) | | | 4.66 | | | | 4.52 | | | | — | | | | — | | | | — | | | $ | 20.01 | | | | (0.81 | ) | | | 2.15 | | | | 2.15 | | | | 2.17 | | | | 29.18 | | | | 89.17 | | | $ | 116,453 | |
2012 | | $ | 13.23 | | | | (0.17 | ) | | | 2.43 | | | | 2.26 | | | | — | | | | — | | | | — | | | $ | 15.49 | | | | (1.19 | ) | | | 2.27 | | | | 2.27 | | | | 2.28 | | | | 17.08 | | | | 95.17 | | | $ | 55,656 | |
2011 | | $ | 12.18 | | | | (0.11 | ) | | | 1.16 | | | | 1.05 | | | | — | | | | — | | | | — | | | $ | 13.23 | | | | (0.77 | ) | | | 2.30 | | | | 2.30 | | | | 2.34 | | | | 8.62 | | | | 142.59 | | | $ | 35,706 | |
2010 | | $ | 10.33 | | | | (0.09 | ) | | | 1.94 | | | | 1.85 | | | | — | | | | — | | | | — | | | $ | 12.18 | | | | (0.81 | ) | | | 2.38 | | | | 2.38 | | | | 2.51 | | | | 17.91 | | | | 128.86 | | | $ | 24,829 | |
Class I Shares | | | | | | | | | | | | | | | | | | | | | | | | | | | | | | | | | | | | | | | | | | | | | | | | | | | | | |
2015(c) | | $ | 19.51 | | | | (0.01 | ) | | | 0.82 | | | | 0.81 | | | | — | (e) | | | (0.98 | ) | | | (0.98 | ) | | $ | 19.34 | | | | (0.09 | )(d) | | | 0.98 | (d) | | | 0.98 | (d) | | | 1.00 | (d) | | | 4.31 | | | | 40.46 | | | $ | 1,069,937 | |
2014 | | $ | 20.96 | | | | 0.10 | | | | (0.91 | ) | | | (0.81 | ) | | | (0.07 | ) | | | (0.57 | ) | | | (0.64 | ) | | $ | 19.51 | | | | 0.47 | | | | 0.98 | | | | 0.98 | | | | 0.98 | | | | (4.09 | ) | | | 106.18 | | | $ | 1,171,032 | |
2013 | | $ | 16.04 | | | | 0.07 | | | | 4.85 | | | | 4.92 | | | | — | | | | — | | | | — | | | $ | 20.96 | | | | 0.38 | | | | 0.99 | | | | 0.99 | | | | 1.04 | | | | 30.67 | | | | 89.17 | | | $ | 737,536 | |
2012 | | $ | 13.55 | | | | 0.02 | | | | 2.50 | | | | 2.52 | | | | (0.03 | ) | | | — | | | | (0.03 | ) | | $ | 16.04 | | | | 0.10 | | | | 0.99 | | | | 0.99 | | | | 1.14 | | | | 18.60 | | | | 95.17 | | | $ | 198,938 | |
2011 | | $ | 12.38 | | | | 0.10 | | | | 1.14 | | | | 1.24 | | | | (0.07 | ) | | | — | | | | (0.07 | ) | | $ | 13.55 | | | | 0.66 | | | | 0.99 | | | | 0.98 | | | | 1.16 | | | | 10.03 | | | | 142.59 | | | $ | 75,538 | |
2010 | | $ | 10.44 | | | | 0.07 | | | | 1.96 | | | | 2.03 | | | | (0.09 | ) | | | — | | | | (0.09 | ) | | $ | 12.38 | | | | 0.58 | | | | 0.99 | | | | 0.99 | | | | 1.25 | | | | 19.60 | | | | 128.86 | | | $ | 39,169 | |
Class R3 Shares | | | | | | | | | | | | | | | | | | | | | | | | | | | | | | | | | | | | | | | | | | | | | | | | | | | | | |
2015(c) | | $ | 18.99 | | | | (0.05 | ) | | | 0.80 | | | | 0.75 | | | | — | | | | (0.98 | ) | | | (0.98 | ) | | $ | 18.76 | | | | (0.60 | )(d) | | | 1.50 | (d) | | | 1.50 | (d) | | | 1.86 | (d) | | | 4.08 | | | | 40.46 | | | $ | 23,067 | |
2014 | | $ | 20.46 | | | | — | (f) | | | (0.90 | ) | | | (0.90 | ) | | | — | | | | (0.57 | ) | | | (0.57 | ) | | $ | 18.99 | | | | — | (g) | | | 1.50 | | | | 1.50 | | | | 1.86 | | | | (4.63 | ) | | | 106.18 | | | $ | 22,739 | |
2013 | | $ | 15.73 | | | | (0.03 | ) | | | 4.76 | | | | 4.73 | | | | — | | | | — | | | | — | | | $ | 20.46 | | | | (0.15 | ) | | | 1.50 | | | | 1.50 | | | | 2.01 | | | | 30.07 | | | | 89.17 | | | $ | 13,982 | |
2012 | | $ | 13.34 | | | | (0.06 | ) | | | 2.45 | | | | 2.39 | | | | — | (e) | | | — | | | | — | | | $ | 15.73 | | | | (0.40 | ) | | | 1.50 | | | | 1.50 | | | | 2.49 | | | | 17.94 | | | | 95.17 | | | $ | 5,709 | |
2011 | | $ | 12.22 | | | | 0.01 | | | | 1.15 | | | | 1.16 | | | | (0.04 | ) | | | — | | | | (0.04 | ) | | $ | 13.34 | | | | 0.06 | | | | 1.50 | | | | 1.49 | | | | 3.27 | | | | 9.46 | | | | 142.59 | | | $ | 1,925 | |
2010 | | $ | 10.33 | | | | 0.01 | | | | 1.94 | | | | 1.95 | | | | (0.06 | ) | | | — | | | | (0.06 | ) | | $ | 12.22 | | | | 0.07 | | | | 1.50 | | | | 1.50 | | | | 4.34 | | | | 18.98 | | | | 128.86 | | | $ | 1,094 | |
Class R4 Shares | | | | | | | | | | | | | | | | | | | | | | | | | | | | | | | | | | | | | | | | | | | | | | | | | | | | | |
2015(c) | | $ | 19.00 | | | | (0.05 | ) | | | 0.81 | | | | 0.76 | | | | — | | | | (0.98 | ) | | | (0.98 | ) | | $ | 18.78 | | | | (0.49 | )(d) | | | 1.40 | (d) | | | 1.40 | (d) | | | 1.58 | (d) | | | 4.13 | | | | 40.46 | | | $ | 39,821 | |
2014 | | $ | 20.45 | | | | 0.01 | | | | (0.89 | ) | | | (0.88 | ) | | | — | | | | (0.57 | ) | | | (0.57 | ) | | $ | 19.00 | | | | 0.04 | | | | 1.39 | | | | 1.39 | | | | 1.63 | | | | (4.53 | ) | | | 106.18 | | | $ | 38,575 | |
2013 | | $ | 15.70 | | | | (0.01 | ) | | | 4.76 | | | | 4.75 | | | | — | | | | — | | | | — | | | $ | 20.45 | | | | (0.04 | ) | | | 1.38 | | | | 1.38 | | | | 1.68 | | | | 30.25 | | | | 89.17 | | | $ | 26,441 | |
2012 | | $ | 13.31 | | | | (0.04 | ) | | | 2.46 | | | | 2.42 | | | | (0.03 | ) | | | — | | | | (0.03 | ) | | $ | 15.70 | | | | (0.29 | ) | | | 1.40 | | | | 1.40 | | | | 2.23 | | | | 18.17 | | | | 95.17 | | | $ | 9,326 | |
2011 | | $ | 12.18 | | | | 0.07 | | | | 1.10 | | | | 1.17 | | | | (0.04 | ) | | | — | | | | (0.04 | ) | | $ | 13.31 | | | | 0.46 | | | | 1.40 | | | | 1.40 | | | | 32.23 | (h) | | | 9.62 | | | | 142.59 | | | $ | 146 | |
2010 | | $ | 10.29 | | | | 0.02 | | | | 1.94 | | | | 1.96 | | | | (0.07 | ) | | | — | | | | (0.07 | ) | | $ | 12.18 | | | | 0.15 | | | | 1.42 | | | | 1.40 | | | | 738.92 | (h) | | | 19.11 | | | | 128.86 | | | $ | 3 | |
Class R5 Shares | | | | | | | | | | | | | | | | | | | | | | | | | | | | | | | | | | | | | | | | | | | | | | | | | | | | | |
2015(c) | | $ | 19.55 | | | | (0.01 | ) | | | 0.83 | | | | 0.82 | | | | — | (e) | | | (0.98 | ) | | | (0.98 | ) | | $ | 19.39 | | | | (0.09 | )(d) | | | 0.99 | (d) | | | 0.99 | (d) | | | 1.19 | (d) | | | 4.35 | | | | 40.46 | | | $ | 67,079 | |
2014 | | $ | 21.01 | | | | 0.10 | | | | (0.93 | ) | | | (0.83 | ) | | | (0.06 | ) | | | (0.57 | ) | | | (0.63 | ) | | $ | 19.55 | | | | 0.46 | | | | 0.99 | | | | 0.99 | | | | 1.18 | | | | (4.15 | ) | | | 106.18 | | | $ | 69,217 | |
2013 | | $ | 16.07 | | | | 0.07 | | | | 4.87 | | | | 4.94 | | | | — | | | | — | | | | — | | | $ | 21.01 | | | | 0.35 | | | | 0.99 | | | | 0.99 | | | | 1.22 | | | | 30.74 | | | | 89.17 | | | $ | 43,209 | |
2012 | | $ | 13.58 | | | | 0.02 | | | | 2.50 | | | | 2.52 | | | | (0.03 | ) | | | — | | | | (0.03 | ) | | $ | 16.07 | | | | 0.13 | | | | 0.99 | | | | 0.99 | | | | 1.29 | | | | 18.56 | | | | 95.17 | | | $ | 19,251 | |
2011 | | $ | 12.40 | | | | 0.08 | | | | 1.17 | | | | 1.25 | | | | (0.07 | ) | | | — | | | | (0.07 | ) | | $ | 13.58 | | | | 0.55 | | | | 0.99 | | | | 0.99 | | | | 10.60 | (h) | | | 10.09 | | | | 142.59 | | | $ | 393 | |
2010 | | $ | 10.46 | | | | (0.09 | ) | | | 2.12 | | | | 2.03 | | | | (0.09 | ) | | | — | | | | (0.09 | ) | | $ | 12.40 | | | | (0.83 | ) | | | 0.99 | | | | 0.99 | | | | 17.58 | (h) | | | 19.56 | | | | 128.86 | | | $ | 171 | |
Class R6 Shares | | | | | | | | | | | | | | | | | | | | | | | | | | | | | | | | | | | | | | | | | | | | | | | | | | | | | |
2015(c) | | $ | 19.59 | | | | — | (f) | | | 0.83 | | | | 0.83 | | | | (0.01 | ) | | | (0.98 | ) | | | (0.99 | ) | | $ | 19.43 | | | | 0.04 | (d) | | | 0.89 | (d) | | | 0.89 | (d) | | | 1.41 | (d) | | | 4.37 | | | | 40.46 | | | $ | 5,546 | |
2014 | | $ | 21.05 | | | | 0.12 | | | | (0.93 | ) | | | (0.81 | ) | | | (0.08 | ) | | | (0.57 | ) | | | (0.65 | ) | | $ | 19.59 | | | | 0.58 | | | | 0.89 | | | | 0.89 | | | | 1.34 | | | | (4.05 | ) | | | 106.18 | | | $ | 3,950 | |
2013(i) | | $ | 17.54 | | | | 0.46 | | | | 3.05 | | | | 3.51 | | | | — | | | | — | | | | — | | | $ | 21.05 | | | | 2.21 | (d) | | | 0.89 | (d) | | | 0.89 | (d) | | | 11.83 | (d)(h) | | | 20.01 | | | | 89.17 | | | $ | 2,553 | |
| (a) | Not annualized for periods less than one year. |
| (b) | Sales loads are not reflected in computing total return. |
| (c) | Unaudited Six Month Period Ended March 31. |
| (e) | Dividends from Net Investment Income per share were less than $(0.01). |
| (f) | Net Investment Income (Loss) was less than $0.01 per share. |
| (g) | Net Investment Income Percentage was less than 0.01%. |
| (h) | Due to the size of net assets and fixed expenses, ratios may appear disproportionate. |
| (i) | Effective date of this class of shares was February 1, 2013. |
| + | Based on weighted average shares outstanding, except for Dividends from Net Investment Income and Net Realized Gains, which are actual amounts per share. |
See notes to financial statements.
| | | | |
| 26 Semi-Annual Report | | | | Semi-Annual Report 27 |
| | |
| EXPENSE EXAMPLE | | |
| |
Thornburg International Growth Fund | | March 31, 2015 (Unaudited) |
As a shareholder of the Fund, you incur two types of costs:
| | (1) | transaction costs, including |
(a) sales charges (loads) on purchase payments, for Class A shares;
(b) a deferred sales charge on redemptions of any part or all of a purchase of $1 million of Class A shares within 12 months of purchase;
(c) a deferred sales charge on redemptions of Class C shares within 12 months of purchase;
| | (2) | ongoing costs, including management fees; distribution and/or service (12b-1) fees; and other Fund expenses. |
This example is intended to help you understand your ongoing costs (in dollars) of investing in the Fund and to compare these costs with the ongoing costs of investing in other mutual funds.
The example is based on a $1,000 investment beginning on October 1, 2014, and held until March 31, 2015.
ACTUAL EXPENSES
For each class of shares, the first line of the accompanying table provides information about actual account values and actual expenses. You may use the information in this line, together with the amount you invested, to estimate the expenses that you paid over the period. Simply divide your account value by $1,000 (for example, an $8,600 account value divided by $1,000 = 8.6), then multiply the result by the number in the first line for your class of shares under the heading entitled “Expenses Paid During Period” to estimate the expenses you paid on your account during this period.
| | | | | | | | | | | | |
| | | Beginning | | | Ending | | | Expenses Paid | |
| | | Account Value | | | Account Value | | | During Period† | |
| | | 10/1/14 | | | 3/31/15 | | | 10/1/14–3/31/15 | |
CLASS A SHARES | | | | | | | | | | | | |
Actual | | $ | 1,000.00 | | | $ | 1,041.10 | | | $ | 7.22 | |
Hypothetical* | | $ | 1,000.00 | | | $ | 1,017.86 | | | $ | 7.14 | |
| | | |
CLASS C SHARES | | | | | | | | | | | | |
Actual | | $ | 1,000.00 | | | $ | 1,037.50 | | | $ | 10.68 | |
Hypothetical* | | $ | 1,000.00 | | | $ | 1,014.45 | | | $ | 10.56 | |
| | | |
CLASS I SHARES | | | | | | | | | | | | |
Actual | | $ | 1,000.00 | | | $ | 1,043.10 | | | $ | 5.01 | |
Hypothetical* | | $ | 1,000.00 | | | $ | 1,020.03 | | | $ | 4.95 | |
| | | |
CLASS R3 SHARES | | | | | | | | | | | | |
Actual | | $ | 1,000.00 | | | $ | 1,040.80 | | | $ | 7.62 | |
Hypothetical* | | $ | 1,000.00 | | | $ | 1,017.46 | | | $ | 7.54 | |
| | | |
CLASS R4 SHARES | | | | | | | | | | | | |
Actual | | $ | 1,000.00 | | | $ | 1,041.30 | | | $ | 7.12 | |
Hypothetical* | | $ | 1,000.00 | | | $ | 1,017.95 | | | $ | 7.04 | |
| | | |
CLASS R5 SHARES | | | | | | | | | | | | |
Actual | | $ | 1,000.00 | | | $ | 1,043.50 | | | $ | 5.04 | |
Hypothetical* | | $ | 1,000.00 | | | $ | 1,020.00 | | | $ | 4.99 | |
| | | |
CLASS R6 SHARES | | | | | | | | | | | | |
Actual | | $ | 1,000.00 | | | $ | 1,043.70 | | | $ | 4.53 | |
Hypothetical* | | $ | 1,000.00 | | | $ | 1,020.49 | | | $ | 4.48 | |
| † | Expenses are equal to the annualized expense ratio for each class (A: 1.42%; C: 2.10%; I: 0.98%; R3: 1.50%; R4: 1.40%; R5: 0.99%; R6: 0.89%) multiplied by the average account value over the period, multiplied by 182/365 to reflect the one-half year period. |
| * | Hypothetical assumes a rate of return of 5% per year before expenses. |
HYPOTHETICAL EXAMPLE FOR COMPARISON PURPOSES
For each class of shares, the second line of the accompanying table provides information about hypothetical account values and hypothetical expenses based on the Fund’s actual expense ratio and an assumed rate of return of 5% per year before expenses, which is not the Fund’s actual return. The hypothetical account values and expenses may not be used to estimate the actual ending account balance or expenses you paid for the period. You may use this information to compare the ongoing costs of investing in the Fund and other funds. To do so, compare this 5% hypothetical example with the 5% hypothetical examples that appear in the shareholder reports of the other funds.
Please note that the expenses shown in the table are meant to highlight your ongoing costs only and do not reflect any transactional costs, such as sales charges (loads), redemption fees, or exchange fees. Therefore, the second line of the table for each class of shares is useful in comparing ongoing costs only, and will not help you determine the relative total costs of owning different funds. In addition, if these transactional costs were included, your costs would have been higher.
28 Semi-Annual Report
| | |
| OTHER INFORMATION | | |
| |
Thornburg International Growth Fund | | March 31, 2015 (Unaudited) |
PORTFOLIO PROXY VOTING
Policies and Procedures:
The Trust has delegated to Thornburg Investment Management, Inc. (the “Advisor”) voting decisions respecting proxies for the Fund’s voting securities. The Advisor makes voting decisions in accordance with its Proxy Voting Policy and Procedures. A description of the Policy and Procedures is available (i) without charge, upon request, by calling the Advisor toll-free at 1-800-847-0200, (ii) on the Thornburg website at www.thornburg.com, and (iii) on the Securities and Exchange Commission’s website at www.sec.gov.
Information regarding how proxies were voted is available on or before August 31 of each year for the twelve months ending the preceding June 30. This information is available (i) without charge, upon request by calling the Advisor toll-free at 1-800-847-0200, (ii) on the Thornburg website at www.thornburg.com, and (iii) on the Securities and Exchange Commission’s website at www.sec.gov.
AVAILABILITY OF QUARTERLY PORTFOLIO SCHEDULE
The Fund files with the Securities and Exchange Commission schedules of its portfolio holdings on Form N-Q for the first and third quarters of each fiscal year. The Fund’s Forms N-Q are available on the Commission’s website at www.sec.gov, or may be reviewed and copied at the Commission’s Public Reference Room in Washington, D.C. Information on the operation of the Public Reference Room may be obtained by calling 1-800-SEC-0330. The Fund also makes this information available on its website at www.thornburg. com/download or upon request by calling 1-800-847-0200.
Semi-Annual Report 29
TRUSTEES’ STATEMENT TO SHAREHOLDERS
Revised and Readopted September 15, 2014
The Trustees believe current and prospective shareholders should know how we discharge our responsibilities in supervising the Funds’ investment advisor and in reviewing the advisor’s contract for renewal. Since 2005, we have issued a statement which sets out clearly the three principal guidelines that we follow in supervising the Trust��s investment advisor on your behalf. In accordance with our customary practice, in September of 2014 we again reviewed our statement and concluded we should reissue this statement outlining the principal features of our supervision of the advisor’s performance of investment management services for the Funds.
We begin with the premise that each shareholder selected his or her Fund because its investments are managed by the investment advisor identified in the prospectus and in accordance with the objective and policies described in the prospectus. We realize, as each of you do, that if you believe that your Fund’s stated objective and policies no longer serve your personal investment goals, you can sell your shares and leave the Fund.
Therefore, we believe that our primary supervisory task—our principal obligation to you—is to assess the nature and quality of the advisor’s services, and to confirm that the advisor actively and competently pursues the Fund’s objective, in accordance with the policies set out in the prospectus. To do this, we meet regularly with management to review your Fund’s portfolio and to discuss the advisor’s specific actions and judgments in pursuing the Fund’s objective. We do not substitute our own judgment for the advisor’s decisions in selecting investments; the advisor is paid to exercise its informed judgment on investment decisions, and we seek to confirm, in reviewing the advisor’s performance, that the advisor is doing just that.
Second, we are conscious of costs and the effect that costs have on shareholders’ returns. We try to make sure that your Fund’s fees and costs are reasonable in relationship to the services rendered and that they are generally in line with those charged by other expert investment advisors, consistent with our belief that the Fund’s investors searched for and expect that expertise and attention and have decided to pay a reasonable price for it. We do not put the management contract “out to bid” as a matter of course, and we would not do so unless we had concluded that the advisor materially had failed to pursue the Fund’s objectives in accordance with its policies, or for other equally important reasons. We believe that any other approach would be inconsistent with your interests and contrary to your expectations when you bought shares of the Fund in the first place.
Finally, because we believe that most Thornburg Fund shareholders have invested with a long-term perspective, we try not to focus too much on the fashions of the moment and on short-term performance. The market will not favor any specific investment objective or set of policies at all times and under all economic circumstances. A fund will experience periods of both high and low returns relative to other funds and other investments. Even if one of our Funds is not favored by the market at a particular time, we believe that the advisor is nonetheless obliged to remain true to the Fund’s objective and policies, and we watch to see that it does so.
Trustees of Thornburg Investment Trust
30 Semi-Annual Report
THORNBURG FUND FAMILY
FUNDAMENTAL, BOTTOM-UP EQUITY RESEARCH
We search far and wide for the best stock ideas—within the United States and around the globe. Potential investments that may deserve a deeper look are thoroughly analyzed using both quantitative and qualitative criteria. But the vast majority are discarded. Those that ultimately make it into our highly-selective portfolios are continually monitored to determine whether our investment theses unfold as expected.
| | • | | Thornburg Core Growth Fund |
| | • | | Thornburg International Value Fund |
| | • | | Thornburg International Growth Fund |
| | • | | Thornburg Developing World Fund |
| | • | | Thornburg Investment Income Builder Fund |
| | • | | Thornburg Global Opportunities Fund |
A TRADITION OF DISCIPLINED BOND MANAGEMENT
At Thornburg, the word “disciplined” carries some substance. We don’t make a practice of using shortcuts to enhance yield or total returns. Every strategy is grounded in rigorous, bottom-up credit work. Portfolios are assembled carefully—in the case of our core bond funds, using laddered structures—to mitigate price fluctuation. Position sizes are controlled so that no single bond can have an outsized effect on a portfolio. And as with our equity portfolios, managers enjoy flexibility to seek an optimal risk/reward balance.
| | • | | Thornburg Low Duration Income Fund |
| | • | | Thornburg Limited Term U.S. Government Fund |
| | • | | Thornburg Limited Term Income Fund |
| | • | | Thornburg Strategic Income Fund |
| | • | | Thornburg Low Duration Municipal Fund |
| | • | | Thornburg Limited Term Municipal Fund |
| | • | | Thornburg Intermediate Municipal Fund |
| | • | | Thornburg California Limited Term Municipal Fund |
| | • | | Thornburg New Mexico Intermediate Municipal Fund |
| | • | | Thornburg New York Intermediate Municipal Fund |
| | • | | Thornburg Strategic Municipal Income Fund |
Before investing, carefully consider the Fund’s investment goals, risks, charges, and expenses. For a prospectus or summary prospectus containing this and other information, contact your financial advisor or visit thornburg.com. Read it carefully before investing.
For additional information, please visit thornburg.com
Thornburg Investment Management, Inc. 2300 North Ridgetop Road, Santa Fe, NM 87506
Semi-Annual Report 31

This Semi-Annual Report is submitted for the general information of shareholders of the Fund. It is not authorized for distribution to prospective investors in the Fund unless preceded or accompanied by an effective prospectus.
| | | | |
| Investment Advisor: | | Distributor: | | |
| Thornburg Investment Management® | | Thornburg Securities Corporation® | | |
| 800.847.0200 | | 800.847.0200 | | TH1409 |
FIRM OVERVIEW
THE FIRM
Thornburg Investment Management is a privately owned global investment firm that offers a range of solutions for retail and institutional investors. We are driven by our mission to help our clients reach their long-term financial goals through fundamental research and active portfolio management.
Founded in 1982 and headquartered in Santa Fe, New Mexico, we manage approximately $61 billion (as of March 31, 2015) across seven equity and 11 bond mutual funds, separate accounts for high-net-worth investors and institutional accounts, and five UCITS funds for non-U.S. investors.

CORE INVESTMENT PRINCIPLES
Our focus has always been on maintaining and building the investment expertise to manage Thornburg strategies to a high standard, while adhering to a core set of investment principles:
| | • | | We focus on the fundamentals. We invest according to our view of the fundamental value of an issuer only after performing thorough, bottom-up research. |
| | • | | We think and invest for the long term. We typically make investment decisions based upon an investment thesis we expect to play out over 18 months to several years. We may not always hold a security for several years, but our horizon line is typically a few years out. |
| | • | | We stay flexible. We go where we see value. Our investment mandates are generally broad and flexible, and we exercise as much flexibility as possible within any restrictions. |
| | • | | We collaborate across strategies. We are structured as global generalists. Portfolio managers and analysts do not specialize in sectors, geographies, or even security types, but instead must understand and communicate bottom-up fundamentals across industries, sectors, and borders. |
2 Semi-Annual Report
Semi-Annual Report
Thornburg Investment Income Builder Fund
March 31, 2015
| | | | |
SHARE Class | | NASDAQ Symbol | | CUSIP |
Class A | | TIBAX | | 885-215-558 |
Class C | | TIBCX | | 885-215-541 |
Class I | | TIBIX | | 885-215-467 |
Class R3 | | TIBRX | | 885-215-384 |
Class R4 | | TIBGX | | 885-215-186 |
Class R5 | | TIBMX | | 885-215-236 |
Class I, R3, R4, and R5 shares may not be available to all investors. Minimum investments for Class I shares may be higher than those for other classes.
Investments in the Fund carry risks including possible loss of principal. Additional risks may be associated with investments outside the United States, especially in emerging markets, including currency fluctuations, illiquidity, volatility, and political and economic risks. Additionally, the Fund may invest a portion of the assets in small capitalization companies, which may increase the risk of greater price fluctuations. As with direct bond ownership, funds that invest in bonds are subject to certain risks including interest-rate risk, credit risk, and inflation risk. The value of bonds will fluctuate relative to changes in interest rates, decreasing when interest rates rise. Please see the Fund’s prospectus for a discussion of the risks associated with an investment in the Fund. Investments in the Fund are not FDIC insured, nor are they deposits of or guaranteed by a bank or any other entity.
Semi-Annual Report 3
| | |
| LETTER TO SHAREHOLDERS | | |
| |
Thornburg Investment Income Builder Fund | | March 31, 2015 (Unaudited) |
| | |
April 17, 2015
Dear Fellow Shareholder:
This letter will review the basic results of Thornburg Investment Income Builder Fund’s investment activities for the six-month period ended March 31, 2015, and comment on the overall investment landscape, which continues to evolve.
Fund Performance
Thornburg Investment Income Builder Fund paid ordinary quarterly dividends totaling 42.5¢ per Class A share in the six-month period ended March 31, 2015, down from 47.0¢ in the comparable six-month period of the prior fiscal year. The dividends per share were higher for Class I and R5 shares and lower for C, R3, and R4 shares, to account for varying class-specific expenses. The year-over-year decline in the income dividend paid by Investment Income Builder was largely attributable to a lack of “special” dividends received in the March 2015 quarter; the approximate 20% appreciation of the U.S. dollar vis-à-vis most other currencies, which reduced the value of dividends received in these currencies; the ongoing dearth of yield available from bonds; and modest portfolio repositioning to de-emphasize those holdings that we expect to be most vulnerable to price declines in any rising interest rate environment.
Your Fund’s net asset value increased by $0.02 per share during the six-month period under review, to $21.40, bringing the six-month total return including dividends to 2.10% (Class A shares without sales charge).
Investment Income Builder’s return of 2.10% underperformed its own blended benchmark (75% MSCI World Index and 25% Barclays U.S. Aggregate Bond Index) by 1.33% for the period. Performance comparisons over various periods are shown on page 9 of this report. Reviewing these, you will see that the performance of the Fund compares well to the benchmark over various longer periods.
The quarter ended March 31, 2015, was the 49th full calendar quarter since the inception of Thornburg Investment Income Builder in December 2002. In 36 of these quarters, the Fund delivered a positive total return. The Fund has delivered positive total returns in 11 of its 12 calendar years of existence. As of March 31, 2015, Thornburg Investment Income Builder has delivered tax-efficient average annual total returns in excess of 10.5% since inception (Class A shares without sales charge).
Performance data shown represents past performance and is no guarantee of future results. Investment return and principal value will fluctuate so shares, when redeemed, may be worth more or less than their original cost. Current performance may be lower or higher than quoted. For performance current to the most recent month end, visit thornburg.com or call 800.847.0200.
The maximum sales charge for Class A shares is 4.50%. The total annual fund operating expense of Class A shares is 1.33%, as disclosed in the most recent prospectus.
Factors Impacting Performance
In assessing the performance of Thornburg Investment Income Builder during the semi-annual period under review, it is constructive to consider the performance in U.S. dollars of the sector components of the MSCI World Index over the same period. The MSCI World Index comprises 75%, and the entire equity portion, of the Fund’s global performance benchmark.
| 1. | Six index sectors showed positive total returns for the period, ranging from approximately 2.2% (financials) to more than 12% (consumer discretionary). Energy was the worst sector, with a decline of more than 17% following steep drops in oil and gas prices. |
| 2. | Income Builder Fund investments in firms in financials (25% Fund weighting, on average over the period), telecommunication services (16% weighting), energy (9% weighting), consumer discretionary and consumer staples (7% weighting each), and health care (7% weighting) comprised the largest sector weightings in the Fund portfolio. The Fund’s performance relative to the MSCI World Index was helped by comparative outperformance from our holdings in the financial services and consumer staples sectors, and was hindered by comparative underperformance from our holdings in the health care, telecommunication services, and energy sectors. |
| 3. | In the Income Builder portfolio, 47 equity investments contributed positive returns of at least 0.05% (5 basis points) to the portfolio during the six-month period under review. Forty of the Fund’s equity investments contributed returns of negative 0.05% or worse for the quarter in U.S. dollar terms, though some of these individual security declines were offset by currency hedges. |
Investment Income Builder’s bond holdings delivered modest positive returns during the period.
Contributors and Detractors
Your Fund’s average return from its investments in the financial sector exceeded the performance of the equities in the financial sector of the MSCI World Index in the six months ended March 31, 2015, led by exchange operator CME Group and Zurich Insurance Group. Asset managers Och-Ziff Capital, Blackstone Group, and UBS Group delivered strong returns, and relatively small positions in individual mortgage REITs (MFA Financial, Two Harbors Investment, and Chimera Investment) combined to make a significant contribution to portfolio performance. We sold the Fund’s position in U.K.-based Standard Chartered plc due to concerns about the sustainability of its dividend.
Your Fund’s significant holdings in the telecommunication services sector delivered mixed performances in the semi-annual period, and lagged the returns of telecom stocks in the index. China Mobile and Singapore Telecommunications were among the best performers in the portfolio, while developing market firms MegaFon, America Movil, and Telefonica Brazil were among the worst. Long time Income Builder holding Vodafone
4 Semi-Annual Report
LETTER TO SHAREHOLDERS,
| | |
| |
CONTINUED | | |
| |
Thornburg Investment Income Builder Fund | | March 31, 2015 (Unaudited) |
paid a large special dividend in the first quarter of 2014 following the sale of its 45% holding in Verizon Wireless last year. While we still expect Vodafone to pay an interesting dividend in 2015, it will be much reduced from last year, a significant contributing factor to the year-over-year drop in the Fund’s March 2015 quarter dividend.
Among Income Builder’s investments in the energy sector, French integrated hydrocarbon producer Total SA, Royal Dutch Shell, Husky Energy, Norway’s Statoil, and Canadian Oil Sands Limited each detracted from portfolio performance in the semi-annual period. The price of Brent crude oil declined 42% during the period, to $55.11/barrel. Fund investments in North American pipeline operators Kinder Morgan and The Williams Companies, Inc. each delivered positive performance during the period.
Among Fund investments in the consumer staples and consumer discretionary sectors, drug store chain operator, Walgreens Boots, Dutch grocer Ahold, and U.S. specialty retailers Staples and Home Depot each delivered strong performance during the period. Casino operators Wynn Resorts and Sands China were detractors from portfolio performance.
Investment Income Builder’s semi-annual period returns from its holdings in the health care sector lagged those of the MSCI World Index. Positive performances from Novartis and Pfizer were weighed down by sluggish performances from France’s Sanofi and Switzerland’s Roche Holding. Stock prices of a majority of firms in this sector have risen more than the market as a whole in recent years. As a consequence of higher stock prices, dividend yields are dropping, and we have reduced the portfolio’s percentage weighting in health care stocks.
Among other portfolio holdings, notable contributors included Italian toll road operator Atlantia SpA, Toyota Motor Corporation, Taiwan Semiconductor Manufacturing Corporation, port infrastructure operator China Merchants Holdings, and Netherlands-based technical publisher Wolters Kluwer. Negative contributors included Electricite de France, refiner LyondellBasell Industries, semiconductor chip firms Intel Corporation and Qualcomm, steel manufacturer Nucor, and Microsoft.
Currency Hedging
The euro, British pound, Australian dollar, and Brazilian real each depreciated significantly vis-à-vis the U.S. dollar during the period under review. We hedged a majority of the currency exposure to the euro and other European currencies tied to it to reduce currency risk in the portfolio. We expect ongoing exchange rate volatility, though reduced from levels seen between September 30, 2014 and March 31, 2015.
Fixed Income Analysis
Within its bond portfolio, Investment Income Builder owned significantly fewer U.S. government and agency bonds than the Barclays U.S. Aggregate Bond Index. This fact was broadly neutral in the six-month period under review, since yield spreads of corporate credits over comparable maturity U.S. government yield levels contracted while yields on both government and corporate bonds with maturities greater than three years dropped. You can expect us to increase the portfolio’s allocation to bonds if rising yields lead to lower bond prices. Readers of this commentary who are long-time shareholders of Income Builder will recall that the interest-bearing debt portion of the Fund’s portfolio has varied over time, ranging from less than 12% (currently, and in mid 2005) to 45% at June 30, 2009.
Chart I Interest-Bearing Investments as a Percentage of Total Portfolio as of March 31, 2015
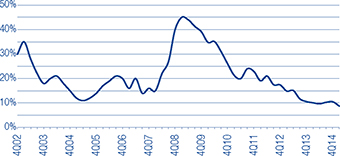
As of March 31, the Fund portfolio included more than 100 bonds and hybrid securities.
Income Component
Since its inception, the dividend increases paid by Investment Income Builder have been powered primarily by dividend increases from the Fund’s equity holdings. For the U.S. equity market as a whole, the dividend payout ratio is around 35% of corporate earnings. For the Income Builder equity portfolio as a whole, the dividend payout ratio is slightly below 60%, reflecting our preference for owning firms with both the ability and willingness to pay attractive dividends. Outside the United States, dividend yields and payout ratios tend to be higher, but exchange rates have been a strong headwind this fiscal year. Between September 30, 2009, and September 30, 2014, the average exchange rate for the U.S. dollar versus the euro was 1.34:1. As we write this letter, the exchange rate is 1.08:1, reflecting euro depreciation of almost 20% versus the trailing five-year average. Most other non-dollar currencies have also fallen by at least 10% against the U.S. dollar over the last year. Dividends we received from foreign firms reflect this depreciation, which has set in quickly during the period under review. Readers should be aware that the reduced yields now available from bond investments, plus U.S. dollar appreciation, pose formidable near-term challenges to delivering year-over-year dividend increases on Investment Income Builder shares.
If the global economy recovers, we expect firming interest rates, better business conditions, and reduced anxiety from corporate boards about distributing earnings. To the extent that the global economy does not recover, and this is always a possibility, we can expect the opposite.
Semi-Annual Report 5
LETTER TO SHAREHOLDERS,
CONTINUED
| | |
Thornburg Investment Income Builder Fund | | March 31, 2015 (Unaudited) |
Market Environment
During the early months of 2015, investors debated the future direction of the economies of China and Japan, and potential policy actions by the U.S. Federal Reserve, Congress, and the Obama administration. They also debated the strength and durability of the European economic recovery, and the financial condition of various emerging market economies. Russia and certain other energy producing economies appear particularly suspect. For the most part, the political and macroeconomic issues remain open. We expect the U.S. economy to show improvement in the coming quarters.
Most major central banks around the world continue to pursue easy monetary conditions, though the U.S. Federal Reserve has reduced its program of unconventional monetary easing. Yields available to investors in the U.S. bond market were lower in the first quarter of 2015:
| | • | | 10-year U.S. government bond yields moved approximately 0.25% lower. Since bond prices move in opposite direction to yields, prices of longer maturity U.S. government bonds rose during the quarter. |
| | • | | Investment-grade corporate bond yields also dropped, as indicated by the 0.20% decrease in the FINRA-Bloomberg Index of Active Investment Grade U.S. Corporate Bond yields, from 3.70% at December 31 to 3.50% at March 31. |
| | • | | High yield (“junk”) corporate bond yields decreased even more, as indicated by the 0.50% drop in the FINRA-Bloomberg Index of Active High Yield U.S. Corporate Bond yields, from 6.80% at December 31 to 6.30% at March 31. For the trailing 12-month period beginning March 31, 2014, the High Yield Index increased by 0.60%, leading to modest price declines for these bonds. |
As we write this, German government bond yields with maturities through eight years are negative, and the 10-year German government bond trades at a yield to maturity of 0.08%. The European Central Bank is expected to buy at least €200 billion more bonds of European governments than will be issued in 2015, reducing the outstanding supply of these bonds at a time of strong demand. While low interest rates are good news for borrowers, they have negative consequences for conservative savers.
Investors must consider other options. Yields on taxable and tax-exempt money funds remain below 1/5 of one percent. Banks in the United States and Europe have aggressively reduced yields on all deposits, in some cases charging depositors with meaningful negative rates in order to recover their own regulatory charges and costs of service. A very large pool of investor dollars is looking for better returns elsewhere, but in sensible investments.
Conclusion
We are optimistic that the types of income-producing investments owned by the Thornburg Investment Income Builder Fund will experience sustainable popularity among investors as their intrinsic values for income production are recognized. A high percentage of investor funds belong to people over the age of 55, for whom income is an increasingly necessary and desirable attribute.
Thank you for being a shareholder of the Thornburg Investment Income Builder Fund. Remember that you can review additional information about your Fund as well as descriptions of many of the stocks in your portfolio at your leisure by going to our web site, www.thornburg.com/iib. Best wishes for a wonderful summer.
Sincerely,
| | | | |
 | |  | |  |
| Brian McMahon | | Jason Brady,CFA | | Ben Kirby,CFA |
| Portfolio Manager | | Portfolio Manager | | Portfolio Manager |
| CEO & Chief Investment Officer | | Managing Director | | Managing Director |
The matters discussed in this report may constitute forward-looking statements made pursuant to the safe harbor provisions of the Securities Litigation Reform Act of 1995. These include any advisor or portfolio manager prediction, assessment, analysis or outlook for individual securities, industries, investment styles, market sectors and/or markets. These statements involve risks and uncertainties. In addition to the general risks described for each fund in its current prospectus, other factors bearing on these reports include the accuracy of the advisor’s or portfolio manager’s forecasts and predictions, the appropriateness of the investment strategies designed by the advisor or portfolio manager and the ability of the advisor or portfolio manager to implement their strategies efficiently and successfully. Any one or more of these factors, as well as other risks affecting the securities markets generally, could cause the actual results of any fund to differ materially as compared to its benchmarks.
The views expressed by the portfolio managers reflect their professional opinions and are subject to change. Under no circumstances does the information contained within represent a recommendation to buy or sell any security.
6 Semi-Annual Report
| | |
| THE DIVIDEND LANDSCAPE | | |
| |
Thornburg Investment Income Builder Fund | | March 31, 2015 (Unaudited) |
To appreciate the investment environment in which Thornburg Investment Income Builder Fund operates, you may wish to review these highlights of the “dividend landscape.”
The S&P 500 Index Payout Ratio — A Historical Perspective
The dividend payout ratio is a fraction that expresses dividend payments as a percentage of per-share earnings. As the economy slowed in the wake of the financial crisis, earnings-per-share on average declined, causing the payout ratio to spike, even as dividends paid by the S&P 500 portfolio declined. Earnings have since materially improved, bringing the payout ratio back in line with the overall trend in recent times.
Corporate Willingness to Pay Dividends is Key to the Fund’s Investment Process
The Russell 1000 Index includes approximately 1,000 public companies that are supposed to be generally representative of corporate America. Between 1980 and 1993, at least 75% of these firms paid some dividend. Between 1994 and 2001, the percentage of Russell 1000 companies paying dividends sank to just over 50%, indicating a preference towards reinvesting retained earnings in growth initiatives. Dividends returned to fashion between 2002 and 2008. A reduction in the number of Russell 1000 firms paying dividends followed the 2008 recession. However, from early 2010, the number steadily climbed back to around 70%.
Rising Dividend Payments Despite Decreasing Dividend Yields
Over time, the dollar dividend per unit of the S&P 500 Index has generally increased. Because the price of the index itself has increased even more, the yield on the S&P 500 Index, as a percentage of the current index price, has generally decreased in recent decades. You should note, however, that the dollar yield on an original investment made at a fixed point in time (say, 1970 or 1989) has increased, even without reinvestment of dividends.
S&P 500 Index Payout Ratio
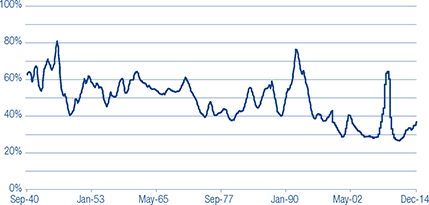
Source: Standard & Poor’s, beginning in 1999 (uses operating earnings); “Irrational Exuberance”
by Robert J. Shiller, through 1998 (uses reported earnings).
Percentage of Companies Paying Dividends in Russell 1000 Index
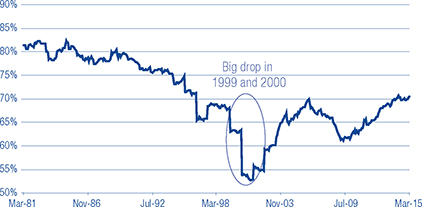
Source: CSFB Quantitative and Equity Derivatives Strategy, Baseline, and FactSet
S&P 500 Index Average Yield vs. Annual Dividends from a Hypothetical $10,000 Investment (Dividends not Reinvested)
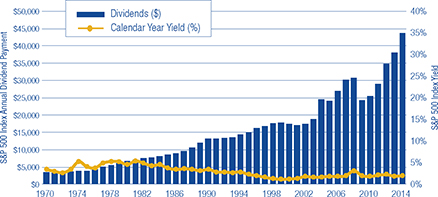
Source: Bloomberg and FactSet.
Past performance does not guarantee future results.
Semi-Annual Report 7
THE DIVIDEND LANDSCAPE,
CONTINUED
| | |
Thornburg Investment Income Builder Fund | | March 31, 2015 (Unaudited) |
The Top 100 Dividend Yields
| | | | | | | | |
| | | Russell 1000
Index | | | Russell 2000
Index | |
Financials | | | 46 | % | | | 58 | % |
Utilities | | | 15 | % | | | 1 | % |
Energy | | | 15 | % | | | 12 | % |
Consumer Discretionary | | | 9 | % | | | 4 | % |
Telecommunication Services | | | 5 | % | | | 2 | % |
Consumer Staples | | | 4 | % | | | 4 | % |
Materials | | | 3 | % | | | 3 | % |
Industrials | | | 3 | % | | | 10 | % |
Health Care | | | 0 | % | | | 3 | % |
Information Technology | | | 0 | % | | | 3 | % |
Source: FactSet as of March 31, 2015.
Average Dividend Yields (MSCI Indices) of Markets Around the Globe
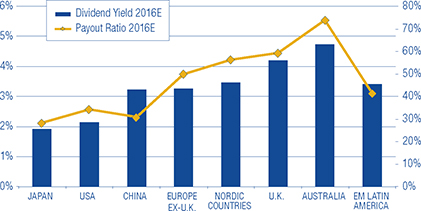
Source: Bloomberg as of March 31, 2015.
A Truly Diversified Dividend-Paying Portfolio Must Look Beyond the Obvious High-Yield Stocks!
In the (large cap) Russell 1000 Index, 76% of the top 100 dividend payers are in the financials, utilities, and energy sectors. In the (small cap) Russell 2000 Index, 70% of the top 100 dividend-yielding stocks are financial or energy companies. To construct a diversified portfolio of attractive yielding stocks, one must look beyond these three sectors. We certainly do.
Dividend yield is a ratio that shows how much a company pays out in dividends each year relative to its share price.
Global Diversification Can Improve the Portfolio Yield
Since firms outside the U.S. tend to pay higher dividends than U.S. firms, particularly outside the financial and utility sectors, we maintain the ability to diversify the Thornburg Investment Income Builder Fund into foreign dividend-paying stocks to try to take advantage of these opportunities.
Diversification does not assure or guarantee better performance and cannot eliminate the risk of investment losses.
Dividends are not guaranteed.
8 Semi-Annual Report
| | |
| PERFORMANCE SUMMARY | | |
| |
Thornburg Investment Income Builder Fund | | March 31, 2015 (Unaudited) |
Average Annual Total Returns
| | | | | | | | | | | | | | | | | | | | |
| | | 1-Yr | | | 3-Yr | | | 5-Yr | | | 10-Yr | | | Since
Incep. | |
Class A Shares (Incep: 12/24/02) | | | | | | | | | | | | | | | | | | | | |
Without sales charge | | | 4.85 | % | | | 10.08 | % | | | 8.96 | % | | | 8.46 | % | | | 10.80 | % |
With sales charge | | | 0.15 | % | | | 8.40 | % | | | 7.95 | % | | | 7.96 | % | | | 10.38 | % |
Class C Shares (Incep: 12/24/02) | | | | | | | | | | | | | | | | | | | | |
Without sales charge | | | 4.11 | % | | | 9.30 | % | | | 8.21 | % | | | 7.76 | % | | | 10.14 | % |
With sales charge | | | 3.11 | % | | | 9.30 | % | | | 8.21 | % | | | 7.76 | % | | | 10.14 | % |
Class I Shares (Incep: 11/3/03) | | | 5.17 | % | | | 10.43 | % | | | 9.32 | % | | | 8.82 | % | | | 9.93 | % |
Class R3 Shares (Incep: 2/1/05) | | | 4.57 | % | | | 9.75 | % | | | 8.64 | % | | | 8.19 | % | | | 8.24 | % |
Class R4 Shares (Incep: 2/1/08) | | | 4.66 | % | | | 9.90 | % | | | 8.77 | % | | | — | | | | 5.86 | % |
Class R5 Shares (Incep: 2/1/07) | | | 5.05 | % | | | 10.30 | % | | | 9.19 | % | | | — | | | | 6.71 | % |
Blended Index (Since 12/24/02) | | | 6.03 | % | | | 9.98 | % | | | 8.81 | % | | | 6.29 | % | | | 7.95 | % |
Growth of a Hypothetical $10,000 Investment
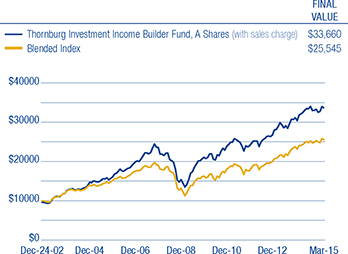
Performance data shown represents past performance and is no guarantee of future results. Investment return and principal value will fluctuate so shares, when redeemed, may be worth more or less than their original cost. Current performance may be lower or higher than quoted. For performance current to the most recent month end, visit thornburg.com or call 800-847-0200. The performance information does not reflect the deduction of taxes that a shareholder would pay on distributions or the redemption of Fund shares. Returns reflect the reinvestment of dividends and capital gains. Class A shares are sold with a maximum sales charge of 4.50%. Class C shares are subject to a 1% CDSC for the first year only. There is no sales charge for Class I, R3, R4, and R5 shares.
As disclosed in the most recent prospectus, the total annual fund operating expenses are as follows: A shares, 1.33%; C shares, 2.08%; I shares, 1.01%; R3 shares, 1.70%; R4 shares, 1.55%; R5 shares, 1.25%. Thornburg Investment Management and/or Thornburg Securities Corporation have contractually agreed to waive fees and reimburse expenses through at least February 1, 2016, for some of the share classes, resulting in net expense ratios of the following: C shares, 2.05%; R3 shares, 1.65%; R5 shares, 1.14%. For more detailed information on fund expenses and waivers/reimbursements please see the Fund’s prospectus.
30-day SEC Yield as of 3/31/15 (A Shares): 3.10%
Glossary
Barclays U.S. Aggregate Bond Index – An index composed of approximately 8,000 publicly traded bonds including U.S. government, mortgage-backed, corporate, and Yankee bonds. The index is weighted by the market value of the bonds included in the index.
Blended Index – The Blended Index is composed of 25% Barclays U.S. Aggregate Bond Index and 75% MSCI World Index.
FlNRA-Bloomberg Active Investment Grade U.S. Corporate Bond Index – An index comprised of the “active” (most frequently traded) fixed-coupon, investment-grade bonds represented by FINRA TRACE, FINRA’s transaction reporting facility that disseminates all over-the-counter secondary market transactions in these public bonds.
FlNRA-Bloomberg Active High Yield U.S. Corporate Bond Index – An index comprised of the “active” (most frequently traded) fixed-coupon, high-yield bonds represented by FINRA TRACE, FINRA’s transaction reporting facility that disseminates all over-the-counter secondary market transactions in these public bonds.
MSCI World Index – An unmanaged market-weighted index that consists of securities traded in 24 of the world’s most developed countries. Securities are listed on exchanges in the U.S., Europe, Canada, Australia, New Zealand, and the Far East. The index is calculated with net dividends reinvested, in U.S. dollars.
S&P 500 Index – An unmanaged broad measure of the U.S. stock market.
Unless otherwise noted, index returns reflect the reinvestment of income dividends and capital gains, if any, but do not reflect fees, brokerage commissions or other expenses of investing. Investors may not make direct investments into any index. The performance of any index is not indicative of the performance of any particular investment.
Basis Point (bp) – A unit equal to 1/100th of 1%. 1% = 100 basis points (bps).
Brent Crude Oil – An international benchmark for oil prices, accounting for roughly two-thirds of the global oil trade. Brent is a sweet crude oil from the North Sea suitable for production of gasoline and middle distillates such as kerosene and diesel.
Semi-Annual Report 9
| | |
| FUND SUMMARY | | |
| |
Thornburg Investment Income Builder Fund | | March 31, 2015 (Unaudited) |
OBJECTIVES AND STRATEGIES
The Fund seeks to provide a level of current income which exceeds the average yield on U.S. stocks generally, and which will generally grow, subject to periodic fluctuations, over the years on a per share basis. The Fund’s secondary investment objective is long-term capital appreciation.
The Fund may invest in any domestic or foreign equity or debt security which Thornburg Investment Management believes may assist the Fund in pursuing its investment goals, although the Fund expects that equity securities in its portfolio will normally be weighted in favor of companies that pay dividends or other current income.
Portfolio Composition
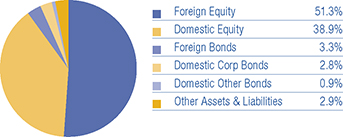
Top Ten Equity Holdings
| | | | |
JPMorgan Chase & Co. | | | 3.4 | % |
China Mobile Ltd. | | | 3.1 | % |
CME Group, Inc. | | | 2.4 | % |
Roche Holding AG | | | 1.9 | % |
Vinci S.A. | | | 1.9 | % |
Atlantia S.p.A. | | | 1.8 | % |
Royal Dutch Shell plc ADR | | | 1.8 | % |
Sanofi | | | 1.8 | % |
The Home Depot, Inc. | | | 1.8 | % |
Swisscom AG | | | 1.6 | % |
Sector Exposure
(percent of equity holdings)
| | | | |
Financials | | | 30.4 | % |
Telecommunication Services | | | 15.5 | % |
Consumer Discretionary | | | 9.5 | % |
Energy | | | 8.4 | % |
Health Care | | | 7.7 | % |
Consumer Staples | | | 7.5 | % |
Industrials | | | 7.3 | % |
Utilities | | | 5.6 | % |
Information Technology | | | 4.8 | % |
Materials | | | 3.3 | % |
Non-Classified | | | 0.1 | % |
Country Exposure*
(percent of Fund)
| | | | |
United States | | | 42.5 | % |
Switzerland | | | 10.0 | % |
France | | | 7.0 | % |
China | | | 5.9 | % |
United Kingdom | | | 4.3 | % |
Netherlands | | | 4.0 | % |
Italy | | | 2.3 | % |
Singapore | | | 2.0 | % |
Brazil | | | 2.0 | % |
Canada | | | 1.8 | % |
Norway | | | 1.7 | % |
Germany | | | 1.6 | % |
Hong Kong | | | 1.6 | % |
Denmark | | | 1.3 | % |
Spain | | | 1.1 | % |
Russia | | | 1.1 | % |
Japan | | | 1.0 | % |
Taiwan | | | 0.9 | % |
Saudi Arabia | | | 0.7 | % |
Korea | | | 0.7 | % |
Turkey | | | 0.7 | % |
South Africa | | | 0.6 | % |
Thailand | | | 0.5 | % |
Australia | | | 0.3 | % |
Cayman Islands | | | 0.3 | % |
Luxembourg | | | 0.3 | % |
New Zealand | | | 0.2 | % |
Bermuda | | | 0.2 | % |
Argentina | | | 0.1 | % |
Sweden | | | 0.1 | % |
Panama | | | 0.1 | % |
Ireland** | | | 0.0 | % |
Trinidad & Tobago** | | | 0.0 | % |
Mexico** | | | 0.0 | % |
Other Assets and Liabilities | | | 2.9 | % |
| * | The country assignment of each holding is determined by the Fund’s Advisor based on various factors, including the location of the issuer’s head office, the issuer’s jurisdiction of incorporation and the country from which a majority of the issuer’s revenue is derived. |
| ** | Country percentage was less than 0.1%. |
There is no guarantee that the Fund will meet its investment objectives.
All portfolio information is subject to change. Charts may not add up to 100% due to rounding.
10 Semi-Annual Report
FUND SUMMARY,
CONTINUED
| | |
Thornburg Investment Income Builder Fund | | March 31, 2015 (Unaudited) |
QUARTERLY DIVIDEND HISTORY, CLASS A
| | | | | | | | | | |
Year | | Q1 | | Q2 | | Q3 | | Q4 | | Total |
2003 | | 9.2¢ | | 11.2¢ | | 12.4¢ | | 17.5¢ | | 50.3¢ |
2004 | | 10.2¢ | | 12.5¢ | | 15.0¢ | | 21.8¢ | | 59.5¢ |
2005 | | 11.0¢ | | 13.6¢ | | 17.4¢ | | 29.0¢ | | 71.0¢ |
2006 | | 12.5¢ | | 16.0¢ | | 19.2¢ | | 33.0¢ | | 80.7¢ |
2007 | | 14.2¢ | | 18.5¢ | | 21.5¢ | | 36.8¢ | | 91.0¢ |
2008 | | 17.9¢ | | 21.8¢ | | 26.0¢ | | 36.8¢ | | 102.4¢ |
2009 | | 18.0¢ | | 24.2¢ | | 28.0¢ | | 34.5¢ | | 104.7¢ |
2010 | | 19.8¢ | | 25.0¢ | | 32.0¢ | | 36.0¢ | | 112.8¢ |
2011 | | 21.0¢ | | 26.0¢ | | 32.0¢ | | 37.5¢ | | 116.5¢ |
2012 | | 21.5¢ | | 26.0¢ | | 28.5¢ | | 36.0¢ | | 112.0¢ |
2013 | | 21.5¢ | | 25.3¢ | | 25.0¢ | | 24.5¢ | | 96.3¢ |
2014 | | 22.5¢ | | 24.0¢ | | 27.0¢ | | 26.0¢ | | 99.5¢ |
2015 | | 16.5¢ | | | | | | | | |
We do not expect each sequential quarter’s dividend to increase over that of the prior quarter, since dividend payments outside the United States tend to be seasonal. Rather, the Fund aspires to increase the dividend paid on an annual basis.
EVOLUTION OF INDUSTRY GROUP EXPOSURE
Top 10 industry groups quarter by quarter (percent of equity holdings)
| | | | |
As of 3/31/15 | | | | |
| |
Telecommunication Services | | | 15.5 | % |
Diversified Financials | | | 11.4 | % |
Energy | | | 8.4 | % |
Real Estate | | | 8.4 | % |
Pharmaceuticals, Biotechnology & Life Sciences | | | 7.7 | % |
Banks | | | 6.3 | % |
Utilities | | | 5.6 | % |
Retailing | | | 4.5 | % |
Insurance | | | 4.4 | % |
Transportation | | | 4.0 | % |
| |
As of 9/30/14 | | | | |
| |
Telecommunication Services | | | 20.5 | % |
Energy | | | 10.5 | % |
Diversified Financials | | | 7.7 | % |
Banks | | | 7.5 | % |
Pharmaceuticals, Biotechnology & Life Sciences | | | 7.4 | % |
Utilities | | | 6.8 | % |
Real Estate | | | 6.3 | % |
Food, Beverage & Tobacco | | | 5.0 | % |
Insurance | | | 3.2 | % |
Materials | | | 3.2 | % |
| | | | |
As of 12/31/14 | | | | |
| |
Telecommunication Services | | | 19.0 | % |
Diversified Financials | | | 9.1 | % |
Energy | | | 9.0 | % |
Real Estate | | | 7.7 | % |
Pharmaceuticals, Biotechnology & Life Sciences | | | 7.1 | % |
Banks | | | 6.9 | % |
Utilities | | | 6.4 | % |
Transportation | | | 4.8 | % |
Food, Beverage & Tobacco | | | 4.7 | % |
Retailing | | | 3.5 | % |
| |
As of 6/30/14 | | | | |
| |
Telecommunication Services | | | 18.6 | % |
Energy | | | 11.5 | % |
Pharmaceuticals, Biotechnology & Life Sciences | | | 7.2 | % |
Banks | | | 7.2 | % |
Real Estate | | | 6.7 | % |
Utilities | | | 6.6 | % |
Diversified Financials | | | 6.1 | % |
Food, Beverage & Tobacco | | | 5.6 | % |
Food & Staples Retailing | | | 3.7 | % |
Materials | | | 3.7 | % |
Semi-Annual Report 11
| | |
| SCHEDULE OF INVESTMENTS | | |
| |
Thornburg Investment Income Builder Fund | | March 31, 2015 (Unaudited) |
| | | | | | | | |
| | | Shares/
Principal Amount | | | Value | |
COMMON STOCK — 89.58% | | | | | | | | |
| | |
AUTOMOBILES & COMPONENTS — 1.13% | | | | | | | | |
Automobiles — 1.13% | | | | | | | | |
SAIC Motor Corp., Ltd. | | | 7,099,950 | | | $ | 28,447,441 | |
Toyota Motor Corp. | | | 2,714,100 | | | | 189,705,260 | |
| | | | | | | | |
| | | | | | | 218,152,701 | |
| | | | | | | | |
| | |
BANKS — 5.46% | | | | | | | | |
Banks — 5.46% | | | | | | | | |
Bank of China Ltd. | | | 87,945,000 | | | | 50,707,068 | |
Banque Cantonale Vaudoise | | | 44,400 | | | | 25,494,134 | |
DBS Group Holdings Ltd. | | | 13,222,200 | | | | 196,162,781 | |
Industrial and Commercial Bank of China Ltd. | | | 64,843,000 | | | | 47,758,319 | |
JPMorgan Chase & Co. | | | 10,973,700 | | | | 664,786,746 | |
Liechtensteinische Landesbank AG | | | 1,150,000 | | | | 45,086,437 | |
St. Galler Kantonalbank AG | | | 78,741 | | | | 27,974,203 | |
| | | | | | | | |
| | | | | | | 1,057,969,688 | |
| | | | | | | | |
| | |
CAPITAL GOODS — 2.99% | | | | | | | | |
Construction & Engineering — 1.88% | | | | | | | | |
Vinci S.A. | | | 6,357,395 | | | | 363,869,155 | |
Industrial Conglomerates — 1.11% | | | | | | | | |
Hopewell Holdings Ltd. | | | 39,958,340 | | | | 150,501,252 | |
NWS Holdings Ltd. | | | 38,000,000 | | | | 63,916,209 | |
| | | | | | | | |
| | | | | | | 578,286,616 | |
| | | | | | | | |
| | |
CONSUMER SERVICES — 1.71% | | | | | | | | |
Hotels, Restaurants & Leisure — 1.71% | | | | | | | | |
Las Vegas Sands Corp. | | | 1,252,900 | | | | 68,959,616 | |
Sands China Ltd. | | | 22,822,000 | | | | 94,642,129 | |
Wynn Macau Ltd. | | | 28,333,200 | | | | 61,471,164 | |
Wynn Resorts Ltd. | | | 839,300 | | | | 105,651,084 | |
| | | | | | | | |
| | | | | | | 330,723,993 | |
| | | | | | | | |
| | |
DIVERSIFIED FINANCIALS — 10.11% | | | | | | | | |
Capital Markets — 7.67% | | | | | | | | |
Aberdeen Asset Management plc | | | 6,940,000 | | | | 47,314,883 | |
Apollo Global Management, LLC | | | 4,250,000 | | | | 91,800,000 | |
a Apollo Investment Corp. | | | 21,251,071 | | | | 163,101,970 | |
Ares Capital Corp. | | | 11,828,600 | | | | 203,097,062 | |
GAM Holding AG | | | 5,914,282 | | | | 122,935,271 | |
KKR & Co. LP | | | 8,025,000 | | | | 183,050,250 | |
Och-Ziff Capital Management Group, LLC | | | 8,400,000 | | | | 106,176,000 | |
a Solar Capital Ltd. | | | 4,607,900 | | | | 93,263,896 | |
The Blackstone Group LP | | | 4,334,000 | | | | 168,549,260 | |
UBS Group AG | | | 16,146,408 | | | | 304,385,876 | |
Diversified Financial Services — 2.44% | | | | | | | | |
CME Group, Inc. | | | 4,991,614 | | | | 472,755,762 | |
| | | | | | | | |
| | | | | | | 1,956,430,230 | |
| | | | | | | | |
| | |
ENERGY — 7.58% | | | | | | | | |
Energy Equipment & Services — 0.63% | | | | | | | | |
Ensco plc | | | 2,600,000 | | | | 54,782,000 | |
Helmerich & Payne, Inc. | | | 997,400 | | | | 67,893,018 | |
Oil, Gas & Consumable Fuels — 6.95% | | | | | | | | |
Canadian Oil Sands Ltd. | | | 18,705,400 | | | | 145,472,496 | |
HollyFrontier Corp. | | | 3,428,900 | | | | 138,081,803 | |
Husky Energy, Inc. | | | 9,322,100 | | | | 190,261,960 | |
Kinder Morgan, Inc. | | | 4,776,000 | | | | 200,878,560 | |
Royal Dutch Shell plc ADR | | | 5,918,100 | | | | 353,014,665 | |
Statoil ASA | | | 1,475,800 | | | | 26,160,885 | |
The Williams Companies, Inc. | | | 3,559,872 | | | | 180,093,924 | |
12 Semi-Annual Report
| | |
| SCHEDULE OF INVESTMENTS, CONTINUED | | |
| |
Thornburg Investment Income Builder Fund | | March 31, 2015 (Unaudited) |
| | | | | | | | |
| | | Shares/
Principal Amount | | | Value | |
Total SA | | | 2,219,500 | | | $ | 110,436,124 | |
b,c TPT Acquisition, Inc. | | | 163,790 | | | | 0 | |
| | | | | | | | |
| | | | | | | 1,467,075,435 | |
| | | | | | | | |
| | |
FOOD & STAPLES RETAILING — 2.66% | | | | | | | | |
Food & Staples Retailing — 2.66% | | | | | | | | |
Koninklijke Ahold NV | | | 12,465,338 | | | | 245,951,631 | |
Walgreens Boots Alliance, Inc. | | | 3,171,106 | | | | 268,529,256 | |
| | | | | | | | |
| | | | | | | 514,480,887 | |
| | | | | | | | |
| | |
FOOD, BEVERAGE & TOBACCO — 3.42% | | | | | | | | |
Beverages — 0.33% | | | | | | | | |
Ambev SA ADR | | | 11,054,700 | | | | 63,675,072 | |
Food Products — 1.15% | | | | | | | | |
Nestle SA | | | 2,948,600 | | | | 222,707,594 | |
Tobacco — 1.94% | | | | | | | | |
KT&G Corp. | | | 1,779,814 | | | | 142,295,283 | |
Lorillard, Inc. | | | 2,729,100 | | | | 178,346,685 | |
Philip Morris International | | | 727,800 | | | | 54,825,174 | |
| | | | | | | | |
| | | | | | | 661,849,808 | |
| | | | | | | | |
| | |
HOUSEHOLD & PERSONAL PRODUCTS — 0.69% | | | | | | | | |
Household Products — 0.69% | | | | | | | | |
Reckitt Benckiser plc | | | 1,552,500 | | | | 133,572,754 | |
| | | | | | | | |
| | | | | | | 133,572,754 | |
| | | | | | | | |
| | |
INSURANCE — 3.85% | | | | | | | | |
Insurance — 3.85% | | | | | | | | |
Allianz SE | | | 566,370 | | | | 98,564,954 | |
AXA S.A. | | | 3,762,900 | | | | 94,900,324 | |
Gjensidige Forsikring ASA | | | 4,567,476 | | | | 78,924,570 | |
Munich Re | | | 917,415 | | | | 198,029,992 | |
Scor SE | | | 1,977,282 | | | | 66,790,587 | |
Zurich Financial Services AG | | | 613,593 | | | | 207,919,505 | |
| | | | | | | | |
| | | | | | | 745,129,932 | |
| | | | | | | | |
| | |
MATERIALS — 3.02% | | | | | | | | |
Chemicals — 1.58% | | | | | | | | |
LyondellBasell Industries NV | | | 1,844,700 | | | | 161,964,660 | |
Saudi Basic Industries Corp. | | | 5,591,948 | | | | 119,185,370 | |
Yanbu National Petrochemical Co. | | | 2,218,322 | | | | 24,968,024 | |
Metals & Mining — 1.44% | | | | | | | | |
c Jaguar Mining, Inc. | | | 797,101 | | | | 191,304 | |
MMC Norilsk Nickel JSC ADR | | | 5,962,500 | | | | 105,923,813 | |
Nucor Corp. | | | 3,625,600 | | | | 172,324,768 | |
| | | | | | | | |
| | | | | | | 584,557,939 | |
| | | | | | | | |
| | |
MEDIA — 1.67% | | | | | | | | |
Media — 1.67% | | | | | | | | |
Vivendi | | | 8,868,068 | | | | 220,505,962 | |
Wolters Kluwer N.V. | | | 3,143,600 | | | | 102,756,770 | |
| | | | | | | | |
| | | | | | | 323,262,732 | |
| | | | | | | | |
| | |
PHARMACEUTICALS, BIOTECHNOLOGY & LIFE SCIENCES — 6.91% | | | | | | | | |
Pharmaceuticals — 6.91% | | | | | | | | |
GlaxoSmithKline plc | | | 4,094,000 | | | | 93,889,193 | |
Novartis AG | | | 3,053,400 | | | | 302,103,735 | |
Pfizer, Inc. | | | 6,409,500 | | | | 222,986,505 | |
Roche Holding AG | | | 1,338,300 | | | | 369,209,951 | |
Sanofi | | | 3,538,899 | | | | 349,812,245 | |
| | | | | | | | |
| | | | | | | 1,338,001,629 | |
| | | | | | | | |
Semi-Annual Report 13
| | |
| SCHEDULE OF INVESTMENTS, CONTINUED | | |
| |
Thornburg Investment Income Builder Fund | | March 31, 2015 (Unaudited) |
| | | | | | | | |
| | | Shares/
Principal Amount | | | Value | |
| | |
REAL ESTATE — 7.54% | | | | | | | | |
Real Estate Investment Trusts — 7.54% | | | | | | | | |
Capstead Mortgage Corp. | | | 3,250,000 | | | $ | 38,252,500 | |
Chimera Investment Corp. | | | 24,956,394 | | | | 78,363,077 | |
Crown Castle International Corp. | | | 2,324,600 | | | | 191,872,484 | |
Digital Realty Trust, Inc. | | | 1,145,700 | | | | 75,570,372 | |
a Dynex Capital, Inc. | | | 5,062,000 | | | | 42,875,140 | |
a Invesco Mortgage Capital, Inc. | | | 12,278,764 | | | | 190,689,205 | |
Lamar Advertising Co. | | | 1,159,610 | | | | 68,730,085 | |
a MFA Financial, Inc. | | | 31,197,518 | | | | 245,212,491 | |
Outfront Media, Inc. | | | 2,292,699 | | | | 68,597,554 | |
Senior Housing Properties Trust | | | 4,670,000 | | | | 103,627,300 | |
a Two Harbors Investment Corp. | | | 18,716,700 | | | | 198,771,354 | |
a Washington REIT | | | 5,721,000 | | | | 158,071,230 | |
| | | | | | | | |
| | | | | | | 1,460,632,792 | |
| | | | | | | | |
| | |
RETAILING — 4.03% | | | | | | | | |
Multiline Retail — 1.06% | | | | | | | | |
Target Corp. | | | 2,515,500 | | | | 206,447,085 | |
Specialty Retail — 2.97% | | | | | | | | |
Staples, Inc. | | | 14,198,200 | | | | 231,217,687 | |
The Home Depot, Inc. | | | 3,021,700 | | | | 343,295,337 | |
| | | | | | | | |
| | | | | | | 780,960,109 | |
| | | | | | | | |
| | |
SEMICONDUCTORS & SEMICONDUCTOR EQUIPMENT — 2.03% | | | | | | | | |
Semiconductors & Semiconductor Equipment — 2.03% | | | | | | | | |
Intel Corp. | | | 6,761,600 | | | | 211,435,232 | |
Taiwan Semiconductor Manufacturing Co., Ltd. | | | 39,144,000 | | | | 182,021,477 | |
| | | | | | | | |
| | | | | | | 393,456,709 | |
| | | | | | | | |
| | |
SOFTWARE & SERVICES — 0.35% | | | | | | | | |
Software — 0.35% | | | | | | | | |
Microsoft Corp. | | | 1,647,100 | | | | 66,962,851 | |
| | | | | | | | |
| | | | | | | 66,962,851 | |
| | | | | | | | |
| | |
TECHNOLOGY HARDWARE & EQUIPMENT — 1.95% | | | | | | | | |
Communications Equipment — 1.26% | | | | | | | | |
Qualcomm, Inc. | | | 3,521,300 | | | | 244,166,942 | |
Technology, Hardware, Storage & Peripherals — 0.69% | | | | | | | | |
Apple, Inc. | | | 1,069,400 | | | | 133,065,442 | |
| | | | | | | | |
| | | | | | | 377,232,384 | |
| | | | | | | | |
| | |
TELECOMMUNICATION SERVICES — 13.87% | | | | | | | | |
Diversified Telecommunication Services — 7.60% | | | | | | | | |
AT&T, Inc. | | | 3,431,100 | | | | 112,025,415 | |
BT Group plc | | | 20,304,184 | | | | 131,922,213 | |
a,c Jasmine Broadband Internet Infrastructure Fund | | | 359,941,200 | | | | 101,765,797 | |
Singapore Telecommunications Ltd. | | | 60,807,615 | | | | 193,630,836 | |
Swisscom AG | | | 535,200 | | | | 310,887,426 | |
TDC A/S | | | 36,300,200 | | | | 260,158,442 | |
Telefonica Brasil SA ADR | | | 7,939,553 | | | | 121,395,765 | |
Telenor ASA | | | 10,999,100 | | | | 222,420,571 | |
TeliaSonera AB | | | 2,740,000 | | | | 17,434,903 | |
Wireless Telecommunication Services — 6.27% | | | | | | | | |
China Mobile Ltd. | | | 45,574,477 | | | | 593,735,326 | |
d MegaFon OAO 144a GDR | | | 3,278,300 | | | | 52,452,800 | |
MegaFon OAO Reg S GDR | | | 2,035,900 | | | | 32,574,400 | |
MTN Group Ltd. | | | 5,720,810 | | | | 96,691,075 | |
c Turkcell Iletisim Hizmetleri AS | | | 26,556,900 | | | | 136,419,807 | |
Vodafone Group plc | | | 92,094,324 | | | | 301,162,744 | |
| | | | | | | | |
| | | | | | | 2,684,677,520 | |
| | | | | | | | |
14 Semi-Annual Report
| | |
| SCHEDULE OF INVESTMENTS, CONTINUED | | |
| |
Thornburg Investment Income Builder Fund | | March 31, 2015 (Unaudited) |
| | | | | | | | |
| | | Shares/
Principal Amount | | | Value | |
| | |
TRANSPORTATION — 3.60% | | | | | | | | |
Road & Rail — 0.50% | | | | | | | | |
Daqin Railway Co., Ltd. | | | 54,645,464 | | | $ | 97,134,172 | |
Transportation Infrastructure — 3.10% | | | | | | | | |
Atlantia S.p.A. | | | 13,462,402 | | | | 353,924,802 | |
China Merchants Holdings International Co., Ltd. | | | 26,370,830 | | | | 103,916,578 | |
Jiangsu Express Co., Ltd. | | | 45,798,000 | | | | 62,027,694 | |
Santos Brasil Participacoes S.A. | | | 5,341,150 | | | | 18,274,932 | |
Sydney Airport | | | 15,560,254 | | | | 61,390,602 | |
| | | | | | | | |
| | | | | | | 696,668,780 | |
| | | | | | | | |
| | |
UTILITIES — 5.01% | | | | | | | | |
Electric Utilities — 2.76% | | | | | | | | |
Duke Energy Corp. | | | 2,098,500 | | | | 161,122,830 | |
EDP—Energias do Brasil SA | | | 14,054,100 | | | | 45,576,580 | |
Electricite de France SA | | | 5,982,401 | | | | 143,703,806 | |
Endesa, S.A. | | | 973,900 | | | | 18,849,353 | |
Entergy Corp. | | | 948,600 | | | | 73,507,014 | |
Mighty River Power Ltd. | | | 18,732,800 | | | | 43,414,378 | |
Terna Rete Elettrica Nazionale S.p.A. | | | 10,826,921 | | | | 47,730,766 | |
Gas Utilities — 0.61% | | | | | | | | |
Enagas SA | | | 2,354,300 | | | | 67,412,828 | |
Snam S.p.A. | | | 10,561,204 | | | | 51,328,840 | |
Independent Power & Renewable Electricity Producers — 0.52% | | | | | | | | |
China Resources Power Holdings Co. | | | 13,184,000 | | | | 33,059,271 | |
Huaneng Power International, Inc. | | | 56,713,000 | | | | 67,008,195 | |
Multi-Utilities — 1.12% | | | | | | | | |
Dominion Resources, Inc. | | | 1,923,191 | | | | 136,296,546 | |
Sempra Energy | | | 739,900 | | | | 80,663,898 | |
| | | | | | | | |
| | | | | | | 969,674,305 | |
| | | | | | | | |
TOTAL COMMON STOCK (Cost $15,673,317,642) | | | | | | | 17,339,759,794 | |
| | | | | | | | |
PREFERRED STOCK — 0.62% | | | | | | | | |
| | |
BANKS — 0.18% | | | | | | | | |
Banks — 0.18% | | | | | | | | |
Barclays Bank plc Pfd, 7.10% | | | 200,000 | | | | 5,168,000 | |
First Niagara Financial Group Pfd, 8.625% | | | 143,295 | | | | 3,946,344 | |
d First Tennessee Bank Pfd, 3.75% | | | 12,000 | | | | 8,593,126 | |
GMAC Capital Trust I Pfd, 8.125% | | | 628,126 | | | | 16,488,307 | |
| | | | | | | | |
| | | | | | | 34,195,777 | |
| | | | | | | | |
| | |
DIVERSIFIED FINANCIALS — 0.14% | | | | | | | | |
Capital Markets — 0.01% | | | | | | | | |
Morgan Stanley Pfd, 4.00% | | | 120,000 | | | | 2,540,400 | |
Consumer Finance — 0.13% | | | | | | | | |
Ally Financial, Inc. Pfd, 8.50% | | | 930,495 | | | | 24,816,302 | |
| | | | | | | | |
| | | | | | | 27,356,702 | |
| | | | | | | | |
| | |
ENERGY — 0.03% | | | | | | | | |
Oil, Gas & Consumable Fuels — 0.03% | | | | | | | | |
b Halcon Resources Corp. Pfd, 5.75% | | | 18,822 | | | | 5,646,600 | |
| | | | | | | | |
| | | | | | | 5,646,600 | |
| | | | | | | | |
| | |
INSURANCE — 0.12% | | | | | | | | |
Insurance — 0.12% | | | | | | | | |
Principal Financial Group Pfd, 5.563% | | | 234,400 | | | | 23,593,837 | |
| | | | | | | | |
| | | | | | | 23,593,837 | |
| | | | | | | | |
Semi-Annual Report 15
| | |
| SCHEDULE OF INVESTMENTS, CONTINUED | | |
| |
Thornburg Investment Income Builder Fund | | March 31, 2015 (Unaudited) |
| | | | | | | | |
| | | Shares/
Principal Amount | | | Value | |
| | |
MISCELLANEOUS — 0.06% | | | | | | | | |
U.S. Government Agencies — 0.06% | | | | | | | | |
Farm Credit Bank of Texas Pfd, 10.00% | | | 9,000 | | | $ | 11,224,687 | |
| | | | | | | | |
| | | | | | | 11,224,687 | |
| | | | | | | | |
| | |
TELECOMMUNICATION SERVICES — 0.09% | | | | | | | | |
Wireless Telecommunication Services — 0.09% | | | | | | | | |
d Centaur Funding Corp. Pfd, 9.08% | | | 15,000 | | | | 18,628,125 | |
| | | | | | | | |
| | | | | | | 18,628,125 | |
| | | | | | | | |
TOTAL PREFERRED STOCK (Cost $127,932,090) | | | | | | | 120,645,728 | |
| | | | | | | | |
ASSET BACKED SECURITIES — 0.34% | | | | | | | | |
| | |
COMMERCIAL MTG TRUST — 0.10% | | | | | | | | |
Citigroup Commercial Mtg Trust, Series 2004-HYB2 Class B1, 2.641%, 3/25/2034 | | $ | 1,045,559 | | | | 852,072 | |
d CVS Pass-Through Trust, 9.35%, 1/10/2023 | | | 15,000,000 | | | | 18,110,265 | |
| | | | | | | | |
| | | | | | | 18,962,337 | |
| | | | | | | | |
| | |
OTHER ASSET BACKED — 0.07% | | | | | | | | |
d Fairway Outdoor Funding, LLC, Series 2012-1 Class B, 8.835%, 10/15/2042 | | | 7,000,000 | | | | 7,434,321 | |
d JPR Royalty, LLC, 14.00%, 9/1/2020 | | | 5,000,000 | | | | 2,500,000 | |
b,d Northwind Holdings, LLC, Series 2007-1A Class A1 Floating Rate Note, 1.014%, 12/1/2037 | | | 3,231,318 | | | | 2,997,047 | |
| | | | | | | | |
| | | | | | | 12,931,368 | |
| | | | | | | | |
| | |
RESIDENTIAL MTG TRUST — 0.17% | | | | | | | | |
Banc of America Funding Corp., Series 2006-I Class SB1, 2.26%, 12/20/2036 | | | 2,745,371 | | | | 974,604 | |
Bear Stearns ARM Mtg, Series 2003-6 Class 2B-1, 2.586%, 8/25/2033 | | | 281,162 | | | | 279,159 | |
FBR Securitization Trust, Series 2005-2 Class M1, 0.891%, 9/25/2035 | | | 19,220,463 | | | | 19,058,819 | |
Merrill Lynch Mtg Investors Trust, Series 2004-A4 Class M1, 2.463%, 8/25/2034 | | | 5,314,809 | | | | 4,885,071 | |
Morgan Stanley Capital, Inc., Series 2005-HE7 Class A2C, 0.491%, 11/25/2035 | | | 5,086,930 | | | | 5,002,602 | |
Residential Asset Securities Corp., Series 2006-KS4 Class A3, 0.324%, 6/25/2036 | | | 873,179 | | | | 870,902 | |
Wells Fargo Asset Securities Corp., Series 2005-AR1 Class 1B1, 2.622%, 2/25/2035 | | | 5,622,439 | | | | 1,981,530 | |
| | | | | | | | |
| | | | | | | 33,052,687 | |
| | | | | | | | |
TOTAL ASSET BACKED SECURITIES (Cost $64,716,279) | | | | | | | 64,946,392 | |
| | | | | | | | |
CORPORATE BONDS — 5.97% | | | | | | | | |
| | |
BANKS — 0.24% | | | | | | | | |
Banks — 0.24% | | | | | | | | |
d Banco Santander Brasil S.A. (BRL), 8.00%, 3/18/2016 | | | 42,200,000 | | | | 12,429,070 | |
DEPFA Bank plc (EUR), 0.782%, 12/15/2015 | | | 7,500,000 | | | | 7,862,768 | |
d,e Groupe BPCE, 12.50%, 8/29/2049 | | | 10,211,000 | | | | 13,778,519 | |
d Itau Unibanco Holding S.A. (BRL), 10.50%, 11/23/2015 | | | 10,000,000 | | | | 3,059,642 | |
PNC Financial Services Group, Inc., 4.482%, 5/29/2049 | | | 10,000,000 | | | | 10,020,000 | |
| | | | | | | | |
| | | | | | | 47,149,999 | |
| | | | | | | | |
| | |
CAPITAL GOODS — 0.20% | | | | | | | | |
Construction & Engineering — 0.10% | | | | | | | | |
d,e Abengoa Finance, S.A.U., 8.875%, 11/1/2017 | | | 5,000,000 | | | | 5,100,000 | |
d Zachry Holdings, Inc., 7.50%, 2/1/2020 | | | 14,420,000 | | | | 13,699,000 | |
Industrial Conglomerates — 0.10% | | | | | | | | |
Otter Tail Corp., 9.00%, 12/15/2016 | | | 17,000,000 | | | | 19,033,999 | |
| | | | | | | | |
| | | | | | | 37,832,999 | |
| | | | | | | | |
| | |
COMMERCIAL & PROFESSIONAL SERVICES — 0.04% | | | | | | | | |
Commercial Services & Supplies — 0.04% | | | | | | | | |
d,e GFL Environmental, Inc., 7.875%, 4/1/2020 | | | 8,000,000 | | | | 8,080,000 | |
| | | | | | | | |
| | | | | | | 8,080,000 | |
| | | | | | | | |
| | |
CONSUMER SERVICES — 0.11% | | | | | | | | |
Hotels, Restaurants & Leisure — 0.11% | | | | | | | | |
d,e Arcos Dorados Holdings I, 6.625%, 9/27/2023 | | | 3,000,000 | | | | 2,850,000 | |
d Arcos Dorados Holdings, Inc. (BRL), 10.25%, 7/13/2016 | | | 66,000,000 | | | | 18,611,646 | |
| | | | | | | | |
| | | | | | | 21,461,646 | |
| | | | | | | | |
16 Semi-Annual Report
| | |
| SCHEDULE OF INVESTMENTS, CONTINUED | | |
| |
Thornburg Investment Income Builder Fund | | March 31, 2015 (Unaudited) |
| | | | | | | | |
| | | Shares/
Principal Amount | | | Value | |
| | |
DIVERSIFIED FINANCIALS — 0.68% | | | | | | | | |
Capital Markets — 0.05% | | | | | | | | |
Goldman Sachs Group, Inc., 5.625%, 1/15/2017 | | $ | 8,000,000 | | | $ | 8,578,256 | |
d Morgan Stanley (BRL), 10.09%, 5/3/2017 | | | 4,560,000 | | | | 1,383,052 | |
Consumer Finance — 0.25% | | | | | | | | |
Capital One Bank, 6.15%, 9/1/2016 | | | 25,000,000 | | | | 26,636,325 | |
c,d,f Cash Store Financial (CAD), 0%, 1/31/2017 | | | 10,000,000 | | | | 1,561,328 | |
d Lowell Group Financing plc (GBP), 10.75%, 4/1/2019 | | | 12,000,000 | | | | 19,313,868 | |
Diversified Financial Services — 0.38% | | | | | | | | |
b Bank of America Corp. (BRL), 10.75%, 8/20/2018 | | | 5,000,000 | | | | 1,511,805 | |
d,e CFG Holdings Ltd./CFG Finance, LLC, 11.50%, 11/15/2019 | | | 27,634,000 | | | | 27,841,255 | |
JPMorgan Chase & Co., 7.90%, 4/29/2049 | | | 15,000,000 | | | | 16,143,750 | |
KFW (BRL), 5.375%, 9/14/2015 | | | 53,000,000 | | | | 16,137,056 | |
National Rural Utilities CFC, 10.375%, 11/1/2018 | | | 5,000,000 | | | | 6,478,160 | |
d TMX Finance, LLC/Titlemax Finance, 8.50%, 9/15/2018 | | | 8,000,000 | | | | 5,680,000 | |
| | | | | | | | |
| | | | | | | 131,264,855 | |
| | | | | | | | |
| | |
ENERGY — 1.01% | | | | | | | | |
Energy Equipment & Services — 0.04% | | | | | | | | |
d,e Schahin II Finance Co. (SPV) Ltd., 5.875%, 9/25/2023 | | | 11,640,133 | | | | 7,036,461 | |
Oil, Gas & Consumable Fuels — 0.97% | | | | | | | | |
d DCP Midstream, LLC, 9.75%, 3/15/2019 | | | 5,000,000 | | | | 5,561,920 | |
Enbridge Energy Partners LP, 9.875%, 3/1/2019 | | | 9,750,000 | | | | 12,278,155 | |
Energy Transfer Partners LP, 3.272%, 11/1/2066 | | | 13,820,000 | | | | 12,161,600 | |
Enterprise Products Operating LP, 7.034%, 1/15/2068 | | | 14,480,000 | | | | 15,654,676 | |
Gastar Exploration USA, Inc., 8.625%, 5/15/2018 | | | 9,267,000 | | | | 8,618,310 | |
d,e Gaz Capital SA, 8.146%, 4/11/2018 | | | 2,000,000 | | | | 2,090,000 | |
Kinder Morgan Energy Partners LP, 9.00%, 2/1/2019 | | | 8,000,000 | | | | 9,744,736 | |
d Linc Energy, 12.50%, 10/31/2017 | | | 21,300,000 | | | | 4,899,000 | |
d Linc Energy, 9.625%, 10/31/2017 | | | 19,433,000 | | | | 17,586,865 | |
NuStar Logistics LP, 8.15%, 4/15/2018 | | | 18,000,000 | | | | 20,164,212 | |
d,e Odebrecht Offshore Drilling Finance Ltd., 6.75%, 10/1/2022 | | | 46,505,000 | | | | 36,143,686 | |
Oneok Partners LP, 8.625%, 3/1/2019 | | | 8,000,000 | | | | 9,478,976 | |
d,e Petro Co., Trinidad Tobago Ltd., 9.75%, 8/14/2019 | | | 4,000,000 | | | | 4,745,000 | |
e Petrobras Global Finance B.V., 3.00%, 1/15/2019 | | | 4,000,000 | | | | 3,453,280 | |
b RAAM Global Energy Co., 12.50%, 10/1/2015 | | | 15,000,000 | | | | 5,737,500 | |
Teppco Partners LP, 7.00%, 6/1/2067 | | | 7,000,000 | | | | 7,000,000 | |
d,e Tullow Oil plc, 6.25%, 4/15/2022 | | | 15,000,000 | | | | 12,975,000 | |
| | | | | | | | |
| | | | | | | 195,329,377 | |
| | | | | | | | |
| | |
FOOD & STAPLES RETAILING — 0.12% | | | | | | | | |
Food & Staples Retailing — 0.12% | | | | | | | | |
d Bakkavor Finance 2 plc (GBP), 8.75%, 6/15/2020 | | | 14,132,000 | | | | 22,954,933 | |
| | | | | | | | |
| | | | | | | 22,954,933 | |
| | | | | | | | |
| | |
FOOD, BEVERAGE & TOBACCO — 0.13% | | | | | | | | |
Beverages — 0.07% | | | | | | | | |
Ambev International Finance Co., Ltd. (BRL), 9.50%, 7/24/2017 | | | 21,669,000 | | | | 6,500,938 | |
Anheuser-Busch InBev (BRL), 9.75%, 11/17/2015 | | | 20,000,000 | | | | 6,160,016 | |
Food Products — 0.03% | | | | | | | | |
d,e BRF S.A., 4.75%, 5/22/2024 | | | 6,000,000 | | | | 5,835,000 | |
Tobacco — 0.03% | | | | | | | | |
d,e B.A.T. International Finance, plc, 9.50%, 11/15/2018 | | | 5,000,000 | | | | 6,328,250 | |
| | | | | | | | |
| | | | | | | 24,824,204 | |
| | | | | | | | |
| | |
INSURANCE — 1.00% | | | | | | | | |
Insurance — 1.00% | | | | | | | | |
d,e Dai Ichi Mutual Life Insurance Co., Ltd., 7.25%, 12/29/2049 | | | 9,000,000 | | | | 10,676,250 | |
ELM B.V. (AUD), 3.985%, 4/29/2049 | | | 8,000,000 | | | | 6,006,451 | |
ELM B.V. (AUD), 7.635%, 12/29/2049 | | | 10,500,000 | | | | 8,558,577 | |
Genworth Holdings, Inc., 4.90%, 8/15/2023 | | | 24,020,000 | | | | 20,537,100 | |
Hartford Financial Services Group, 8.125%, 6/15/2068 | | | 9,650,000 | | | | 10,988,938 | |
Semi-Annual Report 17
| | |
| SCHEDULE OF INVESTMENTS, CONTINUED | | |
| |
Thornburg Investment Income Builder Fund | | March 31, 2015 (Unaudited) |
| | | | | | | | |
| | | Shares/
Principal Amount | | | VALUE | |
d MetLife Capital Trust X, 9.25%, 4/8/2068 | | $ | 12,000,000 | | | $ | 17,865,000 | |
MetLife, Inc., 6.817%, 8/15/2018 | | | 4,000,000 | | | | 4,661,876 | |
d National Life Insurance of Vermont, 10.50%, 9/15/2039 | | | 2,000,000 | | | | 3,243,094 | |
d,e QBE Capital Funding III Ltd., 7.25%, 5/24/2041 | | | 40,000,000 | | | | 44,500,000 | |
d,e Sirius International Group, 7.506%, 5/29/2049 | | | 28,590,000 | | | | 30,126,712 | |
Transatlantic Holdings, Inc., 5.75%, 12/14/2015 | | | 8,147,000 | | | | 8,395,997 | |
d ZFS Finance USA Trust II, 6.45%, 12/15/2065 | | | 25,748,000 | | | | 27,035,400 | |
d ZFS Finance USA Trust V, 6.50%, 5/9/2067 | | | 1,260,000 | | | | 1,326,150 | |
| | | | | | | | |
| | | | | | | 193,921,545 | |
| | | | | | | | |
| | |
MATERIALS — 0.38% | | | | | | | | |
Chemicals — 0.03% | | | | | | | | |
d,e Consolidated Energy Finance S.A., 6.75%, 10/15/2019 | | | 5,000,000 | | | | 5,037,500 | |
Construction Materials — 0.17% | | | | | | | | |
d,e CEMEX Espana Luxembourg, 9.875%, 4/30/2019 | | | 1,460,000 | | | | 1,624,250 | |
d,e Cimpor Financial Operations B.V., 5.75%, 7/17/2024 | | | 21,500,000 | | | | 17,845,000 | |
CRH America, Inc., 8.125%, 7/15/2018 | | | 12,000,000 | | | | 14,291,316 | |
Metals & Mining — 0.18% | | | | | | | | |
d,e Alrosa Finance S.A., 7.75%, 11/3/2020 | | | 6,000,000 | | | | 5,970,480 | |
e Anglogold Holdings, 8.50%, 7/30/2020 | | | 20,000,000 | | | | 21,495,000 | |
Coeur d’Alene Mines Corp., 7.875%, 2/1/2021 | | | 7,687,000 | | | | 6,553,167 | |
| | | | | | | | |
| | | | | | | 72,816,713 | |
| | | | | | | | |
| | |
MEDIA — 0.15% | | | | | | | | |
Media — 0.15% | | | | | | | | |
Comcast Cable Communications, LLC, 8.875%, 5/1/2017 | | | 5,000,000 | | | | 5,789,920 | |
Time Warner Cable, Inc., 8.75%, 2/14/2019 | | | 14,000,000 | | | | 17,282,328 | |
WMG Holdings Corp., 13.75%, 10/1/2019 | | | 6,000,000 | | | | 6,540,000 | |
| | | | | | | | |
| | | | | | | 29,612,248 | |
| | | | | | | | |
| | |
MISCELLANEOUS — 0.21% | | | | | | | | |
Miscellaneous — 0.21% | | | | | | | | |
Federative Republic of Brazil (BRL), 12.50%, 1/5/2022 | | | 20,000,000 | | | | 7,269,195 | |
Federative Republic of Brazil (BRL), 12.50%, 1/5/2016 | | | 109,401,000 | | | | 34,346,886 | |
| | | | | | | | |
| | | | | | | 41,616,081 | |
| | | | | | | | |
| | |
SOFTWARE & SERVICES — 0.04% | | | | | | | | |
Internet Software & Services — 0.04% | | | | | | | | |
b,d Yahoo!, Inc., 6.65%, 8/10/2026 | | | 7,362,807 | | | | 8,099,088 | |
| | | | | | | | |
| | | | | | | 8,099,088 | |
| | | | | | | | |
| | |
TELECOMMUNICATION SERVICES — 1.04% | | | | | | | | |
Diversified Telecommunication Services — 0.97% | | | | | | | | |
e Deutsche Telekom International Finance BV, 8.75%, 6/15/2030 | | | 26,150,000 | | | | 39,974,119 | |
Level 3 Communications, Inc., 8.875%, 6/1/2019 | | | 9,000,000 | | | | 9,472,500 | |
Qwest Corp., 6.75%, 12/1/2021 | | | 9,000,000 | | | | 10,316,250 | |
e Telefonica Emisiones SAU, 7.045%, 6/20/2036 | | | 85,390,000 | | | | 117,950,829 | |
e Telefonica Emisiones SAU, 6.221%, 7/3/2017 | | | 2,770,000 | | | | 3,058,490 | |
d,e Telemar Norte Leste SA, 5.50%, 10/23/2020 | | | 9,065,000 | | | | 7,918,278 | |
Wireless Telecommunication Services — 0.07% | | | | | | | | |
d,e VimpelCom (UBS SA), 8.25%, 5/23/2016 | | | 4,500,000 | | | | 4,699,845 | |
d,e VimpelCom Holdings B.V., 7.504%, 3/1/2022 | | | 8,735,000 | | | | 8,287,331 | |
| | | | | | | | |
| | | | | | | 201,677,642 | |
| | | | | | | | |
| | |
TRANSPORTATION — 0.04% | | | | | | | | |
Airlines — 0.04% | | | | | | | | |
American Airlines, 4.95%, 7/15/2024 | | | 4,876,845 | | | | 5,340,146 | |
US Airways, 6.25%, 10/22/2024 | | | 2,322,133 | | | | 2,635,621 | |
| | | | | | | | |
| | | | | | | 7,975,767 | |
| | | | | | | | |
| | |
UTILITIES — 0.58% | | | | | | | | |
Electric Utilities — 0.36% | | | | | | | | |
Alabama Power Capital Trust V, 3.355%, 10/1/2042 | | | 4,000,000 | | | | 3,743,264 | |
18 Semi-Annual Report
| | |
| SCHEDULE OF INVESTMENTS, CONTINUED | | |
| |
Thornburg Investment Income Builder Fund | | March 31, 2015 (Unaudited) |
| | | | | | | | |
| | | Shares/
Principal Amount | | | Value | |
Arizona Public Service Co., 8.75%, 3/1/2019 | | $ | 6,500,000 | | | $ | 8,188,921 | |
Cia de Eletricidade do Estado da Bahia (BRL), 11.75%, 4/27/2016 | | | 12,000,000 | | | | 3,543,733 | |
d,e Enel Finance International S.A., 6.25%, 9/15/2017 | | | 40,000,000 | | | | 44,518,560 | |
Entergy Gulf States Louisiana, LLC, 6.00%, 5/1/2018 | | | 8,000,000 | | | | 9,006,960 | |
d Great River Energy, 5.829%, 7/1/2017 | | | 764,327 | | | | 805,153 | |
Multi-Utilities — 0.22% | | | | | | | | |
Ameren Illinois Co., 9.75%, 11/15/2018 | | | 5,000,000 | | | | 6,348,255 | |
d Enable Oklahoma Intrastate Transmission, LLC, 6.25%, 3/15/2020 | | | 2,500,000 | | | | 2,838,330 | |
NiSource Finance Corp., 6.40%, 3/15/2018 | | | 20,000,000 | | | | 22,732,880 | |
Sempra Energy, 9.80%, 2/15/2019 | | | 7,750,000 | | | | 9,976,265 | |
| | | | | | | | |
| | | | | | | 111,702,321 | |
| | | | | | | | |
TOTAL CORPORATE BONDS (Cost $1,105,559,364) | | | | | | | 1,156,319,418 | |
| | | | | | | | |
| | |
CONVERTIBLE BONDS — 0.01% | | | | | | | | |
| | |
TELECOMMUNICATION SERVICES — 0.01% | | | | | | | | |
Diversified Telecommunication Services — 0.01% | | | | | | | | |
Alaska Communication Systems Group, Inc., 6.25%, 5/1/2018 | | | 2,535,000 | | | | 2,473,210 | |
| | | | | | | | |
TOTAL CONVERTIBLE BONDS (Cost $2,138,438) | | | | | | | 2,473,210 | |
| | | | | | | | |
| | |
MUNICIPAL BONDS — 0.02% | | | | | | | | |
San Bernardino County California Redevelopment Agency (San Sevaine), 8.45%, 9/1/2030 | | | 2,555,000 | | | | 2,958,102 | |
| | | | | | | | |
TOTAL MUNICIPAL BONDS (Cost $2,505,044) | | | | | | | 2,958,102 | |
| | | | | | | | |
| | |
U.S. GOVERNMENT AGENCIES — 0.04% | | | | | | | | |
d Agribank FCB, 9.125%, 7/15/2019 | | | 6,750,000 | | | | 8,614,343 | |
| | | | | | | | |
TOTAL U.S. GOVERNMENT AGENCIES (Cost $6,750,000) | | | | | | | 8,614,343 | |
| | | | | | | | |
| | |
LOAN PARTICIPATIONS — 0.56% | | | | | | | | |
| | |
COMMERCIAL & PROFESSIONAL SERVICES — 0.13% | | | | | | | | |
Professional Services — 0.13% | | | | | | | | |
Academi Holdings, LLC, 11.00%, 7/24/2020 | | | 26,000,000 | | | | 25,480,000 | |
| | |
CONSUMER SERVICES — 0.13% | | | | | | | | |
Hotels, Restaurants & Leisure — 0.08% | | | | | | | | |
b Private Restaurants Properties, Inc., 9.00%, 4/10/2017 | | | 15,107,712 | | | | 15,379,651 | |
Diversified Consumer Services — 0.05% | | | | | | | | |
Laureate Education, Inc., 5.00%, 6/15/2018 | | | 10,000,000 | | | | 9,333,300 | |
| | |
DIVERSIFIED FINANCIALS — 0.07% | | | | | | | | |
Diversified Financial Services — 0.07% | | | | | | | | |
NCP Finance LP, 11.00%, 9/25/2018 | | | 14,090,297 | | | | 13,914,168 | |
| | |
FOOD, BEVERAGE & TOBACCO — 0.05% | | | | | | | | |
Tobacco — 0.05% | | | | | | | | |
North Atlantic Trading Co., Inc., 7.75%-8.75%, 1/13/2020 | | | 9,878,676 | | | | 9,730,496 | |
| | |
MATERIALS — 0.01% | | | | | | | | |
Construction Materials — 0.01% | | | | | | | | |
e CEMEX S.A.B. de C.V., 4.68%, 2/17/2017 | | | 1,630,321 | | | | 1,628,968 | |
| | |
RETAILING — 0.03% | | | | | | | | |
Specialty Retail — 0.03% | | | | | | | | |
Rue21, Inc., 5.63%, 10/9/2020 | | | 5,801,600 | | | | 5,166,325 | |
| | |
TRANSPORTATION — 0.08% | | | | | | | | |
Airlines — 0.08% | | | | | | | | |
b,e Synergy Aerospace Corp., 6.50%, 3/3/2015 | | | 10,669,964 | | | | 10,659,294 | |
b,d,e ET Two LLC, 10.00%, 9/30/2019 | | | 2,568,954 | | | | 2,568,954 | |
b,d,e ET Three LLC, 10.00%, 9/30/2019 | | | 2,568,954 | | | | 2,568,954 | |
Semi-Annual Report 19
| | |
| SCHEDULE OF INVESTMENTS, CONTINUED | | |
| |
Thornburg Investment Income Builder Fund | | March 31, 2015 (Unaudited) |
| | | | | | | | |
| | | Shares/
Principal Amount | | | Value | |
| | |
UTILITIES — 0.06% | | | | | | | | |
Electric Utilities — 0.06% | | | | | | | | |
Texas Competitive Electric Holdings Co., LLC, 4.66%, 10/10/2015 | | $ | 20,669,860 | | | $ | 12,227,463 | |
| | | | | | | | |
TOTAL LOAN PARTICIPATIONS (Cost $116,738,993) | | | | | | | 108,657,573 | |
| | | | | | | | |
SHORT TERM INVESTMENTS — 0.88% | | | | | | | | |
Airgas, Inc., 0.44%, 4/1/2015 | | | 9,000,000 | | | | 9,000,000 | |
Bank of New York Tri-Party Repurchase Agreement 0.23% dated 3/31/2015 due 4/1/2015, repurchase price $19,000,121 collateralized by 1 U.S. Government debt security and 21 corporate debt securities, having an average coupon of 4. 48%, a minimum credit rating of BBB-, maturity dates from 4/1/2015 to 2/26/2055, and having an aggregate market value of $20,357,990 at 3/31/2015 | | | 19,000,000 | | | | 19,000,000 | |
Eversource Energy, 0.48%, 4/7/2015 | | | 27,000,000 | | | | 26,997,840 | |
Ingerosoll-Rand, Inc., 0.40%, 4/1/2015 | | | 50,000,000 | | | | 50,000,000 | |
J.M. Smucker Co., 0.40%, 4/1/2015 | | | 18,000,000 | | | | 18,000,000 | |
PPL Electric Utilities Corp., 0.52%, 4/1/2015 | | | 13,250,000 | | | | 13,250,000 | |
Spectra Energy Partners, 0.40%, 4/1/2015 | | | 8,000,000 | | | | 8,000,000 | |
Union Electric Co., 0.55%, 4/1/2015 | | | 25,500,000 | | | | 25,500,000 | |
| | | | | | | | |
TOTAL SHORT TERM INVESTMENTS (Cost $169,747,840) | | | | | | | 169,747,840 | |
| | | | | | | | |
TOTAL INVESTMENTS — 98.02% (Cost $17,269,405,690) | | | | | | $ | 18,974,122,400 | |
OTHER ASSETS LESS LIABILITIES — 1.98% | | | | | | | 383,214,393 | |
| | | | | | | | |
NET ASSETS — 100.00% | | | | | | $ | 19,357,336,793 | |
| | | | | | | | |
Footnote Legend
| a | Investment in Affiliates—Holdings of voting securities of each portfolio company which is considered “affiliated” to the Fund under the Investment Company Act of 1940 because the Fund’s holding represented 5% or more of the company’s voting securities during the period, are shown below: |
| | | | | | | | | | | | | | | | | | | | | | | | | | | | |
Issuer | | Shares/Principal
September 30,
2014 | | | Gross
Additions | | | Gross
Reductions | | | Shares/Principal
March 31, 2015 | | | Market Value
March 31,
2015 | | | Investment
Income | | | Realized
Gain (loss) | |
Apollo Investment Corp. | | | 13,590,000 | | | | 7,661,071 | | | | — | | | | 21,251,071 | | | $ | 163,101,970 | | | $ | 7,750,214 | | | $ | — | |
Dynex Capital, Inc. | | | 5,062,000 | | | | — | | | | — | | | | 5,062,000 | | | | 42,875,140 | | | | 2,531,000 | | | | — | |
Invesco Mortgage Capital, Inc. | | | 8,350,000 | | | | 3,928,764 | | | | — | | | | 12,278,764 | | | | 190,689,205 | | | | 9,794,064 | | | | — | |
Jasmine Broadband Internet | | | | | | | | | | | | | | | | | | | | | | | | | | | | |
Infrastructure Fund* | | | — | | | | 359,941,200 | | | | — | | | | 359,941,200 | | | | 101,765,797 | | | | — | | | | — | |
MFA Financial, Inc. | | | 25,500,000 | | | | 5,697,518 | | | | — | | | | 31,197,518 | | | | 245,212,491 | | | | 11,749,807 | | | | — | |
Solar Capital Ltd. | | | 4,607,000 | | | | — | | | | — | | | | 4,607,900 | | | | 93,263,896 | | | | 3,551,062 | | | | — | |
Two Harbors Investment Corp.* | | | 14,900,000 | | | | 3,816,700 | | | | — | | | | 18,716,700 | | | | 198,771,354 | | | | 8,974,342 | | | | — | |
Washington REIT | | | 5,721,000 | | | | — | | | | — | | | | 5,721,000 | | | | 158,071,230 | | | | 1,659,319 | | | | — | |
| | | | | | | | | | | | | | | | | | | | | | | | | | | | |
Total non-controlled affiliated issuers - 6.17% of net assets | | | | | | | | | | | $ | 1,193,751,083 | | | $ | 46,009,808 | | | $ | — | |
| | | | | | | | | | | | | | | | | | | | | | | | | | | | |
| * | Issuers not affiliated at September 30, 2014. |
| b | Security currently fair valued by the Valuation and Pricing Committee using procedures approved by the Trustees. |
| d | Securities exempt from registration under Rule 144A of the Securities Act of 1933, as amended. These securities may only be resold in the ordinary course of business in transactions exempt from registration, normally to qualified institutional buyers. As of March 31, 2015, the aggregate value of these securities in the Fund’s portfolio was $626,427,852, representing 3.24% of the Fund’s net assets. |
| e | Yankee Bond—Denominated in U.S. dollars and is issued in the U.S. by foreign banks and corporations. f Bond in default. |
Portfolio Abbreviations
To simplify the listings of securities, abbreviations are used per the table below:
| | |
| ADR | | American Depositary Receipt |
| ARM | | Adjustable Rate Mortgage |
| AUD | | Denominated in Australian Dollars |
| BRL | | Denominated in Brazilian Real |
| CAD | | Denominated in Canadian Dollars |
| CMO | | Collateralized Mortgage Obligation |
| EUR | | Denominated in Euros |
| FCB | | Farm Credit Bank |
| GBP | | Denominated in Great Britain Pounds |
| GDR | | Global Depository Receipt |
| | |
| MFA | | Mortgage Finance Authority |
| Mtg | | Mortgage |
| MTN | | Medium-Term Note |
| Pfd | | Preferred Stock |
| REIT | | Real Estate Investment Trust |
| SEK | | Denominated in Swedish Kronor |
| SPV | | Special Purpose Vehicle |
See notes to financial statements.
20 Semi-Annual Report
This page intentionally left blank.
Semi-Annual Report 21
| | |
| STATEMENT OF ASSETS AND LIABILITIES | | |
| |
Thornburg Investment Income Builder Fund | | March 31, 2015 (Unaudited) |
| | | | |
ASSETS | | | | |
Investments at value | | | | |
Non-affiliated issuers (cost $16,074,337,339) (Note 2) | | $ | 17,780,371,317 | |
Non-controlled affiliated issuers (cost $1,195,068,351) (Note 2) | | | 1,193,751,083 | |
Cash | | | 31,494,272 | |
Cash denominated in foreign currency (cost $23,560,946) | | | 23,460,095 | |
Receivable for investments sold | | | 166,190,768 | |
Receivable for fund shares sold | | | 41,792,742 | |
Unrealized appreciation on forward currency contracts (Note 7) | | | 192,214,962 | |
Dividends receivable | | | 54,626,250 | |
Dividend and interest reclaim receivable | | | 29,487,982 | |
Interest receivable | | | 25,811,442 | |
Prepaid expenses and other assets | | | 158,040 | |
| | | | |
Total Assets | | | 19,539,358,953 | |
| | | | |
LIABILITIES | | | | |
Payable for investments purchased | | | 125,110,014 | |
Payable for fund shares redeemed | | | 21,100,950 | |
Unrealized depreciation on forward currency contracts (Note 7) | | | 4,404,961 | |
Payable to investment advisor and other affiliates (Note 3) | | | 19,215,981 | |
Accounts payable and accrued expenses | | | 2,796,356 | |
Dividends payable | | | 9,393,898 | |
| | | | |
Total Liabilities | | | 182,022,160 | |
| | | | |
| |
NET ASSETS | | $ | 19,357,336,793 | |
| | | | |
NET ASSETS CONSIST OF | | | | |
Undistributed net investment income | | $ | 45,579,924 | |
Net unrealized appreciation on investments | | | 1,889,864,258 | |
Accumulated net realized gain (loss) | | | (252,196,369 | ) |
Net capital paid in on shares of beneficial interest | | | 17,674,088,980 | |
| | | | |
| | $ | 19,357,336,793 | |
| | | | |
22 Semi-Annual Report
| | |
| STATEMENT OF ASSETS AND LIABILITIES, CONTINUED |
| |
Thornburg Investment Income Builder Fund | | March 31, 2015 (Unaudited) |
| | | | |
NET ASSET VALUE | | | | |
Class A Shares: | | | | |
Net asset value and redemption price per share ($4,718,332,923 applicable to 220,468,157 shares of beneficial interest outstanding - Note 4) | | | $21.40 | |
Maximum sales charge, 4.50% of offering price | | | 1.01 | |
| | | | |
Maximum offering price per share | | | $22.41 | |
| | | | |
| |
Class C Shares: | | | | |
Net asset value and offering price per share* ($6,472,041,417 applicable to 302,547,138 shares of beneficial interest outstanding - Note 4) | | | $21.39 | |
| | | | |
| |
Class I Shares: | | | | |
Net asset value, offering and redemption price per share ($7,956,661,892 applicable to 369,166,195 shares of beneficial interest outstanding - Note 4) | | | $21.55 | |
| | | | |
| |
Class R3 Shares: | | | | |
Net asset value, offering and redemption price per share ($87,243,737 applicable to 4,077,544 shares of beneficial interest outstanding - Note 4) | | | $21.40 | |
| | | | |
| |
Class R4 Shares: | | | | |
Net asset value, offering and redemption price per share ($44,563,645 applicable to 2,078,626 shares of beneficial interest outstanding - Note 4) | | | $21.44 | |
| | | | |
| |
Class R5 Shares: | | | | |
Net asset value, offering and redemption price per share | | | | |
($78,493,179 applicable to 3,643,915 shares of beneficial interest outstanding - Note 4) | | | $21.54 | |
| | | | |
| * | Redemption price per share is equal to net asset value less any applicable contingent deferred sales charge. |
See notes to financial statements.
Semi-Annual Report 23
| | |
| STATEMENT OF OPERATIONS | | |
| |
Thornburg Investment Income Builder Fund | | Six Months Ended March 31, 2015 (Unaudited) |
| | | | |
| |
INVESTMENT INCOME | | | | |
Dividend income | | | | |
Non-affiliated issuers (net of foreign taxes withheld of $21,325,814) | | $ | 312,102,779 | |
Non-controlled affiliated issuers | | | 46,009,808 | |
Interest income (net of premium amortized of $1,645,148) | | | 54,480,434 | |
| | | | |
Total Income | | | 412,593,021 | |
| | | | |
| |
EXPENSES | | | | |
Investment advisory fees (Note 3) | | | 64,113,200 | |
Administration fees (Note 3) | | | | |
Class A Shares | | | 2,864,527 | |
Class C Shares | | | 3,916,252 | |
Class I Shares | | | 1,895,494 | |
Class R3 Shares | | | 51,676 | |
Class R4 Shares | | | 25,829 | |
Class R5 Shares | | | 17,980 | |
Distribution and service fees (Note 3) | | | | |
Class A Shares | | | 5,734,302 | |
Class C Shares | | | 31,367,609 | |
Class R3 Shares | | | 206,834 | |
Class R4 Shares | | | 50,917 | |
Transfer agent fees | | | | |
Class A Shares | | | 1,541,650 | |
Class C Shares | | | 1,822,592 | |
Class I Shares | | | 2,545,865 | |
Class R3 Shares | | | 66,158 | |
Class R4 Shares | | | 47,845 | |
Class R5 Shares | | | 60,066 | |
Registration and filing fees | | | | |
Class A Shares | | | 46,559 | |
Class C Shares | | | 41,896 | |
Class I Shares | | | 54,253 | |
Class R3 Shares | | | 1,820 | |
Class R4 Shares | | | 8,776 | |
Class R5 Shares | | | 11,238 | |
Custodian fees (Note 3) | | | 1,587,053 | |
Professional fees | | | 137,979 | |
Accounting fees | | | 327,600 | |
Trustee fees | | | 373,425 | |
Other expenses | | | 680,409 | |
| | | | |
Total Expenses | | | 119,599,804 | |
Less: | | | | |
Expenses reimbursed by investment advisor (Note 3) | | | (300,270 | ) |
Fees paid indirectly (Note 3) | | | (9,653 | ) |
| | | | |
Net Expenses | | | 119,289,881 | |
| | | | |
Net Investment Income | | $ | 293,303,140 | |
| | | | |
24 Semi-Annual Report
| | |
| STATEMENT OF OPERATIONS, CONTINUED | | |
| |
Thornburg Investment Income Builder Fund | | Six Months Ended March 31, 2015 (Unaudited) |
| | | | |
REALIZED AND UNREALIZED GAIN (LOSS) | | | | |
Net realized gain (loss) from: | | | | |
Investments | | | | |
Non-affiliated issuers | | $ | 3,890,334 | |
Forward currency contracts (Note 7) | | | 400,174,116 | |
Foreign currency transactions | | | (4,503,821 | ) |
| | | | |
| | | 399,560,629 | |
| | | | |
Net change in unrealized appreciation (depreciation) on: | | | | |
Investments | | | | |
Non-affiliated issuers | | | (355,916,924 | ) |
Non-controlled affiliated issuers | | | 17,690,035 | |
Foreign currency contracts (Note 7) | | | 36,186,447 | |
Forward currency translations | | | (432,291 | ) |
| | | | |
| | | (302,472,733 | ) |
| | | | |
Net Realized and Unrealized Gain | | | 97,087,896 | |
| | | | |
Net Increase in Net Assets Resulting from Operations | | $ | 390,391,036 | |
| | | | |
See notes to financial statements.
Semi-Annual Report 25
| | |
| STATEMENTS OF CHANGES IN NET ASSETS | | |
| |
Thornburg Investment Income Builder Fund | | |
| | | | | | | | |
| | | Six Months Ended
March 31, 2015* | | | Year Ended
September 30, 2014 | |
INCREASE (DECREASE) IN NET ASSETS FROM | | | | | | | | |
| | |
OPERATIONS | | | | | | | | |
Net investment income | | $ | 293,303,140 | | | $ | 867,746,227 | |
Net realized gain (loss) from investments, forward currency contracts, and foreign currency transactions | | | 399,560,629 | | | | 395,489,176 | |
Net unrealized appreciation (depreciation) on investments forward currency contracts, and foreign currency translations | | | (302,472,733 | ) | | | 467,713,787 | |
| | | | | | | | |
| | |
Net Increase (Decrease) in Net Assets Resulting from Operations | | | 390,391,036 | | | | 1,730,949,190 | |
| | |
DIVIDENDS TO SHAREHOLDERS | | | | | | | | |
From net investment income | | | | | | | | |
Class A Shares | | | (91,464,510 | ) | | | (217,737,169 | ) |
Class C Shares | | | (102,853,035 | ) | | | (229,272,611 | ) |
Class I Shares | | | (163,005,861 | ) | | | (321,305,859 | ) |
Class R3 Shares | | | (1,518,861 | ) | | | (3,172,949 | ) |
Class R4 Shares | | | (782,536 | ) | | | (1,442,451 | ) |
Class R5 Shares | | | (1,492,167 | ) | | | (2,394,204 | ) |
| | |
FUND SHARE TRANSACTIONS (NOTE 4) | | | | | | | | |
Class A Shares | | | 123,521,189 | | | | 27,382,304 | |
Class C Shares | | | 197,764,659 | | | | 778,778,530 | |
Class I Shares | | | 488,376,767 | | | | 1,544,961,767 | |
Class R3 Shares | | | 3,467,375 | | | | 18,411,872 | |
Class R4 Shares | | | 4,575,347 | | | | 13,430,799 | |
Class R5 Shares | | | 13,470,290 | | | | 22,689,436 | |
| | | | | | | | |
Net Increase in Net Assets | | | 860,449,693 | | | | 3,361,278,655 | |
| | |
NET ASSETS | | | | | | | | |
Beginning of Period | | | 18,496,887,100 | | | | 15,135,608,445 | |
| | | | | | | | |
End of Period | | $ | 19,357,336,793 | | | $ | 18,496,887,100 | |
| | | | | | | | |
Undistributed net investment income | | $ | 45,579,924 | | | $ | 113,393,754 | |
See notes to financial statements.
26 Semi-Annual Report
| | |
| NOTES TO FINANCIAL STATEMENTS | | |
| |
Thornburg Investment Income Builder Fund | | March 31, 2015 (Unaudited) |
NOTE 1 – ORGANIZATION
Thornburg Investment Income Builder Fund (the “Fund”) is a diversified series of Thornburg Investment Trust (the “Trust”). The Trust was organized as a Massachusetts business trust under a Declaration of Trust dated June 3, 1987 and is registered as a diversified, open-end management investment company under the Investment Company Act of 1940, as amended. The Fund is currently one of eighteen separate series of the Trust. Each series is considered to be a separate entity for financial reporting and tax purposes and bears expenses directly attributable to it. The Fund’s primary investment goal is to provide a level of current income which exceeds the average yield on U.S. stocks generally, and which will generally grow, subject to periodic fluctuations, over the years on a per share basis. The Fund’s secondary investment goal is long-term capital appreciation.
The Fund currently offers six classes of shares of beneficial interest: Class A, Class C, Institutional Class (“Class I”), and Retirement Classes (“Class R3,” “Class R4,” and “Class R5”). Each class of shares of the Fund represents an interest in the same portfolio of investments, except that (i) Class A shares are sold subject to a front-end sales charge collected at the time the shares are purchased and bear a service fee, (ii) Class C shares are sold at net asset value without a sales charge at the time of purchase, but are subject to a contingent deferred sales charge upon redemption within one year of purchase, and bear both a service fee and a distribution fee, (iii) Class I shares are sold at net asset value without a sales charge at the time of purchase and may be subject to a service fee, (iv) Class R3 shares are sold at net asset value without a sales charge at the time of purchase, but bear both a service fee and distribution fee, (v) Class R4 shares are sold at net asset value without sales charge at the time of purchase, but bear a service fee, (vi) Class R5 shares are sold at net asset value without a sales charge at the time of purchase, and may be subject to a service fee (vii) the respective classes may have different reinvestment privileges and conversion rights. Additionally, the Fund may allocate among its classes certain expenses, to the extent allocable to specific classes, including transfer agent fees, government registration fees, certain printing and postage costs, and administrative and legal expenses. Currently, class specific expenses of the Fund are limited to service and distribution fees, administration fees, and certain registration and transfer agent expenses.
NOTE 2 – SIGNIFICANT ACCOUNTING POLICIES
The following is a summary of significant accounting policies followed by the Fund in the preparation of its financial statements. The Fund is an investment company and prepares its financial statements in conformity with U.S. generally accepted accounting principles (“GAAP”), including the investment company accounting and reporting guidance in the Financial Accounting Standards Board (the “FASB”) Accounting Standard Codification Topic 946. The preparation of financial statements in conformity with GAAP requires management to make estimates and assumptions that affect the reported amounts of assets and liabilities and disclosure of contingent assets and liabilities at the date of the financial statements and the reported amounts of increases (decreases) in net assets from operations during the reporting period. Actual results could differ from those estimates.
Significant accounting policies of the Fund are as follows:
Valuation Policy and Procedures: The Trustees of the Trust (the “Trustees”) have authorized employees of the Fund’s investment advisor, acting as the Valuation and Pricing Committee (the “Committee”), to make certain valuation determinations, subject to oversight and review by the Trustees and the Audit Committee of the Trustees. The Committee and other employees of the Fund’s investment advisor administer and implement the valuation process. The Committee regularly reviews its own fair value decisions, as well as valuations, valuation techniques and services furnished by pricing services, considers circumstances in the markets which may require valuation determinations by the Committee and reviews previous valuation determinations. The Committee also reports on its activities, the performance of the pricing services and other matters to the Trustees and the Audit Committee of the Trustees.
In determining a fair value for a portfolio investment, the Committee seeks to determine the price that the Fund would reasonably expect to receive upon a sale of the investment in an orderly transaction between market participants at the measurement date. Typically, the fair value process employs standing instructions to use quoted prices in active markets or the use of independent pricing services. Less frequently, the Committee may make a fair value determination using other methods. However, because fair value prices are estimated prices, the determination of fair value for an investment may differ from the value that would be realized by the Fund upon a sale of the investment, and that difference could be material to the Fund’s financial statements. The Committee’s determination of fair value for an investment may also differ from the prices obtained by other persons (including other mutual funds) for the investment.
Valuation of Investments: Portfolio investments listed or traded on a national securities exchange are valued on the valuation date at the last reported trade price on the exchange that is the primary market for the investment. Portfolio investments reported by NASDAQ are valued at the NASDAQ official closing price. Portfolio investments traded on an exchange for which there has been no trade that day and other equity investments traded in the over-the-counter market are valued at the mean between the last reported bid and ask prices. Any foreign investment traded on exchanges outside the United States is valued at the price of the investment on the exchange that is normally the investment’s primary market, as of the close of that exchange preceding the time of the Fund’s valuation measurement date.
Semi-Annual Report 27
| | |
| NOTES TO FINANCIAL STATEMENTS, CONTINUED | | |
| |
Thornburg Investment Income Builder Fund | | March 31, 2015 (Unaudited) |
In any case when the market value of an equity investment held by the Fund is not readily available, a determination of a fair value for the investment is made by the Committee. The Committee’s determinations are made using procedures in accordance with a policy approved by the Trustees, which may include the use of a price obtained from an independent pricing service. The pricing service ordinarily values equity investments in these instances using multi-factor models to adjust market prices based upon various inputs, including exchange data, depositary receipt prices, futures, index data and other data. An investment’s market value is deemed not readily available whenever the exchange or market on which the investment is primarily traded is closed for the entire scheduled day of trading. Additionally, an investment’s market value may be deemed not readily available under other circumstances identified by the Trustees, including when developments occurring after the most recent close of the investment’s primary exchange or market, but before the most recent close of trading in Fund shares, or an unusual event or significant period of time occurring since the availability of a market quotation, create a question about the reliability of the investment’s market value. For example, on days when market volatility thresholds pre-determined by the Trustees are exceeded, foreign equity investments held by the Fund may be valued using synthetic pricing obtained from an independent pricing service approved by the Trustees, subject to the ability of the Committee to determine in any such instance to utilize market closing prices if the Committee considers closing prices to be more reliable.
Debt obligations held by the Fund have a primary over-the-counter market and are valued by an independent pricing service approved by the Trustees. The pricing service ordinarily values debt obligations using quoted bid prices and other methods, which include consideration of yields or prices of debt obligations of comparable quality, type of issue, coupon, maturity and rating, and indications as to value from dealers and general market conditions.
In any case when a pricing service fails to provide a price for a debt obligation held by the Fund, the Committee determines a fair value for the debt obligation using procedures in accordance with a policy approved by the Trustees, which may include the use of a price obtained from a different independent pricing service. Additionally, in any case when management believes that a price provided by a pricing service for a debt obligation held by the Fund may be unreliable, the Committee decides whether or not to use the pricing service’s valuation or to use an alternative method to determine a fair value for the debt obligation.
Quotations in foreign currencies for foreign portfolio investments are converted to U.S. dollar equivalents using the foreign exchange quotation in effect at the time of valuation.
Valuation Measurements: The Fund categorizes its investments based upon the inputs used in valuing those investments, according to a three-level hierarchy established by guidance from the FASB. Categorization of investments using this hierarchy is intended by the FASB to maximize the use of observable inputs and minimize the use of unobservable inputs by prioritizing that the most observable input be used when available. Observable inputs are those that market participants would use in valuing an investment based on available market data. Unobservable inputs are those that reflect assumptions about the information market participants would use in valuing an investment. An investment’s level within the hierarchy is based on the lowest level input that is deemed significant to the fair value measurement. The methodologies and relative inputs used to value investments are not necessarily indications of the risk or liquidity associated with investing in those investments.
Various inputs are used in determining the fair value measurement of the Fund’s investments. These inputs are generally summarized according to the three-level hierarchy below:
Level 1: Quoted prices in active markets for identical investments.
Level 2: Other direct or indirect significant observable inputs (including quoted prices for similar investments in active markets and other observable inputs, such as interest rates, prepayment rates, credit risk, etc.).
When market volatility thresholds are exceeded, foreign equity investments may be fair valued according to other significant observable inputs rather than quoted market prices. The affected investments will be characterized as Level 2 within the valuation hierarchy and revert to Level 1 after the threshold is no longer exceeded.
Level 3: Significant unobservable inputs, (including the Committee’s own assumptions in determining the fair value of investments).
Portfolio investments with minimal, if any, market activity are characterized as Level 3 and are valued using significant unobservable inputs, typically including single broker quotes, which may be adjusted or unadjusted, related or comparable investments, last available transactions, and other relevant information. Valuations may also be based upon current market prices of securities that are comparable in coupon, rating, maturity and industry. An income based valuation approach would consider discounted anticipated future cash flows of the investment. Discounts may also be applied due to the nature or duration of any restrictions on the disposition of the investment. Valuations based upon the use of inputs from Levels 1, 2, or 3, may not represent the actual price received upon the disposition of an investment, and the Fund may receive a price that is lower than the valuation when it sells the investment.
The following table displays a summary of the fair value hierarchy measurements of the Fund’s investments as of March 31, 2015. In any instance when valuation inputs from more than one level are used to determine the fair value of a specific investment, the investment is placed in the level of the table based upon the lowest level input that is significant in determining the fair value of the investment:
28 Semi-Annual Report
| | |
| NOTES TO FINANCIAL STATEMENTS, CONTINUED | | |
| |
Thornburg Investment Income Builder Fund | | March 31, 2015 (Unaudited) |
| | | | | | | | | | | | | | | | |
| | | Fair Value Measurements at March 31, 2015 | |
| | | Total | | | Level 1 | | | Level 2 | | | Level 3(b) | |
Assets | | | | | | | | | | | | | | | | |
Investments in Securities* | | | | | | | | | | | | | | | | |
Common Stock | | $ | 17,339,759,794 | | | $ | 17,237,993,997 | | | $ | 101,765,797 | | | $ | — | |
Preferred Stock(a) | | | 120,645,728 | | | | 76,553,190 | | | | 44,092,538 | | | | — | |
Asset Backed Securities | | | 64,946,392 | | | | — | | | | 61,949,345 | | | | 2,997,047 | |
Corporate Bonds | | | 1,156,319,418 | | | | — | | | | 1,146,708,525 | | | | 9,610,893 | |
Convertible Bonds | | | 2,473,210 | | | | — | | | | 2,473,210 | | | | — | |
Municipal Bonds | | | 2,958,102 | | | | — | | | | 2,958,102 | | | | — | |
U.S. Government Agencies | | | 8,614,343 | | | | — | | | | 8,614,343 | | | | — | |
Loan Participations | | | 108,657,573 | | | | — | | | | 77,480,720 | | | | 31,176,853 | |
Short Term Investments | | | 169,747,840 | | | | — | | | | 169,747,840 | | | | — | |
| | | | | | | | | | | | | | | | |
Total Investments in Securities | | $ | 18,974,122,400 | | | $ | 17,314,547,187 | | | $ | 1,615,790,420 | | | $ | 43,784,793 | |
Other Financial Instruments** | | | | | | | | | | | | | | | | |
Forward Currency Contracts | | $ | 192,214,962 | | | $ | — | | | $ | 192,214,962 | | | $ | — | |
Spot Currency | | $ | 42,490 | | | $ | 42,490 | | | $ | — | | | $ | — | |
Liabilities | | | | | | | | | | | | | | | | |
Other Financial Instruments** | | | | | | | | | | | | | | | | |
Forward Currency Contracts | | $ | (4,404,961 | ) | | $ | — | | | $ | (4,404,961 | ) | | $ | — | |
Spot Currency | | $ | (9,466 | ) | | $ | (9,466 | ) | | $ | — | | | $ | — | |
| * | See Schedule of Investments for a summary of the industry exposure as grouped according to the Global Industry Classification Standard (GICS), which is an industry taxonomy developed by MSCI, Inc. and Standard & Poor’s (S&P). |
| ** | Other Financial Instruments include investments not reflected in the Schedule of Investments, which may include futures, forwards and swap contracts, which are valued at the unrealized appreciation (depreciation) on the investment. |
| (a) | At March 31, 2015, industry classifications for Preferred Stock in Level 2 consist of $8,593,126 in Banks, $5,646,600 in Energy, $11,224,687 in Miscellaneous, and $18,628,125 in Telecommunication Services. |
| (b) | In accordance with the guidance prescribed in Accounting Standards Update (“ASU”) No. 2011-04, unadjusted broker quotes were applied to $12,607,940 of portfolio securities characterized as Level 3 investments at March 31, 2015. The following table displays a summary of the valuation techniques and unobservable inputs used to value portfolio securities characterized as Level 3 investments, where no unadjusted broker quotes were available at March 31, 2015: |
| | | | | | | | | | |
| | | Fair Value at
March 31, 2015 | | | Valuation Technique(s) | | Unobservable Input | | Range (Weighted Average) |
Common Stock | | $ | 0 | | | Terms of plan reorganization | | Discount to zero for lack of | | N/A (N/A) |
| | | | | | | | marketability and company | | |
| | | | | | | | sustainability in question | | |
Loan Participations | | | 31,176,853 | | | Discounted cash flows | | Third party vendor projection | | 5.00% - 11.00% (9.45%) |
| | | | | | | | of discounted cash flows | | |
| | | | | | | | | | |
Total | | $ | 31,176,853 | | | | | | | |
In accordance with the guidance prescribed in ASU No. 2011-04, it is the policy of the Fund to recognize transfers between levels and those underlying events which caused the movement. The Fund recognized no transfers between Levels 1 and 2 for the six months ended March 31, 2015, other than when the Fund exceeded market volatility thresholds for foreign equity investments during the period.
Semi-Annual Report 29
| | |
| NOTES TO FINANCIAL STATEMENTS, CONTINUED | | |
| |
Thornburg Investment Income Builder Fund | | March 31, 2015 (Unaudited) |
A rollforward of fair value measurements using significant unobservable inputs (Level 3) for the six months ended March 31, 2015 is as follows:
| | | | | | | | | | | | | | | | | | | | |
| | | Common
Stock | | | Asset
Backed
Securities | | | Corporate
Bonds | | | Loan
Participations | | | Total(d) | |
Beginning Balance 9/30/2014 | | $ | — | | | $ | 3,188,142 | | | $ | 19,918,844 | | | $ | 36,848,923 | | | $ | 59,955,909 | |
Accrued Discounts (Premiums) | | | — | | | | 10,699 | | | | 58,578 | | | | — | | | | 69,277 | |
Net Realized Gain (Loss)(a) | | | — | | | | 43,971 | | | | (1,051,768 | ) | | | — | | | | (1,007,797 | ) |
Gross Purchases | | | — | | | | — | | | | — | | | | 15,807,872 | | | | 15,807,872 | |
Gross Sales | | | — | | | | (311,062 | ) | | | (9,620,973 | ) | | | (21,634,764 | ) | | | (31,566,799 | ) |
Net Change in Unrealized | | | | | | | | | | | | | | | | | | | | |
Appreciation (Depreciation)(b)(e) | | | — | | | | 65,297 | | | | 306,212 | | | | 154,822 | | | | 526,331 | |
Transfers into Level 3(c) | | | — | | | | — | | | | — | | | | — | | | | — | |
Transfers out of Level 3(c) | | | — | | | | — | | | | — | | | | — | | | | — | |
| | | | | | | | | | | | | | | | | | | | |
Ending Balance 3/31/2015 | | $ | — | | | $ | 2,997,047 | | | $ | 9,610,893 | | | $ | 31,176,853 | | | $ | 43,784,793 | |
| (a) | Total amount of Net Realized Gain (Loss) recognized in the net increase in net assets resulting from operations is included in the Fund’s Statement of Operations for the six months ended March 31, 2015. |
| (b) | Total amount of Net Change in Unrealized Appreciation (Depreciation) recognized in the net increase in net assets resulting from operations is included in the Fund’s Statement of Operations for the six months ended March 31, 2015. |
| (c) | Transfers into or out of Level 3 were out of or into Level 2, and were due to changes in other significant observable inputs available during the six months ended March 31, 2015. Transfers into or out of Level 3 would be indicative of pricing by an independent pricing service or increased market activity. Transfers are based upon the beginning market value of the period in which they occurred. |
| (d) | Level 3 investments represent 0.23% of total net assets as of March 31, 2015. Significant fluctuations of unobservable inputs applied to portfolio investments characterized as Level 3 investments could be expected to increase or decrease the fair value of these portfolio investments. |
| (e) | The Net Change in Unrealized Appreciation (Depreciation) attributable to securities owned at March 31, 2015, which were valued using significant unobservable inputs (Level 3) was $(309,804). This is included within net change in unrealized appreciation (depreciation) on investments within the Statement of Operations. |
Foreign Currency Translation: Portfolio investments and other assets and liabilities denominated in foreign currencies are translated into U.S. dollars based on the exchange rate of such currencies against the U.S. dollar on the date of valuation. Purchases and sales of investments and income items denominated in foreign currencies are translated into U.S. dollars at the exchange rate in effect on the transaction date. When the Fund purchases or sells foreign investments, it will customarily enter into a foreign exchange contract to minimize foreign exchange risk from the trade date to the settlement date of such transactions. The values of such spot contracts are included in receivable for investments sold and payable for investments purchased on the Statement of Assets and Liabilities.
The Fund does not separately report the effect of changes in foreign exchange rates from changes in market prices on investments held. Such changes are included in net unrealized appreciation or depreciation from investments.
Reported net realized gains or losses from foreign currency transactions arise due to purchases and sales of foreign currencies, currency gains or losses realized between the trade and settlement dates on investment transactions and the difference between the amounts of dividends, interest, and foreign withholding taxes recorded on the Fund’s books, and the U.S. dollar equivalent of the amounts actually received or paid.
Net change in unrealized appreciation and depreciation on foreign currency translations arise from changes in the fair value of assets and liabilities, other than investments at fiscal period end, resulting from changes in exchange rates.
Foreign Withholding Taxes: The Fund is subject to foreign tax withholding imposed by certain foreign countries in which the Fund may invest. Withholding taxes are incurred on certain foreign dividends and are accrued at the time the dividend is recognized based on applicable foreign tax law. The Fund files withholding tax reclaims in certain jurisdictions to recover a portion of amounts previously withheld, in view of various considerations, including recent decisions rendered by the courts in those and other jurisdictions. The Fund would expect to record a receivable for such a reclaim based on a variety of factors, including assessments of a jurisdiction’s legal obligation to pay reclaims, the jurisdiction’s administrative practices and payment history, and industry convention. To date the Fund has recorded no such receivable because there is no precedent for collecting such prior year reclaims and the likelihood of collection remains uncertain.
Deferred Foreign Capital Gain Taxes: The Fund is subject to a tax imposed on net realized gains of securities of certain foreign countries. The Fund records an estimated deferred tax liability for net unrealized gains on these investments as reflected in the accompanying financial statements.
30 Semi-Annual Report
| | |
| NOTES TO FINANCIAL STATEMENTS, CONTINUED | | |
| |
Thornburg Investment Income Builder Fund | | March 31, 2015 (Unaudited) |
Federal Income Taxes: It is the policy of the Trust to comply with the provisions of the Internal Revenue Code applicable to “regulated investment companies” and to distribute to shareholders substantially all taxable income, including any net realized gain on investments of the Fund. Therefore, no provision for federal income taxes is required.
Management reviews each uncertain tax position believed to be material to the preparation of the Fund’s financial statements, to assess if it is more likely than not that the position would be sustained upon examination, based upon the technical merits of the position. As of March 31, 2015, management has not identified any such position for which an asset or liability must be reflected in the Statement of Assets and Liabilities. The Fund’s tax returns remain subject to examination for three years after filing.
When-Issued and Delayed Delivery Transactions: The Fund may engage in when-issued or delayed delivery transactions. To the extent the Fund engages in such transactions, it will do so for the purpose of acquiring portfolio investments consistent with the Fund’s investment objectives and not for the purpose of investment leverage or to speculate on interest rate and/or market changes. At the time the Fund makes a commitment to purchase an investment on a when-issued or delayed delivery basis, the Fund will record the transaction and reflect the value in determining its net asset value. When effecting such transactions, assets of an amount sufficient to make payment for the portfolio investments to be purchased will be segregated on the Fund’s records on the trade date. Investments purchased on a when-issued or delayed delivery basis do not earn interest until the settlement date.
Dividends: Net investment income of the Fund is declared daily as a dividend on shares for which the Fund has received payment. Dividends are paid quarterly and are reinvested in additional shares of the Fund at net asset value per share at the close of business on the dividend payment date, or at the shareholder’s option, paid in cash. Net realized capital gains, to the extent available, will be distributed at least annually. Distributions to shareholders are based on income tax regulations and therefore, their characteristics may differ for financial statement and tax purposes.
Repurchase Agreements: The Fund may invest excess cash in repurchase agreements whereby the Fund purchases investments, which serve as collateral, with an agreement to resell such collateral to the seller at an agreed upon price at the maturity date of the repurchase agreement. Investments pledged as collateral for repurchase agreements are held in custody until maturity of the repurchase agreement. Provisions in the agreements require that the market value of the collateral is at least equal to the repurchase value in the event of default. In the event of default, the Fund has the right to liquidate the collateral and apply the proceeds in satisfaction of the obligation. Under certain circumstances, in the event of default or bankruptcy by the other party to the agreement, realization and/or retention of the collateral may be subject to legal proceedings.
Bridge Participation Commitments: On March 27, 2015, the Fund executed a Bridge Participation Commitment Letter to JPMorgan Chase Bank, N.A. The Fund has committed to provide up to $15,000,000 in aggregate principal. The termination date for this commitment is July 15, 2015. No amount of this commitment is funded and the commitment is not reflected in the Fund’s Statement of Assets and Liabilities.
General: Investment transactions are accounted for on a trade date basis. Interest income is accrued as earned and dividend income is recorded on the ex-dividend date. Certain income from foreign investments is recognized as soon as information is available to the Fund. Realized gains and losses from the sale of investments are recorded on an identified cost basis. Net investment income (other than class specific expenses) and realized and unrealized gains and losses are allocated daily to each class of shares based upon the relative net asset value of outstanding shares of each class of shares at the beginning of the day (after adjusting for the current share activity of the respective class). Expenses common to all Funds are allocated among the Funds comprising the Trust based upon their relative net asset values or other appropriate allocation methods.
Guarantees and Indemnifications: Under the Trust’s organizational documents (and under separate agreements with the independent Trustees), its officers and Trustees are indemnified against certain liabilities arising out of the performance of their duties to the Fund. Additionally, in the normal course of business the Trust enters into contracts with service providers that contain general indemnification clauses. The Trust’s maximum exposure under these arrangements is unknown. However, based on experience, the Trust expects the risk of loss to be remote.
NOTE 3 – INVESTMENT ADVISORY FEE AND OTHER TRANSACTIONS WITH AFFILIATES
Pursuant to an investment advisory agreement, Thornburg Investment Management, Inc. (the “Advisor”) serves as the investment advisor and performs services for the Fund for which the fees are payable at the end of each month. For the six months ended March 31, 2015, these fees were payable at annual rates ranging from .875 of 1% to .675 of 1% per annum of the average daily net assets of the Fund depending on the Fund’s asset size. The Trust also has entered into administrative services agreements with the Advisor, whereby the Advisor will perform certain administrative services for the shareholders of each class of the Fund’s shares, and for which fees will be payable at an annual rate of up to .125 of 1% per annum of the average daily net assets attributable to each class of shares.
The Trust has an underwriting agreement with Thornburg Securities Corporation (the “Distributor,” an affiliate of the Advisor), which acts as the distributor of the Fund’s shares. For the six months ended March 31, 2015, the Distributor has advised the Fund that it earned
Semi-Annual Report 31
| | |
| NOTES TO FINANCIAL STATEMENTS, CONTINUED | | |
| |
Thornburg Investment Income Builder Fund | | March 31, 2015 (Unaudited) |
commissions aggregating $750,382 from the sale of Class A shares, and collected contingent deferred sales charges aggregating $215,107 from redemptions of Class C shares of the Fund.
Pursuant to a service plan under Rule 12b-1 of the Investment Company Act of 1940, the Fund may reimburse to the Advisor an amount not to exceed .25 of 1% per annum of the average daily net assets attributable to each class of shares of the Fund for payments made by the Advisor to securities dealers and other financial institutions to obtain various shareholder and distribution related services. For the six months ended March 31, 2015, there were no 12b-1 service plan fees charged for Class I and R5 shares. The Advisor may pay out of its own resources additional expenses for distribution of the Fund’s shares and shareholder services.
The Trust has also adopted distribution plans pursuant to Rule 12b-1, applicable only to the Fund’s Class C and Class R3 shares, under which the Fund compensates the Distributor for services in promoting the sale of Class C and Class R3 shares of the Fund at an annual rate of up to .75 of 1% per annum of the average daily net assets attributable to Class C shares, and an annual rate of up to .25 of 1% per annum of the average daily net assets attributable to Class R3 shares. Total fees incurred by each class of shares of the Fund under their respective service and distribution plans for the six months ended March 31, 2015, are set forth in the Statement of Operations.
The Advisor and Distributor have contractually agreed to waive fees and reimburse expenses incurred by the Fund so that actual expenses of certain share classes do not exceed levels as specified in the Fund’s most recent prospectuses. The agreement may be terminated by the Fund at any time, but may not be terminated by the Advisor or Distributor before February 1, 2016, unless the Advisor ceases to be the investment advisor to the Fund or the Distributor ceases to be the distributor of the Fund prior to that date. The Advisor and Distributor retain the right to be repaid by the Fund for fee waivers and expense reimbursements if expenses fall below the contractual limit prior to the end of the fiscal year.
For the six months ended March 31, 2015, the Advisor contractually reimbursed certain class specific expenses, administrative fees, and distribution fees of $293,858 for Class C shares, $5,636 for Class R3 shares, $758 for Class R4 shares, and $18 for Class R5 shares.
The Trust has an agreement with the custodian bank to indirectly pay a portion of the custodian’s fees through credits earned by the Fund’s cash on deposit with the bank. This deposit agreement is an alternative to overnight investments. Custodial fees are adjusted to reflect amounts that would have been paid without this agreement, with a corresponding adjustment reflected as fees paid indirectly in the Statement of Operations. For the six months ended March 31, 2015, fees paid indirectly were $9,653.
Certain officers and Trustees of the Trust are also officers or directors of the Advisor and Distributor. The compensation of independent Trustees is borne by the Trust.
NOTE 4 – SHARES OF BENEFICIAL INTEREST
At March 31, 2015, there were an unlimited number of shares with no par value of beneficial interest authorized. Transactions in shares of beneficial interest were as follows:
| | | | | | | | | | | | | | | | |
| | | Six Months Ended
March 31, 2015 (Unaudited) | | | Year Ended
September 30, 2014 (Audited) | |
| | | Shares | | | Amount | | | Shares | | | Amount | |
Class A Shares | | | | | | | | | | | | | | | | |
Shares sold | | | 20,633,292 | | | $ | 435,792,061 | | | | 48,612,162 | | | $ | 1,028,388,480 | |
Shares issued to shareholders in reinvestment of dividends | | | 3,985,556 | | | | 84,518,506 | | | | 9,375,792 | | | | 200,214,215 | |
Shares repurchased | | | (18,780,046 | ) | | | (396,789,378 | ) | | | (55,979,046 | ) | | | (1,201,220,391 | ) |
| | | | | | | | | | | | | | | | |
| | | | |
Net increase (decrease) | | | 5,838,802 | | | $ | 123,521,189 | | | | 2,008,908 | | | $ | 27,382,304 | |
| | | | | | | | | | | | | | | | |
Class C Shares | | | | | | | | | | | | | | | | |
Shares sold | | | 22,645,195 | | | $ | 478,910,004 | | | | 56,872,819 | | | $ | 1,202,445,858 | |
Shares issued to shareholders in reinvestment of dividends | | | 4,162,353 | | | | 88,190,830 | | | | 8,976,982 | | | | 191,699,714 | |
Shares repurchased | | | (17,491,545 | ) | | | (369,336,175 | ) | | | (28,974,490 | ) | | | (615,367,042 | ) |
| | | | | | | | | | | | | | | | |
| | | | |
Net increase (decrease) | | | 9,316,003 | | | $ | 197,764,659 | | | | 36,875,311 | | | $ | 778,778,530 | |
| | | | | | | | | | | | | | | | |
32 Semi-Annual Report
| | |
| NOTES TO FINANCIAL STATEMENTS, CONTINUED | | |
| |
Thornburg Investment Income Builder Fund | | March 31, 2015 (Unaudited) |
| | | | | | | | | | | | | | | | |
| | | Six Months Ended
March 31, 2015 (Unaudited) | | | Year Ended
September 30, 2014 (Audited) | |
| | | Shares | | | Amount | | | Shares | | | Amount | |
| | | | |
Class I Shares | | | | | | | | | | | | | | | | |
Shares sold | | | 50,270,984 | | | $ | 1,070,608,611 | | | | 118,183,924 | | | $ | 2,536,009,530 | |
Shares issued to shareholders in reinvestment of dividends | | | 6,689,263 | | | | 142,884,550 | | | | 12,871,189 | | | | 277,002,806 | |
Shares repurchased | | | (34,069,819 | ) | | | (725,116,394 | ) | | | (59,386,156 | ) | | | (1,268,050,569 | ) |
| | | | | | | | | | | | | | | | |
| | | | |
Net increase (decrease) | | | 22,890,428 | | | $ | 488,376,767 | | | | 71,668,957 | | | $ | 1,544,961,767 | |
| | | | | | | | | | | | | | | | |
Class R3 Shares | | | | | | | | | | | | | | | | |
Shares sold | | | 783,112 | | | $ | 16,571,466 | | | | 1,473,125 | | | $ | 31,281,547 | |
Shares issued to shareholders in reinvestment of dividends | | | 65,515 | | | | 1,388,696 | | | | 132,598 | | | | 2,834,610 | |
Shares repurchased | | | (686,037 | ) | | | (14,492,787 | ) | | | (737,624 | ) | | | (15,704,285 | ) |
| | | | | | | | | | | | | | | | |
| | | | |
Net increase (decrease) | | | 162,590 | | | $ | 3,467,375 | | | | 868,099 | | | $ | 18,411,872 | |
| | | | | | | | | | | | | | | | |
Class R4 Shares | | | | | | | | | | | | | | | | |
Shares sold | | | 551,275 | | | $ | 11,667,656 | | | | 1,061,369 | | | $ | 22,674,871 | |
Shares issued to shareholders in reinvestment of dividends | | | 23,725 | | | | 504,181 | | | | 39,714 | | | | 851,725 | |
Shares repurchased | | | (359,081 | ) | | | (7,596,490 | ) | | | (473,144 | ) | | | (10,095,797 | ) |
| | | | | | | | | | | | | | | | |
| | | | |
Net increase (decrease) | | | 215,919 | | | $ | 4,575,347 | | | | 627,939 | | | $ | 13,430,799 | |
| | | | | | | | | | | | | | | | |
Class R5 Shares | | | | | | | | | | | | | | | | |
Shares sold | | | 903,818 | | | $ | 19,201,162 | | | | 1,791,210 | | | $ | 38,729,499 | |
Shares issued to shareholders in reinvestment of dividends | | | 63,018 | | | | 1,345,428 | | | | 98,278 | | | | 2,118,145 | |
Shares repurchased | | | (332,327 | ) | | | (7,076,300 | ) | | | (853,331 | ) | | | (18,158,208 | ) |
| | | | | | | | | | | | | | | | |
| | | | |
Net increase (decrease) | | | 634,509 | | | $ | 13,470,290 | | | | 1,036,157 | | | $ | 22,689,436 | |
| | | | | | | | | | | | | | | | |
NOTE 5 – INVESTMENT TRANSACTIONS
For the six months ended March 31, 2015, the Fund had purchase and sale transactions of investments (excluding short-term investments and U. S. Government obligations) of $5,170,264,806 and $4,003,617,017, respectively.
NOTE 6 – INCOME TAXES
At March 31, 2015, information on the tax components of capital was as follows:
| | | | |
Cost of investments for tax purposes | | $ | 17,317,111,048 | |
| | | | |
Gross unrealized appreciation on a tax basis | | $ | 2,619,575,962 | |
Gross unrealized depreciation on a tax basis | | | (962,564,610 | ) |
| | | | |
Net unrealized appreciation (depreciation) on investments (tax basis) | | $ | 1,657,011,352 | |
| | | | |
At March 31, 2015, the Fund had cumulative tax basis capital losses generated prior to October 1, 2011, which may be carried forward to offset future capital gains. To the extent such carryforwards are used, capital gain distributions may be reduced to the extent provided by regulations. Such capital loss carryforwards of $445,145,452 expire as of September 30, 2018.
Semi-Annual Report 33
| | |
| NOTES TO FINANCIAL STATEMENTS, CONTINUED | | |
| |
Thornburg Investment Income Builder Fund | | March 31, 2015 (Unaudited) |
NOTE 7 — DERIVATIVE FINANCIAL INSTRUMENTS WITH OFF-BALANCE SHEET RISK AND FOREIGN INVESTMENT RISK
The Fund may use a variety of derivative financial instruments to hedge or adjust the risks affecting its investment portfolio or to enhance investment returns. Provisions of FASB Accounting Standards Codification 815-10-50 (“ASC 815”), require certain disclosures. The disclosures are intended to provide users of financial statements with an understanding of the use of derivative instruments by the Fund and how these derivatives affect the financial position, financial performance and cash flows of the Fund. The Fund does not designate any derivative instruments as hedging instruments under ASC 815. During the six months ended March 31, 2015, the Fund’s principal exposure to derivative financial instruments of the type addressed by ASC 815 was investment in foreign exchange contracts. A foreign exchange contract is an agreement between two parties to exchange different currencies at a specified rate of exchange at an agreed upon future date. Foreign exchange contracts involve risks to the Fund, including the risk that a contract counterparty will not meet its obligations to the Fund, the risk that a change in a contract’s value may not correlate perfectly with the currency the contract was intended to track, and the risk that the Fund’s advisor is unable to correctly implement its strategy in using a contract. In any such instance, the Fund may not achieve the intended benefit of entering into a contract, and may experience a loss.
The Fund entered into forward currency contracts during the six months ended March 31, 2015 in the normal course of pursuing its investment objectives, with the objective of purchasing foreign investments or with the intent of reducing the risk to the value of the Fund’s foreign investments from adverse changes in the relationship between the U.S. dollar and foreign currencies. In each case these contracts have been initiated in conjunction with foreign investment transactions.
These contracts are accounted for by the Fund under ASC 815. Unrealized appreciation and depreciation on outstanding contracts are reported in the Fund’s Statement of Assets and Liabilities, as measured by the difference between the forward exchange rates at the reporting date and the forward exchange rates at each contract’s inception date. Net realized gain (loss) on contracts closed during the period, and changes in net unrealized appreciation (depreciation) on outstanding contracts are recognized in the Fund’s Statement of Operations. The average value of open sell currency contracts for the six months ended March 31, 2015 was $3,718,194,460. Open buy currency contracts are entered into for the purpose of closing open sell currency contracts and the values are dependent upon the values of the open sell currency contracts to which they relate.
The following table displays the outstanding forward currency contracts at March 31, 2015:
| | | | | | | | | | | | | | | | | | | | | | | | | | | | |
| | | Outstanding Forward Currency Contracts to Buy or Sell At March 31, 2015 | |
Contract Description | | Buy/Sell | | | Contract Amount | | | Counter
Party(a) | | | Contract
Value Date | | | Value
USD | | | Unrealized
Appreciation | | | Unrealized
Depreciation | |
Swedish Krona | | | Sell | | | | 848,151,300 | | | | BBH | | | | 05/04/2015 | | | | 98,528,299 | | | $ | 4,646,849 | | | $ | — | |
Swedish Krona | | | Sell | | | | 75,076,000 | | | | BBH | | | | 05/04/2015 | | | | 8,721,452 | | | | — | | | | (26,263 | ) |
Swedish Krona | | | Buy | | | | 187,300,800 | | | | BBH | | | | 05/04/2015 | | | | 21,758,416 | | | | — | | | | (198,701 | ) |
Swedish Krona | | | Buy | | | | 291,819,000 | | | | BBH | | | | 05/04/2015 | | | | 33,900,118 | | | | — | | | | (437,911 | ) |
Swedish Krona | | | Buy | | | | 369,031,500 | | | | BBH | | | | 05/04/2015 | | | | 42,869,764 | | | | — | | | | (551,786 | ) |
South Korean Won | | | Sell | | | | 14,638,697,500 | | | | SSB | | | | 06/09/2015 | | | | 13,165,816 | | | | — | | | | (54,577 | ) |
South Korean Won | | | Sell | | | | 70,012,841,600 | | | | SSB | | | | 06/09/2015 | | | | 62,968,456 | | | | — | | | | (966,293 | ) |
Australian Dollar | | | Sell | | | | 160,455,500 | | | | SSB | | | | 05/11/2015 | | | | 121,938,598 | | | | 14,341,072 | | | | — | |
Australian Dollar | | | Buy | | | | 21,578,600 | | | | SSB | | | | 05/11/2015 | | | | 16,398,716 | | | | 5,260 | | | | — | |
Australian Dollar | | | Buy | | | | 20,273,000 | | | | SSB | | | | 05/11/2015 | | | | 15,406,522 | | | | — | | | | (214,129 | ) |
Australian Dollar | | | Buy | | | | 20,836,000 | | | | SSB | | | | 05/11/2015 | | | | 15,834,375 | | | | — | | | | (401,848 | ) |
Australian Dollar | | | Buy | | | | 29,652,900 | | | | SSB | | | | 05/11/2015 | | | | 22,534,803 | | | | — | | | | (453,015 | ) |
Euro | | | Sell | | | | 1,903,077,300 | | | | SSB | | | | 08/25/2015 | | | | 2,050,736,894 | | | | 109,921,918 | | | | — | |
Euro | | | Sell | | | | 174,238,200 | | | | SSB | | | | 08/25/2015 | | | | 187,757,326 | | | | 1,000,143 | | | | — | |
Great Britain Pound | | | Sell | | | | 404,634,800 | | | | SSB | | | | 04/08/2015 | | | | 600,210,989 | | | | 46,245,706 | | | | — | |
Great Britain Pound | | | Sell | | | | 56,686,600 | | | | SSB | | | | 04/08/2015 | | | | 84,085,502 | | | | 5,317,769 | | | | — | |
Great Britain Pound | | | Buy | | | | 80,190,800 | | | | SSB | | | | 04/08/2015 | | | | 118,950,222 | | | | — | | | | (1,051,300 | ) |
Japanese Yen | | | Sell | | | | 19,786,752,000 | | | | BBH | | | | 06/08/2015 | | | | 165,129,478 | | | | 560,959 | | | | — | |
Japanese Yen | | | Sell | | | | 3,549,079,800 | | | | BBH | | | | 06/08/2015 | | | | 29,618,691 | | | | 68,797 | | | | — | |
Swiss Franc | | | Sell | | | | 54,585,000 | | | | SSB | | | | 04/07/2015 | | | | 56,178,462 | | | | 6,228,645 | | | | — | |
Swiss Franc | | | Sell | | | | 425,888,600 | | | | SSB | | | | 04/07/2015 | | | | 438,321,270 | | | | 3,877,844 | | | | — | |
Thai Baht | | | Sell | | | | 1,709,720,700 | | | | BBH | | | | 06/09/2015 | | | | 52,393,402 | | | | — | | | | (49,138 | ) |
| | | | | | | | | | | | | | | | | | | | | | | | | | | | |
Total | | | | | | | | | | | | | | | | | | | | | | $ | 192,214,962 | | | $ | (4,404,961 | ) |
| | | | | | | | | | | | | | | | | | | | | | | | | | | | |
Net unrealized appreciation (depreciation) | | | | | | | | | | | | | | | $ | 187,810,001 | | | | | |
| | | | | | | | | | | | | | | | | | | | | | | | | | | | |
| (a) | Counterparties include State Street Bank and Trust Company (“SSB”) and Brown Brothers Harriman & Co. (“BBH”). |
34 Semi-Annual Report
| | |
| NOTES TO FINANCIAL STATEMENTS, CONTINUED | | |
| |
Thornburg Investment Income Builder Fund | | March 31, 2015 (Unaudited) |
Certain forward currency contracts were entered into with State Street Bank and Trust Company (“SSB”) pursuant to an International Swaps and Derivatives Association (“ISDA”) Master Agreement. Other forward currency contracts were entered into with Brown Brothers Harriman & Co. (“BBH”) pursuant to a written agreement with BBH. In the event of a default or termination under the ISDA Master Agreement with SSB or the agreement with BBH, the non-defaulting party has the right to close out all outstanding forward currency contracts between the parties and to net any payment amounts under those contracts, resulting in a single net amount payable by one party to the other. Because the ISDA Master Agreement with SSB and the agreement with BBH does not result in an offset of reported amounts of financial assets and financial liabilities in the Fund’s Statement of Assets and Liabilities unless there has been an event of default or termination event under that agreement, the Fund does not net its outstanding forward currency contracts for purposes of the disclosure in the Fund’s Statement of Assets and Liabilities. Instead the Fund recognizes the unrealized appreciation or depreciation on those forward currency contracts on a gross basis in the Fund’s Statement of Assets and Liabilities. At March 31, 2015, those recognized amounts are disclosed in the following table:
| | | | | | |
Fair Values of Derivative Financial Instruments at March 31, 2015 | |
| ASSET DERIVATIVES | | BALANCE SHEET LOCATION | | FAIR VALUE | |
Foreign exchange contracts | | Assets—Unrealized appreciation on forward currency contracts | | $ | 192,214,962 | |
| | |
| LIABILITY DERIVATIVES | | BALANCE SHEET LOCATION | | FAIR VALUE | |
Foreign exchange contracts | | Liabilities—Unrealized depreciation on forward currency contracts | | $ | (4,404,961 | ) |
Because the Fund does not currently receive or post cash collateral in connection with its currency forward contracts, the net amounts of the Fund’s assets and liabilities which are attributable to those contracts at March 31, 2015 can be determined by offsetting the dollar amounts shown in the preceding table. Based on those amounts, the net amount of the Fund’s assets which is attributable to its outstanding forward currency contracts at March 31, 2015 is $187,810,001 ($183,797,195 attributable to the Fund’s contracts with SSB, and $4,012,806 attributable to the Fund’s contracts with BBH), and the net amount of the Fund’s liabilities which is attributable to those contracts at that date is $0. The Fund’s forward currency contracts are valued each day, and the net amounts of the Fund’s assets and liabilities which are attributable to those contracts are expected to vary over time.
The net realized gain (loss) from forward currency contracts and the net change in unrealized appreciation (depreciation) on outstanding forward currency contracts recognized in the Fund’s Statement of Operations for the six months ended March 31, 2015 are disclosed in the following tables:
| | | | | | | | | | |
Net Realized Gain (loss) From Derivative Financial Instruments Recognized in Income for the Six Months Ended March 31, 2015 | |
| | | Total | | | | | Forward Currency Contracts | |
Foreign exchange contracts | | $ | 400,174,116 | | | | | $ | 400,174,116 | |
Net Change in Unrealized Appreciation (depreciation) on Derivative Financial Instruments Recognized in Income for the Six Months Ended March 31, 2015 | |
| | | Total | | | | | Forward Currency Contracts | |
Foreign exchange contracts | | $ | 36,186,447 | | | | | $ | 36,186,447 | |
OTHER NOTES
Risks: The Fund’s investments subject it to risks including, but not limited to, management risk, market and economic risk, risks affecting specific issuers, credit risk, interest rate risk, high yield risk, prepayment risk, liquidity risk, and the risks associated with investments in smaller companies, non-U.S. issuers, and real estate investment trusts. Please see the Fund’s prospectus for a discussion of the risks associated with an investment in the Fund.
Subsequent Events: Fund management believes no events have occurred between March 31, 2015 and the date of issuance of the financial statements that require adjustment to or disclosure in the accompanying financial statements.
Semi-Annual Report 35
FINANCIAL HIGHLIGHTS
Thornburg Investment Income Builder Fund
| | | | | | | | | | | | | | | | | | | | | | | | | | | | | | | | | | | | | | | | | | | | | | | | |
| | | PER SHARE PERFORMANCE (for a share outstanding throughout the Period)+ | | RATIOS TO AVERAGE NET ASSETS | | | SUPPLEMENTAL DATA | |
Unless
Otherwise
Noted,
Periods
are
Fiscal
Years
Ended
Sept. 30, | | Net Asset
Value
Beginning
of Period | | | Net
Investment
Income
(Loss) | | Net
Realized
&
Unrealized
Gain (Loss)
on
Investments | | | Total from
Investment
Operations | | Dividends
from Net
Investment
Income | | | Dividends
from Net
Realized
Gains | | Total
Dividends | | | Net Asset
Value
End
of Period | | Net
Investment
Income
(Loss)
(%) | | | Expenses,
After
Expense
Reductions
(%) | | | Expenses,
After
Expense
Reductions
and
Net of
Custody
Credits
(%) | | | Expenses,
Before
Expense
Reductions
(%) | | | Total
Return
(%)(a) | | Portfolio
Turnover
Rate
(%)(a) | | Net
Assets
at End
of
Period
(Thousands) | |
Class A Shares | | | | | | | | | | | | | | | | | | | | | | | | | | | | | | | | | | | | | | | | | | |
2015(b)(c) | | $ | 21.38 | | | 0.34 | | | 0.10 | | | 0.44 | | | (0.42 | ) | | — | | | (0.42 | ) | | $21.40 | | | 3.26 | (d) | | | 1.17 | (d) | | | 1.17 | (d) | | | 1.17 | (d) | | 2.10 | | 21.98 | | $ | 4,718,333 | |
2014(b) | | $ | 20.13 | | | 1.10 | | | 1.13 | | | 2.23 | | | (0.98 | ) | | — | | | (0.98 | ) | | $21.38 | | | 5.21 | | | | 1.18 | | | | 1.18 | | | | 1.18 | | | 11.19 | | 38.81 | | $ | 4,588,033 | |
2013(b) | | $ | 18.90 | | | 1.03 | | | 1.27 | | | 2.30 | | | (1.07 | ) | | — | | | (1.07 | ) | | $20.13 | | | 5.26 | | | | 1.18 | | | | 1.18 | | | | 1.18 | | | 12.51 | | 46.14 | | $ | 4,281,060 | |
2012(b) | | $ | 17.29 | | | 1.15 | | | 1.60 | | | 2.75 | | | (1.14 | ) | | — | | | (1.14 | ) | | $18.90 | | | 6.32 | | | | 1.20 | | | | 1.20 | | | | 1.20 | | | 16.26 | | 40.96 | | $ | 3,420,877 | |
2011(b) | | $ | 18.31 | | | 1.12 | | | (0.99 | ) | | 0.13 | | | (1.15 | ) | | — | | | (1.15 | ) | | $17.29 | | | 5.91 | | | | 1.21 | | | | 1.21 | | | | 1.21 | | | 0.42 | | 30.34 | | $ | 2,734,845 | |
2010(b) | | $ | 17.38 | | | 1.14 | | | 0.90 | | | 2.04 | | | (1.11 | ) | | — | | | (1.11 | ) | | $18.31 | | | 6.47 | | | | 1.25 | | | | 1.25 | | | | 1.25 | | | 12.08 | | 35.50 | | $ | 2,018,202 | |
Class C Shares | | | | | | | | | | | | | | | | | | | | | | | | | | | | | | | | | | | | | | | | | | |
2015(c) | | $ | 21.37 | | | 0.27 | | | 0.10 | | | 0.37 | | | (0.35 | ) | | — | | | (0.35 | ) | | $21.39 | | | 2.53 | (d) | | | 1.90 | (d) | | | 1.90 | (d) | | | 1.91 | (d) | | 1.75 | | 21.98 | | $ | 6,472,041 | |
2014 | | $ | 20.13 | | | 0.94 | | | 1.13 | | | 2.07 | | | (0.83 | ) | | — | | | (0.83 | ) | | $21.37 | | | 4.44 | | | | 1.90 | | | | 1.90 | | | | 1.93 | | | 10.36 | | 38.81 | | $ | 6,266,270 | |
2013 | | $ | 18.89 | | | 0.89 | | | 1.28 | | | 2.17 | | | (0.93 | ) | | — | | | (0.93 | ) | | $20.13 | | | 4.55 | | | | 1.90 | | | | 1.90 | | | | 1.94 | | | 11.78 | | 46.14 | | $ | 5,160,706 | |
2012 | | $ | 17.29 | | | 1.02 | | | 1.59 | | | 2.61 | | | (1.01 | ) | | — | | | (1.01 | ) | | $18.89 | | | 5.63 | | | | 1.90 | | | | 1.90 | | | | 1.97 | | | 15.43 | | 40.96 | | $ | 4,051,242 | |
2011 | | $ | 18.31 | | | 0.99 | | | (0.99 | ) | | — | | | (1.02 | ) | | — | | | (1.02 | ) | | $17.29 | | | 5.23 | | | | 1.90 | | | | 1.90 | | | | 1.96 | | | (0.26) | | 30.34 | | $ | 3,167,624 | |
2010 | | $ | 17.39 | | | 1.03 | | | 0.89 | | | 1.92 | | | (1.00 | ) | | — | | | (1.00 | ) | | $18.31 | | | 5.86 | | | | 1.90 | | | | 1.90 | | | | 2.02 | | | 11.32 | | 35.50 | | $ | 2,234,953 | |
Class I Shares | | | | | | | | | | | | | | | | | | | | | | | | | | | | | | | | | | | | | | | | | | | | | |
2015(c) | | $ | 21.53 | | | 0.38 | | | 0.10 | | | 0.48 | | | (0.46 | ) | | — | | | (0.46 | ) | | $21.55 | | | 3.59 | (d) | | | 0.84 | (d) | | | 0.84 | (d) | | | 0.84 | (d) | | 2.26 | | 21.98 | | $ | 7,956,662 | |
2014 | | $ | 20.27 | | | 1.16 | | | 1.15 | | | 2.31 | | | (1.05 | ) | | — | | | (1.05 | ) | | $21.53 | | | 5.45 | | | | 0.86 | | | | 0.86 | | | | 0.86 | | | 11.54 | | 38.81 | | $ | 7,454,275 | |
2013 | | $ | 19.03 | | | 1.10 | | | 1.28 | | | 2.38 | | | (1.14 | ) | | — | | | (1.14 | ) | | $20.27 | | | 5.58 | | | | 0.85 | | | | 0.85 | | | | 0.85 | | | 12.94 | | 46.14 | | $ | 5,567,617 | |
2012 | | $ | 17.40 | | | 1.22 | | | 1.61 | | | 2.83 | | | (1.20 | ) | | — | | | (1.20 | ) | | $19.03 | | | 6.67 | | | | 0.89 | | | | 0.89 | | | | 0.89 | | | 16.61 | | 40.96 | | $ | 3,981,955 | |
2011 | | $ | 18.43 | | | 1.21 | | | (1.02 | ) | | 0.19 | | | (1.22 | ) | | — | | | (1.22 | ) | | $17.40 | | | 6.31 | | | | 0.87 | | | | 0.87 | | | | 0.87 | | | 0.74 | | 30.34 | | $ | 2,878,655 | |
2010 | | $ | 17.50 | | | 1.22 | | | 0.89 | | | 2.11 | | | (1.18 | ) | | — | | | (1.18 | ) | | $18.43 | | | 6.87 | | | | 0.93 | | | | 0.93 | | | | 0.93 | | | 12.39 | | 35.50 | | $ | 1,682,616 | |
Class R3 Shares | | | | | | | | | | | | | | | | | | | | | | | | | | | | | | | | | | | | | | | | | | | | | |
2015(c) | | $ | 21.37 | | | 0.31 | | | 0.11 | | | 0.42 | | | (0.39 | ) | | — | | | (0.39 | ) | | $21.40 | | | 2.93 | (d) | | | 1.50 | (d) | | | 1.50 | (d) | | | 1.51 | (d) | | 1.99 | | 21.98 | | $ | 87,244 | |
2014 | | $ | 20.13 | | | 1.03 | | | 1.12 | | | 2.15 | | | (0.91 | ) | | — | | | (0.91 | ) | | $21.37 | | | 4.84 | | | | 1.49 | | | | 1.49 | | | | 1.55 | | | 10.80 | | 38.81 | | $ | 83,671 | |
2013 | | $ | 18.89 | | | 0.97 | | | 1.28 | | | 2.25 | | | (1.01 | ) | | — | | | (1.01 | ) | | $20.13 | | | 4.96 | | | | 1.49 | | | | 1.49 | | | | 1.70 | | | 12.23 | | 46.14 | | $ | 61,334 | |
2012 | | $ | 17.28 | | | 1.10 | | | 1.60 | | | 2.70 | | | (1.09 | ) | | — | | | (1.09 | ) | | $18.89 | | | 6.05 | | | | 1.50 | | | | 1.50 | | | | 1.59 | | | 15.94 | | 40.96 | | $ | 47,023 | |
2011 | | $ | 18.30 | | | 1.08 | | | (1.00 | ) | | 0.08 | | | (1.10 | ) | | — | | | (1.10 | ) | | $17.28 | | | 5.67 | | | | 1.50 | | | | 1.50 | | | | 1.58 | | | 0.13 | | 30.34 | | $ | 34,861 | |
2010 | | $ | 17.38 | | | 1.11 | | | 0.88 | | | 1.99 | | | (1.07 | ) | | — | | | (1.07 | ) | | $18.30 | | | 6.27 | | | | 1.50 | | | | 1.50 | | | | 1.69 | | | 11.75 | | 35.50 | | $ | 23,550 | |
Class R4 Shares | | | | | | | | | | | | | | | | | | | | | | | | | | | | | | | | | | | | | | | | | | | | | |
2015(c) | | $ | 21.42 | | | 0.32 | | | 0.10 | | | 0.42 | | | (0.40 | ) | | — | | | (0.40 | ) | | $21.44 | | | 3.06 | (d) | | | 1.36 | (d) | | | 1.36 | (d) | | | 1.37 | (d) | | 2.01 | | 21.98 | | $ | 44,564 | |
2014 | | $ | 20.17 | | | 1.04 | | | 1.16 | | | 2.20 | | | (0.95 | ) | | — | | | (0.95 | ) | | $21.42 | | | 4.88 | | | | 1.35 | | | | 1.35 | | | | 1.40 | | | 11.00 | | 38.81 | | $ | 39,890 | |
2013 | | $ | 18.93 | | | 0.99 | | | 1.29 | | | 2.28 | | | (1.04 | ) | | — | | | (1.04 | ) | | $20.17 | | | 5.05 | | | | 1.37 | | | | 1.37 | | | | 1.41 | | | 12.35 | | 46.14 | | $ | 24,906 | |
2012 | | $ | 17.31 | | | 1.12 | | | 1.61 | | | 2.73 | | | (1.11 | ) | | — | | | (1.11 | ) | | $18.93 | | | 6.14 | | | | 1.39 | | | | 1.39 | | | | 1.53 | | | 16.10 | | 40.96 | | $ | 19,471 | |
2011 | | $ | 18.34 | | | 1.15 | | | (1.06 | ) | | 0.09 | | | (1.12 | ) | | — | | | (1.12 | ) | | $17.31 | | | 6.02 | | | | 1.40 | | | | 1.40 | | | | 1.65 | | | 0.19 | | 30.34 | | $ | 10,162 | |
2010 | | $ | 17.47 | | | 1.22 | | | 0.74 | | | 1.96 | | | (1.09 | ) | | — | | | (1.09 | ) | | $18.34 | | | 6.89 | | | | 1.40 | | | | 1.40 | | | | 3.60 | | | 11.52 | | 35.50 | | $ | 1,950 | |
Class R5 Shares | | | | | | | | | | | | | | | | | | | | | | | | | | | | | | | | | | | | | | | | | | | | | |
2015(c) | | $ | 21.52 | | | 0.37 | | | 0.09 | | | 0.46 | | | (0.44 | ) | | — | | | (0.44 | ) | | $21.54 | | | 3.47 | (d) | | | 0.97 | (d) | | | 0.97 | (d) | | | 0.97 | (d) | | 2.20 | | 21.98 | | $ | 78,493 | |
2014 | | $ | 20.26 | | | 1.10 | | | 1.19 | | | 2.29 | | | (1.03 | ) | | — | | | (1.03 | ) | | $21.52 | | | 5.15 | | | | 0.99 | | | | 0.99 | | | | 1.10 | | | 11.40 | | 38.81 | | $ | 64,748 | |
2013 | | $ | 19.01 | | | 1.07 | | | 1.30 | | | 2.37 | | | (1.12 | ) | | — | | | (1.12 | ) | | $20.26 | | | 5.37 | | | | 0.99 | | | | 0.98 | | | | 1.05 | | | 12.80 | | 46.14 | | $ | 39,985 | |
2012 | | $ | 17.40 | | | 1.21 | | | 1.58 | | | 2.79 | | | (1.18 | ) | | — | | | (1.18 | ) | | $19.01 | | | 6.61 | | | | 0.99 | | | | 0.99 | | | | 1.29 | | | 16.44 | | 40.96 | | $ | 14,914 | |
2011 | | $ | 18.42 | | | 1.18 | | | (1.00 | ) | | 0.18 | | | (1.20 | ) | | — | | | (1.20 | ) | | $17.40 | | | 6.16 | | | | 0.99 | | | | 0.99 | | | | 1.51 | | | 0.68 | | 30.34 | | $ | 4,424 | |
2010 | | $ | 17.50 | | | 1.36 | | | 0.74 | | | 2.10 | | | (1.18 | ) | | — | | | (1.18 | ) | | $18.42 | | | 7.67 | | | | 0.99 | | | | 0.99 | | | | 2.35 | | | 12.31 | | 35.50 | | $ | 3,366 | |
| (a) | Not annualized for periods less than one year. |
| (b) | Sales loads are not reflected in computing total return. |
| (c) | Unaudited Six Month Period Ended March 31 |
| + | Based on weighted average shares outstanding, except for Dividends from Net Investment Income and Net Realized Gains, which are actual amounts per share. |
See notes to financial statements.
| | | | |
| 36 Semi-Annual Report | | | | Semi-Annual Report 37 |
| | |
| EXPENSE EXAMPLE | | |
| |
Thornburg Investment Income Builder Fund | | March 31, 2015 (Unaudited) |
As a shareholder of the Fund, you incur two types of costs:
| | (1) | transaction costs, including |
(a) sales charges (loads) on purchase payments, for Class A shares;
(b) a deferred sales charge on redemptions of any part or all of a purchase of $1 million of Class A shares within 12 months of purchase;
(c) a deferred sales charge on redemptions of Class C shares within 12 months of purchase;
| | (2) | ongoing costs, including management fees; distribution and/or service (12b-1) fees; and other Fund expenses. |
This example is intended to help you understand your ongoing costs (in dollars) of investing in the Fund and to compare these costs with the ongoing costs of investing in other mutual funds.
The example is based on a $1,000 investment beginning on October 1, 2014, and held until March 31, 2015.
ACTUAL EXPENSES
For each class of shares, the first line of the accompanying table provides information about actual account values and actual expenses. You may use the information in this line, together with the amount you invested, to estimate the expenses that you paid over the period. Simply divide your account value by $1,000 (for example, an $8,600 account value divided by $1,000 = 8.6), then multiply the result by the number in the first line for your class of shares under the heading entitled “Expenses Paid During Period” to estimate the expenses you paid on your account during this period.
| | | | | | | | | | | | |
| | | Beginning
Account Value
10/1/14 | | | Ending
Account Value
3/31/15 | | | Expenses Paid
During Period†
10/1/14–3/31/15 | |
Class A Shares | | | | | | | | | | | | |
Actual | | $ | 1,000.00 | | | $ | 1,021.00 | | | $ | 5.88 | |
Hypothetical* | | $ | 1,000.00 | | | $ | 1,019.12 | | | $ | 5.87 | |
Class C Shares | | | | | | | | | | | | |
Actual | | $ | 1,000.00 | | | $ | 1,017.50 | | | $ | 9.55 | |
Hypothetical* | | $ | 1,000.00 | | | $ | 1,015.47 | | | $ | 9.54 | |
Class I Shares | | | | | | | | | | | | |
Actual | | $ | 1,000.00 | | | $ | 1,022.60 | | | $ | 4.24 | |
Hypothetical* | | $ | 1,000.00 | | | $ | 1,020.74 | | | $ | 4.23 | |
Class R3 Shares | | | | | | | | | | | | |
Actual | | $ | 1,000.00 | | | $ | 1,019.90 | | | $ | 7.54 | |
Hypothetical* | | $ | 1,000.00 | | | $ | 1,017.46 | | | $ | 7.53 | |
Class R4 Shares | | | | | | | | | | | | |
Actual | | $ | 1,000.00 | | | $ | 1,020.10 | | | $ | 6.87 | |
Hypothetical* | | $ | 1,000.00 | | | $ | 1,018.13 | | | $ | 6.86 | |
Class R5 Shares | | | | | | | | | | | | |
Actual | | $ | 1,000.00 | | | $ | 1,022.00 | | | $ | 4.89 | |
Hypothetical* | | $ | 1,000.00 | | | $ | 1,020.10 | | | $ | 4.88 | |
| † | Expenses are equal to the annualized expense ratio for each class (A: 1.17%; C: 1.90%; I: 0.84%; R3: 1.50%; R4: 1.36%; R5: 0.97%) multiplied by the average account value over the period, multiplied by 182/365 to reflect the one-half year period. |
| * | Hypothetical assumes a rate of return of 5% per year before expenses. |
HYPOTHETICAL EXAMPLE FOR COMPARISON PURPOSES
For each class of shares, the second line of the accompanying table provides information about hypothetical account values and hypothetical expenses based on the Fund’s actual expense ratio and an assumed rate of return of 5% per year before expenses, which is not the Fund’s actual return. The hypothetical account values and expenses may not be used to estimate the actual ending account balance or expenses you paid for the period. You may use this information to compare the ongoing costs of investing in the Fund and other funds. To do so, compare this 5% hypothetical example with the 5% hypothetical examples that appear in the shareholder reports of the other funds.
Please note that the expenses shown in the table are meant to highlight your ongoing costs only and do not reflect any transactional costs, such as sales charges (loads), redemption fees, or exchange fees. Therefore, the second line of the table for each class of shares is useful in comparing ongoing costs only, and will not help you determine the relative total costs of owning different funds. In addition, if these transactional costs were included, your costs would have been higher.
38 Semi-Annual Report
| | |
| OTHER INFORMATION | | |
| |
Thornburg Investment Income Builder Fund | | March 31, 2015 (Unaudited) |
PORTFOLIO PROXY VOTING
Policies and Procedures:
The Trust has delegated to Thornburg Investment Management, Inc. (the “Advisor”) voting decisions respecting proxies for the Fund’s voting securities. The Advisor makes voting decisions in accordance with its Proxy Voting Policy and Procedures. A description of the Policy and Procedures is available (i) without charge, upon request, by calling the Advisor toll-free at 1-800-847-0200, (ii) on the Thornburg website at www.thornburg.com, and (iii) on the Securities and Exchange Commission’s website at www.sec.gov.
Information regarding how proxies were voted is available on or before August 31 of each year for the twelve months ending the preceding June 30. This information is available (i) without charge, upon request by calling the Advisor toll-free at 1-800-847-0200, (ii) on the Thornburg website at www.thornburg.com, and (iii) on the Securities and Exchange Commission’s website at www.sec.gov.
AVAILABILITY OF QUARTERLY PORTFOLIO SCHEDULE
The Fund files with the Securities and Exchange Commission schedules of its portfolio holdings on Form N-Q for the first and third quarters of each fiscal year. The Fund’s Forms N-Q are available on the Commission’s website at www.sec.gov, or may be reviewed and copied at the Commission’s Public Reference Room in Washington, D.C. Information on the operation of the Public Reference Room may be obtained by calling 1-800-SEC-0330. The Fund also makes this information available on its website at www.thornburg. com/download or upon request by calling 1-800-847-0200.
Semi-Annual Report 39
TRUSTEES’ STATEMENT TO SHAREHOLDERS
Revised and Readopted September 15, 2014
The Trustees believe current and prospective shareholders should know how we discharge our responsibilities in supervising the Funds’ investment advisor and in reviewing the advisor’s contract for renewal. Since 2005, we have issued a statement which sets out clearly the three principal guidelines that we follow in supervising the Trust’s investment advisor on your behalf. In accordance with our customary practice, in September of 2014 we again reviewed our statement and concluded we should reissue this statement outlining the principal features of our supervision of the advisor’s performance of investment management services for the Funds.
We begin with the premise that each shareholder selected his or her Fund because its investments are managed by the investment advisor identified in the prospectus and in accordance with the objective and policies described in the prospectus. We realize, as each of you do, that if you believe that your Fund’s stated objective and policies no longer serve your personal investment goals, you can sell your shares and leave the Fund.
Therefore, we believe that our primary supervisory task—our principal obligation to you—is to assess the nature and quality of the advisor’s services, and to confirm that the advisor actively and competently pursues the Fund’s objective, in accordance with the policies set out in the prospectus. To do this, we meet regularly with management to review your Fund’s portfolio and to discuss the advisor’s specific actions and judgments in pursuing the Fund’s objective. We do not substitute our own judgment for the advisor’s decisions in selecting investments; the advisor is paid to exercise its informed judgment on investment decisions, and we seek to confirm, in reviewing the advisor’s performance, that the advisor is doing just that.
Second, we are conscious of costs and the effect that costs have on shareholders’ returns. We try to make sure that your Fund’s fees and costs are reasonable in relationship to the services rendered and that they are generally in line with those charged by other expert investment advisors, consistent with our belief that the Fund’s investors searched for and expect that expertise and attention and have decided to pay a reasonable price for it. We do not put the management contract “out to bid” as a matter of course, and we would not do so unless we had concluded that the advisor materially had failed to pursue the Fund’s objectives in accordance with its policies, or for other equally important reasons. We believe that any other approach would be inconsistent with your interests and contrary to your expectations when you bought shares of the Fund in the first place.
Finally, because we believe that most Thornburg Fund shareholders have invested with a long-term perspective, we try not to focus too much on the fashions of the moment and on short-term performance. The market will not favor any specific investment objective or set of policies at all times and under all economic circumstances. A fund will experience periods of both high and low returns relative to other funds and other investments. Even if one of our Funds is not favored by the market at a particular time, we believe that the advisor is nonetheless obliged to remain true to the Fund’s objective and policies, and we watch to see that it does so.
Trustees of Thornburg Investment Trust
40 Semi-Annual Report
This page intentionally left blank.
Semi-Annual Report 41
This page intentionally left blank.
42 Semi-Annual Report
THORNBURG FUND FAMILY
FUNDAMENTAL, BOTTOM-UP EQUITY RESEARCH
We search far and wide for the best stock ideas—within the United States and around the globe. Potential investments that may deserve a deeper look are thoroughly analyzed using both quantitative and qualitative criteria. But the vast majority are discarded. Those that ultimately make it into our highly-selective portfolios are continually monitored to determine whether our investment theses unfold as expected.
| | • | | Thornburg Core Growth Fund |
| | • | | Thornburg International Value Fund |
| | • | | Thornburg International Growth Fund |
| | • | | Thornburg Developing World Fund |
| | • | | Thornburg Investment Income Builder Fund |
| | • | | Thornburg Global Opportunities Fund |
A TRADITION OF DISCIPLINED BOND MANAGEMENT
At Thornburg, the word “disciplined” carries some substance. We don’t make a practice of using shortcuts to enhance yield or total returns. Every strategy is grounded in rigorous, bottom-up credit work. Portfolios are assembled carefully—in the case of our core bond funds, using laddered structures—to mitigate price fluctuation. Position sizes are controlled so that no single bond can have an outsized effect on a portfolio. And as with our equity portfolios, managers enjoy flexibility to seek an optimal risk/reward balance.
| | • | | Thornburg Low Duration Income Fund |
| | • | | Thornburg Limited Term U.S. Government Fund |
| | • | | Thornburg Limited Term Income Fund |
| | • | | Thornburg Strategic Income Fund |
| | • | | Thornburg Low Duration Municipal Fund |
| | • | | Thornburg Limited Term Municipal Fund |
| | • | | Thornburg Intermediate Municipal Fund |
| | • | | Thornburg California Limited Term Municipal Fund |
| | • | | Thornburg New Mexico Intermediate Municipal Fund |
| | • | | Thornburg New York Intermediate Municipal Fund |
| | • | | Thornburg Strategic Municipal Income Fund |
Before investing, carefully consider the Fund’s investment goals, risks, charges, and expenses. For a prospectus or summary prospectus containing this and other information, contact your financial advisor or visit thornburg.com. Read it carefully before investing.
For additional information, please visit thornburg.com
Thornburg Investment Management, Inc. 2300 North Ridgetop Road, Santa Fe, NM 87506
Semi-Annual Report 43

This Semi-Annual Report is submitted for the general information of shareholders of the Fund. It is not authorized for distribution to prospective investors in the Fund unless preceded or accompanied by an effective prospectus.
| | | | |
| Investment Advisor: | | Distributor: | | |
| Thornburg Investment Management® | | Thornburg Securities Corporation® | | |
| 800.847.0200 | | 800.847.0200 | | TH1075 |
FIRM OVERVIEW
THE FIRM
Thornburg Investment Management is a privately owned global investment firm that offers a range of solutions for retail and institutional investors. We are driven by our mission to help our clients reach their long-term financial goals through fundamental research and active portfolio management.
Founded in 1982 and headquartered in Santa Fe, New Mexico, we manage approximately $61 billion (as of March 31, 2015) across seven equity and 11 bond mutual funds, separate accounts for high-net-worth investors and institutional accounts, and five UCITS funds for non-U.S. investors.

CORE INVESTMENT PRINCIPLES
Our focus has always been on maintaining and building the investment expertise to manage Thornburg strategies to a high standard, while adhering to a core set of investment principles:
| | • | | We focus on the fundamentals. We invest according to our view of the fundamental value of an issuer only after performing thorough, bottom-up research. |
| | • | | We think and invest for the long term. We typically make investment decisions based upon an investment thesis we expect to play out over 18 months to several years. We may not always hold a security for several years, but our horizon line is typically a few years out. |
| | • | | We stay flexible. We go where we see value. Our investment mandates are generally broad and flexible, and we exercise as much flexibility as possible within any restrictions. |
| | • | | We collaborate across strategies. We are structured as global generalists. Portfolio managers and analysts do not specialize in sectors, geographies, or even security types, but instead must understand and communicate bottom-up fundamentals across industries, sectors, and borders. |
2 Semi-Annual Report
Semi-Annual Report
Thornburg Global Opportunities Fund
March 31, 2015
| | | | | | |
Share Class | | NASDAQ Symbol | | CUSIP | |
Class A | | THOAX | | | 885-215-343 | |
Class C | | THOCX | | | 885-215-335 | |
Class I | | THOIX | | | 885-215-327 | |
Class R3 | | THORX | | | 885-215-145 | |
Class R4 | | THOVX | | | 885-215-137 | |
Class R5 | | THOFX | | | 885-215-129 | |
Class I, R3, R4, and R5 shares may not be available to all investors. Minimum investments for Class I shares may be higher than those for other classes.
Investments in the Fund carry risks, including possible loss of principal. Additional risks may be associated with investments outside the United States, especially in emerging markets, including currency fluctuations, illiquidity, volatility, and political and economic risks. Investments in small capitalization companies may increase the risk of greater price fluctuations. Please see the Fund’s prospectus for a discussion of the risks associated with an investment in the Fund. Investments in the Fund are not FDIC insured, nor are they deposits of or guaranteed by a bank or any other entity.
Funds invested in a limited number of holdings may expose an investor to greater volatility.
Semi-Annual Report 3
| | |
| LETTER TO SHAREHOLDERS | | |
| |
Thornburg Global Opportunities Fund | | March 31, 2015 (Unaudited) |
April 15, 2015
Dear Fellow Shareholder:
This letter highlights the results of Thornburg Global Opportunities Fund’s investment activities for the six-month period ended March 31, 2015. In addition, we comment on the overall investment landscape. Recall that the Thornburg Global Opportunities Fund seeks capital appreciation from a portfolio of typically 30–40 equity investments from around the world. We believe the structure of the Fund—built on our core investment principles of flexibility, focus, and value—gives us a durable framework for value-added investing.
In the six months ended March 31, 2015, the Fund’s net asset value (NAV) per Class A share increased to $26.90, up 13.31% from $23.74, considerably outpacing the MSCI All Country World Index’s (ACWI) gain of 2.73% for the period.
Although six months is a very short measurement period, these recent results extend the favorable performance that your Fund has seen over the long term. For the one, three, and five-year periods ended March 31, 2015, Thornburg Global Opportunities Fund has outperformed the MSCI ACWI. From its inception on July 28, 2006, through March 31, 2015, the Global Opportunities Fund has outperformed the MSCI ACWI by an average margin of over 6% per year, resulting in a total cumulative return since inception of 162.81% (for the Class A shares without sales charge) versus 55.95% for the index. As of March 2015, the Fund was ranked in the top 1% of World Stock Funds for the time period starting from Fund inception (based on total returns without sales charge, among 591 funds). Table I below displays the Fund’s ranking over various periods by performance percentile relative to the Morningstar World Stock category (lower numbers represent higher ranking). Performance data for various measurement periods are included on page six of this report.
Performance data shown represents past performance and is no guarantee of future results. Investment return and principal value will fluctuate so shares, when redeemed, may be worth more or less than their original cost. Current performance may be lower or higher than quoted. For performance current to the most recent month end, visit thornburg.com or call 800.847.0200.
The maximum sales charge for Class A shares is 4.50% . The total annual fund operating expense of Class A shares is 1.41%, as disclosed in the most recent prospectus.
Table I Thornburg Global Opportunities Fund
Percent Rank in Morningstar World Stock Category as of 3/31/15
| | | | | | | | | | | | | | | | |
| | | | | | | | | | | | Since | |
| | | 1-Yr | | | 3-Yr | | | 5-Yr | | | Inception | |
Class A | | | 1 | % | | | 1 | % | | | 4 | % | | | 1 | % |
Class I | | | 1 | % | | | 1 | % | | | 3 | % | | | 1 | % |
Funds in Category | | | 1,164 | | | | 903 | | | | 702 | | | | 591 | |
Based on total returns without sales charge. Past performance does not guarantee future results. Source: Morningstar
As shown in Table II, global equity markets were mixed in the semi-annual period ended March 31, 2015. Loose monetary policy has buoyed asset valuations in Europe and Asia and also produced significant devaluations of the euro and yen, tempering results in those markets for U.S. investors. European equities, as measured by the EURO STOXX 50 Index, were slightly negative for the six-month period, in U.S. dollar terms. Japan’s Nikkei 225 Stock Average Index produced a strong result of 9.34% for the same period while emerging markets struggled, with the MSCI Emerging Markets Index posting a decline of 2.27%.
Table II Total Return for Global Indices
In U.S. Dollar Terms
| | | | |
| | | 6-Months Ended | |
| | | March 31, 2015 | |
EURO STOXX 50 Index | | | -1.83 | % |
Nikkei 225 Stock Average Index | | | 9.34 | % |
MSCI Emerging Markets Index | | | -2.27 | % |
Source: Bloomberg
Contributors and Detractors
During the period under review, 13 stocks contributed at least 25 basis points (0.25%) to overall Fund performance, while eight subtracted at least 25 basis points. Contribution to overall Fund performance takes into account both position size and return on the investment. Significant positive contributors to the Fund included Spanish airport operator Aena S.A. and Canadian drug maker Concordia Healthcare.
We purchased Madrid-based Aena S.A. upon its initial public offering this past February. Aena owns and operates 46 airports in Spain and is the world’s largest global airport operator by passenger volume (196 million in 2014). During a research trip to Europe, we were attracted to Aena for several reasons including its strong competitive position and dividend potential. In late March, the company reported good 2014 operating results, and European interest rates have ebbed further since our investment—rendering Aena’s dividend payments more attractive by comparison.
Canada’s Concordia Healthcare (CXR) was also a standout for the Fund over the past six months, rising over 100% during the period. CXR is a specialty pharmaceutical company primarily focused on the ownership and acquisition of niche and/or mature legacy drugs. CXR appears to have a sensible operating strategy that is aligned with its financial structure, and its executive team has performed well so far. During the first quarter of 2015, the company announced the acquisition of a product portfolio from privately held Covis Pharma that should produce a more diversified CXR business and an expanded opportunity set in coming years.
4 Semi-Annual Report
| | |
| LETTER TO SHAREHOLDERS, CONTINUED | | |
| |
Thornburg Global Opportunities Fund | | March 31, 2015 (Unaudited) |
Other significant contributors to positive performance were a disparate group of businesses, including long-time holdings American Airlines, Level 3 Communications, French telecommunications concern Numericable-SFR SAS, and Valeant Pharmaceuticals.
Significant detractors from portfolio performance during the period included Canadian energy producer Bankers Petroleum, Hong Kong casino operator Galaxy Entertainment, U.S. semiconductor manufacturer Micron Technology, Australian resources company Mineral Resources, and Korean gaming concern Paradise Co. Ltd.
Bankers Petroleum, a Canada-listed heavy oil producer with assets in Albania, sank on depressed oil prices and the company’s above-average operating leverage. Galaxy and Paradise were both affected by China’s slowing economy and Beijing’s campaign against corruption and conspicuous consumption, causing Chinese visitor traffic to ebb. Seasonal order softness combined with PC-industry headwinds weighed on Micron’s share performance. Weak iron ore prices impacted Mineral Resources’ mining business.
We continue to hold all of the above-mentioned companies in the portfolio, and we believe a long-term orientation is an important element of our strategy.
Top sector weightings as of March 31, 2015, were information technology (20.7% portfolio weighting); health care (16.9%); financials (15.9%); consumer discretionary (13.6%); industrials (10.0%); and telecommunication services (4.9%). As of March 31, 2015, the average expected price-to-earnings multiple for 2015 on the portfolio companies owned in the Thornburg Global Opportunities Fund stands at 15.6x versus 16.4x for the MSCI ACWI. Compared to this index, we have lower direct exposure to the U.S. and are modestly overweight Europe. Approximately 8.4% of the Fund is invested in companies based in emerging markets. Table III illustrates the Fund’s largest geographic weightings.
Table III Geographic Weightings of the Fund
As of March 31, 2015
| | | | |
USA | | | 46.0 | % |
Canada | | | 12.9 | % |
United Kingdom | | | 9.5 | % |
France | | | 6.1 | % |
Netherlands | | | 5.8 | % |
Source: Bloomberg
Market Environment
Monetary policy continues to be an important theme in equity markets. While the U.S.’s six-year experiment with quantitative easing (QE) draws to a close, Europe’s has just begun—in January, the European Central Bank announced an asset-purchase program totaling $1.3 trillion. Whether a sustainable European economic recovery follows or not, rising European asset prices already partly reflect both the calculus of lower interest rates and optimism for better days ahead. Some of this enthusiasm may prove well-founded; monetary easing appears to have played a meaningful role in the economic recovery of the United States and the United Kingdom, where leading indicators (e.g., consumer sentiment and industrial production) now appear healthy. Meanwhile, growth in China and many emerging markets has slowed but remains far above that of Western countries. In any case we recognize that equity valuations can outpace fundamental developments, leaving a more narrow opportunity set for value-oriented investors like ourselves. In this setting we believe the Fund’s geographic flexibility is a virtue.
We urge fellow shareholders of the Fund to maintain a long-term investment perspective. Competing macroeconomic forces of fiscal restraint and monetary stimulus from governments will affect business conditions and investor sentiment, so we expect periods of volatility in the markets. The strategy of the Thornburg Global Opportunities Fund is based on fundamental analysis of individual businesses, not macroeconomic forecasts. This approach has served us well over the years.
Thank you for your support of the Thornburg Global Opportunities Fund. Remember that you can review additional information about your portfolio at www.thornburg. com/global.
Best wishes for a great summer.
Sincerely,
| | | | |
 | |  | | |
| Brian McMahon | | W. Vinson Walden,CFA | | |
| Portfolio Manager | | Portfolio Manager | | |
| CEO & Chief Investment Officer | | Managing Director | | |
The matters discussed in this report may constitute forward-looking statements made pursuant to the safe harbor provisions of the Securities Litigation Reform Act of 1995. These include any advisor or portfolio manager prediction, assessment, analysis or outlook for individual securities, industries, investment styles, market sectors and/or markets. These statements involve risks and uncertainties. In addition to the general risks described for each fund in its current prospectus, other factors bearing on these reports include the accuracy of the advisor’s or portfolio manager’s forecasts and predictions, the appropriateness of the investment strategies designed by the advisor or portfolio manager and the ability of the advisor or portfolio manager to implement their strategies efficiently and successfully. Any one or more of these factors, as well as other risks affecting the securities markets generally, could cause the actual results of any fund to differ materially as compared to its benchmarks.
The views expressed by the portfolio managers reflect their professional opinions and are subject to change. Under no circumstances does the information contained within represent a recommendation to buy or sell any security.
Semi-Annual Report 5
| | |
| PERFORMANCE SUMMARY | | |
| |
Thornburg Global Opportunities Fund | | March 31, 2015 (Unaudited) |
AVERAGE ANNUAL TOTAL RETURNS
| | | | | | | | | | | | | | | | |
| | | | | | | | | | | | Since | |
| | | 1-Yr | | | 3-Yr | | | 5-Yr | | | Incep. | |
Class A Shares (Incep: 7/28/06) | | | | | | | | | | | | | | | | |
Without sales charge | | | 21.60 | % | | | 20.32 | % | | | 13.93 | % | | | 11.78 | % |
With sales charge | | | 16.14 | % | | | 18.48 | % | | | 12.89 | % | | | 11.19 | % |
Class C Shares (Incep: 7/28/06) | | | | | | | | | | | | | | | | |
Without sales charge | | | 20.62 | % | | | 19.37 | % | | | 13.06 | % | | | 10.91 | % |
With sales charge | | | 19.62 | % | | | 19.37 | % | | | 13.06 | % | | | 10.91 | % |
Class I Shares (Incep: 7/28/06) | | | 22.04 | % | | | 20.84 | % | | | 14.46 | % | | | 12.32 | % |
Class R3 Shares (Incep: 2/1/08) | | | 21.40 | % | | | 20.21 | % | | | 13.87 | % | | | 7.50 | % |
Class R4 Shares (Incep: 2/1/08) | | | 21.50 | % | | | 20.34 | % | | | 13.98 | % | | | 7.60 | % |
Class R5 Shares (Incep: 2/1/08) | | | 22.01 | % | | | 20.82 | % | | | 14.44 | % | | | 8.06 | % |
MSCI AC World Index (Since 7/28/06) | | | 5.42 | % | | | 10.75 | % | | | 9.00 | % | | | 5.26 | % |
Growth of a Hypothetical $10,000 Investment
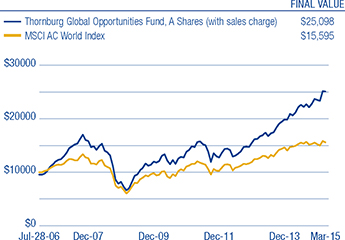
Performance data shown represents past performance and is no guarantee of future results. Investment return and principal value will fluctuate so shares, when redeemed, may be worth more or less than their original cost. Current performance may be lower or higher than quoted. For performance current to the most recent month end, visit thornburg.com or call 800-847-0200. The performance information does not reflect the deduction of taxes that a shareholder would pay on distributions or the redemption of Fund shares. Returns reflect the reinvestment of dividends and capital gains. Class A shares are sold with a maximum sales charge of 4.50%. Class C shares are subject to a 1% CDSC for the first year only. There is no sales charge for Class I, R3, R4, and R5 shares.
As disclosed in the most recent prospectus, the total annual fund operating expenses are as follows: A shares, 1.41%; C shares, 2.17%; I shares, 1.08%; R3 shares, 2.59%; R4 shares, 2.23%; R5 shares, 1.10%. Thornburg Investment Management and/or Thornburg Securities Corporation have contractually agreed to waive fees and reimburse expenses through at least February 1, 2016, for some of the share classes, resulting in net expense ratios of the following: I shares, 0.99%; R3 shares, 1.50%; R4 shares, 1.40%; R5 shares, 0.99%. For more detailed information on fund expenses and waivers/reimbursements please see the Fund’s prospectus.
From time to time, the Fund may invest in shares of companies through initial public offerings (IPOs). IPOs have the potential to produce substantial gains for the Fund. There is no assurance that the Fund will have continued access to profitable IPOs and, as the Fund’s assets grow, the impact of IPO investments may decline. Therefore, investors should not rely on these past gains as an indication of future performance.
Glossary
EURO STOXX 50 Index – This index is Europe’s leading Blue-chip index for the Eurozone, it provides a Blue-chip representation of supersector leaders in the Eurozone. The index covers 50 stocks from 12 countries: Austria, Belgium, Finland, France, Germany, Greece, Ireland, Italy, Luxembourg, the Netherlands, Portugal and Spain.
Nikkei 225 Stock Average – This is the leading index of Japanese stocks. It is a price-weighted index comprised of Japan’s top 225 blue-chip companies on the Tokyo Stock Exchange.
MSCI All Country (AC) World Index – A market capitalization weighted index that is representative of the market structure of 46 developed and emerging market countries in North and South America, Europe, Africa, and the Pacific Rim. The index is calculated with net dividends reinvested in U.S. dollars.
MSCI Emerging Markets Index – A free float-adjusted market capitalization index that is designed to measure equity market performance of emerging markets. The MSCI Emerging Markets Index consists of the following 23 emerging market country indexes: Brazil, Chile, China, Colombia, Czech Republic, Egypt, Greece, Hungary, India, Indonesia, Korea, Malaysia, Mexico, Peru, Philippines, Poland, Qatar, Russia, South Africa, Taiwan, Thailand, Turkey and United Arab Emirates.
Unless otherwise noted, index returns reflect the reinvestment of income dividends and capital gains, if any, but do not reflect fees, brokerage commissions or other expenses of investing. Investors may not make direct investments into any index. The performance of any index is not indicative of the performance of any particular investment.
Basis Point (bp) – A unit equal to 1/100th of 1%. 1% = 100 basis points (bps).
Beta – A measure of market-related risk. Less than one means the portfolio is less volatile than the index, while greater than one indicates more volatility than the index.
P/E – Price/Earnings ratio (P/E ratio) is a valuation ratio of a company’s current share price compared to its per-share earnings. P/E equals a company’s market value per share divided by earnings per share. Forecasted P/E is not intended to be a forecast of the fund’s future performance.
Quantitative Easing (QE) – An unconventional monetary policy in which a central bank purchases financial assets from the market in order to lower interest rates and increase the money supply.
6 Semi-Annual Report
| | |
| FUND SUMMARY | | |
| |
Thornburg Global Opportunities Fund | | March 31, 2015 (Unaudited) |
OBJECTIVES AND STRATEGIES
The Fund seeks long-term capital appreciation by investing in equity and debt securities of all types from issuers around the world.
The Fund pursues its investment goals by investing primarily in a broad range of equity securities, including common stocks, preferred stocks, real estate investment trusts, other equity trusts, and partnership interests. The Fund may invest in any stock or other equity security which the investment advisor believes may assist the Fund in pursuing its goals, including smaller companies with market capitalizations of less than $500 million. The Fund may also invest in debt obligations of any kind.
Market Capitalization Exposure
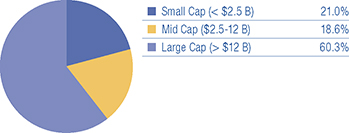
Asset Structure
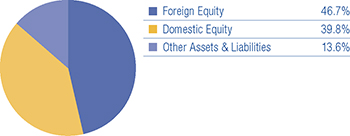
Top Ten Equity Holdings
| | | | |
American Realty Capital Properties, Inc. | | | 5.4 | % |
Numericable-SFR SAS | | | 5.2 | % |
Valeant Pharmaceuticals International, Inc. | | | 5.2 | % |
Concordia Healthcare Corp. | | | 5.0 | % |
Level 3 Communications, Inc. | | | 4.4 | % |
American Airlines Group, Inc. | | | 3.8 | % |
Citigroup, Inc. | | | 3.7 | % |
Google | | | 3.5 | % |
Express Scripts Holding Company | | | 3.5 | % |
InterXion Holding NV | | | 3.2 | % |
There is no guarantee that the Fund will meet its investment objectives.
All portfolio information is subject to change. Charts may not add up to 100% due to rounding.
Sector Exposure
| | | | |
Information Technology | | | 20.7 | % |
Health Care | | | 16.9 | % |
Financials | | | 15.9 | % |
Consumer Discretionary | | | 13.6 | % |
Industrials | | | 10.0 | % |
Telecommunication Services | | | 4.9 | % |
Energy | | | 2.9 | % |
Consumer Staples | | | 1.4 | % |
Other Assets & Liabilities | | | 13.6 | % |
Top Ten Industry Groups
| | | | |
Pharmaceuticals, Biotechnology & Life Sciences | | | 13.5 | % |
Software & Services | | | 13.2 | % |
Transportation | | | 6.8 | % |
Real Estate | | | 6.6 | % |
Banks | | | 5.5 | % |
Media | | | 5.2 | % |
Telecommunication Services | | | 4.9 | % |
Technology Hardware & Equipment | | | 4.7 | % |
Consumer Services | | | 4.0 | % |
Diversified Financials | | | 3.8 | % |
Country Exposure*
(percent of equity holdings)
| | | | |
United States | | | 46.0 | % |
Canada | | | 12.9 | % |
United Kingdom | | | 9.5 | % |
France | | | 6.1 | % |
Netherlands | | | 5.8 | % |
China | | | 5.4 | % |
Spain | | | 3.4 | % |
Australia | | | 3.0 | % |
Ireland | | | 2.8 | % |
South Korea | | | 2.4 | % |
Switzerland | | | 1.5 | % |
Brazil | | | 0.6 | % |
Hong Kong | | | 0.6 | % |
| * | The country assignment of each equity holding is determined by the Fund’s Advisor based on various factors, including the location of the issuer’s head office, the issuer’s jurisdiction of incorporation and the country from which a majority of the issuer’s revenue is derived. |
Semi-Annual Report 7
| | |
| SCHEDULE OF INVESTMENTS | | |
| |
Thornburg Global Opportunities Fund | | March 31, 2015 (Unaudited) |
| | | | | | | | |
| | | Shares/ | | | | |
| | | Principal Amount | | | Value | |
COMMON STOCK — 86.43% | | | | | | | | |
AUTOMOBILES & COMPONENTS — 1.91% | | | | | | | | |
Auto Components — 1.91% | | | | | | | | |
Delphi Automotive plc | | | 410,335 | | | $ | 32,720,113 | |
| | | | | | | | |
| | | | | | | 32,720,113 | |
| | | | | | | | |
BANKS — 5.54% | | | | | | | | |
Banks — 5.54% | | | | | | | | |
Citigroup, Inc. | | | 1,234,074 | | | | 63,579,492 | |
a ING Groep N.V. | | | 2,126,287 | | | | 31,196,438 | |
| | | | | | | | |
| | | | | | | 94,775,930 | |
| | | | | | | | |
CAPITAL GOODS — 0.65% | | | | | | | | |
Trading Companies & Distributors — 0.65% | | | | | | | | |
Fly Leasing Ltd. ADR | | | 767,076 | | | | 11,168,627 | |
| | | | | | | | |
| | | | | | | 11,168,627 | |
| | | | | | | | |
COMMERCIAL & PROFESSIONAL SERVICES — 2.63% | | | | | | | | |
Commercial Services & Supplies — 2.63% | | | | | | | | |
Mineral Resources Ltd. | | | 8,751,476 | | | | 44,992,542 | |
| | | | | | | | |
| | | | | | | 44,992,542 | |
| | | | | | | | |
CONSUMER DURABLES & APPAREL — 2.54% | | | | | | | | |
Household Durables — 2.54% | | | | | | | | |
Barratt Developments plc | | | 5,531,193 | | | | 43,363,276 | |
| | | | | | | | |
| | | | | | | 43,363,276 | |
| | | | | | | | |
CONSUMER SERVICES — 3.96% | | | | | | | | |
Hotels, Restaurants & Leisure — 3.96% | | | | | | | | |
Galaxy Entertainment Group Ltd. | | | 7,097,427 | | | | 32,225,036 | |
Paradise Co. Ltd. | | | 1,622,652 | | | | 35,467,404 | |
| | | | | | | | |
| | | | | | | 67,692,440 | |
| | | | | | | | |
DIVERSIFIED FINANCIALS — 3.82% | | | | | | | | |
Capital Markets — 1.27% | | | | | | | | |
UBS Group AG | | | 1,156,372 | | | | 21,799,480 | |
Consumer Finance — 2.55% | | | | | | | | |
Capital One Financial Corp. | | | 553,320 | | | | 43,612,683 | |
| | | | | | | | |
| | | | | | | 65,412,163 | |
| | | | | | | | |
ENERGY — 2.93% | | | | | | | | |
Energy Equipment & Services — 2.01% | | | | | | | | |
Helmerich & Payne, Inc. | | | 505,721 | | | | 34,424,429 | |
Oil, Gas & Consumable Fuels — 0.92% | | | | | | | | |
a Bankers Petroleum Ltd. | | | 7,302,303 | | | | 15,624,524 | |
| | | | | | | | |
| | | | | | | 50,048,953 | |
| | | | | | | | |
FOOD & STAPLES RETAILING — 0.84% | | | | | | | | |
Food & Staples Retailing — 0.84% | | | | | | | | |
Walgreens Boots Alliance, Inc. | | | 169,980 | | | | 14,393,906 | |
| | | | | | | | |
| | | | | | | 14,393,906 | |
| | | | | | | | |
FOOD, BEVERAGE & TOBACCO — 0.54% | | | | | | | | |
Food Products — 0.54% | | | | | | | | |
BRF SA | | | 469,671 | | | | 9,315,278 | |
| | | | | | | | |
| | | | | | | 9,315,278 | |
| | | | | | | | |
HEALTH CARE EQUIPMENT & SERVICES — 3.47% | | | | | | | | |
Health Care Providers & Services — 3.47% | | | | | | | | |
a Express Scripts Holding Company | | | 684,253 | | | | 59,372,633 | |
| | | | | | | | |
| | | | | | | 59,372,633 | |
| | | | | | | | |
MEDIA — 5.24% | | | | | | | | |
Media — 5.24% | | | | | | | | |
a Numericable-SFR SAS | | | 1,642,348 | | | | 89,603,552 | |
| | | | | | | | |
| | | | | | | 89,603,552 | |
| | | | | | | | |
8 Semi-Annual Report
| | |
| SCHEDULE OF INVESTMENTS, CONTINUED | | |
| |
Thornburg Global Opportunities Fund | | March 31, 2015 (Unaudited) |
| | | | | | | | |
| | | Shares/ | | | | |
| | | Principal Amount | | | Value | |
PHARMACEUTICALS, BIOTECHNOLOGY & LIFE SCIENCES — 13.46% | | | | | | | | |
Biotechnology — 1.52% | | | | | | | | |
a Gilead Sciences, Inc. | | | 264,018 | | | $ | 25,908,086 | |
Pharmaceuticals — 11.94% | | | | | | | | |
a Actavis plc | | | 100,237 | | | | 29,832,536 | |
Concordia Healthcare Corp. | | | 1,274,271 | | | | 85,659,021 | |
a Valeant Pharmaceuticals International, Inc. | | | 447,127 | | | | 88,808,365 | |
| | | | | | | | |
| | | | | | | 230,208,008 | |
| | | | | | | | |
REAL ESTATE — 6.55% | | | | | | | | |
Real Estate Investment Trusts — 6.55% | | | | | | | | |
Ryman Hospitality Properties, Inc. | | | 324,636 | | | | 19,773,579 | |
American Realty Capital Properties, Inc. | | | 9,369,646 | | | | 92,291,013 | |
| | | | | | | | |
| | | | | | | 112,064,592 | |
| | | | | | | | |
SEMICONDUCTORS & SEMICONDUCTOR EQUIPMENT — 2.75% | | | | | | | | |
Semiconductors & Semiconductor Equipment — 2.75% | | | | | | | | |
a Micron Technology, Inc. | | | 1,735,287 | | | | 47,078,336 | |
| | | | | | | | |
| | | | | | | 47,078,336 | |
| | | | | | | | |
SOFTWARE & SERVICES — 13.21% | | | | | | | | |
Information Technology Services — 3.22% | | | | | | | | |
a InterXion Holding NV | | | 1,955,084 | | | | 55,133,369 | |
Internet Software & Services — 9.99% | | | | | | | | |
a Alibaba Group Holding Ltd. ADR | | | 260,270 | | | | 21,664,875 | |
a Auto Trader Group plc | | | 7,549,291 | | | | 28,192,522 | |
a Baidu, Inc. ADR | | | 122,292 | | | | 25,485,653 | |
a Google, Inc. Class A | | | 78,408 | | | | 43,492,917 | |
a Google, Inc. Class C | | | 29,342 | | | | 16,079,416 | |
Telecity Group plc | | | 2,771,422 | | | | 35,972,365 | |
| | | | | | | | |
| | | | | | | 226,021,117 | |
| | | | | | | | |
TECHNOLOGY HARDWARE & EQUIPMENT — 4.73% | | | | | | | | |
Communications Equipment — 4.41% | | | | | | | | |
a EchoStar Corp. | | | 1,042,709 | | | | 53,928,909 | |
Ubiquiti Networks, Inc. | | | 729,856 | | | | 21,567,245 | |
Technology, Hardware, Storage & Peripherals — 0.32% | | | | | | | | |
Apple, Inc. | | | 43,274 | | | | 5,384,584 | |
| | | | | | | | |
| | | | | | | 80,880,738 | |
| | | | | | | | |
TELECOMMUNICATION SERVICES — 4.91% | | | | | | | | |
Diversified Telecommunication Services — 4.91% | | | | | | | | |
a HKBN Ltd. | | | 7,419,628 | | | | 9,235,476 | |
a Level 3 Communications, Inc. | | | 1,387,435 | | | | 74,699,500 | |
| | | | | | | | |
| | | | | | | 83,934,976 | |
| | | | | | | | |
TRANSPORTATION — 6.75% | | | | | | | | |
Airlines — 3.78% | | | | | | | | |
American Airlines Group, Inc. | | | 1,224,505 | | | | 64,629,374 | |
Transportation Infrastructure — 2.97% | | | | | | | | |
a Aena S.A. | | | 505,968 | | | | 50,873,391 | |
| | | | | | | | |
| | | | | | | 115,502,765 | |
| | | | | | | | |
TOTAL COMMON STOCK (Cost $1,212,458,587) | | | | | | | 1,478,549,945 | |
| | | | | | | | |
Semi-Annual Report 9
| | |
| SCHEDULE OF INVESTMENTS, CONTINUED | | |
| |
Thornburg Global Opportunities Fund | | March 31, 2015 (Unaudited) |
| | | | | | |
| | | Shares/ | | | |
| | | Principal Amount | | Value | |
SHORT TERM INVESTMENTS — 11.67% | | | | | | |
Apache Corp., 0.50%, 4/6/2015 | | $23,000,000 | | $ | 22,998,403 | |
Bank of New York Tri-Party Repurchase Agreement 0.23% dated 3/31/2015 due 4/1/2015, repurchase price $19,000,121 collateralized by 5 U.S. Government debt securities and 13 corporate debt securities, having an average coupon of 4.83%,a minimum credit rating of BBB-, maturity dates from 8/15/2015 to 5/15/2044, and having an aggregate market value of $20,253,777 at 3/31/2015 | | 19,000,000 | | | 19,000,000 | |
CenterPoint Energy, Inc., 0.57%, 4/1/2015 | | 25,000,000 | | | 25,000,000 | |
Delmarva Power & Light Co., 0.48%, 4/6/2015 | | 25,000,000 | | | 24,998,333 | |
Eversource Energy, 0.48%, 4/2/2015 | | 25,000,000 | | | 24,999,667 | |
Ingerosoll-Rand, Inc., 0.40%, 4/1/2015 | | 25,000,000 | | | 25,000,000 | |
Kansas City Power & Light Co., 0.50%, 4/6/2015 | | 25,000,000 | | | 24,998,264 | |
New York State Electric & Gas Corp., 0.34%, 4/1/2015 | | 7,600,000 | | | 7,600,000 | |
Public Service Co. of Colorado, 0.50%, 4/7/2015 | | 25,000,000 | | | 24,997,916 | |
| | | | | | |
TOTAL SHORT TERM INVESTMENTS (Cost $199,592,583) | | | | | 199,592,583 | |
| | | | | | |
TOTAL INVESTMENTS — 98.10% (Cost $1,412,051,170) | | | | $ | 1,678,142,528 | |
OTHER ASSETS LESS LIABILITIES — 1.90% | | | | | 32,492,976 | |
| | | | | | |
NET ASSETS — 100.00% | | | | $ | 1,710,635,504 | |
| | | | | | |
Footnote Legend
Portfolio Abbreviations
To simplify the listings of securities, abbreviations are used per the table below:
| | |
| ADR – | | American Depositary Receipt |
See notes to financial statements.
10 Semi-Annual Report
This page intentionally left blank.
Semi-Annual Report 11
| | |
| STATEMENT OF ASSETS AND LIABILITIES | | |
| |
Thornburg Global Opportunities Fund | | March 31, 2015 (Unaudited) |
| | | | |
ASSETS | | | | |
Investments at value (cost $1,412,051,170) (Note 2) | | $ | 1,678,142,528 | |
Cash | | | 6,193,504 | |
Receivable for fund shares sold | | | 24,922,995 | |
Unrealized appreciation on forward currency contracts (Note 7) | | | 20,769,075 | |
Dividends receivable | | | 1,591,088 | |
Dividend and interest reclaim receivable | | | 154,823 | |
Interest receivable | | | 121 | |
Prepaid expenses and other assets | | | 89,912 | |
| | | | |
Total Assets | | | 1,731,864,046 | |
| | | | |
| |
LIABILITIES | | | | |
Payable for investments purchased | | | 15,032,584 | |
Payable for fund shares redeemed | | | 3,746,098 | |
Unrealized depreciation on forward currency contracts (Note 7) | | | 740,335 | |
Payable to investment advisor and other affiliates (Note 3) | | | 1,505,671 | |
Accounts payable and accrued expenses | | | 203,710 | |
Dividends payable | | | 144 | |
| | | | |
Total Liabilities | | | 21,228,542 | |
| | | | |
| |
NET ASSETS | | $ | 1,710,635,504 | |
| | | | |
NET ASSETS CONSIST OF | | | | |
Distribution in excess of net investment income | | $ | (4,330,947 | ) |
Net unrealized appreciation on investments | | | 286,103,722 | |
Accumulated net realized gain (loss) | | | (83,876,938 | ) |
Net capital paid in on shares of beneficial interest | | | 1,512,739,667 | |
| | | | |
| | $ | 1,710,635,504 | |
| | | | |
12 Semi-Annual Report
| | |
| STATEMENT OF ASSETS AND LIABILITIES, CONTINUED |
| |
Thornburg Global Opportunities Fund | | March 31, 2015 (Unaudited) |
| | | | |
NET ASSET VALUE | | | | |
Class A Shares: | | | | |
Net asset value and redemption price per share ($382,039,739 applicable to 14,204,296 shares of beneficial interest outstanding - Note 4) | | $ | 26.90 | |
Maximum sales charge, 4.50% of offering price | | | 1.27 | |
| | | | |
Maximum offering price per share | | $ | 28.17 | |
| | | | |
| |
Class C Shares: | | | | |
Net asset value and offering price per share* ($252,761,411 applicable to 9,644,226 shares of beneficial interest outstanding - Note 4) | | $ | 26.21 | |
| | | | |
| |
Class I Shares: | | | | |
Net asset value, offering and redemption price per share ($961,730,237 applicable to 35,647,745 shares of beneficial interest outstanding - Note 4) | | $ | 26.98 | |
| | | | |
| |
Class R3 Shares: | | | | |
Net asset value, offering and redemption price per share ($4,282,415 applicable to 160,634 shares of beneficial interest outstanding - Note 4) | | $ | 26.66 | |
| | | | |
| |
Class R4 Shares: | | | | |
Net asset value, offering and redemption price per share ($9,727,812 applicable to 364,460 shares of beneficial interest outstanding - Note 4) | | $ | 26.69 | |
| | | | |
| |
Class R5 Shares: | | | | |
Net asset value, offering and redemption price per share ($100,093,890 applicable to 3,707,160 shares of beneficial interest outstanding - Note 4) | | $ | 27.00 | |
| | | | |
| * | Redemption price per share is equal to net asset value less any applicable contingent deferred sales charge. |
See notes to financial statements.
Semi-Annual Report 13
| | |
| STATEMENT OF OPERATIONS | | |
| |
Thornburg Global Opportunities Fund | | Six Months Ended March 31, 2015 (Unaudited) |
| | | | |
INVESTMENT INCOME | | | | |
Dividend income (net of foreign taxes withheld of $160,320) | | $ | 4,143,550 | |
Interest income | | | 233,774 | |
| | | | |
Total Income | | | 4,377,324 | |
| | | | |
| |
EXPENSES | | | | |
Investment advisory fees (Note 3) | | | 4,940,268 | |
Administration fees (Note 3) | | | | |
Class A Shares | | | 166,168 | |
Class C Shares | | | 111,916 | |
Class I Shares | | | 159,791 | |
Class R3 Shares | | | 2,048 | |
Class R4 Shares | | | 4,143 | |
Class R5 Shares | | | 21,818 | |
Distribution and service fees (Note 3) | | | | |
Class A Shares | | | 333,303 | |
Class C Shares | | | 898,446 | |
Class R3 Shares | | | 8,261 | |
Class R4 Shares | | | 8,333 | |
Transfer agent fees | | | | |
Class A Shares | | | 96,665 | |
Class C Shares | | | 68,097 | |
Class I Shares | | | 208,290 | |
Class R3 Shares | | | 4,332 | |
Class R4 Shares | | | 8,377 | |
Class R5 Shares | | | 29,266 | |
Registration and filing fees | | | | |
Class A Shares | | | 16,121 | |
Class C Shares | | | 62,687 | |
Class I Shares | | | 26,527 | |
Class R3 Shares | | | 8,493 | |
Class R4 Shares | | | 8,608 | |
Class R5 Shares | | | 9,245 | |
Custodian fees (Note 3) | | | 110,174 | |
Professional fees | | | 31,327 | |
Accounting fees | | | 16,270 | |
Trustee fees | | | 19,760 | |
Other expenses | | | 52,763 | |
| | | | |
Total Expenses | | | 7,431,497 | |
Less: | | | | |
Expenses reimbursed by investment advisor (Note 3) | | | (80,829 | ) |
Fees paid indirectly (Note 3) | | | (179 | ) |
| | | | |
Net Expenses | | | 7,350,489 | |
| | | | |
Net Investment Loss | | $ | (2,973,165 | ) |
| | | | |
14 Semi-Annual Report
| | |
| STATEMENT OF OPERATIONS, CONTINUED | | |
| |
Thornburg Global Opportunities Fund | | Six Months Ended March 31, 2015 (Unaudited) |
| | | | |
REALIZED AND UNREALIZED GAIN (LOSS) | | | | |
Net realized gain (loss) from: | | | | |
Investments | | $ | 2,774,006 | |
Forward currency contracts (Note 7) | | | 25,650,318 | |
Foreign currency transactions | | | (352,165 | ) |
| | | | |
| | | 28,072,159 | |
| | | | |
Net change in unrealized appreciation (depreciation) on: | | | | |
Investments | | | 111,164,649 | |
Foreign currency translations | | | 27,720 | |
Forward currency contracts (Note 7) | | | 13,172,029 | |
| | | | |
| | | 124,364,398 | |
| | | | |
Net Realized and Unrealized Gain | | | 152,436,557 | |
| | | | |
Net Increase in Net Assets Resulting from Operations | | $ | 149,463,392 | |
| | | | |
See notes to financial statements.
Semi-Annual Report 15
| | |
| STATEMENTS OF CHANGES IN NET ASSETS | | |
| |
Thornburg Global Opportunities Fund | | |
| | | | | | | | |
| | | Six Months Ended
March 31, 2015* | | | Year Ended
September 30, 2014 | |
INCREASE (DECREASE) IN NET ASSETS FROM | | | | | | | | |
| | |
OPERATIONS | | | | | | | | |
Net investment income (loss) | | $ | (2,973,165 | ) | | $ | (215,521 | ) |
Net realized gain (loss) from investments, forward currency contracts, and foreign currency transactions | | | 28,072,159 | | | | 42,961,694 | |
Net unrealized appreciation (depreciation) on investments, forward currency contracts, and foreign currency translations | | | 124,364,398 | | | | 68,740,491 | |
| | | | | | | | |
| | |
Net Increase (Decrease) in Net Assets Resulting from Operations | | | 149,463,392 | | | | 111,486,664 | |
| | |
DIVIDENDS TO SHAREHOLDERS | | | | | | | | |
From net investment income | | | | | | | | |
Class A Shares | | | — | | | | (535,375 | ) |
Class C Shares | | | — | | | | (72,787 | ) |
Class I Shares | | | (344,505 | ) | | | (2,665,731 | ) |
Class R3 Shares | | | — | | | | (4,336 | ) |
Class R4 Shares | | | — | | | | (13,693 | ) |
Class R5 Shares | | | (48,802 | ) | | | (428,753 | ) |
| | |
FUND SHARE TRANSACTIONS (NOTE 4) | | | | | | | | |
Class A Shares | | | 142,173,096 | | | | 88,026,299 | |
Class C Shares | | | 87,711,053 | | | | 37,592,422 | |
Class I Shares | | | 425,776,133 | | | | 148,583,481 | |
Class R3 Shares | | | 1,676,786 | | | | 174,028 | |
Class R4 Shares | | | 4,415,609 | | | | 1,826,623 | |
Class R5 Shares | | | 14,712,403 | | | | 14,348,287 | |
| | | | | | | | |
Net Increase in Net Assets | | | 825,535,165 | | | | 398,317,129 | |
| | |
NET ASSETS | | | | | | | | |
Beginning of Period | | | 885,100,339 | | | | 486,783,210 | |
| | | | | | | | |
| | |
End of Period | | $ | 1,710,635,504 | | | $ | 885,100,339 | |
| | | | | | | | |
Distribution in excess of net investment income | | $ | (4,330,947 | ) | | $ | (997,444 | ) |
See notes to financial statements.
16 Semi-Annual Report
| | |
| NOTES TO FINANCIAL STATEMENTS | | |
| |
Thornburg Global Opportunities Fund | | March 31, 2015 (Unaudited) |
NOTE 1 – ORGANIZATION
Thornburg Global Opportunities Fund, hereinafter referred to as (the “Fund)” is a diversified series of Thornburg Investment Trust (the “Trust”). The Trust was organized as a Massachusetts business trust under a Declaration of Trust dated June 3, 1987 and is registered as a diversified, open-end management investment company under the Investment Company Act of 1940, as amended. The Fund is currently one of eighteen separate series of the Trust. Each series is considered to be a separate entity for financial reporting and tax purposes and bears expenses directly attributable to it. The Fund seeks long-term capital appreciation by investing in equity and debt securities of all types from issuers around the world.
The Fund currently offers six classes of shares of beneficial interest: Class A, Class C, Institutional Class (“Class I”), and Retirement Classes (“Class R3,” “Class R4,” and “Class R5”). Each class of shares of the Fund represents an interest in the same portfolio of investments, except that (i) Class A shares are sold subject to a front-end sales charge collected at the time the shares are purchased and bear a service fee, (ii) Class C shares are sold at net asset value without a sales charge at the time of purchase, but are subject to a contingent deferred sales charge upon redemption within one year of purchase, and bear both a service fee and a distribution fee, (iii) Class I and Class R5 shares are sold at net asset value without a sales charge at the time of purchase and may be subject to a service fee, (iv) Class R3 shares are sold at net asset value without a sales charge at the time of purchase, but bear both a service fee and distribution fee, (v) Class R4 shares are sold at net asset value without a sales charge at the time of purchase, but bear a service fee, and (vi) the respective classes may have different reinvestment privileges and conversion rights. Additionally, the Fund may allocate among its classes certain expenses, to the extent allocable to specific classes, including transfer agent fees, government registration fees, certain printing and postage costs, and administrative and legal expenses. Currently, class specific expenses of the Fund are limited to service and distribution fees, administration fees, and certain registration and transfer agent expenses.
NOTE 2 – SIGNIFICANT ACCOUNTING POLICIES
The following is a summary of significant accounting policies followed by the Fund in the preparation of its financial statements. The Fund is an investment company and prepares its financial statements in conformity with U.S. generally accepted accounting principles (“GAAP”), including the investment company accounting and reporting guidance in the Financial Accounting Standards Board (the “FASB”) Accounting Standard Codification Topic 946. The preparation of financial statements in conformity with GAAP requires management to make estimates and assumptions that affect the reported amounts of assets and liabilities and disclosure of contingent assets and liabilities at the date of the financial statements and the reported amounts of increases (decreases) in net assets from operations during the reporting period. Actual results could differ from those estimates.
Significant accounting policies of the Fund are as follows:
Valuation Policy and Procedures: The Trustees of the Trust (the “Trustees”) have authorized employees of the Fund’s investment advisor, acting as the Valuation and Pricing Committee (the “Committee”), to make certain valuation determinations, subject to oversight and review by the Trustees and the Audit Committee of the Trustees. The Committee and other employees of the Fund’s investment advisor administer and implement the valuation process. The Committee regularly reviews its own fair value decisions, as well as valuations, valuation techniques and services furnished by pricing services, considers circumstances in the markets which may require valuation determinations by the Committee and reviews previous valuation determinations. The Committee also reports on its activities, the performance of the pricing services and other matters to the Trustees and the Audit Committee of the Trustees.
In determining a fair value for a portfolio investment, the Committee seeks to determine the price that the Fund would reasonably expect to receive upon a sale of the investment in an orderly transaction between market participants at the measurement date. Typically, the fair value process employs standing instructions to use quoted prices in active markets or the use of independent pricing services. Less frequently, the Committee may make a fair value determination using other methods. However, because fair value prices are estimated prices, the determination of fair value for an investment may differ from the value that would be realized by the Fund upon a sale of the investment, and that difference could be material to the Fund’s financial statements. The Committee’s determination of fair value for an investment may also differ from the prices obtained by other persons (including other mutual funds) for the investment.
Valuation of Investments: Portfolio investments listed or traded on a national securities exchange are valued on the valuation date at the last reported trade price on the exchange that is the primary market for the investment. Portfolio investments reported by NASDAQ are valued at the NASDAQ official closing price. Portfolio investments traded on an exchange for which there has been no trade that day and other equity investments traded in the over-the-counter market are valued at the mean between the last reported bid and ask prices. Any foreign investment traded on exchanges outside the United States is valued at the price of the investment on the exchange that is normally the investment’s primary market, as of the close of that exchange preceding the time of the Fund’s valuation measurement date.
In any case when the market value of an equity investment held by the Fund is not readily available, a determination of a fair value for the investment is made by the Committee. The Committee’s determinations are made using procedures in accordance with a policy approved by the Trustees, which may include the use of a price obtained from an independent pricing service. The pricing service
Semi-Annual Report 17
| | |
| NOTES TO FINANCIAL STATEMENTS, CONTINUED | | |
| |
Thornburg Global Opportunities Fund | | March 31, 2015 (Unaudited) |
ordinarily values equity investments in these instances using multi-factor models to adjust market prices based upon various inputs, including exchange data, depositary receipt prices, futures, index data and other data. An investment’s market value is deemed not readily available whenever the exchange or market on which the investment is primarily traded is closed for the entire scheduled day of trading. Additionally, an investment’s market value may be deemed not readily available under other circumstances identified by the Trustees, including when developments occurring after the most recent close of the investment’s primary exchange or market, but before the most recent close of trading in Fund shares, or an unusual event or significant period of time occurring since the availability of a market quotation, create a question about the reliability of the investment’s market value. For example, on days when market volatility thresholds pre-determined by the Trustees are exceeded, foreign equity investments held by the Fund may be valued using synthetic pricing obtained from an independent pricing service approved by the Trustees, subject to the ability of the Committee to determine in any such instance to utilize market closing prices if the Committee considers closing prices to be more reliable.
Debt obligations held by the Fund have a primary over-the-counter market and are valued by an independent pricing service approved by the Trustees. The pricing service ordinarily values debt obligations using quoted bid prices and other methods, which include consideration of yields or prices of debt obligations of comparable quality, type of issue, coupon, maturity and rating, and indications as to value from dealers and general market conditions.
In any case when a pricing service fails to provide a price for a debt obligation held by the Fund, the Committee determines a fair value for the debt obligation using procedures in accordance with a policy approved by the Trustees, which may include the use of a price obtained from a different independent pricing service. Additionally, in any case when management believes that a price provided by a pricing service for a debt obligation held by the Fund may be unreliable, the Committee decides whether or not to use the pricing service’s valuation or to use an alternative method to determine a fair value for the debt obligation.
Quotations in foreign currencies for foreign portfolio investments are converted to U.S. dollar equivalents using the foreign exchange quotation in effect at the time of valuation.
Valuation Measurements: The Fund categorizes its investments based upon the inputs used in valuing those investments, according to a three-level hierarchy established by guidance from the FASB. Categorization of investments using this hierarchy is intended by the FASB to maximize the use of observable inputs and minimize the use of unobservable inputs by prioritizing that the most observable input be used when available. Observable inputs are those that market participants would use in valuing an investment based on available market data. Unobservable inputs are those that reflect assumptions about the information market participants would use in valuing an investment. An investment’s level within the hierarchy is based on the lowest level input that is deemed significant to the fair value measurement. The methodologies and relative inputs used to value investments are not necessarily indications of the risk or liquidity associated with investing in those investments.
Various inputs are used in determining the fair value measurement of the Fund’s investments. These inputs are generally summarized according to the three-level hierarchy below:
Level 1: Quoted prices in active markets for identical investments.
Level 2: Other direct or indirect significant observable inputs (including quoted prices for similar investments in active markets and other observable inputs, such as interest rates, prepayment rates, credit risk, etc.).
When market volatility thresholds are exceeded, foreign equity investments may be fair valued according to other significant observable inputs rather than quoted market prices. The affected investments will be characterized as Level 2 within the valuation hierarchy and revert to Level 1 after the threshold is no longer exceeded.
Level 3: Significant unobservable inputs, (including the Committee’s own assumptions in determining the fair value of investments).
Portfolio investments with minimal, if any, market activity are characterized as Level 3 and are valued using significant unobservable inputs, typically including single broker quotes, which may be adjusted or unadjusted, related or comparable investments, last available transactions, and other relevant information. Valuations may also be based upon current market prices of securities that are comparable in coupon, rating, maturity and industry. An income based valuation approach would consider discounted anticipated future cash flows of the investment. Discounts may also be applied due to the nature or duration of any restrictions on the disposition of the investment. Valuations based upon the use of inputs from Levels 1, 2, or 3, may not represent the actual price received upon the disposition of an investment, and the Fund may receive a price that is lower than the valuation when it sells the investment.
The following table displays a summary of the fair value hierarchy measurements of the Fund’s investments as of March 31, 2015. In any instance when valuation inputs from more than one level are used to determine the fair value of a specific investment, the investment is placed in the level of the table based upon the lowest level input that is significant in determining the fair value of the investment:
18 Semi-Annual Report
| | |
| NOTES TO FINANCIAL STATEMENTS, CONTINUED | | |
| |
Thornburg Global Opportunities Fund | | March 31, 2015 (Unaudited) |
| | | | | | | | | | | | | | | | |
| | | Fair Value Measurements at March 31, 2015 | |
| | | Total | | | Level 1 | | | Level 2 | | | Level 3 | |
Assets | | | | | | | | | | | | | | | | |
Investments in Securities* | | | | | | | | | | | | | | | | |
Common Stock | | $ | 1,478,549,945 | | | $ | 1,478,549,945 | | | $ | — | | | $ | — | |
Short Term Investments | | | 199,592,583 | | | | — | | | | 199,592,583 | | | | — | |
| | | | | | | | | | | | | | | | |
Total Investments in Securities | | $ | 1,678,142,528 | | | $ | 1,478,549,945 | | | $ | 199,592,583 | | | $ | — | |
Other Financial Instruments** | | | | | | | | | | | | | | | | |
Forward Currency Contracts | | $ | 20,769,075 | | | $ | — | | | $ | 20,769,075 | | | $ | — | |
| | | | | | | | | | | | | | | | |
Liabilities | | | | | | | | | | | | | | | | |
Other Financial Instruments** | | | | | | | | | | | | | | | | |
Forward Currency Contracts | | $ | (740,335 | ) | | $ | — | | | $ | (740,335 | ) | | $ | — | |
Spot Currency | | $ | (23,575 | ) | | $ | (23,575 | ) | | $ | — | | | $ | — | |
| * | See Schedule of Investments for a summary of the industry exposure as grouped according to the Global Industry Classification Standard (GICS), which is an industry taxonomy developed by MSCI, Inc. and Standard & Poor’s (S&P). |
| ** | Other Financial Instruments include investments not reflected in the Schedule of Investments, which may include futures, forwards and swap contracts, which are valued at the unrealized appreciation (depreciation) on the investment. |
In accordance with the guidance prescribed in Accounting Standards Update No. 2011-04, it is the policy of the Fund to recognize transfers between levels and the underlying events which caused the movement. The Fund recognized no transfers between levels for the six months ended March 31, 2015, other than when the Fund exceeded market volatility thresholds for foreign equity investments during the period.
Foreign Currency Translation: Portfolio investments and other assets and liabilities denominated in foreign currencies are translated into U.S. dollars based on the exchange rate of such currencies against the U.S. dollar on the date of valuation. Purchases and sales of investments and income items denominated in foreign currencies are translated into U.S. dollars at the exchange rate in effect on the transaction date. When the Fund purchases or sells foreign investments, it will customarily enter into a foreign exchange contract to minimize foreign exchange risk from the trade date to the settlement date of such transactions. The values of such spot contracts are included in receivable for investments sold and payable for investments purchased on the Statement of Assets and Liabilities.
The Fund does not separately report the effect of changes in foreign exchange rates from changes in market prices on investments held. Such changes are included in net unrealized appreciation or depreciation from investments.
Reported net realized gains or losses from foreign currency transactions arise due to purchases and sales of foreign currencies, currency gains or losses realized between the trade and settlement dates on investment transactions and the difference between the amounts of dividends, interest, and foreign withholding taxes recorded on the Fund’s books, and the U.S. dollar equivalent of the amounts actually received or paid.
Net change in unrealized appreciation and depreciation on foreign currency translations arise from changes in the fair value of assets and liabilities, other than investments at fiscal period end, resulting from changes in exchange rates.
Foreign Withholding Taxes: The Fund is subject to foreign tax withholding imposed by certain foreign countries in which the Fund may invest. Withholding taxes are incurred on certain foreign dividends and are accrued at the time the dividend is recognized based on applicable foreign tax law. The Fund files withholding tax reclaims in certain jurisdictions to recover a portion of amounts previously withheld, in view of various considerations, including recent decisions rendered by the courts in those and other jurisdictions. The Fund would expect to record a receivable for such a reclaim based on a variety of factors, including assessments of a jurisdiction’s legal obligation to pay reclaims, the jurisdiction’s administrative practices and payment history, and industry convention. To date the Fund has recorded no such receivable because there is no precedent for collecting such prior year reclaims and the likelihood of collection remains uncertain.
Deferred Foreign Capital Gain Taxes: The Fund is subject to a tax imposed on net realized gains of securities of certain foreign countries. The Fund records an estimated deferred tax liability for net unrealized gains on these investments as reflected in the accompanying financial statements.
Federal Income Taxes: It is the policy of the Trust to comply with the provisions of the Internal Revenue Code applicable to “regulated investment companies” and to distribute to shareholders substantially all taxable income, including any net realized gain on investments of the Fund. Therefore, no provision for federal income taxes is required.
Semi-Annual Report 19
| | |
| NOTES TO FINANCIAL STATEMENTS, CONTINUED | | |
| |
Thornburg Global Opportunities Fund | | March 31, 2015 (Unaudited) |
Management reviews each uncertain tax position believed to be material to the preparation of the Fund’s financial statements, to assess if it is more likely than not that the position would be sustained upon examination, based upon the technical merits of the position. As of March 31, 2015, management has not identified any such position for which an asset or liability must be reflected in the Statement of Assets and Liabilities. The Fund’s tax returns remain subject to examination for three years after filing.
When-Issued and Delayed Delivery Transactions: The Fund may engage in when-issued or delayed delivery transactions. To the extent the Fund engages in such transactions, it will do so for the purpose of acquiring portfolio investments consistent with the Fund’s investment objectives and not for the purpose of investment leverage or to speculate on interest rate and/or market changes. At the time the Fund makes a commitment to purchase an investment on a when-issued or delayed delivery basis, the Fund will record the transaction and reflect the value in determining its net asset value. When effecting such transactions, assets of an amount sufficient to make payment for the portfolio investments to be purchased will be segregated on the Fund’s records on the trade date. Investments purchased on a when-issued or delayed delivery basis do not earn interest until the settlement date.
Dividends: Dividends to shareholders, if any, are generally paid quarterly and are reinvested in additional shares of the Fund at net asset value per share at the close of business on the dividend payment date or, at the shareholder’s option, paid in cash. Net realized capital gains, to the extent available, will be distributed at least annually. Distributions to shareholders are based on income tax regulations and therefore, their characteristics may differ for financial statement and tax purposes.
Repurchase Agreements: The Fund may invest excess cash in repurchase agreements whereby the Fund purchases investments, which serve as collateral, with an agreement to resell such collateral to the seller at an agreed upon price at the maturity date of the repurchase agreement. Investments pledged as collateral for repurchase agreements are held in custody until maturity of the repurchase agreement. Provisions in the agreements require that the market value of the collateral is at least equal to the repurchase value in the event of default. In the event of default, the Fund has the right to liquidate the collateral and apply the proceeds in satisfaction of the obligation. Under certain circumstances, in the event of default or bankruptcy by the other party to the agreement, realization and/or retention of the collateral may be subject to legal proceedings.
General: Investment transactions are accounted for on a trade date basis. Interest income is accrued as earned and dividend income is recorded on the ex-dividend date. Certain income from foreign investments is recognized as soon as information is available to the Fund. Realized gains and losses from the sale of investments are recorded on an identified cost basis. Net investment income (other than class specific expenses) and realized and unrealized gains and losses are allocated daily to each class of shares based upon the relative net asset value of outstanding shares of each class of shares at the beginning of the day (after adjusting for the current share activity of the respective class). Expenses common to all Funds are allocated among the Funds comprising the Trust based upon their relative net asset values or other appropriate allocation methods.
Guarantees and Indemnifications: Under the Trust’s organizational documents (and under separate agreements with the independent Trustees), its officers and Trustees are indemnified against certain liabilities arising out of the performance of their duties to the Fund. Additionally, in the normal course of business the Trust enters into contracts with service providers that contain general indemnification clauses. The Trust’s maximum exposure under these arrangements is unknown. However, based on experience, the Trust expects the risk of loss to be remote.
NOTE 3 – INVESTMENT ADVISORY FEE AND OTHER TRANSACTIONS WITH AFFILIATES
Pursuant to an investment advisory agreement, Thornburg Investment Management, Inc. (the “Advisor”) serves as the investment advisor and performs services for the Fund for which the fees are payable at the end of each month. For the six months ended March 31, 2015, these fees were payable at annual rates ranging from .875 of 1% to .675 of 1% per annum of the average daily net assets of the Fund depending on the Fund’s asset size. The Trust also has entered into administrative services agreements with the Advisor, whereby the Advisor will perform certain administrative services for the shareholders of each class of the Fund’s shares, and for which fees will be payable at an annual rate of up to .125 of 1% per annum of the average daily net assets attributable to each class of shares.
The Trust has an underwriting agreement with Thornburg Securities Corporation (the “Distributor,” an affiliate of the Advisor), which acts as the distributor of the Fund’s shares. For the six months ended March 31, 2015, the Distributor has advised the Fund that it earned commissions aggregating $85,683 from the sale of Class A shares, and collected contingent deferred sales charges aggregating $20,839 from redemptions of Class C shares of the Fund.
Pursuant to a service plan under Rule 12b-1 of the Investment Company Act of 1940, the Fund may reimburse to the Advisor an amount not to exceed .25 of 1% per annum of the average daily net assets attributable to each class of shares of the Fund for payments made by the Advisor to securities dealers and other financial institutions to obtain various shareholder and distribution related services. For the six months ended March 31, 2015, there were no 12b-1 service plan fees charged for Class I and R5 shares. The Advisor may pay out of its own resources additional expenses for distribution of the Fund’s shares and shareholder services.
20 Semi-Annual Report
| | |
| NOTES TO FINANCIAL STATEMENTS, CONTINUED | | |
| |
Thornburg Global Opportunities Fund | | March 31, 2015 (Unaudited) |
The Trust has also adopted distribution plans pursuant to Rule 12b-1, applicable only to the Fund’s Class C and Class R3 shares, under which the Fund compensates the Distributor for services in promoting the sale of Class C and Class R3 shares of the Fund at an annual rate of up to .75 of 1% per annum of the average daily net assets attributable to Class C shares, and an annual rate of up to .25 of 1% per annum of the average daily net assets attributable to Class R3 shares. Total fees incurred by each class of shares of the Fund under their respective service and distribution plans for the six months ended March 31, 2015, are set forth in the Statement of Operations.
The Advisor and Distributor have contractually agreed to waive fees and reimburse expenses incurred by the Fund so that actual expenses of certain share classes do not exceed levels as specified in the Fund’s most recent prospectuses. The agreement may be terminated by the Fund at any time, but may not be terminated by the Advisor or Distributor before February 1, 2016, unless the Advisor ceases to be the investment advisor to the Fund or the Distributor ceases to be the distributor of the Fund prior to that date. The Advisor and Distributor retain the right to be repaid by the Fund for fee waivers and expense reimbursements if expenses fall below the contractual limit prior to the end of the fiscal year.
For the six months ended March 31, 2015, the Advisor contractually reimbursed certain class specific expenses, administrative fees, and distribution fees of $43,429 for Class I shares, $12,906 for Class R3 shares, $12,048 for Class R4 shares, and $12,446 for Class R5 shares.
The Trust has an agreement with the custodian bank to indirectly pay a portion of the custodian’s fees through credits earned by the Fund’s cash on deposit with the bank. This deposit agreement is an alternative to overnight investments. Custodial fees are adjusted to reflect amounts that would have been paid without this agreement, with a corresponding adjustment reflected as fees paid indirectly in the Statement of Operations. For the six months ended March 31, 2015, fees paid indirectly were $179.
Certain officers and Trustees of the Trust are also officers or directors of the Advisor and Distributor. The compensation of independent Trustees is borne by the Trust.
NOTE 4 – SHARES OF BENEFICIAL INTEREST
At March 31, 2015, there were an unlimited number of shares with no par value of beneficial interest authorized. Transactions in shares of beneficial interest were as follows:
| | | | | | | | | | | | | | | | |
| | | Six Months Ended
March 31, 2015 (Unaudited) | | | Year Ended
September 30, 2014 (Audited) | |
| | | Shares | | | Amount | | | Shares | | | Amount | |
Class A Shares | | | | | | | | | | | | | | | | |
Shares sold | | | 6,702,850 | | | $ | 172,553,195 | | | | 5,052,565 | | | $ | 116,337,625 | |
Shares issued to shareholders in reinvestment of dividends | | | — | | | | — | | | | 22,873 | | | | 511,661 | |
Shares repurchased | | | (1,227,041 | ) | | | (30,380,099 | ) | | | (1,258,744 | ) | | | (28,822,987 | ) |
| | | | | | | | | | | | | | | | |
| | | | |
Net increase (decrease) | | | 5,475,809 | | | $ | 142,173,096 | | | | 3,816,694 | | | $ | 88,026,299 | |
| | | | | | | | | | | | | | | | |
| | | | |
Class C Shares | | | | | | | | | | | | | | | | |
Shares sold | | | 3,836,314 | | | $ | 96,811,497 | | | | 2,075,521 | | | $ | 46,986,621 | |
Shares issued to shareholders in reinvestment of dividends | | | — | | | | — | | | | 3,176 | | | | 65,901 | |
Shares repurchased | | | (370,241 | ) | | | (9,100,444 | ) | | | (431,040 | ) | | | (9,460,100 | ) |
| | | | | | | | | | | | | | | | |
| | | | |
Net increase (decrease) | | | 3,466,073 | | | $ | 87,711,053 | | | | 1,647,657 | | | $ | 37,592,422 | |
| | | | | | | | | | | | | | | | |
| | | | |
Class I Shares | | | | | | | | | | | | | | | | |
Shares sold | | | 18,837,881 | | | $ | 482,898,980 | | | | 9,089,512 | | | $ | 208,338,592 | |
Shares issued to shareholders in reinvestment of dividends | | | 11,868 | | | | 299,435 | | | | 101,301 | | | | 2,305,745 | |
Shares repurchased | | | (2,267,316 | ) | | | (57,422,282 | ) | | | (2,751,982 | ) | | | (62,060,856 | ) |
| | | | | | | | | | | | | | | | |
| | | | |
Net increase (decrease) | | | 16,582,433 | | | $ | 425,776,133 | | | | 6,438,831 | | | $ | 148,583,481 | |
| | | | | | | | | | | | | | | | |
Semi-Annual Report 21
| | |
| NOTES TO FINANCIAL STATEMENTS, CONTINUED | | |
| |
Thornburg Global Opportunities Fund | | March 31, 2015 (Unaudited) |
| | | | | | | | | | | | | | | | |
| | | Six Months Ended
March 31, 2015 (Unaudited) | | | Year Ended
September 30, 2014 (Audited) | |
| | | Shares | | | Amount | | | Shares | | | Amount | |
Class R3 Shares | | | | | | | | | | | | | | | | |
Shares sold | | | 80,164 | | | $ | 1,976,637 | | | | 19,984 | | | $ | 453,631 | |
Shares issued to shareholders in reinvestment of dividends | | | — | | | | — | | | | 96 | | | | 2,008 | |
Shares repurchased | | | (12,151 | ) | | | (299,851 | ) | | | (11,991 | ) | | | (281,611 | ) |
| | | | | | | | | | | | | | | | |
| | | | |
Net increase (decrease) | | | 68,013 | | | $ | 1,676,786 | | | | 8,089 | | | $ | 174,028 | |
| | | | | | | | | | | | | | | | |
| | | | |
Class R4 Shares | | | | | | | | | | | | | | | | |
Shares sold | | | 231,792 | | | $ | 5,870,588 | | | | 107,381 | | | $ | 2,461,793 | |
Shares issued to shareholders in reinvestment of dividends | | | — | | | | — | | | | 525 | | | | 11,587 | |
Shares repurchased | | | (56,631 | ) | | | (1,454,979 | ) | | | (28,952 | ) | | | (646,757 | ) |
| | | | | | | | | | | | | | | | |
| | | | |
Net increase (decrease) | | | 175,161 | | | $ | 4,415,609 | | | | 78,954 | | | $ | 1,826,623 | |
| | | | | | | | | | | | | | | | |
| | | | |
Class R5 Shares | | | | | | | | | | | | | | | | |
Shares sold | | | 753,347 | | | $ | 19,003,902 | | | | 1,105,718 | | | $ | 24,997,109 | |
Shares issued to shareholders in reinvestment of dividends | | | 1,933 | | | | 48,802 | | | | 18,870 | | | | 428,753 | |
Shares repurchased | | | (165,553 | ) | | | (4,340,301 | ) | | | (488,449 | ) | | | (11,077,575 | ) |
| | | | | | | | | | | | | | | | |
| | | | |
Net increase (decrease) | | | 589,727 | | | $ | 14,712,403 | | | | 636,139 | | | $ | 14,348,287 | |
| | | | | | | | | | | | | | | | |
NOTE 5 – INVESTMENT TRANSACTIONS
For the six months ended March 31, 2015, the Fund had purchase and sale transactions of investments (excluding short-term investments) of $902,711,686 and $368,331,056, respectively.
NOTE 6 – INCOME TAXES
At March 31, 2015, information on the tax components of capital was as follows:
| | | | |
Cost of investments for tax purposes | | $ | 1,412,051,170 | |
| | | | |
Gross unrealized appreciation on a tax basis | | $ | 307,544,486 | |
Gross unrealized depreciation on a tax basis | | | (41,453,128 | ) |
| | | | |
Net unrealized appreciation (depreciation) on investments (tax basis) | | $ | 266,091,358 | |
| | | | |
At March 31, 2015, the Fund had cumulative tax basis capital losses of $103,590,213 generated prior to October 1, 2011, which may be carried forward to offset future capital gains. To the extent such carryforwards are used, capital gain distributions may be reduced to the extent provided by regulations. Such capital loss carryforwards expire September 30, 2018.
NOTE 7 – DERIVATIVE FINANCIAL INSTRUMENTS WITH OFF-BALANCE SHEET RISK AND FOREIGN INVESTMENT RISK
The Fund may use a variety of derivative financial instruments to hedge or adjust the risks affecting its investment portfolio or to enhance investment returns. Provisions of FASB Accounting Standards Codification 815-10-50 (“ASC 815”), require certain disclosures. The disclosures are intended to provide users of financial statements with an understanding of the use of derivative instruments by the Fund and how these derivatives affect the financial position, financial performance and cash flows of the Fund. The Fund does not designate any derivative instruments as hedging instruments under ASC 815. During the six months ended March 31, 2015, the Fund’s principal exposure to derivative financial instruments of the type addressed by ASC 815 was investment in foreign exchange contracts. A foreign exchange contract is an agreement between two parties to exchange different currencies at a specified rate of exchange at an agreed upon future date. Foreign exchange contracts involve risks to the Fund, including the risk that a contract’s counterparty
22 Semi-Annual Report
| | |
| NOTES TO FINANCIAL STATEMENTS, CONTINUED | | |
| |
Thornburg Global Opportunities Fund | | March 31, 2015 (Unaudited) |
will not meet its obligations to the Fund, the risk that a change in a contract’s value may not correlate perfectly with the currency the contract was intended to track, and the risk that the advisor is unable to correctly implement its strategy in using a contract. In any such instance, the Fund may not achieve the intended benefit of entering into a contract, and may experience a loss. Additionally, the Fund’s risk of loss may exceed the amounts recognized on the Statement of Assets and Liabilities.
The Fund entered into forward currency contracts during the six months ended March 31, 2015 in the normal course of pursuing its investment objectives, with the objective of reducing the risk to the value of the Fund’s foreign investments from adverse changes in the relationship between the U.S. dollar and foreign currencies. In each case these contracts have been initiated in conjunction with foreign investment transactions.
These contracts are accounted for by the Fund under ASC 815. Unrealized appreciation and depreciation on outstanding contracts are reported in the Fund’s Statement of Assets and Liabilities, as measured by the difference between the forward exchange rates at the reporting date and the forward exchange rates at each contract’s inception date. Net realized gain (loss) on contracts closed during the period, and changes in net unrealized appreciation (depreciation) on outstanding contracts are recognized in the Fund’s Statement of Operations. The average value of open sell currency contracts for the six months ended March 31, 2015 was $268,281,684. Open buy currency contracts are entered into for the purpose of closing open sell currency contracts and the values are dependent upon the values of the open sell currency contracts to which they relate.
The following table displays the outstanding forward currency contracts at March 31, 2015:
| | | | | | | | | | | | | | | | | | | | | | |
| | | Outstanding Forward Currency Contracts to Buy or Sell at March 31, 2015 | |
Contract Description | | Buy/Sell | | Contract
Amount | | | Contract
Value Date | | | Value USD | | | Unrealized
Appreciation | | | Unrealized
Depreciation | |
South Korean Won | | Sell | | | 3,302,702,100 | | | | 06/09/2015 | | | | 2,970,399 | | | $ | 18,472 | | | $ | — | |
South Korean Won | | Sell | | | 17,618,723,100 | | | | 06/09/2015 | | | | 15,846,004 | | | | — | | | | (215,483 | ) |
Australian Dollar | | Sell | | | 22,168,800 | | | | 05/11/2015 | | | | 16,847,240 | | | | 1,981,386 | | | | — | |
Australian Dollar | | Sell | | | 6,019,900 | | | | 05/11/2015 | | | | 4,574,840 | | | | 496,324 | | | | — | |
Australian Dollar | | Sell | | | 13,371,200 | | | | 05/11/2015 | | | | 10,161,480 | | | | 234,962 | | | | — | |
Australian Dollar | | Sell | | | 6,227,300 | | | | 05/11/2015 | | | | 4,732,454 | | | | 135,146 | | | | — | |
Australian Dollar | | Sell | | | 5,496,000 | | | | 05/11/2015 | | | | 4,176,700 | | | | 88,470 | | | | — | |
Australian Dollar | | Buy | | | 3,946,400 | | | | 05/11/2015 | | | | 2,999,078 | | | | — | | | | (207,799 | ) |
Canadian Dollar | | Sell | | | 36,502,000 | | | | 06/10/2015 | | | | 28,793,146 | | | | 2,856,353 | | | | — | |
Canadian Dollar | | Sell | | | 18,327,300 | | | | 06/10/2015 | | | | 14,456,759 | | | | 25,215 | | | | — | |
Euro | | Sell | | | 151,612,200 | | | | 08/11/2015 | | | | 163,337,246 | | | | 8,454,538 | | | | — | |
Euro | | Sell | | | 38,672,500 | | | | 08/11/2015 | | | | 41,663,268 | | | | 2,469,789 | | | | — | |
Euro | | Buy | | | 18,096,400 | | | | 08/11/2015 | | | | 19,495,899 | | | | — | | | | (289,836 | ) |
Great Britain Pound | | Sell | | | 12,720,100 | | | | 04/08/2015 | | | | 18,868,233 | | | | 1,449,710 | | | | — | |
Great Britain Pound | | Sell | | | 7,733,100 | | | | 04/08/2015 | | | | 11,470,817 | | | | 645,250 | | | | — | |
Great Britain Pound | | Sell | | | 2,811,600 | | | | 04/08/2015 | | | | 4,170,559 | | | | 351,619 | | | | — | |
Great Britain Pound | | Sell | | | 5,487,000 | | | | 04/08/2015 | | | | 8,139,087 | | | | 276,276 | | | | — | |
Great Britain Pound | | Sell | | | 2,281,300 | | | | 04/08/2015 | | | | 3,383,944 | | | | 240,568 | | | | — | |
Great Britain Pound | | Sell | | | 5,090,600 | | | | 04/08/2015 | | | | 7,551,091 | | | | 173,880 | | | | — | |
Great Britain Pound | | Sell | | | 14,736,800 | �� | | | 04/08/2015 | | | | 21,859,685 | | | | 32,509 | | | | — | |
Swiss Franc | | Sell | | | 5,872,100 | | | | 04/07/2015 | | | | 6,043,520 | | | | 705,012 | | | | — | |
Swiss Franc | | Sell | | | 3,201,800 | | | | 04/07/2015 | | | | 3,295,268 | | | | 83,120 | | | | — | |
Swiss Franc | | Sell | | | 2,858,300 | | | | 04/07/2015 | | | | 2,941,740 | | | | 50,476 | | | | — | |
Swiss Franc | | Buy | | | 1,217,400 | | | | 04/07/2015 | | | | 1,252,939 | | | | — | | | | (27,217 | ) |
| | | | | | | | | | | | | | | | | | | | | | |
Total | | | | | | | | | | | | | | | | $ | 20,769,075 | | | $ | (740,335 | ) |
| | | | | | | | | | | | | | | | | | | | | | |
Net unrealized appreciation (depreciation) | | | | | | | | | | | $ | 20,028,740 | | | | | |
| | | | | | | | | | | | | | | | | | | | | | |
Certain forward currency contracts were entered into with State Street Bank and Trust Company (“SSB”) pursuant to an International Swaps and Derivatives Association (“ISDA”) Master Agreement. In the event of a default or termination under the ISDA Master Agreement with SSB, the non-defaulting party has the right to close out all outstanding forward currency contracts between the parties and to net any payment amounts under those contracts, resulting in a single net amount payable by one party to the other. Because the ISDA Master Agreement with SSB does not result in an offset of reported amounts of financial assets and financial liabilities in the Fund’s Statement of Assets and Liabilities unless there has been an event of default or termination event under that agreement, the Fund does not net its outstanding forward currency contracts for purposes of the disclosure in the Fund’s Statement of Assets and Liabilities. Instead the Fund recognizes the unrealized appreciation or depreciation on those forward currency contracts on a gross
Semi-Annual Report 23
| | |
| NOTES TO FINANCIAL STATEMENTS, CONTINUED | | |
| |
Thornburg Global Opportunities Fund | | March 31, 2015 (Unaudited) |
basis in the Fund’s Statement of Assets and Liabilities. At March 31, 2015, those recognized amounts are disclosed in the following table:
| | | | | | |
Fair Values of Derivative Financial Instruments at March 31, 2015 | |
| Asset Derivatives | | Balance Sheet Location | | Fair Value | |
Foreign exchange contracts | | Assets - Unrealized appreciation on forward currency contracts | | $ | 20,769,075 | |
| | |
| Liability Derivatives | | Balance Sheet Location | | Fair Value | |
Foreign exchange contracts | | Liabilities - Unrealized depreciation on forward currency contracts | | $ | (740,335 | ) |
Because the Fund does not currently receive or post cash collateral in connection with its currency forward contracts, and because all of the Fund’s outstanding currency forward contracts are with State Street Bank and Trust Company, the net amounts of the Fund’s assets and liabilities which are attributable to those contracts at March 31, 2015 can be determined by offsetting the dollar amounts shown in the preceding table. Based on those amounts, the net amount of the Fund’s assets which is attributable to its outstanding forward currency contracts at March 31, 2015 is $20,028,740, and the net amount of the Fund’s liabilities which is attributable to those contracts at that date is $0. The Fund’s forward currency contracts are valued each day, and the net amounts of the Fund’s assets and liabilities which are attributable to those contracts are expected to vary over time.
The net realized gain (loss) from forward currency contracts and the net change in unrealized appreciation (depreciation) on outstanding forward currency contracts recognized in the Fund’s Statement of Operations for the six months ended March 31, 2015 are disclosed in the following tables:
| | | | | | |
| Net Realized Gain (loss) from Derivative Financial Instruments | |
Recognized in Income for the Six Months ended March 31, 2015 | |
| | | Total | | Forward Currency Contracts | |
Foreign exchange contracts | | $ 25,650,318 | | $ | 25,650,318 | |
|
Net Change in Unrealized Appreciation (Depreciation) on Derivative Financial Instruments Recognized in Income for the Six Months Ended March 31, 2015 | |
| | | Total | | Forward Currency Contracts | |
Foreign exchange contracts | | $ 13,172,029 | | $ | 13,172,029 | |
OTHER NOTES
Risks: The Fund’s investments subject it to risks including, but not limited to, management risk, market and economic risk, risks affecting specific issuers, liquidity risk, the risks associated with investments in small- and mid-cap companies and non-U.S. issuers, credit risk, and interest rate risk. Please see the Fund’s prospectus for a discussion of the risks associated with an investment in the Fund.
Subsequent Events: Fund management believes no events have occurred between March 31, 2015 and the date of issuance of the financial statements that require adjustment to or disclosure in the accompanying financial statements.
24 Semi-Annual Report
This page intentionally left blank.
Semi-Annual Report 25
FINANCIAL HIGHLIGHTS
Thornburg Global Opportunities Fund
| | | | | | | | | | | | | | | | | | | | | | | | | | | | | | | | | | | | | | | | | | | | | | | | | | | | | | | | | | | | |
| | | Per Share Performance (for a Share Outstanding Throughout the Period)+ | | | Ratios to Average Net Assets | | | Supplemental Data | |
Unless Otherwise Noted, Periods are Fiscal Years Ended Sept. 30, | | Net Asset
Value
Beginning
of
Period | | | Net
Investment
Income
(Loss) | | | Net
Realized &
Unrealized
Gain (loss)
on
Investments | | | Total from
Investment
Operations | | | Dividends
from Net
Investment
Income | | | Dividends
from Net
Realized
Gains | | | Total
Dividends | | | Net
Asset
Value
End
of
Period | | | Net
Investment
Income (loss)
(%) | | | Expenses,
After Expense
Reductions (%) | | | Expenses,
After
Expense
Reductions
and
Net of
Custody
Credits (%) | | | Expenses,
Before
Expense
Reductions
(%) | | | Total
Return
(%)(a) | | | Portfolio
Turnover
Rate
(%)(a) | | | Net
Assets
At End
of
Period
(thousands) | |
Class A Shares | | | | | | | | | | | | | | | | | | | | | | | | | | | | | | | | | | | | | | | | | | | | | | | | | | | | | |
2015(b)(c) | | $ | 23.74 | | | | (0.08 | ) | | | 3.24 | | | | 3.16 | | | | — | | | | — | | | | — | | | $ | 26.90 | | | | (0.60 | )(d) | | | 1.34 | (d) | | | 1.34 | (d) | | | 1.34 | (d) | | | 13.31 | | | | 34.59 | | | $ | 382,040 | |
2014(c) | | $ | 19.72 | | | | (0.03 | ) | | | 4.13 | | | | 4.10 | | | | (0.08 | ) | | | — | | | | (0.08 | ) | | $ | 23.74 | | | | (0.15 | ) | | | 1.41 | | | | 1.41 | | | | 1.41 | | | | 20.85 | | | | 60.29 | | | $ | 207,227 | |
2013(c) | | $ | 15.97 | | | | 0.11 | | | | 3.79 | | | | 3.90 | | | | (0.15 | ) | | | — | | | | (0.15 | ) | | $ | 19.72 | | | | 0.60 | | | | 1.46 | | | | 1.46 | | | | 1.46 | | | | 24.50 | | | | 66.12 | | | $ | 96,855 | |
2012(c) | | $ | 13.15 | | | | 0.14 | | | | 2.89 | | | | 3.03 | | | | (0.21 | ) | | | — | | | | (0.21 | ) | | $ | 15.97 | | | | 0.94 | | | | 1.49 | | | | 1.49 | | | | 1.49 | | | | 23.22 | | | | 66.07 | | | $ | 77,103 | |
2011(c) | | $ | 13.98 | | | | 0.18 | | | | (0.82 | ) | | | (0.64 | ) | | | (0.19 | ) | | | — | | | | (0.19 | ) | | $ | 13.15 | | | | 1.13 | | | | 1.48 | | | | 1.48 | | | | 1.48 | | | | (4.81 | ) | | | 70.33 | | | $ | 73,538 | |
2010(c) | | $ | 13.10 | | | | 0.18 | | | | 0.86 | | | | 1.04 | | | | (0.16 | ) | | | — | | | | (0.16 | ) | | $ | 13.98 | | | | 1.29 | | | | 1.47 | | | | 1.47 | | | | 1.47 | | | | 7.98 | | | | 66.27 | | | $ | 92,927 | |
Class C Shares | | | | | | | | | | | | | | | | | | | | | | | | | | | | | | | | | | | | | | | | | | | | | | | | | | | | | |
2015(b) | | $ | 23.23 | | | | (0.17 | ) | | | 3.15 | | | | 2.98 | | | | — | | | | — | | | | — | | | $ | 26.21 | | | | (1.41 | )(d) | | | 2.15 | (d) | | | 2.15 | (d) | | | 2.15 | (d) | | | 12.83 | | | | 34.59 | | | $ | 252,762 | |
2014 | | $ | 19.38 | | | | (0.20 | ) | | | 4.07 | | | | 3.87 | | | | (0.02 | ) | | | — | | | | (0.02 | ) | | $ | 23.23 | | | | (0.92 | ) | | | 2.17 | | | | 2.17 | | | | 2.17 | | | | 19.96 | | | | 60.29 | | | $ | 143,506 | |
2013 | | $ | 15.69 | | | | (0.03 | ) | | | 3.72 | | | | 3.69 | | | | — | | | | — | | | | — | | | $ | 19.38 | | | | (0.18 | ) | | | 2.22 | | | | 2.22 | | | | 2.22 | | | | 23.52 | | | | 66.12 | | | $ | 87,808 | |
2012 | | $ | 12.98 | | | | 0.02 | | | | 2.84 | | | | 2.86 | | | | (0.15 | ) | | | — | | | | (0.15 | ) | | $ | 15.69 | | | | 0.17 | | | | 2.27 | | | | 2.27 | | | | 2.27 | | | | 22.21 | | | | 66.07 | | | $ | 76,738 | |
2011 | | $ | 13.83 | | | | 0.06 | | | | (0.80 | ) | | | (0.74 | ) | | | (0.11 | ) | | | — | | | | (0.11 | ) | | $ | 12.98 | | | | 0.40 | | | | 2.23 | | | | 2.23 | | | | 2.23 | | | | (5.45 | ) | | | 70.33 | | | $ | 70,643 | |
2010 | | $ | 12.96 | | | | 0.07 | | | | 0.85 | | | | 0.92 | | | | (0.05 | ) | | | — | | | | (0.05 | ) | | $ | 13.83 | | | | 0.48 | | | | 2.28 | | | | 2.28 | | | | 2.28 | | | | 7.10 | | | | 66.27 | | | $ | 82,139 | |
Class I Shares | | | | | | | | | | | | | | | | | | | | | | | | | | | | | | | | | | | | | | | | | | | | | | | | | | | | | |
2015(b) | | $ | 23.79 | | | | (0.03 | ) | | | 3.23 | | | | 3.20 | | | | (0.01 | ) | | | — | | | | (0.01 | ) | | $ | 26.98 | | | | (0.24 | )(d) | | | 0.98 | (d) | | | 0.98 | (d) | | | 1.00 | (d) | | | 13.47 | | | | 34.59 | | | $ | 961,730 | |
2014 | | $ | 19.74 | | | | 0.06 | | | | 4.15 | | | | 4.21 | | | | (0.16 | ) | | | — | | | | (0.16 | ) | | $ | 23.79 | | | | 0.26 | | | | 0.99 | | | | 0.99 | | | | 1.08 | | | | 21.39 | | | | 60.29 | | | $ | 453,511 | |
2013 | | $ | 16.06 | | | | 0.19 | | | | 3.80 | | | | 3.99 | | | | (0.31 | ) | | | — | | | | (0.31 | ) | | $ | 19.74 | | | | 1.07 | | | | 0.99 | | | | 0.99 | | | | 1.11 | | | | 25.08 | | | | 66.12 | | | $ | 249,283 | |
2012 | | $ | 13.20 | | | | 0.21 | | | | 2.90 | | | | 3.11 | | | | (0.25 | ) | | | — | | | | (0.25 | ) | | $ | 16.06 | | | | 1.44 | | | | 0.99 | | | | 0.99 | | | | 1.21 | | | | 23.82 | | | | 66.07 | | | $ | 169,384 | |
2011 | | $ | 14.01 | | | | 0.26 | | | | (0.83 | ) | | | (0.57 | ) | | | (0.24 | ) | | | — | | | | (0.24 | ) | | $ | 13.20 | | | | 1.65 | | | | 0.99 | | | | 0.99 | | | | 1.11 | | | | (4.30 | ) | | | 70.33 | | | $ | 115,837 | |
2010 | | $ | 13.13 | | | | 0.24 | | | | 0.87 | | | | 1.11 | | | | (0.23 | ) | | | — | | | | (0.23 | ) | | $ | 14.01 | | | | 1.78 | | | | 0.99 | | | | 0.99 | | | | 1.19 | | | | 8.48 | | | | 66.27 | | | $ | 131,892 | |
Class R3 Shares | | | | | | | | | | | | | | | | | | | | | | | | | | | | | | | | | | | | | | | | | | | | | | | | | | | | | |
2015(b) | | $ | 23.55 | | | | (0.10 | ) | | | 3.21 | | | | 3.11 | | | | — | | | | — | | | | — | | | $ | 26.66 | | | | (0.76 | )(d) | | | 1.50 | (d) | | | 1.50 | (d) | | | 2.29 | (d) | | | 13.21 | | | | 34.59 | | | $ | 4,282 | |
2014 | | $ | 19.55 | | | | (0.06 | ) | | | 4.11 | | | | 4.05 | | | | (0.05 | ) | | | — | | | | (0.05 | ) | | $ | 23.55 | | | | (0.26 | ) | | | 1.50 | | | | 1.50 | | | | 2.59 | | | | 20.75 | | | | 60.29 | | | $ | 2,182 | |
2013 | | $ | 15.91 | | | | 0.11 | | | | 3.74 | | | | 3.85 | | | | (0.21 | ) | | | — | | | | (0.21 | ) | | $ | 19.55 | | | | 0.60 | | | | 1.49 | | | | 1.49 | | | | 3.41 | | | | 24.37 | | | | 66.12 | | | $ | 1,653 | |
2012 | | $ | 13.11 | | | | 0.11 | | | | 2.90 | | | | 3.01 | | | | (0.21 | ) | | | — | | | | (0.21 | ) | | $ | 15.91 | | | | 0.75 | | | | 1.50 | | | | 1.50 | | | | 9.01 | (e) | | | 23.22 | | | | 66.07 | | | $ | 894 | |
2011 | | $ | 13.93 | | | | 0.18 | | | | (0.82 | ) | | | (0.64 | ) | | | (0.18 | ) | | | — | | | | (0.18 | ) | | $ | 13.11 | | | | 1.12 | | | | 1.49 | | | | 1.49 | | | | 14.23 | (e) | | | (4.77 | ) | | | 70.33 | | | $ | 75 | |
2010 | | $ | 13.08 | | | | 0.17 | | | | 0.87 | | | | 1.04 | | | | (0.19 | ) | | | — | | | | (0.19 | ) | | $ | 13.93 | | | | 1.28 | | | | 1.46 | | | | 1.46 | | | | 32.05 | (e) | | | 7.97 | | | | 66.27 | | | $ | 151 | |
Class R4 Shares | | | | | | | | | | | | | | | | | | | | | | | | | | | | | | | | | | | | | | | | | | | | | | | | | | | | | |
2015(b) | | $ | 23.57 | | | | (0.08 | ) | | | 3.20 | | | | 3.12 | | | | — | | | | — | | | | — | | | $ | 26.69 | | | | (0.67 | )(d) | | | 1.40 | (d) | | | 1.40 | (d) | | | 1.76 | (d) | | | 13.24 | | | | 34.59 | | | $ | 9,728 | |
2014 | | $ | 19.59 | | | | (0.03 | ) | | | 4.10 | | | | 4.07 | | | | (0.09 | ) | | | — | | | | (0.09 | ) | | $ | 23.57 | | | | (0.14 | ) | | | 1.40 | (d) | | | 1.40 | | | | 2.23 | | | | 20.82 | | | | 60.29 | | | $ | 4,462 | |
2013 | | $ | 15.90 | | | | 0.12 | | | | 3.76 | | | | 3.88 | | | | (0.19 | ) | | | — | | | | (0.19 | ) | | $ | 19.59 | | | | 0.68 | | | | 1.40 | (d) | | | 1.40 | | | | 2.76 | | | | 24.57 | | | | 66.12 | | | $ | 2,161 | |
2012 | | $ | 13.09 | | | | 0.15 | | | | 2.88 | | | | 3.03 | | | | (0.22 | ) | | | — | | | | (0.22 | ) | | $ | 15.90 | | | | 1.05 | | | | 1.40 | (d) | | | 1.40 | | | | 3.72 | | | | 23.36 | | | | 66.07 | | | $ | 1,329 | |
2011 | | $ | 13.90 | | | | 0.19 | | | | (0.81 | ) | | | (0.62 | ) | | | (0.19 | ) | | | — | | | | (0.19 | ) | | $ | 13.09 | | | | 1.23 | | | | 1.40 | (d) | | | 1.40 | | | | 3.16 | | | | (4.66 | ) | | | 70.33 | | | $ | 900 | |
2010 | | $ | 13.04 | | | | 0.19 | | | | 0.84 | | | | 1.03 | | | | (0.17 | ) | | | — | | | | (0.17 | ) | | $ | 13.90 | | | | 1.38 | | | | 1.40 | (d) | | | 1.40 | | | | 3.29 | | | | 7.96 | | | | 66.27 | | | $ | 1,345 | |
Class R5 Shares | | | | | | | | | | | | | | | | | | | | | | | | | | | | | | | | | | | | | | | | | | | | | | | | | | | | | |
2015(b) | | $ | 23.81 | | | | (0.03 | ) | | | 3.23 | | | | 3.20 | | | | (0.01 | ) | | | — | | | | (0.01 | ) | | $ | 27.00 | | | | (0.25 | )(d) | | | 0.99 | (d) | | | 0.99 | (d) | | | 1.02 | (d) | | | 13.46 | | | | 34.59 | | | $ | 100,094 | |
2014 | | $ | 19.76 | | | | 0.06 | | | | 4.15 | | | | 4.21 | | | | (0.16 | ) | | | — | | | | (0.16 | ) | | $ | 23.81 | | | | 0.26 | | | | 0.99 | | | | 0.99 | | | | 1.10 | | | | 21.36 | | | | 60.29 | | | $ | 74,212 | |
2013 | | $ | 16.07 | | | | 0.18 | | | | 3.82 | | | | 4.00 | | | | (0.31 | ) | | | — | | | | (0.31 | ) | | $ | 19.76 | | | | 1.03 | | | | 0.99 | | | | 0.99 | | | | 1.15 | | | | 25.13 | | | | 66.12 | | | $ | 49,023 | |
2012 | | $ | 13.21 | | | | 0.21 | | | | 2.90 | | | | 3.11 | | | | (0.25 | ) | | | — | | | | (0.25 | ) | | $ | 16.07 | | | | 1.44 | | | | 0.99 | | | | 0.99 | | | | 1.15 | | | | 23.80 | | | | 66.07 | | | $ | 50,327 | |
2011 | | $ | 14.02 | | | | 0.29 | | | | (0.86 | ) | | | (0.57 | ) | | | (0.24 | ) | | | — | | | | (0.24 | ) | | $ | 13.21 | | | | 1.84 | | | | 0.99 | | | | 0.99 | | | | 1.24 | | | | (4.29 | ) | | | 70.33 | | | $ | 32,223 | |
2010 | | $ | 13.15 | | | | 0.34 | | | | 0.76 | | | | 1.10 | | | | (0.23 | ) | | | — | | | | (0.23 | ) | | $ | 14.02 | | | | 2.46 | | | | 0.99 | | | | 0.99 | | | | 1.64 | | | | 8.41 | | | | 66.27 | | | $ | 16,380 | |
| (a) | Not annualized for periods less than one year. |
| (b) | Unaudited Six Month Period Ended March 31. |
| (c) | Sales loads are not reflected in computing total return. |
| (e) | Due to the size of net assets and fixed expenses, ratios may appear disproportionate. |
| + | Based on weighted average shares outstanding, except for Dividends from Net Investment Income and Net Realized Gains, which are actual amounts per share. |
See notes to financial statements.
| | | | |
| 26 Semi-Annual Report | | | | Semi-Annual Report 27 |
| | |
| EXPENSE EXAMPLE | | |
| |
Thornburg Global Opportunities Fund | | March 31, 2015 (Unaudited) |
As a shareholder of the Fund, you incur two types of costs:
| | (1) | transaction costs, including |
(a) sales charges (loads) on purchase payments, for Class A shares;
(b) a deferred sales charge on redemptions of any part or all of a purchase of $1 million of Class A shares within 12 months of purchase;
(c) a deferred sales charge on redemptions of Class C shares within 12 months of purchase;
| | (2) | ongoing costs, including management fees; distribution and/or service (12b-1) fees; and other Fund expenses. |
This example is intended to help you understand your ongoing costs (in dollars) of investing in the Fund and to compare these costs with the ongoing costs of investing in other mutual funds.
The example is based on a $1,000 investment beginning on October 1, 2014, and held until March 31, 2015.
| | | | | | | | | | | | |
| | | Beginning
Account Value
10/1/14 | | | Ending
Account Value
3/31/15 | | | Expenses Paid
During Period†
10/1/14–3/31/15 | |
Class A Shares | | | | | | | | | | | | |
Actual | | $ | 1,000.00 | | | $ | 1,133.10 | | | $ | 7.11 | |
Hypothetical* | | $ | 1,000.00 | | | $ | 1,018.27 | | | $ | 6.72 | |
Class C Shares | | | | | | | | | | | | |
Actual | | $ | 1,000.00 | | | $ | 1,128.30 | | | $ | 11.41 | |
Hypothetical* | | $ | 1,000.00 | | | $ | 1,014.21 | | | $ | 10.80 | |
Class I Shares | | | | | | | | | | | | |
Actual | | $ | 1,000.00 | | | $ | 1,134.70 | | | $ | 5.24 | |
Hypothetical* | | $ | 1,000.00 | | | $ | 1,020.02 | | | $ | 4.96 | |
Class R3 Shares | | | | | | | | | | | | |
Actual | | $ | 1,000.00 | | | $ | 1,132.10 | | | $ | 7.97 | |
Hypothetical* | | $ | 1,000.00 | | | $ | 1,017.45 | | | $ | 7.54 | |
Class R4 Shares | | | | | | | | | | | | |
Actual | | $ | 1,000.00 | | | $ | 1,132.40 | | | $ | 7.44 | |
Hypothetical* | | $ | 1,000.00 | | | $ | 1,017.95 | | | $ | 7.04 | |
Class R5 Shares | | | | | | | | | | | | |
Actual | | $ | 1,000.00 | | | $ | 1,134.60 | | | $ | 5.25 | |
Hypothetical* | | $ | 1,000.00 | | | $ | 1,020.01 | | | $ | 4.97 | |
| † | Expenses are equal to the annualized expense ratio for each class (A: 1.34%; C: 2.15%; I: 0.98%; R3: 1.50%; R4: 1.40%; R5: 0.99%) multiplied by the average account value over the period, multiplied by 182/365 to reflect the one-half year period. |
| * | Hypothetical assumes a rate of return of 5% per year before expenses. |
ACTUAL EXPENSES
For each class of shares, the first line of the accompanying table provides information about actual account values and actual expenses. You may use the information in this line, together with the amount you invested, to estimate the expenses that you paid over the period. Simply divide your account value by $1,000 (for example, an $8,600 account value divided by $1,000 = 8.6), then multiply the result by the number in the first line for your class of shares under the heading entitled “Expenses Paid During Period” to estimate the expenses you paid on your account during this period.
HYPOTHETICAL EXAMPLE FOR COMPARISON PURPOSES
For each class of shares, the second line of the accompanying table provides information about hypothetical account values and hypothetical expenses based on the Fund’s actual expense ratio and an assumed rate of return of 5% per year before expenses, which is not the Fund’s actual return. The hypothetical account values and expenses may not be used to estimate the actual ending account balance or expenses you paid for the period. You may use this information to compare the ongoing costs of investing in the Fund and other funds. To do so, compare this 5% hypothetical example with the 5% hypothetical examples that appear in the shareholder reports of the other funds.
Please note that the expenses shown in the table are meant to highlight your ongoing costs only and do not reflect any transactional costs, such as sales charges (loads), redemption fees, or exchange fees. Therefore, the second line of the table for each class of shares is useful in comparing ongoing costs only, and will not help you determine the relative total costs of owning different funds. In addition, if these transactional costs were included, your costs would have been higher.
28 Semi-Annual Report
| | |
| OTHER INFORMATION | | |
| |
Thornburg Global Opportunities Fund | | March 31, 2015 (Unaudited) |
PORTFOLIO PROXY VOTING
Policies and Procedures:
The Trust has delegated to Thornburg Investment Management, Inc. (the “Advisor”) voting decisions respecting proxies for the Fund’s voting securities. The Advisor makes voting decisions in accordance with its Proxy Voting Policy and Procedures. A description of the Policy and Procedures is available (i) without charge, upon request, by calling the Advisor toll-free at 1-800-847-0200, (ii) on the Thornburg website at www.thornburg.com, and (iii) on the Securities and Exchange Commission’s website at www.sec.gov.
Information regarding how proxies were voted is available on or before August 31 of each year for the twelve months ending the preceding June 30. This information is available (i) without charge, upon request by calling the Advisor toll-free at 1-800-847-0200, (ii) on the Thornburg website at www.thornburg.com, and (iii) on the Securities and Exchange Commission’s website at www.sec.gov.
AVAILABILITY OF QUARTERLY PORTFOLIO SCHEDULE
The Fund files with the Securities and Exchange Commission schedules of its portfolio holdings on Form N-Q for the first and third quarters of each fiscal year. The Fund’s Forms N-Q are available on the Commission’s website at www.sec.gov, or may be reviewed and copied at the Commission’s Public Reference Room in Washington, D.C. Information on the operation of the Public Reference Room may be obtained by calling 1-800-SEC-0330. The Fund also makes this information available on its website at www.thornburg.com/download or upon request by calling 1-800-847-0200.
Semi-Annual Report 29
TRUSTEES’ STATEMENT TO SHAREHOLDERS
Revised and Readopted September 15, 2014
The Trustees believe current and prospective shareholders should know how we discharge our responsibilities in supervising the Funds’ investment advisor and in reviewing the advisor’s contract for renewal. Since 2005, we have issued a statement which sets out clearly the three principal guidelines that we follow in supervising the Trust’s investment advisor on your behalf. In accordance with our customary practice, in September of 2014 we again reviewed our statement and concluded we should reissue this statement outlining the principal features of our supervision of the advisor’s performance of investment management services for the Funds.
We begin with the premise that each shareholder selected his or her Fund because its investments are managed by the investment advisor identified in the prospectus and in accordance with the objective and policies described in the prospectus. We realize, as each of you do, that if you believe that your Fund’s stated objective and policies no longer serve your personal investment goals, you can sell your shares and leave the Fund.
Therefore, we believe that our primary supervisory task—our principal obligation to you—is to assess the nature and quality of the advisor’s services, and to confirm that the advisor actively and competently pursues the Fund’s objective, in accordance with the policies set out in the prospectus. To do this, we meet regularly with management to review your Fund’s portfolio and to discuss the advisor’s specific actions and judgments in pursuing the Fund’s objective. We do not substitute our own judgment for the advisor’s decisions in selecting investments; the advisor is paid to exercise its informed judgment on investment decisions, and we seek to confirm, in reviewing the advisor’s performance, that the advisor is doing just that.
Second, we are conscious of costs and the effect that costs have on shareholders’ returns. We try to make sure that your Fund’s fees and costs are reasonable in relationship to the services rendered and that they are generally in line with those charged by other expert investment advisors, consistent with our belief that the Fund’s investors searched for and expect that expertise and attention and have decided to pay a reasonable price for it. We do not put the management contract “out to bid” as a matter of course, and we would not do so unless we had concluded that the advisor materially had failed to pursue the Fund’s objectives in accordance with its policies, or for other equally important reasons. We believe that any other approach would be inconsistent with your interests and contrary to your expectations when you bought shares of the Fund in the first place.
Finally, because we believe that most Thornburg Fund shareholders have invested with a long-term perspective, we try not to focus too much on the fashions of the moment and on short-term performance. The market will not favor any specific investment objective or set of policies at all times and under all economic circumstances. A fund will experience periods of both high and low returns relative to other funds and other investments. Even if one of our Funds is not favored by the market at a particular time, we believe that the advisor is nonetheless obliged to remain true to the Fund’s objective and policies, and we watch to see that it does so.
Trustees of Thornburg Investment Trust
30 Semi-Annual Report
THORNBURG FUND FAMILY
FUNDAMENTAL, BOTTOM-UP EQUITY RESEARCH
We search far and wide for the best stock ideas - within the United States and around the globe. Potential investments that may deserve a deeper look are thoroughly analyzed using both quantitative and qualitative criteria. But the vast majority are discarded. Those that ultimately make it into our highly-selective portfolios are continually monitored to determine whether our investment theses unfold as expected.
| | • | | Thornburg Core Growth Fund |
| | • | | Thornburg International Value Fund |
| | • | | Thornburg International Growth Fund |
| | • | | Thornburg Developing World Fund |
| | • | | Thornburg Investment Income Builder Fund |
| | • | | Thornburg Global Opportunities Fund |
A TRADITION OF DISCIPLINED BOND MANAGEMENT
At Thornburg, the word “disciplined” carries some substance. We don’t make a practice of using shortcuts to enhance yield or total returns. Every strategy is grounded in rigorous, bottom-up credit work. Portfolios are assembled carefully - in the case of our core bond funds, using laddered structures - to mitigate price fluctuation. Position sizes are controlled so that no single bond can have an outsized effect on a portfolio. And as with our equity portfolios, managers enjoy flexibility to seek an optimal risk/reward balance.
| | • | | Thornburg Low Duration Income Fund |
| | • | | Thornburg Limited Term U.S. Government Fund |
| | • | | Thornburg Limited Term Income Fund |
| | • | | Thornburg Strategic Income Fund |
| | • | | Thornburg Low Duration Municipal Fund |
| | • | | Thornburg Limited Term Municipal Fund |
| | • | | Thornburg Intermediate Municipal Fund |
| | • | | Thornburg California Limited Term Municipal Fund |
| | • | | Thornburg New Mexico Intermediate Municipal Fund |
| | • | | Thornburg New York Intermediate Municipal Fund |
| | • | | Thornburg Strategic Municipal Income Fund |
Before investing, carefully consider the Fund’s investment goals, risks, charges, and expenses. For a prospectus or summary prospect’us containing this and other information, contact your financial advisor or visit thornburg.com. Read it carefully before investing.
For additional information, please visit thornburg.com
Thornburg Investment Management, Inc. 2300 North Ridgetop Road, Santa Fe, NM 87506
Semi-Annual Report 31

This Semi-Annual Report is submitted for the general information of shareholders of the Fund. It is not authorized for distribution to prospective investors in the Fund unless preceded or accompanied by an effective prospectus.
| | | | |
| Investment Advisor: | | Distributor: | | |
| Thornburg Investment Management® | | Thornburg Securities Corporation® | | |
| 800.847.0200 | | 800.847.0200 | | TH1411 |
FIRM OVERVIEW
THE FIRM
Thornburg Investment Management is a privately owned global investment firm that offers a range of solutions for retail and institutional investors. We are driven by our mission to help our clients reach their long-term financial goals through fundamental research and active portfolio management.
Founded in 1982 and headquartered in Santa Fe, New Mexico, we manage approximately $61 billion (as of March 31, 2015) across seven equity and 11 bond mutual funds, separate accounts for high-net-worth investors and institutional accounts, and five UCITS funds for non-U.S. investors.

CORE INVESTMENT PRINCIPLES
Our focus has always been on maintaining and building the investment expertise to manage Thornburg strategies to a high standard, while adhering to a core set of investment principles:
| | • | | We focus on the fundamentals. We invest according to our view of the fundamental value of an issuer only after performing thorough, bottom-up research. |
| | • | | We think and invest for the long term. We typically make investment decisions based upon an investment thesis we expect to play out over 18 months to several years. We may not always hold a security for several years, but our horizon line is typically a few years out. |
| | • | | We stay flexible. We go where we see value. Our investment mandates are generally broad and flexible, and we exercise as much flexibility as possible within any restrictions. |
| | • | | We collaborate across strategies. We are structured as global generalists. Portfolio managers and analysts do not specialize in sectors, geographies, or even security types, but instead must understand and communicate bottom-up fundamentals across industries, sectors, and borders. |
2 Semi-Annual Report
Semi-Annual Report
Thornburg Developing World Fund
March 31, 2015
| | | | |
Share Class | | NASDAQ Symbol | | CUSIP |
Class A | | THDAX | | 885-216-408 |
Class C | | THDCX | | 885-216-507 |
Class I | | THDIX | | 885-216-606 |
Class R5 | | THDRX | | 885-216-846 |
Class R6 | | TDWRX | | 885-216-838 |
Class I, R5, and R6 shares may not be available to all investors. Minimum investments for Class I shares may be higher than those for other classes.
Investments in the Fund carry risks, including possible loss of principal. Additional risks may be associated with investments outside the United States, especially in emerging markets, including currency fluctuations, illiquidity, volatility, and political and economic risks. Investments in small capitalization companies may increase the risk of greater price fluctuations. Please see the Fund’s prospectus for a discussion of the risks associated with an investment in the Fund. Investments in the Fund are not FDIC insured, nor are they deposits of or guaranteed by a bank or any other entity.
Funds invested in a limited number of holdings may expose an investor to greater volatility.
Semi-Annual Report 3
| | |
| LETTER TO SHAREHOLDERS | | |
| |
Thornburg Developing World Fund | | March 31, 2015 (Unaudited) |
April 2, 2015
Dear Fellow Shareholder:
We are pleased to present the sixth semi-annual report for the Thornburg Developing World Fund for the period ended March 31, 2015. The Class A shares of the Fund produced a total return of negative 4.46% (without sales charge) in the six-month period ended March 31, 2015, compared to negative 2.37% for the MSCI Emerging Markets Index. Since inception on December 16, 2009, the Class A shares of the Thornburg Developing World Fund produced a cumulative total return of 49.17% (without sales charge), compared to 13.57% for the MSCI Emerging Markets Index.
Performance data shown represents past performance and is no guarantee of future results. Investment return and principal value will fluctuate so shares, when redeemed, may be worth more or less than their original cost. Current performance may be lower or higher than quoted. For performance current to the most recent month end, visit thornburg.com or call 800.847.0200.
The maximum sales charge for Class A shares is 4.50%. The total annual fund operating expense of Class A shares is 1.45%, as disclosed in the most recent prospectus.
Market Impact
The six-month period ended March 31, 2015, was defined by OPEC’s (Organization of the Petroleum Exporting Countries) November 26th decision to maintain oil production, precipitating a 40% decline in the price of Brent crude oil over the ensuing six weeks and driving a coincident downward inflection in emerging market economic surprise indicators. Emerging market equities declined by 10% in the 20 trading days following the OPEC decision and remain below the pre-OPEC decision level. The Russian ruble lost 38% of its value between November 27th and December 16th, the day global emerging markets troughed. The Brazilian real, Mexican peso, Turkish lira, and Indonesian rupiah also depreciated meaningfully in this time period, as global investors retreated to safer assets. The Developing World Fund outperformed in the period leading up to the OPEC decision, performed in line with the broader market during the market correction, but underperformed in the subsequent rebound. Given the relatively defensive security selection framework and currency exposures, it isn’t unusual for the Developing World Fund to trail its benchmark in sharp market recoveries.
Contributors and Detractors
Detractors during the six-month period included three Brazilian companies—higher education provider Kroton Educacional SA, insurance broker Qualicorp SA, and fast food concession operator International Meal Company Alimentacao SA. These stocks suffered from a degree of specific company challenges, but were also impacted by the broader deterioration in sentiment toward Brazilian assets. The Brazilian real has depreciated by over 30% in the last six months. Capital flight accelerated due to the Petrobras bribery scandal and threat of sovereign credit-rating downgrade. Brazilian 10-year bonds now yield approximately 13%, implying a high hurdle rate for equity investments into the country. Two oil exploration and production companies, Gran Tierra Energy and DNO ASA, were also key detractors, driven largely by the decline in the price of crude oil. Top contributors were mainly in Asia and in currencies with solid fundamentals. HDFC Bank in India, Industrial & Commercial Bank of China, Taiwanese synthetic textile manufacturer Eclat Textile Company, and Chinese social networking giant Tencent were all top contributors, along with Visa, the global payments processing leader.
Market Outlook
The potential for normalization of U.S. monetary policy in the second half of 2015 has driven the dollar to a 10- to 12-year high versus many free-floating emerging market currencies. A prolonged tightening cycle in the United States could drive negative growth surprises in emerging markets, precipitating further currency depreciation, higher inflation, and continued capital flight. Nevertheless, we are encouraged by the lower levels of external dependencies in most emerging markets today than existed in past crises. Stronger balance sheets and fewer macro imbalances may give these countries a heightened ability to weather the storm of tighter global liquidity. While the fundamental outlook for emerging markets may not necessarily be supportive of a broad-based recovery in share prices, there is intuitive appeal to the notion that the rebound in emerging market indices and currencies may continue. Most notably, there is a lot of bad news reflected in prices. Emerging markets have underperformed global stocks by almost 48% in the last five years, and cumulative equity market outflow since the “taper tantrum” of 2013 is approaching $100 billion. Today, relative valuation of emerging market stocks is at a 32% price-to-earnings discount versus global stocks, near a 10-year low. Given this backdrop, it seems reasonable to assume that we are in the middle-to-later stages of a cyclical correction in the emerging markets, though we will of course be delighted to see full resolution of cyclical emerging-market pressures sooner than we expect.
4 Semi-Annual Report
| | |
| LETTER TO SHAREHOLDERS, | | |
| |
CONTINUED | | |
| |
Thornburg Developing World Fund | | March 31, 2015 (Unaudited) |
Fund Positioning
The portfolio management team of the Developing World Fund intends to maintain the same process and philosophy employed since inception of the Fund. We expect that the strategy will remain focused on bottom-up security selection and will continue to make use of Thornburg’s “three basket” approach as a key risk management tool.
Four additional key pillars of the process are expected to remain in place:
| | 1. | A focus on financially sound, cash-generative companies |
| | 2. | A focus on fundamentally sound currencies |
| | 3. | Flexible, multi-cap security selection |
| | 4. | Economic exposure to domestic consumption in emerging markets and to the rise of the emerging middle class |
We invite you to visit our website at www.thornburg.com, where you will find additional information about the Thornburg Developing World Fund. Thank you for your trust and confidence.
Sincerely,
| | | | |
 | |  | | |
| Ben Kirby,CFA | | Charlie Wilson,PhD | | |
| Portfolio Manager | | Portfolio Manager | | |
| Managing Director | | Managing Director | | |
The matters discussed in this report may constitute forward-looking statements made pursuant to the safe harbor provisions of the Securities Litigation Reform Act of 1995. These include any advisor or portfolio manager prediction, assessment, analysis or outlook for individual securities, industries, investment styles, market sectors and/or markets. These statements involve risks and uncertainties. In addition to the general risks described for each fund in its current prospectus, other factors bearing on these reports include the accuracy of the advisor’s or portfolio manager’s forecasts and predictions, the appropriateness of the investment strategies designed by the advisor or portfolio manager and the ability of the advisor or portfolio manager to implement their strategies efficiently and successfully. Any one or more of these factors, as well as other risks affecting the securities markets generally, could cause the actual results of any fund to differ materially as compared to its benchmarks.
The views expressed by the portfolio managers reflect their professional opinions and are subject to change. Under no circumstances does the information contained within represent a recommendation to buy or sell any security.
Semi-Annual Report 5
| | |
| PERFORMANCE SUMMARY | | |
| |
Thornburg Developing World Fund | | March 31, 2015 (Unaudited) |
Average Annual Total Returns
| | | | | | | | | | | | | | | | |
| | | 1-Yr | | | 3-Yr | | | 5-Yr | | | Since
Incep. | |
Class A Shares (Incep: 12/16/09) | | | | | | | | | | | | | | | | |
Without sales charge | | | -4.77 | % | | | 4.64 | % | | | 7.10 | % | | | 7.86 | % |
With sales charge | | | -9.05 | % | | | 3.05 | % | | | 6.11 | % | | | 6.93 | % |
Class C Shares (Incep: 12/16/09) | | | | | | | | | | | | | | | | |
Without sales charge | | | -5.45 | % | | | 3.85 | % | | | 6.34 | % | | | 7.12 | % |
With sales charge | | | -6.40 | % | | | 3.85 | % | | | 6.34 | % | | | 7.12 | % |
Class I Shares (Incep: 12/16/09) | | | -4.39 | % | | | 5.13 | % | | | 7.65 | % | | | 8.43 | % |
Class R5 Shares (Incep: 2/1/13) | | | -4.39 | % | | | — | | | | — | | | | 1.74 | % |
Class R6 Shares (Incep: 2/1/13) | | | -4.26 | % | | | — | | | | — | | | | 1.87 | % |
MSCI Emerging Markets Index (Since 12/16/09) | | | 0.44 | % | | | 0.31 | % | | | 1.75 | % | | | 2.44 | % |
Growth of a Hypothetical $10,000 Investment
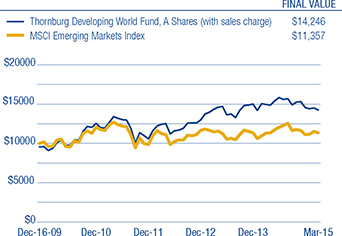
Performance data shown represents past performance and is no guarantee of future results. Investment return and principal value will fluctuate so shares, when redeemed, may be worth more or less than their original cost. Current performance may be lower or higher than quoted. For performance current to the most recent month end, visit thornburg.com or call 800.847.0200. The performance information does not reflect the deduction of taxes that a shareholder would pay on distributions or the redemption of Fund shares. Returns reflect the reinvestment of dividends and capital gains as well as applicable sales charges. Class A shares are sold with a maximum sales charge of 4.50%. Class C shares are subject to a 1% CDSC for the first year only. There is no sales charge for Class I, R5, and R6 shares.
As disclosed in the most recent prospectus, the total annual fund operating expenses are as follows: A shares, 1.45%; C shares, 2.23%; I shares, 1.09%; R5 shares, 1.90%; R6 shares, 1.10%. Thornburg Investment Management and/or Thornburg Securities Corporation have contractually agreed to waive fees and reimburse expenses through at least February 1, 2016, for some of the share classes, resulting in net expense ratios of the following: R5 shares, 1.09%; R6 shares, 0.99%. For more detailed information on fund expenses and waivers/reimbursements please see the Fund’s prospectus.
From time to time, the Fund may invest in shares of companies through initial public offerings (IPOs). IPOs have the potential to produce substantial gains for the Fund. There is no assurance that the Fund will have continued access to profitable IPOs and, as the Fund’s assets grow, the impact of IPO investments may decline. Therefore, investors should not rely on these past gains as an indication of future performance.
Glossary
MSCI Emerging Markets Index – Free float-adjusted market capitalization index that is designed to measure equity market performance of emerging markets. The MSCI Emerging Markets Index consists of the following 23 emerging market country indexes: Brazil, Chile, China, Colombia, Czech Republic, Egypt, Greece, Hungary, India, Indonesia, Korea, Malaysia, Mexico, Peru, Philippines, Poland, Qatar, Russia, South Africa, Taiwan, Thailand, Turkey and United Arab Emirates.
Unless otherwise noted, index returns reflect the reinvestment of income dividends and capital gains, if any, but do not reflect fees, brokerage commissions or other expenses of investing. Investors may not make direct investments into any index. The performance of any index is not indicative of the performance of any particular investment.
Brent Crude Oil – An international benchmark for oil prices, accounting for roughly two-thirds of the global oil trade. Brent is a sweet crude oil from the North Sea suitable for production of gasoline and middle distillates such as kerosene and diesel.
Economic Surprise Indicators – Indices that track how economic data are progressing relative to the consensus forecasts of market economists.
Price to Earnings Ratio (P/E) – A valuation ratio of a company’s current share price compared to its per-share earnings. P/E equals a company’s market value per share divided by earnings per share.
6 Semi-Annual Report
| | |
| FUND SUMMARY | | |
| |
Thornburg Developing World Fund | | March 31, 2015 (Unaudited) |
OBJECTIVES AND STRATEGIES
The Fund seeks long-term capital appreciation. Under normal market conditions the Fund invests at least 80% of its assets in equity securities and debt obligations of developing country issuers. A developing country issuer is a company or sovereign entity that is domiciled or otherwise tied economically to one or more developing countries. The Fund expects that investments in the Fund’s portfolio normally will be weighted in favor of equity securities.
Market Capitalization Exposure
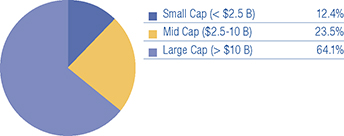
Basket Structure
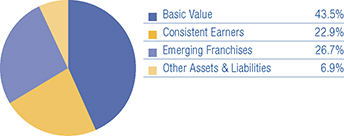
Top Ten Equity Holdings
| | | | |
Siam Commercial Bank plc | | | 3.4 | % |
Alibaba Group Holding Ltd. ADR | | | 3.1 | % |
Industrial and Commercial Bank of China Ltd. | | | 2.9 | % |
China Mobile Ltd. | | | 2.9 | % |
HDFC Bank Ltd. ADR | | | 2.9 | % |
Tencent Holdings Ltd. | | | 2.7 | % |
Kansas City Southern | | | 2.5 | % |
Baidu, Inc. ADR | | | 2.5 | % |
Largan Precision Co. Ltd. | | | 2.2 | % |
Wal-Mart de Mexico SAB de C.V. | | | 2.2 | % |
There is no guarantee that the Fund will meet its investment objectives.
All portfolio information is subject to change. Charts may not add up to 100% due to rounding.
Sector Exposure
| | | | |
Financials | | | 24.9 | % |
Information Technology | | | 20.6 | % |
Consumer Discretionary | | | 15.4 | % |
Consumer Staples | | | 12.5 | % |
Industrials | | | 7.5 | % |
Energy | | | 4.4 | % |
Telecommunication Services | | | 3.4 | % |
Health Care | | | 3.3 | % |
Non-Classified | | | 0.7 | % |
Materials | | | 0.5 | % |
Cash | | | 6.9 | % |
Top Ten Industry Groups
| | | | |
Banks | | | 18.9 | % |
Software & Services | | | 13.4 | % |
Consumer Services | | | 8.1 | % |
Transportation | | | 6.8 | % |
Food & Staples Retailing | | | 5.8 | % |
Food, Beverage & Tobacco | | | 5.1 | % |
Energy | | | 4.4 | % |
Technology Hardware & Equipment | | | 4.3 | % |
Telecommunication Services | | | 3.4 | % |
Retailing | | | 3.2 | % |
Semi-Annual Report 7
| | |
| FUND SUMMARY, | | |
| |
CONTINUED | | |
| |
Thornburg Developing World Fund | | March 31, 2015 (Unaudited) |
Country Exposure*
(percent of equity holdings)
| | | | |
China | | | 22.8 | % |
United States | | | 12.4 | % |
India | | | 8.8 | % |
Brazil | | | 7.0 | % |
Taiwan | | | 6.7 | % |
Thailand | | | 5.5 | % |
Mexico | | | 5.2 | % |
Philippines | | | 4.9 | % |
Indonesia | | | 4.2 | % |
United Arab Emirates | | | 3.5 | % |
Saudi Arabia | | | 2.8 | % |
Netherlands | | | 2.3 | % |
Peru | | | 1.7 | % |
South Africa | | | 1.6 | % |
United Kingdom | | | 1.3 | % |
Panama | | | 1.1 | % |
South Korea | | | 1.0 | % |
Turkey | | | 1.0 | % |
Norway | | | 0.9 | % |
Cambodia | | | 0.8 | % |
Hong Kong | | | 0.8 | % |
Greece | | | 0.7 | % |
Romania | | | 0.7 | % |
Egypt | | | 0.6 | % |
Lao People’s Democratic Republic | | | 0.5 | % |
Russia | | | 0.5 | % |
Georgia | | | 0.3 | % |
Nigeria | | | 0.3 | % |
Canada | | | 0.1 | % |
| * | The country assignment of each equity holding is determined by the Fund’s Advisor based on various factors, including the location of the issuer’s head office, the issuer’s jurisdiction of incorporation and the country from which a majority of the issuer’s revenue is derived. The Advisor may deem certain issuers to be developing country issuers, as defined in the Fund’s prospectus, even if those issuers have country exposure in a developed country. |
8 Semi-Annual Report
| | |
| SCHEDULE OF INVESTMENTS | | |
| |
Thornburg Developing World Fund | | March 31, 2015 (Unaudited) |
| | | | | | |
| | | Shares/
Principal Amount | | Value | |
COMMON STOCK — 92.41% | | | | | | |
| | |
BANKS — 18.93% | | | | | | |
Banks — 18.93% | | | | | | |
Bank of Georgia Holdings plc | | 240,772 | | $ | 6,196,746 | |
Commercial International Bank Egypt S.A.E. | | 1,079,887 | | | 7,580,807 | |
Credicorp Ltd. | | 253,549 | | | 35,656,596 | |
First Gulf Bank | | 4,038,980 | | | 16,055,190 | |
Grupo Financiero Banorte S.A.B. de C.V. | | 4,235,359 | | | 24,556,669 | |
Guaranty Trust Bank plc | | 53,440,078 | | | 7,047,486 | |
HDFC Bank Ltd. ADR | | 1,089,387 | | | 64,154,000 | |
ICICI Bank Ltd. ADR | | 3,467,359 | | | 35,921,839 | |
Industrial and Commercial Bank of China Ltd. | | 87,904,858 | | | 64,743,893 | |
Itau Unibanco Holding SA ADR | | 3,298,939 | | | 36,486,265 | |
PT Bank Mandiri | | 48,070,480 | | | 45,864,569 | |
Siam Commercial Bank plc | | 13,830,031 | | | 75,652,905 | |
| | | | | | |
| | | | | 419,916,965 | |
| | | | | | |
| | |
CAPITAL GOODS — 0.67% | | | | | | |
Industrial Conglomerates — 0.67% | | | | | | |
Alliance Global Group, Inc. | | 25,092,931 | | | 14,876,122 | |
| | | | | | |
| | | | | 14,876,122 | |
| | | | | | |
| | |
CONSUMER DURABLES & APPAREL — 1.96% | | | | | | |
Household Durables — 0.18% | | | | | | |
Steinhoff International Holdings Ltd. | | 410,800 | | | 2,575,078 | |
TTK Prestige Ltd. | | 26,119 | | | 1,439,897 | |
Textiles, Apparel & Luxury Goods — 1.78% | | | | | | |
Eclat Textile Co. Ltd. | | 2,996,058 | | | 39,401,658 | |
| | | | | | |
| | | | | 43,416,633 | |
| | | | | | |
| | |
CONSUMER SERVICES — 8.15% | | | | | | |
Diversified Consumer Services — 2.20% | | | | | | |
Fu Shou Yuan International Group Ltd. | | 31,888,918 | | | 15,136,917 | |
Kroton Educacional S.A. | | 10,447,075 | | | 33,682,819 | |
Hotels, Restaurants & Leisure — 5.95% | | | | | | |
Al Tayyar Travel Group | | 1,717,823 | | | 46,207,336 | |
Bloomberry Resorts Corp. | | 78,086,789 | | | 18,237,720 | |
Galaxy Entertainment Group Ltd. | | 4,334,391 | | | 19,679,795 | |
International Meal Co. SA | | 1,364,761 | | | 2,822,272 | |
a Jubilant FoodWorks Ltd. | | 557,007 | | | 13,191,937 | |
NagaCorp Ltd. | | 25,824,256 | | | 17,121,459 | |
OPAP SA | | 1,562,846 | | | 14,670,334 | |
| | | | | | |
| | | | | 180,750,589 | |
| | | | | | |
| | |
DIVERSIFIED FINANCIALS — 1.20% | | | | | | |
Consumer Finance — 1.20% a First Cash Financial Services, Inc. | | 570,948 | | | 26,560,501 | |
| | | | | | |
| | | | | 26,560,501 | |
| | | | | | |
| | |
ENERGY — 4.39% | | | | | | |
Energy Equipment & Services — 2.12% | | | | | | |
Schlumberger Ltd. | | 562,879 | | | 46,966,624 | |
Oil, Gas & Consumable Fuels — 2.27% a Bankers Petroleum Ltd. | | 624,462 | | | 1,336,143 | |
BG Group plc | | 2,255,834 | | | 27,740,862 | |
a DNO International ASA | | 5,502,520 | | | 7,206,274 | |
b ROMGAZ SA-GDR | | 1,330,085 | | | 11,505,235 | |
ROMGAZ SA-GDR Reg S | | 302,206 | | | 2,614,082 | |
| | | | | | |
| | | | | 97,369,220 | |
| | | | | | |
| | |
FOOD & STAPLES RETAILING — 5.78% | | | | | | |
Food & Staples Retailing — 5.78% | | | | | | |
Clicks Group Ltd. | | 3,942,291 | | | 29,720,759 | |
a Edita Food Industries S.A.E. GDR | | 395,000 | | | 4,850,600 | |
Magnit OJCS GDR | | 207,898 | | | 10,613,193 | |
PriceSmart, Inc. | | 128,462 | | | 10,916,701 | |
Puregold Price Club, Inc. | | 24,913,939 | | | 23,158,259 | |
Wal-Mart de Mexico SAB de C.V. | | 19,627,078 | | | 48,908,462 | |
| | | | | | |
| | | | | 128,167,974 | |
| | | | | | |
Semi-Annual Report 9
| | |
| SCHEDULE OF INVESTMENTS, CONTINUED | | |
| |
Thornburg Developing World Fund | | March 31, 2015 (Unaudited) |
| | | | | | |
| | | Shares/
Principal Amount | | Value | |
FOOD, BEVERAGE & TOBACCO — 5.09% | | | | | | |
Beverages — 1.50% | | | | | | |
Kweichow Moutai Co., Ltd. | | 1,058,074 | | $ | 33,415,109 | |
Food Products — 3.59% | | | | | | |
Grupo Lala, S.A.B. de C.V. | | 17,108,489 | | | 34,612,907 | |
Ulker Biskuvi Sanayi A.S. | | 2,801,029 | | | 21,017,013 | |
Universal Robina Corp. | | 4,743,151 | | | 23,981,032 | |
| | | | | | |
| | | | | 113,026,061 | |
| | | | | | |
| | |
HEALTH CARE EQUIPMENT & SERVICES — 1.25% | | | | | | |
Health Care Equipment & Supplies — 0.26% | | | | | | |
St. Shine Optical Co. Ltd. | | 358,164 | | | 5,780,531 | |
Health Care Providers & Services — 0.99% | | | | | | |
a Qualicorp SA | | 3,087,420 | | | 22,056,110 | |
| | | | | | |
| | | | | 27,836,641 | |
| | | | | | |
| | |
HOUSEHOLD & PERSONAL PRODUCTS — 1.59% | | | | | | |
Household Products — 1.59% | | | | | | |
Colgate Palmolive Co. | | 508,787 | | | 35,279,291 | |
| | | | | | |
| | | | | 35,279,291 | |
| | | | | | |
| | |
INSURANCE — 2.18% | | | | | | |
Insurance — 2.18% | | | | | | |
AIA Group Ltd. | | 2,452,700 | | | 15,423,000 | |
BB Seguridade Participacoes S.A. | | 3,209,583 | | | 32,985,328 | |
| | | | | | |
| | | | | 48,408,328 | |
| | | | | | |
| | |
MATERIALS — 0.51% | | | | | | |
Chemicals — 0.51% | | | | | | |
Yanbu National Petrochemical Co. | | 1,004,900 | | | 11,310,516 | |
| | | | | | |
| | | | | 11,310,516 | |
| | | | | | |
| | |
MEDIA — 2.06% | | | | | | |
Media — 2.06% | | | | | | |
Zee Entertainment Enterprises Ltd. | | 8,367,513 | | | 45,674,103 | |
| | | | | | |
| | | | | 45,674,103 | |
| | | | | | |
| | |
PHARMACEUTICALS, BIOTECHNOLOGY & LIFE SCIENCES — 2.04% | | | | | | |
Pharmaceuticals — 2.04% | | | | | | |
China Animal Healthcare Ltd. | | 36,512,418 | | | 24,490,280 | |
China Medical System Holdings Ltd. | | 13,485,813 | | | 20,769,751 | |
| | | | | | |
| | | | | 45,260,031 | |
| | | | | | |
| | |
REAL ESTATE — 2.58% | | | | | | |
Real Estate Management & Development — 2.58% | | | | | | |
a Emaar Malls Group PJSC | | 33,145,566 | | | 26,351,127 | |
Emaar Properties PJSC | | 17,133,738 | | | 30,788,388 | |
| | | | | | |
| | | | | 57,139,515 | |
| | | | | | |
| | |
RETAILING — 3.23% | | | | | | |
Multiline Retail — 2.77% | | | | | | |
Matahari Department Store Tbk | | 27,225,278 | | | 41,020,113 | |
Robinsons Retail Holdings, Inc. | | 10,827,379 | | | 20,346,753 | |
Specialty Retail — 0.46% | | | | | | |
Kolao Holdings | | 662,000 | | | 10,203,434 | |
| | | | | | |
| | | | | 71,570,300 | |
| | | | | | |
| | |
SEMICONDUCTORS & SEMICONDUCTOR EQUIPMENT — 2.89% | | | | | | |
Semiconductors & Semiconductor Equipment — 2.89% | | | | | | |
Hermes Microvision, Inc. | | 429,303 | | | 24,764,842 | |
Mediatek, Inc. | | 1,429,738 | | | 19,351,040 | |
Sk Hynix, Inc. | | 488,016 | | | 20,036,170 | |
| | | | | | |
| | | | | 64,152,052 | |
| | | | | | |
| | |
SOFTWARE & SERVICES — 13.40% | | | | | | |
Information Technology Services — 1.57% | | | | | | |
Visa, Inc. | | 530,881 | | | 34,724,927 | |
Internet Software & Services — 11.12% | | | | | | |
a Alibaba Group Holding Ltd. ADR | | 818,564 | | | 68,137,267 | |
a Baidu, Inc. ADR | | 265,148 | | | 55,256,843 | |
a Facebook, Inc. | | 516,344 | | | 42,451,222 | |
Just Dial Ltd. | | 994,393 | | | 21,052,173 | |
10 Semi-Annual Report
| | |
| SCHEDULE OF INVESTMENTS, CONTINUED | | |
| |
Thornburg Developing World Fund | | March 31, 2015 (Unaudited) |
| | | | | | | | |
| | | Shares/
Principal Amount | | | Value | |
Tencent Holdings Ltd. | | | 3,146,815 | | | $ | 59,789,343 | |
Software — 0.71% | | | | | | | | |
Linx S.A. | | | 1,080,184 | | | | 15,805,672 | |
| | | | | | | | |
| | | | | | | 297,217,447 | |
| | | | | | | | |
| | |
TECHNOLOGY HARDWARE & EQUIPMENT — 4.28% | | | | | | | | |
Electronic Equipment, Instruments & Components — 2.22% | | | | | | | | |
Largan Precision Co. Ltd. | | | 572,765 | | | | 49,332,109 | |
Technology, Hardware, Storage & Peripherals — 2.06% | | | | | | | | |
Apple, Inc. | | | 280,611 | | | | 34,916,427 | |
Goldpac Group Ltd. | | | 18,177,978 | | | | 10,692,031 | |
| | | | | | | | |
| | | | | | | 94,940,567 | |
| | | | | | | | |
| | |
TELECOMMUNICATION SERVICES — 3.44% | | | | | | | | |
Diversified Telecommunication Services — 0.53% | | | | | | | | |
Telenor ASA | | | 580,183 | | | | 11,732,290 | |
Wireless Telecommunication Services — 2.91% | | | | | | | | |
China Mobile Ltd. | | | 4,950,221 | | | | 64,490,506 | |
| | | | | | | | |
| | | | | | | 76,222,796 | |
| | | | | | | | |
| | |
TRANSPORTATION — 6.79% | | | | | | | | |
Airlines — 1.04% | | | | | | | | |
Copa Holdings SA | | | 228,296 | | | | 23,051,047 | |
Road & Rail — 2.51% | | | | | | | | |
Kansas City Southern | | | 545,105 | | | | 55,644,319 | |
Transportation Infrastructure — 3.24% | | | | | | | | |
Airports of Thailand Public Company Ltd. | | | 4,403,707 | | | | 37,892,992 | |
Shanghai International Air Co., Ltd. | | | 8,743,485 | | | | 34,031,275 | |
| | | | | | | | |
| | | | | | | 150,619,633 | |
| | | | | | | | |
TOTAL COMMON STOCK (Cost $1,854,773,151) | | | | | | | 2,049,715,285 | |
| | | | | | | | |
EXCHANGE-TRADED FUNDS — 0.70% | | | | | | | | |
iShares MSCI Emerging Markets Index | | | 385,000 | | | | 15,450,050 | |
| | | | | | | | |
TOTAL EXCHANGE-TRADED FUNDS (Cost $15,362,848) | | | | | | | 15,450,050 | |
| | | | | | | | |
SHORT TERM INVESTMENTS — 4.18% | | | | | | | | |
Ameren Corp., 0.45%, 4/1/2015 | | | $16,000,000 | | | | 16,000,000 | |
Anthem, Inc., 0.30%, 4/1/2015 | | | 24,750,000 | | | | 24,750,000 | |
Bank of New York Tri-Party Repurchase Agreement 0.23% dated 3/31/2015 due 4/1/2015, repurchase price $18,000,115 collateralized by 15 U.S. Government debt securities and 11 corporate debt securities, having an average coupon of | | | | | | | | |
3.91%, a minimum credit rating of BBB-, maturity dates from 3/12/2020 to 8/21/2054, and having an aggregate market value of $18,938,795 at 3/31/2015 | | | 18,000,000 | | | | 18,000,000 | |
CenterPoint Energy, Inc., 0.60%, 4/1/2015 | | | 8,000,000 | | | | 8,000,000 | |
Delmarva Power & Light Co., 0.45%, 4/1/2015 | | | 7,000,000 | | | | 7,000,000 | |
Johnson Controls, Inc., 0.45%, 4/1/2015 | | | 19,000,000 | | | | 19,000,000 | |
| | | | | | | | |
TOTAL SHORT TERM INVESTMENTS (Cost $92,750,000) | | | | | | | 92,750,000 | |
| | | | | | | | |
TOTAL INVESTMENTS — 97.29% (Cost $1,962,885,999) | | | | | | $ | 2,157,915,335 | |
OTHER ASSETS LESS LIABILITIES — 2.71% | | | | | | | 60,103,480 | |
| | | | | | | | |
NET ASSETS — 100.00% | | | | | | $ | 2,218,018,815 | |
| | | | | | | | |
Footnote Legend
| b | Securities exempt from registration under Rule 144A of the Securities Act of 1933, as amended. These securities may only be resold in the ordinary course of business in transactions exempt from registration, normally to qualified institutional buyers. As of March 31, 2015, the aggregate value of these securities in the Fund’s portfolio was $11,505,235, representing 0.52% of the Fund’s net assets. |
Portfolio Abbreviations
To simplify the listings of securities, abbreviations are used per the table below:
| | |
| ADR | | American Depositary Receipt |
| GDR | | Global Depository Receipt |
See notes to financial statements.
Semi-Annual Report 11
| | |
| STATEMENT OF ASSETS AND LIABILITIES | | |
| |
Thornburg Developing World Fund | | March 31, 2015, (Unaudited) |
| | | | |
ASSETS | | | | |
Investments at value (cost $1,962,885,999) (Note 2) | | $ | 2,157,915,335 | |
Cash | | | 26,937,925 | |
Cash denominated in foreign currency (cost $6,273,320) | | | 6,271,362 | |
Receivable for investments sold | | | 50,064,720 | |
Receivable for fund shares sold | | | 5,882,500 | |
Unrealized appreciation on forward currency contracts (Note 7) | | | 5,421,245 | |
Dividends receivable | | | 3,819,701 | |
Dividend and interest reclaim receivable | | | 382,779 | |
Interest receivable | | | 115 | |
Prepaid expenses and other assets | | | 136,668 | |
| | | | |
Total Assets | | | 2,256,832,350 | |
| | | | |
| |
LIABILITIES | | | | |
Payable for investments purchased | | | 6,954,209 | |
Payable for fund shares redeemed | | | 26,993,480 | |
Unrealized depreciation on forward currency contracts (Note 7) | | | 1,362,063 | |
Payable to investment advisor and other affiliates (Note 3) | | | 2,013,231 | |
Deferred taxes payable | | | 1,055,787 | |
Accounts payable and accrued expenses | | | 434,705 | |
Dividends payable | | | 60 | |
| | | | |
Total Liabilities | | | 38,813,535 | |
| | | | |
| |
NET ASSETS | | $ | 2,218,018,815 | |
| | | | |
NET ASSETS CONSIST OF | | | | |
Distribution in excess of net investment income | | $ | (2,345,136 | ) |
Net unrealized appreciation on investments | | | 198,000,452 | |
Accumulated net realized gain (loss) | | | (240,115,733 | ) |
Net capital paid in on shares of beneficial interest | | | 2,262,479,232 | |
| | | | |
| | $ | 2,218,018,815 | |
| | | | |
12 Semi-Annual Report
| | |
| STATEMENT OF ASSETS AND LIABILITIES, CONTINUED |
| |
Thornburg Developing World Fund | | March 31, 2015 (Unaudited) |
| | | | |
NET ASSET VALUE | | | | |
Class A Shares: | | | | |
Net asset value and redemption price per share ($332,314,528 applicable to 18,695,613 shares of beneficial interest outstanding - Note 4) | | $ | 17.78 | |
Maximum sales charge, 4.50% of offering price | | | 0.84 | |
| | | | |
Maximum offering price per share | | $ | 18.62 | |
| | | | |
| |
Class C Shares: | | | | |
Net asset value and offering price per share* ($214,972,015 applicable to 12,531,129 shares of beneficial interest outstanding - Note 4) | | $ | 17.16 | |
| | | | |
| |
Class I Shares: | | | | |
Net asset value, offering and redemption price per share ($1,631,662,395 applicable to 90,164,749 shares of beneficial interest outstanding - Note 4) | | $ | 18.10 | |
| | | | |
| |
Class R5 Shares: | | | | |
Net asset value, offering and redemption price per share ($8,314,012 applicable to 460,822 shares of beneficial interest outstanding - Note 4) | | $ | 18.04 | |
| | | | |
| |
Class R6 Shares: | | | | |
Net asset value, offering and redemption price per share ($30,755,865 applicable to 1,699,663 shares of beneficial interest outstanding - Note 4) | | $ | 18.10 | |
| | | | |
| * | Redemption price per share is equal to net asset value less any applicable contingent deferred sales charge. |
See notes to financial statements.
Semi-Annual Report 13
| | |
| STATEMENT OF OPERATIONS | | |
| |
Thornburg Developing World Fund | | Six Months Ended March 31, 2015 (Unaudited) |
| | | | |
INVESTMENT INCOME | | | | |
Dividend income (net of foreign taxes withheld of $1,102,949) | | $ | 16,370,125 | |
Interest income | | | 345,259 | |
| | | | |
Total Income | | | 16,715,384 | |
| | | | |
| |
EXPENSES | | | | |
Investment advisory fees (Note 3) | | | 13,024,230 | |
Administration fees (Note 3) | | | | |
Class A Shares | | | 245,166 | |
Class C Shares | | | 143,921 | |
Class I Shares | | | 595,281 | |
Class R5 Shares | | | 2,056 | |
Distribution and service fees (Note 3) | | | | |
Class A Shares | | | 490,334 | |
Class C Shares | | | 1,151,399 | |
Transfer agent fees | | | | |
Class A Shares | | | 250,255 | |
Class C Shares | | | 126,665 | |
Class I Shares | | | 929,120 | |
Class R5 Shares | | | 8,079 | |
Class R6 Shares | | | 2,756 | |
Registration and filing fees | | | | |
Class A Shares | | | 23,343 | |
Class C Shares | | | 15,496 | |
Class I Shares | | | 95,646 | |
Class R5 Shares | | | 11,795 | |
Class R6 Shares | | | 11,511 | |
Custodian fees (Note 3) | | | 1,036,439 | |
Professional fees | | | 41,257 | |
Accounting fees | | | 56,830 | |
Trustee fees | | | 59,820 | |
Other expenses | | | 132,858 | |
| | | | |
Total Expenses | | | 18,454,257 | |
Less: | | | | |
Expenses reimbursed by investment advisor (Note 3) | | | (262,047 | ) |
Fees paid indirectly (Note 3) | | | (1,715 | ) |
| | | | |
Net Expenses | | | 18,190,495 | |
| | | | |
Net Investment Loss | | $ | (1,475,111 | ) |
| | | | |
14 Semi-Annual Report
| | |
| STATEMENT OF OPERATIONS, CONTINUED | | |
| |
Thornburg Developing World Fund | | Six Months Ended March 31, 2015 (Unaudited) |
| | | | |
REALIZED AND UNREALIZED GAIN (LOSS) | | | | |
Net realized gain (loss) from: | | | | |
Investments (net of foreign capital gains taxes paid of $869,610) | | $ | (179,026,008 | ) |
Forward currency contracts (Note 7) | | | 14,995,898 | |
Foreign currency transactions | | | (126,835 | ) |
| | | | |
| | | (164,156,945 | ) |
| | | | |
Net change in unrealized appreciation (depreciation) on: | | | | |
Investments (net of change in deferred taxes payable of $904,981) | | | 38,612,109 | |
Foreign currency translations | | | (42,827 | ) |
Forward currency contracts (Note 7) | | | (5,857,799 | ) |
| | | | |
| | | 32,711,483 | |
| | | | |
Net Realized and Unrealized Loss | | | (131,445,462 | ) |
| | | | |
Net Decrease in Net Assets Resulting from Operations | | $ | (132,920,573 | ) |
| | | | |
See notes to financial statements.
Semi-Annual Report 15
| | |
| STATEMENTS OF CHANGES IN NET ASSETS | | |
| |
Thornburg Developing World Fund | | |
| | | | | | | | |
| | | Six Months Ended | | | Year Ended | |
| | | March 31, 2015* | | | September 30, 2014 | |
INCREASE (DECREASE) IN NET ASSETS FROM | | | | | | | | |
| | |
OPERATIONS | | | | | | | | |
Net investment income (loss) | | $ | (1,475,111 | ) | | $ | 8,944,272 | |
Net realized gain (loss) from investments, forward currency contracts, and foreign currency transactions, net of foreign capital gains taxes paid | | | (164,156,945 | ) | | | (55,956,032 | ) |
Net unrealized appreciation (depreciation) on investments, forward currency contracts, foreign currency translations, and deferred taxes | | | 32,711,483 | | | | 106,193,757 | |
| | | | | | | | |
| | |
Net Increase (Decrease) in Net Assets Resulting from Operations | | | (132,920,573 | ) | | | 59,181,997 | |
| | |
DIVIDENDS TO SHAREHOLDERS | | | | | | | | |
From net investment income | | | | | | | | |
Class I Shares | | | (959,862 | ) | | | (8,251,450 | ) |
Class R5 Shares | | | (2,282 | ) | | | (30,897 | ) |
Class R6 Shares | | | (13,531 | ) | | | (125,833 | ) |
| | |
FUND SHARE TRANSACTIONS (NOTE 4) | | | | | | | | |
Class A Shares | | | (110,051,464 | ) | | | 82,624,988 | |
Class C Shares | | | (5,977,664 | ) | | | 123,568,782 | |
Class I Shares | | | (640,781,297 | ) | | | 1,529,968,464 | |
Class R5 Shares | | | 1,243,989 | | | | 6,846,989 | |
Class R6 Shares | | | 9,287,357 | | | | 7,904,266 | |
| | | | | | | | |
Net Increase (Decrease) in Net Assets | | | (880,175,327 | ) | | | 1,801,687,306 | |
| | |
NET ASSETS | | | | | | | | |
Beginning of Period | | | 3,098,194,142 | | | | 1,296,506,836 | |
| | | | | | | | |
| | |
End of Period | | $ | 2,218,018,815 | | | $ | 3,098,194,142 | |
| | | | | | | | |
Undistributed (distribution in excess of) net investment income | | $ | (2,345,136 | ) | | $ | 975,260 | |
See notes to financial statements.
16 Semi-Annual Report
| | |
| NOTES TO FINANCIAL STATEMENTS | | |
| |
Thornburg Developing World Fund | | March 31, 2015 (Unaudited) |
NOTE 1 – ORGANIZATION
Thornburg Developing World Fund, hereinafter referred to as (the “Fund)” is a diversified series of Thornburg Investment Trust (the “Trust”). The Fund commenced operations on December 16, 2009. The Trust was organized as a Massachusetts business trust under a Declaration of Trust dated June 3, 1987 and is registered as a diversified, open-end management investment company under the Investment Company Act of 1940, as amended. The Fund is currently one of eighteen separate series of the Trust. Each series is considered to be a separate entity for financial reporting and tax purposes and bears expenses directly attributable to it. The Fund seeks long-term capital appreciation.
The Fund currently offers five classes of shares of beneficial interest: Class A, Class C, Institutional Class (“Class I”) and Retirement Classes (“Class R5” and “Class R6”). Each class of shares of the Fund represents an interest in the same portfolio of investments, except that (i) Class A shares are sold subject to a front-end sales charge collected at the time the shares are purchased and bear a service fee, (ii) Class C shares are sold at net asset value without a sales charge at the time of purchase, but are subject to a contingent deferred sales charge upon redemption within one year of purchase, and bear both a service fee and a distribution fee, (iii) Class I and Class R5 shares are sold at net asset value without a sales charge at the time of purchase and may be subject to a service fee, (iv) Class R6 shares are sold at net asset value without a sales charge at the time of purchase, and (v) the respective classes may have different reinvestment privileges and conversion rights. Additionally, the Fund may allocate among its classes certain expenses, to the extent allocable to specific classes, including transfer agent fees, government registration fees, certain printing and postage costs, and administrative and legal expenses. Currently, class specific expenses of the Fund are limited to service and distribution fees, administration fees, and certain registration and transfer agent expenses.
NOTE 2 – SIGNIFICANT ACCOUNTING POLICIES
The following is a summary of significant accounting policies followed by the Fund in the preparation of its financial statements. The Fund is an investment company and prepares its financial statements in conformity with U.S. generally accepted accounting principles (“GAAP”), including the investment company accounting and reporting guidance in the Financial Accounting Standards Board (the “FASB”) Accounting Standard Codification Topic 946. The preparation of financial statements in conformity with GAAP requires management to make estimates and assumptions that affect the reported amounts of assets and liabilities and disclosure of contingent assets and liabilities at the date of the financial statements and the reported amounts of increases (decreases) in net assets from operations during the reporting period. Actual results could differ from those estimates.
Significant accounting policies of the Fund are as follows:
Valuation Policy and Procedures: The Trustees of the Trust (the “Trustees”) have authorized employees of the Fund’s investment advisor, acting as the Valuation and Pricing Committee (the “Committee”), to make certain valuation determinations, subject to oversight and review by the Trustees and the Audit Committee of the Trustees. The Committee and other employees of the Fund’s investment advisor administer and implement the valuation process. The Committee regularly reviews its own fair value decisions, as well as valuations, valuation techniques and services furnished by pricing services, considers circumstances in the markets which may require valuation determinations by the Committee and reviews previous valuation determinations. The Committee also reports on its activities, the performance of the pricing services and other matters to the Trustees and the Audit Committee of the Trustees.
In determining a fair value for a portfolio investment, the Committee seeks to determine the price that the Fund would reasonably expect to receive upon a sale of the investment in an orderly transaction between market participants at the measurement date. Typically, the fair value process employs standing instructions to use quoted prices in active markets or the use of independent pricing services. Less frequently, the Committee may make a fair value determination using other methods. However, because fair value prices are estimated prices, the determination of fair value for an investment may differ from the value that would be realized by the Fund upon a sale of the investment, and that difference could be material to the Fund’s financial statements. The Committee’s determination of fair value for an investment may also differ from the prices obtained by other persons (including other mutual funds) for the investment.
Valuation of Investments: Portfolio investments listed or traded on a national securities exchange are valued on the valuation date at the last reported trade price on the exchange that is the primary market for the investment. Portfolio investments reported by NASDAQ are valued at the NASDAQ official closing price. Portfolio investments traded on an exchange for which there has been no trade that day and other equity investments traded in the over-the-counter market are valued at the mean between the last reported bid and ask prices. Any foreign investment traded on exchanges outside the United States is valued at the price of the investment on the exchange that is normally the investment’s primary market, as of the close of that exchange preceding the time of the Fund’s valuation measurement date.
In any case when the market value of an equity investment held by the Fund is not readily available, a determination of a fair value for the investment is made by the Committee. The Committee’s determinations are made using procedures in accordance with a policy approved by the Trustees, which may include the use of a price obtained from an independent pricing service. The pricing service ordinarily values equity investments in these instances using multi-factor models to adjust market prices based upon various inputs, including exchange data, depositary receipt prices, futures, index data and other data. An investment’s market value is deemed not
Semi-Annual Report 17
| | |
| NOTES TO FINANCIAL STATEMENTS, CONTINUED | | |
| |
Thornburg Developing World Fund | | March 31, 2015 (Unaudited) |
readily available whenever the exchange or market on which the investment is primarily traded is closed for the entire scheduled day of trading. Additionally, an investment’s market value may be deemed not readily available under other circumstances identified by the Trustees, including when developments occurring after the most recent close of the investment’s primary exchange or market, but before the most recent close of trading in Fund shares, or an unusual event or significant period of time occurring since the availability of a market quotation, create a question about the reliability of the investment’s market value. For example, on days when market volatility thresholds pre-determined by the Trustees are exceeded, foreign equity investments held by the Fund may be valued using synthetic pricing obtained from an independent pricing service approved by the Trustees, subject to the ability of the Committee to determine in any such instance to utilize market closing prices if the Committee considers closing prices to be more reliable.
Debt obligations held by the Fund have a primary over-the-counter market and are valued by an independent pricing service approved by the Trustees. The pricing service ordinarily values debt obligations using quoted bid prices and other methods, which include consideration of yields or prices of debt obligations of comparable quality, type of issue, coupon, maturity and rating, and indications as to value from dealers and general market conditions.
In any case when a pricing service fails to provide a price for a debt obligation held by the Fund, the Committee determines a fair value for the debt obligation using procedures in accordance with a policy approved by the Trustees, which may include the use of a price obtained from a different independent pricing service. Additionally, in any case when management believes that a price provided by a pricing service for a debt obligation held by the Fund may be unreliable, the Committee decides whether or not to use the pricing service’s valuation or to use an alternative method to determine a fair value for the debt obligation.
Quotations in foreign currencies for foreign portfolio investments are converted to U.S. dollar equivalents using the foreign exchange quotation in effect at the time of valuation.
Valuation Measurements: The Fund categorizes its investments based upon the inputs used in valuing those investments, according to a three-level hierarchy established by guidance from the FASB. Categorization of investments using this hierarchy is intended by the FASB to maximize the use of observable inputs and minimize the use of unobservable inputs by prioritizing that the most observable input be used when available. Observable inputs are those that market participants would use in valuing an investment based on available market data. Unobservable inputs are those that reflect assumptions about the information market participants would use in valuing an investment. An investment’s level within the hierarchy is based on the lowest level input that is deemed significant to the fair value measurement. The methodologies and relative inputs used to value investments are not necessarily indications of the risk or liquidity associated with investing in those investments.
Various inputs are used in determining the fair value measurement of the Fund’s investments. These inputs are generally summarized according to the three-level hierarchy below:
Level 1: Quoted prices in active markets for identical investments.
Level 2: Other direct or indirect significant observable inputs (including quoted prices for similar investments in active markets and other observable inputs, such as interest rates, prepayment rates, credit risk, etc.).
When market volatility thresholds are exceeded, foreign equity investments may be fair valued according to other significant observable inputs rather than quoted market prices. The affected investments will be characterized as Level 2 within the valuation hierarchy and revert to Level 1 after the threshold is no longer exceeded.
Level 3: Significant unobservable inputs (including the Committee’s own assumptions in determining the fair value of investments).
Portfolio investments with minimal, if any, market activity are characterized as Level 3 and are valued using significant unobservable inputs, typically including single broker quotes, which may be adjusted or unadjusted, related or comparable investments, last available transactions, and other relevant information. Valuations may also be based upon current market prices of securities that are comparable in coupon, rating, maturity and industry. An income based valuation approach would consider discounted anticipated future cash flows of the investment. Discounts may also be applied due to the nature or duration of any restrictions on the disposition of the investment. Valuations based upon the use of inputs from Levels 1, 2, or 3, may not represent the actual price received upon the disposition of an investment, and the Fund may receive a price that is lower than the valuation when it sells the investment.
The following table displays a summary of the fair value hierarchy measurements of the Fund’s investments as of March 31, 2015. In any instance when valuation inputs from more than one level are used to determine the fair value of a specific investment, the investment is placed in the level of the table based upon the lowest level input that is significant in determining the fair value of the investment:
18 Semi-Annual Report
| | |
| NOTES TO FINANCIAL STATEMENTS, CONTINUED | | |
| |
Thornburg Developing World Fund | | March 31, 2015 (Unaudited) |
| | | | | | | | | | | | | | | | |
| | | Fair Value Measurements at March 31, 2015 | |
| | | Total | | | Level 1 | | | Level 2 | | | Level 3 | |
Assets | | | | | | | | | | | | | | | | |
Investments in Securities* | | | | | | | | | | | | | | | | |
Common Stock | | $ | 2,049,715,285 | | | $ | 1,924,664,153 | | | $ | 125,051,132 | | | $ | — | |
Exchange–Traded Funds | | | 15,450,050 | | | | 15,450,050 | | | | — | | | | — | |
Short Term Investments | | | 92,750,000 | | | | — | | | | 92,750,000 | | | | — | |
| | | | | | | | | | | | | | | | |
Total Investments in Securities | | $ | 2,157,915,335 | | | $ | 1,940,114,203 | | | $ | 217,801,132 | | | $ | — | |
Other Financial Instruments** | | | | | | | | | | | | | | | | |
Forward Currency Contracts | | $ | 5,421,245 | | | $ | — | | | $ | 5,421,245 | | | $ | — | |
| | | | |
Liabilities | | | | | | | | | | | | | | | | |
Other Financial Instruments** | | | | | | | | | | | | | | | | |
Forward Currency Contracts | | $ | (1,362,063 | ) | | $ | — | | | $ | (1,362,063 | ) | | $ | — | |
Spot Currency | | $ | (51,699 | ) | | $ | (51,699 | ) | | $ | — | | | $ | — | |
| * | See Schedule of Investments for a summary of the industry exposure as grouped according to the Global Industry Classification Standard (GICS), which is an industry taxonomy developed by MSCI, Inc. and Standard & Poor’s (S&P). |
| ** | Other Financial Instruments include investments not reflected in the Schedule of Investments, which may include futures, forwards and swap contracts, which are valued at the unrealized appreciation (depreciation) on the investment. |
In accordance with the guidance prescribed in Accounting Standards Update No. 2011-04, it is the policy of the Fund to recognize transfers between levels and the underlying events which caused the movement. The Fund recognized no transfers between levels for the six months ended March 31, 2015, other than when the Fund exceeded market volatility thresholds for foreign equity investments during the period.
Foreign Currency Translation: Portfolio investments and other assets and liabilities denominated in foreign currencies are translated into U.S. dollars based on the exchange rate of such currencies against the U.S. dollar on the date of valuation. Purchases and sales of investments and income items denominated in foreign currencies are translated into U.S. dollars at the exchange rate in effect on the transaction date. When the Fund purchases or sells foreign investments, it will customarily enter into a foreign exchange contract to minimize foreign exchange risk from the trade date to the settlement date of such transactions. The values of such spot contracts are included in receivable for investments sold and payable for investments purchased on the Statement of Assets and Liabilities.
The Fund does not separately report the effect of changes in foreign exchange rates from changes in market prices on investments held. Such changes are included in net unrealized appreciation or depreciation from investments.
Reported net realized gains or losses from foreign currency transactions arise due to purchases and sales of foreign currencies, currency gains or losses realized between the trade and settlement dates on investment transactions and the difference between the amounts of dividends, interest, and foreign withholding taxes recorded on the Fund’s books, and the U.S. dollar equivalent of the amounts actually received or paid.
Net change in unrealized appreciation and depreciation on foreign currency translations arise from changes in the fair value of assets and liabilities, other than investments at fiscal period end, resulting from changes in exchange rates.
Foreign Withholding Taxes: The Fund is subject to foreign tax withholding imposed by certain foreign countries in which the Fund may invest. Withholding taxes are incurred on certain foreign dividends and are accrued at the time the dividend is recognized based on applicable foreign tax law. The Fund files withholding tax reclaims in certain jurisdictions to recover a portion of amounts previously withheld, in view of various considerations, including recent decisions rendered by the courts in those and other jurisdictions. The Fund would expect to record a receivable for such a reclaim based on a variety of factors, including assessments of a jurisdiction’s legal obligation to pay reclaims, the jurisdiction’s administrative practices and payment history, and industry convention. To date the Fund has recorded no such receivable because there is no precedent for collecting such prior year reclaims and the likelihood of collection remains uncertain.
Deferred Foreign Capital Gain Taxes: The Fund is subject to a tax imposed on net realized gains of securities of certain foreign countries. The Fund records an estimated deferred tax liability for net unrealized gains on these investments as reflected in the accompanying financial statements.
Federal Income Taxes: It is the policy of the Trust to comply with the provisions of the Internal Revenue Code applicable to “regulated investment companies” and to distribute to shareholders substantially all taxable income, including any net realized gain on investments of the Fund. Therefore, no provision for federal income taxes is required.
Semi-Annual Report 19
| | |
| NOTES TO FINANCIAL STATEMENTS, CONTINUED | | |
| |
Thornburg Developing World Fund | | March 31, 2015 (Unaudited) |
Management reviews each uncertain tax position believed to be material to the preparation of the Fund’s financial statements, to assess if it is more likely than not that the position would be sustained upon examination, based upon the technical merits of the position. As of March 31, 2015, management has not identified any such position for which an asset or liability must be reflected in the Statement of Assets and Liabilities. The Fund’s tax returns remain subject to examination for three years after filing.
When-Issued and Delayed Delivery Transactions: The Fund may engage in when-issued or delayed delivery transactions. To the extent the Fund engages in such transactions, it will do so for the purpose of acquiring portfolio investments consistent with the Fund’s investment objectives and not for the purpose of investment leverage or to speculate on interest rate and/or market changes. At the time the Fund makes a commitment to purchase an investment on a when-issued or delayed delivery basis, the Fund will record the transaction and reflect the value in determining its net asset value. When effecting such transactions, assets of an amount sufficient to make payment for the portfolio investments to be purchased will be segregated on the Fund’s records on the trade date. Investments purchased on a when-issued or delayed delivery basis do not earn interest until the settlement date.
Dividends: Dividends to shareholders, if any, are generally paid quarterly and are reinvested in additional shares of the Fund at net asset value per share at the close of business on the dividend payment date or, at the shareholder’s option, paid in cash. Net realized capital gains, to the extent available, will be distributed at least annually. Distributions to shareholders are based on income tax regulations and therefore, their characteristics may differ for financial statement and tax purposes.
Repurchase Agreements: The Fund may invest excess cash in repurchase agreements whereby the Fund purchases investments, which serve as collateral, with an agreement to resell such collateral to the seller at an agreed upon price at the maturity date of the repurchase agreement. Investments pledged as collateral for repurchase agreements are held in custody until maturity of the repurchase agreement. Provisions in the agreements require that the market value of the collateral is at least equal to the repurchase value in the event of default. In the event of default, the Fund has the right to liquidate the collateral and apply the proceeds in satisfaction of the obligation. Under certain circumstances, in the event of default or bankruptcy by the other party to the agreement, realization and/or retention of the collateral may be subject to legal proceedings.
General: Investment transactions are accounted for on a trade date basis. Interest income is accrued as earned and dividend income is recorded on the ex-dividend date. Certain income from foreign investments is recognized as soon as information is available to the Fund. Realized gains and losses from the sale of investments are recorded on an identified cost basis. Net investment income (other than class specific expenses) and realized and unrealized gains and losses are allocated daily to each class of shares based upon the relative net asset value of outstanding shares of each class of shares at the beginning of the day (after adjusting for the current share activity of the respective class). Expenses common to all Funds are allocated among the Funds comprising the Trust based upon their relative net asset values or other appropriate allocation methods.
Guarantees and Indemnifications: Under the Trust’s organizational documents (and under separate agreements with the independent Trustees), its officers and Trustees are indemnified against certain liabilities arising out of the performance of their duties to the Fund. Additionally, in the normal course of business the Trust enters into contracts with service providers that contain general indemnification clauses. The Trust’s maximum exposure under these arrangements is unknown. However, based on experience, the Trust expects the risk of loss to be remote.
NOTE 3 – INVESTMENT ADVISORY FEE AND OTHER TRANSACTIONS WITH AFFILIATES
Pursuant to an investment advisory agreement, Thornburg Investment Management, Inc. (the “Advisor”) serves as the investment advisor and performs services for the Fund for which the fees are payable at the end of each month. For the six months ended March 31, 2015, these fees were payable at annual rates ranging from .975 of 1% to .775 of 1% per annum of the average daily net assets of the Fund depending on the Fund’s asset size. The Trust also has entered into administrative services agreements with the Advisor, whereby the Advisor will perform certain administrative services for the shareholders of each class of the Fund’s shares (except for Class R6 shares, which do not have an administrative services agreement) and for which fees will be payable at an annual rate of up to .125 of 1% per annum of the average daily net assets attributable to each class of shares.
The Trust has an underwriting agreement with Thornburg Securities Corporation (the “Distributor,” an affiliate of the Advisor), which acts as the distributor of the Fund’s shares. For the six months ended March 31, 2015, the Distributor has advised the Fund that it earned commissions aggregating $28,646 from the sale of Class A shares, and collected contingent deferred sales charges aggregating $57,216 from redemptions of Class C shares of the Fund.
Pursuant to a service plan under Rule 12b-1 of the Investment Company Act of 1940, the Fund may reimburse to the Advisor an amount not to exceed .25 of 1% per annum of the average daily net assets attributable to each class of shares of the Fund (except for Class R6 shares, which do not have a Rule 12b-1 service plan) for payments made by the Advisor to securities dealers and other financial institutions to obtain various shareholder and distribution related services. For the six months ended March 31, 2015, there were no
20 Semi-Annual Report
| | |
| NOTES TO FINANCIAL STATEMENTS, CONTINUED | | |
| |
Thornburg Developing World Fund | | March 31, 2015 (Unaudited) |
12b-1 service plan fees charged for Class I shares. The Advisor may pay out of its own resources additional expenses for distribution of the Fund’s shares and shareholder services.
The Trust has also adopted a distribution plan pursuant to Rule 12b-1, applicable only to the Fund’s Class C shares under which the Fund compensates the Distributor for services in promoting the sale of Class C shares of the Fund at an annual rate of up to .75 of 1% per annum of the average daily net assets attributable to Class C shares. Total fees incurred by each class of shares of the Fund under their respective service and distribution plans for the six months ended March 31, 2015, are set forth in the Statement of Operations.
The Advisor and Distributor have contractually agreed to waive fees and reimburse expenses incurred by the Fund so that actual expenses of certain share classes do not exceed levels as specified in the Fund’s most recent prospectuses. The agreement may be terminated by the Fund at any time, but may not be terminated by the Advisor or Distributor before February 1, 2016, unless the Advisor ceases to be the investment advisor to the Fund or the Distributor ceases to be the distributor of the Fund prior to that date. The Advisor and Distributor retain the right to be repaid by the Fund for fee waivers and expense reimbursements if expenses fall below the contractual limit prior to the end of the fiscal year.
For the six months ended March 31, 2015, the Advisor contractually reimbursed certain class specific expenses, administrative fees, and distribution fees of $237,654 for Class I shares, $16,027 for Class R5 shares, and $8,366 for Class R6 shares.
The Trust has an agreement with the custodian bank to indirectly pay a portion of the custodian’s fees through credits earned by the Fund’s cash on deposit with the bank. This deposit agreement is an alternative to overnight investments. Custodial fees are adjusted to reflect amounts that would have been paid without this agreement, with a corresponding adjustment reflected as fees paid indirectly in the Statement of Operations. For the six months ended March 31, 2015, fees paid indirectly were $1,715.
Certain officers and Trustees of the Trust are also officers or directors of the Advisor and Distributor. The compensation of independent Trustees is borne by the Trust.
NOTE 4 – SHARES OF BENEFICIAL INTEREST
At March 31, 2015, there were an unlimited number of shares with no par value of beneficial interest authorized. Transactions in shares of beneficial interest were as follows:
| | | | | | | | | | | | | | | | |
| | | Six Months Ended | | | Year Ended | |
| | | March 31, 2015 (Unaudited) | | | September 30, 2014 (Audited) | |
| | | Shares | | | Amount | | | Shares | | | Amount | |
Class A Shares | | | | | | | | | | | | | | | | |
Shares sold | | | 3,889,089 | | | $ | 71,147,935 | | | | 26,633,924 | | | $ | 496,153,221 | |
Shares issued to shareholders in reinvestment of dividends | | | — | | | | — | | | | — | | | | — | |
Shares repurchased | | | (9,858,631 | ) | | | (181,199,399 | ) | | | (21,504,634 | ) | | | (413,528,233 | ) |
| | | | | | | | | | | | | | | | |
| | | | |
Net increase (decrease) | | | (5,969,542 | ) | | $ | (110,051,464 | ) | | | 5,129,290 | | | $ | 82,624,988 | |
| | | | | | | | | | | | | | | | |
| | | | |
Class C Shares | | | | | | | | | | | | | | | | |
Shares sold | | | 1,847,748 | | | $ | 32,683,124 | | | | 8,033,799 | | | $ | 146,627,479 | |
Shares issued to shareholders in reinvestment of dividends | | | — | | | | — | | | | — | | | | — | |
Shares repurchased | | | (2,211,086 | ) | | | (38,660,788 | ) | | | (1,261,929 | ) | | | (23,058,697 | ) |
| | | | | | | | | | | | | | | | |
| | | | |
Net increase (decrease) | | | (363,338 | ) | | $ | (5,977,664 | ) | | | 6,771,870 | | | $ | 123,568,782 | |
| | | | | | | | | | | | | | | | |
| | | | |
Class I Shares | | | | | | | | | | | | | | | | |
Shares sold | | | 42,271,970 | | | $ | 787,703,086 | | | | 97,016,008 | | | $ | 1,859,284,051 | |
Shares issued to shareholders in reinvestment of dividends | | | 46,850 | | | | 866,255 | | | | 380,810 | | | | 7,330,398 | |
Shares repurchased | | | (77,758,735 | ) | | | (1,429,350,638 | ) | | | (17,664,136 | ) | | | (336,645,985 | ) |
| | | | | | | | | | | | | | | | |
| | | | |
Net increase (decrease) | | | (35,439,915 | ) | | $ | (640,781,297 | ) | | | 79,732,682 | | | $ | 1,529,968,464 | |
| | | | | | | | | | | | | | | | |
Semi-Annual Report 21
| | |
| NOTES TO FINANCIAL STATEMENTS, CONTINUED | | |
| |
Thornburg Developing World Fund | | March 31, 2015 (Unaudited) |
| | | | | | | | | | | | | | | | |
| | | Six Months Ended | | | Year Ended | |
| | | March 31, 2015 (Unaudited) | | | September 30, 2014 (Audited) | |
| | | Shares | | | Amount | | | Shares | | | Amount | |
| | | | |
Class R5 Shares | | | | | | | | | | | | | | | | |
Shares sold | | | 158,429 | | | $ | 2,927,778 | | | | 404,809 | | | $ | 7,802,660 | |
Shares issued to shareholders in reinvestment of dividends | | | 124 | | | | 2,282 | | | | 1,613 | | | | 30,897 | |
Shares repurchased | | | (91,786 | ) | | | (1,686,071 | ) | | | (51,015 | ) | | | (986,568 | ) |
| | | | | | | | | | | | | | | | |
| | | | |
Net increase (decrease) | | | 66,767 | | | $ | 1,243,989 | | | | 355,407 | | | $ | 6,846,989 | |
| | | | | | | | | | | | | | | | |
| | | | |
Class R6 Shares | | | | | | | | | | | | | | | | |
Shares sold | | | 721,756 | | | $ | 13,419,511 | | | | 941,731 | | | $ | 18,097,326 | |
Shares issued to shareholders in reinvestment of dividends | | | 562 | | | | 10,387 | | | | 4,651 | | | | 89,174 | |
Shares repurchased | | | (224,188 | ) | | | (4,142,541 | ) | | | (542,356 | ) | | | (10,282,234 | ) |
| | | | | | | | | | | | | | | | |
| | | | |
Net increase (decrease) | | | 498,130 | | | $ | 9,287,357 | | | | 404,026 | | | $ | 7,904,266 | |
| | | | | | | | | | | | | | | | |
NOTE 5 – INVESTMENT TRANSACTIONS
For the six months ended March 31, 2015, the Fund had purchase and sale transactions of investments (excluding short-term investments) of $1,254,919,003 and $1,946,168,308, respectively.
NOTE 6 – INCOME TAXES
At March 31, 2015, information on the tax components of capital was as follows:
| | | | |
Cost of investments for tax purposes | | $ | 1,962,885,999 | |
| | | | |
Gross unrealized appreciation on a tax basis | | $ | 309,855,769 | |
Gross unrealized depreciation on a tax basis | | | (114,826,433 | ) |
| | | | |
Net unrealized appreciation (depreciation) on investments (tax basis) | | $ | 195,029,336 | |
| | | | |
At March 31, 2015, the Fund had deferred tax basis capital losses occurring subsequent to October 31, 2013 of $42,072,586. For tax purposes, such losses will be reflected in the year ending September 30, 2015.
At March 31, 2015, the Fund had cumulative tax basis capital losses of $12,743,545, (of which $12,743,545 is short-term and $0 is long-term) generated after September 30, 2011, which may be carried forward to offset future capital gains. To the extent such carryforwards are used, capital gain distributions may be reduced to the extent provided by regulations. Such capital loss carryforwards do not expire.
NOTE 7 – DERIVATIVE FINANCIAL INSTRUMENTS WITH OFF-BALANCE SHEET RISK AND FOREIGN INVESTMENT RISK
The Fund may use a variety of derivative financial instruments to hedge or adjust the risks affecting its investment portfolio or to enhance investment returns. Provisions of FASB Accounting Standards Codification 815-10-50 (“ASC 815”), require certain disclosures. The disclosures are intended to provide users of financial statements with an understanding of the use of derivative instruments by the Fund and how these derivatives affect the financial position, financial performance and cash flows of the Fund. The Fund does not designate any derivative instruments as hedging instruments under ASC 815. During the six months ended March 31, 2015, the Fund’s principal exposure to derivative financial instruments of the type addressed by ASC 815 was investment in foreign exchange contracts. A foreign exchange contract is an agreement between two parties to exchange different currencies at a specified rate of exchange at an agreed upon future date. Foreign exchange contracts involve risks to the Fund, including the risk that a contract’s counterparty will not meet its obligations to the Fund, the risk that a change in a contract’s value may not correlate perfectly with the currency the contract was intended to track, and the risk that the advisor is unable to correctly implement its strategy in using a contract. In any such instance, the Fund may not achieve the intended benefit of entering into a contract, and may experience a loss. Additionally, the Fund’s risk of loss may exceed the amounts recognized on the Statement of Assets and Liabilities.
22 Semi-Annual Report
| | |
| NOTES TO FINANCIAL STATEMENTS, CONTINUED | | |
| |
Thornburg Developing World Fund | | March 31, 2015 (Unaudited) |
The Fund entered into forward currency contracts during the six months ended March 31, 2015 in the normal course of pursuing its investment objectives, with the objective of reducing the risk to the value of the Fund’s foreign investments from adverse changes in the relationship between the U.S. dollar and foreign currencies. In each case these contracts have been initiated in conjunction with foreign investment transactions.
These contracts are accounted for by the Fund under ASC 815. Unrealized appreciation and depreciation on outstanding contracts are reported in the Fund’s Statement of Assets and Liabilities, as measured by the difference between the forward exchange rates at the reporting date and the forward exchange rates at each contract’s inception date. Net realized gain (loss) on contracts closed during the period, and changes in net unrealized appreciation (depreciation) on outstanding contracts are recognized in the Fund’s Statement of Operations. The average value of open sell currency contracts for the six months ended March 31, 2015 was $94,700,838. Open buy currency contracts are entered into for the purpose of closing open sell currency contracts and the values are dependent upon the values of the open sell currency contracts to which they relate.
The following table displays the outstanding forward currency contracts at March 31, 2015:
| | | | | | | | | | | | | | | | | | | | | | | | |
| | | Outstanding Forward Currency Contracts to Buy or Sell at March 31, 2015 | |
Contract Description | | Buy/Sell | | | Contract
Amount | | | Contract
Value Date | | | Value USD | | | Unrealized
Appreciation | | | Unrealized
Depreciation | |
Euro | | | Sell | | | | 51,947,400 | | | | 7/31/2015 | | | | 55,937,465 | | | $ | 5,421,245 | | | $ | — | |
Euro | | | Buy | | | | 1,825,400 | | | | 7/31/2015 | | | | 1,965,608 | | | | — | | | | (29,172 | ) |
Euro | | | Buy | | | | 2,849,400 | | | | 7/31/2015 | | | | 3,068,262 | | | | — | | | | (92,008 | ) |
Euro | | | Buy | | | | 2,448,200 | | | | 7/31/2015 | | | | 2,636,246 | | | | — | | | | (114,772 | ) |
Euro | | | Buy | | | | 8,294,200 | | | | 7/31/2015 | | | | 8,931,275 | | | | — | | | | (504,207 | ) |
Euro | | | Buy | | | | 10,494,100 | | | | 7/31/2015 | | | | 11,300,149 | | | | — | | | | (621,904 | ) |
| | | | | | | | | | | | | | | | | | | | | | | | |
Total | | | | | | | | | | | | | | | | | | $ | 5,421,245 | | | $ | (1,362,063 | ) |
| | | | | | | | | | | | | | | | | | | | | | | | |
Net unrealized appreciation (depreciation) | | | | | | | | | | | $ | 4,059,182 | | | | | |
| | | | | | | | | | | | | | | | | | | | | | | | |
Certain forward currency contracts were entered into with State Street Bank and Trust Company (“SSB”) pursuant to an International Swaps and Derivatives Association (“ISDA”) Master Agreement. In the event of a default or termination under the ISDA Master Agreement with SSB, the non-defaulting party has the right to close out all outstanding forward currency contracts between the parties and to net any payment amounts under those contracts, resulting in a single net amount payable by one party to the other. Because the ISDA Master Agreement with SSB does not result in an offset of reported amounts of financial assets and financial liabilities in the Fund’s Statement of Assets and Liabilities unless there has been an event of default or termination event under that agreement, the Fund does not net its outstanding forward currency contracts for purposes of the disclosure in the Fund’s Statement of Assets and Liabilities. Instead the Fund recognizes the unrealized appreciation or depreciation on those forward currency contracts on a gross basis in the Fund’s Statement of Assets and Liabilities. At March 31, 2015, those recognized amounts are disclosed in the following table:
| | | | | | |
Fair Values of Derivative Financial Instruments at March 31, 2015 | |
| Asset Derivatives | | Balance Sheet Location | | Fair Value | |
Foreign exchange contracts | | Assets - Unrealized appreciation on forward currency contracts | | $ | 5,421,245 | |
| | |
| Liability Derivatives | | Balance Sheet Location | | Fair Value | |
Foreign exchange contracts | | Liabilities - Unrealized depreciation on forward currency contracts | | $ | (1,362,063 | ) |
Because the Fund does not currently receive or post cash collateral in connection with its currency forward contracts, and because all of the Fund’s outstanding currency forward contracts are with State Street Bank and Trust Company, the net amounts of the Fund’s assets and liabilities which are attributable to those contracts at March 31, 2015 can be determined by offsetting the dollar amounts shown in the preceding table. Based on those amounts, the net amount of the Fund’s assets which is attributable to its outstanding forward currency contracts at March 31, 2015 is $4,059,182, and the net amount of the Fund’s liabilities which is attributable to those contracts at that date is $0. The Fund’s forward currency contracts are valued each day, and the net amounts of the Fund’s assets and liabilities which are attributable to those contracts are expected to vary over time.
Semi-Annual Report 23
| | |
| NOTES TO FINANCIAL STATEMENTS, CONTINUED | | |
| |
Thornburg Developing World Fund | | March 31, 2015 (Unaudited) |
The net realized gain (loss) from forward currency contracts, and the net change in unrealized appreciation (depreciation) on outstanding forward currency contracts recognized in the Fund’s Statement of Operations for the six months ended March 31, 2015 are disclosed in the following tables:
| | | | | | | | | | |
| Net Realized Gain (loss) from Derivative Financial Instruments | |
Recognized in Income for the Six Months Ended March 31, 2015 | |
| | | Total | | | | | Forward Currency Contracts | |
Foreign exchange contracts | | $ | 14,995,898 | | | | | $ | 14,995,898 | |
|
| Net Change in Unrealized Appreciation (depreciation) on Derivative Financial Instruments | |
Recognized in Income for the Six Months Ended March 31, 2015 | |
| | | Total | | | | | Forward Currency Contracts | |
Foreign exchange contracts | | $ | (5,857,799 | ) | | | | $ | (5,857,799 | ) |
OTHER NOTES
Risks: The Fund’s investments subject it to risks including, but not limited to, management risk, market and economic risk, risks affecting specific issuers, liquidity risk, the risks associated with investments in small- and mid-cap companies and non-U.S. issuers (including developing country issuers), credit risk, and interest rate risk. Please see the Fund’s prospectus for a discussion of the risks associated with an investment in the Fund.
Subsequent Events: Fund management believes no events have occurred between March 31, 2015 and the date of issuance of the financial statements that require adjustment to or disclosure in the accompanying financial statements.
24 Semi-Annual Report
This page intentionally left blank.
Semi-Annual Report 25
FINANCIAL HIGHLIGHTS
Thornburg Developing World Fund
| | | | | | | | | | | | | | | | | | | | | | | | | | | | | | | | | | | | | | | | | | | | | | | | |
| | | PER SHARE PERFORMANCE (for a share outstanding throughout the period)+ | | RATIOS TO AVERAGE NET ASSETS | | | SUPPLEMENTAL DATA | |
Unless
Otherwise
Noted,
Periods
are
Fiscal
Years
Ended
Sept. 30, | | Net Asset
Value
Beginning
of Period | | | Net
Investment
Income
(Loss) | | Net
Realized
&
Unrealized
Gain (Loss)
on
Investments | | | Total from
Investment
Operations | | Dividends
from Net
Investment
Income | | | Dividends
from Net
Realized
Gains | | Total
Dividends | | | Net
Asset
Value
End
of
Period | | Net
Investment
Income
(Loss)
(%) | | | Expenses,
After
Expense
Reductions
(%) | | | Expenses,
After
Expense
Reductions
and Net of
Custody
Credits
(%) | | | Expenses,
Before
Expense
Reductions
(%) | | | Total
Return
(%)(a) | | Portfolio
Turnover
Rate
(%)(a) | | Net
Assets
at End
of
Period
(Thousands) | |
Class A Shares | | | | | | | | | | | | | | | | | | | | | | | | | | | | | | | | | | | | | | | |
2015(b)(c) | | $ | 18.61 | | | (0.04) | | | (0.79 | ) | | (0.83) | | | — | | | — | | | — | | | $17.78 | | | (0.39 | )(d) | | | 1.46 | (d) | | | 1.46 | (d) | | | 1.46 | (d) | | (4.46) | | 45.70 | | $ | 332,315 | |
2014(c) | | $ | 17.77 | | | 0.03 | | | 0.81 | | | 0.84 | | | — | | | — | | | — | | | $18.61 | | | 0.15 | | | | 1.45 | | | | 1.45 | | | | 1.45 | | | 4.73 | | 61.46 | | $ | 459,121 | |
2013(c) | | $ | 15.71 | | | 0.01 | | | 2.06 | | | 2.07 | | | (0.01 | ) | | — | | | (0.01 | ) | | $17.77 | | | 0.05 | | | | 1.48 | | | | 1.48 | | | | 1.59 | | | 13.19 | | 61.67 | | $ | 347,073 | |
2012(c) | | $ | 12.50 | | | (0.01) | | | 3.22 | | | 3.21 | | | — | | | — | | | — | | | $15.71 | | | (0.05 | ) | | | 1.69 | | | | 1.69 | | | | 1.85 | | | 25.68 | | 129.49 | | $ | 39,390 | |
2011(c) | | $ | 14.44 | | | (0.01) | | | (1.91 | ) | | (1.92) | | | (0.02 | ) | | — | | | (0.02 | ) | | $12.50 | | | (0.05 | ) | | | 1.63 | | | | 1.62 | | | | 1.89 | | | (13.34) | | 129.15 | | $ | 24,929 | |
2010(c)(e) | | $ | 11.94 | | | 0.06 | | | 2.44 | | | 2.50 | | | — | | | — | | | — | | | $14.44 | | | 0.55 | (d) | | | 1.83 | (d) | | | 1.82 | (d) | | | 3.30 | (d) | | 20.94 | | 47.37 | | $ | 14,116 | |
Class C Shares | | | | | | | | | | | | | | | | | | | | | | | | | | | | | | | | | | | | | | | |
2015(b) | | $ | 18.03 | | | (0.10) | | | (0.77 | ) | | (0.87) | | | — | | | — | | | — | | | $17.16 | | | (1.10 | )(d) | | | 2.19 | (d) | | | 2.19 | (d) | | | 2.19 | (d) | | (4.83) | | 45.70 | | $ | 214,972 | |
2014 | | $ | 17.34 | | | (0.11) | | | 0.80 | | | 0.69 | | | — | | | — | | | — | | | $18.03 | | | (0.62 | ) | | | 2.23 | | | | 2.23 | | | | 2.23 | | | 3.98 | | 61.46 | | $ | 232,493 | |
2013 | | $ | 15.44 | | | (0.12) | | | 2.02 | | | 1.90 | | | — | | | — | | | — | | | $17.34 | | | (0.71 | ) | | | 2.26 | | | | 2.26 | | | | 2.40 | | | 12.31 | | 61.67 | | $ | 106,168 | |
2012 | | $ | 12.37 | | | (0.11) | | | 3.18 | | | 3.07 | | | — | | | — | | | — | | | $15.44 | | | (0.76 | ) | | | 2.38 | | | | 2.38 | | | | 2.86 | | | 24.82 | | 129.49 | | $ | 10,006 | |
2011 | | $ | 14.39 | | | (0.11) | | | (1.90 | ) | | (2.01) | | | (0.01 | ) | | — | | | (0.01 | ) | | $12.37 | | | (0.74 | ) | | | 2.34 | | | | 2.34 | | | | 2.89 | | | (13.96) | | 129.15 | | $ | 7,258 | |
2010(e) | | $ | 11.94 | | | (0.01) | | | 2.46 | | | 2.45 | | | — | | | — | | | — | | | $14.39 | | | (0.11 | )(d) | | | 2.39 | (d) | | | 2.38 | (d) | | | 6.89 | (d) | | 20.52 | | 47.37 | | $ | 2,889 | |
Class I Shares | | | | | | | | | | | | | | | | | | | | | | | | | | | | | | | | | | | | | | | |
2015(b) | | $ | 18.92 | | | — (f) | | | (0.81 | ) | | (0.81) | | | (0.01 | ) | | — | | | (0.01 | ) | | $18.10 | | | 0.04 | (d) | | | 1.06 | (d) | | | 1.06 | (d) | | | 1.08 | (d) | | (4.30) | | 45.70 | | $ | 1,631,662 | |
2014 | | $ | 18.05 | | | 0.10 | | | 0.84 | | | 0.94 | | | (0.07 | ) | | — | | | (0.07 | ) | | $18.92 | | | 0.54 | | | | 1.09 | | | | 1.09 | | | | 1.09 | | | 5.20 | | 61.46 | | $ | 2,376,420 | |
2013 | | $ | 15.96 | | | 0.09 | | | 2.09 | | | 2.18 | | | (0.09 | ) | | — | | | (0.09 | ) | | $18.05 | | | 0.52 | | | | 1.04 | | | | 1.04 | | | | 1.22 | | | 13.74 | | 61.67 | | $ | 828,147 | |
2012 | | $ | 12.62 | | | 0.08 | | | 3.26 | | | 3.34 | | | — | | | — | | | — | | | $15.96 | | | 0.57 | | | | 1.09 | | | | 1.09 | | | | 1.45 | | | 26.47 | | 129.49 | | $ | 53,103 | |
2011 | | $ | 14.52 | | | 0.09 | | | (1.96 | ) | | (1.87) | | | (0.03 | ) | | — | | | (0.03 | ) | | $12.62 | | | 0.55 | | | | 1.04 | | | | 1.04 | | | | 1.47 | | | (12.89) | | 129.15 | | $ | 27,019 | |
2010(e) | | $ | 11.94 | | | 0.11 | | | 2.47 | | | 2.58 | | | — | | | — | | | — | | | $14.52 | | | 1.09 | (d) | | | 1.10 | (d) | | | 1.09 | (d) | | | 2.63 | (d) | | 21.61 | | 47.37 | | $ | 17,581 | |
Class R5 Shares | | | | | | | | | | | | | | | | | | | | | | | | | | | | | | | | | | | | | | | |
2015(b) | | $ | 18.86 | | | — (f) | | | (0.81 | ) | | (0.81) | | | (0.01 | ) | | — | | | (0.01 | ) | | $18.04 | | | 0.02 | (d) | | | 1.09 | (d) | | | 1.09 | (d) | | | 1.48 | (d) | | (4.32) | | 45.70 | | $ | 8,314 | |
2014 | | $ | 18.04 | | | 0.13 | | | 0.80 | | | 0.93 | | | (0.11 | ) | | — | | | (0.11 | ) | | $18.86 | | | 0.67 | | | | 1.09 | | | | 1.09 | | | | 1.90 | | | 5.17 | | 61.46 | | $ | 7,433 | |
2013(g) | | $ | 17.49 | | | 0.08 | | | 0.47 | | | 0.55 | | | — | | | — | | | — | | | $18.04 | | | 0.47 | (d) | | | 1.07 | (d) | | | 1.07 | (d) | | | 17.45 | (d)(h) | | 3.14 | | 61.67 | | $ | 697 | |
Class R6 Shares | | | | | | | | | | | | | | | | | | | | | | | | | | | | | | | | | | | | | | | |
2015(b) | | $ | 18.91 | | | 0.01 | | | (0.81 | ) | | (0.80) | | | (0.01 | ) | | — | | | (0.01 | ) | | $18.10 | | | 0.15 | (d) | | | 0.99 | (d) | | | 0.99 | (d) | | | 1.05 | (d) | | (4.23) | | 45.70 | | $ | 30,756 | |
2014 | | $ | 18.08 | | | 0.11 | | | 0.84 | | | 0.95 | | | (0.12 | ) | | — | | | (0.12 | ) | | $18.91 | | | 0.57 | | | | 0.99 | | | | 0.99 | | | | 1.10 | | | 5.26 | | 61.46 | | $ | 22,727 | |
2013(g) | | $ | 17.51 | | | 0.04 | | | 0.53 | | | 0.57 | | | — | | | — | | | — | | | $18.08 | | | 0.20 | (d) | | | 0.98 | (d) | | | 0.98 | (d) | | | 1.99 | (d) | | 3.26 | | 61.67 | | $ | 14,422 | |
| (a) | Not annualized for periods less than one year. |
| (b) | Unaudited Six Month Period Ended March 31. |
| (c) | Sales loads are not reflected in computing total return. |
| (e) | Fund commenced operations on December 16, 2009. |
| (f) | Net Investment Income (Loss) was less than $0.01 per share. |
| (g) | Effective date of this class of shares was February 1, 2013. |
| (h) | Due to the size of net assets and fixed expenses, ratios may appear disproportionate. |
| + | Based on weighted average shares outstanding, except for Dividends from Net Investment Income and Net Realized Gains, which are actual amounts per share. |
See notes to financial statements.
| | | | |
| 26 Semi-Annual Report | | | | Semi-Annual Report 27 |
| | |
| EXPENSE EXAMPLE | | |
| |
Thornburg Developing World Fund | | March 31, 2015 (Unaudited) |
As a shareholder of the Fund, you incur two types of costs:
| | (1) | transaction costs, including |
(a) sales charges (loads) on purchase payments, for Class A shares;
(b) a deferred sales charge on redemptions of any part or all of a purchase of $1 million of Class A shares within 12 months of purchase;
(c) a deferred sales charge on redemptions of Class C shares within 12 months of purchase;
| | (2) | ongoing costs, including management fees; distribution and/or service (12b-1) fees; and other Fund expenses. |
This example is intended to help you understand your ongoing costs (in dollars) of investing in the Fund and to compare these costs with the ongoing costs of investing in other mutual funds.
The example is based on a $1,000 investment beginning on October 1, 2014, and held until March 31, 2015.
ACTUAL EXPENSES
For each class of shares, the first line of the accompanying table provides information about actual account values and actual expenses. You may use the information in this line, together with the amount you invested, to estimate the expenses that you paid over the period. Simply divide your account value by $1,000 (for example, an $8,600 account value divided by $1,000 = 8.6), then multiply the result by the number in the first line for your class of shares under the heading entitled “Expenses Paid During Period” to estimate the expenses you paid on your account during this period.
| | | | | | | | | | | | |
| | | Beginning | | | Ending | | | Expenses paid | |
| | | Account Value | | | Account Value | | | During period† | |
| | | 10/1/14 | | | 3/31/15 | | | 10/1/14–3/31/15 | |
Class A Shares | | | | | | | | | | | | |
Actual | | $ | 1,000.00 | | | $ | 955.40 | | | $ | 7.11 | |
Hypothetical* | | $ | 1,000.00 | | | $ | 1,017.65 | | | $ | 7.34 | |
Class C Shares | | | | | | | | | | | | |
Actual | | $ | 1,000.00 | | | $ | 951.70 | | | $ | 10.68 | |
Hypothetical* | | $ | 1,000.00 | | | $ | 1,013.99 | | | $ | 11.02 | |
Class I Shares | | | | | | | | | | | | |
Actual | | $ | 1,000.00 | | | $ | 957.00 | | | $ | 5.17 | |
Hypothetical* | | $ | 1,000.00 | | | $ | 1,019.65 | | | $ | 5.34 | |
Class R5 Shares | | | | | | | | | | | | |
Actual | | $ | 1,000.00 | | | $ | 956.80 | | | $ | 5.32 | |
Hypothetical* | | $ | 1,000.00 | | | $ | 1,019.50 | | | $ | 5.49 | |
Class R6 Shares | | | | | | | | | | | | |
Actual | | $ | 1,000.00 | | | $ | 957.70 | | | $ | 4.83 | |
Hypothetical* | | $ | 1,000.00 | | | $ | 1,020.00 | | | $ | 4.99 | |
| † | Expenses are equal to the annualized expense ratio for each class (A: 1.46%; C: 2.19%; I: 1.06%; R5: 1.09%; R6: 0.99%;) multiplied by the average account value over the period, multiplied by 182/365 to reflect the one-half year period. |
| * | Hypothetical assumes a rate of return of 5% per year before expenses. |
HYPOTHETICAL EXAMPLE FOR COMPARISON PURPOSES
For each class of shares, the second line of the accompanying table provides information about hypothetical account values and hypothetical expenses based on the Fund’s actual expense ratio and an assumed rate of return of 5% per year before expenses, which is not the Fund’s actual return. The hypothetical account values and expenses may not be used to estimate the actual ending account balance or expenses you paid for the period. You may use this information to compare the ongoing costs of investing in the Fund and other funds. To do so, compare this 5% hypothetical example with the 5% hypothetical examples that appear in the shareholder reports of the other funds.
Please note that the expenses shown in the table are meant to highlight your ongoing costs only and do not reflect any transactional costs, such as sales charges (loads), redemption fees, or exchange fees. Therefore, the second line of the table for each class of shares is useful in comparing ongoing costs only, and will not help you determine the relative total costs of owning different funds. In addition, if these transactional costs were included, your costs would have been higher.
28 Semi-Annual Report
| | |
| OTHER INFORMATION | | |
| |
Thornburg Developing World Fund | | March 31, 2015 (Unaudited) |
PORTFOLIO PROXY VOTING
Policies and Procedures:
The Trust has delegated to Thornburg Investment Management, Inc. (the “Advisor”) voting decisions respecting proxies for the Fund’s voting securities. The Advisor makes voting decisions in accordance with its Proxy Voting Policy and Procedures. A description of the Policy and Procedures is available (i) without charge, upon request, by calling the Advisor toll-free at 1-800-847-0200, (ii) on the Thornburg website at www.thornburg.com, and (iii) on the Securities and Exchange Commission’s website at www.sec.gov.
Information regarding how proxies were voted is available on or before August 31 of each year for the twelve months ending the preceding June 30. This information is available (i) without charge, upon request by calling the Advisor toll-free at 1-800-847-0200, (ii) on the Thornburg website at www.thornburg.com, and (iii) on the Securities and Exchange Commission’s website at www.sec.gov.
AVAILABILITY OF QUARTERLY PORTFOLIO SCHEDULE
The Fund files with the Securities and Exchange Commission schedules of its portfolio holdings on Form N-Q for the first and third quarters of each fiscal year. The Fund’s Forms N-Q are available on the Commission’s website at www.sec.gov, or may be reviewed and copied at the Commission’s Public Reference Room in Washington, D.C. Information on the operation of the Public Reference Room may be obtained by calling 1-800-SEC-0330. The Fund also makes this information available on its website at www.thornburg. com/download or upon request by calling 1-800-847-0200.
Semi-Annual Report 29
TRUSTEES’ STATEMENT TO SHAREHOLDERS
Revised and Readopted September 15, 2014
The Trustees believe current and prospective shareholders should know how we discharge our responsibilities in supervising the Funds’ investment advisor and in reviewing the advisor’s contract for renewal. Since 2005, we have issued a statement which sets out clearly the three principal guidelines that we follow in supervising the Trust’s investment advisor on your behalf. In accordance with our customary practice, in September of 2014 we again reviewed our statement and concluded we should reissue this statement outlining the principal features of our supervision of the advisor’s performance of investment management services for the Funds.
We begin with the premise that each shareholder selected his or her Fund because its investments are managed by the investment advisor identified in the prospectus and in accordance with the objective and policies described in the prospectus. We realize, as each of you do, that if you believe that your Fund’s stated objective and policies no longer serve your personal investment goals, you can sell your shares and leave the Fund.
Therefore, we believe that our primary supervisory task – our principal obligation to you—is to assess the nature and quality of the advisor’s services, and to confirm that the advisor actively and competently pursues the Fund’s objective, in accordance with the policies set out in the prospectus. To do this, we meet regularly with management to review your Fund’s portfolio and to discuss the advisor’s specific actions and judgments in pursuing the Fund’s objective. We do not substitute our own judgment for the advisor’s decisions in selecting investments; the advisor is paid to exercise its informed judgment on investment decisions, and we seek to confirm, in reviewing the advisor’s performance, that the advisor is doing just that.
Second, we are conscious of costs and the effect that costs have on shareholders’ returns. We try to make sure that your Fund’s fees and costs are reasonable in relationship to the services rendered and that they are generally in line with those charged by other expert investment advisors, consistent with our belief that the Fund’s investors searched for and expect that expertise and attention and have decided to pay a reasonable price for it. We do not put the management contract “out to bid” as a matter of course, and we would not do so unless we had concluded that the advisor materially had failed to pursue the Fund’s objectives in accordance with its policies, or for other equally important reasons. We believe that any other approach would be inconsistent with your interests and contrary to your expectations when you bought shares of the Fund in the first place.
Finally, because we believe that most Thornburg Fund shareholders have invested with a long-term perspective, we try not to focus too much on the fashions of the moment and on short-term performance. The market will not favor any specific investment objective or set of policies at all times and under all economic circumstances. A fund will experience periods of both high and low returns relative to other funds and other investments. Even if one of our Funds is not favored by the market at a particular time, we believe that the advisor is nonetheless obliged to remain true to the Fund’s objective and policies, and we watch to see that it does so.
Trustees of Thornburg Investment Trust
30 Semi-Annual Report
THORNBURG FUND FAMILY
FUNDAMENTAL, BOTTOM-UP EQUITY RESEARCH
We search far and wide for the best stock ideas—within the United States and around the globe. Potential investments that may deserve a deeper look are thoroughly analyzed using both quantitative and qualitative criteria. But the vast majority are discarded. Those that ultimately make it into our highly-selective portfolios are continually monitored to determine whether our investment theses unfold as expected.
| | • | | Thornburg Core Growth Fund |
| | • | | Thornburg International Value Fund |
| | • | | Thornburg International Growth Fund |
| | • | | Thornburg Developing World Fund |
| | • | | Thornburg Investment Income Builder Fund |
| | • | | Thornburg Global Opportunities Fund |
A TRADITION OF DISCIPLINED BOND MANAGEMENT
At Thornburg, the word “disciplined” carries some substance. We don’t make a practice of using shortcuts to enhance yield or total returns. Every strategy is grounded in rigorous, bottom-up credit work. Portfolios are assembled carefully—in the case of our core bond funds, using laddered structures—to mitigate price fluctuation. Position sizes are controlled so that no single bond can have an outsized effect on a portfolio. And as with our equity portfolios, managers enjoy flexibility to seek an optimal risk/reward balance.
| | • | | Thornburg Low Duration Income Fund |
| | • | | Thornburg Limited Term U.S. Government Fund |
| | • | | Thornburg Limited Term Income Fund |
| | • | | Thornburg Strategic Income Fund |
| | • | | Thornburg Low Duration Municipal Fund |
| | • | | Thornburg Limited Term Municipal Fund |
| | • | | Thornburg Intermediate Municipal Fund |
| | • | | Thornburg California Limited Term Municipal Fund |
| | • | | Thornburg New Mexico Intermediate Municipal Fund |
| | • | | Thornburg New York Intermediate Municipal Fund |
| | • | | Thornburg Strategic Municipal Income Fund |
Before investing, carefully consider the Fund’s investment goals, risks, charges, and expenses. For a prospectus or summary prospectus containing this and other information, contact your financial advisor or visit thornburg.com. Read it carefully before investing.
For additional information, please visit thornburg.com
Thornburg Investment Management, Inc. 2300 North Ridgetop Road, Santa Fe, NM 87506
Semi-Annual Report 31

This Semi-Annual Report is submitted for the general information of shareholders of the Fund. It is not authorized for distribution to prospective investors in the Fund unless preceded or accompanied by an effective prospectus.
| | | | |
| Investment Advisor: | | Distributor: | | |
| Thornburg Investment Management® | | Thornburg Securities Corporation® | | |
| 800.847.0200 | | 800.847.0200 | | TH2148 |
Item 2. Code of Ethics
Not applicable.
Item 3. Audit Committee Financial Expert
Not applicable.
Item 4. Principal Accountant Fees and Services
Not applicable.
Item 5. Audit Committee of Listed Registrants
Not applicable.
Item 6. Schedule of Investments
Filed as part of the reports to shareholders filed under item 1 of this Form.
Item 7. Disclosure of Proxy Voting Policies and Procedures for Closed-End Management Investment Companies
Not applicable.
Item 8. Portfolio Managers of Closed-End Management Investment Companies
Not applicable.
Item 9. Purchases of Equity Securities by Closed-End Management Investment Companies and Affiliated Purchasers.
Not applicable.
Item 10. Submission of Matters to a Vote of Security Holders
The authority to consider candidates recommended by the shareholders in accordance with the Trust’s Procedures for Shareholder Communications is committed to the Governance and Nominating Committee.
Item 11. Controls and Procedures
(a) The principal executive officer and the principal financial officer have concluded that Thornburg Investment Trust’s disclosure controls and procedures provide reasonable assurance that material information relating to Thornburg Investment Trust is made known to them by the appropriate persons, based on their evaluation of these controls and procedures as of a date within 90 days prior to the filing date of this report.
(b) There was no change in Thornburg Investment Trust’s internal control over financial reporting that occurred during the registrant’s second fiscal quarter of the period covered by this report (that is, the registrant’s second fiscal quarter) that has materially affected, or is reasonably likely to materially affect, the registrant’s internal control over financial reporting.
Item 12. Exhibits
(a) (1) Not Applicable
(a) (2) Certifications pursuant to Rule 30a-2(a) under the Investment Company Act of 1940 (17 CFR 70.30a-2(a)) attached hereto as Exhibit 99.CERT.
(a) (3) Not Applicable
(b) Certification pursuant to Section 906 of the Sarbanes-Oxley Act of 2002 and Rule 30a-2(b) under the Investment Company Act of 1940 (17 CFR 70.30a-2(b)) attached hereto as Exhibit 99.906CERT.
SIGNATURES
Pursuant to the requirements of the Securities Exchange Act of 1934 and the Investment Company Act of 1940, the registrant has duly caused this report to be signed on its behalf by the undersigned, thereunto duly authorized.
Thornburg Investment Trust, in respect of the following Thornburg Funds: Low Duration Municipal Fund, Limited Term Municipal Fund, Intermediate Municipal Fund, Strategic Municipal Income Fund, California Limited Term Municipal Fund, New Mexico Intermediate Municipal Fund, New York Intermediate Municipal Fund, Limited Term U.S. Government Fund, Low Duration Income Fund, Limited Term Income Fund, Strategic Income Fund, Value Fund, International Value Fund, Core Growth Fund, International Growth Fund, Investment Income Builder Fund, Global Opportunities Fund, and Developing World Fund.
Brian J. McMahon
President and principal executive officer
Pursuant to the requirements of the Securities Exchange Act of 1934 and the Investment Company Act of 1940, this report has been signed below by the following persons on behalf of the registrant and in the capacities and on the dates indicated.
Brian J. McMahon
President and principal executive officer
Jason H. Brady
Treasurer and principal financial officer