UNITED STATES
SECURITIES AND EXCHANGE COMMISSION
Washington, D.C. 20549
FORM N-CSR
CERTIFIED SHAREHOLDER REPORT OF REGISTERED MANAGEMENT INVESTMENT
COMPANIES
Investment Company Act file number 811-05201
Thornburg Investment Trust
(Exact name of registrant as specified in charter)
c/o Thornburg Investment Management, Inc.
2300 North Ridgetop Road, Santa Fe, New Mexico 87506
(Address of principal executive offices) (Zip code)
Garrett Thornburg, 2300 North Ridgetop Road, Santa Fe, New Mexico 87506
(Name and address of agent for service)
Registrant’s telephone number, including area code: 505-984-0200
Date of fiscal year end: September 30, 2016
Date of reporting period: March 31, 2016
Item 1. Reports to Stockholders
The following annual reports are attached hereto, in order:
Thornburg Low Duration Municipal Fund
Thornburg Limited Term Municipal Fund
Thornburg Intermediate Municipal Fund
Thornburg Strategic Municipal Income Fund
Thornburg California Limited Term Municipal Fund
Thornburg New Mexico Intermediate Municipal Fund
Thornburg New York Intermediate Municipal Fund
Thornburg Limited Term U.S. Government Fund
Thornburg Limited Term Income Fund
Thornburg Low Duration Income Fund
Thornburg Strategic Income Fund
Thornburg Value Fund
Thornburg International Value Fund
Thornburg Core Growth Fund
Thornburg International Growth Fund
Thornburg Investment Income Builder Fund
Thornburg Global Opportunities Fund
Thornburg Developing World Fund
Thornburg Better World Fund
Thornburg Capital Management Fund
2 Semi-Annual Report
Semi-Annual Report
Thornburg Low Duration Municipal Fund
March 31, 2016
| | | | |
SHARE CLASS | | NASDAQ SYMBOL | | CUSIP |
Class A | | TLMAX | | 885-216-788 |
Class I | | TLMIX | | 885-216-770 |
Minimum investments for Class I shares may be higher than those for Class A shares. Class I shares may not be available to all investors.
Investments carry risks, including possible loss of principal. Portfolios investing in bonds have the same interest rate, inflation, and credit risks that are associated with the underlying bonds. The value of bonds will fluctuate relative to changes in interest rates, decreasing when interest rates rise. Unlike bonds, bond funds have ongoing fees and expenses. Please see the Fund’s prospectus for a discussion of the risks associated with an investment in the Fund. Investments in the Fund are not FDIC insured, nor are they bank deposits or guaranteed by a bank or any other entity.
The laddering strategy does not assure or guarantee better performance and cannot eliminate the risk of investment losses.
Semi-Annual Report 3
| | |
| LETTER TO SHAREHOLDERS | | |
| |
Thornburg Low Duration Municipal Fund | | March 31, 2016 (Unaudited) |
April 11, 2016
Dear Fellow Shareholder:
We are pleased to present the semi-annual report for Thornburg Low Duration Municipal Fund. The net asset value (NAV) of the Class A shares increased by one cent to $12.36 per share during the six months ended March 31, 2016. If you were with us for the entire period, you received dividends of 1.02 cents per share. Dividends were higher for Class I shares, to account for varying class-specific expenses. The Class A shares underperformed the Fund’s benchmark index, with a 0.16% total return (without sales charge) for the six months ended March 31, 2016, compared to the 0.42% total return for the BofA Merrill Lynch 1-3 Year U.S. Municipal Securities Index.
Global Fears Sway the Municipal Markets
The past six months have been a roller-coaster ride for the municipal market. During the last quarter of 2015, it seemed that every day was spent anxiously awaiting the first Federal Reserve rate increase – for what seemed like an eternity. When that rate increase finally came, it was met with a yawn. Markets quickly reminded investors that while the Federal Reserve (the Fed) has control over short-term rates, the market forces of supply and demand for bonds have a much heavier influence on interest rates – especially long-term rates.
As in life, expectations in the bond markets mean a lot. And perhaps more important than the Fed’s initial rate hike was its stated intent to raise rates four additional times in 2016. The expectation for higher rates evaporated almost immediately after the Fed’s statement, with the release of weaker-than-expected economic data, collapsing commodity prices, an emerging-markets stock rout, and profound weakness in Europe, with the European Central Bank retrenching in its effort to drive European rates lower, spurring fears of deflation.
A Roller-Coaster Ride to Start the Year
The beginning of 2016 proved volatile for equity markets domestically and globally, and the fixed income markets followed suit. The 10-year U.S. Treasury stood at a respectable 2.27% at the end of 2015. But within six weeks, that rate fell 0.61% to 1.66%, before bouncing back to 1.77% by March 31, 2016.
As we noted, the Fed has backed off of its initial intent to raise rates four times in a stepped-up fashion. Rates will probably remain low and income elusive. Unfortunately, municipal bond investors have only a few “levers” to pull to seek higher income. The most effective two are credit quality and duration. An investor looking for yield can always buy a bond with a longer maturity – the duration lever. And bonds of lower credit quality can be purchased to drive up yield – the credit quality lever. In both instances, the investor assumes risk in hope of higher returns.
At Thornburg, we always evaluate both of these options as a means to increase the total return of the portfolios, but over the past six months, as in the prior six months, we found them less than optimal. Real rates (interest rates after inflation is subtracted) remained low during the entire period, and the municipal yield curve was fairly flat. Investors who reached
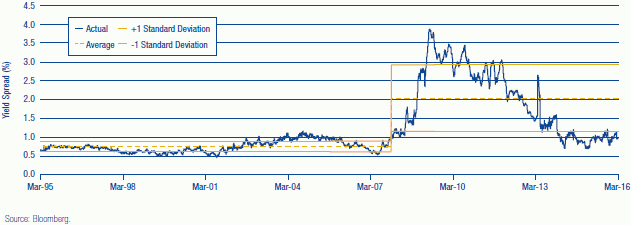
Chart I | Credit Spreads: Investors Are Not Being Paid to Assume the Risk
10-Year Credit-Quality Spreads: BBB Revenue Less AAA General Obligations
4 Semi-Annual Report
| | |
| LETTER TO SHAREHOLDERS, | | |
| |
CONTINUED | | |
| |
Thornburg Low Duration Municipal Fund | | March 31, 2016 (Unaudited) |
for yield by buying longer maturities gained very little relative to the duration risk that comes with longer-dated bonds. And the amount investors are compensated to invest in lower-rated bonds is minimal; credit spreads remain at extremely tight levels. Investors who purchased debt from lower-rated issuers were essentially buying weaker credits at very expensive levels. Chart I on the previous page shows credit spreads remaining near historically low levels, offering investors little compensation for risk assumed. Not a great strategy!
We believe that the only logical thing to do when you’re not being paid to take risk is to take less of it. That is exactly what we have been seeking to do in Thornburg Low Duration Municipal Fund since its inception. The Fund is being managed on the bearish (shorter) end of its duration range. We have also actively sought to increase the average credit quality, at least at the margins. Cash reserve positions are being managed in a manner we view as conservative.
Continued volatility seems a certainty. That can manifest via interest-rate movements, or changing credit spreads. While the likelihood of the Fed raising rates appears low, given the afore-mentioned anemic economic growth in the U.S. and abroad, investors are wise to recall that rates moved up over 1.00% in 2013 without the Fed having taken any action whatsoever. It may be unlikely, but that does not mean it’s a probability that can be ignored. And any event that causes spreads to widen appreciably may prove detrimental to an investor who assumed undue credit risk in search of return.
We will do what we have always done with Thornburg Low Duration Municipal Fund: provide you with a tax-exempt laddered portfolio that aims to generate attractive levels of income, while attempting to preserve principal and minimize volatility. And, of course, we’ll seek to only assume the risk for which we believe we are adequately compensated.
Staying Faithful to Thornburg’s Tested Approach
While a focus on risk mitigation may not make the sexiest marketing story, we believe it is in the best long-term interest of shareholders. And to any investor considering abandoning municipal bonds for the promise of higher returns elsewhere, we remind you that if the first quarter of 2016 has taught us anything, it is that in a volatile market, an appropriate asset allocation may save you a few sleepless nights.
We will continue to strive to manage your assets to fulfill the Fund’s objectives.
Sincerely,
| | | | |

| | 
| | |
| Christopher Ryon, CFA | | Nicholos Venditti | | |
| Portfolio Manager | | Portfolio Manager | | |
| Managing Director | | Managing Director | | |
The matters discussed in this report may constitute forward-looking statements made pursuant to the safe harbor provisions of the Securities Litigation Reform Act of 1995. These include any advisor or portfolio manager prediction, assessment, analysis or outlook for individual securities, industries, investment styles, market sectors and/or markets. These statements involve risks and uncertainties. In addition to the general risks described for each fund in its current prospectus, other factors bearing on these reports include the accuracy of the advisor’s or portfolio manager’s forecasts and predictions, the appropriateness of the investment strategies designed by the advisor or portfolio manager and the ability of the advisor or portfolio manager to implement their strategies efficiently and successfully. Any one or more of these factors, as well as other risks affecting the securities markets generally, could cause the actual results of any fund to differ materially as compared to its benchmarks.
The views expressed by the portfolio managers reflect their professional opinions and are subject to change. Under no circumstances does the information contained within represent a recommendation to buy or sell any security.
Semi-Annual Report 5
| | |
| PERFORMANCE SUMMARY | | |
| |
Thornburg Low Duration Municipal Fund | | March 31, 2016 (Unaudited) |
Average Annual Total Returns
| | | | | | | | |
| | | 1-YR | | | SINCE
INCEP. | |
A Shares (Incep: 12/30/13) | | | | | | | | |
Without sales charge | | | 0.42 | % | | | 0.35 | % |
With sales charge | | | -1.10 | % | | | -0.33 | % |
I Shares (Incep: 12/30/13) | | | 0.54 | % | | | 0.51 | % |
30-Day Yields, A Shares
(with sales charge)
| | | | |
Annualized Distribution Yield | | | 0.17 | % |
| |
SEC Yield | | | 0.18 | % |
Performance data shown represents past performance and is no guarantee of future results. Investment return and principal value will fluctuate so shares, when redeemed, may be worth more or less than their original cost. Current performance may be lower or higher than quoted. For performance current to the most recent month end, visit thornburg.com or call 800-847-0200. The performance information does not reflect the deduction of taxes that a shareholder would pay on distributions or the redemption of Fund shares. Returns reflect the reinvestment of dividends and capital gains. Class A shares are sold with a maximum sales charge of 1.50%. There is no sales charge for Class I shares.
As disclosed in the most recent prospectus, the total annual fund operating expenses are as follows: A shares, 2.85%; I shares, 0.82%. Thornburg Investment Management and/or Thornburg Securities Corporation have contractually agreed to waive fees and reimburse expenses through at least February 1, 2017, for some of the share classes, resulting in net expense ratios of the following: A shares, 0.70%; I shares, 0.50%. For more detailed information on fund expenses and waivers/reimbursements, please see the Fund’s prospectus.
Without fee waivers and expense reimbursements, the Annualized Distribution yield would have been negative 1.47%, and the SEC yield would have been negative 1.46%. Unsubsidized yields may be disproportionately negative due to the size of net assets and fixed expenses.
Glossary
BofA Merrill Lynch 1-3 Year Municipal Securities Index – A subset of the BofA Merrill Lynch U.S. Municipal Securities Index including all securities with a remaining term to final maturity less than 3 years.
Unless otherwise noted, index returns reflect the reinvestment of income dividends and capital gains, if any, but do not reflect fees, brokerage commissions or other expenses of investing. Investors may not make direct investments into any index. The performance of any index is not indicative of the performance of any particular investment.
Annualized Distribution Yield – The distribution yield reflects actual distributions made to shareholders. The annualized distribution yield is calculated by summing the last 30 days of income at a given month end and annualizing to a 360-day year. The result is divided by the ending maximum offering price.
Bond Credit Ratings (Credit Quality) – A bond credit rating assesses the financial ability of a debt issuer to make timely payments of principal and interest. Ratings of AAA (the highest), AA, A, and BBB are investment-grade quality. Ratings of BB, B, CCC, CC, C and D (the lowest) are considered below investment grade, speculative grade, or junk bonds.
Credit Spread/Quality Spread – The difference between the yields of securities with different credit qualities.
Duration – A bond’s sensitivity to interest rates. Effective duration incorporates the embedded option features, such as call provisions. Bonds with longer durations experience greater price volatility than bonds with shorter durations.
Laddering – Involves building a portfolio of bonds with staggered maturities so that a portion matures each year. Money that comes in from maturing bonds is typically invested in bonds with longer maturities at the far end of the portfolio.
SEC Yield – SEC yield is computed in accordance with SEC standards measuring the net investment income per share over a specified 30-day period expressed as a percentage of the maximum offering price of the Fund’s shares at the end of the period.
Yield Curve – A line that plots the interest rates, at a set point in time, of bonds having equal credit quality, but differing maturity dates.
6 Semi-Annual Report
| | |
| FUND SUMMARY | | |
| |
Thornburg Low Duration Municipal Fund | | March 31, 2016 (Unaudited) |
Objectives and Strategies
The Fund seeks current income exempt from federal income tax, consistent with preservation of capital (may be subject to Alternative Minimum Tax).
This Fund invests principally in a laddered portfolio of municipal bonds with a dollar-weighted average duration of normally no more than three years. Laddering involves building a portfolio of bonds with staggered maturities so that a portion of the portfolio matures each year. Cash from maturing bonds, if not needed for other purposes, is typically invested in bonds with longer maturities at the far end of the ladder. We regard the strategy as a good compromise for managing different types of risk
Portfolio Ladder
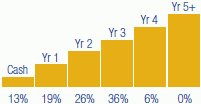
Percent of portfolio maturing in each year. Cash includes cash equivalents.
There is no guarantee that the Fund will meet its investment objectives.
All data is subject to change. Charts may not add up to 100% due to rounding.
Security Credit Ratings†
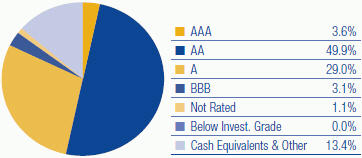
A bond credit rating assesses the financial ability of a debt issuer to make timely payments of principal and interest. Ratings of AAA (the highest), AA, A, and BBB are investment-grade quality. Ratings of BB, B, CCC, CC, C and D (the lowest) are considered below investment grade, speculative grade, or junk bonds. Credit quality ratings for Thornburg’s municipal portfolios used the highest rating available from either Standard & Poor’s or Moody’s Investors Service.
Key Portfolio Attributes
| | | | |
Number of Bonds | | | 95 | |
Effective Duration | | | 1.5 Yrs | |
Average Maturity | | | 1.6 Yrs | |
Semi-Annual Report 7
| | |
| SCHEDULE OF INVESTMENTS | | |
| |
Thornburg Low Duration Municipal Fund | | March 31, 2016 (Unaudited) |
| | | | | | | | | | |
ISSUER-DESCRIPTION | | CREDIT RATING†
S&P/ MOODY’S | | PRINCIPAL
AMOUNT | | | VALUE | |
ARIZONA — 3.02% | | | | | | | | | | |
Arizona Board of Regents, 0.40% due 7/1/2034 put 4/7/2016 (Arizona State University; LOC: JPMorgan Chase Bank, N.A.) (weekly demand notes) | | AAA/Aa1 | | $ | 900,000 | | | $ | 900,000 | |
Arizona HFA, 3.00% due 12/1/2016 (Scottsdale Lincoln Hospitals) | | NR/A2 | | | 480,000 | | | | 487,262 | |
| | | |
ARKANSAS — 0.69% | | | | | | | | | | |
Board of Trustees of the University of Arkansas, 4.00% due 11/1/2018 (Fayetteville Campus) | | NR/Aa2 | | | 295,000 | | | | 318,662 | |
| | | |
CALIFORNIA — 9.52% | | | | | | | | | | |
Bay Area Toll Authority, 1.00% due 4/1/2047 put 5/1/2017 (San Francisco Bay Area Toll Bridge) | | AA/Aa3 | | | 250,000 | | | | 250,567 | |
California HFFA, 4.00% due 7/1/2016 (Children’s Hospital Los Angeles; Insured: AGM) | | AA/A2 | | | 200,000 | | | | 201,436 | |
California Statewide Communities Development Authority, 5.25% due 7/1/2017 (St. Joseph Health System; Insured: AGM) | | AA/A1 | | | 100,000 | | | | 105,303 | |
City of Chula Vista, 1.65% due 7/1/2018 (San Diego Gas & Electric Co.) | | A+/Aa2 | | | 1,000,000 | | | | 1,000,850 | |
County of Los Angeles Redevelopment Refunding Authority, 3.00% due 6/1/2016 (Bunker Hill Project) | | A+/NR | | | 305,000 | | | | 306,321 | |
County of Los Angeles Redevelopment Refunding Authority, 3.00% due 12/15/2016 (Covina Revitalization-Redevelopment Project) | | A-/NR | | | 575,000 | | | | 583,999 | |
Jurupa Public Financing Authority, 4.00% due 9/1/2017 | | BBB+/NR | | | 100,000 | | | | 104,021 | |
Murrieta Valley USD GO, 2.00% due 9/1/2016 (Riverside County Educational Facilities; Insured: BAM) | | AA/NR | | | 200,000 | | | | 201,310 | |
Riverside County Public Financing Authority, 4.00% due 9/1/2017 (Hemet Project) | | A+/NR | | | 485,000 | | | | 506,296 | |
San Diego Redevelopment Agency, 5.00% due 9/1/2016 (Centre City Redevelopment; Insured: AMBAC) | | NR/A2 | | | 50,000 | | | | 50,680 | |
Successor Agency to the Redevelopment Agency of Carson, 4.00% due 10/1/2016 (Carson Merged and Amended Project Area) | | AA-/NR | | | 425,000 | | | | 432,463 | |
Successor Agency to the Redevelopment Agency of the City of Chino, 5.00% due 9/1/2017 (Merged Chino Areas 2001 and 2003 and Central City Redevelopment Projects; Insured: BAM) | | AA/NR | | | 300,000 | | | | 317,697 | |
Successor Agency to the Redevelopment Agency of the Richmond Community, 4.00% due 9/1/2017 (Harbour and Merged Area Redevelopment Projects; Insured: BAM) | | AA/NR | | | 300,000 | | | | 312,927 | |
| | | |
COLORADO — 1.86% | | | | | | | | | | |
City of Aurora COP, 3.00% due 12/1/2016 (Aurora Municipal Center) | | AA-/Aa2 | | | 530,000 | | | | 537,934 | |
Regional Transportation District COP, 5.00% due 6/1/2017 (FasTracks Transportation System) | | A/Aa3 | | | 300,000 | | | | 314,676 | |
| | | |
DISTRICT OF COLUMBIA — 0.43% | | | | | | | | | | |
District of Columbia, 5.00% due 4/1/2016 (National Public Radio) (ETM) | | AA-/A1 | | | 200,000 | | | | 200,000 | |
| | | |
FLORIDA — 6.35% | | | | | | | | | | |
County of Osceola, 5.00% due 10/1/2017 (Transportation Capital Improvements; Insured: AMBAC) | | A+/A1 | | | 150,000 | | | | 159,025 | |
Florida Municipal Power Agency, 5.25% due 10/1/2018 (Stanton Project) | | NR/A1 | | | 1,000,000 | | | | 1,105,720 | |
Hillsborough County IDA, 5.65% due 5/15/2018 (Tampa Electric Co.) | | BBB+/A2 | | | 200,000 | | | | 218,692 | |
Orange County School Board COP, 5.00% due 8/1/2018 (Educational Facilities) | | NR/Aa2 | | | 1,000,000 | | | | 1,096,560 | |
Volusia County Educational Facilities Authority, 2.00% due 10/15/2016 (Embry-Riddle Aeronautical University, Inc.) | | NR/Baa1 | | | 105,000 | | | | 105,771 | |
Volusia County Educational Facilities Authority, 3.00% due 10/15/2017 (Embry-Riddle Aeronautical University, Inc.) | | NR/Baa1 | | | 105,000 | | | | 108,420 | |
Volusia County Educational Facilities Authority, 3.00% due 10/15/2018 (Embry-Riddle Aeronautical University, Inc.) | | NR/Baa1 | | | 120,000 | | | | 125,876 | |
| | | |
GEORGIA — 0.45% | | | | | | | | | | |
City of Atlanta, 5.25% due 12/1/2016 (Atlantic Station Project; Insured: AGM) | | AA/A3 | | | 200,000 | | | | 205,604 | |
| | | |
GUAM — 1.31% | | | | | | | | | | |
Government of Guam, 3.00% due 11/15/2017 (Economic Development) | | A/NR | | | 300,000 | | | | 309,408 | |
Government of Guam, 4.00% due 11/15/2018 (Economic Development) | | A/NR | | | 275,000 | | | | 294,539 | |
| | | |
ILLINOIS — 8.62% | | | | | | | | | | |
Chicago Park District GO, 5.00% due 1/1/2020 (Harbor Facilities) | | AA+/Ba1 | | | 500,000 | | | | 549,545 | |
City of Rockford GO, 3.00% due 12/15/2016 (New Fire Station Construction; Insured: AGM) | | AA/A1 | | | 250,000 | | | | 254,232 | |
Illinois Educational Facilities Authority, 4.75% due 11/1/2036 put 11/1/2016 (Field Museum of Natural History) | | A/A2 | | | 100,000 | | | | 102,026 | |
Illinois Finance Authority, 5.00% due 11/15/2017 (Rush University Medical Center) | | A+/A1 | | | 1,000,000 | | | | 1,064,820 | |
Illinois Finance Authority, 5.00% due 8/15/2018 (Silver Cross Hospital and Medical Centers) | | NR/Baa1 | | | 500,000 | | | | 538,165 | |
Illinois Finance Authority, 5.00% due 11/15/2018 (Rush University Medical Center) | | A+/A1 | | | 500,000 | | | | 550,330 | |
Illinois Finance Authority, 4.30% due 6/1/2035 put 6/1/2016 (Peoples Gas Light & Coke Co.; Insured: AMBAC) | | A/Aa3 | | | 200,000 | | | | 201,218 | |
State of Illinois, 4.00% due 6/15/2019 (Build Illinois Program) | | AAA/Baa1 | | | 520,000 | | | | 566,223 | |
Town of Cicero GO, 5.00% due 1/1/2018 (Cicero and Laramie Development Areas; Insured: AGM) | | AA/A2 | | | 125,000 | | | | 132,929 | |
| | | |
INDIANA — 2.56% | | | | | | | | | | |
City of Evansville, 5.00% due 1/1/2018 (Waterworks District; Insured: BAM) | | AA/NR | | | 810,000 | | | | 866,206 | |
8 Semi-Annual Report
| | |
| SCHEDULE OF INVESTMENTS, CONTINUED | | |
| |
Thornburg Low Duration Municipal Fund | | March 31, 2016 (Unaudited) |
| | | | | | | | | | |
ISSUER-DESCRIPTION | | CREDIT RATING†
S&P/ MOODY’S | | PRINCIPAL
AMOUNT | | | VALUE | |
Hammond Multi-School Building Corp., 4.00% due 7/15/2017 (Educational Facilities) (State Aid Withholding) | | AA+/NR | | $ | 300,000 | | | $ | 312,030 | |
| | | |
KANSAS — 6.24% | | | | | | | | | | |
Kansas DFA, 5.00% due 12/1/2016 (Department of Commerce Impact Program) | | AA-/A3 | | | 400,000 | | | | 411,348 | |
Kansas DFA, 5.00% due 12/1/2018 (Department of Commerce Impact Program) | | AA-/A3 | | | 1,250,000 | | | | 1,368,962 | |
Topeka Public Building Commission, 5.00% due 6/1/2018 (10th and Jackson Projects; Insured: Natl-Re) | | AA-/A3 | | | 1,000,000 | | | | 1,086,750 | |
| | | |
KENTUCKY — 2.46% | | | | | | | | | | |
Commonwealth of Kentucky State Property and Buildings Commission, 5.00% due 11/1/2019 (Project No. 112) | | A/Aa3 | | | 1,000,000 | | | | 1,128,480 | |
| | | |
LOUISIANA — 2.46% | | | | | | | | | | |
City of New Orleans, 5.00% due 12/1/2017 (Water System Facilities Capital Improvement Program) | | A-/NR | | | 100,000 | | | | 106,587 | |
City of New Orleans GO, 4.00% due 12/1/2016 (Public Improvements) | | A+/A3 | | | 1,000,000 | | | | 1,021,940 | |
| | | |
MARYLAND — 1.96% | | | | | | | | | | |
County of Montgomery GO, 0.32% due 6/1/2026 put 4/1/2016 (Consolidated Public Improvements; SPA: Wells Fargo Bank, N.A.) (daily demand notes) | | AAA/Aaa | | | 900,000 | | | | 900,000 | |
| | | |
MASSACHUSETTS — 0.62% | | | | | | | | | | |
Massachusetts Educational Financing Authority, 5.50% due 1/1/2017 | | AA/NR | | | 275,000 | | | | 284,578 | |
| | | |
MICHIGAN — 7.76% | | | | | | | | | | |
Berkley School District GO, 4.00% due 5/1/2018 (Educational Facilities; Insured: Q-SBLF) | | AA-/NR | | | 1,000,000 | | | | 1,064,340 | |
Charles Stewart Mott Community College GO, 5.00% due 5/1/2018 (Higher Education Facilities) | | A+/NR | | | 750,000 | | | | 810,457 | |
Michigan Finance Authority, 4.00% due 11/15/2016 (Sparrow Clinton Hospital Cancer Center and Sparrow Ionia Hospital) | | A+/A1 | | | 150,000 | | | | 153,086 | |
Michigan Finance Authority, 5.00% due 5/1/2018 (School District of the City of Detroit; Insured: Q-SBLF) | | AA-/NR | | | 250,000 | | | | 270,385 | |
Michigan State Hospital Finance Authority, 5.00% due 11/15/2016 (Ascension Health) | | AA+/Aa2 | | | 200,000 | | | | 205,424 | |
Northville Public Schools GO, 5.00% due 5/1/2017 (Educational Facilities; Insured: Q-SBLF) | | NR/Aa1 | | | 250,000 | | | | 261,460 | |
Regents of the University of Michigan, 0.27% due 4/1/2042 put 4/1/2016 (Higher Education Facility Renovations; SPA: Northern Trust Co.) (daily demand notes) | | AAA/Aaa | | | 800,000 | | | | 800,000 | |
| | | |
NEVADA — 1.24% | | | | | | | | | | |
Carson City, 4.00% due 9/1/2016 (Carson Tahoe Regional Healthcare Project) | | BBB+/NR | | | 200,000 | | | | 202,276 | |
City of Reno GO, 5.00% due 6/1/2017 (Fire Protection Projects) | | A-/A1 | | | 200,000 | | | | 209,928 | |
Washoe County School District GO, 5.25% due 6/1/2017 (Educational Facilities; Insured: AGM) | | AA/Aa3 | | | 150,000 | | | | 158,009 | |
| | | |
NEW JERSEY — 2.25% | | | | | | | | | | |
Essex County Improvement Authority GO, 4.00% due 10/1/2017 (County Correctional Facility) | | NR/Aa2 | | | 545,000 | | | | 569,530 | |
New Jersey Educational Facilities Authority, 5.00% due 9/1/2016 (Higher Education Capital Improvements; Insured: AGM) | | AA/A2 | | | 300,000 | | | | 304,398 | |
New Jersey Health Care Facilities Financing Authority, 5.00% due 1/1/2018 (Hackensack University Medical Center; Insured: AGM) | | AA/A2 | | | 150,000 | | | | 160,110 | |
| | | |
NEW YORK — 6.22% | | | | | | | | | | |
City of New York GO, 5.00% due 8/1/2017 (Capital Projects) | | AA/Aa2 | | | 500,000 | | | | 528,810 | |
City of New York GO, 5.00% due 8/1/2019 (Capital Projects) | | AA/Aa2 | | | 450,000 | | | | 508,991 | |
Lake Placid Central School District GO, 5.00% due 6/15/2017 (Educational Facilities; Insured: Natl-Re) (State Aid Withholding) | | NR/Aa3 | | | 200,000 | | | | 210,096 | |
Monroe County Industrial Development Corp., 4.00% due 1/15/2018 (Monroe Community College Association; Insured: AGM) | | AA/A2 | | | 200,000 | | | | 209,398 | |
New York City Municipal Water Finance Authority, 0.37% due 6/15/2048 put 4/1/2016 (Water & Sewer System; SPA: Mizuho Bank, Ltd.) (daily demand notes) | | AA+/Aa1 | | | 500,000 | | | | 500,000 | |
New York City Transitional Finance Authority, 0.55% due 11/1/2028 put 4/7/2016 (City Capital Projects; SPA: JPMorgan Chase Bank, N.A.) (weekly demand notes) | | AAA/Aaa | | | 900,000 | | | | 900,000 | |
| | | |
NORTH DAKOTA — 1.63% | | | | | | | | | | |
North Dakota Housing Finance Agency, 0.85% due 1/1/2017 (Housing Mortgage Finance Program) | | NR/Aa1 | | | 750,000 | | | | 750,278 | |
| | | |
OHIO — 3.62% | | | | | | | | | | |
City of Cleveland, 3.00% due 10/1/2016 (Public Facilities) | | AA/A1 | | | 200,000 | | | | 202,312 | |
County of Franklin, 4.00% due 11/15/2033 put 8/1/2016 (OhioHealth Corp. Hospital Facilities) | | AA+/Aa2 | | | 200,000 | | | | 202,268 | |
County of Hamilton, 0.41% due 5/15/2017 put 4/1/2016 (Children’s Hospital Medical Center; LOC: PNC Bank, N.A.) (daily demand notes) | | NR/A1 | | | 300,000 | | | | 300,000 | |
Semi-Annual Report 9
| | |
| SCHEDULE OF INVESTMENTS, CONTINUED | | |
| |
Thornburg Low Duration Municipal Fund | | March 31, 2016 (Unaudited) |
| | | | | | | | | | |
ISSUER-DESCRIPTION | | CREDIT RATING†
S&P/ MOODY’S | | PRINCIPAL
AMOUNT | | | VALUE | |
Ohio Higher Educational Facility Commission, 0.32% due 1/1/2043 put 4/1/2016 (Cleveland Clinic Health System; SPA: Barclays Bank plc) (daily demand notes) | | AA-/Aa2 | | $ | 700,000 | | | $ | 700,000 | |
University of Toledo, 3.50% due 6/1/2016 (Medical Center Capital Improvements) | | A/A1 | | | 260,000 | | | | 261,277 | |
| | | |
OKLAHOMA — 3.05% | | | | | | | | | | |
Oklahoma DFA, 5.00% due 8/15/2018 (INTEGRIS Health) | | AA-/Aa3 | | | 270,000 | | | | 296,395 | |
Tulsa County Industrial Authority, 5.50% due 9/1/2018 (Jenks Public Schools) | | AA-/NR | | | 1,000,000 | | | | 1,104,210 | |
| | | |
OREGON — 2.19% | | | | | | | | | | |
State of Oregon GO, 2.00% due 9/15/2016 (Cash Management) | | SP-1+/Mig1 | | | 1,000,000 | | | | 1,007,610 | |
| | | |
PENNSYLVANIA — 9.25% | | | | | | | | | | |
City of Philadelphia, 5.00% due 10/1/2017 (Pennsylvania Gas Works) | | A-/Baa1 | | | 200,000 | | | | 212,314 | |
City of Philadelphia, 5.00% due 7/1/2018 (Pennsylvania Gas Works) | | AA/A2 | | | 350,000 | | | | 381,475 | |
Cumberland County Municipal Authority, 3.00% due 1/1/2017 (Diakon Lutheran Social Ministries Project) | | NR/NR | | | 500,000 | | | | 505,830 | |
East Allegheny School District GO, 2.00% due 4/1/2017 (Insured: BAM) (State Aid Withholding) | | AA/Ba2 | | | 300,000 | | | | 303,324 | |
Lancaster County Hospital Authority, 5.00% due 11/1/2018 (Masonic Villages Project) | | A/NR | | | 1,500,000 | | | | 1,644,540 | |
Lehigh County IDA, 0.90% due 2/15/2027 put 8/15/2017 (PPL Electric Utilities Corp. Project) | | A/A1 | | | 1,000,000 | | | | 999,650 | |
Wilson School District GO, 3.00% due 6/1/2017 (State Aid Withholding) | | AA/NR | | | 200,000 | | | | 205,370 | |
| | | |
SOUTH CAROLINA — 2.53% | | | | | | | | | | |
City of North Charleston Public Facilities Corp. COP, 5.00% due 10/1/2017 (Convention Center Complex) | | AA-/NR | | | 300,000 | | | | 316,851 | |
Kershaw County Public Schools Foundation, 4.00% due 12/1/2017 (Kershaw County School District Project) | | A-/A1 | | | 500,000 | | | | 524,470 | |
Piedmont Municipal Power Agency, 5.00% due 1/1/2018 (Catawba Project) | | AA/A3 | | | 300,000 | | | | 321,306 | |
| | | |
TEXAS — 7.33% | | | | | | | | | | |
City of Houston, 4.00% due 9/1/2017 (Convention & Entertainment Facilities Department) | | A-/A2 | | | 200,000 | | | | 208,802 | |
City of Houston, 4.00% due 9/1/2018 (Convention & Entertainment Facilities Department) | | A-/A2 | | | 600,000 | | | | 642,318 | |
City of Houston Higher Education Finance Corp., 5.00% due 8/15/2018 (KIPP Program; Guaranty: PSF) | | AAA/NR | | | 970,000 | | | | 1,061,869 | |
Coastal Water Authority, 4.00% due 12/15/2017 (City of Houston Projects) | | AA/NR | | | 905,000 | | | | 954,087 | |
San Antonio Education Facilities Corp., 0.45% due 6/1/2033 put 4/7/2016 (Trinity University) (weekly demand notes) | | AA/NR | | | 500,000 | | | | 500,000 | |
| | | |
WASHINGTON — 2.70% | | | | | | | | | | |
King County Public Hospital District No. 2 GO, 5.00% due 12/1/2018 (Evergreen Health) | | NR/Aa3 | | | 835,000 | | | | 924,838 | |
Ocean Beach School District No. 101 GO, 4.00% due 12/1/2017 (Educational Facilities) | | NR/A2 | | | 300,000 | | | | 316,023 | |
| | | |
WEST VIRGINIA — 0.44% | | | | | | | | | | |
Mason County, 1.625% due 10/1/2022 put 10/1/2018 (Appalachian Power Company Project) | | BBB/Baa1 | | | 200,000 | | | | 201,176 | |
| | | |
WISCONSIN — 0.44% | | | | | | | | | | |
Wisconsin Health & Educational Facilities Authority, 1.25% due 8/15/2025 put 8/15/2017 (Aurora Health Care, Inc.) | | NR/A2 | | | 200,000 | | | | 200,550 | |
| | | | | | | | | | |
TOTAL INVESTMENTS — 99.20% (Cost $45,495,491) | | | | | | | | $ | 45,584,229 | |
OTHER ASSETS LESS LIABILITIES — 0.80% | | | | | | | | | 365,586 | |
| | | | | | | | | | |
NET ASSETS — 100.00% | | | | | | | | $ | 45,949,815 | |
| | | | | | | | | | |
Footnote Legend
| † | Credit ratings are unaudited. Rating changes may have occurred subsequent to the reporting period end. Bonds issued with a maturity of one year or less are assigned Moody’s ratings from MIG-1 to MIG-4 and Standard and Poor’s ratings from SP-1+ to SP-3 with MIG-1 and SP-1+ being the strongest ratings. |
Portfolio Abbreviations
To simplify the listings of securities, abbreviations are used per the table below:
| | |
| AGM | | Insured by Assured Guaranty Municipal Corp. |
| AMBAC | | Insured by American Municipal Bond Assurance Corp. |
| BAM | | Insured by Build America Mutual Insurance Co. |
| COP | | Certificates of Participation |
| DFA | | Development Finance Authority |
| ETM | | Escrowed to Maturity |
| GO | | General Obligation |
| | |
| HFA | | Health Facilities Authority |
| HFFA | | Health Facilities Financing Authority |
| IDA | | Industrial Development Authority |
| Natl-Re | | Insured by National Public Finance Guarantee Corp. |
| PSF | | Guaranteed by Permanent School Fund |
| Q-SBLF | | Insured by Qualified School Bond Loan Fund |
| USD | | Unified School District |
See notes to financial statements.
10 Semi-Annual Report
| | |
| STATEMENT OF ASSETS AND LIABILITIES | | |
| |
Thornburg Low Duration Municipal Fund | | March 31, 2016 (Unaudited) |
| | | | |
ASSETS | | | | |
Investments at value (cost $45,495,491) (Note 2) | | $ | 45,584,229 | |
Cash | | | 1,055,005 | |
Receivable for investments sold | | | 325,000 | |
Interest receivable | | | 455,286 | |
Prepaid expenses and other assets | | | 31,478 | |
| | | | |
Total Assets | | | 47,450,998 | |
| | | | |
| |
LIABILITIES | | | | |
Payable for investments purchased | | | 1,466,788 | |
Payable for fund shares redeemed | | | 639 | |
Payable to investment advisor and other affiliates (Note 3) | | | 4,098 | |
Accounts payable and accrued expenses | | | 29,334 | |
Dividends payable | | | 324 | |
| | | | |
Total Liabilities | | | 1,501,183 | |
| | | | |
| |
NET ASSETS | | $ | 45,949,815 | |
| | | | |
NET ASSETS CONSIST OF | | | | |
Net unrealized appreciation on investments | | $ | 88,738 | |
Accumulated net realized gain (loss) | | | (23,333 | ) |
Net capital paid in on shares of beneficial interest | | | 45,884,410 | |
| | | | |
| | $ | 45,949,815 | |
| | | | |
NET ASSET VALUE | | | | |
Class A Shares: | | | | |
Net asset value and redemption price per share ($4,091,193 applicable to 331,100 shares of beneficial interest outstanding - Note 4) | | $ | 12.36 | |
Maximum sales charge, 1.50% of offering price | | | 0.19 | |
| | | | |
Maximum offering price per share | | $ | 12.55 | |
| | | | |
| |
Class I Shares: | | | | |
Net asset value, offering and redemption price per share ($41,858,622 applicable to 3,388,031 shares of beneficial interest outstanding - Note 4) | | $ | 12.35 | |
| | | | |
See notes to financial statements.
Semi-Annual Report 11
| | |
| STATEMENT OF OPERATIONS | | |
| |
Thornburg Low Duration Municipal Fund | | March 31, 2016 (Unaudited) |
| | | | |
INVESTMENT INCOME | | | | |
Interest income (net of premium amortized of $524,906) | | $ | 206,077 | |
| | | | |
| |
EXPENSES | | | | |
Investment advisory fees (Note 3) | | | 95,253 | |
Administration fees (Note 3) | | | | |
Class A Shares | | | 2,576 | |
Class I Shares | | | 10,876 | |
Distribution and service fees (Note 3) | | | | |
Class A Shares | | | 4,162 | |
Transfer agent fees | | | | |
Class A Shares | | | 13,262 | |
Class I Shares | | | 6,191 | |
Registration and filing fees | | | | |
Class A Shares | | | 14,354 | |
Class I Shares | | | 14,498 | |
Custodian fees (Note 3) | | | 14,025 | |
Professional fees | | | 22,480 | |
Accounting fees (Note 3) | | | 733 | |
Trustee fees | | | 946 | |
Other expenses | | | 2,389 | |
| | | | |
Total Expenses | | | 201,745 | |
Less: | | | | |
Expenses reimbursed by investment advisor (Note 3) | | | (61,840 | ) |
Investment advisory fees waived by investment advisor (Note 3) | | | (16,718 | ) |
| | | | |
Net Expenses | | | 123,187 | |
| | | | |
Net Investment Income | | | 82,890 | |
| | | | |
REALIZED AND UNREALIZED GAIN (LOSS) | | | | |
Net realized gain (loss) from investments | | | (18,130 | ) |
Net change in unrealized appreciation (depreciation) on investments | | | 30,075 | |
| | | | |
Net Realized and Unrealized Gain | | | 11,945 | |
| | | | |
Net Increase in Net Assets Resulting from Operations | | $ | 94,835 | |
| | | | |
See notes to financial statements.
12 Semi-Annual Report
| | |
| STATEMENTS OF CHANGES IN NET ASSETS | | |
| |
Thornburg Low Duration Municipal Fund | | |
| | | | | | | | |
| | | SIX MONTHS ENDED
MARCH 31, 2016* | | | YEAR ENDED
SEPTEMBER 30, 2015 | |
INCREASE (DECREASE) IN NET ASSETS FROM | | | | | | | | |
| | |
OPERATIONS | | | | | | | | |
Net investment income | | $ | 82,890 | | | $ | 112,321 | |
Net realized gain (loss) from investments | | | (18,130 | ) | | | (5,203 | ) |
Net unrealized appreciation (depreciation) on investments | | | 30,075 | | | | 24,676 | |
| | | | | | | | |
| | |
Net Increase (Decrease) in Net Assets Resulting from Operations | | | 94,835 | | | | 131,794 | |
| | |
DIVIDENDS TO SHAREHOLDERS | | | | | | | | |
From net investment income | | | | | | | | |
Class A Shares | | | (3,470 | ) | | | (4,414 | ) |
Class I Shares | | | (79,420 | ) | | | (107,907 | ) |
| | |
FUND SHARE TRANSACTIONS (NOTE 4) | | | | | | | | |
Class A Shares | | | 816,781 | | | | 519,307 | |
Class I Shares | | | 93,272 | | | | 29,065,721 | |
| | | | | | | | |
Net Increase in Net Assets | | | 921,998 | | | | 29,604,501 | |
| | |
NET ASSETS | | | | | | | | |
Beginning of Period | | | 45,027,817 | | | | 15,423,316 | |
| | | | | | | | |
| | |
End of Period | | $ | 45,949,815 | | | $ | 45,027,817 | |
| | | | | | | | |
See notes to financial statements.
Semi-Annual Report 13
| | |
| NOTES TO FINANCIAL STATEMENTS | | |
| |
Thornburg Low Duration Municipal Fund | | March 31, 2016 (Unaudited) |
NOTE 1 – ORGANIZATION
Thornburg Low Duration Municipal Fund (the “Fund”) is a diversified series of Thornburg Investment Trust (the “Trust”). The Trust is organized as a Massachusetts business trust under a Declaration of Trust dated June 3, 1987 and is registered as a diversified, open-end management investment company under the Investment Company Act of 1940, as amended. The Fund is currently one of twenty separate series of the Trust. Each series is considered to be a separate entity for financial reporting and tax purposes and bears expenses directly attributable to it. The Fund’s investment objective is to seek current income exempt from federal income tax, consistent with preservation of capital.
The Fund currently offers two classes of shares of beneficial interest: Class A and Institutional Class (“Class I”). Each class of shares of the Fund represents an interest in the same portfolio of investments, except that (i) Class A shares are sold subject to a front-end sales charge collected at the time the shares are purchased and bear a service fee, (ii) Class I shares are sold at net asset value without a sales charge at the time of purchase and may be subject to a service fee, and (iii) the respective classes may have different reinvestment privileges and conversion rights. Additionally, the Fund may allocate among its classes certain expenses, to the extent allocable to specific classes, including transfer agent fees, government registration fees, certain printing and postage costs, and administrative and legal expenses. Currently, class specific expenses of the Fund are limited to service and distribution fees, administration fees, and certain registration and transfer agent expenses.
NOTE 2 – SIGNIFICANT ACCOUNTING POLICIES
The following is a summary of significant accounting policies followed by the Fund in the preparation of its financial statements. The Fund is an investment company and prepares its financial statements in conformity with United States generally accepted accounting principles (“GAAP”), including investment company accounting and reporting guidance in the Financial Accounting Standards Board (the “FASB”) Accounting Standard Codification Topic 946. The preparation of financial statements in conformity with GAAP requires management to make estimates and assumptions that affect the reported amounts of assets and liabilities and disclosure of contingent assets and liabilities at the date of the financial statements and the reported amounts of increases (decreases) in net assets from operations during the reporting period. Actual results could differ from those estimates.
Significant accounting policies of the Trust are as follows:
Valuation Policy and Procedures: The Trustees of the Trust have appointed Thornburg Investment Management, Inc. (the “Advisor”) to assist the Trustees in obtaining market values for portfolio investments, perform certain evaluation and supervisory functions respecting professional pricing service providers appointed by the Trustees’ Audit Committee (the “Audit Committee”) to assist in determining fair values for portfolio investments, assist in calculating fair values for portfolio investments in certain circumstances, and to perform other functions in connection with the valuation of investments. The Advisor acts through its Valuation and Pricing Committee (the “Committee”) and other employees of the Advisor. The Committee regularly reviews its own valuation calculations, as well as the valuations, valuation techniques and services furnished by pricing service providers, considers circumstances which may require valuation calculations by the Committee, and reviews previous valuation calculations. The Committee reports to the Audit Committee on the Committee’s activities, the performance of pricing service providers, and other matters relating to valuation of portfolio investments.
In those instances when the Committee assists in calculating a fair value for a portfolio investment, the Committee seeks to determine the price that the Fund would reasonably expect to receive upon a sale of the investment in an orderly transaction between market participants on the valuation date. The Committee customarily utilizes quotations from securities broker dealers in calculating valuations, but also may utilize prices obtained from pricing service providers or other methods approved by the Audit Committee. Because fair values calculated by the Committee are estimates, the calculation of a value for an investment may differ from the price that would be realized by the Fund upon a sale of the investment, and the difference could be material to the Fund’s financial statements. The Committee’s calculation of a fair value for an investment may also differ from the prices obtained by other persons (including other mutual funds) for the investment.
Valuation of Investments: Debt obligations held by the Fund which are not listed or traded on exchanges or for which no reported market exists are ordinarily valued at the valuation obtained from a pricing service provider approved by the Audit Committee.
In any case when a pricing service provider fails to provide a valuation for a debt obligation held by the Fund, the Committee calculates a fair value for the obligation using alternative methods under procedures approved by the Audit Committee. Additionally, in cases when management believes that a valuation obtained from a pricing service provider merits review for significant reasons, the Committee decides whether or not to use the valuation calculated by the pricing service provider or to use an alternative method approved by the Audit Committee to calculate a fair value for the obligation.
Valuation Measurements: The Fund categorizes its investments based upon the inputs used in valuing those investments, according to a three-level hierarchy established in guidance from the FASB. Categorization of investments using this hierarchy is intended by the FASB to maximize the use of observable inputs in valuing investments and minimize the use of unobservable inputs by requiring that
14 Semi-Annual Report
| | |
| NOTES TO FINANCIAL STATEMENTS, CONTINUED | | |
| |
Thornburg Low Duration Municipal Fund | | March 31, 2016 (Unaudited) |
the most observable inputs be used when available. Observable inputs are those that market participants would use in valuing an investment based on available market information. Unobservable inputs are those that reflect assumptions about the information market participants would use in valuing an investment. An investment’s level within the hierarchy is based on the lowest level input that is deemed significant to the valuation. The methodologies and inputs used to value investments are not necessarily indications of the risk or liquidity associated with those investments.
Various inputs are used in calculating valuations for the Fund’s investments. These inputs are generally summarized according to the three-level hierarchy below:
Level 1: Quoted prices in active markets for identical investments.
Level 2: Other direct or indirect significant observable inputs (including quoted prices for similar investments in active markets and other observable inputs, such as interest rates, prepayment rates, credit risk, etc.).
Level 3: Significant unobservable inputs (including the Committee’s own assumptions in calculating the fair values of investments).
Valuations for debt obligations held by the Fund are typically calculated by pricing service providers approved by the Audit Committee and are characterized as Level 2 within the valuation hierarchy.
In a limited number of cases the Committee calculates a fair value for investments using broker quotations or other methods approved by the Audit Committee. When the Committee uses a single broker quotation to calculate a fair value for an investment without other significant observable inputs, or if a fair value is calculated using other significant inputs that are considered unobservable, the investment is characterized as Level 3 within the hierarchy. Other significant unobservable inputs used to calculate a fair value in these instances might include an income-based valuation approach which considers discounted anticipated future cash flows from the investment, and application of discounts due to the nature or duration of any restrictions on the disposition of the investment.
Valuations based upon the use of inputs from Levels 1, 2 or 3 may not represent the actual price received upon the disposition of an investment, and the Fund may receive a price that is lower than the valuation based upon these inputs when it sells the investment.
The following table displays a summary of the fair value hierarchy measurements of the Fund’s investments as of March 31, 2016. In any instance when valuation inputs from more than one level are used to determine the fair value of a specific investment, the investment is placed in the level of the table based upon the lowest level input that is significant in determining the fair value of the investment:
| | | | | | | | | | | | | | | | |
| | | FAIR VALUE MEASUREMENTS AT MARCH 31, 2016 | |
| | | TOTAL | | | LEVEL 1 | | | LEVEL 2 | | | LEVEL 3 | |
Assets | | | | | | | | | | | | | | | | |
Investments in Securities | | | | | | | | | | | | | | | | |
Municipal Bonds | | $ | 45,584,229 | | | $ | — | | | $ | 45,584,229 | | | $ | — | |
| | | | | | | | | | | | | | | | |
Total Investments in Securities | | $ | 45,584,229 | | | $ | — | | | $ | 45,584,229 | | | $ | — | |
In accordance with the guidance prescribed in Accounting Standards Update No. 2011-04, it is the policy of the Fund to recognize transfers between levels and the underlying events which caused the movement. The Fund recognized no transfers between levels for the six months ended March 31, 2016.
Federal Income Taxes: It is the policy of the Trust to comply with the provisions of the Internal Revenue Code applicable to “regulated investment companies” and to distribute to shareholders substantially all taxable income including net realized gains on investments (if any), and tax exempt income of the Fund. Therefore, no provision for federal income tax is required.
Management reviews each uncertain tax position believed to be material to the preparation of the Fund’s financial statements, to assess if it is more likely than not that the position would be sustained upon examination, based upon the technical merits of the position. As of March 31, 2016, management has not identified any such position for which an asset or liability must be reflected in the Statement of Assets and Liabilities. The Fund’s tax returns remain subject to examination for three years after filing.
When-Issued and Delayed Delivery Transactions: The Fund may engage in when-issued or delayed delivery transactions. To the extent the Fund engages in such transactions, it will do so for the purpose of acquiring portfolio investments consistent with the Fund’s investment objectives and not for the purpose of investment leverage or to speculate on interest rate and, or market changes. At the time the Fund makes a commitment to purchase an investment on a when-issued or delayed delivery basis, the Fund will record the transaction and reflect the value in determining its net asset value. When effecting such transactions, assets of an amount sufficient to make payment for the portfolio investments to be purchased will be segregated on the Fund’s records on the trade date. Investments purchased on a when-issued or delayed delivery basis do not earn interest until the settlement date.
Semi-Annual Report 15
| | |
| NOTES TO FINANCIAL STATEMENTS, CONTINUED | | |
| |
Thornburg Low Duration Municipal Fund | | March 31, 2016 (Unaudited) |
Dividends: Net investment income of the Fund is declared daily as a dividend on shares for which the Fund has received payment. Dividends are paid monthly and are reinvested in additional shares of the Fund at net asset value per share at the close of business on the dividend payment date, or at the shareholder’s option, paid in cash. Net realized capital gains, to the extent available, will be distributed at least annually.
General: Investment transactions are accounted for on a trade date basis. Interest income is accrued as earned. Premiums and discounts on investments purchased are amortized to call dates or maturity dates of the respective investments. Realized gains and losses from the sale of investments are recorded on an identified cost basis. Net investment income (other than class specific expenses) and realized and unrealized gains and losses are allocated daily to each class of shares based upon the relative net asset value of outstanding shares (or the value of the dividend-eligible shares, as appropriate) of each class of shares at the beginning of the day (after adjusting for the current capital shares activity of the respective class). Expenses common to all Funds are allocated among the Funds comprising the Trust based upon their relative net asset values or other appropriate allocation methods.
Guarantees and Indemnifications: Under the Trust’s organizational documents (and under separate agreements with the independent Trustees), its officers and Trustees are indemnified against certain liabilities arising out of the performance of their duties to the Fund. Additionally, in the normal course of business the Trust enters into contracts with service providers that contain general indemnification clauses. The Trust’s maximum exposure under these arrangements is unknown. However, based on experience, the Trust expects the risk of loss to be remote.
NOTE 3 – INVESTMENT ADVISORY FEE AND OTHER TRANSACTIONS WITH AFFILIATES
Pursuant to an investment advisory agreement, the Advisor serves as the investment advisor and performs services for the Fund for which the fees are payable at the end of each month. For the six months ended March 31, 2016, these fees were payable at annual rates ranging from .40 of 1% to .225 of 1% per annum of the average daily net assets of the Fund depending on the Fund’s asset size. The Fund pays to the Advisor the costs of personnel who perform certain accounting services for the Fund. For the six months ended March 31, 2016 the Fund paid $733 to the Advisor for these accounting services. The Trust has also entered into administrative service agreements with the Advisor, whereby the Advisor will perform certain administrative services for the shareholders of each class of the Fund’s shares, and for which fees will be payable at an annual rate of up to .125 of 1% per annum of the average daily net assets attributable to each class of shares.
The Trust has an underwriting agreement with Thornburg Securities Corporation (the “Distributor”), an affiliate of the Advisor, which acts as the distributor of the Fund’s shares. For the six months ended March 31, 2016, the Distributor has advised the Fund that it earned net commissions aggregating $16 from the sale of Class A shares of the Fund.
Pursuant to a service plan under Rule 12b-1 of the Investment Company Act of 1940, the Fund may reimburse to the Advisor an amount not to exceed .20 of 1% per annum of the average daily net assets attributable to each Class of shares of the Fund for payments made by the Advisor to securities dealers and other financial institutions to obtain various shareholder and distribution related services. For the six months ended March 31, 2016, there were no 12b-1 service plan fees charged for Class I shares. The Advisor may pay out of its own resources additional expenses for distribution of the Fund’s shares and shareholder services.
The Advisor and Distributor have contractually agreed to waive fees and reimburse expenses incurred by the Fund so that actual expenses of certain share classes do not exceed levels as specified in the Fund’s most recent prospectus. The agreement may be terminated by the Fund at any time, but may not be terminated by the Advisor or Distributor before February 1, 2017, unless the Advisor ceases to be the investment advisor to the Trust or the Distributor ceases to be the distributor of the Fund prior to that date. The Advisor and Distributor retain the right to be repaid by the Fund for fee waivers and expense reimbursements if expenses fall below the contractual limit prior to the end of the fiscal year.
For the six months ended March 31, 2016, the Advisor voluntarily waived Fund level investment expenses of $16,718. The Advisor contractually reimbursed certain class specific expenses, administrative fees, and distribution fees of $30,233 for Class A shares and $31,607 for Class I shares.
Certain officers and Trustees of the Trust are also officers or directors of the Advisor and Distributor. The compensation of independent Trustees is borne by the Trust.
The percentage of direct investments in the Fund held by affiliated Trustees and Officers and the Advisor is approximately 68.25%.
The Fund may purchase or sell securities from or to an affiliated fund, provided the affiliation is due solely to having a common investment advisor, common officers, or common trustees, and provided that all such transactions will comply with Rule 17a-7 under the 1940 Act. For the six months ended March 31, 2016, the Fund had no transactions with affiliated funds.
16 Semi-Annual Report
| | |
| NOTES TO FINANCIAL STATEMENTS, CONTINUED | | |
| |
Thornburg Low Duration Municipal Fund | | March 31, 2016 (Unaudited) |
NOTE 4 – SHARES OF BENEFICIAL INTEREST
At March 31, 2016, there were an unlimited number of shares with no par value of beneficial interest authorized. Transactions in shares of beneficial interest were as follows:
| | | | | | | | | | | | | | | | |
| | | SIX MONTHS ENDED
MARCH 31, 2016 (UNAUDITED) | | | PERIOD ENDED
SEPTEMBER 30, 2015 (AUDITED) | |
| | | SHARES | | | AMOUNT | | | SHARES | | | AMOUNT | |
Class A Shares | | | | | | | | | | | | | | | | |
Shares sold | | | 159,791 | | | $ | 1,973,515 | | | | 172,222 | | | $ | 2,123,915 | |
Shares issued to shareholders in reinvestment of dividends | | | 279 | | | | 3,445 | | | | 350 | | | | 4,315 | |
Shares repurchased | | | (93,961 | ) | | | (1,160,179 | ) | | | (130,474 | ) | | | (1,608,923 | ) |
| | | | | | | | | | | | | | | | |
Net increase (decrease) | | | 66,109 | | | $ | 816,781 | | | | 42,098 | | | $ | 519,307 | |
| | | | | | | | | | | | | | | | |
| | | | |
Class I Shares | | | | | | | | | | | | | | | | |
Shares sold | | | 618,691 | | | $ | 7,641,797 | | | | 3,405,347 | | | $ | 42,016,558 | |
Shares issued to shareholders in reinvestment of dividends | | | 6,259 | | | | 77,296 | | | | 8,471 | | | | 104,442 | |
Shares repurchased | | | (617,946 | ) | | | (7,625,821 | ) | | | (1,059,361 | ) | | | (13,055,279 | ) |
| | | | | | | | | | | | | | | | |
Net increase (decrease) | | | 7,004 | | | $ | 93,272 | | | | 2,354,457 | | | $ | 29,065,721 | |
| | | | | | | | | | | | | | | | |
NOTE 5 – INVESTMENT TRANSACTIONS
For the six months ended March 31, 2016, the Fund had purchase and sale transactions of investments (excluding short-term investments) of $8,249,982 and $5,218,000, respectively.
NOTE 6 – INCOME TAXES
At March 31, 2016, information on the tax components of capital was as follows:
| | | | |
Cost of investments for tax purposes | | $ | 45,495,491 | |
| | | | |
Gross unrealized appreciation on a tax basis | | $ | 104,483 | |
Gross unrealized depreciation on a tax basis | | | (15,745 | ) |
| | | | |
Net unrealized appreciation (depreciation)on investments (tax basis) | | $ | 88,738 | |
| | | | |
At March 31, 2016, the Fund had deferred tax basis capital losses occurring subsequent to October 31, 2014, through September 30, 2015, of $5,203. For tax purposes, such losses will be recognized in the year ending September 30, 2016.
OTHER NOTES
Risks: The Fund’s investments subject it to risks including, but not limited to, credit risk, interest rate risk, management risk, market and economic risk, and liquidity risk. Please see the Fund’s prospectus for a discussion of the risks associated with an investment in the Fund.
Subsequent Events: Fund management believes no events have occurred between March 31, 2016 and the date of issuance of the financial statements that require adjustment to or disclosure in the accompanying financial statements.
Semi-Annual Report 17
FINANCIAL HIGHLIGHTS
Thornburg Low Duration Municipal Fund
| | | | | | | | | | | | | | | | | | | | | | | | | | | | | | | | | | | | | | | | | | | | | | | | | | |
| | | PER SHARE PERFORMANCE (FOR A SHARE OUTSTANDING THROUGHOUT THE PERIOD) | | | RATIOS TO AVERAGE NET ASSETS | | | SUPPLEMENTAL DATA | |
UNLESS
OTHERWISE
NOTED,
PERIODS
ARE
FISCAL
YEARS
ENDED
SEPT. 30, | | NET ASSET
VALUE
BEGINNING
OF PERIOD | | | NET
INVESTMENT
INCOME
(LOSS)+ | | NET
REALIZED
&
UNREALIZED
GAIN (LOSS)
ON
INVESTMENTS | | | TOTAL FROM
INVESTMENT
OPERATIONS | | DIVIDENDS
FROM NET
INVESTMENT
INCOME | | | DIVIDENDS
FROM NET
REALIZED
GAINS | | TOTAL
DIVIDENDS | | | NET
ASSET
VALUE
END
OF
PERIOD | | | NET
INVESTMENT
INCOME
(LOSS)
(%) | | | EXPENSES,
AFTER
EXPENSE
REDUCTIONS
(%) | | | EXPENSES,
AFTER
EXPENSE
REDUCTIONS
AND
NET OF
CUSTODY
CREDITS
(%) | | | EXPENSES,
BEFORE
EXPENSE
REDUCTIONS
(%) | | | TOTAL
RETURN
(%)(a) | | PORTFOLIO
TURNOVER
RATE (%)(a) | | NET
ASSETS
AT END
OF
PERIOD
(THOUSANDS) | |
CLASS A SHARES | | | | | | | | | | | | | | | | | | | | | | | | | | | | | | | | | | | | | | | | | | | | |
2016(b)(c) | | $ | 12.35 | | | 0.01 | | | 0.01 | | | 0.02 | | | (0.01 | ) | | — | | | (0.01 | ) | | $ | 12.36 | | | | 0.17 | (d) | | | 0.70 | (d) | | | 0.70 | (d) | | | 2.24 | (d) | | 0.16 | | 13.66 | | $ | 4,091 | |
2015(c) | | $ | 12.34 | | | 0.02 | | | 0.01 | | | 0.03 | | | (0.02 | ) | | — | | | (0.02 | ) | | $ | 12.35 | | | | 0.15 | | | | 0.67 | | | | 0.67 | | | | 2.85 | | | 0.22 | | 15.75 | | $ | 3,273 | |
2014(c)(e) | | $ | 12.31 | | | 0.02 | | | 0.03 | | | 0.05 | | | (0.02 | ) | | — | | | (0.02 | ) | | $ | 12.34 | | | | 0.20 | (d) | | | 0.66 | (d) | | | 0.65 | (d) | | | 3.14 | (d) | | 0.40 | | 4.54 | | $ | 2,751 | |
CLASS I SHARES | | | | | | | | | | | | | | | | | | | | | | | | | | | | | | | | | | | | | | | | | | | | |
2016(b) | | $ | 12.35 | | | 0.02 | | | — | (f) | | 0.02 | | | (0.02 | ) | | — | | | (0.02 | ) | | $ | 12.35 | | | | 0.37 | (d) | | | 0.50 | (d) | | | 0.50 | (d) | | | 0.72 | (d) | | 0.18 | | 13.66 | | $ | 41,859 | |
2015 | | $ | 12.34 | | | 0.04 | | | 0.01 | | | 0.05 | | | (0.04 | ) | | — | | | (0.04 | ) | | $ | 12.35 | | | | 0.32 | | | | 0.50 | | | | 0.50 | | | | 0.82 | | | 0.40 | | 15.75 | | $ | 41,755 | |
2014(e) | | $ | 12.31 | | | 0.04 | | | 0.03 | | | 0.07 | | | (0.04 | ) | | — | | | (0.04 | ) | | $ | 12.34 | | | | 0.42 | (d) | | | 0.44 | (d) | | | 0.44 | (d) | | | 1.77 | (d) | | 0.56 | | 4.54 | | $ | 12,672 | |
| (a) | Not annualized for periods less than one year. |
| (b) | Unaudited Six Month Period Ended March 31. |
| (c) | Sales loads are not reflected in computing total return. |
| (e) | Fund commenced operations on December 30, 2013. |
| (f) | Net realized & unrealized gain (loss) on investments was less than $0.01 per share. |
| + | Based on weighted average shares outstanding. |
See notes to financial statements.
| | | | |
| 18 Semi-Annual Report | | | | Semi-Annual Report 19 |
| | |
| EXPENSE EXAMPLE | | |
| |
Thornburg Low Duration Municipal Fund | | March 31, 2016 (Unaudited) |
As a shareholder of the Fund, you incur two types of costs:
| | (1) | transaction costs, including |
(a) sales charges (loads) on purchase payments, for Class A shares;
(b) a deferred sales charge on redemptions of any part or all of a purchase of $1 million of Class A shares within 12 months of purchase;
| | (2) | ongoing costs, including management fees; distribution and/or service (12b-1) fees; and other Fund expenses. |
This example is intended to help you understand your ongoing costs (in dollars) of investing in the Fund and to compare these costs with the ongoing costs of investing in other mutual funds.
The example is based on a $1,000 investment beginning on October 1, 2015, and held until March 31, 2016.
| | | | | | | | | | | | |
| | | BEGINNING
ACCOUNT VALUE
10/1/15 | | | ENDING
ACCOUNT VALUE
3/31/16 | | | EXPENSES PAID
DURING PERIOD†
10/1/15–3/31/16 | |
Class A Shares | | | | | | | | | | | | |
Actual | | $ | 1,000.00 | | | $ | 1,001.60 | | | $ | 3.50 | |
Hypothetical* | | $ | 1,000.00 | | | $ | 1,021.50 | | | $ | 3.54 | |
Class I Shares | | | | | | | | | | | | |
Actual | | $ | 1,000.00 | | | $ | 1,001.80 | | | $ | 2.50 | |
Hypothetical* | | $ | 1,000.00 | | | $ | 1,022.50 | | | $ | 2.53 | |
| † | Expenses are equal to the annualized expense ratio for each class (A: 0.70%; I: 0.50%) multiplied by the average account value over the period, multiplied by 183/366 to reflect the one-half year period. |
| * | Hypothetical assumes a rate of return of 5% per year before expenses. |
ACTUAL EXPENSES
For each class of shares, the first line of the accompanying table provides information about actual account values and actual expenses. You may use the information in this line, together with the amount you invested, to estimate the expenses that you paid over the period. Simply divide your account value by $1,000 (for example, an $8,600 account value divided by $1,000 = 8.6), then multiply the result by the number in the first line for your class of shares under the heading entitled “Expenses Paid During Period” to estimate the expenses you paid on your account during this period.
HYPOTHETICAL EXAMPLE FOR COMPARISON PURPOSES
For each class of shares, the second line of the accompanying table provides information about hypothetical account values and hypothetical expenses based on the Fund’s actual expense ratio and an assumed rate of return of 5% per year before expenses, which is not the Fund’s actual return. The hypothetical account values and expenses may not be used to estimate the actual ending account balance or expenses you paid for the period. You may use this information to compare the ongoing costs of investing in the Fund and other funds. To do so, compare this 5% hypothetical example with the 5% hypothetical examples that appear in the shareholder reports of the other funds.
Please note that the expenses shown in the table are meant to highlight your ongoing costs only and do not reflect any transactional costs, such as sales charges (loads), redemption fees, or exchange fees. Therefore, the second line of the table for each class of shares is useful in comparing ongoing costs only, and will not help you determine the relative total costs of owning different funds. In addition, if these transactional costs were included, your costs would have been higher.
20 Semi-Annual Report
| | |
| OTHER INFORMATION | | |
| |
Thornburg Low Duration Municipal Fund | | March 31, 2016 (Unaudited) |
PORTFOLIO PROXY VOTING
Policies and Procedures:
The Trust has delegated to Thornburg Investment Management, Inc. (the “Advisor”) voting decisions respecting proxies for the Fund’s voting securities. The Advisor makes voting decisions in accordance with its Proxy Voting Policy. A description of the Policy is available (i) without charge, upon request, by calling the Advisor toll-free at 1-800-847-0200, (ii) on the Thornburg website at www.thornburg. com, and (iii) on the Securities and Exchange Commission’s website at www.sec.gov.
Information regarding how proxies were voted is available on or before August 31 of each year for the twelve months ending the preceding June 30. This information is available (i) without charge, upon request by calling the Advisor toll-free at 1-800-847-0200, (ii) on the Thornburg website at www.thornburg.com, and (iii) on the Securities and Exchange Commission’s website at www.sec.gov.
AVAILABILITY OF QUARTERLY PORTFOLIO SCHEDULE
The Fund files with the Securities and Exchange Commission schedules of its portfolio holdings on Form N-Q for the first and third quarters of each fiscal year. The Fund’s Forms N-Q are available on the Commission’s website at www. sec. gov, or may be reviewed and copied at the Commission’s Public Reference Room in Washington, D. C. Information on the operation of the Public Reference Room may be obtained by calling 1-800-SEC-0330. The Fund also makes this information available on its website at www.thornburg. com/download or upon request by calling 1-800-847-0200.
Semi-Annual Report 21
TRUSTEES’ STATEMENT TO SHAREHOLDERS
Revised and Readopted September 15, 2015
The Trustees believe current and prospective shareholders should know how we discharge our responsibilities in supervising the Funds’ investment advisor and in reviewing the advisor’s contract for renewal. Since 2005, we have issued a statement which sets out clearly the three principal guidelines that we follow in supervising the Trust’s investment advisor on your behalf. In accordance with our customary practice, in September of 2015 we again reviewed our statement and concluded we should reissue this statement outlining the principal features of our supervision of the advisor’s performance of investment management services for the Funds.
We begin with the premise that each shareholder selected his or her Fund because its investments are managed by the investment advisor identified in the prospectus and in accordance with the objective and policies described in the prospectus. We realize, as each of you do, that if you believe that your Fund’s stated objective and policies no longer serve your personal investment goals, you can sell your shares and leave the Fund.
Therefore, we believe that our primary supervisory task – our principal obligation to you – is to assess the nature and quality of the advisor’s services, and to confirm that the advisor actively and competently pursues the Fund’s objective, in accordance with the policies set out in the prospectus. To do this, we meet regularly with management to review your Fund’s portfolio and to discuss the advisor’s specific actions and judgments in pursuing the Fund’s objective. We do not substitute our own judgment for the advisor’s decisions in selecting investments; the advisor is paid to exercise its informed judgment on investment decisions, and we seek to confirm, in reviewing the advisor’s performance, that the advisor is doing just that.
Second, we are conscious of costs and the effect that costs have on shareholders’ returns. We try to make sure that your Fund’s fees and costs are reasonable in relationship to the services rendered and that they are generally in line with those charged by other expert investment advisors, consistent with our belief that the Fund’s investors searched for and expect that expertise and attention and have decided to pay a reasonable price for it. We do not put the management contract “out to bid” as a matter of course, and we would not do so unless we had concluded that the advisor materially had failed to pursue the Fund’s objectives in accordance with its policies, or for other equally important reasons. We believe that any other approach would be inconsistent with your interests and contrary to your expectations when you bought shares of the Fund in the first place.
Finally, because we believe that most Thornburg Fund shareholders have invested with a long-term perspective, we try not to focus too much on the fashions of the moment and on short-term performance. The market will not favor any specific investment objective or set of policies at all times and under all economic circumstances. A fund will experience periods of both high and low returns relative to other funds and other investments. Even if one of our Funds is not favored by the market at a particular time, we believe that the advisor is nonetheless obliged to remain true to the Fund’s objective and policies, and we watch to see that it does so.
Trustees of Thornburg Investment Trust
22 Semi-Annual Report
THORNBURG FUND FAMILY
Thornburg Investment Management is a privately-owned global investment firm that offers a range of solutions for retail and institutional investors. Founded in 1982 and headquartered in Santa Fe, New Mexico, we manage approximately $54 billion (as of March 31, 2016) across eight equity and 11 bond mutual funds, separate accounts for high-net-worth investors and institutional accounts, and five UCITS funds for non-U.S. investors.
The fund outlined in this report is one of many equity and fixed-income products available from Thornburg Investment Management.
EQUITY FUNDS
| | • | | Thornburg Core Growth Fund |
| | • | | Thornburg International Value Fund |
| | • | | Thornburg Better World International Fund |
| | • | | Thornburg International Growth Fund |
| | • | | Thornburg Developing World Fund |
| | • | | Thornburg Investment Income Builder Fund |
| | • | | Thornburg Global Opportunities Fund |
FIXED INCOME FUNDS
| | • | | Thornburg Low Duration Income Fund |
| | • | | Thornburg Limited Term U.S. Government Fund |
| | • | | Thornburg Limited Term Income Fund |
| | • | | Thornburg Strategic Income Fund |
| | • | | Thornburg Low Duration Municipal Fund |
| | • | | Thornburg Limited Term Municipal Fund |
| | • | | Thornburg Intermediate Municipal Fund |
| | • | | Thornburg California Limited Term Municipal Fund |
| | • | | Thornburg New Mexico Intermediate Municipal Fund |
| | • | | Thornburg New York Intermediate Municipal Fund |
| | • | | Thornburg Strategic Municipal Income Fund |
Before investing, carefully consider the Fund’s investment goals, risks, charges, and expenses. For a prospectus or summary prospectus containing this and other information, contact your financial advisor or visit thornburg.com. Read it carefully before investing.
For additional information, please visit thornburg.com
Thornburg Investment Management, Inc. 2300 North Ridgetop Road, Santa Fe, NM 87506
Semi-Annual Report 23
This Semi-Annual Report is submitted for the general information of shareholders of the Fund. It is not authorized for distribution to prospective investors in the Fund unless preceded or accompanied by an effective prospectus.
| | | | |
| Investment Advisor: | | Distributor: | | |
| Thornburg Investment Management® | | Thornburg Securities Corporation® | | |
| 800.847.0200 | | 800.847.0200 | | TH3053 |
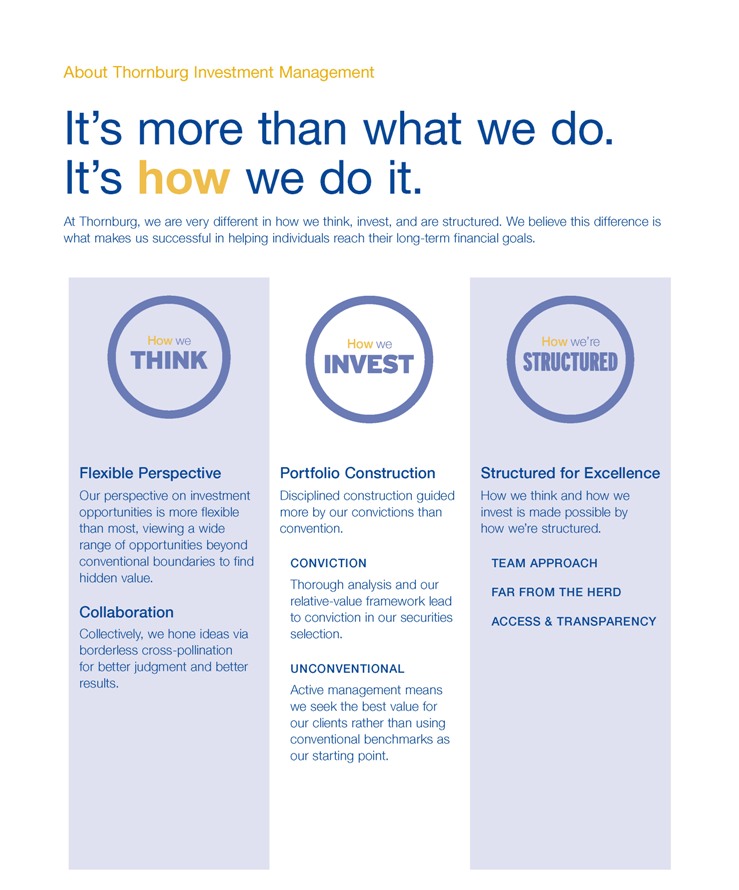
About Thornburg Investment Management
It’s more than what we do. It’s how we do it.
At Thornburg, we are very different in how we think, invest, and are structured. We believe this difference is what makes us successful in helping individuals reach their long-term financial goals.
How we THINK How we INVEST How we’re STRUCTURED
Flexible Perspective
Our perspective on investment opportunities is more flexible than most, viewing a wide range of opportunities beyond conventional boundaries to find hidden value.
Collaboration
Collectively, we hone ideas via borderless cross-pollination for better judgment and better results.
Portfolio Construction
Disciplined construction guided more by our convictions than convention.
CONVICTION
Thorough analysis and our relative-value framework lead to conviction in our securities selection.
UNCONVENTIONAL
Active management means we seek the best value for our clients rather than using conventional benchmarks as our starting point.
Structured for Excellence
How we think and how we invest is made possible by how we’re structured.
TEAM APPROACH
FAR FROM THE HERD
ACCESS & TRANSPARENCY
2 Semi-Annual Report
Semi-Annual Report
Thornburg Limited Term Municipal Fund
March 31, 2016
| | | | |
Share Class | | NASDAQ Symbol | | CUSIP |
Class A | | LTMFX | | 885-215-459 |
Class C | | LTMCX | | 885-215-442 |
Class I | | LTMIX | | 885-215-434 |
Minimum investments for Class I shares may be higher than those for other classes. Class I shares may not be available to all investors.
Investments carry risks, including possible loss of principal. Portfolios investing in bonds have the same interest rate, inflation, and credit risks that are associated with the underlying bonds. The value of bonds will fluctuate relative to changes in interest rates, decreasing when interest rates rise. Unlike bonds, bond funds have ongoing fees and expenses. Please see the Fund’s prospectus for a discussion of the risks associated with an investment in the Fund. Investments in the Funds are not FDIC insured, nor are they bank deposits or guaranteed by a bank or any other entity.
The laddering strategy does not assure or guarantee better performance and cannot eliminate the risk of investment losses.
Semi-Annual Report 3
LETTER TO SHAREHOLDERS
| | |
Thornburg Limited Term Municipal Fund | | March 31, 2016 (Unaudited) |
April 11, 2016
Dear Fellow Shareholder:
We are pleased to present the semi-annual report for Thornburg Limited Term Municipal Fund. The net asset value (NAV) of the Class A shares increased by nine cents to $14.61 per share during the six months ended March 31, 2016. If you were with us for the entire period, you received dividends of 11.25 cents per share. If you reinvested your dividends, you received 11.29 cents per share. Dividends were lower for Class C shares and higher for Class I shares, to account for varying class-specific expenses. The Class A shares underperformed the Fund’s benchmark index, with a negative 1.40% total return (without sales charge) for the six months ended March 31, 2016, compared to the 1.80% total return for the BofA Merrill Lynch 1-10 Year U.S. Municipal Securities Index.
Throughout the six-month period, the Fund maintained a lower risk posture vis-a-vis interest rates than its benchmark; the Fund’s average effective duration (a measure of interest-rate sensitivity) was 3.31 years, compared to 3.80 years for the benchmark. The shorter duration hurt relative price performance by 0.08%. The Fund’s position along the yield curve added 0.03% and sector selection added 0.23% of relative price performance. Our underweight in high-quality bonds added 0.05% of relative price performance. Other factors include the amortization of bond premiums and accretion of discounts, which is not an active management decision but rather a standard accounting practice—and the largest component of this category. We also include the effects of security selection and of price change derived from factors we cannot account for (statistically: “unexplained error”). Together, these three account for 0.75% of price performance relative to the index.
Global Fears Sway the Municipal Markets
The past six months have been a roller-coaster ride for the municipal market. During the last quarter of 2015, it seemed that every day was spent anxiously awaiting the first Federal Reserve rate increase—for what seemed like an eternity. When that rate increase finally came, it was met with a yawn. Markets quickly reminded investors that while the Federal Reserve (the Fed) has control over short-term rates, the market forces of supply and demand for bonds have a much heavier influence on interest rates—especially long-term rates.
As in life, expectations in the bond markets mean a lot. And perhaps more important than the Fed’s initial rate hike was its stated intent to raise rates four additional times in 2016. The expectation for higher rates evaporated almost immediately after the Fed’s statement, with the release of weaker-than-expected economic data, collapsing commodity prices, an emerging-markets stock rout, and profound weakness in Europe, with the European Central Bank retrenching in its effort to drive European rates lower, spurring fears of deflation.
A Roller-Coaster Ride to Start the Year
The beginning of 2016 proved volatile for equity markets domestically and globally, and the fixed income markets followed suit. The 10-year U.S. Treasury stood at a respectable 2.27% at the end of 2015. But within six weeks, that rate fell 0.61% to 1.66%, before bouncing back to 1.77% by March 31, 2016.
Chart I Credit Spreads: Investors Are Not Being Paid to Assume the Risk
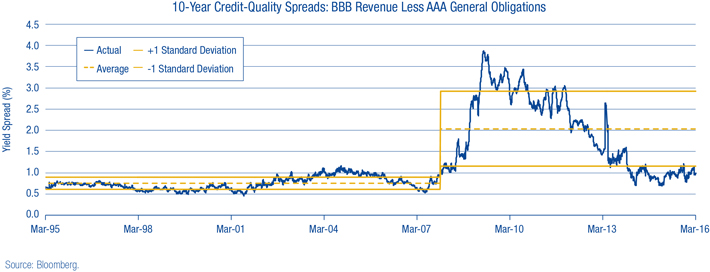
4 Semi-Annual Report
LETTER TO SHAREHOLDERS,
CONTINUED
| | |
Thornburg Limited Term Municipal Fund | | March 31, 2016 (Unaudited) |
As we noted, the Fed has backed off of its initial intent to raise rates four times in a stepped-up fashion. Rates will probably remain low and income elusive. Unfortunately, municipal bond investors have only a few “levers” to pull to seek higher income. The most effective two are credit quality and duration. An investor looking for yield can always buy a bond with a longer maturity—the duration lever. And bonds of lower credit quality can be purchased to drive up yield—the credit quality lever. In both instances, the investor assumes risk in hope of higher returns.
At Thornburg, we always evaluate both of these options as a means to increase the total return of the portfolios, but over the past six months, as in the prior six months, we found them less than optimal. Real rates (interest rates after inflation is subtracted) remained low during the entire period, and the municipal yield curve was fairly flat. Investors who reached for yield by buying longer maturities gained very little relative to the duration risk that comes with longer-dated bonds. And the amount investors are compensated to invest in lower-rated bonds is minimal; credit spreads remain at extremely tight levels. Investors who purchased debt from lower-rated issuers were essentially buying weaker credits at very expensive levels. Chart I on the previous page shows credit spreads remaining near historically low levels, offering investors little compensation for risk assumed. Not a great strategy!
We believe that the only logical thing to do when you’re not being paid to take risk is to take less of it. That is exactly what we have been seeking to do in Thornburg Limited Term Municipal Fund for quite some time. The Fund is being managed on the bearish (shorter) end of its duration range. We have also actively sought to increase the average credit quality, at least at the margins. Cash reserve positions are being managed in a manner we view as conservative.
Continued volatility seems a certainty. That can manifest via interest-rate movements, or changing credit spreads. While the likelihood of the Fed raising rates appears low, given the aforementioned anemic economic growth in the U.S. and abroad, investors are wise to recall that rates moved up over 1.00% in 2013 without the Fed having taken any action whatsoever. It may be unlikely, but that does not mean it’s a probability that can be ignored. And any event that causes spreads to widen appreciably may prove detrimental to an investor who assumed undue credit risk in search of return.
We will do what we have always done with Thornburg Limited Term Municipal Fund: provide you with a tax-exempt laddered portfolio that aims to generate attractive levels of income, while attempting to preserve principal and minimize volatility. And, of course, we’ll seek to only assume the risk for which we believe we are adequately compensated.
Staying Faithful to Thornburg’s Tested Approach
While a focus on risk mitigation may not make the sexiest marketing story, we believe it is in the best long-term interest of shareholders. And to any investor considering abandoning municipal bonds for the promise of higher returns elsewhere, we remind you that if the first quarter of 2016 has taught us anything, it is that in a volatile market, an appropriate asset allocation may save you a few sleepless nights.
We will continue to strive to manage your assets to fulfill the Fund’s objectives.
Sincerely,
| | | | |
 | |  | | |
| Christopher Ryon, CFA | | Nicholos Venditti | | |
| Portfolio Manager | | Portfolio Manager | | |
| Managing Director | | Managing Director | | |
The matters discussed in this report may constitute forward-looking statements made pursuant to the safe harbor provisions of the Securities Litigation Reform Act of 1995. These include any advisor or portfolio manager prediction, assessment, analysis or outlook for individual securities, industries, investment styles, market sectors and/or markets. These statements involve risks and uncertainties. In addition to the general risks described for each fund in its current prospectus, other factors bearing on these reports include the accuracy of the advisor’s or portfolio manager’s forecasts and predictions, the appropriateness of the investment strategies designed by the advisor or portfolio manager and the ability of the advisor or portfolio manager to implement their strategies efficiently and successfully. Any one or more of these factors, as well as other risks affecting the securities markets generally, could cause the actual results of any fund to differ materially as compared to its benchmarks.
The views expressed by the portfolio managers reflect their professional opinions and are subject to change. Under no circumstances does the information contained within represent a recommendation to buy or sell any security.
Semi-Annual Report 5
PERFORMANCE SUMMARY
| | |
Thornburg Limited Term Municipal Fund | | March 31, 2016 (Unaudited) |
Average Annual Total Returns
| | | | | | | | | | | | | | | | | | | | |
| | | 1-Yr | | | 3-Yr | | | 5-Yr | | | 10-Yr | | | Since
Incep. | |
A Shares (Incep: 9/28/84) | | | | | | | | | | | | | | | | | | | | |
Without sales charge | | | 1.91 | % | | | 1.52 | % | | | 2.88 | % | | | 3.44 | % | | | 5.04 | % |
With sales charge | | | 0.40 | % | | | 1.02 | % | | | 2.58 | % | | | 3.29 | % | | | 4.99 | % |
C Shares (Incep: 9/1/94) | | | | | | | | | | | | | | | | | | | | |
Without sales charge | | | 1.68 | % | | | 1.30 | % | | | 2.62 | % | | | 3.17 | % | | | 3.48 | % |
With sales charge | | | 1.18 | % | | | 1.30 | % | | | 2.62 | % | | | 3.17 | % | | | 3.48 | % |
I Shares (Incep: 7/5/96) | | | 2.23 | % | | | 1.85 | % | | | 3.22 | % | | | 3.78 | % | | | 4.09 | % |
30-Day Yields, A Shares
(with sales charge)
| | | | |
Annualized Distribution Yield | | | 1.42 | % |
| |
SEC Yield | | | 0.56 | % |
Performance data shown represents past performance and is no guarantee of future results. Investment return and principal value will fluctuate so shares, when redeemed, may be worth more or less than their original cost. Current performance may be lower or higher than quoted. For performance current to the most recent month end, visit thornburg.com or call 800-847-0200. The performance information does not reflect the deduction of taxes that a shareholder would pay on distributions or the redemption of Fund shares. Returns reflect the reinvestment of dividends and capital gains. Class A shares are sold with a maximum sales charge of 1.50%. Class C shares include a 0.50% CDSC for the first year only. There is no sales charge for Class I shares.
As disclosed in the most recent prospectus, the total annual fund operating expenses are as follows: A shares, 0.73%; C shares, 0.96%; I shares, 0.41%.
Glossary
BofA Merrill Lynch 1-10 Year Municipal Securities Index – A subset of the BofA Merrill Lynch U.S. Municipal Securities Index including all securities with a remaining term to final maturity less than 10 years.
Unless otherwise noted, index returns reflect the reinvestment of income dividends and capital gains, if any, but do not reflect fees, brokerage commissions or other expenses of investing. Investors may not make direct investments into any index. The performance of any index is not indicative of the performance of any particular investment.
Annualized Distribution Yield – The distribution yield reflects actual distributions made to shareholders. The annualized distribution yield is calculated by summing the last 30 days of income at a given month end and annualizing to a 360-day year. The result is divided by the ending maximum offering price.
Bond Credit Ratings (Credit Quality) – A bond credit rating assesses the financial ability of a debt issuer to make timely payments of principal and interest. Ratings of AAA (the highest), AA, A, and BBB are investment-grade quality. Ratings of BB, B, CCC, CC, C and D (the lowest) are considered below investment grade, speculative grade, or junk bonds.
Credit Spread/Quality Spread – The difference between the yields of securities with different credit qualities.
Duration – A bond’s sensitivity to interest rates. Effective duration incorporates the embedded option features, such as call provisions. Bonds with longer durations experience greater price volatility than bonds with shorter durations.
Laddering – Involves building a portfolio of bonds with staggered maturities so that a portion matures each year. Money that comes in from maturing bonds is typically invested in bonds with longer maturities at the far end of the portfolio.
SEC Yield – SEC yield is computed in accordance with SEC standards measuring the net investment income per share over a specified 30-day period expressed as a percentage of the maximum offering price of the Fund’s shares at the end of the period.
Yield Curve – A line that plots the interest rates, at a set point in time, of bonds having equal credit quality, but differing maturity dates.
6 Semi-Annual Report
FUND SUMMARY
| | |
Thornburg Limited Term Municipal Fund | | March 31, 2016 (Unaudited) |
OBJECTIVES AND STRATEGIES
The Fund’s primary investment objective is to obtain as high a level of current income exempt from federal individual income tax as is consistent, in the view of the Fund’s investment advisor, with preservation of capital (may be subject to Alternative Minimum Tax).
The secondary goal of the Fund is to reduce expected changes in its share price compared to longer intermediate and long-term bond portfolios.
This Fund is a laddered portfolio of municipal bonds with a dollar-weighted average maturity of normally less than five years. Laddering involves building a portfolio of bonds with staggered maturities so that a portion of the portfolio matures each year. Cash from maturing bonds, if not needed for other purposes, is typically invested in bonds with longer maturities at the far end of the ladder. We regard the strategy as a good compromise for managing different types of risk.
Long Term Stability of Principal
Net Asset Value History of A Shares
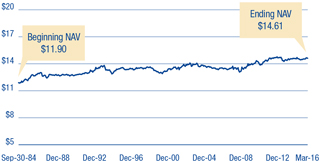
Security Credit Ratings
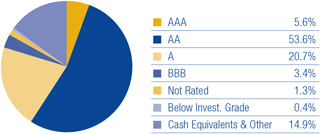
A bond credit rating assesses the financial ability of a debt issuer to make timely payments of principal and interest. Ratings of AAA (the highest), AA, A, and BBB are investment-grade quality. Ratings of BB, B, CCC, CC, C and D (the lowest) are considered below investment grade, speculative grade, or junk bonds. Credit quality ratings for Thornburg’s municipal portfolios used the highest rating available from either Standard & Poor’s or Moody’s Investors Service.
Portfolio Ladder
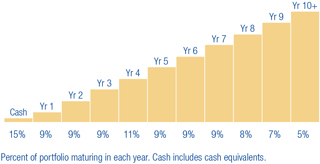
Key Portfolio Attributes
| | | | |
Number of Bonds | | | 1,972 | |
| |
Effective Duration | | | 3.4 Yrs | |
| |
Average Maturity | | | 4.0 Yrs | |
There is no guarantee that the Fund will meet its investment objectives.
All data is subject to change. Charts may not add up to 100% due to rounding.
Semi-Annual Report 7
| | |
| SCHEDULE OF INVESTMENTS | | |
| |
Thornburg Limited Term Municipal Fund | | March 31, 2016 (Unaudited) |
| | | | | | | | | | |
Issuer-Description | | Credit Rating†
S&P/ Moody’s | | Principal
Amount | | | Value | |
ALABAMA — 1.00% | | | | | | | | | | |
Alabama Public School & College Authority, 5.00% due 5/1/2016 (Education System Capital Improvements) | | AA/Aa1 | | $ | 5,000,000 | | | $ | 5,019,650 | |
Alabama Public School & College Authority, 5.00% due 6/1/2019 (Education System Capital Improvements) | | AA/Aa1 | | | 4,840,000 | | | | 5,449,743 | |
Alabama Public School & College Authority, 5.00% due 6/1/2019 (Education System Capital Improvements) | | AA/Aa1 | | | 770,000 | | | | 867,005 | |
Alabama Public School & College Authority, 5.00% due 6/1/2020 (Education System Capital Improvements) | | AA/Aa1 | | | 5,085,000 | | | | 5,874,294 | |
Alabama Public School & College Authority, 5.00% due 6/1/2021 (Education System Capital Improvements) | | AA/Aa1 | | | 5,335,000 | | | | 6,312,799 | |
Alabama Public School & College Authority, 5.00% due 6/1/2022 (Education System Capital Improvements) | | AA/Aa1 | | | 5,605,000 | | | | 6,777,118 | |
Alabama Public School & College Authority, 5.00% due 6/1/2023 (Education System Capital Improvements) | | AA/Aa1 | | | 735,000 | | | | 903,241 | |
Alabama State Board of Education, 3.00% due 5/1/2017 (Calhoun Community College) | | NR/A1 | | | 2,070,000 | | | | 2,110,655 | |
Alabama State Board of Education, 3.00% due 5/1/2018 (Calhoun Community College) | | NR/A1 | | | 2,130,000 | | | | 2,204,337 | |
Alabama State Board of Education, 4.00% due 5/1/2019 (Calhoun Community College) | | NR/A1 | | | 2,195,000 | | | | 2,357,891 | |
Alabama State Board of Education, 4.00% due 5/1/2020 (Calhoun Community College) | | NR/A1 | | | 1,000,000 | | | | 1,085,820 | |
Alabama State Board of Education, 4.00% due 5/1/2021 (Calhoun Community College) | | NR/A1 | | | 1,000,000 | | | | 1,090,650 | |
Alabama State Board of Education, 4.00% due 5/1/2022 (Calhoun Community College) | | NR/A1 | | | 1,230,000 | | | | 1,352,483 | |
City of Birmingham GO, 4.00% due 8/1/2016 (Government Services) | | AA/Aa2 | | | 3,645,000 | | | | 3,688,084 | |
City of Birmingham GO, 5.00% due 2/1/2017 (Government Services) | | AA/Aa2 | | | 2,045,000 | | | | 2,120,154 | |
City of Birmingham GO, 4.00% due 8/1/2017 (Government Services) | | AA/Aa2 | | | 2,760,000 | | | | 2,881,026 | |
City of Birmingham GO, 5.00% due 2/1/2018 (Government Services) | | AA/Aa2 | | | 2,000,000 | | | | 2,153,300 | |
City of Mobile GO, 4.50% due 8/15/2016 (Senior Center) | | NR/NR | | | 195,000 | | | | 196,402 | |
City of Mobile GO, 5.00% due 2/15/2019 (Capital Improvements) | | A+/Aa2 | | | 2,000,000 | | | | 2,155,380 | |
City of Mobile Industrial Development Board, 1.65% due 6/1/2034 put 3/20/2017 (Alabama Power Company Barry Plant Project) | | A-/A1 | | | 6,000,000 | | | | 6,048,060 | |
East Alabama Health Care Authority GO, 5.00% due 9/1/2021 | | A/NR | | | 1,245,000 | | | | 1,436,244 | |
East Alabama Health Care Authority GO, 5.00% due 9/1/2022 | | A/NR | | | 800,000 | | | | 927,784 | |
Montgomery Waterworks and Sanitation, 5.00% due 9/1/2016 | | AAA/Aa1 | | | 2,080,000 | | | | 2,119,312 | |
Montgomery Waterworks and Sanitation, 5.00% due 9/1/2019 | | AAA/Aa1 | | | 3,375,000 | | | | 3,697,920 | |
State of Alabama GO, 5.00% due 6/1/2016 (State Parks System Improvement) | | AA/Aa1 | | | 2,250,000 | | | | 2,267,550 | |
University of Alabama at Birmingham Hospital, 5.25% due 9/1/2017 | | A+/A1 | | | 2,500,000 | | | | 2,647,825 | |
University of Alabama at Birmingham Hospital, 5.00% due 9/1/2018 | | A+/A1 | | | 1,700,000 | | | | 1,854,241 | |
| | | |
ALASKA — 0.50% | | | | | | | | | | |
Alaska Energy Authority, 6.00% due 7/1/2016 (Bradley Lake Hydroelectric; Insured: AGM) | | AA/Aa3 | | | 775,000 | | | | 785,532 | |
Alaska Housing Finance Corp., 5.00% due 12/1/2018 pre-refunded 12/1/2017 (State Capital Project; Insured: Natl-Re) | | AA-/NR | | | 1,610,000 | | | | 1,723,199 | |
Alaska Housing Finance Corp., 5.00% due 12/1/2018 (State Capital Project; Insured: Natl-Re) | | AA+/Aa2 | | | 390,000 | | | | 417,948 | |
Alaska Industrial Development & Export Authority GO, 5.00% due 4/1/2016 (DeLong Mountain Transportation Project) | | AA+/Aa3 | | | 1,100,000 | | | | 1,100,000 | |
Alaska Industrial Development & Export Authority GO, 5.00% due 4/1/2017 (DeLong Mountain Transportation Project) | | AA+/Aa3 | | | 3,000,000 | | | | 3,127,710 | |
Alaska Industrial Development & Export Authority GO, 5.00% due 4/1/2018 (DeLong Mountain Transportation Project) | | AA+/Aa3 | | | 2,455,000 | | | | 2,652,799 | |
City of Valdez, 5.00% due 1/1/2021 (BP Pipelines (Alaska), Inc. Project) | | A-/A2 | | | 12,000,000 | | | | 13,710,960 | |
City of Valdez, 5.00% due 1/1/2021 (BP Pipelines (Alaska), Inc. Project) | | A-/A2 | | | 3,700,000 | | | | 4,227,546 | |
North Slope Borough GO, 5.00% due 6/30/2017 (Insured: Natl-Re) | | AA-/Aa2 | | | 8,800,000 | | | | 9,275,728 | |
State of Alaska, 5.00% due 10/1/2017 (Alaska International Airports System; Insured: Natl-Re) | | AA-/A1 | | | 1,115,000 | | | | 1,141,125 | |
| | | |
ARIZONA — 2.93% | | | | | | | | | | |
Arizona Board of Regents, 5.00% due 8/1/2020 (University of Arizona SPEED) | | A+/Aa3 | | | 575,000 | | | | 666,057 | |
Arizona Board of Regents, 5.00% due 8/1/2023 (University of Arizona SPEED) | | A+/Aa3 | | | 800,000 | | | | 980,408 | |
Arizona Board of Regents, 5.00% due 8/1/2024 (University of Arizona SPEED) | | A+/Aa3 | | | 550,000 | | | | 683,095 | |
Arizona Board of Regents COP, 5.00% due 7/1/2018 (Arizona State University; Insured: Natl-Re) | | AA-/A1 | | | 1,285,000 | | | | 1,349,494 | |
Arizona Board of Regents COP, 3.00% due 9/1/2018 (Northern Arizona University Projects) | | A/A2 | | | 1,000,000 | | | | 1,047,050 | |
Arizona Board of Regents COP, 5.00% due 7/1/2019 (Arizona State University; Insured: Natl-Re) | | AA-/A1 | | | 3,735,000 | | | | 3,926,344 | |
Arizona Board of Regents COP, 3.00% due 9/1/2019 (Northern Arizona University Projects) | | A/A2 | | | 2,525,000 | | | | 2,670,263 | |
Arizona Board of Regents COP, 5.00% due 9/1/2019 (Arizona State University) | | AA-/A1 | | | 1,085,000 | | | | 1,221,298 | |
Arizona Board of Regents COP, 5.00% due 9/1/2020 (Northern Arizona University Projects) | | A/A2 | | | 1,000,000 | | | | 1,142,860 | |
Arizona Board of Regents COP, 5.00% due 9/1/2020 (Arizona State University) | | AA-/A1 | | | 3,170,000 | | | | 3,649,177 | |
Arizona Board of Regents COP, 5.00% due 9/1/2021 (Arizona State University) | | AA-/A1 | | | 4,020,000 | | | | 4,717,229 | |
Arizona Board of Regents COP, 5.00% due 6/1/2022 (University of Arizona) | | A+/Aa3 | | | 6,080,000 | | | | 7,300,134 | |
Arizona Board of Regents COP, 5.00% due 9/1/2022 (Northern Arizona University Projects) | | A/A2 | | | 2,500,000 | | | | 2,970,475 | |
Arizona Board of Regents COP, 5.00% due 9/1/2022 (Arizona State University) | | AA-/A1 | | | 4,380,000 | | | | 5,216,887 | |
Arizona Board of Regents COP, 5.00% due 9/1/2023 (Northern Arizona University Projects) | | A/A2 | | | 3,325,000 | | | | 3,962,535 | |
Arizona Board of Regents COP, 5.00% due 9/1/2023 (Arizona State University) | | AA-/A1 | | | 5,580,000 | | | | 6,718,432 | |
Arizona HFA, 5.25% due 1/1/2018 (Banner Health) | | AA-/NR | | | 3,500,000 | | | | 3,771,355 | |
Arizona HFA, 5.00% due 7/1/2018 (Dignity Health) | | A/A3 | | | 1,470,000 | | | | 1,597,728 | |
Arizona HFA, 5.00% due 7/1/2019 (Dignity Health) | | A/A3 | | | 1,365,000 | | | | 1,535,407 | |
Arizona HFA, 5.00% due 7/1/2020 (Dignity Health) | | A/A3 | | | 1,290,000 | | | | 1,442,697 | |
Arizona HFA, 5.00% due 12/1/2022 (Scottsdale Lincoln Hospitals) | | NR/A2 | | | 1,600,000 | | | | 1,929,920 | |
Arizona HFA, 5.00% due 12/1/2024 (Scottsdale Lincoln Hospitals) | | NR/A2 | | | 1,500,000 | | | | 1,853,250 | |
Arizona HFA, 0.52% due 7/1/2035 put 4/7/2016 (Dignity Health; LOC: JPMorgan Chase Bank, N.A.) (weekly demand notes) | | AAA/Aa1 | | | 13,980,000 | | | | 13,980,000 | |
Arizona School Facilities Board, 5.00% due 7/1/2016 (State School Land Trust; Insured: AMBAC) | | NR/NR | | | 5,775,000 | | | | 5,836,966 | |
8 Semi-Annual Report
| | |
| SCHEDULE OF INVESTMENTS, CONTINUED | | |
| |
Thornburg Limited Term Municipal Fund | | March 31, 2016 (Unaudited) |
| | | | | | | | | | |
Issuer-Description | | Credit Rating†
S&P/ Moody’s | | Principal
Amount | | | Value | |
Arizona School Facilities Board, 5.00% due 7/1/2018 (State School Land Trust; Insured: AMBAC) | | NR/NR | | $ | 4,040,000 | | | $ | 4,385,380 | |
Arizona School Facilities Board COP, 5.25% due 9/1/2023 pre-refunded 9/1/2018 (School Site and Building Projects) | | AA-/Aa3 | | | 1,315,000 | | | | 1,453,877 | |
Arizona Transportation Board, 5.00% due 7/1/2019 | | AA+/Aa2 | | | 3,510,000 | | | | 3,968,652 | |
Arizona Transportation Board, 5.00% due 7/1/2021 | | AA+/Aa2 | | | 7,465,000 | | | | 8,899,848 | |
Arizona Transportation Board, 5.00% due 7/1/2022 | | AA+/Aa2 | | | 5,000,000 | | | | 5,992,100 | |
City of Glendale IDA, 5.00% due 5/15/2016 (Midwestern University) | | A-/NR | | | 1,575,000 | | | | 1,583,379 | |
City of Glendale IDA, 5.00% due 5/15/2017 (Midwestern University) | | A-/NR | | | 1,440,000 | | | | 1,501,214 | |
City of Phoenix Civic Improvement Corp., 5.00% due 7/1/2022 | | AA+/Aa3 | | | 1,250,000 | | | | 1,517,562 | |
City of Phoenix Civic Improvement Corp., 5.00% due 7/1/2023 | | AA+/Aa3 | | | 1,830,000 | | | | 2,262,795 | |
City of Phoenix Civic Improvement Corp., 5.00% due 7/1/2024 | | AA+/Aa3 | | | 2,000,000 | | | | 2,507,760 | |
City of Phoenix Civic Improvement Corp., 5.00% due 7/1/2025 | | AA+/Aa3 | | | 3,500,000 | | | | 4,438,455 | |
City of Tucson, 5.00% due 7/1/2022 (Street and Highway Projects) | | AA+/A1 | | | 2,135,000 | | | | 2,555,979 | |
City of Tucson COP, 5.00% due 7/1/2018 pre-refunded 7/1/2016 (Northwest Police Patrol Substation and Train Depot; Insured: Natl-Re) | | AA-/A1 | | | 1,485,000 | | | | 1,501,810 | |
City of Yuma Municipal Property Corp., 5.00% due 7/1/2016 (Water and Wastewater System; Insured: Syncora) (ETM) | | A+/A1 | | | 2,000,000 | | | | 2,022,600 | |
City of Yuma Municipal Property Corp., 5.00% due 7/1/2018 pre-refunded 7/1/2017 (Water and Wastewater System; Insured: Syncora) | | A+/A1 | | | 2,130,000 | | | | 2,244,317 | |
County of Pinal, 5.00% due 8/1/2025 (Hunt Highway (Phases III-V)) | | AA-/NR | | | 3,000,000 | | | | 3,703,590 | |
Maricopa County Public Finance Corp., 5.00% due 7/1/2024 (Insured: AMBAC) | | AA+/Aa1 | | | 1,000,000 | | | | 1,011,550 | |
Mohave County IDA, 7.50% due 5/1/2019 (Mohave Prison, LLC Expansion) | | BBB+/NR | | | 11,645,000 | | | | 12,639,716 | |
Navajo County Pollution Control Corp., 5.75% due 6/1/2034 put 6/1/2016 (Arizona Public Service Co.) | | A-/A2 | | | 9,700,000 | | | | 9,779,928 | |
Pima County, 5.00% due 7/1/2016 (Ina & Roger Road Wastewater Reclamation Facilities) | | AA-/NR | | | 2,000,000 | | | | 2,022,960 | |
Pima County, 4.50% due 7/1/2017 (Ina & Roger Road Wastewater Reclamation Facilities; Insured: AGM) | | AA/A2 | | | 5,040,000 | | | | 5,281,114 | |
Pima County, 5.00% due 7/1/2017 (Ina & Roger Road Wastewater Reclamation Facilities) | | AA-/NR | | | 2,750,000 | | | | 2,898,665 | |
Pima County, 3.00% due 7/1/2018 (Ina & Roger Road Wastewater Reclamation Facilities) | | AA-/NR | | | 500,000 | | | | 524,590 | |
Pima County, 5.00% due 7/1/2018 (Ina & Roger Road Wastewater Reclamation Facilities) | | AA-/NR | | | 2,000,000 | | | | 2,187,380 | |
Pima County, 5.00% due 7/1/2018 (Ina & Roger Road Wastewater Reclamation Facilities) | | AA-/NR | | | 700,000 | | | | 765,583 | |
Pima County, 5.00% due 7/1/2018 (Ina & Roger Road Wastewater Reclamation Facilities; Insured: AGM) | | AA/A2 | | | 5,000,000 | | | | 5,468,450 | |
Pima County, 5.00% due 7/1/2020 (Ina & Roger Road Wastewater Reclamation Facilities) | | AA-/NR | | | 500,000 | | | | 579,390 | |
Pima County, 3.00% due 7/1/2021 (Ina & Roger Road Wastewater Reclamation Facilities) | | AA-/NR | | | 1,200,000 | | | | 1,300,008 | |
Pima County, 5.00% due 7/1/2021 (Ina & Roger Road Wastewater Reclamation Facilities) | | AA-/NR | | | 400,000 | | | | 473,748 | |
Pima County, 3.00% due 7/1/2022 (Ina & Roger Road Wastewater Reclamation Facilities) | | AA-/NR | | | 1,325,000 | | | | 1,439,029 | |
Pima County, 5.00% due 7/1/2022 (Ina & Roger Road Wastewater Reclamation Facilities) | | AA-/NR | | | 500,000 | | | | 602,375 | |
Pima County COP, 5.00% due 12/1/2016 (Sewer System & Fleet Services Facilities Expansion) | | A+/NR | | | 600,000 | | | | 617,598 | |
Pima County COP, 5.00% due 12/1/2017 (Sewer System & Fleet Services Facilities Expansion) | | A+/NR | | | 1,395,000 | | | | 1,491,074 | |
Pima County COP, 5.00% due 12/1/2018 (Sewer System & Fleet Services Facilities Expansion) | | A+/NR | | | 2,700,000 | | | | 2,976,912 | |
Pima County COP, 5.00% due 12/1/2019 (Sewer System & Fleet Services Facilities Expansion) | | A+/NR | | | 500,000 | | | | 567,975 | |
Pima County COP, 5.00% due 12/1/2020 (Sewer System & Fleet Services Facilities Expansion) | | A+/NR | | | 765,000 | | | | 890,536 | |
Pima County COP, 5.00% due 12/1/2021 (Sewer System & Fleet Services Facilities Expansion) | | A+/NR | | | 1,220,000 | | | | 1,449,519 | |
Pima County COP, 5.00% due 12/1/2022 (Sewer System & Fleet Services Facilities Expansion) | | A+/NR | | | 1,275,000 | | | | 1,519,813 | |
Pinal County, 5.00% due 8/1/2019 (Detention and Training Facilities) | | AA-/NR | | | 1,115,000 | | | | 1,256,460 | |
Pinal County, 5.00% due 8/1/2021 (Detention and Training Facilities) | | AA-/NR | | | 1,775,000 | | | | 2,096,807 | |
Pinal County, 5.00% due 8/1/2023 (Detention and Training Facilities) | | AA-/NR | | | 1,100,000 | | | | 1,344,662 | |
Pinal County, 5.00% due 8/1/2024 (Detention and Training Facilities) | | AA-/NR | | | 700,000 | | | | 867,713 | |
Pinal County, 5.00% due 8/1/2025 (Detention and Training Facilities) | | AA-/NR | | | 1,500,000 | | | | 1,872,930 | |
Scottsdale IDA, 5.00% due 9/1/2019 (Scottsdale Healthcare) | | NR/A2 | | | 6,885,000 | | | | 7,550,642 | |
State of Arizona Department of Administration, 5.00% due 7/1/2018 (State Lottery; Insured: AGM) | | AA/A1 | | | 8,370,000 | | | | 9,120,789 | |
State of Arizona Department of Administration, 5.00% due 7/1/2020 (State Lottery; Insured: AGM) | | AA/A1 | | | 8,705,000 | | | | 10,046,005 | |
| | | |
ARKANSAS — 0.41% | | | | | | | | | | |
Arkansas Development Finance Authority, 2.00% due 12/1/2016 (State Dept. of Environmental Quality Project) | | AA-/NR | | | 460,000 | | | | 464,048 | |
Board of Trustees of the University of Arkansas, 2.00% due 11/1/2016 (Fayetteville Campus Athletic Facilities) | | NR/Aa2 | | | 600,000 | | | | 604,890 | |
Board of Trustees of the University of Arkansas, 5.00% due 9/15/2019 pre-refunded 9/15/2016 (Fayetteville Campus Athletic Facilities) | | NR/Aa2 | | | 600,000 | | | | 612,252 | |
Board of Trustees of the University of Arkansas, 3.00% due 11/1/2023 (Fayetteville Campus Athletic Facilities) | | NR/Aa2 | | | 615,000 | | | | 672,558 | |
City of Fort Smith, 3.50% due 10/1/2016 (Water and Sewer System Construction; Insured: AGM) | | AA/NR | | | 1,370,000 | | | | 1,389,728 | |
City of Fort Smith, 3.50% due 10/1/2017 (Water and Sewer System Construction; Insured: AGM) | | AA/NR | | | 1,930,000 | | | | 2,007,103 | |
City of Fort Smith, 4.00% due 10/1/2018 (Water and Sewer System Construction; Insured: AGM) | | AA/NR | | | 1,000,000 | | | | 1,074,650 | |
City of Fort Smith, 4.00% due 10/1/2019 (Water and Sewer System Construction; Insured: AGM) | | AA/NR | | | 1,670,000 | | | | 1,831,289 | |
Independence County, 4.90% due 7/1/2022 (Entergy Mississippi, Inc.; Insured: AMBAC) | | NR/A3 | | | 6,400,000 | | | | 6,419,904 | |
Jefferson County, 4.00% due 6/1/2016 (Jefferson Regional Medical Center; Insured: AGM) | | AA/NR | | | 1,395,000 | | | | 1,401,933 | |
Jefferson County, 4.00% due 6/1/2017 (Jefferson Regional Medical Center; Insured: AGM) | | AA/NR | | | 1,375,000 | | | | 1,413,321 | |
Jefferson County, 1.55% due 10/1/2017 (Entergy Arkansas, Inc. Project) | | A-/A2 | | | 10,000,000 | | | | 10,103,500 | |
Jefferson County, 4.50% due 6/1/2018 (Jefferson Regional Medical Center; Insured: AGM) | | AA/NR | | | 1,495,000 | | | | 1,580,903 | |
Jefferson County, 4.50% due 6/1/2019 (Jefferson Regional Medical Center; Insured: AGM) | | AA/NR | | | 1,580,000 | | | | 1,707,917 | |
Semi-Annual Report 9
| | |
| SCHEDULE OF INVESTMENTS, CONTINUED | | |
| |
Thornburg Limited Term Municipal Fund | | March 31, 2016 (Unaudited) |
| | | | | | | | | | |
Issuer-Description | | Credit Rating†
S&P/ Moody’s | | Principal
Amount | | | Value | |
CALIFORNIA — 7.26% | | | | | | | | | | |
Alameda County COP, 5.00% due 12/1/2017 (Santa Rita Jail; Insured: AMBAC) | | AA/NR | | $ | 1,220,000 | | | $ | 1,304,156 | |
Alameda County Joint Powers Authority, 5.00% due 12/1/2021 (Alameda County Medical Center Highland Hospital) | | AA/Aa3 | | | 1,000,000 | | | | 1,201,320 | |
Alameda County Joint Powers Authority, 5.00% due 12/1/2022 (Alameda County Medical Center Highland Hospital) | | AA/Aa3 | | | 2,000,000 | | | | 2,446,960 | |
Alameda County Joint Powers Authority, 5.00% due 12/1/2023 (Alameda County Medical Center Highland Hospital) | | AA/Aa3 | | | 3,200,000 | | | | 3,974,144 | |
Anaheim Public Financing Authority, 0% due 9/1/2022 (Public Improvements; Insured: AGM) | | AA/A2 | | | 3,250,000 | | | | 2,835,657 | |
Brentwood Infrastructure, 4.00% due 11/1/2016 (Insured: AGM) | | AA/NR | | | 325,000 | | | | 330,883 | |
Brentwood Infrastructure, 5.00% due 11/1/2017 (Insured: AGM) | | AA/NR | | | 965,000 | | | | 1,021,385 | |
Brentwood Infrastructure, 5.25% due 11/1/2018 (Insured: AGM) | | AA/NR | | | 1,020,000 | | | | 1,119,817 | |
Brentwood Infrastructure, 5.25% due 11/1/2019 (Insured: AGM) | | AA/NR | | | 725,000 | | | | 818,764 | |
Cabrillo USD GO, 0% due 8/1/2021 (Educational Facilities; Insured: AMBAC) | | NR/NR | | | 1,000,000 | | | | 900,720 | |
California Educational Facilities Authority, 5.00% due 4/1/2017 (Pitzer College) | | NR/A2 | | | 1,460,000 | | | | 1,521,714 | |
California Educational Facilities Authority, 5.00% due 4/1/2021 (Chapman University) | | NR/A2 | | | 4,870,000 | | | | 5,702,283 | |
California HFFA, 5.50% due 2/1/2017 (Community Developmental Disabilities Program; Insured: California Mtg Insurance) | | AA-/NR | | | 2,575,000 | | | | 2,679,442 | |
California HFFA, 5.50% due 2/1/2019 (Community Developmental Disabilities Program; Insured: California Mtg Insurance) | | AA-/NR | | | 2,865,000 | | | | 3,230,660 | |
California HFFA, 5.75% due 2/1/2020 (Community Developmental Disabilities Program; Insured: California Mtg Insurance) | | AA-/NR | | | 1,975,000 | | | | 2,317,406 | |
California HFFA, 5.00% due 3/1/2020 (Dignity Health) | | A/A3 | | | 4,400,000 | | | | 5,060,924 | |
California HFFA, 5.75% due 2/1/2021 (Community Developmental Disabilities Program; Insured: California Mtg Insurance) | | AA-/NR | | | 1,695,000 | | | | 2,047,340 | |
California HFFA, 5.00% due 3/1/2021 (Dignity Health) | | A/A3 | | | 3,450,000 | | | | 4,063,893 | |
California HFFA, 5.25% due 3/1/2022 (Dignity Health) | | A/A3 | | | 7,020,000 | | | | 8,370,999 | |
California HFFA, 5.00% due 7/1/2043 put 10/15/2020 (St. Joseph Health System) | | AA-/A1 | | | 5,000,000 | | | | 5,798,700 | |
California State Department of Water Resources, 5.00% due 5/1/2016 (Power Supply Program) | | AA/Aa2 | | | 5,000,000 | | | | 5,019,350 | |
California State Economic Recovery GO, 5.00% due 7/1/2020 pre-refunded 7/1/2019 | | AA+/Aaa | | | 4,200,000 | | | | 4,770,570 | |
California State Housing Finance Agency, 2.50% due 12/1/2017 (One Santa Fe Apartments Multi-Family Housing; Collateralized: GNMA) | | NR/Aa1 | | | 1,725,000 | | | | 1,727,122 | |
California State Public Works Board, 5.00% due 9/1/2016 (Regents of University of California; Insured: Natl-Re) (ETM) | | AA+/Aaa | | | 3,000,000 | | | | 3,057,090 | |
California State Public Works Board, 5.00% due 9/1/2017 (Regents of University of California; Insured: Natl-Re) (ETM) | | AA+/Aaa | | | 3,000,000 | | | | 3,183,990 | |
California State Public Works Board, 5.00% due 11/1/2017 (California State University) | | A+/Aa3 | | | 3,000,000 | | | | 3,202,740 | |
California State Public Works Board, 5.00% due 11/1/2018 (California State University) | | A+/Aa3 | | | 2,700,000 | | | | 2,984,202 | |
California State Public Works Board, 5.00% due 4/1/2020 (California School for the Deaf Riverside Campus) | | A+/A1 | | | 1,585,000 | | | | 1,829,946 | |
California State Public Works Board, 5.00% due 6/1/2020 (Yuba City Courthouse) | | A+/A1 | | | 1,675,000 | | | | 1,943,637 | |
California State Public Works Board, 5.00% due 6/1/2020 (Coalinga State Hospital) | | A+/A1 | | | 5,685,000 | | | | 6,596,760 | |
California State Public Works Board, 5.00% due 10/1/2020 (California State University) | | A+/A1 | | | 1,000,000 | | | | 1,171,240 | |
California State Public Works Board, 5.00% due 11/1/2020 (Various Capital Projects) | | A+/A1 | | | 1,500,000 | | | | 1,760,745 | |
California State Public Works Board, 5.00% due 4/1/2021 (California School for the Deaf Riverside Campus) | | A+/A1 | | | 890,000 | | | | 1,053,902 | |
California State Public Works Board, 5.00% due 6/1/2021 (Yuba City Courthouse) | | A+/A1 | | | 1,250,000 | | | | 1,485,525 | |
California State Public Works Board, 5.00% due 6/1/2021 (Coalinga State Hospital) | | A+/A1 | | | 5,000,000 | | | | 5,942,100 | |
California State Public Works Board, 5.00% due 10/1/2021 (Various Capital Projects) | | A+/A1 | | | 1,000,000 | | | | 1,196,350 | |
California State Public Works Board, 5.00% due 11/1/2021 (Various Capital Projects) | | A+/A1 | | | 1,750,000 | | | | 2,096,850 | |
California State Public Works Board, 5.00% due 11/1/2021 (Laboratory Facility and San Diego Courthouse) | | A+/A1 | | | 750,000 | | | | 898,650 | |
California State Public Works Board, 5.00% due 4/1/2022 (California School for the Deaf Riverside Campus) | | A+/A1 | | | 500,000 | | | | 602,855 | |
California State Public Works Board, 5.00% due 6/1/2022 (Coalinga State Hospital) | | A+/A1 | | | 11,555,000 | | | | 13,978,430 | |
California State Public Works Board, 5.00% due 11/1/2022 (Laboratory Facility and San Diego Courthouse) | | A+/A1 | | | 10,075,000 | | | | 12,285,556 | |
California State Public Works Board, 5.00% due 6/1/2023 (Yuba City Courthouse) | | A+/A1 | | | 1,900,000 | | | | 2,338,995 | |
California State Public Works Board, 5.00% due 11/1/2024 (Laboratory Facility and San Diego Courthouse) | | A+/A1 | | | 2,050,000 | | | | 2,544,993 | |
California Statewide Communities Development Authority, 5.00% due 4/1/2019 (Kaiser Foundation Hospitals) | | A+/NR | | | 27,000,000 | | | | 30,299,400 | |
California Statewide Communities Development Authority, 5.00% due 7/1/2020 pre-refunded 1/1/2019 (Aspire Public Schools; LOC: PCSD Guaranty Pool I, LLC) | | NR/NR | | | 1,555,000 | | | | 1,650,275 | |
Castaic Lake Water Agency COP, 0% due 8/1/2023 (Water System Improvement; Insured: AMBAC) | | AA+/NR | | | 10,125,000 | | | | 8,671,151 | |
Castaic USD GO, 0% due 5/1/2018 (Insured: Natl-Re) | | AA-/NR | | | 3,735,000 | | | | 3,446,135 | |
Central Valley Financing Authority, 5.00% due 7/1/2017 (Carson Ice) | | AA-/Aa3 | | | 600,000 | | | | 631,890 | |
Central Valley Financing Authority, 5.00% due 7/1/2019 (Carson Ice) | | AA-/Aa3 | | | 1,750,000 | | | | 1,973,265 | |
Chula Vista COP, 5.25% due 3/1/2018 | | AA-/NR | | | 1,170,000 | | | | 1,269,310 | |
Chula Vista COP, 5.25% due 3/1/2019 | | AA-/NR | | | 1,235,000 | | | | 1,387,152 | |
Clovis USD GO, 0% due 8/1/2019 (Insured: Natl-Re) | | AA/A3 | | | 2,685,000 | | | | 2,573,760 | |
Community Facilities District No. 86-1 of the Irvine USD, 5.25% due 9/1/2017 (Educational Facilities; Insured: AGM) | | AA/NR | | | 5,000,000 | | | | 5,294,450 | |
Community Facilities District No. 86-1 of the Irvine USD, 5.25% due 9/1/2018 (Educational Facilities; Insured: AGM) | | AA/NR | | | 3,000,000 | | | | 3,291,240 | |
Community Facilities District No. 86-1 of the Irvine USD, 5.25% due 9/1/2019 (Educational Facilities; Insured: AGM) | | AA/NR | | | 3,000,000 | | | | 3,396,090 | |
County of Los Angeles COP, 0% due 3/1/2017 (Disney Parking Garage and Walt Disney Concert Hall) | | AA/A1 | | | 1,075,000 | | | | 1,066,647 | |
County of Los Angeles COP, 0% due 9/1/2017 (Disney Parking Garage and Walt Disney Concert Hall; Insured: AMBAC) | | AA/A1 | | | 1,200,000 | | | | 1,183,536 | |
County of Los Angeles Redevelopment Refunding Authority, 5.00% due 6/1/2020 (Bunker Hill Project) | | A+/NR | | | 1,730,000 | | | | 1,998,600 | |
County of Los Angeles Redevelopment Refunding Authority, 5.00% due 12/1/2020 (Bunker Hill Project) | | A+/NR | | | 3,805,000 | | | | 4,453,714 | |
County of Los Angeles Redevelopment Refunding Authority, 5.00% due 6/1/2021 (Bunker Hill Project) | | A+/NR | | | 360,000 | | | | 425,225 | |
County of Los Angeles Redevelopment Refunding Authority, 5.00% due 12/1/2021 (Bunker Hill Project) | | A+/NR | | | 5,805,000 | | | | 6,935,408 | |
County of Los Angeles Redevelopment Refunding Authority, 5.00% due 6/1/2022 (Bunker Hill Project) | | A+/NR | | | 1,645,000 | | | | 1,976,188 | |
County of Los Angeles Redevelopment Refunding Authority, 5.00% due 12/1/2022 (Bunker Hill Project) | | A+/NR | | | 5,000,000 | | | | 6,057,550 | |
10 Semi-Annual Report
| | |
| SCHEDULE OF INVESTMENTS, CONTINUED | | |
| |
Thornburg Limited Term Municipal Fund | | March 31, 2016 (Unaudited) |
| | | | | | | | | | |
Issuer-Description | | Credit Rating†
S&P/ Moody’s | | Principal
Amount | | | Value | |
County of Los Angeles Redevelopment Refunding Authority, 5.00% due 6/1/2023 (Bunker Hill Project) | | A+/NR | | $ | 450,000 | | | $ | 548,919 | |
County of Los Angeles Redevelopment Refunding Authority, 5.00% due 12/1/2023 (Bunker Hill Project) | | A+/NR | | | 6,875,000 | | | | 8,454,256 | |
County of Los Angeles Redevelopment Refunding Authority, 5.00% due 6/1/2024 (Bunker Hill Project) | | A+/NR | | | 4,775,000 | | | | 5,884,996 | |
County of Los Angeles Redevelopment Refunding Authority, 5.00% due 12/1/2024 (Bunker Hill Project) | | A+/NR | | | 5,150,000 | | | | 6,391,304 | |
Escondido Union High School District GO, 0% due 11/1/2020 (Insured: Natl-Re) | | AA-/A3 | | | 2,655,000 | | | | 2,405,085 | |
Los Angeles Convention and Exhibition Center Authority, 5.00% due 8/15/2018 (ETM) | | A+/A1 | | | 2,295,000 | | | | 2,525,900 | |
Los Angeles County Public Works Financing Authority, 5.00% due 8/1/2018 (Multiple Capital Projects) | | AA/A1 | | | 4,000,000 | | | | 4,394,040 | |
Los Angeles County Public Works Financing Authority, 5.00% due 8/1/2019 (Multiple Capital Projects) | | AA/A1 | | | 17,935,000 | | | | 20,355,687 | |
Los Angeles USD COP, 5.00% due 10/1/2017 (Educational Facilities and Information Technology Infrastructure; Insured: AMBAC) | | A+/A1 | | | 2,445,000 | | | | 2,602,360 | |
Los Angeles USD COP, 5.50% due 12/1/2018 (Educational Facilities and Information Technology Infrastructure) | | A+/A1 | | | 4,600,000 | | | | 5,169,664 | |
Los Angeles USD COP, 5.50% due 12/1/2019 (Educational Facilities and Information Technology Infrastructure) | | A+/A1 | | | 7,040,000 | | | | 8,194,701 | |
Los Angeles USD GO, 5.00% due 7/1/2018 pre-refunded 7/1/2017 (Educational Facilities Improvements; Insured: AGM) | | AA/Aa2 | | | 4,000,000 | | | | 4,218,280 | |
a Los Angeles USD GO, 5.00% due 7/1/2022 (Educational Facilities and Information Technology Infrastructure) | | AA-/Aa2 | | | 12,260,000 | | | | 14,974,487 | |
Los Angeles USD GO, 5.00% due 7/1/2023 (Educational Facilities and Information Technology Infrastructure) | | AA-/Aa2 | | | 11,950,000 | | | | 14,840,944 | |
Los Angeles USD GO, 5.00% due 7/1/2024 (Educational Facilities and Information Technology Infrastructure) | | AA-/Aa2 | | | 10,640,000 | | | | 13,430,127 | |
Monterey County COP, 5.00% due 8/1/2016 (Insured: AGM) | | AA/A1 | | | 1,435,000 | | | | 1,456,869 | |
Monterey County COP, 5.00% due 8/1/2018 (Insured: AGM) | | AA/A1 | | | 2,260,000 | | | | 2,477,661 | |
Mount San Antonio Community College GO, 0% due 8/1/2017 (Insured: Natl-Re) (ETM) | | AA/Aa2 | | | 5,000,000 | | | | 4,951,000 | |
Needles USD GO, 0% due 8/1/2023 | | AA-/A3 | | | 1,005,000 | | | | 804,985 | |
North City West School Facilities Financing Authority, 5.00% due 9/1/2023 (Carmel Valley Educational Facilities; Insured: AGM) | | AA/NR | | | 4,545,000 | | | | 5,526,993 | |
Northern California Power Agency, 5.00% due 7/1/2017 (Hydroelectric Project) | | A+/A1 | | | 1,000,000 | | | | 1,055,220 | |
Northern California Power Agency, 5.00% due 6/1/2018 (Lodi Energy Center) | | A-/A2 | | | 4,480,000 | | | | 4,893,459 | |
Northern California Power Agency, 5.00% due 7/1/2019 (Hydroelectric Project) | | A+/A1 | | | 1,000,000 | | | | 1,132,390 | |
Northern California Power Agency, 5.00% due 7/1/2020 (Hydroelectric Project) | | A+/A1 | | | 1,325,000 | | | | 1,494,044 | |
Oakland Building Authority, 2.00% due 12/1/2016 (Elihu M. Harris State Office Building) | | A+/A1 | | | 2,250,000 | | | | 2,272,522 | |
Oakland Building Authority, 5.00% due 12/1/2018 (Elihu M. Harris State Office Building) | | A+/A1 | | | 7,240,000 | | | | 8,023,006 | |
Oakland USD GO, 5.00% due 8/1/2022 (Construction & Modernization Project; Insured: AGM) | | AA/A2 | | | 2,240,000 | | | | 2,671,021 | |
Oakland USD GO, 5.00% due 8/1/2023 (Construction & Modernization Project; Insured: AGM) | | AA/A2 | | | 1,290,000 | | | | 1,562,925 | |
Oakland USD GO, 5.00% due 8/1/2024 (Construction & Modernization Project; Insured: AGM) | | AA/A2 | | | 1,500,000 | | | | 1,839,600 | |
Oakland USD GO, 5.00% due 8/1/2025 (Construction & Modernization Project; Insured: AGM) | | AA/A2 | | | 1,750,000 | | | | 2,170,945 | |
Orange County Public Financing Authority, 5.00% due 7/1/2017 (Insured: Natl-Re) | | AA/Aa3 | | | 1,245,000 | | | | 1,311,334 | |
Palo Alto USD GO, 0% due 8/1/2019 | | AAA/Aaa | | | 1,000,000 | | | | 964,620 | |
Palomar Community College District GO, 0% due 8/1/2021 | | AA-/Aa2 | | | 2,560,000 | | | | 2,337,536 | |
Redding Electrical Systems COP, 5.00% due 6/1/2020 (Insured: AGM) | | NR/A2 | | | 3,955,000 | | | | 4,321,708 | |
Rocklin USD GO, 0% due 8/1/2022 (Insured: Natl-Re) | | AA-/Aa2 | | | 3,910,000 | | | | 3,468,522 | |
Sacramento City Financing Authority, 0% due 12/1/2019 (Merged Downtown & Oak Park; Insured: Natl-Re) | | AA-/A3 | | | 2,920,000 | | | | 2,750,582 | |
Sacramento City Financing Authority, 0% due 12/1/2021 (Merged Downtown & Oak Park; Insured: Natl-Re) | | AA-/A3 | | | 1,600,000 | | | | 1,426,096 | |
Sacramento City USD GO, 5.00% due 7/1/2021 (Educational Facilities Improvements) | | A+/A1 | | | 3,265,000 | | | | 3,874,249 | |
Sacramento Cogeneration Authority, 5.00% due 7/1/2017 (Procter & Gamble) | | AA-/Aa3 | | | 750,000 | | | | 791,025 | |
Sacramento Municipal Utility District, 5.00% due 7/1/2016 (Cosumnes Project; Insured: Natl-Re) (ETM) | | NR/A3 | | | 4,870,000 | | | | 4,926,248 | |
Sacramento Municipal Utility District, 5.00% due 7/1/2019 pre-refunded 7/1/2016 (Cosumnes Project; Insured: Natl-Re) | | NR/A3 | | | 5,000,000 | | | | 5,057,750 | |
Sacramento Municipal Utility District, 5.00% due 7/1/2020 pre-refunded 7/1/2016 (Cosumnes Project; Insured: Natl-Re) | | NR/A3 | | | 8,675,000 | | | | 8,775,196 | |
San Diego Convention Center Expansion Financing Authority, 5.00% due 4/15/2020 | | AA-/NR | | | 4,000,000 | | | | 4,569,960 | |
San Diego Convention Center Expansion Financing Authority, 5.00% due 4/15/2021 | | AA-/NR | | | 3,000,000 | | | | 3,497,520 | |
San Diego Convention Center Expansion Financing Authority, 5.00% due 4/15/2022 | | AA-/NR | | | 8,000,000 | | | | 9,488,080 | |
San Diego Redevelopment Agency, 4.50% due 9/1/2019 (Centre City Redevelopment; Insured: AMBAC) | | NR/A2 | | | 1,240,000 | | | | 1,260,423 | |
San Diego USD GO, 5.50% due 7/1/2020 (Educational System Capital Projects; Insured: Natl-Re) | | AA-/Aa2 | | | 10,000,000 | | | | 11,872,300 | |
San Francisco Building Authority, 2.00% due 12/1/2016 (San Francisco Civic Center Complex) | | A+/A1 | | | 5,000,000 | | | | 5,051,050 | |
San Francisco Building Authority, 5.00% due 12/1/2018 (San Francisco Civic Center Complex) | | A+/A1 | | | 13,130,000 | | | | 14,564,715 | |
San Joaquin Delta Community College District GO, 0% due 8/1/2019 (Insured: AGM) | | AA/Aa2 | | | 7,600,000 | | | | 7,016,472 | |
Santa Ana Financing Authority, 6.25% due 7/1/2018 (Police Administration & Holding Facility; Insured: Natl-Re) (ETM) | | AA-/A3 | | | 2,017,500 | | | | 2,267,004 | |
Santa Ana Financing Authority, 6.25% due 7/1/2018 (Police Administration & Holding Facility; Insured: Natl-Re) | | AA-/A3 | | | 2,017,500 | | | | 2,247,737 | |
Santa Ana USD GO, 0% due 8/1/2019 (Insured: Natl-Re) | | AA-/A3 | | | 3,425,000 | | | | 3,265,737 | |
Santa Fe Springs Community Development Commission, 0% due 9/1/2024 (Consolidated Redevelopment Project; Insured: Natl-Re) | | AA-/A3 | | | 7,000,000 | | | | 5,491,990 | |
Solano County COP, 5.00% due 11/15/2017 | | AA-/A1 | | | 1,580,000 | | | | 1,685,275 | |
South San Francisco USD GO, 4.00% due 6/15/2018 (Educational Facilities) | | SP-1+/NR | | | 5,130,000 | | | | 5,492,691 | |
Southeast Resource Recovery Facilities Authority, 5.25% due 12/1/2017 (Insured: AMBAC) | | AA-/A2 | | | 2,000,000 | | | | 2,008,180 | |
State of California Economic Recovery GO, 5.00% due 7/1/2018 (ETM) | | AA+/Aaa | | | 3,105,000 | | | | 3,402,490 | |
State of California Economic Recovery GO, 5.00% due 7/1/2018 (ETM) | | AA+/Aaa | | | 895,000 | | | | 980,750 | |
State of California GO, 4.75% due 4/1/2018 (Various Purposes) | | AA-/Aa3 | | | 1,250,000 | | | | 1,349,200 | |
State of California GO, 5.00% due 9/1/2020 (Various Purposes) | | AA-/Aa3 | | | 10,000,000 | | | | 11,706,500 | |
State of California GO, 5.00% due 9/1/2021 (Various Purposes) | | AA-/Aa3 | | | 5,000,000 | | | | 5,989,500 | |
Tuolumne Wind Project Authority, 5.00% due 1/1/2018 | | AA-/A2 | | | 2,000,000 | | | | 2,143,120 | |
Semi-Annual Report 11
| | |
| SCHEDULE OF INVESTMENTS, CONTINUED | | |
| |
Thornburg Limited Term Municipal Fund | | March 31, 2016 (Unaudited) |
| | | | | | | | | | |
Issuer-Description | | Credit Rating†
S&P/ Moody’s | | Principal
Amount | | | Value | |
Tuolumne Wind Project Authority, 5.00% due 1/1/2019 | | AA-/A2 | | $ | 2,000,000 | | | $ | 2,215,280 | |
Tustin Community Redevelopment Agency, 4.00% due 9/1/2017 (Tustin Redevelopment) | | A/NR | | | 935,000 | | | | 973,672 | |
Tustin Community Redevelopment Agency, 4.00% due 9/1/2019 (Tustin Redevelopment) | | A/NR | | | 1,010,000 | | | | 1,094,567 | |
Tustin Community Redevelopment Agency, 4.00% due 9/1/2020 (Tustin Redevelopment) | | A/NR | | | 1,050,000 | | | | 1,144,616 | |
Ventura County COP, 5.00% due 8/15/2016 | | AA+/Aa3 | | | 1,520,000 | | | | 1,545,658 | |
Ventura County COP, 5.25% due 8/15/2017 | | AA+/Aa3 | | | 1,635,000 | | | | 1,736,125 | |
West Contra Costa USD GO, 0% due 8/1/2022 (Educational Facilities; Insured: AGM) | | AA/Aa3 | | | 4,000,000 | | | | 3,508,880 | |
West Covina Redevelopment Agency, 6.00% due 9/1/2022 (Fashion Plaza) | | NR/NR | | | 6,075,000 | | | | 7,093,352 | |
| | | |
COLORADO — 2.34% | | | | | | | | | | |
City & County of Denver Airport System, 5.00% due 11/15/2016 (Insured: Natl-Re) | | AA-/A1 | | | 1,725,000 | | | | 1,772,110 | |
City & County of Denver Airport System, 5.00% due 11/15/2017 (Insured: Natl-Re) | | AA-/A1 | | | 1,000,000 | | | | 1,067,970 | |
City & County of Denver COP, 5.00% due 12/1/2020 (Buell Theatre Property) | | AA+/Aa1 | | | 3,065,000 | | | | 3,577,560 | |
City & County of Denver COP, 5.00% due 12/1/2021 (Buell Theatre Property) | | AA+/Aa1 | | | 3,825,000 | | | | 4,559,897 | |
City & County of Denver COP, 5.00% due 12/1/2023 (Buell Theatre Property) | | AA+/Aa1 | | | 1,720,000 | | | | 2,119,264 | |
City & County of Denver COP, 0.35% due 12/1/2029 put 4/1/2016 (Wellington E. Webb Municipal Office Building; SPA: JPMorgan Chase Bank, N.A.) (daily demand notes) | | AA+/Aa1 | | | 29,945,000 | | | | 29,945,000 | |
City & County of Denver COP, 0.35% due 12/1/2029 put 4/1/2016 (Wellington E. Webb Municipal Office Building; SPA: JPMorgan Chase Bank, N.A.) (daily demand notes) | | AA+/Aa1 | | | 16,015,000 | | | | 16,015,000 | |
City & County of Denver COP, 0.35% due 12/1/2031 put 4/1/2016 (Wellington E. Webb Municipal Office Building; SPA: JPMorgan Chase Bank, N.A.) (daily demand notes) | | AA+/Aa1 | | | 48,310,000 | | | | 48,310,000 | |
City & County of Denver School District No. 1 COP, 4.00% due 12/15/2016 (Eastbridge Elementary and Conservatory Green K-8 Schools) | | NR/Aa3 | | | 350,000 | | | | 358,158 | |
City & County of Denver School District No. 1 COP, 4.00% due 12/15/2019 (Eastbridge Elementary and Conservatory Green K-8 Schools) | | NR/Aa3 | | | 400,000 | | | | 439,188 | |
City & County of Denver School District No. 1 COP, 4.00% due 12/15/2020 (Eastbridge Elementary and Conservatory Green K-8 Schools) | | NR/Aa3 | | | 600,000 | | | | 667,758 | |
City & County of Denver School District No. 1 COP, 5.00% due 12/15/2021 (Eastbridge Elementary and Conservatory Green K-8 Schools) | | NR/Aa3 | | | 1,000,000 | | | | 1,178,950 | |
City & County of Denver School District No. 1 COP, 5.00% due 12/15/2022 (Eastbridge Elementary and Conservatory Green K-8 Schools) | | NR/Aa3 | | | 1,030,000 | | | | 1,232,014 | |
City & County of Denver School District No. 1 COP, 5.00% due 12/15/2023 (Eastbridge Elementary and Conservatory Green K-8 Schools) | | NR/Aa3 | | | 1,180,000 | | | | 1,432,048 | |
City & County of Denver School District No. 1 GO, 4.00% due 12/1/2016 (Capital Projects) (State Aid Withholding) | | AA/Aa2 | | | 3,775,000 | | | | 3,862,995 | |
City of Longmont, 6.00% due 5/15/2019 | | AA+/NR | | | 3,215,000 | | | | 3,679,889 | |
Colorado Department of Corrections COP, 5.00% due 3/1/2017 (Colorado Penitentiary II Project) (ETM) | | AA-/Aa2 | | | 2,000,000 | | | | 2,080,260 | |
Colorado Department of Corrections COP, 5.00% due 3/1/2018 (Colorado Penitentiary II Project) (ETM) | | AA-/Aa2 | | | 1,590,000 | | | | 1,717,089 | |
Colorado Educational & Cultural Facilities Authority, 5.00% due 6/1/2016 (National Conference of State Legislatures) | | A/A3 | | | 755,000 | | | | 760,293 | |
Colorado Educational & Cultural Facilities Authority, 5.00% due 6/1/2018 (National Conference of State Legislatures) | | A/A3 | | | 1,625,000 | | | | 1,741,139 | |
Colorado Educational & Cultural Facilities Authority, 5.00% due 6/1/2020 (National Conference of State Legislatures) | | A/A3 | | | 1,805,000 | | | | 2,026,167 | |
Colorado Educational & Cultural Facilities Authority, 5.00% due 6/1/2021 (National Conference of State Legislatures) | | A/A3 | | | 1,000,000 | | | | 1,135,440 | |
Colorado HFA, 5.25% due 5/15/2017 (Northern Colorado Medical Center; Insured: AGM) | | AA/NR | | | 1,185,000 | | | | 1,244,546 | |
Colorado HFA, 5.25% due 5/15/2019 (Northern Colorado Medical Center; Insured: AGM) | | AA/NR | | | 2,225,000 | | | | 2,512,425 | |
Denver Convention Center Hotel Authority, 5.25% due 12/1/2021 (Insured: Syncora) | | BBB-/Baa3 | | | 3,700,000 | | | | 3,788,652 | |
Denver Convention Center Hotel Authority, 5.25% due 12/1/2022 (Insured: Syncora) | | BBB-/Baa3 | | | 1,100,000 | | | | 1,132,296 | |
Denver West Metropolitan District GO, 5.00% due 12/1/2021 (Insured: AGM) | | AA/NR | | | 2,175,000 | | | | 2,553,189 | |
El Paso County COP, 4.00% due 12/1/2021 (Pikes Peak Regional Development Center) | | AA-/Aa2 | | | 1,000,000 | | | | 1,123,050 | |
El Paso County COP, 5.00% due 12/1/2023 (Pikes Peak Regional Development Center) | | AA-/Aa2 | | | 1,330,000 | | | | 1,606,906 | |
El Paso County School District No. 49 Falcon COP, 5.00% due 12/15/2020 | | NR/Aa3 | | | 350,000 | | | | 407,631 | |
El Paso County School District No. 49 Falcon COP, 5.00% due 12/15/2023 | | NR/Aa3 | | | 945,000 | | | | 1,152,135 | |
El Paso County School District No. 49 Falcon COP, 5.00% due 12/15/2024 | | NR/Aa3 | | | 655,000 | | | | 808,578 | |
Park Creek Metropolitan District, 5.00% due 12/1/2016 (Insured: AGM) (ETM) | | AA/NR | | | 1,035,000 | | | | 1,064,663 | |
Park Creek Metropolitan District, 5.00% due 12/1/2017 (Insured: AGM) (ETM) | | AA/NR | | | 1,525,000 | | | | 1,627,480 | |
Park Creek Metropolitan District, 5.50% due 12/1/2018 (Insured: AGM) (ETM) | | AA/NR | | | 1,200,000 | | | | 1,338,972 | |
Park Creek Metropolitan District, 5.50% due 12/1/2019 (Insured: AGM) (ETM) | | AA/NR | | | 1,000,000 | | | | 1,155,140 | |
Regents of the University of Colorado COP, 5.00% due 11/1/2016 (UCDHSC Fitzsimons Academic Facilities) | | AA-/Aa2 | | | 700,000 | | | | 718,207 | |
Regents of the University of Colorado COP, 5.00% due 11/1/2017 (UCDHSC Fitzsimons Academic Facilities) | | AA-/Aa2 | | | 850,000 | | | | 907,026 | |
Regional Transportation District COP, 5.00% due 6/1/2018 (FasTracks Transportation System) | | A/Aa3 | | | 1,750,000 | | | | 1,903,457 | |
Regional Transportation District COP, 5.00% due 6/1/2019 (FasTracks Transportation System) | | A/Aa3 | | | 4,730,000 | | | | 5,311,128 | |
Regional Transportation District COP, 5.00% due 6/1/2020 (FasTracks Transportation System) | | A/Aa3 | | | 3,655,000 | | | | 4,213,740 | |
Regional Transportation District COP, 5.50% due 6/1/2021 (FasTracks Transportation System) | | A/Aa3 | | | 2,370,000 | | | | 2,797,050 | |
Regional Transportation District COP, 5.00% due 6/1/2023 (North Metro Rail Line) | | A/Aa3 | | | 4,000,000 | | | | 4,905,960 | |
Regional Transportation District COP, 5.00% due 6/1/2024 (North Metro Rail Line) | | A/Aa3 | | | 4,000,000 | | | | 4,839,000 | |
| | | |
CONNECTICUT — 2.28% | | | | | | | | | | |
City of Hartford GO, 5.00% due 10/1/2022 (Various Public Improvements; Insured: AGM) | | AA/A3 | | | 1,765,000 | | | | 2,095,408 | |
City of Hartford GO, 5.00% due 7/1/2024 (Various Public Improvements; Insured: AGM) | | AA/A2 | | | 800,000 | | | | 969,144 | |
12 Semi-Annual Report
| | |
| SCHEDULE OF INVESTMENTS, CONTINUED | | |
| |
Thornburg Limited Term Municipal Fund | | March 31, 2016 (Unaudited) |
| | | | | | | | | | |
Issuer-Description | | Credit Rating†
S&P/ Moody’s | | Principal
Amount | | | Value | |
City of Hartford GO, 5.00% due 7/1/2025 (Various Public Improvements; Insured: AGM) | | AA/A2 | | $ | 1,020,000 | | | $ | 1,248,755 | |
City of West Haven GO, 4.00% due 8/1/2018 (Insured: AGM) | | AA/A2 | | | 2,080,000 | | | | 2,211,747 | |
Connecticut Housing Finance Authority, 0.35% due 11/15/2036 put 4/1/2016 (Housing Mortgage Financing Program; SPA: JPMorgan Chase Bank, N.A.) (daily demand notes) | | AAA/Aaa | | | 10,820,000 | | | | 10,820,000 | |
Connecticut Housing Finance Authority, 0.35% due 5/15/2039 put 4/1/2016 (Housing Mortgage Financing Program; SPA: JPMorgan Chase Bank, N.A.) (daily demand notes) | | AAA/Aaa | | | 9,160,000 | | | | 9,160,000 | |
Connecticut Housing Finance Authority, 0.35% due 5/15/2039 put 4/1/2016 (Housing Mortgage Financing Program; SPA: JPMorgan Chase Bank, N.A.) (daily demand notes) | | AAA/Aaa | | | 41,315,000 | | | | 41,315,000 | |
State of Connecticut GO, 5.00% due 6/1/2019 pre-refunded 6/1/2016 (General State Capital Projects; Insured: AGM) | | AA/Aa3 | | | 2,865,000 | | | | 2,886,373 | |
State of Connecticut GO, 5.00% due 6/15/2023 (Housing Development & Rehabilitation) | | AA/Aa3 | | | 13,915,000 | | | | 16,831,445 | |
State of Connecticut GO, 5.00% due 9/1/2023 (Housing Development & Rehabilitation) | | AA/Aa3 | | | 5,550,000 | | | | 6,737,700 | |
State of Connecticut GO, 5.00% due 6/15/2024 (Housing Development & Rehabilitation) | | AA/Aa3 | | | 19,385,000 | | | | 23,756,318 | |
State of Connecticut GO, 5.00% due 8/15/2024 (General State Capital Projects) | | AA/Aa3 | | | 1,845,000 | | | | 2,240,273 | |
State of Connecticut GO, 5.00% due 6/15/2025 (Housing Development & Rehabilitation) | | AA/Aa3 | | | 11,015,000 | | | | 13,588,214 | |
State of Connecticut GO, 5.00% due 6/15/2026 (Housing Development & Rehabilitation) | | AA/Aa3 | | | 22,240,000 | | | | 27,169,274 | |
State of Connecticut GO Floating Rate Note, 1.06% due 9/15/2018 (General State Capital Projects) | | AA/Aa3 | | | 725,000 | | | | 723,441 | |
State of Connecticut GO Floating Rate Note, 0.78% due 9/15/2024 put 9/15/2017 (General State Capital Projects) | | AA/Aa3 | | | 10,000,000 | | | | 9,980,400 | |
| | | |
DELAWARE — 0.03% | | | | | | | | | | |
Delaware Transportation Authority, 5.00% due 7/1/2020 (Transportation System) | | AA+/Aa2 | | | 500,000 | | | | 581,875 | |
Delaware Transportation Authority, 5.00% due 7/1/2022 (Transportation System) | | AA+/Aa2 | | | 1,440,000 | | | | 1,754,006 | |
| | | |
DISTRICT OF COLUMBIA — 0.27% | | | | | | | | | | |
District of Columbia, 5.00% due 4/1/2016 (National Public Radio) (ETM) | | AA-/A1 | | | 685,000 | | | | 685,000 | |
District of Columbia, 4.00% due 4/1/2017 (National Public Radio) | | AA-/A1 | | | 1,830,000 | | | | 1,890,171 | |
District of Columbia, 5.00% due 4/1/2018 (National Public Radio) | | AA-/A1 | | | 1,745,000 | | | | 1,886,502 | |
District of Columbia, 5.00% due 4/1/2019 (National Public Radio) | | AA-/A1 | | | 805,000 | | | | 897,905 | |
District of Columbia, 5.00% due 4/1/2020 (National Public Radio) | | AA-/A1 | | | 1,890,000 | | | | 2,166,677 | |
District of Columbia GO, 6.00% due 6/1/2018 (Insured: Natl-Re) | | AA/Aa1 | | | 5,000,000 | | | | 5,555,600 | |
District of Columbia GO, 5.25% due 6/1/2020 (Insured: Syncora) | | AA/Aa1 | | | 3,005,000 | | | | 3,515,249 | |
Metropolitan Washington Airports Authority, 0% due 10/1/2016 (Dulles Toll Road; Insured: AGM) | | AA/A3 | | | 4,000,000 | | | | 3,978,520 | |
| | | |
FLORIDA — 7.91% | | | | | | | | | | |
Broward County, 5.00% due 9/1/2017 (Port Facilities) | | A-/A1 | | | 2,820,000 | | | | 2,965,822 | |
Broward County, 4.00% due 10/1/2017 (Airport, Marina & Port Improvements) | | A+/A1 | | | 500,000 | | | | 524,075 | |
Broward County, 5.00% due 10/1/2017 (Airport, Marina & Port Improvements) | | A+/A1 | | | 1,000,000 | | | | 1,063,040 | |
Broward County, 5.50% due 9/1/2018 (Port Facilities) | | A-/A1 | | | 3,500,000 | | | | 3,837,680 | |
Broward County, 4.00% due 10/1/2018 (Airport, Marina & Port Improvements) | | A+/A1 | | | 425,000 | | | | 457,003 | |
Broward County, 5.00% due 10/1/2018 (Airport, Marina & Port Improvements) | | A+/A1 | | | 500,000 | | | | 549,975 | |
Broward County, 5.50% due 9/1/2019 (Port Facilities) | | A-/A1 | | | 2,800,000 | | | | 3,164,924 | |
Broward County, 5.00% due 10/1/2019 (Airport, Marina & Port Improvements) | | A+/A1 | | | 1,000,000 | | | | 1,133,910 | |
Broward County, 4.00% due 10/1/2020 (Airport, Marina & Port Improvements) | | A+/A1 | | | 1,660,000 | | | | 1,846,816 | |
Broward County, 5.00% due 10/1/2020 (Airport, Marina & Port Improvements) | | A+/A1 | | | 2,000,000 | | | | 2,326,220 | |
Broward County School Board COP, 5.00% due 7/1/2016 (Educational Facilities; Insured: AGM) | | AA/Aa3 | | | 1,495,000 | | | | 1,512,073 | |
Broward County School Board COP, 5.25% due 7/1/2016 (Educational Facilities; Insured: AGM) | | AA/Aa3 | | | 7,630,000 | | | | 7,721,941 | |
Broward County School Board COP, 5.25% due 7/1/2016 (Educational Facilities; Insured: AGM) | | AA/Aa3 | | | 3,715,000 | | | | 3,759,766 | |
Broward County School Board COP, 5.00% due 7/1/2017 (Educational Facilities; Insured: Natl-Re) | | AA-/Aa3 | | | 1,000,000 | | | | 1,052,380 | |
Broward County School Board COP, 5.00% due 7/1/2021 (Educational Facilities) | | A+/Aa3 | | | 4,000,000 | | | | 4,708,600 | |
Broward County School Board COP, 5.00% due 7/1/2022 (Educational Facilities) | | A+/Aa3 | | | 4,580,000 | | | | 5,499,618 | |
Broward County School Board COP, 5.00% due 7/1/2023 (Educational Facilities) | | A+/Aa3 | | | 3,000,000 | | | | 3,649,770 | |
Broward County School Board COP, 5.00% due 7/1/2023 (Educational Facilities) | | A+/Aa3 | | | 2,000,000 | | | | 2,433,180 | |
Broward County School Board COP, 5.00% due 7/1/2024 (Educational Facilities) | | A+/Aa3 | | | 4,000,000 | | | | 4,918,640 | |
Broward County School Board COP, 5.00% due 7/1/2024 (Educational Facilities) | | A+/Aa3 | | | 2,000,000 | | | | 2,459,320 | |
Broward County School Board COP, 5.00% due 7/1/2025 (Educational Facilities) | | A+/Aa3 | | | 7,000,000 | | | | 8,701,840 | |
Broward County School Board COP, 5.00% due 7/1/2025 (Educational Facilities) | | A+/Aa3 | | | 5,000,000 | | | | 6,215,600 | |
City of Fort Myers, 5.00% due 12/1/2018 (Gulf Breeze Loan Program; Insured: Natl-Re) | | AA-/Aa3 | | | 2,195,000 | | | | 2,337,214 | |
City of Fort Myers, 5.00% due 10/1/2023 (Utility Systems Capital Projects) | | A/Aa3 | | | 3,360,000 | | | | 4,009,958 | |
City of Gainesville, 0.35% due 10/1/2026 put 4/1/2016 (Utilities System; SPA: Union Bank) (daily demand notes) | | AA-/Aa2 | | | 21,185,000 | | | | 21,185,000 | |
City of Gainesville, 0.52% due 10/1/2042 put 4/7/2016 (Utilities System; LOC: Sumitomo Mitsui Banking) (weekly demand notes) | | NR/NR | | | 46,600,000 | | | | 46,600,000 | |
City of Hollywood Community Redevelopment Agency, 5.00% due 3/1/2017 (Beach Community Redevelopment Project; Insured: Syncora) (ETM) | | NR/A3 | | | 2,000,000 | | | | 2,080,080 | |
City of Hollywood Community Redevelopment Agency, 5.00% due 3/1/2024 pre-refunded 3/1/2017 (Beach Community Redevelopment Project; Insured: Syncora) | | NR/A3 | | | 4,850,000 | | | | 5,044,194 | |
City of Jacksonville, 5.00% due 10/1/2017 | | AA-/Aa3 | | | 1,000,000 | | | | 1,063,890 | |
City of Jacksonville, 5.00% due 10/1/2018 | | AA-/Aa3 | | | 1,050,000 | | | | 1,157,006 | |
City of Jacksonville, 5.00% due 10/1/2019 | | AA-/Aa3 | | | 500,000 | | | | 568,250 | |
Semi-Annual Report 13
| | |
| SCHEDULE OF INVESTMENTS, CONTINUED | | |
| |
Thornburg Limited Term Municipal Fund | | March 31, 2016 (Unaudited) |
| | | | | | | | | | |
Issuer-Description | | Credit Rating†
S&P/ Moody’s | | Principal
Amount | | | Value | |
City of Jacksonville, 5.00% due 10/1/2020 | | AA-/Aa3 | | $ | 1,000,000 | | | $ | 1,165,730 | |
a City of Jacksonville, 5.00% due 10/1/2023 | | AA-/Aa3 | | | 1,105,000 | | | | 1,356,167 | |
City of Lakeland, 5.00% due 10/1/2016 (Energy System; Insured: AGM) | | AA/Aa3 | | | 9,780,000 | | | | 10,001,517 | |
City of Lakeland, 5.00% due 10/1/2017 (Energy System; Insured: AGM) | | AA/Aa3 | | | 7,105,000 | | | | 7,565,617 | |
City of Lakeland, 5.00% due 10/1/2019 (Energy System; Insured: AGM) | | AA/Aa3 | | | 5,000,000 | | | | 5,693,600 | |
City of Lakeland, 5.00% due 11/15/2019 (Lakeland Regional Health Systems) | | NR/A2 | | | 5,655,000 | | | | 6,403,100 | |
City of Lakeland, 5.00% due 10/1/2020 (Energy System; Insured: AGM) | | AA/Aa3 | | | 1,695,000 | | | | 1,984,031 | |
City of Miami, 5.00% due 1/1/2018 (Street & Sidewalk Improvement Program; Insured: Natl-Re) | | AA-/A2 | | | 1,970,000 | | | | 2,101,340 | |
City of North Miami Beach, 5.00% due 8/1/2017 (North Miami Beach Water Project) | | A+/NR | | | 750,000 | | | | 789,420 | |
City of North Miami Beach, 3.00% due 8/1/2018 (North Miami Beach Water Project) | | A+/NR | | | 1,280,000 | | | | 1,333,645 | |
City of North Miami Beach, 5.00% due 8/1/2019 (North Miami Beach Water Project) | | A+/NR | | | 1,650,000 | | | | 1,847,340 | |
City of North Miami Beach, 5.00% due 8/1/2020 (North Miami Beach Water Project) | | A+/NR | | | 780,000 | | | | 892,484 | |
City of North Miami Beach, 5.00% due 8/1/2021 (North Miami Beach Water Project) | | A+/NR | | | 1,000,000 | | | | 1,167,640 | |
City of Port St. Lucie, 1.875% due 7/1/2017 (Tesoro Special Assessment District; Insured: AGM) | | NR/A2 | | | 250,000 | | | | 251,903 | |
City of Port St. Lucie, 2.00% due 7/1/2018 (Tesoro Special Assessment District; Insured: AGM) | | NR/A2 | | | 2,215,000 | | | | 2,244,814 | |
City of Tampa, 5.00% due 11/15/2016 (BayCare Health System) | | NR/Aa2 | | | 2,855,000 | | | | 2,933,884 | |
City of Tampa, 5.00% due 11/15/2017 (BayCare Health System) | | NR/Aa2 | | | 1,215,000 | | | | 1,297,887 | |
Florida Atlantic University Financing Corp., 5.00% due 7/1/2016 (Innovation Village Capital Improvements) | | A/A1 | | | 2,275,000 | | | | 2,300,184 | |
Florida Department of Management Services, 5.25% due 9/1/2016 (Insured: AGM) | | AA+/Aa2 | | | 3,500,000 | | | | 3,570,665 | |
Florida Higher Educational Facilities Financing Authority, 5.00% due 4/1/2016 (Nova Southeastern University) | | A-/Baa1 | | | 2,345,000 | | | | 2,345,000 | |
Florida Higher Educational Facilities Financing Authority, 5.25% due 4/1/2017 (Nova Southeastern University) | | A-/Baa1 | | | 1,325,000 | | | | 1,375,019 | |
Florida Higher Educational Facilities Financing Authority, 5.25% due 4/1/2018 (Nova Southeastern University) | | A-/Baa1 | | | 2,630,000 | | | | 2,820,649 | |
Florida Higher Educational Facilities Financing Authority, 5.00% due 4/1/2019 (University of Tampa) | | BBB+/NR | | | 1,225,000 | | | | 1,349,558 | |
Florida Higher Educational Facilities Financing Authority, 5.00% due 4/1/2019 (Nova Southeastern University) | | A-/Baa1 | | | 1,035,000 | | | | 1,133,698 | |
Florida Higher Educational Facilities Financing Authority, 5.50% due 4/1/2019 (Nova Southeastern University) | | A-/Baa1 | | | 1,705,000 | | | | 1,892,397 | |
Florida Higher Educational Facilities Financing Authority, 5.00% due 4/1/2020 (Nova Southeastern University) | | A-/Baa1 | | | 1,030,000 | | | | 1,150,953 | |
Florida Higher Educational Facilities Financing Authority, 5.00% due 4/1/2022 (University of Tampa) | | BBB+/NR | | | 620,000 | | | | 723,633 | |
Florida State Board of Education GO, 5.00% due 6/1/2016 (Public Education Capital Outlay) | | AAA/Aa1 | | | 3,900,000 | | | | 3,930,537 | |
Florida State Board of Governors, 4.00% due 7/1/2020 (University System Capital Improvements) | | AA/Aa2 | | | 4,055,000 | | | | 4,509,768 | |
Florida State Board of Governors, 4.00% due 7/1/2021 (University System Capital Improvements) | | AA/Aa2 | | | 4,215,000 | | | | 4,760,927 | |
Florida State Board of Governors, 4.00% due 7/1/2022 (University System Capital Improvements) | | AA/Aa2 | | | 4,385,000 | | | | 5,036,655 | |
Florida State Department of Transportation GO, 5.00% due 7/1/2018 | | AAA/Aa1 | | | 3,000,000 | | | | 3,189,570 | |
Highlands County HFA, 5.00% due 11/15/2016 (Adventist Health System Sunbelt Group) | | AA-/Aa2 | | | 1,000,000 | | | | 1,027,500 | |
Highlands County HFA, 5.00% due 11/15/2017 (Adventist Health System Sunbelt Group) | | AA-/Aa2 | | | 3,200,000 | | | | 3,419,392 | |
Highlands County HFA, 5.00% due 11/15/2019 (Adventist Health System Sunbelt Group) | | AA-/Aa2 | | | 3,000,000 | | | | 3,415,200 | |
Hillsborough County, 5.00% due 11/1/2016 (Transportation Related Capital Improvements; Insured: AMBAC) | | AA/A1 | | | 1,000,000 | | | | 1,026,070 | |
Hillsborough County, 5.00% due 11/1/2018 (Court Facilities) | | AA/A1 | | | 4,210,000 | | | | 4,648,177 | |
Hillsborough County, 5.00% due 11/1/2019 (Court Facilities) | | AA/A1 | | | 4,420,000 | | | | 5,033,982 | |
Hillsborough County, 5.00% due 11/1/2020 (Court Facilities) | | AA/A1 | | | 4,645,000 | | | | 5,418,811 | |
Hillsborough County, 5.00% due 11/1/2021 (Court Facilities) | | AA/A1 | | | 4,880,000 | | | | 5,813,495 | |
Hillsborough County, 5.00% due 11/1/2021 (Jail and Storm Water Projects) | | AA/A1 | | | 2,300,000 | | | | 2,739,967 | |
Hillsborough County, 5.00% due 11/1/2022 (Jail and Storm Water Projects) | | AA/A1 | | | 3,005,000 | | | | 3,637,763 | |
Hillsborough County IDA, 5.65% due 5/15/2018 (Tampa Electric Co.) | | BBB+/A2 | | | 3,200,000 | | | | 3,499,072 | |
Hillsborough County School Board COP, 5.25% due 7/1/2017 (Educational Facilities; Insured: Natl-Re) | | AA-/Aa2 | | | 1,300,000 | | | | 1,373,138 | |
Jacksonville Economic Development Commission, 6.00% due 9/1/2017 (Florida Proton Therapy Institute) | | NR/NR | | | 1,985,000 | | | | 2,107,395 | |
JEA, 4.00% due 10/1/2016 (Electric System) | | A+/Aa3 | | | 3,540,000 | | | | 3,602,162 | |
JEA, 5.00% due 10/1/2018 (Water and Sewer System) | | AA/Aa2 | | | 1,500,000 | | | | 1,655,625 | |
JEA, 5.00% due 10/1/2023 (Electric System) | | A+/Aa3 | | | 1,395,000 | | | | 1,720,077 | |
JEA, 5.00% due 10/1/2024 (Electric System) | | A+/Aa3 | | | 1,200,000 | | | | 1,480,584 | |
Kissimmee Utility Authority, 5.25% due 10/1/2016 (Electrical Systems; Insured: AGM) | | NR/A1 | | | 1,700,000 | | | | 1,739,576 | |
Lee County School Board COP, 5.00% due 8/1/2023 (School Facilities Improvements) | | A+/Aa3 | | | 1,000,000 | | | | 1,216,280 | |
Lee County School Board COP, 5.00% due 8/1/2024 (School Facilities Improvements) | | A+/Aa3 | | | 2,000,000 | | | | 2,456,960 | |
Manatee County, 5.00% due 10/1/2016 (County Capital Projects) | | NR/Aa2 | | | 1,000,000 | | | | 1,022,440 | |
Manatee County, 4.00% due 10/1/2017 (Public Utilities Improvements) | | NR/Aa2 | | | 1,000,000 | | | | 1,048,380 | |
Manatee County, 5.00% due 10/1/2018 (County Capital Projects) | | NR/Aa2 | | | 2,400,000 | | | | 2,642,064 | |
Manatee County, 5.00% due 10/1/2021 (County Capital Projects) | | NR/Aa2 | | | 2,775,000 | | | | 3,307,717 | |
Manatee County, 5.00% due 10/1/2024 (Public Utilities Improvements) | | NR/Aa2 | | | 500,000 | | | | 625,695 | |
Manatee County, 5.00% due 10/1/2025 (Public Utilities Improvements) | | NR/Aa2 | | | 470,000 | | | | 587,585 | |
Marion County School Board COP, 5.00% due 6/1/2018 (Insured: BAM) | | AA/A2 | | | 2,500,000 | | | | 2,712,000 | |
Marion County School Board COP, 5.00% due 6/1/2019 (Insured: BAM) | | AA/A2 | | | 2,635,000 | | | | 2,942,109 | |
Marion County School Board COP, 5.00% due 6/1/2020 (Insured: BAM) | | AA/A2 | | | 2,760,000 | | | | 3,142,094 | |
Marion County School Board COP, 5.00% due 6/1/2021 (Insured: BAM) | | AA/A2 | | | 2,505,000 | | | | 2,910,810 | |
Marion County School Board COP, 5.00% due 6/1/2024 (Insured: BAM) | | AA/A2 | | | 3,065,000 | | | | 3,691,149 | |
Miami Beach GO, 4.00% due 9/1/2019 | | AA+/Aa2 | | | 2,745,000 | | | | 3,010,194 | |
Miami Beach GO, 5.00% due 9/1/2020 | | AA+/Aa2 | | | 3,720,000 | | | | 4,312,894 | |
Miami Beach GO, 4.00% due 9/1/2021 | | AA+/Aa2 | | | 1,015,000 | | | | 1,149,904 | |
14 Semi-Annual Report
| | |
| SCHEDULE OF INVESTMENTS, CONTINUED | | |
| |
Thornburg Limited Term Municipal Fund | | March 31, 2016 (Unaudited) |
| | | | | | | | | | |
Issuer-Description | | Credit Rating†
S&P/ Moody’s | | Principal
Amount | | | Value | |
Miami Beach GO, 5.00% due 9/1/2022 | | AA+/Aa2 | | $ | 1,000,000 | | | $ | 1,174,020 | |
Miami-Dade County, 0% due 10/1/2016 (Professional Sports Franchise Facilities; Insured: AGM) | | AA/A1 | | | 3,535,000 | | | | 3,517,396 | |
Miami-Dade County, 0% due 10/1/2017 (Professional Sports Franchise Facilities; Insured: AGM) | | AA/A1 | | | 2,435,000 | | | | 2,373,930 | |
Miami-Dade County, 0% due 10/1/2018 (Professional Sports Franchise Facilities; Insured: AGM) | | AA/A1 | | | 5,385,000 | | | | 5,142,029 | |
Miami-Dade County, 0% due 10/1/2019 (Professional Sports Franchise Facilities; Insured: AGM) | | AA/A1 | | | 2,170,000 | | | | 2,017,688 | |
Miami-Dade County, 5.00% due 7/1/2023 (Transit System) | | AA/A1 | | | 1,000,000 | | | | 1,219,240 | |
Miami-Dade County, 5.00% due 7/1/2024 (Transit System) | | AA/A1 | | | 5,565,000 | | | | 6,859,753 | |
Miami-Dade County, 5.00% due 7/1/2025 (Transit System) | | AA/A1 | | | 3,650,000 | | | | 4,537,388 | |
Miami-Dade County, 5.00% due 10/1/2025 (Miami International Airport) | | A/A2 | | | 2,500,000 | | | | 3,081,925 | |
Miami-Dade County Educational Facilities Authority GO, 5.00% due 4/1/2016 (University of Miami; Insured: AMBAC) | | A-/A3 | | | 3,000,000 | | | | 3,000,000 | |
Miami-Dade County Expressway Authority, 5.00% due 7/1/2019 (Toll System; Insured: AGM) | | AA/A2 | | | 7,530,000 | | | | 8,452,048 | |
Miami-Dade County Expressway Authority, 5.00% due 7/1/2024 (Toll System) | | A/A2 | | | 2,000,000 | | | | 2,454,200 | |
Miami-Dade County Expressway Authority, 5.00% due 7/1/2025 (Toll System) | | A/A2 | | | 2,000,000 | | | | 2,447,400 | |
Miami-Dade County GO, 5.25% due 7/1/2018 (Building Better Communities) | | AA/Aa2 | | | 5,040,000 | | | | 5,524,798 | |
Miami-Dade County School Board COP, 5.00% due 5/1/2016 (Insured: Natl-Re) | | AA-/A1 | | | 4,065,000 | | | | 4,081,097 | |
Miami-Dade County School Board COP, 5.00% due 10/1/2016 (Insured: AMBAC) | | A/A1 | | | 1,000,000 | | | | 1,022,470 | |
Miami-Dade County School Board COP, 5.00% due 5/1/2022 (Educational Facilities Improvements) | | A/A1 | | | 3,405,000 | | | | 4,051,099 | |
Miami-Dade County School Board COP, 5.00% due 5/1/2023 (Educational Facilities Improvements) | | A/A1 | | | 4,130,000 | | | | 4,967,770 | |
Miami-Dade County School Board COP, 5.00% due 5/1/2024 (Educational Facilities Improvements) | | A/A1 | | | 8,000,000 | | | | 9,690,000 | |
Miami-Dade County School Board COP, 5.00% due 5/1/2025 (Educational Facilities Improvements) | | A/A1 | | | 15,000,000 | | | | 18,371,850 | |
Miami-Dade County School Board COP, 5.00% due 5/1/2031 put 5/1/2024 (Educational Facilities Improvements) | | A/A1 | | | 2,425,000 | | | | 2,884,416 | |
Orange County HFA, 6.25% due 10/1/2016 (Orlando Health, Inc.; Insured: Natl-Re) | | AA-/A2 | | | 820,000 | | | | 837,663 | |
Orange County HFA, 5.00% due 10/1/2017 (Orlando Health, Inc.) | | A/A2 | | | 1,980,000 | | | | 2,094,721 | |
Orange County HFA, 5.25% due 10/1/2019 (Orlando Health, Inc.) | | A/A2 | | | 6,050,000 | | | | 6,822,948 | |
Orange County HFA, 6.25% due 10/1/2021 (Orlando Health, Inc.; Insured: Natl-Re) | | AA-/A2 | | | 1,870,000 | | | | 2,133,633 | |
Orange County HFA, 5.375% due 10/1/2023 (Orlando Health, Inc.) | | A/A2 | | | 4,150,000 | | | | 4,710,001 | |
Orange County School Board COP, 5.00% due 8/1/2019 (Educational Facilities) | | NR/Aa2 | | | 1,000,000 | | | | 1,132,560 | |
Orange County School Board COP, 5.00% due 8/1/2020 (Educational Facilities) | | NR/Aa2 | | | 1,695,000 | | | | 1,969,590 | |
Orange County School Board COP, 5.00% due 8/1/2021 (Educational Facilities) | | NR/Aa2 | | | 2,100,000 | | | | 2,491,608 | |
Orange County School Board COP, 5.00% due 8/1/2022 (Educational Facilities) | | NR/Aa2 | | | 1,825,000 | | | | 2,206,151 | |
Orange County School Board COP, 5.00% due 8/1/2023 (Educational Facilities) | | NR/Aa2 | | | 1,540,000 | | | | 1,888,979 | |
Orange County School Board COP, 5.00% due 8/1/2024 (Educational Facilities) | | NR/Aa2 | | | 1,445,000 | | | | 1,791,944 | |
Orange County School Board COP, 5.00% due 8/1/2025 (Educational Facilities) | | NR/Aa2 | | | 1,190,000 | | | | 1,487,000 | |
Orlando and Orange County Expressway Authority, 8.25% due 7/1/2016 (Insured: Natl-Re/FGIC/IBC) | | AA-/A2 | | | 3,000,000 | | | | 3,056,910 | |
Palm Beach County HFA, 5.00% due 12/1/2020 (Boca Raton Regional Hospital) | | BBB+/NR | | | 600,000 | | | | 682,860 | |
Palm Beach County School Board COP, 5.00% due 8/1/2018 (Educational Facilities Master Lease Program) | | NR/Aa3 | | | 800,000 | | | | 876,272 | |
Palm Beach County School Board COP, 4.00% due 8/1/2019 (Educational Facilities Master Lease Program) | | NR/Aa3 | | | 940,000 | | | | 1,030,259 | |
Palm Beach County School Board COP, 5.00% due 8/1/2020 (Educational Facilities Master Lease Program) | | NR/Aa3 | | | 1,090,000 | | | | 1,262,067 | |
Palm Beach County School Board COP, 4.00% due 8/1/2021 (Educational Facilities Master Lease Program) | | NR/Aa3 | | | 3,835,000 | | | | 4,342,984 | |
Palm Beach County School Board COP, 5.00% due 8/1/2022 (Educational Facilities Master Lease Program) | | NR/Aa3 | | | 1,000,000 | | | | 1,206,560 | |
Palm Beach County School Board COP, 5.00% due 8/1/2022 (Educational Facilities Master Lease Program) | | NR/Aa3 | | | 1,660,000 | | | | 2,002,890 | |
Palm Beach County School Board COP, 5.00% due 8/1/2023 (Educational Facilities Master Lease Program) | | NR/Aa3 | | | 1,000,000 | | | | 1,225,830 | |
Palm Beach County School Board COP, 5.00% due 8/1/2023 (Educational Facilities Master Lease Program) | | NR/Aa3 | | | 3,500,000 | | | | 4,290,405 | |
Palm Beach County School Board COP, 5.00% due 8/1/2024 (Educational Facilities Master Lease Program) | | NR/Aa3 | | | 1,000,000 | | | | 1,243,590 | |
Palm Beach County School Board COP, 5.00% due 8/1/2024 (Educational Facilities Master Lease Program) | | NR/Aa3 | | | 3,595,000 | | | | 4,470,706 | |
Palm Beach County School Board COP, 5.00% due 8/1/2032 pre-refunded 8/1/2016 (Educational Facilities Master Lease Program) | | NR/Aa3 | | | 1,300,000 | | | | 1,319,461 | |
Polk County, 4.00% due 10/1/2020 (Water and Wastewater Utility Systems; Insured: AGM) | | A+/Aa3 | | | 3,100,000 | | | | 3,467,908 | |
Polk County, 3.00% due 10/1/2021 (Water and Wastewater Utility Systems; Insured: AGM) | | A+/Aa3 | | | 3,125,000 | | | | 3,370,687 | |
Polk County, 5.00% due 10/1/2023 (Water and Wastewater Utility Systems) | | A+/Aa3 | | | 1,420,000 | | | | 1,705,278 | |
Putnam County Development Authority, 5.35% due 3/15/2042 put 5/1/2018 (Seminole Project; Insured: AMBAC) | | A-/A3 | | | 10,200,000 | | | | 11,036,808 | |
Putnam County Development Authority, 5.35% due 3/15/2042 put 5/1/2018 (Seminole Project; Insured: AMBAC) | | A-/A3 | | | 4,165,000 | | | | 4,506,697 | |
Reedy Creek Improvement District, 5.00% due 10/1/2017 (Walt Disney World Resort Complex Utility Systems) | | A/A1 | | | 400,000 | | | | 424,348 | |
Reedy Creek Improvement District, 5.00% due 10/1/2018 (Walt Disney World Resort Complex Utility Systems) | | A/A1 | | | 755,000 | | | | 827,216 | |
Reedy Creek Improvement District, 5.00% due 10/1/2021 (Walt Disney World Resort Complex Utility Systems) | | A/A1 | | | 1,200,000 | | | | 1,410,528 | |
Reedy Creek Improvement District, 5.00% due 10/1/2022 (Walt Disney World Resort Complex Utility Systems) | | A/A1 | | | 625,000 | | | | 745,369 | |
Reedy Creek Improvement District, 5.00% due 6/1/2023 (Buena Vista Drive Corridor Improvements) | | A+/Aa3 | | | 1,940,000 | | | | 2,381,990 | |
Reedy Creek Improvement District, 5.00% due 10/1/2023 (Walt Disney World Resort Complex Utility Systems) | | A/A1 | | | 750,000 | | | | 904,095 | |
Reedy Creek Improvement District GO, 5.00% due 6/1/2021 (Walt Disney World Resort Complex Utility Systems) | | A+/Aa3 | | | 500,000 | | | | 590,705 | |
Reedy Creek Improvement District GO, 5.00% due 6/1/2023 (Walt Disney World Resort Complex Utility Systems) | | A+/Aa3 | | | 860,000 | | | | 1,055,934 | |
Reedy Creek Improvement District GO, 5.00% due 6/1/2024 (Walt Disney World Resort Complex Utility Systems) | | A+/Aa3 | | | 850,000 | | | | 1,059,236 | |
Reedy Creek Improvement District GO, 5.00% due 6/1/2025 (Walt Disney World Resort Complex Utility Systems) | | A+/Aa3 | | | 2,000,000 | | | | 2,525,560 | |
School Board of Alachua County COP, 5.00% due 7/1/2022 (Educational Facilities) | | A+/Aa3 | | | 1,600,000 | | | | 1,887,376 | |
School Board of Alachua County COP, 5.00% due 7/1/2023 (Educational Facilities) | | A+/Aa3 | | | 2,250,000 | | | | 2,694,195 | |
School Board of Lake County COP, 5.25% due 6/1/2017 (Insured: AMBAC) | | A/NR | | | 2,000,000 | | | | 2,103,640 | |
School Board of Lake County COP, 5.25% due 6/1/2018 (Insured: AMBAC) | | A/NR | | | 1,475,000 | | | | 1,612,234 | |
Semi-Annual Report 15
| | |
| SCHEDULE OF INVESTMENTS, CONTINUED | | |
| |
Thornburg Limited Term Municipal Fund | | March 31, 2016 (Unaudited) |
| | | | | | | | | | |
Issuer-Description | | Credit Rating†
S&P/ Moody’s | | Principal
Amount | | | Value | |
South Broward Hospital District, 5.00% due 5/1/2020 (Insured: Natl-Re) | | AA/Aa3 | | $ | 1,955,000 | | | $ | 1,962,351 | |
South Florida Water Management District COP, 5.00% due 10/1/2017 (Everglades Restoration Plan) | | AA/Aa3 | | | 2,000,000 | | | | 2,130,280 | |
South Florida Water Management District COP, 5.00% due 10/1/2018 (Everglades Restoration Plan) | | AA/Aa3 | | | 2,500,000 | | | | 2,760,675 | |
South Florida Water Management District COP, 5.00% due 10/1/2019 (Everglades Restoration Plan) | | AA/Aa3 | | | 1,500,000 | | | | 1,707,525 | |
South Florida Water Management District COP, 5.00% due 10/1/2020 (Everglades Restoration Plan) | | AA/Aa3 | | | 1,780,000 | | | | 2,079,894 | |
South Florida Water Management District COP, 5.00% due 10/1/2021 (Everglades Restoration Plan) | | AA/Aa3 | | | 1,750,000 | | | | 2,086,717 | |
South Florida Water Management District COP, 5.00% due 10/1/2022 (Everglades Restoration Plan) | | AA/Aa3 | | | 2,000,000 | | | | 2,427,160 | |
South Florida Water Management District COP, 5.00% due 10/1/2023 pre-refunded 10/1/2016 (Everglades Restoration Plan; Insured: AMBAC) | | AA/Aa3 | | | 500,000 | | | | 511,185 | |
South Miami HFA, 5.00% due 8/15/2016 (Baptist Health) | | AA/Aa3 | | | 4,985,000 | | | | 5,068,000 | |
South Miami HFA, 5.00% due 8/15/2017 (Baptist Health) | | AA/Aa3 | | | 4,610,000 | | | | 4,878,901 | |
Sunshine State Governmental Financing Commission, 5.00% due 9/1/2021 (Miami-Dade County Program; Insured: AGM) | | AA/Aa3 | | | 5,000,000 | | | | 5,907,000 | |
Sunshine State Governmental Financing Commission, 5.00% due 9/1/2021 (Miami-Dade County Program) | | AA-/Aa3 | | | 1,450,000 | | | | 1,718,018 | |
Sunshine State Governmental Financing Commission, 5.00% due 9/1/2022 (Miami-Dade County Program) | | AA-/Aa3 | | | 2,000,000 | | | | 2,414,420 | |
Sunshine State Governmental Financing Commission, 5.00% due 9/1/2023 (Miami-Dade County Program) | | AA-/Aa3 | | | 2,100,000 | | | | 2,575,461 | |
Sunshine State Governmental Financing Commission, 5.00% due 9/1/2024 (Miami-Dade County Program) | | AA-/Aa3 | | | 1,725,000 | | | | 2,098,135 | |
Tampa Bay Regional Water Supply Authority, 5.00% due 10/1/2017 | | AA+/Aa1 | | | 5,615,000 | | | | 5,972,900 | |
Tampa Bay Regional Water Supply Authority, 5.00% due 10/1/2018 | | AA+/Aa1 | | | 2,890,000 | | | | 3,185,271 | |
Tampa Bay Regional Water Supply Authority, 5.00% due 10/1/2019 | | AA+/Aa1 | | | 3,000,000 | | | | 3,411,150 | |
University of North Florida Foundation, Inc., 0.39% due 5/1/2028 put 4/1/2016 (Parking Facility; LOC: Wachovia Bank, N.A.) (daily demand notes) | | AA-/NR | | | 600,000 | | | | 600,000 | |
Volusia County Educational Facilities Authority, 5.00% due 10/15/2016 (Embry-Riddle Aeronautical University, Inc.; Insured: AGM) | | AA/A2 | | | 2,320,000 | | | | 2,373,592 | |
Volusia County Educational Facilities Authority, 4.00% due 10/15/2017 (Embry-Riddle Aeronautical University, Inc.; Insured: AGM) | | AA/A2 | | | 1,030,000 | | | | 1,077,802 | |
Volusia County Educational Facilities Authority, 5.00% due 10/15/2018 (Embry-Riddle Aeronautical University, Inc.; Insured: AGM) | | AA/A2 | | | 2,075,000 | | | | 2,274,511 | |
Volusia County Educational Facilities Authority, 5.00% due 10/15/2019 (Embry-Riddle Aeronautical University, Inc.; Insured: AGM) | | AA/A2 | | | 2,350,000 | | | | 2,651,975 | |
Volusia County Educational Facilities Authority, 5.00% due 10/15/2023 (Embry-Riddle Aeronautical University, Inc.) | | NR/Baa1 | | | 700,000 | | | | 841,260 | |
Volusia County Educational Facilities Authority, 5.00% due 10/15/2024 (Embry-Riddle Aeronautical University, Inc.) | | NR/Baa1 | | | 650,000 | | | | 790,355 | |
Volusia County Educational Facilities Authority, 5.00% due 10/15/2025 (Embry-Riddle Aeronautical University, Inc.) | | NR/Baa1 | | | 400,000 | | | | 485,468 | |
Volusia County School Board COP, 5.00% due 8/1/2024 (Master Lease Program) | | NR/Aa3 | | | 1,000,000 | | | | 1,241,840 | |
| | | |
GEORGIA — 1.93% | | | | | | | | | | |
Athens-Clarke County Unified Government Development Authority, 3.00% due 6/15/2016 (UGAREF Bolton Commons, LLC) | | NR/Aa2 | | | 300,000 | | | | 301,635 | |
Athens-Clarke County Unified Government Development Authority, 4.00% due 6/15/2017 (UGAREF Bolton Commons, LLC) | | NR/Aa2 | | | 495,000 | | | | 515,057 | |
Athens-Clarke County Unified Government Development Authority, 5.00% due 6/15/2019 (UGAREF Bolton Commons, LLC) | | NR/Aa2 | | | 400,000 | | | | 451,476 | |
Athens-Clarke County Unified Government Development Authority, 4.00% due 6/15/2020 (UGAREF Bolton Commons, LLC) | | NR/Aa2 | | | 395,000 | | | | 440,800 | |
Athens-Clarke County Unified Government Development Authority, 0.35% due 7/1/2035 put 4/1/2016 (University of Georgia Athletic Association; LOC: Wells Fargo Bank, N.A.) (daily demand notes) | | NR/Aa1 | | | 100,000 | | | | 100,000 | |
City of Atlanta, 5.00% due 11/1/2016 (Water & Wastewater System; Insured: AGM) | | AA/Aa3 | | | 3,215,000 | | | | 3,300,165 | |
City of Atlanta, 5.50% due 11/1/2016 (Water & Wastewater System; Insured: Natl-Re) | | AA-/Aa3 | | | 8,215,000 | | | | 8,456,521 | |
City of Atlanta, 5.25% due 12/1/2016 (Atlantic Station Project; Insured: AGM) | | AA/A3 | | | 3,650,000 | | | | 3,752,273 | |
City of Atlanta, 5.00% due 11/1/2017 (Water & Wastewater System; Insured: AGM) | | AA/Aa3 | | | 4,745,000 | | | | 5,067,992 | |
City of Atlanta, 5.00% due 1/1/2018 (Hartsfield-Jackson Atlanta International Airport) | | NR/Aa3 | | | 2,100,000 | | | | 2,255,232 | |
City of Atlanta, 5.00% due 1/1/2019 (Hartsfield-Jackson Atlanta International Airport) | | NR/Aa3 | | | 3,145,000 | | | | 3,485,352 | |
City of Atlanta, 6.00% due 11/1/2019 (Water & Wastewater System) | | AA-/Aa3 | | | 5,650,000 | | | | 6,642,536 | |
City of Atlanta, 5.00% due 1/1/2020 (Hartsfield-Jackson Atlanta International Airport) | | NR/Aa3 | | | 6,000,000 | | | | 6,862,020 | |
City of Atlanta, 5.25% due 1/1/2020 (Hartsfield-Jackson Atlanta International Airport) | | NR/Aa3 | | | 5,000,000 | | | | 5,746,250 | |
City of Atlanta, 5.00% due 1/1/2021 (Hartsfield-Jackson Atlanta International Airport) | | NR/Aa3 | | | 7,000,000 | | | | 8,044,680 | |
City of Atlanta, 5.50% due 1/1/2021 (Hartsfield-Jackson Atlanta International Airport) | | NR/Aa3 | | | 3,525,000 | | | | 4,204,761 | |
City of Atlanta, 5.00% due 11/1/2021 (Water & Wastewater System) | | AA-/Aa3 | | | 2,500,000 | | | | 2,994,300 | |
City of Atlanta, 5.00% due 11/1/2022 (Water & Wastewater System) | | AA-/Aa3 | | | 1,000,000 | | | | 1,222,110 | |
City of Atlanta, 5.00% due 1/1/2023 (Airport Passenger Facility) | | AA-/Aa3 | | | 1,000,000 | | | | 1,213,130 | |
a City of Atlanta, 5.00% due 11/1/2023 (Water & Wastewater System) | | AA-/Aa3 | | | 1,130,000 | | | | 1,406,048 | |
City of Atlanta, 5.00% due 1/1/2024 (Airport Passenger Facility) | | AA-/Aa3 | | | 1,350,000 | | | | 1,675,485 | |
City of Atlanta, 5.00% due 11/1/2024 (Water & Wastewater System) | | AA-/Aa3 | | | 1,000,000 | | | | 1,261,270 | |
City of Atlanta, 5.00% due 1/1/2025 (Airport Passenger Facility) | | AA-/Aa3 | | | 1,645,000 | | | | 2,012,164 | |
City of Atlanta, 5.00% due 1/1/2025 (Airport Passenger Facility) | | AA-/Aa3 | | | 2,500,000 | | | | 3,070,125 | |
City of Atlanta, 5.00% due 11/1/2025 (Water & Wastewater System) | | AA-/Aa3 | | | 1,000,000 | | | | 1,265,260 | |
County of Douglas GO, 5.00% due 8/1/2016 (Jail & Law Enforcement Complex) | | AA/Aa2 | | | 4,000,000 | | | | 4,060,960 | |
Development Authority of Bartow County, 2.70% due 8/1/2043 put 8/23/2018 (Georgia Power Co. Plant Bowen Project) | | A-/A3 | | | 6,000,000 | | | | 6,188,940 | |
Fulton County Development Authority, 5.00% due 10/1/2022 (Georgia Tech Athletic Association) | | NR/A2 | | | 4,550,000 | | | | 5,463,322 | |
Fulton County Facilities Corp. COP, 5.00% due 11/1/2017 (Public Purpose Project) | | AA-/Aa3 | | | 8,400,000 | | | | 8,923,656 | |
Fulton County Facilities Corp. COP, 5.00% due 11/1/2019 (Public Purpose Project) | | AA-/Aa3 | | | 6,600,000 | | | | 7,452,918 | |
Gwinnett County Hospital Authority, 5.00% due 7/1/2023 (Gwinnett Hospital System, Inc.; Insured: AGM) | | NR/A2 | | | 5,000,000 | | | | 5,595,300 | |
16 Semi-Annual Report
| | |
| SCHEDULE OF INVESTMENTS, CONTINUED | | |
| |
Thornburg Limited Term Municipal Fund | | March 31, 2016 (Unaudited) |
| | | | | | | | | | |
Issuer-Description | | Credit Rating†
S&P/ Moody’s | | Principal
Amount | | | Value | |
Gwinnett County School District GO, 4.50% due 10/1/2017 (Capital Projects) | | AAA/Aaa | | $ | 13,000,000 | | | $ | 13,757,900 | |
LaGrange-Troup County Hospital Authority, 5.00% due 7/1/2018 (West Georgia Health Foundation, Inc.) | | A+/Aa2 | | | 1,570,000 | | | | 1,626,708 | |
Main Street Natural Gas, Inc., 5.00% due 3/15/2018 (Georgia Gas) | | BBB+/Baa1 | | | 5,000,000 | | | | 5,324,400 | |
Municipal Electric Authority of Georgia, 6.60% due 1/1/2018 (Insured: Natl-Re) | | AA-/A1 | | | 655,000 | | | | 684,324 | |
State of Georgia GO, 5.00% due 7/1/2017 (Capital Projects) | | AAA/Aaa | | | 8,625,000 | | | | 9,096,788 | |
Valdosta and Lowndes County Hospital Authority, 5.00% due 10/1/2022 (South Medical Center) | | AA-/Aa2 | | | 1,500,000 | | | | 1,776,825 | |
| | | |
GUAM — 0.64% | | | | | | | | | | |
Government of Guam, 5.25% due 12/1/2016 (Layon Solid Waste Disposal Facility) | | BBB+/NR | | | 5,610,000 | | | | 5,756,309 | |
Government of Guam, 5.25% due 12/1/2017 (Layon Solid Waste Disposal Facility) | | BBB+/NR | | | 2,000,000 | | | | 2,129,220 | |
Government of Guam, 5.50% due 12/1/2018 (Layon Solid Waste Disposal Facility) | | BBB+/NR | | | 3,000,000 | | | | 3,308,730 | |
Government of Guam, 5.00% due 11/15/2019 (Various Capital Projects) | | A/NR | | | 1,000,000 | | | | 1,128,120 | |
Government of Guam, 5.50% due 12/1/2019 (Layon Solid Waste Disposal Facility) | | BBB+/NR | | | 2,000,000 | | | | 2,271,440 | |
Government of Guam, 5.00% due 11/15/2020 (Various Capital Projects) | | A/NR | | | 1,500,000 | | | | 1,726,875 | |
Government of Guam, 5.00% due 11/15/2021 (Various Capital Projects) | | A/NR | | | 2,210,000 | | | | 2,578,142 | |
Government of Guam, 5.00% due 11/15/2022 (Various Capital Projects) | | A/NR | | | 2,960,000 | | | | 3,492,830 | |
Government of Guam, 5.00% due 11/15/2023 (Economic Development) | | A/NR | | | 6,280,000 | | | | 7,500,392 | |
Government of Guam, 5.00% due 11/15/2024 (Various Capital Projects) | | A/NR | | | 4,500,000 | | | | 5,419,440 | |
Guam Government Waterworks Authority, 5.25% due 7/1/2020 (Water & Wastewater System Improvements) | | A-/Baa2 | | | 300,000 | | | | 343,479 | |
Guam Government Waterworks Authority, 5.25% due 7/1/2022 (Water & Wastewater System Improvements) | | A-/Baa2 | | | 1,050,000 | | | | 1,247,169 | |
Guam Government Waterworks Authority, 5.25% due 7/1/2023 (Water & Wastewater System Improvements) | | A-/Baa2 | | | 645,000 | | | | 779,044 | |
Guam Power Authority, 5.00% due 10/1/2019 (Electric Power System; Insured: AGM) | | AA/A2 | | | 1,000,000 | | | | 1,131,510 | |
Guam Power Authority, 5.00% due 10/1/2020 (Electric Power System; Insured: AGM) | | AA/A2 | | | 1,500,000 | | | | 1,740,735 | |
Guam Power Authority, 5.00% due 10/1/2022 (Electric Power System; Insured: AGM) | | AA/A2 | | | 6,340,000 | | | | 7,642,933 | |
| | | |
HAWAII — 1.41% | | | | | | | | | | |
City and County of Honolulu GO, 5.00% due 11/1/2019 (Capital Improvement Projects) | | NR/Aa1 | | | 3,620,000 | | | | 4,133,388 | |
City and County of Honolulu GO, 5.00% due 11/1/2020 (Capital Improvement Projects) | | NR/Aa1 | | | 8,265,000 | | | | 9,697,738 | |
City and County of Honolulu GO, 5.00% due 11/1/2021 (Capital Improvement Projects) | | NR/Aa1 | | | 2,770,000 | | | | 3,326,798 | |
City and County of Honolulu GO, 5.00% due 11/1/2022 (Capital Improvement Projects) | | NR/Aa1 | | | 1,750,000 | | | | 2,146,498 | |
City and County of Honolulu GO, 5.00% due 11/1/2022 (Capital Improvement Projects) | | NR/Aa1 | | | 6,695,000 | | | | 8,211,886 | |
County of Hawaii GO, 5.00% due 9/1/2021 (Capital Improvement Projects) | | AA-/Aa2 | | | 1,500,000 | | | | 1,793,685 | |
County of Hawaii GO, 5.00% due 9/1/2021 (Capital Improvement Projects) | | AA-/Aa2 | | | 2,165,000 | | | | 2,588,885 | |
County of Hawaii GO, 5.00% due 9/1/2022 (Capital Improvement Projects) | | AA-/Aa2 | | | 1,250,000 | | | | 1,524,938 | |
County of Hawaii GO, 5.00% due 9/1/2022 (Capital Improvement Projects) | | AA-/Aa2 | | | 1,000,000 | | | | 1,219,950 | |
County of Hawaii GO, 5.00% due 9/1/2023 (Capital Improvement Projects) | | AA-/Aa2 | | | 800,000 | | | | 990,544 | |
County of Hawaii GO, 5.00% due 9/1/2023 (Capital Improvement Projects) | | AA-/Aa2 | | | 1,500,000 | | | | 1,857,270 | |
County of Hawaii GO, 5.00% due 9/1/2023 (Capital Improvement Projects) | | AA-/Aa2 | | | 1,000,000 | | | | 1,238,180 | |
County of Hawaii GO, 5.00% due 9/1/2023 (Capital Improvement Projects) | | AA-/Aa2 | | | 1,000,000 | | | | 1,238,180 | |
County of Hawaii GO, 5.00% due 9/1/2023 (Capital Improvement Projects) | | AA-/Aa2 | | | 1,000,000 | | | | 1,238,180 | |
County of Hawaii GO, 5.00% due 9/1/2024 (Capital Improvement Projects) | | AA-/Aa2 | | | 1,515,000 | | | | 1,901,431 | |
County of Hawaii GO, 5.00% due 9/1/2024 (Capital Improvement Projects) | | AA-/Aa2 | | | 2,000,000 | | | | 2,510,140 | |
County of Hawaii GO, 5.00% due 9/1/2024 (Capital Improvement Projects) | | AA-/Aa2 | | | 1,430,000 | | | | 1,794,750 | |
County of Hawaii GO, 5.00% due 9/1/2025 (Capital Improvement Projects) | | AA-/Aa2 | | | 2,000,000 | | | | 2,542,120 | |
County of Hawaii GO, 5.00% due 9/1/2025 (Capital Improvement Projects) | | AA-/Aa2 | | | 1,255,000 | | | | 1,595,180 | |
County of Hawaii GO, 5.00% due 9/1/2026 (Capital Improvement Projects) | | AA-/Aa2 | | | 500,000 | | | | 636,715 | |
County of Hawaii GO, 5.00% due 9/1/2026 (Capital Improvement Projects) | | AA-/Aa2 | | | 1,500,000 | | | | 1,910,145 | |
County of Hawaii GO, 5.00% due 9/1/2026 (Capital Improvement Projects) | | AA-/Aa2 | | | 2,085,000 | | | | 2,655,102 | |
State of Hawaii GO, 5.00% due 11/1/2017 (Hawaiian Home Lands Settlement) | | AA/Aa2 | | | 12,000,000 | | | | 12,813,480 | |
State of Hawaii GO, 5.00% due 11/1/2018 (Hawaiian Home Lands Settlement) | | AA/Aa2 | | | 20,000,000 | | | | 22,123,200 | |
State of Hawaii GO, 5.00% due 12/1/2019 pre-refunded 12/1/2019 (Hawaiian Home Lands Settlement) (ETM) | | NR/NR | | | 30,000 | | | | 34,373 | |
State of Hawaii GO, 5.00% due 12/1/2019 (Hawaiian Home Lands Settlement) | | AA/Aa2 | | | 2,970,000 | | | | 3,394,116 | |
State of Hawaii GO, 5.00% due 12/1/2020 (Hawaiian Home Lands Settlement) | | AA/Aa2 | | | 2,500,000 | | | | 2,940,425 | |
State of Hawaii GO, 5.00% due 12/1/2021 (Hawaiian Home Lands Settlement) | | AA/Aa2 | | | 3,000,000 | | | | 3,610,800 | |
State of Hawaii GO, 5.00% due 12/1/2022 pre-refunded 12/1/2021 (Hawaiian Home Lands Settlement) | | NR/NR | | | 1,590,000 | | | | 1,920,656 | |
State of Hawaii GO, 5.00% due 12/1/2022 (Hawaiian Home Lands Settlement) | | AA/Aa2 | | | 2,410,000 | | | | 2,893,615 | |
| | | |
IDAHO — 0.27% | | | | | | | | | | |
Idaho HFA, 5.00% due 12/1/2022 (Trinity Health Credit Group) | | AA-/Aa3 | | | 1,000,000 | | | | 1,223,300 | |
Idaho HFA, 5.00% due 12/1/2023 (Trinity Health Credit Group) | | AA-/Aa3 | | | 2,200,000 | | | | 2,732,224 | |
Idaho HFA, 5.00% due 12/1/2024 (Trinity Health Credit Group) | | AA-/Aa3 | | | 1,000,000 | | | | 1,254,700 | |
University of Idaho, 5.25% due 4/1/2041 put 4/1/2021 | | A+/Aa3 | | | 13,160,000 | | | | 15,335,480 | |
| | | |
ILLINOIS — 5.94% | | | | | | | | | | |
Board of Education of the City of Chicago GO, 0% due 12/1/2020 (Educational Facilities; Insured: BHAC) | | AA+/Aa1 | | | 12,000,000 | | | | 10,160,880 | |
Board of Trustees of Southern Illinois University, 5.25% due 4/1/2020 (Housing & Auxiliary Facilities; Insured: Natl-Re) | | AA-/A3 | | | 1,000,000 | | | | 1,141,820 | |
Chicago Housing Authority, 5.00% due 7/1/2016 (Housing Transformation Capital Program; Insured: AGM) (ETM) | | NR/A2 | | | 2,000,000 | | | | 2,022,600 | |
Semi-Annual Report 17
| | |
| SCHEDULE OF INVESTMENTS, CONTINUED | | |
| |
Thornburg Limited Term Municipal Fund | | March 31, 2016 (Unaudited) |
| | | | | | | | | | |
Issuer-Description | | Credit Rating†
S&P/ Moody’s | | Principal
Amount | | | Value | |
a Chicago Midway International Airport, 5.00% due 1/1/2022 | | A/A3 | | $ | 800,000 | | | $ | 944,496 | |
Chicago Midway International Airport, 5.00% due 1/1/2023 | | A/A3 | | | 1,900,000 | | | | 2,266,111 | |
Chicago Midway International Airport, 5.00% due 1/1/2024 | | A/A3 | | | 1,000,000 | | | | 1,202,420 | |
Chicago O’Hare International Airport, 5.00% due 1/1/2019 (2015 Airport Projects) | | A/NR | | | 3,000,000 | | | | 3,316,890 | |
Chicago O’Hare International Airport, 5.00% due 1/1/2020 (2015 Airport Projects) | | A/NR | | | 2,350,000 | | | | 2,670,892 | |
Chicago O’Hare International Airport, 5.00% due 1/1/2021 (2015 Airport Projects) | | A/NR | | | 3,000,000 | | | | 3,488,580 | |
Chicago O’Hare International Airport, 5.00% due 1/1/2022 Capital Development Programs) | | A/A2 | | | 5,835,000 | | | | 6,744,618 | |
Chicago Park District GO, 4.00% due 1/1/2017 (Capital Improvement Plan) | | AA+/NR | | | 1,000,000 | | | | 1,018,780 | |
Chicago Park District GO, 4.00% due 1/1/2018 (Capital Improvement Plan) | | AA+/NR | | | 1,420,000 | | | | 1,477,297 | |
Chicago Park District GO, 4.00% due 1/1/2018 (Capital Improvement Plan) | | AA+/NR | | | 1,250,000 | | | | 1,300,438 | |
Chicago Park District GO, 4.00% due 1/1/2018 (Capital Improvement Plan) | | AA+/NR | | | 945,000 | | | | 983,131 | |
Chicago Park District GO, 5.00% due 1/1/2018 (Capital Improvement Plan) | | AA+/Ba1 | | | 1,150,000 | | | | 1,216,160 | |
Chicago Park District GO, 4.00% due 1/1/2019 (Capital Improvement Plan) | | AA+/NR | | | 1,745,000 | | | | 1,845,093 | |
Chicago Park District GO, 4.00% due 1/1/2019 (Capital Improvement Plan) | | AA+/NR | | | 820,000 | | | | 867,035 | |
Chicago Park District GO, 4.00% due 1/1/2020 (Capital Improvement Plan) | | AA+/NR | | | 2,730,000 | | | | 2,902,836 | |
Chicago Park District GO, 4.00% due 1/1/2020 (Capital Improvement Plan) | | AA+/NR | | | 815,000 | | | | 866,598 | |
Chicago Park District GO, 5.00% due 1/1/2020 (Capital Improvement Plan) | | AA+/Ba1 | | | 530,000 | | | | 582,518 | |
Chicago Park District GO, 5.00% due 1/1/2021 (Capital Improvement Plan) | | AA+/NR | | | 2,840,000 | | | | 3,170,860 | |
Chicago Park District GO, 5.00% due 1/1/2022 (Capital Improvement Plan) | | AA+/NR | | | 1,940,000 | | | | 2,187,098 | |
Chicago Park District GO, 5.00% due 1/1/2022 (Capital Improvement Plan) | | AA+/NR | | | 1,485,000 | | | | 1,674,144 | |
Chicago Park District GO, 5.00% due 1/1/2023 (Capital Improvement Plan) | | AA+/NR | | | 3,215,000 | | | | 3,661,981 | |
Chicago Park District GO, 5.00% due 1/1/2023 (Capital Improvement Plan) | | AA+/NR | | | 1,605,000 | | | | 1,828,143 | |
Chicago Park District GO, 5.00% due 1/1/2023 (Capital Improvement Plan) | | AA+/NR | | | 1,675,000 | | | | 1,907,875 | |
Chicago Park District GO, 5.00% due 1/1/2024 (Capital Improvement Plan) | | AA+/NR | | | 1,340,000 | | | | 1,539,017 | |
Chicago Park District GO, 5.00% due 1/1/2024 (Capital Improvement Plan) | | AA+/NR | | | 1,305,000 | | | | 1,498,819 | |
Chicago Park District GO, 5.00% due 1/1/2024 (Capital Improvement Plan) | | AA+/NR | | | 1,760,000 | | | | 2,021,395 | |
Chicago School Reform Board of Trustees of the Board of Education GO, 5.25% due 12/1/2021 (School District Capital Improvement Program; Insured: Natl-Re) | | AA-/A3 | | | 1,500,000 | | | | 1,644,855 | |
Chicago Transit Authority, 5.25% due 6/1/2017 (Federal Transit Program-Rail Systems; Insured: AGM) | | A/A3 | | | 3,000,000 | | | | 3,136,110 | |
Chicago Transit Authority, 5.50% due 6/1/2018 (Federal Transit Program-Rail Systems; Insured: AGM) | | A/A3 | | | 2,500,000 | | | | 2,716,625 | |
City of Chicago, 4.00% due 1/1/2017 (Wastewater Transmission System) | | A/NR | | | 2,000,000 | | | | 2,039,240 | |
City of Chicago, 4.00% due 1/1/2018 (Wastewater Transmission System) | | A/Baa3 | | | 1,475,000 | | | | 1,532,436 | |
City of Chicago, 5.00% due 1/1/2018 (Wastewater Transmission System) | | A/NR | | | 2,500,000 | | | | 2,640,250 | |
City of Chicago, 5.00% due 1/1/2019 (Wastewater Transmission System) | | A/NR | | | 1,750,000 | | | | 1,892,187 | |
City of Chicago, 5.00% due 1/1/2020 (Wastewater Transmission System) | | A/NR | | | 1,000,000 | | | | 1,102,500 | |
City of Chicago, 5.00% due 1/1/2020 (Project Fund; Insured: AGM) | | AA/A2 | | | 1,320,000 | | | | 1,339,589 | |
City of Chicago, 5.50% due 1/1/2020 (Wastewater Transmission System; Insured: BHAC) | | AA+/Aa1 | | | 1,250,000 | | | | 1,335,338 | |
City of Chicago, 5.00% due 1/1/2021 (Wastewater Transmission System) | | A/NR | | | 1,000,000 | | | | 1,113,170 | |
City of Chicago, 5.00% due 1/1/2021 (Riverwalk Expansion Project; Insured: AGM) | | BBB+/Ba1 | | | 1,410,000 | | | | 1,512,592 | |
City of Chicago, 5.00% due 1/1/2022 (Wastewater Transmission System) | | A/NR | | | 2,000,000 | | | | 2,253,600 | |
City of Chicago, 5.00% due 1/1/2023 (Wastewater Transmission System) | | A/NR | | | 3,000,000 | | | | 3,397,320 | |
City of Chicago, 5.00% due 1/1/2023 (Chicago Midway Airport) | | A/A3 | | | 6,215,000 | | | | 7,412,568 | |
City of Chicago, 5.00% due 1/1/2023 (Riverwalk Expansion Project; Insured: AGM) | | BBB+/Ba1 | | | 1,000,000 | | | | 1,082,560 | |
City of Chicago, 5.00% due 1/1/2024 (Project Fund) | | AA/Ba1 | | | 5,510,000 | | | | 5,891,788 | |
City of Chicago, 5.00% due 1/1/2024 (Wastewater Transmission System) | | A/NR | | | 6,250,000 | | | | 7,117,625 | |
City of Chicago, 5.00% due 1/1/2024 (Chicago Midway Airport) | | A/A3 | | | 16,060,000 | | | | 19,031,903 | |
City of Chicago, 5.00% due 1/1/2025 (Wastewater Transmission System) | | A/NR | | | 4,500,000 | | | | 5,146,920 | |
City of Chicago, 5.00% due 1/1/2026 (Project Fund) | | AA/Ba1 | | | 6,030,000 | | | | 6,397,227 | |
City of Chicago, 5.00% due 1/1/2027 (Project Fund) | | AA/Ba1 | | | 6,310,000 | | | | 6,657,744 | |
City of Chicago Board of Education GO, 5.00% due 12/1/2018 (Insured: Natl-Re) | | AA-/A3 | | | 1,000,000 | | | | 1,056,380 | |
City of Chicago Building Acquisition Certificates GO, 5.40% due 1/1/2018 (Parking Facility Improvements; Insured: AGM) | | AA/A2 | | | 1,110,000 | | | | 1,114,362 | |
City of Chicago GO, 5.44% due 1/1/2018 (Transportation Infrastructure Capital Projects; Insured: Natl-Re) | | AA-/A3 | | | 3,050,000 | | | | 3,091,602 | |
City of Chicago School Reform Board of Trustees GO, 5.25% due 12/1/2017 (Insured: Natl-Re) | | AA-/A3 | | | 4,100,000 | | | | 4,287,575 | |
City of Mount Vernon GO, 4.00% due 12/15/2019 (Various Municipal Capital Improvements; Insured: AGM) | | AA/A2 | | | 1,000,000 | | | | 1,095,680 | |
City of Mount Vernon GO, 4.00% due 12/15/2020 (Various Municipal Capital Improvements; Insured: AGM) | | AA/A2 | | | 785,000 | | | | 871,758 | |
City of Mount Vernon GO, 4.00% due 12/15/2021 (Various Municipal Capital Improvements; Insured: AGM) | | AA/A2 | | | 1,640,000 | | | | 1,804,722 | |
City of Quincy, 5.00% due 11/15/2016 (Blessing Hospital) | | A-/A3 | | | 1,750,000 | | | | 1,790,075 | |
City of Quincy, 5.00% due 11/15/2017 (Blessing Hospital) | | A-/A3 | | | 500,000 | | | | 527,170 | |
City of Waukegan GO, 5.00% due 12/30/2019 (Lakehurst Redevelopment Project; Insured: AGM) | | NR/A2 | | | 1,935,000 | | | | 2,165,265 | |
City of Waukegan GO, 5.00% due 12/30/2020 (Lakehurst Redevelopment Project; Insured: AGM) | | NR/A2 | | | 1,000,000 | | | | 1,139,660 | |
City of Waukegan GO, 5.00% due 12/30/2021 (Lakehurst Redevelopment Project; Insured: AGM) | | NR/A2 | | | 2,100,000 | | | | 2,433,144 | |
City of Waukegan GO, 5.00% due 12/30/2022 (Lakehurst Redevelopment Project; Insured: AGM) | | NR/A2 | | | 1,000,000 | | | | 1,171,320 | |
Community College District No. 516 GO, 4.50% due 12/15/2020 (Waubonsee Community College) | | NR/Aa1 | | | 1,325,000 | | | | 1,517,430 | |
Community College District No. 516 GO, 5.00% due 12/15/2021 (Waubonsee Community College) | | NR/Aa1 | | | 6,175,000 | | | | 7,368,319 | |
Community Consolidated School District No. 146 GO, 9.00% due 12/1/2016 (Tinley Park; Insured: Natl-Re) | | NR/Aa2 | | | 1,315,000 | | | | 1,383,380 | |
18 Semi-Annual Report
| | |
| SCHEDULE OF INVESTMENTS, CONTINUED | | |
| |
Thornburg Limited Term Municipal Fund | | March 31, 2016 (Unaudited) |
| | | | | | | | | | |
Issuer-Description | | Credit Rating†
S&P/ Moody’s | | Principal
Amount | | | Value | |
Community Consolidated School District No. 158 GO, 0% due 1/1/2017 (McHenry and Kane Counties; Insured: Natl-Re) (ETM) | | NR/A3 | | $ | 95,000 | | | $ | 94,461 | |
Community Consolidated School District No. 158 GO, 0% due 1/1/2017 (McHenry and Kane Counties; Insured: Natl-Re) | | NR/A3 | | | 1,090,000 | | | | 1,074,969 | |
Community Consolidated School District No. 93 GO, 2.00% due 1/1/2017 (Village of Carol Stream) | | AA+/NR | | | 370,000 | | | | 373,367 | |
Community High School District No. 127 GO, 9.00% due 2/1/2017 (Lake County-Grayslake School Bldg.; Insured: AGM) | | AA+/A2 | | | 2,025,000 | | | | 2,153,830 | |
Community High School District No. 127 GO, 7.375% due 2/1/2020 (Lake County-Grayslake School Bldg.; Insured: Syncora) | | AA+/NR | | | 1,000,000 | | | | 1,214,210 | |
Community Unit School District No. 200 GO, 5.25% due 10/1/2023 (DuPage County Educational Facilities; Insured: FSA) | | AA/Aa3 | | | 1,000,000 | | | | 1,132,520 | |
Community Unit School District No. 302 GO, 0% due 2/1/2021 (Kane & DeKalb Counties Educational Facilities; Insured: Natl-Re) | | NR/Aa3 | | | 3,165,000 | | | | 2,814,793 | |
Community Unit School District No. 428 GO, 0% due 1/1/2021 (DeKalb County Educational Facilities) | | AA-/Aa2 | | | 6,140,000 | | | | 5,543,745 | |
Cook County Community College District No. 508 GO, 5.00% due 12/1/2020 (City Colleges of Chicago) | | AA/NR | | | 720,000 | | | | 821,333 | |
Cook County Community College District No. 508 GO, 5.00% due 12/1/2021 (City Colleges of Chicago) | | AA/NR | | | 1,000,000 | | | | 1,161,090 | |
Cook County Community College District No. 508 GO, 5.00% due 12/1/2022 (City Colleges of Chicago) | | AA/NR | | | 1,250,000 | | | | 1,472,600 | |
Cook County Community College District No. 508 GO, 5.00% due 12/1/2023 (City Colleges of Chicago) | | AA/NR | | | 1,250,000 | | | | 1,491,750 | |
Cook County Forest Preserve District GO, 5.00% due 11/15/2021 | | AA/A2 | | | 1,500,000 | | | | 1,714,545 | |
Cook County Township High School District No. 227 GO, 5.00% due 12/1/2018 (Rich Township Educational Facilities; Insured: AGM) | | NR/Aa3 | | | 190,000 | | | | 195,531 | |
County of Cook GO, 5.00% due 11/15/2019 (Capital Improvement Plan) | | AA/A2 | | | 3,690,000 | | | | 4,087,155 | |
County of Cook GO, 4.00% due 11/15/2020 (Capital Improvement Plan) | | AA/A2 | | | 925,000 | | | | 988,538 | |
County of Cook GO, 5.00% due 11/15/2020 (Capital Improvement Plan) | | AA/A2 | | | 3,590,000 | | | | 3,945,805 | |
County of Cook GO, 5.00% due 11/15/2020 (Capital Improvement Plan) | | AA/A2 | | | 2,000,000 | | | | 2,224,320 | |
County of Cook GO, 4.00% due 11/15/2021 (Capital Improvement Plan) | | AA/A2 | | | 2,000,000 | | | | 2,149,340 | |
County of Cook GO, 5.00% due 11/15/2021 (Capital Improvement Plan) | | AA/A2 | | | 5,000,000 | | | | 5,655,900 | |
County of Cook GO, 5.00% due 11/15/2021 (Capital Improvement Plan) | | AA/A2 | | | 2,105,000 | | | | 2,371,725 | |
County of Cook GO, 4.00% due 11/15/2022 (Capital Improvement Plan) | | AA/A2 | | | 1,000,000 | | | | 1,079,040 | |
County of Cook GO, 5.00% due 11/15/2022 (Capital Improvement Plan) | | AA/A2 | | | 1,500,000 | | | | 1,708,995 | |
DuPage County Forest Preserve District GO, 5.00% due 11/1/2020 | | AAA/Aaa | | | 500,000 | | | | 581,320 | |
DuPage County Forest Preserve District GO, 5.00% due 11/1/2021 | | AAA/Aaa | | | 1,425,000 | | | | 1,692,814 | |
DuPage County Forest Preserve District GO, 5.00% due 11/1/2022 | | AAA/Aaa | | | 900,000 | | | | 1,086,291 | |
DuPage County Forest Preserve District GO, 5.00% due 11/1/2023 | | AAA/Aaa | | | 1,300,000 | | | | 1,590,342 | |
DuPage County Forest Preserve District GO, 5.00% due 11/1/2024 | | AAA/Aaa | | | 5,000,000 | | | | 6,193,050 | |
Illinois Educational Facilities Authority, 4.75% due 3/1/2030 put 3/1/2017 (Art Institute of Chicago) | | AA-/NR | | | 3,030,000 | | | | 3,119,021 | |
Illinois Educational Facilities Authority, 5.00% due 3/1/2030 put 3/1/2017 (Art Institute of Chicago) | | NR/A1 | | | 3,000,000 | | | | 3,094,950 | |
Illinois Educational Facilities Authority, 5.25% due 3/1/2034 put 3/1/2018 (Art Institute of Chicago) | | NR/NR | | | 3,600,000 | | | | 3,828,960 | |
Illinois Educational Facilities Authority, 3.40% due 11/1/2036 put 11/1/2017 (Field Museum of Natural History) | | A/NR | | | 1,300,000 | | | | 1,334,086 | |
Illinois Finance Authority, 5.00% due 4/1/2016 (Advocate Health Care) | | AA/Aa2 | | | 1,250,000 | | | | 1,250,000 | |
Illinois Finance Authority, 5.00% due 11/15/2016 (Rush University Medical Center) | | A+/A1 | | | 1,750,000 | | | | 1,798,247 | |
Illinois Finance Authority, 5.00% due 12/1/2016 (Columbia College) (ETM) | | BBB+/NR | | | 1,710,000 | | | | 1,759,009 | |
Illinois Finance Authority, 5.00% due 11/1/2017 (Rush University Medical Center; Insured: Natl-Re) (ETM) | | AA-/Aaa | | | 1,000,000 | | | | 1,065,390 | |
Illinois Finance Authority, 5.00% due 12/1/2017 (Columbia College) (ETM) | | BBB+/NR | | | 1,395,000 | | | | 1,488,744 | |
Illinois Finance Authority, 5.50% due 11/1/2018 (Advocate Health Care) | | AA/Aa2 | | | 1,000,000 | | | | 1,085,530 | |
Illinois Finance Authority, 5.25% due 5/1/2019 (Educational Advancement Fund, Inc.) | | NR/Baa3 | | | 4,675,000 | | | | 4,759,571 | |
Illinois Finance Authority, 5.00% due 4/1/2020 (Advocate Health Care) | | AA/Aa2 | | | 1,315,000 | | | | 1,471,945 | |
Illinois Finance Authority, 5.00% due 11/15/2020 (Rush University Medical Center) | | A+/A1 | | | 250,000 | | | | 290,023 | |
Illinois Finance Authority, 5.00% due 11/15/2021 (Rush University Medical Center) | | A+/A1 | | | 250,000 | | | | 295,193 | |
Illinois Finance Authority, 4.00% due 12/1/2021 (Trinity Health) | | AA-/Aa3 | | | 1,000,000 | | | | 1,123,050 | |
Illinois Finance Authority, 5.00% due 11/15/2022 (Rush University Medical Center) | | A+/A1 | | | 250,000 | | | | 300,420 | |
Illinois Finance Authority, 5.00% due 8/1/2023 (Advocate Health Care) | | AA/Aa2 | | | 565,000 | | | | 691,289 | |
Illinois Finance Authority, 5.00% due 11/15/2023 (Rush University Medical Center) | | A+/A1 | | | 1,000,000 | | | | 1,219,100 | |
Illinois Finance Authority, 5.00% due 8/1/2024 (Advocate Health Care) | | AA/Aa2 | | | 800,000 | | | | 988,600 | |
Illinois Finance Authority, 5.00% due 11/15/2024 (Rush University Medical Center) | | A+/A1 | | | 500,000 | | | | 612,920 | |
Illinois Finance Authority, 5.00% due 11/15/2025 (Rush University Medical Center) | | A+/A1 | | | 1,655,000 | | | | 2,028,236 | |
Illinois Finance Authority, 5.00% due 11/1/2030 put 1/15/2020 (Advocate Health Care) | | AA/Aa2 | | | 1,250,000 | | | | 1,418,825 | |
Illinois Finance Authority, 0.35% due 1/5/2031 put 4/1/2016 (Evanston Northwestern Healthcare Corp.; SPA: Wells Fargo Bank, N.A.) (daily demand notes) | | AA/Aa2 | | | 19,900,000 | | | | 19,900,000 | |
Illinois Finance Authority, 4.30% due 6/1/2035 put 6/1/2016 (Peoples Gas Light & Coke Co.; Insured: AMBAC) | | A/Aa3 | | | 2,350,000 | | | | 2,364,311 | |
Illinois Finance Authority, 0.35% due 8/1/2044 put 4/1/2016 (University of Chicago Medical Center; LOC: Wells Fargo Bank, N.A.) (daily demand notes) | | AA-/Aa1 | | | 500,000 | | | | 500,000 | |
Illinois Health Facilities Authority, 0.35% due 8/15/2032 put 4/1/2016 (Northwestern Memorial HealthCare & Cadence Health; SPA: Northern Trust Co.) (daily demand notes) | | AA+/Aa2 | | | 1,500,000 | | | | 1,500,000 | |
Illinois State Toll Highway Authority, 5.00% due 1/1/2023 | | AA-/Aa3 | | | 4,000,000 | | | | 4,841,160 | |
Illinois State Toll Highway Authority, 5.00% due 1/1/2024 | | AA-/Aa3 | | | 6,500,000 | | | | 7,977,060 | |
Illinois State Toll Highway Authority, 5.00% due 1/1/2025 | | AA-/Aa3 | | | 6,500,000 | | | | 7,328,945 | |
Kane McHenry Cook & DeKalb Counties Unit School District No. 300 GO, 0% due 12/1/2021 (Insured: AMBAC) (ETM) | | NR/Aa3 | | | 765,000 | | | | 704,795 | |
Kane McHenry Cook & DeKalb Counties Unit School District No. 300 GO, 0% due 12/1/2021 (Insured: AMBAC) | | NR/Aa3 | | | 1,235,000 | | | | 1,076,364 | |
Kane McHenry Cook & DeKalb Counties Unit School District No. 300 GO, 5.00% due 1/1/2024 | | AA/NR | | | 7,150,000 | | | | 8,597,303 | |
Semi-Annual Report 19
| | |
| SCHEDULE OF INVESTMENTS, CONTINUED | | |
| |
Thornburg Limited Term Municipal Fund | | March 31, 2016 (Unaudited) |
| | | | | | | | | | |
Issuer-Description | | Credit Rating†
S&P/ Moody’s | | Principal
Amount | | | Value | |
McHenry County Conservation District GO, 5.00% due 2/1/2021 | | AA+/Aa1 | | $ | 2,325,000 | | | $ | 2,722,784 | |
McHenry County Conservation District GO, 5.00% due 2/1/2025 | | AA+/Aa1 | | | 2,000,000 | | | | 2,478,500 | |
Metropolitan Pier & Exposition Authority, 0% due 6/15/2016 (McCormick Place Expansion; Insured: Natl-Re) (ETM) | | AA-/NR | | | 1,155,000 | | | | 1,153,949 | |
Metropolitan Pier & Exposition Authority, 0% due 6/15/2016 (McCormick Place Expansion; Insured: Natl-Re) | | AA-/NR | | | 7,090,000 | | | | 7,074,756 | |
Metropolitan Pier & Exposition Authority, 0% due 6/15/2016 (McCormick Place Expansion; Insured: Natl-Re) (ETM) | | AA-/NR | | | 3,475,000 | | | | 3,471,838 | |
Metropolitan Pier & Exposition Authority, 5.00% due 12/15/2020 (McCormick Place Expansion) | | BBB+/NR | | | 4,000,000 | | | | 4,484,040 | |
Railsplitter Tobacco Settlement Authority, 5.00% due 6/1/2019 | | A/NR | | | 22,000,000 | | | | 24,456,520 | |
Railsplitter Tobacco Settlement Authority, 5.125% due 6/1/2019 | | A/NR | | | 6,780,000 | | | | 7,563,226 | |
School District No. 97 GO, 9.00% due 12/1/2018 (Village of Oak Park; Insured: Natl-Re) | | NR/Aa2 | | | 4,000,000 | | | | 4,794,400 | |
Southwestern Illinois Development Authority, 5.125% due 8/15/2016 (Anderson Hospital) | | BBB+/Baa3 | | | 320,000 | | | | 324,429 | |
State of Illinois, 5.00% due 6/15/2016 (Build Illinois Bond Retirement & Interest Fund) | | AAA/NR | | | 3,500,000 | | | | 3,533,600 | |
State of Illinois, 5.00% due 6/15/2021 (Build Illinois Bond Retirement & Interest Fund) | | AAA/Baa1 | | | 9,945,000 | | | | 11,080,122 | |
Town of Cicero Cook County GO, 5.00% due 1/1/2019 (Cicero and Laramie Development Areas; Insured: AGM) | | AA/A2 | | | 2,000,000 | | | | 2,187,280 | |
Town of Cicero Cook County GO, 5.00% due 12/1/2019 (Cicero and Laramie Development Areas) | | A+/NR | | | 1,070,000 | | | | 1,187,850 | |
Town of Cicero Cook County GO, 5.00% due 1/1/2020 (Cicero and Laramie Development Areas; Insured: AGM) | | AA/A2 | | | 1,450,000 | | | | 1,623,652 | |
Town of Cicero Cook County GO, 5.00% due 1/1/2021 (Cicero and Laramie Development Areas; Insured: AGM) | | AA/A2 | | | 1,250,000 | | | | 1,427,000 | |
Town of Cicero GO, 5.00% due 1/1/2018 (Cicero and Laramie Development Areas; Insured: AGM) | | AA/A2 | | | 2,375,000 | | | | 2,525,646 | |
University of Illinois Board of Trustees COP, 5.00% due 10/1/2019 (Insured: AGM) | | AA/Aa3 | | | 2,000,000 | | | | 2,122,600 | |
Village of Downers Grove GO, 3.00% due 1/1/2017 | | AAA/NR | | | 970,000 | | | | 984,084 | |
Village of Melrose Park, 5.20% due 7/1/2018 (Insured: Natl-Re) | | AA-/A3 | | | 1,190,000 | | | | 1,203,685 | |
Village of Tinley Park GO, 4.00% due 12/1/2022 | | AA+/NR | | | 625,000 | | | | 712,125 | |
Will & Kendall Counties Plainfield Community Consolidated School District 202 GO, 5.00% due 1/1/2023 (Capital Improvements; Insured: BAM) | | AA/Aa3 | | | 8,050,000 | | | | 9,685,840 | |
Will & Kendall Counties Plainfield Community Consolidated School District 202 GO, 5.00% due 1/1/2024 (Capital Improvements; Insured: BAM) | | AA/Aa3 | | | 4,580,000 | | | | 5,572,761 | |
Will & Kendall Counties Plainfield Community Consolidated School District 202 GO, 5.00% due 1/1/2025 (Capital Improvements; Insured: BAM) | | AA/Aa3 | | | 8,495,000 | | | | 10,424,045 | |
Will County Valley View Community Unit School District No. 365 GO, 0% due 11/1/2018 (Insured: AGM) | | AA/Aa2 | | | 3,370,000 | | | | 3,231,560 | |
| | | |
INDIANA — 2.25% | | | | | | | | | | |
Avon Community School Building Corp., 5.00% due 7/15/2017 (Insured: AMBAC) (State Aid Withholding) | | AA+/NR | | | 2,500,000 | | | | 2,637,525 | |
Board of Trustees for the Vincennes University, 4.00% due 6/1/2018 | | NR/Aa3 | | | 1,000,000 | | | | 1,064,130 | |
Board of Trustees for the Vincennes University, 5.00% due 6/1/2020 | | NR/Aa3 | | | 1,000,000 | | | | 1,154,630 | |
City of Carmel Redevelopment Authority, 5.00% due 8/1/2021 (Road and Intersection Improvements) | | AA+/NR | | | 2,405,000 | | | | 2,831,575 | |
City of Carmel Redevelopment Authority, 5.00% due 8/1/2022 (Road and Intersection Improvements) | | AA+/NR | | | 2,510,000 | | | | 3,009,063 | |
City of Carmel Redevelopment District COP, 5.75% due 7/15/2022 (CFP Energy Center, LLC Installment Purchase Agreement) | | NR/NR | | | 3,175,000 | | | | 3,616,388 | |
City of Fort Wayne, 2.00% due 12/1/2016 (Waterworks Utility Improvements) | | NR/Aa3 | | | 1,160,000 | | | | 1,169,976 | |
City of Fort Wayne, 2.00% due 12/1/2017 (Waterworks Utility Improvements) | | NR/Aa3 | | | 1,175,000 | | | | 1,194,952 | |
Clay Multiple School Building Corp., 5.00% due 7/15/2016 (State Aid Withholding) | | AA+/NR | | | 1,295,000 | | | | 1,310,993 | |
Clay Multiple School Building Corp., 5.00% due 1/15/2017 (State Aid Withholding) | | AA+/NR | | | 1,000,000 | | | | 1,032,250 | |
Duneland School Building Corp., 0% due 2/1/2020 (State Aid Withholding) | | A/NR | | | 2,970,000 | | | | 2,718,589 | |
Duneland School Building Corp., 0% due 8/1/2020 (State Aid Withholding) | | A/NR | | | 3,470,000 | | | | 3,138,441 | |
Duneland School Building Corp., 0% due 2/1/2021 (State Aid Withholding) | | A/NR | | | 2,770,000 | | | | 2,472,724 | |
Duneland School Building Corp., 0% due 8/1/2021 (State Aid Withholding) | | A/NR | | | 3,270,000 | | | | 2,882,963 | |
Hamilton Southeastern Consolidated School Building Corp., 5.00% due 7/15/2021 (Educational Facilities; Insured: State Intercept) | | AA+/NR | | | 1,230,000 | | | | 1,451,560 | |
Hamilton Southeastern Consolidated School Building Corp., 5.00% due 7/15/2022 (Educational Facilities; Insured: State Intercept) | | AA+/NR | | | 885,000 | | | | 1,060,203 | |
Hamilton Southeastern Consolidated School Building Corp., 5.00% due 7/15/2023 (Educational Facilities; Insured: State Intercept) | | AA+/NR | | | 570,000 | | | | 692,801 | |
Hamilton Southeastern Consolidated School Building Corp., 5.00% due 1/15/2024 (Educational Facilities; Insured: State Intercept) | | AA+/NR | | | 525,000 | | | | 642,117 | |
Indiana Bond Bank, 5.25% due 10/15/2016 (Special Gas Program) | | NR/A3 | | | 1,545,000 | | | | 1,582,219 | |
Indiana Bond Bank, 5.00% due 10/15/2017 (Special Gas Program) | | NR/A3 | | | 5,000,000 | | | | 5,295,600 | |
Indiana Bond Bank, 5.00% due 8/1/2021 (Columbus Learning Center) | | AA/NR | | | 1,300,000 | | | | 1,520,818 | |
Indiana Finance Authority, 5.00% due 5/1/2016 (Parkview Health Systems) | | A+/A1 | | | 3,090,000 | | | | 3,101,958 | |
Indiana Finance Authority, 5.00% due 7/1/2016 (Forensic & Health Science; Insured: Natl-Re) (ETM) | | AA+/Aa1 | | | 1,030,000 | | | | 1,041,557 | |
Indiana Finance Authority, 5.00% due 9/15/2016 (Marian University Health Sciences) | | BBB-/NR | | | 1,500,000 | | | | 1,512,885 | |
Indiana Finance Authority, 5.00% due 5/1/2017 (Parkview Health Systems) | | A+/A1 | | | 1,000,000 | | | | 1,041,920 | |
Indiana Finance Authority, 5.00% due 9/15/2017 (Marian University Health Sciences) | | BBB-/NR | | | 1,940,000 | | | | 1,991,468 | |
Indiana Finance Authority, 4.00% due 5/1/2018 (Community Health Network) | | A/A2 | | | 2,820,000 | | | | 2,990,187 | |
Indiana Finance Authority, 5.25% due 7/1/2018 (Wabash Correctional Facilities) | | AA+/Aa1 | | | 1,000,000 | | | | 1,096,900 | |
Indiana Finance Authority, 5.25% due 7/1/2018 (Rockville Correctional Facilities) (ETM) | | AA+/Aa1 | | | 2,150,000 | | | | 2,359,840 | |
Indiana Finance Authority, 5.00% due 9/15/2018 (Marian University Health Sciences) | | BBB-/NR | | | 1,790,000 | | | | 1,863,766 | |
Indiana Finance Authority, 5.00% due 11/1/2018 (Indianapolis Airport) | | AA+/Aa2 | | | 2,750,000 | | | | 3,027,310 | |
Indiana Finance Authority, 5.00% due 11/1/2018 (Sisters of St. Francis Health Services, Inc.) | | NR/Aa3 | | | 1,250,000 | | | | 1,375,037 | |
20 Semi-Annual Report
| | |
| SCHEDULE OF INVESTMENTS, CONTINUED | | |
| |
Thornburg Limited Term Municipal Fund | | March 31, 2016 (Unaudited) |
| | | | | | | | | | |
Issuer-Description | | Credit Rating†
S&P/ Moody’s | | Principal
Amount | | | Value | |
Indiana Finance Authority, 5.00% due 5/1/2019 (Community Health Network) | | A/A2 | | $ | 1,790,000 | | | $ | 1,990,104 | |
Indiana Finance Authority, 5.00% due 9/15/2019 (Marian University Health Sciences) | | BBB-/NR | | | 1,250,000 | | | | 1,317,588 | |
Indiana Finance Authority, 5.00% due 3/1/2020 (Indiana University Health System) | | AA-/Aa3 | | | 5,000,000 | | | | 5,736,550 | |
Indiana Finance Authority, 5.00% due 5/1/2020 (Community Health Network) | | A/A2 | | | 860,000 | | | | 979,635 | |
Indiana Finance Authority, 5.00% due 9/15/2020 (Marian University Health Sciences) | | BBB-/NR | | | 2,245,000 | | | | 2,386,592 | |
Indiana Finance Authority, 5.00% due 3/1/2021 (Indiana University Health System) | | AA-/Aa3 | | | 9,880,000 | | | | 11,605,443 | |
Indiana Finance Authority, 5.00% due 5/1/2021 (Community Health Network) | | A/A2 | | | 2,250,000 | | | | 2,616,862 | |
Indiana Finance Authority, 5.00% due 9/15/2021 (Marian University Health Sciences) | | BBB-/NR | | | 2,320,000 | | | | 2,480,730 | |
Indiana Finance Authority, 5.00% due 10/1/2021 (CWA Authority, Inc. Wastewater System Project) | | AA/NR | | | 500,000 | | | | 594,160 | |
Indiana Finance Authority, 5.00% due 3/1/2022 (Indiana University Health System) | | AA-/Aa3 | | | 3,240,000 | | | | 3,784,255 | |
Indiana Finance Authority, 5.00% due 5/1/2022 (Community Health Network) | | A/A2 | | | 1,230,000 | | | | 1,455,324 | |
a Indiana Finance Authority, 5.00% due 5/1/2022 (Parkview Regional Medical Center) | | A+/A1 | | | 1,135,000 | | | | 1,357,369 | |
Indiana Finance Authority, 5.00% due 10/1/2023 (CWA Authority, Inc. Wastewater System Project) | | AA/NR | | | 1,000,000 | | | | 1,227,300 | |
Indiana Finance Authority, 5.00% due 10/1/2024 (CWA Authority, Inc. Wastewater System Project) | | AA/NR | | | 500,000 | | | | 621,460 | |
Indiana Finance Authority, 0.35% due 2/1/2037 put 4/1/2016 (Stadium Project; SPA: JPMorgan Chase Bank, N.A.) (daily demand notes) | | AA+/Aa2 | | | 23,090,000 | | | | 23,090,000 | |
Indiana Finance Authority, 0.38% due 2/1/2037 put 4/1/2016 (Stadium Project; SPA: JPMorgan Chase Bank, N.A.) (daily demand notes) | | AA+/Aa2 | | | 3,510,000 | | | | 3,510,000 | |
Indiana HFFA, 5.00% due 10/1/2027 put 6/1/2017 (Ascension Health) | | NR/Aa3 | | | 7,100,000 | | | | 7,435,404 | |
Indianapolis Public Schools Multi-School Building Corp., 5.00% due 7/15/2016 (Insured: Natl-Re) | | AA/A3 | | | 5,000,000 | | | | 5,066,500 | |
Knox Middle School Building Corp., 0% due 1/15/2020 (Insured: Natl-Re) (State Aid Withholding) | | AA-/A3 | | | 1,295,000 | | | | 1,186,609 | |
Lake Central Multi-District School Building Corp., 4.00% due 1/15/2019 (Educational Facilities) (State Aid Withholding) | | AA+/A2 | | | 1,000,000 | | | | 1,076,180 | |
Lake Central Multi-District School Building Corp., 5.00% due 7/15/2019 (Educational Facilities) (State Aid Withholding) | | AA+/A2 | | | 1,680,000 | | | | 1,886,674 | |
Lake Central Multi-District School Building Corp., 4.00% due 1/15/2020 (Educational Facilities) (State Aid Withholding) | | AA+/A2 | | | 1,345,000 | | | | 1,471,376 | |
a Lake Central Multi-District School Building Corp., 5.00% due 7/15/2020 (Educational Facilities) (State Aid Withholding) | | AA+/A2 | | | 1,170,000 | | | | 1,347,559 | |
Lake Central Multi-District School Building Corp., 4.00% due 1/15/2021 (Educational Facilities) (State Aid Withholding) | | AA+/A2 | | | 1,250,000 | | | | 1,387,975 | |
Lake Central Multi-District School Building Corp., 5.00% due 7/15/2021 (Educational Facilities) (State Aid Withholding) | | AA+/A2 | | | 1,250,000 | | | | 1,469,212 | |
Lake Central Multi-District School Building Corp., 4.00% due 1/15/2022 (Educational Facilities) (State Aid Withholding) | | AA+/A2 | | | 1,455,000 | | | | 1,629,702 | |
Lake Central Multi-District School Building Corp., 5.00% due 7/15/2022 (Educational Facilities) (State Aid Withholding) | | AA+/A2 | | | 1,000,000 | | | | 1,196,650 | |
Metropolitan School District of Pike Township GO, 3.00% due 1/15/2017 (College Park Ancillary Rooms) (State Aid Withholding) | | AA+/NR | | | 2,115,000 | | | | 2,153,472 | |
Noblesville Redevelopment Authority, 5.00% due 8/1/2016 (146th Street Extension A) (ETM) | | AA/NR | | | 840,000 | | | | 852,684 | |
Perry Township Multischool Building Corp., 4.00% due 1/15/2018 (Educational Facilities) (State Aid Withholding) | | AA+/NR | | | 1,000,000 | | | | 1,054,810 | |
Perry Township Multischool Building Corp., 3.00% due 1/10/2019 (Educational Facilities) (State Aid Withholding) | | AA+/NR | | | 1,000,000 | | | | 1,051,440 | |
Perry Township Multischool Building Corp., 4.00% due 7/10/2019 (Educational Facilities) (State Aid Withholding) | | AA+/NR | | | 1,000,000 | | | | 1,091,210 | |
Perry Township Multischool Building Corp., 5.00% due 7/10/2020 (Educational Facilities) (State Aid Withholding) | | AA+/NR | | | 2,090,000 | | | | 2,403,563 | |
Perry Township Multischool Building Corp., 5.00% due 7/10/2021 (Educational Facilities) (State Aid Withholding) | | AA+/NR | | | 1,000,000 | | | | 1,176,710 | |
Pike Township Multischool Building Corp., 4.00% due 1/15/2017 (Metropolitan School District of Pike Township) (State Aid Withholding) | | AA+/NR | | | 1,080,000 | | | | 1,108,123 | |
South Bend Community School Building Corp., 5.00% due 7/15/2016 (Insured: Natl-Re) (State Aid Withholding) | | AA+/A3 | | | 1,785,000 | | | | 1,808,312 | |
Whitko High School Building Corp., 3.00% due 7/15/2016 (School Corp. Capital Improvements) (State Aid Withholding) | | AA+/NR | | | 645,000 | | | | 649,483 | |
Whitko High School Building Corp., 4.00% due 7/15/2018 (School Corp. Capital Improvements) (State Aid Withholding) | | AA+/NR | | | 1,025,000 | | | | 1,093,532 | |
Zionsville Community Schools Building Corp., 5.00% due 7/15/2019 (Insured: AGM) (State Aid Withholding) | | AA/A2 | | | 1,100,000 | | | | 1,243,693 | |
| | | |
IOWA — 0.38% | | | | | | | | | | |
Des Moines Independent Community School District, 4.00% due 6/1/2019 (School Infrastructure; Insured: AGM) | | AA/A2 | | | 3,870,000 | | | | 4,211,527 | |
Des Moines Independent Community School District, 4.00% due 6/1/2020 (School Infrastructure; Insured: AGM) | | AA/A2 | | | 3,990,000 | | | | 4,419,763 | |
Des Moines Independent Community School District, 4.00% due 6/1/2021 (School Infrastructure; Insured: AGM) | | AA/A2 | | | 4,125,000 | | | | 4,579,245 | |
Des Moines Independent Community School District, 4.00% due 6/1/2022 (School Infrastructure; Insured: AGM) | | AA/A2 | | | 2,140,000 | | | | 2,368,680 | |
Iowa Finance Authority, 5.00% due 8/15/2016 (Iowa Health System; Insured: AGM) | | NR/Aa3 | | | 1,500,000 | | | | 1,523,610 | |
Iowa Finance Authority, 5.00% due 2/15/2017 (Iowa Health System; Insured: AGM) | | NR/Aa3 | | | 1,600,000 | | | | 1,656,064 | |
Iowa Finance Authority, 5.00% due 8/15/2017 (Iowa Health System; Insured: AGM) | | NR/Aa3 | | | 990,000 | | | | 1,044,381 | |
Iowa Finance Authority, 5.00% due 2/15/2018 (Iowa Health System; Insured: AGM) | | NR/Aa3 | | | 1,405,000 | | | | 1,508,015 | |
Iowa Finance Authority, 5.00% due 7/1/2022 (Genesis Health System) | | NR/A1 | | | 1,735,000 | | | | 2,075,390 | |
Iowa Finance Authority, 5.00% due 7/1/2023 (Genesis Health System) | | NR/A1 | | | 2,000,000 | | | | 2,430,880 | |
Iowa Finance Authority, 5.00% due 7/1/2024 (Genesis Health System) | | NR/A1 | | | 2,350,000 | | | | 2,825,311 | |
| | | |
KANSAS — 0.88% | | | | | | | | | | |
Johnson County USD No. 512 GO, 4.00% due 10/1/2016 (Shawnee Mission School District) | | NR/Aaa | | | 6,455,000 | | | | 6,569,964 | |
Johnson County USD No. 512 GO, 4.00% due 10/1/2017 (Shawnee Mission School District) | | NR/Aaa | | | 6,700,000 | | | | 7,028,300 | |
Kansas DFA, 5.00% due 4/1/2020 (National Bio and Agro-Defense Facility) | | AA-/Aa3 | | | 6,980,000 | | | | 7,987,842 | |
Kansas DFA, 5.00% due 12/1/2020 (New Jobs Training; Insured: BAM) | | AA/NR | | | 1,500,000 | | | | 1,693,560 | |
Kansas DFA, 5.00% due 4/1/2021 (National Bio and Agro-Defense Facility) | | AA-/Aa3 | | | 5,075,000 | | | | 5,940,947 | |
Kansas DFA, 5.00% due 4/1/2022 (National Bio and Agro-Defense Facility) | | AA-/Aa3 | | | 2,730,000 | | | | 3,252,631 | |
Kansas DFA, 5.00% due 4/1/2023 (National Bio and Agro-Defense Facility) | | AA-/Aa3 | | | 8,110,000 | | | | 9,817,317 | |
Kansas DFA, 5.00% due 4/1/2024 (National Bio and Agro-Defense Facility) | | AA-/Aa3 | | | 9,275,000 | | | | 11,249,462 | |
Kansas DFA, 5.00% due 4/1/2025 (National Bio and Agro-Defense Facility) | | AA-/Aa3 | | | 6,895,000 | | | | 8,307,510 | |
Semi-Annual Report 21
| | |
| SCHEDULE OF INVESTMENTS, CONTINUED | | |
| |
Thornburg Limited Term Municipal Fund | | March 31, 2016 (Unaudited) |
| | | | | | | | | | |
Issuer-Description | | Credit Rating†
S&P/ Moody’s | | Principal
Amount | | | Value | |
Unified Government of Wyandotte County-Kansas City, 5.00% due 9/1/2022 (Utility Systems Improvement) | | A+/A3 | | $ | 2,000,000 | | | $ | 2,409,000 | |
Unified Government of Wyandotte County-Kansas City, 5.00% due 9/1/2023 (Utility Systems Improvement) | | A+/A3 | | | 1,000,000 | | | | 1,224,070 | |
Unified Government of Wyandotte County-Kansas City, 5.00% due 9/1/2024 (Utility Systems Improvement) | | A+/A3 | | | 600,000 | | | | 743,850 | |
| | | |
KENTUCKY — 2.50% | | | | | | | | | | |
Commonwealth of Kentucky State Property and Buildings Commission, 5.00% due 11/1/2020 (Project No. 112) | | A/Aa3 | | | 10,000,000 | | | | 11,526,000 | |
Commonwealth of Kentucky State Property and Buildings Commission, 5.00% due 11/1/2021 (Project No. 112) | | A/Aa3 | | | 10,000,000 | | | | 11,696,100 | |
a Commonwealth of Kentucky State Property and Buildings Commission, 5.00% due 11/1/2022 (Project No. 112) | | A/Aa3 | | | 30,000,000 | | | | 35,595,900 | |
Commonwealth of Kentucky State Property and Buildings Commission, 5.00% due 11/1/2023 (Project No. 112) | | A/Aa3 | | | 40,000,000 | | | | 48,024,400 | |
Commonwealth of Kentucky State Property and Buildings Commission, 5.00% due 11/1/2025 (Project No. 112) | | A/Aa3 | | | 25,000,000 | | | | 30,590,250 | |
Commonwealth of Kentucky State Property and Buildings Commission, 5.00% due 11/1/2026 (Project No. 112) | | A/Aa3 | | | 20,000,000 | | | | 24,585,200 | |
Kentucky Economic DFA, 0% due 10/1/2019 (Norton Healthcare, Inc.; Insured: Natl-Re) | | AA-/A3 | | | 5,000,000 | | | | 4,626,550 | |
Kentucky Economic DFA, 0% due 10/1/2020 (Norton Healthcare, Inc.; Insured: Natl-Re) | | AA-/A3 | | | 9,600,000 | | | | 8,614,080 | |
Kentucky Economic DFA, 0% due 10/1/2021 (Norton Healthcare, Inc.; Insured: Natl-Re) | | AA-/A3 | | | 2,885,000 | | | | 2,522,326 | |
Kentucky Economic DFA, 0% due 10/1/2023 (Norton Healthcare, Inc.; Insured: Natl-Re) | | AA-/A3 | | | 4,195,000 | | | | 3,422,407 | |
Lexington-Fayette Urban County Government Public Facilities Corp., 5.00% due 6/1/2022 (Eastern State Hospital) | | A/Aa3 | | | 6,165,000 | | | | 7,248,622 | |
| | | |
LOUISIANA — 2.67% | | | | | | | | | | |
City of Bossier, 4.00% due 12/1/2018 (Public Improvements; Insured: AGM) | | AA/Aa3 | | | 2,020,000 | | | | 2,176,449 | |
City of Bossier, 4.50% due 12/1/2021 (Public Improvements; Insured: AGM) | | AA/Aa3 | | | 2,240,000 | | | | 2,603,485 | |
City of Lafayette, 4.00% due 11/1/2016 (Utilities System Improvements) | | AA-/A1 | | | 1,395,000 | | | | 1,423,263 | |
City of Lafayette, 5.00% due 11/1/2019 (Utilities System Improvements) | | AA-/A1 | | | 1,000,000 | | | | 1,136,770 | |
City of New Orleans GO, 5.00% due 10/1/2016 (Audubon Park Aquarium) | | A/NR | | | 2,380,000 | | | | 2,427,005 | |
City of New Orleans GO, 4.00% due 12/1/2016 (Public Improvements) | | A+/A3 | | | 3,000,000 | | | | 3,065,820 | |
City of New Orleans GO, 4.00% due 12/1/2017 (Public Improvements) | | A+/A3 | | | 750,000 | | | | 787,898 | |
City of New Orleans GO, 4.00% due 10/1/2018 (Audubon Park Aquarium; Insured: AGM) | | AA/NR | | | 1,110,000 | | | | 1,177,699 | |
City of New Orleans GO, 4.00% due 12/1/2018 (Public Improvements) | | A+/A3 | | | 700,000 | | | | 753,060 | |
City of New Orleans GO, 4.00% due 12/1/2019 (Public Improvements) | | A+/A3 | | | 750,000 | | | | 822,780 | |
City of New Orleans GO, 5.00% due 12/1/2019 (Public Improvements; Insured: AGM) | | A+/A3 | | | 3,080,000 | | | | 3,483,911 | |
City of New Orleans GO, 5.00% due 12/1/2020 (Public Improvements) | | A+/A3 | | | 1,315,000 | | | | 1,519,193 | |
City of New Orleans GO, 5.00% due 12/1/2020 (Public Improvements; Insured: AGM) | | A+/A3 | | | 3,250,000 | | | | 3,754,660 | |
City of New Orleans GO, 5.00% due 12/1/2021 (Public Improvements) | | A+/A3 | | | 1,200,000 | | | | 1,408,068 | |
City of New Orleans GO, 5.00% due 12/1/2021 (Public Improvements; Insured: AGM) | | A+/A3 | | | 5,700,000 | | | | 6,688,323 | |
City of Shreveport, 5.00% due 12/1/2020 (Water and Sewer System; Insured: BAM) | | AA/A3 | | | 7,770,000 | | | | 8,995,484 | |
City of Shreveport, 5.00% due 12/1/2021 (Water and Sewer System; Insured: BAM) | | AA/A3 | | | 8,185,000 | | | | 9,642,094 | |
City of Shreveport, 5.00% due 12/1/2022 (Water and Sewer System; Insured: BAM) | | AA/A3 | | | 6,460,000 | | | | 7,722,736 | |
City of Shreveport, 5.00% due 12/1/2023 (Water and Sewer System; Insured: BAM) | | AA/A3 | | | 4,245,000 | | | | 5,148,930 | |
City of Shreveport, 5.00% due 12/1/2024 (Water and Sewer System; Insured: BAM) | | AA/A3 | | | 4,490,000 | | | | 5,488,127 | |
Consolidated Sales Tax District A of the Parish of LaFourche, 4.00% due 3/1/2021 (Roads, Bridges & Drainage Works) | | A/NR | | | 1,990,000 | | | | 2,221,318 | |
Consolidated Sales Tax District A of the Parish of LaFourche, 4.00% due 3/1/2022 (Roads, Bridges & Drainage Works) | | A/NR | | | 1,545,000 | | | | 1,744,722 | |
East Baton Rouge Sewerage Commission, 5.00% due 2/1/2023 (Wastewater System Improvements) | | AA-/Aa3 | | | 450,000 | | | | 548,649 | |
East Baton Rouge Sewerage Commission, 5.00% due 2/1/2024 (Wastewater System Improvements) | | AA-/Aa3 | | | 1,000,000 | | | | 1,236,140 | |
East Baton Rouge Sewerage Commission, 5.00% due 2/1/2025 (Wastewater System Improvements) | | AA-/Aa3 | | | 700,000 | | | | 874,482 | |
Ernest N. Morial - New Orleans Exhibition Hall Authority, 5.00% due 7/15/2020 (Convention Center) | | NR/A1 | | | 1,000,000 | | | | 1,153,600 | |
Ernest N. Morial - New Orleans Exhibition Hall Authority, 5.00% due 7/15/2021 (Convention Center) | | NR/A1 | | | 780,000 | | | | 918,996 | |
Ernest N. Morial - New Orleans Exhibition Hall Authority, 5.00% due 7/15/2022 (Convention Center) | | NR/A1 | | | 1,000,000 | | | | 1,200,610 | |
Ernest N. Morial - New Orleans Exhibition Hall Authority, 5.00% due 7/15/2023 (Convention Center) | | NR/A1 | | | 1,000,000 | | | | 1,191,480 | |
Jefferson Sales Tax District Parish of Jefferson, 5.00% due 12/1/2018 (Sewerage Capital Project; Insured: AGM) | | AA/A2 | | | 2,000,000 | | | | 2,212,940 | |
Louisiana Energy & Power Authority, 5.00% due 1/1/2020 (Rodemacher Unit No. 2 Power) | | A-/Baa1 | | | 1,000,000 | | | | 1,134,190 | |
Louisiana Energy & Power Authority, 5.00% due 1/1/2021 (Rodemacher Unit No. 2 Power) | | A-/Baa1 | | | 1,000,000 | | | | 1,161,860 | |
Louisiana Energy & Power Authority, 5.00% due 6/1/2022 (LEPA Unit No. 1 Power; Insured: AGM) | | AA/A2 | | | 1,000,000 | | | | 1,206,720 | |
Louisiana Energy & Power Authority, 5.00% due 1/1/2023 (Rodemacher Unit No. 2 Power) | | A-/Baa1 | | | 1,640,000 | | | | 1,961,752 | |
Louisiana Energy & Power Authority, 5.00% due 6/1/2023 (LEPA Unit No. 1 Power; Insured: AGM) | | AA/A2 | | | 750,000 | | | | 920,873 | |
Louisiana Local Govt Environmental Facilities & Community Development Authority, 4.00% due 10/1/2016 (Town of Vinton Public Power Authority; Insured: AGM) | | AA/NR | | | 1,000,000 | | | | 1,014,570 | |
Louisiana Local Govt Environmental Facilities & Community Development Authority, 5.00% due 3/1/2017 (Independence Stadium) | | A/NR | | | 1,265,000 | | | | 1,307,112 | |
Louisiana Local Govt Environmental Facilities & Community Development Authority, 4.00% due 10/1/2017 (Town of Vinton Public Power Authority; Insured: AGM) | | AA/NR | | | 1,000,000 | | | | 1,039,220 | |
Louisiana Local Govt Environmental Facilities & Community Development Authority, 5.00% due 3/1/2018 (Independence Stadium) | | A/NR | | | 1,000,000 | | | | 1,067,190 | |
Louisiana Local Govt Environmental Facilities & Community Development Authority, 4.50% due 10/1/2018 (Town of Vinton Public Power Authority; Insured: AGM) | | AA/NR | | | 1,000,000 | | | | 1,074,870 | |
Louisiana Local Govt Environmental Facilities & Community Development Authority, 4.00% due 12/1/2018 (Bossier Parish Community College - Campus Facilities, Inc. Project) | | AA-/NR | | | 2,655,000 | | | | 2,859,170 | |
Louisiana Local Govt Environmental Facilities & Community Development Authority, 4.50% due 10/1/2019 (Town of Vinton Public Power Authority; Insured: AGM) | | AA/NR | | | 1,000,000 | | | | 1,096,350 | |
22 Semi-Annual Report
| | |
| SCHEDULE OF INVESTMENTS, CONTINUED | | |
| |
Thornburg Limited Term Municipal Fund | | March 31, 2016 (Unaudited) |
| | | | | | | | | | |
Issuer-Description | | Credit Rating†
S&P/ Moody’s | | Principal
Amount | | | Value | |
Louisiana Local Govt Environmental Facilities & Community Development Authority, 4.00% due 12/1/2019 (Bossier Parish Community College - Campus Facilities, Inc. Project) | | AA-/NR | | $ | 1,310,000 | | | $ | 1,440,253 | |
Louisiana Local Govt Environmental Facilities & Community Development Authority, 5.00% due 12/1/2020 (Bossier Parish Community College - Campus Facilities, Inc. Project) | | AA-/NR | | | 1,200,000 | | | | 1,392,888 | |
Louisiana Offshore Terminal Authority, 5.00% due 10/1/2018 (Deepwater Oil Port-Loop LLC) | | BBB/NR | | | 22,140,000 | | | | 24,020,129 | |
Louisiana Offshore Terminal Authority, 2.20% due 10/1/2040 put 10/1/2017 (Deepwater Oil Port-Loop LLC) | | BBB/NR | | | 6,000,000 | | | | 6,074,100 | |
Louisiana Public Facilities Authority, 5.00% due 5/15/2016 (Ochsner Clinic Foundation) | | NR/Baa1 | | | 725,000 | | | | 728,654 | |
Louisiana Public Facilities Authority, 5.00% due 5/15/2016 (Ochsner Clinic Foundation) (ETM) | | NR/NR | | | 275,000 | | | | 276,548 | |
Louisiana Public Facilities Authority, 5.00% due 5/15/2017 (Ochsner Clinic Foundation) (ETM) | | NR/NR | | | 285,000 | | | | 298,857 | |
Louisiana Public Facilities Authority, 5.00% due 5/15/2017 (Ochsner Clinic Foundation) | | NR/Baa1 | | | 750,000 | | | | 781,305 | |
Louisiana Public Facilities Authority, 5.00% due 5/15/2018 (Ochsner Clinic Foundation) | | NR/Baa1 | | | 1,450,000 | | | | 1,515,598 | |
Louisiana Public Facilities Authority, 5.00% due 5/15/2018 pre-refunded 5/15/2017 (Ochsner Clinic Foundation) | | NR/NR | | | 550,000 | | | | 576,824 | |
Louisiana Public Facilities Authority, 5.00% due 6/1/2022 (Hurricane Recovery Program) | | NR/A1 | | | 2,945,000 | | | | 3,513,090 | |
Louisiana Public Facilities Authority, 5.00% due 6/1/2023 (Hurricane Recovery Program) | | NR/A1 | | | 5,000,000 | | | | 6,057,800 | |
Louisiana State Office Facilities Corp., 5.00% due 5/1/2016 (State Capitol) | | NR/A1 | | | 1,000,000 | | | | 1,003,830 | |
Louisiana State Office Facilities Corp., 5.00% due 5/1/2018 (State Capitol) | | NR/A1 | | | 2,500,000 | | | | 2,708,725 | |
Louisiana State Office Facilities Corp., 5.00% due 5/1/2021 (State Capitol) | | NR/A1 | | | 4,595,000 | | | | 5,249,282 | |
Parish of LaFourche, 5.00% due 1/1/2019 (Roads, Highways & Bridges) | | AA-/NR | | | 595,000 | | | | 658,022 | |
Parish of LaFourche, 5.00% due 1/1/2022 (Roads, Highways & Bridges) | | AA-/NR | | | 415,000 | | | | 491,704 | |
Parish of LaFourche, 5.00% due 1/1/2023 (Roads, Highways & Bridges) | | AA-/NR | | | 515,000 | | | | 619,653 | |
Parish of Orleans School District GO, 5.00% due 9/1/2016 (Insured: AGM) | | AA/Aa3 | | | 4,500,000 | | | | 4,577,220 | |
Parish of Orleans School District GO, 5.00% due 9/1/2018 (Insured: AGM) | | AA/Aa3 | | | 4,800,000 | | | | 5,225,088 | |
Parish of Orleans School District GO, 5.00% due 9/1/2020 (Insured: AGM) | | AA/Aa3 | | | 3,840,000 | | | | 4,396,838 | |
Parish of Plaquemines Law Enforcement District GO, 5.00% due 9/1/2019 | | A+/NR | | | 1,005,000 | | | | 1,137,137 | |
Parish of Plaquemines Law Enforcement District GO, 5.00% due 9/1/2021 | | A+/NR | | | 1,115,000 | | | | 1,271,423 | |
Parish of St. Charles, 4.00% due 12/1/2040 put 6/1/2022 (Valero Energy Corp. Refinery) | | BBB/Baa2 | | | 14,195,000 | | | | 15,453,529 | |
Parish of St. Tammany Sales Tax District No. 3, 5.00% due 6/1/2017 pre-refunded 6/1/2016 (Public Works, Improvements and Facilities; Insured: CIFG) | | AA/NR | | | 1,405,000 | | | | 1,429,826 | |
Parish of Terrebonne Hospital Service District No. 1, 4.00% due 4/1/2017 (Terrebonne General Medical Center) | | A+/A2 | | | 1,000,000 | | | | 1,024,170 | |
Parish of Terrebonne Hospital Service District No. 1, 5.00% due 4/1/2018 (Terrebonne General Medical Center) | | A+/A2 | | | 1,000,000 | | | | 1,064,620 | |
Parish of Terrebonne Hospital Service District No. 1, 5.00% due 4/1/2019 (Terrebonne General Medical Center) | | A+/A2 | | | 1,810,000 | | | | 1,975,923 | |
Parish of Terrebonne Hospital Service District No. 1, 5.00% due 4/1/2021 (Terrebonne General Medical Center) | | A+/A2 | | | 2,320,000 | | | | 2,621,113 | |
Regional Transit Authority, 5.00% due 12/1/2017 (Streetcar Rail Lines; Insured: AGM) | | AA/Aa3 | | | 755,000 | | | | 805,170 | |
Regional Transit Authority, 5.00% due 12/1/2019 (Streetcar Rail Lines; Insured: AGM) | | AA/Aa3 | | | 1,000,000 | | | | 1,133,640 | |
Regional Transit Authority, 5.00% due 12/1/2021 (Streetcar Rail Lines; Insured: AGM) | | AA/Aa3 | | | 1,000,000 | | | | 1,150,330 | |
Regional Transit Authority, 5.00% due 12/1/2022 (Streetcar Rail Lines; Insured: AGM) | | AA/Aa3 | | | 1,110,000 | | | | 1,279,608 | |
| | | |
MAINE — 0.08% | | | | | | | | | | |
Maine Governmental Facilities Authority, 5.00% due 10/1/2020 (Augusta & Machias Courthouses) | | AA-/Aa3 | | | 1,245,000 | | | | 1,441,859 | |
Maine Governmental Facilities Authority, 5.00% due 10/1/2021 (Augusta & Machias Courthouses) | | AA-/Aa3 | | | 1,315,000 | | | | 1,560,340 | |
Maine Governmental Facilities Authority, 5.00% due 10/1/2022 (Augusta & Machias Courthouses) | | AA-/Aa3 | | | 1,175,000 | | | | 1,420,493 | |
Maine Governmental Facilities Authority, 5.00% due 10/1/2023 (Augusta & Machias Courthouses) | | AA-/Aa3 | | | 1,445,000 | | | | 1,771,180 | |
| | | |
MARYLAND — 0.74% | | | | | | | | | | |
County of Montgomery GO, 0.39% due 6/1/2026 put 4/1/2016 (Consolidated Public Improvements; SPA: Wells Fargo Bank, N.A.) (daily demand notes) | | AAA/Aaa | | | 22,835,000 | | | | 22,835,000 | |
Maryland Economic Development Corp., 5.00% due 6/1/2021 (Public Health Laboratory) | | AA+/Aa1 | | | 8,725,000 | | | | 10,333,715 | |
Maryland Economic Development Corp., 4.00% due 6/1/2022 (Public Health Laboratory) | | AA+/Aa1 | | | 8,245,000 | | | | 9,251,467 | |
Prince George’s County GO, 5.00% due 9/15/2017 (Consolidated Public Improvements) | | AAA/Aaa | | | 12,340,000 | | | | 13,120,999 | |
| | | |
MASSACHUSETTS — 1.95% | | | | | | | | | | |
Berkshire Wind Power Cooperative Corp., 5.00% due 7/1/2017 | | A/NR | | | 2,540,000 | | | | 2,670,759 | |
Berkshire Wind Power Cooperative Corp., 5.00% due 7/1/2018 | | A/NR | | | 2,825,000 | | | | 3,074,419 | |
Berkshire Wind Power Cooperative Corp., 5.00% due 7/1/2019 | | A/NR | | | 2,765,000 | | | | 3,101,694 | |
Berkshire Wind Power Cooperative Corp., 5.00% due 7/1/2020 | | A/NR | | | 2,965,000 | | | | 3,399,224 | |
Commonwealth of Massachusetts, 5.00% due 6/15/2016 (Accelerated Bridge Program) | | AAA/Aa1 | | | 6,390,000 | | | | 6,451,152 | |
Massachusetts Bay Transportation Authority, 0.42% due 7/1/2026 put 4/7/2016 (Capital Investment Program; SPA: JPMorgan Chase Bank, N.A.) (weekly demand notes) | | AA+/Aa2 | | | 77,435,000 | | | | 77,435,000 | |
Massachusetts Development Finance Agency, 3.00% due 7/1/2018 (Mount Auburn Hospital Health Records System) | | A-/A3 | | | 1,000,000 | | | | 1,040,740 | |
Massachusetts Development Finance Agency, 5.00% due 7/1/2022 (Mount Auburn Hospital Health Records System) | | A-/A3 | | | 2,750,000 | | | | 3,255,450 | |
Massachusetts Development Finance Agency, 5.00% due 7/1/2023 (Mount Auburn Hospital Health Records System) | | A-/A3 | | | 4,000,000 | | | | 4,795,640 | |
Massachusetts Development Finance Agency, 5.25% due 10/1/2023 (Simmons College) | | BBB+/Baa1 | | | 595,000 | | | | 721,211 | |
Massachusetts Development Finance Agency, 5.00% due 7/1/2024 (Mount Auburn Hospital Health Records System) | | A-/A3 | | | 6,050,000 | | | | 7,291,158 | |
Massachusetts Development Finance Agency, 5.00% due 7/1/2025 (Mount Auburn Hospital Health Records System) | | A-/A3 | | | 2,465,000 | | | | 2,983,513 | |
Massachusetts Development Finance Agency, 5.75% due 12/1/2042 pre-refunded 5/1/2019 (Dominion Energy Brayton Point Station Units 1 and 2) | | BBB/Baa2 | | | 2,000,000 | | | | 2,295,840 | |
Massachusetts Educational Financing Authority, 5.50% due 1/1/2017 | | AA/NR | | | 1,800,000 | | | | 1,862,694 | |
Semi-Annual Report 23
| | |
| SCHEDULE OF INVESTMENTS, CONTINUED | | |
| |
Thornburg Limited Term Municipal Fund | | March 31, 2016 (Unaudited) |
| | | | | | | | | | |
Issuer-Description | | Credit Rating†
S&P/ Moody’s | | Principal
Amount | | | Value | |
Massachusetts Educational Financing Authority, 5.50% due 1/1/2018 | | AA/NR | | $ | 11,170,000 | | | $ | 12,035,563 | |
Massachusetts Educational Financing Authority, 5.75% due 1/1/2020 | | AA/NR | | | 7,500,000 | | | | 8,622,375 | |
Massachusetts Health & Educational Facilities Authority, 5.00% due 7/1/2018 (UMass Memorial Health Care) | | BBB+/Baa3 | | | 4,290,000 | | | | 4,654,736 | |
Massachusetts Health & Educational Facilities Authority, 5.00% due 10/1/2019 (Berkshire Health Systems; Insured: AGM) | | AA/A3 | | | 1,750,000 | | | | 1,755,968 | |
| | | |
MICHIGAN — 3.07% | | | | | | | | | | |
Board of Governors of Wayne State University, 5.00% due 11/15/2022 (Educational Facilities and Equipment) | | AA-/Aa3 | | | 425,000 | | | | 512,155 | |
Board of Governors of Wayne State University, 5.00% due 11/15/2023 (Educational Facilities and Equipment) | | AA-/Aa3 | | | 305,000 | | | | 373,341 | |
Board of Governors of Wayne State University, 5.00% due 11/15/2024 (Educational Facilities and Equipment) | | AA-/Aa3 | | | 515,000 | | | | 635,592 | |
Board of Governors of Wayne State University, 5.00% due 11/15/2025 (Educational Facilities and Equipment) | | AA-/Aa3 | | | 625,000 | | | | 764,569 | |
Byron Center Michigan Public Schools, 4.00% due 5/1/2017 (Insured: AGM/Q-SBLF) | | AA/NR | | | 1,305,000 | | | | 1,351,197 | |
Byron Center Michigan Public Schools, 4.00% due 5/1/2018 (Insured: AGM/Q-SBLF) | | AA/NR | | | 1,935,000 | | | | 2,059,633 | |
Byron Center Michigan Public Schools, 4.00% due 5/1/2020 (Insured: AGM/Q-SBLF) | | AA/NR | | | 1,000,000 | | | | 1,110,690 | |
City of Battle Creek County of Calhoun GO, 5.00% due 5/1/2020 (Downtown Development; Insured: AMBAC) | | AA/A1 | | | 3,200,000 | | | | 3,456,128 | |
City of Grand Haven, 5.50% due 7/1/2016 (Electric System; Insured: Natl-Re) | | AA-/A3 | | | 3,890,000 | | | | 3,926,060 | |
County of Genesee GO, 3.00% due 11/1/2016 (Water Supply System; Insured: BAM) | | AA/A2 | | | 615,000 | | | | 622,792 | |
County of Genesee GO, 5.00% due 11/1/2022 (Water Supply System; Insured: BAM) | | AA/A2 | | | 600,000 | | | | 711,240 | |
Kalamazoo Hospital Finance Authority, 4.00% due 5/15/2016 (Bronson Methodist Hospital; Insured: AGM) | | NR/A2 | | | 1,850,000 | | | | 1,857,123 | |
Kalamazoo Hospital Finance Authority, 4.50% due 5/15/2017 (Bronson Methodist Hospital; Insured: AGM) | | NR/A2 | | | 1,830,000 | | | | 1,899,357 | |
Kalamazoo Hospital Finance Authority, 5.00% due 5/15/2018 (Bronson Methodist Hospital; Insured: AGM) | | AA/A2 | | | 1,520,000 | | | | 1,638,423 | |
Kalamazoo Hospital Finance Authority, 5.00% due 5/15/2018 (Bronson Methodist Hospital; Insured: AGM) | | AA/A2 | | | 2,500,000 | | | | 2,694,775 | |
Kalamazoo Hospital Finance Authority, 5.00% due 5/15/2020 (Bronson Methodist Hospital; Insured: AGM) | | NR/A2 | | | 1,735,000 | | | | 1,980,589 | |
Kalamazoo Hospital Finance Authority, 5.00% due 5/15/2021 (Bronson Methodist Hospital; Insured: AGM) | | NR/A2 | | | 2,350,000 | | | | 2,671,809 | |
Livingston County GO, 4.00% due 5/1/2018 (Howell Public Schools; Insured: Q-SBLF) | | AA-/NR | | | 1,000,000 | | | | 1,062,480 | |
Livingston County GO, 4.00% due 5/1/2020 (Howell Public Schools; Insured: Q-SBLF) | | AA-/NR | | | 1,000,000 | | | | 1,105,910 | |
Livingston County GO, 4.00% due 5/1/2021 (Howell Public Schools; Insured: Q-SBLF) | | AA-/NR | | | 1,000,000 | | | | 1,122,620 | |
Livonia Public Schools School District GO, 4.00% due 5/1/2020 (School Building & Site) | | A/A2 | | | 800,000 | | | | 870,632 | |
Livonia Public Schools School District GO, 5.00% due 5/1/2021 (School Building & Site) | | A/A2 | | | 900,000 | | | | 1,041,669 | |
Michigan Finance Authority, 4.00% due 8/1/2018 (Beaumont Health Credit Group) | | A/A1 | | | 500,000 | | | | 533,665 | |
Michigan Finance Authority, 5.00% due 8/1/2019 (Ypsilanti Community Schools) | | A+/NR | | | 1,150,000 | | | | 1,274,741 | |
Michigan Finance Authority, 5.00% due 8/1/2020 (Ypsilanti Community Schools) | | A+/NR | | | 1,220,000 | | | | 1,378,649 | |
Michigan Finance Authority, 5.00% due 8/1/2021 (Ypsilanti Community Schools) | | A+/NR | | | 1,295,000 | | | | 1,489,146 | |
Michigan Finance Authority, 5.00% due 8/1/2022 (Ypsilanti Community Schools) | | A+/NR | | | 1,375,000 | | | | 1,605,478 | |
Michigan Finance Authority, 5.00% due 12/1/2022 (Trinity Health Credit Group) | | AA-/Aa3 | | | 1,000,000 | | | | 1,210,580 | |
Michigan Finance Authority, 5.00% due 8/1/2023 (Beaumont Health Credit Group) | | A/A1 | | | 3,800,000 | | | | 4,576,074 | |
Michigan Finance Authority, 5.00% due 12/1/2023 (Trinity Health Credit Group) | | AA-/Aa3 | | | 2,500,000 | | | | 3,080,475 | |
Michigan Finance Authority, 5.00% due 8/1/2024 (Beaumont Health Credit Group) | | A/A1 | | | 7,000,000 | | | | 8,510,460 | |
Michigan Finance Authority, 5.00% due 12/1/2024 (Trinity Health Credit Group) | | AA-/Aa3 | | | 1,000,000 | | | | 1,243,810 | |
Michigan Finance Authority, 5.00% due 8/1/2025 (Beaumont Health Credit Group) | | A/A1 | | | 8,000,000 | | | | 9,635,520 | |
Michigan Municipal Bond Authority, 5.00% due 10/1/2020 (Clean Water Fund) | | AAA/Aaa | | | 35,000 | | | | 36,404 | |
Michigan State Building Authority, 5.50% due 10/15/2017 pre-refunded 10/15/2017 (ETM) | | NR/NR | | | 525,000 | | | | 563,283 | |
Michigan State Building Authority, 5.50% due 10/15/2017 | | A+/Aa2 | | | 3,625,000 | | | | 3,883,752 | |
Michigan State Hospital Finance Authority, 5.00% due 7/15/2016 (Oakwood Hospital) | | A/A1 | | | 1,205,000 | | | | 1,219,737 | |
Michigan State Hospital Finance Authority, 5.00% due 11/15/2016 (Ascension Health) | | AA+/Aa2 | | | 3,330,000 | | | | 3,420,310 | |
Michigan State Hospital Finance Authority, 5.00% due 11/15/2017 (Sparrow Memorial Hospital) | | A+/A1 | | | 1,500,000 | | | | 1,595,235 | |
Michigan State Hospital Finance Authority, 5.50% due 11/15/2017 (Henry Ford Health System) | | A-/A3 | | | 1,530,000 | | | | 1,617,730 | |
Michigan State Hospital Finance Authority, 5.00% due 7/15/2018 pre-refunded 7/15/2017 (Oakwood Hospital) | | A/A1 | | | 1,000,000 | | | | 1,055,520 | |
Michigan State Hospital Finance Authority, 5.50% due 11/15/2018 (Henry Ford Health System) | | A-/A3 | | | 3,500,000 | | | | 3,810,660 | |
Michigan State Hospital Finance Authority, 6.00% due 12/1/2018 (Trinity Health) (ETM) | | AA-/Aa3 | | | 2,000,000 | | | | 2,264,340 | |
Michigan State Hospital Finance Authority, 5.00% due 7/15/2019 pre-refunded 7/15/2017 (Oakwood Hospital) | | A/A1 | | | 2,000,000 | | | | 2,111,040 | |
Michigan State Hospital Finance Authority, 5.00% due 10/1/2026 put 6/1/2017 (Ascension Health) | | NR/Aa3 | | | 12,140,000 | | | | 12,735,346 | |
Michigan State Housing Development Authority, 5.00% due 4/1/2016 (Multi-Family Mtg Loan Financing) | | AA/NR | | | 290,000 | | | | 290,000 | |
Michigan State Housing Development Authority, 4.00% due 10/1/2016 (Multi-Family Mtg Loan Financing) | | AA/NR | | | 1,715,000 | | | | 1,742,594 | |
Michigan Strategic Fund, 5.00% due 10/15/2017 (Michigan House of Representatives Facilities; Insured: AGM) | | AA/Aa3 | | | 2,000,000 | | | | 2,125,780 | |
Michigan Strategic Fund, 5.25% due 10/15/2019 (Michigan House of Representatives Facilities; Insured: AGM) | | AA/Aa3 | | | 2,550,000 | | | | 2,814,154 | |
Michigan Strategic Fund, 5.25% due 10/15/2020 (Michigan House of Representatives Facilities; Insured: AGM) | | AA/Aa3 | | | 4,025,000 | | | | 4,436,959 | |
Michigan Strategic Fund, 5.50% due 8/1/2029 put 8/1/2016 (Detroit Edison Co. Exempt Facilities Project) | | A/Aa3 | | | 5,160,000 | | | | 5,236,987 | |
Plymouth-Canton Community Schools GO, 4.00% due 5/1/2018 (Insured: Q-SBLF) | | NR/Aa1 | | | 1,500,000 | | | | 1,593,720 | |
Plymouth-Canton Community Schools GO, 4.00% due 5/1/2019 (Insured: Q-SBLF) | | NR/Aa1 | | | 1,000,000 | | | | 1,086,190 | |
Plymouth-Canton Community Schools GO, 5.00% due 5/1/2020 (Insured: Q-SBLF) | | NR/Aa1 | | | 1,000,000 | | | | 1,145,530 | |
Royal Oak Hospital Finance Authority, 5.25% due 8/1/2017 (William Beaumont Hospital) (ETM) | | NR/A1 | | | 5,855,000 | | | | 6,209,989 | |
Royal Oak Hospital Finance Authority, 5.00% due 9/1/2020 (William Beaumont Hospital) | | A/A1 | | | 1,200,000 | | | | 1,380,288 | |
Royal Oak Hospital Finance Authority, 5.00% due 9/1/2021 (William Beaumont Hospital) | | A/A1 | | | 2,500,000 | | | | 2,930,275 | |
Royal Oak Hospital Finance Authority, 5.00% due 9/1/2023 (William Beaumont Hospital) | | A/A1 | | | 1,240,000 | | | | 1,501,863 | |
Royal Oak Hospital Finance Authority, 5.00% due 9/1/2024 (William Beaumont Hospital) | | A/A1 | | | 2,000,000 | | | | 2,420,400 | |
School District of the City of Dearborn GO, 3.00% due 5/1/2019 (Insured: Q-SBLF) (State Aid Withholding) | | NR/Aa1 | | | 445,000 | | | | 469,916 | |
School District of the City of Dearborn GO, 4.00% due 5/1/2020 (Insured: Q-SBLF) (State Aid Withholding) | | NR/Aa1 | | | 350,000 | | | | 387,069 | |
24 Semi-Annual Report
| | |
| SCHEDULE OF INVESTMENTS, CONTINUED | | |
| |
Thornburg Limited Term Municipal Fund | | March 31, 2016 (Unaudited) |
| | | | | | | | | | |
Issuer-Description | | Credit Rating†
S&P/ Moody’s | | Principal
Amount | | | Value | |
School District of the City of Dearborn GO, 4.00% due 5/1/2021 (Insured: Q-SBLF) (State Aid Withholding) | | NR/Aa1 | | $ | 570,000 | | | $ | 639,893 | |
School District of the City of Dearborn GO, 4.00% due 5/1/2022 (Insured: Q-SBLF) (State Aid Withholding) | | NR/Aa1 | | | 535,000 | | | | 607,273 | |
School District of the City of Dearborn GO, 4.00% due 5/1/2023 (Insured: Q-SBLF) (State Aid Withholding) | | NR/Aa1 | | | 625,000 | | | | 715,619 | |
School District of the City of Detroit GO, 5.00% due 5/1/2020 (Wayne County School Building & Site; Insured: Q-SBLF) | | AA-/Aa1 | | | 2,200,000 | | | | 2,488,002 | |
School District of the City of Detroit GO, 5.00% due 5/1/2021 (Wayne County School Building & Site; Insured: Q-SBLF) | | AA-/Aa1 | | | 4,000,000 | | | | 4,604,400 | |
School District of the City of Detroit GO, 5.00% due 5/1/2022 (Wayne County School Building & Site; Insured: Q-SBLF) | | AA-/Aa1 | | | 3,000,000 | | | | 3,511,860 | |
Sparta Area Schools, Counties of Kent and Ottawa GO, 4.00% due 5/1/2016 (School Building & Site; Insured: Q-SBLF) | | AA-/NR | | | 1,000,000 | | | | 1,002,800 | |
Sparta Area Schools, Counties of Kent and Ottawa GO, 5.00% due 5/1/2017 (School Building & Site; Insured: Q-SBLF) | | AA-/NR | | | 1,085,000 | | | | 1,133,196 | |
Sparta Area Schools, Counties of Kent and Ottawa GO, 5.00% due 5/1/2018 (School Building & Site; Insured: Q-SBLF) | | AA-/NR | | | 1,285,000 | | | | 1,390,627 | |
Sparta Area Schools, Counties of Kent and Ottawa GO, 5.00% due 5/1/2020 (School Building & Site; Insured: Q-SBLF) | | AA-/NR | | | 1,335,000 | | | | 1,530,230 | |
St. Johns Public Schools GO, 5.00% due 5/1/2021 (Insured: Natl-Re/FGIC/Q-SBLF) | | AA-/Aa2 | | | 1,000,000 | | | | 1,171,400 | |
State Building Authority of the State of Michigan, 5.00% due 10/15/2016 (Higher Education Facilities Program) | | A+/Aa2 | | | 9,055,000 | | | | 9,275,761 | |
State Building Authority of the State of Michigan, 5.00% due 10/15/2020 (Higher Education Facilities Program) | | A+/Aa2 | | | 1,000,000 | | | | 1,165,900 | |
State Building Authority of the State of Michigan, 5.00% due 10/15/2021 (Higher Education Facilities Program) | | A+/Aa2 | | | 1,000,000 | | | | 1,191,740 | |
State Building Authority of the State of Michigan, 5.00% due 10/15/2022 (Higher Education Facilities Program) | | A+/Aa2 | | | 3,000,000 | | | | 3,640,260 | |
State Building Authority of the State of Michigan, 5.00% due 10/15/2023 (Higher Education Facilities Program) | | A+/Aa2 | | | 7,715,000 | | | | 9,481,889 | |
Utica Community Schools County of Macomb GO, 4.00% due 5/1/2018 (Technology Infrastructure Improvements; Insured: Q-SBLF) | | AA-/NR | | | 1,725,000 | | | | 1,832,778 | |
Utica Community Schools County of Macomb GO, 4.00% due 5/1/2019 (Technology Infrastructure Improvements; Insured: Q-SBLF) | | AA-/NR | | | 9,925,000 | | | | 10,780,436 | |
Warren Consolidated School District GO, 4.00% due 5/1/2017 (Insured: Q-SBLF) | | AA-/NR | | | 1,035,000 | | | | 1,069,124 | |
Warren Consolidated School District GO, 5.00% due 5/1/2018 (Insured: Q-SBLF) | | AA-/NR | | | 1,000,000 | | | | 1,080,530 | |
Warren Consolidated School District GO, 5.00% due 5/1/2020 (Insured: Q-SBLF) | | AA-/NR | | | 1,000,000 | | | | 1,136,990 | |
Warren Consolidated School District GO, 5.00% due 5/1/2021 (Insured: Q-SBLF) | | AA-/NR | | | 1,000,000 | | | | 1,162,000 | |
Wayne County Airport Authority, 5.00% due 12/1/2017 (Detroit Metropolitan Airport) | | A/A2 | | | 2,420,000 | | | | 2,584,149 | |
Wayne County Airport Authority, 5.00% due 12/1/2017 (Detroit Metropolitan Airport; Insured: Natl-Re) | | AA-/A2 | | | 1,000,000 | | | | 1,068,600 | |
Wayne County Airport Authority, 5.00% due 12/1/2019 (Detroit Metropolitan Airport) | | A/A2 | | | 12,645,000 | | | | 14,318,692 | |
Wayne County Airport Authority, 5.50% due 12/1/2019 (Detroit Metropolitan Airport) | | A/A2 | | | 2,600,000 | | | | 2,990,520 | |
Wayne County Airport Authority, 5.50% due 12/1/2020 (Detroit Metropolitan Airport) | | A/A2 | | | 4,395,000 | | | | 5,145,754 | |
Wayne County Airport Authority, 5.50% due 12/1/2020 (Detroit Metropolitan Airport) | | A/A2 | | | 3,115,000 | | | | 3,647,104 | |
Western Townships Utilities Authority GO, 5.00% due 1/1/2017 (Sewage Disposal System) | | AA/NR | | | 1,500,000 | | | | 1,546,425 | |
Western Townships Utilities Authority GO, 5.00% due 1/1/2018 (Sewage Disposal System) | | AA/NR | | | 1,500,000 | | | | 1,603,800 | |
| | | |
MINNESOTA — 1.58% | | | | | | | | | | |
Cities of Minneapolis-St. Paul Metropolitan Airports Commission, 5.00% due 1/1/2017 (Insured: AMBAC) | | AA-/NR | | | 8,005,000 | | | | 8,273,648 | |
City of St. Cloud, 5.00% due 5/1/2016 (CentraCare Health System) | | NR/A1 | | | 1,250,000 | | | | 1,254,800 | |
City of St. Cloud, 5.00% due 5/1/2017 (CentraCare Health System) | | NR/A1 | | | 2,920,000 | | | | 3,053,094 | |
City of St. Cloud, 5.00% due 5/1/2017 (CentraCare Health System) | | NR/A1 | | | 1,000,000 | | | | 1,045,580 | |
City of St. Cloud, 5.00% due 5/1/2018 (CentraCare Health System) | | NR/A1 | | | 3,105,000 | | | | 3,361,100 | |
City of St. Cloud, 5.00% due 5/1/2019 (CentraCare Health System) | | NR/A1 | | | 3,495,000 | | | | 3,902,587 | |
City of St. Cloud, 5.00% due 5/1/2020 (CentraCare Health System) | | NR/A1 | | | 3,310,000 | | | | 3,801,667 | |
City of St. Paul Housing & Redevelopment Authority, 5.00% due 2/1/2018 (Gillette Children’s Specialty Healthcare Project) | | A-/NR | | | 1,255,000 | | | | 1,329,020 | |
City of St. Paul Housing & Redevelopment Authority, 5.25% due 2/1/2020 (Gillette Children’s Specialty Healthcare Project) | | A-/NR | | | 2,010,000 | | | | 2,199,684 | |
City of St. Paul Housing & Redevelopment Authority, 5.25% due 5/15/2021 pre-refunded 11/15/2016 (Regions Hospital) | | A/Aaa | | | 1,070,000 | | | | 1,101,169 | |
City of St. Paul Housing & Redevelopment Authority, 0.35% due 11/15/2035 put 4/1/2016 (Allina Health System; LOC: JPMorgan Chase Bank, N.A.) (daily demand notes) | | AA-/Aa2 | | | 42,865,000 | | | | 42,865,000 | |
County of Clay GO, 3.00% due 4/1/2018 (State-Aid Road Improvements) | | AA/NR | | | 1,225,000 | | | | 1,278,986 | |
Le Sueur-Henderson ISD No. 2397 GO, 3.00% due 4/1/2021 (Minnesota School District Credit Enhancement Program) | | AA+/NR | | | 1,125,000 | | | | 1,211,929 | |
Minnesota Agricultural & Economic Development Board, 5.00% due 2/15/2017 (Essential Health; Insured: AGM) | | AA/NR | | | 2,500,000 | | | | 2,586,875 | |
Northern Municipal Power Agency, 5.00% due 1/1/2019 (Electric System) | | A-/A3 | | | 5,000,000 | | | | 5,535,350 | |
Northern Municipal Power Agency, 5.00% due 1/1/2020 (Electric System) | | A-/A3 | | | 3,500,000 | | | | 3,986,220 | |
Port Authority of the City of St. Paul, 5.00% due 12/1/2017 (Minnesota Andersen Office Building) | | AA/Aa2 | | | 4,945,000 | | | | 5,280,963 | |
Port Authority of the City of St. Paul, 4.00% due 12/1/2018 (Minnesota Freeman Office Building) | | AA/Aa2 | | | 3,925,000 | | | | 4,231,503 | |
Port Authority of the City of St. Paul, 5.00% due 12/1/2019 (Minnesota Freeman Office Building) | | AA/Aa2 | | | 2,000,000 | | | | 2,275,520 | |
Port Authority of the City of St. Paul, 5.00% due 12/1/2020 (Minnesota Freeman Office Building) | | AA/Aa2 | | | 2,675,000 | | | | 3,121,029 | |
Port Authority of the City of St. Paul, 5.00% due 12/1/2021 (Minnesota Andersen Office Building) | | AA/Aa2 | | | 965,000 | | | | 1,150,405 | |
Port Authority of the City of St. Paul, 5.00% due 12/1/2022 (Minnesota Andersen Office Building) | | AA/Aa2 | | | 1,250,000 | | | | 1,519,163 | |
St. Paul Housing and Redevelopment Authority, 5.00% due 7/1/2023 (HealthPartners) | | A/A2 | | | 1,000,000 | | | | 1,202,640 | |
St. Paul Housing and Redevelopment Authority, 5.00% due 7/1/2024 (HealthPartners) | | A/A2 | | | 600,000 | | | | 728,628 | |
St. Paul Housing and Redevelopment Authority, 5.00% due 7/1/2025 (HealthPartners) | | A/A2 | | | 250,000 | | | | 306,300 | |
State of Minnesota GO, 5.00% due 8/1/2016 | | AA+/Aa1 | | | 5,000,000 | | | | 5,076,750 | |
State of Minnesota GO, 5.00% due 10/1/2016 (Various Purpose) | | AA+/Aa1 | | | 7,500,000 | | | | 7,671,375 | |
| | | |
MISSISSIPPI — 0.35% | | | | | | | | | | |
Lamar County School District GO, 3.00% due 6/1/2016 (Educational and Performing Arts Capital Projects) | | A/NR | | | 1,800,000 | | | | 1,807,380 | |
Lamar County School District GO, 3.50% due 6/1/2017 (Educational and Performing Arts Capital Projects) | | A/NR | | | 1,700,000 | | | | 1,751,969 | |
Medical Center Educational Building, 4.00% due 6/1/2016 (University of Mississippi Medical Center) | | AA-/Aa2 | | | 3,300,000 | | | | 3,318,612 | |
Semi-Annual Report 25
| | |
| SCHEDULE OF INVESTMENTS, CONTINUED | | |
| |
Thornburg Limited Term Municipal Fund | | March 31, 2016 (Unaudited) |
| | | | | | | | | | |
Issuer-Description | | Credit Rating†
S&P/ Moody’s | | Principal
Amount | | | Value | |
Mississippi Development Bank, 4.75% due 7/1/2017 (Canton GO Public Improvement Project) | | NR/NR | | $ | 620,000 | | | $ | 632,189 | |
Mississippi Development Bank, 5.00% due 8/1/2018 (Department of Corrections) | | AA-/NR | | | 4,910,000 | | | | 5,349,445 | |
Mississippi Development Bank, 5.00% due 1/1/2020 (MDOT-Harrison County Highway) | | AA-/Aa3 | | | 1,500,000 | | | | 1,708,380 | |
Mississippi Development Bank, 5.00% due 1/1/2020 (MDOT-Madison County Highway) | | AA-/Aa3 | | | 1,000,000 | | | | 1,138,920 | |
Mississippi Development Bank, 5.00% due 1/1/2021 (MDOT-Harrison County Highway) | | AA-/Aa3 | | | 2,500,000 | | | | 2,920,925 | |
Mississippi Development Bank, 5.00% due 1/1/2021 (MDOT-Madison County Highway) | | AA-/Aa3 | | | 2,000,000 | | | | 2,336,740 | |
Mississippi Development Bank, 5.00% due 1/1/2022 (MDOT-Harrison County Highway) | | AA-/Aa3 | | | 1,000,000 | | | | 1,193,930 | |
Mississippi Development Bank, 5.00% due 1/1/2022 (MDOT-Madison County Highway) | | AA-/Aa3 | | | 1,000,000 | | | | 1,193,930 | |
Mississippi Development Bank, 5.00% due 1/1/2023 (MDOT-Harrison County Highway) | | AA-/Aa3 | | | 1,500,000 | | | | 1,820,760 | |
Mississippi Development Bank, 5.00% due 1/1/2023 (MDOT-Madison County Highway) | | AA-/Aa3 | | | 1,250,000 | | | | 1,517,300 | |
| | | |
MISSOURI — 1.08% | | | | | | | | | | |
Cass County COP, 4.00% due 5/1/2018 | | A/NR | | | 2,255,000 | | | | 2,373,207 | |
Cass County COP, 4.50% due 5/1/2019 | | A/NR | | | 1,270,000 | | | | 1,378,496 | |
Cass County COP, 5.00% due 5/1/2020 | | A/NR | | | 2,255,000 | | | | 2,536,898 | |
Cass County COP, 5.00% due 5/1/2021 | | A/NR | | | 1,750,000 | | | | 1,952,668 | |
Jackson County, 4.00% due 12/1/2016 (Parking Facility Projects) | | NR/Aa3 | | | 500,000 | | | | 511,245 | |
Jackson County, 4.00% due 12/1/2017 (Parking Facility Projects) | | NR/Aa3 | | | 500,000 | | | | 526,345 | |
Jackson County, 4.00% due 12/1/2019 (Parking Facility Projects) | | NR/Aa3 | | | 500,000 | | | | 550,850 | |
Jackson County, 4.00% due 12/1/2021 (Parking Facility Projects) | | NR/Aa3 | | | 1,000,000 | | | | 1,130,650 | |
Kansas City IDA, 5.00% due 9/1/2018 (Kansas City Redevelopment District) (ETM) | | NR/NR | | | 695,000 | | | | 764,069 | |
Kansas City IDA, 5.00% due 9/1/2018 (Kansas City Redevelopment District) | | AA-/A1 | | | 1,305,000 | | | | 1,424,160 | |
Kansas City Municipal Assistance Corp., 5.00% due 4/15/2018 (Bartle Music Hall and Municipal Auditorium Parking Garage; Insured: Natl-Re) | | AA/A1 | | | 1,000,000 | | | | 1,078,950 | |
Kansas City Municipal Assistance Corp., 0% due 4/15/2021 (H. Roe Bartle Convention Center & Infrastructure Project; Insured: AMBAC) | | AA-/A1 | | | 10,055,000 | | | | 8,929,946 | |
Kansas City Municipal Assistance Corp., 0% due 4/15/2022 (H. Roe Bartle Convention Center & Infrastructure Project; Insured: AMBAC) | | AA-/A1 | | | 5,040,000 | | | | 4,340,398 | |
Missouri Development Finance Board, 4.00% due 6/1/2016 (City of Independence Electric System Projects) | | A/NR | | | 1,560,000 | | | | 1,568,564 | |
Missouri Development Finance Board, 5.00% due 6/1/2017 (City of Independence Electric System Projects) | | A/NR | | | 1,525,000 | | | | 1,591,826 | |
Missouri Development Finance Board, 5.00% due 6/1/2018 (City of Independence Electric System Projects) | | A/NR | | | 1,705,000 | | | | 1,838,808 | |
Missouri Development Finance Board, 4.00% due 6/1/2019 (City of Independence Electric System Projects) | | A/NR | | | 1,000,000 | | | | 1,074,440 | |
Missouri Development Finance Board, 5.00% due 6/1/2019 (City of Independence Electric System Projects) | | A/NR | | | 1,790,000 | | | | 1,978,326 | |
Missouri Development Finance Board, 4.00% due 6/1/2020 (City of Independence Electric System Projects) | | A/NR | | | 1,265,000 | | | | 1,372,221 | |
Missouri Development Finance Board, 5.00% due 6/1/2020 (City of Independence Electric System Projects) | | A/NR | | | 1,000,000 | | | | 1,124,660 | |
Missouri Development Finance Board, 4.00% due 6/1/2021 (City of Independence Electric System Projects) | | A/NR | | | 2,465,000 | | | | 2,700,728 | |
Missouri Development Finance Board, 4.00% due 6/1/2022 (City of Independence Electric System Projects) | | A/NR | | | 3,155,000 | | | | 3,484,287 | |
Missouri Health and Educational Facilities Authority, 4.00% due 4/1/2016 (Webster University) | | NR/A2 | | | 1,685,000 | | | | 1,685,000 | |
Missouri Health and Educational Facilities Authority, 5.00% due 5/15/2017 (Children’s Mercy Hospital) | | A+/NR | | | 1,000,000 | | | | 1,043,350 | |
Missouri Health and Educational Facilities Authority, 5.00% due 5/15/2019 (Children’s Mercy Hospital) | | A+/NR | | | 1,000,000 | | | | 1,111,140 | |
Missouri Health and Educational Facilities Authority, 5.00% due 5/15/2020 (Children’s Mercy Hospital) | | A+/NR | | | 1,000,000 | | | | 1,122,330 | |
Missouri Health and Educational Facilities Authority, 0.35% due 9/1/2030 put 4/1/2016 (Washington University; SPA: Wells Fargo Bank, N.A.) (daily demand notes) | | AAA/Aaa | | | 400,000 | | | | 400,000 | |
Missouri Health and Educational Facilities Authority, 0.35% due 7/1/2032 put 4/1/2016 (St. Louis University; SPA: U.S. Bank, N.A.) (daily demand notes) | | NR/A1 | | | 1,835,000 | | | | 1,835,000 | |
Platte County, 4.00% due 4/1/2017 (Community & Resource Centers) | | NR/A1 | | | 1,500,000 | | | | 1,542,990 | |
Platte County, 4.00% due 4/1/2018 (Community & Resource Centers) | | NR/A1 | | | 2,110,000 | | | | 2,225,544 | |
Platte County, 5.00% due 4/1/2019 (Community & Resource Centers) | | NR/A1 | | | 2,000,000 | | | | 2,213,600 | |
Platte County, 5.00% due 4/1/2021 (Community & Resource Centers) | | NR/A1 | | | 2,440,000 | | | | 2,819,347 | |
Southeast Missouri State University, 5.00% due 4/1/2016 (City of Cape Girardeau Campus System Facilities) | | A/NR | | | 750,000 | | | | 750,000 | |
Southeast Missouri State University, 5.00% due 4/1/2018 (City of Cape Girardeau Campus System Facilities) | | A/NR | | | 1,165,000 | | | | 1,258,258 | |
Southeast Missouri State University, 5.00% due 4/1/2020 (City of Cape Girardeau Campus System Facilities) | | A/NR | | | 2,825,000 | | | | 3,231,715 | |
Special Administrative Board of the Transitional School District of the City of St. Louis GO, 4.00% due 4/1/2019 (State Aid Withholding) | | AA+/NR | | | 1,615,000 | | | | 1,749,110 | |
Special Administrative Board of the Transitional School District of the City of St. Louis GO, 4.00% due 4/1/2020 (State Aid Withholding) | | AA+/NR | | | 1,600,000 | | | | 1,762,256 | |
Special Administrative Board of the Transitional School District of the City of St. Louis GO, 4.00% due 4/1/2021 (State Aid Withholding) | | AA+/NR | | | 2,055,000 | | | | 2,294,777 | |
Special Administrative Board of the Transitional School District of the City of St. Louis GO, 4.00% due 4/1/2022 (State Aid Withholding) | | AA+/NR | | | 3,300,000 | | | | 3,729,231 | |
St. Louis Municipal Finance Corp., 5.00% due 2/15/2017 (City Justice Center) | | A/A2 | | | 2,000,000 | | | | 2,073,200 | |
St. Louis Municipal Finance Corp., 5.00% due 2/15/2018 (City Justice Center) | | A/A2 | | | 3,865,000 | | | | 4,153,058 | |
| | | |
NEBRASKA — 0.11% | | | | | | | | | | |
Douglas County Hospital Authority No. 3, 5.00% due 11/1/2022 (Nebraska Methodist Health System) | | A-/NR | | | 1,670,000 | | | | 1,963,285 | |
Douglas County Hospital Authority No. 3, 5.00% due 11/1/2023 (Nebraska Methodist Health System) | | A-/NR | | | 1,905,000 | | | | 2,266,112 | |
26 Semi-Annual Report
| | |
| SCHEDULE OF INVESTMENTS, CONTINUED | | |
| |
Thornburg Limited Term Municipal Fund | | March 31, 2016 (Unaudited) |
| | | | | | | | | | |
Issuer-Description | | Credit Rating†
S&P/ Moody’s | | Principal
Amount | | | Value | |
Douglas County Hospital Authority No. 3, 5.00% due 11/1/2024 (Nebraska Methodist Health System) | | A-/NR | | $ | 1,400,000 | | | $ | 1,671,600 | |
Douglas County Hospital Authority No. 3, 5.00% due 11/1/2025 (Nebraska Methodist Health System) | | A-/NR | | | 2,005,000 | | | | 2,399,825 | |
| | | |
NEVADA — 2.08% | | | | | | | | | | |
Carson City, 4.00% due 9/1/2016 (Carson Tahoe Regional Healthcare Project) | | BBB+/NR | | | 1,045,000 | | | | 1,056,892 | |
Carson City, 5.00% due 9/1/2019 (Carson Tahoe Regional Healthcare Project) | | BBB+/NR | | | 1,000,000 | | | | 1,103,110 | |
Carson City, 5.00% due 9/1/2020 (Carson Tahoe Regional Healthcare Project) | | BBB+/NR | | | 1,000,000 | | | | 1,125,130 | |
Carson City, 5.00% due 9/1/2022 (Carson Tahoe Regional Healthcare Project) | | BBB+/NR | | | 2,450,000 | | | | 2,840,359 | |
City of Las Vegas COP, 5.00% due 9/1/2016 pre-refunded 9/1/2016 (City Hall) | | NR/NR | | | 2,395,000 | | | | 2,439,810 | |
City of Las Vegas COP, 5.00% due 9/1/2016 (City Hall) | | AA-/Aa3 | | | 1,605,000 | | | | 1,631,932 | |
City of Las Vegas COP, 5.00% due 9/1/2017 (City Hall) | | AA-/Aa3 | | | 2,690,000 | | | | 2,831,171 | |
City of Las Vegas COP, 5.00% due 9/1/2017 pre-refunded 9/1/2017 (City Hall) | | NR/NR | | | 1,610,000 | | | | 1,707,244 | |
City of Las Vegas COP, 5.00% due 9/1/2018 pre-refunded 9/1/2018 (City Hall) | | NR/NR | | | 720,000 | | | | 791,374 | |
City of Las Vegas COP, 5.00% due 9/1/2018 (City Hall) | | AA-/Aa3 | | | 3,280,000 | | | | 3,550,830 | |
City of Las Vegas GO, 7.00% due 4/1/2017 (Performing Arts Center) | | AA/Aa2 | | | 1,825,000 | | | | 1,939,099 | |
City of Las Vegas GO, 7.00% due 4/1/2018 (Performing Arts Center) | | AA/Aa2 | | | 2,095,000 | | | | 2,348,202 | |
City of Reno, 5.25% due 6/1/2016 (Washoe Medical Center; Insured: AGM) | | AA/A2 | | | 1,100,000 | | | | 1,108,415 | |
City of Reno, 5.25% due 6/1/2018 (Washoe Medical Center; Insured: AGM) | | AA/A2 | | | 1,000,000 | | | | 1,082,530 | |
Clark County GO, 5.00% due 11/1/2017 pre-refunded 11/1/2016 (Southern Nevada Water Authority; Insured: AMBAC) | | NR/Aa1 | | | 800,000 | | | | 820,840 | |
Clark County GO, 5.00% due 11/1/2017 (Southern Nevada Water Authority; Insured: AMBAC) | | AA/Aa1 | | | 510,000 | | | | 523,938 | |
Las Vegas Clark County Library District GO, 5.00% due 1/1/2018 | | AA/Aa2 | | | 6,535,000 | | | | 7,003,821 | |
Las Vegas Clark County Library District GO, 5.00% due 1/1/2019 | | AA/Aa2 | | | 3,000,000 | | | | 3,322,920 | |
Las Vegas Valley Water District GO, 5.00% due 6/1/2016 | | AA/Aa1 | | | 1,000,000 | | | | 1,007,710 | |
Las Vegas Valley Water District GO, 5.00% due 6/1/2017 | | AA/Aa1 | | | 1,050,000 | | | | 1,102,700 | |
Las Vegas Valley Water District GO, 5.00% due 6/1/2019 | | AA/Aa1 | | | 1,000,000 | | | | 1,125,310 | |
Las Vegas Valley Water District GO, 5.00% due 6/1/2020 | | AA/Aa1 | | | 4,255,000 | | | | 4,922,992 | |
Las Vegas Valley Water District GO, 5.00% due 6/1/2020 | | AA/Aa1 | | | 5,080,000 | | | | 5,877,509 | |
Las Vegas Valley Water District GO, 5.00% due 6/1/2021 | | AA/Aa1 | | | 5,000,000 | | | | 5,927,400 | |
Las Vegas Valley Water District GO, 5.00% due 6/1/2023 | | AA/Aa1 | | | 15,995,000 | | | | 19,656,255 | |
Las Vegas Valley Water District GO, 5.00% due 6/1/2024 | | AA/Aa1 | | | 13,825,000 | | | | 17,197,332 | |
Las Vegas Valley Water District GO, 5.00% due 6/1/2025 | | AA/Aa1 | | | 7,505,000 | | | | 9,435,736 | |
Las Vegas Valley Water District GO, 5.00% due 12/1/2025 | | AA/Aa1 | | | 20,000,000 | | | | 25,240,800 | |
Las Vegas Valley Water District GO, 5.00% due 6/1/2026 | | AA/Aa1 | | | 18,630,000 | | | | 23,372,453 | |
Washoe County GO, 5.00% due 7/1/2021 (Reno-Sparks Convention & Visitors Authority) | | AA/Aa2 | | | 1,700,000 | | | | 2,019,124 | |
Washoe County GO, 5.00% due 7/1/2022 (Reno-Sparks Convention & Visitors Authority) | | AA/Aa2 | | | 2,500,000 | | | | 2,947,050 | |
| | | |
NEW HAMPSHIRE — 0.30% | | | | | | | | | | |
New Hampshire Health and Education Facilities Authority, 5.00% due 10/1/2016 (Southern New Hampshire Medical Center) | | A-/NR | | | 1,260,000 | | | | 1,284,368 | |
New Hampshire Health and Education Facilities Authority, 5.00% due 10/1/2017 (Southern New Hampshire Medical Center) | | A-/NR | | | 1,000,000 | | | | 1,053,020 | |
New Hampshire Health and Education Facilities Authority, 0.35% due 7/1/2033 put 4/1/2016 (University System of New Hampshire; SPA: Wells Fargo Bank, N.A.) (daily demand notes) | | A+/Aa3 | | | 835,000 | | | | 835,000 | |
New Hampshire Health and Education Facilities Authority, 0.39% due 7/1/2033 put 4/1/2016 (University System of New Hampshire; SPA: Wells Fargo Bank, N.A.) (daily demand notes) | | A+/Aa3 | | | 1,685,000 | | | | 1,685,000 | |
New Hampshire Municipal Bond Bank, 5.00% due 8/15/2016 (Insured: Natl-Re) | | AA/Aa3 | | | 2,985,000 | | | | 3,035,924 | |
New Hampshire Municipal Bond Bank, 5.00% due 8/15/2017 (Insured: Natl-Re) | | AA/Aa3 | | | 3,130,000 | | | | 3,315,046 | |
New Hampshire Municipal Bond Bank, 5.25% due 8/15/2020 | | AA+/Aa2 | | | 1,000,000 | | | | 1,173,050 | |
New Hampshire Municipal Bond Bank, 5.25% due 8/15/2022 | | AA+/Aa2 | | | 2,770,000 | | | | 3,399,039 | |
New Hampshire Turnpike System, 5.00% due 2/1/2017 | | A+/A1 | | | 2,425,000 | | | | 2,513,949 | |
New Hampshire Turnpike System, 5.00% due 2/1/2018 | | A+/A1 | | | 1,295,000 | | | | 1,394,016 | |
New Hampshire Turnpike System, 5.00% due 2/1/2020 | | A+/A1 | | | 1,000,000 | | | | 1,144,900 | |
New Hampshire Turnpike System, 5.00% due 2/1/2021 | | A+/A1 | | | 1,260,000 | | | | 1,478,156 | |
| | | |
NEW JERSEY — 2.11% | | | | | | | | | | |
Burlington County Bridge Commission, 3.00% due 12/1/2016 (County Governmental Loan Program) | | AA/Aa2 | | | 1,000,000 | | | | 1,016,720 | |
Burlington County Bridge Commission, 5.00% due 12/1/2018 (County Governmental Loan Program) | | AA/Aa2 | | | 1,000,000 | | | | 1,107,960 | |
Camden County Improvement Authority, 5.00% due 7/1/2016 (Cooper Medical School) | | A/A2 | | | 3,040,000 | | | | 3,072,558 | |
City of Jersey City GO, 4.00% due 8/1/2020 (Qualified General Improvement; Insured: BAM) (State Aid Withholding) | | AA/A1 | | | 2,650,000 | | | | 2,925,521 | |
City of Jersey City GO, 4.00% due 8/1/2021 (Qualified General Improvement; Insured: BAM) (State Aid Withholding) | | AA/A1 | | | 2,805,000 | | | | 3,132,540 | |
City of Jersey City GO, 5.00% due 8/1/2022 (Qualified General Improvement; Insured: BAM) (State Aid Withholding) | | AA/A1 | | | 2,530,000 | | | | 3,002,933 | |
City of Jersey City GO, 5.00% due 8/1/2023 (Qualified General Improvement; Insured: BAM) (State Aid Withholding) | | AA/A1 | | | 2,455,000 | | | | 2,957,931 | |
County of Essex GO, 4.00% due 6/1/2016 | | NR/Aa2 | | | 500,000 | | | | 503,080 | |
County of Hudson COP, 6.25% due 12/1/2016 (Correctional Facility Lease-Purchase; Insured: Natl-Re) | | AA-/A3 | | | 550,000 | | | | 568,167 | |
Essex County Improvement Authority, 5.50% due 10/1/2024 (County Correctional Facilities & Gibraltar Facilities; Insured: Natl-Re) | | NR/Aa2 | | | 5,000,000 | | | | 6,417,950 | |
Gloucester County Improvement Authority, 2.125% due 12/1/2029 put 12/1/2017 (Waste Management, Inc. Project) | | A-/NR | | | 2,000,000 | | | | 2,033,360 | |
Hudson County Improvement Authority, 4.75% due 10/1/2016 (Hudson County Lease Project; Insured: AGM) | | AA/Aa3 | | | 3,155,000 | | | | 3,219,614 | |
Hudson County Improvement Authority, 4.75% due 10/1/2017 (Hudson County Lease Project; Insured: AGM) | | AA/Aa3 | | | 4,065,000 | | | | 4,293,575 | |
Hudson County Improvement Authority, 4.75% due 10/1/2018 (Hudson County Lease Project; Insured: AGM) | | AA/Aa3 | | | 2,000,000 | | | | 2,179,000 | |
Semi-Annual Report 27
| | |
| SCHEDULE OF INVESTMENTS, CONTINUED | | |
| |
Thornburg Limited Term Municipal Fund | | March 31, 2016 (Unaudited) |
| | | | | | | | | | |
Issuer-Description | | Credit Rating†
S&P/ Moody’s | | Principal
Amount | | | Value | |
Hudson County Improvement Authority, 4.75% due 10/1/2019 (Hudson County Lease Project; Insured: AGM) | | AA/Aa3 | | $ | 4,390,000 | | | $ | 4,910,522 | |
Hudson County Improvement Authority, 5.375% due 10/1/2020 (Hudson County Lease Project; Insured: AGM) | | AA/Aa3 | | | 2,020,000 | | | | 2,360,814 | |
Monmouth County Improvement Authority, 5.00% due 12/1/2016 (Insured: AMBAC) | | NR/NR | | | 1,000,000 | | | | 1,026,430 | |
New Jersey EDA, 5.00% due 12/15/2016 (School Facilities Construction) (ETM) | | NR/NR | | | 6,795,000 | | | | 7,009,110 | |
New Jersey EDA, 5.00% due 12/15/2016 (School Facilities Construction) | | A-/A3 | | | 4,155,000 | | | | 4,272,711 | |
New Jersey EDA, 5.50% due 12/15/2019 (School Facilities Construction; Insured: AMBAC) | | A-/A3 | | | 5,525,000 | | | | 6,107,722 | |
New Jersey EDA, 5.00% due 9/1/2020 (School Facilities Construction) (ETM) | | NR/NR | | | 365,000 | | | | 425,794 | |
New Jersey EDA, 5.00% due 9/1/2020 (School Facilities Construction) | | A-/A3 | | | 135,000 | | | | 146,784 | |
New Jersey EDA, 5.00% due 6/15/2022 (School Facilities Construction) | | A-/A3 | | | 8,000,000 | | | | 8,806,960 | |
New Jersey EDA, 5.00% due 3/1/2023 (School Facilities Construction) | | A-/A3 | | | 8,015,000 | | | | 8,856,735 | |
New Jersey EDA, 5.00% due 6/15/2023 (School Facilities Construction) | | A-/A3 | | | 2,000,000 | | | | 2,213,060 | |
New Jersey EDA, 5.75% due 9/1/2023 pre-refunded 3/1/2021 (School Facilities Construction) | | NR/A3 | | | 4,955,000 | | | | 6,009,870 | |
New Jersey EDA, 5.75% due 9/1/2023 (School Facilities Construction) | | A-/A3 | | | 550,000 | | | | 614,114 | |
New Jersey EDA, 5.00% due 6/15/2024 (School Facilities Construction) | | A-/A3 | | | 4,250,000 | | | | 4,710,658 | |
New Jersey EDA, 5.00% due 3/1/2025 (School Facilities Construction) | | A-/A3 | | | 4,575,000 | | | | 4,989,861 | |
New Jersey EDA, 5.00% due 3/1/2026 (School Facilities Construction) | | A-/A3 | | | 11,150,000 | | | | 12,115,813 | |
New Jersey Educational Facilities Authority, 5.00% due 9/1/2016 (Higher Education Capital Improvements; Insured: AGM) | | AA/A2 | | | 675,000 | | | | 684,896 | |
New Jersey Health Care Facilities Financing Authority, 5.00% due 7/1/2023 (Virtua Health Issue) | | AA-/NR | | | 535,000 | | | | 650,260 | |
New Jersey Health Care Facilities Financing Authority, 5.00% due 7/1/2024 (Virtua Health Issue) | | AA-/NR | | | 1,000,000 | | | | 1,215,170 | |
New Jersey Higher Educational Assistance Authority, 5.00% due 12/1/2017 | | AA/Aa2 | | | 1,910,000 | | | | 2,022,614 | |
New Jersey Higher Educational Assistance Authority, 5.00% due 12/1/2018 | | AA/Aa2 | | | 3,000,000 | | | | 3,268,020 | |
New Jersey Higher Educational Assistance Authority, 5.25% due 12/1/2019 | | AA/Aa2 | | | 5,650,000 | | | | 6,351,673 | |
New Jersey Transit Corp., 5.00% due 9/15/2021 (Urban Public Transportation Capital Improvement) | | A/A3 | | | 3,395,000 | | | | 3,868,976 | |
New Jersey Transportation Trust Fund Authority, 5.00% due 6/15/2019 (State Transportation System) | | A-/A3 | | | 1,000,000 | | | | 1,079,600 | |
New Jersey Transportation Trust Fund Authority, 5.00% due 6/15/2020 (State Transportation System) | | A-/A3 | | | 1,000,000 | | | | 1,091,380 | |
New Jersey Transportation Trust Fund Authority, 5.00% due 6/15/2021 (State Transportation System) | | A-/A3 | | | 2,570,000 | | | | 2,825,921 | |
New Jersey Transportation Trust Fund Authority, 5.25% due 12/15/2022 (State Transportation System) | | A-/A3 | | | 2,000,000 | | | | 2,250,100 | |
New Jersey Transportation Trust Fund Authority, 5.25% due 12/15/2023 (State Transportation System; Insured: AMBAC) | | A-/A3 | | | 3,545,000 | | | | 4,013,259 | |
New Jersey Transportation Trust Fund Authority, 5.00% due 6/15/2024 (State Transportation System) | | A-/A3 | | | 1,660,000 | | | | 1,853,174 | |
Ocean Township Municipal Utility Authority, 6.00% due 8/1/2017 (Insured: Natl-Re) | | AA-/A3 | | | 1,515,000 | | | | 1,563,586 | |
Passaic Valley Sewer Commissioners GO, 5.625% due 12/1/2018 (Sewer System) | | NR/A3 | | | 1,210,000 | | | | 1,342,531 | |
Passaic Valley Sewer Commissioners GO, 5.75% due 12/1/2019 (Sewer System) | | NR/A3 | | | 2,000,000 | | | | 2,289,240 | |
Passaic Valley Sewer Commissioners GO, 5.75% due 12/1/2020 (Sewer System) | | NR/A3 | | | 4,250,000 | | | | 4,981,723 | |
Passaic Valley Sewer Commissioners GO, 5.75% due 12/1/2021 (Sewer System) | | NR/A3 | | | 4,500,000 | | | | 5,373,000 | |
Township of Wayne GO, 2.00% due 2/15/2018 (General Improvements and Water Utility System) | | AA+/Aaa | | | 1,295,000 | | | | 1,323,335 | |
| | | |
NEW MEXICO — 0.96% | | | | | | | | | | |
Albuquerque Municipal School District No. 12 GO, 5.00% due 8/1/2019 (Bernalillo and Sandoval Counties School Facilities) (State Aid Withholding) | | AA/Aa1 | | | 2,300,000 | | | | 2,607,441 | |
Albuquerque Municipal School District No. 12 GO, 5.00% due 8/1/2021 pre-refunded 8/1/2016 (Bernalillo and Sandoval | | | | | | | | | | |
Counties School Facilities) (State Aid Withholding) | | AA/Aa1 | | | 2,425,000 | | | | 2,461,618 | |
City of Farmington, 1.875% due 6/1/2032 put 9/1/2017 (El Paso Electric Co.-Four Corners Project) | | BBB/Baa1 | | | 3,000,000 | | | | 3,017,790 | |
City of Gallup, 5.00% due 8/15/2016 (Tri-State Generation and Transmission Assoc., Inc.; Insured: AMBAC) | | A/A3 | | | 2,500,000 | | | | 2,508,975 | |
City of Santa Fe, 4.50% due 5/15/2022 (El Castillo Retirement Residences) | | BBB-/NR | | | 2,585,000 | | | | 2,698,869 | |
Incorporated County of Los Alamos, 5.50% due 6/1/2017 | | AA+/A1 | | | 2,365,000 | | | | 2,496,825 | |
Incorporated County of Los Alamos, 5.50% due 6/1/2018 | | AA+/A1 | | | 2,205,000 | | | | 2,423,119 | |
New Mexico Educational Assistance Foundation, 4.00% due 9/1/2017 (Student Loans) | | NR/Aaa | | | 6,000,000 | | | | 6,282,060 | |
New Mexico Educational Assistance Foundation, 5.00% due 12/1/2018 (Student Loans) | | AAA/Aaa | | | 5,000,000 | | | | 5,539,350 | |
New Mexico Educational Assistance Foundation, 5.00% due 12/1/2021 (Student Loans) | | AAA/Aaa | | | 3,000,000 | | | | 3,485,790 | |
New Mexico Hospital Equipment Loan Council, 5.00% due 8/1/2024 (Presbyterian Healthcare Services) | | AA/Aa3 | | | 1,030,000 | | | | 1,277,303 | |
New Mexico Hospital Equipment Loan Council, 5.00% due 8/1/2025 (Presbyterian Healthcare Services) | | AA/Aa3 | | | 750,000 | | | | 937,605 | |
New Mexico Hospital Equipment Loan Council, 0.50% due 8/1/2034 put 4/7/2016 (Presbyterian Healthcare Services; SPA: JPMorgan Chase Bank, N.A.) (weekly demand notes) | | AA/Aa3 | | | 14,600,000 | | | | 14,600,000 | |
Regents of New Mexico State University, 5.00% due 4/1/2020 (Corbett Center Student Union & NMSU Golf Course) | | AA-/Aa3 | | | 3,095,000 | | | | 3,560,179 | |
Regents of New Mexico State University, 5.00% due 4/1/2021 (Corbett Center Student Union & NMSU Golf Course) | | AA-/Aa3 | | | 1,845,000 | | | | 2,175,919 | |
Regents of New Mexico State University, 5.00% due 4/1/2022 (Corbett Center Student Union & NMSU Golf Course) | | AA-/Aa3 | | | 1,250,000 | | | | 1,506,525 | |
Rio Rancho Public School District No. 94 GO, 4.00% due 8/1/2018 (State Aid Withholding) | | NR/Aa1 | | | 3,940,000 | | | | 4,230,181 | |
State of New Mexico, 5.00% due 7/1/2016 (Statewide Capital Project Funding) | | AA/Aa1 | | | 10,265,000 | | | | 10,383,355 | |
| | | |
NEW YORK — 10.34% | | | | | | | | | | |
City of Long Beach School District GO, 3.50% due 5/1/2022 (Insured: AGM) (State Aid Withholding) | | AA/Aa2 | | | 1,600,000 | | | | 1,726,512 | |
City of New York GO, 4.00% due 8/1/2016 (Capital Projects) | | AA/Aa2 | | | 1,930,000 | | | | 1,952,928 | |
City of New York GO, 0.36% due 8/1/2020 put 4/1/2016 (Capital Projects; LOC: JPMorgan Chase Bank, N.A.) (daily demand notes) | | AAA/Aa1 | | | 1,000,000 | | | | 1,000,000 | |
City of New York GO, 0.36% due 8/1/2021 put 4/1/2016 (Capital Projects; LOC: JPMorgan Chase Bank, N.A.) (daily demand notes) | | AAA/Aa1 | | | 500,000 | | | | 500,000 | |
City of New York GO, 5.00% due 8/1/2021 (City Budget Financial Management) | | AA/Aa2 | | | 9,000,000 | | | | 10,695,780 | |
28 Semi-Annual Report
| | |
| SCHEDULE OF INVESTMENTS, CONTINUED | | |
| |
Thornburg Limited Term Municipal Fund | | March 31, 2016 (Unaudited) |
| | | | | | | | | | |
Issuer-Description | | Credit Rating†
S&P/ Moody’s | | Principal
Amount | | | Value | |
City of New York GO, 5.00% due 8/1/2021 (City Budget Financial Management) | | AA/Aa2 | | $ | 7,350,000 | | | $ | 8,734,887 | |
City of New York GO, 5.00% due 8/1/2021 (City Budget Financial Management) | | AA/Aa2 | | | 7,775,000 | | | | 9,239,966 | |
City of New York GO, 5.00% due 8/1/2021 (City Budget Financial Management) | | AA/Aa2 | | | 3,000,000 | | | | 3,565,260 | |
City of New York GO, 5.00% due 8/1/2022 (City Budget Financial Management) | | AA/Aa2 | | | 3,000,000 | | | | 3,637,320 | |
City of New York GO, 5.00% due 8/1/2022 (City Budget Financial Management) | | AA/Aa2 | | | 6,625,000 | | | | 8,032,415 | |
City of New York GO, 5.00% due 8/1/2022 (City Budget Financial Management) | | AA/Aa2 | | | 20,000,000 | | | | 24,248,800 | |
City of New York GO, 5.00% due 8/1/2022 (City Budget Financial Management) | | AA/Aa2 | | | 13,075,000 | | | | 15,852,653 | |
City of New York GO, 5.00% due 8/1/2023 (City Budget Financial Management) | | AA/Aa2 | | | 9,520,000 | | | | 11,721,500 | |
City of New York GO, 5.00% due 8/1/2023 (City Budget Financial Management) | | AA/Aa2 | | | 12,985,000 | | | | 15,987,781 | |
City of New York GO, 0.36% due 10/1/2023 put 4/1/2016 (Capital Projects; LOC: JPMorgan Chase Bank, N.A.) (daily demand notes) | | AAA/Aa1 | | | 7,200,000 | | | | 7,200,000 | |
City of New York GO, 5.00% due 8/1/2024 (City Budget Financial Management) | | AA/Aa2 | | | 40,145,000 | | | | 50,064,428 | |
City of New York GO, 0.39% due 8/1/2035 put 4/1/2016 (Capital Projects) (daily demand notes) | | AA/Aa2 | | | 3,100,000 | | | | 3,100,000 | |
Erie County Individual Development Agency, 5.00% due 5/1/2016 (Buffalo School District) (ETM) | | NR/NR | | | 4,090,000 | | | | 4,105,419 | |
Erie County Individual Development Agency, 5.00% due 5/1/2016 (Buffalo School District) | | AA/Aa2 | | | 4,705,000 | | | | 4,723,679 | |
Erie County Individual Development Agency, 5.00% due 5/1/2017 (Buffalo School District) | | AA/Aa2 | | | 7,265,000 | | | | 7,612,340 | |
Erie County Individual Development Agency, 5.00% due 5/1/2018 (Buffalo School District) | | AA/Aa2 | | | 5,000,000 | | | | 5,437,000 | |
Metropolitan Transportation Authority, 5.00% due 11/15/2020 | | AA-/A1 | | | 12,955,000 | | | | 15,127,813 | |
Metropolitan Transportation Authority, 5.00% due 11/15/2020 | | AA/NR | | | 2,000,000 | | | | 2,355,260 | |
Metropolitan Transportation Authority, 5.00% due 11/15/2021 | | AA-/A1 | | | 24,325,000 | | | | 29,001,724 | |
Monroe County Industrial Development Corp., 5.00% due 6/1/2018 (St. John Fisher College) | | BBB+/NR | | | 1,425,000 | | | | 1,533,343 | |
Monroe County Industrial Development Corp., 5.00% due 6/1/2019 (St. John Fisher College) | | BBB+/NR | | | 1,030,000 | | | | 1,139,994 | |
Monroe County Industrial Development Corp., 5.00% due 6/1/2022 (St. John Fisher College) | | BBB+/NR | | | 2,000,000 | | | | 2,339,900 | |
a Nassau County IDA, 5.25% due 3/1/2018 (New York Institute of Technology) | | BBB+/Baa2 | | | 1,260,000 | | | | 1,352,333 | |
Nassau County IDA, 5.25% due 3/1/2020 (New York Institute of Technology) | | BBB+/Baa2 | | | 1,715,000 | | | | 1,944,055 | |
New York City Health and Hospital Corp. GO, 5.00% due 2/15/2019 (Healthcare Facilities Improvements) | | A+/Aa3 | | | 2,700,000 | | | | 3,005,829 | |
New York City Health and Hospital Corp. GO, 5.00% due 2/15/2021 (Healthcare Facilities Improvements) | | A+/Aa3 | | | 2,615,000 | | | | 3,005,393 | |
New York City Health and Hospital Corp. GO, 5.00% due 2/15/2020 (Healthcare Facilities Improvements) | | A+/Aa3 | | | 10,000,000 | | | | 11,500,100 | |
New York City Municipal Water Finance Authority, 0.37% due 6/15/2035 put 4/1/2016 (Water & Sewer System; SPA: Bayerische Landesbank) (daily demand notes) | | AAA/Aa1 | | | 71,100,000 | | | | 71,100,000 | |
New York City Municipal Water Finance Authority, 0.39% due 6/15/2044 put 4/1/2016 (Water & Sewer System; SPA: Mizuho Bank, Ltd.) (daily demand notes) | | AAA/Aa1 | | | 33,345,000 | | | | 33,345,000 | |
New York City Municipal Water Finance Authority, 0.37% due 6/15/2045 put 4/1/2016 (Water & Sewer System; SPA: CalPERS) (daily demand notes) | | AAA/Aa1 | | | 2,000,000 | | | | 2,000,000 | |
New York City Municipal Water Finance Authority, 0.36% due 6/15/2050 put 4/1/2016 (Water & Sewer System; SPA: JPMorgan Chase Bank, N.A.) (daily demand notes) | | AA+/Aa1 | | | 57,310,000 | | | | 57,310,000 | |
New York City Municipal Water Finance Authority, 0.36% due 6/15/2050 put 4/1/2016 (Water & Sewer System; SPA: JPMorgan Chase Bank, N.A.) (daily demand notes) | | AA+/Aa1 | | | 2,100,000 | | | | 2,100,000 | |
New York City Transitional Finance Authority, 5.00% due 7/15/2016 (School Financing Act) (State Aid Withholding) | | AA/Aa2 | | | 3,155,000 | | | | 3,196,204 | |
New York City Transitional Finance Authority, 5.00% due 11/1/2016 (City Capital Projects & WTC Recovery Costs) | | AAA/Aa1 | | | 12,680,000 | | | | 13,015,893 | |
New York City Transitional Finance Authority, 5.00% due 11/1/2016 (City Capital Projects & WTC Recovery Costs) | | AAA/Aa1 | | | 5,000,000 | | | | 5,132,450 | |
New York City Transitional Finance Authority, 5.00% due 1/15/2018 (School Financing Act) (State Aid Withholding) | | AA/Aa2 | | | 4,865,000 | | | | 5,231,335 | |
New York City Transitional Finance Authority, 5.00% due 11/1/2018 (City Capital Projects & WTC Recovery Costs) | | AAA/Aa1 | | | 11,730,000 | | | | 12,992,265 | |
New York City Transitional Finance Authority, 5.00% due 11/1/2018 (City Capital Projects & WTC Recovery Costs) | | AAA/Aa1 | | | 3,075,000 | | | | 3,405,901 | |
New York City Transitional Finance Authority, 5.00% due 11/1/2018 (City Capital Projects & WTC Recovery Costs) | | AAA/Aa1 | | | 1,645,000 | | | | 1,822,018 | |
New York City Transitional Finance Authority, 5.00% due 11/1/2018 (City Capital Projects & WTC Recovery Costs) | | AAA/Aa1 | | | 12,725,000 | | | | 14,094,337 | |
New York City Transitional Finance Authority, 5.00% due 11/1/2018 (City Capital Projects & WTC Recovery Costs) | | AAA/Aa1 | | | 1,500,000 | | | | 1,661,415 | |
New York City Transitional Finance Authority, 5.00% due 11/1/2018 (City Capital Projects & WTC Recovery Costs) | | AAA/Aa1 | | | 2,000,000 | | | | 2,215,220 | |
New York City Transitional Finance Authority, 0.52% due 11/15/2022 put 4/7/2016 (City Capital Projects; SPA: JPMorgan Chase Bank, N.A.) (weekly demand notes) | | AAA/Aaa | | | 14,000,000 | | | | 14,000,000 | |
New York City Transitional Finance Authority, 0.55% due 11/1/2028 put 4/7/2016 (City Capital Projects; SPA: JPMorgan Chase Bank, N.A.) (weekly demand notes) | | AAA/Aaa | | | 8,500,000 | | | | 8,500,000 | |
New York City Transitional Finance Authority, 0.36% due 11/1/2036 put 4/1/2016 (City Capital Projects; SPA: JPMorgan Chase Bank, N.A.) (daily demand notes) | | AAA/Aa1 | | | 250,000 | | | | 250,000 | |
New York City Transitional Finance Authority, 0.37% due 8/1/2039 put 4/1/2016 (City Capital Projects; SPA: State Street Bank & Trust Co.) (daily demand notes) | | AAA/Aa1 | | | 1,000,000 | | | | 1,000,000 | |
New York City Transitional Finance Authority, 0.39% due 11/1/2042 put 4/1/2016 (City Capital Projects; SPA: Barclays Bank plc) (daily demand notes) | | AAA/Aa1 | | | 27,500,000 | | | | 27,500,000 | |
New York City Transitional Finance Authority, 0.36% due 2/1/2045 put 4/1/2016 (City Capital Projects; SPA: JPMorgan Chase Bank, N.A.) (daily demand notes) | | AAA/Aa1 | | | 1,410,000 | | | | 1,410,000 | |
New York State Dormitory Authority, 5.50% due 2/15/2017 (Mental Health Services Facilities) | | AA/NR | | | 9,000,000 | | | | 9,388,710 | |
New York State Dormitory Authority, 5.25% due 5/15/2017 (Court Facilities Lease; Insured: AMBAC) | | AA-/Aa2 | | | 4,945,000 | | | | 5,199,222 | |
New York State Dormitory Authority, 5.50% due 2/15/2018 (Mental Health Services Facilities) | | AA/NR | | | 5,280,000 | | | | 5,742,528 | |
New York State Dormitory Authority, 2.25% due 4/1/2018 (School Districts Financing Program) (State Aid Withholding) | | AA+/NR | | | 4,800,000 | | | | 4,929,120 | |
New York State Dormitory Authority, 5.00% due 4/1/2018 (School Districts Financing Program) (State Aid Withholding) | | AA+/NR | | | 325,000 | | | | 351,962 | |
New York State Dormitory Authority, 5.00% due 10/1/2018 (School Districts Financing Program) (State Aid Withholding) | | NR/Aa3 | | | 1,395,000 | | | | 1,536,802 | |
Semi-Annual Report 29
| | |
| SCHEDULE OF INVESTMENTS, CONTINUED | | |
| |
Thornburg Limited Term Municipal Fund | | March 31, 2016 (Unaudited) |
| | | | | | | | | | |
Issuer-Description | | Credit Rating†
S&P/ Moody’s | | Principal
Amount | | | Value | |
New York State Dormitory Authority, 5.00% due 10/1/2018 (School Districts Financing Program) (State Aid Withholding) | | AA-/NR | | $ | 2,520,000 | | | $ | 2,770,211 | |
New York State Dormitory Authority, 5.00% due 10/1/2018 (School Districts Financing Program; Insured: AGM) (State Aid Withholding) | | AA/A2 | | | 2,500,000 | | | | 2,754,125 | |
New York State Dormitory Authority, 5.00% due 4/1/2019 (School Districts Financing Program) (State Aid Withholding) | | AA+/NR | | | 610,000 | | | | 682,901 | |
New York State Dormitory Authority, 5.00% due 7/1/2019 (New York Department of Health Projects; Insured: Natl-Re) | | AA/Aa2 | | | 6,975,000 | | | | 7,002,272 | |
New York State Dormitory Authority, 5.00% due 10/1/2019 (School Districts Financing Program) (State Aid Withholding) | | NR/Aa3 | | | 1,585,000 | | | | 1,799,878 | |
New York State Dormitory Authority, 5.00% due 10/1/2019 (School Districts Financing Program) (State Aid Withholding) | | AA-/NR | | | 2,645,000 | | | | 2,997,711 | |
New York State Dormitory Authority, 5.00% due 10/1/2019 (School Districts Financing Program; Insured: AGM) (State Aid Withholding) | | AA/A2 | | | 2,100,000 | | | | 2,384,697 | |
New York State Dormitory Authority, 5.00% due 12/15/2019 (Metropolitan Transportation Authority Service Contract) | | AAA/Aa1 | | | 60,000,000 | | | | 68,534,400 | |
New York State Dormitory Authority, 5.00% due 4/1/2020 (School Districts Financing Program) (State Aid Withholding) | | AA+/NR | | | 1,000,000 | | | | 1,150,830 | |
New York State Dormitory Authority, 5.00% due 7/1/2020 (NYSARC, Inc. Developmental Disability Programs) | | NR/Aa2 | | | 1,000,000 | | | | 1,145,790 | |
New York State Dormitory Authority, 5.00% due 10/1/2020 (School Districts Financing Program) (State Aid Withholding) | | NR/Aa3 | | | 1,000,000 | | | | 1,164,180 | |
New York State Dormitory Authority, 5.00% due 10/1/2020 (School Districts Financing Program) (State Aid Withholding) | | AA-/NR | | | 2,775,000 | | | | 3,226,631 | |
New York State Dormitory Authority, 5.00% due 10/1/2020 (School Districts Financing Program; Insured: AGM) (State Aid Withholding) | | AA/A2 | | | 2,100,000 | | | | 2,447,781 | |
New York State Dormitory Authority, 5.00% due 10/1/2020 (School Districts Financing Program; Insured: AGM) | | AA/NR | | | 1,250,000 | | | | 1,457,013 | |
New York State Dormitory Authority, 5.00% due 4/1/2021 (School Districts Financing Program) (State Aid Withholding) | | AA+/NR | | | 450,000 | | | | 530,177 | |
New York State Dormitory Authority, 5.00% due 10/1/2021 (School Districts Financing Program) (State Aid Withholding) | | NR/Aa3 | | | 750,000 | | | | 891,675 | |
New York State Dormitory Authority, 5.00% due 10/1/2021 (School Districts Financing Program; Insured: AGM) (State Aid Withholding) | | AA/A2 | | | 1,250,000 | | | | 1,489,775 | |
New York State Dormitory Authority, 5.00% due 10/1/2021 (School Districts Financing Program; Insured: AGM) | | AA/NR | | | 1,100,000 | | | | 1,311,002 | |
New York State Dormitory Authority, 5.00% due 10/1/2022 (School Districts Financing Program) (State Aid Withholding) | | AA+/NR | | | 300,000 | | | | 364,488 | |
New York State Dormitory Authority, 5.00% due 10/1/2022 (School Districts Financing Program; Insured: AGM) | | AA/NR | | | 1,800,000 | | | | 2,186,928 | |
New York State Dormitory Authority, 5.00% due 10/1/2023 (School Districts Financing Program; Insured: AGM) | | AA/NR | | | 2,500,000 | | | | 3,090,525 | |
New York State Dormitory Authority, 5.25% due 10/1/2023 (School Districts Financing Program; Insured: AGM) (State Aid Withholding) | | AA/A1 | | | 2,000,000 | | | | 2,395,700 | |
New York State Dormitory Authority, 5.00% due 10/1/2024 (School Districts Financing Program; Insured: AGM) | | AA/NR | | | 2,000,000 | | | | 2,508,600 | |
New York State Thruway Authority, 5.00% due 5/1/2019 (New NY Bridge Project) | | A-/A3 | | | 5,000,000 | | | | 5,604,650 | |
New York State Thruway Authority, 5.00% due 1/1/2020 (Governor Thomas E. Dewey Thruway) | | A/A2 | | | 2,000,000 | | | | 2,283,360 | |
New York State Thruway Authority, 5.00% due 1/1/2021 (Governor Thomas E. Dewey Thruway) | | A/A2 | | | 2,500,000 | | | | 2,932,250 | |
New York State Thruway Authority, 5.00% due 1/1/2022 (Governor Thomas E. Dewey Thruway) | | A/A2 | | | 3,000,000 | | | | 3,598,260 | |
New York State Thruway Authority, 5.00% due 1/1/2024 (Governor Thomas E. Dewey Thruway) | | A/A2 | | | 1,000,000 | | | | 1,243,570 | |
New York State Thruway Authority, 5.00% due 3/15/2024 (Highway, Bridge, Multi-Modal and MTA Projects) | | AAA/Aa1 | | | 18,300,000 | | | | 21,599,124 | |
New York State Thruway Authority, 5.00% due 1/1/2025 (Governor Thomas E. Dewey Thruway) | | A/A2 | | | 2,000,000 | | | | 2,521,460 | |
The Port Authority of New York and New Jersey GO, 5.00% due 8/15/2017 (Insured: AGM) | | AA/Aa3 | | | 4,725,000 | | | | 5,006,657 | |
Suffolk County Economic Development Corp., 5.00% due 7/1/2020 (Catholic Health Services) | | BBB+/Baa1 | | | 5,000,000 | | | | 5,720,050 | |
Suffolk County Economic Development Corp., 5.00% due 7/1/2021 (Catholic Health Services) | | BBB+/Baa1 | | | 5,000,000 | | | | 5,827,950 | |
Suffolk County Economic Development Corp., 5.00% due 7/1/2022 (Catholic Health Services) | | BBB+/Baa1 | | | 5,000,000 | | | | 5,789,900 | |
Suffolk County IDA Civic Facilities GO, 5.25% due 3/1/2019 (New York Institute of Technology) | | BBB+/Baa2 | | | 1,400,000 | | | | 1,410,934 | |
Tobacco Settlement Financing Corp., 5.00% due 6/1/2018 | | AA/NR | | | 3,725,000 | | | | 4,057,829 | |
Triborough Bridge & Tunnel Authority, 5.00% due 11/15/2021 (MTA Bridges & Tunnels) | | AA-/Aa3 | | | 5,140,000 | | | | 6,184,037 | |
United Nations Development Corp., 5.00% due 7/1/2016 (One, Two and Three U.N. Plaza Project) | | NR/A1 | | | 3,400,000 | | | | 3,438,046 | |
United Nations Development Corp., 5.00% due 7/1/2017 (One, Two and Three U.N. Plaza Project) | | NR/A1 | | | 3,000,000 | | | | 3,158,700 | |
United Nations Development Corp., 5.00% due 7/1/2019 (One, Two and Three U.N. Plaza Project) | | NR/A1 | | | 4,000,000 | | | | 4,499,360 | |
West Seneca Central School District GO, 5.00% due 11/15/2022 (Insured: BAM) (State Aid Withholding) | | AA/A2 | | | 1,000,000 | | | | 1,214,490 | |
| | | |
NORTH CAROLINA — 2.31% | | | | | | | | | | |
Catawba County, 4.00% due 10/1/2016 | | AA-/Aa2 | | | 1,000,000 | | | | 1,017,300 | |
Catawba County, 4.00% due 10/1/2017 | | AA-/Aa2 | | | 1,000,000 | | | | 1,048,690 | |
Charlotte-Mecklenburg Hospital Authority, 5.00% due 1/15/2017 (Carolinas HealthCare System) | | AA-/Aa3 | | | 2,000,000 | | | | 2,067,400 | |
Charlotte-Mecklenburg Hospital Authority, 4.00% due 1/15/2019 (Carolinas HealthCare System) | | AA-/Aa3 | | | 600,000 | | | | 649,986 | |
Charlotte-Mecklenburg Hospital Authority, 3.00% due 1/15/2021 (Carolinas HealthCare System) | | AA-/Aa3 | | | 1,595,000 | | | | 1,717,815 | |
Charlotte-Mecklenburg Hospital Authority, 4.00% due 1/15/2022 (Carolinas HealthCare System) | | AA-/Aa3 | | | 845,000 | | | | 962,996 | |
Charlotte-Mecklenburg Hospital Authority, 5.00% due 1/15/2023 (Carolinas HealthCare System) | | AA-/Aa3 | | | 1,400,000 | | | | 1,701,560 | |
Charlotte-Mecklenburg Hospital Authority, 5.00% due 1/15/2024 (Carolinas HealthCare System) | | AA-/Aa3 | | | 2,855,000 | | | | 3,435,450 | |
Charlotte-Mecklenburg Hospital Authority, 1.00% due 1/15/2037 put 4/7/2016 (Carolinas HealthCare System; SPA: JPMorgan Chase Bank, N.A.) (weekly demand notes) | | AA-/Aa3 | | | 17,315,000 | | | | 17,315,000 | |
Charlotte-Mecklenburg Hospital Authority, 0.35% due 1/15/2038 put 4/1/2016 (Carolinas HealthCare System; SPA: JPMorgan Chase Bank, N.A.) (daily demand notes) | | AA-/Aa3 | | | 4,100,000 | | | | 4,100,000 | |
City of Charlotte COP, 5.00% due 12/1/2020 (Equipment Acquisition & Public Facilities) | | AA+/Aa1 | | | 1,000,000 | | | | 1,172,680 | |
City of Charlotte COP, 5.00% due 12/1/2021 (Equipment Acquisition & Public Facilities) | | AA+/Aa1 | | | 1,100,000 | | | | 1,319,956 | |
City of Charlotte COP, 5.00% due 12/1/2022 (Equipment Acquisition & Public Facilities) | | AA+/Aa1 | | | 2,405,000 | | | | 2,945,043 | |
City of Charlotte COP, 5.00% due 12/1/2023 (Equipment Acquisition & Public Facilities) | | AA+/Aa1 | | | 2,145,000 | | | | 2,665,527 | |
City of Charlotte COP, 5.00% due 12/1/2025 (Equipment Acquisition & Public Facilities) | | AA+/Aa1 | | | 2,290,000 | | | | 2,915,285 | |
City of Charlotte GO, 4.00% due 12/1/2016 (Equipment Acquisition & Public Facilities) | | AAA/Aaa | | | 5,315,000 | | | | 5,440,328 | |
County of Buncombe, 5.00% due 6/1/2022 (Primary, Middle School & Community College Facilities) | | AA+/Aa2 | | | 1,000,000 | | | | 1,209,780 | |
30 Semi-Annual Report
| | |
| SCHEDULE OF INVESTMENTS, CONTINUED | | |
| |
Thornburg Limited Term Municipal Fund | | March 31, 2016 (Unaudited) |
| | | | | | | | | | |
Issuer-Description | | Credit Rating†
S&P/ Moody’s | | Principal
Amount | | | Value | |
County of Buncombe, 5.00% due 6/1/2023 (Primary, Middle School & Community College Facilities) | | AA+/Aa2 | | $ | 750,000 | | | $ | 922,245 | |
County of Buncombe, 5.00% due 6/1/2024 (Primary, Middle School & Community College Facilities) | | AA+/Aa2 | | | 600,000 | | | | 748,428 | |
County of Dare, 4.00% due 6/1/2016 (Educational Facility Capital Projects) | | AA/Aa3 | | | 500,000 | | | | 502,980 | |
County of Dare, 4.00% due 6/1/2017 (Educational Facility Capital Projects) | | AA/Aa3 | | | 400,000 | | | | 415,204 | |
County of Dare, 4.00% due 6/1/2018 (Educational Facility Capital Projects) | | AA/Aa3 | | | 425,000 | | | | 452,825 | |
County of Dare, 4.00% due 6/1/2019 (Educational Facility Capital Projects) | | AA/Aa3 | | | 500,000 | | | | 544,455 | |
County of Dare, 4.00% due 6/1/2020 (Educational Facility Capital Projects) | | AA/Aa3 | | | 765,000 | | | | 848,660 | |
County of Dare, 5.00% due 6/1/2021 (Educational Facility Capital Projects) | | AA/Aa3 | | | 1,225,000 | | | | 1,445,206 | |
County of Dare, 4.00% due 6/1/2022 (Educational Facility Capital Projects) | | AA/Aa3 | | | 490,000 | | | | 554,719 | |
County of Dare, 5.00% due 6/1/2024 (Educational Facility Capital Projects) | | AA/Aa3 | | | 700,000 | | | | 848,085 | |
County of Mecklenburg GO, 5.00% due 12/1/2018 (County Debt Restructuring) | | AAA/Aaa | | | 3,015,000 | | | | 3,349,394 | |
County of Randolph, 5.00% due 10/1/2020 | | A+/Aa3 | | | 500,000 | | | | 579,770 | |
County of Randolph, 5.00% due 10/1/2021 | | A+/Aa3 | | | 1,065,000 | | | | 1,260,758 | |
County of Randolph, 5.00% due 10/1/2021 | | A+/Aa3 | | | 500,000 | | | | 591,905 | |
County of Randolph, 5.00% due 10/1/2022 | | A+/Aa3 | | | 1,945,000 | | | | 2,343,375 | |
County of Randolph, 5.00% due 10/1/2023 | | A+/Aa3 | | | 550,000 | | | | 673,288 | |
County of Randolph, 5.00% due 10/1/2023 | | A+/Aa3 | | | 400,000 | | | | 489,664 | |
North Carolina Eastern Municipal Power Agency, 6.00% due 1/1/2018 (Insured: AMBAC) (ETM) | | NR/NR | | | 7,500,000 | | | | 8,179,050 | |
North Carolina Eastern Municipal Power Agency, 6.00% due 1/1/2018 (Insured: BHAC/AMBAC) (ETM) | | AA+/Aa1 | | | 5,965,000 | | | | 6,500,657 | |
North Carolina Eastern Municipal Power Agency, 5.25% due 1/1/2019 pre-refunded 1/1/2018 (Insured: AGM) | | AA/A3 | | | 3,105,000 | | | | 3,347,438 | |
North Carolina Eastern Municipal Power Agency, 5.00% due 1/1/2021 (ETM) | | NR/NR | | | 5,000,000 | | | | 5,889,800 | |
North Carolina Eastern Municipal Power Agency, 5.00% due 1/1/2022 (ETM) | | NR/NR | | | 4,715,000 | | | | 5,695,861 | |
North Carolina Infrastructure Finance Corp. COP, 5.00% due 5/1/2026 pre-refunded 5/1/2017 (North Carolina Capital Improvements; Insured: AGM) | | AA+/Aa1 | | | 3,000,000 | | | | 3,142,440 | |
North Carolina Municipal Power Agency, 5.25% due 1/1/2017 (Catawba Electric) (ETM) | | NR/NR | | | 1,120,000 | | | | 1,158,987 | |
North Carolina Municipal Power Agency, 5.25% due 1/1/2017 (Catawba Electric) | | A/A2 | | | 2,000,000 | | | | 2,069,940 | |
North Carolina Municipal Power Agency, 4.00% due 1/1/2018 (Catawba Electric) | | A/A2 | | | 11,750,000 | | | | 12,406,237 | |
North Carolina Municipal Power Agency, 4.00% due 1/1/2018 (Catawba Electric) (ETM) | | NR/NR | | | 3,250,000 | | | | 3,427,417 | |
North Carolina Municipal Power Agency, 5.00% due 1/1/2019 (Catawba Electric) | | A/A2 | | | 3,280,000 | | | | 3,638,734 | |
North Carolina Municipal Power Agency, 5.00% due 1/1/2019 (Catawba Electric) (ETM) | | NR/NR | | | 1,220,000 | | | | 1,353,078 | |
North Carolina Municipal Power Agency, 4.00% due 1/1/2020 (Catawba Electric) (ETM) | | NR/NR | | | 945,000 | | | | 1,045,397 | |
North Carolina Municipal Power Agency, 4.00% due 1/1/2020 (Catawba Electric) | | A/A2 | | | 605,000 | | | | 668,567 | |
North Carolina Municipal Power Agency, 5.00% due 1/1/2020 (Catawba Electric) | | A/A2 | | | 720,000 | | | | 822,010 | |
North Carolina Municipal Power Agency, 5.00% due 1/1/2020 (Catawba Electric) (ETM) | | NR/NR | | | 280,000 | | | | 320,116 | |
North Carolina Municipal Power Agency, 4.00% due 1/1/2022 (Catawba Electric) | | A/A2 | | | 1,000,000 | | | | 1,142,550 | |
State of North Carolina, 5.00% due 5/1/2016 (Various Capital Improvements) | | AA+/Aa1 | | | 5,070,000 | | | | 5,089,925 | |
State of North Carolina, 5.00% due 11/1/2019 (State Capital Projects and Correctional Facilities) | | AA+/Aa1 | | | 23,635,000 | | | | 26,986,916 | |
State of North Carolina GO, 5.00% due 6/1/2017 (Various Capital Improvements) | | AAA/Aaa | | | 6,070,000 | | | | 6,380,966 | |
University of North Carolina at Chapel Hill, 0.35% due 2/15/2031 put 4/1/2016 (University of North Carolina Hospitals; SPA: Landesbank Hessen-Thueringen) (daily demand notes) | | AA/Aa3 | | | 3,800,000 | | | | 3,800,000 | |
Winston-Salem State University, 4.00% due 4/1/2016 (Student Housing and Student Services Facilities) | | A-/A3 | | | 640,000 | | | | 640,000 | |
Winston-Salem State University, 4.00% due 4/1/2017 (Student Housing and Student Services Facilities) | | A-/A3 | | | 645,000 | | | | 662,576 | |
Winston-Salem State University, 5.00% due 4/1/2019 (Student Housing and Student Services Facilities) | | A-/A3 | | | 815,000 | | | | 893,468 | |
Winston-Salem State University, 5.00% due 4/1/2022 (Student Housing and Student Services Facilities) | | A-/A3 | | | 945,000 | | | | 1,092,259 | |
| | | |
NORTH DAKOTA — 0.06% | | | | | | | | | | |
County of Ward, 4.00% due 4/1/2020 (Insured: AGM) | | AA/A2 | | | 2,445,000 | | | | 2,696,468 | |
North Dakota Public Finance Authority, 4.00% due 6/1/2017 (City of Fargo Flood Mitigation Projects) | | A+/NR | | | 1,460,000 | | | | 1,515,174 | |
| | | |
OHIO — 3.70% | | | | | | | | | | |
Akron, Bath & Copley Joint Township Hospital District, 5.00% due 11/15/2021 (Children’s Hospital Medical Center) | | NR/A1 | | | 1,000,000 | | | | 1,175,480 | |
Allen County Hospital Facilities, 5.00% due 9/1/2016 (Catholic Healthcare Partners) | | AA-/A1 | | | 10,000,000 | | | | 10,178,400 | |
American Municipal Power, Inc., 5.25% due 2/15/2018 (AMP Combined Hydroelectric Projects) | | A/A3 | | | 5,500,000 | | | | 5,939,395 | |
American Municipal Power, Inc., 5.25% due 2/15/2019 (AMP Combined Hydroelectric Projects) | | A/A3 | | | 5,595,000 | | | | 6,249,671 | |
American Municipal Power, Inc., 5.00% due 2/15/2020 (AMP Fremont Energy Center) | | A/A1 | | | 1,865,000 | | | | 2,129,401 | |
American Municipal Power, Inc., 5.00% due 2/15/2021 (AMP Fremont Energy Center) | | A/A1 | | | 1,300,000 | | | | 1,519,661 | |
American Municipal Power, Inc., 5.00% due 2/15/2022 (AMP Fremont Energy Center) | | A/A1 | | | 2,750,000 | | | | 3,279,045 | |
Cincinnati City School District Board of Education GO, 5.25% due 12/1/2023 (Educational Facilities; Insured: Natl-Re) | | AA-/Aa2 | | | 2,690,000 | | | | 3,371,431 | |
City of Akron, 5.00% due 12/1/2021 (Community Learning Centers) | | AA+/NR | | | 4,120,000 | | | | 4,911,576 | |
City of Akron GO, 5.00% due 12/1/2019 (Various Municipal Capital Projects) | | AA-/NR | | | 1,685,000 | | | | 1,923,208 | |
City of Cleveland, 3.00% due 10/1/2016 (Public Facilities) | | AA/A1 | | | 690,000 | | | | 697,976 | |
City of Cleveland, 4.00% due 10/1/2018 (Parks & Recreation Facilities) | | AA/A1 | | | 500,000 | | | | 535,785 | |
City of Cleveland, 5.00% due 5/15/2019 (Police & Fire Pension Payment) | | NR/NR | | | 1,750,000 | | | | 1,954,907 | |
City of Cleveland, 4.00% due 10/1/2019 (Parks & Recreation Facilities) | | AA/A1 | | | 520,000 | | | | 569,473 | |
City of Cleveland, 4.00% due 10/1/2019 (Public Facilities) | | AA/A1 | | | 600,000 | | | | 657,084 | |
City of Cleveland, 5.00% due 5/15/2020 (Police & Fire Pension Payment) | | NR/NR | | | 1,605,000 | | | | 1,840,518 | |
City of Cleveland, 5.00% due 10/1/2020 (Parks & Recreation Facilities) | | AA/A1 | | | 545,000 | | | | 630,788 | |
Semi-Annual Report 31
| | |
| SCHEDULE OF INVESTMENTS, CONTINUED | | |
| |
Thornburg Limited Term Municipal Fund | | March 31, 2016 (Unaudited) |
| | | | | | | | | | |
Issuer-Description | | Credit Rating†
S&P/ Moody’s | | Principal
Amount | | | Value | |
City of Cleveland, 5.00% due 10/1/2020 (Public Facilities) | | AA/A1 | | $ | 510,000 | | | $ | 590,279 | |
City of Cleveland, 5.00% due 5/15/2021 (Police & Fire Pension Payment) | | NR/NR | | | 750,000 | | | | 879,787 | |
City of Cleveland, 5.00% due 10/1/2021 (Parks & Recreation Facilities) | | AA/A1 | | | 570,000 | | | | 674,111 | |
City of Cleveland, 5.00% due 10/1/2022 (Parks & Recreation Facilities) | | AA/A1 | | | 600,000 | | | | 719,622 | |
City of Cleveland, 5.00% due 10/1/2022 (Public Facilities) | | AA/A1 | | | 905,000 | | | | 1,085,430 | |
City of Cleveland, 5.00% due 11/15/2022 (Parks & Recreation Facilities) | | AA/A1 | | | 1,030,000 | | | | 1,237,648 | |
City of Cleveland, 5.00% due 10/1/2023 (Public Facilities) | | AA/A1 | | | 1,155,000 | | | | 1,403,960 | |
City of Cleveland, 5.00% due 10/1/2023 (Parks & Recreation Facilities) | | AA/A1 | | | 630,000 | | | | 765,797 | |
City of Cleveland COP, 5.00% due 11/15/2016 (Cleveland Stadium) | | A/A2 | | | 2,200,000 | | | | 2,258,894 | |
City of Cleveland COP, 4.75% due 11/15/2020 (Cleveland Stadium) | | A/A2 | | | 2,000,000 | | | | 2,255,540 | |
City of Cleveland GO, 5.50% due 10/1/2016 (City Capital Projects; Insured: AMBAC) | | AA/A1 | | | 7,710,000 | | | | 7,898,124 | |
City of Cleveland GO, 5.50% due 10/1/2019 (City Capital Projects; Insured: AMBAC) | | AA/A1 | | | 1,260,000 | | | | 1,444,918 | |
City of Toledo, 5.00% due 11/15/2018 (Water System Improvements) | | AA-/Aa3 | | | 1,175,000 | | | | 1,299,233 | |
City of Toledo, 5.00% due 11/15/2019 (Water System Improvements) | | AA-/Aa3 | | | 2,260,000 | | | | 2,576,242 | |
City of Toledo, 5.00% due 11/15/2020 (Water System Improvements) | | AA-/Aa3 | | | 2,000,000 | | | | 2,337,640 | |
City of Toledo, 5.00% due 11/15/2021 (Water System Improvements) | | AA-/Aa3 | | | 2,000,000 | | | | 2,388,100 | |
City of Toledo, 5.00% due 11/15/2022 (Water System Improvements) | | AA-/Aa3 | | | 3,255,000 | | | | 3,949,747 | |
City of Toledo, 5.00% due 11/15/2023 (Water System Improvements) | | AA-/Aa3 | | | 1,750,000 | | | | 2,139,112 | |
Cleveland Package Facilities, 5.25% due 9/15/2021 (Insured: AGM) (ETM) | | AA/A2 | | | 965,000 | | | | 1,171,549 | |
Cleveland Package Facilities, 5.25% due 9/15/2021 (Insured: AGM) | | AA/A2 | | | 2,035,000 | | | | 2,372,342 | |
Cleveland State University, 5.00% due 6/1/2019 (Campus Capital Projects) | | A+/A1 | | | 1,000,000 | | | | 1,122,920 | |
Cleveland State University, 5.00% due 6/1/2020 (Campus Capital Projects) | | A+/A1 | | | 700,000 | | | | 807,499 | |
Cleveland State University, 5.00% due 6/1/2021 (Campus Capital Projects) | | A+/A1 | | | 1,000,000 | | | | 1,179,760 | |
Cleveland State University, 5.00% due 6/1/2022 (Campus Capital Projects) | | A+/A1 | | | 2,000,000 | | | | 2,390,920 | |
Cleveland-Cuyahoga County Port Authority, 5.00% due 10/1/2019 (Cleveland Museum of Art) | | AA+/NR | | | 2,000,000 | | | | 2,264,500 | |
County of Clermont, 2.00% due 8/1/2016 (Water System) | | NR/Aa3 | | | 1,855,000 | | | | 1,862,847 | |
County of Clermont, 2.00% due 8/1/2016 (Sanitary Sewer System) | | NR/Aa3 | | | 1,325,000 | | | | 1,330,552 | |
County of Clermont, 4.00% due 8/1/2019 (Sanitary Sewer System) | | NR/Aa3 | | | 1,420,000 | | | | 1,517,242 | |
County of Cuyahoga COP, 5.00% due 12/1/2019 (Convention Hotel Project) | | AA-/Aa3 | | | 2,585,000 | | | | 2,928,133 | |
County of Cuyahoga COP, 5.00% due 12/1/2022 (Convention Hotel Project) | | AA-/Aa3 | | | 9,725,000 | | | | 11,623,709 | |
County of Cuyahoga COP, 5.00% due 12/1/2023 (Convention Hotel Project) | | AA-/Aa3 | | | 5,645,000 | | | | 6,843,321 | |
County of Cuyahoga COP, 5.00% due 12/1/2024 (Convention Hotel Project) | | AA-/Aa3 | | | 11,515,000 | | | | 13,968,616 | |
County of Franklin, 4.00% due 11/15/2033 put 8/1/2016 (OhioHealth Corp. Hospital Facilities) | | AA+/Aa2 | | | 3,235,000 | | | | 3,271,685 | |
County of Hamilton, 0.41% due 5/15/2028 put 4/7/2016 (Children’s Hospital Medical Center; LOC: JPMorgan Chase Bank, N.A.) (weekly demand notes) | | NR/Aa2 | | | 25,000,000 | | | | 25,000,000 | |
County of Hamilton, 0.52% due 5/15/2037 put 4/7/2016 (Children’s Hospital Medical Center; LOC: JPMorgan Chase Bank, N.A.) (weekly demand notes) | | NR/Aa2 | | | 5,200,000 | | | | 5,200,000 | |
County of Montgomery, 0.35% due 11/15/2039 put 4/1/2016 (Miami Valley Hospital; SPA: Wells Fargo Bank, N.A.) (daily demand notes) | | NR/Aa3 | | | 1,900,000 | | | | 1,900,000 | |
Deerfield Township, 5.00% due 12/1/2017 | | NR/A1 | | | 1,000,000 | | | | 1,056,860 | |
Franklin County Convention Facilities Authority, 5.00% due 12/1/2021 (Greater Columbus Convention Center) | | AA/Aaa | | | 1,000,000 | | | | 1,192,130 | |
Franklin County Convention Facilities Authority, 5.00% due 12/1/2022 (Greater Columbus Convention Center) | | AA/Aaa | | | 500,000 | | | | 607,315 | |
Franklin County Convention Facilities Authority, 5.00% due 12/1/2024 (Greater Columbus Convention Center) | | AA/Aaa | | | 1,000,000 | | | | 1,241,860 | |
Garfield Heights City School District GO, 5.375% due 12/15/2016 (School Improvements; Insured: Natl-Re) | | NR/A2 | | | 1,625,000 | | | | 1,674,351 | |
Kent State University, 5.00% due 5/1/2020 (Insured: AGM) | | AA/Aa3 | | | 1,000,000 | | | | 1,122,450 | |
Ohio Higher Educational Facility Commission, 0.39% due 1/1/2043 put 4/1/2016 (Cleveland Clinic Health System; SPA: Barclays Bank plc) (daily demand notes) | | AA-/Aa2 | | | 38,750,000 | | | | 38,750,000 | |
Ohio State Air Quality Development Authority, 5.625% due 6/1/2018 (FirstEnergy Nuclear Generation Corp.) | | BBB-/Baa2 | | | 5,000,000 | | | | 5,347,050 | |
Ohio State Air Quality Development Authority, 5.75% due 6/1/2033 put 06/1/2016 (FirstEnergy Nuclear Generation Corp.) | | BBB-/Baa2 | | | 5,800,000 | | | | 5,839,730 | |
Ohio State Building Authority, 5.00% due 10/1/2020 | | AA/Aa2 | | | 1,700,000 | | | | 1,946,738 | |
Ohio State Water Development Authority, 5.875% due 6/1/2033 put 6/1/2016 (FirstEnergy Nuclear Generation Corp.) | | BBB-/Baa2 | | | 5,500,000 | | | | 5,538,830 | |
Ohio State Water Development Authority, 3.625% due 10/1/2033 put 4/1/2020 (FirstEnergy Nuclear Generation Corp.) | | BBB-/Baa3 | | | 2,000,000 | | | | 2,076,640 | |
Penta Career Center COP, 4.00% due 4/1/2017 (School District Facilities Project) | | NR/Aa3 | | | 1,550,000 | | | | 1,597,972 | |
RiverSouth Authority, 5.00% due 12/1/2019 (RiverSouth Area Redevelopment) | | AA+/Aa2 | | | 2,500,000 | | | | 2,839,875 | |
State of Ohio, 4.00% due 12/15/2018 (Major New Street Infrastructure Project) | | AA/Aa2 | | | 1,000,000 | | | | 1,083,420 | |
State of Ohio, 4.00% due 12/15/2019 (Major New Street Infrastructure Project) | | AA/Aa2 | | | 1,000,000 | | | | 1,108,320 | |
State of Ohio, 5.00% due 10/1/2020 (Cultural and Sports Capital Facilities) | | AA/Aa2 | | | 3,845,000 | | | | 4,461,661 | |
State of Ohio, 5.00% due 12/15/2020 (Major New Street Infrastructure Project) | | AA/Aa2 | | | 1,000,000 | | | | 1,173,620 | |
State of Ohio, 5.00% due 12/15/2021 (Major New Street Infrastructure Project) | | AA/Aa2 | | | 2,500,000 | | | | 2,993,925 | |
State of Ohio GO, 5.50% due 9/15/2019 (Common Schools Capital Facilities) | | AA+/Aa1 | | | 4,150,000 | | | | 4,790,262 | |
State of Ohio Higher Educational Facility Commission, 5.05% due 7/1/2037 pre-refunded 7/1/2016 (Kenyon College) | | A+/A1 | | | 3,500,000 | | | | 3,539,515 | |
University of Akron Ohio, 5.00% due 1/1/2018 (Insured: AGM) | | AA/A1 | | | 3,415,000 | | | | 3,663,714 | |
University of Toledo, 3.50% due 6/1/2016 (Medical Center Capital Improvements) | | A/A1 | | | 1,000,000 | | | | 1,004,910 | |
Youngstown City School District GO, 3.00% due 12/1/2016 (Educational Facilities) (State Aid Withholding) | | NR/Aa2 | | | 1,440,000 | | | | 1,461,096 | |
Youngstown City School District GO, 4.00% due 12/1/2017 (Educational Facilities) (State Aid Withholding) | | NR/Aa2 | | | 1,480,000 | | | | 1,552,594 | |
Youngstown City School District GO, 4.00% due 12/1/2018 (Educational Facilities) (State Aid Withholding) | | NR/Aa2 | | | 1,545,000 | | | | 1,661,833 | |
Youngstown City School District GO, 4.00% due 12/1/2019 (Educational Facilities) (State Aid Withholding) | | NR/Aa2 | | | 1,605,000 | | | | 1,762,579 | |
32 Semi-Annual Report
| | |
| SCHEDULE OF INVESTMENTS, CONTINUED | | |
| |
Thornburg Limited Term Municipal Fund | | March 31, 2016 (Unaudited) |
| | | | | | | | | | |
Issuer-Description | | Credit Rating†
S&P/ Moody’s | | Principal
Amount | | | Value | |
Youngstown City School District GO, 4.00% due 12/1/2020 (Educational Facilities) (State Aid Withholding) | | NR/Aa2 | | $ | 1,670,000 | | | $ | 1,865,056 | |
Youngstown City School District GO, 4.00% due 12/1/2021 (Educational Facilities) (State Aid Withholding) | | NR/Aa2 | | | 1,735,000 | | | | 1,921,894 | |
Youngstown City School District GO, 4.00% due 12/1/2022 (Educational Facilities) (State Aid Withholding) | | NR/Aa2 | | | 1,805,000 | | | | 1,984,200 | |
Youngstown City School District GO, 4.00% due 12/1/2023 (Educational Facilities) (State Aid Withholding) | | NR/Aa2 | | | 1,700,000 | | | | 1,849,872 | |
| | | |
OKLAHOMA — 1.73% | | | | | | | | | | |
Canadian County Educational Facilities Authority, 4.00% due 9/1/2019 (Mustang Public Schools) | | A+/NR | | | 1,410,000 | | | | 1,537,126 | |
Canadian County Educational Facilities Authority, 4.50% due 9/1/2020 (Mustang Public Schools) | | A+/NR | | | 2,690,000 | | | | 3,032,733 | |
Canadian County Educational Facilities Authority, 4.50% due 9/1/2021 (Mustang Public Schools) | | A+/NR | | | 2,290,000 | | | | 2,617,012 | |
Cleveland County Educational Facilities Authority, 5.00% due 6/1/2023 (Moore Public Schools) | | A+/NR | | | 5,355,000 | | | | 6,405,169 | |
Cleveland County ISD No. 29 GO, 1.50% due 3/1/2017 (Norman School District) | | NR/Aa3 | | | 3,630,000 | | | | 3,654,394 | |
Oklahoma County Finance Authority, 5.00% due 9/1/2016 (Western Heights Public Schools) | | A+/NR | | | 3,000,000 | | | | 3,051,720 | |
Oklahoma County Finance Authority, 5.00% due 9/1/2017 (Western Heights Public Schools) | | A+/NR | | | 4,075,000 | | | | 4,301,081 | |
Oklahoma County Finance Authority, 4.00% due 9/1/2018 (Western Heights Public Schools) | | A+/NR | | | 250,000 | | | | 267,445 | |
Oklahoma County Finance Authority, 5.00% due 9/1/2018 (Western Heights Public Schools) | | A+/NR | | | 2,120,000 | | | | 2,314,107 | |
Oklahoma County Finance Authority, 5.00% due 9/1/2020 (Western Heights Public Schools) | | A+/NR | | | 2,000,000 | | | | 2,292,160 | |
Oklahoma DFA, 5.00% due 8/15/2017 (INTEGRIS Health) (ETM) | | AA-/Aa3 | | | 4,375,000 | | | | 4,632,075 | |
Oklahoma DFA, 5.00% due 8/15/2018 (INTEGRIS Health) (ETM) | | AA-/Aa3 | | | 500,000 | | | | 548,720 | |
Oklahoma DFA, 5.00% due 8/15/2022 (INTEGRIS Health) | | AA-/Aa3 | | | 1,000,000 | | | | 1,211,360 | |
Oklahoma DFA, 5.00% due 8/15/2023 (INTEGRIS Health) | | AA-/Aa3 | | | 1,500,000 | | | | 1,839,900 | |
Oklahoma DFA, 5.00% due 8/15/2024 (INTEGRIS Health) | | AA-/Aa3 | | | 1,225,000 | | | | 1,517,799 | |
Oklahoma DFA, 5.00% due 8/15/2025 (INTEGRIS Health) | | AA-/Aa3 | | | 1,000,000 | | | | 1,253,660 | |
Oklahoma State Industrial Authority, 5.00% due 7/1/2016 (Medical Research Foundation) | | NR/A2 | | | 1,165,000 | | | | 1,177,151 | |
Oklahoma State Industrial Authority, 5.25% due 7/1/2017 (Medical Research Foundation) | | NR/A2 | | | 1,075,000 | | | | 1,129,244 | |
Oklahoma Turnpike Authority, 0.35% due 1/1/2028 put 4/1/2016 (Oklahoma Turnpike System; SPA: JPMorgan Chase Bank, N.A.) (daily demand notes) | | AA-/Aa3 | | | 67,900,000 | | | | 67,900,000 | |
Tulsa County Industrial Authority, 5.50% due 9/1/2018 (Jenks Public Schools) | | AA-/NR | | | 4,210,000 | | | | 4,648,724 | |
Tulsa County Industrial Authority, 4.50% due 9/1/2020 (Broken Arrow Public Schools) | | AA-/NR | | | 1,585,000 | | | | 1,792,255 | |
Tulsa County Industrial Authority, 4.50% due 9/1/2021 (Broken Arrow Public Schools) | | AA-/NR | | | 8,775,000 | | | | 10,080,193 | |
Tulsa County ISD No. 3 GO, 2.00% due 4/1/2016 (Broken Arrow School District) | | AA/NR | | | 1,725,000 | | | | 1,725,000 | |
Tulsa Parking Authority, 3.00% due 7/1/2017 | | AA-/NR | | | 1,470,000 | | | | 1,507,162 | |
| | | |
OREGON — 2.36% | | | | | | | | | | |
Oregon Facilities Authority, 4.50% due 3/15/2018 (Legacy Health System) | | AA-/A1 | | | 1,100,000 | | | | 1,173,260 | |
Polk County Dallas School District No. 2 GO, 0% due 6/15/2017 (Capital Improvements) | | AA+/NR | | | 2,270,000 | | | | 2,247,096 | |
Polk County Dallas School District No. 2 GO, 0% due 6/15/2019 (Capital Improvements) | | AA+/NR | | | 515,000 | | | | 498,432 | |
Polk County Dallas School District No. 2 GO, 0% due 6/15/2021 (Capital Improvements) | | AA+/NR | | | 1,475,000 | | | | 1,364,272 | |
State of Oregon GO, 2.00% due 9/15/2016 (Cash Management) | | SP-1+/Mig1 | | | 158,000,000 | | | | 159,202,380 | |
State of Oregon GO, 0.35% due 6/1/2028 put 4/1/2016 (Veterans’ Loan Program; SPA: U.S. Bank, N.A.) (daily demand notes) | | AA+/Aa1 | | | 4,600,000 | | | | 4,600,000 | |
State of Oregon GO, 0.35% due 6/1/2040 put 4/1/2016 (Veterans’ Loan Program; SPA: U.S. Bank, N.A.) (daily demand notes) | | AA+/Aa1 | | | 3,000,000 | | | | 3,000,000 | |
State of Oregon GO, 0.35% due 12/1/2041 put 4/1/2016 (Veterans’ Loan Program; SPA: U.S. Bank, N.A.) (daily demand notes) | | AA+/Aa1 | | | 6,050,000 | | | | 6,050,000 | |
| | | |
PENNSYLVANIA — 4.29% | | | | | | | | | | |
Adams County IDA, 5.00% due 8/15/2016 (Gettysburg College) | | A/A2 | | | 1,250,000 | | | | 1,269,813 | |
Adams County IDA, 5.00% due 8/15/2017 (Gettysburg College) | | A/A2 | | | 1,340,000 | | | | 1,414,089 | |
Adams County IDA, 5.00% due 8/15/2019 (Gettysburg College) | | A/A2 | | | 1,765,000 | | | | 1,984,284 | |
Allegheny County Higher Education Building Authority, 5.00% due 3/1/2020 (Duquesne University of the Holy Spirit) | | A/A2 | | | 250,000 | | | | 285,073 | |
Allegheny County Higher Education Building Authority, 5.00% due 3/1/2023 (Duquesne University of the Holy Spirit) | | A/A2 | | | 300,000 | | | | 359,553 | |
Allegheny County Higher Education Building Authority, 5.00% due 3/1/2024 (Duquesne University of the Holy Spirit) | | A/A2 | | | 500,000 | | | | 606,200 | |
Allegheny County Higher Education Building Authority, 5.00% due 3/1/2025 (Duquesne University of the Holy Spirit) | | A/A2 | | | 1,145,000 | | | | 1,402,797 | |
Allegheny County Hospital Development Authority, 5.00% due 6/15/2017 (University of Pittsburgh Medical Center) | | A+/Aa3 | | | 3,000,000 | | | | 3,152,280 | |
Allegheny County Hospital Development Authority, 5.00% due 9/1/2017 (University of Pittsburgh Medical Center) | | A+/Aa3 | | | 1,875,000 | | | | 1,985,606 | |
Allegheny County Hospital Development Authority, 5.00% due 5/15/2018 (University of Pittsburgh Medical Center) | | A+/Aa3 | | | 5,915,000 | | | | 6,429,191 | |
Allegheny County Hospital Development Authority, 5.00% due 6/15/2018 (University of Pittsburgh Medical Center) | | A+/Aa3 | | | 3,310,000 | | | | 3,608,297 | |
Allegheny County Hospital Development Authority, 5.00% due 9/1/2018 (University of Pittsburgh Medical Center) | | A+/Aa3 | | | 3,100,000 | | | | 3,401,010 | |
Allegheny County Sanitary Authority, 4.00% due 12/1/2018 (2015 Capital Project) | | A/A1 | | | 650,000 | | | | 699,452 | |
Allegheny County Sanitary Authority, 5.00% due 12/1/2023 (2015 Capital Project) | | A/A1 | | | 14,500,000 | | | | 17,668,250 | |
Allegheny County Sanitary Authority, 5.00% due 12/1/2024 (2015 Capital Project) | | A/A1 | | | 4,650,000 | | | | 5,724,987 | |
Allegheny County Sanitary Authority, 5.00% due 12/1/2025 (2015 Capital Project; Insured: BAM) | | AA/A1 | | | 1,000,000 | | | | 1,246,210 | |
Altoona Area School District GO, 3.25% due 12/1/2016 (Insured: AGM) (State Aid Withholding) | | AA/NR | | | 1,475,000 | | | | 1,498,733 | |
Altoona Area School District GO, 3.00% due 12/1/2022 (Insured: AGM) (State Aid Withholding) | | AA/NR | | | 1,335,000 | | | | 1,425,006 | |
Athens Area School District GO, 2.00% due 4/15/2016 (Insured: AGM) (State Aid Withholding) | | NR/A2 | | | 470,000 | | | | 470,273 | |
Athens Area School District GO, 3.00% due 4/15/2018 (Insured: AGM) (State Aid Withholding) | | NR/A2 | | | 2,600,000 | | | | 2,709,044 | |
Athens Area School District GO, 3.00% due 4/15/2019 (Insured: AGM) (State Aid Withholding) | | NR/A2 | | | 2,680,000 | | | | 2,780,795 | |
Semi-Annual Report 33
| | |
| SCHEDULE OF INVESTMENTS, CONTINUED | | |
| |
Thornburg Limited Term Municipal Fund | | March 31, 2016 (Unaudited) |
| | | | | | | | | | |
Issuer-Description | | Credit Rating†
S&P/ Moody’s | | Principal
Amount | | | Value | |
Beaver County IDA, 4.00% due 1/1/2035 put 7/1/2021 (FirstEnergy Nuclear Generation Corp.) | | BBB-/Baa3 | | $ | 18,000,000 | | | $ | 18,858,780 | |
City of Philadelphia, 5.00% due 6/15/2017 (Water and Wastewater System; Insured: AGM) | | AA/A1 | | | 5,570,000 | | | | 5,858,359 | |
City of Philadelphia, 5.00% due 10/1/2017 (Pennsylvania Gas Works) | | A-/Baa1 | | | 400,000 | | | | 424,628 | |
City of Philadelphia, 5.00% due 7/1/2018 (Pennsylvania Gas Works) | | AA/A2 | | | 1,395,000 | | | | 1,520,452 | |
City of Philadelphia, 5.00% due 8/1/2023 (Pennsylvania Gas Works) | | A-/Baa1 | | | 3,750,000 | | | | 4,520,587 | |
City of Philadelphia, 5.00% due 8/1/2024 (Pennsylvania Gas Works) | | A-/Baa1 | | | 4,000,000 | | | | 4,876,200 | |
City of Philadelphia, 5.00% due 8/1/2025 (Pennsylvania Gas Works) | | A-/Baa1 | | | 1,900,000 | | | | 2,335,366 | |
City of Pittsburgh GO, 5.25% due 9/1/2016 (Insured: AGM) | | AA/A1 | | | 3,030,000 | | | | 3,088,994 | |
City of Pittsburgh GO, 5.25% due 9/1/2017 (Insured: AGM) | | AA/A1 | | | 2,210,000 | | | | 2,255,327 | |
City of Pittsburgh GO, 5.25% due 9/1/2018 pre-refunded 9/1/2016 (Insured: AGM) | | AA/A1 | | | 3,240,000 | | | | 3,304,508 | |
City of Pittsburgh GO, 5.00% due 9/1/2022 (Insured: BAM) | | AA/A1 | | | 1,100,000 | | | | 1,324,950 | |
Commonwealth of Pennsylvania GO, 5.00% due 10/1/2022 pre-refunded 10/1/2016 (Capital Facilities) | | AA-/Aa3 | | | 575,000 | | | | 587,903 | |
Commonwealth of Pennsylvania GO, 5.00% due 8/15/2023 (Capital Facilities) | | AA-/Aa3 | | | 19,125,000 | | | | 22,983,469 | |
Commonwealth of Pennsylvania GO, 5.00% due 8/15/2024 (Capital Facilities) | | AA-/Aa3 | | | 15,500,000 | | | | 18,833,430 | |
Commonwealth of Pennsylvania GO, 5.00% due 8/15/2025 (Capital Facilities) | | AA-/Aa3 | | | 14,825,000 | | | | 18,185,827 | |
Commonwealth of Pennsylvania State Public School Building Authority, 5.00% due 10/1/2016 (Harrisburg Area Community College Project) | | A-/NR | | | 1,390,000 | | | | 1,417,480 | |
County of Luzerne GO, 5.00% due 11/15/2021 (Insured: AGM) | | AA/NR | | | 2,680,000 | | | | 3,097,008 | |
County of Luzerne GO, 5.00% due 11/15/2022 (Insured: AGM) | | AA/NR | | | 2,560,000 | | | | 2,985,907 | |
County of Luzerne GO, 5.00% due 11/15/2023 (Insured: AGM) | | AA/NR | | | 2,600,000 | | | | 3,061,344 | |
County of Luzerne GO, 5.00% due 11/15/2024 (Insured: AGM) | | AA/NR | | | 4,000,000 | | | | 4,728,280 | |
Economy Borough Municipal Authority, 3.00% due 12/15/2016 (Beaver County Sewer System; Insured: BAM) | | AA/NR | | | 505,000 | | | | 512,757 | |
Economy Borough Municipal Authority, 3.00% due 12/15/2018 (Beaver County Sewer System; Insured: BAM) | | AA/NR | | | 435,000 | | | | 455,741 | |
Economy Borough Municipal Authority, 4.00% due 12/15/2020 (Beaver County Sewer System; Insured: BAM) | | AA/NR | | | 605,000 | | | | 672,736 | |
Economy Borough Municipal Authority, 4.00% due 12/15/2022 (Beaver County Sewer System; Insured: BAM) | | AA/NR | | | 1,180,000 | | | | 1,335,819 | |
Lancaster County Hospital Authority, 3.00% due 11/1/2016 (Masonic Villages Project) | | A/NR | | | 1,550,000 | | | | 1,569,158 | |
Lancaster County Hospital Authority, 4.00% due 11/1/2017 (Masonic Villages Project) | | A/NR | | | 865,000 | | | | 902,351 | |
Lancaster County Hospital Authority, 5.00% due 11/1/2018 (Masonic Villages Project) | | A/NR | | | 1,105,000 | | | | 1,211,478 | |
Lancaster County Solid Waste Management Authority, 5.00% due 12/15/2023 (Harrisburg Resource Recovery Facility) | | AA-/NR | | | 2,680,000 | | | | 3,229,293 | |
Lancaster County Solid Waste Management Authority, 5.25% due 12/15/2024 (Harrisburg Resource Recovery Facility) | | AA-/NR | | | 4,000,000 | | | | 4,906,280 | |
Lehigh County IDA, 0.90% due 2/15/2027 put 8/15/2017 (PPL Electric Utilities Corp. Project) | | A/A1 | | | 1,360,000 | | | | 1,359,524 | |
Lehigh County IDA, 0.90% due 9/1/2029 put 9/1/2017 (PPL Electric Utilities Corp.) | | A/A1 | | | 15,000,000 | | | | 14,991,600 | |
Monroeville Finance Authority, 5.00% due 2/15/2021 (University of Pittsburgh Medical Center) | | A+/Aa3 | | | 2,400,000 | | | | 2,812,320 | |
Monroeville Finance Authority, 5.00% due 2/15/2022 (University of Pittsburgh Medical Center) | | A+/Aa3 | | | 1,250,000 | | | | 1,494,737 | |
Montgomery County Higher Education & Health Authority, 5.00% due 6/1/2022 (Abington Memorial Hospital) | | A/NR | | | 3,000,000 | | | | 3,519,000 | |
Northampton Borough Municipal Authority, 4.00% due 5/15/2021 (Water System; Insured: AGM) | | NR/A1 | | | 500,000 | | | | 549,330 | |
Northampton Borough Municipal Authority, 4.00% due 5/15/2022 (Water System; Insured: AGM) | | NR/A1 | | | 1,185,000 | | | | 1,312,601 | |
Northampton Borough Municipal Authority, 3.00% due 5/15/2023 (Water System; Insured: AGM) | | NR/A1 | | | 1,255,000 | | | | 1,316,570 | |
Norwin School District GO, 4.00% due 4/1/2018 (Insured: AGM) (State Aid Withholding) | | AA/A1 | | | 1,835,000 | | | | 1,941,118 | |
Pennsylvania Economic DFA, 5.00% due 7/1/2016 (Pennsylvania Dept. of Labor and Industry) | | AA+/Aaa | | | 10,000,000 | | | | 10,115,300 | |
Pennsylvania Higher Educational Facilities Authority, 5.00% due 5/15/2019 (University of Pittsburgh Medical Center) | | A+/Aa3 | | | 5,600,000 | | | | 6,278,664 | |
Pennsylvania Higher Educational Facilities Authority, 5.00% due 5/15/2020 (University of Pittsburgh Medical Center) | | A+/Aa3 | | | 5,100,000 | | | | 5,872,497 | |
Pennsylvania Higher Educational Facilities Authority, 4.00% due 10/1/2022 (Shippensburg University Student Services, Inc. Student Housing) | | BBB-/Baa3 | | | 1,825,000 | | | | 1,940,924 | |
Pennsylvania Higher Educational Facilities Authority, 5.00% due 11/1/2023 (Saint Joseph’s University) | | A-/NR | | | 1,075,000 | | | | 1,229,230 | |
Philadelphia Authority for Industrial Development, 5.00% due 8/1/2020 (Mast Charter School) | | BBB+/NR | | | 515,000 | | | | 549,943 | |
Philadelphia Gas Works Co., 3.00% due 8/1/2016 | | A-/Baa1 | | | 500,000 | | | | 504,060 | |
Philadelphia Parking Authority, 5.00% due 9/1/2016 | | A/A1 | | | 1,500,000 | | | | 1,525,350 | |
Philadelphia Parking Authority, 5.00% due 9/1/2017 | | A/A1 | | | 1,020,000 | | | | 1,074,274 | |
Philadelphia School District GO, 4.50% due 9/1/2017 (State Aid Withholding) | | NR/Ba2 | | | 2,270,000 | | | | 2,369,948 | |
Philadelphia School District GO, 5.00% due 9/1/2019 (State Aid Withholding) | | NR/Ba2 | | | 18,410,000 | | | | 20,237,561 | |
Philadelphia School District GO, 5.00% due 9/1/2019 (State Aid Withholding) | | NR/Ba2 | | | 4,210,000 | | | | 4,598,751 | |
Philadelphia School District GO, 5.25% due 9/1/2021 (State Aid Withholding) | | NR/Ba2 | | | 2,265,000 | | | | 2,525,883 | |
Pittsburgh Water and Sewer Authority, 5.00% due 9/1/2023 | | A/A2 | | | 2,520,000 | | | | 3,072,913 | |
Pittsburgh Water and Sewer Authority, 5.00% due 9/1/2024 | | A/A2 | | | 7,365,000 | | | | 8,958,123 | |
Pittsburgh Water and Sewer Authority, 5.00% due 9/1/2024 | | A/A2 | | | 2,395,000 | | | | 2,913,062 | |
Plum Borough School District GO, 3.00% due 9/15/2016 (Insured: BAM) (State Aid Withholding) | | AA/NR | | | 750,000 | | | | 757,688 | |
Plum Borough School District GO, 3.00% due 9/15/2017 (Insured: BAM) (State Aid Withholding) | | AA/NR | | | 240,000 | | | | 247,183 | |
Plum Borough School District GO, 4.00% due 9/15/2018 (Insured: BAM) (State Aid Withholding) | | AA/NR | | | 740,000 | | | | 791,230 | |
Plum Borough School District GO, 4.00% due 9/15/2019 (Insured: BAM) (State Aid Withholding) | | AA/NR | | | 390,000 | | | | 426,032 | |
Plum Borough School District GO, 4.00% due 9/15/2019 (Insured: BAM) (State Aid Withholding) | | AA/NR | | | 395,000 | | | | 431,494 | |
Plum Borough School District GO, 4.00% due 9/15/2019 (Insured: BAM) (State Aid Withholding) | | AA/NR | | | 1,205,000 | | | | 1,316,330 | |
Plum Borough School District GO, 4.00% due 9/15/2020 (Insured: BAM) (State Aid Withholding) | | AA/NR | | | 1,455,000 | | | | 1,613,915 | |
Plum Borough School District GO, 4.00% due 9/15/2021 (Insured: BAM) (State Aid Withholding) | | AA/NR | | | 1,610,000 | | | | 1,807,064 | |
Plum Borough School District GO, 5.00% due 9/15/2022 (Insured: BAM) (State Aid Withholding) | | AA/NR | | | 1,410,000 | | | | 1,680,410 | |
Plum Borough School District GO, 5.00% due 9/15/2023 (Insured: BAM) (State Aid Withholding) | | AA/NR | | | 1,495,000 | | | | 1,801,026 | |
34 Semi-Annual Report
| | |
| SCHEDULE OF INVESTMENTS, CONTINUED | | |
| |
Thornburg Limited Term Municipal Fund | | March 31, 2016 (Unaudited) |
| | | | | | | | | | |
Issuer-Description | | Credit Rating†
S&P/ Moody’s | | Principal
Amount | | | Value | |
Plum Borough School District GO, 5.00% due 9/15/2023 (Insured: BAM) (State Aid Withholding) | | AA/NR | | $ | 470,000 | | | $ | 566,209 | |
Plum Borough School District GO, 5.00% due 9/15/2024 (Insured: BAM) (State Aid Withholding) | | AA/NR | | | 1,885,000 | | | | 2,298,531 | |
School District of Pittsburgh GO, 5.50% due 9/1/2016 (Insured: AGM) (State Aid Withholding) | | AA/Aa3 | | | 4,000,000 | | | | 4,078,440 | |
Wayne County Hospital and HFA, 2.00% due 7/1/2016 (Wayne Memorial Hospital; Insured: AGM) | | AA/NR | | | 500,000 | | | | 501,630 | |
Wayne County Hospital and HFA, 2.00% due 7/1/2017 (Wayne Memorial Hospital; Insured: AGM) | | AA/NR | | | 1,000,000 | | | | 1,015,770 | |
Wayne County Hospital and HFA, 2.00% due 7/1/2018 (Wayne Memorial Hospital; Insured: AGM) | | AA/NR | | | 625,000 | | | | 639,850 | |
Wayne County Hospital and HFA, 3.00% due 7/1/2019 (Wayne Memorial Hospital; Insured: AGM) | | AA/NR | | | 1,185,000 | | | | 1,235,694 | |
| | | |
RHODE ISLAND — 1.57% | | | | | | | | | | |
Rhode Island Clean Water Finance Agency, 5.00% due 10/1/2018 (Public Drinking Water Supply or Treatment Facilities) | | AAA/NR | | | 870,000 | | | | 958,775 | |
Rhode Island Clean Water Finance Agency, 5.00% due 10/1/2019 (Public Drinking Water Supply or Treatment Facilities) | | AAA/NR | | | 1,250,000 | | | | 1,422,475 | |
Rhode Island Clean Water Finance Agency, 5.00% due 10/1/2020 (Public Drinking Water Supply or Treatment Facilities) | | AAA/NR | | | 1,300,000 | | | | 1,520,740 | |
Rhode Island Clean Water Finance Agency, 5.00% due 10/1/2021 (Public Drinking Water Supply or Treatment Facilities) | | AAA/NR | | | 2,000,000 | | | | 2,395,660 | |
Rhode Island Clean Water Finance Agency, 5.00% due 10/1/2022 (Public Drinking Water Supply or Treatment Facilities) | | AAA/NR | | | 2,280,000 | | | | 2,789,854 | |
Rhode Island Clean Water Finance Agency, 5.00% due 10/1/2023 (Public Drinking Water Supply or Treatment Facilities) | | AAA/NR | | | 2,380,000 | | | | 2,959,268 | |
Rhode Island Convention Center Authority, 5.00% due 5/15/2018 (Convention Center and Parking Projects) | | AA-/Aa3 | | | 5,890,000 | | | | 6,377,692 | |
Rhode Island Convention Center Authority, 5.00% due 5/15/2019 (Convention Center and Parking Projects) | | AA-/Aa3 | | | 7,310,000 | | | | 8,153,940 | |
Rhode Island Convention Center Authority, 5.00% due 5/15/2020 (Convention Center and Parking Projects) | | AA-/Aa3 | | | 5,890,000 | | | | 6,728,795 | |
Rhode Island Health & Educational Building Corp., 5.00% due 9/15/2020 (University of Rhode Island Auxiliary Enterprise) | | A+/A1 | | | 750,000 | | | | 863,805 | |
Rhode Island Health & Educational Building Corp., 5.00% due 9/15/2023 (University of Rhode Island Auxiliary Enterprise) | | A+/A1 | | | 1,400,000 | | | | 1,687,644 | |
State of Rhode Island and Providence Plantations COP, 5.00% due 10/1/2019 (Kent County Courthouse) | | AA-/Aa3 | | | 600,000 | | | | 678,024 | |
State of Rhode Island and Providence Plantations COP, 5.00% due 10/1/2019 (Training School Project) | | AA-/Aa3 | | | 1,575,000 | | | | 1,773,466 | |
State of Rhode Island and Providence Plantations COP, 5.00% due 10/1/2020 (Kent County Courthouse) | | AA-/Aa3 | | | 1,375,000 | | | | 1,593,061 | |
State of Rhode Island and Providence Plantations COP, 5.00% due 10/1/2020 (Training School Project) | | AA-/Aa3 | | | 1,405,000 | | | | 1,627,819 | |
State of Rhode Island and Providence Plantations COP, 5.00% due 10/1/2021 (Kent County Courthouse) | | AA-/Aa3 | | | 2,000,000 | | | | 2,363,000 | |
State of Rhode Island and Providence Plantations COP, 5.00% due 10/1/2021 (Training School Project) | | AA-/Aa3 | | | 3,540,000 | | | | 4,182,510 | |
State of Rhode Island and Providence Plantations COP, 5.00% due 4/1/2022 (Energy Conservation Project) | | AA-/Aa3 | | | 2,020,000 | | | | 2,402,891 | |
State of Rhode Island and Providence Plantations COP, 5.00% due 10/1/2022 (Kent County Courthouse) | | AA-/Aa3 | | | 2,100,000 | | | | 2,518,677 | |
State of Rhode Island and Providence Plantations COP, 5.00% due 10/1/2022 (Training School Project) | | AA-/Aa3 | | | 3,620,000 | | | | 4,341,719 | |
State of Rhode Island and Providence Plantations COP, 5.00% due 10/1/2023 (Kent County Courthouse) | | AA-/Aa3 | | | 1,500,000 | | | | 1,824,495 | |
State of Rhode Island and Providence Plantations COP, 5.00% due 10/1/2023 (Training School Project) | | AA-/Aa3 | | | 1,705,000 | | | | 2,073,843 | |
State of Rhode Island and Providence Plantations COP, 5.00% due 11/1/2024 (Information Technology Project) | | AA-/Aa3 | | | 3,010,000 | | | | 3,696,641 | |
State of Rhode Island and Providence Plantations GO, 5.00% due 8/1/2016 (Consolidated Capital Development Loan) | | AA/Aa2 | | | 3,000,000 | | | | 3,045,720 | |
State of Rhode Island and Providence Plantations GO, 5.00% due 10/1/2019 (Consolidated Capital Development Loan) | | AA/Aa2 | | | 5,000,000 | | | | 5,670,450 | |
State of Rhode Island and Providence Plantations GO, 5.00% due 8/1/2020 (Consolidated Capital Development Loan) | | AA/Aa2 | | | 8,365,000 | | | | 9,728,160 | |
State of Rhode Island and Providence Plantations GO, 4.00% due 10/15/2020 (Consolidated Capital Development Loan) | | AA/Aa2 | | | 1,200,000 | | | | 1,345,020 | |
State of Rhode Island and Providence Plantations GO, 5.00% due 8/1/2021 (Consolidated Capital Development Loan) | | AA/Aa2 | | | 16,535,000 | | | | 19,663,091 | |
State of Rhode Island and Providence Plantations GO, 4.00% due 10/15/2021 (Consolidated Capital Development Loan) | | AA/Aa2 | | | 1,000,000 | | | | 1,137,470 | |
State of Rhode Island and Providence Plantations GO, 5.00% due 8/1/2022 (Consolidated Capital Development Loan) | | AA/Aa2 | | | 9,825,000 | | | | 11,870,860 | |
State of Rhode Island and Providence Plantations GO, 4.00% due 10/15/2022 (Consolidated Capital Development Loan) | | AA/Aa2 | | | 1,000,000 | | | | 1,149,220 | |
| | | |
SOUTH CAROLINA — 0.52% | | | | | | | | | | |
b Beaufort-Jasper Water & Sewer Authority, 5.00% due 3/1/2019 (Waterworks & Sewer System) | | AA/Aa1 | | | 1,000,000 | | | | 1,074,390 | |
b Beaufort-Jasper Water & Sewer Authority, 5.00% due 3/1/2021 (Waterworks & Sewer System) | | AA/Aa1 | | | 750,000 | | | | 846,112 | |
b Beaufort-Jasper Water & Sewer Authority, 5.00% due 3/1/2022 (Waterworks & Sewer System) | | AA/Aa1 | | | 1,000,000 | | | | 1,151,170 | |
b Beaufort-Jasper Water & Sewer Authority, 5.00% due 3/1/2023 (Waterworks & Sewer System) | | AA/Aa1 | | | 1,000,000 | | | | 1,171,730 | |
b Beaufort-Jasper Water & Sewer Authority, 5.00% due 3/1/2024 (Waterworks & Sewer System) | | AA/Aa1 | | | 1,000,000 | | | | 1,187,080 | |
b Beaufort-Jasper Water & Sewer Authority, 5.00% due 3/1/2025 (Waterworks & Sewer System) | | AA/Aa1 | | | 1,000,000 | | | | 1,198,420 | |
Berkeley County School District, 5.00% due 12/1/2020 (School Facility Equipment Acquisition) | | AA-/NR | | | 550,000 | | | | 634,040 | |
Berkeley County School District, 5.00% due 12/1/2021 (School Facility Equipment Acquisition) | | AA-/NR | | | 1,000,000 | | | | 1,173,880 | |
Berkeley County School District, 5.00% due 12/1/2024 (School Facility Equipment Acquisition) | | AA-/NR | | | 2,000,000 | | | | 2,423,200 | |
City of Charleston Public Facilities Corp., 5.00% due 9/1/2019 (City of Charleston Project) | | AA+/Aa1 | | | 390,000 | | | | 441,187 | |
City of Charleston Public Facilities Corp., 5.00% due 9/1/2020 (City of Charleston Project) | | AA+/Aa1 | | | 700,000 | | | | 811,132 | |
City of Charleston Public Facilities Corp., 5.00% due 9/1/2021 (City of Charleston Project) | | AA+/Aa1 | | | 460,000 | | | | 544,240 | |
City of Charleston Public Facilities Corp., 5.00% due 9/1/2022 (City of Charleston Project) | | AA+/Aa1 | | | 425,000 | | | | 512,682 | |
City of Charleston Public Facilities Corp., 5.00% due 9/1/2023 (City of Charleston Project) | | AA+/Aa1 | | | 345,000 | | | | 422,304 | |
City of Charleston Public Facilities Corp., 5.00% due 9/1/2025 (City of Charleston Project) | | AA+/Aa1 | | | 930,000 | | | | 1,162,928 | |
City of North Charleston Public Facilities Corp. COP, 5.00% due 10/1/2016 (Convention Center Complex) | | AA-/NR | | | 1,560,000 | | | | 1,591,762 | |
City of North Charleston Public Facilities Corp. COP, 5.00% due 10/1/2017 (Convention Center Complex) | | AA-/NR | | | 710,000 | | | | 749,881 | |
County of Charleston, 5.00% due 12/1/2022 (South Aviation Ave. Construction) | | AA+/NR | | | 1,810,000 | | | | 2,212,580 | |
County of Charleston, 5.00% due 12/1/2023 (South Aviation Ave. Construction) | | AA+/NR | | | 2,460,000 | | | | 3,048,949 | |
Greenville County School District, 5.50% due 12/1/2016 (Building Equity Sooner for Tomorrow) | | AA/Aa2 | | | 3,500,000 | | | | 3,615,500 | |
Greenwood County, 5.00% due 10/1/2022 (Self Regional Healthcare) | | A+/A1 | | | 1,000,000 | | | | 1,171,910 | |
Greenwood Fifty Facilities School District, 5.00% due 12/1/2016 (Insured: AGM) (ETM) | | AA/A1 | | | 1,000,000 | | | | 1,029,480 | |
Piedmont Municipal Power Agency, 6.75% due 1/1/2019 (Insured: Natl-Re) | | NR/A3 | | | 3,800,000 | | | | 4,364,566 | |
SCAGO Educational Facilities Corp., 5.00% due 12/1/2021 (School District of Pickens County) | | A/A1 | | | 1,810,000 | | | | 2,152,868 | |
SCAGO Educational Facilities Corp., 5.00% due 12/1/2022 (School District of Pickens County) | | A/A1 | | | 500,000 | | | | 604,560 | |
Semi-Annual Report 35
| | |
| SCHEDULE OF INVESTMENTS, CONTINUED | | |
| |
Thornburg Limited Term Municipal Fund | | March 31, 2016 (Unaudited) |
| | | | | | | | | | |
Issuer-Description | | Credit Rating†
S&P/ Moody’s | | Principal
Amount | | | Value | |
SCAGO Educational Facilities Corp., 5.00% due 12/1/2023 (School District of Pickens County) | | A/A1 | | $ | 1,000,000 | | | $ | 1,222,560 | |
SCAGO Educational Facilities Corp., 5.00% due 12/1/2024 (School District of Pickens County) | | A/A1 | | | 1,010,000 | | | | 1,247,178 | |
SCAGO Educational Facilities Corp., 5.00% due 12/1/2025 (School District of Pickens County) | | A/A1 | | | 1,000,000 | | | | 1,225,440 | |
| | | |
SOUTH DAKOTA — 0.36% | | | | | | | | | | |
South Dakota Building Authority, 4.50% due 6/1/2016 (Insured: Natl-Re) (ETM) | | AA+/A3 | | | 2,000,000 | | | | 2,013,540 | |
South Dakota Building Authority, 5.00% due 6/1/2022 | | AA+/Aa1 | | | 500,000 | | | | 603,090 | |
South Dakota Building Authority, 5.00% due 6/1/2024 | | AA+/Aa1 | | | 1,000,000 | | | | 1,220,120 | |
South Dakota Health & Educational Facilities Authority, 5.00% due 9/1/2016 (Regional Health) | | NR/A1 | | | 1,000,000 | | | | 1,018,230 | |
South Dakota Health & Educational Facilities Authority, 2.00% due 11/1/2016 (Sanford Health) | | A+/A1 | | | 400,000 | | | | 402,972 | |
South Dakota Health & Educational Facilities Authority, 5.00% due 4/1/2017 (Prairie Lakes Health) | | A+/NR | | | 2,215,000 | | | | 2,294,807 | |
South Dakota Health & Educational Facilities Authority, 5.00% due 9/1/2017 (Regional Health) | | NR/A1 | | | 1,100,000 | | | | 1,163,118 | |
South Dakota Health & Educational Facilities Authority, 3.00% due 11/1/2017 (Sanford Health) | | A+/A1 | | | 450,000 | | | | 464,049 | |
South Dakota Health & Educational Facilities Authority, 5.00% due 4/1/2018 (Prairie Lakes Health) | | A+/NR | | | 2,290,000 | | | | 2,433,102 | |
South Dakota Health & Educational Facilities Authority, 5.00% due 9/1/2018 (Regional Health) | | NR/A1 | | | 1,275,000 | | | | 1,394,735 | |
South Dakota Health & Educational Facilities Authority, 5.00% due 9/1/2018 (Regional Health) | | NR/A1 | | | 1,000,000 | | | | 1,091,990 | |
South Dakota Health & Educational Facilities Authority, 4.00% due 11/1/2018 (Sanford Health) | | A+/A1 | | | 800,000 | | | | 857,856 | |
South Dakota Health & Educational Facilities Authority, 5.00% due 4/1/2019 (Prairie Lakes Health) | | A+/NR | | | 2,440,000 | | | | 2,652,500 | |
South Dakota Health & Educational Facilities Authority, 5.00% due 9/1/2020 (Regional Health) | | NR/A1 | | | 1,000,000 | | | | 1,154,880 | |
South Dakota Health & Educational Facilities Authority, 5.00% due 7/1/2021 (Avera Health) | | AA-/A1 | | | 1,670,000 | | | | 1,960,296 | |
South Dakota Health & Educational Facilities Authority, 5.00% due 11/1/2021 (Sanford Health) | | A+/A1 | | | 350,000 | | | | 412,146 | |
South Dakota Health & Educational Facilities Authority, 5.00% due 11/1/2022 (Sanford Health) | | A+/A1 | | | 1,070,000 | | | | 1,281,892 | |
South Dakota Health & Educational Facilities Authority, 5.00% due 11/1/2024 (Sanford Health) | | A+/A1 | | | 400,000 | | | | 487,968 | |
South Dakota Health & Educational Facilities Authority, 5.00% due 11/1/2025 (Sanford Health) | | A+/A1 | | | 965,000 | | | | 1,181,556 | |
South Dakota Housing Development Authority, 4.00% due 11/1/2016 (Single Family Mtg) | | NR/Aa3 | | | 1,040,000 | | | | 1,058,543 | |
South Dakota Housing Development Authority, 4.00% due 11/1/2017 (Single Family Mtg) | | NR/Aa3 | | | 1,055,000 | | | | 1,101,684 | |
South Dakota Housing Development Authority, 4.00% due 11/1/2018 (Single Family Mtg) | | NR/Aa3 | | | 1,165,000 | | | | 1,244,837 | |
| | | |
TENNESSEE — 0.65% | | | | | | | | | | |
Clarksville Natural Gas Acquisition Corp., 5.00% due 12/15/2019 | | NR/Baa1 | | | 6,000,000 | | | | 6,690,120 | |
Hallsdale-Powell Utility District, 3.00% due 4/1/2016 | | AA/NR | | | 500,000 | | | | 500,000 | |
State of Tennessee GO, 4.00% due 8/1/2017 | | AA+/Aaa | | | 3,250,000 | | | | 3,396,510 | |
State of Tennessee GO, 4.00% due 8/1/2018 | | AA+/Aaa | | | 2,000,000 | | | | 2,150,920 | |
State of Tennessee GO, 5.00% due 8/1/2018 | | AA+/Aaa | | | 2,000,000 | | | | 2,197,120 | |
State of Tennessee GO, 5.00% due 8/1/2019 | | AA+/Aaa | | | 3,000,000 | | | | 3,407,220 | |
State of Tennessee GO, 5.00% due 8/1/2019 | | AA+/Aaa | | | 2,000,000 | | | | 2,271,480 | |
State of Tennessee GO, 5.00% due 8/1/2020 | | AA+/Aaa | | | 2,000,000 | | | | 2,339,320 | |
State of Tennessee GO, 5.00% due 8/1/2020 | | AA+/Aaa | | | 2,000,000 | | | | 2,339,320 | |
Tennessee Energy Acquisition Corp., 5.00% due 2/1/2017 | | BBB+/A3 | | | 5,000,000 | | | | 5,171,050 | |
Tennessee Energy Acquisition Corp., 5.25% due 9/1/2017 | | BBB+/A3 | | | 11,000,000 | | | | 11,628,100 | |
Tennessee Energy Acquisition Corp., 5.25% due 9/1/2018 | | BBB+/A3 | | | 5,000,000 | | | | 5,468,300 | |
Tennessee Energy Acquisition Corp., 5.25% due 9/1/2020 | | BBB+/A3 | | | 1,190,000 | | | | 1,372,843 | |
| | | |
TEXAS — 8.15% | | | | | | | | | | |
Austin Community College Public Facilities Corp., 5.25% due 8/1/2017 (Round Rock Campus) (ETM) | | AA/Aa2 | | | 1,500,000 | | | | 1,590,540 | |
Capital Area Cultural Education Facilities Finance Corp., 5.00% due 4/1/2018 (Roman Catholic Diocese of Austin) | | NR/Baa1 | | | 1,370,000 | | | | 1,467,366 | |
Cities of Dallas and Fort Worth, 5.25% due 11/1/2023 (DFW International Airport Terminal Renewal & Improvement Program) | | A+/A2 | | | 3,000,000 | | | | 3,614,310 | |
City of Austin, 5.00% due 11/15/2022 (Water and Wastewater System) | | AA/Aa2 | | | 2,640,000 | | | | 3,187,219 | |
City of Beaumont, 5.00% due 9/1/2023 (Waterworks & Sewer System Improvements; Insured: AGM) | | AA/A2 | | | 5,000,000 | | | | 6,141,150 | |
City of Beaumont, 5.00% due 9/1/2024 (Waterworks & Sewer System Improvements; Insured: AGM) | | AA/A2 | | | 2,500,000 | | | | 3,051,750 | |
City of Brownsville, 5.00% due 9/1/2020 (Water, Wastewater & Electric Utilities Systems) | | A+/A2 | | | 1,500,000 | | | | 1,730,685 | |
City of Brownsville, 5.00% due 9/1/2022 (Water, Wastewater & Electric Utilities Systems) | | A+/A2 | | | 1,300,000 | | | | 1,555,060 | |
City of Brownsville, 5.00% due 9/1/2022 (Water, Wastewater & Electric Utilities Systems) | | A+/A2 | | | 1,520,000 | | | | 1,818,224 | |
City of Brownsville, 5.00% due 9/1/2023 (Water, Wastewater & Electric Utilities Systems) | | A+/A2 | | | 2,380,000 | | | | 2,891,771 | |
City of Bryan, 5.00% due 7/1/2019 (Electric System) | | A+/A2 | | | 8,000,000 | | | | 8,385,120 | |
City of Denton GO, 5.00% due 2/15/2017 | | AA+/Aa2 | | | 3,675,000 | | | | 3,814,760 | |
City of Denton GO, 5.00% due 2/15/2019 | | AA+/Aa2 | | | 3,990,000 | | | | 4,450,087 | |
City of Denton GO, 5.00% due 2/15/2020 | | AA+/Aa2 | | | 4,195,000 | | | | 4,658,506 | |
City of Houston, 5.00% due 7/1/2017 (Airport System) | | AA-/Aa3 | | | 1,600,000 | | | | 1,683,808 | |
City of Houston, 5.00% due 7/1/2018 (Airport System) | | AA-/Aa3 | | | 1,000,000 | | | | 1,089,460 | |
City of Houston, 0% due 9/1/2020 (Convention & Entertainment Facilities; Insured: AGM/AMBAC) | | AA/A2 | | | 3,650,000 | | | | 3,279,671 | |
City of Houston, 5.00% due 9/1/2020 (Convention & Entertainment Facilities) | | A-/A2 | | | 650,000 | | | | 752,381 | |
City of Houston, 4.00% due 5/15/2021 (Combined Utility System) | | AA/Aa2 | | | 13,545,000 | | | | 15,321,427 | |
City of Houston, 5.00% due 9/1/2021 (Convention & Entertainment Facilities) | | A-/A2 | | | 1,500,000 | | | | 1,762,710 | |
City of Houston, 5.00% due 11/15/2021 (Combined Utility System) | | NR/Aa2 | | | 5,455,000 | | | | 6,548,237 | |
City of Houston, 5.00% due 5/15/2022 (Combined Utility System) | | AA/Aa2 | | | 3,000,000 | | | | 3,623,760 | |
City of Houston, 5.00% due 9/1/2022 (Convention & Entertainment Facilities) | | A-/A2 | | | 600,000 | | | | 713,844 | |
36 Semi-Annual Report
| | |
| SCHEDULE OF INVESTMENTS, CONTINUED | | |
| |
Thornburg Limited Term Municipal Fund | | March 31, 2016 (Unaudited) |
| | | | | | | | | | |
Issuer-Description | | Credit Rating†
S&P/ Moody’s | | Principal
Amount | | | Value | |
City of Houston, 5.00% due 11/15/2022 (Combined Utility System) | | NR/Aa2 | | $ | 7,110,000 | | | $ | 8,693,184 | |
City of Houston, 5.00% due 11/15/2022 (Combined Utility System) | | AA/Aa2 | | | 7,535,000 | | | | 9,202,194 | |
City of Houston, 5.00% due 5/15/2023 (Combined Utility System) | | AA/Aa2 | | | 4,445,000 | | | | 5,458,238 | |
City of Houston, 5.00% due 11/15/2023 (Combined Utility System) | | AA/Aa2 | | | 5,000,000 | | | | 6,192,500 | |
City of Houston, 5.00% due 11/15/2023 (Combined Utility System) | | NR/Aa2 | | | 7,400,000 | | | | 9,182,882 | |
City of Houston, 5.00% due 5/15/2024 (Combined Utility System) | | AA/Aa2 | | | 7,250,000 | | | | 9,030,817 | |
City of Houston, 5.00% due 9/1/2024 (Convention & Entertainment Facilities) | | A-/A2 | | | 1,215,000 | | | | 1,480,611 | |
City of Houston, 5.00% due 11/15/2024 (Combined Utility System) | | AA/Aa2 | | | 5,000,000 | | | | 6,277,600 | |
City of Houston, 5.00% due 11/15/2024 (Combined Utility System) | | NR/Aa2 | | | 11,525,000 | | | | 14,469,868 | |
City of Houston, 5.00% due 11/15/2025 (Combined Utility System) | | NR/Aa2 | | | 16,000,000 | | | | 20,306,560 | |
City of Houston GO, 5.00% due 3/1/2020 (Public Improvements) | | AA/Aa3 | | | 4,000,000 | | | | 4,567,200 | |
b City of Houston GO, 5.00% due 3/1/2025 (Public Improvements) | | AA/Aa3 | | | 23,570,000 | | | | 29,104,472 | |
b City of Houston GO, 5.00% due 3/1/2026 (Public Improvements) | | AA/Aa3 | | | 10,455,000 | | | | 13,049,722 | |
City of Laredo, 5.00% due 3/15/2021 (Sports Venues; Insured: AGM) | | AA/A1 | | | 600,000 | | | | 701,418 | |
City of Laredo, 5.00% due 3/15/2022 (Sports Venues; Insured: AGM) | | AA/A1 | | | 2,000,000 | | | | 2,377,280 | |
City of Laredo, 5.00% due 3/15/2023 (Sports Venues; Insured: AGM) | | AA/A1 | | | 1,500,000 | | | | 1,806,810 | |
City of Laredo, 5.00% due 3/15/2024 (Sports Venues; Insured: AGM) | | AA/A1 | | | 300,000 | | | | 364,896 | |
City of Laredo GO, 5.00% due 2/15/2018 pre-refunded 2/15/2017 (Streets, Sidewalks, Drainage, Signals, Lighting; Insured: Natl-Re) | | AA/Aa2 | | | 2,000,000 | | | | 2,075,760 | |
City of Lubbock GO, 5.00% due 2/15/2020 (Waterworks System) | | AA+/Aa2 | | | 2,000,000 | | | | 2,296,320 | |
City of Lubbock GO, 5.00% due 2/15/2020 (Waterworks System) | | AA+/Aa2 | | | 2,325,000 | | | | 2,669,472 | |
City of Lubbock GO, 5.00% due 2/15/2021 (Waterworks System) | | AA+/Aa2 | | | 7,490,000 | | | | 8,826,216 | |
City of Lubbock GO, 5.00% due 2/15/2022 (Waterworks System) | | AA+/Aa2 | | | 2,895,000 | | | | 3,487,780 | |
City of Lubbock GO, 5.00% due 2/15/2023 (Waterworks System) | | AA+/Aa2 | | | 500,000 | | | | 612,630 | |
City of Lubbock GO, 5.00% due 2/15/2023 (Waterworks System) | | AA+/Aa2 | | | 4,180,000 | | | | 5,121,587 | |
City of Lubbock GO, 5.00% due 2/15/2024 (Waterworks System) | | AA+/Aa2 | | | 4,460,000 | | | | 5,543,379 | |
City of Lubbock GO, 5.00% due 2/15/2024 (Waterworks System) | | AA+/Aa2 | | | 4,440,000 | | | | 5,518,520 | |
City of Lubbock GO, 5.00% due 2/15/2025 (Waterworks System) | | AA+/Aa2 | | | 7,735,000 | | | | 9,714,696 | |
City of Lubbock GO, 5.00% due 2/15/2025 (Waterworks System) | | AA+/Aa2 | | | 5,725,000 | | | | 7,190,256 | |
City of Olmos Park Higher Education Facilities Corp., 5.00% due 12/1/2020 (University of the Incarnate Word Project) | | NR/A3 | | | 3,620,000 | | | | 4,180,195 | |
City of Olmos Park Higher Education Facilities Corp., 5.00% due 12/1/2021 (University of the Incarnate Word Project) | | NR/A3 | | | 1,000,000 | | | | 1,176,840 | |
City of San Antonio, 5.00% due 2/1/2022 (CPS Energy) | | AA/Aa1 | | | 20,000,000 | | | | 24,072,800 | |
City of San Antonio, 5.00% due 5/15/2023 (San Antonio Water System) | | AA/Aa2 | | | 1,500,000 | | | | 1,841,925 | |
City of San Antonio, 5.25% due 2/1/2024 (CPS Energy) | | AA/Aa1 | | | 7,000,000 | | | | 8,881,180 | |
City of San Antonio, 5.00% due 5/15/2024 (San Antonio Water System) | | AA/Aa2 | | | 1,500,000 | | | | 1,868,445 | |
City of San Antonio, 5.00% due 5/15/2025 (San Antonio Water System) | | AA/Aa2 | | | 1,000,000 | | | | 1,261,160 | |
City of San Antonio, 5.00% due 5/15/2026 (San Antonio Water System) | | AA/Aa2 | | | 1,200,000 | | | | 1,530,972 | |
City of San Antonio, 3.00% due 12/1/2045 put 12/1/2020 (CPS Energy) | | AA-/Aa2 | | | 36,000,000 | | | | 38,558,880 | |
City of San Antonio Public Facilities Corp., 5.00% due 9/15/2022 (Convention Center Refinancing & Expansion) | | AA+/Aa2 | | | 1,450,000 | | | | 1,751,629 | |
City of Weslaco GO, 5.25% due 2/15/2019 (Waterworks and Sewer System; Insured: Natl-Re) | | AA-/A2 | | | 2,835,000 | | | | 2,941,624 | |
Clifton Higher Education Finance Corp., 5.00% due 8/15/2016 (IDEA Public Schools) | | BBB/NR | | | 225,000 | | | | 228,078 | |
Clifton Higher Education Finance Corp., 5.00% due 8/15/2017 (IDEA Public Schools) | | BBB/NR | | | 315,000 | | | | 330,309 | |
Clifton Higher Education Finance Corp., 5.00% due 8/15/2018 (IDEA Public Schools) | | BBB/NR | | | 325,000 | | | | 350,695 | |
Clifton Higher Education Finance Corp., 5.00% due 8/15/2019 (IDEA Public Schools) | | BBB/NR | | | 445,000 | | | | 492,615 | |
Clifton Higher Education Finance Corp., 5.00% due 8/15/2023 (IDEA Public Schools) | | BBB/NR | | | 1,100,000 | | | | 1,266,485 | |
Corpus Christi Business and Job Development Corp., 5.00% due 3/1/2021 (Seawall Project) | | A+/A1 | | | 625,000 | | | | 725,206 | |
Dallas Area Rapid Transit, 5.00% due 12/1/2026 | | AA+/Aa2 | | | 2,245,000 | | | | 2,840,262 | |
Dallas Convention Center Hotel Development Corp., 0% due 1/1/2018 | | A/A1 | | | 5,240,000 | | | | 5,064,146 | |
Dallas Convention Center Hotel Development Corp., 5.00% due 1/1/2019 | | A/A1 | | | 5,200,000 | | | | 5,700,240 | |
Dallas County Utility & Reclamation District, 5.00% due 2/15/2017 (Insured: AMBAC) | | A-/A3 | | | 1,160,000 | | | | 1,203,106 | |
Dallas County Utility & Reclamation District, 5.00% due 2/15/2017 (Insured: AMBAC) | | A-/A3 | | | 1,260,000 | | | | 1,306,822 | |
Dallas County Utility & Reclamation District, 5.00% due 2/15/2018 (Insured: AMBAC) | | A-/A3 | | | 1,935,000 | | | | 2,005,531 | |
Dallas County Utility & Reclamation District, 5.00% due 2/15/2018 (Insured: AMBAC) | | A-/A3 | | | 2,035,000 | | | | 2,109,176 | |
Dallas County Utility & Reclamation District, 5.00% due 2/15/2019 (Insured: AMBAC) | | A-/A3 | | | 2,175,000 | | | | 2,251,364 | |
Dallas ISD GO, 5.00% due 2/15/2036 put 2/15/2022 (Educational Facilities Improvements; Guaranty: PSF) | | AAA/Aaa | | | 3,975,000 | | | | 4,730,608 | |
Grayson County GO, 1.625% due 1/1/2017 (State Highway Toll System) | | AA/Aa2 | | | 1,200,000 | | | | 1,208,196 | |
Grayson County GO, 4.00% due 1/1/2020 (State Highway Toll System) | | AA/Aa2 | | | 2,000,000 | | | | 2,202,400 | |
Grayson County GO, 5.00% due 1/1/2022 (State Highway Toll System) | | AA/Aa2 | | | 3,000,000 | | | | 3,574,500 | |
Guadalupe-Blanco River Authority, 5.625% due 10/1/2017 (AEP Texas Central Co.) | | BBB/Baa1 | | | 5,000,000 | | | | 5,330,200 | |
Gulf Coast Waste Disposal Authority, 4.00% due 10/1/2016 (Bayport Area Wastewater Treatment System; Insured: AGM) | | AA/A2 | | | 500,000 | | | | 508,145 | |
Gulf Coast Waste Disposal Authority, 4.00% due 10/1/2017 (Bayport Area Wastewater Treatment System; Insured: AGM) | | AA/A2 | | | 800,000 | | | | 836,128 | |
Gulf Coast Waste Disposal Authority, 5.00% due 10/1/2019 (Bayport Area Wastewater Treatment System; Insured: AGM) | | AA/A2 | | | 1,000,000 | | | | 1,125,640 | |
Gulf Coast Waste Disposal Authority, 5.00% due 10/1/2020 (Bayport Area Wastewater Treatment System; Insured: AGM) | | AA/A2 | | | 2,000,000 | | | | 2,294,320 | |
Gulf Coast Waste Disposal Authority, 5.00% due 10/1/2022 (Bayport Area Wastewater Treatment System; Insured: AGM) | | AA/A2 | | | 1,635,000 | | | | 1,932,308 | |
Gulf Coast Waste Disposal Authority, 5.00% due 10/1/2023 (Bayport Area Wastewater Treatment System; Insured: AGM) | | AA/NR | | | 500,000 | | | | 606,315 | |
Gulf Coast Waste Disposal Authority, 5.00% due 10/1/2024 (Bayport Area Wastewater Treatment System; Insured: AGM) | | AA/NR | | | 350,000 | | | | 429,398 | |
Semi-Annual Report 37
| | |
| SCHEDULE OF INVESTMENTS, CONTINUED | | |
| |
Thornburg Limited Term Municipal Fund | | March 31, 2016 (Unaudited) |
| | | | | | | | | | |
Issuer-Description | | Credit Rating†
S&P/ Moody’s | | Principal
Amount | | | Value | |
Gulf Coast Waste Disposal Authority, 5.00% due 10/1/2025 (Bayport Area Wastewater Treatment System; Insured: AGM) | | AA/NR | | $ | 1,000,000 | | | $ | 1,240,800 | |
Harris County Cultural Education Facilities Finance Corp., 3.00% due 10/1/2016 (Texas Children’s Hospital) | | AA/Aa2 | | | 5,590,000 | | | | 5,657,415 | |
Harris County Cultural Education Facilities Finance Corp., 5.00% due 11/15/2018 (Texas Medical Center Central Heating & Cooling Services Corp.) | | AA/Aa3 | | | 2,365,000 | | | | 2,608,240 | |
Harris County Cultural Education Facilities Finance Corp., 5.00% due 11/15/2019 (Texas Medical Center Central Heating & Cooling Services Corp.) | | AA/Aa3 | | | 1,000,000 | | | | 1,136,290 | |
Harris County Cultural Education Facilities Finance Corp., 5.00% due 12/1/2022 (Memorial Hermann Health) | | A+/A1 | | | 200,000 | | | | 242,082 | |
Harris County Cultural Education Facilities Finance Corp., 5.00% due 12/1/2023 (Memorial Hermann Health) | | A+/A1 | | | 400,000 | | | | 489,584 | |
Harris County Cultural Education Facilities Finance Corp., 5.00% due 12/1/2024 (Memorial Hermann Health) | | A+/A1 | | | 3,000,000 | | | | 3,706,500 | |
Harris County Cultural Education Facilities Finance Corp., 5.00% due 12/1/2025 (Memorial Hermann Health) | | A+/A1 | | | 2,845,000 | | | | 3,481,853 | |
Harris County Cultural Education Facilities Finance Corp., 0.35% due 9/1/2031 put 4/1/2016 (Texas Medical Center; LOC: JPMorgan Chase Bank, N.A.) (daily demand notes) | | AAA/Aa1 | | | 300,000 | | | | 300,000 | |
Harris County Cultural Education Facilities Finance Corp., 0.35% due 9/1/2031 put 4/1/2016 (Texas Medical Center; LOC: JPMorgan Chase Bank, N.A.) (daily demand notes) | | AAA/Aa1 | | | 600,000 | | | | 600,000 | |
Harris County GO, 5.00% due 10/1/2017 (Texas Permanent Improvement) | | AAA/Aaa | | | 3,500,000 | | | | 3,721,445 | |
Harris County GO, 5.00% due 10/1/2018 (Texas Permanent Improvement) | | AAA/Aaa | | | 3,000,000 | | | | 3,304,170 | |
Harris County GO, 5.00% due 10/1/2019 (Texas Permanent Improvement) | | AAA/Aaa | | | 700,000 | | | | 797,755 | |
Harris County GO, 5.00% due 10/1/2020 (Texas Permanent Improvement) | | AAA/Aaa | | | 500,000 | | | | 585,265 | |
Harris County Health Facilities Development Corp., 5.00% due 7/1/2016 (CHRISTUS Health System; Insured: AGM) | | AA/A1 | | | 6,260,000 | | | | 6,329,611 | |
Harris County Health Facilities Development Corp., 7.00% due 12/1/2027 pre-refunded 12/1/2018 (Memorial Hermann Healthcare System; LOC: JPMorgan Chase Bank, N.A.) | | NR/NR | | | 1,245,000 | | | | 1,445,657 | |
Harris County Hospital District, 5.00% due 2/15/2017 (Insured: Natl-Re) | | AA-/A2 | | | 1,500,000 | | | | 1,547,865 | |
Harris County-Houston Sports Authority, 5.00% due 11/15/2022 (Insured: AGM) | | AA/A2 | | | 5,410,000 | | | | 6,524,568 | |
Harris County-Houston Sports Authority, 5.00% due 11/15/2023 (Insured: AGM) | | AA/A2 | | | 9,975,000 | | | | 12,203,116 | |
Harris County-Houston Sports Authority, 5.00% due 11/15/2024 (Insured: AGM) | | AA/A2 | | | 7,930,000 | | | | 9,794,819 | |
Hays County GO, 5.00% due 2/15/2022 | | AA/NR | | | 750,000 | | | | 897,015 | |
Hays County GO, 5.00% due 2/15/2023 | | AA/NR | | | 1,500,000 | | | | 1,822,605 | |
Hays County GO, 5.00% due 2/15/2024 | | AA/NR | | | 1,300,000 | | | | 1,601,782 | |
Hays County GO, 5.00% due 2/15/2025 | | AA/NR | | | 500,000 | | | | 622,880 | |
Houston Higher Education Finance Corp., 5.00% due 8/15/2016 (KIPP, Inc.; Guaranty: PSF) | | AAA/NR | | | 880,000 | | | | 894,925 | |
Houston Higher Education Finance Corp., 5.00% due 8/15/2017 (KIPP, Inc.; Guaranty: PSF) | | AAA/NR | | | 925,000 | | | | 977,549 | |
Houston Higher Education Finance Corp., 5.00% due 8/15/2019 (KIPP, Inc.; Guaranty: PSF) | | AAA/NR | | | 1,020,000 | | | | 1,149,877 | |
Houston Higher Education Finance Corp., 5.875% due 5/15/2021 (Cosmos Foundation, Inc.) | | BBB/NR | | | 1,645,000 | | | | 1,849,654 | |
Houston Higher Education Finance Corp., 5.00% due 8/15/2021 (KIPP, Inc.; Guaranty: PSF) | | AAA/NR | | | 300,000 | | | | 355,275 | |
Houston Higher Education Finance Corp., 5.00% due 8/15/2022 (KIPP, Inc.; Guaranty: PSF) | | AAA/NR | | | 1,185,000 | | | | 1,431,053 | |
Houston ISD GO, 2.00% due 6/1/2037 put 6/1/2016 (Harris County School Buildings; Guaranty: PSF) | | AAA/Aaa | | | 10,000,000 | | | | 10,025,500 | |
Hutto ISD GO, 0% due 8/1/2017 pre-refunded 8/1/2016 (Guaranty: PSF) | | AAA/NR | | | 2,170,000 | | | | 2,068,921 | |
Katy ISD GO, 5.00% due 2/15/2023 (Educational Facilities Improvements; Guaranty: PSF) | | AAA/Aaa | | | 1,500,000 | | | | 1,841,730 | |
Katy ISD GO, 5.00% due 2/15/2024 (Educational Facilities Improvements; Guaranty: PSF) | | AAA/Aaa | | | 2,385,000 | | | | 2,974,047 | |
Katy ISD GO, 5.00% due 2/15/2025 (Educational Facilities Improvements; Guaranty: PSF) | | AAA/Aaa | | | 2,830,000 | | | | 3,569,507 | |
Katy ISD GO, 5.00% due 2/15/2026 (Educational Facilities Improvements; Guaranty: PSF) | | AAA/Aaa | | | 2,955,000 | | | | 3,777,140 | |
Laredo Community College District GO, 5.00% due 8/1/2019 (School Facilities Improvements) | | AA-/Aa3 | | | 880,000 | | | | 991,030 | |
Laredo Community College District GO, 5.00% due 8/1/2020 (School Facilities Improvements) | | AA-/Aa3 | | | 1,360,000 | | | | 1,571,575 | |
Laredo Community College District GO, 5.00% due 8/1/2022 (School Facilities Improvements) | | AA-/Aa3 | | | 655,000 | | | | 786,105 | |
Laredo Community College District GO, 5.00% due 8/1/2023 (School Facilities Improvements) | | AA-/Aa3 | | | 610,000 | | | | 742,864 | |
Laredo Community College District GO, 5.00% due 8/1/2024 (School Facilities Improvements) | | AA-/Aa3 | | | 715,000 | | | | 881,087 | |
Lower Colorado River Authority, 5.00% due 5/15/2025 pre-refunded 5/15/2022 | | NR/NR | | | 55,000 | | | | 66,850 | |
Lower Colorado River Authority, 5.00% due 5/15/2025 | | A/A2 | | | 8,020,000 | | | | 9,536,021 | |
New Caney ISD GO, 5.00% due 2/15/2024 (Guaranty: PSF) | | AAA/Aaa | | | 865,000 | | | | 1,054,124 | |
North East ISD GO, 5.00% due 8/1/2016 (Educational Facilities; Guaranty: PSF) | | AAA/Aaa | | | 2,000,000 | | | | 2,031,180 | |
North East ISD GO, 2.00% due 8/1/2044 put 8/1/2019 (Educational Facilities; Guaranty: PSF) | | AAA/Aaa | | | 10,615,000 | | | | 10,889,822 | |
North Texas University, 5.00% due 4/15/2016 | | NR/Aa2 | | | 2,250,000 | | | | 2,254,140 | |
Northside ISD GO, 2.00% due 6/1/2039 put 6/1/2019 (Educational Facilities; Guaranty: PSF) | | NR/Aaa | | | 2,185,000 | | | | 2,239,254 | |
Pasadena ISD GO, 3.00% due 2/15/2044 put 8/15/2019 (Educational Facilities; Guaranty: PSF) | | AAA/Aaa | | | 8,775,000 | | | | 9,293,164 | |
Round Rock ISD GO, 5.00% due 8/1/2017 (Educational Facilities Improvements; Guaranty: PSF) | | NR/Aaa | | | 1,290,000 | | | | 1,364,356 | |
Round Rock ISD GO, 5.00% due 8/1/2018 (Educational Facilities Improvements; Guaranty: PSF) | | NR/Aaa | | | 1,075,000 | | | | 1,179,372 | |
Round Rock ISD GO, 5.00% due 8/1/2019 (Educational Facilities Improvements; Guaranty: PSF) | | NR/Aaa | | | 1,500,000 | | | | 1,697,865 | |
Round Rock ISD GO, 5.00% due 8/1/2020 (Educational Facilities Improvements; Guaranty: PSF) | | NR/Aaa | | | 1,000,000 | | | | 1,163,110 | |
Round Rock ISD GO, 5.00% due 8/1/2021 (Educational Facilities Improvements; Guaranty: PSF) | | NR/Aaa | | | 2,000,000 | | | | 2,384,980 | |
Round Rock ISD GO, 5.00% due 8/1/2022 (Educational Facilities Improvements; Guaranty: PSF) | | NR/Aaa | | | 670,000 | | | | 815,571 | |
Round Rock ISD GO, 5.00% due 8/1/2024 (Educational Facilities Improvements; Guaranty: PSF) | | NR/Aaa | | | 2,305,000 | | | | 2,896,025 | |
Round Rock ISD GO, 5.00% due 8/1/2025 (Educational Facilities Improvements; Guaranty: PSF) | | NR/Aaa | | | 1,000,000 | | | | 1,270,170 | |
Round Rock ISD GO, 5.00% due 8/1/2026 (Educational Facilities Improvements; Guaranty: PSF) | | NR/Aaa | | | 1,575,000 | | | | 1,987,792 | |
Sam Rayburn Municipal Power Agency, 5.00% due 10/1/2017 | | BBB+/NR | | | 1,000,000 | | | | 1,060,170 | |
Sam Rayburn Municipal Power Agency, 5.00% due 10/1/2019 | | BBB+/NR | | | 2,565,000 | | | | 2,889,601 | |
Sam Rayburn Municipal Power Agency, 5.00% due 10/1/2020 | | BBB+/NR | | | 1,620,000 | | | | 1,860,116 | |
38 Semi-Annual Report
| | |
| SCHEDULE OF INVESTMENTS, CONTINUED | | |
| |
Thornburg Limited Term Municipal Fund | | March 31, 2016 (Unaudited) |
| | | | | | | | | | |
Issuer-Description | | Credit Rating†
S&P/ Moody’s | | Principal
Amount | | | Value | |
San Antonio Public Facilities Corp., 5.00% due 9/15/2020 (Convention Center Refinancing & Expansion) | | AA+/Aa2 | | $ | 915,000 | | | $ | 1,063,157 | |
San Juan Higher Education Finance Authority, 5.125% due 8/15/2020 (IDEA Public Schools) | | BBB/NR | | | 1,365,000 | | | | 1,495,876 | |
Tarrant County Cultural Education Facilities Finance Corp., 5.00% due 8/15/2016 (Scott & White Memorial Hospital) (ETM) | | AA-/Aa3 | | | 2,280,000 | | | | 2,318,213 | |
Tarrant County Cultural Education Facilities Finance Corp., 5.00% due 8/15/2017 (Scott & White Memorial Hospital) (ETM) | | AA-/Aa3 | | | 2,000,000 | | | | 2,117,240 | |
Texas Municipal Power Agency, 5.00% due 9/1/2017 (Insured: AGM) | | AA/A2 | | | 10,000,000 | | | | 10,590,400 | |
Texas Transportation Commission, 5.00% due 8/15/2022 (Central Texas Turnpike System) | | BBB+/Baa1 | | | 400,000 | | | | 471,756 | |
Texas Transportation Commission, 5.00% due 8/15/2023 (Central Texas Turnpike System) | | BBB+/Baa1 | | | 730,000 | | | | 873,627 | |
Texas Transportation Commission, 5.00% due 8/15/2024 (Central Texas Turnpike System) | | BBB+/Baa1 | | | 1,000,000 | | | | 1,209,950 | |
Uptown Development Authority, 5.00% due 9/1/2017 (Infrastructure Improvements) | | BBB/NR | | | 1,580,000 | | | | 1,664,135 | |
Uptown Development Authority, 5.00% due 9/1/2018 (Infrastructure Improvements) | | BBB/NR | | | 1,870,000 | | | | 2,032,484 | |
Uptown Development Authority, 5.00% due 9/1/2019 (Infrastructure Improvements) | | BBB/NR | | | 1,945,000 | | | | 2,169,006 | |
Walnut Creek Special Utility District, 4.00% due 1/10/2020 (Water System Improvements; Insured: BAM) | | AA/NR | | | 520,000 | | | | 568,703 | |
Walnut Creek Special Utility District, 4.00% due 1/10/2021 (Water System Improvements; Insured: BAM) | | AA/NR | | | 445,000 | | | | 492,949 | |
Walnut Creek Special Utility District, 5.00% due 1/10/2022 (Water System Improvements; Insured: BAM) | | AA/NR | | | 525,000 | | | | 616,623 | |
Walnut Creek Special Utility District, 5.00% due 1/10/2024 (Water System Improvements; Insured: BAM) | | AA/NR | | | 750,000 | | | | 902,122 | |
West Harris County Regional Water Authority, 5.00% due 12/15/2020 (Insured: Natl-Re) | | AA-/A1 | | | 2,140,000 | | | | 2,276,703 | |
Ysleta ISD, 5.00% due 8/15/2017 (Guaranty: PSF) | | AAA/Aaa | | | 2,190,000 | | | | 2,319,779 | |
| | | |
U.S. VIRGIN ISLANDS — 0.09% | | | | | | | | | | |
Virgin Islands Public Finance Authority, 6.75% due 10/1/2019 (Matching Fund Loan Diageo Project) | | NR/Baa3 | | | 6,350,000 | | | | 7,044,372 | |
| | | |
UTAH — 1.24% | | | | | | | | | | |
City of Murray, 0.35% due 5/15/2037 put 4/1/2016 (IHC Health Services, Inc.; SPA: JPMorgan Chase Bank, N.A.) (daily demand notes) | | AA+/Aa1 | | | 38,390,000 | | | | 38,390,000 | |
Utah Transit Authority, 5.00% due 6/15/2022 (Integrated Mass Transit System) | | A+/A1 | | | 710,000 | | | | 856,083 | |
Utah Transit Authority, 5.00% due 6/15/2023 (Integrated Mass Transit System) | | A+/A1 | | | 775,000 | | | | 949,832 | |
Utah Transit Authority, 5.00% due 6/15/2024 (Integrated Mass Transit System) | | A+/A1 | | | 825,000 | | | | 1,023,396 | |
Utah Transit Authority, 5.00% due 6/15/2025 (Integrated Mass Transit System) | | A+/A1 | | | 1,235,000 | | | | 1,540,909 | |
Weber County, 0.35% due 2/15/2031 put 4/1/2016 (IHC Health Services, Inc.; SPA: The Bank of NY Mellon) (daily demand notes) | | AA+/Aa1 | | | 29,800,000 | | | | 29,800,000 | |
Weber County, 0.35% due 2/15/2035 put 4/1/2016 (IHC Health Services, Inc.; SPA: The Bank of NY Mellon) (daily demand notes) | | AA+/Aa1 | | | 20,700,000 | | | | 20,700,000 | |
| | | |
VERMONT — 0.27% | | | | | | | | | | |
Vermont Colleges GO, 4.00% due 7/1/2017 | | A-/NR | | | 3,650,000 | | | | 3,739,206 | |
Vermont EDA, 5.00% due 12/15/2020 (Vermont Public Service Corp.) | | NR/NR | | | 14,250,000 | | | | 16,436,520 | |
| | | |
VIRGINIA — 0.21% | | | | | | | | | | |
Fairfax County EDA, 5.00% due 8/1/2016 (Wiehle Avenue Metrorail Station Parking Project) | | AA+/Aa2 | | | 2,600,000 | | | | 2,638,818 | |
Fairfax County GO, 5.00% due 10/1/2016 (Public Facilities and Improvements) (State Aid Withholding) | | AAA/Aaa | | | 1,100,000 | | | | 1,125,135 | |
Fairfax County IDA, 4.00% due 5/15/2022 (Inova Health System) | | AA+/Aa2 | | | 5,500,000 | | | | 6,304,650 | |
Fairfax County IDA, 5.00% due 5/15/2022 (Inova Health System) | | AA+/Aa2 | | | 5,000,000 | | | | 6,058,850 | |
Virginia College Building Authority, 0.35% due 11/1/2036 put 4/1/2016 (University of Richmond; SPA: Wells Fargo Bank, N.A.) (daily demand notes) | | NR/Aa1 | | | 100,000 | | | | 100,000 | |
| | | |
WASHINGTON — 1.95% | | | | | | | | | | |
Energy Northwest, 5.00% due 7/1/2017 (Bonneville Power Administration Project 3) | | AA-/Aa1 | | | 5,470,000 | | | | 5,766,419 | |
Energy Northwest, 5.00% due 7/1/2017 (Bonneville Power Administration Project 1) | | AA-/Aa1 | | | 5,000,000 | | | | 5,270,950 | |
Energy Northwest, 5.00% due 7/1/2018 (Bonneville Power Administration Project 3) | | AA-/Aa1 | | | 475,000 | | | | 500,493 | |
Energy Northwest, 5.00% due 7/1/2018 (Nine Canyon Wind Project Phase I-III) | | NR/A2 | | | 1,000,000 | | | | 1,089,700 | |
Energy Northwest, 5.00% due 7/1/2019 (Nine Canyon Wind Project Phase I-III) | | NR/A2 | | | 2,000,000 | | | | 2,246,260 | |
Energy Northwest, 5.00% due 7/1/2020 (Nine Canyon Wind Project Phase I-III) | | NR/A2 | | | 2,000,000 | | | | 2,288,900 | |
Energy Northwest, 5.00% due 7/1/2021 (Nine Canyon Wind Project Phase I-III) | | NR/A2 | | | 2,000,000 | | | | 2,336,660 | |
Energy Northwest, 5.00% due 7/1/2022 (Nine Canyon Wind Project Phase I-III) | | NR/A2 | | | 1,000,000 | | | | 1,189,980 | |
Energy Northwest, 5.00% due 7/1/2023 (Nine Canyon Wind Project Phase I-III) | | NR/A2 | | | 1,000,000 | | | | 1,205,650 | |
Energy Northwest, 5.00% due 7/1/2025 (Nine Canyon Wind Project Phase I-III) | | NR/A2 | | | 850,000 | | | | 1,044,608 | |
King County Federal Way School District No. 210 GO, 4.125% due 12/1/2019 pre-refunded 12/1/2017 (Insured: Natl-Re) | | AA+/Aa1 | | | 2,000,000 | | | | 2,111,340 | |
Marysville School District No. 25 GO, 4.00% due 12/1/2017 (Snohomish County Educational Facilities) (State Aid Withholding) | | NR/Aa1 | | | 1,000,000 | | | | 1,051,440 | |
Marysville School District No. 25 GO, 4.00% due 12/1/2018 (Snohomish County Educational Facilities) (State Aid Withholding) | | NR/Aa1 | | | 1,100,000 | | | | 1,189,529 | |
Marysville School District No. 25 GO, 5.00% due 12/1/2019 (Snohomish County Educational Facilities) (State Aid Withholding) | | NR/Aa1 | | | 1,390,000 | | | | 1,587,950 | |
Marysville School District No. 25 GO, 5.00% due 12/1/2020 (Snohomish County Educational Facilities) (State Aid Withholding) | | NR/Aa1 | | | 1,625,000 | | | | 1,904,809 | |
Marysville School District No. 25 GO, 5.00% due 12/1/2021 (Snohomish County Educational Facilities) (State Aid Withholding) | | NR/Aa1 | | | 1,750,000 | | | | 2,096,763 | |
Semi-Annual Report 39
| | |
| SCHEDULE OF INVESTMENTS, CONTINUED | | |
| |
Thornburg Limited Term Municipal Fund | | March 31, 2016 (Unaudited) |
| | | | | | | | | | |
Issuer-Description | | Credit Rating†
S&P/ Moody’s | | Principal
Amount | | | Value | |
Marysville School District No. 25 GO, 5.00% due 12/1/2022 (Snohomish County Educational Facilities) (State Aid Withholding) | | NR/Aa1 | | $ | 2,620,000 | | | $ | 3,193,439 | |
Marysville School District No. 25 GO, 5.00% due 12/1/2023 (Snohomish County Educational Facilities) (State Aid Withholding) | | NR/Aa1 | | | 1,700,000 | | | | 2,091,034 | |
Port of Seattle, 5.50% due 9/1/2018 (Insured: Natl-Re) | | AA-/A2 | | | 5,000,000 | | | | 5,540,050 | |
Seattle Municipal Light & Power, 5.00% due 2/1/2017 | | AA/Aa2 | | | 2,000,000 | | | | 2,072,740 | |
Skagit County Public Hospital District No. 1, 4.00% due 12/1/2016 (Skagit Regional Health) | | NR/Baa2 | | | 1,000,000 | | | | 1,016,700 | |
Skagit County Public Hospital District No. 1, 5.00% due 12/1/2018 (Skagit Regional Health) | | NR/Baa2 | | | 800,000 | | | | 864,344 | |
Skagit County Public Hospital District No. 1, 5.00% due 12/1/2019 (Skagit Regional Health) | | NR/Baa2 | | | 835,000 | | | | 922,959 | |
Skagit County Public Hospital District No. 1, 5.00% due 12/1/2021 (Skagit Regional Health) | | NR/Baa2 | | | 1,160,000 | | | | 1,319,628 | |
Skagit County Public Hospital District No. 1, 5.00% due 12/1/2022 (Skagit Regional Health) | | NR/Baa2 | | | 500,000 | | | | 574,865 | |
Skagit County Public Hospital District No. 1, 5.375% due 12/1/2022 (Skagit Regional Health) | | NR/Baa2 | | | 500,000 | | | | 501,605 | |
Skagit County Public Hospital District No. 1, 5.00% due 12/1/2023 (Skagit Regional Health) | | NR/Baa2 | | | 750,000 | | | | 869,693 | |
Skagit County Public Hospital District No. 1 GO, 4.00% due 12/1/2017 (Skagit Regional Health) | | NR/A1 | | | 1,000,000 | | | | 1,050,670 | |
Skagit County Public Hospital District No. 1 GO, 4.00% due 12/1/2018 (Skagit Regional Health) | | NR/A1 | | | 1,270,000 | | | | 1,367,892 | |
Skagit County Public Hospital District No. 1 GO, 5.00% due 12/1/2019 (Skagit Regional Health) | | NR/A1 | | | 1,695,000 | | | | 1,931,012 | |
Skagit County Public Hospital District No. 1 GO, 5.00% due 12/1/2020 (Skagit Regional Health) | | NR/A1 | | | 1,570,000 | | | | 1,831,907 | |
Skagit County Public Hospital District No. 1 GO, 5.00% due 12/1/2021 (Skagit Regional Health) | | NR/A1 | | | 3,135,000 | | | | 3,725,415 | |
Skagit County Public Hospital District No. 1 GO, 5.00% due 12/1/2022 (Skagit Regional Health) | | NR/A1 | | | 3,635,000 | | | | 4,399,840 | |
Skagit County Public Hospital District No. 2 GO, 4.00% due 12/1/2018 (Island Hospital) | | NR/A1 | | | 1,000,000 | | | | 1,071,070 | |
Skagit County Public Hospital District No. 2 GO, 4.00% due 12/1/2019 (Island Hospital) | | NR/A1 | | | 1,000,000 | | | | 1,093,160 | |
Skagit County Public Hospital District No. 2 GO, 4.00% due 12/1/2020 (Island Hospital) | | NR/A1 | | | 1,000,000 | | | | 1,106,380 | |
Skagit County Public Hospital District No. 2 GO, 4.00% due 12/1/2021 (Island Hospital) | | NR/A1 | | | 1,000,000 | | | | 1,114,650 | |
Skagit County Public Hospital District No. 2 GO, 5.00% due 12/1/2022 (Island Hospital) | | NR/A1 | | | 1,700,000 | | | | 2,021,062 | |
State of Washington COP, 5.00% due 7/1/2016 (State Agency Real Property Projects) (State Aid Withholding) | | NR/Aa2 | | | 2,415,000 | | | | 2,442,724 | |
State of Washington COP, 5.00% due 7/1/2017 (State Agency Real Property Projects) (State Aid Withholding) | | NR/Aa2 | | | 2,555,000 | | | | 2,693,123 | |
State of Washington COP, 5.00% due 7/1/2018 (State Agency Real Property Projects) (State Aid Withholding) | | NR/Aa2 | | | 2,670,000 | | | | 2,917,028 | |
State of Washington COP, 5.00% due 7/1/2019 (State and Local Agency Real and Personal Property Projects) (State Aid Withholding) | | NR/Aa2 | | | 1,000,000 | | | | 1,126,550 | |
State of Washington COP, 5.00% due 7/1/2020 (State and Local Agency Real and Personal Property Projects) (State Aid Withholding) | | NR/Aa2 | | | 3,290,000 | | | | 3,801,990 | |
State of Washington COP, 5.00% due 7/1/2021 (State and Local Agency Real and Personal Property Projects) (State Aid Withholding) | | NR/Aa2 | | | 3,125,000 | | | | 3,689,000 | |
State of Washington COP, 5.00% due 7/1/2022 (State and Local Agency Real and Personal Property Projects) (State Aid Withholding) | | NR/Aa2 | | | 3,000,000 | | | | 3,614,250 | |
State of Washington GO, 5.00% due 7/1/2016 (Capital Projects) | | AA+/Aa1 | | | 2,000,000 | | | | 2,023,100 | |
State of Washington GO, 0% due 1/1/2018 (Stadium and Exhibition Center; Insured: Natl-Re) | | AA+/Aa1 | | | 4,000,000 | | | | 3,930,080 | |
State of Washington GO, 0% due 1/1/2019 (Stadium and Exhibition Center; Insured: Natl-Re) | | AA+/Aa1 | | | 3,000,000 | | | | 2,904,480 | |
State of Washington GO, 0% due 12/1/2019 (Public Highway, Bridge, Ferry Capital and Operating Costs; Insured: Natl-Re) | | AA+/Aa1 | | | 3,030,000 | | | | 2,891,832 | |
State of Washington GO, 5.00% due 7/1/2025 (Capital Projects) | | AA+/Aa1 | | | 10,475,000 | | | | 13,138,792 | |
Tacoma School District No.10 GO, 5.00% due 12/1/2017 (Pierce County Capital Projects) | | AA+/Aa1 | | | 2,280,000 | | | | 2,440,808 | |
Tacoma School District No.10 GO, 5.00% due 12/1/2018 (Pierce County Capital Projects) | | AA+/Aa1 | | | 4,000,000 | | | | 4,434,080 | |
Tacoma School District No.10 GO, 5.00% due 12/1/2019 (Pierce County Capital Projects) | | AA+/Aa1 | | | 2,000,000 | | | | 2,287,140 | |
Tacoma School District No.10 GO, 5.00% due 12/1/2020 (Pierce County Capital Projects) | | AA+/Aa1 | | | 2,500,000 | | | | 2,936,675 | |
Washington Health Care Facilities Authority, 5.00% due 8/15/2016 (MultiCare Health Systems) | | AA-/Aa3 | | | 2,075,000 | | | | 2,109,237 | |
Washington Health Care Facilities Authority, 5.00% due 7/1/2017 (Overlake Hospital Medical Center) | | A/A2 | | | 1,245,000 | | | | 1,309,728 | |
Washington Health Care Facilities Authority, 5.00% due 8/15/2017 (MultiCare Health Systems) | | AA-/Aa3 | | | 1,000,000 | | | | 1,057,910 | |
Washington Health Care Facilities Authority, 5.25% due 8/1/2018 (Highline Medical Center; Insured: FHA 242) (ETM) | | NR/NR | | | 7,935,000 | | | | 8,368,965 | |
Washington Health Care Facilities Authority, 5.00% due 8/15/2018 (MultiCare Health Systems) | | AA-/Aa3 | | | 2,000,000 | | | | 2,194,020 | |
Washington Health Care Facilities Authority, 5.00% due 7/1/2019 (Overlake Hospital Medical Center) | | A/A2 | | | 1,050,000 | | | | 1,178,573 | |
Washington Health Care Facilities Authority, 4.75% due 7/1/2020 (Overlake Hospital Medical Center) | | A/A2 | | | 1,000,000 | | | | 1,109,760 | |
| | | |
WEST VIRGINIA — 0.10% | | | | | | | | | | |
Mason County, 1.625% due 10/1/2022 put 10/1/2018 (Appalachian Power Company Project) | | BBB/Baa1 | | | 3,300,000 | | | | 3,319,404 | |
West Virginia Higher Education Policy Commission, 5.00% due 4/1/2020 (Higher Education Facilities) | | A+/Aa3 | | | 1,000,000 | | | | 1,145,970 | |
West Virginia Higher Education Policy Commission, 5.00% due 4/1/2021 (Higher Education Facilities) | | A+/Aa3 | | | 1,000,000 | | | | 1,173,400 | |
West Virginia Higher Education Policy Commission, 5.00% due 4/1/2022 (Higher Education Facilities) | | A+/Aa3 | | | 1,500,000 | | | | 1,791,885 | |
| | | |
WISCONSIN — 0.62% | | | | | | | | | | |
Wisconsin Health & Educational Facilities Authority, 5.00% due 7/15/2016 (Aurora Health Care, Inc.) | | NR/A2 | | | 3,695,000 | | | | 3,738,896 | |
Wisconsin Health & Educational Facilities Authority, 5.00% due 4/15/2017 (Aurora Health Care, Inc.) | | NR/A2 | | | 1,295,000 | | | | 1,343,588 | |
Wisconsin Health & Educational Facilities Authority, 5.00% due 7/1/2017 (Agnesian Healthcare, Inc.) | | A/A2 | | | 1,000,000 | | | | 1,045,330 | |
Wisconsin Health & Educational Facilities Authority, 5.00% due 7/15/2017 (Aurora Health Care, Inc.) | | NR/A2 | | | 5,025,000 | | | | 5,256,150 | |
Wisconsin Health & Educational Facilities Authority, 5.00% due 7/1/2018 (Agnesian Healthcare, Inc.) | | A/A2 | | | 1,855,000 | | | | 1,998,503 | |
Wisconsin Health & Educational Facilities Authority, 5.00% due 7/1/2019 (Agnesian Healthcare, Inc.) | | A/A2 | | | 1,000,000 | | | | 1,107,570 | |
Wisconsin Health & Educational Facilities Authority, 5.00% due 7/1/2020 (Agnesian Healthcare, Inc.) | | A/A2 | | | 2,110,000 | | | | 2,390,567 | |
Wisconsin Health & Educational Facilities Authority, 5.00% due 8/15/2020 (ProHealth Care, Inc.) | | A+/A1 | | | 1,075,000 | | | | 1,237,583 | |
40 Semi-Annual Report
| | |
| SCHEDULE OF INVESTMENTS, CONTINUED | | |
| |
Thornburg Limited Term Municipal Fund | | March 31, 2016 (Unaudited) |
| | | | | | | | | | |
Issuer-Description | | Credit Rating†
S&P/ Moody’s | | Principal
Amount | | | Value | |
Wisconsin Health & Educational Facilities Authority, 5.00% due 8/15/2021 (ProHealth Care, Inc.) | | A+/A1 | | $ | 2,575,000 | | | $ | 3,022,870 | |
Wisconsin Health & Educational Facilities Authority, 5.00% due 8/15/2022 (ProHealth Care, Inc.) | | A+/A1 | | | 1,600,000 | | | | 1,865,520 | |
Wisconsin Health & Educational Facilities Authority, 5.00% due 12/1/2022 (UnityPoint Health) | | NR/Aa3 | | | 1,000,000 | | | | 1,211,980 | |
Wisconsin Health & Educational Facilities Authority, 1.25% due 8/15/2025 put 8/15/2017 (Aurora Health Care, Inc.) | | NR/A2 | | | 1,800,000 | | | | 1,804,950 | |
Wisconsin Health & Educational Facilities Authority, 5.125% due 8/15/2027 put 8/15/2016 (Aurora Health Care, Inc.) | | NR/A2 | | | 4,500,000 | | | | 4,574,970 | |
Wisconsin Health & Educational Facilities Authority, 5.00% due 11/15/2043 put 6/1/2021 (Ascension Health Alliance System) | | AA+/Aa2 | | | 10,000,000 | | | | 11,744,400 | |
WPPI Energy, 5.00% due 7/1/2021 (Power Supply System) | | A/A1 | | | 4,100,000 | | | | 4,852,514 | |
| | | | | | | | | | |
TOTAL INVESTMENTS — 98.73% (Cost $7,190,776,834) | | | | | | | | $ | 7,449,933,987 | |
OTHER ASSETS LESS LIABILITIES — 1.27% | | | | | | | | | 95,982,313 | |
| | | | | | | | | | |
NET ASSETS — 100.00% | | | | | | | | $ | 7,545,916,300 | |
| | | | | | | | | | |
Footnote Legend
| † | Credit ratings are unaudited. Rating changes may have occurred subsequent to the reporting period end. Bonds issued with a maturity of one year or less are assigned Moody’s ratings from MIG-1 to MIG-4 and Standard and Poor’s ratings from SP-1+ to SP-3 with MIG-1 and SP-1+ being the strongest ratings. |
| a | Segregated as collateral for a when-issued security. |
Portfolio Abbreviations
To simplify the listings of securities, abbreviations are used per the table below:
| | |
| AGM | | Insured by Assured Guaranty Municipal Corp. |
| AMBAC | | Insured by American Municipal Bond Assurance Corp. |
| BAM | | Insured by Build America Mutual Insurance Co. |
| BHAC | | Insured by Berkshire Hathaway Assurance Corp. |
| CalPERS | | California Public Employees’ Retirement System |
| CIFG | | Insured by CIFG Assurance North America Inc. |
| COP | | Certificates of Participation |
| DFA | | Development Finance Authority |
| EDA | | Economic Development Authority |
| ETM | | Escrowed to Maturity |
| FGIC | | Insured by Financial Guaranty Insurance Co. |
| FHA | | Insured by Federal Housing Administration |
| FSA | | Insured by Financial Security Assurance Co. |
| GNMA | | Collateralized by Government National Mortgage Association |
| | |
| GO | | General Obligation |
| HFA | | Health Facilities Authority |
| HFFA | | Health Facilities Financing Authority |
| IBC | | Insured Bond Certificate |
| IDA | | Industrial Development Authority |
| ISD | | Independent School District |
| JEA | | Jacksonville Electric Authority |
| Mtg | | Mortgage |
| Natl-Re | | Insured by National Public Finance Guarantee Corp. |
| PSF | | Guaranteed by Permanent School Fund |
| Q-SBLF | | Insured by Qualified School Bond Loan Fund |
| Syncora | | Insured by Syncora Guarantee Inc. |
| USD | | Unified School District |
See notes to financial statements.
Semi-Annual Report 41
| | |
| STATEMENT OF ASSETS AND LIABILITIES | | |
| |
Thornburg Limited Term Municipal Fund | | March 31, 2016 (Unaudited) |
| | | | |
ASSETS | | | | |
Investments at value (cost $7,190,776,834) (Note 2) | | $ | 7,449,933,987 | |
Cash | | | 38,821,782 | |
Receivable for investments sold | | | 47,605,898 | |
Receivable for fund shares sold | | | 25,318,169 | |
Interest receivable | | | 76,064,769 | |
Prepaid expenses and other assets | | | 117,995 | |
| | | | |
Total Assets | | | 7,637,862,600 | |
| | | | |
| |
LIABILITIES | | | | |
Payable for investments purchased | | | 74,162,047 | |
Payable for fund shares redeemed | | | 13,571,414 | |
Payable to investment advisor and other affiliates (Note 3) | | | 2,800,160 | |
Accounts payable and accrued expenses | | | 534,628 | |
Dividends payable | | | 878,051 | |
| | | | |
Total Liabilities | | | 91,946,300 | |
| | | | |
| |
NET ASSETS | | $ | 7,545,916,300 | |
| | | | |
NET ASSETS CONSIST OF | | | | |
Distribution in excess of net investment income | | $ | (947,051 | ) |
Net unrealized appreciation on investments | | | 259,157,153 | |
Accumulated net realized gain (loss) | | | (740,220 | ) |
Net capital paid in on shares of beneficial interest | | | 7,288,446,418 | |
| | | | |
| | $ | 7,545,916,300 | |
| | | | |
NET ASSET VALUE | | | | |
Class A Shares: | | | | |
Net asset value and redemption price per share ($1,698,213,480 applicable to 116,215,379 shares of beneficial interest outstanding - Note 4) | | $ | 14.61 | |
Maximum sales charge, 1.50% of offering price | | | 0.22 | |
| | | | |
Maximum offering price per share | | $ | 14.83 | |
| | | | |
| |
Class C Shares: | | | | |
Net asset value and offering price per share* ($739,389,918 applicable to 50,506,796 shares of beneficial interest outstanding - Note 4) | | $ | 14.64 | |
| | | | |
| |
Class I Shares: | | | | |
Net asset value, offering and redemption price per share ($5,108,312,902 applicable to 349,533,625 shares of beneficial interest outstanding - Note 4) | | $ | 14.61 | |
| | | | |
| * | Redemption price per share is equal to net asset value less any applicable contingent deferred sales charge. |
See notes to financial statements.
42 Semi-Annual Report
| | |
| STATEMENT OF OPERATIONS | | |
| |
Thornburg Limited Term Municipal Fund | | Six Months Ended March 31, 2016 (Unaudited) |
| | | | |
INVESTMENT INCOME | | | | |
Interest income (net of premium amortized of $48,033,579) | | $ | 83,781,973 | |
| | | | |
| |
EXPENSES | | | | |
Investment advisory fees (Note 3) | | | 9,671,577 | |
Administration fees (Note 3) | | | | |
Class A Shares | | | 1,058,683 | |
Class C Shares | | | 456,987 | |
Class I Shares | | | 1,237,411 | |
Distribution and service fees (Note 3) | | | | |
Class A Shares | | | 2,117,367 | |
Class C Shares | | | 1,830,682 | |
Transfer agent fees | | | | |
Class A Shares | | | 553,185 | |
Class C Shares | | | 173,183 | |
Class I Shares | | | 1,773,560 | |
Registration and filing fees | | | | |
Class A Shares | | | 24,954 | |
Class C Shares | | | 16,346 | |
Class I Shares | | | 96,142 | |
Custodian fees (Note 3) | | | 310,635 | |
Professional fees | | | 70,420 | |
Accounting fees (Note 3) | | | 131,440 | |
Trustee fees | | | 148,660 | |
Other expenses | | | 189,069 | |
| | | | |
Total Expenses | | | 19,860,301 | |
| | | | |
Net Investment Income | | | 63,921,672 | |
| | | | |
REALIZED AND UNREALIZED GAIN (LOSS) | | | | |
Net realized gain (loss) from investments | | | 28,317 | |
Net change in unrealized appreciation (depreciation) on investments | | | 44,875,633 | |
| | | | |
Net Realized and Unrealized Gain | | | 44,903,950 | |
| | | | |
Net Increase in Net Assets Resulting from Operations | | $ | 108,825,622 | |
| | | | |
See notes to financial statements.
Semi-Annual Report 43
| | |
| STATEMENT OF CHANGES IN NET ASSETS | | |
| |
Thornburg Limited Term Municipal Fund | | |
| | | | | | | | |
| | | Six Months Ended
March 31, 2016* | | | Year Ended
September 30, 2015 | |
INCREASE (DECREASE) IN NET ASSETS FROM | | | | | | | | |
| | |
OPERATIONS | | | | | | | | |
Net investment income | | $ | 63,921,672 | | | $ | 126,221,554 | |
Net realized gain (loss) from investments | | | 28,317 | | | | (246,405 | ) |
Net unrealized appreciation (depreciation) on investments | | | 44,875,633 | | | | (27,314,650 | ) |
| | | | | | | | |
| | |
Net Increase (Decrease) in Net Assets Resulting from Operations | | | 108,825,622 | | | | 98,660,499 | |
| | |
DIVIDENDS TO SHAREHOLDERS | | | | | | | | |
From net investment income | | | | | | | | |
Class A Shares | | | (13,073,841 | ) | | | (28,555,079 | ) |
Class C Shares | | | (4,786,572 | ) | | | (9,883,065 | ) |
Class I Shares | | | (46,061,259 | ) | | | (87,783,410 | ) |
| | |
FUND SHARE TRANSACTIONS (NOTE 4) | | | | | | | | |
Class A Shares | | | (12,270,112 | ) | | | (157,979,365 | ) |
Class C Shares | | | 4,547,874 | | | | (16,433,151 | ) |
Class I Shares | | | 245,745,794 | | | | 432,554,387 | |
| | | | | | | | |
Net Increase in Net Assets | | | 282,927,506 | | | | 230,580,816 | |
| | |
NET ASSETS | | | | | | | | |
Beginning of Period | | | 7,262,988,794 | | | | 7,032,407,978 | |
| | | | | | | | |
| | |
End of Period | | $ | 7,545,916,300 | | | $ | 7,262,988,794 | |
| | | | | | | | |
| | |
Distribution in excess of net investment income | | $ | (947,051 | ) | | $ | (947,051 | ) |
See notes to financial statements.
44 Semi-Annual Report
| | |
| NOTES TO FINANCIAL STATEMENTS | | |
| |
Thornburg Limited Term Municipal Fund | | March 31, 2016 (Unaudited) |
NOTE 1 – ORGANIZATION
Thornburg Limited Term Municipal Fund (the “Fund”) is a diversified series of Thornburg Investment Trust (the “Trust”). The Trust is organized as a Massachusetts business trust under a Declaration of Trust dated June 3, 1987 and is registered as a diversified, open-end management investment company under the Investment Company Act of 1940, as amended. The Fund is currently one of twenty separate series of the Trust. Each series is considered to be a separate entity for financial reporting and tax purposes and bears expenses directly attributable to it. The Fund’s primary investment objective is to obtain as high a level of current income exempt from federal individual income taxes as is consistent, in the view of Thornburg Investment Management, Inc., the Trust’s investment advisor (the “Advisor”), with the preservation of capital. The Fund’s secondary objective is to reduce expected changes in its share price compared to longer intermediate and long-term bond portfolios.
The Fund currently offers three classes of shares of beneficial interest: Class A, Class C, and Institutional Class (“Class I”). Each class of shares of the Fund represents an interest in the same portfolio of investments, except that (i) Class A shares are sold subject to a front-end sales charge collected at the time the shares are purchased and bear a service fee, (ii) Class C shares are sold at net asset value without a sales charge at the time of purchase, but are subject to a contingent deferred sales charge upon redemption within one year of purchase, and bear both a service fee and a distribution fee, (iii) Class I shares are sold at net asset value without a sales charge at the time of purchase and may be subject to a service fee, and (iv) the respective classes may have different reinvestment privileges and conversion rights. Additionally, the Fund may allocate among its classes certain expenses, to the extent allocable to specific classes, including transfer agent fees, government registration fees, certain printing and postage costs, and administrative and legal expenses. Currently, class specific expenses of the Fund are limited to service and distribution fees, administration fees, and certain registration and transfer agent expenses.
NOTE 2 – SIGNIFICANT ACCOUNTING POLICIES
The following is a summary of significant accounting policies followed by the Fund in the preparation of its financial statements. The Fund is an investment company and prepares its financial statements in conformity with United States generally accepted accounting principles (“GAAP”), including investment company accounting and reporting guidance in the Financial Accounting Standards Board (the “FASB”) Accounting Standard Codification Topic 946. The preparation of financial statements in conformity with GAAP requires management to make estimates and assumptions that affect the reported amounts of assets and liabilities and disclosure of contingent assets and liabilities at the date of the financial statements and the reported amounts of increases (decreases) in net assets from operations during the reporting period. Actual results could differ from those estimates.
Significant accounting policies of the Trust are as follows:
Valuation Policy and Procedures: The Trustees of the Trust have appointed the Advisor to assist the Trustees in obtaining market values for portfolio investments, perform certain evaluation and supervisory functions respecting professional pricing service providers appointed by the Trustees’ Audit Committee (the “Audit Committee”) to assist in determining fair values for portfolio investments, assist in calculating fair values for portfolio investments in certain circumstances, and to perform other functions in connection with the valuation of investments. The Advisor acts through its Valuation and Pricing Committee (the “Committee”) and other employees of the Advisor. The Committee regularly reviews its own valuation calculations, as well as the valuations, valuation techniques and services furnished by pricing service providers, considers circumstances which may require valuation calculations by the Committee, and reviews previous valuation calculations. The Committee reports to the Audit Committee on the Committee’s activities, the performance of pricing service providers, and other matters relating to valuation of portfolio investments.
In those instances when the Committee assists in calculating a fair value for a portfolio investment, the Committee seeks to determine the price that the Fund would reasonably expect to receive upon a sale of the investment in an orderly transaction between market participants on the valuation date. The Committee customarily utilizes quotations from securities broker dealers in calculating valuations, but also may utilize prices obtained from pricing service providers or other methods approved by the Audit Committee. Because fair values calculated by the Committee are estimates, the calculation of a value for an investment may differ from the price that would be realized by the Fund upon a sale of the investment, and the difference could be material to the Fund’s financial statements. The Committee’s calculation of a fair value for an investment may also differ from the prices obtained by other persons (including other mutual funds) for the investment.
Valuation of Investments: Debt obligations held by the Fund which are not listed or traded on exchanges or for which no reported market exists are ordinarily valued at the valuation obtained from a pricing service provider approved by the Audit Committee.
In any case when a pricing service provider fails to provide a valuation for a debt obligation held by the Fund, the Committee calculates a fair value for the obligation using alternative methods under procedures approved by the Audit Committee. Additionally, in cases when management believes that a valuation obtained from a pricing service provider merits review for significant reasons, the Committee decides whether or not to use the valuation calculated by the pricing service provider or to use an alternative method approved by the Audit Committee to calculate a fair value for the obligation.
Semi-Annual Report 45
| | |
| NOTES TO FINANCIAL STATEMENTS, CONTINUED | | |
| |
Thornburg Limited Term Municipal Fund | | March 31, 2016 (Unaudited) |
Valuation Measurements: The Fund categorizes its investments based upon the inputs used in valuing those investments, according to a three-level hierarchy established in guidance from the FASB. Categorization of investments using this hierarchy is intended by the FASB to maximize the use of observable inputs in valuing investments and minimize the use of unobservable inputs by requiring that the most observable inputs be used when available. Observable inputs are those that market participants would use in valuing an investment based on available market information. Unobservable inputs are those that reflect assumptions about the information market participants would use in valuing an investment. An investment’s level within the hierarchy is based on the lowest level input that is deemed significant to the valuation. The methodologies and inputs used to value investments are not necessarily indications of the risk or liquidity associated with those investments.
Various inputs are used in calculating valuations for the Fund’s investments. These inputs are generally summarized according to the three-level hierarchy below:
Level 1: Quoted prices in active markets for identical investments.
Level 2: Other direct or indirect significant observable inputs (including quoted prices for similar investments in active markets and other observable inputs, such as interest rates, prepayment rates, credit risk, etc.).
Level 3: Significant unobservable inputs (including the Committee’s own assumptions in calculating the fair values of investments).
Valuations for debt obligations held by the Fund are typically calculated by pricing service providers approved by the Audit Committee and are characterized as Level 2 within the valuation hierarchy.
In a limited number of cases the Committee calculates a fair value for investments using broker quotations or other methods approved by the Audit Committee. When the Committee uses a single broker quotation to calculate a fair value for an investment without other significant observable inputs, or if a fair value is calculated using other significant inputs that are considered unobservable, the investment is characterized as Level 3 within the hierarchy. Other significant unobservable inputs used to calculate a fair value in these instances might include an income-based valuation approach which considers discounted anticipated future cash flows from the investment, and application of discounts due to the nature or duration of any restrictions on the disposition of the investment.
Valuations based upon the use of inputs from Levels 1, 2 or 3 may not represent the actual price received upon the disposition of an investment, and the Fund may receive a price that is lower than the valuation based upon these inputs when it sells the investment.
The following table displays a summary of the fair value hierarchy measurements of the Fund’s investments as of March 31, 2016. In any instance when valuation inputs from more than one level are used to determine the fair value of a specific investment, the investment is placed in the level of the table based upon the lowest level input that is significant in determining the fair value of the investment:
| | | | | | | | | | | | | | | | |
| | | Fair Value Measurements at March 31, 2016 | |
| | | Total | | | Level 1 | | | Level 2 | | | Level 3 | |
Assets | | | | | | | | | | | | | | | | |
Investments in Securities | | | | | | | | | | | | | | | | |
Municipal Bonds | | $ | 7,449,933,987 | | | $ | — | | | $ | 7,449,933,987 | | | $ | — | |
| | | | | | | | | | | | | | | | |
Total Investments in Securities | | $ | 7,449,933,987 | | | $ | — | | | $ | 7,449,933,987 | | | $ | — | |
In accordance with the guidance prescribed in Accounting Standards Update No. 2011-04, it is the policy of the Fund to recognize transfers between levels and the underlying events which caused the movement. The Fund recognized no transfers between levels for the six months ended March 31, 2016.
Federal Income Taxes: It is the policy of the Trust to comply with the provisions of the Internal Revenue Code applicable to “regulated investment companies” and to distribute to shareholders substantially all taxable income including net realized gains on investments (if any), and tax exempt income of the Fund. Therefore, no provision for federal income tax is required.
Management reviews each uncertain tax position believed to be material to the preparation of the Fund’s financial statements, to assess if it is more likely than not that the position would be sustained upon examination, based upon the technical merits of the position. As of March 31, 2016, management has not identified any such position for which an asset or liability must be reflected in the Statement of Assets and Liabilities. The Fund’s tax returns remain subject to examination for three years after filing.
When-Issued and Delayed Delivery Transactions: The Fund may engage in when-issued or delayed delivery transactions. To the extent the Fund engages in such transactions, it will do so for the purpose of acquiring portfolio investments consistent with the Fund’s investment objectives and not for the purpose of investment leverage or to speculate on interest rate and, or market changes. At the time the Fund makes a commitment to purchase an investment on a when-issued or delayed delivery basis, the Fund will record the transaction and reflect the value in determining its net asset value.
46 Semi-Annual Report
| | |
| NOTES TO FINANCIAL STATEMENTS, CONTINUED | | |
| |
Thornburg Limited Term Municipal Fund | | March 31, 2016 (Unaudited) |
When effecting such transactions, assets of an amount sufficient to make payment for the portfolio investments to be purchased will be segregated on the Fund’s records on the trade date. Investments purchased on a when-issued or delayed delivery basis do not earn interest until the settlement date.
Dividends: Net investment income of the Fund is declared daily as a dividend on shares for which the Fund has received payment. Dividends are paid monthly and are reinvested in additional shares of the Fund at net asset value per share at the close of business on the dividend payment date, or at the shareholder’s option, paid in cash. Net realized capital gains, to the extent available, will be distributed at least annually.
General: Investment transactions are accounted for on a trade date basis. Interest income is accrued as earned. Premiums and discounts on investments purchased are amortized to call dates or maturity dates of the respective investments. Realized gains and losses from the sale of investments are recorded on an identified cost basis. Net investment income (other than class specific expenses) and realized and unrealized gains and losses are allocated daily to each class of shares based upon the relative net asset value of outstanding shares (or the value of the dividend-eligible shares, as appropriate) of each class of shares at the beginning of the day (after adjusting for the current capital shares activity of the respective class). Expenses common to all Funds are allocated among the Funds comprising the Trust based upon their relative net asset values or other appropriate allocation methods.
Guarantees and Indemnifications: Under the Trust’s organizational documents (and under separate agreements with the independent Trustees), its officers and Trustees are indemnified against certain liabilities arising out of the performance of their duties to the Fund. Additionally, in the normal course of business the Trust enters into contracts with service providers that contain general indemnification clauses. The Trust’s maximum exposure under these arrangements is unknown. However, based on experience, the Trust expects the risk of loss to be remote.
NOTE 3 – INVESTMENT ADVISORY FEE AND OTHER TRANSACTIONS WITH AFFILIATES
Pursuant to an investment advisory agreement, the Advisor serves as the investment advisor and performs services for the Fund for which the fees are payable at the end of each month. For the six months ended March 31, 2016, these fees were payable at annual rates ranging from .50 of 1% to .225 of 1% per annum of the average daily net assets of the Fund depending on the Fund’s asset size. The Fund pays to the Advisor the costs of personnel who perform certain accounting services for the Fund. For the six months ended March 31, 2016 the Fund paid $131,440 to the Advisor for these accounting services. The Trust has also entered into administrative service agreements with the Advisor, whereby the Advisor will perform certain administrative services for the shareholders of each class of the Fund’s shares, and for which fees will be payable at an annual rate of up to .125 of 1% per annum of the average daily net assets attributable to each class of shares.
The Trust has an underwriting agreement with Thornburg Securities Corporation (the “Distributor”), an affiliate of the Advisor, which acts as the distributor of the Fund’s shares. For the six months ended March 31, 2016, the Distributor has advised the Fund that it earned commissions aggregating $7,392 from the sale of Class A shares, and collected contingent deferred sales charges aggregating $18,390 from redemptions of Class C shares of the Fund.
Pursuant to a service plan under Rule 12b-1 of the Investment Company Act of 1940, the Fund may reimburse to the Advisor an amount not to exceed .25 of 1% per annum of the average daily net assets attributable to each class of shares of the Fund for payments made by the Advisor to securities dealers and other financial institutions to obtain various shareholder and distribution related services. For the six months ended March 31, 2016, there were no 12b-1 service plan fees charged for Class I shares. The Advisor may pay out of its own resources additional expenses for distribution of the Fund’s shares and shareholder services.
The Trust has also adopted a distribution plan pursuant to Rule 12b-1, applicable only to the Fund’s Class C shares under which the Fund compensates the Distributor for services in promoting the sale of Class C shares of the Fund at an annual rate of up to .25 of 1% per annum of the average daily net assets attributable to Class C shares. Total fees incurred by each class of shares of the Fund under their respective service and distribution plans for the six months ended March 31, 2016, are set forth in the Statement of Operations.
Certain officers and Trustees of the Trust are also officers or directors of the Advisor and Distributor. The compensation of independent Trustees is borne by the Trust.
The Fund may purchase or sell securities from, or to an affiliated fund, provided the affiliation is due solely to having a common investment advisor, common officers, or common trustees, and provided that all such transactions will comply with Rule 17a-7 under the 1940 Act. For the six months ended March 31, 2016, the Fund had no transactions with affiliated funds.
Semi-Annual Report 47
| | |
| NOTES TO FINANCIAL STATEMENTS, CONTINUED | | |
| |
Thornburg Limited Term Municipal Fund | | March 31, 2016 (Unaudited) |
NOTE 4 – SHARES OF BENEFICIAL INTEREST
At March 31, 2016, there were an unlimited number of shares with no par value of beneficial interest authorized. Transactions in shares of beneficial interest were as follows:
| | | | | | | | | | | | | | | | |
| | | Six Months Ended
March 31, 2016 (Unaudited) | | | Year Ended
September 30, 2015 (Audited) | |
| | | Shares | | | Amount | | | Shares | | | Amount | |
Class A Shares | | | | | | | | | | | | | | | | |
Shares sold | | | 12,190,929 | | | $ | 177,765,080 | | | | 19,409,135 | | | $ | 282,189,980 | |
Shares issued to shareholders in reinvestment of dividends | | | 808,307 | | | | 11,789,969 | | | | 1,764,554 | | | | 25,651,510 | |
Shares repurchased | | | (13,843,256 | ) | | | (201,825,161 | ) | | | (32,078,869 | ) | | | (465,820,855 | ) |
| | | | | | | | | | | | | | | | |
| | | | |
Net increase (decrease) | | | (844,020 | ) | | $ | (12,270,112 | ) | | | (10,905,180 | ) | | $ | (157,979,365 | ) |
| | | | | | | | | | | | | | | | |
| | | | |
Class C Shares | | | | | | | | | | | | | | | | |
Shares sold | | | 4,044,726 | | | $ | 59,098,154 | | | | 6,892,790 | | | $ | 100,433,041 | |
Shares issued to shareholders in reinvestment of dividends | | | 281,913 | | | | 4,119,966 | | | | 580,603 | | | | 8,455,627 | |
Shares repurchased | | | (4,018,132 | ) | | | (58,670,246 | ) | | | (8,611,331 | ) | | | (125,321,819 | ) |
| | | | | | | | | | | | | | | | |
| | | | |
Net increase (decrease) | | | 308,507 | | | $ | 4,547,874 | | | | (1,137,938 | ) | | $ | (16,433,151 | ) |
| | | | | | | | | | | | | | | | |
| | | | |
Class I Shares | | | | | | | | | | | | | | | | |
Shares sold | | | 54,685,844 | | | $ | 797,737,471 | | | | 99,672,701 | | | $ | 1,449,480,327 | |
Shares issued to shareholders in reinvestment of dividends | | | 2,885,934 | | | | 42,104,699 | | | | 5,492,589 | | | | 79,846,726 | |
Shares repurchased | | | (40,724,765 | ) | | | (594,096,376 | ) | | | (75,505,844 | ) | | | (1,096,772,666 | ) |
| | | | | | | | | | | | | | | | |
| | | | |
Net increase (decrease) | | | 16,847,013 | | | $ | 245,745,794 | | | | 29,659,446 | | | $ | 432,554,387 | |
| | | | | | | | | | | | | | | | |
NOTE 5 – INVESTMENT TRANSACTIONS
For the six months ended March 31, 2016, the Fund had purchase and sale transactions of investments (excluding short-term investments) of $671,817,895 and $354,552,819, respectively.
NOTE 6 – INCOME TAXES
At March 31, 2016, information on the tax components of capital was as follows:
| | | | |
Cost of investments for tax purposes | | $ | 7,190,776,834 | |
| | | | |
Gross unrealized appreciation on a tax basis | | $ | 261,171,763 | |
Gross unrealized depreciation on a tax basis | | | (2,014,610 | ) |
| | | | |
Net unrealized appreciation (depreciation) on investments (tax basis) | | $ | 259,157,153 | |
| | | | |
At March 31, 2016, the Fund had deferred tax basis capital losses occurring subsequent to October 31, 2014, through September 30, 2015, of $268,898. For tax purposes, such losses will be recognized in the year ending September 30, 2016.
At March 31, 2016, the Fund had cumulative tax basis capital losses of $307,195, (of which $232,601 are short-term and $74,594 are long-term) generated after September 30, 2011, which may be carried forward to offset future capital gains. To the extent such carry-forwards are used, capital gain distributions may be reduced to the extent provided by regulations. Such capital loss carryforwards do not expire, but are required to be utilized to offset future gains prior to the utilization of losses generated prior to October 1, 2011.
At March 31, 2016, the Fund had tax basis capital losses of $192,444 generated prior to October 1, 2011, which may be carried forward to offset future capital gains. Such capital loss carryforwards expire September 30, 2016.
48 Semi-Annual Report
| | |
| NOTES TO FINANCIAL STATEMENTS, CONTINUED | | |
| |
Thornburg Limited Term Municipal Fund | | March 31, 2016 (Unaudited) |
OTHER NOTES
Risks: The Fund’s investments subject it to risks including, but not limited to, credit risk, interest rate risk, management risk, market and economic risk, and liquidity risk. Please see the Fund’s prospectus for a discussion of the risks associated with an investment in the Fund.
Subsequent Events: Fund management believes no events have occurred between March 31, 2016 and the date of issuance of the financial statements that require adjustment to or disclosure in the accompanying financial statements.
Semi-Annual Report 49
FINANCIAL HIGHLIGHTS
Thornburg Limited Term Municipal Fund
| | | | | | | | | | | | | | | | | | | | | | | | | | | | | | | | | | | | | | | | | | | | | | | | | | | | |
| | | PER SHARE PERFORMANCE (for a share outstanding throughout the period) | | RATIOS TO AVERAGE NET ASSETS | | | SUPPLEMENTAL DATA | |
Unless
Otherwise
Noted,
Periods
are
Fiscal
Years
Ended
Sept. 30, | | Net Asset
Value
Beginning
of Period | | | Net
Investment
Income
(loss)+ | | Net
Realized
&
Unrealized
Gain (Loss)
on
Investments | | | Total from
Investment
Operations | | | Dividends
from Net
Investment
Income | | | Dividends
from Net
Realized
Gains | | Total
Dividends | | | Net
Asset
Value
End
of
Period | | Net
Investment
Income
(Loss)
(%) | | | Expenses,
After
Expense
Reductions
(%) | | | Expenses,
After
Expense
Reductions
and
Net of
Custody
Credits
(%) | | | Expenses,
Before
Expense
Reductions
(%) | | | Total
Return
(%)(a) | | | Portfolio
Turnover
Rate
(%)(a) | | Net
Assets
at End
of
Period
(Thousands) | |
Class A Shares | | | | | | | | | | | | | | | | | | | | | | | | | | | | | | | | | | | | | | | | | | | | | | |
2016(b)(c) | | $ | 14.52 | | | 0.11 | | | 0.09 | | | | 0.20 | | | | (0.11 | ) | | — | | | (0.11 | ) | | $14.61 | | | 1.54 | (d) | | | 0.73 | (d) | | | 0.73 | (d) | | | 0.73 | (d) | | | 1.40 | | | 5.68 | | $ | 1,698,213 | |
2015(c) | | $ | 14.58 | | | 0.23 | | | (0.06 | ) | | | 0.17 | | | | (0.23 | ) | | — | | | (0.23 | ) | | $14.52 | | | 1.56 | | | | 0.73 | | | | 0.73 | | | | 0.73 | | | | 1.15 | | | 18.56 | | $ | 1,700,127 | |
2014(c) | | $ | 14.38 | | | 0.26 | | | 0.20 | | | | 0.46 | | | | (0.26 | ) | | — | | | (0.26 | ) | | $14.58 | | | 1.78 | | | | 0.72 | | | | 0.71 | | | | 0.72 | | | | 3.20 | | | 14.46 | | $ | 1,865,213 | |
2013(c) | | $ | 14.70 | | | 0.26 | | | (0.32 | ) | | | (0.06 | ) | | | (0.26 | ) | | — | | | (0.26 | ) | | $14.38 | | | 1.81 | | | | 0.71 | | | | 0.71 | | | | 0.71 | | | | (0.39 | ) | | 17.47 | | $ | 2,178,317 | |
2012(c) | | $ | 14.39 | | | 0.31 | | | 0.31 | | �� | | 0.62 | | | | (0.31 | ) | | — | | | (0.31 | ) | | $14.70 | | | 2.13 | | | | 0.72 | | | | 0.72 | | | | 0.72 | | | | 4.36 | | | 12.72 | | $ | 2,131,540 | |
2011(c) | | $ | 14.27 | | | 0.36 | | | 0.12 | | | | 0.48 | | | | (0.36 | ) | | — | | | (0.36 | ) | | $14.39 | | | 2.53 | | | | 0.74 | | | | 0.74 | | | | 0.74 | | | | 3.43 | | | 16.15 | | $ | 1,649,965 | |
Class C Shares | | | | | | | | | | | | | | | | | | | | | | | | | | | | | | | | | | | | | | | | | | | | | | |
2016(b) | | $ | 14.55 | | | 0.10 | | | 0.09 | | | | 0.19 | | | | (0.10 | ) | | — | | | (0.10 | ) | | $14.64 | | | 1.31 | (d) | | | 0.96 | (d) | | | 0.96 | (d) | | | 0.96 | (d) | | | 1.28 | | | 5.68 | | $ | 739,390 | |
2015 | | $ | 14.60 | | | 0.19 | | | (0.05 | ) | | | 0.14 | | | | (0.19 | ) | | — | | | (0.19 | ) | | $14.55 | | | 1.32 | | | | 0.96 | | | | 0.96 | | | | 0.96 | | | | 0.98 | | | 18.56 | | $ | 730,395 | |
2014 | | $ | 14.41 | | | 0.22 | | | 0.19 | | | | 0.41 | | | | (0.22 | ) | | — | | | (0.22 | ) | | $14.60 | | | 1.52 | | | | 0.97 | | | | 0.96 | | | | 0.97 | | | | 2.87 | | | 14.46 | | $ | 749,648 | |
2013 | | $ | 14.72 | | | 0.23 | | | (0.31 | ) | | | (0.08 | ) | | | (0.23 | ) | | — | | | (0.23 | ) | | $14.41 | | | 1.55 | | | | 0.97 | | | | 0.97 | | | | 0.97 | | | | (0.58 | ) | | 17.47 | | $ | 795,052 | |
2012 | | $ | 14.41 | | | 0.27 | | | 0.31 | | | | 0.58 | | | | (0.27 | ) | | — | | | (0.27 | ) | | $14.72 | | | 1.85 | | | | 0.99 | | | | 0.99 | | | | 0.99 | | | | 4.08 | | | 12.72 | | $ | 777,026 | |
2011 | | $ | 14.30 | | | 0.32 | | | 0.11 | | | | 0.43 | | | | (0.32 | ) | | — | | | (0.32 | ) | | $14.41 | | | 2.27 | | | | 1.00 | | | | 1.00 | | | | 1.00 | | | | 3.08 | | | 16.15 | | $ | 525,923 | |
Class I Shares | | | | | | | | | | | | | | | | | | | | | | | | | | | | | | | | | | | | | | | | | | | | | | |
2016(b) | | $ | 14.53 | | | 0.14 | | | 0.08 | | | | 0.22 | | | | (0.14 | ) | | — | | | (0.14 | ) | | $14.61 | | | 1.86 | (d) | | | 0.41 | (d) | | | 0.41 | (d) | | | 0.41 | (d) | | | 1.49 | | | 5.68 | | $ | 5,108,313 | |
2015 | | $ | 14.58 | | | 0.27 | | | (0.05 | ) | | | 0.22 | | | | (0.27 | ) | | — | | | (0.27 | ) | | $14.53 | | | 1.88 | | | | 0.41 | | | | 0.41 | | | | 0.41 | | | | 1.54 | | | 18.56 | | $ | 4,832,467 | |
2014 | | $ | 14.38 | | | 0.30 | | | 0.20 | | | | 0.50 | | | | (0.30 | ) | | — | | | (0.30 | ) | | $14.58 | | | 2.09 | | | | 0.40 | | | | 0.40 | | | | 0.40 | | | | 3.53 | | | 14.46 | | $ | 4,417,547 | |
2013 | | $ | 14.70 | | | 0.31 | | | (0.32 | ) | | | (0.01 | ) | | | (0.31 | ) | | — | | | (0.31 | ) | | $14.38 | | | 2.15 | | | | 0.37 | | | | 0.37 | | | | 0.37 | | | | (0.05 | ) | | 17.47 | | $ | 3,502,580 | |
2012 | | $ | 14.39 | | | 0.36 | | | 0.31 | | | | 0.67 | | | | (0.36 | ) | | — | | | (0.36 | ) | | $14.70 | | | 2.46 | | | | 0.39 | | | | 0.39 | | | | 0.39 | | | | 4.71 | | | 12.72 | | $ | 3,084,872 | |
2011 | | $ | 14.27 | | | 0.41 | | | 0.12 | | | | 0.53 | | | | (0.41 | ) | | — | | | (0.41 | ) | | $14.39 | | | 2.87 | | | | 0.40 | | | | 0.40 | | | | 0.40 | | | | 3.78 | | | 16.15 | | $ | 2,228,418 | |
| (a) | Not annualized for periods less than one year. |
| (b) | Unaudited Six Month Period Ended March 31. |
| (c) | Sales loads are not reflected in computing total return. |
| + | Based on weighted average shares outstanding. |
See notes to financial statements.
| | | | |
| 50 Semi-Annual Report | | | | Semi-Annual Report 51 |
| | |
| EXPENSE EXAMPLE | | |
| |
Thornburg Limited Term Municipal Fund | | March 31, 2016 (Unaudited) |
As a shareholder of the Fund, you incur two types of costs:
| | (1) | transaction costs, including |
(a) sales charges (loads) on purchase payments, for Class A shares;
(b) a deferred sales charge on redemptions of any part or all of a purchase of $1 million of Class A shares within 12 months of purchase;
(c) a deferred sales charge on redemptions of Class C shares within 12 months of purchase;
| | (2) | ongoing costs, including management fees; distribution and/or service (12b-1) fees; and other Fund expenses. |
This example is intended to help you understand your ongoing costs (in dollars) of investing in the Fund and to compare these costs with the ongoing costs of investing in other mutual funds.
The example is based on a $1,000 investment beginning on October 1, 2015, and held until March 31, 2016.
| | | | | | | | | | | | |
| | | Beginning
Account Value
10/1/15 | | | Ending
Account Value
3/31/16 | | | Expenses paid
During period†
10/1/15–3/31/16 | |
Class A Shares | | | | | | | | | | | | |
Actual | | $ | 1,000.00 | | | $ | 1,014.00 | | | $ | 3.67 | |
Hypothetical* | | $ | 1,000.00 | | | $ | 1,021.36 | | | $ | 3.68 | |
Class C Shares | | | | | | | | | | | | |
Actual | | $ | 1,000.00 | | | $ | 1,012.80 | | | $ | 4.85 | |
Hypothetical* | | $ | 1,000.00 | | | $ | 1,020.19 | | | $ | 4.86 | |
Class I Shares | | | | | | | | | | | | |
Actual | | $ | 1,000.00 | | | $ | 1,014.90 | | | $ | 2.07 | |
Hypothetical* | | $ | 1,000.00 | | | $ | 1,022.95 | | | $ | 2.08 | |
| † | Expenses are equal to the annualized expense ratio for each class (A: 0.73%; C: 0.96%; I: 0.41%) multiplied by the average account value over the period, multiplied by 183/366 to reflect the one-half year period. |
| * | Hypothetical assumes a rate of return of 5% per year before expenses. |
ACTUAL EXPENSES
For each class of shares, the first line of the accompanying table provides information about actual account values and actual expenses. You may use the information in this line, together with the amount you invested, to estimate the expenses that you paid over the period. Simply divide your account value by $1,000 (for example, an $8,600 account value divided by $1,000 = 8.6), then multiply the result by the number in the first line for your class of shares under the heading entitled “Expenses Paid During Period” to estimate the expenses you paid on your account during this period.
HYPOTHETICAL EXAMPLE FOR COMPARISON PURPOSES
For each class of shares, the second line of the accompanying table provides information about hypothetical account values and hypothetical expenses based on the Fund’s actual expense ratio and an assumed rate of return of 5% per year before expenses, which is not the Fund’s actual return. The hypothetical account values and expenses may not be used to estimate the actual ending account balance or expenses you paid for the period. You may use this information to compare the ongoing costs of investing in the Fund and other funds. To do so, compare this 5% hypothetical example with the 5% hypothetical examples that appear in the shareholder reports of the other funds.
Please note that the expenses shown in the table are meant to highlight your ongoing costs only and do not reflect any transactional costs, such as sales charges (loads), redemption fees, or exchange fees. Therefore, the second line of the table for each class of shares is useful in comparing ongoing costs only, and will not help you determine the relative total costs of owning different funds. In addition, if these transactional costs were included, your costs would have been higher.
52 Semi-Annual Report
| | |
| OTHER INFORMATION | | |
| |
Thornburg Limited Term Municipal Fund | | March 31, 2016 (Unaudited) |
PORTFOLIO PROXY VOTING
Policies and Procedures:
The Trust has delegated to Thornburg Investment Management, Inc. (the “Advisor”) voting decisions respecting proxies for the Fund’s voting securities. The Advisor makes voting decisions in accordance with its Proxy Voting Policy. A description of the Policy is available (i) without charge, upon request, by calling the Advisor toll-free at 1-800-847-0200, (ii) on the Thornburg website at www.thornburg.com, and (iii) on the Securities and Exchange Commission’s website at www.sec.gov.
Information regarding how proxies were voted is available on or before August 31 of each year for the twelve months ending the preceding June 30. This information is available (i) without charge, upon request by calling the Advisor toll-free at 1-800-847-0200, (ii) on the Thornburg website at www.thornburg.com, and (iii) on the Securities and Exchange Commission’s website at www.sec.gov.
AVAILABILITY OF QUARTERLY PORTFOLIO SCHEDULE
The Fund files with the Securities and Exchange Commission schedules of its portfolio holdings on Form N-Q for the first and third quarters of each fiscal year. The Fund’s Forms N-Q are available on the Commission’s website at www.sec.gov, or may be reviewed and copied at the Commission’s Public Reference Room in Washington, D.C. Information on the operation of the Public Reference Room may be obtained by calling 1-800-SEC-0330. The Fund also makes this information available on its website at www.thornburg.com/download or upon request by calling 1-800-847-0200.
Semi-Annual Report 53
TRUSTEES’ STATEMENT TO SHAREHOLDERS
Revised and Readopted September 15, 2015
The Trustees believe current and prospective shareholders should know how we discharge our responsibilities in supervising the Funds’ investment advisor and in reviewing the advisor’s contract for renewal. Since 2005, we have issued a statement which sets out clearly the three principal guidelines that we follow in supervising the Trust’s investment advisor on your behalf. In accordance with our customary practice, in September of 2015 we again reviewed our statement and concluded we should reissue this statement outlining the principal features of our supervision of the advisor’s performance of investment management services for the Funds.
We begin with the premise that each shareholder selected his or her Fund because its investments are managed by the investment advisor identified in the prospectus and in accordance with the objective and policies described in the prospectus. We realize, as each of you do, that if you believe that your Fund’s stated objective and policies no longer serve your personal investment goals, you can sell your shares and leave the Fund.
Therefore, we believe that our primary supervisory task – our principal obligation to you – is to assess the nature and quality of the advisor’s services, and to confirm that the advisor actively and competently pursues the Fund’s objective, in accordance with the policies set out in the prospectus. To do this, we meet regularly with management to review your Fund’s portfolio and to discuss the advisor’s specific actions and judgments in pursuing the Fund’s objective. We do not substitute our own judgment for the advisor’s decisions in selecting investments; the advisor is paid to exercise its informed judgment on investment decisions, and we seek to confirm, in reviewing the advisor’s performance, that the advisor is doing just that.
Second, we are conscious of costs and the effect that costs have on shareholders’ returns. We try to make sure that your Fund’s fees and costs are reasonable in relationship to the services rendered and that they are generally in line with those charged by other expert investment advisors, consistent with our belief that the Fund’s investors searched for and expect that expertise and attention and have decided to pay a reasonable price for it. We do not put the management contract “out to bid” as a matter of course, and we would not do so unless we had concluded that the advisor materially had failed to pursue the Fund’s objectives in accordance with its policies, or for other equally important reasons. We believe that any other approach would be inconsistent with your interests and contrary to your expectations when you bought shares of the Fund in the first place.
Finally, because we believe that most Thornburg Fund shareholders have invested with a long-term perspective, we try not to focus too much on the fashions of the moment and on short-term performance. The market will not favor any specific investment objective or set of policies at all times and under all economic circumstances. A fund will experience periods of both high and low returns relative to other funds and other investments. Even if one of our Funds is not favored by the market at a particular time, we believe that the advisor is nonetheless obliged to remain true to the Fund’s objective and policies, and we watch to see that it does so.
Trustees of Thornburg Investment Trust
54 Semi-Annual Report
THORNBURG FUND FAMILY
Thornburg Investment Management is a privately-owned global investment firm that offers a range of solutions for retail and institutional investors. Founded in 1982 and headquartered in Santa Fe, New Mexico, we manage approximately $54 billion (as of March 31, 2016) across eight equity and 11 bond mutual funds, separate accounts for high-net-worth investors and institutional accounts, and five UCITS funds for non-U.S. investors.
The fund outlined in this report is one of many equity and fixed-income products available from Thornburg Investment Management.
Equity Funds
| | • | | Thornburg Core Growth Fund |
| | • | | Thornburg International Value Fund |
| | • | | Thornburg Better World International Fund |
| | • | | Thornburg International Growth Fund |
| | • | | Thornburg Developing World Fund |
| | • | | Thornburg Investment Income Builder Fund |
| | • | | Thornburg Global Opportunities Fund |
Fixed Income Funds
| | • | | Thornburg Low Duration Income Fund |
| | • | | Thornburg Limited Term U.S. Government Fund |
| | • | | Thornburg Limited Term Income Fund |
| | • | | Thornburg Strategic Income Fund |
| | • | | Thornburg Low Duration Municipal Fund |
| | • | | Thornburg Limited Term Municipal Fund |
| | • | | Thornburg Intermediate Municipal Fund |
| | • | | Thornburg California Limited Term Municipal Fund |
| | • | | Thornburg New Mexico Intermediate Municipal Fund |
| | • | | Thornburg New York Intermediate Municipal Fund |
| | • | | Thornburg Strategic Municipal Income Fund |
Before investing, carefully consider the Fund’s investment goals, risks, charges, and expenses. For a prospectus or summary prospectus containing this and other information, contact your financial advisor or visit thornburg.com. Read it carefully before investing.
For additional information, please visit thornburg.com
Thornburg Investment Management, Inc. 2300 North Ridgetop Road, Santa Fe, NM 87506
Semi-Annual Report 55

This Semi-Annual Report is submitted for the general information of shareholders of the Fund. It is not authorized for distribution to prospective investors in the Fund unless preceded or accompanied by an effective prospectus.
| | | | |
| Investment Advisor: | | Distributor: | | |
| Thornburg Investment Management® | | Thornburg Securities Corporation® | | |
| 800.847.0200 | | 800.847.0200 | | TH1072 |
2 Semi-Annual Report
Semi-Annual Report
Thornburg Intermediate Municipal Fund
March 31, 2016
| | | | |
SHARE CLASS | | NASDAQ SYMBOL | | CUSIP |
Class A | | THIMX | | 885-215-202 |
Class C | | THMCX | | 885-215-780 |
Class I | | THMIX | | 885-215-673 |
Minimum investments for Class I shares may be higher than those for other classes. Class I shares may not be available to all investors.
Investments carry risks, including possible loss of principal. Portfolios investing in bonds have the same interest rate, inflation, and credit risks that are associated with the underlying bonds. The value of bonds will fluctuate relative to changes in interest rates, decreasing when interest rates rise. Unlike bonds, bond funds have ongoing fees and expenses. Please see the Fund’s prospectus for a discussion of the risks associated with an investment in the Fund. Investments in the Fund are not FDIC insured, nor are they bank deposits or guaranteed by a bank or any other entity.
The laddering strategy does not assure or guarantee better performance and cannot eliminate the risk of investment losses.
Semi-Annual Report 3
| | |
| LETTER TO SHAREHOLDERS | | |
| |
Thornburg Intermediate Municipal Fund | | March 31, 2016 (Unaudited) |
April 11, 2016
Dear Fellow Shareholder:
We are pleased to present the semi-annual report for Thornburg Intermediate Municipal Fund. The net asset value (NAV) of the Class A shares increased by 21 cents to $14.38 per share during the six months ended March 31, 2016. If you were with us for the entire period, you received dividends of 14.47 cents per share. If you reinvested your dividends, you received 14.53 cents per share. Dividends were lower for Class C shares and higher for Class I shares, to account for varying class-specific expenses. The Class A shares underperformed the Fund’s benchmark index, with a 2.51% total return (without sales charge) for the six months ended March 31, 2016, compared to the 3.04% total return for the BofA Merrill Lynch 3-15 Year U.S. Municipal Securities Index.
Throughout the six-month period, the Fund maintained a lower risk posture on interest rates than its benchmark; its average effective duration (a measure of interest-rate sensitivity) was 4.64 years, compared to 5.58 years for the benchmark. The shorter duration hurt relative price performance by 0.23%. The Fund’s position along the yield curve added 0.06% and sector selection added 0.04% of relative price performance. Our underweight in high-quality bonds added 0.16% of relative price performance. Other factors include the amortization of bond premiums and accretion of discounts, which is not an active management decision but rather a standard accounting practice—and the largest component of this category. We also include the effects of security selection and of price change derived from factors we cannot account for (statistically: “unexplained error”). Together, these three account for 0.54% of price performance relative to the index.
Global Fears Sway the Municipal Markets
The past six months have been a roller-coaster ride for the municipal markets. During the last quarter of 2015, it seemed that every day was spent anxiously awaiting the first Federal Reserve rate increase—for what seemed like an eternity. When that rate increase finally came, it was met with a yawn. Markets quickly reminded investors that while the Federal Reserve (the Fed) has control over short-term rates, the market forces of supply and demand for bonds have a much heavier influence on interest rates—especially long-term rates.
As in life, expectations in the bond markets mean a lot. And perhaps more important than the Fed’s initial rate hike was its stated intent to raise rates four additional times in 2016. The expectation for higher rates evaporated almost immediately after the Fed’s statement, with the release of weaker-than-expected economic data, collapsing commodity prices, an emerging-markets stock rout, and profound weakness in Europe, with the European Central Bank retrenching in its effort to drive European rates lower, spurring fears of deflation.
A Roller-Coaster Ride to Start the Year
The beginning of 2016 proved volatile for equity markets domestically and globally, and the fixed income markets followed suit. The 10-year U.S. Treasury stood at a respectable 2.27% at the end of 2015. But within six weeks, that rate fell 0.61% to 1.66%, before bouncing back to 1.77% by March 31, 2016.
Chart I Credit Spreads: Investors Are Not Being Paid to Assume the Risk
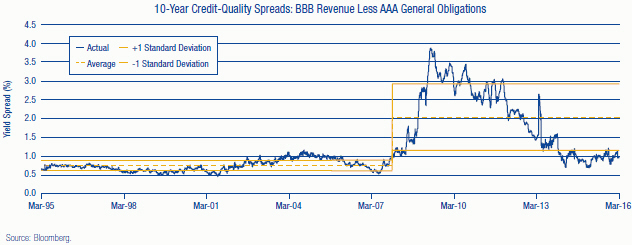
4 Semi-Annual Report
| | |
| LETTER TO SHAREHOLDERS, | | |
| |
CONTINUED Thornburg Intermediate Municipal Fund | | March 31, 2016 (Unaudited) |
As we noted, the Fed has backed off of its initial intent to raise rates four times in a stepped-up fashion. Rates will probably remain low and income elusive. Unfortunately, municipal bond investors have only a few “levers” to pull to seek higher income. The most effective two are credit quality and duration. An investor looking for yield can always buy a bond with a longer maturity—the duration lever. And bonds of lower credit quality can be purchased to drive up yield—the credit quality lever. In both instances, the investor assumes risk in hope of higher returns.
At Thornburg, we always evaluate both of these options as a means to increase the total return of the portfolios, but over the past six months, as in the prior six months, we found them less than optimal. Real rates (interest rates after inflation is subtracted) remained low during the entire period, and the municipal yield curve was fairly flat. Investors who reached for yield by buying longer maturities gained very little relative to the duration risk that comes with longer-dated bonds. And the amount investors are compensated to invest in lower-rated bonds is minimal; credit spreads remain at extremely tight levels. Investors who purchased debt from lower-rated issuers were essentially buying weaker credits at very expensive levels. Chart I on the previous page shows credit spreads remaining near historically low levels, offering investors little compensation for risk assumed. Not a great strategy!
We believe that the only logical thing to do when you’re not being paid to take risk is to take less of it. That is exactly what we have been seeking to do in Thornburg Intermediate Municipal Fund for quite some time. The Fund is being managed on the bearish (shorter) end of its duration range. We have also actively sought to increase the average credit quality, at least at the margins. Cash reserve positions are being managed in a manner we view as conservative.
Continued volatility seems a certainty. That can manifest via interest-rate movements, or changing credit spreads. While the likelihood of the Fed raising rates appears low, given the afore-mentioned anemic economic growth in the U.S. and abroad, investors are wise to recall that rates moved up over 1.00% in 2013 without the Fed having taken any action whatsoever. It may be unlikely, but that does not mean it’s a probability that can be ignored. And any event that causes spreads to widen appreciably may prove detrimental to an investor who assumed undue credit risk in search of return.
We will do what we have always done with Thornburg Intermediate Municipal Fund: provide you with a tax-exempt laddered portfolio that aims to generate attractive levels of income, while attempting to preserve principal and minimize volatility. And, of course, we’ll seek to only assume the risk for which we believe we are adequately compensated.
Staying Faithful to Thornburg’s Tested Approach
While a focus on risk mitigation may not make the sexiest marketing story, we believe it is in the best long-term interest of shareholders. And to any investor considering abandoning municipal bonds for the promise of higher returns elsewhere, we remind you that if the first quarter of 2016 has taught us anything, it is that in a volatile market, an appropriate asset allocation may save you a few sleepless nights.
We will continue to strive to manage your assets to fulfill the Fund’s objectives.
Sincerely,
| | | | |
 | |  | | |
| Christopher Ryon,CFA | | Nicholos Venditti | | |
| Portfolio Manager | | Portfolio Manager | | |
| Managing Director | | Managing Director | | |
The matters discussed in this report may constitute forward-looking statements made pursuant to the safe harbor provisions of the Securities Litigation Reform Act of 1995. These include any advisor or portfolio manager prediction, assessment, analysis or outlook for individual securities, industries, investment styles, market sectors and/or markets. These statements involve risks and uncertainties. In addition to the general risks described for each fund in its current prospectus, other factors bearing on these reports include the accuracy of the advisor’s or portfolio manager’s forecasts and predictions, the appropriateness of the investment strategies designed by the advisor or portfolio manager and the ability of the advisor or portfolio manager to implement their strategies efficiently and successfully. Any one or more of these factors, as well as other risks affecting the securities markets generally, could cause the actual results of any fund to differ materially as compared to its benchmarks.
The views expressed by the portfolio managers reflect their professional opinions and are subject to change. Under no circumstances does the information contained within represent a recommendation to buy or sell any security.
Semi-Annual Report 5
| | |
| PERFORMANCE SUMMARY | | |
| |
Thornburg Intermediate Municipal Fund | | March 31, 2016 (Unaudited) |
Average Annual Total Returns
| | | | | | | | | | | | | | | | | | | | |
| | | 1-YR | | | 3-YR | | | 5-YR | | | 10-YR | | | SINCE
INCEP. | |
A Shares (Incep: 7/22/91) | | | | | | | | | | | | | | | | | | | | |
Without sales charge | | | 2.78 | % | | | 2.63 | % | | | 4.65 | % | | | 4.15 | % | | | 4.96 | % |
With sales charge | | | 0.73 | % | | | 1.94 | % | | | 4.22 | % | | | 3.94 | % | | | 4.88 | % |
C Shares (Incep: 9/1/94) | | | | | | | | | | | | | | | | | | | | |
Without sales charge | | | 2.45 | % | | | 2.31 | % | | | 4.32 | % | | | 3.85 | % | | | 4.14 | % |
With sales charge | | | 1.85 | % | | | 2.31 | % | | | 4.32 | % | | | 3.85 | % | | | 4.14 | % |
I Shares (Incep: 7/5/96) | | | 3.15 | % | | | 2.97 | % | | | 4.99 | % | | | 4.48 | % | | | 4.69 | % |
30-Day Yields, A Shares
(with sales charge)
| | | | |
Annualized Distribution Yield | | | 1.81 | % |
| |
SEC Yield | | | 0.74 | % |
Performance data shown represents past performance and is no guarantee of future results. Investment return and principal value will fluctuate so shares, when redeemed, may be worth more or less than their original cost. Current performance may be lower or higher than quoted. For performance current to the most recent month end, visit thornburg.com or call 800-847-0200. The performance information does not reflect the deduction of taxes that a shareholder would pay on distributions or the redemption of Fund shares. Returns reflect the reinvestment of dividends and capital gains. Class A shares are sold with a maximum sales charge of 2.00%. Class C shares include a 0.60% CDSC for the first year only. There is no sales charge for Class I shares.
As disclosed in the most recent prospectus, the total annual fund operating expenses are as follows: A shares, 0.92%; C shares, 1.28%; I shares, 0.62%. Thornburg Investment Management and/or Thornburg Securities Corporation have contractually agreed to waive fees and reimburse expenses through at least February 1, 2017, for some of the share classes, resulting in net expense ratios of the following: C shares, 1.24%. For more detailed information on fund expenses and waivers/reimbursements please see the Fund’s prospectus.
Glossary
BofA Merrill Lynch 3-15 Year Municipal Securities Index – subset of the BofA Merrill Lynch U.S. Municipal Securities Index including all securities with a remaining term to final maturity greater than or equal to 3 years and less than 15 years.
Unless otherwise noted, index returns reflect the reinvestment of income dividends and capital gains, if any, but do not reflect fees, brokerage commissions or other expenses of investing. Investors may not make direct investments into any index. The performance of any index is not indicative of the performance of any particular investment.
Annualized Distribution Yield – The distribution yield reflects actual distributions made to shareholders. The annualized distribution yield is calculated by summing the last 30 days of income at a given month end and annualizing to a 360-day year. The result is divided by the ending maximum offering price.
Bond Credit Ratings (Credit Quality) – A bond credit rating assesses the financial ability of a debt issuer to make timely payments of principal and interest. Ratings of AAA (the highest), AA, A, and BBB are investment-grade quality. Ratings of BB, B, CCC, CC, C and D (the lowest) are considered below investment grade, speculative grade, or junk bonds.
Credit Spread/Quality Spread – The difference between the yields of securities with different credit qualities.
Duration – A bond’s sensitivity to interest rates. Effective duration incorporates the embedded option features, such as call provisions. Bonds with longer durations experience greater price volatility than bonds with shorter durations.
Laddering – Involves building a portfolio of bonds with staggered maturities so that a portion matures each year. Money that comes in from maturing bonds is typically invested in bonds with longer maturities at the far end of the portfolio.
SEC Yield – SEC yield is computed in accordance with SEC standards measuring the net investment income per share over a specified 30-day period expressed as a percentage of the maximum offering price of the Fund’s shares at the end of the period.
Yield Curve – A line that plots the interest rates, at a set point in time, of bonds having equal credit quality, but differing maturity dates.
6 Semi-Annual Report
| | |
| FUND SUMMARY | | |
| |
Thornburg Intermediate Municipal Fund | | March 31, 2016 (Unaudited) |
Objectives and Strategies
The Fund’s primary investment goal is to obtain as high a level of current income exempt from federal individual income tax as is consistent, in the view of the Fund’s investment advisor, with preservation of capital (may be subject to Alternative Minimum Tax).
The secondary goal of the Fund is to reduce expected changes in its share price compared to long-term bond portfolios.
This Fund invests principally in a laddered portfolio of municipal bonds with a dollar-weighted average maturity of normally three to ten years. Laddering involves building a portfolio of bonds with staggered maturities so that a portion of the portfolio matures each year. Cash from maturing bonds, if not needed for other purposes, is typically invested in bonds with longer maturities at the far end of the ladder. We regard the strategy as a good compromise for managing different types of risk.
Long Term Stability of Principal
Net Asset Value History of A Shares
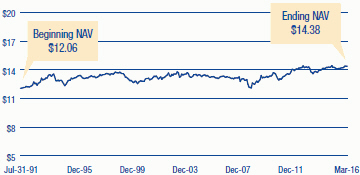
Security Credit Ratings
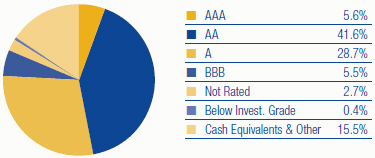
A bond credit rating assesses the financial ability of a debt issuer to make timely payments of principal and interest. Ratings of AAA (the highest), AA, A, and BBB are investment-grade quality. Ratings of BB, B, CCC, CC, C and D (the lowest) are considered below investment grade, speculative grade, or junk bonds. Credit quality ratings for Thornburg’s municipal portfolios used the highest rating available from either Standard & Poor’s or Moody’s Investors Service.
Key Portfolio Attributes
| | | | |
Number of Bonds | | | 547 | |
| |
Effective Duration | | | 5.0 Yrs | |
| |
Average Maturity | | | 7.7 Yrs | |
Portfolio Ladder
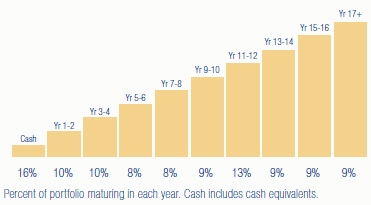
There is no guarantee that the Fund will meet its investment objectives.
All data is subject to change. Charts may not add up to 100% due to rounding.
Semi-Annual Report 7
| | |
| SCHEDULE OF INVESTMENTS | | |
| |
Thornburg Intermediate Municipal Fund | | March 31, 2016 (Unaudited) |
| | | | | | | | | | |
ISSUER-DESCRIPTION | | CREDIT RATING†
S&P/ MOODY’S | | PRINCIPAL
AMOUNT | | | VALUE | |
ALABAMA — 1.49% | | | | | | | | | | |
Alabama Capital Region Solid Waste Disposal Authority, 4.00% due 6/15/2016 (Montgomery Materials Recovery Facility) (AMT) | | AA/NR | | $ | 160,000 | | | $ | 160,912 | |
Alabama Capital Region Solid Waste Disposal Authority, 4.00% due 6/15/2017 (Montgomery Materials Recovery Facility) (AMT) | | AA/NR | | | 750,000 | | | | 772,283 | |
Alabama Capital Region Solid Waste Disposal Authority, 4.00% due 6/15/2019 (Montgomery Materials Recovery Facility) (AMT) | | AA/NR | | | 815,000 | | | | 870,159 | |
Alabama Capital Region Solid Waste Disposal Authority, 5.00% due 6/15/2020 (Montgomery Materials Recovery Facility) (AMT) | | AA/NR | | | 845,000 | | | | 946,501 | |
Alabama Capital Region Solid Waste Disposal Authority, 5.00% due 6/15/2021 (Montgomery Materials Recovery Facility) (AMT) | | AA/NR | | | 890,000 | | | | 1,011,298 | |
Alabama Capital Region Solid Waste Disposal Authority, 5.00% due 6/15/2022 (Montgomery Materials Recovery Facility) (AMT) | | AA/NR | | | 930,000 | | | | 1,066,357 | |
Alabama Capital Region Solid Waste Disposal Authority, 5.00% due 6/15/2023 (Montgomery Materials Recovery Facility) (AMT) | | AA/NR | | | 980,000 | | | | 1,115,612 | |
Alabama Public School & College Authority, 5.00% due 5/1/2016 (Educational Facilities) | | NR/Aa1 | | | 2,000,000 | | | | 2,007,860 | |
Alabama Public School & College Authority, 5.00% due 6/1/2021 (Educational Facilities) | | AA/Aa1 | | | 775,000 | | | | 917,042 | |
Alabama Public School & College Authority, 5.00% due 6/1/2026 (Educational Facilities) | | AA/Aa1 | | | 4,380,000 | | | | 5,323,846 | |
City of Mobile Industrial Development Board, 1.65% due 6/1/2034 put 3/20/2017 (Alabama Power Company Barry Plant Project) | | A-/A1 | | | 2,000,000 | | | | 2,016,020 | |
East Alabama Health Care Authority GO, 5.00% due 9/1/2027 (Health Care Facilities Capital Improvements) | | A/NR | | | 1,250,000 | | | | 1,394,388 | |
Montgomery Water Works & Sanitary Sewer Board, 5.00% due 9/1/2017 | | AAA/Aa1 | | | 2,185,000 | | | | 2,318,154 | |
University of Alabama at Birmingham Hospital, 5.25% due 9/1/2025 | | A+/A1 | | | 2,000,000 | | | | 2,189,840 | |
| | | |
ALASKA — 0.19% | | | | | | | | | | |
Alaska Housing Finance Corp. GO, 5.00% due 12/1/2021 (State Capital Project) | | AA+/Aa2 | | | 500,000 | | | | 588,790 | |
City of Valdez, 5.00% due 1/1/2021 (BP Pipelines (Alaska), Inc. Project) | | A-/A2 | | | 2,000,000 | | | | 2,285,160 | |
| | | |
ARIZONA — 2.08% | | | | | | | | | | |
Arizona Board of Regents, 5.00% due 8/1/2024 (University of Arizona SPEED) | | A+/Aa3 | | | 1,635,000 | | | | 1,926,161 | |
Arizona Board of Regents, 5.00% due 8/1/2029 (University of Arizona SPEED) | | A+/Aa3 | | | 1,000,000 | | | | 1,194,310 | |
Arizona HFA, 5.00% due 7/1/2017 (Dignity Health) | | A/A3 | | | 1,450,000 | | | | 1,522,964 | |
Arizona HFA, 5.00% due 12/1/2031 (Scottsdale Lincoln Hospitals) | | NR/A2 | | | 2,500,000 | | | | 2,937,375 | |
Arizona HFA, 0.52% due 7/1/2035 put 4/7/2016 (Dignity Health; LOC: JPMorgan Chase Bank, N.A.) (weekly demand notes) | | AAA/Aa1 | | | 6,410,000 | | | | 6,410,000 | |
Arizona State University Energy Management LLC, 5.00% due 7/1/2017 (Tempe Campus Project) | | AA-/A1 | | | 465,000 | | | | 488,520 | |
City of Flagstaff GO, 1.75% due 7/1/2016 (Urban Trail, Street and Utilities Improvements) | | AA/Aa2 | | | 200,000 | | | | 200,638 | |
City of Flagstaff GO, 3.00% due 7/1/2020 (Urban Trail, Street and Utilities Improvements) | | AA/Aa2 | | | 700,000 | | | | 749,637 | |
City of Flagstaff GO, 4.00% due 7/1/2022 (Urban Trail, Street and Utilities Improvements) | | AA/Aa2 | | | 420,000 | | | | 480,799 | |
City of Flagstaff GO, 4.00% due 7/1/2023 (Urban Trail, Street and Utilities Improvements) | | AA/Aa2 | | | 200,000 | | | | 231,030 | |
Phoenix Civic Improvement Corp., 5.00% due 7/1/2017 (Insured: Natl-Re) | | AA+/Aa3 | | | 1,000,000 | | | | 1,054,320 | |
Pima County IDA, 5.00% due 12/1/2030 (Providence Day School Project) | | BBB+/NR | | | 2,000,000 | | | | 2,168,440 | |
Salt Verde Financial Corp., 5.25% due 12/1/2022 (Salt River Project Agricultural Improvement and Power District) | | BBB+/Baa1 | | | 2,000,000 | | | | 2,356,040 | |
Salt Verde Financial Corp., 5.25% due 12/1/2028 (Salt River Project Agricultural Improvement and Power District) | | BBB+/Baa1 | | | 770,000 | | | | 938,684 | |
State of Arizona, 5.00% due 7/1/2019 (Insured: AGM) | | AA/A1 | | | 7,280,000 | | | | 8,186,360 | |
| | | |
ARKANSAS — 0.29% | | | | | | | | | | |
Board of Trustees of the University of Arkansas, 5.00% due 11/1/2031 (Fayetteville Campus) | | NR/Aa2 | | | 1,000,000 | | | | 1,198,860 | |
Board of Trustees of the University of Arkansas, 5.00% due 11/1/2032 (Fayetteville Campus) | | NR/Aa2 | | | 655,000 | | | | 781,893 | |
Board of Trustees of the University of Arkansas, 5.00% due 11/1/2033 (Fayetteville Campus) | | NR/Aa2 | | | 1,000,000 | | | | 1,185,240 | |
Board of Trustees of the University of Arkansas, 5.00% due 11/1/2034 (Fayetteville Campus) | | NR/Aa2 | | | 1,000,000 | | | | 1,178,490 | |
| | | |
CALIFORNIA — 6.43% | | | | | | | | | | |
Alameda County Joint Powers Authority, 5.25% due 12/1/2027 (Alameda County Medical Center Highland Hospital) | | AA/Aa3 | | | 1,000,000 | | | | 1,232,240 | |
Alameda County Joint Powers Authority, 5.25% due 12/1/2028 (Alameda County Medical Center Highland Hospital) | | AA/Aa3 | | | 1,150,000 | | | | 1,414,810 | |
Alameda County Joint Powers Authority, 5.25% due 12/1/2029 (Alameda County Medical Center Highland Hospital) | | AA/Aa3 | | | 1,500,000 | | | | 1,842,465 | |
Brentwood Infrastructure Financing Authority, 5.00% due 11/1/2026 (Insured: AGM) | | AA/NR | | | 2,000,000 | | | | 2,259,360 | |
California Educational Facilities Authority, 5.50% due 4/1/2029 (Pitzer College) | | NR/A2 | | | 3,000,000 | | | | 3,435,930 | |
California HFFA, 5.00% due 11/15/2022 (Children’s Hospital Los Angeles) | | BBB+/Baa2 | | | 1,000,000 | | | | 1,153,660 | |
California HFFA, 5.00% due 3/1/2026 (Adventist Health System/West) | | A/NR | | | 3,020,000 | | | | 3,595,401 | |
California HFFA, 5.25% due 3/1/2027 (Dignity Health) | | A/A3 | | | 5,250,000 | | | | 6,180,247 | |
California Infrastructure & Economic Development Bank, 5.75% due 8/15/2029 (King City Joint Union High School District) | | AA-/NR | | | 1,500,000 | | | | 1,743,075 | |
California Pollution Control Financing Authority, 5.25% due 6/1/2023 put 12/1/2017 (Solid Waste Disposal-Republic Services, Inc.) (AMT) | | BBB+/Baa3 | | | 2,000,000 | | | | 2,106,540 | |
California State Public Works Board, 5.00% due 6/1/2017 (University of California Multiple Campus Capital Projects; Insured: Natl-Re) (ETM) | | AA+/Aaa | | | 2,000,000 | | | | 2,102,060 | |
California State Public Works Board, 5.00% due 4/1/2028 (Corrections & Rehabilitation and Judicial Council) | | A+/A1 | | | 2,500,000 | | | | 2,974,600 | |
California Statewide Community Development Authority, 6.25% due 8/15/2028 pre-refunded 8/15/2018 (Enloe Medical Center; Insured: California Mtg Insurance) | | AA-/NR | | | 1,050,000 | | | | 1,186,721 | |
California Statewide Community Development Authority, 6.00% due 7/1/2030 pre-refunded 1/1/2019 (Aspire Public Schools) | | NR/NR | | | 7,015,000 | | | | 7,959,850 | |
Carson Redevelopment Agency, 6.25% due 10/1/2022 (Redevelopment Project Area No. 1) | | A-/NR | | | 1,620,000 | | | | 1,881,274 | |
Carson Redevelopment Agency, 6.375% due 10/1/2024 (Redevelopment Project Area No. 1) | | A-/NR | | | 1,300,000 | | | | 1,495,975 | |
8 Semi-Annual Report
| | |
| SCHEDULE OF INVESTMENTS, CONTINUED | | |
| |
Thornburg Intermediate Municipal Fund | | March 31, 2016 (Unaudited) |
| | | | | | | | | | |
ISSUER-DESCRIPTION | | CREDIT RATING†
S&P/ MOODY’S | | PRINCIPAL
AMOUNT | | | VALUE | |
Chico Redevelopment Agency, 5.00% due 4/1/2030 (Chico Amended & Merged Redevelopment; Insured: AMBAC) | | A+/NR | | $ | 5,500,000 | | | $ | 5,516,060 | |
Corona-Norco USD COP, 5.00% due 4/15/2018 (Insured: AGM) | | AA/A1 | | | 1,245,000 | | | | 1,347,775 | |
Corona-Norco USD COP, 5.00% due 4/15/2021 (Insured: AGM) | | AA/A1 | | | 1,000,000 | | | | 1,146,690 | |
Delano Financing Authority, 5.00% due 12/1/2025 (City of Delano Police Station and Woollomes Avenue Bridge) | | A-/NR | | | 2,555,000 | | | | 2,794,020 | |
El Camino Hospital District, 6.25% due 8/15/2017 (Insured: AMBAC) (ETM) | | NR/NR | | | 300,000 | | | | 312,345 | |
Franklin-McKinley School District GO, 5.25% due 8/1/2027 (Insured: Natl-Re) | | NR/A1 | | | 1,000,000 | | | | 1,226,300 | |
Fresno USD GO, 6.00% due 8/1/2026 (Educational Facilities and Improvements; Insured: Natl-Re) | | AA-/A3 | | | 1,165,000 | | | | 1,424,049 | |
Jurupa Public Financing Authority, 5.50% due 9/1/2025 (Eastvale Community Services; Insured: AGM) | | AA/NR | | | 1,195,000 | | | | 1,486,592 | |
Jurupa Public Financing Authority, 5.50% due 9/1/2027 (Eastvale Community Services; Insured: AGM) | | AA/NR | | | 1,335,000 | | | | 1,636,296 | |
Los Angeles Regional Airport Improvement Corp., 5.00% due 1/1/2017 (LAX Fuel Corp.; Insured: AGM) (AMT) | | AA/A2 | | | 1,120,000 | | | | 1,133,026 | |
M-S-R Energy Authority, 6.125% due 11/1/2029 | | BBB+/NR | | | 2,500,000 | | | | 3,277,700 | |
North City West School Facilities Financing Authority, 5.00% due 9/1/2024 (Carmel Valley Schools; Insured: AGM) | | AA/NR | | | 1,080,000 | | | | 1,303,301 | |
Oakland USD GO, 5.00% due 8/1/2032 (County of Alameda Educational Facilities) | | NR/NR | | | 1,000,000 | | | | 1,175,070 | |
Oakland USD GO, 5.00% due 8/1/2033 (County of Alameda Educational Facilities) | | NR/NR | | | 1,000,000 | | | | 1,168,820 | |
Oakland USD GO, 5.00% due 8/1/2034 (County of Alameda Educational Facilities) | | NR/NR | | | 1,000,000 | | | | 1,160,840 | |
Redwood City Redevelopment Agency, 0% due 7/15/2023 (Redevelopment Area A-2; Insured: AMBAC) | | A-/NR | | | 2,065,000 | | | | 1,676,801 | |
San Jose Redevelopment Agency, 5.25% due 8/1/2027 (Merged Area Redevelopment Project) | | A/A2 | | | 2,400,000 | | | | 2,724,480 | |
San Jose Redevelopment Agency, 5.375% due 8/1/2028 (Merged Area Redevelopment Project) | | A/A2 | | | 1,175,000 | | | | 1,339,923 | |
San Mateo Union High School District GO, 0% due 9/1/2019 (Educational Facilities; Insured: Natl-Re) | | AA+/Aaa | | | 3,000,000 | | | | 2,883,060 | |
Saratoga Union School District GO, 0% due 9/1/2023 (Insured: Natl-Re) | | AA+/Aa2 | | | 900,000 | | | | 774,792 | |
a Southern California Public Power Authority, 1.00% due 7/1/2036 put 4/1/2016 (Magnolia Power Project; LOC: U.S. Bank, N.A.) (daily demand notes) | | AAA/Aa1 | | | 5,375,000 | | | | 5,375,000 | |
State of California GO, 5.25% due 9/1/2026 (Kindergarten University Facilities) | | AA-/Aa3 | | | 5,000,000 | | | | 6,032,600 | |
Tuolumne Wind Project Authority, 5.875% due 1/1/2029 (Tuolumne Co.) | | AA-/A2 | | | 3,000,000 | | | | 3,404,460 | |
Turlock Irrigation District, 5.00% due 1/1/2021 | | AA-/A2 | | | 1,750,000 | | | | 2,009,770 | |
William S. Hart Union High School District GO, 0% due 9/1/2021 (Educational Facilities) | | AA/A2 | | | 800,000 | | | | 725,472 | |
| | | |
COLORADO — 0.80% | | | | | | | | | | |
Denver Convention Center Hotel Authority, 5.25% due 12/1/2023 (Insured: Syncora) | | BBB-/Baa3 | | | 2,530,000 | | | | 2,604,281 | |
Housing Authority of the City and County of Denver, 5.20% due 11/1/2027 pre-refunded 11/1/2017 (Three Towers Rehabilitation; Insured: AGM) (AMT) | | NR/Aaa | | | 1,220,000 | | | | 1,304,802 | |
Housing Authority of the City and County of Denver, 5.20% due 11/1/2027 (Three Towers Rehabilitation; Insured: AGM) (AMT) | | NR/A2 | | | 1,335,000 | | | | 1,407,744 | |
Park Creek Metropolitan District, 5.25% due 12/1/2020 pre-refunded 12/1/2019 (Insured: AGM) | | AA/NR | | | 1,120,000 | | | | 1,286,779 | |
Regional Transportation District COP, 5.50% due 6/1/2022 (FasTracks Transportation System) | | A/Aa3 | | | 3,000,000 | | | | 3,528,960 | |
Regional Transportation District COP, 5.00% due 6/1/2028 (North Metro Rail Line) | | A/Aa3 | | | 1,550,000 | | | | 1,816,445 | |
| | | |
CONNECTICUT — 1.30% | | | | | | | | | | |
City of Hartford GO, 5.00% due 7/1/2031 (Various Public Improvements; Insured: AGM) | | AA/A2 | | | 1,700,000 | | | | 1,993,777 | |
Connecticut Health & Educational Facilities Authority, 5.75% due 7/1/2029 (Ethel Walker School) | | BBB/NR | | | 1,350,000 | | | | 1,433,079 | |
Connecticut Housing Finance Authority, 0.35% due 5/15/2039 put 4/1/2016 (Housing Mortgage Financing Program; SPA: JPMorgan Chase Bank, N.A.) (daily demand notes) | | AAA/Aaa | | | 13,885,000 | | | | 13,885,000 | |
State of Connecticut GO Floating Rate Note, 0.81% due 9/15/2017 (Public Facility Improvements) | | AA/Aa3 | | | 2,000,000 | | | | 1,992,380 | |
| | | |
DELAWARE — 0.04% | | | | | | | | | | |
Delaware Solid Waste Authority, 5.00% due 6/1/2021 (Capital Improvement Program; Insured: Natl-Re) | | AA+/Aa3 | | | 615,000 | | | | 619,785 | |
| | | |
DISTRICT OF COLUMBIA — 0.60% | | | | | | | | | | |
District of Columbia Association of American Medical Colleges, 5.00% due 2/15/2017 (Insured: AMBAC) (ETM) | | NR/NR | | | 1,000,000 | | | | 1,038,080 | |
Metropolitan Airports Authority, 0% due 10/1/2023 (Dulles Toll Road; Insured: AGM) | | AA/A3 | | | 4,890,000 | | | | 3,968,822 | |
Metropolitan Airports Authority, 0% due 10/1/2024 (Dulles Toll Road; Insured: AGM) | | AA/A3 | | | 5,000,000 | | | | 3,895,750 | |
| | | |
FLORIDA — 5.42% | | | | | | | | | | |
Broward County School Board COP, 5.00% due 7/1/2030 (Educational Facilities) | | A+/Aa3 | | | 1,250,000 | | | | 1,489,538 | |
Broward County School Board COP, 5.00% due 7/1/2032 (Educational Facilities) | | A+/Aa3 | | | 2,000,000 | | | | 2,352,740 | |
City of Hollywood Community Redevelopment Agency, 5.00% due 3/1/2021 pre-refunded 3/1/2017 (Beach Community Redevelopment; Insured: Syncora) | | NR/A3 | | | 3,000,000 | | | | 3,120,120 | |
City of Jacksonville, 5.00% due 10/1/2026 (Better Jacksonville Plan) | | A+/A1 | | | 2,075,000 | | | | 2,459,954 | |
City of Lakeland, 5.00% due 10/1/2018 (Electric Power System Smart Grid Project; Insured: AGM) | | AA/Aa3 | | | 2,000,000 | | | | 2,207,500 | |
City of Lakeland, 5.25% due 10/1/2027 (Electric Power System Smart Grid Project; Insured: AGM) | | AA/Aa3 | | | 3,680,000 | | | | 4,810,570 | |
City of Lakeland, 5.25% due 10/1/2036 (Electric Power System Smart Grid Project; Insured: AGM) | | AA/Aa3 | | | 2,770,000 | | | | 3,719,168 | |
Escambia County HFA, 5.95% due 7/1/2020 (Florida Health Care Facility; Insured: AMBAC) | | NR/NR | | | 1,510,000 | | | | 1,608,044 | |
Florida Department of Management Services, 5.00% due 9/1/2018 (Financing or Acquisition of State-Owned Office Buildings; Insured: AMBAC) | | AA+/Aa2 | | | 500,000 | | | | 506,985 | |
Florida Department of Management Services COP, 3.50% due 8/1/2016 (Correctional Facilities Construction and Improvements; Insured: AGM) | | AA+/Aa2 | | | 500,000 | | | | 505,090 | |
Semi-Annual Report 9
| | |
| SCHEDULE OF INVESTMENTS, CONTINUED | | |
| |
Thornburg Intermediate Municipal Fund | | March 31, 2016 (Unaudited) |
| | | | | | | | | | |
ISSUER-DESCRIPTION | | CREDIT RATING†
S&P/ MOODY’S | | PRINCIPAL
AMOUNT | | | VALUE | |
Florida Municipal Loan Council, 5.00% due 10/1/2020 (Insured: Natl-Re) | | AA-/A3 | | $ | 1,000,000 | | | $ | 1,058,560 | |
Florida Municipal Loan Council, 5.00% due 10/1/2024 (Insured: Natl-Re) | | AA-/A3 | | | 2,235,000 | | | | 2,361,054 | |
Florida State Department of Children & Families COP, 5.00% due 10/1/2018 (South Florida Evaluation Treatment) | | AA+/NR | | | 2,090,000 | | | | 2,098,130 | |
Florida State Department of Children & Families COP, 5.00% due 10/1/2019 (South Florida Evaluation Treatment) | | AA+/NR | | | 2,255,000 | | | | 2,263,772 | |
Lake County School Board COP, 5.00% due 6/1/2026 (School District Facility Projects) | | A/NR | | | 1,210,000 | | | | 1,425,937 | |
Manatee County, 5.00% due 10/1/2026 (Public Utilities System Improvements) | | NR/Aa2 | | | 370,000 | | | | 457,235 | |
Manatee County, 5.00% due 10/1/2027 (Public Utilities System Improvements) | | NR/Aa2 | | | 470,000 | | | | 576,493 | |
Manatee County, 5.00% due 10/1/2028 (Public Utilities System Improvements) | | NR/Aa2 | | | 1,030,000 | | | | 1,256,322 | |
Manatee County, 5.00% due 10/1/2031 (Public Utilities System Improvements) | | NR/Aa2 | | | 2,675,000 | | | | 3,210,990 | |
Manatee County, 5.00% due 10/1/2033 (Public Utilities System Improvements) | | NR/Aa2 | | | 1,535,000 | | | | 1,824,869 | |
Miami-Dade County Aviation Department, 5.00% due 10/1/2028 | | A/A2 | | | 1,000,000 | | | | 1,206,310 | |
Miami-Dade County Aviation Department, 5.00% due 10/1/2029 | | A/A2 | | | 1,335,000 | | | | 1,601,586 | |
Miami-Dade County Aviation Department, 5.00% due 10/1/2030 | | A/A2 | | | 1,000,000 | | | | 1,193,120 | |
Miami-Dade County Aviation Department, 5.00% due 10/1/2031 | | A/A2 | | | 2,000,000 | | | | 2,372,340 | |
Miami-Dade County Educational Facilities Authority, 5.25% due 4/1/2024 (University of Miami; Insured: AMBAC) | | A-/A3 | | | 1,000,000 | | | | 1,231,280 | |
Miami-Dade County GO, 5.00% due 10/1/2023 (Seaport Properties) | | AA/Aa2 | | | 1,040,000 | | | | 1,224,257 | |
Miami-Dade County GO, 6.25% due 7/1/2026 (Building Better Communities) | | AA/Aa2 | | | 2,130,000 | | | | 2,384,279 | |
Miami-Dade County School Board COP, 5.00% due 10/1/2021 (Insured: AMBAC) | | A/A1 | | | 3,035,000 | | | | 3,591,983 | |
Miami-Dade County School Board COP, 5.25% due 5/1/2022 pre-refunded 5/1/2018 (Insured: AGM) | | AA/A1 | | | 2,600,000 | | | | 2,839,512 | |
Miami-Dade County School Board COP, 5.00% due 5/1/2030 | | A/A1 | | | 3,250,000 | | | | 3,837,990 | |
Orange County HFA, 6.25% due 10/1/2016 (Orlando Health, Inc.; Insured: Natl-Re) | | AA-/A2 | | | 795,000 | | | | 812,124 | |
Orange County HFA, 5.125% due 10/1/2026 (Orlando Health, Inc.) | | A/A2 | | | 2,000,000 | | | | 2,225,500 | |
Palm Beach County HFA, 5.00% due 12/1/2025 (Boca Raton Regional Hospital) | | BBB+/NR | | | 500,000 | | | | 591,955 | |
Palm Beach County School Board COP, 5.00% due 8/1/2032 pre-refunded 8/1/2016 | | NR/Aa3 | | | 1,500,000 | | | | 1,522,455 | |
Sarasota County Public Hospital Board, 0.598% due 10/1/2021 (Sarasota Memorial Hospital; Insured: Natl-Re) | | AA-/A1 | | | 2,000,000 | | | | 2,071,960 | |
School Board of Broward County COP, 5.00% due 7/1/2020 pre-refunded 7/1/2016 (Educational Facilities and Equipment; Insured: AGM) | | AA/Aa3 | | | 1,000,000 | | | | 1,011,370 | |
School Board of Broward County COP, 5.00% due 7/1/2026 (Educational Facilities and Equipment) | | A+/Aa3 | | | 3,000,000 | | | | 3,508,950 | |
School Board of Broward County COP, 5.00% due 7/1/2027 (Educational Facilities and Equipment) | | A+/Aa3 | | | 2,000,000 | | | | 2,320,220 | |
South Miami HFA, 5.00% due 8/15/2022 (Baptist Health Group) | | AA/Aa3 | | | 1,500,000 | | | | 1,586,925 | |
Sunshine State Governmental Finance Commission, 5.00% due 9/1/2028 (Miami-Dade County Program) | | AA-/Aa3 | | | 3,500,000 | | | | 4,139,135 | |
| | | |
GEORGIA — 3.30% | | | | | | | | | | |
Athens-Clarke County Unified Government Development Authority, 5.00% due 6/15/2024 (UGAREF Bolton Commons, LLC) | | NR/Aa2 | | | 485,000 | | | | 589,430 | |
Athens-Clarke County Unified Government Development Authority, 5.00% due 6/15/2025 (UGAREF Bolton Commons, LLC) | | NR/Aa2 | | | 510,000 | | | | 615,397 | |
Athens-Clarke County Unified Government Development Authority, 5.00% due 6/15/2027 (UGAREF Bolton Commons, LLC) | | NR/Aa2 | | | 735,000 | | | | 872,349 | |
Athens-Clarke County Unified Government Development Authority, 5.00% due 6/15/2028 (UGAREF Bolton Commons, LLC) | | NR/Aa2 | | | 590,000 | | | | 697,038 | |
Athens-Clarke County Unified Government Development Authority, 0.35% due 7/1/2035 put 4/1/2016 (University of Georgia Athletic Association; LOC: Wells Fargo Bank, N.A.) (daily demand notes) | | NR/Aa1 | | | 15,530,000 | | | | 15,530,000 | |
City of Atlanta, 5.50% due 11/1/2022 (Water & Wastewater System; Insured: Natl-Re) | | AA-/Aa3 | | | 530,000 | | | | 644,560 | |
City of Atlanta, 5.50% due 11/1/2024 (Water & Wastewater System; Insured: AGM) | | AA/Aa3 | | | 5,000,000 | | | | 5,694,150 | |
Clarke County Hospital Authority, 5.00% due 1/1/2023 (Athens Regional Medical Center) | | AA/Aa1 | | | 2,060,000 | | | | 2,450,720 | |
Clarke County Hospital Authority, 5.00% due 1/1/2024 (Athens Regional Medical Center) | | AA/Aa1 | | | 2,310,000 | | | | 2,718,916 | |
Clarke County Hospital Authority, 5.00% due 1/1/2025 (Athens Regional Medical Center) | | AA/Aa1 | | | 525,000 | | | | 612,927 | |
Clarke County Hospital Authority, 5.00% due 1/1/2026 (Athens Regional Medical Center) | | AA/Aa1 | | | 725,000 | | | | 842,566 | |
Development Authority of Fulton County, 5.00% due 10/1/2019 (Georgia Tech Athletic Assoc.) | | NR/A2 | | | 3,000,000 | | | | 3,397,860 | |
b Gwinnett County School District GO, 4.50% due 10/1/2017 (Capital Projects) | | AAA/Aaa | | | 7,000,000 | | | | 7,408,100 | |
Municipal Electric Authority of Georgia, 6.60% due 1/1/2018 (Insured: Natl-Re) | | AA-/A1 | | | 665,000 | | | | 694,772 | |
State of Georgia GO, 5.00% due 12/1/2016 (Various Capital Outlay Projects) | | AAA/Aaa | | | 4,790,000 | | | | 4,934,754 | |
Valdosta and Lowndes County Hospital Authority, 5.00% due 10/1/2024 (South Medical Center) | | AA-/Aa2 | | | 1,200,000 | | | | 1,402,788 | |
| | | |
GUAM — 2.79% | | | | | | | | | | |
Government of Guam, 5.00% due 11/15/2031 (Economic Development) | | A/NR | | | 5,500,000 | | | | 6,398,315 | |
Government of Guam, 5.00% due 11/15/2032 (Economic Development) | | A/NR | | | 12,000,000 | | | | 13,884,000 | |
Government of Guam, 5.00% due 11/15/2033 (Economic Development) | | A/NR | | | 10,500,000 | | | | 12,110,700 | |
Guam Power Authority, 5.00% due 10/1/2023 (Electric Power System; Insured: AGM) | | AA/A2 | | | 2,000,000 | | | | 2,401,120 | |
Guam Power Authority, 5.00% due 10/1/2024 (Electric Power System; Insured: AGM) | | AA/A2 | | | 2,000,000 | | | | 2,410,660 | |
Guam Power Authority, 5.00% due 10/1/2025 (Electric Power System; Insured: AGM) | | AA/A2 | | | 2,500,000 | | | | 3,000,125 | |
Guam Waterworks Authority, 5.25% due 7/1/2024 (Water and Wastewater System) | | A-/Baa2 | | | 1,000,000 | | | | 1,197,780 | |
| | | |
HAWAII — 1.24% | | | | | | | | | | |
County of Hawaii GO, 5.00% due 9/1/2033 | | AA-/Aa2 | | | 1,250,000 | | | | 1,526,625 | |
State of Hawaii GO, 5.00% due 12/1/2016 | | AA/Aa2 | | | 4,915,000 | | | | 5,062,942 | |
State of Hawaii GO, 5.00% due 12/1/2027 pre-refunded 12/1/2021 | | NR/NR | | | 145,000 | | | | 175,154 | |
State of Hawaii GO, 5.00% due 12/1/2027 | | AA/Aa2 | | | 9,855,000 | | | | 11,704,488 | |
10 Semi-Annual Report
| | |
| SCHEDULE OF INVESTMENTS, CONTINUED | | |
| |
Thornburg Intermediate Municipal Fund | | March 31, 2016 (Unaudited) |
| | | | | | | | | | |
ISSUER-DESCRIPTION | | CREDIT RATING†
S&P/ MOODY’S | | PRINCIPAL
AMOUNT | | | VALUE | |
ILLINOIS — 7.01% | | | | | | | | | | |
Board of Trustees of Southern Illinois University, 5.25% due 4/1/2019 (Housing & Auxiliary Facilities; Insured: Natl-Re) | | AA-/A3 | | $ | 1,000,000 | | | $ | 1,113,660 | |
Chicago Housing Authority, 5.00% due 7/1/2018 pre-refunded 7/1/2016 (Low-Income Public Housing Program; Insured: AGM) | | NR/A2 | | | 5,295,000 | | | | 5,351,445 | |
Chicago O’Hare International Airport, 5.00% due 1/1/2019 (2015 Airport Projects) | | A/NR | | | 1,000,000 | | | | 1,105,630 | |
Chicago O’Hare International Airport, 5.00% due 1/1/2020 (2015 Airport Projects) | | A/NR | | | 1,000,000 | | | | 1,136,550 | |
Chicago O’Hare International Airport, 5.00% due 1/1/2021 (2015 Airport Projects) | | A/NR | | | 1,000,000 | | | | 1,162,860 | |
Chicago Park District GO, 5.00% due 1/1/2025 (Capital Improvement Plan) | | AA+/NR | | | 1,000,000 | | | | 1,138,820 | |
Chicago Park District GO, 5.00% due 1/1/2027 (Capital Improvement Plan) | | AA+/NR | | | 1,945,000 | | | | 2,180,695 | |
Chicago Park District GO, 5.00% due 1/1/2028 (Capital Improvement Plan) | | AA+/NR | | | 3,450,000 | | | | 3,850,510 | |
Chicago Park District GO, 5.00% due 1/1/2029 (Capital Improvement Plan) | | AA+/NR | | | 1,995,000 | | | | 2,216,505 | |
Chicago Park District GO, 5.00% due 1/1/2030 (Capital Improvement Plan) | | AA+/NR | | | 3,500,000 | | | | 3,865,995 | |
Chicago Transit Authority, 5.00% due 12/1/2018 (Bombardier Transit Rail System) | | AA/A1 | | | 1,500,000 | | | | 1,625,820 | |
City of Chicago, 5.00% due 1/1/2019 (Midway Airport; Insured: AMBAC) (AMT) | | A/A3 | | | 1,210,000 | | | | 1,214,513 | |
City of Chicago, 5.00% due 1/1/2028 (Wastewater Transmission System) | | A/NR | | | 5,365,000 | | | | 6,066,045 | |
City of Chicago, 5.00% due 1/1/2029 (Wastewater Transmission System) | | A/NR | | | 2,500,000 | | | | 2,806,450 | |
City of Chicago, 5.75% due 11/1/2030 (Water System; Insured: AMBAC) | | AA+/Aa1 | | | 1,270,000 | | | | 1,604,708 | |
City of Chicago, 5.00% due 1/1/2032 (Midway Airport) | | A/A3 | | | 4,805,000 | | | | 5,461,363 | |
City of Chicago, 5.00% due 1/1/2033 (Midway Airport) | | A/A3 | | | 5,000,000 | | | | 5,697,850 | |
City of Chicago, 5.25% due 1/1/2034 (Midway Airport) | | A/A3 | | | 4,700,000 | | | | 5,344,699 | |
City of Chicago GO, 5.00% due 1/1/2020 (Municipal Facilities Projects; Insured: AMBAC) | | BBB+/Ba1 | | | 1,000,000 | | | | 1,020,980 | |
City of Chicago GO, 5.00% due 12/1/2022 (Modern Schools Across Chicago Program; Insured: AMBAC) | | BBB+/Ba1 | | | 415,000 | | | | 423,109 | |
City of Chicago GO, 5.00% due 12/1/2024 (Modern Schools Across Chicago Program; Insured: AMBAC) | | BBB+/Ba1 | | | 500,000 | | | | 509,600 | |
City of Mount Vernon GO, 4.00% due 12/15/2025 (Various Municipal Capital Improvements; Insured: AGM) | | AA/A2 | | | 1,900,000 | | | | 2,029,523 | |
City of Waukegan GO, 5.00% due 12/30/2016 (Insured: AGM) | | NR/A2 | | | 1,500,000 | | | | 1,543,785 | |
City of Waukegan GO, 5.00% due 12/30/2017 (Insured: AGM) | | NR/A2 | | | 1,680,000 | | | | 1,784,160 | |
City of Waukegan GO, 5.00% due 12/30/2018 (Insured: AGM) | | NR/A2 | | | 2,000,000 | | | | 2,183,340 | |
Community College District No. 525 GO, 6.25% due 6/1/2024 (Joliet Junior College) | | AA/NR | | | 500,000 | | | | 554,070 | |
Cook County Community College District No. 508 GO, 5.25% due 12/1/2026 (City Colleges of Chicago) | | AA/NR | | | 1,000,000 | | | | 1,154,080 | |
Cook County GO, 5.25% due 11/15/2024 | | AA/A2 | | | 3,000,000 | | | | 3,310,350 | |
Cook County School District No. 104 GO, 0% due 12/1/2022 (Argo Summit Elementary School Facilities; Insured: AGM) (ETM) | | NR/NR | | | 2,000,000 | | | | 1,792,360 | |
Forest Preserve District of DuPage County GO, 4.00% due 11/1/2022 (Land Acquisition and Development) | | AAA/NR | | | 750,000 | | | | 864,735 | |
Illinois Educational Facilities Authority, 5.00% due 11/1/2016 (Rush University Medical Center) (ETM) | | AA-/Aaa | | | 1,000,000 | | | | 1,025,530 | |
Illinois Educational Facilities Authority, 5.75% due 11/1/2028 pre-refunded 11/1/2018 (Rush University Medical Center) | | AA-/Aaa | | | 1,000,000 | | | | 1,123,920 | |
Illinois Finance Authority, 5.00% due 11/1/2016 (Central DuPage Health) | | AA+/Aa2 | | | 2,000,000 | | | | 2,047,860 | |
Illinois Finance Authority, 5.00% due 11/1/2017 (Central DuPage Health) | | AA+/Aa2 | | | 2,000,000 | | | | 2,123,480 | |
Illinois Finance Authority, 5.00% due 8/1/2022 (Bradley University; Insured: Syncora) | | A/NR | | | 1,000,000 | | | | 1,048,790 | |
Illinois Finance Authority, 6.125% due 11/1/2023 pre-refunded 11/1/2018 (Advocate Health Care Network) | | AA/Aa2 | | | 5,175,000 | | | | 5,865,759 | |
Illinois Finance Authority, 5.00% due 8/15/2024 (Silver Cross Hospital and Medical Centers) | | NR/Baa1 | | | 1,000,000 | | | | 1,172,130 | |
Illinois Finance Authority, 5.00% due 11/15/2033 (Rush University Medical Center) | | A+/A1 | | | 1,000,000 | | | | 1,159,410 | |
Illinois Finance Authority, 0.35% due 8/15/2038 put 4/1/2016 (Northwestern Memorial Hospital; SPA: Northern Trust Co.) (daily demand notes) | | AA+/Aa2 | | | 2,000,000 | | | | 2,000,000 | |
Illinois HFA, 5.70% due 2/20/2021 (Midwest Care Center I, Inc.; Collateralized: GNMA) | | NR/Aa1 | | | 430,000 | | | | 431,944 | |
Illinois Toll Highway Authority, 5.00% due 1/1/2037 (Move Illinois Program) | | AA-/Aa3 | | | 5,550,000 | | | | 6,440,553 | |
McHenry & Lake Counties Community Consolidated School District No. 15 GO, 0% due 1/1/2017 (Insured: AGM) (ETM) | | NR/Aa2 | | | 45,000 | | | | 44,768 | |
McHenry & Lake Counties Community Consolidated School District No. 15 GO, 0% due 1/1/2017 (Insured: AGM) | | NR/Aa2 | | | 955,000 | | | | 946,119 | |
Metropolitan Pier & Exposition Authority, 5.00% due 12/15/2022 (McCormick Place Expansion Project) | | BBB+/NR | | | 1,000,000 | | | | 1,145,710 | |
Niles Park District GO, 2.00% due 12/1/2016 (Parks and Recreation Projects) | | NR/Aa2 | | | 330,000 | | | | 332,574 | |
Niles Park District GO, 3.00% due 12/1/2017 (Parks and Recreation Projects) | | NR/Aa2 | | | 340,000 | | | | 351,907 | |
Niles Park District GO, 3.00% due 12/1/2018 (Parks and Recreation Projects) | | NR/Aa2 | | | 350,000 | | | | 366,888 | |
Niles Park District GO, 3.00% due 12/1/2019 (Parks and Recreation Projects) | | NR/Aa2 | | | 360,000 | | | | 381,726 | |
Niles Park District GO, 3.00% due 12/1/2020 (Parks and Recreation Projects) | | NR/Aa2 | | | 370,000 | | | | 395,608 | |
State of Illinois, 5.00% due 6/15/2018 | | AAA/NR | | | 2,000,000 | | | | 2,175,640 | |
Tazewell County School District GO, 9.00% due 12/1/2024 (Insured: Natl-Re) | | NR/Aa3 | | | 1,205,000 | | | | 1,824,683 | |
Village of Tinley Park GO, 4.00% due 12/1/2021 | | AA+/NR | | | 585,000 | | | | 659,909 | |
Village of Tinley Park GO, 5.00% due 12/1/2024 | | AA+/NR | | | 870,000 | | | | 1,053,770 | |
| | | |
INDIANA — 3.96% | | | | | | | | | | |
Board of Trustees for the Vincennes University, 5.375% due 6/1/2022 | | NR/Aa3 | | | 895,000 | | | | 1,057,049 | |
City of Carmel Redevelopment Authority, 0% due 2/1/2021 (Performing Arts Center) | | AA+/Aa1 | | | 2,000,000 | | | | 1,834,560 | |
City of Carmel Redevelopment District COP, 6.50% due 7/15/2035 (Performing Arts Center) | | NR/NR | | | 2,730,000 | | | | 3,025,058 | |
City of Petersburg, 5.40% due 8/1/2017 (Indianapolis Power and Light Company; Insured: Natl-Re/IBC) | | AA-/A2 | | | 1,325,000 | | | | 1,404,182 | |
Clay Multi-School Building Corp., 5.00% due 1/15/2018 (State Aid Withholding) | | AA+/NR | | | 1,735,000 | | | | 1,860,302 | |
Fort Wayne Redevelopment Authority, 5.00% due 8/1/2023 pre-refunded 2/1/2017 (Harrison Square; Insured: AGM) | | NR/Aa2 | | | 2,290,000 | | | | 2,373,677 | |
Franklin Township Multi-School Building Corp., 5.00% due 7/10/2017 (Franklin Central High School) (State Aid Withholding) | | AA+/NR | | | 630,000 | | | | 664,297 | |
Semi-Annual Report 11
| | |
| SCHEDULE OF INVESTMENTS, CONTINUED | | |
| |
Thornburg Intermediate Municipal Fund | | March 31, 2016 (Unaudited) |
| | | | | | | | | | |
ISSUER-DESCRIPTION | | CREDIT RATING†
S&P/ MOODY’S | | PRINCIPAL
AMOUNT | | | VALUE | |
Hobart Building Corp., 6.50% due 7/15/2019 (Insured: Natl-Re) (State Aid Withholding) | | AA+/A3 | | $ | 1,000,000 | | | $ | 1,155,060 | |
Indiana Bond Bank, 5.25% due 10/15/2020 (Natural Gas Utility Improvements) | | NR/A3 | | | 5,340,000 | | | | 6,157,073 | |
Indiana Bond Bank, 5.25% due 4/1/2023 (Hendricks Regional Health Financing Program; Insured: AMBAC) | | AA/NR | | | 2,000,000 | | | | 2,429,600 | |
Indiana Finance Authority, 5.00% due 3/1/2019 (Indiana University Health) | | AA-/Aa3 | | | 5,000,000 | | | | 5,576,050 | |
Indiana Finance Authority, 5.00% due 11/1/2021 (Sisters of St. Francis Health Services, Inc.) | | NR/Aa3 | | | 605,000 | | | | 667,593 | |
Indiana Finance Authority, 5.25% due 9/15/2022 (Marian University) | | BBB-/NR | | | 2,480,000 | | | | 2,681,004 | |
Indiana Finance Authority, 5.25% due 9/15/2023 (Marian University) | | BBB-/NR | | | 2,605,000 | | | | 2,796,129 | |
Indiana Finance Authority, 0.38% due 2/1/2037 put 4/1/2016 (Stadium Project; SPA: JPMorgan Chase Bank, N.A.) (dailydemand notes) | | AA+/Aa2 | | | 12,300,000 | | | | 12,300,000 | |
Indiana Health and Educational Facility Financing Authority, 4.10% due 11/15/2046 put 11/3/2016 (Ascension Health Senior Credit Group) | | AA+/Aa2 | | | 1,000,000 | | | | 1,020,430 | |
Indiana Health Facility Financing Authority, 5.00% due 11/15/2034 (Ascension Health Credit Group) | | NR/Aa2 | | | 1,325,000 | | | | 1,580,447 | |
Indiana Health Facility Financing Authority, 5.00% due 11/15/2035 (Ascension Health Credit Group) | | NR/Aa2 | | | 5,000,000 | | | | 5,936,000 | |
Indiana Health Facility Financing Authority, 5.00% due 11/15/2036 (Ascension Health Credit Group) | | NR/Aa2 | | | 2,000,000 | | | | 2,365,120 | |
Noblesville Redevelopment Authority, 5.00% due 8/1/2017 pre-refunded 8/1/2016 (146th Street Extension) | | AA/NR | | | 1,000,000 | | | | 1,015,160 | |
Noblesville Redevelopment Authority, 5.00% due 8/1/2020 pre-refunded 8/1/2016 (146th Street Extension) | | AA/NR | | | 1,000,000 | | | | 1,015,160 | |
| | | |
IOWA — 0.32% | | | | | | | | | | |
Iowa Finance Authority, 5.00% due 2/15/2030 (UnityPoint Health) | | NR/Aa3 | | | 2,250,000 | | | | 2,637,135 | |
Iowa Finance Authority, 5.00% due 2/15/2032 (UnityPoint Health) | | NR/Aa3 | | | 1,850,000 | | | | 2,147,036 | |
| | | |
KANSAS — 0.14% | | | | | | | | | | |
Johnson County Community College GO, 4.00% due 9/1/2016 (Various Capital Improvements) | | NR/Aaa | | | 1,460,000 | | | | 1,482,206 | |
Kansas Development Finance Authority, 5.00% due 6/1/2020 (Wichita State University) | | NR/Aa3 | | | 575,000 | | | | 662,544 | |
| | | |
KENTUCKY — 2.20% | | | | | | | | | | |
Commonwealth of Kentucky State Property and Buildings Commission, 5.00% due 11/1/2019 (Project No. 112) | | A/Aa3 | | | 5,870,000 | | | | 6,624,178 | |
Commonwealth of Kentucky State Property and Buildings Commission, 5.00% due 11/1/2020 (Project No. 112) | | A/Aa3 | | | 4,385,000 | | | | 5,054,151 | |
b Commonwealth of Kentucky State Property and Buildings Commission, 5.00% due 11/1/2021 (Project No. 112) | | A/Aa3 | | | 5,990,000 | | | | 7,005,964 | |
Commonwealth of Kentucky State Property and Buildings Commission, 5.00% due 11/1/2022 (Project No. 112) | | A/Aa3 | | | 6,960,000 | | | | 8,258,249 | |
Commonwealth of Kentucky State Property and Buildings Commission, 5.00% due 11/1/2023 (Project No. 112) | | A/Aa3 | | | 2,440,000 | | | | 2,929,488 | |
Louisville/Jefferson County Metro Government, 5.25% due 10/1/2026 (Norton Suburban Hospital and Kosair Children’s Hospital) | | A-/NR | | | 2,320,000 | | | | 2,771,356 | |
| | | |
LOUISIANA — 2.77% | | | | | | | | | | |
City of New Orleans, 6.00% due 6/1/2024 pre-refunded 6/1/2019 (Sewerage System; Insured: AGM) | | AA/A3 | | | 750,000 | | | | 869,228 | |
City of New Orleans GO, 4.00% due 12/1/2016 (Public Improvements) | | A+/A3 | | | 2,320,000 | | | | 2,370,901 | |
East Baton Rouge Sewerage Commission, 5.00% due 2/1/2030 | | AA-/Aa3 | | | 1,170,000 | | | | 1,406,586 | |
East Baton Rouge Sewerage Commission, 5.00% due 2/1/2031 | | AA-/Aa3 | | | 2,655,000 | | | | 3,171,105 | |
East Baton Rouge Sewerage Commission, 5.00% due 2/1/2032 | | AA-/Aa3 | | | 3,000,000 | | | | 3,567,480 | |
Law Enforcement District of the Parish of Plaquemines, 5.00% due 9/1/2023 | | A+/NR | | | 1,230,000 | | | | 1,395,730 | |
Law Enforcement District of the Parish of Plaquemines, 5.00% due 9/1/2025 | | A+/NR | | | 1,350,000 | | | | 1,525,406 | |
Law Enforcement District of the Parish of Plaquemines, 5.15% due 9/1/2027 | | A+/NR | | | 1,490,000 | | | | 1,681,078 | |
Law Enforcement District of the Parish of Plaquemines, 5.30% due 9/1/2029 | | A+/NR | | | 1,650,000 | | | | 1,865,110 | |
Louisiana Energy and Power Authority, 5.25% due 6/1/2029 (LEPA Unit No. 1; Insured: AGM) | | AA/A2 | | | 1,000,000 | | | | 1,191,190 | |
Louisiana Energy and Power Authority, 5.25% due 6/1/2030 (LEPA Unit No. 1; Insured: AGM) | | AA/A2 | | | 2,955,000 | | | | 3,505,487 | |
Louisiana Energy and Power Authority, 5.25% due 6/1/2031 (LEPA Unit No. 1; Insured: AGM) | | AA/A2 | | | 2,145,000 | | | | 2,534,403 | |
Louisiana Public Facilities Authority, 5.00% due 7/1/2022 (Black & Gold Facilities; Insured: CIFG) | | AA/A3 | | | 1,590,000 | | | | 1,663,903 | |
New Orleans Aviation Board, 5.25% due 1/1/2018 (Insured: AGM) (AMT) | | AA/A2 | | | 1,000,000 | | | | 1,072,080 | |
New Orleans Aviation Board, 5.25% due 1/1/2020 (Insured: AGM) | | AA/A2 | | | 2,000,000 | | | | 2,134,760 | |
New Orleans Regional Transit Authority, 5.00% due 12/1/2023 (Insured: AGM) | | AA/Aa3 | | | 1,000,000 | | | | 1,148,790 | |
New Orleans Regional Transit Authority, 5.00% due 12/1/2024 (Insured: AGM) | | AA/Aa3 | | | 1,000,000 | | | | 1,144,440 | |
Office Facilities Corp., 5.00% due 3/1/2019 (Louisiana State Capitol Complex Program) | | AA-/A1 | | | 390,000 | | | | 433,263 | |
Parish of Lafourche, 5.00% due 1/1/2024 (Roads, Highways and Bridges) | | AA-/NR | | | 1,065,000 | | | | 1,289,033 | |
Parish of Lafourche, 5.00% due 1/1/2025 (Roads, Highways and Bridges) | | AA-/NR | | | 2,620,000 | | | | 3,200,906 | |
St. Tammany Parish, 5.00% due 6/1/2019 pre-refunded 6/1/2016 (Insured: CIFG) | | AA/NR | | | 1,300,000 | | | | 1,322,971 | |
St. Tammany Parish, 5.00% due 6/1/2020 pre-refunded 6/1/2016 (Insured: CIFG) | | AA/NR | | | 1,000,000 | | | | 1,017,670 | |
Terrebonne Parish Hospital Service District 1, 5.00% due 4/1/2028 (General Medical Center) | | A+/A2 | | | 1,500,000 | | | | 1,669,410 | |
| | | |
MARYLAND — 0.96% | | | | | | | | | | |
County of Montgomery GO, 5.00% due 12/1/2016 (Consolidated Public Improvements) | | AAA/Aaa | | | 8,300,000 | | | | 8,550,826 | |
County of Montgomery GO, 0.35% due 6/1/2026 put 4/1/2016 (Consolidated Public Improvements; SPA: Wells Fargo Bank, N.A.) (daily demand notes) | | AAA/Aaa | | | 650,000 | | | | 650,000 | |
County of Montgomery GO, 0.39% due 6/1/2026 put 4/1/2016 (Consolidated Public Improvements; SPA: Wells Fargo Bank, N.A.) (daily demand notes) | | AAA/Aaa | | | 5,100,000 | | | | 5,100,000 | |
12 Semi-Annual Report
| | |
| SCHEDULE OF INVESTMENTS, CONTINUED | | |
| |
Thornburg Intermediate Municipal Fund | | March 31, 2016 (Unaudited) |
| | | | | | | | | | |
ISSUER-DESCRIPTION | | CREDIT RATING†
S&P/ MOODY’S | | PRINCIPAL
AMOUNT | | | VALUE | |
MASSACHUSETTS — 1.10% | | | | | | | | | | |
Massachusetts Bay Transportation Authority, 5.25% due 7/1/2030 (Transportation Capital Program) | | AAA/Aa1 | | $ | 1,000,000 | | | $ | 1,330,770 | |
Massachusetts Development Finance Agency, 5.00% due 7/1/2019 (CareGroup Healthcare System) | | A-/A3 | | | 2,800,000 | | | | 3,122,896 | |
Massachusetts Development Finance Agency, 5.00% due 7/1/2020 (CareGroup Healthcare System) | | A-/A3 | | | 5,000,000 | | | | 5,711,150 | |
Massachusetts Development Finance Agency, 5.00% due 7/1/2021 (CareGroup Healthcare System) | | A-/A3 | | | 2,330,000 | | | | 2,710,745 | |
Massachusetts DFA, 5.50% due 10/1/2025 (Simmons College) | | BBB+/Baa1 | | | 460,000 | | | | 551,149 | |
Massachusetts DFA, 5.50% due 10/1/2028 (Simmons College) | | BBB+/Baa1 | | | 1,330,000 | | | | 1,577,340 | |
Massachusetts Educational Financing Authority, 5.50% due 1/1/2022 (Higher Education Student Loans) | | AA/NR | | | 1,130,000 | | | | 1,276,539 | |
| | | |
MICHIGAN — 5.45% | | | | | | | | | | |
Board of Governors of Wayne State University, 5.00% due 11/15/2031 (Educational Facilities and Equipment) | | AA-/Aa3 | | | 1,010,000 | | | | 1,186,750 | |
Brighton Area Schools GO, 5.00% due 5/1/2016 (Livingston County School Building and Site; Insured: Q-SBLF) | | NR/Aa1 | | | 370,000 | | | | 371,376 | |
City of Troy GO, 5.00% due 10/1/2016 (Public Safety Facilities and City Hall) | | AAA/NR | | | 1,060,000 | | | | 1,082,059 | |
City of Troy GO, 5.00% due 11/1/2025 (Downtown Development Authority-Community Center Facilities) | | AAA/NR | | | 300,000 | | | | 358,992 | |
County of Genesee, 5.00% due 11/1/2024 (Water Supply System; Insured: BAM) | | AA/A2 | | | 610,000 | | | | 719,910 | |
County of Genesee, 5.00% due 11/1/2025 (Water Supply System; Insured: BAM) | | AA/A2 | | | 345,000 | | | | 404,202 | |
County of Genesee, 5.25% due 11/1/2026 (Water Supply System; Insured: BAM) | | AA/A2 | | | 900,000 | | | | 1,063,143 | |
County of Genesee, 5.25% due 11/1/2027 (Water Supply System; Insured: BAM) | | AA/A2 | | | 1,375,000 | | | | 1,613,342 | |
County of Genesee, 5.25% due 11/1/2028 (Water Supply System; Insured: BAM) | | AA/A2 | | | 645,000 | | | | 750,974 | |
County of Genesee, 5.00% due 11/1/2029 (Water Supply System; Insured: BAM) | | AA/A2 | | | 1,210,000 | | | | 1,384,663 | |
County of Genesee, 5.00% due 11/1/2030 (Water Supply System; Insured: BAM) | | AA/A2 | | | 1,195,000 | | | | 1,361,452 | |
County of Genesee, 5.125% due 11/1/2032 (Water Supply System; Insured: BAM) | | AA/A2 | | | 750,000 | | | | 855,367 | |
Detroit City School District GO, 5.25% due 5/1/2026 (School Building & Site Improvement; Insured: AGM/Q-SBLF) | | AA/Aa1 | | | 3,150,000 | | | | 3,784,000 | |
Detroit City School District GO, 5.25% due 5/1/2027 (School Building & Site Improvement; Insured: AGM/Q-SBLF) | | AA/Aa1 | | | 1,100,000 | | | | 1,337,314 | |
Kalamazoo Hospital Finance Authority, 5.00% due 5/15/2019 (Bronson Hospital; Insured: AGM) | | AA/A2 | | | 2,000,000 | | | | 2,179,080 | |
Kalamazoo Hospital Finance Authority, 5.00% due 5/15/2022 (Bronson Hospital; Insured: AGM) | | NR/A2 | | | 2,470,000 | | | | 2,797,398 | |
Kalamazoo Hospital Finance Authority, 5.25% due 5/15/2026 (Bronson Hospital) | | NR/A2 | | | 1,285,000 | | | | 1,440,112 | |
Michigan Finance Authority, 5.00% due 4/1/2026 (Government Loan Program) | | A+/NR | | | 1,580,000 | | | | 1,776,631 | |
Michigan Finance Authority, 5.00% due 8/1/2031 (Beaumont Health Credit Group) | | A/A1 | | | 19,080,000 | | | | 22,257,011 | |
Michigan Finance Authority, 5.00% due 8/1/2032 (Beaumont Health Credit Group) | | A/A1 | | | 12,000,000 | | | | 13,949,640 | |
Michigan Public School Academy, 8.00% due 8/1/2035 (Will Carleton Charter School) | | NR/NR | | | 930,000 | | | | 988,581 | |
Michigan State Building Authority, 0% due 10/15/2025 pre-refunded 10/15/2016 (Insured: Nat’l-Re) | | AA-/Aa2 | | | 2,790,000 | | | | 1,796,230 | |
Michigan State Building Authority, 0% due 10/15/2025 (Insured: Nat’l-Re) | | AA-/Aa2 | | | 2,210,000 | | | | 1,416,301 | |
Michigan State Hospital Finance Authority, 5.00% due 11/15/2024 pre-refunded 11/15/2017 (Edward W. Sparrow Hospital Association) | | NR/NR | | | 1,520,000 | | | | 1,623,193 | |
Michigan State Hospital Finance Authority, 5.00% due 11/15/2024 (Edward W. Sparrow Hospital Association) | | A+/A1 | | | 620,000 | | | | 656,636 | |
Michigan State Hospital Finance Authority, 5.00% due 7/15/2025 pre-refunded 7/15/2017 (Oakwood Health System) | | A/A1 | | | 3,000,000 | | | | 3,166,560 | |
Michigan State Hospital Finance Authority, 5.625% due 11/15/2029 (Henry Ford Health System) | | A-/A3 | | | 2,500,000 | | | | 2,869,375 | |
Michigan Strategic Fund, 5.25% due 10/15/2023 (Michigan House of Representatives Facilities; Insured: AGM) | | AA/Aa3 | | | 1,000,000 | | | | 1,098,380 | |
Royal Oak Hospital Finance Authority, 5.25% due 8/1/2016 (William Beaumont Hospital) (ETM) | | NR/A1 | | | 2,000,000 | | | | 2,031,660 | |
Royal Oak Hospital Finance Authority, 8.00% due 9/1/2029 pre-refunded 9/1/2018 (William Beaumont Hospital) | | NR/Aaa | | | 2,540,000 | | | | 2,974,340 | |
State of Michigan, 5.50% due 11/1/2020 (Trunk Line Fund; Insured: AGM) | | AA+/Aa2 | | | 1,500,000 | | | | 1,783,320 | |
| | | |
MINNESOTA — 0.45% | | | | | | | | | | |
Housing & Redevelopment Authority of the City of St. Paul, 5.25% due 5/15/2020 pre-refunded 11/15/2016 (HealthPartners Health System) | | A/Aaa | | | 1,965,000 | | | | 2,022,240 | |
Minnesota Agriculture & Economic Development Board, 5.50% due 2/15/2025 (Essentia Health; Insured: AGM) | | AA/NR | | | 2,500,000 | | | | 2,873,650 | |
State of Minnesota GO, 5.00% due 8/1/2016 (State Trunk Highway System) | | AA+/Aa1 | | | 1,745,000 | | | | 1,771,786 | |
| | | |
MISSISSIPPI — 0.64% | | | | | | | | | | |
Mississippi Development Bank, 5.00% due 7/1/2022 (City of Canton Parking Facilities) | | NR/NR | | | 1,935,000 | | | | 2,089,606 | |
Mississippi Development Bank, 5.25% due 8/1/2027 (Department of Corrections) | | AA-/NR | | | 3,415,000 | | | | 3,908,809 | |
Mississippi Development Bank GO, 5.00% due 3/1/2025 (Capital City Convention Center) | | AA-/A3 | | | 2,850,000 | | | | 3,484,353 | |
| | | |
MISSOURI — 1.55% | | | | | | | | | | |
Kansas City Metropolitan Community Colleges Building Corp., 5.00% due 7/1/2017 pre-refunded 7/1/2016 (Junior College District; Insured: Natl-Re) | | NR/A3 | | | 1,000,000 | | | | 1,011,450 | |
Missouri Development Finance Board, 5.00% due 4/1/2019 (Eastland Center) | | A-/NR | | | 1,000,000 | | | | 1,039,860 | |
Missouri Development Finance Board, 5.00% due 4/1/2021 (Eastland Center) | | A-/NR | | | 2,000,000 | | | | 2,079,720 | |
Missouri Development Finance Board, 5.125% due 4/1/2022 (Eastland Center) | | A-/NR | | | 2,000,000 | | | | 2,139,060 | |
Missouri Development Finance Board, 0.35% due 12/1/2033 put 4/1/2016 (The Nelson Gallery Foundation; SPA: Northern Trust Co.) (daily demand notes) | | AAA/Aaa | | | 700,000 | | | | 700,000 | |
Missouri Health and Educational Facilities Authority, 5.00% due 4/1/2019 (Webster University) | | NR/A2 | | | 2,235,000 | | | | 2,484,873 | |
Missouri Health and Educational Facilities Authority, 5.00% due 4/1/2021 (Webster University) | | NR/A2 | | | 2,520,000 | | | | 2,917,026 | |
Semi-Annual Report 13
| | |
| SCHEDULE OF INVESTMENTS, CONTINUED | | |
| |
Thornburg Intermediate Municipal Fund | | March 31, 2016 (Unaudited) |
| | | | | | | | | | |
ISSUER-DESCRIPTION | | CREDIT RATING†
S&P/ MOODY’S | | PRINCIPAL
AMOUNT | | | VALUE | |
Missouri Health and Educational Facilities Authority, 0.35% due 3/1/2040 put 4/1/2016 (Washington University; SPA: U.S. Bank, N.A.) (daily demand notes) | | AAA/Aaa | | $ | 7,000,000 | | | $ | 7,000,000 | |
Tax Increment Financing Commission of Kansas City, 5.25% due 3/1/2018 (Maincor Public Improvements) (ETM) | | NR/NR | | | 515,000 | | | | 545,818 | |
Tax Increment Financing Commission of Kansas City, 5.00% due 5/1/2022 (Union Hill Redevelopment Project) | | NR/NR | | | 2,915,000 | | | | 3,088,355 | |
| | | |
NEVADA — 0.88% | | | | | | | | | | |
Carson City, 5.00% due 9/1/2027 (Carson Tahoe Regional Medical Center) | | BBB+/NR | | | 2,450,000 | | | | 2,741,084 | |
Washoe County GO, 5.00% due 7/1/2026 (Reno Sparks Convention & Visitors Authority) | | AA/Aa2 | | | 5,000,000 | | | | 5,772,250 | |
Washoe County GO, 5.00% due 7/1/2029 (Reno Sparks Convention & Visitors Authority) | | AA/Aa2 | | | 2,000,000 | | | | 2,338,320 | |
Washoe County GO, 5.00% due 7/1/2032 (Reno Sparks Convention & Visitors Authority) | | AA/Aa2 | | | 2,000,000 | | | | 2,288,980 | |
| | | |
NEW HAMPSHIRE — 1.57% | | | | | | | | | | |
New Hampshire Health and Education Facilities Authority, 5.25% due 10/1/2023 (Southern New Hampshire Medical Center) | | A-/NR | | | 1,000,000 | | | | 1,064,670 | |
New Hampshire Health and Education Facilities Authority, 0.39% due 7/1/2033 put 4/1/2016 (University System of New Hampshire; SPA: Wells Fargo Bank, N.A.) (daily demand notes) | | A+/Aa3 | | | 11,685,000 | | | | 11,685,000 | |
New Hampshire Health and Education Facilities Authority, 0.39% due 7/1/2035 put 4/1/2016 (University System of New Hampshire; SPA: U.S. Bank, N.A.) (daily demand notes) | | A+/Aa3 | | | 3,610,000 | | | | 3,610,000 | |
New Hampshire Municipal Bond Bank, 5.00% due 8/15/2026 | | AA+/Aa2 | | | 1,860,000 | | | | 2,270,651 | |
State of New Hampshire, 5.00% due 2/1/2022 (Turnpike System) | | A+/A1 | | | 2,250,000 | | | | 2,693,520 | |
State of New Hampshire, 5.00% due 2/1/2024 (Turnpike System) | | A+/A1 | | | 1,755,000 | | | | 2,080,816 | |
| | | |
NEW JERSEY — 2.31% | | | | | | | | | | |
Burlington County Bridge Commission, 4.00% due 12/1/2017 (County Governmental Loan Program) | | AA/Aa2 | | | 850,000 | | | | 896,146 | |
Cape May County Industrial Pollution Control Financing Authority, 6.80% due 3/1/2021 (Atlantic City Electric Company; Insured: Natl-Re) | | AA-/A3 | | | 560,000 | | | | 675,937 | |
Essex County Improvement Authority, 5.50% due 10/1/2024 (County Correctional Facilities & Gibraltar Facilities; Insured: Natl-Re) | | NR/Aa2 | | | 2,500,000 | | | | 3,208,975 | |
New Jersey EDA, 5.00% due 3/1/2026 (School Facilities Construction) | | A-/A3 | | | 2,000,000 | | | | 2,173,240 | |
New Jersey EDA, 5.50% due 9/1/2026 (School Facilities Construction; Insured: AMBAC) | | A-/A3 | | | 3,000,000 | | | | 3,502,740 | |
New Jersey EDA, 5.50% due 9/1/2027 (School Facilities Construction; Insured: Natl-Re) | | AA-/A3 | | | 1,700,000 | | | | 2,039,558 | |
New Jersey EDA, 5.00% due 6/15/2029 (School Facilities Construction) | | A-/A3 | | | 12,890,000 | | | | 13,982,170 | |
New Jersey State Health Care Facilities Financing Authority, 5.00% due 7/1/2027 (Virtua Health) | | AA-/NR | | | 2,000,000 | | | | 2,364,920 | |
New Jersey State Health Care Facilities Financing Authority, 5.00% due 7/1/2028 (Virtua Health) | | AA-/NR | | | 1,000,000 | | | | 1,173,190 | |
New Jersey Water Supply Authority, 5.00% due 8/1/2019 (Manasquan Reservoir Water Supply System; Insured: Natl-Re) | | AA/Aa3 | | | 635,000 | | | | 637,502 | |
Passaic Valley Sewage Commissioners GO, 5.75% due 12/1/2022 | | NR/A3 | | | 3,000,000 | | | | 3,650,520 | |
| | | |
NEW MEXICO — 0.87% | | | | | | | | | | |
City of Farmington, 4.70% due 9/1/2024 (Arizona Public Service Co.-Four Corners Project) | | A-/A2 | | | 3,000,000 | | | | 3,336,750 | |
City of Las Cruces, 5.00% due 6/1/2030 (NMFA Loan) | | NR/Aa3 | | | 2,040,000 | | | | 2,315,298 | |
New Mexico Hospital Equipment Loan Council, 5.00% due 7/1/2032 (Haverland Carter Lifestyle Group) | | NR/NR | | | 2,130,000 | | | | 2,253,881 | |
New Mexico Hospital Equipment Loan Council, 0.50% due 8/1/2034 put 4/7/2016 (Presbyterian Healthcare Services; SPA: JPMorgan Chase Bank, N.A.) (weekly demand notes) | | AA/Aa3 | | | 5,000,000 | | | | 5,000,000 | |
| | | |
NEW YORK — 8.28% | | | | | | | | | | |
City of New York GO, 0.36% due 8/1/2020 put 4/1/2016 (Capital Projects; LOC: JPMorgan Chase Bank, N.A.) (daily demand notes) | | AAA/Aa1 | | | 100,000 | | | | 100,000 | |
City of New York GO, 0.38% due 8/1/2020 put 4/1/2016 (Capital Projects; Insured: AGM; SPA: State Street Bank & Trust Co.) (daily demand notes) | | AA/Aa2 | | | 2,000,000 | | | | 2,000,000 | |
City of New York GO, 0.38% due 8/1/2023 put 4/1/2016 (Capital Projects SPA; State Street Bank & Trust Co.) (daily demand notes) | | AA/Aa2 | | | 900,000 | | | | 900,000 | |
City of New York GO, 0.36% due 10/1/2023 put 4/1/2016 (Capital Projects; LOC: JPMorgan Chase Bank, N.A.) (daily demand notes) | | AAA/Aa1 | | | 1,100,000 | | | | 1,100,000 | |
City of New York GO, 5.00% due 8/1/2027 (City Budget Financial Management) | | AA/Aa2 | | | 4,530,000 | | | | 5,486,962 | |
City of New York GO, 5.00% due 8/1/2030 (City Budget Financial Management) | | AA/Aa2 | | | 5,000,000 | | | | 6,058,050 | |
City of New York GO, 5.00% due 8/1/2031 (City Budget Financial Management) | | AA/Aa2 | | | 4,000,000 | | | | 4,821,360 | |
City of New York GO, 0.39% due 8/1/2035 put 4/1/2016 (Capital Projects) (daily demand notes) | | AA/Aa2 | | | 6,000,000 | | | | 6,000,000 | |
City of New York GO, 0.36% due 1/1/2036 put 4/1/2016 (Gowanus Canal Site; SPA: JPMorgan Chase Bank, N.A.) (daily demand notes) | | AA/Aa2 | | | 4,800,000 | | | | 4,800,000 | |
City of New York GO, 0.36% due 3/1/2040 put 4/1/2016 (Capital Projects) (daily demand notes) | | AA/Aa2 | | | 100,000 | | | | 100,000 | |
County of Nassau GO, 5.00% due 4/1/2026 (Insured: BAM) | | AA/NR | | | 1,300,000 | | | | 1,570,335 | |
Erie County Industrial Development Agency, 5.00% due 5/1/2019 (City of Buffalo School District) | | AA/Aa2 | | | 3,000,000 | | | | 3,368,640 | |
Erie County Industrial Development Agency, 5.00% due 5/1/2027 (City of Buffalo School District) (State Aid Withholding) | | AA/Aa2 | | | 5,000,000 | | | | 6,052,200 | |
Lake Placid Central School District GO, 5.00% due 6/15/2017 (Educational Facilities; Insured: Natl-Re) (State Aid Withholding) | | NR/Aa3 | | | 305,000 | | | | 320,396 | |
Metropolitan Transportation Authority, 5.00% due 11/15/2016 | | AA-/A1 | | | 4,200,000 | | | | 4,318,734 | |
14 Semi-Annual Report
| | |
| SCHEDULE OF INVESTMENTS, CONTINUED | | |
| |
Thornburg Intermediate Municipal Fund | | March 31, 2016 (Unaudited) |
| | | | | | | | | | |
ISSUER-DESCRIPTION | | CREDIT RATING†
S&P/ MOODY’S | | PRINCIPAL
AMOUNT | | | VALUE | |
New York City Municipal Water Finance Authority, 0.36% due 6/15/2043 put 4/1/2016 (Water & Sewer System; SPA: JPMorgan Chase Bank, N.A.) (daily demand notes) | | AA+/Aa2 | | $ | 4,050,000 | | | $ | 4,050,000 | |
New York City Municipal Water Finance Authority, 0.36% due 6/15/2050 put 4/1/2016 (Water & Sewer System; SPA: JPMorgan Chase Bank, N.A.) (daily demand notes) | | AA+/Aa1 | | | 17,300,000 | | | | 17,300,000 | |
New York City Municipal Water Finance Authority, 0.36% due 6/15/2050 put 4/1/2016 (Water & Sewer System; SPA: JPMorgan Chase Bank, N.A.) (daily demand notes) | | AA+/Aa1 | | | 7,350,000 | | | | 7,350,000 | |
New York City Transitional Finance Authority, 5.00% due 11/1/2016 pre-refunded 11/1/2016 (City Capital Projects) (ETM) | | NR/NR | | | 1,315,000 | | | | 1,348,888 | |
New York City Transitional Finance Authority, 0.55% due 11/1/2028 put 4/7/2016 (City Capital Projects; SPA: JPMorgan Chase Bank, N.A.) (weekly demand notes) | | AAA/Aaa | | | 2,500,000 | | | | 2,500,000 | |
New York City Transitional Finance Authority, 0.38% due 8/1/2031 put 4/1/2016 (City Capital Projects; SPA: Landesbank Hessen-Thuringen) (daily demand notes) | | AAA/Aaa | | | 25,000,000 | | | | 25,000,000 | |
New York State Dormitory Authority, 5.625% due 7/1/2016 (City University System) | | AA/Aa2 | | | 365,000 | | | | 369,504 | |
New York State Dormitory Authority, 5.00% due 7/1/2017 (Bishop Henry B. Hucles Nursing Home; Insured: SONYMA) | | NR/Aa1 | | | 850,000 | | | | 858,823 | |
New York State Dormitory Authority, 5.25% due 5/15/2021 (State University Educational Facilities) | | AA/Aa2 | | | 500,000 | | | | 582,280 | |
New York State Dormitory Authority, 5.00% due 7/1/2023 (Miriam Osborn Memorial Home Assoc.) | | NR/NR | | | 2,180,000 | | | | 2,367,175 | |
New York State Dormitory Authority, 5.00% due 12/15/2027 (Metropolitan Transportation Authority & State Urban Development Corp.) | | AAA/Aa1 | | | 2,500,000 | | | | 3,030,300 | |
New York State Dormitory Authority, 0.36% due 7/1/2033 put 4/1/2016 (University of Rochester; LOC: HSBC Bank USA, N.A.) (daily demand notes) | | AAA/Aa1 | | | 500,000 | | | | 500,000 | |
New York State Thruway Authority, 5.00% due 1/1/2030 (Multi-Year Highway and Bridge Capital Program) | | A/A2 | | | 7,480,000 | | | | 8,973,756 | |
United Nations Development Corp., 5.00% due 7/1/2025 (One, Two and Three U.N. Plaza Project) | | NR/A1 | | | 1,700,000 | | | | 1,895,194 | |
| | | |
NORTH CAROLINA — 0.55% | | | | | | | | | | |
Charlotte-Mecklenburg Hospital Authority, 3.00% due 1/15/2018 (Carolinas HealthCare System) | | AA-/Aa3 | | | 600,000 | | | | 623,346 | |
Charlotte-Mecklenburg Hospital Authority, 5.00% due 1/15/2028 (Carolinas HealthCare System) | | AA-/Aa3 | | | 2,190,000 | | | | 2,565,278 | |
Charlotte-Mecklenburg Hospital Authority, 0.35% due 1/15/2038 put 4/1/2016 (Carolinas HealthCare System; SPA: JPMorgan Chase Bank, N.A.) (daily demand notes) | | AA-/Aa3 | | | 1,460,000 | | | | 1,460,000 | |
North Carolina Medical Care Commission, 5.00% due 6/1/2030 (Vidant Health) | | A+/A1 | | | 3,000,000 | | | | 3,543,540 | |
| | | |
NORTH DAKOTA — 0.07% | | | | | | | | | | |
County of Ward, 5.125% due 7/1/2021 (Trinity Health System) | | BBB-/NR | | | 1,000,000 | | | | 1,010,150 | |
| | | |
OHIO — 4.57% | | | | | | | | | | |
Akron, Bath and Copley Joint Township Hospital District, 5.00% due 11/15/2024 (Children’s Hospital Medical Center of Akron) | | NR/A1 | | | 1,000,000 | | | | 1,167,650 | |
American Municipal Power, Inc., 5.25% due 2/15/2028 (AMP Fremont Energy Center) | | A/A1 | | | 4,000,000 | | | | 4,710,440 | |
Cincinnati City School District COP, 5.00% due 12/15/2031 (School Improvement Project) | | A+/Aa3 | | | 3,075,000 | | | | 3,602,086 | |
City of Cleveland, 3.00% due 10/1/2017 (Parks and Recreation Facilities) | | AA/A1 | | | 490,000 | | | | 505,332 | |
City of Cleveland, 5.00% due 11/15/2027 (Public Facilities Improvements) | | AA/A1 | | | 1,285,000 | | | | 1,554,747 | |
City of Cleveland, 5.00% due 10/1/2028 (Bridges and Roadways) | | AA/A1 | | | 2,420,000 | | | | 2,907,436 | |
City of Cleveland, 5.00% due 11/15/2028 (Public Facilities Improvements) | | AA/A1 | | | 1,000,000 | | | | 1,204,230 | |
City of Cleveland, 5.00% due 10/1/2029 (Bridges and Roadways) | | AA/A1 | | | 100,000 | | | | 119,605 | |
City of Cleveland, 5.00% due 11/15/2029 (Public Facilities Improvements) | | AA/A1 | | | 1,415,000 | | | | 1,696,274 | |
City of Cleveland, 5.00% due 11/15/2030 (Public Facilities Improvements) | | AA/A1 | | | 1,485,000 | | | | 1,772,986 | |
City of Cleveland GO, 5.00% due 12/1/2016 (Various Municipal Capital Improvements) | | AA/A1 | | | 2,390,000 | | | | 2,459,166 | |
City of Cleveland GO, 5.00% due 12/1/2024 (Various Municipal Capital Improvements) | | AA/A1 | | | 1,000,000 | | | | 1,228,170 | |
City of Cleveland GO, 5.00% due 12/1/2026 (Various Municipal Capital Improvements) | | AA/A1 | | | 1,230,000 | | | | 1,498,263 | |
City of Hamilton, 5.25% due 10/1/2017 (Wastewater System; Insured: AGM) | | NR/A1 | | | 1,500,000 | | | | 1,506,255 | |
Cleveland-Cuyahoga County Port Authority, 6.25% due 5/15/2016 (Council for Economic Opportunities in Greater Cleveland; LOC: FifthThird Bank) | | BBB+/NR | | | 130,000 | | | | 130,260 | |
Cleveland-Cuyahoga County Port Authority, 5.00% due 10/1/2021 (Cleveland Museum of Art) | | AA+/NR | | | 2,040,000 | | | | 2,380,558 | |
Cleveland-Cuyahoga County Port Authority, 5.00% due 7/1/2025 (County Administration Offices) | | AA-/Aa2 | | | 1,780,000 | | | | 2,200,098 | |
County of Allen, 5.00% due 5/1/2025 (Catholic Health Partners-Mercy Health West Facility) | | AA-/A1 | | | 4,470,000 | | | | 5,215,015 | |
County of Allen, 5.00% due 5/1/2026 (Catholic Health Partners-Mercy Health West Facility) | | AA-/A1 | | | 3,855,000 | | | | 4,471,222 | |
County of Cuyahoga COP, 5.00% due 12/1/2026 (Convention Center Hotel) | | AA-/Aa3 | | | 2,910,000 | | | | 3,471,921 | |
County of Hamilton, 5.00% due 5/15/2028 (Cincinnati Children’s Hospital Medical Center) | | AA/Aa2 | | | 2,665,000 | | | | 3,214,496 | |
County of Hamilton, 5.00% due 5/15/2029 (Cincinnati Children’s Hospital Medical Center) | | AA/Aa2 | | | 1,000,000 | | | | 1,201,040 | |
County of Hamilton, 5.00% due 5/15/2031 (Cincinnati Children’s Hospital Medical Center) | | AA/Aa2 | | | 4,420,000 | | | | 5,231,158 | |
Deerfield Township, 5.00% due 12/1/2016 | | NR/A1 | | | 1,035,000 | | | | 1,061,051 | |
Deerfield Township, 5.00% due 12/1/2025 | | NR/A1 | | | 1,000,000 | | | | 1,055,700 | |
Lucas County Health Care Facility, 5.00% due 8/15/2021 (Sunset Retirement Community) | | NR/NR | | | 1,400,000 | | | | 1,481,536 | |
Lucas County Health Care Facility, 5.125% due 8/15/2025 (Sunset Retirement Community) | | NR/NR | | | 1,250,000 | | | | 1,384,550 | |
Ohio Air Quality Development Authority, 5.70% due 8/1/2020 (FirstEnergy Nuclear Generation Corp.) | | BBB-/Baa3 | | | 3,000,000 | | | | 3,359,070 | |
Ohio Air Quality Development Authority, 3.625% due 12/1/2033 put 6/1/2020 (FirstEnergy Nuclear Generation Corp.) | | BBB-/Baa3 | | | 1,000,000 | | | | 1,034,600 | |
Semi-Annual Report 15
| | |
| SCHEDULE OF INVESTMENTS, CONTINUED | | |
| |
Thornburg Intermediate Municipal Fund | | March 31, 2016 (Unaudited) |
| | | | | | | | | | |
ISSUER-DESCRIPTION | | CREDIT RATING†
S&P/ MOODY’S | | PRINCIPAL
AMOUNT | | | VALUE | |
Ohio Higher Educational Facility Commission, 0.39% due 1/1/2043 put 4/1/2016 (Cleveland Clinic Health System; SPA: Barclays Bank plc) (daily demand notes) | | AA-/Aa2 | | $ | 2,900,000 | | | $ | 2,900,000 | |
Ohio Water Development Authority, 5.875% due 6/1/2033 put 6/1/2016 (FirstEnergy Nuclear Generation Corp.) | | BBB-/Baa2 | | | 1,000,000 | | | | 1,007,060 | |
State of Ohio Higher Educational Facility Commission, 5.05% due 7/1/2037 pre-refunded 7/1/2016 (Kenyon College) | | A+/A1 | | | 1,200,000 | | | | 1,213,548 | |
| | | |
OKLAHOMA — 0.78% | | | | | | | | | | |
Oklahoma DFA, 5.00% due 8/15/2026 (INTEGRIS Health) | | AA-/Aa3 | | | 1,000,000 | | | | 1,243,040 | |
Oklahoma DFA, 5.00% due 8/15/2027 (INTEGRIS Health) | | AA-/Aa3 | | | 1,000,000 | | | | 1,233,350 | |
Oklahoma Industries Authority, 5.50% due 7/1/2023 (Oklahoma Medical Research Foundation) | | NR/A2 | | | 3,730,000 | | | | 4,108,670 | |
Oklahoma Municipal Power Authority, 5.00% due 1/1/2018 (Insured: AGM) | | AA/A2 | | | 1,000,000 | | | | 1,071,560 | |
Oklahoma Turnpike Authority, 0.35% due 1/1/2028 put 4/1/2016 (Oklahoma Turnpike System; SPA: JPMorgan Chase Bank, N.A.) (daily demand notes) | | AA-/Aa3 | | | 2,700,000 | | | | 2,700,000 | |
Tulsa County Industrial Authority, 5.00% due 12/15/2024 (St. Francis Health System, Inc.) | | AA+/Aa2 | | | 1,130,000 | | | | 1,165,482 | |
| | | |
OREGON — 2.79% | | | | | | | | | | |
State of Oregon GO, 2.00% due 9/15/2016 (Cash Management) | | SP-1+/Mig1 | | | 30,000,000 | | | | 30,228,300 | |
State of Oregon GO, 0.35% due 12/1/2041 put 4/1/2016 (Veterans’ Loan Program; SPA: U.S. Bank, N.A.) (daily demand notes) | | AA+/Aa1 | | | 11,300,000 | | | | 11,300,000 | |
| | | |
PENNSYLVANIA — 5.85% | | | | | | | | | | |
Allegheny County Hospital Development Authority, 5.00% due 5/15/2019 (University of Pittsburgh Medical Center) | | A+/Aa3 | | | 2,500,000 | | | | 2,803,800 | |
Allegheny County IDA, 5.90% due 8/15/2026 (Propel Charter School-McKeesport) | | BBB-/NR | | | 970,000 | | | | 1,040,228 | |
Allegheny County IDA, 6.375% due 8/15/2035 (Propel Charter School-McKeesport) | | BBB-/NR | | | 1,130,000 | | | | 1,225,993 | |
Bethlehem Area School District GO, 5.00% due 10/15/2020 pre-refunded 04/15/2019 (Northampton and Lehigh Counties District; Insured: AGM) (State Aid Withholding) | | AA/NR | | | 95,000 | | | | 106,615 | |
Bethlehem Area School District GO, 5.00% due 10/15/2020 (Northampton and Lehigh Counties District; Insured: AGM) (State Aid Withholding) | | AA/NR | | | 380,000 | | | | 418,498 | |
Chartiers Valley Industrial & Commercial Development Authority, 5.75% due 12/1/2022 (Asbury Health Center) | | NR/NR | | | 900,000 | | | | 913,059 | |
City of Philadelphia, 5.00% due 8/1/2032 (Pennsylvania Gas Works) | | A-/Baa1 | | | 1,000,000 | | | | 1,165,260 | |
City of Philadelphia, 5.00% due 8/1/2033 (Pennsylvania Gas Works) | | A-/Baa1 | | | 800,000 | | | | 928,672 | |
City of Philadelphia, 5.00% due 8/1/2034 (Pennsylvania Gas Works) | | A-/Baa1 | | | 500,000 | | | | 578,215 | |
Commonwealth of Pennsylvania GO, 5.00% due 3/15/2022 (Capital Facilities) | | AA-/Aa3 | | | 12,485,000 | | | | 14,711,450 | |
County of Lehigh GO, 5.00% due 11/15/2016 | | NR/Aa1 | | | 5,725,000 | | | | 5,885,472 | |
County of Luzerne GO, 5.00% due 11/15/2029 (Insured: AGM) | | AA/NR | | | 3,000,000 | | | | 3,456,180 | |
Dallastown Area School District GO, 4.00% due 5/1/2021 (State Aid Withholding) | | AA/NR | | | 460,000 | | | | 513,774 | |
Lancaster County Solid Waste Management Authority, 5.25% due 12/15/2030 (Acquisition of Susquehanna Resource Management Facility) | | AA-/NR | | | 3,000,000 | | | | 3,549,660 | |
Lehigh County IDA, 0.90% due 2/15/2027 put 8/15/2017 (PPL Electric Utilities Corp.) | | A/A1 | | | 3,250,000 | | | | 3,248,862 | |
Monroeville Financing Authority, 5.00% due 2/15/2026 (University of Pittsburgh Medical Center) | | A+/Aa3 | | | 3,490,000 | | | | 4,341,909 | |
b Pennsylvania Economic DFA, 4.625% due 12/1/2018 (Colver Project; Insured: AMBAC) (AMT) | | BBB-/Ba1 | | | 7,470,000 | | | | 7,493,605 | |
Pennsylvania Higher Education Facilities Authority, 0% due 7/1/2020 (Insured: AMBAC) | | NR/NR | | | 2,032,839 | | | | 1,491,392 | |
Pennsylvania State Public School Building Authority GO, 5.00% due 6/1/2027 (Philadelphia District; Insured: AGM) (State Aid Withholding) | | AA/A2 | | | 5,000,000 | | | | 5,819,300 | |
Pennsylvania Turnpike Commission, 5.35% due 12/1/2030 (PennDOT-Mass Transit Agencies) | | A-/A3 | | | 4,000,000 | | | | 4,574,720 | |
Pittsburgh Water & Sewer Authority, 5.00% due 9/1/2030 (Water and Sewer System; Insured: AGM) | | A/A2 | | | 5,000,000 | | | | 5,853,600 | |
Pittsburgh Water & Sewer Authority, 5.00% due 9/1/2031 (Water and Sewer System; Insured: AGM) | | A/A2 | | | 3,740,000 | | | | 4,355,567 | |
Pittsburgh Water & Sewer Authority, 5.00% due 9/1/2031 (Water and Sewer System; Insured: AGM) | | A/A2 | | | 3,665,000 | | | | 4,268,222 | |
Plum Borough School District GO, 4.00% due 9/15/2020 (Insured: BAM) (State Aid Withholding) | | AA/NR | | | 405,000 | | | | 449,234 | |
Plum Borough School District GO, 4.00% due 9/15/2017 (Insured: BAM) (State Aid Withholding) | | AA/NR | | | 365,000 | | | | 381,082 | |
Plum Borough School District GO, 4.00% due 9/15/2018 (Insured: BAM) (State Aid Withholding) | | AA/NR | | | 355,000 | | | | 379,577 | |
Plum Borough School District GO, 4.00% due 9/15/2020 (Insured: BAM) (State Aid Withholding) | | AA/NR | | | 385,000 | | | | 427,050 | |
Plum Borough School District GO, 4.00% due 9/15/2021 (Insured: BAM) (State Aid Withholding) | | AA/NR | | | 425,000 | | | | 477,020 | |
Plum Borough School District GO, 5.00% due 9/15/2021 (Insured: BAM) (State Aid Withholding) | | AA/NR | | | 430,000 | | | | 504,979 | |
School District of Philadelphia GO, 5.00% due 9/1/2018 (School Reform Commission) (State Aid Withholding) | | NR/Ba2 | | | 5,250,000 | | | | 5,670,945 | |
| | | |
RHODE ISLAND — 0.36% | | | | | | | | | | |
State of Rhode Island and Providence Plantations COP, 5.00% due 10/1/2024 (Training School Project) | | AA-/Aa3 | | | 3,595,000 | | | | 4,372,670 | |
State of Rhode Island and Providence Plantations GO, 4.00% due 10/15/2023 (Consolidated Capital Development Loan) | | AA/Aa2 | | | 800,000 | | | | 913,160 | |
| | | |
SOUTH CAROLINA — 0.94% | | | | | | | | | | |
City of Myrtle Beach, 5.00% due 6/1/2028 (Municipal Sports Complex) | | AA-/A1 | | | 1,000,000 | | | | 1,183,340 | |
City of Myrtle Beach, 5.00% due 6/1/2030 (Municipal Sports Complex) | | AA-/A1 | | | 1,000,000 | | | | 1,170,850 | |
County of Oconee, 0.37% due 2/1/2017 put 4/1/2016 (Duke Energy Corp.) (daily demand notes) | | A-/A1 | | | 800,000 | | | | 800,000 | |
Greenwood Fifty School Facilities, Inc., 5.00% due 12/1/2025 pre-refunded 12/1/2017 (School District No. 50; Insured: AGM) | | AA/A1 | | | 2,400,000 | | | | 2,568,384 | |
16 Semi-Annual Report
| | |
| SCHEDULE OF INVESTMENTS, CONTINUED | | |
| |
Thornburg Intermediate Municipal Fund | | March 31, 2016 (Unaudited) |
| | | | | | | | | | |
ISSUER-DESCRIPTION | | CREDIT RATING†
S&P/ MOODY’S | | PRINCIPAL
AMOUNT | | | VALUE | |
Lexington County Health Services District, Inc., 5.00% due 11/1/2016 (Lexington Medical Center) | | AA-/A1 | | $ | 250,000 | | | $ | 256,370 | |
Lexington One School Facilities Corp., 5.00% due 12/1/2019 pre-refunded 12/1/2016 (School District No. 1) | | NR/Aa3 | | | 1,000,000 | | | | 1,029,280 | |
SCAGO Educational Facilities Corp., 5.00% due 12/1/2017 pre-refunded 12/1/2016 (Colleton School District; Insured: AGM) | | AA/A3 | | | 1,000,000 | | | | 1,029,280 | |
Securing Assets For Education, 5.00% due 12/1/2019 pre-refunded 12/1/2016 (School District of Berkeley County) | | AA-/Aa3 | | | 2,000,000 | | | | 2,058,560 | |
South Carolina Housing Finance & Development Authority, 5.30% due 7/1/2023 (AMT) | | NR/Aa1 | | | 730,000 | | | | 748,965 | |
Sumter Two School Facilities, Inc., 5.00% due 12/1/2021 pre-refunded 12/1/2017 (School District No. 2; Insured: AGM) | | AA/A3 | | | 2,855,000 | | | | 3,055,307 | |
| | | |
SOUTH DAKOTA — 0.40% | | | | | | | | | | |
South Dakota Health and Educational Facilities Authority, 5.00% due 7/1/2023 (Avera Health) | | AA-/A1 | | | 1,575,000 | | | | 1,841,017 | |
South Dakota Health and Educational Facilities Authority, 5.00% due 11/1/2024 (Sanford Health) | | A+/A1 | | | 1,700,000 | | | | 1,907,638 | |
South Dakota Health and Educational Facilities Authority, 5.00% due 11/1/2028 (Sanford Health) | | A+/A1 | | | 800,000 | | | | 952,328 | |
South Dakota Health and Educational Facilities Authority, 5.00% due 11/1/2029 (Sanford Health) | | A+/A1 | | | 1,000,000 | | | | 1,184,700 | |
| | | |
TENNESSEE — 0.83% | | | | | | | | | | |
City of Memphis GO, 5.00% due 10/1/2016 (General Improvements; Insured: Natl-Re) | | AA/Aa2 | | | 1,000,000 | | | | 1,022,670 | |
Tennessee Energy Acquisition Corp., 5.00% due 2/1/2023 (The Gas Project) | | BBB+/A3 | | | 2,500,000 | | | | 2,914,175 | |
Tennessee Energy Acquisition Corp., 5.25% due 9/1/2023 (The Gas Project) | | BBB+/A3 | | | 7,000,000 | | | | 8,368,920 | |
| | | |
TEXAS — 10.47% | | | | | | | | | | |
Austin Community College District, 5.50% due 8/1/2023 pre-refunded 8/1/2018 (Round Rock Campus) | | AA/Aa2 | | | 2,180,000 | | | | 2,414,306 | |
Bexar County Health Facilities Development Corp., 5.00% due 7/1/2027 (Army Retirement Residence) | | BBB/NR | | | 1,630,000 | | | | 1,674,597 | |
Bexar Metropolitan Water District, 5.00% due 5/1/2021 pre-refunded 5/1/2017 (Waterworks System; Insured: Syncora) | | A+/A1 | | | 1,300,000 | | | | 1,360,996 | |
Bexar Metropolitan Water District, 5.00% due 5/1/2022 pre-refunded 5/1/2017 (Waterworks System; Insured: Syncora) | | A+/A1 | | | 2,300,000 | | | | 2,407,916 | |
City of Brownsville, 5.00% due 9/1/2017 (Water, Wastewater & Electric Utilities Systems) | | A+/A2 | | | 500,000 | | | | 528,955 | |
City of Brownsville, 5.00% due 9/1/2020 (Water, Wastewater & Electric Utilities Systems) | | A+/A2 | | | 1,000,000 | | | | 1,153,790 | |
City of Galveston, 5.00% due 9/1/2021 (Galveston Island Convention Center; Insured: AGM) | | NR/A2 | | | 545,000 | | | | 630,647 | |
City of Galveston, 5.00% due 9/1/2024 (Galveston Island Convention Center; Insured: AGM) | | NR/A2 | | | 1,115,000 | | | | 1,325,568 | |
City of Houston, 5.00% due 9/1/2032 (Convention & Entertainment Facilities) | | A-/A2 | | | 3,560,000 | | | | 4,166,873 | |
a City of Houston GO, 5.00% due 3/1/2020 (Public Improvements) | | AA/Aa3 | | | 5,000,000 | | | | 5,703,100 | |
a City of Houston GO, 5.00% due 3/1/2021 (Public Improvements) | | AA/Aa3 | | | 5,000,000 | | | | 5,835,650 | |
a City of Houston GO, 5.00% due 3/1/2023 (Public Improvements) | | AA/Aa3 | | | 5,000,000 | | | | 6,039,350 | |
City of Pharr Higher Education Finance Authority, 5.75% due 8/15/2024 (IDEA Public Schools) | | BBB/NR | | | 5,050,000 | | | | 5,555,101 | |
City of San Antonio, 5.00% due 7/1/2024 (Airport System Capital Improvements) (AMT) | | A/A2 | | | 2,065,000 | | | | 2,396,928 | |
City of San Antonio, 5.00% due 7/1/2025 (Airport System Capital Improvements) (AMT) | | A/A2 | | | 1,160,000 | | | | 1,333,698 | |
City of San Antonio, 5.00% due 5/15/2033 (Water System) | | AA/Aa2 | | | 1,500,000 | | | | 1,823,010 | |
City of San Antonio, 5.00% due 5/15/2034 (Water System) | | AA/Aa2 | | | 1,575,000 | | | | 1,904,789 | |
City of San Antonio, 3.00% due 12/1/2045 put 12/1/2019 (Electric and Gas Systems) | | AA-/Aa2 | | | 5,000,000 | | | | 5,321,100 | |
City of Texas City Industrial Development Corp., 7.375% due 10/1/2020 (ARCO Pipe Line Co. Project) | | A-/A2 | | | 2,705,000 | | | | 3,346,112 | |
City of San Antonio, 5.00% due 5/15/2027 (Water System) | | AA/Aa2 | | | 2,575,000 | | | | 3,254,697 | |
Dallas Area Rapid Transit, 5.00% due 12/1/2034 | | AA+/Aa2 | | | 5,475,000 | | | | 6,628,035 | |
Dallas Area Rapid Transit, 5.00% due 12/1/2035 | | AA+/Aa2 | | | 4,000,000 | | | | 4,819,560 | |
Dallas Area Rapid Transit, 5.00% due 12/1/2036 | | AA+/Aa2 | | | 3,000,000 | | | | 3,594,810 | |
Dallas County Utilities & Reclamation District, 5.15% due 2/15/2022 (Insured: AMBAC) | | A-/A3 | | | 3,000,000 | | | | 3,098,130 | |
Dallas ISD GO, 5.00% due 2/15/2036 put 2/15/2022 (Educational Facilities Improvements; Guaranty: PSF) | | AAA/Aaa | | | 7,000,000 | | | | 8,330,630 | |
Harris County Cultural Education Facilities Finance Corp., 5.00% due 12/1/2028 (Memorial Hermann Health System) | | A+/A1 | | | 3,000,000 | | | | 3,586,440 | |
Harris County Cultural Education Facilities Finance Corp., 0.35% due 9/1/2031 put 4/1/2016 (Texas Medical Center; LOC: JPMorgan Chase Bank, N.A.) (daily demand notes) | | AAA/Aa1 | | | 16,880,000 | | | | 16,880,000 | |
Houston Higher Education Finance Corp., 6.50% due 5/15/2031 pre-refunded 5/15/2021 (Cosmos Foundation, Inc.) | | NR/NR | | | 415,000 | | | | 525,021 | |
Houston Higher Education Finance Corp., 6.50% due 5/15/2031 (Cosmos Foundation, Inc.) | | BBB/NR | | | 360,000 | | | | 428,436 | |
Katy ISD GO, 5.00% due 2/15/2034 (Educational Facilities Improvements; Guaranty: PSF) | | AAA/Aaa | | | 7,560,000 | | | | 9,196,740 | |
Kimble County Hospital District GO, 5.00% due 8/15/2017 (Medical Facilities Improvements) | | NR/NR | | | 510,000 | | | | 534,378 | |
Kimble County Hospital District GO, 5.00% due 8/15/2018 (Medical Facilities Improvements) | | NR/NR | | | 525,000 | | | | 562,123 | |
La Vernia Higher Education Finance Corp., 5.75% due 8/15/2024 pre-refunded 8/15/2019 (Kipp, Inc.) | | BBB/NR | | | 3,000,000 | | | | 3,468,360 | |
Lower Colorado River Authority, 5.00% due 5/15/2026 pre-refunded 5/15/2022 | | NR/NR | | | 55,000 | | | | 66,850 | |
Lower Colorado River Authority, 5.00% due 5/15/2026 | | A/A2 | | | 9,415,000 | | | | 11,142,276 | |
North Central Texas Health Facilities Development Corp., 5.00% due 8/15/2019 (Children’s Medical Center of Dallas) | | NR/Aa2 | | | 270,000 | | | | 303,691 | |
North Texas Tollway Authority, 5.00% due 9/1/2017 (DOT-President George Bush Turnpike Western Extension) | | AA+/NR | | | 450,000 | | | | 477,004 | |
Round Rock ISD GO, 5.00% due 8/1/2027 (Educational Facilities Improvements; Guaranty: PSF) | | NR/Aaa | | | 2,705,000 | | | | 3,385,091 | |
Round Rock ISD GO, 5.00% due 8/1/2028 (Educational Facilities Improvements; Guaranty: PSF) | | NR/Aaa | | | 2,840,000 | | | | 3,531,483 | |
Round Rock ISD GO, 5.00% due 8/1/2029 (Educational Facilities Improvements; Guaranty: PSF) | | NR/Aaa | | | 2,980,000 | | | | 3,685,664 | |
San Juan Higher Education Finance Authority, 5.75% due 8/15/2024 (IDEA Public Schools) | | BBB/NR | | | 1,590,000 | | | | 1,793,568 | |
Texas Public Finance Authority Charter School Finance Corp., 5.00% due 8/15/2023 pre-refunded 8/15/2017 (IDEA Public Schools; Insured: ACA) | | BBB/NR | | | 3,000,000 | | | | 3,175,740 | |
Texas Public Finance Authority Charter School Finance Corp., 6.00% due 2/15/2030 pre-refunded 2/15/2020 (Cosmos Foundation, Inc.) | | BBB/NR | | | 1,750,000 | | | | 2,077,285 | |
Semi-Annual Report 17
| | |
| SCHEDULE OF INVESTMENTS, CONTINUED | | |
| |
Thornburg Intermediate Municipal Fund | | March 31, 2016 (Unaudited) |
| | | | | | | | | | |
ISSUER-DESCRIPTION | | CREDIT RATING†
S&P/ MOODY’S | | PRINCIPAL
AMOUNT | | | VALUE | |
Texas Public Finance Authority Charter School Finance Corp., 5.00% due 8/15/2030 pre-refunded 8/15/2017 (IDEA Public Schools; Insured: ACA) | | BBB/NR | | $ | 2,000,000 | | | $ | 2,117,160 | |
Texas Transportation Commission, 5.00% due 8/15/2024 (Central Texas Turnpike System) | | BBB+/Baa1 | | | 1,500,000 | | | | 1,814,925 | |
Texas Transportation Commission, 5.00% due 8/15/2025 (Central Texas Turnpike System) | | BBB+/Baa1 | | | 750,000 | | | | 900,495 | |
Uptown Development Authority, 5.50% due 9/1/2029 (Infrastructure Improvements) | | BBB/NR | | | 1,250,000 | | | | 1,378,225 | |
| | | |
U.S. VIRGIN ISLANDS — 0.38% | | | | | | | | | | |
Virgin Islands Public Finance Authority, 6.625% due 10/1/2029 | | NR/Baa3 | | | 5,000,000 | | | | 5,578,600 | |
| | | |
UTAH — 0.68% | | | | | | | | | | |
City of Murray, 0.35% due 5/15/2037 put 4/1/2016 (IHC Health Services, Inc.; SPA: JPMorgan Chase Bank, N.A.) (dailydemand notes) | | AA+/Aa1 | | | 2,300,000 | | | | 2,300,000 | |
Local Building Authority of Salt Lake Valley Fire Service Area, 5.25% due 4/1/2020 | | NR/Aa2 | | | 1,250,000 | | | | 1,349,037 | |
Weber County, 0.35% due 2/15/2031 put 4/1/2016 (IHC Health Services, Inc.; SPA: The Bank of NY Mellon) (daily demandnotes) | | AA+/Aa1 | | | 3,700,000 | | | | 3,700,000 | |
Weber County, 0.35% due 2/15/2035 put 4/1/2016 (IHC Health Services, Inc.; SPA: The Bank of NY Mellon) (daily demandnotes) | | AA+/Aa1 | | | 2,750,000 | | | | 2,750,000 | |
| | | |
VIRGINIA — 0.50% | | | | | | | | | | |
County of Hanover IDA, 6.00% due 10/1/2021 (FirstHealth Richmond Memorial Hospital) (ETM) | | AA-/NR | | | 690,000 | | | | 741,198 | |
Pittsylvania County GO, 3.00% due 7/15/2017 (Educational Capital Projects) (State Aid Withholding) | | AA-/Aa3 | | | 210,000 | | | | 210,443 | |
Virginia Housing Development Authority GO, 4.85% due 4/1/2019 (Multi-Family Housing Development) (AMT) | | AAA/Aaa | | | 3,100,000 | | | | 3,224,744 | |
Virginia Housing Development Authority GO, 4.85% due 10/1/2019 (Multi-Family Housing Development) (AMT) | | AAA/Aaa | | | 3,100,000 | | | | 3,205,710 | |
| | | |
WASHINGTON — 2.27% | | | | | | | | | | |
City of Seattle, 5.00% due 2/1/2019 (Light and Power Improvements) | | AA/Aa2 | | | 3,000,000 | | | | 3,341,640 | |
King County Public Hospital District No. 2 GO, 5.00% due 12/1/2028 (EvergreenHealth Medical Center) | | NR/Aa3 | | | 1,015,000 | | | | 1,230,515 | |
King County Public Hospital District No. 2 GO, 5.00% due 12/1/2029 (EvergreenHealth Medical Center) | | NR/Aa3 | | | 2,930,000 | | | | 3,533,814 | |
King County Public Hospital District No. 2 GO, 5.00% due 12/1/2030 (EvergreenHealth Medical Center) | | NR/Aa3 | | | 600,000 | | | | 719,874 | |
King County Public Hospital District No. 2 GO, 5.00% due 12/1/2031 (EvergreenHealth Medical Center) | | NR/Aa3 | | | 2,040,000 | | | | 2,424,622 | |
Skagit County Public Hospital District No. 1 GO, 5.00% due 12/1/2025 (Skagit Regional Health) | | NR/A1 | | | 4,860,000 | | | | 5,737,619 | |
Skagit County Public Hospital District No. 1 GO, 5.00% due 12/1/2028 (Skagit Regional Health) | | NR/A1 | | | 3,000,000 | | | | 3,473,940 | |
Skagit County Public Hospital District No. 2 GO, 5.00% due 12/1/2027 (Island Hospital) | | NR/A1 | | | 2,445,000 | | | | 2,805,858 | |
Skagit County Public Hospital District No. 2 GO, 5.00% due 12/1/2028 (Island Hospital) | | NR/A1 | | | 2,195,000 | | | | 2,512,682 | |
Tacoma School District No.10 GO, 5.00% due 12/1/2019 (Pierce County Capital Projects) | | AA+/Aa1 | | | 1,000,000 | | | | 1,143,570 | |
Tacoma School District No.10 GO, 5.00% due 12/1/2020 (Pierce County Capital Projects) | | AA+/Aa1 | | | 1,000,000 | | | | 1,174,670 | |
Washington Health Care Facilities Authority, 5.25% due 8/15/2024 pre-refunded 8/15/2018 (MultiCare Systems; Insured: AGM) | | AA/Aa3 | | | 1,000,000 | | | | 1,102,800 | |
Washington Health Care Facilities Authority, 6.25% due 8/1/2028 pre-refunded 8/1/2018 (Highline Medical Centers; Insured: FHA 242) | | NR/NR | | | 3,985,000 | | | | 4,480,216 | |
| | | |
WEST VIRGINIA — 0.10% | | | | | | | | | | |
West Virginia Hospital Finance Authority, 5.00% due 6/1/2020 (United Hospital Center; Insured: AMBAC) | | A/A2 | | | 1,530,000 | | | | 1,539,991 | |
| | | |
WISCONSIN — 1.40% | | | | | | | | | | |
Wisconsin Health & Educational Facilities Authority, 5.00% due 7/1/2021 (Agnesian Healthcare, Inc.) | | A/A2 | | | 2,170,000 | | | | 2,442,400 | |
Wisconsin Health & Educational Facilities Authority, 5.00% due 8/15/2023 (ProHealth Care, Inc.) | | A+/A1 | | | 1,980,000 | | | | 2,300,166 | |
Wisconsin Health & Educational Facilities Authority, 5.00% due 8/15/2024 (ProHealth Care, Inc.) | | A+/A1 | | | 2,460,000 | | | | 2,844,990 | |
Wisconsin Health & Educational Facilities Authority, 5.50% due 7/1/2025 (Agnesian Healthcare, Inc.) | | A/A2 | | | 5,000,000 | | | | 5,704,000 | |
Wisconsin Health & Educational Facilities Authority, 5.00% due 8/15/2025 (ProHealth Care, Inc.) | | A+/A1 | | | 3,180,000 | | | | 3,690,676 | |
Wisconsin Health & Educational Facilities Authority, 5.00% due 8/15/2026 (ProHealth Care, Inc.) | | A+/A1 | | | 3,305,000 | | | | 3,815,623 | |
| | | | | | | | | | |
TOTAL INVESTMENTS — 99.37% (Cost $1,397,932,030) | | | | | | | | $ | 1,477,096,974 | |
OTHER ASSETS LESS LIABILITIES — 0.63% | | | | | | | | | 9,398,052 | |
| | | | | | | | | | |
NET ASSETS — 100.00% | | | | | | | | $ | 1,486,495,026 | |
| | | | | | | | | | |
18 Semi-Annual Report
| | |
| SCHEDULE OF INVESTMENTS, CONTINUED | | |
| |
Thornburg Intermediate Municipal Fund | | March 31, 2016 (Unaudited) |
Footnote Legend
| † | Credit ratings are unaudited. Rating changes may have occurred subsequent to the reporting period end. Bonds issued with a maturity of one year or less are assigned Moody’s ratings from MIG-1 to MIG-4 and Standard and Poor’s ratings from SP-1+ to SP-3 with MIG-1 and SP-1+ being the strongest ratings. |
| b | Segregated as collateral for a when-issued security. |
Portfolio Abbreviations
To simplify the listings of securities, abbreviations are used per the table below:
| | |
ACA | | Insured by American Capital Access |
AGM | | Insured by Assured Guaranty Municipal Corp. |
AMBAC | | Insured by American Municipal Bond Assurance Corp. |
AMT | | Alternative Minimum Tax |
BAM | | Insured by Build America Mutual Insurance Co. |
CIFG | | Insured by CIFG Assurance North America Inc. |
COP | | Certificates of Participation |
DFA | | Development Finance Authority |
EDA | | Economic Development Authority |
ETM | | Escrowed to Maturity |
FHA | | Insured by Federal Housing Administration |
GNMA | | Collateralized by Government National Mortgage Association |
GO | | General Obligation |
| | |
HFA | | Health Facilities Authority |
HFFA | | Health Facilities Financing Authority |
IBC | | Insured Bond Certificate |
IDA | | Industrial Development Authority |
ISD | | Independent School District |
Mtg | | Mortgage |
Natl-Re | | Insured by National Public Finance Guarantee Corp. |
PSF | | Guaranteed by Permanent School Fund |
Q-SBLF | | Insured by Qualified School Bond Loan Fund |
SONYMA | | State of New York Mortgage Authority |
Syncora | | Insured by Syncora Guarantee Inc. |
USD | | Unified School District |
See notes to financial statements.
Semi-Annual Report 19
| | |
| STATEMENT OF ASSETS AND LIABILITIES | | |
| |
Thornburg Intermediate Municipal Fund | | March 31, 2016 (Unaudited) |
| | | | |
ASSETS | | | | |
Investments at value (cost $1,397,932,030) (Note 2) | | $ | 1,477,096,974 | |
Cash | | | 2,675,304 | |
Receivable for investments sold | | | 17,356,583 | |
Receivable for fund shares sold | | | 4,356,574 | |
Interest receivable | | | 15,318,672 | |
Prepaid expenses and other assets | | | 116,207 | |
| | | | |
Total Assets | | | 1,516,920,314 | |
| | | | |
| |
LIABILITIES | | | | |
Payable for investments purchased | | | 26,106,111 | |
Payable for fund shares redeemed | | | 3,145,645 | |
Payable to investment advisor and other affiliates (Note 3) | | | 839,489 | |
Accounts payable and accrued expenses | | | 93,744 | |
Dividends payable | | | 240,299 | |
| | | | |
Total Liabilities | | | 30,425,288 | |
| | | | |
| |
NET ASSETS | | $ | 1,486,495,026 | |
| | | | |
NET ASSETS CONSIST OF | | | | |
Distribution in excess of net investment income | | $ | (3,781 | ) |
Net unrealized appreciation on investments | | | 79,164,944 | |
Accumulated net realized gain (loss) | | | (174,546 | ) |
Net capital paid in on shares of beneficial interest | | | 1,407,508,409 | |
| | | | |
| | $ | 1,486,495,026 | |
| | | | |
| |
NET ASSET VALUE | | | | |
Class A Shares: | | | | |
Net asset value and redemption price per share ($455,657,492 applicable to 31,679,476 shares of beneficial interest outstanding - Note 4) | | $ | 14.38 | |
Maximum sales charge, 2.00% of offering price | | | 0.29 | |
| | | | |
Maximum offering price per share | | $ | 14.67 | |
| | | | |
| |
Class C Shares: | | | | |
Net asset value and offering price per share* ($168,029,197 applicable to 11,666,858 shares of beneficial interest outstanding - Note 4) | | $ | 14.40 | |
| | | | |
| |
Class I Shares: | | | | |
Net asset value, offering and redemption price per share ($862,808,337 applicable to 60,062,475 shares of beneficial interest outstanding - Note 4) | | $ | 14.37 | |
| | | | |
| * | Redemption price per share is equal to net asset value less any applicable contingent deferred sales charge. |
See notes to financial statements.
20 Semi-Annual Report
| | |
| STATEMENT OF OPERATIONS | | |
| |
Thornburg Intermediate Municipal Fund | | Six Months Ended March 31, 2016 (Unaudited) |
| | | | |
INVESTMENT INCOME | | | | |
Interest income (net of premium amortized of $5,503,398) | | $ | 20,707,556 | |
| | | | |
| |
EXPENSES | | | | |
Investment advisory fees (Note 3) | | | 3,186,862 | |
Administration fees (Note 3) | | | | |
Class A Shares | | | 272,602 | |
Class C Shares | | | 102,576 | |
Class I Shares | | | 201,411 | |
Distribution and service fees (Note 3) | | | | |
Class A Shares | | | 545,204 | |
Class C Shares | | | 493,547 | |
Transfer agent fees | | | | |
Class A Shares | | | 103,718 | |
Class C Shares | | | 42,087 | |
Class I Shares | | | 297,607 | |
Registration and filing fees | | | | |
Class A Shares | | | 44,621 | |
Class C Shares | | | 12,838 | |
Class I Shares | | | 56,564 | |
Custodian fees (Note 3) | | | 75,030 | |
Professional fees | | | 30,860 | |
Accounting fees (Note 3) | | | 24,161 | |
Trustee fees | | | 27,295 | |
Other expenses | | | 34,162 | |
| | | | |
Total Expenses | | | 5,551,145 | |
Less: | | | | |
Expenses reimbursed by investment advisor (Note 3) | | | (27,910 | ) |
| | | | |
Net Expenses | | | 5,523,235 | |
| | | | |
Net Investment Income | | | 15,184,321 | |
| | | | |
REALIZED AND UNREALIZED GAIN (LOSS) | | | | |
Net realized gain (loss) from investments | | | 4,158 | |
Net change in unrealized appreciation (depreciation) on investments | | | 20,544,418 | |
| | | | |
Net Realized and Unrealized Gain | | | 20,548,576 | |
| | | | |
Net Increase in Net Assets Resulting from Operations | | $ | 35,732,897 | |
| | | | |
See notes to financial statements.
Semi-Annual Report 21
| | |
| STATEMENTS OF CHANGES IN NET ASSETS | | |
| |
Thornburg Intermediate Municipal Fund | | |
| | | | | | | | |
| | | SIX MONTHS ENDED
MARCH 31, 2016* | | | YEAR ENDED
SEPTEMBER 30, 2015 | |
INCREASE (DECREASE) IN NET ASSETS FROM | | | | | | | | |
| | |
OPERATIONS | | | | | | | | |
Net investment income | | $ | 15,184,321 | | | $ | 28,604,238 | |
Net realized gain (loss) from investments | | | 4,158 | | | | (178,705 | ) |
Net unrealized appreciation (depreciation) on investments | | | 20,544,418 | | | | (6,311,268 | ) |
| | | | | | | | |
| | |
Net Increase (Decrease) in Net Assets Resulting from Operations | | | 35,732,897 | | | | 22,114,265 | |
| | |
DIVIDENDS TO SHAREHOLDERS | | | | | | | | |
From net investment income | | | | | | | | |
Class A Shares | | | (4,413,066 | ) | | | (8,826,286 | ) |
Class C Shares | | | (1,401,649 | ) | | | (2,839,671 | ) |
Class I Shares | | | (9,369,606 | ) | | | (16,938,281 | ) |
| | |
FUND SHARE TRANSACTIONS (NOTE 4) | | | | | | | | |
Class A Shares | | | 26,164,323 | | | | 7,597,943 | |
Class C Shares | | | 5,573,619 | | | | 3,649,607 | |
Class I Shares | | | 99,567,547 | | | | 137,108,465 | |
| | | | | | | | |
Net Increase in Net Assets | | | 151,854,065 | | | | 141,866,042 | |
| | |
NET ASSETS | | | | | | | | |
Beginning of Period | | | 1,334,640,961 | | | | 1,192,774,919 | |
| | | | | | | | |
| | |
End of Period | | $ | 1,486,495,026 | | | $ | 1,334,640,961 | |
| | | | | | | | |
Distribution in excess of net investment income | | $ | (3,781 | ) | | $ | (3,781 | ) |
See notes to financial statements.
22 Semi-Annual Report
| | |
| NOTES TO FINANCIAL STATEMENTS | | |
| |
Thornburg Intermediate Municipal Fund | | March 31, 2016 (Unaudited) |
NOTE 1 – ORGANIZATION
Thornburg Intermediate Municipal Fund (the “Fund”) is a diversified series of Thornburg Investment Trust (the “Trust”). The Trust is organized as a Massachusetts business trust under a Declaration of Trust dated June 3, 1987 and is registered as a diversified, open-end management investment company under the Investment Company Act of 1940, as amended. The Fund is currently one of twenty separate series of the Trust. Each series is considered to be a separate entity for financial reporting and tax purposes and bears expenses directly attributable to it. The Fund’s primary investment objective is to obtain as high a level of current income exempt from federal individual income taxes as is consistent, in the view of Thornburg Investment Management, Inc., the Trust’s investment advisor (the “Advisor”), with the preservation of capital. The Fund’s secondary objective is to reduce expected changes in its share price compared to long-term bond portfolios.
The Fund currently offers three classes of shares of beneficial interest: Class A, Class C, and Institutional Class (“Class I”). Each class of shares of the Fund represents an interest in the same portfolio of investments, except that (i) Class A shares are sold subject to a front-end sales charge collected at the time the shares are purchased and bear a service fee, (ii) Class C shares are sold at net asset value without a sales charge at the time of purchase, but are subject to a contingent deferred sales charge upon redemption within one year of purchase, and bear both a service fee and a distribution fee, (iii) Class I shares are sold at net asset value without a sales charge at the time of purchase and may be subject to a service fee, and (iv) the respective classes may have different reinvestment privileges and conversion rights. Additionally, the Fund may allocate among its classes certain expenses, to the extent allocable to specific classes, including transfer agent fees, government registration fees, certain printing and postage costs, and administrative and legal expenses. Currently, class specific expenses of the Fund are limited to service and distribution fees, administration fees, and certain registration and transfer agent expenses.
NOTE 2 – SIGNIFICANT ACCOUNTING POLICIES
The following is a summary of significant accounting policies followed by the Fund in the preparation of its financial statements. The Fund is an investment company and prepares its financial statements in conformity with United States generally accepted accounting principles (“GAAP”), including investment company accounting and reporting guidance in the Financial Accounting Standards Board (the “FASB”) Accounting Standard Codification Topic 946. The preparation of financial statements in conformity with GAAP requires management to make estimates and assumptions that affect the reported amounts of assets and liabilities and disclosure of contingent assets and liabilities at the date of the financial statements and the reported amounts of increases (decreases) in net assets from operations during the reporting period. Actual results could differ from those estimates.
Significant accounting policies of the Trust are as follows:
Valuation Policy and Procedures: The Trustees of the Trust have appointed the Advisor to assist the Trustees in obtaining market values for portfolio investments, perform certain evaluation and supervisory functions respecting professional pricing service providers appointed by the Trustees’ Audit Committee (the “Audit Committee”) to assist in determining fair values for portfolio investments, assist in calculating fair values for portfolio investments in certain circumstances, and to perform other functions in connection with the valuation of investments. The Advisor acts through its Valuation and Pricing Committee (the “Committee”) and other employees of the Advisor. The Committee regularly reviews its own valuation calculations, as well as the valuations, valuation techniques and services furnished by pricing service providers, considers circumstances which may require valuation calculations by the Committee, and reviews previous valuation calculations. The Committee reports to the Audit Committee on the Committee’s activities, the performance of pricing service providers, and other matters relating to valuation of portfolio investments.
In those instances when the Committee assists in calculating a fair value for a portfolio investment, the Committee seeks to determine the price that the Fund would reasonably expect to receive upon a sale of the investment in an orderly transaction between market participants on the valuation date. The Committee customarily utilizes quotations from securities broker dealers in calculating valuations, but also may utilize prices obtained from pricing service providers or other methods approved by the Audit Committee. Because fair values calculated by the Committee are estimates, the calculation of a value for an investment may differ from the price that would be realized by the Fund upon a sale of the investment, and the difference could be material to the Fund’s financial statements. The Committee’s calculation of a fair value for an investment may also differ from the prices obtained by other persons (including other mutual funds) for the investment.
Valuation of Investments: Debt obligations held by the Fund which are not listed or traded on exchanges or for which no reported market exists are ordinarily valued at the valuation obtained from a pricing service provider approved by the Audit Committee.
In any case when a pricing service provider fails to provide a valuation for a debt obligation held by the Fund, the Committee calculates a fair value for the obligation using alternative methods under procedures approved by the Audit Committee. Additionally, in cases when management believes that a valuation obtained from a pricing service provider merits review for significant reasons, the Committee decides whether or not to use the valuation calculated by the pricing service provider or to use an alternative method approved by the Audit Committee to calculate a fair value for the obligation.
Semi-Annual Report 23
| | |
| NOTES TO FINANCIAL STATEMENTS, CONTINUED | | |
| |
Thornburg Intermediate Municipal Fund | | March 31, 2016 (Unaudited) |
Valuation Measurements: The Fund categorizes its investments based upon the inputs used in valuing those investments, according to a three-level hierarchy established in guidance from the FASB. Categorization of investments using this hierarchy is intended by the FASB to maximize the use of observable inputs in valuing investments and minimize the use of unobservable inputs by requiring that the most observable inputs be used when available. Observable inputs are those that market participants would use in valuing an investment based on available market information. Unobservable inputs are those that reflect assumptions about the information market participants would use in valuing an investment. An investment’s level within the hierarchy is based on the lowest level input that is deemed significant to the valuation. The methodologies and inputs used to value investments are not necessarily indications of the risk or liquidity associated with those investments.
Various inputs are used in calculating valuations for the Fund’s investments. These inputs are generally summarized according to the three-level hierarchy below:
Level 1: Quoted prices in active markets for identical investments.
Level 2: Other direct or indirect significant observable inputs (including quoted prices for similar investments in active markets and other observable inputs, such as interest rates, prepayment rates, credit risk, etc.).
Level 3: Significant unobservable inputs (including the Committee’s own assumptions in calculating the fair values of investments).
Valuations for debt obligations held by the Fund are typically calculated by pricing service providers approved by the Audit Committee and are characterized as Level 2 within the valuation hierarchy.
In a limited number of cases the Committee calculates a fair value for investments using broker quotations or other methods approved by the Audit Committee. When the Committee uses a single broker quotation to calculate a fair value for an investment without other significant observable inputs, or if a fair value is calculated using other significant inputs that are considered unobservable, the investment is characterized as Level 3 within the hierarchy. Other significant unobservable inputs used to calculate a fair value in these instances might include an income-based valuation approach which considers discounted anticipated future cash flows from the investment, and application of discounts due to the nature or duration of any restrictions on the disposition of the investment.
Valuations based upon the use of inputs from Levels 1, 2 or 3 may not represent the actual price received upon the disposition of an investment, and the Fund may receive a price that is lower than the valuation based upon these inputs when it sells the investment.
The following table displays a summary of the fair value hierarchy measurements of the Fund’s investments as of March 31, 2016. In any instance when valuation inputs from more than one level are used to determine the fair value of a specific investment, the investment is placed in the level of the table based upon the lowest level input that is significant in determining the fair value of the investment:
| | | | | | | | | | | | | | | | |
| | | FAIR VALUE MEASUREMENTS AT MARCH 31, 2016 | |
| | | TOTAL | | | LEVEL 1 | | | LEVEL 2 | | | LEVEL 3 | |
Assets | | | | | | | | | | | | | | | | |
Investments in Securities | | | | | | | | | | | | | | | | |
Municipal Bonds | | $ | 1,477,096,974 | | | $ | — | | | $ | 1,477,096,974 | | | $ | — | |
| | | | | | | | | | | | | | | | |
Total Investments in Securities | | $ | 1,477,096,974 | | | $ | — | | | $ | 1,477,096,974 | | | $ | — | |
In accordance with the guidance prescribed in Accounting Standards Update No. 2011-04, it is the policy of the Fund to recognize transfers between levels and the underlying events which caused the movement. The Fund recognized no transfers between levels for the six months ended March 31, 2016.
Federal Income Taxes: It is the policy of the Trust to comply with the provisions of the Internal Revenue Code applicable to “regulated investment companies” and to distribute to shareholders substantially all taxable income including net realized gains on investments (if any), and tax exempt income of the Fund. Therefore, no provision for federal income tax is required.
Management reviews each uncertain tax position believed to be material to the preparation of the Fund’s financial statements, to assess if it is more likely than not that the position would be sustained upon examination, based upon the technical merits of the position. As of March 31, 2016, management has not identified any such position for which an asset or liability must be reflected in the Statement of Assets and Liabilities. The Fund’s tax returns remain subject to examination for three years after filing.
When-Issued and Delayed Delivery Transactions: The Fund may engage in when-issued or delayed delivery transactions. To the extent the Fund engages in such transactions, it will do so for the purpose of acquiring portfolio investments consistent with the Fund’s investment objectives and not for the purpose of investment leverage or to speculate on interest rate and, or market changes. At the time the Fund makes a commitment to purchase an investment on a when-issued or delayed delivery basis, the Fund will record the transaction and reflect the value in determining its net asset value.
24 Semi-Annual Report
| | |
| NOTES TO FINANCIAL STATEMENTS, CONTINUED | | |
| |
Thornburg Intermediate Municipal Fund | | March 31, 2016 (Unaudited) |
When effecting such transactions, assets of an amount sufficient to make payment for the portfolio investments to be purchased will be segregated on the Fund’s records on the trade date. Investments purchased on a when-issued or delayed delivery basis do not earn interest until the settlement date.
Dividends: Net investment income of the Fund is declared daily as a dividend on shares for which the Fund has received payment. Dividends are paid monthly and are reinvested in additional shares of the Fund at net asset value per share at the close of business on the dividend payment date, or at the shareholder’s option, paid in cash. Net realized capital gains, to the extent available, will be distributed at least annually.
General: Investment transactions are accounted for on a trade date basis. Interest income is accrued as earned. Premiums and discounts on investments purchased are amortized to call dates or maturity dates of the respective investments. Realized gains and losses from the sale of investments are recorded on an identified cost basis. Net investment income (other than class specific expenses) and realized and unrealized gains and losses are allocated daily to each class of shares based upon the relative net asset value of outstanding shares (or the value of the dividend-eligible shares, as appropriate) of each class of shares at the beginning of the day (after adjusting for the current capital shares activity of the respective class). Expenses common to all Funds are allocated among the Funds comprising the Trust based upon their relative net asset values or other appropriate allocation methods.
Guarantees and Indemnifications: Under the Trust’s organizational documents (and under separate agreements with the independent Trustees), its officers and Trustees are indemnified against certain liabilities arising out of the performance of their duties to the Fund. Additionally, in the normal course of business the Trust enters into contracts with service providers that contain general indemnification clauses. The Trust’s maximum exposure under these arrangements is unknown. However, based on experience, the Trust expects the risk of loss to be remote.
NOTE 3 – INVESTMENT ADVISORY FEE AND OTHER TRANSACTIONS WITH AFFILIATES
Pursuant to an investment advisory agreement, the Advisor serves as the investment advisor and performs services for the Fund for which the fees are payable at the end of each month. For the six months ended March 31, 2016, these fees were payable at annual rates ranging from .50 of 1% to .275 of 1% per annum of the average daily net assets of the Fund depending on the Fund’s asset size. The Fund pays to the Advisor the costs of personnel who perform certain accounting services for the Fund. For the six months ended March 31, 2016 the Fund paid $24,161 to the Advisor for these accounting services. The Trust has also entered into administrative service agreements with the Advisor, whereby the Advisor will perform certain administrative services for the shareholders of each class of the Fund’s shares, and for which fees will be payable at an annual rate of up to .125 of 1% per annum of the average daily net assets attributable to each class of shares.
The Trust has an underwriting agreement with Thornburg Securities Corporation (the “Distributor”), an affiliate of the Advisor, which acts as the distributor of the Fund’s shares. For the six months ended March 31, 2016, the Distributor has advised the Fund that it earned net commissions aggregating $2,475 from the sale of Class A shares, and collected contingent deferred sales charges aggregating $3,560 from redemptions of Class C shares of the Fund.
Pursuant to a service plan under Rule 12b-1 of the Investment Company Act of 1940, the Fund may reimburse to the Advisor an amount not to exceed .25 of 1% per annum of the average daily net assets attributable to each class of shares of the Fund for payments made by the Advisor to securities dealers and other financial institutions to obtain various shareholder and distribution related services. For the six months ended March 31, 2016, there were no 12b-1 service plan fees charged for Class I shares. The Advisor may pay out of its own resources additional expenses for distribution of the Fund’s shares and shareholder services.
The Trust has also adopted a distribution plan pursuant to Rule 12b-1, applicable only to the Fund’s Class C shares, under which the Fund compensates the Distributor for services in promoting the sale of Class C shares of the Fund at an annual rate of up to .35 of 1% per annum of the average daily net assets attributable to Class C shares. Total fees incurred by each class of shares of the Fund under their respective service and distribution plans for the six months ended March 31, 2016, are set forth in the Statement of Operations.
The Advisor and Distributor have contractually agreed to waive fees and reimburse expenses incurred by the Fund so that actual expenses of certain share classes do not exceed levels as specified in the Fund’s most recent prospectus. The agreement may be terminated by the Fund at any time, but may not be terminated by the Advisor or Distributor before February 1, 2017, unless the Advisor ceases to be the investment advisor to the Trust or the Distributor ceases to be the distributor of the Fund prior to that date. The Advisor and Distributor retain the right to be repaid by the Fund for fee waivers and expense reimbursements if expenses fall below the contractual limit prior to the end of the fiscal year.
For the six months ended March 31, 2016, The Advisor contractually reimbursed certain class specific expenses, administrative fees, and distribution fees of $27,910 for Class C shares.
Certain officers and Trustees of the Trust are also officers or directors of the Advisor and Distributor. The compensation of independent Trustees is borne by the Trust.
Semi-Annual Report 25
| | |
| NOTES TO FINANCIAL STATEMENTS, CONTINUED | | |
| |
Thornburg Intermediate Municipal Fund | | March 31, 2016 (Unaudited) |
The Fund may purchase or sell securities from or to an affiliated fund, provided the affiliation is due solely to having a common investment advisor, common officers, or common trustees, and provided that all such transactions will comply with Rule 17a-7 under the 1940 Act. For the six months ended March 31, 2016, the Fund had no transactions with affiliated funds.
NOTE 4 – SHARES OF BENEFICIAL INTEREST
At March 31, 2016, there were an unlimited number of shares with no par value of beneficial interest authorized. Transactions in shares of beneficial interest were as follows:
| | | | | | | | | | | | | | | | |
| | | SIX MONTHS ENDED
MARCH 31, 2016 (UNAUDITED) | | | YEAR ENDED
SEPTEMBER 30, 2015 (AUDITED) | |
| | | SHARES | | | AMOUNT | | | SHARES | | | AMOUNT | |
Class A Shares | | | | | | | | | | | | | | | | |
Shares sold | | | 5,890,227 | | | $ | 84,200,146 | | | | 4,268,461 | | | $ | 60,729,148 | |
Shares issued to shareholders in reinvestment of dividends | | | 283,785 | | | | 4,058,676 | | | | 567,704 | | | | 8,071,945 | |
Shares repurchased | | | (4,347,823 | ) | | | (62,094,499 | ) | | | (4,303,842 | ) | | | (61,203,150 | ) |
| | | | | | | | | | | | | | | | |
| | | | |
Net increase (decrease) | | | 1,826,189 | | | $ | 26,164,323 | | | | 532,323 | | | $ | 7,597,943 | |
| | | | | | | | | | | | | | | | |
| | | | |
Class C Shares | | | | | | | | | | | | | | | | |
Shares sold | | | 1,060,039 | | | $ | 15,170,725 | | | | 1,735,534 | | | $ | 24,731,966 | |
Shares issued to shareholders in reinvestment of dividends | | | 83,691 | | | | 1,198,344 | | | | 169,292 | | | | 2,410,060 | |
Shares repurchased | | | (754,417 | ) | | | (10,795,450 | ) | | | (1,651,624 | ) | | | (23,492,419 | ) |
| | | | | | | | | | | | | | | | |
| | | | |
Net increase (decrease) | | | 389,313 | | | $ | 5,573,619 | | | | 253,202 | | | $ | 3,649,607 | |
| | | | | | | | | | | | | | | | |
| | | | |
Class I Shares | | | | | | | | | | | | | | | | |
Shares sold | | | 13,417,893 | | | $ | 191,659,169 | | | | 20,039,316 | | | $ | 284,969,358 | |
Shares issued to shareholders in reinvestment of dividends | | | 575,251 | | | | 8,220,180 | | | | 1,036,238 | | | | 14,709,303 | |
Shares repurchased | | | (7,021,899 | ) | | | (100,311,802 | ) | | | (11,476,359 | ) | | | (162,570,196 | ) |
| | | | | | | | | | | | | | | | |
| | | | |
Net increase (decrease) | | | 6,971,245 | | | $ | 99,567,547 | | | | 9,599,195 | | | $ | 137,108,465 | |
| | | | | | | | | | | | | | | | |
NOTE 5 – INVESTMENT TRANSACTIONS
For the six months ended March 31, 2016, the Fund had purchase and sale transactions of investments (excluding short-term investments) of $175,834,900 and $55,346,455, respectively.
NOTE 6 – INCOME TAXES
At March 31, 2016, information on the tax components of capital was as follows:
| | | | |
Cost of investments for tax purposes | | $ | 1,397,932,030 | |
| | | | |
Gross unrealized appreciation on a tax basis | | $ | 79,342,988 | |
Gross unrealized depreciation on a tax basis | | | (178,044 | ) |
| | | | |
Net unrealized appreciation (depreciation) on investments (tax basis) | | $ | 79,164,944 | |
| | | | |
At March 31, 2016, the Fund had deferred tax basis capital losses occurring subsequent to October 31, 2014, through September 30, 2015, of $177,883. For tax purposes, such losses will be reflected in the year ending September 30, 2016.
At March 31, 2016, the Fund had cumulative tax basis capital losses of $823, (of which $0 are short-term and $823 are long-term) generated after September 30, 2011, which may be carried forward to offset future capital gains. To the extent such carryforwards are used, capital gain distributions may be reduced to the extent provided by regulations. Such capital loss carryforwards do not expire.
26 Semi-Annual Report
| | |
| NOTES TO FINANCIAL STATEMENTS, CONTINUED | | |
| |
Thornburg Intermediate Municipal Fund | | March 31, 2016 (Unaudited) |
OTHER NOTES
Risks: The Fund’s investments subject it to risks including, but not limited to, credit risk, interest rate risk, management risk, market and economic risk, and liquidity risk. Please see the Fund’s prospectus for a discussion of the risks associated with an investment in the Fund.
Subsequent Events: Fund management believes no events have occurred between March 31, 2016 and the date of issuance of the financial statements that require adjustment to or disclosure in the accompanying financial statements.
Semi-Annual Report 27
FINANCIAL HIGHLIGHTS
Thornburg Intermediate Municipal Fund
| | | | | | | | | | | | | | | | | | | | | | | | | | | | | | | | | | | | | | | | | | | | | | | | | | | | |
| | | PER SHARE PERFORMANCE (FOR A SHARE OUTSTANDING THROUGHOUT THE PERIOD) | | RATIOS TO AVERAGE NET ASSETS | | | SUPPLEMENTAL DATA | |
UNLESS OTHERWISE NOTED, PERIODS ARE FISCAL YEARS ENDED
SEPT. 30, | | NET ASSET
VALUE
BEGINNING
OF PERIOD | | | NET
INVESTMENT
INCOME
(LOSS)+ | | NET
REALIZED
&
UNREALIZED
GAIN (LOSS)
ON
INVESTMENTS | | | TOTAL FROM
INVESTMENT
OPERATIONS | | | DIVIDENDS
FROM NET
INVESTMENT
INCOME | | | DIVIDENDS
FROM NET
REALIZED
GAINS | | TOTAL
DIVIDENDS | | | NET ASSET VALUE END OF PERIOD | | NET
INVESTMENT
INCOME
(LOSS)
(%) | | | EXPENSES,
AFTER
EXPENSE
REDUCTIONS
(%) | | | EXPENSES,
AFTER
EXPENSE
REDUCTIONS
AND
NET OF
CUSTODY
CREDITS (%) | | | EXPENSES,
BEFORE
EXPENSE
REDUCTIONS
(%) | | | TOTAL
RETURN
(%)(a) | | | PORTFOLIO
TURNOVER
RATE (%)(a) | | NET
ASSETS
AT END
OF
PERIOD
(THOUSANDS) | |
CLASS A SHARES | | | | | | | | | | | | | | | | | | | | | | | | | | | | | | | | | | | | | | | | | | | | | | |
2016(b)(c) | | $ | 14.17 | | | 0.14 | | | 0.21 | | | | 0.35 | | | | (0.14 | ) | | — | | | (0.14 | ) | | $14.38 | | | 2.02 | (d) | | | 0.92 | (d) | | | 0.92 | (d) | | | 0.92 | (d) | | | 2.51 | | | 4.68 | | $ | 455,658 | |
2015(c) | | $ | 14.23 | | | 0.30 | | | (0.06 | ) | | | 0.24 | | | | (0.30 | ) | | — | | | (0.30 | ) | | $14.17 | | | 2.09 | | | | 0.92 | | | | 0.92 | | | | 0.92 | | | | 1.68 | | | 13.49 | | $ | 423,113 | |
2014(c) | | $ | 13.76 | | | 0.34 | | | 0.47 | | | | 0.81 | | | | (0.34 | ) | | — | | | (0.34 | ) | | $14.23 | | | 2.43 | | | | 0.92 | | | | 0.92 | | | | 0.92 | | | | 5.95 | | | 14.85 | | $ | 417,369 | |
2013(c) | | $ | 14.22 | | | 0.33 | | | (0.46 | ) | | | (0.13 | ) | | | (0.33 | ) | | — | | | (0.33 | ) | | $13.76 | | | 2.37 | | | | 0.92 | | | | 0.92 | | | | 0.92 | | | | (0.91 | ) | | 29.18 | | $ | 429,941 | |
2012(c) | | $ | 13.59 | | | 0.40 | | | 0.63 | | | | 1.03 | | | | (0.40 | ) | | — | | | (0.40 | ) | | $14.22 | | | 2.88 | | | | 0.93 | | | | 0.93 | | | | 0.93 | | | | 7.69 | | | 16.94 | | $ | 456,527 | |
2011(c) | | $ | 13.64 | | | 0.48 | | | (0.05 | ) | | | 0.43 | | | | (0.48 | ) | | — | | | (0.48 | ) | | $13.59 | | | 3.59 | | | | 0.95 | | | | 0.95 | | | | 0.95 | | | | 3.27 | | | 18.33 | | $ | 381,839 | |
CLASS C SHARES | | | | | | | | | | | | | | | | | | | | | | | | | | | | | | | | | | | | | | | | | | | | | | |
2016(b) | | $ | 14.19 | | | 0.12 | | | 0.21 | | | | 0.33 | | | | (0.12 | ) | | — | | | (0.12 | ) | | $14.40 | | | 1.71 | (d) | | | 1.24 | (d) | | | 1.24 | (d) | | | 1.27 | (d) | | | 2.35 | | | 4.68 | | $ | 168,029 | |
2015 | | $ | 14.25 | | | 0.25 | | | (0.06 | ) | | | 0.19 | | | | (0.25 | ) | | — | | | (0.25 | ) | | $14.19 | | | 1.77 | | | | 1.24 | | | | 1.24 | | | | 1.28 | | | | 1.35 | | | 13.49 | | $ | 160,042 | |
2014 | | $ | 13.78 | | | 0.30 | | | 0.47 | | | | 0.77 | | | | (0.30 | ) | | — | | | (0.30 | ) | | $14.25 | | | 2.11 | | | | 1.24 | | | | 1.24 | | | | 1.29 | | | | 5.61 | | | 14.85 | | $ | 157,126 | |
2013 | | $ | 14.24 | | | 0.29 | | | (0.46 | ) | | | (0.17 | ) | | | (0.29 | ) | | — | | | (0.29 | ) | | $13.78 | | | 2.05 | | | | 1.24 | | | | 1.24 | | | | 1.30 | | | | (1.22 | ) | | 29.18 | | $ | 159,727 | |
2012 | | $ | 13.61 | | | 0.36 | | | 0.63 | | | | 0.99 | | | | (0.36 | ) | | — | | | (0.36 | ) | | $14.24 | | | 2.56 | | | | 1.24 | | | | 1.24 | | | | 1.31 | | | | 7.36 | | | 16.94 | | $ | 170,071 | |
2011 | | $ | 13.65 | | | 0.44 | | | (0.04 | ) | | | 0.40 | | | | (0.44 | ) | | — | | | (0.44 | ) | | $13.61 | | | 3.29 | | | | 1.24 | | | | 1.24 | | | | 1.32 | | | | 3.05 | | | 18.33 | | $ | 125,512 | |
CLASS I SHARES | | | | | | | | | | | | | | | | | | | | | | | | | | | | | | | | | | | | | | | | | | | | | | |
2016(b) | | $ | 14.15 | | | 0.17 | | | 0.22 | | | | 0.39 | | | | (0.17 | ) | | — | | | (0.17 | ) | | $14.37 | | | 2.33 | (d) | | | 0.62 | (d) | | | 0.62 | (d) | | | 0.62 | (d) | | | 2.74 | | | 4.68 | | $ | 862,808 | |
2015 | | $ | 14.22 | | | 0.34 | | | (0.07 | ) | | | 0.27 | | | | (0.34 | ) | | — | | | (0.34 | ) | | $14.15 | | | 2.39 | | | | 0.62 | | | | 0.62 | | | | 0.62 | | | | 1.91 | | | 13.49 | | $ | 751,486 | |
2014 | | $ | 13.75 | | | 0.38 | | | 0.47 | | | | 0.85 | | | | (0.38 | ) | | — | | | (0.38 | ) | | $14.22 | | | 2.73 | | | | 0.62 | | | | 0.61 | | | | 0.62 | | | | 6.28 | | | 14.85 | | $ | 618,280 | |
2013 | | $ | 14.20 | | | 0.38 | | | (0.45 | ) | | | (0.07 | ) | | | (0.38 | ) | | — | | | (0.38 | ) | | $13.75 | | | 2.68 | | | | 0.61 | | | | 0.61 | | | | 0.61 | | | | (0.53 | ) | | 29.18 | | $ | 449,501 | |
2012 | | $ | 13.58 | | | 0.44 | | | 0.63 | | | | 1.07 | | | | (0.45 | ) | | — | | | (0.45 | ) | | $14.20 | | | 3.18 | | | | 0.61 | | | | 0.61 | | | | 0.61 | | | | 7.96 | | | 16.94 | | $ | 365,443 | |
2011 | | $ | 13.62 | | | 0.52 | | | (0.04 | ) | | | 0.48 | | | | (0.52 | ) | | — | | | (0.52 | ) | | $13.58 | | | 3.90 | | | | 0.63 | | | | 0.63 | | | | 0.63 | | | | 3.67 | | | 18.33 | | $ | 232,422 | |
| (a) | Not annualized for periods less than one year. |
| (b) | Unaudited Six Month Period Ended March 31. |
| (c) | Sales loads are not reflected in computing total return. |
| + | Based on weighted average shares outstanding. |
See notes to financial statements.
| | | | |
| 28 Semi-Annual Report | | | | Semi-Annual Report 29 |
| | |
| EXPENSE EXAMPLE | | |
| |
Thornburg Intermediate Municipal Fund | | March 31, 2016 (Unaudited) |
As a shareholder of the Fund, you incur two types of costs:
| | (1) | transaction costs, including |
(a) sales charges (loads) on purchase payments, for Class A shares;
(b) a deferred sales charge on redemptions of any part or all of a purchase of $1 million of Class A shares within 12 months of purchase;
(c) a deferred sales charge on redemptions of Class C shares within 12 months of purchase;
| | (2) | ongoing costs, including management fees; distribution and/or service (12b-1) fees; and other Fund expenses. |
This example is intended to help you understand your ongoing costs (in dollars) of investing in the Fund and to compare these costs with the ongoing costs of investing in other mutual funds.
The example is based on a $1,000 investment beginning on October 1, 2015, and held until March 31, 2016.
| | | | | | | | | | | | |
| | | BEGINNING
ACCOUNT VALUE
10/1/15 | | | ENDING
ACCOUNT VALUE
3/31/16 | | | EXPENSES PAID
DURING PERIOD†
10/1/15–3/31/16 | |
Class A Shares | | | | | | | | | | | | |
Actual | | $ | 1,000.00 | | | $ | 1,025.10 | | | $ | 4.68 | |
Hypothetical* | | $ | 1,000.00 | | | $ | 1,020.38 | | | $ | 4.67 | |
Class C Shares | | | | | | | | | | | | |
Actual | | $ | 1,000.00 | | | $ | 1,023.50 | | | $ | 6.27 | |
Hypothetical* | | $ | 1,000.00 | | | $ | 1,018.80 | | | $ | 6.26 | |
Class I Shares | | | | | | | | | | | | |
Actual | | $ | 1,000.00 | | | $ | 1,027.40 | | | $ | 3.13 | |
Hypothetical* | | $ | 1,000.00 | | | $ | 1,021.91 | | | $ | 3.13 | |
| † | Expenses are equal to the annualized expense ratio for each class (A: 0.92%; C: 1.24%; I: 0.62%) multiplied by the average account value over the period, multiplied by 183/366 to reflect the one-half year period. |
| * | Hypothetical assumes a rate of return of 5% per year before expenses. |
ACTUAL EXPENSES
For each class of shares, the first line of the accompanying table provides information about actual account values and actual expenses. You may use the information in this line, together with the amount you invested, to estimate the expenses that you paid over the period. Simply divide your account value by $1,000 (for example, an $8,600 account value divided by $1,000 = 8.6), then multiply the result by the number in the first line for your class of shares under the heading entitled “Expenses Paid During Period” to estimate the expenses you paid on your account during this period.
HYPOTHETICAL EXAMPLE FOR COMPARISON PURPOSES
For each class of shares, the second line of the accompanying table provides information about hypothetical account values and hypothetical expenses based on the Fund’s actual expense ratio and an assumed rate of return of 5% per year before expenses, which is not the Fund’s actual return. The hypothetical account values and expenses may not be used to estimate the actual ending account balance or expenses you paid for the period. You may use this information to compare the ongoing costs of investing in the Fund and other funds. To do so, compare this 5% hypothetical example with the 5% hypothetical examples that appear in the shareholder reports of the other funds.
Please note that the expenses shown in the table are meant to highlight your ongoing costs only and do not reflect any transactional costs, such as sales charges (loads), redemption fees, or exchange fees. Therefore, the second line of the table for each class of shares is useful in comparing ongoing costs only, and will not help you determine the relative total costs of owning different funds. In addition, if these transactional costs were included, your costs would have been higher.
30 Semi-Annual Report
| | |
| OTHER INFORMATION | | |
| |
Thornburg Intermediate Municipal Fund | | March 31, 2016 (Unaudited) |
PORTFOLIO PROXY VOTING
Policies and Procedures:
The Trust has delegated to Thornburg Investment Management, Inc. (the “Advisor”) voting decisions respecting proxies for the Fund’s voting securities. The Advisor makes voting decisions in accordance with its Proxy Voting Policy. A description of the Policy is available (i) without charge, upon request, by calling the Advisor toll-free at 1-800-847-0200, (ii) on the Thornburg website at www.thornburg.com, and (iii) on the Securities and Exchange Commission’s website at www.sec.gov.
Information regarding how proxies were voted is available on or before August 31 of each year for the twelve months ending the preceding June 30. This information is available (i) without charge, upon request by calling the Advisor toll-free at 1-800-847-0200, (ii) on the Thornburg website at www.thornburg.com, and (iii) on the Securities and Exchange Commission’s website at www.sec.gov.
AVAILABILITY OF QUARTERLY PORTFOLIO SCHEDULE
The Fund files with the Securities and Exchange Commission schedules of its portfolio holdings on Form N-Q for the first and third quarters of each fiscal year. The Fund’s Forms N-Q are available on the Commission’s website at www.sec.gov, or may be reviewed and copied at the Commission’s Public Reference Room in Washington, D.C. Information on the operation of the Public Reference Room may be obtained by calling 1-800-SEC-0330. The Fund also makes this information available on its website at www.thornburg.com/download or upon request by calling 1-800-847-0200.
Semi-Annual Report 31
TRUSTEES’ STATEMENT TO SHAREHOLDERS
Revised and Readopted September 15, 2015
The Trustees believe current and prospective shareholders should know how we discharge our responsibilities in supervising the Funds’ investment advisor and in reviewing the advisor’s contract for renewal. Since 2005, we have issued a statement which sets out clearly the three principal guidelines that we follow in supervising the Trust’s investment advisor on your behalf. In accordance with our customary practice, in September of 2015 we again reviewed our statement and concluded we should reissue this statement outlining the principal features of our supervision of the advisor’s performance of investment management services for the Funds.
We begin with the premise that each shareholder selected his or her Fund because its investments are managed by the investment advisor identified in the prospectus and in accordance with the objective and policies described in the prospectus. We realize, as each of you do, that if you believe that your Fund’s stated objective and policies no longer serve your personal investment goals, you can sell your shares and leave the Fund.
Therefore, we believe that our primary supervisory task—our principal obligation to you—is to assess the nature and quality of the advisor’s services, and to confirm that the advisor actively and competently pursues the Fund’s objective, in accordance with the policies set out in the prospectus. To do this, we meet regularly with management to review your Fund’s portfolio and to discuss the advisor’s specific actions and judgments in pursuing the Fund’s objective. We do not substitute our own judgment for the advisor’s decisions in selecting investments; the advisor is paid to exercise its informed judgment on investment decisions, and we seek to confirm, in reviewing the advisor’s performance, that the advisor is doing just that.
Second, we are conscious of costs and the effect that costs have on shareholders’ returns. We try to make sure that your Fund’s fees and costs are reasonable in relationship to the services rendered and that they are generally in line with those charged by other expert investment advisors, consistent with our belief that the Fund’s investors searched for and expect that expertise and attention and have decided to pay a reasonable price for it. We do not put the management contract “out to bid” as a matter of course, and we would not do so unless we had concluded that the advisor materially had failed to pursue the Fund’s objectives in accordance with its policies, or for other equally important reasons. We believe that any other approach would be inconsistent with your interests and contrary to your expectations when you bought shares of the Fund in the first place.
Finally, because we believe that most Thornburg Fund shareholders have invested with a long-term perspective, we try not to focus too much on the fashions of the moment and on short-term performance. The market will not favor any specific investment objective or set of policies at all times and under all economic circumstances. A fund will experience periods of both high and low returns relative to other funds and other investments. Even if one of our Funds is not favored by the market at a particular time, we believe that the advisor is nonetheless obliged to remain true to the Fund’s objective and policies, and we watch to see that it does so.
Trustees of Thornburg Investment Trust
32 Semi-Annual Report
THORNBURG FUND FAMILY
Thornburg Investment Management is a privately-owned global investment firm that offers a range of solutions for retail and institutional investors. Founded in 1982 and headquartered in Santa Fe, New Mexico, we manage approximately $54 billion (as of March 31, 2016) across eight equity and 11 bond mutual funds, separate accounts for high-net-worth investors and institutional accounts, and five UCITS funds for non-U.S. investors.
The fund outlined in this report is one of many equity and fixed-income products available from Thornburg Investment Management.
Equity Funds
| | • | | Thornburg Core Growth Fund |
| | • | | Thornburg International Value Fund |
| | • | | Thornburg Better World International Fund |
| | • | | Thornburg International Growth Fund |
| | • | | Thornburg Developing World Fund |
| | • | | Thornburg Investment Income Builder Fund |
| | • | | Thornburg Global Opportunities Fund |
Fixed Income Funds
| | • | | Thornburg Low Duration Income Fund |
| | • | | Thornburg Limited Term U.S. Government Fund |
| | • | | Thornburg Limited Term Income Fund |
| | • | | Thornburg Strategic Income Fund |
| | • | | Thornburg Low Duration Municipal Fund |
| | • | | Thornburg Limited Term Municipal Fund |
| | • | | Thornburg Intermediate Municipal Fund |
| | • | | Thornburg California Limited Term Municipal Fund |
| | • | | Thornburg New Mexico Intermediate Municipal Fund |
| | • | | Thornburg New York Intermediate Municipal Fund |
| | • | | Thornburg Strategic Municipal Income Fund |
Before investing, carefully consider the Fund’s investment goals, risks, charges, and expenses. For a prospectus or summary prospectus containing this and other information, contact your financial advisor or visit thornburg.com. Read it carefully before investing.
For additional information, please visit thornburg.com
Thornburg Investment Management, Inc. 2300 North Ridgetop Road, Santa Fe, NM 87506
Semi-Annual Report 33
This page intentionally left blank.
34 Semi-Annual Report
This page intentionally left blank.
Semi-Annual Report 35
This Semi-Annual Report is submitted for the general information of shareholders of the Fund. It is not authorized for distribution to prospective investors in the Fund unless preceded or accompanied by an effective prospectus.
| | | | |
| Investment Advisor: | | Distributor: | | |
| Thornburg Investment Management® | | Thornburg Securities Corporation® | | |
| 800.847.0200 | | 800.847.0200 | | |
| | | | TH172 |
2 Semi-Annual Report
Semi-Annual Report
Thornburg Strategic Municipal Income Fund
March 31, 2016
| | | | |
SHARE CLASS | | NASDAQ SYMBOL | | CUSIP |
Class A | | TSSAX | | 885-216-101 |
Class C | | TSSCX | | 885-216-200 |
Class I | | TSSIX | | 885-216-309 |
Minimum investments for Class I shares may be higher than those for other classes. Class I shares may not be available to all investors.
Investments carry risks, including possible loss of principal. Portfolios investing in bonds have the same interest rate, inflation, and credit risks that are associated with the underlying bonds. The value of bonds will fluctuate relative to changes in interest rates, decreasing when interest rates rise. This effect is more pronounced for longer-term bonds. Unlike bonds, bond funds have ongoing fees and expenses. Investments in lower rated and unrated bonds may be more sensitive to default, downgrades, and market volatility; these investments may also be less liquid than higher rated bonds. Investments in derivatives are subject to the risks associated with the securities or other assets underlying the pool of securities, including illiquidity and difficulty in valuation. Please see the Fund’s prospectus for a discussion of the risks associated with an investment in the Fund. Investments in the Fund are not FDIC insured, nor are they bank deposits or guaranteed by a bank or any other entity.
Diversification does not assure or guarantee better performance and cannot eliminate the risk of investment losses.
Semi-Annual Report 3
| | |
| LETTER TO SHAREHOLDERS | | |
| |
Thornburg Strategic Municipal Income Fund | | March 31, 2016 (Unaudited) |
April 11, 2016
Dear Fellow Shareholder:
We are pleased to present the semi-annual report for Thornburg Strategic Municipal Income Fund. The net asset value (NAV) of the Class A shares increased by 22 cents to $15.38 per share during the six months ended March 31, 2016. If you were with us for the entire period, you received dividends of 17.51 cents per share. If you reinvested your dividends, you received 17.59 cents per share. Dividends were lower for Class C shares and higher for Class I shares, to account for varying class-specific expenses. The Class A shares underperformed the Fund’s benchmark index, with a 2.62% total return (without sales charge) for the six months ended March 31, 2016, compared to the 3.39% total return for the BofA Merrill Lynch Municipal Master Index.
Throughout the six-month period, the Fund maintained a lower risk posture on interest rates than its benchmark; its average effective duration (a measure of interest-rate sensitivity) was 5.94 years, compared to 6.85 years for the benchmark. The shorter duration hurt relative price performance by 0.22%. The Fund’s position along the yield curve added 0.09% and sector selection added 0.78% of relative price performance. Our underweight in high-quality bonds subtracted 0.95% of relative price performance. Our underweight to bonds priced above par (100) and other such allocations added 0.62%. Other factors include the amortization of bond premiums and accretion of discounts, which is not an active management decision but rather a standard accounting practice—and the largest component of this category. We also include the effects of security selection and of price change derived from factors we cannot account for (statistically: “unexplained error”). Together, these three account for 0.05% of price performance relative to the index.
Global Fears Sway the Municipal Markets
The past six months have been a roller-coaster ride for the municipal markets. During the last quarter of 2015, it seemed that every day was spent anxiously awaiting the first Federal Reserve rate increase—for what seemed like an eternity. When that rate increase finally came, it was met with a yawn. Markets quickly reminded investors that while the Federal Reserve (the Fed) has control over short-term rates, the market forces of supply and demand for bonds have a much heavier influence on interest rates—especially long-term rates.
As in life, expectations in the bond markets mean a lot. And perhaps more important than the Fed’s initial rate hike was its stated intent to raise rates four additional times in 2016. The expectation for higher rates evaporated almost immediately after the Fed’s statement, with the release of weaker-than-expected economic data, collapsing commodity prices, an emerging-markets stock rout, and profound weakness in Europe, with the European Central Bank retrenching in its effort to drive European rates lower, spurring fears of deflation.
A Roller-Coaster Ride to Start the Year
The beginning of 2016 proved volatile for equity markets domestically and globally, and the fixed income markets followed suit.
Chart I Credit Spreads: Investors Are Not Being Paid to Assume the Risk
10-Year Credit-Quality Spreads: BBB Revenue Less AAA General Obligations
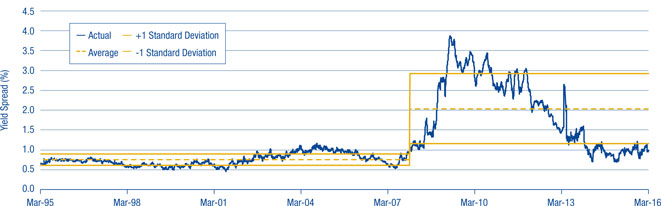
Source: Bloomberg.
4 Semi-Annual Report
| | |
| LETTER TO SHAREHOLDERS, | | |
| |
CONTINUED | | |
| |
Thornburg Strategic Municipal Income Fund | | March 31, 2016 (Unaudited) |
The 10-year U.S. Treasury stood at a respectable 2.27% at the end of 2015. But within six weeks, that rate fell 0.61% to 1.66%, before bouncing back to 1.77% by March 31, 2016.
As we noted, the Fed has backed off of its initial intent to raise rates four times in a stepped-up fashion. Rates will probably remain low and income elusive. Unfortunately, municipal bond investors have only a few “levers” to pull to seek higher income. The most effective two are credit quality and duration. An investor looking for yield can always buy a bond with a longer maturity—the duration lever. And bonds of lower credit quality can be purchased to drive up yield—the credit quality lever. In both instances, the investor assumes risk in hope of higher returns.
At Thornburg, we always evaluate both of these options as a means to increase the total return of the portfolios, but over the past six months, as in the prior six months, we found them less than optimal. Real rates (interest rates after inflation is subtracted) remained low during the entire period, and the municipal yield curve was fairly flat. Investors who reached for yield by buying longer maturities gained very little relative to the duration risk that comes with longer-dated bonds. And the amount investors are compensated to invest in lower-rated bonds is minimal; credit spreads remain at extremely tight levels. Investors who purchased debt from lower-rated issuers were essentially buying weaker credits at very expensive levels. Chart I on the previous page shows credit spreads remaining near historically low levels, offering investors little compensation for risk assumed. Not a great strategy!
We believe that the only logical thing to do when you’re not being paid to take risk is to take less of it. That is exactly what we have been seeking to do in Thornburg Strategic Municipal Income Fund for quite some time. The Fund is being managed on the bearish (shorter) end of its duration range. We have also actively sought to increase the average credit quality, at least at the margins. Cash reserve positions are being managed in a manner we view as conservative.
Continued volatility seems a certainty. That can manifest via interest-rate movements, or changing credit spreads. While the likelihood of the Fed raising rates appears low, given the aforementioned anemic economic growth in the U.S. and abroad, investors are wise to recall that rates moved up over 1.00% in 2013 without the Fed having taken any action whatsoever. It may be unlikely, but that does not mean it’s a probability that can be ignored. And any event that causes spreads to widen appreciably may prove detrimental to an investor who assumed undue credit risk in search of return.
We will do what we have always done with Thornburg Strategic Municipal Income Fund: provide you with a tax-exempt laddered portfolio that aims to generate attractive levels of income, while attempting to preserve principal and minimize volatility. And, of course, we’ll seek to only assume the risk for which we believe we are adequately compensated.
Staying Faithful to Thornburg’s Tested Approach
While a focus on risk mitigation may not make the sexiest marketing story, we believe it is in the best long-term interest of shareholders. And to any investor considering abandoning municipal bonds for the promise of higher returns elsewhere, we remind you that if the first quarter of 2016 has taught us anything, it is that in a volatile market, an appropriate asset allocation may save you a few sleepless nights.
We will continue to strive to manage your assets to fulfill the Fund’s objectives.
Sincerely,
| | | | |
 | |  | | |
| Christopher Ryon, CFA | | Nicholos Venditti | | |
| Portfolio Manager | | Portfolio Manager | | |
| Managing Director | | Managing Director | | |
The matters discussed in this report may constitute forward-looking statements made pursuant to the safe harbor provisions of the Securities Litigation Reform Act of 1995. These include any advisor or portfolio manager prediction, assessment, analysis or outlook for individual securities, industries, investment styles, market sectors and/or markets. These statements involve risks and uncertainties. In addition to the general risks described for each fund in its current prospectus, other factors bearing on these reports include the accuracy of the advisor’s or portfolio manager’s forecasts and predictions, the appropriateness of the investment strategies designed by the advisor or portfolio manager and the ability of the advisor or portfolio manager to implement their strategies efficiently and successfully. Any one or more of these factors, as well as other risks affecting the securities markets generally, could cause the actual results of any fund to differ materially as compared to its benchmarks.
The views expressed by the portfolio managers reflect their professional opinions and are subject to change. Under no circumstances does the information contained within represent a recommendation to buy or sell any security.
Semi-Annual Report 5
| | |
| PERFORMANCE SUMMARY | | |
| |
Thornburg Strategic Municipal Income Fund | | March 31, 2016 (Unaudited) |
Average Annual Total Returns
| | | | | | | | | | | | | | | | |
| | | 1-Yr | | | 3-Yr | | | 5-Yr | | | Since
Incep. | |
A Shares (Incep: 4/1/09) | | | | | | | | | | | | | | | | |
Without sales charge | | | 2.88 | % | | | 3.23 | % | | | 6.44 | % | | | 7.49 | % |
With sales charge | | | 0.84 | % | | | 2.54 | % | | | 6.01 | % | | | 7.18 | % |
C Shares (Incep: 4/1/09) | | | | | | | | | | | | | | | | |
Without sales charge | | | 2.57 | % | | | 2.92 | % | | | 6.14 | % | | | 7.19 | % |
With sales charge | | | 1.97 | % | | | 2.92 | % | | | 6.14 | % | | | 7.19 | % |
I Shares (Incep: 4/1/09) | | | 3.20 | % | | | 3.55 | % | | | 6.77 | % | | | 7.82 | % |
30-Day Yields, a Shares
(with sales charge)
| | | | |
Annualized Distribution Yield | | | 1.93 | % |
SEC Yield | | | 0.92 | % |
Performance data shown represents past performance and is no guarantee of future results. Investment return and principal value will fluctuate so shares, when redeemed, may be worth more or less than their original cost. Current performance may be lower or higher than quoted. For performance current to the most recent month end, visit thornburg.com or call 800-847-0200. The performance information does not reflect the deduction of taxes that a shareholder would pay on distributions or the redemption of Fund shares. Returns reflect the reinvestment of dividends and capital gains. Class A shares are sold with a maximum sales charge of 2.00%. Class C shares include a 0.60% CDSC for the first year only. There is no sales charge for Class I shares.
As disclosed in the most recent prospectus, the total annual fund operating expenses are as follows: A shares, 1.31%; C shares, 1.70%; I shares, 0.93%. Thornburg Investment Management and/or Thornburg Securities Corporation have contractually agreed to waive fees and reimburse expenses through at least February 1, 2017, for some of the share classes, resulting in net expense ratios of the following: A shares, 1.25%; C shares, 1.55%. For more detailed information on fund expenses and waivers/reimbursements please see the Fund’s prospectus.
Without the fee waivers and expense reimbursements described above, the Annualized Distribution yield would have been 1.91%, and the SEC yield would have been 0.90%.
Glossary
BofA Merrill Lynch Municipal Master Index – Tracks the performance of the investment-grade U.S. tax-exempt bond market. Qualifying bonds must have at least one year remaining term to maturity, a fixed coupon schedule, and an investment grade rating (based on average of Moody’s, S&P, and Fitch).
Unless otherwise noted, index returns reflect the reinvestment of income dividends and capital gains, if any, but do not reflect fees, brokerage commissions or other expenses of investing. Investors may not make direct investments into any index. The performance of any index is not indicative of the performance of any particular investment.
Annualized Distribution Yield – The distribution yield reflects actual distributions made to shareholders. The annualized distribution yield is calculated by summing the last 30 days of income at a given month end and annualizing to a 360-day year. The result is divided by the ending maximum offering price.
Bond Credit Ratings (Credit Quality) – A bond credit rating assesses the financial ability of a debt issuer to make timely payments of principal and interest. Ratings of AAA (the highest), AA, A, and BBB are investment-grade quality. Ratings of BB, B, CCC, CC, C and D (the lowest) are considered below investment grade, speculative grade, or junk bonds.
Credit Spread/Quality Spread – The difference between the yields of securities with different credit qualities.
Duration – A bond’s sensitivity to interest rates. Effective duration incorporates the embedded option features, such as call provisions. Bonds with longer durations experience greater price volatility than bonds with shorter durations.
SEC Yield – SEC yield is computed in accordance with SEC standards measuring the net investment income per share over a specified 30-day period expressed as a percentage of the maximum offering price of the Fund’s shares at the end of the period.
Yield Curve – A line that plots the interest rates, at a set point in time, of bonds having equal credit quality, but differing maturity dates.
6 Semi-Annual Report
| | |
| FUND SUMMARY | | |
| |
Thornburg Strategic Municipal Income Fund | | March 31, 2016 (Unaudited) |
OBJECTIVES AND STRATEGIES
The Fund seeks a high level of current income exempt from federal individual income tax (may be subject to Alternative Minimum Tax).
The Fund invests principally in a portfolio of municipal bonds issued by states and state agencies, local governments and their agencies, and by certain U.S. territories and possessions.
Not more than 50% of the portfolio is invested in bonds rated below investment grade (or of equivalent quality as determined in accordance with the prospectus) at the time of purchase. Also, the portfolio is typically diversified among sectors, issuers, credit qualities, geographic regions, and segments of the yield curve. The flexible nature of the Fund allows the team to adapt the portfolio’s duration and credit quality to our perception of future market conditions.
Key Portfolio Attributes
| | | | |
Number of Bonds | | | 221 | |
Effective Duration | | | 5.9 Yrs | |
Average Maturity | | | 11.0 Yrs | |
Security Credit Ratings
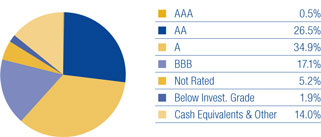
A bond credit rating assesses the financial ability of a debt issuer to make timely payments of principal and interest. Ratings of AAA (the highest), AA, A, and BBB are investment-grade quality. Ratings of BB, B, CCC, CC, C and D (the lowest) are considered below investment grade, speculative grade, or junk bonds. Credit quality ratings for Thornburg’s municipal portfolios used the highest rating available from either Standard & Poor’s or Moody’s Investors Service.
There is no guarantee that the Fund will meet its investment objectives.
All data is subject to change. Charts may not add up to 100% due to rounding.
Semi-Annual Report 7
| | |
| SCHEDULE OF INVESTMENTS | | |
| |
Thornburg Strategic Municipal Income Fund | | March 31, 2016 (Unaudited) |
| | | | | | | | | | |
Issuer-Description | | Credit Rating†
S&P/ Moody’s | | Principal
Amount | | | Value | |
ALABAMA — 0.36% | | | | | | | | | | |
City of Mobile Industrial Development Board, 1.65% due 6/1/2034 put 3/20/2017 (Alabama Power Company Barry Plant Project) | | A-/A1 | | $ | 1,000,000 | | | $ | 1,008,010 | |
| | | |
ARIZONA — 1.33% | | | | | | | | | | |
Arizona HFA, 5.00% due 12/1/2031 (Scottsdale Lincoln Hospitals) | | NR/A2 | | | 2,500,000 | | | | 2,937,375 | |
Pima County IDA, 5.125% due 12/1/2040 (Providence Day School) | | BBB+/NR | | | 710,000 | | | | 758,294 | |
| | | |
ARKANSAS — 0.42% | | | | | | | | | | |
University of Arkansas Board of Trustees, 5.00% due 11/1/2036 (Fayetteville Campus) | | NR/Aa2 | | | 1,000,000 | | | | 1,166,800 | |
| | | |
CALIFORNIA — 12.25% | | | | | | | | | | |
ABAG Finance Authority for Nonprofit Corporations, 5.00% due 7/1/2047 (Episcopal Senior Communities) | | NR/NR | | | 1,635,000 | | | | 1,789,933 | |
Benicia USD GO, 0% due 8/1/2026 (Benicia High School; Insured: AGM) | | AA/A2 | | | 830,000 | | | | 632,809 | |
California HFFA, 6.25% due 2/1/2026 (Community Program Developmental Disabilities; Insured: California Mtg Insurance) | | AA-/NR | | | 1,500,000 | | | | 1,835,850 | |
California HFFA, 5.00% due 11/15/2034 (Children’s Hospital Los Angeles) | | BBB+/Baa2 | | | 420,000 | | | | 466,368 | |
California Housing Finance Agency, 4.625% due 8/1/2016 (Low-Moderate Income Housing Loans; Insured: FGIC) (AMT) | | A/A2 | | | 1,175,000 | | | | 1,179,136 | |
California Housing Finance Agency, 4.625% due 8/1/2026 (Low-Moderate Income Housing Loans; Insured: FGIC) (AMT) | | A/A2 | | | 545,000 | | | | 548,700 | |
California Municipal Finance Authority, 8.50% due 11/1/2039 pre-refunded 11/1/2019 (Harbor Regional Center) | | NR/A3 | | | 1,000,000 | | | | 1,260,500 | |
California Pollution Control Financing Authority, 0.45% due 11/1/2026 put 4/1/2016 (Pacific Gas & Electric Co.; LOC: Mizuho Bank Ltd.) (daily demand notes) | | AA+/NR | | | 2,000,000 | | | | 2,000,000 | |
California Pollution Control Financing Authority, 5.00% due 11/21/2045 (Poseidon Resources (Channelside) LP Desalination Project) (AMT) | | NR/Baa3 | | | 3,000,000 | | | | 3,275,310 | |
California State Public Works Board, 5.00% due 4/1/2028 (Corrections & Rehabilitation and Judicial Council) | | A+/A1 | | | 1,000,000 | | | | 1,189,840 | |
California State Public Works Board, 6.25% due 4/1/2034 (Department of General Services-Office Buildings 8 and 9 Renovation) | | A+/A1 | | | 100,000 | | | | 116,174 | |
California Statewide Communities Development Authority, 5.00% due 7/1/2020 pre-refunded 1/1/2019 (Aspire Public Schools; LOC: PCSD Guaranty Pool I, LLC) | | NR/NR | | | 150,000 | | | | 159,190 | |
California Statewide Communities Development Authority, 6.125% due 7/1/2046 pre-refunded 1/1/2019 (Aspire Public Schools) | | NR/NR | | | 995,000 | | | | 1,132,380 | |
Calipatria USD GO, 0% due 8/1/2025 (Educational Facilities; Insured: ACA) | | NR/NR | | | 2,315,000 | | | | 1,667,842 | |
Carson Redevelopment Agency, 7.00% due 10/1/2036 (Project Area 1) | | A-/NR | | | 500,000 | | | | 581,065 | |
Chico Redevelopment Agency, 5.00% due 4/1/2030 (Chico Amended & Merged Redevelopment; Insured: AMBAC) | | A+/NR | | | 1,500,000 | | | | 1,504,380 | |
City of Moorpark Mobile Home Park, 6.15% due 5/15/2031 (Villa Del Arroyo) | | A+/NR | | | 1,000,000 | | | | 1,138,310 | |
City of Palm Springs Financing Authority, 5.25% due 6/1/2027 (Downtown Revitalization Project) | | AA/NR | | | 1,620,000 | | | | 1,935,673 | |
Corona-Norco USD COP, 5.00% due 4/15/2031 (Insured: AGM) | | AA/A1 | | | 1,750,000 | | | | 1,980,212 | |
County of El Dorado, 5.00% due 9/1/2026 (El Dorado Hills Development-Community Facilities) | | A/NR | | | 630,000 | | | | 733,648 | |
Daly County Housing Development Finance Agency, 5.25% due 12/15/2023 (Franciscan Country Club Mobile Home Park Acquisition) | | A+/NR | | | 650,000 | | | | 689,403 | |
Los Angeles County Public Works Financing Authority, 3.625% due 9/1/2016 (Lynwood Regional Justice Center and Central Jail Expansion; Insured: Natl-Re) | | AA-/A3 | | | 200,000 | | | | 202,676 | |
M-S-R Energy Authority, 6.50% due 11/1/2039 | | BBB+/NR | | | 1,000,000 | | | | 1,418,050 | |
Oakland USD GO, 5.00% due 8/1/2035 (County of Alameda Educational Facilities) | | NR/NR | | | 1,000,000 | | | | 1,153,800 | |
Redwood City Redevelopment Agency, 0% due 7/15/2021 (Redevelopment Project Area 2; Insured: AMBAC) | | A-/NR | | | 1,285,000 | | | | 1,119,402 | |
Riverside County Asset Leasing Corp., 0% due 6/1/2021 (Riverside County Hospital; Insured: Natl-Re) | | AA-/A2 | | | 535,000 | | | | 477,504 | |
San Francisco City & County Redevelopment Financing Authority, 0% due 8/1/2023 (Redevelopment Project; Insured: Natl- Re) | | AA-/A2 | | | 1,025,000 | | | | 855,824 | |
San Francisco City & County Redevelopment Financing Authority, 6.50% due 8/1/2039 (Mission Bay North Redevelopment) | | A-/NR | | | 250,000 | | | | 284,922 | |
San Francisco City & County Redevelopment Financing Authority, 6.75% due 8/1/2041 (Mission Bay North Redevelopment) | | A-/NR | | | 500,000 | | | | 605,155 | |
San Jose Redevelopment Agency, 5.50% due 8/1/2035 (Merged Area Redevelopment) | | A/A2 | | | 1,000,000 | | | | 1,128,580 | |
Sonoma County Community Redevelopment Agency, 6.50% due 8/1/2034 (The Springs Redevelopment; Insured: AGM) | | AA/NR | | | 100,000 | | | | 100,478 | |
Southeast Resource Recovery Facilities Authority, 5.25% due 12/1/2016 (Insured: AMBAC) | | AA-/A2 | | | 225,000 | | | | 225,925 | |
Union Elementary School District, 0% due 9/1/2027 (Santa Clara County District Schools; Insured: Natl-Re) | | AA+/NR | | | 905,000 | | | | 670,062 | |
| | | |
COLORADO — 2.28% | | | | | | | | | | |
Denver Convention Center Hotel Authority, 5.125% due 12/1/2026 (Insured: Syncora) | | BBB-/Baa3 | | | 2,450,000 | | | | 2,501,597 | |
Denver Convention Center Hotel Authority, 5.00% due 12/1/2030 (Insured: Syncora) | | BBB-/Baa3 | | | 450,000 | | | | 456,440 | |
Denver Convention Center Hotel Authority, 5.00% due 12/1/2035 (Insured: Syncora) | | BBB-/Baa3 | | | 605,000 | | | | 612,671 | |
Eagle River Fire District, 6.625% due 12/1/2024 pre-refunded 12/1/2019 | | NR/NR | | | 225,000 | | | | 270,495 | |
Eagle River Fire District, 6.875% due 12/1/2030 pre-refunded 12/1/2019 | | NR/NR | | | 400,000 | | | | 484,472 | |
Public Authority for Colorado Energy, 5.75% due 11/15/2018 (Natural Gas Purchase) | | BBB+/Baa1 | | | 410,000 | | | | 439,856 | |
Public Authority for Colorado Energy, 6.50% due 11/15/2038 (Natural Gas Purchase) | | BBB+/Baa1 | | | 260,000 | | | | 366,384 | |
Regional Transportation District COP, 5.375% due 6/1/2031 (FasTracks Transportation System) | | A/Aa3 | | | 500,000 | | | | 572,820 | |
Regional Transportation District COP, 5.00% due 6/1/2044 (FasTracks Transportation System) | | A/Aa3 | | | 565,000 | | | | 637,360 | |
8 Semi-Annual Report
| | |
| SCHEDULE OF INVESTMENTS, CONTINUED | | |
| |
Thornburg Strategic Municipal Income Fund | | March 31, 2016 (Unaudited) |
| | | | | | | | | | |
Issuer-Description | | Credit Rating†
S&P/ Moody’s | | Principal
Amount | | | Value | |
CONNECTICUT — 3.88% | | | | | | | | | | |
Connecticut Health & Educational Facilities Authority, 6.00% due 7/1/2039 (Ethel Walker School) | | BBB/NR | | $ | 1,000,000 | | | $ | 1,062,190 | |
Connecticut Housing Finance Authority, 0.35% due 5/15/2039 put 4/1/2016 (Housing Mortgage Financing Program; SPA: JPMorgan Chase Bank, N.A.) (daily demand notes) | | AAA/Aaa | | | 8,725,000 | | | | 8,725,000 | |
State of Connecticut GO Floating Rate Note, 0.81% due 9/15/2017 (Public Facility Improvements) | | AA/Aa3 | | | 1,000,000 | | | | 996,190 | |
| | | |
DELAWARE — 0.40% | | | | | | | | | | |
Delaware HFA, 5.00% due 7/1/2021 (Nanticoke Memorial Hospital) | | BBB/NR | | | 1,000,000 | | | | 1,112,360 | |
| | | |
DISTRICT OF COLUMBIA — 0.37% | | | | | | | | | | |
Metropolitan Washington Airports Authority, 0% due 10/1/2027 (Dulles Toll Road; Insured: AGM) | | AA/A3 | | | 1,500,000 | | | | 1,017,330 | |
| | | |
FLORIDA — 4.26% | | | | | | | | | | |
City of Miami GO, 5.00% due 1/1/2017 (Homeland Defense/Neighborhood Capital Improvements) | | A/A2 | | | 1,245,000 | | | | 1,281,142 | |
City of Miami GO, 5.00% due 1/1/2018 (Homeland Defense/Neighborhood Capital Improvements) | | A/A2 | | | 1,790,000 | | | | 1,906,439 | |
Florida Higher Educational Facilities Financing Authority, 5.00% due 4/1/2027 (Nova Southeastern University) | | A-/Baa1 | | | 1,000,000 | | | | 1,135,670 | |
Miami-Dade County Expressway Authority, 5.00% due 7/1/2022 (Toll System Five-Year Work Program) | | A/A2 | | | 625,000 | | | | 750,494 | |
Miami-Dade County Expressway Authority, 5.00% due 7/1/2024 (Toll System Five-Year Work Program) | | A/A2 | | | 625,000 | | | | 771,219 | |
Miami-Dade County School Board COP, 5.00% due 8/1/2027 (District School Facilities and Infrastructure) | | A/A1 | | | 1,100,000 | | | | 1,258,675 | |
Orange County, 0% due 10/1/2016 (County Correctional Facilities and Communications System; Insured: AMBAC) | | NR/NR | | | 410,000 | | | | 407,757 | |
Pinellas County Educational Facilities Authority, 5.25% due 10/1/2030 (Barry University) | | BBB/NR | | | 500,000 | | | | 565,440 | |
Sarasota County Public Hospital Board, 0.598% due 10/1/2021 (Sarasota Memorial Hospital; Insured: Natl-Re) | | AA-/A1 | | | 1,000,000 | | | | 1,035,980 | |
Tampa Sports Authority, 5.75% due 10/1/2020 (Tampa Bay Arena; Insured: Natl-Re) | | AA-/NR | | | 910,000 | | | | 989,334 | |
Volusia County Educational Facilities Authority, 5.00% due 10/15/2030 (Embry-Riddle Aeronautical University, Inc.) | | NR/Baa1 | | | 1,500,000 | | | | 1,739,070 | |
| | | |
GEORGIA — 1.10% | | | | | | | | | | |
City of Atlanta, 6.25% due 11/1/2034 pre-refunded 11/1/2019 (Water and Wastewater Capital Improvement Program) | | AA-/Aa3 | | | 500,000 | | | | 593,135 | |
Development Authority of Fulton County, 5.00% due 10/1/2019 (Georgia Tech Athletic Assoc.) | | NR/A2 | | | 1,000,000 | | | | 1,132,620 | |
Main Street Natural Gas, Inc., 5.00% due 3/15/2018 (Georgia Gas) | | A-/A3 | | | 515,000 | | | | 551,776 | |
Main Street Natural Gas, Inc., 5.50% due 9/15/2023 (Georgia Gas) | | BBB+/Baa1 | | | 350,000 | | | | 423,661 | |
Municipal Gas Authority of Georgia GO, 5.00% due 4/1/2016 (Public Gas Partners, Inc.-Gas Portfolio III Project) | | AA-/A1 | | | 350,000 | | | | 350,000 | |
| | | |
GUAM — 3.76% | | | | | | | | | | |
Government of Guam, 5.00% due 11/15/2031 (Economic Development) | | A/NR | | | 2,000,000 | | | | 2,326,660 | |
Government of Guam, 5.00% due 11/15/2032 (Economic Development) | | A/NR | | | 3,000,000 | | | | 3,471,000 | |
Government of Guam, 5.75% due 12/1/2034 (Layon Solid Waste Disposal Facility) | | BBB+/NR | | | 500,000 | | | | 556,390 | |
Government of Guam Department of Education COP, 6.875% due 12/1/2040 (John F. Kennedy High School) | | B+/NR | | | 1,000,000 | | | | 1,099,330 | |
Government of Guam GO, 7.00% due 11/15/2039 pre-refunded 11/15/2019 (Economic Development) | | NR/NR | | | 520,000 | | | | 632,320 | |
Guam Power Authority, 5.00% due 10/1/2027 (Electric Power System; Insured: AGM) | | AA/A2 | | | 1,000,000 | | | | 1,185,520 | |
Guam Waterworks Authority, 5.25% due 7/1/2024 (Water and Wastewater System) | | A-/Baa2 | | | 500,000 | | | | 598,890 | |
Guam Waterworks Authority, 5.00% due 7/1/2028 (Water and Wastewater System) | | A-/Baa2 | | | 500,000 | | | | 576,670 | |
| | | |
ILLINOIS — 7.91% | | | | | | | | | | |
Board of Education of the City of Chicago GO, 5.00% due 12/1/2020 (Education Capital Improvement Program; Insured: AGM) | | AA/A2 | | | 365,000 | | | | 372,428 | |
Chicago Park District GO, 5.00% due 1/1/2035 (Various Capital Projects) | | AA+/NR | | | 2,000,000 | | | | 2,162,480 | |
City of Chicago, 5.00% due 11/1/2029 (Water System Improvements) | | A-/Baa2 | | | 200,000 | | | | 219,924 | |
City of Chicago, 5.00% due 1/1/2030 (Wastewater Transmission System) | | A/NR | | | 1,500,000 | | | | 1,674,240 | |
City of Chicago, 5.00% due 1/1/2031 (Riverwalk Expansion Project; Insured: AGM) | | AA/A2 | | | 500,000 | | | | 548,720 | |
City of Chicago GO, 5.00% due 1/1/2020 (Capital Projects; Insured: AGM) | | AA/A2 | | | 475,000 | | | | 476,776 | |
City of Chicago GO, 5.00% due 1/1/2026 (Debt Restructuring) | | BBB+/NR | | | 500,000 | | | | 496,155 | |
City of Chicago GO, 5.25% due 1/1/2035 (Various Infrastructure Projects) | | BBB+/Ba1 | | | 500,000 | | | | 491,180 | |
Cook County GO, 5.25% due 11/15/2033 | | AA/A2 | | | 1,000,000 | | | | 1,074,050 | |
Illinois Finance Authority, 5.00% due 8/1/2029 (Advocate Health Care Network) | | AA/Aa2 | | | 2,195,000 | | | | 2,613,916 | |
Illinois Finance Authority, 5.00% due 8/15/2035 (Silver Cross Hospital & Medical Centers) | | NR/Baa1 | | | 2,355,000 | | | | 2,649,116 | |
Illinois Finance Authority, 5.75% due 11/15/2037 pre-refunded 11/15/2017 (OSF Healthcare System) | | A/A2 | | | 330,000 | | | | 356,050 | |
Illinois Finance Authority, 6.00% due 5/15/2039 (OSF Healthcare System) | | A/A2 | | | 1,545,000 | | | | 1,783,687 | |
Illinois Toll Highway Authority, 5.00% due 1/1/2037 (Move Illinois Program) | | AA-/Aa3 | | | 1,000,000 | | | | 1,160,460 | |
Kane, Cook, & DuPage Counties School District No. 46 GO, 5.00% due 1/1/2028 | | AA-/NR | | | 1,000,000 | | | | 1,174,340 | |
Kane, Cook, & DuPage Counties School District No. 46 GO, 5.00% due 1/1/2031 | | AA-/NR | | | 2,255,000 | | | | 2,596,678 | |
Metropolitan Pier & Exposition Authority, 5.00% due 6/15/2050 (McCormick Place) | | BBB+/Baa2 | | | 1,500,000 | | | | 1,565,715 | |
Metropolitan Water Reclamation District of Greater Chicago GO, 5.25% due 12/1/2032 (Various Capital Improvement Projects) | | AAA/Aa2 | | | 40,000 | | | | 49,761 | |
Village of Melrose Park GO, 6.75% due 12/15/2016 (Redevelopment Project Costs; Insured: Natl-Re) | | A-/A3 | | | 90,000 | | | | 93,182 | |
Will County School District No. 114 GO, 0% due 12/1/2023 (Educational Facilities; Insured: Natl-Re) | | NR/A3 | | | 570,000 | | | | 437,657 | |
Semi-Annual Report 9
| | |
| SCHEDULE OF INVESTMENTS, CONTINUED | | |
| |
Thornburg Strategic Municipal Income Fund | | March 31, 2016 (Unaudited) |
| | | | | | | | | | |
Issuer-Description | | Credit Rating†
S&P/ Moody’s | | Principal
Amount | | | Value | |
INDIANA — 1.19% | | | | | | | | | | |
City of Carmel Redevelopment District COP, 6.50% due 7/15/2035 (Performing Arts Center) | | NR/NR | | $ | 1,000,000 | | | $ | 1,108,080 | |
Indiana Finance Authority, 0.38% due 2/1/2037 put 4/1/2016 (Stadium Project; SPA: JPMorgan Chase Bank, N.A.) (daily demand notes) | | AA+/Aa2 | | | 1,100,000 | | | | 1,100,000 | |
Indiana Finance Authority, 6.375% due 9/15/2041 (Marian University) | | BBB-/NR | | | 1,000,000 | | | | 1,103,250 | |
| | | |
IOWA — 0.62% | | | | | | | | | | |
Iowa Finance Authority, 5.25% due 12/1/2025 (Iowa Fertilizer Company Project) | | BB-/NR | | | 1,615,000 | | | | 1,726,064 | |
| | | |
KANSAS — 1.24% | | | | | | | | | | |
City of Wichita, 5.90% due 12/1/2016 (Brentwood Apartments) | | B/NR | | | 90,000 | | | | 89,898 | |
City of Wichita, 5.85% due 12/1/2025 (Brentwood Apartments) | | B/NR | | | 895,000 | | | | 841,408 | |
Kansas City Community College COP, 3.00% due 4/1/2016 (Higher Education Campus Facilities) | | AA-/NR | | | 150,000 | | | | 150,000 | |
Unified Government of Wyandotte County/Kansas City, 5.00% due 9/1/2031 (Utility System Improvement) | | A+/A3 | | | 1,000,000 | | | | 1,189,510 | |
Unified Government of Wyandotte County/Kansas City, 5.00% due 9/1/2032 (Utility System Improvement) | | A+/A3 | | | 1,000,000 | | | | 1,184,510 | |
| | | |
KENTUCKY — 4.45% | | | | | | | | | | |
Commonwealth of Kentucky State Property and Buildings Commission, 5.00% due 11/1/2020 pre-refunded 11/1/2018 (Project No. 89; Insured: AGM) | | AA/Aa3 | | | 2,500,000 | | | | 2,763,600 | |
Commonwealth of Kentucky State Property and Buildings Commission, 5.00% due 11/1/2026 (Project No. 112) | | A/Aa3 | | | 5,000,000 | | | | 6,146,300 | |
County of Owen, 6.25% due 6/1/2039 (Kentucky-American Water Co. Project) | | A/A3 | | | 540,000 | | | | 606,442 | |
Kentucky Economic DFA, 0% due 10/1/2021 (Norton Healthcare, Inc.; Insured: Natl-Re) | | AA-/A3 | | | 715,000 | | | | 625,117 | |
Kentucky Economic DFA, 0% due 10/1/2022 (Norton Healthcare, Inc.; Insured: Natl-Re) | | AA-/A3 | | | 2,650,000 | | | | 2,238,587 | |
| | | |
LOUISIANA — 2.11% | | | | | | | | | | |
City of New Orleans, 5.00% due 12/1/2034 (Water System Facilities Improvement) | | A-/NR | | | 400,000 | | | | 459,652 | |
Louisiana Energy and Power Authority, 5.25% due 6/1/2038 (LEPA Unit No. 1; Insured: AGM) | | AA/A2 | | | 2,000,000 | | | | 2,314,700 | |
Louisiana Public Facilities Authority, 5.00% due 7/1/2032 (Black & Gold Facilities; Insured: CIFG) | | AA/A3 | | | 120,000 | | | | 125,020 | |
Louisiana Public Facilities Authority, 5.375% due 5/15/2043 pre-refunded 5/15/2017 (Ochsner Clinic Foundation) | | NR/NR | | | 140,000 | | | | 147,413 | |
Louisiana Public Facilities Authority, 5.375% due 5/15/2043 (Ochsner Clinic Foundation) | | NR/Baa1 | | | 360,000 | | | | 373,532 | |
Parish of St. Charles, 4.00% due 12/1/2040 put 6/1/2022 (Valero Energy Corp. Refinery) | | BBB/Baa2 | | | 2,250,000 | | | | 2,449,485 | |
| | | |
MARYLAND — 1.71% | | | | | | | | | | |
City of Baltimore, 5.00% due 7/1/2020 (Wastewater Projects) | | AA/Aa2 | | | 3,055,000 | | | | 3,545,572 | |
County of Montgomery GO, 0.39% due 6/1/2026 put 4/1/2016 (Consolidated Public Improvements; SPA: Wells Fargo Bank, N.A.) (daily demand notes) | | AAA/Aaa | | | 1,200,000 | | | | 1,200,000 | |
| | | |
MASSACHUSETTS — 0.32% | | | | | | | | | | |
Massachusetts Development Finance Agency, 5.00% due 7/1/2032 (Jordan Hospital and Milton Hospital) | | A-/A3 | | | 355,000 | | | | 409,173 | |
Massachusetts Development Finance Agency, 5.00% due 7/1/2033 (Jordan Hospital and Milton Hospital) | | A-/A3 | | | 200,000 | | | | 229,654 | |
Massachusetts Educational Financing Authority, 6.00% due 1/1/2028 | | AA/NR | | | 245,000 | | | | 259,874 | |
| | | |
MICHIGAN — 8.07% | | | | | | | | | | |
Board of Governors of Wayne State University, 5.00% due 11/15/2033 (Educational Facilities and Equipment) | | AA-/Aa3 | | | 1,250,000 | | | | 1,457,250 | |
City of Kalamazoo Hospital Finance Authority, 5.00% due 5/15/2036 (Bronson Methodist Hospital) | | NR/A2 | | | 1,000,000 | | | | 1,092,800 | |
City of Kalamazoo Hospital Finance Authority, 5.25% due 5/15/2041 (Bronson Nursing and Rehabilitation Center) | | NR/A2 | | | 1,000,000 | | | | 1,094,620 | |
City of Troy GO, 5.25% due 11/1/2032 (Downtown Development Authority-Community Center Facilities) | | AAA/NR | | | 1,025,000 | | | | 1,212,021 | |
County of Genesee GO, 5.375% due 11/1/2038 (Water Supply System; Insured: BAM) | | AA/A2 | | | 1,000,000 | | | | 1,154,660 | |
Detroit City School District, 5.00% due 5/1/2025 (School Building & Site; Insured: Q-SBLF) | | AA-/Aa1 | | | 1,000,000 | | | | 1,151,850 | |
Detroit City School District GO, 5.25% due 5/1/2027 (School Building & Site; Insured: AGM) | | AA/Aa1 | | | 1,000,000 | | | | 1,215,740 | |
Livonia Public School District GO, 5.00% due 5/1/2036 (School Building & Site) | | AA/A2 | | | 225,000 | | | | 255,670 | |
Michigan Finance Authority, 5.00% due 4/1/2031 (State Dept. of Human Services Office Buildings) | | A+/NR | | | 1,000,000 | | | | 1,098,050 | |
Michigan Finance Authority, 5.00% due 8/1/2032 (Beaumont Health Credit Group) | | A/A1 | | | 5,000,000 | | | | 5,812,350 | |
Michigan Housing Development Authority, 3.375% due 11/1/2016 (AMT) | | AA/NR | | | 655,000 | | | | 656,225 | |
Michigan Public School Academy, 8.00% due 8/1/2035 (Will Carleton Charter School) | | NR/NR | | | 1,015,000 | | | | 1,078,935 | |
Michigan State Hospital Finance Authority, 5.00% due 7/15/2025 pre-refunded 7/15/2017 (Oakwood Southshore Medical Center) | | A/A1 | | | 650,000 | | | | 686,088 | |
Michigan State Hospital Finance Authority, 5.75% due 11/15/2039 (Henry Ford Health System) | | A-/A3 | | | 1,000,000 | | | | 1,137,140 | |
Michigan Strategic Fund, 7.00% due 5/1/2021 (Detroit Edison Company; Insured: Natl-Re/AMBAC) | | NR/NR | | | 250,000 | | | | 312,465 | |
Wayne County Airport Authority, 5.00% due 12/1/2031 (Detroit Metropolitan Wayne County Airport) | | A/A2 | | | 650,000 | | | | 755,541 | |
Wayne County Airport Authority, 5.00% due 12/1/2033 (Detroit Metropolitan Wayne County Airport) | | A/A2 | | | 825,000 | | | | 951,431 | |
Wayne County Airport Authority, 5.00% due 12/1/2034 (Detroit Metropolitan Wayne County Airport) | | A/A2 | | | 1,140,000 | | | | 1,310,008 | |
10 Semi-Annual Report
| | |
| SCHEDULE OF INVESTMENTS, CONTINUED | | |
| |
Thornburg Strategic Municipal Income Fund | | March 31, 2016 (Unaudited) |
| | | | | | | | | | |
Issuer-Description | | Credit Rating†
S&P/ Moody’s | | Principal
Amount | | | Value | |
MINNESOTA — 0.20% | | | | | | | | | | |
St. Paul Housing & Redevelopment Authority, 5.25% due 5/15/2023 pre-refunded 11/15/2016 | | A/Aaa | | $ | 115,000 | | | $ | 118,350 | |
Washington County Housing Redevelopment Authority, 5.625% due 6/1/2037 (Birchwood and Woodbury Healthcare Facility Projects) | | NR/NR | | | 415,000 | | | | 430,243 | |
| | | |
MISSOURI — 1.20% | | | | | | | | | | |
Tax Increment Financing Commission of Kansas City, 5.25% due 3/1/2018 (Maincor Project-Public Improvements) (ETM) | | NR/NR | | | 650,000 | | | | 688,896 | |
Tax Increment Financing Commission of Kansas City, 6.00% due 5/1/2030 (Union Hill Redevelopment Project) | | NR/NR | | | 2,505,000 | | | | 2,649,413 | |
| | | |
NEBRASKA — 0.73% | | | | | | | | | | |
Douglas County Health Facilities, 5.00% due 11/1/2029 (Nebraska Methodist Health System) | | A-/NR | | | 950,000 | | | | 1,104,631 | |
Douglas County Health Facilities, 5.00% due 11/1/2030 (Nebraska Methodist Health System) | | A-/NR | | | 800,000 | | | | 925,888 | |
| | | |
NEW JERSEY — 2.68% | | | | | | | | | | |
Higher Education Student Assistance Authority, 5.75% due 12/1/2039 (NJCLASS Student Loan Program) (AMT) | | A/A2 | | | 750,000 | | | | 827,017 | |
New Jersey EDA, 5.00% due 3/1/2026 (School Facilities Construction) | | A-/A3 | | | 1,000,000 | | | | 1,086,620 | |
New Jersey EDA, 5.50% due 9/1/2027 (School Facilities Construction; Insured: Natl-Re) | | AA-/A3 | | | 1,000,000 | | | | 1,199,740 | |
New Jersey EDA, 5.00% due 6/15/2029 (School Facilities Construction) | | A-/A3 | | | 2,000,000 | | | | 2,169,460 | |
New Jersey Transit Corp., 5.00% due 9/15/2020 (Federal Transit Administration Section 5307 Urbanized Area Formula Funds) | | A/A3 | | | 1,000,000 | | | | 1,121,540 | |
New Jersey Transportation Trust Fund Authority, 5.00% due 6/15/2042 (Transportation System Improvements) | | A-/A3 | | | 1,000,000 | | | | 1,044,910 | |
| | | |
NEW MEXICO — 1.35% | | | | | | | | | | |
City of Farmington, 4.70% due 9/1/2024 (Arizona Public Service Co.-Four Corners Project) | | A-/A2 | | | 1,000,000 | | | | 1,112,250 | |
New Mexico Hospital Equipment Loan Council, 5.00% due 7/1/2032 (Haverland Carter Lifestyle Group) | | NR/NR | | | 2,500,000 | | | | 2,645,400 | |
| | | |
NEW YORK — 7.68% | | | | | | | | | | |
City of New York GO, 0.36% due 8/1/2020 put 4/1/2016 (Capital Projects; LOC: JPMorgan Chase Bank, N.A.) (daily demand notes) | | AAA/Aa1 | | | 500,000 | | | | 500,000 | |
City of New York GO, 5.00% due 8/1/2023 (City Budget Financial Management) | | AA/Aa2 | | | 3,000,000 | | | | 3,693,750 | |
City of New York GO, 0.36% due 10/1/2023 put 4/1/2016 (Capital Projects; LOC: JPMorgan Chase Bank, N.A.) (daily demand notes) | | AAA/Aa1 | | | 400,000 | | | | 400,000 | |
City of New York GO, 5.00% due 8/1/2031 (City Budget Financial Management) | | AA/Aa2 | | | 2,000,000 | | | | 2,410,680 | |
City of Syracuse, 5.00% due 8/1/2017 (City Public and School Building Capital Projects; Insured: AGM) (State Aid Withholding) | | AA/A1 | | | 400,000 | | | | 401,556 | |
New York City Municipal Water Finance Authority, 0.36% due 6/15/2050 put 4/1/2016 (Water & Sewer System; SPA: JPMorgan Chase Bank, N.A.) (daily demand notes) | | AA+/Aa1 | | | 1,050,000 | | | | 1,050,000 | |
New York City Transitional Finance Authority, 0.38% due 11/1/2022 put 4/1/2016 (World Trade Center Recovery; SPA: Landesbank Hessen-Thuringen) (daily demand notes) | | AAA/Aa1 | | | 500,000 | | | | 500,000 | |
New York City Transitional Finance Authority, 0.52% due 11/15/2022 put 4/7/2016 (City Capital Projects; SPA: JPMorgan Chase Bank, N.A.) (weekly demand notes) | | AAA/Aaa | | | 5,000,000 | | | | 5,000,000 | |
New York City Transitional Finance Authority, 1.00% due 11/1/2028 put 4/7/2016 (City Capital Projects; SPA: JPMorgan Chase Bank, N.A.) (weekly demand notes) | | AAA/Aaa | | | 6,000,000 | | | | 6,000,000 | |
New York City Transitional Finance Authority, 0.38% due 8/1/2031 put 4/1/2016 (City Capital Projects; SPA: Landesbank Hessen-Thuringen) (daily demand notes) | | AAA/Aaa | | | 250,000 | | | | 250,000 | |
New York City Transitional Finance Authority, 0.36% due 2/1/2045 put 4/1/2016 (City Capital Projects; SPA: JPMorgan Chase Bank, N.A.) (daily demand notes) | | AAA/Aa1 | | | 1,150,000 | | | | 1,150,000 | |
| | | |
NORTH CAROLINA — 1.47% | | | | | | | | | | |
Charlotte-Mecklenburg Hospital Authority, 1.00% due 1/15/2037 put 4/7/2016 (Carolinas HealthCare System; SPA: JPMorgan Chase Bank, N.A.) (weekly demand notes) | | AA-/Aa3 | | | 2,300,000 | | | | 2,300,000 | |
North Carolina Medical Care Commission, 5.00% due 6/1/2029 (Vidant Health) | | A+/A1 | | | 1,500,000 | | | | 1,781,130 | |
| | | |
OHIO — 1.63% | | | | | | | | | | |
American Municipal Power, Inc., 5.25% due 2/15/2018 (AMP Combined Hydroelectric Projects) | | A/A3 | | | 500,000 | | | | 539,945 | |
City of Akron, 5.00% due 12/1/2031 (Community Learning Centers) | | AA+/NR | | | 625,000 | | | | 740,025 | |
Cleveland-Cuyahoga County Port Authority, 6.25% due 5/15/2016 (Council for Economic Opportunities in Greater Cleveland Project; LOC: Fifth Third Bank) | | BBB+/NR | | | 100,000 | | | | 100,200 | |
Cleveland-Cuyahoga County Port Authority, 7.00% due 5/15/2040 (Flats East Development Project; LOC: Fifth Third Bank) | | BBB+/NR | | | 960,000 | | | | 1,095,293 | |
Ohio State Air Quality Development Authority, 3.625% due 10/1/2033 put 4/1/2020 (FirstEnergy Nuclear Generation Corp.) | | BBB-/Baa3 | | | 1,000,000 | | | | 1,038,320 | |
Ohio State Water Development Authority, 5.875% due 6/1/2033 put 6/1/2016 (FirstEnergy Nuclear Generation Corp.) | | BBB-/Baa2 | | | 1,000,000 | | | | 1,007,060 | |
Semi-Annual Report 11
| | |
| SCHEDULE OF INVESTMENTS, CONTINUED | | |
| |
Thornburg Strategic Municipal Income Fund | | March 31, 2016 (Unaudited) |
| | | | | | | | | | |
Issuer-Description | | Credit Rating†
S&P/ Moody’s | | Principal
Amount | | | Value | |
OKLAHOMA — 0.22% | | | | | | | | | | |
Oklahoma Turnpike Authority, 0.35% due 1/1/2028 put 4/1/2016 (Oklahoma Turnpike System; SPA: JPMorgan Chase Bank, N.A.) (daily demand notes) | | AA-/Aa3 | | $ | 600,000 | | | $ | 600,000 | |
| | | |
OREGON — 2.82% | | | | | | | | | | |
State of Oregon GO, 2.00% due 9/15/2016 (Cash Management) | | SP-1+/Mig1 | | | 6,000,000 | | | | 6,045,660 | |
State of Oregon GO, 0.40% due 12/1/2036 put 4/7/2016 (Veterans’ Loan Program; SPA: U.S. Bank, N.A.) (weekly demand notes) | | AA+/Aa1 | | | 600,000 | | | | 600,000 | |
State of Oregon GO, 0.35% due 6/1/2040 put 4/1/2016 (Veterans’ Loan Program; SPA: U.S. Bank, N.A.) (daily demand notes) | | AA+/Aa1 | | | 800,000 | | | | 800,000 | |
State of Oregon GO, 0.35% due 12/1/2041 put 4/1/2016 (Veterans’ Loan Program; SPA: U.S. Bank, N.A.) (daily demand notes) | | AA+/Aa1 | | | 400,000 | | | | 400,000 | |
| | | |
PENNSYLVANIA — 5.71% | | | | | | | | | | |
Allegheny County IDA, 6.75% due 8/15/2035 (Propel Charter School) | | BBB-/NR | | | 925,000 | | | | 1,015,021 | |
County of Luzerne GO, 5.00% due 11/15/2029 (Insured: AGM) | | AA/NR | | | 1,000,000 | | | | 1,152,060 | |
Lancaster County Hospital Authority, 5.00% due 11/1/2019 (Masonic Villages Project) | | A/NR | | | 2,675,000 | | | | 3,018,390 | |
a Lehigh County IDA, 0.90% due 2/15/2027 put 8/15/2017 (PPL Electric Utilities Corp.) | | A/A1 | | | 5,500,000 | | | | 5,498,075 | |
Pennsylvania Economic DFA, 4.625% due 12/1/2018 (Colver Project; Insured: AMBAC) (AMT) | | BBB-/Ba1 | | | 1,800,000 | | | | 1,805,688 | |
Pennsylvania Turnpike Commission, 5.35% due 12/1/2030 (PennDOT-Mass Transit Agencies) | | A-/A3 | | | 2,000,000 | | | | 2,287,360 | |
Philadelphia IDA, 6.00% due 8/1/2035 (Mast Charter School) | | BBB+/NR | | | 1,000,000 | | | | 1,108,560 | |
| | | |
RHODE ISLAND — 0.28% | | | | | | | | | | |
Housing Authority of the City of Pawtucket, 5.50% due 9/1/2022 (Public Housing Development) | | A+/NR | | | 315,000 | | | | 375,234 | |
Housing Authority of the City of Pawtucket, 5.50% due 9/1/2024 (Public Housing Development) | | A+/NR | | | 350,000 | | | | 413,060 | |
| | | |
SOUTH CAROLINA — 0.42% | | | | | | | | | | |
Spartanburg County School District No. 1 GO, 4.00% due 3/1/2017 | | AA/Aa1 | | | 1,125,000 | | | | 1,159,673 | |
| | | |
SOUTH DAKOTA — 0.46% | | | | | | | | | | |
South Dakota Health & Educational Facilities Authority, 5.00% due 7/1/2027 (Avera Health) | | AA-/A1 | | | 400,000 | | | | 455,768 | |
South Dakota Health & Educational Facilities Authority, 5.50% due 11/1/2040 (Sanford Health) | | A+/A1 | | | 750,000 | | | | 837,562 | |
| | | |
TENNESSEE — 0.22% | | | | | | | | | | |
Tennessee Energy Acquisition Corp., 5.25% due 9/1/2024 | | BBB+/A3 | | | 500,000 | | | | 602,510 | |
| | | |
TEXAS — 9.58% | | | | | | | | | | |
Austin Convention Enterprises, Inc., 5.25% due 1/1/2024 (Austin Convention Center; Insured: Syncora) | | BBB-/Ba1 | | | 720,000 | | | | 735,970 | |
Austin Convention Enterprises, Inc., 5.00% due 1/1/2034 (Austin Convention Center; Insured: Syncora) | | BBB-/Ba1 | | | 795,000 | | | | 801,622 | |
City of Houston, 5.00% due 9/1/2025 (Convention & Entertainment Facilities Department) | | A-/A2 | | | 1,000,000 | | | | 1,224,650 | |
City of Houston, 5.00% due 9/1/2028 (Convention & Entertainment Facilities Department) | | A-/A2 | | | 325,000 | | | | 389,041 | |
City of Houston, 5.00% due 11/15/2028 (Combined Utility System) | | AA/Aa2 | | | 2,500,000 | | | | 3,051,925 | |
City of Houston, 5.00% due 9/1/2034 (Convention & Entertainment Facilities Department) | | A-/A2 | | | 1,550,000 | | | | 1,804,091 | |
b City of Houston GO, 5.00% due 3/1/2032 (Public Improvements) | | AA/Aa3 | | | 3,000,000 | | | | 3,597,840 | |
City of Texas City Industrial Development Corp., 7.375% due 10/1/2020 (ARCO Pipe Line Co. Project) | | A-/A2 | | | 1,165,000 | | | | 1,441,117 | |
Harris County-Houston Sports Authority, 5.00% due 11/15/2030 | | A-/A2 | | | 2,000,000 | | | | 2,353,780 | |
Kimble County Hospital District, 6.25% due 8/15/2033 | | NR/NR | | | 500,000 | | | | 558,540 | |
La Vernia Higher Education Finance Corp., 6.25% due 8/15/2039 pre-refunded 8/15/2019 (Kipp, Inc.) | | BBB/NR | | | 1,000,000 | | | | 1,172,650 | |
Lower Colorado River Authority, 5.00% due 5/15/2026 pre-refunded 5/15/2022 | | NR/NR | | | 20,000 | | | | 24,309 | |
Lower Colorado River Authority, 5.00% due 5/15/2026 | | A/A2 | | | 2,980,000 | | | | 3,526,711 | |
San Antonio Education Facilities Corp., 0.45% due 6/1/2033 put 4/7/2016 (Trinity University) (weekly demand notes) | | AA/NR | | | 500,000 | | | | 500,000 | |
San Antonio Energy Acquisition Public Facilities Corp., 5.50% due 8/1/2021 | | BBB+/Baa3 | | | 40,000 | | | | 47,471 | |
San Juan Higher Education Finance Authority, 6.70% due 8/15/2040 (IDEA Public Schools) | | BBB/NR | | | 1,000,000 | | | | 1,159,400 | |
Texas Public Finance Authority Charter School Finance Corp., 4.15% due 8/15/2016 (IDEA Public Schools; Insured: ACA) | | BBB/NR | | | 100,000 | | | | 101,057 | |
Texas Public Finance Authority Charter School Finance Corp., 5.00% due 8/15/2023 pre-refunded 8/15/2017 (IDEA Public Schools; Insured: ACA) | | BBB/NR | | | 155,000 | | | | 164,080 | |
Texas Public Finance Authority Charter School Finance Corp., 5.00% due 8/15/2030 pre-refunded 8/15/2017 (IDEA Public Schools; Insured: ACA) | | BBB/NR | | | 1,550,000 | | | | 1,640,799 | |
Texas Public Finance Authority Charter School Finance Corp., 6.20% due 2/15/2040 pre-refunded 2/15/2020 (Cosmos Foundation, Inc.) | | BBB/NR | | | 1,000,000 | | | | 1,194,590 | |
Texas Transportation Commission, 5.00% due 8/15/2034 (Central Texas Turnpike System) | | BBB+/Baa1 | | | 1,000,000 | | | | 1,141,500 | |
12 Semi-Annual Report
| | |
| SCHEDULE OF INVESTMENTS, CONTINUED | | |
| |
Thornburg Strategic Municipal Income Fund | | March 31, 2016 (Unaudited) |
| | | | | | | | | | |
Issuer-Description | | Credit Rating†
S&P/ Moody’s | | Principal
Amount | | | Value | |
U.S. VIRGIN ISLANDS — 0.20% | | | | | | | | | | |
Virgin Islands Public Finance Authority, 6.75% due 10/1/2037 | | NR/Baa3 | | $ | 500,000 | | | $ | 561,435 | |
| | | |
UTAH — 0.83% | | | | | | | | | | |
Herriman City, 4.75% due 11/1/2022 (Towne Center Access and Utility Improvements) | | AA-/NR | | | 1,000,000 | | | | 1,131,990 | |
Utah Transit Authority, 5.00% due 6/15/2033 (Integrated Mass Transit System) | | A+/A1 | | | 1,000,000 | | | | 1,178,290 | |
| | | |
VIRGINIA — 0.90% | | | | | | | | | | |
City of Lexington IDA, 5.25% due 1/1/2021 (Kendal at Lexington Residential Care Facility) | | NR/NR | | | 395,000 | | | | 403,006 | |
City of Lexington IDA, 5.375% due 1/1/2022 (Kendal at Lexington Residential Care Facility) | | NR/NR | | | 630,000 | | | | 643,350 | |
City of Lexington IDA, 5.375% due 1/1/2023 (Kendal at Lexington Residential Care Facility) | | NR/NR | | | 425,000 | | | | 434,006 | |
City of Lexington IDA, 5.375% due 1/1/2028 (Kendal at Lexington Residential Care Facility) | | NR/NR | | | 1,000,000 | | | | 1,021,190 | |
| | | |
WASHINGTON — 1.84% | | | | | | | | | | |
Skagit County Public Hospital District No. 1, 5.75% due 12/1/2028 (Skagit Valley Hospital) | | NR/Baa2 | | | 1,510,000 | | | | 1,612,227 | |
Washington Health Care Facilities Authority, 5.70% due 7/1/2038 (Overlake Hospital Medical Center) | | A/A2 | | | 1,000,000 | | | | 1,147,620 | |
Washington Health Care Facilities Authority, 5.75% due 1/1/2045 (Catholic Health Initiatives) | | A/A2 | | | 2,000,000 | | | | 2,367,240 | |
| | | |
WISCONSIN — 0.36% | | | | | | | | | | |
Wisconsin Health & Educational Facilities Authority, 1.25% due 8/15/2025 put 8/15/2017 (Aurora Health Care, Inc.) | | NR/A2 | | | 1,000,000 | | | | 1,002,751 | |
| | | | | | | | | | |
TOTAL INVESTMENTS — 98.81% (Cost $255,533,827) | | | | | | | | $ | 274,731,323 | |
OTHER ASSETS LESS LIABILITIES — 1.19% | | | | | | | | | 3,318,092 | |
| | | | | | | | | | |
NET ASSETS — 100.00% | | | | | | | | $ | 278,049,415 | |
| | | | | | | | | | |
Footnote Legend
| † | Credit ratings are unaudited. Rating changes may have occurred subsequent to the reporting period end. Bonds issued with a maturity of one year or less are assigned Moody’s ratings from MIG-1 to MIG-4 and Standard and Poor’s ratings from SP-1+ to SP-3 with MIG-1 and SP-1+ being the strongest ratings. |
| a | Segregated as collateral for a when-issued security. |
Portfolio Abbreviations
To simplify the listings of securities, abbreviations are used per the table below:
| | |
| ABAG | | Association of Bay Area Governments |
| ACA | | Insured by American Capital Access |
| AGM | | Insured by Assured Guaranty Municipal Corp. |
| AMBAC | | Insured by American Municipal Bond Assurance Corp. |
| AMT | | Alternative Minimum Tax |
| BAM | | Insured by Build America Mutual Insurance Co. |
| CIFG | | Insured by CIFG Assurance North America Inc. |
| COP | | Certificates of Participation |
| DFA | | Development Finance Authority |
| EDA | | Economic Development Authority |
| ETM | | Escrowed to Maturity |
| | |
| FGIC | | Insured by Financial Guaranty Insurance Co. |
| GO | | General Obligation |
| HFA | | Health Facilities Authority |
| HFFA | | Health Facilities Financing Authority |
| IDA | | Industrial Development Authority |
| Mtg | | Mortgage |
| Natl-Re | | Insured by National Public Finance Guarantee Corp. |
| Q-SBLF | | Insured by Qualified School Bond Loan Fund |
| Syncora | | Insured by Syncora Guarantee Inc. |
| USD | | Unified School District |
See notes to financial statements.
Semi-Annual Report 13
| | |
| STATEMENT OF ASSETS AND LIABILITIES | | |
| |
Thornburg Strategic Municipal Income Fund | | March 31, 2016 (Unaudited) |
| | | | |
ASSETS | | | | |
Investments at value (cost $255,533,827) (Note 2) | | $ | 274,731,323 | |
Cash | | | 11,043,462 | |
Receivable for investments sold | | | 669,878 | |
Receivable for fund shares sold | | | 1,319,046 | |
Interest receivable | | | 2,964,254 | |
Prepaid expenses and other assets | | | 39,648 | |
| | | | |
Total Assets | | | 290,767,611 | |
| | | | |
| |
LIABILITIES | | | | |
Payable for investments purchased | | | 11,836,649 | |
Payable for fund shares redeemed | | | 564,269 | |
Payable to investment advisor and other affiliates (Note 3) | | | 221,400 | |
Accounts payable and accrued expenses | | | 27,708 | |
Dividends payable | | | 68,170 | |
| | | | |
Total Liabilities | | | 12,718,196 | |
| | | | |
| |
NET ASSETS | | $ | 278,049,415 | |
| | | | |
NET ASSETS CONSIST OF | | | | |
Undistributed net investment income | | $ | 3,353 | |
Net unrealized appreciation on investments | | | 19,197,495 | |
Accumulated net realized gain (loss) | | | (460,449 | ) |
Net capital paid in on shares of beneficial interest | | | 259,309,016 | |
| | | | |
| | $ | 278,049,415 | |
| | | | |
NET ASSET VALUE | | | | |
Class A Shares: | | | | |
Net asset value and redemption price per share ($73,925,726 applicable to 4,805,102 shares of beneficial interest outstanding - Note 4) | | $ | 15.38 | |
Maximum sales charge, 2.00% of offering price | | | 0.31 | |
| | | | |
Maximum offering price per share | | $ | 15.69 | |
| | | | |
| |
Class C Shares: | | | | |
Net asset value and offering price per share* ($34,964,994 applicable to 2,270,412 shares of beneficial interest outstanding - Note 4) | | $ | 15.40 | |
| | | | |
| |
Class I Shares: | | | | |
Net asset value, offering and redemption price per share ($169,158,695 applicable to 10,984,749 shares of beneficial interest outstanding - Note 4) | | $ | 15.40 | |
| | | | |
| * | Redemption price per share is equal to net asset value less any applicable contingent deferred sales charge. |
See notes to financial statements.
14 Semi-Annual Report
| | |
| STATEMENT OF OPERATIONS | | |
| |
Thornburg Strategic Municipal Income Fund | | Six Months Ended March 31, 2016 (Unaudited) |
| | | | |
INVESTMENT INCOME | | | | |
Interest income (net of premium amortized of $740,768) | | $ | 4,592,184 | |
| | | | |
| |
EXPENSES | | | | |
Investment advisory fees (Note 3) | | | 973,715 | |
Administration fees (Note 3) | | | | |
Class A Shares | | | 42,837 | |
Class C Shares | | | 19,781 | |
Class I Shares | | | 39,867 | |
Distribution and service fees (Note 3) | | | | |
Class A Shares | | | 85,675 | |
Class C Shares | | | 94,867 | |
Transfer agent fees | | | | |
Class A Shares | | | 27,655 | |
Class C Shares | | | 10,615 | |
Class I Shares | | | 46,599 | |
Registration and filing fees | | | | |
Class A Shares | | | 12,975 | |
Class C Shares | | | 12,235 | |
Class I Shares | | | 14,413 | |
Custodian fees (Note 3) | | | 28,975 | |
Professional fees | | | 24,613 | |
Accounting fees (Note 3) | | | 4,334 | |
Trustee fees | | | 5,003 | |
Other expenses | | | 9,659 | |
| | | | |
Total Expenses | | | 1,453,818 | |
Less: | | | | |
Expenses reimbursed by investment advisor (Note 3) | | | (36,693 | ) |
| | | | |
Net Expenses | | | 1,417,125 | |
| | | | |
Net Investment Income | | | 3,175,059 | |
| | | | |
REALIZED AND UNREALIZED GAIN (LOSS) | | | | |
Net realized gain (loss) from investments | | | (395,999 | ) |
Net change in unrealized appreciation (depreciation) on investments | | | 4,257,779 | |
| | | | |
Net Realized and Unrealized Gain | | | 3,861,780 | |
| | | | |
Net Increase in Net Assets Resulting from Operations | | $ | 7,036,839 | |
| | | | |
See notes to financial statements.
Semi-Annual Report 15
| | |
| STATEMENTS OF CHANGES IN NET ASSETS | | |
| |
Thornburg Strategic Municipal Income Fund | | |
| | | | | | | | |
| | | Six Months Ended
March 31, 2016* | | | Year Ended
September 30, 2015 | |
INCREASE (DECREASE) IN NET ASSETS FROM | | | | | | | | |
| | |
OPERATIONS | | | | | | | | |
Net investment income | | $ | 3,175,059 | | | $ | 5,972,241 | |
Net realized gain (loss) from investments | | | (395,999 | ) | | | (64,450 | ) |
Net unrealized appreciation (depreciation) on investments | | | 4,257,779 | | | | (459,355 | ) |
| | | | | | | | |
| | |
Net Increase (Decrease) in Net Assets Resulting from Operations | | | 7,036,839 | | | | 5,448,436 | |
| | |
DIVIDENDS TO SHAREHOLDERS | | | | | | | | |
From net investment income | | | | | | | | |
Class A Shares | | | (783,915 | ) | | | (1,527,762 | ) |
Class C Shares | | | (313,664 | ) | | | (567,402 | ) |
Class I Shares | | | (2,077,480 | ) | | | (3,877,077 | ) |
From realized gains | | | | | | | | |
Class A Shares | | | — | | | | (46,826 | ) |
Class C Shares | | | — | | | | (20,477 | ) |
Class I Shares | | | — | | | | (107,131 | ) |
| | |
FUND SHARE TRANSACTIONS (NOTE 4) | | | | | | | | |
Class A Shares | | | 6,209,349 | | | | 5,512,992 | |
Class C Shares | | | 5,419,957 | | | | 2,985,965 | |
Class I Shares | | | 14,770,906 | | | | 15,285,881 | |
| | | | | | | | |
Net Increase in Net Assets | | | 30,261,992 | | | | 23,086,599 | |
| | |
NET ASSETS | | | | | | | | |
Beginning of Period | | | 247,787,423 | | | | 224,700,824 | |
| | | | | | | | |
| | |
End of Period | | $ | 278,049,415 | | | $ | 247,787,423 | |
| | | | | | | | |
Undistributed net investment income | | $ | 3,353 | | | $ | 3,353 | |
See notes to financial statements.
16 Semi-Annual Report
| | |
| NOTES TO FINANCIAL STATEMENTS | | |
| |
Thornburg Strategic Municipal Income Fund | | March 31, 2016 (Unaudited) |
NOTE 1 – ORGANIZATION
Thornburg Strategic Municipal Income Fund (the “Fund”) is a diversified series of Thornburg Investment Trust (the “Trust”). The Trust is organized as a Massachusetts business trust under a Declaration of Trust dated June 3, 1987 and is registered as a diversified, open-end management investment company under the Investment Company Act of 1940, as amended. The Fund is currently one of twenty separate series of the Trust. Each series is considered to be a separate entity for financial reporting and tax purposes and bears expenses directly attributable to it. The Fund’s primary investment objective is to seek a high level of current income exempt from federal individual income tax.
The Fund currently offers three classes of shares of beneficial interest outstanding: Class A, Class C, and Institutional Class (“Class I”). Each class of shares of the Fund represents an interest in the same portfolio of investments, except that (i) Class A shares are sold subject to a front-end sales charge collected at the time the shares are purchased and bear a service fee, (ii) Class C shares are sold at net asset value without a sales charge at the time of purchase, but are subject to a contingent deferred sales charge upon redemption within one year of purchase, and bear both a service fee and a distribution fee, (iii) Class I shares are sold at net asset value without a sales charge at the time of purchase and may be subject to a service fee, and (iv) the respective classes may have different reinvestment privileges and conversion rights. Additionally, the Fund may allocate among its classes certain expenses, to the extent allocable to specific classes, including transfer agent fees, government registration fees, certain printing and postage costs, and administrative and legal expenses. Currently, class specific expenses of the Fund are limited to service and distribution fees, administration fees, and certain registration and transfer agent expenses.
NOTE 2 – SIGNIFICANT ACCOUNTING POLICIES
The following is a summary of significant accounting policies followed by the Fund in the preparation of its financial statements. The Fund is an investment company and prepares its financial statements in conformity with United States generally accepted accounting principles (“GAAP”), including investment company accounting and reporting guidance in the Financial Accounting Standards Board (the “FASB”) Accounting Standard Codification Topic 946. The preparation of financial statements in conformity with GAAP requires management to make estimates and assumptions that affect the reported amounts of assets and liabilities and disclosure of contingent assets and liabilities at the date of the financial statements and the reported amounts of increases (decreases) in net assets from operations during the reporting period. Actual results could differ from those estimates.
Significant accounting policies of the Trust are as follows:
Valuation Policy and Procedures: The Trustees of the Trust have appointed Thornburg Investment Management, Inc. (the “Advisor”) to assist the Trustees in obtaining market values for portfolio investments, perform certain evaluation and supervisory functions respecting professional pricing service providers appointed by the Trustees’ Audit Committee (the “Audit Committee”) to assist in determining fair values for portfolio investments, assist in calculating fair values for portfolio investments in certain circumstances, and to perform other functions in connection with valuation of investments. The Advisor acts through its Valuation and Pricing Committee (the “Committee”) and other employees of the Advisor. The Committee regularly reviews its own valuation calculations, as well as the valuations, valuation techniques and services furnished by pricing service providers, considers circumstances which may require valuation calculations by the Committee, and reviews previous valuation calculations. The Committee reports to the Audit Committee on the Committee’s activities, the performance of pricing service providers, and other matters relating to valuation of portfolio investments.
In those instances when the Committee assists in calculating a fair value for a portfolio investment, the Committee seeks to determine the price that the Fund would reasonably expect to receive upon a sale of the investment in an orderly transaction between market participants on the valuation date. The Committee customarily utilizes quotations from securities broker dealers in calculating valuations, but also may utilize prices obtained from pricing service providers or other methods approved by the Audit Committee. Because fair values calculated by the Committee are estimates, the calculation of a value for an investment may differ from the price that would be realized by the Fund upon a sale of the investment, and the difference could be material to the Fund’s financial statements. The Committee’s calculation of a fair value for an investment may also differ from the prices obtained by other persons (including other mutual funds) for the investment.
Valuation of Investments: Debt obligations held by the Fund which are not listed or traded on exchanges or for which no reported market exists are ordinarily valued at the valuation obtained from a pricing service provider approved by the Audit Committee.
In any case when a pricing service provider fails to provide a valuation for a debt obligation held by the Fund, the Committee calculates a fair value for the obligation using alternative methods under procedures approved by the Audit Committee. Additionally, in cases when management believes that a valuation obtained from a pricing service provider merits review for significant reasons, the Committee decides whether or not to use the valuation calculated by the pricing service provider or to use an alternative method approved by the Audit Committee to calculate a fair value for the obligation.
Semi-Annual Report 17
| | |
| NOTES TO FINANCIAL STATEMENTS, CONTINUED | | |
| |
Thornburg Strategic Municipal Income Fund | | March 31, 2016 (Unaudited) |
Valuation Measurements: The Fund categorizes its investments based upon the inputs used in valuing those investments, according to a three-level hierarchy established in guidance from the FASB. Categorization of investments using this hierarchy is intended by the FASB to maximize the use of observable inputs in valuing investments and minimize the use of unobservable inputs by requiring that the most observable inputs be used when available. Observable inputs are those that market participants would use in valuing an investment based on available market information. Unobservable inputs are those that reflect assumptions about the information market participants would use in valuing an investment. An investment’s level within the hierarchy is based on the lowest level input that is deemed significant to the valuation. The methodologies and inputs used to value investments are not necessarily indications of the risk or liquidity associated with those investments.
Various inputs are used in calculating valuations for the Fund’s investments. These inputs are generally summarized according to the three-level hierarchy below:
Level 1: Quoted prices in active markets for identical investments.
Level 2: Other direct or indirect significant observable inputs (including quoted prices for similar investments in active markets and other observable inputs, such as interest rates, prepayment rates, credit risk, etc.).
Level 3: Significant unobservable inputs (including the Committee’s own assumptions in calculating the fair values of investments).
Valuations for debt obligations held by the Fund are typically calculated by pricing service providers approved by the Audit Committee and are characterized as Level 2 within the valuation hierarchy.
In a limited number of cases the Committee calculates a fair value for investments using broker quotations or other methods approved by the Audit Committee. When the Committee uses a single broker quotation to calculate a fair value for an investment without other significant observable inputs, or if a fair value is calculated using other significant inputs that are considered unobservable, the investment is characterized as Level 3 within the hierarchy. Other significant unobservable inputs used to calculate a fair value in these instances might include an income-based valuation approach which considers discounted anticipated future cash flows from the investment, and application of discounts due to the nature or duration of any restrictions on the disposition of the investment.
Valuations based upon the use of inputs from Levels 1, 2 or 3 may not represent the actual price received upon the disposition of an investment, and the Fund may receive a price that is lower than the valuation based upon these inputs when it sells the investment.
The following table displays a summary of the fair value hierarchy measurements of the Fund’s investments as of March 31, 2016. In any instance when valuation inputs from more than one level are used to determine the fair value of a specific investment, the investment is placed in the level of the table based upon the lowest level input that is significant in determining the fair value of the investment:
| | | | | | | | | | | | | | | | |
| | | Fair Value Measurements At March 31, 2016 | |
| | | Total | | | Level 1 | | | Level 2 | | | Level 3 | |
Assets | | | | | | | | | | | | | | | | |
Investments in Securities | | | | | | | | | | | | | | | | |
Municipal Bonds | | $ | 274,731,323 | | | $ | — | | | $ | 274,731,323 | | | $ | — | |
| | | | | | | | | | | | | | | | |
Total Investments in Securities | | $ | 274,731,323 | | | $ | — | | | $ | 274,731,323 | | | $ | — | |
In accordance with the guidance prescribed in Accounting Standards Update No. 2011-04, it is the policy of the Fund to recognize transfers between levels and the underlying events which caused the movement. The Fund recognized no transfers between levels for the six months ended March 31, 2016.
Federal Income Taxes: It is the policy of the Trust to comply with the provisions of the Internal Revenue Code applicable to “regulated investment companies” and to distribute to shareholders substantially all taxable income including net realized gains on investments (if any), and tax exempt income of the Fund. Therefore, no provision for federal income tax is required.
Management reviews each uncertain tax position believed to be material to the preparation of the Fund’s financial statements, to assess if it is more likely than not that the position would be sustained upon examination, based upon the technical merits of the position. As of March 31, 2016, management has not identified any such position for which an asset or liability must be reflected in the Statement of Assets and Liabilities. The Fund’s tax returns remain subject to examination for three years after filing.
When-Issued and Delayed Delivery Transactions: The Fund may engage in when-issued or delayed delivery transactions. To the extent the Fund engages in such transactions, it will do so for the purpose of acquiring portfolio investments consistent with the Fund’s investment objectives and not for the purpose of investment leverage or to speculate on interest rate and, or market changes. At the time the Fund makes a commitment to purchase an investment on a when-issued or delayed delivery basis, the Fund will record the transaction and reflect the value in determining its net asset value. When effecting such transactions, assets of an amount sufficient to make payment
18 Semi-Annual Report
| | |
| NOTES TO FINANCIAL STATEMENTS, CONTINUED | | |
| |
Thornburg Strategic Municipal Income Fund | | March 31, 2016 (Unaudited) |
for the portfolio investments to be purchased will be segregated on the Fund’s records on the trade date. Investments purchased on a when-issued or delayed delivery basis do not earn interest until the settlement date.
Dividends: Net investment income of the Fund is declared daily as a dividend on shares for which the Fund has received payment. Dividends are paid monthly and are reinvested in additional shares of the Fund at net asset value per share at the close of business on the dividend payment date, or at the shareholder’s option, paid in cash. Net realized capital gains, to the extent available, will be distributed at least annually.
General: Investment transactions are accounted for on a trade date basis. Interest income is accrued as earned. Premiums and discounts on investments purchased are amortized to call dates or maturity dates of the respective investments. Realized gains and losses from the sale of investments are recorded on an identified cost basis. Net investment income (other than class specific expenses) and realized and unrealized gains and losses are allocated daily to each class of shares based upon the relative net asset value of outstanding shares (or the value of the dividend-eligible shares, as appropriate) of each class of shares at the beginning of the day (after adjusting for the current capital shares activity of the respective class). Expenses common to all Funds are allocated among the Funds comprising the Trust based upon their relative net asset values or other appropriate allocation methods.
Guarantees and Indemnifications: Under the Trust’s organizational documents (and under separate agreements with the independent Trustees), its officers and Trustees are indemnified against certain liabilities arising out of the performance of their duties to the Fund. Additionally, in the normal course of business the Trust enters into contracts with service providers that contain general indemnification clauses. The Trust’s maximum exposure under these arrangements is unknown. However, based on experience, the Trust expects the risk of loss to be remote.
NOTE 3 – INVESTMENT ADVISORY FEE AND OTHER TRANSACTIONS WITH AFFILIATES
Pursuant to an investment advisory agreement, the Advisor serves as the investment advisor and performs services for the Fund for which the fees are payable at the end of each month. For the six months ended March 31, 2016, these fees were payable at annual rates ranging from .75 of 1% to .50 of 1% per annum of the average daily net assets of the Fund depending on the Fund’s asset size. The Fund pays to the Advisor the costs of personnel who perform certain accounting services for the Fund. For the six months ended March 31, 2016 the Fund paid $4,334 to the Advisor for these accounting services. The Trust has also entered into administrative service agreements with the Advisor, whereby the Advisor will perform certain administrative services for the shareholders of each class of the Fund’s shares, and for which fees will be payable at an annual rate of up to .125 of 1% per annum of the average daily net assets attributable to each class of shares.
The Trust has an underwriting agreement with Thornburg Securities Corporation (the “Distributor”), an affiliate of the Advisor, which acts as the distributor of the Fund’s shares. For the six months ended March 31, 2016, the Distributor has advised the Fund that it earned no commissions from the sale of Class A shares, and collected contingent deferred sales charges aggregating $1,609 from redemptions of Class C shares of the Fund.
Pursuant to a service plan under Rule 12b-1 of the Investment Company Act of 1940, the Fund may reimburse to the Advisor an amount not to exceed .25 of 1% per annum of the average daily net assets attributable to each class of shares of the Fund for payments made by the Advisor to securities dealers and other financial institutions to obtain various shareholder and distribution related services. For the six months ended March 31, 2016, there were no 12b-1 service plan fees charged for Class I shares. The Advisor may pay out of its own resources additional expenses for distribution of the Fund’s shares and shareholder services.
The Trust has also adopted a distribution plan pursuant to Rule 12b-1, applicable only to the Fund’s Class C shares, under which the Fund compensates the Distributor for services in promoting the sale of Class C shares of the Fund at an annual rate of up to .35 of 1% per annum of the average daily net assets attributable to Class C shares. Total fees incurred by each class of shares of the Fund under their respective service and distribution plans for the six months ended March 31, 2016, are set forth in the Statement of Operations.
The Advisor and Distributor have contractually agreed to waive fees and reimburse expenses incurred by the Fund so that actual expenses of certain share classes do not exceed levels as specified in the Fund’s most recent prospectus. The agreement may be terminated by the Fund at any time, but may not be terminated by the Advisor or Distributor before February 1, 2017, unless the Advisor ceases to be the investment advisor to the Trust or the Distributor ceases to be the distributor of the Fund prior to that date. The Advisor and Distributor retain the right to be repaid by the Fund for fee waivers and expense reimbursements if expenses fall below the contractual limit prior to the end of the fiscal year.
For the six months ended March 31, 2016, the Advisor contractually reimbursed certain class specific expenses, administrative fees, and distribution fees of $16,953 for Class A shares and $19,740 for Class C shares.
Certain officers and Trustees of the Trust are also officers or directors of the Advisor and Distributor. The compensation of independent Trustees is borne by the Trust.
Semi-Annual Report 19
| | |
| NOTES TO FINANCIAL STATEMENTS, CONTINUED | | |
| |
Thornburg Strategic Municipal Income Fund | | March 31, 2016 (Unaudited) |
The Fund may purchase or sell securities from, or to an affiliated fund, provided the affiliation is due solely to having a common investment advisor, common officers, or common trustees, and provided that all such transactions will comply with Rule 17a-7 under the 1940 Act. For the six months ended March 31, 2016, the Fund had transactions of $2,000,214 in sales.
NOTE 4 – SHARES OF BENEFICIAL INTEREST
At March 31, 2016, there were an unlimited number of shares with no par value of beneficial interest authorized. Transactions in shares of beneficial interest were as follows:
| | | | | | | | | | | | | | | | |
| | | Six Months Ended | | | Year Ended | |
| | | March 31, 2016 (Unaudited) | | | September 30, 2015 (Audited) | |
| | | Shares | | | Amount | | | Shares | | | Amount | |
Class A Shares | | | | | | | | | | | | | | | | |
Shares sold | | | 981,520 | | | $ | 15,012,398 | | | | 1,498,078 | | | $ | 22,857,138 | |
Shares issued to shareholders in reinvestment of dividends | | | 46,397 | | | | 708,899 | | | | 95,940 | | | | 1,458,653 | |
Shares repurchased | | | (624,243 | ) | | | (9,511,948 | ) | | | (1,237,044 | ) | | | (18,802,799 | ) |
| | | | | | | | | | | | | | | | |
| | | | |
Net increase (decrease) | | | 403,674 | | | $ | 6,209,349 | | | | 356,974 | | | $ | 5,512,992 | |
| | | | | | | | | | | | | | | | |
| | | | |
Class C Shares | | | | | | | | | | | | | | | | |
Shares sold | | | 583,655 | | | $ | 8,936,452 | | | | 571,928 | | | $ | 8,720,448 | |
Shares issued to shareholders in reinvestment of dividends | | | 18,393 | | | | 281,382 | | | | 34,108 | | | | 519,034 | |
Shares repurchased | | | (247,565 | ) | | | (3,797,877 | ) | | | (411,444 | ) | | | (6,253,517 | ) |
| | | | | | | | | | | | | | | | |
| | | | |
Net increase (decrease) | | | 354,483 | | | $ | 5,419,957 | | | | 194,592 | | | $ | 2,985,965 | |
| | | | | | | | | | | | | | | | |
| | | | |
Class I Shares | | | | | | | | | | | | | | | | |
Shares sold | | | 2,504,215 | | | $ | 38,317,221 | | | | 3,149,898 | | | $ | 48,040,749 | |
Shares issued to shareholders in reinvestment of dividends | | | 118,772 | | | | 1,816,827 | | | | 235,896 | | | | 3,590,289 | |
Shares repurchased | | | (1,655,076 | ) | | | (25,363,142 | ) | | | (2,388,594 | ) | | | (36,345,157 | ) |
| | | | | | | | | | | | | | | | |
| | | | |
Net increase (decrease) | | | 967,911 | | | $ | 14,770,906 | | | | 997,200 | | | $ | 15,285,881 | |
| | | | | | | | | | | | | | | | |
NOTE 5 – INVESTMENT TRANSACTIONS
For the six months ended March 31, 2016, the Fund had purchase and sale transactions of investments (excluding short-term investments) of $24,709,581 and $13,002,609, respectively.
NOTE 6 – INCOME TAXES
At March 31, 2016, information on the tax components of capital was as follows:
| | | | |
Cost of investments for tax purposes | | $ | 255,533,827 | |
| | | | |
Gross unrealized appreciation on a tax basis | | $ | 19,262,769 | |
Gross unrealized depreciation on a tax basis | | | (65,273 | ) |
| | | | |
Net unrealized appreciation (depreciation) on investments (tax basis) | | $ | 19,197,496 | |
| | | | |
At March 31, 2016, the Fund had deferred tax basis capital losses occurring subsequent to October 31, 2014, through September 30, 2015, of $63,616. For tax purposes, such losses will be recognized in the year ending September 30, 2016.
At March 31, 2016, the Fund had cumulative tax basis capital losses of $834, (of which $0 are short-term and $834 are long-term) generated after September 30, 2011, which may be carried forward to offset future capital gains. To the extent such carryforwards are used, capital gain distributions may be reduced to the extent provided by regulations. Such capital loss carryforwards do not expire.
20 Semi-Annual Report
| | |
| NOTES TO FINANCIAL STATEMENTS, CONTINUED | | |
| |
Thornburg Strategic Municipal Income Fund | | March 31, 2016 (Unaudited) |
OTHER NOTES
Risks: The Fund’s investments subject it to risks including, but not limited to, credit risk, interest rate risk, management risk, market and economic risk, liquidity risk, and the risks associated with investments in high yield bonds and derivative instruments. Please see the Fund’s prospectus for a discussion of the risks associated with an investment in the Fund.
Subsequent Events: Fund management believes no events have occurred between March 31, 2016 and the date of issuance of the financial statements that require adjustment to or disclosure in the accompanying financial statements.
Semi-Annual Report 21
FINANCIAL HIGHLIGHTS
Thornburg Strategic Municipal Income Fund
| | | | | | | | | | | | | | | | | | | | | | | | | | | | | | | | | | | | | | | | | | | | | | | | |
| | | PER SHARE PERFORMANCE (for A Share Outstanding Throughout The Period) | | RATIOS TO AVERAGE NET ASSETS | | | SUPPLEMENTAL DATA | |
Unless
Otherwise
Noted, Periods are Fiscal Years Ended Sept. 30, | | Net Asset
Value
Beginning
of Period | | | Net
Investment
Income
(Loss)+ | | Net
Realized
&
Unrealized
Gain (Loss)
on
Investments | | | Total From
Investment
Operations | | Dividends
From Net
Investment
Income | | | Dividends
From Net
Realized
Gains | | Total
Dividends | | | Net
Asset
Value
End of
Period | | Net
Investment
Income
(Loss)
(%) | | | Expenses,
After
Expense
Reductions
(%) | | | Expenses,
After
Expense
Reductions
and
Net of
Custody
Credits
(%) | | | Expenses,
Before
Expense
Reductions
(%) | | | Total
Return
(%)(a) | | Portfolio
Turnover
Rate (%)(a) | | Net
Assets
at End
of
Period
(thousands) | |
CLASS A SHARES | | | | | | | | | | | | | | | | | | | | | | | | | | | | | | | | | | | | | | | | | | |
2016(b)(c) | | $ | 15.16 | | | 0.17 | | | 0.23 | | | 0.40 | | | (0.18 | ) | | — | | | (0.18 | ) | | $15.38 | | | 2.29 | (d) | | | 1.25 | (d) | | | 1.25 | (d) | | | 1.30 | (d) | | 2.62 | | 5.68 | | $ | 73,926 | |
2015(c) | | $ | 15.19 | | | 0.35 | | | (0.02 | ) | | 0.33 | | | (0.35 | ) | | (0.01) | | | (0.36 | ) | | $15.16 | | | 2.28 | | | | 1.25 | | | | 1.25 | | | | 1.31 | | | 2.18 | | 12.13 | | $ | 66,722 | |
2014(c) | | $ | 14.40 | | | 0.41 | | | 0.85 | | | 1.26 | | | (0.42 | ) | | (0.05) | | | (0.47 | ) | | $15.19 | | | 2.82 | | | | 1.25 | | | | 1.25 | | | | 1.31 | | | 8.93 | | 21.89 | | $ | 61,424 | |
2013(c) | | $ | 15.17 | | | 0.41 | | | (0.74 | ) | | (0.33) | | | (0.41 | ) | | (0.03) | | | (0.44 | ) | | $14.40 | | | 2.74 | | | | 1.25 | | | | 1.25 | | | | 1.31 | | | (2.21) | | 37.42 | | $ | 52,278 | |
2012(c) | | $ | 14.06 | | | 0.49 | | | 1.13 | | | 1.62 | | | (0.50 | ) | | (0.01) | | | (0.51 | ) | | $15.17 | | | 3.34 | | | | 1.25 | | | | 1.25 | | | | 1.31 | | | 11.71 | | 12.52 | | $ | 65,446 | |
CLASS C SHARES | | | | | | | | | | | | | | | | | | | | | | | | | | | | | | | | | | | | | | | | | | |
2016(b) | | $ | 15.17 | | | 0.15 | | | 0.23 | | | 0.38 | | | (0.15 | ) | | — | | | (0.15 | ) | | $15.40 | | | 1.98 | (d) | | | 1.55 | (d) | | | 1.55 | (d) | | | 1.67 | (d) | | 2.53 | | 5.68 | | $ | 34,965 | |
2015 | | $ | 15.20 | | | 0.30 | | | (0.02 | ) | | 0.28 | | | (0.30 | ) | | (0.01) | | | (0.31 | ) | | $15.17 | | | 1.98 | | | | 1.55 | | | | 1.55 | | | | 1.70 | | | 1.87 | | 12.13 | | $ | 29,073 | |
2014 | | $ | 14.41 | | | 0.37 | | | 0.84 | | | 1.21 | | | (0.37 | ) | | (0.05) | | | (0.42 | ) | | $15.20 | | | 2.53 | | | | 1.55 | | | | 1.55 | | | | 1.72 | | | 8.60 | | 21.89 | | $ | 26,168 | |
2013 | | $ | 15.18 | | | 0.37 | | | (0.74 | ) | | (0.37) | | | (0.37 | ) | | (0.03) | | | (0.40 | ) | | $14.41 | | | 2.44 | | | | 1.55 | | | | 1.55 | | | | 1.73 | | | (2.50) | | 37.42 | | $ | 21,344 | |
2012 | | $ | 14.07 | | | 0.45 | | | 1.12 | | | 1.57 | | | (0.45 | ) | | (0.01) | | | (0.46 | ) | | $15.18 | | | 3.04 | | | | 1.55 | | | | 1.55 | | | | 1.78 | | | 11.38 | | 12.52 | | $ | 23,521 | |
CLASS I SHARES | | | | | | | | | | | | | | | | | | | | | | | | | | | | | | | | | | | | | | | | | | |
2016(b) | | $ | 15.17 | | | 0.20 | | | 0.23 | | | 0.43 | | | (0.20 | ) | | — | | | (0.20 | ) | | $15.40 | | | 2.61 | (d) | | | 0.93 | (d) | | | 0.93 | (d) | | | 0.93 | (d) | | 2.85 | | 5.68 | | $ | 169,158 | |
2015 | | $ | 15.20 | | | 0.39 | | | (0.01 | ) | | 0.38 | | | (0.40 | ) | | (0.01) | | | (0.41 | ) | | $15.17 | | | 2.60 | | | | 0.93 | | | | 0.93 | | | | 0.93 | | | 2.50 | | 12.13 | | $ | 151,992 | |
2014 | | $ | 14.41 | | | 0.46 | | | 0.85 | | | 1.31 | | | (0.47 | ) | | (0.05) | | | (0.52 | ) | | $15.20 | | | 3.12 | | | | 0.94 | | | | 0.93 | | | | 0.94 | | | 9.27 | | 21.89 | | $ | 137,109 | |
2013 | | $ | 15.18 | | | 0.45 | | | (0.73 | ) | | (0.28) | | | (0.46 | ) | | (0.03) | | | (0.49 | ) | | $14.41 | | | 3.04 | | | | 0.95 | | | | 0.95 | | | | 0.96 | | | (1.92) | | 37.42 | | $ | 89,262 | |
2012 | | $ | 14.07 | | | 0.53 | | | 1.13 | | | 1.66 | | | (0.54 | ) | | (0.01) | | | (0.55 | ) | | $15.18 | | | 3.62 | | | | 0.95 | | | | 0.95 | | | | 0.95 | | | 12.03 | | 12.52 | | $ | 92,386 | |
| (a) | Not annualized for periods less than one year. |
| (b) | Unaudited Six Month Period Ended March 31. |
| (c) | Sales loads are not reflected in computing total return. |
| + | Based on weighted average shares outstanding. |
See notes to financial statements.
| | | | |
| 22 Semi-Annual Report | | | | Semi-Annual Report 23 |
| | |
| EXPENSE EXAMPLE | | |
| |
Thornburg Strategic Municipal Income Fund | | March 31, 2016 (Unaudited) |
As a shareholder of the Fund, you incur two types of costs:
| | (1) | transaction costs, including |
(a) sales charges (loads) on purchase payments, for Class A shares;
(b) a deferred sales charge on redemptions of any part or all of a purchase of $1 million of Class A shares within 12 months of purchase;
(c) a deferred sales charge on redemptions of Class C shares within 12 months of purchase;
| | (2) | ongoing costs, including management fees; distribution and/or service (12b-1) fees; and other Fund expenses. |
This example is intended to help you understand your ongoing costs (in dollars) of investing in the Fund and to compare these costs with the ongoing costs of investing in other mutual funds.
The example is based on a $1,000 investment beginning on October 1, 2015, and held until March 31, 2016.
| | | | | | | | | | | | |
| | | Beginning
Account Value
10/1/15 | | | Ending
Account Value
3/31/16 | | | Expenses Paid
During Period†
10/1/15–3/31/16 | |
Class A Shares | | | | | | | | | | | | |
Actual | | $ | 1,000.00 | | | $ | 1,026.20 | | | $ | 6.33 | |
Hypothetical* | | $ | 1,000.00 | | | $ | 1,018.75 | | | $ | 6.31 | |
Class C Shares | | | | | | | | | | | | |
Actual | | $ | 1,000.00 | | | $ | 1,025.30 | | | $ | 7.85 | |
Hypothetical* | | $ | 1,000.00 | | | $ | 1,017.25 | | | $ | 7.82 | |
Class I Shares | | | | | | | | | | | | |
Actual | | $ | 1,000.00 | | | $ | 1,028.50 | | | $ | 4.73 | |
Hypothetical* | | $ | 1,000.00 | | | $ | 1,020.34 | | | $ | 4.71 | |
| † | Expenses are equal to the annualized expense ratio for each class (A: 1.25%; C: 1.55%; I: 0.93%) multiplied by the average account value over the period, multiplied by 183/366 to reflect the one-half year period. |
| * | Hypothetical assumes a rate of return of 5% per year before expenses. |
ACTUAL EXPENSES
For each class of shares, the first line of the accompanying table provides information about actual account values and actual expenses. You may use the information in this line, together with the amount you invested, to estimate the expenses that you paid over the period. Simply divide your account value by $1,000 (for example, an $8,600 account value divided by $1,000 = 8.6), then multiply the result by the number in the first line for your class of shares under the heading entitled “Expenses Paid During Period” to estimate the expenses you paid on your account during this period.
HYPOTHETICAL EXAMPLE FOR COMPARISON PURPOSES
For each class of shares, the second line of the accompanying table provides information about hypothetical account values and hypothetical expenses based on the Fund’s actual expense ratio and an assumed rate of return of 5% per year before expenses, which is not the Fund’s actual return. The hypothetical account values and expenses may not be used to estimate the actual ending account balance or expenses you paid for the period. You may use this information to compare the ongoing costs of investing in the Fund and other funds. To do so, compare this 5% hypothetical example with the 5% hypothetical examples that appear in the shareholder reports of the other funds.
Please note that the expenses shown in the table are meant to highlight your ongoing costs only and do not reflect any transactional costs, such as sales charges (loads), redemption fees, or exchange fees. Therefore, the second line of the table for each class of shares is useful in comparing ongoing costs only, and will not help you determine the relative total costs of owning different funds. In addition, if these transactional costs were included, your costs would have been higher.
24 Semi-Annual Report
| | |
| OTHER INFORMATION | | |
| |
Thornburg Strategic Municipal Income Fund | | March 31, 2016 (Unaudited) |
PORTFOLIO PROXY VOTING
Policies and Procedures:
The Trust has delegated to Thornburg Investment Management, Inc. (the “Advisor”) voting decisions respecting proxies for the Fund’s voting securities. The Advisor makes voting decisions in accordance with its Proxy Voting Policy. A description of the Policy is available (i) without charge, upon request, by calling the Advisor toll-free at 1-800-847-0200, (ii) on the Thornburg website at www.thornburg. com, and (iii) on the Securities and Exchange Commission’s website at www.sec.gov.
Information regarding how proxies were voted is available on or before August 31 of each year for the twelve months ending the preceding June 30. This information is available (i) without charge, upon request by calling the Advisor toll-free at 1-800-847-0200, (ii) on the Thornburg website at www.thornburg.com, and (iii) on the Securities and Exchange Commission’s website at www.sec.gov.
AVAILABILITY OF QUARTERLY PORTFOLIO SCHEDULE
The Fund files with the Securities and Exchange Commission schedules of its portfolio holdings on Form N-Q for the first and third quarters of each fiscal year. The Fund’s Forms N-Q are available on the Commission’s website at www.sec.gov, or may be reviewed and copied at the Commission’s Public Reference Room in Washington, D.C. Information on the operation of the Public Reference Room may be obtained by calling 1-800-SEC-0330. The Fund also makes this information available on its website at www.thornburg.com/download or upon request by calling 1-800-847-0200.
Semi-Annual Report 25
TRUSTEES’ STATEMENT TO SHAREHOLDERS
Revised and Readopted September 15, 2015
The Trustees believe current and prospective shareholders should know how we discharge our responsibilities in supervising the Funds’ investment advisor and in reviewing the advisor’s contract for renewal. Since 2005, we have issued a statement which sets out clearly the three principal guidelines that we follow in supervising the Trust’s investment advisor on your behalf. In accordance with our customary practice, in September of 2015 we again reviewed our statement and concluded we should reissue this statement outlining the principal features of our supervision of the advisor’s performance of investment management services for the Funds.
We begin with the premise that each shareholder selected his or her Fund because its investments are managed by the investment advisor identified in the prospectus and in accordance with the objective and policies described in the prospectus. We realize, as each of you do, that if you believe that your Fund’s stated objective and policies no longer serve your personal investment goals, you can sell your shares and leave the Fund.
Therefore, we believe that our primary supervisory task—our principal obligation to you—is to assess the nature and quality of the advisor’s services, and to confirm that the advisor actively and competently pursues the Fund’s objective, in accordance with the policies set out in the prospectus. To do this, we meet regularly with management to review your Fund’s portfolio and to discuss the advisor’s specific actions and judgments in pursuing the Fund’s objective. We do not substitute our own judgment for the advisor’s decisions in selecting investments; the advisor is paid to exercise its informed judgment on investment decisions, and we seek to confirm, in reviewing the advisor’s performance, that the advisor is doing just that.
Second, we are conscious of costs and the effect that costs have on shareholders’ returns. We try to make sure that your Fund’s fees and costs are reasonable in relationship to the services rendered and that they are generally in line with those charged by other expert investment advisors, consistent with our belief that the Fund’s investors searched for and expect that expertise and attention and have decided to pay a reasonable price for it. We do not put the management contract “out to bid” as a matter of course, and we would not do so unless we had concluded that the advisor materially had failed to pursue the Fund’s objectives in accordance with its policies, or for other equally important reasons. We believe that any other approach would be inconsistent with your interests and contrary to your expectations when you bought shares of the Fund in the first place.
Finally, because we believe that most Thornburg Fund shareholders have invested with a long-term perspective, we try not to focus too much on the fashions of the moment and on short-term performance. The market will not favor any specific investment objective or set of policies at all times and under all economic circumstances. A fund will experience periods of both high and low returns relative to other funds and other investments. Even if one of our Funds is not favored by the market at a particular time, we believe that the advisor is nonetheless obliged to remain true to the Fund’s objective and policies, and we watch to see that it does so.
Trustees of Thornburg Investment Trust
26 Semi-Annual Report
THORNBURG FUND FAMILY
Thornburg Investment Management is a privately-owned global investment firm that offers a range of solutions for retail and institutional investors. Founded in 1982 and headquartered in Santa Fe, New Mexico, we manage approximately $54 billion (as of March 31, 2016) across eight equity and 11 bond mutual funds, separate accounts for high-net-worth investors and institutional accounts, and five UCITS funds for non-U.S. investors.
The fund outlined in this report is one of many equity and fixed-income products available from Thornburg Investment Management.
Equity Funds
| | • | | Thornburg Core Growth Fund |
| | • | | Thornburg International Value Fund |
| | • | | Thornburg Better World International Fund |
| | • | | Thornburg International Growth Fund |
| | • | | Thornburg Developing World Fund |
| | • | | Thornburg Investment Income Builder Fund |
| | • | | Thornburg Global Opportunities Fund |
Fixed Income Funds
| | • | | Thornburg Low Duration Income Fund |
| | • | | Thornburg Limited Term U.S. Government Fund |
| | • | | Thornburg Limited Term Income Fund |
| | • | | Thornburg Strategic Income Fund |
| | • | | Thornburg Low Duration Municipal Fund |
| | • | | Thornburg Limited Term Municipal Fund |
| | • | | Thornburg Intermediate Municipal Fund |
| | • | | Thornburg California Limited Term Municipal Fund |
| | • | | Thornburg New Mexico Intermediate Municipal Fund |
| | • | | Thornburg New York Intermediate Municipal Fund |
| | • | | Thornburg Strategic Municipal Income Fund |
Before investing, carefully consider the Fund’s investment goals, risks, charges, and expenses. For a prospectus or summary prospectus containing this and other information, contact your financial advisor or visit thornburg.com. Read it carefully before investing.
For additional information, please visit thornburg.com
Thornburg Investment Management, Inc. 2300 North Ridgetop Road, Santa Fe, NM 87506
Semi-Annual Report 27
This Semi-Annual Report is submitted for the general information of shareholders of the Fund. It is not authorized for distribution to prospective investors in the Fund unless preceded or accompanied by an effective prospectus.
| | | | |
| Investment Advisor: | | Distributor: | | |
| Thornburg Investment Management® | | Thornburg Securities Corporation® | | |
| 800.847.0200 | | 800.847.0200 | | TH1979 |

2 Semi-Annual Report
Semi-Annual Report
Thornburg California Limited Term Municipal Fund
March 31, 2016
| | | | |
SHARE CLASS | | NASDAQ SYMBOL | | CUSIP |
Class A | | LTCAX | | 885-215-426 |
Class C | | LTCCX | | 885-215-418 |
Class I | | LTCIX | | 885-215-392 |
Minimum investments for Class I shares may be higher than those for other classes. Class I shares may not be available to all investors.
Investments carry risks, including possible loss of principal. Portfolios investing in bonds have the same interest rate, inflation, and credit risks that are associated with the underlying bonds. The value of bonds will fluctuate relative to changes in interest rates, decreasing when interest rates rise. Unlike bonds, bond funds have ongoing fees and expenses. Please see the Fund’s prospectus for a discussion of the risks associated with an investment in the Fund. Investments in the Funds are not FDIC insured, nor are they bank deposits or guaranteed by a bank or any other entity.
The laddering strategy does not assure or guarantee better performance and cannot eliminate the risk of investment losses.
Semi-Annual Report 3
| | |
| LETTER TO SHAREHOLDERS | | |
| |
Thornburg California Limited Term Municipal Fund | | March 31, 2016 (Unaudited) |
April 11, 2016
Dear Fellow Shareholder:
We are pleased to present the semi-annual report for Thornburg California Limited Term Municipal Fund. The net asset value (NAV) of the Class A shares increased by 10 cents to $13.94 per share during the six months ended March 31, 2016. If you were with us for the entire period, you received dividends of 9.17 cents per share. If you reinvested your dividends, you received 9.20 cents per share. Dividends were lower for Class C shares and higher for Class I shares, to account for varying class-specific expenses. The Class A shares underperformed the Fund’s benchmark index, with a 1.39% total return (without sales charge) for the six months ended March 31, 2016, compared to the 1.80% total return for the BofA Merrill Lynch 1-10 Year U.S. Municipal Securities Index.
Throughout the six-month period, the Fund maintained a lower risk posture on interest rates than its benchmark; its average effective duration (a measure of interest-rate sensitivity) was 3.58 years, compared to 3.80 for the benchmark. The shorter duration hurt relative price performance by 0.57%. The Fund’s position along the yield curve added 0.18% and sector selection added 0.72% of relative price performance. Our underweight in high-quality bonds added 0.25% of relative price performance. Other factors include the amortization of bond premiums and accretion of discounts, which is not an active management decision but rather a standard accounting practice—and the largest component of this category. We also include the effects of security selection, and of price change derived from factors we cannot account for (statistically: “unexplained error”). Together, these three account for 0.50% of price performance relative to the index.
Global Fears Sway the Municipal Markets
The past six months have been a roller-coaster ride for the municipal market. During the last quarter of 2015, it seemed that every day was spent anxiously awaiting the first Federal Reserve rate increase—for what seemed like an eternity. When that rate increase finally came, it was met with a yawn. Markets quickly reminded investors that while the Federal Reserve (the Fed) has control over short-term rates, the market forces of supply and demand for bonds have a much heavier influence on interest rates—especially long-term rates.
As in life, expectations in the bond markets mean a lot. And perhaps more important than the Fed’s initial rate hike was its stated intent to raise rates four additional times in 2016. The expectation for higher rates evaporated almost immediately after the Fed’s statement, with the release of weaker-than-expected economic data, collapsing commodity prices, an emerging-markets stock rout, and profound weakness in Europe, with the European Central Bank retrenching in its effort to drive European rates lower, spurring fears of deflation.
A Roller-Coaster Ride to Start the Year
The beginning of 2016 proved volatile for equity markets domestically and globally, and the fixed income markets followed suit. The 10-year U.S. Treasury stood at a respectable 2.27% at the end of 2015. But within six weeks, that rate fell 0.61% to 1.66%, before bouncing back to 1.77% by March 31, 2016.
Chart I Credit Spreads: Investors Are Not Being Paid to Assume the Risk
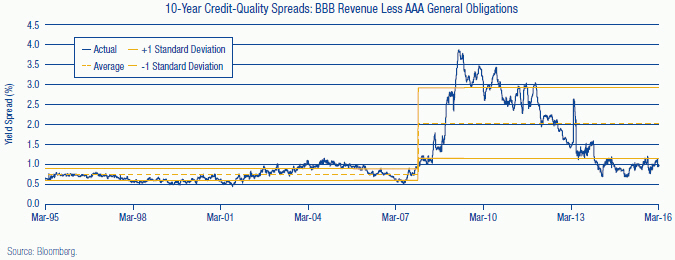
4 Semi-Annual Report
| | |
LETTER TO SHAREHOLDERS, CONTINUED | | |
| |
Thornburg California Limited Term Municipal Fund | | March 31, 2016 (Unaudited) |
As we noted, the Fed has backed off of its initial intent to raise rates four times in a stepped-up fashion. Rates will probably remain low and income elusive. Unfortunately, municipal bond investors have only a few “levers” to pull to seek higher income. The most effective two are credit quality and duration. An investor looking for yield can always buy a bond with a longer maturity – the duration lever. And bonds of lower credit quality can be purchased to drive up yield – the credit quality lever. In both instances, the investor assumes risk in hope of higher returns.
At Thornburg, we always evaluate both of these options as a means to increase the total return of the portfolios, but over the past six months, as in the prior six months, we found them less than optimal. Real rates (interest rates after inflation is subtracted) remained low during the entire period, and the municipal yield curve was fairly flat. Investors who reached for yield by buying longer maturities gained very little relative to the duration risk that comes with longer-dated bonds. And the amount investors are compensated to invest in lower-rated bonds is minimal; credit spreads remain at extremely tight levels. Investors who purchased debt from lower-rated issuers were essentially buying weaker credits at very expensive levels. Chart I on the previous page shows credit spreads remaining near historically low levels, offering investors little compensation for risk assumed. Not a great strategy!
We believe that the only logical thing to do when you’re not being paid to take risk is to take less of it. That is exactly what we have been seeking to do in Thornburg California Limited Term Municipal Fund for quite some time. The Fund is being managed on the bearish (shorter) end of its duration range. We have also actively sought to increase the average credit quality, at least at the margins. Cash reserve positions are being managed in a manner we view as conservative.
Continued volatility seems a certainty. That can manifest via interest-rate movements, or changing credit spreads. While the likelihood of the Fed raising rates appears low, given the aforementioned anemic economic growth in the U.S. and abroad, investors are wise to recall that rates moved up over 1.00% in 2013 without the Fed having taken any action whatsoever. It may be unlikely, but that does not mean it’s a probability that can be ignored. And any event that causes spreads to widen appreciably may prove detrimental to an investor who assumed undue credit risk in search of return.
We will do what we have always done with Thornburg California Limited Term Municipal Fund: provide you with a tax-exempt laddered portfolio that aims to generate attractive levels of income, while attempting to preserve principal and minimize volatility. And, of course, we’ll seek to only assume the risk for which we believe we are adequately compensated.
California
Demand for municipal debt in California continues to be exceptionally high. Excess demand has led to very high municipal prices. To some extent, investors in municipal bonds from California are even more desperate for yield than their national counterparts. The good news is that, for the most part, the credit picture throughout the state is strong. Incomes are up and housing prices have stabilized and are increasing in most areas, leading to stronger fundamentals for most local issuers.
Staying Faithful to Thornburg’s Tested Approach
While a focus on risk mitigation may not make the sexiest marketing story, we believe it is in the best long-term interest of shareholders. And to any investor considering abandoning municipal bonds for the promise of higher returns elsewhere, we remind you that if the first quarter of 2016 has taught us anything, it is that in a volatile market, an appropriate asset allocation may save you a few sleepless nights.
We will continue to strive to manage your assets to fulfill the Fund’s objectives.
Sincerely,
| | | | |
 | |  | | |
| Christopher Ryon,CFA | | Nicholos Venditti | | |
| Portfolio Manager | | Portfolio Manager | | |
| Managing Director | | Managing Director | | |
The matters discussed in this report may constitute forward-looking statements made pursuant to the safe harbor provisions of the Securities Litigation Reform Act of 1995. These include any advisor or portfolio manager prediction, assessment, analysis or outlook for individual securities, industries, investment styles, market sectors and/or markets. These statements involve risks and uncertainties. In addition to the general risks described for each fund in its current prospectus, other factors bearing on these reports include the accuracy of the advisor’s or portfolio manager’s forecasts and predictions, the appropriateness of the investment strategies designed by the advisor or portfolio manager and the ability of the advisor or portfolio manager to implement their strategies efficiently and successfully. Any one or more of these factors, as well as other risks affecting the securities markets generally, could cause the actual results of any fund to differ materially as compared to its benchmarks.
The views expressed by the portfolio managers reflect their professional opinions and are subject to change. Under no circumstances does the information contained within represent a recommendation to buy or sell any security.
Semi-Annual Report 5
| | |
| PERFORMANCE SUMMARY | | |
| |
Thornburg California Limited Term Municipal Fund | | March 31, 2016 (Unaudited) |
Average Annual Total Returns
| | | | | | | | | | | | | | | | |
| | | 1-YR | | | 5-YR | | | 10-YR | | | SINCE
INCEP. | |
A Shares (Incep: 2/19/87) | | | | | | | | | | | | | | | | |
Without sales charge | | | 1.86 | % | | | 3.37 | % | | | 3.52 | % | | | 4.44 | % |
With sales charge | | | 0.34 | % | | | 3.05 | % | | | 3.37 | % | | | 4.38 | % |
C Shares (Incep: 9/1/94) | | | | | | | | | | | | | | | | |
Without sales charge | | | 1.62 | % | | | 3.10 | % | | | 3.26 | % | | | 3.42 | % |
With sales charge | | | 1.12 | % | | | 3.10 | % | | | 3.26 | % | | | 3.42 | % |
I Shares (Incep: 4/1/97) | | | 2.26 | % | | | 3.72 | % | | | 3.87 | % | | | 3.94 | % |
30-Day Yields, A Shares
(with sales charge)
| | | | |
Annualized Distribution Yield | | | 1.18 | % |
| |
SEC Yield | | | 0.32 | % |
Performance data shown represents past performance and is no guarantee of future results. Investment return and principal value will fluctuate so shares, when redeemed, may be worth more or less than their original cost. Current performance may be lower or higher than quoted. For performance current to the most recent month end, visit thornburg.com or call 800-847-0200. The performance information does not reflect the deduction of taxes that a shareholder would pay on distributions or the redemption of Fund shares. Returns reflect the reinvestment of dividends and capital gains. Class A shares are sold with a maximum sales charge of 1.50%. Class C shares include a 0.50% CDSC for the first year only. There is no sales charge for Class I shares.
As disclosed in the most recent prospectus, the total annual fund operating expenses are as follows: A shares, 0.94%; C shares, 1.18%; I shares, 0.63%.
Glossary
BofA Merrill Lynch 1-10 Year Municipal Securities Index – A subset of the BofA Merrill Lynch U.S. Municipal Securities Index including all securities with a remaining term to final maturity less than 10 years.
Unless otherwise noted, index returns reflect the reinvestment of income dividends and capital gains, if any, but do not reflect fees, brokerage commissions or other expenses of investing. Investors may not make direct investments into any index. The performance of any index is not indicative of the performance of any particular investment.
Annualized Distribution Yield – The distribution yield reflects actual distributions made to shareholders. The annualized distribution yield is calculated by summing the last 30 days of income at a given month end and annualizing to a 360-day year. The result is divided by the ending maximum offering price.
Bond Credit Ratings (Credit Quality) – A bond credit rating assesses the financial ability of a debt issuer to make timely payments of principal and interest. Ratings of AAA (the highest), AA, A, and BBB are investment-grade quality. Ratings of BB, B, CCC, CC, C and D (the lowest) are considered below investment grade, speculative grade, or junk bonds.
Credit Spread/Quality Spread – The difference between the yields of securities with different credit qualities.
Duration – A bond’s sensitivity to interest rates. Effective duration incorporates the embedded option features, such as call provisions. Bonds with longer durations experience greater price volatility than bonds with shorter durations.
Laddering – Involves building a portfolio of bonds with staggered maturities so that a portion matures each year. Money that comes in from maturing bonds is typically invested in bonds with longer maturities at the far end of the portfolio.
SEC Yield – SEC yield is computed in accordance with SEC standards measuring the net investment income per share over a specified 30-day period expressed as a percentage of the maximum offering price of the Fund’s shares at the end of the period.
Yield Curve – A line that plots the interest rates, at a set point in time, of bonds having equal credit quality, but differing maturity dates.
6 Semi-Annual Report
| | |
| FUND SUMMARY | | |
| |
Thornburg California Limited Term Municipal Fund | | March 31, 2016 (Unaudited) |
Objectives and Strategies
The Fund’s primary investment objective is to obtain as high a level of current income exempt from federal and California state individual income taxes as is consistent, in the view of the Fund’s investment advisor, with preservation of capital.
The secondary goal of the Fund is to reduce expected changes in its share price compared to longer intermediate and long-term bond portfolios.
The Fund offers California investors double tax-free yields (may be subject to Alternative Minimum Tax) in a laddered municipal bond portfolio with a dollar-weighted average maturity of normally less than five years. Laddering involves building a portfolio of bonds with staggered maturities so that a portion of the portfolio matures each year. Cash from maturing bonds, if not needed for other purposes, is typically invested in bonds with longer maturities at the far end of the ladder. We regard this strategy as a good compromise for managing different types of risk.
Long Term Stability of Principal
Net Asset Value History of A Shares
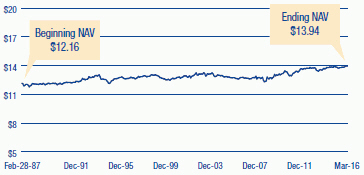
Key Portfolio Attributes
| | | | |
Number of Bonds | | | 373 | |
| |
Effective Duration | | | 3.4 Yrs | |
| |
Average Maturity | | | 4.4 Yrs | |
Security Credit Ratings
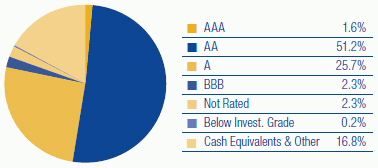
A bond credit rating assesses the financial ability of a debt issuer to make timely payments of principal and interest. Ratings of AAA (the highest), AA, A, and BBB are investment-grade quality. Ratings of BB, B, CCC, CC, C and D (the lowest) are considered below investment grade, speculative grade, or junk bonds. Credit quality ratings for Thornburg’s municipal portfolios used the highest rating available from either Standard & Poor’s or Moody’s Investors Service.
Portfolio Ladder
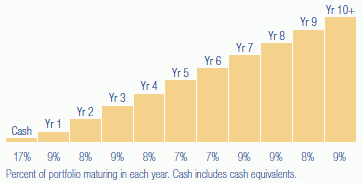
There is no guarantee that the Fund will meet its investment objectives.
All data is subject to change. Charts may not add up to 100% due to rounding.
Semi-Annual Report 7
| | |
| SCHEDULE OF INVESTMENTS | | |
| |
Thornburg California Limited Term Municipal Fund | | March 31, 2016 (Unaudited) |
| | | | | | | | | | |
ISSUER-DESCRIPTION | | CREDIT RATING†
S&P/ MOODY’S | | PRINCIPAL
AMOUNT | | | VALUE | |
ABAG Finance Authority for Nonprofit Corporations, 0.39% due 8/1/2024 put 4/7/2016 (Sharp HealthCare; LOC: Bank of America, N.A.) (weekly demand notes) | | AAA/Aa1 | | $ | 4,670,000 | | | $ | 4,670,000 | |
Alameda County COP, 5.625% due 12/1/2016 (Santa Rita Jail; Insured: AMBAC) | | AA/NR | | | 1,830,000 | | | | 1,890,719 | |
Alameda County Joint Powers Authority, 5.00% due 12/1/2018 (Alameda County Medical Center Highland Hospital) | | AA/Aa3 | | | 400,000 | | | | 443,484 | |
Alameda County Joint Powers Authority, 5.00% due 12/1/2019 (Alameda County Medical Center Highland Hospital) | | AA/Aa3 | | | 750,000 | | | | 858,067 | |
Alameda County Joint Powers Authority, 5.00% due 12/1/2020 (Alameda County Medical Center Highland Hospital) | | AA/Aa3 | | | 725,000 | | | | 851,817 | |
Alameda County Joint Powers Authority, 5.00% due 12/1/2021 (Public Facilities Capital Projects) | | AA/Aa3 | | | 1,000,000 | | | | 1,200,110 | |
Alameda County Joint Powers Authority, 5.00% due 12/1/2024 (Alameda County Medical Center Highland Hospital) | | AA/Aa3 | | | 2,500,000 | | | | 3,059,050 | |
Anaheim Public Financing Authority, 6.00% due 9/1/2016 (Public Improvements; Insured: AGM) | | AA/A2 | | | 1,055,000 | | | | 1,078,379 | |
Anaheim Public Financing Authority, 0% due 9/1/2022 (Public Improvements; Insured: AGM) | | AA/A2 | | | 3,000,000 | | | | 2,617,530 | |
Bay Area Toll Authority, 5.00% due 4/1/2016 (San Francisco Bay Area Toll Bridge) | | AA/Aa3 | | | 2,075,000 | | | | 2,075,000 | |
Bay Area Toll Authority, 0.99% due 4/1/2047 put 10/1/2019 (San Francisco Bay Area Toll Bridge) | | AA/Aa3 | | | 5,000,000 | | | | 4,994,050 | |
Bay Area Toll Authority, 1.50% due 4/1/2047 put 4/2/2018 (San Francisco Bay Area Toll Bridge) | | AA/Aa3 | | | 1,000,000 | | | | 1,010,860 | |
Bay Area Water Supply & Conservation Agency, 3.00% due 10/1/2016 (Regional Water System Improvements) | | AA-/Aa3 | | | 3,965,000 | | | | 4,015,435 | |
Bonita USD GO, 5.00% due 8/1/2024 (Educational Facilities) | | AA-/NR | | | 1,000,000 | | | | 1,228,440 | |
Brea Redevelopment Agency, 5.00% due 8/1/2019 (Redevelopment Project AB) | | AA-/NR | | | 2,000,000 | | | | 2,261,480 | |
Brentwood Infrastructure Financing Authority, 3.00% due 9/2/2016 (Residential Single Family Development; Insured: AGM) | | AA/NR | | | 315,000 | | | | 318,263 | |
Brentwood Infrastructure Financing Authority, 4.00% due 9/2/2017 (Residential Single Family Development; Insured: AGM) | | AA/NR | | | 920,000 | | | | 962,568 | |
Brentwood Infrastructure Financing Authority, 5.00% due 9/2/2020 (Residential Single Family Development; Insured: AGM) | | AA/NR | | | 1,760,000 | | | | 2,042,832 | |
Brentwood Infrastructure Financing Authority, 5.00% due 9/2/2021 (Residential Single Family Development; Insured: AGM) | | AA/NR | | | 925,000 | | | | 1,097,096 | |
Brentwood Infrastructure Financing Authority, 5.00% due 9/2/2022 (Residential Single Family Development; Insured: AGM) | | AA/NR | | | 850,000 | | | | 1,024,258 | |
Brentwood Infrastructure Financing Authority, 5.00% due 9/2/2023 (Residential Single Family Development; Insured: AGM) | | AA/NR | | | 2,690,000 | | | | 3,291,511 | |
Calexico USD COP, 6.75% due 9/1/2017 | | A-/NR | | | 1,630,000 | | | | 1,684,132 | |
California Educational Facilities Authority, 5.00% due 4/1/2018 (Pitzer College) | | NR/A2 | | | 1,540,000 | | | | 1,663,754 | |
California Educational Facilities Authority, 0% due 10/1/2019 (Loyola Marymount University; Insured: Natl-Re) | | NR/A2 | | | 2,025,000 | | | | 1,926,808 | |
California Educational Facilities Authority, 5.00% due 4/1/2020 (Pitzer College) | | NR/A2 | | | 1,445,000 | | | | 1,653,802 | |
California Educational Facilities Authority, 5.00% due 4/1/2022 (Chapman University) | | NR/A2 | | | 2,000,000 | | | | 2,347,340 | |
California HFFA, 0.55% due 7/1/2016 put 4/1/2016 (Dignity Health; Insured: Natl-Re; LOC: JPMorgan Chase Bank, N.A.) (daily demand notes) | | AAA/Aa1 | | | 600,000 | | | | 600,000 | |
California HFFA, 5.50% due 10/1/2017 (Providence Health and Services) | | AA-/Aa3 | | | 1,100,000 | | | | 1,179,167 | |
California HFFA, 5.50% due 2/1/2018 (Community Program Developmental Disabilities; Insured: California Mtg Insurance) | | AA-/NR | | | 2,715,000 | | | | 2,948,816 | |
California HFFA, 6.00% due 10/1/2018 (Providence Health and Services) | | AA-/Aa3 | | | 1,000,000 | | | | 1,127,380 | |
California HFFA, 5.00% due 11/15/2018 (Children’s Hospital Los Angeles) | | BBB+/Baa2 | | | 1,235,000 | | | | 1,333,862 | |
California HFFA, 5.10% due 2/1/2019 (Episcopal Home; Insured: California Mtg Insurance) (ETM) | | AA-/NR | | | 785,000 | | | | 841,873 | |
California HFFA, 0.55% due 7/1/2020 put 4/7/2016 (Dignity Health; LOC: JPMorgan Chase Bank, N.A.; Insured: Natl-Re) (weekly demand notes) | | AAA/Aa1 | | | 2,200,000 | | | | 2,200,000 | |
California HFFA, 5.00% due 11/15/2020 (Children’s Hospital Los Angeles) | | BBB+/Baa2 | | | 1,190,000 | | | | 1,338,441 | |
California HFFA, 5.25% due 3/1/2022 (Dignity Health) | | A/A3 | | | 1,000,000 | | | | 1,192,450 | |
California HFFA, 1.45% due 8/15/2023 put 3/15/2017 (Lucile Salter Packard Children’s Hospital) | | AA-/Aa3 | | | 2,710,000 | | | | 2,730,569 | |
California HFFA, 5.00% due 11/15/2023 (Children’s Hospital Los Angeles) | | BBB+/Baa2 | | | 1,000,000 | | | | 1,150,450 | |
California HFFA, 5.00% due 7/1/2024 (St. Joseph Health System) | | AA-/A1 | | | 1,000,000 | | | | 1,231,470 | |
California HFFA, 5.00% due 7/1/2034 put 10/18/2022 (St. Joseph Health System) | | AA-/A1 | | | 2,000,000 | | | | 2,428,360 | |
California HFFA, 0.38% due 7/1/2035 put 4/1/2016 (Dignity Health; LOC: Sumitomo Mitsui Bank) (daily demand notes) | | AAA/Aa2 | | | 5,910,000 | | | | 5,910,000 | |
California HFFA, 5.00% due 7/1/2043 put 10/17/2017 (St. Joseph Health System) | | AA-/A1 | | | 3,000,000 | | | | 3,189,510 | |
California HFFA, 5.00% due 7/1/2043 put 10/15/2020 (St. Joseph Health System) | | AA-/A1 | | | 5,000,000 | | | | 5,798,700 | |
California Municipal Finance Authority, 5.00% due 10/1/2021 (Biola University Residential Hall and Parking Structure) | | NR/Baa1 | | | 150,000 | | | | 173,073 | |
California Municipal Finance Authority, 5.00% due 10/1/2022 (Biola University Residential Hall and Parking Structure) | | NR/Baa1 | | | 160,000 | | | | 187,550 | |
California Municipal Finance Authority, 5.00% due 10/1/2023 (Biola University Residential Hall and Parking Structure) | | NR/Baa1 | | | 125,000 | | | | 148,365 | |
California Pollution Control Financing Authority, 5.25% due 6/1/2023 put 12/1/2017 (Solid Waste Disposal-Republic Services, Inc.) (AMT) | | BBB+/Baa3 | | | 2,820,000 | | | | 2,970,221 | |
California Pollution Control Financing Authority, 0.45% due 11/1/2026 put 4/1/2016 (Pacific Gas & Electric Co.; LOC: Mizuho Bank Ltd.) (daily demand notes) | | AA+/NR | | | 31,000,000 | | | | 31,000,000 | |
California State Department of Veterans Affairs, 2.75% due 12/1/2018 (Farm and Home Purchase Program) | | AA/Aa3 | | | 1,000,000 | | | | 1,046,650 | |
California State Department of Veterans Affairs, 3.00% due 12/1/2019 (Farm and Home Purchase Program) | | AA/Aa3 | | | 500,000 | | | | 533,545 | |
California State Housing Finance Agency, 3.05% due 12/1/2019 (Multi-Family Housing; Insured: FHA) | | NR/Aa1 | | | 735,000 | | | | 736,007 | |
California State Infrastructure & Economic Development Bank, 5.25% due 8/15/2020 (King City High School) | | AA-/NR | | | 1,000,000 | | | | 1,139,440 | |
California State Public Works Board, 5.00% due 11/1/2016 (California State University-J. Paul Leonard & Sutro Library) | | A+/Aa3 | | | 1,000,000 | | | | 1,026,130 | |
California State Public Works Board, 5.00% due 6/1/2020 (University of California; Insured: Natl-Re) (ETM) | | AA+/Aaa | | | 1,185,000 | | | | 1,382,445 | |
California State Public Works Board, 5.125% due 3/1/2021 (Various State Participating Agency Capital Projects) | | A+/A1 | | | 1,635,000 | | | | 1,881,198 | |
California State Public Works Board, 5.00% due 12/1/2021 (Judicial Council Projects) | | A+/A1 | | | 3,100,000 | | | | 3,720,155 | |
California State Public Works Board, 5.00% due 4/1/2022 (California School for the Deaf Riverside Campus) | | A+/A1 | | | 565,000 | | | | 681,226 | |
California State Public Works Board, 5.00% due 6/1/2022 (Yuba City Courthouse) | | A+/A1 | | | 1,950,000 | | | | 2,358,973 | |
California State Public Works Board, 5.00% due 9/1/2022 (Correctional and Rehabilitation Facilities) | | A+/A1 | | | 3,250,000 | | | | 3,950,732 | |
California State Public Works Board, 5.00% due 11/1/2022 (Correctional and Rehabilitation Facilities) | | A+/A1 | | | 1,500,000 | | | | 1,829,115 | |
California State Public Works Board, 5.00% due 12/1/2022 (Judicial Council Projects) | | A+/A1 | | | 1,200,000 | | | | 1,427,376 | |
California State Public Works Board, 5.00% due 3/1/2023 (Judicial Council Projects) | | A+/A1 | | | 1,400,000 | | | | 1,715,140 | |
8 Semi-Annual Report
| | |
| SCHEDULE OF INVESTMENTS, CONTINUED | | |
| |
Thornburg California Limited Term Municipal Fund | | March 31, 2016 (Unaudited) |
| | | | | | | | | | |
ISSUER-DESCRIPTION | | CREDIT RATING†
S&P/ MOODY’S | | PRINCIPAL
AMOUNT | | | VALUE | |
California State Public Works Board, 5.00% due 6/1/2023 (Coalinga State Hospital) | | A+/A1 | | $ | 7,200,000 | | | $ | 8,863,560 | |
California State Public Works Board, 5.00% due 9/1/2023 (Correctional and Rehabilitation Facilities) | | A+/A1 | | | 3,600,000 | | | | 4,452,732 | |
California State Public Works Board, 5.00% due 11/1/2023 (Laboratory Facility and San Diego Courthouse) | | A+/A1 | | | 3,000,000 | | | | 3,721,980 | |
California State Public Works Board, 5.00% due 3/1/2024 (Judicial Council Projects) | | A+/A1 | | | 1,000,000 | | | | 1,216,670 | |
California State Public Works Board, 5.00% due 4/1/2024 (Correctional and Rehabilitation Facilities) | | A+/A1 | | | 3,350,000 | | | | 4,054,605 | |
California State Public Works Board, 5.00% due 9/1/2024 (Correctional and Rehabilitation Facilities) | | A+/A1 | | | 3,580,000 | | | | 4,493,151 | |
California State Public Works Board, 5.00% due 11/1/2024 (Laboratory Facility and San Diego Courthouse) | | A+/A1 | | | 4,000,000 | | | | 4,965,840 | |
California Statewide Communities Development Authority, 4.00% due 5/15/2017 (Irvine East Campus Apartments) | | NR/Baa1 | | | 2,000,000 | | | | 2,072,220 | |
California Statewide Communities Development Authority, 5.00% due 4/1/2019 (Kaiser Foundation Hospitals) | | A+/NR | | | 3,715,000 | | | | 4,168,973 | |
California Statewide Communities Development Authority, 5.00% due 5/15/2019 (Irvine East Campus Apartments) | | NR/Baa1 | | | 655,000 | | | | 732,493 | |
California Statewide Communities Development Authority, 5.00% due 5/15/2020 (Irvine East Campus Apartments) | | NR/Baa1 | | | 565,000 | | | | 646,756 | |
California Statewide Communities Development Authority, 5.00% due 7/1/2020 pre-refunded 1/1/2019 (Aspire Public Schools; LOC: PCSD Guaranty Pool I, LLC) | | NR/NR | | | 1,085,000 | | | | 1,151,478 | |
California Statewide Communities Development Authority, 5.00% due 11/1/2020 (Cottage Health System) | | A+/NR | | | 100,000 | | | | 116,571 | |
California Statewide Communities Development Authority, 5.00% due 5/15/2021 (Irvine East Campus Apartments) | | NR/Baa1 | | | 760,000 | | | | 888,850 | |
California Statewide Communities Development Authority, 4.00% due 11/1/2021 (Cottage Health System) | | A+/NR | | | 150,000 | | | | 170,210 | |
California Statewide Communities Development Authority, 5.00% due 11/1/2022 (Cottage Health System) | | A+/NR | | | 125,000 | | | | 152,005 | |
California Statewide Communities Development Authority, 5.00% due 11/1/2023 (Cottage Health System) | | A+/NR | | | 150,000 | | | | 185,738 | |
California Statewide Communities Development Authority, 5.00% due 11/1/2024 (Cottage Health System) | | A+/NR | | | 200,000 | | | | 248,050 | |
California Statewide Communities Development Authority, 5.00% due 11/1/2025 (Cottage Health System) | | A+/NR | | | 135,000 | | | | 165,857 | |
Calipatria USD GO, 0% due 8/1/2025 (Educational Facilities; Insured: ACA) | | NR/NR | | | 4,770,000 | | | | 3,436,546 | |
Carson Redevelopment Agency, 6.00% due 10/1/2019 (Project Area 1) | | A-/NR | | | 1,050,000 | | | | 1,217,328 | |
Castaic USD GO, 0% due 5/1/2018 (Insured: Natl-Re) | | AA-/NR | | | 1,760,000 | | | | 1,623,882 | |
Central Valley Financing Authority, 5.25% due 7/1/2020 (Carson Ice) | | AA-/Aa3 | | | 500,000 | | | | 584,555 | |
Chabot-Las Positas Community College District GO, 0% due 8/1/2018 (Capital Improvements; Insured: AMBAC) | | A+/Aa3 | | | 2,465,000 | | | | 2,242,830 | |
City and County of San Francisco COP, 5.00% due 11/1/2016 (525 Golden Gate Avenue-Public Utilities Commission Office Project) | | AA/Aa3 | | | 200,000 | | | | 205,286 | |
City and County of San Francisco COP, 5.00% due 9/1/2018 (City Office Buildings-Multiple Properties Project; Insured: Natl-Re) | | AA/Aa3 | | | 5,000 | | | | 5,020 | |
City and County of San Francisco COP, 5.00% due 11/1/2022 (525 Golden Gate Avenue-Public Utilities Commission Office Project) | | AA/Aa3 | | | 700,000 | | | | 793,184 | |
City and County of San Francisco Redevelopment Agency, 5.00% due 6/1/2020 (Yerba Buena Center Redevelopment Project Area; Insured: AGM) | | AA/A1 | | | 1,730,000 | | | | 1,990,521 | |
City of Antioch Public Financing Authority, 5.00% due 5/1/2022 (Municipal Facilities Project) | | AA-/NR | | | 500,000 | | | | 597,860 | |
City of Antioch Public Financing Authority, 5.00% due 5/1/2024 (Municipal Facilities Project) | | AA-/NR | | | 900,000 | | | | 1,107,135 | |
City of Burbank, 5.00% due 6/1/2016 (Burbank Water and Power System) | | AA-/A1 | | | 500,000 | | | | 503,755 | |
City of Burbank, 5.00% due 6/1/2017 (Burbank Water and Power System) | | AA-/A1 | | | 1,000,000 | | | | 1,049,680 | |
City of Burbank, 5.00% due 6/1/2018 (Burbank Water and Power System) | | AA-/A1 | | | 360,000 | | | | 392,069 | |
City of Burbank, 5.00% due 6/1/2020 (Burbank Water and Power System) | | AA-/A1 | | | 625,000 | | | | 723,806 | |
City of Chula Vista, 1.65% due 7/1/2018 (San Diego Gas & Electric Co.) | | A+/Aa2 | | | 3,500,000 | | | | 3,502,975 | |
City of Chula Vista COP, 5.25% due 3/1/2020 (Capital Facilities Project) | | AA-/NR | | | 1,300,000 | | | | 1,496,183 | |
City of Chula Vista COP, 5.00% due 10/1/2024 (Police Facility Project) | | AA-/A1 | | | 1,700,000 | | | | 2,079,355 | |
City of Clovis, 5.00% due 3/1/2021 (Water System Facilities; Insured: BAM) | | AA/A2 | | | 550,000 | | | | 638,369 | |
City of Clovis, 5.00% due 3/1/2022 (Water System Facilities; Insured: BAM) | | AA/A2 | | | 720,000 | | | | 851,954 | |
City of Clovis, 5.00% due 3/1/2023 (Water System Facilities; Insured: BAM) | | AA/A2 | | | 1,000,000 | | | | 1,204,260 | |
City of Folsom, 5.00% due 12/1/2016 (Community Facilities District No. 2) | | A+/NR | | | 1,100,000 | | | | 1,130,360 | |
City of Folsom, 5.00% due 12/1/2018 (Community Facilities District No. 2) | | A+/NR | | | 965,000 | | | | 1,058,441 | |
City of Los Angeles Community Facilities District No. 4, 4.00% due 9/1/2016 (Playa Vista - Phase 1) | | BBB+/NR | | | 650,000 | | | | 659,341 | |
City of Los Angeles Community Facilities District No. 4, 4.00% due 9/1/2017 (Playa Vista - Phase 1) | | BBB+/NR | | | 500,000 | | | | 522,390 | |
City of Los Angeles COP, 3.00% due 11/1/2030 put 2/1/2018 (American Academy of Dramatic Arts; LOC: TD Bank, N.A.) | | NR/Aa2 | | | 2,490,000 | | | | 2,550,109 | |
City of Los Angeles Department of Water & Power, 0.34% due 7/1/2034 put 4/1/2016 (Electric Power Plant; SPA: Barclays Bank plc) (daily demand notes) | | AA-/Aa3 | | | 10,000,000 | | | | 10,000,000 | |
City of Los Angeles GO, 2.00% due 6/30/2016 (Cash Flow Management) | | SP-1+/Mig1 | | | 4,000,000 | | | | 4,017,160 | |
City of Manteca, 4.00% due 7/1/2016 (Water Supply System) | | AA-/A1 | | | 300,000 | | | | 302,703 | |
City of Manteca, 3.00% due 12/1/2016 (Wastewater Quality Control Facility) | | AA-/Aa3 | | | 520,000 | | | | 528,382 | |
City of Manteca, 4.00% due 7/1/2018 (Water Supply System) | | AA-/A1 | | | 550,000 | | | | 589,034 | |
City of Manteca, 4.00% due 12/1/2018 (Wastewater Quality Control Facility) | | AA-/Aa3 | | | 375,000 | | | | 404,558 | |
City of Manteca, 5.00% due 7/1/2019 (Water Supply System) | | AA-/A1 | | | 400,000 | | | | 451,720 | |
City of Manteca, 5.00% due 7/1/2021 (Water Supply System) | | AA-/A1 | | | 1,000,000 | | | | 1,187,440 | |
City of Manteca, 5.00% due 7/1/2023 (Water Supply System) | | AA-/A1 | | | 650,000 | | | | 779,448 | |
City of Moorpark Mobile Home Park, 4.90% due 5/15/2017 (Villa Del Arroyo) | | A+/NR | | | 415,000 | | | | 426,645 | |
City of Porterville COP, 6.30% due 10/1/2018 (Public Service Capital Projects; Insured: AMBAC) (ETM) | | NR/NR | | | 685,000 | | | | 738,238 | |
City of San Jose Financing Authority, 5.00% due 6/1/2019 (Civic Center Project) | | AA/Aa3 | | | 650,000 | | | | 733,551 | |
City of San Jose Financing Authority, 5.00% due 6/1/2020 (Civic Center Project) | | AA/Aa3 | | | 600,000 | | | | 695,430 | |
City of San Jose Financing Authority, 4.00% due 6/1/2021 (Civic Center Project) | | AA/Aa3 | | | 1,000,000 | | | | 1,135,420 | |
City of San Jose Financing Authority, 5.00% due 6/1/2022 (Civic Center Project) | | AA/Aa3 | | | 745,000 | | | | 901,822 | |
Semi-Annual Report 9
| | |
| SCHEDULE OF INVESTMENTS, CONTINUED | | |
| |
Thornburg California Limited Term Municipal Fund | | March 31, 2016 (Unaudited) |
| | | | | | | | | | |
ISSUER-DESCRIPTION | | CREDIT RATING†
S&P/ MOODY’S | | PRINCIPAL
AMOUNT | | | VALUE | |
City of San Jose Financing Authority, 5.00% due 6/1/2023 (Civic Center Project) | | AA/Aa3 | | $ | 1,000,000 | | | $ | 1,229,660 | |
City of San Jose Financing Authority, 5.00% due 6/1/2024 (Civic Center Project) | | AA/Aa3 | | | 750,000 | | | | 924,187 | |
City of Torrance, 5.00% due 9/1/2020 (Torrance Memorial Medical Center) | | BBB+/A3 | | | 1,155,000 | | | | 1,324,797 | |
City of Torrance, 6.00% due 6/1/2022 (Torrance Memorial Medical Center) | | BBB+/A3 | | | 2,600,000 | | | | 2,636,946 | |
City of Vallejo, 5.00% due 5/1/2017 (Water Improvement Project; Insured: Natl-Re) | | AA-/A3 | | | 1,240,000 | | | | 1,244,774 | |
Community Development Commission of the City of Santa Fe Springs, 5.00% due 9/1/2018 (Redevelopment Project; Insured: Natl-Re) | | AA-/A3 | | | 1,235,000 | | | | 1,306,408 | |
Community Facilities District No. 86-1 of the Irvine USD, 5.25% due 9/1/2017 (Educational Facilities; Insured: AGM) | | AA/NR | | | 250,000 | | | | 264,723 | |
Corona-Norco USD GO, 0% due 9/1/2017 (Insured: AGM) | | AA/Aa2 | | | 1,595,000 | | | | 1,573,117 | |
Coronado Community Development Agency, 0% due 9/1/2016 (Insured: AGM) | | AA/A2 | | | 225,000 | | | | 224,474 | |
County of El Dorado Community Facilities District, 5.00% due 9/1/2019 (El Dorado Hills Development) | | A/NR | | | 1,700,000 | | | | 1,904,238 | |
County of Los Angeles, 5.00% due 6/30/2016 (General Fund Expenditures) | | SP-1+/Mig1 | | | 12,000,000 | | | | 12,140,280 | |
County of Los Angeles Redevelopment Refunding Authority, 5.00% due 6/1/2020 (Bunker Hill Project) | | A+/NR | | | 1,000,000 | | | | 1,155,260 | |
County of Los Angeles Redevelopment Refunding Authority, 5.00% due 6/1/2021 (Bunker Hill Project) | | A+/NR | | | 2,500,000 | | | | 2,952,950 | |
County of Los Angeles Redevelopment Refunding Authority, 5.00% due 6/1/2022 (Bunker Hill Project) | | A+/NR | | | 1,000,000 | | | | 1,201,330 | |
County of Los Angeles Redevelopment Refunding Authority, 5.00% due 6/1/2023 (Bunker Hill Project) | | A+/NR | | | 1,000,000 | | | | 1,219,820 | |
County of Los Angeles Redevelopment Refunding Authority, 5.00% due 6/1/2024 (Bunker Hill Project) | | A+/NR | | | 500,000 | | | | 616,230 | |
County of Monterey COP, 5.25% due 8/1/2021 (Natividad Medical Center; Insured: AGM) | | AA/A1 | | | 3,700,000 | | | | 4,251,818 | |
County of San Diego and San Diego County School District, 2.00% due 6/30/2016 | | SP-1+/NR | | | 7,430,000 | | | | 7,462,246 | |
Delano Financing Authority, 5.00% due 12/1/2017 (Police Station and Capital Improvements) | | A-/NR | | | 1,085,000 | | | | 1,152,096 | |
Delano Financing Authority, 5.00% due 12/1/2018 (Police Station and Capital Improvements) | | A-/NR | | | 1,135,000 | | | | 1,234,698 | |
Delano Financing Authority, 5.00% due 12/1/2019 (Police Station and Capital Improvements) | | A-/NR | | | 1,195,000 | | | | 1,332,162 | |
Desert Sands USD COP, 4.00% due 3/1/2019 (Educational Facilities; Insured: BAM) | | AA/A1 | | | 1,000,000 | | | | 1,084,220 | |
Desert Sands USD COP, 5.00% due 3/1/2020 (Educational Facilities; Insured: BAM) | | AA/A1 | | | 700,000 | | | | 799,211 | |
Desert Sands USD COP, 5.00% due 3/1/2021 (Educational Facilities; Insured: BAM) | | AA/A1 | | | 1,080,000 | | | | 1,262,455 | |
East Bay Municipal Utility District, 5.00% due 6/1/2016 (Water System) | | AAA/Aa1 | | | 3,100,000 | | | | 3,124,397 | |
Elk Grove Finance Authority, 4.00% due 9/1/2020 (Poppy Ridge CFD No. 2003-1 and East Franklin CFD No. 2002-1) | | A-/NR | | | 575,000 | | | | 636,370 | |
Elk Grove Finance Authority, 5.00% due 9/1/2021 (Poppy Ridge CFD No. 2003-1 and East Franklin CFD No. 2002-1) | | A-/NR | | | 450,000 | | | | 527,792 | |
Elk Grove Finance Authority, 5.00% due 9/1/2025 (Poppy Ridge CFD No. 2003-1 and East Franklin CFD No. 2002-1) | | A-/NR | | | 750,000 | | | | 918,420 | |
Emeryville Redevelopment Agency, 5.00% due 9/1/2022 (Emeryville and Shellmound Park Projects; Insured: AGM) | | AA/NR | | | 2,775,000 | | | | 3,379,645 | |
Emeryville Redevelopment Agency, 5.00% due 9/1/2023 (Emeryville and Shellmound Park Projects; Insured: AGM) | | AA/NR | | | 2,420,000 | | | | 2,993,225 | |
Emeryville Redevelopment Agency, 5.00% due 9/1/2024 (Emeryville and Shellmound Park Projects; Insured: AGM) | | AA/NR | | | 3,900,000 | | | | 4,886,661 | |
Evergreen School District GO, 2.00% due 8/1/2016 (Educational Facilities Improvements) | | NR/Aa2 | | | 2,250,000 | | | | 2,261,925 | |
Fillmore Public Financing Authority, 5.00% due 5/1/2016 (Water Recycling Financing Project; Insured: CIFG) | | AA/A3 | | | 735,000 | | | | 737,639 | |
Folsom Cordova USD COP, 5.00% due 4/1/2021 (Educational Facilities; Insured: AGM) | | AA/NR | | | 1,000,000 | | | | 1,175,650 | |
Fresno County USD GO, 5.90% due 8/1/2017 (Educational Facilities; Insured: Natl-Re) | | AA-/A3 | | | 590,000 | | | | 628,999 | |
Fresno County USD GO, 5.90% due 8/1/2018 (Educational Facilities; Insured: Natl-Re) | | AA-/A3 | | | 630,000 | | | | 700,182 | |
Fresno County USD GO, 5.90% due 8/1/2019 (Educational Facilities; Insured: Natl-Re) | | AA-/A3 | | | 675,000 | | | | 777,587 | |
Fresno County USD GO, 5.00% due 2/1/2020 (Educational Facilities; Insured: Natl-Re) | | AA-/A3 | | | 2,510,000 | | | | 2,853,594 | |
Fresno County USD GO, 5.90% due 8/1/2020 (Educational Facilities; Insured: Natl-Re) | | AA-/A3 | | | 720,000 | | | | 857,081 | |
Fullerton Public Financing Authority, 5.00% due 9/1/2016 (Insured: AMBAC) | | A/NR | | | 1,775,000 | | | | 1,807,482 | |
Government of Guam, 5.00% due 11/15/2023 (Economic Development) | | A/NR | | | 1,250,000 | | | | 1,492,912 | |
Government of Guam, 5.00% due 11/15/2025 (Economic Development) | | A/NR | | | 4,175,000 | | | | 5,079,138 | |
Guam Power Authority, 5.00% due 10/1/2021 (Electric Power System; Insured: AGM) | | AA/A2 | | | 1,275,000 | | | | 1,510,097 | |
Hacienda La Puente USD COP, 2.00% due 6/1/2016 (Educational Facilities; Insured: AGM) | | AA/A1 | | | 850,000 | | | | 852,363 | |
Hacienda La Puente USD COP, 3.00% due 6/1/2017 (Educational Facilities; Insured: AGM) | | AA/A1 | | | 160,000 | | | | 164,438 | |
Hacienda La Puente USD COP, 4.00% due 6/1/2018 (Educational Facilities; Insured: AGM) | | AA/A1 | | | 705,000 | | | | 753,490 | |
Hacienda La Puente USD COP, 5.00% due 6/1/2019 (Educational Facilities; Insured: AGM) | | AA/A1 | | | 875,000 | | | | 986,011 | |
Hacienda La Puente USD COP, 5.00% due 6/1/2020 (Educational Facilities; Insured: AGM) | | AA/A1 | | | 740,000 | | | | 857,697 | |
Hacienda La Puente USD COP, 5.00% due 6/1/2022 (Educational Facilities; Insured: AGM) | | AA/A1 | | | 575,000 | | | | 696,946 | |
Hacienda La Puente USD COP, 5.00% due 6/1/2023 (Educational Facilities; Insured: AGM) | | AA/A1 | | | 1,535,000 | | | | 1,890,552 | |
Hacienda La Puente USD COP, 5.00% due 6/1/2024 (Educational Facilities; Insured: AGM) | | AA/A1 | | | 880,000 | | | | 1,100,097 | |
Hacienda La Puente USD COP, 5.00% due 6/1/2025 (Educational Facilities; Insured: AGM) | | AA/A1 | | | 1,300,000 | | | | 1,643,590 | |
Hemet USD GO, 4.00% due 8/1/2018 (Insured: AGM) | | AA/NR | | | 1,335,000 | | | | 1,431,507 | |
Jurupa Public Financing Authority, 4.50% due 9/1/2018 (Community Services District-Eastvale Area; Insured: AGM) | | AA/NR | | | 870,000 | | | | 938,956 | |
Jurupa Public Financing Authority, 4.50% due 9/1/2019 (Community Services District-Eastvale Area; Insured: AGM) | | AA/NR | | | 905,000 | | | | 1,001,871 | |
Jurupa Public Financing Authority, 4.50% due 9/1/2020 (Community Services District-Eastvale Area; Insured: AGM) | | AA/NR | | | 945,000 | | | | 1,064,250 | |
Kern High School District GO, 4.00% due 8/1/2016 (Insured: AGM) | | A+/Aa2 | | | 500,000 | | | | 505,910 | |
Kern High School District GO, 4.00% due 8/1/2017 (Insured: AGM) | | A+/Aa2 | | | 500,000 | | | | 522,195 | |
Kern High School District GO, 4.00% due 8/1/2018 (Insured: AGM) | | A+/Aa2 | | | 500,000 | | | | 537,290 | |
La Quinta Redevelopment Agency, 5.00% due 9/1/2021 (Redevelopment Project Areas No. 1 and 2) | | A+/NR | | | 1,000,000 | | | | 1,170,610 | |
La Quinta Redevelopment Agency, 5.00% due 9/1/2022 (Redevelopment Project Areas No. 1 and 2) | | A+/NR | | | 2,000,000 | | | | 2,383,040 | |
La Quinta Redevelopment Agency, 5.00% due 9/1/2023 (Redevelopment Project Areas No. 1 and 2) | | A+/NR | | | 1,500,000 | | | | 1,802,985 | |
Lodi Public Financing Authority, 3.00% due 10/1/2016 (City Police Building and Jail) | | A+/NR | | | 830,000 | | | | 838,839 | |
Lodi Public Financing Authority, 5.00% due 10/1/2020 (City Police Building and Jail) | | A+/NR | | | 965,000 | | | | 1,099,473 | |
Lodi Public Financing Authority, 5.00% due 10/1/2021 (City Police Building and Jail) | | A+/NR | | | 1,020,000 | | | | 1,182,649 | |
10 Semi-Annual Report
| | |
| SCHEDULE OF INVESTMENTS, CONTINUED | | |
| |
Thornburg California Limited Term Municipal Fund | | March 31, 2016 (Unaudited) |
| | | | | | | | | | |
ISSUER-DESCRIPTION | | CREDIT RATING†
S&P/ MOODY’S | | PRINCIPAL
AMOUNT | | | VALUE | |
Lodi Public Financing Authority, 5.00% due 10/1/2022 (City Police Building and Jail) | | A+/NR | | $ | 1,040,000 | | | $ | 1,211,579 | |
Lodi Public Financing Authority, 5.00% due 10/1/2023 (City Police Building and Jail) | | A+/NR | | | 1,120,000 | | | | 1,296,904 | |
Los Alamitos USD GO, 0% due 9/1/2016 (Educational Facilities) (ETM) | | SP-1+/Aa2 | | | 2,000,000 | | | | 1,995,980 | |
Los Angeles Convention & Exhibition Center Authority, 5.00% due 8/15/2016 (ETM) | | A+/A1 | | | 2,100,000 | | | | 2,135,910 | |
Los Angeles Convention & Exhibition Center Authority, 5.00% due 8/15/2017 (ETM) | | A+/A1 | | | 1,660,000 | | | | 1,759,019 | |
Los Angeles County Public Works Financing Authority, 5.25% due 10/1/2016 (Los Angeles County Regional Park and Open Space District; Insured: AGM) | | AA/Aa1 | | | 700,000 | | | | 716,548 | |
Los Angeles County Public Works Financing Authority, 5.00% due 8/1/2018 (Multiple Capital Projects) | | AA/A1 | | | 2,060,000 | | | | 2,262,931 | |
Los Angeles County Sanitation District Financing Authority, 5.00% due 10/1/2016 (Capital Projects) | | AA+/Aa1 | | | 4,000,000 | | | | 4,092,320 | |
Los Angeles County Schools Pooled Financing Program COP, 5.00% due 6/1/2022 (Compton USD; Insured: AGM) | | AA/A2 | | | 1,500,000 | | | | 1,800,120 | |
Los Angeles County Schools Regionalized Business Services Corp. COP, 0% due 8/1/2021 (Insured: AMBAC) | | NR/NR | | | 2,135,000 | | | | 1,898,250 | |
Los Angeles Department of Airports, 5.50% due 5/15/2018 (Los Angeles International Airport) (AMT) | | AA/Aa3 | | | 2,000,000 | | | | 2,192,180 | |
Los Angeles Municipal Improvement Corp., 5.00% due 11/1/2017 (Capital Improvements) | | A+/A2 | | | 3,235,000 | | | | 3,456,274 | |
Los Angeles Municipal Improvement Corp., 5.00% due 3/1/2018 (Capital Improvements) | | A+/A2 | | | 4,765,000 | | | | 5,147,105 | |
Los Angeles USD COP, 5.00% due 10/1/2016 (Educational Facilities and Information Technology Infrastructure; Insured: AMBAC) | | A+/A1 | | | 425,000 | | | | 434,669 | |
Los Angeles USD COP, 5.50% due 12/1/2018 (Educational Facilities and Information Technology Infrastructure) | | A+/A1 | | | 2,000,000 | | | | 2,247,680 | |
Los Angeles USD GO, 5.00% due 7/1/2022 (Educational Facilities and Information Technology Infrastructure) | | AA-/Aa2 | | | 2,750,000 | | | | 3,358,877 | |
Los Angeles USD GO, 5.00% due 7/1/2022 (Educational Facilities and Information Technology Infrastructure) | | AA-/Aa2 | | | 6,360,000 | | | | 7,768,168 | |
Los Angeles USD GO, 5.00% due 7/1/2023 (Educational Facilities and Information Technology Infrastructure) | | AA-/Aa2 | | | 3,000,000 | | | | 3,725,760 | |
Los Angeles USD GO, 5.00% due 7/1/2024 (Educational Facilities and Information Technology Infrastructure) | | AA-/Aa2 | | | 3,000,000 | | | | 3,786,690 | |
Lynwood USD GO, 5.00% due 8/1/2023 (Insured: AGM) | | AA/A2 | | | 1,000,000 | | | | 1,233,260 | |
Manteca USD Community Facilities District No. 1989-2, 3.00% due 9/1/2016 (Educational Facilities; Insured: AGM) | | AA/A2 | | | 410,000 | | | | 413,916 | |
Manteca USD Community Facilities District No. 1989-2, 4.00% due 9/1/2018 (Educational Facilities; Insured: AGM) | | AA/A2 | | | 500,000 | | | | 533,690 | |
Manteca USD Community Facilities District No. 1989-2, 4.00% due 9/1/2019 (Educational Facilities; Insured: AGM) | | AA/A2 | | | 870,000 | | | | 948,631 | |
Manteca USD Community Facilities District No. 1989-2, 5.00% due 9/1/2020 (Educational Facilities; Insured: AGM) | | AA/A2 | | | 1,425,000 | | | | 1,635,145 | |
Manteca USD Community Facilities District No. 1989-2, 5.00% due 9/1/2021 (Educational Facilities; Insured: AGM) | | AA/A2 | | | 750,000 | | | | 877,957 | |
Manteca USD Community Facilities District No. 1989-2, 5.00% due 9/1/2023 (Educational Facilities; Insured: AGM) | | AA/A2 | | | 500,000 | | | | 604,945 | |
Mark West Union School District GO, 4.125% due 8/1/2020 (Educational Facilities; Insured: Natl-Re) | | AA/A3 | | | 1,275,000 | | | | 1,279,003 | |
Metropolitan Water District of Southern California, 0.33% due 7/1/2036 put 8/16/2016 | | A-1+/Aa1 | | | 7,500,000 | | | | 7,500,000 | |
Milpitas Redevelopment Agency, 3.00% due 9/1/2016 (Redevelopment Project Area No. 1) | | AA-/NR | | | 1,000,000 | | | | 1,010,840 | |
Milpitas Redevelopment Agency, 4.00% due 9/1/2017 (Redevelopment Project Area No. 1) | | AA-/NR | | | 1,000,000 | | | | 1,046,770 | |
Milpitas Redevelopment Agency, 5.00% due 9/1/2025 (Redevelopment Project Area No. 1) | | AA-/NR | | | 2,300,000 | | | | 2,898,506 | |
Modesto Irrigation District, 5.00% due 7/1/2022 (San Joaquin Valley Electric System) | | A+/A2 | | | 1,000,000 | | | | 1,218,060 | |
Moreno Valley Public Financing Authority, 5.00% due 11/1/2024 (Public Improvements) | | A+/NR | | | 1,455,000 | | | | 1,771,797 | |
Murrieta Valley USD Public Financing Authority GO, 5.00% due 9/1/2023 (Educational Facilities; Insured: BAM) | | AA/NR | | | 1,080,000 | | | | 1,333,832 | |
Natomas USD GO, 5.00% due 8/1/2024 (Insured: BAM) | | AA/A1 | | | 2,425,000 | | | | 2,991,747 | |
North City West School Facilities Financing Authority, 5.00% due 9/1/2021 (Carmel Valley; Insured: AGM) | | AA/NR | | | 2,155,000 | | | | 2,550,852 | |
North City West School Facilities Financing Authority, 5.00% due 9/1/2022 (Carmel Valley; Insured: AGM) | | AA/NR | | | 2,260,000 | | | | 2,723,210 | |
Northern California Power Agency, 5.00% due 7/1/2016 (Hydroelectric Project) | | A+/A1 | | | 500,000 | | | | 505,865 | |
Northern California Power Agency, 5.00% due 7/1/2017 (Hydroelectric Project) | | A+/A1 | | | 100,000 | | | | 105,522 | |
Northern California Power Agency, 5.00% due 7/1/2018 (Hydroelectric Project) | | A+/A1 | | | 1,250,000 | | | | 1,369,475 | |
Northern California Power Agency, 5.00% due 6/1/2019 (Lodi Energy Center) | | A-/A2 | | | 2,340,000 | | | | 2,642,351 | |
Oakland USD GO, 5.00% due 8/1/2022 (County of Alameda Educational Facilities) | | NR/NR | | | 745,000 | | | | 876,627 | |
Oakland USD GO, 5.00% due 8/1/2023 (County of Alameda Educational Facilities) | | NR/NR | | | 700,000 | | | | 836,241 | |
Oakland USD GO, 5.00% due 8/1/2025 (County of Alameda Educational Facilities) | | NR/NR | | | 1,300,000 | | | | 1,590,537 | |
Palomar Pomerado Health GO, 0% due 8/1/2019 (Insured: AGM) | | AA/A2 | | | 2,000,000 | | | | 1,900,700 | |
Palomar Pomerado Health GO, 0% due 8/1/2021 (Insured: Natl-Re) | | AA-/A2 | | | 2,850,000 | | | | 2,557,020 | |
Pomona USD GO, 6.10% due 2/1/2020 (Educational Facilities; Insured: Natl-Re) | | AA-/A3 | | | 465,000 | | | | 547,710 | |
Redding Electrical Systems COP, 5.00% due 6/1/2020 (Insured: AGM) | | NR/A2 | | | 2,500,000 | | | | 2,731,800 | |
Redevelopment Agency of the City and County of San Francisco Community Facilities District No. 4, 0.38% due 8/1/2032 put 4/1/2016 (Mission Bay North Public Improvements; LOC: Bank of America, N.A.) (daily demand notes) | | NR/A1 | | | 850,000 | | | | 850,000 | |
Redevelopment Agency of the City of Rialto, 5.00% due 9/1/2023 (Merged Project Area; Insured: BAM) | | AA/NR | | | 550,000 | | | | 667,134 | |
Redevelopment Agency of the City of Rialto, 5.00% due 9/1/2024 (Merged Project Area; Insured: BAM) | | AA/NR | | | 500,000 | | | | 615,360 | |
Regents of the University of California, 4.00% due 5/15/2017 (Campus Housing and Facilities) | | AA-/Aa3 | | | 1,250,000 | | | | 1,298,175 | |
Ridgecrest Redevelopment Agency, 5.00% due 6/30/2016 (Redevelopment Project) | | A-/NR | | | 1,055,000 | | | | 1,066,415 | |
Ridgecrest Redevelopment Agency, 5.00% due 6/30/2017 (Redevelopment Project) | | A-/NR | | | 1,055,000 | | | | 1,106,874 | |
Ridgecrest Redevelopment Agency, 5.25% due 6/30/2018 (Redevelopment Project) | | A-/NR | | | 1,050,000 | | | | 1,145,823 | |
Ridgecrest Redevelopment Agency, 5.50% due 6/30/2019 (Redevelopment Project) | | A-/NR | | | 1,050,000 | | | | 1,191,666 | |
Ridgecrest Redevelopment Agency, 5.50% due 6/30/2020 (Redevelopment Project) | | A-/NR | | | 1,040,000 | | | | 1,210,196 | |
Riverside County Infrastructure Financing Authority, 2.00% due 11/1/2016 (Capital Improvement Projects) | | AA-/NR | | | 1,500,000 | | | | 1,513,110 | |
Riverside County Infrastructure Financing Authority, 3.00% due 11/1/2017 (Capital Improvement Projects) | | AA-/NR | | | 1,000,000 | | | | 1,035,500 | |
Riverside County Infrastructure Financing Authority, 4.00% due 11/1/2018 (Capital Improvement Projects) | | AA-/NR | | | 1,000,000 | | | | 1,077,540 | |
Riverside County Infrastructure Financing Authority, 4.00% due 11/1/2019 (Capital Improvement Projects) | | AA-/NR | | | 1,700,000 | | | | 1,871,241 | |
Riverside County Infrastructure Financing Authority, 5.00% due 11/1/2020 (Capital Improvement Projects) | | AA-/NR | | | 605,000 | | | | 703,198 | |
Riverside County Infrastructure Financing Authority, 5.00% due 11/1/2021 (Capital Improvement Projects) | | AA-/NR | | | 500,000 | | | | 593,375 | |
Semi-Annual Report 11
| | |
| SCHEDULE OF INVESTMENTS, CONTINUED | | |
| |
Thornburg California Limited Term Municipal Fund | | March 31, 2016 (Unaudited) |
| | | | | | | | | | |
ISSUER-DESCRIPTION | | CREDIT RATING†
S&P/ MOODY’S | | PRINCIPAL
AMOUNT | | | VALUE | |
Riverside County Palm Desert Financing Authority, 6.00% due 5/1/2022 (Palm Desert Sheriff’s Station Facilities) | | AA-/A2 | | $ | 2,600,000 | | | $ | 2,866,786 | |
Riverside County Public Financing Authority, 4.00% due 11/1/2017 (Capital Facilities Project) | | AA-/NR | | | 550,000 | | | | 578,166 | |
Riverside County Public Financing Authority, 5.00% due 11/1/2019 (Capital Facilities Project) | | AA-/NR | | | 2,000,000 | | | | 2,271,500 | |
Riverside County Public Financing Authority, 4.00% due 11/1/2020 (Capital Facilities Project) | | AA-/NR | | | 465,000 | | | | 517,457 | |
Riverside County Public Financing Authority, 5.00% due 11/1/2021 (Capital Facilities Project) | | AA-/NR | | | 1,000,000 | | | | 1,179,120 | |
Riverside County Public Financing Authority, 5.00% due 11/1/2025 (Capital Facilities Project) | | AA-/NR | | | 1,000,000 | | | | 1,226,660 | |
Riverside USD Financing Authority, 3.00% due 9/1/2016 (Educational Facilities; Insured: BAM) | | AA/NR | | | 500,000 | | | | 505,105 | |
Riverside USD Financing Authority, 4.00% due 9/1/2017 (Educational Facilities; Insured: BAM) | | AA/NR | | | 285,000 | | | | 297,777 | |
Riverside USD Financing Authority, 5.00% due 9/1/2019 (Educational Facilities; Insured: BAM) | | AA/NR | | | 950,000 | | | | 1,073,766 | |
Riverside USD Financing Authority, 5.00% due 9/1/2022 (Educational Facilities; Insured: BAM) | | AA/NR | | | 215,000 | | | | 258,533 | |
Riverside USD Financing Authority, 5.00% due 9/1/2024 (Educational Facilities; Insured: BAM) | | AA/NR | | | 680,000 | | | | 834,523 | |
Riverside USD Financing Authority, 5.00% due 9/1/2025 (Educational Facilities; Insured: BAM) | | AA/NR | | | 350,000 | | | | 430,430 | |
Rosemead Community Development Commission, 5.00% due 10/1/2016 (Redevelopment Project Area No. 1; Insured: AMBAC) | | A/NR | | | 700,000 | | | | 714,924 | |
Roseville Natural Gas Financing Authority, 5.00% due 2/15/2017 | | BBB+/Baa1 | | | 1,390,000 | | | | 1,432,965 | |
Sacramento City Financing Authority, 0% due 11/1/2016 (Merged Downtown Sacramento, Alkali Flat, Del Paso Heights and Oak Park Redevelopment Project Areas; Insured: Nat’l-Re) | | AA-/A3 | | | 3,200,000 | | | | 3,187,232 | |
Sacramento City Schools Joint Power Financing Authority, 5.00% due 3/1/2021 (Sacramento City USD Educational Facility Sublease; Insured: BAM) | | AA/NR | | | 830,000 | | | | 965,066 | |
Sacramento City Schools Joint Power Financing Authority, 5.00% due 3/1/2022 (Sacramento City USD Educational Facility Sublease; Insured: BAM) | | AA/NR | | | 775,000 | | | | 918,948 | |
Sacramento City Schools Joint Power Financing Authority, 5.00% due 3/1/2023 (Sacramento City USD Educational Facility Sublease; Insured: BAM) | | AA/NR | | | 815,000 | | | | 981,472 | |
Sacramento City Schools Joint Power Financing Authority, 5.00% due 3/1/2024 (Sacramento City USD Educational Facility Sublease; Insured: BAM) | | AA/NR | | | 765,000 | | | | 930,699 | |
Sacramento City Schools Joint Power Financing Authority, 5.00% due 3/1/2025 (Sacramento City USD Educational Facility Sublease; Insured: BAM) | | AA/NR | | | 2,175,000 | | | | 2,626,704 | |
Sacramento City USD GO, 5.00% due 7/1/2018 (Educational Facilities Improvements; Insured: AGM) | | AA/NR | | | 360,000 | | | | 394,070 | |
Sacramento City USD GO, 4.00% due 7/1/2019 (Educational Facilities Improvements) | | A+/A1 | | | 5,455,000 | | | | 5,988,008 | |
Sacramento City USD GO, 5.00% due 7/1/2019 (Educational Facilities Improvements; Insured: AGM) | | AA/NR | | | 635,000 | | | | 718,630 | |
Sacramento City USD GO, 5.00% due 7/1/2020 (Educational Facilities Improvements; Insured: AGM) | | AA/NR | | | 500,000 | | | | 581,875 | |
Sacramento City USD GO, 5.00% due 7/1/2021 (Educational Facilities Improvements) | | A+/A1 | | | 3,600,000 | | | | 4,271,760 | |
Sacramento City USD GO, 5.00% due 7/1/2021 (Educational Facilities Improvements; Insured: AGM) | | AA/NR | | | 400,000 | | | | 476,544 | |
Sacramento City USD GO, 5.00% due 7/1/2022 (Educational Facilities Improvements; Insured: AGM) | | AA/NR | | | 700,000 | | | | 852,642 | |
Sacramento Cogeneration Authority, 5.00% due 7/1/2019 (Procter & Gamble Project) | | AA-/Aa3 | | | 625,000 | | | | 706,238 | |
Sacramento Municipal Utility District, 5.00% due 7/1/2020 pre-refunded 7/1/2016 (Cosumnes Project; Insured: Natl-Re) | | NR/A3 | | | 3,000,000 | | | | 3,034,650 | |
Sacramento Municipal Utility District, 1.00% due 8/15/2028 put 4/1/2016 (Electric System; LOC: Bank of America N.A.) (daily demand notes) | | AAA/A1 | | | 8,800,000 | | | | 8,800,000 | |
Salinas Valley Solid Waste Authority, 5.00% due 8/1/2023 (Insured: AGM) (AMT) | | AA/A2 | | | 1,530,000 | | | | 1,818,726 | |
San Diego Redevelopment Agency, 5.00% due 9/1/2018 (Centre City Redevelopment; Insured: AMBAC) | | NR/A2 | | | 3,215,000 | | | | 3,275,410 | |
San Diego Redevelopment Agency, 0.01% due 9/1/2019 (Centre City Redevelopment; Insured: AGM) | | AA/A2 | | | 1,910,000 | | | | 1,808,961 | |
San Diego USD GO, 3.00% due 7/1/2017 (Educational System Capital Projects) | | NR/Aa2 | | | 5,000,000 | | | | 5,149,200 | |
San Diego USD GO, 5.50% due 7/1/2020 (Educational System Capital Projects; Insured: Natl-Re) | | AA-/Aa2 | | | 1,390,000 | | | | 1,650,250 | |
San Diego USD GO, 5.00% due 7/1/2023 (Educational System Capital Projects) | | AA-/Aa2 | | | 5,000,000 | | | | 6,244,700 | |
San Diego USD GO, 5.00% due 7/1/2024 (Educational System Capital Projects) | | AA-/Aa2 | | | 3,000,000 | | | | 3,764,250 | |
San Francisco City and County Airports Commission, 5.00% due 5/1/2026 (San Francisco International Airport) | | A+/A1 | | | 5,000,000 | | | | 6,433,950 | |
San Francisco City and County Redevelopment Agency, 5.00% due 8/1/2019 (San Francisco Redevelopment Projects) | | A+/NR | | | 2,050,000 | | | | 2,318,017 | |
San Francisco City and County Redevelopment Agency, 5.00% due 8/1/2020 (San Francisco Redevelopment Projects) | | A+/NR | | | 1,685,000 | | | | 1,958,425 | |
San Francisco City and County Redevelopment Agency, 5.00% due 8/1/2021 (San Francisco Redevelopment Projects) | | A+/NR | | | 1,000,000 | | | | 1,188,980 | |
San Joaquin Delta Community College District GO, 0% due 8/1/2019 (Insured: AGM) | | AA/Aa2 | | | 5,000,000 | | | | 4,616,100 | |
San Juan USD GO, 1.00% due 8/1/2016 (Educational Facilities) | | NR/Aa2 | | | 3,000,000 | | | | 3,005,820 | |
San Mateo County Joint Powers Financing Authority, 5.00% due 6/15/2017 (Maple Street Correctional Center) | | AA+/Aa2 | | | 750,000 | | | | 790,148 | |
San Mateo County Joint Powers Financing Authority, 5.00% due 7/15/2018 (County Capital Projects) | | AA+/Aa2 | | | 800,000 | | | | 872,872 | |
San Mateo County Joint Powers Financing Authority, 5.00% due 6/15/2021 (Maple Street Correctional Center) | | AA+/Aa2 | | | 410,000 | | | | 488,650 | |
San Mateo County Joint Powers Financing Authority, 5.00% due 6/15/2022 (Maple Street Correctional Center) | | AA+/Aa2 | | | 1,000,000 | | | | 1,218,920 | |
San Mateo County Joint Powers Financing Authority, 5.00% due 6/15/2023 (Maple Street Correctional Center) | | AA+/Aa2 | | | 585,000 | | | | 726,389 | |
San Mateo Union High School District GO, 0% due 9/1/2019 (Educational Facilities; Insured: Natl-Re) | | AA+/Aaa | | | 2,000,000 | | | | 1,922,040 | |
Santa Ana Financing Authority, 6.25% due 7/1/2018 (Police Administration & Holding Facility; Insured: Natl-Re) (ETM) | | AA-/A3 | | | 1,000,000 | | | | 1,123,670 | |
Santa Ana Financing Authority, 6.25% due 7/1/2018 (Police Administration & Holding Facility; Insured: Natl-Re) | | AA-/A3 | | | 1,000,000 | | | | 1,114,120 | |
Santa Ana USD GO, 0% due 8/1/2020 (Insured: Natl-Re) | | AA-/A3 | | | 2,035,000 | | | | 1,888,887 | |
Santa Clara County Financing Authority, 4.00% due 5/15/2017 (Multiple Facilities Projects) | | AA+/A1 | | | 1,000,000 | | | | 1,036,740 | |
Santa Clara County Financing Authority, 5.00% due 5/15/2025 (Multiple Facilities Projects) | | AA+/NR | | | 6,755,000 | | | | 8,596,413 | |
Semitropic Water Storage Improvement District, 5.00% due 12/1/2022 (Irrigation Water System; Insured: AGM) | | AA/A2 | | | 400,000 | | | | 489,108 | |
Semitropic Water Storage Improvement District, 5.00% due 12/1/2023 (Irrigation Water System; Insured: AGM) | | AA/A2 | | | 500,000 | | | | 620,555 | |
Semitropic Water Storage Improvement District, 5.00% due 12/1/2024 (Irrigation Water System; Insured: AGM) | | AA/A2 | | | 500,000 | | | | 629,175 | |
Semitropic Water Storage Improvement District, 5.00% due 12/1/2025 (Irrigation Water System; Insured: AGM) | | AA/A2 | | | 1,110,000 | | | | 1,410,088 | |
12 Semi-Annual Report
| | |
| SCHEDULE OF INVESTMENTS, CONTINUED | | |
| |
Thornburg California Limited Term Municipal Fund | | March 31, 2016 (Unaudited) |
| | | | | | | | | | |
ISSUER-DESCRIPTION | | CREDIT RATING†
S&P/ MOODY’S | | PRINCIPAL
AMOUNT | | | VALUE | |
Solano County COP, 5.00% due 11/15/2016 (Health & Social Services Headquarters) | | AA-/A1 | | $ | 1,000,000 | | | $ | 1,027,420 | |
South San Francisco USD GO, 4.00% due 6/15/2018 (Educational Facilities) | | SP-1+/NR | | | 5,000,000 | | | | 5,353,500 | |
Southeast Resource Recovery Facilities Authority, 5.25% due 12/1/2017 (Insured: AMBAC) | | AA-/A2 | | | 1,000,000 | | | | 1,004,090 | |
Southeast Resource Recovery Facilities Authority, 5.375% due 12/1/2018 (Insured: AMBAC) (AMT) | | AA-/A2 | | | 2,000,000 | | | | 2,008,380 | |
Southern California Public Power Authority, 5.00% due 7/1/2016 (Southern Transmission Project) | | AA-/NR | | | 2,000,000 | | | | 2,023,000 | |
Southern California Public Power Authority, 1.00% due 7/1/2036 put 4/1/2016 (Magnolia Power Project; LOC: U.S. Bank, N.A.) (daily demand notes) | | AAA/Aa1 | | | 11,000,000 | | | | 11,000,000 | |
State of California Department of Water Resources, 5.00% due 12/1/2016 (Central Valley Project Water System) | | AAA/Aa1 | | | 1,000,000 | | | | 1,030,830 | |
State of California Economic Recovery GO, 5.00% due 7/1/2018 (ETM) | | AA+/Aaa | | | 2,330,000 | | | | 2,553,237 | |
State of California Economic Recovery GO, 5.00% due 7/1/2018 (ETM) | | AA+/Aaa | | | 670,000 | | | | 734,193 | |
State of California GO, 4.00% due 8/1/2016 (Various Capital Projects) | | AA-/Aa3 | | | 500,000 | | | | 506,000 | |
State of California GO, 4.75% due 9/1/2018 (Various Capital Projects; Insured: AGM) | | AA/Aa3 | | | 220,000 | | | | 224,083 | |
State of California GO, 5.00% due 9/1/2020 (Various Capital Projects) | | AA-/Aa3 | | | 2,000,000 | | | | 2,341,300 | |
Successor Agency to the City Colton Redevelopment Agency, 5.00% due 8/1/2021 (Downtown Area No. 1 and No. 2, Cooley Ranch, Santa Ana River, West Valley, Mount Vernon Corridor, Rancho/Mill; Insured: BAM) | | AA/NR | | | 940,000 | | | | 1,094,367 | |
Successor Agency to the City Colton Redevelopment Agency, 5.00% due 8/1/2023 (Downtown Area No. 1 and No. 2, Cooley Ranch, Santa Ana River, West Valley, Mount Vernon Corridor, Rancho/Mill; Insured: BAM) | | AA/NR | | | 925,000 | | | | 1,113,099 | |
Successor Agency to the City Colton Redevelopment Agency, 5.00% due 8/1/2025 (Downtown Area No. 1 and No. 2, Cooley Ranch, Santa Ana River, West Valley, Mount Vernon Corridor, Rancho/Mill; Insured: BAM) | | AA/NR | | | 950,000 | | | | 1,169,478 | |
Successor Agency to the City of Riverside Redevelopment Agency, 5.00% due 9/1/2023 (Multiple Redevelopment Project Areas) | | AA-/NR | | | 1,735,000 | | | | 2,133,252 | |
Successor Agency to the City of Riverside Redevelopment Agency, 5.00% due 9/1/2024 (Multiple Redevelopment Project Areas) | | AA-/NR | | | 1,250,000 | | | | 1,557,387 | |
Successor Agency to the City of Sacramento Redevelopment Agency, 2.00% due 12/1/2016 (Multiple Redevelopment Project Areas) | | A/NR | | | 1,000,000 | | | | 1,008,400 | |
Successor Agency to the City of Sacramento Redevelopment Agency, 3.00% due 12/1/2017 (Multiple Redevelopment Project Areas) | | A/NR | | | 1,315,000 | | | | 1,359,013 | |
Successor Agency to the City of San Diego Redevelopment Agency, 5.00% due 9/1/2025 (Multiple Redevelopment Project Areas) | | AA-/NR | | | 2,745,000 | | | | 3,508,137 | |
Successor Agency to the City of San Diego Redevelopment Agency, 5.00% due 9/1/2026 (Multiple Redevelopment Project Areas) | | AA-/NR | | | 1,500,000 | | | | 1,897,695 | |
Successor Agency to the Community Development Agency of the City of Menlo Park, 3.00% due 10/1/2017 (Las Pulgas Community Development Project) | | A+/NR | | | 655,000 | | | | 677,735 | |
Successor Agency to the Community Development Agency of the City of Menlo Park, 5.00% due 10/1/2019 (Las Pulgas Community Development Project) | | A+/NR | | | 400,000 | | | | 454,080 | |
Successor Agency to the Community Development Agency of the City of Menlo Park, 5.00% due 10/1/2020 (Las Pulgas Community Development Project) | | A+/NR | | | 325,000 | | | | 379,096 | |
Successor Agency to the Community Development Agency of the City of Menlo Park, 5.00% due 10/1/2021 (Las Pulgas Community Development Project; Insured: AGM) | | AA/NR | | | 1,250,000 | | | | 1,497,837 | |
Successor Agency to the Community Development Agency of the City of Menlo Park, 5.00% due 10/1/2022 (Las Pulgas Community Development Project; Insured: AGM) | | AA/NR | | | 900,000 | | | | 1,096,101 | |
Successor Agency to the Community Development Agency of the City of Menlo Park, 5.00% due 10/1/2025 (Las Pulgas Community Development Project; Insured: AGM) | | AA/NR | | | 500,000 | | | | 632,285 | |
Successor Agency to the Poway Redevelopment Agency, 5.00% due 6/15/2025 (Paguay Redevelopment Project) | | AA-/NR | | | 4,665,000 | | | | 5,943,863 | |
Successor Agency to the Rancho Cucamonga Redevelopment Project, 5.00% due 9/1/2023 (Insured: AGM) | | AA/NR | | | 1,000,000 | | | | 1,239,230 | |
Successor Agency to the Rancho Cucamonga Redevelopment Project, 5.00% due 9/1/2024 (Insured: AGM) | | AA/NR | | | 2,000,000 | | | | 2,511,320 | |
Successor Agency to the Richmond County Redevelopment Agency, 5.00% due 9/1/2022 (Joint Powers Financing Authority & Harbour Redevelopment Project; Insured: BAM) | | AA/NR | | | 400,000 | | | | 476,608 | |
Successor Agency to the Richmond County Redevelopment Agency, 5.00% due 9/1/2023 (Joint Powers Financing Authority & Harbour Redevelopment Project; Insured: BAM) | | AA/NR | | | 400,000 | | | | 481,916 | |
Successor Agency to the Richmond County Redevelopment Agency, 5.00% due 9/1/2024 (Joint Powers Financing Authority & Harbour Redevelopment Project; Insured: BAM) | | AA/NR | | | 450,000 | | | | 548,631 | |
Temecula Valley USD Financing Authority, 3.00% due 9/1/2016 (Educational Facilities; Insured: BAM) | | AA/NR | | | 580,000 | | | | 585,922 | |
Temecula Valley USD Financing Authority, 4.00% due 9/1/2017 (Educational Facilities; Insured: BAM) | | AA/NR | | | 400,000 | | | | 418,128 | |
Temecula Valley USD Financing Authority, 5.00% due 9/1/2018 (Educational Facilities; Insured: BAM) | | AA/NR | | | 325,000 | | | | 356,229 | |
Temecula Valley USD Financing Authority, 5.00% due 9/1/2019 (Educational Facilities; Insured: BAM) | | AA/NR | | | 375,000 | | | | 423,855 | |
Temecula Valley USD Financing Authority, 5.00% due 9/1/2020 (Educational Facilities; Insured: BAM) | | AA/NR | | | 400,000 | | | | 463,564 | |
Temecula Valley USD Financing Authority, 5.00% due 9/1/2021 (Educational Facilities; Insured: BAM) | | AA/NR | | | 515,000 | | | | 611,274 | |
Temecula Valley USD Financing Authority, 5.00% due 9/1/2022 (Educational Facilities; Insured: BAM) | | AA/NR | | | 275,000 | | | | 331,053 | |
Temecula Valley USD Financing Authority, 5.00% due 9/1/2023 (Educational Facilities; Insured: BAM) | | AA/NR | | | 300,000 | | | | 366,756 | |
Temecula Valley USD Financing Authority, 5.00% due 9/1/2024 (Educational Facilities; Insured: BAM) | | AA/NR | | | 300,000 | | | | 370,785 | |
Temecula Valley USD Financing Authority, 5.00% due 9/1/2025 (Educational Facilities; Insured: BAM) | | AA/NR | | | 300,000 | | | | 369,762 | |
Town of Hillsborough COP, 0.52% due 6/1/2030 put 4/1/2016 (Water and Sewer Systems Project; SPA: JPMorgan Chase Bank, N.A.) (daily demand notes) | | NR/NR | | | 6,700,000 | | | | 6,700,000 | |
a Trustees of the California State University, 5.00% due 11/1/2026 (Educational Facilities Improvements) | | AA-/Aa2 | | | 1,000,000 | | | | 1,279,790 | |
Tuolumne Wind Project Authority, 5.00% due 1/1/2018 | | AA-/A2 | | | 1,690,000 | | | | 1,810,936 | |
Semi-Annual Report 13
| | |
| SCHEDULE OF INVESTMENTS, CONTINUED | | |
| |
Thornburg California Limited Term Municipal Fund | | March 31, 2016 (Unaudited) |
| | | | | | | | | | |
ISSUER-DESCRIPTION | | CREDIT RATING†
S&P/ MOODY’S | | PRINCIPAL
AMOUNT | | | VALUE | |
Turlock Irrigation District, 5.00% due 1/1/2019 | | AA-/A2 | | $ | 1,000,000 | | | $ | 1,110,240 | |
Ukiah USD GO, 0% due 8/1/2019 (Insured: Natl-Re) | | AA-/A1 | | | 2,000,000 | | | | 1,923,700 | |
Upper Lake Union High School District GO, 0% due 8/1/2020 (Insured: Natl-Re) | | NR/A3 | | | 1,050,000 | | | | 909,573 | |
Ventura County Public Financing Authority, 5.00% due 11/1/2023 (Office Building Purchase and Improvements) | | AA+/Aa3 | | | 500,000 | | | | 614,850 | |
Ventura County Public Financing Authority, 5.00% due 11/1/2024 (Office Building Purchase and Improvements) | | AA+/Aa3 | | | 1,060,000 | | | | 1,300,949 | |
b Virgin Islands Public Finance Authority, 5.00% due 10/1/2017 | | BBB-/Baa2 | | | 1,440,000 | | | | 1,505,707 | |
Vista Redevelopment Agency, 5.00% due 9/1/2019 (Vista Redevelopment Project; Insured: AGM) | | AA/NR | | | 300,000 | | | | 339,696 | |
Vista Redevelopment Agency, 5.00% due 9/1/2020 (Vista Redevelopment Project; Insured: AGM) | | AA/NR | | | 275,000 | | | | 319,041 | |
Vista Redevelopment Agency, 5.00% due 9/1/2021 (Vista Redevelopment Project; Insured: AGM) | | AA/NR | | | 265,000 | | | | 314,285 | |
Vista Redevelopment Agency, 5.00% due 9/1/2022 (Vista Redevelopment Project; Insured: AGM) | | AA/NR | | | 335,000 | | | | 405,404 | |
Vista Redevelopment Agency, 5.00% due 9/1/2023 (Vista Redevelopment Project; Insured: AGM) | | AA/NR | | | 400,000 | | | | 491,920 | |
Walnut Improvement Agency, 4.00% due 3/1/2017 (City of Walnut Improvement Plan; Insured: BAM) | | AA/NR | | | 1,000,000 | | | | 1,027,400 | |
Walnut Improvement Agency, 4.00% due 3/1/2018 (City of Walnut Improvement Plan; Insured: BAM) | | AA/NR | | | 1,000,000 | | | | 1,054,790 | |
Walnut Improvement Agency, 5.00% due 3/1/2019 (City of Walnut Improvement Plan; Insured: BAM) | | AA/NR | | | 400,000 | | | | 442,908 | |
Washington USD Yolo County COP, 5.00% due 8/1/2017 (West Sacramento High School; Insured: AMBAC) | | A/NR | | | 725,000 | | | | 767,239 | |
Washington USD Yolo County COP, 5.00% due 8/1/2021 (West Sacramento High School; Insured: AMBAC) | | A/NR | | | 910,000 | | | | 955,072 | |
Washington USD Yolo County COP, 5.00% due 8/1/2022 (West Sacramento High School; Insured: AMBAC) | | A/NR | | | 2,010,000 | | | | 2,109,555 | |
Westminster Redevelopment Agency, 5.00% due 8/1/2024 (Commercial Redevelopment Project No. 1; Insured: AGM) | | AA/A2 | | | 1,205,000 | | | | 1,306,256 | |
Whittier Union High School GO, 5.00% due 8/1/2016 (School Facilities Improvements) | | AA-/Aa1 | | | 6,180,000 | | | | 6,275,110 | |
| | | | | | | | | | |
TOTAL INVESTMENTS — 98.18% (Cost $652,580,760) | | | | | | | | $ | 680,272,019 | |
OTHER ASSETS LESS LIABILITIES — 1.82% | | | | | | | | | 12,643,523 | |
| | | | | | | | | | |
NET ASSETS — 100.00% | | | | | | | | $ | 692,915,542 | |
| | | | | | | | | | |
Footnote Legend
| † | Credit ratings are unaudited. Rating changes may have occurred subsequent to the reporting period end. Bonds issued with a maturity of one year or less are assigned Moody’s ratings from MIG-1 to MIG-4 and Standard and Poor’s ratings from SP-1+ to SP-3 with MIG-1 and SP-1+ being the strongest ratings. |
| b | Segregated as collateral for a when-issued security. |
Portfolio Abbreviations
To simplify the listings of securities, abbreviations are used per the table below:
| | |
| ABAG | | Association of Bay Area Governments |
| ACA | | Insured by American Capital Access |
| AGM | | Insured by Assured Guaranty Municipal Corp. |
| AMBAC | | Insured by American Municipal Bond Assurance Corp. |
| AMT | | Alternative Minimum Tax |
| BAM | | Insured by Build America Mutual Insurance Co. |
| CIFG | | Insured by CIFG Assurance North America Inc. |
| COP | | Certificates of Participation |
| | |
| ETM | | Escrowed to Maturity |
| FHA | | Insured by Federal Housing Administration |
| GO | | General Obligation |
| HFFA | | Health Facilities Financing Authority |
| Mtg | | Mortgage |
| Natl-Re | | Insured by National Public Finance Guarantee Corp. |
| USD | | Unified School District |
See notes to financial statements.
14 Semi-Annual Report
| | |
| STATEMENT OF ASSETS AND LIABILITIES | | |
| |
Thornburg California Limited Term Municipal Fund | | March 31, 2016 (Unaudited) |
| | | | |
ASSETS | | | | |
Investments at value (cost $652,580,760) (Note 2) | | $ | 680,272,019 | |
Cash | | | 12,093,529 | |
Receivable for investments sold | | | 16,501,068 | |
Receivable for fund shares sold | | | 1,298,513 | |
Interest receivable | | | 6,316,168 | |
Prepaid expenses and other assets | | | 2,001 | |
| | | | |
Total Assets | | | 716,483,298 | |
| | | | |
| |
LIABILITIES | | | | |
Payable for investments purchased | | | 21,077,673 | |
Payable for fund shares redeemed | | | 1,848,020 | |
Payable to investment advisor and other affiliates (Note 3) | | | 386,248 | |
Accounts payable and accrued expenses | | | 59,416 | |
Dividends payable | | | 196,399 | |
| | | | |
Total Liabilities | | | 23,567,756 | |
| | | | |
| |
NET ASSETS | | $ | 692,915,542 | |
| | | | |
NET ASSETS CONSIST OF | | | | |
Undistributed net investment income | | $ | 2,404 | |
Net unrealized appreciation on investments | | | 27,691,259 | |
Accumulated net realized gain (loss) | | | (61,597 | ) |
Net capital paid in on shares of beneficial interest | | | 665,283,476 | |
| | | | |
| | $ | 692,915,542 | |
| | | | |
| |
NET ASSET VALUE | | | | |
Class A Shares: | | | | |
Net asset value and redemption price per share ($185,731,932 applicable to 13,320,210 shares of beneficial interest outstanding - Note 4) | | $ | 13.94 | |
Maximum sales charge, 1.50% of offering price | | | 0.21 | |
| | | | |
Maximum offering price per share | | $ | 14.15 | |
| | | | |
| |
Class C Shares: | | | | |
Net asset value and offering price per share* ($66,918,029 applicable to 4,795,301 shares of beneficial interest outstanding - Note 4) | | $ | 13.95 | |
| | | | |
| |
Class I Shares: | | | | |
Net asset value, offering and redemption price per share ($440,265,581 applicable to 31,544,137 shares of beneficial interest outstanding - Note 4) | | $ | 13.96 | |
| | | | |
| * | Redemption price per share is equal to net asset value less any applicable contingent deferred sales charge. |
See notes to financial statements.
Semi-Annual Report 15
| | |
| STATEMENT OF OPERATIONS | | |
| |
Thornburg California Limited Term Municipal Fund | | Six Months Ended March 31, 2016 (Unaudited) |
| | | | |
INVESTMENT INCOME | | | | |
Interest income (net of premium amortized of $4,518,507) | | $ | 7,486,561 | |
| | | | |
| |
EXPENSES | | | | |
Investment advisory fees (Note 3) | | | 1,577,925 | |
Administration fees (Note 3) | | | | |
Class A Shares | | | 110,386 | |
Class C Shares | | | 40,948 | |
Class I Shares | | | 105,459 | |
Distribution and service fees (Note 3) | | | | |
Class A Shares | | | 220,771 | |
Class C Shares | | | 164,075 | |
Transfer agent fees | | | | |
Class A Shares | | | 44,504 | |
Class C Shares | | | 15,617 | |
Class I Shares | | | 122,017 | |
Registration and filing fees | | | | |
Class A Shares | | | 18 | |
Class C Shares | | | 17 | |
Class I Shares | | | 18 | |
Custodian fees (Note 3) | | | 48,495 | |
Professional fees | | | 26,167 | |
Accounting fees (Note 3) | | | 11,378 | |
Trustee fees | | | 13,208 | |
Other expenses | | | 15,665 | |
| | | | |
Total Expenses | | | 2,516,668 | |
| | | | |
Net Investment Income | | | 4,969,893 | |
| | | | |
REALIZED AND UNREALIZED GAIN (LOSS) | | | | |
Net realized gain (loss) from investments | | | 144,542 | |
Net change in unrealized appreciation (depreciation) on investments | | | 4,862,942 | |
| | | | |
Net Realized and Unrealized Gain | | | 5,007,484 | |
| | | | |
Net Increase in Net Assets Resulting from Operations | | $ | 9,977,377 | |
| | | | |
See notes to financial statements.
16 Semi-Annual Report
| | |
| STATEMENTS OF CHANGES IN NET ASSETS | | |
| |
Thornburg California Limited Term Municipal Fund | | |
| | | | | | | | |
| | | SIX MONTHS ENDED
MARCH 31, 2016* | | | YEAR ENDED
SEPTEMBER 30, 2015 | |
INCREASE (DECREASE) IN NET ASSETS FROM | | | | | | | | |
| | |
OPERATIONS | | | | | | | | |
Net investment income | | $ | 4,969,893 | | | $ | 9,704,464 | |
Net realized gain (loss) from investments | | | 144,542 | | | | (102,451 | ) |
Net unrealized appreciation (depreciation) on investments | | | 4,862,942 | | | | 94,220 | |
| | | | | | | | |
| | |
Net Increase (Decrease) in Net Assets Resulting from Operations | | | 9,977,377 | | | | 9,696,233 | |
| | |
DIVIDENDS TO SHAREHOLDERS | | | | | | | | |
From net investment income | | | | | | | | |
Class A Shares | | | (1,165,733 | ) | | | (2,333,303 | ) |
Class C Shares | | | (351,025 | ) | | | (735,680 | ) |
Class I Shares | | | (3,453,135 | ) | | | (6,635,481 | ) |
| | |
FUND SHARE TRANSACTIONS (NOTE 4) | | | | | | | | |
Class A Shares | | | 13,057,207 | | | | 11,239,731 | |
Class C Shares | | | 2,208,354 | | | | 1,372,807 | |
Class I Shares | | | 29,525,227 | | | | 46,488,377 | |
| | | | | | | | |
Net Increase in Net Assets | | | 49,798,272 | | | | 59,092,684 | |
| | |
NET ASSETS | | | | | | | | |
Beginning of Period | | | 643,117,270 | | | | 584,024,586 | |
| | | | | | | | |
| | |
End of Period | | $ | 692,915,542 | | | $ | 643,117,270 | |
| | | | | | | | |
Undistributed net investment income | | $ | 2,404 | | | $ | 2,404 | |
See notes to financial statements.
Semi-Annual Report 17
| | |
| NOTES TO FINANCIAL STATEMENTS | | |
| |
Thornburg California Limited Term Municipal Fund | | March 31, 2016 (Unaudited) |
NOTE 1 – ORGANIZATION
Thornburg California Limited Term Municipal Fund (the “Fund”) is a diversified series of Thornburg Investment Trust (the “Trust”). The Trust is organized as a Massachusetts business trust under a Declaration of Trust dated June 3, 1987 and is registered as a diversified, open-end management investment company under the Investment Company Act of 1940, as amended. The Fund is currently one of twenty separate series of the Trust. Each series is considered to be a separate entity for financial reporting and tax purposes and bears expenses directly attributable to it. The Fund’s primary investment objective is to obtain as high a level of current income exempt from federal and California state individual income tax as is consistent, in the view of Thornburg Investment Management, Inc., the Trust’s investment advisor (the “Advisor”), with the preservation of capital. The Fund’s secondary objective is to reduce expected changes in its share price compared to longer intermediate and long-term bond portfolios.
The Fund currently offers three classes of shares of beneficial interest: Class A, Class C, and Institutional Class (“Class I”). Each class of shares of the Fund represents an interest in the same portfolio of investments, except that (i) Class A shares are sold subject to a front-end sales charge collected at the time the shares are purchased and bear a service fee, (ii) Class C shares are sold at net asset value without a sales charge at the time of purchase, but are subject to a contingent deferred sales charge upon redemption within one year of purchase, and bear both a service fee and a distribution fee, (iii) Class I shares are sold at net asset value without a sales charge at the time of purchase and may be subject to a service fee, and (iv) the respective classes may have different reinvestment privileges and conversion rights. Additionally, the Fund may allocate among its classes certain expenses, to the extent allocable to specific classes, including transfer agent fees, government registration fees, certain printing and postage costs, and administrative and legal expenses. Currently, class specific expenses of the Fund are limited to service and distribution fees, administration fees, and certain registration and transfer agent expenses.
NOTE 2 – SIGNIFICANT ACCOUNTING POLICIES
The following is a summary of significant accounting policies followed by the Fund in the preparation of its financial statements. The Fund is an investment company and prepares its financial statements in conformity with United States generally accepted accounting principles (“GAAP”), including investment company accounting and reporting guidance in the Financial Accounting Standards Board (the “FASB”) Accounting Standard Codification Topic 946. The preparation of financial statements in conformity with GAAP requires management to make estimates and assumptions that affect the reported amounts of assets and liabilities and disclosure of contingent assets and liabilities at the date of the financial statements and the reported amounts of increases (decreases) in net assets from operations during the reporting period. Actual results could differ from those estimates.
Significant accounting policies of the Trust are as follows:
Valuation Policy and Procedures: The Trustees of the Trust have appointed the Advisor to assist the Trustees in obtaining market values for portfolio investments, perform certain evaluation and supervisory functions respecting professional pricing service providers appointed by the Trustees’ Audit Committee (the “Audit Committee”) to assist in determining fair values for portfolio investments, assist in calculating fair values for portfolio investments in certain circumstances, and to perform other functions in connection with valuation of investments. The Advisor acts through its Valuation and Pricing Committee (the “Committee”) and other employees of the Advisor. The Committee regularly reviews its own valuation calculations, as well as the valuations, valuation techniques and services furnished by pricing service providers, considers circumstances which may require valuation calculations by the Committee, and reviews previous valuation calculations. The Committee reports to the Audit Committee on the Committee’s activities, the performance of pricing service providers, and other matters relating to valuation of portfolio investments.
In those instances when the Committee assists in calculating a fair value for a portfolio investment, the Committee seeks to determine the price that the Fund would reasonably expect to receive upon a sale of the investment in an orderly transaction between market participants on the valuation date. The Committee customarily utilizes quotations from securities broker dealers in calculating valuations, but also may utilize prices obtained from pricing service providers or other methods approved by the Audit Committee. Because fair values calculated by the Committee are estimates, the calculation of a value for an investment may differ from the price that would be realized by the Fund upon a sale of the investment, and the difference could be material to the Fund’s financial statements. The Committee’s calculation of a fair value for an investment may also differ from the prices obtained by other persons (including other mutual funds) for the investment.
Valuation of Investments: Debt obligations held by the Fund which are not listed or traded on exchanges or for which no reported market exists are ordinarily valued at the valuation obtained from a pricing service provider approved by the Audit Committee.
In any case when a pricing service provider fails to provide a valuation for a debt obligation held by the Fund, the Committee calculates a fair value for the obligation using alternative methods under procedures approved by the Audit Committee. Additionally, in cases when management believes that a valuation obtained from a pricing service provider merits review for significant reasons, the Committee decides whether or not to use the valuation calculated by the pricing service provider or to use an alternative method approved by the Audit Committee to calculate a fair value for the obligation.
18 Semi-Annual Report
| | |
| NOTES TO FINANCIAL STATEMENTS, CONTINUED | | |
| |
Thornburg California Limited Term Municipal Fund | | March 31, 2016 (Unaudited) |
Valuation Measurements: The Fund categorizes its investments based upon the inputs used in valuing those investments, according to a three-level hierarchy established in guidance from the FASB. Categorization of investments using this hierarchy is intended by the FASB to maximize the use of observable inputs in valuing investments and minimize the use of unobservable inputs by requiring that the most observable inputs be used when available. Observable inputs are those that market participants would use in valuing an investment based on available market information. Unobservable inputs are those that reflect assumptions about the information market participants would use in valuing an investment. An investment’s level within the hierarchy is based on the lowest level input that is deemed significant to the valuation. The methodologies and inputs used to value investments are not necessarily indications of the risk or liquidity associated with those investments.
Various inputs are used in calculating valuations for the Fund’s investments. These inputs are generally summarized according to the three-level hierarchy below:
Level 1: Quoted prices in active markets for identical investments.
Level 2: Other direct or indirect significant observable inputs (including quoted prices for similar investments in active markets and other observable inputs, such as interest rates, prepayment rates, credit risk, etc.).
Level 3: Significant unobservable inputs (including the Committee’s own assumptions in calculating the fair values of investments).
Valuations for debt obligations held by the Fund are typically calculated by pricing service providers approved by the Audit Committee and are characterized as Level 2 within the valuation hierarchy.
In a limited number of cases the Committee calculates a fair value for investments using broker quotations or other methods approved by the Audit Committee. When the Committee uses a single broker quotation to calculate a fair value for an investment without other significant observable inputs, or if a fair value is calculated using other significant inputs that are considered unobservable, the investment is characterized as Level 3 within the hierarchy. Other significant unobservable inputs used to calculate a fair value in these instances might include an income-based valuation approach which considers discounted anticipated future cash flows from the investment, and application of discounts due to the nature or duration of any restrictions on the disposition of the investment.
Valuations based upon the use of inputs from Levels 1, 2 or 3 may not represent the actual price received upon the disposition of an investment, and the Fund may receive a price that is lower than the valuation based upon these inputs when it sells the investment.
The following table displays a summary of the fair value hierarchy measurements of the Fund’s investments as of March 31, 2016. In any instance when valuation inputs from more than one level are used to determine the fair value of a specific investment, the investment is placed in the level of the table based upon the lowest level input that is significant in determining the fair value of the investment:
| | | | | | | | | | | | | | | | |
| | | FAIR VALUE MEASUREMENTS AT MARCH 31, 2016 | |
| | | TOTAL | | | LEVEL 1 | | | LEVEL 2 | | | LEVEL 3 | |
Assets | | | | | | | | | | | | | | | | |
Investments in Securities | | | | | | | | | | | | | | | | |
Municipal Bonds | | $ | 680,272,019 | | | $ | — | | | $ | 680,272,019 | | | $ | — | |
| | | | | | | | | | | | | | | | |
Total Investments in Securities | | $ | 680,272,019 | | | $ | — | | | $ | 680,272,019 | | | $ | — | |
In accordance with the guidance prescribed in Accounting Standards Update No. 2011-04, it is the policy of the Fund to recognize transfers between levels and the underlying events which caused the movement. The Fund recognized no transfers between levels for the six months ended March 31, 2016.
Federal Income Taxes: It is the policy of the Trust to comply with the provisions of the Internal Revenue Code applicable to “regulated investment companies” and to distribute to shareholders substantially all taxable income including net realized gains on investments (if any), and tax exempt income of the Fund. Therefore, no provision for federal income tax is required.
Management reviews each uncertain tax position believed to be material to the preparation of the Fund’s financial statements, to assess if it is more likely than not that the position would be sustained upon examination, based upon the technical merits of the position. As of March 31, 2016, management has not identified any such position for which an asset or liability must be reflected in the Statement of Assets and Liabilities. The Fund’s tax returns remain subject to examination for three years after filing.
When-Issued and Delayed Delivery Transactions: The Fund may engage in when-issued or delayed delivery transactions. To the extent the Fund engages in such transactions, it will do so for the purpose of acquiring portfolio investments consistent with the Fund’s investment objectives and not for the purpose of investment leverage or to speculate on interest rate and, or market changes. At the time the Fund makes a commitment to purchase an investment on a when-issued or delayed delivery basis, the Fund will record the transaction and reflect the value in determining its net asset value. When effecting such transactions, assets of an amount sufficient to make
Semi-Annual Report 19
| | |
| NOTES TO FINANCIAL STATEMENTS, CONTINUED | | |
| |
Thornburg California Limited Term Municipal Fund | | March 31, 2016 (Unaudited) |
payment for the portfolio investments to be purchased will be segregated on the Fund’s records on the trade date. Investments purchased on a when-issued or delayed delivery basis do not earn interest until the settlement date.
Dividends: Net investment income of the Fund is declared daily as a dividend on shares for which the Fund has received payment. Dividends are paid monthly and are reinvested in additional shares of the Fund at net asset value per share at the close of business on the dividend payment date, or at the shareholder’s option, paid in cash. Net realized capital gains, to the extent available, will be distributed at least annually.
General: Investment transactions are accounted for on a trade date basis. Interest income is accrued as earned. Premiums and discounts on investments purchased are amortized to call dates or maturity dates of the respective investments. Realized gains and losses from the sale of investments are recorded on an identified cost basis. Net investment income (other than class specific expenses) and realized and unrealized gains and losses are allocated daily to each class of shares based upon the relative net asset value of outstanding shares (or the value of the dividend-eligible shares, as appropriate) of each class of shares at the beginning of the day (after adjusting for the current capital shares activity of the respective class). Expenses common to all Funds are allocated among the Funds comprising the Trust based upon their relative net asset values or other appropriate allocation methods.
Guarantees and Indemnifications: Under the Trust’s organizational documents (and under separate agreements with the independent Trustees), its officers and Trustees are indemnified against certain liabilities arising out of the performance of their duties to the Fund. Additionally, in the normal course of business the Trust enters into contracts with service providers that contain general indemnification clauses. The Trust’s maximum exposure under these arrangements is unknown. However, based on experience, the Trust expects the risk of loss to be remote.
NOTE 3 – INVESTMENT ADVISORY FEE AND OTHER TRANSACTIONS WITH AFFILIATES
Pursuant to an investment advisory agreement, the Advisor serves as the investment advisor and performs services for the Fund for which the fees are payable at the end of each month. For the six months ended March 31, 2016, these fees were payable at annual rates ranging from .50 of 1% to .225 of 1% per annum of the average daily net assets of the Fund depending on the Fund’s asset size. The Fund pays to the Advisor the costs of personnel who perform certain accounting services for the Fund. For the six months ended March 31, 2016 the Fund paid $11,378 to the Advisor for these accounting services. The Trust has also entered into administrative service agreements with the Advisor, whereby the Advisor will perform certain administrative services for the shareholders of each class of the Fund’s shares, and for which fees will be payable at an annual rate of up to .125 of 1% per annum of the average daily net assets attributable to each class of shares.
The Trust has an underwriting agreement with Thornburg Securities Corporation (the “Distributor”), an affiliate of the Advisor, which acts as the distributor of the Fund’s shares. For the six months ended March 31, 2016, the Distributor has advised the Fund that it earned net commissions aggregating $2,221 from the sale of Class A shares, and collected contingent deferred sales charges aggregating $3,149 from redemptions of Class C shares of the Fund.
Pursuant to a service plan under Rule 12b-1 of the Investment Company Act of 1940, the Fund may reimburse to the Advisor an amount not to exceed .25 of 1% per annum of the average daily net assets attributable to each class of shares of the Fund for payments made by the Advisor to securities dealers and other financial institutions to obtain various shareholder and distribution related services. For the six months ended March 31, 2016, there were no 12b-1 service plan fees charged for Class I shares. The Advisor may pay out of its own resources additional expenses for distribution of the Fund’s shares and shareholder services.
The Trust has also adopted a distribution plan pursuant to Rule 12b-1, applicable only to the Fund’s Class C shares, under which the Fund compensates the Distributor for services in promoting the sale of Class C shares of the Fund at an annual rate of up to .25 of 1% per annum of the average daily net assets attributable to Class C shares. Total fees incurred by each class of shares of the Fund under their respective service and distribution plans for the six months ended March 31, 2016, are set forth in the Statement of Operations.
Certain officers and Trustees of the Trust are also officers or directors of the Advisor and Distributor. The compensation of independent Trustees is borne by the Trust.
The Fund may purchase or sell securities from or to an affiliated fund, provided the affiliation is due solely to having a common investment advisor, common officers, or common trustees, and provided that all such transactions will comply with Rule 17a-7 under the 1940 Act. For the six months ended March 31, 2016, the Fund had transactions of $2,000,214 in purchases from affiliated funds.
20 Semi-Annual Report
| | |
| NOTES TO FINANCIAL STATEMENTS, CONTINUED | | |
| |
Thornburg California Limited Term Municipal Fund | | March 31, 2016 (Unaudited) |
NOTE 4 – SHARES OF BENEFICIAL INTEREST
At March 31, 2016, there were an unlimited number of shares with no par value of beneficial interest authorized. Transactions in shares of beneficial interest were as follows:
| | | | | | | | | | | | | | | | |
| | | SIX MONTHS ENDED
MARCH 31, 2016 (UNAUDITED) | | | YEAR ENDED
SEPTEMBER 30, 2015 (AUDITED) | |
| | | SHARES | | | AMOUNT | | | SHARES | | | AMOUNT | |
Class A Shares | | | | | | | | | | | | | | | | |
Shares sold | | | 1,738,809 | | | $ | 24,179,707 | | | | 2,968,706 | | | $ | 41,089,831 | |
Shares issued to shareholders in reinvestment of dividends | | | 70,464 | | | | 980,126 | | | | 142,066 | | | | 1,965,359 | |
Shares repurchased | | | (870,852 | ) | | | (12,102,626 | ) | | | (2,302,492 | ) | | | (31,815,459 | ) |
| | | | | | | | | | | | | | | | |
| | | | |
Net increase (decrease) | | | 938,421 | | | $ | 13,057,207 | | | | 808,280 | | | $ | 11,239,731 | |
| | | | | | | | | | | | | | | | |
| | | | |
Class C Shares | | | | | | | | | | | | | | | | |
Shares sold | | | 491,103 | | | $ | 6,831,657 | | | | 839,501 | | | $ | 11,635,591 | |
Shares issued to shareholders in reinvestment of dividends | | | 19,539 | | | | 271,962 | | | | 41,674 | | | | 576,985 | |
Shares repurchased | | | (351,906 | ) | | | (4,895,265 | ) | | | (783,398 | ) | | | (10,839,769 | ) |
| | | | | | | | | | | | | | | | |
| | | | |
Net increase (decrease) | | | 158,736 | | | $ | 2,208,354 | | | | 97,777 | | | $ | 1,372,807 | |
| | | | | | | | | | | | | | | | |
| | | | |
Class I Shares | | | | | | | | | | | | | | | | |
Shares sold | | | 6,180,038 | | | $ | 86,075,321 | | | | 11,038,248 | | | $ | 152,815,141 | |
Shares issued to shareholders in reinvestment of dividends | | | 180,472 | | | | 2,512,864 | | | | 340,247 | | | | 4,711,496 | |
Shares repurchased | | | (4,239,055 | ) | | | (59,062,958 | ) | | | (8,019,859 | ) | | | (111,038,260 | ) |
| | | | | | | | | | | | | | | | |
| | | | |
Net increase (decrease) | | | 2,121,455 | | | $ | 29,525,227 | | | | 3,358,636 | | | $ | 46,488,377 | |
| | | | | | | | | | | | | | | | |
NOTE 5 – INVESTMENT TRANSACTIONS
For the six months ended March 31, 2016, the Fund had purchase and sale transactions of investments (excluding short-term investments) of $72,102,580 and $24,054,879, respectively.
NOTE 6 – INCOME TAXES
At March 31, 2016, information on the tax components of capital was as follows:
| | | | |
Cost of investments for tax purposes | | $ | 652,580,760 | |
| | | | |
Gross unrealized appreciation on a tax basis | | $ | 27,804,836 | |
Gross unrealized depreciation on a tax basis | | | (113,577 | ) |
| | | | |
Net unrealized appreciation (depreciation) on investments (tax basis) | | $ | 27,691,259 | |
| | | | |
At March 31, 2016, the Fund had deferred tax basis capital losses occurring subsequent to October 31, 2014 through September 30, 2015 of $103,776. For tax purposes, such losses will be recognized in the year ending September 30, 2016.
At March 31, 2016, the Fund had cumulative tax basis capital losses of $102,362, (of which $34,205 are short-term and $68,157 are long-term) generated after September 30, 2011, which may be carried forward to offset future capital gains. To the extent such carry-forwards are used, capital gain distributions may be reduced to the extent provided by regulations. Such capital loss carryforwards do not expire.
OTHER NOTES
Risks: The Fund’s investments subject it to risks including, but not limited to, credit risk, interest rate risk, management risk, market and economic risk, liquidity risk, and the risks of investing primarily in the obligations of a single state. Please see the Fund’s prospectus for a discussion of the risks associated with an investment in the Fund.
Subsequent Events: Fund management believes no events have occurred between March 31, 2016 and the date of issuance of the financial statements that require adjustment to or disclosure in the accompanying financial statements.
Semi-Annual Report 21
FINANCIAL HIGHLIGHTS
Thornburg California Limited Term Municipal Fund
| | | | | | | | | | | | | | | | | | | | | | | | | | | | | | | | | | | | | | | | | | | | | | | | | | | | |
| | | PER SHARE PERFORMANCE (FOR A SHARE OUTSTANDING THROUGHOUT THE PERIOD) | | RATIOS TO AVERAGE NET ASSETS | | | SUPPLEMENTAL DATA | |
UNLESS
OTHERWISE
NOTED,
PERIODS
ARE
FISCAL
YEARS
ENDED
SEPT. 30, | | NET ASSET
VALUE
BEGINNING
OF PERIOD | | | NET
INVESTMENT
INCOME
(LOSS)+ | | NET
REALIZED
&
UNREALIZED
GAIN (LOSS)
ON
INVESTMENTS | | | TOTAL FROM
INVESTMENT
OPERATIONS | | | DIVIDENDS
FROM NET
INVESTMENT
INCOME | | | DIVIDENDS
FROM NET
REALIZED
GAINS | | TOTAL
DIVIDENDS | | | NET
ASSET
VALUE
END
OF
PERIOD | | NET
INVESTMENT
INCOME
(LOSS)
(%) | | | EXPENSES,
AFTER
EXPENSE
REDUCTIONS
(%) | | | EXPENSES,
AFTER
EXPENSE
REDUCTIONS
AND
NET OF
CUSTODY
CREDITS (%) | | | EXPENSES,
BEFORE
EXPENSE
REDUCTIONS
(%) | | | TOTAL
RETURN
(%)(a) | | | PORTFOLIO
TURNOVER
RATE (%)(a) | | NET
ASSETS
AT END
OF
PERIOD
(THOUSANDS) | |
CLASS A SHARES | | | | | | | | | | | | | | | | | | | | | | | | | | | | | | | | | | | | | | | | | | | | | | |
2016(b)(c) | | $ | 13.84 | | | 0.09 | | | 0.10 | | | | 0.19 | | | | (0.09 | ) | | — | | | (0.09 | ) | | $13.94 | | | 1.32 | (d) | | | 0.94 | (d) | | | 0.94 | (d) | | | 0.94 | (d) | | | 1.39 | | | 4.12 | | $ | 185,732 | |
2015(c) | | $ | 13.84 | | | 0.19 | | | — | (e) | | | 0.19 | | | | (0.19 | ) | | — | | | (0.19 | ) | | $13.84 | | | 1.39 | | | | 0.94 | | | | 0.94 | | | | 0.94 | | | | 1.40 | | | 14.43 | | $ | 171,344 | |
2014(c) | | $ | 13.54 | | | 0.23 | | | 0.30 | | | | 0.53 | | | | (0.23 | ) | | — | | | (0.23 | ) | | $13.84 | | | 1.67 | | | | 0.95 | | | | 0.94 | | | | 0.95 | | | | 3.93 | | | 16.85 | | $ | 160,151 | |
2013(c) | | $ | 13.75 | | | 0.24 | | | (0.20 | ) | | | 0.04 | | | | (0.24 | ) | | (0.01) | | | (0.25 | ) | | $13.54 | | | 1.75 | | | | 0.94 | | | | 0.94 | | | | 0.94 | | | | 0.28 | | | 17.57 | | $ | 159,058 | |
2012(c) | | $ | 13.41 | | | 0.29 | | | 0.34 | | | | 0.63 | | | | (0.29 | ) | | — | | | (0.29 | ) | | $13.75 | | | 2.15 | | | | 0.95 | | | | 0.95 | | | | 0.95 | | | | 4.78 | | | 13.06 | | $ | 150,155 | |
2011(c) | | $ | 13.38 | | | 0.36 | | | 0.03 | | | | 0.39 | | | | (0.36 | ) | | — | | | (0.36 | ) | | $13.41 | | | 2.71 | | | | 0.96 | | | | 0.96 | | | | 0.96 | | | | 2.98 | | | 13.33 | | $ | 123,910 | |
CLASS C SHARES | | | | | | | | | | | | | | | | | | | | | | | | | | | | | | | | | | | | | | | | | | | | | | |
2016(b) | | $ | 13.85 | | | 0.07 | | | 0.10 | | | | 0.17 | | | | (0.07 | ) | | — | | | (0.07 | ) | | $13.95 | | | 1.07 | (d) | | | 1.18 | (d) | | | 1.18 | (d) | | | 1.18 | (d) | | | 1.26 | | | 4.12 | | $ | 66,918 | |
2015 | | $ | 13.85 | | | 0.16 | | | — | (e) | | | 0.16 | | | | (0.16 | ) | | — | | | (0.16 | ) | | $13.85 | | | 1.15 | | | | 1.18 | | | | 1.18 | | | | 1.18 | | | | 1.15 | | | 14.43 | | $ | 64,216 | |
2014 | | $ | 13.55 | | | 0.19 | | | 0.30 | | | | 0.49 | | | | (0.19 | ) | | — | | | (0.19 | ) | | $13.85 | | | 1.41 | | | | 1.21 | | | | 1.20 | | | | 1.21 | | | | 3.66 | | | 16.85 | | $ | 62,858 | |
2013 | | $ | 13.76 | | | 0.20 | | | (0.20 | ) | | | — | | | | (0.20 | ) | | (0.01) | | | (0.21 | ) | | $13.55 | | | 1.48 | | | | 1.21 | | | | 1.21 | | | | 1.21 | | | | 0.02 | | | 17.57 | | $ | 59,585 | |
2012 | | $ | 13.42 | | | 0.26 | | | 0.34 | | | | 0.60 | | | | (0.26 | ) | | — | | | (0.26 | ) | | $13.76 | | | 1.88 | | | | 1.22 | | | | 1.22 | | | | 1.22 | | | | 4.49 | | | 13.06 | | $ | 59,563 | |
2011 | | $ | 13.40 | | | 0.32 | | | 0.02 | | | | 0.34 | | | | (0.32 | ) | | — | | | (0.32 | ) | | $13.42 | | | 2.45 | | | | 1.22 | | | | 1.22 | | | | 1.22 | | | | 2.63 | | | 13.33 | | $ | 45,897 | |
CLASS I SHARES | | | | | | | | | | | | | | | | | | | | | | | | | | | | | | | | | | | | | | | | | | | | | | |
2016(b) | | $ | 13.85 | | | 0.11 | | | 0.11 | | | | 0.22 | | | | (0.11 | ) | | — | | | (0.11 | ) | | $13.96 | | | 1.64 | (d) | | | 0.62 | (d) | | | 0.62 | (d) | | | 0.62 | (d) | | | 1.62 | | | 4.12 | | $ | 440,266 | |
2015 | | $ | 13.85 | | | 0.24 | | | — | (e) | | | 0.24 | | | | (0.24 | ) | | — | | | (0.24 | ) | | $13.85 | | | 1.70 | | | | 0.63 | | | | 0.63 | | | | 0.63 | | | | 1.72 | | | 14.43 | | $ | 407,557 | |
2014 | | $ | 13.55 | | | 0.27 | | | 0.30 | | | | 0.57 | | | | (0.27 | ) | | — | | | (0.27 | ) | | $13.85 | | | 1.99 | | | | 0.62 | | | | 0.62 | | | | 0.62 | | | | 4.27 | | | 16.85 | | $ | 361,015 | |
2013 | | $ | 13.76 | | | 0.28 | | | (0.19 | ) | | | 0.09 | | | | (0.29 | ) | | (0.01) | | | (0.30 | ) | | $13.55 | | | 2.08 | | | | 0.61 | | | | 0.61 | | | | 0.61 | | | | 0.62 | | | 17.57 | | $ | 254,869 | |
2012 | | $ | 13.42 | | | 0.33 | | | 0.35 | | | | 0.68 | | | | (0.34 | ) | | — | | | (0.34 | ) | | $13.76 | | | 2.46 | | | | 0.62 | | | | 0.62 | | | | 0.62 | | | | 5.12 | | | 13.06 | | $ | 196,071 | |
2011 | | $ | 13.40 | | | 0.40 | | | 0.02 | | | | 0.42 | | | | (0.40 | ) | | — | | | (0.40 | ) | | $13.42 | | | 3.03 | | | | 0.63 | | | | 0.62 | | | | 0.63 | | | | 3.24 | | | 13.33 | | $ | 120,693 | |
| (a) | Not annualized for periods less than one year. |
| (b) | Unaudited Six Month Period Ended March 31. |
| (c) | Sales loads are not reflected in computing total return. |
| (e) | Net realized and unrealized gain (loss) on investments was less than $0.01 per share. |
| + | Based on weighted average shares outstanding. |
See notes to financial statements.
| | | | |
| 22 Semi-Annual Report | | | | Semi-Annual Report 23 |
| | |
| EXPENSE EXAMPLE | | |
| |
Thornburg California Limited Term Municipal Fund | | March 31, 2016 (Unaudited) |
As a shareholder of the Fund, you incur two types of costs:
| | (1) | transaction costs, including |
(a) sales charges (loads) on purchase payments, for Class A shares;
(b) a deferred sales charge on redemptions of any part or all of a purchase of $1 million of Class A shares within 12 months of purchase;
(c) a deferred sales charge on redemptions of Class C shares within 12 months of purchase;
| | (2) | ongoing costs, including management fees; distribution and/or service (12b-1) fees; and other Fund expenses. |
This example is intended to help you understand your ongoing costs (in dollars) of investing in the Fund and to compare these costs with the ongoing costs of investing in other mutual funds.
The example is based on a $1,000 investment beginning on October 1, 2015, and held until March 31, 2016.
| | | | | | | | | | | | |
| | | BEGINNING
ACCOUNT VALUE
10/1/15 | | | ENDING
ACCOUNT VALUE
3/31/16 | | | EXPENSES PAID
DURING PERIOD†
10/1/15–3/31/16 | |
Class A Shares | | | | | | | | | | | | |
Actual | | $ | 1,000.00 | | | $ | 1,013.90 | | | $ | 4.71 | |
Hypothetical* | | $ | 1,000.00 | | | $ | 1,020.32 | | | $ | 4.72 | |
Class C Shares | | | | | | | | | | | | |
Actual | | $ | 1,000.00 | | | $ | 1,012.60 | | | $ | 5.95 | |
Hypothetical* | | $ | 1,000.00 | | | $ | 1,019.08 | | | $ | 5.97 | |
Class I Shares | | | | | | | | | | | | |
Actual | | $ | 1,000.00 | | | $ | 1,016.20 | | | $ | 3.11 | |
Hypothetical* | | $ | 1,000.00 | | | $ | 1,021.91 | | | $ | 3.12 | |
| † | Expenses are equal to the annualized expense ratio for each class (A: 0.94%; C: 1.18%; I: 0.62%) multiplied by the average account value over the period, multiplied by 183/366 to reflect the one-half year period. |
| * | Hypothetical assumes a rate of return of 5% per year before expenses. |
ACTUAL EXPENSES
For each class of shares, the first line of the accompanying table provides information about actual account values and actual expenses. You may use the information in this line, together with the amount you invested, to estimate the expenses that you paid over the period. Simply divide your account value by $1,000 (for example, an $8,600 account value divided by $1,000 = 8.6), then multiply the result by the number in the first line for your class of shares under the heading entitled “Expenses Paid During Period” to estimate the expenses you paid on your account during this period.
HYPOTHETICAL EXAMPLE FOR COMPARISON PURPOSES
For each class of shares, the second line of the accompanying table provides information about hypothetical account values and hypothetical expenses based on the Fund’s actual expense ratio and an assumed rate of return of 5% per year before expenses, which is not the Fund’s actual return. The hypothetical account values and expenses may not be used to estimate the actual ending account balance or expenses you paid for the period. You may use this information to compare the ongoing costs of investing in the Fund and other funds. To do so, compare this 5% hypothetical example with the 5% hypothetical examples that appear in the shareholder reports of the other funds.
Please note that the expenses shown in the table are meant to highlight your ongoing costs only and do not reflect any transactional costs, such as sales charges (loads), redemption fees, or exchange fees. Therefore, the second line of the table for each class of shares is useful in comparing ongoing costs only, and will not help you determine the relative total costs of owning different funds. In addition, if these transactional costs were included, your costs would have been higher.
24 Semi-Annual Report
| | |
| OTHER INFORMATION | | |
| |
Thornburg California Limited Term Municipal Fund | | March 31, 2016 (Unaudited) |
PORTFOLIO PROXY VOTING
Policies and Procedures:
The Trust has delegated to Thornburg Investment Management, Inc. (the “Advisor”) voting decisions respecting proxies for the Fund’s voting securities. The Advisor makes voting decisions in accordance with its Proxy Voting Policy. A description of the Policy is available (i) without charge, upon request, by calling the Advisor toll-free at 1-800-847-0200, (ii) on the Thornburg website at www.thornburg.com, and (iii) on the Securities and Exchange Commission’s website at www.sec.gov.
Information regarding how proxies were voted is available on or before August 31 of each year for the twelve months ending the preceding June 30. This information is available (i) without charge, upon request by calling the Advisor toll-free at 1-800-847-0200, (ii) on the Thornburg website at www.thornburg.com, and (iii) on the Securities and Exchange Commission’s website at www.sec.gov.
AVAILABILITY OF QUARTERLY PORTFOLIO SCHEDULE
The Fund files with the Securities and Exchange Commission schedules of its portfolio holdings on Form N-Q for the first and third quarters of each fiscal year. The Fund’s Forms N-Q are available on the Commission’s website at www.sec.gov, or may be reviewed and copied at the Commission’s Public Reference Room in Washington, D.C. Information on the operation of the Public Reference Room may be obtained by calling 1-800-SEC-0330. The Fund also makes this information available on its website at www.thornburg.com/download or upon request by calling 1-800-847-0200.
Semi-Annual Report 25
TRUSTEES’ STATEMENT TO SHAREHOLDERS
Revised and Readopted September 15, 2015
The Trustees believe current and prospective shareholders should know how we discharge our responsibilities in supervising the Funds’ investment advisor and in reviewing the advisor’s contract for renewal. Since 2005, we have issued a statement which sets out clearly the three principal guidelines that we follow in supervising the Trust’s investment advisor on your behalf. In accordance with our customary practice, in September of 2015 we again reviewed our statement and concluded we should reissue this statement outlining the principal features of our supervision of the advisor’s performance of investment management services for the Funds.
We begin with the premise that each shareholder selected his or her Fund because its investments are managed by the investment advisor identified in the prospectus and in accordance with the objective and policies described in the prospectus. We realize, as each of you do, that if you believe that your Fund’s stated objective and policies no longer serve your personal investment goals, you can sell your shares and leave the Fund.
Therefore, we believe that our primary supervisory task—our principal obligation to you—is to assess the nature and quality of the advisor’s services, and to confirm that the advisor actively and competently pursues the Fund’s objective, in accordance with the policies set out in the prospectus. To do this, we meet regularly with management to review your Fund’s portfolio and to discuss the advisor’s specific actions and judgments in pursuing the Fund’s objective. We do not substitute our own judgment for the advisor’s decisions in selecting investments; the advisor is paid to exercise its informed judgment on investment decisions, and we seek to confirm, in reviewing the advisor’s performance, that the advisor is doing just that.
Second, we are conscious of costs and the effect that costs have on shareholders’ returns. We try to make sure that your Fund’s fees and costs are reasonable in relationship to the services rendered and that they are generally in line with those charged by other expert investment advisors, consistent with our belief that the Fund’s investors searched for and expect that expertise and attention and have decided to pay a reasonable price for it. We do not put the management contract “out to bid” as a matter of course, and we would not do so unless we had concluded that the advisor materially had failed to pursue the Fund’s objectives in accordance with its policies, or for other equally important reasons. We believe that any other approach would be inconsistent with your interests and contrary to your expectations when you bought shares of the Fund in the first place.
Finally, because we believe that most Thornburg Fund shareholders have invested with a long-term perspective, we try not to focus too much on the fashions of the moment and on short-term performance. The market will not favor any specific investment objective or set of policies at all times and under all economic circumstances. A fund will experience periods of both high and low returns relative to other funds and other investments. Even if one of our Funds is not favored by the market at a particular time, we believe that the advisor is nonetheless obliged to remain true to the Fund’s objective and policies, and we watch to see that it does so.
Trustees of Thornburg Investment Trust
26 Semi-Annual Report
THORNBURG FUND FAMILY
Thornburg Investment Management is a privately-owned global investment firm that offers a range of solutions for retail and institutional investors. Founded in 1982 and headquartered in Santa Fe, New Mexico, we manage approximately $54 billion (as of March 31, 2016) across eight equity and 11 bond mutual funds, separate accounts for high-net-worth investors and institutional accounts, and five UCITS funds for non-U.S. investors.
The fund outlined in this report is one of many equity and fixed-income products available from Thornburg Investment Management.
Equity Funds
| | • | | Thornburg Core Growth Fund |
| | • | | Thornburg International Value Fund |
| | • | | Thornburg Better World International Fund |
| | • | | Thornburg International Growth Fund |
| | • | | Thornburg Developing World Fund |
| | • | | Thornburg Investment Income Builder Fund |
| | • | | Thornburg Global Opportunities Fund |
Fixed Income Funds
| | • | | Thornburg Low Duration Income Fund |
| | • | | Thornburg Limited Term U.S. Government Fund |
| | • | | Thornburg Limited Term Income Fund |
| | • | | Thornburg Strategic Income Fund |
| | • | | Thornburg Low Duration Municipal Fund |
| | • | | Thornburg Limited Term Municipal Fund |
| | • | | Thornburg Intermediate Municipal Fund |
| | • | | Thornburg California Limited Term Municipal Fund |
| | • | | Thornburg New Mexico Intermediate Municipal Fund |
| | • | | Thornburg New York Intermediate Municipal Fund |
| | • | | Thornburg Strategic Municipal Income Fund |
Before investing, carefully consider the Fund’s investment goals, risks, charges, and expenses. For a prospectus or summary prospectus containing this and other information, contact your financial advisor or visit thornburg.com. Read it carefully before investing.
For additional information, please visit thornburg.com
Thornburg Investment Management, Inc. 2300 North Ridgetop Road, Santa Fe, NM 87506
Semi-Annual Report 27
This Semi-Annual Report is submitted for the general information of shareholders of the Fund. It is not authorized for distribution to prospective investors in the Fund unless preceded or accompanied by an effective prospectus.
| | | | |
| Investment Advisor: | | Distributor: | | |
| Thornburg Investment Management® | | Thornburg Securities Corporation® | | |
800.847.0200 | | 800.847.0200 | | |
| | | | TH1070 |
2 Semi-Annual Report
Semi-Annual Report
Thornburg New Mexico Intermediate Municipal Fund
March 31, 2016
| | | | |
SHARE CLASS | | NASDAQ SYMBOL | | CUSIP |
Class A | | THNMX | | 885-215-301 |
Class D | | THNDX | | 885-215-624 |
Class I | | THNIX | | 885-215-285 |
Minimum investments for Class I shares may be higher than those for other classes. Class I shares may not be available to all investors.
Investments carry risks, including possible loss of principal. Portfolios investing in bonds have the same interest rate, inflation, and credit risks that are associated with the underlying bonds. The value of bonds will fluctuate relative to changes in interest rates, decreasing when interest rates rise. Unlike bonds, bond funds have ongoing fees and expenses. Please see the Fund’s prospectus for a discussion of the risks associated with an investment in the Fund. Investments in the Funds are not FDIC insured, nor are they bank deposits or guaranteed by a bank or any other entity.
The laddering strategy does not assure or guarantee better performance and cannot eliminate the risk of investment losses.
Semi-Annual Report 3
| | |
| LETTER TO SHAREHOLDERS | | |
| |
Thornburg New Mexico Intermediate Municipal Fund | | March 31, 2016 (Unaudited) |
April 11, 2016
Dear Fellow Shareholder:
We are pleased to present the semi-annual report for Thornburg New Mexico Intermediate Municipal Fund. The net asset value (NAV) of the Class A shares increased by 12 cents to $13.67 per share during the six months ended March 31, 2016. If you were with us for the entire period, you received dividends of 14.93 cents per share. If you reinvested your dividends, you received 15.00 cents per share. Dividends were lower for Class D shares and higher for Class I shares, to account for varying class-specific expenses. The Class A shares underperformed the Fund’s benchmark index, with a 2.00% total return (without sales charge) for the six months ended March 31, 2016, compared to the 3.04% total return for the BofA Merrill Lynch 3-15 Year U.S. Municipal Securities Index.
Throughout the six-month period, the Fund maintained a lower risk posture on interest rates than its benchmark; its average effective duration (a measure of interest-rate sensitivity) was 4.65 years, compared to 5.58 years for the benchmark. The shorter duration hurt performance by 0.22%. The Fund’s position along the yield curve subtracted 0.04% of relative price performance, and sector selection added 0.23% of relative price performance. Our underweight in high-quality bonds subtracted 0.40% of relative price performance. Other factors include the amortization of bond premiums and accretion of discounts, which is not an active management decision but rather a standard accounting practice – and the largest component of this category. We also include the effects of security selection and of price change derived from factors we cannot account for (statistically: “unexplained error”). Together, these three account for 0.40% of price performance relative to the index.
Global Fears Sway the Municipal Markets
The past six months have been a roller-coaster ride for the municipal markets. During the last quarter of 2015, it seemed that every day was spent anxiously awaiting the first Federal Reserve rate increase – for what seemed like an eternity. When that rate increase finally came, it was met with a yawn. Markets quickly reminded investors that while the Federal Reserve (the Fed) has control over short-term rates, the market forces of supply and demand for bonds have a much heavier influence on interest rates – especially long-term rates.
As in life, expectations in the bond markets mean a lot. And perhaps more important than the Fed’s initial rate hike was its stated intent to raise rates four additional times in 2016. The expectation for higher rates evaporated almost immediately after the Fed’s statement, with the release of weaker-than-expected economic data, collapsing commodity prices, an emerging-markets stock rout, and profound weakness in Europe, with the European Central Bank retrenching in its effort to drive European rates lower, spurring fears of deflation.
A Roller-Coaster Ride to Start the Year
The beginning of 2016 proved volatile for equity markets domestically and globally, and the fixed income markets followed suit. The 10-year U.S. Treasury stood at a respectable 2.27% at the end of 2015. But within six weeks, that rate fell 0.61% to 1.66%, before bouncing back to 1.77% by March 31, 2016.
Chart I Credit Spreads: Investors Are Not Being Paid to Assume the Risk
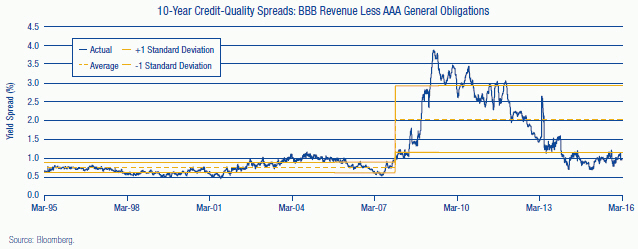
4 Semi-Annual Report
| | |
| LETTER TO SHAREHOLDERS, | | |
| |
CONTINUED | | |
| |
Thornburg New Mexico Intermediate Municipal Fund | | March 31, 2016 (Unaudited) |
As we noted, the Fed has backed off of its initial intent to raise rates four times in a stepped-up fashion. Rates will probably remain low and income elusive. Unfortunately, municipal bond investors have only a few “levers” to pull to seek higher income. The most effective two are credit quality and duration. An investor looking for yield can always buy a bond with a longer maturity – the duration lever. And bonds of lower credit quality can be purchased to drive up yield – the credit quality lever. In both instances, the investor assumes risk in hope of higher returns.
At Thornburg, we always evaluate both of these options as a means to increase the total return of the portfolios, but over the past six months, as in the prior six months, we found them less than optimal. Real rates (interest rates after inflation is subtracted) remained low during the entire period, and the municipal yield curve was fairly flat. Investors who reached for yield by buying longer maturities gained very little relative to the duration risk that comes with longer-dated bonds. And the amount investors are compensated to invest in lower-rated bonds is minimal; credit spreads remain at extremely tight levels. Investors who purchased debt from lower-rated issuers were essentially buying weaker credits at very expensive levels. Chart I on the previous page shows credit spreads remaining near historically low levels, offering investors little compensation for risk assumed. Not a great strategy!
We believe that the only logical thing to do when you’re not being paid to take risk is to take less of it. That is exactly what we have been seeking to do in Thornburg New Mexico Intermediate Municipal Fund for quite some time. The Fund is being managed on the bearish (shorter) end of its duration range. We have also actively sought to increase the average credit quality, at least at the margins. Cash reserve positions are being managed in a manner we view as conservative.
Continued volatility seems a certainty. That can manifest via interest-rate movements, or changing credit spreads. While the likelihood of the Fed raising rates appears low, given the aforementioned anemic economic growth in the U.S. and abroad, investors are wise to recall that rates moved up over 1.00% in 2013 without the Fed having taken any action whatsoever. It may be unlikely, but that does not mean it’s a probability that can be ignored. And any event that causes spreads to widen appreciably may prove detrimental to an investor who assumed undue credit risk in search of return.
We will do what we have always done with Thornburg New Mexico Intermediate Municipal Fund: provide you with a tax-exempt laddered portfolio that aims to generate attractive levels of income, while attempting to preserve principal and minimize volatility. And, of course, we’ll seek to only assume the risk for which we believe we are adequately compensated.
New Mexico
The economy in New Mexico continues to be pressured by low energy prices. New Mexico is heavily dependent on the energy sector to boost tax receipts both at the state and local level. While the downturn hasn’t had a material impact on bond prices to date, a prolonged period of low prices could begin to adversely affect credit fundamentals. This is particularly true for any small community that is predominantly energy-based.
Staying Faithful to Thornburg’s Tested Approach
While a focus on risk mitigation may not make the sexiest marketing story, we believe it is in the best long-term interest of shareholders. And to any investor considering abandoning municipal bonds for the promise of higher returns elsewhere, we remind you that if the first quarter of 2016 has taught us anything, it is that in a volatile market, an appropriate asset allocation may save you a few sleepless nights.
We will continue to strive to manage your assets to fulfill the Fund’s objectives.
Sincerely,
| | | | |
 | |  | | |
| Christopher Ryon, CFA | | Nicholos Venditti | | |
| Portfolio Manager | | Portfolio Manager | | |
| Managing Director | | Managing Director | | |
The matters discussed in this report may constitute forward-looking statements made pursuant to the safe harbor provisions of the Securities Litigation Reform Act of 1995. These include any advisor or portfolio manager prediction, assessment, analysis or outlook for individual securities, industries, investment styles, market sectors and/or markets. These statements involve risks and uncertainties. In addition to the general risks described for each fund in its current prospectus, other factors bearing on these reports include the accuracy of the advisor’s or portfolio manager’s forecasts and predictions, the appropriateness of the investment strategies designed by the advisor or portfolio manager and the ability of the advisor or portfolio manager to implement their strategies efficiently and successfully. Any one or more of these factors, as well as other risks affecting the securities markets generally, could cause the actual results of any fund to differ materially as compared to its benchmarks.
The views expressed by the portfolio managers reflect their professional opinions and are subject to change. Under no circumstances does the information contained within represent a recommendation to buy or sell any security.
Semi-Annual Report 5
| | |
| PERFORMANCE SUMMARY | | |
| |
Thornburg New Mexico Intermediate Municipal Fund | | March 31, 2016 (Unaudited) |
Average Annual Total Returns
| | | | | | | | | | | | | | | | | | | | |
| | | 1-YR | | | 3-YR | | | 5-YR | | | 10-YR | | | SINCE
INCEP. | |
A Shares (Incep: 6/18/91) | | | | | | | | | | | | | | | | | | | | |
Without sales charge | | | 2.43 | % | | | 2.26 | % | | | 3.48 | % | | | 3.65 | % | | | 4.53 | % |
With sales charge | | | 0.37 | % | | | 1.58 | % | | | 3.07 | % | | | 3.44 | % | | | 4.45 | % |
D Shares (Incep: 6/1/99) | | | 2.28 | % | | | 2.01 | % | | | 3.25 | % | | | 3.39 | % | | | 3.45 | % |
I Shares (Incep: 2/1/07) | | | 2.85 | % | | | 2.60 | % | | | 3.84 | % | | | — | | | | 3.97 | % |
30-Day Yields, A Shares
(with sales charge)
| | | | |
Annualized Distribution Yield | | | 2.04 | % |
| |
SEC Yield | | | 0.69 | % |
Performance data shown represents past performance and is no guarantee of future results. Investment return and principal value will fluctuate so shares, when redeemed, may be worth more or less than their original cost. Current performance may be lower or higher than quoted. For performance current to the most recent month end, visit thornburg.com or call 800-847-0200. The performance information does not reflect the deduction of taxes that a shareholder would pay on distributions or the redemption of Fund shares. Returns reflect the reinvestment of dividends and capital gains. Class A shares are sold with a maximum sales charge of 2.00%. There is no sales charge for Class D and Class I shares.
As disclosed in the most recent prospectus, the total annual fund operating expenses are as follows: A shares, 0.98%; D shares, 1.20%; I shares, 0.65%.
Glossary
BofA Merrill Lynch 3-15 Year U.S. Municipal Securities Index – A subset of the BofA Merrill Lynch U.S. Municipal Securities Index including all securities with a remaining term to final maturity greater than or equal to 3 years and less than 15 years.
Unless otherwise noted, index returns reflect the reinvestment of income dividends and capital gains, if any, but do not reflect fees, brokerage commissions or other expenses of investing. Investors may not make direct investments into any index. The performance of any index is not indicative of the performance of any particular investment.
Annualized Distribution Yield – The distribution yield reflects actual distributions made to shareholders. The annualized distribution yield is calculated by summing the last 30 days of income at a given month end and annualizing to a 360-day year. The result is divided by the ending maximum offering price.
Bond Credit Ratings (Credit Quality) – A bond credit rating assesses the financial ability of a debt issuer to make timely payments of principal and interest. Ratings of AAA (the highest), AA, A, and BBB are investment-grade quality. Ratings of BB, B, CCC, CC, C and D (the lowest) are considered below investment grade, speculative grade, or junk bonds.
Credit Spread/Quality Spread – The difference between the yields of securities with different credit qualities.
Duration – A bond’s sensitivity to interest rates. Effective duration incorporates the embedded option features, such as call provisions. Bonds with longer durations experience greater price volatility than bonds with shorter durations.
Laddering – Involves building a portfolio of bonds with staggered maturities so that a portion matures each year. Money that comes in from maturing bonds is typically invested in bonds with longer maturities at the far end of the portfolio.
SEC Yield – SEC yield is computed in accordance with SEC standards measuring the net investment income per share over a specified 30-day period expressed as a percentage of the maximum offering price of the Fund’s shares at the end of the period.
Yield Curve – A line that plots the interest rates, at a set point in time, of bonds having equal credit quality, but differing maturity dates.
6 Semi-Annual Report
| | |
| FUND SUMMARY | | |
| |
Thornburg New Mexico Intermediate Municipal Fund | | March 31, 2016 (Unaudited) |
Objectives and Strategies
The Fund’s primary investment objective is to obtain as high a level of current income exempt from federal and New Mexico state individual income taxes as is consistent, in the view of the investment advisor, with preservation of capital.
The secondary goal of the Fund is to reduce expected changes in its share price compared to long-term bond portfolios.
This Fund offers New Mexico investors double tax-free yields (may be subject to Alternative Minimum Tax) in a laddered municipal bond portfolio with a dollar-weighted average maturity of normally three to ten years. Laddering involves building a portfolio of bonds with staggered maturities so that a portion of the portfolio matures each year. Cash from maturing bonds, if not needed for other purposes, is typically invested in bonds with longer maturities at the far end of the ladder. We regard the strategy as a good compromise for managing different types of risk.
Key Portfolio Attributes
| | | | |
Number of Bonds | | | 142 | |
| |
Effective Duration | | | 4.9 Yrs | |
| |
Average Maturity | | | 8.3 Yrs | |
Long Term Stability of Principal
Net Asset Value History of A Shares
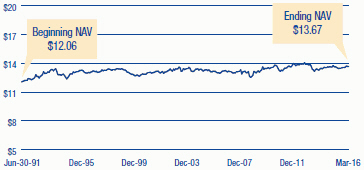
Security Credit Ratings
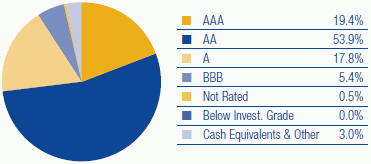
A bond credit rating assesses the financial ability of a debt issuer to make timely payments of principal and interest. Ratings of AAA (the highest), AA, A, and BBB are investment-grade quality. Ratings of BB, B, CCC, CC, C and D (the lowest) are considered below investment grade, speculative grade, or junk bonds. Credit quality ratings for Thornburg’s municipal portfolios used the highest rating available from either Standard & Poor’s or Moody’s Investors Service.
Portfolio Ladder
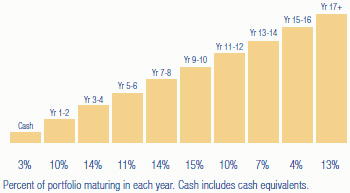
There is no guarantee that the Fund will meet its investment objectives.
All data is subject to change. Charts may not add up to 100% due to rounding.
Semi-Annual Report 7
| | |
| SCHEDULE OF INVESTMENTS | | |
| |
Thornburg New Mexico Intermediate Municipal Fund | | March 31, 2016 (Unaudited) |
| | | | | | | | | | |
ISSUER-DESCRIPTION | | CREDIT RATING†
S&P/ MOODY’S | | PRINCIPAL
AMOUNT | | | VALUE | |
Albuquerque Bernalillo County Water Utility Authority, 5.00% due 7/1/2021 pre-refunded 7/1/2019 (New Mexico Utilities, Inc. Water System) | | AA+/Aa2 | | $ | 1,760,000 | | | $ | 1,990,595 | |
Albuquerque Bernalillo County Water Utility Authority, 5.50% due 7/1/2025 pre-refunded 7/1/2019 (New Mexico Utilities, Inc. Water System) | | AA+/Aa2 | | | 1,000,000 | | | | 1,146,990 | |
Albuquerque Bernalillo County Water Utility Authority, 5.00% due 7/1/2026 (2005 NMFA Loan and Joint Water and Sewer System Improvements) | | AA+/Aa2 | | | 2,000,000 | | | | 2,469,620 | |
Albuquerque Bernalillo County Water Utility Authority, 5.00% due 7/1/2026 pre-refunded 7/1/2016 (San Juan-Chama Drinking Water Project; Insured: AMBAC) | | AA+/Aa2 | | | 500,000 | | | | 505,660 | |
Albuquerque Bernalillo County Water Utility Authority, 5.00% due 7/1/2026 pre-refunded 7/1/2018 (San Juan-Chama Drinking Water Project) | | AA+/Aa2 | | | 1,420,000 | | | | 1,552,372 | |
Albuquerque Bernalillo County Water Utility Authority, 5.00% due 7/1/2031 (2007 NMFA Loan and Joint Water and Sewer System Improvements) | | AA+/Aa2 | | | 500,000 | | | | 610,960 | |
Albuquerque Bernalillo County Water Utility Authority, 5.00% due 7/1/2032 (2007 NMFA Loan and Joint Water and Sewer System Improvements) | | AA+/Aa2 | | | 1,000,000 | | | | 1,215,420 | |
Albuquerque Municipal School District No. 12 GO, 5.00% due 8/1/2016 (Bernalillo and Sandoval Counties School Facilities) (State Aid Withholding) | | AA/Aa1 | | | 3,700,000 | | | | 3,756,388 | |
Albuquerque Municipal School District No. 12 GO, 5.00% due 8/1/2017 pre-refunded 8/1/2016 (Bernalillo and Sandoval Counties School Facilities) (State Aid Withholding) | | AA/Aa1 | | | 345,000 | | | | 350,210 | |
Albuquerque Municipal School District No. 12 GO, 5.00% due 8/1/2019 (Bernalillo and Sandoval Counties School Facilities) (State Aid Withholding) | | AA/Aa1 | | | 3,585,000 | | | | 4,064,207 | |
Albuquerque Municipal School District No. 12 GO, 4.00% due 8/1/2029 (Bernalillo and Sandoval Counties School Facilities) (State Aid Withholding) | | AA/Aa1 | | | 1,300,000 | | | | 1,444,456 | |
Bernalillo County, 5.00% due 4/1/2021 (Government Services; Insured: Natl-Re) | | AAA/Aa2 | | | 3,000,000 | | | | 3,317,760 | |
Bernalillo County, 5.25% due 10/1/2022 (Government Services; Insured: AMBAC) | | AAA/Aa2 | | | 3,170,000 | | | | 3,923,509 | |
Bernalillo County, 5.25% due 10/1/2023 (Government Services; Insured: AMBAC) | | AAA/Aa2 | | | 1,275,000 | | | | 1,601,387 | |
Bernalillo County, 5.25% due 10/1/2025 (Government Services; Insured: AMBAC) | | AAA/Aa2 | | | 3,850,000 | | | | 4,921,955 | |
Bernalillo County, 5.25% due 4/1/2027 (Government Services) | | AAA/Aa2 | | | 300,000 | | | | 373,518 | |
Bernalillo County, 5.70% due 4/1/2027 (Government Services; Insured: Natl-Re) | | AAA/Aa2 | | | 815,000 | | | | 1,048,302 | |
Bernalillo County, 5.70% due 4/1/2027 (Government Services) | | AAA/Aa2 | | | 3,000,000 | | | | 3,858,780 | |
Bernalillo County GO, 4.00% due 8/15/2019 (Capital Improvements) | | AAA/Aaa | | | 1,505,000 | | | | 1,658,826 | |
Carlsbad Municipal School District GO, 5.00% due 8/1/2018 (Educational Facilities) (State Aid Withholding) | | NR/Aa1 | | | 1,000,000 | | | | 1,097,210 | |
Carlsbad Municipal School District GO, 5.00% due 8/1/2023 (Educational Facilities) (State Aid Withholding) | | NR/Aa1 | | | 1,650,000 | | | | 2,043,888 | |
Central New Mexico Community College GO, 5.00% due 8/15/2020 (Campus Buildings Acquisition & Improvements) | | AA+/Aa1 | | | 1,375,000 | | | | 1,605,368 | |
Central New Mexico Community College GO, 5.00% due 8/15/2021 (Campus Buildings Acquisition & Improvements) | | AA+/Aa1 | | | 1,435,000 | | | | 1,716,432 | |
Central New Mexico Community College GO, 5.00% due 8/15/2022 (Campus Buildings Acquisition & Improvements) | | AA+/Aa1 | | | 1,100,000 | | | | 1,345,124 | |
Central New Mexico Community College GO, 4.00% due 8/15/2023 (Campus Buildings Acquisition & Improvements)
| | AA+/Aa1 | | | 1,920,000 | | | | 2,153,299 | |
Cibola County, 3.00% due 6/1/2016 (County Building Improvements) | | NR/A2 | | | 185,000 | | | | 185,801 | |
Cibola County, 3.00% due 6/1/2016 (County Building Improvements) | | NR/NR | | | 245,000 | | | | 246,061 | |
Cibola County, 5.00% due 6/1/2025 (County Building Improvements) | | NR/A2 | | | 360,000 | | | | 438,347 | |
Cibola County, 5.00% due 6/1/2025 (County Building Improvements) | | NR/NR | | | 355,000 | | | | 432,259 | |
City of Albuquerque, 5.00% due 7/1/2021 (Lodgers’ Tax Obligations Surplus Fund) | | AAA/Aa2 | | | 1,340,000 | | | | 1,505,704 | |
City of Albuquerque, 5.00% due 7/1/2021 (Lodgers’ Tax Obligations Surplus Fund) | | AAA/Aa2 | | | 3,000,000 | | | | 3,370,980 | |
City of Albuquerque, 5.00% due 7/1/2025 (I-25/Paseo del Norte Interchange) | | AAA/Aa2 | | | 540,000 | | | | 662,299 | |
City of Albuquerque, 5.00% due 7/1/2027 (I-25/Paseo del Norte Interchange) | | AAA/Aa2 | | | 555,000 | | | | 671,417 | |
City of Albuquerque, 5.00% due 7/1/2033 (City Infrastructure Improvements) | | AAA/Aa2 | | | 1,100,000 | | | | 1,327,832 | |
City of Albuquerque, 5.00% due 7/1/2034 (City Infrastructure Improvements) | | AAA/Aa2 | | | 1,200,000 | | | | 1,441,944 | |
City of Albuquerque GO, 4.00% due 7/1/2016 (City Infrastructure Improvements) | | AAA/Aa1 | | | 275,000 | | | | 277,483 | |
City of Farmington, 5.00% due 6/1/2017 (San Juan Regional Medical Center) | | NR/A3 | | | 1,035,000 | | | | 1,062,448 | |
City of Farmington, 5.125% due 6/1/2018 (San Juan Regional Medical Center) | | NR/A3 | | | 570,000 | | | | 572,246 | |
City of Farmington, 5.125% due 6/1/2019 (San Juan Regional Medical Center) | | NR/A3 | | | 645,000 | | | | 647,470 | |
City of Farmington, 5.00% due 6/1/2022 (San Juan Regional Medical Center) | | NR/A3 | | | 2,825,000 | | | | 2,952,803 | |
City of Farmington, 4.70% due 5/1/2024 (Arizona Public Service Co.-Four Corners Project) | | A-/A2 | | | 965,000 | | | | 1,073,929 | |
City of Farmington, 4.70% due 9/1/2024 (Arizona Public Service Co.-Four Corners Project) | | A-/A2 | | | 4,000,000 | | | | 4,449,000 | |
City of Farmington, 1.875% due 4/1/2029 (Southern California Edison Co.-Four Corners Project) | | A/Aa3 | | | 3,000,000 | | | | 3,044,100 | |
City of Gallup, 5.00% due 8/15/2017 (Tri-State Generation & Transmission Assoc., Inc. Project; Insured: AMBAC) | | A/A3 | | | 3,540,000 | | | | 3,551,540 | |
City of Gallup, 5.125% due 6/1/2017 (City Infrastructure Improvements) | | NR/NR | | | 140,000 | | | | 145,922 | |
City of Gallup, 5.125% due 6/1/2019 (City Infrastructure Improvements) | | NR/NR | | | 310,000 | | | | 338,660 | |
City of Las Cruces, 4.00% due 6/1/2021 (Joint Utility System) | | NR/Aa2 | | | 100,000 | | | | 113,350 | |
City of Las Cruces, 5.00% due 6/1/2021 (NMFA Loan) | | NR/Aa3 | | | 730,000 | | | | 834,448 | |
City of Las Cruces, 4.00% due 6/1/2022 (Joint Utility System) | | NR/Aa2 | | | 670,000 | | | | 770,714 | |
City of Las Cruces, 5.00% due 6/1/2022 (NMFA Loan) | | NR/Aa3 | | | 765,000 | | | | 878,977 | |
City of Las Cruces, 4.00% due 6/1/2023 (Joint Utility System) | | NR/Aa2 | | | 695,000 | | | | 807,729 | |
City of Las Cruces, 5.00% due 6/1/2023 (NMFA Loan) | | NR/Aa3 | | | 800,000 | | | | 917,560 | |
City of Las Cruces, 5.00% due 6/1/2024 (NMFA Loan) | | NR/Aa3 | | | 840,000 | | | | 960,960 | |
City of Las Cruces, 4.00% due 6/1/2025 (Joint Utility System) | | NR/Aa2 | | | 750,000 | | | | 883,650 | |
City of Las Cruces, 5.00% due 6/1/2030 (NMFA Loan) | | NR/Aa3 | | | 2,000,000 | | | | 2,269,900 | |
8 Semi-Annual Report
| | |
| SCHEDULE OF INVESTMENTS, CONTINUED | | |
| |
Thornburg New Mexico Intermediate Municipal Fund | | March 31, 2016 (Unaudited) |
| | | | | | | | | | |
ISSUER-DESCRIPTION | | CREDIT RATING†
S&P/ MOODY’S | | PRINCIPAL
AMOUNT | | | VALUE | |
City of Las Cruces, 5.00% due 6/1/2037 (NMFA Loan) | | NR/Aa3 | | $ | 5,000,000 | | | $ | 5,613,200 | |
City of Rio Rancho, 2.00% due 5/15/2016 (Water and Wastewater System) | | AA-/Aa3 | | | 260,000 | | | | 260,471 | |
City of Rio Rancho, 2.00% due 5/15/2017 (Water and Wastewater System) | | AA-/Aa3 | | | 100,000 | | | | 101,293 | |
City of Santa Fe, 4.50% due 5/15/2027 (El Castillo Retirement Residences) | | BBB-/NR | | | 3,275,000 | | | | 3,445,038 | |
City of Santa Fe, 5.00% due 5/15/2034 (El Castillo Retirement Residences) | | BBB-/NR | | | 1,465,000 | | | | 1,534,060 | |
City of Santa Fe, 4.00% due 6/1/2017 (Public Facility Capital Projects) | | AA+/NR | | | 100,000 | | | | 103,859 | |
Colfax County, 5.00% due 9/1/2019 (Government Center Facility) | | A-/NR | | | 465,000 | | | | 501,214 | |
Colfax County, 5.50% due 9/1/2029 (Government Center Facility) | | A-/NR | | | 2,510,000 | | | | 2,855,727 | |
County of Los Alamos, 5.75% due 6/1/2016 (Public Facilities) | | AA+/A1 | | | 1,315,000 | | | | 1,326,677 | |
County of Los Alamos, 4.875% due 6/1/2018 (Public Facilities) | | AA+/A1 | | | 500,000 | | | | 542,770 | |
County of Los Alamos, 5.625% due 6/1/2023 pre-refunded 6/1/2018 (Public Facilities) | | AA+/A1 | | | 1,000,000 | | | | 1,103,190 | |
County of Los Alamos, 5.75% due 6/1/2024 pre-refunded 6/1/2018 (Public Facilities) | | AA+/A1 | | | 3,000,000 | | | | 3,317,610 | |
County of Los Alamos, 5.75% due 6/1/2025 pre-refunded 6/1/2018 (Public Facilities) | | AA+/A1 | | | 1,000,000 | | | | 1,105,870 | |
County of Taos, 3.00% due 4/1/2018 (County Educational Improvements; Insured: BAM) | | AA/NR | | | 1,000,000 | | | | 1,030,250 | |
Farmington Municipal School District No. 5 GO, 5.00% due 9/1/2019 (Educational Facilities) (State Aid Withholding) | | NR/Aa1 | | | 600,000 | | | | 681,564 | |
Government of Guam, 5.375% due 12/1/2024 (Layon Solid Waste Disposal Facility) | | BBB+/NR | | | 2,000,000 | | | | 2,221,640 | |
Government of Guam, 5.00% due 11/15/2031 (Economic Development) | | A/NR | | | 2,500,000 | | | | 2,908,325 | |
Government of Guam, 5.00% due 11/15/2033 (Economic Development) | | A/NR | | | 2,500,000 | | | | 2,883,500 | |
Grant County, 5.50% due 7/1/2020 (State Dept. of Health-Ft. Bayard Project) | | AA/Aa1 | | | 1,565,000 | | | | 1,717,603 | |
Grant County, 5.50% due 7/1/2021 (State Dept. of Health-Ft. Bayard Project) | | AA/Aa1 | | | 1,655,000 | | | | 1,816,379 | |
Grant County, 5.50% due 7/1/2022 (State Dept. of Health-Ft. Bayard Project) | | AA/Aa1 | | | 1,745,000 | | | | 1,915,155 | |
Guam Power Authority, 5.00% due 10/1/2026 (Electric Power System; Insured: AGM) | | AA/A2 | | | 2,000,000 | | | | 2,392,620 | |
Las Cruces School District No. 2 GO, 2.00% due 8/1/2018 (New Mexico SD Credit Enhancement Program) (State Aid Withholding) | | NR/Aa1 | | | 630,000 | | | | 646,153 | |
New Mexico Educational Assistance Foundation, 4.00% due 9/1/2016 (Student Loans) | | NR/Aaa | | | 690,000 | | | | 700,260 | |
New Mexico Educational Assistance Foundation, 4.00% due 9/1/2017 (Student Loans) | | NR/Aaa | | | 1,150,000 | | | | 1,204,062 | |
New Mexico Educational Assistance Foundation, 5.00% due 12/1/2019 (Student Loans) | | AAA/Aaa | | | 1,000,000 | | | | 1,141,370 | |
New Mexico Educational Assistance Foundation, 5.00% due 12/1/2022 (Student Loans) | | AAA/Aaa | | | 3,000,000 | | | | 3,458,400 | |
New Mexico Finance Authority, 5.00% due 12/15/2017 (State Highway Infrastructure) | | AA/Aa2 | | | 250,000 | | | | 267,920 | |
New Mexico Finance Authority, 5.00% due 6/1/2020 (The Public Project Revolving Fund Program; Insured: AMBAC) | | AAA/Aa1 | | | 365,000 | | | | 367,876 | |
New Mexico Finance Authority, 5.00% due 6/15/2022 (The Public Project Revolving Fund Program; Insured: Natl-Re) | | AA+/Aa2 | | | 1,300,000 | | | | 1,363,856 | |
New Mexico Finance Authority, 5.00% due 6/1/2024 (The Public Project Revolving Fund Program) | | AAA/Aa1 | | | 4,185,000 | | | | 5,245,605 | |
New Mexico Finance Authority, 5.00% due 6/15/2024 (The Public Project Revolving Fund Program; Insured: Natl-Re) | | AA+/Aa2 | | | 7,000,000 | | | | 7,343,840 | |
New Mexico Finance Authority, 5.00% due 6/15/2026 (State Highway Infrastructure) | | AA/Aa2 | | | 1,220,000 | | | | 1,502,284 | |
New Mexico Finance Authority, 0.31% due 12/15/2026 put 4/7/2016 (The Public Project Revolving Fund Program; LOC: State Street Bank & Trust) (weekly demand notes) | | AA-/Aa2 | | | 1,360,000 | | | | 1,360,000 | |
New Mexico Finance Authority, 5.00% due 6/15/2027 (State Highway Infrastructure) | | AA/Aa2 | | | 1,195,000 | | | | 1,459,143 | |
New Mexico Finance Authority, 5.00% due 6/15/2031 (The Public Project Revolving Fund Program) | | AA+/Aa2 | | | 1,000,000 | | | | 1,218,180 | |
New Mexico Hospital Equipment Loan Council, 6.00% due 8/1/2023 pre-refunded 8/1/2018 (Presbyterian Healthcare Services) | | AA/Aa3 | | | 6,000,000 | | | | 6,703,620 | |
New Mexico Hospital Equipment Loan Council, 5.00% due 8/1/2031 (Presbyterian Healthcare Services) | | AA/Aa3 | | | 600,000 | | | | 719,184 | |
New Mexico Hospital Equipment Loan Council, 5.00% due 7/1/2032 (Haverland Carter Lifestyle Group) | | NR/NR | | | 2,000,000 | | | | 2,116,320 | |
New Mexico Hospital Equipment Loan Council, 5.00% due 8/1/2039 (Presbyterian Healthcare Services) | | AA/Aa3 | | | 3,000,000 | | | | 3,282,630 | |
New Mexico Housing Authority, 5.30% due 12/1/2022 (El Paseo Apartments; Insured: AMBAC) (AMT) | | NR/NR | | | 595,000 | | | | 595,536 | |
New Mexico Institute of Mining and Technology, 5.00% due 7/1/2020 | | A+/A1 | | | 590,000 | | | | 678,907 | |
New Mexico Institute of Mining and Technology, 5.00% due 7/1/2023 | | A+/A1 | | | 685,000 | | | | 804,087 | |
New Mexico Institute of Mining and Technology, 5.00% due 7/1/2024 | | A+/A1 | | | 525,000 | | | | 607,793 | |
New Mexico Institute of Mining and Technology, 5.00% due 7/1/2025 | | A+/A1 | | | 505,000 | | | | 582,997 | |
New Mexico Institute of Mining and Technology, 5.00% due 7/1/2028 | | A+/A1 | | | 1,500,000 | | | | 1,726,815 | |
New Mexico Mortgage Finance Authority, 5.25% due 7/1/2023 (HERO SFM Loan Program; Collateralized: GNMA/FNMA/ FHLMC) (AMT) | | AA+/NR | | | 410,000 | | | | 428,204 | |
New Mexico Mortgage Finance Authority, 5.375% due 7/1/2023 (Saver SFM Loan Program; Collateralized: GNMA/FNMA/ FHLMC) (AMT) | | AA+/NR | | | 235,000 | | | | 236,300 | |
New Mexico Mortgage Finance Authority, 4.625% due 3/1/2028 (NIBP SFM Loan Program; Collateralized: GNMA/FNMA/ FHLMC) | | AA+/NR | | | 1,150,000 | | | | 1,222,795 | |
New Mexico Mortgage Finance Authority, 5.50% due 7/1/2028 (HERO SFM Loan Program; Collateralized: GNMA/FNMA/ FHLMC) (AMT) | | AA+/NR | | | 900,000 | | | | 934,290 | |
New Mexico Mortgage Finance Authority, 5.60% due 7/1/2028 (Saver SFM Loan Program; Collateralized: GNMA/FNMA/ FHLMC) (AMT) | | AA+/NR | | | 215,000 | | | | 223,897 | |
New Mexico Mortgage Finance Authority, 5.40% due 9/1/2029 (Saver SFM Loan Program; Collateralized: GNMA/FNMA/ FHLMC) | | AA+/NR | | | 480,000 | | | | 511,618 | |
Regents of the University of New Mexico, 6.00% due 6/1/2021 (Campus Buildings Acquisition & Improvements) | | AA/Aa2 | | | 435,000 | | | | 484,838 | |
Regents of the University of New Mexico, 0.40% due 6/1/2030 put 4/7/2016 (Campus Buildings Acquisition & Improvements; SPA: U.S. Bank, N.A.) (weekly demand notes) | | AA/Aa2 | | | 2,000,000 | | | | 2,000,000 | |
Regents of the University of New Mexico, 4.50% due 6/1/2034 (Campus Buildings Acquisition & Improvements) | | AA/Aa2 | | | 1,500,000 | | | | 1,744,395 | |
Regents of the University of New Mexico, 4.50% due 6/1/2035 (Campus Buildings Acquisition & Improvements) | | AA/Aa2 | | | 1,500,000 | | | | 1,735,710 | |
Semi-Annual Report 9
| | |
| SCHEDULE OF INVESTMENTS, CONTINUED | | |
| |
Thornburg New Mexico Intermediate Municipal Fund | | March 31, 2016 (Unaudited) |
| | | | | | | | | | |
ISSUER-DESCRIPTION | | CREDIT RATING†
S&P/ MOODY’S | | PRINCIPAL
AMOUNT | | | VALUE | |
Regents of the University of New Mexico, 4.50% due 6/1/2036 (Campus Buildings Acquisition & Improvements) | | AA/Aa2 | | $ | 1,500,000 | | | $ | 1,725,645 | |
Rio Rancho Public School District No. 94 GO, 2.00% due 8/1/2016 (State Aid Withholding) | | NR/Aa1 | | | 1,000,000 | | | | 1,005,120 | |
Rio Rancho Public School District No. 94 GO, 3.00% due 8/1/2017 (State Aid Withholding) | | NR/Aa1 | | | 2,530,000 | | | | 2,608,202 | |
San Juan County, 3.00% due 6/15/2016 (County Capital Improvements) | | A+/A2 | | | 410,000 | | | | 412,087 | |
San Juan County, 4.00% due 6/15/2017 (County Capital Improvements) | | A+/A2 | | | 500,000 | | | | 519,040 | |
San Juan County, 5.00% due 6/15/2028 (County Capital Improvements) | | A+/A1 | | | 1,280,000 | | | | 1,524,672 | |
San Juan County, 5.00% due 6/15/2030 (County Capital Improvements) | | A+/A1 | | | 1,365,000 | | | | 1,605,117 | |
Santa Fe Community College District GO, 4.00% due 8/1/2018 (Campus Buildings Acquisition & Improvements) | | NR/Aa1 | | | 1,000,000 | | | | 1,073,650 | |
Santa Fe County, 5.00% due 2/1/2018 (County Correctional System; Insured: AGM) | | AA/A2 | | | 400,000 | | | | 417,400 | |
Santa Fe County, 5.00% due 6/1/2025 (County Courthouse and Other Public Facilities) | | AA+/Aa2 | | | 1,400,000 | | | | 1,519,924 | |
Santa Fe County, 5.00% due 6/1/2026 (County Courthouse and Other Public Facilities) | | AA+/Aa2 | | | 1,535,000 | | | | 1,656,848 | |
Santa Fe County, 6.00% due 2/1/2027 (County Correctional System; Insured: AGM) | | AA/A2 | | | 1,520,000 | | | | 1,908,634 | |
Santa Fe County GO, 4.00% due 7/1/2019 pre-refunded 7/1/2016 (County Road and Water System Improvement; Insured: Natl-Re) | | NR/Aaa | | | 750,000 | | | | 756,660 | |
Santa Fe Public School District GO, 4.00% due 8/1/2016 (Santa Fe County School Facilities) (State Aid Withholding) | | AA/Aa1 | | | 500,000 | | | | 505,805 | |
Santa Fe Public School District GO, 3.00% due 8/1/2017 (Santa Fe County School Facilities) (State Aid Withholding) | | AA/Aa1 | | | 400,000 | | | | 412,528 | |
Santa Fe Public School District GO, 5.00% due 8/1/2022 (Santa Fe County School Facilities) (State Aid Withholding) | | AA/Aa1 | | | 2,205,000 | | | | 2,684,962 | |
State of New Mexico, 5.00% due 7/1/2020 (Capital Improvements) | | AA/Aa1 | | | 4,000,000 | | | | 4,642,320 | |
State of New Mexico, 5.00% due 7/1/2022 (Capital Improvements) | | AA/Aa1 | | | 350,000 | | | | 395,556 | |
State of New Mexico, 5.00% due 7/1/2023 (Capital Improvements) | | AA/Aa1 | | | 2,000,000 | | | | 2,473,760 | |
State of New Mexico, 5.00% due 7/1/2025 (Capital Improvements) | | AA/Aa1 | | | 2,000,000 | | | | 2,543,080 | |
State of New Mexico GO, 5.00% due 3/1/2018 (Capital Improvements) | | AA+/Aaa | | | 1,000,000 | | | | 1,081,790 | |
Taos Municipal School District No. 1 GO, 5.00% due 9/1/2016 (Educational Facilities) (State Aid Withholding) | | NR/Aa1 | | | 200,000 | | | | 203,794 | |
Taos Municipal School District No. 1 GO, 5.00% due 9/1/2021 (Educational Facilities) (State Aid Withholding) | | NR/Aa1 | | | 520,000 | | | | 620,906 | |
Town of Silver City, 2.00% due 12/1/2016 (Joint Utility System Improvement; Insured: BAM) | | AA/NR | | | 125,000 | | | | 126,034 | |
Town of Silver City, 2.00% due 12/1/2018 (Joint Utility System Improvement; Insured: BAM) | | AA/NR | | | 260,000 | | | | 266,568 | |
Town of Silver City, 2.00% due 12/1/2019 (Joint Utility System Improvement; Insured: BAM) | | AA/NR | | | 265,000 | | | | 274,206 | |
Town of Silver City, 4.00% due 6/1/2029 (Public Facility Capital Projects) | | A+/NR | | | 1,000,000 | | | | 1,063,560 | |
Town of Silver City, 4.25% due 6/1/2032 (Public Facility Capital Projects) | | A+/NR | | | 1,050,000 | | | | 1,115,972 | |
Village of Los Ranchos de Albuquerque, 4.50% due 9/1/2040 (Albuquerque Academy) | | A/NR | | | 3,000,000 | | | | 3,195,000 | |
Virgin Islands Public Finance Authority, 6.625% due 10/1/2029 | | NR/Baa3 | | | 2,500,000 | | | | 2,789,300 | |
Zuni Public School District, 5.00% due 8/1/2028 (Teacher Housing Projects) | | A/NR | | | 1,600,000 | | | | 1,771,664 | |
| | | | | | | | | | |
TOTAL INVESTMENTS — 97.47% (Cost $210,293,040) | | | | | | | | $ | 223,504,473 | |
OTHER ASSETS LESS LIABILITIES — 2.53% | | | | | | | | | 5,797,502 | |
| | | | | | | | | | |
NET ASSETS — 100.00% | | | | | | | | $ | 229,301,975 | |
| | | | | | | | | | |
Footnote Legend
| † | Credit ratings are unaudited. Rating changes may have occurred subsequent to the reporting period end. Bonds issued with a maturity of one year or less are assigned Moody’s ratings from MIG-1 to MIG-4 and Standard and Poor’s ratings from SP-1+ to SP-3 with MIG-1 and SP-1+ being the strongest ratings. |
Portfolio Abbreviations
To simplify the listings of securities, abbreviations are used per the table below:
| | |
| AGM | | Insured by Assured Guaranty Municipal Corp. |
| AMBAC | | Insured by American Municipal Bond Assurance Corp. |
| AMT | | Alternative Minimum Tax |
| BAM | | Insured by Build America Mutual Insurance Co. |
| FHLMC | | Insured by Federal Home Loan Mortgage Corp. |
| | |
| FNMA | | Collateralized by Federal National Mortgage Association |
| GNMA | | Collateralized by Government National Mortgage Association |
| GO | | General Obligation |
| Natl-Re | | Insured by National Public Finance Guarantee Corp. |
See notes to financial statements.
10 Semi-Annual Report
| | |
| STATEMENT OF ASSETS AND LIABILITIES | | |
| |
Thornburg New Mexico Intermediate Municipal Fund | | March 31, 2016 (Unaudited) |
| | | | |
ASSETS | | | | |
Investments at value (cost $210,293,040) (Note 2) | | $ | 223,504,473 | |
Cash | | | 3,567,917 | |
Receivable for fund shares sold | | | 291,269 | |
Interest receivable | | | 2,757,340 | |
Prepaid expenses and other assets | | | 1,483 | |
| | | | |
Total Assets | | | 230,122,482 | |
| | | | |
| |
LIABILITIES | | | | |
Payable for fund shares redeemed | | | 577,625 | |
Payable to investment advisor and other affiliates (Note 3) | | | 158,842 | |
Accounts payable and accrued expenses | | | 41,992 | |
Dividends payable | | | 42,048 | |
| | | | |
Total Liabilities | | | 820,507 | |
| | | | |
| |
NET ASSETS | | $ | 229,301,975 | |
| | | | |
NET ASSETS CONSIST OF | | | | |
Distribution in excess of net investment income | | $ | (25,896 | ) |
Net unrealized appreciation on investments | | | 13,211,433 | |
Accumulated net realized gain (loss) | | | (1,149,954 | ) |
Net capital paid in on shares of beneficial interest | | | 217,266,392 | |
| | | | |
| | $ | 229,301,975 | |
| | | | |
NET ASSET VALUE | | | | |
Class A Shares: | | | | |
Net asset value and redemption price per share ($138,883,305 applicable to 10,156,516 shares of beneficial interest outstanding - Note 4) | | $ | 13.67 | |
Maximum sales charge, 2.00% of offering price | | | 0.28 | |
| | | | |
Maximum offering price per share | | $ | 13.95 | |
| | | | |
| |
Class D Shares: | | | | |
Net asset value, offering and redemption price per share ($28,496,041 applicable to 2,082,917 shares of beneficial interest outstanding - Note 4) | | $ | 13.68 | |
| | | | |
| |
Class I Shares: | | | | |
Net asset value, offering and redemption price per share ($61,922,629 applicable to 4,530,613 shares of beneficial interest outstanding - Note 4) | | $ | 13.67 | |
| | | | |
See notes to financial statements.
Semi-Annual Report 11
| | |
| STATEMENT OF OPERATIONS | | |
| |
Thornburg New Mexico Intermediate Municipal Fund | | Six Months Ended March 31, 2016 (Unaudited) |
| | | | |
INVESTMENT INCOME | | | | |
Interest income (net of premium amortized of $1,088,486) | | $ | 3,609,844 | |
| | | | |
| |
EXPENSES | | | | |
Investment advisory fees (Note 3) | | | 569,100 | |
Administration fees (Note 3) | | | | |
Class A Shares | | | 86,927 | |
Class D Shares | | | 18,034 | |
Class I Shares | | | 14,925 | |
Distribution and service fees (Note 3) | | | | |
Class A Shares | | | 173,854 | |
Class D Shares | | | 71,909 | |
Transfer agent fees | | | | |
Class A Shares | | | 32,267 | |
Class D Shares | | | 6,501 | |
Class I Shares | | | 10,075 | |
Registration and filing fees | | | | |
Class A Shares | | | 682 | |
Class D Shares | | | 358 | |
Class I Shares | | | 256 | |
Custodian fees (Note 3) | | | 24,090 | |
Professional fees | | | 23,454 | |
Accounting fees (Note 3) | | | 4,057 | |
Trustee fees | | | 4,819 | |
Other expenses | | | 7,952 | |
| | | | |
Total Expenses | | | 1,049,260 | |
| | | | |
Net Investment Income | | | 2,560,584 | |
| | | | |
REALIZED AND UNREALIZED GAIN (LOSS) | | | | |
Net realized gain (loss) from investments | | | (4,080 | ) |
Net change in unrealized appreciation (depreciation) on investments | | | 2,143,366 | |
| | | | |
Net Realized and Unrealized Gain | | | 2,139,286 | |
| | | | |
Net Increase in Net Assets Resulting from Operations | | $ | 4,699,870 | |
| | | | |
See notes to financial statements.
12 Semi-Annual Report
| | |
| STATEMENTS OF CHANGES IN NET ASSETS | | |
| |
Thornburg New Mexico Intermediate Municipal Fund | | |
| | | | | | | | |
| | | SIX MONTHS ENDED
MARCH 31, 2016* | | | YEAR ENDED
SEPTEMBER 30, 2015 | |
INCREASE (DECREASE) IN NET ASSETS FROM | | | | | | | | |
| | |
OPERATIONS | | | | | | | | |
Net investment income | | $ | 2,560,584 | | | $ | 5,657,203 | |
Net realized gain (loss) from investments | | | (4,080 | ) | | | (9,565 | ) |
Net unrealized appreciation (depreciation) on investments | | | 2,143,366 | | | | (890,859 | ) |
| | | | | | | | |
| | |
Net Increase (Decrease) in Net Assets Resulting from Operations | | | 4,699,870 | | | | 4,756,779 | |
| | |
DIVIDENDS TO SHAREHOLDERS | | | | | | | | |
From net investment income | | | | | | | | |
Class A Shares | | | (1,524,833 | ) | | | (3,516,957 | ) |
Class D Shares | | | (280,482 | ) | | | (676,838 | ) |
Class I Shares | | | (755,270 | ) | | | (1,463,408 | ) |
| | |
FUND SHARE TRANSACTIONS (NOTE 4) | | | | | | | | |
Class A Shares | | | (2,364,726 | ) | | | (3,515,955 | ) |
Class D Shares | | | (726,016 | ) | | | 637,262 | |
Class I Shares | | | 3,403,037 | | | | 20,817,817 | |
| | | | | | | | |
Net Increase in Net Assets | | | 2,451,580 | | | | 17,038,700 | |
| | |
NET ASSETS | | | | | | | | |
Beginning of Period | | | 226,850,395 | | | | 209,811,695 | |
| | | | | | | | |
| | |
End of Period | | $ | 229,301,975 | | | $ | 226,850,395 | |
| | | | | | | | |
| | |
Distribution in excess of net investment income | | $ | (25,896 | ) | | $ | (25,896 | ) |
See notes to financial statements.
Semi-Annual Report 13
| | |
| NOTES TO FINANCIAL STATEMENTS | | |
| |
Thornburg New Mexico Intermediate Municipal Fund | | March 31, 2016 (Unaudited) |
NOTE 1 – ORGANIZATION
Thornburg New Mexico Intermediate Municipal Fund (the “Fund”) is a diversified series of Thornburg Investment Trust (the “Trust”). The Trust is organized as a Massachusetts business trust under a Declaration of Trust dated June 3, 1987 and is registered as a diversified, open-end management investment company under the Investment Company Act of 1940, as amended. The Fund is currently one of twenty separate series of the Trust. Each series is considered to be a separate entity for financial reporting and tax purposes and bears expenses directly attributable to it. The Fund’s primary investment objective is to obtain as high a level of current income exempt from federal and New Mexico state individual income tax as is consistent, in the view of Thornburg Investment Management, Inc., the Trust’s investment advisor (the “Advisor”), with the preservation of capital. The Fund’s secondary objective is to reduce expected changes in its share price compared to long-term bond portfolios.
The Fund currently offers three classes of shares of beneficial interest: Class A, Class D, and Institutional Class (“Class I”). Each class of shares of the Fund represents an interest in the same portfolio of investments, except that (i) Class A shares are sold subject to a front-end sales charge collected at the time the shares are purchased and bear a service fee, (ii) Class D shares are sold at net asset value without a sales charge at the time of purchase or redemption, and bear both a service fee and a distribution fee, (iii) Class I shares are sold at net asset value without a sales charge at the time of purchase and may be subject to a service fee, and (iv) the respective classes may have different reinvestment privileges and conversion rights. Additionally, the Fund may allocate among its classes certain expenses, to the extent allocable to specific classes, including transfer agent fees, government registration fees, certain printing and postage costs, and administrative and legal expenses. Currently, class specific expenses of the Fund are limited to service and distribution fees, administration fees, and certain registration and transfer agent expenses.
NOTE 2 – SIGNIFICANT ACCOUNTING POLICIES
The following is a summary of significant accounting policies followed by the Fund in the preparation of its financial statements. The Fund is an investment company and prepares its financial statements in conformity with United States generally accepted accounting principles (“GAAP”), including investment company accounting and reporting guidance in the Financial Accounting Standards Board (the “FASB”) Accounting Standard Codification Topic 946. The preparation of financial statements in conformity with GAAP requires management to make estimates and assumptions that affect the reported amounts of assets and liabilities and disclosure of contingent assets and liabilities at the date of the financial statements and the reported amounts of increases (decreases) in net assets from operations during the reporting period. Actual results could differ from those estimates.
Significant accounting policies of the Trust are as follows:
Valuation Policy and Procedures: The Trustees of the Trust have appointed the Advisor to assist the Trustees in obtaining market values for portfolio investments, perform certain evaluation and supervisory functions respecting professional pricing service providers appointed by the Trustees’ Audit Committee (the “Audit Committee”) to assist in determining fair values for portfolio investments, assist in calculating fair values for portfolio investments in certain circumstances, and to perform other functions in connection with the valuation of investments. The Advisor acts through its Valuation and Pricing Committee (the “Committee”) and other employees of the Advisor. The Committee regularly reviews its own valuation calculations, as well as the valuations, valuation techniques and services furnished by pricing service providers, considers circumstances which may require valuation calculations by the Committee, and reviews previous valuation calculations. The Committee reports to the Audit Committee on the Committee’s activities, the performance of pricing service providers, and other matters relating to valuation of portfolio investments.
In those instances when the Committee assists in calculating a fair value for a portfolio investment, the Committee seeks to determine the price that the Fund would reasonably expect to receive upon a sale of the investment in an orderly transaction between market participants on the valuation date. The Committee customarily utilizes quotations from securities broker dealers in calculating valuations, but also may utilize prices obtained from pricing service providers or other methods approved by the Audit Committee. Because fair values calculated by the Committee are estimates, the calculation of a value for an investment may differ from the price that would be realized by the Fund upon a sale of the investment, and the difference could be material to the Fund’s financial statements. The Committee’s calculation of a fair value for an investment may also differ from the prices obtained by other persons (including other mutual funds) for the investment.
Valuation of Investments: Debt obligations held by the Fund which are not listed or traded on exchanges or for which no reported market exists are ordinarily valued at the valuation obtained from a pricing service provider approved by the Audit Committee.
In any case when a pricing service provider fails to provide a valuation for a debt obligation held by the Fund, the Committee calculates a fair value for the obligation using alternative methods under procedures approved by the Audit Committee. Additionally, in cases when management believes that a valuation obtained from a pricing service provider merits review for significant reasons, the Committee decides whether or not to use the valuation calculated by the pricing service provider or to use an alternative method approved by the Audit Committee to calculate a fair value for the obligation.
Valuation Measurements: The Fund categorizes its investments based upon the inputs used in valuing those investments, according to a three-level hierarchy established in guidance from the FASB. Categorization of investments using this hierarchy is intended by the FASB
14 Semi-Annual Report
| | |
| NOTES TO FINANCIAL STATEMENTS, CONTINUED | | |
| |
Thornburg New Mexico Intermediate Municipal Fund | | March 31, 2016 (Unaudited) |
to maximize the use of observable inputs in valuing investments and minimize the use of unobservable inputs by requiring that the most observable inputs be used when available. Observable inputs are those that market participants would use in valuing an investment based on available market information. Unobservable inputs are those that reflect assumptions about the information market participants would use in valuing an investment. An investment’s level within the hierarchy is based on the lowest level input that is deemed significant to the valuation. The methodologies and inputs used to value investments are not necessarily indications of the risk or liquidity associated with those investments.
Various inputs are used in calculating valuations for the Fund’s investments. These inputs are generally summarized according to the three-level hierarchy below:
Level 1: Quoted prices in active markets for identical investments.
Level 2: Other direct or indirect significant observable inputs (including quoted prices for similar investments in active markets and other observable inputs, such as interest rates, prepayment rates, credit risk, etc.).
Level 3: Significant unobservable inputs (including the Committee’s own assumptions in calculating the fair values of investments).
Valuations for debt obligations held by the Fund are typically calculated by pricing service providers approved by the Audit Committee and are characterized as Level 2 within the valuation hierarchy.
In a limited number of cases the Committee calculates a fair value for investments using broker quotations or other methods approved by the Audit Committee. When the Committee uses a single broker quotation to calculate a fair value for an investment without other significant observable inputs, or if a fair value is calculated using other significant inputs that are considered unobservable, the investment is characterized as Level 3 within the hierarchy. Other significant unobservable inputs used to calculate a fair value in these instances might include an income-based valuation approach which considers discounted anticipated future cash flows from the investment, and application of discounts due to the nature or duration of any restrictions on the disposition of the investment.
Valuations based upon the use of inputs from Levels 1, 2 or 3 may not represent the actual price received upon the disposition of an investment, and the Fund may receive a price that is lower than the valuation based upon these inputs when it sells the investment.
The following table displays a summary of the fair value hierarchy measurements of the Fund’s investments as of March 31, 2016. In any instance when valuation inputs from more than one level are used to determine the fair value of a specific investment, the investment is placed in the level of the table based upon the lowest level input that is significant in determining the fair value of the investment:
| | | | | | | | | | | | | | | | |
| | | FAIR VALUE MEASUREMENTS AT MARCH 31, 2016 | |
| | | TOTAL | | | LEVEL 1 | | | LEVEL 2 | | | LEVEL 3 | |
Assets | | | | | | | | | | | | | | | | |
Investments in Securities | | | | | | | | | | | | | | | | |
Municipal Bonds | | $ | 223,504,473 | | | $ | — | | | $ | 223,504,473 | | | $ | — | |
| | | | | | | | | | | | | | | | |
Total Investments in Securities | | $ | 223,504,473 | | | $ | — | | | $ | 223,504,473 | | | $ | — | |
In accordance with the guidance prescribed in Accounting Standards Update No. 2011-04, it is the policy of the Fund to recognize transfers between levels and the underlying events which caused the movement. The Fund recognized no transfers between levels for the six months ended March 31, 2016.
Federal Income Taxes: It is the policy of the Trust to comply with the provisions of the Internal Revenue Code applicable to “regulated investment companies” and to distribute to shareholders substantially all taxable income including net realized gains on investments (if any), and tax exempt income of the Fund. Therefore, no provision for federal income tax is required.
Management reviews each uncertain tax position believed to be material to the preparation of the Fund’s financial statements, to assess if it is more likely than not that the position would be sustained upon examination, based upon the technical merits of the position. As of March 31, 2016, management has not identified any such position for which an asset or liability must be reflected in the Statement of Assets and Liabilities. The Fund’s tax returns remain subject to examination for three years after filing.
When-Issued and Delayed Delivery Transactions: The Fund may engage in when-issued or delayed delivery transactions. To the extent the Fund engages in such transactions, it will do so for the purpose of acquiring portfolio investments consistent with the Fund’s investment objectives and not for the purpose of investment leverage or to speculate on interest rate and, or market changes. At the time the Fund makes a commitment to purchase an investment on a when-issued or delayed delivery basis, the Fund will record the transaction and reflect the value in determining its net asset value. When effecting such transactions, assets of an amount sufficient to make payment for the portfolio investments to be purchased will be segregated on the Fund’s records on the trade date. Investments purchased on a when-issued or delayed delivery basis do not earn interest until the settlement date.
Semi-Annual Report 15
| | |
| NOTES TO FINANCIAL STATEMENTS, CONTINUED | | |
| |
Thornburg New Mexico Intermediate Municipal Fund | | March 31, 2016 (Unaudited) |
Dividends: Net investment income of the Fund is declared daily as a dividend on shares for which the Fund has received payment. Dividends are paid monthly and are reinvested in additional shares of the Fund at net asset value per share at the close of business on the dividend payment date, or at the shareholder’s option, paid in cash. Net realized capital gains, to the extent available, will be distributed at least annually.
General: Investment transactions are accounted for on a trade date basis. Interest income is accrued as earned. Premiums and discounts on investments purchased are amortized to call dates or maturity dates of the respective investments. Realized gains and losses from the sale of investments are recorded on an identified cost basis. Net investment income (other than class specific expenses) and realized and unrealized gains and losses are allocated daily to each class of shares based upon the relative net asset value of outstanding shares (or the value of the dividend-eligible shares, as appropriate) of each class of shares at the beginning of the day (after adjusting for the current capital shares activity of the respective class). Expenses common to all Funds are allocated among the Funds comprising the Trust based upon their relative net asset values or other appropriate allocation methods.
Guarantees and Indemnifications: Under the Trust’s organizational documents (and under separate agreements with the independent Trustees), its officers and Trustees are indemnified against certain liabilities arising out of the performance of their duties to the Fund. Additionally, in the normal course of business the Trust enters into contracts with service providers that contain general indemnification clauses. The Trust’s maximum exposure under these arrangements is unknown. However, based on experience, the Trust expects the risk of loss to be remote.
NOTE 3 – INVESTMENT ADVISORY FEE AND OTHER TRANSACTIONS WITH AFFILIATES
Pursuant to an investment advisory agreement, the Advisor serves as the investment advisor and performs services for the Fund for which the fees are payable at the end of each month. For the six months ended March 31, 2016, these fees were payable at annual rates ranging from .50 of 1% to .275 of 1% per annum of the average daily net assets of the Fund depending on the Fund’s asset size. The Fund pays to the Advisor the costs of personnel who perform certain accounting services for the Fund. For the six months ended March 31, 2016 the Fund paid $4,057 to the Advisor for these accounting services. The Trust has also entered into administrative service agreements with the Advisor, whereby the Advisor will perform certain administrative services for the shareholders of each class of the Fund’s shares, and for which fees will be payable at an annual rate of up to .125 of 1% per annum of the average daily net assets attributable to each class of shares.
The Trust has an underwriting agreement with Thornburg Securities Corporation (the “Distributor”), an affiliate of the Advisor, which acts as the distributor of the Fund’s shares. For the six months ended March 31, 2016, the Distributor has advised the Fund that it earned net commissions aggregating $1,019 from the sale of Class A shares.
Pursuant to a service plan under Rule 12b-1 of the Investment Company Act of 1940, the Fund may reimburse to the Advisor an amount not to exceed .25 of 1% per annum of the average daily net assets attributable to each class of shares of the Fund for payments made by the Advisor to securities dealers and other financial institutions to obtain various shareholder and distribution related services. For the six months ended March 31, 2016, there were no 12b-1 service plan fees charged for Class I shares. The Advisor may pay out of its own resources additional expenses for distribution of the Fund’s shares and shareholder services.
The Trust has also adopted a distribution plan pursuant to Rule 12b-1, applicable only to the Fund’s Class D shares, under which the Fund compensates the Distributor for services in promoting the sale of Class D shares of the Fund at an annual rate of up to .25 of 1% per annum of the average daily net assets attributable to Class D shares. Total fees incurred by each class of shares of the Fund under their respective service and distribution plans for the six months ended March 31, 2016, are set forth in the Statement of Operations.
Certain officers and Trustees of the Trust are also officers or directors of the Advisor and Distributor. The compensation of independent Trustees is borne by the Trust.
The percentage of direct investments in the Fund held by affiliated Trustees and Officers and the Advisor is approximately 11.60%.
The Fund may purchase or sell securities from, or to an affiliated fund, provided the affiliation is due solely to having a common investment advisor, common officers, or common trustees, and provided that all such transactions will comply with Rule 17a-7 under the 1940 Act. For the six months ended March 31, 2016, the Fund had no transactions with affiliated funds.
16 Semi-Annual Report
| | |
| NOTES TO FINANCIAL STATEMENTS, CONTINUED | | |
| |
Thornburg New Mexico Intermediate Municipal Fund | | March 31, 2016 (Unaudited) |
NOTE 4 – SHARES OF BENEFICIAL INTEREST
At March 31, 2016, there were an unlimited number of shares with no par value of beneficial interest authorized. Transactions in shares of beneficial interest were as follows:
| | | | | | | | | | | | | | | | |
| | | SIX MONTHS ENDED | | | YEAR ENDED | |
| | | MARCH 31, 2016 (UNAUDITED) | | | SEPTEMBER 30, 2015 (AUDITED) | |
| | | SHARES | | | AMOUNT | | | SHARES | | | AMOUNT | |
Class A Shares | | | | | | | | | | | | | | | | |
Shares sold | | | 391,569 | | | $ | 5,332,428 | | | | 745,966 | | | $ | 10,124,128 | |
Shares issued to shareholders in reinvestment of dividends | | | 94,591 | | | | 1,289,185 | | | | 223,380 | | | | 3,036,783 | |
Shares repurchased | | | (660,562 | ) | | | (8,986,339 | ) | | | (1,226,723 | ) | | | (16,676,866 | ) |
| | | | | | | | | | | | | | | | |
| | | | |
Net increase (decrease) | | | (174,402 | ) | | $ | (2,364,726 | ) | | | (257,377 | ) | | $ | (3,515,955 | ) |
| | | | | | | | | | | | | | | | |
| | | | |
Class D Shares | | | | | | | | | | | | | | | | |
Shares sold | | | 145,126 | | | $ | 1,980,508 | | | | 381,666 | | | $ | 5,181,343 | |
Shares issued to shareholders in reinvestment of dividends | | | 19,702 | | | | 268,667 | | | | 48,673 | | | | 661,799 | |
Shares repurchased | | | (218,378 | ) | | | (2,975,191 | ) | | | (383,942 | ) | | | (5,205,880 | ) |
| | | | | | | | | | | | | | | | |
| | | | |
Net increase (decrease) | | | (53,550 | ) | | $ | (726,016 | ) | | | 46,397 | | | $ | 637,262 | |
| | | | | | | | | | | | | | | | |
| | | | |
Class I Shares | | | | | | | | | | | | | | | | |
Shares sold | | | 347,129 | | | $ | 4,725,466 | | | | 1,680,477 | | | $ | 22,851,550 | |
Shares issued to shareholders in reinvestment of dividends | | | 51,307 | | | | 699,124 | | �� | | 99,465 | | | | 1,350,685 | |
Shares repurchased | | | (148,687 | ) | | | (2,021,553 | ) | | | (248,971 | ) | | | (3,384,418 | ) |
| | | | | | | | | | | | | | | | |
| | | | |
Net increase (decrease) | | | 249,749 | | | $ | 3,403,037 | | | | 1,530,971 | | | $ | 20,817,817 | |
| | | | | | | | | | | | | | | | |
NOTE 5 – INVESTMENT TRANSACTIONS
For the six months ended March 31, 2016, the Fund had purchase and sale transactions of investments (excluding short-term investments) of $15,565,958 and $3,140,000, respectively.
NOTE 6 – INCOME TAXES
At March 31, 2016, information on the tax components of capital was as follows:
| | | | |
Cost of investments for tax purposes | | $ | 210,293,040 | |
| | | | |
Gross unrealized appreciation on a tax basis | | $ | 13,235,634 | |
Gross unrealized depreciation on a tax basis | | | (24,201 | ) |
| | | | |
Net unrealized appreciation (depreciation) on investments (tax basis) | | $ | 13,211,433 | |
| | | | |
At March 31, 2016, the Fund had deferred tax basis capital losses occurring subsequent to October 31, 2014, through September 30, 2015, of $7,848. For tax purposes, such losses will be recognized in the year ending September 30, 2016.
At March 31, 2016, the Fund had cumulative tax basis capital losses of $1,138,025, (of which $87,413 are short-term and $1,050,612 are long-term) generated after September 30, 2011, which may be carried forward to offset future capital gains. To the extent such carryforwards are used, capital gain distributions may be reduced to the extent provided by regulations. Such capital loss carryforwards do not expire.
OTHER NOTES
Risks: The Fund’s investments subject it to risks including, but not limited to, credit risk, interest rate risk, management risk, market and economic risk, liquidity risk, diversification risk, and the risks of investing primarily in the obligations of a single state. Please see the Fund’s prospectus for a discussion of the risks associated with an investment in the Fund.
Subsequent Events: Fund management believes no events have occurred between March 31, 2016 and the date of issuance of the financial statements that require adjustment to or disclosure in the accompanying financial statements.
Semi-Annual Report 17
FINANCIAL HIGHLIGHTS
Thornburg New Mexico Intermediate Municipal Fund
| | | | | | | | | | | | | | | | | | | | | | | | | | | | | | | | | | | | | | | | | | | | | | | | | | | | |
| | | PER SHARE PERFORMANCE (FOR A SHARE OUTSTANDING THROUGHOUT THE PERIOD) | | RATIOS TO AVERAGE NET ASSETS | | | SUPPLEMENTAL DATA | |
UNLESS
OTHERWISE NOTED,
PERIODS
ARE FISCAL
YEARS
ENDED SEPT. 30, | | NET ASSET
VALUE
BEGINNING
OF PERIOD | | | NET INVESTMENT INCOME (LOSS)+ | | NET
REALIZED
&
UNREALIZED
GAIN (LOSS)
ON
INVESTMENTS | | | TOTAL FROM
INVESTMENT
OPERATIONS | | | DIVIDENDS
FROM NET
INVESTMENT
INCOME | | | DIVIDENDS FROM NET REALIZED GAINS | | TOTAL
DIVIDENDS | | | NET
ASSET VALUE END
OF
PERIOD | | NET
INVESTMENT
INCOME
(LOSS)
(%) | | | EXPENSES,
AFTER
EXPENSE
REDUCTIONS
(%) | | | EXPENSES,
AFTER
EXPENSE
REDUCTIONS
AND
NET OF
CUSTODY
CREDITS (%) | | | EXPENSES,
BEFORE
EXPENSE
REDUCTIONS
(%) | | | TOTAL
RETURN
(%)(a) | | | PORTFOLIO TURNOVER RATE (%)(a) | | NET
ASSETS
AT END
OF
PERIOD
(THOUSANDS) | |
CLASS A SHARES | | | | | | | | | | | | | | | | | | | | | | | | | | | | | | | | | | | | | | | | | | | |
2016(b)(c) | | $ | 13.55 | | | 0.15 | | | 0.12 | | | | 0.27 | | | | (0.15 | ) | | — | | | (0.15 | ) | | $13.67 | | | 2.19 | (d) | | | 0.98 | (d) | | | 0.98 | (d) | | | 0.98 | (d) | | | 2.00 | | | 1.46 | | $ | 138,883 | |
2015(c) | | $ | 13.60 | | | 0.34 | | | (0.05 | ) | | | 0.29 | | | | (0.34 | ) | | — | | | (0.34 | ) | | $13.55 | | | 2.50 | | | | 0.98 | | | | 0.98 | | | | 0.98 | | | | 2.15 | | | 19.01 | | $ | 139,939 | |
2014(c) | | $ | 13.35 | | | 0.39 | | | 0.25 | | | | 0.64 | | | | (0.39 | ) | | — | | | (0.39 | ) | | $13.60 | | | 2.87 | | | | 0.97 | | | | 0.97 | | | | 0.97 | | | | 4.83 | | | 10.79 | | $ | 143,994 | |
2013(c) | | $ | 13.95 | | | 0.38 | | | (0.60 | ) | | | (0.22 | ) | | | (0.38 | ) | | — | | | (0.38 | ) | | $13.35 | | | 2.76 | | | | 0.96 | | | | 0.95 | | | | 0.96 | | | | (1.61 | ) | | 11.78 | | $ | 148,499 | |
2012(c) | | $ | 13.72 | | | 0.41 | | | 0.24 | | | | 0.65 | | | | (0.41 | ) | | (0.01) | | | (0.42 | ) | | $13.95 | | | 2.95 | | | | 0.95 | | | | 0.95 | | | | 0.95 | | | | 4.80 | | | 11.66 | | $ | 187,578 | |
2011(c) | | $ | 13.78 | | | 0.44 | | | (0.05 | ) | | | 0.39 | | | | (0.44 | ) | | (0.01) | | | (0.45 | ) | | $13.72 | | | 3.23 | | | | 0.96 | | | | 0.96 | | | | 0.96 | | | | 2.93 | | | 10.64 | | $ | 185,208 | |
CLASS D SHARES | | | | | | | | | | | | | | | | | | | | | | | | | | | | | | | | | | | | | | | | | | | |
2016(b) | | $ | 13.55 | | | 0.13 | | | 0.13 | | | | 0.26 | | | | (0.13 | ) | | — | | | (0.13 | ) | | $13.68 | | | 1.94 | (d) | | | 1.23 | (d) | | | 1.23 | (d) | | | 1.23 | (d) | | | 1.94 | | | 1.46 | | $ | 28,496 | |
2015 | | $ | 13.61 | | | 0.31 | | | (0.06 | ) | | | 0.25 | | | | (0.31 | ) | | — | | | (0.31 | ) | | $13.55 | | | 2.27 | | | | 1.20 | | | | 1.20 | | | | 1.20 | | | | 1.84 | | | 19.01 | | $ | 28,953 | |
2014 | | $ | 13.36 | | | 0.35 | | | 0.25 | | | | 0.60 | | | | (0.35 | ) | | — | | | (0.35 | ) | | $13.61 | | | 2.60 | | | | 1.23 | | | | 1.23 | | | | 1.23 | | | | 4.55 | | | 10.79 | | $ | 28,438 | |
2013 | | $ | 13.96 | | | 0.34 | | | (0.59 | ) | | | (0.25 | ) | | | (0.35 | ) | | — | | | (0.35 | ) | | $13.36 | | | 2.51 | | | | 1.21 | | | | 1.21 | | | | 1.22 | | | | (1.85 | ) | | 11.78 | | $ | 28,858 | |
2012 | | $ | 13.72 | | | 0.37 | | | 0.26 | | | | 0.63 | | | | (0.38 | ) | | (0.01) | | | (0.39 | ) | | $13.96 | | | 2.71 | | | | 1.18 | | | | 1.18 | | | | 1.22 | | | | 4.62 | | | 11.66 | | $ | 31,984 | |
2011 | | $ | 13.78 | | | 0.40 | | | (0.05 | ) | | | 0.35 | | | | (0.40 | ) | | (0.01) | | | (0.41 | ) | | $13.72 | | | 2.97 | | | | 1.22 | | | | 1.21 | | | | 1.22 | | | | 2.66 | | | 10.64 | | $ | 24,228 | |
CLASS I SHARES | | | | | | | | | | | | | | | | | | | | | | | | | | | | | | | | | | | | | | | | | | | |
2016(b) | | $ | 13.54 | | | 0.17 | | | 0.13 | | | | 0.30 | | | | (0.17 | ) | | — | | | (0.17 | ) | | $13.67 | | | 2.53 | (d) | | | 0.64 | (d) | | | 0.64 | (d) | | | 0.64 | (d) | | | 2.24 | | | 1.46 | | $ | 61,923 | |
2015 | | $ | 13.59 | | | 0.38 | | | (0.05 | ) | | | 0.33 | | | | (0.38 | ) | | — | | | (0.38 | ) | | $13.54 | | | 2.80 | | | | 0.65 | | | | 0.65 | | | | 0.65 | | | | 2.48 | | | 19.01 | | $ | 57,958 | |
2014 | | $ | 13.35 | | | 0.43 | | | 0.24 | | | | 0.67 | | | | (0.43 | ) | | — | | | (0.43 | ) | | $13.59 | | | 3.19 | | | | 0.65 | | | | 0.64 | | | | 0.65 | | | | 5.09 | | | 10.79 | | $ | 37,380 | |
2013 | | $ | 13.95 | | | 0.43 | | | (0.61 | ) | | | (0.18 | ) | | | (0.42 | ) | | — | | | (0.42 | ) | | $13.35 | | | 3.09 | | | | 0.61 | | | | 0.61 | | | | 0.61 | | | | (1.29 | ) | | 11.78 | | $ | 25,590 | |
2012 | | $ | 13.71 | | | 0.46 | | | 0.25 | | | | 0.71 | | | | (0.46 | ) | | (0.01) | | | (0.47 | ) | | $13.95 | | | 3.30 | | | | 0.61 | | | | 0.61 | | | | 0.61 | | | | 5.24 | | | 11.66 | | $ | 38,099 | |
2011 | | $ | 13.77 | | | 0.48 | | | (0.05 | ) | | | 0.43 | | | | (0.48 | ) | | (0.01) | | | (0.49 | ) | | $13.71 | | | 3.57 | | | | 0.62 | | | | 0.61 | | | | 0.62 | | | | 3.28 | | | 10.64 | | $ | 41,645 | |
| (a) | Not annualized for periods less than one year. |
| (b) | Unaudited Six Month Period Ended March 31. |
| (c) | Sales loads are not reflected in computing total return. |
| + | Based on weighted average shares outstanding. |
See notes to financial statements.
| | | | |
| 18 Semi-Annual Report | | | | Semi-Annual Report 19 |
| | |
| EXPENSE EXAMPLE | | |
| |
Thornburg New Mexico Intermediate Municipal Fund | | March 31, 2016 (Unaudited) |
As a shareholder of the Fund, you incur two types of costs:
| | (1) | transaction costs, including |
(a) sales charges (loads) on purchase payments, for Class A shares;
(b) a deferred sales charge on redemptions of any part or all of a purchase of $1 million of Class A shares within 12 months of purchase;
| | (2) | ongoing costs, including management fees; distribution and/or service (12b-1) fees; and other Fund expenses. |
This example is intended to help you understand your ongoing costs (in dollars) of investing in the Fund and to compare these costs with the ongoing costs of investing in other mutual funds.
The example is based on a $1,000 investment beginning on October 1, 2015, and held until March 31, 2016.
| | | | | | | | | | | | |
| | | BEGINNING
ACCOUNT VALUE
10/1/15 | | | ENDING
ACCOUNT VALUE
3/31/16 | | | EXPENSES PAID
DURING PERIOD†
10/1/15–3/31/16 | |
CLASS A SHARES | | | | | | | | | | | | |
Actual | | $ | 1,000.00 | | | $ | 1,020.00 | | | $ | 4.94 | |
Hypothetical* | | $ | 1,000.00 | | | $ | 1,020.11 | | | $ | 4.94 | |
CLASS D SHARES | | | | | | | | | | | | |
Actual | | $ | 1,000.00 | | | $ | 1,019.40 | | | $ | 6.20 | |
Hypothetical* | | $ | 1,000.00 | | | $ | 1,018.86 | | | $ | 6.20 | |
CLASS I SHARES | | | | | | | | | | | | |
Actual | | $ | 1,000.00 | | | $ | 1,022.40 | | | $ | 3.24 | |
Hypothetical* | | $ | 1,000.00 | | | $ | 1,021.79 | | | $ | 3.24 | |
| † | Expenses are equal to the annualized expense ratio for each class (A: 0.98%; D: 1.23%; I: 0.64%) multiplied by the average account value over the period, multiplied by 183/366 to reflect the one-half year period. |
| * | Hypothetical assumes a rate of return of 5% per year before expenses. |
ACTUAL EXPENSES
For each class of shares, the first line of the accompanying table provides information about actual account values and actual expenses. You may use the information in this line, together with the amount you invested, to estimate the expenses that you paid over the period. Simply divide your account value by $1,000 (for example, an $8,600 account value divided by $1,000 = 8.6), then multiply the result by the number in the first line for your class of shares under the heading entitled “Expenses Paid During Period” to estimate the expenses you paid on your account during this period.
HYPOTHETICAL EXAMPLE FOR COMPARISON PURPOSES
For each class of shares, the second line of the accompanying table provides information about hypothetical account values and hypothetical expenses based on the Fund’s actual expense ratio and an assumed rate of return of 5% per year before expenses, which is not the Fund’s actual return. The hypothetical account values and expenses may not be used to estimate the actual ending account balance or expenses you paid for the period. You may use this information to compare the ongoing costs of investing in the Fund and other funds. To do so, compare this 5% hypothetical example with the 5% hypothetical examples that appear in the shareholder reports of the other funds.
Please note that the expenses shown in the table are meant to highlight your ongoing costs only and do not reflect any transactional costs, such as sales charges (loads), redemption fees, or exchange fees. Therefore, the second line of the table for each class of shares is useful in comparing ongoing costs only, and will not help you determine the relative total costs of owning different funds. In addition, if these transactional costs were included, your costs would have been higher.
20 Semi-Annual Report
| | |
| OTHER INFORMATION | | |
| |
Thornburg New Mexico Intermediate Municipal Fund | | March 31, 2016 (Unaudited) |
PORTFOLIO PROXY VOTING
Policies and Procedures:
The Trust has delegated to Thornburg Investment Management, Inc. (the “Advisor”) voting decisions respecting proxies for the Fund’s voting securities. The Advisor makes voting decisions in accordance with its Proxy Voting Policy. A description of the Policy is available (i) without charge, upon request, by calling the Advisor toll-free at 1-800-847-0200, (ii) on the Thornburg website at www.thornburg.com, and (iii) on the Securities and Exchange Commission’s website at www.sec.gov.
Information regarding how proxies were voted is available on or before August 31 of each year for the twelve months ending the preceding June 30. This information is available (i) without charge, upon request by calling the Advisor toll-free at 1-800-847-0200, (ii) on the Thornburg website at www.thornburg.com, and (iii) on the Securities and Exchange Commission’s website at www.sec.gov.
AVAILABILITY OF QUARTERLY PORTFOLIO SCHEDULE
The Fund files with the Securities and Exchange Commission schedules of its portfolio holdings on Form N-Q for the first and third quarters of each fiscal year. The Fund’s Forms N-Q are available on the Commission’s website at www.sec.gov, or may be reviewed and copied at the Commission’s Public Reference Room in Washington, D.C. Information on the operation of the Public Reference Room may be obtained by calling 1-800-SEC-0330. The Fund also makes this information available on its website at www.thornburg.com/download or upon request by calling 1-800-847-0200.
Semi-Annual Report 21
TRUSTEES’ STATEMENT TO SHAREHOLDERS
Revised and Readopted September 15, 2015
The Trustees believe current and prospective shareholders should know how we discharge our responsibilities in supervising the Funds’ investment advisor and in reviewing the advisor’s contract for renewal. Since 2005, we have issued a statement which sets out clearly the three principal guidelines that we follow in supervising the Trust’s investment advisor on your behalf. In accordance with our customary practice, in September of 2015 we again reviewed our statement and concluded we should reissue this statement outlining the principal features of our supervision of the advisor’s performance of investment management services for the Funds.
We begin with the premise that each shareholder selected his or her Fund because its investments are managed by the investment advisor identified in the prospectus and in accordance with the objective and policies described in the prospectus. We realize, as each of you do, that if you believe that your Fund’s stated objective and policies no longer serve your personal investment goals, you can sell your shares and leave the Fund.
Therefore, we believe that our primary supervisory task – our principal obligation to you – is to assess the nature and quality of the advisor’s services, and to confirm that the advisor actively and competently pursues the Fund’s objective, in accordance with the policies set out in the prospectus. To do this, we meet regularly with management to review your Fund’s portfolio and to discuss the advisor’s specific actions and judgments in pursuing the Fund’s objective. We do not substitute our own judgment for the advisor’s decisions in selecting investments; the advisor is paid to exercise its informed judgment on investment decisions, and we seek to confirm, in reviewing the advisor’s performance, that the advisor is doing just that.
Second, we are conscious of costs and the effect that costs have on shareholders’ returns. We try to make sure that your Fund’s fees and costs are reasonable in relationship to the services rendered and that they are generally in line with those charged by other expert investment advisors, consistent with our belief that the Fund’s investors searched for and expect that expertise and attention and have decided to pay a reasonable price for it. We do not put the management contract “out to bid” as a matter of course, and we would not do so unless we had concluded that the advisor materially had failed to pursue the Fund’s objectives in accordance with its policies, or for other equally important reasons. We believe that any other approach would be inconsistent with your interests and contrary to your expectations when you bought shares of the Fund in the first place.
Finally, because we believe that most Thornburg Fund shareholders have invested with a long-term perspective, we try not to focus too much on the fashions of the moment and on short-term performance. The market will not favor any specific investment objective or set of policies at all times and under all economic circumstances. A fund will experience periods of both high and low returns relative to other funds and other investments. Even if one of our Funds is not favored by the market at a particular time, we believe that the advisor is nonetheless obliged to remain true to the Fund’s objective and policies, and we watch to see that it does so.
Trustees of Thornburg Investment Trust
22 Semi-Annual Report
THORNBURG FUND FAMILY
Thornburg Investment Management is a privately-owned global investment firm that offers a range of solutions for retail and institutional investors. Founded in 1982 and headquartered in Santa Fe, New Mexico, we manage approximately $54 billion (as of March 31, 2016) across eight equity and 11 bond mutual funds, separate accounts for high-net-worth investors and institutional accounts, and five UCITS funds for non-U.S. investors.
The fund outlined in this report is one of many equity and fixed-income products available from Thornburg Investment Management.
EQUITY FUNDS
| | • | | Thornburg Core Growth Fund |
| | • | | Thornburg International Value Fund |
| | • | | Thornburg Better World International Fund |
| | • | | Thornburg International Growth Fund |
| | • | | Thornburg Developing World Fund |
| | • | | Thornburg Investment Income Builder Fund |
| | • | | Thornburg Global Opportunities Fund |
FIXED INCOME FUNDS
| | • | | Thornburg Low Duration Income Fund |
| | • | | Thornburg Limited Term U.S. Government Fund |
| | • | | Thornburg Limited Term Income Fund |
| | • | | Thornburg Strategic Income Fund |
| | • | | Thornburg Low Duration Municipal Fund |
| | • | | Thornburg Limited Term Municipal Fund |
| | • | | Thornburg Intermediate Municipal Fund |
| | • | | Thornburg California Limited Term Municipal Fund |
| | • | | Thornburg New Mexico Intermediate Municipal Fund |
| | • | | Thornburg New York Intermediate Municipal Fund |
| | • | | Thornburg Strategic Municipal Income Fund |
Before investing, carefully consider the Fund’s investment goals, risks, charges, and expenses. For a prospectus or summary prospectus containing this and other information, contact your financial advisor or visit thornburg.com. Read it carefully before investing.
For additional information, please visit thornburg.com
Thornburg Investment Management, Inc. 2300 North Ridgetop Road, Santa Fe, NM 87506
Semi-Annual Report 23
This Semi-Annual Report is submitted for the general information of shareholders of the Fund. It is not authorized for distribution to prospective investors in the Fund unless preceded or accompanied by an effective prospectus.
| | | | |
| Investment Advisor: | | Distributor: | | |
| Thornburg Investment Management® | | Thornburg Securities Corporation® | | |
| 800.847.0200 | | 800.847.0200 | | TH178 |

2 Semi-Annual Report
Semi-Annual Report
Thornburg New York Intermediate Municipal Fund
March 31, 2016
| | | | |
SHARE CLASS | | NASDAQ SYMBOL | | CUSIP |
Class A | | THNYX | | 885-215-665 |
Class I | | TNYIX | | 885-216-705 |
Minimum investments for Class I shares may be higher than those for Class A. Class I shares may not be available to all investors.
Investments carry risks, including possible loss of principal. Portfolios investing in bonds have the same interest rate, inflation, and credit risks that are associated with the underlying bonds. The value of bonds will fluctuate relative to changes in interest rates, decreasing when interest rates rise. Unlike bonds, bond funds have ongoing fees and expenses. Please see the Fund’s prospectus for a discussion of the risks associated with an investment in the Fund. Investments in the Funds are not FDIC insured, nor are they bank deposits or guaranteed by a bank or any other entity.
The laddering strategy does not assure or guarantee better performance and cannot eliminate the risk of investment losses.
Semi-Annual Report 3
| | |
| LETTER TO SHAREHOLDERS | | |
| |
Thornburg New York Intermediate Municipal Fund | | March 31, 2016 (Unaudited) |
April 11, 2016
Dear Fellow Shareholder:
We are pleased to present the semi-annual report for Thornburg New York Intermediate Municipal Fund. The net asset value (NAV) of the Class A shares increased by 18 cents to $13.36 per share during the six months ended March 31, 2016. If you were with us for the entire period, you received dividends of 14.13 cents per share. If you reinvested your dividends, you received 14.19 cents per share. Dividends were higher for Class I shares, to account for varying class-specific expenses. The Class A shares underperformed the Fund’s benchmark index, with a 2.45% total return (without sales charge) for the six months ended March 31, 2016, compared to the 3.04% total return for the BofA Merrill Lynch 3-15 Year U.S. Municipal Securities Index.
Throughout the six-month period, the Fund maintained a lower risk posture on interest rates than its benchmark; its average effective duration (a measure of interest-rate sensitivity) was 4.90 years, compared to 5.58 years for the benchmark. The shorter duration helped relative price performance by 0.08%. The Fund’s position along the yield curve subtracted 0.22% and sector selection added 0.59% of relative price performance. Our underweight in high-quality bonds subtracted 0.62%. Other factors include the amortization of bond premiums and accretion of discounts, which is not an active management decision but rather a standard accounting practice—and the largest component of this category. We also include the effects of security selection and of price change derived from factors we cannot account for (statistically: “unexplained error”). Together, these three account for 0.62% of price performance relative to the index.
Global Fears Sway the Municipal Markets
The past six months have been a roller-coaster ride for the municipal markets. During the last quarter of 2015, it seemed that every day was spent anxiously awaiting the first Federal Reserve rate increase—for what seemed like an eternity. When that rate increase finally came, it was met with a yawn. Markets quickly reminded investors that while the Federal Reserve (the Fed) has control over short-term rates, the market forces of supply and demand for bonds have a much heavier influence on interest rates—especially long-term rates.
As in life, expectations in the bond markets mean a lot. And perhaps more important than the Fed’s initial rate hike was its stated intent to raise rates four additional times in 2016. The expectation for higher rates evaporated almost immediately after the Fed’s statement, with the release of weaker-than-expected economic data, collapsing commodity prices, an emerging-markets stock rout, and profound weakness in Europe, with the European Central Bank retrenching in its effort to drive European rates lower, spurring fears of deflation.
A Roller-Coaster Ride to Start the Year
The beginning of 2016 proved volatile for equity markets domestically and globally, and the fixed income markets followed suit. The 10-year U.S. Treasury stood at a respectable 2.27% at the end of 2015. But within six weeks, that rate fell 0.61% to 1.66%, before bouncing back to 1.77% by March 31, 2016.
Chart I Credit Spreads: Investors Are Not Being Paid to Assume the Risk
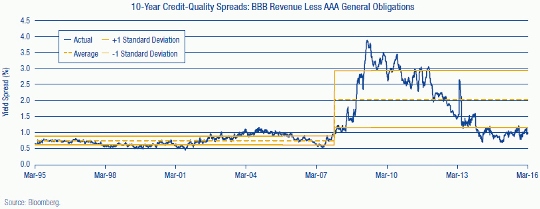
4 Semi-Annual Report
LETTER TO SHAREHOLDERS,
CONTINUED
| | |
| |
Thornburg New York Intermediate Municipal Fund | | March 31, 2016 (Unaudited) |
As we noted, the Fed has backed off of its initial intent to raise rates four times in a stepped-up fashion. Rates will probably remain low and income elusive. Unfortunately, municipal bond investors have only a few “levers” to pull to seek higher income. The most effective two are credit quality and duration. An investor looking for yield can always buy a bond with a longer maturity—the duration lever. And bonds of lower credit quality can be purchased to drive up yield—the credit quality lever. In both instances, the investor assumes risk in hope of higher returns.
At Thornburg, we always evaluate both of these options as a means to increase the total return of the portfolios, but over the past six months, as in the prior six months, we found them less than optimal. Real rates (interest rates after inflation is subtracted) remained low during the entire period, and the municipal yield curve was fairly flat. Investors who reached for yield by buying longer maturities gained very little relative to the duration risk that comes with longer-dated bonds. And the amount investors are compensated to invest in lower-rated bonds is minimal; credit spreads remain at extremely tight levels. Investors who purchased debt from lower-rated issuers were essentially buying weaker credits at very expensive levels. Chart I on the previous page shows credit spreads remaining near historically low levels, offering investors little compensation for risk assumed. Not a great strategy!
We believe that the only logical thing to do when you’re not being paid to take risk is to take less of it. That is exactly what we have been seeking to do in Thornburg New York Intermediate Municipal Fund for quite some time. The Fund is being managed on the bearish (shorter) end of its duration range. We have also actively sought to increase the average credit quality, at least at the margins. Cash reserve positions are being managed in a manner we view as conservative.
Continued volatility seems a certainty. That can manifest via interest-rate movements, or changing credit spreads. While the likelihood of the Fed raising rates appears low, given the aforementioned anemic economic growth in the U.S. and abroad, investors are wise to recall that rates moved up over 1.00% in 2013 without the Fed having taken any action whatsoever. It may be unlikely, but that does not mean it’s a probability that can be ignored. And any event that causes spreads to widen appreciably may prove detrimental to an investor who assumed undue credit risk in search of return.
We will do what we have always done with Thornburg New York Intermediate Municipal Fund: provide you with a tax-exempt laddered portfolio that aims to generate attractive levels of income, while attempting to preserve principal and minimize volatility. And, of course, we’ll seek to only assume the risk for which we believe we are adequately compensated.
New York
Demand for municipal debt in New York continues to be exceptionally high. Excess demand has led to very high municipal prices. To some extent, investors in municipal bonds from New York are even more desperate for yield than their national counterparts. The good news is that, for the most part, the credit picture throughout the state is strong. Incomes are up and housing prices have stabilized and are increasing in most areas, leading to stronger fundamentals for most local issuers.
Staying Faithful to Thornburg’s Tested Approach
While a focus on risk mitigation may not make the sexiest marketing story, we believe it is in the best long-term interest of shareholders. And to any investor considering abandoning municipal bonds for the promise of higher returns elsewhere, we remind you that if the first quarter of 2016 has taught us anything, it is that in a volatile market, an appropriate asset allocation may save you a few sleepless nights.
We will continue to strive to manage your assets to fulfill the Fund’s objectives.
Sincerely,
| | | | |
 | |  | | |
Christopher Ryon,CFA Portfolio Manager Managing Director | | Nicholos Venditti Portfolio Manager Managing Director | | |
The matters discussed in this report may constitute forward-looking statements made pursuant to the safe harbor provisions of the Securities Litigation Reform Act of 1995. These include any advisor or portfolio manager prediction, assessment, analysis or outlook for individual securities, industries, investment styles, market sectors and/or markets. These statements involve risks and uncertainties. In addition to the general risks described for each fund in its current prospectus, other factors bearing on these reports include the accuracy of the advisor’s or portfolio manager’s forecasts and predictions, the appropriateness of the investment strategies designed by the advisor or portfolio manager and the ability of the advisor or portfolio manager to implement their strategies efficiently and successfully. Any one or more of these factors, as well as other risks affecting the securities markets generally, could cause the actual results of any fund to differ materially as compared to its benchmarks.
The views expressed by the portfolio managers reflect their professional opinions and are subject to change. Under no circumstances does the information contained within represent a recommendation to buy or sell any security.
Semi-Annual Report 5
| | |
| PERFORMANCE SUMMARY | | |
| |
Thornburg New York Intermediate Municipal Fund | | March 31, 2016 (Unaudited) |
Average Annual Total Returns
| | | | | | | | | | | | | | | | | | | | |
| | | 1-YR | | | 3-YR | | | 5-YR | | | 10-YR | | | SINCE
INCEP. | |
A Shares (Incep: 9/5/97) | | | | | | | | | | | | | | | | | | | | |
Without sales charge | | | 2.85 | % | | | 2.30 | % | | | 4.23 | % | | | 3.96 | % | | | 4.08 | % |
With sales charge | | | 0.80 | % | | | 1.62 | % | | | 3.81 | % | | | 3.75 | % | | | 3.97 | % |
I Shares (Incep: 2/1/10) | | | 3.17 | % | | | 2.63 | % | | | 4.56 | % | | | — | | | | 4.15 | % |
30-day Yields, A Shares
(with sales charge)
| | | | |
Annualized Distribution Yield | | | 1.99 | % |
| |
SEC Yield | | | 0.56 | % |
Performance data shown represents past performance and is no guarantee of future results. Investment return and principal value will fluctuate so shares, when redeemed, may be worth more or less than their original cost. Current performance may be lower or higher than quoted. For performance current to the most recent month end, visit thornburg.com or call 800-847-0200. The performance information does not reflect the deduction of taxes that a shareholder would pay on distributions or the redemption of Fund shares. Returns reflect the reinvestment of dividends and capital gains. Class A shares are sold with a maximum sales charge of 2.00%. There is no sales charge for Class I shares.
As disclosed in the most recent prospectus, the total annual fund operating expenses are as follows: A shares, 1.05%; I shares, 0.76%. Thornburg Investment Management and/or Thornburg Securities Corporation have contractually agreed to waive fees and reimburse expenses through at least February 1, 2017, for all share classes, resulting in net expense ratios of the following: A shares, 0.99%; I shares, 0.67%. For more detailed information on fund expenses and waivers/reimbursements please see the Fund’s prospectus.
Without the fee waivers and expense reimbursements described above, the Annualized Distribution yield would have been 1.93%, and the SEC yield would have been 0.49%.
Glossary
BofA Merrill Lynch 3-15 Year Municipal Securities Index – subset of the BofA Merrill Lynch U.S. Municipal Securities Index including all securities with a remaining term to final maturity greater than or equal to 3 years and less than 15 years.
Unless otherwise noted, index returns reflect the reinvestment of income dividends and capital gains, if any, but do not reflect fees, brokerage commissions or other expenses of investing. Investors may not make direct investments into any index. The performance of any index is not indicative of the performance of any particular investment.
Annualized Distribution Yield – The distribution yield reflects actual distributions made to shareholders. The annualized distribution yield is calculated by summing the last 30 days of income at a given month end and annualizing to a 360-day year. The result is divided by the ending maximum offering price.
Bond Credit Ratings (Credit Quality) – A bond credit rating assesses the financial ability of a debt issuer to make timely payments of principal and interest. Ratings of AAA (the highest), AA, A, and BBB are investment-grade quality. Ratings of BB, B, CCC, CC, C and D (the lowest) are considered below investment grade, speculative grade, or junk bonds.
Credit Spread/Quality Spread – The difference between the yields of securities with different credit qualities.
Duration – A bond’s sensitivity to interest rates. Effective duration incorporates the embedded option features, such as call provisions. Bonds with longer durations experience greater price volatility than bonds with shorter durations.
Laddering – Involves building a portfolio of bonds with staggered maturities so that a portion matures each year. Money that comes in from maturing bonds is typically invested in bonds with longer maturities at the far end of the portfolio.
SEC Yield – SEC yield is computed in accordance with SEC standards measuring the net investment income per share over a specified 30-day period expressed as a percentage of the maximum offering price of the Fund’s shares at the end of the period.
Yield Curve – A line that plots the interest rates, at a set point in time, of bonds having equal credit quality, but differing maturity dates.
6 Semi-Annual Report
| | |
| FUND SUMMARY | | |
| |
Thornburg New York Intermediate Municipal Fund | | March 31, 2016 (Unaudited) |
Objectives and Strategies
The Fund’s primary investment objective is to obtain as high a level of current income exempt from federal, New York State and New York City individual income taxes as is consistent, in the view of the Fund’s investment advisor, with preservation of capital.
The secondary goal of the Fund is to reduce expected changes in its share price compared to long-term bond portfolios.
The Fund offers New York investors double (or for New York City residents triple) tax-free yields in a laddered municipal bond portfolio with a dollar-weighted average maturity of normally three to ten years (may be subject to Alternative Minimum Tax). Laddering involves building a portfolio of bonds with staggered maturities so that a portion of the portfolio matures each year. Cash from maturing bonds, if not needed for other purposes, is typically invested in bonds with longer maturities at the far end of the ladder. We regard the strategy as a good compromise for managing different types of risk.
Key Portfolio Attributes
| | | | |
Number of Bonds | | | 76 | |
| |
Effective Duration | | | 5.1 Yrs | |
| |
Average Maturity | | | 7.9 Yrs | |
Long Term Stability of Principal
Net Asset Value History of A Shares

Security Credit Ratings
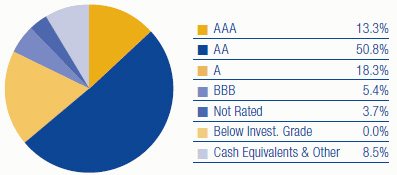
A bond credit rating assesses the financial ability of a debt issuer to make timely payments of principal and interest. Ratings of AAA (the highest), AA, A, and BBB are investment-grade quality. Ratings of BB, B, CCC, CC, C and D (the lowest) are considered below investment grade, speculative grade, or junk bonds. Credit quality ratings for Thornburg’s municipal portfolios used the highest rating available from either Standard & Poor’s or Moody’s Investors Service.
Portfolio Ladder
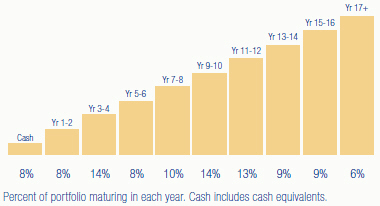
There is no guarantee that the Fund will meet its investment objectives.
All data is subject to change. Charts may not add up to 100% due to rounding.
Semi-Annual Report 7
| | |
| SCHEDULE OF INVESTMENTS | | |
| |
Thornburg New York Intermediate Municipal Fund | | March 31, 2016 (Unaudited) |
| | | | | | | | | | |
ISSUER-DESCRIPTION | | CREDIT RATING†
S&P/ MOODY’S | | PRINCIPAL
AMOUNT | | | VALUE | |
City of New York GO, 5.00% due 6/1/2019 pre-refunded 6/1/2016 (City Budget Financial Management; Insured: AGM) | | AA/Aa2 | | $ | 255,000 | | | $ | 256,925 | |
City of New York GO, 5.00% due 8/1/2019 (City Budget Financial Management) | | AA/Aa2 | | | 1,000,000 | | | | 1,131,090 | |
City of New York GO, 5.00% due 8/1/2023 (City Budget Financial Management) | | AA/Aa2 | | | 1,000,000 | | | | 1,231,250 | |
City of New York GO, 5.00% due 8/1/2025 (City Budget Financial Management) | | AA/Aa2 | | | 400,000 | | | | 422,940 | |
City of New York GO, 5.00% due 8/1/2030 (City Budget Financial Management) | | AA/Aa2 | | | 1,000,000 | | | | 1,199,970 | |
County of Nassau GO, 5.00% due 4/1/2026 (Insured: BAM) | | AA/NR | | | 1,000,000 | | | | 1,207,950 | |
Dutchess County Local Development Corp., 5.00% due 7/1/2021 (Health Quest Systems, Inc.; Insured: AGM) | | AA/A2 | | | 535,000 | | | | 610,622 | |
Dutchess County Local Development Corp., 5.00% due 7/1/2022 (Health Quest Systems, Inc.; Insured: AGM) | | AA/A2 | | | 510,000 | | | | 580,064 | |
Erie County Industrial Development Agency, 5.25% due 5/1/2025 (Buffalo City School District) | | AA/Aa2 | | | 1,000,000 | | | | 1,129,050 | |
Government of Guam, 5.375% due 12/1/2024 (Layon Solid Waste Disposal Facility) | | BBB+/NR | | | 1,000,000 | | | | 1,110,820 | |
Government of Guam, 5.00% due 11/15/2033 (Economic Development) | | A/NR | | | 2,000,000 | | | | 2,306,800 | |
Guam Waterworks Authority, 5.00% due 7/1/2028 (Water and Wastewater System) | | A-/Baa2 | | | 500,000 | | | | 576,670 | |
Hempstead Town Local Development Corp., 5.00% due 7/1/2028 (Hofstra University) | | A/A3 | | | 500,000 | | | | 576,410 | |
Long Island Power Authority, 5.00% due 9/1/2022 (Electric System Capital Improvements) | | A-/Baa1 | | | 395,000 | | | | 475,335 | |
Long Island Power Authority, 5.25% due 9/1/2029 (Electric System Capital Improvements) | | A-/Baa1 | | | 645,000 | | | | 816,022 | |
Metropolitan Transportation Authority, 6.25% due 11/15/2023 | | AA-/A1 | | | 200,000 | | | | 228,316 | |
Metropolitan Transportation Authority, 6.25% due 11/15/2023 pre-refunded 11/15/2018 | | NR/NR | | | 800,000 | | | | 912,064 | |
Monroe County Industrial Development Corp., 4.00% due 6/1/2016 (St. John Fisher College) | | BBB+/NR | | | 880,000 | | | | 884,673 | |
Monroe County Industrial Development Corp., 5.00% due 1/15/2028 (Monroe Community College Association, Inc.; Insured: AGM) | | AA/A2 | | | 250,000 | | | | 288,940 | |
Monroe County Industrial Development Corp., 5.00% due 1/15/2029 (Monroe Community College Association, Inc.; Insured: AGM) | | AA/A2 | | | 300,000 | | | | 344,946 | |
Nassau County IDA, 4.75% due 3/1/2026 (New York Institute of Technology) | | BBB+/Baa2 | | | 1,000,000 | | | | 1,082,930 | |
Nassau County Sewer & Storm Water Finance Authority, 5.00% due 10/1/2021 (Sewerage and Storm Water Resource Facilities) | | AAA/Aa3 | | | 275,000 | | | | 330,701 | |
Nassau County Sewer & Storm Water Finance Authority, 5.00% due 10/1/2028 (Sewerage and Storm Water Resource Facilities) | | AAA/Aa3 | | | 400,000 | | | | 492,844 | |
Nassau County Sewer & Storm Water Finance Authority, 5.00% due 10/1/2031 (Sewerage and Storm Water Resource Facilities) | | AAA/Aa3 | | | 1,000,000 | | | | 1,212,540 | |
New York City Health and Hospitals Corp. GO, 5.00% due 2/15/2020 (Healthcare Facilities Improvements) | | A+/Aa3 | | | 770,000 | | | | 885,508 | |
New York City Health and Hospitals Corp. GO, 5.00% due 2/15/2025 (Healthcare Facilities Improvements) | | A+/Aa3 | | | 1,000,000 | | | | 1,134,760 | |
New York City Housing Development Corp., 0.42% due 11/1/2018 put 4/1/2016 (Multi-Family Housing; SPA: JPMorgan | | | | | | | | | | |
Chase Bank, N.A.) (daily demand notes) | | AA+/Aa2 | | | 1,175,000 | | | | 1,175,000 | |
New York City Municipal Water Finance Authority, 5.00% due 6/15/2032 (Water and Sewer System) | | AA+/Aa1 | | | 1,000,000 | | | | 1,210,810 | |
New York City Transitional Finance Authority, 5.00% due 1/15/2020 (Educational Facilities) (State Aid Withholding) | | AA/Aa2 | | | 1,000,000 | | | | 1,119,890 | |
New York City Transitional Finance Authority, 0.37% due 11/1/2022 put 4/1/2016 (City Capital Projects; SPA: Royal Bank of Canada) (daily demand notes) | | AAA/Aa1 | | | 1,980,000 | | | | 1,980,000 | |
New York City Transitional Finance Authority, 0.42% due 11/15/2028 put 4/1/2016 (City Capital Projects; SPA: TD Bank, N.A.) (daily demand notes) | | AAA/Aa1 | | | 300,000 | | | | 300,000 | |
New York City Transitional Finance Authority, 0.39% due 11/1/2042 put 4/1/2016 (City Capital Projects; SPA: Barclays Bank plc) (daily demand notes) | | AAA/Aa1 | | | 1,400,000 | | | | 1,400,000 | |
New York City Trust for Cultural Resources, 5.25% due 12/1/2018 (Lincoln Center for the Performing Arts) | | A+/A2 | | | 175,000 | | | | 194,388 | |
New York Municipal Bond Bank Agency, 5.00% due 4/15/2018 (Insured: AGM) | | AA/A2 | | | 1,000,000 | | | | 1,079,070 | |
New York State Dormitory Authority, 5.00% due 10/1/2023 (School District Financing Program; Insured: AGM) (State Aid Withholding) | | AA/A2 | | | 400,000 | | | | 426,164 | |
New York State Dormitory Authority, 5.00% due 7/1/2016 (Bishop Henry B. Hucles Nursing Home; Insured: SONYMA) | | NR/Aa1 | | | 600,000 | | | | 606,576 | |
New York State Dormitory Authority, 5.50% due 2/15/2017 (Mental Health Services Facilities) | | AA/NR | | | 1,000,000 | | | | 1,043,190 | |
New York State Dormitory Authority, 5.00% due 10/1/2018 (School District Financing Program; Insured: AGM) | | AA/Aa3 | | | 805,000 | | | | 842,537 | |
New York State Dormitory Authority, 5.25% due 10/1/2018 (School District Financing Program; Insured: AGM) | | AA/Aa3 | | | 775,000 | | | | 859,374 | |
New York State Dormitory Authority, 5.00% due 7/1/2020 (NYSARC, Inc. Developmental Disability Programs) | | NR/Aa2 | | | 1,175,000 | | | | 1,346,303 | |
New York State Dormitory Authority, 4.00% due 10/1/2020 (School District Financing Program; Insured: AGM) (State Aid Withholding) | | AA/A1 | | | 325,000 | | | | 363,571 | |
New York State Dormitory Authority, 5.25% due 7/1/2022 (St. John’s University; Insured: Natl-Re) | | AA-/A3 | | | 1,000,000 | | | | 1,226,940 | |
New York State Dormitory Authority, 5.00% due 1/15/2023 (Municipal Health Facilities) | | AA-/Aa3 | | | 1,000,000 | | | | 1,075,680 | |
New York State Dormitory Authority, 5.00% due 10/1/2023 (School District Financing Program) (State Aid Withholding) | | AA-/NR | | | 575,000 | | | | 703,892 | |
New York State Dormitory Authority, 5.00% due 7/1/2024 (Miriam Osborn Memorial Home Assoc.) | | NR/NR | | | 1,540,000 | | | | 1,673,472 | |
New York State Dormitory Authority, 5.00% due 7/1/2024 (Bishop Henry B. Hucles Nursing Home; Insured: SONYMA) | | NR/Aa1 | | | 1,000,000 | | | | 1,007,460 | |
New York State Dormitory Authority, 5.00% due 10/1/2024 (School District Financing Program; Insured: AGM) (State Aid Withholding) | | AA/Aa3 | | | 1,000,000 | | | | 1,177,460 | |
New York State Dormitory Authority, 5.00% due 7/1/2025 (Miriam Osborn Memorial Home Assoc.) | | NR/NR | | | 1,105,000 | | | | 1,192,295 | |
New York State Dormitory Authority, 5.00% due 7/1/2027 (Columbia University Teachers College) | | A+/A1 | | | 750,000 | | | | 883,733 | |
New York State Dormitory Authority, 5.00% due 7/1/2027 (Interagency Council Pooled Loan Program) | | NR/Aa2 | | | 1,000,000 | | | | 1,165,140 | |
New York State Dormitory Authority, 5.25% due 7/1/2027 (Health Quest Systems; Insured: AGM) | | AA/A3 | | | 500,000 | | | | 525,620 | |
New York State Dormitory Authority, 5.00% due 12/15/2027 (Metropolitan Transportation Authority & State Urban Development Corp.) | | AAA/Aa1 | | | 2,500,000 | | | | 3,030,300 | |
New York State Dormitory Authority, 5.00% due 10/1/2028 (School District Financing Program; Insured: AGM) | | AA/NR | | | 200,000 | | | | 242,076 | |
8 Semi-Annual Report
| | |
| SCHEDULE OF INVESTMENTS, CONTINUED | | |
| |
Thornburg New York Intermediate Municipal Fund | | March 31, 2016 (Unaudited) |
| | | | | | | | | | |
ISSUER-DESCRIPTION | | CREDIT RATING†
S&P/ MOODY’S | | PRINCIPAL
AMOUNT | | | VALUE | |
New York State Dormitory Authority, 5.25% due 5/1/2030 pre-refunded 5/1/2019 (North Shore Long Island Jewish Medical) | | A-/A3 | | $ | 1,000,000 | | | $ | 1,132,530 | |
New York State Dormitory Authority, 5.00% due 7/1/2034 (Pratt Institute) | | NR/A3 | | | 1,000,000 | | | | 1,154,650 | |
New York State Energy Research and Development Authority, 0.39% due 5/1/2039 put 4/1/2016 (Consolidated Edison Co.; LOC: Mizuho Bank, Ltd.) (daily demand notes) | | AAA/Aa2 | | | 1,200,000 | | | | 1,200,000 | |
New York State Thruway Authority, 5.00% due 5/1/2019 (New NY Bridge Project) | | A-/A3 | | | 2,000,000 | | | | 2,241,860 | |
New York State Thruway Authority, 5.00% due 4/1/2022 (Multi-Year Highway and Bridge Capital Program) | | AA/NR | | | 1,000,000 | | | | 1,064,820 | |
New York State Thruway Authority, 5.00% due 1/1/2028 (Multi-Year Highway and Bridge Capital Program) | | A/A2 | | | 500,000 | | | | 609,085 | |
New York State Urban Development Corp., 5.25% due 1/1/2021 | | AA/NR | | | 1,000,000 | | | | 1,122,830 | |
Onondaga Civic Development Corp., 5.00% due 7/1/2021 (Le Moyne College) | | NR/Baa2 | | | 1,000,000 | | | | 1,105,490 | |
Onondaga Civic Development Corp., 5.50% due 12/1/2031 (State University of New York Upstate Medical University) | | A+/NR | | | 1,000,000 | | | | 1,190,430 | |
Port Authority New York & New Jersey, 5.00% due 8/15/2022 (Insured: AGM) | | AA/Aa3 | | | 1,000,000 | | | | 1,059,040 | |
Sales Tax Asset Receivable Corp., 5.00% due 10/15/2029 (New York Local Government Assistance Corp.) | | AAA/Aa1 | | | 250,000 | | | | 309,453 | |
Sales Tax Asset Receivable Corp., 5.00% due 10/15/2030 (New York Local Government Assistance Corp.) | | AAA/Aa1 | | | 1,000,000 | | | | 1,232,640 | |
Sales Tax Asset Receivable Corp., 5.00% due 10/15/2031 (New York Local Government Assistance Corp.) | | AAA/Aa1 | | | 1,000,000 | | | | 1,224,730 | |
Syracuse Industrial Development Agency, 5.25% due 5/1/2026 (Syracuse City School District) | | AA/Aa2 | | | 2,150,000 | | | | 2,545,879 | |
Town of Amherst Development Corp., 5.00% due 10/1/2020 (University at Buffalo Foundation Facility-Student Housing; Insured: AGM) | | AA/A2 | | | 1,000,000 | | | | 1,149,510 | |
Triborough Bridge & Tunnel Authority GO, 5.00% due 11/15/2025 pre-refunded 11/15/2017 (MTA Bridges and Tunnels) | | AA-/Aa3 | | | 1,410,000 | | | | 1,508,813 | |
Triborough Bridge & Tunnel Authority GO, 5.00% due 11/15/2028 (MTA Bridges and Tunnels) | | AA-/Aa3 | | | 1,000,000 | | | | 1,218,620 | |
Triborough Bridge & Tunnel Authority GO, 5.00% due 11/15/2029 (MTA Bridges and Tunnels) | | AA-/Aa3 | | | 1,000,000 | | | | 1,207,610 | |
United Nations Development Corp., 5.00% due 7/1/2019 (One, Two and Three U.N. Plaza Project) | | NR/A1 | | | 230,000 | | | | 258,713 | |
United Nations Development Corp., 5.00% due 7/1/2025 (One, Two and Three U.N. Plaza Project) | | NR/A1 | | | 710,000 | | | | 791,522 | |
Utility Debt Securitization Authority, 5.00% due 12/15/2029 (Long Island Power Authority-Electric Service) | | AAA/Aaa | | | 1,000,000 | | | | 1,222,950 | |
Utility Debt Securitization Authority, 5.00% due 12/15/2030 (Long Island Power Authority-Electric Service) | | AAA/Aaa | | | 1,000,000 | | | | 1,218,840 | |
West Seneca Central School District GO, 5.00% due 11/15/2023 (Facilities Improvements; Insured: BAM) (State Aid Withholding) | | AA/A2 | | | 1,300,000 | | | | 1,604,954 | |
| | | | | | | | | | |
TOTAL INVESTMENTS — 97.74% (Cost $71,295,187) | | | | | | | | $ | 76,656,050 | |
OTHER ASSETS LESS LIABILITIES — 2.26% | | | | | | | | | 1,773,417 | |
| | | | | | | | | | |
NET ASSETS — 100.00% | | | | | | | | $ | 78,429,467 | |
| | | | | | | | | | |
Footnote Legend
| † | Credit ratings are unaudited. Rating changes may have occurred subsequent to the reporting period end. Bonds issued with a maturity of one year or less are assigned Moody’s ratings from MIG-1 to MIG-4 and Standard and Poor’s ratings from SP-1+ to SP-3 with MIG-1 and SP-1+ being the strongest ratings. |
Portfolio Abbreviations
To simplify the listings of securities, abbreviations are used per the table below:
| | |
| AGM | | Insured by Assured Guaranty Municipal Corp. |
| BAM | | Insured by Build America Mutual Insurance Co. |
| GO | | General Obligation |
| IDA | | Industrial Development Authority |
| Natl-Re | | Insured by National Public Finance Guarantee Corp. |
| SONYMA | | State of New York Mortgage Authority |
See notes to financial statements.
Semi-Annual Report 9
| | |
| STATEMENT OF ASSETS AND LIABILITIES | | |
| |
Thornburg New York Intermediate Municipal Fund | | March 31, 2016 (Unaudited) |
| | | | |
ASSETS | | | | |
Investments at value (cost $71,295,187) (Note 2) | | $ | 76,656,050 | |
Cash | | | 73,516 | |
Receivable for investments sold | | | 695,010 | |
Receivable for fund shares sold | | | 140,658 | |
Interest receivable | | | 1,000,622 | |
Prepaid expenses and other assets | | | 580 | |
| | | | |
Total Assets | | | 78,566,436 | |
| | | | |
| |
LIABILITIES | | | | |
Payable for fund shares redeemed | | | 36,681 | |
Payable to investment advisor and other affiliates (Note 3) | | | 44,540 | |
Accounts payable and accrued expenses | | | 36,623 | |
Dividends payable | | | 19,125 | |
| | | | |
Total Liabilities | | | 136,969 | |
| | | | |
| |
NET ASSETS | | $ | 78,429,467 | |
| | | | |
NET ASSETS CONSIST OF | | | | |
Distribution in excess of net investment income | | $ | (16,847 | ) |
Net unrealized appreciation on investments | | | 5,360,863 | |
Accumulated net realized gain (loss) | | | (478,475 | ) |
Net capital paid in on shares of beneficial interest | | | 73,563,926 | |
| | | | |
| | $ | 78,429,467 | |
| | | | |
| |
NET ASSET VALUE | | | | |
Class A Shares: | | | | |
Net asset value and redemption price per share ($47,220,405 applicable to 3,534,673 shares of beneficial interest outstanding - Note 4) | | $ | 13.36 | |
Maximum sales charge, 2.00% of offering price | | | 0.27 | |
| | | | |
Maximum offering price per share | | $ | 13.63 | |
| | | | |
| |
Class I Shares: | | | | |
Net asset value, offering and redemption price per share ($31,209,062 applicable to 2,336,097 shares of beneficial interest outstanding - Note 4) | | $ | 13.36 | |
| | | | |
See notes to financial statements.
10 Semi-Annual Report
| | |
| STATEMENT OF OPERATIONS | | |
| |
Thornburg New York Intermediate Municipal Fund | | Six Months Ended March 31, 2016 (Unaudited) |
| | | | |
INVESTMENT INCOME | | | | |
Interest income (net of premium amortized of $338,852) | | $ | 1,243,064 | |
| | | | |
| |
EXPENSES | | | | |
Investment advisory fees (Note 3) | | | 199,262 | |
Administration fees (Note 3) | | | | |
Class A Shares | | | 30,384 | |
Class I Shares | | | 7,772 | |
Distribution and service fees (Note 3) | | | | |
Class A Shares | | | 60,768 | |
Transfer agent fees | | | | |
Class A Shares | | | 17,693 | |
Class I Shares | | | 13,640 | |
Registration and filing fees | | | | |
Class A Shares | | | 89 | |
Class I Shares | | | 89 | |
Custodian fees (Note 3) | | | 13,570 | |
Professional fees | | | 22,509 | |
Accounting fees (Note 3) | | | 1,526 | |
Trustee fees | | | 1,830 | |
Other expenses | | | 4,899 | |
| | | | |
Total Expenses | | | 374,031 | |
Less: | | | | |
Expenses reimbursed by investment advisor (Note 3) | | | (29,397 | ) |
| | | | |
Net Expenses | | | 344,634 | |
| | | | |
Net Investment Income | | | 898,430 | |
| | | | |
| |
REALIZED AND UNREALIZED GAIN (LOSS) | | | | |
Net realized gain (loss) from investments | | | 864 | |
Net change in unrealized appreciation (depreciation) on investments | | | 1,065,566 | |
| | | | |
Net Realized and Unrealized Gain | | | 1,066,430 | |
| | | | |
Net Increase in Net Assets Resulting from Operations | | $ | 1,964,860 | |
| | | | |
See notes to financial statements.
Semi-Annual Report 11
| | |
| STATEMENTS OF CHANGES IN NET ASSETS | | |
| |
Thornburg New York Intermediate Municipal Fund | | |
| | | | | | | | |
| | | SIX MONTHS ENDED
MARCH 31, 2016* | | | YEAR ENDED
SEPTEMBER 30, 2015 | |
INCREASE (DECREASE) IN NET ASSETS FROM | | | | | | | | |
| | |
OPERATIONS | | | | | | | | |
Net investment income | | $ | 898,430 | | | $ | 1,811,546 | |
Net realized gain (loss) from investments | | | 864 | | | | (51,436 | ) |
Net unrealized appreciation (depreciation) on investments | | | 1,065,566 | | | | (179,372 | ) |
| | | | | | | | |
| | |
Net Increase (Decrease) in Net Assets Resulting from Operations | | | 1,964,860 | | | | 1,580,738 | |
| | |
DIVIDENDS TO SHAREHOLDERS | | | | | | | | |
From net investment income | | | | | | | | |
Class A Shares | | | (517,540 | ) | | | (1,122,691 | ) |
Class I Shares | | | (380,890 | ) | | | (688,855 | ) |
| | |
FUND SHARE TRANSACTIONS (NOTE 4) | | | | | | | | |
Class A Shares | | | (3,277,172 | ) | | | (4,324,129 | ) |
Class I Shares | | | 553,004 | | | | 6,419,536 | |
| | | | | | | | |
Net Increase (Decrease) in Net Assets | | | (1,657,738 | ) | | | 1,864,599 | |
| | |
NET ASSETS | | | | | | | | |
Beginning of Period | | | 80,087,205 | | | | 78,222,606 | |
| | | | | | | | |
| | |
End of Period | | $ | 78,429,467 | | | $ | 80,087,205 | |
| | | | | | | | |
Distribution in excess of net investment income | | $ | (16,847 | ) | | $ | (16,847 | ) |
See notes to financial statements.
12 Semi-Annual Report
| | |
| NOTES TO FINANCIAL STATEMENTS | | |
| |
Thornburg New York Intermediate Municipal Fund | | March 31, 2016 (Unaudited) |
NOTE 1 – ORGANIZATION
Thornburg New York Intermediate Municipal Fund (the “Fund”) is a diversified series of Thornburg Investment Trust (the “Trust”). The Trust is organized as a Massachusetts business trust under a Declaration of Trust dated June 3, 1987 and is registered as a diversified, open-end management investment company under the Investment Company Act of 1940, as amended. The Fund is currently one of twenty separate series of the Trust. Each series is considered to be a separate entity for financial reporting and tax purposes and bears expenses directly attributable to it. The Fund’s primary investment objective is to obtain as high a level of current income exempt from federal, New York State, and New York City individual income tax as is consistent, in the view of Thornburg Investment Management, Inc., the Trust’s investment advisor (the “Advisor”), with the preservation of capital. The Fund’s secondary objective is to reduce expected changes in its share price compared to long-term bond portfolios. The Fund will invest primarily in municipal obligations within the state of New York.
The Fund currently offers two classes of shares of beneficial interest: Class A and Institutional Class (“Class I”) shares. Each class of shares of the Fund represents an interest in the same portfolio of investments, except that (i) Class A shares are sold subject to a front-end sales charge collected at the time the shares are purchased and bear a service fee and (ii) Class I shares are sold at net asset value without a sales charge at the time of purchase and may be subject to a service fee, and (iii) the respective classes may have different reinvestment privileges and conversion rights. Additionally, the Fund may allocate among its classes certain expenses, to the extent allocable to specific classes, including transfer agent fees, government registration fees, certain printing and postage costs, and administrative and legal expenses. Currently, class specific expenses of the Fund are limited to service and distribution fees, administration fees, and certain registration and transfer agent expenses.
NOTE 2 – SIGNIFICANT ACCOUNTING POLICIES
The following is a summary of significant accounting policies followed by the Fund in the preparation of its financial statements. The Fund is an investment company and prepares its financial statements in conformity with United States generally accepted accounting principles (“GAAP”), including investment company accounting and reporting guidance in the Financial Accounting Standards Board (the “FASB”) Accounting Standard Codification Topic 946. The preparation of financial statements in conformity with GAAP requires management to make estimates and assumptions that affect the reported amounts of assets and liabilities and disclosure of contingent assets and liabilities at the date of the financial statements and the reported amounts of increases (decreases) in net assets from operations during the reporting period. Actual results could differ from those estimates.
Significant accounting policies of the Trust are as follows:
Valuation Policy and Procedures: The Trustees of the Trust have appointed the Advisor to assist the Trustees in obtaining market values for portfolio investments, perform certain evaluation and supervisory functions respecting professional pricing service providers appointed by the Trustees’ Audit Committee (the “Audit Committee”) to assist in determining fair values for portfolio investments, assist in calculating fair values for portfolio investments in certain circumstances, and to perform other functions in connection with the valuation of investments. The Advisor acts through its Valuation and Pricing Committee (the “Committee”) and other employees of the Advisor. The Committee regularly reviews its own valuation calculations, as well as the valuations, valuation techniques and services furnished by pricing service providers, considers circumstances which may require valuation calculations by the Committee, and reviews previous valuation calculations. The Committee reports to the Audit Committee on the Committee’s activities, the performance of pricing service providers, and other matters relating to valuation of portfolio investments.
In those instances when the Committee assists in calculating a fair value for a portfolio investment, the Committee seeks to determine the price that the Fund would reasonably expect to receive upon a sale of the investment in an orderly transaction between market participants on the valuation date. The Committee customarily utilizes quotations from securities broker dealers in calculating valuations, but also may utilize prices obtained from pricing service providers or other methods approved by the Audit Committee. Because fair values calculated by the Committee are estimates, the calculation of a value for an investment may differ from the price that would be realized by the Fund upon a sale of the investment, and the difference could be material to the Fund’s financial statements. The Committee’s calculation of a fair value for an investment may also differ from the prices obtained by other persons (including other mutual funds) for the investment.
Valuation of Investments: Debt obligations held by the Fund which are not listed or traded on exchanges or for which no reported market exists are ordinarily valued at the valuation obtained from a pricing service provider approved by the Audit Committee.
In any case when a pricing service provider fails to provide a valuation for a debt obligation held by the Fund, the Committee calculates a fair value for the obligation using alternative methods under procedures approved by the Audit Committee. Additionally, in cases when management believes that a valuation obtained from a pricing service provider merits review for significant reasons, the Committee decides whether or not to use the valuation calculated by the pricing service provider or to use an alternative method approved by the Audit Committee to calculate a fair value for the obligation.
Semi-Annual Report 13
| | |
| NOTES TO FINANCIAL STATEMENTS, CONTINUED | | |
| |
Thornburg New York Intermediate Municipal Fund | | March 31, 2016 (Unaudited) |
Valuation Measurements: The Fund categorizes its investments based upon the inputs used in valuing those investments, according to a three-level hierarchy established in guidance from the FASB. Categorization of investments using this hierarchy is intended by the FASB to maximize the use of observable inputs in valuing investments and minimize the use of unobservable inputs by requiring that the most observable inputs be used when available. Observable inputs are those that market participants would use in valuing an investment based on available market information. Unobservable inputs are those that reflect assumptions about the information market participants would use in valuing an investment. An investment’s level within the hierarchy is based on the lowest level input that is deemed significant to the valuation. The methodologies and inputs used to value investments are not necessarily indications of the risk or liquidity associated with those investments.
Various inputs are used in calculating valuations for the Fund’s investments. These inputs are generally summarized according to the three-level hierarchy below:
Level 1: Quoted prices in active markets for identical investments.
Level 2: Other direct or indirect significant observable inputs (including quoted prices for similar investments in active markets and other observable inputs, such as interest rates, prepayment rates, credit risk, etc.).
Level 3: Significant unobservable inputs (including the Committee’s own assumptions in calculating the fair values of investments).
Valuations for debt obligations held by the Fund are typically calculated by pricing service providers approved by the Audit Committee and are characterized as Level 2 within the valuation hierarchy.
In a limited number of cases the Committee calculates a fair value for investments using broker quotations or other methods approved by the Audit Committee. When the Committee uses a single broker quotation to calculate a fair value for an investment without other significant observable inputs, or if a fair value is calculated using other significant inputs that are considered unobservable, the investment is characterized as Level 3 within the hierarchy. Other significant unobservable inputs used to calculate a fair value in these instances might include an income-based valuation approach which considers discounted anticipated future cash flows from the investment, and application of discounts due to the nature or duration of any restrictions on the disposition of the investment.
Valuations based upon the use of inputs from Levels 1, 2 or 3 may not represent the actual price received upon the disposition of an investment, and the Fund may receive a price that is lower than the valuation based upon these inputs when it sells the investment.
The following table displays a summary of the fair value hierarchy measurements of the Fund’s investments as of March 31, 2016. In any instance when valuation inputs from more than one level are used to determine the fair value of a specific investment, the investment is placed in the level of the table based upon the lowest level input that is significant in determining the fair value of the investment:
| | | | | | | | | | | | | | | | |
| | | FAIR VALUE MEASUREMENTS AT MARCH 31, 2016 | |
| | | TOTAL | | | LEVEL 1 | | | LEVEL 2 | | | LEVEL 3 | |
Assets | | | | | | | | | | | | | | | | |
Investments in Securities | | | | | | | | | | | | | | | | |
Municipal Bonds | | $ | 76,656,050 | | | $ | — | | | $ | 76,656,050 | | | $ | — | |
| | | | | | | | | | | | | | | | |
Total Investments in Securities | | $ | 76,656,050 | | | $ | — | | | $ | 76,656,050 | | | $ | — | |
In accordance with the guidance prescribed in Accounting Standards Update No. 2011-04, it is the policy of the Fund to recognize transfers between levels and the underlying events which caused the movement. The Fund recognized no transfers between levels for the six months ended March 31, 2016.
Federal Income Taxes: It is the policy of the Trust to comply with the provisions of the Internal Revenue Code applicable to “regulated investment companies” and to distribute to shareholders substantially all taxable income including net realized gains on investments (if any), and tax exempt income of the Fund. Therefore, no provision for federal income tax is required.
Management reviews each uncertain tax position believed to be material to the preparation of the Fund’s financial statements, to assess if it is more likely than not that the position would be sustained upon examination, based upon the technical merits of the position. As of March 31, 2016, management has not identified any such position for which an asset or liability must be reflected in the Statement of Assets and Liabilities. The Fund’s tax returns remain subject to examination for three years after filing.
When-Issued and Delayed Delivery Transactions: The Fund may engage in when-issued or delayed delivery transactions. To the extent the Fund engages in such transactions, it will do so for the purpose of acquiring portfolio investments consistent with the Fund’s investment objectives and not for the purpose of investment leverage or to speculate on interest rate and, or market changes. At the time the Fund makes a commitment to purchase an investment on a when-issued or delayed delivery basis, the Fund will record the transaction and reflect the value in determining its net asset value.
14 Semi-Annual Report
| | |
| NOTES TO FINANCIAL STATEMENTS, CONTINUED | | |
| |
Thornburg New York Intermediate Municipal Fund | | March 31, 2016 (Unaudited) |
When effecting such transactions, assets of an amount sufficient to make payment for the portfolio investments to be purchased will be segregated on the Fund’s records on the trade date. Investments purchased on a when-issued or delayed delivery basis do not earn interest until the settlement date.
Dividends: Net investment income of the Fund is declared daily as a dividend on shares for which the Fund has received payment. Dividends are paid monthly and are reinvested in additional shares of the Fund at net asset value per share at the close of business on the dividend payment date, or at the shareholder’s option, paid in cash. Net realized capital gains, to the extent available, will be distributed at least annually.
General: Investment transactions are accounted for on a trade date basis. Interest income is accrued as earned. Premiums and discounts on investments purchased are amortized to call dates or maturity dates of the respective investments. Realized gains and losses from the sale of investments are recorded on an identified cost basis. Net investment income (other than class specific expenses) and realized and unrealized gains and losses are allocated daily to each class of shares based upon the relative net asset value of outstanding shares (or the value of the dividend-eligible shares, as appropriate) of each class of shares at the beginning of the day (after adjusting for the current capital shares activity of the respective class). Expenses common to all Funds are allocated among the Funds comprising the Trust based upon their relative net asset values or other appropriate allocation methods.
Guarantees and Indemnifications: Under the Trust’s organizational documents (and under separate agreements with the independent Trustees), its officers and Trustees are indemnified against certain liabilities arising out of the performance of their duties to the Fund. Additionally, in the normal course of business the Trust enters into contracts with service providers that contain general indemnification clauses. The Trust’s maximum exposure under these arrangements is unknown. However, based on experience, the Trust expects the risk of loss to be remote.
NOTE 3 – INVESTMENT ADVISORY FEE AND OTHER TRANSACTIONS WITH AFFILIATES
Pursuant to an investment advisory agreement, the Advisor serves as the investment advisor and performs services for the Fund for which the fees are payable at the end of each month. For the six months ended March 31, 2016, these fees were payable at annual rates ranging from .50 of 1% to .275 of 1% per annum of the average daily net assets of the Fund depending on the Fund’s asset size. The Fund pays to the Advisor the costs of personnel who perform certain accounting services for the Fund. For the six months ended March 31, 2016 the Fund paid $1,526 to the Advisor for these accounting services. The Trust has also entered into administrative service agreements with the Advisor, whereby the Advisor will perform certain administrative services for the shareholders of each class of the fund shares, and for which fees will be payable at an annual rate of up to .125 of 1% per annum of the average daily net assets attributable to each class of shares.
The Trust has an underwriting agreement with Thornburg Securities Corporation (the “Distributor”), an affiliate of the Advisor, which acts as the distributor of the Fund’s shares. For the six months ended March 31, 2016, the Distributor has advised the Fund that it earned net commissions aggregating $369 from the sale of Class A shares.
Pursuant to a service plan under Rule 12b-1 of the Investment Company Act of 1940, the Fund may reimburse to the Advisor an amount not to exceed .25 of 1% per annum of the average daily net assets attributable to each class of shares of the Fund for payments made by the Advisor to securities dealers and other financial institutions to obtain various shareholder and distribution related services. For the six months ended March 31, 2016, there were no 12b-1 service plan fees charged for Class I shares. The Advisor may pay out of its own resources additional expenses for distribution of the Fund’s shares and shareholder services.
The Advisor and Distributor have contractually agreed to waive fees and reimburse expenses incurred by the Fund so that actual expenses of certain share classes do not exceed levels as specified in the Fund’s most recent prospectus. The agreement may be terminated by the Fund at any time, but may not be terminated by the Advisor or Distributor before February 1, 2017, unless the Advisor ceases to be the investment advisor to the Trust or the Distributor ceases to be the distributor of the Fund prior to that date. The Advisor and Distributor retain the right to be repaid by the Fund for fee waivers and expense reimbursements if expenses fall below the contractual limit prior to the end of the fiscal year.
For the six months ended March 31, 2016, the Advisor contractually reimbursed certain class specific expenses, administrative fees, and distribution fees of $16,874 for Class A shares and $12,523 for Class I shares.
Certain officers and Trustees of the Trust are also officers or directors of the Advisor and Distributor. The compensation of independent Trustees is borne by the Trust.
The Fund may purchase or sell securities from, or to an affiliated fund, provided the affiliation is due solely to having a common investment advisor, common officers, or common trustees, and provided that all such transactions will comply with Rule 17a-7 under the 1940 Act. For the six months ended March 31, 2016, the Fund had no transactions with affiliated funds.
Semi-Annual Report 15
| | |
| NOTES TO FINANCIAL STATEMENTS, CONTINUED | | |
| |
Thornburg New York Intermediate Municipal Fund | | March 31, 2016 (Unaudited) |
NOTE 4 – SHARES OF BENEFICIAL INTEREST
At March 31, 2016, there were an unlimited number of shares with no par value of beneficial interest authorized. Transactions in shares of beneficial interest were as follows:
| | | | | | | | | | | | | | | | |
| | | SIX MONTHS ENDED
MARCH 31, 2016 (UNAUDITED) | | | YEAR ENDED
SEPTEMBER 30, 2015 (AUDITED) | |
| | | SHARES | | | AMOUNT | | | SHARES | | | AMOUNT | |
Class A Shares | | | | | | | | | | | | | | | | |
Shares sold | | | 153,904 | | | $ | 2,044,927 | | | | 419,229 | | | $ | 5,533,635 | |
Shares issued to shareholders in reinvestment of dividends | | | 30,584 | | | | 406,501 | | | | 67,191 | | | | 887,864 | |
Shares repurchased | | | (431,231 | ) | | | (5,728,600 | ) | | | (813,285 | ) | | | (10,745,628 | ) |
| | | | | | | | | | | | | | | | |
| | | | |
Net increase (decrease) | | | (246,743 | ) | | $ | (3,277,172 | ) | | | (326,865 | ) | | $ | (4,324,129 | ) |
| | | | | | | | | | | | | | | | |
| | | | |
Class I Shares | | | | | | | | | | | | | | | | |
Shares sold | | | 320,802 | | | $ | 4,260,824 | | | | 858,058 | | | $ | 11,351,074 | |
Shares issued to shareholders in reinvestment of dividends | | | 28,495 | | | | 378,836 | | | | 51,871 | | | | 685,089 | |
Shares repurchased | | | (307,474 | ) | | | (4,086,656 | ) | | | (425,508 | ) | | | (5,616,627 | ) |
| | | | | | | | | | | | | | | | |
| | | | |
Net increase (decrease) | | | 41,823 | | | $ | 553,004 | | | | 484,421 | | | $ | 6,419,536 | |
| | | | | | | | | | | | | | | | |
NOTE 5 – INVESTMENT TRANSACTIONS
For the six months ended March 31, 2016, the Fund had purchase and sale transactions of investments (excluding short-term investments) of $1,451,738 and $4,180,010, respectively.
NOTE 6 – INCOME TAXES
At March 31, 2016, information on the tax components of capital was as follows:
| | | | |
Cost of investments for tax purposes | | $ | 71,295,187 | |
| | | | |
Gross unrealized appreciation on a tax basis | | $ | 5,374,561 | |
Gross unrealized depreciation on a tax basis | | | (13,698 | ) |
| | | | |
Net unrealized appreciation (depreciation) on investments (tax basis) | | $ | 5,360,863 | |
| | | | |
At March 31, 2016, the Fund had deferred tax basis capital losses occurring subsequent to October 31, 2014, through September 30, 2015, of $53,522. For tax purposes, such losses will be recognized in the year ending September 30, 2016.
At March 31, 2016, the Fund had cumulative tax basis capital losses of $425,816, (of which $127,505 are short-term and $298,311 are long-term) generated after September 30, 2011, which may be carried forward to offset future capital gains. To the extent such carryforwards are used, capital gain distributions may be reduced to the extent provided by regulations. Such capital loss carryforwards do not expire.
OTHER NOTES
Risks: The Fund’s investments subject it to risks including, but not limited to, credit risk, interest rate risk, management risk, market and economic risk, liquidity risk, diversification risk, and the risks of investing primarily in the obligations of a single state. Please see the Fund’s prospectus for a discussion of the risks associated with an investment in the Fund.
Subsequent Events: Fund management believes no events have occurred between March 31, 2016 and the date of issuance of the financial statements that require adjustment to or disclosure in the accompanying financial statements.
16 Semi-Annual Report
This page intentionally left blank.
Semi-Annual Report 17
FINANCIAL HIGHLIGHTS
Thornburg New York Intermediate Municipal Fund
| | | | | | | | | | | | | | | | | | | | | | | | | | | | | | | | | | | | | | | | | | | | | | | | |
| | | PER SHARE PERFORMANCE (FOR A SHARE OUTSTANDING THROUGHOUT THE PERIOD) | | RATIOS TO AVERAGE NET ASSETS | | | SUPPLEMENTAL DATA | |
UNLESS
OTHERWISE
NOTED,
PERIODS
ARE
FISCAL
YEARS
ENDED
SEPT. 30, | | NET ASSET
VALUE
BEGINNING
OF PERIOD | | | NET
INVESTMENT
INCOME
(LOSS)+ | | NET
REALIZED &
UNREALIZED
GAIN (LOSS)
ON
INVESTMENTS | | | TOTAL
FROM
INVESTMENT
OPERATIONS | | DIVIDENDS
FROM NET
INVESTMENT
INCOME | | | DIVIDENDS
FROM NET
REALIZED
GAINS | | TOTAL
DIVIDENDS | | | NET
ASSET
VALUE
END
OF
PERIOD | | NET
INVESTMENT
INCOME
(LOSS) (%) | | | EXPENSES,
AFTER
EXPENSE
REDUCTIONS
(%) | | | EXPENSES,
AFTER
EXPENSE
REDUCTIONS
AND NET OF
CUSTODY
CREDITS (%) | | | EXPENSES,
BEFORE
EXPENSE
REDUCTIONS
(%) | | | TOTAL
RETURN
(%)(a) | | PORTFOLIO
TURNOVER
RATE (%)(a) | | NET ASSETS
AT END OF
PERIOD
(THOUSANDS) | |
CLASS A SHARES | | | | | | | | | | | | | | | | | | | | | | | | | | | | | | | | | | | | | | | | | | |
2016(b)(c) | | $ | 13.18 | | | 0.14 | | | 0.18 | | | 0.32 | | | (0.14 | ) | | — | | | (0.14 | ) | | $13.36 | | | 2.13 | (d) | | | 0.99 | (d) | | | 0.99 | (d) | | | 1.06 | (d) | | 2.45 | | 2.04 | | $ | 47,220 | |
2015(c) | | $ | 13.22 | | | 0.29 | | | (0.04 | ) | | 0.25 | | | (0.29 | ) | | — | | | (0.29 | ) | | $13.18 | | | 2.16 | | | | 0.98 | | | | 0.98 | | | | 1.05 | | | 1.87 | | 7.72 | | $ | 49,845 | |
2014(c) | | $ | 12.93 | | | 0.30 | | | 0.29 | | | 0.59 | | | (0.30 | ) | | — | | | (0.30 | ) | | $13.22 | | | 2.27 | | | | 0.99 | | | | 0.99 | | | | 1.05 | | | 4.59 | | 14.12 | | $ | 54,301 | |
2013(c) | | $ | 13.44 | | | 0.34 | | | (0.51 | ) | | (0.17) | | | (0.34 | ) | | — | | | (0.34 | ) | | $12.93 | | | 2.54 | | | | 0.99 | | | | 0.99 | | | | 1.05 | | | (1.32) | | 11.31 | | $ | 54,061 | |
2012(c) | | $ | 12.93 | | | 0.37 | | | 0.51 | | | 0.88 | | | (0.37 | ) | | — | | | (0.37 | ) | | $13.44 | | | 2.80 | | | | 0.99 | | | | 0.99 | | | | 1.05 | | | 6.90 | | 13.37 | | $ | 55,862 | |
2011(c) | | $ | 12.82 | | | 0.41 | | | 0.11 | | | 0.52 | | | (0.41 | ) | | — | | | (0.41 | ) | | $12.93 | | | 3.26 | | | | 0.99 | | | | 0.99 | | | | 1.07 | | | 4.20 | | 26.39 | | $ | 45,551 | |
CLASS I SHARES | | | | | | | | | | | | | | | | | | | | | | | | | | | | | | | | | | | | | | | | | | |
2016(b) | | $ | 13.18 | | | 0.16 | | | 0.18 | | | 0.34 | | | (0.16 | ) | | — | | | (0.16 | ) | | $13.36 | | | 2.45 | (d) | | | 0.67 | (d) | | | 0.67 | (d) | | | 0.75 | (d) | | 2.61 | | 2.04 | | $ | 31,209 | |
2015 | | $ | 13.22 | | | 0.33 | | | (0.04 | ) | | 0.29 | | | (0.33 | ) | | — | | | (0.33 | ) | | $13.18 | | | 2.47 | | | | 0.67 | | | | 0.67 | | | | 0.76 | | | 2.19 | | 7.72 | | $ | 30,242 | |
2014 | | $ | 12.93 | | | 0.33 | | | 0.30 | | | 0.63 | | | (0.34 | ) | | — | | | (0.34 | ) | | $13.22 | | | 2.57 | | | | 0.67 | | | | 0.67 | | | | 0.73 | | | 4.93 | | 14.12 | | $ | 23,922 | |
2013 | | $ | 13.44 | | | 0.38 | | | (0.51 | ) | | (0.13) | | | (0.38 | ) | | — | | | (0.38 | ) | | $12.93 | | | 2.86 | | | | 0.67 | | | | 0.67 | | | | 0.74 | | | (1.00) | | 11.31 | | $ | 7,060 | |
2012 | | $ | 12.92 | | | 0.41 | | | 0.52 | | | 0.93 | | | (0.41 | ) | | — | | | (0.41 | ) | | $13.44 | | | 3.12 | | | | 0.67 | | | | 0.67 | | | | 0.77 | | | 7.33 | | 13.37 | | $ | 4,707 | |
2011 | | $ | 12.82 | | | 0.45 | | | 0.10 | | | 0.55 | | | (0.45 | ) | | — | | | (0.45 | ) | | $12.92 | | | 3.54 | | | | 0.67 | | | | 0.67 | | | | 0.71 | | | 4.45 | | 26.39 | | $ | 3,514 | |
| (a) | Not annualized for periods less than one year. |
| (b) | Unaudited Six Month Period Ended March 31. |
| (c) | Sales loads are not reflected in computing total return. |
| + | Based on weighted average shares outstanding. |
See notes to financial statements.
| | | | |
| 18 Semi-Annual Report | | | | Semi-Annual Report 19 |
| | |
| EXPENSE EXAMPLE | | |
| |
Thornburg New York Intermediate Municipal Fund | | March 31, 2016 (Unaudited) |
As a shareholder of the Fund, you incur two types of costs:
| | (1) | transaction costs, including |
(a) sales charges (loads) on purchase payments, for Class A shares;
(b) a deferred sales charge on redemptions of any part or all of a purchase of $1 million of Class A shares within 12 months of purchase;
| | (2) | ongoing costs, including management fees; distribution and/or service (12b-1) fees; and other Fund expenses. |
This example is intended to help you understand your ongoing costs (in dollars) of investing in the Fund and to compare these costs with the ongoing costs of investing in other mutual funds.
The example is based on a $1,000 investment beginning on October 1, 2015, and held until March 31, 2016.
| | | | | | | | | | | | |
| | | BEGINNING
ACCOUNT VALUE
10/1/15 | | | ENDING
ACCOUNT VALUE
3/31/16 | | | EXPENSES PAID
DURING PERIOD†
10/1/15–3/31/16 | |
Class A Shares | | | | | | | | | | | | |
Actual | | $ | 1,000.00 | | | $ | 1,024.50 | | | $ | 5.01 | |
Hypothetical* | | $ | 1,000.00 | | | $ | 1,020.05 | | | $ | 5.00 | |
Class I Shares | | | | | | | | | | | | |
Actual | | $ | 1,000.00 | | | $ | 1,026.10 | | | $ | 3.39 | |
Hypothetical* | | $ | 1,000.00 | | | $ | 1,021.66 | | | $ | 3.38 | |
| † | Expenses are equal to the annualized expense ratio for each class (A: 0.99%; I: 0.67%) multiplied by the average account value over the period, multiplied by 183/366 to reflect the one-half year period. |
| * | Hypothetical assumes a rate of return of 5% per year before expenses. |
ACTUAL EXPENSES
For each class of shares, the first line of the accompanying table provides information about actual account values and actual expenses. You may use the information in this line, together with the amount you invested, to estimate the expenses that you paid over the period. Simply divide your account value by $1,000 (for example, an $8,600 account value divided by $1,000 = 8.6), then multiply the result by the number in the first line for your class of shares under the heading entitled “Expenses Paid During Period” to estimate the expenses you paid on your account during this period.
HYPOTHETICAL EXAMPLE FOR COMPARISON PURPOSES
For each class of shares, the second line of the accompanying table provides information about hypothetical account values and hypothetical expenses based on the Fund’s actual expense ratio and an assumed rate of return of 5% per year before expenses, which is not the Fund’s actual return. The hypothetical account values and expenses may not be used to estimate the actual ending account balance or expenses you paid for the period. You may use this information to compare the ongoing costs of investing in the Fund and other funds. To do so, compare this 5% hypothetical example with the 5% hypothetical examples that appear in the shareholder reports of the other funds.
Please note that the expenses shown in the table are meant to highlight your ongoing costs only and do not reflect any transactional costs, such as sales charges (loads), redemption fees, or exchange fees. Therefore, the second line of the table for each class of shares is useful in comparing ongoing costs only, and will not help you determine the relative total costs of owning different funds. In addition, if these transactional costs were included, your costs would have been higher.
20 Semi-Annual Report
| | |
| OTHER INFORMATION | | |
| |
Thornburg New York Intermediate Municipal Fund | | March 31, 2016 (Unaudited) |
PORTFOLIO PROXY VOTING
Policies and Procedures:
The Trust has delegated to Thornburg Investment Management, Inc. (the “Advisor”) voting decisions respecting proxies for the Fund’s voting securities. The Advisor makes voting decisions in accordance with its Proxy Voting Policy. A description of the Policy is available (i) without charge, upon request, by calling the Advisor toll-free at 1-800-847-0200, (ii) on the Thornburg website at www.thornburg. com, and (iii) on the Securities and Exchange Commission’s website at www.sec.gov.
Information regarding how proxies were voted is available on or before August 31 of each year for the twelve months ending the preceding June 30. This information is available (i) without charge, upon request by calling the Advisor toll-free at 1-800-847-0200, (ii) on the Thornburg website at www.thornburg.com, and (iii) on the Securities and Exchange Commission’s website at www.sec.gov.
AVAILABILITY OF QUARTERLY PORTFOLIO SCHEDULE
The Fund files with the Securities and Exchange Commission schedules of its portfolio holdings on Form N-Q for the first and third quarters of each fiscal year. The Fund’s Forms N-Q are available on the Commission’s website at www.sec.gov, or may be reviewed and copied at the Commission’s Public Reference Room in Washington, D.C. Information on the operation of the Public Reference Room may be obtained by calling 1-800-SEC-0330. The Fund also makes this information available on its website at www.thornburg. com/download or upon request by calling 1-800-847-0200.
Semi-Annual Report 21
TRUSTEES’ STATEMENT TO SHAREHOLDERS
Revised and Readopted September 15, 2015
The Trustees believe current and prospective shareholders should know how we discharge our responsibilities in supervising the Funds’ investment advisor and in reviewing the advisor’s contract for renewal. Since 2005, we have issued a statement which sets out clearly the three principal guidelines that we follow in supervising the Trust’s investment advisor on your behalf. In accordance with our customary practice, in September of 2015 we again reviewed our statement and concluded we should reissue this statement outlining the principal features of our supervision of the advisor’s performance of investment management services for the Funds.
We begin with the premise that each shareholder selected his or her Fund because its investments are managed by the investment advisor identified in the prospectus and in accordance with the objective and policies described in the prospectus. We realize, as each of you do, that if you believe that your Fund’s stated objective and policies no longer serve your personal investment goals, you can sell your shares and leave the Fund.
Therefore, we believe that our primary supervisory task—our principal obligation to you—is to assess the nature and quality of the advisor’s services, and to confirm that the advisor actively and competently pursues the Fund’s objective, in accordance with the policies set out in the prospectus. To do this, we meet regularly with management to review your Fund’s portfolio and to discuss the advisor’s specific actions and judgments in pursuing the Fund’s objective. We do not substitute our own judgment for the advisor’s decisions in selecting investments; the advisor is paid to exercise its informed judgment on investment decisions, and we seek to confirm, in reviewing the advisor’s performance, that the advisor is doing just that.
Second, we are conscious of costs and the effect that costs have on shareholders’ returns. We try to make sure that your Fund’s fees and costs are reasonable in relationship to the services rendered and that they are generally in line with those charged by other expert investment advisors, consistent with our belief that the Fund’s investors searched for and expect that expertise and attention and have decided to pay a reasonable price for it. We do not put the management contract “out to bid” as a matter of course, and we would not do so unless we had concluded that the advisor materially had failed to pursue the Fund’s objectives in accordance with its policies, or for other equally important reasons. We believe that any other approach would be inconsistent with your interests and contrary to your expectations when you bought shares of the Fund in the first place.
Finally, because we believe that most Thornburg Fund shareholders have invested with a long-term perspective, we try not to focus too much on the fashions of the moment and on short-term performance. The market will not favor any specific investment objective or set of policies at all times and under all economic circumstances. A fund will experience periods of both high and low returns relative to other funds and other investments. Even if one of our Funds is not favored by the market at a particular time, we believe that the advisor is nonetheless obliged to remain true to the Fund’s objective and policies, and we watch to see that it does so.
Trustees of Thornburg Investment Trust
22 Semi-Annual Report
THORNBURG FUND FAMILY
Thornburg Investment Management is a privately-owned global investment firm that offers a range of solutions for retail and institutional investors. Founded in 1982 and headquartered in Santa Fe, New Mexico, we manage approximately $54 billion (as of March 31, 2016) across eight equity and 11 bond mutual funds, separate accounts for high-net-worth investors and institutional accounts, and five UCITS funds for non-U.S. investors.
The fund outlined in this report is one of many equity and fixed-income products available from Thornburg Investment Management.
Equity Funds
| | • | | Thornburg Core Growth Fund |
| | • | | Thornburg International Value Fund |
| | • | | Thornburg Better World International Fund |
| | • | | Thornburg International Growth Fund |
| | • | | Thornburg Developing World Fund |
| | • | | Thornburg Investment Income Builder Fund |
| | • | | Thornburg Global Opportunities Fund |
Fixed Income Funds
| | • | | Thornburg Low Duration Income Fund |
| | • | | Thornburg Limited Term U.S. Government Fund |
| | • | | Thornburg Limited Term Income Fund |
| | • | | Thornburg Strategic Income Fund |
| | • | | Thornburg Low Duration Municipal Fund |
| | • | | Thornburg Limited Term Municipal Fund |
| | • | | Thornburg Intermediate Municipal Fund |
| | • | | Thornburg California Limited Term Municipal Fund |
| | • | | Thornburg New Mexico Intermediate Municipal Fund |
| | • | | Thornburg New York Intermediate Municipal Fund |
| | • | | Thornburg Strategic Municipal Income Fund |
Before investing, carefully consider the Fund’s investment goals, risks, charges, and expenses. For a prospectus or summary prospectus containing this and other information, contact your financial advisor or visit thornburg.com. Read it carefully before investing.
For additional information, please visit thornburg.com
Thornburg Investment Management, Inc. 2300 North Ridgetop Road, Santa Fe, NM 87506
Semi-Annual Report 23

This Semi-Annual Report is submitted for the general information of shareholders of the Fund. It is not authorized for distribution to prospective investors in the Fund unless preceded or accompanied by an effective prospectus.
| | | | |
| Investment Advisor: | | Distributor: | | |
| Thornburg Investment Management® | | Thornburg Securities Corporation® | | |
| 800.847.0200 | | 800.847.0200 | | TH1069 |

About Thornburg Investment Management
It’s more than what we do. It’s how we do it.
At Thornburg, we are very different in how we think, invest, and are structured. We believe this difference is what makes us successful in helping individuals reach their long-term financial goals.
Flexible Perspective Our perspective on investment opportunities is more flexible than most, viewing a wide range of opportunities beyond conventional boundaries to find hidden value.
Portfolio Construction
Structured for Excellence How we think and how we invest is made possible by how we’re structured.
Collaboration
Disciplined construction guided more by our convictions than convention.
TEAM APPROACH
Collectively, we hone ideas via borderless cross-pollination for better judgment and better results.
CONVICTION
FAR FROM THE HERD
Thorough analysis and our relative-value framework lead to conviction in our securities selection.
ACCESS & TRANSPARENCY
UNCONVENTIONAL
Active management means we seek the best value for our clients rather than using conventional benchmarks as our starting point.
2 | Semi-Annual Reports
2 Semi-Annual Reports
Semi-Annual Reports
Thornburg Limited Term U.S. Government Fund
Thornburg Limited Term Income Fund
Thornburg Low Duration Income Fund
March 31, 2016
| | | | |
Limited Term U.S. Government Fund | | NASDAQ Symbols | | CUSIPS |
Class A | | LTUSX | | 885-215-103 |
Class B | | LTUBX | | 885-215-848 |
Class C | | LTUCX | | 885-215-830 |
Class I | | LTUIX | | 885-215-699 |
Class R3 | | LTURX | | 885-215-491 |
Class R4 | | LTUGX | | 885-216-747 |
Class R5 | | LTGRX | | 885-216-861 |
| | |
Limited Term Income Fund | | | | |
Class A | | THIFX | | 885-215-509 |
Class C | | THICX | | 885-215-764 |
Class I | | THIIX | | 885-215-681 |
Class R3 | | THIRX | | 885-215-483 |
Class R4 | | THRIX | | 885-216-762 |
Class R5 | | THRRX | | 885-216-853 |
| | |
Low Duration Income Fund | | | | |
Class A | | TLDAX | | 885-216-812 |
Class I | | TLDIX | | 885-216-796 |
Class I, R3, R4, R5 shares may not be available to all investors. Minimum investments for Class I shares may be higher than those for other classes.
Investments carry risks, including possible loss of principal. Portfolios investing in bonds have the same interest rate, inflation, and credit risks that are associated with the underlying bonds. The value of bonds will fluctuate relative to changes in interest rates, decreasing when interest rates rise. Unlike bonds, bond funds have ongoing fees and expenses. Investments in mortgage backed securities (MBS) may bear additional risk. Please see the Fund’s prospectus for a discussion of the risks associated with an investment in the Fund. Investments in the Funds are not FDIC insured, nor are they bank deposits or guaranteed by a bank or any other entity.
The laddering strategy does not assure or guarantee better performance and cannot eliminate the risk of investment losses.
Semi-Annual Reports 3
LETTER TO SHAREHOLDERS
March 31, 2016 (Unaudited)
April 18, 2016
Dear Fellow Shareholder:
We are pleased to present the semi-annual report for Thornburg Limited Term U.S. Government Fund, Thornburg Limited Term Income Fund, and Thornburg Low Duration Income Fund for the six months ended March 31, 2016. The net asset value (NAV) of a Class A share of the Limited Term U.S. Government Fund increased two cents in the period to $13.28, and if you were invested for the entire period, you received dividends of 8.76 cents per share. If you reinvested your dividends, you received 8.78 cents per share. The NAV of a Class A share of Thornburg Limited Term Income Fund increased three cents in the period to $13.35. If you were invested for the entire period, you received dividends of 12.52 cents per share. If you reinvested your dividends, you received 12.57 cents per share. The NAV of a Class A share of Thornburg Low Duration Income Fund increased two cents in the period to $12.40. If you were invested for the entire period, you received dividends of 5.14 cents per share. If you reinvested your dividends, you received 5.15 cents per share. Dividends per share were lower or higher depending on the share class expenses as a percentage of NAV to account for varying class-specific expenses.
Putting income and price change together, the Class A shares of Thornburg Limited Term U.S. Government Fund produced total return of 0.82% (without sales charge) over the six-month period. The Barclays Intermediate Government Bond Index produced a total return of 1.43% over the same period. The average return for the Lipper Short-Intermediate U.S. Government Bond category was 0.65%. The Class A shares of Thornburg Limited Term Income Fund produced a total return of 1.18% (without sales charge) over the six-month period ended March 31, 2016. The Barclays Intermediate Government/Credit Bond Index produced a 1.74% total return over the same time period. The return for the Lipper Short-Intermediate Investment Grade Debt category was 1.06%. Class A shares of Thornburg Low Duration Income Fund produced a total return of 0.58% (without sales charge) over the six-month period. The Barclays U.S. 1-3 Yr Aggregate Bond Index produced a total return of 0.61% over the same period. The average return for the Lipper Short Investment Grade Bond category was 0.58%. The indices reflect no deduction for fees and expenses.
A Fickle Federal Reserve, and Markets Reaction
Late in the quarter ended December 31, 2015, the big event—the one fixed income investors and markets had anticipated for not just months, but years—came and went with hardly a sound. On December 17, the U.S. Federal Reserve (the Fed), in a long-telegraphed move, raised its benchmark short-term rate by 0.25%. It was arguably the most anticipated Fed rate hike in history. The quarter ended December 31, 2015, finished broadly negative for most fixed-income asset classes, with core fixed-income returns having largely dictated movements in Treasury yields. Ten-year Treasury rates moved from 2.04% at the beginning of the quarter to end 2015 at 2.27%, while the two-year Treasury climbed from 0.63% to 1.05%, causing the yield curve to flatten and driving negative total returns for the Thornburg core bond funds, their benchmark indices, and their Morningstar category averages.
Shortly after the beginning of the year, with weak economic data from the United States, a collapse in global commodity prices, a free-fall in emerging markets stocks, and with the European Central Bank redoubling its quantitative easing efforts to fight potential deflation, the Fed quickly backed off of its intent to raise rates four times in 2016—but only after markets had already figured that out. As of this writing, markets now expect only one rate hike, while the Fed itself maintains a projection for two. We believe it may prove challenging for the Fed to square that discrepancy in the face of rising wages and inflationary pressures in the United States. So we expect the coming year to be one of reconciliation—with the Fed and the markets, again, each expecting a different pace of tightening and with a different ending (or “terminal”) Fed funds rate.
The U.S. Treasury yield curve flattened during the quarter ended December 31, 2015, as short rates rose in the wake of the Fed increase, and longer rates remained relatively stable. It continues to flatten at this writing, with most of that flattening driven by long-term rates falling due to weak U.S. economic growth, weak inflation expectations, and even some cynicism regarding the potential for future Fed rate increases. Investment-grade credit spreads have been relatively well behaved for most of the period.
Volatility by Almost any Measure
Global risk markets endured an unpleasant ride during both quarters. Yet if you had closed your eyes for any part of that journey, it would have been easy to think that not much changed. Snapshots taken at December 31, 2015, and at March 31, 2016 would show things looking tranquil. But intra-quarter lows for each of these periods would show how tumultuous the journey really was. See Table I on the next page, which shows the S&P 500 Index falling to a low on February 11, both high-yield and investment-grade indices, crude oil prices, and Treasury yields all hit their year-to-date lows, followed by steadily improving trends. But roughly flat returns with volatility in the interim is not what investors tend to grow excited about.
4 Semi-Annual Reports
| | |
| LETTER TO SHAREHOLDERS, | | |
| |
CONTINUED | | |
| |
| | March 31, 2016 (Unaudited) |
Table I Markets, Spreads, and Oil Prices Swoon through February 11, 2016, Then Recover
| | | | | | | | | | | | |
| | | 12/31/15 | | | 2/11/16 | | | 3/31/16 | |
S&P 500 Index | | | 2043.94 | | | | 1829.08 | | | | 2059.74 | |
Barclays U.S. Investment Grade Option Adjusted Spread | | | 165.39 | | | | 214.02 | | | | 163.06 | |
Barclays U.S. Corporate High Yield Spread | | | 660.40 | | | | 839.43 | | | | 665.57 | |
West Texas Intermediate Crude Price | | $ | 37.04 | | | $ | 26.21 | | | $ | 38.34 | |
10-Year U.S. Treasury Yield | | | 2.27 | % | | | 1.66 | % | | | 1.77 | % |
Source: Bloomberg.
We are happy to report, though, that each of Thornburg’s core fixed income portfolios ended the first quarter with positive returns and strong performance relative to their Morningstar peers. However, Low Duration Income Class I shares outperformed, but Class A shares slightly underperformed.
Why did Limited Term Income Fund and Limited Term U.S. Government Fund trail their benchmarks for the quarter ended March 31, 2016? The answer, quite simply, is duration, which is a measure of a bond’s sensitivity to changes in interest rates, and it’s usually measured against movements in so-called “risk free” rates, especially those of U.S. Treasuries. Accepting significant Treasury-related duration risk (that is, having relatively “long” duration measures) is something we have actively avoided, simply because the reward in increased yield isn’t apparent to us. The 10-year U.S. Treasury ended the quarter at 1.77%, not a lot of compensation for the risk that comes with a rising-rate environment, when bond prices fall. While the Funds did not perform well versus their benchmarks during the quarter ended March 31, 2016, due to our cautious stance on duration, they did perform relatively well versus their Morningstar peer groups, as shown in Table II.
Table II Thornburg Core Bond Funds Performance versus Indices and Morningstar Category Average
| | | | | | | | | | | | |
Class A Shares (without sales charge) | | Quarter
Ended
12/31/15 | | | Quarter
Ended
3/31/16 | | | Six-month
Ended
3/31/16 | |
Thornburg Limited Term Income Fund | | | -0.59 | % | | | 1.78 | % | | | 1.18 | % |
Barclays Intermediate Government/Credit Index | | | -0.69 | % | | | 2.45 | % | | | 1.74 | % |
Morningstar U.S. Short-Term Bond Category | | | -0.41 | % | | | 0.99 | % | | | 0.58 | % |
| | | |
Class A Shares (without sales charge) | | | | | | | | | |
Thornburg Limited Term U.S. Government Fund | | | -0.74 | % | | | 1.57 | % | | | 0.82 | % |
Barclays Intermediate U.S. Government Index | | | -0.84 | % | | | 2.28 | % | | | 1.43 | % |
Morningstar U.S. Short Government Category | | | -0.57 | % | | | 1.00 | % | | | 0.44 | % |
| | | |
Class A Shares (without sales charge) | | | | | | | | | |
Thornburg Low Duration Income Fund | | | -0.37 | % | | | 0.95 | % | | | 0.58 | % |
Barclays U.S. Aggregate 1-3 Year Index | | | -0.36 | % | | | 0.97 | % | | | 0.61 | % |
Morningstar U.S. Short-Term Bond Category | | | -0.41 | % | | | 0.99 | % | | | 0.58 | % |
Performance data shown represents past performance and is no guarantee of future results. Investment return and principal value will fluctuate so shares, when redeemed, may be worth more or less than their original cost. Current performance may be lower or higher than quoted. For performance current to the most recent month end, visit thornburg.com or call 877-215-1330.
We have written entire articles recently comparing our Funds’ stated durations (the mathematical figure calculated versus U.S. Treasury yields) with our Funds’ empirical durations (how the Funds actually behave, when credit risk and other factor influences are taken into account). In periods of rising U.S. Treasury yields, the core fixed income funds have performed better than models would suggest. This is no coincidence, but the result of an intentional effort to find good businesses with strong cash flows, where fundamentals are improving during periods of rising risk-free rates. We do this with the intention of providing a measure of protection to shareholders from price declines in the eventuality of rising U.S. Treasury rates.
Most every credit and risk spread ended the quarter flat. Treasuries, however, were one of the few bright spots in fixed income. As we began 2016, we didn’t believe we were adequately compensated for accepting duration risk. And as we have written many times, if shareholders aren’t being compensated for our assuming a given risk, we simply choose not to take it.
Challenges for “Core” Fixed-Income Investors
We see many challenges facing those who invest in “core” investment-grade fixed income portfolios. With their quantitative easing programs that have pushed bond yields to historic lows and even negative levels, global central banks have declared war against any type of sustainable income via high-quality holdings. They have done this with the intention of pushing investors further out the risk spectrum in order to drive down borrowing costs, in hopes of spurring more borrowing (a re-leveraging cycle) and encouraging companies to invest in the economy. The problem, though, is that most parties are still reluctant to oblige the central banks’ plans. Instead, consumers continue to deleverage, while businesses lack confidence in the economy and refuse, generally speaking, to make significant capital outlays. Central banks have failed to generate growth and, in many areas of the world, still struggle with the prospect of deflation. While we will not suggest that the United States is immune to these challenges, it is one of the few bright spots globally.
The Fed under Chair Janet Yellen has finally moved off of zero percent interest rates and continues to suggest its intent to
Semi-Annual Reports 5
| | |
| LETTER TO SHAREHOLDERS, | | |
| |
CONTINUED | | |
| |
| | March 31, 2016 (Unaudited) |
move the Fed funds rate higher two times this year. However, as U.S. economic data show more signs of resilience versus the challenges facing the global economy, markets reacted with caution and bouts of volatility. This has caused Fed officials to move rate-hike expectations lower—and further away. One difficulty for markets and policy makers will be to move toward a more normalized monetary policy, given current price stability (low inflation) and the economy having reached full employment—the Fed’s twin objectives. While risk markets were on a one-way move lower from January 1 to February 11, economic fundamentals within the United States had not materially changed, and Fed rhetoric appeared substantially more accommodative. It has become unclear to us if policy makers are reacting to markets or if markets are reacting to policy makers. This will ultimately manifest in periods of greater uncertainty and volatility.
During the quarter ended March 31, 2016, markets provided us with an opportunity to harvest gains in securities that performed well during the flight from risk, move and redeploy that cash into niche areas of the market that had moved notably cheaper. This meant selling securities with highly rated bonds more closely aligned with U.S. Treasuries and buying securities with a higher credit-related component at the lower prices that then prevailed. As markets recovered, the opportunity to continue this approach diminished, and we are beginning to harvest gains from the recovery in markets and raise portfolio quality once again.
During late January and early February 2016, we would have classified the markets as “cheap.” But as in any risk-off move, we remain highly selective and only add “stories” where we believe we understand the risks and are appropriately compensated. Today, markets seem “fair,” though there is the occasional opportunity to add compelling stories to the portfolios at attractive levels. In today’s market, we are being forced to be much more selective and discerning, and the changes to the portfolios we make are more incremental than they were early in the year.
Core Fixed Income as Portfolio Ballast
We continue to believe that core fixed income holdings can serve as ballast to an investor’s portfolio, continue to provide a source of income, and provide diversification benefits to more volatile equity markets. Volatility is likely to remain high going forward, and fixed income should continue to provide important diversification to an investor’s overall allocation. Today’s markets provide opportunity for us to buy incremental credit-related positions. When the assumption of risk is appropriately compensated, we are willing to move each portfolio toward finding value, consistent with the strategy’s mandate. However, when risk is not well compensated, we will do the opposite and wait for an attractive entry point.
We plan to remain on the short end of each strategy’s maturity ladder for the near term, in order to limit the risk associated with change in rates of U.S. Treasuries. We believe the U.S. economy is late in its recovery and plan to manage the portfolios with that in mind, and with an eye toward limiting volatility.
Thank you for your continued trust in us. We look forward to working hard to add value to your holdings.
Sincerely,
| | | | |
 | |  | |  |
| Jason Brady, CFA | | Lon R. Erickson, CFA | | Jeff Klingelhofer, CFA |
| Portfolio Manager | | Portfolio Manager | | Portfolio Manager |
| CEO, President, and Managing Director | | Managing Director | | Managing Director |
The matters discussed in this report may constitute forward-looking statements made pursuant to the safe harbor provisions of the Securities Litigation Reform Act of 1995. These include any advisor or portfolio manager prediction, assessment, analysis or outlook for individual securities, industries, investment styles, market sectors and/or markets. These statements involve risks and uncertainties. In addition to the general risks described for each fund in its current prospectus, other factors bearing on these reports include the accuracy of the advisor’s or portfolio manager’s forecasts and predictions, the appropriateness of the investment strategies designed by the advisor or portfolio manager and the ability of the advisor or portfolio manager to implement their strategies efficiently and successfully. Any one or more of these factors, as well as other risks affecting the securities markets generally, could cause the actual results of any fund to differ materially as compared to its benchmarks.
The views expressed by the portfolio managers reflect their professional opinions and are subject to change. Under no circumstances does the information contained within represent a recommendation to buy or sell any security.
6 Semi-Annual Reports
| | |
| PERFORMANCE SUMMARY | | |
| |
| | March 31, 2016 (Unaudited) |
Average Annual Total Returns
| | | | | | | | | | | | | | | | | | | | |
Limited Term U.S. Government Fund | | 1-Yr | | | 3-Yr | | | 5-Yr | | | 10-Yr | | | Since
Incep. | |
A Shares (Incep: 11/16/87) | | | | | | | | | | | | | | | | | | | | |
Without sales charge | | | 1.19 | % | | | 0.81 | % | | | 1.53 | % | | | 3.23 | % | | | 5.06 | % |
With sales charge | | | -0.30 | % | | | 0.30 | % | | | 1.23 | % | | | 3.08 | % | | | 5.01 | % |
B Shares (Incep: 11/1/02) | | | | | | | | | | | | | | | | | | | | |
Without sales charge | | | -0.18 | % | | | -0.56 | % | | | 0.15 | % | | | 2.15 | % | | | 2.11 | % |
With sales charge | | | -5.16 | % | | | -1.72 | % | | | -0.24 | % | | | 2.15 | % | | | 2.11 | % |
C Shares (Incep: 9/1/94) | | | | | | | | | | | | | | | | | | | | |
Without sales charge | | | 0.91 | % | | | 0.52 | % | | | 1.24 | % | | | 2.95 | % | | | 3.98 | % |
With sales charge | | | 0.42 | % | | | 0.52 | % | | | 1.24 | % | | | 2.95 | % | | | 3.98 | % |
I Shares (Incep: 7/5/96) | | | 1.52 | % | | | 1.13 | % | | | 1.86 | % | | | 3.56 | % | | | 4.47 | % |
R3 Shares (Incep: 7/1/03) | | | 1.12 | % | | | 0.74 | % | | | 1.45 | % | | | 3.16 | % | | | 2.67 | % |
R4 Shares (Incep: 2/1/14) | | | 1.13 | % | | | — | | | | — | | | | — | | | | 1.45 | % |
R5 Shares (Incep: 5/1/12) | | | 1.45 | % | | | 1.09 | % | | | — | | | | — | | | | 1.16 | % |
| | | | | |
Limited Term Income fund | | | | | | | | | | | | | | | |
A Shares (Incep: 10/1/92) | | | | | | | | | | | | | | | | | | | | |
Without sales charge | | | 1.05 | % | | | 1.58 | % | | | 3.33 | % | | | 4.58 | % | | | 5.15 | % |
With sales charge | | | -0.51 | % | | | 1.07 | % | | | 3.02 | % | | | 4.42 | % | | | 5.08 | % |
C Shares (Incep: 9/1/94) | | | | | | | | | | | | | | | | | | | | |
Without sales charge | | | 0.81 | % | | | 1.35 | % | | | 3.09 | % | | | 4.33 | % | | | 4.84 | % |
With sales charge | | | 0.32 | % | | | 1.35 | % | | | 3.09 | % | | | 4.33 | % | | | 4.84 | % |
I Shares (Incep: 7/5/96) | | | 1.40 | % | | | 1.94 | % | | | 3.69 | % | | | 4.93 | % | | | 5.37 | % |
R3 Shares (Incep: 7/1/03) | | | 0.92 | % | | | 1.47 | % | | | 3.23 | % | | | 4.53 | % | | | 3.89 | % |
R4 Shares (Incep: 2/1/14) | | | 0.93 | % | | | — | | | | — | | | | — | | | | 1.91 | % |
R5 Shares (Incep: 5/1/12) | | | 1.29 | % | | | 1.83 | % | | | — | | | | — | | | | 2.76 | % |
| | | | | |
Low Duration Income fund | | | | | | | | | | | | | | | |
A Shares (Incep: 12/30/13) | | | | | | | | | | | | | | | | | | | | |
Without sales charge | | | 0.74 | % | | | — | | | | — | | | | — | | | | 1.15 | % |
With sales charge | | | -0.78 | % | | | — | | | | — | | | | — | | | | 0.46 | % |
I Shares (Incep: 12/30/13) | | | 0.94 | % | | | — | | | | — | | | | — | | | | 1.35 | % |
30-Day Yields
(with sales charge)
| | | | |
Thornburg Limited Term U.S. Government Fund, A Shares | | | | |
Annualized Distribution Yield | | | 1.62 | % |
SEC Yield | | | 1.01 | % |
| |
Thornburg Limited Term Income Fund, A Shares | | | | |
Annualized Distribution Yield | | | 1.90 | % |
SEC Yield | | | 1.62 | % |
| |
Thornburg Low Duration Income Fund, A Shares | | | | |
Annualized Distribution Yield | | | 0.95 | % |
SEC Yield | | | 0.84 | % |
Performance data shown represents past performance and is no guarantee of future results. Investment return and principal value will fluctuate so shares, when redeemed, may be worth more or less than their original cost. Current performance may be lower or higher than quoted. For performance current to the most recent month end, visit thornburg.com or call 800-847-0200. The performance information does not reflect the deduction of taxes that a shareholder would pay on distributions or the redemption of Fund shares. Returns reflect the reinvestment of dividends and capital gains. Class A shares are sold with a maximum sales charge of 1.50%. Class B shares carry a contingent deferred sales charge (CDSC) that declines from 5.00% to 0% depending upon the period of time the shares are held. Class B shares will automatically convert to Class A shares on a quarterly basis approximately eight years after purchase. Class C shares include a 0.50% CDSC for the first year only. There is no sales charge for Class I, Class R3, Class R4, and Class R5 shares.
As disclosed in the most recent prospectus, the total annual fund operating expenses are as follows: Limited Term U.S. Government Fund A shares, 0.92%; B shares, 7.08%; C shares, 1.21%; I shares, 0.62%; R3 shares, 1.35%; R4 shares, 1.13%; R5 shares 2.02%; Limited Term Income Fund A shares, 0.87%; C shares, 1.10%; I shares, 0.52%; R3 shares, 1.11%; R4 shares, 1.66%; R5 shares 0.67%; and Low Duration Income Fund A shares, 2.10%; I shares, 1.89%. Thornburg Investment Management and/or Thornburg Securities Corporation have contractually agreed to waive fees and reimburse expenses through at least February 1, 2017, for some of the share classes, resulting in net expense ratios of the following: For Limited Term U.S. Government Fund B shares, 2.50%; R3 shares, 0.99%; R4 shares, 0.99%; R5 shares, 0.67%. Limited Term Income Fund R3 shares, 0.99%; R4 shares, 0.99%. Low Duration Income Fund A shares, 0.70%; I shares, 0.50% For more detailed information on fund expenses and waivers/reimbursements please see the Fund’s prospectus.
Without the fee waivers and expense reimbursements described above, the Annualized Distribution yield for Low Duration Income Fund would have been negative 0.14%, and the SEC yield would have been negative 0.26%. Unsubsidized yields may be disproportionately negative due to the size of net assets and fixed expenses.
Semi-Annual Reports 7
Glossary
March 31, 2016 (Unaudited)
Barclays Intermediate Government Bond Index – An unmanaged, market-weighted index generally representative of all public obligations of the U.S. Government, its agencies and instrumentalities having maturities from one up to ten years.
Barclays Intermediate Government/Credit Bond Index – An unmanaged, market-weighted index generally representative of intermediate government and investment-grade corporate debt securities having maturities from one up to ten years.
Barclays U.S. Aggregate Bond 1-3 Year Index – Composed of approximately 8,000 publicly traded bonds including U.S. government, mortgage-backed, corporate and Yankee bonds. The index is weighted by the market value of the bonds included in the index.
Barclays U.S. Corporate Index – A broad-based benchmark that measures the investment grade, U.S. dollar-denominated, fixed-rate, taxable corporate bond market. It includes USD-denominated securities publicly issued by U.S. and non-U.S. industrial, utility, and financial issuers that meet specified maturity, liquidity, and quality requirements.
Unless otherwise noted, index returns reflect the reinvestment of income dividends and capital gains, if any, but do not reflect fees, brokerage commissions or other expenses of investing. Investors may not make direct investments into any index. The performance of any index is not indicative of the performance of any particular investment.
Basis Point (bp) – A unit equal to 1/100th of 1%. 1% = 100 basis points (bps).
Credit Spread/Quality Spread – The difference between the yields of securities with different credit qualities.
Duration – A bond’s sensitivity to interest rates. Effective duration incorporates the embedded option features, such as call provisions. Bonds with longer durations experience greater price volatility than bonds with shorter durations.
Laddering – Laddering involves building a portfolio of bonds with staggered maturities so that a portion matures each year. Money that comes in from maturing bonds is typically invested in bonds with longer maturities at the far end of the portfolio.
Lipper Short-Intermediate U.S. Government Funds – Funds that invest primarily in securities issued or guaranteed by the U.S. government, its agencies, or its instrumentalities, with dollar-weighted average maturities of one to five years.
Lipper Short-Intermediate Investment-Grade Debt Funds – Funds that invest primarily in investment-grade debt issues (rated in the top four grades) with dollar-weighted average maturities of one to five years.
Lipper Short Investment-Grade Debt Funds – Funds that invest primarily in investment-grade debt issues (rated in the top four grades) with dollar-weighted average maturities of less than three years.
Quantitative Easing (QE) – An unconventional monetary policy in which a central bank purchases financial assets from the market in order to lower interest rates and increase the money supply.
Riskless (or risk-free) Interest Rate – The theoretical rate of return of an investment with zero risk. The risk-free rate represents the interest that an investor would expect from an absolutely risk-free investment over a given period of time. Though a truly risk-free asset exists only in theory, in practice most professionals and academics use short-dated government bonds, such as a three-month U.S. Treasury bill.
Treasuries – U.S. Treasury securities, such as bills, notes and bonds, are negotiable debt obligations of the U.S. government. These debt obligations are backed by the “full faith and credit” of the government and issued at various schedules and maturities. Income from Treasury securities is exempt from state and local, but not federal, taxes.
West Texas Intermediate (WTI) – A grade of crude oil used as a benchmark in oil pricing.
8 Semi-Annual Reports
| | |
| FUND SUMMARY | | |
| |
Thornburg Limited Term U.S. Government Fund | | March 31, 2016 (Unaudited) |
OBJECTIVES AND STRATEGIES
The Fund’s primary objective is to obtain as high a level of current income as is consistent, in the view of the Fund’s investment advisor, with the safety of capital. As a secondary goal, the Fund seeks to reduce changes in its share price compared to longer term portfolios.
This Fund is a laddered portfolio primarily composed of short/ intermediate debt obligations at least 80% of which are issued by the U.S. Government, its agencies, or its instrumentalities, with a dollar-weighted average maturity of normally less than five years.
Long Term Stability of Principal
Net Asset Value History of A Shares
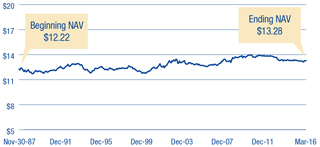
Key Portfolio Attributes
| | | | |
Number of Bonds | | | 151 | |
| |
Effective Duration | | | 2.7 Yrs | |
| |
Average Maturity | | | 3.5 Yrs | |
Types of Holdings
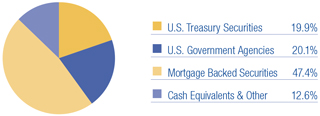
Portfolio Ladder
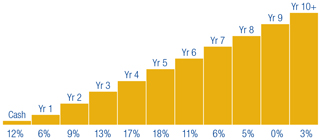
Percent of portfolio maturing in each year. Cash includes cash equivalents.
There is no guarantee that the Fund will meet its investment objectives.
All data is subject to change. Charts may not add up to 100% due to rounding.
Semi-Annual Reports 9
| | |
| SCHEDULE OF INVESTMENTS | | |
| |
Thornburg Limited Term U.S. Government Fund | | March 31, 2016 (Unaudited) |
| | | | | | | | |
Issuer-Description | | Principal
Amount | | | Value | |
U.S. TREASURY SECURITIES — 19.93% | | | | | | | | |
United States Treasury Notes, 4.875%, 8/15/2016 | | $ | 5,000,000 | | | $ | 5,083,447 | |
United States Treasury Notes, 4.625%, 2/15/2017 | | | 4,000,000 | | | | 4,138,789 | |
United States Treasury Notes, 2.25%, 11/30/2017 | | | 7,500,000 | | | | 7,686,731 | |
United States Treasury Notes, 2.625%, 1/31/2018 | | | 6,700,000 | | | | 6,928,219 | |
United States Treasury Notes, 1.125%, 6/15/2018 | | | 4,000,000 | | | | 4,030,117 | |
United States Treasury Notes, 3.625%, 2/15/2020 | | | 1,000,000 | | | | 1,097,637 | |
United States Treasury Notes, 1.375%, 2/29/2020 | | | 2,500,000 | | | | 2,527,539 | |
United States Treasury Notes, 1.625%, 6/30/2020 | | | 4,000,000 | | | | 4,079,258 | |
United States Treasury Notes Inflationary Index, 0.125%, 4/15/2020 | | | 9,094,554 | | | | 9,288,100 | |
United States Treasury Notes Inflationary Index, 0.625%, 7/15/2021 | | | 2,627,775 | | | | 2,759,841 | |
United States Treasury Notes Inflationary Index, 0.125%, 7/15/2022 | | | 5,150,900 | | | | 5,242,887 | |
United States Treasury Notes Inflationary Index, 0.125%, 1/15/2023 | | | 2,565,875 | | | | 2,588,864 | |
United States Treasury Notes Inflationary Index, 0.375%, 7/15/2025 | | | 8,741,163 | | | | 8,936,993 | |
| | | | | | | | |
TOTAL U.S. TREASURY SECURITIES (Cost $62,695,704) | | | | | | | 64,388,422 | |
| | | | | | | | |
| | |
U.S. GOVERNMENT AGENCIES — 20.08% | | | | | | | | |
Federal Home Loan Bank, 5.00%, 12/8/2017 | | | 3,000,000 | | | | 3,208,050 | |
Federal Home Loan Mtg Corp., 4.875%, 6/13/2018 | | | 3,000,000 | | | | 3,262,638 | |
Federal National Mtg Assoc., 1.875%, 12/28/2020 | | | 2,000,000 | | | | 2,052,705 | |
a HNA Group 2015 LLC, (Guaranty: Export-Import Bank of the United States), 2.291%, 6/30/2027 | | | 2,887,773 | | | | 2,919,539 | |
Mortgage-Linked Amortizing Notes, Series 2012-1 Class A10, 2.06%, 1/15/2022 | | | 565,692 | | | | 574,146 | |
New Valley Generation I, Tennessee Valley Authority, 7.299%, 3/15/2019 | | | 1,286,774 | | | | 1,402,633 | |
b Petroleos Mexicanos Floating Rate Note, (Guaranty: Export-Import Bank of the United States), 0.972%, 4/15/2025 | | | 3,237,500 | | | | 3,189,093 | |
b Petroleos Mexicanos, (Guaranty: Export-Import Bank of the United States), 1.70%, 12/20/2022 | | | 3,657,500 | | | | 3,657,975 | |
b Petroleos Mexicanos, (Guaranty: Export-Import Bank of the United States), 2.46%, 12/15/2025 | | | 2,500,000 | | | | 2,564,108 | |
Private Export Funding Corp., (Guaranty: Export-Import Bank of the United States), 5.45%, 9/15/2017 | | | 3,000,000 | | | | 3,200,229 | |
b Reliance Industries Ltd., (Guaranty: Export-Import Bank of the United States), 2.06%, 1/15/2026 | | | 3,500,000 | | | | 3,526,925 | |
b Reliance Industries Ltd., (Guaranty: Export-Import Bank of the United States), 2.512%, 1/15/2026 | | | 3,500,000 | | | | 3,601,374 | |
Small Business Administration Participation Certificates, Series 2001-20D Class 1, 6.35%, 4/1/2021 | | | 968,752 | | | | 1,053,816 | |
Small Business Administration Participation Certificates, Series 2001-20F Class 1, 6.44%, 6/1/2021 | | | 581,123 | | | | 629,167 | |
Small Business Administration Participation Certificates, Series 2002-20A Class 1, 6.14%, 1/1/2022 | | | 391,046 | | | | 423,106 | |
Small Business Administration Participation Certificates, Series 2002-20K Class 1, 5.08%, 11/1/2022 | | | 373,771 | | | | 400,805 | |
Small Business Administration Participation Certificates, Series 2005-20H Class 1, 5.11%, 8/1/2025 | | | 319,532 | | | | 348,287 | |
Small Business Administration Participation Certificates, Series 2007-20D Class 1, 5.32%, 4/1/2027 | | | 871,034 | | | | 971,334 | |
Small Business Administration Participation Certificates, Series 2007-20F Class 1, 5.71%, 6/1/2027 | | | 509,445 | | | | 576,047 | |
Small Business Administration Participation Certificates, Series 2007-20I Class 1, 5.56%, 9/1/2027 | | | 1,490,716 | | | | 1,684,730 | |
Small Business Administration Participation Certificates, Series 2007-20K Class 1, 5.51%, 11/1/2027 | | | 986,919 | | | | 1,112,221 | |
Small Business Administration Participation Certificates, Series 2008-20G Class 1, 5.87%, 7/1/2028 | | | 2,517,160 | | | | 2,851,941 | |
Small Business Administration Participation Certificates, Series 2011-20G Class 1, 3.74%, 7/1/2031 | | | 2,518,135 | | | | 2,725,379 | |
Small Business Administration Participation Certificates, Series 2011-20K Class 1, 2.87%, 11/1/2031 | | | 2,840,230 | | | | 2,957,993 | |
Small Business Administration Participation Certificates, Series 2015-20G Class 1, 2.88%, 7/1/2035 | | | 2,444,880 | | | | 2,512,412 | |
Small Business Administration Participation Certificates, Series 2015-20I Class 1, 2.82%, 9/1/2035 | | | 2,678,284 | | | | 2,751,594 | |
Ulani MSN 35940 LLC, (Guaranty: Export-Import Bank of the United States), 2.227%, 5/16/2025 | | | 3,854,167 | | | | 3,915,506 | |
Union 13 Leasing LLC, (Guaranty: Export-Import Bank of the United States), 1.87%, 6/28/2024 | | | 2,136,884 | | | | 2,140,827 | |
b Washington Aircraft 2 Co. Ltd. Floating Rate Note, (Guaranty: Export-Import Bank of the United States), 1.06%, 6/26/2024 | | | 4,733,811 | | | | 4,671,538 | |
| | | | | | | | |
TOTAL U.S. GOVERNMENT AGENCIES (Cost $63,207,530) | | | | | | | 64,886,118 | |
| | | | | | | | |
| | |
MORTGAGE BACKED — 47.41% | | | | | | | | |
Federal Home Loan Mtg Corp., CMO Series 1321 Class TE, 7.00%, 8/15/2022 | | | 161,621 | | | | 174,992 | |
Federal Home Loan Mtg Corp., CMO Series 2420 Class MC, 6.00%, 2/15/2017 | | | 22,861 | | | | 23,243 | |
Federal Home Loan Mtg Corp., CMO Series 2527 Class BP, 5.00%, 11/15/2017 | | | 127,919 | | | | 130,991 | |
Federal Home Loan Mtg Corp., CMO Series 2529 Class MB, 5.00%, 11/15/2017 | | | 127,279 | | | | 130,123 | |
Federal Home Loan Mtg Corp., CMO Series 2553 Class GB, 5.00%, 1/15/2018 | | | 100,404 | | | | 103,024 | |
Federal Home Loan Mtg Corp., CMO Series 2558 Class BD, 5.00%, 1/15/2018 | | | 476,142 | | | | 488,677 | |
Federal Home Loan Mtg Corp., CMO Series 2622 Class PE, 4.50%, 5/15/2018 | | | 262,732 | | | | 269,599 | |
Federal Home Loan Mtg Corp., CMO Series 2641 Class WE, 4.50%, 1/15/2033 | | | 64,875 | | | | 66,626 | |
Federal Home Loan Mtg Corp., CMO Series 2642 Class JE, 5.00%, 9/15/2032 | | | 247,602 | | | | 250,415 | |
Federal Home Loan Mtg Corp., CMO Series 2649 Class QH, 4.50%, 7/15/2018 | | | 133,810 | | | | 137,990 | |
Federal Home Loan Mtg Corp., CMO Series 2814 Class GB, 5.00%, 6/15/2019 | | | 32,880 | | | | 34,111 | |
Federal Home Loan Mtg Corp., CMO Series 2827 Class BU, 3.50%, 7/15/2019 | | | 506,736 | | | | 517,530 | |
Federal Home Loan Mtg Corp., CMO Series 3291 Class BY, 4.50%, 3/15/2022 | | | 984,126 | | | | 1,028,328 | |
Federal Home Loan Mtg Corp., CMO Series 3589 Class CA, 4.00%, 10/15/2021 | | | 109,768 | | | | 110,760 | |
Federal Home Loan Mtg Corp., CMO Series 3640 Class EL, 4.00%, 3/15/2020 | | | 668,319 | | | | 691,321 | |
10 Semi-Annual Reports
| | |
| SCHEDULE OF INVESTMENTS, CONTINUED | | |
| |
Thornburg Limited Term U.S. Government Fund | | March 31, 2016 (Unaudited) |
| | | | | | | | |
Issuer-Description | | Principal
Amount | | | Value | |
Federal Home Loan Mtg Corp., CMO Series 3704 Class DC, 4.00%, 11/15/2036 | | $ | 596,215 | | | $ | 643,668 | |
Federal Home Loan Mtg Corp., CMO Series 3867 Class VA, 4.50%, 3/15/2024 | | | 1,969,939 | | | | 2,177,954 | |
Federal Home Loan Mtg Corp., CMO Series 3922 Class PQ, 2.00%, 4/15/2041 | | | 1,321,803 | | | | 1,329,450 | |
Federal Home Loan Mtg Corp., CMO Series 4050 Class MV, 3.50%, 8/15/2023 | | | 2,458,585 | | | | 2,622,313 | |
Federal Home Loan Mtg Corp., CMO Series 4097 Class TE, 1.75%, 5/15/2039 | | | 2,608,981 | | | | 2,582,353 | |
Federal Home Loan Mtg Corp., CMO Series 4120 Class TC, 1.50%, 10/15/2027 | | | 3,041,176 | | | | 3,012,038 | |
Federal Home Loan Mtg Corp., CMO Series 4120 Class UE, 2.00%, 10/15/2027 | | | 3,115,287 | | | | 3,137,800 | |
Federal Home Loan Mtg Corp., CMO Series K018 Class A1, 1.781%, 10/25/2020 | | | 1,493,178 | | | | 1,509,872 | |
Federal Home Loan Mtg Corp., CMO Series K035 Class A1, 2.615%, 3/25/2023 | | | 3,253,496 | | | | 3,380,850 | |
Federal Home Loan Mtg Corp., CMO Series K037 Class A1, 2.592%, 4/25/2023 | | | 1,776,760 | | | | 1,848,331 | |
Federal Home Loan Mtg Corp., CMO Series K038 Class A1, 2.604%, 10/25/2023 | | | 5,424,907 | | | | 5,644,572 | |
Federal Home Loan Mtg Corp., CMO Series K039 Class A1, 2.683%, 12/25/2023 | | | 2,452,495 | | | | 2,560,110 | |
Federal Home Loan Mtg Corp., CMO Series K042 Class A1, 2.267%, 6/25/2024 | | | 2,277,879 | | | | 2,336,726 | |
Federal Home Loan Mtg Corp., CMO Series K709 Class A2, 2.086%, 3/25/2019 | | | 3,000,000 | | | | 3,064,829 | |
Federal Home Loan Mtg Corp., CMO Series K716 Class A1, 2.413%, 8/25/2047 | | | 1,732,071 | | | | 1,777,316 | |
Federal Home Loan Mtg Corp., CMO Series KLH1 Class A, 1.10%, 11/25/2022 | | | 2,000,000 | | | | 2,000,675 | |
Federal Home Loan Mtg Corp., CMO Series KP02 Class A2, 2.355%, 4/25/2021 | | | 3,000,000 | | | | 3,062,751 | |
Federal Home Loan Mtg Corp., CMO Series KS03 Class A2, 2.79%, 6/25/2022 | | | 2,500,000 | | | | 2,606,994 | |
Federal Home Loan Mtg Corp., CMO Series SC02 Class 2A, 3.50%, 9/25/2045 | | | 2,761,081 | | | | 2,868,371 | |
Federal Home Loan Mtg Corp., Pool AK6768, 3.00%, 3/1/2027 | | | 2,408,216 | | | | 2,520,536 | |
Federal Home Loan Mtg Corp., Pool B14155, 3.50%, 5/1/2019 | | | 162,075 | | | | 171,122 | |
Federal Home Loan Mtg Corp., Pool D98887, 3.50%, 1/1/2032 | | | 1,503,521 | | | | 1,593,615 | |
Federal Home Loan Mtg Corp., Pool E96575, 4.50%, 6/1/2018 | | | 257,106 | | | | 264,839 | |
Federal Home Loan Mtg Corp., Pool G12079, 4.50%, 4/1/2019 | | | 295,155 | | | | 305,261 | |
Federal Home Loan Mtg Corp., Pool G12140, 4.00%, 2/1/2020 | | | 85,987 | | | | 89,470 | |
Federal Home Loan Mtg Corp., Pool G13804, 5.00%, 3/1/2025 | | | 608,362 | | | | 659,653 | |
Federal Home Loan Mtg Corp., Pool G18435, 2.50%, 5/1/2027 | | | 2,995,503 | | | | 3,092,038 | |
Federal Home Loan Mtg Corp., Pool J11371, 4.50%, 12/1/2024 | | | 614,733 | | | | 658,076 | |
Federal Home Loan Mtg Corp., Pool J13583, 3.50%, 11/1/2025 | | | 1,042,226 | | | | 1,109,197 | |
Federal Home Loan Mtg Corp., Pool J14888, 3.50%, 4/1/2026 | | | 1,079,127 | | | | 1,142,062 | |
Federal Home Loan Mtg Corp., Pool T61943, 3.50%, 8/1/2045 | | | 1,408,046 | | | | 1,454,467 | |
Federal Home Loan Mtg Corp., REMIC Series 4072 Class VA, 3.50%, 10/15/2023 | | | 2,147,600 | | | | 2,292,494 | |
Federal National Mtg Assoc., CMO Series 1993-32 Class H, 6.00%, 3/25/2023 | | | 19,627 | | | | 21,358 | |
Federal National Mtg Assoc., CMO Series 2003-15 Class CY, 5.00%, 3/25/2018 | | | 83,143 | | | | 85,281 | |
Federal National Mtg Assoc., CMO Series 2003-4 Class PE, 5.00%, 2/25/2018 | | | 214,269 | | | | 220,245 | |
Federal National Mtg Assoc., CMO Series 2003-9 Class DB, 5.00%, 2/25/2018 | | | 96,925 | | | | 99,457 | |
Federal National Mtg Assoc., CMO Series 2009-17 Class AH, 1.056%, 3/25/2039 | | | 474,670 | | | | 422,339 | |
Federal National Mtg Assoc., CMO Series 2009-49 Class KA, 5.00%, 2/25/2024 | | | 45,198 | | | | 45,741 | |
Federal National Mtg Assoc., CMO Series 2009-52 Class AJ, 4.00%, 7/25/2024 | | | 265,087 | | | | 273,451 | |
Federal National Mtg Assoc., CMO Series 2009-70 Class NK, 4.50%, 8/25/2019 | | | 124,472 | | | | 127,854 | |
Federal National Mtg Assoc., CMO Series 2009-78 Class A, 4.50%, 8/25/2019 | | | 180,897 | | | | 186,097 | |
Federal National Mtg Assoc., CMO Series 2011-103 Class VA, 4.00%, 12/25/2022 | | | 1,942,856 | | | | 1,996,143 | |
Federal National Mtg Assoc., CMO Series 2011-110 Class JV, 4.00%, 1/25/2023 | | | 2,173,666 | | | | 2,232,315 | |
Federal National Mtg Assoc., CMO Series 2011-118 Class V, 4.00%, 10/25/2029 | | | 1,225,529 | | | | 1,238,057 | |
Federal National Mtg Assoc., CMO Series 2011-124 Class QA, 2.00%, 12/25/2041 | | | 2,030,930 | | | | 2,007,759 | |
Federal National Mtg Assoc., CMO Series 2011-45 Class VA, 4.00%, 3/25/2024 | | | 2,703,108 | | | | 2,867,222 | |
Federal National Mtg Assoc., CMO Series 2011-63 Class MV, 3.50%, 7/25/2024 | | | 2,738,114 | | | | 2,890,097 | |
Federal National Mtg Assoc., CMO Series 2011-70 Class CA, 3.00%, 8/25/2026 | | | 4,868,618 | | | | 4,920,002 | |
Federal National Mtg Assoc., CMO Series 2011-72 Class KV, 3.50%, 11/25/2022 | | | 1,507,426 | | | | 1,568,356 | |
Federal National Mtg Assoc., CMO Series 2012-36 Class CV, 4.00%, 6/25/2023 | | | 2,758,875 | | | | 2,940,011 | |
Federal National Mtg Assoc., CMO Series 2013-92 Class FA, 0.983%, 9/25/2043 | | | 2,566,830 | | | | 2,562,906 | |
Federal National Mtg Assoc., CMO Series 2015-AB5 Class A10, 3.15%, 9/25/2035 | | | 2,461,111 | | | | 2,536,175 | |
Federal National Mtg Assoc., Pool 044003, 8.00%, 6/1/2017 | | | 687 | | | | 708 | |
Federal National Mtg Assoc., Pool 076388, 9.25%, 9/1/2018 | | | 3,323 | | | | 3,405 | |
Federal National Mtg Assoc., Pool 252648, 6.50%, 5/1/2022 | | | 29,037 | | | | 32,095 | |
Federal National Mtg Assoc., Pool 342947, 7.25%, 4/1/2024 | | | 64,690 | | | | 73,420 | |
Federal National Mtg Assoc., Pool 443909, 6.50%, 9/1/2018 | | | 11,084 | | | | 12,683 | |
Federal National Mtg Assoc., Pool 555207, 7.00%, 11/1/2017 | | | 2,737 | | | | 2,878 | |
Federal National Mtg Assoc., Pool 726308, 4.00%, 7/1/2018 | | | 156,458 | | | | 163,034 | |
Federal National Mtg Assoc., Pool 889906, 4.00%, 7/1/2023 | | | 231,667 | | | | 245,534 | |
Federal National Mtg Assoc., Pool 895572, 2.586%, 6/1/2036 | | | 291,204 | | | | 307,746 | |
Federal National Mtg Assoc., Pool 930986, 4.50%, 4/1/2019 | | | 309,824 | | | | 320,492 | |
Federal National Mtg Assoc., Pool AA2870, 4.00%, 3/1/2024 | | | 633,011 | | | | 673,860 | |
Federal National Mtg Assoc., Pool AB7997, 2.50%, 2/1/2023 | | | 1,129,903 | | | | 1,164,815 | |
Federal National Mtg Assoc., Pool AB8447, 2.50%, 2/1/2028 | | | 2,417,846 | | | | 2,494,820 | |
Federal National Mtg Assoc., Pool AD8191, 4.00%, 9/1/2025 | | | 952,247 | | | | 1,014,292 | |
Semi-Annual Reports 11
| | |
| SCHEDULE OF INVESTMENTS, CONTINUED | | |
| |
Thornburg Limited Term U.S. Government Fund | | March 31, 2016 (Unaudited) |
| | | | | | | | |
Issuer-Description | | Principal
Amount | | | Value | |
Federal National Mtg Assoc., Pool AJ1752, 3.50%, 9/1/2026 | | $ | 2,528,839 | | | $ | 2,688,571 | |
Federal National Mtg Assoc., Pool AK6518, 3.00%, 3/1/2027 | | | 2,346,056 | | | | 2,463,908 | |
Federal National Mtg Assoc., Pool MA0045, 4.00%, 4/1/2019 | | | 216,312 | | | | 225,404 | |
Federal National Mtg Assoc., Pool MA0071, 4.50%, 5/1/2019 | | | 161,316 | | | | 166,871 | |
Federal National Mtg Assoc., Pool MA0125, 4.50%, 7/1/2019 | | | 133,694 | | | | 138,405 | |
Federal National Mtg Assoc., Pool MA0380, 4.00%, 4/1/2020 | | | 351,750 | | | | 366,534 | |
Federal National Mtg Assoc., Pool MA1582, 3.50%, 9/1/2043 | | | 5,189,263 | | | | 5,464,537 | |
Federal National Mtg Assoc., Pool MA1585, 2.00%, 9/1/2023 | | | 2,609,132 | | | | 2,655,302 | |
Federal National Mtg Assoc., Pool MA1625, 3.00%, 10/1/2023 | | | 2,952,123 | | | | 3,092,579 | |
Federal National Mtg Assoc., Pool MA2322, 2.50%, 7/1/2025 | | | 2,227,660 | | | | 2,297,187 | |
Federal National Mtg Assoc., Pool MA2353, 3.00%, 8/1/2035 | | | 3,126,628 | | | | 3,244,487 | |
Federal National Mtg Assoc., Pool MA2480, 4.00%, 12/1/2035 | | | 3,479,313 | | | | 3,746,377 | |
Federal National Mtg Assoc., Pool MA2499, 2.50%, 1/1/2026 | | | 3,570,650 | | | | 3,682,093 | |
Government National Mtg Assoc., CMO Series 2010-160 Class VY, 4.50%, 1/20/2022 | | | 585,654 | | | | 635,586 | |
Government National Mtg Assoc., Pool 000623, 8.00%, 9/20/2016 | | | 307 | | | | 309 | |
Government National Mtg Assoc., Pool 003550, 5.00%, 5/20/2019 | | | 142,665 | | | | 149,068 | |
Government National Mtg Assoc., Pool 714631, 5.691%, 10/20/2059 | | | 595,077 | | | | 616,649 | |
Government National Mtg Assoc., Pool 721652, 5.044%, 5/20/2061 | | | 3,328,962 | | | | 3,521,958 | |
Government National Mtg Assoc., Pool 751388, 5.307%, 1/20/2061 | | | 2,492,763 | | | | 2,677,132 | |
Government National Mtg Assoc., Pool 751392, 5.00%, 2/20/2061 | | | 4,631,127 | | | | 5,147,416 | |
Government National Mtg Assoc., Pool 757313, 4.307%, 12/20/2060 | | | 4,292,535 | | | | 4,419,126 | |
Government National Mtg Assoc., Pool 894205, 2.00%, 8/20/2039 | | | 561,768 | | | | 581,865 | |
Government National Mtg Assoc., Pool MA0100, 2.50%, 5/20/2042 | | | 1,763,418 | | | | 1,795,422 | |
| | | | | | | | |
TOTAL MORTGAGE BACKED (Cost $151,601,908) | | | | | | | 153,204,967 | |
| | | | | | | | |
| | |
SHORT TERM INVESTMENTS — 7.92% | | | | | | | | |
Bank of New York Tri-Party Repurchase Agreement 0.37% dated 3/31/2016 due 4/1/2016, repurchase price $14,000,144 collateralized by 18 U.S. Government debt securities, having an average coupon of 2.96%, a minimum credit rating of BBB-, maturity dates from 3/25/2021 to 7/20/2042, and having an aggregate market value of $14,257,216 at 3/31/2016 | | | 14,000,000 | | | | 14,000,000 | |
Federal Home Loan Bank Discount Note, 0.27%, 4/8/2016 | | | 1,600,000 | | | | 1,599,916 | |
Federal Home Loan Bank Discount Note, 0.27%, 4/15/2016 | | | 2,500,000 | | | | 2,499,738 | |
United States Treasury Bill, 0.257%, 4/7/2016 | | | 2,500,000 | | | | 2,499,893 | |
United States Treasury Bill, 0.254%, 4/14/2016 | | | 2,500,000 | | | | 2,499,774 | |
United States Treasury Bill, 0.234%, 4/21/2016 | | | 2,500,000 | | | | 2,499,674 | |
| | | | | | | | |
TOTAL SHORT TERM INVESTMENTS (Cost $25,598,995) | | | | | | | 25,598,995 | |
| | | | | | | | |
TOTAL INVESTMENTS — 95.34% (Cost $303,104,137) | | | | | | $ | 308,078,502 | |
OTHER ASSETS LESS LIABILITIES — 4.66% | | | | | | | 15,050,119 | |
| | | | | | | | |
NET ASSETS — 100.00% | | | | | | $ | 323,128,621 | |
| | | | | | | | |
Footnote Legend
| a | Security currently fair valued by the Valuation and Pricing Committee using procedures approved by the Trustees’ Audit Committee. |
| b | Yankee bond denominated in U.S. dollars and is issued in the U.S. by foreign banks and corporations. |
Portfolio Abbreviations
To simplify the listings of securities, abbreviations are used per the table below:
| | |
| CMO | | Collateralized Mortgage Obligation |
| Mtg | | Mortgage |
| REMIC | | Real Estate Mortgage Investment Conduit |
| VA | | Veterans Affairs |
See notes to financial statements.
12 Semi-Annual Reports
| | |
| FUND SUMMARY | | |
| |
Thornburg Limited Term Income Fund | | March 31, 2016 (Unaudited) |
OBJECTIVES AND STRATEGIES
The Fund’s primary objective is to obtain as high a level of current income as is consistent, in the view of the Fund’s investment advisor, with the preservation of capital. As a secondary goal, the Fund seeks to reduce changes in its share price compared to longer term portfolios.
This Fund is a laddered portfolio primarily composed of short/ intermediate debt obligations which are investment grade or judged by the advisor to be of equivalent quality, with a dollar-weighted average maturity of normally less than five years.
Long-Term Stability of Principal
Net Asset Value History of A Shares
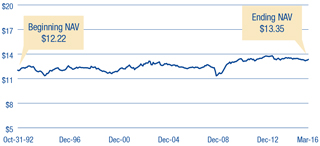
Key Portfolio Attributes
| | | | |
Number of Bonds | | | 581 | |
| |
Effective Duration | | | 2.9 Yrs | |
| |
Average Maturity | | | 3.8 Yrs | |
Security Credit Ratings
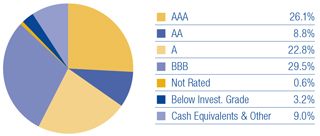
Credit quality ratings for Thornburg’s global fixed income portfolios used ratings from Moody’s Investors Service. Where Moody’s ratings are not available, we have used Standard & Poor’s ratings. Where neither rating is available, we have used ratings from other rating agencies.
Portfolio Ladder
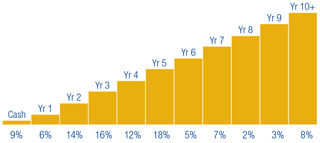
Percent of portfolio maturing in each year. Cash includes cash equivalents.
There is no guarantee that the Fund will meet its investment objectives.
All data is subject to change. Charts may not add up to 100% due to rounding.
Semi-Annual Reports 13
| | |
| SCHEDULE OF INVESTMENTS | | |
| |
Thornburg Limited Term Income Fund | | March 31, 2016 (Unaudited) |
| | | | | | | | | | |
Issuer-Description | | Credit Rating†
S&P/ Moody’s | | Principal
Amount | | | Value | |
U.S. TREASURY SECURITIES — 1.47% | | | | | | | | | | |
United States Treasury Notes, 5.125% due 5/15/2016 | | NR/Aaa | | $ | 1,000,000 | | | $ | 1,005,713 | |
United States Treasury Notes, 4.875% due 8/15/2016 | | NR/Aaa | | | 2,000,000 | | | | 2,033,379 | |
United States Treasury Notes, 3.00% due 2/28/2017 | | NR/Aaa | | | 2,000,000 | | | | 2,042,666 | |
United States Treasury Notes, 0.875% due 6/15/2017 | | NR/Aaa | | | 14,900,000 | | | | 14,936,813 | |
United States Treasury Notes, 1.625% due 3/31/2019 | | NR/Aaa | | | 15,000,000 | | | | 15,323,585 | |
United States Treasury Notes, 1.50% due 5/31/2019 | | NR/Aaa | | | 10,000,000 | | | | 10,178,223 | |
United States Treasury Notes Inflationary Index, 0.125% due 4/15/2020 | | NR/Aaa | | | 16,750,570 | | | | 17,107,048 | |
| | | | | | | | | | |
TOTAL U.S. TREASURY SECURITIES (Cost $61,467,715) | | | | | | | | | 62,627,427 | |
| | | | | | | | | | |
| | | |
U.S. GOVERNMENT AGENCIES — 6.65% | | | | | | | | | | |
a AgriBank FCB, 9.125% due 7/15/2019 | | A-/A2 | | | 14,185,000 | | | | 17,183,638 | |
Alex Alpha, LLC, (Guaranty: Export-Import Bank of the United States), 1.617% due 8/15/2024 | | NR/NR | | | 3,695,652 | | | | 3,666,578 | |
Altitude Investments 12, LLC, (Guaranty: Export-Import Bank of the United States), 2.454% due 12/9/2025 | | NR/NR | | | 5,845,888 | | | | 5,997,922 | |
a CoBank ACB Floating Rate Note, (Farm Credit Banks), 1.234% due 6/15/2022 | | A-/NR | | | 27,800,000 | | | | 25,999,005 | |
b Durrah MSN 35603, (Guaranty: Export-Import Bank of the United States), 1.684% due 1/22/2025 | | NR/NR | | | 11,498,745 | | | | 11,414,815 | |
DY8 Leasing, LLC, (Guaranty: Export-Import Bank of the United States), 2.627% due 4/29/2026 | | NR/NR | | | 4,377,604 | | | | 4,528,360 | |
Export Leasing (2009), LLC, (Guaranty: Export-Import Bank of the United States), 1.859% due 8/28/2021 | | NR/NR | | | 4,969,223 | | | | 5,003,963 | |
b Gate Capital Cayman One Ltd., (Guaranty: Export-Import Bank of the United States), 1.839% due 3/27/2021 | | NR/NR | | | 8,191,113 | | | | 8,244,880 | |
Helios Leasing I, LLC, (Guaranty: Export-Import Bank of the United States), 1.562% due 9/28/2024 | | NR/NR | | | 4,370,706 | | | | 4,318,401 | |
b Micron Semiconductor Ltd., (Guaranty: Export-Import Bank of the United States), 1.258% due 1/15/2019 | | NR/NR | | | 2,580,000 | | | | 2,572,500 | |
Mortgage-Linked Amortizing Notes, Series 2012-1 Class A10, 2.06% due 1/15/2022 | | AA+/NR | | | 777,826 | | | | 789,450 | |
b MSN 41079 and 41084 Ltd., (Guaranty: Export-Import Bank of the United States), 1.717% due 7/13/2024 | | NR/NR | | | 8,770,104 | | | | 8,733,138 | |
b Petroleos Mexicanos Floating Rate Note, (Guaranty: Export-Import Bank of the United States), 0.972% due 4/15/2025 | | NR/NR | | | 9,583,000 | | | | 9,439,715 | |
b Petroleos Mexicanos, (Guaranty: Export-Import Bank of the United States), 1.70% due 12/20/2022 | | NR/NR | | | 7,280,000 | | | | 7,280,946 | |
b Petroleos Mexicanos, (Guaranty: Export-Import Bank of the United States), 2.46% due 12/15/2025 | | NR/NR | | | 7,500,000 | | | | 7,692,323 | |
Private Export Funding Corp., (Guaranty: Export-Import Bank of the United States), 5.45% due 9/15/2017 | | NR/Aaa | | | 3,000,000 | | | | 3,200,229 | |
Private Export Funding Corp., (Guaranty: Export-Import Bank of the United States), 3.55% due 1/15/2024 | | NR/Aaa | | | 10,000,000 | | | | 10,971,750 | |
b Reliance Industries Ltd., (Guaranty: Export-Import Bank of the United States), 2.06% due 1/15/2026 | | NR/NR | | | 1,500,000 | | | | 1,511,540 | |
b Reliance Industries Ltd., (Guaranty: Export-Import Bank of the United States), 2.512% due 1/15/2026 | | NR/NR | | | 6,500,000 | | | | 6,688,266 | |
Sandalwood 2013, LLC, (Guaranty: Export-Import Bank of the United States), 2.821% due 2/12/2026 | | NR/NR | | | 5,966,488 | | | | 6,227,564 | |
Santa Rosa Leasing, LLC, (Guaranty: Export-Import Bank of the United States), 1.693% due 8/15/2024 | | NR/NR | | | 4,355,774 | | | | 4,334,300 | |
Santa Rosa Leasing, LLC, (Guaranty: Export-Import Bank of the United States), 1.472% due 11/3/2024 | | NR/NR | | | 11,967,542 | | | | 11,781,219 | |
Small Business Administration Participation Certificates, Series 2001-20J Class 1, 5.76% due 10/1/2021 | | NR/NR | | | 292,442 | | | | 313,429 | |
Small Business Administration Participation Certificates, Series 2008-20D Class 1, 5.37% due 4/1/2028 | | NR/NR | | | 1,486,715 | | | | 1,669,894 | |
Small Business Administration Participation Certificates, Series 2009-20E Class 1, 4.43% due 5/1/2029 | | NR/NR | | | 1,244,672 | | | | 1,356,703 | |
Small Business Administration Participation Certificates, Series 2009-20K Class 1, 4.09% due 11/1/2029 | | NR/NR | | | 7,276,156 | | | | 7,867,038 | |
Small Business Administration Participation Certificates, Series 2011-20E Class 1, 3.79% due 5/1/2031 | | NR/NR | | | 9,814,388 | | | | 10,630,191 | |
Small Business Administration Participation Certificates, Series 2011-20F Class 1, 3.67% due 6/1/2031 | | NR/NR | | | 1,561,452 | | | | 1,690,656 | |
Small Business Administration Participation Certificates, Series 2011-20G Class 1, 3.74% due 7/1/2031 | | NR/NR | | | 10,072,541 | | | | 10,901,517 | |
Small Business Administration Participation Certificates, Series 2011-20I Class 1, 2.85% due 9/1/2031 | | NR/NR | | | 13,675,794 | | | | 14,225,299 | |
Small Business Administration Participation Certificates, Series 2011-20K Class 1, 2.87% due 11/1/2031 | | NR/NR | | | 11,055,596 | | | | 11,513,988 | |
Small Business Administration Participation Certificates, Series 2012-20D Class 1, 2.67% due 4/1/2032 | | NR/NR | | | 11,290,404 | | | | 11,627,511 | |
Small Business Administration Participation Certificates, Series 2012-20J Class 1, 2.18% due 10/1/2032 | | NR/NR | | | 8,662,909 | | | | 8,734,971 | |
Small Business Administration Participation Certificates, Series 2012-20K Class 1, 2.09% due 11/1/2032 | | NR/NR | | | 5,275,639 | | | | 5,313,464 | |
Southaven Combined Cycle Generation, LLC (Tennessee Valley Authority), 3.846% due 8/15/2033 | | AA-/Aaa | | | 5,533,000 | | | | 5,961,415 | |
a,c U.S. Department of Transportation, 6.001% due 12/7/2021 | | NR/NR | | | 3,000,000 | | | | 3,525,000 | |
Union 13 Leasing, LLC, (Guaranty: Export-Import Bank of the United States), 1.682% due 12/19/2024 | | NR/NR | | | 11,215,710 | | | | 11,129,461 | |
b Washington Aircraft 2 Co. Ltd. Floating Rate Note, (Guaranty: Export-Import Bank of the United States), 1.06% due 6/26/2024 | | NR/NR | | | 8,369,666 | | | | 8,259,563 | |
| | | | | | | | | | |
TOTAL U.S. GOVERNMENT AGENCIES (Cost $278,424,304) | | | | | | | | | 282,300,602 | |
| | | | | | | | | | |
| | | |
OTHER GOVERNMENT — 2.12% | | | | | | | | | | |
a,b Carpintero Finance Ltd., (Guaranty: Export Credits Guarantee Department of the United Kingdom), 2.004% due 9/18/2024 | | NR/NR | | | 8,399,135 | | | | 8,456,871 | |
a,b Carpintero Finance Ltd., (Guaranty: Export Credits Guarantee Department of the United Kingdom), 2.581% due 11/11/2024 | | NR/NR | | | 11,823,382 | | | | 12,196,268 | |
a,b Government of Bermuda, 5.603% due 7/20/2020 | | A+/A1 | | | 3,000,000 | | | | 3,292,500 | |
a,b Government of Bermuda, 4.138% due 1/3/2023 | | A+/A1 | | | 4,000,000 | | | | 4,041,580 | |
a,b Khadrawy Ltd., (Guaranty: Export Credit Guarantee Department of the United Kingdom), 2.471% due 3/31/2025 | | NR/NR | | | 5,499,258 | | | | 5,519,605 | |
a,b Korea National Oil Corp., 4.00% due 10/27/2016 | | AA-/Aa2 | | | 2,000,000 | | | | 2,032,196 | |
a,b Korea National Oil Corp., 2.75% due 1/23/2019 | | AA-/Aa2 | | | 5,000,000 | | | | 5,118,165 | |
b North American Development Bank, 4.375% due 2/11/2020 | | NR/Aa1 | | | 15,500,000 | | | | 17,007,995 | |
a,b Seven and Seven Ltd. Floating Rate Note, (Guaranty: Export-Import Bank of Korea), 1.898% due 9/11/2019 | | NR/NR | | | 15,610,000 | | | | 15,547,919 | |
14 Semi-Annual Reports
| | |
| SCHEDULE OF INVESTMENTS, CONTINUED | | |
| |
Thornburg Limited Term Income Fund | | March 31, 2016 (Unaudited) |
| | | | | | | | | | |
Issuer-Description | | Credit Rating†
S&P/ Moody’s | | Principal
Amount | | | Value | |
a,b State of Qatar, 3.125% due 1/20/2017 | | AA/Aa2 | | $ | 4,000,000 | | | $ | 4,060,000 | |
b United Mexican States, 4.125% due 1/21/2026 | | BBB+/A3 | | | 12,000,000 | | | | 12,582,000 | |
| | | | | | | | | | |
TOTAL OTHER GOVERNMENT (Cost $87,980,513) | | | | | | | | | 89,855,099 | |
| | | | | | | | | | |
| | | |
MORTGAGE BACKED — 3.65% | | | | | | | | | | |
Federal Home Loan Mtg Corp., CMO Interest Only Series K008 Class X1, 1.642% due 6/25/2020 | | NR/NR | | | 36,719,914 | | | | 1,881,220 | |
Federal Home Loan Mtg Corp., CMO Interest Only Series K710 Class X1, 1.765% due 5/25/2019 | | NR/NR | | | 47,219,001 | | | | 2,173,033 | |
Federal Home Loan Mtg Corp., CMO Series 2528 Class HN, 5.00% due 11/15/2017 | | NR/NR | | | 73,648 | | | | 75,447 | |
Federal Home Loan Mtg Corp., CMO Series 2627 Class GY, 4.50% due 6/15/2018 | | NR/NR | | | 514,485 | | | | 528,487 | |
Federal Home Loan Mtg Corp., CMO Series 2628 Class AB, 4.50% due 6/15/2018 | | NR/NR | | | 127,630 | | | | 131,124 | |
Federal Home Loan Mtg Corp., CMO Series 2682 Class JG, 4.50% due 10/15/2023 | | NR/NR | | | 844,271 | | | | 891,021 | |
Federal Home Loan Mtg Corp., CMO Series 2814 Class GB, 5.00% due 6/15/2019 | | NR/NR | | | 32,880 | | | | 34,110 | |
Federal Home Loan Mtg Corp., CMO Series 2827 Class BU, 3.50% due 7/15/2019 | | NR/NR | | | 608,083 | | | | 621,036 | |
Federal Home Loan Mtg Corp., CMO Series 3195 Class PD, 6.50% due 7/15/2036 | | NR/NR | | | 1,279,386 | | | | 1,436,860 | |
Federal Home Loan Mtg Corp., CMO Series 3291 Class BY, 4.50% due 3/15/2022 | | NR/NR | | | 1,312,168 | | | | 1,371,104 | |
Federal Home Loan Mtg Corp., CMO Series 3504 Class PC, 4.00% due 1/15/2039 | | NR/NR | | | 124,733 | | | | 129,856 | |
Federal Home Loan Mtg Corp., CMO Series 3589 Class CA, 4.00% due 10/15/2021 | | NR/NR | | | 164,652 | | | | 166,140 | |
Federal Home Loan Mtg Corp., CMO Series 3919 Class VB, 4.00% due 8/15/2024 | | NR/NR | | | 4,243,858 | | | | 4,635,884 | |
Federal Home Loan Mtg Corp., CMO Series 3922 Class PQ, 2.00% due 4/15/2041 | | NR/NR | | | 1,982,704 | | | | 1,994,175 | |
Federal Home Loan Mtg Corp., CMO Series 4050 Class MV, 3.50% due 8/15/2023 | | NR/NR | | | 2,809,008 | | | | 2,996,073 | |
Federal Home Loan Mtg Corp., CMO Series 4079 Class WV, 3.50% due 3/15/2027 | | NR/NR | | | 3,018,190 | | | | 3,224,119 | |
Federal Home Loan Mtg Corp., CMO Series 4097 Class TE, 1.75% due 5/15/2039 | | NR/NR | | | 7,826,943 | | | | 7,747,058 | |
Federal Home Loan Mtg Corp., CMO Series 4120 Class TC, 1.50% due 10/15/2027 | | NR/NR | | | 3,948,993 | | | | 3,911,157 | |
Federal Home Loan Mtg Corp., CMO Series K038 Class A1, 2.604% due 10/25/2023 | | NR/NR | | | 12,658,117 | | | | 13,170,668 | |
Federal Home Loan Mtg Corp., CMO Series K039 Class A1, 2.683% due 12/25/2023 | | NR/NR | | | 6,381,958 | | | | 6,661,997 | |
Federal Home Loan Mtg Corp., CMO Series K716 Class A1, 2.413% due 8/25/2047 | | NR/Aaa | | | 5,326,119 | | | | 5,465,246 | |
Federal Home Loan Mtg Corp., Pool D98887, 3.50% due 1/1/2032 | | NR/NR | | | 5,033,029 | | | | 5,334,617 | |
Federal Home Loan Mtg Corp., Pool J17504, 3.00% due 12/1/2026 | | NR/NR | | | 2,454,865 | | | | 2,580,965 | |
Federal Home Loan Mtg Corp., REMIC Series 3838 Class GV, 4.00% due 3/15/2024 | | NR/NR | | | 8,261,727 | | | | 8,973,272 | |
Federal Home Loan Mtg Corp., REMIC Series 4072 Class VA, 3.50% due 10/15/2023 | | NR/NR | | | 2,161,075 | | | | 2,306,878 | |
Federal National Mtg Assoc., CMO Series 2003-4 Class PE, 5.00% due 2/25/2018 | | NR/NR | | | 215,925 | | | | 221,947 | |
Federal National Mtg Assoc., CMO Series 2003-74 Class KN, 4.50% due 8/25/2018 | | NR/NR | | | 100,869 | | | | 103,423 | |
Federal National Mtg Assoc., CMO Series 2005-48 Class AR, 5.50% due 2/25/2035 | | NR/NR | | | 323,380 | | | | 343,325 | |
Federal National Mtg Assoc., CMO Series 2007-42 Class PA, 5.50% due 4/25/2037 | | NR/NR | | | 472,190 | | | | 508,205 | |
Federal National Mtg Assoc., CMO Series 2009-17 Class AH, 1.056% due 3/25/2039 | | NR/NR | | | 791,117 | | | | 703,898 | |
Federal National Mtg Assoc., CMO Series 2009-49 Class KA, 5.00% due 2/25/2024 | | NR/NR | | | 105,462 | | | | 106,729 | |
Federal National Mtg Assoc., CMO Series 2009-5 Class A, 4.50% due 12/25/2023 | | NR/NR | | | 588,835 | | | | 605,063 | |
Federal National Mtg Assoc., CMO Series 2009-52 Class AJ, 4.00% due 7/25/2024 | | NR/NR | | | 441,811 | | | | 455,751 | |
Federal National Mtg Assoc., CMO Series 2009-70 Class NK, 4.50% due 8/25/2019 | | NR/NR | | | 311,180 | | | | 319,636 | |
Federal National Mtg Assoc., CMO Series 2011-103 Class VA, 4.00% due 12/25/2022 | | NR/NR | | | 1,924,722 | | | | 1,977,513 | |
Federal National Mtg Assoc., CMO Series 2011-15 Class VA, 4.00% due 4/25/2022 | | NR/NR | | | 1,190,350 | | | | 1,250,979 | |
Federal National Mtg Assoc., CMO Series 2012-129 Class LA, 3.50% due 12/25/2042 | | NR/NR | | | 10,412,184 | | | | 10,930,278 | |
Federal National Mtg Assoc., CMO Series 2012-36 Class CV, 4.00% due 6/25/2023 | | NR/NR | | | 2,516,784 | | | | 2,682,025 | |
Federal National Mtg Assoc., Pool 357384, 4.50% due 5/1/2018 | | NR/NR | | | 69,615 | | | | 71,853 | |
Federal National Mtg Assoc., Pool 897936, 5.50% due 8/1/2021 | | NR/NR | | | 569,330 | | | | 613,825 | |
Federal National Mtg Assoc., Pool AB7997, 2.50% due 2/1/2023 | | NR/NR | | | 6,151,432 | | | | 6,341,501 | |
Federal National Mtg Assoc., Pool AK6518, 3.00% due 3/1/2027 | | NR/NR | | | 3,272,449 | | | | 3,436,838 | |
Federal National Mtg Assoc., Pool MA1278, 2.50% due 12/1/2022 | | NR/NR | | | 8,085,477 | | | | 8,335,305 | |
Federal National Mtg Assoc., Pool MA1585, 2.00% due 9/1/2023 | | NR/NR | | | 9,882,089 | | | | 10,056,955 | |
Federal National Mtg Assoc., Pool MA1691, 3.00% due 12/1/2023 | | NR/NR | | | 8,793,328 | | | | 9,211,698 | |
Government National Mtg Assoc., CMO Series 2009-68 Class DP, 4.50% due 11/16/2038 | | NR/NR | | | 473,883 | | | | 506,751 | |
Government National Mtg Assoc., Pool 714631, 5.691% due 10/20/2059 | | NR/NR | | | 1,606,708 | | | | 1,664,952 | |
Government National Mtg Assoc., Pool 721652, 5.044% due 5/20/2061 | | NR/NR | | | 4,853,475 | | | | 5,134,855 | |
Government National Mtg Assoc., Pool 731491, 5.156% due 12/20/2060 | | NR/NR | | | 2,817,220 | | | | 3,037,117 | |
Government National Mtg Assoc., Pool 751388, 5.307% due 1/20/2061 | | NR/NR | | | 3,917,198 | | | | 4,206,923 | |
Government National Mtg Assoc., Pool 783299, 4.50% due 2/15/2022 | | NR/NR | | | 1,645,745 | | | | 1,702,602 | |
Government National Mtg Assoc., Pool 827148, 1.75% due 2/20/2024 | | NR/NR | | | 20,324 | | | | 20,725 | |
Government National Mtg Assoc., Pool MA0100, 2.50% due 5/20/2042 | | NR/NR | | | 1,781,230 | | | | 1,813,557 | |
| | | | | | | | | | |
TOTAL MORTGAGE BACKED (Cost $153,010,382) | | | | | | | | | 154,805,776 | |
| | | | | | | | | | |
| | | |
ASSET BACKED SECURITIES — 21.29% | | | | | | | | | | |
ADVANCE RECEIVABLES — 0.33% | | | | | | | | | | |
a SPS Servicer Advance Receivables Trust, Series 2015-T3 Class AT3, 2.92% due 7/15/2047 | | AAA/NR | | | 13,875,000 | | | | 13,883,075 | |
| | | | | | | | | | |
| | | | | | | | | 13,883,075 | |
| | | | | | | | | | |
Semi-Annual Reports 15
| | |
| SCHEDULE OF INVESTMENTS, CONTINUED | | |
| |
Thornburg Limited Term Income Fund | | March 31, 2016 (Unaudited) |
| | | | | | | | | | |
Issuer-Description | | Credit Rating†
S&P/ Moody’s | | Principal
Amount | | | Value | |
AUTO RECEIVABLES — 3.36% | | | | | | | | | | |
a Avis Budget Rental Car Funding AESOP, LLC, Series 2012-3A Class A, 2.10% due 3/20/2019 | | NR/Aaa | | $ | 10,200,000 | | | $ | 10,187,475 | |
a Avis Budget Rental Car Funding AESOP, LLC, Series 2015-2A Class A, 2.63% due 12/20/2021 | | NR/Aaa | | | 6,000,000 | | | | 5,985,914 | |
a Chesapeake Funding II, LLC, Series 16-1A Class A1, 2.11% due 3/15/2028 | | NR/Aaa | | | 13,800,000 | | | | 13,797,992 | |
a Exeter Automobile Receivables Trust, Series 2014-1A Class A, 1.29% due 5/15/2018 | | AA/NR | | | 290,445 | | | | 290,367 | |
a Exeter Automobile Receivables Trust, Series 2015-1A Class B, 2.84% due 3/16/2020 | | A/NR | | | 14,250,000 | | | | 14,119,929 | |
Ford Credit Auto Owner Trust, Series 2013-C Class A4, 1.25% due 10/15/2018 | | AAA/NR | | | 1,200,000 | | | | 1,201,301 | |
a Ford Credit Auto Owner Trust, Series 2014-2 Class A, 2.31% due 4/15/2026 | | NR/Aaa | | | 18,000,000 | | | | 18,238,102 | |
a Ford Credit Auto Owner Trust, Series 2015-1 Class A, 2.12% due 7/15/2026 | | AAA/NR | | | 9,900,000 | | | | 9,953,935 | |
a GM Financial Automobile Leasing Trust, Series 2014-2A Class A4, 1.62% due 2/20/2018 | | NR/Aaa | | | 13,400,000 | | | | 13,486,896 | |
a Hertz Vehicle Financing, LLC, Series 2013-1A Class A2, 1.83% due 8/25/2019 | | NR/Aaa | | | 10,275,000 | | | | 10,102,137 | |
a Hertz Vehicle Financing, LLC, Series 2015-2A Class A, 2.02% due 9/25/2019 | | NR/Aaa | | | 15,000,000 | | | | 14,988,698 | |
a OSCAR US Funding Trust, Series 2014-1A Class A3, 1.72% due 4/15/2019 | | AA+/Aaa | | | 9,900,000 | | | | 9,838,511 | |
a OSCAR US Funding Trust, Series 2015-1A Class A2A, 1.30% due 2/15/2018 | | AA+/Aaa | | | 9,568,560 | | | | 9,527,128 | |
Santander Drive Auto Receivables Trust, Series 2013-2 Class B, 1.33% due 3/15/2018 | | AAA/Aaa | | | 912,513 | | | | 912,581 | |
Santander Drive Auto Receivables Trust, Series 2013-4 Class B, 2.16% due 1/15/2020 | | AAA/Aaa | | | 1,821,235 | | | | 1,823,414 | |
World Omni Auto Receivables Trust, Series 2014-B Class A4, 1.68% due 12/15/2020 | | AAA/NR | | | 8,400,000 | | | | 8,459,674 | |
| | | | | | | | | | |
| | | | | | | | | 142,914,054 | |
| | | | | | | | | | |
COMMERCIAL MTG TRUST — 5.55% | | | | | | | | | | |
a BAMLL-DB Trust, Series 2012-OSI Class A2FX, 3.352% due 4/13/2029 | | NR/Aaa | | | 41,300,776 | | | | 41,841,647 | |
Banc of America Commercial Mtg Inc., Series 2006-6 Class A3, 5.369% due 10/10/2045 | | AAA/Aaa | | | 153,893 | | | | 153,907 | |
a Barclays Commercial Mtg Securities, LLC, Series 2015-STP Class A, 3.323% due 9/10/2028 | | AAA/NR | | | 5,900,000 | | | | 6,002,560 | |
a Bayview Commercial Asset Trust, Series 2004-3 Class A2 Floating Rate Note, 0.853% due 1/25/2035 | | NR/Aa2 | | | 3,202,164 | | | | 2,852,330 | |
a BHMS Mtg Trust, Series 2014-ATLS Class AFL Floating Rate Note, 1.941% due 7/5/2033 | | NR/NR | | | 10,000,000 | | | | 9,799,907 | |
a CFCRE Commercial Mtg Trust, Series 2011-C1 Class A4, 4.961% due 4/15/2044 | | NR/Aaa | | | 11,877,000 | | | | 13,187,429 | |
Citigroup Commercial Mtg Trust, Series 2004-HYB2 Class B1, 2.928% due 3/25/2034 | | CCC/Caa2 | | | 235,676 | | | | 192,578 | |
COMM Mtg Trust, Series 2016-DC2 Class A1, 1.82% due 2/10/2049 | | NR/Aaa | | | 24,615,000 | | | | 24,771,889 | |
Credit Suisse Commercial Mtg Capital Certificates, Series 2007-C2 Class A2, 5.448% due 1/15/2049 | | AAA/Aaa | | | 8,184 | | | | 8,188 | |
a DBUBS Mtg Trust CMO, Series 2011-LC1A Class A1, 3.742% due 11/10/2046 | | NR/Aaa | | | 317,194 | | | | 318,055 | |
a DBUBS Mtg Trust CMO, Series 2011-LC2A Class A1FL, 1.788% due 7/12/2044 | | NR/Aaa | | | 5,075,693 | | | | 5,112,112 | |
d Deutsche Bank Commercial Mtg Trust, Series 2016-C1 Class A1, 1.676% due 5/10/2049 | | NR/NR | | | 6,208,000 | | | | 6,207,904 | |
a Extended Stay America Trust, Series 2013-ESH7 Class B7, 3.604% due 12/5/2031 | | AA/NR | | | 11,380,000 | | | | 11,410,523 | |
a FREMF Mtg Trust, Series 2012-KF01 Class B Floating Rate Note, 3.041% due 10/25/2044 | | NR/Aaa | | | 4,000,000 | | | | 4,013,796 | |
a FREMF Mtg Trust, Series 2013-KF02 Class B Floating Rate Note, 3.433% due 12/25/2045 | | NR/Baa3 | | | 1,445,224 | | | | 1,468,420 | |
a GAHR Commercial Mtg Trust, Series 2015-NRF Class BFX, 3.382% due 12/15/2019 | | AA-/NR | | | 24,880,000 | | | | 25,191,749 | |
a Hilton USA Trust, Series 2013-HLT Class BFX, 3.367% due 11/5/2030 | | AA-/Aaa | | | 18,500,000 | | | | 18,533,735 | |
a JPMorgan Chase Commercial Mtg, Series 2014-BXH Class A Floating Rate Note, 1.336% due 4/15/2027 | | AAA/NR | | | 19,900,000 | | | | 19,378,833 | |
a Madison Avenue Trust, Series 2013-650M Class A, 3.843% due 10/12/2032 | | NR/Aaa | | | 6,000,000 | | | | 6,423,434 | |
a Madison Avenue Trust, Series 2015-11MD Class A, 3.555% due 9/10/2035 | | AAA/NR | | | 12,000,000 | | | | 12,777,898 | |
a Morgan Stanley Re-REMIC Trust, Series 2009-GG10 Class A4A, 5.794% due 8/12/2045 | | NR/Aaa | | | 5,954,965 | | | | 6,055,254 | |
a Wells Fargo Commercial Mtg Trust, Series 2013-120B Class A, 2.71% due 3/18/2028 | | AAA/NR | | | 15,000,000 | | | | 15,224,871 | |
WFRBS Commercial Mtg Trust, Series 2014-C22 Class A1, 1.479% due 9/15/2057 | | NR/Aaa | | | 4,730,229 | | | | 4,728,733 | |
| | | | | | | | | | |
| | | | | | | | | 235,655,752 | |
| | | | | | | | | | |
CREDIT CARD — 1.32% | | | | | | | | | | |
Cabela’s Master Credit Card Trust, Series 2015-1A Class A2 Floating Rate Note, 0.976% due 3/15/2023 | | AAA/NR | | | 15,665,000 | | | | 15,415,062 | |
Synchrony Credit Card Master Note Trust, Series 2014-1 Class A, 1.61% due 11/15/2020 | | AAA/Aaa | | | 14,613,000 | | | | 14,653,538 | |
Synchrony Credit Card Master Note Trust, Series 2015-2 Class A, 1.60% due 4/15/2021 | | AAA/NR | | | 7,400,000 | | | | 7,404,749 | |
Synchrony Credit Card Master Note Trust, Series 2016-1 Class A, 2.04% due 3/15/2022 | | NR/Aaa | | | 8,400,000 | | | | 8,466,564 | |
a,b Turquoise Card Backed Securities plc, Series 2012-1A Class A Floating Rate Note, 1.236% due 6/17/2019 | | NR/Aaa | | | 10,000,000 | | | | 9,993,980 | |
| | | | | | | | | | |
| | | | | | | | | 55,933,893 | |
| | | | | | | | | | |
OTHER ASSET BACKED — 8.37% | | | | | | | | | | |
a 321 Henderson Receivables, LLC, Series 2014-1A Class A, 3.96% due 3/15/2063 | | NR/Aaa | | | 17,957,774 | | | | 18,118,228 | |
a Alterna Funding I, LLC, Series 2014-1A, 1.639% due 2/15/2021 | | NR/NR | | | 3,554,733 | | | | 3,521,407 | |
Appalachian Consumer Rate Relief Funding, LLC, Series 2013-1 Class A1, 2.008% due 2/1/2024 | | AAA/Aaa | | | 11,929,345 | | | | 12,065,097 | |
a Ascentium Equipment Receivables, LLC, Series 2015-1A Class B, 2.26% due 6/10/2021 | | NR/Aaa | | | 5,920,000 | | | | 5,883,173 | |
a CLI Funding V, LLC, Series 2014-2A Class A, 3.38% due 10/18/2029 | | A/NR | | | 8,579,132 | | | | 8,031,364 | |
a,b Cronos Containers Program Ltd., Series 2013-1A Class A, 3.08% due 4/18/2028 | | A+/NR | | | 7,083,333 | | | | 6,699,740 | |
a Dell Equipment Finance Trust, Series 2015-2 Class A3, 1.72% due 9/22/2020 | | AAA/Aaa | | | 9,875,000 | | | | 9,860,454 | |
a Dominos Pizza Master Issuer, LLC, Series 2012-1A Class A2, 5.216% due 1/25/2042 | | BBB+/Baa1 | | | 12,922,520 | | | | 13,378,090 | |
Entergy New Orleans Storm Recovery Funding I, LLC, Series 2015-1 Class A, 2.67% due 6/1/2027 | | AAA/Aa1 | | | 15,000,000 | | | | 15,634,469 | |
a Fairway Outdoor Funding, LLC, Series 2012-1A Class A2, 4.212% due 10/15/2042 | | NR/NR | | | 6,325,301 | | | | 6,435,216 | |
GE Dealer Floorplan Master Note Trust, Series 2012-2 Class A Floating Rate Note, 1.182% due 4/22/2019 | | NR/Aaa | | | 14,900,000 | | | | 14,879,588 | |
a GTP Acquisition Partners I, LLC, Series 2015-1 Class A, 2.35% due 6/15/2045 | | NR/Aaa | | | 9,900,000 | | | | 9,741,798 | |
a GTP Cellular Sites, LLC, 3.721% due 3/15/2042 | | NR/NR | | | 14,588,262 | | | | 14,608,539 | |
16 Semi-Annual Reports
| | |
| SCHEDULE OF INVESTMENTS, CONTINUED | | |
| |
Thornburg Limited Term Income Fund | | March 31, 2016 (Unaudited) |
| | | | | | | | | | |
Issuer-Description | | Credit Rating†
S&P/ Moody’s | | Principal
Amount | | | Value | |
Harley-Davidson Motorcycle Trust, Series 2015-2 Class A4, 1.66% due 12/15/2022 | | AAA/Aaa | | $ | 22,544,000 | | | $ | 22,587,904 | |
a,c HERO Funding Trust, Series 2015-1A Class A, 3.84% due 9/21/2040 | | NR/NR | | | 17,944,637 | | | | 18,016,416 | |
a Navistar Financial Dealer Note Master Owner Trust II, Series 2014-1 Class A Floating Rate Note, 1.183% due 10/25/2019 | | NR/Aaa | | | 17,730,000 | | | | 17,655,873 | |
a Navistar Financial Dealer Note Master Owner Trust II, Series 2015-1 Class A Floating Rate Note, 1.836% due 6/25/2020 | | NR/Aaa | | | 15,259,000 | | | | 15,240,285 | |
a Navitas Equipment Receivables, LLC, Series 2015-1 Class A2, 2.12% due 11/15/2018 | | NR/A3 | | | 10,229,840 | | | | 10,261,233 | |
Northwest Airlines, Inc., 7.027% due 5/1/2021 | | A/A2 | | | 4,036,082 | | | | 4,520,412 | |
a,c Northwind Holdings, LLC, Series 2007-1A Class A1 Floating Rate Note, 1.415% due 12/1/2037 | | A/Baa1 | | | 2,719,500 | | | | 2,529,135 | |
a OneMain Financial Issuance Trust, Series 16-2A Class A, 4.10% due 3/20/2028 | | A+/NR | | | 22,900,000 | | | | 22,996,750 | |
a PFS Financing Corp., Series 2014-BA Class A Floating Rate Note, 1.036% due 10/15/2019 | | AAA/Aaa | | | 6,000,000 | | | | 5,945,140 | |
a PFS Financing Corp., Series 2015-AA Class A Floating Rate Note, 1.056% due 4/15/2020 | | AAA/Aaa | | | 7,400,000 | | | | 7,307,853 | |
a PFS Tax Lien Trust, Series 2014-1, 1.44% due 5/15/2029 | | AAA/NR | | | 2,159,665 | | | | 2,152,946 | |
a SBA Tower Trust, Series 2010-2 Class C, 5.101% due 4/15/2042 | | NR/A2 | | | 7,671,000 | | | | 7,745,481 | |
a SBA Tower Trust, Series 2012-1 Class C, 2.933% due 12/15/2042 | | NR/A2 | | | 11,198,000 | | | | 11,148,181 | |
a SBA Tower Trust, Series 2014-1A Class C, 2.898% due 10/15/2044 | | NR/A2 | | | 17,900,000 | | | | 17,984,699 | |
a SBA Tower Trust, Series 2015-1 Class C, 3.156% due 10/15/2045 | | NR/A2 | | | 5,000,000 | | | | 5,001,900 | |
a Sierra Receivables Funding Co., LLC, Series 2012-1A Class A, 2.84% due 11/20/2028 | | A+/NR | | | 1,405,166 | | | | 1,413,708 | |
a Sierra Receivables Funding Co., LLC, Series 2012-2A Class A, 2.05% due 6/20/2031 | | A/NR | | | 2,613,406 | | | | 2,609,031 | |
a Sierra Receivables Funding Co., LLC, Series 2014-1A Class A, 2.07% due 3/20/2030 | | A/NR | | | 5,695,455 | | | | 5,664,792 | |
a Sierra Receivables Funding Co., LLC, Series 2015-1A Class A, 2.40% due 3/22/2032 | | A/NR | | | 6,090,725 | | | | 6,111,557 | |
a Sierra Receivables Funding Co., LLC, Series 2015-3A Class A, 2.58% due 9/20/2032 | | A/NR | | | 12,606,084 | | | | 12,539,006 | |
a Sonic Capital, LLC, Series 2011-1A Class A2, 5.438% due 5/20/2041 | | BBB/Baa2 | | | 4,268,800 | | | | 4,404,014 | |
a Springleaf Funding Trust, Series 2015-AA Class A, 3.16% due 11/15/2024 | | A+/NR | | | 13,000,000 | | | | 12,801,095 | |
| | | | | | | | | | |
| | | | | | | | | 355,494,574 | |
| | | | | | | | | | |
RESIDENTIAL MTG TRUST — 1.01% | | | | | | | | | | |
a B2R Mtg Trust, Series 2015-2 Class A, 3.336% due 11/15/2048 | | NR/NR | | | 9,810,987 | | | | 9,988,464 | |
a Citigroup Mtg Loan Trust, Inc., Series 2014-A Class A, 4.00% due 1/25/2035 | | AA/NR | | | 4,655,547 | | | | 4,801,131 | |
Countrywide Home Loan, Series 2004-HYB2 Class 1A, 2.921% due 7/20/2034 | | A/B1 | | | 347,004 | | | | 337,430 | |
a FDIC Trust, Series 2013-R1 Class A, 1.15% due 3/25/2033 | | NR/NR | | | 3,676,336 | | | | 3,613,325 | |
Merrill Lynch Mtg Investors Trust, Series 2003-E Class B3, 2.683% due 10/25/2028 | | CCC/Ca | | | 964,241 | | | | 255,403 | |
Merrill Lynch Mtg Investors Trust, Series 2004-A4 Class M1, 2.56% due 8/25/2034 | | CCC/NR | | | 694,412 | | | | 642,194 | |
a,c Nationstar HECM Loan Trust, Series 16-1A Class A, 2.981% due 2/25/2026 | | NR/Aaa | | | 8,511,836 | | | | 8,511,829 | |
Option One Mtg Loan Trust, Series 2005-5 Class A3 Floating Rate Note, 0.643% due 12/25/2035 | | AA+/A2 | | | 607,323 | | | | 602,756 | |
Popular ABS Mtg Pass-Through Trust, Series 2005-4 Class AF5, 5.537% due 9/25/2035 | | BB+/A1 | | | 1,893,693 | | | | 1,941,998 | |
Residential Asset Mtg Products, Inc., Series 2003-SL1 Class A31, 7.125% due 4/25/2031 | | AA+/NR | | | 1,421,224 | | | | 1,514,754 | |
a Shellpoint Asset Funding Trust, Series 2013-1 Class A1, 3.75% due 7/25/2043 | | AAA/NR | | | 7,965,805 | | | | 8,344,777 | |
Structured Asset Securities Corp., Series 2003-9A Class 2A2, 2.63% due 3/25/2033 | | AA+/Ba1 | | | 1,695,423 | | | | 1,618,800 | |
Structured Asset Securities Corp., Series 2004-3 Class 3A1, 5.50% due 3/25/2019 | | A+/Ba2 | | | 309,195 | | | | 310,023 | |
Washington Mutual Mtg, Series 2003-S13 Class 21A1, 4.50% due 12/25/2018 | | A+/NR | | | 252,545 | | | | 253,153 | |
Wells Fargo Asset Securities Corp., Series 2005-AR1 Class 1B1, 2.77% due 2/25/2035 | | D/C | | | 412,471 | | | | 51,674 | |
| | | | | | | | | | |
| | | | | | | | | 42,787,711 | |
| | | | | | | | | | |
STUDENT LOAN — 1.35% | | | | | | | | | | |
Navient Student Loan Trust, Series 2014-1 Class A3 Floating Rate Note, 0.943% due 6/25/2031 | | NR/Aaa | | | 10,750,000 | | | | 10,225,179 | |
a Navient Student Loan Trust, Series 2015-AA Class A2B Floating Rate Note, 1.636% due 12/15/2028 | | NR/Aaa | | | 7,000,000 | | | | 6,756,537 | |
a Nelnet Student Loan Trust, Series 2013-1A Class A Floating Rate Note, 1.033% due 6/25/2041 | | NR/Aaa | | | 9,728,075 | | | | 9,399,376 | |
a Pennsylvania Higher Education Assistance Agency, Series 2012-1A Class A1 Floating Rate Note, 0.983% due 5/25/2027 | | AA+/NR | | | 3,509,773 | | | | 3,457,135 | |
SLM Student Loan Trust, Series 2003-C Class A2 Floating Rate Note, 1.024% due 9/15/2020 | | A-/Aaa | | | 1,094,101 | | | | 1,071,041 | |
a SLM Student Loan Trust, Series 2011-A Class A3 Floating Rate Note, 2.936% due 1/15/2043 | | AAA/Aaa | | | 13,650,000 | | | | 13,773,747 | |
a SLM Student Loan Trust, Series 2011-B Class A2, 3.74% due 2/15/2029 | | AAA/Aaa | | | 5,000,000 | | | | 5,095,860 | |
a Social Professional Loan Program, LLC, Series 2014-A Class A1 Floating Rate Note, 2.033% due 6/25/2025 | | A/NR | | | 2,613,316 | | | | 2,613,314 | |
a Social Professional Loan Program, LLC, Series 2014-A Class A2, 3.02% due 10/25/2027 | | A/NR | | | 4,926,097 | | | | 4,968,521 | |
| | | | | | | | | | |
| | | | | | | | | 57,360,710 | |
| | | | | | | | | | |
TOTAL ASSET BACKED SECURITIES (Cost $906,223,541) | | | | | | | | | 904,029,769 | |
| | | | | | | | | | |
| | | |
CORPORATE BONDS — 50.81% | | | | | | | | | | |
AUTOMOBILES & COMPONENTS — 1.61% | | | | | | | | | | |
Automobiles — 1.61% | | | | | | | | | | |
a American Honda Finance Corp., 2.60% due 9/20/2016 | | A+/A1 | | | 5,000,000 | | | | 5,044,945 | |
a Daimler Finance North America, LLC, 2.45% due 5/18/2020 | | A-/A3 | | | 9,850,000 | | | | 9,954,075 | |
a Daimler Finance North America, LLC, 1.60% due 8/3/2017 | | A-/A3 | | | 3,000,000 | | | | 3,002,196 | |
a Daimler Finance North America, LLC, 3.875% due 9/15/2021 | | A-/A3 | | | 5,000,000 | | | | 5,353,035 | |
a Hyundai Capital America, 2.00% due 3/19/2018 | | A-/Baa1 | | | 4,950,000 | | | | 4,984,972 | |
a Hyundai Capital America, 2.40% due 10/30/2018 | | A-/Baa1 | | | 9,950,000 | | | | 10,016,386 | |
a,b Hyundai Capital Services, Inc. Floating Rate Note, 1.439% due 3/18/2017 | | A-/Baa1 | | | 5,000,000 | | | | 4,999,800 | |
Semi-Annual Reports 17
| | |
| SCHEDULE OF INVESTMENTS, CONTINUED | | |
| |
Thornburg Limited Term Income Fund | | March 31, 2016 (Unaudited) |
| | | | | | | | | | |
Issuer-Description | | Credit Rating†
S&P/ Moody’s | | Principal
Amount | | | Value | |
a Nissan Motor Acceptance Corp., 1.95% due 9/12/2017 | | A-/A3 | | $ | 14,900,000 | | | $ | 14,956,143 | |
a Volkswagen Group of America, Inc., 1.65% due 5/22/2018 | | BBB+/A3 | | | 10,000,000 | | | | 9,859,860 | |
| | | | | | | | | | |
| | | | | | | | | 68,171,412 | |
| | | | | | | | | | |
BANKS — 4.05% | | | | | | | | | | |
Banks — 4.05% | | | | | | | | | | |
b Abbey National Treasury Services plc Floating Rate Note, 2.112% due 3/14/2019 | | A/A1 | | | 9,900,000 | | | | 9,949,876 | |
a,b Banco BTG Pactual SA/Cayman Islands N.A., 4.00% due 1/16/2020 | | NR/Ba3 | | | 7,000,000 | | | | 5,709,900 | |
a,b Banco Latinoamericano de Comercio Exterior, S.A., 3.75% due 4/4/2017 | | BBB/NR | | | 4,000,000 | | | | 4,066,000 | |
Bank of America Corp. Floating Rate Note, 1.495% due 4/1/2019 | | BBB+/Baa1 | | | 8,000,000 | | | | 7,923,200 | |
Bank of America Corp. Floating Rate Note, 1.662% due 1/15/2019 | | BBB+/Baa1 | | | 4,225,000 | | | | 4,204,175 | |
Bank of America Corp. Floating Rate Note, 1.086% due 6/5/2017 | | A/A1 | | | 7,000,000 | | | | 6,990,571 | |
a,b Bank of China Hong Kong, 3.75% due 11/8/2016 | | A+/Aa3 | | | 4,000,000 | | | | 4,059,572 | |
Citigroup, Inc., 4.60% due 3/9/2026 | | BBB/Baa3 | | | 15,000,000 | | | | 15,380,010 | |
Citigroup, Inc., 2.50% due 7/29/2019 | | BBB+/Baa1 | | | 2,925,000 | | | | 2,964,312 | |
a,b DNB Bank ASA, 3.20% due 4/3/2017 | | A+/Aa2 | | | 10,000,000 | | | | 10,176,710 | |
Fifth Third Bank, 2.30% due 3/15/2019 | | A-/A3 | | | 3,800,000 | | | | 3,834,299 | |
First Tennessee Bank, 2.95% due 12/1/2019 | | BBB-/Baa3 | | | 7,000,000 | | | | 7,016,471 | |
JPMorgan Chase & Co. Floating Rate Note, 2.115% due 3/1/2021 | | A-/A3 | | | 7,000,000 | | | | 7,106,022 | |
Manufacturers and Traders Trust Co., 2.30% due 1/30/2019 | | A/A2 | | | 10,000,000 | | | | 10,137,380 | |
b Mitsubishi UFJ Financial Group, Inc. Floating Rate Note, 2.515% due 3/1/2021 | | A/A1 | | | 9,500,000 | | | | 9,689,914 | |
a,b Mizuho Bank Ltd., 2.45% due 4/16/2019 | | A/A1 | | | 7,000,000 | | | | 7,069,454 | |
a,b Mizuho Bank Ltd. Floating Rate Note, 1.814% due 10/20/2018 | | A/A1 | | | 5,000,000 | | | | 5,014,525 | |
National City Bank Floating Rate Note, 1.006% due 6/7/2017 | | A-/A3 | | | 5,000,000 | | | | 4,964,485 | |
b Royal Bank of Scotland Group plc, 9.50% due 3/16/2022 | | BB+/NR | | | 12,000,000 | | | | 12,691,200 | |
a,b Sberbank of Russia, 5.50% due 2/26/2024 | | NR/NR | | | 1,030,000 | | | | 935,879 | |
a Sovereign Bank, 12.18% due 6/30/2020 | | BBB+/A3 | | | 2,945,211 | | | | 3,749,666 | |
a,b Standard Chartered PLC, 3.20% due 5/12/2016 | | BBB+/A1 | | | 4,900,000 | | | | 4,911,932 | |
b Sumitomo Mitsui Banking Corp. Floating Rate Note, 1.359% due 7/23/2018 | | A/A1 | | | 14,700,000 | | | | 14,631,851 | |
Wells Fargo & Co. Floating Rate Note, 1.646% due 12/7/2020 | | A/A2 | | | 4,400,000 | | | | 4,390,201 | |
Wells Fargo Bank, N.A., 0.828% due 5/16/2016 | | A/Aa3 | | | 4,629,000 | | | | 4,627,209 | |
| | | | | | | | | | |
| | | | | | | | | 172,194,814 | |
| | | | | | | | | | |
CAPITAL GOODS — 1.94% | | | | | | | | | | |
Aerospace & Defense — 0.30% | | | | | | | | | | |
Exelis, Inc., 5.55% due 10/1/2021 | | BBB-/Baa3 | | | 11,338,000 | | | | 12,639,024 | |
Construction & Engineering — 0.21% | | | | | | | | | | |
URS Corp., 3.85% due 4/1/2017 | | BB-/NR | | | 8,895,000 | | | | 8,860,941 | |
Electrical Equipment — 0.16% | | | | | | | | | | |
Hubbell, Inc., 3.35% due 3/1/2026 | | A/A3 | | | 7,000,000 | | | | 7,031,010 | |
Industrial Conglomerates — 0.75% | | | | | | | | | | |
a,b Hutchison Whampoa Ltd., 3.50% due 1/13/2017 | | A-/A3 | | | 5,000,000 | | | | 5,076,125 | |
Roper Technologies, Inc., 3.00% due 12/15/2020 | | BBB/Baa2 | | | 4,770,000 | | | | 4,873,633 | |
Roper Technologies, Inc., 3.125% due 11/15/2022 | | BBB/Baa2 | | | 6,000,000 | | | | 5,970,006 | |
a,b Siemens Financieringsmaatschappij N.V., 2.90% due 5/27/2022 | | A+/A1 | | | 12,000,000 | | | | 12,489,996 | |
a,b Smiths Group plc, 7.20% due 5/15/2019 | | BBB+/Baa2 | | | 3,000,000 | | | | 3,393,828 | |
Machinery — 0.29% | | | | | | | | | | |
Aeroquip Vickers, Inc., 6.875% due 4/9/2018 | | A-/NR | | | 1,500,000 | | | | 1,608,356 | |
Ingersoll Rand Co., 6.391% due 11/15/2027 | | BBB/Baa2 | | | 3,000,000 | | | | 3,518,592 | |
Stanley Black & Decker, Inc., 2.451% due 11/17/2018 | | A-/Baa2 | | | 6,900,000 | | | | 7,006,501 | |
Trading Companies & Distributors — 0.23% | | | | | | | | | | |
a Aviation Capital Group Corp., 6.75% due 4/6/2021 | | BBB-/NR | | | 4,860,000 | | | | 5,467,500 | |
a Aviation Capital Group Corp., 7.125% due 10/15/2020 | | BBB-/NR | | | 3,912,000 | | | | 4,420,560 | |
| | | | | | | | | | |
| | | | | | | | | 82,356,072 | |
| | | | | | | | | | |
COMMERCIAL & PROFESSIONAL SERVICES — 0.33% | | | | | | | | | | |
Professional Services — 0.33% | | | | | | | | | | |
Dun & Bradstreet, Inc., 4.00% due 6/15/2020 | | BBB-/NR | | | 7,175,000 | | | | 7,125,744 | |
Verisk Analytics, Inc., 4.00% due 6/15/2025 | | BBB-/Baa3 | | | 6,930,000 | | | | 6,981,247 | |
| | | | | | | | | | |
| | | | | | | | | 14,106,991 | |
| | | | | | | | | | |
18 Semi-Annual Reports
| | |
| SCHEDULE OF INVESTMENTS, CONTINUED | | |
| |
Thornburg Limited Term Income Fund | | March 31, 2016 (Unaudited) |
| | | | | | | | | | |
Issuer-Description | | Credit Rating†
S&P/ Moody’s | | Principal
Amount | | | Value | |
CONSUMER DURABLES & APPAREL — 0.24% | | | | | | | | | | |
Household Durables — 0.24% | | | | | | | | | | |
Tupperware Brands Corp., 4.75% due 6/1/2021 | | BBB-/Baa3 | | $ | 10,000,000 | | | $ | 10,380,160 | |
| | | | | | | | | | |
| | | | | | | | | 10,380,160 | |
| | | | | | | | | | |
CONSUMER SERVICES — 0.49% | | | | | | | | | | |
Diversified Consumer Services — 0.37% | | | | | | | | | | |
George Washington University, 4.411% due 9/15/2017 | | A+/A1 | | | 1,650,000 | | | | 1,716,644 | |
Rensselaer Polytechnic I, 5.60% due 9/1/2020 | | A-/A3 | | | 10,925,000 | | | | 12,417,901 | |
University of Chicago, 3.065% due 10/1/2024 | | AA-/Aa2 | | | 1,470,000 | | | | 1,510,397 | |
Hotels, Restaurants & Leisure — 0.12% | | | | | | | | | | |
Marriott International, Inc., 3.125% due 10/15/2021 | | BBB/Baa2 | | | 5,000,000 | | | | 5,091,320 | |
| | | | | | | | | | |
| | | | | | | | | 20,736,262 | |
| | | | | | | | | | |
DIVERSIFIED FINANCIALS — 7.69% | | | | | | | | | | |
Capital Markets — 4.70% | | | | | | | | | | |
Ares Capital Corp., 4.875% due 11/30/2018 | | BBB/NR | | | 18,000,000 | | | | 18,492,444 | |
a Ares Finance Co., LLC, 4.00% due 10/8/2024 | | BBB+/NR | | | 5,000,000 | | | | 4,812,395 | |
a,b BTG Investments LP, 4.50% due 4/17/2018 | | NR/NR | | | 18,500,000 | | | | 14,892,500 | |
b Credit Suisse Group AG - New York, 1.70% due 4/27/2018 | | A/A2 | | | 9,325,000 | | | | 9,284,529 | |
b Credit Suisse Group Funding (Guernsey) Ltd., 3.80% due 9/15/2022 | | BBB+/Baa3 | | | 7,000,000 | | | | 6,966,925 | |
a,b Credit Suisse Group Funding (Guernsey) Ltd., 3.125% due 12/10/2020 | | BBB+/Baa3 | | | 10,000,000 | | | | 9,944,830 | |
b Deutsche Bank AG, 2.95% due 8/20/2020 | | BBB+/Baa1 | | | 8,600,000 | | | | 8,633,162 | |
FS Investment Corp., 4.00% due 7/15/2019 | | BBB/NR | | | 12,000,000 | | | | 12,027,936 | |
Goldman Sachs Group, Inc. Floating Rate Note, 1.639% due 10/23/2019 | | BBB+/A3 | | | 14,722,000 | | | | 14,621,066 | |
Goldman Sachs Group, Inc. Floating Rate Note, 1.834% due 9/15/2020 | | BBB+/A3 | | | 17,900,000 | | | | 17,776,311 | |
a,b IPIC GMTN Ltd., 5.00% due 11/15/2020 | | AA/Aa2 | | | 1,000,000 | | | | 1,106,250 | |
a,b IPIC GMTN Ltd., 3.75% due 3/1/2017 | | AA/Aa2 | | | 3,000,000 | | | | 3,058,092 | |
a,b IPIC GMTN Ltd., 5.50% due 3/1/2022 | | AA/Aa2 | | | 3,500,000 | | | | 3,984,204 | |
Legg Mason, Inc., 4.75% due 3/15/2026 | | BBB/Baa1 | | | 5,000,000 | | | | 5,069,670 | |
Legg Mason, Inc., 2.70% due 7/15/2019 | | BBB/Baa1 | | | 1,660,000 | | | | 1,676,469 | |
a,b Macquarie Bank Ltd., 1.60% due 10/27/2017 | | A/A2 | | | 5,000,000 | | | | 4,981,425 | |
Merrill Lynch & Co., 1.163% due 5/2/2017 | | BBB/Baa3 | | | 5,000,000 | | | | 4,961,570 | |
Morgan Stanley, 2.80% due 6/16/2020 | | BBB+/A3 | | | 1,350,000 | | | | 1,374,586 | |
Morgan Stanley Floating Rate Note, 1.761% due 1/27/2020 | | BBB+/A3 | | | 925,000 | | | | 918,970 | |
State Street Corp. Floating Rate Note, 1.518% due 8/18/2020 | | A/A2 | | | 9,475,000 | | | | 9,432,400 | |
a,b SumitG Guaranteed Secured Obligation Issuer D.A.C, 2.251% due 11/2/2020 | | AA+/Aa2 | | | 15,000,000 | | | | 14,984,865 | |
TD Ameritrade Holding Corp., 2.95% due 4/1/2022 | | A/A3 | | | 2,550,000 | | | | 2,602,711 | |
The Bank of New York Mellon Corp. Floating Rate Note, 1.488% due 8/17/2020 | | A/A1 | | | 4,525,000 | | | | 4,504,547 | |
a,b UBS AG Jersey Floating Rate Note, 2.068% due 9/24/2020 | | BBB+/Baa2 | | | 10,800,000 | | | | 10,746,929 | |
b UBS AG Stamford, 2.375% due 8/14/2019 | | A/A1 | | | 9,500,000 | | | | 9,643,488 | |
b UBS AG Stamford, 1.80% due 3/26/2018 | | A/A1 | | | 3,000,000 | | | | 3,010,140 | |
Consumer Finance — 0.63% | | | | | | | | | | |
American Express Credit Co., 2.80% due 9/19/2016 | | A-/A2 | | | 8,000,000 | | | | 8,068,072 | |
Capital One Bank (USA), N.A., 2.30% due 6/5/2019 | | BBB+/Baa1 | | | 3,000,000 | | | | 2,989,716 | |
Synchrony Financial, 3.00% due 8/15/2019 | | BBB-/NR | | | 1,950,000 | | | | 1,980,915 | |
Western Union Co., 3.65% due 8/22/2018 | | BBB/Baa2 | | | 2,000,000 | | | | 2,052,440 | |
Western Union Co., 3.35% due 5/22/2019 | | BBB/Baa2 | | | 11,350,000 | | | | 11,537,060 | |
Diversified Financial Services — 2.36% | | | | | | | | | | |
a Athene Global Funding, 2.875% due 10/23/2018 | | A-/NR | | | 13,925,000 | | | | 13,706,879 | |
General Electric Capital Corp. Floating Rate Note, 0.773% due 12/28/2018 | | AA+/A1 | | | 4,850,000 | | | | 4,766,798 | |
General Electric Capital Corp. Floating Rate Note, 1.634% due 3/15/2023 | | AA+/A1 | | | 7,725,000 | | | | 7,657,978 | |
Intercontinental Exchange, Inc., 2.75% due 12/1/2020 | | A/A2 | | | 4,900,000 | | | | 5,003,068 | |
Intercontinental Exchange, Inc., 3.75% due 12/1/2025 | | A/A2 | | | 4,250,000 | | | | 4,338,533 | |
JPMorgan Chase Bank, N.A. Floating Rate Note, 0.962% due 6/13/2016 | | A-/A1 | | | 16,875,000 | | | | 16,876,401 | |
McGraw Hill Financial, Inc., 4.00% due 6/15/2025 | | NR/Baa1 | | | 8,000,000 | | | | 8,335,408 | |
McGraw Hill Financial, Inc., 2.50% due 8/15/2018 | | NR/Baa1 | | | 2,950,000 | | | | 2,989,294 | |
McGraw Hill Financial, Inc., 3.30% due 8/14/2020 | | NR/Baa1 | | | 2,450,000 | | | | 2,534,552 | |
Moody’s Corp., 4.875% due 2/15/2024 | | BBB+/NR | | | 17,000,000 | | | | 18,686,077 | |
Moody’s Corp., 2.75% due 7/15/2019 | | BBB+/NR | | | 4,875,000 | | | | 5,000,814 | |
National Rural Utilities Cooperative Finance Corp., 10.375% due 11/1/2018 | | A/A1 | | | 2,000,000 | | | | 2,439,014 | |
a USAA Capital Corp., 2.25% due 12/13/2016 | | AA+/Aa1 | | | 8,000,000 | | | | 8,085,456 | |
| | | | | | | | | | |
| | | | | | | | | 326,556,889 | |
| | | | | | | | | | |
Semi-Annual Reports 19
| | |
| SCHEDULE OF INVESTMENTS, CONTINUED | | |
| |
Thornburg Limited Term Income Fund | | March 31, 2016 (Unaudited) |
| | | | | | | | | | |
Issuer-Description | | Credit Rating†
S&P/ Moody’s | | Principal
Amount | | | Value | |
ENERGY — 5.71% | | | | | | | | | | |
Energy Equipment & Services — 0.30% | | | | | | | | | | |
b Ensco plc, 4.70% due 3/15/2021 | | BBB/B1 | | $ | 5,000,000 | | | $ | 3,489,350 | |
Oceaneering International, Inc., 4.65% due 11/15/2024 | | BBB/Baa3 | | | 10,000,000 | | | | 8,611,990 | |
a,b,e Schahin II Finance Co. (SPV) Ltd., 5.875% due 9/25/2023 | | NR/NR | | | 4,082,733 | | | | 594,038 | |
Oil, Gas & Consumable Fuels — 5.41% | | | | | | | | | | |
a,b BG Energy Capital plc, 2.875% due 10/15/2016 | | A+/A2 | | | 5,000,000 | | | | 5,021,835 | |
Buckeye Partners LP, 4.15% due 7/1/2023 | | BBB-/Baa3 | | | 7,000,000 | | | | 6,310,661 | |
a Chevron Phillips Chemical Co., LLC, Floating Rate Note, 1.366% due 5/1/2020 | | A-/A2 | | | 24,900,000 | | | | 24,109,923 | |
a,b CNPC General Capital Ltd., 2.75% due 4/19/2017 | | A+/A1 | | | 5,000,000 | | | | 5,057,760 | |
a,b CNPC General Capital Ltd., 1.45% due 4/16/2016 | | A+/A1 | | | 3,000,000 | | | | 3,000,000 | |
a,b CNPC General Capital Ltd., 2.75% due 5/14/2019 | | A+/A1 | | | 5,000,000 | | | | 5,070,270 | |
a,b CNPC General Capital Ltd. Floating Rate Note, 1.518% due 5/14/2017 | | A+/A1 | | | 5,000,000 | | | | 5,001,050 | |
Energen Corp., 4.625% due 9/1/2021 | | BB/B3 | | | 10,000,000 | | | | 8,750,000 | |
Exxon Mobil Corp., 2.222% due 3/1/2021 | | AAA/Aaa | | | 4,925,000 | | | | 5,012,182 | |
Exxon Mobil Corp. Floating Rate Note, 1.412% due 3/1/2019 | | AAA/Aaa | | | 6,625,000 | | | | 6,649,976 | |
Exxon Mobil Corp. Floating Rate Note, 1.232% due 2/28/2018 | | AAA/Aaa | | | 6,950,000 | | | | 6,971,038 | |
a Florida Gas Transmission Co., LLC, 3.875% due 7/15/2022 | | BBB/Baa2 | | | 9,000,000 | | | | 8,713,413 | |
a Florida Gas Transmission Co., LLC, 4.35% due 7/15/2025 | | BBB/Baa2 | | | 4,200,000 | | | | 3,988,215 | |
a,b Gazprom, 4.95% due 5/23/2016 | | BB+/Ba1 | | | 4,000,000 | | | | 4,013,560 | |
Gulf South Pipeline Co., LP, 4.00% due 6/15/2022 | | BBB-/Baa2 | | | 13,690,000 | | | | 12,481,187 | |
a Gulfstream Natural Gas System, LLC, 4.60% due 9/15/2025 | | BBB/Baa2 | | | 9,000,000 | | | | 8,808,507 | |
a,b Harvest Operations Corp., 2.125% due 5/14/2018 | | AA-/Aa2 | | | 7,000,000 | | | | 7,049,098 | |
HollyFrontier Corp., 5.875% due 4/1/2026 | | BBB-/Baa3 | | | 25,000,000 | | | | 24,887,725 | |
Marathon Petroleum Corp., 2.70% due 12/14/2018 | | BBB/Baa2 | | | 7,900,000 | | | | 7,890,725 | |
a Northern Natural Gas Co., 5.75% due 7/15/2018 | | A/A2 | | | 50,000 | | | | 54,554 | |
NuStar Logistics LP, 4.75% due 2/1/2022 | | BB+/Ba1 | | | 5,000,000 | | | | 4,200,000 | |
a,b Odebrecht Offshore Drilling Finance Ltd., 6.75% due 10/1/2023 | | CCC+/Caa3 | | | 10,003,175 | | | | 2,200,699 | |
b Petrobras Global Finance B.V. Floating Rate Note, 3.002% due 3/17/2017 | | B+/B3 | | | 5,750,000 | | | | 5,549,325 | |
b Petroleos Mexicanos Floating Rate Note, 2.64% due 7/18/2018 | | BBB+/Baa3 | | | 10,000,000 | | | | 9,750,000 | |
b Sasol Financing International plc, 4.50% due 11/14/2022 | | BBB/Baa2 | | | 4,000,000 | | | | 3,870,000 | |
a Semco Energy, Inc., 5.15% due 4/21/2020 | | A-/A2 | | | 3,000,000 | | | | 3,357,189 | |
a,b Sinopec Group Overseas Development Ltd., 2.75% due 5/17/2017 | | A+/Aa3 | | | 6,000,000 | | | | 6,074,706 | |
a Texas Gas Transmission, LLC, 4.50% due 2/1/2021 | | BBB-/Baa2 | | | 9,480,000 | | | | 8,966,449 | |
a Transcontinental Gas Pipe Line Co., LLC, 7.85% due 2/1/2026 | | BBB-/Baa2 | | | 11,000,000 | | | | 12,580,898 | |
Williams Partners LP, 4.50% due 11/15/2023 | | BBB-/Baa3 | | | 15,000,000 | | | | 12,743,235 | |
Williams Partners LP, 3.60% due 3/15/2022 | | BBB-/Baa3 | | | 1,800,000 | | | | 1,482,151 | |
| | | | | | | | | | |
| | | | | | | | | 242,311,709 | |
| | | | | | | | | | |
FOOD & STAPLES RETAILING — 0.45% | | | | | | | | | | |
Food & Staples Retailing — 0.45% | | | | | | | | | | |
a Whole Foods Market, Inc., 5.20% due 12/3/2025 | | BBB-/Baa3 | | | 18,175,000 | | | | 19,045,728 | |
| | | | | | | | | | |
| | | | | | | | | 19,045,728 | |
| | | | | | | | | | |
FOOD, BEVERAGE & TOBACCO — 2.28% | | | | | | | | | | |
Beverages — 1.14% | | | | | | | | | | |
Anheuser-Busch InBev Finance Inc., 3.30% due 2/1/2023 | | A-/(p)a3 | | | 9,650,000 | | | | 10,032,362 | |
Anheuser-Busch InBev Finance Inc. Floating Rate Note, 1.879% due 2/1/2021 | | A-/(p)a3 | | | 7,550,000 | | | | 7,683,537 | |
Coca Cola Enterprises, Inc., 5.71% due 3/18/2037 | | AA-/NR | | | 3,380,000 | | | | 3,876,748 | |
a,b Coca Cola Icecek Uretim A.S., 4.75% due 10/1/2018 | | NR/Baa3 | | | 5,000,000 | | | | 5,198,335 | |
a,b JB y Compania, SA de C.V., 3.75% due 5/13/2025 | | BBB/NR | | | 11,750,000 | | | | 11,806,188 | |
PepsiCo, Inc., 3.10% due 7/17/2022 | | A/A1 | | | 9,250,000 | | | | 9,871,138 | |
Food Products — 0.61% | | | | | | | | | | |
General Mills, Inc., 1.40% due 10/20/2017 | | BBB+/A3 | | | 4,600,000 | | | | 4,626,671 | |
General Mills, Inc., 2.20% due 10/21/2019 | | BBB+/A3 | | | 3,950,000 | | | | 4,016,376 | |
Ingredion, Inc., 1.80% due 9/25/2017 | | BBB/Baa2 | | | 12,150,000 | | | | 12,092,713 | |
Mead Johnson Nutrition Co., 4.125% due 11/15/2025 | | BBB-/Baa1 | | | 3,000,000 | | | | 3,185,343 | |
Mead Johnson Nutrition Co., 3.00% due 11/15/2020 | | BBB-/Baa1 | | | 1,900,000 | | | | 1,952,466 | |
Tobacco — 0.53% | | | | | | | | | | |
Altria Group, Inc., 2.625% due 1/14/2020 | | A-/A3 | | | 4,900,000 | | | | 5,064,733 | |
a,b B.A.T. International Finance plc, 2.125% due 6/7/2017 | | A-/A3 | | | 8,000,000 | | | | 8,065,504 | |
a,b B.A.T. International Finance plc, 3.95% due 6/15/2025 | | A-/A3 | | | 3,000,000 | | | | 3,283,953 | |
Reynolds American, Inc., 6.875% due 5/1/2020 | | BBB-/Baa3 | | | 5,000,000 | | | | 5,891,795 | |
| | | | | | | | | | |
| | | | | | | | | 96,647,862 | |
| | | | | | | | | | |
20 Semi-Annual Reports
| | |
| SCHEDULE OF INVESTMENTS, CONTINUED | | |
| |
Thornburg Limited Term Income Fund | | March 31, 2016 (Unaudited) |
| | | | | | | | | | |
Issuer-Description | | Credit Rating†
S&P/ Moody’s | | Principal
Amount | | | Value | |
HEALTH CARE EQUIPMENT & SERVICES — 0.96% | | | | | | | | | | |
Health Care Equipment & Supplies — 0.26% | | | | | | | | | | |
Stryker Corp., 2.625% due 3/15/2021 | | A+/Baa1 | | $ | 2,925,000 | | | $ | 2,982,707 | |
Stryker Corp., 2.00% due 3/8/2019 | | A+/Baa1 | | | 2,900,000 | | | | 2,930,969 | |
Stryker Corp., 3.375% due 11/1/2025 | | A+/Baa1 | | | 5,000,000 | | | | 5,128,495 | |
Health Care Providers & Services — 0.70% | | | | | | | | | | |
Catholic Health Initiatives, 1.60% due 11/1/2017 | | A/NR | | | 1,900,000 | | | | 1,902,611 | |
Catholic Health Initiatives, 2.95% due 11/1/2022 | | A/NR | | | 7,000,000 | | | | 7,016,212 | |
UnitedHealth Group, Inc., 3.35% due 7/15/2022 | | A+/A3 | | | 5,000,000 | | | | 5,319,045 | |
UnitedHealth Group, Inc., 3.75% due 7/15/2025 | | A+/A3 | | | 5,000,000 | | | | 5,387,415 | |
Wellpoint, Inc., 2.25% due 8/15/2019 | | A/Baa2 | | | 10,000,000 | | | | 10,054,350 | |
| | | | | | | | | | |
| | | | | | | | | 40,721,804 | |
| | | | | | | | | | |
HOUSEHOLD & PERSONAL PRODUCTS — 0.12% | | | | | | | | | | |
Household Products — 0.12% | | | | | | | | | | |
Energizer Holdings, Inc., 4.70% due 5/24/2022 | | BB+/Ba2 | | | 2,000,000 | | | | 2,040,000 | |
a,b Kimberly-Clark de Mexico, 3.80% due 4/8/2024 | | A-/NR | | | 3,000,000 | | | | 3,106,473 | |
| | | | | | | | | | |
| | | | | | | | | 5,146,473 | |
| | | | | | | | | | |
INSURANCE — 3.74% | | | | | | | | | | |
Insurance — 3.74% | | | | | | | | | | |
CNA Financial Corp., 4.50% due 3/1/2026 | | BBB/Baa2 | | | 20,000,000 | | | | 20,274,420 | |
a,b DaVinciRe Holdings Ltd., 4.75% due 5/1/2025 | | A/Baa2 | | | 10,000,000 | | | | 9,888,670 | |
a Forethought Financial Group, Inc., 8.625% due 4/15/2021 | | BBB-/Ba1 | | | 2,270,000 | | | | 2,471,867 | |
Hanover Insurance Group, Inc., 6.375% due 6/15/2021 | | BBB/Baa3 | | | 2,480,000 | | | | 2,833,065 | |
Horace Mann Educators Corp., 4.50% due 12/1/2025 | | BBB/Baa3 | | | 4,800,000 | | | | 4,939,670 | |
Infinity Property & Casualty Corp., 5.00% due 9/19/2022 | | BBB/Baa2 | | | 3,000,000 | | | | 3,159,264 | |
Kemper Corp., 4.35% due 2/15/2025 | | BBB-/Baa3 | | | 15,000,000 | | | | 15,173,580 | |
a,b Lancashire Holdings Ltd., 5.70% due 10/1/2022 | | BBB/Baa2 | | | 11,000,000 | | | | 11,880,539 | |
Marsh & McLennan Companies, Inc., 3.30% due 3/14/2023 | | A-/Baa1 | | | 3,000,000 | | | | 3,059,406 | |
a MassMutual Global Funding, LLC, 2.00% due 4/5/2017 | | AA+/Aa2 | | | 8,000,000 | | | | 8,079,224 | |
b Montpelier Re Holdings Ltd., 4.70% due 10/15/2022 | | BBB+/NR | | | 5,000,000 | | | | 5,205,430 | |
a Pricoa Global Funding I, 1.35% due 8/18/2017 | | AA-/A1 | | | 10,000,000 | | | | 9,959,610 | |
a Principal Life Global Funding II, 1.50% due 9/11/2017 | | A+/A1 | | | 6,950,000 | | | | 6,962,197 | |
a Principal Life Global Funding II, 2.375% due 9/11/2019 | | A+/A1 | | | 2,450,000 | | | | 2,479,361 | |
a Principal Life Global Funding II, 2.20% due 4/8/2020 | | A+/A1 | | | 7,000,000 | | | | 7,042,917 | |
a Reliance Standard Life Insurance Co., 2.50% due 4/24/2019 | | A/A2 | | | 9,900,000 | | | | 9,980,160 | |
a Reliance Standard Life Insurance Co., 2.50% due 1/15/2020 | | A/A2 | | | 15,000,000 | | | | 15,048,825 | |
a Reliance Standard Life Insurance Co., 3.05% due 1/20/2021 | | A/A2 | | | 3,975,000 | | | | 4,038,886 | |
a,b Sirius International Group Ltd., 6.375% due 3/20/2017 | | BBB/Baa3 | | | 6,335,000 | | | | 6,498,139 | |
b Trinity Acquisition plc, 4.40% due 3/15/2026 | | BBB/Baa3 | | | 9,815,000 | | | | 9,957,092 | |
| | | | | | | | | | |
| | | | | | | | | 158,932,322 | |
| | | | | | | | | | |
MATERIALS — 2.06% | | | | | | | | | | |
Chemicals — 0.53% | | | | | | | | | | |
Airgas, Inc., 3.05% due 8/1/2020 | | BBB/Baa2 | | | 4,950,000 | | | | 5,065,058 | |
a Incitec Pivot Finance, LLC, 6.00% due 12/10/2019 | | BBB/Baa3 | | | 4,538,000 | | | | 4,863,565 | |
a,b Office Cherifien des Phosphates, 5.625% due 4/25/2024 | | BBB-/NR | | | 12,010,000 | | | | 12,487,998 | |
Construction Materials — 0.02% | | | | | | | | | | |
CRH America, Inc., 8.125% due 7/15/2018 | | BBB+/Baa2 | | | 650,000 | | | | 731,894 | |
Metals & Mining — 1.51% | | | | | | | | | | |
a,b Anglo American Capital plc, 2.625% due 9/27/2017 | | BB/Ba3 | | | 9,700,000 | | | | 9,360,500 | |
b Anglogold Holdings plc, 5.375% due 4/15/2020 | | BB+/Baa3 | | | 9,100,000 | | | | 8,974,875 | |
b Anglogold Holdings plc, 5.125% due 8/1/2022 | | BB+/Baa3 | | | 6,500,000 | | | | 6,108,765 | |
b ArcelorMittal, 5.50% due 2/25/2017 | | BB/Ba1 | | | 3,000,000 | | | | 3,037,500 | |
a,b Glencore Finance Canada Ltd., 4.95% due 11/15/2021 | | BBB-/Baa3 | | | 5,000,000 | | | | 4,496,875 | |
a Glencore Funding, LLC Floating Rate Note, 1.982% due 1/15/2019 | | BBB-/Baa3 | | | 17,600,000 | | | | 15,400,000 | |
b Kinross Gold Corp., 3.625% due 9/1/2016 | | BB+/Ba1 | | | 7,000,000 | | | | 7,000,000 | |
a,b Newcrest Finance Property Ltd., 4.20% due 10/1/2022 | | BBB-/Baa3 | | | 10,459,000 | | | | 9,911,471 | |
| | | | | | | | | | |
| | | | | | | | | 87,438,501 | |
| | | | | | | | | | |
Semi-Annual Reports 21
| | |
| SCHEDULE OF INVESTMENTS, CONTINUED | | |
| |
Thornburg Limited Term Income Fund | | March 31, 2016 (Unaudited) |
| | | | | | | | | | |
Issuer-Description | | Credit Rating†
S&P/ Moody’s | | Principal
Amount | | | Value | |
MEDIA — 0.13% | | | | | | | | | | |
Media — 0.13% | | | | | | | | | | |
The Washington Post Co., 7.25% due 2/1/2019 | | BB+/Ba1 | | $ | 5,000,000 | | | $ | 5,375,000 | |
| | | | | | | | | | |
| | | | | | | | | 5,375,000 | |
| | | | | | | | | | |
PHARMACEUTICALS, BIOTECHNOLOGY & LIFE SCIENCES — 1.12% | | | | | | | | |
Biotechnology — 0.43% | | | | | | | | | | |
Biogen, Inc., 3.625% due 9/15/2022 | | A-/Baa1 | | | 5,000,000 | | | | 5,288,480 | |
Gilead Sciences, Inc., 2.55% due 9/1/2020 | | A/A3 | | | 4,820,000 | | | | 4,963,708 | |
Gilead Sciences, Inc., 3.25% due 9/1/2022 | | A/A3 | | | 4,650,000 | | | | 4,913,544 | |
Gilead Sciences, Inc., 3.65% due 3/1/2026 | | A/A3 | | | 2,950,000 | | | | 3,134,770 | |
Pharmaceuticals — 0.69% | | | | | | | | | | |
b Actavis Funding SCS, 1.85% due 3/1/2017 | | BBB-/Baa3 | | | 2,000,000 | | | | 2,009,618 | |
b Actavis Funding SCS, 2.35% due 3/12/2018 | | BBB-/Baa3 | | | 1,720,000 | | | | 1,740,316 | |
b Actavis Funding SCS, 3.45% due 3/15/2022 | | BBB-/Baa3 | | | 5,000,000 | | | | 5,190,785 | |
b Actavis Funding SCS, 3.80% due 3/15/2025 | | BBB-/Baa3 | | | 5,000,000 | | | | 5,203,715 | |
b Actavis Funding SCS Floating Rate Note, 1.887% due 3/12/2020 | | BBB-/Baa3 | | | 4,940,000 | | | | 4,922,241 | |
a,b Mylan N.V., 3.00% due 12/15/2018 | | BBB-/Baa3 | | | 4,900,000 | | | | 4,967,243 | |
Zoetis, Inc., 3.45% due 11/13/2020 | | BBB-/Baa2 | | | 1,925,000 | | | | 1,977,626 | |
Zoetis, Inc., 4.50% due 11/13/2025 | | BBB-/Baa2 | | | 3,000,000 | | | | 3,208,098 | |
| | | | | | | | | | |
| | | | | | | | | 47,520,144 | |
| | | | | | | | | | |
REAL ESTATE — 1.26% | | | | | | | | | | |
Real Estate Investment Trusts — 0.95% | | | | | | | | | | |
Alexandria Real Estate Equities, Inc., 3.90% due 6/15/2023 | | BBB-/Baa2 | | | 11,700,000 | | | | 11,836,633 | |
Commonwealth REIT (HRPT Properties), 6.25% due 6/15/2017 | | BBB-/Baa3 | | | 4,000,000 | | | | 4,104,208 | |
EPR Properties, 5.25% due 7/15/2023 | | BBB-/Baa2 | | | 4,041,000 | | | | 4,127,999 | |
Washington REIT, 4.95% due 10/1/2020 | | BBB/Baa2 | | | 19,100,000 | | | | 20,341,041 | |
Real Estate Management & Development — 0.31% | | | | | | | | | | |
Jones Lang LaSalle, Inc., 4.40% due 11/15/2022 | | BBB+/Baa2 | | | 3,000,000 | | | | 3,082,173 | |
a,b Vonovia Finance B.V., 3.20% due 10/2/2017 | | BBB+/NR | | | 10,000,000 | | | | 10,096,140 | |
| | | | | | | | | | |
| | | | | | | | | 53,588,194 | |
| | | | | | | | | | |
RETAILING — 0.58% | | | | | | | | | | |
Multiline Retail — 0.58% | | | | | | | | | | |
Family Dollar Stores, Inc., 5.00% due 2/1/2021 | | BBB/Ba1 | | | 23,225,000 | | | | 24,453,626 | |
| | | | | | | | | | |
| | | | | | | | | 24,453,626 | |
| | | | | | | | | | |
SEMICONDUCTORS & SEMICONDUCTOR EQUIPMENT — 0.12% | | | | | | | | | | |
Semiconductors & Semiconductor Equipment — 0.12% | | | | | | | | | | |
Intel Corp., 3.10% due 7/29/2022 | | A+/A1 | | | 5,000,000 | | | | 5,286,135 | |
| | | | | | | | | | |
| | | | | | | | | 5,286,135 | |
| | | | | | | | | | |
SOFTWARE & SERVICES — 2.56% | | | | | | | | | | |
Information Technology Services — 1.21% | | | | | | | | | | |
Broadridge Financial Solutions, Inc., 3.95% due 9/1/2020 | | BBB+/Baa1 | | | 8,000,000 | | | | 8,459,936 | |
Fidelity National Information Services, 2.85% due 10/15/2018 | | BBB/Baa3 | | | 4,850,000 | | | | 4,929,050 | |
Fiserv, Inc., 2.70% due 6/1/2020 | | BBB/Baa2 | | | 6,900,000 | | | | 7,017,852 | |
SAIC, Inc., 4.45% due 12/1/2020 | | BBB-/Ba1 | | | 2,000,000 | | | | 1,970,020 | |
Total System Services, Inc., 3.80% due 4/1/2021 | | BBB-/Baa3 | | | 2,950,000 | | | | 3,033,789 | |
Total System Services, Inc., 3.75% due 6/1/2023 | | BBB-/Baa3 | | | 5,000,000 | | | | 4,895,645 | |
Total System Services, Inc., 2.375% due 6/1/2018 | | BBB-/Baa3 | | | 20,915,000 | | | | 20,887,957 | |
Internet Software & Services — 0.43% | | | | | | | | | | |
eBay, Inc., 2.50% due 3/9/2018 | | BBB+/Baa1 | | | 4,885,000 | | | | 4,964,235 | |
Lender Processing Services, Inc./Black Knight Lending Solutions, Inc., 5.75% due 4/15/2023 | | BBB/Baa3 | | | 8,175,000 | | | | 8,461,125 | |
a,b Tencent Holdings Ltd., 2.00% due 5/2/2017 | | A/A2 | | | 5,000,000 | | | | 5,024,420 | |
Software — 0.92% | | | | | | | | | | |
Autodesk, Inc., 3.125% due 6/15/2020 | | BBB/Baa2 | | | 1,945,000 | | | | 1,972,749 | |
Autodesk, Inc., 4.375% due 6/15/2025 | | BBB/Baa2 | | | 1,000,000 | | | | 1,021,899 | |
CA Technologies, Inc., 2.875% due 8/15/2018 | | BBB+/Baa2 | | | 4,082,000 | | | | 4,148,818 | |
CA Technologies, Inc., 3.60% due 8/1/2020 | | BBB+/Baa2 | | | 13,905,000 | | | | 14,231,475 | |
CDK Global, Inc., 3.30% due 10/15/2019 | | BBB-/Baa3 | | | 5,000,000 | | | | 5,029,825 | |
22 Semi-Annual Reports
| | |
| SCHEDULE OF INVESTMENTS, CONTINUED | | |
| |
Thornburg Limited Term Income Fund | | March 31, 2016 (Unaudited) |
| | | | | | | | | | |
Issuer-Description | | Credit Rating†
S&P/ Moody’s | | Principal
Amount | | | Value | |
Electronic Arts, Inc., 3.70% due 3/1/2021 | | BBB-/Baa2 | | $ | 2,925,000 | | | $ | 3,040,655 | |
Oracle Corp., 2.50% due 5/15/2022 | | AA-/A1 | | | 9,400,000 | | | | 9,589,382 | |
| | | | | | | | | | |
| | | | | | | | | 108,678,832 | |
| | | | | | | | | | |
TECHNOLOGY HARDWARE & EQUIPMENT — 2.67% | | | | | | | | | | |
Communications Equipment — 1.33% | | | | | | | | | | |
Cisco Systems, Inc., 3.00% due 6/15/2022 | | AA-/A1 | | | 1,700,000 | | | | 1,805,519 | |
Cisco Systems, Inc., 2.20% due 2/28/2021 | | AA-/A1 | | | 9,520,000 | | | | 9,709,410 | |
Cisco Systems, Inc. Floating Rate Note, 1.236% due 2/21/2018 | | AA-/A1 | | | 9,850,000 | | | | 9,875,807 | |
b Ericsson LM, 4.125% due 5/15/2022 | | BBB+/Baa1 | | | 19,215,000 | | | | 20,020,742 | |
Juniper Networks, Inc., 3.30% due 6/15/2020 | | BBB/Baa2 | | | 4,825,000 | | | | 4,892,975 | |
Juniper Networks, Inc., 3.125% due 2/26/2019 | | BBB/Baa2 | | | 10,000,000 | | | | 10,169,990 | |
Computers & Peripherals — 0.23% | | | | | | | | | | |
Lexmark International, Inc., 5.125% due 3/15/2020 | | BBB-/Baa3 | | | 9,320,000 | | | | 9,730,499 | |
Electronic Equipment, Instruments & Components — 0.54% | | | | | | | | | | |
Ingram Micro, Inc., 4.95% due 12/15/2024 | | BBB-/Baa3 | | | 5,596,000 | | | | 5,445,983 | |
Trimble Navigation, Ltd., 4.75% due 12/1/2024 | | BBB-/Baa2 | | | 17,000,000 | | | | 17,334,628 | |
Technology, Hardware, Storage & Peripherals — 0.57% | | | | | | | | | | |
Apple, Inc. Floating Rate Note, 1.438% due 2/22/2019 | | AA+/Aa1 | | | 4,950,000 | | | | 4,993,892 | |
Apple, Inc. Floating Rate Note, 1.748% due 2/23/2021 | | AA+/Aa1 | | | 9,050,000 | | | | 9,173,442 | |
a Hewlett-Packard Enterprise Co., 3.60% due 10/15/2020 | | BBB/Baa2 | | | 5,000,000 | | | | 5,199,205 | |
a Hewlett-Packard Enterprise Co. Floating Rate Note, 2.559% due 10/5/2018 | | BBB/Baa2 | | | 4,900,000 | | | | 4,907,526 | |
| | | | | | | | | | |
| | | | | | | | | 113,259,618 | |
| | | | | | | | | | |
TELECOMMUNICATION SERVICES — 2.75% | | | | | | | | | | |
Diversified Telecommunication Services — 2.07% | | | | | | | | | | |
AT&T, Inc., 4.45% due 4/1/2024 | | BBB+/Baa1 | | | 10,000,000 | | | | 10,823,970 | |
AT&T, Inc., 1.546% due 11/27/2018 | | BBB+/Baa1 | | | 11,350,000 | | | | 11,284,533 | |
AT&T, Inc., 2.45% due 6/30/2020 | | BBB+/Baa1 | | | 4,500,000 | | | | 4,559,944 | |
AT&T, Inc., 1.559% due 6/30/2020 | | BBB+/Baa1 | | | 4,950,000 | | | | 4,899,500 | |
AT&T, Inc., 3.60% due 2/17/2023 | | BBB+/Baa1 | | | 8,000,000 | | | | 8,311,008 | |
a Hidden Ridge Facility, 5.65% due 1/1/2022 | | NR/Baa2 | | | 3,235,273 | | | | 3,324,674 | |
Michigan Bell Telephone Co., 7.85% due 1/15/2022 | | BBB+/NR | | | 3,000,000 | | | | 3,661,056 | |
a,b Ooredoo International Finance Ltd., 3.375% due 10/14/2016 | | A-/A2 | | | 500,000 | | | | 504,537 | |
Qwest Corp., 6.75% due 12/1/2021 | | BBB-/Ba1 | | | 3,000,000 | | | | 3,225,000 | |
b Telefonica Emisiones SAU, 6.421% due 6/20/2016 | | BBB/Baa2 | | | 9,900,000 | | | | 10,006,148 | |
Verizon Communications, Inc., 2.625% due 2/21/2020 | | BBB+/Baa1 | | | 4,997,000 | | | | 5,141,603 | |
Verizon Communications, Inc., 3.45% due 3/15/2021 | | BBB+/Baa1 | | | 9,600,000 | | | | 10,189,402 | |
Verizon Communications, Inc., 3.50% due 11/1/2024 | | BBB+/Baa1 | | | 4,683,000 | | | | 4,913,450 | |
Verizon Communications, Inc., 3.00% due 11/1/2021 | | BBB+/Baa1 | | | 5,000,000 | | | | 5,195,110 | |
Verizon Communications, Inc. Floating Rate Note, 2.382% due 9/14/2018 | | BBB+/Baa1 | | | 1,825,000 | | | | 1,869,658 | |
Wireless Telecommunication Services — 0.68% | | | | | | | | | | |
a Crown Castle Towers, LLC, 6.113% due 1/15/2040 | | NR/A2 | | | 6,970,000 | | | | 7,690,253 | |
a Crown Castle Towers, LLC, 5.495% due 1/15/2037 | | NR/A2 | | | 8,120,000 | | | | 8,197,702 | |
a Unison Ground Lease Funding, LLC, 6.392% due 4/15/2040 | | NR/NR | | | 9,640,000 | | | | 10,509,888 | |
a Unison Ground Lease Funding, LLC, 5.349% due 4/15/2040 | | NR/NR | | | 2,470,000 | | | | 2,548,070 | |
| | | | | | | | | | |
| | | | | | | | | 116,855,506 | |
| | | | | | | | | | |
| | | |
TRANSPORTATION — 2.03% | | | | | | | | | | |
Air Freight & Logistics — 0.03% | | | | | | | | | | |
a FedEx Corp. 2012 Pass-Through Trust, 2.625% due 1/15/2018 | | BBB/Baa1 | | | 1,156,053 | | | | 1,163,930 | |
Airlines — 0.53% | | | | | | | | | | |
American Airlines Group, Inc., 4.95% due 7/15/2024 | | A/NR | | | 6,118,023 | | | | 6,545,795 | |
American Airlines Group, Inc., 3.60% due 3/22/2029 | | AA/Aa3 | | | 10,000,000 | | | | 10,300,000 | |
US Airways, 6.25% due 10/22/2024 | | A/A3 | | | 5,330,361 | | | | 5,863,396 | |
Road & Rail — 1.47% | | | | | | | | | | |
a,b Asciano Finance Ltd., 5.00% due 4/7/2018 | | BBB/Baa2 | | | 2,000,000 | | | | 2,034,754 | |
a BNSF Railway Co., 3.442% due 6/16/2028 | | AA/Aa2 | | | 14,717,910 | | | | 14,994,929 | |
a,b LeasePlan Corp. NV, 2.50% due 5/16/2018 | | BBB-/Baa1 | | | 10,000,000 | | | | 9,912,810 | |
a Penske Truck Leasing Co., LP/PTL Finance Corp., 3.375% due 2/1/2022 | | BBB-/Baa3 | | | 20,000,000 | | | | 19,857,020 | |
a TTX Co., 4.15% due 1/15/2024 | | A+/Baa1 | | | 6,000,000 | | | | 6,361,230 | |
Semi-Annual Reports 23
| | |
| SCHEDULE OF INVESTMENTS, CONTINUED | | |
| |
Thornburg Limited Term Income Fund | | March 31, 2016 (Unaudited) |
| | | | | | | | | | |
Issuer-Description | | Credit Rating†
S&P/ Moody’s | | Principal
Amount | | | Value | |
a TTX Co., 5.453% due 1/2/2022 | | NR/NR | | $ | 4,005,296 | | | $ | 4,149,647 | |
a TTX Co., 2.25% due 2/1/2019 | | A+/Baa1 | | | 5,000,000 | | | | 5,061,580 | |
| | | | | | | | | | |
| | | | | | | | | 86,245,091 | |
| | | | | | | | | | |
UTILITIES — 5.92% | | | | | | | | | | |
Electric Utilities — 4.05% | | | | | | | | | | |
Appalachian Power Co., 3.40% due 6/1/2025 | | BBB/Baa1 | | | 7,000,000 | | | | 7,161,770 | |
Cleveland Electric Illuminating Co., 7.88% due 11/1/2017 | | BBB+/Baa1 | | | 15,359,000 | | | | 16,784,408 | |
a,b Electricite de France S.A., 2.15% due 1/22/2019 | | A+/A1 | | | 4,900,000 | | | | 4,956,821 | |
a,b Enel Finance International S.A., 6.25% due 9/15/2017 | | BBB/Baa2 | | | 11,000,000 | | | | 11,737,000 | |
Entergy Louisiana, LLC, 4.80% due 5/1/2021 | | A-/A2 | | | 4,300,000 | | | | 4,738,746 | |
Entergy Texas, Inc., 7.125% due 2/1/2019 | | A-/Baa1 | | | 2,000,000 | | | | 2,271,776 | |
Exelon Corp., 1.55% due 6/9/2017 | | BBB-/Baa2 | | | 2,950,000 | | | | 2,945,301 | |
Exelon Corp., 2.85% due 6/15/2020 | | BBB-/Baa2 | | | 2,950,000 | | | | 3,010,457 | |
a Jersey Central Power & Light Co., 4.30% due 1/15/2026 | | BBB-/Baa2 | | | 15,000,000 | | | | 15,632,955 | |
a,b Korea Western Power Co., Ltd., 2.875% due 10/10/2018 | | NR/Aa2 | | | 10,000,000 | | | | 10,244,590 | |
a Monongahela Power Co., 5.70% due 3/15/2017 | | BBB+/A3 | | | 4,785,000 | | | | 4,964,753 | |
a Monongahela Power Co., 4.10% due 4/15/2024 | | BBB+/A3 | | | 8,000,000 | | | | 8,547,392 | |
NextEra Energy Capital Holdings, Inc., 1.586% due 6/1/2017 | | BBB+/Baa1 | | | 6,715,000 | | | | 6,720,553 | |
Northern States Power Company-Wisconsin, 3.30% due 6/15/2024 | | A/Aa3 | | | 10,000,000 | | | | 10,388,600 | |
Public Service Co. of New Mexico, 5.35% due 10/1/2021 | | BBB+/Baa2 | | | 3,000,000 | | | | 3,293,610 | |
a Rochester Gas & Electric, 5.90% due 7/15/2019 | | A/A2 | | | 11,732,000 | | | | 13,105,254 | |
Southern Power Co., 2.375% due 6/1/2020 | | BBB+/Baa1 | | | 9,693,000 | | | | 9,660,034 | |
a,b State Grid Overseas Investment (2014) Ltd., 2.75% due 5/7/2019 | | AA-/Aa3 | | | 9,000,000 | | | | 9,235,125 | |
a Steelriver Transmission Co., LLC, 4.71% due 6/30/2017 | | NR/Baa1 | | | 2,977,402 | | | | 3,029,652 | |
The Southern Co., 2.45% due 9/1/2018 | | BBB+/Baa1 | | | 4,825,000 | | | | 4,902,157 | |
Toledo Edison Co., 7.25% due 5/1/2020 | | BBB+/Baa1 | | | 167,000 | | | | 194,040 | |
a,b Transelec S.A., 4.25% due 1/14/2025 | | BBB/Baa1 | | | 6,000,000 | | | | 5,953,770 | |
UIL Holdings Corp., 4.625% due 10/1/2020 | | BBB-/Baa2 | | | 11,660,000 | | | | 12,364,019 | |
Gas Utilities — 0.95% | | | | | | | | | | |
AGL Capital Corp., 3.50% due 9/15/2021 | | BBB+/Baa1 | | | 9,925,000 | | | | 10,143,816 | |
a,b APT Pipelines Ltd., 3.875% due 10/11/2022 | | BBB/Baa2 | | | 5,500,000 | | | | 5,426,361 | |
a Southern Star Central Gas Pipeline, Inc., 6.00% due 6/1/2016 | | BBB-/Baa2 | | | 5,715,000 | | | | 5,745,547 | |
The Laclede Group, Inc., 2.55% due 8/15/2019 | | BBB+/Baa2 | | | 2,350,000 | | | | 2,308,941 | |
The Laclede Group, Inc. Floating Rate Note, 1.368% due 8/15/2017 | | BBB+/Baa2 | | | 16,900,000 | | | | 16,833,380 | |
Independent Power & Renewable Electricity Producers — 0.16% | | | | | |
a Midland Cogeneration Venture, 6.00% due 3/15/2025 | | BBB-/NR | | | 6,539,864 | | | | 6,947,108 | |
Multi-Utilities — 0.76% | | | | | | | | | | |
Dominion Gas Holdings, LLC, 2.50% due 12/15/2019 | | BBB+/A2 | | | 3,900,000 | | | | 3,958,941 | |
Dominion Gas Holdings, LLC, 2.80% due 11/15/2020 | | BBB+/A2 | | | 5,000,000 | | | | 5,105,220 | |
a Enable Oklahoma Intrastate Transmission, LLC, 6.25% due 3/15/2020 | | BB+/Baa3 | | | 3,640,000 | | | | 2,911,337 | |
a,b Korea Hydro & Nuclear Power Co. Ltd., 2.875% due 10/2/2018 | | AA-/Aa2 | | | 7,000,000 | | | | 7,161,091 | |
a Niagara Mohawk Power Corp., 4.881% due 8/15/2019 | | A-/A2 | | | 10,000,000 | | | | 10,933,220 | |
SCANA Corp., 4.125% due 2/1/2022 | | BBB/Baa3 | | | 2,000,000 | | | | 2,045,074 | |
| | | | | | | | | | |
| | | | | | | | | 251,362,819 | |
| | | | | | | | | | |
TOTAL CORPORATE BONDS (Cost $2,150,448,326) | | | | | | | | | 2,157,371,964 | |
| | | | | | | | | | |
| | | |
CONVERTIBLE BONDS — 0.44% | | | | | | | | | | |
REAL ESTATE — 0.44% | | | | | | | | | | |
Real Estate Investment Trusts — 0.44% | | | | | | | | | | |
a IAS Operating Partnership LP, 5.00% due 3/15/2018 | | NR/NR | | | 19,950,000 | | | | 18,852,750 | |
| | | | | | | | | | |
| | | | | | | | | 18,852,750 | |
| | | | | | | | | | |
TOTAL CONVERTIBLE BONDS (Cost $19,950,000) | | | | | | | | | 18,852,750 | |
| | | | | | | | | | |
| | | |
MUNICIPAL BONDS — 3.41% | | | | | | | | | | |
American Municipal Power Ohio, Inc., 5.072% due 2/15/2018 (Meldahl Hydroelectric) | | A/A3 | | | 5,000,000 | | | | 5,314,550 | |
Anaheim California Public Financing Authority, 5.316% due 9/1/2017 (Anaheim Public Improvements; Insured: Natl-Re/FGIC) | | AA-/A1 | | | 1,000,000 | | | | 1,024,070 | |
Anaheim California Public Financing Authority, 5.486% due 9/1/2020 (Anaheim Public Improvements; Insured: Natl-Re) | | AA-/A1 | | | 3,270,000 | | | | 3,503,314 | |
Brentwood California Infrastructure Financing Authority, 6.16% due 10/1/2019 (Civic Center) | | AA/NR | | | 2,110,000 | | | | 2,311,400 | |
California HFFA, 6.76% due 2/1/2019 (Community Program for Persons with Developmental Disabilities) | | AA-/NR | | | 3,905,000 | | | | 4,306,707 | |
California School Finance Authority, 5.041% due 7/1/2020 (LOC: City National Bank) | | AA+/NR | | | 4,000,000 | | | | 4,514,080 | |
Camden County Improvement Authority, 5.47% due 7/1/2018 (Cooper Medical School of Rowan University) | | A/A2 | | | 2,140,000 | | | | 2,299,558 | |
24 Semi-Annual Reports
| | |
| SCHEDULE OF INVESTMENTS, CONTINUED | | |
| |
Thornburg Limited Term Income Fund | | March 31, 2016 (Unaudited) |
| | | | | | | | | | |
Issuer-Description | | Credit Rating†
S&P/ Moody’s | | Principal
Amount | | | Value | |
Camden County Improvement Authority, 5.62% due 7/1/2019 (Cooper Medical School of Rowan University) | | A/A2 | | $ | 3,025,000 | | | $ | 3,319,696 | |
Carson Redevelopment Agency, 4.511% due 10/1/2016 (Low and Moderate Income Housing) | | A-/NR | | | 1,375,000 | | | | 1,390,373 | |
f City and County of San Francisco Redevelopment Financing Authority, 8.00% due 8/1/2019 (San Francisco Redevelopment Projects) | | AA-/A2 | | | 6,500,000 | | | | 7,369,310 | |
City of Fort Collins, Colorado Electric Utility Enterprise, 4.92% due 12/1/2020 (Fort Collins Smart Grid) | | AA-/NR | | | 2,250,000 | | | | 2,430,045 | |
City of North Little Rock, Arkansas, 3.562% due 7/1/2022 (Electric System; Insured: AGM) | | AA/NR | | | 7,280,000 | | | | 7,290,119 | |
City of Riverside, California, 5.61% due 8/1/2017 (City Sewer System) | | A/A1 | | | 2,000,000 | | | | 2,124,940 | |
Connecticut Housing Finance Authority, 5.071% due 11/15/2019 (Housing Mtg Finance Program) | | AAA/Aaa | | | 2,040,000 | | | | 2,121,192 | |
Denver Public Schools COP, 2.018% due 12/15/2019 (School District No. 1 Educational Facilities) | | NR/Aa3 | | | 3,000,000 | | | | 3,080,520 | |
Florida Hurricane Catastrophe Fund Finance Corp., 1.298% due 7/1/2016 (Reimbursement Contracts for Covered Event Losses) | | AA/Aa3 | | | 7,500,000 | | | | 7,512,825 | |
Illinois Finance Authority, 5.629% due 7/1/2016 (Theory and Computing Sciences Building; Insured: Syncora) | | AA-/NR | | | 390,000 | | | | 393,218 | |
JobsOhio Beverage System, 2.217% due 1/1/2019 (State Liquor Enterprise) | | AA/Aa3 | | | 11,245,000 | | | | 11,581,113 | |
Kentucky Asset/Liability Commission, 2.099% due 4/1/2019 (Commonwealth of Kentucky and Teachers’ Retirement System Funding Obligations) | | A/Aa3 | | | 3,000,000 | | | | 3,079,260 | |
Los Angeles County Public Works Financing Authority, 5.591% due 8/1/2020 (Los Angeles County & USC Medical Center Projects) | | AA/A1 | | | 3,000,000 | | | | 3,484,770 | |
Louisiana Local Government Environmental Facilities and Community Development Authority, 1.66% due 2/1/2022 (Louisiana Utilities Restoration) | | AAA/Aaa | | | 6,272,998 | | | | 6,352,100 | |
a Midwest Family Housing, 5.168% due 7/1/2016 (Insured: CIFG) | | A+/Baa1 | | | 151,017 | | | | 151,414 | |
Municipal Improvement Corp. of Los Angeles, 6.165% due 11/1/2020 (Recovery Zone Economic Development) | | A+/A2 | | | 11,885,000 | | | | 13,228,480 | |
New York City Transitional Finance Authority, 4.075% due 11/1/2020 (World Trade Center Recovery) | | AAA/Aa1 | | | 2,500,000 | | | | 2,737,525 | |
Oakland California Redevelopment Agency, 8.00% due 9/1/2016 (Central District Redevelopment Project) | | A-/NR | | | 5,200,000 | | | | 5,323,084 | |
Oklahoma Development Finance Authority, 8.00% due 5/1/2020 (Cleveland County Industrial Authority (CCIA) - Hitachi Norman, Oklahoma Project) | | NR/NR | | | 4,560,000 | | | | 4,661,506 | |
Orleans Parish School Board GO, 4.40% due 2/1/2021 (Educational Facilities Improvements; Insured: AGM) | | AA/A2 | | | 10,000,000 | | | | 11,027,600 | |
Redevelopment Agency of the City of Redlands, 5.818% due 8/1/2022 (Redlands Redevelopment; Insured: AMBAC) (ETM) | | A-/NR | | | 1,700,000 | | | | 1,841,967 | |
Redevelopment Agency of the County of San Bernardino, 7.135% due 9/1/2020 (San Sevaine Redevelopment Project) | | BBB/NR | | | 1,265,000 | | | | 1,343,607 | |
Rutgers State University GO, 2.342% due 5/1/2019 (New Brunswick, Newark and Camden Campus Facilities ) | | A+/Aa3 | | | 3,485,000 | | | | 3,574,530 | |
Rutgers State University GO, 3.028% due 5/1/2021 (New Brunswick, Newark and Camden Campus Facilities) | | A+/Aa3 | | | 1,500,000 | | | | 1,561,920 | |
Sandoval County, New Mexico, 1.452% due 6/1/2017 | | A+/NR | | | 1,000,000 | | | | 1,007,280 | |
Tampa-Hillsborough County Florida Expressway Authority, 2.22% due 7/1/2018 (Electronic Tolling Program) | | A/A2 | | | 2,000,000 | | | | 2,024,620 | |
Tampa-Hillsborough County Florida Expressway Authority, 2.49% due 7/1/2019 (Electronic Tolling Program) | | A/A2 | | | 2,500,000 | | | | 2,544,650 | |
Tampa-Hillsborough County Florida Expressway Authority, 2.84% due 7/1/2020 (Electronic Tolling Program) | | A/A2 | | | 1,750,000 | | | | 1,798,055 | |
Wallenpaupack Area School District GO, 3.80% due 9/1/2019 (Pike and Wayne Counties Educational Facilities) (State Aid Withholding) | | AA/NR | | | 3,000,000 | | | | 3,070,110 | |
Wallenpaupack Area School District GO, 4.00% due 9/1/2020 (Pike and Wayne Counties Educational Facilities) (State Aid Withholding) | | AA/NR | | | 2,750,000 | | | | 2,822,765 | |
Wisconsin Health & Educational Facilities Authority, 7.08% due 6/1/2016 (Richland Hospital) | | NR/NR | | | 80,000 | | | | 79,995 | |
Yuba Levee Financing Authority, 6.375% due 9/1/2021 (Yuba County Levee Financing Project) | | AA/NR | | | 1,000,000 | | | | 1,062,620 | |
| | | | | | | | | | |
TOTAL MUNICIPAL BONDS (Cost $136,965,753) | | | | | | | | | 144,664,888 | |
| | | | | | | | | | |
| | | |
OTHER SECURITIES — 0.33% | | | | | | | | | | |
LOAN PARTICIPATIONS — 0.33% | | | | | | | | | | |
Freeport-McMoRan Copper & Gold, Inc., 2.94%, due 5/31/2018 | | NR/NR | | | 15,000,000 | | | | 14,050,050 | |
| | | | | | | | | | |
TOTAL OTHER SECURITIES (Cost $14,962,192) | | | | | | | | | 14,050,050 | |
| | | | | | | | | | |
| | | |
SHORT TERM INVESTMENTS — 8.95% | | | | | | | | | | |
a B.A.T International Finance plc, 0.60% due 4/1/2016 | | NR/NR | | | 10,000,000 | | | | 10,000,000 | |
Bank of New York Tri-Party Repurchase Agreement 0.45% dated 3/31/2016 due 4/1/2016, repurchase price $110,001,375 collateralized by 6 U.S. Government debt securities and 9 corporate debt securities, having an average coupon of 2.63%, a minimum credit rating of BBB-, maturity dates from 4/1/2016 to 3/1/2041, and having an aggregate market value of $118,567,825 at 3/31/2016 | | NR/NR | | | 110,000,000 | | | | 110,000,000 | |
a Consolidated Edison, Inc., 0.50% due 4/5/2016 | | NR/NR | | | 50,000,000 | | | | 49,997,222 | |
Farmer Mac Discount Note, 0.23% due 4/5/2016 | | NR/NR | | | 25,000,000 | | | | 24,999,361 | |
Federal Home Loan Bank Discount Note, 0.28% due 4/27/2016 | | NR/NR | | | 1,380,000 | | | | 1,379,721 | |
Federal Home Loan Bank Discount Note, 0.27% due 4/27/2016 | | NR/NR | | | 5,000,000 | | | | 4,999,025 | |
Federal Home Loan Bank Discount Note, 0.16% due 4/27/2016 | | NR/NR | | | 5,000,000 | | | | 4,999,422 | |
Federal Home Loan Bank Discount Note, 0.27% due 4/25/2016 | | NR/NR | | | 6,200,000 | | | | 6,198,884 | |
Federal Home Loan Bank Discount Note, 0.22% due 4/25/2016 | | NR/NR | | | 1,100,000 | | | | 1,099,839 | |
Federal Home Loan Bank Discount Note, 0.27% due 4/20/2016 | | NR/NR | | | 3,600,000 | | | | 3,599,487 | |
Federal Home Loan Bank Discount Note, 0.16% due 4/20/2016 | | NR/NR | | | 1,665,000 | | | | 1,664,859 | |
Federal Home Loan Bank Discount Note, 0.27% due 4/13/2016 | | NR/NR | | | 5,000,000 | | | | 4,999,543 | |
Federal Home Loan Bank Discount Note, 0.26% due 4/12/2016 | | NR/NR | | | 3,322,000 | | | | 3,321,736 | |
Federal Home Loan Bank Discount Note, 0.26% due 4/6/2016 | | NR/NR | | | 3,400,000 | | | | 3,399,877 | |
Semi-Annual Reports 25
| | |
| SCHEDULE OF INVESTMENTS, CONTINUED | | |
| |
Thornburg Limited Term Income Fund | | March 31, 2016 (Unaudited) |
| | | | | | | | | | |
Issuer-Description | | Credit Rating†
S&P/ Moody’s | | Principal
Amount | | | Value | |
Federal Home Loan Bank Discount Note, 0.27% due 4/15/2016 | | NR/NR | | $ | 2,150,000 | | | $ | 2,149,774 | |
Federal Home Loan Bank Discount Note, 0.27% due 4/8/2016 | | NR/NR | | | 7,700,000 | | | | 7,699,596 | |
a Intercontinental Exchange, Inc., 0.43% due 4/5/2016 | | NR/NR | | | 7,682,000 | | | | 7,681,633 | |
b International Bank for Reconstruction and Development Discount Note, 0.20% due 4/4/2016 | | NR/NR | | | 20,000,000 | | | | 19,999,667 | |
a Kansas City Power & Light Co., 0.55% due 4/1/2016 | | NR/NR | | | 28,000,000 | | | | 28,000,000 | |
a Kentucky Utilities Co., 0.57% due 4/4/2016 | | NR/NR | | | 15,000,000 | | | | 14,999,287 | |
a Kentucky Utilities Co., 0.58% due 4/4/2016 | | NR/NR | | | 15,000,000 | | | | 14,999,275 | |
a Precision Castparts Corp., 0.30% due 4/1/2016 | | NR/NR | | | 15,000,000 | | | | 15,000,000 | |
a The Home Depot, 0.25% due 4/1/2016 | | NR/NR | | | 9,000,000 | | | | 9,000,000 | |
United States Treasury Bill, 0.24% due 4/21/2016 | | NR/NR | | | 10,000,000 | | | | 9,998,667 | |
United States Treasury Bill, 0.25% due 4/14/2016 | | NR/NR | | | 10,000,000 | | | | 9,999,097 | |
United States Treasury Bill, 0.26% due 4/7/2016 | | NR/NR | | | 10,000,000 | | | | 9,999,572 | |
| | | | | | | | | | |
TOTAL SHORT TERM INVESTMENTS (Cost $380,185,544) | | | | | | | 380,185,544 | |
| | | | | | | | | | |
TOTAL INVESTMENTS — 99.12% (Cost $4,189,618,270) | | | | | | | | $ | 4,208,743,869 | |
OTHER ASSETS LESS LIABILITIES — 0.88% | | | | | | | | | 37,232,159 | |
| | | | | | | | | | |
NET ASSETS — 100.00% | | | | | | | | $ | 4,245,976,028 | |
| | | | | | | | | | |
Footnote Legend
| † | Credit ratings are unaudited. Rating changes may have occurred subsequent to the reporting period end. Bonds issued with a maturity of one year or less are assigned Moody’s ratings from MIG-1 to MIG-4 and Standard and Poor’s ratings from SP-1+ to SP-3 with MIG-1 and SP-1+ being the strongest ratings. |
| a | Securities exempt from registration under Rule 144A of the Securities Act of 1933, as amended. These securities may only be resold in the ordinary course of business in transactions exempt from registration, normally to qualified institutional buyers. As of March 31, 2016, the aggregate value of these securities in the Fund’s portfolio was $1,799,845,707, representing 42.39% of the Fund’s net assets. |
| b | Yankee bond denominated in U.S. dollars and is issued in the U.S. by foreign banks and corporations. |
| c | Security currently fair valued by the Valuation and Pricing Committee using procedures approved by the Trustees’ Audit Committee. |
| f | Segregated as collateral for a when-issued security. |
Portfolio Abbreviations
To simplify the listings of securities, abbreviations are used per the table below:
| | |
| AGM | | Insured by Assured Guaranty Municipal Corp. |
| AMBAC | | Insured by American Municipal Bond Assurance Corp. |
| CIFG | | Insured by CIFG Assurance North America Inc. |
| CMO | | Collateralized Mortgage Obligation |
| COP | | Certificates of Participation |
| ETM | | Escrowed to Maturity |
| FCB | | Farm Credit Bank |
| FGIC | | Insured by Financial Guaranty Insurance Co. |
| GO | | General Obligation |
| | |
| HFFA | | Health Facilities Financing Authority |
| Mtg | | Mortgage |
| Natl-Re | | Insured by National Public Finance Guarantee Corp. |
| REIT | | Real Estate Investment Trust |
| REMIC | | Real Estate Mortgage Investment Conduit |
| SPV | | Special Purpose Vehicle |
| Syncora | | Insured by Syncora Guarantee Inc. |
| VA | | Veterans Affairs |
See notes to financial statements.
26 Semi-Annual Reports
| | |
| FUND SUMMARY | | |
| |
Thornburg Low Duration Income Fund | | March 31, 2016 (Unaudited) |
OBJECTIVES AND STRATEGIES
The Fund’s objective is to seek current income, consistent with preservation of capital.
The Fund invests in debt obligations issued by the U.S. Government, its agencies, or its instrumentalities, and in debt obligations rated at the time of purchase in one of the four highest credit ratings categories or, if not credit rating is available, judged to be of comparable quality by the Fund’s advisor The Fund aims to reduce changes in its share value compared to longer duration fixed income portfolios by maintaining a laddered portfolio of investments with a dollar-weighted average duration of normally no more than three years.
Portfolio Ladder
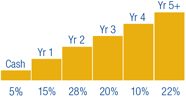
Percent of portfolio maturing in each year. Cash includes cash equivalents.
Security Credit Ratings
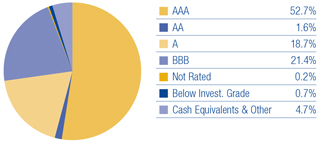
We have used ratings from Moody’s Investors Service. Where Moody’s ratings are not available, we have used Standard & Poor’s ratings. Where neither rating is available, we have used ratings from other rating agencies.
Key Portfolio Attributes
| | | | |
Number of Bonds | | | 180 | |
| |
Effective Duration | | | 1.6 Yrs | |
| |
Average Maturity | | | 2.5 Yrs | |
There is no guarantee that the Fund will meet its investment objective.
All data is subject to change. Charts may not add up to 100% due to rounding.
Semi-Annual Reports 27
| | |
| SCHEDULE OF INVESTMENTS | | |
| |
Thornburg Low Duration Income Fund | | March 31, 2016 (Unaudited) |
| | | | | | | | | | |
Issuer-Description | | Credit Rating†
S&P/ Moody’s | | Principal
Amount | | | Value | |
U.S. TREASURY SECURITIES — 29.82% | | | | | | | | | | |
United States Treasury Notes, 0.375% due 4/30/2016 | | NR/Aaa | | $ | 100,000 | | | $ | 100,005 | |
United States Treasury Notes, 1.75% due 5/31/2016 | | NR/Aaa | | | 615,000 | | | | 616,442 | |
United States Treasury Notes, 0.50% due 6/15/2016 | | NR/Aaa | | | 100,000 | | | | 100,041 | |
United States Treasury Notes, 1.00% due 8/31/2016 | | NR/Aaa | | | 750,000 | | | | 751,824 | |
United States Treasury Notes, 0.625% due 12/15/2016 | | NR/Aaa | | | 100,000 | | | | 100,053 | |
United States Treasury Notes, 0.625% due 2/15/2017 | | NR/Aaa | | | 750,000 | | | | 750,117 | |
United States Treasury Notes, 2.75% due 5/31/2017 | | NR/Aaa | | | 750,000 | | | | 767,977 | |
United States Treasury Notes, 0.875% due 6/15/2017 | | NR/Aaa | | | 100,000 | | | | 100,247 | |
United States Treasury Notes, 0.50% due 7/31/2017 | | NR/Aaa | | | 400,000 | | | | 398,998 | |
United States Treasury Notes, 0.625% due 8/31/2017 | | NR/Aaa | | | 200,000 | | | | 199,754 | |
United States Treasury Notes, 0.75% due 12/31/2017 | | NR/Aaa | | | 800,000 | | | | 800,258 | |
United States Treasury Notes, 1.00% due 5/15/2018 | | NR/Aaa | | | 200,000 | | | | 200,943 | |
United States Treasury Notes, 1.00% due 5/31/2018 | | NR/Aaa | | | 500,000 | | | | 502,358 | |
United States Treasury Notes, 1.00% due 8/15/2018 | | NR/Aaa | | | 100,000 | | | | 100,469 | |
United States Treasury Notes, 0.125% due 4/15/2019 | | NR/Aaa | | | 227,482 | | | | 232,409 | |
a United States Treasury Notes, 1.125% due 5/31/2019 | | NR/Aaa | | | 250,000 | | | | 251,650 | |
United States Treasury Notes Inflationary Index, 0.125% due 4/15/2020 | | NR/Aaa | | | 480,524 | | | | 490,751 | |
United States Treasury Notes Inflationary Index, 0.375% due 7/15/2025 | | NR/Aaa | | | 299,697 | | | | 306,411 | |
| | | | | | | | | | |
TOTAL U.S. TREASURY SECURITIES (Cost $6,736,985) | | | | | | | | | 6,770,707 | |
| | | | | | | | | | |
| | | |
U.S. GOVERNMENT AGENCIES — 2.31% | | | | | | | | | | |
Export Leasing (2009), LLC, (Guaranty: Export-Import Bank of the United States), 1.859% due 8/28/2021 | | NR/NR | | | 72,018 | | | | 72,521 | |
b Micron Semiconductor Ltd., (Guaranty: Export-Import Bank of the United States), 1.258% due 1/15/2019 | | NR/NR | | | 60,000 | | | | 59,826 | |
b Petroleos Mexicanos Floating Rate Note, (Guaranty: Export-Import Bank of the United States), 0.972% due 4/15/2025 | | NR/NR | | | 92,500 | | | | 91,117 | |
b Petroleos Mexicanos, (Guaranty: Export-Import Bank of the United States), 1.70% due 12/20/2022 | | NR/NR | | | 70,000 | | | | 70,009 | |
Small Business Administration Participation Certificates, Series 2005-20K Class 1, 5.36% due 11/1/2025 | | NR/NR | | | 48,165 | | | | 52,643 | |
b Washington Aircraft 2 Co. Ltd. Floating Rate Note, (Guaranty: Export-Import Bank of the United States), 1.06% due 6/26/2024 | | NR/NR | | | 179,993 | | | | 177,625 | |
| | | | | | | | | | |
TOTAL U.S. GOVERNMENT AGENCIES (Cost $523,817) | | | | | | | | | 523,741 | |
| | | | | | | | | | |
| | | |
MORTGAGE BACKED — 0.93% | | | | | | | | | | |
Federal Home Loan Mtg Corp., CMO Series K716 Class A1, 2.413% due 8/25/2047 | | NR/Aaa | | | 86,604 | | | | 88,866 | |
Federal National Mtg Assoc. Pool AS3705, 2.50% due 11/1/2024 | | NR/NR | | | 119,659 | | | | 123,356 | |
| | | | | | | | | | |
TOTAL MORTGAGE BACKED (Cost $210,858) | | | | | | | | | 212,222 | |
| | | | | | | | | | |
| | | |
ASSET BACKED SECURITIES — 23.58% | | | | | | | | | | |
ADVANCE RECEIVABLES — 0.55% | | | | | | | | | | |
c SPS Servicer Advance Receivables Trust, Series 2015-T3 Class AT3, 2.92% due 7/15/2047 | | AAA/NR | | | 125,000 | | | | 125,073 | |
| | | | | | | | | | |
| | | | | | | | | 125,073 | |
| | | | | | | | | | |
AUTO RECEIVABLES — 4.36% | | | | | | | | | | |
Ally Auto Receivables Trust, Series 15-1 Class A3, 1.39% due 9/16/2019 | | AAA/Aaa | | | 150,000 | | | | 150,272 | |
Ally Auto Receivables Trust, Series 15-2 Class A3, 1.49% due 11/15/2019 | | AAA/Aaa | | | 100,000 | | | | 100,315 | |
c Avis Budget Rental Car Funding AESOP, LLC, Series 2012-3A Class A, 2.10% due 3/20/2019 | | NR/Aaa | | | 100,000 | | | | 99,877 | |
c Chesapeake Funding II, LLC, Series 16-1A Class A1, 2.11% due 3/15/2028 | | NR/Aaa | | | 200,000 | | | | 199,971 | |
c Exeter Automobile Receivables Trust, Series 2014-1A Class A, 1.29% due 5/15/2018 | | AA/NR | | | 3,925 | | | | 3,924 | |
c Ford Credit Auto Owner Trust, Series 2015-1 Class A, 2.12% due 7/15/2026 | | AAA/NR | | | 100,000 | | | | 100,545 | |
c GM Financial Automobile Leasing Trust, Series 2014-2A Class A4, 1.62% due 2/20/2018 | | NR/Aaa | | | 100,000 | | | | 100,648 | |
c Hertz Vehicle Financing, LLC, Series 2013-1A Class A2, 1.83% due 8/25/2019 | | NR/Aaa | | | 125,000 | | | | 122,897 | |
c OSCAR US Funding Trust, Series 2014-1A Class A3, 1.72% due 4/15/2019 | | AA+/Aaa | | | 100,000 | | | | 99,379 | |
Santander Drive Auto Receivables Trust, Series 2013-2 Class B, 1.33% due 3/15/2018 | | AAA/Aaa | | | 11,647 | | | | 11,648 | |
| | | | | | | | | | |
| | | | | | | | | 989,476 | |
| | | | | | | | | | |
COMMERCIAL MTG TRUST — 6.15% | | | | | | | | | | |
c BAMLL-DB Trust, Series 2012-OSI Class A2FX, 3.352% due 4/13/2029 | | NR/Aaa | | | 399,814 | | | | 405,050 | |
c Barclays Commercial Mtg Securities, LLC, Series 2015-STP Class A, 3.323% due 9/10/2028 | | AAA/NR | | | 100,000 | | | | 101,738 | |
COMM Mtg Trust, Series 2016-DC2 Class A1, 1.82% due 2/10/2049 | | NR/Aaa | | | 130,000 | | | | 130,829 | |
c DBUBS Mtg Trust CMO, Series 2011-LC1A Class A1, 3.742% due 11/10/2046 | | NR/Aaa | | | 5,874 | | | | 5,890 | |
c DBUBS Mtg Trust CMO, Series 2011-LC2A Class A1FL, 1.788% due 7/12/2044 | | NR/Aaa | | | 51,661 | | | | 52,032 | |
d Deutsche Bank Commercial Mtg Trust, Series 2016-C1 Class A1, 1.676% due 5/10/2049 | | NR/Aaa | | | 150,000 | | | | 149,998 | |
c FREMF Mtg Trust, Series 2013-KF02 Class B Floating Rate Note, 3.433% due 12/25/2045 | | NR/Baa3 | | | 25,134 | | | | 25,538 | |
c GAHR Commercial Mtg Trust, Series 2015-NRF Class BFX, 3.382% due 12/15/2019 | | AA-/NR | | | 100,000 | | | | 101,253 | |
c JPMorgan Chase Commercial Mtg, Series 2014-BXH Class A Floating Rate Note, 1.336% due 4/15/2027 | | AAA/NR | | | 100,000 | | | | 97,381 | |
Morgan Stanley BAML Trust, Series 2012-C6 Class A2, 1.868% due 11/15/2045 | | NR/Aaa | | | 100,000 | | | | 100,359 | |
28 Semi-Annual Reports
| | |
| SCHEDULE OF INVESTMENTS, CONTINUED | | |
| |
Thornburg Low Duration Income Fund | | March 31, 2016 (Unaudited) |
| | | | | | | | | | |
Issuer-Description | | Credit Rating†
S&P/ Moody’s | | Principal
Amount | | | Value | |
c Morgan Stanley Re-REMIC Trust, Series 2009-GG10 Class A4A, 5.794% due 8/12/2045 | | NR/Aaa | | $ | 145,486 | | | $ | 147,936 | |
WFRBS Commercial Mtg Trust, Series 2014-C22 Class A1, 1.479% due 9/15/2057 | | NR/Aaa | | | 77,040 | | | | 77,015 | |
| | | | | | | | | | |
| | | | | | | | | 1,395,019 | |
| | | | | | | | | | |
CREDIT CARD — 1.88% | | | | | | | | | | |
c Cabela’s Master Credit Card Trust, Series 2013-2A Class A1, 2.17% due 8/16/2021 | | AAA/NR | | | 150,000 | | | | 152,440 | |
Cabela’s Master Credit Card Trust, Series 2015-1A Class A2 Floating Rate Note, 0.976% due 3/15/2023 | | AAA/NR | | | 75,000 | | | | 73,803 | |
Synchrony Credit Card Master Note Trust, Series 2014-1 Class A, 1.61% due 11/15/2020 | | AAA/Aaa | | | 100,000 | | | | 100,277 | |
Synchrony Credit Card Master Note Trust, Series 2016-1 Class A, 2.04% due 3/15/2022 | | NR/Aaa | | | 100,000 | | | | 100,792 | |
| | | | | | | | | | |
| | | | | | | | | 427,312 | |
| | | | | | | | | | |
OTHER ASSET BACKED — 7.09% | | | | | | | | | | |
c Alterna Funding I, LLC, Series 2014-1A, 1.639% due 2/15/2021 | | NR/NR | | | 51,518 | | | | 51,035 | |
c Ascentium Equipment Receivables, LLC, Series 2015-1A Class B, 2.26% due 6/10/2021 | | NR/Aaa | | | 50,000 | | | | 49,689 | |
c CLI Funding, LLC, Series 2014-1A Class A, 3.29% due 6/18/2029 | | A/NR | | | 81,725 | | | | 76,163 | |
c Dell Equipment Finance Trust, Series 2015-2 Class A3, 1.72% due 9/22/2020 | | AAA/Aaa | | | 125,000 | | | | 124,816 | |
c Dominos Pizza Master Issuer, LLC, Series 2012-1A Class A2, 5.216% due 1/25/2042 | | BBB+/Baa1 | | | 119,184 | | | | 123,385 | |
GE Dealer Floorplan Master Note Trust, Series 2012-2 Class A Floating Rate Note, 1.182% due 4/22/2019 | | NR/Aaa | | | 100,000 | | | | 99,863 | |
c GTP Acquisition Partners I, LLC, Series 2015-1 Class A, 2.35% due 6/15/2045 | | NR/Aaa | | | 100,000 | | | | 98,402 | |
c GTP Cellular Sites, LLC, 3.721% due 3/15/2042 | | NR/NR | | | 94,729 | | | | 94,861 | |
Harley-Davidson Motorcycle Trust, Series 2015-2 Class A4, 1.66% due 12/15/2022 | | AAA/Aaa | | | 100,000 | | | | 100,195 | |
MVW Owner Trust, Series 2013-1X Class A, 2.15% due 4/22/2030 | | A+/NR | | | 43,293 | | | | 42,953 | |
c Navistar Financial Dealer Note Master Owner Trust II, Series 2014-1 Class A Floating Rate Note, 1.183% due 10/25/2019 | | NR/Aaa | | | 100,000 | | | | 99,582 | |
c Navistar Financial Dealer Note Master Owner Trust II, Series 2015-1 Class A Floating Rate Note, 1.836% due 6/25/2020 | | NR/Aaa | | | 71,000 | | | | 70,913 | |
c OneMain Financial Issuance Trust, Series 16-2A Class A, 4.10% due 3/20/2028 | | A+/NR | | | 100,000 | | | | 100,422 | |
c PFS Financing Corp., Series 2015-AA Class A Floating Rate Note, 1.056% due 4/15/2020 | | AAA/Aaa | | | 100,000 | | | | 98,755 | |
c PFS Tax Lien Trust, Series 2014-1, 1.44% due 5/15/2029 | | AAA/NR | | | 44,075 | | | | 43,938 | |
c SBA Tower Trust, Series 2012-1 Class C, 2.933% due 12/15/2042 | | NR/A2 | | | 100,000 | | | | 99,555 | |
c SBA Tower Trust, Series 2014-1A Class C, 2.898% due 10/15/2044 | | NR/A2 | | | 100,000 | | | | 100,473 | |
c Sierra Receivables Funding Co., LLC, Series 2012-1A Class A, 2.84% due 11/20/2028 | | A+/NR | | | 21,398 | | | | 21,528 | |
c Sierra Receivables Funding Co., LLC, Series 2014-1A Class A, 2.07% due 3/20/2030 | | A/NR | | | 33,503 | | | | 33,322 | |
c Sierra Receivables Funding Co., LLC, Series 2015-3A Class A, 2.58% due 9/20/2032 | | A/NR | | | 79,284 | | | | 78,862 | |
| | | | | | | | | | |
| | | | | | | | | 1,608,712 | |
| | | | | | | | | | |
RESIDENTIAL MTG TRUST — 0.86% | | | | | | | | | | |
c B2R Mortgage Trust, Series 2015-2 Class A, 3.336% due 11/15/2048 | | NR/NR | | | 99,101 | | | | 100,894 | |
c,e Nationstar HECM Loan Trust, Series 16-1A Class A, 2.981% due 2/25/2026 | | NR/Aaa | | | 95,104 | | | | 95,104 | |
| | | | | | | | | | |
| | | | | | | | | 195,998 | |
| | | | | | | | | | |
STUDENT LOAN — 2.69% | | | | | | | | | | |
c Navient Student Loan Trust, Series 2015-AA Class A1, 0.936% due 12/15/2021 | | NR/Aaa | | | 36,785 | | | | 36,651 | |
c Pennsylvania Higher Education Assistance Agency, Series 2012-1A Class A1 Floating Rate Note, 0.983% due 5/25/2027 | | AA+/NR | | | 63,814 | | | | 62,857 | |
c SLM Student Loan Trust, Series 2011-A Class A3 Floating Rate Note, 2.936% due 1/15/2043 | | AAA/Aaa | | | 100,000 | | | | 100,907 | |
SLM Student Loan Trust, Series 2013-4 Class A Floating Rate Note, 0.983% due 6/25/2027 | | NR/Aaa | | | 68,719 | | | | 65,437 | |
c SLM Student Loan Trust, Series 2013-B Class A2B Floating Rate Note, 1.536% due 6/17/2030 | | AAA/NR | | | 200,000 | | | | 198,303 | |
c Social Professional Loan Program, LLC, Series 2014-A Class A1 Floating Rate Note, 2.033% due 6/25/2025 | | A/NR | | | 146,816 | | | | 146,815 | |
| | | | | | | | | | |
| | | | | | | | | 610,970 | |
| | | | | | | | | | |
TOTAL ASSET BACKED SECURITIES (Cost $5,376,025) | | | | | | | | | 5,352,560 | |
| | | | | | | | | | |
| | | |
CORPORATE BONDS — 37.31% | | | | | | | | | | |
AUTOMOBILES & COMPONENTS — 1.55% | | | | | | | | | | |
Automobiles — 1.55% | | | | | | | | | | |
c Daimler Finance North America, LLC, 2.45% due 5/18/2020 | | A-/A3 | | | 150,000 | | | | 151,585 | |
c Hyundai Capital America, 2.00% due 3/19/2018 | | A-/Baa1 | | | 50,000 | | | | 50,353 | |
c Hyundai Capital America, 2.40% due 10/30/2018 | | A-/Baa1 | | | 50,000 | | | | 50,334 | |
c Nissan Motor Acceptance Corp., 1.95% due 9/12/2017 | | A-/A3 | | | 100,000 | | | | 100,377 | |
| | | | | | | | | | |
| | | | | | | | | 352,649 | |
| | | | | | | | | | |
BANKS — 4.77% | | | | | | | | | | |
Banks — 4.77% | | | | | | | | | | |
b Abbey National Treasury Services plc Floating Rate Note, 2.112% due 3/14/2019 | | A/A1 | | | 100,000 | | | | 100,504 | |
Bank of America Corp. Floating Rate Note, 1.662% due 1/15/2019 | | BBB+/Baa1 | | | 100,000 | | | | 99,507 | |
Citigroup, Inc., 2.50% due 7/29/2019 | | BBB+/Baa1 | | | 75,000 | | | | 76,008 | |
Citigroup, Inc., 1.70% due 4/27/2018 | | BBB+/Baa1 | | | 75,000 | | | | 74,730 | |
Fifth Third Bank, 2.30% due 3/15/2019 | | A-/A3 | | | 200,000 | | | | 201,805 | |
JPMorgan Chase & Co., 1.823% due 10/29/2020 | | A-/A3 | | | 125,000 | | | | 126,409 | |
Semi-Annual Reports 29
| | |
| SCHEDULE OF INVESTMENTS, CONTINUED | | |
| |
Thornburg Low Duration Income Fund | | March 31, 2016 (Unaudited) |
| | | | | | | | | | |
Issuer-Description | | Credit Rating†
S&P/ Moody’s | | Principal
Amount | | | Value | |
b Mitsubishi UFJ Financial Group, Inc. Floating Rate Note, 2.515% due 3/1/2021 | | A/A1 | | $ | 200,000 | | | $ | 203,998 | |
b,c Standard Chartered PLC, 3.20% due 5/12/2016 | | BBB+/A1 | | | 100,000 | | | | 100,244 | |
Wells Fargo & Co. Floating Rate Note, 1.646% due 12/7/2020 | | A/A2 | | | 100,000 | | | | 99,777 | |
| | | | | | | | | | |
| | | | | | | | | 1,082,982 | |
| | | | | | | | | | |
CAPITAL GOODS — 1.34% | | | | | | | | | | |
Construction & Engineering — 0.44% | | | | | | | | | | |
URS Corp., 3.85% due 4/1/2017 | | BB-/NR | | | 100,000 | | | | 99,617 | |
Industrial Conglomerates — 0.45% | | | | | | | | | | |
Roper Technologies, Inc., 3.00% due 12/15/2020 | | BBB/Baa2 | | | 100,000 | | | | 102,173 | |
Machinery — 0.45% | | | | | | | | | | |
Stanley Black & Decker, Inc., 2.451% due 11/17/2018 | | A-/Baa2 | | | 100,000 | | | | 101,543 | |
| | | | | | | | | | |
| | | | | | | | | 303,333 | |
| | | | | | | | | | |
COMMERCIAL & PROFESSIONAL SERVICES — 0.77% | | | | | | | | | | |
Commercial Services & Supplies — 0.44% | | | | | | | | | | |
Cintas Corp. No. 2, 2.85% due 6/1/2016 | | A-/A2 | | | 100,000 | | | | 100,356 | |
Professional Services — 0.33% | | | | | | | | | | |
Dun & Bradstreet, Inc., 4.00% due 6/15/2020 | | BBB-/NR | | | 75,000 | | | | 74,485 | |
| | | | | | | | | | |
| | | | | | | | | 174,841 | |
| | | | | | | | | | |
CONSUMER SERVICES — 0.46% | | | | | | | | | | |
Diversified Consumer Services — 0.46% | | | | | | | | | | |
George Washington University, 4.411% due 9/15/2017 | | A+/A1 | | | 100,000 | | | | 104,039 | |
| | | | | | | | | | |
| | | | | | | | | 104,039 | |
| | | | | | | | | | |
DIVERSIFIED FINANCIALS — 4.98% | | | | | | | | | | |
Capital Markets — 3.30% | | | | | | | | | | |
b Deutsche Bank AG, 2.95% due 8/20/2020 | | BBB+/Baa1 | | | 75,000 | | | | 75,289 | |
Goldman Sachs Group, Inc. Floating Rate Note, 1.834% due 9/15/2020 | | BBB+/A3 | | | 100,000 | | | | 99,309 | |
Goldman Sachs Group, Inc. Floating Rate Note, 1.639% due 10/23/2019 | | BBB+/A3 | | | 50,000 | | | | 49,657 | |
Legg Mason, Inc., 2.70% due 7/15/2019 | | BBB/Baa1 | | | 100,000 | | | | 100,992 | |
Morgan Stanley, 2.80% due 6/16/2020 | | BBB+/A3 | | | 50,000 | | | | 50,911 | |
Morgan Stanley Floating Rate Note, 1.761% due 1/27/2020 | | BBB+/A3 | | | 75,000 | | | | 74,511 | |
State Street Corp. Floating Rate Note, 1.518% due 8/18/2020 | | A/A2 | | | 100,000 | | | | 99,551 | |
b,c UBS AG Jersey Floating Rate Note, 2.068% due 9/24/2020 | | BBB+/Baa2 | | | 200,000 | | | | 199,017 | |
Consumer Finance — 0.23% | | | | | | | | | | |
Synchrony Financial, 3.00% due 8/15/2019 | | BBB-/NR | | | 50,000 | | | | 50,793 | |
Diversified Financial Services — 1.45% | | | | | | | | | | |
c Athene Global Funding, 2.875% due 10/23/2018 | | A-/NR | | | 75,000 | | | | 73,825 | |
Intercontinental Exchange, Inc., 2.75% due 12/1/2020 | | A/A2 | | | 100,000 | | | | 102,103 | |
McGraw Hill Financial, Inc., 2.50% due 8/15/2018 | | NR/Baa1 | | | 50,000 | | | | 50,666 | |
McGraw Hill Financial, Inc., 3.30% due 8/14/2020 | | NR/Baa1 | | | 50,000 | | | | 51,726 | |
Moody’s Corp., 2.75% due 7/15/2019 | | BBB+/NR | | | 50,000 | | | | 51,290 | |
| | | | | | | | | | |
| | | | | | | | | 1,129,640 | |
| | | | | | | | | | |
ENERGY — 2.35% | | | | | | | | | | |
Oil, Gas & Consumable Fuels — 2.35% | | | | | | | | | | |
c Chevron Phillips Chemical Co., LLC, Floating Rate Note, 1.366% due 5/1/2020 | | A-/A2 | | | 100,000 | | | | 96,827 | |
Exxon Mobil Corp., 2.222% due 3/1/2021 | | AAA/Aaa | | | 75,000 | | | | 76,328 | |
Exxon Mobil Corp. Floating Rate Note, 1.413% due 3/1/2019 | | AAA/Aaa | | | 75,000 | | | | 75,283 | |
Exxon Mobil Corp. Floating Rate Note, 1.229% due 2/28/2018 | | AAA/Aaa | | | 50,000 | | | | 50,151 | |
c Kern River Funding Corp., 4.893% due 4/30/2018 | | A/A2 | | | 83,175 | | | | 86,338 | |
Marathon Petroleum Corp., 2.70% due 12/14/2018 | | BBB/Baa2 | | | 100,000 | | | | 99,883 | |
b Petrobras Global Finance B.V. Floating Rate Note, 3.002% due 3/17/2017 | | B+/B3 | | | 50,000 | | | | 48,255 | |
| | | | | | | | | | |
| | | | | | | | | 533,065 | |
| | | | | | | | | | |
FOOD & STAPLES RETAILING — 0.24% | | | | | | | | | | |
Food & Staples Retailing — 0.24% | | | | | | | | | | |
Smith’s 1994-A3 Pass Through Trust, 9.20% due 7/2/2018 | | BBB/A3 | | | 49,021 | | | | 53,896 | |
| | | | | | | | | | |
| | | | | | | | | 53,896 | |
| | | | | | | | | | |
30 Semi-Annual Reports
| | |
| SCHEDULE OF INVESTMENTS, CONTINUED | | |
| |
Thornburg Low Duration Income Fund | | March 31, 2016 (Unaudited) |
| | | | | | | | | | |
Issuer-Description | | Credit Rating†
S&P/ Moody’s | | Principal
Amount | | | Value | |
FOOD, BEVERAGE & TOBACCO — 2.24% | | | | | | | | | | |
Beverages — 0.45% | | | | | | | | | | |
Anheuser-Busch InBev Finance Inc. Floating Rate Note, 1.879% due 2/1/2021 | | A-/(p)a3 | | $ | 100,000 | | | $ | 101,769 | |
Food Products — 1.34% | | | | | | | | | | |
General Mills, Inc., 1.40% due 10/20/2017 | | BBB+/A3 | | | 50,000 | | | | 50,290 | |
General Mills, Inc., 2.20% due 10/21/2019 | | BBB+/A3 | | | 50,000 | | | | 50,840 | |
Ingredion, Inc., 1.80% due 9/25/2017 | | BBB/Baa2 | | | 100,000 | | | | 99,529 | |
Mead Johnson Nutrition Co., 3.00% due 11/15/2020 | | BBB-/Baa1 | | | 100,000 | | | | 102,761 | |
Tobacco — 0.45% | | | | | | | | | | |
Altria Group, Inc., 2.625% due 1/14/2020 | | A-/A3 | | | 100,000 | | | | 103,362 | |
| | | | | | | | | | |
| | | | | | | | | 508,551 | |
| | | | | | | | | | |
HEALTH CARE EQUIPMENT & SERVICES — 1.22% | | | | | | | | | | |
Health Care Equipment & Supplies — 0.78% | | | | | | | | | | |
Stryker Corp., 2.625% due 3/15/2021 | | A+/Baa1 | | | 75,000 | | | | 76,480 | |
Stryker Corp., 2.00% due 3/8/2019 | | A+/Baa1 | | | 100,000 | | | | 101,068 | |
Health Care Providers & Services — 0.44% | | | | | | | | | | |
Catholic Health Initiatives, 1.60% due 11/1/2017 | | A/NR | | | 100,000 | | | | 100,137 | |
| | | | | | | | | | |
| | | | | | | | | 277,685 | |
| | | | | | | | | | |
INSURANCE — 1.00% | | | | | | | | | | |
Insurance — 1.00% | | | | | | | | | | |
c Principal Life Global Funding II, 1.50% due 9/11/2017 | | A+/A1 | | | 50,000 | | | | 50,088 | |
c Principal Life Global Funding II, 2.375% due 9/11/2019 | | A+/A1 | | | 50,000 | | | | 50,599 | |
c Reliance Standard Life Insurance Co., 2.50% due 4/24/2019 | | A/A2 | | | 100,000 | | | | 100,809 | |
c Reliance Standard Life Insurance Co., 3.05% due 1/20/2021 | | A/A2 | | | 25,000 | | | | 25,402 | |
| | | | | | | | | | |
| | | | | | | | | 226,898 | |
| | | | | | | | | | |
MATERIALS — 0.61% | | | | | | | | | | |
Chemicals — 0.23% | | | | | | | | | | |
Airgas, Inc., 3.05% due 8/1/2020 | | BBB/Baa2 | | | 50,000 | | | | 51,162 | |
Metals & Mining — 0.38% | | | | | | | | | | |
c Glencore Funding, LLC Floating Rate Note, 1.982% due 1/15/2019 | | BBB-/Baa3 | | | 100,000 | | | | 87,500 | |
| | | | | | | | | | |
| | | | | | | | | 138,662 | |
| | | | | | | | | | |
PHARMACEUTICALS, BIOTECHNOLOGY & LIFE SCIENCES — 1.77% | | | | | | | | | | |
Biotechnology — 0.45% | | | | | | | | | | |
Gilead Sciences, Inc., 2.55% due 9/1/2020 | | A/A3 | | | 100,000 | | | | 102,981 | |
Pharmaceuticals — 1.32% | | | | | | | | | | |
b Actavis Funding SCS, 2.35% due 3/12/2018 | | BBB-/Baa3 | | | 60,000 | | | | 60,709 | |
b Actavis Funding SCS Floating Rate Note, 1.887% due 3/12/2020 | | BBB-/Baa3 | | | 60,000 | | | | 59,784 | |
b,c Mylan N.V., 3.00% due 12/15/2018 | | BBB-/Baa3 | | | 100,000 | | | | 101,372 | |
Zoetis, Inc., 3.45% due 11/13/2020 | | BBB-/Baa2 | | | 75,000 | | | | 77,051 | |
| | | | | | | | | | |
| | | | | | | | | 401,897 | |
| | | | | | | | | | |
REAL ESTATE — 0.44% | | | | | | | | | | |
Real Estate Investment Trusts — 0.44% | | | | | | | | | | |
Select Income REIT, 2.85% due 2/1/2018 | | BBB-/Baa2 | | | 100,000 | | | | 100,070 | |
| | | | | | | | | | |
| | | | | | | | | 100,070 | |
| | | | | | | | | | |
SOFTWARE & SERVICES — 3.65% | | | | | | | | | | |
Information Technology Services — 1.79% | | | | | | | | | | |
Fidelity National Information Services Inc., 2.85% due 10/15/2018 | | BBB/Baa3 | | | 150,000 | | | | 152,445 | |
Fiserv, Inc., 2.70% due 6/1/2020 | | BBB/Baa2 | | | 100,000 | | | | 101,708 | |
Total System Services, Inc., 3.80% due 4/1/2021 | | BBB-/Baa3 | | | 50,000 | | | | 51,420 | |
Total System Services, Inc., 2.375% due 6/1/2018 | | BBB-/Baa3 | | | 100,000 | | | | 99,871 | |
Internet Software & Services — 0.51% | | | | | | | | | | |
eBay, Inc., 2.50% due 3/9/2018 | | BBB+/Baa1 | | | 115,000 | | | | 116,865 | |
Semi-Annual Reports 31
| | |
| SCHEDULE OF INVESTMENTS, CONTINUED | | |
| |
Thornburg Low Duration Income Fund | | March 31, 2016 (Unaudited) |
| | | | | | | | | | |
Issuer-Description | | Credit Rating†
S&P/ Moody’s | | Principal
Amount | | | Value | |
Software — 1.35% | | | | | | | | | | |
Autodesk, Inc., 3.125% due 6/15/2020 | | BBB/Baa2 | | $ | 100,000 | | | $ | 101,427 | |
CA Technologies, Inc., 2.875% due 8/15/2018 | | BBB+/Baa2 | | | 125,000 | | | | 127,046 | |
Electronic Arts, Inc., 3.70% due 3/1/2021 | | BBB-/Baa2 | | | 75,000 | | | | 77,965 | |
| | | | | | | | | | |
| | | | | | | | | 828,747 | |
| | | | | | | | | | |
TECHNOLOGY HARDWARE & EQUIPMENT — 2.22% | | | | | | | | | | |
Communications Equipment — 1.33% | | | | | | | | | | |
Cisco Systems, Inc., 2.20% due 2/28/2021 | | AA-/A1 | | | 50,000 | | | | 50,995 | |
Cisco Systems, Inc. Floating Rate Note, 1.212% due 2/21/2018 | | AA-/A1 | | | 150,000 | | | | 150,393 | |
Juniper Networks, Inc., 3.30% due 6/15/2020 | | BBB/Baa2 | | | 100,000 | | | | 101,409 | |
Technology, Hardware, Storage & Peripherals — 0.89% | | | | | | | | | | |
Apple, Inc. Floating Rate Note, 1.438% due 2/22/2019 | | AA+/Aa1 | | | 50,000 | | | | 50,443 | |
Apple, Inc. Floating Rate Note, 1.748% due 2/23/2021 | | AA+/Aa1 | | | 50,000 | | | | 50,682 | |
c Hewlett-Packard Enterprise Co. Floating Rate Note, 2.543% due 10/5/2018 | | BBB/Baa2 | | | 100,000 | | | | 100,154 | |
| | | | | | | | | | |
| | | | | | | | | 504,076 | |
| | | | | | | | | | |
TELECOMMUNICATION SERVICES — 2.66% | | | | | | | | | | |
Diversified Telecommunication Services — 2.22% | | | | | | | | | | |
AT&T, Inc., 2.45% due 6/30/2020 | | BBB+/Baa1 | | | 100,000 | | | | 101,332 | |
AT&T, Inc., 1.546% due 11/27/2018 | | BBB+/Baa1 | | | 50,000 | | | | 49,712 | |
AT&T, Inc., 1.559% due 6/30/2020 | | BBB+/Baa1 | | | 50,000 | | | | 49,490 | |
b Telefonica Emisiones SAU, 6.421% due 6/20/2016 | | BBB/Baa2 | | | 100,000 | | | | 101,072 | |
Verizon Communications, Inc. Floating Rate Note, 2.382% due 9/14/2018 | | BBB+/Baa1 | | | 100,000 | | | | 102,447 | |
Verizon Communications, Inc. Floating Rate Note, 1.412% due 6/17/2019 | | BBB+/Baa1 | | | 100,000 | | | | 99,762 | |
Wireless Telecommunication Services — 0.44% | | | | | | | | | | |
c Crown Castle Towers, LLC, 5.495% due 1/15/2037 | | NR/A2 | | | 100,000 | | | | 100,957 | |
| | | | | | | | | | |
| | | | | | | | | 604,772 | |
| | | | | | | | | | |
TRANSPORTATION — 0.57% | | | | | | | | | | |
Air Freight & Logistics — 0.13% | | | | | | | | | | |
c FedEx Corp. 2012 Pass Through Trust, 2.625% due 1/15/2018 | | BBB/Baa1 | | | 29,642 | | | | 29,844 | |
Road & Rail — 0.44% | | | | | | | | | | |
c Penske Truck Leasing Co. LP/PTL Finance Corp., 3.20% due 7/15/2020 | | BBB-/Baa3 | | | 100,000 | | | | 100,054 | |
| | | | | | | | | | |
| | | | | | | | | 129,898 | |
| | | | | | | | | | |
UTILITIES — 4.47% | | | | | | | | | | |
Electric Utilities — 3.58% | | | | | | | | | | |
Cleveland Electric Illuminating Co., 7.88% due 11/1/2017 | | BBB+/Baa1 | | | 185,000 | | | | 202,169 | |
b,c Electricite de France S.A., 2.15% due 1/22/2019 | | A+/A1 | | | 100,000 | | | | 101,160 | |
b,c Enel Finance International S.A., 6.25% due 9/15/2017 | | BBB/Baa2 | | | 100,000 | | | | 106,700 | |
Exelon Corp., 1.55% due 6/9/2017 | | BBB-/Baa2 | | | 50,000 | | | | 49,920 | |
Exelon Corp., 2.85% due 6/15/2020 | | BBB-/Baa2 | | | 50,000 | | | | 51,025 | |
NextEra Energy Capital Holdings, Inc., 1.586% due 6/1/2017 | | BBB+/Baa1 | | | 100,000 | | | | 100,083 | |
Southern Power Co., 2.375% due 6/1/2020 | | BBB+/Baa1 | | | 100,000 | | | | 99,660 | |
The Southern Co., 2.45% due 9/1/2018 | | BBB+/Baa1 | | | 100,000 | | | | 101,599 | |
Gas Utilities — 0.44% | | | | | | | | | | |
The Laclede Group, Inc. Floating Rate Note, 1.368% due 8/15/2017 | | BBB+/Baa2 | | | 100,000 | | | | 99,606 | |
Multi-Utilities — 0.45% | | | | | | | | | | |
Dominion Gas Holdings, LLC, 2.50% due 12/15/2019 | | BBB+/A2 | | | 100,000 | | | | 101,511 | |
| | | | | | | | | | |
| | | | | | | | | 1,013,433 | |
| | | | | | | | | | |
TOTAL CORPORATE BONDS (Cost $8,418,662) | | | | | | | | | 8,469,134 | |
| | | | | | | | | | |
| | | |
CONVERTIBLE BONDS — 0.21% | | | | | | | | | | |
REAL ESTATE — 0.21% | | | | | | | | | | |
Real Estate Investment Trusts — 0.21% | | | | | | | | | | |
c IAS Operating Partnership LP, 5.00% due 3/15/2018 | | NR/NR | | | 50,000 | | | | 47,250 | |
| | | | | | | | | | |
| | | | | | | | | 47,250 | |
| | | | | | | | | | |
TOTAL CONVERTIBLE BONDS (Cost $47,945) | | | | | | | | | 47,250 | |
| | | | | | | | | | |
32 Semi-Annual Reports
| | |
| SCHEDULE OF INVESTMENTS, CONTINUED | | |
| |
Thornburg Low Duration Income Fund | | March 31, 2016 (Unaudited) |
| | | | | | | | | | |
Issuer-Description | | Credit Rating†
S&P/ Moody’s | | Principal
Amount | | | Value | |
MUNICIPAL BONDS — 1.23% | | | | | | | | | | |
JobsOhio Beverage System, 2.217% due 1/1/2019 (State Liquor Enterprise) | | AA/Aa3 | | $ | 100,000 | | | $ | 102,989 | |
Louisiana Local Government Environmental Facilities and Community Development Authority, 1.66% due 2/1/2022 (Louisiana Utilities Restoration) | | AAA/Aaa | | | 75,126 | | | | 76,073 | |
Sandoval County, New Mexico, 1.452% due 6/1/2017 | | A+/NR | | | 100,000 | | | | 100,728 | |
| | | | | | | | | | |
TOTAL MUNICIPAL BONDS (Cost $272,619) | | | | | | | | | 279,790 | |
| | | | | | | | | | |
SHORT TERM INVESTMENTS — 5.43% | | | | | | | | | | |
f Thornburg Capital Management Fund | | NR/NR | | | 123,210 | | | | 1,232,103 | |
| | | | | | | | | | |
TOTAL SHORT TERM INVESTMENTS (Cost $1,232,103) | | | | | | | | | 1,232,103 | |
| | | | | | | | | | |
TOTAL INVESTMENTS — 100.82% (Cost $22,819,014) | | | | | | | | $ | 22,887,507 | |
LIABILITIES NET OF OTHER ASSETS — (0.82)% | | | | | | | | | (186,699 | ) |
| | | | | | | | | | |
NET ASSETS — 100.00% | | | | | | | | $ | 22,700,808 | |
| | | | | | | | | | |
Footnote Legend
| † | Credit ratings are unaudited. Rating changes may have occurred subsequent to the reporting period end. Bonds issued with a maturity of one year or less are assigned Moody’s ratings from MIG-1 to MIG-4 and Standard and Poor’s ratings from SP-1+ to SP-3 with MIG-1 and SP-1+ being the strongest ratings. |
| a | Segregated as collateral for a when-issued security. |
| b | Yankee bond denominated in U.S. dollars and is issued in the U.S. by foreign banks and corporations. |
| c | Securities exempt from registration under Rule 144A of the Securities Act of 1933, as amended. These securities may only be resold in the ordinary course of business in transactions exempt from registration, normally to qualified institutional buyers. As of March 31, 2016, the aggregate value of these securities in the Fund’s portfolio was $5,959,593, representing 26.25% of the Fund’s net assets. |
| e | Security currently fair valued by the Valuation and Pricing Committee using procedures approved by the Trustees’ Audit Committee. |
| f | Investment in Affiliates – Shown below are holdings of voting securities of each portfolio company which is considered “affiliated” to the Fund under the Investment Company Act of 1940, including companies for which the Fund’s holding represented 5% or more of the company’s voting securities, and a series of the Thornburg Investment Trust in which the Fund invested for cash management purposes during the period. |
| | | | | | | | | | | | | | | | | | | | | | | | | | | | |
Issuer | | Shares/Principal
September 30,
2015 | | | Gross
Additions | | | Gross
Reductions | | | Shares/Principal
March 31,
2016 | | | Market Value
March 31,
2016 | | | Investment
Income | | | Realized
Gain (loss) | |
Thornburg Capital Management Fund | | | 307,812 | | | | 867,919 | | | | 1,052,521 | | | | 123,210 | | | $ | 1,232,103 | | | $ | 4,793 | | | $ | — | |
| | | | | | | | | | | | | | | | | | | | | | | | | | | | |
Total non-controlled affiliated issuers - 5.43% of net assets | | | | | | | | | | | $ | 1,232,103 | | | $ | 4,793 | | | $ | — | |
| | | | | | | | | | | | | | | | | | | | | | | | | | | | |
Portfolio Abbreviations
To simplify the listings of securities, abbreviations are used per the table below:
| | |
| CMO | | Collateralized Mortgage Obligation |
| Mtg | | Mortgage |
| REIT | | Real Estate Investment Trust |
See notes to financial statements.
Semi-Annual Reports 33
| | |
| STATEMENTS OF ASSETS AND LIABILITIES | | |
| |
| | March 31, 2016 (Unaudited) |
| | | | | | | | | | | | |
| | | Thornburg
Limited Term U.S.
Government Fund | | | Thornburg
Limited Term
Income Fund | | | Thornburg
Low Duration
Income Fund | |
ASSETS | | | | | | | | | | | | |
Investments at value (cost $303,104,137, $4,189,618,270, and $22,819,014, respectively) (Note 2) | | $ | 308,078,502 | | | $ | 4,208,743,869 | | | $ | 22,887,507 | |
Cash | | | 12,717,965 | | | | 357,723 | | | | 2,896 | |
Receivable for investments sold | | | — | | | | 7,558,771 | | | | — | |
Receivable for fund shares sold | | | 2,070,431 | | | | 22,624,839 | | | | — | |
Receivable from investment advisor | | | — | | | | — | | | | 12,292 | |
Dividend and interest reclaim receivable | | | — | | | | 2,047 | | | | 21 | |
Interest receivable | | | 1,034,888 | | | | 25,133,434 | | | | 77,635 | |
Prepaid expenses and other assets | | | 73,077 | | | | 129,137 | | | | 31,225 | |
| | | | | | | | | | | | |
Total Assets | | | 323,974,863 | | | | 4,264,549,820 | | | | 23,011,576 | |
| | | | | | | | | | | | |
| | | |
LIABILITIES | | | | | | | | | | | | |
Payable for investments purchased | | | 26,304 | | | | 6,213,106 | | | | 151,048 | |
Payable for fund shares redeemed | | | 438,729 | | | | 8,720,956 | | | | 110,379 | |
Payable to investment advisor and other affiliates (Note 3) | | | 169,540 | | | | 2,043,850 | | | | — | |
Accounts payable and accrued expenses | | | 92,031 | | | | 677,442 | | | | 48,549 | |
Dividends payable | | | 119,638 | | | | 918,438 | | | | 792 | |
| | | | | | | | | | | | |
Total Liabilities | | | 846,242 | | | | 18,573,792 | | | | 310,768 | |
| | | | | | | | | | | | |
| | | |
NET ASSETS | | $ | 323,128,621 | | | $ | 4,245,976,028 | | | $ | 22,700,808 | |
| | | | | | | | | | | | |
NET ASSETS CONSIST OF | | | | | | | | | | | | |
Distribution in excess of net investment income | | $ | (592,542 | ) | | $ | (1,723,028 | ) | | $ | (7,135 | ) |
Net unrealized appreciation on investments | | | 4,974,365 | | | | 19,125,600 | | | | 68,492 | |
Accumulated net realized gain (loss) | | | (8,569,216 | ) | | | 4,333,743 | | | | 576 | |
Net capital paid in on shares of beneficial interest | | | 327,316,014 | | | | 4,224,239,713 | | | | 22,638,875 | |
| | | | | | | | | | | | |
| | | |
| | $ | 323,128,621 | | | $ | 4,245,976,028 | | | $ | 22,700,808 | |
| | | | | | | | | | | | |
34 Semi-Annual Reports
| | |
| STATEMENTS OF ASSETS AND LIABILITIES, CONTINUED |
| |
| | March 31, 2016 (Unaudited) |
| | | | | | | | | | | | |
| | | Thornburg
Limited Term U.S.
Government Fund | | | Thornburg
Limited Term
Income Fund | | | Thornburg
Low Duration
Income Fund | |
NET ASSET VALUE | | | | | | | | | | | | |
| | | |
Class A Shares: | | | | | | | | | | | | |
Net asset value and redemption price per share ($114,093,982, $1,105,939,678, and $10,509,582 applicable to 8,589,651, 82,855,050, and 847,569 shares of beneficial interest outstanding - Note 4) | | $ | 13.28 | | | $ | 13.35 | | | $ | 12.40 | |
Maximum sales charge, 1.50% of offering price | | | 0.20 | | | | 0.20 | | | | 0.19 | |
| | | | | | | | | | | | |
Maximum offering price per share | | $ | 13.48 | | | $ | 13.55 | | | $ | 12.59 | |
| | | | | | | | | | | | |
| | | |
Class B Shares: | | | | | | | | | | | | |
Net asset value per share* ($246,684 applicable to 18,612 shares of beneficial interest outstanding - Note 4) | | $ | 13.25 | | | $ | — | | | $ | — | |
| | | | | | | | | | | | |
| | | |
Class C Shares: | | | | | | | | | | | | |
Net asset value and offering price per share* ($52,377,869 and $638,331,544 applicable to 3,919,796 and 47,900,023 shares of beneficial interest outstanding - Note 4) | | $ | 13.36 | | | $ | 13.33 | | | $ | — | |
| | | | | | | | | | | | |
| | | |
Class I Shares: | | | | | | | | | | | | |
Net asset value, offering and redemption price per share ($130,234,493, $2,325,173,113, and $12,191,226 applicable to 9,804,899, 174,169,107, and 983,315 shares of beneficial interest outstanding - Note 4) | | $ | 13.28 | | | $ | 13.35 | | | $ | 12.40 | |
| | | | | | | | | | | | |
| | | |
Class R3 Shares: | | | | | | | | | | | | |
Net asset value, offering and redemption price per share ($22,571,758 and $109,835,750 applicable to 1,698,367 and 8,222,680 shares of beneficial interest outstanding - Note 4) | | $ | 13.29 | | | $ | 13.36 | | | $ | — | |
| | | | | | | | | | | | |
| | | |
Class R4 Shares: | | | | | | | | | | | | |
Net asset value, offering and redemption price per share ($1,202,464 and $6,035,221 applicable to 90,542 and 452,444 shares of beneficial interest outstanding - Note 4) | | $ | 13.28 | | | $ | 13.34 | | | $ | — | |
| | | | | | | | | | | | |
| | | |
Class R5 Shares: | | | | | | | | | | | | |
Net asset value, offering and redemption price per share ($2,401,371 and $60,660,722 applicable to 180,747 and 4,544,988 shares of beneficial interest outstanding - Note 4) | | $ | 13.29 | | | $ | 13.35 | | | $ | — | |
| | | | | | | | | | | | |
| * | Redemption price per share is equal to net asset value less any applicable contingent deferred sales charge. |
See notes to financial statements.
Semi-Annual Reports 35
| | |
| STATEMENTS OF OPERATIONS | | |
| |
| | Six Months Ended March 31, 2016 (Unaudited) |
| | | | | | | | | | | | |
| | | Thornburg
Limited Term U.S.
Government Fund | | | Thornburg
Limited Term
Income Fund | | | Thornburg
Low Duration
Income Fund | |
INVESTMENT INCOME | | | | | | | | | | | | |
Dividend income | | $ | — | | | $ | — | | | $ | 4,793 | |
Interest income (net of premium amortized of $389,905, $4,445,266, and $36,930 and net of paydown losses of $526,007, $2,382,456, and $7,981, respectively) | | | 2,741,915 | | | | 52,787,058 | | | | 135,581 | |
| | | | | | | | | | | | |
Total Income | | | 2,741,915 | | | | 52,787,058 | | | | 140,374 | |
| | | |
EXPENSES | | | | | | | | | | | | |
Investment advisory fees (Note 3) | | | 562,618 | | | | 6,941,554 | | | | 39,050 | |
Administration fees (Note 3) | | | | | | | | | | | | |
Class A Shares | | | 66,966 | | | | 626,998 | | | | 6,514 | |
Class B Shares | | | 112 | | | | — | | | | — | |
Class C Shares | | | 30,627 | | | | 386,814 | | | | — | |
Class I Shares | | | 30,246 | | | | 526,143 | | | | 2,276 | |
Class R3 Shares | | | 12,139 | | | | 89,924 | | | | — | |
Class R4 Shares | | | 657 | | | | 2,887 | | | | — | |
Class R5 Shares | | | 569 | | | | 20,562 | | | | — | |
Distribution and service fees (Note 3) | | | | | | | | | | | | |
Class A Shares | | | 133,932 | | | | 1,253,997 | | | | 10,488 | |
Class B Shares | | | 888 | | | | — | | | | — | |
Class C Shares | | | 122,747 | | | | 1,551,005 | | | | — | |
Class R3 Shares | | | 48,853 | | | | 363,304 | | | | — | |
Class R4 Shares | | | 1,322 | | | | 5,804 | | | | — | |
Transfer agent fees | | | | | | | | | | | | |
Class A Shares | | | 43,214 | | | | 510,130 | | | | 13,631 | |
Class B Shares | | | 2,291 | | | | — | | | | — | |
Class C Shares | | | 25,376 | | | | 245,260 | | | | — | |
Class I Shares | | | 39,204 | | | | 731,354 | | | | 1,618 | |
Class R3 Shares | | | 17,663 | | | | 54,210 | | | | — | |
Class R4 Shares | | | 1,555 | | | | 11,252 | | | | — | |
Class R5 Shares | | | 3,873 | | | | 58,562 | | | | — | |
Registration and filing fees | | | | | | | | | | | | |
Class A Shares | | | 12,967 | | | | 18,696 | | | | 14,359 | |
Class B Shares | | | 8,124 | | | | — | | | | — | |
Class C Shares | | | 10,930 | | | | 15,647 | | | | — | |
Class I Shares | | | 11,096 | | | | 76,859 | | | | 14,503 | |
Class R3 Shares | | | 9,286 | | | | 10,485 | | | | — | |
Class R4 Shares | | | 11,687 | | | | 11,684 | | | | — | |
Class R5 Shares | | | 11,345 | | | | 11,679 | | | | — | |
Custodian fees (Note 3) | | | 47,425 | | | | 214,865 | | | | 23,170 | |
Professional fees | | | 23,850 | | | | 57,625 | | | | 27,878 | |
Accounting fees (Note 3) | | | 4,972 | | | | 68,950 | | | | 366 | |
Trustee fees | | | 5,918 | | | | 77,750 | | | | 366 | |
Other expenses | | | 12,103 | | | | 125,791 | | | | 2,584 | |
| | | | | | | | | | | | |
Total Expenses | | | 1,314,555 | | | | 14,069,791 | | | | 156,803 | |
Less: | | | | | | | | | | | | |
Expenses reimbursed by investment advisor (Note 3) | | | (72,837 | ) | | | (101,485 | ) | | | (53,244 | ) |
Investment advisory fees waived by investment advisor (Note 3) | | | — | | | | — | | | | (44,292 | ) |
| | | | | | | | | | | | |
Net Expenses | | | 1,241,718 | | | | 13,968,306 | | | | 59,267 | |
| | | | | | | | | | | | |
Net Investment Income | | $ | 1,500,197 | | | $ | 38,818,752 | | | $ | 81,107 | |
| | | | | | | | | | | | |
36 Semi-Annual Reports
| | |
| STATEMENTS OF OPERATIONS, CONTINUED | | |
| |
| | Six Months Ended March 31, 2016 (Unaudited) |
| | | | | | | | | | | | |
| | | Thornburg
Limited Term U.S.
Government Fund | | | Thornburg
Limited Term
Income Fund | | | Thornburg
Low Duration
Income Fund | |
REALIZED AND UNREALIZED GAIN (LOSS) | | | | | | | | | | | | |
Net realized gain (loss) from investments | | $ | 196,035 | | | $ | 4,439,404 | | | $ | 3,774 | |
Net change in unrealized appreciation (depreciation) on investments | | �� | 971,105 | | | | 7,036,560 | | | | 53,989 | |
| | | | | | | | | | | | |
Net Realized and Unrealized Gain | | | 1,167,140 | | | | 11,475,964 | | | | 57,763 | |
| | | | | | | | | | | | |
Net Increase in Net Assets Resulting from Operations | | $ | 2,667,337 | | | $ | 50,294,716 | | | $ | 138,870 | |
| | | | | | | | | | | | |
See notes to financial statements.
Semi-Annual Reports 37
| | |
| STATEMENTS OF CHANGES IN NET ASSETS | | |
| |
Thornburg Limited Term U.S. Government Fund | | |
| | | | | | | | |
| | | Six Months Ended
March 31, 2016* | | | Year Ended
September 30, 2015 | |
INCREASE (DECREASE) IN NET ASSETS FROM | | | | | | | | |
| | |
OPERATIONS | | | | | | | | |
Net investment income | | $ | 1,500,197 | | | $ | 3,153,913 | |
Net realized gain (loss) from investments | | | 196,035 | | | | 185,164 | |
Net unrealized appreciation (depreciation) on investments | | | 971,105 | | | | 1,226,277 | |
| | | | | | | | |
Net Increase (Decrease) in Net Assets Resulting from Operations | | | 2,667,337 | | | | 4,565,354 | |
| | |
DIVIDENDS TO SHAREHOLDERS | | | | | | | | |
From net investment income | | | | | | | | |
Class A Shares | | | (712,262 | ) | | | (1,998,645 | ) |
Class B Shares | | | (74 | ) | | | (1,634 | ) |
Class C Shares | | | (257,867 | ) | | | (673,384 | ) |
Class I Shares | | | (1,015,227 | ) | | | (1,613,526 | ) |
Class R3 Shares | | | (123,202 | ) | | | (223,583 | ) |
Class R4 Shares | | | (6,669 | ) | | | (2,013 | ) |
Class R5 Shares | | | (17,996 | ) | | | (40,628 | ) |
| | |
FUND SHARE TRANSACTIONS (NOTE 4) | | | | | | | | |
Class A Shares | | | 8,956,877 | | | | (28,020,798 | ) |
Class B Shares | | | 100,249 | | | | (569,272 | ) |
Class C Shares | | | 5,497,579 | | | | (4,206,537 | ) |
Class I Shares | | | 17,212,567 | | | | 43,553,428 | |
Class R3 Shares | | | 6,201,239 | | | | 2,569,073 | |
Class R4 Shares | | | 494,906 | | | | 689,938 | |
Class R5 Shares | | | 227,425 | | | | 313,658 | |
| | | | | | | | |
Net Increase in Net Assets | | | 39,224,882 | | | | 14,341,431 | |
| | |
NET ASSETS | | | | | | | | |
Beginning of Period | | | 283,903,739 | | | | 269,562,308 | |
| | | | | | | | |
| | |
End of Period | | $ | 323,128,621 | | | $ | 283,903,739 | |
| | | | | | | | |
Undistributed (distribution in excess of) net investment income | | $ | (592,542 | ) | | $ | 40,558 | |
See notes to financial statements.
38 Semi-Annual Reports
| | |
| STATEMENTS OF CHANGES IN NET ASSETS | | |
| |
Thornburg Limited Term Income Fund | | |
| | | | | | | | |
| | | Six Months Ended
March 31, 2016* | | | Year Ended
September 30, 2015 | |
INCREASE (DECREASE) IN NET ASSETS FROM | | | | | | | | |
| | |
OPERATIONS | | | | | | | | |
Net investment income | | $ | 38,818,752 | | | $ | 72,828,989 | |
Net realized gain (loss) from investments | | | 4,439,404 | | | | 2,898,742 | |
Net unrealized appreciation (depreciation) on investments | | | 7,036,560 | | | | (26,307,541 | ) |
| | | | | | | | |
Net Increase (Decrease) in Net Assets Resulting from Operations | | | 50,294,716 | | | | 49,420,190 | |
| | |
DIVIDENDS TO SHAREHOLDERS | | | | | | | | |
From net investment income | | | | | | | | |
Class A Shares | | | (9,487,255 | ) | | | (19,108,273 | ) |
Class C Shares | | | (5,136,962 | ) | | | (10,876,303 | ) |
Class I Shares | | | (23,637,640 | ) | | | (42,187,380 | ) |
Class R3 Shares | | | (1,264,488 | ) | | | (2,507,503 | ) |
Class R4 Shares | | | (40,859 | ) | | | (45,910 | ) |
Class R5 Shares | | | (891,048 | ) | | | (693,620 | ) |
From realized gains | | | | | | | | |
Class A Shares | | | — | | | | (4,830,351 | ) |
Class C Shares | | | — | | | | (3,183,519 | ) |
Class I Shares | | | — | | | | (8,807,696 | ) |
Class R3 Shares | | | — | | | | (673,050 | ) |
Class R4 Shares | | | — | | | | (477 | ) |
Class R5 Shares | | | — | | | | (93,460 | ) |
| | |
FUND SHARE TRANSACTIONS (NOTE 4) | | | | | | | | |
Class A Shares | | | 125,884,793 | | | | 82,366,188 | |
Class C Shares | | | 25,512,110 | | | | 25,363,704 | |
Class I Shares | | | 336,920,726 | | | | 426,827,856 | |
Class R3 Shares | | | (63,292,628 | ) | | | 54,628,845 | |
Class R4 Shares | | | 2,105,601 | | | | 3,896,559 | |
Class R5 Shares | | | (35,778,482 | ) | | | 79,873,082 | |
| | | | | | | | |
Net Increase in Net Assets | | | 401,188,584 | | | | 629,368,882 | |
| | |
NET ASSETS | | | | | | | | |
Beginning of Period | | | 3,844,787,444 | | | | 3,215,418,562 | |
| | | | | | | | |
| | |
End of Period | | $ | 4,245,976,028 | | | $ | 3,844,787,444 | |
| | | | | | | | |
Distribution in excess of net investment income | | $ | (1,723,028 | ) | | $ | (83,528 | ) |
See notes to financial statements.
Semi-Annual Reports 39
| | |
| STATEMENTS OF CHANGES IN NET ASSETS | | |
| |
Thornburg Low Duration Income Fund | | |
| | | | | | | | |
| | | Six Months Ended
March 31, 2016* | | | Year Ended
September 30, 2015 | |
INCREASE (DECREASE) IN NET ASSETS FROM | | | | | | | | |
| | |
OPERATIONS | | | | | | | | |
Net investment income | | $ | 81,107 | | | $ | 103,665 | |
Net realized gain (loss) from investments | | | 3,774 | | | | (1,200 | ) |
Net unrealized appreciation (depreciation) on investments | | | 53,989 | | | | (10,894 | ) |
| | | | | | | | |
Net Increase (Decrease) in Net Assets Resulting from Operations | | | 138,870 | | | | 91,571 | |
| | |
DIVIDENDS TO SHAREHOLDERS | | | | | | | | |
From net investment income | | | | | | | | |
Class A Shares | | | (43,361 | ) | | | (62,161 | ) |
Class I Shares | | | (47,462 | ) | | | (41,488 | ) |
| | |
FUND SHARE TRANSACTIONS (NOTE 4) | | | | | | | | |
Class A Shares | | | 552,755 | | | | 3,274,840 | |
Class I Shares | | | 4,104,412 | | | | 4,356,593 | |
| | | | | | | | |
Net Increase in Net Assets | | | 4,705,214 | | | | 7,619,355 | |
| | |
NET ASSETS | | | | | | | | |
Beginning of Period | | | 17,995,594 | | | | 10,376,239 | |
| | | | | | | | |
| | |
End of Period | | $ | 22,700,808 | | | $ | 17,995,594 | |
| | | | | | | | |
Undistributed (distribution in excess of) net investment income | | $ | (7,135 | ) | | $ | 2,542 | |
See notes to financial statements.
40 Semi-Annual Reports
| | |
| NOTES TO FINANCIAL STATEMENTS | | |
| |
| | March 31, 2016 (Unaudited) |
NOTE 1 – ORGANIZATION
Thornburg Limited Term U.S. Government Fund (the “Government Fund”), Thornburg Limited Term Income Fund (the “Income Fund”) and Thornburg Low Duration Income Fund (the “Low Duration Fund”), collectively the “Funds”, are a diversified series of Thornburg Investment Trust (the “Trust”). The Trust is organized as a Massachusetts business trust under a Declaration of Trust dated June 3, 1987 and is registered as a diversified, open-end management investment company under the Investment Company Act of 1940, as amended. The Funds are currently three of twenty separate series of the Trust. Each series is considered to be a separate entity for financial reporting and tax purposes and bears expenses directly attributable to it. The Funds’ primary objectives are to obtain as high a level of current income as is consistent, in the view of Thornburg Investment Management, Inc., the Trust’s investment advisor (the “Advisor”), with the preservation of capital. As a secondary objective, the Government Fund and the Income Fund seek to reduce changes in their share prices compared to longer term portfolios.
The Government Fund currently has seven classes of shares of beneficial interest: Class A, Class B, Class C, Institutional Class (“Class I”), and Retirement Classes (“Class R3,” “Class R4,” and “Class R5”). The Fund no longer offers Class B shares for sale. Class B shares outstanding for eight years convert to Class A shares of the Government Fund.
The Income Fund currently offers six classes of shares of beneficial interest outstanding, Class A, Class C, Institutional Class (“Class I”), and Retirement Classes (“Class R3,” “Class R4,” and “Class R5”).
The Low Duration Fund currently offers two classes of shares of beneficial interest outstanding, Class A and Institutional Class (“Class I”).
Each class of shares of the Funds represents an interest in the same portfolio of investments, except that (i) Class A shares are sold subject to a front-end sales charge collected at the time the shares are purchased and bear a service fee, (ii) Class B shares were sold at net asset value without a sales charge at the time of purchase, but are subject to a contingent deferred sales charge upon redemption and bear both a service fee and distribution fee, (iii) Class C shares are sold at net asset value without a sales charge at the time of purchase, but are subject to a contingent deferred sales charge upon redemption within one year of purchase, and bear both a service fee and a distribution fee, (iv) Class I shares are sold at net asset value without a sales charge at the time of purchase and may be subject to a service fee, (v) Class R3 shares are sold at net asset value without a sales charge, but bear both a service fee and a distribution fee, (vi) Class R4 shares are sold at net asset value without a sales charge at the time of purchase but bear a service fee, (vii) Class R5 shares are sold at net asset value without a sales charge at the time of purchase and may be subject to a service fee, and (viii) the respective classes may have different reinvestment privileges and conversion rights. Additionally, each Fund may allocate among its classes certain expenses, to the extent allocable to specific classes, including transfer agent fees, government registration fees, certain printing and postage costs, and administrative and legal expenses. Currently, class specific expenses of the Funds are limited to distribution and service fees, administration fees, and certain registration and transfer agent expenses.
NOTE 2 – SIGNIFICANT ACCOUNTING POLICIES
The following is a summary of significant accounting policies followed by each Fund in the preparation of its financial statements. Each Fund is an investment company and prepares its financial statements in conformity with United States generally accepted accounting principles (“GAAP”), including investment company accounting and reporting guidance in the Financial Accounting Standards Board (the “FASB”) Accounting Standard Codification Topic 946. The preparation of financial statements in conformity with GAAP requires management to make estimates and assumptions that affect the reported amounts of assets and liabilities and disclosure of contingent assets and liabilities at the date of the financial statements and the reported amounts of increases (decreases) in net assets from operations during the reporting period. Actual results could differ from those estimates.
Significant accounting policies of the Trust are as follows:
Valuation Policy and Procedures: The Trustees of the Trust have appointed the Advisor to assist the Trustees in obtaining market values for portfolio investments, perform certain evaluation and supervisory functions respecting professional pricing service providers appointed by the Trustees’ Audit Committee (the “Audit Committee”) to assist in determining fair values for portfolio investments, assist in calculating fair values for portfolio investments in certain circumstances, and to perform other functions in connection with the valuation of investments. The Advisor acts through its Valuation and Pricing Committee (the “Committee”) and other employees of the Advisor. The Committee regularly reviews its own valuation calculations, as well as the valuations, valuation techniques and services furnished by pricing service providers, considers circumstances which may require valuation calculations by the Committee, and reviews previous valuation calculations. The Committee reports to the Audit Committee on the Committee’s activities, the performance of pricing service providers, and other matters relating to valuation of portfolio investments.
In those instances when the Committee assists in calculating a fair value for a portfolio investment, the Committee seeks to determine the price that the Funds would reasonably expect to receive upon a sale of the investment in an orderly transaction between market participants on the valuation date. The Committee customarily utilizes quotations from securities broker dealers in calculating valuations, but also may utilize prices obtained from pricing service providers or other methods approved by the Audit Committee. Because fair values calculated by the Committee are estimates, the calculation of a value for an investment may differ from the
Semi-Annual Reports 41
| | |
| NOTES TO FINANCIAL STATEMENTS, CONTINUED | | |
| |
| | March 31, 2016 (Unaudited) |
price that would be realized by the Funds upon a sale of the investment, and the difference could be material to the Funds’ financial statements. The Committee’s calculation of a fair value for an investment may also differ from the prices obtained by other persons (including other mutual funds) for the investment.
Valuation of Investments: Debt obligations held by the Funds which are not listed or traded on exchanges or for which no reported market exists are ordinarily valued at the valuation obtained from a pricing service provider approved by the Audit Committee.
In any case when a pricing service provider fails to provide a valuation for a debt obligation held by the Funds, the Committee calculates a fair value for the obligation using alternative methods under procedures approved by the Audit Committee. Additionally, in cases when management believes that a valuation obtained from a pricing service provider merits review for significant reasons, the Committee decides whether or not to use the valuation calculated by the pricing service provider or to use an alternative method approved by the Audit Committee to calculate a fair value for the obligation.
Valuation Measurements: The Funds categorize investments based upon the inputs used in valuing those investments, according to a three-level hierarchy established in guidance from the FASB. Categorization of investments using this hierarchy is intended by the FASB to maximize the use of observable inputs in valuing investments and minimize the use of unobservable inputs by requiring that the most observable inputs be used when available. Observable inputs are those that market participants would use in valuing an investment based on available market information. Unobservable inputs are those that reflect assumptions about the information market participants would use in valuing an investment. An investment’s level within a Fund’s hierarchy is based on the lowest level input that is deemed significant to the valuation. The methodologies and inputs used to value investments are not necessarily indications of the risk or liquidity associated with those investments.
Various inputs are used in calculating valuations for the Funds’ investments. These inputs are generally summarized according to the three-level hierarchy below:
Level 1: Quoted prices in active markets for identical investments.
Level 2: Other direct or indirect significant observable inputs (including quoted prices for similar investments in active markets and other observable inputs, such as interest rates, prepayment rates, credit risk, etc.).
Level 3: Significant unobservable inputs (including the Committee’s own assumptions in calculating the fair values of investments).
Valuations for debt obligations held by a Fund are typically calculated by pricing service providers approved by the Audit Committee and are characterized as Level 2 within the Fund’s valuation hierarchy.
In a limited number of cases the Committee calculates a fair value for investments using broker quotations or other methods approved by the Audit Committee. When the Committee uses a single broker quotation to calculate a fair value for an investment without other significant observable inputs, or if a fair value is calculated using other significant inputs that are considered unobservable, the investment is characterized as Level 3 within the Fund’s hierarchy. Other significant unobservable inputs used to calculate a fair value in these instances might include an income-based valuation approach which considers discounted anticipated future cash flows from the investment, and application of discounts due to the nature or duration of any restrictions on the disposition of the investment.
Valuations based upon the use of inputs from Levels 1, 2 or 3 may not represent the actual price received upon the disposition of an investment, and the Fund may receive a price that is lower than the valuation based upon these inputs when it sells the investment.
GOVERNMENT FUND
The following table displays a summary of the fair value hierarchy measurements of the Government Fund’s investments as of March 31, 2016. In any instance when valuation inputs from more than one level are used to determine the fair value of a specific investment, the investment is placed in the level of the table based upon the lowest level input that is significant in determining the fair value of the investment:
| | | | | | | | | | | | | | | | |
| | | Fair Value Measurements at March 31, 2016 | |
| | | Total | | | Level 1 | | | Level 2 | | | Level 3(a) | |
Assets | | | | | | | | | | | | | | | | |
Investments in Securities | | | | | | | | | | | | | | | | |
U.S. Treasury Securities | | $ | 64,388,422 | | | $ | 64,388,422 | | | $ | — | | | $ | — | |
U.S. Government Agencies | | | 64,886,118 | | | | — | | | | 61,966,579 | | | | 2,919,539 | |
Mortgage Backed | | | 153,204,967 | | | | — | | | | 153,204,967 | | | | — | |
Short Term Investments | | | 25,598,995 | | | | — | | | | 25,598,995 | | | | — | |
| | | | | | | | | | | | | | | | |
Total Investments in Securities | | $ | 308,078,502 | | | $ | 64,388,422 | | | $ | 240,770,541 | | | $ | 2,919,539 | |
| (a) | In accordance with the guidance prescribed in Accounting Standards Update (“ASU”) No. 2011-04, a portfolio security characterized as a Level 3 investment was fair valued by the Committee using a yield of 2.2%, based upon current market prices and yields of comparable securities. |
42 Semi-Annual Reports
| | |
| NOTES TO FINANCIAL STATEMENTS, CONTINUED | | |
| |
| | March 31, 2016 (Unaudited) |
In accordance with the guidance prescribed in ASU No. 2011-04, it is the policy of the Fund to recognize transfers between levels and those underlying events which caused the movement. The Fund recognized no transfers between levels for the six months ended March 31, 2016.
A rollforward of fair value measurements using significant unobservable inputs (Level 3) for the six months ended March 31, 2016 is as follows:
| | | | | | | | |
| | | U.S. Government Agencies | | | Total(d) | |
Beginning Balance 9/30/2015 | | $ | 2,108,287 | | | $ | 2,108,287 | |
Accrued Discounts (Premiums) | | | 425 | | | | 425 | |
Net Realized Gain (Loss)(a) | | | 226,696 | | | | 226,696 | |
Gross Purchases | | | 3,000,000 | | | | 3,000,000 | |
Gross Sales | | | (2,261,898 | ) | | | (2,261,898 | ) |
Net Change in Unrealized Appreciation (Depreciation)(b)(c) | | | (153,971 | ) | | | (153,971 | ) |
Transfers into Level 3 | | | — | | | | — | |
Transfers out of Level 3 | | | — | | | | — | |
| | | | | | | | |
Ending Balance 3/31/2016 | | $ | 2,919,539 | | | $ | 2,919,539 | |
| (a) | Amount of net realized gain (loss) from investments recognized in income is included in the Fund’s Statement of Operations for the six months ended March 31, 2016. |
| (b) | Amount of net change in unrealized appreciation (depreciation) on investments recognized in income is included in the Fund’s Statement of Operations for the six months ended March 31, 2016. |
| (c) | The net change in unrealized appreciation (depreciation) attributable to securities owned at March 31, 2016, which were valued using significant unobservable inputs were $31,766. This is included within net change in unrealized appreciation (depreciation) on investments in the Fund’s the Statement of Operations for the six months ended March 31, 2016. |
| (d) | Level 3 investments represent 0.90% of total net assets at the six months ended March 31, 2016. Significant fluctuations of the unobservable inputs applied to portfolio securities characterized as Level 3 investments could be expected to increase or decrease the fair value of these portfolio securities. |
INCOME FUND
The following table displays a summary of the fair value hierarchy measurements of the Income Fund’s investments as of March 31, 2016. In any instance when valuation inputs from more than one level are used to determine the fair value of a specific investment, the investment is placed in the level of the table based upon the lowest level input that is significant in determining the fair value of the investment:
| | | | | | | | | | | | | | | | |
| | | Fair Value Measurements at March 31, 2016 | |
| | | Total | | | Level 1 | | | Level 2 | | | Level 3(a) | |
Assets | | | | | | | | | | | | | | | | |
Investments in Securities | | | | | | | | | | | | | | | | |
U.S. Treasury Securities | | $ | 62,627,427 | | | $ | 62,627,427 | | | $ | — | | | $ | — | |
U.S. Government Agencies | | | 282,300,602 | | | | — | | | | 278,775,602 | | | | 3,525,000 | |
Other Government | | | 89,855,099 | | | | — | | | | 89,855,099 | | | | — | |
Mortgage Backed | | | 154,805,776 | | | | — | | | | 154,805,776 | | | | — | |
Asset Backed Securities | | | 904,029,769 | | | | — | | | | 874,972,389 | | | | 29,057,380 | |
Corporate Bonds | | | 2,157,371,964 | | | | — | | | | 2,157,371,964 | | | | — | |
Convertible Bonds | | | 18,852,750 | | | | — | | | | 18,852,750 | | | | — | |
Municipal Bonds | | | 144,664,888 | | | | — | | | | 144,664,888 | | | | — | |
Other Securities | | | 14,050,050 | | | | — | | | | 14,050,050 | | | | — | |
Short Term Investments | | | 380,185,544 | | | | — | | | | 380,185,544 | | | | — | |
| | | | | | | | | | | | | | | | |
Total Investments in Securities | | $ | 4,208,743,869 | | | $ | 62,627,427 | | | $ | 4,113,534,062 | | | $ | 32,582,380 | |
| (a) | In accordance with the guidance prescribed in Accounting Standards Update (“ASU”) No. 2011-04, unadjusted broker quotes were applied to $14,565,964 in portfolio securities characterized as Level 3 investments at March 31, 2016. The following table displays a summary of the valuation techniques and unobservable inputs used to value portfolio securities characterized as Level 3 investments, where no unadjusted broker quotes were available at March 31, 2016: |
Semi-Annual Reports 43
| | |
| NOTES TO FINANCIAL STATEMENTS, CONTINUED | | |
| |
| | March 31, 2016 (Unaudited) |
INCOME FUND (Continued)
| | | | | | | | | | |
| | | Fair Value at
March 31, 2016 | | | Valuation
Technique(s) | | Unobservable Input | | Range
(Weighted Average) |
Asset Backed Securities | | $ | 18,016,416 | | | Discounted cash flows | | Third party vendor projection of discounted cash flows | | 3.8% (N/A) |
| | | | | | | | | | |
Total | | $ | 18,016,416 | | | | | | | |
In accordance with the guidance prescribed in ASU No. 2011-04, it is the policy of the Fund to recognize transfers between levels and those underlying events which caused the movement. The Fund recognized no transfers between levels for the six months ended March 31, 2016.
A rollforward of fair value measurements using significant unobservable inputs (Level 3) for the six months ended March 31, 2016 is as follows:
| | | | | | | | | | | | |
| | | Asset Backed
Securities | | | U.S. Government
Agencies | | | Total(d) | |
Beginning Balance 9/30/2015 | | $ | 21,798,405 | | | $ | 5,300,096 | | | $ | 27,098,501 | |
Accrued Discounts (Premiums) | | | 8,989 | | | | (19,256 | ) | | | (10,267 | ) |
Net Realized Gain (Loss)(a) | | | 30,157 | | | | 207,817 | | | | 237,974 | |
Gross Purchases | | | 8,949,992 | | | | — | | | | 8,949,992 | |
Gross Sales | | | (1,769,872 | ) | | | (1,970,532 | ) | | | (3,740,404 | ) |
Net Change in Unrealized Appreciation (Depreciation)(b)(c) | | | 39,709 | | | | 6,875 | | | | 46,584 | |
Transfers into Level 3 | | | — | | | | — | | | | — | |
Transfers out of Level 3 | | | — | | | | — | | | | — | |
| | | | | | | | | | | | |
Ending Balance 3/31/2016 | | $ | 29,057,380 | | | $ | 3,525,000 | | | $ | 32,582,380 | |
| (a) | Amount of net realized gain (loss) from investments recognized in income is included in the Fund’s Statement of Operations for the six months ended March 31, 2016. |
| (b) | Amount of net change in unrealized appreciation (depreciation) on investments recognized in income is included in the Fund’s Statement of Operations for the six months ended March 31, 2016. |
| (c) | The net change in unrealized appreciation (depreciation) attributable to securities owned at March 31, 2016, which were valued using significant unobservable inputs were $46,584. This is included within net change in unrealized appreciation (depreciation) on investments in the Fund’s the Statement of Operations for the six months ended March 31, 2016. |
| (d) | Level 3 investments represent 0.77% of total net assets at the six months ended March 31, 2016. Significant fluctuations of the unobservable inputs applied to portfolio securities characterized as Level 3 investments could be expected to increase or decrease the fair value of these portfolio securities. |
LOW DURATION FUND
The following table displays a summary of the fair value hierarchy measurements of the Low Duration Fund’s investments as of March 31, 2016. In any instance when valuation inputs from more than one level are used to determine the fair value of a specific investment, the investment is placed in the level of the table based upon the lowest level input that is significant in determining the fair value of the investment:
| | | | | | | | | | | | | | | | |
| | | Fair Value Measurements at March 31, 2016 | |
| | | Total | | | Level 1 | | | Level 2 | | | Level 3(a) | |
Assets | | | | | | | | | | | | | | | | |
Investments in Securities | | | | | | | | | | | | | | | | |
U.S. Treasury Securities | | $ | 6,770,707 | | | $ | 6,770,707 | | | $ | — | | | $ | — | |
U.S. Government Agencies | �� | | 523,741 | | | | — | | | | 523,741 | | | | — | |
Mortgage Backed | | | 212,222 | | | | — | | | | 212,222 | | | | — | |
Asset Backed Securities | | | 5,352,560 | | | | — | | | | 5,257,456 | | | | 95,104 | |
Corporate Bonds | | | 8,469,134 | | | | — | | | | 8,469,134 | | | | — | |
Convertible Bonds | | | 47,250 | | | | — | | | | 47,250 | | | | — | |
Municipal Bonds | | | 279,790 | | | | — | | | | 279,790 | | | | — | |
Short Term Investments | | | 1,232,103 | | | | 1,232,103 | | | | — | | | | — | |
| | | | | | | | | | | | | | | | |
Total Investments in Securities | | $ | 22,887,507 | | | $ | 8,002,810 | | | $ | 14,789,593 | | | $ | 95,104 | |
| (a) | In accordance with the guidance prescribed in Accounting Standards Update (“ASU”) No. 2011-04, unadjusted broker quotes were applied to a $95,104 portfolio security characterized as a Level 3 investment at March 31, 2016. |
44 Semi-Annual Reports
| | |
| NOTES TO FINANCIAL STATEMENTS, CONTINUED | | |
| |
| | March 31, 2016 (Unaudited) |
In accordance with the guidance prescribed in ASU No. 2011-04, it is the policy of the Fund to recognize transfers between levels and those underlying events which caused the movement. The Fund recognized no transfers between levels for the six months ended March 31, 2016.
A rollforward of fair value measurements using significant unobservable inputs (Level 3) for the six months ended March 31, 2016 is as follows:
| | | | | | | | |
| | | Asset Backed Securities | | | Total(a) | |
Beginning Balance 9/30/2015 | | $ | — | | | $ | — | |
Accrued Discounts (Premiums) | | | — | | | | — | |
Net Realized Gain (Loss) | | | — | | | | — | |
Gross Purchases | | | 100,000 | | | | 100,000 | |
Gross Sales | | | (4,896 | ) | | | (4,896 | ) |
Net Change in Unrealized Appreciation (Depreciation) | | | — | | | | — | |
Transfers into Level 3 | | | — | | | | — | |
Transfers out of Level 3 | | | — | | | | — | |
| | | | | | | | |
Ending Balance 3/31/2016 | | $ | 95,104 | | | $ | 95,104 | |
| (a) | Level 3 investments represent 0.42% of total net assets at the six months ended March 31, 2016. Significant fluctuations of the unobservable inputs applied to portfolio securities characterized as Level 3 investments could be expected to increase or decrease the fair value of these portfolio securities. |
Federal Income Taxes: It is the policy of the Trust to comply with the provisions of the Internal Revenue Code applicable to “regulated investment companies” and to distribute to shareholders substantially all taxable income, including any net realized gain on investments of the Funds. Therefore, no provision for federal income taxes is required.
Management reviews each uncertain tax position believed to be material to the preparation of each Fund’s financial statements, to assess if it is more likely than not that the position would be sustained upon examination, based upon the technical merits of the position. As of March 31, 2016, management has not identified any such position for which an asset or liability must be reflected in the Statements of Assets and Liabilities. The Funds’ tax returns remain subject to examination for three years after filing.
When-Issued and Delayed Delivery Transactions: The Funds may engage in when-issued or delayed delivery transactions. To the extent a Fund engages in such transactions, it will do so for the purpose of acquiring portfolio securities consistent with the Fund’s investment objectives and not for the purpose of investment leverage or to speculate on interest rate and, or market changes. At the time a Fund makes a commitment to purchase a security on a when-issued or delayed delivery basis, the Fund will record the transaction and reflect the value in determining the Fund’s net asset value. When effecting such transactions, assets of an amount sufficient to make payment for the portfolio securities to be purchased will be segregated on the Fund’s records at the trade date. Securities purchased on a when-issued or delayed delivery basis do not earn interest until the settlement date.
Dividends: Net investment income of the Funds is declared daily as a dividend on shares for which the Funds have received payment. Dividends are paid monthly and are reinvested in additional shares of the Funds at net asset value per share at the close of business on the dividend payment date, or at the shareholder’s option, paid in cash. Net realized capital gains, to the extent available, will be distributed at least annually.
Repurchase Agreements: The Funds may invest excess cash in repurchase agreements whereby the Funds purchase investments, which serve as collateral, with an agreement to resell such collateral to the seller at an agreed upon price at the maturity date of the repurchase agreement. Investments pledged as collateral for repurchase agreements are held in custody until maturity of the repurchase agreement. Provisions in the agreements require that the market value of the collateral is at least equal to the repurchase value in the event of default. In the event of default, the Funds have the right to liquidate the collateral and apply the proceeds in satisfaction of the obligation. Under certain circumstances, in the event of default or bankruptcy by the other party to the agreement, realization and/or retention of the collateral may be subject to legal proceedings.
General: Investment transactions are accounted for on a trade date basis. Interest income is accrued as earned. Premiums and discounts on securities purchased are amortized over the life of the respective securities. Realized gains and losses from the sale of securities are recorded on an identified cost basis. The Funds invest in various mortgage-backed securities. Such securities pay interest and a portion of principal each month, which is then available for investment in securities at prevailing prices. Pay down gains and losses on these securities are included in interest income. Net investment income (other than class specific expenses) and realized and unrealized gains and losses are allocated daily to each class of shares based upon the relative net asset value of outstanding shares (or the value of the dividend-eligible shares, as appropriate) of each class of shares at the beginning of the day
Semi-Annual Reports 45
| | |
| NOTES TO FINANCIAL STATEMENTS, CONTINUED | | |
| |
| | March 31, 2016 (Unaudited) |
(after adjusting for the current share activity of the respective class). Expenses common to all Funds are allocated among the Funds comprising the Trust based upon their relative net asset values or other appropriate allocation methods.
Guarantees and Indemnifications: Under the Trust’s organizational documents, its officers and Trustees are indemnified against certain liabilities arising out of the performance of their duties to the Funds. Additionally, in the normal course of business the Trust enters into contracts with service providers that contain general indemnification clauses. The Trust’s maximum exposure under these arrangements is unknown. However, based on experience, the Trust expects the risk of loss to be remote.
NOTE 3 – INVESTMENT ADVISORY FEE AND OTHER TRANSACTIONS WITH AFFILIATES
Pursuant to an investment advisory agreement, the Advisor serves as the investment advisor and performs services for the Funds for which the fees are payable at the end of each month. For the six months ended March 31, 2016, these fees were payable at annual rates ranging from .375 of 1% to .275 of 1% per annum of the average daily net assets of the Government Fund, .50 of 1% to .275 of 1% per annum of the average daily net assets of the Income Fund and .40 of 1% to .225 of 1% per annum of the average daily net assets of the Low Duration Fund, depending on each Fund’s asset size. The Funds pay the Advisor the costs of personnel who perform certain accounting services for the Funds. For the six months ended March 31, 2016, the Government Fund, Income Fund, and Low Duration Fund paid $4,972, $68,950, and $366 to the Advisor for these accounting services, respectively. The Trust has also entered into administrative service agreements with the Advisor, whereby the Advisor will perform certain administrative services for the shareholders of each class of the Funds’ shares, and for which fees will be payable at an annual rate of up to .125 of 1% per annum of the average daily net assets attributable to Class A, Class B, Class C, Class R3, and Class R4 shares, and up to .05 of 1% per annum of the average daily net assets attributable to Class I and Class R5 shares.
The Trust has an underwriting agreement with Thornburg Securities Corporation (the “Distributor”), an affiliate of the Advisor, which acts as the distributor of the Funds’ shares. For the six months ended March 31, 2016, the Distributor has advised the Funds that they earned net commissions and collected contingent deferred sales charges (CDSC fees) as follows:
| | | | | | | | | | | | |
| | | Government Fund | | | Income Fund | | | Low Duration Fund | |
Commissions | | $ | — | | | $ | — | | | $ | 13 | |
CDSC fees | | $ | 697 | | | $ | 9,906 | | | $ | N/A | |
Pursuant to a service plan under Rule 12b-1 of the Investment Company Act of 1940, the Funds may reimburse to the Advisor an amount not to exceed .25 of 1% per annum of the average daily net assets attributable to the applicable Class A, Class B, Class C, Class I, Class R3, and Class R4 shares of the Funds for payments made by the Advisor to securities dealers and other financial institutions to obtain various shareholder and distribution related services. For the six months ended March 31, 2016, there were no 12b-1 service plan fees charged for Class I or Class R5 shares. The Advisor may pay out of its own resources additional expenses for distribution of each Fund’s shares and shareholder services.
The Trust has also adopted distribution plans pursuant to Rule 12b-1, applicable to Government Fund’s and Income Fund’s Class C and Class R3 shares, and also applicable to Government Fund’s Class B shares, under which the Funds compensate the Distributor for services in promoting the sale of Class B, C, and R3 shares of the Funds at an annual rate of up to .75 of 1% per annum of the average daily net assets attributable to Class B shares, and an annual rate of up to .25 of 1% per annum of the average daily net assets attributable to Class C and Class R3 shares. Total fees incurred by each class of shares of the Funds under their respective service and distribution plans for the six months ended March 31, 2016, are set forth in the Statements of Operations.
The Advisor and Distributor have contractually agreed to waive fees and reimburse expenses incurred by the Funds so that actual expenses of certain share classes do not exceed levels as specified in each Fund’s most recent prospectus. The agreement may be terminated by the Funds at any time, but may not be terminated by the Advisor or Distributor before February 1, 2017, unless the Advisor ceases to be the investment advisor to the Trust or the Distributor ceases to be the distributor of the Funds prior to that date. The Advisor and Distributor retain the right to be repaid by the Funds for fee waivers and expense reimbursements if expenses fall below the contractual limit prior to the end of the fiscal year.
For the six months ended March 31, 2016, the Advisor contractually reimbursed certain class specific expenses, administrative fees, distribution fees, and voluntarily waived Fund level investment advisory fees as follows:
46 Semi-Annual Reports
| | |
| NOTES TO FINANCIAL STATEMENTS, CONTINUED | | |
| |
| | March 31, 2016 (Unaudited) |
| | | | | | | | | | | | |
| | | Government Fund | | | Income Fund | | | Low Duration Fund | |
Contractual: | | | | | | | | | | | | |
Class A | | $ | — | | | $ | — | | | $ | 34,790 | |
Class B | | $ | 9,864 | | | $ | — | | | $ | — | |
Class C | | $ | 3,181 | | | $ | — | | | $ | — | |
Class I | | $ | — | | | $ | — | | | $ | 18,454 | |
Class R3 | | $ | 34,318 | | | $ | 77,919 | | | $ | — | |
Class R4 | | $ | 12,318 | | | $ | 17,495 | | | $ | — | |
Class R5 | | $ | 13,156 | | | $ | 6,071 | | | $ | — | |
| | | |
| | | Government Fund | | | Income Fund | | | Low Duration Fund | |
Voluntary: | | | | | | | | | | | | |
Class A | | $ | — | | | $ | — | | | $ | 23,643 | |
Class I | | $ | — | | | $ | — | | | $ | 20,649 | |
Certain officers and Trustees of the Trust are also officers or directors of the Advisor and Distributor. The compensation of independent Trustees is borne by the Trust.
The percentage of direct investments in the Low Duration Fund held by affiliated Trustees and Officers and the Advisor is approximately 24.83%.
The Funds may purchase or sell securities from or to an affiliated fund, provided the affiliation is due solely to having a common investment advisor, common officers, or common trustees, and provided that all such transactions will comply with Rule 17a-7 under the 1940 Act. For the six months ended March 31, 2016, the Income Fund had transactions of $15,135,343 in purchases; the Government Fund and the Low Duration Fund had no transactions with affiliated funds.
NOTE 4 – SHARES OF BENEFICIAL INTEREST
At March 31, 2016, there were an unlimited number of shares with no par value of beneficial interest authorized. Transactions in shares of beneficial interest were as follows:
GOVERNMENT FUND
| | | | | | | | | | | | | | | | |
| | | Six Months Ended | | | Year Ended | |
| | | March 31, 2016 (Unaudited) | | | September 30, 2015 (Audited) | |
| | | Shares | | | Amount | | | Shares | | | Amount | |
Class A Shares | | | | | | | | | | | | | | | | |
Shares sold | | | 1,633,887 | | | $ | 21,574,964 | | | | 1,924,018 | | | $ | 25,556,433 | |
Shares issued to shareholders in reinvestment of dividends | | | 46,731 | | | | 617,757 | | | | 117,336 | | | | 1,559,285 | |
Shares repurchased | | | (1,001,858 | ) | | | (13,235,844 | ) | | | (4,145,593 | ) | | | (55,136,516 | ) |
| | | | | | | | | | | | | | | | |
| | | | |
Net increase (decrease) | | | 678,760 | | | $ | 8,956,877 | | | | (2,104,239 | ) | | $ | (28,020,798 | ) |
| | | | | | | | | | | | | | | | |
Class B Shares | | | | | | | | | | | | | | | | |
Shares sold | | | 13,171 | | | $ | 173,000 | | | | 1,585 | | | $ | 21,000 | |
Shares issued to shareholders in reinvestment of dividends | | | 6 | | | | 72 | | | | 118 | | | | 1,567 | |
Shares repurchased | | | (5,517 | ) | | | (72,823 | ) | | | (44,658 | ) | | | (591,839 | ) |
| | | | | | | | | | | | | | | | |
| | | | |
Net increase (decrease) | | | 7,660 | | | $ | 100,249 | | | | (42,955 | ) | | $ | (569,272 | ) |
| | | | | | | | | | | | | | | | |
Class C Shares | | | | | | | | | | | | | | | | |
Shares sold | | | 1,078,796 | | | $ | 14,321,959 | | | | 567,096 | | | $ | 7,580,761 | |
Shares issued to shareholders in reinvestment of dividends | | | 16,960 | | | | 225,522 | | | | 44,200 | | | | 590,931 | |
Shares repurchased | | | (681,294 | ) | | | (9,049,902 | ) | | | (925,703 | ) | | | (12,378,229 | ) |
| | | | | | | | | | | | | | | | |
| | | | |
Net increase (decrease) | | | 414,462 | | | $ | 5,497,579 | | | | (314,407 | ) | | $ | (4,206,537 | ) |
| | | | | | | | | | | | | | | | |
Semi-Annual Reports 47
| | |
| NOTES TO FINANCIAL STATEMENTS, CONTINUED | | |
| |
| | March 31, 2016 (Unaudited) |
GOVERNMENT FUND (Continued)
| | | | | | | | | | | | | | | | |
| | | Six Months Ended | | | Year Ended | |
| | | March 31, 2016 (Unaudited) | | | September 30, 2015 (Audited) | |
| | | Shares | | | Amount | | | Shares | | | Amount | |
Class I Shares | | | | | | | | | | | | | | | | |
Shares sold | | | 4,245,403 | | | $ | 56,105,523 | | | | 4,981,837 | | | $ | 66,066,766 | |
Shares issued to shareholders in reinvestment of dividends | | | 43,087 | | | | 569,609 | | | | 89,785 | | | | 1,193,030 | |
Shares repurchased | | | (2,992,084 | ) | | | (39,462,565 | ) | | | (1,785,584 | ) | | | (23,706,368 | ) |
| | | | | | | | | | | | | | | | |
| | | | |
Net increase (decrease) | | | 1,296,406 | | | $ | 17,212,567 | | | | 3,286,038 | | | $ | 43,553,428 | |
| | | | | | | | | | | | | | | | |
Class R3 Shares | | | | | | | | | | | | | | | | |
Shares sold | | | 793,317 | | | $ | 10,491,803 | | | | 565,901 | | | $ | 7,509,633 | |
Shares issued to shareholders in reinvestment of dividends | | | 8,529 | | | | 112,774 | | | | 15,356 | | | | 204,132 | |
Shares repurchased | | | (333,117 | ) | | | (4,403,338 | ) | | | (386,887 | ) | | | (5,144,692 | ) |
| | | | | | | | | | | | | | | | |
| | | | |
Net increase (decrease) | | | 468,729 | | | $ | 6,201,239 | | | | 194,370 | | | $ | 2,569,073 | |
| | | | | | | | | | | | | | | | |
Class R4 Shares | | | | | | | | | | | | | | | | |
Shares sold | | | 39,976 | | | $ | 530,192 | | | | 59,286 | | | $ | 785,142 | |
Shares issued to shareholders in reinvestment of dividends | | | 500 | | | | 6,605 | | | | 145 | | | | 1,922 | |
Shares repurchased | | | (3,171 | ) | | | (41,891 | ) | | | (7,333 | ) | | | (97,126 | ) |
| | | | | | | | | | | | | | | | |
| | | | |
Net increase (decrease) | | | 37,305 | | | $ | 494,906 | | | | 52,098 | | | $ | 689,938 | |
| | | | | | | | | | | | | | | | |
Class R5 Shares | | | | | | | | | | | | | | | | |
Shares sold | | | 36,782 | | | $ | 486,105 | | | | 83,822 | | | $ | 1,113,821 | |
Shares issued to shareholders in reinvestment of dividends | | | 211 | | | | 2,785 | | | | 402 | | | | 5,348 | |
Shares repurchased | | | (19,812 | ) | | | (261,465 | ) | | | (60,670 | ) | | | (805,511 | ) |
| | | | | | | | | | | | | | | | |
| | | | |
Net increase (decrease) | | | 17,181 | | | $ | 227,425 | | | | 23,554 | | | $ | 313,658 | |
| | | | | | | | | | | | | | | | |
48 Semi-Annual Reports
| | |
| NOTES TO FINANCIAL STATEMENTS, CONTINUED | | |
| |
| | March 31, 2016 (Unaudited) |
INCOME FUND
| | | | | | | | | | | | | | | | |
| | | Six Months Ended | | | Year Ended | |
| | | March 31, 2016 (Unaudited) | | | September 30, 2015 (Audited) | |
| | | Shares | | | Amount | | | Shares | | | Amount | |
Class A Shares | | | | | | | | | | | | | | | | |
Shares sold | | | 19,564,221 | | | $ | 259,471,535 | | | | 25,227,014 | | | $ | 338,693,537 | |
Shares issued to shareholders in reinvestment of dividends | | | 627,816 | | | | 8,330,818 | | | | 1,573,173 | | | | 21,117,049 | |
Shares repurchased | | | (10,697,572 | ) | | | (141,917,560 | ) | | | (20,664,967 | ) | | | (277,444,398 | ) |
| | | | | | | | | | | | | | | | |
| | | | |
Net increase (decrease) | | | 9,494,465 | | | $ | 125,884,793 | | | | 6,135,220 | | | $ | 82,366,188 | |
| | | | | | | | | | | | | | | | |
Class C Shares | | | | | | | | | | | | | | | | |
Shares sold | | | 6,765,293 | | | $ | 89,543,505 | | | | 10,395,179 | | | $ | 139,390,004 | |
Shares issued to shareholders in reinvestment of dividends | | | 346,274 | | | | 4,587,108 | | | | 932,129 | | | | 12,491,193 | |
Shares repurchased | | | (5,183,976 | ) | | | (68,618,503 | ) | | | (9,440,866 | ) | | | (126,517,493 | ) |
| | | | | | | | | | | | | | | | |
| | | | |
Net increase (decrease) | | | 1,927,591 | | | $ | 25,512,110 | | | | 1,886,442 | | | $ | 25,363,704 | |
| | | | | | | | | | | | | | | | |
Class I Shares | | | | | | | | | | | | | | | | |
Shares sold | | | 50,232,167 | | | $ | 666,195,179 | | | | 67,108,821 | | | $ | 901,062,644 | |
Shares issued to shareholders in reinvestment of dividends | | | 1,561,410 | | | | 20,720,444 | | | | 3,275,176 | | | | 43,963,186 | |
Shares repurchased | | | (26,392,205 | ) | | | (349,994,897 | ) | | | (38,605,988 | ) | | | (518,197,974 | ) |
| | | | | | | | | | | | | | | | |
| | | | |
Net increase (decrease) | | | 25,401,372 | | | $ | 336,920,726 | | | | 31,778,009 | | | $ | 426,827,856 | |
| | | | | | | | | | | | | | | | |
Class R3 Shares | | | | | | | | | | | | | | | | |
Shares sold | | | 3,865,692 | | | $ | 51,242,903 | | | | 9,152,610 | | | $ | 122,597,022 | |
Shares issued to shareholders in reinvestment of dividends | | | 90,833 | | | | 1,206,020 | | | | 227,265 | | | | 3,052,454 | |
Shares repurchased | | | (8,707,230 | ) | | | (115,741,551 | ) | | | (5,298,078 | ) | | | (71,020,631 | ) |
| | | | | | | | | | | | | | | | |
| | | | |
Net increase (decrease) | | | (4,750,705 | ) | | $ | (63,292,628 | ) | | | 4,081,797 | | | $ | 54,628,845 | |
| | | | | | | | | | | | | | | | |
Class R4 Shares | | | | | | | | | | | | | | | | |
Shares sold | | | 184,181 | | | $ | 2,439,917 | | | | 342,702 | | | $ | 4,602,724 | |
Shares issued to shareholders in reinvestment of dividends | | | 558 | | | | 7,409 | | | | 287 | | | | 3,848 | |
Shares repurchased | | | (25,777 | ) | | | (341,725 | ) | | | (52,971 | ) | | | (710,013 | ) |
| | | | | | | | | | | | | | | | |
| | | | |
Net increase (decrease) | | | 158,962 | | | $ | 2,105,601 | | | | 290,018 | | | $ | 3,896,559 | |
| | | | | | | | | | | | | | | | |
Class R5 Shares | | | | | | | | | | | | | | | | |
Shares sold | | | 3,174,335 | | | $ | 42,049,029 | | | | 6,867,097 | | | $ | 91,721,414 | |
Shares issued to shareholders in reinvestment of dividends | | | 67,312 | | | | 893,060 | | | | 57,917 | | | | 775,893 | |
Shares repurchased | | | (5,925,888 | ) | | | (78,720,571 | ) | | | (943,243 | ) | | | (12,624,225 | ) |
| | | | | | | | | | | | | | | | |
| | | | |
Net increase (decrease) | | | (2,684,241 | ) | | $ | (35,778,482 | ) | | | 5,981,771 | | | $ | 79,873,082 | |
| | | | | | | | | | | | | | | | |
Semi-Annual Reports 49
| | |
| NOTES TO FINANCIAL STATEMENTS, CONTINUED | | |
| |
| | March 31, 2016 (Unaudited) |
LOW DURATION INCOME FUND
| | | | | | | | | | | | | | | | |
| | | Six Months Ended
March 31, 2016 (Unaudited) | | | Year Ended
September 30, 2015 (Audited) | |
| | | Shares | | | Amount | | | Shares | | | Amount | |
Class A Shares | | | | | | | | | | | | | | | | |
Shares sold | | | 214,532 | | | $ | 2,650,712 | | | | 591,759 | | | $ | 7,333,655 | |
Shares issued to shareholders in reinvestment of dividends | | | 3,451 | | | | 42,637 | | | | 4,384 | | | | 54,300 | |
Shares repurchased | | | (173,479 | ) | | | (2,140,594 | ) | | | (332,679 | ) | | | (4,113,115 | ) |
| | | | | | | | | | | | | | | | |
| | | | |
Net increase (decrease) | | | 44,504 | | | $ | 552,755 | | | | 263,464 | | | $ | 3,274,840 | |
| | | | | | | | | | | | | | | | |
| | | | |
Class I Shares | | | | | | | | | | | | | | | | |
Shares sold | | | 380,527 | | | $ | 4,699,340 | | | | 377,417 | | | $ | 4,668,821 | |
Shares issued to shareholders in reinvestment of dividends | | | 3,597 | | | | 44,448 | | | | 3,074 | | | | 38,070 | |
Shares repurchased | | | (51,812 | ) | | | (639,376 | ) | | | (28,279 | ) | | | (350,298 | ) |
| | | | | | | | | | | | | | | | |
| | | | |
Net increase (decrease) | | | 332,312 | | | $ | 4,104,412 | | | | 352,212 | | | $ | 4,356,593 | |
| | | | | | | | | | | | | | | | |
NOTE 5 – INVESTMENT TRANSACTIONS
For the six months ended March 31, 2016, the Government Fund had purchase and sale transactions of investments (excluding short-term investments) of $66,143,577 and $13,084,756, respectively. The Income Fund had purchase and sale transactions of investments (excluding short-term investments and U.S. Government obligations) of $837,456,740 and $359,381,924, respectively. The Low Duration Fund had purchase and sale transactions of investments (excluding short-term investments and U.S. Government obligations) of $7,097,711 and $1,427,995, respectively.
NOTE 6 – INCOME TAXES
At March 31, 2016, information on the tax components of capital was as follows:
| | | | | | | | | | | | |
| | | Government Fund | | | Income Fund | | | Low Duration Fund | |
Cost of investments for tax purposes | | $ | 303,104,137 | | | $ | 4,189,618,270 | | | $ | 22,819,014 | |
| | | | | | | | | | | | |
| | | |
Gross unrealized appreciation on a tax basis | | $ | 5,564,873 | | | $ | 64,791,265 | | | $ | 134,753 | |
Gross unrealized depreciation on a tax basis | | | (590,508 | ) | | | (45,665,666 | ) | | | (66,260 | ) |
| | | | | | | | | | | | |
| | | |
Net unrealized appreciation (depreciation) on investments (tax basis) | | $ | 4,974,365 | | | $ | 19,125,599 | | | $ | 68,493 | |
| | | | | | | | | | | | |
At March 31, 2016, the Government Fund, Income Fund, and Low Duration Fund had deferred tax basis capital loses occurring subsequent to October 31, 2014, through September 30, 2015, of $1,216,806, $71,842, and $0, respectively. For tax purposes, such losses will be recognized in the year ending September 30, 2016.
At March 31, 2016, the Government Fund had cumulative tax basis capital losses of $7,424,164, (of which $2,089,134 are short-term and $5,335,030 are long-term) generated after September 30, 2011, which may be carried forward to offset future capital gains. To the extent such carryforwards are used, capital gain distributions may be reduced to the extent provided by regulations. Such capital loss carryforwards do not expire, but are required to be utilized to offset future gains prior to the utilization of losses generated prior to October 1, 2011 which may expire prior to utilization.
50 Semi-Annual Reports
| | |
| NOTES TO FINANCIAL STATEMENTS, CONTINUED | | |
| |
| | March 31, 2016 (Unaudited) |
At March 31, 2016, the Government Fund had cumulative tax basis capital losses generated prior to October 1, 2011 which may expire prior to utilization. Such capital loss carryforwards expire as follows:
| | | | |
2018 | | $ | 17,316 | |
2019 | | | 106,151 | |
| | | | |
| | $ | 123,467 | |
| | | | |
At March 31, 2016, the Low Duration Fund had cumulative tax basis capital losses of $3,198, (of which $0 are short-term and $3,198 are long-term) generated after September 30, 2011, which may be carried forward to offset future capital gains. To the extent such carryforwards are used, capital gain distributions may be reduced to the extent provided by regulations. Such capital loss carryforwards do not expire.
OTHER NOTES
Risks: Each Fund’s investments subject it to risks including, but not limited to, credit risk, interest rate risk, prepayment risk, management risk, market and economic risk, liquidity risk, the risks associated with investments in structured finance arrangements, and, in the case of Income Fund and Low Duration Fund, the risks associated with investments in non-U.S. issuers. Please see each Fund’s prospectus for a discussion of the risks associated with an investment in the Funds.
Subsequent Events: Fund management believes no events have occurred between March 31, 2016 and the date of issuance of the financial statements that require adjustment to or disclosure in the accompanying financial statements.
Semi-Annual Reports 51
FINANCIAL HIGHLIGHTS
Thornburg Limited Term U.S. Government Fund
| | | | | | | | | | | | | | | | | | | | | | | | | | | | | | | | | | | | | | | | | | | | | | | | | | | | | | |
| | | PER SHARE PERFORMANCE (for a share outstanding throughout the Period) | | RATIOS TO AVERAGE NET ASSETS | | | SUPPLEMENTAL DATA | |
Unless
Otherwise
Noted,
Periods
are Fiscal
Years
Ended
Sept. 30, | | Net Asset
Value
Beginning
of Period | | | Net
Investment
Income
(Loss)+ | | | Net
Realized
&
Unrealized
Gain(Loss)
on
Investments | | | Total from
Investment
Operations | | | Dividends
from Net
Investment
Income | | | Dividends
from Net
Realized
Gains | | Total
Dividends | | | Net
Asset
Value
End
of
Period | | Net
Investment
Income
(Loss)
(%) | | | Expenses,
After
Expense
Reductions
(%) | | | Expenses,
After
Expense
Reductions
and
Net of
Custody
Credits
(%) | | | Expenses,
Before
Expense
Reductions
(%) | | | Total
Return
(%)(a) | | | Portfolio
Turnover
Rate (%)(a) | | Net
Assets
at End
of
Period
(Thousands) | |
Class A Shares | | | | | | | | | | | | | | | | | | | | | | | | | | | | | | | | | | | | | | | | | | | | | | | |
2016(b)(c) | | $ | 13.26 | | | | 0.06 | | | | 0.05 | | | | 0.11 | | | | (0.09 | ) | | — | | | (0.09 | ) | | $13.28 | | | 0.91 | (d) | | | 0.92 | (d) | | | 0.92 | (d) | | | 0.92 | (d) | | | 0.82 | | | 5.01 | | $ | 114,094 | |
2015(c) | | $ | 13.27 | | | | 0.15 | | | | 0.06 | | | | 0.21 | | | | (0.22 | ) | | — | | | (0.22 | ) | | $13.26 | | | 1.15 | | | | 0.92 | | | | 0.92 | | | | 0.92 | | | | 1.62 | | | 14.15 | | $ | 104,933 | |
2014(c) | | $ | 13.36 | | | | 0.19 | | | | (0.02 | ) | | | 0.17 | | | | (0.26 | ) | | — | | | (0.26 | ) | | $13.27 | | | 1.41 | | | | 0.93 | | | | 0.93 | | | | 0.94 | | | | 1.30 | | | 8.14 | | $ | 132,916 | |
2013(c) | | $ | 13.86 | | | | 0.20 | | | | (0.39 | ) | | | (0.19 | ) | | | (0.31 | ) | | — | | | (0.31 | ) | | $13.36 | | | 1.45 | | | | 0.89 | | | | 0.89 | | | | 0.89 | | | | (1.38 | ) | | 12.18 | | $ | 159,225 | |
2012(c) | | $ | 13.90 | | | | 0.25 | | | | 0.06 | | | | 0.31 | | | | (0.35 | ) | | — | | | (0.35 | ) | | $13.86 | | | 1.79 | | | | 0.89 | | | | 0.89 | | | | 0.89 | | | | 2.29 | | | 9.89 | | $ | 214,749 | |
2011(c) | | $ | 13.94 | | | | 0.33 | | | | 0.03 | | | | 0.36 | | | | (0.40 | ) | | — | | | (0.40 | ) | | $13.90 | | | 2.42 | | | | 0.90 | | | | 0.89 | | | | 0.90 | | | | 2.66 | | | 14.62 | | $ | 202,910 | |
Class B Shares | | | | | | | | | | | | | | | | | | | | | | | | | | | | | | | | | | | | | | | | | | | | | | | |
2016(b) | | $ | 13.24 | | | | (0.02 | ) | | | 0.04 | | | | 0.02 | | | | (0.01 | ) | | — | | | (0.01 | ) | | $13.25 | | | (0.35 | )(d) | | | 2.17 | (d) | | | 2.17 | (d) | | | 13.22 | (d) | | | 0.13 | | | 5.01 | | $ | 247 | |
2015 | | $ | 13.24 | | | | (0.02 | ) | | | 0.07 | | | | 0.05 | | | | (0.05 | ) | | — | | | (0.05 | ) | | $13.24 | | | (0.14 | ) | | | 2.23 | | | | 2.22 | | | | 7.08 | | | | 0.35 | | | 14.15 | | $ | 145 | |
2014 | | $ | 13.33 | | | | (0.01 | ) | | | (0.02 | ) | | | (0.03 | ) | | | (0.06 | ) | | — | | | (0.06 | ) | | $13.24 | | | (0.06 | ) | | | 2.40 | | | | 2.40 | | | | 3.60 | | | | (0.19 | ) | | 8.14 | | $ | 714 | |
2013 | | $ | 13.83 | | | | 0.01 | | | | (0.39 | ) | | | (0.38 | ) | | | (0.12 | ) | | — | | | (0.12 | ) | | $13.33 | | | 0.07 | | | | 2.29 | | | | 2.29 | | | | 2.57 | | | | (2.75 | ) | | 12.18 | | $ | 1,384 | |
2012 | | $ | 13.87 | | | | 0.06 | | | | 0.06 | | | | 0.12 | | | | (0.16 | ) | | — | | | (0.16 | ) | | $13.83 | | | 0.42 | | | | 2.26 | | | | 2.25 | | | | 2.26 | | | | 0.90 | | | 9.89 | | $ | 3,452 | |
2011 | | $ | 13.91 | | | | 0.16 | | | | 0.02 | | | | 0.18 | | | | (0.22 | ) | | — | | | (0.22 | ) | | $13.87 | | | 1.13 | | | | 2.20 | | | | 2.19 | | | | 2.20 | | | | 1.33 | | | 14.62 | | $ | 4,368 | |
Class C Shares | | | | | | | | | | | | | | | | | | | | | | | | | | | | | | | | | | | | | | | | | | | | | | | |
2016(b) | | $ | 13.34 | | | | 0.04 | | | | 0.05 | | | | 0.09 | | | | (0.07 | ) | | — | | | (0.07 | ) | | $13.36 | | | 0.63 | (d) | | | 1.20 | (d) | | | 1.20 | (d) | | | 1.21 | (d) | | | 0.67 | | | 5.01 | | $ | 52,378 | |
2015 | | $ | 13.35 | | | | 0.12 | | | | 0.06 | | | | 0.18 | | | | (0.19 | ) | | — | | | (0.19 | ) | | $13.34 | | | 0.88 | | | | 1.20 | | | | 1.20 | | | | 1.21 | | | | 1.34 | | | 14.15 | | $ | 46,777 | |
2014 | | $ | 13.45 | | | | 0.15 | | | | (0.02 | ) | | | 0.13 | | | | (0.23 | ) | | — | | | (0.23 | ) | | $13.35 | | | 1.14 | | | | 1.19 | | | | 1.19 | | | | 1.20 | | | | 0.96 | | | 8.14 | | $ | 51,001 | |
2013 | | $ | 13.94 | | | | 0.16 | | | | (0.37 | ) | | | (0.21 | ) | | | (0.28 | ) | | — | | | (0.28 | ) | | $13.45 | | | 1.17 | | | | 1.17 | | | | 1.17 | | | | 1.17 | | | | (1.56 | ) | | 12.18 | | $ | 73,877 | |
2012 | | $ | 13.98 | | | | 0.21 | | | | 0.07 | | | | 0.28 | | | | (0.32 | ) | | — | | | (0.32 | ) | | $13.94 | | | 1.51 | | | | 1.17 | | | | 1.17 | | | | 1.17 | | | | 2.01 | | | 9.89 | | $ | 102,790 | |
2011 | | $ | 14.03 | | | | 0.30 | | | | 0.02 | | | | 0.32 | | | | (0.37 | ) | | — | | | (0.37 | ) | | $13.98 | | | 2.15 | | | | 1.17 | | | | 1.16 | | | | 1.17 | | | | 2.31 | | | 14.62 | | $ | 100,212 | |
Class I Shares | | | | | | | | | | | | | | | | | | | | | | | | | | | | | | | | | | | | | | | | | | | | | | | |
2016(b) | | $ | 13.26 | | | | 0.08 | | | | 0.05 | | | | 0.13 | | | | (0.11 | ) | | — | | | (0.11 | ) | | $13.28 | | | 1.26 | (d) | | | 0.57 | (d) | | | 0.57 | (d) | | | 0.57 | (d) | | | 0.99 | | | 5.01 | | $ | 130,234 | |
2015 | | $ | 13.27 | | | | 0.19 | | | | 0.06 | | | | 0.25 | | | | (0.26 | ) | | — | | | (0.26 | ) | | $13.26 | | | 1.45 | | | | 0.62 | | | | 0.62 | | | | 0.62 | | | | 1.93 | | | 14.15 | | $ | 112,853 | |
2014 | | $ | 13.36 | | | | 0.23 | | | | (0.02 | ) | | | 0.21 | | | | (0.30 | ) | | — | | | (0.30 | ) | | $13.27 | | | 1.73 | | | | 0.61 | | | | 0.61 | | | | 0.61 | | | | 1.62 | | | 8.14 | | $ | 69,309 | |
2013 | | $ | 13.86 | | | | 0.24 | | | | (0.38 | ) | | | (0.14 | ) | | | (0.36 | ) | | — | | | (0.36 | ) | | $13.36 | | | 1.78 | | | | 0.56 | | | | 0.56 | | | | 0.56 | | | | (1.05 | ) | | 12.18 | | $ | 73,645 | |
2012 | | $ | 13.90 | | | | 0.29 | | | | 0.07 | | | | 0.36 | | | | (0.40 | ) | | — | | | (0.40 | ) | | $13.86 | | | 2.12 | | | | 0.56 | | | | 0.55 | | | | 0.56 | | | | 2.63 | | | 9.89 | | $ | 98,112 | |
2011 | | $ | 13.94 | | | | 0.37 | | | | 0.04 | | | | 0.41 | | | | (0.45 | ) | | — | | | (0.45 | ) | | $13.90 | | | 2.71 | | | | 0.57 | | | | 0.57 | | | | 0.57 | | | | 2.99 | | | 14.62 | | $ | 82,994 | |
Class R3 Shares | | | | | | | | | | | | | | | | | | | | | | | | | | | | | | | | | | | | | | | | | | | | | | | |
2016(b) | | $ | 13.27 | | | | 0.06 | | | | 0.04 | | | | 0.10 | | | | (0.08 | ) | | — | | | (0.08 | ) | | $13.29 | | | 0.84 | (d) | | | 0.99 | (d) | | | 0.99 | (d) | | | 1.34 | (d) | | | 0.78 | | | 5.01 | | $ | 22,572 | |
2015 | | $ | 13.28 | | | | 0.14 | | | | 0.06 | | | | 0.20 | | | | (0.21 | ) | | — | | | (0.21 | ) | | $13.27 | | | 1.09 | | | | 0.99 | | | | 0.99 | | | | 1.35 | | | | 1.55 | | | 14.15 | | $ | 16,320 | |
2014 | | $ | 13.37 | | | | 0.18 | | | | (0.02 | ) | | | 0.16 | | | | (0.25 | ) | | — | | | (0.25 | ) | | $13.28 | | | 1.35 | | | | 0.99 | | | | 0.99 | | | | 1.31 | | | | 1.23 | | | 8.14 | | $ | 13,748 | |
2013 | | $ | 13.87 | | | | 0.18 | | | | (0.38 | ) | | | (0.20 | ) | | | (0.30 | ) | | — | | | (0.30 | ) | | $13.37 | | | 1.35 | | | | 0.99 | | | | 0.99 | | | | 1.27 | | | | (1.47 | ) | | 12.18 | | $ | 15,350 | |
2012 | | $ | 13.91 | | | | 0.23 | | | | 0.07 | | | | 0.30 | | | | (0.34 | ) | | — | | | (0.34 | ) | | $13.87 | | | 1.69 | | | | 1.00 | | | | 0.99 | | | | 1.29 | | | | 2.19 | | | 9.89 | | $ | 15,486 | |
2011 | | $ | 13.95 | | | | 0.32 | | | | 0.03 | | | | 0.35 | | | | (0.39 | ) | | — | | | (0.39 | ) | | $13.91 | | | 2.33 | | | | 1.00 | | | | 0.99 | | | | 1.32 | | | | 2.56 | | | 14.62 | | $ | 12,749 | |
Class R4 Shares | | | | | | | | | | | | | | | | | | | | | | | | | | | | | | | | | | | | | | | | | | | | | | | |
2016(b) | | $ | 13.26 | | | | 0.06 | | | | 0.04 | | | | 0.10 | | | | (0.08 | ) | | — | | | (0.08 | ) | | $13.28 | | | 0.84 | (d) | | | 0.99 | (d) | | | 0.99 | (d) | | | 3.33 | (d) | | | 0.78 | | | 5.01 | | $ | 1,203 | |
2015 | | $ | 13.27 | | | | 0.13 | | | | 0.08 | | | | 0.21 | | | | (0.22 | ) | | — | | | (0.22 | ) | | $13.26 | | | 1.00 | | | | 0.99 | | | | 0.99 | | | | 17.30 | (e) | | | 1.55 | | | 14.15 | | $ | 706 | |
2014(f) | | $ | 13.36 | | | | 0.14 | | | | (0.03 | ) | | | 0.11 | | | | (0.20 | ) | | — | | | (0.20 | ) | | $13.27 | | | 1.57 | (d) | | | 0.99 | (d) | | | 0.99 | (d) | | | 64.66 | (d)(e) | | | 0.78 | | | 8.14 | | $ | 15 | |
Class R5 Shares | | | | | | | | | | | | | | | | | | | | | | | | | | | | | | | | | | | | | | | | | | | | | | | |
2016(b) | | $ | 13.27 | | | | 0.08 | | | | 0.04 | | | | 0.12 | | | | (0.10 | ) | | — | | | (0.10 | ) | | $13.29 | | | 1.16 | (d) | | | 0.67 | (d) | | | 0.67 | (d) | | | 1.82 | (d) | | | 0.94 | | | 5.01 | | $ | 2,401 | |
2015 | | $ | 13.27 | | | | 0.19 | | | | 0.07 | | | | 0.26 | | | | (0.26 | ) | | — | | | (0.26 | ) | | $13.27 | | | 1.40 | | | | 0.67 | | | | 0.67 | | | | 2.02 | | | | 1.95 | | | 14.15 | | $ | 2,170 | |
2014 | | $ | 13.36 | | | | 0.21 | | | | — | (g) | | | 0.21 | | | | (0.30 | ) | | — | | | (0.30 | ) | | $13.27 | | | 1.59 | | | | 0.67 | | | | 0.67 | | | | 2.87 | | | | 1.56 | | | 8.14 | | $ | 1,859 | |
2013 | | $ | 13.85 | | | | 0.24 | | | | (0.39 | ) | | | (0.15 | ) | | | (0.34 | ) | | — | | | (0.34 | ) | | $13.36 | | | 1.83 | | | | 0.67 | | | | 0.67 | | | | 7.28 | (e) | | | (1.09 | ) | | 12.18 | | $ | 881 | |
2012(h) | | $ | 13.84 | | | | 0.10 | | | | 0.07 | | | | 0.17 | | | | (0.16 | ) | | — | | | (0.16 | ) | | $13.85 | | | 1.87 | (d) | | | 0.68 | (d) | | | 0.67 | (d) | | | 44.86 | (d)(e) | | | 1.20 | | | 9.89 | | $ | 299 | |
| (a) | Not annualized for periods less than one year. |
| (b) | Unaudited Six Month Period Ended March 31. |
| (c) | Sales loads are not reflected in computing total return. |
| (e) | Due to the size of net assets and fixed expenses, ratios may appear disproportionate. |
| (f) | Effective date of this class of shares was February 1, 2014. |
| (g) | Net realized and unrealized gain (loss) on investments was less than $0.01 per share. |
| (h) | Effective date of this class of shares was May 1, 2012. |
| + | Based on weighted average shares outstanding. |
See notes to financial statements.
| | | | |
| 52 Semi-Annual Reports | | | | Semi-Annual Reports 53 |
FINANCIAL HIGHLIGHTS
Thornburg Limited Term Income Fund
| | | | | | | | | | | | | | | | | | | | | | | | | | | | | | | | | | | | | | | | | | | | | | | | | | |
| | | PER SHARE PERFORMANCE (for a share outstanding throughout the Period) | | RATIOS TO AVERAGE NET ASSETS | | | SUPPLEMENTAL DATA | |
Unless
Otherwise
Noted,
Periods
are
Fiscal
Years
Ended
Sept. 30, | | Net Asset
Value
Beginning
of Period | | | Net
Investment
Income
(Loss)+ | | Net
Realized
&
Unrealized
Gain(Loss)
on
Investments | | | Total from
Investment
Operations | | Dividends
from Net
Investment
Income | | | Dividends
from Net
Realized
Gains | | | Total
Dividends | | | Net
Asset
Value
End
of
Period | | Net
Investment
Income
(Loss)
(%) | | | Expenses,
After
Expense
Reductions
(%) | | | Expenses,
After
Expense
Reductions
and
Net of
Custody
Credits
(%) | | | Expenses,
Before
Expense
Reductions
(%) | | | Total
Return
(%)(a) | | Portfolio
Turnover
Rate
(%)(a) | | Net
Assets
at End
of
Period
(Thousands) | |
Class A Shares | | | | | | | | | | | | | | | | | | | | | | | | | | | | | | | | | | | | | | | | | | | | |
2016(b)(c) | | $ | 13.32 | | | 0.12 | | | 0.04 | | | 0.16 | | | (0.13 | ) | | | — | | | | (0.13 | ) | | $13.35 | | | 1.81 | (d) | | | 0.86 | (d) | | | 0.86 | (d) | | | 0.86 | (d) | | 1.18 | | 10.78 | | $ | 1,105,939 | |
2015(c) | | $ | 13.49 | | | 0.26 | | | (0.09 | ) | | 0.17 | | | (0.27 | ) | | | (0.07 | ) | | | (0.34 | ) | | $13.32 | | | 1.94 | | | | 0.87 | | | | 0.87 | | | | 0.87 | | | 1.27 | | 18.71 | | $ | 977,470 | |
2014(c) | | $ | 13.42 | | | 0.29 | | | 0.19 | | | 0.48 | | | (0.30 | ) | | | (0.11 | ) | | | (0.41 | ) | | $13.49 | | | 2.15 | | | | 0.89 | | | | 0.89 | | | | 0.89 | | | 3.61 | | 29.41 | | $ | 906,708 | |
2013(c) | | $ | 13.72 | | | 0.32 | | | (0.22 | ) | | 0.10 | | | (0.34 | ) | | | (0.06 | ) | | | (0.40 | ) | | $13.42 | | | 2.33 | | | | 0.88 | | | | 0.88 | | | | 0.88 | | | 0.69 | | 36.66 | | $ | 1,029,692 | |
2012(c) | | $ | 13.32 | | | 0.39 | | | 0.52 | | | 0.91 | | | (0.42 | ) | | | (0.09 | ) | | | (0.51 | ) | | $13.72 | | | 2.94 | | | | 0.93 | | | | 0.93 | | | | 0.93 | | | 7.04 | | 23.72 | | $ | 1,049,044 | |
2011(c) | | $ | 13.41 | | | 0.46 | | | (0.04 | ) | | 0.42 | | | (0.47 | ) | | | (0.04 | ) | | | (0.51 | ) | | $13.32 | | | 3.44 | | | | 0.98 | | | | 0.97 | | | | 0.98 | | | 3.19 | | 24.86 | | $ | 578,731 | |
Class C Shares | | | | | | | | | | | | | | | | | | | | | | | | | | | | | | | | | | | | | | | | | | | | |
2016(b) | | $ | 13.30 | | | 0.10 | | | 0.04 | | | 0.14 | | | (0.11 | ) | | | — | | | | (0.11 | ) | | $13.33 | | | 1.58 | (d) | | | 1.09 | (d) | | | 1.09 | (d) | | | 1.09 | (d) | | 1.06 | | 10.78 | | $ | 638,332 | |
2015 | | $ | 13.47 | | | 0.23 | | | (0.09 | ) | | 0.14 | | | (0.24 | ) | | | (0.07 | ) | | | (0.31 | ) | | $13.30 | | | 1.71 | | | | 1.10 | | | | 1.10 | | | | 1.10 | | | 1.04 | | 18.71 | | $ | 611,555 | �� |
2014 | | $ | 13.39 | | | 0.26 | | | 0.20 | | | 0.46 | | | (0.27 | ) | | | (0.11 | ) | | | (0.38 | ) | | $13.47 | | | 1.92 | | | | 1.11 | | | | 1.11 | | | | 1.11 | | | 3.46 | | 29.41 | | $ | 593,658 | |
2013 | | $ | 13.70 | | | 0.28 | | | (0.23 | ) | | 0.05 | | | (0.30 | ) | | | (0.06 | ) | | | (0.36 | ) | | $13.39 | | | 2.09 | | | | 1.12 | | | | 1.12 | | | | 1.12 | | | 0.38 | | 36.66 | | $ | 632,918 | |
2012 | | $ | 13.30 | | | 0.36 | | | 0.52 | | | 0.88 | | | (0.39 | ) | | | (0.09 | ) | | | (0.48 | ) | | $13.70 | | | 2.70 | | | | 1.18 | | | | 1.18 | | | | 1.18 | | | 6.78 | | 23.72 | | $ | 604,314 | |
2011 | | $ | 13.39 | | | 0.42 | | | (0.04 | ) | | 0.38 | | | (0.43 | ) | | | (0.04 | ) | | | (0.47 | ) | | $13.30 | | | 3.19 | | | | 1.22 | | | | 1.22 | | | | 1.23 | | | 2.93 | | 24.86 | | $ | 366,822 | |
Class I Shares | | | | | | | | | | | | | | | | | | | | | | | | | | | | | | | | | | | | | | | | | | | | |
2016(b) | | $ | 13.33 | | | 0.14 | | | 0.03 | | | 0.17 | | | (0.15 | ) | | | — | | | | (0.15 | ) | | $13.35 | | | 2.16 | (d) | | | 0.51 | (d) | | | 0.51 | (d) | | | 0.51 | (d) | | 1.28 | | 10.78 | | $ | 2,325,173 | |
2015 | | $ | 13.49 | | | 0.31 | | | (0.08 | ) | | 0.23 | | | (0.32 | ) | | | (0.07 | ) | | | (0.39 | ) | | $13.33 | | | 2.29 | | | | 0.52 | | | | 0.52 | | | | 0.52 | | | 1.71 | | 18.71 | | $ | 1,982,536 | |
2014 | | $ | 13.42 | | | 0.33 | | | 0.20 | | | 0.53 | | | (0.35 | ) | | | (0.11 | ) | | | (0.46 | ) | | $13.49 | | | 2.49 | | | | 0.54 | | | | 0.54 | | | | 0.54 | | | 3.98 | | 29.41 | | $ | 1,578,168 | |
2013 | | $ | 13.73 | | | 0.36 | | | (0.23 | ) | | 0.13 | | | (0.38 | ) | | | (0.06 | ) | | | (0.44 | ) | | $13.42 | | | 2.68 | | | | 0.53 | | | | 0.53 | | | | 0.53 | | | 0.98 | | 36.66 | | $ | 1,260,449 | |
2012 | | $ | 13.32 | | | 0.44 | | | 0.53 | | | 0.97 | | | (0.47 | ) | | | (0.09 | ) | | | (0.56 | ) | | $13.73 | | | 3.27 | | | | 0.58 | | | | 0.58 | | | | 0.58 | | | 7.49 | | 23.72 | | $ | 1,012,430 | |
2011 | | $ | 13.41 | | | 0.50 | | | (0.04 | ) | | 0.46 | | | (0.51 | ) | | | (0.04 | ) | | | (0.55 | ) | | $13.32 | | | 3.79 | | | | 0.63 | | | | 0.63 | | | | 0.63 | | | 3.55 | | 24.86 | | $ | 448,669 | |
Class R3 Shares | | | | | | | | | | | | | | | | | | | | | | | | | | | | | | | | | | | | | | | | | | | | |
2016(b) | | $ | 13.33 | | | 0.11 | | | 0.04 | | | 0.15 | | | (0.12 | ) | | | — | | | | (0.12 | ) | | $13.36 | | | 1.68 | (d) | | | 0.99 | (d) | | | 0.99 | (d) | | | 1.10 | (d) | | 1.11 | | 10.78 | | $ | 109,836 | |
2015 | | $ | 13.50 | | | 0.24 | | | (0.09 | ) | | 0.15 | | | (0.25 | ) | | | (0.07 | ) | | | (0.32 | ) | | $13.33 | | | 1.82 | | | | 0.99 | | | | 0.99 | | | | 1.11 | | | 1.16 | | 18.71 | | $ | 172,992 | |
2014 | | $ | 13.43 | | | 0.27 | | | 0.19 | | | 0.46 | | | (0.28 | ) | | | (0.11 | ) | | | (0.39 | ) | | $13.50 | | | 2.04 | | | | 0.99 | | | | 0.99 | | | | 1.12 | | | 3.51 | | 29.41 | | $ | 120,013 | |
2013 | | $ | 13.73 | | | 0.30 | | | (0.22 | ) | | 0.08 | | | (0.32 | ) | | | (0.06 | ) | | | (0.38 | ) | | $13.43 | | | 2.22 | | | | 0.99 | | | | 0.99 | | | | 1.14 | | | 0.59 | | 36.66 | | $ | 81,585 | |
2012 | | $ | 13.33 | | | 0.39 | | | 0.52 | | | 0.91 | | | (0.42 | ) | | | (0.09 | ) | | | (0.51 | ) | | $13.73 | | | 2.88 | | | | 0.99 | | | | 0.99 | | | | 1.19 | | | 6.97 | | 23.72 | | $ | 73,373 | |
2011 | | $ | 13.42 | | | 0.45 | | | (0.03 | ) | | 0.42 | | | (0.47 | ) | | | (0.04 | ) | | | (0.51 | ) | | $13.33 | | | 3.42 | | | | 0.99 | | | | 0.99 | | | | 1.29 | | | 3.17 | | 24.86 | | $ | 30,022 | |
Class R4 Shares | | | | | | | | | | | | | | | | | | | | | | | | | | | | | | | | | | | | | | | | | | | | |
2016(b) | | $ | 13.32 | | | 0.11 | | | 0.03 | | | 0.14 | | | (0.12 | ) | | | — | | | | (0.12 | ) | | $13.34 | | | 1.68 | (d) | | | 0.99 | (d) | | | 0.99 | (d) | | | 1.75 | (d) | | 1.03 | | 10.78 | | $ | 6,035 | |
2015 | | $ | 13.48 | | | 0.24 | | | (0.08 | ) | | 0.16 | | | (0.25 | ) | | | (0.07 | ) | | | (0.32 | ) | | $13.32 | | | 1.82 | | | | 0.98 | | | | 0.98 | | | | 1.66 | | | 1.24 | | 18.71 | | $ | 3,908 | |
2014(e) | | $ | 13.42 | | | 0.18 | | | 0.07 | | | 0.25 | | | (0.19 | ) | | | — | | | | (0.19 | ) | | $13.48 | | | 1.99 | (d) | | | 0.99 | (d) | | | 0.99 | (d) | | | 61.75 | (d) | | 1.84 | | 29.41 | | $ | 47 | |
Class R5 Shares | | | | | | | | | | | | | | | | | | | | | | | | | | | | | | | | | | | | | | | | | | | | |
2016(b) | | $ | 13.32 | | | 0.14 | | | 0.03 | | | 0.17 | | | (0.14 | ) | | | — | | | | (0.14 | ) | | $13.35 | | | 2.08 | (d) | | | 0.58 | (d) | | | 0.58 | (d) | | | 0.60 | (d) | | 1.31 | | 10.78 | | $ | 60,661 | |
2015 | | $ | 13.49 | | | 0.29 | | | (0.09 | ) | | 0.20 | | | (0.30 | ) | | | (0.07 | ) | | | (0.37 | ) | | $13.32 | | | 2.17 | | | | 0.64 | | | | 0.64 | | | | 0.67 | | | 1.50 | | 18.71 | | $ | 96,326 | |
2014 | | $ | 13.42 | | | 0.32 | | | 0.19 | | | 0.51 | | | (0.33 | ) | | | (0.11 | ) | | | (0.44 | ) | | $13.49 | | | 2.38 | | | | 0.64 | | | | 0.64 | | | | 0.72 | | | 3.86 | | 29.41 | | $ | 16,825 | |
2013 | | $ | 13.72 | | | 0.34 | | | (0.21 | ) | | 0.13 | | | (0.37 | ) | | | (0.06 | ) | | | (0.43 | ) | | $13.42 | | | 2.52 | | | | 0.65 | | | | 0.65 | | | | 1.01 | | | 0.92 | | 36.66 | | $ | 8,164 | |
2012(f) | | $ | 13.47 | | | 0.16 | | | 0.27 | | | 0.43 | | | (0.18 | ) | | | — | | | | (0.18 | ) | | $13.72 | | | 2.96 | (d) | | | 0.67 | (d) | | | 0.67 | (d) | | | 25.61 | (d)(g) | | 3.19 | | 23.72 | | $ | 1,322 | |
| (a) | Not annualized for periods less than one year. |
| (b) | Unaudited Six Month Period Ended March 31. |
| (c) | Sales loads are not reflected in computing total return. |
| (e) | Effective date of this class of shares was February 1, 2014. |
| (f) | Effective date of this class of shares was May 1, 2012. |
| (g) | Due to the size of net assets and fixed expenses, ratios may appear disproportionate. |
| + | Based on weighted average shares outstanding. |
See notes to financial statements.
| | | | |
| 54 Semi-Annual Reports | | | | Semi-Annual Reports 55 |
FINANCIAL HIGHLIGHTS
Thornburg Low Duration Income Fund
| | | | | | | | | | | | | | | | | | | | | | | | | | | | | | | | | | | | | | | | | | | | | | | | |
| | | PER SHARE PERFORMANCE (for a share outstanding throughout the Period) | | RATIOS TO AVERAGE NET ASSETS | | | SUPPLEMENTAL DATA | |
Unless
Otherwise
Noted,
Periods are Fiscal Years Ended
Sept. 30, | | Net Asset
Value
Beginning
of Period | | | Net
Investment
Income
(Loss)+ | | Net
Realized
&
Unrealized
Gain(Loss)
on
Investments | | | Total from
Investment
Operations | | Dividends
from Net
Investment
Income | | | Dividends
from Net
Realized
Gains | | Total
Dividends | | | Net Asset Value End of Period | | Net
Investment
Income
(Loss)
(%) | | | Expenses,
After
Expense
Reductions
(%) | | | Expenses,
After
Expense
Reductions
And
Net Of
Custody
Credits
(%) | | | Expenses,
Before
Expense
Reductions
(%) | | | Total
Return
(%)(a) | | Portfolio
Turnover
Rate (%)(a) | | Net
Assets
at End
of
Period
(Thousands) | |
Class A Shares | | | | | | | | | | | | | | | | | | | | | | | | | | | | | | | | | | | | | | | | | | |
2016(b)(c) | | $ | 12.38 | | | 0.05 | | | 0.02 | | | 0.07 | | | (0.05 | ) | | — | | | (0.05 | ) | | $12.40 | | | 0.73 | (d) | | | 0.70 | (d) | | | 0.70 | (d) | | | 1.82 | (d) | | 0.58 | | 16.91 | | $ | 10,510 | |
2015(c) | | $ | 12.38 | | | 0.08 | | | — | (e) | | 0.08 | | | (0.08 | ) | | — | | | (0.08 | ) | | $12.38 | | | 0.67 | | | | 0.70 | | | | 0.70 | | | | 2.10 | | | 0.68 | | 29.22 | | $ | 9,940 | |
2014(c)(f) | | $ | 12.31 | | | 0.08 | | | 0.08 | | | 0.16 | | | (0.09 | ) | | — | | | (0.09 | ) | | $12.38 | | | 0.92 | (d) | | | 0.62 | (d) | | | 0.61 | (d) | | | 3.14 | (d) | | 1.33 | | 23.70 | | $ | 6,678 | |
Class I Shares | | | | | | | | | | | | | | | | | | | | | | | | | | | | | | | | | | | | | | | | | | |
2016(b) | | $ | 12.37 | | | 0.06 | | | 0.03 | | | 0.09 | | | (0.06 | ) | | — | | | (0.06 | ) | | $12.40 | | | 0.94 | (d) | | | 0.50 | (d) | | | 0.50 | (d) | | | 1.36 | (d) | | 0.76 | | 16.91 | | $ | 12,191 | |
2015 | | $ | 12.38 | | | 0.11 | | | (0.01 | ) | | 0.10 | | | (0.11 | ) | | — | | | (0.11 | ) | | $12.37 | | | 0.87 | | | | 0.50 | | | | 0.50 | | | | 1.89 | | | 0.80 | | 29.22 | | $ | 8,056 | |
2014(f) | | $ | 12.31 | | | 0.11 | | | 0.07 | | | 0.18 | | | (0.11 | ) | | — | | | (0.11 | ) | | $12.38 | | | 1.19 | (d) | | | 0.41 | (d) | | | 0.41 | (d) | | | 3.19 | (d) | | 1.48 | | 23.70 | | $ | 3,698 | |
| (a) | Not annualized for periods less than one year. |
| (b) | Unaudited Six Month Period Ended March 31. |
| (c) | Sales loads are not reflected in computing total return. |
| (e) | Net realized and unrealized gain (loss) on investments was less than $0.01 per share. |
| (f) | Fund commenced operations on December 30, 2013. |
| + | Based on weighted average shares outstanding. |
See notes to financial statements.
| | | | |
| 56 Semi-Annual Reports | | | | Semi-Annual Reports 57 |
| | |
| EXPENSE EXAMPLES | | |
| |
| | March 31, 2016 (Unaudited) |
As a shareholder of a Fund, you incur two types of costs:
| | (1) | transaction costs, including |
(a) sales charges (loads) on purchase payments, for Class A shares;
(b) a deferred sales charge on redemptions of any part or all of a purchase of $1 million of Class A shares within 12 months of purchase;
(c) a deferred sales charge on redemptions of Class B shares within eight years of purchase; (d) a deferred sales charge on redemptions of Class C shares within 12 months of purchase;
| | (2) | ongoing costs, including management fees; distribution and/or service (12b-1) fees; and other Fund expenses. |
This example is intended to help you understand your ongoing costs (in dollars) of investing in a Fund and to compare these costs with the ongoing costs of investing in other mutual funds.
The example is based on a $1,000 investment beginning on October 1, 2015, and held until March 31, 2016.
| | | | | | | | | | | | |
| | | Beginning
Account Value
10/1/15 | | | Ending
Account Value
3/31/16 | | | Expenses Paid
During Period†
10/1/15–3/31/16 | |
LIMITED TERM U.S. GOVERNMENT FUND | | | | | | | | | | | | |
Class A Shares | | | | | | | | | | | | |
Actual | | $ | 1,000.00 | | | $ | 1,008.20 | | | $ | 4.61 | |
Hypothetical* | | $ | 1,000.00 | | | $ | 1,020.41 | | | $ | 4.64 | |
Class B Shares | | | | | | | | | | | | |
Actual | | $ | 1,000.00 | | | $ | 1,001.30 | | | $ | 10.88 | |
Hypothetical* | | $ | 1,000.00 | | | $ | 1,014.13 | | | $ | 10.95 | |
Class C Shares | | | | | | | | | | | | |
Actual | | $ | 1,000.00 | | | $ | 1,006.70 | | | $ | 6.02 | |
Hypothetical* | | $ | 1,000.00 | | | $ | 1,019.00 | | | $ | 6.05 | |
Class I Shares | | | | | | | | | | | | |
Actual | | $ | 1,000.00 | | | $ | 1,009.90 | | | $ | 2.87 | |
Hypothetical* | | $ | 1,000.00 | | | $ | 1,022.15 | | | $ | 2.89 | |
Class R3 Shares | | | | | | | | | | | | |
Actual | | $ | 1,000.00 | | | $ | 1,007.80 | | | $ | 4.97 | |
Hypothetical* | | $ | 1,000.00 | | | $ | 1,020.05 | | | $ | 5.00 | |
Class R4 Shares | | | | | | | | | | | | |
Actual | | $ | 1,000.00 | | | $ | 1,007.80 | | | $ | 4.97 | |
Hypothetical* | | $ | 1,000.00 | | | $ | 1,020.05 | | | $ | 5.00 | |
Class R5 Shares | | | | | | | | | | | | |
Actual | | $ | 1,000.00 | | | $ | 1,009.40 | | | $ | 3.36 | |
Hypothetical* | | $ | 1,000.00 | | | $ | 1,021.66 | | | $ | 3.38 | |
LIMITED TERM INCOME FUND | | | | | | | | | | | | |
Class A Shares | | | | | | | | | | | | |
Actual | | $ | 1,000.00 | | | $ | 1,011.80 | | | $ | 4.32 | |
Hypothetical* | | $ | 1,000.00 | | | $ | 1,020.71 | | | $ | 4.34 | |
Class C Shares | | | | | | | | | | | | |
Actual | | $ | 1,000.00 | | | $ | 1,010.60 | | | $ | 5.47 | |
Hypothetical* | | $ | 1,000.00 | | | $ | 1,019.56 | | | $ | 5.50 | |
Class I Shares | | | | | | | | | | | | |
Actual | | $ | 1,000.00 | | | $ | 1,012.80 | | | $ | 2.54 | |
Hypothetical* | | $ | 1,000.00 | | | $ | 1,022.47 | | | $ | 2.55 | |
Class R3 Shares | | | | | | | | | | | | |
Actual | | $ | 1,000.00 | | | $ | 1,011.10 | | | $ | 4.98 | |
Hypothetical* | | $ | 1,000.00 | | | $ | 1,020.05 | | | $ | 5.00 | |
Class R4 Shares | | | | | | | | | | | | |
Actual | | $ | 1,000.00 | | | $ | 1,010.30 | | | $ | 4.98 | |
Hypothetical* | | $ | 1,000.00 | | | $ | 1,020.05 | | | $ | 5.00 | |
Class R5 Shares | | | | | | | | | | | | |
Actual | | $ | 1,000.00 | | | $ | 1,013.10 | | | $ | 2.94 | |
Hypothetical* | | $ | 1,000.00 | | | $ | 1,022.08 | | | $ | 2.95 | |
LOW DURATION INCOME FUND | | | | | | | | | | | | |
Class A Shares | | | | | | | | | | | | |
Actual | | $ | 1,000.00 | | | $ | 1,005.80 | | | $ | 3.51 | |
Hypothetical* | | $ | 1,000.00 | | | $ | 1,021.50 | | | $ | 3.54 | |
Class I Shares | | | | | | | | | | | | |
Actual | | $ | 1,000.00 | | | $ | 1,007.60 | | | $ | 2.51 | |
Hypothetical* | | $ | 1,000.00 | | | $ | 1,022.50 | | | $ | 2.53 | |
| † | Thornburg Limited Term U.S. Government Fund expenses are equal to the annualized expense ratio for each class (A: 0.92%; B: 2.17%; C: 1.20%; I: 0.57%; R3: 0.99% R4: 0.99% R5: 0.67%) multiplied by the average account value over the period, multiplied by 183/366 to reflect the one-half year period. |
| † | Thornburg Limited Term Income Fund expenses are equal to the annualized expense ratio for each class (A: 0.86%; C: 1.09%; I: 0.51%; R3: 0.99% R4: 0.99% R5: 0.58%) multiplied by the average account value over the period, multiplied by 183/366 to reflect the one-half year period. |
| † | Thornburg Low Duration Income Fund expenses are equal to the the annualized expense ratio for each class (A: 0.70%; I: 0.50%) multiplied by the average account value over the period, multiplied by 183/366 to reflect the one-half year period. |
| * | Hypothetical assumes a rate of return of 5% per year before expenses. |
ACTUAL EXPENSES
For each class of shares, the first line of the accompanying table provides information about actual account values and actual expenses. You may use the information in this line, together with the amount you invested, to estimate the expenses that you paid over the period. Simply divide your account value by $1,000 (for example, an $8,600 account value divided by $1,000 = 8.6), then multiply the result by the number in the first line for your class of shares under the heading entitled “Expenses Paid During Period” to estimate the expenses you paid on your account during this period.
HYPOTHETICAL EXAMPLE FOR COMPARISON PURPOSES
For each class of shares, the second line of the accompanying table provides information about hypothetical account values and hypothetical expenses based on the Fund’s actual expense ratio and an assumed rate of return of 5% per year before expenses, which is not the Fund’s actual return. The hypothetical account values and expenses may not be used to estimate the actual ending account balance or expenses you paid for the period. You may use this information to compare the ongoing costs of investing in the Fund and other funds. To do so, compare this 5% hypothetical example with the 5% hypothetical examples that appear in the shareholder reports of the other funds.
Please note that the expenses shown in the table are meant to highlight your ongoing costs only and do not reflect any transactional costs, such as sales charges (loads), redemption fees, or exchange fees. Therefore, the second line of the table for each class of shares is useful in comparing ongoing costs only, and will not help you determine the relative total costs of owning different funds. In addition, if these transactional costs were included, your costs would have been higher.
58 Semi-Annual Reports
| | |
| OTHER INFORMATION | | |
| |
| | March 31, 2016 (Unaudited) |
PORTFOLIO PROXY VOTING
Policies and Procedures:
The Trust has delegated to Thornburg Investment Management, Inc. (the “Advisor”) voting decisions respecting proxies for each of the Funds’ voting securities. The Advisor makes voting decisions in accordance with its Proxy Voting Policy. A description of the Policy is available (i) without charge, upon request, by calling the Advisor toll-free at 1-800-847-0200, (ii) on the Thornburg website at www. thornburg.com, and (iii) on the Securities and Exchange Commission’s website at www.sec.gov.
Information regarding how proxies were voted is available on or before August 31 of each year for the twelve months ending the preceding June 30. This information is available (i) without charge, upon request by calling the Advisor toll-free at 1-800-847-0200, (ii) on the Thornburg website at www.thornburg.com, and (iii) on the Securities and Exchange Commission’s website at www.sec.gov.
AVAILABILITY OF QUARTERLY PORTFOLIO SCHEDULE
The Funds file with the Securities and Exchange Commission schedules of their portfolio holdings on Form N-Q for the first and third quarters of each fiscal year. The Funds’ Forms N-Q are available on the Commission’s website at www.sec.gov, or may be reviewed and copied at the Commission’s Public Reference Room in Washington, D.C. Information on the operation of the Public Reference Room may be obtained by calling 1-800-SEC-0330. The Funds also make this information available on their website at www.thornburg. com/download or upon request by calling 1-800-847-0200.
Semi-Annual Reports 59
TRUSTEES’ STATEMENT TO SHAREHOLDERS
Revised and Readopted September 15, 2015
The Trustees believe current and prospective shareholders should know how we discharge our responsibilities in supervising the Funds’ investment advisor and in reviewing the advisor’s contract for renewal. Since 2005, we have issued a statement which sets out clearly the three principal guidelines that we follow in supervising the Trust’s investment advisor on your behalf. In accordance with our customary practice, in September of 2015 we again reviewed our statement and concluded we should reissue this statement outlining the principal features of our supervision of the advisor’s performance of investment management services for the Funds.
We begin with the premise that each shareholder selected his or her Fund because its investments are managed by the investment advisor identified in the prospectus and in accordance with the objective and policies described in the prospectus. We realize, as each of you do, that if you believe that your Fund’s stated objective and policies no longer serve your personal investment goals, you can sell your shares and leave the Fund.
Therefore, we believe that our primary supervisory task – our principal obligation to you – is to assess the nature and quality of the advisor’s services, and to confirm that the advisor actively and competently pursues the Fund’s objective, in accordance with the policies set out in the prospectus. To do this, we meet regularly with management to review your Fund’s portfolio and to discuss the advisor’s specific actions and judgments in pursuing the Fund’s objective. We do not substitute our own judgment for the advisor’s decisions in selecting investments; the advisor is paid to exercise its informed judgment on investment decisions, and we seek to confirm, in reviewing the advisor’s performance, that the advisor is doing just that.
Second, we are conscious of costs and the effect that costs have on shareholders’ returns. We try to make sure that your Fund’s fees and costs are reasonable in relationship to the services rendered and that they are generally in line with those charged by other expert investment advisors, consistent with our belief that the Fund’s investors searched for and expect that expertise and attention and have decided to pay a reasonable price for it. We do not put the management contract “out to bid” as a matter of course, and we would not do so unless we had concluded that the advisor materially had failed to pursue the Fund’s objectives in accordance with its policies, or for other equally important reasons. We believe that any other approach would be inconsistent with your interests and contrary to your expectations when you bought shares of the Fund in the first place.
Finally, because we believe that most Thornburg Fund shareholders have invested with a long-term perspective, we try not to focus too much on the fashions of the moment and on short-term performance. The market will not favor any specific investment objective or set of policies at all times and under all economic circumstances. A fund will experience periods of both high and low returns relative to other funds and other investments. Even if one of our Funds is not favored by the market at a particular time, we believe that the advisor is nonetheless obliged to remain true to the Fund’s objective and policies, and we watch to see that it does so.
Trustees of Thornburg Investment Trust
60 Semi-Annual Reports
THORNBURG FUND FAMILY
Thornburg Investment Management is a privately-owned global investment firm that offers a range of solutions for retail and institutional investors. Founded in 1982 and headquartered in Santa Fe, New Mexico, we manage approximately $54 billion (as of March 31, 2016) across eight equity and 11 bond mutual funds, separate accounts for high-net-worth investors and institutional accounts, and five UCITS funds for non-U.S. investors.
The fund outlined in this report is one of many equity and fixed-income products available from Thornburg Investment Management.
Equity Funds
| | • | | Thornburg Core Growth Fund |
| | • | | Thornburg International Value Fund |
| | • | | Thornburg Better World International Fund |
| | • | | Thornburg International Growth Fund |
| | • | | Thornburg Developing World Fund |
| | • | | Thornburg Investment Income Builder Fund |
| | • | | Thornburg Global Opportunities Fund |
Fixed Income Funds
| | • | | Thornburg Low Duration Income Fund |
| | • | | Thornburg Limited Term U.S. Government Fund |
| | • | | Thornburg Limited Term Income Fund |
| | • | | Thornburg Strategic Income Fund |
| | • | | Thornburg Low Duration Municipal Fund |
| | • | | Thornburg Limited Term Municipal Fund |
| | • | | Thornburg Intermediate Municipal Fund |
| | • | | Thornburg California Limited Term Municipal Fund |
| | • | | Thornburg New Mexico Intermediate Municipal Fund |
| | • | | Thornburg New York Intermediate Municipal Fund |
| | • | | Thornburg Strategic Municipal Income Fund |
Before investing, carefully consider the Fund’s investment goals, risks, charges, and expenses. For a prospectus or summary prospectus containing this and other information, contact your financial advisor or visit thornburg.com. Read it carefully before investing.
For additional information, please visit thornburg.com
Thornburg Investment Management, Inc. 2300 North Ridgetop Road, Santa Fe, NM 87506
Semi-Annual Reports 61
This page intentionally left blank.
62 Semi-Annual Reports
This page intentionally left blank.
Semi-Annual Reports 63

This Semi-Annual Report is submitted for the general information of shareholders of the Fund. It is not authorized for distribution to prospective investors in the Fund unless preceded or accompanied by an effective prospectus.
| | | | |
| Investment Advisor: | | Distributor: | | |
| Thornburg Investment Management® | | Thornburg Securities Corporation® | | |
| 800.847.0200 | | 800.847.0200 | | TH174 |

About Thornburg Investment Management
It’s more than what we do.
It’s how we do it.
At Thornburg, we are very different in how we think, invest, and are structured. We believe this difference is
what makes us successful in helping individuals reach their long-term financial goals.
How we
THINK
Flexible Perspective
Our perspective on investment opportunities is more flexible than most, viewing a wide range of opportunities beyond conventional boundaries to find hidden value.
Collaboration
Collectively, we hone ideas via borderless cross-pollination for better judgment and better results.
How we
INVEST
Portfolio Construction
Disciplined construction guided more by our convictions than convention.
CONVICTION
Thorough analysis and our relative-value framework lead to conviction in our securities selection.
UNCONVENTIONAL
Active management means we seek the best value for our clients rather than using conventional benchmarks as our starting point.
How we’re
STRUCTURED
Structured for Excellence
How we think and how we invest is made possible by how we’re structured.
TEAM APPROACH FAR FROM THE HERD ACCESS & TRANSPARENCY
2 | Semi-Annual Report
2 Semi-Annual Report
Semi-Annual Report
Thornburg Strategic Income Fund
March 31, 2016
| | | | |
Share Class | | NASDAQ Symbol | | CUSIP |
Class A | | TSIAX | | 885-215-228 |
Class C | | TSICX | | 885-215-210 |
Class I | | TSIIX | | 885-215-194 |
Class R3 | | TSIRX | | 885-216-887 |
Class R4 | | TSRIX | | 885-216-754 |
Class R5 | | TSRRX | | 885-216-879 |
Class I, R3, R4, and R5 shares may not be available to all investors. Minimum investments for Class I shares may be higher than those for other classes.
Investments carry risks, including possible loss of principal. Portfolios investing in bonds have the same interest rate, inflation, and credit risks that are associated with the underlying bonds. The value of bonds will fluctuate relative to changes in interest rates, decreasing when interest rates rise. This effect is more pronounced for longer-term bonds. Unlike bonds, bond funds have ongoing fees and expenses. Investments in lower rated and unrated bonds may be more sensitive to default, downgrades, and market volatility; these investments may also be less liquid than higher rated bonds. Investments in derivatives are subject to the risks associated with the securities or other assets underlying the pool of securities, including illiquidity and difficulty in valuation. Investments in equity securities are subject to additional risks, such as greater market fluctuations. Additional risks may be associated with investments outside the United States, especially in emerging markets, including currency fluctuations, illiquidity, volatility, and political and economic risks. Please see the Fund’s prospectus for a discussion of the risks associated with an investment in the Fund. Investments in the Fund are not FDIC insured, nor are they bank deposits or guaranteed by a bank or any other entity.
Semi-Annual Report 3
| | |
| LETTER TO SHAREHOLDERS | | |
| |
Thornburg Strategic Income Fund | | March 31, 2016 (Unaudited) |
April 15, 2016
Dear Fellow Shareholder:
We are pleased to present the semi-annual report for Thornburg Strategic Income Fund for the six months ended March 31, 2016. The net asset value (NAV) of a Class A share of the Fund decreased 12 cents in the period to $11.10. If you were invested for the entire period, you received dividends of 19.9 cents per share. If you reinvested your dividends, you received 20.0 cents per share. Dividends per share varied for other share classes to account for class-specific expenses.
Combining income and change in price, Class A shares of Thornburg Strategic Income Fund produced a total return of 0.97% (without sales charge) over the six-month period. A blend of 80% Barclays U.S. Aggregate Bond Index and 20% MSCI World Index produced a 3.10% total return over the same period. The Barclays U.S. Universal Bond Index produced a return of 2.51%, while the Barclays U.S. Corporate High Yield Index produced a 1.22% total return over the same period. These indices reflect no deduction for fees and expenses.
Market Impact
During the six months ended March 31, 2016, financial markets took investors on a stomach-churning, yet spine-tingling, rollercoaster ride; presenting both challenges and opportunities. The period opened with a welcome relief rally in October. The S&P 500 Index increased 6.45%. Corporations have credit profiles, just like people do, and those that are less creditworthy find it more expensive to borrow. Average high-yield credit spreads* (the difference between what the U.S. Treasury might pay to borrow and what a less credit-worthy corporation might pay) declined from 630 basis points (or 6.30%; a basis point is 1/100 of 1%) to 560 basis points, or 5.60%. Unfortunately, the calm did not last long. Global growth concerns reemerged and the Federal Reserve (the Fed) raised its target short-term interest rate. Commodity prices fell markedly, taking most risk asset prices with them.
The carnage only grew as the calendar turned to 2016. China and many developed nations released weak economic figures, highlighted by tepid manufacturing output. China then frightened markets by lowering its target renminbi rate and implementing tight stock-market circuit breakers. While that country slowly found a degree of stability behind “national team” asset buying, suspension of the circuit breakers, and speculation (which ultimately proved correct) about additional monetary and fiscal stimulus, the energy markets (specifically the price of oil) continued to plunge. Most markets became highly correlated with oil-price movements: the riskier the asset class (equities and high-yield bonds, for example), the higher the correlation. Oil prices** fell 29% from December 31, 2015 before finding a bottom on February 11, 2016 at $26.21 to start the year. By February 11, 2016, high-yield spreads had moved 179 basis points (or 1.79%) wider to 839 basis points (or 8.39%) above U.S. Treasury yields, having already given back all of the October gain, and then some.
While the six-month period was extremely challenging, difficult times often present opportunities. Energy markets led the credit-market selloff, and most sectors also declined. We selectively added credit risk (the risk investors assume by lending to bond issuers with credit ratings below the highest AAA rating) to the portfolio, as we found interesting opportunities in both investment-grade and high-yield markets. Even though all credit sectors were impacted to some degree, it was not a time to simply “buy the market” (i.e., to buy everything). In 2008 and 2009, when the financial system appeared to be on the verge of collapse and investors sold anything with any component of risk, nearly everything could be bought at attractive levels, if one was brave enough to assume the world was not at an end.
In the six-month period ended March 31, 2016, there was notable dispersion in the performance of various industry sectors and among the various “names” within sectors themselves, driven by differences in underlying investment fundamentals. It was, and remains, despite the recent rally, a time for careful credit analysis. Thornburg Investment Management’s bottom-up, fundamentals-driven, long-term approach to investing should, we believe, serve shareholders well during and after stormy periods like these.
Like most storms, this one passed quickly. Around February 11, 2016, most risk assets found price bottoms. Chinese economic data showed improvement, and the country’s financial markets gained momentum from reassurances made at an economic retreat in early February that suggested China’s growth might not decelerate more quickly. Fed Chair Janet Yellen struck a more dovish tone at her congressional testimony, and suggested that a more cautious outlook for the U.S. economy was warranted. And finally, European Central Bank (ECB) President Mario Draghi pledged to do whatever necessary to support the European economy and generate inflation.
The switch was flipped. Risk asset prices began to rise. The ascent quickened in mid March when Mr. Draghi delivered on this pledge by making the ECB’s target rate more negative, increased its quantitative easing program from 60 million to 80 million euros per month, and expanded the scope to include euro-denominated investment-grade corporate bonds. Then the Fed blinked and decreased its forecast for rate hikes to two from four, as the market had been predicting it would. Fed Chair Yellen sounded yet more dovish during a March press conference, citing global economic weakness and financial market volatility. A cynic might suggest that the Fed’s
| * | As indicated by the Barclays U.S. Corporate High Yield Bond Index Option Adjusted Spread (OAS). |
| ** | As indicated by West Texas Intermediate Crude prices. |
4 Semi-Annual Report
LETTER TO SHAREHOLDERS,
| | |
| |
CONTINUED | | |
| |
Thornburg Strategic Income Fund | | March 31, 2016 (Unaudited) |
and other global central banks’ zero or negative-rate monetary policies are causing the financial-market volatility. That same cynic might also be justified in believing the Fed seems to think it has a third mandate: to keep stock market prices high.
But cynicism is not much of an investment strategy. We do not invest for the world we want but for the world that we have—and the world we think we may see in coming quarters and years. While market strength continued into the second quarter of this year, we are cautious. Nascent signs of wage growth and inflation have appeared in the U.S., but it does not appear that U.S. Treasury rates grant those signs much credibility. Should rising U.S. inflation prove sustained, even if it moves up in small increments, long-term rates could move markedly higher, and shake up markets. An opposing risk (and perhaps a more likely eventuality) is that global economic weakness continues, disinflation concerns escalate, and commodity prices take another dip downward.
An eerie feeling of “déjà vu all over again” lingers as we write this. We should remember that oil prices fell as 2015 began, and led markets lower before they rallied during the spring months, taking stocks higher, and credit spreads tighter. Of course, markets fell apart in July and August of 2015, when oil declined from $60 per barrel to $41 per barrel. Will it happen again this year? We don’t know, but as always, we remain prudent, taking on risk only when we believe we are compensated appropriately, and avoiding it when we are not. This includes liquidity risk, the risk that positions the Fund holds might be more difficult to sell or that other positions might be more difficult to initiate.
We have discussed the decline of liquidity in fixed income markets in previous letters, and the situation remains largely unchanged. But we believe it deserves more attention, given the December 2015 events surrounding the Third Avenue Focused Credit Fund. Unable to liquidate holdings fast enough, Third Avenue halted shareholder redemptions, leaving investors unable to access their investments. We believe that all investors should exercise prudence and caution, and take the time to know and understand what their portfolios own. The Third Avenue debacle is not typical of open-end mutual funds, though; it was a highly concentrated portfolio consisting of the least-creditworthy investments: mostly CCC-rated, or unrated, securities and loans.
As of March 31, 2016, Thornburg Strategic Income Fund’s average position size was about 0.50% of the portfolio (meaning that a default from any one issuer would have relatively little impact upon the net asset value of the fund as a whole) and 48.6% of the Fund was rated investment-grade (BBB or higher), or was in cash or cash equivalents. This does not mean the Fund is immune to liquidity issues in the market. But by owning some high-quality bonds that are more liquid, on average, and holding higher than normal amounts of cash (over 9% at March 31), we believe the Fund is positioned prudently, to weather difficult periods. Moreover, the high cash position will allow us to take advantage of market dislocations as they arise (to initiate new positions or add to existing ones when prices are weak) but we will not “sell” our liquidity cheaply. For Thornburg Strategic Income Fund, security prices must also offer attractive compensation to reflect liquidity risk, not just credit or other types of risk.
We believe your Fund is well positioned to achieve its longer-term goals of a high current level of income and some long-term capital appreciation. Thank you for your trust and confidence.
Sincerely,
| | | | |
 | |  | |  |
| Jason H. Brady, CFA | | Lon R. Erickson, CFA | | Jeff Klingelhofer, CFA |
| Portfolio Manager | | Portfolio Manager | | Portfolio Manager |
| CEO, President, and Managing Director | | Managing Director | | Managing Director |
The matters discussed in this report may constitute forward-looking statements made pursuant to the safe harbor provisions of the Securities Litigation Reform Act of 1995. These include any advisor or portfolio manager prediction, assessment, analysis or outlook for individual securities, industries, investment styles, market sectors and/or markets. These statements involve risks and uncertainties. In addition to the general risks described for each fund in its current prospectus, other factors bearing on these reports include the accuracy of the advisor’s or portfolio manager’s forecasts and predictions, the appropriateness of the investment strategies designed by the advisor or portfolio manager and the ability of the advisor or portfolio manager to implement their strategies efficiently and successfully. Any one or more of these factors, as well as other risks affecting the securities markets generally, could cause the actual results of any fund to differ materially as compared to its benchmarks.
The views expressed by the portfolio managers reflect their professional opinions and are subject to change. Under no circumstances does the information contained within represent a recommendation to buy or sell any security.
Semi-Annual Report 5
| | |
| PERFORMANCE SUMMARY | | |
| |
Thornburg Strategic Income Fund | | March 31, 2016 (Unaudited) |
Average Annual Total Returns
| | | | | | | | | | | | | | | | |
| | | 1-Yr | | | 3-Yr | | | 5-Yr | | | Since
Incep. | |
Class A Shares (Incep: 12/19/07) | | | | | | | | | | | | | | | | |
Without sales charge | | | -1.17 | % | | | 1.76 | % | | | 4.30 | % | | | 6.18 | % |
With sales charge | | | -5.60 | % | | | 0.20 | % | | | 3.35 | % | | | 5.59 | % |
Class C Shares (Incep: 12/19/07) | | | | | | | | | | | | | | | | |
Without sales charge | | | -1.71 | % | | | 1.18 | % | | | 3.72 | % | | | 5.59 | % |
With sales charge | | | -2.66 | % | | | 1.18 | % | | | 3.72 | % | | | 5.59 | % |
Class I Shares (Incep: 12/19/07) | | | -0.84 | % | | | 2.09 | % | | | 4.65 | % | | | 6.51 | % |
Class R3 Shares (Incep: 5/1/12) | | | -1.17 | % | | | 1.71 | % | | | — | | | | 3.78 | % |
Class R4 Shares (Incep: 2/1/14) | | | -1.16 | % | | | — | | | | — | | | | 1.00 | % |
Class R5 Shares (Incep: 5/1/12) | | | -0.83 | % | | | 2.03 | % | | | — | | | | 4.10 | % |
Barclays U.S. Universal Index (Since 12/19/07) | | | 1.75 | % | | | 2.51 | % | | | 3.95 | % | | | 4.68 | % |
Blended Index (Since 12/19/07) | | | 1.04 | % | | | 3.47 | % | | | 4.48 | % | | | 4.45 | % |
Growth of a Hypothetical $10,000 Investment
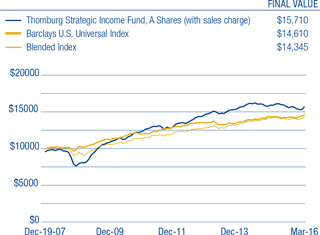
30-Day Yields, A Shares
(with sales charge)
| | | | |
SEC Yield | | | 6.38 | % |
| |
Annualized Distribution Yield | | | 4.12 | % |
Performance data shown represents past performance and is no guarantee of future results. Investment return and principal value will fluctuate so shares, when redeemed, may be worth more or less than their original cost. Current performance may be lower or higher than quoted. For performance current to the most recent month end, visit thornburg.com or call 800-847-0200. The performance information does not reflect the deduction of taxes that a shareholder would pay on distributions or the redemption of Fund shares. Returns reflect the reinvestment of dividends and capital gains. Class A shares are sold with a maximum sales charge of 4.50%. Class C shares are subject to a 1% CDSC for the first year only. There is no sales charge for Class I, R3, R4, and R5 shares.
As disclosed in the most recent prospectus, the total annual fund operating expenses are as follows: A shares, 1.23%; C shares, 1.97%; I shares, 0.89%; R3 shares, 2.70%; R4 shares, 2.64%; R5 shares, 1.55%. Thornburg Investment Management and/or Thornburg Securities Corporation have contractually agreed to waive fees and reimburse expenses through at least February 1, 2017, for some of the share classes, resulting in net expense ratios of the following: C shares, 1.80%; R3 shares, 1.25%; R4 shares, 1.25%; R5 shares, 0.99%. For more detailed information on fund expenses and waivers/reimbursements please see the Fund’s prospectus.
Thornburg voluntarily reimbursed certain expenses for Class A shares, without which, the SEC yield would have been 6.37% and the Annualized Distribution yield would have been 4.11%.
Glossary
Barclays U.S. Aggregate Bond Index – This index is composed of approximately 8,000 publicly traded bonds including U.S. government, mortgage-backed, corporate and Yankee bonds. The index is weighted by the market value of the bonds included in the index.
Barclays U.S. Corporate High-Yield Index – This index measures the market of USD-denominated, non-investment grade, fixed-rate, taxable corporate bonds. Securities are classified as high yield if the middle rating of Moody’s, Fitch, and S&P is Ba1/BB+/BB+ or below. The index excludes emerging market debt.
Barclays U.S. Universal Bond Index – This index represents the union of the U.S. Aggregate Index, U.S. Corporate High-Yield, Investment Grade 144A Index, Eurodollar Index, U.S. Emerging Markets Index, and the non-ERISA eligible portion of the CMBS Index. The index covers USD denominated, taxable bonds that are rated either investment-grade or below investment-grade.
Blended Index – Thornburg Strategic Income Fund’s Blended Index is composed of 80% Barclays U.S. Aggregate Bond Index and 20% MSCI World Index, rebalanced monthly.
MSCI World Index – This index is an unmanaged market-weighted index that consists of securities traded in 23 of the world’s most developed countries. Securities are listed on exchanges in the U.S., Europe, Canada, Australia, New Zealand, and the Far East. The index is calculated with net dividends reinvested, in U.S. dollars.
Unless otherwise noted, index returns reflect the reinvestment of income dividends and capital gains, if any, but do not reflect fees, brokerage commissions or other expenses of investing. Investors may not make direct investments into any index. The performance of any index is not indicative of the performance of any particular investment.
Annualized Distribution Yield – The distribution yield reflects actual distributions made to shareholders. The Annualized distribution yield is calculated by summing the last 30 days of income at a given month end and annualizing to a 360-day year. The result is divided by the ending maximum offering price.
Credit Spread/Quality Spread – The difference between the yields of securities with different credit qualities.
Duration – A bond’s sensitivity to interest rates. Bonds with longer durations experience greater price volatility than bonds with shorter durations.
OAS (Option Adjusted Spread) – The flat spread over the treasury yield curve required to discount a security payment to match its market price.
Quantitative Easing (QE) – An unconventional monetary policy in which a central bank purchases financial assets from the market in order to lower interest rates and increase the money supply.
SEC Yield – SEC Yield is computed in accordance with SEC standards measuring the net investment income per share over a specified 30-day period expressed as a percentage of the maximum offering price of the Fund’s shares at the end of the period.
West Texas Intermediate (WTI) – A grade of crude oil used as a benchmark in oil pricing.
6 Semi-Annual Report
| | |
| FUND SUMMARY | | |
| |
Thornburg Strategic Income Fund | | March 31, 2016 (Unaudited) |
OBJECTIVES AND STRATEGIES
The Fund’s primary investment goal is to seek a high level of current income. The Fund’s secondary investment goal is some long-term capital appreciation.
The Fund pursues its investment goals by investing in a broad range of income producing investments from throughout the world, primarily including debt obligations and income producing stocks. The Fund expects, under normal conditions, to invest a majority of its assets in debt obligations, but the relative proportions of the Fund’s investments in debt obligations and in income producing stocks can be expected to vary over time.
Portfolio Composition
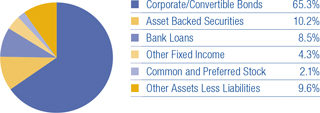
Fixed Income Credit Quality*
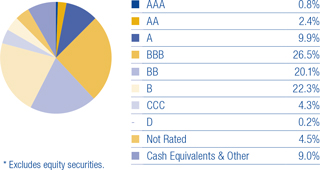
A bond credit rating assesses the financial ability of a debt issuer to make timely payments of principal and interest. Ratings of AAA (the highest), AA, A, and BBB are investment-grade quality. Ratings of BB, B, CCC, CC, C and D (the lowest) are considered below investment grade, speculative grade, or junk bonds. We have used ratings from Moody’s Investors Service. Where Moody’s ratings are not available, we have used Standard & Poor’s ratings. Where neither rating is available, we have used ratings from other rating agencies.
Top Ten Industry Groups
| | | | |
Energy | | | 9.6 | % |
Diversified Financials | | | 8.7 | % |
Materials | | | 5.8 | % |
Capital Goods | | | 5.6 | % |
Media | | | 4.5 | % |
Telecommunication Services | | | 4.2 | % |
Commercial & Professional Services | | | 3.8 | % |
Transportation | | | 3.3 | % |
Consumer Services | | | 3.2 | % |
Retailing | | | 3.1 | % |
Country Exposure**
| | | | |
United States | | | 65.4 | % |
Mexico | | | 4.0 | % |
Canada | | | 3.6 | % |
United Kingdom | | | 2.7 | % |
Brazil | | | 2.2 | % |
Switzerland | | | 1.2 | % |
Sweden | | | 1.2 | % |
Morocco | | | 1.0 | % |
Australia | | | 1.0 | % |
Cayman Islands | | | 1.0 | % |
Argentina | | | 0.9 | % |
France | | | 0.9 | % |
Luxembourg | | | 0.8 | % |
Jamaica | | | 0.7 | % |
Netherlands | | | 0.6 | % |
South Korea | | | 0.4 | % |
Belgium | | | 0.4 | % |
Barbados | | | 0.4 | % |
Mauritius | | | 0.4 | % |
Romania | | | 0.3 | % |
China | | | 0.3 | % |
Chile | | | 0.2 | % |
Russia | | | 0.2 | % |
Hong Kong | | | 0.2 | % |
Panama | | | 0.1 | % |
Spain | | | 0.1 | % |
Indonesia | | | 0.1 | % |
Other Assets Less Liabilities | | | 9.6 | % |
| ** | The country assignment of each holding is determined by the Fund’s Advisor based on various factors, including the location of the issuer’s head office, the issuer’s jurisdiction of incorporation and the country from which a majority of the issuer’s revenue is derived. |
There is no guarantee that the Fund will meet its investment objectives.
All portfolio information is subject to change. Charts may not add up to 100% due to rounding.
Semi-Annual Report 7
| | |
| SCHEDULE OF INVESTMENTS | | |
| |
Thornburg Strategic Income Fund | | March 31, 2016 (Unaudited) |
| | | | | | | | |
| | | Shares/
Principal Amount | | | Value | |
COMMON STOCK — 0.34% | | | | | | | | |
| | |
ENERGY — 0.34% | | | | | | | | |
Oil, Gas & Consumable Fuels — 0.34% | | | | | | | | |
a ROMGAZ SA-GDR | | | 531,954 | | | $ | 3,537,494 | |
| | | | | | | | |
| | | | | | | 3,537,494 | |
| | | | | | | | |
TOTAL COMMON STOCK (Cost $5,258,023) | | | | | | | 3,537,494 | |
| | | | | | | | |
| | |
PREFERRED STOCK — 1.76% | | | | | | | | |
| | |
BANKS — 0.38% | | | | | | | | |
Banks — 0.38% | | | | | | | | |
First Niagara Financial Group Pfd, 8.625% | | | 17,732 | | | | 472,380 | |
GMAC Capital Trust I Pfd, 8.125% | | | 140,000 | | | | 3,431,400 | |
| | | | | | | | |
| | | | | | | 3,903,780 | |
| | | | | | | | |
| | |
ENERGY — 0.01% | | | | | | | | |
Oil, Gas & Consumable Fuels — 0.01% | | | | | | | | |
Halcon Resources Corp. Pfd, 5.75% | | | 4,441 | | | | 153,215 | |
| | | | | | | | |
| | | | | | | 153,215 | |
| | | | | | | | |
| | |
MISCELLANEOUS — 1.03% | | | | | | | | |
U.S. Government Agencies — 1.03% | | | | | | | | |
a Cobank, ACB Pfd, 6.25% | | | 50,000 | | | | 5,137,500 | |
AgriBank, FCB Pfd, 6.875% | | | 40,000 | | | | 4,242,500 | |
Farm Credit Bank of Texas Pfd, 10.00% | | | 1,000 | | | | 1,254,375 | |
| | | | | | | | |
| | | | | | | 10,634,375 | |
| | | | | | | | |
| | |
REAL ESTATE — 0.06% | | | | | | | | |
Real Estate Investment Trusts — 0.06% | | | | | | | | |
VEREIT, Inc. Pfd, 6.70% | | | 25,857 | | | | 654,958 | |
| | | | | | | | |
| | | | | | | 654,958 | |
| | | | | | | | |
| | |
TELECOMMUNICATION SERVICES — 0.28% | | | | | | | | |
Wireless Telecommunication Services — 0.28% | | | | | | | | |
a Centaur Funding Corp. Pfd, 9.08% | | | 2,380 | | | | 2,850,050 | |
| | | | | | | | |
| | | | | | | 2,850,050 | |
| | | | | | | | |
TOTAL PREFERRED STOCK (Cost $21,158,619) | | | | | | | 18,196,378 | |
| | | | | | | | |
| | |
ASSET BACKED SECURITIES — 10.22% | | | | | | | | |
| | |
AUTO RECEIVABLES — 0.89% | | | | | | | | |
a Drive Auto Receivables Trust, 2.59%, 12/16/2019 | | $ | 9,125,000 | | | | 9,185,892 | |
| | | | | | | | |
| | | | | | | 9,185,892 | |
| | | | | | | | |
| | |
COMMERCIAL MTG TRUST — 1.21% | | | | | | | | |
a Capital Automotive REIT, Series 2012-1A Class A, 4.70%, 7/15/2042 | | | 2,833,443 | | | | 2,940,989 | |
a CFCRE Commercial Mortgage Trust, Series 2011-C1 Class C, 6.096%, 4/15/2044 | | | 6,200,000 | | | | 6,693,956 | |
Citigroup Commercial Mtg Trust, Series 2004-HYB2 Class B1, 2.928%, 3/25/2034 | | | 106,161 | | | | 86,747 | |
a FREMF Mtg Trust, Series 2012-KF01 Class B Floating Rate Note, 3.025%, 10/25/2044 | | | 2,000,000 | | | | 2,006,898 | |
a FREMF Mtg Trust, Series 2013-KF02 Class B Floating Rate Note, 3.433%, 12/25/2045 | | | 754,030 | | | | 766,132 | |
| | | | | | | | |
| | | | | | | 12,494,722 | |
| | | | | | | | |
OTHER ASSET BACKED — 6.19% | | | | | | | | |
a 321 Henderson Receivables, LLC, Series 2014-1A Class A, 3.96%, 3/15/2063 | | | 5,883,988 | | | | 5,936,562 | |
a,b Aircraft Certificate Owner Trust, Series 2003-1A Class E, 7.001%, 9/20/2022 | | | 3,156,928 | | | | 3,317,932 | |
a American Credit Acceptance, Series 2014-2 Class B, 2.26%, 3/10/2020 | | | 4,570,254 | | | | 4,551,778 | |
a,b Concord Funding Co., LLC, Series 2012-2 Class B, 4.145%, 1/15/2017 | | | 4,000,000 | | | | 4,008,000 | |
a Dominos Pizza Master Issuer, LLC, Series 2012-1A Class A2, 5.216%, 1/25/2042 | | | 5,988,994 | | | | 6,200,129 | |
a,c ECAF Ltd., Series 2015-1A Class B1, 5.802%, 6/15/2040 | | | 7,356,975 | | | | 7,173,051 | |
a Fairway Outdoor Funding, LLC, Series 2012-1 Class B, 8.835%, 10/15/2042 | | | 3,000,000 | | | | 3,150,104 | |
a,c Global SC Finance SRL, Series 2014-1A Class A1, 3.19%, 7/17/2029 | | | 3,958,333 | | | | 3,727,697 | |
a JPR Royalty, LLC, 14.00%, 9/1/2020 | | | 2,000,000 | | | | 1,000,000 | |
a New Residential Advance Receivables, Series 2015-T3 Class DT3, 4.266%, 11/15/2046 | | | 1,900,000 | | | | 1,898,373 | |
a,b Northwind Holdings, LLC, Series 2007-1A Class A1 Floating Rate Note, 1.109%, 12/1/2037 | | | 777,000 | | | | 722,610 | |
a Ocwen Master Advance Receivables Trust, Series 2015-T2 Class DT2, 4.258%, 11/15/2046 | | | 2,345,000 | | | | 2,340,781 | |
a Progreso Receivables Funding, LLC, Series 2015-A Class A, 3.625%, 2/8/2020 | | | 10,025,000 | | | | 10,016,952 | |
a SBA Tower Trust, Series 2015-1 Class C, 3.156%, 10/15/2045 | | | 3,750,000 | | | | 3,751,425 | |
a SolarCity LMC, LLC, Series 2013-1 Class A, 4.80%, 11/20/2038 | | | 3,148,417 | | | | 3,155,950 | |
a SolarCity LMC, LLC, Series 2014-1 Class A, 4.59%, 4/20/2044 | | | 3,211,689 | | | | 3,160,237 | |
| | | | | | | | |
| | | | | | | 64,111,581 | |
| | | | | | | | |
8 Semi-Annual Report
| | |
| SCHEDULE OF INVESTMENTS, CONTINUED | | |
| |
Thornburg Strategic Income Fund | | March 31, 2016 (Unaudited) |
| | | | | | | | |
| | | Shares/
Principal Amount | | | Value | |
RESIDENTIAL MTG TRUST — 1.62% | | | | | | | | |
Banc of America Funding Corp., Series 2006-I Class SB1, 2.467%, 12/20/2036 | | $ | 565,554 | | | $ | 179,960 | |
Bear Stearns ARM Mtg, Series 2003-6 Class 2B-1, 2.606%, 8/25/2033 | | | 190,351 | | | | 187,510 | |
a Citigroup Mtg Loan Trust, Inc., Series 2014-A Class A, 4.00%, 1/25/2035 | | | 3,584,772 | | | | 3,696,871 | |
Countrywide, Series 2005-11 Class AF3, 4.778%, 2/25/2036 | | | 433,765 | | | | 436,253 | |
a CS First Boston Mtg Securities Co., Series 2005-CF1 Class M1, 1.133%, 3/25/2045 | | | 1,142,084 | | | | 1,113,162 | |
JPMorgan Mtg Acquisition Corp., Series 2006-CH1 Class A4, 0.573%, 7/25/2036 | | | 327,689 | | | | 325,731 | |
Merrill Lynch Mtg Investors Trust, Series 2004-A4 Class M1, 2.56%, 8/25/2034 | | | 277,765 | | | | 256,878 | |
Morgan Stanley Capital, Inc., Series 2005-HE7 Class A2C, 0.753%, 11/25/2035 | | | 767,001 | | | | 763,696 | |
a,b SHAP, Series 2013-RM1 Class A, 4.00%, 5/26/2053 | | | 2,578,558 | | | | 2,563,087 | |
Structured Asset Securities Corp., Series 2004-20 Class 7A1, 5.25%, 11/25/2034 | | | 590,913 | | | | 608,912 | |
a TAL Advantage, LLC, Series 2014-1A Class A, 3.51%, 2/22/2039 | | | 6,927,083 | | | | 6,590,460 | |
Wells Fargo Asset Securities Corp., Series 2005-AR1 Class 1B1, 2.77%, 2/25/2035 | | | 172,686 | | | | 21,634 | |
| | | | | | | | |
| | | | | | | 16,744,154 | |
| | | | | | | | |
| | |
STUDENT LOAN — 0.31% | | | | | | | | |
Access Group, Inc., Series 2005-A Class A3, 1.019%, 7/25/2034 | | | 3,522,415 | | | | 3,219,380 | |
| | | | | | | | |
| | | | | | | 3,219,380 | |
| | | | | | | | |
TOTAL ASSET BACKED SECURITIES (Cost $107,272,991) | | | | | | | 105,755,729 | |
| | | | | | | | |
| | |
CORPORATE BONDS — 63.02% | | | | | | | | |
| | |
AUTOMOBILES & COMPONENTS — 0.20% | | | | | | | | |
Auto Components — 0.20% | | | | | | | | |
a,c Nexteer Automotive Group Ltd., 5.875%, 11/15/2021 | | | 2,000,000 | | | | 2,033,760 | |
| | | | | | | | |
| | | | | | | 2,033,760 | |
| | | | | | | | |
| | |
BANKS — 0.96% | | | | | | | | |
Banks — 0.96% | | | | | | | | |
Bank of America Corp., 4.20%, 8/26/2024 | | | 3,200,000 | | | | 3,258,528 | |
c Royal Bank of Scotland Group plc, 9.50%, 3/16/2022 | | | 2,000,000 | | | | 2,115,200 | |
c Royal Bank of Scotland Group plc, 6.125%, 12/15/2022 | | | 2,000,000 | | | | 2,121,532 | |
a,c Sberbank of Russia, 5.50%, 2/26/2024 | | | 2,750,000 | | | | 2,498,705 | |
| | | | | | | | |
| | | | | | | 9,993,965 | |
| | | | | | | | |
| | |
CAPITAL GOODS — 5.59% | | | | | | | | |
Aerospace & Defense — 0.22% | | | | | | | | |
a CBC Ammo, LLC, 7.25%, 11/15/2021 | | | 2,970,000 | | | | 2,272,050 | |
Construction & Engineering — 1.63% | | | | | | | | |
a,c Ausdrill Finance Property Ltd., 6.875%, 11/1/2019 | | | 4,385,000 | | | | 3,398,375 | |
URS Corp., 3.85%, 4/1/2017 | | | 7,310,000 | | | | 7,282,010 | |
a Zachry Holdings, Inc., 7.50%, 2/1/2020 | | | 6,310,000 | | | | 6,152,250 | |
Electrical Equipment — 0.44% | | | | | | | | |
a EnerSys Co., 5.00%, 4/30/2023 | | | 795,000 | | | | 767,175 | |
a,c Sensata Technologies UK Finance Co., 6.25%, 2/15/2026 | | | 3,550,000 | | | | 3,780,750 | |
Industrial Conglomerates — 0.40% | | | | | | | | |
Otter Tail Corp., 9.00%, 12/15/2016 | | | 4,000,000 | | | | 4,165,568 | |
Machinery — 0.31% | | | | | | | | |
a,c Automation Tooling Systems, 6.50%, 6/15/2023 | | | 3,125,000 | | | | 3,214,844 | |
Trading Companies & Distributors — 2.59% | | | | | | | | |
a Aviation Capital Group Corp., 6.75%, 4/6/2021 | | | 11,500,000 | | | | 12,937,500 | |
a Aviation Capital Group Corp., 7.125%, 10/15/2020 | | | 1,881,000 | | | | 2,125,530 | |
a International Lease Finance Corp., 7.125%, 9/1/2018 | | | 8,000,000 | | | | 8,720,000 | |
a Wajax Corp. (CAD), 6.125%, 10/23/2020 | | | 4,210,000 | | | | 3,014,668 | |
| | | | | | | | |
| | | | | | | 57,830,720 | |
| | | | | | | | |
| | |
COMMERCIAL & PROFESSIONAL SERVICES — 3.03% | | | | | | | | |
Commercial Services & Supplies — 1.52% | | | | | | | | |
a GFL Environmental Corp. (CAD), 7.50%, 6/18/2018 | | | 5,460,000 | | | | 4,204,042 | |
RR Donnelley & Sons Co., 7.875%, 3/15/2021 | | | 6,968,000 | | | | 7,020,260 | |
RR Donnelley & Sons Co., 8.875%, 4/15/2021 | | | 4,500,000 | | | | 4,494,375 | |
Professional Services — 1.51% | | | | | | | | |
Dun & Bradstreet, Inc., 4.00%, 6/15/2020 | | | 4,185,000 | | | | 4,156,270 | |
a Nielsen Finance, LLC, 5.00%, 4/15/2022 | | | 7,420,000 | | | | 7,605,500 | |
Verisk Analytics, Inc., 4.00%, 6/15/2025 | | | 3,920,000 | | | | 3,948,989 | |
| | | | | | | | |
| | | | | | | 31,429,436 | |
| | | | | | | | |
Semi-Annual Report 9
| | |
| SCHEDULE OF INVESTMENTS, CONTINUED | | |
| |
Thornburg Strategic Income Fund | | March 31, 2016 (Unaudited) |
| | | | | | | | |
| | | Shares/
Principal Amount | | | Value | |
COMMERCIAL SERVICES & SUPPLIES — 0.42% | | | | | | | | |
Diversified Support Services — 0.42% | | | | | | | | |
Lavare Holding AB (SEK), 4.693%, 4/4/2019 | | $ | 35,000,000 | | | $ | 4,317,741 | |
| | | | | | | | |
| | | | | | | 4,317,741 | |
| | | | | | | | |
| | |
CONSUMER DURABLES & APPAREL — 0.20% | | | | | | | | |
Leisure Products — 0.20% | | | | | | | | |
a Vista Outdoor, Inc., 5.875%, 10/1/2023 | | | 1,985,000 | | | | 2,079,288 | |
| | | | | | | | |
| | | | | | | 2,079,288 | |
| | | | | | | | |
| | |
CONSUMER SERVICES — 2.63% | | | | | | | | |
Diversified Consumer Services — 0.41% | | | | | | | | |
a Nord Anglia Education Finance, LLC (CHF), 5.75%, 7/15/2022 | | | 3,985,000 | | | | 4,247,959 | |
Hotels, Restaurants & Leisure — 2.22% | | | | | | | | |
Aramark Services, Inc., 5.125%, 1/15/2024 | | | 2,410,000 | | | | 2,539,537 | |
Aramark Services, Inc., 5.75%, 3/15/2020 | | | 8,720,000 | | | | 8,992,500 | |
a,c Arcos Dorados Holdings, Inc., 6.625%, 9/27/2023 | | | 7,470,000 | | | | 7,115,175 | |
a Arcos Dorados Holdings, Inc. (BRL), 10.25%, 7/13/2016 | | | 8,000,000 | | | | 2,069,167 | |
a Nathan’s Famous, Inc., 10.00%, 3/15/2020 | | | 2,160,000 | | | | 2,273,400 | |
| | | | | | | | |
| | | | | | | 27,237,738 | |
| | | | | | | | |
| | |
DIVERSIFIED FINANCIALS — 7.43% | | | | | | | | |
Capital Markets — 3.41% | | | | | | | | |
Ares Capital Corp., 4.875%, 11/30/2018 | | | 7,000,000 | | | | 7,191,506 | |
a Ares Finance Co., LLC, 4.00%, 10/8/2024 | | | 4,025,000 | | | | 3,873,978 | |
a,c BTG Investments LP, 4.50%, 4/17/2018 | | | 4,750,000 | | | | 3,823,750 | |
c Credit Suisse Group Funding (Guernsey) Ltd., 3.80%, 9/15/2022 | | | 2,450,000 | | | | 2,438,424 | |
FS Investment Corp., 4.00%, 7/15/2019 | | | 6,286,000 | | | | 6,300,634 | |
Goldman Sachs Group, Inc. Floating Rate Note, 1.639%, 10/23/2019 | | | 11,760,000 | | | | 11,679,373 | |
Consumer Finance — 1.35% | | | | | | | | |
Ally Financial, Inc., 4.75%, 9/10/2018 | | | 4,000,000 | | | | 4,060,000 | |
a,d,e Cash Store Financial (CAD), 0%, 1/31/2017 | | | 1,700,000 | | | | 250,337 | |
First Cash Financial Services, Inc., 6.75%, 4/1/2021 | | | 10,000,000 | | | | 9,625,000 | |
Diversified Financial Services — 2.67% | | | | | | | | |
a Athene Global Funding, 2.875%, 10/23/2018 | | | 4,725,000 | | | | 4,650,988 | |
a,c CFG Holdings Ltd./CFG Finance, LLC, 11.50%, 11/15/2019 | | | 7,000,000 | | | | 7,000,000 | |
a Citicorp, 8.04%, 12/15/2019 | | | 250,000 | | | | 292,555 | |
General Electric Capital Corp. (SEK), 2.625%, 1/16/2018 | | | 24,000,000 | | | | 3,076,139 | |
McGraw Hill Financial, Inc., 4.00%, 6/15/2025 | | | 1,590,000 | | | | 1,656,662 | |
McGraw Hill Financial, Inc., 3.30%, 8/14/2020 | | | 1,975,000 | | | | 2,043,159 | |
a MSCI, Inc., 5.75%, 8/15/2025 | | | 2,640,000 | | | | 2,778,600 | |
a MSCI, Inc., 5.25%, 11/15/2024 | | | 1,625,000 | | | | 1,677,812 | |
a TMX Finance, LLC/Titlemax Finance, 8.50%, 9/15/2018 | | | 5,610,000 | | | | 4,488,000 | |
| | | | | | | | |
| | | | | | | 76,906,917 | |
| | | | | | | | |
| | |
ENERGY — 8.56% | | | | | | | | |
Energy Equipment & Services — 1.11% | | | | | | | | |
a,c Anton Oilfield Services Group, 7.50%, 11/6/2018 | | | 7,000,000 | | | | 3,080,000 | |
Compressco Partners, L.P., 7.25%, 8/15/2022 | | | 4,800,000 | | | | 3,348,000 | |
Oceaneering International, Inc., 4.65%, 11/15/2024 | | | 4,075,000 | | | | 3,509,386 | |
a,c,d Schahin II Finance Co. (SPV) Ltd., 5.875%, 9/25/2023 | | | 10,684,600 | | | | 1,554,609 | |
Oil, Gas & Consumable Fuels — 7.45% | | | | | | | | |
Atlas Energy Holdings Operating Co., LLC, 7.75%, 1/15/2021 | | | 3,000,000 | | | | 435,000 | |
Calumet Specialty Products Partners, L.P., 7.625%, 1/15/2022 | | | 2,050,000 | | | | 1,450,375 | |
Calumet Specialty Products Partners, L.P., 6.50%, 4/15/2021 | | | 1,420,000 | | | | 1,008,200 | |
a Citgo Petroleum Corp., 6.25%, 8/15/2022 | | | 450,000 | | | | 434,250 | |
Energy Transfer Partners LP, 3.633%, 11/1/2066 | | | 1,200,000 | | | | 684,000 | |
Enterprise Products Operating LP, 7.034%, 1/15/2068 | | | 1,400,000 | | | | 1,419,600 | |
a Florida Gas Transmission Co., LLC, 3.875%, 7/15/2022 | | | 4,765,000 | | | | 4,613,268 | |
a Florida Gas Transmission Co., LLC, 4.35%, 7/15/2025 | | | 2,224,000 | | | | 2,111,855 | |
Gastar Exploration USA, Inc., 8.625%, 5/15/2018 | | | 1,911,000 | | | | 1,223,040 | |
Global Partners LP/GLP Finance Corp., 6.25%, 7/15/2022 | | | 4,975,000 | | | | 3,706,375 | |
Gulf South Pipeline Co. LP, 4.00%, 6/15/2022 | | | 4,860,000 | | | | 4,430,867 | |
a Gulfstream Natural Gas System, LLC, 4.60%, 9/15/2025 | | | 5,515,000 | | | | 5,397,657 | |
HollyFrontier Corp., 5.875%, 4/1/2026 | | | 3,500,000 | | | | 3,484,282 | |
a Kinder Morgan (Delaware), Inc., 5.00%, 2/15/2021 | | | 6,101,000 | | | | 6,225,894 | |
a Linc Energy, 9.625%, 10/31/2017 | | | 1,324,000 | | | | 178,740 | |
a Linc Energy, 12.50%, 10/31/2017 | | | 6,617,950 | | | | 8,272 | |
10 Semi-Annual Report
| | |
| SCHEDULE OF INVESTMENTS, CONTINUED | | |
| |
Thornburg Strategic Income Fund | | March 31, 2016 (Unaudited) |
| | | | | | | | |
| | | Shares/
Principal Amount | | | Value | |
NGL Energy Partners LP, 6.875%, 10/15/2021 | | $ | 6,000,000 | | | $ | 3,540,000 | |
Northern Tier Energy, LLC, 7.125%, 11/15/2020 | | | 6,450,000 | | | | 6,321,000 | |
a,c Odebrecht Offshore Drilling Finance Ltd., 6.75%, 10/1/2023 | | | 3,957,300 | | | | 870,606 | |
c Petrobras Global Finance B.V., 3.00%, 1/15/2019 | | | 1,000,000 | | | | 859,424 | |
c Petrobras Global Finance B.V. Floating Rate Note, 3.002%, 3/17/2017 | | | 3,650,000 | | | | 3,522,615 | |
Plains All American Pipeline LP, 8.75%, 5/1/2019 | | | 1,000,000 | | | | 1,105,490 | |
a,c QGOG Atlantic/Alaskan Rigs Ltd., 5.25%, 7/30/2019 | | | 1,003,590 | | | | 747,675 | |
d RAAM Global Energy Co., 12.50%, 10/1/2049 | | | 2,000,000 | | | | 15,000 | |
a Rockies Express Pipeline, LLC, 6.85%, 7/15/2018 | | | 2,000,000 | | | | 1,995,000 | |
Summit Midstream Holdings, LLC, 5.50%, 8/15/2022 | | | 8,360,000 | | | | 5,935,600 | |
Tesoro Logistics LP, 6.125%, 10/15/2021 | | | 2,000,000 | | | | 2,000,000 | |
a Transcontinental Gas Pipe Line Co., LLC, 7.85%, 2/1/2026 | | | 3,600,000 | | | | 4,117,385 | |
a,c Tullow Oil plc, 6.25%, 4/15/2022 | | | 6,400,000 | | | | 4,540,800 | |
Williams Partners LP, 4.50%, 11/15/2023 | | | 5,600,000 | | | | 4,757,474 | |
| | | | | | | | |
| | | | | | | 88,631,739 | |
| | | | | | | | |
| | |
FOOD & STAPLES RETAILING — 2.21% | | | | | | | | |
Food & Staples Retailing — 2.21% | | | | | | | | |
a Bakkavor Finance (2) plc (GBP), 8.75%, 6/15/2020 | | | 6,275,000 | | | | 9,645,589 | |
a C&S Group Enterprises, LLC, 5.375%, 7/15/2022 | | | 6,485,000 | | | | 6,144,537 | |
US Foods, Inc., 8.50%, 6/30/2019 | | | 2,000,000 | | | | 2,055,000 | |
a,f Whole Foods Market, Inc., 5.20%, 12/3/2025 | | | 4,830,000 | | | | 5,061,396 | |
| | | | | | | | |
| | | | | | | 22,906,522 | |
| | | | | | | | |
| | |
FOOD, BEVERAGE & TOBACCO — 2.05% | | | | | | | | |
Beverages — 0.56% | | | | | | | | |
Ambev International Finance Co., Ltd. (BRL), 9.50%, 7/24/2017 | | | 2,000,000 | | | | 523,076 | |
a,c Central America Bottling Corp., 6.75%, 2/9/2022 | | | 5,000,000 | | | | 5,262,500 | |
Food Products — 1.14% | | | | | | | | |
a,c Barry Callebaut Services NV, 5.50%, 6/15/2023 | | | 4,000,000 | | | | 4,164,080 | |
a,c BRF S.A., 4.75%, 5/22/2024 | | | 4,650,000 | | | | 4,394,250 | |
a,c Comfeed Finance B.V., 6.00%, 5/2/2018 | | | 1,000,000 | | | | 901,250 | |
a Dean Foods Co., 6.50%, 3/15/2023 | | | 2,300,000 | | | | 2,366,125 | |
Tobacco — 0.35% | | | | | | | | |
Vector Group Ltd., 7.75%, 2/15/2021 | | | 3,400,000 | | | | 3,570,000 | |
| | | | | | | | |
| | | | | | | 21,181,281 | |
| | | | | | | | |
| | |
HEALTH CARE EQUIPMENT & SERVICES — 1.21% | | | | | | | | |
Health Care Providers & Services — 1.21% | | | | | | | | |
a Covenant Surgical Partners, Inc., 8.75%, 8/1/2019 | | | 6,125,000 | | | | 5,880,000 | |
DaVita Healthcare Partners, Inc., 5.00%, 5/1/2025 | | | 3,450,000 | | | | 3,415,500 | |
HCA, Inc., 4.75%, 5/1/2023 | | | 1,735,000 | | | | 1,765,362 | |
LifePoint Health, Inc., 5.875%, 12/1/2023 | | | 1,375,000 | | | | 1,436,875 | |
| | | | | | | | |
| | | | | | | 12,497,737 | |
| | | | | | | | |
| | |
HOUSEHOLD & PERSONAL PRODUCTS — 0.87% | | | | | | | | |
Household Products — 0.87% | | | | | | | | |
Energizer Holdings, Inc., 4.70%, 5/24/2022 | | | 5,990,000 | | | | 6,109,800 | |
a Energizer Holdings, Inc., 5.50%, 6/15/2025 | | | 2,850,000 | | | | 2,864,250 | |
| | | | | | | | |
| | | | | | | 8,974,050 | |
| | | | | | | | |
| | |
INSURANCE — 2.68% | | | | | | | | |
Insurance — 2.68% | | | | | | | | |
CNA Financial Corp., 4.50%, 3/1/2026 | | | 3,460,000 | | | | 3,507,475 | |
a,c DaVinciRe Holdings Ltd., 4.75%, 5/1/2025 | | | 4,790,000 | | | | 4,736,673 | |
ELM B.V. (AUD), 7.635%, 12/29/2049 | | | 1,000,000 | | | | 787,996 | |
ELM B.V. (AUD), 3.538%, 4/29/2049 | | | 1,000,000 | | | | 752,122 | |
a Forethought Financial Group, Inc., 8.625%, 4/15/2021 | | | 1,160,000 | | | | 1,263,157 | |
Genworth Holdings, Inc., 4.90%, 8/15/2023 | | | 6,000,000 | | | | 4,455,000 | |
Kemper Corp., 4.35%, 2/15/2025 | | | 3,950,000 | | | | 3,995,709 | |
a,c Lancashire Holdings Ltd., 5.70%, 10/1/2022 | | | 4,900,000 | | | | 5,292,240 | |
a National Life Insurance of Vermont, 10.50%, 9/15/2039 | | | 1,000,000 | | | | 1,475,936 | |
a ZFS Finance USA Trust II, 6.45%, 12/15/2065 | | | 1,460,000 | | | | 1,457,080 | |
| | | | | | | | |
| | | | | | | 27,723,388 | |
| | | | | | | | |
| | |
MATERIALS — 4.79% | | | | | | | | |
Chemicals — 1.79% | | | | | | | | |
a,c Consolidated Energy Finance S.A., 6.75%, 10/15/2019 | | | 3,030,000 | | | | 2,886,075 | |
a,c Kissner Milling Co., Ltd., 7.25%, 6/1/2019 | | | 5,595,000 | | | | 5,245,312 | |
Semi-Annual Report 11
| | |
| SCHEDULE OF INVESTMENTS, CONTINUED | | |
| |
Thornburg Strategic Income Fund | | March 31, 2016 (Unaudited) |
| | | | | | | | |
| | | Shares/
Principal Amount | | | Value | |
a,c Office Cherifien des Phosphates, 5.625%, 4/25/2024 | | $ | 10,000,000 | | | $ | 10,398,000 | |
Construction Materials — 0.65% | | | | | | | | |
a,c Cimpor Financial Operations B.V., 5.75%, 7/17/2024 | | | 6,500,000 | | | | 4,712,500 | |
Wesco Distribution, Inc., 5.375%, 12/15/2021 | | | 2,000,000 | | | | 2,020,000 | |
Metals & Mining — 1.71% | | | | | | | | |
Coeur d’Alene Mines Corp., 7.875%, 2/1/2021 | | | 1,793,000 | | | | 1,438,883 | |
a Glencore Funding, LLC Floating Rate Note, 1.982%, 1/15/2019 | | | 11,000,000 | | | | 9,625,000 | |
a,c Newcrest Finance Property Ltd., 4.20%, 10/1/2022 | | | 7,000,000 | | | | 6,633,550 | |
Paper & Forest Products — 0.64% | | | | | | | | |
a Neenah Paper, Inc., 5.25%, 5/15/2021 | | | 6,725,000 | | | | 6,590,500 | |
| | | | | | | | |
| | | | | | | 49,549,820 | |
| | | | | | | | |
| | |
MEDIA — 2.35% | | | | | | | | |
Media — 2.35% | | | | | | | | |
a Cable One, Inc., 5.75%, 6/15/2022 | | | 8,831,000 | | | | 8,963,465 | |
a,c Numericable Group -SFR, 4.875%, 5/15/2019 | | | 3,800,000 | | | | 3,781,000 | |
a,c Numericable Group -SFR, 6.00%, 5/15/2022 | | | 5,475,000 | | | | 5,338,125 | |
The Washington Post Co., 7.25%, 2/1/2019 | | | 2,100,000 | | | | 2,257,500 | |
a,c Virgin Media, Inc., 5.375%, 4/15/2021 | | | 3,829,500 | | | | 3,992,254 | |
| | | | | | | | |
| | | | | | | 24,332,344 | |
| | | | | | | | |
| | |
PHARMACEUTICALS, BIOTECHNOLOGY & LIFE SCIENCES — 0.45% | | | | | | | | |
Pharmaceuticals — 0.45% | | | | | | | | |
a,b Atlas U.S. Royalty, LLC, 12.25%, 3/15/2027 | | | 5,450,000 | | | | 207,100 | |
a,c Concordia Healthcare Corp., 7.00%, 4/15/2023 | | | 3,395,000 | | | | 2,911,212 | |
a,c Concordia Healthcare Corp., 9.50%, 10/21/2022 | | | 1,560,000 | | | | 1,509,300 | |
| | | | | | | | |
| | | | | | | 4,627,612 | |
| | | | | | | | |
| | |
REAL ESTATE — 0.81% | | | | | | | | |
Real Estate Investment Trusts — 0.81% | | | | | | | | |
EPR Properties, 5.25%, 7/15/2023 | | | 5,000,000 | | | | 5,107,645 | |
Retail Opportunity Investments Corp., 5.00%, 12/15/2023 | | | 1,500,000 | | | | 1,540,804 | |
Select Income REIT, 2.85%, 2/1/2018 | | | 1,720,000 | | | | 1,721,211 | |
| | | | | | | | |
| | | | | | | 8,369,660 | |
| | | | | | | | |
| | |
RETAILING — 2.76% | | | | | | | | |
Distributors — 1.06% | | | | | | | | |
LKQ Corp., Inc., 4.75%, 5/15/2023 | | | 11,254,000 | | | | 10,944,515 | |
Internet & Catalog Retail — 0.76% | | | | | | | | |
QVC, Inc., 4.45%, 2/15/2025 | | | 8,147,000 | | | | 7,875,664 | |
Multiline Retail — 0.47% | | | | | | | | |
a,c Grupo Famsa S.A.B. de C.V., 7.25%, 6/1/2020 | | | 5,550,000 | | | | 4,897,875 | |
Specialty Retail — 0.47% | | | | | | | | |
Outerwall, Inc., 5.875%, 6/15/2021 | | | 6,615,000 | | | | 4,895,100 | |
| | | | | | | | |
| | | | | | | 28,613,154 | |
| | | | | | | | |
| | |
SEMICONDUCTORS & SEMICONDUCTOR EQUIPMENT — 0.23% | | | | | | | | |
Semiconductors & Semiconductor Equipment — 0.23% | | | | | | | | |
a,c Sensata Technologies B.V., 5.00%, 10/1/2025 | | | 2,400,000 | | | | 2,418,000 | |
| | | | | | | | |
| | | | | | | 2,418,000 | |
| | | | | | | | |
| | |
SOFTWARE & SERVICES — 1.89% | | | | | | | | |
Information Technology Services — 0.69% | | | | | | | | |
Neustar, Inc., 4.50%, 1/15/2023 | | | 8,770,000 | | | | 7,147,550 | |
Internet Software & Services — 0.54% | | | | | | | | |
Lender Processing Services, Inc./Black Knight Lending Solutions, Inc., 5.75%, 4/15/2023 | | | 5,417,000 | | | | 5,606,595 | |
Software — 0.66% | | | | | | | | |
Autodesk, Inc., 3.125%, 6/15/2020 | | | 2,350,000 | | | | 2,383,528 | |
Autodesk, Inc., 4.375%, 6/15/2025 | | | 1,600,000 | | | | 1,635,038 | |
a Solera Capital, LLC, 10.50%, 3/1/2024 | | | 2,830,000 | | | | 2,844,150 | |
| | | | | | | | |
| | | | | | | 19,616,861 | |
| | | | | | | | |
| | |
TECHNOLOGY HARDWARE & EQUIPMENT — 2.51% | | | | | | | | |
Computers & Peripherals — 0.11% | | | | | | | | |
Lexmark International, Inc., 5.125%, 3/15/2020 | | | 1,038,000 | | | | 1,083,719 | |
Electronic Equipment, Instruments & Components — 1.64% | | | | | | | | |
Anixter, Inc., 5.125%, 10/1/2021 | | | 8,395,000 | | | | 8,436,975 | |
Ingram Micro, Inc., 4.95%, 12/15/2024 | | | 1,951,000 | | | | 1,898,698 | |
12 Semi-Annual Report
| | |
| SCHEDULE OF INVESTMENTS, CONTINUED | | |
| |
Thornburg Strategic Income Fund | | March 31, 2016 (Unaudited) |
| | | | | | | | |
| | | Shares/
Principal Amount | | | Value | |
Trimble Navigation Ltd., 4.75%, 12/1/2024 | | $ | 6,525,000 | | | $ | 6,653,438 | |
Technology, Hardware, Storage & Peripherals — 0.76% | | | | | | | | |
a Hewlett-Packard Enterprise Co., 3.60%, 10/15/2020 | | | 3,930,000 | | | | 4,086,575 | |
a,g Western Digital Corp., 7.375%, 4/1/2023 | | | 3,725,000 | | | | 3,799,500 | |
| | | | | | | | |
| | | | | | | 25,958,905 | |
| | | | | | | | |
| | |
TELECOMMUNICATION SERVICES — 3.96% | | | | | | | | |
Diversified Telecommunication Services — 1.14% | | | | | | | | |
AT&T, Inc., 3.00%, 6/30/2022 | | | 2,395,000 | | | | 2,429,823 | |
c Telefonica Emisiones SAU, 6.421%, 6/20/2016 | | | 1,000,000 | | | | 1,010,722 | |
a,c Videotron Ltd. Co., 5.375%, 6/15/2024 | | | 8,050,000 | | | | 8,351,875 | |
Wireless Telecommunication Services — 2.82% | | | | | | | | |
America Movil Sab de CV (MXN), 6.45%, 12/5/2022 | | | 120,000,000 | | | | 6,613,591 | |
a,c Digicel Ltd., 6.00%, 4/15/2021 | | | 8,450,000 | | | | 7,562,750 | |
a,c Millicom International Cellular S.A., 6.00%, 3/15/2025 | | | 5,578,000 | | | | 5,173,595 | |
a,c MTN International (Mauritius) Ltd., 4.755%, 11/11/2024 | | | 4,125,000 | | | | 3,713,325 | |
a WCP Issuer, LLC, 7.143%, 8/15/2043 | | | 6,000,000 | | | | 6,172,500 | |
| | | | | | | | |
| | | | | | | 41,028,181 | |
| | | | | | | | |
| | |
TRANSPORTATION — 3.14% | | | | | | | | |
Airlines — 2.77% | | | | | | | | |
a American Airlines Group, Inc., 5.60%, 1/15/2022 | | | 12,658,122 | | | | 12,784,703 | |
American Airlines Group, Inc., 4.95%, 7/15/2024 | | | 2,520,471 | | | | 2,696,702 | |
Continental Airlines, 9.798%, 10/1/2022 | | | 5,367,252 | | | | 5,850,304 | |
a,c Guanay Finance Ltd., 6.00%, 12/15/2020 | | | 2,631,685 | | | | 2,546,156 | |
US Airways, 5.90%, 4/1/2026 | | | 1,660,974 | | | | 1,856,138 | |
US Airways, 7.076%, 9/20/2022 | | | 1,368,749 | | | | 1,454,296 | |
US Airways, 6.25%, 10/22/2024 | | | 1,418,970 | | | | 1,560,867 | |
Marine — 0.37% | | | | | | | | |
a,c Stena International SA, 5.75%, 3/1/2024 | | | 4,650,000 | | | | 3,813,000 | |
| | | | | | | | |
| | | | | | | 32,562,166 | |
| | | | | | | | |
| | |
UTILITIES — 2.09% | | | | | | | | |
Electric Utilities — 1.12% | | | | | | | | |
a Duquesne Light Holdings, Inc., 6.40%, 9/15/2020 | | | 2,000,000 | | | | 2,290,330 | |
a Jersey Central Power & Light Co., 4.30%, 1/15/2026 | | | 3,965,000 | | | | 4,132,311 | |
Puget Energy, Inc., 6.50%, 12/15/2020 | | | 2,000,000 | | | | 2,319,022 | |
Puget Energy, Inc., 5.625%, 7/15/2022 | | | 2,500,000 | | | | 2,799,655 | |
Gas Utilities — 0.32% | | | | | | | | |
a Source Gas, LLC., 5.90%, 4/1/2017 | | | 1,250,000 | | | | 1,291,113 | |
a Southern Star Central Gas Pipeline, Inc., 6.00%, 6/1/2016 | | | 2,000,000 | | | | 2,010,690 | |
Independent Power & Renewable Electricity Producers — 0.42% | | | | | | | | |
Ipalco Enterprises, Inc., 5.00%, 5/1/2018 | | | 2,500,000 | | | | 2,625,000 | |
a Midland Cogeneration Venture, 6.00%, 3/15/2025 | | | 1,634,966 | | | | 1,736,777 | |
Multi-Utilities — 0.23% | | | | | | | | |
CMS Energy Corp., 8.75%, 6/15/2019 | | | 2,000,000 | | | | 2,421,658 | |
| | | | | | | | |
| | | | | | | 21,626,556 | |
| | | | | | | | |
TOTAL CORPORATE BONDS (Cost $712,516,621) | | | | | | | 652,447,541 | |
| | | | | | | | |
| | |
CONVERTIBLE BONDS — 2.32% | | | | | | | | |
| | |
DIVERSIFIED FINANCIALS — 0.49% | | | | | | | | |
Consumer Finance — 0.49% | | | | | | | | |
EZCORP, Inc., 2.125%, 6/15/2019 | | | 8,159,000 | | | | 5,119,772 | |
| | | | | | | | |
| | | | | | | 5,119,772 | |
| | | | | | | | |
| | |
FOOD, BEVERAGE & TOBACCO — 0.24% | | | | | | | | |
Tobacco — 0.24% | | | | | | | | |
Vector Group Ltd., 1.75%, 4/15/2020 | | | 2,260,000 | | | | 2,498,713 | |
| | | | | | | | |
| | | | | | | 2,498,713 | |
| | | | | | | | |
| | |
MEDIA — 0.76% | | | | | | | | |
Media — 0.76% | | | | | | | | |
Comcast Holdings Corp., 2.00%, 10/15/2029 | | | 15,500,000 | | | | 7,827,500 | |
| | | | | | | | |
| | | | | | | 7,827,500 | |
| | | | | | | | |
| | |
REAL ESTATE — 0.83% | | | | | | | | |
Real Estate Investment Trusts — 0.83% | | | | | | | | |
VEREIT, Inc., 3.00%, 8/1/2018 | | | 3,890,000 | | | | 3,778,162 | |
Semi-Annual Report 13
| | |
| SCHEDULE OF INVESTMENTS, CONTINUED | | |
| |
Thornburg Strategic Income Fund | | March 31, 2016 (Unaudited) |
| | | | | | | | |
| | | Shares/
Principal Amount | | | Value | |
a IAS Operating Partnership LP, 5.00%, 3/15/2018 | | $ | 5,040,000 | | | $ | 4,762,800 | |
| | | | | | | | |
| | | | | | | 8,540,962 | |
| | | | | | | | |
TOTAL CONVERTIBLE BONDS (Cost $25,431,537) | | | | | | | 23,986,947 | |
| | | | | | | | |
| | |
WARRANTS — 0.00% | | | | | | | | |
| | |
PHARMACEUTICALS, BIOTECHNOLOGY & LIFE SCIENCES — 0.00% | | | | | | | | |
Pharmaceuticals — 0.00% | | | | | | | | |
e Alexza Pharmaceuticals, Inc. | | | 41,863 | | | | 20,283 | |
| | | | | | | | |
| | | | | | | 20,283 | |
| | | | | | | | |
TOTAL WARRANTS (Cost $213,640) | | | | | | | 20,283 | |
| | | | | | | | |
| | |
MUNICIPAL BONDS — 0.43% | | | | | | | | |
California Health Facilities Financing Authority (Developmental Disabilities), 7.875%, 2/1/2026 | | | 1,940,000 | | | | 2,302,878 | |
a Midwest Family Housing, 5.168%, 7/1/2016 | | | 98,136 | | | | 98,394 | |
Oklahoma Development Finance Authority, 8.00%, 5/1/2020 | | | 805,000 | | | | 822,919 | |
San Bernardino County California Redevelopment Agency (San Sevaine), 8.45%, 9/1/2030 | | | 1,000,000 | | | | 1,178,470 | |
Wisconsin Health & Educational Facilities Authority (Richland Hospital), 7.08%, 6/1/2016 | | | 25,000 | | | | 24,998 | |
| | | | | | | | |
TOTAL MUNICIPAL BONDS (Cost $3,831,711) | | | | | | | 4,427,659 | |
| | | | | | | | |
| | |
U.S. GOVERNMENT AGENCIES — 1.15% | | | | | | | | |
a CoBank ACB Floating Rate Note, (Farm Credit Banks), 1.234%, 6/15/2022 | | | 12,700,000 | | | | 11,877,243 | |
| | | | | | | | |
TOTAL U.S. GOVERNMENT AGENCIES (Cost $12,186,912) | | | | | | | 11,877,243 | |
| | | | | | | | |
| | |
OTHER GOVERNMENT — 2.68% | | | | | | | | |
Mexican Bonos de Desarrollo (MXN), 5.00%, 6/15/2017 | | | 130,000,000 | | | | 7,607,240 | |
Mexican Bonos de Desarrollo (MXN), 4.75%, 6/14/2018 | | | 275,000,000 | | | | 16,006,192 | |
a,c Seven and Seven Ltd. Floating Rate Note, (Guaranty: Export-Import Bank of Korea), 1.898%, 9/11/2019 | | | 4,200,000 | | | | 4,183,296 | |
| | | | | | | | |
TOTAL OTHER GOVERNMENT (Cost $33,937,071) | | | | | | | 27,796,728 | |
| | | | | | | | |
| | |
MORTGAGE BACKED — 0.04% | | | | | | | | |
Federal National Mtg Assoc., CMO Series 1994-37 Class L, 6.50%, 3/25/2024 | | | 3,173 | | | | 3,526 | |
b Reilly FHA 1997-A Mtg, 6.896%, 7/1/2020 | | | 405,955 | | | | 405,955 | |
| | | | | | | | |
TOTAL MORTGAGE BACKED (Cost $417,225) | | | | | | | 409,481 | |
| | | | | | | | |
| | |
LOAN PARTICIPATIONS — 8.45% | | | | | | | | |
| | |
COMMERCIAL & PROFESSIONAL SERVICES — 0.76% | | | | | | | | |
Professional Services — 0.76% | | | | | | | | |
Affinion Group, Inc., 6.75%, 4/30/2018 | | | 3,939,698 | | | | 3,483,836 | |
Extreme Reach, Inc., 6.75%, 2/7/2020 | | | 4,366,778 | | | | 4,343,110 | |
| | | | | | | | |
| | | | | | | 7,826,946 | |
| | | | | | | | |
| | |
CONSUMER DURABLES & APPAREL — 0.21% | | | | | | | | |
Textiles, Apparel & Luxury Goods — 0.21% | | | | | | | | |
5.11, Inc., 6.00%, 2/28/2020 | | | 2,140,714 | | | | 2,132,687 | |
| | | | | | | | |
| | | | | | | 2,132,687 | |
| | | | | | | | |
| | |
CONSUMER SERVICES — 0.57% | | | | | | | | |
Diversified Consumer Services — 0.57% | | | | | | | | |
Laureate Education, Inc., 5.00%, 6/15/2018 | | | 6,878,962 | | | | 5,915,907 | |
| | | | | | | | |
| | | | | | | 5,915,907 | |
| | | | | | | | |
| | |
DIVERSIFIED FINANCIALS — 0.76% | | | | | | | | |
Diversified Financial Services — 0.76% | | | | | | | | |
NCP Finance LP, 11.00%, 10/1/2018 | | | 4,190,300 | | | | 3,561,755 | |
c Stena International S.A., 4.00%, 3/3/2021 | | | 5,262,600 | | | | 4,335,067 | |
| | | | | | | | |
| | | | | | | 7,896,822 | |
| | | | | | | | |
| | |
ENERGY — 0.55% | | | | | | | | |
Oil, Gas & Consumable Fuels — 0.55% | | | | | | | | |
CITGO Holding, Inc., 9.50%, 5/12/2018 | | | 3,585,566 | | | | 3,582,195 | |
Murray Energy Corp., 7.00%, 4/7/2017 | | | 3,162,395 | | | | 2,118,805 | |
| | | | | | | | |
| | | | | | | 5,701,000 | |
| | | | | | | | |
14 Semi-Annual Report
| | |
| SCHEDULE OF INVESTMENTS, CONTINUED | | |
| |
Thornburg Strategic Income Fund | | March 31, 2016 (Unaudited) |
| | | | | | | | |
| | |
| | | Shares/
Principal Amount | | | Value | |
FOOD, BEVERAGE & TOBACCO — 0.62% | | | | | | | | |
Tobacco — 0.62% | | | | | | | | |
North Atlantic Trading Co., Inc., 7.75%-9.00%, 1/13/2020 | | $ | 6,553,673 | | | $ | 6,455,368 | |
| | | | | | | | |
| | | | | | | 6,455,368 | |
| | | | | | | | |
| | |
INDUSTRIALS — 0.92% | | | | | | | | |
Construction & Engineering — 0.92% | | | | | | | | |
ABG Intermediate Holdings (2), LLC, 9.50%, 5/27/2022 | | | 10,100,000 | | | | 9,544,500 | |
| | | | | | | | |
| | | | | | | 9,544,500 | |
| | | | | | | | |
| | |
MATERIALS — 0.98% | | | | | | | | |
Chemicals — 0.52% | | | | | | | | |
OCI Beaumont, LLC, 5.50%, 8/20/2019 | | | 5,334,376 | | | | 5,361,048 | |
Metals & Mining — 0.46% | | | | | | | | |
Coeur Mining, Inc., 9.00%, 6/9/2020 | | | 4,962,500 | | | | 4,813,625 | |
| | | | | | | | |
| | | | | | | 10,174,673 | |
| | | | | | | | |
| | |
MEDIA — 1.40% | | | | | | | | |
Media — 1.40% | | | | | | | | |
Cumulus Media Holdings, Inc., 6.25%, 12/23/2020 | | | 450,195 | | | | 302,756 | |
c Mood Media Corp., 7.00%, 5/1/2019 | | | 9,735,634 | | | | 9,032,818 | |
New Media Holdings II, LLC, 6.25%, 6/4/2020 | | | 5,301,123 | | | | 5,158,682 | |
| | | | | | | | |
| | | | | | | 14,494,256 | |
| | | | | | | | |
| | |
REAL ESTATE — 0.36% | | | | | | | | |
Real Estate Management & Development — 0.36% | | | | | | | | |
DTZ U.S. Borrower, LLC, 9.25%, 11/4/2022 | | | 3,740,000 | | | | 3,665,200 | |
| | | | | | | | |
| | | | | | | 3,665,200 | |
| | | | | | | | |
| | |
RETAILING — 0.37% | | | | | | | | |
Specialty Retail — 0.37% | | | | | | | | |
NBTY, Inc., 3.50%, 10/1/2017 | | | 3,844,851 | | | | 3,826,435 | |
| | | | | | | | |
| | | | | | | 3,826,435 | |
| | | | | | | | |
| | |
SOFTWARE & SERVICES — 0.84% | | | | | | | | |
Information Technology Services — 0.84% | | | | | | | | |
First Data Corp. | | | 2,199,847 | | | | 2,193,798 | |
b Valores Corporativos Softtek, S.A. de C.V., 3.38%-6.93%, 8/27/2019 | | | 6,833,333 | | | | 6,443,833 | |
| | | | | | | | |
| | | | | | | 8,637,631 | |
| | | | | | | | |
| | |
TRANSPORTATION — 0.11% | | | | | | | | |
Airlines — 0.11% | | | | | | | | |
a,b,c ET Two, LLC, 10.00%, 9/30/2019 | | | 338,633 | | | | 335,924 | |
a,b,c ET Three, LLC, 10.00%, 9/30/2019 | | | 338,633 | | | | 335,924 | |
a,b,c OS Two, LLC, 10.00%, 12/15/2020 | | | 494,100 | | | | 493,111 | |
| | | | | | | | |
| | | | | | | 1,164,959 | |
| | | | | | | | |
TOTAL LOAN PARTICIPATIONS (Cost $92,701,911) | | | | | | | 87,436,384 | |
| | | | | | | | |
| | |
SHORT TERM INVESTMENTS — 8.78% | | | | | | | | |
h Thornburg Capital Management Fund | | | 9,093,557 | | | | 90,935,572 | |
| | | | | | | | |
TOTAL SHORT TERM INVESTMENTS (Cost $90,935,572) | | | | | | | 90,935,572 | |
| | | | | | | | |
TOTAL INVESTMENTS — 99.19% (Cost $1,105,861,833) | | | | | | $ | 1,026,827,439 | |
OTHER ASSETS LESS LIABILITIES — 0.81% | | | | | | | 8,398,760 | |
| | | | | | | | |
NET ASSETS — 100.00% | | | | | | $ | 1,035,226,199 | |
| | | | | | | | |
Footnote Legend
| a | Securities exempt from registration under Rule 144A of the Securities Act of 1933, as amended. These securities may only be resold in the ordinary course of business in transactions exempt from registration, normally to qualified institutional buyers. As of March 31, 2016, the aggregate value of these securities in the Fund’s portfolio was $491,830,615, representing 47.51% of the Fund’s net assets. |
| b | Security currently fair valued by the Valuation and Pricing Committee using procedures approved by the Trustees’ Audit Committee. |
| c | Yankee bond denominated in U.S. dollars and is issued in the U.S. by foreign banks and corporations. |
| f | Segregated as collateral for a when-issued security. |
Semi-Annual Report 15
| | |
| SCHEDULE OF INVESTMENTS, CONTINUED | | |
| |
Thornburg Strategic Income Fund | | March 31, 2016 (Unaudited) |
| h | Investment in Affiliates – Shown below are holdings of voting securities of each portfolio company which is considered “affiliated” to the Fund under the Investment Company Act of 1940, including companies for which the Fund’s holding represented 5% or more of the company’s voting securities, and a series of the Thornburg Investment Trust in which the Fund invested for cash management purposes during the period: |
| | | | | | | | | | | | | | | | | | | | | | | | | | | | |
Issuer | | Shares/Principal
September 30,
2015 | | | Gross
Additions | | | Gross
Reductions | | | Shares/Principal
March 31,
2016 | | | Market Value
March 31,
2016 | | | Investment
Income | | | Realized
Gain (Loss) | |
Thornburg Capital Management Fund | | | 10,170,287 | | | | 14,546,076 | | | | 15,622,806 | | | | 9,093,557 | | | $ | 90,935,572 | | | $ | 162,779 | | | $ | — | |
| | | | | | | | | | | | | | | | | | | | | | | | | | | | |
Total non-controlled affiliated issuers - 8.78% of net assets | | | | | | | | | | | $ | 90,935,572 | | | $ | 162,779 | | | $ | — | |
| | | | | | | | | | | | | | | | | | | | | | | | | | | | |
Portfolio Abbreviations
To simplify the listings of securities, abbreviations are used per the table below:
| | |
| ARM | | Adjustable Rate Mortgage |
| AUD | | Denominated in Australian Dollars |
| BRL | | Denominated in Brazilian Real |
| CAD | | Denominated in Canadian Dollars |
| CHL | | Denominated in Chilean Peso |
| CMO | | Collateralized Mortgage Obligation |
| FCB | | Farm Credit Bank |
| FHA | | Insured by Federal Housing Administration |
| | |
| GBP | �� | Denominated in Great Britain Pounds |
| Mtg | | Mortgage |
| MTN | | Medium-Term Note |
| MXN | | Denominated in Mexican Pesos |
| Pfd | | Preferred Stock |
| REIT | | Real Estate Investment Trust |
| SEK | | Denominated in Swedish Kronor |
| SPV | | Special Purpose Vehicle |
See notes to financial statements.
16 Semi-Annual Report
This page intentionally left blank.
Semi-Annual Report 17
| | |
| STATEMENT OF ASSETS AND LIABILITIES | | |
| |
Thornburg Strategic Income Fund | | March 31, 2016 (Unaudited) |
| | | | |
ASSETS | | | | |
Investments at value (cost $1,105,861,833) (Note 2) | | $ | 1,026,827,439 | |
Cash | | | 1,415,569 | |
Receivable for investments sold | | | 1,174,440 | |
Receivable for fund shares sold | | | 2,023,029 | |
Unrealized appreciation on forward currency contracts (Note 7) | | | 330,844 | |
Dividends receivable | | | 141,529 | |
Dividend and interest reclaim receivable | | | 50,345 | |
Interest receivable | | | 13,321,282 | |
Prepaid expenses and other assets | | | 75,938 | |
| | | | |
Total Assets | | | 1,045,360,415 | |
| | | | |
| |
LIABILITIES | | | | |
Payable for investments purchased | | | 3,760,228 | |
Payable for fund shares redeemed | | | 4,378,743 | |
Unrealized depreciation on forward currency contracts (Note 7) | | | 302,582 | |
Payable to investment advisor and other affiliates (Note 3) | | | 938,104 | |
Accounts payable and accrued expenses | | | 257,697 | |
Dividends payable | | | 496,862 | |
| | | | |
Total Liabilities | | | 10,134,216 | |
| | | | |
| |
NET ASSETS | | $ | 1,035,226,199 | |
| | | | |
NET ASSETS CONSIST OF | | | | |
Distribution in excess of net investment income | | $ | (1,169,301 | ) |
Net unrealized depreciation on investments | | | (78,980,956 | ) |
Accumulated net realized gain (loss) | | | (18,569,610 | ) |
Net capital paid in on shares of beneficial interest | | | 1,133,946,066 | |
| | | | |
| | $ | 1,035,226,199 | |
| | | | |
18 Semi-Annual Report
| | |
| STATEMENT OF ASSETS AND LIABILITIES, CONTINUED | | |
| |
Thornburg Strategic Income Fund | | March 31, 2016 (Unaudited) |
| | | | |
NET ASSET VALUE | | | | |
Class A Shares: | | | | |
Net asset value and redemption price per share ($294,727,765 applicable to 26,540,357 shares of beneficial interest outstanding - Note 4) | | $ | 11.10 | |
Maximum sales charge, 4.50% of offering price | | | 0.52 | |
| | | | |
Maximum offering price per share | | $ | 11.62 | |
| | | | |
| |
Class C Shares: | | | | |
Net asset value and offering price per share* ($280,220,887 applicable to 25,272,021 shares of beneficial interest outstanding - Note 4) | | $ | 11.09 | |
| | | | |
| |
Class I Shares: | | | | |
Net asset value, offering and redemption price per share ($449,081,113 applicable to 40,532,722 shares of beneficial interest outstanding - Note 4) | | $ | 11.08 | |
| | | | |
| |
Class R3 Shares: | | | | |
Net asset value, offering and redemption price per share ($1,681,933 applicable to 151,617 shares of beneficial interest outstanding - Note 4) | | $ | 11.09 | |
| | | | |
| |
Class R4 Shares: | | | | |
Net asset value, offering and redemption price per share ($2,637,668 applicable to 237,652 shares of beneficial interest outstanding - Note 4) | | $ | 11.10 | |
| | | | |
| |
Class R5 Shares: | | | | |
Net asset value, offering and redemption price per share ($6,876,833 applicable to 620,787 shares of beneficial interest outstanding - Note 4) | | $ | 11.08 | |
| | | | |
| * | Redemption price per share is equal to net asset value less any applicable contingent deferred sales charge. |
See notes to financial statements.
Semi-Annual Report 19
| | |
| STATEMENT OF OPERATIONS | | |
| |
Thornburg Strategic Income Fund | | Six Months Ended March 31, 2016 (Unaudited) |
| | | | |
INVESTMENT INCOME | | | | |
Dividend income | | $ | 992,541 | |
Interest income (net of premium amortized of $1,054,045) | | | 29,438,436 | |
| | | | |
Total Income | | | 30,430,977 | |
| | | | |
| |
EXPENSES | | | | |
Investment advisory fees (Note 3) | | | 3,871,371 | |
Administration fees (Note 3) | | | | |
Class A Shares | | | 196,887 | |
Class C Shares | | | 180,827 | |
Class I Shares | | | 121,174 | |
Class R3 Shares | | | 944 | |
Class R4 Shares | | | 1,494 | |
Class R5 Shares | | | 1,474 | |
Distribution and service fees (Note 3) | | | | |
Class A Shares | | | 393,978 | |
Class C Shares | | | 1,446,890 | |
Class R3 Shares | | | 3,748 | |
Class R4 Shares | | | 2,994 | |
Transfer agent fees | | | | |
Class A Shares | | | 177,413 | |
Class C Shares | | | 145,303 | |
Class I Shares | | | 234,587 | |
Class R3 Shares | | | 4,635 | |
Class R4 Shares | | | 3,863 | |
Class R5 Shares | | | 8,113 | |
Registration and filing fees | | | | |
Class A Shares | | | 13,218 | |
Class C Shares | | | 13,616 | |
Class I Shares | | | 16,156 | |
Class R3 Shares | | | 11,618 | |
Class R4 Shares | | | 11,977 | |
Class R5 Shares | | | 11,772 | |
Custodian fees (Note 3) | | | 139,875 | |
Professional fees | | | 66,627 | |
Accounting fees (Note 3) | | | 22,664 | |
Trustee fees | | | 24,373 | |
Other expenses | | | 57,107 | |
| | | | |
Total Expenses | | | 7,184,698 | |
Less: | | | | |
Expenses reimbursed by investment advisor (Note 3) | | | (346,210 | ) |
| | | | |
Net Expenses | | | 6,838,488 | |
| | | | |
Net Investment Income | | $ | 23,592,489 | |
| | | | |
20 Semi-Annual Report
| | |
| STATEMENT OF OPERATIONS, CONTINUED | | |
| |
Thornburg Strategic Income Fund | | Six Months Ended March 31, 2016 (Unaudited) |
| | | | |
REALIZED AND UNREALIZED GAIN (LOSS) | | | | |
Net realized gain (loss) from: | | | | |
Investments | | $ | (15,556,174 | ) |
Forward currency contracts (Note 7) | | | (45,873 | ) |
Foreign currency transactions | | | (102,340 | ) |
| | | | |
| | | (15,704,387 | ) |
| | | | |
Net change in unrealized appreciation (depreciation) on: | | | | |
Investments | | | 1,422,790 | |
Forward currency contracts (Note 7) | | | (92,470 | ) |
Foreign currency translations | | | 93,053 | |
| | | | |
| | | 1,423,373 | |
| | | | |
Net Realized and Unrealized Loss | | | (14,281,014 | ) |
| | | | |
Net Increase in Net Assets Resulting from Operations | | $ | 9,311,475 | |
| | | | |
See notes to financial statements.
Semi-Annual Report 21
| | |
| STATEMENTS OF CHANGES IN NET ASSETS | | |
| |
Thornburg Strategic Income Fund | | |
| | | | | | | | |
| | | Six Months Ended
March 31, 2016* | | | Year Ended
September 30, 2015 | |
INCREASE (DECREASE) IN NET ASSETS FROM | | | | | | | | |
| | |
OPERATIONS | | | | | | | | |
Net investment income | | $ | 23,592,489 | | | $ | 52,601,931 | |
Net realized gain (loss) from investments, forward currency contracts and foreign currency transactions | | | (15,704,387 | ) | | | (3,934,186 | ) |
Net unrealized appreciation (depreciation) on investments, forward currency contracts and foreign currency translation | | | 1,423,373 | | | | (86,863,981 | ) |
| | | | | | | | |
| | |
Net Increase (Decrease) in Net Assets Resulting from Operations | | | 9,311,475 | | | | (38,196,236 | ) |
| | |
DIVIDENDS TO SHAREHOLDERS | | | | | | | | |
From net investment income | | | | | | | | |
Class A Shares | | | (5,589,713 | ) | | | (15,032,369 | ) |
Class C Shares | | | (4,364,002 | ) | | | (11,384,849 | ) |
Class I Shares | | | (9,379,463 | ) | | | (24,576,257 | ) |
Class R3 Shares | | | (27,339 | ) | | | (94,447 | ) |
Class R4 Shares | | | (43,489 | ) | | | (58,755 | ) |
Class R5 Shares | | | (113,154 | ) | | | (206,806 | ) |
From realized gains | | | | | | | | |
Class A Shares | | | (816,703 | ) | | | (4,909,559 | ) |
Class C Shares | | | (732,196 | ) | | | (4,451,217 | ) |
Class I Shares | | | (1,265,868 | ) | | | (7,233,973 | ) |
Class R3 Shares | | | (3,811 | ) | | | (42,240 | ) |
Class R4 Shares | | | (5,676 | ) | | | (514 | ) |
Class R5 Shares | | | (14,864 | ) | | | (39,105 | ) |
| | |
FUND SHARE TRANSACTIONS (NOTE 4) | | | | | | | | |
Class A Shares | | | (39,817,486 | ) | | | (23,177,909 | ) |
Class C Shares | | | (22,728,546 | ) | | | (14,575,088 | ) |
Class I Shares | | | (76,781,293 | ) | | | 26,490,308 | |
Class R3 Shares | | | 265,458 | | | | (1,421,430 | ) |
Class R4 Shares | | | 552,764 | | | | 2,180,876 | |
Class R5 Shares | | | 523,691 | | | | 4,235,726 | |
| | | | | | | | |
Net Decrease in Net Assets | | | (151,030,215 | ) | | | (112,493,844 | ) |
| | |
NET ASSETS | | | | | | | | |
Beginning of Period | | | 1,186,256,414 | | | | 1,298,750,258 | |
| | | | | | | | |
| | |
End of Period | | $ | 1,035,226,199 | | | $ | 1,186,256,414 | |
| | | | | | | | |
Distribution in excess of net investment income | | $ | (1,169,301 | ) | | $ | (5,244,630 | ) |
See notes to financial statements.
22 Semi-Annual Report
| | |
| NOTES TO FINANCIAL STATEMENTS | | |
| |
Thornburg Strategic Income Fund | | March 31, 2016 (Unaudited) |
NOTE 1 – ORGANIZATION
Thornburg Strategic Income Fund (the “Fund”) is a diversified series of Thornburg Investment Trust (the “Trust”). The Fund commenced operations on December 19, 2007. The Trust was organized as a Massachusetts business trust under a Declaration of Trust dated June 3, 1987 and is registered as a diversified, open-end management investment company under the Investment Company Act of 1940, as amended. The Fund is currently one of twenty separate series of the Trust. Each series is considered to be a separate entity for financial reporting and tax purposes and bears expenses directly attributable to it. The Fund’s primary investment goal is to seek a high level of current income. The Fund’s secondary investment goal is some long-term capital appreciation.
The Fund currently offers six classes of shares of beneficial interest: Class A, Class C, Institutional Class (“Class I”) and Retirement Classes (“Class R3”, “Class R4”, and “Class R5”). Each class of shares of the Fund represents an interest in the same portfolio of investments, except that (i) Class A shares are sold subject to a front-end sales charge collected at the time the shares are purchased and bear a service fee, (ii) Class C shares are sold at net asset value without a sales charge at the time of purchase, but are subject to a contingent deferred sales charge upon redemption within one year of purchase, and bear both a service fee and a distribution fee, (iii) Class I shares are sold at net asset value without a sales charge at the time of purchase and may be subject to a service fee, (iv) Class R3 shares are sold at net asset value without a sales charge at the time of purchase, but bear both a service fee and distribution fee, (v) Class R4 shares are sold at net asset value without a sales charge at the time of purchase, but bear a service fee, (vi) Class R5 shares are sold at net asset value without a sales charge at the time of purchase and may be subject to a service fee, and (vii) the respective classes may have different reinvestment privileges and conversion rights. Additionally, the Fund may allocate among its classes certain expenses, to the extent allocable to specific classes, including transfer agent fees, government registration fees, certain printing and postage costs, and administrative and legal expenses. Currently, class specific expenses of the Fund are limited to service and distribution fees, administration fees, and certain registration and transfer agent expenses.
NOTE 2 – SIGNIFICANT ACCOUNTING POLICIES
The following is a summary of significant accounting policies followed by the Fund in the preparation of its financial statements. The Fund is an investment company and prepares its financial statements in conformity with United States generally accepted accounting principles (“GAAP”), including investment company accounting and reporting guidance in the Financial Accounting Standards Board (the “FASB”) Accounting Standard Codification Topic 946. The preparation of financial statements in conformity with GAAP requires management to make estimates and assumptions that affect the reported amounts of assets and liabilities and disclosure of contingent assets and liabilities at the date of the financial statements and the reported amounts of increases (decreases) in net assets from operations during the reporting period. Actual results could differ from those estimates.
Significant accounting policies of the Trust are as follows:
Valuation Policy and Procedures: The Trustees of the Trust have appointed Thornburg Investment Management, Inc. the Trust’s investment advisor, the (“Advisor”), to assist the Trustees in obtaining market values for portfolio investments, perform certain evaluation and supervisory functions respecting professional pricing service providers appointed by the Trustees’ Audit Committee (the “Audit Committee”) to assist in determining fair values for portfolio investments, assist in calculating fair values for portfolio investments in certain circumstances, and to perform other functions in connection with the valuation of investments. The Advisor acts through its Valuation and Pricing Committee (the “Committee”) and other employees of the Advisor. The Committee regularly reviews its own valuation calculations, as well as the valuations, valuation techniques and services furnished by pricing service providers, considers circumstances which may require valuation calculations by the Committee, and reviews previous valuation calculations. The Committee reports to the Audit Committee on the Committee’s activities, the performance of pricing service providers, and other matters relating to valuation of portfolio investments.
In those instances when the Committee assists in calculating a fair value for a portfolio investment, the Committee seeks to determine the price that the Fund would reasonably expect to receive upon a sale of the investment in an orderly transaction between market participants on the valuation date. The Committee customarily utilizes quotations from securities broker dealers in calculating valuations, but also may utilize prices obtained from pricing service providers or other methods approved by the Audit Committee. Because fair values calculated by the Committee are estimates, the calculation of a value for an investment may differ from the price that would be realized by the Fund upon a sale of the investment, and the difference could be material to the Fund’s financial statements. The Committee’s calculation of a fair value for an investment may also differ from the prices obtained by other persons (including other mutual funds) for the investment.
Valuation of Investments: Securities and other portfolio investments which are listed or traded on a United States securities exchange are valued at the last reported sale price on the valuation date. Investments listed or traded on an exchange for which there has been no sale that day are valued at the mean between the last reported bid and asked prices on that valuation date. Portfolio investments reported by NASDAQ are valued at the official closing price on the valuation date. If an investment is traded on more than one exchange, the investment is considered traded on the exchange that is normally the primary market for that investment. Securities and
Semi-Annual Report 23
| | |
| NOTES TO FINANCIAL STATEMENTS, CONTINUED | | |
| |
Thornburg Strategic Income Fund | | March 31, 2016 (Unaudited) |
other portfolio investments which are listed or traded on exchanges outside the United States are valued at the last price or the closing price of the investment on the exchange that is normally the primary market for the investment, as of the close of the exchange preceding the Fund’s valuation date. Foreign investments listed or traded on an exchange for which there has been no sale that day are valued at the mean between the last reported bid and asked prices on that valuation date.
In any case when a market quotation is not readily available for a portfolio investment ordinarily valued by market quotation, the Committee calculates a fair value for the investment using alternative methods approved by the Audit Committee. A market quotation is not readily available when the primary market or exchange for the investment is not open for the entire scheduled day of trading. Market quotations for an investment also may not be readily available if developments after the most recent close of the investment’s primary exchange or market, but prior to the close of business on any Fund business day, or an unusual event or significant period of time occurring since the availability of a market quotation, create a serious question concerning the reliability of the most recent market quotation available for the investment. In particular, on days when market volatility thresholds established by the Audit Committee are exceeded, foreign equity investments held by the Fund may be valued using alternative methods. The Committee customarily obtains valuations in these instances from pricing service providers approved by the Audit Committee. Pricing service providers ordinarily calculate valuations using multi-factor models to adjust market prices based upon various inputs, including exchange data, depository receipt prices, futures, index data and other data.
Debt obligations held by the Fund which are not listed or traded on exchanges or for which no reported market exists are ordinarily valued at the valuation obtained from a pricing service provider approved by the Audit Committee.
In any case when a pricing service provider fails to provide a valuation for a debt obligation held by the Fund, the Committee calculates a fair value for the obligation using alternative methods under procedures approved by the Audit Committee. Additionally, in cases when management believes that a valuation obtained from a pricing service provider merits review for significant reasons, the Committee decides whether or not to use the valuation calculated by the pricing service provider or to use an alternative method approved by the Audit Committee to calculate a fair value for the obligation.
Quotations for foreign investments expressed in foreign currency amounts are converted to U.S. dollar equivalents using a foreign exchange quotation from a third party service provider at the time of valuation. Foreign investments held by the Fund may be traded on days and at times when the Fund is not open for business. Consequently, the value of Fund investments may be significantly affected on days when shareholders cannot purchase or sell Fund shares. Futures contracts and other financial and derivative instruments traded on an exchange are valued at the latest published price for the instrument on its primary exchange. Listed options are valued at the last bid price.
Valuation Measurements: The Fund categorizes its investments based upon the inputs used in valuing those investments, according to a three-level hierarchy established in guidance from the FASB. Categorization of investments using this hierarchy is intended by the FASB to maximize the use of observable inputs in valuing investments and minimize the use of unobservable inputs by requiring that the most observable inputs be used when available. Observable inputs are those that market participants would use in valuing an investment based on available market information. Unobservable inputs are those that reflect assumptions about the information market participants would use in valuing an investment. An investment’s level within the hierarchy is based on the lowest level input that is deemed significant to the valuation. The methodologies and inputs used to value investments are not necessarily indications of the risk or liquidity associated with those investments.
Various inputs are used in calculating valuations for the Fund’s investments. These inputs are generally summarized according to the three-level hierarchy below:
Level 1: Quoted prices in active markets for identical investments.
Level 2: Other direct or indirect significant observable inputs (including quoted prices for similar investments in active markets and other observable inputs, such as interest rates, prepayment rates, credit risk, etc.).
Level 3: Significant unobservable inputs (including the Committee’s own assumptions in calculating the fair values of investments).
Valuations for debt obligations held by the Fund are typically calculated by pricing service providers approved by the Audit Committee and are characterized as Level 2 within the valuation hierarchy.
On days when market volatility thresholds established by the Audit Committee are exceeded, foreign securities for which valuations are obtained from pricing service providers are fair valued. On these days, the foreign securities are characterized as Level 2 within the valuation hierarchy and revert to Level 1 after the threshold is no longer exceeded.
In a limited number of cases the Committee calculates a fair value for investments using broker quotations or other methods approved by the Audit Committee. When the Committee uses a single broker quotation to calculate a fair value for an investment without other significant observable inputs, or if a fair value is calculated using other significant inputs that are considered unobservable, the investment is characterized as Level 3 within the hierarchy. Other significant unobservable inputs used to calculate a fair value in these
24 Semi-Annual Report
| | |
| NOTES TO FINANCIAL STATEMENTS, CONTINUED | | |
| |
Thornburg Strategic Income Fund | | March 31, 2016 (Unaudited) |
instances might include an income-based valuation approach which considers discounted anticipated future cash flows from the investment, and application of discounts due to the nature or duration of any restrictions on the disposition of the investment.
Valuations based upon the use of inputs from Levels 1, 2 or 3 may not represent the actual price received upon the disposition of an investment, and the Fund may receive a price that is lower than the valuation based upon these inputs when it sells the investment.
The following table displays a summary of the fair value hierarchy measurements of the Fund’s investments as of March 31, 2016. In any instance when valuation inputs from more than one level are used to determine the fair value of a specific investment, the investment is placed in the level of the table based upon the lowest level input that is significant in determining the fair value of the investment:
| | | | | | | | | | | | | | | | |
| | | Fair Value Measurements at March 31, 2016 | |
| | | Total | | | Level 1 | | | Level 2 | | | Level 3(b) | |
Assets | | | | | | | | | | | | | | | | |
Investments in Securities* | | | | | | | | | | | | | | | | |
Common Stock(a) | | $ | 3,537,494 | | | $ | — | | | $ | 3,537,494 | | | $ | — | |
Preferred Stock(a) | | | 18,196,378 | | | | 4,711,953 | | | | 13,484,425 | | | | — | |
Asset Backed Securities | | | 105,755,729 | | | | — | | | | 95,144,101 | | | | 10,611,628 | |
Corporate Bonds | | | 652,447,541 | | | | — | | | | 652,240,441 | | | | 207,100 | |
Convertible Bonds | | | 23,986,947 | | | | — | | | | 23,986,947 | | | | — | |
Warrants | | | 20,283 | | | | — | | | | 20,283 | | | | — | |
Municipal Bonds | | | 4,427,659 | | | | — | | | | 4,427,659 | | | | — | |
U.S. Government Agencies | | | 11,877,243 | | | | — | | | | 11,877,243 | | | | — | |
Other Government | | | 27,796,728 | | | | — | | | | 27,796,728 | | | | — | |
Mortgage Backed | | | 409,481 | | | | — | | | | 3,526 | | | | 405,955 | |
Loan Participations | | | 87,436,384 | | | | — | | | | 75,013,966 | | | | 12,422,418 | |
Short Term Investments | | | 90,935,572 | | | | 90,935,572 | | | | — | | | | — | |
| | | | | | | | | | | | | | | | |
Total Investments in Securities | | $ | 1,026,827,439 | | | $ | 95,647,525 | | | $ | 907,532,813 | | | $ | 23,647,101 | |
| | | | |
Other Financial Instruments** | | | | | | | | | | | | | | | | |
Forward Currency Contracts | | $ | 330,844 | | | $ | — | | | $ | 330,844 | | | $ | — | |
| | | | |
Liabilities | | | | | | | | | | | | | | | | |
Other Financial Instruments** | | | | | | | | | | | | | | | | |
Forward Currency Contracts | | $ | (302,582 | ) | | $ | — | | | $ | (302,582 | ) | | $ | — | |
| * | See Schedule of Investments for a summary of the industry exposure as grouped according to the Global Industry Classification Standard (GICS), which is an industry taxonomy developed by MSCI, Inc. and Standard & Poor’s (S&P). |
| ** | Other Financial Instruments include investments not reflected in the Schedule of Investments, which may include futures, forwards and swap contracts, which are valued at the unrealized appreciation (depreciation) on the investment. |
| (a) | At March 31, 2016, industry classifications for Common and Preferred Stock in Levels 2 consist of $3,537,494 in Energy, $10,634,375 in Miscellaneous and $2,850,050 in Telecommunication Services. |
| (b) | In accordance with the guidance prescribed in Accounting Standards Update (“ASU”) No. 2011-04, unadjusted broker quotes were applied to $12,386,023 portfolio securities characterized as Level 3 investments at March 31, 2016. The following table displays a summary of the valuation techniques and unobservable inputs used to value portfolio securities characterized as Level 3 investments, where no unadjusted broker quotes were available at March 31, 2016: |
| | | | | | | | | | |
| | | Fair Value at
March 31, 2016 | | | Valuation Technique(s) | | Unobservable Input | | Range (Weighted Average) |
Corporate Bond | | $ | 207,100 | | | Discounted cash flows | | Third party vendor projection | | 25.00% (N/A) |
| | | | | | | | of discounted cash flows | | |
| | | | | | | | | | |
| | | 207,100 | | | | | | | |
Loan Participations | | | 1,164,960 | | | Discounted cash flows | | Third party vendor projection | | 9.50% - 11.00% (10.25%) |
| | | | | | | | of discounted cash flows | | |
| | | | | | | | | | |
| | | 1,164,960 | | | | | | | |
Asset-Backed Securities | | | 9,889,018 | | | Discounted cash flows | | Third party vendor projection | | 3.40% - 4.40% (3.93%) |
| | | | | | | | of discounted cash flows | | |
| | | | | | | | | | |
| | | 9,889,018 | | | | | | | |
| | | | | | | | | | |
Total | | $ | 11,261,078 | | | | | | | |
Semi-Annual Report 25
| | |
| NOTES TO FINANCIAL STATEMENTS, CONTINUED | | |
| |
Thornburg Strategic Income Fund | | March 31, 2016 (Unaudited) |
In accordance with the guidance prescribed in ASU No. 2011-04, it is the policy of the Fund to recognize transfers between levels and the underlying events which caused the movement. The Fund recognized no transfers between levels for the six months ended March 31, 2016, other than when the Fund exceeded market volatility thresholds for foreign equity investments during the period.
A rollforward of fair value measurements using significant unobservable inputs (Level 3) for the six months ended March 31, 2016 is as follows:
| | | | | | | | | | | | | | | | | | | | |
| | | Asset Backed
Securities | | | Corporate
Bonds | | | Mortgage
Backed | | | Loan
Participations | | | Total(d) | |
Beginning Balance 9/30/2015 | | $ | 12,202,675 | | | $ | 1,242,600 | | | $ | 489,490 | | | $ | 17,037,739 | | | $ | 30,972,504 | |
Accrued Discounts (Premiums) | | | 6,542 | | | | 939 | | | | (892 | ) | | | 13,652 | | | | 20,241 | |
Net Realized Gain (Loss)(a) | | | 7,098 | | | | — | | | | (1,759 | ) | | | 4,092 | | | | 9,431 | |
Gross Purchases | | | — | | | | — | | | | — | | | | 494,100 | | | | 494,100 | |
Gross Sales | | | (1,525,510 | ) | | | — | | | | (83,536 | ) | | | (4,935,091 | ) | | | (6,544,137 | ) |
Net Change in Unrealized | | | | | | | | | | | | | | | | | | | | |
Appreciation (Depreciation)(b)(c) | | | (79,177 | ) | | | (1,036,439 | ) | | | 2,652 | | | | (192,074 | ) | | | (1,305,038 | ) |
Transfers into Level 3 | | | — | | | | — | | | | — | | | | — | | | | — | |
Transfers out of Level 3 | | | — | | | | — | | | | — | | | | — | | | | — | |
| | | | | | | | | | | | | | | | | | | | |
Ending Balance 3/31/2016 | | $ | 10,611,628 | | | $ | 207,100 | | | $ | 405,955 | | | $ | 12,422,418 | | | $ | 23,647,101 | |
| (a) | Amount of net realized gain (loss) from investments recognized in income is included in the Fund’s Statement of Operations for the six months ended March 31, 2016. |
| (b) | Amount of net change in unrealized appreciation (depreciation) on investments recognized in income is included in the Fund’s Statement of Operations for the six months ended March 31, 2016. |
| (c) | The net change in unrealized appreciation (depreciation) attributable to securities owned at March 31, 2016, which were valued using significant unobservable inputs, was $(1,120,940). This is included within net change in unrealized appreciation (depreciation) on investments in the Fund’s the Statement of Operations for the six months ended March 31, 2016. |
| (d) | Level 3 investments represent 2.28% of total net assets at the six months ended March 31, 2016. Significant fluctuations of the unobservable inputs applied to portfolio securities characterized as Level 3 investments could be expected to increase or decrease the fair value of these portfolio securities. |
Foreign Currency Translation: Portfolio investments and other assets and liabilities denominated in foreign currencies are translated into U.S. dollars based on the exchange rate of such currencies against the U.S. dollar on the date of valuation. Purchases and sales of investments and income items denominated in foreign currencies are translated into U.S. dollars at the exchange rate in effect on the transaction date. When the Fund purchases or sells foreign investments, it will customarily enter into a foreign exchange contract to minimize foreign exchange risk from the trade date to the settlement date of such transactions. The values of such spot contracts are included in receivable for investments sold and payable for investments purchased on the Statement of Assets and Liabilities.
The Fund does not separately report the effect of changes in foreign exchange rates from changes in market prices on investments held. Such changes are included in net unrealized appreciation (depreciation) from investments.
Reported net realized gains and losses from foreign currency transactions arise due to purchases and sales of foreign currencies, currency gains and losses realized between the trade and settlement dates on investment transactions and the difference between the amounts of dividends, interest, and foreign withholding taxes recorded on the Fund’s books, and the U.S. dollar equivalent of the amounts actually received or paid.
Net change in unrealized appreciation (depreciation) on foreign currency translations arise from changes in the fair value of assets and liabilities, other than investments at period end, resulting from changes in exchange rates.
Foreign Withholding Taxes: The Fund is subject to foreign tax withholding imposed by certain foreign countries in which the Fund may invest. Withholding taxes are incurred on certain foreign dividends and are accrued at the time the dividend is recognized based on applicable foreign tax law. The Fund files withholding tax reclaims in certain jurisdictions to recover a portion of amounts previously withheld, in view of various considerations, including recent decisions rendered by the courts in those and other jurisdictions. The Fund would expect to record a receivable for such a reclaim based on a variety of factors, including assessments of a jurisdiction’s legal obligation to pay reclaims, the jurisdiction’s administrative practices and payment history, and industry convention. To date the Fund has recorded no such receivable because there is limited precedent for collecting such prior year reclaims and the likelihood of collection remains uncertain.
Deferred Foreign Capital Gain Taxes: The Fund is subject to a tax imposed on net realized gains of securities of certain foreign countries. The Fund records an estimated deferred tax liability for net unrealized gains on these investments as reflected in the accompanying financial statements.
26 Semi-Annual Report
| | |
| NOTES TO FINANCIAL STATEMENTS, CONTINUED | | |
| |
Thornburg Strategic Income Fund | | March 31, 2016 (Unaudited) |
Federal Income Taxes: It is the policy of the Trust to comply with the provisions of the Internal Revenue Code applicable to “regulated investment companies” and to distribute to shareholders substantially all taxable income, including any net realized gain on investments of the Fund. Therefore, no provision for federal income taxes is required.
Management reviews each uncertain tax position believed to be material to the preparation of the Fund’s financial statements, to assess if it is more likely than not that the position would be sustained upon examination, based upon the technical merits of the position. As of March 31, 2016, management has not identified any such position for which an asset or liability must be reflected in the Statement of Assets and Liabilities. The Fund’s tax returns remain subject to examination for three years after filing.
When-Issued and Delayed Delivery Transactions: The Fund may engage in when-issued or delayed delivery transactions. To the extent the Fund engages in such transactions, it will do so for the purpose of acquiring portfolio investments consistent with the Fund’s investment objectives and not for the purpose of investment leverage or to speculate on interest rate and, or market changes. At the time the Fund makes a commitment to purchase an investment on a when-issued or delayed delivery basis, the Fund will record the transaction and reflect the value in determining its net asset value. When effecting such transactions, assets of an amount sufficient to make payment for the portfolio investments to be purchased will be segregated on the Fund’s records on the trade date. Investments purchased on a when-issued or delayed delivery basis do not earn interest until the settlement date.
Dividends: Dividends to shareholders, if any, are generally paid monthly and are reinvested in additional shares of the Fund at net asset value per share at the close of business on the dividend payment date or, at the shareholder’s option, paid in cash. Net realized capital gains, to the extent available, will be distributed at least annually.
Repurchase Agreements: The Fund may invest excess cash in repurchase agreements whereby the Fund purchases investments, which serve as collateral, with an agreement to resell such collateral to the seller at an agreed upon price at the maturity date of the repurchase agreement. Investments pledged as collateral for repurchase agreements are held in custody until maturity of the repurchase agreement. Provisions in the agreements require that the market value of the collateral is at least equal to the repurchase value in the event of default. In the event of default, the Fund has the right to liquidate the collateral and apply the proceeds in satisfaction of the obligation. Under certain circumstances, in the event of default or bankruptcy by the other party to the agreement, realization and/or retention of the collateral may be subject to legal proceedings.
Unfunded Loan Commitments: The Fund has entered into a loan commitment with Nexstar Broadcasting, Inc., of which at March 31, 2016 no par commitment had been funded. The Fund is committed for the amount of $3,435,000 until January 27, 2017 for possible funding.
General: Investment transactions are accounted for on a trade date basis. Interest income is accrued as earned and dividend income is recorded on the ex-dividend date. Certain income from foreign investments is recognized as soon as information is available to the Fund. Realized gains and losses from the sale of investments are recorded on an identified cost basis. Net investment income (other than class specific expenses) and realized and unrealized gains and losses are allocated daily to each class of shares based upon the relative net asset value of outstanding shares of each class of shares at the beginning of the day (after adjusting for the current share activity of the respective class). Expenses common to all Funds are allocated among the Funds comprising the Trust based upon their relative net asset values or other appropriate allocation methods.
Guarantees and Indemnifications: Under the Trust’s organizational documents (and under separate agreements with the independent Trustees), its officers and Trustees are indemnified against certain liabilities arising out of the performance of their duties to the Fund. Additionally, in the normal course of business the Trust enters into contracts with service providers that contain general indemnification clauses. The Trust’s maximum exposure under these arrangements is unknown. However, based on experience, the Trust expects the risk of loss to be remote.
NOTE 3 – INVESTMENT ADVISORY FEE AND OTHER TRANSACTIONS WITH AFFILIATES
Pursuant to an investment advisory agreement, the Advisor serves as the investment advisor and performs services for the Fund for which the fees are payable at the end of each month. For the six months ended March 31, 2016, these fees were payable at annual rates ranging from .75 of 1% to .50 of 1% per annum of the average daily net assets of the Fund depending on the Fund’s asset size. The Fund pays to the Advisor the costs of personnel who perform certain accounting services for the Fund. For the six months ended March 31, 2016 the Fund paid $22,664 to the Advisor for these accounting services. The Trust has also entered into administrative service agreements with the Advisor, whereby the Advisor will perform certain administrative services for the shareholders of each class of the Fund’s shares, and for which fees will be payable at an annual rate of up to .125 of 1% per annum of the average daily net assets attributable to each class of shares.
The Trust has an underwriting agreement with Thornburg Securities Corporation (the “Distributor”), an affiliate of the Advisor, which acts as the distributor of the Fund’s shares. For the six months ended March 31, 2016, the Distributor has advised the Fund that it earned
Semi-Annual Report 27
| | |
| NOTES TO FINANCIAL STATEMENTS, CONTINUED | | |
| |
Thornburg Strategic Income Fund | | March 31, 2016 (Unaudited) |
commissions aggregating $23,829 from the sale of Class A shares, and collected contingent deferred sales charges aggregating $12,927 from redemptions of Class C shares of the Fund.
Pursuant to a service plan under Rule 12b-1 of the Investment Company Act of 1940, the Fund may reimburse to the Advisor an amount not to exceed .25 of 1% per annum of the average daily net assets attributable to each class of shares of the Fund for payments made by the Advisor to securities dealers and other financial institutions to obtain various shareholder and distribution related services. For the six months ended March 31, 2016, there were no 12b-1 service plan fees charged for Class I shares. The Advisor may pay out of its own resources additional expenses for distribution of the Fund’s shares and shareholder services.
The Trust has also adopted a distribution plan pursuant to Rule 12b-1, applicable only to the Fund’s Class C shares, under which the Fund compensates the Distributor for services in promoting the sale of Class C and Class R3 shares of the Fund at an annual rate of up to .75 of 1% per annum of the average daily net assets attributable to Class C shares and an annual rate of .25 of 1% of the average daily net assets attributable to Class R3 shares. Total fees incurred by each class of shares of the Fund under their respective service and distribution plans for the six months ended March 31, 2016, are set forth in the Statement of Operations.
The Advisor and Distributor have contractually agreed to waive fees and reimburse expenses incurred by the Fund so that actual expenses of certain share classes do not exceed levels as specified in the Fund’s most recent prospectus. The agreement may be terminated by the Fund at any time, but may not be terminated by the Advisor or Distributor before February 1, 2017, unless the Advisor ceases to be the investment advisor to the Trust or the Distributor ceases to be the distributor of the Fund prior to that date. The Advisor and Distributor retain the right to be repaid by the Fund for fee waivers and expense reimbursements if expenses fall below the contractual limit prior to the end of the fiscal year.
The Advisor voluntarily reimbursed certain class specific expenses, administrative fees, and distribution fees of $15,734 for Class A shares, and contractually reimbursed certain class specific expenses, administrative fees, and distribution fees of $284,103 for Class C shares, $17,258 for Class R3 shares, $14,494 for Class R4 shares, and $14,621 for Class R5 shares.
Certain officers and Trustees of the Trust are also officers or directors of the Advisor and Distributor. The compensation of independent Trustees is borne by the Trust.
The Fund may purchase or sell securities from, or to an affiliated fund, provided the affiliation is due solely to having a common investment advisor, common officers, or common trustees, and provided that all such transactions will comply with Rule 17a-7 under the 1940 Act. For the six months ended March 31, 2016, the Fund had transactions of $15,135,343 in sales.
NOTE 4 – SHARES OF BENEFICIAL INTEREST
At March 31, 2016, there were an unlimited number of shares with no par value of beneficial interest authorized. Transactions in shares of beneficial interest were as follows:
| | | | | | | | | | | | | | | | |
| | | Six Months Ended
March 31, 2016 (Unaudited) | | | Year Ended
September 30, 2015 (Audited) | |
| | | Shares | | | Amount | | | Shares | | | Amount | |
Class A Shares | | | | | | | | | | | | | | | | |
Shares sold | | | 2,775,910 | | | $ | 30,766,088 | | | | 9,448,626 | | | $ | 111,515,219 | |
Shares issued to shareholders in reinvestment of dividends | | | 526,532 | | | | 5,826,853 | | | | 1,545,329 | | | | 18,164,165 | |
Shares repurchased | | | (6,925,236 | ) | | | (76,410,427 | ) | | | (13,052,160 | ) | | | (152,857,293 | ) |
| | | | | | | | | | | | | | | | |
| | | | |
Net increase (decrease) | | | (3,622,794 | ) | | $ | (39,817,486 | ) | | | (2,058,205 | ) | | $ | (23,177,909 | ) |
| | | | | | | | | | | | | | | | |
| | | | |
Class C Shares | | | | | | | | | | | | | | | | |
Shares sold | | | 1,808,771 | | | $ | 19,959,808 | | | | 5,713,342 | | | $ | 67,448,862 | |
Shares issued to shareholders in reinvestment of dividends | | | 401,112 | | | | 4,430,237 | | | | 1,148,477 | | | | 13,483,171 | |
Shares repurchased | | | (4,262,549 | ) | | | (47,118,591 | ) | | | (8,167,118 | ) | | | (95,507,121 | ) |
| | | | | | | | | | | | | | | | |
| | | | |
Net increase (decrease) | | | (2,052,666 | ) | | $ | (22,728,546 | ) | | | (1,305,299 | ) | | $ | (14,575,088 | ) |
| | | | | | | | | | | | | | | | |
28 Semi-Annual Report
| | |
| NOTES TO FINANCIAL STATEMENTS, CONTINUED | | |
| |
Thornburg Strategic Income Fund | | March 31, 2016 (Unaudited) |
| | | | | | | | | | | | | | | | |
| | | Six Months Ended
March 31, 2016 (Unaudited) | | | Year Ended
September 30, 2015 (Audited) | |
| | | Shares | | | Amount | | | Shares | | | Amount | |
Class I Shares | | | | | | | | | | | | | | | | |
Shares sold | | | 6,410,472 | | | $ | 70,662,006 | | | | 20,927,899 | | | $ | 246,352,797 | |
Shares issued to shareholders in reinvestment of dividends | | | 812,038 | | | | 8,965,338 | | | | 2,234,492 | | | | 26,178,868 | |
Shares repurchased | | | (14,205,801 | ) | | | (156,408,637 | ) | | | (21,065,602 | ) | | | (246,041,357 | ) |
| | | | | | | | | | | | | | | | |
| | | | |
Net increase (decrease) | | | (6,983,291 | ) | | $ | (76,781,293 | ) | | | 2,096,789 | | | $ | 26,490,308 | |
| | | | | | | | | | | | | | | | |
| | | | |
Class R3 Shares | | | | | | | | | | | | | | | | |
Shares sold | | | 65,239 | | | $ | 723,596 | | | | 111,029 | | | $ | 1,316,018 | |
Shares issued to shareholders in reinvestment of dividends | | | 1,875 | | | | 20,715 | | | | 9,969 | | | | 117,693 | |
Shares repurchased | | | (43,064 | ) | | | (478,853 | ) | | | (243,813 | ) | | | (2,855,141 | ) |
| | | | | | | | | | | | | | | | |
| | | | |
Net increase (decrease) | | | 24,050 | | | $ | 265,458 | | | | (122,815 | ) | | $ | (1,421,430 | ) |
| | | | | | | | | | | | | | | | |
| | | | |
Class R4 Shares | | | | | | | | | | | | | | | | |
Shares sold | | | 56,413 | | | $ | 627,569 | | | | 188,418 | | | $ | 2,202,476 | |
Shares issued to shareholders in reinvestment of dividends | | | 2,951 | | | | 32,603 | | | | 3,607 | | | | 41,823 | |
Shares repurchased | | | (9,542 | ) | | | (107,408 | ) | | | (5,480 | ) | | | (63,423 | ) |
| | | | | | | | | | | | | | | | |
| | | | |
Net increase (decrease) | | | 49,822 | | | $ | 552,764 | | | | 186,545 | | | $ | 2,180,876 | |
| | | | | | | | | | | | | | | | |
| | | | |
Class R5 Shares | | | | | | | | | | | | | | | | |
Shares sold | | | 280,542 | | | $ | 3,077,244 | | | | 582,339 | | | $ | 6,800,748 | |
Shares issued to shareholders in reinvestment of dividends | | | 7,821 | | | | 86,206 | | | | 16,493 | | | | 192,828 | |
Shares repurchased | | | (239,411 | ) | | | (2,639,759 | ) | | | (238,073 | ) | | | (2,757,850 | ) |
| | | | | | | | | | | | | | | | |
| | | | |
Net increase (decrease) | | | 48,952 | | | $ | 523,691 | | | | 360,759 | | | $ | 4,235,726 | |
| | | | | | | | | | | | | | | | |
NOTE 5 – INVESTMENT TRANSACTIONS
For the six months ended March 31, 2016, the Fund had purchase and sale transactions of investments (excluding short-term investments and U.S. Government obligations) of $141,660,123 and $250,898,832, respectively.
NOTE 6 – INCOME TAXES
At March 31, 2016, information on the tax components of capital was as follows:
| | | | |
Cost of investments for tax purposes | | $ | 1,105,861,833 | |
| | | | |
Gross unrealized appreciation on a tax basis | | $ | 15,524,233 | |
Gross unrealized depreciation on a tax basis | | | (94,558,627 | ) |
| | | | |
Net unrealized appreciation (depreciation) on investments (tax basis) | | $ | (79,034,394 | ) |
| | | | |
At March 31, 2016, the Fund had deferred tax basis capital losses occurring subsequent to October 31, 2014 through September 30, 2015 of $2,743,921. For tax purposes, such losses will be recognized in the year ending September 30, 2016.
NOTE 7 – DERIVATIVE FINANCIAL INSTRUMENTS WITH OFF-BALANCE SHEET RISK AND FOREIGN INVESTMENT RISK
The Fund may use a variety of derivative financial instruments to hedge or adjust the risks affecting its investment portfolio or to enhance investment returns. Provisions of the FASB Accounting Standards Codification 815-10-50 (“ASC 815”) require certain disclosures. The disclosures are intended to provide users of financial statements with an understanding of the use of derivative instruments by the Fund and how these derivatives affect the financial position, financial performance and cash flows of the Fund. The Fund does
Semi-Annual Report 29
| | |
| NOTES TO FINANCIAL STATEMENTS, CONTINUED | | |
| |
Thornburg Strategic Income Fund | | March 31, 2016 (Unaudited) |
not designate any derivative instruments as hedging instruments under ASC 815. During the six months ended March 31, 2016, the Fund’s principal exposure to derivative financial instruments of the type addressed by ASC 815 was investment in foreign exchange contracts. A foreign exchange contract is an agreement between two parties to exchange different currencies at a specified rate of exchange at an agreed upon future date. Foreign exchange contracts involve risks to the Fund, including the risk that a contract’s counterparty will not meet its obligations to the Fund, the risk that a change in a contract’s value may not correlate perfectly with the currency the contract was intended to track, and the risk that the Fund’s Advisor is unable to correctly implement its strategy in using a contract. In any such instance, the Fund may not achieve the intended benefit of entering into a contract, and may experience a loss.
The Fund entered into forward currency contracts during the six months ended March 31, 2016 in the normal course of pursuing its investment objectives, with the objective of purchasing foreign investments or with the intent of reducing the risk to the value of the Fund’s foreign investments from adverse changes in the relationship between the U.S. dollar and foreign currencies. In each case these contracts have been initiated in conjunction with foreign investment transactions.
These contracts are accounted for by the Fund under ASC 815. Unrealized appreciation and depreciation on outstanding contracts are reported in the Fund’s Statement of Assets and Liabilities, as measured by the difference between the forward exchange rates at the reporting date and the forward exchange rates at each contract’s inception date. Net realized gain (loss) on contracts closed during the period, and changes in net unrealized appreciation (depreciation) on outstanding contracts are recognized in the Fund’s Statement of Operations.
The quarterly average value of open sell currency contracts for the six months ended March 31, 2016 was $11,256,119. Open buy currency contracts are entered into for the purpose of closing open sell currency contracts and the values are dependent upon the values of the open sell currency contracts to which they relate.
The following table displays the outstanding forward currency contracts at March 31, 2016:
| | | | | | | | | | | | | | | | | | | | | | |
Outstanding Forward Currency Contracts to Buy or Sell at March 31, 2016 | |
Contract Description | | Contract
Buy/Sell | | Contract
Amount | | | Value
Date | | | Value
USD | | | Unrealized
Appreciation | | | Unrealized
Depreciation | |
Canadian Dollar | | Sell | | | 9,338,300 | | | | 09/07/2016 | | | | 7,191,366 | | | $ | — | | | $ | (178,629 | ) |
Euro | | Buy | | | 2,128,500 | | | | 05/17/2016 | | | | 2,425,138 | | | | 95,556 | | | | — | |
Euro | | Sell | | | 2,128,500 | | | | 05/17/2016 | | | | 2,425,138 | | | | — | | | | (123,953 | ) |
Swiss Franc | | Sell | | | 3,985,000 | | | | 06/22/2016 | | | | 4,158,947 | | | | 235,288 | | | | — | |
| | | | | | | | | | | | | | | | | | | | | | |
Total | | | | | | | | | | | | | | | | $ | 330,844 | | | $ | (302,582 | ) |
| | | | | | | | | | | | | | | | | | | | | | |
Net unrealized appreciation (depreciation) | | | | | | | | | | | | | | $ | 28,262 | | | | | |
| | | | | | | | | | | | | | | | | | | | | | |
The outstanding forward currency contracts in the foregoing table were entered into with State Street Bank and Trust Company (“SSB”), pursuant to an International Swaps and Derivatives Association (“ISDA”) Master Agreement. In the event of a default or termination under the ISDA Master Agreement with SSB, the non-defaulting party has the right to close out all outstanding forward currency contracts between the parties and to net any payment amounts under those contracts, resulting in a single net amount payable by one party to the other.
Because the ISDA Master Agreement with SSB does not result in an offset of reported amounts of financial assets and liabilities in the Fund’s Statement of Assets and Liabilities unless there has been an event of default or termination event under that agreement, the Fund does not net its outstanding forward currency contracts for purposes of the disclosure in the Fund’s Statement of Assets and Liabilities. Instead the Fund recognizes the unrealized appreciation or depreciation on those forward currency contracts on a gross basis in the Fund’s Statement of Assets and Liabilities.
The unrealized appreciation (depreciation) of the outstanding forward currency contracts recognized in the Fund’s Statement of Assets and Liabilities at March 31, 2016 is disclosed in the following table:
| | | | |
Fair Values of Derivative Financial Instruments at March 31, 2016 |
Asset Derivatives | | Balance Sheet Location | | Fair Value |
Foreign exchange contracts | | Assets - Unrealized appreciation on forward currency contracts | | $ 330,844 |
| | |
Liability Derivatives | | Balance Sheet Location | | Fair Value |
Foreign exchange contracts | | Liabilities - Unrealized depreciation on forward currency contracts | | $(302,582) |
30 Semi-Annual Report
| | |
| NOTES TO FINANCIAL STATEMENTS, CONTINUED | | |
| |
Thornburg Strategic Income Fund | | March 31, 2016 (Unaudited) |
Because the Fund does not currently receive or post cash collateral in connection with its currency forward contracts, and because all of the Fund’s outstanding currency forward contracts are with SSB, the net amounts of the Fund’s assets and liabilities which are attributable to those contracts at March 31, 2016 can be determined by offsetting the dollar amounts shown in the preceding table. Based on those amounts, the net amount of the Fund’s assets which is attributable to its outstanding forward currency contracts at March 31, 2016 is $28,262, and the net amount of the Fund’s liabilities which is attributable to those contracts at that date is $0. The Fund’s forward currency contracts are valued each day, and the net amounts of the Fund’s assets and liabilities which are attributable to those contracts are expected to vary over time.
The net realized gain (loss) from forward currency contracts and the net change in unrealized appreciation (depreciation) of outstanding forward currency contracts recognized in the Fund’s Statement of Operations for the six months ended March 31, 2016 are disclosed in the following tables:
| | | | |
Net Realized Gain (Loss) on Derivative Financial Instruments Recognized in Income for the Six Months Ended March 31, 2016 |
| | | Total | | Forward Currency Contracts |
Foreign exchange contracts | | $(45,873) | | $(45,873) |
|
Net Change in Unrealized Appreciation (Depreciation) of Derivative Financial Instruments Recognized in Income for the Six Months Ended March 31, 2016 |
| | | Total | | Forward Currency Contracts |
Foreign exchange contracts | | $(92,470) | | $(92,470) |
OTHER NOTES
Risks: The Fund’s investments subject it to risks including, but not limited to, credit risk, interest rate risk, prepayment risk, management risk, market and economic risk, liquidity risk, risks affecting specific issuers, and the risks associated with investments in derivative instruments, small- and mid-cap companies, non-U.S. issuers, real estate investment trusts, below investment grade debt obligations, and structured finance arrangements. Please see the Fund’s prospectus for a discussion of the risks associated with an investment in the Fund.
Subsequent Events: Fund management believes no events have occurred between March 31, 2016 and the date of issuance of the financial statements that require adjustment to or disclosure in the accompanying financial statements.
Semi-Annual Report 31
FINANCIAL HIGHLIGHTS
Thornburg Strategic Income Fund
| | | | | | | | | | | | | | | | | | | | | | | | | | | | | | | | | | | | | | | | | | | | | | | | | | | | | | |
| | | PER SHARE PERFORMANCE (for a share outstanding throughout the Period) | | RATIOS TO AVERAGE NET ASSETS | | | SUPPLEMENTAL DATA | |
Unless
Otherwise
Noted,
Periods
are
Fiscal
Years
Ended
Sept. 30, | | Net Asset
Value
Beginning
of Period | | | Net
Investment
Income
(Loss)+ | | Net
Realized
&
Unrealized
Gain (Loss)
on
Investments | | | Total from
Investment
Operations | | | Dividends
from Net
Investment
Income | | | Dividends
from Net
Realized
Gains | | | Total
Dividends | | | Net
Asset
Value
End
of
Period | | Net
Investment
Income
(Loss)
(%) | | | Expenses,
After
Expense
Reductions
(%) | | | Expenses,
After
Expense
Reductions
and
Net of
Custody
Credits
(%) | | | Expenses,
Before
Expense
Reductions
(%) | | | Total
Return
(%)(a) | | | Portfolio
Turnover
Rate
(%)(a) | | Net
Assets
at End
of
Period
(Thousands) | |
Class A Shares | | | | | | | | | | | | | | | | | | | | | | | | | | | | | | | | | | | | | | | | | | | | | | | | | | | | | | |
2016(b)(c) | | $ | 11.22 | | | 0.24 | | | (0.13 | ) | | | 0.11 | | | | (0.20 | ) | | | (0.03 | ) | | | (0.23 | ) | | $11.10 | | | 4.29 | (d) | | | 1.25 | (d) | | | 1.25 | (d) | | | 1.26 | (d) | | | 0.97 | | | 13.91 | | $ | 294,728 | |
2015(c) | | $ | 12.18 | | | 0.47 | | | (0.82 | ) | | | (0.35 | ) | | | (0.46 | ) | | | (0.15 | ) | | | (0.61 | ) | | $11.22 | | | 4.04 | | | | 1.23 | | | | 1.23 | | | | 1.23 | | | | (2.97 | ) | | 38.40 | | $ | 338,387 | |
2014(c) | | $ | 12.19 | | | 0.52 | | | 0.28 | | | | 0.80 | | | | (0.54 | ) | | | (0.27 | ) | | | (0.81 | ) | | $12.18 | | | 4.30 | | | | 1.22 | | | | 1.22 | | | | 1.24 | | | | 6.79 | | | 51.20 | | $ | 392,604 | |
2013(c) | | $ | 12.28 | | | 0.67 | | | 0.03 | | | | 0.70 | | | | (0.65 | ) | | | (0.14 | ) | | | (0.79 | ) | | $12.19 | | | 5.44 | | | | 1.25 | | | | 1.25 | | | | 1.27 | | | | 5.79 | | | 76.47 | | $ | 251,106 | |
2012(c) | | $ | 11.86 | | | 0.71 | | | 0.73 | | | | 1.44 | | | | (0.74 | ) | | | (0.28 | ) | | | (1.02 | ) | | $12.28 | | | 5.97 | | | | 1.25 | | | | 1.25 | | | | 1.31 | | | | 12.73 | | | 34.54 | | $ | 199,770 | |
2011(c) | | $ | 12.35 | | | 0.79 | | | (0.21 | ) | | | 0.58 | | | | (0.79 | ) | | | (0.28 | ) | | | (1.07 | ) | | $11.86 | | | 6.47 | | | | 1.20 | | | | 1.20 | | | | 1.32 | | | | 4.78 | | | 48.09 | | $ | 115,704 | |
Class C Shares | | | | | | | | | | | | | | | | | | | | | | | | | | | | | | | | | | | | | | | | | | | | | | | | | | | | | | |
2016(b) | | $ | 11.20 | | | 0.21 | | | (0.12 | ) | | | 0.09 | | | | (0.17 | ) | | | (0.03 | ) | | | (0.20 | ) | | $11.09 | | | 3.74 | (d) | | | 1.80 | (d) | | | 1.80 | (d) | | | 2.00 | (d) | | | 0.78 | | | 13.91 | | $ | 280,221 | |
2015 | | $ | 12.17 | | | 0.41 | | | (0.83 | ) | | | (0.42 | ) | | | (0.40 | ) | | | (0.15 | ) | | | (0.55 | ) | | $11.20 | | | 3.47 | | | | 1.80 | | | | 1.80 | | | | 1.97 | | | | (3.61 | ) | | 38.40 | | $ | 306,085 | |
2014 | | $ | 12.17 | | | 0.45 | | | 0.29 | | | | 0.74 | | | | (0.47 | ) | | | (0.27 | ) | | | (0.74 | ) | | $12.17 | | | 3.73 | | | | 1.80 | | | | 1.80 | | | | 1.98 | | | | 6.27 | | | 51.20 | | $ | 348,334 | |
2013 | | $ | 12.26 | | | 0.60 | | | 0.03 | | | | 0.63 | | | | (0.58 | ) | | | (0.14 | ) | | | (0.72 | ) | | $12.17 | | | 4.88 | | | | 1.80 | | | | 1.80 | | | | 2.02 | | | | 5.21 | | | 76.47 | | $ | 237,177 | |
2012 | | $ | 11.84 | | | 0.64 | | | 0.73 | | | | 1.37 | | | | (0.67 | ) | | | (0.28 | ) | | | (0.95 | ) | | $12.26 | | | 5.42 | | | | 1.79 | | | | 1.79 | | | | 2.05 | | | | 12.15 | | | 34.54 | | $ | 188,782 | |
2011 | | $ | 12.34 | | | 0.72 | | | (0.22 | ) | | | 0.50 | | | | (0.72 | ) | | | (0.28 | ) | | | (1.00 | ) | | $11.84 | | | 5.86 | | | | 1.80 | | | | 1.80 | | | | 2.07 | | | | 4.11 | | | 48.09 | | $ | 106,684 | |
Class I Shares | | | | | | | | | | | | | | | | | | | | | | | | | | | | | | | | | | | | | | | | | | | | | | | | | | | | | | |
2016(b) | | $ | 11.19 | | | 0.26 | | | (0.12 | ) | | | 0.14 | | | | (0.22 | ) | | | (0.03 | ) | | | (0.25 | ) | | $11.08 | | | 4.62 | (d) | | | 0.91 | (d) | | | 0.91 | (d) | | | 0.91 | (d) | | | 1.23 | | | 13.91 | | $ | 449,081 | |
2015 | | $ | 12.16 | | | 0.51 | | | (0.83 | ) | | | (0.32 | ) | | | (0.50 | ) | | | (0.15 | ) | | | (0.65 | ) | | $11.19 | | | 4.38 | | | | 0.89 | | | | 0.89 | | | | 0.89 | | | | (2.73 | ) | | 38.40 | | $ | 531,849 | |
2014 | | $ | 12.17 | | | 0.56 | | | 0.28 | | | | 0.84 | | | | (0.58 | ) | | | (0.27 | ) | | | (0.85 | ) | | $12.16 | | | 4.60 | | | | 0.90 | | | | 0.90 | | | | 0.90 | | | | 7.15 | | | 51.20 | | $ | 552,182 | |
2013 | | $ | 12.25 | | | 0.70 | | | 0.04 | | | | 0.74 | | | | (0.68 | ) | | | (0.14 | ) | | | (0.82 | ) | | $12.17 | | | 5.75 | | | | 0.94 | | | | 0.94 | | | | 0.94 | | | | 6.21 | | | 76.47 | | $ | 246,332 | |
2012 | | $ | 11.83 | | | 0.74 | | | 0.73 | | | | 1.47 | | | | (0.77 | ) | | | (0.28 | ) | | | (1.05 | ) | | $12.25 | | | 6.27 | | | | 0.96 | | | | 0.96 | | | | 0.97 | | | | 13.06 | | | 34.54 | | $ | 191,090 | |
2011 | | $ | 12.35 | | | 0.83 | | | (0.20 | ) | | | 0.63 | | | | (0.87 | ) | | | (0.28 | ) | | | (1.15 | ) | | $11.83 | | | 6.71 | | | | 0.97 | | | | 0.97 | | | | 0.98 | | | | 5.16 | | | 48.09 | | $ | 99,594 | |
Class R3 Shares | | | | | | | | | | | | | | | | | | | | | | | | | | | | | | | | | | | | | | | | | | | | | | | | | | | | | | |
2016(b) | | $ | 11.21 | | | 0.24 | | | (0.13 | ) | | | 0.11 | | | | (0.20 | ) | | | (0.03 | ) | | | (0.23 | ) | | $11.09 | | | 4.31 | (d) | | | 1.25 | (d) | | | 1.25 | (d) | | | 3.54 | (d) | | | 0.97 | | | 13.91 | | $ | 1,682 | |
2015 | | $ | 12.18 | | | 0.47 | | | (0.83 | ) | | | (0.36 | ) | | | (0.46 | ) | | | (0.15 | ) | | | (0.61 | ) | | $11.21 | | | 3.98 | | | | 1.25 | | | | 1.25 | | | | 2.70 | | | | (3.07 | ) | | 38.40 | | $ | 1,430 | |
2014 | | $ | 12.19 | | | 0.49 | | | 0.31 | | | | 0.80 | | | | (0.54 | ) | | | (0.27 | ) | | | (0.81 | ) | | $12.18 | | | 4.10 | | | | 1.25 | | | | 1.25 | | | | 3.10 | | | | 6.76 | | | 51.20 | | $ | 3,049 | |
2013 | | $ | 12.28 | | | 0.63 | | | 0.06 | | | | 0.69 | | | | (0.64 | ) | | | (0.14 | ) | | | (0.78 | ) | | $12.19 | | | 5.19 | | | | 1.25 | | | | 1.25 | | | | 32.64 | (e) | | | 5.78 | | | 76.47 | | $ | 171 | |
2012(f) | | $ | 12.03 | | | 0.30 | | | 0.25 | | | | 0.55 | | | | (0.30 | ) | | | — | | | | (0.30 | ) | | $12.28 | | | 5.93 | (d) | | | 1.22 | (d) | | | 1.22 | (d) | | | 373.07 | (d)(e) | | | 4.63 | | | 34.54 | | $ | 11 | |
Class R4 Shares | | | | | | | | | | | | | | | | | | | | | | | | | | | | | | | | | | | | | | | | | | | | | | | | | | | | | | |
2016(b) | | $ | 11.21 | | | 0.24 | | | (0.12 | ) | | | 0.12 | | | | (0.20 | ) | | | (0.03 | ) | | | (0.23 | ) | | $11.10 | | | 4.31 | (d) | | | 1.25 | (d) | | | 1.25 | (d) | | | 2.46 | (d) | | | 1.06 | | | 13.91 | | $ | 2,637 | |
2015 | | $ | 12.18 | | | 0.48 | | | (0.84 | ) | | | (0.36 | ) | | | (0.46 | ) | | | (0.15 | ) | | | (0.61 | ) | | $11.21 | | | 4.15 | | | | 1.25 | | | | 1.25 | | | | 2.64 | | | | (3.07 | ) | | 38.40 | | $ | 2,106 | |
2014(g) | | $ | 12.00 | | | 0.35 | | | 0.17 | | | | 0.52 | | | | (0.34 | ) | | | — | | | | (0.34 | ) | | $12.18 | | | 4.25 | (d) | | | 1.25 | (d) | | | 1.25 | (d) | | | 60.66 | (d)(e) | | | 4.29 | | | 51.20 | | $ | 16 | |
Class R5 Shares | | | | | | | | | | | | | | | | | | | | | | | | | | | | | | | | | | | | | | | | | | | | | | | | | | | | | | |
2016(b) | | $ | 11.19 | | | 0.25 | | | (0.12 | ) | | | 0.13 | | | | (0.21 | ) | | | (0.03 | ) | | | (0.24 | ) | | $11.08 | | | 4.55 | (d) | | | 0.99 | (d) | | | 0.99 | (d) | | | 1.49 | (d) | | | 1.19 | | | 13.91 | | $ | 6,877 | |
2015 | | $ | 12.15 | | | 0.50 | | | (0.82 | ) | | | (0.32 | ) | | | (0.49 | ) | | | (0.15 | ) | | | (0.64 | ) | | $11.19 | | | 4.33 | | | | 0.99 | | | | 0.99 | | | | 1.55 | | | | (2.75 | ) | | 38.40 | | $ | 6,399 | |
2014 | | $ | 12.16 | | | 0.55 | | | 0.28 | | | | 0.83 | | | | (0.57 | ) | | | (0.27 | ) | | | (0.84 | ) | | $12.15 | | | 4.51 | | | | 0.99 | | | | 0.99 | | | | 2.11 | | | | 7.05 | | | 51.20 | | $ | 2,565 | |
2013 | | $ | 12.25 | | | 0.70 | | | 0.03 | | | | 0.73 | | | | (0.68 | ) | | | (0.14 | ) | | | (0.82 | ) | | $12.16 | | | 5.68 | | | | 0.99 | | | | 0.99 | | | | 227.33 | (e) | | | 6.07 | | | 76.47 | | $ | 11 | |
2012(f) | | $ | 12.00 | | | 0.31 | | | 0.25 | | | | 0.56 | | | | (0.31 | ) | | | — | | | | (0.31 | ) | | $12.25 | | | 6.22 | (d) | | | 0.97 | (d) | | | 0.97 | (d) | | | 372.35 | (d)(e) | | | 4.75 | | | 34.54 | | $ | 11 | |
| (a) | Not annualized for periods less than one year. |
| (b) | Unaudited Six Month Period Ended March 31. |
| (c) | Sales loads are not reflected in computing total return. |
| (e) | Due to the size of net assets and fixed expenses, ratios may appear disproportionate. |
| (f) | Effective date of this class of shares was May 1, 2012. |
| (g) | Effective date of this class of shares was February 1, 2014. |
| + | Based on weighted average shares outstanding. |
See notes to financial statements.
| | | | |
| 32 Semi-Annual Report | | | | Semi-Annual Report 33 |
| | |
| EXPENSE EXAMPLE | | |
| |
Thornburg Strategic Income Fund | | March 31, 2016 (Unaudited) |
As a shareholder of the Fund, you incur two types of costs:
| | (1) | transaction costs, including |
(a) sales charges (loads) on purchase payments, for Class A shares;
(b) a deferred sales charge on redemptions of any part or all of a purchase of $1 million of Class A shares within 12 months of purchase;
(c) a deferred sales charge on redemptions of Class C shares within 12 months of purchase;
| | (2) | ongoing costs, including management fees; distribution and/or service (12b-1) fees; and other Fund expenses. |
This example is intended to help you understand your ongoing costs (in dollars) of investing in the Fund and to compare these costs with the ongoing costs of investing in other mutual funds.
The example is based on a $1,000 investment beginning on October 1, 2015, and held until March 31, 2016.
ACTUAL EXPENSES
For each class of shares, the first line of the accompanying table provides information about actual account values and actual expenses. You may use the information in this line, together with the amount you invested, to estimate the expenses that you paid over the period. Simply divide your account value by $1,000 (for example, an $8,600 account value divided by $1,000 = 8.6), then multiply the result by the number in the first line for your class of shares under the heading entitled “Expenses Paid During Period” to estimate the expenses you paid on your account during this period.
| | | | | | | | | | | | |
| | | Beginning
Account Value
10/1/15 | | | Ending
Account Value
3/31/16 | | | Expenses paid
During period†
10/1/15–3/31/16 | |
Class A Shares | | | | | | | | | | | | |
Actual | | $ | 1,000.00 | | | $ | 1,009.70 | | | $ | 6.27 | |
Hypothetical* | | $ | 1,000.00 | | | $ | 1,018.76 | | | $ | 6.30 | |
Class C Shares | | | | | | | | | | | | |
Actual | | $ | 1,000.00 | | | $ | 1,007.80 | | | $ | 9.04 | |
Hypothetical* | | $ | 1,000.00 | | | $ | 1,016.00 | | | $ | 9.07 | |
Class I Shares | | | | | | | | | | | | |
Actual | | $ | 1,000.00 | | | $ | 1,012.30 | | | $ | 4.60 | |
Hypothetical* | | $ | 1,000.00 | | | $ | 1,020.43 | | | $ | 4.62 | |
Class R3 Shares | | | | | | | | | | | | |
Actual | | $ | 1,000.00 | | | $ | 1,009.70 | | | $ | 6.28 | |
Hypothetical* | | $ | 1,000.00 | | | $ | 1,018.75 | | | $ | 6.31 | |
Class R4 Shares | | | | | | | | | | | | |
Actual | | $ | 1,000.00 | | | $ | 1,010.60 | | | $ | 6.28 | |
Hypothetical* | | $ | 1,000.00 | | | $ | 1,018.75 | | | $ | 6.31 | |
Class R5 Shares | | | | | | | | | | | | |
Actual | | $ | 1,000.00 | | | $ | 1,011.90 | | | $ | 4.98 | |
Hypothetical* | | $ | 1,000.00 | | | $ | 1,020.05 | | | $ | 5.00 | |
| † | Expenses are equal to the annualized expense ratio for each class (A: 1.25%; C: 1.80%; I: 0.91% R3: 1.25% R4: 1.25% R5: 0.99%) multiplied by the average account value over the period, multiplied by 183/366 to reflect the one-half year period. |
| * | Hypothetical assumes a rate of return of 5% per year before expenses. |
HYPOTHETICAL EXAMPLE FOR COMPARISON PURPOSES
For each class of shares, the second line of the accompanying table provides information about hypothetical account values and hypothetical expenses based on the Fund’s actual expense ratio and an assumed rate of return of 5% per year before expenses, which is not the Fund’s actual return. The hypothetical account values and expenses may not be used to estimate the actual ending account balance or expenses you paid for the period. You may use this information to compare the ongoing costs of investing in the Fund and other funds. To do so, compare this 5% hypothetical example with the 5% hypothetical examples that appear in the shareholder reports of the other funds.
Please note that the expenses shown in the table are meant to highlight your ongoing costs only and do not reflect any transactional costs, such as sales charges (loads), redemption fees, or exchange fees. Therefore, the second line of the table for each class of shares is useful in comparing ongoing costs only, and will not help you determine the relative total costs of owning different funds. In addition, if these transactional costs were included, your costs would have been higher.
34 Semi-Annual Report
| | |
| OTHER INFORMATION | | |
| |
Thornburg Strategic Income Fund | | March 31, 2016 (Unaudited) |
PORTFOLIO PROXY VOTING
Policies and Procedures:
The Trust has delegated to Thornburg Investment Management, Inc. (the “Advisor”) voting decisions respecting proxies for the Fund’s voting securities. The Advisor makes voting decisions in accordance with its Proxy Voting Policy and Procedures. A description of the Policy and Procedures is available (i) without charge, upon request, by calling the Advisor toll-free at 1-800-847-0200, (ii) on the Thornburg website at www.thornburg.com, and (iii) on the Securities and Exchange Commission’s website at www.sec.gov.
Information regarding how proxies were voted is available on or before August 31 of each year for the twelve months ending the preceding June 30. This information is available (i) without charge, upon request by calling the Advisor toll-free at 1-800-847-0200, (ii) on the Thornburg website at www.thornburg.com, and (iii) on the Securities and Exchange Commission’s website at www.sec.gov.
AVAILABILITY OF QUARTERLY PORTFOLIO SCHEDULE
The Fund files with the Securities and Exchange Commission schedules of its portfolio holdings on Form N-Q for the first and third quarters of each fiscal year. The Fund’s Forms N-Q are available on the Commission’s website at www.sec.gov, or may be reviewed and copied at the Commission’s Public Reference Room in Washington, D.C. Information on the operation of the Public Reference Room may be obtained by calling 1-800-SEC-0330. The Fund also makes this information available on its website at www.thornburg. com/download or upon request by calling 1-800-847-0200.
Semi-Annual Report 35
TRUSTEES’ STATEMENT TO SHAREHOLDERS
Revised and Readopted September 15, 2015
The Trustees believe current and prospective shareholders should know how we discharge our responsibilities in supervising the Funds’ investment advisor and in reviewing the advisor’s contract for renewal. Since 2005, we have issued a statement which sets out clearly the three principal guidelines that we follow in supervising the Trust’s investment advisor on your behalf. In accordance with our customary practice, in September of 2015 we again reviewed our statement and concluded we should reissue this statement outlining the principal features of our supervision of the advisor’s performance of investment management services for the Funds.
We begin with the premise that each shareholder selected his or her Fund because its investments are managed by the investment advisor identified in the prospectus and in accordance with the objective and policies described in the prospectus. We realize, as each of you do, that if you believe that your Fund’s stated objective and policies no longer serve your personal investment goals, you can sell your shares and leave the Fund.
Therefore, we believe that our primary supervisory task – our principal obligation to you – is to assess the nature and quality of the advisor’s services, and to confirm that the advisor actively and competently pursues the Fund’s objective, in accordance with the policies set out in the prospectus. To do this, we meet regularly with management to review your Fund’s portfolio and to discuss the advisor’s specific actions and judgments in pursuing the Fund’s objective. We do not substitute our own judgment for the advisor’s decisions in selecting investments; the advisor is paid to exercise its informed judgment on investment decisions, and we seek to confirm, in reviewing the advisor’s performance, that the advisor is doing just that.
Second, we are conscious of costs and the effect that costs have on shareholders’ returns. We try to make sure that your Fund’s fees and costs are reasonable in relationship to the services rendered and that they are generally in line with those charged by other expert investment advisors, consistent with our belief that the Fund’s investors searched for and expect that expertise and attention and have decided to pay a reasonable price for it. We do not put the management contract “out to bid” as a matter of course, and we would not do so unless we had concluded that the advisor materially had failed to pursue the Fund’s objectives in accordance with its policies, or for other equally important reasons. We believe that any other approach would be inconsistent with your interests and contrary to your expectations when you bought shares of the Fund in the first place.
Finally, because we believe that most Thornburg Fund shareholders have invested with a long-term perspective, we try not to focus too much on the fashions of the moment and on short-term performance. The market will not favor any specific investment objective or set of policies at all times and under all economic circumstances. A fund will experience periods of both high and low returns relative to other funds and other investments. Even if one of our Funds is not favored by the market at a particular time, we believe that the advisor is nonetheless obliged to remain true to the Fund’s objective and policies, and we watch to see that it does so.
Trustees of Thornburg Investment Trust
36 Semi-Annual Report
THORNBURG FUND FAMILY
Thornburg Investment Management is a privately-owned global investment firm that offers a range of solutions for retail and institutional investors. Founded in 1982 and headquartered in Santa Fe, New Mexico, we manage approximately $54 billion (as of March 31, 2016) across eight equity and 11 bond mutual funds, separate accounts for high-net-worth investors and institutional accounts, and five UCITS funds for non-U.S. investors.
The fund outlined in this report is one of many equity and fixed-income products available from Thornburg Investment Management.
Equity Funds
| | • | | Thornburg Core Growth Fund |
| | • | | Thornburg International Value Fund |
| | • | | Thornburg Better World International Fund |
| | • | | Thornburg International Growth Fund |
| | • | | Thornburg Developing World Fund |
| | • | | Thornburg Investment Income Builder Fund |
| | • | | Thornburg Global Opportunities Fund |
Fixed Income Funds
| | • | | Thornburg Low Duration Income Fund |
| | • | | Thornburg Limited Term U.S. Government Fund |
| | • | | Thornburg Limited Term Income Fund |
| | • | | Thornburg Strategic Income Fund |
| | • | | Thornburg Low Duration Municipal Fund |
| | • | | Thornburg Limited Term Municipal Fund |
| | • | | Thornburg Intermediate Municipal Fund |
| | • | | Thornburg California Limited Term Municipal Fund |
| | • | | Thornburg New Mexico Intermediate Municipal Fund |
| | • | | Thornburg New York Intermediate Municipal Fund |
| | • | | Thornburg Strategic Municipal Income Fund |
Before investing, carefully consider the Fund’s investment goals, risks, charges, and expenses. For a prospectus or summary prospectus containing this and other information, contact your financial advisor or visit thornburg.com. Read it carefully before investing.
For additional information, please visit thornburg.com
Thornburg Investment Management, Inc. 2300 North Ridgetop Road, Santa Fe, NM 87506
Semi-Annual Report 37
This page intentionally left blank.
38 Semi-Annual Report
This page intentionally left blank.
Semi-Annual Report 39

This Semi-Annual Report is submitted for the general information of shareholders of the Fund. It is not authorized for distribution to prospective investors in the Fund unless preceded or accompanied by an effective prospectus.
| | | | |
| Investment Advisor: | | Distributor: | | |
| Thornburg Investment Management® | | Thornburg Securities Corporation® | | |
| 800.847.0200 | | 800.847.0200 | | TH1663 |
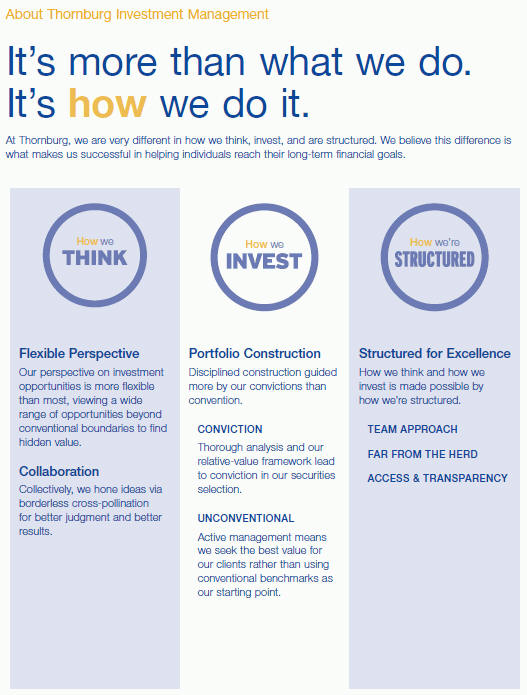
2 Semi-Annual Report
Semi-Annual Report
Thornburg Value Fund
March 31, 2016
| | | | |
SHARE CLASS | | NASDAQ SYMBOL | | CUSIP |
Class A | | TVAFX | | 885-215-731 |
Class B | | TVBFX | | 885-215-590 |
Class C | | TVCFX | | 885-215-715 |
Class I | | TVIFX | | 885-215-632 |
Class R3 | | TVRFX | | 885-215-533 |
Class R4 | | TVIRX | | 885-215-277 |
Class R5 | | TVRRX | | 885-215-376 |
Class I, R3, R4, and R5 shares may not be available to all investors. Minimum investments for Class I shares may be higher than those for other classes. Class B shares are no longer offered.
Investments carry risks, including possible loss of principal. Additional risks may be associated with investments outside the United States, especially in emerging markets, including currency fluctuations, illiquidity, volatility, and political and economic risks. Investments in small- and mid-capitalization companies may increase the risk of greater price fluctuations. Please see the Fund’s prospectus for a discussion of the risks associated with an investment in the Fund. Investments in the Fund are not FDIC insured, nor are they bank deposits or guaranteed by a bank or any other entity.
Semi-Annual Report 3
LETTER TO SHAREHOLDERS
| | |
| |
Thornburg Value Fund | | March 31, 2016 (Unaudited) |
April 18, 2016
Dear Fellow Shareholders:
The first half of Thornburg Value Fund’s 2016 fiscal year showed a positive result, though this result was disappointing relative to our benchmark, the S&P 500 Index. During the period, the Fund (A shares without sales charge) under-performed the S&P 500 Index, returning 2.81%, versus the index’s 8.49%. While near-term performance has been disappointing, both long-term performance (since the Fund’s inception) and performance since we bolstered the consistent earning characteristics (in mid-2012) remain constructive. We have updated the table (Table I) that we included in last year’s semi-annual letter highlighting strong performance and an improved beta characteristic since mid-2012. We’re excited that since June of 2012, we have provided a significant return for shareholders (in absolute terms) while also outpacing many applicable investment alternatives.
Table I Historical Performance Statistics
| | | | | | | | | | | | |
| | | 10/2/95–
12/31/10 | | | 12/31/10–
6/30/12 | | | 6/30/12–
3/31/16 | |
Value Fund Beta | | | 0.94 | | | | 1.22 | | | | 0.95 | |
Value Fund Total Return, Annualized (A shares without sales charge) | | | 9.9 | % | | | -8.9 | % | | | 15.7 | % |
S&P 500 Total Return, Annualized | | | 7.1 | % | | | 7.7 | % | | | 14.1 | % |
Value Fund Total Return, Cumulative | | | 320.3 | % | | | -12.9 | % | | | 72.5 | % |
S&P 500 Total Return, Cumulative | | | 184.3 | % | | | 11.8 | % | | | 63.9 | % |
Source: Bloomberg and Confluence
Performance data shown represents past performance and is no guarantee of future results. Investment return and principal value will fluctuate so shares, when redeemed, may be worth more or less than their original cost. Current performance may be lower or higher than quoted. For performance current to the most recent month end, visit thornburg.com or call 800.847.0200.
The maximum sales charge for Class A shares is 4.50%. The total annual fund operating expense of Class A shares is 1.37%, as disclosed in the most recent prospectus. If the sales charge had been deducted, returns would be lower.
We sailed into twin headwinds during the period: worse performance for small- and mid-cap stocks (we own more of these) and very good performance for what we call expensive defensives (we own fewer of these). Our stock picking also weighed on results during the period. We expect to add value over the long term with fundamental, bottom-up analysis of individual securities and by buying promising companies at a discount. That said, as long-term focused investors, we know that our stock picking won’t add value over every short-term interval. Our stock attribution during the period showed a combination of permanent setbacks (where fundamental deterioration led to the sale of a few of our investments, for example) and more temporary ones (where we believe good companies at great prices are not fairly valued by the markets and got even cheaper).
Phibro Animal Health is an example of the latter. Recently, we had a long visit with the company’s management team at its headquarters in Teaneck, NJ. As we were escorted to a large conference room by the receptionist, she told us how years ago she had scored the deal of the century on the large boardroom table (she said she had bought it used from the guy she has been buying furniture from for the last 20 years). We then spent two hours at that table with Phibro’s senior management. Jack Bendheim, Phibro’s chairman, president, and CEO, started working at the company in 1969, and has been president of the company since 1988. He is also the controlling manager of BFI, Inc., the investment vehicle for the Bendheim family, which owns a majority of the stock.
For those of us who are besieged each day by flashing lights on a screen, meetings like this are refreshing. Phibro management views the price of their stock as a simple outcome of how well they manage their business over the next few years. Jack mentioned with a smile, “I know just about everything that happens day to day in my business. Even so, I have no idea what drives our stock price over the short term.”
We had the good fortune of finding this business and management team before their initial public offering in early 2014 at $13 per share. The company (and the stock) has performed well, and we trimmed our position materially, at values between $30 and $40—during 2015. The stock has been under significant pressure, though, since Hillary Clinton’s scathing tweet on drug prices last fall. While Phibro is a health care company, its products treat livestock, not humans. Phibro’s stock has traded from a high of just over $40 late last year to a low of under $24 recently. While there are always issues in the short term that we can pin a stock price move on after the fact, the truth is that very little has changed with regard to our calculation of the intrinsic value of this business. When we focus on the long term, the stock move in Phibro shares is exciting to us and our fellow Value Fund shareholders. Why? We have been given the opportunity to add to this high-quality business, with its great management team whose interests are closely aligned with ours, at a great price.
During the first half of the fiscal year, the telecommunication and utilities sectors of the S&P 500 were the best performers, while health care and financials were the worst. Our large cash position hurt performance during the period – high cash levels dampen the portfolio impact from heightened market volatility. This will tend to aid performance in down markets, but weighs on performance in up markets. Also, our stock selection within telecommunication and utilities was poor, while picks in the energy sector performed better.
Our best-performing stocks for the period were ITC Holdings, Facebook, Alphabet (i.e., Google), Thermo Fisher
4 Semi-Annual Report
| | |
LETTER TO SHAREHOLDERS, CONTINUED | | |
| |
Thornburg Value Fund | | March 31, 2016 (Unaudited) |
Scientific, and Wal-Mart. ITC is an independent electrical transmission operator in the Midwest. The stock benefitted from lower interest rates and its upcoming merger with Fortis.
Facebook continued to outperform as it increased its market-leading user base. Monthly users topped 1.5 billion worldwide, with over one billion people logging in on a single day. Facebook continues to monetize this user base better than analysts’ expectations, aided by additional contributions from Instagram, and more visible forward monetization opportunities from Messenger, WhatsApp, and Oculus Rift.
Alphabet outperformed during the period as revenue accelerated and the management team took shareholder-friendly actions. The company announced a share buyback and provided more segment-level disclosures.
Thermo Fisher Scientific provides tools and services which aid in all forms of research. The company’s growth prospects look good, aided by a National Institutes of Health budget that is likely to grow over coming years.
Wal-Mart continued to recover from the lows set last year after they guided earnings much lower than expectations during an investor day in October 2015. The market reaction to the news gave us an opportunity to initiate a position. We believe that management’s significant reinvestment in its U.S. stores should drive a continuation of traffic growth and place Wal-Mart back on what Sam Walton called the virtuous cycle—more customers allowing Wal-Mart to leverage fixed costs and save money, which allows the company to lower prices, which gets Wal-Mart more customers, and around and around.
The Fund’s worst-performing stocks during the period were Dynegy, Express Scripts, Citizens Financial, Citigroup, and Phibro Animal Health. Dynegy is an independent power producer serving the Northeast and Midwest markets. The combination of increasing balance-sheet debt and lower natural gas and electricity prices in the U.S. caused shares of Dynegy to fall during the period.
Express Scripts shares were negatively impacted due to a contract dispute with a major client. Express Scripts should remain a key player in helping contain rising pharmaceutical drug costs.
Citizens Financial, along with many other banks, performed poorly during the period, as lower interest rates may translate into lower earnings power.
Shares of Citigroup fell as money-center banks under-performed the S&P 500 and financials more broadly during the period, due to expectations of lower interest rates, concerns surrounding higher credit losses from energy-related sectors, weaker capital markets revenues (trading and banking) and general macroeconomic concerns. Citigroup has the highest emerging markets exposure amongst money-center banks, and those concerns hurt stock performance during the period.
By continuing to employ our bottom-up investing approach, our goal is to position the Thornburg Value Fund to have the opportunity to outperform in any market environment. We plan to continue to execute on this approach, which has worked well over the long term. We invite you to visit our website at www.thornburg.com, where you will find useful information on the Thornburg Value Fund and on other Thornburg funds and investment topics.
Thank you for your continued trust.
| | |
| Sincerely, | | |
| |
 | |  |
| Connor Browne,CFA | | Robert MacDonald,CFA |
| Portfolio Manager | | Portfolio Manager |
| Managing Director | | Managing Director |
The matters discussed in this report may constitute forward-looking statements made pursuant to the safe harbor provisions of the Securities Litigation Reform Act of 1995. These include any advisor or portfolio manager prediction, assessment, analysis or outlook for individual securities, industries, investment styles, market sectors and/or markets. These statements involve risks and uncertainties. In addition to the general risks described for each fund in its current prospectus, other factors bearing on these reports include the accuracy of the advisor’s or portfolio manager’s forecasts and predictions, the appropriateness of the investment strategies designed by the advisor or portfolio manager and the ability of the advisor or portfolio manager to implement their strategies efficiently and successfully. Any one or more of these factors, as well as other risks affecting the securities markets generally, could cause the actual results of any fund to differ materially as compared to its benchmarks.
The views expressed by the portfolio managers reflect their professional opinions and are subject to change. Under no circumstances does the information contained within represent a recommendation to buy or sell any security.
Semi-Annual Report 5
| | |
| PERFORMANCE SUMMARY | | |
| |
Thornburg Value Fund | | March 31, 2016 (Unaudited) |
Average Annual Total Returns
| | | | | | | | | | | | | | | | | | | | |
| | | 1-YR | | | 3-YR | | | 5-YR | | | 10-YR | | | SINCE
INCEP. | |
Class A Shares (Incep: 10/2/95) | | | | | | | | | | | | | | | | | | | | |
Without sales charge | | | -2.54 | % | | | 12.22 | % | | | 6.62 | % | | | 5.37 | % | | | 9.41 | % |
With sales charge | | | -6.92 | % | | | 10.50 | % | | | 5.64 | % | | | 4.88 | % | | | 9.16 | % |
Class B Shares (Incep: 4/3/00) | | | | | | | | | | | | | | | | | | | | |
Without sales charge | | | -3.51 | % | | | 11.12 | % | | | 5.57 | % | | | 4.63 | % | | | 3.72 | % |
With sales charge | | | -8.34 | % | | | 10.17 | % | | | 5.25 | % | | | 4.63 | % | | | 3.72 | % |
Class C Shares (Incep: 10/2/95) | | | | | | | | | | | | | | | | | | | | |
Without sales charge | | | -3.29 | % | | | 11.36 | % | | | 5.80 | % | | | 4.57 | % | | | 8.57 | % |
With sales charge | | | -4.26 | % | | | 11.36 | % | | | 5.80 | % | | | 4.57 | % | | | 8.57 | % |
Class I Shares (Incep: 11/2/98) | | | -2.15 | % | | | 12.65 | % | | | 7.04 | % | | | 5.77 | % | | | 6.98 | % |
Class R3 Shares (Incep: 7/1/03) | | | -2.50 | % | | | 12.25 | % | | | 6.63 | % | | | 5.35 | % | | | 7.03 | % |
Class R4 Shares (Incep: 2/1/07) | | | -2.42 | % | | | 12.36 | % | | | 6.74 | % | | | — | | | | 3.94 | % |
Class R5 Shares (Incep: 2/1/05) | | | -2.16 | % | | | 12.65 | % | | | 7.01 | % | | | 5.74 | % | | | 6.83 | % |
S&P 500 Index (Since 10/2/95) | | | 1.78 | % | | | 11.82 | % | | | 11.58 | % | | | 7.01 | % | | | 8.38 | % |
Growth of a Hypothetical $10,000 Investment
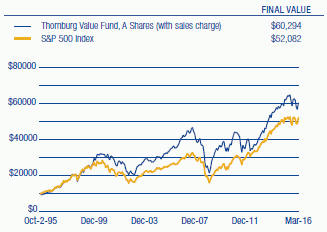
Performance data shown represents past performance and is no guarantee of future results. Investment return and principal value will fluctuate so shares, when redeemed, may be worth more or less than their original cost. Current performance may be lower or higher than quoted. For performance current to the most recent month end, visit thornburg.com or call 800-847-0200. The performance information does not reflect the deduction of taxes that a shareholder would pay on distributions or the redemption of Fund shares. Returns reflect the reinvestment of dividends and capital gains. Class A shares are sold with a maximum sales charge of 4.50%. Class B shares carry a contingent deferred sales charge (CDSC) that declines from 5.00% to 0% depending upon the period of time the shares are held. Class B shares will automatically convert to Class A shares on a quarterly basis approximately eight years after purchase. Class C shares are subject to a 1% CDSC for the first year only. There is no sales charge for Class I, R3, R4, and R5 shares.
As disclosed in the most recent prospectus, the total annual fund operating expenses are as follows: A shares, 1.37%; B shares, 2.92%; C shares, 2.12%; I shares, 1.06%; R3 shares, 1.77%; R4 shares, 1.67%; R5 shares, 1.20%. Thornburg Investment Management and/or Thornburg Securities Corporation have contractually agreed to waive fees and reimburse expenses through at least February 1, 2017, for some of the share classes, resulting in net expense ratios of the following: B shares, 2.38%; I shares, 0.99%; R3 shares, 1.35%; R4 shares, 1.25%; R5 shares, 0.99%. For more detailed information on fund expenses and waivers/reimbursements please see the Fund’s prospectus.
From time to time, the Fund may invest in shares of companies through initial public offerings (IPOs). IPOs have the potential to produce substantial gains for the Fund. There is no assurance that the Fund will have continued access to profitable IPOs and, as the Fund’s assets grow, the impact of IPO investments may decline. Therefore, investors should not rely on these past gains as an indication of future performance.
Glossary
S&P 500 Index – The S&P 500 Index is a broad measure of the U.S. stock market.
Unless otherwise noted, index returns reflect the reinvestment of income dividends and capital gains, if any, but do not reflect fees, brokerage commissions or other expenses of investing. Investors may not make direct investments into any index. The performance of any index is not indicative of the performance of any particular investment.
Beta – A measure of market-related risk. Less than one means the portfolio is less volatile than the index, while greater than one indicates more volatility than the index.
Money-Center Bank – A large bank in a major financial center which borrows from and lends to governments, corporations, and other banks.
6 Semi-Annual Report
| | |
| FUND SUMMARY | | |
| |
Thornburg Value Fund | | March 31, 2016 (Unaudited) |
OBJECTIVES AND STRATEGIES
The Fund seeks long-term capital appreciation by investing in equity and debt securities of all types. As a secondary consideration, the Fund also seeks some current income.
The Fund expects to invest primarily in domestic equity securities (primarily common stocks) selected on a value basis. However, the Fund may own a variety of securities, including foreign equity securities, partnership interests, and foreign and domestic debt obligations which, in the opinion of the Fund’s investment advisor, offer prospects for meeting the Fund’s investment goals.
Market Capitalization Exposure
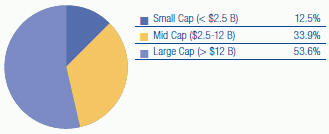
Basket Structure
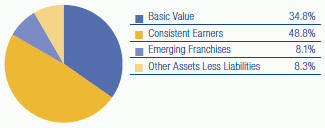
Top Ten Equity Holdings
| | | | |
ITC Holdings Corp. | | | 4.2 | % |
Thermo Fisher Scientific, Inc. | | | 4.1 | % |
Wal-Mart Stores, Inc. | | | 3.7 | % |
JPMorgan Chase & Co. | | | 3.5 | % |
Facebook, Inc. | | | 3.0 | % |
Medtronic plc | | | 2.7 | % |
Grand Canyon Education, Inc. | | | 2.5 | % |
Alphabet, Inc. Class C | | | 2.5 | % |
Oaktree Capital Group, LLC | | | 2.4 | % |
Activision Blizzard, Inc. | | | 2.3 | % |
There is no guarantee that the Fund will meet its investment objectives.
All portfolio information is subject to change.
| | | | |
| Sector Exposure | |
| |
Health Care | | | 16.9 | % |
Financials | | | 15.3 | % |
Information Technology | | | 14.9 | % |
Consumer Staples | | | 12.5 | % |
Consumer Discretionary | | | 12.5 | % |
Industrials | | | 6.2 | % |
Utilities | | | 4.2 | % |
Energy | | | 3.5 | % |
Telecommunication Services | | | 3.2 | % |
Materials | | | 2.2 | % |
Other Assets Less Liabilities | | | 8.3 | % |
|
| Top Ten Industry Groups | |
| |
Pharmaceuticals, Biotechnology & Life Sciences | | | 11.9 | % |
Software & Services | | | 8.2 | % |
Banks | | | 7.6 | % |
Food, Beverage & Tobacco | | | 7.1 | % |
Technology Hardware & Equipment | | | 6.7 | % |
Food & Staples Retailing | | | 5.4 | % |
Consumer Services | | | 5.2 | % |
Health Care Equipment & Services | | | 5.0 | % |
Diversified Financials | | | 4.3 | % |
Utilities | | | 4.2 | % |
Semi-Annual Report 7
SCHEDULE OF INVESTMENTS
| | |
| |
Thornburg Value Fund | | March 31, 2016 (Unaudited) |
| | | | | | | | |
| | | SHARES/ | | | | |
| | | PRINCIPAL AMOUNT | | | VALUE | |
COMMON STOCK — 91.66% | | | | | | | | |
| | |
BANKS — 7.59% | | | | | | | | |
Banks — 7.59% | | | | | | | | |
Citigroup, Inc. | | | 384,400 | | | $ | 16,048,700 | |
Citizens Financial Group, Inc. | | | 1,016,315 | | | | 21,291,799 | |
JPMorgan Chase & Co. | | | 539,040 | | | | 31,921,949 | |
| | | | | | | | |
| | | | | | | 69,262,448 | |
| | | | | | | | |
| | |
CAPITAL GOODS — 1.23% | | | | | | | | |
Machinery — 1.23% | | | | | | | | |
Allison Transmission Holdings, Inc. | | | 416,122 | | | | 11,226,972 | |
| | | | | | | | |
| | | | | | | 11,226,972 | |
| | | | | | | | |
| | |
COMMERCIAL & PROFESSIONAL SERVICES — 3.68% | | | | | | | | |
Commercial Services & Supplies — 3.68% | | | | | | | | |
Covanta Holding Corp. | | | 1,128,623 | | | | 19,028,584 | |
Rentokil Initial plc | | | 5,730,668 | | | | 14,551,820 | |
| | | | | | | | |
| | | | | | | 33,580,404 | |
| | | | | | | | |
| | |
CONSUMER DURABLES & APPAREL — 2.02% | | | | | | | | |
Household Durables — 2.02% | | | | | | | | |
a TRI Pointe Homes, Inc. | | | 1,565,471 | | | | 18,441,248 | |
| | | | | | | | |
| | | | | | | 18,441,248 | |
| | | | | | | | |
| | |
CONSUMER SERVICES — 5.15% | | | | | | | | |
Diversified Consumer Services — 3.25% | | | | | | | | |
a Grand Canyon Education, Inc. | | | 540,118 | | | | 23,084,643 | |
a Nord Anglia Education, Inc. | | | 314,156 | | | | 6,562,719 | |
Hotels, Restaurants & Leisure — 1.90% | | | | | | | | |
Aramark Holdings Corp. | | | 525,183 | | | | 17,394,061 | |
| | | | | | | | |
| | | | | | | 47,041,423 | |
| | | | | | | | |
| | |
DIVERSIFIED FINANCIALS — 4.33% | | | | | | | | |
Capital Markets — 4.33% | | | | | | | | |
Apollo Global Management, LLC | | | 1,036,419 | | | | 17,743,493 | |
Oaktree Capital Group, LLC | | | 441,634 | | | | 21,785,805 | |
| | | | | | | | |
| | | | | | | 39,529,298 | |
| | | | | | | | |
| | |
ENERGY — 3.54% | | | | | | | | |
Energy Equipment & Services — 1.42% | | | | | | | | |
a Weatherford International Ltd. | | | 1,663,120 | | | | 12,939,074 | |
Oil, Gas & Consumable Fuels — 2.12% | | | | | | | | |
Chevron Corp. | | | 202,875 | | | | 19,354,275 | |
| | | | | | | | |
| | | | | | | 32,293,349 | |
| | | | | | | | |
| | |
FOOD & STAPLES RETAILING — 5.45% | | | | | | | | |
Food & Staples Retailing — 5.45% | | | | | | | | |
Wal-Mart Stores, Inc. | | | 497,651 | | | | 34,084,117 | |
Whole Foods Market, Inc. | | | 503,602 | | | | 15,667,058 | |
| | | | | | | | |
| | | | | | | 49,751,175 | |
| | | | | | | | |
| | |
FOOD, BEVERAGE & TOBACCO — 7.09% | | | | | | | | |
Beverages — 1.60% | | | | | | | | |
Kweichow Moutai Co., Ltd. | | | 380,902 | | | | 14,585,656 | |
Food Products — 5.49% | | | | | | | | |
Mead Johnson Nutrition Co. | | | 174,419 | | | | 14,820,383 | |
Mondelez International, Inc. | | | 493,807 | | | | 19,811,537 | |
The Kraft Heinz Co. | | | 197,781 | | | | 15,537,675 | |
| | | | | | | | |
| | | | | | | 64,755,251 | |
| | | | | | | | |
| | |
HEALTH CARE EQUIPMENT & SERVICES — 5.00% | | | | | | | | |
Health Care Equipment & Supplies — 2.75% | | | | | | | | |
Medtronic plc | | | 334,565 | | | | 25,092,375 | |
Health Care Providers & Services — 2.25% | | | | | | | | |
a Envision Healthcare Holdings, Inc. | | | 592,105 | | | | 12,078,942 | |
8 Semi-Annual Report
| | |
| SCHEDULE OF INVESTMENTS, CONTINUED | | |
| |
Thornburg Value Fund | | March 31, 2016 (Unaudited) |
| | | | | | | | |
| | | SHARES/ | | | | |
| | | PRINCIPAL AMOUNT | | | VALUE | |
a Express Scripts Holding Company | | | 123,437 | | | $ | 8,478,887 | |
| | | | | | | | |
| | | | | | | 45,650,204 | |
| | | | | | | | |
INSURANCE — 1.58% | | | | | | | | |
Insurance — 1.58% | | | | | | | | |
Assured Guaranty Ltd. | | | 568,300 | | | | 14,377,990 | |
| | | | | | | | |
| | | | | | | 14,377,990 | |
| | | | | | | | |
MATERIALS — 2.24% | | | | | | | | |
Chemicals — 2.24% | | | | | | | | |
International Flavors & Fragrances, Inc. | | | 179,500 | | | | 20,421,715 | |
| | | | | | | | |
| | | | | | | 20,421,715 | |
| | | | | | | | |
MEDIA — 1.84% | | | | | | | | |
Media — 1.84% | | | | | | | | |
Vivendi SA | | | 799,969 | | | | 16,822,059 | |
| | | | | | | | |
| | | | | | | 16,822,059 | |
| | | | | | | | |
PHARMACEUTICALS, BIOTECHNOLOGY & LIFE SCIENCES — 11.87% | | | | | | | | |
Biotechnology — 3.73% | | | | | | | | |
Gilead Sciences, Inc. | | | 207,199 | | | | 19,033,300 | |
a Seattle Genetics, Inc. | | | 429,213 | | | | 15,061,084 | |
Life Sciences Tools & Services — 4.06% | | | | | | | | |
Thermo Fisher Scientific, Inc. | | | 261,740 | | | | 37,059,766 | |
Pharmaceuticals — 4.08% | | | | | | | | |
GlaxoSmithKline plc | | | 942,603 | | | | 19,115,837 | |
Phibro Animal Health Corp. | | | 668,743 | | | | 18,082,811 | |
| | | | | | | | |
| | | | | | | 108,352,798 | |
| | | | | | | | |
| | |
REAL ESTATE — 1.80% | | | | | | | | |
Real Estate Investment Trusts — 1.80% | | | | | | | | |
PennyMac Mortgage Investment Trust | | | 1,207,530 | | | | 16,470,709 | |
| | | | | | | | |
| | | | | | | 16,470,709 | |
| | | | | | | | |
| | |
RETAILING — 3.52% | | | | | | | | |
Distributors — 0.53% | | | | | | | | |
Pool Corp. | | | 55,346 | | | | 4,856,058 | |
Specialty Retail — 2.99% | | | | | | | | |
a AutoZone, Inc. | | | 11,178 | | | | 8,905,401 | |
a Office Depot, Inc. | | | 1,357,000 | | | | 9,634,700 | |
Staples, Inc. | | | 792,100 | | | | 8,736,863 | |
| | | | | | | | |
| | | | | | | 32,133,022 | |
| | | | | | | | |
| | |
SOFTWARE & SERVICES — 8.23% | | | | | | | | |
Internet Software & Services — 5.88% | | | | | | | | |
a Alphabet, Inc. Class C | | | 30,680 | | | | 22,855,066 | |
a Facebook, Inc. | | | 243,800 | | | | 27,817,580 | |
a Marin Software, Inc. | | | 1,006,735 | | | | 3,040,340 | |
Software — 2.35% | | | | | | | | |
Activision Blizzard, Inc. | | | 633,355 | | | | 21,432,733 | |
| | | | | | | | |
| | | | | | | 75,145,719 | |
| | | | | | | | |
| | |
TECHNOLOGY HARDWARE & EQUIPMENT — 6.70% | | | | | | | | |
Communications Equipment — 1.18% | | | | | | | | |
Nokia Oyj | | | 1,819,095 | | | | 10,815,477 | |
Electronic Equipment, Instruments & Components — 1.25% | | | | | | | | |
CDW Corp. | | | 273,801 | | | | 11,362,742 | |
Technology, Hardware, Storage & Peripherals — 4.27% | | | | | | | | |
Apple, Inc. | | | 166,700 | | | | 18,168,633 | |
HP, Inc. | | | 1,691,303 | | | | 20,836,853 | |
| | | | | | | | |
| | | | | | | 61,183,705 | |
| | | | | | | | |
| | |
TELECOMMUNICATION SERVICES — 3.24% | | | | | | | | |
Diversified Telecommunication Services — 1.75% | | | | | | | | |
a Zayo Group Holdings, Inc. | | | 658,061 | | | | 15,951,398 | |
Semi-Annual Report 9
| | |
| SCHEDULE OF INVESTMENTS, CONTINUED | | |
| |
Thornburg Value Fund | | March 31, 2016 (Unaudited) |
| | | | | | | | |
| | | SHARES/ | | | | |
| | | PRINCIPAL AMOUNT | | | VALUE | |
Wireless Telecommunication Services — 1.49% | | | | | | | | |
a T-Mobile US, Inc. | | | 354,996 | | | $ | 13,596,347 | |
| | | | | | | | |
| | | | | | | 29,547,745 | |
| | | | | | | | |
| | |
TRANSPORTATION — 1.34% | | | | | | | | |
Airlines — 1.34% | | | | | | | | |
American Airlines Group, Inc. | | | 298,379 | | | | 12,236,523 | |
| | | | | | | | |
| | | | | | | 12,236,523 | |
| | | | | | | | |
| | |
UTILITIES — 4.22% | | | | | | | | |
Electric Utilities — 4.22% | | | | | | | | |
ITC Holdings Corp. | | | 883,808 | | | | 38,507,515 | |
| | | | | | | | |
| | | | | | | 38,507,515 | |
| | | | | | | | |
TOTAL COMMON STOCK (Cost $744,808,056) | | | | | | | 836,731,272 | |
| | | | | | | | |
SHORT TERM INVESTMENTS — 8.49% | | | | | | | | |
b Thornburg Capital Management Fund | | | 7,753,449 | | | | 77,534,486 | |
| | | | | | | | |
TOTAL SHORT TERM INVESTMENTS (Cost $77,534,486) | | | | | | | 77,534,486 | |
| | | | | | | | |
TOTAL INVESTMENTS — 100.15% (Cost $822,342,542) | | | | | | $ | 914,265,758 | |
LIABILITIES NET OF OTHER ASSETS — (0.15)% | | | | | | | (1,343,929 | ) |
| | | | | | | | |
NET ASSETS — 100.00% | | | | | | $ | 912,921,829 | |
| | | | | | | | |
Footnote Legend
| b | Investment in Affiliates – Shown below are holdings of voting securities of each portfolio company which is considered “affiliated” to the Fund under the Investment Company Act of 1940, including companies for which the Fund’s holding represented 5% or more of the company’s voting securities, and a series of the Thornburg Investment Trust in which the Fund invested for cash management purposes during the period: |
| | | | | | | | | | | | | | | | | | | | | | | | | | | | |
ISSUER | | SHARES/
PRINCIPAL
SEPTEMBER 30,
2015 | | | GROSS
ADDITIONS | | | GROSS
REDUCTIONS | | | SHARES/
PRINCIPAL
MARCH 31,
2016 | | | MARKET
VALUE
MARCH 31,
2016 | | | INVESTMENT
INCOME | | | REALIZED
GAIN (LOSS) | |
Thornburg Capital Management Fund | | | 8,186,055 | | | | 9,900,433 | | | | 10,333,039 | | | | 7,753,449 | | | $ | 77,534,486 | | | $ | 163,242 | | | $ | — | |
| | | | | | | | | | | | | | | | | | | | | | | | | | | | |
Total non-controlled affiliated issuers - 8.49% of net assets | | | $ | 77,534,486 | | | $ | 163,242 | | | $ | — | |
| | | | | | | | | | | | | | | | | | | | | | | | | | | | |
See notes to financial statements.
10 Semi-Annual Report
This page intentionally left blank.
Semi-Annual Report 11
| | |
| STATEMENT OF ASSETS AND LIABILITIES | | |
| |
Thornburg Value Fund | | March 31, 2016 (Unaudited) |
| | | | |
ASSETS | | | | |
Investments at value (cost $822,342,542) (Note 2) | | $ | 914,265,758 | |
Cash | | | 36,815 | |
Receivable for fund shares sold | | | 576,768 | |
Dividends receivable | | | 2,104,595 | |
Dividend and interest reclaim receivable | | | 174,798 | |
Prepaid expenses and other assets | | | 57,786 | |
| | | | |
Total Assets | | | 917,216,520 | |
| | | | |
| |
LIABILITIES | | | | |
Payable for investments purchased | | | 36,815 | |
Payable for fund shares redeemed | | | 2,479,986 | |
Unrealized depreciation on forward currency contracts (Note 7) | | | 614,566 | |
Payable to investment advisor and other affiliates (Note 3) | | | 917,410 | |
Accounts payable and accrued expenses | | | 245,914 | |
| | | | |
Total Liabilities | | | 4,294,691 | |
| | | | |
| |
NET ASSETS | | $ | 912,921,829 | |
| | | | |
NET ASSETS CONSIST OF | | | | |
Undistributed net investment income | | $ | 2,859,777 | |
Net unrealized appreciation on investments | | | 91,295,439 | |
Accumulated net realized gain (loss) | | | (394,134,307 | ) |
Net capital paid in on shares of beneficial interest | | | 1,212,900,920 | |
| | | | |
| | $ | 912,921,829 | |
| | | | |
12 Semi-Annual Report
| | |
| STATEMENT OF ASSETS AND LIABILITIES, CONTINUED | | |
| |
Thornburg Value Fund | | March 31, 2016 (Unaudited) |
| | | | |
| |
NET ASSET VALUE | | | | |
Class A Shares: | | | | |
Net asset value and redemption price per share ($377,187,066 applicable to 7,462,370 shares of beneficial interest outstanding - Note 4) | | $ | 50.55 | |
Maximum sales charge, 4.50% of offering price | | | 2.38 | |
| | | | |
Maximum offering price per share | | $ | 52.93 | |
| | | | |
| |
Class B Shares: | | | | |
Net asset value per share* ($793,202 applicable to 17,384 shares of beneficial interest outstanding - Note 4) | | $ | 45.63 | |
| | | | |
| |
Class C Shares: | | | | |
Net asset value and offering price per share* ($170,052,043 applicable to 3,638,915 shares of beneficial interest outstanding - Note 4) | | $ | 46.73 | |
| | | | |
| |
Class I Shares: | | | | |
Net asset value, offering and redemption price per share ($284,529,560 applicable to 5,466,573 shares of beneficial interest outstanding - Note 4) | | $ | 52.05 | |
| | | | |
| |
Class R3 Shares: | | | | |
Net asset value, offering and redemption price per share ($55,096,633 applicable to 1,096,520 shares of beneficial interest outstanding - Note 4) | | $ | 50.25 | |
| | | | |
| |
Class R4 Shares: | | | | |
Net asset value, offering and redemption price per share ($10,494,794 applicable to 206,654 shares of beneficial interest outstanding - Note 4) | | $ | 50.78 | |
| | | | |
| |
Class R5 Shares: | | | | |
Net asset value, offering and redemption price per share ($14,768,531 applicable to 284,155 shares of beneficial interest outstanding - Note 4) | | $ | 51.97 | |
| | | | |
| * | Redemption price per share is equal to net asset value less any applicable contingent deferred sales charge. |
See notes to financial statements.
Semi-Annual Report 13
STATEMENT OF OPERATIONS
| | |
| |
Thornburg Value Fund | | Six Months Ended March 31, 2016 (Unaudited) |
| | | | |
INVESTMENT INCOME | | | | |
Dividend income (net of foreign taxes withheld of $172,518) | | $ | 9,258,218 | |
| | | | |
| |
EXPENSES | | | | |
Investment advisory fees (Note 3) | | | 3,925,086 | |
Administration fees (Note 3) | | | | |
Class A Shares | | | 237,273 | |
Class B Shares | | | 703 | |
Class C Shares | | | 107,342 | |
Class I Shares | | | 71,224 | |
Class R3 Shares | | | 35,444 | |
Class R4 Shares | | | 6,873 | |
Class R5 Shares | | | 4,027 | |
Distribution and service fees (Note 3) | | | | |
Class A Shares | | | 474,896 | |
Class B Shares | | | 5,623 | |
Class C Shares | | | 860,312 | |
Class R3 Shares | | | 141,858 | |
Class R4 Shares | | | 13,130 | |
Transfer agent fees | | | | |
Class A Shares | | | 228,256 | |
Class B Shares | | | 4,168 | |
Class C Shares | | | 102,079 | |
Class I Shares | | | 180,944 | |
Class R3 Shares | | | 80,302 | |
Class R4 Shares | | | 17,835 | |
Class R5 Shares | | | 46,741 | |
Registration and filing fees | | | | |
Class A Shares | | | 17,677 | |
Class B Shares | | | 9,297 | |
Class C Shares | | | 14,533 | |
Class I Shares | | | 26,873 | |
Class R3 Shares | | | 11,060 | |
Class R4 Shares | | | 9,280 | |
Class R5 Shares | | | 8,532 | |
Custodian fees (Note 3) | | | 61,645 | |
Professional fees | | | 43,285 | |
Accounting fees (Note 3) | | | 17,995 | |
Trustee fees | | | 19,670 | |
Other expenses | | | 38,930 | |
| | | | |
Total Expenses | | | 6,822,893 | |
Less: | | | | |
Expenses reimbursed by investment advisor (Note 3) | | | (367,964 | ) |
| | | | |
Net Expenses | | | 6,454,929 | |
| | | | |
Net Investment Income | | $ | 2,803,289 | |
| | | | |
14 Semi-Annual Report
| | |
| STATEMENT OF OPERATIONS, CONTINUED | | |
| |
Thornburg Value Fund | | Six Months Ended March 31, 2016 (Unaudited) |
| | | | |
REALIZED AND UNREALIZED GAIN (LOSS) | | | | |
Net realized gain (loss) from: | | | | |
Investments | | $ | (6,465,127 | ) |
Forward currency contracts (Note 7) | | | 716,794 | |
Foreign currency transactions | | | 16,475 | |
| | | | |
| | | (5,731,858 | ) |
| | | | |
Net change in unrealized appreciation (depreciation) on: | | | | |
Investments | | | 28,751,335 | |
Forward currency contracts (Note 7) | | | (630,291 | ) |
Foreign currency translations | | | 10,400 | |
| | | | |
| | | 28,131,446 | |
| | | | |
Net Realized and Unrealized Gain | | | 22,399,588 | |
| | | | |
Net Increase in Net Assets Resulting from Operations | | $ | 25,202,877 | |
| | | | |
See notes to financial statements.
Semi-Annual Report 15
| | |
| STATEMENT OF CHANGES IN NET ASSETS | | |
| |
Thornburg Value Fund | | |
| | | | | | | | |
| | | SIX MONTHS ENDED
MARCH 31, 2016* | | | YEAR ENDED
SEPTEMBER 30, 2015 | |
INCREASE (DECREASE) IN NET ASSETS FROM | | | | | | | | |
| | |
OPERATIONS | | | | | | | | |
Net investment income | | $ | 2,803,289 | | | $ | 1,341,032 | |
Net realized gain (loss) from investments, forward currency contracts, and foreign currency transactions | | | (5,731,858 | ) | | | 151,512,375 | |
Net unrealized appreciation (depreciation) on investments, forward currency contracts, and foreign currency translations | | | 28,131,446 | | | | (128,134,616 | ) |
| | | | | | | | |
| | |
Net Increase (Decrease) in Net Assets Resulting from Operations | | | 25,202,877 | | | | 24,718,791 | |
| | |
DIVIDENDS TO SHAREHOLDERS | | | | | | | | |
From net investment income | | | | | | | | |
Class A Shares | | | — | | | | (149,783 | ) |
Class I Shares | | | — | | | | (409,330 | ) |
Class R3 Shares | | | — | | | | (31,715 | ) |
Class R4 Shares | | | — | | | | (8,095 | ) |
Class R5 Shares | | | — | | | | (39,382 | ) |
| | |
FUND SHARE TRANSACTIONS (NOTE 4) | | | | | | | | |
Class A Shares | | | (10,382,416 | ) | | | (27,491,471 | ) |
Class B Shares | | | (794,440 | ) | | | (2,626,614 | ) |
Class C Shares | | | (1,889,115 | ) | | | (10,439,429 | ) |
Class I Shares | | | (12,786,582 | ) | | | (17,760,734 | ) |
Class R3 Shares | | | (5,826,416 | ) | | | (17,826,494 | ) |
Class R4 Shares | | | 106,720 | | | | (1,538,680 | ) |
Class R5 Shares | | | (5,117,521 | ) | | | (12,826,806 | ) |
| | | | | | | | |
Net Decrease in Net Assets | | | (11,486,893 | ) | | | (66,429,742 | ) |
| | |
NET ASSETS | | | | | | | | |
Beginning of Period | | | 924,408,722 | | | | 990,838,464 | |
| | | | | | | | |
| | |
End of Period | | $ | 912,921,829 | | | $ | 924,408,722 | |
| | | | | | | | |
Undistributed net investment income | | $ | 2,859,777 | | | $ | 56,488 | |
See notes to financial statements.
16 Semi-Annual Report
| | |
| NOTES TO FINANCIAL STATEMENTS | | |
| |
Thornburg Value Fund | | March 31, 2016 (Unaudited) |
NOTE 1 – ORGANIZATION
Thornburg Value Fund (the “Fund”) is a diversified series of Thornburg Investment Trust (the “Trust”). The Trust is organized as a Massachusetts business trust under a Declaration of Trust dated June 3, 1987 and is registered as a diversified, open-end management investment company under the Investment Company Act of 1940, as amended. The Fund is currently one of twenty separate series of the Trust. Each series is considered to be a separate entity for financial reporting and tax purposes and bears expenses directly attributable to it. The Fund seeks long-term capital appreciation by investing in equity and debt securities of all types. As a secondary objective, the Fund also seeks some current income.
The Fund currently has seven classes of shares of beneficial interest: Class A, Class B, Class C, Institutional Class (“Class I”), and Retirement Classes (“Class R3,” “Class R4,” and “Class R5”). The Fund no longer offers Class B shares for sale. Class B shares outstanding for eight years will convert to Class A shares of the Fund. Each class of shares of the Fund represents an interest in the same portfolio of investments, except that (i) Class A shares are sold subject to a front-end sales charge collected at the time the shares are purchased and bear a service fee, (ii) Class B shares were sold at net asset value without a sales charge at the time of purchase, but are subject to a contingent deferred sales charge upon redemption and bear both a service fee and distribution fee, (iii) Class C shares are sold at net asset value without a sales charge at the time of purchase, but are subject to a contingent deferred sales charge upon redemption within one year of purchase, and bear both a service fee and a distribution fee, (iv) Class I shares are sold at net asset value without a sales charge at the time of purchase and may be subject to a service fee, (v) Class R3 shares are sold at net asset value without a sales charge at the time of purchase, but bear both a service fee and distribution fee, (vi) Class R4 shares are sold at net asset value without a sales charge at the time of purchase, but bear a service fee, (vii) Class R5 shares are sold at net asset value without a sales charge at the time of purchase and may be subject to a service fee, and (viii) the respective classes may have different reinvestment privileges and conversion rights. Additionally, the Fund may allocate among its classes certain expenses, to the extent allocable to specific classes, including transfer agent fees, government registration fees, certain printing and postage costs, and administrative and legal expenses. Currently, class specific expenses of the Fund are limited to service and distribution fees, administration fees, and certain registration and transfer agent expenses.
NOTE 2 – SIGNIFICANT ACCOUNTING POLICIES
The following is a summary of significant accounting policies followed by the Fund in the preparation of its financial statements. The Fund is an investment company and prepares its financial statements in conformity with United States generally accepted accounting principles (“GAAP”), including investment company accounting and reporting guidance in the Financial Accounting Standards Board (the “FASB”) Accounting Standard Codification Topic 946. The preparation of financial statements in conformity with GAAP requires management to make estimates and assumptions that affect the reported amounts of assets and liabilities and disclosure of contingent assets and liabilities at the date of the financial statements and the reported amounts of increases (decreases) in net assets from operations during the reporting period. Actual results could differ from those estimates.
Significant accounting policies of the Trust are as follows:
Valuation Policy and Procedures: The Trustees of the Trust have appointed Thornburg Investment Management, Inc., the Trust’s investment advisor (“the Advisor”), to assist the Trustees in obtaining market values for portfolio investments, perform certain evaluation and supervisory functions respecting professional pricing service providers appointed by the Trustees’ Audit Committee (the “Audit Committee”) to assist in determining fair values for portfolio investments, assist in calculating fair values for portfolio investments in certain circumstances, and to perform other functions in connection with the valuation of investments. The Advisor acts through its Valuation and Pricing Committee (the “Committee”) and other employees of the Advisor. The Committee regularly reviews its own valuation calculations, as well as the valuations, valuation techniques and services furnished by pricing service providers, considers circumstances which may require valuation calculations by the Committee, and reviews previous valuation calculations. The Committee reports to the Audit Committee on the Committee’s activities, the performance of pricing service providers, and other matters relating to valuation of portfolio investments.
In those instances when the Committee assists in calculating a fair value for a portfolio investment, the Committee seeks to determine the price that the Fund would reasonably expect to receive upon a sale of the investment in an orderly transaction between market participants on the valuation date. The Committee customarily utilizes quotations from securities broker dealers in calculating valuations, but also may utilize prices obtained from pricing service providers or other methods approved by the Audit Committee. Because fair values calculated by the Committee are estimates, the calculation of a value for an investment may differ from the price that would be realized by the Fund upon a sale of the investment, and the difference could be material to the Fund’s financial statements. The Committee’s calculation of a fair value for an investment may also differ from the prices obtained by other persons (including other mutual funds) for the investment.
Valuation of Investments: Securities and other portfolio investments which are listed or traded on a United States securities exchange are valued at the last reported sale price on the valuation date. Investments listed or traded on an exchange for which there has been no sale that day are valued at the mean between the last reported bid and asked prices on that valuation date. Portfolio investments
Semi-Annual Report 17
| | |
| NOTES TO FINANCIAL STATEMENTS, CONTINUED | | |
| |
Thornburg Value Fund | | March 31, 2016 (Unaudited) |
reported by NASDAQ are valued at the official closing price on the valuation date. If an investment is traded on more than one exchange, the investment is considered traded on the exchange that is normally the primary market for that investment. Securities and other portfolio investments which are listed or traded on exchanges outside the United States are valued at the last price or the closing price of the investment on the exchange that is normally the primary market for the investment, as of the close of the exchange preceding the Fund’s valuation date. Foreign investments listed or traded on an exchange for which there has been no sale that day are valued at the mean between the last reported bid and asked prices on that valuation date.
In any case when a market quotation is not readily available for a portfolio investment ordinarily valued by market quotation, the Committee calculates a fair value for the investment using alternative methods approved by the Audit Committee. A market quotation is not readily available when the primary market or exchange for the investment is not open for the entire scheduled day of trading. Market quotations for an investment also may not be readily available if developments after the most recent close of the investment’s primary exchange or market, but prior to the close of business on any Fund business day, or an unusual event or significant period of time occurring since the availability of a market quotation, create a serious question concerning the reliability of the most recent market quotation available for the investment. In particular, on days when market volatility thresholds established by the Audit Committee are exceeded, foreign equity investments held by the Fund may be valued using alternative methods. The Committee customarily obtains valuations in these instances from pricing service providers approved by the Audit Committee. Pricing service providers ordinarily calculate valuations using multi-factor models to adjust market prices based upon various inputs, including exchange data, depository receipt prices, futures, index data and other data.
Debt obligations held by the Fund which are not listed or traded on exchanges or for which no reported market exists are ordinarily valued at the valuation obtained from a pricing service provider approved by the Audit Committee.
In any case when a pricing service provider fails to provide a valuation for a debt obligation held by the Fund, the Committee calculates a fair value for the obligation using alternative methods under procedures approved by the Audit Committee. Additionally, in cases when management believes that a valuation obtained from a pricing service provider merits review for significant reasons, the Committee decides whether or not to use the valuation calculated by the pricing service provider or to use an alternative method approved by the Audit Committee to calculate a fair value for the obligation.
Quotations for foreign investments expressed in foreign currency amounts are converted to U.S. dollar equivalents using a foreign exchange quotation from a third party service provider at the time of valuation. Foreign investments held by the Fund may be traded on days and at times when the Fund is not open for business. Consequently, the value of Fund investments may be significantly affected on days when shareholders cannot purchase or sell Fund shares. Futures contracts and other financial and derivative instruments traded on an exchange are valued at the latest published price for the instrument on its primary exchange. Listed options are valued at the last bid price.
Valuation Measurements: The Fund categorizes its investments based upon the inputs used in valuing those investments, according to a three-level hierarchy established in guidance from the FASB. Categorization of investments using this hierarchy is intended by the FASB to maximize the use of observable inputs in valuing investments and minimize the use of unobservable inputs by requiring that the most observable inputs be used when available. Observable inputs are those that market participants would use in valuing an investment based on available market information. Unobservable inputs are those that reflect assumptions about the information market participants would use in valuing an investment. An investment’s level within the hierarchy is based on the lowest level input that is deemed significant to the valuation. The methodologies and inputs used to value investments are not necessarily indications of the risk or liquidity associated with those investments.
Various inputs are used in calculating valuations for the Fund’s investments. These inputs are generally summarized according to the three-level hierarchy below:
Level 1: Quoted prices in active markets for identical investments.
Level 2: Other direct or indirect significant observable inputs (including quoted prices for similar investments in active markets and other observable inputs, such as interest rates, prepayment rates, credit risk, etc.).
Level 3: Significant unobservable inputs (including the Committee’s own assumptions in calculating the fair values of investments).
Valuations for debt obligations held by the Fund are typically calculated by pricing service providers approved by the Audit Committee and are characterized as Level 2 within the valuation hierarchy.
On days when market volatility thresholds established by the Audit Committee are exceeded, foreign securities for which valuations are obtained from pricing service providers are fair valued. On these days, the foreign securities are characterized as Level 2 within the valuation hierarchy and revert to Level 1 after the threshold is no longer exceeded.
In a limited number of cases the Committee calculates a fair value for investments using broker quotations or other methods approved by the Audit Committee. When the Committee uses a single broker quotation to calculate a fair value for an investment without
18 Semi-Annual Report
| | |
| NOTES TO FINANCIAL STATEMENTS, CONTINUED | | |
| |
Thornburg Value Fund | | March 31, 2016 (Unaudited) |
other significant observable inputs, or if a fair value is calculated using other significant inputs that are considered unobservable, the investment is characterized as Level 3 within the hierarchy. Other significant unobservable inputs used to calculate a fair value in these instances might include an income-based valuation approach which considers discounted anticipated future cash flows from the investment, and application of discounts due to the nature or duration of any restrictions on the disposition of the investment.
Valuations based upon the use of inputs from Levels 1, 2 or 3 may not represent the actual price received upon the disposition of an investment, and the Fund may receive a price that is lower than the valuation based upon these inputs when it sells the investment.
The following table displays a summary of the fair value hierarchy measurements of the Fund’s investments as of March 31, 2016. In any instance when valuation inputs from more than one level are used to determine the fair value of a specific investment, the investment is placed in the level of the table based upon the lowest level input that is significant in determining the fair value of the investment:
| | | | | | | | | | | | | | | | |
| | | FAIR VALUE MEASUREMENTS AT MARCH 31, 2016 | |
| | | TOTAL | | | LEVEL 1 | | | LEVEL 2 | | | LEVEL 3 | |
Assets | | | | | | | | | | | | | | | | |
Investments in Securities* | | | | | | | | | | | | | | | | |
Common Stock | | $ | 836,731,272 | | | $ | 836,731,272 | | | $ | — | | | $ | — | |
Short Term Investments | | | 77,534,486 | | | | 77,534,486 | | | | — | | | | — | |
| | | | | | | | | | | | | | | | |
Total Investments in Securities | | $ | 914,265,758 | | | $ | 914,265,758 | | | $ | — | | | $ | — | |
Liabilities | | | | | | | | | | | | | | | | |
Other Financial Instruments** | | | | | | | | | | | | | | | | |
Forward Currency Contracts | | $ | (614,566 | ) | | $ | — | | | $ | (614,566 | ) | | $ | — | |
| * | See Schedule of Investments for a summary of the industry exposure as grouped according to the Global Industry Classification Standard (GICS), which is an industry taxonomy developed by MSCI, Inc. and Standard & Poor’s (S&P). |
| ** | Other Financial Instruments include investments not reflected in the Schedule of Investments, which may include futures, forwards and swap contracts, which are valued at the unrealized appreciation (depreciation) on the investment. |
In accordance with the guidance prescribed in Accounting Standards Update No. 2011-04, it is the policy of the Fund to recognize transfers between levels and the underlying events which caused the movement. The Fund recognized no transfers between levels for the six months ended March 31, 2016, other than when the Fund exceeded market volatility thresholds for foreign equity investments during the period.
Foreign Currency Translation: Portfolio investments and other assets and liabilities denominated in foreign currencies are translated into U.S. dollars based on the exchange rate of such currencies against the U.S. dollar on the date of valuation. Purchases and sales of investments and income items denominated in foreign currencies are translated into U.S. dollars at the exchange rate in effect on the transaction date. When the Fund purchases or sells foreign investments, it will customarily enter into a foreign exchange contract to minimize foreign exchange risk from the trade date to the settlement date of such transactions. The values of such spot contracts are included in receivable for investments sold and payable for investments purchased on the Statement of Assets and Liabilities.
The Fund does not separately report the effect of changes in foreign exchange rates from changes in market prices on investments held. Such changes are included in net unrealized appreciation (depreciation) from investments.
Reported net realized gains and losses from foreign currency transactions arise due to purchases and sales of foreign currencies, currency gains and losses realized between the trade and settlement dates on investment transactions and the difference between the amounts of dividends, interest, and foreign withholding taxes recorded on the Fund’s books, and the U.S. dollar equivalent of the amounts actually received or paid.
Net change in unrealized appreciation (depreciation) on foreign currency translations arise from changes in the fair value of assets and liabilities, other than investments at period end, resulting from changes in exchange rates.
Foreign Withholding Taxes: The Fund is subject to foreign tax withholding imposed by certain foreign countries in which the Fund may invest. Withholding taxes are incurred on certain foreign dividends and are accrued at the time the dividend is recognized based on applicable foreign tax law. The Fund files withholding tax reclaims in certain jurisdictions to recover a portion of amounts previously withheld, in view of various considerations, including recent decisions rendered by the courts in those and other jurisdictions. The Fund would expect to record a receivable for such a reclaim based on a variety of factors, including assessments of a jurisdiction’s legal obligation to pay reclaims, the jurisdiction’s administrative practices and payment history, and industry convention. To date the Fund has recorded no such receivable because there is limited precedent for collecting such prior year reclaims and the likelihood of collection remains uncertain.
Semi-Annual Report 19
| | |
| NOTES TO FINANCIAL STATEMENTS, CONTINUED | | |
| |
Thornburg Value Fund | | March 31, 2016 (Unaudited) |
Deferred Foreign Capital Gain Taxes: The Fund is subject to a tax imposed on net realized gains of securities of certain foreign countries. The Fund records an estimated deferred tax liability for net unrealized gains on these investments as reflected in the accompanying financial statements.
Federal Income Taxes: It is the policy of the Trust to comply with the provisions of the Internal Revenue Code applicable to “regulated investment companies” and to distribute to shareholders substantially all taxable income, including any net realized gain on investments of the Fund. Therefore, no provision for federal income taxes is required.
Management reviews each uncertain tax position believed to be material to the preparation of the Fund’s financial statements, to assess if it is more likely than not that the position would be sustained upon examination, based upon the technical merits of the position. As of March 31, 2016, management has not identified any such position for which an asset or liability must be reflected in the Statement of Assets and Liabilities. The Fund’s tax returns remain subject to examination for three years after filing.
When-Issued and Delayed Delivery Transactions: The Fund may engage in when-issued or delayed delivery transactions. To the extent the Fund engages in such transactions, it will do so for the purpose of acquiring portfolio investments consistent with the Fund’s investment objectives and not for the purpose of investment leverage or to speculate on interest rate and, or market changes. At the time the Fund makes a commitment to purchase an investment on a when-issued or delayed delivery basis, the Fund will record the transaction and reflect the value in determining its net asset value. When effecting such transactions, assets of an amount sufficient to make payment for the portfolio investments to be purchased will be segregated on the Fund’s records on the trade date. Investments purchased on a when-issued or delayed delivery basis do not earn interest until the settlement date.
Dividends: Dividends to shareholders, if any, are generally paid quarterly and are reinvested in additional shares of the Fund at net asset value per share at the close of business on the dividend payment date or, at the shareholder’s option, paid in cash. Net realized capital gains, to the extent available, will be distributed at least annually.
Repurchase Agreements: The Fund may invest excess cash in repurchase agreements whereby the Fund purchases investments, which serve as collateral, with an agreement to resell such collateral to the seller at an agreed upon price at the maturity date of the repurchase agreement. Investments pledged as collateral for repurchase agreements are held in custody until maturity of the repurchase agreement. Provisions in the agreements require that the market value of the collateral is at least equal to the repurchase value in the event of default. In the event of default, the Fund has the right to liquidate the collateral and apply the proceeds in satisfaction of the obligation. Under certain circumstances, in the event of default or bankruptcy by the other party to the agreement, realization and/or retention of the collateral may be subject to legal proceedings.
General: Investment transactions are accounted for on a trade date basis. Interest income is accrued as earned and dividend income is recorded on the ex-dividend date. Certain income from foreign investments is recognized as soon as information is available to the Fund. Realized gains and losses from the sale of investments are recorded on an identified cost basis. Net investment income (other than class specific expenses) and realized and unrealized gains and losses are allocated daily to each class of shares based upon the relative net asset value of outstanding shares of each class of shares at the beginning of the day (after adjusting for the current share activity of the respective class). Expenses common to all Funds are allocated among the Funds comprising the Trust based upon their relative net asset values or other appropriate allocation methods.
Guarantees and Indemnifications: Under the Trust’s organizational documents (and under separate agreements with the independent Trustees), its officers and Trustees are indemnified against certain liabilities arising out of the performance of their duties to the Fund. Additionally, in the normal course of business the Trust enters into contracts with service providers that contain general indemnification clauses. The Trust’s maximum exposure under these arrangements is unknown. However, based on experience, the Trust expects the risk of loss to be remote.
NOTE 3 – INVESTMENT ADVISORY FEE AND OTHER TRANSACTIONS WITH AFFILIATES
Pursuant to an investment advisory agreement, the Advisor serves as the investment advisor and performs services for the Fund for which the fees are payable at the end of each month. For the six months ended March 31, 2016, these fees were payable at annual rates ranging from .875 of 1% to .675 of 1% per annum of the average daily net assets of the Fund depending on the Fund’s asset size. The Fund pays to the Advisor the costs of personnel who perform certain accounting services for the Fund. For the six months ended March 31, 2016 the Fund paid $17,995 to the Advisor for these accounting services. The Trust has also entered into administrative service agreements with the Advisor, whereby the Advisor will perform certain administrative services for the shareholders of each class of the Fund’s shares, and for which fees will be payable at an annual rate of up to ..125 of 1% per annum of the average daily net assets attributable to each class of shares.
The Trust has an underwriting agreement with Thornburg Securities Corporation (the “Distributor”), an affiliate of the Advisor, which acts as the distributor of the Fund’s shares. For the six months ended March 31, 2016, the Distributor has advised the Fund that it earned net commissions aggregating $11,831 from the sale of Class A shares, and collected contingent deferred sales charges aggregating $3,125 from redemptions of Class C shares of the Fund.
20 Semi-Annual Report
| | |
| NOTES TO FINANCIAL STATEMENTS, CONTINUED | | |
| |
Thornburg Value Fund | | March 31, 2016 (Unaudited) |
Pursuant to a service plan under Rule 12b-1 of the Investment Company Act of 1940, the Fund may reimburse to the Advisor an amount not to exceed .25 of 1% per annum of the average daily net assets attributable to each class of shares of the Fund for payments made by the Advisor to securities dealers and other financial institutions to obtain various shareholder and distribution related services. For the six months ended March 31, 2016, there were no 12b-1 service plan fees charged for Class I and R5 shares. The Advisor may pay out of its own resources additional expenses for distribution of the Fund’s shares and shareholder services.
The Trust has also adopted distribution plans pursuant to Rule 12b-1, applicable only to the Fund’s Class B, Class C, and Class R3 shares, under which the Fund compensates the Distributor for services in promoting the sale of Class B, Class C, and Class R3 shares of the Fund at an annual rate of up to .75 of 1% per annum of the average daily net assets attributable to Class B and Class C shares, and an annual rate of up to .25 of 1% per annum of the average daily net assets attributable to Class R3 shares. Total fees incurred by each class of shares of the Fund under their respective service and distribution plans for the six months ended March 31, 2016, are set forth in the Statement of Operations.
The Advisor and Distributor have contractually agreed to waive fees and reimburse expenses incurred by the Fund so that actual expenses of certain share classes do not exceed levels as specified in the Fund’s most recent prospectus. The agreement may be terminated by the Fund at any time, but may not be terminated by the Advisor or Distributor before February 1, 2017, unless the Advisor ceases to be the investment advisor to the Trust or the Distributor ceases to be the distributor of the Fund prior to that date. The Advisor and Distributor retain the right to be repaid by the Fund for fee waivers and expense reimbursements if expenses fall below the contractual limit prior to the end of the fiscal year.
For the six months ended March 31, 2016, the Advisor contractually reimbursed certain class specific expenses, administrative fees, and distribution fees of $11,418 for Class B shares, $138,796 for Class I shares, $138,628 for Class R3 shares, $27,773 for Class R4 shares, and $51,349 for Class R5 shares.
Certain officers and Trustees of the Trust are also officers or directors of the Advisor and Distributor. The compensation of independent Trustees is borne by the Trust.
The Fund may purchase or sell securities from, or to an affiliated fund, provided the affiliation is due solely to having a common investment advisor, common officers, or common trustees, and provided that all such transactions will comply with Rule 17a-7 under the 1940 Act. For the six months ended March 31, 2016, the Fund had no transactions with affiliated funds.
NOTE 4 – SHARES OF BENEFICIAL INTEREST
At March 31, 2016, there were an unlimited number of shares with no par value of beneficial interest authorized. Transactions in shares of beneficial interest were as follows:
| | | | | | | | | | | | | | | | |
| | | SIX MONTHS ENDED
MARCH 31, 2016 (UNAUDITED) | | | YEAR ENDED
SEPTEMBER 30, 2015 (AUDITED) | |
| | | SHARES | | | AMOUNT | | | SHARES | | | AMOUNT | |
Class A Shares | | | | | | | | | | | | | | | | |
Shares sold | | | 360,698 | | | $ | 18,207,449 | | | | 737,926 | | | $ | 38,257,811 | |
Shares issued to shareholders in reinvestment of dividends | | | — | | | | — | | | | 2,867 | | | | 143,603 | |
Shares repurchased | | | (572,377 | ) | | | (28,589,865 | ) | | | (1,284,634 | ) | | | (65,892,885 | ) |
| | | | | | | | | | | | | | | | |
| | | | |
Net increase (decrease) | | | (211,679 | ) | | $ | (10,382,416 | ) | | | (543,841 | ) | | $ | (27,491,471 | ) |
| | | | | | | | | | | | | | | | |
| | | | |
Class B Shares | | | | | | | | | | | | | | | | |
Shares sold | | | 899 | | | $ | 41,768 | | | | 6,680 | | | $ | 297,816 | |
Shares issued to shareholders in reinvestment of dividends | | | — | | | | — | | | | — | | | | — | |
Shares repurchased | | | (18,492 | ) | | | (836,208 | ) | | | (61,925 | ) | | | (2,924,430 | ) |
| | | | | | | | | | | | | | | | |
| | | | |
Net increase (decrease) | | | (17,593 | ) | | $ | (794,440 | ) | | | (55,245 | ) | | $ | (2,626,614 | ) |
| | | | | | | | | | | | | | | | |
| | | | |
Class C Shares | | | | | | | | | | | | | | | | |
Shares sold | | | 232,834 | | | $ | 11,070,923 | | | | 306,671 | | | $ | 14,470,492 | |
Shares issued to shareholders in reinvestment of dividends | | | — | | | | — | | | | — | | | | — | |
Shares repurchased | | | (282,875 | ) | | | (12,960,038 | ) | | | (521,694 | ) | | | (24,909,921 | ) |
| | | | | | | | | | | | | | | | |
| | | | |
Net increase (decrease) | | | (50,041 | ) | | $ | (1,889,115 | ) | | | (215,023 | ) | | $ | (10,439,429 | ) |
| | | | | | | | | | | | | | | | |
Semi-Annual Report 21
| | |
| NOTES TO FINANCIAL STATEMENTS, CONTINUED | | |
| |
Thornburg Value Fund | | March 31, 2016 (Unaudited) |
| | | | | | | | | | | | | | | | |
| | | SIX MONTHS ENDED
MARCH 31, 2016 (UNAUDITED) | | | YEAR ENDED
SEPTEMBER 30, 2015 (AUDITED) | |
| | | SHARES | | | AMOUNT | | | SHARES | | | AMOUNT | |
Class I Shares | | | | | | | | | | | | | | | | |
Shares sold | | | 451,397 | | | $ | 23,436,067 | | | | 842,023 | | | $ | 45,593,747 | |
Shares issued to shareholders in reinvestment of dividends | | | — | | | | — | | | | 7,702 | | | | 397,296 | |
Shares repurchased | | | (697,614 | ) | | | (36,222,649 | ) | | | (1,215,376 | ) | | | (63,751,777 | ) |
| | | | | | | | | | | | | | | | |
| | | | |
Net increase (decrease) | | | (246,217 | ) | | $ | (12,786,582 | ) | | | (365,651 | ) | | $ | (17,760,734 | ) |
| | | | | | | | | | | | | | | | |
| | | | |
Class R3 Shares | | | | | | | | | | | | | | | | |
Shares sold | | | 77,766 | | | $ | 3,836,223 | | | | 221,665 | | | $ | 11,268,997 | |
Shares issued to shareholders in reinvestment of dividends | | | — | | | | — | | | | 621 | | | | 30,881 | |
Shares repurchased | | | (191,758 | ) | | | (9,662,639 | ) | | | (572,369 | ) | | | (29,126,372 | ) |
| | | | | | | | | | | | | | | | |
| | | | |
Net increase (decrease) | | | (113,992 | ) | | $ | (5,826,416 | ) | | | (350,083 | ) | | $ | (17,826,494 | ) |
| | | | | | | | | | | | | | | | |
| | | | |
Class R4 Shares | | | | | | | | | | | | | | | | |
Shares sold | | | 35,671 | | | $ | 1,836,463 | | | | 53,145 | | | $ | 2,666,567 | |
Shares issued to shareholders in reinvestment of dividends | | | — | | | | — | | | | 126 | | | | 6,316 | |
Shares repurchased | | | (34,992 | ) | | | (1,729,743 | ) | | | (82,169 | ) | | | (4,211,563 | ) |
| | | | | | | | | | | | | | | | |
| | | | |
Net increase (decrease) | | | 679 | | | $ | 106,720 | | | | (28,898 | ) | | $ | (1,538,680 | ) |
| | | | | | | | | | | | | | | | |
| | | | |
Class R5 Shares | | | | | | | | | | | | | | | | |
Shares sold | | | 27,419 | | | $ | 1,403,417 | | | | 80,803 | | | $ | 4,258,589 | |
Shares issued to shareholders in reinvestment of dividends | | | — | | | | — | | | | 677 | | | | 34,703 | |
Shares repurchased | | | (125,207 | ) | | | (6,520,938 | ) | | | (322,909 | ) | | | (17,120,098 | ) |
| | | | | | | | | | | | | | | | |
| | | | |
Net increase (decrease) | | | (97,788 | ) | | $ | (5,117,521 | ) | | | (241,429 | ) | | $ | (12,826,806 | ) |
| | | | | | | | | | | | | | | | |
NOTE 5 – INVESTMENT TRANSACTIONS
For the six months ended March 31, 2016, the Fund had purchase and sale transactions of investments (excluding short-term investments) of $140,406,317 and $160,788,252, respectively.
NOTE 6 – INCOME TAXES
At March 31, 2016, information on the tax components of capital was as follows:
| | | | |
Cost of investments for tax purposes | | $ | 822,342,542 | |
| | | | |
Gross unrealized appreciation on a tax basis | | $ | 157,968,175 | |
Gross unrealized depreciation on a tax basis | | | (66,044,959 | ) |
| | | | |
Net unrealized appreciation (depreciation) on investments (tax basis) | | $ | 91,923,216 | |
| | | | |
At March 31, 2016, the Fund had cumulative tax basis capital losses generated prior to October 1, 2011 which may expire prior to utilization. Such capital losses may be carried forward to offset future capital gains. To the extent such carryforwards are used, capital gain distributions may be reduced to the extent provided by regulations.
Capital loss carryforwards generated prior to October 31, 2011 expire as follows:
| | | | |
2017 | | $ | 144,464,769 | |
2018 | | | 242,353,997 | |
| | | | |
| | $ | 386,818,766 | |
| | | | |
22 Semi-Annual Report
| | |
| NOTES TO FINANCIAL STATEMENTS, CONTINUED | | |
| |
Thornburg Value Fund | | March 31, 2016 (Unaudited) |
NOTE 7 – DERIVATIVE FINANCIAL INSTRUMENTS WITH OFF-BALANCE SHEET RISK AND FOREIGN INVESTMENT RISK
The Fund may use a variety of derivative financial instruments to hedge or adjust the risks affecting its investment portfolio or to enhance investment returns. Provisions of the FASB Accounting Standards Codification 815-10-50 (“ASC 815”) require certain disclosures. The disclosures are intended to provide users of financial statements with an understanding of the use of derivative instruments by the Fund and how these derivatives affect the financial position, financial performance and cash flows of the Fund. The Fund does not designate any derivative instruments as hedging instruments under ASC 815. During the six months ended March 31, 2016, the Fund’s principal exposure to derivative financial instruments of the type addressed by ASC 815 was investment in foreign exchange contracts. A foreign exchange contract is an agreement between two parties to exchange different currencies at a specified rate of exchange at an agreed upon future date. Foreign exchange contracts involve risks to the Fund, including the risk that a contract’s counterparty will not meet its obligations to the Fund, the risk that a change in a contract’s value may not correlate perfectly with the currency the contract was intended to track, and the risk that the Fund’s Advisor is unable to correctly implement its strategy in using a contract. In any such instance, the Fund may not achieve the intended benefit of entering into a contract, and may experience a loss.
The Fund entered into forward currency contracts during the six months ended March 31, 2016 in the normal course of pursuing its investment objectives, with the objective of purchasing foreign investments or with the intent of reducing the risk to the value of the Fund’s foreign investments from adverse changes in the relationship between the U.S. dollar and foreign currencies. In each case these contracts have been initiated in conjunction with foreign investment transactions.
These contracts are accounted for by the Fund under ASC 815. Unrealized appreciation and depreciation on outstanding contracts are reported in the Fund’s Statement of Assets and Liabilities, as measured by the difference between the forward exchange rates at the reporting date and the forward exchange rates at each contract’s inception date. Net realized gain (loss) on contracts closed during the period, and changes in net unrealized appreciation (depreciation) on outstanding contracts are recognized in the Fund’s Statement of Operations.
The quarterly average value of open sell currency contracts for the six months ended March 31, 2016 was $24,779,302. Open buy currency contracts are entered into for the purpose of closing open sell currency contracts and the values are dependent upon the values of the open sell currency contracts to which they relate.
The following table displays the outstanding forward currency contracts at March 31, 2016:
| | | | | | | | | | | | | | | | | | | | | | |
OUTSTANDING FORWARD CURRENCY CONTRACTS TO BUY OR SELL AT MARCH 31, 2016 | |
CONTRACT DESCRIPTION | | BUY/SELL | | CONTRACT
AMOUNT | | | CONTRACT
VALUE DATE | | | VALUE
USD | | | UNREALIZED
APPRECIATION | | | UNREALIZED
DEPRECIATION | |
Euro | | Sell | | | 12,651,200 | | | | 06/02/2016 | | | | 14,421,264 | | | $ | — | | | $ | (614,566 | ) |
| | | | | | | | | | | | | | | | | | | | | | |
| | | | | | |
Total | | | | | | | | | | | | | | | | $ | — | | | $ | (614,566 | ) |
| | | | | | | | | | | | | | | | | | | | | | |
| | | | |
Net unrealized appreciation (depreciation) | | | | | | | | | | | | | | | $ | (614,566 | ) |
| | | | | | | | | | | | | | | | | | | | | | |
The outstanding forward currency contracts in the foregoing table were entered into with State Street Bank and Trust Company (“SSB”), pursuant to an International Swaps and Derivatives Association (“ISDA”) Master Agreement. In the event of a default or termination under the ISDA Master Agreement with SSB, the non-defaulting party has the right to close out all outstanding forward currency contracts between the parties and to net any payment amounts under those contracts, resulting in a single net amount payable by one party to the other.
Because the ISDA Master Agreement with SSB does not result in an offset of reported amounts of financial assets and liabilities in the Fund’s Statement of Assets and Liabilities unless there has been an event of default or termination event under that agreement, the Fund does not net its outstanding forward currency contracts for purposes of the disclosure in the Fund’s Statement of Assets and Liabilities. Instead the Fund recognizes the unrealized appreciation or depreciation on those forward currency contracts on a gross basis in the Fund’s Statement of Assets and Liabilities.
The unrealized appreciation (depreciation) of the outstanding forward currency contracts recognized in the Fund’s Statement of Assets and Liabilities at March 31, 2016 is disclosed in the following table:
| | | | | | |
FAIR VALUES OF DERIVATIVE FINANCIAL INSTRUMENTS AT MARCH 31, 2016 | |
| LIABILITY DERIVATIVES | | BALANCE SHEET LOCATION | | FAIR VALUE | |
Foreign exchange contracts | | Liabilities - Unrealized depreciation on forward currency contracts | | $ | (614,566 | ) |
Semi-Annual Report 23
| | |
| NOTES TO FINANCIAL STATEMENTS, CONTINUED | | |
| |
Thornburg Value Fund | | March 31, 2016 (Unaudited) |
Because the Fund does not currently receive or post cash collateral in connection with its currency forward contracts, and because all of the Fund’s outstanding currency forward contracts are with SSB, the net amounts of the Fund’s assets and liabilities which are attributable to those contracts at March 31, 2016 can be determined by offsetting the dollar amounts shown in the preceding table. Based on those amounts, the net amount of the Fund’s assets which is attributable to its outstanding forward currency contracts at March 31, 2016 is $0, and the net amount of the Fund’s liabilities which is attributable to those contracts at that date is $614,566. The Fund’s forward currency contracts are valued each day, and the net amounts of the Fund’s assets and liabilities which are attributable to those contracts are expected to vary over time.
The net realized gain (loss) from forward currency contracts and the net change in unrealized appreciation (depreciation) of outstanding forward currency contracts recognized in the Fund’s Statement of Operations for the six months ended March 31, 2016 are disclosed in the following tables:
| | | | |
NET REALIZED GAIN (LOSS) ON DERIVATIVE FINANCIAL INSTRUMENTS RECOGNIZED IN INCOME FOR THE SIX MONTHS ENDED MARCH 31, 2016 |
| | | TOTAL | | FORWARD CURRENCY CONTRACTS |
Foreign exchange contracts | | $ 716,794 | | $ 716,794 |
|
NET CHANGE IN UNREALIZED APPRECIATION (DEPRECIATION) OF DERIVATIVE FINANCIAL INSTRUMENTS RECOGNIZED IN INCOME FOR THE SIX MONTHS ENDED MARCH 31, 2016 |
| | | TOTAL | | FORWARD CURRENCY CONTRACTS |
Foreign exchange contracts | | $ (630,291) | | $ (630,291) |
OTHER NOTES
Risks: The Fund’s investments subject it to risks including, but not limited to, management risk, market and economic risk, risks affecting specific issuers, credit risk, interest rate risk, liquidity risk, and the risks associated with investments in small- and mid-cap companies, and non-U.S. issuers. Please see the Fund’s prospectus for a discussion of the risks associated with an investment in the Fund.
Subsequent Events: Fund management believes no events have occurred between March 31, 2016 and the date of issuance of the financial statements that require adjustment to or disclosure in the accompanying financial statements.
24 Semi-Annual Report
This page intentionally left blank.
Semi-Annual Report 25
Financial Highlights
Thornburg Value Fund
| | | | | | | | | | | | | | | | | | | | | | | | | | | | | | | | | | | | | | | | | | | | | | | | | | |
| | | PER SHARE PERFORMANCE (FOR A SHARE OUTSTANDING THROUGHOUT THE PERIOD) | | RATIOS TO AVERAGE NET ASSETS | | | SUPPLEMENTAL DATA | |
UNLESS
OTHERWISE
NOTED,
PERIODS
ARE
FISCAL
YEARS
ENDED
SEPT. 30, | | NET ASSET
VALUE
BEGINNING
OF PERIOD | | | NET
INVESTMENT
INCOME
(LOSS)+ | | | NET
REALIZED &
UNREALIZED
GAIN (LOSS)
ON
INVESTMENTS | | | TOTAL
FROM
INVESTMENT
OPERATIONS | | DIVIDENDS
FROM NET
INVESTMENT
INCOME | | | DIVIDENDS
FROM NET
REALIZED
GAINS | | TOTAL
DIVIDENDS | | | NET
ASSET
VALUE
END
OF
PERIOD | | NET
INVESTMENT
INCOME
(LOSS) (%) | | | EXPENSES,
AFTER
EXPENSE
REDUCTIONS
(%) | | | EXPENSES,
AFTER
EXPENSE
REDUCTIONS
AND NET OF
CUSTODY
CREDITS (%) | | | EXPENSES,
BEFORE
EXPENSE
REDUCTIONS
(%) | | | TOTAL
RETURN
(%)(a) | | PORTFOLIO
TURNOVER
RATE (%)(a) | | NET ASSETS
AT END OF
PERIOD
(THOUSANDS) | |
CLASS A SHARES | | | | | | | | | | | | | | | | | | | | | | | | | | | | | | | | | | | | | | | | | | | |
2016(b)(c) | | $ | 49.17 | | | | 0.15 | | | | 1.23 | | | 1.38 | | | — | | | — | | | — | | | $50.55 | | | 0.62 | (d) | | | 1.40 | (d) | | | 1.40 | (d) | | | 1.40 | (d) | | 2.81 | | 16.37 | | $ | 377,187 | |
2015(c) | | $ | 48.09 | | | | 0.07 | | | | 1.03 | | | 1.10 | | | (0.02 | ) | | — | | | (0.02 | ) | | $49.17 | | | 0.14 | | | | 1.37 | | | | 1.37 | | | | 1.37 | | | 2.28 | | 59.70 | | $ | 377,299 | |
2014(c) | | $ | 40.84 | | | | 0.10 | | | | 7.41 | | | 7.51 | | | (0.26 | ) | | — | | | (0.26 | ) | | $48.09 | | | 0.22 | | | | 1.37 | | | | 1.37 | | | | 1.37 | | | 18.40 | | 72.43 | | $ | 395,216 | |
2013(c) | | $ | 31.51 | | | | 0.08 | | | | 9.25 | | | 9.33 | | | — | | | — | | | — | | | $40.84 | | | 0.23 | | | | 1.40 | | | | 1.40 | | | | 1.40 | | | 29.61 | | 61.50 | | $ | 400,275 | |
2012(c) | | $ | 27.71 | | | | (0.10 | ) | | | 3.90 | | | 3.80 | | | — | | | — | | | — | | | $31.51 | | | (0.32 | ) | | | 1.32 | | | | 1.32 | | | | 1.32 | | | 13.71 | | 54.16 | | $ | 470,120 | |
2011(c) | | $ | 30.44 | | | | (0.03 | ) | | | (2.70 | ) | | (2.73) | | | — | | | — | | | — | | | $27.71 | | | (0.10 | ) | | | 1.28 | | | | 1.28 | | | | 1.28 | | | (8.97) | | 64.14 | | $ | 825,700 | |
CLASS B SHARES | | | | | | | | | | | | | | | | | | | | | | | | | | | | | | | | | | | | | | | | | | | |
2016(b) | | $ | 44.60 | | | | (0.10 | ) | | | 1.13 | | | 1.03 | | | — | | | — | | | — | | | $45.63 | | | (0.44 | )(d) | | | 2.38 | (d) | | | 2.38 | (d) | | | 4.41 | (d) | | 2.29 | | 16.37 | | $ | 793 | |
2015 | | $ | 44.05 | | | | (0.41 | ) | | | 0.96 | | | 0.55 | | | — | | | — | | | — | | | $44.60 | | | (0.88 | ) | | | 2.37 | | | | 2.37 | | | | 2.92 | | | 1.25 | | 59.70 | | $ | 1,560 | |
2014 | | $ | 37.55 | | | | (0.31 | ) | | | 6.81 | | | 6.50 | | | — | | | — | | | — | | | $44.05 | | | (0.74 | ) | | | 2.32 | | | | 2.32 | | | | 2.55 | | | 17.31 | | 72.43 | | $ | 3,974 | |
2013 | | $ | 29.25 | | | | (0.24 | ) | | | 8.54 | | | 8.30 | | | — | | | — | | | — | | | $37.55 | | | (0.74 | ) | | | 2.37 | | | | 2.37 | | | | 2.47 | | | 28.38 | | 61.50 | | $ | 7,448 | |
2012 | | $ | 25.99 | | | | (0.38 | ) | | | 3.64 | | | 3.26 | | | — | | | — | | | — | | | $29.25 | | | (1.33 | ) | | | 2.34 | | | | 2.34 | | | | 2.36 | | | 12.53 | | 54.16 | | $ | 9,344 | |
2011 | | $ | 28.81 | | | | (0.33 | ) | | | (2.49 | ) | | (2.82) | | | — | | | — | | | — | | | $25.99 | | | (1.03 | ) | | | 2.19 | | | | 2.19 | | | | 2.19 | | | (9.79) | | 64.14 | | $ | 13,616 | |
CLASS C SHARES | | | | | | | | | | | | | | | | | | | | | | | | | | | | | | | | | | | | | | | | | | | |
2016(b) | | $ | 45.63 | | | | (0.03 | ) | | | 1.13 | | | 1.10 | | | — | | | — | | | — | | | $46.73 | | | (0.14 | )(d) | | | 2.15 | (d) | | | 2.15 | (d) | | | 2.15 | (d) | | 2.41 | | 16.37 | | $ | 170,052 | |
2015 | | $ | 44.95 | | | | (0.29 | ) | | | 0.97 | | | 0.68 | | | — | | | — | | | — | | | $45.63 | | | (0.61 | ) | | | 2.12 | | | | 2.12 | | | | 2.12 | | | 1.51 | | 59.70 | | $ | 168,321 | |
2014 | | $ | 38.26 | | | | (0.24 | ) | | | 6.93 | | | 6.69 | | | — | | | — | | | — | | | $44.95 | | | (0.55 | ) | | | 2.14 | | | | 2.14 | | | | 2.14 | | | 17.49 | | 72.43 | | $ | 175,495 | |
2013 | | $ | 29.75 | | | | (0.18 | ) | | | 8.69 | | | 8.51 | | | — | | | — | | | — | | | $38.26 | | | (0.55 | ) | | | 2.18 | | | | 2.18 | | | | 2.18 | | | 28.60 | | 61.50 | | $ | 166,971 | |
2012 | | $ | 26.36 | | | | (0.32 | ) | | | 3.71 | | | 3.39 | | | — | | | — | | | — | | | $29.75 | | | (1.09 | ) | | | 2.09 | | | | 2.09 | | | | 2.09 | | | 12.86 | | 54.16 | | $ | 185,286 | |
2011 | | $ | 29.18 | | | | (0.28 | ) | | | (2.54 | ) | | (2.82) | | | — | | | — | | | — | | | $26.36 | | | (0.85 | ) | | | 2.03 | | | | 2.03 | | | | 2.03 | | | (9.66) | | 64.14 | | $ | 253,065 | |
CLASS I SHARES | | | | | | | | | | | | | | | | | | | | | | | | | | | | | | | | | | | | | | | | | | | |
2016(b) | | $ | 50.53 | | | | 0.26 | | | | 1.26 | | | 1.52 | | | — | | | — | | | — | | | $52.05 | | | 1.02 | (d) | | | 0.99 | (d) | | | 0.99 | (d) | | | 1.09 | (d) | | 3.01 | | 16.37 | | $ | 284,529 | |
2015 | | $ | 49.28 | | | | 0.28 | | | | 1.04 | | | 1.32 | | | (0.07 | ) | | — | | | (0.07 | ) | | $50.53 | | | 0.53 | | | | 0.99 | | | | 0.99 | | | | 1.06 | | | 2.68 | | 59.70 | | $ | 288,642 | |
2014 | | $ | 41.96 | | | | 0.28 | | | | 7.62 | | | 7.90 | | | (0.58 | ) | | — | | | (0.58 | ) | | $49.28 | | | 0.60 | | | | 0.99 | | | | 0.99 | | | | 1.06 | | | 18.86 | | 72.43 | | $ | 299,568 | |
2013 | | $ | 32.24 | | | | 0.20 | | | | 9.52 | | | 9.72 | | | — | | | — | | | — | | | $41.96 | | | 0.59 | | | | 0.98 | | | | 0.98 | | | | 1.01 | | | 30.15 | | 61.50 | | $ | 272,468 | |
2012 | | $ | 28.26 | | | | 0.02 | | | | 3.99 | | | 4.01 | | | (0.03 | ) | | — | | | (0.03 | ) | | $32.24 | | | 0.07 | | | | 0.93 | | | | 0.93 | | | | 0.93 | | | 14.18 | | 54.16 | | $ | 1,104,163 | |
2011 | | $ | 30.95 | | | | 0.09 | | | | (2.76 | ) | | (2.67) | | | (0.02 | ) | | — | | | (0.02 | ) | | $28.26 | | | 0.27 | | | | 0.91 | | | | 0.91 | | | | 0.91 | | | (8.65) | | 64.14 | | $ | 1,968,181 | |
CLASS R3 SHARES | | | | | | | | | | | | | | | | | | | | | | | | | | | | | | | | | | | | | | | | | | | |
2016(b) | | $ | 48.86 | | | | 0.16 | | | | 1.23 | | | 1.39 | | | — | | | — | | | — | | | $50.25 | | | 0.65 | (d) | | | 1.35 | (d) | | | 1.35 | (d) | | | 1.84 | (d) | | 2.84 | | 16.37 | | $ | 55,097 | |
2015 | | $ | 47.79 | | | | 0.08 | | | | 1.01 | | | 1.09 | | | (0.02 | ) | | — | | | (0.02 | ) | | $48.86 | | | 0.16 | | | | 1.35 | | | | 1.35 | | | | 1.77 | | | 2.28 | | 59.70 | | $ | 59,150 | |
2014 | | $ | 40.56 | | | | 0.11 | | | | 7.37 | | | 7.48 | | | (0.25 | ) | | — | | | (0.25 | ) | | $47.79 | | | 0.23 | | | | 1.35 | | | | 1.35 | | | | 1.77 | | | 18.45 | | 72.43 | | $ | 74,579 | |
2013 | | $ | 31.28 | | | | 0.10 | | | | 9.18 | | | 9.28 | | | — | | | — | | | — | | | $40.56 | | | 0.29 | | | | 1.34 | | | | 1.34 | | | | 1.78 | | | 29.67 | | 61.50 | | $ | 80,671 | |
2012 | | $ | 27.51 | | | | (0.10 | ) | | | 3.87 | | | 3.77 | | | — | | | — | | | — | | | $31.28 | | | (0.34 | ) | | | 1.35 | | | | 1.35 | | | | 1.66 | | | 13.70 | | 54.16 | | $ | 131,013 | |
2011 | | $ | 30.24 | | | | (0.06 | ) | | | (2.67 | ) | | (2.73) | | | — | | | — | | | — | | | $27.51 | | | (0.17 | ) | | | 1.35 | | | | 1.35 | | | | 1.64 | | | (9.03) | | 64.14 | | $ | 169,234 | |
CLASS R4 SHARES | | | | | | | | | | | | | | | | | | | | | | | | | | | | | | | | | | | | | | | | | | | |
2016(b) | | $ | 49.36 | | | | 0.20 | | | | 1.22 | | | 1.42 | | | — | | | — | | | — | | | $50.78 | | | 0.78 | (d) | | | 1.24 | (d) | | | 1.24 | (d) | | | 1.75 | (d) | | 2.88 | | 16.37 | | $ | 10,495 | |
2015 | | $ | 48.24 | | | | 0.14 | | | | 1.01 | | | 1.15 | | | (0.03 | ) | | — | | | (0.03 | ) | | $49.36 | | | 0.26 | | | | 1.25 | | | | 1.25 | | | | 1.67 | | | 2.39 | | 59.70 | | $ | 10,167 | |
2014 | | $ | 40.89 | | | | 0.16 | | | | 7.43 | | | 7.59 | | | (0.24 | ) | | — | | | (0.24 | ) | | $48.24 | | | 0.36 | | | | 1.24 | | | | 1.24 | | | | 1.69 | | | 18.56 | | 72.43 | | $ | 11,330 | |
2013 | | $ | 31.50 | | | | 0.13 | | | | 9.26 | | | 9.39 | | | — | | | — | | | — | | | $40.89 | | | 0.39 | | | | 1.25 | | | | 1.25 | | | | 1.67 | | | 29.81 | | 61.50 | | $ | 13,340 | |
2012 | | $ | 27.68 | | | | (0.07 | ) | | | 3.89 | | | 3.82 | | | — | | | — | | | — | | | $31.50 | | | (0.24 | ) | | | 1.25 | | | | 1.25 | | | | 1.50 | | | 13.80 | | 54.16 | | $ | 45,989 | |
2011 | | $ | 30.39 | | | | (0.02 | ) | | | (2.69 | ) | | (2.71) | | | — | | | — | | | — | | | $27.68 | | | (0.06 | ) | | | 1.25 | | | | 1.25 | | | | 1.47 | | | (8.92) | | 64.14 | | $ | 51,900 | |
CLASS R5 SHARES | | | | | | | | | | | | | | | | | | | | | | | | | | | | | | | | | | | | | | | | | | | |
2016(b) | | $ | 50.45 | | | | 0.25 | | | | 1.27 | | | 1.52 | | | — | | | — | | | — | | | $51.97 | | | 0.99 | (d) | | | 0.99 | (d) | | | 0.99 | (d) | | | 1.63 | (d) | | 3.01 | | 16.37 | | $ | 14,769 | |
2015 | | $ | 49.21 | | | | 0.27 | | | | 1.04 | | | 1.31 | | | (0.07 | ) | | — | | | (0.07 | ) | | $50.45 | | | 0.51 | | | | 0.99 | | | | 0.99 | | | | 1.20 | | | 2.65 | | 59.70 | | $ | 19,270 | |
2014 | | $ | 41.89 | | | | 0.28 | | | | 7.61 | | | 7.89 | | | (0.57 | ) | | — | | | (0.57 | ) | | $49.21 | | | 0.59 | | | | 0.98 | | | | 0.98 | | | | 1.42 | | | 18.88 | | 72.43 | | $ | 30,676 | |
2013 | | $ | 32.19 | | | | 0.22 | | | | 9.48 | | | 9.70 | | | — | | | — | | | — | | | $41.89 | | | 0.63 | | | | 0.99 | | | | 0.99 | | | | 1.37 | | | 30.13 | | 61.50 | | $ | 47,076 | |
2012 | | $ | 28.22 | | | | — | (e) | | | 3.98 | | | 3.98 | | | (0.01 | ) | | — | | | (0.01 | ) | | $32.19 | | | — | (f) | | | 0.99 | | | | 0.99 | | | | 1.17 | | | 14.10 | | 54.16 | | $ | 129,995 | |
2011 | | $ | 30.92 | | | | 0.07 | | | | (2.76 | ) | | (2.69) | | | (0.01 | ) | | — | | | (0.01 | ) | | $28.22 | | | 0.20 | | | | 0.98 | | | | 0.99 | | | | 1.09 | | | (8.70) | | 64.14 | | $ | 215,364 | |
| (a) | Not annualized for periods less than one year. |
| (b) | Unaudited Six Month Period Ended March 31. |
| (c) | Sales loads are not reflected in computing total return. |
| (e) | Net investment income (loss) was less than $0.01 per share. |
| (f) | Net investment income (loss) is less than 0.01%. |
| + | Based on weighted average shares outstanding. |
See notes to financial statements.
| | | | |
| 26 Semi-Annual Report | | | | Semi-Annual Report 27 |
| | |
| EXPENSE EXAMPLE | | |
| |
Thornburg Value Fund | | March 31, 2016 (Unaudited) |
As a shareholder of the Fund, you incur two types of costs:
| | (1) | transaction costs, including |
(a) sales charges (loads) on purchase payments for Class A shares;
(b) a deferred sales charge on redemptions of any part or all of a purchase of $1 million of Class A shares within 12 months of purchase;
(c) a deferred sales charge on redemptions of Class B shares within eight years of purchase;
(d) a deferred sales charge on redemptions of Class C shares within 12 months of purchase;
| | (2) | ongoing costs, including management fees; distribution and/or service (12b-1) fees; and other Fund expenses. |
This example is intended to help you understand your ongoing costs (in dollars) of investing in the Fund and to compare these costs with the ongoing costs of investing in other mutual funds.
The example is based on a $1,000 investment beginning on October 1, 2015, and held until March 31, 2016.
| | | | | | | | | | | | |
| | | BEGINNING
ACCOUNT VALUE
10/1/15 | | | ENDING
ACCOUNT VALUE
3/31/16 | | | EXPENSES PAID
DURING PERIOD†
10/1/15–3/31/16 | |
CLASS A SHARES | | | | | | | | | | | | |
Actual | | $ | 1,000.00 | | | $ | 1,028.10 | | | $ | 7.08 | |
Hypothetical* | | $ | 1,000.00 | | | $ | 1,018.02 | | | $ | 7.04 | |
CLASS B SHARES | | | | | | | | | | | | |
Actual | | $ | 1,000.00 | | | $ | 1,022.90 | | | $ | 12.04 | |
Hypothetical* | | $ | 1,000.00 | | | $ | 1,013.10 | | | $ | 11.98 | |
CLASS C SHARES | | | | | | | | | | | | |
Actual | | $ | 1,000.00 | | | $ | 1,024.10 | | | $ | 10.90 | |
Hypothetical* | | $ | 1,000.00 | | | $ | 1,014.23 | | | $ | 10.85 | |
CLASS I SHARES | | | | | | | | | | | | |
Actual | | $ | 1,000.00 | | | $ | 1,030.10 | | | $ | 5.02 | |
Hypothetical* | | $ | 1,000.00 | | | $ | 1,020.05 | | | $ | 5.00 | |
CLASS R3 SHARES | | | | | | | | | | | | |
Actual | | $ | 1,000.00 | | | $ | 1,028.40 | | | $ | 6.85 | |
Hypothetical* | | $ | 1,000.00 | | | $ | 1,018.25 | | | $ | 6.81 | |
CLASS R4 SHARES | | | | | | | | | | | | |
Actual | | $ | 1,000.00 | | | $ | 1,028.80 | | | $ | 6.31 | |
Hypothetical* | | $ | 1,000.00 | | | $ | 1,018.78 | | | $ | 6.28 | |
CLASS R5 SHARES | | | | | | | | | | | | |
Actual | | $ | 1,000.00 | | | $ | 1,030.10 | | | $ | 5.02 | |
Hypothetical* | | $ | 1,000.00 | | | $ | 1,020.05 | | | $ | 5.00 | |
| † | Expenses are equal to the annualized expense ratio for each class (A: 1.40%; B: 2.38%; C: 2.15%; I: 0.99%; R3: 1.35%; R4: 1.24%; R5: 0.99%) multiplied by the average account value over the period, multiplied by 183/366 to reflect the one-half year period. |
| * | Hypothetical assumes a rate of return of 5% per year before expenses. |
ACTUAL EXPENSES
For each class of shares, the first line of the accompanying table provides information about actual account values and actual expenses. You may use the information in this line, together with the amount you invested, to estimate the expenses that you paid over the period. Simply divide your account value by $1,000 (for example, an $8,600 account value divided by $1,000 = 8.6), then multiply the result by the number in the first line for your class of shares under the heading entitled “Expenses Paid During Period” to estimate the expenses you paid on your account during this period.
HYPOTHETICAL EXAMPLE FOR COMPARISON PURPOSES
For each class of shares, the second line of the accompanying table provides information about hypothetical account values and hypothetical expenses based on the Fund’s actual expense ratio and an assumed rate of return of 5% per year before expenses, which is not the Fund’s actual return. The hypothetical account values and expenses may not be used to estimate the actual ending account balance or expenses you paid for the period. You may use this information to compare the ongoing costs of investing in the Fund and other funds. To do so, compare this 5% hypothetical example with the 5% hypothetical examples that appear in the shareholder reports of the other funds.
Please note that the expenses shown in the table are meant to highlight your ongoing costs only and do not reflect any transactional costs, such as sales charges (loads), redemption fees, or exchange fees. Therefore, the second line of the table for each class of shares is useful in comparing ongoing costs only, and will not help you determine the relative total costs of owning different funds. In addition, if these transactional costs were included, your costs would have been higher.
28 Semi-Annual Report
| | |
| OTHER INFORMATION | | |
| |
Thornburg Value Fund | | March 31, 2016 (Unaudited) |
PORTFOLIO PROXY VOTING
Policies and Procedures:
The Trust has delegated to Thornburg Investment Management, Inc. (the “Advisor”) voting decisions respecting proxies for the Fund’s voting securities. The Advisor makes voting decisions in accordance with its Proxy Voting Policy and Procedures. A description of the Policy and Procedures is available (i) without charge, upon request, by calling the Advisor toll-free at 1-800-847-0200, (ii) on the Thornburg website at www.thornburg.com, and (iii) on the Securities and Exchange Commission’s website at www.sec.gov.
Information regarding how proxies were voted is available on or before August 31 of each year for the twelve months ending the preceding June 30. This information is available (i) without charge, upon request by calling the Advisor toll-free at 1-800-847-0200, (ii) on the Thornburg website at www.thornburg.com, and (iii) on the Securities and Exchange Commission’s website at www.sec.gov.
AVAILABILITY OF QUARTERLY PORTFOLIO SCHEDULE
The Fund files with the Securities and Exchange Commission schedules of its portfolio holdings on Form N-Q for the first and third quarters of each fiscal year. The Fund’s Forms N-Q are available on the Commission’s website at www.sec.gov, or may be reviewed and copied at the Commission’s Public Reference Room in Washington, D.C. Information on the operation of the Public Reference Room may be obtained by calling 1-800-SEC-0330. The Fund also makes this information available on its website at www.thornburg. com/download or upon request by calling 1-800-847-0200.
Semi-Annual Report 29
TRUSTEES’ STATEMENT TO SHAREHOLDERS
Revised and Readopted September 15, 2015
The Trustees believe current and prospective shareholders should know how we discharge our responsibilities in supervising the Funds’ investment advisor and in reviewing the advisor’s contract for renewal. Since 2005, we have issued a statement which sets out clearly the three principal guidelines that we follow in supervising the Trust’s investment advisor on your behalf. In accordance with our customary practice, in September of 2015 we again reviewed our statement and concluded we should reissue this statement outlining the principal features of our supervision of the advisor’s performance of investment management services for the Funds.
We begin with the premise that each shareholder selected his or her Fund because its investments are managed by the investment advisor identified in the prospectus and in accordance with the objective and policies described in the prospectus. We realize, as each of you do, that if you believe that your Fund’s stated objective and policies no longer serve your personal investment goals, you can sell your shares and leave the Fund.
Therefore, we believe that our primary supervisory task – our principal obligation to you – is to assess the nature and quality of the advisor’s services, and to confirm that the advisor actively and competently pursues the Fund’s objective, in accordance with the policies set out in the prospectus. To do this, we meet regularly with management to review your Fund’s portfolio and to discuss the advisor’s specific actions and judgments in pursuing the Fund’s objective. We do not substitute our own judgment for the advisor’s decisions in selecting investments; the advisor is paid to exercise its informed judgment on investment decisions, and we seek to confirm, in reviewing the advisor’s performance, that the advisor is doing just that.
Second, we are conscious of costs and the effect that costs have on shareholders’ returns. We try to make sure that your Fund’s fees and costs are reasonable in relationship to the services rendered and that they are generally in line with those charged by other expert investment advisors, consistent with our belief that the Fund’s investors searched for and expect that expertise and attention and have decided to pay a reasonable price for it. We do not put the management contract “out to bid” as a matter of course, and we would not do so unless we had concluded that the advisor materially had failed to pursue the Fund’s objectives in accordance with its policies, or for other equally important reasons. We believe that any other approach would be inconsistent with your interests and contrary to your expectations when you bought shares of the Fund in the first place.
Finally, because we believe that most Thornburg Fund shareholders have invested with a long-term perspective, we try not to focus too much on the fashions of the moment and on short-term performance. The market will not favor any specific investment objective or set of policies at all times and under all economic circumstances. A fund will experience periods of both high and low returns relative to other funds and other investments. Even if one of our Funds is not favored by the market at a particular time, we believe that the advisor is nonetheless obliged to remain true to the Fund’s objective and policies, and we watch to see that it does so.
Trustees of Thornburg Investment Trust
30 Semi-Annual Report
THORNBURG FUND FAMILY
Thornburg Investment Management is a privately-owned global investment firm that offers a range of solutions for retail and institutional investors. Founded in 1982 and headquartered in Santa Fe, New Mexico, we manage approximately $54 billion (as of March 31, 2016) across eight equity and 11 bond mutual funds, separate accounts for high-net-worth investors and institutional accounts, and five UCITS funds for non-U.S. investors.
The fund outlined in this report is one of many equity and fixed-income products available from Thornburg Investment Management.
Equity Funds
| | • | | Thornburg Core Growth Fund |
| | • | | Thornburg International Value Fund |
| | • | | Thornburg Better World International Fund |
| | • | | Thornburg International Growth Fund |
| | • | | Thornburg Developing World Fund |
| | • | | Thornburg Investment Income Builder Fund |
| | • | | Thornburg Global Opportunities Fund |
Fixed Income Funds
| | • | | Thornburg Low Duration Income Fund |
| | • | | Thornburg Limited Term U.S. Government Fund |
| | • | | Thornburg Limited Term Income Fund |
| | • | | Thornburg Strategic Income Fund |
| | • | | Thornburg Low Duration Municipal Fund |
| | • | | Thornburg Limited Term Municipal Fund |
| | • | | Thornburg Intermediate Municipal Fund |
| | • | | Thornburg California Limited Term Municipal Fund |
| | • | | Thornburg New Mexico Intermediate Municipal Fund |
| | • | | Thornburg New York Intermediate Municipal Fund |
| | • | | Thornburg Strategic Municipal Income Fund |
Before investing, carefully consider the Fund’s investment goals, risks, charges, and expenses. For a prospectus or summary prospectus containing this and other information, contact your financial advisor or visit thornburg.com. Read it carefully before investing.
For additional information, please visit thornburg.com
Thornburg Investment Management, Inc. 2300 North Ridgetop Road, Santa Fe, NM 87506
Semi-Annual Report 31
This Semi-Annual Report is submitted for the general information of shareholders of the Fund. It is not authorized for distribution to prospective investors in the Fund unless preceded or accompanied by an effective prospectus.
| | | | |
| Investment Advisor: | | Distributor: | | |
| Thornburg Investment Management® | | Thornburg Securities Corporation® | | |
| 800.847.0200 | | 800.847.0200 | | TH170 |

2 Semi-Annual Report
Semi-Annual Report
Thornburg International Value Fund
March 31, 2016
| | | | |
SHARE CLASS | | NASDAQ SYMBOL | | CUSIP |
Class A | | TGVAX | | 885-215-657 |
Class B | | THGBX | | 885-215-616 |
Class C | | THGCX | | 885-215-640 |
Class I | | TGVIX | | 885-215-566 |
Class R3 | | TGVRX | | 885-215-525 |
Class R4 | | THVRX | | 885-215-269 |
Class R5 | | TIVRX | | 885-215-368 |
Class R6 | | TGIRX | | 885-216-804 |
Class I, R3, R4, R5, and R6 shares may not be available to all investors. Minimum investments for Class I shares may be higher than those for other classes. Class B shares are no longer offered.
Investments carry risks, including possible loss of principal. Additional risks may be associated with investments outside the United States, especially in emerging markets, including currency fluctuations, illiquidity, volatility, and political and economic risks. Investments in small- and mid-capitalization companies may increase the risk of greater price fluctuations. Please see the Fund’s prospectus for a discussion of the risks associated with an investment in the Fund. Investments in the Fund are not FDIC insured, nor are they bank deposits or guaranteed by a bank or any other entity.
Funds invested in a smaller number of holdings may expose an investor to greater volatility.
Diversification does not assure or guarantee better performance and cannot eliminate the risk of investment losses.
Semi-Annual Report 3
| | |
| LETTER TO SHAREHOLDERS | | |
| |
Thornburg International Value Fund | | March 31, 2016 (Unaudited) |
April 15, 2016
Dear Fellow Shareholder:
After much anticipation, the Federal Reserve Open Market Committee finally started raising rates in December 2015. The volatility that marked most of the fiscal year ending September 30, 2015 continued into the first half of the current fiscal year. Global equity markets rallied at the beginning of October 2015, led by a rebound in commodity prices, emerging market equities, and cyclical stocks. Then, and in sharp contrast, early 2016 saw global equity markets post one of the worst starts in recent decades. Mounting investor concern for a potential U.S. economic recession added to existing fears over a “hard landing” in China, rising stress in Europe’s financial system, and the impact of low commodity prices. International equity markets then reversed sharply half way through the first quarter of 2016 as U.S. and Chinese economic data improved and commodity prices rebounded off their lows.
For the six-month period ended March 31, 2016, the Thornburg International Value Fund returned negative 1.38% (A shares without sales charge), versus a return of positive 1.56% for the MSCI EAFE Index and positive 3.03% for the MSCI All Country (AC) World ex-U.S. Index.
While we are disappointed with the Fund’s relative performance during the first half of this fiscal year, we are pleased with the Fund’s longer-term track record. For the trailing 12-month period, the Fund returned negative 5.37% (A shares without sales charge), outperforming the MSCI EAFE Index and the MSCI AC World ex-U.S. Index by nearly 300 basis points and 350 basis points, respectively (please refer to the performance table on page 6 for details). The Fund’s underweight to commodity-exposed emerging markets and a large-cap “quality” tilt, proved to be performance headwinds in the period. However, we have been, and will remain, disciplined, only investing in attractive stocks from both return and risk perspectives. As fundamental, valuation-focused stock pickers, we became motivated by the valuation dislocations caused by market volatility and took the opportunity to upgrade the portfolio, building positions in high-quality stocks at what we believed to be attractive valuations. Among new additions to the portfolio were China’s leading social networking provider Tencent and leading global consumer products company Reckitt Benckiser. We had owned both Tencent and Reckitt Benckiser in the past and thought highly of their businesses, but had exited both names due to valuation. Both Tencent and Reckitt Benckiser have already contributed positively to performance.
Performance data shown represents past performance and is no guarantee of future results. Investment return and principal value will fluctuate so shares, when redeemed, may be worth more or less than their original cost. Current performance may be lower or higher than quoted. For performance current to the most recent month end, visit thornburg.com or call 800.847.0200.
The maximum sales charge for Class A shares is 4.50%. The total annual fund operating expense of Class A shares is 1.27%, as disclosed in the most recent prospectus. If the sales charge had been deducted, returns would be lower.
Top contributors to performance during the period included Nippon Telegraph and Telephone (NTT), Japan’s largest telecom operator; Ctrip, China’s dominant online travel services provider; Vinci, a French toll-road operator; Kweichow Moutai, China’s premium spirits producer; and AXA, a French-based insurer and asset manager. NTT performed well on the back of strong operating results from the company’s NTT Docomo subsidiary as well as positive progress made in their fiber wholesaling initiatives. Ctrip was up following news around industry consolidation and the stronger profit growth which is expected to result. Vinci posted stronger-than-expected earnings, thanks mainly to higher traffic volume. Kweichow Moutai re-rated after delivering solid operating results. And finally, AXA was up due to lower capital requirements under the new Solvency II regulatory regime.
The main detractors from performance were drug company Novartis; media concern Liberty Global; and financials Intesa Sanpaolo, ING Groep, and Sumitomo Mitsui Trust. Shares of Swiss pharmaceutical company Novartis were dragged down by pressure across the broader pharmaceuticals sector. The company also missed earnings in the fourth quarter due to issues which are now being addressed at its Alcon division. Negative sentiment toward leverage hurt media conglomerate Liberty Global, which was also hit by failed merger discussions.
4 Semi-Annual Report
| | |
| LETTER TO SHAREHOLDERS, | | |
| |
CONTINUED | | |
| |
Thornburg International Value Fund | | March 31, 2016 (Unaudited) |
European banks Intesa Sanpaolo and ING Groep, as well as Japanese financial Sumitomo Mitsui Trust, were all affected by the turn toward negative interest rates in their home markets. We exited all three positions.
Even though international equity markets posted positive returns over the past six-month period, the extreme volatility negatively impacted investor sentiment. Our fundamental-research approach and focus on individual stock selection are intended to yield an understanding of each company’s challenges and prospects as economic and market conditions evolve. This approach means volatility can be an opportunity, as much as it is a threat. We remain confident that our fundamental approach to investing in promising companies at a discount can produce superior investment results over the long run.
Thank you for investing alongside us in the Thornburg International Value Fund.
Sincerely,
| | | | |
 | |  | |  |
| William V. Fries, CFA | | Lei Wang, CFA | | Di Zhou, CFA |
| Portfolio Manager | | Portfolio Manager | | Portfolio Manager |
| Managing Director | | Managing Director | | Managing Director |
The matters discussed in this report may constitute forward-looking statements made pursuant to the safe harbor provisions of the Securities Litigation Reform Act of 1995. These include any advisor or portfolio manager prediction, assessment, analysis or outlook for individual securities, industries, investment styles, market sectors and/or markets. These statements involve risks and uncertainties. In addition to the general risks described for each fund in its current prospectus, other factors bearing on these reports include the accuracy of the advisor’s or portfolio manager’s forecasts and predictions, the appropriateness of the investment strategies designed by the advisor or portfolio manager and the ability of the advisor or portfolio manager to implement their strategies efficiently and successfully. Any one or more of these factors, as well as other risks affecting the securities markets generally, could cause the actual results of any fund to differ materially as compared to its benchmarks.
The views expressed by the portfolio managers reflect their professional opinions and are subject to change. Under no circumstances does the information contained within represent a recommendation to buy or sell any security.
Semi-Annual Report 5
| | |
| PERFORMANCE SUMMARY | | |
| |
Thornburg International Value Fund | | March 31, 2016 (Unaudited) |
Average Annual Total Returns
| | | | | | | | | | | | | | | | | | | | |
| | | 1-YR | | | 3-YR | | | 5-YR | | | 10-YR | | | SINCE
INCEP. | |
Class A Shares (Incep: 5/28/98) | | | | | | | | | | | | | | | | | | | | |
Without sales charge | | | -5.37 | % | | | 2.51 | % | | | 1.15 | % | | | 3.42 | % | | | 7.25 | % |
With sales charge | | | -9.63 | % | | | 0.96 | % | | | 0.22 | % | | | 2.95 | % | | | 6.98 | % |
Class B Shares (Incep: 4/3/00) | | | | | | | | | | | | | | | | | | | | |
Without sales charge | | | -6.38 | % | | | 1.55 | % | | | 0.25 | % | | | 2.77 | % | | | 4.86 | % |
With sales charge | | | -10.30 | % | | | 0.65 | % | | | -0.05 | % | | | 2.77 | % | | | 4.86 | % |
Class C Shares (Incep: 5/28/98) | | | | | | | | | | | | | | | | | | | | |
Without sales charge | | | -6.05 | % | | | 1.76 | % | | | 0.41 | % | | | 2.67 | % | | | 6.41 | % |
With sales charge | | | -6.83 | % | | | 1.76 | % | | | 0.41 | % | | | 2.67 | % | | | 6.41 | % |
Class I Shares (Incep: 3/30/01) | | | -5.03 | % | | | 2.90 | % | | | 1.54 | % | | | 3.83 | % | | | 6.90 | % |
Class R3 Shares (Incep: 7/1/03) | | | -5.52 | % | | | 2.33 | % | | | 0.97 | % | | | 3.26 | % | | | 8.09 | % |
Class R4 Shares (Incep: 2/1/07) | | | -5.37 | % | | | 2.52 | % | | | 1.17 | % | | | — | | | | 2.13 | % |
Class R5 Shares (Incep: 2/1/05) | | | -5.12 | % | | | 2.80 | % | | | 1.43 | % | | | 3.75 | % | | | 5.97 | % |
Class R6 Shares (Incep: 5/1/12) | | | -4.86 | % | | | 3.06 | % | | | — | | | | — | | | | 4.18 | % |
MSCI AC World ex-U.S. Index (Gross) (Since 5/28/98) | | | -8.78 | % | | | 0.76 | % | | | 0.76 | % | | | 2.39 | % | | | 4.34 | % |
MSCI EAFE Index (Since 5/28/98) | | | -8.27 | % | | | 2.23 | % | | | 2.29 | % | | | 1.80 | % | | | 3.50 | % |
Growth of a Hypothetical $10,000 Investment

Performance data shown represents past performance and is no guarantee of future results. Investment return and principal value will fluctuate so shares, when redeemed, may be worth more or less than their original cost. Current performance may be lower or higher than quoted. For performance current to the most recent month end, visit thornburg.com or call 800-847-0200. The performance information does not reflect the deduction of taxes that a shareholder would pay on distributions or the redemption of Fund shares. Returns reflect the reinvestment of dividends and capital gains. Class A shares are sold with a maximum sales charge of 4.50%. Class B shares carry a contingent deferred sales charge (CDSC) that declines from 5.00% to 0% depending upon the period of time the shares are held. Class B shares will automatically convert to Class A shares on a quarterly basis approximately eight years after purchase. Class C shares are subject to a 1% CDSC for the first year only. There is no sales charge for Class I, R3, R4, R5 and R6 shares.
As disclosed in the most recent prospectus, the total annual fund operating expenses are as follows: A shares, 1.27%; B shares, 2.24%; C shares, 1.99%; I shares, 0.90%; R3 shares, 1.58%; R4 shares, 1.37%; R5 shares, 1.11%; R6 shares, 0.74%. Thornburg Investment Management and/or Thornburg Securities Corporation have contractually agreed to waive fees and reimburse expenses through at least February 1, 2017, for some of the share classes, resulting in net expense ratios of the following: R3 shares, 1.45%; R4 shares, 1.25%; R5 shares, 0.99%. For more detailed information on fund expenses and waivers/reimbursements please see the Fund’s prospectus.
Glossary
MSCI All Country (AC) World ex-US Index – A market capitalization weighted index representative of the market structure of 45 developed and emerging market countries in North and South America, Europe, Africa, and the Pacific Rim, excluding securities of United States issuers. The index is calculated with gross dividends reinvested in U.S. dollars.
MSCI EAFE (Europe, Australasia, Far East) Index – An unmanaged, market capitalization weighted index that is a common benchmark for international portfolio performance. The index is calculated with net dividends reinvested in U.S. dollars.
Unless otherwise noted, index returns reflect the reinvestment of income dividends and capital gains, if any, but do not reflect fees, brokerage commissions or other expenses of investing. Investors may not make direct investments into any index. The performance of any index is not indicative of the performance of any particular investment.
Basis Point (bp) – A unit equal to 1/100th of 1%. 1% = 100 basis points (bps).
6 Semi-Annual Report
| | |
| FUND SUMMARY | | |
| |
Thornburg International Value Fund | | March 31, 2016 (Unaudited) |
OBJECTIVES AND STRATEGIES
The Fund seeks long-term capital appreciation by investing in equity and debt securities of all types. As a secondary consideration, the Fund also seeks some current income.
The Fund invests primarily in foreign securities or depositary receipts of foreign securities. The Fund may invest in developing countries.
Market Capitalization Exposure

Basket Structure
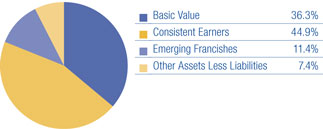
Top Ten Equity Holdings
| | | | |
Nestle SA | | | 3.0 | % |
Nippon Telegraph & Telephone Corp. | | | 2.9 | % |
Novartis AG | | | 2.8 | % |
Reckitt Benckiser plc | | | 2.7 | % |
Total SA | | | 2.7 | % |
UBS Group AG | | | 2.7 | % |
Atlantia S.p.A. | | | 2.6 | % |
Japan Exchange Group, Inc. | | | 2.6 | % |
Aviva plc | | | 2.6 | % |
Sony Corp. | | | 2.5 | % |
There is no guarantee that the Fund will meet its investment objectives.
All portfolio information is subject to change. Charts may not add up to 100% due to rounding.
Sector Exposure
| | | | |
Financials | | | 18.3 | % |
Industrials | | | 15.2 | % |
Consumer Staples | | | 12.2 | % |
Health Care | | | 12.2 | % |
Consumer Discretionary | | | 11.0 | % |
Information Technology | | | 7.1 | % |
Telecommunication Services | | | 7.0 | % |
Utilities | | | 4.0 | % |
Energy | | | 3.2 | % |
Materials | | | 2.5 | % |
Other Assets Less Liabilities | | | 7.4 | % |
Top Ten Industry Groups
| | | | |
Transportation | | | 9.9 | % |
Pharmaceuticals, Biotechnology & Life Sciences | | | 9.8 | % |
Diversified Financials | | | 8.3 | % |
Food, Beverage & Tobacco | | | 7.5 | % |
Telecommunication Services | | | 7.0 | % |
Insurance | | | 5.5 | % |
Capital Goods | | | 5.3 | % |
Media | | | 4.9 | % |
Banks | | | 4.6 | % |
Utilities | | | 4.0 | % |
Country Exposure*
(percent of equity holdings)
| | | | |
Japan | | | 15.6 | % |
United Kingdom | | | 13.5 | % |
France | | | 13.2 | % |
Switzerland | | | 11.7 | % |
China | | | 11.5 | % |
Netherlands | | | 5.9 | % |
United States | | | 5.8 | % |
Germany | | | 4.7 | % |
Italy | | | 4.3 | % |
Hong Kong | | | 4.0 | % |
Denmark | | | 2.5 | % |
Finland | | | 2.1 | % |
Ireland | | | 1.4 | % |
Mexico | | | 1.4 | % |
Spain | | | 1.3 | % |
Australia | | | 1.1 | % |
| * | The country assignment of each equity holding is determined by the Fund’s Advisor based on various factors, including the location of the issuer’s head office, the issuer’s jurisdiction of incorporation and the country from which a majority of the issuer’s revenue is derived. |
Semi-Annual Report 7
| | |
| SCHEDULE OF INVESTMENTS | | |
| |
Thornburg International Value Fund | | March 31, 2016 (Unaudited) |
| | | | | | | | |
| | | SHARES/
PRINCIPAL AMOUNT | | | VALUE | |
COMMON STOCK — 92.63% | | | | | | | | |
| | |
AUTOMOBILES & COMPONENTS — 1.25% | | | | | | | | |
Auto Components — 1.25% | | | | | | | | |
Delphi Automotive plc | | | 1,455,970 | | | $ | 109,226,869 | |
| | | | | | | | |
| | | | | | | 109,226,869 | |
| | | | | | | | |
| | |
BANKS — 4.61% | | | | | | | | |
Banks — 4.61% | | | | | | | | |
Citigroup, Inc. | | | 5,078,414 | | | | 212,023,784 | |
Lloyds Banking Group plc | | | 195,228,362 | | | | 190,725,754 | |
| | | | | | | | |
| | | | | | | 402,749,538 | |
| | | | | | | | |
| | |
CAPITAL GOODS — 5.33% | | | | | | | | |
Building Products — 1.60% | | | | | | | | |
Compagnie de Saint-Gobain | | | 3,162,366 | | | | 139,368,187 | |
Construction & Engineering — 2.52% | | | | | | | | |
Vinci S.A. | | | 2,958,963 | | | | 220,437,713 | |
Industrial Conglomerates — 1.21% | | | | | | | | |
Koninklijke Philips N.V. | | | 3,708,942 | | | | 105,657,823 | |
| | | | | | | | |
| | | | | | | 465,463,723 | |
| | | | | | | | |
| | |
CONSUMER DURABLES & APPAREL — 2.53% | | | | | | | | |
Household Durables — 2.53% | | | | | | | | |
Sony Corp. | | | 8,588,808 | | | | 220,777,658 | |
| | | | | | | | |
| | | | | | | 220,777,658 | |
| | | | | | | | |
| | |
CONSUMER SERVICES — 0.51% | | | | | | | | |
Hotels, Restaurants & Leisure — 0.51% | | | | | | | | |
Accor S.A. | | | 1,039,960 | | | | 44,068,709 | |
| | | | | | | | |
| | | | | | | 44,068,709 | |
| | | | | | | | |
| | |
DIVERSIFIED FINANCIALS — 8.26% | | | | | | | | |
Capital Markets — 3.53% | | | | | | | | |
CITIC Securities Co., Ltd. | | | 27,003,247 | | | | 74,359,551 | |
UBS Group AG | | | 14,528,262 | | | | 234,041,681 | |
Diversified Financial Services — 4.73% | | | | | | | | |
Hong Kong Exchanges & Clearing Ltd. | | | 7,666,490 | | | | 184,414,398 | |
Japan Exchange Group, Inc. | | | 14,926,800 | | | | 228,653,456 | |
| | | | | | | | |
| | | | | | | 721,469,086 | |
| | | | | | | | |
| | |
ENERGY — 3.21% | | | | | | | | |
Oil, Gas & Consumable Fuels — 3.21% | | | | | | | | |
Exxon Mobil Corp. | | | 523,413 | | | | 43,752,093 | |
Total SA | | | 5,191,995 | | | | 236,673,281 | |
| | | | | | | | |
| | | | | | | 280,425,374 | |
| | | | | | | | |
| | |
FOOD & STAPLES RETAILING — 1.99% | | | | | | | | |
Food & Staples Retailing — 1.99% | | | | | | | | |
Seven & i Holdings Co., Ltd. | | | 4,091,665 | | | | 174,217,057 | |
| | | | | | | | |
| | | | | | | 174,217,057 | |
| | | | | | | | |
| | |
FOOD, BEVERAGE & TOBACCO — 7.50% | | | | | | | | |
Beverages — 4.50% | | | | | | | | |
Heineken NV | | | 2,215,753 | | | | 200,821,935 | |
Kweichow Moutai Co., Ltd. | | | 5,026,604 | | | | 192,480,789 | |
Food Products — 3.00% | | | | | | | | |
Nestle SA | | | 3,509,384 | | | | 262,232,063 | |
| | | | | | | | |
| | | | | | | 655,534,787 | |
| | | | | | | | |
| | |
HEALTH CARE EQUIPMENT & SERVICES — 2.37% | | | | | | | | |
Health Care Providers & Services — 2.37% | | | | | | | | |
Fresenius SE & Co. KGaA | | | 2,838,869 | | | | 207,420,675 | |
| | | | | | | | |
| | | | | | | 207,420,675 | |
| | | | | | | | |
| | |
HOUSEHOLD & PERSONAL PRODUCTS — 2.72% | | | | | | | | |
Household Products — 2.72% | | | | | | | | |
Reckitt Benckiser plc | | | 2,460,844 | | | | 237,864,127 | |
| | | | | | | | |
| | | | | | | 237,864,127 | |
| | | | | | | | |
| | |
INSURANCE — 5.46% | | | | | | | | |
Insurance — 5.46% | | | | | | | | |
AIA Group Ltd. | | | 24,536,418 | | | | 139,013,396 | |
8 Semi-Annual Report
| | |
| SCHEDULE OF INVESTMENTS, CONTINUED | | |
| |
Thornburg International Value Fund | | March 31, 2016 (Unaudited) |
| | | | | | | | |
| | | SHARES/
PRINCIPAL AMOUNT | | | VALUE | |
Aviva plc | | | 34,768,824 | | | $ | 227,761,270 | |
AXA S.A. | | | 4,664,777 | | | | 109,823,530 | |
| | | | | | | | |
| | | | | | | 476,598,196 | |
| | | | | | | | |
| | |
MATERIALS — 2.51% | | | | | | | | |
Construction Materials — 0.60% | | | | | | | | |
Anhui Conch Cement Co., Ltd. | | | 20,222,186 | | | | 52,841,076 | |
Metals & Mining — 1.91% | | | | | | | | |
BHP Billiton plc | | | 7,907,347 | | | | 88,901,977 | |
Freeport-McMoRan Copper & Gold, Inc. | | | 7,505,377 | | | | 77,605,598 | |
| | | | | | | | |
| | | | | | | 219,348,651 | |
| | | | | | | | |
| | |
MEDIA — 4.93% | | | | | | | | |
Media — 4.93% | | | | | | | | |
China South Publishing & Media Group Co., Ltd. | | | 18,283,558 | | | | 53,627,172 | |
ITV plc | | | 46,507,520 | | | | 161,112,889 | |
a Liberty Global plc | | | 2,083,138 | | | | 78,242,663 | |
Vivendi | | | 6,537,863 | | | | 137,480,722 | |
| | | | | | | | |
| | | | | | | 430,463,446 | |
| | | | | | | | |
| | |
PHARMACEUTICALS, BIOTECHNOLOGY & LIFE SCIENCES — 9.78% | | | | | | | | |
Pharmaceuticals — 9.78% | | | | | | | | |
GlaxoSmithKline plc | | | 4,360,142 | | | | 88,422,977 | |
Novartis AG | | | 3,347,066 | | | | 242,619,209 | |
Novo Nordisk A/S | | | 3,770,980 | | | | 204,543,345 | |
Perrigo Co. plc | | | 878,826 | | | | 112,428,210 | |
Roche Holding AG | | | 839,201 | | | | 206,581,953 | |
| | | | | | | | |
| | | | | | | 854,595,694 | |
| | | | | | | | |
| | |
RETAILING — 1.75% | | | | | | | | |
Internet & Catalog Retail — 1.75% | | | | | | | | |
a Ctrip.com International, Ltd. ADR | | | 2,945,137 | | | | 130,351,764 | |
Rakuten, Inc. | | | 2,309,116 | | | | 22,271,495 | |
| | | | | | | | |
| | | | | | | 152,623,259 | |
| | | | | | | | |
| | |
SEMICONDUCTORS & SEMICONDUCTOR EQUIPMENT — 1.97% | | | | | | | | |
Semiconductors & Semiconductor Equipment — 1.97% | | | | | | | | |
a NXP Semiconductors N.V. | | | 2,118,156 | | | | 171,718,907 | |
| | | | | | | | |
| | | | | | | 171,718,907 | |
| | | | | | | | |
| | |
SOFTWARE & SERVICES — 3.19% | | | | | | | | |
Information Technology Services — 1.57% | | | | | | | | |
MasterCard, Inc. | | | 1,452,928 | | | | 137,301,696 | |
Internet Software & Services — 1.62% | | | | | | | | |
Tencent Holdings Ltd. | | | 6,935,079 | | | | 141,699,166 | |
| | | | | | | | |
| | | | | | | 279,000,862 | |
| | | | | | | | |
| | |
TECHNOLOGY HARDWARE & EQUIPMENT — 1.91% | | | | | | | | |
Communications Equipment — 1.91% | | | | | | | | |
Nokia Oyj | | | 28,026,048 | | | | 166,629,610 | |
| | | | | | | | |
| | | | | | | 166,629,610 | |
| | | | | | | | |
| | |
TELECOMMUNICATION SERVICES — 6.98% | | | | | | | | |
Diversified Telecommunication Services — 6.30% | | | | | | | | |
Deutsche Telekom AG | | | 9,677,178 | | | | 173,708,919 | |
Nippon Telegraph & Telephone Corp. | | | 5,965,447 | | | | 256,968,209 | |
a Telecom Italia S.p.A. | | | 111,324,716 | | | | 120,089,201 | |
Wireless Telecommunication Services — 0.68% | | | | | | | | |
China Mobile Ltd. | | | 5,298,405 | | | | 59,012,703 | |
| | | | | | | | |
| | | | | | | 609,779,032 | |
| | | | | | | | |
| | |
TRANSPORTATION — 9.87% | | | | | | | | |
Airlines — 1.81% | | | | | | | | |
Japan Airlines Co., Ltd. | | | 4,321,769 | | | | 158,286,302 | |
Road & Rail — 3.60% | | | | | | | | |
East Japan Railway Co. | | | 2,315,651 | | | | 199,848,222 | |
Kansas City Southern | | | 1,346,147 | | | | 115,028,261 | |
Transportation Infrastructure — 4.46% | | | | | | | | |
Atlantia S.p.A. | | | 8,283,202 | | | | 229,698,312 | |
Shanghai International Air Co., Ltd. | | | 34,309,956 | | | | 159,730,468 | |
| | | | | | | | |
| | | | | | | 862,591,565 | |
| | | | | | | | |
Semi-Annual Report 9
| | |
| SCHEDULE OF INVESTMENTS, CONTINUED | | |
| |
Thornburg International Value Fund | | March 31, 2016 (Unaudited) |
| | | | | | | | |
| | | SHARES/
PRINCIPAL AMOUNT | | | VALUE | |
UTILITIES — 4.00% | | | | | | | | |
Electric Utilities — 2.25% | | | | | | | | |
Electricite de France SA | | | 7,900,671 | | | $ | 88,679,056 | |
Iberdrola S.A. | | | 16,132,095 | | | | 107,588,665 | |
Independent Power & Renewable Electricity Producers — 0.74% | | | | | | | | |
CGN Power Co., Ltd. | | | 191,257,690 | | | | 65,089,277 | |
Multi-Utilities — 1.01% | | | | | | | | |
Suez Environnement Co. | | | 4,812,779 | | | | 88,280,539 | |
| | | | | | | | |
| | | | | | | 349,637,537 | |
| | | | | | | | |
TOTAL COMMON STOCK (Cost $7,585,546,255) | | | | | | | 8,092,204,362 | |
| | | | | | | | |
SHORT TERM INVESTMENTS — 7.99% | | | | | | | | |
b Thornburg Capital Management Fund | | | 69,770,685 | | | | 697,706,850 | |
| | | | | | | | |
TOTAL SHORT TERM INVESTMENTS (Cost $697,706,850) | | | | | | | 697,706,850 | |
| | | | | | | | |
TOTAL INVESTMENTS — 100.62% (Cost $8,283,253,105) | | | | | | $ | 8,789,911,212 | |
LIABILITIES NET OF OTHER ASSETS — (0.62)% | | | | | | | (53,833,668 | ) |
| | | | | | | | |
NET ASSETS — 100.00% | | | | | | $ | 8,736,077,544 | |
| | | | | | | | |
Footnote Legend
| b | Investment in Affiliates – Shown below are holdings of voting securities of each portfolio company which is considered “affiliated” to the Fund under the Investment Company Act of 1940, including companies for which the Fund’s holding represented 5% or more of the company’s voting securities, and a series of the Thornburg Investment Trust in which the Fund invested for cash management purposes during the period: |
| | | | | | | | | | | | | | | | | | | | | | | | | | | | |
ISSUER | | SHARES/PRINCIPAL
SEPTEMBER 30,
2015 | | | GROSS
ADDITIONS | | | GROSS
REDUCTIONS | | | SHARES/PRINCIPAL
MARCH 31,
2016 | | | MARKET
VALUE
MARCH 31,
2016 | | | INVESTMENT
INCOME | | | REALIZED
GAIN (LOSS) | |
Thornburg Capital Management Fund | | | 59,256,131 | | | | 248,894,006 | | | | 238,379,452 | | | | 69,770,685 | | | $ | 697,706,850 | | | $ | 1,392,339 | | | $ | — | |
| | | | | | | | | | | | | | | | | | | | | | | | | | | | |
Total non-controlled affiliated issuers – 7.99% of net assets | | | $ | 697,706,850 | | | $ | 1,392,339 | | | $ | — | |
| | | | | | | | | | | | | | | | | | | | | | | | | | | | |
Portfolio Abbreviations
To simplify the listings of securities, abbreviations are used per the table below:
| | |
| ADR | | American Depositary Receipt |
See notes to financial statements.
10 Semi-Annual Report
This page intentionally left blank.
Semi-Annual Report 11
| | |
| STATEMENT OF ASSETS AND LIABILITIES | | |
| |
Thornburg International Value Fund | | March 31, 2016 (Unaudited) |
| | | | |
ASSETS | | | | |
Investments at value (cost $8,283,253,105) (Note 2) | | $ | 8,789,911,212 | |
Cash | | | 349,097 | |
Cash denominated in foreign currency (cost $867,867) | | | 866,840 | |
Receivable for investments sold | | | 15,749,236 | |
Receivable for fund shares sold | | | 21,030,954 | |
Unrealized appreciation on forward currency contracts (Note 7) | | | 37,689,852 | |
Dividends receivable | | | 21,995,701 | |
Dividend and interest reclaim receivable | | | 8,769,470 | |
Prepaid expenses and other assets | | | 254,256 | |
| | | | |
Total Assets | | | 8,896,616,618 | |
| | | | |
| |
LIABILITIES | | | | |
Payable for investments purchased | | | 63,617,032 | |
Payable for fund shares redeemed | | | 20,561,016 | |
Unrealized depreciation on forward currency contracts (Note 7) | | | 63,589,232 | |
Payable to investment advisor and other affiliates (Note 3) | | | 6,540,990 | |
Accounts payable and accrued expenses | | | 6,230,804 | |
| | | | |
Total Liabilities | | | 160,539,074 | |
| | | | |
| |
NET ASSETS | | $ | 8,736,077,544 | |
| | | | |
NET ASSETS CONSIST OF | | | | |
Undistributed net investment income | | $ | 21,856,387 | |
Net unrealized appreciation on investments | | | 481,064,325 | |
Accumulated net realized gain (loss) | | | 96,498,898 | |
Net capital paid in on shares of beneficial interest | | | 8,136,657,934 | |
| | | | |
| | $ | 8,736,077,544 | |
| | | | |
12 Semi-Annual Report
| | |
| STATEMENT OF ASSETS AND LIABILITIES, CONTINUED | | |
| |
Thornburg International Value Fund | | March 31, 2016 (Unaudited) |
| | | | |
NET ASSET VALUE | | | | |
Class A Shares: | | | | |
Net asset value and redemption price per share ($1,169,453,503 applicable to 50,699,850 shares of beneficial interest outstanding - Note 4) | | $ | 23.07 | |
Maximum sales charge, 4.50% of offering price | | | 1.09 | |
| | | | |
Maximum offering price per share | | $ | 24.16 | |
| | | | |
| |
Class B Shares: | | | | |
Net asset value per share* ($3,528,718 applicable to 169,968 shares of beneficial interest outstanding - Note 4) | | $ | 20.76 | |
| | | | |
| |
Class C Shares: | | | | |
Net asset value and offering price per share* ($607,822,312 applicable to 29,004,998 shares of beneficial interest outstanding - Note 4) | | $ | 20.96 | |
| | | | |
| |
Class I Shares: | | | | |
Net asset value, offering and redemption price per share ($5,175,592,549 applicable to 218,688,426 shares of beneficial interest outstanding - Note 4) | | $ | 23.67 | |
| | | | |
| |
Class R3 Shares: | | | | |
Net asset value, offering and redemption price per share ($432,535,720 applicable to 18,759,643 shares of beneficial interest outstanding - Note 4) | | $ | 23.06 | |
| | | | |
| |
Class R4 Shares: | | | | |
Net asset value, offering and redemption price per share ($291,949,952 applicable to 12,741,839 shares of beneficial interest outstanding - Note 4) | | $ | 22.91 | |
| | | | |
| |
Class R5 Shares: | | | | |
Net asset value, offering and redemption price per share ($625,042,741 applicable to 26,426,746 shares of beneficial interest outstanding - Note 4) | | $ | 23.65 | |
| | | | |
| |
Class R6 Shares: | | | | |
Net asset value, offering and redemption price per share ($430,152,049 applicable to 18,220,215 shares of beneficial interest outstanding - Note 4) | | $ | 23.61 | |
| | | | |
| * | Redemption price per share is equal to net asset value less any applicable contingent deferred sales charge. |
See notes to financial statements.
Semi-Annual Report 13
| | |
| STATEMENT OF OPERATIONS | | |
| |
Thornburg International Value Fund | | Six Months Ended March 31, 2016 (Unaudited) |
| | | | |
INVESTMENT INCOME | | | | |
Dividend income (net of foreign taxes withheld of $7,486,775) | | $ | 73,973,072 | |
| | | | |
| |
EXPENSES | | | | |
Investment advisory fees (Note 3) | | | 32,324,994 | |
Administration fees (Note 3) | | | | |
Class A Shares | | | 792,752 | |
Class B Shares | | | 3,287 | |
Class C Shares | | | 410,418 | |
Class I Shares | | | 1,356,944 | |
Class R3 Shares | | | 284,768 | |
Class R4 Shares | | | 195,404 | |
Class R5 Shares | �� | | 163,715 | |
Distribution and service fees (Note 3) | | | | |
Class A Shares | | | 1,583,243 | |
Class B Shares | | | 26,388 | |
Class C Shares | | | 3,285,915 | |
Class R3 Shares | | | 1,141,358 | |
Class R4 Shares | | | 388,412 | |
Transfer agent fees | | | | |
Class A Shares | | | 1,187,630 | |
Class B Shares | | | 11,169 | |
Class C Shares | | | 529,602 | |
Class I Shares | | | 3,557,725 | |
Class R3 Shares | | | 658,472 | |
Class R4 Shares | | | 533,674 | |
Class R5 Shares | | | 717,479 | |
Class R6 Shares | | | 3,660 | |
Registration and filing fees | | | | |
Class A Shares | | | 15,520 | |
Class B Shares | | | 8,675 | |
Class C Shares | | | 14,407 | |
Class I Shares | | | 149,603 | |
Class R3 Shares | | | 11,809 | |
Class R4 Shares | | | 14,173 | |
Class R5 Shares | | | 26,882 | |
Class R6 Shares | | | 14,529 | |
Custodian fees (Note 3) | | | 762,800 | |
Professional fees | | | 104,198 | |
Accounting fees (Note 3) | | | 186,880 | |
Trustee fees | | | 210,190 | |
Other expenses | | | 443,669 | |
| | | | |
Total Expenses | | | 51,120,344 | |
Less: | | | | |
Expenses reimbursed by investment advisor (Note 3) | | | (906,654 | ) |
| | | | |
Net Expenses | | | 50,213,690 | |
| | | | |
Net Investment Income | | $ | 23,759,382 | |
| | | | |
14 Semi-Annual Report
| | |
| STATEMENT OF OPERATIONS, CONTINUED | | |
| |
Thornburg International Value Fund | | Six Months Ended March 31, 2016 (Unaudited) |
| | | | |
REALIZED AND UNREALIZED GAIN (LOSS) | | | | |
Net realized gain (loss) from: | | | | |
Investments | | $ | 108,053,635 | |
Forward currency contracts (Note 7) | | | (9,333,041 | ) |
Foreign currency transactions | | | (2,367,856 | ) |
| | | | |
| | | 96,352,738 | |
| | | | |
Net change in unrealized appreciation (depreciation) on: | | | | |
Investments | | | (203,205,027 | ) |
Forward currency contracts (Note 7) | | | (3,670,524 | ) |
Foreign currency translations | | | 2,412,760 | |
| | | | |
| | | (204,462,791 | ) |
| | | | |
Net Realized and Unrealized Loss | | | (108,110,053 | ) |
| | | | |
Net Decrease in Net Assets Resulting from Operations | | $ | (84,350,671 | ) |
| | | | |
See notes to financial statements.
Semi-Annual Report 15
| | |
| STATEMENTS OF CHANGES IN NET ASSETS | | |
| |
Thornburg International Value Fund | | |
| | | | | | | | |
| | | SIX MONTHS ENDED MARCH 31, 2016* | | | YEAR ENDED
SEPTEMBER 30, 2015 | |
INCREASE (DECREASE) IN NET ASSETS FROM | | | | | | | | |
| | |
OPERATIONS | | | | | | | | |
Net investment income | | $ | 23,759,382 | | | $ | 127,599,192 | |
Net realized gain (loss) from investments, forward currency contracts, and foreign currency transactions | | | 96,352,738 | | | | 2,158,354,443 | |
Net unrealized appreciation (depreciation) on investments, forward currency contracts, and foreign currency translations | | | (204,462,791 | ) | | | (2,050,088,223 | ) |
| | | | | | | | |
Net Increase (Decrease) in Net Assets Resulting from Operations | | | (84,350,671 | ) | | | 235,865,412 | |
| | |
DIVIDENDS TO SHAREHOLDERS | | | | | | | | |
From net investment income | | | | | | | | |
Class A Shares | | | — | | | | (13,268,050 | ) |
Class B Shares | | | — | | | | (5,365 | ) |
Class C Shares | | | — | | | | (2,886,929 | ) |
Class I Shares | | | (3,997,776 | ) | | | (82,112,732 | ) |
Class R3 Shares | | | — | | | | (3,933,658 | ) |
Class R4 Shares | | | — | | | | (3,650,855 | ) |
Class R5 Shares | | | (387,326 | ) | | | (10,245,399 | ) |
Class R6 Shares | | | (526,944 | ) | | | (7,249,669 | ) |
From realized gains | | | | | | | | |
Class A Shares | | | (206,189,949 | ) | | | (166,562,573 | ) |
Class B Shares | | | (1,033,957 | ) | | | (1,316,453 | ) |
Class C Shares | | | (114,820,498 | ) | | | (75,585,562 | ) |
Class I Shares | | | (855,268,178 | ) | | | (617,568,803 | ) |
Class R3 Shares | | | (72,397,527 | ) | | | (57,375,341 | ) |
Class R4 Shares | | | (50,071,447 | ) | | | (46,567,679 | ) |
Class R5 Shares | | | (102,430,055 | ) | | | (145,792,152 | ) |
Class R6 Shares | | | (63,967,908 | ) | | | (62,251,716 | ) |
FUND SHARE TRANSACTIONS (NOTE 4) | | | | | | | | |
Class A Shares | | | 30,276,879 | | | | (1,089,390,257 | ) |
Class B Shares | | | (2,889,278 | ) | | | (7,775,348 | ) |
Class C Shares | | | 26,468,465 | | | | (96,267,790 | ) |
Class I Shares | | | 174,314,396 | | | | (1,275,407,107 | ) |
Class R3 Shares | | | 32,207,126 | | | | (229,305,280 | ) |
Class R4 Shares | | | 12,735,757 | | | | (351,180,663 | ) |
Class R5 Shares | | | 49,439,836 | | | | (1,362,741,831 | ) |
Class R6 Shares | | | 78,635,087 | | | | (399,050,412 | ) |
| | | | | | | | |
Net Decrease in Net Assets | | | (1,154,253,968 | ) | | | (5,871,626,212 | ) |
| | |
NET ASSETS | | | | | | | | |
Beginning of Period | | | 9,890,331,512 | | | | 15,761,957,724 | |
| | | | | | | | |
| | |
End of Period | | $ | 8,736,077,544 | | | $ | 9,890,331,512 | |
| | | | | | | | |
| | |
Undistributed net investment income | | $ | 21,856,387 | | | $ | 3,009,051 | |
See notes to financial statements.
16 Semi-Annual Report
| | |
| NOTES TO FINANCIAL STATEMENTS | | |
| |
Thornburg International Value Fund | | March 31, 2016 (Unaudited) |
NOTE 1 – ORGANIZATION
Thornburg International Value Fund (the “Fund”) is a diversified series of Thornburg Investment Trust (the “Trust”). The Trust was organized as a Massachusetts business trust under a Declaration of Trust dated June 3, 1987 and is registered as a diversified, open-end management investment company under the Investment Company Act of 1940, as amended. The Fund is currently one of twenty separate series of the Trust. Each series is considered to be a separate entity for financial reporting and tax purposes and bears expenses directly attributable to it. The Fund seeks long-term capital appreciation by investing in equity and debt securities of all types. As a secondary objective, the Fund also seeks some current income.
The Fund currently has eight classes of shares of beneficial interest: Class A, Class B, Class C, Institutional Class (“Class I”), and Retirement Classes (“Class R3,” “Class R4,” “Class R5,” and “Class R6”). The Fund no longer offers Class B shares for sale. Class B shares outstanding for eight years convert to Class A shares of the Fund. Each class of shares of the Fund represents an interest in the same portfolio of investments, except that (i) Class A shares are sold subject to a front-end sales charge collected at the time the shares are purchased and bear a service fee, (ii) Class B shares were sold at net asset value without a sales charge at the time of purchase, but are subject to a contingent deferred sales charge upon redemption and bear both a service fee and distribution fee, (iii) Class C shares are sold at net asset value without a sales charge at the time of purchase, but are subject to a contingent deferred sales charge upon redemption within one year of purchase, and bear both a service fee and a distribution fee, (iv) Class I and Class R5 shares are sold at net asset value without a sales charge at the time of purchase and may be subject to a service fee, (v) Class R3 shares are sold at net asset value without a sales charge at the time of purchase, but bear both a service fee and distribution fee, (vi) Class R4 shares are sold at net asset value without a sales charge at the time of purchase, but bear a service fee, (vii) Class R6 shares are sold at net asset value without a sales charge at the time of purchase, and (viii) the respective classes may have different reinvestment privileges and conversion rights. Additionally, the Fund may allocate among its classes certain expenses, to the extent allocable to specific classes, including transfer agent fees, government registration fees, certain printing and postage costs, and administrative and legal expenses. Currently, class specific expenses of the Fund are limited to service and distribution fees, administration fees, and certain registration and transfer agent expenses.
NOTE 2 – SIGNIFICANT ACCOUNTING POLICIES
The following is a summary of significant accounting policies followed by the Fund in the preparation of its financial statements. The Fund is an investment company and prepares its financial statements in conformity with United States generally accepted accounting principles (“GAAP”), including investment company accounting and reporting guidance in the Financial Accounting Standards Board (the “FASB”) Accounting Standard Codification Topic 946. The preparation of financial statements in conformity with GAAP requires management to make estimates and assumptions that affect the reported amounts of assets and liabilities and disclosure of contingent assets and liabilities at the date of the financial statements and the reported amounts of increases (decreases) in net assets from operations during the reporting period. Actual results could differ from those estimates.
Significant accounting policies of the Trust are as follows:
Valuation Policy and Procedures: The Trustees of the Trust have appointed Thornburg Investment Management, Inc. the Trust’s investment advisor, the (“Advisor”), to assist the Trustees in obtaining market values for portfolio investments, perform certain evaluation and supervisory functions respecting professional pricing service providers appointed by the Trustees’ Audit Committee (the “Audit Committee”) to assist in determining fair values for portfolio investments, assist in calculating fair values for portfolio investments in certain circumstances, and to perform other functions in connection with the valuation of investments. The Advisor acts through its Valuation and Pricing Committee (the “Committee”) and other employees of the Advisor. The Committee regularly reviews its own valuation calculations, as well as the valuations, valuation techniques and services furnished by pricing service providers, considers circumstances which may require valuation calculations by the Committee, and reviews previous valuation calculations. The Committee reports to the Audit Committee on the Committee’s activities, the performance of pricing service providers, and other matters relating to valuation of portfolio investments.
In those instances when the Committee assists in calculating a fair value for a portfolio investment, the Committee seeks to determine the price that the Fund would reasonably expect to receive upon a sale of the investment in an orderly transaction between market participants on the valuation date. The Committee customarily utilizes quotations from securities broker dealers in calculating valuations, but also may utilize prices obtained from pricing service providers or other methods approved by the Audit Committee. Because fair values calculated by the Committee are estimates, the calculation of a value for an investment may differ from the price that would be realized by the Fund upon a sale of the investment, and the difference could be material to the Fund’s financial statements. The Committee’s calculation of a fair value for an investment may also differ from the prices obtained by other persons (including other mutual funds) for the investment.
Valuation of Investments: Securities and other portfolio investments which are listed or traded on a United States securities exchange are valued at the last reported sale price on the valuation date. Investments listed or traded on an exchange for which there has been no sale that day are valued at the mean between the last reported bid and asked prices on that valuation date. Portfolio investments
Semi-Annual Report 17
| | |
| NOTES TO FINANCIAL STATEMENTS, CONTINUED | | |
| |
Thornburg International Value Fund | | March 31, 2016 (Unaudited) |
reported by NASDAQ are valued at the official closing price on the valuation date. If an investment is traded on more than one exchange, the investment is considered traded on the exchange that is normally the primary market for that investment. Securities and other portfolio investments which are listed or traded on exchanges outside the United States are valued at the last price or the closing price of the investment on the exchange that is normally the primary market for the investment, as of the close of the exchange preceding the Fund’s valuation date. Foreign investments listed or traded on an exchange for which there has been no sale that day are valued at the mean between the last reported bid and asked prices on that valuation date.
In any case when a market quotation is not readily available for a portfolio investment ordinarily valued by market quotation, the Committee calculates a fair value for the investment using alternative methods approved by the Audit Committee. A market quotation is not readily available when the primary market or exchange for the investment is not open for the entire scheduled day of trading. Market quotations for an investment also may not be readily available if developments after the most recent close of the investment’s primary exchange or market, but prior to the close of business on any Fund business day, or an unusual event or significant period of time occurring since the availability of a market quotation, create a serious question concerning the reliability of the most recent market quotation available for the investment. In particular, on days when market volatility thresholds established by the Audit Committee are exceeded, foreign equity investments held by the Fund may be valued using alternative methods. The Committee customarily obtains valuations in these instances from pricing service providers approved by the Audit Committee. Pricing service providers ordinarily calculate valuations using multi-factor models to adjust market prices based upon various inputs, including exchange data, depository receipt prices, futures, index data and other data.
Debt obligations held by the Fund which are not listed or traded on exchanges or for which no reported market exists are ordinarily valued at the valuation obtained from a pricing service provider approved by the Audit Committee.
In any case when a pricing service provider fails to provide a valuation for a debt obligation held by the Fund, the Committee calculates a fair value for the obligation using alternative methods under procedures approved by the Audit Committee. Additionally, in cases when management believes that a valuation obtained from a pricing service provider merits review for significant reasons, the Committee decides whether or not to use the valuation calculated by the pricing service provider or to use an alternative method approved by the Audit Committee to calculate a fair value for the obligation.
Quotations for foreign investments expressed in foreign currency amounts are converted to U.S. dollar equivalents using a foreign exchange quotation from a third party service provider at the time of valuation. Foreign investments held by the Fund may be traded on days and at times when the Fund is not open for business. Consequently, the value of Fund investments may be significantly affected on days when shareholders cannot purchase or sell Fund shares. Futures contracts and other financial and derivative instruments traded on an exchange are valued at the latest published price for the instrument on its primary exchange. Listed options are valued at the last bid price.
Valuation Measurements: The Fund categorizes its investments based upon the inputs used in valuing those investments, according to a three-level hierarchy established in guidance from the FASB. Categorization of investments using this hierarchy is intended by the FASB to maximize the use of observable inputs in valuing investments and minimize the use of unobservable inputs by requiring that the most observable inputs be used when available. Observable inputs are those that market participants would use in valuing an investment based on available market information. Unobservable inputs are those that reflect assumptions about the information market participants would use in valuing an investment. An investment’s level within the hierarchy is based on the lowest level input that is deemed significant to the valuation. The methodologies and inputs used to value investments are not necessarily indications of the risk or liquidity associated with those investments.
Various inputs are used in calculating valuations for the Fund’s investments. These inputs are generally summarized according to the three-level hierarchy below:
Level 1: Quoted prices in active markets for identical investments.
Level 2: Other direct or indirect significant observable inputs (including quoted prices for similar investments in active markets and other observable inputs, such as interest rates, prepayment rates, credit risk, etc.).
Level 3: Significant unobservable inputs (including the Committee’s own assumptions in calculating the fair values of investments).
Valuations for debt obligations held by the Fund are typically calculated by pricing service providers approved by the Audit Committee and are characterized as Level 2 within the valuation hierarchy.
On days when market volatility thresholds established by the Audit Committee are exceeded, foreign securities for which valuations are obtained from pricing service providers are fair valued. On these days, the foreign securities are characterized as Level 2 within the valuation hierarchy and revert to Level 1 after the threshold is no longer exceeded.
18 Semi-Annual Report
| | |
| NOTES TO FINANCIAL STATEMENTS, CONTINUED | | |
| |
Thornburg International Value Fund | | March 31, 2016 (Unaudited) |
In a limited number of cases the Committee calculates a fair value for investments using broker quotations or other methods approved by the Audit Committee. When the Committee uses a single broker quotation to calculate a fair value for an investment without other significant observable inputs, or if a fair value is calculated using other significant inputs that are considered unobservable, the investment is characterized as Level 3 within the hierarchy. Other significant unobservable inputs used to calculate a fair value in these instances might include an income-based valuation approach which considers discounted anticipated future cash flows from the investment, and application of discounts due to the nature or duration of any restrictions on the disposition of the investment.
Valuations based upon the use of inputs from Levels 1, 2 or 3 may not represent the actual price received upon the disposition of an investment, and the Fund may receive a price that is lower than the valuation based upon these inputs when it sells the investment.
The following table displays a summary of the fair value hierarchy measurements of the Fund’s investments as of March 31, 2016. In any instance when valuation inputs from more than one level are used to determine the fair value of a specific investment, the investment is placed in the level of the table based upon the lowest level input that is significant in determining the fair value of the investment:
| | | | | | | | | | | | | | | | |
| | | FAIR VALUE MEASUREMENTS AT MARCH 31, 2016 | |
| | | TOTAL | | | LEVEL 1 | | | LEVEL 2 | | | LEVEL 3 | |
Assets | | | | | | | | | | | | | | | | |
Investments in Securities* | | | | | | | | | | | | | | | | |
Common Stock | | $ | 8,092,204,362 | | | $ | 8,092,204,362 | | | $ | — | | | $ | — | |
Short Term Investments | | | 697,706,850 | | | | 697,706,850 | | | | — | | | | — | |
| | | | | | | | | | | | | | | | |
Total Investments in Securities | | $ | 8,789,911,212 | | | $ | 8,789,911,212 | | | $ | — | | | $ | — | |
Other Financial Instruments** | | | | | | | | | | | | | | | | |
Forward Currency Contracts | | $ | 37,689,852 | | | | — | | | $ | 37,689,852 | | | $ | — | |
Spot Currency | | $ | 102,809 | | | | 102,809 | | | $ | — | | | $ | — | |
Liabilities | | | | | | | | | | | | | | | | |
Other Financial Instruments** | | | | | | | | | | | | | | | | |
Forward Currency Contracts | | $ | (63,589,232 | ) | | $ | — | | | $ | (63,589,232 | ) | | $ | — | |
Spot Currency | | $ | (893 | ) | | | (893 | ) | | $ | — | | | $ | — | |
| * | See Schedule of Investments for a summary of the industry exposure as grouped according to the Global Industry Classification Standard (GICS), which is an industry taxonomy developed by MSCI, Inc. and Standard & Poor’s (S&P). |
| ** | Other Financial Instruments include investments not reflected in the Schedule of Investments, which may include futures, forwards and swap contracts, which are valued at the unrealized appreciation (depreciation) on the investment. |
In accordance with the guidance prescribed in Accounting Standards Update No. 2011-04, it is the policy of the Fund to recognize transfers between levels and the underlying events which caused the movement. The Fund recognized no transfers between levels for the six months ended March 31, 2016, other than when the Fund exceeded market volatility thresholds for foreign equity investments during the period.
Foreign Currency Translation: Portfolio investments and other assets and liabilities denominated in foreign currencies are translated into U.S. dollars based on the exchange rate of such currencies against the U.S. dollar on the date of valuation. Purchases and sales of investments and income items denominated in foreign currencies are translated into U.S. dollars at the exchange rate in effect on the transaction date. When the Fund purchases or sells foreign investments, it will customarily enter into a foreign exchange contract to minimize foreign exchange risk from the trade date to the settlement date of such transactions. The values of such spot contracts are included in receivable for investments sold and payable for investments purchased on the Statement of Assets and Liabilities.
The Fund does not separately report the effect of changes in foreign exchange rates from changes in market prices on investments held. Such changes are included in net unrealized appreciation (depreciation) from investments.
Reported net realized gains and losses from foreign currency transactions arise due to purchases and sales of foreign currencies, currency gains and losses realized between the trade and settlement dates on investment transactions and the difference between the amounts of dividends, interest, and foreign withholding taxes recorded on the Fund’s books, and the U.S. dollar equivalent of the amounts actually received or paid.
Net change in unrealized appreciation (depreciation) on foreign currency translations arise from changes in the fair value of assets and liabilities, other than investments at period end, resulting from changes in exchange rates.
Foreign Withholding Taxes: The Fund is subject to foreign tax withholding imposed by certain foreign countries in which the Fund may invest. Withholding taxes are incurred on certain foreign dividends and are accrued at the time the dividend is recognized based on applicable foreign tax law. The Fund may file withholding tax reclaims in certain jurisdictions to recover a portion of amounts previously
Semi-Annual Report 19
| | |
| NOTES TO FINANCIAL STATEMENTS, CONTINUED | | |
| |
Thornburg International Value Fund | | March 31, 2016 (Unaudited) |
withheld, in view of various considerations, including recent decisions rendered by the courts in those and other jurisdictions. The Fund would expect to record a receivable for such a reclaim based on a variety of factors, including assessments of a jurisdiction’s legal obligation to pay reclaims, the jurisdiction’s administrative practices and payment history, and industry convention. To date the Fund has recorded no such receivable because there is limited precedent for collecting such prior year reclaims and the likelihood of collection remains uncertain.
Deferred Foreign Capital Gain Taxes: The Fund is subject to a tax imposed on net realized gains of securities of certain foreign countries. The Fund records an estimated deferred tax liability for net unrealized gains on these investments as reflected in the accompanying financial statements.
Federal Income Taxes: It is the policy of the Trust to comply with the provisions of the Internal Revenue Code applicable to “regulated investment companies” and to distribute to shareholders substantially all taxable income, including any net realized gain on investments of the Fund. Therefore, no provision for federal income taxes is required.
Management reviews each uncertain tax position believed to be material to the preparation of the Fund’s financial statements, to assess if it is more likely than not that the position would be sustained upon examination, based upon the technical merits of the position. As of March 31, 2016, management has not identified any such position for which an asset or liability must be reflected in the Statement of Assets and Liabilities. The Fund’s tax returns remain subject to examination for three years after filing.
When-Issued and Delayed Delivery Transactions: The Fund may engage in when-issued or delayed delivery transactions. To the extent the Fund engages in such transactions, it will do so for the purpose of acquiring portfolio investments consistent with the Fund’s investment objectives and not for the purpose of investment leverage or to speculate on interest rate and, or market changes. At the time the Fund makes a commitment to purchase an investment on a when-issued or delayed delivery basis, the Fund will record the transaction and reflect the value in determining its net asset value. When effecting such transactions, assets of an amount sufficient to make payment for the portfolio investments to be purchased will be segregated on the Fund’s records on the trade date. Investments purchased on a when-issued or delayed delivery basis do not earn interest until the settlement date.
Dividends: Dividends to shareholders, if any, are generally paid quarterly and are reinvested in additional shares of the Fund at net asset value per share at the close of business on the dividend payment date or, at the shareholder’s option, paid in cash. Net realized capital gains, to the extent available, will be distributed at least annually.
Repurchase Agreements: The Fund may invest excess cash in repurchase agreements whereby the Fund purchases investments, which serve as collateral, with an agreement to resell such collateral to the seller at an agreed upon price at the maturity date of the repurchase agreement. Investments pledged as collateral for repurchase agreements are held in custody until maturity of the repurchase agreement. Provisions in the agreements require that the market value of the collateral is at least equal to the repurchase value in the event of default. In the event of default, the Fund has the right to liquidate the collateral and apply the proceeds in satisfaction of the obligation. Under certain circumstances, in the event of default or bankruptcy by the other party to the agreement, realization and/ or retention of the collateral may be subject to legal proceedings.
General: Investment transactions are accounted for on a trade date basis. Interest income is accrued as earned and dividend income is recorded on the ex-dividend date. Certain income from foreign investments is recognized as soon as information is available to the Fund. Realized gains and losses from the sale of investments are recorded on an identified cost basis. Net investment income (other than class specific expenses) and realized and unrealized gains and losses are allocated daily to each class of shares based upon the relative net asset value of outstanding shares of each class of shares at the beginning of the day (after adjusting for the current share activity of the respective class). Expenses common to all Funds are allocated among the Funds comprising the Trust based upon their relative net asset values or other appropriate allocation methods.
Guarantees and Indemnifications: Under the Trust’s organizational documents (and under separate agreements with the independent Trustees), its officers and Trustees are indemnified against certain liabilities arising out of the performance of their duties to the Fund. Additionally, in the normal course of business the Trust enters into contracts with service providers that contain general indemnification clauses. The Trust’s maximum exposure under these arrangements is unknown. However, based on experience, the Trust expects the risk of loss to be remote.
NOTE 3 – INVESTMENT ADVISORY FEE AND OTHER TRANSACTIONS WITH AFFILIATES
Pursuant to an investment advisory agreement, the Advisor serves as the investment advisor and performs services for the Fund for which the fees are payable at the end of each month. For the six months ended March 31, 2016, these fees were payable at annual rates ranging from .875 of 1% to .675 of 1% per annum of the average daily net assets of the Fund depending on the Fund’s asset size. The Fund pays to the Advisor the costs of personnel who perform certain accounting services for the Fund. For the six months ended March 31, 2016 the Fund paid $186,880 to the Advisor for these accounting services. The Trust has also entered into administrative service agreements with the Advisor, whereby the Advisor will perform certain administrative services for the shareholders of each class
20 Semi-Annual Report
| | |
| NOTES TO FINANCIAL STATEMENTS, CONTINUED | | |
| |
Thornburg International Value Fund | | March 31, 2016 (Unaudited) |
of the Fund’s shares (except for Class R6 shares, which do not have an administrative services agreement) and for which fees will be payable at an annual rate of up to .125 of 1% per annum of the average daily net assets attributable to each class of shares.
The Trust has an underwriting agreement with Thornburg Securities Corporation (the “Distributor”), an affiliate of the Advisor, which acts as the distributor of the Fund’s shares. For the six months ended March 31, 2016, the Distributor has advised the Fund that it earned net commissions aggregating $19,779 from the sale of Class A shares, and collected contingent deferred sales charges aggregating $19,261 from redemptions of Class C shares of the Fund.
Pursuant to a service plan under Rule 12b-1 of the Investment Company Act of 1940, the Fund may reimburse to the Advisor an amount not to exceed .25 of 1% per annum of the average daily net assets attributable to each class of shares of the Fund (except for Class R6 shares, which do not have a Rule 12b-1 service plan) for payments made by the Advisor to securities dealers and other financial institutions to obtain various shareholder and distribution related services. For the six months ended March 31, 2016, there were no 12b-1 service plan fees charged for Class I and R5 shares. The Advisor may pay out of its own resources additional expenses for distribution of the Fund’s shares and shareholder services.
The Trust has also adopted distribution plans pursuant to Rule 12b-1, applicable only to the Fund’s Class B, Class C, and Class R3 shares, under which the Fund compensates the Distributor for services in promoting the sale of Class B, Class C, and Class R3 shares of the Fund at an annual rate of up to .75 of 1% per annum of the average daily net assets attributable to Class B and Class C shares, and an annual rate of up to .25 of 1% per annum of the average daily net assets attributable to Class R3 shares. Total fees incurred by each class of shares of the Fund under their respective service and distribution plans for the six months ended March 31, 2016, are set forth in the Statement of Operations.
The Advisor and Distributor have contractually agreed to waive fees and reimburse expenses incurred by the Fund so that actual expenses of certain share classes do not exceed levels as specified in the Fund’s most recent prospectus. The agreement may be terminated by the Fund at any time, but may not be terminated by the Advisor or Distributor before February 1, 2017, unless the Advisor ceases to be the investment advisor to the Trust or the Distributor ceases to be the distributor of the Fund prior to that date. The Advisor and Distributor retain the right to be repaid by the Fund for fee waivers and expense reimbursements if expenses fall below the contractual limit prior to the end of the fiscal year.
For the six months ended March 31, 2016, the Advisor contractually reimbursed certain class specific expenses, administrative fees, and distribution fees of $6,370 for Class B shares, $477,299 for Class R3 shares, $333,248 for Class R4 shares, and $89,737 for Class R5 shares.
Certain officers and Trustees of the Trust are also officers or directors of the Advisor and Distributor. The compensation of independent Trustees is borne by the Trust.
The Fund may purchase or sell securities from or to an affiliated fund, provided the affiliation is due solely to having a common investment advisor, common officers, or common trustees, and provided that all such transactions will comply with Rule 17a-7 under the 1940 Act. For the six months ended March 31, 2016, the Fund had no transactions with affiliated funds.
NOTE 4 – SHARES OF BENEFICIAL INTEREST
At March 31, 2016, there were an unlimited number of shares with no par value of beneficial interest authorized. Transactions in shares of beneficial interest were as follows:
| | | | | | | | | | | | | | | | |
| | | Six Months Ended
March 31, 2016 (unaudited) | | | Year Ended
September 30, 2015 (audited) | |
| | | Shares | | | Amount | | | Shares | | | Amount | |
Class A Shares | | | | | | | | | | | | | | | | |
Shares sold | | | 4,507,241 | | | $ | 109,963,056 | | | | 8,248,175 | | | $ | 241,288,378 | |
Shares issued to shareholders in reinvestment of dividends | | | 7,715,763 | | | | 189,190,500 | | | | 5,853,841 | | | | 162,599,810 | |
Shares repurchased | | | (11,109,472 | ) | | | (268,876,677 | ) | | | (51,693,689 | ) | | | (1,493,278,445 | ) |
| | | | | | | | | | | | | | | | |
| | | | |
Net increase (decrease) | | | 1,113,532 | | | $ | 30,276,879 | | | | (37,591,673 | ) | | $ | (1,089,390,257 | ) |
| | | | | | | | | | | | | | | | |
Semi-Annual Report 21
| | |
| NOTES TO FINANCIAL STATEMENTS, CONTINUED | | |
| |
Thornburg International Value Fund | | March 31, 2016 (Unaudited) |
| | | | | | | | | | | | | | | | |
| | | SIX MONTHS ENDED
MARCH 31, 2016 (UNAUDITED) | | | YEAR ENDED
SEPTEMBER 30, 2015 (AUDITED) | |
| | | SHARES | | | AMOUNT | | | SHARES | | | AMOUNT | |
Class B Shares | | | | | | | | | | | | | | | | |
Shares sold | | | 8,185 | | | $ | 181,449 | | | | 25,095 | | | $ | 674,468 | |
Shares issued to shareholders in reinvestment of dividends | | | 36,506 | | | | 808,607 | | | | 38,401 | | | | 976,975 | |
Shares repurchased | | | (173,113 | ) | | | (3,879,334 | ) | | | (353,486 | ) | | | (9,426,791 | ) |
| | | | | | | | | | | | | | | | |
| | | | |
Net increase (decrease) | | | (128,422 | ) | | $ | (2,889,278 | ) | | | (289,990 | ) | | $ | (7,775,348 | ) |
| | | | | | | | | | | | | | | | |
| | | | |
Class C Shares | | | | | | | | | | | | | | | | |
Shares sold | | | 1,979,538 | | | $ | 44,126,009 | | | | 2,374,020 | | | $ | 63,814,668 | |
Shares issued to shareholders in reinvestment of dividends | | | 3,958,239 | | | | 88,387,477 | | | | 2,324,577 | | | | 59,667,023 | |
Shares repurchased | | | (4,752,639 | ) | | | (106,045,021 | ) | | | (8,267,215 | ) | | | (219,749,481 | ) |
| | | | | | | | | | | | | | | | |
| | | | |
Net increase (decrease) | | | 1,185,138 | | | $ | 26,468,465 | | | | (3,568,618 | ) | | $ | (96,267,790 | ) |
| | | | | | | | | | | | | | | | |
| | | | |
Class I Shares | | | | | | | | | | | | | | | | |
Shares sold | | | 37,633,035 | | | $ | 913,158,858 | | | | 51,033,802 | | | $ | 1,526,947,270 | |
Shares issued to shareholders in reinvestment of dividends | | | 30,045,904 | | | | 755,307,421 | | | | 21,516,580 | | | | 612,023,354 | |
Shares repurchased | | | (59,270,481 | ) | | | (1,494,151,883 | ) | | | (116,894,145 | ) | | | (3,414,377,731 | ) |
| | | | | | | | | | | | | | | | |
| | | | |
Net increase (decrease) | | | 8,408,458 | | | $ | 174,314,396 | | | | (44,343,763 | ) | | $ | (1,275,407,107 | ) |
| | | | | | | | | | | | | | | | |
| | | | |
Class R3 Shares | | | | | | | | | | | | | | | | |
Shares sold | | | 2,123,777 | | | $ | 51,044,473 | | | | 4,183,276 | | | $ | 121,693,500 | |
Shares issued to shareholders in reinvestment of dividends | | | 2,739,230 | | | | 67,165,933 | | | | 2,069,052 | | | | 57,455,170 | |
Shares repurchased | | | (3,550,982 | ) | | | (86,003,280 | ) | | | (14,059,202 | ) | | | (408,453,950 | ) |
| | | | | | | | | | | | | | | | |
| | | | |
Net increase (decrease) | | | 1,312,025 | | | $ | 32,207,126 | | | | (7,806,874 | ) | | $ | (229,305,280 | ) |
| | | | | | | | | | | | | | | | |
| | | | |
Class R4 Shares | | | | | | | | | | | | | | | | |
Shares sold | | | 1,809,393 | | | $ | 43,709,027 | | | | 4,065,341 | | | $ | 116,638,346 | |
Shares issued to shareholders in reinvestment of dividends | | | 1,481,647 | | | | 36,078,105 | | | | 1,405,574 | | | | 38,816,115 | |
Shares repurchased | | | (2,757,943 | ) | | | (67,051,375 | ) | | | (17,591,772 | ) | | | (506,635,124 | ) |
| | | | | | | | | | | | | | | | |
| | | | |
Net increase (decrease) | | | 533,097 | | | $ | 12,735,757 | | | | (12,120,857 | ) | | $ | (351,180,663 | ) |
| | | | | | | | | | | | | | | | |
| | | | |
Class R5 Shares | | | | | | | | | | | | | | | | |
Shares sold | | | 3,089,621 | | | $ | 77,862,126 | | | | 9,113,063 | | | $ | 266,509,147 | |
Shares issued to shareholders in reinvestment of dividends | | | 3,907,713 | | | | 98,195,904 | | | | 5,223,489 | | | | 147,978,195 | |
Shares repurchased | | | (5,034,452 | ) | | | (126,618,194 | ) | | | (61,286,367 | ) | | | (1,777,229,173 | ) |
| | | | | | | | | | | | | | | | |
| | | | |
Net increase (decrease) | | | 1,962,882 | | | $ | 49,439,836 | | | | (46,949,815 | ) | | $ | (1,362,741,831 | ) |
| | | | | | | | | | | | | | | | |
| | | | |
Class R6 Shares | | | | | | | | | | | | | | | | |
Shares sold | | | 1,785,391 | | | $ | 43,469,685 | | | | 4,410,128 | | | $ | 129,266,866 | |
Shares issued to shareholders in reinvestment of dividends | | | 2,564,248 | | | | 64,278,484 | | | | 2,450,164 | | | | 69,470,703 | |
Shares repurchased | | | (1,177,002 | ) | | | (29,113,082 | ) | | | (20,550,235 | ) | | | (597,787,981 | ) |
| | | | | | | | | | | | | | | | |
| | | | |
Net increase (decrease) | | | 3,172,637 | | | $ | 78,635,087 | | | | (13,689,943 | ) | | $ | (399,050,412 | ) |
| | | | | | | | | | | | | | | | |
22 Semi-Annual Report
| | |
| NOTES TO FINANCIAL STATEMENTS, CONTINUED | | |
| |
Thornburg International Value Fund | | March 31, 2016 (Unaudited) |
NOTE 5 – INVESTMENT TRANSACTIONS
For the six months ended March 31, 2016, the Fund had purchase and sale transactions of investments (excluding short-term investments) of $4,409,512,191 and $5,128,056,949, respectively.
NOTE 6 – INCOME TAXES
At March 31, 2016, information on the tax components of capital was as follows:
| | | | |
Cost of investments for tax purposes | | $ | 8,283,253,105 | |
| | | | |
Gross unrealized appreciation on a tax basis | | $ | 816,986,494 | |
Gross unrealized depreciation on a tax basis | | | (310,328,387 | ) |
| | | | |
Net unrealized appreciation (depreciation) on investments (tax basis) | | $ | 506,658,107 | |
| | | | |
NOTE 7 – DERIVATIVE FINANCIAL INSTRUMENTS WITH OFF-BALANCE SHEET RISK AND FOREIGN INVESTMENT RISK
The Fund may use a variety of derivative financial instruments to hedge or adjust the risks affecting its investment portfolio or to enhance investment returns. Provisions of the FASB Accounting Standards Codification 815-10-50 (“ASC 815”) require certain disclosures. The disclosures are intended to provide users of financial statements with an understanding of the use of derivative instruments by the Fund and how these derivatives affect the financial position, financial performance and cash flows of the Fund. The Fund does not designate any derivative instruments as hedging instruments under ASC 815. During the six months ended March 31, 2016, the Fund’s principal exposure to derivative financial instruments of the type addressed by ASC 815 was investment in foreign exchange contracts. A foreign exchange contract is an agreement between two parties to exchange different currencies at a specified rate of exchange at an agreed upon future date. Foreign exchange contracts involve risks to the Fund, including the risk that a contract’s counterparty will not meet its obligations to the Fund, the risk that a change in a contract’s value may not correlate perfectly with the currency the contract was intended to track, and the risk that the Fund’s Advisor is unable to correctly implement its strategy in using a contract. In any such instance, the Fund may not achieve the intended benefit of entering into a contract, and may experience a loss.
The Fund entered into forward currency contracts during the six months ended March 31, 2016 in the normal course of pursuing its investment objectives, with the objective of purchasing foreign investments or with the intent of reducing the risk to the value of the Fund’s foreign investments from adverse changes in the relationship between the U.S. dollar and foreign currencies. In each case these contracts have been initiated in conjunction with foreign investment transactions.
These contracts are accounted for by the Fund under ASC 815. Unrealized appreciation and depreciation on outstanding contracts are reported in the Fund’s Statement of Assets and Liabilities, as measured by the difference between the forward exchange rates at the reporting date and the forward exchange rates at each contract’s inception date. Net realized gain (loss) on contracts closed during the period, and changes in net unrealized appreciation (depreciation) on outstanding contracts are recognized in the Fund’s Statement of Operations.
The quarterly average value of open sell currency contracts for the six months ended March 31, 2016 was $1,969,067,168. Open buy currency contracts are entered into for the purpose of closing open sell currency contracts and the values are dependent upon the values of the open sell currency contracts to which they relate.
Semi-Annual Report 23
| | |
| NOTES TO FINANCIAL STATEMENTS, CONTINUED | | |
| |
Thornburg International Value Fund | | March 31, 2016 (Unaudited) |
The following table displays the outstanding forward currency contracts at March 31, 2016:
| | | | | | | | | | | | | | | | | | | | | | | | |
OUTSTANDING FORWARD CURRENCY CONTRACTS TO BUY OR SELL AT MARCH 31, 2016 | |
| CONTRACT DESCRIPTION | | BUY/SELL | | | CONTRACT AMOUNT | | | CONTRACT
VALUE DATE | | | VALUE USD | | | UNREALIZED
APPRECIATION | | | UNREALIZED
DEPRECIATION | |
Euro | | | Buy | | | | 183,014,000 | | | | 05/11/2016 | | | | 208,482,102 | | | $ | 9,710,597 | | | $ | — | |
Euro | | | Sell | | | | 183,014,000 | | | | 05/11/2016 | | | | 208,482,102 | | | | — | | | | (828,744 | ) |
Euro | | | Sell | | | | 97,142,100 | | | | 06/09/2016 | | | | 110,758,077 | | | | — | | | | (1,909,897 | ) |
Euro | | | Sell | | | | 203,789,700 | | | | 06/09/2016 | | | | 232,353,998 | | | | — | | | | (6,898,783 | ) |
Euro | | | Sell | | | | 312,680,400 | | | | 06/09/2016 | | | | 356,507,424 | | | | — | | | | (13,124,622 | ) |
Japanese Yen | | | Buy | | | | 49,222,018,700 | | | | 04/07/2016 | | | | 437,403,749 | | | | 26,641,770 | | | | — | |
Japanese Yen | | | Sell | | | | 9,727,410,400 | | | | 05/06/2016 | | | | 86,510,740 | | | | 670,715 | | | | — | |
Japanese Yen | | | Buy | | | | 28,034,976,900 | | | | 05/06/2016 | | | | 249,329,113 | | | | 666,770 | | | | — | |
Japanese Yen | | | Buy | | | | 35,582,980,100 | | | | 05/06/2016 | | | | 316,457,292 | | | | — | | | | (173,604 | ) |
Japanese Yen | | | Sell | | | | 6,608,927,800 | | | | 05/06/2016 | | | | 58,776,510 | | | | — | | | | (926,771 | ) |
Japanese Yen | | | Sell | | | | 13,077,724,700 | | | | 05/06/2016 | | | | 116,306,766 | | | | — | | | | (4,265,123 | ) |
Japanese Yen | | | Sell | | | | 15,081,024,800 | | | | 04/07/2016 | | | | 134,015,162 | | | | — | | | | (5,704,235 | ) |
Japanese Yen | | | Sell | | | | 34,203,894,100 | | | | 05/06/2016 | | | | 304,192,389 | | | | — | | | | (13,654,240 | ) |
Japanese Yen | | | Sell | | | | 34,140,993,900 | | | | 04/07/2016 | | | | 303,388,588 | | | | — | | | | (16,103,213 | ) |
| | | | | | | | | | | | | | | | | | | | | | | | |
Total | | | | | | | | | | | | | | | | | | $ | 37,689,852 | | | $ | (63,589,232 | ) |
| | | | | | | | | | | | | | | | | | | | | | | | |
Net unrealized appreciation (depreciation) | | | | | | | | | | | | | | | $ | (25,899,380 | ) |
| | | | | | | | | | | | | | | | | | | | | | | | |
The outstanding forward currency contracts in the foregoing table were entered into with State Street Bank and Trust Company (“SSB”), pursuant to an International Swaps and Derivatives Association (“ISDA”) Master Agreement. In the event of a default or termination under the ISDA Master Agreement with SSB, the non-defaulting party has the right to close out all outstanding forward currency contracts between the parties and to net any payment amounts under those contracts, resulting in a single net amount payable by one party to the other.
Because the ISDA Master Agreement with SSB does not result in an offset of reported amounts of financial assets and liabilities in the Fund’s Statement of Assets and Liabilities unless there has been an event of default or termination event under that agreement, the Fund does not net its outstanding forward currency contracts for purposes of the disclosure in the Fund’s Statement of Assets and Liabilities. Instead the Fund recognizes the unrealized appreciation or depreciation on those forward currency contracts on a gross basis in the Fund’s Statement of Assets and Liabilities.
The unrealized appreciation (depreciation) of the outstanding forward currency contracts recognized in the Fund’s Statement of Assets and Liabilities at March 31, 2016 is disclosed in the following table:
| | | | |
FAIR VALUES OF DERIVATIVE FINANCIAL INSTRUMENTS AT MARCH 31, 2016 |
| ASSET DERIVATIVES | | BALANCE SHEET LOCATION | | FAIR VALUE |
Foreign exchange contracts | | Assets - Unrealized appreciation on forward currency contracts | | $37,689,852 |
| | |
| LIABILITY DERIVATIVES | | BALANCE SHEET LOCATION | | FAIR VALUE |
Foreign exchange contracts | | Liabilities - Unrealized depreciation on forward currency contracts | | $(63,589,232) |
Because the Fund does not currently receive or post cash collateral in connection with its currency forward contracts, and because all of the Fund’s outstanding currency forward contracts are with SSB, the net amounts of the Fund’s assets and liabilities which are attributable to those contracts at March 31, 2016 can be determined by offsetting the dollar amounts shown in the preceding table. Based on those amounts, the net amount of the Fund’s assets which is attributable to its outstanding forward currency contracts at March 31, 2016 is $0, and the net amount of the Fund’s liabilities which is attributable to those contracts at that date is $25,899,380. The Fund’s forward currency contracts are valued each day, and the net amounts of the Fund’s assets and liabilities which are attributable to those contracts are expected to vary over time.
24 Semi-Annual Report
| | |
| NOTES TO FINANCIAL STATEMENTS, CONTINUED | | |
| |
Thornburg International Value Fund | | March 31, 2016 (Unaudited) |
The net realized gain (loss) from forward currency contracts and the net change in unrealized appreciation (depreciation) of outstanding forward currency contracts recognized in the Fund’s Statement of Operations for the six months ended March 31, 2016 are disclosed in the following tables:
| | | | |
| NET REALIZED GAIN (LOSS) ON DERIVATIVE FINANCIAL INSTRUMENTS |
| RECOGNIZED IN INCOME FOR THE SIX MONTHS ENDED MARCH 31, 2016 |
| | | TOTAL | | FORWARD CURRENCY CONTRACTS |
Foreign exchange contracts | | $(9,333,041) | | $(9,333,041) |
|
| NET CHANGE IN UNREALIZED APPRECIATION (DEPRECIATION) OF DERIVATIVE FINANCIAL INSTRUMENTS |
RECOGNIZED IN INCOME FOR THE SIX MONTHS ENDED MARCH 31, 2016 |
| | | TOTAL | | FORWARD CURRENCY CONTRACTS |
Foreign exchange contracts | | $(3,670,524) | | $(3,670,524) |
OTHER NOTES
Risks: The Fund’s investments subject it to risks including, but not limited to, management risk, market and economic risk, risks affecting specific issuers, liquidity risk, the risks associated with investments in small- and mid-cap companies and non-U.S. issuers, credit risk, and interest rate risk. Please see the Fund’s prospectus for a discussion of the risks associated with an investment in the Fund.
Subsequent Events: Fund management believes no events have occurred between March 31, 2016 and the date of issuance of the financial statements that require adjustment to or disclosure in the accompanying financial statements.
Semi-Annual Report 25
Financial Highlights
Thornburg International Value Fund
| | | | | | | | | | | | | | | | | | | | | | | | | | | | | | | | | | | | | | | | | | | | | | | | | | | | | | | | | | | | |
| | | PER SHARE PERFORMANCE (FOR A SHARE OUTSTANDING THROUGHOUT THE PERIOD) | | | RATIOS TO AVERAGE NET ASSETS | | | SUPPLEMENTAL DATA | |
UNLESS
OTHERWISE
NOTED,
PERIODS
ARE
FISCAL
YEARS
ENDED
SEPT. 30, | | NET ASSET
VALUE
BEGINNING
OF PERIOD | | | NET
INVESTMENT
INCOME
(LOSS)+ | | | NET
REALIZED &
UNREALIZED
GAIN (LOSS)
ON
INVESTMENTS | | | TOTAL FROM
INVESTMENT
OPERATIONS | | | DIVIDENDS
FROM NET
INVESTMENT
INCOME | | | DIVIDENDS
FROM NET
REALIZED
GAINS | | | TOTAL
DIVIDENDS | | | NET
ASSET
VALUE
END OF
PERIOD | | | NET
INVESTMENT
INCOME
(LOSS) (%) | | | EXPENSES,
AFTER
EXPENSE
REDUCTIONS
(%) | | | EXPENSES,
AFTER
EXPENSE
REDUCTIONS
AND NET OF
CUSTODY
CREDITS (%) | | | EXPENSES,
BEFORE
EXPENSE
REDUCTIONS
(%) | | | TOTAL
RETURN
(%)(a) | | | PORTFOLIO
TURNOVER
RATE
(%)(a) | | | NET
ASSETS
AT END
OF
PERIOD
(THOUSANDS) | |
CLASS A SHARES | | | | | | | | | | | | | | | | | | | | | | | | | | | | | | | | | | | | | | | | | | | | | | | | | | | | | |
2016(b)(c) | | $ | 27.46 | | | | 0.04 | | | | (0.18 | ) | | | (0.14 | ) | | | — | | | | (4.25 | ) | | | (4.25 | ) | | $ | 23.07 | | | | 0.29 | (d) | | | 1.30 | (d) | | | 1.30 | (d) | | | 1.30 | (d) | | | (1.38 | ) | | | 51.30 | | | $ | 1,169,453 | |
2015(c) | | $ | 29.84 | | | | 0.24 | | | | 0.16 | | | | 0.40 | | | | (0.26 | ) | | | (2.52 | ) | | | (2.78 | ) | | $ | 27.46 | | | | 0.82 | | | | 1.27 | | | | 1.27 | | | | 1.27 | | | | 1.25 | | | | 70.88 | | | $ | 1,361,529 | |
2014(c) | | $ | 30.12 | | | | 0.19 | | | | (0.23 | ) | | | (0.04 | ) | | | (0.24 | ) | | | — | | | | (0.24 | ) | | $ | 29.84 | | | | 0.63 | | | | 1.26 | | | | 1.26 | | | | 1.26 | | | | (0.14 | ) | | | 37.25 | | | $ | 2,601,689 | |
2013(c) | | $ | 26.08 | | | | 0.26 | | | | 4.02 | | | | 4.28 | | | | (0.24 | ) | | | — | | | | (0.24 | ) | | $ | 30.12 | | | | 0.92 | | | | 1.25 | | | | 1.25 | | | | 1.25 | | | | 16.49 | | | | 34.67 | | | $ | 5,212,813 | |
2012(c) | | $ | 23.14 | | | | 0.28 | | | | 2.95 | | | | 3.23 | | | | (0.29 | ) | | | — | | | | (0.29 | ) | | $ | 26.08 | | | | 1.09 | | | | 1.29 | | | | 1.29 | | | | 1.29 | | | | 14.02 | | | | 17.86 | | | $ | 5,429,316 | |
2011(c) | | $ | 26.00 | | | | 0.30 | | | | (2.89 | ) | | | (2.59 | ) | | | (0.27 | ) | | | — | | | | (0.27 | ) | | $ | 23.14 | | | | 1.06 | | | | 1.25 | | | | 1.25 | | | | 1.25 | | | | (10.10 | ) | | | 20.78 | | | $ | 5,932,896 | |
CLASS B SHARES | | | | | | | | | | | | | | | | | | | | | | | | | | | | | | | | | | | | | | | | | | | | | | | | | | | | | |
2016(b) | | $ | 25.24 | | | | (0.10 | ) | | | (0.13 | ) | | | (0.23 | ) | | | — | | | | (4.25 | ) | | | (4.25 | ) | | $ | 20.76 | | | | (0.93 | )(d) | | | 2.38 | (d) | | | 2.38 | (d) | | | 2.62 | (d) | | | (1.95 | ) | | | 51.30 | | | $ | 3,529 | |
2015 | | $ | 27.68 | | | | (0.04 | ) | | | 0.14 | | | | 0.10 | | | | (0.02 | ) | | | (2.52 | ) | | | (2.54 | ) | | $ | 25.24 | | | | (0.14 | ) | | | 2.24 | | | | 2.24 | | | | 2.24 | | | | 0.29 | | | | 70.88 | | | $ | 7,530 | |
2014 | | $ | 28.02 | | | | (0.07 | ) | | | (0.20 | ) | | | (0.27 | ) | | | (0.07 | ) | | | — | | | | (0.07 | ) | | $ | 27.68 | | | | (0.24 | ) | | | 2.13 | | | | 2.13 | | | | 2.13 | | | | (0.96 | ) | | | 37.25 | | | $ | 16,288 | |
2013 | | $ | 24.37 | | | | 0.01 | | | | 3.74 | | | | 3.75 | | | | (0.10 | ) | | | — | | | | (0.10 | ) | | $ | 28.02 | | | | 0.02 | | | | 2.10 | | | | 2.10 | | | | 2.10 | | | | 15.45 | | | | 34.67 | | | $ | 33,562 | |
2012 | | $ | 21.67 | | | | 0.06 | | | | 2.77 | | | | 2.83 | | | | (0.13 | ) | | | — | | | | (0.13 | ) | | $ | 24.37 | | | | 0.26 | | | | 2.09 | | | | 2.09 | | | | 2.09 | | | | 13.07 | | | | 17.86 | | | $ | 44,009 | |
2011 | | $ | 24.43 | | | | 0.05 | | | | (2.67 | ) | | | (2.62 | ) | | | (0.14 | ) | | | — | | | | (0.14 | ) | | $ | 21.67 | | | | 0.21 | | | | 2.06 | | | | 2.06 | | | | 2.06 | | | | (10.80 | ) | | | 20.78 | | | $ | 56,002 | |
CLASS C SHARES | | | | | | | | | | | | | | | | | | | | | | | | | | | | | | | | | | | | | | | | | | | | | | | | | | | | | |
2016(b) | | $ | 25.40 | | | | (0.05 | ) | | | (0.14 | ) | | | (0.19 | ) | | | — | | | | (4.25 | ) | | | (4.25 | ) | | $ | 20.96 | | | | (0.43 | )(d) | | | 2.03 | (d) | | | 2.03 | (d) | | | 2.03 | (d) | | | (1.76 | ) | | | 51.30 | | | $ | 607,822 | |
2015 | | $ | 27.86 | | | | 0.05 | | | | 0.11 | | | | 0.16 | | | | (0.10 | ) | | | (2.52 | ) | | | (2.62 | ) | | $ | 25.40 | | | | 0.19 | | | | 1.99 | | | | 1.99 | | | | 1.99 | | | | 0.52 | | | | 70.88 | | | $ | 706,606 | |
2014 | | $ | 28.17 | | | | – | (e) | | | (0.23 | ) | | | (0.23 | ) | | | (0.08 | ) | | | — | | | | (0.08 | ) | | $ | 27.86 | | | | – | (f) | | | 1.99 | | | | 1.99 | | | | 1.99 | | | | (0.83 | ) | | | 37.25 | | | $ | 874,358 | |
2013 | | $ | 24.48 | | | | 0.04 | | | | 3.77 | | | | 3.81 | | | | (0.12 | ) | | | — | | | | (0.12 | ) | | $ | 28.17 | | | | 0.15 | | | | 2.01 | | | | 2.01 | | | | 2.01 | | | | 15.62 | | | | 34.67 | | | $ | 1,181,438 | |
2012 | | $ | 21.77 | | | | 0.08 | | | | 2.77 | | | | 2.85 | | | | (0.14 | ) | | | — | | | | (0.14 | ) | | $ | 24.48 | | | | 0.35 | | | | 2.03 | | | | 2.03 | | | | 2.03 | | | | 13.14 | | | | 17.86 | | | $ | 1,254,732 | |
2011 | | $ | 24.54 | | | | 0.08 | | | | (2.70 | ) | | | (2.62 | ) | | | (0.15 | ) | | | — | | | | (0.15 | ) | | $ | 21.77 | | | | 0.31 | | | | 1.99 | | | | 1.99 | | | | 1.99 | | | | (10.78 | ) | | | 20.78 | | | $ | 1,391,173 | |
CLASS I SHARES | | | | | | | | | | | | | | | | | | | | | | | | | | | | | | | | | | | | | | | | | | | | | | | | | | | | | |
2016(b) | | $ | 28.04 | | | | 0.09 | | | | (0.19 | ) | | | (0.10 | ) | | | (0.02 | ) | | | (4.25 | ) | | | (4.27 | ) | | $ | 23.67 | | | | 0.68 | (d) | | | 0.93 | (d) | | | 0.93 | (d) | | | 0.93 | (d) | | | (1.23 | ) | | | 51.30 | | | $ | 5,175,593 | |
2015 | | $ | 30.43 | | | | 0.38 | | | | 0.13 | | | | 0.51 | | | | (0.38 | ) | | | (2.52 | ) | | | (2.90 | ) | | $ | 28.04 | | | | 1.27 | | | | 0.90 | | | | 0.90 | | | | 0.90 | | | | 1.65 | | | | 70.88 | | | $ | 5,895,731 | |
2014 | | $ | 30.76 | | | | 0.33 | | | | (0.25 | ) | | | 0.08 | | | | (0.41 | ) | | | — | | | | (0.41 | ) | | $ | 30.43 | | | | 1.05 | | | | 0.88 | | | | 0.88 | | | | 0.88 | | | | 0.23 | | | | 37.25 | | | $ | 7,748,950 | |
2013 | | $ | 26.66 | | | | 0.38 | | | | 4.10 | | | | 4.48 | | | | (0.38 | ) | | | — | | | | (0.38 | ) | | $ | 30.76 | | | | 1.34 | | | | 0.86 | | | | 0.86 | | | | 0.86 | | | | 16.94 | | | | 34.67 | | | $ | 14,601,876 | |
2012 | | $ | 23.65 | | | | 0.40 | | | | 3.00 | | | | 3.40 | | | | (0.39 | ) | | | — | | | | (0.39 | ) | | $ | 26.66 | | | | 1.53 | | | | 0.88 | | | | 0.88 | | | | 0.88 | | | | 14.47 | | | | 17.86 | | | $ | 12,505,553 | |
2011 | | $ | 26.57 | | | | 0.41 | | | | (2.96 | ) | | | (2.55 | ) | | | (0.37 | ) | | | — | | | | (0.37 | ) | | $ | 23.65 | | | | 1.45 | | | | 0.88 | | | | 0.88 | | | | 0.88 | | | | (9.77 | ) | | | 20.78 | | | $ | 10,942,112 | |
CLASS R3 SHARES | | | | | | | | | | | | | | | | | | | | | | | | | | | | | | | | | | | | | | | | | | | | | | | | | | | | | |
2016(b) | | $ | 27.47 | | | | 0.02 | | | | (0.18 | ) | | | (0.16 | ) | | | — | | | | (4.25 | ) | | | (4.25 | ) | | $ | 23.06 | | | | 0.16 | (d) | | | 1.45 | (d) | | | 1.45 | (d) | | | 1.66 | (d) | | | (1.49 | ) | | | 51.30 | | | $ | 432,536 | |
2015 | | $ | 29.86 | | | | 0.21 | | | | 0.13 | | | | 0.34 | | | | (0.21 | ) | | | (2.52 | ) | | | (2.73 | ) | | $ | 27.47 | | | | 0.71 | | | | 1.45 | | | | 1.45 | | | | 1.58 | | | | 1.09 | | | | 70.88 | | | $ | 479,223 | |
2014 | | $ | 30.14 | | | | 0.15 | | | | (0.24 | ) | | | (0.09 | ) | | | (0.19 | ) | | | — | | | | (0.19 | ) | | $ | 29.86 | | | | 0.51 | | | | 1.45 | | | | 1.45 | | | | 1.61 | | | | (0.30 | ) | | | 37.25 | | | $ | 754,139 | |
2013 | | $ | 26.11 | | | | 0.20 | | | | 4.02 | | | | 4.22 | | | | (0.19 | ) | | | — | | | | (0.19 | ) | | $ | 30.14 | | | | 0.71 | | | | 1.45 | | | | 1.45 | | | | 1.57 | | | | 16.23 | | | | 34.67 | | | $ | 1,152,795 | |
2012 | | $ | 23.17 | | | | 0.24 | | | | 2.95 | | | | 3.19 | | | | (0.25 | ) | | | — | | | | (0.25 | ) | | $ | 26.11 | | | | 0.95 | | | | 1.45 | | | | 1.45 | | | | 1.60 | | | | 13.82 | | | | 17.86 | | | $ | 1,323,765 | |
2011 | | $ | 26.04 | | | | 0.24 | | | | (2.89 | ) | | | (2.65 | ) | | | (0.22 | ) | | | — | | | | (0.22 | ) | | $ | 23.17 | | | | 0.86 | | | | 1.45 | | | | 1.45 | | | | 1.58 | | | | (10.27 | ) | | | 20.78 | | | $ | 1,270,000 | |
CLASS R4 SHARES | | | | | | | | | | | | | | | | | | | | | | | | | | | | | | | | | | | | | | | | | | | | | | | | | | | | | |
2016(b) | | $ | 27.30 | | | | 0.04 | | | | (0.18 | ) | | | (0.14 | ) | | | — | | | | (4.25 | ) | | | (4.25 | ) | | $ | 22.91 | | | | 0.35 | (d) | | | 1.25 | (d) | | | 1.25 | (d) | | | 1.46 | (d) | | | (1.42 | ) | | | 51.30 | | | $ | 291,950 | |
2015 | | $ | 29.69 | | | | 0.25 | | | | 0.15 | | | | 0.40 | | | | (0.27 | ) | | | (2.52 | ) | | | (2.79 | ) | | $ | 27.30 | | | | 0.86 | | | | 1.24 | | | | 1.24 | | | | 1.37 | | | | 1.30 | | | | 70.88 | | | $ | 333,247 | |
2014 | | $ | 29.98 | | | | 0.21 | | | | (0.24 | ) | | | (0.03 | ) | | | (0.26 | ) | | | — | | | | (0.26 | ) | | $ | 29.69 | | | | 0.70 | | | | 1.25 | | | | 1.25 | | | | 1.49 | | | | (0.12 | ) | | | 37.25 | | | $ | 722,349 | |
2013 | | $ | 25.96 | | | | 0.25 | | | | 4.01 | | | | 4.26 | | | | (0.24 | ) | | | — | | | | (0.24 | ) | | $ | 29.98 | | | | 0.91 | | | | 1.25 | | | | 1.25 | | | | 1.38 | | | | 16.49 | | | | 34.67 | | | $ | 1,342,883 | |
2012 | | $ | 23.04 | | | | 0.29 | | | | 2.93 | | | | 3.22 | | | | (0.30 | ) | | | — | | | | (0.30 | ) | | $ | 25.96 | | | | 1.16 | | | | 1.25 | | | | 1.25 | | | | 1.45 | | | | 14.05 | | | | 17.86 | | | $ | 1,495,958 | |
2011 | | $ | 25.90 | | | | 0.31 | | | | (2.89 | ) | | | (2.58 | ) | | | (0.28 | ) | | | — | | | | (0.28 | ) | | $ | 23.04 | | | | 1.12 | | | | 1.25 | | | | 1.25 | | | | 1.41 | | | | (10.11 | ) | | | 20.78 | | | $ | 1,296,493 | |
CLASS R5 SHARES | | | | | | | | | | | | | | | | | | | | | | | | | | | | | | | | | | | | | | | | | | | | | | | | | | | | | |
2016(b) | | $ | 28.03 | | | | 0.08 | | | | (0.20 | ) | | | (0.12 | ) | | | (0.01 | ) | | | (4.25 | ) | | | (4.26 | ) | | $ | 23.65 | | | | 0.62 | (d) | | | 0.99 | (d) | | | 0.99 | (d) | | | 1.02 | (d) | | | (1.29 | ) | | | 51.30 | | | $ | 625,043 | |
2015 | | $ | 30.41 | | | | 0.30 | | | | 0.19 | | | | 0.49 | | | | (0.35 | ) | | | (2.52 | ) | | | (2.87 | ) | | $ | 28.03 | | | | 1.01 | | | | 0.98 | | | | 0.98 | | | | 1.11 | | | | 1.57 | | | | 70.88 | | | $ | 685,617 | |
2014 | | $ | 30.71 | | | | 0.30 | | | | (0.24 | ) | | | 0.06 | | | | (0.36 | ) | | | — | | | | (0.36 | ) | | $ | 30.41 | | | | 0.97 | | | | 0.99 | | | | 0.99 | | | | 1.12 | | | | 0.17 | | | | 37.25 | | | $ | 2,171,673 | |
2013 | | $ | 26.61 | | | | 0.34 | | | | 4.10 | | | | 4.44 | | | | (0.34 | ) | | | — | | | | (0.34 | ) | | $ | 30.71 | | | | 1.20 | | | | 0.96 | | | | 0.96 | | | | 1.00 | | | | 16.80 | | | | 34.67 | | | $ | 4,376,567 | |
2012 | | $ | 23.61 | | | | 0.37 | | | | 3.00 | | | | 3.37 | | | | (0.37 | ) | | | — | | | | (0.37 | ) | | $ | 26.61 | | | | 1.44 | | | | 0.99 | | | | 0.99 | | | | 1.06 | | | | 14.33 | | | | 17.86 | | | $ | 4,512,144 | |
2011 | | $ | 26.53 | | | | 0.40 | | | | (2.98 | ) | | | (2.58 | ) | | | (0.34 | ) | | | — | | | | (0.34 | ) | | $ | 23.61 | | | | 1.39 | | | | 0.99 | | | | 0.99 | | | | 1.04 | | | | (9.88 | ) | | | 20.78 | | | $ | 3,709,978 | |
CLASS R6 SHARES | | | | | | | | | | | | | | | | | | | | | | | | | | | | | | | | | | | | | | | | | | | | | | | | | | | | | |
2016(b) | | $ | 27.97 | | | | 0.11 | | | | (0.19 | ) | | | (0.08 | ) | | | (0.03 | ) | | | (4.25 | ) | | | (4.28 | ) | | $ | 23.61 | | | | 0.90 | (d) | | | 0.75 | (d) | | | 0.75 | (d) | | | 0.75 | (d) | | | (1.15 | ) | | | 51.30 | | | $ | 430,152 | |
2015 | | $ | 30.36 | | | | 0.39 | | | | 0.17 | | | | 0.56 | | | | (0.43 | ) | | | (2.52 | ) | | | (2.95 | ) | | $ | 27.97 | | | | 1.33 | | | | 0.74 | | | | 0.74 | | | | 0.74 | | | | 1.81 | | | | 70.88 | | | $ | 420,849 | |
2014 | | $ | 30.70 | | | | 0.40 | | | | (0.26 | ) | | | 0.14 | | | | (0.48 | ) | | | — | | | | (0.48 | ) | | $ | 30.36 | | | | 1.28 | | | | 0.73 | | | | 0.73 | | | | 0.73 | | | | 0.42 | | | | 37.25 | | | $ | 872,512 | |
2013 | | $ | 26.62 | | | | 0.46 | | | | 4.05 | | | | 4.51 | | | | (0.43 | ) | | | — | | | | (0.43 | ) | | $ | 30.70 | | | | 1.59 | | | | 0.74 | | | | 0.74 | | | | 0.74 | | | | 17.07 | | | | 34.67 | | | $ | 1,345,680 | |
2012(g) | | $ | 27.14 | | | | 0.15 | | | | (0.38 | ) | | | (0.23 | ) | | | (0.29 | ) | | | — | | | | (0.29 | ) | | $ | 26.62 | | | | 1.35 | (d) | | | 0.76 | (d) | | | 0.76 | (d) | | | 0.76 | (d) | | | (0.77 | ) | | | 17.86 | | | $ | 478,078 | |
| (a) | Not annualized for periods less than one year. |
| (b) | Unaudited Six Month Period Ended March 31. |
| (c) | Sales loads are not reflected in computing total return. |
| (e) | Net investment income (loss) was less than $0.01 per share. |
| (f) | Net investment income (loss) is less than 0.01%. |
| (g) | Effective date of this class of shares was May 1, 2012. |
| + | Based on weighted average shares outstanding. |
See notes to financial statements.
| | | | |
| 26 Semi-Annual Report | | | | Semi-Annual Report 27 |
| | |
| EXPENSE EXAMPLE | | |
| |
Thornburg International Value Fund | | March 31, 2016 (Unaudited) |
As a shareholder of the Fund, you incur two types of costs:
| | (1) | transaction costs, including |
(a) sales charges (loads) on purchase payments for Class A shares;
(b) a deferred sales charge on redemptions of any part or all of a purchase of $1 million of Class A shares within 12 months of purchase;
(c) a deferred sales charge on redemptions of Class B shares within eight years of purchase;
(d) a deferred sales charge on redemptions of Class C shares within 12 months of purchase;
| | (2) | ongoing costs, including management fees; distribution and/or service (12b-1) fees; and other Fund expenses. |
This example is intended to help you understand your ongoing costs (in dollars) of investing in the Fund and to compare these costs with the ongoing costs of investing in other mutual funds.
The example is based on a $1,000 investment beginning on October 1, 2015, and held until March 31, 2016.
| | | | | | | | | | | | |
| | | BEGINNING
ACCOUNT VALUE
10/1/15 | | | ENDING
ACCOUNT VALUE
3/31/16 | | | EXPENSES PAID
DURING PERIOD†
10/1/15–3/31/16 | |
Class A Shares | | | | | | | | | | | | |
Actual | | $ | 1,000.00 | | | $ | 986.20 | | | $ | 6.47 | |
Hypothetical* | | $ | 1,000.00 | | | $ | 1,018.48 | | | $ | 6.58 | |
Class B Shares | | | | | | | | | | | | |
Actual | | $ | 1,000.00 | | | $ | 980.50 | | | $ | 11.78 | |
Hypothetical* | | $ | 1,000.00 | | | $ | 1,013.10 | | | $ | 11.98 | |
Class C Shares | | | | | | | | | | | | |
Actual | | $ | 1,000.00 | | | $ | 982.40 | | | $ | 10.06 | |
Hypothetical* | | $ | 1,000.00 | | | $ | 1,014.85 | | | $ | 10.23 | |
Class I Shares | | | | | | | | | | | | |
Actual | | $ | 1,000.00 | | | $ | 987.70 | | | $ | 4.60 | |
Hypothetical* | | $ | 1,000.00 | | | $ | 1,020.37 | | | $ | 4.68 | |
Class R3 Shares | | | | | | | | | | | | |
Actual | | $ | 1,000.00 | | | $ | 985.10 | | | $ | 7.20 | |
Hypothetical* | | $ | 1,000.00 | | | $ | 1,017.75 | | | $ | 7.31 | |
Class R4 Shares | | | | | | | | | | | | |
Actual | | $ | 1,000.00 | | | $ | 985.80 | | | $ | 6.21 | |
Hypothetical* | | $ | 1,000.00 | | | $ | 1,018.75 | | | $ | 6.31 | |
Class R5 Shares | | | | | | | | | | | | |
Actual | | $ | 1,000.00 | | | $ | 987.10 | | | $ | 4.91 | |
Hypothetical* | | $ | 1,000.00 | | | $ | 1,020.05 | | | $ | 5.00 | |
Class R6 Shares | | | | | | | | | | | | |
Actual | | $ | 1,000.00 | | | $ | 988.50 | | | $ | 3.72 | |
Hypothetical* | | $ | 1,000.00 | | | $ | 1,021.26 | | | $ | 3.78 | |
| † | Expenses are equal to the annualized expense ratio for each class (A: 1.30%; B: 2.38%; C: 2.03%; I: 0.93%; R3: 1.45%; R4: 1.25%; R5: 0.99%; R6: 0.75%) multiplied by the average account value over the period, multiplied by 183/366 to reflect the one-half year period. |
| * | Hypothetical assumes a rate of return of 5% per year before expenses. |
ACTUAL EXPENSES
For each class of shares, the first line of the accompanying table provides information about actual account values and actual expenses. You may use the information in this line, together with the amount you invested, to estimate the expenses that you paid over the period. Simply divide your account value by $1,000 (for example, an $8,600 account value divided by $1,000 = 8.6), then multiply the result by the number in the first line for your class of shares under the heading entitled “Expenses Paid During Period” to estimate the expenses you paid on your account during this period.
HYPOTHETICAL EXAMPLE FOR COMPARISON PURPOSES
For each class of shares, the second line of the accompanying table provides information about hypothetical account values and hypothetical expenses based on the Fund’s actual expense ratio and an assumed rate of return of 5% per year before expenses, which is not the Fund’s actual return. The hypothetical account values and expenses may not be used to estimate the actual ending account balance or expenses you paid for the period. You may use this information to compare the ongoing costs of investing in the Fund and other funds. To do so, compare this 5% hypothetical example with the 5% hypothetical examples that appear in the shareholder reports of the other funds.
Please note that the expenses shown in the table are meant to highlight your ongoing costs only and do not reflect any transactional costs, such as sales charges (loads), redemption fees, or exchange fees. Therefore, the second line of the table for each class of shares is useful in comparing ongoing costs only, and will not help you determine the relative total costs of owning different funds. In addition, if these transactional costs were included, your costs would have been higher.
28 Semi-Annual Report
| | |
| OTHER INFORMATION | | |
| |
Thornburg International Value Fund | | March 31, 2016 (Unaudited) |
PORTFOLIO PROXY VOTING
Policies and Procedures:
The Trust has delegated to Thornburg Investment Management, Inc. (the “Advisor”) voting decisions respecting proxies for the Fund’s voting securities. The Advisor makes voting decisions in accordance with its Proxy Voting Policy and Procedures. A description of the Policy and Procedures is available (i) without charge, upon request, by calling the Advisor toll-free at 1-800-847-0200, (ii) on the Thornburg website at www.thornburg.com, and (iii) on the Securities and Exchange Commission’s website at www.sec.gov.
Information regarding how proxies were voted is available on or before August 31 of each year for the twelve months ending the preceding June 30. This information is available (i) without charge, upon request by calling the Advisor toll-free at 1-800-847-0200, (ii) on the Thornburg website at www.thornburg.com, and (iii) on the Securities and Exchange Commission’s website at www.sec.gov.
AVAILABILITY OF QUARTERLY PORTFOLIO SCHEDULE
The Fund files with the Securities and Exchange Commission schedules of its portfolio holdings on Form N-Q for the first and third quarters of each fiscal year. The Fund’s Forms N-Q are available on the Commission’s website at www.sec.gov, or may be reviewed and copied at the Commission’s Public Reference Room in Washington, D.C. Information on the operation of the Public Reference Room may be obtained by calling 1-800-SEC-0330. The Fund also makes this information available on its website at www.thornburg. com/download or upon request by calling 1-800-847-0200.
Semi-Annual Report 29
TRUSTEES’ STATEMENT TO SHAREHOLDERS
Revised and Readopted September 15, 2015
The Trustees believe current and prospective shareholders should know how we discharge our responsibilities in supervising the Funds’ investment advisor and in reviewing the advisor’s contract for renewal. Since 2005, we have issued a statement which sets out clearly the three principal guidelines that we follow in supervising the Trust’s investment advisor on your behalf. In accordance with our customary practice, in September of 2015 we again reviewed our statement and concluded we should reissue this statement outlining the principal features of our supervision of the advisor’s performance of investment management services for the Funds.
We begin with the premise that each shareholder selected his or her Fund because its investments are managed by the investment advisor identified in the prospectus and in accordance with the objective and policies described in the prospectus. We realize, as each of you do, that if you believe that your Fund’s stated objective and policies no longer serve your personal investment goals, you can sell your shares and leave the Fund.
Therefore, we believe that our primary supervisory task—our principal obligation to you—is to assess the nature and quality of the advisor’s services, and to confirm that the advisor actively and competently pursues the Fund’s objective, in accordance with the policies set out in the prospectus. To do this, we meet regularly with management to review your Fund’s portfolio and to discuss the advisor’s specific actions and judgments in pursuing the Fund’s objective. We do not substitute our own judgment for the advisor’s decisions in selecting investments; the advisor is paid to exercise its informed judgment on investment decisions, and we seek to confirm, in reviewing the advisor’s performance, that the advisor is doing just that.
Second, we are conscious of costs and the effect that costs have on shareholders’ returns. We try to make sure that your Fund’s fees and costs are reasonable in relationship to the services rendered and that they are generally in line with those charged by other expert investment advisors, consistent with our belief that the Fund’s investors searched for and expect that expertise and attention and have decided to pay a reasonable price for it. We do not put the management contract “out to bid” as a matter of course, and we would not do so unless we had concluded that the advisor materially had failed to pursue the Fund’s objectives in accordance with its policies, or for other equally important reasons. We believe that any other approach would be inconsistent with your interests and contrary to your expectations when you bought shares of the Fund in the first place.
Finally, because we believe that most Thornburg Fund shareholders have invested with a long-term perspective, we try not to focus too much on the fashions of the moment and on short-term performance. The market will not favor any specific investment objective or set of policies at all times and under all economic circumstances. A fund will experience periods of both high and low returns relative to other funds and other investments. Even if one of our Funds is not favored by the market at a particular time, we believe that the advisor is nonetheless obliged to remain true to the Fund’s objective and policies, and we watch to see that it does so.
Trustees of Thornburg Investment Trust
30 Semi-Annual Report
THORNBURG FUND FAMILY
Thornburg Investment Management is a privately-owned global investment firm that offers a range of solutions for retail and institutional investors. Founded in 1982 and headquartered in Santa Fe, New Mexico, we manage approximately $54 billion (as of March 31, 2016) across eight equity and 11 bond mutual funds, separate accounts for high-net-worth investors and institutional accounts, and five UCITS funds for non-U.S. investors.
The fund outlined in this report is one of many equity and fixed-income products available from Thornburg Investment Management.
EQUITY FUNDS
| | • | | Thornburg Core Growth Fund |
| | • | | Thornburg International Value Fund |
| | • | | Thornburg Better World International Fund |
| | • | | Thornburg International Growth Fund |
| | • | | Thornburg Developing World Fund |
| | • | | Thornburg Investment Income Builder Fund |
| | • | | Thornburg Global Opportunities Fund |
FIXED INCOME FUNDS
| | • | | Thornburg Low Duration Income Fund |
| | • | | Thornburg Limited Term U.S. Government Fund |
| | • | | Thornburg Limited Term Income Fund |
| | • | | Thornburg Strategic Income Fund |
| | • | | Thornburg Low Duration Municipal Fund |
| | • | | Thornburg Limited Term Municipal Fund |
| | • | | Thornburg Intermediate Municipal Fund |
| | • | | Thornburg California Limited Term Municipal Fund |
| | • | | Thornburg New Mexico Intermediate Municipal Fund |
| | • | | Thornburg New York Intermediate Municipal Fund |
| | • | | Thornburg Strategic Municipal Income Fund |
Before investing, carefully consider the Fund’s investment goals, risks, charges, and expenses. For a prospectus or summary prospectus containing this and other information, contact your financial advisor or visit thornburg.com. Read it carefully before investing.
For additional information, please visit thornburg.com
Thornburg Investment Management, Inc. 2300 North Ridgetop Road, Santa Fe, NM 87506
Semi-Annual Report 31

This Semi-Annual Report is submitted for the general information of shareholders of the Fund. It is not authorized for distribution to prospective investors in the Fund unless preceded or accompanied by an effective prospectus.
| | | | |
| Investment Advisor: | | Distributor: | | |
| Thornburg Investment Management® | | Thornburg Securities Corporation® | | |
| 800.847.0200 | | 800.847.0200 | | TH176 |
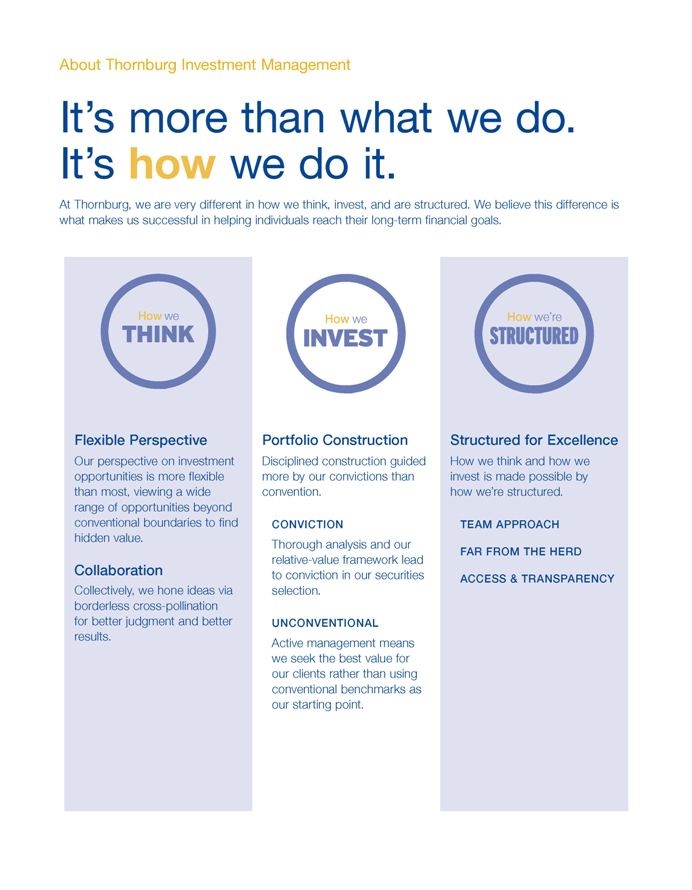
2 Semi-Annual Report
Semi-Annual Report
Thornburg Core Growth Fund
March 31, 2016
| | | | |
SHARE CLASS | | NASDAQ SYMBOL | | CUSIP |
Class A | | THCGX | | 885-215-582 |
Class C | | TCGCX | | 885-215-574 |
Class I | | THIGX | | 885-215-475 |
Class R3 | | THCRX | | 885-215-517 |
Class R4 | | TCGRX | | 885-215-251 |
Class R5 | | THGRX | | 885-215-350 |
Class I, R3, R4, and R5 shares may not be available to all investors. Minimum investments for Class I shares may be higher than those for other classes.
Investments carry risks, including possible loss of principal. Additional risks may be associated with investments outside the United States, especially in emerging markets, including currency fluctuations, illiquidity, volatility, and political and economic risks. Investments in small- and mid-capitalization companies may increase the risk of greater price fluctuations. Please see the Fund’s prospectus for a discussion of the risks associated with an investment in the Fund. Investments in the Fund are not FDIC insured,
nor are they bank deposits or guaranteed by a bank or any other entity.
Funds invested in a limited number of holdings may expose an investor to greater volatility.
Semi-Annual Report 3
| | |
| LETTER TO SHAREHOLDERS | | |
| |
Thornburg Core Growth Fund | | March 31, 2016 (Unaudited) |
April 18, 2016
Dear Fellow Shareholder:
For the six-month period ended March 31, 2016, Thornburg Core Growth Fund returned negative 0.04% for the Class A shares, without sales charge, underperforming its benchmark, the Russell 3000 Growth Index, which returned 7.45%. On March 31, 2016, the net asset value per share of the Class A shares was $26.08.
The period started with the market having just corrected more than 10% from July 2015 highs. The rally that ensued nearly brought us back to those highs before an even deeper correction occurred to start the calendar year 2016, culminating in early February lows. As we write this the market has again rallied to recover most of the losses. Clearly, volatility has kicked up a notch with two corrections in the last nine months that are both bigger than any pullback we’ve seen since 2012.
The upward trend has stalled and we’ve been experiencing lower highs and lower lows as equities whipsaw. Volatility and risk aversion have been especially evident in the small- and mid-capitalization growth space, with these stocks underperforming by an unusually wide margin since the peak last July. In fact, one of the best performing indices over the last six months was the Dow Jones Industrial Average, as investors favor mega-cap stability and yield over growth. Within growth stocks the dispersion between large caps and small/mid caps has been as wide as we’ve seen it in many years. Over the past 15 years, there have been only two instances where the Russell 2000 Growth Index underperformed the Russell 1000 Growth Index by more than 10% on a trailing one-year basis (measured quarterly), and one of them was the one-year period ended March 31, 2016.
As all-cap growth investors, we have significantly more exposure to small- and mid-caps than our large-cap heavy, market-cap weighted benchmark. This has been a significant headwind. So has the current lack of risk appetite that has left many stocks with characteristics we prefer out of favor. And that’s OK. We aren’t in the business of trying to time near-term market sentiment. We try to identify and own growth companies with stock prices that undervalue future prospects over the coming years, not months or quarters. We are disappointed with the trailing six-month performance, but excited about the prospects of the businesses we own.
Contributors and Detractors
The top five positive contributors during the period were Sprouts Farmer’s Market, Autodesk, Facebook, Acuity, and Mobileye.
Sprouts – Sprouts is a small, but growing (under 250 stores) grocery chain that focuses on natural and organic products. They are a market disruptor as they focus on a higher mix of fresh produce and low prices for customers. The entire natural and organic group came under pressure as a competitor (Whole Foods) signaled it would start to compete more on price. A more competitive environment, coupled with unusual food deflation, put pressure on same-store revenue growth. As Sprouts lapped the pressure from both competition and food deflation, it returned to very healthy same-store revenue growth and margin expansion.
Autodesk – Autodesk is one of the world’s leading providers of design software, known widely as AutoCAD. Autodesk is in the process of transitioning from a perpetual license revenue model to a subscription model. This creates near-term uncertainty as it delays revenue receipt and recognition, but we believe over the long term it has the potential to increase lifetime customer value as the subscription model reduces barriers to adoption, eliminates piracy, and increases software update flexibility.
Facebook – Facebook continued to outperform as it increased its market-leading user base. Monthly users topped 1.5 billion worldwide, with over 1 billion people logging in on a single day. Facebook continues to monetize this user base better than expectations, aided by additional contributions from Instagram, and more visible forward monetization opportunities from Messenger, WhatsApp, and Oculus Rift (VR).
Acuity – Acuity is the leader in lighting solutions for the commercial construction market in North America. Over the last six months, Acuity has reported two very good quarters and continued to lead the market’s transition from traditional to LED-based lighting in North America.
Mobileye – Mobileye is the leading vision-based active safety software provider for passenger vehicles (think automatic braking, etc.). Mobileye stock has been depressed by concerns over increasing competition in the semi-autonomous driving space. We believed the selloff was overdone and bought the stock during the period based on our belief that Mobileye’s growth prospects and competitive position were intact. Shares rallied after reporting strong fourth-quarter earnings and announcing several key original equipment manufacturer wins.
The top five detractors from performance were Advisory Board, LinkedIn, Tableau, VMware, and First Data.
Advisory Board – Advisory Board provides best-practice research and analysis to the health care industry through software tools and membership in research programs. Recently demand for their products unexpectedly fell with revenue growth slowing from the mid-teens to the mid-single digits. The fundamental deterioration in their business led us to sell during the period.
LinkedIn – LinkedIn operates the world’s largest professional network. The company monetizes the network via a product
4 Semi-Annual Report
LETTER TO SHAREHOLDERS,
CONTINUED
| | |
| |
Thornburg Core Growth Fund | | March 31, 2016 (Unaudited) |
called Talent Solutions, which employers use to identify and recruit talent. Recent results and guidance seem to imply that Talent Solutions may be closer to saturation than we had previously thought. In addition, their newest product, Sales Navigator, does not seem to be enjoying the kind of demand we had hoped for. We sold the stock during the period.
Tableau – Tableau specializes in visualizing data in easy and efficient ways. During the period it reported decelerating
revenue growth and accelerating investment spending. We sold on the deteriorating fundamental picture.
VMware – VMware provides virtualization software enabling servers to run more efficiently, thereby generating capital expenditure savings for its customers. Bad quarterly results, a confusing deal with EMC, and poor management communication caused confusion around management’s ability to execute its longer-term growth plan. We sold the stock on these worries.
First Data – First Data is a merchant acquirer (enabling electronic payment processing for merchants) and was an initial public offering during the period. Fourth-quarter 2015 results were weak as First Data lost market share to competitors. We sold our position due to fundamental deterioration.
Heightened market volatility can be unnerving for investors. But such periods are inevitable. Moreover, as long-term investors, they often provide us with opportunities to buy high-quality growth stocks at attractive valuations. As always we will continue to search out promising growth companies.
Thanks for investing alongside us in Thornburg Core Growth Fund.
Sincerely,
| | | | |
 | |  | | |
Greg Dunn Managing Director Portfolio Manager | | Tim Cunningham,CFA Managing Director Portfolio Manager | | |
The matters discussed in this report may constitute forward-looking statements made pursuant to the safe harbor provisions of the Securities Litigation Reform Act of 1995. These include any advisor or portfolio manager prediction, assessment, analysis or outlook for individual securities, industries, investment styles, market sectors and/or markets. These statements involve risks and uncertainties. In addition to the general risks described for each fund in its current prospectus, other factors bearing on these reports include the accuracy of the advisor’s or portfolio manager’s forecasts and predictions, the appropriateness of the investment strategies designed by the advisor or portfolio manager and the ability of the advisor or portfolio manager to implement their strategies efficiently and successfully. Any one or more of these factors, as well as other risks affecting the securities markets generally, could cause the actual results of any fund to differ materially as compared to its benchmarks.
The views expressed by the portfolio managers reflect their professional opinions and are subject to change. Under no circumstances does the information contained within represent a recommendation to buy or sell any security.
Semi-Annual Report 5
| | |
| PERFORMANCE SUMMARY | | |
| |
Thornburg Core Growth Fund | | March 31, 2016 (Unaudited) |
Average Annual Total Returns
| | | | | | | | | | | | | | | | | | | | |
| | | | | | | | | | | | | | | SINCE | |
| | | 1-YR | | | 3-YR | | | 5-YR | | | 10-YR | | | INCEP. | |
Class A Shares (Incep: 12/27/00) | | | | | | | | | | | | | | | | | | | | |
Without sales charge | | | -7.91 | % | | | 7.00 | % | | | 9.84 | % | | | 4.70 | % | | | 5.37 | % |
With sales charge | | | -12.04 | % | | | 5.37 | % | | | 8.83 | % | | | 4.22 | % | | | 5.06 | % |
Class C Shares (Incep: 12/27/00) | | | | | | | | | | | | | | | | | | | | |
Without sales charge | | | -8.62 | % | | | 6.19 | % | | | 9.00 | % | | | 3.92 | % | | | 4.54 | % |
With sales charge | | | -9.54 | % | | | 6.19 | % | | | 9.00 | % | | | 3.92 | % | | | 4.54 | % |
Class I Shares (Incep: 11/3/03) | | | -7.55 | % | | | 7.42 | % | | | 10.32 | % | | | 5.18 | % | | | 7.97 | % |
Class R3 Shares (Incep: 7/1/03) | | | -8.00 | % | | | 6.89 | % | | | 9.75 | % | | | 4.64 | % | | | 8.28 | % |
Class R4 Shares (Incep: 2/1/07) | | | -7.91 | % | | | 7.00 | % | | | 9.87 | % | | | — | | | | 3.63 | % |
Class R5 Shares (Incep: 10/3/05) | | | -7.56 | % | | | 7.43 | % | | | 10.31 | % | | | 5.17 | % | | | 6.57 | % |
Russell 3K G (Since 12/27/00) | | | 1.34 | % | | | 13.16 | % | | | 12.00 | % | | | 8.09 | % | | | 4.30 | % |
Growth of a Hypothetical $10,000 Investment
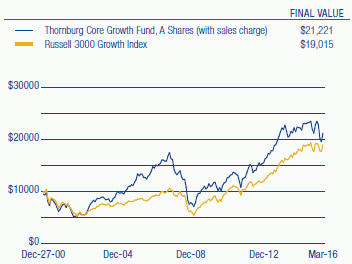
Performance data shown represents past performance and is no guarantee of future results. Investment return and principal value will fluctuate so shares, when redeemed, may be worth more or less than their original cost. Current performance may be lower or higher than quoted. For performance current to the most recent month end, visit thornburg.com or call 800-847-0200. The performance information does not reflect the deduction of taxes that a shareholder would pay on distributions or the redemption of Fund shares. Returns reflect the reinvestment of dividends and capital gains. Class A shares are sold with a maximum sales charge of 4.50%. Class C shares are subject to a 1% CDSC for the first year only. There is no sales charge for Class I, R3, R4, and R5 shares.
As disclosed in the most recent prospectus, the total annual fund operating expenses are as follows: A shares, 1.39%; C shares, 2.15%; I shares, 1.05%; R3 shares, 1.79%; R4 shares, 1.82%; R5 shares, 1.24%. Thornburg Investment Management and/or Thornburg Securities Corporation have contractually agreed to waive fees and reimburse expenses through at least February 1, 2017, for some of the share classes, resulting in net expense ratios of the following: I shares, 0.99%; R3 shares, 1.50%; R4 shares, 1.40%; R5 shares, 0.99%. For more detailed information on fund expenses and waivers/reimbursements please see the Fund’s prospectus.
Glossary
Dow Jones Industrial Average (DJIA) – A price-weighted average of 30 actively traded “blue chip” stocks, primarily industrials, but includes financials and other service-oriented companies. The components, which change from time to time, represent between 15% and 20% of the market value of NYSE stocks.
Russell 1000 Index – This index measures the performance of the large-cap segment of the U.S. equity universe. It is a subset of the Russell 3000 Index and includes approximately 1,000 of the largest securities based on a combination of their market cap and current index membership.
Russell 2000 Index – This index measures the performance of the small-cap segment of the U.S. equity universe. The Russell 2000 Index is a subset of the Russell 3000 Index including approximately 2,000 of the smallest securities based on a combination of their market cap and current index membership.
Russell 3000 Growth Index (Russell 3K G) – An unmanaged index comprised of those Russell 3000 companies with higher price-to-book ratios and higher forecasted growth values.
Unless otherwise noted, index returns reflect the reinvestment of income dividends and capital gains, if any, but do not reflect fees, brokerage commissions or other expenses of investing. Investors may not make direct investments into any index. The performance of any index is not indicative of the performance of any particular investment.
6 Semi-Annual Report
| | |
| FUND SUMMARY | | |
| |
Thornburg Core Growth Fund | | March 31, 2016 (Unaudited) |
Objectives and Strategies
The Fund seeks long-term growth of capital by investing in equity securities selected for their growth potential.
The Fund expects to invest primarily in domestic equity securities (primarily common stocks) selected for their growth potential. However, the Fund may own a variety of securities, including foreign equity securities and partnership interests. The Fund may also invest in developing countries.
Market Capitalization Exposure
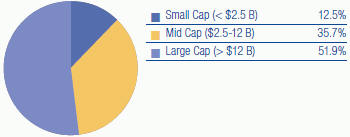
Basket Structure
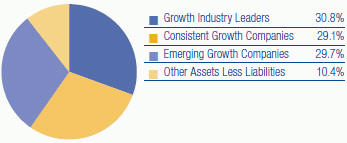
Top Ten Equity Holdings
| | | | |
Apple, Inc. | | | 4.1 | % |
Affiliated Managers Group, Inc. | | | 3.4 | % |
Charles Schwab Corp. | | | 3.2 | % |
SVB Financial Group | | | 3.0 | % |
Visa, Inc. | | | 3.0 | % |
Amazon.com, Inc. | | | 2.8 | % |
Stericycle, Inc. | | | 2.6 | % |
Facebook, Inc. | | | 2.5 | % |
Alexion Pharmaceuticals, Inc. | | | 2.5 | % |
Sprouts Farmers Market, Inc. | | | 2.4 | % |
There is no guarantee that the Fund will meet its investment objective.
All portfolio information is subject to change. Charts may not add up to 100% due to rounding.
Sector Exposure
| | | | |
Information Technology | | | 37.5 | % |
Health Care | | | 16.1 | % |
Financials | | | 12.4 | % |
Consumer Discretionary | | | 9.1 | % |
Industrials | | | 6.8 | % |
Consumer Staples | | | 4.2 | % |
Telecommunication Services | | | 2.3 | % |
Energy | | | 1.1 | % |
Other Assets Less Liabilities | | | 10.4 | % |
Top Ten Industry Groups
| | | | |
Software & Services | | | 31.0 | % |
Diversified Financials | | | 9.4 | % |
Health Care Equipment & Services | | | 8.3 | % |
Pharmaceuticals, Biotechnology & Life Sciences | | | 7.8 | % |
Technology Hardware & Equipment | | | 6.5 | % |
Retailing | | | 6.0 | % |
Commercial & Professional Services | | | 4.5 | % |
Banks | | | 3.0 | % |
Food & Staples Retailing | | | 2.4 | % |
Capital Goods | | | 2.3 | % |
Country Exposure*
(percent of equity holdings)
| | | | |
United States | | | 92.8 | % |
Ireland | | | 5.5 | % |
Netherlands | | | 1.7 | % |
| * | The country assignment of each equity holding is determined by the Fund’s Advisor based on various factors, including the location of the issuer’s head office, the issuer’s jurisdiction of incorporation and the country from which a majority of the issuer’s revenue is derived. |
Semi-Annual Report 7
| | |
| SCHEDULE OF INVESTMENTS | | |
| |
Thornburg Core Growth Fund | | March 31, 2016 (Unaudited) |
| | | | | | | | |
| | | SHARES/ | | | | |
| | | PRINCIPAL AMOUNT | | | VALUE | |
COMMON STOCK — 89.56% | | | | | | | | |
| | |
BANKS — 2.99% | | | | | | | | |
Banks — 2.99% | | | | | | | | |
a SVB Financial Group | | | 203,292 | | | $ | 20,745,949 | |
| | | | | | | | |
| | | | | | | 20,745,949 | |
| | | | | | | | |
CAPITAL GOODS — 2.33% | | | | | | | | |
Electrical Equipment — 2.33% | | | | | | | | |
Acuity Brands, Inc. | | | 73,941 | | | | 16,129,490 | |
| | | | | | | | |
| | | | | | | 16,129,490 | |
| | | | | | | | |
COMMERCIAL & PROFESSIONAL SERVICES — 4.51% | | | | | | | | |
Commercial Services & Supplies — 2.57% | | | | | | | | |
a Stericycle, Inc. | | | 140,981 | | | | 17,790,392 | |
Professional Services — 1.94% | | | | | | | | |
a Verisk Analytics, Inc. | | | 168,404 | | | | 13,458,848 | |
| | | | | | | | |
| | | | | | | 31,249,240 | |
| | | | | | | | |
CONSUMER SERVICES — 1.54% | | | | | | | | |
Hotels, Restaurants & Leisure — 1.54% | | | | | | | | |
a Chipotle Mexican Grill, Inc. | | | 22,681 | | | | 10,682,071 | |
| | | | | | | | |
| | | | | | | 10,682,071 | |
| | | | | | | | |
DIVERSIFIED FINANCIALS — 9.41% | | | | | | | | |
Capital Markets — 8.19% | | | | | | | | |
a Affiliated Managers Group, Inc. | | | 145,539 | | | | 23,635,534 | |
Charles Schwab Corp. | | | 780,856 | | | | 21,879,585 | |
WisdomTree Investments, Inc. | | | 980,709 | | | | 11,209,504 | |
Consumer Finance — 1.22% | | | | | | | | |
a PRA Group, Inc. | | | 287,960 | | | | 8,463,144 | |
| | | | | | | | |
| | | | | | | 65,187,767 | |
| | | | | | | | |
ENERGY — 1.13% | | | | | | | | |
Oil, Gas & Consumable Fuels — 1.13% | | | | | | | | |
a Concho Resources, Inc. | | | 77,309 | | | | 7,811,301 | |
| | | | | | | | |
| | | | | | | 7,811,301 | |
| | | | | | | | |
FOOD & STAPLES RETAILING — 2.43% | | | | | | | | |
Food & Staples Retailing — 2.43% | | | | | | | | |
a Sprouts Farmers Market, Inc. | | | 578,699 | | | | 16,805,419 | |
| | | | | | | | |
| | | | | | | 16,805,419 | |
| | | | | | | | |
FOOD, BEVERAGE & TOBACCO — 1.81% | | | | | | | | |
Beverages — 1.81% | | | | | | | | |
a Monster Beverage Corp. | | | 94,157 | | | | 12,558,661 | |
| | | | | | | | |
| | | | | | | 12,558,661 | |
| | | | | | | | |
HEALTH CARE EQUIPMENT & SERVICES — 8.32% | | | | | | | | |
Health Care Equipment & Supplies — 6.31% | | | | | | | | |
a Align Technology, Inc. | | | 144,880 | | | | 10,531,327 | |
Cooper Companies, Inc. | | | 80,331 | | | | 12,368,564 | |
a DexCom, Inc. | | | 170,068 | | | | 11,549,318 | |
a Inogen, Inc. | | | 205,929 | | | | 9,262,686 | |
Health Care Providers & Services — 2.01% | | | | | | | | |
a HealthEquity, Inc. | | | 241,500 | | | | 5,957,805 | |
Patterson Companies, Inc. | | | 170,769 | | | | 7,945,882 | |
| | | | | | | | |
| | | | | | | 57,615,582 | |
| | | | | | | | |
MEDIA — 1.50% | | | | | | | | |
Media — 1.50% | | | | | | | | |
Comcast Corp. | | | 169,700 | | | | 10,365,276 | |
| | | | | | | | |
| | | | | | | 10,365,276 | |
| | | | | | | | |
PHARMACEUTICALS, BIOTECHNOLOGY & LIFE SCIENCES — 7.83% | | | | | |
Biotechnology — 2.46% | | | | | | | | |
a Alexion Pharmaceuticals, Inc. | | | 122,628 | | | | 17,072,270 | |
Life Sciences Tools & Services — 2.10% | | | | | | | | |
a Illumina, Inc. | | | 89,596 | | | | 14,524,408 | |
Pharmaceuticals — 3.27% | | | | | | | | |
a Allergan plc | | | 31,937 | | | | 8,560,074 | |
Perrigo Co. plc | | | 110,059 | | | | 14,079,848 | |
| | | | | | | | |
| | | | | | | 54,236,600 | |
| | | | | | | | |
RETAILING — 6.04% | | | | | | | | |
Distributors — 1.31% | | | | | | | | |
a LKQ Corp. | | | 283,215 | | | | 9,043,055 | |
Internet & Catalog Retail — 4.73% | | | | | | | | |
a Amazon.com, Inc. | | | 33,131 | | | | 19,667,887 | |
a priceline.com, Inc. | | | 10,163 | | | | 13,099,700 | |
| | | | | | | | |
| | | | | | | 41,810,642 | |
| | | | | | | | |
8 Semi-Annual Report
| | |
| SCHEDULE OF INVESTMENTS, CONTINUED | | |
| |
Thornburg Core Growth Fund | | March 31, 2016 (Unaudited) |
| | | | | | | | |
| | | SHARES/ | | | | |
| | | PRINCIPAL AMOUNT | | | VALUE | |
| | |
SOFTWARE & SERVICES — 30.99% | | | | | | | | |
Information Technology Services — 7.17% | | | | | | | | |
a FleetCor Technologies, Inc. | | | 87,800 | | | $ | 13,060,250 | |
a PayPal Holdings, Inc. | | | 419,165 | | | | 16,179,769 | |
Visa, Inc. | | | 267,283 | | | | 20,441,804 | |
Internet Software & Services — 8.58% | | | | | | | | |
a Alphabet, Inc. Class C | | | 21,656 | | | | 16,132,637 | |
a CoStar Group, Inc. | | | 62,400 | | | | 11,741,808 | |
a Facebook, Inc. | | | 154,486 | | | | 17,626,852 | |
a Zillow Group, Inc. Class C | | | 586,720 | | | | 13,922,866 | |
Software — 15.24% | | | | | | | | |
a Autodesk, Inc. | | | 244,269 | | | | 14,243,325 | |
a Fleetmatics Group plc | | | 287,448 | | | | 11,702,008 | |
a Mobileye N.V. | | | 282,484 | | | | 10,533,828 | |
a Paycom Software, Inc. | | | 268,000 | | | | 9,540,800 | |
a Proofpoint, Inc. | | | 258,034 | | | | 13,877,069 | |
a Rapid7, Inc. | | | 552,190 | | | | 7,217,123 | |
a ServiceNow, Inc. | | | 187,267 | | | | 11,456,995 | |
a Splunk, Inc. | | | 334,774 | | | | 16,380,492 | |
a Workday, Inc. | | | 137,991 | | | | 10,603,229 | |
| | | | | | | | |
| | | | | | | 214,660,855 | |
| | | | | | | | |
TECHNOLOGY HARDWARE & EQUIPMENT — 6.47% | | | | | | | | |
Communications Equipment — 2.38% | | | | | | | | |
a Palo Alto Networks, Inc. | | | 100,800 | | | | 16,444,512 | |
Technology, Hardware, Storage & Peripherals — 4.09% | | | | | | | | |
Apple, Inc. | | | 260,026 | | | | 28,340,234 | |
| | | | | | | | |
| | | | | | | 44,784,746 | |
| | | | | | | | |
TELECOMMUNICATION SERVICES — 2.26% | | | | | | | | |
Diversified Telecommunication Services — 2.26% | | | | | | | | |
a SBA Communications Corp. | | | 156,221 | | | | 15,648,657 | |
| | | | | | | | |
| | | | | | | 15,648,657 | |
| | | | | | | | |
TOTAL COMMON STOCK (Cost $501,583,611) | | | | | | | 620,292,256 | |
| | | | | | | | |
| | |
SHORT TERM INVESTMENTS — 12.30% | | | | | | | | |
b Thornburg Capital Management Fund | | | 8,519,264 | | | | 85,192,640 | |
| | | | | | | | |
TOTAL SHORT TERM INVESTMENTS (Cost $85,192,640) | | | | | | | 85,192,640 | |
| | | | | | | | |
TOTAL INVESTMENTS — 101.86% (Cost $586,776,252) | | | | | | $ | 705,484,896 | |
LIABILITIES NET OF OTHER ASSETS — (1.86)% | | | | | | | (12,876,850 | ) |
| | | | | | | | |
NET ASSETS — 100.00% | | | | | | $ | 692,608,046 | |
| | | | | | | | |
Footnote Legend
| b | Investment in Affiliates – Shown below are holdings of voting securities of each portfolio company which is considered “affiliated” to the Fund under the Investment Company Act of 1940, including companies for which the Fund’s holding represented 5% or more of the company’s voting securities, and a series of the Thornburg Investment Trust in which the Fund invested for cash management purposes during the period: |
| | | | | | | | | | | | | | | | | | | | | | | | | | | | |
ISSUER | | SHARES/PRINCIPAL
SEPTEMBER 30,
2015 | | | GROSS
ADDITIONS | | | GROSS
REDUCTIONS | | | SHARES/PRINCIPAL
MARCH 31,
2016 | | | MARKET VALUE
MARCH 31,
2016 | | | INVESTMENT
INCOME | | | REALIZED
GAIN (LOSS) | |
Thornburg Capital Management Fund | | | 4,081,390 | | | | 30,370,251 | | | | 25,932,377 | | | | 8,519,264 | | | $ | 85,192,640 | | | $ | 89,490 | | | $ | — | |
| | | | | | | | | | | | | | | | | | | | | | | | | | | | |
Total non-controlled affiliated issuers - 12.30% of net assets | | | $ | 85,192,640 | | | $ | 89,490 | | | $ | — | |
| | | | | | | | | | | | | | | | | | | | | | | | | | | | |
See notes to financial statements.
Semi-Annual Report 9
| | |
| STATEMENT OF ASSETS AND LIABILITIES | | |
| |
Thornburg Core Growth Fund | | March 31, 2016 (Unaudited) |
| | | | |
ASSETS | | | | |
Investments at value (cost $586,776,252) (Note 2) | | $ | 705,484,896 | |
Cash | | | 30,539 | |
Receivable for investments sold | | | 7,306,034 | |
Receivable for fund shares sold | | | 256,102 | |
Prepaid expenses and other assets | | | 60,072 | |
| | | | |
Total Assets | | | 713,137,643 | |
| | | | |
| |
LIABILITIES | | | | |
Payable for investments purchased | | | 18,279,789 | |
Payable for fund shares redeemed | | | 1,293,466 | |
Payable to investment advisor and other affiliates (Note 3) | | | 711,091 | |
Accounts payable and accrued expenses | | | 245,251 | |
| | | | |
Total Liabilities | | | 20,529,597 | |
| | | | |
| |
NET ASSETS | | $ | 692,608,046 | |
| | | | |
NET ASSETS CONSIST OF | | | | |
Accumulated net investment loss | | $ | (9,779,725 | ) |
Net unrealized appreciation on investments | | | 118,708,644 | |
Accumulated net realized gain (loss) | | | (281,988,379 | ) |
Net capital paid in on shares of beneficial interest | | | 865,667,506 | |
| | | | |
| | $ | 692,608,046 | |
| | | | |
10 Semi-Annual Report
| | |
| STATEMENT OF ASSETS AND LIABILITIES, CONTINUED | | |
| |
Thornburg Core Growth Fund | | March 31, 2016 (Unaudited) |
| | | | |
NET ASSET VALUE | | | | |
Class A Shares: | | | | |
Net asset value and redemption price per share ($211,982,789 applicable to 8,129,580 shares of beneficial interest outstanding - Note 4) | | $ | 26.08 | |
Maximum sales charge, 4.50% of offering price | | | 1.23 | |
| | | | |
Maximum offering price per share | | $ | 27.31 | |
| | | | |
| |
Class C Shares: | | | | |
Net asset value and offering price per share* ($165,681,558 applicable to 7,172,745 shares of beneficial interest outstanding - Note 4) | | $ | 23.10 | |
| | | | |
| |
Class I Shares: | | | | |
Net asset value, offering and redemption price per share ($203,347,730 applicable to 7,345,438 shares of beneficial interest outstanding - Note 4) | | $ | 27.68 | |
| | | | |
| |
Class R3 Shares: | | | | |
Net asset value, offering and redemption price per share ($62,203,285 applicable to 2,393,574 shares of beneficial interest outstanding - Note 4) | | $ | 25.99 | |
| | | | |
| |
Class R4 Shares: | | | | |
Net asset value, offering and redemption price per share ($8,445,253 applicable to 322,593 shares of beneficial interest outstanding - Note 4) | | $ | 26.18 | |
| | | | |
| |
Class R5 Shares: | | | | |
Net asset value, offering and redemption price per share ($40,947,431 applicable to 1,480,680 shares of beneficial interest outstanding - Note 4) | | $ | 27.65 | |
| | | | |
| * | Redemption price per share is equal to net asset value less any applicable contingent deferred sales charge. |
See notes to financial statements.
Semi-Annual Report 11
| | |
| STATEMENT OF OPERATIONS | | |
| |
Thornburg Core Growth Fund | | Six Months Ended March 31, 2016 (Unaudited) |
| | | | |
INVESTMENT INCOME | | | | |
Dividend income | | $ | 1,686,955 | |
| | | | |
| |
EXPENSES | | | | |
Investment advisory fees (Note 3) | | | 3,262,363 | |
Administration fees (Note 3) | | | | |
Class A Shares | | | 143,659 | |
Class C Shares | | | 109,398 | |
Class I Shares | | | 59,069 | |
Class R3 Shares | | | 41,837 | |
Class R4 Shares | | | 5,448 | |
Class R5 Shares | | | 10,938 | |
Distribution and service fees (Note 3) | | | | |
Class A Shares | | | 287,754 | |
Class C Shares | | | 877,509 | |
Class R3 Shares | | | 167,839 | |
Class R4 Shares | | | 10,700 | |
Transfer agent fees | | | | |
Class A Shares | | | 156,225 | |
Class C Shares | | | 115,599 | |
Class I Shares | | | 125,017 | |
Class R3 Shares | | | 101,957 | |
Class R4 Shares | | | 17,382 | |
Class R5 Shares | | | 70,615 | |
Registration and filing fees | | | | |
Class A Shares | | | 10,472 | |
Class C Shares | | | 9,718 | |
Class I Shares | | | 13,468 | |
Class R3 Shares | | | 10,423 | |
Class R4 Shares | | | 10,838 | |
Class R5 Shares | | | 9,465 | |
Custodian fees (Note 3) | | | 45,310 | |
Professional fees | | | 28,486 | |
Accounting fees (Note 3) | | | 15,281 | |
Trustee fees | | | 16,867 | |
Other expenses | | | 42,329 | |
| | | | |
Total Expenses | | | 5,775,966 | |
Less: | | | | |
Expenses reimbursed by investment advisor (Note 3) | | | (300,558 | ) |
| | | | |
Net Expenses | | | 5,475,408 | |
| | | | |
Net Investment Loss | | $ | (3,788,453 | ) |
| | | | |
12 Semi-Annual Report
| | |
| STATEMENT OF OPERATIONS, CONTINUED | | |
| |
Thornburg Core Growth Fund | | Six Months Ended March 31, 2016 (Unaudited) |
| | | | |
REALIZED AND UNREALIZED GAIN (LOSS) | | | | |
Net realized gain (loss) from investments | | $ | (18,909,487 | ) |
Net change in unrealized appreciation (depreciation) on investments | | | 17,173,598 | |
| | | | |
Net Realized and Unrealized Loss | | | (1,735,889 | ) |
| | | | |
Net Decrease in Net Assets Resulting from Operations | | $ | (5,524,342 | ) |
| | | | |
See notes to financial statements.
Semi-Annual Report 13
| | |
| STATEMENTS OF CHANGES IN NET ASSETS | | |
| |
Thornburg Core Growth Fund | | |
| | | | | | | | |
| | | SIX MONTHS ENDED | | | YEAR ENDED | |
| | | MARCH 31, 2016* | | | SEPTEMBER 30, 2015 | |
INCREASE (DECREASE) IN NET ASSETS FROM | | | | | | | | |
| | |
OPERATIONS | | | | | | | | |
Net investment income (loss) | | $ | (3,788,453 | ) | | $ | (8,552,558 | ) |
Net realized gain (loss) from investments | | | (18,909,487 | ) | | | 69,189,563 | |
Net unrealized appreciation (depreciation) on investments | | | 17,173,598 | | | | (66,357,267 | ) |
| | | | | | | | |
| | |
Net Increase (Decrease) in Net Assets Resulting from Operations | | | (5,524,342 | ) | | | (5,720,262 | ) |
| | |
FUND SHARE TRANSACTIONS (NOTE 4) | | | | | | | | |
Class A Shares | | | (21,385,148 | ) | | | (41,435,655 | ) |
Class C Shares | | | (9,389,627 | ) | | | (21,544,509 | ) |
Class I Shares | | | (37,954,450 | ) | | | (4,425,232 | ) |
Class R3 Shares | | | (8,125,986 | ) | | | (20,360,037 | ) |
Class R4 Shares | | | (1,264,920 | ) | | | (1,594,283 | ) |
Class R5 Shares | | | (4,212,049 | ) | | | (17,252,526 | ) |
| | | | | | | | |
Net Decrease in Net Assets | | | (87,856,522 | ) | | | (112,332,504 | ) |
| | |
NET ASSETS | | | | | | | | |
Beginning of Period | | | 780,464,568 | | | | 892,797,072 | |
| | | | | | | | |
| | |
End of Period | | $ | 692,608,046 | | | $ | 780,464,568 | |
| | | | | | | | |
Accumulated net investment loss | | $ | (9,779,725 | ) | | $ | (5,991,272 | ) |
See notes to financial statements.
14 Semi-Annual Report
| | |
| NOTES TO FINANCIAL STATEMENTS | | |
| |
Thornburg Core Growth Fund | | March 31, 2016 (Unaudited) |
NOTE 1 – ORGANIZATION
Thornburg Core Growth Fund (the “Fund”) is a diversified series of Thornburg Investment Trust (the “Trust”). The Trust was organized as a Massachusetts business trust under a Declaration of Trust dated June 3, 1987 and is registered as a diversified, open-end management investment company under the Investment Company Act of 1940, as amended. The Fund is currently one of twenty separate series of the Trust. Each series is considered to be a separate entity for financial reporting and tax purposes and bears expenses directly attributable to it. The Fund seeks long-term capital appreciation by investing in equity securities selected for their growth potential.
The Fund currently offers six classes of shares of beneficial interest: Class A, Class C, Institutional Class (“Class I”), and Retirement Classes (“Class R3,” “Class R4,” and “Class R5”). Each class of shares of the Fund represents an interest in the same portfolio of investments, except that (i) Class A shares are sold subject to a front-end sales charge collected at the time the shares are purchased and bear a service fee, (ii) Class C shares are sold at net asset value without a sales charge at the time of purchase, but are subject to a contingent deferred sales charge upon redemption within one year of purchase, and bear both a service fee and a distribution fee, (iii) Class I shares are sold at net asset value without a sales charge at the time of purchase and may be subject to a service fee, (iv) Class R3 shares are sold at net asset value without a sales charge at the time of purchase, but bear both a service fee and distribution fee, (v) Class R4 shares are sold at net asset value without sales charge at the time of purchase, but bear a service fee, (vi) Class R5 shares are sold at net asset value without a sales charge at the time of purchase and may bear a service fee, and (vii) the respective classes may have different reinvestment privileges and conversion rights. Additionally, the Fund may allocate among its classes certain expenses, to the extent allocable to specific classes, including transfer agent fees, government registration fees, certain printing and postage costs, and administrative and legal expenses. Currently, class specific expenses of the Fund are limited to service and distribution fees, administration fees, and certain registration and transfer agent expenses.
NOTE 2 – SIGNIFICANT ACCOUNTING POLICIES
The following is a summary of significant accounting policies followed by the Fund in the preparation of its financial statements. The Fund is an investment company and prepares its financial statements in conformity with United States generally accepted accounting principles (“GAAP”), including investment company accounting and reporting guidance in the Financial Accounting Standards Board (the “FASB”) Accounting Standard Codification Topic 946. The preparation of financial statements in conformity with GAAP requires management to make estimates and assumptions that affect the reported amounts of assets and liabilities and disclosure of contingent assets and liabilities at the date of the financial statements and the reported amounts of increases (decreases) in net assets from operations during the reporting period. Actual results could differ from those estimates.
Significant accounting policies of the Trust are as follows:
Valuation Policy and Procedures: The Trustees of the Trust have appointed Thornburg Investment Management, Inc. the Trust’s investment advisor (the “Advisor”) to assist the Trustees in obtaining market values for portfolio investments, perform certain evaluation and supervisory functions respecting professional pricing service providers appointed by the Trustees’ Audit Committee (the “Audit Committee”) to assist in determining fair values for portfolio investments, assist in calculating fair values for portfolio investments in certain circumstances, and to perform other functions in connection with the valuation of investments. The Advisor acts through its Valuation and Pricing Committee (the “Committee”) and other employees of the Advisor. The Committee regularly reviews its own valuation calculations, as well as the valuations, valuation techniques and services furnished by pricing service providers, considers circumstances which may require valuation calculations by the Committee, and reviews previous valuation calculations. The Committee reports to the Audit Committee on the Committee’s activities, the performance of pricing service providers, and other matters relating to valuation of portfolio investments.
In those instances when the Committee assists in calculating a fair value for a portfolio investment, the Committee seeks to determine the price that the Fund would reasonably expect to receive upon a sale of the investment in an orderly transaction between market participants on the valuation date. The Committee customarily utilizes quotations from securities broker dealers in calculating valuations, but also may utilize prices obtained from pricing service providers or other methods approved by the Audit Committee. Because fair values calculated by the Committee are estimates, the calculation of a value for an investment may differ from the price that would be realized by the Fund upon a sale of the investment, and the difference could be material to the Fund’s financial statements. The Committee’s calculation of a fair value for an investment may also differ from the prices obtained by other persons (including other mutual funds) for the investment.
Valuation of Investments: Securities and other portfolio investments which are listed or traded on a United States securities exchange are valued at the last reported sale price on the valuation date. Investments listed or traded on an exchange for which there has been no sale that day are valued at the mean between the last reported bid and asked prices on that valuation date. Portfolio investments reported by NASDAQ are valued at the official closing price on the valuation date. If an investment is traded on more than one exchange, the investment is considered traded on the exchange that is normally the primary market for that investment. Securities and other portfolio investments which are listed or traded on exchanges outside the United States are valued at the last price or the closing
Semi-Annual Report 15
| | |
| NOTES TO FINANCIAL STATEMENTS, CONTINUED | | |
| |
Thornburg Core Growth Fund | | March 31, 2016 (Unaudited) |
price of the investment on the exchange that is normally the primary market for the investment, as of the close of the exchange preceding the Fund’s valuation date. Foreign investments listed or traded on an exchange for which there has been no sale that day are valued at the mean between the last reported bid and asked prices on that valuation date.
In any case when a market quotation is not readily available for a portfolio investment ordinarily valued by market quotation, the Committee calculates a fair value for the investment using alternative methods approved by the Audit Committee. A market quotation is not readily available when the primary market or exchange for the investment is not open for the entire scheduled day of trading. Market quotations for an investment also may not be readily available if developments after the most recent close of the investment’s primary exchange or market, but prior to the close of business on any Fund business day, or an unusual event or significant period of time occurring since the availability of a market quotation, create a serious question concerning the reliability of the most recent market quotation available for the investment. In particular, on days when market volatility thresholds established by the Audit Committee are exceeded, foreign equity investments held by the Fund may be valued using alternative methods. The Committee customarily obtains valuations in these instances from pricing service providers approved by the Audit Committee. Pricing service providers ordinarily calculate valuations using multi-factor models to adjust market prices based upon various inputs, including exchange data, depository receipt prices, futures, index data and other data.
Debt obligations held by the Fund which are not listed or traded on exchanges or for which no reported market exists are ordinarily valued at the valuation obtained from a pricing service provider approved by the Audit Committee.
In any case when a pricing service provider fails to provide a valuation for a debt obligation held by the Fund, the Committee calculates a fair value for the obligation using alternative methods under procedures approved by the Audit Committee. Additionally, in cases when management believes that a valuation obtained from a pricing service provider merits review for significant reasons, the Committee decides whether or not to use the valuation calculated by the pricing service provider or to use an alternative method approved by the Audit Committee to calculate a fair value for the obligation.
Quotations for foreign investments expressed in foreign currency amounts are converted to U.S. dollar equivalents using a foreign exchange quotation from a third party service provider at the time of valuation. Foreign investments held by the Fund may be traded on days and at times when the Fund is not open for business. Consequently, the value of Fund investments may be significantly affected on days when shareholders cannot purchase or sell Fund shares. Futures contracts and other financial and derivative instruments traded on an exchange are valued at the latest published price for the instrument on its primary exchange. Listed options are valued at the last bid price.
Valuation Measurements: The Fund categorizes its investments based upon the inputs used in valuing those investments, according to a three-level hierarchy established in guidance from the FASB. Categorization of investments using this hierarchy is intended by the FASB to maximize the use of observable inputs in valuing investments and minimize the use of unobservable inputs by requiring that the most observable inputs be used when available. Observable inputs are those that market participants would use in valuing an investment based on available market information. Unobservable inputs are those that reflect assumptions about the information market participants would use in valuing an investment. An investment’s level within the hierarchy is based on the lowest level input that is deemed significant to the valuation. The methodologies and inputs used to value investments are not necessarily indications of the risk or liquidity associated with those investments.
Various inputs are used in calculating valuations for the Fund’s investments. These inputs are generally summarized according to the three-level hierarchy below:
Level 1: Quoted prices in active markets for identical investments.
Level 2: Other direct or indirect significant observable inputs (including quoted prices for similar investments in active markets and other observable inputs, such as interest rates, prepayment rates, credit risk, etc.).
Level 3: Significant unobservable inputs (including the Committee’s own assumptions in calculating the fair values of investments).
Valuations for debt obligations held by the Fund are typically calculated by pricing service providers approved by the Audit Committee and are characterized as Level 2 within the valuation hierarchy.
On days when market volatility thresholds established by the Audit Committee are exceeded, foreign securities for which valuations are obtained from pricing service providers are fair valued. On these days, the foreign securities are characterized as Level 2 within the valuation hierarchy and revert to Level 1 after the threshold is no longer exceeded.
In a limited number of cases the Committee calculates a fair value for investments using broker quotations or other methods approved by the Audit Committee. When the Committee uses a single broker quotation to calculate a fair value for an investment without other significant observable inputs, or if a fair value is calculated using other significant inputs that are considered unobservable, the
16 Semi-Annual Report
| | |
| NOTES TO FINANCIAL STATEMENTS, CONTINUED | | |
| |
Thornburg Core Growth Fund | | March 31, 2016 (Unaudited) |
investment is characterized as Level 3 within the hierarchy. Other significant unobservable inputs used to calculate a fair value in these instances might include an income-based valuation approach which considers discounted anticipated future cash flows from the investment, and application of discounts due to the nature or duration of any restrictions on the disposition of the investment.
Valuations based upon the use of inputs from Levels 1, 2 or 3 may not represent the actual price received upon the disposition of an investment, and the Fund may receive a price that is lower than the valuation based upon these inputs when it sells the investment.
The following table displays a summary of the fair value hierarchy measurements of the Fund’s investments as of March 31, 2016. In any instance when valuation inputs from more than one level are used to determine the fair value of a specific investment, the investment is placed in the level of the table based upon the lowest level input that is significant in determining the fair value of the investment:
| | | | | | | | | | | | | | | | |
| | | FAIR VALUE MEASUREMENTS AT MARCH 31, 2016 | |
| | | TOTAL | | | LEVEL 1 | | | LEVEL 2 | | | LEVEL 3 | |
Assets | | | | | | | | | | | | | | | | |
Investments in Securities* | | | | | | | | | | | | | | | | |
Common Stock | | $ | 620,292,256 | | | $ | 620,292,256 | | | $ | — | | | $ | — | |
Short Term Investments | | | 85,192,640 | | | | 85,192,640 | | | | — | | | | — | |
| | | | | | | | | | | | | | | | |
Total Investments in Securities | | $ | 705,484,896 | | | $ | 705,484,896 | | | $ | — | | | $ | — | |
| * | See Schedule of Investments for a summary of the industry exposure as grouped according to the Global Industry Classification Standard (GICS), which is an industry taxonomy developed by MSCI, Inc. and Standard & Poor’s (S&P). |
| ** | Other Financial Instruments include investments not reflected in the Schedule of Investments, which may include futures, forwards and swap contracts, which are valued at the unrealized appreciation (depreciation) on the investment. |
In accordance with the guidance prescribed in Accounting Standards Update No. 2011-04, it is the policy of the Fund to recognize transfers between levels and the underlying events which caused the movement. The Fund recognized no transfers between levels for the six months ended March 31, 2016, other than when the Fund exceeded market volatility thresholds for foreign equity investments during the period.
Foreign Currency Translation: Portfolio investments and other assets and liabilities denominated in foreign currencies are translated into U.S. dollars based on the exchange rate of such currencies against the U.S. dollar on the date of valuation. Purchases and sales of investments and income items denominated in foreign currencies are translated into U.S. dollars at the exchange rate in effect on the transaction date. When the Fund purchases or sells foreign investments, it will customarily enter into a foreign exchange contract to minimize foreign exchange risk from the trade date to the settlement date of such transactions. The values of such spot contracts are included in receivable for investments sold and payable for investments purchased on the Statement of Assets and Liabilities.
The Fund does not separately report the effect of changes in foreign exchange rates from changes in market prices on investments held. Such changes are included in net unrealized appreciation (depreciation) from investments.
Reported net realized gains and losses from foreign currency transactions arise due to purchases and sales of foreign currencies, currency gains and losses realized between the trade and settlement dates on investment transactions and the difference between the amounts of dividends, interest, and foreign withholding taxes recorded on the Fund’s books, and the U.S. dollar equivalent of the amounts actually received or paid.
Net change in unrealized appreciation (depreciation) on foreign currency translations arise from changes in the fair value of assets and liabilities, other than investments at period end, resulting from changes in exchange rates.
Foreign Withholding Taxes: The Fund is subject to foreign tax withholding imposed by certain foreign countries in which the Fund may invest. Withholding taxes are incurred on certain foreign dividends and are accrued at the time the dividend is recognized based on applicable foreign tax laws. The Fund files withholding tax reclaims in certain jurisdictions to recover a portion of amounts previously withheld based on applicable laws and regulations, and industry convention. The Fund would expect to record a receivable for such a reclaim based on a variety of factors, including assessments of a jurisdiction’s legal obligation to pay reclaims, the jurisdiction’s administrative practices and payment history, and industry convention. To date the Fund has recorded no such receivable because there is limited precedent for collecting such prior year reclaims and the likelihood of collection remains uncertain.
Deferred Foreign Capital Gain Taxes: The Fund is subject to a tax imposed on net realized gains of securities of certain foreign countries. The Fund records an estimated deferred tax liability for net unrealized gains on these investments as reflected in the accompanying financial statements.
Federal Income Taxes: It is the policy of the Trust to comply with the provisions of the Internal Revenue Code applicable to “regulated investment companies” and to distribute to shareholders substantially all taxable income, including any net realized gain on investments of the Fund. Therefore, no provision for federal income taxes is required.
Semi-Annual Report 17
| | |
| NOTES TO FINANCIAL STATEMENTS, CONTINUED | | |
| |
Thornburg Core Growth Fund | | March 31, 2016 (Unaudited) |
Management reviews each uncertain tax position believed to be material to the preparation of the Fund’s financial statements, to assess if it is more likely than not that the position would be sustained upon examination, based upon the technical merits of the position. As of March 31, 2016, management has not identified any such position for which an asset or liability must be reflected in the Statement of Assets and Liabilities. The Fund’s tax returns remain subject to examination for three years after filing.
When-Issued and Delayed Delivery Transactions: The Fund may engage in when-issued or delayed delivery transactions. To the extent the Fund engages in such transactions, it will do so for the purpose of acquiring portfolio investments consistent with the Fund’s investment objectives and not for the purpose of investment leverage or to speculate on interest rate and, or market changes. At the time the Fund makes a commitment to purchase an investment on a when-issued or delayed delivery basis, the Fund will record the transaction and reflect the value in determining its net asset value. When effecting such transactions, assets of an amount sufficient to make payment for the portfolio investments to be purchased will be segregated on the Fund’s records on the trade date. Investments purchased on a when-issued or delayed delivery basis do not earn interest until the settlement date.
Dividends: Dividends to shareholders, if any, are generally paid quarterly and are reinvested in additional shares of the Fund at net asset value per share at the close of business on the dividend payment date or, at the shareholder’s option, paid in cash. Net realized capital gains, to the extent available, will be distributed at least annually.
Repurchase Agreements: The Fund may invest excess cash in repurchase agreements whereby the Fund purchases investments, which serve as collateral, with an agreement to resell such collateral to the seller at an agreed upon price at the maturity date of the repurchase agreement. Investments pledged as collateral for repurchase agreements are held in custody until maturity of the repurchase agreement. Provisions in the agreements require that the market value of the collateral is at least equal to the repurchase value in the event of default. In the event of default, the Fund has the right to liquidate the collateral and apply the proceeds in satisfaction of the obligation. Under certain circumstances, in the event of default or bankruptcy by the other party to the agreement, realization and/or retention of the collateral may be subject to legal proceedings.
General: Investment transactions are accounted for on a trade date basis. Interest income is accrued as earned and dividend income is recorded on the ex-dividend date. Certain income from foreign investments is recognized as soon as information is available to the Fund. Realized gains and losses from the sale of investments are recorded on an identified cost basis. Net investment income (other than class specific expenses) and realized and unrealized gains and losses are allocated daily to each class of shares based upon the relative net asset value of outstanding shares of each class of shares at the beginning of the day (after adjusting for the current share activity of the respective class). Expenses common to all Funds are allocated among the Funds comprising the Trust based upon their relative net asset values or other appropriate allocation methods.
Guarantees and Indemnifications: Under the Trust’s organizational documents (and under separate agreements with the independent Trustees), its officers and Trustees are indemnified against certain liabilities arising out of the performance of their duties to the Fund. Additionally, in the normal course of business the Trust enters into contracts with service providers that contain general indemnification clauses. The Trust’s maximum exposure under these arrangements is unknown. However, based on experience, the Trust expects the risk of loss to be remote.
NOTE 3 – INVESTMENT ADVISORY FEE AND OTHER TRANSACTIONS WITH AFFILIATES
Pursuant to an investment advisory agreement, the Advisor serves as the investment advisor and performs services for the Fund for which the fees are payable at the end of each month. For the six months ended March 31, 2016, these fees were payable at annual rates ranging from .875 of 1% to .675 of 1% per annum of the average daily net assets of the Fund depending on the Fund’s asset size. The Fund pays to the Advisor the costs of personnel who perform certain accounting services for the Fund. For the six months ended March 31, 2016 the Fund paid $15,281 to the Advisor for these accounting services. The Trust has also entered into administrative service agreements with the Advisor, whereby the Advisor will perform certain administrative services for the shareholders of each class of the Fund’s shares, and for which fees will be payable at an annual rate of up to ..125 of 1% per annum of the average daily net assets attributable to each class of shares.
The Trust has an underwriting agreement with Thornburg Securities Corporation (the “Distributor”), an affiliate of the Advisor, which acts as the distributor of the Fund’s shares. For the six months ended March 31, 2016, the Distributor has advised the Fund that it earned commissions aggregating $8,550 from the sale of Class A shares, and collected contingent deferred sales charges aggregating $2,035 from redemptions of Class C shares of the Fund.
Pursuant to a service plan under Rule 12b-1 of the Investment Company Act of 1940, the Fund may reimburse to the Advisor an amount not to exceed .25 of 1% per annum of the average daily net assets attributable to each class of shares of the Fund for payments made by the Advisor to securities dealers and other financial institutions to obtain various shareholder and distribution related services. For the six months ended March 31, 2016, there were no 12b-1 service plan fees charged for Class I and R5 shares. The Advisor may pay out of its own resources additional expenses for distribution of the Fund’s shares and shareholder services.
18 Semi-Annual Report
| | |
| NOTES TO FINANCIAL STATEMENTS, CONTINUED | | |
| |
Thornburg Core Growth Fund | | March 31, 2016 (Unaudited) |
The Trust has also adopted distribution plans pursuant to Rule 12b-1, applicable only to the Fund’s Class C and Class R3 shares, under which the Fund compensates the Distributor for services in promoting the sale of Class C and Class R3 shares of the Fund at an annual rate of up to .75 of 1% per annum of the average daily net assets attributable to Class C shares, and an annual rate of up to .25 of 1% per annum of the average daily net assets attributable to Class R3 shares. Total fees incurred by each class of shares of the Fund under their respective service and distribution plans for the six months ended March 31, 2016, are set forth in the Statement of Operations.
The Advisor and Distributor have contractually agreed to waive fees and reimburse expenses incurred by the Fund so that actual expenses of certain share classes do not exceed levels as specified in the Fund’s most recent prospectus. The agreement may be terminated by the Fund at any time, but may not be terminated by the Advisor or Distributor before February 1, 2017, unless the Advisor ceases to be the investment advisor to the Trust or the Distributor ceases to be the distributor of the Fund prior to that date. The Advisor and Distributor retain the right to be repaid by the Fund for fee waivers and expense reimbursements if expenses fall below the contractual limit prior to the end of the fiscal year.
For the six months ended March 31, 2016, the Advisor contractually reimbursed certain class specific expenses, administrative fees, and distribution fees of $87,235 for Class I shares, $120,202 for Class R3 shares, $22,451 for Class R4 shares, and $70,670 for Class R5 shares.
Certain officers and Trustees of the Trust are also officers or directors of the Advisor and Distributor. The compensation of independent Trustees is borne by the Trust.
The Fund may purchase or sell securities from or to an affiliated fund, provided the affiliation is due solely to having a common investment advisor, common officers, or common trustees, and provided that all such transactions will comply with Rule 17a-7 under the 1940 Act. For the six months ended March 31, 2016, the Fund had no transactions with affiliated funds.
NOTE 4 – SHARES OF BENEFICIAL INTEREST
At March 31, 2016, there were an unlimited number of shares with no par value of beneficial interest authorized. Transactions in shares of beneficial interest were as follows:
| | | | | | | | | | | | | | | | |
| | | SIX MONTHS ENDED | | | YEAR ENDED | |
| | | MARCH 31, 2016 (UNAUDITED) | | | SEPTEMBER 30, 2015 (UNAUDITED) | |
| | | SHARES | | | AMOUNT | | | SHARES | | | AMOUNT | |
Class A Shares | | | | | | | | | | | | | | | | |
Shares sold | | | 356,809 | | | $ | 9,570,215 | | | | 996,259 | | | $ | 28,022,370 | |
Shares issued to shareholders in reinvestment of dividends | | | — | | | | — | | | | — | | | | — | |
Shares repurchased | | | (1,207,418 | ) | | | (30,955,363 | ) | | | (2,497,551 | ) | | | (69,458,025 | ) |
| | | | | | | | | | | | | | | | |
| | | | |
Net increase (decrease) | | | (850,609 | ) | | $ | (21,385,148 | ) | | | (1,501,292 | ) | | $ | (41,435,655 | ) |
| | | | | | | | | | | | | | | | |
| | | | |
Class C Shares | | | | | | | | | | | | | | | | |
Shares sold | | | 307,172 | | | $ | 7,455,331 | | | | 444,961 | | | $ | 10,904,013 | |
Shares issued to shareholders in reinvestment of dividends | | | — | | | | — | | | | — | | | | — | |
Shares repurchased | | | (739,619 | ) | | | (16,844,958 | ) | | | (1,311,327 | ) | | | (32,448,522 | ) |
| | | | | | | | | | | | | | | | |
| | | | |
Net increase (decrease) | | | (432,447 | ) | | $ | (9,389,627 | ) | | | (866,366 | ) | | $ | (21,544,509 | ) |
| | | | | | | | | | | | | | | | |
| | | | |
Class I Shares | | | | | | | | | | | | | | | | |
Shares sold | | | 423,336 | | | $ | 11,855,022 | | | | 1,813,121 | | | $ | 52,780,952 | |
Shares issued to shareholders in reinvestment of dividends | | | — | | | | — | | | | — | | | | — | |
Shares repurchased | | | (1,931,132 | ) | | | (49,809,472 | ) | | | (1,961,775 | ) | | | (57,206,184 | ) |
| | | | | | | | | | | | | | | | |
| | | | |
Net increase (decrease) | | | (1,507,796 | ) | | $ | (37,954,450 | ) | | | (148,654 | ) | | $ | (4,425,232 | ) |
| | | | | | | | | | | | | | | | |
Semi-Annual Report 19
| | |
| NOTES TO FINANCIAL STATEMENTS, CONTINUED | | |
| |
Thornburg Core Growth Fund | | March 31, 2016 (Unaudited) |
| | | | | | | | | | | | | | | | |
| | | SIX MONTHS ENDED
MARCH 31, 2016 (UNAUDITED) | | | YEAR ENDED
SEPTEMBER 30, 2015 (UNAUDITED) | |
| | | SHARES | | | AMOUNT | | | SHARES | | | AMOUNT | |
Class R3 Shares | | | | | | | | | | | | | | | | |
Shares sold | | | 164,302 | | | $ | 4,303,675 | | | | 400,614 | | | $ | 11,097,621 | |
Shares issued to shareholders in reinvestment of dividends | | | — | | | | — | | | | — | | | | — | |
Shares repurchased | | | (473,745 | ) | | | (12,429,661 | ) | | | (1,138,031 | ) | | | (31,457,658 | ) |
| | | | | | | | | | | | | | | | |
| | | | |
Net increase (decrease) | | | (309,443 | ) | | $ | (8,125,986 | ) | | | (737,417 | ) | | $ | (20,360,037 | ) |
| | | | | | | | | | | | | | | | |
| | | | |
Class R4 Shares | | | | | | | | | | | | | | | | |
Shares sold | | | 103,571 | | | $ | 2,628,515 | | | | 161,503 | | | $ | 4,454,266 | |
Shares issued to shareholders in reinvestment of dividends | | | — | | | | — | | | | — | | | | — | |
Shares repurchased | | | (148,735 | ) | | | (3,893,435 | ) | | | (219,673 | ) | | | (6,048,549 | ) |
| | | | | | | | | | | | | | | | |
| | | | |
Net increase (decrease) | | | (45,164 | ) | | $ | (1,264,920 | ) | | | (58,170 | ) | | $ | (1,594,283 | ) |
| | | | | | | | | | | | | | | | |
| | | | |
Class R5 Shares | | | | | | | | | | | | | | | | |
Shares sold | | | 109,941 | | | $ | 3,098,346 | | | | 330,694 | | | $ | 9,632,579 | |
Shares issued to shareholders in reinvestment of dividends | | | — | | | | — | | | | — | | | | — | |
Shares repurchased | | | (263,680 | ) | | | (7,310,395 | ) | | | (914,591 | ) | | | (26,885,105 | ) |
| | | | | | | | | | | | | | | | |
| | | | |
Net increase (decrease) | | | (153,739 | ) | | $ | (4,212,049 | ) | | | (583,897 | ) | | $ | (17,252,526 | ) |
| | | | | | | | | | | | | | | | |
NOTE 5 – INVESTMENT TRANSACTIONS
For the six months ended March 31, 2016, the Fund had purchase and sale transactions of investments (excluding short-term investments) of $432,910,734 and $561,103,259, respectively.
NOTE 6 – INCOME TAXES
At March 31, 2016, information on the tax components of capital was as follows:
| | | | |
Cost of investments for tax purposes | | $ | 586,776,252 | |
| | | | |
Gross unrealized appreciation on a tax basis | | $ | 137,096,338 | |
Gross unrealized depreciation on a tax basis | | | (18,387,694 | ) |
| | | | |
Net unrealized appreciation (depreciation) on investments (tax basis) | | $ | 118,708,644 | |
| | | | |
At March 31, 2016, the Fund had deferred tax basis capital losses occurring subsequent to October 31, 2014 through September 30, 2015 of $11,934,582. For tax purposes such losses will be reflected in the year ended September 30, 2016.
At March 31, 2016, the Fund had tax basis capital losses of $250,752,568 generated prior to October 1, 2011, which may be carried forward to offset future capital gains. To the extent such carryforwards are used, capital gain distributions may be reduced to the extent provided by regulations. Such capital loss carryforwards expire September 30, 2018.
NOTE 7 – DERIVATIVE FINANCIAL INSTRUMENTS WITH OFF-BALANCE SHEET RISK AND FOREIGN INVESTMENT RISK
The Fund may use a variety of derivative financial instruments to hedge or adjust the risks affecting its investment portfolio or to enhance investment returns. Provisions of FASB Accounting Standards Codification ASC 815-10-50 (“ASC 815”) require certain disclosures. The disclosures are intended to provide users of financial statements with an understanding of the use of derivative instruments by the Fund and how these derivatives affect the financial position, financial performance and cash flows of the Fund. The Fund does not designate any derivative instruments as hedging instruments under ASC 815. Additionally, the Fund’s risk of loss may exceed the amounts recognized on the Statement of Assets and Liabilities.
20 Semi-Annual Report
| | |
| NOTES TO FINANCIAL STATEMENTS, CONTINUED | | |
| |
Thornburg Core Growth Fund | | March 31, 2016 (Unaudited) |
During the six months ended March 31, 2016, the Fund did not invest in any derivative financial instruments of the type addressed by ASC 815.
OTHER NOTES
Risks: The Fund’s investments subject it to risks including, but not limited to, management risk, market and economic risk, risks affecting specific issuers, liquidity risk, the risks associated with investments in small- and mid-cap companies and non-U.S. issuers, credit risk, and interest rate risk. Please see the Fund’s prospectus for a discussion of the risks associated with an investment in the Fund.
Subsequent Events: Fund management believes no events have occurred between March 31, 2016 and the date of issuance of the financial statements that require adjustment to or disclosure in the accompanying financial statements.
Semi-Annual Report 21
FINANCIAL HIGHLIGHTS
Thornburg Core Growth Fund
| | | | | | | | | | | | | | | | | | | | | | | | | | | | | | | | | | | | | | | | | | | | | | | | | | | | | | | | | | | | |
| | | PER SHARE PERFORMANCE (FOR A SHARE OUTSTANDING THROUGHOUT THE PERIOD) | | | RATIOS TO AVERAGE NET ASSETS | | | SUPPLEMENTAL DATA | |
UNLESS
OTHERWISE
NOTED,
PERIODS
ARE FISCAL
YEARS
ENDED
SEPT. 30, | | NET ASSET
VALUE
BEGINNING
OF PERIOD | | | NET
INVESTMENT
INCOME
(LOSS)+ | | | NET
REALIZED &
UNREALIZED
GAIN (LOSS)
ON
INVESTMENTS | | | TOTAL
FROM
INVESTMENT
OPERATIONS | | | DIVIDENDS
FROM NET
INVESTMENT
INCOME | | | DIVIDENDS
FROM NET
REALIZED
GAINS | | | TOTAL
DIVIDENDS | | | NET
ASSET
VALUE
END
OF
PERIOD | | | NET
INVESTMENT
INCOME
(LOSS) (%) | | | EXPENSES,
AFTER
EXPENSE
REDUCTIONS
(%) | | | EXPENSES,
AFTER
EXPENSE
REDUCTIONS
AND NET OF
CUSTODY
CREDITS (%) | | | EXPENSES,
BEFORE
EXPENSE
REDUCTIONS
(%) | | | TOTAL
RETURN
(%)(a) | | | PORTFOLIO
TURNOVER
RATE (%)(a) | | | NET ASSETS
AT END
OF PERIOD
(THOUSANDS) | |
CLASS A SHARES | | | | | | | | | | | | | | | | | | | | | | | | | | | | | | | | | | | | | | | | | | | | | | | | | | | | | |
2016(b)(c) | | $ | 26.09 | | | | (0.13 | ) | | | 0.12 | | | | (0.01 | ) | | | — | | | | — | | | | — | | | | $26.08 | | | | (0.97 | )(d) | | | 1.42 | (d) | | | 1.42 | (d) | | | 1.42 | (d) | | | (0.04 | ) | | | 59.23 | | | $ | 211,983 | |
2015(c) | | $ | 26.44 | | | | (0.26 | ) | | | (0.09 | ) | | | (0.35 | ) | | | — | | | | — | | | | — | | | | $26.09 | | | | (0.93 | ) | | | 1.39 | | | | 1.39 | | | | 1.39 | | | | (1.32 | ) | | | 96.02 | | | $ | 234,284 | |
2014(c) | | $ | 24.35 | | | | (0.28 | ) | | | 2.37 | | | | 2.09 | | | | — | | | | — | | | | — | | | | $26.44 | | | | (1.06 | ) | | | 1.40 | | | | 1.40 | | | | 1.40 | | | | 8.58 | | | | 100.62 | | | $ | 277,099 | |
2013(c) | | $ | 19.11 | | | | (0.21 | ) | | | 5.45 | | | | 5.24 | | | | — | | | | — | | | | — | | | | $24.35 | | | | (1.01 | ) | | | 1.45 | | | | 1.45 | | | | 1.45 | | | | 27.42 | | | | 91.92 | | | $ | 279,483 | |
2012(c) | | $ | 13.33 | | | | (0.17 | ) | | | 5.95 | | | | 5.78 | | | | — | | | | — | | | | — | | | | $19.11 | | | | (1.02 | ) | | | 1.48 | | | | 1.49 | | | | 1.48 | | | | 43.36 | | | | 122.93 | | | $ | 225,945 | |
2011(c) | | $ | 13.81 | | | | (0.15 | ) | | | (0.33 | ) | | | (0.48 | ) | | | — | | | | — | | | | — | | | | $13.33 | | | | (0.96 | ) | | | 1.45 | | | | 1.45 | | | | 1.45 | | | | (3.48 | ) | | | 80.53 | | | $ | 208,135 | |
CLASS C SHARES | | | | | | | | | | | | | | | | | | | | | | | | | | | | | | | | | | | | | | | | | | | | | | | | | | | | | |
2016(b) | | $ | 23.20 | | | | (0.20 | ) | | | 0.10 | | | | (0.10 | ) | | | — | | | | — | | | | — | | | | $23.10 | | | | (1.73 | )(d) | | | 2.17 | (d) | | | 2.17 | (d) | | | 2.17 | (d) | | | (0.43 | ) | | | 59.23 | | | $ | 165,682 | |
2015 | | $ | 23.69 | | | | (0.42 | ) | | | (0.07 | ) | | | (0.49 | ) | | | — | | | | — | | | | — | | | | $23.20 | | | | (1.69 | ) | | | 2.15 | | | | 2.15 | | | | 2.15 | | | | (2.07 | ) | | | 96.02 | | | $ | 176,422 | |
2014 | | $ | 21.98 | | | | (0.43 | ) | | | 2.14 | | | | 1.71 | | | | — | | | | — | | | | — | | | | $23.69 | | | | (1.81 | ) | | | 2.14 | | | | 2.14 | | | | 2.14 | | | | 7.78 | | | | 100.62 | | | $ | 200,664 | |
2013 | | $ | 17.38 | | | | (0.34 | ) | | | 4.94 | | | | 4.60 | | | | — | | | | — | | | | — | | | | $21.98 | | | | (1.76 | ) | | | 2.20 | | | | 2.20 | | | | 2.20 | | | | 26.47 | | | | 91.92 | | | $ | 182,999 | |
2012 | | $ | 12.22 | | | | (0.28 | ) | | | 5.44 | | | | 5.16 | | | | — | | | | — | | | | — | | | | $17.38 | | | | (1.79 | ) | | | 2.25 | | | | 2.25 | | | | 2.25 | | | | 42.23 | | | | 122.93 | | | $ | 156,597 | |
2011 | | $ | 12.75 | | | | (0.24 | ) | | | (0.29 | ) | | | (0.53 | ) | | | — | | | | — | | | | — | | | | $12.22 | | | | (1.71 | ) | | | 2.20 | | | | 2.20 | | | | 2.20 | | | | (4.16 | ) | | | 80.53 | | | $ | 137,799 | |
CLASS I SHARES | | | | | | | | | | | | | | | | | | | | | | | | | | | | | | | | | | | | | | | | | | | | | | | | | | | | | |
2016(b) | | $ | 27.64 | | | | (0.08 | ) | | | 0.12 | | | | 0.04 | | | | — | | | | — | | | | — | | | | $27.68 | | | | (0.54 | )(d) | | | 0.99 | (d) | | | 0.99 | (d) | | | 1.06 | (d) | | | 0.14 | | | | 59.23 | | | $ | 203,348 | |
2015 | | $ | 27.90 | | | | (0.16 | ) | | | (0.10 | ) | | | (0.26 | ) | | | — | | | | — | | | | — | | | | $27.64 | | | | (0.53 | ) | | | 0.99 | | | | 0.99 | | | | 1.05 | | | | (0.93 | ) | | | 96.02 | | | $ | 244,691 | |
2014 | | $ | 25.59 | | | | (0.18 | ) | | | 2.49 | | | | 2.31 | | | | — | | | | — | | | | — | | | | $27.90 | | | | (0.65 | ) | | | 0.99 | | | | 0.99 | | | | 1.03 | | | | 9.03 | | | | 100.62 | | | $ | 251,122 | |
2013 | | $ | 19.99 | | | | (0.12 | ) | | | 5.72 | | | | 5.60 | | | | — | | | | — | | | | — | | | | $25.59 | | | | (0.55 | ) | | | 0.99 | | | | 0.99 | | | | 1.02 | | | | 28.01 | | | | 91.92 | | | $ | 191,358 | |
2012 | | $ | 13.88 | | | | (0.09 | ) | | | 6.20 | | | | 6.11 | | | | — | | | | — | | | | — | | | | $19.99 | | | | (0.52 | ) | | | 0.99 | | | | 0.99 | | | | 1.08 | | | | 44.02 | | | | 122.93 | | | $ | 116,567 | |
2011 | | $ | 14.31 | | | | (0.08 | ) | | | (0.35 | ) | | | (0.43 | ) | | | — | | | | — | | | | — | | | | $13.88 | | | | (0.49 | ) | | | 0.99 | | | | 0.99 | | | | 1.07 | | | | (3.00 | ) | | | 80.53 | | | $ | 114,679 | |
CLASS R3 SHARES | | | | | | | | | | | | | | | | | | | | | | | | | | | | | | | | | | | | | | | | | | | | | | | | | | | | | |
2016(b) | | $ | 26.01 | | | | (0.14 | ) | | | 0.12 | | | | (0.02 | ) | | | — | | | | — | | | | — | | | | $25.99 | | | | (1.06 | )(d) | | | 1.50 | (d) | | | 1.50 | (d) | | | 1.86 | (d) | | | (0.08 | ) | | | 59.23 | | | $ | 62,203 | |
2015 | | $ | 26.39 | | | | (0.29 | ) | | | (0.09 | ) | | | (0.38 | ) | | | — | | | | — | | | | — | | | | $26.01 | | | | (1.05 | ) | | | 1.50 | | | | 1.50 | | | | 1.79 | | | | (1.44 | ) | | | 96.02 | | | $ | 70,310 | |
2014 | | $ | 24.33 | | | | (0.31 | ) | | | 2.37 | | | | 2.06 | | | | — | | | | — | | | | — | | | | $26.39 | | | | (1.16 | ) | | | 1.50 | | | | 1.50 | | | | 1.80 | | | | 8.47 | | | | 100.62 | | | $ | 90,788 | |
2013 | | $ | 19.11 | | | | (0.22 | ) | | | 5.44 | | | | 5.22 | | | | — | | | | — | | | | — | | | | $24.33 | | | | (1.06 | ) | | | 1.50 | | | | 1.50 | | | | 1.79 | | | | 27.32 | | | | 91.92 | | | $ | 95,545 | |
2012 | | $ | 13.33 | | | | (0.18 | ) | | | 5.96 | | | | 5.78 | | | | — | | | | — | | | | — | | | | $19.11 | | | | (1.04 | ) | | | 1.50 | | | | 1.50 | | | | 1.80 | | | | 43.36 | | | | 122.93 | | | $ | 106,353 | |
2011 | | $ | 13.82 | | | | (0.16 | ) | | | (0.33 | ) | | | (0.49 | ) | | | — | | | | — | | | | — | | | | $13.33 | | | | (1.01 | ) | | | 1.50 | | | | 1.50 | | | | 1.77 | | | | (3.55 | ) | | | 80.53 | | | $ | 109,127 | |
CLASS R4 SHARES | | | | | | | | | | | | | | | | | | | | | | | | | | | | | | | | | | | | | | | | | | | | | | | | | | | | | |
2016(b) | | $ | 26.19 | | | | (0.13 | ) | | | 0.12 | | | | (0.01 | ) | | | — | | | | — | | | | — | | | | $26.18 | | | | (0.96 | )(d) | | | 1.40 | (d) | | | 1.40 | (d) | | | 1.92 | (d) | | | (0.04 | ) | | | 59.23 | | | $ | 8,445 | |
2015 | | $ | 26.54 | | | | (0.26 | ) | | | (0.09 | ) | | | (0.35 | ) | | | — | | | | — | | | | — | | | | $26.19 | | | | (0.94 | ) | | | 1.40 | | | | 1.40 | | | | 1.82 | | | | (1.32 | ) | | | 96.02 | | | $ | 9,632 | |
2014 | | $ | 24.44 | | | | (0.28 | ) | | | 2.38 | | | | 2.10 | | | | — | | | | — | | | | — | | | | $26.54 | | | | (1.06 | ) | | | 1.40 | | | | 1.40 | | | | 1.77 | | | | 8.59 | | | | 100.62 | | | $ | 11,306 | |
2013 | | $ | 19.18 | | | | (0.20 | ) | | | 5.46 | | | | 5.26 | | | | — | | | | — | | | | — | | | | $24.44 | | | | (0.96 | ) | | | 1.40 | | | | 1.40 | | | | 1.79 | | | | 27.42 | | | | 91.92 | | | $ | 10,277 | |
2012 | | $ | 13.37 | | | | (0.16 | ) | | | 5.97 | | | | 5.81 | | | | — | | | | — | | | | — | | | | $19.18 | | | | (0.93 | ) | | | 1.40 | | | | 1.40 | | | | 1.78 | | | | 43.46 | | | | 122.93 | | | $ | 9,344 | |
2011 | | $ | 13.84 | | | | (0.14 | ) | | | (0.33 | ) | | | (0.47 | ) | | | — | | | | — | | | | — | | | | $13.37 | | | | (0.91 | ) | | | 1.40 | | | | 1.40 | | | | 1.76 | | | | (3.40 | ) | | | 80.53 | | | $ | 10,423 | |
CLASS R5 SHARES | | | | | | | | | | | | | | | | | | | | | | | | | | | | | | | | | | | | | | | | | | | | | | | | | | | | | |
2016(b) | | $ | 27.61 | | | | (0.08 | ) | | | 0.12 | | | | 0.04 | | | | — | | | | — | | | | — | | | | $27.65 | | | | (0.55 | )(d) | | | 0.99 | (d) | | | 0.99 | (d) | | | 1.31 | (d) | | | 0.14 | | | | 59.23 | | | $ | 40,947 | |
2015 | | $ | 27.87 | | | | (0.16 | ) | | | (0.10 | ) | | | (0.26 | ) | | | — | | | | — | | | | — | | | | $27.61 | | | | (0.54 | ) | | | 0.99 | | | | 0.99 | | | | 1.24 | | | | (0.93 | ) | | | 96.02 | | | $ | 45,126 | |
2014 | | $ | 25.56 | | | | (0.18 | ) | | | 2.49 | | | | 2.31 | | | | — | | | | — | | | | — | | | | $27.87 | | | | (0.65 | ) | | | 0.99 | | | | 0.99 | | | | 1.28 | | | | 9.04 | | | | 100.62 | | | $ | 61,818 | |
2013 | | $ | 19.97 | | | | (0.12 | ) | | | 5.71 | | | | 5.59 | | | | — | | | | — | | | | — | | | | $25.56 | | | | (0.55 | ) | | | 0.99 | | | | 0.99 | | | | 1.12 | | | | 27.99 | | | | 91.92 | | | $ | 62,146 | |
2012 | | $ | 13.86 | | | | (0.09 | ) | | | 6.20 | | | | 6.11 | | | | — | | | | — | | | | — | | | | $19.97 | | | | (0.52 | ) | | | 0.98 | | | | 0.99 | | | | 1.32 | | | | 44.08 | | | | 122.93 | | | $ | 61,411 | |
2011 | | $ | 14.30 | | | | (0.08 | ) | | | (0.36 | ) | | | (0.44 | ) | | | — | | | | — | | | | — | | | | $13.86 | | | | (0.51 | ) | | | 0.99 | | | | 0.99 | | | | 1.22 | | | | (3.08 | ) | | | 80.53 | | | $ | 66,901 | |
| (a) | Not annualized for periods less than one year. |
| (b) | Unaudited Six Month Period Ended March 31. |
| (c) | Sales loads are not reflected in computing total return. |
| + | Based on weighted average shares outstanding. |
See notes to financial statements.
| | | | |
| 22 Semi-Annual Report | | | | Semi-Annual Report 23 |
| | |
| EXPENSE EXAMPLE | | |
| |
Thornburg Core Growth Fund | | March 31, 2016 (Unaudited) |
As a shareholder of the Fund, you incur two types of costs:
| | (1) | transaction costs, including |
(a) sales charges (loads) on purchase payments, for Class A shares;
(b) a deferred sales charge on redemptions of any part or all of a purchase of $1 million of Class A shares within 12 months of purchase;
(c) a deferred sales charge on redemptions of Class C shares within 12 months of purchase;
| | (2) | ongoing costs, including management fees; distribution and/or service (12b-1) fees; and other Fund expenses. |
This example is intended to help you understand your ongoing costs (in dollars) of investing in the Fund and to compare these costs with the ongoing costs of investing in other mutual funds.
The example is based on a $1,000 investment beginning on October 1, 2015, and held until March 31, 2016.
| | | | | | | | | | | | |
| | | BEGINNING
ACCOUNT VALUE
10/1/15 | | | ENDING
ACCOUNT VALUE
3/31/16 | | | EXPENSES PAID
DURING PERIOD†
10/1/15–3/31/16 | |
CLASS A SHARES | | | | | | | | | | | | |
Actual | | $ | 1,000.00 | | | $ | 999.60 | | | $ | 7.09 | |
Hypothetical* | | $ | 1,000.00 | | | $ | 1,017.91 | | | $ | 7.15 | |
CLASS C SHARES | | | | | | | | | | | | |
Actual | | $ | 1,000.00 | | | $ | 995.70 | | | $ | 10.82 | |
Hypothetical* | | $ | 1,000.00 | | | $ | 1,014.16 | | | $ | 10.92 | |
CLASS I SHARES | | | | | | | | | | | | |
Actual | | $ | 1,000.00 | | | $ | 1,001.40 | | | $ | 4.95 | |
Hypothetical* | | $ | 1,000.00 | | | $ | 1,020.05 | | | $ | 5.00 | |
CLASS R3 SHARES | | | | | | | | | | | | |
Actual | | $ | 1,000.00 | | | $ | 999.20 | | | $ | 7.50 | |
Hypothetical* | | $ | 1,000.00 | | | $ | 1,017.50 | | | $ | 7.57 | |
CLASS R4 SHARES | | | | | | | | | | | | |
Actual | | $ | 1,000.00 | | | $ | 999.60 | | | $ | 7.00 | |
Hypothetical* | | $ | 1,000.00 | | | $ | 1,018.00 | | | $ | 7.06 | |
CLASS R5 SHARES | | | | | | | | | | | | |
Actual | | $ | 1,000.00 | | | $ | 1,001.40 | | | $ | 4.95 | |
Hypothetical* | | $ | 1,000.00 | | | $ | 1,020.05 | | | $ | 5.00 | |
| † | Expenses are equal to the annualized expense ratio for each class (A: 1.42%; C: 2.17%; I: 0.99%; R3: 1.50%; R4: 1.40%; R5: 0.99%) multiplied by the average account value over the period, multiplied by 183/366 to reflect the one-half year period. |
| * | Hypothetical assumes a rate of return of 5% per year before expenses. |
ACTUAL EXPENSES
For each class of shares, the first line of the accompanying table provides information about actual account values and actual expenses. You may use the information in this line, together with the amount you invested, to estimate the expenses that you paid over the period. Simply divide your account value by $1,000 (for example, an $8,600 account value divided by $1,000 = 8.6), then multiply the result by the number in the first line for your class of shares under the heading entitled “Expenses Paid During Period” to estimate the expenses you paid on your account during this period.
HYPOTHETICAL EXAMPLE FOR COMPARISON PURPOSES
For each class of shares, the second line of the accompanying table provides information about hypothetical account values and hypothetical expenses based on the Fund’s actual expense ratio and an assumed rate of return of 5% per year before expenses, which is not the Fund’s actual return. The hypothetical account values and expenses may not be used to estimate the actual ending account balance or expenses you paid for the period. You may use this information to compare the ongoing costs of investing in the Fund and other funds. To do so, compare this 5% hypothetical example with the 5% hypothetical examples that appear in the shareholder reports of the other funds.
Please note that the expenses shown in the table are meant to highlight your ongoing costs only and do not reflect any transactional costs, such as sales charges (loads), redemption fees, or exchange fees. Therefore, the second line of the table for each class of shares is useful in comparing ongoing costs only, and will not help you determine the relative total costs of owning different funds. In addition, if these transactional costs were included, your costs would have been higher.
24 Semi-Annual Report
| | |
| OTHER INFORMATION | | |
| |
Thornburg Core Growth Fund | | March 31, 2016 (Unaudited) |
PORTFOLIO PROXY VOTING
Policies and Procedures:
The Trust has delegated to Thornburg Investment Management, Inc. (the “Advisor”) voting decisions respecting proxies for the Fund’s voting securities. The Advisor makes voting decisions in accordance with its Proxy Voting Policy and Procedures. A description of the Policy and Procedures is available (i) without charge, upon request, by calling the Advisor toll-free at 1-800-847-0200, (ii) on the Thornburg website at www.thornburg.com, and (iii) on the Securities and Exchange Commission’s website at www.sec.gov.
Information regarding how proxies were voted is available on or before August 31 of each year for the twelve months ending the preceding June 30. This information is available (i) without charge, upon request by calling the Advisor toll-free at 1-800-847-0200, (ii) on the Thornburg website at www.thornburg.com, and (iii) on the Securities and Exchange Commission’s website at www.sec.gov.
AVAILABILITY OF QUARTERLY PORTFOLIO SCHEDULE
The Fund files with the Securities and Exchange Commission schedules of its portfolio holdings on Form N-Q for the first and third quarters of each fiscal year. The Fund’s Forms N-Q are available on the Commission’s website at www.sec.gov, or may be reviewed and copied at the Commission’s Public Reference Room in Washington, D.C. Information on the operation of the Public Reference Room may be obtained by calling 1-800-SEC-0330. The Fund also makes this information available on its website at www.thornburg. com/download or upon request by calling 1-800-847-0200.
Semi-Annual Report 25
TRUSTEES’ STATEMENT TO SHAREHOLDERS
Revised and Readopted September 15, 2015
The Trustees believe current and prospective shareholders should know how we discharge our responsibilities in supervising the Funds’ investment advisor and in reviewing the advisor’s contract for renewal. Since 2005, we have issued a statement which sets out clearly the three principal guidelines that we follow in supervising the Trust’s investment advisor on your behalf. In accordance with our customary practice, in September of 2015 we again reviewed our statement and concluded we should reissue this statement outlining the principal features of our supervision of the advisor’s performance of investment management services for the Funds.
We begin with the premise that each shareholder selected his or her Fund because its investments are managed by the investment advisor identified in the prospectus and in accordance with the objective and policies described in the prospectus. We realize, as each of you do, that if you believe that your Fund’s stated objective and policies no longer serve your personal investment goals, you can sell your shares and leave the Fund.
Therefore, we believe that our primary supervisory task—our principal obligation to you—is to assess the nature and quality of the advisor’s services, and to confirm that the advisor actively and competently pursues the Fund’s objective, in accordance with the policies set out in the prospectus. To do this, we meet regularly with management to review your Fund’s portfolio and to discuss the advisor’s specific actions and judgments in pursuing the Fund’s objective. We do not substitute our own judgment for the advisor’s decisions in selecting investments; the advisor is paid to exercise its informed judgment on investment decisions, and we seek to confirm, in reviewing the advisor’s performance, that the advisor is doing just that.
Second, we are conscious of costs and the effect that costs have on shareholders’ returns. We try to make sure that your Fund’s fees and costs are reasonable in relationship to the services rendered and that they are generally in line with those charged by other expert investment advisors, consistent with our belief that the Fund’s investors searched for and expect that expertise and attention and have decided to pay a reasonable price for it. We do not put the management contract “out to bid” as a matter of course, and we would not do so unless we had concluded that the advisor materially had failed to pursue the Fund’s objectives in accordance with its policies, or for other equally important reasons. We believe that any other approach would be inconsistent with your interests and contrary to your expectations when you bought shares of the Fund in the first place.
Finally, because we believe that most Thornburg Fund shareholders have invested with a long-term perspective, we try not to focus too much on the fashions of the moment and on short-term performance. The market will not favor any specific investment objective or set of policies at all times and under all economic circumstances. A fund will experience periods of both high and low returns relative to other funds and other investments. Even if one of our Funds is not favored by the market at a particular time, we believe that the advisor is nonetheless obliged to remain true to the Fund’s objective and policies, and we watch to see that it does so.
Trustees of Thornburg Investment Trust
26 Semi-Annual Report
THORNBURG FUND FAMILY
Thornburg Investment Management is a privately-owned global investment firm that offers a range of solutions for retail and institutional investors. Founded in 1982 and headquartered in Santa Fe, New Mexico, we manage approximately $54 billion (as of March 31, 2016) across eight equity and 11 bond mutual funds, separate accounts for high-net-worth investors and institutional accounts, and five UCITS funds for non-U.S. investors.
The fund outlined in this report is one of many equity and fixed-income products available from Thornburg Investment Management.
Equity Funds
| | • | | Thornburg Core Growth Fund |
| | • | | Thornburg International Value Fund |
| | • | | Thornburg Better World International Fund |
| | • | | Thornburg International Growth Fund |
| | • | | Thornburg Developing World Fund |
| | • | | Thornburg Investment Income Builder Fund |
| | • | | Thornburg Global Opportunities Fund |
Fixed Income Funds
| | • | | Thornburg Low Duration Income Fund |
| | • | | Thornburg Limited Term U.S. Government Fund |
| | • | | Thornburg Limited Term Income Fund |
| | • | | Thornburg Strategic Income Fund |
| | • | | Thornburg Low Duration Municipal Fund |
| | • | | Thornburg Limited Term Municipal Fund |
| | • | | Thornburg Intermediate Municipal Fund |
| | • | | Thornburg California Limited Term Municipal Fund |
| | • | | Thornburg New Mexico Intermediate Municipal Fund |
| | • | | Thornburg New York Intermediate Municipal Fund |
| | • | | Thornburg Strategic Municipal Income Fund |
Before investing, carefully consider the Fund’s investment goals, risks, charges, and expenses. For a prospectus or summary prospectus containing this and other information, contact your financial advisor or visit thornburg.com. Read it carefully before investing.
For additional information, please visit thornburg.com
Thornburg Investment Management, Inc. 2300 North Ridgetop Road, Santa Fe, NM 87506
Semi-Annual Report 27

This Semi-Annual Report is submitted for the general information of shareholders of the Fund. It is not authorized for distribution to prospective investors in the Fund unless preceded or accompanied by an effective prospectus.
| | | | |
| Investment Advisor: | | Distributor: | | |
| Thornburg Investment Management® | | Thornburg Securities Corporation® | | |
| 800.847.0200 | | 800.847.0200 | | TH180 |
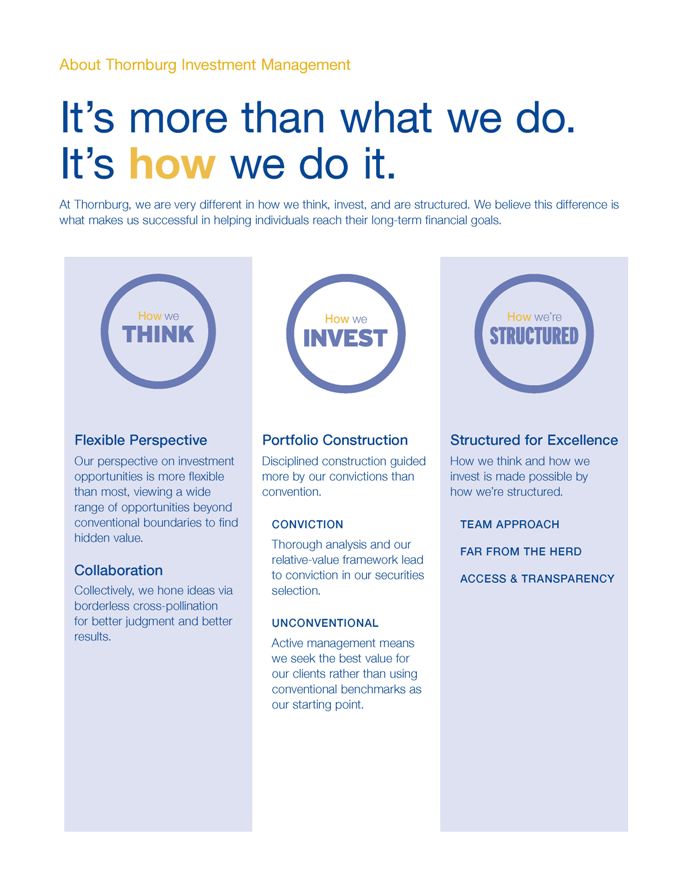
Semi-Annual Report
Thornburg International Growth Fund
March 31, 2016
| | | | |
SHARE CLASS | | NASDAQ SYMBOL | | CUSIP |
Class A | | TIGAX | | 885-215-319 |
Class C | | TIGCX | | 885-215-293 |
Class I | | TINGX | | 885-215-244 |
Class R3 | | TIGVX | | 885-215-178 |
Class R4 | | TINVX | | 885-215-160 |
Class R5 | | TINFX | | 885-215-152 |
Class R6 | | THGIX | | 885-216-820 |
Class I, R3, R4, R5, and R6 shares may not be available to all investors. Minimum investments for Class I shares may be higher than those for other classes.
Investments carry risks, including possible loss of principal. Additional risks may be associated with investments outside the United States, especially in emerging markets, including currency fluctuations, illiquidity, volatility, and political and economic risks. Investments in small- and mid-capitalization companies may increase the risk of greater price fluctuations. Please see the Fund’s prospectus for a discussion of the risks associated with an investment in the Fund. Investments in the Fund are not FDIC insured, nor are they bank deposits or guaranteed by a bank or any other entity.
Semi-Annual Report 3
LETTER TO SHAREHOLDERS
| | |
| |
Thornburg International Growth Fund | | March 31, 2016 (Unaudited) |
April 18, 2016
Dear Fellow Shareholder:
For the six months ended March 31, 2016, Thornburg International Growth Fund produced returns marginally behind its benchmark. The Fund’s Class A shares returned 4.22% (without sales charge) compared to 4.65% for the MSCI All Country (AC) World ex-U.S. Growth Index. On September 30, 2015, the net asset value (NAV) for the Class A shares was $17.77. On March 31, 2016 the NAV of the Class A shares was $18.52.
Those headline return numbers fail to capture the significant recent volatility. As a reminder, the six-month period started just after a short but severe pullback in global equities. Starting late September 2015, soon after the period began, equity markets rebounded strongly. However, that rebound was short lived as markets rolled over again starting in late 2015 and into early 2016. In February 2016, markets bottomed and managed a strong finish to the period ended March 31, 2016. To summarize, in an eight-month period we experienced two steep corrections followed by sharp rebounds. It is worth noting that while Europe and Asia participated in both rebounds, those equity markets remain well below highs, while the U.S. declined less and rebounded more.
A number of factors caused the volatility, including: a recession in U.S. manufacturing; further weakening of the Chinese economy; continued pressure on commodity prices, including oil; a broad lack of inflation; and central banks reaching the limits of unconventional policy tools.
Digging more closely into performance, the Fund performed particularly well in information technology and consumer discretionary, two broad areas we tend to overweight due to the number of interesting growth companies in those spaces. The Fund lagged in health care and financials, where a few stocks performed poorly, dragging down results for the respective industries.
Contributors and Detractors
Some individual names that positively contributed to performance were Paysafe; REA Group; Galaxy Entertainment; Mobileye; and Edenred.
Paysafe – Paysafe (formerly Optimal Payments) is an online payments processor and mobile wallet operator. Investors have been growing more comfortable with the recent large acquisition of main competitor Skrill. Even after the stock move, the company continues to trade at a meaningful discount to global payment peers.
REA Group – REA Group is the dominant online real estate portal in Australia. This is a network effect business model, where one company tends to dominate with the most traffic and listings. The stock rebounded during the period as concerns surrounding the competitive environment eased.
Galaxy – Galaxy operates casinos in Macau. After a long period of weak results due to the ongoing corruption crack-down in China, we have recently started to see a stabilization in traffic and gaming revenues, leading to a substantial rebound in the stock price.
Mobileye – Mobileye is the leading vision-based active safety software provider for passenger vehicles (think automatic braking, etc.). Mobileye stock has been depressed by concerns over increasing competition in the semi-autonomous driving space. We believed the selloff was overdone and bought the stock during the period based on our belief that Mobileye’s growth prospects and competitive position were intact. Shares rallied after reporting strong fourth-quarter earnings and announcing several key original manufacturing wins.
Edenred – Edenred mainly offers employee benefit and expense management solutions. It essentially operates a closed loop payment network allowing companies to better manage costs, governments to better track employment, and companies to offer more attractive perquisites. A large portion of the business is in Latin America, specifically Brazil. Recently, the stock has been volatile on both the upside and downside along with the political turmoil in Brazil.
Detractors to performance during the period include Foxtons; Nomura; Concordia Healthcare; Whitbread; and Valeant Pharmaceuticals.
Foxtons – Foxtons is a real estate brokerage focused on the London housing market. Real estate transactions in the U.K. have been depressed due to changes in real estate taxation and increased political fears, mainly from Brexit, the potential for Britain to exit the European Union.
Nomura – Nomura is a Japan-based financial services group and bank. A combination of a disappointing earnings report and recent central bank policy actions that are dilutive to earnings power led us to exit the position.
Concordia Healthcare – Concordia is a small Canadian pharmaceutical company. Stocks across the entire pharmaceutical and biotechnology space came under pressure during the period. A focus on drug pricing tactics and financial leverage has pressured valuations in the group. We believe the current concerns leave Concordia greatly undervalued.
Whitbread – Whitbread is the leading budget hotel and coffee shop operator in the U.K. Whitbread reported two consecutive
4 Semi-Annual Report
LETTER TO SHAREHOLDERS,
CONTINUED
| | |
Thornburg International Growth Fund | | March 31, 2016 (Unaudited) |
periods of soft earnings, highlighting incremental weakness in both its hotel and coffee businesses. We exited the position due to deteriorating fundamentals and worsening macroeconomic trends.
Valeant – Valeant Pharmaceuticals International, Inc. is a multi-national specialty pharmaceutical and medical device company headquartered in Quebec, Canada. The company came under fire for its drug pricing practices and use of a specialty pharmacy. Given the uncertainty around the business outlook and high debt levels, we exited the position early in the period.
Market volatility and pullbacks can be hard on investor psyches. But they also provide opportunities. We have been able to purchase a number of new names and add to existing holdings at more attractive valuations. We hope many of those stocks will go on to drive performance in future periods. As always, we will continue to seek out promising growth companies at what we view as reasonable valuations.
Thank you for investing alongside us in Thornburg International Growth Fund.
Sincerely,
| | | | |
 | |  | | |
| Greg Dunn | | Tim Cunningham, CFA | | |
| Managing Director | | Managing Director | | |
| Portfolio Manager | | Portfolio Manager | | |
The matters discussed in this report may constitute forward-looking statements made pursuant to the safe harbor provisions of the Securities Litigation Reform Act of 1995. These include any advisor or portfolio manager prediction, assessment, analysis or outlook for individual securities, industries, investment styles, market sectors and/or markets. These statements involve risks and uncertainties. In addition to the general risks described for each fund in its current prospectus, other factors bearing on these reports include the accuracy of the advisor’s or portfolio manager’s forecasts and predictions, the appropriateness of the investment strategies designed by the advisor or portfolio manager and the ability of the advisor or portfolio manager to implement their strategies efficiently and successfully. Any one or more of these factors, as well as other risks affecting the securities markets generally, could cause the actual results of any fund to differ materially as compared to its benchmarks.
The views expressed by the portfolio managers reflect their professional opinions and are subject to change. Under no circumstances does the information contained within represent a recommendation to buy or sell any security.
Semi-Annual Report 5
PERFORMANCE SUMMARY
| | |
Thornburg International Growth Fund | | March 31, 2016 (Unaudited) |
Average Annual Total Returns
| | | | | | | | | | | | | | | | |
| | | 1 YR | | | 3 YRS | | | 5 YRS | | | SINCE
INCEP. | |
Class A Shares (Incep: 2/1/07) | | | | | | | | | | | | | | | | |
Without sales charge | | | -1.91 | % | | | 3.49 | % | | | 6.89 | % | | | 6.38 | % |
With sales charge | | | -6.32 | % | | | 1.92 | % | | | 5.91 | % | | | 5.85 | % |
Class C Shares (Incep: 2/1/07) | | | | | | | | | | | | | | | | |
Without sales charge | | | -2.70 | % | | | 2.70 | % | | | 6.07 | % | | | 5.64 | % |
With sales charge | | | -3.67 | % | | | 2.70 | % | | | 6.07 | % | | | 5.64 | % |
Class I Shares (Incep: 2/1/07) | | | -1.51 | % | | | 3.89 | % | | | 7.36 | % | | | 6.94 | % |
Class R3 Shares (Incep: 2/1/08) | | | -2.03 | % | | | 3.36 | % | | | 6.80 | % | | | 4.87 | % |
Class R4 Shares (Incep: 2/1/08) | | | -1.92 | % | | | 3.47 | % | | | 6.96 | % | | | 4.98 | % |
Class R5 Shares (Incep: 2/1/08) | | | -1.51 | % | | | 3.88 | % | | | 7.36 | % | | | 5.40 | % |
Class R6 Shares (Incep: 2/1/13) | | | -1.41 | % | | | 3.97 | % | | | — | | | | 5.52 | % |
MSCI AC World ex-U.S. Growth Index (Since 2/1/07) | | | -6.08 | % | | | 1.92 | % | | | 1.60 | % | | | 1.40 | % |
Growth of a Hypothetical $10,000 Investment
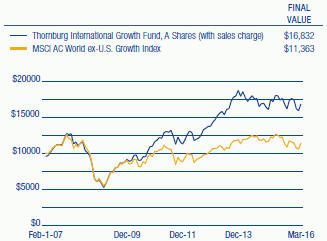
Performance data shown represents past performance and is no guarantee of future results. Investment return and principal value will fluctuate so shares, when redeemed, may be worth more or less than their original cost. Current performance may be lower or higher than quoted. For performance current to the most recent month end, visit thornburg.com or call 800-847-0200. The performance information does not reflect the deduction of taxes that a shareholder would pay on distributions or the redemption of Fund shares. Returns reflect the reinvestment of dividends and capital gains. Class A shares are sold with a maximum sales charge of 4.50%. Class C shares are subject to a 1% CDSC for the first year only. There is no sales charge for Class I, R3, R4, R5, and R6 shares.
As disclosed in the most recent prospectus, the total annual fund operating expenses are as follows: A shares, 1.42%; C shares, 2.20%; I shares, 1.01%; R3 shares, 1.98%; R4 shares, 1.65%; R5 shares, 1.20%; R6 shares, 1.43%. Thornburg Investment Management and/or Thornburg Securities Corporation have contractually agreed to waive fees and reimburse expenses through at least February 1, 2017, for some of the share classes, resulting in net expense ratios of the following: I shares, 0.99%; R3 shares, 1.50%; R4 shares, 1.40%; R5 shares, 0.99%; R6 shares, 0.89%. For more detailed information on fund expenses and waivers/reimbursements please see the Fund’s prospectus.
From time to time, the Fund may invest in shares of companies through initial public offerings (IPOs). IPOs have the potential to produce substantial gains for the Fund. There is no assurance that the Fund will have continued access to profitable IPOs and, as the Fund’s assets grow, the impact of IPO investments may decline. Therefore, investors should not rely on these past gains as an indication of future performance.
Glossary
MSCI All Country (AC) World ex-U.S. Growth Index – A market capitalization weighted index that includes growth companies in developed and emerging markets throughout the world, excluding the United States.
Unless otherwise noted, index returns reflect the reinvestment of income dividends and capital gains, if any, but do not reflect fees, brokerage commissions or other expenses of investing. Investors may not make direct investments into any index. The performance of any index is not indicative of the performance of any particular investment.
6 Semi-Annual Report
FUND SUMMARY
| | |
Thornburg International Growth Fund | | March 31, 2016 (Unaudited) |
OBJECTIVES AND STRATEGIES
The Fund seeks long-term growth of capital by investing in equity securities selected for their growth potential.
The Fund normally invests at least 75% of its assets in foreign securities or depositary receipts of foreign securities. However, the Fund may own a variety of securities, including domestic equity securities, partnership interests, and debt obligations. The Fund may also invest in developing countries and in smaller companies with market capitalizations of less than $500 million.
Market Capitalization Exposure
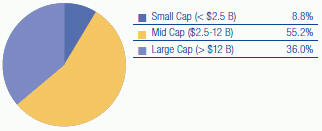
Basket Structure
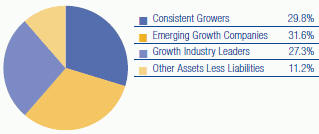
Top Ten Equity Holdings
| | | | |
Wirecard AG | | | 3.1 | % |
Paysafe Group plc | | | 2.8 | % |
REA Group Ltd. | | | 2.7 | % |
MasterCard, Inc. | | | 2.6 | % |
Constellation Software, Inc. | | | 2.5 | % |
Perrigo Co. plc | | | 2.5 | % |
Edenred | | | 2.3 | % |
Schroders plc | | | 2.3 | % |
St. James’s Place plc | | | 2.3 | % |
Japan Exchange Group, Inc. | | | 2.3 | % |
There is no guarantee that the Fund will meet its investment objectives.
All portfolio information is subject to change. Charts may not add up to 100% due to rounding.
Sector Exposure
| | | | |
Information Technology | | | 23.4 | % |
Financials | | | 20.4 | % |
Consumer Discretionary | | | 18.3 | % |
Consumer Staples | | | 9.5 | % |
Health Care | | | 8.3 | % |
Industrials | | | 6.1 | % |
Materials | | | 1.6 | % |
Energy | | | 1.1 | % |
Other Assets Less Liabilities | | | 11.2 | % |
| |
| Top Ten Industry Groups | | | | |
| |
Software & Services | | | 19.8 | % |
Diversified Financials | | | 13.6 | % |
Retailing | | | 10.9 | % |
Pharmaceuticals, Biotechnology & Life Sciences | | | 8.3 | % |
Food, Beverage & Tobacco | | | 7.9 | % |
Commercial & Professional Services | | | 5.6 | % |
Media | | | 2.7 | % |
Banks | | | 2.6 | % |
Consumer Services | | | 2.6 | % |
Insurance | | | 2.3 | % |
| |
Country Exposure* | | | | |
(percent of equity holdings) | | | | |
| |
United Kingdom | | | 19.2 | % |
France | | | 10.3 | % |
Germany | | | 7.3 | % |
China | | | 7.1 | % |
United States | | | 6.9 | % |
Switzerland | | | 6.4 | % |
Ireland | | | 6.1 | % |
Canada | | | 5.2 | % |
Japan | | | 4.4 | % |
Mexico | | | 4.3 | % |
India | | | 3.3 | % |
Australia | | | 3.0 | % |
Netherlands | | | 3.0 | % |
Spain | | | 2.3 | % |
Sweden | | | 2.1 | % |
Costa Rica | | | 1.8 | % |
Denmark | | | 1.8 | % |
Italy | | | 1.7 | % |
Argentina | | | 1.5 | % |
Taiwan | | | 1.3 | % |
Turkey | | | 1.2 | % |
| * | The country assignment of each equity holding is determined by the Fund’s Advisor based on various factors, including the location of the issuer’s head office, the issuer’s jurisdiction of incorporation and the country from which a majority of the issuer’s revenue is derived. |
Semi-Annual Report 7
| | |
SCHEDULE OF INVESTMENTS | | |
| |
Thornburg International Growth Fund | | March 31, 2016 (Unaudited) |
| | | | | | | | |
| | | SHARES/
PRINCIPAL AMOUNT | | | VALUE | |
COMMON STOCK — 88.76% | | | | | | | | |
| | |
BANKS — 2.62% | | | | | | | | |
Banks — 1.16% | | | | | | | | |
ING Groep N.V. | | | 1,549,332 | | | $ | 18,740,526 | |
Thrifts & Mortgage Finance — 1.46% | | | | | | | | |
Housing Development Finance Corp. Ltd. | | | 1,405,800 | | | | 23,499,877 | |
| | | | | | | | |
| | | | | | | 42,240,403 | |
| | | | | | | | |
| | |
CAPITAL GOODS — 0.52% | | | | | | | | |
Machinery — 0.52% | | | | | | | | |
a Arcam AB | | | 387,441 | | | | 8,375,684 | |
| | | | | | | | |
| | | | | | | 8,375,684 | |
| | | | | | | | |
| | |
COMMERCIAL & PROFESSIONAL SERVICES — 5.59% | | | | | | | | |
Commercial Services & Supplies — 2.32% | | | | | | | | |
Edenred | | | 1,925,777 | | | | 37,406,195 | |
Professional Services — 3.27% | | | | | | | | |
Experian plc | | | 909,100 | | | | 16,255,892 | |
SGS S.A. | | | 17,337 | | | | 36,637,496 | |
| | | | | | | | |
| | | | | | | 90,299,583 | |
| | | | | | | | |
| | |
CONSUMER DURABLES & APPAREL — 2.11% | | | | | | | | |
Textiles, Apparel & Luxury Goods — 2.11% | | | | | | | | |
Eclat Textile Co. Ltd. | | | 1,363,952 | | | | 17,947,852 | |
Gildan Activewear, Inc. | | | 530,525 | | | | 16,186,318 | |
| | | | | | | | |
| | | | | | | 34,134,170 | |
| | | | | | | | |
| | |
CONSUMER SERVICES — 2.61% | | | | | | | | |
Hotels, Restaurants & Leisure — 2.61% | | | | | | | | |
Galaxy Entertainment Group Ltd. | | | 5,920,500 | | | | 22,171,299 | |
Sands China Ltd. | | | 4,921,600 | | | | 20,016,691 | |
| | | | | | | | |
| | | | | | | 42,187,990 | |
| | | | | | | | |
| | |
DIVERSIFIED FINANCIALS — 13.57% | | | | | | | | |
Capital Markets — 8.34% | | | | | | | | |
Hargreaves Lansdown plc | | | 824,742 | | | | 15,920,151 | |
Partners Group Holding AG | | | 89,458 | | | | 35,958,106 | |
Schroders plc | | | 967,685 | | | | 37,289,322 | |
UBS Group AG | | | 1,191,420 | | | | 19,193,069 | |
WisdomTree Investments, Inc. | | | 2,304,337 | | | | 26,338,572 | |
Consumer Finance — 1.58% | | | | | | | | |
First Cash Financial Services, Inc. | | | 554,185 | | | | 25,525,761 | |
Diversified Financial Services — 3.65% | | | | | | | | |
Investment AB Kinnevik | | | 777,837 | | | | 22,065,822 | |
Japan Exchange Group, Inc. | | | 2,408,713 | | | | 36,897,430 | |
| | | | | | | | |
| | | | | | | 219,188,233 | |
| | | | | | | | |
| | |
ENERGY — 1.09% | | | | | | | | |
Oil, Gas & Consumable Fuels — 1.09% | | | | | | | | |
Total SA | | | 385,728 | | | | 17,583,128 | |
| | | | | | | | |
| | | | | | | 17,583,128 | |
| | | | | | | | |
| | |
FOOD & STAPLES RETAILING — 1.61% | | | | | | | | |
Food & Staples Retailing — 1.61% | | | | | | | | |
PriceSmart, Inc. | | | 307,463 | | | | 26,005,221 | |
| | | | | | | | |
| | | | | | | 26,005,221 | |
| | | | | | | | |
| | |
FOOD, BEVERAGE & TOBACCO — 7.88% | | | | | | | | |
Beverages — 6.39% | | | | | | | | |
Coca Cola Icecek AS | | | 1,194,684 | | | | 17,416,999 | |
Fomento Economico Mexicano SAB de CV ADR | | | 377,858 | | | | 36,391,504 | |
Pernod Ricard SA | | | 297,331 | | | | 33,156,623 | |
Remy Cointreau SA | | | 214,276 | | | | 16,267,978 | |
Tobacco — 1.49% | | | | | | | | |
ITC Ltd. | | | 4,859,401 | | | | 24,031,920 | |
| | | | | | | | |
| | | | | | | 127,265,024 | |
| | | | | | | | |
| | |
INSURANCE — 2.30% | | | | | | | | |
Insurance — 2.30% | | | | | | | | |
St. James’s Place plc | | | 2,820,423 | | | | 37,206,876 | |
| | | | | | | | |
| | | | | | | 37,206,876 | |
| | | | | | | | |
8 Semi-Annual Report
| | |
| SCHEDULE OF INVESTMENTS, CONTINUED | | |
| |
Thornburg International Growth Fund | | March 31, 2016 (Unaudited) |
| | | | | | | | |
| | | SHARES/
PRINCIPAL AMOUNT | | | VALUE | |
MATERIALS — 1.57% | | | | | | | | |
Chemicals — 1.57% | | | | | | | | |
Novozymes AS | | | 564,000 | | | $ | 25,355,669 | |
| | | | | | | | |
| | | | | | | 25,355,669 | |
| | | | | | | | |
| | |
MEDIA — 2.67% | | | | | | | | |
Media — 2.67% | | | | | | | | |
REA Group Ltd. | | | 1,042,727 | | | | 43,186,319 | |
| | | | | | | | |
| | | | | | | 43,186,319 | |
| | | | | | | | |
| | |
PHARMACEUTICALS, BIOTECHNOLOGY & LIFE SCIENCES — 8.34% | | | | | | | | |
Biotechnology — 2.05% | | | | | | | | |
Grifols S.A. | | | 1,482,756 | | | | 33,019,047 | |
Life Sciences Tools & Services — 0.94% | | | | | | | | |
Eurofins Scientific | | | 41,382 | | | | 15,179,001 | |
Pharmaceuticals — 5.35% | | | | | | | | |
a Allergan plc | | | 110,137 | | | | 29,520,020 | |
Concordia Healthcare Corp. | | | 666,664 | | | | 17,062,492 | |
Perrigo Co. plc | | | 311,788 | | | | 39,887,039 | |
| | | | | | | | |
| | | | | | | 134,667,599 | |
| | | | | | | | |
| | |
REAL ESTATE — 1.89% | | | | | | | | |
Real Estate Management & Development — 1.89% | | | | | | | | |
Foxtons Group plc | | | 13,082,222 | | | | 30,579,636 | |
| | | | | | | | |
| | | | | | | 30,579,636 | |
| | | | | | | | |
| | |
RETAILING — 10.94% | | | | | | | | |
Internet & Catalog Retail — 9.69% | | | | | | | | |
a ASOS plc | | | 266,604 | | | | 12,444,568 | |
a Ctrip.com International, Ltd. ADR | | | 549,518 | | | | 24,321,667 | |
a JD.com, Inc. ADR | | | 315,333 | | | | 8,356,324 | |
a priceline.com, Inc. | | | 23,723 | | | | 30,577,998 | |
Rakuten, Inc. | | | 2,665,400 | | | | 25,707,865 | |
a Vipshop Holdings Ltd. ADR | | | 725,600 | | | | 9,345,728 | |
a YOOX S.p.A | | | 774,384 | | | | 23,765,193 | |
a Zalando SE | | | 670,393 | | | | 22,007,936 | |
Multiline Retail — 1.25% | | | | | | | | |
B&M European Value Retail S.A. | | | 5,308,169 | | | | 20,233,707 | |
| | | | | | | | |
| | | | | | | 176,760,986 | |
| | | | | | | | |
| | |
SEMICONDUCTORS & SEMICONDUCTOR EQUIPMENT — 1.91% | | | | | | | | |
Semiconductors & Semiconductor Equipment — 1.91% | | | | | | | | |
ARM Holdings plc | | | 2,119,462 | | | | 30,866,927 | |
| | | | | | | | |
| | | | | | | 30,866,927 | |
| | | | | | | | |
| | |
SOFTWARE & SERVICES — 19.80% | | | | | | | | |
Information Technology Services — 9.32% | | | | | | | | |
MasterCard, Inc. | | | 448,947 | | | | 42,425,491 | |
a Paysafe Group plc | | | 7,491,788 | | | | 45,590,436 | |
Wirecard AG | | | 1,333,986 | | | | 50,547,482 | |
a Worldpay Group plc | | | 3,029,400 | | | | 11,969,528 | |
Internet Software & Services — 5.31% | | | | | | | | |
a Baidu, Inc. ADR | | | 44,327 | | | | 8,461,138 | |
MercadoLibre, Inc. | | | 176,428 | | | | 20,792,040 | |
Rightmove plc | | | 272,090 | | | | 16,456,127 | |
a Rocket Internet SE | | | 1,126,305 | | | | 31,540,723 | |
Tencent Holdings Ltd. | | | 421,889 | | | | 8,620,135 | |
Software — 5.17% | | | | | | | | |
Constellation Software, Inc. | | | 100,561 | | | | 41,176,003 | |
a Fleetmatics Group plc | | | 440,657 | | | | 17,939,147 | |
a Mobileye N.V. | | | 653,279 | | | | 24,360,774 | |
| | | | | | | | |
| | | | | | | 319,879,024 | |
| | | | | | | | |
| | |
TECHNOLOGY HARDWARE & EQUIPMENT — 1.74% | | | | | | | | |
Electronic Equipment, Instruments & Components — 1.74% | | | | | | | | |
Ingenico S.A. | | | 244,210 | | | | 28,052,642 | |
| | | | | | | | |
| | | | | | | 28,052,642 | |
| | | | | | | | |
TOTAL COMMON STOCK (Cost $1,319,110,715) | | | | | | | 1,433,835,114 | |
| | | | | | | | |
Semi-Annual Report 9
| | |
| SCHEDULE OF INVESTMENTS, CONTINUED | | |
| |
Thornburg International Growth Fund | | March 31, 2016 (Unaudited) |
| | | | | | | | |
| | | SHARES/
PRINCIPAL AMOUNT | | | VALUE | |
SHORT TERM INVESTMENTS — 10.06% | | | | | | | | |
b Thornburg Capital Management Fund | | | 16,259,541 | | | $ | 162,595,408 | |
| | | | | | | | |
TOTAL SHORT TERM INVESTMENTS (Cost $162,595,408) | | | | | | | 162,595,408 | |
| | | | | | | | |
TOTAL INVESTMENTS — 98.82% (Cost $1,481,706,123) | | | | | | $ | 1,596,430,522 | |
OTHER ASSETS LESS LIABILITIES — 1.18% | | | | | | | 19,058,861 | |
| | | | | | | | |
NET ASSETS — 100.00% | | | | | | $ | 1,615,489,383 | |
| | | | | | | | |
Footnote Legend
| b | Investment in Affiliates – Shown below are holdings of voting securities of each portfolio company which is considered “affiliated” to the Fund under the Investment Company Act of 1940, including companies for which the Fund’s holding represented 5% or more of the company’s voting securities, and a series of the Thornburg Investment Trust in which the Fund invested for cash management purposes during the period: |
| | | | | | | | | | | | | | | | | | | | | | | | | | | | |
ISSUER | | SHARES/PRINCIPAL
SEPTEMBER 30,
2015 | | | GROSS
ADDITIONS | | | GROSS
REDUCTIONS | | | SHARES/PRINCIPAL
MARCH 31,
2016 | | | MARKET
VALUE
MARCH 31,
2016 | | | INVESTMENT
INCOME | | | REALIZED
GAIN (LOSS) | |
Thornburg Capital Management Fund | | | 11,457,937 | | | | 54,015,065 | | | | 49,213,461 | | | | 16,259,541 | | | $ | 162,595,408 | | | $ | 250,447 | | | $ | — | |
| | | | | | | | | | | | | | | | | | | | | | | | | | | | |
Total non-controlled affiliated issuers – 10.06% of net assets | | | $ | 162,595,408 | | | $ | 250,447 | | | $ | — | |
| | | | | | | | | | | | | | | | | | | | | | | | | | | | |
Portfolio Abbreviations
To simplify the listings of securities, abbreviations are used per the table below:
| ADR | American Depositary Receipt |
See notes to financial statements.
10 Semi-Annual Report
This page intentionally left blank.
Semi-Annual Report 11
| | |
| STATEMENT OF ASSETS AND LIABILITIES | | |
| |
Thornburg International Growth Fund | | March 31, 2016, (Unaudited) |
| | | | |
ASSETS | | | | |
Investments at value (cost $1,481,706,123) (Note 2) | | $ | 1,596,430,522 | |
Cash | | | 55,919 | |
Cash denominated in foreign currency (cost $92,462) | | | 92,394 | |
Receivable for investments sold | | | 11,892,921 | |
Receivable for fund shares sold | | | 12,724,830 | |
Unrealized appreciation on forward currency contracts (Note 7) | | | 90,431 | |
Dividends receivable | | | 1,874,043 | |
Dividend and interest reclaim receivable | | | 1,016,831 | |
Prepaid expenses and other assets | | | 101,687 | |
| | | | |
Total Assets | | | 1,624,279,578 | |
| | | | |
| |
LIABILITIES | | | | |
Payable for investments purchased | | | 57,109 | |
Payable for fund shares redeemed | | | 3,201,734 | |
Unrealized depreciation on forward currency contracts (Note 7) | | | 3,776,212 | |
Payable to investment advisor and other affiliates (Note 3) | | | 1,297,314 | |
Accounts payable and accrued expenses | | | 456,509 | |
Dividends payable | | | 1,317 | |
| | | | |
Total Liabilities | | | 8,790,195 | |
| | | | |
| |
NET ASSETS | | $ | 1,615,489,383 | |
| | | | |
NET ASSETS CONSIST OF | | | | |
Net investment income (loss) | | $ | (1,530,961 | ) |
Net unrealized appreciation on investments | | | 111,013,369 | |
Accumulated net realized gain (loss) | | | (44,820,369 | ) |
Net capital paid in on shares of beneficial interest | | | 1,550,827,344 | |
| | | | |
| | $ | 1,615,489,383 | |
| | | | |
12 Semi-Annual Report
| | |
| STATEMENT OF ASSETS AND LIABILITIES, CONTINUED | | |
| |
Thornburg International Growth Fund | | March 31, 2016, (Unaudited) |
| | | | |
NET ASSET VALUE | | | | |
Class A Shares: | | | | |
Net asset value and redemption price per share ($221,896,376 applicable to 11,983,141 shares of beneficial interest outstanding - Note 4) | | $ | 18.52 | |
Maximum sales charge, 4.50% of offering price | | | 0.87 | |
| | | | |
Maximum offering price per share | | $ | 19.39 | |
| | | | |
| |
Class C Shares: | | | | |
Net asset value and offering price per share* ($111,166,880 applicable to 6,298,389 shares of beneficial interest outstanding - Note 4) | | $ | 17.65 | |
| | | | |
| |
Class I Shares: | | | | |
Net asset value, offering and redemption price per share ($1,146,596,444 applicable to 60,379,432 shares of beneficial interest outstanding - Note 4) | | $ | 18.99 | |
| | | | |
| |
Class R3 Shares: | | | | |
Net asset value, offering and redemption price per share ($17,826,465 applicable to 969,621 shares of beneficial interest outstanding - Note 4) | | $ | 18.38 | |
| | | | |
| |
Class R4 Shares: | | | | |
Net asset value, offering and redemption price per share ($42,109,610 applicable to 2,286,514 shares of beneficial interest outstanding - Note 4) | | $ | 18.42 | |
| | | | |
| |
Class R5 Shares: | | | | |
Net asset value, offering and redemption price per share ($70,468,458 applicable to 3,701,423 shares of beneficial interest outstanding - Note 4) | | $ | 19.04 | |
| | | | |
| |
Class R6 Shares: | | | | |
Net asset value, offering and redemption price per share ($5,425,150 applicable to 284,303 shares of beneficial interest outstanding - Note 4) | | $ | 19.08 | |
| | | | |
| * | Redemption price per share is equal to net asset value less any applicable contingent deferred sales charge. |
See notes to financial statements.
Semi-Annual Report 13
| | |
| STATEMENT OF OPERATIONS | | |
| |
Thornburg International Growth Fund | | Six Months Ended March 31, 2016, (Unaudited) |
| | | | |
INVESTMENT INCOME | | | | |
Dividend income (net of foreign taxes withheld of $552,642) | | $ | 7,598,954 | |
| | | | |
| |
EXPENSES | | | | |
Investment advisory fees (Note 3) | | | 6,537,639 | |
Administration fees (Note 3) | | | | |
Class A Shares | | | 143,260 | |
Class C Shares | | | 71,034 | |
Class I Shares | | | 280,653 | |
Class R3 Shares | | | 10,590 | |
Class R4 Shares | | | 25,341 | |
Class R5 Shares | | | 17,299 | |
Distribution and service fees (Note 3) | | | | |
Class A Shares | | | 291,531 | |
Class C Shares | | | 569,525 | |
Class R3 Shares | | | 42,482 | |
Class R4 Shares | | | 50,828 | |
Transfer agent fees | | | | |
Class A Shares | | | 156,608 | |
Class C Shares | | | 81,037 | |
Class I Shares | | | 437,627 | |
Class R3 Shares | | | 35,485 | |
Class R4 Shares | | | 84,301 | |
Class R5 Shares | | | 88,799 | |
Class R6 Shares | | | 1,404 | |
Registration and filing fees | | | | |
Class A Shares | | | 19,165 | |
Class C Shares | | | 10,291 | |
Class I Shares | | | 30,068 | |
Class R3 Shares | | | 9,527 | |
Class R4 Shares | | | 9,486 | |
Class R5 Shares | | | 10,064 | |
Class R6 Shares | | | 11,946 | |
Custodian fees (Note 3) | | | 174,255 | |
Professional fees | | | 43,304 | |
Accounting fees (Note 3) | | | 29,590 | |
Trustee fees | | | 33,395 | |
Other expenses | | | 81,949 | |
| | | | |
Total Expenses | | | 9,388,483 | |
Less: | | | | |
Expenses reimbursed by investment advisor (Note 3) | | | (250,567 | ) |
| | | | |
Net Expenses | | | 9,137,916 | |
| | | | |
Net Investment Loss | | $ | (1,538,962 | ) |
| | | | |
14 Semi-Annual Report
| | |
| STATEMENT OF OPERATIONS, CONTINUED | | |
| |
Thornburg International Growth Fund | | Six Months Ended March 31, 2016, (Unaudited) |
| | | | |
REALIZED AND UNREALIZED GAIN (LOSS) | | | | |
Net realized gain (loss) from: | | | | |
Investments | | $ | (8,337,689 | ) |
Forward currency contracts (Note 7) | | | 405,662 | |
Foreign currency transactions | | | (446,590 | ) |
| | | | |
| | | (8,378,617 | ) |
| | | | |
Net change in unrealized appreciation (depreciation) on: | | | | |
Investments (net of change in deferred taxes payable of $ 1,546) | | | 75,118,966 | |
Forward currency contracts (Note 7) | | | (2,065,565 | ) |
Foreign currency translations | | | 48,200 | |
| | | | |
| | | 73,101,601 | |
| | | | |
Net Realized and Unrealized Gain | | | 64,722,984 | |
| | | | |
Net Increase in Net Assets Resulting from Operations | | $ | 63,184,022 | |
| | | | |
See notes to financial statements.
Semi-Annual Report 15
| | |
| STATEMENTS OF CHANGES IN NET ASSETS | | |
| |
Thornburg International Growth Fund | | |
| | | | | | | | |
| | | SIX MONTHS ENDED
MARCH 31, 2016* | | | YEAR ENDED
SEPTEMBER 30, 2015 | |
INCREASE (DECREASE) IN NET ASSETS FROM | | | | | | | | |
| | |
OPERATIONS | | | | | | | | |
Net investment income (loss) | | $ | (1,538,962 | ) | | $ | 4,470,206 | |
Net realized gain (loss) from investments, forward currency contracts, and foreign currency transactions | | | (8,378,617 | ) | | | 20,219,922 | |
Net unrealized appreciation (depreciation) on investments, foreign currency contracts, foreign currency translations, and deferred taxes | | | 73,101,601 | | | | (56,836,989 | ) |
| | | | | | | | |
Net Increase (Decrease) in Net Assets Resulting from Operations | | | 63,184,022 | | | | (32,146,861 | ) |
| | |
DIVIDENDS TO SHAREHOLDERS | | | | | | | | |
From net investment income | | | | | | | | |
Class I Shares | | | (547,537 | ) | | | (3,138,933 | ) |
Class R5 Shares | | | (31,371 | ) | | | (189,313 | ) |
Class R6 Shares | | | (3,372 | ) | | | (16,090 | ) |
From realized gains | | | | | | | | |
Class A Shares | | | — | | | | (15,965,821 | ) |
Class C Shares | | | — | | | | (7,113,275 | ) |
Class I Shares | | | — | | | | (60,990,387 | ) |
Class R3 Shares | | | — | | | | (1,180,199 | ) |
Class R4 Shares | | | — | | | | (1,967,801 | ) |
Class R5 Shares | | | — | | | | (3,451,556 | ) |
Class R6 Shares | | | — | | | | (216,084 | ) |
| | |
FUND SHARE TRANSACTIONS (NOTE 4) | | | | | | | | |
Class A Shares | | | (7,009,301 | ) | | | (269,211,981 | ) |
Class C Shares | | | (411,956 | ) | | | (28,226,569 | ) |
Class I Shares | | | 21,322,719 | | | | (2,150,772 | ) |
Class R3 Shares | | | 1,295,793 | | | | (5,749,165 | ) |
Class R4 Shares | | | 2,452,841 | | | | 2,288,498 | |
Class R5 Shares | | | 727,740 | | | | 2,395,126 | |
Class R6 Shares | | | 1,033,826 | | | | 551,299 | |
| | | | | | | | |
Net Increase (Decrease) in Net Assets | | | 82,013,404 | | | | (426,479,884 | ) |
| | |
NET ASSETS | | | | | | | | |
Beginning of Period | | | 1,533,475,979 | | | | 1,959,955,863 | |
| | | | | | | | |
| | |
End of Period | | $ | 1,615,489,383 | | | $ | 1,533,475,979 | |
| | | | | | | | |
| | |
Undistributed (distribution in excess of) net investment income (loss) | | $ | (1,530,961 | ) | | $ | 590,281 | |
See notes to financial statements.
16 Semi-Annual Report
| | |
| NOTES TO FINANCIAL STATEMENTS | | |
| |
Thornburg International Growth Fund | | March 31, 2016 (Unaudited) |
NOTE 1 – ORGANIZATION
Thornburg International Growth Fund (the “Fund”) is a diversified series of Thornburg Investment Trust (the “Trust”). The Fund commenced operations on February 1, 2007. The Trust was organized as a Massachusetts business trust under a Declaration of Trust dated June 3, 1987 and is registered as a diversified, open-end management investment company under the Investment Company Act of 1940, as amended. The Fund is currently one of twenty separate series of the Trust. Each series is considered to be a separate entity for financial reporting and tax purposes and bears expenses directly attributable to it. The Fund seeks long-term capital appreciation by investing in equity securities selected for their growth potential.
The Fund currently offers seven classes of shares of beneficial interest: Class A, Class C, Institutional Class (“Class I”), and Retirement Classes (“Class R3,” “Class R4,” “Class R5,” and “Class R6”). Each class of shares of the Fund represents an interest in the same portfolio of investments, except that (i) Class A shares are sold subject to a front-end sales charge collected at the time the shares are purchased and bear a service fee, (ii) Class C shares are sold at net asset value without a sales charge at the time of purchase, but are subject to a contingent deferred sales charge upon redemption within one year of purchase, and bear both a service fee and a distribution fee, (iii) Class I and Class R5 shares are sold at net asset value without a sales charge at the time of purchase and may be subject to a service fee, (iv) Class R3 shares are sold at net asset value without a sales charge at the time of purchase, but bear both a service fee and distribution fee, (v) Class R4 shares are sold at net asset value without a sales charge at the time of purchase, but bear a service fee, (vi) Class R6 shares are sold at net asset value without a sales charge at the time of purchase, and (vii) the respective classes may have different reinvestment privileges and conversion rights. Additionally, the Fund may allocate among its classes certain expenses, to the extent allocable to specific classes, including transfer agent fees, government registration fees, certain printing and postage costs, and administrative and legal expenses. Currently, class specific expenses of the Fund are limited to service and distribution fees, administration fees, and certain registration and transfer agent expenses.
NOTE 2 – SIGNIFICANT ACCOUNTING POLICIES
The following is a summary of significant accounting policies followed by the Fund in the preparation of its financial statements. The Fund is an investment company and prepares its financial statements in conformity with United States generally accepted accounting principles (“GAAP”), including investment company accounting and reporting guidance in the Financial Accounting Standards Board (the “FASB”) Accounting Standard Codification Topic 946. The preparation of financial statements in conformity with GAAP requires management to make estimates and assumptions that affect the reported amounts of assets and liabilities and disclosure of contingent assets and liabilities at the date of the financial statements and the reported amounts of increases (decreases) in net assets from operations during the reporting period. Actual results could differ from those estimates.
Significant accounting policies of the Trust are as follows:
Valuation Policy and Procedures: The Trustees of the Trust have appointed Thornburg Investment Management, Inc., the Trust’s investment advisor (the “Advisor”), to assist the Trustees in obtaining market values for portfolio investments, perform certain evaluation and supervisory functions respecting professional pricing service providers appointed by the Trustees’ Audit Committee (the “Audit Committee”) to assist in determining fair values for portfolio investments, assist in calculating fair values for portfolio investments in certain circumstances, and to perform other functions in connection with the valuation of investments. The Advisor acts through its Valuation and Pricing Committee (the “Committee”) and other employees of the Advisor. The Committee regularly reviews its own valuation calculations, as well as the valuations, valuation techniques and services furnished by pricing service providers, considers circumstances which may require valuation calculations by the Committee, and reviews previous valuation calculations. The Committee reports to the Audit Committee on the Committee’s activities, the performance of pricing service providers, and other matters relating to valuation of portfolio investments.
In those instances when the Committee assists in calculating a fair value for a portfolio investment, the Committee seeks to determine the price that the Fund would reasonably expect to receive upon a sale of the investment in an orderly transaction between market participants on the valuation date. The Committee customarily utilizes quotations from securities broker dealers in calculating valuations, but also may utilize prices obtained from pricing service providers or other methods approved by the Audit Committee. Because fair values calculated by the Committee are estimates, the calculation of a value for an investment may differ from the price that would be realized by the Fund upon a sale of the investment, and the difference could be material to the Fund’s financial statements. The Committee’s calculation of a fair value for an investment may also differ from the prices obtained by other persons (including other mutual funds) for the investment.
Valuation of Investments: Securities and other portfolio investments which are listed or traded on a United States securities exchange are valued at the last reported sale price on the valuation date. Investments listed or traded on an exchange for which there has been no sale that day are valued at the mean between the last reported bid and asked prices on that valuation date. Portfolio investments reported by NASDAQ are valued at the official closing price on the valuation date. If an investment is traded on more than one exchange, the investment is considered traded on the exchange that is normally the primary market for that investment. Securities and other portfolio investments which are listed or traded on exchanges outside the United States are valued at the last price or the closing
Semi-Annual Report 17
| | |
| NOTES TO FINANCIAL STATEMENTS, CONTINUED | | |
| |
Thornburg International Growth Fund | | March 31, 2016 (Unaudited) |
price of the investment on the exchange that is normally the primary market for the investment, as of the close of the exchange preceding the Fund’s valuation date. Foreign investments listed or traded on an exchange for which there has been no sale that day are valued at the mean between the last reported bid and asked prices on that valuation date.
In any case when a market quotation is not readily available for a portfolio investment ordinarily valued by market quotation, the Committee calculates a fair value for the investment using alternative methods approved by the Audit Committee. A market quotation is not readily available when the primary market or exchange for the investment is not open for the entire scheduled day of trading. Market quotations for an investment also may not be readily available if developments after the most recent close of the investment’s primary exchange or market, but prior to the close of business on any Fund business day, or an unusual event or significant period of time occurring since the availability of a market quotation, create a serious question concerning the reliability of the most recent market quotation available for the investment. In particular, on days when market volatility thresholds established by the Audit Committee are exceeded, foreign equity investments held by the Fund may be valued using alternative methods. The Committee customarily obtains valuations in these instances from pricing service providers approved by the Audit Committee. Pricing service providers ordinarily calculate valuations using multi-factor models to adjust market prices based upon various inputs, including exchange data, depository receipt prices, futures, index data and other data.
Debt obligations held by the Fund which are not listed or traded on exchanges or for which no reported market exists are ordinarily valued at the valuation obtained from a pricing service provider approved by the Audit Committee.
In any case when a pricing service provider fails to provide a valuation for a debt obligation held by the Fund, the Committee calculates a fair value for the obligation using alternative methods under procedures approved by the Audit Committee. Additionally, in cases when management believes that a valuation obtained from a pricing service provider merits review for significant reasons, the Committee decides whether or not to use the valuation calculated by the pricing service provider or to use an alternative method approved by the Audit Committee to calculate a fair value for the obligation.
Quotations for foreign investments expressed in foreign currency amounts are converted to U.S. dollar equivalents using a foreign exchange quotation from a third party service provider at the time of valuation. Foreign investments held by the Fund may be traded on days and at times when the Fund is not open for business. Consequently, the value of Fund investments may be significantly affected on days when shareholders cannot purchase or sell Fund shares. Futures contracts and other financial and derivative instruments traded on an exchange are valued at the latest published price for the instrument on its primary exchange. Listed options are valued at the last bid price.
Valuation Measurements: The Fund categorizes its investments based upon the inputs used in valuing those investments, according to a three-level hierarchy established in guidance from the FASB. Categorization of investments using this hierarchy is intended by the FASB to maximize the use of observable inputs in valuing investments and minimize the use of unobservable inputs by requiring that the most observable inputs be used when available. Observable inputs are those that market participants would use in valuing an investment based on available market information. Unobservable inputs are those that reflect assumptions about the information market participants would use in valuing an investment. An investment’s level within the hierarchy is based on the lowest level input that is deemed significant to the valuation. The methodologies and inputs used to value investments are not necessarily indications of the risk or liquidity associated with those investments.
Various inputs are used in calculating valuations for the Fund’s investments. These inputs are generally summarized according to the three-level hierarchy below:
Level 1: Quoted prices in active markets for identical investments.
Level 2: Other direct or indirect significant observable inputs (including quoted prices for similar investments in active markets and other observable inputs, such as interest rates, prepayment rates, credit risk, etc.).
Level 3: Significant unobservable inputs (including the Committee’s own assumptions in calculating the fair values of investments).
Valuations for debt obligations held by the Fund are typically calculated by pricing service providers approved by the Audit Committee and are characterized as Level 2 within the valuation hierarchy.
On days when market volatility thresholds established by the Audit Committee are exceeded, foreign securities for which valuations are obtained from pricing service providers may be fair valued. On these days, the foreign securities are characterized as Level 2 within the valuation hierarchy and revert to Level 1 after the threshold is no longer exceeded.
In a limited number of cases the Committee calculates a fair value for investments using broker quotations or other methods approved by the Audit Committee. When the Committee uses a single broker quotation to calculate a fair value for an investment without other significant observable inputs, or if a fair value is calculated using other significant inputs that are considered unobservable, the
18 Semi-Annual Report
| | |
| NOTES TO FINANCIAL STATEMENTS, CONTINUED | | |
| |
Thornburg International Growth Fund | | March 31, 2016 (Unaudited) |
investment is characterized as Level 3 within the hierarchy. Other significant unobservable inputs used to calculate a fair value in these instances might include an income-based valuation approach which considers discounted anticipated future cash flows from the investment, and application of discounts due to the nature or duration of any restrictions on the disposition of the investment.
Valuations based upon the use of inputs from Levels 1, 2 or 3 may not represent the actual price received upon the disposition of an investment, and the Fund may receive a price that is lower than the valuation based upon these inputs when it sells the investment.
The following table displays a summary of the fair value hierarchy measurements of the Fund’s investments as of March 31, 2016. In any instance when valuation inputs from more than one level are used to determine the fair value of a specific investment, the investment is placed in the level of the table based upon the lowest level input that is significant in determining the fair value of the investment:
| | | | | | | | | | | | | | | | |
| | | FAIR VALUE MEASUREMENTS AT MARCH 31, 2016 | |
| | | TOTAL | | | LEVEL 1 | | | LEVEL 2 | | | LEVEL 3 | |
Assets | | | | | | | | | | | | | | | | |
Investments in Securities* | | | | | | | | | | | | | | | | |
Common Stock | | $ | 1,433,835,114 | | | $ | 1,433,835,114 | | | $ | — | | | $ | — | |
Short Term Investments | | | 162,595,408 | | | | 162,595,408 | | | | — | | | | — | |
| | | | | | | | | | | | | | | | |
Total Investments in Securities | | $ | 1,596,430,522 | | | $ | 1,596,430,522 | | | $ | — | | | $ | — | |
Other Financial Instruments** | | | | | | | | | | | | | | | | |
Forward Currency Contracts | | $ | 90,431 | | | $ | — | | | $ | 90,431 | | | $ | — | |
Liabilities | | | | | | | | | | | | | | | | |
Other Financial Instruments** | | | | | | | | | | | | | | | | |
Forward Currency Contracts | | $ | (3,776,212 | ) | | $ | — | | | $ | (3,776,212 | ) | | $ | — | |
Spot Currency | | $ | (1,190 | ) | | $ | (1,190 | ) | | $ | — | | | $ | — | |
| * | See Schedule of Investments for a summary of the industry exposure as grouped according to the Global Industry Classification Standard (GICS), which is an industry taxonomy developed by MSCI, Inc. and Standard & Poor’s (S&P). |
| ** | Other Financial Instruments include investments not reflected in the Schedule of Investments, which may include futures, forwards and swap contracts, which are valued at the unrealized appreciation (depreciation) on the investment. |
In accordance with the guidance prescribed in Accounting Standards Update No. 2011-04, it is the policy of the Fund to recognize transfers between levels and the underlying events which caused the movement. The Fund recognized no transfers between levels for the six months ended March 31, 2016, other than when the Fund exceeded market volatility thresholds for foreign equity investments during the period.
Foreign Currency Translation: Portfolio investments and other assets and liabilities denominated in foreign currencies are translated into U.S. dollars based on the exchange rate of such currencies against the U.S. dollar on the date of valuation. Purchases and sales of investments and income items denominated in foreign currencies are translated into U.S. dollars at the exchange rate in effect on the transaction date. When the Fund purchases or sells foreign investments, it will customarily enter into a foreign exchange contract to minimize foreign exchange risk from the trade date to the settlement date of such transactions. The values of such spot contracts are included in receivable for investments sold and payable for investments purchased on the Statement of Assets and Liabilities.
The Fund does not separately report the effect of changes in foreign exchange rates from changes in market prices on investments held. Such changes are included in net unrealized appreciation (depreciation) from investments.
Reported net realized gains and losses from foreign currency transactions arise due to purchases and sales of foreign currencies, currency gains and losses realized between the trade and settlement dates on investment transactions and the difference between the amounts of dividends, interest, and foreign withholding taxes recorded on the Fund’s books, and the U.S. dollar equivalent of the amounts actually received or paid.
Net change in unrealized appreciation (depreciation) on foreign currency translations arise from changes in the fair value of assets and liabilities, other than investments at period end, resulting from changes in exchange rates.
Foreign Withholding Taxes: The Fund is subject to foreign tax withholding imposed by certain foreign countries in which the Fund may invest. Withholding taxes are incurred on certain foreign dividends and are accrued at the time the dividend is recognized based on applicable foreign tax law. The Fund may file withholding tax reclaims in certain jurisdictions to recover a portion of amounts previously withheld, in view of various considerations, including recent decisions rendered by the courts in those and other jurisdictions. The Fund would expect to record a receivable for such a reclaim based on a variety of factors, including assessments of a jurisdiction’s legal obligation to pay reclaims, the jurisdiction’s administrative practices and payment history, and industry convention. To date the Fund has
Semi-Annual Report 19
| | |
| NOTES TO FINANCIAL STATEMENTS, CONTINUED | | |
| |
Thornburg International Growth Fund | | March 31, 2016 (Unaudited) |
recorded no such receivable because there is limited precedent for collecting such prior year reclaims and the likelihood of collection remains uncertain.
Deferred Foreign Capital Gain Taxes: The Fund is subject to a tax imposed on net realized gains of securities of certain foreign countries. The Fund records an estimated deferred tax liability for net unrealized gains on these investments as reflected in the accompanying financial statements.
Federal Income Taxes: It is the policy of the Trust to comply with the provisions of the Internal Revenue Code applicable to “regulated investment companies” and to distribute to shareholders substantially all taxable income, including any net realized gain on investments of the Fund. Therefore, no provision for federal income taxes is required.
Management reviews each uncertain tax position believed to be material to the preparation of the Fund’s financial statements, to assess if it is more likely than not that the position would be sustained upon examination, based upon the technical merits of the position. As of March 31, 2016, management has not identified any such position for which an asset or liability must be reflected in the Statement of Assets and Liabilities. The Fund’s tax returns remain subject to examination for three years after filing.
When-Issued and Delayed Delivery Transactions: The Fund may engage in when-issued or delayed delivery transactions. To the extent the Fund engages in such transactions, it will do so for the purpose of acquiring portfolio investments consistent with the Fund’s investment objectives and not for the purpose of investment leverage or to speculate on interest rate and, or market changes. At the time the Fund makes a commitment to purchase an investment on a when-issued or delayed delivery basis, the Fund will record the transaction and reflect the value in determining its net asset value. When effecting such transactions, assets of an amount sufficient to make payment for the portfolio investments to be purchased will be segregated on the Fund’s records on the trade date. Investments purchased on a when-issued or delayed delivery basis do not earn interest until the settlement date.
Dividends: Dividends to shareholders, if any, are generally paid quarterly and are reinvested in additional shares of the Fund at net asset value per share at the close of business on the dividend payment date or, at the shareholder’s option, paid in cash. Net realized capital gains, to the extent available, will be distributed at least annually.
Repurchase Agreements: The Fund may invest excess cash in repurchase agreements whereby the Fund purchases investments, which serve as collateral, with an agreement to resell such collateral to the seller at an agreed upon price at the maturity date of the repurchase agreement. Investments pledged as collateral for repurchase agreements are held in custody until maturity of the repurchase agreement. Provisions in the agreements require that the market value of the collateral is at least equal to the repurchase value in the event of default. In the event of default, the Fund has the right to liquidate the collateral and apply the proceeds in satisfaction of the obligation. Under certain circumstances, in the event of default or bankruptcy by the other party to the agreement, realization and/or retention of the collateral may be subject to legal proceedings.
General: Investment transactions are accounted for on a trade date basis. Interest income is accrued as earned and dividend income is recorded on the ex-dividend date. Certain income from foreign investments is recognized as soon as information is available to the Fund. Realized gains and losses from the sale of investments are recorded on an identified cost basis. Net investment income (other than class specific expenses) and realized and unrealized gains and losses are allocated daily to each class of shares based upon the relative net asset value of outstanding shares of each class of shares at the beginning of the day (after adjusting for the current share activity of the respective class). Expenses common to all Funds are allocated among the Funds comprising the Trust based upon their relative net asset values or other appropriate allocation methods.
Guarantees and Indemnifications: Under the Trust’s organizational documents (and under separate agreements with the independent Trustees), its officers and Trustees are indemnified against certain liabilities arising out of the performance of their duties to the Fund. Additionally, in the normal course of business the Trust enters into contracts with service providers that contain general indemnification clauses. The Trust’s maximum exposure under these arrangements is unknown. However, based on experience, the Trust expects the risk of loss to be remote.
NOTE 3 – INVESTMENT ADVISORY FEE AND OTHER TRANSACTIONS WITH AFFILIATES
Pursuant to an investment advisory agreement, the Advisor serves as the investment advisor and performs services for the Fund for which the fees are payable at the end of each month. For the six months ended March 31, 2016, these fees were payable at annual rates ranging from .875 of 1% to .675 of 1% per annum of the average daily net assets of the Fund depending on the Fund’s asset size. The Fund pays to the Advisor the costs of personnel who perform certain accounting services for the Fund. For the six months ended March 31, 2016 the Fund paid $29,590 to the Advisor for these accounting services. The Trust has also entered into administrative service agreements with the Advisor, whereby the Advisor will perform certain administrative services for the shareholders of each class of the Fund’s shares (except for Class R6 shares, which do not have an administrative services agreement) and for which fees will be payable at an annual rate of up to .125 of 1% per annum of the average daily net assets attributable to each class of shares.
20 Semi-Annual Report
| | |
| NOTES TO FINANCIAL STATEMENTS, CONTINUED | | |
| |
Thornburg International Growth Fund | | March 31, 2016 (Unaudited) |
The Trust has an underwriting agreement with Thornburg Securities Corporation (the “Distributor”), an affiliate of the Advisor, which acts as the distributor of the Fund’s shares. For the six months ended March 31, 2016, the Distributor has advised the Fund that it earned commissions aggregating $6,207 from the sale of Class A shares, and collected contingent deferred sales charges aggregating $7,451 from redemptions of Class C shares of the Fund.
Pursuant to a service plan under Rule 12b-1 of the Investment Company Act of 1940, the Fund may reimburse to the Advisor an amount not to exceed .25 of 1% per annum of the average daily net assets attributable to each class of shares of the Fund (except for Class R6 shares, which do not have a Rule 12b-1 service plan) for payments made by the Advisor to securities dealers and other financial institutions to obtain various shareholder and distribution related services. For the six months ended March 31, 2016, there were no 12b-1 service plan fees charged for Class I and R5 shares. The Advisor may pay out of its own resources additional expenses for distribution of the Fund’s shares and shareholder services.
The Trust has also adopted distribution plans pursuant to Rule 12b-1, applicable only to the Fund’s Class C and Class R3 shares, under which the Fund compensates the Distributor for services in promoting the sale of Class C and Class R3 shares of the Fund at an annual rate of up to .75 of 1% per annum of the average daily net assets attributable to Class C shares, and an annual rate of up to ..25 of 1% per annum of the average daily net assets attributable to Class R3 shares. Total fees incurred by each class of shares of the Fund under their respective service and distribution plans for the six months ended March 31, 2016, are set forth in the Statement of Operations.
The Advisor and Distributor have contractually agreed to waive fees and reimburse expenses incurred by the Fund so that actual expenses of certain share classes do not exceed levels as specified in the Fund’s most recent prospectus. The agreement may be terminated by the Fund at any time, but may not be terminated by the Advisor or Distributor before February 1, 2017, unless the Advisor ceases to be the investment advisor to the Trust or the Distributor ceases to be the distributor of the Fund prior to that date. The Advisor and Distributor retain the right to be repaid by the Fund for fee waivers and expense reimbursements if expenses fall below the contractual limit prior to the end of the fiscal year.
For the six months ended March 31, 2016, the Advisor contractually reimbursed certain class specific expenses, administrative fees, and distribution fees of $60,007 for Class I shares, $44,177 for Class R3 shares, $61,221 for Class R4 shares, $72,427 for Class R5 shares, and $12,735 for Class R6 shares.
Certain officers and Trustees of the Trust are also officers or directors of the Advisor and Distributor. The compensation of independent Trustees is borne by the Trust.
The Fund may purchase or sell securities from, or to an affiliated fund, provided the affiliation is due solely to having a common investment advisor, common officers, or common trustees, and provided that all such transactions will comply with Rule 17a-7 under the 1940 Act. For the six months ended March 31, 2016, the Fund had no transactions with affiliated funds.
NOTE 4 – SHARES OF BENEFICIAL INTEREST
At March 31, 2016, there were an unlimited number of shares with no par value of beneficial interest authorized. Transactions in shares of beneficial interest were as follows:
| | | | | | | | | | | | | | | | |
| | | SIX MONTHS ENDED
MARCH 31, 2016 (UNAUDITED) | | | YEAR ENDED
SEPTEMBER 30, 2015 (AUDITED) | |
| | | SHARES | | | AMOUNT | | | SHARES | | | AMOUNT | |
Class A Shares | | | | | | | | | | | | | | | | |
Shares sold | | | 1,974,657 | | | $ | 37,003,808 | | | | 3,316,312 | | | $ | 63,027,736 | |
Shares issued to shareholders in reinvestment of dividends | | | — | | | | — | | | | 805,337 | | | | 14,850,417 | |
Shares repurchased | | | (2,416,488 | ) | | | (44,013,109 | ) | | | (18,297,115 | ) | | | (347,090,134 | ) |
| | | | | | | | | | | | | | | | |
| | | | |
Net increase (decrease) | | | (441,831 | ) | | $ | (7,009,301 | ) | | | (14,175,466 | ) | | $ | (269,211,981 | ) |
| | | | | | | | | | | | | | | | |
| | | | |
Class C Shares | | | | | | | | | | | | | | | | |
Shares sold | | | 755,077 | | | $ | 13,625,263 | | | | 1,000,742 | | | $ | 18,106,596 | |
Shares issued to shareholders in reinvestment of dividends | | | — | | | | — | | | | 348,284 | | | | 6,189,006 | |
Shares repurchased | | | (809,559 | ) | | | (14,037,219 | ) | | | (2,929,423 | ) | | | (52,522,171 | ) |
| | | | | | | | | | | | | | | | |
| | | | |
Net increase (decrease) | | | (54,482 | ) | | $ | (411,956 | ) | | | (1,580,397 | ) | | $ | (28,226,569 | ) |
| | | | | | | | | | | | | | | | |
Semi-Annual Report 21
| | |
| NOTES TO FINANCIAL STATEMENTS, CONTINUED | | |
| |
Thornburg International Growth Fund | | March 31, 2016 (Unaudited) |
| | | | | | | | | | | | | | | | |
| | | SIX MONTHS ENDED | | | YEAR ENDED | |
| | | MARCH 31, 2016 (UNAUDITED) | | | SEPTEMBER 30, 2015 (AUDITED) | |
| | | SHARES | | | AMOUNT | | | SHARES | | | AMOUNT | |
Class I Shares | | | | | | | | | | | | | | | | |
Shares sold | | | 11,774,474 | | | $ | 220,030,515 | | | | 28,739,621 | | | $ | 556,653,254 | |
Shares issued to shareholders in reinvestment of dividends | | | 26,189 | | | | 514,607 | | | | 3,121,242 | | | | 58,816,576 | |
Shares repurchased | | | (10,739,752 | ) | | �� | (199,222,403 | ) | | | (32,575,817 | ) | | | (617,620,602 | ) |
| | | | | | | | | | | | | | | | |
| | | | |
Net increase (decrease) | | | 1,060,911 | | | $ | 21,322,719 | | | | (714,954 | ) | | $ | (2,150,772 | ) |
| | | | | | | | | | | | | | | | |
| | | | |
Class R3 Shares | | | | | | | | | | | | | | | | |
Shares sold | | | 187,628 | | | $ | 3,382,958 | | | | 437,924 | | | $ | 8,250,207 | |
Shares issued to shareholders in reinvestment of dividends | | | — | | | | — | | | | 57,359 | | | | 1,051,381 | |
Shares repurchased | | | (115,544 | ) | | | (2,087,165 | ) | | | (794,860 | ) | | | (15,050,753 | ) |
| | | | | | | | | | | | | | | | |
| | | | |
Net increase (decrease) | | | 72,084 | | | $ | 1,295,793 | | | | (299,577 | ) | | $ | (5,749,165 | ) |
| | | | | | | | | | | | | | | | |
| | | | |
Class R4 Shares | | | | | | | | | | | | | | | | |
Shares sold | | | 361,181 | | | $ | 6,567,491 | | | | 856,027 | | | $ | 16,247,799 | |
Shares issued to shareholders in reinvestment of dividends | | | — | | | | — | | | | 76,525 | | | | 1,403,461 | |
Shares repurchased | | | (225,882 | ) | | | (4,114,650 | ) | | | (811,713 | ) | | | (15,362,762 | ) |
| | | | | | | | | | | | | | | | |
| | | | |
Net increase (decrease) | | | 135,299 | | | $ | 2,452,841 | | | | 120,839 | | | $ | 2,288,498 | |
| | | | | | | | | | | | | | | | |
| | | | |
Class R5 Shares | | | | | | | | | | | | | | | | |
Shares sold | | | 621,825 | | | $ | 11,573,845 | | | | 1,035,688 | | | $ | 20,181,653 | |
Shares issued to shareholders in reinvestment of dividends | | | 1,558 | | | | 30,701 | | | | 192,484 | | | | 3,636,644 | |
Shares repurchased | | | (573,886 | ) | | | (10,876,806 | ) | | | (1,116,192 | ) | | | (21,423,171 | ) |
| | | | | | | | | | | | | | | | |
| | | | |
Net increase (decrease) | | | 49,497 | | | $ | 727,740 | | | | 111,980 | | | $ | 2,395,126 | |
| | | | | | | | | | | | | | | | |
| | | | |
Class R6 Shares | | | | | | | | | | | | | | | | |
Shares sold | | | 97,577 | | | $ | 1,830,389 | | | | 174,955 | | | $ | 3,437,664 | |
Shares issued to shareholders in reinvestment of dividends | | | 171 | | | | 3,372 | | | | 12,269 | | | | 232,174 | |
Shares repurchased | | | (42,600 | ) | | | (799,935 | ) | | | (159,642 | ) | | | (3,118,539 | ) |
| | | | | | | | | | | | | | | | |
| | | | |
Net increase (decrease) | | | 55,148 | | | $ | 1,033,826 | | | | 27,582 | | | $ | 551,299 | |
| | | | | | | | | | | | | | | | |
NOTE 5 – INVESTMENT TRANSACTIONS
For the six months ended March 31, 2016, the Fund had purchase and sale transactions of investments (excluding short-term investments) of $1,039,434,497 and $1,129,140,374, respectively.
NOTE 6 – INCOME TAXES
At March 31, 2016, information on the tax components of capital was as follows:
| | | | |
Cost of investments for tax purposes | | $ | 1,481,706,123 | |
| | | | |
Gross unrealized appreciation on a tax basis | | $ | 194,089,167 | |
Gross unrealized depreciation on a tax basis | | | (79,364,768 | ) |
| | | | |
Net unrealized appreciation (depreciation) on investments (tax basis) | | $ | 114,724,399 | |
| | | | |
22 Semi-Annual Report
| | |
| NOTES TO FINANCIAL STATEMENTS, CONTINUED | | |
| |
Thornburg International Growth Fund | | March 31, 2016 (Unaudited) |
At March 31, 2016, the Fund had cumulative tax basis capital losses of $36,203,393 (of which $36,203,393 are short-term and $0 are long-term) generated after September 30, 2011, which may be carried forward to offset future capital gains. To the extent such carryforwards are used, capital gain distributions may be reduced to the extent provided by regulations. Such capital loss carryforwards do not expire.
NOTE 7 – DERIVATIVE FINANCIAL INSTRUMENTS WITH OFF-BALANCE SHEET RISK AND FOREIGN INVESTMENT RISK
The Fund may use a variety of derivative financial instruments to hedge or adjust the risks affecting its investment portfolio or to enhance investment returns. Provisions of the FASB Accounting Standards Codification 815-10-50 (“ASC 815”) require certain disclosures. The disclosures are intended to provide users of financial statements with an understanding of the use of derivative instruments by the Fund and how these derivatives affect the financial position, financial performance and cash flows of the Fund. The Fund does not designate any derivative instruments as hedging instruments under ASC 815. During the six months ended March 31, 2016, the Fund’s principal exposure to derivative financial instruments of the type addressed by ASC 815 was investment in foreign exchange contracts. A foreign exchange contract is an agreement between two parties to exchange different currencies at a specified rate of exchange at an agreed upon future date. Foreign exchange contracts involve risks to the Fund, including the risk that a contract’s counterparty will not meet its obligations to the Fund, the risk that a change in a contract’s value may not correlate perfectly with the currency the contract was intended to track, and the risk that the Fund’s Advisor is unable to correctly implement its strategy in using a contract. In any such instance, the Fund may not achieve the intended benefit of entering into a contract, and may experience a loss.
The Fund entered into forward currency contracts during the six months ended March 31, 2016 in the normal course of pursuing its investment objectives, with the objective of purchasing foreign investments or with the intent of reducing the risk to the value of the Fund’s foreign investments from adverse changes in the relationship between the U.S. dollar and foreign currencies. In each case these contracts have been initiated in conjunction with foreign investment transactions.
These contracts are accounted for by the Fund under ASC 815. Unrealized appreciation and depreciation on outstanding contracts are reported in the Fund’s Statement of Assets and Liabilities, as measured by the difference between the forward exchange rates at the reporting date and the forward exchange rates at each contract’s inception date. Net realized gain (loss) on contracts closed during the period, and changes in net unrealized appreciation (depreciation) on outstanding contracts are recognized in the Fund’s Statement of Operations.
The quarterly average value of open sell currency contracts for the six months ended March 31, 2016 was $176,402,694. Open buy currency contracts are entered into for the purpose of closing open sell currency contracts and the values are dependent upon the values of the open sell currency contracts to which they relate.
The following table displays the outstanding forward currency contracts at March 31, 2016:
| | | | | | | | | | | | | | | | | | | | | | | | |
| OUTSTANDING FORWARD CURRENCY CONTRACTS TO BUY OR SELL AT MARCH 31, 2016 | |
| | | | | CONTRACT | | | COUNTER | | CONTRACT | | | VALUE | | | UNREALIZED | | | UNREALIZED | |
| CONTRACT DESCRIPTION | | BUY/SELL | | AMOUNT | | | PARTY(a) | | VALUE DATE | | | USD | | | APPRECIATION | | | DEPRECIATION | |
Chinese Yuan Renminbi | | Buy | | | 11,222,800 | | | SSB | | | 05/05/2016 | | | | 1,734,242 | | | $ | 50,047 | | | $ | — | |
Chinese Yuan Renminbi | | Buy | | | 9,941,700 | | | SSB | | | 05/05/2016 | | | | 1,536,276 | | | | 40,384 | | | | — | |
Chinese Yuan Renminbi | | Sell | | | 63,769,400 | | | SSB | | | 05/05/2016 | | | | 9,854,187 | | | | — | | | | (29,907) | |
Chinese Yuan Renminbi | | Sell | | | 45,146,000 | | | SSB | | | 05/05/2016 | | | | 6,976,342 | | | | — | | | | (139,354) | |
Chinese Yuan Renminbi | | Sell | | | 48,914,200 | | | SSB | | | 05/05/2016 | | | | 7,558,636 | | | | — | | | | (204,333) | |
Chinese Yuan Renminbi | | Sell | | | 302,640,300 | | | SSB | | | 05/05/2016 | | | | 46,766,538 | | | | — | | | | (1,774,299) | |
Euro | | Sell | | | 72,985,600 | | | BBH | | | 06/24/2016 | | | | 83,257,937 | | | | — | | | | (1,104,616) | |
Great Britain Pound | | Sell | | | 44,104,900 | | | BBH | | | 06/23/2016 | | | | 63,362,600 | | | | — | | | | (523,703) | |
| | | | | | | | | | | | | | | | | | | | | | | | |
| | | | | | | |
Total | | | | | | | | | | | | | | | | | | $ | 90,431 | | | $ | (3,776,212) | |
| | | | | | | | | | | | | | | | | | | | | | | | |
| | | | |
Net unrealized appreciation (depreciation) | | | | | | | | | | | | | | $ | (3,685,781) | |
| | | | | | | | | | | | | | | | | | | | | | | | |
| (a) | Counterparties include State Street Bank and Trust Company (“SSB”) and Brown Brothers Harriman & Co. (“BBH”). |
Semi-Annual Report 23
| | |
| NOTES TO FINANCIAL STATEMENTS, CONTINUED | | |
| |
Thornburg International Growth Fund | | March 31, 2016 (Unaudited) |
The outstanding forward currency contracts in the foregoing table which were entered into with State Street Bank and Trust Company (“SSB”) were entered into pursuant to an International Swaps and Derivatives Association (“ISDA”) Master Agreement. Outstanding forward currency contracts which were entered into with Brown Brothers Harriman & Co. (“BBH”) were entered into pursuant to a written agreement with BBH. In the event of a default or termination under the ISDA Master Agreement with SSB or the agreement with BBH, the non-defaulting party has the right to close out all outstanding forward currency contracts between the parties and to net any payment amounts under those contracts, resulting in a single net amount payable by one party to the other.
Because the ISDA Master Agreement with SSB and the agreement with BBH does not result in an offset of reported amounts of financial assets and financial liabilities in the Fund’s Statement of Assets and Liabilities unless there has been an event of default or termination event under such agreements, the Fund does not net its outstanding forward currency contracts for the purpose of disclosure in the Fund’s Statement of Assets and Liabilities. Instead the Fund recognizes the unrealized appreciation (depreciation) on those forward currency contracts on a gross basis in the Fund’s Statement of Assets and Liabilities.
The unrealized appreciation (depreciation) of the outstanding forward currency contracts recognized in the Fund’s Statement of Assets and Liabilities at March 31, 2016 is disclosed in the following table:
| | | | |
FAIR VALUES OF DERIVATIVE FINANCIAL INSTRUMENTS AT MARCH 31, 2016 |
| ASSET DERIVATIVES | | BALANCE SHEET LOCATION | | FAIR VALUE |
Foreign exchange contracts | | Assets - Unrealized appreciation | | |
| | on forward currency contracts | | $90,431 |
| | |
| LIABILITY DERIVATIVES | | BALANCE SHEET LOCATION | | FAIR VALUE |
Foreign exchange contracts | | Liabilities - Unrealized depreciation | | |
| | on forward currency contracts | | $(3,776,212) |
Because the Fund does not currently receive or post cash collateral in connection with its currency forward contracts, the net amounts of the Fund’s assets and liabilities which are attributable to those contracts at March 31, 2016 can be determined by offsetting the dollar amounts shown in the preceding table. Based on those amounts, the net amount of the Fund’s assets which is attributable to its outstanding forward currency contracts at March 31, 2016 is $0, and the net amount of the Fund’s liabilities which is attributable to those contracts at that date is $3,685,781 ($2,057,462 attributable to the Fund’s contracts with SSB, and $1,628,319 attributable to the Fund’s contracts with BBH). The Fund’s forward currency contracts are valued each day, and the net amounts of the Fund’s assets and liabilities which are attributable to those contracts are expected to vary over time.
The net realized gain (loss) from forward currency contracts and the net change in unrealized appreciation (depreciation) of outstanding forward currency contracts recognized in the Fund’s Statement of Operations for the six months ended March 31, 2016 are disclosed in the following tables:
| | | | |
| NET REALIZED GAIN (LOSS) ON DERIVATIVE FINANCIAL INSTRUMENTS |
| RECOGNIZED IN INCOME FOR THE SIX MONTHS ENDED MARCH 31, 2016 |
| | | TOTAL | | FORWARD CURRENCY CONTRACTS |
Foreign exchange contracts | | $ 405,662 | | $ 405,662 |
|
| NET CHANGE IN UNREALIZED APPRECIATION (DEPRECIATION) OF DERIVATIVE FINANCIAL INSTRUMENTS |
RECOGNIZED IN INCOME FOR THE SIX MONTHS ENDED MARCH 31, 2016 |
| | | TOTAL | | FORWARD CURRENCY CONTRACTS |
Foreign exchange contracts | | $ (2,065,565) | | $ (2,065,565) |
24 Semi-Annual Report
| | |
| NOTES TO FINANCIAL STATEMENTS, CONTINUED | | |
| |
Thornburg International Growth Fund | | March 31, 2016 (Unaudited) |
OTHER NOTES
Risks: The Fund’s investments subject it to risks including, but not limited to, management risk, market and economic risk, risks affecting specific issuers, liquidity risk, the risks associated with investments in small- and mid-cap companies and non-U.S. issuers, credit risk, and interest rate risk. Please see the Fund’s prospectus for a discussion of the risks associated with an investment in the Fund.
Subsequent Events: Fund management believes no events have occurred between March 31, 2016 and the date of issuance of the financial statements that require adjustment to or disclosure in the accompanying financial statements.
Semi-Annual Report 25
Financial Highlights
Thornburg International Growth Fund
| | | | | | | | | | | | | | | | | | | | | | | | | | | | | | | | | | | | | | | | | | | | | | | | | | | | | | | | | | | | |
| | | PER SHARE PERFORMANCE (FOR A SHARE OUTSTANDING THROUGHOUT THE PERIOD) | | | RATIOS TO AVERAGE NET ASSETS | | | SUPPLEMENTAL DATA | |
UNLESS
OTHERWISE
NOTED,
PERIODS
ARE
FISCAL
YEARS
ENDED
SEPT. 30, | | NET ASSET
VALUE
BEGINNING
OF PERIOD | | | NET
INVESTMENT
INCOME
(LOSS)+ | | | NET
REALIZED &
UNREALIZED
GAIN (LOSS)
ON
INVESTMENTS | | | TOTAL FROM
INVESTMENT
OPERATIONS | | | DIVIDENDS
FROM NET
INVESTMENT
INCOME | | | DIVIDENDS
FROM NET
REALIZED
GAINS | | | TOTAL
DIVIDENDS | | | NET
ASSET
VALUE
END OF
PERIOD | | | NET
INVESTMENT
INCOME
(LOSS) (%) | | | EXPENSES,
AFTER
EXPENSE
REDUCTIONS
(%) | | | EXPENSES,
AFTER
EXPENSE
REDUCTIONS
AND NET OF
CUSTODY
CREDITS (%) | | | EXPENSES,
BEFORE
EXPENSE
REDUCTIONS
(%) | | | TOTAL
RETURN
(%)(a) | | | PORTFOLIO
TURNOVER
RATE
(%)(a) | | | NET
ASSETS
AT END
OF
PERIOD
(THOUSANDS) | |
CLASS A SHARES | | | | | | | | | | | | | | | | | | | | | | | | | | | | | | | | | | | | | | | | | | | | | | | | | | | | | |
2016(b)(c) | | $ | 17.78 | | | | (0.04 | ) | | | 0.78 | | | | 0.74 | | | | — | | | | — | | | | — | | | $ | 18.52 | | | | (0.45 | )(d) | | | 1.40 | (d) | | | 1.40 | (d) | | | 1.40 | (d) | | | 4.22 | | | | 69.24 | | | $ | 221,896 | |
2015(c) | | $ | 19.10 | | | | (0.01 | ) | | | (0.33 | ) | | | (0.34 | ) | | | — | | | | (0.98 | ) | | | (0.98 | ) | | $ | 17.78 | | | | (0.06 | ) | | | 1.42 | | | | 1.42 | | | | 1.42 | | | | (2.01 | ) | | | 92.01 | | | $ | 220,897 | |
2014(c) | | $ | 20.54 | | | | 0.02 | | | | (0.89 | ) | | | (0.87 | ) | | | — | | | | (0.57 | ) | | | (0.57 | ) | | $ | 19.10 | | | | 0.07 | | | | 1.33 | | | | 1.33 | | | | 1.33 | | | | (4.46 | ) | | | 106.18 | | | $ | 508,044 | |
2013(c) | | $ | 15.78 | | | | (0.01 | ) | | | 4.77 | | | | 4.76 | | | | — | | | | — | | | | — | | | $ | 20.54 | | | | (0.06 | ) | | | 1.41 | | | | 1.41 | | | | 1.42 | | | | 30.16 | | | | 89.17 | | | $ | 580,194 | |
2012(c) | | $ | 13.37 | | | | (0.06 | ) | | | 2.47 | | | | 2.41 | | | | — | (e) | | | — | | | | — | | | $ | 15.78 | | | | (0.41 | ) | | | 1.51 | | | | 1.51 | | | | 1.52 | | | | 18.03 | | | | 95.17 | | | $ | 255,725 | |
2011(c) | | $ | 12.25 | | | | 0.03 | | | | 1.13 | | | | 1.16 | | | | (0.04 | ) | | | — | | | | (0.04 | ) | | $ | 13.37 | | | | 0.19 | | | | 1.51 | | | | 1.50 | | | | 1.54 | | | | 9.43 | | | | 142.59 | | | $ | 104,918 | |
CLASS C SHARES | | | | | | | | | | | | | | | | | | | | | | | | | | | | | | | | | | | | | | | | | | | | | | | | | | | | | |
2016(b) | | $ | 17.01 | | | | (0.11 | ) | | | 0.75 | | | | 0.64 | | | | — | | | | — | | | | — | | | $ | 17.65 | | | | (1.21 | )(d) | | | 2.15 | (d) | | | 2.15 | (d) | | | 2.15 | (d) | | | 3.76 | | | | 69.24 | | | $ | 111,167 | |
2015 | | $ | 18.45 | | | | (0.14 | ) | | | (0.32 | ) | | | (0.46 | ) | | | — | | | | (0.98 | ) | | | (0.98 | ) | | $ | 17.01 | | | | (0.77 | ) | | | 2.20 | | | | 2.20 | | | | 2.20 | | | | (2.72 | ) | | | 92.01 | | | $ | 108,062 | |
2014 | | $ | 20.01 | | | | (0.13 | ) | | | (0.86 | ) | | | (0.99 | ) | | | — | | | | (0.57 | ) | | | (0.57 | ) | | $ | 18.45 | | | | (0.65 | ) | | | 2.09 | | | | 2.09 | | | | 2.09 | | | | (5.19 | ) | | | 106.18 | | | $ | 146,399 | |
2013 | | $ | 15.49 | | | | (0.14 | ) | | | 4.66 | | | | 4.52 | | | | — | | | | — | | | | — | | | $ | 20.01 | | | | (0.81 | ) | | | 2.15 | | | | 2.15 | | | | 2.17 | | | | 29.18 | | | | 89.17 | | | $ | 116,453 | |
2012 | | $ | 13.23 | | | | (0.17 | ) | | | 2.43 | | | | 2.26 | | | | — | | | | — | | | | — | | | $ | 15.49 | | | | (1.19 | ) | | | 2.27 | | | | 2.27 | | | | 2.28 | | | | 17.08 | | | | 95.17 | | | $ | 55,656 | |
2011 | | $ | 12.18 | | | | (0.11 | ) | | | 1.16 | | | | 1.05 | | | | — | | | | — | | | | — | | | $ | 13.23 | | | | (0.77 | ) | | | 2.30 | | | | 2.30 | | | | 2.34 | | | | 8.62 | | | | 142.59 | | | $ | 35,706 | |
CLASS I SHARES | | | | | | | | | | | | | | | | | | | | | | | | | | | | | | | | | | | | | | | | | | | | | | | | | | | | | |
2016(b) | | $ | 18.20 | | | | — | (f) | | | 0.80 | | | | 0.80 | | | | (0.01 | ) | | | — | | | | (0.01 | ) | | $ | 18.99 | | | | (0.03 | )(d) | | | 0.99 | (d) | | | 0.99 | (d) | | | 1.00 | (d) | | | 4.39 | | | | 69.24 | | | $ | 1,146,597 | |
2015 | | $ | 19.51 | | | | 0.09 | | | | (0.37 | ) | | | (0.28 | ) | | | (0.05 | ) | | | (0.98 | ) | | | (1.03 | ) | | $ | 18.20 | | | | 0.47 | | | | 0.99 | | | | 0.99 | | | | 1.01 | | | | (1.58 | ) | | | 92.01 | | | $ | 1,079,791 | |
2014 | | $ | 20.96 | | | | 0.10 | | | | (0.91 | ) | | | (0.81 | ) | | | (0.07 | ) | | | (0.57 | ) | | | (0.64 | ) | | $ | 19.51 | | | | 0.47 | | | | 0.98 | | | | 0.98 | | | | 0.98 | | | | (4.09 | ) | | | 106.18 | | | $ | 1,171,032 | |
2013 | | $ | 16.04 | | | | 0.07 | | | | 4.85 | | | | 4.92 | | | | — | | | | — | | | | — | | | $ | 20.96 | | | | 0.38 | | | | 0.99 | | | | 0.99 | | | | 1.04 | | | | 30.67 | | | | 89.17 | | | $ | 737,536 | |
2012 | | $ | 13.55 | | | | 0.02 | | | | 2.50 | | | | 2.52 | | | | (0.03 | ) | | | — | | | | (0.03 | ) | | $ | 16.04 | | | | 0.10 | | | | 0.99 | | | | 0.99 | | | | 1.14 | | | | 18.60 | | | | 95.17 | | | $ | 198,938 | |
2011 | | $ | 12.38 | | | | 0.10 | | | | 1.14 | | | | 1.24 | | | | (0.07 | ) | | | — | | | | (0.07 | ) | | $ | 13.55 | | | | 0.66 | | | | 0.99 | | | | 0.98 | | | | 1.16 | | | | 10.03 | | | | 142.59 | | | $ | 75,538 | |
CLASS R3 SHARES | | | | | | | | | | | | | | | | | | | | | | | | | | | | | | | | | | | | | | | | | | | | | | | | | | | | | |
2016(b) | | $ | 17.66 | | | | (0.05 | ) | | | 0.77 | | | | 0.72 | | | | — | | | | — | | | | — | | | $ | 18.38 | | | | (0.54 | )(d) | | | 1.50 | (d) | | | 1.50 | (d) | | | 2.02 | (d) | | | 4.08 | | | | 69.24 | | | $ | 17,826 | |
2015 | | $ | 18.99 | | | | (0.02 | ) | | | (0.33 | ) | | | (0.35 | ) | | | — | | | | (0.98 | ) | | | (0.98 | ) | | $ | 17.66 | | | | (0.13 | ) | | | 1.50 | | | | 1.50 | | | | 1.98 | | | | (2.03 | ) | | | 92.01 | | | $ | 15,851 | |
2014 | | $ | 20.46 | | | | — | (f) | | | (0.90 | ) | | | (0.90 | ) | | | — | | | | (0.57 | ) | | | (0.57 | ) | | $ | 18.99 | | | | — | (g) | | | 1.50 | | | | 1.50 | | | | 1.86 | | | | (4.63 | ) | | | 106.18 | | | $ | 22,739 | |
2013 | | $ | 15.73 | | | | (0.03 | ) | | | 4.76 | | | | 4.73 | | | | — | | | | — | | | | — | | | $ | 20.46 | | | | (0.15 | ) | | | 1.50 | | | | 1.50 | | | | 2.01 | | | | 30.07 | | | | 89.17 | | | $ | 13,982 | |
2012 | | $ | 13.34 | | | | (0.06 | ) | | | 2.45 | | | | 2.39 | | | | — | (e) | | | — | | | | — | | | $ | 15.73 | | | | (0.40 | ) | | | 1.50 | | | | 1.50 | | | | 2.49 | | | | 17.94 | | | | 95.17 | | | $ | 5,709 | |
2011 | | $ | 12.22 | | | | 0.01 | | | | 1.15 | | | | 1.16 | | | | (0.04 | ) | | | — | | | | (0.04 | ) | | $ | 13.34 | | | | 0.06 | | | | 1.50 | | | | 1.49 | | | | 3.27 | | | | 9.46 | | | | 142.59 | | | $ | 1,925 | |
CLASS R4 SHARES | | | | | | | | | | | | | | | | | | | | | | | | | | | | | | | | | | | | | | | | | | | | | | | | | | | | | |
2016(b) | | $ | 17.68 | | | | (0.04 | ) | | | 0.78 | | | | 0.74 | | | | — | | | | — | | | | — | | | $ | 18.42 | | | | (0.44 | )(d) | | | 1.40 | (d) | | | 1.40 | (d) | | | 1.70 | (d) | | | 4.19 | | | | 69.24 | | | $ | 42,110 | |
2015 | | $ | 19.00 | | | | 0.02 | | | | (0.36 | ) | | | (0.34 | ) | | | — | | | | (0.98 | ) | | | (0.98 | ) | | $ | 17.68 | | | | 0.10 | | | | 1.40 | | | | 1.40 | | | | 1.65 | | | | (1.97 | ) | | | 92.01 | | | $ | 38,038 | |
2014 | | $ | 20.45 | | | | 0.01 | | | | (0.89 | ) | | | (0.88 | ) | | | — | | | | (0.57 | ) | | | (0.57 | ) | | $ | 19.00 | | | | 0.04 | | | | 1.39 | | | | 1.39 | | | | 1.63 | | | | (4.53 | ) | | | 106.18 | | | $ | 38,575 | |
2013 | | $ | 15.70 | | | | (0.01 | ) | | | 4.76 | | | | 4.75 | | | | — | | | | — | | | | — | | | $ | 20.45 | | | | (0.04 | ) | | | 1.38 | | | | 1.38 | | | | 1.68 | | | | 30.25 | | | | 89.17 | | | $ | 26,441 | |
2012 | | $ | 13.31 | | | | (0.04 | ) | | | 2.46 | | | | 2.42 | | | | (0.03 | ) | | | — | | | | (0.03 | ) | | $ | 15.70 | | | | (0.29 | ) | | | 1.40 | | | | 1.40 | | | | 2.23 | | | | 18.17 | | | | 95.17 | | | $ | 9,326 | |
2011 | | $ | 12.18 | | | | 0.07 | | | | 1.10 | | | | 1.17 | | | | (0.04 | ) | | | — | | | | (0.04 | ) | | $ | 13.31 | | | | 0.46 | | | | 1.40 | | | | 1.40 | | | | 32.23 | (h) | | | 9.62 | | | | 142.59 | | | $ | 146 | |
CLASS R5 SHARES | | | | | | | | | | | | | | | | | | | | | | | | | | | | | | | | | | | | | | | | | | | | | | | | | | | | | |
2016(b) | | $ | 18.25 | | | | — | (f) | | | 0.80 | | | | 0.80 | | | | (0.01 | ) | | | — | | | | (0.01 | ) | | $ | 19.04 | | | | (0.04 | )(d) | | | 0.99 | (d) | | | 0.99 | (d) | | | 1.20 | (d) | | | 4.37 | | | | 69.24 | | | $ | 70,468 | |
2015 | | $ | 19.55 | | | | 0.09 | | | | (0.36 | ) | | | (0.27 | ) | | | (0.05 | ) | | | (0.98 | ) | | | (1.03 | ) | | $ | 18.25 | | | | 0.46 | | | | 0.99 | | | | 0.99 | | | | 1.20 | | | | (1.53 | ) | | | 92.01 | | | $ | 66,646 | |
2014 | | $ | 21.01 | | | | 0.10 | | | | (0.93 | ) | | | (0.83 | ) | | | (0.06 | ) | | | (0.57 | ) | | | (0.63 | ) | | $ | 19.55 | | | | 0.46 | | | | 0.99 | | | | 0.99 | | | | 1.18 | | | | (4.15 | ) | | | 106.18 | | | $ | 69,217 | |
2013 | | $ | 16.07 | | | | 0.07 | | | | 4.87 | | | | 4.94 | | | | — | | | | — | | | | — | | | $ | 21.01 | | | | 0.35 | | | | 0.99 | | | | 0.99 | | | | 1.22 | | | | 30.74 | | | | 89.17 | | | $ | 43,209 | |
2012 | | $ | 13.58 | | | | 0.02 | | | | 2.50 | | | | 2.52 | | | | (0.03 | ) | | | — | | | | (0.03 | ) | | $ | 16.07 | | | | 0.13 | | | | 0.99 | | | | 0.99 | | | | 1.29 | | | | 18.56 | | | | 95.17 | | | $ | 19,251 | |
2011 | | $ | 12.40 | | | | 0.08 | | | | 1.17 | | | | 1.25 | | | | (0.07 | ) | | | — | | | | (0.07 | ) | | $ | 13.58 | | | | 0.55 | | | | 0.99 | | | | 0.99 | | | | 10.60 | (h) | | | 10.09 | | | | 142.59 | | | $ | 393 | |
CLASS R6 SHARES | | | | | | | | | | | | | | | | | | | | | | | | | | | | | | | | | | | | | | | | | | | | | | | | | | | | | |
2016(b) | | $ | 18.29 | | | | 0.01 | | | | 0.79 | | | | 0.80 | | | | (0.01 | ) | | | — | | | | (0.01 | ) | | $ | 19.08 | | | | 0.09 | (d) | | | 0.89 | (d) | | | 0.89 | (d) | | | 1.43 | (d) | | | 4.39 | | | | 69.24 | | | $ | 5,425 | |
2015 | | $ | 19.59 | | | | 0.13 | | | | (0.38 | ) | | | (0.25 | ) | | | (0.07 | ) | | | (0.98 | ) | | | (1.05 | ) | | $ | 18.29 | | | | 0.66 | | | | 0.89 | | | | 0.89 | | | | 1.43 | | | | (1.43 | ) | | | 92.01 | | | $ | 4,191 | |
2014 | | $ | 21.05 | | | | 0.12 | | | | (0.93 | ) | | | (0.81 | ) | | | (0.08 | ) | | | (0.57 | ) | | | (0.65 | ) | | $ | 19.59 | | | | 0.58 | | | | 0.89 | | | | 0.89 | | | | 1.34 | | | | (4.05 | ) | | | 106.18 | | | $ | 3,950 | |
2013(i) | | $ | 17.54 | | | | 0.46 | | | | 3.05 | | | | 3.51 | | | | — | | | | — | | | | — | | | $ | 21.05 | | | | 2.21 | (d) | | | 0.89 | (d) | | | 0.89 | (d) | | | 11.83 | (d)(h) | | | 20.01 | | | | 89.17 | | | $ | 2,553 | |
| (a) | Not annualized for periods less than one year. |
| (b) | Unaudited Six Month Period Ended March 31. |
| (c) | Sales loads are not reflected in computing total return. |
| (e) | Dividends from net investment income per share were less than $(0.01). |
| (f) | Net investment income (loss) was less than $0.01 per share. |
| (g) | Net investment income (loss) is less than 0.01%. |
| (h) | Due to the size of net assets and fixed expenses, ratios may appear disproportionate. |
| (i) | Effective date of this class of shares was February 1, 2013. |
| + | Based on weighted average shares outstanding. |
See notes to financial statements.
| | | | |
| 26 Semi-Annual Report | | | | Semi-Annual Report 27 |
| | |
| EXPENSE EXAMPLE | | |
| |
Thornburg International Growth Fund | | March 31, 2016 (Unaudited) |
As a shareholder of the Fund, you incur two types of costs:
| | (1) | transaction costs, including |
(a) sales charges (loads) on purchase payments, for Class A shares;
(b) a deferred sales charge on redemptions of any part or all of a purchase of $1 million of Class A shares within 12 months of purchase;
(c) a deferred sales charge on redemptions of Class C shares within 12 months of purchase;
| | (2) | ongoing costs, including management fees; distribution and/or service (12b-1) fees; and other Fund expenses. |
This example is intended to help you understand your ongoing costs (in dollars) of investing in the Fund and to compare these costs with the ongoing costs of investing in other mutual funds.
The example is based on a $1,000 investment beginning on October 1, 2015, and held until March 31, 2016.
| | | | | | | | | | | | |
| | | BEGINNING
ACCOUNT VALUE
10/1/15 | | | ENDING
ACCOUNT VALUE
3/31/16 | | | EXPENSES PAID
DURING PERIOD†
10/1/15–3/31/16 | |
CLASS A SHARES | | | | | | | | | | | | |
Actual | | $ | 1,000.00 | | | $ | 1,042.20 | | | $ | 7.13 | |
Hypothetical* | | $ | 1,000.00 | | | $ | 1,018.02 | | | $ | 7.04 | |
CLASS C SHARES | | | | | | | | | | | | |
Actual | | $ | 1,000.00 | | | $ | 1,037.60 | | | $ | 10.96 | |
Hypothetical* | | $ | 1,000.00 | | | $ | 1,014.24 | | | $ | 10.83 | |
CLASS I SHARES | | | | | | | | | | | | |
Actual | | $ | 1,000.00 | | | $ | 1,043.90 | | | $ | 5.04 | |
Hypothetical* | | $ | 1,000.00 | | | $ | 1,020.07 | | | $ | 4.98 | |
CLASS R3 SHARES | | | | | | | | | | | | |
Actual | | $ | 1,000.00 | | | $ | 1,040.80 | | | $ | 7.65 | |
Hypothetical* | | $ | 1,000.00 | | | $ | 1,017.50 | | | $ | 7.57 | |
CLASS R4 SHARES | | | | | | | | | | | | |
Actual | | $ | 1,000.00 | | | $ | 1,041.90 | | | $ | 7.15 | |
Hypothetical* | | $ | 1,000.00 | | | $ | 1,018.00 | | | $ | 7.06 | |
CLASS R5 SHARES | | | | | | | | | | | | |
Actual | | $ | 1,000.00 | | | $ | 1,043.70 | | | $ | 5.06 | |
Hypothetical* | | $ | 1,000.00 | | | $ | 1,020.05 | | | $ | 5.00 | |
CLASS R6 SHARES | | | | | | | | | | | | |
Actual | | $ | 1,000.00 | | | $ | 1,043.90 | | | $ | 4.55 | |
Hypothetical* | | $ | 1,000.00 | | | $ | 1,020.55 | | | $ | 4.50 | |
| † | Expenses are equal to the annualized expense ratio for each class (A: 1.40%; C: 2.15%; I: 0.99%; R3: 1.50%; R4: 1.40%; R5: 0.99%; R6: 0.89%) multiplied by the average account value over the period, multiplied by 183/366 to reflect the one-half year period. |
| * | Hypothetical assumes a rate of return of 5% per year before expenses. |
ACTUAL EXPENSES
For each class of shares, the first line of the accompanying table provides information about actual account values and actual expenses. You may use the information in this line, together with the amount you invested, to estimate the expenses that you paid over the period. Simply divide your account value by $1,000 (for example, an $8,600 account value divided by $1,000 = 8.6), then multiply the result by the number in the first line for your class of shares under the heading entitled “Expenses Paid During Period” to estimate the expenses you paid on your account during this period.
HYPOTHETICAL EXAMPLE FOR COMPARISON PURPOSES
For each class of shares, the second line of the accompanying table provides information about hypothetical account values and hypothetical expenses based on the Fund’s actual expense ratio and an assumed rate of return of 5% per year before expenses, which is not the Fund’s actual return. The hypothetical account values and expenses may not be used to estimate the actual ending account balance or expenses you paid for the period. You may use this information to compare the ongoing costs of investing in the Fund and other funds. To do so, compare this 5% hypothetical example with the 5% hypothetical examples that appear in the shareholder reports of the other funds.
Please note that the expenses shown in the table are meant to highlight your ongoing costs only and do not reflect any transactional costs, such as sales charges (loads), redemption fees, or exchange fees. Therefore, the second line of the table for each class of shares is useful in comparing ongoing costs only, and will not help you determine the relative total costs of owning different funds. In addition, if these transactional costs were included, your costs would have been higher.
28 Semi-Annual Report
| | |
| OTHER INFORMATION | | |
| |
Thornburg International Growth Fund | | March 31, 2016 (Unaudited) |
PORTFOLIO PROXY VOTING
Policies and Procedures:
The Trust has delegated to Thornburg Investment Management, Inc. (the “Advisor”) voting decisions respecting proxies for the Fund’s voting securities. The Advisor makes voting decisions in accordance with its Proxy Voting Policy and Procedures. A description of the Policy and Procedures is available (i) without charge, upon request, by calling the Advisor toll-free at 1-800-847-0200, (ii) on the Thornburg website at www.thornburg.com, and (iii) on the Securities and Exchange Commission’s website at www.sec.gov.
Information regarding how proxies were voted is available on or before August 31 of each year for the twelve months ending the preceding June 30. This information is available (i) without charge, upon request by calling the Advisor toll-free at 1-800-847-0200, (ii) on the Thornburg website at www.thornburg.com, and (iii) on the Securities and Exchange Commission’s website at www.sec.gov.
AVAILABILITY OF QUARTERLY PORTFOLIO SCHEDULE
The Fund files with the Securities and Exchange Commission schedules of its portfolio holdings on Form N-Q for the first and third quarters of each fiscal year. The Fund’s Forms N-Q are available on the Commission’s website at www.sec.gov, or may be reviewed and copied at the Commission’s Public Reference Room in Washington, D.C. Information on the operation of the Public Reference Room may be obtained by calling 1-800-SEC-0330. The Fund also makes this information available on its website at www.thornburg. com/download or upon request by calling 1-800-847-0200.
Semi-Annual Report 29
TRUSTEES’ STATEMENT TO SHAREHOLDERS
Revised and Readopted September 15, 2015
The Trustees believe current and prospective shareholders should know how we discharge our responsibilities in supervising the Funds’ investment advisor and in reviewing the advisor’s contract for renewal. Since 2005, we have issued a statement which sets out clearly the three principal guidelines that we follow in supervising the Trust’s investment advisor on your behalf. In accordance with our customary practice, in September of 2015 we again reviewed our statement and concluded we should reissue this statement outlining the principal features of our supervision of the advisor’s performance of investment management services for the Funds.
We begin with the premise that each shareholder selected his or her Fund because its investments are managed by the investment advisor identified in the prospectus and in accordance with the objective and policies described in the prospectus. We realize, as each of you do, that if you believe that your Fund’s stated objective and policies no longer serve your personal investment goals, you can sell your shares and leave the Fund.
Therefore, we believe that our primary supervisory task – our principal obligation to you – is to assess the nature and quality of the advisor’s services, and to confirm that the advisor actively and competently pursues the Fund’s objective, in accordance with the policies set out in the prospectus. To do this, we meet regularly with management to review your Fund’s portfolio and to discuss the advisor’s specific actions and judgments in pursuing the Fund’s objective. We do not substitute our own judgment for the advisor’s decisions in selecting investments; the advisor is paid to exercise its informed judgment on investment decisions, and we seek to confirm, in reviewing the advisor’s performance, that the advisor is doing just that.
Second, we are conscious of costs and the effect that costs have on shareholders’ returns. We try to make sure that your Fund’s fees and costs are reasonable in relationship to the services rendered and that they are generally in line with those charged by other expert investment advisors, consistent with our belief that the Fund’s investors searched for and expect that expertise and attention and have decided to pay a reasonable price for it. We do not put the management contract “out to bid” as a matter of course, and we would not do so unless we had concluded that the advisor materially had failed to pursue the Fund’s objectives in accordance with its policies, or for other equally important reasons. We believe that any other approach would be inconsistent with your interests and contrary to your expectations when you bought shares of the Fund in the first place.
Finally, because we believe that most Thornburg Fund shareholders have invested with a long-term perspective, we try not to focus too much on the fashions of the moment and on short-term performance. The market will not favor any specific investment objective or set of policies at all times and under all economic circumstances. A fund will experience periods of both high and low returns relative to other funds and other investments. Even if one of our Funds is not favored by the market at a particular time, we believe that the advisor is nonetheless obliged to remain true to the Fund’s objective and policies, and we watch to see that it does so.
Trustees of Thornburg Investment Trust
30 Semi-Annual Report
THORNBURG FUND FAMILY
Thornburg Investment Management is a privately-owned global investment firm that offers a range of solutions for retail and institutional investors. Founded in 1982 and headquartered in Santa Fe, New Mexico, we manage approximately $54 billion (as of March 31, 2016) across eight equity and 11 bond mutual funds, separate accounts for high-net-worth investors and institutional accounts, and five UCITS funds for non-U.S. investors.
The fund outlined in this report is one of many equity and fixed-income products available from Thornburg Investment Management.
EQUITY FUNDS
| | • | | Thornburg Core Growth Fund |
| | • | | Thornburg International Value Fund |
| | • | | Thornburg Better World International Fund |
| | • | | Thornburg International Growth Fund |
| | • | | Thornburg Developing World Fund |
| | • | | Thornburg Investment Income Builder Fund |
| | • | | Thornburg Global Opportunities Fund |
FIXED INCOME FUNDS
| | • | | Thornburg Low Duration Income Fund |
| | • | | Thornburg Limited Term U.S. Government Fund |
| | • | | Thornburg Limited Term Income Fund |
| | • | | Thornburg Strategic Income Fund |
| | • | | Thornburg Low Duration Municipal Fund |
| | • | | Thornburg Limited Term Municipal Fund |
| | • | | Thornburg Intermediate Municipal Fund |
| | • | | Thornburg California Limited Term Municipal Fund |
| | • | | Thornburg New Mexico Intermediate Municipal Fund |
| | • | | Thornburg New York Intermediate Municipal Fund |
| | • | | Thornburg Strategic Municipal Income Fund |
Before investing, carefully consider the Fund’s investment goals, risks, charges, and expenses. For a prospectus or summary prospectus containing this and other information, contact your financial advisor or visit thornburg.com. Read it carefully before investing.
For additional information, please visit thornburg.com
Thornburg Investment Management, Inc. 2300 North Ridgetop Road, Santa Fe, NM 87506
Semi-Annual Report 31
This Semi-Annual Report is submitted for the general information of shareholders of the Fund. It is not authorized for distribution to prospective investors in the Fund unless preceded or accompanied by an effective prospectus.
| | | | |
| Investment Advisor: | | Distributor: | | |
| Thornburg Investment Management® | | Thornburg Securities Corporation® | | |
| 800.847.0200 | | 800.847.0200 | | TH1409 |
Semi-Annual Report
March 31, 2016
THORNBURG INVESTMENT INCOME BUILDER FUND
Thornburg
INVESTMENT MANAGEMENT

About Thornburg Investment Management
It’s more than what we do. It’s how we do it.
At Thornburg, we are very different in how we think, invest, and are structured. We believe this difference is what makes us successful in helping individuals reach their long-term financial goals.
How we THINK
Flexible Perspective
Our perspective on investment opportunities is more flexible than most, viewing a wide range of opportunities beyond conventional boundaries to find hidden value.
Collaboration
Collectively, we hone ideas via borderless cross-pollination for better judgment and better results.
How we INVEST
Portfolio Construction
Disciplined construction guided more by our convictions than convention.
CONVICTION
Thorough analysis and our relative-value framework lead to conviction in our securities selection.
UNCONVENTIONAL
Active management means we seek the best value for our clients rather than using conventional benchmarks as our starting point.
How we’re STRUCTURED
Structured for Excellence
How we think and how we invest is made possible by how we’re structured.
TEAM APPROACH FAR FROM THE HERD ACCESS & TRANSPARENCY
2 Semi-Annual Report
Semi-Annual Report
Thornburg Investment Income Builder Fund
March 31, 2016
| | | | |
Share Class | | NASDAQ Symbol | | CUSIP |
Class A | | TIBAX | | 885-215-558 |
Class C | | TIBCX | | 885-215-541 |
Class I | | TIBIX | | 885-215-467 |
Class R3 | | TIBRX | | 885-215-384 |
Class R4 | | TIBGX | | 885-215-186 |
Class R5 | | TIBMX | | 885-215-236 |
Class I, R3, R4, and R5 shares may not be available to all investors. Minimum investments for Class I shares may be higher than those for other classes.
Investments carry risks, including possible loss of principal. Additional risks may be associated with investments outside the United States, especially in emerging markets, including currency fluctuations, illiquidity, volatility, and political and economic risks. Investments in small- and mid-capitalization companies may increase the risk of greater price fluctuations. Portfolios investing in bonds have the same interest rate, inflation, and credit risks that are associated with the underlying bonds. The value of bonds will fluctuate relative to changes in interest rates, decreasing when interest rates rise. Please see the Fund’s prospectus for a discussion of the risks associated with an investment in the Fund. Investments in the Fund are not FDIC insured, nor are they deposits of or guaranteed by a bank or any other entity.
Semi-Annual Report 3
| | |
| LETTER TO SHAREHOLDERS | | |
| |
Thornburg Investment Income Builder Fund | | March 31, 2016 (Unaudited) |
April 21, 2016
Dear Fellow Shareholder:
This letter will highlight the basic results of your Fund’s investment activities for the six-month period ended March 31, 2016. In addition, we will comment on the overall investment landscape, which continues to evolve.
Your Fund’s Performance
Thornburg Investment Income Builder Fund paid an ordinary quarterly dividend of $0.423 per Class A share in the six-month period ended March 31, 2016. This compares to a dividend of $0.425 for the comparable period ended March 31, 2015. The Fund paid $0.823 per Class A share in the 12-month period ended March 31, 2016, down from $0.935 in the prior comparable 12-month period. Dividends per share varied for other share classes to account for class-specific expenses.
The Fund’s net asset value per share was unchanged at $19.07 from September 30, 2015 to March 31, 2016. Price changes of the Fund’s portfolio holdings were mixed during the period, with the dividend providing the Fund’s return.
Investment Income Builder’s Class A share return of 2.21% (without sales charge) for the six-month period trailed its own blended benchmark (75% MSCI World Index and 25% Barclays U.S. Aggregate Bond Index) by 2.39% for the period. Performance comparisons of Investment Income Builder to this benchmark over various periods are shown on page 10. Reviewing these, you will see that the performance of the Fund compares well over various longer periods, though disappointing results in late 2014 and 2015 weigh on comparisons over the trailing one- and three-year periods. Following our comments on performance for the semi-annual period, we will describe the share-price declines of the biggest detractors from the Fund’s performance from June 30, 2015 through mid-February of this year, along with the subsequent performance of these investments through April 20th. While the data demonstrate that market prices of our investments can decline from time to time, we believe they also show the potential for these prices to recover if the underlying businesses resiliently generate revenues, cash flows, and dividends over time.
The quarter ended March 31, 2016 was the 53rd full calendar quarter since the inception of Thornburg Investment Income Builder in December 2002. In 38 of these quarters, the Fund delivered a positive total return. The Fund has delivered positive total returns in 11 of its 13 calendar years of existence. As of March 31, 2016, Thornburg Investment Income Builder has delivered what we view as tax-efficient average annual total returns in excess of 9.3% since inception (Class A shares without sales charge).
Factors Impacting Your Fund’s Performance
In assessing the performance of Thornburg Investment Income Builder for the six-month period ended March 31, 2016, it is constructive to consider the performance in U.S. dollars of the sector components of the MSCI World Index over the period.
Performance data shown represents past performance and is no guarantee of future results. Investment return and principal value will fluctuate so shares, when redeemed, may be worth more or less than their original cost. Current performance may be lower or higher than quoted. For performance current to the most recent month end, visit thornburg.com or call 800.847.0200.
The maximum sales charge for Class A shares is 4.50%. The total annual fund operating expense of Class A shares is 1.33%, as disclosed in the most recent prospectus.
The MSCI World Index comprises 75%, and the entire equity portion, of the Fund’s global performance benchmark:
| 1. | Eight of 10 index sectors showed positive total returns for the period, with sector results ranging from approximately negative 2% (financials) to 14% (telecommunications). |
| 2. | Relative to the MSCI World Index, Thornburg Investment Income Builder’s portfolio was significantly overweight the higher dividend-paying financial and telecommunications sectors, as it has been for most of its history. |
| 3. | The Fund’s performance relative to the MSCI Index in the period was hindered by comparative underperformance from its holdings in the energy, telecommunications, and utilities sectors, and helped by comparative outperformance from holdings in the financial and consumer discretionary sectors. |
| 4. | In the Investment Income Builder portfolio, 45 equity investments contributed positive returns of at least 0.05% (five basis points) during the period. Twenty-two of the Fund’s equity investments contributed negative returns of 0.05% or worse for the quarter. |
Investment Income Builder’s bond holdings delivered positive returns during the semi-annual period. U.S. government bond yields with maturities beyond four years dropped between 0.15% and 0.25% during the period. Investment-grade bond yields dropped slightly more, and sub-investment-grade bond yields were approximately unchanged on the beginning and end dates, though these were volatile within the semi-annual period.
Your Fund’s average return from its investments in the financial sector exceeded the negative performance of the equities in the finance sector of the MSCI World Index in the semi-annual period, led by several non-bank entities. CME Group, Senior Housing Properties Trust, Digital Realty Trust, Washington REIT, Lamar Advertising, Crown Castle International, and Norwegian insurer Gjensidige Forsikring were among the strongest performers in the portfolio. The Fund’s bank holdings, including JPMorgan Chase, ING Group, and UBS Group, were negative contributors, as was a small holding in alternative asset manager Och-Ziff Capital Management, which has been sold to make room for other opportunities.
Investment Income Builder’s significant holdings in the telecommunications sector delivered mixed performances in the semi-
4 Semi-Annual Report
LETTER TO SHAREHOLDERS,
| | |
| |
CONTINUED | | |
| |
Thornburg Investment Income Builder Fund | | March 31, 2016 (Unaudited) |
annual period. AT&T, Telefonica Brasil, Swisscom, and Singapore Telecommunications were among the best performers in the portfolio, while England’s BT Group, Norway’s Telenor, China Mobile, and Denmark’s TDC each delivered negative quarterly returns. We see encouraging signs in the most recent reported business results from each of these negative performers.
Among your Fund’s holdings in the consumer discretionary sector, casino operator Las Vegas Sands, Home Depot, business publisher Wolters Kluwer, and Target Corporation each contributed positively to performance during the period under review. Office supplies retailer Staples delivered a negative return, though its share price recovered materially in the final weeks of March.
Investment Income Builder’s returns from its holdings in the health care sector generally trailed the negative returns of the MSCI World Index during the period, but our lower weighting in investments from this sector aided the Fund’s relative performance. Novartis, Pfizer, Roche, and Sanofi were each negative contributors, as concerns about the political backdrop for drug pricing and cautious guidance on the 2016 business outlook depressed sentiment on the sector. Stock prices of a majority of firms in this sector have risen more than the market as a whole in 2013 and 2014, and we had reduced the portfolio’s percentage weighting in health care stocks prior to September 30, 2015.
Investment Income Builder’s investments in the industrials sector performed well. European toll road operators Vinci and Atlantia and China’s Jiangsu Expressway were strong contributors as low gasoline prices provided a tailwind to road traffic and low interest rates heightened investor interest in dividend-paying infrastructure investments. Your Fund’s investments in Australia’s Sydney airport and Chinese port and road infrastructure operator NWS also rose in accordance with heightened investor interest in these assets. Hong Kong-based real estate and infrastructure investor Hopewell Holdings was a negative contributor in the quarter.
Among Investment Income Builder’s investments in the energy sector, Royal Dutch Shell, Canada’s Suncor Energy, and drilling-rig operator Helmerich & Payne each delivered positive returns in the semi-annual period. U.S. refiner HollyFrontier, Canada’s Husky Energy, and pipeline operators Williams Companies and Kinder Morgan were negative contributors. The average Brent crude oil price fell from approximately $115 per barrel in June 2014 to $38 per barrel at year-end 2015, and dropped further to an average price of $35 per barrel during the March quarter. The overall performance of Investment Income Builder’s energy sector investments was negative for the six-month period, but positive for the March 2016 quarter, as oil prices bounced back from a January low below $28 per barrel.
Investment Income Builder investments in the consumer staples sector were positive in the period, though a modest weighting in these types of businesses hurt relative portfolio performance. Dutch grocer Ahold and Korea Tobacco & Ginseng were positive contributors in the quarter, while Walgreens and Nestle each delivered marginally positive returns. As we write this letter, investors appear to be selling consumer staples businesses in order to fund purchases of more cyclical businesses in materials, energy, and financials sectors.
Among other portfolio holdings, notable contributors during the semi-annual period included Taiwan Semiconductor Manufacturing, and chemicals manufacturer Saudi Basic Industries Corporation. Negative contributors included Electricite de France, Spanish gas pipeline operator Enagas, and Thai fiber-optic communications network owner Jasmine Broadband Internet Infrastructure Fund. We sold the Fund’s remaining position in Enagas. Electricite de France, which supplies more than 70% of the electrical power consumed in France, suffered from a low power-price outlook in its home market and concerns that it will take on potential liabilities if it moves forward with a proposed nuclear power plant project in England.
Market Volatility and Performance of Holdings
Because of the significant volatility in financial markets over the last 10 months, we wish to review the share price declines of the most negative contributors to the Fund’s performance during the second half of 2015 through February 11 of this year (see Table I), along with the subsequent performance of these investments through April 20. February 11 was the lowest net asset value day,
Table I The 20 Most Negative Contributors to Investment Income Builder Performance
Between June 30, 2015 and February 11, 2016
| | | | | | | | | | |
| | | | | Stock Price Change | |
Company Name | | Industry Sector | | (6/30/15 to
2/11/16) | | | (2/11/16 to
4/20/16) | |
Williams Companies | | Energy | | | -76.8 | % | | | +41.7 | % |
JP Morgan Chase & Co | | Financial | | | -21.7 | % | | | +21.0 | % |
China Mobile Ltd. | | Telecommunications | | | -17.8 | % | | | +8.7 | % |
TDC A/S | | Telecommunications | | | -40.3 | % | | | +16.1 | % |
Telenor ASA | | Telecommunications | | | -36.7 | % | | | +23.7 | % |
KKR & Co. | | Financial | | | -51.3 | % | | | +33.1 | % |
Electricite de France | | Utility | | | -48.0 | % | | | +17.1 | % |
Kinder Morgan Inc. | | Energy | | | -63.6 | % | |
| sold during
decline period |
|
DBS Group Holdings | | Financial | | | -38.4 | % | | | +25.4 | % |
Novartis AG | | Health Care | | | -27.4 | % | | | +6.9 | % |
Royal Dutch Shell | | Energy | | | -25.9 | % | | | +25.3 | % |
Staples, Inc. | | Consumer
Discretionary | | | -46.5 | % | | | +33.0 | % |
Blackstone Group | | Financial | | | -42.6 | % | | | +27.9 | % |
Husky Energy | | Energy | | | -55.4 | % | |
| +66.9
(now sold) | %
|
Vodafone Group | | Telecommunications | | | -19.8 | % | | | +15.4 | % |
Sanofi | | Health Care | | | -22.6 | % | | | +15.9 | % |
ONEOK, Inc. | | Energy | | | -50.3 | % | | | +77.4 | % |
Apollo Investment Corp. | | Financial | | | -39.5 | % | | | +35.5 | % |
Qualcomm | | Technology | | | -31.3 | % | | | +21.1 | % |
Invesco Mortgage Capital | | Financial | | | -31.5 | % | | | +27.9 | % |
Semi-Annual Report 5
LETTER TO SHAREHOLDERS,
| | |
| |
CONTINUED | | |
| |
Thornburg Investment Income Builder Fund | | March 31, 2016 (Unaudited) |
at $17.10 per Class A share, for Thornburg Investment Income Builder, over the past year. For the most part, the companies listed in Table I appear capable of demonstrating resilience, and the stock-price recoveries shown have contributed significantly to Thornburg Investment Income Builder’s net asset value increase from $17.10 per share on February 11, 2016 to $19.56 on April 20, 2016. The Fund still holds 18 of the 20 investments shown. We sold the Fund’s position in Kinder Morgan to make room for attractively priced bonds of energy pipeline firms, and to increase our equity holding in another North American pipeline business, ONEOK. More recently, we sold the Fund’s position in Husky Energy in order to increase position sizes in Royal Dutch Shell and Suncor, following Husky’s decision to eliminate its dividend.
A slightly weaker U.S. dollar increased the value of our non-U.S. assets during the six-month period ended March 31, 2016. We hedged the majority of the currency exposure of our asset positions denominated in the Australian dollar, the British pound, the euro, the Chinese yuan, and the Swiss franc. We are more focused on risk management than on reaping possible currency gains from exposure to assets denominated in these currencies. We do not hedge the currency risk of our dividend-income exposure to these currencies, as this would necessitate offsetting unrealized hedge losses against our dividend income each period, which would magnify the volatility of our quarterly dividend payments.
Your Fund’s Bond Component
We modestly increased the portfolio’s allocation to bonds early in 2016, when corporate bond prices were under pressure. You can expect us to increase the portfolio’s allocation to bonds if rising yields lead to significantly lower bond prices. Readers of this commentary who are longtime shareholders of Investment Income Builder will recall that the interest-bearing debt portion of the Fund’s portfolio has varied over time, ranging from 45% at June 30, 2009 to less than 9% last year.
Chart I Interest-Bearing Investments as a Percentage of Total Portfolio as of March 31, 2016
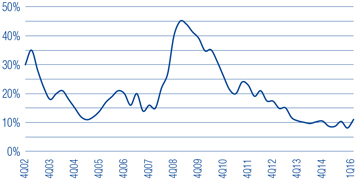
As of March 31, 2016, the portfolio included more than 100 bonds and hybrid securities. In recent years, the reduced yields available from bond investments have posed a meaningful headwind to delivering year-over-year dividend increases for Investment Income Builder shares.
The Economic and Policy Investment Backdrop
If the global economy recovers, we expect firming interest rates, better business conditions, and reduced anxiety from corporate boards about distributing retained earnings. To the extent that the global economy does not continue to recover—and this is always a possibility—we will expect the opposite.
At present, investors debate the future direction of the economies of China, Europe, various emerging markets, and the United States. They buy and sell based in significant part upon expectations of potential policy actions (and inaction) by the U.S. Federal Reserve, Congress, the Obama administration, and an expanding number of non-U.S. policy makers. For the most part, the political and macroeconomic issues remain open. Production growth of many commodities has outpaced demand growth in recent years, depressing prices of oil and other commodities. At today’s commodity prices, flows of investment capital necessary to sustain the higher production levels are contracting. It may take several quarters for markets to tighten sufficiently to move prices materially higher, but equity investors increasingly appear to anticipate this outcome. For now, tolerable commodities prices and firming labor markets in most large economies support growth of global consumer spending.
Most major central banks around the world continue to pursue easy monetary conditions, as indicated by the fact that 62% of euro-area government bonds on issue and 100% of Japanese government bonds are now priced with negative yields. After rising during the first four months of this semi-annual period, yields available to investors in the U.S. bond market fell decisively in February and March, to close the period slightly below September 30, 2015 levels:
| | • | | Ten-year U.S. government bond yields moved approximately 0.15% lower. Since bond prices move in opposite direction to yields, prices of longer-maturity U.S. government bonds rose during the quarter. |
| | • | | Investment-grade corporate bond yields also dropped, as indicated by the 0.29% decrease in the FINRA-Bloomberg Index of Active Investment Grade U.S. Corporate Bond Index, from 3.96% at September 30, 2015 to 3.67% at March 31, 2016. |
| | • | | High yield (“junk”) corporate bond yields ended nearly flat, as indicated by the 0.04% drop in the FINRA-Bloomberg Active High Yield U.S. Corporate Bond Index yields, from 7.96% at September 30, 2015 to 7.92% at March 31. For the trailing 12-month period beginning March 31, 2015, the High Yield Index increased by 1.62%, leading to significant year-over-year price declines for these bonds. |
6 Semi-Annual Report
LETTER TO SHAREHOLDERS,
| | |
| |
CONTINUED | | |
| |
Thornburg Investment Income Builder Fund | | March 31, 2016 (Unaudited) |
While low interest rates are good news for borrowers, they have negative consequences for conservative savers. Interest income as a percentage of the aggregate adjusted gross income of U.S. households fell from 4% in 2007 to less than 2% in 2013, according to Statistics of Income published by the Internal Revenue Service.
Investors must consider other options. Yields on taxable and tax-exempt money funds remain below 1/5 of one percent. Banks in the United States have aggressively reduced yields on all deposits. A very large pool of investor dollars is looking for better returns elsewhere, but in sensible investments. We are optimistic that the types of income-producing investments owned by Thornburg Investment Income Builder Fund will experience sustainable popularity among investors, as their intrinsic values for income production are recognized. A high percentage of investor funds belong to people over the age of 55, for whom income is an increasingly necessary and desirable attribute.
Thank you for being a shareholder of Thornburg Investment Income Builder Fund. Remember that you can review descriptions of many of the stocks in your portfolio at your leisure by going to our internet site, www.thornburg.com/iib. Best wishes for a wonderful summer.
Sincerely,
| | | | |
 | |  | |  |
| Brian McMahon | | Jason Brady, CFA | | Ben Kirby, CFA |
| Portfolio Manager | | Portfolio Manager | | Portfolio Manager |
| Chief Investment Officer and Managing Director | | CEO, President, and Managing Director | | Managing Director |
The matters discussed in this report may constitute forward-looking statements made pursuant to the safe harbor provisions of the Securities Litigation Reform Act of 1995. These include any advisor or portfolio manager prediction, assessment, analysis or outlook for individual securities, industries, investment styles, market sectors and/or markets. These statements involve risks and uncertainties. In addition to the general risks described for each fund in its current prospectus, other factors bearing on these reports include the accuracy of the advisor’s or portfolio manager’s forecasts and predictions, the appropriateness of the investment strategies designed by the advisor or portfolio manager and the ability of the advisor or portfolio manager to implement their strategies efficiently and successfully. Any one or more of these factors, as well as other risks affecting the securities markets generally, could cause the actual results of any fund to differ materially as compared to its benchmarks.
The views expressed by the portfolio managers reflect their professional opinions and are subject to change. Under no circumstances does the information contained within represent a recommendation to buy or sell any security.
Semi-Annual Report 7
| | |
| THE DIVIDEND LANDSCAPE | | |
| |
Thornburg Investment Income Builder Fund | | March 31, 2016 (Unaudited) |
To appreciate the investment environment in which Thornburg Investment Income Builder Fund operates, you may wish to review these highlights of the “dividend landscape.”
The S&P 500 Index Payout Ratio — A Historical Perspective
The dividend payout ratio is a fraction that expresses dividend payments as a percentage of per-share earnings. As the economy slowed in the wake of the financial crisis, earnings-per-share on average declined, causing the payout ratio to spike, even as dividends paid by the S&P 500 portfolio declined. Earnings have since materially improved, bringing the payout ratio back in line with the overall trend in recent times.
Corporate Willingness to Pay Dividends is Key to the Fund’s Investment Process
The Russell 1000 Index includes approximately 1,000 public companies that are supposed to be generally representative of corporate America. Between 1980 and 1993, at least 75% of these firms paid some dividend. Between 1994 and 2001, the percentage of Russell 1000 companies paying dividends sank to just over 50%, indicating a preference towards reinvesting retained earnings in growth initiatives. Dividends returned to fashion between 2002 and 2008. A reduction in the number of Russell 1000 firms paying dividends followed the 2008 recession. However, from early 2010, the number steadily climbed back to around 70%.
Rising Dividend Payments Despite Decreasing Dividend Yields
Over time, the dollar dividend per unit of the S&P 500 Index has generally increased. Because the price of the index itself has increased even more, the yield on the S&P 500 Index, as a percentage of the current index price, has generally decreased in recent decades. You should note, however, that the dollar yield on an original investment made at a fixed point in time (say, 1970 or 1989) has increased, even without reinvestment of dividends.
S&P 500 Index Payout Ratio
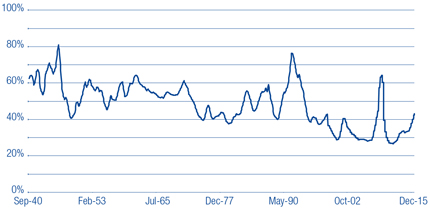
Source: Standard & Poor’s, beginning in 1999 (uses operating earnings); “Irrational Exuberance”
by Robert J. Shiller, through 1998 (uses reported earnings).
Percentage of Companies Paying Dividends in Russell 1000 Index
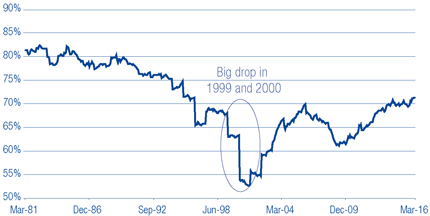
Source: CSFB Quantitative and Equity Derivatives Strategy, Baseline, and FactSet
S&P 500 Index Average Yield vs. Annual Dividends from a Hypothetical $10,000 Investment (Dividends not Reinvested)
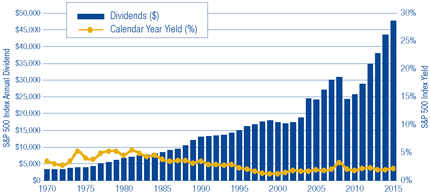
Source: Bloomberg and FactSet.
Past performance does not guarantee future results.
8 Semi-Annual Report
THE DIVIDEND LANDSCAPE,
| | |
| |
CONTINUED | | |
| |
Thornburg Investment Income Builder Fund | | March 31, 2016 (Unaudited) |
The Top 100 Dividend Yields
| | | | | | | | |
| | | Russell 1000
Index | | | Russell 2000
Index | |
Financials | | | 43 | % | | | 54 | % |
Energy | | | 19 | % | | | 16 | % |
Consumer Discretionary | | | 12 | % | | | 6 | % |
Utilities | | | 7 | % | | | 5 | % |
Industrials | | | 5 | % | | | 10 | % |
Information Technology | | | 4 | % | | | 1 | % |
Materials | | | 4 | % | | | 5 | % |
Telecommunication Services | | | 4 | % | | | 1 | % |
Consumer Staples | | | 2 | % | | | 1 | % |
Health Care | | | 0 | % | | | 1 | % |
Source: FactSet as of March 31, 2016.
Estimated Average Dividend Yields (MSCI Indices) of Markets Around the Globe
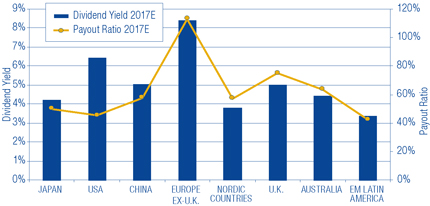
Source: Bloomberg as of March 31, 2016.
A Truly Diversified Dividend-Paying Portfolio Must Look Beyond the Obvious High-Yield Stocks!
In the (large cap) Russell 1000 Index, 74% of the top 100 dividend payers are in the financials, energy, and consumer discretionary sectors. In the (small cap) Russell 2000 Index, 70% of the top 100 dividend-yielding stocks are financial or energy companies. To construct a diversified portfolio of attractive yielding stocks, one must look beyond these three sectors. We certainly do.
Dividend yield is a ratio that shows how much a company pays out in dividends each year relative to its share price.
Global Diversification Can Improve the Portfolio Yield
Since firms outside the U.S. tend to pay higher dividends than U.S. firms, particularly outside the financial and utility sectors, we maintain the ability to diversify the Thornburg Investment Income Builder Fund into foreign dividend-paying stocks to try to take advantage of these opportunities.
Diversification does not assure or guarantee better performance and cannot eliminate the risk of investment losses.
Dividends are not guaranteed.
Semi-Annual Report 9
| | |
| PERFORMANCE SUMMARY | | |
| |
Thornburg Investment Income Builder Fund | | March 31, 2016 (Unaudited) |
Average Annual Total Returns
| | | | | | | | | | | | | | | | | | | | |
| | | 1-Yr | | | 3-Yr | | | 5-Yr | | | 10-Yr | | | Since
Incep. | |
Class A Shares (Incep: 12/24/02) | | | | | | | | | | | | | | | | | | | | |
Without sales charge | | | -7.11 | % | | | 2.72 | % | | | 4.66 | % | | | 5.95 | % | | | 9.33 | % |
With sales charge | | | -11.29 | % | | | 1.15 | % | | | 3.70 | % | | | 5.46 | % | | | 8.95 | % |
Class C Shares (Incep: 12/24/02) | | | | | | | | | | | | | | | | | | | | |
Without sales charge | | | -7.77 | % | | | 1.98 | % | | | 3.92 | % | | | 5.25 | % | | | 8.68 | % |
With sales charge | | | -8.66 | % | | | 1.98 | % | | | 3.92 | % | | | 5.25 | % | | | 8.68 | % |
Class I Shares (Incep: 11/3/03) | | | -6.83 | % | | | 3.04 | % | | | 4.99 | % | | | 6.30 | % | | | 8.48 | % |
Class R3 Shares (Incep: 2/1/05) | | | -7.45 | % | | | 2.39 | % | | | 4.33 | % | | | 5.68 | % | | | 6.73 | % |
Class R4 Shares (Incep: 2/1/08) | | | -7.33 | % | | | 2.52 | % | | | 4.47 | % | | | — | | | | 4.15 | % |
Class R5 Shares (Incep: 2/1/07) | | | -6.95 | % | | | 2.91 | % | | | 4.86 | % | | | — | | | | 5.12 | % |
Blended Index (Since 12/24/02) | | | -1.92 | % | | | 5.86 | % | | | 6.01 | % | | | 4.71 | % | | | 7.17 | % |
Growth of a Hypothetical $10,000 Investment
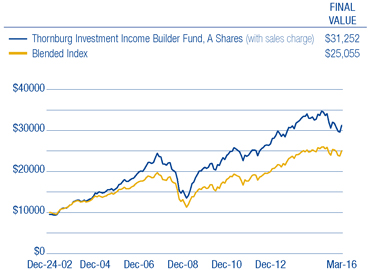
Performance data shown represents past performance and is no guarantee of future results. Investment return and principal value will fluctuate so shares, when redeemed, may be worth more or less than their original cost. Current performance may be lower or higher than quoted. For performance current to the most recent month end, visit thornburg.com or call 800-847-0200. The performance information does not reflect the deduction of taxes that a shareholder would pay on distributions or the redemption of Fund shares. Returns reflect the reinvestment of dividends and capital gains. Class A shares are sold with a maximum sales charge of 4.50%. Class C shares are subject to a 1% CDSC for the first year only. There is no sales charge for Class I, R3, R4, and R5 shares.
As disclosed in the most recent prospectus, the total annual fund operating expenses are as follows: A shares, 1.33%; C shares, 2.08%; I shares, 1.01%; R3 shares, 1.71%; R4 shares, 1.62%; R5 shares, 1.23%. Thornburg Investment Management and/or Thornburg Securities Corporation have contractually agreed to waive fees and reimburse expenses through at least February 1, 2017, for some of the share classes, resulting in net expense ratios of the following: C shares, 2.06%; R3 shares, 1.66%; R4 shares, 1.56%; R5 shares, 1.15%. For more detailed information on fund expenses and waivers/reimbursements please see the Fund’s prospectus.
30-day SEC Yield as of 3/31/16 (A Shares): 3.83%
Glossary
Barclays U.S. Aggregate Bond Index – An index composed of approximately 8,000 publicly traded bonds including U.S. government, mortgage-backed, corporate, and Yankee bonds. The index is weighted by the market value of the bonds included in the index.
Blended Index – The Blended Index is composed of 25% Barclays U.S. Aggregate Bond Index and 75% MSCI World Index.
FlNRA-Bloomberg Active High Yield U.S. Corporate Bond Index – An index comprised of the “active” (most frequently traded) fixed-coupon, high-yield bonds represented by FINRA TRACE, FINRA’s transaction reporting facility that disseminates all over-the-counter secondary market transactions in these public bonds.
FlNRA-Bloomberg Active Investment Grade U.S. Corporate Bond Index – An index comprised of the “active” (most frequently traded) fixed-coupon, investment-grade bonds represented by FINRA TRACE, FINRA’s transaction reporting facility that disseminates all over-the-counter secondary market transactions in these public bonds.
MSCI Country Indices – These indices are free float-adjusted market capitalization indices that are designed to measure equity market performance in that specific country in U.S. dollars.
MSCI World Index – An unmanaged market-weighted index that consists of securities traded in 24 of the world’s most developed countries. Securities are listed on exchanges in the U.S., Europe, Canada, Australia, New Zealand, and the Far East. The index is calculated with net dividends reinvested, in U.S. dollars.
S&P 500 Index – An unmanaged broad measure of the U.S. stock market.
Unless otherwise noted, index returns reflect the reinvestment of income dividends and capital gains, if any, but do not reflect fees, brokerage commissions or other expenses of investing. Investors may not make direct investments into any index. The performance of any index is not indicative of the performance of any particular investment.
Basis Point (bp) – A unit equal to 1/100th of 1%. 1% = 100 basis points (bps).
Effective Duration – A bond’s sensitivity to interest rates, incorporating the embedded option features, such as call provisions. Bonds with longer durations experience greater price volatility than bonds with shorter durations.
10 Semi-Annual Report
| | |
| FUND SUMMARY | | |
| |
Thornburg Investment Income Builder Fund | | March 31, 2016 (Unaudited) |
OBJECTIVES AND STRATEGIES
The Fund seeks to provide a level of current income which exceeds the average yield on U.S. stocks generally, and which will generally grow, subject to periodic fluctuations, over the years on a per share basis. The Fund’s secondary investment objective is long-term capital appreciation.
The Fund may invest in any domestic or foreign equity or debt security which Thornburg Investment Management believes may assist the Fund in pursuing its investment goals, although the Fund expects that equity securities in its portfolio will normally be weighted in favor of companies that pay dividends or other current income.
Portfolio Composition
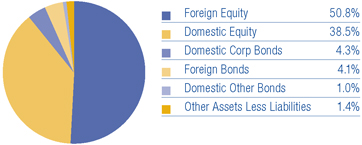
Top Ten Equity Holdings
| | | | |
China Mobile Ltd. | | | 4.3 | % |
JPMorgan Chase & Co. | | | 3.3 | % |
CME Group, Inc. | | | 2.8 | % |
Atlantia S.p.A. | | | 2.7 | % |
The Home Depot, Inc. | | | 2.7 | % |
Royal Dutch Shell plc | | | 2.5 | % |
Roche Holding AG | | | 2.5 | % |
AT&T, Inc. | | | 2.4 | % |
Vinci S.A. | | | 2.4 | % |
BT Group plc | | | 2.2 | % |
Sector Exposure
(percent of equity holdings)
| | | | |
Financials | | | 29.2 | % |
Telecommunication Services | | | 20.9 | % |
Consumer Discretionary | | | 10.2 | % |
Health Care | | | 9.5 | % |
Industrials | | | 8.2 | % |
Consumer Staples | | | 6.7 | % |
Energy | | | 6.1 | % |
Information Technology | | | 4.4 | % |
Utilities | | | 3.5 | % |
Materials | | | 1.2 | % |
Other | | | 0.1 | % |
Country Exposure*
(percent of Fund)
| | | | |
United States | | | 43.7 | % |
Switzerland | | | 10.3 | % |
France | | | 6.8 | % |
Netherlands | | | 5.7 | % |
United Kingdom | | | 5.5 | % |
China | | | 5.2 | % |
Italy | | | 3.2 | % |
Singapore | | | 2.6 | % |
Norway | | | 2.1 | % |
Taiwan | | | 2.0 | % |
Canada | | | 1.6 | % |
Hong Kong | | | 1.1 | % |
Brazil | | | 1.1 | % |
Germany | | | 1.1 | % |
Denmark | | | 1.0 | % |
Russia | | | 0.9 | % |
Australia | | | 0.8 | % |
Korea | | | 0.8 | % |
Spain | | | 0.7 | % |
South Africa | | | 0.5 | % |
Thailand | | | 0.4 | % |
Jamaica | | | 0.4 | % |
New Zealand | | | 0.3 | % |
Cayman Islands | | | 0.3 | % |
Luxembourg | | | 0.2 | % |
Argentina | | | 0.1 | % |
Chile | | | 0.1 | % |
Ireland | | | 0.1 | % |
Japan | | | 0.1 | % |
Panama** | | | 0.0 | % |
Trinidad & Tobago** | | | 0.0 | % |
Other Assets Less Liabilities | | | 1.4 | % |
| * | The country assignment of each holding is determined by the Fund’s Advisor based on various factors, including the location of the issuer’s head office, the issuer’s jurisdiction of incorporation and the country from which a majority of the issuer’s revenue is derived. |
| ** | Country percentage was less than 0.1%. |
There is no guarantee that the Fund will meet its investment objectives.
All portfolio information is subject to change. Charts may not add up to 100% due to rounding.
Semi-Annual Report 11
FUND SUMMARY,
CONTINUED
| | |
Thornburg Investment Income Builder Fund | | March 31, 2016 (Unaudited) |
QUARTERLY DIVIDEND HISTORY, CLASS A
| | | | | | | | | | |
Year | | Q1 | | Q2 | | Q3 | | Q4 | | Total |
2003 | | 9.2¢ | | 11.2¢ | | 12.4¢ | | 17.5¢ | | 50.3¢ |
2004 | | 10.2¢ | | 12.5¢ | | 15.0¢ | | 21.8¢ | | 59.5¢ |
2005 | | 11.0¢ | | 13.6¢ | | 17.4¢ | | 29.0¢ | | 71.0¢ |
2006 | | 12.5¢ | | 16.0¢ | | 19.2¢ | | 33.0¢ | | 80.7¢ |
2007 | | 14.2¢ | | 18.5¢ | | 21.5¢ | | 36.8¢ | | 91.0¢ |
2008 | | 17.9¢ | | 21.8¢ | | 26.0¢ | | 36.8¢ | | 102.4¢ |
2009 | | 18.0¢ | | 24.2¢ | | 28.0¢ | | 34.5¢ | | 104.7¢ |
2010 | | 19.8¢ | | 25.0¢ | | 32.0¢ | | 36.0¢ | | 112.8¢ |
2011 | | 21.0¢ | | 26.0¢ | | 32.0¢ | | 37.5¢ | | 116.5¢ |
2012 | | 21.5¢ | | 26.0¢ | | 28.5¢ | | 36.0¢ | | 112.0¢ |
2013 | | 21.5¢ | | 25.3¢ | | 25.0¢ | | 24.5¢ | | 96.3¢ |
2014 | | 22.5¢ | | 24.0¢ | | 27.0¢ | | 26.0¢ | | 99.5¢ |
2015 | | 16.5¢ | | 20.0¢ | | 20.0¢ | | 25.3¢ | | 81.8¢ |
2016 | | 17.0¢ | | | | | | | | |
We do not expect each sequential quarter’s dividend to increase over that of the prior quarter, since dividend payments outside the United States tend to be seasonal. Rather, the Fund aspires to increase the dividend paid on an annual basis.
EVOLUTION OF INDUSTRY GROUP EXPOSURE
Top 10 industry groups quarter by quarter (percent of equity holdings)
| | | | |
As of 3/31/16 | | | | |
| |
Telecommunication Services | | | 20.9 | % |
Diversified Financials | | | 10.3 | % |
Real Estate | | | 9.9 | % |
Pharmaceuticals, Biotechnology & Life Sciences | | | 9.5 | % |
Banks | | | 7.0 | % |
Energy | | | 6.1 | % |
Retailing | | | 5.6 | % |
Transportation | | | 4.3 | % |
Capital Goods | | | 3.9 | % |
Utilities | | | 3.5 | % |
| |
As of 9/30/15 | | | | |
| |
Telecommunication Services | | | 19.9 | % |
Diversified Financials | | | 11.0 | % |
Real Estate | | | 9.2 | % |
Energy | | | 8.1 | % |
Pharmaceuticals, Biotechnology & Life Sciences | | | 7.8 | % |
Banks | | | 6.8 | % |
Utilities | | | 5.9 | % |
Retailing | | | 5.2 | % |
Transportation | | | 4.3 | % |
Capital Goods | | | 3.8 | % |
| | | | |
As of 12/31/15 | | | | |
| |
Telecommunication Services | | | 21.1 | % |
Diversified Financials | | | 11.1 | % |
Real Estate | | | 9.9 | % |
Pharmaceuticals, Biotechnology & Life Sciences | | | 9.3 | % |
Banks | | | 6.8 | % |
Energy | | | 5.9 | % |
Utilities | | | 5.5 | % |
Retailing | | | 5.4 | % |
Transportation | | | 4.2 | % |
Capital Goods | | | 3.5 | % |
| |
As of 6/30/15 | | | | |
| |
Telecommunication Services | | | 18.4 | % |
Diversified Financials | | | 10.9 | % |
Banks | | | 9.2 | % |
Real Estate | | | 8.0 | % |
Energy | | | 7.9 | % |
Pharmaceuticals, Biotechnology & Life Sciences | | | 7.4 | % |
Utilities | | | 5.9 | % |
Retailing | | | 4.8 | % |
Transportation | | | 4.2 | % |
Capital Goods | | | 3.6 | % |
12 Semi-Annual Report
| | |
| SCHEDULE OF INVESTMENTS | | |
| |
Thornburg Investment Income Builder Fund | | March 31, 2016 (Unaudited) |
| | | | | | | | |
| | | Shares/
Principal Amount | | | Value | |
COMMON STOCK — 88.77% | | | | | | | | |
| | |
AUTOMOBILES & COMPONENTS — 0.82% | | | | | | | | |
Automobiles — 0.82% | | | | | | | | |
Daimler AG | | | 1,796,900 | | | $ | 137,750,910 | |
| | | | | | | | |
| | | | | | | 137,750,910 | |
| | | | | | | | |
| | |
BANKS — 6.02% | | | | | | | | |
Banks — 6.02% | | | | | | | | |
DBS Group Holdings Ltd. | | | 20,322,200 | | | | 231,891,855 | |
ING Groep N.V. | | | 15,070,300 | | | | 182,288,463 | |
JPMorgan Chase & Co. | | | 9,279,000 | | | | 549,502,380 | |
Liechtensteinische Landesbank AG | | | 1,150,000 | | | | 45,925,849 | |
| | | | | | | | |
| | | | | | | 1,009,608,547 | |
| | | | | | | | |
| | |
CAPITAL GOODS — 3.48% | | | | | | | | |
Construction & Engineering — 2.39% | | | | | | | | |
Vinci S.A. | | | 5,380,595 | | | | 400,845,180 | |
Industrial Conglomerates — 1.09% | | | | | | | | |
Hopewell Holdings Ltd. | | | 37,798,340 | | | | 122,058,231 | |
NWS Holdings Ltd. | | | 38,000,000 | | | | 60,350,506 | |
| | | | | | | | |
| | | | | | | 583,253,917 | |
| | | | | | | | |
| | |
CONSUMER SERVICES — 1.06% | | | | | | | | |
Hotels, Restaurants & Leisure — 1.06% | | | | | | | | |
Las Vegas Sands Corp. | | | 3,444,000 | | | | 177,985,920 | |
| | | | | | | | |
| | | | | | | 177,985,920 | |
| | | | | | | | |
| | |
DIVERSIFIED FINANCIALS — 9.00% | | | | | | | | |
Capital Markets — 6.24% | | | | | | | | |
Apollo Global Management, LLC | | | 3,887,163 | | | | 66,548,231 | |
a Apollo Investment Corp. | | | 24,800,000 | | | | 137,640,000 | |
Ares Capital Corp. | | | 15,285,900 | | | | 226,842,756 | |
GAM Holding AG | | | 4,073,882 | | | | 58,891,331 | |
KKR & Co. LP | | | 9,876,400 | | | | 145,084,316 | |
Och-Ziff Capital Management Group, LLC | | | 6,202,249 | | | | 26,979,783 | |
a Solar Capital Ltd. | | | 4,607,900 | | | | 79,624,512 | |
The Blackstone Group LP | | | 6,052,600 | | | | 169,775,430 | |
UBS Group AG | | | 8,327,525 | | | | 134,151,487 | |
Diversified Financial Services — 2.76% | | | | | | | | |
CME Group, Inc. | | | 4,819,600 | | | | 462,922,580 | |
| | | | | | | | |
| | | | | | | 1,508,460,426 | |
| | | | | | | | |
| | |
ENERGY — 5.47% | | | | | | | | |
Energy Equipment & Services — 0.24% | | | | | | | | |
Helmerich & Payne, Inc. | | | 703,200 | | | | 41,291,904 | |
Oil, Gas & Consumable Fuels — 5.23% | | | | | | | | |
HollyFrontier Corp. | | | 1,757,460 | | | | 62,073,487 | |
ONEOK, Inc. | | | 4,285,900 | | | | 127,976,974 | |
Royal Dutch Shell plc A Shares | | | 3,020,880 | | | | 73,064,323 | |
Royal Dutch Shell plc ADR | | | 7,277,800 | | | | 352,609,410 | |
Suncor Energy, Inc. | | | 6,795,976 | | | | 189,266,950 | |
The Williams Companies, Inc. | | | 4,418,600 | | | | 71,006,902 | |
| | | | | | | | |
| | | | | | | 917,289,950 | |
| | | | | | | | |
| | |
FOOD & STAPLES RETAILING — 2.41% | | | | | | | | |
Food & Staples Retailing — 2.41% | | | | | | | | |
Koninklijke Ahold NV | | | 6,100,638 | | | | 137,241,655 | |
Walgreens Boots Alliance, Inc. | | | 3,171,106 | | | | 267,133,969 | |
| | | | | | | | |
| | | | | | | 404,375,624 | |
| | | | | | | | |
Semi-Annual Report 13
| | |
| SCHEDULE OF INVESTMENTS, CONTINUED | | |
| |
Thornburg Investment Income Builder Fund | | March 31, 2016 (Unaudited) |
| | | | | | | | |
| | | Shares/
Principal Amount | | | Value | |
FOOD, BEVERAGE & TOBACCO — 2.96% | | | | | | | | |
Beverages — 0.20% | | | | | | | | |
Coca-Cola Amatil Ltd. | | | 4,877,000 | | | $ | 33,048,033 | |
Food Products — 1.93% | | | | | | | | |
Nestle SA | | | 4,325,600 | | | | 323,222,256 | |
Tobacco — 0.83% | | | | | | | | |
KT&G Corp. | | | 1,452,986 | | | | 139,759,059 | |
| | | | | | | | |
| | | | | | | 496,029,348 | |
| | | | | | | | |
| | |
HOUSEHOLD & PERSONAL PRODUCTS — 0.61% | | | | | | | | |
Household Products — 0.61% | | | | | | | | |
Reckitt Benckiser plc | | | 1,053,700 | | | | 101,850,191 | |
| | | | | | | | |
| | | | | | | 101,850,191 | |
| | | | | | | | |
| | |
INSURANCE — 1.89% | | | | | | | | |
Insurance — 1.89% | | | | | | | | |
AXA S.A. | | | 3,130,500 | | | | 73,701,821 | |
Gjensidige Forsikring ASA | | | 3,991,276 | | | | 68,059,150 | |
NN Group NV | | | 2,444,100 | | | | 79,971,707 | |
Zurich Financial Services AG | | | 405,300 | | | | 94,122,500 | |
| | | | | | | | |
| | | | | | | 315,855,178 | |
| | | | | | | | |
| | |
MATERIALS — 1.11% | | | | | | | | |
Chemicals — 0.74% | | | | | | | | |
LyondellBasell Industries NV | | | 1,452,500 | | | | 124,304,950 | |
Metals & Mining — 0.37% | | | | | | | | |
Mining and Metallurgical Co. Norilsk Nickel PJSC ADR | | | 690,000 | | | | 8,907,900 | |
Mining and Metallurgical Co. Norilsk Nickel PJSC ADR | | | 4,119,000 | | | | 53,382,240 | |
| | | | | | | | |
| | | | | | | 186,595,090 | |
| | | | | | | | |
| | |
MEDIA — 2.18% | | | | | | | | |
Media — 2.18% | | | | | | | | |
Vivendi | | | 10,946,968 | | | | 230,197,094 | |
Wolters Kluwer N.V. | | | 3,396,674 | | | | 135,586,819 | |
| | | | | | | | |
| | | | | | | 365,783,913 | |
| | | | | | | | |
| | |
PHARMACEUTICALS, BIOTECHNOLOGY & LIFE SCIENCES — 8.44% | | | | | | | | |
Pharmaceuticals — 8.44% | | | | | | | | |
Merck & Co., Inc. | | | 5,144,087 | | | | 272,173,643 | |
Novartis AG | | | 3,885,600 | | | | 281,655,993 | |
Pfizer, Inc. | | | 7,248,900 | | | | 214,857,396 | |
Roche Holding AG | | | 1,685,800 | | | | 414,985,035 | |
Sanofi | | | 2,871,599 | | | | 231,541,564 | |
| | | | | | | | |
| | | | | | | 1,415,213,631 | |
| | | | | | | | |
| | |
REAL ESTATE — 8.84% | | | | | | | | |
Real Estate Investment Trusts — 8.84% | | | | | | | | |
Capstead Mortgage Corp. | | | 3,938,400 | | | | 38,950,776 | |
Chimera Investment Corp. | | | 6,515,284 | | | | 88,542,710 | |
Crown Castle International Corp. | | | 2,069,300 | | | | 178,994,450 | |
Digital Realty Trust, Inc. | | | 1,039,800 | | | | 92,011,901 | |
a Dynex Capital, Inc. | | | 4,418,542 | | | | 29,383,305 | |
a Invesco Mortgage Capital, Inc. | | | 15,851,700 | | | | 193,073,706 | |
Lamar Advertising Co. | | | 1,690,620 | | | | 103,973,130 | |
a MFA Financial, Inc. | | | 34,911,900 | | | | 239,146,515 | |
Outfront Media, Inc. | | | 3,031,219 | | | | 63,958,721 | |
Senior Housing Properties Trust | | | 5,123,900 | | | | 91,666,571 | |
a Two Harbors Investment Corp. | | | 24,462,700 | | | | 194,233,838 | |
a Washington REIT | | | 5,721,000 | | | | 167,110,410 | |
| | | | | | | | |
| | | | | | | 1,481,046,033 | |
| | | | | | | | |
14 Semi-Annual Report
| | |
| SCHEDULE OF INVESTMENTS, CONTINUED | | |
| |
Thornburg Investment Income Builder Fund | | March 31, 2016 (Unaudited) |
| | | | | | | | |
| | | Shares/
Principal Amount | | | Value | |
RETAILING — 5.03% | | | | | | | | |
Multiline Retail — 1.78% | | | | | | | | |
Target Corp. | | | 3,629,734 | | | $ | 298,654,514 | |
Specialty Retail — 3.25% | | | | | | | | |
Staples, Inc. | | | 8,640,400 | | | | 95,303,612 | |
The Home Depot, Inc. | | | 3,366,800 | | | | 449,232,124 | |
| | | | | | | | |
| | | | | | | 843,190,250 | |
| | | | | | | | |
| | |
SEMICONDUCTORS & SEMICONDUCTOR EQUIPMENT — 3.00% | | | | | | | | |
Semiconductors & Semiconductor Equipment — 3.00% | | | | | | | | |
Advanced Semiconductor Engineering, Inc. | | | 51,998,000 | | | | 60,506,000 | |
Qualcomm, Inc. | | | 3,321,500 | | | | 169,861,510 | |
Taiwan Semiconductor Manufacturing Co. Ltd. | | | 54,127,000 | | | | 272,451,342 | |
| | | | | | | | |
| | | | | | | 502,818,852 | |
| | | | | | | | |
| | |
TECHNOLOGY HARDWARE & EQUIPMENT — 0.92% | | | | | | | | |
Technology, Hardware, Storage & Peripherals — 0.92% | | | | | | | | |
Apple, Inc. | | | 1,406,400 | | | | 153,283,536 | |
| | | | | | | | |
| | | | | | | 153,283,536 | |
| | | | | | | | |
| | |
TELECOMMUNICATION SERVICES — 18.55% | | | | | | | | |
Diversified Telecommunication Services — 11.54% | | | | | | | | |
AT&T, Inc. | | | 10,387,900 | | | | 406,894,043 | |
BT Group plc | | | 58,183,784 | | | | 368,110,052 | |
a Jasmine Broadband Internet Infrastructure Fund | | | 295,626,500 | | | | 69,326,851 | |
Singapore Telecommunications Ltd. | | | 70,235,215 | | | | 198,014,480 | |
Swisscom AG | | | 596,600 | | | | 324,188,550 | |
TDC A/S | | | 35,922,950 | | | | 175,815,919 | |
Telefonica Brasil SA ADR | | | 9,257,283 | | | | 115,623,465 | |
Telenor ASA | | | 17,039,200 | | | | 275,725,873 | |
Wireless Telecommunication Services — 7.01% | | | | | | | | |
China Mobile Ltd. | | | 64,336,574 | | | | 716,569,446 | |
b MegaFon PJSC GDR | | | 2,592,300 | | | | 28,515,300 | |
MegaFon PJSC Reg S GDR | | | 4,337,000 | | | | 47,707,000 | |
MTN Group Ltd. | | | 8,761,110 | | | | 80,230,434 | |
Vodafone Group plc | | | 94,966,424 | | | | 301,706,738 | |
| | | | | | | | |
| | | | | | | 3,108,428,151 | |
| | | | | | | | |
| | |
TRANSPORTATION — 3.86% | | | | | | | | |
Transportation Infrastructure — 3.86% | | | | | | | | |
Atlantia S.p.A. | | | 16,322,902 | | | | 452,644,163 | |
China Merchants Holdings International Co. Ltd. | | | 32,112,830 | | | | 95,212,294 | |
Jiangsu Express Co. Ltd. | | | 27,642,000 | | | | 37,272,435 | |
Sydney Airport | | | 12,023,554 | | | | 61,659,440 | |
| | | | | | | | |
| | | | | | | 646,788,332 | |
| | | | | | | | |
| | |
UTILITIES — 3.12% | | | | | | | | |
Electric Utilities — 1.64% | | | | | | | | |
Electricite de France SA | | | 16,627,303 | | | | 186,628,900 | |
Mighty River Power Ltd. | | | 24,482,800 | | | | 49,413,742 | |
Terna Rete Elettrica Nazionale S.p.A. | | | 6,648,421 | | | | 37,939,663 | |
Independent Power & Renewable Electricity Producers — 0.15% | | | | | | | | |
Huaneng Power International, Inc. | | | 28,849,000 | | | | 25,734,959 | |
Multi-Utilities — 1.33% | | | | | | | | |
Dominion Resources, Inc. | | | 1,436,547 | | | | 107,913,411 | |
National Grid plc | | | 8,068,200 | | | | 114,396,201 | |
| | | | | | | | |
| | | | | | | 522,026,876 | |
| | | | | | | | |
TOTAL COMMON STOCK (Cost $14,505,350,677) | | | | | | | 14,877,634,675 | |
| | | | | | | | |
Semi-Annual Report 15
| | |
| SCHEDULE OF INVESTMENTS, CONTINUED | | |
| |
Thornburg Investment Income Builder Fund | | March 31, 2016 (Unaudited) |
| | | | | | | | |
| | | Shares/
Principal Amount | | | Value | |
PREFERRED STOCK — 0.53% | | | | | | | | |
| | |
BANKS — 0.19% | | | | | | | | |
Banks — 0.19% | | | | | | | | |
Barclays Bank plc Pfd, 7.10% | | | 200,000 | | | $ | 5,108,000 | |
First Niagara Financial Group Pfd, 8.625% | | | 143,295 | | | | 3,817,379 | |
b First Tennessee Bank Pfd, 3.75% | | | 12,000 | | | | 7,966,500 | |
GMAC Capital Trust I Pfd, 8.125% | | | 628,126 | | | | 15,395,368 | |
| | | | | | | | |
| | | | | | | 32,287,247 | |
| | | | | | | | |
| | |
DIVERSIFIED FINANCIALS — 0.16% | | | | | | | | |
Capital Markets — 0.02% | | | | | | | | |
Morgan Stanley Pfd, 4.00% | | | 120,000 | | | | 2,433,600 | |
Consumer Finance — 0.14% | | | | | | | | |
Ally Financial, Inc. Pfd, 8.50% | | | 930,495 | | | | 23,690,402 | |
| | | | | | | | |
| | | | | | | 26,124,002 | |
| | | | | | | | |
| | |
ENERGY — 0.00% | | | | | | | | |
Oil, Gas & Consumable Fuels — 0.00% | | | | | | | | |
Halcon Resources Corp. Pfd, 5.75% | | | 18,822 | | | | 649,359 | |
| | | | | | | | |
| | | | | | | 649,359 | |
| | | | | | | | |
| | |
MISCELLANEOUS — 0.07% | | | | | | | | |
U.S. Government Agencies — 0.07% | | | | | | | | |
Farm Credit Bank of Texas Pfd, 10.00% | | | 9,000 | | | | 11,289,375 | |
| | | | | | | | |
| | | | | | | 11,289,375 | |
| | | | | | | | |
| | |
TELECOMMUNICATION SERVICES — 0.11% | | | | | | | | |
Wireless Telecommunication Services — 0.11% | | | | | | | | |
b Centaur Funding Corp. Pfd, 9.08% | | | 15,000 | | | | 17,962,500 | |
| | | | | | | | |
| | | | | | | 17,962,500 | |
| | | | | | | | |
TOTAL PREFERRED STOCK (Cost $106,129,740) | | | | | | | 88,312,483 | |
| | | | | | | | |
| | |
ASSET BACKED SECURITIES — 0.22% | | | | | | | | |
| | |
COMMERCIAL MTG TRUST — 0.01% | | | | | | | | |
Citigroup Commercial Mtg Trust, Series 2004-HYB2 Class B1, 2.928%, 3/25/2034 | | $ | 849,284 | | | | 693,977 | |
| | | | | | | | |
| | | | | | | 693,977 | |
| | | | | | | | |
| | |
OTHER ASSET BACKED — 0.07% | | | | | | | | |
b Fairway Outdoor Funding, LLC, Series 2012-1 Class B, 8.835%, 10/15/2042 | | | 7,000,000 | | | | 7,350,243 | |
b JPR Royalty, LLC, 14.00%, 9/1/2020 | | | 5,000,000 | | | | 2,500,000 | |
b,c Northwind Holdings, LLC, Series 2007-1A Class A1 Floating Rate Note, 1.415%, 12/1/2037 | | | 2,719,500 | | | | 2,529,135 | |
| | | | | | | | |
| | | | | | | 12,379,378 | |
| | | | | | | | |
| | |
RESIDENTIAL MTG TRUST — 0.14% | | | | | | | | |
Banc of America Funding Corp., Series 2006-I Class SB1, 2.467%, 12/20/2036 | | | 1,899,978 | | | | 604,577 | |
Bear Stearns ARM Mtg, Series 2003-6 Class 2B-1, 2.606%, 8/25/2033 | | | 190,351 | | | | 187,510 | |
FBR Securitization Trust, Series 2005-2 Class M1, 1.156%, 9/25/2035 | | | 13,910,575 | | | | 13,809,910 | |
Merrill Lynch Mtg Investors Trust, Series 2004-A4 Class M1, 2.56%, 8/25/2034 | | | 5,110,870 | | | | 4,726,547 | |
Morgan Stanley Capital, Inc., Series 2005-HE7 Class A2C, 0.753%, 11/25/2035 | | | 4,084,140 | | | | 4,066,541 | |
Wells Fargo Asset Securities Corp., Series 2005-AR1 Class 1B1, 2.77%, 2/25/2035 | | | 4,580,507 | | | | 573,841 | |
| | | | | | | | |
| | | | | | | 23,968,926 | |
| | | | | | | | |
TOTAL ASSET BACKED SECURITIES (Cost $40,967,125) | | | | | | | 37,042,281 | |
| | | | | | | | |
| | |
CORPORATE BONDS — 8.05% | | | | | | | | |
| | |
AUTOMOBILES & COMPONENTS — 0.03% | | | | | | | | |
Auto Components — 0.03% | | | | | | | | |
b,d Nexteer Automotive Group Ltd., 5.875%, 11/15/2021 | | | 4,300,000 | | | | 4,372,584 | |
| | | | | | | | |
| | | | | | | 4,372,584 | |
| | | | | | | | |
16 Semi-Annual Report
| | |
| SCHEDULE OF INVESTMENTS, CONTINUED | | |
| |
Thornburg Investment Income Builder Fund | | March 31, 2016 (Unaudited) |
| | | | | | | | |
| | | Shares/
Principal Amount | | | Value | |
BANKS — 0.08% | | | | | | | | |
Banks — 0.08% | | | | | | | | |
b,d Groupe BPCE, 12.50%, 8/29/2049 | | $ | 10,211,000 | | | $ | 12,619,060 | |
| | | | | | | | |
| | | | | | | 12,619,060 | |
| | | | | | | | |
| | |
CAPITAL GOODS — 0.24% | | | | | | | | |
Aerospace & Defense — 0.04% | | | | | | | | |
b CBC Ammo, LLC, 7.25%, 11/15/2021 | | | 9,265,000 | | | | 7,087,725 | |
Construction & Engineering — 0.09% | | | | | | | | |
b Zachry Holdings, Inc., 7.50%, 2/1/2020 | | | 15,420,000 | | | | 15,034,500 | |
Industrial Conglomerates — 0.11% | | | | | | | | |
Otter Tail Corp., 9.00%, 12/15/2016 | | | 17,000,000 | | | | 17,703,664 | |
| | | | | | | | |
| | | | | | | 39,825,889 | |
| | | | | | | | |
| | |
COMMERCIAL & PROFESSIONAL SERVICES — 0.11% | | | | | | | | |
Commercial Services & Supplies — 0.11% | | | | | | | | |
b,d GFL Environmental, Inc., 9.875%, 2/1/2021 | | | 8,000,000 | | | | 8,320,000 | |
b,d GFL Environmental, Inc., 7.875%, 4/1/2020 | | | 8,000,000 | | | | 7,940,000 | |
RR Donnelley, 7.625%, 6/15/2020 | | | 1,697,000 | | | | 1,709,728 | |
| | | | | | | | |
| | | | | | | 17,969,728 | |
| | | | | | | | |
| | |
CONSUMER SERVICES — 0.33% | | | | | | | | |
Diversified Consumer Services — 0.22% | | | | | | | | |
b Laureate Education, Inc., 10.00%, 9/1/2019 | | | 49,484,000 | | | | 36,370,740 | |
Hotels, Restaurants & Leisure — 0.11% | | | | | | | | |
b,d Arcos Dorados Holdings, Inc., 6.625%, 9/27/2023 | | | 2,490,000 | | | | 2,371,725 | |
b Arcos Dorados Holdings, Inc. (BRL), 10.25%, 7/13/2016 | | | 66,000,000 | | | | 17,070,627 | |
| | | | | | | | |
| | | | | | | 55,813,092 | |
| | | | | | | | |
| | |
DIVERSIFIED FINANCIALS — 0.61% | | | | | | | | |
Capital Markets — 0.05% | | | | | | | | |
Goldman Sachs Group, Inc., 5.625%, 1/15/2017 | | | 8,000,000 | | | | 8,253,296 | |
b Morgan Stanley (BRL), 10.09%, 5/3/2017 | | | 4,560,000 | | | | 1,232,309 | |
Consumer Finance — 0.22% | | | | | | | | |
Capital One Bank, 6.15%, 9/1/2016 | | | 25,000,000 | | | | 25,507,475 | |
b,e,f Cash Store Financial (CAD), 0%, 1/31/2017 | | | 10,000,000 | | | | 1,472,570 | |
First Cash Financial Services, Inc., 6.75%, 4/1/2021 | | | 10,395,000 | | | | 10,005,187 | |
Diversified Financial Services — 0.34% | | | | | | | | |
Bank of America Corp. (BRL), 10.75%, 8/20/2018 | | | 5,000,000 | | | | 1,340,314 | |
b,d CFG Holdings Ltd./CFG Finance, LLC, 11.50%, 11/15/2019 | | | 27,634,000 | | | | 27,634,000 | |
JPMorgan Chase & Co., 7.90%, 4/29/2049 | | | 15,000,000 | | | | 15,000,000 | |
National Rural Utilities Cooperative Finance Corp., 10.375%, 11/1/2018 | | | 5,000,000 | | | | 6,097,535 | |
b TMX Finance, LLC/Titlemax Finance, 8.50%, 9/15/2018 | | | 8,000,000 | | | | 6,400,000 | |
| | | | | | | | |
| | | | | | | 102,942,686 | |
| | | | | | | | |
| | |
ENERGY — 2.17% | | | | | | | | |
Energy Equipment & Services — 0.01% | | | | | | | | |
b,d,e Schahin II Finance Co. (SPV) Ltd., 5.875%, 9/25/2023 | | | 11,640,133 | | | | 1,693,639 | |
Oil, Gas & Consumable Fuels — 2.16% | | | | | | | | |
Calumet Specialty Products Partners LP, 7.75%, 4/15/2023 | | | 5,000,000 | | | | 3,400,000 | |
Calumet Specialty Products Partners LP, 7.625%, 1/15/2022 | | | 6,550,000 | | | | 4,634,125 | |
Calumet Specialty Products Partners LP, 6.50%, 4/15/2021 | | | 15,010,000 | | | | 10,657,100 | |
b Citgo Petroleum Corp., 6.25%, 8/15/2022 | | | 27,000,000 | | | | 26,055,000 | |
b DCP Midstream, LLC, 9.75%, 3/15/2019 | | | 5,000,000 | | | | 4,781,140 | |
Enbridge Energy Partners LP, 9.875%, 3/1/2019 | | | 9,750,000 | | | | 10,919,357 | |
Energy Transfer Partners LP, 3.633%, 11/1/2066 | | | 13,820,000 | | | | 7,877,400 | |
Enterprise Products Operating LP, 7.034%, 1/15/2068 | | | 14,480,000 | | | | 14,682,720 | |
Gastar Exploration USA, Inc., 8.625%, 5/15/2018 | | | 7,782,000 | | | | 4,980,480 | |
b,d Gaz Capital SA, 8.146%, 4/11/2018 | | | 2,000,000 | | | | 2,166,780 | |
HollyFrontier Corp., 5.875%, 4/1/2026 | | | 25,000,000 | | | | 24,887,725 | |
Kinder Morgan Energy Partners LP, 9.00%, 2/1/2019 | | | 8,000,000 | | | | 9,079,280 | |
Kinder Morgan Energy Partners LP, 5.00%, 3/1/2043 | | | 10,000,000 | | | | 8,250,220 | |
Semi-Annual Report 17
| | |
| SCHEDULE OF INVESTMENTS, CONTINUED | | |
| |
Thornburg Investment Income Builder Fund | | March 31, 2016 (Unaudited) |
| | | | | | | | |
| | | Shares/
Principal Amount | | | Value | |
Kinder Morgan Energy Partners LP, 5.80%, 3/15/2035 | | $ | 10,000,000 | | | $ | 8,981,760 | |
Kinder Morgan, Inc., 5.30%, 12/1/2034 | | | 23,630,000 | | | | 20,338,270 | |
Kinder Morgan, Inc., 5.55%, 6/1/2045 | | | 5,000,000 | | | | 4,443,640 | |
b Linc Energy, 12.50%, 10/31/2017 | | | 22,791,000 | | | | 28,489 | |
b Linc Energy, 9.625%, 10/31/2017 | | | 19,433,000 | | | | 2,623,455 | |
NuStar Logistics LP, 8.15%, 4/15/2018 | | | 18,000,000 | | | | 18,000,000 | |
b,d Odebrecht Offshore Drilling Finance Ltd., 6.75%, 10/1/2023 | | | 30,317,315 | | | | 6,669,809 | |
Oneok Partners LP, 8.625%, 3/1/2019 | | | 8,000,000 | | | | 8,703,392 | |
b,d Petro Co., Trinidad Tobago Ltd., 9.75%, 8/14/2019 | | | 4,000,000 | | | | 4,118,000 | |
d Petrobras Global Finance B.V., 4.375%, 5/20/2023 | | | 15,000,000 | | | | 10,945,500 | |
d Petrobras Global Finance B.V., 3.00%, 1/15/2019 | | | 4,000,000 | | | | 3,437,696 | |
e,f RAAM Global Energy Co., 12.50%, 10/1/2049 | | | 15,000,000 | | | | 112,500 | |
Summit Midstream Holdings, LLC, 5.50%, 8/15/2022 | | | 8,700,000 | | | | 6,177,000 | |
Teppco Partners LP, 7.00%, 6/1/2067 | | | 7,000,000 | | | | 4,952,500 | |
The Williams Companies, Inc., 5.75%, 6/24/2044 | | | 14,198,000 | | | | 9,441,670 | |
The Williams Companies, Inc., 3.70%, 1/15/2023 | | | 29,129,000 | | | | 21,773,927 | |
The Williams Companies, Inc., 4.55%, 6/24/2024 | | | 69,318,000 | | | | 52,681,680 | |
b Transcontinental Gas Pipe Line Co., LLC, 7.85%, 2/1/2026 | | | 32,700,000 | | | | 37,399,579 | |
b,d Tullow Oil plc, 6.25%, 4/15/2022 | | | 13,500,000 | | | | 9,578,250 | |
| | | | | | | | |
| | | | | | | 364,472,083 | |
| | | | | | | | |
| | |
FOOD & STAPLES RETAILING — 0.17% | | | | | | | | |
Food & Staples Retailing — 0.17% | | | | | | | | |
b Bakkavor Finance (2) plc (GBP), 8.75%, 6/15/2020 | | | 14,132,000 | | | | 21,722,943 | |
b C&S Group Enterprises, LLC, 5.375%, 7/15/2022 | | | 7,860,000 | | | | 7,447,350 | |
| | | | | | | | |
| | | | | | | 29,170,293 | |
| | | | | | | | |
| | |
FOOD, BEVERAGE & TOBACCO — 0.10% | | | | | | | | |
Beverages — 0.03% | | | | | | | | |
Ambev International Finance Co., Ltd. (BRL), 9.50%, 7/24/2017 | | | 21,669,000 | | | | 5,667,272 | |
Food Products — 0.03% | | | | | | | | |
b,d BRF S.A., 4.75%, 5/22/2024 | | | 6,000,000 | | | | 5,670,000 | |
Tobacco — 0.04% | | | | | | | | |
b,d B.A.T. International Finance, plc, 9.50%, 11/15/2018 | | | 5,000,000 | | | | 5,951,305 | |
| | | | | | | | |
| | | | | | | 17,288,577 | |
| | | | | | | | |
| | |
HOUSEHOLD & PERSONAL PRODUCTS — 0.04% | | | | | | | | |
Household Products — 0.04% | | | | | | | | |
b Energizer Holdings, Inc., 5.50%, 6/15/2025 | | | 7,500,000 | | | | 7,537,500 | |
| | | | | | | | |
| | | | | | | 7,537,500 | |
| | | | | | | | |
| | |
INSURANCE — 1.05% | | | | | | | | |
Insurance — 1.05% | | | | | | | | |
b,d Dai Ichi Mutual Life Insurance Co., Ltd., 7.25%, 12/29/2049 | | | 9,000,000 | | | | 10,676,250 | |
ELM B.V. (AUD), 7.635%, 12/29/2049 | | | 10,500,000 | | | | 8,273,958 | |
ELM B.V. (AUD), 3.538%, 4/29/2049 | | | 8,000,000 | | | | 6,016,977 | |
Genworth Holdings, Inc., 4.90%, 8/15/2023 | | | 24,020,000 | | | | 17,834,850 | |
Hartford Financial Services Group, 8.125%, 6/15/2068 | | | 9,650,000 | | | | 10,301,375 | |
b MetLife Capital Trust X, 9.25%, 4/8/2068 | | | 12,000,000 | | | | 16,275,000 | |
MetLife, Inc., 6.817%, 8/15/2018 | | | 4,000,000 | | | | 4,460,772 | |
b National Life Insurance of Vermont, 10.50%, 9/15/2039 | | | 2,000,000 | | | | 2,951,872 | |
b,d QBE Capital Funding III Ltd., 7.25%, 5/24/2041 | | | 40,000,000 | | | | 43,200,000 | |
b,d Sirius International Group, 7.506%, 5/29/2049 | | | 28,590,000 | | | | 28,232,625 | |
b ZFS Finance USA Trust II, 6.45%, 12/15/2065 | | | 25,748,000 | | | | 25,696,504 | |
b ZFS Finance USA Trust V, 6.50%, 5/9/2067 | | | 1,260,000 | | | | 1,237,950 | |
| | | | | | | | |
| | | | | | | 175,158,133 | |
| | | | | | | | |
| | |
MATERIALS — 0.25% | | | | | | | | |
Chemicals — 0.06% | | | | | | | | |
b,d Consolidated Energy Finance S.A., 6.75%, 10/15/2019 | | | 11,000,000 | | | | 10,477,500 | |
Construction Materials — 0.17% | | | | | | | | |
b,d CEMEX Espana Luxembourg, 9.875%, 4/30/2019 | | | 1,460,000 | | | | 1,538,110 | |
b,d Cimpor Financial Operations B.V., 5.75%, 7/17/2024 | | | 17,985,000 | | | | 13,039,125 | |
CRH America, Inc., 8.125%, 7/15/2018 | | | 12,000,000 | | | | 13,511,880 | |
18 Semi-Annual Report
| | |
| SCHEDULE OF INVESTMENTS, CONTINUED | | |
| |
Thornburg Investment Income Builder Fund | | March 31, 2016 (Unaudited) |
| | | | | | | | |
| | | Shares/
Principal Amount | | | Value | |
Metals & Mining — 0.02% | | | | | | | | |
Coeur d’Alene Mines Corp., 7.875%, 2/1/2021 | | $ | 4,387,000 | | | $ | 3,520,568 | |
| | | | | | | | |
| | | | | | | 42,087,183 | |
| | | | | | | | |
| | |
MEDIA — 0.23% | | | | | | | | |
Media — 0.23% | | | | | | | | |
Comcast Cable Communications, LLC, 8.875%, 5/1/2017 | | | 5,000,000 | | | | 5,415,030 | |
b,d Mood Media Corp., 9.25%, 10/15/2020 | | | 18,445,000 | | | | 12,265,925 | |
Time Warner Cable, Inc., 8.75%, 2/14/2019 | | | 14,000,000 | | | | 16,392,446 | |
WMG Holdings Corp., 13.75%, 10/1/2019 | | | 4,001,000 | | | | 4,231,058 | |
| | | | | | | | |
| | | | | | | 38,304,459 | |
| | | | | | | | |
| | |
PHARMACEUTICALS, BIOTECHNOLOGY & LIFE SCIENCES — 0.06% | | | | | | | | |
Pharmaceuticals — 0.06% | | | | | | | | |
b,d Concordia Healthcare Corp., 7.00%, 4/15/2023 | | | 11,400,000 | | | | 9,775,500 | |
| | | | | | | | |
| | | | | | | 9,775,500 | |
| | | | | | | | |
| | |
SOFTWARE & SERVICES — 0.29% | | | | | | | | |
Information Technology Services — 0.05% | | | | | | | | |
Neustar, Inc., 4.50%, 1/15/2023 | | | 11,185,000 | | | | 9,115,775 | |
Internet Software & Services — 0.05% | | | | | | | | |
b,c Yahoo!, Inc., 6.65%, 8/10/2026 | | | 7,053,550 | | | | 7,794,173 | |
Software — 0.19% | | | | | | | | |
b Solera Capital, LLC, 10.50%, 3/1/2024 | | | 31,000,000 | | | | 31,155,000 | |
| | | | | | | | |
| | | | | | | 48,064,948 | |
| | | | | | | | |
| | |
TELECOMMUNICATION SERVICES — 1.55% | | | | | | | | |
Diversified Telecommunication Services — 0.97% | | | | | | | | |
d Deutsche Telekom International Finance BV, 8.75%, 6/15/2030 | | | 26,150,000 | | | | 39,204,524 | |
Qwest Corp., 6.75%, 12/1/2021 | | | 9,000,000 | | | | 9,675,000 | |
d Telefonica Emisiones SAU, 6.221%, 7/3/2017 | | | 2,770,000 | | | | 2,924,378 | |
d Telefonica Emisiones SAU, 7.045%, 6/20/2036 | | | 85,390,000 | | | | 108,091,273 | |
b,d Telemar Norte Leste SA, 5.50%, 10/23/2020 | | | 9,065,000 | | | | 3,172,750 | |
Wireless Telecommunication Services — 0.58% | | | | | | | | |
b,d Digicel Ltd., 6.00%, 4/15/2021 | | | 69,037,000 | | | | 61,788,115 | |
b,d Millicom International Cellular S.A., 6.00%, 3/15/2025 | | | 28,423,000 | | | | 26,362,333 | |
b,d VimpelCom Holdings B.V., 7.504%, 3/1/2022 | | | 8,735,000 | | | | 9,204,506 | |
| | | | | | | | |
| | | | | | | 260,422,879 | |
| | | | | | | | |
| | |
TRANSPORTATION — 0.13% | | | | | | | | |
Airlines — 0.13% | | | | | | | | |
American Airlines Group, Inc., 4.95%, 7/15/2024 | | | 4,473,836 | | | | 4,786,646 | |
b,d Guanay Finance Ltd., 6.00%, 12/15/2020 | | | 14,751,793 | | | | 14,272,359 | |
US Airways, 6.25%, 10/22/2024 | | | 2,128,455 | | | | 2,341,301 | |
| | | | | | | | |
| | | | | | | 21,400,306 | |
| | | | | | | | |
| | |
UTILITIES — 0.61% | | | | | | | | |
Electric Utilities — 0.38% | | | | | | | | |
Arizona Public Service Co., 8.75%, 3/1/2019 | | | 6,500,000 | | | | 7,707,810 | |
b Cia de Eletricidade do Estado da Bahia (BRL), 11.75%, 4/27/2016 | | | 12,000,000 | | | | 3,228,902 | |
b,d Enel Finance International S.A., 6.25%, 9/15/2017 | | | 40,000,000 | | | | 42,680,000 | |
Entergy Gulf States Louisiana, LLC, 6.00%, 5/1/2018 | | | 8,000,000 | | | | 8,721,472 | |
b Great River Energy, 5.829%, 7/1/2017 | | | 503,551 | | | | 513,240 | |
Multi-Utilities — 0.23% | | | | | | | | |
Ameren Illinois Co., 9.75%, 11/15/2018 | | | 5,000,000 | | | | 6,005,355 | |
b Enable Oklahoma Intrastate Transmission, LLC, 6.25%, 3/15/2020 | | | 2,500,000 | | | | 1,999,545 | |
NiSource Finance Corp., 6.40%, 3/15/2018 | | | 20,000,000 | | | | 21,688,220 | |
Sempra Energy, 9.80%, 2/15/2019 | | | 7,750,000 | | | | 9,322,173 | |
| | | | | | | | |
| | | | | | | 101,866,717 | |
| | | | | | | | |
TOTAL CORPORATE BONDS (Cost $1,368,722,528) | | | | | | | 1,349,091,617 | |
| | | | | | | | |
Semi-Annual Report 19
| | |
| SCHEDULE OF INVESTMENTS, CONTINUED | | |
| |
Thornburg Investment Income Builder Fund | | March 31, 2016 (Unaudited) |
| | | | | | | | |
| | | Shares/
Principal Amount | | | Value | |
MUNICIPAL BONDS — 0.02% | | | | | | | | |
San Bernardino County California Redevelopment Agency (San Sevaine), 8.45%, 9/1/2030 | | $ | 2,555,000 | | | $ | 3,010,991 | |
| | | | | | | | |
TOTAL MUNICIPAL BONDS (Cost $2,506,681) | | | | | | | 3,010,991 | |
| | | | | | | | |
| | |
U.S. GOVERNMENT AGENCIES — 0.05% | | | | | | | | |
b Agribank FCB, 9.125%, 7/15/2019 | | | 6,750,000 | | | | 8,176,916 | |
| | | | | | | | |
TOTAL U.S. GOVERNMENT AGENCIES (Cost $6,750,000) | | | | | | | 8,176,916 | |
| | | | | | | | |
| | |
OTHER GOVERNMENT — 0.03% | | | | | | | | |
Federative Republic of Brazil (BRL), 12.50%, 1/5/2022 | | | 20,000,000 | | | | 5,284,163 | |
| | | | | | | | |
TOTAL OTHER GOVERNMENT (Cost $12,863,632) | | | | | | | 5,284,163 | |
| | | | | | | | |
| | |
LOAN PARTICIPATIONS — 0.97% | | | | | | | | |
| | |
CONSUMER SERVICES — 0.15% | | | | | | | | |
Diversified Consumer Services — 0.15% | | | | | | | | |
Laureate Education, Inc., 5.00%, 6/15/2018 | | | 29,007,728 | | | | 24,946,646 | |
| | |
DIVERSIFIED FINANCIALS — 0.07% | | | | | | | | |
Diversified Financial Services — 0.07% | | | | | | | | |
NCP Finance LP, 11.00%, 10/1/2018 | | | 13,947,527 | | | | 11,867,538 | |
| | |
FOOD, BEVERAGE & TOBACCO — 0.05% | | | | | | | | |
Tobacco — 0.05% | | | | | | | | |
North Atlantic Trading Co., Inc., 7.75%-9.00%, 1/13/2020 | | | 8,738,231 | | | | 8,607,158 | |
| | |
INDUSTRIALS — 0.06% | | | | | | | | |
Construction & Engineering — 0.06% | | | | | | | | |
ABG Intermediate Holdings (2), LLC, 9.50%, 5/27/2022 | | | 11,266,667 | | | | 10,647,000 | |
| | |
MATERIALS — 0.12% | | | | | | | | |
Metals & Mining — 0.12% | | | | | | | | |
Coeur Mining, Inc., 9.00%, 6/9/2020 | | | 21,562,063 | | | | 20,915,201 | |
| | |
MEDIA — 0.05% | | | | | | | | |
Media — 0.05% | | | | | | | | |
d Mood Media Corp., 7.00%, 5/1/2019 | | | 8,428,895 | | | | 7,820,414 | |
| | |
PHARMACEUTICALS, BIOTECHNOLOGY & LIFE SCIENCES — 0.20% | | | | | | | | |
Pharmaceuticals — 0.20% | | | | | | | | |
c,d Concordia Healthcare Corp., 9.50%, 10/21/2017 | | | 33,610,960 | | | | 33,543,738 | |
| | |
SOFTWARE & SERVICES — 0.19% | | | | | | | | |
Information Technology Services — 0.19% | | | | | | | | |
Neustar, Inc., 4.38%, 01/22/2018 | | | 32,515,000 | | | | 31,864,700 | |
| | |
TRANSPORTATION — 0.05% | | | | | | | | |
Airlines — 0.05% | | | | | | | | |
b,c,d ET Two, LLC, 10.00%, 9/30/2019 | | | 2,201,115 | | | | 2,183,506 | |
b,c,d ET Three, LLC, 10.00%, 9/30/2019 | | | 2,201,115 | | | | 2,183,506 | |
b,c,d OS Two, LLC, 10.00%, 12/15/2020 | | | 3,211,200 | | | | 3,204,777 | |
| | |
UTILITIES — 0.03% | | | | | | | | |
Electric Utilities — 0.03% | | | | | | | | |
e,f Texas Competitive Electric Holdings Co. LLC, 4.9178%, 10/10/2016 | | | 20,669,860 | | | | 5,753,042 | |
| | | | | | | | |
TOTAL LOAN PARTICIPATIONS (Cost $183,758,353) | | | | | | | 163,537,226 | |
| | | | | | | | |
| | |
SHORT TERM INVESTMENTS — 1.38% | | | | | | | | |
a Thornburg Capital Management Fund | | | 23,177,936 | | | | 231,779,363 | |
| | | | | | | | |
TOTAL SHORT TERM INVESTMENTS (Cost $231,779,363) | | | | | | | 231,779,363 | |
| | | | | | | | |
TOTAL INVESTMENTS — 100.02% (Cost $16,458,828,099) | | | | | | $ | 16,763,869,715 | |
LIABILITIES NET OF OTHER ASSETS — (0.02)% | | | | | | | (3,475,022 | ) |
| | | | | | | | |
NET ASSETS — 100.00% | | | | | | $ | 16,760,394,693 | |
| | | | | | | | |
20 Semi-Annual Report
| | |
| SCHEDULE OF INVESTMENTS, CONTINUED | | |
| |
Thornburg Investment Income Builder Fund | | March 31, 2016 (Unaudited) |
Footnote Legend
| a | Investment in Affiliates – Shown below are holdings of voting securities of each portfolio company which is considered “affiliated” to the Fund under the Investment Company Act of 1940, including companies for which the Fund’s holding represented 5% or more of the company’s voting securities, and a series of the Thornburg Investment Trust in which the Fund invested for cash management purposes during the period: |
| | | | | | | | | | | | | | | | | | | | | | | | | | | | |
Issuer | | Shares/Principal
September 30,
2015 | | | Gross
Additions | | | Gross
Reductions | | | Shares/Principal
March 31,
2016 | | | Market Value
March 31,
2016 | | | Investment
Income | | | Realized
Gain (loss) | |
Apollo Investment Corp. | | | 24,800,000 | | | | — | | | | — | | | | 24,800,000 | | | $ | 137,640,000 | | | $ | 6,480,000 | | | $ | — | |
Dynex Capital, Inc. | | | 4,418,542 | | | | — | | | | — | | | | 4,418,542 | | | | 29,383,305 | | | | 3,048,794 | | | | — | |
Invesco Mortgage Capital, Inc. | | | 15,851,700 | | | | — | | | | — | | | | 15,851,700 | | | | 193,073,706 | | | | 12,283,691 | | | | — | |
Jasmine Broadband Internet Infrastructure Fund | | | 359,941,200 | | | | — | | | | 64,314,700 | | | | 295,626,500 | | | | 69,326,851 | | | | — | | | | (80,092,261 | ) |
MFA Financial, Inc. | | | 33,531,700 | | | | 1,910,200 | | | | 530,000 | | | | 34,911,900 | | | | 239,146,515 | | | | 14,176,760 | | | | (940,863 | ) |
Solar Capital Ltd. | | | 4,607,900 | | | | — | | | | — | | | | 4,607,900 | | | | 79,624,512 | | | | 3,686,320 | | | | — | |
TDC A/S* | | | 45,566,900 | | | | | | | | | | | | | | | | | | | | | | | | | |
Thornburg Capital Management Fund | | | 55,637,891 | | | | 155,180,024 | | | | 187,639,979 | | | | 23,177,936 | | | | 231,779,363 | | | | 725,670 | | | | — | |
Two Harbors Investment Corp. | | | 20,272,500 | | | | 4,190,200 | | | | — | | | | 24,462,700 | | | | 194,233,838 | | | | 11,478,527 | | | | — | |
Washington REIT | | | 5,721,000 | | | | — | | | | — | | | | 5,721,000 | | | | 167,110,410 | | | | 2,694,591 | | | | — | |
| | | | | | | | | | | | | | | | | | | | | | | | | | | | |
Total non-controlled affiliated issuers - 8.00% of net assets | | | | | | | $ | 1,341,318,500 | | | $ | 54,542,353 | | | $ | (81,033,124 | ) |
| | | | | | | | | | | | | | | | | | | | | | | | | | | | |
| * | Issuer not affiliated at March 31, 2016 |
| b | Securities exempt from registration under Rule 144A of the Securities Act of 1933, as amended. These securities may only be resold in the ordinary course of business in transactions exempt from registration, normally to qualified institutional buyers. As of March 31, 2016, the aggregate value of these securities in the Fund’s portfolio was $751,478,746, representing 4.48% of the Fund’s net assets. |
| c | Security currently fair valued by the Valuation and Pricing Committee using procedures approved by the Trustees’ Audit Committee. |
| d | Yankee bond denominated in U.S. dollars and is issued in the U.S. by foreign banks and corporations. |
Portfolio Abbreviations
To simplify the listings of securities, abbreviations are used per the table below:
| | |
| ADR | | American Depositary Receipt |
| ARM | | Adjustable Rate Mortgage |
| AUD | | Denominated in Australian Dollars |
| BRL | | Denominated in Brazilian Real |
| CAD | | Denominated in Canadian Dollars |
| CHL | | Denominated in Chilean Peso |
| CMO | | Collateralized Mortgage Obligation |
| FCB | | Farm Credit Bank |
| | |
| GBP | | Denominated in Great Britain Pounds |
| GDR | | Global Depository Receipt |
| MFA | | Mortgage Finance Authority |
| Mtg | | Mortgage |
| MTN | | Medium-Term Note |
| Pfd | | Preferred Stock |
| REIT | | Real Estate Investment Trust |
| SPV | | Special Purpose Vehicle |
See notes to financial statements.
Semi-Annual Report 21
| | |
| STATEMENT OF ASSETS AND LIABILITIES | | |
| |
Thornburg Investment Income Builder Fund | | March 31, 2016 (Unaudited) |
| | | | |
ASSETS | | | | |
Investments at value | | | | |
Non-affiliated issuers (cost $14,919,750,937) (Note 2) | | $ | 15,422,551,215 | |
Non-controlled affiliated issuers (cost $1,539,077,162) (Note 2) | | | 1,341,318,500 | |
Cash | | | 4,679,596 | |
Cash denominated in foreign currency (cost $31,329,630) | | | 31,334,798 | |
Receivable for investments sold | | | 64,136,719 | |
Receivable for fund shares sold | | | 22,141,732 | |
Unrealized appreciation on forward currency contracts (Note 7) | | | 23,357,947 | |
Dividends receivable | | | 52,043,784 | |
Dividend and interest reclaim receivable | | | 18,401,044 | |
Interest receivable | | | 29,272,532 | |
Prepaid expenses and other assets | | | 131,203 | |
| | | | |
Total Assets | | | 17,009,369,070 | |
| | | | |
| |
LIABILITIES | | | | |
Payable for investments purchased | | | 100,018,004 | |
Payable for fund shares redeemed | | | 31,512,674 | |
Unrealized depreciation on forward currency contracts (Note 7) | | | 91,134,835 | |
Payable to investment advisor and other affiliates (Note 3) | | | 16,365,674 | |
Accounts payable and accrued expenses | | | 3,867,641 | |
Dividends payable | | | 6,075,549 | |
| | | | |
Total Liabilities | | | 248,974,377 | |
| | | | |
| |
NET ASSETS | | $ | 16,760,394,693 | |
| | | | |
NET ASSETS CONSIST OF | | | | |
Undistributed net investment income | | $ | 58,637,111 | |
Net unrealized appreciation on investments | | | 237,630,803 | |
Accumulated net realized gain (loss) | | | (829,055,689 | ) |
Net capital paid in on shares of beneficial interest | | | 17,293,182,468 | |
| | | | |
| | $ | 16,760,394,693 | |
| | | | |
22 Semi-Annual Report
| | |
| STATEMENT OF ASSETS AND LIABILITIES, CONTINUED | | |
| |
Thornburg Investment Income Builder Fund | | March 31, 2016 (Unaudited) |
| | | | |
| |
NET ASSET VALUE | | | | |
Class A Shares: | | | | |
Net asset value and redemption price per share ($3,914,569,791 applicable to 205,297,231 shares of beneficial interest outstanding - Note 4) | | $ | 19.07 | |
Maximum sales charge, 4.50% of offering price | | | 0.90 | |
| | | | |
Maximum offering price per share | | $ | 19.97 | |
| | | | |
| |
Class C Shares: | | | | |
Net asset value and offering price per share* ($5,604,813,069 applicable to 294,113,415 shares of beneficial interest outstanding - Note 4) | | $ | 19.06 | |
| | | | |
| |
Class I Shares: | | | | |
Net asset value, offering and redemption price per share ($7,029,328,538 applicable to 366,025,150 shares of beneficial interest outstanding - Note 4) | | $ | 19.20 | |
| | | | |
| |
Class R3 Shares: | | | | |
Net asset value, offering and redemption price per share ($79,389,343 applicable to 4,164,685 shares of beneficial interest outstanding - Note 4) | | $ | 19.06 | |
| | | | |
| |
Class R4 Shares: | | | | |
Net asset value, offering and redemption price per share ($44,345,657 applicable to 2,322,247 shares of beneficial interest outstanding - Note 4) | | $ | 19.10 | |
| | | | |
| |
Class R5 Shares: | | | | |
Net asset value, offering and redemption price per share ($87,948,295 applicable to 4,582,238 shares of beneficial interest outstanding - Note 4) | | $ | 19.19 | |
| | | | |
| * | Redemption price per share is equal to net asset value less any applicable contingent deferred sales charge. |
See notes to financial statements.
Semi-Annual Report 23
| | |
| STATEMENT OF OPERATIONS | | |
| |
Thornburg Investment Income Builder Fund | | Six Months Ended March 31, 2016 (Unaudited) |
| | | | |
INVESTMENT INCOME | | | | |
Dividend income | | | | |
Non-affiliated issuers (net of foreign taxes withheld of $16,614,057) | | $ | 316,951,664 | |
Non-controlled affiliated issuers | | | 54,542,353 | |
Interest income (net of premium amortized of $978,288) | | | 65,569,015 | |
| | | | |
Total Income | | | 437,063,032 | |
| | | | |
| |
EXPENSES | | | | |
Investment advisory fees (Note 3) | | | 59,357,238 | |
Administration fees (Note 3) | | | | |
Class A Shares | | | 2,540,275 | |
Class C Shares | | | 3,584,234 | |
Class I Shares | | | 1,803,019 | |
Class R3 Shares | | | 49,704 | |
Class R4 Shares | | | 26,898 | |
Class R5 Shares | | | 20,775 | |
Distribution and service fees (Note 3) | | | | |
Class A Shares | | | 5,082,116 | |
Class C Shares | | | 28,705,331 | |
Class R3 Shares | | | 199,021 | |
Class R4 Shares | | | 53,197 | |
Transfer agent fees | | | | |
Class A Shares | | | 1,741,450 | |
Class C Shares | | | 2,384,745 | |
Class I Shares | | | 3,172,570 | |
Class R3 Shares | | | 97,027 | |
Class R4 Shares | | | 76,299 | |
Class R5 Shares | | | 116,862 | |
Registration and filing fees | | | | |
Class A Shares | | | 37,943 | |
Class C Shares | | | 34,417 | |
Class I Shares | | | 61,464 | |
Class R3 Shares | | | 1,830 | |
Class R4 Shares | | | 9,969 | |
Class R5 Shares | | | 12,943 | |
Custodian fees (Note 3) | | | 1,658,450 | |
Professional fees | | | 176,610 | |
Accounting fees (Note 3) | | | 345,190 | |
Trustee fees | | | 380,320 | |
Other expenses | | | 648,962 | |
| | | | |
Total Expenses | | | 112,378,859 | |
Less: | | | | |
Expenses reimbursed by investment advisor (Note 3) | | | (1,172,322 | ) |
| | | | |
Net Expenses | | | 111,206,537 | |
| | | | |
Net Investment Income | | $ | 325,856,495 | |
| | | | |
24 Semi-Annual Report
| | |
| STATEMENT OF OPERATIONS, CONTINUED | | |
| |
Thornburg Investment Income Builder Fund | | Six Months Ended March 31, 2016 (Unaudited) |
| | | | |
REALIZED AND UNREALIZED GAIN (LOSS) | | | | |
Net realized gain (loss) from: | | | | |
Investments | | | | |
Non-affiliated issuers | | $ | (474,992,899 | ) |
Non-controlled affiliated issuers | | | (81,033,124 | ) |
Forward currency contracts (Note 7) | | | 59,929,182 | |
Foreign currency transactions | | | (6,247,634 | ) |
| | | | |
| | | (502,344,475 | ) |
| | | | |
Net change in unrealized appreciation (depreciation) on: | | | | |
Investments | | | | |
Non-affiliated issuers (net of deferred taxes payable of $743,783) | | | 428,916,858 | |
Non-controlled affiliated issuers | | | 124,438,552 | |
Forward currency contracts (Note 7) | | | (48,443,707 | ) |
Foreign currency translations | | | 3,743,440 | |
| | | | |
| | | 508,655,143 | |
| | | | |
Net Realized and Unrealized Gain | | | 6,310,668 | |
| | | | |
Net Increase in Net Assets Resulting from Operations | | $ | 332,167,163 | |
| | | | |
See notes to financial statements.
Semi-Annual Report 25
| | |
| STATEMENT OF CHANGES IN NET ASSETS | | |
| |
Thornburg Investment Income Builder Fund | | |
| | | | | | | | |
| | | Six Months Ended
March 31, 2016* | | | Year Ended
September 30, 2015 | |
INCREASE (DECREASE) IN NET ASSETS FROM | | | | | | | | |
| | |
OPERATIONS | | | | | | | | |
Net investment income | | $ | 325,856,495 | | | $ | 747,432,600 | |
Net realized gain (loss) from investments, forward currency contracts and foreign currency transactions | | | (502,344,475 | ) | | | 284,086,721 | |
Net unrealized appreciation (depreciation) on investments, forward currency contracts, foreign currency translations, and deferred taxes payable | | | 508,655,143 | | | | (2,463,361,330 | ) |
| | | | | | | | |
| | |
Net Increase (Decrease) in Net Assets Resulting from Operations | | | 332,167,163 | | | | (1,431,842,009 | ) |
| | |
DIVIDENDS TO SHAREHOLDERS | | | | | | | | |
From net investment income | | | | | | | | |
Class A Shares | | | (89,753,737 | ) | | | (180,681,373 | ) |
Class C Shares | | | (106,977,287 | ) | | | (202,366,869 | ) |
Class I Shares | | | (170,451,547 | ) | | | (329,515,668 | ) |
Class R3 Shares | | | (1,635,857 | ) | | | (3,040,478 | ) |
Class R4 Shares | | | (906,431 | ) | | | (1,592,222 | ) |
Class R5 Shares | | | (1,912,750 | ) | | | (3,132,039 | ) |
| | |
FUND SHARE TRANSACTIONS (NOTE 4) | | | | | | | | |
Class A Shares | | | (334,025,898 | ) | | | 185,220,853 | |
Class C Shares | | | (290,602,950 | ) | | | 354,009,401 | |
Class I Shares | | | (423,984,092 | ) | | | 916,835,216 | |
Class R3 Shares | | | (274,467 | ) | | | 5,970,486 | |
Class R4 Shares | | | 2,015,916 | | | | 7,486,131 | |
Class R5 Shares | | | 9,072,163 | | | | 23,425,938 | |
| | | | | | | | |
Net Decrease in Net Assets | | | (1,077,269,774 | ) | | | (659,222,633 | ) |
| | |
NET ASSETS | | | | | | | | |
Beginning of Period | | | 17,837,664,467 | | | | 18,496,887,100 | |
| | | | | | | | |
| | |
End of Period | | $ | 16,760,394,693 | | | $ | 17,837,664,467 | |
| | | | | | | | |
| | |
Undistributed net investment income | | $ | 58,637,111 | | | $ | 104,418,225 | |
See notes to financial statements.
26 Semi-Annual Report
| | |
| NOTES TO FINANCIAL STATEMENTS | | |
| |
Thornburg Investment Income Builder Fund | | March 31, 2016 (Unaudited) |
NOTE 1 – ORGANIZATION
Thornburg Investment Income Builder Fund (the “Fund”) is a diversified series of Thornburg Investment Trust (the “Trust”). The Trust was organized as a Massachusetts business trust under a Declaration of Trust dated June 3, 1987 and is registered as a diversified, open-end management investment company under the Investment Company Act of 1940, as amended. The Fund is currently one of twenty separate series of the Trust. Each series is considered to be a separate entity for financial reporting and tax purposes and bears expenses directly attributable to it. The Fund’s primary investment goal is to provide a level of current income which exceeds the average yield on U.S. stocks generally, and which will generally grow, subject to periodic fluctuations, over the years on a per share basis. The Fund’s secondary investment goal is long-term capital appreciation.
The Fund currently offers six classes of shares of beneficial interest: Class A, Class C, Institutional Class (“Class I”), and Retirement Classes (“Class R3,” “Class R4,” and “Class R5”). Each class of shares of the Fund represents an interest in the same portfolio of investments, except that (i) Class A shares are sold subject to a front-end sales charge collected at the time the shares are purchased and bear a service fee, (ii) Class C shares are sold at net asset value without a sales charge at the time of purchase, but are subject to a contingent deferred sales charge upon redemption within one year of purchase, and bear both a service fee and a distribution fee, (iii) Class I shares are sold at net asset value without a sales charge at the time of purchase and may be subject to a service fee, (iv) Class R3 shares are sold at net asset value without a sales charge at the time of purchase, but bear both a service fee and distribution fee, (v) Class R4 shares are sold at net asset value without sales charge at the time of purchase, but bear a service fee, (vi) Class R5 shares are sold at net asset value without a sales charge at the time of purchase and may be subject to a service fee, and (vii) the respective classes may have different reinvestment privileges and conversion rights. Additionally, the Fund may allocate among its classes certain expenses, to the extent allocable to specific classes, including transfer agent fees, government registration fees, certain printing and postage costs, and administrative and legal expenses. Currently, class specific expenses of the Fund are limited to service and distribution fees, administration fees, and certain registration and transfer agent expenses.
NOTE 2 – SIGNIFICANT ACCOUNTING POLICIES
The following is a summary of significant accounting policies followed by the Fund in the preparation of its financial statements. The Fund is an investment company and prepares its financial statements in conformity with United States generally accepted accounting principles (“GAAP”), including investment company accounting and reporting guidance in the Financial Accounting Standards Board (the “FASB”) Accounting Standard Codification Topic 946. The preparation of financial statements in conformity with GAAP requires management to make estimates and assumptions that affect the reported amounts of assets and liabilities and disclosure of contingent assets and liabilities at the date of the financial statements and the reported amounts of increases (decreases) in net assets from operations during the reporting period. Actual results could differ from those estimates.
Significant accounting policies of the Trust are as follows:
Valuation Policy and Procedures: The Trustees of the Trust have appointed Thornburg Investment Management, Inc., the Trust’s investment advisor, the (“Advisor”), to assist the Trustees in obtaining market values for portfolio investments, perform certain evaluation and supervisory functions respecting professional pricing service providers appointed by the Trustees’ Audit Committee (the “Audit Committee”) to assist in determining fair values for portfolio investments, assist in calculating fair values for portfolio investments in certain circumstances, and to perform other functions in connection with the valuation of investments. The Advisor acts through its Valuation and Pricing Committee (the “Committee”) and other employees of the Advisor. The Committee regularly reviews its own valuation calculations, as well as the valuations, valuation techniques and services furnished by pricing service providers, considers circumstances which may require valuation calculations by the Committee, and reviews previous valuation calculations. The Committee reports to the Audit Committee on the Committee’s activities, the performance of pricing service providers, and other matters relating to valuation of portfolio investments.
In those instances when the Committee assists in calculating a fair value for a portfolio investment, the Committee seeks to determine the price that the Fund would reasonably expect to receive upon a sale of the investment in an orderly transaction between market participants on the valuation date. The Committee customarily utilizes quotations from securities broker dealers in calculating valuations, but also may utilize prices obtained from pricing service providers or other methods approved by the Audit Committee. Because fair values calculated by the Committee are estimates, the calculation of a value for an investment may differ from the price that would be realized by the Fund upon a sale of the investment, and the difference could be material to the Fund’s financial statements. The Committee’s calculation of a fair value for an investment may also differ from the prices obtained by other persons (including other mutual funds) for the investment.
Valuation of Investments: Securities and other portfolio investments which are listed or traded on a United States securities exchange are valued at the last reported sale price on the valuation date. Investments listed or traded on an exchange for which there has been no sale that day are valued at the mean between the last reported bid and asked prices on that valuation date. Portfolio investments reported by NASDAQ are valued at the official closing price on the valuation date. If an investment is traded on more than one exchange, the investment is considered traded on the exchange that is normally the primary market for that investment. Securities and
Semi-Annual Report 27
| | |
| NOTES TO FINANCIAL STATEMENTS, CONTINUED | | |
| |
Thornburg Investment Income Builder Fund | | March 31, 2016 (Unaudited) |
other portfolio investments which are listed or traded on exchanges outside the United States are valued at the last price or the closing price of the investment on the exchange that is normally the primary market for the investment, as of the close of the exchange preceding the Fund’s valuation date. Foreign investments listed or traded on an exchange for which there has been no sale that day are valued at the mean between the last reported bid and asked prices on that valuation date.
In any case when a market quotation is not readily available for a portfolio investment ordinarily valued by market quotation, the Committee calculates a fair value for the investment using alternative methods approved by the Audit Committee. A market quotation is not readily available when the primary market or exchange for the investment is not open for the entire scheduled day of trading. Market quotations for an investment also may not be readily available if developments after the most recent close of the investment’s primary exchange or market, but prior to the close of business on any Fund business day, or an unusual event or significant period of time occurring since the availability of a market quotation, create a serious question concerning the reliability of the most recent market quotation available for the investment. In particular, on days when market volatility thresholds established by the Audit Committee are exceeded, foreign equity investments held by the Fund may be valued using alternative methods. The Committee customarily obtains valuations in these instances from pricing service providers approved by the Audit Committee. Pricing service providers ordinarily calculate valuations using multi-factor models to adjust market prices based upon various inputs, including exchange data, depository receipt prices, futures, index data and other data.
Debt obligations held by the Fund which are not listed or traded on exchanges or for which no reported market exists are ordinarily valued at the valuation obtained from a pricing service provider approved by the Audit Committee.
In any case when a pricing service provider fails to provide a valuation for a debt obligation held by the Fund, the Committee calculates a fair value for the obligation using alternative methods under procedures approved by the Audit Committee. Additionally, in cases when management believes that a valuation obtained from a pricing service provider merits review for significant reasons, the Committee decides whether or not to use the valuation calculated by the pricing service provider or to use an alternative method approved by the Audit Committee to calculate a fair value for the obligation.
Quotations for foreign investments expressed in foreign currency amounts are converted to U.S. dollar equivalents using a foreign exchange quotation from a third party service provider at the time of valuation. Foreign investments held by the Fund may be traded on days and at times when the Fund is not open for business. Consequently, the value of Fund investments may be significantly affected on days when shareholders cannot purchase or sell Fund shares. Futures contracts and other financial and derivative instruments traded on an exchange are valued at the latest published price for the instrument on its primary exchange. Listed options are valued at the last bid price.
Valuation Measurements: The Fund categorizes its investments based upon the inputs used in valuing those investments, according to a three-level hierarchy established in guidance from the FASB. Categorization of investments using this hierarchy is intended by the FASB to maximize the use of observable inputs in valuing investments and minimize the use of unobservable inputs by requiring that the most observable inputs be used when available. Observable inputs are those that market participants would use in valuing an investment based on available market information. Unobservable inputs are those that reflect assumptions about the information market participants would use in valuing an investment. An investment’s level within the hierarchy is based on the lowest level input that is deemed significant to the valuation. The methodologies and inputs used to value investments are not necessarily indications of the risk or liquidity associated with those investments.
Various inputs are used in calculating valuations for the Fund’s investments. These inputs are generally summarized according to the three-level hierarchy below:
Level 1: Quoted prices in active markets for identical investments.
Level 2: Other direct or indirect significant observable inputs (including quoted prices for similar investments in active markets and other observable inputs, such as interest rates, prepayment rates, credit risk, etc.).
Level 3: Significant unobservable inputs (including the Committee’s own assumptions in calculating the fair values of investments).
Valuations for debt obligations held by the Fund are typically calculated by pricing service providers approved by the Audit Committee and are characterized as Level 2 within the valuation hierarchy.
On days when market volatility thresholds established by the Audit Committee are exceeded, foreign securities for which valuations are obtained from pricing service providers are fair valued. On these days, the foreign securities are characterized as Level 2 within the valuation hierarchy and revert to Level 1 after the threshold is no longer exceeded.
In a limited number of cases the Committee calculates a fair value for investments using broker quotations or other methods approved by the Audit Committee. When the Committee uses a single broker quotation to calculate a fair value for an investment without other significant observable inputs, or if a fair value is calculated using other significant inputs that are considered unobservable, the
28 Semi-Annual Report
| | |
| NOTES TO FINANCIAL STATEMENTS, CONTINUED | | |
| |
Thornburg Investment Income Builder Fund | | March 31, 2016 (Unaudited) |
investment is characterized as Level 3 within the hierarchy. Other significant unobservable inputs used to calculate a fair value in these instances might include an income-based valuation approach which considers discounted anticipated future cash flows from the investment, and application of discounts due to the nature or duration of any restrictions on the disposition of the investment.
Valuations based upon the use of inputs from Levels 1, 2 or 3 may not represent the actual price received upon the disposition of an investment, and the Fund may receive a price that is lower than the valuation based upon these inputs when it sells the investment.
The following table displays a summary of the fair value hierarchy measurements of the Fund’s investments as of March 31, 2016. In any instance when valuation inputs from more than one level are used to determine the fair value of a specific investment, the investment is placed in the level of the table based upon the lowest level input that is significant in determining the fair value of the investment:
| | | | | | | | | | | | | | | | |
| | | Fair Value Measurements At March 31, 2016 | |
| | | Total | | | Level 1 | | | Level 2 | | | Level 3(b) | |
Assets | | | | | | | | | | | | | | | | |
Investments in Securities* | | | | | | | | | | | | | | | | |
Common Stock(a) | | $ | 14,877,634,675 | | | $ | 14,808,307,824 | | | $ | 69,326,851 | | | $ | — | |
Preferred Stock(a) | | | 88,312,483 | | | | 51,094,108 | | | | 37,218,375 | | | | — | |
Asset Backed Securities | | | 37,042,281 | | | | — | | | | 34,513,146 | | | | 2,529,135 | |
Corporate Bonds | | | 1,349,091,617 | | | | — | | | | 1,341,297,444 | | | | 7,794,173 | |
Municipal Bonds | | | 3,010,991 | | | | — | | | | 3,010,991 | | | | — | |
U.S. Government Agencies | | | 8,176,916 | | | | — | | | | 8,176,916 | | | | — | |
Other Government | | | 5,284,163 | | | | — | | | | 5,284,163 | | | | — | |
Loan Participations | | | 163,537,226 | | | | — | | | | 101,506,498 | | | | 62,030,728 | |
Short Term Investments | | | 231,779,363 | | | | 231,779,363 | | | | — | | | | — | |
| | | | | | | | | | | | | | | | |
Total Investments in Securities | | $ | 16,763,869,715 | | | $ | 15,091,181,295 | | | $ | 1,600,334,384 | | | $ | 72,354,036 | |
| | | | |
Other Financial Instruments** | | | | | | | | | | | | | | | | |
Forward Currency Contracts | | $ | 23,357,947 | | | $ | — | | | $ | 23,357,947 | | | $ | — | |
| | | | |
Liabilities | | | | | | | | | | | | | | | | |
Other Financial Instruments** | | | | | | | | | | | | | | | | |
Forward Currency Contracts | | $ | (91,134,835 | ) | | $ | — | | | $ | (91,134,835 | ) | | $ | — | |
Spot Currency | | $ | (15,035 | ) | | $ | (15,035 | ) | | $ | — | | | $ | — | |
| * | See Schedule of Investments for a summary of the industry exposure as grouped according to the Global Industry Classification Standard (GICS), which is an industry taxonomy developed by MSCI, Inc. and Standard & Poor’s (S&P). |
| ** | Other Financial Instruments include investments not reflected in the Schedule of Investments, which may include futures, forwards and swap contracts, which are valued at the unrealized appreciation (depreciation) on the investment. |
| (a) | At March 31, 2016, industry classifications for Common Stock and Preferred Stock in Level 2 consist of $7,966,500 in Banks, $11,289,375 in Miscellaneous and $87,289,351 in Telecommunication Services, respectively. |
| (b) | In accordance with the guidance prescribed in Accounting Standards Update (“ASU”) No. 2011-04, unadjusted broker quotes were applied to $10,323,308 portfolio securities characterized as Level 3 investments at March 31, 2016. The following table displays a summary of the valuation techniques and unobservable inputs used to value portfolio securities characterized as Level 3 investments, where no unadjusted broker quotes were available at March 31, 2016: |
| | | | | | | | | | |
| | | Fair Value At
March 31, 2016 | | | Valuation Technique(s) | | Unobservable Input | | Range
(Weighted Average) |
Loan Participations | | $ | 62,030,728 | | | Discounted cash flows | | Third party vendor projection | | 7.00% - 12.00% (9.71%) |
| | | | | | | | of discounted cash flows | | |
| | | | | | | | | | |
Total | | $ | 62,030,728 | | | | | | | |
In accordance with the guidance prescribed in ASU No. 2011-04, it is the policy of the Fund to recognize transfers between levels and those underlying events which caused the movement. The Fund recognized no significant transfers between Levels 1 and 2 for the six months ended March 31, 2016, other than when the Fund exceeded market volatility thresholds for foreign equity investments during the period.
Semi-Annual Report 29
| | |
| NOTES TO FINANCIAL STATEMENTS, CONTINUED | | |
| |
Thornburg Investment Income Builder Fund | | March 31, 2016 (Unaudited) |
A rollforward of fair value measurements using significant unobservable inputs (Level 3) for the six months ended March 31, 2016 is as follows:
| | | | | | | | | | | | | | | | |
| | | Asset Backed
Securities | | | Corporate
Bonds | | | Loan
Participations | | | Total(e) | |
Beginning Balance 9/30/2015 | | $ | 2,710,536 | | | $ | 9,121,792 | | | $ | 47,514,542 | | | $ | 59,346,870 | |
Accrued Discounts (Premiums) | | | 8,854 | | | | 27,084 | | | | 54,839 | | | | 90,777 | |
Net Realized Gain (Loss)(a) | | | 29,664 | | | | 15,419 | | | | 57,733 | | | | 102,816 | |
Gross Purchases | | | — | | | | — | | | | 47,986,200 | | | | 47,986,200 | |
Gross Sales | | | (218,750 | ) | | | (162,835 | ) | | | (33,159,409 | ) | | | (33,540,994 | ) |
Net Change in Unrealized | | | | | | | | | | | | | | | | |
Appreciation (Depreciation)(b)(c) | | | (1,169 | ) | | | (59,601 | ) | | | (423,177 | ) | | | (483,947 | ) |
Transfers into Level 3(d) | | | — | | | | — | | | | — | | | | — | |
Transfers out of Level 3(d) | | | — | | | | (1,147,686 | ) | | | — | | | | (1,147,686 | ) |
| | | | | | | | | | | | | | | | |
Ending Balance 3/31/2016 | | $ | 2,529,135 | | | $ | 7,794,173 | | | $ | 62,030,728 | | | $ | 72,354,036 | |
| (a) | Amount of net realized gain (loss) from investments recognized in income is included in the Fund’s Statement of Operations for the six months ended March 31, 2016. |
| (b) | Amount of net change in unrealized appreciation (depreciation) on investments recognized in income is included in the Fund’s Statement of Operations for the six months ended March 31, 2016. |
| (c) | The net change in unrealized appreciation (depreciation) attributable to securities owned at March 31, 2016, which were valued using significant unobservable inputs, was $(265,787). This is included within net change in unrealized appreciation (depreciation) on investments in the Fund’s the Statement of Operations for the six months ended March 31, 2016. |
| (d) | Transfers into or out of Level 3 were out of or into Level 2, and were due to changes in other significant observable inputs available during the six months ended March 31, 2016. Transfers into or out of Level 3 are based on the beginning market value of the period in which they occurred. |
| (e) | Level 3 investments represent 0.43% of total net assets at the six months ended March 31, 2016. Significant fluctuations of the unobservable inputs applied to portfolio securities characterized as Level 3 investments could be expected to increase or decrease the fair value of these portfolio securities. |
Foreign Currency Translation: Portfolio investments and other assets and liabilities denominated in foreign currencies are translated into U.S. dollars based on the exchange rate of such currencies against the U.S. dollar on the date of valuation. Purchases and sales of investments and income items denominated in foreign currencies are translated into U.S. dollars at the exchange rate in effect on the transaction date. When the Fund purchases or sells foreign investments, it will customarily enter into a foreign exchange contract to minimize foreign exchange risk from the trade date to the settlement date of such transactions. The values of such spot contracts are included in receivable for investments sold and payable for investments purchased on the Statement of Assets and Liabilities.
The Fund does not separately report the effect of changes in foreign exchange rates from changes in market prices on investments held. Such changes are included in net unrealized appreciation (depreciation) from investments.
Reported net realized gains and losses from foreign currency transactions arise due to purchases and sales of foreign currencies, currency gains and losses realized between the trade and settlement dates on investment transactions and the difference between the amounts of dividends, interest, and foreign withholding taxes recorded on the Fund’s books, and the U.S. dollar equivalent of the amounts actually received or paid.
Net change in unrealized appreciation (depreciation) on foreign currency translations arise from changes in the fair value of assets and liabilities, other than investments at period end, resulting from changes in exchange rates.
Foreign Withholding Taxes: The Fund is subject to foreign tax withholding imposed by certain foreign countries in which the Fund may invest. Withholding taxes are incurred on certain foreign dividends and are accrued at the time the dividend is recognized based on applicable foreign tax law. The Fund files withholding tax reclaims in certain jurisdictions to recover a portion of amounts previously withheld, in view of various considerations, including recent decisions rendered by the courts in those and other jurisdictions. The Fund would expect to record a receivable for such a reclaim based on a variety of factors, including assessments of a jurisdiction’s legal obligation to pay reclaims, the jurisdiction’s administrative practices and payment history, and industry convention. To date the Fund has recorded no such receivable because there is limited precedent for collecting such prior year reclaims and the likelihood of collection remains uncertain.
Deferred Foreign Capital Gain Taxes: The Fund is subject to a tax imposed on net realized gains of securities of certain foreign countries. The Fund records an estimated deferred tax liability for net unrealized gains on these investments as reflected in the accompanying financial statements.
Federal Income Taxes: It is the policy of the Trust to comply with the provisions of the Internal Revenue Code applicable to “regulated investment companies” and to distribute to shareholders substantially all taxable income, including any net realized gain on investments of the Fund. Therefore, no provision for federal income taxes is required.
30 Semi-Annual Report
| | |
| NOTES TO FINANCIAL STATEMENTS, CONTINUED | | |
| |
Thornburg Investment Income Builder Fund | | March 31, 2016 (Unaudited) |
Management reviews each uncertain tax position believed to be material to the preparation of the Fund’s financial statements, to assess if it is more likely than not that the position would be sustained upon examination, based upon the technical merits of the position. As of March 31, 2016, management has not identified any such position for which an asset or liability must be reflected in the Statement of Assets and Liabilities. The Fund’s tax returns remain subject to examination for three years after filing.
When-Issued and Delayed Delivery Transactions: The Fund may engage in when-issued or delayed delivery transactions. To the extent the Fund engages in such transactions, it will do so for the purpose of acquiring portfolio investments consistent with the Fund’s investment objectives and not for the purpose of investment leverage or to speculate on interest rate and, or market changes. At the time the Fund makes a commitment to purchase an investment on a when-issued or delayed delivery basis, the Fund will record the transaction and reflect the value in determining its net asset value. When effecting such transactions, assets of an amount sufficient to make payment for the portfolio investments to be purchased will be segregated on the Fund’s records on the trade date. Investments purchased on a when-issued or delayed delivery basis do not earn interest until the settlement date.
Dividends: Net investment income of the Fund is declared daily as a dividend on shares for which the Fund has received payment. Dividends are paid quarterly and are reinvested in additional shares of the Fund at net asset value per share at the close of business on the dividend payment date, or at the shareholder’s option, paid in cash. Net realized capital gains, to the extent available, will be distributed at least annually.
Repurchase Agreements: The Fund may invest excess cash in repurchase agreements whereby the Fund purchases investments, which serve as collateral, with an agreement to resell such collateral to the seller at an agreed upon price at the maturity date of the repurchase agreement. Investments pledged as collateral for repurchase agreements are held in custody until maturity of the repurchase agreement. Provisions in the agreements require that the market value of the collateral is at least equal to the repurchase value in the event of default. In the event of default, the Fund has the right to liquidate the collateral and apply the proceeds in satisfaction of the obligation. Under certain circumstances, in the event of default or bankruptcy by the other party to the agreement, realization and/or retention of the collateral may be subject to legal proceedings.
Unfunded Loan Commitments: The Fund has entered into a bridge term loan commitment with Nexstar Broadcasting, Inc., of which at March 31, 2016, no par commitment had been funded. The Fund is committed to fund up to the amount of $55,480,000 until January 27, 2017, when the commitment expires.
General: Investment transactions are accounted for on a trade date basis. Interest income is accrued as earned and dividend income is recorded on the ex-dividend date. Certain income from foreign investments is recognized as soon as information is available to the Fund. Realized gains and losses from the sale of investments are recorded on an identified cost basis. Net investment income (other than class specific expenses) and realized and unrealized gains and losses are allocated daily to each class of shares based upon the relative net asset value of outstanding shares of each class of shares at the beginning of the day (after adjusting for the current share activity of the respective class). Expenses common to all Funds are allocated among the Funds comprising the Trust based upon their relative net asset values or other appropriate allocation methods.
Guarantees and Indemnifications: Under the Trust’s organizational documents (and under separate agreements with the independent Trustees), its officers and Trustees are indemnified against certain liabilities arising out of the performance of their duties to the Fund. Additionally, in the normal course of business the Trust enters into contracts with service providers that contain general indemnification clauses. The Trust’s maximum exposure under these arrangements is unknown. However, based on experience, the Trust expects the risk of loss to be remote.
NOTE 3 – INVESTMENT ADVISORY FEE AND OTHER TRANSACTIONS WITH AFFILIATES
Pursuant to an investment advisory agreement, the Advisor serves as the investment advisor and performs services for the Fund for which the fees are payable at the end of each month. For the six months ended March 31, 2016, these fees were payable at annual rates ranging from .875 of 1% to .675 of 1% per annum of the average daily net assets of the Fund depending on the Fund’s asset size. The Fund pays to the Advisor the costs of personnel who perform certain accounting services for the Fund. For the six months ended March 31, 2016 the Fund paid $345,190 to the Advisor for these accounting services. The Trust has also entered into administrative service agreements with the Advisor, whereby the Advisor will perform certain administrative services for the shareholders of each class of the Fund’s shares, and for which fees will be payable at an annual rate of up to .125 of 1% per annum of the average daily net assets attributable to each class of shares.
The Trust has an underwriting agreement with Thornburg Securities Corporation (the “Distributor”), an affiliate of the Advisor, which acts as the distributor of the Fund’s shares. For the six months ended March 31, 2016, the Distributor has advised the Fund that it earned commissions aggregating $296,319 from the sale of Class A shares, and collected contingent deferred sales charges aggregating $288,929 from redemptions of Class C shares of the Fund.
Semi-Annual Report 31
| | |
| NOTES TO FINANCIAL STATEMENTS, CONTINUED | | |
| |
Thornburg Investment Income Builder Fund | | March 31, 2016 (Unaudited) |
Pursuant to a service plan under Rule 12b-1 of the Investment Company Act of 1940, the Fund may reimburse to the Advisor an amount not to exceed .25 of 1% per annum of the average daily net assets attributable to each class of shares of the Fund for payments made by the Advisor to securities dealers and other financial institutions to obtain various shareholder and distribution related services. For the six months ended March 31, 2016, there were no 12b-1 service plan fees charged for Class I and R5 shares. The Advisor may pay out of its own resources additional expenses for distribution of the Fund’s shares and shareholder services.
The Trust has also adopted distribution plans pursuant to Rule 12b-1, applicable only to the Fund’s Class C and Class R3 shares, under which the Fund compensates the Distributor for services in promoting the sale of Class C and Class R3 shares of the Fund at an annual rate of up to .75 of 1% per annum of the average daily net assets attributable to Class C shares, and an annual rate of up to .25 of 1% per annum of the average daily net assets attributable to Class R3 shares. Total fees incurred by each class of shares of the Fund under their respective service and distribution plans for the six months ended March 31, 2016, are set forth in the Statement of Operations.
The Advisor and Distributor have contractually agreed to waive fees and reimburse expenses incurred by the Fund so that actual expenses of certain share classes do not exceed levels as specified in the Fund’s most recent prospectus. The agreement may be terminated by the Fund at any time, but may not be terminated by the Advisor or Distributor before February 1, 2017, unless the Advisor ceases to be the investment advisor to the Trust or the Distributor ceases to be the distributor of the Fund prior to that date. The Advisor and Distributor retain the right to be repaid by the Fund for fee waivers and expense reimbursements if expenses fall below the contractual limit prior to the end of the fiscal year.
For the six months ended March 31, 2016, the Advisor contractually reimbursed certain class specific expenses, administrative fees, and distribution fees of $1,069,086 for Class C shares, $40,152 for Class R3 shares, $21,819 for Class R4 shares, and $41,265 for Class R5 shares.
Certain officers and Trustees of the Trust are also officers or directors of the Advisor and Distributor. The compensation of independent Trustees is borne by the Trust.
The Fund may purchase or sell securities from or to an affiliated fund, provided the affiliation is due solely to having a common investment advisor, common officers, or common trustees, and provided that all such transactions will comply with Rule 17a-7 under the 1940 Act. For the six months ended March 31, 2016, the Fund had no transactions with affiliated funds.
NOTE 4 – SHARES OF BENEFICIAL INTEREST
At March 31, 2016, there were an unlimited number of shares with no par value of beneficial interest authorized. Transactions in shares of beneficial interest were as follows:
| | | | | | | | | | | | | | | | |
| | | Six Months Ended
March 31, 2016 (Unaudited) | | | Year Ended
September 30, 2015 (Audited) | |
| | | Shares | | | Amount | | | Shares | | | Amount | |
Class A Shares | | | | | | | | | | | | | | | | |
Shares sold | | | 12,279,980 | | | $ | 233,053,390 | | | | 39,942,804 | | | $ | 845,842,088 | |
Shares issued to shareholders in reinvestment of dividends | | | 4,443,497 | | | | 84,364,332 | | | | 8,027,583 | | | | 166,841,094 | |
Shares repurchased | | | (34,676,795 | ) | | | (651,443,620 | ) | | | (39,349,193 | ) | | | (827,462,329 | ) |
| | | | | | | | | | | | | | | | |
| | | | |
Net increase (decrease) | | | (17,953,318 | ) | | $ | (334,025,898 | ) | | | 8,621,194 | | | $ | 185,220,853 | |
| | | | | | | | | | | | | | | | |
| | | | |
Class C Shares | | | | | | | | | | | | | | | | |
Shares sold | | | 12,097,325 | | | $ | 229,617,682 | | | | 44,700,687 | | | $ | 948,313,812 | |
Shares issued to shareholders in reinvestment of dividends | | | 4,941,031 | | | | 93,767,861 | | | | 8,343,112 | | | | 173,215,686 | |
Shares repurchased | | | (32,733,228 | ) | | | (613,988,493 | ) | | | (36,466,647 | ) | | | (767,520,097 | ) |
| | | | | | | | | | | | | | | | |
| | | | |
Net increase (decrease) | | | (15,694,872 | ) | | $ | (290,602,950 | ) | | | 16,577,152 | | | $ | 354,009,401 | |
| | | | | | | | | | | | | | | | |
| | | | |
Class I Shares | | | | | | | | | | | | | | | | |
Shares sold | | | 39,469,834 | | | $ | 752,561,599 | | | | 98,224,899 | | | $ | 2,092,406,561 | |
Shares issued to shareholders in reinvestment of dividends | | | 7,883,436 | | | | 150,715,731 | | | | 13,752,647 | | | | 287,659,480 | |
Shares repurchased | | | (70,359,387 | ) | | | (1,327,261,422 | ) | | | (69,222,046 | ) | | | (1,463,230,825 | ) |
| | | | | | | | | | | | | | | | |
| | | | |
Net increase (decrease) | | | (23,006,117 | ) | | $ | (423,984,092 | ) | | | 42,755,500 | | | $ | 916,835,216 | |
| | | | | | | | | | | | | | | | |
32 Semi-Annual Report
| | |
| NOTES TO FINANCIAL STATEMENTS, CONTINUED | | |
| |
Thornburg Investment Income Builder Fund | | March 31, 2016 (Unaudited) |
| | | | | | | | | | | | | | | | |
| | | Six Months Ended
March 31, 2016 (Unaudited) | | | Year Ended
September 30, 2015 (Audited) | |
| | | Shares | | | Amount | | | Shares | | | Amount | |
Class R3 Shares | | | | | | | | | | | | | | | | |
Shares sold | | | 456,918 | | | $ | 8,683,513 | | | | 1,511,834 | | | $ | 32,132,928 | |
Shares issued to shareholders in reinvestment of dividends | | | 77,743 | | | | 1,475,440 | | | | 133,120 | | | | 2,764,150 | |
Shares repurchased | | | (556,781 | ) | | | (10,433,420 | ) | | | (1,373,103 | ) | | | (28,926,592 | ) |
| | | | | | | | | | | | | | | | |
| | | | |
Net increase (decrease) | | | (22,120 | ) | | $ | (274,467 | ) | | | 271,851 | | | $ | 5,970,486 | |
| | | | | | | | | | | | | | | | |
| | | | |
Class R4 Shares | | | | | | | | | | | | | | | | |
Shares sold | | | 360,089 | | | $ | 6,880,456 | | | | 981,655 | | | $ | 20,835,501 | |
Shares issued to shareholders in reinvestment of dividends | | | 32,547 | | | | 618,788 | | | | 49,770 | | | | 1,034,418 | |
Shares repurchased | | | (289,678 | ) | | | (5,483,328 | ) | | | (674,843 | ) | | | (14,383,788 | ) |
| | | | | | | | | | | | | | | | |
| | | | |
Net increase (decrease) | | | 102,958 | | | $ | 2,015,916 | | | | 356,582 | | | $ | 7,486,131 | |
| | | | | | | | | | | | | | | | |
| | | | |
Class R5 Shares | | | | | | | | | | | | | | | | |
Shares sold | | | 902,762 | | | $ | 17,155,478 | | | | 1,847,706 | | | $ | 39,326,203 | |
Shares issued to shareholders in reinvestment of dividends | | | 88,212 | | | | 1,685,104 | | | | 132,999 | | | | 2,777,304 | |
Shares repurchased | | | (521,085 | ) | | | (9,768,419 | ) | | | (877,762 | ) | | | (18,677,569 | ) |
| | | | | | | | | | | | | | | | |
| | | | |
Net increase (decrease) | | | 469,889 | | | $ | 9,072,163 | | | | 1,102,943 | | | $ | 23,425,938 | |
| | | | | | | | | | | | | | | | |
NOTE 5 – INVESTMENT TRANSACTIONS
For the six months ended March 31, 2016, the Fund had purchase and sale transactions of investments (excluding short-term investments and U.S. Government obligations) of $4,787,770,997 and $5,807,001,320, respectively.
NOTE 6 – INCOME TAXES
At March 31, 2016, information on the tax components of capital was as follows:
| | | | |
Cost of investments for tax purposes | | $ | 16,510,769,757 | |
| | | | |
Gross unrealized appreciation on a tax basis | | $ | 1,917,918,788 | |
Gross unrealized depreciation on a tax basis | | | (1,664,818,830 | ) |
| | | | |
Net unrealized appreciation (depreciation) on investments (tax basis) | | $ | 253,099,958 | |
| | | | |
Temporary book to tax adjustments made to the cost of investments and net unrealized appreciation (depreciation) for tax purposes result primarily from outstanding publicly traded partnership (“PTP”) and real estate investment trust (“REIT”) tax basis adjustments.
At March 31, 2016, the Fund had deferred tax basis capital losses occurring subsequent to October 31, 2014 through September 30, 2015 of $201,075,792. For tax purposes, such losses will be recognized in the year ending September 30, 2016.
At March 31, 2016, the Fund had cumulative tax basis capital losses of $5,535,453 generated prior to October 1, 2011, which may be carried forward to offset future capital gains. To the extent such carryforwards are used, capital gain distributions may be reduced to the extent provided by regulations. Such capital loss carryforwards expire September 30, 2018.
NOTE 7 – DERIVATIVE FINANCIAL INSTRUMENTS WITH OFF-BALANCE SHEET RISK AND FOREIGN INVESTMENT RISK
The Fund may use a variety of derivative financial instruments to hedge or adjust the risks affecting its investment portfolio or to enhance investment returns. Provisions of the FASB Accounting Standards Codification 815-10-50 (“ASC 815”) require certain disclosures. The disclosures are intended to provide users of financial statements with an understanding of the use of derivative instruments by the Fund and how these derivatives affect the financial position, financial performance and cash flows of the Fund. The Fund does not designate any derivative instruments as hedging instruments under ASC 815. During the six months ended March 31, 2016, the
Semi-Annual Report 33
| | |
| NOTES TO FINANCIAL STATEMENTS, CONTINUED | | |
| |
Thornburg Investment Income Builder Fund | | March 31, 2016 (Unaudited) |
Fund’s principal exposure to derivative financial instruments of the type addressed by ASC 815 was investment in foreign exchange contracts. A foreign exchange contract is an agreement between two parties to exchange different currencies at a specified rate of exchange at an agreed upon future date. Foreign exchange contracts involve risks to the Fund, including the risk that a contract’s counterparty will not meet its obligations to the Fund, the risk that a change in a contract’s value may not correlate perfectly with the currency the contract was intended to track, and the risk that the Fund’s Advisor is unable to correctly implement its strategy in using a contract. In any such instance, the Fund may not achieve the intended benefit of entering into a contract, and may experience a loss.
The Fund entered into forward currency contracts during the six months ended March 31, 2016 in the normal course of pursuing its investment objectives, with the objective of purchasing foreign investments or with the intent of reducing the risk to the value of the Fund’s foreign investments from adverse changes in the relationship between the U.S. dollar and foreign currencies. In each case these contracts have been initiated in conjunction with foreign investment transactions.
These contracts are accounted for by the Fund under ASC 815. Unrealized appreciation and depreciation on outstanding contracts are reported in the Fund’s Statement of Assets and Liabilities, as measured by the difference between the forward exchange rates at the reporting date and the forward exchange rates at each contract’s inception date. Net realized gain (loss) on contracts closed during the period, and changes in net unrealized appreciation (depreciation) on outstanding contracts are recognized in the Fund’s Statement of Operations.
The quarterly average value of open sell currency contracts for the six months ended March 31, 2016 was $4,401,767,099. Open buy currency contracts are entered into for the purpose of closing open sell currency contracts and the values are dependent upon the values of the open sell currency contracts to which they relate.
The following table displays the outstanding forward currency contracts at March 31, 2016:
| | | | | | | | | | | | | | | | | | | | | | | | |
Outstanding Forward Currency Contracts to Buy or Sell at March 31, 2016 | |
Contract Description | | Buy/Sell | | Counter
Party(a) | | Contract
Amount | | | Contract
Value Date | | | Value
USD | | | Unrealized
Appreciation | | | Unrealized
Depreciation | |
Euro | | Sell | | SSB | | | 1,580,592,200 | | | | 05/23/2016 | | | | 1,801,195,663 | | | $ | — | | | $ | (37,863,296 | ) |
Great Britain Pound | | Sell | | SSB | | | 654,621,100 | | | | 04/07/2016 | | | | 940,207,452 | | | | 21,601,145 | | | | — | |
Great Britain Pound | | Buy | | SSB | | | 88,228,000 | | | | 04/07/2016 | | | | 126,718,529 | | | | 1,756,802 | | | | — | |
South Korean Won | | Sell | | SSB | | | 93,281,701,200 | | | | 06/03/2016 | | | | 81,441,539 | | | | — | | | | (6,468,302 | ) |
Swiss Franc | | Sell | | SSB | | | 56,105,400 | | | | 04/06/2016 | | | | 58,353,944 | | | | — | | | | (811,243 | ) |
Swiss Franc | | Sell | | SSB | | | 57,864,900 | | | | 04/06/2016 | | | | 60,183,960 | | | | — | | | | (2,197,869 | ) |
Swiss Franc | | Sell | | SSB | | | 252,341,500 | | | | 04/06/2016 | | | | 262,454,627 | | | | — | | | | (9,428,184 | ) |
Thailand Baht | | Buy | | BBH | | | 236,609,200 | | | | 06/02/2016 | | | | 6,716,382 | | | | — | | | | (10,821 | ) |
Thailand Baht | | Sell | | BBH | | | 1,770,910,700 | | | | 06/02/2016 | | | | 50,269,024 | | | | — | | | | (690,069 | ) |
Chinese Yuan Renminbi | | Sell | | SSB | | | 5,742,212,900 | | | | 05/05/2016 | | | | 887,335,296 | | | | — | | | | (33,665,051 | ) |
| | | | | | | | | | | | | | | | | | | | | | | | |
Total | | | | | | | | | | | | | | | | | | $ | 23,357,947 | | | $ | (91,134,835 | ) |
| | | | | | | | | | | | | | | | | | | | | | | | |
Net unrealized appreciation (depreciation) | | | | | | | | | | | | | | | | | | $ | (67,776,888 | ) |
| | | | | | | | | | | | | | | | | | | | | | | | |
| (a) | Counterparties include State Street Bank and Trust Company (“SSB”) and Brown Brothers Harriman & Co. (“BBH”). |
The outstanding forward currency contracts in the foregoing table which were entered into with State Street Bank and Trust Company (“SSB”), were entered into pursuant to an International Swaps and Derivatives Association (“ISDA”) Master Agreement. Outstanding forward currency contracts which were entered into with Brown Brothers Harriman & Co. (“BBH”) were entered into pursuant to a written agreement with BBH. In the event of a default or termination under the ISDA Master Agreement with SSB or the agreement with BBH, the non-defaulting party has the right to close out all outstanding forward currency contracts between the parties and to net any payment amounts under those contracts, resulting in a single net amount payable by one party to the other.
34 Semi-Annual Report
| | |
| NOTES TO FINANCIAL STATEMENTS, CONTINUED | | |
| |
Thornburg Investment Income Builder Fund | | March 31, 2016 (Unaudited) |
Because the ISDA Master Agreement with SSB and the agreement with BBH do not result in an offset of reported amounts of financial assets and liabilities in the Fund’s Statement of Assets and Liabilities unless there has been an event of default or termination event under such agreements, the Fund does not net its outstanding forward currency contracts for the purpose of disclosure in the Fund’s Statement of Assets and Liabilities. Instead the Fund recognizes the unrealized appreciation (depreciation) on those forward currency contracts on a gross basis in the Fund’s Statement of Assets and Liabilities.
The unrealized appreciation (depreciation) of the outstanding forward currency contracts recognized in the Fund’s Statement of Assets and Liabilities at March 31, 2016 is disclosed in the following table:
| | | | |
Fair Values of Derivative Financial Instruments at March 31, 2016 |
Asset Derivatives | | Balance Sheet Location | | Fair Value |
Foreign exchange contracts | | Assets - Unrealized appreciation on forward currency contracts | | $ 23,357,947 |
| | |
Liability Derivatives | | Balance Sheet Location | | Fair Value |
Foreign exchange contracts | | Liabilities - Unrealized depreciation on forward currency contracts | | $(91,134,835) |
Because the Fund does not currently receive or post cash collateral in connection with its currency forward contracts, the net amounts of the Fund’s assets and liabilities which are attributable to those contracts at March 31, 2016 can be determined by offsetting the dollar amounts shown in the preceding table. Based on those amounts, the net amount of the Fund’s liabilities which is attributable to its outstanding forward currency contracts at March 31, 2016 is $(67,075,998) attributable to the Fund’s contracts with SSB, and the net amount of the Fund’s liabilities which is attributable to those contracts is $(700,890) attributable to the Fund’s contracts with BBH. The Fund’s forward currency contracts are valued each day, and the net amounts of the Fund’s assets and liabilities which are attributable to those contracts are expected to vary over time.
The net realized gain (loss) from forward currency contracts and the net change in unrealized appreciation (depreciation) of outstanding forward currency contracts recognized in the Fund’s Statement of Operations for the six months ended March 31, 2016 are disclosed in the following tables:
| | | | |
Net Realized Gain (Loss) on Derivative Financial Instruments Recognized in Income for the Six Months Ended March 31, 2016 |
| | | Total | | Forward Currency Contracts |
Foreign exchange contracts | | $ 59,929,182 | | $ 59,929,182 |
|
Net Change in Unrealized Appreciation (Depreciation) of Derivative Financial Instruments Recognized in Income for the Six Months Ended March 31, 2016 |
| | | Total | | Forward Currency Contracts |
Foreign exchange contracts | | $(48,443,707) | | $(48,443,707) |
OTHER NOTES
Risks: The Fund’s investments subject it to risks including, but not limited to, management risk, market and economic risk, risks affecting specific issuers, credit risk, interest rate risk, high yield risk, prepayment risk, liquidity risk, and the risks associated with investments in small- and mid-cap companies, non-U.S. issuers, real estate investment trusts, and structured finance arrangements. Please see the Fund’s prospectus for a discussion of the risks associated with an investment in the Fund.
Subsequent Events: Fund management believes no events have occurred between March 31, 2016 and the date of issuance of the financial statements that require adjustment to or disclosure in the accompanying financial statements.
Semi-Annual Report 35
FINANCIAL HIGHLIGHTS
Thornburg Investment Income Builder Fund
| | | | | | | | | | | | | | | | | | | | | | | | | | | | | | | | | | | | | | | | | | | | | | | | | | | | |
| | | PER SHARE PERFORMANCE (for a share outstanding throughout the Period) | | RATIOS TO AVERAGE NET ASSETS | | | SUPPLEMENTAL DATA | |
Unless
Otherwise
Noted,
Periods
are
Fiscal
Years
Ended
Sept. 30, | | Net Asset
Value
Beginning
of Period | | | Net
Investment
Income
(Loss)+ | | Net
Realized
&
Unrealized
Gain (Loss)
on
Investments | | | Total from
Investment
Operations | | | Dividends
from Net
Investment
Income | | | Dividends
from Net
Realized
Gains | | Total
Dividends | | | Net Asset
Value
End
of Period | | Net
Investment
Income
(Loss)
(%) | | | Expenses,
After
Expense
Reductions
(%) | | | Expenses,
After
Expense
Reductions
and
Net of
Custody
Credits
(%) | | | Expenses,
Before
Expense
Reductions
(%) | | | Total
Return
(%)(a) | | | Portfolio
Turnover
Rate
(%)(a) | | Net
Assets
at End
of
Period
(Thousands) | |
Class A Shares | | | | | | | | | | | | | | | | | | | | | | | | | | | | | | | | | | | | | | | | | | | | | | |
2016(b)(c) | | $ | 19.07 | | | 0.37 | | | 0.05 | | | | 0.42 | | | | (0.42 | ) | | — | | | (0.42 | ) | | $19.07 | | | 3.88 | (d) | | | 1.19 | (d) | | | 1.19 | (d) | | | 1.19 | (d) | | | 2.21 | | | 19.07 | | $ | 3,914,570 | |
2015(c) | | $ | 21.38 | | | 0.85 | | | (2.34 | ) | | | (1.49 | ) | | | (0.82 | ) | | — | | | (0.82 | ) | | $19.07 | | | 4.02 | | | | 1.17 | | | | 1.17 | | | | 1.17 | | | | (7.27 | ) | | 47.71 | | $ | 4,257,943 | |
2014(c) | | $ | 20.13 | | | 1.10 | | | 1.13 | | | | 2.23 | | | | (0.98 | ) | | — | | | (0.98 | ) | | $21.38 | | | 5.21 | | | | 1.18 | | | | 1.18 | | | | 1.18 | | | | 11.19 | | | 38.81 | | $ | 4,588,033 | |
2013(c) | | $ | 18.90 | | | 1.03 | | | 1.27 | | | | 2.30 | | | | (1.07 | ) | | — | | | (1.07 | ) | | $20.13 | | | 5.26 | | | | 1.18 | | | | 1.18 | | | | 1.18 | | | | 12.51 | | | 46.14 | | $ | 4,281,060 | |
2012(c) | | $ | 17.29 | | | 1.15 | | | 1.60 | | | | 2.75 | | | | (1.14 | ) | | — | | | (1.14 | ) | | $18.90 | | | 6.32 | | | | 1.20 | | | | 1.20 | | | | 1.20 | | | | 16.26 | | | 40.96 | | $ | 3,420,877 | |
2011(c) | | $ | 18.31 | | | 1.12 | | | (0.99 | ) | | | 0.13 | | | | (1.15 | ) | | — | | | (1.15 | ) | | $17.29 | | | 5.91 | | | | 1.21 | | | | 1.21 | | | | 1.21 | | | | 0.42 | | | 30.34 | | $ | 2,734,845 | |
Class C Shares | | | | | | | | | | | | | | | | | | | | | | | | | | | | | | | | | | | | | | | | | | | | | | |
2016(b) | | $ | 19.06 | | | 0.30 | | | 0.05 | | | | 0.35 | | | | (0.35 | ) | | — | | | (0.35 | ) | | $19.06 | | | 3.18 | (d) | | | 1.90 | (d) | | | 1.90 | (d) | | | 1.94 | (d) | | | 1.87 | | | 19.07 | | $ | 5,604,813 | |
2015 | | $ | 21.37 | | | 0.70 | | | (2.34 | ) | | | (1.64 | ) | | | (0.67 | ) | | — | | | (0.67 | ) | | $19.06 | | | 3.30 | | | | 1.90 | | | | 1.90 | | | | 1.92 | | | | (7.93 | ) | | 47.71 | | $ | 5,906,206 | |
2014 | | $ | 20.13 | | | 0.94 | | | 1.13 | | | | 2.07 | | | | (0.83 | ) | | — | | | (0.83 | ) | | $21.37 | | | 4.44 | | | | 1.90 | | | | 1.90 | | | | 1.93 | | | | 10.36 | | | 38.81 | | $ | 6,266,270 | |
2013 | | $ | 18.89 | | | 0.89 | | | 1.28 | | | | 2.17 | | | | (0.93 | ) | | — | | | (0.93 | ) | | $20.13 | | | 4.55 | | | | 1.90 | | | | 1.90 | | | | 1.94 | | | | 11.78 | | | 46.14 | | $ | 5,160,706 | |
2012 | | $ | 17.29 | | | 1.02 | | | 1.59 | | | | 2.61 | | | | (1.01 | ) | | — | | | (1.01 | ) | | $18.89 | | | 5.63 | | | | 1.90 | | | | 1.90 | | | | 1.97 | | | | 15.43 | | | 40.96 | | $ | 4,051,242 | |
2011 | | $ | 18.31 | | | 0.99 | | | (0.99 | ) | | | — | | | | (1.02 | ) | | — | | | (1.02 | ) | | $17.29 | | | 5.23 | | | | 1.90 | | | | 1.90 | | | | 1.96 | | | | (0.26 | ) | | 30.34 | | $ | 3,167,624 | |
Class I Shares | | | | | | | | | | | | | | | | | | | | | | | | | | | | | | | | | | | | | | | | | | | | | | | | | |
2016(b) | | $ | 19.21 | | | 0.40 | | | 0.04 | | | | 0.44 | | | | (0.45 | ) | | — | | | (0.45 | ) | | $19.20 | | | 4.21 | (d) | | | 0.87 | (d) | | | 0.87 | (d) | | | 0.87 | (d) | | | 2.31 | | | 19.07 | | $ | 7,029,329 | |
2015 | | $ | 21.53 | | | 0.93 | | | (2.35 | ) | | | (1.42 | ) | | | (0.90 | ) | | — | | | (0.90 | ) | | $19.21 | | | 4.35 | | | | 0.85 | | | | 0.85 | | | | 0.85 | | | | (6.94 | ) | | 47.71 | | $ | 7,472,344 | |
2014 | | $ | 20.27 | | | 1.16 | | | 1.15 | | | | 2.31 | | | | (1.05 | ) | | — | | | (1.05 | ) | | $21.53 | | | 5.45 | | | | 0.86 | | | | 0.86 | | | | 0.86 | | | | 11.54 | | | 38.81 | | $ | 7,454,275 | |
2013 | | $ | 19.03 | | | 1.10 | | | 1.28 | | | | 2.38 | | | | (1.14 | ) | | — | | | (1.14 | ) | | $20.27 | | | 5.58 | | | | 0.85 | | | | 0.85 | | | | 0.85 | | | | 12.94 | | | 46.14 | | $ | 5,567,617 | |
2012 | | $ | 17.40 | | | 1.22 | | | 1.61 | | | | 2.83 | | | | (1.20 | ) | | — | | | (1.20 | ) | | $19.03 | | | 6.67 | | | | 0.89 | | | | 0.89 | | | | 0.89 | | | | 16.61 | | | 40.96 | | $ | 3,981,955 | |
2011 | | $ | 18.43 | | | 1.21 | | | (1.02 | ) | | | 0.19 | | | | (1.22 | ) | | — | | | (1.22 | ) | | $17.40 | | | 6.31 | | | | 0.87 | | | | 0.87 | | | | 0.87 | | | | 0.74 | | | 30.34 | | $ | 2,878,655 | |
Class R3 Shares | | | | | | | | | | | | | | | | | | | | | | | | | | | | | | | | | | | | | | | | | | | | | | | | | |
2016(b) | | $ | 19.07 | | | 0.34 | | | 0.04 | | | | 0.38 | | | | (0.39 | ) | | — | | | (0.39 | ) | | $19.06 | | | 3.59 | (d) | | | 1.50 | (d) | | | 1.50 | (d) | | | 1.60 | (d) | | | 2.01 | | | 19.07 | | $ | 79,389 | |
2015 | | $ | 21.37 | | | 0.78 | | | (2.32 | ) | | | (1.54 | ) | | | (0.76 | ) | | — | | | (0.76 | ) | | $19.07 | | | 3.70 | | | | 1.50 | | | | 1.50 | | | | 1.55 | | | | (7.52 | ) | | 47.71 | | $ | 79,834 | |
2014 | | $ | 20.13 | | | 1.03 | | | 1.12 | | | | 2.15 | | | | (0.91 | ) | | — | | | (0.91 | ) | | $21.37 | | | 4.84 | | | | 1.49 | | | | 1.49 | | | | 1.55 | | | | 10.80 | | | 38.81 | | $ | 83,671 | |
2013 | | $ | 18.89 | | | 0.97 | | | 1.28 | | | | 2.25 | | | | (1.01 | ) | | — | | | (1.01 | ) | | $20.13 | | | 4.96 | | | | 1.49 | | | | 1.49 | | | | 1.70 | | | | 12.23 | | | 46.14 | | $ | 61,334 | |
2012 | | $ | 17.28 | | | 1.10 | | | 1.60 | | | | 2.70 | | | | (1.09 | ) | | — | | | (1.09 | ) | | $18.89 | | | 6.05 | | | | 1.50 | | | | 1.50 | | | | 1.59 | | | | 15.94 | | | 40.96 | | $ | 47,023 | |
2011 | | $ | 18.30 | | | 1.08 | | | (1.00 | ) | | | 0.08 | | | | (1.10 | ) | | — | | | (1.10 | ) | | $17.28 | | | 5.67 | | | | 1.50 | | | | 1.50 | | | | 1.58 | | | | 0.13 | | | 30.34 | | $ | 34,861 | |
Class R4 Shares | | | | | | | | | | | | | | | | | | | | | | | | | | | | | | | | | | | | | | | | | | | | | | | | | |
2016(b) | | $ | 19.10 | | | 0.35 | | | 0.05 | | | | 0.40 | | | | (0.40 | ) | | — | | | (0.40 | ) | | $19.10 | | | 3.70 | (d) | | | 1.40 | (d) | | | 1.40 | (d) | | | 1.50 | (d) | | | 2.11 | | | 19.07 | | $ | 44,346 | |
2015 | | $ | 21.42 | | | 0.81 | | | (2.35 | ) | | | (1.54 | ) | | | (0.78 | ) | | — | | | (0.78 | ) | | $19.10 | | | 3.81 | | | | 1.40 | | | | 1.40 | | | | 1.46 | | | | (7.48 | ) | | 47.71 | | $ | 42,392 | |
2014 | | $ | 20.17 | | | 1.04 | | | 1.16 | | | | 2.20 | | | | (0.95 | ) | | — | | | (0.95 | ) | | $21.42 | | | 4.88 | | | | 1.35 | | | | 1.35 | | | | 1.40 | | | | 11.00 | | | 38.81 | | $ | 39,890 | |
2013 | | $ | 18.93 | | | 0.99 | | | 1.29 | | | | 2.28 | | | | (1.04 | ) | | — | | | (1.04 | ) | | $20.17 | | | 5.05 | | | | 1.37 | | | | 1.37 | | | | 1.41 | | | | 12.35 | | | 46.14 | | $ | 24,906 | |
2012 | | $ | 17.31 | | | 1.12 | | | 1.61 | | | | 2.73 | | | | (1.11 | ) | | — | | | (1.11 | ) | | $18.93 | | | 6.14 | | | | 1.39 | | | | 1.39 | | | | 1.53 | | | | 16.10 | | | 40.96 | | $ | 19,471 | |
2011 | | $ | 18.34 | | | 1.15 | | | (1.06 | ) | | | 0.09 | | | | (1.12 | ) | | — | | | (1.12 | ) | | $17.31 | | | 6.02 | | | | 1.40 | | | | 1.40 | | | | 1.65 | | | | 0.19 | | | 30.34 | | $ | 10,162 | |
Class R5 Shares | | | | | | | | | | | | | | | | | | | | | | | | | | | | | | | | | | | | | | | | | | | | | | | | | |
2016(b) | | $ | 19.20 | | | 0.39 | | | 0.04 | | | | 0.43 | | | | (0.44 | ) | | — | | | (0.44 | ) | | $19.19 | | | 4.13 | (d) | | | 0.99 | (d) | | | 0.99 | (d) | | | 1.09 | (d) | | | 2.25 | | | 19.07 | | $ | 87,948 | |
2015 | | $ | 21.52 | | | 0.90 | | | (2.35 | ) | | | (1.45 | ) | | | (0.87 | ) | | — | | | (0.87 | ) | | $19.20 | | | 4.23 | | | | 0.98 | | | | 0.98 | | | | 1.07 | | | | (7.06 | ) | | 47.71 | | $ | 78,945 | |
2014 | | $ | 20.26 | | | 1.10 | | | 1.19 | | | | 2.29 | | | | (1.03 | ) | | — | | | (1.03 | ) | | $21.52 | | | 5.15 | | | | 0.99 | | | | 0.99 | | | | 1.10 | | | | 11.40 | | | 38.81 | | $ | 64,748 | |
2013 | | $ | 19.01 | | | 1.07 | | | 1.30 | | | | 2.37 | | | | (1.12 | ) | | — | | | (1.12 | ) | | $20.26 | | | 5.37 | | | | 0.99 | | | | 0.98 | | | | 1.05 | | | | 12.80 | | | 46.14 | | $ | 39,985 | |
2012 | | $ | 17.40 | | | 1.21 | | | 1.58 | | | | 2.79 | | | | (1.18 | ) | | — | | | (1.18 | ) | | $19.01 | | | 6.61 | | | | 0.99 | | | | 0.99 | | | | 1.29 | | | | 16.44 | | | 40.96 | | $ | 14,914 | |
2011 | | $ | 18.42 | | | 1.18 | | | (1.00 | ) | | | 0.18 | | | | (1.20 | ) | | — | | | (1.20 | ) | | $17.40 | | | 6.16 | | | | 0.99 | | | | 0.99 | | | | 1.51 | | | | 0.68 | | | 30.34 | | $ | 4,424 | |
| (a) | Not annualized for periods less than one year. |
| (b) | Unaudited Six Month Period Ended March 31. |
| (c) | Sales loads are not reflected in computing total return. |
| + | Based on weighted average shares outstanding. |
See notes to financial statements.
| | | | |
| 36 Semi-Annual Report | | | | Semi-Annual Report 37 |
| | |
| EXPENSE EXAMPLE | | |
| |
Thornburg Investment Income Builder Fund | | March 31, 2016 (Unaudited) |
As a shareholder of the Fund, you incur two types of costs:
| | (1) | transaction costs, including |
(a) sales charges (loads) on purchase payments, for Class A shares;
(b) a deferred sales charge on redemptions of any part or all of a purchase of $1 million of Class A shares within 12 months of purchase;
(c) a deferred sales charge on redemptions of Class C shares within 12 months of purchase;
| | (2) | ongoing costs, including management fees; distribution and/or service (12b-1) fees; and other Fund expenses. |
This example is intended to help you understand your ongoing costs (in dollars) of investing in the Fund and to compare these costs with the ongoing costs of investing in other mutual funds.
The example is based on a $1,000 investment beginning on October 1, 2015, and held until March 31, 2016.
| | | | | | | | | | | | |
| | | Beginning
Account Value
10/1/15 | | | Ending
Account Value
3/31/16 | | | Expenses Paid
During Period†
10/1/15–3/31/16 | |
Class A Shares | | | | | | | | | | | | |
Actual | | $ | 1,000.00 | | | $ | 1,022.10 | | | $ | 6.01 | |
Hypothetical* | | $ | 1,000.00 | | | $ | 1,019.05 | | | $ | 6.00 | |
Class C Shares | | | | | | | | | | | | |
Actual | | $ | 1,000.00 | | | $ | 1,018.70 | | | $ | 9.59 | |
Hypothetical* | | $ | 1,000.00 | | | $ | 1,015.50 | | | $ | 9.57 | |
Class I Shares | | | | | | | | | | | | |
Actual | | $ | 1,000.00 | | | $ | 1,023.10 | | | $ | 4.38 | |
Hypothetical* | | $ | 1,000.00 | | | $ | 1,020.67 | | | $ | 4.38 | |
Class R3 shares | | | | | | | | | | | | |
Actual | | $ | 1,000.00 | | | $ | 1,020.10 | | | $ | 7.58 | |
Hypothetical* | | $ | 1,000.00 | | | $ | 1,017.50 | | | $ | 7.57 | |
Class R4 Shares | | | | | | | | | | | | |
Actual | | $ | 1,000.00 | | | $ | 1,021.10 | | | $ | 7.07 | |
Hypothetical* | | $ | 1,000.00 | | | $ | 1,018.01 | | | $ | 7.06 | |
Class R5 Shares | | | | | | | | | | | | |
Actual | | $ | 1,000.00 | | | $ | 1,022.50 | | | $ | 5.01 | |
Hypothetical* | | $ | 1,000.00 | | | $ | 1,020.05 | | | $ | 5.00 | |
| † | Expenses are equal to the annualized expense ratio for each class (A: 1.19%; C: 1.90%; I: 0.87%; R3: 1.50%; R4: 1.40%; R5: 0.99%) multiplied by the average account value over the period, multiplied by 183/366 to reflect the one-half year period. |
| * | Hypothetical assumes a rate of return of 5% per year before expenses. |
ACTUAL EXPENSES
For each class of shares, the first line of the accompanying table provides information about actual account values and actual expenses. You may use the information in this line, together with the amount you invested, to estimate the expenses that you paid over the period. Simply divide your account value by $1,000 (for example, an $8,600 account value divided by $1,000 = 8.6), then multiply the result by the number in the first line for your class of shares under the heading entitled “Expenses Paid During Period” to estimate the expenses you paid on your account during this period.
HYPOTHETICAL EXAMPLE FOR COMPARISON PURPOSES
For each class of shares, the second line of the accompanying table provides information about hypothetical account values and hypothetical expenses based on the Fund’s actual expense ratio and an assumed rate of return of 5% per year before expenses, which is not the Fund’s actual return. The hypothetical account values and expenses may not be used to estimate the actual ending account balance or expenses you paid for the period. You may use this information to compare the ongoing costs of investing in the Fund and other funds. To do so, compare this 5% hypothetical example with the 5% hypothetical examples that appear in the shareholder reports of the other funds.
Please note that the expenses shown in the table are meant to highlight your ongoing costs only and do not reflect any transactional costs, such as sales charges (loads), redemption fees, or exchange fees. Therefore, the second line of the table for each class of shares is useful in comparing ongoing costs only, and will not help you determine the relative total costs of owning different funds. In addition, if these transactional costs were included, your costs would have been higher.
38 Semi-Annual Report
| | |
| OTHER INFORMATION | | |
| |
Thornburg Investment Income Builder Fund | | March 31, 2016 (Unaudited) |
PORTFOLIO PROXY VOTING
Policies and Procedures:
The Trust has delegated to Thornburg Investment Management, Inc. (the “Advisor”) voting decisions respecting proxies for the Fund’s voting securities. The Advisor makes voting decisions in accordance with its Proxy Voting Policy and Procedures. A description of the Policy and Procedures is available (i) without charge, upon request, by calling the Advisor toll-free at 1-800-847-0200, (ii) on the Thornburg website at www.thornburg.com, and (iii) on the Securities and Exchange Commission’s website at www.sec.gov.
Information regarding how proxies were voted is available on or before August 31 of each year for the twelve months ending the preceding June 30. This information is available (i) without charge, upon request by calling the Advisor toll-free at 1-800-847-0200, (ii) on the Thornburg website at www.thornburg.com, and (iii) on the Securities and Exchange Commission’s website at www.sec.gov.
AVAILABILITY OF QUARTERLY PORTFOLIO SCHEDULE
The Fund files with the Securities and Exchange Commission schedules of its portfolio holdings on Form N-Q for the first and third quarters of each fiscal year. The Fund’s Forms N-Q are available on the Commission’s website at www.sec.gov, or may be reviewed and copied at the Commission’s Public Reference Room in Washington, D.C. Information on the operation of the Public Reference Room may be obtained by calling 1-800-SEC-0330. The Fund also makes this information available on its website at www.thornburg. com/download or upon request by calling 1-800-847-0200.
Semi-Annual Report 39
TRUSTEES’ STATEMENT TO SHAREHOLDERS
Revised and Readopted September 15, 2015
The Trustees believe current and prospective shareholders should know how we discharge our responsibilities in supervising the Funds’ investment advisor and in reviewing the advisor’s contract for renewal. Since 2005, we have issued a statement which sets out clearly the three principal guidelines that we follow in supervising the Trust’s investment advisor on your behalf. In accordance with our customary practice, in September of 2015 we again reviewed our statement and concluded we should reissue this statement outlining the principal features of our supervision of the advisor’s performance of investment management services for the Funds.
We begin with the premise that each shareholder selected his or her Fund because its investments are managed by the investment advisor identified in the prospectus and in accordance with the objective and policies described in the prospectus. We realize, as each of you do, that if you believe that your Fund’s stated objective and policies no longer serve your personal investment goals, you can sell your shares and leave the Fund.
Therefore, we believe that our primary supervisory task – our principal obligation to you – is to assess the nature and quality of the advisor’s services, and to confirm that the advisor actively and competently pursues the Fund’s objective, in accordance with the policies set out in the prospectus. To do this, we meet regularly with management to review your Fund’s portfolio and to discuss the advisor’s specific actions and judgments in pursuing the Fund’s objective. We do not substitute our own judgment for the advisor’s decisions in selecting investments; the advisor is paid to exercise its informed judgment on investment decisions, and we seek to confirm, in reviewing the advisor’s performance, that the advisor is doing just that.
Second, we are conscious of costs and the effect that costs have on shareholders’ returns. We try to make sure that your Fund’s fees and costs are reasonable in relationship to the services rendered and that they are generally in line with those charged by other expert investment advisors, consistent with our belief that the Fund’s investors searched for and expect that expertise and attention and have decided to pay a reasonable price for it. We do not put the management contract “out to bid” as a matter of course, and we would not do so unless we had concluded that the advisor materially had failed to pursue the Fund’s objectives in accordance with its policies, or for other equally important reasons. We believe that any other approach would be inconsistent with your interests and contrary to your expectations when you bought shares of the Fund in the first place.
Finally, because we believe that most Thornburg Fund shareholders have invested with a long-term perspective, we try not to focus too much on the fashions of the moment and on short-term performance. The market will not favor any specific investment objective or set of policies at all times and under all economic circumstances. A fund will experience periods of both high and low returns relative to other funds and other investments. Even if one of our Funds is not favored by the market at a particular time, we believe that the advisor is nonetheless obliged to remain true to the Fund’s objective and policies, and we watch to see that it does so.
Trustees of Thornburg Investment Trust
40 Semi-Annual Report
THORNBURG FUND FAMILY
Thornburg Investment Management is a privately-owned global investment firm that offers a range of solutions for retail and institutional investors. Founded in 1982 and headquartered in Santa Fe, New Mexico, we manage approximately $54 billion (as of March 31, 2016) across eight equity and 11 bond mutual funds, separate accounts for high-net-worth investors and institutional accounts, and five UCITS funds for non-U.S. investors.
The fund outlined in this report is one of many equity and fixed-income products available from Thornburg Investment Management.
Equity Funds
| | • | | Thornburg Core Growth Fund |
| | • | | Thornburg International Value Fund |
| | • | | Thornburg Better World International Fund |
| | • | | Thornburg International Growth Fund |
| | • | | Thornburg Developing World Fund |
| | • | | Thornburg Investment Income Builder Fund |
| | • | | Thornburg Global Opportunities Fund |
Fixed Income Funds
| | • | | Thornburg Low Duration Income Fund |
| | • | | Thornburg Limited Term U.S. Government Fund |
| | • | | Thornburg Limited Term Income Fund |
| | • | | Thornburg Strategic Income Fund |
| | • | | Thornburg Low Duration Municipal Fund |
| | • | | Thornburg Limited Term Municipal Fund |
| | • | | Thornburg Intermediate Municipal Fund |
| | • | | Thornburg California Limited Term Municipal Fund |
| | • | | Thornburg New Mexico Intermediate Municipal Fund |
| | • | | Thornburg New York Intermediate Municipal Fund |
| | • | | Thornburg Strategic Municipal Income Fund |
Before investing, carefully consider the Fund’s investment goals, risks, charges, and expenses. For a prospectus or summary prospectus containing this and other information, contact your financial advisor or visit thornburg.com. Read it carefully before investing.
For additional information, please visit thornburg.com
Thornburg Investment Management, Inc. 2300 North Ridgetop Road, Santa Fe, NM 87506
Semi-Annual Report 41
This page intentionally left blank.
42 Semi-Annual Report
This page intentionally left blank.
Semi-Annual Report 43

This Semi-Annual Report is submitted for the general information of shareholders of the Fund. It is not authorized for distribution to prospective investors in the Fund unless preceded or accompanied by an effective prospectus.
| | | | |
| Investment Advisor: | | Distributor: | | |
| Thornburg Investment Management® | | Thornburg Securities Corporation® | | |
| 800.847.0200 | | 800.847.0200 | | TH1075 |
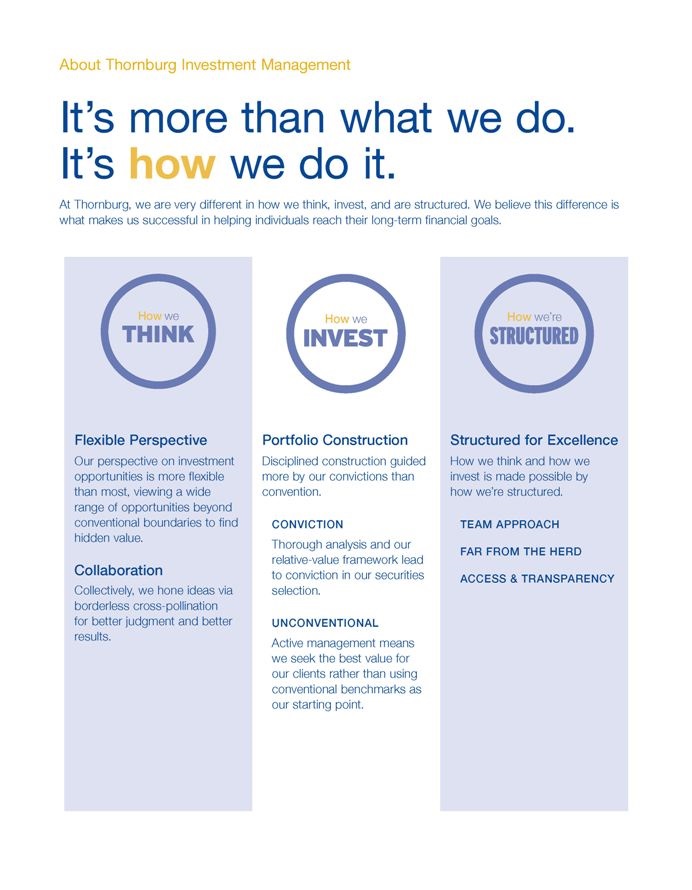
2 Semi-Annual Report
Semi-Annual Report
Thornburg Global Opportunities Fund
March 31, 2016
| | | | |
SHARE CLASS | | NASDAQ SYMBOL | | CUSIP |
Class A | | THOAX | | 885-215-343 |
Class C | | THOCX | | 885-215-335 |
Class I | | THOIX | | 885-215-327 |
Class R3 | | THORX | | 885-215-145 |
Class R4 | | THOVX | | 885-215-137 |
Class R5 | | THOFX | | 885-215-129 |
Class I, R3, R4, and R5 shares may not be available to all investors. Minimum investments for Class I shares may be higher than those for other classes.
Investments carry risks, including possible loss of principal. Additional risks may be associated with investments outside the United States, especially in emerging markets, including currency fluctuations, illiquidity, volatility, and political and economic risks. Investments in small- and mid-capitalization companies may increase the risk of greater price fluctuations. Please see the Fund’s prospectus for a discussion of the risks associated with an investment in the Fund. Investments in the Fund are not FDIC insured, nor are they bank deposits or guaranteed by a bank or any other entity.
Funds invested in a smaller number of holdings may expose an investor to greater volatility.
Semi-Annual Report 3
LETTER TO SHAREHOLDERS
| | |
| |
Thornburg Global Opportunities Fund | | March 31, 2016 (Unaudited) |
April 26, 2016
Dear Fellow Shareholder:
This letter will highlight the results of Thornburg Global Opportunities Fund’s investment activities for the six-month period ended March 31, 2016. In addition, we will comment on the overall investment landscape. Recall that Thornburg Global Opportunities Fund seeks capital appreciation from a portfolio of typically 30–40 equity investments from around the world. We believe that the structure of the Fund—built on our core investment principles of flexibility, focus, and value—gives us a durable framework for value-added investing.
In the six months ended March 31, 2016, Thornburg Global Opportunities Fund produced a total return of 2.09% (Class A shares without sales charge). The net asset value (NAV) per Class A share increased 1.76%, from $24.41 to $24.84. The Fund also paid an income distribution in December 2015 of 8.2 cents per share. Your Fund’s performance for this semi-annual period lagged the MSCI All Country World Index (ACWI) return of 5.28%. This follows a long stretch of good results for your Fund, including a performance advantage over the MSCI ACWI index in every calendar year since 2012.
We remain focused on executing our investment process, which has produced constructive results over the long term. From its inception on July 28, 2006 through March 31, 2016, the Global Opportunities Fund has outperformed the MSCI ACWI by an average margin of over five percentage points per year, resulting in a total cumulative return since inception of 143.46% (for the Class A shares without sales charge) versus 49.19% for the index. As of March 31, 2016, your Fund’s Class A and I shares are rated four-stars and five-stars overall, respectively, by Morningstar (based on risk-adjusted returns among 991 World Stock funds), and rank in the top 1% of World Stock funds for the time period starting August 2006 (based on total returns without sales charge, among 635 funds).
Table I displays your Fund’s ranking over various periods by performance percentile relative to the Morningstar World Stock category (lower numbers represent higher ranking). Performance data for various measurement periods is included on page 8 of this report.
Following a rally in the fourth quarter of 2015, global equity markets declined during the first six weeks of 2016 before recovering recently. Most developed markets saw positive results for the six months ended March 31, 2016, including the U.S. (S&P 500 Index, +8.5%), Japan (Nikkei 225 Index, +3.5%) and the Eurozone (Euro Stoxx Index, +1.4%), see Table II on the next page. Emerging market indices followed a similar path but with more volatility. Two recent concerns have been the slowing Chinese economy and slowing global growth, pressuring banks and other economically sensitive sectors.
Performance data shown represents past performance and is no guarantee of future results. Investment return and principal value will fluctuate so shares, when redeemed, may be worth more or less than their original cost. Current performance may be lower or higher than quoted. For performance current to the most recent month end, visit thornburg.com or call 800.847.0200.
The maximum sales charge for Class A shares is 4.50%. The total annual fund operating expense of Class A shares is 1.32%, as disclosed in the most recent prospectus. If the sales charge had been deducted, returns would be lower.
Chart I Cumulative Fund Performance
Since inception, July 28, 2006 to March 31, 2016
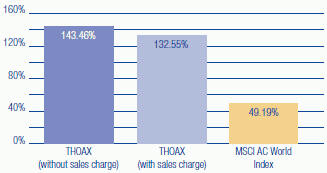
Past performance does not guarantee future results.
Table I Morningstar World Stock Ratings and Rankings
as of March 31, 2016
| | | | | | | | | | | | | | | | | | | | | | | | | | | | |
| | | RATINGS | | | RANKINGS | |
| | | | | | | | | | | | | | | | | | | | | SINCE | |
| | | OVERALL | | | 3-YR | | | 5-YR | | | 1-YR | | | 3-YR | | | 5-YR | | | INCEP. | |
A Shares | | | 4 stars | | | | 5 stars | | | | 4 stars | | | | 73 | % | | | 2 | % | | | 4 | % | | | 1 | % |
I Shares | | | 5 stars | | | | 5 stars | | | | 5 stars | | | | 71 | % | | | 1 | % | | | 3 | % | | | 1 | % |
# of Funds | | | 991 | | | | 991 | | | | 774 | | | | 1,218 | | | | 991 | | | | 774 | | | | 635 | |
Percentile rankings are based on total returns, before sales charge. Source: Morningstar.
The Fund’s Overall Morningstar Rating, based on risk-adjusted returns, uses a weighted average of the Fund’s three- and five-year ratings. To determine a fund’s Morningstar Rating™, funds with at least a three-year history are ranked in their categories by their Morningstar Risk-Adjusted Return scores. The top 10% receive 5 stars; the next 22.5%, 4 stars; the middle 35%, 3 stars; the next 22.5%, 2 stars; and the bottom 10% receive 1 star. The Risk-Adjusted Return accounts for variation in a fund’s performance (including the effects of all sales charges), placing more emphasis on downward variations and rewarding consistent performance. Other share classes may have different performance characteristics.
4 Semi-Annual Report
| | |
LETTER TO SHAREHOLDERS, CONTINUED | | |
| |
Thornburg Global Opportunities Fund | | March 31, 2016 (Unaudited) |
Table II Total Return for Global Indices
In U.S. Dollar Terms, as of March 31, 2016
| | | | |
| | | 6-MONTHS ENDED | |
| | | MARCH 31, 2016 | |
S&P 500 Index | | | 8.5 | % |
Nikkei 225 Index | | | 3.5 | % |
Euro Stoxx Index | | | 1.4 | % |
Source: Bloomberg
From an industry perspective, eight of the 10 sectors of the MSCI ACWI delivered positive returns ranging from more than 4% and 5% (energy and consumer discretionary) to 11% (telecommunications.) The two sectors contributing negative returns for the index were health care (-0.3%) and financials (-1.5%).
Our investments in health care companies were significant detractors from the performance of Thornburg Global Opportunities Fund for the period. The sector has been buffeted by political uncertainty, mixed outcomes of the Affordable Care Act (ACA), and criticisms of the business practices of Valeant and other industry participants. Drug pricing remains a contentious topic in the current U.S. election season.
During the semi-annual period, 13 stocks contributed at least 25 basis points (0.25%) to overall Fund performance, while six subtracted at least 25 basis points. Contribution to overall Fund performance takes into account both position size and return on the investment. Significant detractors included U.K. property developer Barratt Developments; Citigroup; Canadian drug maker Concordia Healthcare; Korean gaming concern Paradise Co; and Canada’s Valeant Pharmaceuticals.
Toronto-based Concordia Healthcare was a weak performer in the portfolio and warrants discussion. Your Fund initially bought this specialty drug manufacturer two years ago and the shares appreciated markedly through August 2015. Its share price decline since then can be attributed to many factors, including the health care industry headwinds cited above as well as company-specific considerations. Concordia completed an acquisition in late 2015, adding debt to the balance sheet but increasing the company’s geographic diversification and growth profile. The timing of this transaction was inopportune, given the industry tumult. Today, less than 40% of Concordia’s revenue comes from its U.S. operations, and management expects new products to drive growth in its larger international segment in the coming years.
Regarding Valeant, our ongoing research, including meetings with management, cast doubt on our investment case. We sold our small remaining stake early this year.
Significant positive contributors to your Fund were a diverse group, including Macau casino operator Galaxy Entertainment Group; oil driller Helmerich & Payne; European datacenter leader InterXion Holding NV; U.S. network services provider Level 3 Communications; and U.S. real estate concern VEREIT.
Because of the significant volatility in financial markets over the last 10 months, we review in Table III the share price declines of the most negative contributors to your Fund’s performance during the second half of 2015 through February 11 of this year, along with the subsequent performance of these investments through April 26, the date of this letter. For the most part, the companies listed below appear capable of demonstrating resilience. The stock price recoveries shown in the following table have contributed significantly to your Fund’s rebound from a 12-month low of $21.70/share on February 11 to $24.91 on April 26. Your Fund still holds 14 of the 15 investments in Table III below.
Table III The 15 Largest Detractors from Performance
June 30, 2015 to February 11, 2016 and February 11, 2016 to April 26, 2016
| | | | | | | | | | |
| | | | | STOCK PRICE CHANGE | |
| COMPANY | | INDUSTRY | | (6/30/15 to | | | (2/11/16 to | |
NAME | | SECTOR | | 2/11/16) | | | 4/26/16) | |
Concordia Healthcare | | Health Care | | | -62.7 | % | | | +34.5 | % |
Valeant Pharmaceuticals | | Health Care | | | -62.4 | % | |
| -56.6
(sold | %
) |
Citigroup | | Financial | | | -36.7 | % | | | +34.6 | % |
Numericable | | Telecommunications | | | -36.9 | % | | | -2.4 | % |
Helmerich & Payne | | Energy | | | -35.0 | % | | | +37.8 | % |
Galaxy Entertainment | | Consumer Discr. | | | -27.4 | % | | | +25.1 | % |
Capital One Financial | | Financial | | | -31.6 | % | | | +26.3 | % |
Express Scripts | | Health Care | | | -25.4 | % | | | +11.9 | % |
Mineral Resources Ltd. | | Industrial | | | -43.9 | % | | | +92.8 | % |
T-Mobile U.S. | | Telecommunications | | | -12.2 | % | | | +15.6 | % |
Level 3 Communications | | Telecommunications | | | -12.9 | % | | | +18.2 | % |
Paradise Co. Ltd. | | Consumer Discr. | | | -44.5 | % | | | +18.8 | % |
ING Group | | Financial | | | -36.2 | % | | | +21.3 | % |
Echostar Corporation | | Information
Technology | | | -31.4 | % | | | +24.9 | % |
Baidu, Inc. | | Software & Services | | | -29.1 | % | | | +33.3 | % |
Source: Bloomberg
A few of Global Opportunities Fund’s holdings, including Galaxy Entertainment, are linked to the Chinese economy. The deceleration of economic growth in China (and associated industrial overcapacity) continues to hamper certain sectors
Semi-Annual Report 5
| | |
LETTER TO SHAREHOLDERS, CONTINUED | | |
| |
Thornburg Global Opportunities Fund | | March 31, 2016 (Unaudited) |
such as chemicals, cement, and steel. Your Fund has limited direct exposure to these areas, and recent economic data show a gradual rebalancing of China’s economy toward consumption. Industrial output through February 2016 was up 5.4% on the previous year, property investment up just 3%, while retail sales were up 10.2%.* Brokerage firm AllianceBernstein tracks 1,800 China-domiciled firms and reports that both revenues and earnings were up 6% in 2015 for this group, excluding the energy and materials sectors. Prices of many industrial commodities have recently shown stability. Our investment in Australia-based Mineral Resources (which provides mining services) has risen sharply this year. A chart of commodity price trends is shown below in Chart II.
Chart II Selected Commodities: Recent Price
Performance March 31, 2015 to March 31, 2016
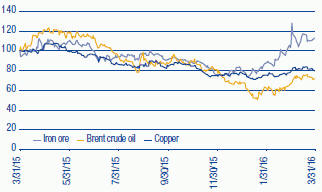
Source: Bloomberg indexed daily price data.
Top sector weightings as of March 31, 2016, were: consumer discretionary (18.7% portfolio weighting), financials (17.9%), information technology (15.1%), telecommunication services (10.8%), and industrials (9.8%). As of March 31, 2016, the average expected 2016 price-to-earnings multiple for companies owned by the Fund stood at 15.1x versus 15.6x for the MSCI ACWI. Relative to the index, your Fund is overweight China and Europe, and has no direct exposure to Japan. Firms located in emerging market countries currently constitute about 8.2% of the portfolio. Table IV illustrates your Fund’s largest geographic weightings.
Table IV Largest Geographic Weightings
| | | | |
| | | WEIGHTING AS OF | |
COUNTRY | | MARCH 31, 2016 | |
United States | | | 51.8 | % |
Netherlands | | | 13.7 | % |
China | | | 7.9 | % |
United Kingdom | | | 6.0 | % |
Spain | | | 5.4 | % |
As a percent of the Fund. Holdings are classified by country of risk, determined at the Fund advisor’s discretion.
Investors continue to debate the direction of the economies of China, Europe, and the U.S., while also considering elevated political uncertainty in several large countries. Some of the political questions will be resolved later this year, but the economic uncertainty will remain. Major central banks around the world continue to pursue easy monetary conditions, causing interest rates to remain lower for longer than many people expected. An unusual result is that toward the end of April, nearly $10 trillion in global sovereign debt was yielding less than zero, with Japanese and euro area government bonds accounting for the overwhelming majority. It would be logical for lower commodity prices and firming labor markets in most major economies to bolster consumer spending. Earnings expectations for the MSCI ACWI portfolio in 2016 have been reduced in recent quarters; however, these show signs of leveling out or recovering in some markets.
It’s important to reiterate that our strategy for the Thornburg Global Opportunities Fund is founded on fundamental analysis of individual businesses, not over-reliance on macroeconomic forecasts. We have managed the Fund this way through a wide variety of macroeconomic settings since its July 2006 inception. Thank you for your support of Thornburg Global Opportunities Fund. Remember that you can review descriptions of many of the stocks in your portfolio at www.thornburg.com/global.
Best wishes for a great summer.
Sincerely,
| | | | |
 | |  | | |
Brian McMahon Portfolio Manager Chief Investment Officer | | W. Vinson Walden,CFA Portfolio Manager Managing Director | | |
| * | National Bureau of Statistics of China |
The matters discussed in this report may constitute forward-looking statements made pursuant to the safe harbor provisions of the Securities Litigation Reform Act of 1995. These include any advisor or portfolio manager prediction, assessment, analysis or outlook for individual securities, industries, investment styles, market sectors and/or markets. These statements involve risks and uncertainties. In addition to the general risks described for each fund in its current prospectus, other factors bearing on these reports include the accuracy of the advisor’s or portfolio manager’s forecasts and predictions, the appropriateness of the investment strategies designed by the advisor or portfolio manager and the ability of the advisor or portfolio manager to implement their strategies efficiently and successfully. Any one or more of these factors, as well as other risks affecting the securities markets generally, could cause the actual results of any fund to differ materially as compared to its benchmarks.
The views expressed by the portfolio managers reflect their professional opinions and are subject to change. Under no circumstances does the information contained within represent a recommendation to buy or sell any security.
6 Semi-Annual Report
This page intentionally left blank.
Semi-Annual Report 7
PERFORMANCE SUMMARY
| | |
| |
Thornburg Global Opportunities Fund | | March 31, 2016 (Unaudited) |
Average Annual Total Returns
| | | | | | | | | | | | | | | | |
| | | | | | | | | | | | SINCE | |
| | | 1-YR | | | 3-YR | | | 5-YR | | | INCEP. | |
Class A Shares (Incep: 7/28/06) | | | | | | | | | | | | | | | | |
Without sales charge | | | -7.36 | % | | | 11.59 | % | | | 9.60 | % | | | 9.63 | % |
With sales charge | | | -11.54 | % | | | 9.89 | % | | | 8.60 | % | | | 9.12 | % |
Class C Shares (Incep: 7/28/06) | | | | | | | | | | | | | | | | |
Without sales charge | | | -8.05 | % | | | 10.74 | % | | | 8.77 | % | | | 8.79 | % |
With sales charge | | | -8.97 | % | | | 10.74 | % | | | 8.77 | % | | | 8.79 | % |
Class I Shares (Incep: 7/28/06) | | | -7.02 | % | | | 12.04 | % | | | 10.07 | % | | | 10.15 | % |
Class R3 Shares (Incep: 2/1/08) | | | -7.51 | % | | | 11.46 | % | | | 9.51 | % | | | 5.54 | % |
Class R4 Shares (Incep: 2/1/08) | | | -7.44 | % | | | 11.55 | % | | | 9.62 | % | | | 5.63 | % |
Class R5 Shares (Incep: 2/1/08) | | | -7.03 | % | | | 12.02 | % | | | 10.07 | % | | | 6.09 | % |
MSCI AC World Index (Since 7/28/06) | | | -4.34 | % | | | 5.54 | % | | | 5.22 | % | | | 4.22 | % |
Growth of a Hypothetical $10,000 Investment
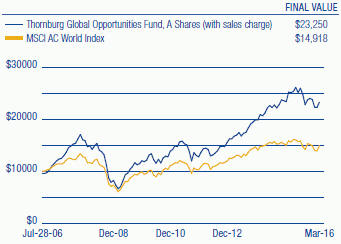
Performance data shown represents past performance and is no guarantee of future results. Investment return and principal value will fluctuate so shares, when redeemed, may be worth more or less than their original cost. Current performance may be lower or higher than quoted. For performance current to the most recent month end, visit thornburg.com or call 800-847-0200. The performance information does not reflect the deduction of taxes that a shareholder would pay on distributions or the redemption of Fund shares. Returns reflect the reinvestment of dividends and capital gains. Class A shares are sold with a maximum sales charge of 4.50%. Class C shares are subject to a 1% CDSC for the first year only. There is no sales charge for Class I, R3, R4, and R5 shares.
As disclosed in the most recent prospectus, the total annual fund operating expenses are as follows: A shares, 1.32%; C shares, 2.10%; I shares, 0.97%; R3 shares, 2.15%; R4 shares, 1.76%; R5 shares, 1.02%. Thornburg Investment Management and/or Thornburg Securities Corporation have contractually agreed to waive fees and reimburse expenses through at least February 1, 2017, for some of the share classes, resulting in net expense ratios of the following: R3 shares, 1.50%; R4 shares, 1.40%; R5 shares, 0.99%. For more detailed information on fund expenses and waivers/reimbursements please see the Fund’s prospectus.
From time to time, the Fund may invest in shares of companies through initial public offerings (IPOs). IPOs have the potential to produce substantial gains for the Fund. There is no assurance that the Fund will have continued access to profitable IPOs and, as the Fund’s assets grow, the impact of IPO investments may decline. Therefore, investors should not rely on these past gains as an indication of future performance.
Glossary
MSCI All Country (AC) World Index – A market capitalization weighted index that is representative of the market structure of 46 developed and emerging market countries in North and South America, Europe, Africa, and the Pacific Rim. The index is calculated with net dividends reinvested in U.S. dollars.
Unless otherwise noted, index returns reflect the reinvestment of income dividends and capital gains, if any, but do not reflect fees, brokerage commissions or other expenses of investing. Investors may not make direct investments into any index. The performance of any index is not indicative of the performance of any particular investment.
Basis Point (bp) – A unit equal to 1/100th of 1%. 1% = 100 basis points (bps).
Beta – A measure of market-related risk. Less than one means the portfolio is less volatile than the index, while greater than one indicates more volatility than the index.
P/E – Price/Earnings ratio (P/E ratio) is a valuation ratio of a company’s current share price compared to its per-share earnings. P/E equals a company’s market value per share divided by earnings per share. Forecasted P/E is not intended to be a forecast of the fund’s future performance.
8 Semi-Annual Report
FUND SUMMARY
| | |
| |
Thornburg Global Opportunities Fund | | March 31, 2016 (Unaudited) |
Objectives and Strategies
The Fund seeks long-term capital appreciation by investing in equity and debt securities of all types from issuers around the world.
The Fund pursues its investment goals by investing primarily in a broad range of equity securities, including common stocks, preferred stocks, real estate investment trusts, other equity trusts, and partnership interests. The Fund may invest in any stock or other equity security which the investment advisor believes may assist the Fund in pursuing its goals, including smaller companies with market capitalizations of less than $500 million. The Fund may also invest in debt obligations of any kind.
Market Capitalization Exposure
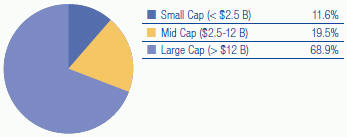
Asset Structure
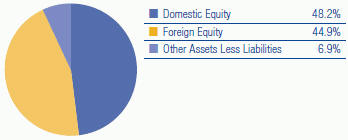
Top Ten Equity Holdings
| | | | |
Level 3 Communications, Inc. | | | 6.2 | % |
VEREIT, Inc. | | | 5.3 | % |
Aena S.A. | | | 5.1 | % |
Alphabet, Inc. Class A | | | 5.0 | % |
T-Mobile US, Inc. | | | 4.6 | % |
Numericable SAS | | | 4.6 | % |
Mondelez International, Inc. | | | 4.3 | % |
Baidu, Inc. ADR | | | 4.2 | % |
Helmerich & Payne, Inc. | | | 4.0 | % |
InterXion Holding NV | | | 3.9 | % |
There is no guarantee that the Fund will meet its investment objective.
All portfolio information is subject to change. Charts may not add up to 100% due to rounding.
Sector Exposure
| | | | |
Consumer Discretionary | | | 18.7 | % |
Financials | | | 17.9 | % |
Information Technology | | | 15.1 | % |
Telecommunication Services | | | 10.8 | % |
Industrials | | | 9.8 | % |
Health Care | | | 8.7 | % |
Consumer Staples | | | 8.1 | % |
Energy | | | 4.0 | % |
Other Assets Less Liabilities | | | 6.9 | % |
Top Ten Industry Groups
| | | | |
Software & Services | | | 13.0 | % |
Telecommunication Services | | | 10.8 | % |
Media | | | 8.4 | % |
Transportation | | | 8.1 | % |
Food, Beverage & Tobacco | | | 7.5 | % |
Pharmaceuticals, Biotechnology & Life Sciences | | | 6.8 | % |
Real Estate | | | 6.6 | % |
Banks | | | 5.2 | % |
Consumer Services | | | 4.7 | % |
Energy | | | 4.0 | % |
Country Exposure*
(percent of equity holdings)
| | | | |
| United States | | | 51.8 | % |
Netherlands | | | 13.7 | % |
China | | | 7.9 | % |
United Kingdom | | | 6.0 | % |
Spain | | | 5.4 | % |
France | | | 4.9 | % |
Ireland | | | 4.1 | % |
Canada | | | 3.2 | % |
Australia | | | 1.9 | % |
Switzerland | | | 0.9 | % |
South Korea | | | 0.2 | % |
Brazil | | | 0.1 | % |
| * | The country assignment of each equity holding is determined by the Fund’s Advisor based on various factors, including the location of the issuer’s head office, the issuer’s jurisdiction of incorporation and the country from which a majority of the issuer’s revenue is derived. |
Semi-Annual Report 9
SCHEDULE OF INVESTMENTS
| | |
| |
Thornburg Global Opportunities Fund | | March 31, 2016 (Unaudited) |
| | | | | | | | |
| | | SHARES/ | | | | |
| | | PRINCIPAL AMOUNT | | | VALUE | |
COMMON STOCK — 93.13% | | | | | | | | |
| | |
AUTOMOBILES & COMPONENTS — 2.58% | | | | | | | | |
Auto Components — 2.58% | | | | | | | | |
Delphi Automotive plc | | | 804,111 | | | $ | 60,324,407 | |
| | | | | | | | |
| | | | | | | 60,324,407 | |
| | | | | | | | |
BANKS — 5.16% | | | | | | | | |
Banks — 5.16% | | | | | | | | |
Citigroup, Inc. | | | 1,865,490 | | | | 77,884,208 | |
ING Groep N.V. | | | 3,527,352 | | | | 42,666,408 | |
| | | | | | | | |
| | | | | | | 120,550,616 | |
| | | | | | | | |
COMMERCIAL & PROFESSIONAL SERVICES — 1.73% | | | | | | | | |
Commercial Services & Supplies — 1.73% | | | | | | | | |
Mineral Resources Ltd. | | | 8,751,476 | | | | 40,317,759 | |
| | | | | | | | |
| | | | | | | 40,317,759 | |
| | | | | | | | |
CONSUMER DURABLES & APPAREL — 3.04% | | | | | | | | |
Household Durables — 3.04% | | | | | | | | |
Barratt Developments plc | | | 8,813,986 | | | | 70,954,146 | |
| | | | | | | | |
| | | | | | | 70,954,146 | |
| | | | | | | | |
CONSUMER SERVICES — 4.71% | | | | | | | | |
Hotels, Restaurants & Leisure — 4.71% | | | | | | | | |
Galaxy Entertainment Group Ltd. | | | 19,735,901 | | | | 73,907,704 | |
Paradise Co. Ltd. | | | 374,166 | | | | 4,744,147 | |
Wynn Resorts, Ltd. | | | 334,305 | | | | 31,234,116 | |
| | | | | | | | |
| | | | | | | 109,885,967 | |
| | | | | | | | |
DIVERSIFIED FINANCIALS — 2.98% | | | | | | | | |
Capital Markets — 0.80% | | | | | | | | |
UBS Group AG | | | 1,156,372 | | | | 18,628,467 | |
Consumer Finance — 2.18% | | | | | | | | |
Capital One Financial Corp. | | | 736,641 | | | | 51,056,587 | |
| | | | | | | | |
| | | | | | | 69,685,054 | |
| | | | | | | | |
ENERGY — 3.98% | | | | | | | | |
Energy Equipment & Services — 3.98% | | | | | | | | |
Helmerich & Payne, Inc. | | | 1,581,211 | | | | 92,848,710 | |
| | | | | | | | |
| | | | | | | 92,848,710 | |
| | | | | | | | |
FOOD & STAPLES RETAILING — 0.61% | | | | | | | | |
Food & Staples Retailing — 0.61% | | | | | | | | |
Walgreens Boots Alliance, Inc. | | | 169,980 | | | | 14,319,115 | |
| | | | | | | | |
| | | | | | | 14,319,115 | |
| | | | | | | | |
FOOD, BEVERAGE & TOBACCO — 7.48% | | | | | | | | |
Food Products — 7.48% | | | | | | | | |
BRF SA | | | 162,960 | | | | 2,325,442 | |
Mondelez International, Inc. | | | 2,519,600 | | | | 101,086,352 | |
The Kraft Heinz Co. | | | 906,562 | | | | 71,219,511 | |
| | | | | | | | |
| | | | | | | 174,631,305 | |
| | | | | | | | |
HEALTH CARE EQUIPMENT & SERVICES — 1.94% | | | | | | | | |
Health Care Providers & Services — 1.94% | | | | | | | | |
a Express Scripts Holding Company | | | 659,355 | | | | 45,291,095 | |
| | | | | | | | |
| | | | | | | 45,291,095 | |
| | | | | | | | |
INSURANCE — 3.17% | | | | | | | | |
Insurance — 3.17% | | | | | | | | |
NN Group NV | | | 2,263,563 | | | | 74,064,480 | |
| | | | | | | | |
| | | | | | | 74,064,480 | |
| | | | | | | | |
MEDIA — 8.41% | | | | | | | | |
Media — 8.41% | | | | | | | | |
a Altice N.V. | | | 5,026,164 | | | | 89,563,784 | |
Numericable SAS | | | 2,539,231 | | | | 106,878,553 | |
| | | | | | | | |
| | | | | | | 196,442,337 | |
| | | | | | | | |
PHARMACEUTICALS, BIOTECHNOLOGY & LIFE SCIENCES — 6.76% | | | | | |
Pharmaceuticals — 6.76% | | | | | | | | |
a Allergan plc | | | 330,571 | | | | 88,602,945 | |
b Concordia Healthcare Corp. | | | 2,703,809 | | | | 69,200,855 | |
| | | | | | | | |
| | | | | | | 157,803,800 | |
| | | | | | | | |
10 Semi-Annual Report
| | |
| SCHEDULE OF INVESTMENTS, CONTINUED | | |
| |
Thornburg Global Opportunities Fund | | March 31, 2016 (Unaudited) |
| | | | | | | | |
| | | SHARES/ | | | | |
| | | PRINCIPAL AMOUNT | | | VALUE | |
REAL ESTATE — 6.57% | | | | | | | | |
Real Estate Investment Trusts — 6.57% | | | | | | | | |
VEREIT, Inc. | | | 13,927,731 | | | $ | 123,538,974 | |
Ryman Hospitality Properties, Inc. | | | 578,615 | | | | 29,787,100 | |
| | | | | | | | |
| | | | | | | 153,326,074 | |
| | | | | | | | |
SOFTWARE & SERVICES — 13.04% | | | | | | | | |
Information Technology Services — 3.91% | | | | | | | | |
a InterXion Holding NV | | | 2,644,150 | | | | 91,434,707 | |
Internet Software & Services — 9.13% | | | | | | | | |
a Alphabet, Inc. Class A | | | 152,178 | | | | 116,096,596 | |
a Baidu, Inc. ADR | | | 508,720 | | | | 97,104,474 | |
| | | | | | | | |
| | | | | | | 304,635,777 | |
| | | | | | | | |
TECHNOLOGY HARDWARE & EQUIPMENT — 2.08% | | | | | | | | |
Communications Equipment — 1.98% | | | | | | | | |
a EchoStar Corp. | | | 1,042,709 | | | | 46,181,582 | |
Technology, Hardware, Storage & Peripherals — 0.10% | | | | | | | | |
Apple, Inc. | | | 22,094 | | | | 2,408,025 | |
| | | | | | | | |
| | | | | | | 48,589,607 | |
| | | | | | | | |
TELECOMMUNICATION SERVICES — 10.80% | | | | | | | | |
Diversified Telecommunication Services — 6.22% | | | | | | | | |
a Level 3 Communications, Inc. | | | 2,749,134 | | | | 145,291,732 | |
Wireless Telecommunication Services — 4.58% | | | | | | | | |
a T-Mobile US, Inc. | | | 2,795,062 | | | | 107,050,874 | |
| | | | | | | | |
| | | | | | | 252,342,606 | |
| | | | | | | | |
TRANSPORTATION — 8.09% | | | | | | | | |
Airlines — 3.02% | | | | | | | | |
American Airlines Group, Inc. | | | 1,721,592 | | | | 70,602,488 | |
Transportation Infrastructure — 5.07% | | | | | | | | |
a Aena S.A. | | | 917,153 | | | | 118,399,621 | |
| | | | | | | | |
| | | | | | | 189,002,109 | |
| | | | | | | | |
TOTAL COMMON STOCK (Cost $2,097,308,402) | | | | | | | 2,175,014,965 | |
| | | | | | | | |
| | |
SHORT TERM INVESTMENTS — 6.92% | | | | | | | | |
b Thornburg Capital Management Fund | | | 16,167,659 | | | | 161,676,586 | |
| | | | | | | | |
TOTAL SHORT TERM INVESTMENTS (Cost $161,676,586) | | | | | | | 161,676,586 | |
| | | | | | | | |
TOTAL INVESTMENTS — 100.05% (Cost $2,258,984,988) | | | | | | $ | 2,336,691,551 | |
LIABILITIES NET OF OTHER ASSETS — (0.05)% | | | | | | | (1,068,293 | ) |
| | | | | | | | |
NET ASSETS — 100.00% | | | | | | $ | 2,335,623,258 | |
| | | | | | | | |
Footnote Legend
| b | Investment in Affiliates – Shown below are holdings of voting securities of each portfolio company which is considered “affiliated” to the Fund under the Investment Company Act of 1940, including companies for which the Fund’s holding represented 5% or more of the company’s voting securities, and a series of the Thornburg Investment Trust in which the Fund invested for cash management purposes during the period: |
| | | | | | | | | | | | | | | | | | | | | | | | | | | | |
ISSUER | | SHARES/PRINCIPAL
SEPTEMBER
30, 2015 | | | GROSS
ADDITIONS | | | GROSS
REDUCTIONS | | | SHARES/PRINCIPAL
MARCH 31,
2016 | | | MARKET
VALUE
MARCH 31,
2016 | | | INVESTMENT
INCOME | | | REALIZED
GAIN
(LOSS) | |
Concordia Healthcare Corp. | | | 1,840,424 | | | | 863,385 | | | | — | | | | 2,703,809 | | | $ | 69,200,855 | | | $ | 351,790 | | | $ | — | |
InterXion Holding NV* | | | 3,881,212 | | | | | | | | | | | | | | | | | | | | | | | | | |
Thornburg Capital Management Fund | | | 18,271,004 | | | | 52,179,576 | | | | 54,282,921 | | | | 16,167,659 | | | | 161,676,586 | | | | 342,320 | | | | — | |
| | | | | | | | | | | | | | | | | | | | | | | | | | | | |
Total non-controlled affiliated issuers – 9.89% of net assets | | | $ | 230,877,441 | | | $ | 694,110 | | | $ | — | |
| | | | | | | | | | | | | | | | | | | | | | | | | | | | |
| * | Issuer not affiliated at March 31, 2016. |
Portfolio Abbreviations
To simplify the listings of securities, abbreviations are used per the table below:
ADR American Depositary Receipt
See notes to financial statements.
Semi-Annual Report 11
STATEMENT OF ASSETS AND LIABILITIES
| | |
| |
Thornburg Global Opportunities Fund | | March 31, 2016 (Unaudited) |
| | | | |
ASSETS | | | | |
Investments at value | | | | |
Non-affiliated issuers (cost $1,977,597,084) (Note 2) | | $ | 2,105,814,110 | |
Non-controlled affiliated issuers (cost $281,387,904) (Note 2) | | | 230,877,441 | |
Cash | | | 73,640 | |
Receivable for fund shares sold | | | 8,861,912 | |
Unrealized appreciation on forward currency contracts (Note 7) | | | 2,916,224 | |
Dividends receivable | | | 3,884,130 | |
Dividend and interest reclaim receivable | | | 47,026 | |
Prepaid expenses and other assets | | | 90,841 | |
| | | | |
Total Assets | | | 2,352,565,324 | |
| | | | |
| |
LIABILITIES | | | | |
Payable for investments purchased | | | 73,641 | |
Payable for fund shares redeemed | | | 6,915,998 | |
Unrealized depreciation on forward currency contracts (Note 7) | | | 7,705,639 | |
Payable to investment advisor and other affiliates (Note 3) | | | 2,174,627 | |
Accounts payable and accrued expenses | | | 72,018 | |
Dividends payable | | | 143 | |
| | | | |
Total Liabilities | | | 16,942,066 | |
| | | | |
| |
NET ASSETS | | $ | 2,335,623,258 | |
| | | | |
NET ASSETS CONSIST OF | | | | |
Undistributed net investment income | | $ | 2,505,209 | |
Net unrealized appreciation on investments | | | 72,923,403 | |
Accumulated net realized gain (loss) | | | (109,646,873 | ) |
Net capital paid in on shares of beneficial interest | | | 2,369,841,519 | |
| | | | |
| | $ | 2,335,623,258 | |
| | | | |
12 Semi-Annual Report
| | |
| STATEMENT OF ASSETS AND LIABILITIES, CONTINUED | | |
| |
Thornburg Global Opportunities Fund | | March 31, 2016 (Unaudited) |
| | | | |
NET ASSET VALUE | | | | |
Class A Shares: | | | | |
Net asset value and redemption price per share ($567,967,487 applicable to 22,863,679 shares of beneficial interest outstanding - Note 4) | | $ | 24.84 | |
Maximum sales charge, 4.50% of offering price | | | 1.17 | |
| | | | |
Maximum offering price per share | | $ | 26.01 | |
| | | | |
| |
Class C Shares: | | | | |
Net asset value and offering price per share* ($419,712,127 applicable to 17,413,308 shares of beneficial interest outstanding - Note 4) | | $ | 24.10 | |
| | | | |
| |
Class I Shares: | | | | |
Net asset value, offering and redemption price per share ($1,193,657,443 applicable to 47,862,275 shares of beneficial interest outstanding - Note 4) | | $ | 24.94 | |
| | | | |
| |
Class R3 Shares: | | | | |
Net asset value, offering and redemption price per share ($10,217,895 applicable to 415,206 shares of beneficial interest outstanding - Note 4) | | $ | 24.61 | |
| | | | |
| |
Class R4 Shares: | | | | |
Net asset value, offering and redemption price per share ($21,606,270 applicable to 877,232 shares of beneficial interest outstanding - Note 4) | | $ | 24.63 | |
| | | | |
| |
Class R5 Shares: | | | | |
Net asset value, offering and redemption price per share ($122,462,036 applicable to 4,906,598 shares of beneficial interest outstanding - Note 4) | | $ | 24.96 | |
| | | | |
| * | Redemption price per share is equal to net asset value less any applicable contingent deferred sales charge. |
See notes to financial statements.
Semi-Annual Report 13
| | |
| STATEMENT OF OPERATIONS | | |
| |
Thornburg Global Opportunities Fund | | Six Months Ended March 31, 2016 (Unaudited) |
| | | | |
INVESTMENT INCOME | | | | |
Dividend income | | | | |
Non-affiliated issuers (net of foreign taxes withheld of $184,024) | | $ | 29,619,390 | |
Non-controlled affiliated issuers | | | 694,110 | |
| | | | |
Total Income | | | 30,313,500 | |
| | | | |
| |
EXPENSES | | | | |
Investment advisory fees (Note 3) | | | 9,242,663 | |
Administration fees (Note 3) | | | | |
Class A Shares | | | 359,776 | |
Class C Shares | | | 251,649 | |
Class I Shares | | | 311,703 | |
Class R3 Shares | | | 5,247 | |
Class R4 Shares | | | 9,929 | |
Class R5 Shares | | | 29,705 | |
Distribution and service fees (Note 3) | | | | |
Class A Shares | | | 721,161 | |
Class C Shares | | | 2,017,867 | |
Class R3 Shares | | | 20,975 | |
Class R4 Shares | | | 19,897 | |
Transfer agent fees | | | | |
Class A Shares | | | 328,670 | |
Class C Shares | | | 204,426 | |
Class I Shares | | | 579,348 | |
Class R3 Shares | | | 12,383 | |
Class R4 Shares | | | 23,992 | |
Class R5 Shares | | | 84,466 | |
Registration and filing fees | | | | |
Class A Shares | | | 26,180 | |
Class C Shares | | | 28,150 | |
Class I Shares | | | 47,688 | |
Class R3 Shares | | | 9,219 | |
Class R4 Shares | | | 9,432 | |
Class R5 Shares | | | 9,958 | |
Custodian fees (Note 3) | | | 130,715 | |
Professional fees | | | 49,095 | |
Accounting fees (Note 3) | | | 42,765 | |
Trustee fees | | | 47,550 | |
Other expenses | | | 79,557 | |
| | | | |
Total Expenses | | | 14,704,166 | |
Less: | | | | |
Expenses reimbursed by investment advisor (Note 3) | | | (56,992 | ) |
| | | | |
Net Expenses | | | 14,647,174 | |
| | | | |
Net Investment Income | | $ | 15,666,326 | |
| | | | |
14 Semi-Annual Report
| | |
| STATEMENT OF OPERATIONS, CONTINUED | | |
| |
Thornburg Global Opportunities Fund | | Six Months Ended March 31, 2016 (Unaudited) |
| | | | |
REALIZED AND UNREALIZED GAIN (LOSS) | | | | |
Net realized gain (loss) from: | | | | |
Investments (non-affiliated issuers) | | $ | (34,244,228 | ) |
Forward currency contracts (Note 7) | | | (5,493,784 | ) |
Foreign currency transactions | | | 464,301 | |
| | | | |
| | | (39,273,711 | ) |
| | | | |
Net change in unrealized appreciation (depreciation) on: | | | | |
Investments | | | | |
Non-affiliated issuers | | | 102,841,589 | |
Non-controlled affiliated issuers | | | (46,782,796 | ) |
Forward currency contracts (Note 7) | | | (958,250 | ) |
Foreign currency translations | | | 15,640 | |
| | | | |
| | | 55,116,183 | |
| | | | |
Net Realized and Unrealized Gain | | | 15,842,472 | |
| | | | |
Net Increase in Net Assets Resulting from Operations | | $ | 31,508,798 | |
| | | | |
See notes to financial statements.
Semi-Annual Report 15
STATEMENTS OF CHANGES IN NET ASSETS
Thornburg Global Opportunities Fund
| | | | | | | | |
| | | SIX MONTHS ENDED | | | YEAR ENDED | |
| | | MARCH 31, 2016* | | | SEPTEMBER 30, 2015 | |
INCREASE (DECREASE) IN NET ASSETS FROM | | | | | | | | |
| | |
OPERATIONS | | | | | | | | |
Net investment income (loss) | | $ | 15,666,326 | | | $ | (5,711,823 | ) |
Net realized gain (loss) from investments, forward currency contracts, and foreign currency transactions | | | (39,273,711 | ) | | | 44,175,598 | |
Net unrealized appreciation (depreciation) on investments forward currency contracts and foreign currency translations | | | 55,116,183 | | | | (142,134,583 | ) |
| | | | | | | | |
| | |
Net Increase (Decrease) in Net Assets Resulting from Operations | | | 31,508,798 | | | | (103,670,808 | ) |
| | |
DIVIDENDS TO SHAREHOLDERS | | | | | | | | |
From net investment income | | | | | | | | |
Class A Shares | | | (1,973,120 | ) | | | — | |
Class I Shares | | | (7,755,775 | ) | | | (344,505 | ) |
Class R3 Shares | | | (16,171 | ) | | | — | |
Class R4 Shares | | | (52,515 | ) | | | — | |
Class R5 Shares | | | (702,640 | ) | | | (48,802 | ) |
| | |
FUND SHARE TRANSACTIONS (NOTE 4) | | | | | | | | |
Class A Shares | | | 12,211,331 | | | | 370,955,478 | |
Class C Shares | | | 51,355,704 | | | | 239,292,442 | |
Class I Shares | | | (100,686,100 | ) | | | 887,933,296 | |
Class R3 Shares | | | 1,044,513 | | | | 7,293,561 | |
Class R4 Shares | | | 8,250,017 | | | | 9,285,030 | |
Class R5 Shares | | | 12,123,115 | | | | 34,520,070 | |
| | | | | | | | |
Net Increase in Net Assets | | | 5,307,157 | | | | 1,445,215,762 | |
| | |
NET ASSETS | | | | | | | | |
Beginning of Period | | | 2,330,316,101 | | | | 885,100,339 | |
| | | | | | | | |
| | |
End of Period | | $ | 2,335,623,258 | | | $ | 2,330,316,101 | |
| | | | | | | | |
Undistributed (distribution in excess of) net investment income | | $ | 2,505,209 | | | $ | (4,461,055 | ) |
See notes to financial statements.
16 Semi-Annual Report
| | |
| NOTES TO FINANCIAL STATEMENTS | | |
| |
Thornburg Global Opportunities Fund | | March 31, 2016 (Unaudited) |
NOTE 1 – ORGANIZATION
Thornburg Global Opportunities Fund (the “Fund”) is a diversified series of Thornburg Investment Trust (the “Trust”). The Trust was organized as a Massachusetts business trust under a Declaration of Trust dated June 3, 1987 and is registered as a diversified, open-end management investment company under the Investment Company Act of 1940, as amended. The Fund is currently one of twenty separate series of the Trust. Each series is considered to be a separate entity for financial reporting and tax purposes and bears expenses directly attributable to it. The Fund seeks long-term capital appreciation by investing in equity and debt securities of all types from issuers around the world.
The Fund currently offers six classes of shares of beneficial interest: Class A, Class C, Institutional Class (“Class I”), and Retirement Classes (“Class R3,” “Class R4,” and “Class R5”). Each class of shares of the Fund represents an interest in the same portfolio of investments, except that (i) Class A shares are sold subject to a front-end sales charge collected at the time the shares are purchased and bear a service fee, (ii) Class C shares are sold at net asset value without a sales charge at the time of purchase, but are subject to a contingent deferred sales charge upon redemption within one year of purchase, and bear both a service fee and a distribution fee, (iii) Class I and Class R5 shares are sold at net asset value without a sales charge at the time of purchase and may be subject to a service fee, (iv) Class R3 shares are sold at net asset value without a sales charge at the time of purchase, but bear both a service fee and distribution fee, (v) Class R4 shares are sold at net asset value without a sales charge at the time of purchase, but bear a service fee, and (vi) the respective classes may have different reinvestment privileges and conversion rights. Additionally, the Fund may allocate among its classes certain expenses, to the extent allocable to specific classes, including transfer agent fees, government registration fees, certain printing and postage costs, and administrative and legal expenses. Currently, class specific expenses of the Fund are limited to service and distribution fees, administration fees, and certain registration and transfer agent expenses.
NOTE 2 – SIGNIFICANT ACCOUNTING POLICIES
The following is a summary of significant accounting policies followed by the Fund in the preparation of its financial statements. The Fund is an investment company and prepares its financial statements in conformity with United States generally accepted accounting principles (“GAAP”), including investment company accounting and reporting guidance in the Financial Accounting Standards Board (the “FASB”) Accounting Standard Codification Topic 946. The preparation of financial statements in conformity with GAAP requires management to make estimates and assumptions that affect the reported amounts of assets and liabilities and disclosure of contingent assets and liabilities at the date of the financial statements and the reported amounts of increases (decreases) in net assets from operations during the reporting period. Actual results could differ from those estimates.
Significant accounting policies of the Trust are as follows:
Valuation Policy and Procedures: The Trustees of the Trust have appointed Thornburg Investment Management, Inc., the (“Advisor”), to assist the Trustees in obtaining market values for portfolio investments, perform certain evaluation and supervisory functions respecting professional pricing service providers appointed by the Trustees’ Audit Committee (the “Audit Committee”) to assist in determining fair values for portfolio investments, assist in calculating fair values for portfolio investments in certain circumstances, and to perform other functions in connection with the valuation of investments. The Advisor acts through its Valuation and Pricing Committee (the “Committee”) and other employees of the Advisor. The Committee regularly reviews its own valuation calculations, as well as the valuations, valuation techniques and services furnished by pricing service providers, considers circumstances which may require valuation calculations by the Committee, and reviews previous valuation calculations. The Committee reports to the Audit Committee on the Committee’s activities, the performance of pricing service providers, and other matters relating to valuation of portfolio investments.
In those instances when the Committee assists in calculating a fair value for a portfolio investment, the Committee seeks to determine the price that the Fund would reasonably expect to receive upon a sale of the investment in an orderly transaction between market participants on the valuation date. The Committee customarily utilizes quotations from securities broker dealers in calculating valuations, but also may utilize prices obtained from pricing service providers or other methods approved by the Audit Committee. Because fair values calculated by the Committee are estimates, the calculation of a value for an investment may differ from the price that would be realized by the Fund upon a sale of the investment, and the difference could be material to the Fund’s financial statements. The Committee’s calculation of a fair value for an investment may also differ from the prices obtained by other persons (including other mutual funds) for the investment.
Valuation of Investments: Securities and other portfolio investments which are listed or traded on a United States securities exchange are valued at the last reported sale price on the valuation date. Investments listed or traded on an exchange for which there has been no sale that day are valued at the mean between the last reported bid and asked prices on that valuation date. Portfolio investments reported by NASDAQ are valued at the official closing price on the valuation date. If an investment is traded on more than one exchange, the investment is considered traded on the exchange that is normally the primary market for that investment. Securities and other portfolio investments which are listed or traded on exchanges outside the United States are valued at the last price or the closing price of the investment on the exchange that is normally the primary market for the investment, as of the close of the exchange
Semi-Annual Report 17
| | |
| NOTES TO FINANCIAL STATEMENTS, CONTINUED | | |
| |
Thornburg Global Opportunities Fund | | March 31, 2016 (Unaudited) |
preceding the Fund’s valuation date. Foreign investments listed or traded on an exchange for which there has been no sale that day are valued at the mean between the last reported bid and asked prices on that valuation date.
In any case when a market quotation is not readily available for a portfolio investment ordinarily valued by market quotation, the Committee calculates a fair value for the investment using alternative methods approved by the Audit Committee. A market quotation is not readily available when the primary market or exchange for the investment is not open for the entire scheduled day of trading. Market quotations for an investment also may not be readily available if developments after the most recent close of the investment’s primary exchange or market, but prior to the close of business on any Fund business day, or an unusual event or significant period of time occurring since the availability of a market quotation, create a serious question concerning the reliability of the most recent market quotation available for the investment. In particular, on days when market volatility thresholds established by the Audit Committee are exceeded, foreign equity investments held by the Fund may be valued using alternative methods. The Committee customarily obtains valuations in these instances from pricing service providers approved by the Audit Committee. Pricing service providers ordinarily calculate valuations using multi-factor models to adjust market prices based upon various inputs, including exchange data, depository receipt prices, futures, index data and other data.
Debt obligations held by the Fund which are not listed or traded on exchanges or for which no reported market exists are ordinarily valued at the valuation obtained from a pricing service provider approved by the Audit Committee.
In any case when a pricing service provider fails to provide a valuation for a debt obligation held by the Fund, the Committee calculates a fair value for the obligation using alternative methods under procedures approved by the Audit Committee. Additionally, in cases when management believes that a valuation obtained from a pricing service provider merits review for significant reasons, the Committee decides whether or not to use the valuation calculated by the pricing service provider or to use an alternative method approved by the Audit Committee to calculate a fair value for the obligation.
Quotations for foreign investments expressed in foreign currency amounts are converted to U.S. dollar equivalents using a foreign exchange quotation from a third party service provider at the time of valuation. Foreign investments held by the Fund may be traded on days and at times when the Fund is not open for business. Consequently, the value of Fund investments may be significantly affected on days when shareholders cannot purchase or sell Fund shares. Futures contracts and other financial and derivative instruments traded on an exchange are valued at the latest published price for the instrument on its primary exchange. Listed options are valued at the last bid price.
Valuation Measurements: The Fund categorizes its investments based upon the inputs used in valuing those investments, according to a three-level hierarchy established in guidance from the FASB. Categorization of investments using this hierarchy is intended by the FASB to maximize the use of observable inputs in valuing investments and minimize the use of unobservable inputs by requiring that the most observable inputs be used when available. Observable inputs are those that market participants would use in valuing an investment based on available market information. Unobservable inputs are those that reflect assumptions about the information market participants would use in valuing an investment. An investment’s level within the hierarchy is based on the lowest level input that is deemed significant to the valuation. The methodologies and inputs used to value investments are not necessarily indications of the risk or liquidity associated with those investments.
Various inputs are used in calculating valuations for the Fund’s investments. These inputs are generally summarized according to the three-level hierarchy below:
Level 1: Quoted prices in active markets for identical investments.
Level 2: Other direct or indirect significant observable inputs (including quoted prices for similar investments in active markets and other observable inputs, such as interest rates, prepayment rates, credit risk, etc.).
Level 3: Significant unobservable inputs (including the Committee’s own assumptions in calculating the fair values of investments).
Valuations for debt obligations held by the Fund are typically calculated by pricing service providers approved by the Audit Committee and are characterized as Level 2 within the valuation hierarchy.
On days when market volatility thresholds established by the Audit Committee are exceeded, foreign securities for which valuations are obtained from pricing service providers are fair valued. On these days, the foreign securities are characterized as Level 2 within the valuation hierarchy and revert to Level 1 after the threshold is no longer exceeded.
In a limited number of cases the Committee calculates a fair value for investments using broker quotations or other methods approved by the Audit Committee. When the Committee uses a single broker quotation to calculate a fair value for an investment without other significant observable inputs, or if a fair value is calculated using other significant inputs that are considered unobservable, the investment is characterized as Level 3 within the hierarchy. Other significant unobservable inputs used to calculate a fair value in these instances might include an income-based valuation approach which considers discounted anticipated future cash flows from the investment, and application of discounts due to the nature or duration of any restrictions on the disposition of the investment.
18 Semi-Annual Report
| | |
| NOTES TO FINANCIAL STATEMENTS, CONTINUED | | |
| |
Thornburg Global Opportunities Fund | | March 31, 2016 (Unaudited) |
Valuations based upon the use of inputs from Levels 1, 2 or 3 may not represent the actual price received upon the disposition of an investment, and the Fund may receive a price that is lower than the valuation based upon these inputs when it sells the investment.
The following table displays a summary of the fair value hierarchy measurements of the Fund’s investments as of March 31, 2016. In any instance when valuation inputs from more than one level are used to determine the fair value of a specific investment, the investment is placed in the level of the table based upon the lowest level input that is significant in determining the fair value of the investment:
| | | | | | | | | | | | | | | | |
| | | FAIR VALUE MEASUREMENTS AT MARCH 31, 2016 | |
| | | TOTAL | | | LEVEL 1 | | | LEVEL 2 | | | LEVEL 3 | |
Assets | | | | | | | | | | | | | | | | |
Investments in Securities* | | | | | | | | | | | | | | | | |
Common Stock | | $ | 2,175,014,965 | | | $ | 2,175,014,965 | | | $ | — | | | $ | — | |
Short Term Investments | | | 161,676,586 | | | | 161,676,586 | | | | — | | | | — | |
| | | | | | | | | | | | | | | | |
Total Investments in Securities | | $ | 2,336,691,551 | | | $ | 2,336,691,551 | | | $ | — | | | $ | — | |
Other Financial Instruments** | | | | | | | | | | | | | | | | |
Forward Currency Contracts | | $ | 2,916,224 | | | $ | — | | | $ | 2,916,224 | | | $ | — | |
Liabilities | | | | | | | | | | | | | | | | |
Other Financial Instruments** | | | | | | | | | | | | | | | | |
Forward Currency Contracts | | $ | (7,705,639 | ) | | $ | — | | | $ | (7,705,639 | ) | | $ | — | |
| * | See Schedule of Investments for a summary of the industry exposure as grouped according to the Global Industry Classification Standard (GICS), which is an industry taxonomy developed by MSCI, Inc. and Standard & Poor’s (S&P). |
| ** | Other Financial Instruments include investments not reflected in the Schedule of Investments, which may include futures, forwards and swap contracts, which are valued at the unrealized appreciation (depreciation) on the investment. |
In accordance with the guidance prescribed in Accounting Standards Update No. 2011-04, it is the policy of the Fund to recognize transfers between levels and the underlying events which caused the movement. The Fund recognized no transfers between levels for the six months ended March 31, 2016, other than when the Fund exceeded market volatility thresholds for foreign equity investments during the period.
Foreign Currency Translation: Portfolio investments and other assets and liabilities denominated in foreign currencies are translated into U.S. dollars based on the exchange rate of such currencies against the U.S. dollar on the date of valuation. Purchases and sales of investments and income items denominated in foreign currencies are translated into U.S. dollars at the exchange rate in effect on the transaction date. When the Fund purchases or sells foreign investments, it will customarily enter into a foreign exchange contract to minimize foreign exchange risk from the trade date to the settlement date of such transactions. The values of such spot contracts are included in receivable for investments sold and payable for investments purchased on the Statement of Assets and Liabilities.
The Fund does not separately report the effect of changes in foreign exchange rates from changes in market prices on investments held. Such changes are included in net unrealized appreciation (depreciation) from investments.
Reported net realized gains and losses from foreign currency transactions arise due to purchases and sales of foreign currencies, currency gains and losses realized between the trade and settlement dates on investment transactions and the difference between the amounts of dividends, interest, and foreign withholding taxes recorded on the Fund’s books, and the U.S. dollar equivalent of the amounts actually received or paid.
Net change in unrealized appreciation (depreciation) on foreign currency translations arise from changes in the fair value of assets and liabilities, other than investments at period end, resulting from changes in exchange rates.
Foreign Withholding Taxes: The Fund is subject to foreign tax withholding imposed by certain foreign countries in which the Fund may invest. Withholding taxes are incurred on certain foreign dividends and are accrued at the time the dividend is recognized based on applicable foreign tax law. The Fund files withholding tax reclaims in certain jurisdictions to recover a portion of amounts previously withheld, in view of various considerations, including recent decisions rendered by the courts in those and other jurisdictions. The Fund would expect to record a receivable for such a reclaim based on a variety of factors, including assessments of a jurisdiction’s legal obligation to pay reclaims, the jurisdiction’s administrative practices and payment history, and industry convention. To date the Fund has recorded no such receivable because there is limited precedent for collecting such prior year reclaims and the likelihood of collection remains uncertain.
Semi-Annual Report 19
| | |
| NOTES TO FINANCIAL STATEMENTS, CONTINUED | | |
| |
Thornburg Global Opportunities Fund | | March 31, 2016 (Unaudited) |
Deferred Foreign Capital Gain Taxes: The Fund is subject to a tax imposed on net realized gains of securities of certain foreign countries. The Fund records an estimated deferred tax liability for net unrealized gains on these investments as reflected in the accompanying financial statements.
Federal Income Taxes: It is the policy of the Trust to comply with the provisions of the Internal Revenue Code applicable to “regulated investment companies” and to distribute to shareholders substantially all taxable income, including any net realized gain on investments of the Fund. Therefore, no provision for federal income taxes is required.
Management reviews each uncertain tax position believed to be material to the preparation of the Fund’s financial statements, to assess if it is more likely than not that the position would be sustained upon examination, based upon the technical merits of the position. As of March 31, 2016, management has not identified any such position for which an asset or liability must be reflected in the Statement of Assets and Liabilities. The Fund’s tax returns remain subject to examination for three years after filing.
When-Issued and Delayed Delivery Transactions: The Fund may engage in when-issued or delayed delivery transactions. To the extent the Fund engages in such transactions, it will do so for the purpose of acquiring portfolio investments consistent with the Fund’s investment objectives and not for the purpose of investment leverage or to speculate on interest rate and, or market changes. At the time the Fund makes a commitment to purchase an investment on a when-issued or delayed delivery basis, the Fund will record the transaction and reflect the value in determining its net asset value. When effecting such transactions, assets of an amount sufficient to make payment for the portfolio investments to be purchased will be segregated on the Fund’s records on the trade date. Investments purchased on a when-issued or delayed delivery basis do not earn interest until the settlement date.
Dividends: Dividends to shareholders, if any, are generally paid quarterly and are reinvested in additional shares of the Fund at net asset value per share at the close of business on the dividend payment date or, at the shareholder’s option, paid in cash. Net realized capital gains, to the extent available, will be distributed at least annually.
Repurchase Agreements: The Fund may invest excess cash in repurchase agreements whereby the Fund purchases investments, which serve as collateral, with an agreement to resell such collateral to the seller at an agreed upon price at the maturity date of the repurchase agreement. Investments pledged as collateral for repurchase agreements are held in custody until maturity of the repurchase agreement. Provisions in the agreements require that the market value of the collateral is at least equal to the repurchase value in the event of default. In the event of default, the Fund has the right to liquidate the collateral and apply the proceeds in satisfaction of the obligation. Under certain circumstances, in the event of default or bankruptcy by the other party to the agreement, realization and/or retention of the collateral may be subject to legal proceedings.
General: Investment transactions are accounted for on a trade date basis. Interest income is accrued as earned and dividend income is recorded on the ex-dividend date. Certain income from foreign investments is recognized as soon as information is available to the Fund. Realized gains and losses from the sale of investments are recorded on an identified cost basis. Net investment income (other than class specific expenses) and realized and unrealized gains and losses are allocated daily to each class of shares based upon the relative net asset value of outstanding shares of each class of shares at the beginning of the day (after adjusting for the current share activity of the respective class). Expenses common to all Funds are allocated among the Funds comprising the Trust based upon their relative net asset values or other appropriate allocation methods.
Guarantees and Indemnifications: Under the Trust’s organizational documents (and under separate agreements with the independent Trustees), its officers and Trustees are indemnified against certain liabilities arising out of the performance of their duties to the Fund. Additionally, in the normal course of business the Trust enters into contracts with service providers that contain general indemnification clauses. The Trust’s maximum exposure under these arrangements is unknown. However, based on experience, the Trust expects the risk of loss to be remote.
NOTE 3 – INVESTMENT ADVISORY FEE AND OTHER TRANSACTIONS WITH AFFILIATES
Pursuant to an investment advisory agreement, the Advisor serves as the investment advisor and performs services for the Fund for which the fees are payable at the end of each month. For the six months ended March 31, 2016, these fees were payable at annual rates ranging from .875 of 1% to .675 of 1% per annum of the average daily net assets of the Fund depending on the Fund’s asset size. The Fund pays to the Advisor the costs of personnel who perform certain accounting services for the Fund. For the six months ended March 31, 2016 the Fund paid $42,765 to the Advisor for these accounting services. The Trust has also entered into administrative service agreements with the Advisor, whereby the Advisor will perform certain administrative services for the shareholders of each class of the Fund’s shares, and for which fees will be payable at an annual rate of up to ..125 of 1% per annum of the average daily net assets attributable to each class of shares.
The Trust has an underwriting agreement with Thornburg Securities Corporation (the “Distributor”), an affiliate of the Advisor, which acts as the distributor of the Fund’s shares. For the six months ended March 31, 2016, the Distributor has advised the Fund that it earned
20 Semi-Annual Report
| | |
| NOTES TO FINANCIAL STATEMENTS, CONTINUED | | |
| |
Thornburg Global Opportunities Fund | | March 31, 2016 (Unaudited) |
commissions aggregating $63,284 from the sale of Class A shares, and collected contingent deferred sales charges aggregating $72,022 from redemptions of Class C shares of the Fund.
Pursuant to a service plan under Rule 12b-1 of the Investment Company Act of 1940, the Fund may reimburse to the Advisor an amount not to exceed .25 of 1% per annum of the average daily net assets attributable to each class of shares of the Fund for payments made by the Advisor to securities dealers and other financial institutions to obtain various shareholder and distribution related services. For the six months ended March 31, 2016, there were no 12b-1 service plan fees charged for Class I and R5 shares. The Advisor may pay out of its own resources additional expenses for distribution of the Fund’s shares and shareholder services.
The Trust has also adopted distribution plans pursuant to Rule 12b-1, applicable only to the Fund’s Class C and Class R3 shares, under which the Fund compensates the Distributor for services in promoting the sale of Class C and Class R3 shares of the Fund at an annual rate of up to .75 of 1% per annum of the average daily net assets attributable to Class C shares, and an annual rate of up to .25 of 1% per annum of the average daily net assets attributable to Class R3 shares. Total fees incurred by each class of shares of the Fund under their respective service and distribution plans for the six months ended March 31, 2016, are set forth in the Statement of Operations.
The Advisor and Distributor have contractually agreed to waive fees and reimburse expenses incurred by the Fund so that actual expenses of certain share classes do not exceed levels as specified in the Fund’s most recent prospectus. The agreement may be terminated by the Fund at any time, but may not be terminated by the Advisor or Distributor before February 1, 2017, unless the Advisor ceases to be the investment advisor to the Trust or the Distributor ceases to be the distributor of the Fund prior to that date. The Advisor and Distributor retain the right to be repaid by the Fund for fee waivers and expense reimbursements if expenses fall below the contractual limit prior to the end of the fiscal year.
For the six months ended March 31, 2016, the Advisor voluntarily reimbursed certain class specific expenses of $3,903 for Class I shares and contractually reimbursed certain class specific expenses, administrative fees, and distribution fees of $18,903 for Class R3 shares, $16,435 for Class R4 shares, and $17,751 for Class R5 shares.
Certain officers and Trustees of the Trust are also officers or directors of the Advisor and Distributor. The compensation of independent Trustees is borne by the Trust.
The Fund may purchase or sell securities from, or to an affiliated fund, provided the affiliation is due solely to having a common investment advisor, common officers, or common trustees, and provided that all such transactions will comply with Rule 17a-7 under the 1940 Act. For the six months ended March 31, 2016, the Fund had no transactions with affiliated funds.
NOTE 4 – SHARES OF BENEFICIAL INTEREST
At March 31, 2016, there were an unlimited number of shares with no par value of beneficial interest authorized. Transactions in shares of beneficial interest were as follows:
| | | | | | | | | | | | | | | | |
| | | SIX MONTHS ENDED
MARCH 31, 2016 (UNAUDITED) | | | YEAR ENDED
SEPTEMBER 30, 2015 (AUDITED) | |
| | | SHARES | | | AMOUNT | | | SHARES | | | AMOUNT | |
Class A Shares | | | | | | | | | | | | | | | | |
Shares sold | | | 6,266,664 | | | $ | 156,122,154 | | | | 17,590,204 | | | $ | 468,824,712 | |
Shares issued to shareholders in reinvestment of dividends | | | 71,062 | | | | 1,822,750 | | | | — | | | | — | |
Shares repurchased | | | (6,016,783 | ) | | | (145,733,573 | ) | | | (3,775,955 | ) | | | (97,869,234 | ) |
| | | | | | | | | | | | | | | | |
| | | | |
Net increase (decrease) | | | 320,943 | | | $ | 12,211,331 | | | | 13,814,249 | | | $ | 370,955,478 | |
| | | | | | | | | | | | | | | | |
| | | | |
Class C Shares | | | | | | | | | | | | | | | | |
Shares sold | | | 3,919,335 | | | $ | 94,845,147 | | | | 10,179,065 | | | $ | 265,057,532 | |
Shares issued to shareholders in reinvestment of dividends | | | — | | | | — | | | | (34 | ) | | | (914 | ) |
Shares repurchased | | | (1,848,722 | ) | | | (43,489,443 | ) | | | (1,014,489 | ) | | | (25,764,176 | ) |
| | | | | | | | | | | | | | | | |
| | | | |
Net increase (decrease) | | | 2,070,613 | | | $ | 51,355,704 | | | | 9,164,542 | | | $ | 239,292,442 | |
| | | | | | | | | | | | | | | | |
Semi-Annual Report 21
| | |
| NOTES TO FINANCIAL STATEMENTS, CONTINUED | | |
| |
Thornburg Global Opportunities Fund | | March 31, 2016 (Unaudited) |
| | | | | | | | | | | | | | | | |
| | | SIX MONTHS ENDED
MARCH 31, 2016 (UNAUDITED) | | | YEAR ENDED
SEPTEMBER 30, 2015 (AUDITED) | |
| | | SHARES | | | AMOUNT | | | SHARES | | | AMOUNT | |
Class I Shares | | | | | | | | | | | | | | | | |
Shares sold | | | 13,125,083 | | | $ | 326,242,576 | | | | 40,710,414 | | | $ | 1,082,618,625 | |
Shares issued to shareholders in reinvestment of dividends | | | 267,866 | | | | 6,892,178 | | | | 11,868 | | | | 299,435 | |
Shares repurchased | | | (17,939,106 | ) | | | (433,820,854 | ) | | | (7,379,162 | ) | | | (194,984,764 | ) |
| | | | | | | | | | | | | | | | |
| | | | |
Net increase (decrease) | | | (4,546,157 | ) | | $ | (100,686,100 | ) | | | 33,343,120 | | | $ | 887,933,296 | |
| | | | | | | | | | | | | | | | |
| | | | |
Class R3 Shares | | | | | | | | | | | | | | | | |
Shares sold | | | 208,035 | | | $ | 5,007,940 | | | | 301,768 | | | $ | 7,931,259 | |
Shares issued to shareholders in reinvestment of dividends | | | 333 | | | | 8,467 | | | | — | | | | — | |
Shares repurchased | | | (162,802 | ) | | | (3,971,894 | ) | | | (24,749 | ) | | | (637,698 | ) |
| | | | | | | | | | | | | | | | |
| | | | |
Net increase (decrease) | | | 45,566 | | | $ | 1,044,513 | | | | 277,019 | | | $ | 7,293,561 | |
| | | | | | | | | | | | | | | | |
| | | | |
Class R4 Shares | | | | | | | | | | | | | | | | |
Shares sold | | | 476,959 | | | $ | 11,745,515 | | | | 455,895 | | | $ | 11,931,206 | |
Shares issued to shareholders in reinvestment of dividends | | | 1,497 | | | | 38,075 | | | | — | | | | — | |
Shares repurchased | | | (145,312 | ) | | | (3,533,573 | ) | | | (101,106 | ) | | | (2,646,176 | ) |
| | | | | | | | | | | | | | | | |
| | | | |
Net increase (decrease) | | | 333,144 | | | $ | 8,250,017 | | | | 354,789 | | | $ | 9,285,030 | |
| | | | | | | | | | | | | | | | |
| | | | |
Class R5 Shares | | | | | | | | | | | | | | | | |
Shares sold | | | 999,580 | | | $ | 24,876,025 | | | | 2,061,965 | | | $ | 54,277,368 | |
Shares issued to shareholders in reinvestment of dividends | | | 27,076 | | | | 697,191 | | | | 1,933 | | | | 48,802 | |
Shares repurchased | | | (546,181 | ) | | | (13,450,101 | ) | | | (755,208 | ) | | | (19,806,100 | ) |
| | | | | | | | | | | | | | | | |
| | | | |
Net increase (decrease) | | | 480,475 | | | $ | 12,123,115 | | | | 1,308,690 | | | $ | 34,520,070 | |
| | | | | | | | | | | | | | | | |
NOTE 5 – INVESTMENT TRANSACTIONS
For the six months ended March 31, 2016, the Fund had purchase and sale transactions of investments (excluding short-term investments) of $462,748,057 and $453,372,680, respectively.
NOTE 6 – INCOME TAXES
At March 31, 2016, information on the tax components of capital was as follows:
| | | | |
Cost of investments for tax purposes | | $ | 2,258,984,988 | |
| | | | |
Gross unrealized appreciation on a tax basis | | $ | 231,623,394 | |
Gross unrealized depreciation on a tax basis | | | (153,916,831 | ) |
| | | | |
Net unrealized appreciation (depreciation) on investments (tax basis) | | $ | 77,706,563 | |
| | | | |
At March 31, 2016, the Fund had tax basis capital losses of $65,569,148 generated prior to October 1, 2011, which may be carried forward to offset future capital gains. To the extent such carryforwards are used, capital gain distributions may be reduced to the extent provided by regulations. Such capital loss carryforwards expire September 30, 2018.
In order to account for permanent book to tax differences, the Fund increased undistributed net investment income by $1,800,159, decreased net unrealized appreciation on investments by $1,797,521, and increased accumulated net realized loss by $2,638. Reclassifications have no impact upon the net asset value of the Fund and resulted from re characterization of income from certain investments.
22 Semi-Annual Report
| | |
| NOTES TO FINANCIAL STATEMENTS, CONTINUED | | |
| |
Thornburg Global Opportunities Fund | | March 31, 2016 (Unaudited) |
NOTE 7 – DERIVATIVE FINANCIAL INSTRUMENTS WITH OFF-BALANCE SHEET RISK AND FOREIGN INVESTMENT RISK
The Fund may use a variety of derivative financial instruments to hedge or adjust the risks affecting its investment portfolio or to enhance investment returns. Provisions of the FASB Accounting Standards Codification 815-10-50 (“ASC 815”) require certain disclosures. The disclosures are intended to provide users of financial statements with an understanding of the use of derivative instruments by the Fund and how these derivatives affect the financial position, financial performance and cash flows of the Fund. The Fund does not designate any derivative instruments as hedging instruments under ASC 815. During the six months ended March 31, 2016, the Fund’s principal exposure to derivative financial instruments of the type addressed by ASC 815 was investment in foreign exchange contracts. A foreign exchange contract is an agreement between two parties to exchange different currencies at a specified rate of exchange at an agreed upon future date. Foreign exchange contracts involve risks to the Fund, including the risk that a contract’s counterparty will not meet its obligations to the Fund, the risk that a change in a contract’s value may not correlate perfectly with the currency the contract was intended to track, and the risk that the Fund’s Advisor is unable to correctly implement its strategy in using a contract. In any such instance, the Fund may not achieve the intended benefit of entering into a contract, and may experience a loss.
The Fund entered into forward currency contracts during the six months ended March 31, 2016 in the normal course of pursuing its investment objectives, with the objective of purchasing foreign investments or with the intent of reducing the risk to the value of the Fund’s foreign investments from adverse changes in the relationship between the U.S. dollar and foreign currencies. In each case these contracts have been initiated in conjunction with foreign investment transactions.
These contracts are accounted for by the Fund under ASC 815. Unrealized appreciation and depreciation on outstanding contracts are reported in the Fund’s Statement of Assets and Liabilities, as measured by the difference between the forward exchange rates at the reporting date and the forward exchange rates at each contract’s inception date. Net realized gain (loss) on contracts closed during the period, and changes in net unrealized appreciation (depreciation) on outstanding contracts are recognized in the Fund’s Statement of Operations.
The quarterly average value of open sell currency contracts for the six months ended March 31, 2016 was $621,957,797. Open buy currency contracts are entered into for the purpose of closing open sell currency contracts and the values are dependent upon the values of the open sell currency contracts to which they relate.
The following table displays the outstanding forward currency contracts at March 31, 2016:
| | | | | | | | | | | | | | | | | | | | | | |
| OUTSTANDING FORWARD CURRENCY CONTRACTS TO BUY OR SELL AT MARCH 31, 2016 | |
| | | | | CONTRACT | | | CONTRACT | | | VALUE | | | UNREALIZED | | | UNREALIZED | |
| CONTRACT DESCRIPTION | | BUY/SELL | | AMOUNT | | | VALUE DATE | | | USD | | | APPRECIATION | | | DEPRECIATION | |
South Korean Won | | Buy | | | 1,415,125,400 | | | | 06/03/2016 | | | | 1,235,505 | | | $ | 24,132 | | | $ | — | |
South Korean Won | | Buy | | | 1,482,148,200 | | | | 06/03/2016 | | | | 1,294,020 | | | | 19,383 | | | | — | |
South Korean Won | | Buy | | | 1,263,838,200 | | | | 06/03/2016 | | | | 1,103,420 | | | | 14,946 | | | | — | |
South Korean Won | | Sell | | | 8,412,573,000 | | | | 06/03/2016 | | | | 7,344,773 | | | | — | | | | (583,341 | ) |
Australian Dollar | | Buy | | | 1,837,900 | | | | 05/16/2016 | | | | 1,406,125 | | | | 85,230 | | | | — | |
Australian Dollar | | Buy | | | 3,119,000 | | | | 05/16/2016 | | | | 2,386,258 | | | | 47,720 | | | | — | |
Australian Dollar | | Buy | | | 2,772,500 | | | | 05/16/2016 | | | | 2,121,161 | | | | 35,936 | | | | — | |
Australian Dollar | | Buy | | | 1,732,800 | | | | 05/16/2016 | | | | 1,325,716 | | | | 35,128 | | | | — | |
Australian Dollar | | Buy | | | 779,800 | | | | 05/16/2016 | | | | 596,603 | | | | 5,082 | | | | — | |
Australian Dollar | | Buy | | | 1,646,100 | | | | 05/16/2016 | | | | 1,259,384 | | | | — | | | | (1,469 | ) |
Australian Dollar | | Sell | | | 11,046,200 | | | | 05/16/2016 | | | | 8,451,134 | | | | — | | | | (240,715 | ) |
Australian Dollar | | Sell | | | 9,731,700 | | | | 05/16/2016 | | | | 7,445,447 | | | | — | | | | (451,450 | ) |
Australian Dollar | | Sell | | | 11,727,000 | | | | 05/16/2016 | | | | 8,971,995 | | | | — | | | | (552,126 | ) |
Australian Dollar | | Sell | | | 28,074,700 | | | | 05/16/2016 | | | | 21,479,156 | | | | — | | | | (1,637,502 | ) |
Canadian Dollar | | Buy | | | 18,798,900 | | | | 05/31/2016 | | | | 14,475,387 | | | | 517,604 | | | | — | |
Canadian Dollar | | Buy | | | 11,035,200 | | | | 05/31/2016 | | | | 8,497,241 | | | | 242,860 | | | | — | |
Canadian Dollar | | Buy | | | 9,172,500 | | | | 05/31/2016 | | | | 7,062,939 | | | | 29,218 | | | | — | |
Canadian Dollar | | Buy | | | 6,773,100 | | | | 05/31/2016 | | | | 5,215,371 | | | | 9,307 | | | | — | |
Canadian Dollar | | Sell | | | 6,642,400 | | | | 05/31/2016 | | | | 5,114,731 | | | | — | | | | (202,189 | ) |
Canadian Dollar | | Sell | | | 79,829,600 | | | | 05/31/2016 | | | | 61,469,784 | | | | — | | | | (2,467,427 | ) |
Euro | | Sell | | | 346,753,000 | | | | 05/16/2016 | | | | 395,066,252 | | | | — | | | | (412,792 | ) |
Euro | | Sell | | | 29,291,800 | | | | 05/16/2016 | | | | 33,373,040 | | | | — | | | | (734,944 | ) |
Great Britain Pound | | Sell | | | 45,529,900 | | | | 04/07/2016 | | | | 65,392,868 | | | | 1,502,392 | | | | — | |
Great Britain Pound | | Buy | | | 14,747,800 | | | | 04/07/2016 | | | | 21,181,706 | | | | 171,710 | | | | — | |
Great Britain Pound | | Sell | | | 8,054,500 | | | | 04/07/2016 | | | | 11,568,373 | | | | 95,429 | | | | — | |
Swiss Franc | | Buy | | | 1,601,600 | | | | 04/06/2016 | | | | 1,665,788 | | | | 66,026 | | | | — | |
Semi-Annual Report 23
| | |
| NOTES TO FINANCIAL STATEMENTS, CONTINUED | | |
| |
Thornburg Global Opportunities Fund | | March 31, 2016 (Unaudited) |
| | | | | | | | | | | | | | | | | | | | | | |
| OUTSTANDING FORWARD CURRENCY CONTRACTS TO BUY OR SELL AT MARCH 31, 2016 (CONTINUED) | |
| | | | | CONTRACT | | | CONTRACT | | | VALUE | | | UNREALIZED | | | UNREALIZED | |
| CONTRACT DESCRIPTION | | BUY/SELL | | AMOUNT | | | VALUE DATE | | | USD | | | APPRECIATION | | | DEPRECIATION | |
Swiss Franc | | Buy | | | 1,272,000 | | | | 04/06/2016 | | | | 1,322,978 | | | $ | 14,121 | | | $ | — | |
Swiss Franc | | Sell | | | 11,286,200 | | | | 04/06/2016 | | | | 11,738,519 | | | | — | | | | (421,684 | ) |
| | | | | | | | | | | | | | | | | | | | | | |
Total | | | | | | | | | | | | | | | | $ | 2,916,224 | | | $ | (7,705,639) | |
| | | | | | | | | | | | | | | | | | | | | | |
Net unrealized appreciation (depreciation) | | | | | | | | | | | $ | (4,789,415) | |
| | | | | | | | | | | | | | | | | | | | | | |
The outstanding forward currency contracts in the foregoing table were entered into with State Street Bank and Trust Company (“SSB”), pursuant to an International Swaps and Derivatives Association (“ISDA”) Master Agreement. In the event of a default or termination under the ISDA Master Agreement with SSB, the non-defaulting party has the right to close out all outstanding forward currency contracts between the parties and to net any payment amounts under those contracts, resulting in a single net amount payable by one party to the other.
Because the ISDA Master Agreement with SSB does not result in an offset of reported amounts of financial assets and liabilities in the Fund’s Statement of Assets and Liabilities unless there has been an event of default or termination event under that agreement, the Fund does not net its outstanding forward currency contracts for purposes of the disclosure in the Fund’s Statement of Assets and Liabilities. Instead the Fund recognizes the unrealized appreciation or depreciation on those forward currency contracts on a gross basis in the Fund’s Statement of Assets and Liabilities.
The unrealized appreciation (depreciation) of the outstanding forward currency contracts recognized in the Fund’s Statement of Assets and Liabilities at March 31, 2016 is disclosed in the following table:
| | | | |
FAIR VALUES OF DERIVATIVE FINANCIAL INSTRUMENTS AT MARCH 31, 2016 |
| ASSET DERIVATIVES | | BALANCE SHEET LOCATION | | FAIR VALUE |
Foreign exchange contracts | | Assets - Unrealized appreciation on forward currency contracts | | $2,916,224 |
| | |
| LIABILITY DERIVATIVES | | BALANCE SHEET LOCATION | | FAIR VALUE |
Foreign exchange contracts | | Liabilities - Unrealized depreciation on forward currency contracts | | $(7,705,639) |
Because the Fund does not currently receive or post cash collateral in connection with its currency forward contracts, and because all of the Fund’s outstanding currency forward contracts are with SSB, the net amounts of the Fund’s assets and liabilities which are attributable to those contracts at March 31, 2016 can be determined by offsetting the dollar amounts shown in the preceding table. Based on those amounts, the net amount of the Fund’s assets which is attributable to its outstanding forward currency contracts at March 31, 2016 is $0, and the net amount of the Fund’s liabilities which is attributable to those contracts at that date is $4,789,415. The Fund’s forward currency contracts are valued each day, and the net amounts of the Fund’s assets and liabilities which are attributable to those contracts are expected to vary over time.
The net realized gain (loss) from forward currency contracts and the net change in unrealized appreciation (depreciation) of outstanding forward currency contracts recognized in the Fund’s Statement of Operations for the six months ended March 31, 2016 are disclosed in the following tables:
| | | | |
| NET REALIZED GAIN (LOSS) ON DERIVATIVE FINANCIAL INSTRUMENTS |
| RECOGNIZED IN INCOME FOR THE SIX MONTHS ENDED MARCH 31, 2016 |
| | | TOTAL | | FORWARD CURRENCY CONTRACTS |
Foreign exchange contracts | | $ (5,493,784) | | $ (5,493,784) |
24 Semi-Annual Report
| | |
| NOTES TO FINANCIAL STATEMENTS, CONTINUED | | |
| |
Thornburg Global Opportunities Fund | | March 31, 2016 (Unaudited) |
| | | | |
| NET CHANGE IN UNREALIZED APPRECIATION (DEPRECIATION) OF DERIVATIVE FINANCIAL INSTRUMENTS |
RECOGNIZED IN INCOME FOR THE SIX MONTHS ENDED MARCH 31, 2016 |
| | | TOTAL | | FORWARD CURRENCY CONTRACTS |
Foreign exchange contracts | | $ (958,250) | | $ (958,250) |
OTHER NOTES
Risks: The Fund’s investments subject it to risks including, but not limited to, management risk, market and economic risk, risks affecting specific issuers, credit risk, interest rate risk, high yield risk, prepayment risk, liquidity risk, and the risks associated with investments in small- and mid-cap companies, non-U.S. issuers (including developing country issuers), and real estate investment trusts. Please see the Fund’s prospectus for a discussion of the risks associated with an investment in the Fund.
Subsequent Events: Fund management believes no events have occurred between March 31, 2016 and the date of issuance of the financial statements that require adjustment to or disclosure in the accompanying financial statements.
Semi-Annual Report 25
FINANCIAL HIGHLIGHTS
Thornburg Global Opportunities Fund
| | | | | | | | | | | | | | | | | | | | | | | | | | | | | | | | | | | | | | | | | | | | | | | | | | | | | | | | | | | | |
| | | PER SHARE PERFORMANCE (FOR A SHARE OUTSTANDING THROUGHOUT THE PERIOD) | | | RATIOS TO AVERAGE NET ASSETS | | | SUPPLEMENTAL DATA | |
UNLESS
OTHERWISE
NOTED,
PERIODS
ARE FISCAL
YEARS
ENDED
SEPT. 30, | | NET ASSET
VALUE
BEGINNING
OF PERIOD | | | NET
INVESTMENT
INCOME
(LOSS)+ | | | NET
REALIZED &
UNREALIZED
GAIN (LOSS)
ON
INVESTMENTS | | | TOTAL
FROM
INVESTMENT
OPERATIONS | | | DIVIDENDS
FROM NET
INVESTMENT
INCOME | | | DIVIDENDS
FROM NET
REALIZED
GAINS | | | TOTAL
DIVIDENDS | | | NET
ASSET
VALUE
END OF
PERIOD | | | NET
INVESTMENT
INCOME
(LOSS) (%) | | | EXPENSES,
AFTER
EXPENSE
REDUCTIONS
(%) | | | EXPENSES,
AFTER
EXPENSE
REDUCTIONS
AND NET OF
CUSTODY
CREDITS (%) | | | EXPENSES,
BEFORE
EXPENSE
REDUCTIONS
(%) | | | TOTAL
RETURN
(%)(a) | | | PORTFOLIO
TURNOVER
RATE (%)(a) | | | NET
ASSETS
AT END
OF
PERIOD
(THOUSANDS) | |
CLASS A SHARES | | | | | | | | | | | | | | | | | | | | | | | | | | | | | | | | | | | | | | | | | | | | | | | | | | | | | |
2016(b)(c) | | $ | 24.41 | | | | 0.15 | | | | 0.36 | | | | 0.51 | | | | (0.08 | ) | | | — | | | | (0.08 | ) | | $ | 24.84 | | | | 1.24 | (d) | | | 1.31 | (d) | | | 1.31 | (d) | | | 1.31 | (d) | | | 2.09 | | | | 20.36 | | | $ | 567,968 | |
2015(c) | | $ | 23.74 | | | | (0.11 | ) | | | 0.78 | | | | 0.67 | | | | — | | | | — | | | | — | | | $ | 24.41 | | | | (0.42 | ) | | | 1.32 | | | | 1.32 | | | | 1.32 | | | | 2.82 | | | | 45.41 | | | $ | 550,327 | |
2014(c) | | $ | 19.72 | | | | (0.03 | ) | | | 4.13 | | | | 4.10 | | | | (0.08 | ) | | | — | | | | (0.08 | ) | | $ | 23.74 | | | | (0.15 | ) | | | 1.41 | | | | 1.41 | | | | 1.41 | | | | 20.85 | | | | 60.29 | | | $ | 207,227 | |
2013(c) | | $ | 15.97 | | | | 0.11 | | | | 3.79 | | | | 3.90 | | | | (0.15 | ) | | | — | | | | (0.15 | ) | | $ | 19.72 | | | | 0.60 | | | | 1.46 | | | | 1.46 | | | | 1.46 | | | | 24.50 | | | | 66.12 | | | $ | 96,855 | |
2012(c) | | $ | 13.15 | | | | 0.14 | | | | 2.89 | | | | 3.03 | | | | (0.21 | ) | | | — | | | | (0.21 | ) | | $ | 15.97 | | | | 0.94 | | | | 1.49 | | | | 1.49 | | | | 1.49 | | | | 23.22 | | | | 66.07 | | | $ | 77,103 | |
2011(c) | | $ | 13.98 | | | | 0.18 | | | | (0.82 | ) | | | (0.64 | ) | | | (0.19 | ) | | | — | | | | (0.19 | ) | | $ | 13.15 | | | | 1.13 | | | | 1.48 | | | | 1.48 | | | | 1.48 | | | | (4.81 | ) | | | 70.33 | | | $ | 73,538 | |
CLASS C SHARES | | | | | | | | | | | | | | | | | | | | | | | | | | | | | | | | | | | | | | | | | | | | | | | | | | | | | |
2016(b) | | $ | 23.70 | | | | 0.06 | | | | 0.34 | | | | 0.40 | | | | — | | | | — | | | | — | | | $ | 24.10 | | | | 0.51 | (d) | | | 2.05 | (d) | | | 2.05 | (d) | | | 2.05 | (d) | | | 1.69 | | | | 20.36 | | | $ | 419,712 | |
2015 | | $ | 23.23 | | | | (0.31 | ) | | | 0.78 | | | | 0.47 | | | | — | | | | — | | | | — | | | $ | 23.70 | | | | (1.20 | ) | | | 2.10 | | | | 2.10 | | | | 2.10 | | | | 2.02 | | | | 45.41 | | | $ | 363,615 | |
2014 | | $ | 19.38 | | | | (0.20 | ) | | | 4.07 | | | | 3.87 | | | | (0.02 | ) | | | — | | | | (0.02 | ) | | $ | 23.23 | | | | (0.92 | ) | | | 2.17 | | | | 2.17 | | | | 2.17 | | | | 19.96 | | | | 60.29 | | | $ | 143,506 | |
2013 | | $ | 15.69 | | | | (0.03 | ) | | | 3.72 | | | | 3.69 | | | | — | | | | — | | | | — | | | $ | 19.38 | | | | (0.18 | ) | | | 2.22 | | | | 2.22 | | | | 2.22 | | | | 23.52 | | | | 66.12 | | | $ | 87,808 | |
2012 | | $ | 12.98 | | | | 0.02 | | | | 2.84 | | | | 2.86 | | | | (0.15 | ) | | | — | | | | (0.15 | ) | | $ | 15.69 | | | | 0.17 | | | | 2.27 | | | | 2.27 | | | | 2.27 | | | | 22.21 | | | | 66.07 | | | $ | 76,738 | |
2011 | | $ | 13.83 | | | | 0.06 | | | | (0.80 | ) | | | (0.74 | ) | | | (0.11 | ) | | | — | | | | (0.11 | ) | | $ | 12.98 | | | | 0.40 | | | | 2.23 | | | | 2.23 | | | | 2.23 | | | | (5.45 | ) | | | 70.33 | | | $ | 70,643 | |
CLASS I SHARES | | | | | | | | | | | | | | | | | | | | | | | | | | | | | | | | | | | | | | | | | | | | | | | | | | | | | |
2016(b) | | $ | 24.53 | | | | 0.20 | | | | 0.36 | | | | 0.56 | | | | (0.15 | ) | | | — | | | | (0.15 | ) | | $ | 24.94 | | | | 1.60 | (d) | | | 0.96 | (d) | | | 0.96 | (d) | | | 0.96 | (d) | | | 2.26 | | | | 20.36 | | | $ | 1,193,657 | |
2015 | | $ | 23.79 | | | | (0.02 | ) | | | 0.77 | | | | 0.75 | | | | (0.01 | ) | | | — | | | | (0.01 | ) | | $ | 24.53 | | | | (0.08 | ) | | | 0.97 | | | | 0.97 | | | | 0.98 | | | | 3.17 | | | | 45.41 | | | $ | 1,285,609 | |
2014 | | $ | 19.74 | | | | 0.06 | | | | 4.15 | | | | 4.21 | | | | (0.16 | ) | | | — | | | | (0.16 | ) | | $ | 23.79 | | | | 0.26 | | | | 0.99 | | | | 0.99 | | | | 1.08 | | | | 21.39 | | | | 60.29 | | | $ | 453,511 | |
2013 | | $ | 16.06 | | | | 0.19 | | | | 3.80 | | | | 3.99 | | | | (0.31 | ) | | | — | | | | (0.31 | ) | | $ | 19.74 | | | | 1.07 | | | | 0.99 | | | | 0.99 | | | | 1.11 | | | | 25.08 | | | | 66.12 | | | $ | 249,283 | |
2012 | | $ | 13.20 | | | | 0.21 | | | | 2.90 | | | | 3.11 | | | | (0.25 | ) | | | — | | | | (0.25 | ) | | $ | 16.06 | | | | 1.44 | | | | 0.99 | | | | 0.99 | | | | 1.21 | | | | 23.82 | | | | 66.07 | | | $ | 169,384 | |
2011 | | $ | 14.01 | | | | 0.26 | | | | (0.83 | ) | | | (0.57 | ) | | | (0.24 | ) | | | — | | | | (0.24 | ) | | $ | 13.20 | | | | 1.65 | | | | 0.99 | | | | 0.99 | | | | 1.11 | | | | (4.30 | ) | | | 70.33 | | | $ | 115,837 | |
CLASS R3 SHARES | | | | | | | | | | | | | | | | | | | | | | | | | | | | | | | | | | | | | | | | | | | | | | | | | | | | | |
2016(b) | | $ | 24.18 | | | | 0.12 | | | | 0.36 | | | | 0.48 | | | | (0.05 | ) | | | — | | | | (0.05 | ) | | $ | 24.61 | | | | 1.01 | (d) | | | 1.50 | (d) | | | 1.50 | (d) | | | 1.95 | (d) | | | 1.97 | | | | 20.36 | | | $ | 10,218 | |
2015 | | $ | 23.55 | | | | (0.15 | ) | | | 0.78 | | | | 0.63 | | | | — | | | | — | | | | — | | | $ | 24.18 | | | | (0.58 | ) | | | 1.50 | | | | 1.50 | | | | 2.15 | | | | 2.68 | | | | 45.41 | | | $ | 8,936 | |
2014 | | $ | 19.55 | | | | (0.06 | ) | | | 4.11 | | | | 4.05 | | | | (0.05 | ) | | | — | | | | (0.05 | ) | | $ | 23.55 | | | | (0.26 | ) | | | 1.50 | | | | 1.50 | | | | 2.59 | | | | 20.75 | | | | 60.29 | | | $ | 2,182 | |
2013 | | $ | 15.91 | | | | 0.11 | | | | 3.74 | | | | 3.85 | | | | (0.21 | ) | | | — | | | | (0.21 | ) | | $ | 19.55 | | | | 0.60 | | | | 1.49 | | | | 1.49 | | | | 3.41 | | | | 24.37 | | | | 66.12 | | | $ | 1,653 | |
2012 | | $ | 13.11 | | | | 0.11 | | | | 2.90 | | | | 3.01 | | | | (0.21 | ) | | | — | | | | (0.21 | ) | | $ | 15.91 | | | | 0.75 | | | | 1.50 | | | | 1.50 | | | | 9.01 | (e) | | | 23.22 | | | | 66.07 | | | $ | 894 | |
2011 | | $ | 13.93 | | | | 0.18 | | | | (0.82 | ) | | | (0.64 | ) | | | (0.18 | ) | | | — | | | | (0.18 | ) | | $ | 13.11 | | | | 1.12 | | | | 1.49 | | | | 1.49 | | | | 14.23 | (e) | | | (4.77 | ) | | | 70.33 | | | $ | 75 | |
CLASS R4 SHARES | | | | | | | | | | | | | | | | | | | | | | | | | | | | | | | | | | | | | | | | | | | | | | | | | | | | | |
2016(b) | | $ | 24.22 | | | | 0.15 | | | | 0.34 | | | | 0.49 | | | | (0.08 | ) | | | — | | | | (0.08 | ) | | $ | 24.63 | | | | 1.24 | (d) | | | 1.40 | (d) | | | 1.40 | (d) | | | 1.61 | (d) | | | 2.00 | | | | 20.36 | | | $ | 21,606 | |
2015 | | $ | 23.57 | | | | (0.13 | ) | | | 0.78 | | | | 0.65 | | | | — | | | | — | | | | — | | | $ | 24.22 | | | | (0.51 | ) | | | 1.40 | | | | 1.40 | | | | 1.76 | | | | 2.76 | | | | 45.41 | | | $ | 13,175 | |
2014 | | $ | 19.59 | | | | (0.03 | ) | | | 4.10 | | | | 4.07 | | | | (0.09 | ) | | | — | | | | (0.09 | ) | | $ | 23.57 | | | | (0.14 | ) | | | 1.40 | | | | 1.40 | | | | 2.23 | | | | 20.82 | | | | 60.29 | | | $ | 4,462 | |
2013 | | $ | 15.90 | | | | 0.12 | | | | 3.76 | | | | 3.88 | | | | (0.19 | ) | | | — | | | | (0.19 | ) | | $ | 19.59 | | | | 0.68 | | | | 1.40 | | | | 1.40 | | | | 2.76 | | | | 24.57 | | | | 66.12 | | | $ | 2,161 | |
2012 | | $ | 13.09 | | | | 0.15 | | | | 2.88 | | | | 3.03 | | | | (0.22 | ) | | | — | | | | (0.22 | ) | | $ | 15.90 | | | | 1.05 | | | | 1.40 | | | | 1.40 | | | | 3.72 | | | | 23.36 | | | | 66.07 | | | $ | 1,329 | |
2011 | | $ | 13.90 | | | | 0.19 | | | | (0.81 | ) | | | (0.62 | ) | | | (0.19 | ) | | | — | | | | (0.19 | ) | | $ | 13.09 | | | | 1.23 | | | | 1.40 | | | | 1.40 | | | | 3.16 | | | | (4.66 | ) | | | 70.33 | | | $ | 900 | |
CLASS R5 SHARES | | | | | | | | | | | | | | | | | | | | | | | | | | | | | | | | | | | | | | | | | | | | | | | | | | | | | |
2016(b) | | $ | 24.55 | | | | 0.19 | | | | 0.37 | | | | 0.56 | | | | (0.15 | ) | | | — | | | | (0.15 | ) | | $ | 24.96 | | | | 1.57 | (d) | | | 0.99 | (d) | | | 0.99 | (d) | | | 1.02 | (d) | | | 2.24 | | | | 20.36 | | | $ | 122,462 | |
2015 | | $ | 23.81 | | | | (0.03 | ) | | | 0.78 | | | | 0.75 | | | | (0.01 | ) | | | — | | | | (0.01 | ) | | $ | 24.55 | | | | (0.11 | ) | | | 0.98 | | | | 0.98 | | | | 1.02 | | | | 3.17 | | | | 45.41 | | | $ | 108,654 | |
2014 | | $ | 19.76 | | | | 0.06 | | | | 4.15 | | | | 4.21 | | | | (0.16 | ) | | | — | | | | (0.16 | ) | | $ | 23.81 | | | | 0.26 | | | | 0.99 | | | | 0.99 | | | | 1.10 | | | | 21.36 | | | | 60.29 | | | $ | 74,212 | |
2013 | | $ | 16.07 | | | | 0.18 | | | | 3.82 | | | | 4.00 | | | | (0.31 | ) | | | — | | | | (0.31 | ) | | $ | 19.76 | | | | 1.03 | | | | 0.99 | | | | 0.99 | | | | 1.15 | | | | 25.13 | | | | 66.12 | | | $ | 49,023 | |
2012 | | $ | 13.21 | | | | 0.21 | | | | 2.90 | | | | 3.11 | | | | (0.25 | ) | | | — | | | | (0.25 | ) | | $ | 16.07 | | | | 1.44 | | | | 0.99 | | | | 0.99 | | | | 1.15 | | | | 23.80 | | | | 66.07 | | | $ | 50,327 | |
2011 | | $ | 14.02 | | | | 0.29 | | | | (0.86 | ) | | | (0.57 | ) | | | (0.24 | ) | | | — | | | | (0.24 | ) | | $ | 13.21 | | | | 1.84 | | | | 0.99 | | | | 0.99 | | | | 1.24 | | | | (4.29 | ) | | | 70.33 | | | $ | 32,223 | |
| (a) | Not annualized for periods less than one year. |
| (b) | Unaudited Six Month Period Ended March 31. |
| (c) | Sales loads are not reflected in computing total return. |
| (e) | Due to the size of net assets and fixed expenses, ratios may appear disproportionate. |
| + | Based on weighted average shares outstanding. |
See notes to financial statements.
| | | | |
| 26 Semi-Annual Report | | | | Semi-Annual Report 27 |
| | |
| EXPENSE EXAMPLE | | |
| |
Thornburg Global Opportunities Fund | | March 31, 2016 (Unaudited) |
As a shareholder of the Fund, you incur two types of costs:
| | (1) | transaction costs, including |
(a) sales charges (loads) on purchase payments, for Class A shares;
(b) a deferred sales charge on redemptions of any part or all of a purchase of $1 million of Class A shares within 12 months of purchase;
(c) a deferred sales charge on redemptions of Class C shares within 12 months of purchase;
| | (2) | ongoing costs, including management fees; distribution and/or service (12b-1) fees; and other Fund expenses. |
This example is intended to help you understand your ongoing costs (in dollars) of investing in the Fund and to compare these costs with the ongoing costs of investing in other mutual funds.
The example is based on a $1,000 investment beginning on October 1, 2015, and held until March 31, 2016.
| | | | | | | | | | | | |
| | | BEGINNING
ACCOUNT VALUE
10/1/15 | | | ENDING
ACCOUNT VALUE
3/31/16 | | | EXPENSES PAID
DURING PERIOD†
10/1/15–3/31/16 | |
CLASS A SHARES | | | | | | | | | | | | |
Actual | | $ | 1,000.00 | | | $ | 1,020.90 | | | $ | 6.61 | |
Hypothetical* | | $ | 1,000.00 | | | $ | 1,018.46 | | | $ | 6.60 | |
CLASS C SHARES | | | | | | | | | | | | |
Actual | | $ | 1,000.00 | | | $ | 1,016.90 | | | $ | 10.35 | |
Hypothetical* | | $ | 1,000.00 | | | $ | 1,014.73 | | | $ | 10.34 | |
CLASS I SHARES | | | | | | | | | | | | |
Actual | | $ | 1,000.00 | | | $ | 1,022.60 | | | $ | 4.85 | |
Hypothetical* | | $ | 1,000.00 | | | $ | 1,020.20 | | | $ | 4.85 | |
CLASS R3 SHARES | | | | | | | | | | | | |
Actual | | $ | 1,000.00 | | | $ | 1,019.70 | | | $ | 7.57 | |
Hypothetical* | | $ | 1,000.00 | | | $ | 1,017.50 | | | $ | 7.57 | |
CLASS R4 SHARES | | | | | | | | | | | | |
Actual | | $ | 1,000.00 | | | $ | 1,020.00 | | | $ | 7.07 | |
Hypothetical* | | $ | 1,000.00 | | | $ | 1,018.00 | | | $ | 7.06 | |
CLASS R5 SHARES | | | | | | | | | | | | |
Actual | | $ | 1,000.00 | | | $ | 1,022.40 | | | $ | 5.00 | |
Hypothetical* | | $ | 1,000.00 | | | $ | 1,020.05 | | | $ | 5.00 | |
| † | Expenses are equal to the annualized expense ratio for each class (A: 1.31%; C: 2.05%; I: 0.96%; R3: 1.50%; R4: 1.40%; R5: 0.99%) multiplied by the average account value over the period, multiplied by 183/366 to reflect the one-half year period. |
| * | Hypothetical assumes a rate of return of 5% per year before expenses. |
ACTUAL EXPENSES
For each class of shares, the first line of the accompanying table provides information about actual account values and actual expenses. You may use the information in this line, together with the amount you invested, to estimate the expenses that you paid over the period. Simply divide your account value by $1,000 (for example, an $8,600 account value divided by $1,000 = 8.6), then multiply the result by the number in the first line for your class of shares under the heading entitled “Expenses Paid During Period” to estimate the expenses you paid on your account during this period.
HYPOTHETICAL EXAMPLE FOR COMPARISON PURPOSES
For each class of shares, the second line of the accompanying table provides information about hypothetical account values and hypothetical expenses based on the Fund’s actual expense ratio and an assumed rate of return of 5% per year before expenses, which is not the Fund’s actual return. The hypothetical account values and expenses may not be used to estimate the actual ending account balance or expenses you paid for the period. You may use this information to compare the ongoing costs of investing in the Fund and other funds. To do so, compare this 5% hypothetical example with the 5% hypothetical examples that appear in the shareholder reports of the other funds.
Please note that the expenses shown in the table are meant to highlight your ongoing costs only and do not reflect any transactional costs, such as sales charges (loads), redemption fees, or exchange fees. Therefore, the second line of the table for each class of shares is useful in comparing ongoing costs only, and will not help you determine the relative total costs of owning different funds. In addition, if these transactional costs were included, your costs would have been higher.
28 Semi-Annual Report
| | |
| OTHER INFORMATION | | |
| |
Thornburg Global Opportunities Fund | | March 31, 2016 (Unaudited) |
PORTFOLIO PROXY VOTING
Policies and Procedures:
The Trust has delegated to Thornburg Investment Management, Inc. (the “Advisor”) voting decisions respecting proxies for the Fund’s voting securities. The Advisor makes voting decisions in accordance with its Proxy Voting Policy and Procedures. A description of the Policy and Procedures is available (i) without charge, upon request, by calling the Advisor toll-free at 1-800-847-0200, (ii) on the Thornburg website at www.thornburg.com, and (iii) on the Securities and Exchange Commission’s website at www.sec.gov.
Information regarding how proxies were voted is available on or before August 31 of each year for the twelve months ending the preceding June 30. This information is available (i) without charge, upon request by calling the Advisor toll-free at 1-800-847-0200, (ii) on the Thornburg website at www.thornburg.com, and (iii) on the Securities and Exchange Commission’s website at www.sec.gov.
AVAILABILITY OF QUARTERLY PORTFOLIO SCHEDULE
The Fund files with the Securities and Exchange Commission schedules of its portfolio holdings on Form N-Q for the first and third quarters of each fiscal year. The Fund’s Forms N-Q are available on the Commission’s website at www.sec.gov, or may be reviewed and copied at the Commission’s Public Reference Room in Washington, D.C. Information on the operation of the Public Reference Room may be obtained by calling 1-800-SEC-0330. The Fund also makes this information available on its website at www.thornburg.com/download or upon request by calling 1-800-847-0200.
Semi-Annual Report 29
TRUSTEES’ STATEMENT TO SHAREHOLDERS
Revised and Readopted September 15, 2015
The Trustees believe current and prospective shareholders should know how we discharge our responsibilities in supervising the Funds’ investment advisor and in reviewing the advisor’s contract for renewal. Since 2005, we have issued a statement which sets out clearly the three principal guidelines that we follow in supervising the Trust’s investment advisor on your behalf. In accordance with our customary practice, in September of 2015 we again reviewed our statement and concluded we should reissue this statement outlining the principal features of our supervision of the advisor’s performance of investment management services for the Funds.
We begin with the premise that each shareholder selected his or her Fund because its investments are managed by the investment advisor identified in the prospectus and in accordance with the objective and policies described in the prospectus. We realize, as each of you do, that if you believe that your Fund’s stated objective and policies no longer serve your personal investment goals, you can sell your shares and leave the Fund.
Therefore, we believe that our primary supervisory task—our principal obligation to you—is to assess the nature and quality of the advisor’s services, and to confirm that the advisor actively and competently pursues the Fund’s objective, in accordance with the policies set out in the prospectus. To do this, we meet regularly with management to review your Fund’s portfolio and to discuss the advisor’s specific actions and judgments in pursuing the Fund’s objective. We do not substitute our own judgment for the advisor’s decisions in selecting investments; the advisor is paid to exercise its informed judgment on investment decisions, and we seek to confirm, in reviewing the advisor’s performance, that the advisor is doing just that.
Second, we are conscious of costs and the effect that costs have on shareholders’ returns. We try to make sure that your Fund’s fees and costs are reasonable in relationship to the services rendered and that they are generally in line with those charged by other expert investment advisors, consistent with our belief that the Fund’s investors searched for and expect that expertise and attention and have decided to pay a reasonable price for it. We do not put the management contract “out to bid” as a matter of course, and we would not do so unless we had concluded that the advisor materially had failed to pursue the Fund’s objectives in accordance with its policies, or for other equally important reasons. We believe that any other approach would be inconsistent with your interests and contrary to your expectations when you bought shares of the Fund in the first place.
Finally, because we believe that most Thornburg Fund shareholders have invested with a long-term perspective, we try not to focus too much on the fashions of the moment and on short-term performance. The market will not favor any specific investment objective or set of policies at all times and under all economic circumstances. A fund will experience periods of both high and low returns relative to other funds and other investments. Even if one of our Funds is not favored by the market at a particular time, we believe that the advisor is nonetheless obliged to remain true to the Fund’s objective and policies, and we watch to see that it does so.
Trustees of Thornburg Investment Trust
30 Semi-Annual Report
THORNBURG FUND FAMILY
Thornburg Investment Management is a privately-owned global investment firm that offers a range of solutions for retail and institutional investors. Founded in 1982 and headquartered in Santa Fe, New Mexico, we manage approximately $54 billion (as of March 31, 2016) across eight equity and 11 bond mutual funds, separate accounts for high-net-worth investors and institutional accounts, and five UCITS funds for non-U.S. investors.
The fund outlined in this report is one of many equity and fixed-income products available from Thornburg Investment Management.
Equity Funds
| | • | | Thornburg Core Growth Fund |
| | • | | Thornburg International Value Fund |
| | • | | Thornburg Better World International Fund |
| | • | | Thornburg International Growth Fund |
| | • | | Thornburg Developing World Fund |
| | • | | Thornburg Investment Income Builder Fund |
| | • | | Thornburg Global Opportunities Fund |
Fixed Income Funds
| | • | | Thornburg Low Duration Income Fund |
| | • | | Thornburg Limited Term U.S. Government Fund |
| | • | | Thornburg Limited Term Income Fund |
| | • | | Thornburg Strategic Income Fund |
| | • | | Thornburg Low Duration Municipal Fund |
| | • | | Thornburg Limited Term Municipal Fund |
| | • | | Thornburg Intermediate Municipal Fund |
| | • | | Thornburg California Limited Term Municipal Fund |
| | • | | Thornburg New Mexico Intermediate Municipal Fund |
| | • | | Thornburg New York Intermediate Municipal Fund |
| | • | | Thornburg Strategic Municipal Income Fund |
Before investing, carefully consider the Fund’s investment goals, risks, charges, and expenses. For a prospectus or summary prospectus containing this and other information, contact your financial advisor or visit thornburg.com. Read it carefully before investing.
For additional information, please visit thornburg.com
Thornburg Investment Management, Inc. 2300 North Ridgetop Road, Santa Fe, NM 87506
Semi-Annual Report 31
This Semi-Annual Report is submitted for the general information of shareholders of the Fund. It is not authorized for distribution to prospective investors in the Fund unless preceded or accompanied by an effective prospectus.
| | | | |
| Investment Advisor: | | Distributor: | | |
| Thornburg Investment Management® | | Thornburg Securities Corporation® | | |
| 800.847.0200 | | 800.847.0200 | | TH1411 |

2 Semi-Annual Report
Semi-Annual Report
Thornburg Developing World Fund
March 31, 2016
| | | | |
SHARE CLASS | | NASDAQ SYMBOL | | CUSIP |
Class A | | THDAX | | 885-216-408 |
Class C | | THDCX | | 885-216-507 |
Class I | | THDIX | | 885-216-606 |
Class R5 | | THDRX | | 885-216-846 |
Class R6 | | TDWRX | | 885-216-838 |
Class I, R5, and R6 shares may not be available to all investors. Minimum investments for Class I shares may be higher than those for other classes.
Investments carry risks, including possible loss of principal. Additional risks may be associated with investments outside the United States, especially in emerging markets, including currency fluctuations, illiquidity, volatility, and political and economic risks. Investments in small- and mid-capitalization companies may increase the risk of greater price fluctuations. Please see the Fund’s prospectus for a discussion of the risks associated with an investment in the Fund. Investments in the Fund are not FDIC insured, nor are they bank deposits or guaranteed by a bank or any other entity.
Funds invested in a smaller number of holdings may expose an investor to greater volatility.
Semi-Annual Report 3
| | |
| LETTER TO SHAREHOLDERS | | |
| |
Thornburg Developing World Fund | | March 31, 2016 (Unaudited) |
April 15, 2016
Dear Fellow Shareholder:
Emerging market asset prices have been a roller coaster over the last six months. After a nearly 26% price decline from the MSCI Emerging Markets (EM) Index’s peak in April 2015 through the end of September 2015, October started with an abrupt 10% rebound. Unfortunately, the positive momentum reversed almost as quickly as it started. The prospect of the U.S. Federal Reserve (the Fed) initiating a tightening cycle in December and further oil price weakness combined to weigh on sentiment and lead to a retracement of all of the October gains and more as the downward pressure continued until late January of this year. After a very difficult performance in 2015, emerging markets should have been ready for a change in course.
Unfortunately, the start to the year saw us testing new lows rather than finding more stable footing. In the weeks through January 21, the MSCI EM Index was down 13.29% or more than 20% from the October highs. The January performance was the second-worst start to a calendar year since the inception of the index in 1988, behind only the poor start of what turned out to be a dismal year in 2008.
As we have noted in previous communications, we believe that the outlook for emerging markets and their equity returns hinges largely on the dollar, which remains tied to U.S. interest-rate policy and more specifically, market expectations for near-term rises in the Fed funds target rate. It has been clear that aggregate expectations for U.S. interest-rate policy expressed by the Fed through its dot plot (the future rate targets of Fed monetary policy committee members) continued to contemplate a different economic reality than that expressed by the market via Fed funds futures. Market expectations were more negative regarding U.S. economic growth and the impact from a still weak global economy, leading market participants to lower their expectations for future rate hikes. The January Fed meeting was the first clear recognition that the Fed was moving toward market expectations rather than vice versa, giving the dollar bears some fuel for their fire. Perhaps in a somewhat coordinated effort, central bankers in Europe and Japan also took additional steps to boost economic growth, but not by pulling the interest-rate currency lever as they had under previous policy initiatives. Instead, they have shifted their focus toward credit easing and targeted asset purchases to spur risk-taking instead of broad-based increases in the money supply through low or increasingly negative key policy lending rates. The combination of the two led to an abrupt selloff in the dollar and a rally in all risk assets that had previously been depressed by dollar strength (see Figure 1).
Figure 1 | Risk Assets Rise on the Dollar’s Fall
Change in Price (January 21–March 31)
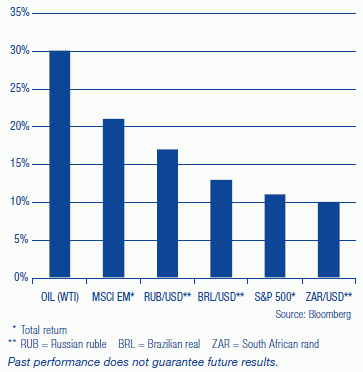
As we predicted previously, a stabilization in the dollar or a rally in emerging markets currencies would pave the way for dollar-based earnings growth, which is something that has been missing for the last few years. The Fed’s decision to shift to a more dovish policy stance gave investors a taste of what a stable-dollar world would look like for emerging market investors.
Fund Performance
We are pleased to announce that Thornburg Developing World Fund delivered a 5.59% return for the trailing six months (A shares, without sales charge from October 1, 2015 to March 31, 2016), slightly behind the benchmark which was up 6.41% during the period. In the year-opening selloff, January 4 to January 21, we outperformed the index by around 1.9% as the market retreated, but failed to outperform in the subsequent market rally. It’s worth noting this rally was one of the sharpest rallies in the history of the index. We typically do not expect to fully participate in sharp rallies, especially in those – such as the latest – which are led by more fragile currencies and commodity producers, due to our preference for more stable currencies and higher-quality businesses.
4 Semi-Annual Report
| | |
| LETTER TO SHAREHOLDERS, | | |
| |
CONTINUED | | |
| |
Thornburg Developing World Fund | | March 31, 2016 (Unaudited) |
Contributors to performance over the last six months included two Latin American financials; two long-term Internet holdings; and a Thai airport operator. Credicorp, a Peruvian bank, rebounded strongly after underperforming in the prior six months due to concerns about a slowing Peruvian economy and the impact of de-dollarization on the financial sector. Shares of Tencent, a dominant Chinese Internet platform, rose following the introduction of advertisements on its dominant WeChat platform. Facebook shares continued to gain ground, driven by strong user engagement and continued migration of traditional advertising dollars to online platforms. Shares of Airports of Thailand, the operator of several Thai airports, increased in price after the company reported strong international passenger arrivals, following a period of market concern driven by a terrorist attack in Bangkok. BB Seguridade, a Brazilian insurance company, rose sharply with general Brazil enthusiasm as well as reduced concerns that parent Banco do Brasil would have to sell its stake in the open market to raise capital.
Detractors to performance over the last six months included a Chinese online retailer; a Chinese railroad equipment supplier; a Taiwanese tech component supplier; a Latin American copper producer; and a South African retailer. The online retailer, Vipshop, saw its shares decline following weaker-than-expected guidance for the current quarter, fueling concerns about market saturation. Shares of Zhuzhou CRRC, a Chinese railroad equipment supplier, fell on concerns of lower railroad capital expenditures by the Chinese government. Hermes Microvision, the global leader in E-beam microprocessor inspection tools, retreated due to concerns over weaker demand growth from its major customers. Grupo Mexico, a low cost copper producer with assets in Peru, slid on concerns around a weaker growth outlook for China, which kept the price of the commodity depressed. Shares of Steinhoff International, a South African diversified retailer, dropped following a period of strong performance in the prior six months, combined with uncertainty around future growth momentum in South Africa.
Market Outlook
As you can see in Figure 2, most markets have bounced a long way from their January lows and in some cases are posting very strong dollar returns year to date. Broadly speaking, emerging market valuations are still well below their developed market peers, but are at the high end of their long-term historical range based on price-to-earnings multiples. The blanket “emerging markets are cheap” statement no longer seems to apply, especially when you consider there is still scope for further earnings downgrades in some major emerging markets such as Brazil and perhaps India and Thailand. But the index is diverse and the answer to the valuation question is more nuanced. If you look at the equity risk premiums in Figure 3 on page 6 (current earnings yield minus the long-term average risk-free rate), you can see several of the markets are showing negative premiums currently. We acknowledge that certain high-inflation markets or markets with large sources of
Figure 2 | Before and After January 21, 2016: Net Returns of Select MSCI Country Indices
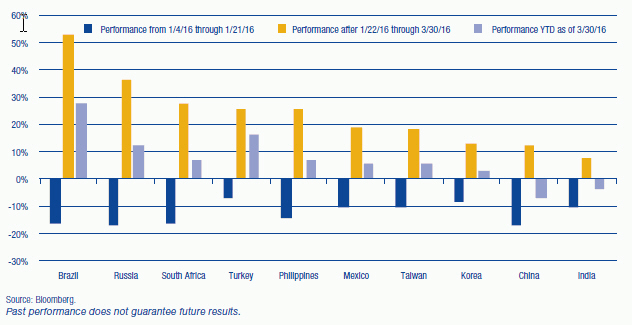
Semi-Annual Report 5
| | |
| LETTER TO SHAREHOLDERS, | | |
| |
CONTINUED | | |
| |
Thornburg Developing World Fund | | March 31, 2016 (Unaudited) |
Figure 3 | Various Country Equity Risk Premiums In Negative Territory
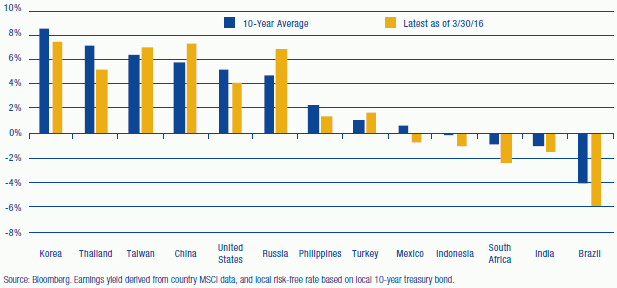
trapped capital (domestic pension funds) consistently exhibit negative equity risk premiums. However, even those markets are more negative than normal. The most risky currencies in several cases are in countries with the most uncertain political outlook, and are trading at the largest premiums relative to history and their local risk-free rates. Several northeast Asian markets, on the other hand, still appear attractive, at least on a country valuation level. The performance differential between many Asian markets and the more fragile markets probably has to do in part with the extreme short-positioning related to concerns over dollar strength and some momentum chasing once the short-dollar unwind began.
In hindsight, the selloff to start the year was precipitated by continued dollar strength and a concern of multiple (up to four) Fed rate hikes over the course of 2016. While expectations for the extent of hikes in 2016 have eased, it’s worth noting that is in part due to concerns about global economic growth and the impact of reduced dollar liquidity on that growth. That’s not necessarily bullish for emerging markets. Global trade is still important to many developing countries, especially in Asia. Roughly two-thirds of the constituent weights of the MSCI EM Index are domiciled in countries with current account surpluses driven by economic models based on exports. The export model built on global trade and driven by increased consumer leverage in developed markets has run its course, and that is reflected in the current state of lackluster global trade growth (see Figure 4 on the next page).
This leads to the question: What are emerging markets without a global-trade tailwind? To us, this is where things get interesting. Strong global trade is great for animal spirits and broad-based equity returns, but it’s also a rising tide that lifts all boats. There were a lot of low-return, capital-intensive business models that survived on excess returns produced in a synchronized global-growth environment over most of the decade starting in 2000. Today, the tide remains out, in our view, but that does not mean there aren’t great businesses, which will increase their value over time in dollar terms. We think the more interesting companies are those with dominant market share and low capital intensity and are located in a stable domestic market with long-term penetration opportunities. The opportunity for those companies remains, regardless of U.S., European, and Japanese monetary policies.
The recent run has been strong and has pushed valuations back to normal levels relative to history in some markets, especially those most impacted by the strong dollar. Parts of northeast Asia still seem to be showing some discount to historical metrics and peers, although weak global trade growth remains a headwind for the region. We still believe we are in a slow-growth world where earnings certainty will be rewarded over potential earnings growth, even more so now after we have seen our margin of safety erode for the more fragile markets. The preference for earnings certainty has been reflected over the last few years in the quality premium noted by many market observers, a premium that is greatly diminished following the recent rally.
6 Semi-Annual Report
| | |
| LETTER TO SHAREHOLDERS, | | |
| |
CONTINUED | | |
| |
Thornburg Developing World Fund | | March 31, 2016 (Unaudited) |
Figure 4 | Global Trade Volume Growth
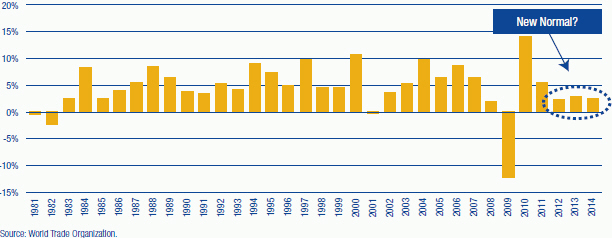
We approach this period of uncertainty by remaining disciplined. In our portfolio construction, we will continue to emphasize diversification across sectors, geographies, market capitalization, as well as style (growth to value). We will also continue to focus on key aspects of the companies we find most attractive:
| | • | | Sound corporate governance and strong management |
| | • | | High or increasing market share of attractive growth markets |
| | • | | Self-funded business model with consistent free cash flow supported by strong returns |
We believe these attributes lead to superior returns over the long run. By limiting the downside in retreating markets, a higher base is created for subsequent rebounds. Over time, the compounding effect of mitigating volatility with high-quality, attractively priced stocks, while participating in rising market tides, has been key to the Fund’s outperformance in the one-, three-, and five-year periods, and since its inception.
Thank you for your trust, confidence, and investing alongside us in Thornburg Developing World Fund.
Sincerely,
| | | | |
 | |  | | |
| Ben Kirby,CFA | | Charlie Wilson,PHD | | |
| Portfolio Manager | | Portfolio Manager | | |
| Managing Director | | Managing Director | | |
The matters discussed in this report may constitute forward-looking statements made pursuant to the safe harbor provisions of the Securities Litigation Reform Act of 1995. These include any advisor or portfolio manager prediction, assessment, analysis or outlook for individual securities, industries, investment styles, market sectors and/or markets. These statements involve risks and uncertainties. In addition to the general risks described for each fund in its current prospectus, other factors bearing on these reports include the accuracy of the advisor’s or portfolio manager’s forecasts and predictions, the appropriateness of the investment strategies designed by the advisor or portfolio manager and the ability of the advisor or portfolio manager to implement their strategies efficiently and successfully. Any one or more of these factors, as well as other risks affecting the securities markets generally, could cause the actual results of any fund to differ materially as compared to its benchmarks.
The views expressed by the portfolio managers reflect their professional opinions and are subject to change. Under no circumstances does the information contained within represent a recommendation to buy or sell any security.
Semi-Annual Report 7
| | |
| PERFORMANCE SUMMARY | | |
| |
Thornburg Developing World Fund | | March 31, 2016 (Unaudited) |
Average Annual Total Returns
| | | | | | | | | | | | | | | | |
| | | 1-YR | | | 3-YR | | | 5-YR | | | SINCE
INCEP. | |
Class A Shares (Incep: 12/16/09) | | | | | | | | | | | | | | | | |
Without sales charge | | | -10.61 | % | | | -3.89 | % | | | 0.13 | % | | | 4.68 | % |
With sales charge | | | -14.65 | % | | | -5.34 | % | | | -0.78 | % | | | 3.92 | % |
Class C Shares (Incep: 12/16/09) | | | | | | | | | | | | | | | | |
Without sales charge | | | -11.25 | % | | | -4.60 | % | | | -0.59 | % | | | 3.96 | % |
With sales charge | | | -12.13 | % | | | -4.60 | % | | | -0.59 | % | | | 3.96 | % |
Class I Shares (Incep: 12/16/09) | | | -10.15 | % | | | -3.46 | % | | | 0.63 | % | | | 5.24 | % |
Class R5 Shares (Incep: 2/1/13) | | | -10.08 | % | | | -3.47 | % | | | — | | | | -2.16 | % |
Class R6 Shares (Incep: 2/1/13) | | | -10.06 | % | | | -3.39 | % | | | — | | | | -2.07 | % |
MSCI Emerging Markets Index (Since 12/16/09) | | | -12.03 | % | | | -4.50 | % | | | -4.13 | % | | | -0.01 | % |
Growth of a Hypothetical $10,000 Investment
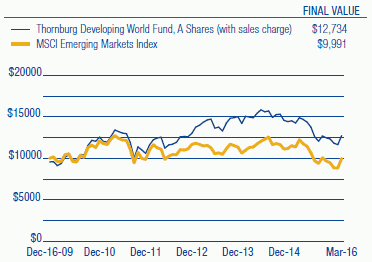
Performance data shown represents past performance and is no guarantee of future results. Investment return and principal value will fluctuate so shares, when redeemed, may be worth more or less than their original cost. Current performance may be lower or higher than quoted. For performance current to the most recent month end, visit thornburg.com or call 800.847.0200. The performance information does not reflect the deduction of taxes that a shareholder would pay on distributions or the redemption of Fund shares. Returns reflect the reinvestment of dividends and capital gains as well as applicable sales charges. Class A shares are sold with a maximum sales charge of 4.50%. Class C shares are subject to a 1% CDSC for the first year only. There is no sales charge for Class I, R5, and R6 shares.
As disclosed in the most recent prospectus, the total annual fund operating expenses are as follows: A shares, 1.53%; C shares, 2.27%; I shares, 1.14%; R5 shares, 1.67%; R6 shares, 1.10%. Thornburg Investment Management and/or Thornburg Securities Corporation have contractually agreed to waive fees and reimburse expenses through at least February 1, 2017, for some of the share classes, resulting in net expense ratios of the following: I shares, 1.09%; R5 shares, 1.09%; R6 shares, 0.99%. For more detailed information on fund expenses and waivers/reimbursements please see the Fund’s prospectus.
From time to time, the Fund may invest in shares of companies through initial public offerings (IPOs). IPOs have the potential to produce substantial gains for the Fund. There is no assurance that the Fund will have continued access to profitable IPOs and, as the Fund’s assets grow, the impact of IPO investments may decline. Therefore, investors should not rely on these past gains as an indication of future performance.
Glossary
MSCI Country Indices – Free float-adjusted market capitalization indices that are designed to measure equity market performance in that specific country in U.S. dollars.
MSCI Emerging Markets (EM) Index – Free float-adjusted market capitalization index that is designed to measure equity market performance of emerging markets. The MSCI Emerging Markets Index consists of the following 23 emerging market country indexes: Brazil, Chile, China, Colombia, Czech Republic, Egypt, Greece, Hungary, India, Indonesia, Korea, Malaysia, Mexico, Peru, Philippines, Poland, Qatar, Russia, South Africa, Taiwan, Thailand, Turkey and United Arab Emirates.
S&P 500 Index – An unmanaged broad measure of the U.S. stock market.
Unless otherwise noted, index returns reflect the reinvestment of income dividends and capital gains, if any, but do not reflect fees, brokerage commissions or other expenses of investing. Investors may not make direct investments into any index. The performance of any index is not indicative of the performance of any particular investment.
Current Account – The sum of the balance of trade (goods and services exports less imports), net income from abroad and net current transfers.
West Texas Intermediate (WTI) – A grade of crude oil used as a benchmark in oil pricing.
P/E – Price/Earnings ratio (P/E ratio) is a valuation ratio of a company’s current share price compared to its per-share earnings. P/E equals a company’s market value per share divided by earnings per share. Forecasted P/E is not intended to be a forecast of the fund’s future performance.
8 Semi-Annual Report
| | |
| FUND SUMMARY | | |
| |
Thornburg Developing World Fund | | March 31, 2016 (Unaudited) |
OBJECTIVES AND STRATEGIES
The Fund seeks long-term capital appreciation. Under normal market conditions the Fund invests at least 80% of its assets in equity securities and debt obligations of developing country issuers. A developing country issuer is a company or sovereign entity that is domiciled or otherwise tied economically to one or more developing countries. The Fund expects that investments in the Fund’s portfolio normally will be weighted in favor of equity securities.
Market Capitalization Exposure
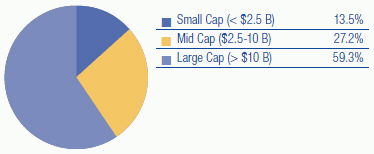
Basket Structure
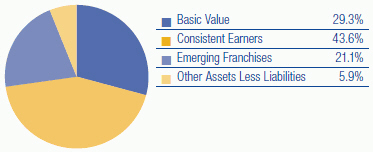
Top Ten Equity Holdings
| | | | |
AIA Group Ltd. | | | 3.5 | % |
Tencent Holdings Ltd. | | | 3.1 | % |
HDFC Bank Ltd. ADR | | | 2.7 | % |
Grupo Financiero Banorte S.A.B. de C.V. | | | 2.5 | % |
Facebook, Inc. | | | 2.4 | % |
Life Healthcare Group Holdings Ltd. | | | 2.4 | % |
Credicorp Ltd. | | | 2.3 | % |
BB Seguridade Participacoes S.A. | | | 2.3 | % |
Kweichow Moutai Co., Ltd. | | | 2.3 | % |
ITC Ltd. | | | 2.2 | % |
There is no guarantee that the Fund will meet its investment objective.
All portfolio information is subject to change. Charts may not add up to 100% due to rounding.
Sector Exposure
| | | | |
Financials | | | 26.5 | % |
Consumer Discretionary | | | 15.9 | % |
Consumer Staples | | | 14.6 | % |
Information Technology | | | 11.5 | % |
Health Care | | | 7.4 | % |
Industrials | | | 7.3 | % |
Energy | | | 3.2 | % |
Telecommunication Services | | | 3.0 | % |
Utilities | | | 3.0 | % |
Miscellaneous | | | 0.9 | % |
Materials | | | 0.7 | % |
Other Assets Less Liabilities | | | 5.9 | % |
Top Ten Industry Groups
| | | | |
Banks | | | 11.1 | % |
Food, Beverage & Tobacco | | | 9.1 | % |
Software & Services | | | 8.6 | % |
Insurance | | | 7.8 | % |
Media | | | 5.5 | % |
Retailing | | | 5.4 | % |
Transportation | | | 4.2 | % |
Real Estate | | | 4.0 | % |
Health Care Equipment & Services | | | 3.9 | % |
Diversified Financials | | | 3.6 | % |
Semi-Annual Report 9
| | |
| FUND SUMMARY, | | |
| |
CONTINUED | | |
| |
Thornburg Developing World Fund | | March 31, 2016 (Unaudited) |
Country Exposure*
(percent of equity holdings)
| | | | |
China | | | 20.6 | % |
India | | | 11.6 | % |
Mexico | | | 8.1 | % |
Hong Kong | | | 7.3 | % |
South Korea | | | 7.2 | % |
Brazil | | | 5.3 | % |
South Africa | | | 4.7 | % |
Philippines | | | 4.5 | % |
United States | | | 4.5 | % |
Taiwan | | | 4.3 | % |
Indonesia | | | 4.1 | % |
United Kingdom | | | 4.0 | % |
Russia | | | 3.8 | % |
Peru | | | 2.5 | % |
Thailand | | | 2.5 | % |
United Arab Emirates | | | 2.2 | % |
Malaysia | | | 1.6 | % |
Saudi Arabia | | | 0.8 | % |
Turkey | | | 0.4 | % |
| * | The country assignment of each equity holding is determined by the Fund’s Advisor based on various factors, including the location of the issuer’s head office, the issuer’s jurisdiction of incorporation and the country from which a majority of the issuer’s revenue is derived. The Advisor may deem certain issuers to be developing country issuers, as defined in the Fund’s prospectus, even if those issuers have country exposure in a developed country. |
10 Semi-Annual Report
| | |
| SCHEDULE OF INVESTMENTS | | |
| |
Thornburg Developing World Fund | | March 31, 2016 (Unaudited) |
| | | | | | | | |
| | | SHARES/
PRINCIPAL AMOUNT | | | VALUE | |
COMMON STOCK — 93.15% | | | | | | | | |
| | |
AUTOMOBILES & COMPONENTS — 1.77% | | | | | | | | |
Auto Components — 1.77% | | | | | | | | |
Delphi Automotive plc | | | 268,766 | | | $ | 20,162,825 | |
| | | | | | | | |
| | | | | | | 20,162,825 | |
| | | | | | | | |
| | |
BANKS — 11.06% | | | | | | | | |
Banks — 11.06% | | | | | | | | |
Credicorp Ltd. | | | 200,071 | | | | 26,211,302 | |
Grupo Financiero Banorte S.A.B. de C.V. | | | 4,970,731 | | | | 28,169,245 | |
HDFC Bank Ltd. ADR | | | 493,541 | | | | 30,416,932 | |
PT Bank Central Asia | | | 25,029,798 | | | | 25,105,303 | |
Siam Commercial Bank plc | | | 3,980,697 | | | | 15,954,470 | |
| | | | | | | | |
| | | | | | | 125,857,252 | |
| | | | | | | | |
| | |
CAPITAL GOODS — 3.14% | | | | | | | | |
Electrical Equipment — 2.18% | | | | | | | | |
Zhuzhou CRRC Times Electric Co., Ltd. | | | 4,263,650 | | | | 24,843,146 | |
Industrial Conglomerates — 0.96% | | | | | | | | |
CJ Corp. | | | 63,639 | | | | 10,879,175 | |
| | | | | | | | |
| | | | | | | 35,722,321 | |
| | | | | | | | |
| | |
CONSUMER DURABLES & APPAREL — 3.21% | | | | | | | | |
Household Durables — 3.21% | | | | | | | | |
Coway Co., Ltd. | | | 289,791 | | | | 24,453,333 | |
Haier Electronics Group Co., Ltd. | | | 6,944,838 | | | | 12,050,187 | |
| | | | | | | | |
| | | | | | | 36,503,520 | |
| | | | | | | | |
| | |
DIVERSIFIED FINANCIALS — 3.63% | | | | | | | | |
Diversified Financial Services — 3.63% | | | | | | | | |
GT Capital Holdings, Inc. | | | 627,624 | | | | 18,946,625 | |
Hong Kong Exchanges & Clearing Ltd. | | | 928,972 | | | | 22,346,056 | |
| | | | | | | | |
| | | | | | | 41,292,681 | |
| | | | | | | | |
| | |
ENERGY — 3.21% | | | | | | | | |
Oil, Gas & Consumable Fuels — 3.21% | | | | | | | | |
NovaTek OAO-GDR Reg S | | | 232,550 | | | | 20,894,618 | |
Reliance Industries Ltd. | | | 988,780 | | | | 15,603,082 | |
| | | | | | | | |
| | | | | | | 36,497,700 | |
| | | | | | | | |
| | |
FOOD & STAPLES RETAILING — 2.32% | | | | | | | | |
Food & Staples Retailing — 2.32% | | | | | | | | |
BGF Retail Co., Ltd. | | | 49,972 | | | | 7,166,324 | |
Magnit PJSC GDR | | | 480,576 | | | | 19,199,011 | |
| | | | | | | | |
| | | | | | | 26,365,335 | |
| | | | | | | | |
| | |
FOOD, BEVERAGE & TOBACCO — 9.07% | | | | | | | | |
Beverages — 2.27% | | | | | | | | |
Kweichow Moutai Co., Ltd. | | | 672,908 | | | | 25,767,270 | |
Food Products — 4.58% | | | | | | | | |
China Mengniu Dairy Co., Ltd. | | | 14,844,931 | | | | 23,652,838 | |
Grupo Lala, S.A.B. de C.V. | | | 4,363,048 | | | | 11,858,943 | |
Ulker Biskuvi Sanayi A.S. | | | 610,305 | | | | 4,526,714 | |
Universal Robina Corp. | | | 2,568,156 | | | | 12,092,002 | |
Tobacco — 2.22% | | | | | | | | |
ITC Ltd. | | | 5,114,323 | | | | 25,292,624 | |
| | | | | | | | |
| | | | | | | 103,190,391 | |
| | | | | | | | |
| | |
HEALTH CARE EQUIPMENT & SERVICES — 3.86% | | | | | | | | |
Health Care Providers & Services — 3.86% | | | | | | | | |
IHH Healthcare Berhad | | | 9,819,422 | | | | 16,510,421 | |
Life Healthcare Group Holdings Ltd. | | | 11,328,370 | | | | 27,377,614 | |
| | | | | | | | |
| | | | | | | 43,888,035 | |
| | | | | | | | |
| | |
HOUSEHOLD & PERSONAL PRODUCTS — 3.25% | | | | | | | | |
Personal Products — 3.25% | | | | | | | | |
AmorePacific Corp. | | | 71,303 | | | | 24,098,119 | |
Grape King Bio Ltd. | | | 2,243,024 | | | | 12,858,499 | |
| | | | | | | | |
| | | | | | | 36,956,618 | |
| | | | | | | | |
Semi-Annual Report 11
| | |
| SCHEDULE OF INVESTMENTS, CONTINUED | | |
| |
Thornburg Developing World Fund | | March 31, 2016 (Unaudited) |
| | | | | | | | |
| | | SHARES/
PRINCIPAL AMOUNT | | | VALUE | |
INSURANCE — 7.75% | | | | | | | | |
Insurance — 7.75% | | | | | | | | |
AIA Group Ltd. | | | 7,084,113 | | | $ | 40,135,712 | |
BB Seguridade Participacoes S.A. | | | 3,148,211 | | | | 26,004,162 | |
Sanlam Ltd. | | | 4,751,913 | | | | 22,044,435 | |
| | | | | | | | |
| | | | | | | 88,184,309 | |
| | | | | | | | |
| | |
MATERIALS — 0.73% | | | | | | | | |
Chemicals — 0.73% | | | | | | | | |
Yanbu National Petrochemical Co. | | | 801,473 | | | | 8,332,404 | |
| | | | | | | | |
| | | | | | | 8,332,404 | |
| | | | | | | | |
| | |
MEDIA — 5.52% | | | | | | | | |
Media — 5.52% | | | | | | | | |
Grupo Televisa, S.A.B. | | | 215,300 | | | | 5,912,138 | |
a IMAX China Holding, Inc. | | | 2,522,906 | | | | 15,171,878 | |
a Liberty Global plc LiLAC | | | 592,369 | | | | 22,438,938 | |
Zee Entertainment Enterprises Ltd. | | | 3,293,260 | | | | 19,250,571 | |
| | | | | | | | |
| | | | | | | 62,773,525 | |
| | | | | | | | |
| | |
PHARMACEUTICALS, BIOTECHNOLOGY & LIFE SCIENCES — 3.54% | | | | | | | | |
Pharmaceuticals — 3.54% | | | | | | | | |
a,b China Animal Healthcare Ltd. | | | 35,787,582 | | | | 3,460,033 | |
Sun Pharmaceutical Industries Ltd. | | | 1,601,562 | | | | 19,978,865 | |
Tasly Pharmaceutical Group Co., Ltd. | | | 2,802,563 | | | | 16,830,284 | |
| | | | | | | | |
| | | | | | | 40,269,182 | |
| | | | | | | | |
| | |
REAL ESTATE — 4.04% | | | | | | | | |
Real Estate Investment Trusts — 2.01% | | | | | | | | |
Fibra Uno Administracion, S.A. de C.V. | | | 9,807,509 | | | | 22,814,167 | |
Real Estate Management & Development — 2.03% | | | | | | | | |
Emaar Properties PJSC | | | 14,088,498 | | | | 23,090,868 | |
| | | | | | | | |
| | | | | | | 45,905,035 | |
| | | | | | | | |
| | |
RETAILING — 5.43% | | | | | | | | |
Internet & Catalog Retail — 2.37% | | | | | | | | |
GS Home Shopping, Inc. | | | 58,268 | | | | 9,461,671 | |
a JD.com, Inc. ADR | | | 657,692 | | | | 17,428,838 | |
Multiline Retail — 3.06% | | | | | | | | |
Matahari Department Store Tbk | | | 13,160,224 | | | | 18,211,924 | |
Robinsons Retail Holdings, Inc. | | | 10,352,568 | | | | 16,637,855 | |
| | | | | | | | |
| | | | | | | 61,740,288 | |
| | | | | | | | |
| | |
SEMICONDUCTORS & SEMICONDUCTOR EQUIPMENT — 1.26% | | | | | | | | |
Semiconductors & Semiconductor Equipment — 1.26% | | | | | | | | |
Hermes Microvision, Inc. | | | 499,820 | | | | 14,287,671 | |
| | | | | | | | |
| | | | | | | 14,287,671 | |
| | | | | | | | |
| | |
SOFTWARE & SERVICES — 8.58% | | | | | | | | |
Information Technology Services — 1.80% | | | | | | | | |
Visa, Inc. | | | 268,500 | | | | 20,534,880 | |
Internet Software & Services — 5.50% | | | | | | | | |
a Facebook, Inc. | | | 243,312 | | | | 27,761,899 | |
Tencent Holdings Ltd. | | | 1,702,175 | | | | 34,779,240 | |
Software — 1.28% | | | | | | | | |
Linx S.A. | | | 1,093,440 | | | | 14,578,592 | |
| | | | | | | | |
| | | | | | | 97,654,611 | |
| | | | | | | | |
| | |
TECHNOLOGY HARDWARE & EQUIPMENT — 1.63% | | | | | | | | |
Electronic Equipment, Instruments & Components — 1.63% | | | | | | | | |
Largan Precision Co., Ltd. | | | 239,862 | | | | 18,594,820 | |
| | | | | | | | |
| | | | | | | 18,594,820 | |
| | | | | | | | |
| | |
TELECOMMUNICATION SERVICES — 3.02% | | | | | | | | |
Diversified Telecommunication Services — 1.12% | | | | | | | | |
Bharti Infratel Ltd. | | | 2,144,880 | | | | 12,696,485 | |
Wireless Telecommunication Services — 1.90% | | | | | | | | |
China Mobile Ltd. | | | 1,943,790 | | | | 21,649,591 | |
| | | | | | | | |
| | | | | | | 34,346,076 | |
| | | | | | | | |
12 Semi-Annual Report
| | |
| SCHEDULE OF INVESTMENTS, CONTINUED | | |
| |
Thornburg Developing World Fund | | March 31, 2016 (Unaudited) |
| | | | | | | | |
| | | SHARES/
PRINCIPAL AMOUNT | | | VALUE | |
TRANSPORTATION — 4.16% | | | | | | | | |
Road & Rail — 1.50% | | | | | | | | |
Kansas City Southern | | | 199,019 | | | $ | 17,006,174 | |
Transportation Infrastructure — 2.66% | | | | | | | | |
Airports of Thailand Public Co., Ltd. | | | 904,568 | | | | 10,336,451 | |
Shanghai International Air Co., Ltd. | | | 4,290,947 | | | | 19,976,562 | |
| | | | | | | | |
| | | | | | | 47,319,187 | |
| | | | | | | | |
| | |
UTILITIES — 2.97% | | | | | | | | |
Electric Utilities — 1.36% | | | | | | | | |
Equatorial Energia SA | | | 1,361,310 | | | | 15,507,421 | |
Water Utilities — 1.61% | | | | | | | | |
CT Environmental Group Ltd. | | | 62,323,152 | | | | 18,237,356 | |
| | | | | | | | |
| | | | | | | 33,744,777 | |
| | | | | | | | |
TOTAL COMMON STOCK (Cost $990,069,468) | | | | | | | 1,059,588,563 | |
| | | | | | | | |
OTHER GOVERNMENT — 0.93% | | | | | | | | |
MISCELLANEOUS — 0.93% | | | | | | | | |
Miscellaneous — 0.93% | | | | | | | | |
Nota do Tesouro Nacional (BRL), 10.00% due 1/1/2021 | | $ | 42,317,000 | | | | 10,589,836 | |
| | | | | | | | |
TOTAL OTHER GOVERNMENT (Cost $9,234,653) | | | | | | | 10,589,836 | |
| | | | | | | | |
SHORT TERM INVESTMENTS — 3.84% | | | | | | | | |
c Thornburg Capital Management Fund | | | 4,372,916 | | | | 43,729,163 | |
| | | | | | | | |
TOTAL SHORT TERM INVESTMENTS (Cost $43,729,163) | | | | | | | 43,729,163 | |
| | | | | | | | |
TOTAL INVESTMENTS — 97.92% (Cost $1,043,033,284) | | | | | | $ | 1,113,907,562 | |
OTHER ASSETS LESS LIABILITIES — 2.08% | | | | | | | 23,627,563 | |
| | | | | | | | |
NET ASSETS — 100.00% | | | | | | $ | 1,137,535,125 | |
| | | | | | | | |
Footnote Legend
| b | Security currently fair valued by the Valuation and Pricing Committee using procedures approved by the Trustees’ Audit Committee. |
| c | Investment in Affiliates – Shown below are holdings of voting securities of each portfolio company which is considered “affiliated” to the Fund under the Investment Company Act of 1940, including companies for which the Fund’s holding represented 5% or more of the company’s voting securities, and a series of the Thornburg Investment Trust in which the Fund invested for cash management purposes during the period: |
| | | | | | | | | | | | | | | | | | | | | | | | | | | | |
ISSUER | | SHARES/PRINCIPAL
SEPTEMBER 30,
2015 | | | GROSS
ADDITIONS | | | GROSS
REDUCTIONS | | | SHARES/PRINCIPAL
MARCH 31,
2016 | | | MARKET VALUE
MARCH 31,
2016 | | | INVESTMENT
INCOME | | | REALIZED
GAIN (LOSS) | |
Thornburg Capital Management Fund | | | 9,917,505 | | | | 27,191,920 | | | | 32,736,509 | | | | 4,372,916 | | | $ | 43,729,163 | | | $ | 125,036 | | | $ | — | |
| | | | | | | | | | | | | | | | | | | | | | | | | | | | |
Total non-controlled affiliated issuers -3.84% of net assets | | | | | | | | | | | $ | 43,729,163 | | | $ | 125,036 | | | $ | — | |
| | | | | | | | | | | | | | | | | | | | | |
Portfolio Abbreviations
To simplify the listings of securities, abbreviations are used per the table below:
| | |
| ADR | | American Depositary Receipt |
| BRL | | Denominated in Brazilian Real |
| GDR | | Global Depository Receipt |
See notes to financial statements.
Semi-Annual Report 13
| | |
| STATEMENT OF ASSETS AND LIABILITIES | | |
| |
Thornburg Developing World Fund | | March 31, 2016 (Unaudited) |
| | | | |
ASSETS | | | | |
Investments at value (cost $1,043,033,284) (Note 2) | | $ | 1,113,907,562 | |
Cash | | | 24,916 | |
Cash denominated in foreign currency (cost $2,242,951) | | | 2,242,951 | |
Receivable for investments sold | | | 27,325,739 | |
Receivable for fund shares sold | | | 9,114,515 | |
Dividends receivable | | | 825,631 | |
Dividend and interest reclaim receivable | | | 379,314 | |
Prepaid expenses and other assets | | | 91,174 | |
| | | | |
Total Assets | | | 1,153,911,802 | |
| | | | |
| |
LIABILITIES | | | | |
Payable for investments purchased | | | 7,454,592 | |
Payable for fund shares redeemed | | | 3,306,590 | |
Unrealized depreciation on forward currency contracts (Note 7) | | | 3,207,126 | |
Payable to investment advisor and other affiliates (Note 3) | | | 1,008,641 | |
Deferred taxes payable | | | 418,574 | |
Accounts payable and accrued expenses | | | 981,094 | |
Dividends payable | | | 60 | |
| | | | |
Total Liabilities | | | 16,376,677 | |
| | | | |
| |
NET ASSETS | | $ | 1,137,535,125 | |
| | | | |
NET ASSETS CONSIST OF | | | | |
Accumulated net investment loss | | $ | (1,008,540 | ) |
Net unrealized appreciation on investments | | | 67,226,238 | |
Accumulated net realized gain (loss) | | | (320,500,404 | ) |
Net capital paid in on shares of beneficial interest | | | 1,391,817,831 | |
| | | | |
| | $ | 1,137,535,125 | |
| | | | |
14 Semi-Annual Report
| | |
| STATEMENT OF ASSETS AND LIABILITIES, CONTINUED |
| |
Thornburg Developing World Fund | | March 31, 2016 (Unaudited) |
| | | | |
NET ASSET VALUE | | | | |
Class A Shares: | | | | |
Net asset value and redemption price per share ($170,373,558 applicable to 10,732,501 shares of beneficial interest outstanding - Note 4) | | $ | 15.87 | |
Maximum sales charge, 4.50% of offering price | | | 0.75 | |
| | | | |
Maximum offering price per share | | $ | 16.62 | |
| | | | |
| |
Class C Shares: | | | | |
Net asset value and offering price per share* ($136,060,974 applicable to 8,934,109 shares of beneficial interest outstanding - Note 4) | | $ | 15.23 | |
| | | | |
| |
Class I Shares: | | | | |
Net asset value, offering and redemption price per share ($804,818,652 applicable to 49,833,671 shares of beneficial interest outstanding - Note 4) | | $ | 16.15 | |
| | | | |
| |
Class R5 Shares: | | | | |
Net asset value, offering and redemption price per share ($5,619,366 applicable to 349,066 shares of beneficial interest outstanding - Note 4) | | $ | 16.10 | |
| | | | |
| |
Class R6 Shares: | | | | |
Net asset value, offering and redemption price per share ($20,662,575 applicable to 1,279,858 shares of beneficial interest outstanding - Note 4) | | $ | 16.14 | |
| | | | |
| * | Redemption price per share is equal to net asset value less any applicable contingent deferred sales charge. |
See notes to financial statements.
Semi-Annual Report 15
| | |
| STATEMENT OF OPERATIONS | | |
| |
Thornburg Developing World Fund | | Six Months Ended March 31, 2016 (Unaudited) |
| | | | |
INVESTMENT INCOME | | | | |
Dividend income (net of foreign taxes withheld of $575,873) | | $ | 5,904,922 | |
Interest income | | | 982,760 | |
| | | | |
Total Income | | | 6,887,682 | |
| | | | |
| |
EXPENSES | | | | |
Investment advisory fees (Note 3) | | | 5,657,046 | |
Administration fees (Note 3) | | | | |
Class A Shares | | | 113,704 | |
Class C Shares | | | 88,660 | |
Class I Shares | | | 214,445 | |
Class R5 Shares | | | 1,358 | |
Distribution and service fees (Note 3) | | | | |
Class A Shares | | | 226,519 | |
Class C Shares | | | 708,888 | |
Transfer agent fees | | | | |
Class A Shares | | | 187,025 | |
Class C Shares | | | 144,637 | |
Class I Shares | | | 549,732 | |
Class R5 Shares | | | 9,821 | |
Class R6 Shares | | | 3,478 | |
Registration and filing fees | | | | |
Class A Shares | | | 20,658 | |
Class C Shares | | | 11,359 | |
Class I Shares | | | 52,035 | |
Class R5 Shares | | | 12,471 | |
Class R6 Shares | | | 12,557 | |
Custodian fees (Note 3) | | | 422,125 | |
Professional fees | | | 39,585 | |
Accounting fees (Note 3) | | | 36,941 | |
Trustee fees | | | 28,255 | |
Other expenses | | | 113,825 | |
| | | | |
Total Expenses | | | 8,655,124 | |
Less: | | | | |
Investment advisory fees waived by investment advisor (Note 3) | | | (324,249 | ) |
Expenses reimbursed by investment advisor (Note 3) | | | (426,714 | ) |
| | | | |
Net Expenses | | | 7,904,161 | |
| | | | |
Net Investment Loss | | $ | (1,016,479 | ) |
| | | | |
16 Semi-Annual Report
| | |
| STATEMENT OF OPERATIONS, CONTINUED | | |
| |
Thornburg Developing World Fund | | Six Months Ended March 31, 2016 (Unaudited) |
| | | | |
REALIZED AND UNREALIZED GAIN (LOSS) | | | | |
Net realized gain (loss) from: | | | | |
Investments | | $ | (65,554,929 | ) |
Forward currency contracts (Note 7) | | | (170,807 | ) |
Foreign currency transactions | | | (1,710,235 | ) |
| | | | |
| | | (67,435,971 | ) |
| | | | |
Net change in unrealized appreciation (depreciation) on: | | | | |
Investments (net of change in deferred taxes payable of $403,751) | | | 136,389,964 | |
Forward currency contracts (Note 7) | | | 1,179,748 | |
Foreign currency translations | | | 6,156 | |
| | | | |
| | | 137,575,868 | |
| | | | |
Net Realized and Unrealized Gain | | | 70,139,897 | |
| | | | |
Net Increase in Net Assets Resulting from Operations | | $ | 69,123,418 | |
| | | | |
See notes to financial statements.
Semi-Annual Report 17
| | |
| STATEMENTS OF CHANGES IN NET ASSETS | | |
| |
Thornburg Developing World Fund | | |
| | | | | | | | |
| | | SIX MONTHS ENDED | | | YEAR ENDED | |
| | | MARCH 31, 2016* | | | SEPTEMBER 30, 2015 | |
INCREASE (DECREASE) IN NET ASSETS FROM | | | | | | | | |
| | |
OPERATIONS | | | | | | | | |
Net investment income (loss) | | $ | (1,016,479 | ) | | $ | 9,495,705 | |
Net realized gain (loss) from investments, forward currency contracts, and foreign currency transactions | | | (67,435,971 | ) | | | (178,080,350 | ) |
Net unrealized appreciation (depreciation) on investments, forward currency contracts, forward currency translations, and deferred taxes | | | 137,575,868 | | | | (235,638,599 | ) |
| | | | | | | | |
| | |
Net Increase (Decrease) in Net Assets Resulting from Operations | | | 69,123,418 | | | | (404,223,244 | ) |
| | |
DIVIDENDS TO SHAREHOLDERS | | | | | | | | |
From net investment income | | | | | | | | |
Class A Shares | | | — | | | | (305,746 | ) |
Class I Shares | | | (556,972 | ) | | | (7,517,677 | ) |
Class R5 Shares | | | (3,949 | ) | | | (39,389 | ) |
Class R6 Shares | | | (16,516 | ) | | | (178,462 | ) |
| | |
FUND SHARE TRANSACTIONS (NOTE 4) | | | | | | | | |
Class A Shares | | | (46,563,179 | ) | | | (194,862,909 | ) |
Class C Shares | | | (26,007,474 | ) | | | (35,907,758 | ) |
Class I Shares | | | (262,406,455 | ) | | | (1,052,861,620 | ) |
Class R5 Shares | | | 5,300 | | | | (677,452 | ) |
Class R6 Shares | | | (1,580,256 | ) | | | 3,921,323 | |
| | | | | | | | |
Net Decrease in Net Assets | | | (268,006,083 | ) | | | (1,692,652,934 | ) |
| | |
NET ASSETS | | | | | | | | |
Beginning of Period | | | 1,405,541,208 | | | | 3,098,194,142 | |
| | | | | | | | |
| | |
End of Period | | $ | 1,137,535,125 | | | $ | 1,405,541,208 | |
| | | | | | | | |
Undistributed (distribution in excess of) net investment income | | $ | (1,008,540 | ) | | $ | 585,376 | |
See notes to financial statements.
18 Semi-Annual Report
| | |
| NOTES TO FINANCIAL STATEMENTS | | |
| |
Thornburg Developing World Fund | | March 31, 2016 (Unaudited) |
NOTE 1 – ORGANIZATION
Thornburg Developing World Fund (the “Fund”) is a diversified series of Thornburg Investment Trust (the “Trust”). The Fund commenced operations on December 16, 2009. The Trust was organized as a Massachusetts business trust under a Declaration of Trust dated June 3, 1987 and is registered as a diversified, open-end management investment company under the Investment Company Act of 1940, as amended. The Fund is currently one of twenty separate series of the Trust. Each series is considered to be a separate entity for financial reporting and tax purposes and bears expenses directly attributable to it. The Fund seeks long-term capital appreciation.
The Fund currently offers five classes of shares of beneficial interest: Class A, Class C, Institutional Class (“Class I”) and Retirement Classes (“Class R5” and “Class R6”). Each class of shares of the Fund represents an interest in the same portfolio of investments, except that (i) Class A shares are sold subject to a front-end sales charge collected at the time the shares are purchased and bear a service fee, (ii) Class C shares are sold at net asset value without a sales charge at the time of purchase, but are subject to a contingent deferred sales charge upon redemption within one year of purchase, and bear both a service fee and a distribution fee, (iii) Class I and Class R5 shares are sold at net asset value without a sales charge at the time of purchase and may be subject to a service fee, (iv) Class R6 shares are sold at net asset value without a sales charge at the time of purchase, and (v) the respective classes may have different reinvestment privileges and conversion rights. Additionally, the Fund may allocate among its classes certain expenses, to the extent allocable to specific classes, including transfer agent fees, government registration fees, certain printing and postage costs, and administrative and legal expenses. Currently, class specific expenses of the Fund are limited to service and distribution fees, administration fees, and certain registration and transfer agent expenses.
NOTE 2 – SIGNIFICANT ACCOUNTING POLICIES
The following is a summary of significant accounting policies followed by the Fund in the preparation of its financial statements. The Fund is an investment company and prepares its financial statements in conformity with United States generally accepted accounting principles (“GAAP”), including investment company accounting and reporting guidance in the Financial Accounting Standards Board (the “FASB”) Accounting Standard Codification Topic 946. The preparation of financial statements in conformity with GAAP requires management to make estimates and assumptions that affect the reported amounts of assets and liabilities and disclosure of contingent assets and liabilities at the date of the financial statements and the reported amounts of increases (decreases) in net assets from operations during the reporting period. Actual results could differ from those estimates.
Significant accounting policies of the Trust are as follows:
Valuation Policy and Procedures: The Trustees of the Trust have appointed Thornburg Investment Management, Inc., the Trust’s investment advisor, the (“Advisor”), to assist the Trustees in obtaining market values for portfolio investments, perform certain evaluation and supervisory functions respecting professional pricing service providers appointed by the Trustees’ Audit Committee (the “Audit Committee”) to assist in determining fair values for portfolio investments, assist in calculating fair values for portfolio investments in certain circumstances, and to perform other functions in connection with the valuation of investments. The Advisor acts through its Valuation and Pricing Committee (the “Committee”) and other employees of the Advisor. The Committee regularly reviews its own valuation calculations, as well as the valuations, valuation techniques and services furnished by pricing service providers, considers circumstances which may require valuation calculations by the Committee, and reviews previous valuation calculations. The Committee reports to the Audit Committee on the Committee’s activities, the performance of pricing service providers, and other matters relating to valuation of portfolio investments.
In those instances when the Committee assists in calculating a fair value for a portfolio investment, the Committee seeks to determine the price that the Fund would reasonably expect to receive upon a sale of the investment in an orderly transaction between market participants on the valuation date. The Committee customarily utilizes quotations from securities broker dealers in calculating valuations, but also may utilize prices obtained from pricing service providers or other methods approved by the Audit Committee. Because fair values calculated by the Committee are estimates, the calculation of a value for an investment may differ from the price that would be realized by the Fund upon a sale of the investment, and the difference could be material to the Fund’s financial statements. The Committee’s calculation of a fair value for an investment may also differ from the prices obtained by other persons (including other mutual funds) for the investment.
Valuation of Investments: Securities and other portfolio investments which are listed or traded on a United States securities exchange are valued at the last reported sale price on the valuation date. Investments listed or traded on an exchange for which there has been no sale that day are valued at the mean between the last reported bid and asked prices on that valuation date. Portfolio investments reported by NASDAQ are valued at the official closing price on the valuation date. If an investment is traded on more than one exchange, the investment is considered traded on the exchange that is normally the primary market for that investment. Securities and other portfolio investments which are listed or traded on exchanges outside the United States are valued at the last price or the closing price of the investment on the exchange that is normally the primary market for the investment, as of the close of the exchange preceding the Fund’s valuation date. Foreign investments listed or traded on an exchange for which there has been no sale that day are valued at the mean between the last reported bid and asked prices on that valuation date.
Semi-Annual Report 19
| | |
| NOTES TO FINANCIAL STATEMENTS, CONTINUED | | |
| |
Thornburg Developing World Fund | | March 31, 2016 (Unaudited) |
In any case when a market quotation is not readily available for a portfolio investment ordinarily valued by market quotation, the Committee calculates a fair value for the investment using alternative methods approved by the Audit Committee. A market quotation is not readily available when the primary market or exchange for the investment is not open for the entire scheduled day of trading. Market quotations for an investment also may not be readily available if developments after the most recent close of the investment’s primary exchange or market, but prior to the close of business on any Fund business day, or an unusual event or significant period of time occurring since the availability of a market quotation, create a serious question concerning the reliability of the most recent market quotation available for the investment. In particular, on days when market volatility thresholds established by the Audit Committee are exceeded, foreign equity investments held by the Fund may be valued using alternative methods. The Committee customarily obtains valuations in these instances from pricing service providers approved by the Audit Committee. Pricing service providers ordinarily calculate valuations using multi-factor models to adjust market prices based upon various inputs, including exchange data, depository receipt prices, futures, index data and other data.
Debt obligations held by the Fund which are not listed or traded on exchanges or for which no reported market exists are ordinarily valued at the valuation obtained from a pricing service provider approved by the Audit Committee.
In any case when a pricing service provider fails to provide a valuation for a debt obligation held by the Fund, the Committee calculates a fair value for the obligation using alternative methods under procedures approved by the Audit Committee. Additionally, in cases when management believes that a valuation obtained from a pricing service provider merits review for significant reasons, the Committee decides whether or not to use the valuation calculated by the pricing service provider or to use an alternative method approved by the Audit Committee to calculate a fair value for the obligation.
Quotations for foreign investments expressed in foreign currency amounts are converted to U.S. dollar equivalents using a foreign exchange quotation from a third party service provider at the time of valuation. Foreign investments held by the Fund may be traded on days and at times when the Fund is not open for business. Consequently, the value of Fund investments may be significantly affected on days when shareholders cannot purchase or sell Fund shares. Futures contracts and other financial and derivative instruments traded on an exchange are valued at the latest published price for the instrument on its primary exchange. Listed options are valued at the last bid price.
Valuation Measurements: The Fund categorizes its investments based upon the inputs used in valuing those investments, according to a three-level hierarchy established in guidance from the FASB. Categorization of investments using this hierarchy is intended by the FASB to maximize the use of observable inputs in valuing investments and minimize the use of unobservable inputs by requiring that the most observable inputs be used when available. Observable inputs are those that market participants would use in valuing an investment based on available market information. Unobservable inputs are those that reflect assumptions about the information market participants would use in valuing an investment. An investment’s level within the hierarchy is based on the lowest level input that is deemed significant to the valuation. The methodologies and inputs used to value investments are not necessarily indications of the risk or liquidity associated with those investments.
Various inputs are used in calculating valuations for the Fund’s investments. These inputs are generally summarized according to the three-level hierarchy below:
Level 1: Quoted prices in active markets for identical investments.
Level 2: Other direct or indirect significant observable inputs (including quoted prices for similar investments in active markets and other observable inputs, such as interest rates, prepayment rates, credit risk, etc.).
Level 3: Significant unobservable inputs (including the Committee’s own assumptions in calculating the fair values of investments).
Valuations for debt obligations held by the Fund are typically calculated by pricing service providers approved by the Audit Committee and are characterized as Level 2 within the valuation hierarchy.
On days when market volatility thresholds established by the Audit Committee are exceeded, foreign securities for which valuations are obtained from pricing service providers are fair valued. On these days, the foreign securities are characterized as Level 2 within the valuation hierarchy and revert to Level 1 after the threshold is no longer exceeded.
In a limited number of cases the Committee calculates a fair value for investments using broker quotations or other methods approved by the Audit Committee. When the Committee uses a single broker quotation to calculate a fair value for an investment without other significant observable inputs, or if a fair value is calculated using other significant inputs that are considered unobservable, the investment is characterized as Level 3 within the hierarchy. Other significant unobservable inputs used to calculate a fair value in these instances might include an income-based valuation approach which considers discounted anticipated future cash flows from the investment, and application of discounts due to the nature or duration of any restrictions on the disposition of the investment.
Valuations based upon the use of inputs from Levels 1, 2 or 3 may not represent the actual price received upon the disposition of an investment, and the Fund may receive a price that is lower than the valuation based upon these inputs when it sells the investment.
20 Semi-Annual Report
| | |
| NOTES TO FINANCIAL STATEMENTS, CONTINUED | | |
| |
Thornburg Developing World Fund | | March 31, 2016 (Unaudited) |
The following table displays a summary of the fair value hierarchy measurements of the Fund’s investments as of March 31, 2016. In any instance when valuation inputs from more than one level are used to determine the fair value of a specific investment, the investment is placed in the level of the table based upon the lowest level input that is significant in determining the fair value of the investment:
| | | | | | | | | | | | | | | | |
| | | FAIR VALUE MEASUREMENTS AT MARCH 31, 2016 | |
| | | TOTAL | | | LEVEL 1 | | | LEVEL 2 | | | LEVEL 3(a) | |
Assets | | | | | | | | | | | | | | | | |
Investments in Securities* | | | | | | | | | | | | | | | | |
Common Stock(b) | | $ | 1,059,588,563 | | | $ | 1,029,837,609 | | | $ | 26,290,921 | | | $ | 3,460,033 | |
Other Government | | | 10,589,836 | | | | — | | | | 10,589,836 | | | | — | |
Short Term Investments | | | 43,729,163 | | | | 43,729,163 | | | | — | | | | — | |
| | | | | | | | | | | | | | | | |
Total Investments in Securities | | $ | 1,113,907,562 | | | $ | 1,073,566,772 | | | $ | 36,880,757 | | | $ | 3,460,033 | |
| | | | |
Liabilities | | | | | | | | | | | | | | | | |
Other Financial Instruments** | | | | | | | | | | | | | | | | |
Forward Currency Contracts | | $ | (3,207,126 | ) | | $ | — | | | $ | (3,207,126 | ) | | $ | — | |
Spot Currency | | $ | (61,818 | ) | | $ | (61,818 | ) | | $ | — | | | $ | — | |
| * | See Schedule of Investments for a summary of the industry exposure as grouped according to the Global Industry Classification Standard (GICS), which is an industry taxonomy developed by MSCI, Inc. and Standard & Poor’s (S&P). |
| ** | Other Financial Instruments include investments not reflected in the Schedule of Investments, which may include futures, forwards and swap contracts, which are valued at the unrealized appreciation (depreciation) on the investment. |
| (a) | In accordance with the guidance prescribed in Accounting Standards Update (“ASU”) No. 2011-04, a fair value determination was applied to a portfolio security characterized as a Level 3 investment at March 31, 2016. The valuation technique and unobservable inputs used to value this portfolio security was the application of a discount to the valuation determined by the Valuation and Pricing Committee due to a halt in trading of the security and lack of information, as well as illiquidity. |
| (b) | At March 31, 2016, industry classifications for Common Stock in Levels 2 and 3 consist of $15,954,470 in Banks, $3,460,033 in Pharmaceuticals, Biotechnology and Life Sciences and $10,336,451 in Transportation. |
In accordance with the guidance prescribed in ASU No. 2011-04, it is the policy of the Fund to recognize transfers between levels and those underlying events which caused the movement. The Fund recognized no transfers between levels for the six months ended March 31, 2016, other than when the Fund exceeded market volatility thresholds for foreign equity investments during the period.
A rollforward of fair value measurements using significant unobservable inputs (Level 3) for the six months ended March 31, 2016 is as follows:
| | | | | | | | |
| | | COMMON
STOCK | | | TOTAL(c) | |
Beginning Balance 9/30/2015 | | $ | 2,355,625 | | | $ | 2,355,625 | |
Accrued Discounts (Premiums) | | | — | | | | — | |
Net Realized Gain (Loss)(a) | | | (428,351 | ) | | | (428,351 | ) |
Gross Purchases | | | — | | | | — | |
Gross Sales | | | (92,896 | ) | | | (92,896 | ) |
Net Change in Unrealized Appreciation (Depreciation)(b) | | | 1,625,655 | | | | 1,625,655 | |
Transfers into Level 3 | | | — | | | | — | |
Transfers out of Level 3 | | | — | | | | — | |
| | | | | | | | |
Ending Balance 3/31/2016 | | $ | 3,460,033 | | | $ | 3,460,033 | |
| (a) | Amount of net realized gain (loss) from investments recognized in income is included in the Fund’s Statement of Operations for the six months ended March 31, 2016. |
| (b) | Amount of net change in unrealized appreciation (depreciation) on investments recognized in income is included in the Fund’s Statement of Operations for the six months ended March 31, 2016, and includes $1,625,655 of the net change in unrealized appreciation (depreciation) attributable to securities owned at March 31, 2016, which were valued using significant unobservable inputs. |
| (c) | Level 3 investments represent 0.30% of total net assets at the six months ended March 31, 2016. Significant fluctuations of the unobservable inputs applied to portfolio investments characterized as Level 3 could be expected to increase or decrease the fair value of these portfolio investments. |
Foreign Currency Translation: Portfolio investments and other assets and liabilities denominated in foreign currencies are translated into U.S. dollars based on the exchange rate of such currencies against the U.S. dollar on the date of valuation. Purchases and sales of investments and income items denominated in foreign currencies are translated into U.S. dollars at the exchange rate in effect on the transaction date. When the Fund purchases or sells foreign investments, it will customarily enter into a foreign exchange contract to minimize foreign exchange risk from the trade date to the settlement date of such transactions. The values of such spot contracts are included in receivable for investments sold and payable for investments purchased on the Statement of Assets and Liabilities.
Semi-Annual Report 21
| | |
| NOTES TO FINANCIAL STATEMENTS, CONTINUED | | |
| |
Thornburg Developing World Fund | | March 31, 2016 (Unaudited) |
The Fund does not separately report the effect of changes in foreign exchange rates from changes in market prices on investments held. Such changes are included in net unrealized appreciation (depreciation) from investments.
Reported net realized gains and losses from foreign currency transactions arise due to purchases and sales of foreign currencies, currency gains and losses realized between the trade and settlement dates on investment transactions and the difference between the amounts of dividends, interest, and foreign withholding taxes recorded on the Fund’s books, and the U.S. dollar equivalent of the amounts actually received or paid.
Net change in unrealized appreciation (depreciation) on foreign currency translations arise from changes in the fair value of assets and liabilities, other than investments at period end, resulting from changes in exchange rates.
Foreign Withholding Taxes: The Fund is subject to foreign tax withholding imposed by certain foreign countries in which the Fund may invest. Withholding taxes are incurred on certain foreign dividends and are accrued at the time the dividend is recognized based on applicable foreign tax law. The Fund files withholding tax reclaims in certain jurisdictions to recover a portion of amounts previously withheld, in view of various considerations, including recent decisions rendered by the courts in those and other jurisdictions. The Fund would expect to record a receivable for such a reclaim based on a variety of factors, including assessments of a jurisdiction’s legal obligation to pay reclaims, the jurisdiction’s administrative practices and payment history, and industry convention. To date the Fund has recorded no such receivable because there is limited precedent for collecting such prior year reclaims and the likelihood of collection remains uncertain.
Deferred Foreign Capital Gain Taxes: The Fund is subject to a tax imposed on net realized gains of securities of certain foreign countries. The Fund records an estimated deferred tax liability for net unrealized gains on these investments as reflected in the accompanying financial statements.
Federal Income Taxes: It is the policy of the Trust to comply with the provisions of the Internal Revenue Code applicable to “regulated investment companies” and to distribute to shareholders substantially all taxable income, including any net realized gain on investments of the Fund. Therefore, no provision for federal income taxes is required.
Management reviews each uncertain tax position believed to be material to the preparation of the Fund’s financial statements, to assess if it is more likely than not that the position would be sustained upon examination, based upon the technical merits of the position. As of March 31, 2016, management has not identified any such position for which an asset or liability must be reflected in the Statement of Assets and Liabilities. The Fund’s tax returns remain subject to examination for three years after filing.
When-Issued and Delayed Delivery Transactions: The Fund may engage in when-issued or delayed delivery transactions. To the extent the Fund engages in such transactions, it will do so for the purpose of acquiring portfolio investments consistent with the Fund’s investment objectives and not for the purpose of investment leverage or to speculate on interest rate and, or market changes. At the time the Fund makes a commitment to purchase an investment on a when-issued or delayed delivery basis, the Fund will record the transaction and reflect the value in determining its net asset value. When effecting such transactions, assets of an amount sufficient to make payment for the portfolio investments to be purchased will be segregated on the Fund’s records on the trade date. Investments purchased on a when-issued or delayed delivery basis do not earn interest until the settlement date.
Dividends: Dividends to shareholders, if any, are generally paid quarterly and are reinvested in additional shares of the Fund at net asset value per share at the close of business on the dividend payment date or, at the shareholder’s option, paid in cash. Net realized capital gains, to the extent available, will be distributed at least annually.
Repurchase Agreements: The Fund may invest excess cash in repurchase agreements whereby the Fund purchases investments, which serve as collateral, with an agreement to resell such collateral to the seller at an agreed upon price at the maturity date of the repurchase agreement. Investments pledged as collateral for repurchase agreements are held in custody until maturity of the repurchase agreement. Provisions in the agreements require that the market value of the collateral is at least equal to the repurchase value in the event of default. In the event of default, the Fund has the right to liquidate the collateral and apply the proceeds in satisfaction of the obligation. Under certain circumstances, in the event of default or bankruptcy by the other party to the agreement, realization and/or retention of the collateral may be subject to legal proceedings.
General: Investment transactions are accounted for on a trade date basis. Interest income is accrued as earned and dividend income is recorded on the ex-dividend date. Certain income from foreign investments is recognized as soon as information is available to the Fund. Realized gains and losses from the sale of investments are recorded on an identified cost basis. Net investment income (other than class specific expenses) and realized and unrealized gains and losses are allocated daily to each class of shares based upon the relative net asset value of outstanding shares of each class of shares at the beginning of the day (after adjusting for the current share activity of the respective class). Expenses common to all Funds are allocated among the Funds comprising the Trust based upon their relative net asset values or other appropriate allocation methods.
22 Semi-Annual Report
| | |
| NOTES TO FINANCIAL STATEMENTS, CONTINUED | | |
| |
Thornburg Developing World Fund | | March 31, 2016 (Unaudited) |
Guarantees and Indemnifications: Under the Trust’s organizational documents (and under separate agreements with the independent Trustees), its officers and Trustees are indemnified against certain liabilities arising out of the performance of their duties to the Fund. Additionally, in the normal course of business the Trust enters into contracts with service providers that contain general indemnification clauses. The Trust’s maximum exposure under these arrangements is unknown. However, based on experience, the Trust expects the risk of loss to be remote.
NOTE 3 – INVESTMENT ADVISORY FEE AND OTHER TRANSACTIONS WITH AFFILIATES
Pursuant to an investment advisory agreement, the Advisor serves as the investment advisor and performs services for the Fund for which the fees are payable at the end of each month. For the six months ended March 31, 2016, these fees were payable at annual rates ranging from .975 of 1% to .775 of 1% per annum of the average daily net assets of the Fund depending on the Fund’s asset size. The Fund pays to the Advisor the costs of personnel who perform certain accounting services for the Fund. For the six months ended March 31, 2016 the Fund paid $36,941 to the Advisor for these accounting services. The Trust has also entered into administrative service agreements with the Advisor, whereby the Advisor will perform certain administrative services for the shareholders of each class of the Fund’s shares (except for Class R6 shares, which do not have an administrative services agreement) and for which fees will be payable at an annual rate of up to .125 of 1% per annum of the average daily net assets attributable to each class of shares.
The Trust has an underwriting agreement with Thornburg Securities Corporation (the “Distributor”), an affiliate of the Advisor, which acts as the distributor of the Fund’s shares. For the six months ended March 31, 2016, the Distributor has advised the Fund that it earned commissions aggregating $11,016 from the sale of Class A shares, and collected contingent deferred sales charges aggregating $1,481 from net redemptions of Class C shares of the Fund.
Pursuant to a service plan under Rule 12b-1 of the Investment Company Act of 1940, the Fund may reimburse to the Advisor an amount not to exceed .25 of 1% per annum of the average daily net assets attributable to each class of shares of the Fund (except for Class R6 shares, which do not have a Rule 12b-1 service plan) for payments made by the Advisor to securities dealers and other financial institutions to obtain various shareholder and distribution related services. For the six months ended March 31, 2016, there were no 12b-1 service plan fees charged for Class I or Class R5 shares. The Advisor may pay out of its own resources additional expenses for distribution of the Fund’s shares and shareholder services.
The Trust has also adopted a distribution plan pursuant to Rule 12b-1, applicable only to the Fund’s Class C shares under which the Fund compensates the Distributor for services in promoting the sale of Class C shares of the Fund at an annual rate of up to .75 of 1% per annum of the average daily net assets attributable to Class C shares. Total fees incurred by each class of shares of the Fund under their respective service and distribution plans for the six months ended March 31, 2016, are set forth in the Statement of Operations.
The Advisor and Distributor have contractually agreed to waive fees and reimburse expenses incurred by the Fund so that actual expenses of certain share classes do not exceed levels as specified in the Fund’s most recent prospectus. The agreement may be terminated by the Fund at any time, but may not be terminated by the Advisor or Distributor before February 1, 2017, unless the Advisor ceases to be the investment advisor to the Trust or the Distributor ceases to be the distributor of the Fund prior to that date. The Advisor and Distributor retain the right to be repaid by the Fund for fee waivers and expense reimbursements if expenses fall below the contractual limit prior to the end of the fiscal year.
For the six months ended March 31, 2016, the Advisor voluntarily waived Fund level investment advisory fees of $48,860 for Class A shares, $38,098 for Class C shares, $230,373 for Class I shares, $1,459 for Class R5 shares and $5,459 for Class R6 shares. The Advisor voluntarily reimbursed certain class specific expenses, administrative fees, and distribution fees of $1,693 for Class A shares and $2,945 for Class C shares. The Advisor contractually reimbursed certain class specific expenses, administrative fees, and distribution fees of $385,121 for Class I shares, $20,906 for Class R5 shares and $16,049 for Class R6 shares.
Certain officers and Trustees of the Trust are also officers or directors of the Advisor and Distributor. The compensation of independent Trustees is borne by the Trust.
The Fund may purchase or sell securities from or to an affiliated fund, provided the affiliation is due solely to having a common investment advisor, common officers, or common trustees, and provided that all such transactions will comply with Rule 17a-7 under the 1940 Act. For the six months ended March 31, 2016, the Fund had no transactions with affiliated funds.
Semi-Annual Report 23
| | |
| NOTES TO FINANCIAL STATEMENTS, CONTINUED | | |
| |
Thornburg Developing World Fund | | March 31, 2016 (Unaudited) |
NOTE 4 – SHARES OF BENEFICIAL INTEREST
At March 31, 2016, there were an unlimited number of shares with no par value of beneficial interest authorized. Transactions in shares of beneficial interest were as follows:
| | | | | | | | | | | | | | | | |
| | | SIX MONTHS ENDED | | | YEAR ENDED | |
| | | MARCH 31, 2016 (UNAUDITED) | | | SEPTEMBER 30, 2015 (AUDITED) | |
| | | SHARES | | | AMOUNT | | | SHARES | | | AMOUNT | |
Class A Shares | | | | | | | | | | | | | | | | |
Shares sold | | | 2,019,031 | | | $ | 30,907,134 | | | | 6,122,531 | | | $ | 109,999,302 | |
Shares issued to shareholders in reinvestment of dividends | | | — | | | | — | | | | 19,021 | | | | 288,166 | |
Shares repurchased | | | (5,075,297 | ) | | | (77,470,313 | ) | | | (17,017,940 | ) | | | (305,150,377 | ) |
| | | | | | | | | | | | | | | | |
| | | | |
Net increase (decrease) | | | (3,056,266 | ) | | $ | (46,563,179 | ) | | | (10,876,388 | ) | | $ | (194,862,909 | ) |
| | | | | | | | | | | | | | | | |
| | | | |
Class C Shares | | | | | | | | | | | | | | | | |
Shares sold | | | 620,255 | | | $ | 9,109,005 | | | | 2,635,964 | | | $ | 46,044,059 | |
Shares issued to shareholders in reinvestment of dividends | | | — | | | | — | | | | — | | | | — | |
Shares repurchased | | | (2,390,102 | ) | | | (35,116,479 | ) | | | (4,826,475 | ) | | | (81,951,817 | ) |
| | | | | | | | | | | | | | | | |
| | | | |
Net increase (decrease) | | | (1,769,847 | ) | | $ | (26,007,474 | ) | | | (2,190,511 | ) | | $ | (35,907,758 | ) |
| | | | | | | | | | | | | | | | |
| | | | |
Class I Shares | | | | | | | | | | | | | | | | |
Shares sold | | | 15,020,856 | | | $ | 230,818,763 | | | | 58,044,611 | | | $ | 1,065,967,200 | |
Shares issued to shareholders in reinvestment of dividends | | | 32,820 | | | | 515,929 | | | | 437,693 | | | | 6,877,427 | |
Shares repurchased | | | (31,832,255 | ) | | | (493,741,147 | ) | | | (117,474,718 | ) | | | (2,125,706,247 | ) |
| | | | | | | | | | | | | | | | |
| | | | |
Net increase (decrease) | | | (16,778,579 | ) | | $ | (262,406,455 | ) | | | (58,992,414 | ) | | $ | (1,052,861,620 | ) |
| | | | | | | | | | | | | | | | |
| | | | |
Class R5 Shares | | | | | | | | | | | | | | | | |
Shares sold | | | 85,909 | | | $ | 1,323,667 | | | | 251,105 | | | $ | 4,536,726 | |
Shares issued to shareholders in reinvestment of dividends | | | 252 | | | | 3,949 | | | | 2,544 | | | | 39,389 | |
Shares repurchased | | | (89,517 | ) | | | (1,322,316 | ) | | | (295,282 | ) | | | (5,253,567 | ) |
| | | | | | | | | | | | | | | | |
| | | | |
Net increase (decrease) | | | (3,356 | ) | | $ | 5,300 | | | | (41,633 | ) | | $ | (677,452 | ) |
| | | | | | | | | | | | | | | | |
| | | | |
Class R6 Shares | | | | | | | | | | | | | | | | |
Shares sold | | | 296,502 | | | $ | 4,563,394 | | | | 1,107,694 | | | $ | 20,345,235 | |
Shares issued to shareholders in reinvestment of dividends | | | 1,029 | | | | 16,169 | | | | 9,657 | | | | 150,167 | |
Shares repurchased | | | (397,892 | ) | | | (6,159,819 | ) | | | (938,665 | ) | | | (16,574,079 | ) |
| | | | | | | | | | | | | | | | |
| | | | |
Net increase (decrease) | | | (100,361 | ) | | $ | (1,580,256 | ) | | | 178,686 | | | $ | 3,921,323 | |
| | | | | | | | | | | | | | | | |
NOTE 5 – INVESTMENT TRANSACTIONS
For the six months ended March 31, 2016, the Fund had purchase and sale transactions of investments (excluding short-term investments) of $483,944,885 and $781,292,619, respectively.
NOTE 6 – INCOME TAXES
At March 31, 2016, information on the tax components of capital was as follows:
| | | | |
Cost of investments for tax purposes | | $ | 1,043,033,284 | |
| | | | |
Gross unrealized appreciation on a tax basis | | $ | 131,673,808 | |
Gross unrealized depreciation on a tax basis | | | (60,799,530 | ) |
| | | | |
Net unrealized appreciation (depreciation) on investments (tax basis) | | $ | 70,874,278 | |
| | | | |
24 Semi-Annual Report
| | |
| NOTES TO FINANCIAL STATEMENTS, CONTINUED | | |
| |
Thornburg Developing World Fund | | March 31, 2016 (Unaudited) |
At March 31, 2016, the Fund had deferred tax basis capital losses occurring subsequent to October 31, 2014 through September 30, 2015 of $179,997,843. For tax purposes, such losses will be recognized in the year ending September 30, 2016.
At March 31, 2016, the Fund had cumulative tax basis capital losses of $72,973,025, (of which $56,834,022 are short-term and $16,139,003 are long-term) generated after September 30, 2011, which may be carried forward to offset future capital gains. To the extent such carryforwards are used, capital gain distributions may be reduced to the extent provided by regulations. Such capital loss carryforwards do not expire.
NOTE 7 – DERIVATIVE FINANCIAL INSTRUMENTS WITH OFF-BALANCE SHEET RISK AND FOREIGN INVESTMENT RISK
The Fund may use a variety of derivative financial instruments to hedge or adjust the risks affecting its investment portfolio or to enhance investment returns. Provisions of the FASB Accounting Standards Codification 815-10-50 (“ASC 815”) require certain disclosures. The disclosures are intended to provide users of financial statements with an understanding of the use of derivative instruments by the Fund and how these derivatives affect the financial position, financial performance and cash flows of the Fund. The Fund does not designate any derivative instruments as hedging instruments under ASC 815. During the six months ended March 31, 2016, the Fund’s principal exposure to derivative financial instruments of the type addressed by ASC 815 was investment in foreign exchange contracts. A foreign exchange contract is an agreement between two parties to exchange different currencies at a specified rate of exchange at an agreed upon future date. Foreign exchange contracts involve risks to the Fund, including the risk that a contract’s counterparty will not meet its obligations to the Fund, the risk that a change in a contract’s value may not correlate perfectly with the currency the contract was intended to track, and the risk that the Fund’s Advisor is unable to correctly implement its strategy in using a contract. In any such instance, the Fund may not achieve the intended benefit of entering into a contract, and may experience a loss.
The Fund entered into forward currency contracts during the six months ended March 31, 2016 in the normal course of pursuing its investment objectives, with the objective of purchasing foreign investments or with the intent of reducing the risk to the value of the Fund’s foreign investments from adverse changes in the relationship between the U.S. dollar and foreign currencies. In each case these contracts have been initiated in conjunction with foreign investment transactions.
These contracts are accounted for by the Fund under ASC 815. Unrealized appreciation and depreciation on outstanding contracts are reported in the Fund’s Statement of Assets and Liabilities, as measured by the difference between the forward exchange rates at the reporting date and the forward exchange rates at each contract’s inception date. Net realized gain (loss) on contracts closed during the period, and changes in net unrealized appreciation (depreciation) on outstanding contracts are recognized in the Fund’s Statement of Operations.
The quarterly average value of open sell currency contracts for the six months ended March 31, 2016 was $289,918,393. Open buy currency contracts are entered into for the purpose of closing open sell currency contracts and the values are dependent upon the values of the open sell currency contracts to which they relate.
The following table displays the outstanding forward currency contracts at March 31, 2016:
| | | | | | | | | | | | | | | | | | | | | | |
OUTSTANDING FORWARD CURRENCY CONTRACTS TO BUY OR SELL AT MARCH 31, 2016 | |
| CONTRACT DESCRIPTION | | BUY/SELL | | CONTRACT
AMOUNT | | | CONTRACT
VALUE
DATE | | | VALUE USD | | | UNREALIZED APPRECIATION | | | UNREALIZED DEPRECIATION | |
Chinese Yuan Renminbi | | Sell | | | 666,949,200 | | | | 02/16/2017 | | | | 101,355,440 | | | $ | — | | | $ | (3,207,126 | ) |
| | | | | | | | | | | | | | | | | | | | | | |
Total | | | | | | | | | | | | | | | | $ | — | | | $ | (3,207,126 | ) |
| | | | | | | | | | | | | | | | | | | | | | |
Net unrealized appreciation (depreciation) | | | | | | | | | | | | | | | | | | | | $ | (3,207,126 | ) |
| | | | | | | | | | | | | | | | | | | | | | |
The outstanding forward currency contracts in the foregoing table were entered into with State Street Bank and Trust Company (“SSB”), pursuant to an International Swaps and Derivatives Association (“ISDA”) Master Agreement. In the event of a default or termination under the ISDA Master Agreement with SSB, the non-defaulting party has the right to close out all outstanding forward currency contracts between the parties and to net any payment amounts under those contracts, resulting in a single net amount payable by one party to the other.
Because the ISDA Master Agreement with SSB does not result in an offset of reported amounts of financial assets and liabilities in the Fund’s Statement of Assets and Liabilities unless there has been an event of default or termination event under that agreement, the Fund does not net its outstanding forward currency contracts for purposes of the disclosure in the Fund’s Statement of Assets and Liabilities. Instead the Fund recognizes the unrealized appreciation or depreciation on those forward currency contracts on a gross basis in the Fund’s Statement of Assets and Liabilities.
Semi-Annual Report 25
| | |
| NOTES TO FINANCIAL STATEMENTS, CONTINUED | | |
| |
Thornburg Developing World Fund | | March 31, 2016 (Unaudited) |
The unrealized appreciation (depreciation) of the outstanding forward currency contracts recognized in the Fund’s Statement of Assets and Liabilities at March 31, 2016 is disclosed in the following table:
| | | | | | |
FAIR VALUES OF DERIVATIVE FINANCIAL INSTRUMENTS AT MARCH 31, 2016 | |
| LIABILITY DERIVATIVES | | BALANCE SHEET LOCATION | | FAIR VALUE | |
Foreign exchange contracts | | Liabilities - Unrealized depreciation on forward currency contracts | | $ | (3,207,126 | ) |
Because the Fund does not currently receive or post cash collateral in connection with its currency forward contracts, and because all of the Fund’s outstanding currency forward contracts are with SSB, the net amounts of the Fund’s assets and liabilities which are attributable to those contracts at March 31, 2016 can be determined by offsetting the dollar amounts shown in the preceding table. Based on those amounts, the net amount of the Fund’s assets which is attributable to its outstanding forward currency contracts at March 31, 2016 is $0, and the net amount of the Fund’s liabilities which is attributable to those contracts at that date is $3,207,126. The Fund’s forward currency contracts are valued each day, and the net amounts of the Fund’s assets and liabilities which are attributable to those contracts are expected to vary over time.
The net realized gain (loss) from forward currency contracts and the net change in unrealized appreciation (depreciation) of outstanding forward currency contracts recognized in the Fund’s Statement of Operations for the six months ended March 31, 2016 are disclosed in the following tables:
| | | | | | | | | | |
| NET REALIZED GAIN (LOSS) ON DERIVATIVE FINANCIAL INSTRUMENTS | |
RECOGNIZED IN INCOME FOR THE SIX MONTHS ENDED MARCH 31, 2016 | |
| | | TOTAL | | | | | FORWARD CURRENCY CONTRACTS | |
Foreign exchange contracts | | $ | (170,807 | ) | | | | $ | (170,807 | ) |
|
| NET CHANGE IN UNREALIZED APPRECIATION (DEPRECIATION) OF DERIVATIVE FINANCIAL INSTRUMENTS | |
RECOGNIZED IN INCOME FOR THE SIX MONTHS ENDED MARCH 31, 2016 | |
| | | TOTAL | | | | | FORWARD CURRENCY CONTRACTS | |
Foreign exchange contracts | | $ | 1,179,748 | | | | | $ | 1,179,748 | |
OTHER NOTES
Risks: The Fund’s investments subject it to risks including, but not limited to, management risk, market and economic risk, risks affecting specific issuers, liquidity risk, the risks associated with investments in small- and mid-cap companies and non-U.S. issuers (including developing country issuers), credit risk, and interest rate risk. Please see the Fund’s prospectus for a discussion of the risks associated with an investment in the Fund.
Subsequent Events: Fund management believes no events have occurred between March 31, 2016 and the date of issuance of the financial statements that require adjustment to or disclosure in the accompanying financial statements.
26 Semi-Annual Report
This page intentionally left blank.
Semi-Annual Report 27
FINANCIAL HIGHLIGHTS
Thornburg Developing World Fund
| | | | | | | | | | | | | | | | | | | | | | | | | | | | | | | | | | | | | | | | | | | | | | | | | | | | | | |
| | | PER SHARE PERFORMANCE (FOR A SHARE OUTSTANDING THROUGHOUT THE PERIOD) | | RATIOS TO AVERAGE NET ASSETS | | | SUPPLEMENTAL DATA | |
UNLESS
OTHERWISE
NOTED,
PERIODS
ARE
FISCAL
YEARS
ENDED
SEPT. 30, | | NET ASSET
VALUE
BEGINNING
OF PERIOD | | | NET
INVESTMENT
INCOME
(LOSS)+ | | | NET
REALIZED
&
UNREALIZED
GAIN (LOSS)
ON
INVESTMENTS | | | TOTAL FROM
INVESTMENT
OPERATIONS | | | DIVIDENDS
FROM NET
INVESTMENT
INCOME | | | DIVIDENDS
FROM NET
REALIZED
GAINS | | TOTAL
DIVIDENDS | | | NET
ASSET
VALUE
END
OF
PERIOD | | NET
INVESTMENT
INCOME
(LOSS)
(%) | | | EXPENSES,
AFTER
EXPENSE
REDUCTIONS
(%) | | | EXPENSES,
AFTER
EXPENSE
REDUCTIONS
AND
NET OF
CUSTODY
CREDITS (%) | | | EXPENSES,
BEFORE
EXPENSE
REDUCTIONS
(%) | | | TOTAL
RETURN
(%)(a) | | | PORTFOLIO
TURNOVER
RATE (%)(a) | | NET
ASSETS
AT END
OF
PERIOD
(THOUSANDS) | |
CLASS A SHARES | | | | | | | | | | | | | | | | | | | | | | | | | | | | | | | | | | | | | | | | | | | |
2016(b)(c) | | $ | 15.03 | | | | (0.03 | ) | | | 0.87 | | | | 0.84 | | | | — | | | — | | | — | | | $15.87 | | | (0.45 | )(d) | | | 1.59 | (d) | | | 1.59 | (d) | | | 1.65 | (d) | | | 5.59 | | | 41.84 | | $ | 170,373 | |
2015(c) | | $ | 18.61 | | | | 0.02 | | | | (3.58 | ) | | | (3.56 | ) | | | (0.02 | ) | | — | | | (0.02 | ) | | $15.03 | | | 0.14 | | | | 1.53 | | | | 1.53 | | | | 1.53 | | | | (19.12 | ) | | 96.74 | | $ | 207,282 | |
2014(c) | | $ | 17.77 | | | | 0.03 | | | | 0.81 | | | | 0.84 | | | | — | | | — | | | — | | | $18.61 | | | 0.15 | | | | 1.45 | | | | 1.45 | | | | 1.45 | | | | 4.73 | | | 61.46 | | $ | 459,121 | |
2013(c) | | $ | 15.71 | | | | 0.01 | | | | 2.06 | | | | 2.07 | | | | (0.01 | ) | | — | | | (0.01 | ) | | $17.77 | | | 0.05 | | | | 1.48 | | | | 1.48 | | | | 1.59 | | | | 13.19 | | | 61.67 | | $ | 347,073 | |
2012(c) | | $ | 12.50 | | | | (0.01 | ) | | | 3.22 | | | | 3.21 | | | | — | | | — | | | — | | | $15.71 | | | (0.05 | ) | | | 1.69 | | | | 1.69 | | | | 1.85 | | | | 25.68 | | | 129.49 | | $ | 39,390 | |
2011(c) | | $ | 14.44 | | | | (0.01 | ) | | | (1.91 | ) | | | (1.92 | ) | | | (0.02 | ) | | — | | | (0.02 | ) | | $12.50 | | | (0.05 | ) | | | 1.63 | | | | 1.62 | | | | 1.89 | | | | (13.34 | ) | | 129.15 | | $ | 24,929 | |
CLASS C SHARES | | | | | | | | | | | | | | | | | | | | | | | | | | | | | | | | | | | | | | | | | | | |
2016(b) | | $ | 14.48 | | | | (0.09 | ) | | | 0.84 | | | | 0.75 | | | | — | | | — | | | — | | | $15.23 | | | (1.18 | )(d) | | | 2.33 | (d) | | | 2.33 | (d) | | | 2.39 | (d) | | | 5.18 | | | 41.84 | | $ | 136,061 | |
2015 | | $ | 18.03 | | | | (0.09 | ) | | | (3.46 | ) | | | (3.55 | ) | | | — | | | — | | | — | | | $14.48 | | | (0.55 | ) | | | 2.27 | | | | 2.27 | | | | 2.27 | | | | (19.69 | ) | | 96.74 | | $ | 154,943 | |
2014 | | $ | 17.34 | | | | (0.11 | ) | | | 0.80 | | | | 0.69 | | | | — | | | — | | | — | | | $18.03 | | | (0.62 | ) | | | 2.23 | | | | 2.23 | | | | 2.23 | | | | 3.98 | | | 61.46 | | $ | 232,493 | |
2013 | | $ | 15.44 | | | | (0.12 | ) | | | 2.02 | | | | 1.90 | | | | — | | | — | | | — | | | $17.34 | | | (0.71 | ) | | | 2.26 | | | | 2.26 | | | | 2.40 | | | | 12.31 | | | 61.67 | | $ | 106,168 | |
2012 | | $ | 12.37 | | | | (0.11 | ) | | | 3.18 | | | | 3.07 | | | | — | | | — | | | — | | | $15.44 | | | (0.76 | ) | | | 2.38 | | | | 2.38 | �� | | | 2.86 | | | | 24.82 | | | 129.49 | | $ | 10,006 | |
2011 | | $ | 14.39 | | | | (0.11 | ) | | | (1.90 | ) | | | (2.01 | ) | | | (0.01 | ) | | — | | | (0.01 | ) | | $12.37 | | | (0.74 | ) | | | 2.34 | | | | 2.34 | | | | 2.89 | | | | (13.96 | ) | | 129.15 | | $ | 7,258 | |
CLASS I SHARES | | | | | | | | | | | | | | | | | | | | | | | | | | | | | | | | | | | | | | | | | | | |
2016(b) | | $ | 15.27 | | | | — | (e) | | | 0.89 | | | | 0.89 | | | | (0.01 | ) | | — | | | (0.01 | ) | | $16.15 | | | 0.05 | (d) | | | 1.09 | (d) | | | 1.09 | (d) | | | 1.23 | (d) | | | 5.83 | | | 41.84 | | $ | 804,819 | |
2015 | | $ | 18.92 | | | | 0.10 | | | | (3.65 | ) | | | (3.55 | ) | | | (0.10 | ) | | — | | | (0.10 | ) | | $15.27 | | | 0.52 | | | | 1.09 | | | | 1.09 | | | | 1.14 | | | | (18.75 | ) | | 96.74 | | $ | 1,016,898 | |
2014 | | $ | 18.05 | | | | 0.10 | | | | 0.84 | | | | 0.94 | | | | (0.07 | ) | | — | | | (0.07 | ) | | $18.92 | | | 0.54 | | | | 1.09 | | | | 1.09 | | | | 1.09 | | | | 5.20 | | | 61.46 | | $ | 2,376,420 | |
2013 | | $ | 15.96 | | | | 0.09 | | | | 2.09 | | | | 2.18 | | | | (0.09 | ) | | — | | | (0.09 | ) | | $18.05 | | | 0.52 | | | | 1.04 | | | | 1.04 | | | | 1.22 | | | | 13.74 | | | 61.67 | | $ | 828,147 | |
2012 | | $ | 12.62 | | | | 0.08 | | | | 3.26 | | | | 3.34 | | | | — | | | — | | | — | | | $15.96 | | | 0.57 | | | | 1.09 | | | | 1.09 | | | | 1.45 | | | | 26.47 | | | 129.49 | | $ | 53,103 | |
2011 | | $ | 14.52 | | | | 0.09 | | | | (1.96 | ) | | | (1.87 | ) | | | (0.03 | ) | | — | | | (0.03 | ) | | $12.62 | | | 0.55 | | | | 1.04 | | | | 1.04 | | | | 1.47 | | | | (12.89 | ) | | 129.15 | | $ | 27,019 | |
CLASS R5 SHARES | | | | | | | | | | | | | | | | | | | | | | | | | | | | | | | | | | | | | | | | | | | |
2016(b) | | $ | 15.22 | | | | — | (e) | | | 0.89 | | | | 0.89 | | | | (0.01 | ) | | — | | | (0.01 | ) | | $16.10 | | | 0.06 | (d) | | | 1.09 | (d) | | | 1.09 | (d) | | | 1.91 | (d) | | | 5.86 | | | 41.84 | | $ | 5,619 | |
2015 | | $ | 18.86 | | | | 0.12 | | | | (3.65 | ) | | | (3.53 | ) | | | (0.11 | ) | | — | | | (0.11 | ) | | $15.22 | | | 0.66 | | | | 1.09 | | | | 1.09 | | | | 1.67 | | | | (18.72 | ) | | 96.74 | | $ | 5,363 | |
2014 | | $ | 18.04 | | | | 0.13 | | | | 0.80 | | | | 0.93 | | | | (0.11 | ) | | — | | | (0.11 | ) | | $18.86 | | | 0.67 | | | | 1.09 | | | | 1.09 | | | | 1.90 | | | | 5.17 | | | 61.46 | | $ | 7,433 | |
2013(f) | | $ | 17.49 | | | | 0.08 | | | | 0.47 | | | | 0.55 | | | | — | | | — | | | — | | | $18.04 | | | 0.47 | (d) | | | 1.07 | (d) | | | 1.07 | (d) | | | 17.45 | (d)(g) | | | 3.14 | | | 61.67 | | $ | 697 | |
CLASS R6 SHARES | | | | | | | | | | | | | | | | | | | | | | | | | | | | | | | | | | | | | | | | | | | |
2016(b) | | $ | 15.25 | | | | 0.01 | | | | 0.89 | | | | 0.90 | | | | (0.01 | ) | | — | | | (0.01 | ) | | $16.14 | | | 0.15 | (d) | | | 0.99 | (d) | | | 0.99 | (d) | | | 1.20 | (d) | | | 5.92 | | | 41.84 | | $ | 20,663 | |
2015 | | $ | 18.91 | | | | 0.15 | | | | (3.68 | ) | | | (3.53 | ) | | | (0.13 | ) | | — | | | (0.13 | ) | | $15.25 | | | 0.84 | | | | 0.99 | | | | 0.99 | | | | 1.10 | | | | (18.68 | ) | | 96.74 | | $ | 21,055 | |
2014 | | $ | 18.08 | | | | 0.11 | | | | 0.84 | | | | 0.95 | | | | (0.12 | ) | | — | | | (0.12 | ) | | $18.91 | | | 0.57 | | | | 0.99 | | | | 0.99 | | | | 1.10 | | | | 5.26 | | | 61.46 | | $ | 22,727 | |
2013(f) | | $ | 17.51 | | | | 0.04 | | | | 0.53 | | | | 0.57 | | | | — | | | — | | | — | | | $18.08 | | | 0.20 | (d) | | | 0.98 | (d) | | | 0.98 | (d) | | | 1.99 | (d) | | | 3.26 | | | 61.67 | | $ | 14,422 | |
| (a) | Not annualized for periods less than one year. |
| (b) | Unaudited Six Month Period Ended March 31. |
| (c) | Sales loads are not reflected in computing total return. |
| (e) | Net investment income (loss) was less than $0.01 per share. |
| (f) | Effective date of this class of shares was February 1, 2013. |
| (g) | Due to the size of net assets and fixed expenses, ratios may appear disproportionate. |
| + | Based on weighted average shares outstanding. |
See notes to financial statements.
| | | | |
| 28 Semi-Annual Report | | | | Semi-Annual Report 29 |
| | |
| EXPENSE EXAMPLE | | |
| |
Thornburg Developing World Fund | | March 31, 2016 (Unaudited) |
As a shareholder of the Fund, you incur two types of costs:
| | (1) | transaction costs, including |
(a) sales charges (loads) on purchase payments, for Class A shares;
(b) a deferred sales charge on redemptions of any part or all of a purchase of $1 million of Class A shares within 12 months of purchase;
(c) a deferred sales charge on redemptions of Class C shares within 12 months of purchase;
| | (2) | ongoing costs, including management fees; distribution and/or service (12b-1) fees; and other Fund expenses. |
This example is intended to help you understand your ongoing costs (in dollars) of investing in the Fund and to compare these costs with the ongoing costs of investing in other mutual funds.
The example is based on a $1,000 investment beginning on October 1, 2015, and held until March 31, 2016.
ACTUAL EXPENSES
For each class of shares, the first line of the accompanying table provides information about actual account values and actual expenses. You may use the information in this line, together with the amount you invested, to estimate the expenses that you paid over the period. Simply divide your account value by $1,000 (for example, an $8,600 account value divided by $1,000 = 8.6), then multiply the result by the number in the first line for your class of shares under the heading entitled “Expenses Paid During Period” to estimate the expenses you paid on your account during this period.
| | | | | | | | | | | | |
| | | BEGINNING | | | ENDING | | | EXPENSES PAID | |
| | | ACCOUNT VALUE | | | ACCOUNT VALUE | | | DURING PERIOD† | |
| | | 10/1/15 | | | 3/31/16 | | | 10/1/15–3/31/16 | |
CLASS A SHARES | | | | | | | | | | | | |
Actual | | $ | 1,000.00 | | | $ | 1,055.90 | | | $ | 8.17 | |
Hypothetical* | | $ | 1,000.00 | | | $ | 1,017.05 | | | $ | 8.02 | |
CLASS C SHARES | �� | | | | | | | | | | | |
Actual | | $ | 1,000.00 | | | $ | 1,051.80 | | | $ | 11.95 | |
Hypothetical* | | $ | 1,000.00 | | | $ | 1,013.35 | | | $ | 11.73 | |
CLASS I SHARES | | | | | | | | | | | | |
Actual | | $ | 1,000.00 | | | $ | 1,058.30 | | | $ | 5.61 | |
Hypothetical* | | $ | 1,000.00 | | | $ | 1,019.55 | | | $ | 5.50 | |
CLASS R5 SHARES | | | | | | | | | | | | |
Actual | | $ | 1,000.00 | | | $ | 1,058.60 | | | $ | 5.62 | |
Hypothetical* | | $ | 1,000.00 | | | $ | 1,019.54 | | | $ | 5.51 | |
CLASS R6 SHARES | | | | | | | | | | | | |
Actual | | $ | 1,000.00 | | | $ | 1,059.20 | | | $ | 5.09 | |
Hypothetical* | | $ | 1,000.00 | | | $ | 1,020.05 | | | $ | 5.00 | |
| † | Expenses are equal to the annualized expense ratio for each class (A: 1.59%; C: 2.33%; I: 1.09%; R5: 1.09%; R6: 0.99%;) multiplied by the average account value over the period, multiplied by 183/366 to reflect the one-half year period. |
| * | Hypothetical assumes a rate of return of 5% per year before expenses. |
HYPOTHETICAL EXAMPLE FOR COMPARISON PURPOSES
For each class of shares, the second line of the accompanying table provides information about hypothetical account values and hypothetical expenses based on the Fund’s actual expense ratio and an assumed rate of return of 5% per year before expenses, which is not the Fund’s actual return. The hypothetical account values and expenses may not be used to estimate the actual ending account balance or expenses you paid for the period. You may use this information to compare the ongoing costs of investing in the Fund and other funds. To do so, compare this 5% hypothetical example with the 5% hypothetical examples that appear in the shareholder reports of the other funds.
Please note that the expenses shown in the table are meant to highlight your ongoing costs only and do not reflect any transactional costs, such as sales charges (loads), redemption fees, or exchange fees. Therefore, the second line of the table for each class of shares is useful in comparing ongoing costs only, and will not help you determine the relative total costs of owning different funds. In addition, if these transactional costs were included, your costs would have been higher.
30 Semi-Annual Report
| | |
| OTHER INFORMATION | | |
| |
Thornburg Developing World Fund | | March 31, 2016 (Unaudited) |
PORTFOLIO PROXY VOTING
Policies and Procedures:
The Trust has delegated to Thornburg Investment Management, Inc. (the “Advisor”) voting decisions respecting proxies for the Fund’s voting securities. The Advisor makes voting decisions in accordance with its Proxy Voting Policy and Procedures. A description of the Policy and Procedures is available (i) without charge, upon request, by calling the Advisor toll-free at 1-800-847-0200, (ii) on the Thornburg website at www.thornburg.com, and (iii) on the Securities and Exchange Commission’s website at www.sec.gov.
Information regarding how proxies were voted is available on or before August 31 of each year for the twelve months ending the preceding June 30. This information is available (i) without charge, upon request by calling the Advisor toll-free at 1-800-847-0200, (ii) on the Thornburg website at www.thornburg.com, and (iii) on the Securities and Exchange Commission’s website at www.sec.gov.
AVAILABILITY OF QUARTERLY PORTFOLIO SCHEDULE
The Fund files with the Securities and Exchange Commission schedules of its portfolio holdings on Form N-Q for the first and third quarters of each fiscal year. The Fund’s Forms N-Q are available on the Commission’s website at www.sec.gov, or may be reviewed and copied at the Commission’s Public Reference Room in Washington, D.C. Information on the operation of the Public Reference Room may be obtained by calling 1-800-SEC-0330. The Fund also makes this information available on its website at www.thornburg. com/download or upon request by calling 1-800-847-0200.
Semi-Annual Report 31
TRUSTEES’ STATEMENT TO SHAREHOLDERS
Revised and Readopted September 15, 2015
The Trustees believe current and prospective shareholders should know how we discharge our responsibilities in supervising the Fund’s investment advisor and in reviewing the advisor’s contract for renewal. Since 2005, we have issued a statement which sets out clearly the three principal guidelines that we follow in supervising the Trust’s investment advisor on your behalf. In accordance with our customary practice, in September of 2015 we again reviewed our statement and concluded we should reissue this statement outlining the principal features of our supervision of the advisor’s performance of investment management services for the Funds.
We begin with the premise that each shareholder selected his or her Fund because its investments are managed by the investment advisor identified in the prospectus and in accordance with the objective and policies described in the prospectus. We realize, as each of you do, that if you believe that your Fund’s stated objective and policies no longer serve your personal investment goals, you can sell your shares and leave the Fund.
Therefore, we believe that our primary supervisory task–our principal obligation to you–is to assess the nature and quality of the advisor’s services, and to confirm that the advisor actively and competently pursues the Fund’s objective, in accordance with the policies set out in the prospectus. To do this, we meet regularly with management to review your Fund’s portfolio and to discuss the advisor’s specific actions and judgments in pursuing the Fund’s objective. We do not substitute our own judgment for the advisor’s decisions in selecting investments; the advisor is paid to exercise its informed judgment on investment decisions, and we seek to confirm, in reviewing the advisor’s performance, that the advisor is doing just that.
Second, we are conscious of costs and the effect that costs have on shareholders’ returns. We try to make sure that your Fund’s fees and costs are reasonable in relationship to the services rendered and that they are generally in line with those charged by other expert investment advisors, consistent with our belief that the Fund’s investors searched for and expect that expertise and attention and have decided to pay a reasonable price for it. We do not put the management contract “out to bid” as a matter of course, and we would not do so unless we had concluded that the advisor materially had failed to pursue the Fund’s objectives in accordance with its policies, or for other equally important reasons. We believe that any other approach would be inconsistent with your interests and contrary to your expectations when you bought shares of the Fund in the first place.
Finally, because we believe that most Thornburg Fund shareholders have invested with a long-term perspective, we try not to focus too much on the fashions of the moment and on short-term performance. The market will not favor any specific investment objective or set of policies at all times and under all economic circumstances. A fund will experience periods of both high and low returns relative to other funds and other investments. Even if one of our Funds is not favored by the market at a particular time, we believe that the advisor is nonetheless obliged to remain true to the Fund’s objective and policies, and we watch to see that it does so.
Trustees of Thornburg Investment Trust
32 Semi-Annual Report
Thornburg Investment Management is a privately-owned global investment firm that offers a range of solutions for retail and institutional investors. Founded in 1982 and headquartered in Santa Fe, New Mexico, we manage approximately $54 billion (as of March 31, 2016) across eight equity and 11 bond mutual funds, separate accounts for high-net-worth investors and institutional accounts, and five UCITS funds for non-U.S. investors.
The fund outlined in this report is one of many equity and fixed-income products available from Thornburg Investment Management.
EQUITY FUNDS
| | • | | Thornburg Core Growth Fund |
| | • | | Thornburg International Value Fund |
| | • | | Thornburg Better World International Fund |
| | • | | Thornburg International Growth Fund |
| | • | | Thornburg Developing World Fund |
| | • | | Thornburg Investment Income Builder Fund |
| | • | | Thornburg Global Opportunities Fund |
FIXED INCOME FUNDS
| | • | | Thornburg Low Duration Income Fund |
| | • | | Thornburg Limited Term U.S. Government Fund |
| | • | | Thornburg Limited Term Income Fund |
| | • | | Thornburg Strategic Income Fund |
| | • | | Thornburg Low Duration Municipal Fund |
| | • | | Thornburg Limited Term Municipal Fund |
| | • | | Thornburg Intermediate Municipal Fund |
| | • | | Thornburg California Limited Term Municipal Fund |
| | • | | Thornburg New Mexico Intermediate Municipal Fund |
| | • | | Thornburg New York Intermediate Municipal Fund |
| | • | | Thornburg Strategic Municipal Income Fund |
Before investing, carefully consider the Fund’s investment goals, risks, charges, and expenses. For a prospectus or summary prospectus containing this and other information, contact your financial advisor or visit thornburg.com. Read it carefully before investing.
For additional information, please visit thornburg.com
Thornburg Investment Management, Inc. 2300 North Ridgetop Road, Santa Fe, NM 87506
Semi-Annual Report 33
This page intentionally left blank.
34 Semi-Annual Report
This page intentionally left blank.
Semi-Annual Report 35

This Semi-Annual Report is submitted for the general information of shareholders of the Fund. It is not authorized for distribution to prospective investors in the Fund unless preceded or accompanied by an effective prospectus.
| | | | |
| Investment Advisor: | | Distributor: | | |
| Thornburg Investment Management® | | Thornburg Securities Corporation® | | |
| 800.847.0200 | | 800.847.0200 | | TH2148 |

2 Semi-Annual Report
Semi-Annual Report
Thornburg Better World International Fund
March 31, 2016
| | | | |
SHARE CLASS | | NASDAQ SYMBOL | | CUSIP |
Class A | | TBWAX | | 885-216-721 |
Class C | | TBWCX | | 885-216-713 |
Class I | | TBWIX | | 885-216-697 |
Class I shares may not be available to all investors. Minimum investments for Class I shares may be higher than those for other classes.
Investments carry risks, including possible loss of principal. Additional risks may be associated with investments outside the United States, especially in emerging markets, including currency fluctuations, illiquidity, volatility, and political and economic risks. Investments in small- and mid-capitalization companies may increase the risk of greater price fluctuations. Investments in the Fund are not FDIC insured, nor are they bank deposits or guaranteed by a bank or any other entity.
Funds invested in a smaller number of holdings may expose an investor to greater volatility.
Semi-Annual Report 3
| | |
| LETTER TO SHAREHOLDERS | | |
| |
Thornburg Better World International Fund | | March 31, 2016 (Unaudited) |
April 22, 2016
Dear Fellow Shareholder:
The market volatility that greeted Thornburg Better World International Fund when it debuted last September returned with greater intensity at the beginning of January. Renewed concerns about the start of monetary tightening in the U.S., tighter financial conditions in Europe and decelerating growth in China and emerging markets more generally hit market sentiment and hurt risk assets, from stocks to high yield bonds and commodities. But the Fund started 2016 strongly, thanks to the conservative nature of the portfolio, outperforming our benchmark by three percentage points over the first three tumultuous weeks of the year. That reflects, we believe, the Fund’s focus on attractively priced stocks of quality companies with solid business models, strong growth prospects and high standards of corporate governance, environmental impact and social responsibility.
While we were pleased to see the downside protection work as intended, the Fund has lagged the rebound in risk assets since early February, as U.S. Federal Reserve monetary guidance turned more dovish, the European Central Bank surprised markets with greater-than-expected stimulus and Chinese economic data beat expectations. Global stocks then rallied, led by commodities and industrials—volatile and cyclical sectors in which we have less exposure. As long-term investors, we aim to take advantage of market volatility to opportunistically upgrade the portfolio, rather than chase rallies that appear driven more by central bank policy and fund flows than company-specific fundamentals. By mitigating downside pressure through its quality tilt and defensive construction, the Fund can create a higher base off which to compound returns over time, hopefully leading to outperformance with less volatility over the long run.
Thornburg Better World International Fund’s net asset value (A shares without sales charge) rose 0.24% in the first quarter of 2016, and in the six months since its inception on September 30, 2015, returned 4.36%, outperforming the MSCI All Country (AC) World ex-U.S. Index’s 0.38% loss in the first quarter and 2.86% gain in the first half of its current fiscal year, respectively. Stock selection accounted for all the outperformance, while effects from currency and, to a marginal extent, allocation were drags.
Top performers over the last six months were Sundrug Co., Premium Brands Holdings and Copa Holdings. Japan’s Sundrug benefitted from its drug and discount store formats, which continue to gain market share while serving the needs of an aging domestic demographic and tourists. Canadian specialty foods retail and foodservice provider Premium Brands saw accelerating growth from serving new, quick-service restaurant customers and further geographic expansion of its core premium natural foods business. Based in Panama, regional air carrier Copa was lifted by early signs of economic recovery in Latin America.
The bottom performers for the six-month period were Bank of Ireland, Italy’s Intesa Sanpaolo and UBS. All three financial stocks were hit by worries that low or negative deposit rates in Europe will hurt net interest margins and profitability, not to mention expanding regulatory capital requirements. Given those macroeconomic and regulatory considerations, our weighting to the financial sector is nearly nine percentage points less than the benchmark’s, and much of our exposure is in non-bank financials, which helps reduce correlations with commercial banking stocks.
We’re bottom-up investors striving to stay on top of innovation and emerging trends across sectors in our focused yet diversified portfolio. Innovative, disruptive companies are oftentimes fast-growing enterprises, with multiples that may screen poorly for traditional value investors. We’re value investors, but not in the traditional sense of low price-to-book or price-to-earnings ratios. Rather, we consider growth an integral component of value, and consider valuation multiples against what we assess to be a stock’s intrinsic appreciation prospects. Is the market accurately assessing the future earnings potential from innovations in the business model of a non-bank financial, or a consumer staple, or a power utility? It’s a critical question for investors who value a margin of safety, particularly when those business models are changing as a result of innovation and structural shifts in an industry.
For example, the business models of traditional power utilities are undergoing radical changes as regulatory initiatives favor cleaner inputs—renewables such as solar and wind generation—over carbon- and even nuclear-based generation. The days of prescribed investment returns for inefficient electricity providers enjoying a captive client base thanks to a geographic monopoly may be numbered. Utilities that adopt new technologies such as solar and manage them efficiently stand to benefit, increasingly without government subsidies. That’s because the marginal cost of solar and wind is zero. And as the scale of utility-installed solar and wind generation units expands, it undercuts the economics of coal, gas and even nuclear, because all three carry additional costs for every additional unit of power produced. As renewables drive clearing prices lower on average, natural gas, coal and nuclear generation earn less and less money.
That’s why, despite current, rock-bottom natural gas and coal prices, it’s not surprising that in 2015 clean energy investment hit new records, doubling the amount going into fossil fuels.1 As Bloomberg New Energy Finance noted: “The reason solar-power generation will increasingly dominate: It’s a technology,
4 Semi-Annual Report
| | |
LETTER TO SHAREHOLDERS, CONTINUED | | |
| |
Thornburg Better World International Fund | | March 31, 2016 (Unaudited) |
not a fuel.” On top of solar’s crucial marginal cost advantage, battery prices to store electricity when it’s not sunny are also falling fast.
Thornburg Better World International Fund does not generally expect to hold tobacco, weaponry, gambling, coal and oil companies. But as for the energy and power firms, it’s important to note that we don’t have hard cut-offs if the company is favoring investment in renewables over legacy power generation assets. That’s why we own NextEra Energy, which has some legacy coal and nuclear generation capacity, but is at the forefront of the solar and wind buildouts in the U.S. Its legacy assets are fast-becoming smaller components of its power generation mix.
Just as we view market volatility as an opportunity, as long-term investors we look at opportunities that dynamic, industry-leading companies can represent.
Thank you for investing alongside us in Thornburg Better World International Fund.
Sincerely,
| | | | |
 | | | | |
Rolf Kelly, CFA | | | | |
Portfolio Manager | | | | |
Managing Director | | | | |
| 1. | Source: Bloomberg, April 4, 2016. |
The matters discussed in this report may constitute forward-looking statements made pursuant to the safe harbor provisions of the Securities Litigation Reform Act of 1995. These include any advisor or portfolio manager prediction, assessment, analysis or outlook for individual securities, industries, investment styles, market sectors and/or markets. These statements involve risks and uncertainties. In addition to the general risks described for each fund in its current prospectus, other factors bearing on these reports include the accuracy of the advisor’s or portfolio manager’s forecasts and predictions, the appropriateness of the investment strategies designed by the advisor or portfolio manager and the ability of the advisor or portfolio manager to implement their strategies efficiently and successfully. Any one or more of these factors, as well as other risks affecting the securities markets generally, could cause the actual results of any fund to differ materially as compared to its benchmarks.
The views expressed by the portfolio managers reflect their professional opinions and are subject to change. Under no circumstances does the information contained within represent a recommendation to buy or sell any security.
Semi-Annual Report 5
| | |
| PERFORMANCE SUMMARY | | |
| |
Thornburg Better World International Fund | | March 31, 2016 (Unaudited) |
Average Annual Total Returns
| | | | |
| | | SINCE
INCEP. | |
Class A Shares (Incep: 9/30/15) | | | | |
Without sales charge | | | 4.36 | % |
With sales charge | | | -0.32 | % |
Class C Shares (Incep: 9/30/15) | | | | |
Without sales charge | | | 4.02 | % |
With sales charge | | | 3.02 | % |
Class I Shares (Incep: 9/30/15) | | | 4.77 | % |
MSCI AC World ex-U.S. Index (Since 9/30/15) | | | 2.86 | % |
Performance data shown represents past performance and is no guarantee of future results. Investment return and principal value will fluctuate so shares, when redeemed, may be worth more or less than their original cost. Current performance may be lower or higher than quoted. For performance current to the most recent month end, visit thornburg.com or call 800-847-0200. The performance information does not reflect the deduction of taxes that a shareholder would pay on distributions or the redemption of Fund shares. Returns reflect the reinvestment of dividends and capital gains. Class A shares are sold with a maximum sales charge of 4.50%. Class C shares are subject to a 1% CDSC for the first year only. There is no sales charge for Class I shares.
As disclosed in the most recent prospectus, the total annual fund operating expenses are as follows: A shares, 2.83%; C shares, 3.13%; I shares, 1.68%. Thornburg Investment Management and/or Thornburg Securities Corporation have contractually agreed to waive fees and reimburse expenses through at least February 1, 2017, for some of the share classes, resulting in net expense ratios of the following: A shares, 1.83%; C shares, 2.38%; I shares, 1.09%. For more detailed information on fund expenses and waivers/reimbursements please see the Fund’s prospectus.
Glossary
MSCI All Country (AC) World ex-US Index – A market capitalization weighted index representative of the market structure of 45 developed and emerging market countries in North and South America, Europe, Africa, and the Pacific Rim, excluding securities of United States’ issuers.
Unless otherwise noted, index returns reflect the reinvestment of income dividends and capital gains, if any, but do not reflect fees, brokerage commissions or other expenses of investing. Investors may not make direct investments into any index. The performance of any index is not indicative of the performance of any particular investment.
Basis Point (bp) – A unit equal to 1/100th of 1%. 1% = 100 basis points (bps).
Margin of safety – The difference between the intrinsic value of a stock and its market price. Margin of safety doesn’t guarantee a successful investment, but it does provide room for error in an analyst’s judgment.
Multiple – A valuation multiple reflects an investment’s market value relative to some key metric. Price to earnings ratio (P/E) is a commonly used multiple. It’s calculated by dividing a stock’s price by the company’s earnings per share.
Price/Book ratio (P/B ratio) – A ratio used to compare a stock’s market value to its book value. It is calculated by dividing the current closing price of the stock by the latest quarter’s book value per share.
P/E – Price/Earnings ratio (P/E ratio) is a valuation ratio of a company’s current share price compared to its per-share earnings. P/E equals a company’s market value per share divided by earnings per share. Forecasted P/E is not intended to be a forecast of the fund’s future performance.
6 Semi-Annual Report
| | |
| FUND SUMMARY | | |
| |
Thornburg Better World International Fund | | March 31, 2016 (Unaudited) |
Objectives and Strategies
The Fund seeks long-term capital appreciation.
The Fund invests primarily in a broad range of foreign companies that demonstrate one or more positive environmental, social and governance (ESG) characteristics that the investment manager identifies as significant. The Fund targets companies of any size or country of origin, and which are high-quality and attractively valued.
Market Capitalization Exposure
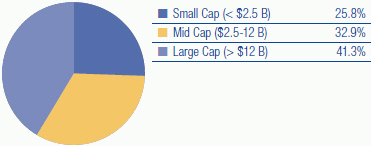
Basket Structure
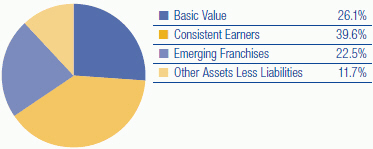
Top Ten Equity Holdings
| | | | |
Europris ASA | | | 2.9 | % |
Thermo Fisher Scientific, Inc. | | | 2.9 | % |
Brenntag AG | | | 2.8 | % |
Telenet Group Holding NV | | | 2.6 | % |
ING Groep N.V. | | | 2.6 | % |
AIA Group Ltd. | | | 2.5 | % |
Perrigo Co. plc | | | 2.4 | % |
Empiric Student Property plc | | | 2.4 | % |
Novartis AG | | | 2.3 | % |
Nokia Oyj | | | 2.3 | % |
There is no guarantee that the Fund will meet its investment objective.
All portfolio information is subject to change. Charts may not add up to 100% due to rounding.
Sector Exposure
| | | | |
Consumer Discretionary | | | 24.8 | % |
Financials | | | 17.7 | % |
Health Care | | | 10.6 | % |
Consumer Staples | | | 10.5 | % |
Information Technology | | | 10.0 | % |
Industrials | | | 6.4 | % |
Utilities | | | 4.0 | % |
Telecommunication Services | | | 3.7 | % |
Materials | | | 0.7 | % |
Other Assets Less Liabilities | | | 11.7 | % |
Top Ten Industry Groups
| | | | |
Media | | | 11.4 | % |
Real Estate | | | 7.9 | % |
Pharmaceuticals, Biotechnology & Life Sciences | | | 7.7 | % |
Food, Beverage & Tobacco | | | 7.0 | % |
Retailing | | | 6.5 | % |
Consumer Durables & Apparel | | | 5.1 | % |
Banks | | | 4.7 | % |
Technology Hardware & Equipment | | | 4.4 | % |
Software & Services | | | 4.1 | % |
Utilities | | | 4.0 | % |
Country Exposure*
(percent of equity holdings)
| | | | |
Japan | | | 16.2 | % |
United Kingdom | | | 11.8 | % |
United States | | | 10.8 | % |
Ireland | | | 6.6 | % |
Netherlands | | | 6.5 | % |
Germany | | | 5.3 | % |
Norway | | | 5.3 | % |
Switzerland | | | 4.8 | % |
India | | | 4.3 | % |
Mexico | | | 3.5 | % |
Spain | | | 3.3 | % |
Belgium | | | 3.0 | % |
Canada | | | 3.0 | % |
Hong Kong | | | 2.8 | % |
Finland | | | 2.6 | % |
Chile | | | 2.0 | % |
Philippines | | | 2.0 | % |
Taiwan | | | 1.8 | % |
Australia | | | 1.3 | % |
South Africa | | | 1.3 | % |
New Zealand | | | 1.1 | % |
China | | | 0.9 | % |
| * | The country assignment of each equity holding is determined by the Fund’s Advisor based on various factors, including the location of the issuer’s head office, the issuer’s jurisdiction of incorporation and the country from which a majority of the issuer’s revenue is derived. |
Semi-Annual Report 7
| | |
| SCHEDULE OF INVESTMENTS | | |
| |
Thornburg Better World International Fund | | March 31, 2016 (Unaudited) |
| | | | | | | | |
| | | SHARES/
PRINCIPAL AMOUNT | | | VALUE | |
COMMON STOCK — 88.27% | | | | | | | | |
| | |
BANKS — 4.74% | | | | | | | | |
Banks — 4.74% | | | | | | | | |
a Bank of Ireland | | | 1,295,527 | | | $ | 375,916 | |
ING Groep N.V. | | | 37,776 | | | | 456,934 | |
| | | | | | | | |
| | | | | | | 832,850 | |
| | | | | | | | |
| | |
CAPITAL GOODS — 2.78% | | | | | | | | |
Trading Companies & Distributors — 2.78% | | | | | | | | |
Brenntag AG | | | 8,546 | | | | 488,169 | |
| | | | | | | | |
| | | | | | | 488,169 | |
| | | | | | | | |
| | |
COMMERCIAL & PROFESSIONAL SERVICES — 1.42% | | | | | | | | |
Commercial Services & Supplies — 1.42% | | | | | | | | |
Multi-Color Corp. | | | 4,674 | | | | 249,358 | |
| | | | | | | | |
| | | | | | | 249,358 | |
| | | | | | | | |
| | |
CONSUMER DURABLES & APPAREL — 5.15% | | | | | | | | |
Household Durables — 3.34% | | | | | | | | |
a Cairn Homes plc | | | 167,656 | | | | 220,823 | |
Sony Corp. | | | 14,216 | | | | 365,426 | |
Leisure Products — 1.81% | | | | | | | | |
Shimano, Inc. | | | 2,029 | | | | 318,020 | |
| | | | | | | | |
| | | | | | | 904,269 | |
| | | | | | | | |
| | |
CONSUMER SERVICES — 1.79% | | | | | | | | |
Hotels, Restaurants & Leisure — 1.79% | | | | | | | | |
Compass Group plc | | | 17,776 | | | | 313,518 | |
| | | | | | | | |
| | | | | | | 313,518 | |
| | | | | | | | |
| | |
DIVERSIFIED FINANCIALS — 2.63% | | | | | | | | |
Diversified Financial Services — 2.63% | | | | | | | | |
GT Capital Holdings, Inc. | | | 10,379 | | | | 313,320 | |
Japan Exchange Group, Inc. | | | 9,736 | | | | 149,139 | |
| | | | | | | | |
| | | | | | | 462,459 | |
| | | | | | | | |
| | |
FOOD & STAPLES RETAILING — 3.55% | | | | | | | | |
Food & Staples Retailing — 3.55% | | | | | | | | |
Sundrug Co., Ltd. | | | 4,219 | | | | 315,642 | |
Tsuruha Holdings, Inc. | | | 3,130 | | | | 307,869 | |
| | | | | | | | |
| | | | | | | 623,511 | |
| | | | | | | | |
| | |
FOOD, BEVERAGE & TOBACCO — 6.96% | | | | | | | | |
Food Products — 6.96% | | | | | | | | |
Aryzta AG | | | 8,100 | | | | 335,524 | |
Marine Harvest ASA | | | 11,041 | | | | 170,124 | |
Orkla ASA | | | 16,157 | | | | 146,346 | |
Premium Brands Holdings Corp. | | | 4,444 | | | | 187,546 | |
Wessanen NV | | | 35,280 | | | | 382,021 | |
| | | | | | | | |
| | | | | | | 1,221,561 | |
| | | | | | | | |
| | |
HEALTH CARE EQUIPMENT & SERVICES — 2.90% | | | | | | | | |
Health Care Equipment & Supplies — 1.78% | | | | | | | | |
Olympus Corp. | | | 8,051 | | | | 312,969 | |
Health Care Providers & Services — 1.12% | | | | | | | | |
Life Healthcare Group Holdings Ltd. | | | 81,467 | | | | 196,884 | |
| | | | | | | | |
| | | | | | | 509,853 | |
| | | | | | | | |
| | |
INSURANCE — 2.47% | | | | | | | | |
Insurance — 2.47% | | | | | | | | |
AIA Group Ltd. | | | 76,465 | | | | 433,220 | |
| | | | | | | | |
| | | | | | | 433,220 | |
| | | | | | | | |
| | |
MATERIALS — 0.65% | | | | | | | | |
Chemicals — 0.65% | | | | | | | | |
International Flavors & Fragrances, Inc. | | | 1,011 | | | | 115,021 | |
| | | | | | | | |
| | | | | | | 115,021 | |
| | | | | | | | |
| | |
MEDIA — 11.36% | | | | | | | | |
Media — 11.36% | | | | | | | | |
DHX Media Ltd. | | | 48,682 | | | | 271,757 | |
a Dish TV India Ltd. | | | 194,760 | | | | 258,808 | |
Megacable Holdings S.A.B. de C.V. | | | 67,207 | | | | 278,908 | |
8 Semi-Annual Report
| | |
| SCHEDULE OF INVESTMENTS, CONTINUED | | |
| |
Thornburg Better World International Fund | | March 31, 2016 (Unaudited) |
| | | | | | | | |
| | | SHARES/
PRINCIPAL AMOUNT | | | VALUE | |
ProSiebenSat.1 Media SE | | | 6,451 | | | $ | 331,685 | |
RELX plc | | | 13,768 | | | | 255,879 | |
a Telenet Group Holding NV | | | 9,166 | | | | 463,978 | |
Zee Entertainment Enterprises Ltd. | | | 22,965 | | | | 134,241 | |
| | | | | | | | |
| | | | | | | 1,995,256 | |
| | | | | | | | |
| | |
PHARMACEUTICALS, BIOTECHNOLOGY & LIFE SCIENCES — 7.65% | | | | | | | | |
Pharmaceuticals — 4.76% | | | | | | | | |
Novartis AG | | | 5,680 | | | | 411,727 | |
Perrigo Co. plc | | | 3,323 | | | | 425,111 | |
Life Sciences Tools & Services — 2.89% | | | | | | | | |
Thermo Fisher Scientific, Inc. | | | 3,583 | | | | 507,317 | |
| | | | | | | | |
| | | | | | | 919,044 | |
| | | | | | | | |
| | |
REAL ESTATE — 7.88% | | | | | | | | |
Real Estate Investment Trusts — 6.52% | | | | | | | | |
Empiric Student Property plc | | | 268,260 | | | | 421,891 | |
Fibra Uno Administracion, S.A. de C.V. | | | 115,337 | | | | 268,296 | |
Merlin Properties Socimi, S.A. | | | 23,355 | | | | 271,603 | |
Tritax Big Box REIT plc | | | 94,895 | | | | 183,314 | |
Real Estate Management & Development — 1.36% | | | | | | | | |
Foxtons Group plc | | | 102,020 | | | | 238,471 | |
| | | | | | | | |
| | | | | | | 1,383,575 | |
| | | | | | | | |
| | |
RETAILING — 6.51% | | | | | | | | |
Internet & Catalog Retail — 2.09% | | | | | | | | |
a SurfStitch Group Ltd. | | | 190,273 | | | | 202,008 | |
Trade Me Ltd. | | | 53,595 | | | | 163,922 | |
Multiline Retail — 4.42% | | | | | | | | |
a Europris ASA | | | 108,585 | | | | 510,466 | |
Poundland Group plc | | | 118,881 | | | | 266,359 | |
| | | | | | | | |
| | | | | | | 1,142,755 | |
| | | | | | | | |
| | |
SEMICONDUCTORS & SEMICONDUCTOR EQUIPMENT — 1.57% | | | | | | | | |
Semiconductors & Semiconductor Equipment — 1.57% | | | | | | | | |
Taiwan Semiconductor Manufacturing Co., Ltd. ADR | | | 10,514 | | | | 275,467 | |
| | | | | | | | |
| | | | | | | 275,467 | |
| | | | | | | | |
| | |
SOFTWARE & SERVICES — 4.07% | | | | | | | | |
Information Technology Services — 4.07% | | | | | | | | |
a InterXion Holding NV | | | 4,662 | | | | 161,212 | |
MasterCard, Inc. | | | 2,421 | | | | 228,784 | |
a PayPal Holdings, Inc. | | | 8,433 | | | | 325,514 | |
| | | | | | | | |
| | | | | | | 715,510 | |
| | | | | | | | |
| | |
TECHNOLOGY HARDWARE & EQUIPMENT — 4.35% | | | | | | | | |
Communications Equipment — 2.26% | | | | | | | | |
Nokia Oyj | | | 66,851 | | | | 397,465 | |
Electronic Equipment, Instruments & Components — 2.09% | | | | | | | | |
Keyence Corp. | | | 672 | | | | 366,556 | |
| | | | | | | | |
| | | | | | | 764,021 | |
| | | | | | | | |
| | |
TELECOMMUNICATION SERVICES — 3.66% | | | | | | | | |
Diversified Telecommunication Services — 3.66% | | | | | | | | |
Bharti Infratel Ltd. | | | 44,976 | | | | 266,233 | |
Nippon Telegraph & Telephone Corp. | | | 8,731 | | | | 376,097 | |
| | | | | | | | |
| | | | | | | 642,330 | |
| | | | | | | | |
| | |
TRANSPORTATION — 2.22% | | | | | | | | |
Transportation Infrastructure — 2.22% | | | | | | | | |
a Aena S.A. | | | 1,923 | | | | 248,249 | |
Shanghai International Air Co., Ltd. | | | 30,600 | | | | 142,459 | |
| | | | | | | | |
| | | | | | | 390,708 | |
| | | | | | | | |
| | |
UTILITIES — 3.96% | | | | | | | | |
Electric Utilities — 1.40% | | | | | | | | |
Nextera Energy, Inc. | | | 2,081 | | | | 246,266 | |
Multi-Utilities — 0.82% | | | | | | | | |
National Grid plc | | | 10,176 | | | | 144,282 | |
Water Utilities — 1.74% | | | | | | | | |
Semi-Annual Report 9
| | |
| SCHEDULE OF INVESTMENTS, CONTINUED | | |
| |
Thornburg Better World International Fund | | March 31, 2016 (Unaudited) |
| | | | | | | | |
| | | SHARES/
PRINCIPAL AMOUNT | | | VALUE | |
Aguas Andinas S.A. | | | 534,700 | | | $ | 304,904 | |
| | | | | | | | |
| | | | | | | 695,452 | |
| | | | | | | | |
TOTAL COMMON STOCK (Cost $14,624,840) | | | | | | | 15,503,018 | |
| | | | | | | | |
RIGHTS — 0.00% | | | | | | | | |
CONSUMER DURABLES & APPAREL — 0.00% | | | | | | | | |
Household Durables — 0.00% | | | | | | | | |
a Cairn Homes plc Rights | | | 29,562 | | | | 0 | |
| | | | | | | | |
TOTAL RIGHTS (Cost $0) | | | | | | | 0 | |
| | | | | | | | |
SHORT TERM INVESTMENTS — 12.17% | | | | | | | | |
b Thornburg Capital Management Fund | | | 213,739 | | | | 2,137,392 | |
| | | | | | | | |
TOTAL SHORT TERM INVESTMENTS (Cost $2,137,392) | | | | | | | 2,137,392 | |
| | | | | | | | |
TOTAL INVESTMENTS — 100.44% (Cost $16,762,232) | | | | | | $ | 17,640,410 | |
LIABILITIES NET OF OTHER ASSETS — (0.44)% | | | | | | | (76,807 | ) |
| | | | | | | | |
NET ASSETS — 100.00% | | | | | | $ | 17,563,603 | |
| | | | | | | | |
Footnote Legend
| b | Investment in Affiliates – Shown below are holdings of voting securities of each portfolio company which is considered “affiliated” to the Fund under the Investment Company Act of 1940, including companies for which the Fund’s holding represented 5% or more of the company’s voting securities, and a series of the Thornburg Investment Trust in which the Fund invested for cash management purposes during the period: |
| | | | | | | | | | | | | | | | | | | | | | | | | | | | |
ISSUER | | SHARES/
PRINCIPAL
SEPTEMBER 30,
2015 | | | GROSS
ADDITIONS | | | GROSS
REDUCTIONS | | | SHARES/
PRINCIPAL
MARCH 31,
2016 | | | MARKET
VALUE
MARCH 31,
2016 | | | INVESTMENT
INCOME | | | REALIZED
GAIN (LOSS) | |
Thornburg Capital Management Fund* | | | — | | | | 1,751,286 | | | | 1,537,547 | | | | 213,739 | | | $ | 2,137,392 | | | $ | 3,473 | | | $ | — | |
| | | | | | | | | | | | | | | | | | | | | | | | | | | | |
Total non-controlled affiliated issuers - 12.17% of net assets | | | | | | | | | | | | | | | | | | $ | 2,137,392 | | | $ | 3,473 | | | $ | — | |
| | | | | | | | | | | | | | | | | | | | | | | | | | | | |
| * | Issuer not affiliated at September 30, 2015. |
Portfolio Abbreviations
To simplify the listings of securities, abbreviations are used per the table below:
| | |
| ADR | | American Depositary Receipt |
See notes to financial statements.
10 Semi-Annual Report
This page intentionally left blank.
Semi-Annual Report 11
| | |
| STATEMENT OF ASSETS AND LIABILITIES | | |
| |
Thornburg Better World International Fund | | March 31, 2016 (Unaudited) |
| | | | |
ASSETS | | | | |
Investments at value (cost $16,762,232) (Note 2) | | $ | 17,640,410 | |
Cash | | | 828 | |
Cash denominated in foreign currency (cost $1,173) | | | 1,174 | |
Receivable for investments sold | | | 105,689 | |
Receivable for fund shares sold | | | 22,004 | |
Receivable from investment advisor | | | 13,970 | |
Dividends receivable | | | 14,088 | |
Dividend and interest reclaim receivable | | | 3,413 | |
Prepaid expenses and other assets | | | 37,625 | |
| | | | |
Total Assets | | | 17,839,201 | |
| | | | |
| |
LIABILITIES | | | | |
Payable for investments purchased | | | 274,867 | |
Accounts payable and accrued expenses | | | 731 | |
| | | | |
Total Liabilities | | | 275,598 | |
| | | | |
| |
NET ASSETS | | $ | 17,563,603 | |
| | | | |
NET ASSETS CONSIST OF | | | | |
Undistributed net investment income | | $ | 18,627 | |
Net unrealized appreciation on investments | | | 878,519 | |
Accumulated net realized gain (loss) | | | (102,299 | ) |
Net capital paid in on shares of beneficial interest | | | 16,768,756 | |
| | | | |
| | $ | 17,563,603 | |
| | | | |
12 Semi-Annual Report
| | |
| STATEMENT OF ASSETS AND LIABILITIES, CONTINUED |
| |
Thornburg Better World International Fund | | March 31, 2016 (Unaudited) |
| | | | |
NET ASSET VALUE | | | | |
Class A Shares: | | | | |
Net asset value and redemption price per share ($ 599,383 applicable to 48,116 shares of beneficial interest outstanding - Note 4) | | $ | 12.46 | |
Maximum sales charge, 4.50% of offering price | | | 0.59 | |
| | | | |
Maximum offering price per share | | $ | 13.05 | |
| | | | |
| |
Class C Shares: | | | | |
Net asset value and offering price per share* ($ 184,702 applicable to 14,875 shares of beneficial interest outstanding - Note 4) | | $ | 12.42 | |
| | | | |
| |
Class I Shares: | | | | |
Net asset value, offering and redemption price per share ($ 16,779,518 applicable to 1,341,549 shares of beneficial interest outstanding - Note 4) | | $ | 12.51 | |
| | | | |
| * | Redemption price per share is equal to net asset value less any applicable contingent deferred sales charge. |
See notes to financial statements.
Semi-Annual Report 13
| | |
| STATEMENT OF OPERATIONS | | |
| |
Thornburg Better World International Fund | | Six Months Ended March 31, 2016 (Unaudited) |
| | | | |
INVESTMENT INCOME | | | | |
Dividend income (net of foreign taxes withheld of $7,848) | | $ | 92,569 | |
| | | | |
| |
EXPENSES | | | | |
Investment advisory fees (Note 3) | | | 74,603 | |
Administration fees (Note 3) | | | | |
Class A Shares | | | 172 | |
Class C Shares | | | 73 | |
Class I Shares | | | 3,728 | |
Distribution and service fees (Note 3) | | | | |
Class A Shares | | | 345 | |
Class C Shares | | | 398 | |
Transfer agent fees | | | | |
Class A Shares | | | 1,098 | |
Class C Shares | | | 1,098 | |
Class I Shares | | | 1,251 | |
Registration and filing fees | | | | |
Class A Shares | | | 15,354 | |
Class C Shares | | | 15,352 | |
Class I Shares | | | 15,358 | |
Custodian fees (Note 3) | | | 19,975 | |
Professional fees | | | 60,016 | |
Accounting fees (Note 3) | | | 214 | |
Trustee fees | | | 915 | |
Other expenses | | | 12,013 | |
| | | | |
Total Expenses | | | 221,963 | |
Less: | | | | |
Expenses reimbursed by investment advisor (Note 3) | | | (52,884 | ) |
Investment advisory fees waived by investment advisor (Note 3) | | | (95,137 | ) |
| | | | |
Net Expenses | | | 73,942 | |
| | | | |
Net Investment Income | | | 18,627 | |
| | | | |
REALIZED AND UNREALIZED GAIN (LOSS) | | | | |
Net realized gain (loss) from: | | | | |
Investments | | | (51,463 | ) |
Forward currency contracts (Note 7) | | | (31,184 | ) |
Foreign currency transactions | | | (19,652 | ) |
| | | | |
| | | (102,299 | ) |
| | | | |
Net change in unrealized appreciation (depreciation) on: | | | | |
Investments | | | 878,178 | |
Foreign currency translations | | | 341 | |
| | | | |
| | | 878,519 | |
| | | | |
Net Realized and Unrealized Gain | | | 776,220 | |
| | | | |
Net Increase in Net Assets Resulting from Operations | | $ | 794,847 | |
| | | | |
See notes to financial statements.
14 Semi-Annual Report
| | |
| STATEMENT OF CHANGES IN NET ASSETS | | |
| |
Thornburg Better World International Fund (Unaudited) | | |
| | | | |
| | | SIX MONTHS ENDED | |
| | | MARCH 31, 2016* | |
INCREASE (DECREASE) IN NET ASSETS FROM | | | | |
| |
OPERATIONS | | | | |
Net investment income | | $ | 18,627 | |
Net realized gain (loss) from investments, forward currency contracts and foreign currency transactions | | | (102,299 | ) |
Net unrealized appreciation (depreciation) on investments and foreign currency translations | | | 878,519 | |
| | | | |
| |
Net Increase (Decrease) in Net Assets Resulting from Operations | | | 794,847 | |
| |
FUND SHARE TRANSACTIONS (NOTE 4) | | | | |
Class A Shares | | | 580,425 | |
Class C Shares | | | 181,271 | |
Class I Shares | | | 16,007,060 | |
| | | | |
Net Increase in Net Assets | | | 17,563,603 | |
| |
NET ASSETS | | | | |
Beginning of Period | | | — | |
| | | | |
| |
End of Period | | $ | 17,563,603 | |
| | | | |
Undistributed net investment income | | $ | 18,627 | |
| * | For the period from commencement of operations on October 1, 2015 through March 31, 2016 (unaudited). |
See notes to financial statements.
Semi-Annual Report 15
| | |
| NOTES TO FINANCIAL STATEMENTS | | |
| |
Thornburg Better World International Fund | | March 31, 2016 (Unaudited) |
NOTE 1 – ORGANIZATION
Thornburg Better World International Fund (the “Fund”) is a diversified series of Thornburg Investment Trust (the “Trust”). The Fund commenced operations on September 30, 2015. The Trust was organized as a Massachusetts business trust under a Declaration of Trust dated June 3, 1987 and is registered as a diversified, open-end management investment company under the Investment Company Act of 1940, as amended. The Fund is currently one of twenty separate series of the Trust. Each series is considered to be a separate entity for financial reporting and tax purposes and bears expenses directly attributable to it. The Fund seeks long-term capital appreciation.
The Fund currently offers three classes of shares of beneficial interest: Class A, Class C, and Institutional Class (“Class I”). Each class of shares of the Fund represents an interest in the same portfolio of investments, except that (i) Class A shares are sold subject to a front-end sales charge collected at the time the shares are purchased and bear a service fee, (ii) Class C shares are sold at net asset value without a sales charge at the time of purchase, but are subject to a contingent deferred sales charge upon redemption within one year of purchase, and bear both a service fee and a distribution fee, (iii) Class I shares are sold at net asset value without a sales charge at the time of purchase and may be subject to a service fee, and (iv) the respective classes may have different reinvestment privileges and conversion rights. Additionally, the Fund may allocate among its classes certain expenses, to the extent allocable to specific classes, including transfer agent fees, government registration fees, certain printing and postage costs, and administrative and legal expenses. Currently, class specific expenses of the Fund are limited to service and distribution fees, administration fees, and certain registration and transfer agent expenses.
NOTE 2 – SIGNIFICANT ACCOUNTING POLICIES
The following is a summary of significant accounting policies followed by the Fund in the preparation of its financial statements. The Fund is an investment company and prepares its financial statements in conformity with United States generally accepted accounting principles (“GAAP”), including investment company accounting and reporting guidance in the Financial Accounting Standards Board (the “FASB”) Accounting Standard Codification Topic 946. The preparation of financial statements in conformity with GAAP requires management to make estimates and assumptions that affect the reported amounts of assets and liabilities and disclosure of contingent assets and liabilities at the date of the financial statements and the reported amounts of increases (decreases) in net assets from operations during the reporting period. Actual results could differ from those estimates.
Significant accounting policies of the Trust are as follows:
Valuation Policy and Procedures: The Trustees of the Trust have appointed Thornburg Investment Management, Inc. (“the Advisor”) to assist the Trustees in obtaining market values for portfolio investments, perform certain evaluation and supervisory functions respecting professional pricing service providers appointed by the Trustees’ Audit Committee (the “Audit Committee”) to assist in determining fair values for portfolio investments, assist in calculating fair values for portfolio investments in certain circumstances, and to perform other functions in connection with the valuation of investments. The Advisor acts through its Valuation and Pricing Committee (the “Committee”) and other employees of the Advisor. The Committee regularly reviews its own valuation calculations, as well as the valuations, valuation techniques and services furnished by pricing service providers, considers circumstances which may require valuation calculations by the Committee, and reviews previous valuation calculations. The Committee reports to the Audit Committee on the Committee’s activities, the performance of pricing service providers, and other matters relating to valuation of portfolio investments.
In those instances when the Committee assists in calculating a fair value for a portfolio investment, the Committee seeks to determine the price that the Fund would reasonably expect to receive upon a sale of the investment in an orderly transaction between market participants on the valuation date. The Committee customarily utilizes quotations from securities broker dealers in calculating valuations, but also may utilize prices obtained from pricing service providers or other methods approved by the Audit Committee. Because fair values calculated by the Committee are estimates, the calculation of a value for an investment may differ from the price that would be realized by the Fund upon a sale of the investment, and the difference could be material to the Fund’s financial statements. The Committee’s calculation of a fair value for an investment may also differ from the prices obtained by other persons (including other mutual funds) for the investment.
Valuation of Investments: Securities and other portfolio investments which are listed or traded on a United States securities exchange are valued at the last reported sale price on the valuation date. Investments listed or traded on an exchange for which there has been no sale that day are valued at the mean between the last reported bid and asked prices on that valuation date. Portfolio investments reported by NASDAQ are valued at the official closing price on the valuation date. If an investment is traded on more than one exchange, the investment is considered traded on the exchange that is normally the primary market for that investment. Securities and other portfolio investments which are listed or traded on exchanges outside the United States are valued at the last price or the closing price of the investment on the exchange that is normally the primary market for the investment, as of the close of the exchange preceding the Fund’s valuation date. Foreign investments listed or traded on an exchange for which there has been no sale that day are valued at the mean between the last reported bid and asked prices on that valuation date.
16 Semi-Annual Report
| | |
| NOTES TO FINANCIAL STATEMENTS, CONTINUED | | |
| |
Thornburg Better World International Fund | | March 31, 2016 (Unaudited) |
In any case when a market quotation is not readily available for a portfolio investment ordinarily valued by market quotation, the Committee calculates a fair value for the investment using alternative methods approved by the Audit Committee. A market quotation is not readily available when the primary market or exchange for the investment is not open for the entire scheduled day of trading. Market quotations for an investment also may not be readily available if developments after the most recent close of the investment’s primary exchange or market, but prior to the close of business on any Fund business day, or an unusual event or significant period of time occurring since the availability of a market quotation, create a serious question concerning the reliability of the most recent market quotation available for the investment. In particular, on days when market volatility thresholds established by the Audit Committee are exceeded, foreign equity investments held by the Fund may be valued using alternative methods. The Committee customarily obtains valuations in these instances from pricing service providers approved by the Audit Committee. Pricing service providers ordinarily calculate valuations using multi-factor models to adjust market prices based upon various inputs, including exchange data, depository receipt prices, futures, index data and other data.
Debt obligations held by the Fund which are not listed or traded on exchanges or for which no reported market exists are ordinarily valued at the valuation obtained from a pricing service provider approved by the Audit Committee.
In any case when a pricing service provider fails to provide a valuation for a debt obligation held by the Fund, the Committee calculates a fair value for the obligation using alternative methods under procedures approved by the Audit Committee. Additionally, in cases when management believes that a valuation obtained from a pricing service provider merits review for significant reasons, the Committee decides whether or not to use the valuation calculated by the pricing service provider or to use an alternative method approved by the Audit Committee to calculate a fair value for the obligation.
Quotations for foreign investments expressed in foreign currency amounts are converted to U.S. dollar equivalents using a foreign exchange quotation from a third party service provider at the time of valuation. Foreign investments held by the Fund may be traded on days and at times when the Fund is not open for business. Consequently, the value of Fund investments may be significantly affected on days when shareholders cannot purchase or sell Fund shares. Futures contracts and other financial and derivative instruments traded on an exchange are valued at the latest published price for the instrument on its primary exchange. Listed options are valued at the last bid price.
Valuation Measurements: The Fund categorizes its investments based upon the inputs used in valuing those investments, according to a three-level hierarchy established in guidance from the FASB. Categorization of investments using this hierarchy is intended by the FASB to maximize the use of observable inputs in valuing investments and minimize the use of unobservable inputs by requiring that the most observable inputs be used when available. Observable inputs are those that market participants would use in valuing an investment based on available market information. Unobservable inputs are those that reflect assumptions about the information market participants would use in valuing an investment. An investment’s level within the hierarchy is based on the lowest level input that is deemed significant to the valuation. The methodologies and inputs used to value investments are not necessarily indications of the risk or liquidity associated with those investments.
Various inputs are used in calculating valuations for the Fund’s investments. These inputs are generally summarized according to the three-level hierarchy below:
Level 1: Quoted prices in active markets for identical investments.
Level 2: Other direct or indirect significant observable inputs (including quoted prices for similar investments in active markets and other observable inputs, such as interest rates, prepayment rates, credit risk, etc.).
Level 3: Significant unobservable inputs (including the Committee’s own assumptions in calculating the fair values of investments).
Valuations for debt obligations held by the Fund are typically calculated by pricing service providers approved by the Audit Committee and are characterized as Level 2 within the valuation hierarchy.
On days when market volatility thresholds established by the Audit Committee are exceeded, foreign securities for which valuations are obtained from pricing service providers are fair valued. On these days, the foreign securities are characterized as Level 2 within the valuation hierarchy and revert to Level 1 after the threshold is no longer exceeded.
In a limited number of cases the Committee calculates a fair value for investments using broker quotations or other methods approved by the Audit Committee. When the Committee uses a single broker quotation to calculate a fair value for an investment without other significant observable inputs, or if a fair value is calculated using other significant inputs that are considered unobservable, the investment is characterized as Level 3 within the hierarchy. Other significant unobservable inputs used to calculate a fair value in these instances might include an income-based valuation approach which considers discounted anticipated future cash flows from the investment, and application of discounts due to the nature or duration of any restrictions on the disposition of the investment.
Valuations based upon the use of inputs from Levels 1, 2 or 3 may not represent the actual price received upon the disposition of an investment, and the Fund may receive a price that is lower than the valuation based upon these inputs when it sells the investment.
Semi-Annual Report 17
| | |
| NOTES TO FINANCIAL STATEMENTS, CONTINUED | | |
| |
Thornburg Better World International Fund | | March 31, 2016 (Unaudited) |
The following table displays a summary of the fair value hierarchy measurements of the Fund’s investments as of March 31, 2016. In any instance when valuation inputs from more than one level are used to determine the fair value of a specific investment, the investment is placed in the level of the table based upon the lowest level input that is significant in determining the fair value of the investment:
| | | | | | | | | | | | | | | | |
| | | FAIR VALUE MEASUREMENTS AT MARCH 31, 2016 | |
| | | TOTAL | | | LEVEL 1 | | | LEVEL 2 | | | LEVEL 3 | |
Assets | | | | | | | | | | | | | | | | |
Investments in Securities* | | | | | | | | | | | | | | | | |
Common Stock | | $ | 15,503,018 | | | $ | 15,503,018 | | | $ | — | | | $ | — | |
Rights | | | — | | | | — | | | | — | | | | — | |
Short Term Investments | | | 2,137,392 | | | | 2,137,392 | | | | — | | | | — | |
| | | | | | | | | | | | | | | | |
Total Investments in Securities | | $ | 17,640,410 | | | $ | 17,640,410 | | | $ | — | | | $ | — | |
Other Financial Instruments** | | | | | | | | | | | | | | | | |
Spot Currency | | $ | 781 | | | $ | 781 | | | $ | — | | | $ | — | |
Liabilities | | | | | | | | | | | | | | | | |
Other Financial Instruments** | | | | | | | | | | | | | | | | |
Spot Currency | | $ | (47 | ) | | $ | (47 | ) | | $ | — | | | $ | — | |
| * | See Schedule of Investments for a summary of the industry exposure as grouped according to the Global Industry Classification Standard (GICS), which is an industry taxonomy developed by MSCI, Inc. and Standard & Poor’s (S&P). |
| ** | Other Financial Instruments include investments not reflected in the Schedule of Investments, which may include futures, forwards and swap contracts, which are valued at the unrealized appreciation (depreciation) on the investment. |
In accordance with the guidance prescribed in Accounting Standards Update No. 2011-04, it is the policy of the Fund to recognize transfers between levels and the underlying events which caused the movement. The Fund recognized no transfers between levels for the six months ended March 31, 2016, other than when the Fund exceeded market volatility thresholds for foreign equity investments during the period.
Foreign Currency Translation: Portfolio investments and other assets and liabilities denominated in foreign currencies are translated into U.S. dollars based on the exchange rate of such currencies against the U.S. dollar on the date of valuation. Purchases and sales of investments and income items denominated in foreign currencies are translated into U.S. dollars at the exchange rate in effect on the transaction date. When the Fund purchases or sells foreign investments, it will customarily enter into a foreign exchange contract to minimize foreign exchange risk from the trade date to the settlement date of such transactions. The values of such spot contracts are included in receivable for investments sold and payable for investments purchased on the Statement of Assets and Liabilities.
The Fund does not separately report the effect of changes in foreign exchange rates from changes in market prices on investments held. Such changes are included in net unrealized appreciation (depreciation) from investments.
Reported net realized gains and losses from foreign currency transactions arise due to purchases and sales of foreign currencies, currency gains and losses realized between the trade and settlement dates on investment transactions and the difference between the amounts of dividends, interest, and foreign withholding taxes recorded on the Fund’s books, and the U.S. dollar equivalent of the amounts actually received or paid.
Net change in unrealized appreciation (depreciation) on foreign currency translations arise from changes in the fair value of assets and liabilities, other than investments at period end, resulting from changes in exchange rates.
Foreign Withholding Taxes: The Fund is subject to foreign tax withholding imposed by certain foreign countries in which the Fund may invest. Withholding taxes are incurred on certain foreign dividends and are accrued at the time the dividend is recognized based on applicable foreign tax laws. The Fund files withholding tax reclaims in certain jurisdictions to recover a portion of amounts previously withheld based on applicable laws and regulations, and industry convention.
Deferred Foreign Capital Gain Taxes: The Fund is subject to a tax imposed on net realized gains of securities of certain foreign countries. The Fund records an estimated deferred tax liability for net unrealized gains on these investments as reflected in the accompanying financial statements.
Federal Income Taxes: It is the policy of the Trust to comply with the provisions of the Internal Revenue Code applicable to “regulated investment companies” and to distribute to shareholders substantially all taxable income, including any net realized gain on investments of the Fund. Therefore, no provision for federal income taxes is required.
18 Semi-Annual Report
| | |
| NOTES TO FINANCIAL STATEMENTS, CONTINUED | | |
| |
Thornburg Better World International Fund | | March 31, 2016 (Unaudited) |
Management reviews each uncertain tax position believed to be material to the preparation of the Fund’s financial statements, to assess if it is more likely than not that the position would be sustained upon examination, based upon the technical merits of the position. As of March 31, 2016, management has not identified any such position for which an asset or liability must be reflected in the Statement of Assets and Liabilities. The Fund’s tax returns remain subject to examination for three years after filing.
When-Issued and Delayed Delivery Transactions: The Fund may engage in when-issued or delayed delivery transactions. To the extent the Fund engages in such transactions, it will do so for the purpose of acquiring portfolio investments consistent with the Fund’s investment objectives and not for the purpose of investment leverage or to speculate on interest rate and, or market changes. At the time the Fund makes a commitment to purchase an investment on a when-issued or delayed delivery basis, the Fund will record the transaction and reflect the value in determining its net asset value. When effecting such transactions, assets of an amount sufficient to make payment for the portfolio investments to be purchased will be segregated on the Fund’s records on the trade date. Investments purchased on a when-issued or delayed delivery basis do not earn interest until the settlement date.
Dividends: Dividends to shareholders, if any, are generally paid quarterly and are reinvested in additional shares of the Fund at net asset value per share at the close of business on the dividend payment date or, at the shareholder’s option, paid in cash. Net realized capital gains, to the extent available, will be distributed at least annually.
Repurchase Agreements: The Fund may invest excess cash in repurchase agreements whereby the Fund purchases investments, which serve as collateral, with an agreement to resell such collateral to the seller at an agreed upon price at the maturity date of the repurchase agreement. Investments pledged as collateral for repurchase agreements are held in custody until maturity of the repurchase agreement. Provisions in the agreements require that the market value of the collateral is at least equal to the repurchase value in the event of default. In the event of default, the Fund has the right to liquidate the collateral and apply the proceeds in satisfaction of the obligation. Under certain circumstances, in the event of default or bankruptcy by the other party to the agreement, realization and/or retention of the collateral may be subject to legal proceedings.
General: Investment transactions are accounted for on a trade date basis. Interest income is accrued as earned and dividend income is recorded on the ex-dividend date. Certain income from foreign investments is recognized as soon as information is available to the Fund. Realized gains and losses from the sale of investments are recorded on an identified cost basis. Net investment income (other than class specific expenses) and realized and unrealized gains and losses are allocated daily to each class of shares based upon the relative net asset value of outstanding shares of each class of shares at the beginning of the day (after adjusting for the current share activity of the respective class). Expenses common to all Funds are allocated among the Funds comprising the Trust based upon their relative net asset values or other appropriate allocation methods.
Guarantees and Indemnifications: Under the Trust’s organizational documents (and under separate agreements with the independent Trustees), its officers and Trustees are indemnified against certain liabilities arising out of the performance of their duties to the Fund. Additionally, in the normal course of business the Trust enters into contracts with service providers that contain general indemnification clauses. The Trust’s maximum exposure under these arrangements is unknown. However, based on experience, the Trust expects the risk of loss to be remote.
NOTE 3 – INVESTMENT ADVISORY FEE AND OTHER TRANSACTIONS WITH AFFILIATES
Pursuant to an investment advisory agreement, the Advisor serves as the investment advisor and performs services for the Fund for which the fees are payable at the end of each month. For the six months ended March 31, 2016, these fees were payable at annual rates ranging from .975 of 1% to .775 of 1% per annum of the average daily net assets of the Fund depending on the Fund’s asset size. The Fund pays to the Advisor the costs of personnel who perform certain accounting services for the Fund. For the six months ended March 31, 2016 the Fund paid $214 to the Advisor for these accounting services. The Trust has also entered into administrative service agreements with the Advisor, whereby the Advisor will perform certain administrative services for the shareholders of each class of the Fund’s shares, and for which fees will be payable at an annual rate of up to .125 of 1% per annum of the average daily net assets attributable to each class of shares.
The Trust has an underwriting agreement with Thornburg Securities Corporation (the “Distributor”), an affiliate of the Advisor, which acts as the distributor of the Fund’s shares. For the six months ended March 31, 2016, the Distributor has advised the Fund that it earned net commissions aggregating $1,117 from the sale of Class A shares of the Fund, and collected no contingent deferred sales charges from redemptions of Class C shares of the Fund.
Pursuant to a service plan under Rule 12b-1 of the Investment Company Act of 1940, the Fund may reimburse to the Advisor an amount not to exceed .20 of 1% per annum of the average daily net assets attributable to each Class of shares of the Fund for payments made by the Advisor to securities dealers and other financial institutions to obtain various shareholder and distribution related services. For the six months ended March 31, 2016, there were no 12b-1 service plan fees charged for Class I shares. The Advisor may pay out of its own resources additional expenses for distribution of the Fund’s shares and shareholder services.
Semi-Annual Report 19
| | |
| NOTES TO FINANCIAL STATEMENTS, CONTINUED | | |
| |
Thornburg Better World International Fund | | March 31, 2016 (Unaudited) |
The Advisor and Distributor have contractually agreed to waive fees and reimburse expenses incurred by the Fund so that actual expenses of certain share classes do not exceed levels as specified in the Fund’s most recent prospectus. The agreement may be terminated by the Fund at any time, but may not be terminated by the Advisor or Distributor before February 1, 2017, unless the Advisor ceases to be the investment advisor to the Trust or the Distributor ceases to be the distributor of the Fund prior to that date. The Advisor and Distributor retain the right to be repaid by the Fund for fee waivers and expense reimbursements if expenses fall below the contractual limit prior to the end of the fiscal year.
For the six months ended March 31, 2016, the Advisor voluntarily waived Fund level investment advisory fees of $1,708 for Class A shares, $732 for Class C shares, and $92,697 for Class I shares. The Advisor contractually reimbursed certain class specific expenses, administrative fees, and distribution fees of $16,160 for Class A shares, $16,133 for Class C shares, and $20,591 for Class I shares.
Certain officers and Trustees of the Trust are also officers or directors of the Advisor and Distributor. The compensation of independent Trustees is borne by the Trust.
The percentage of direct investments in the Fund held by affiliated Trustees and Officers and the Advisor is approximately 90.84%.
The Fund may purchase or sell securities from, or to an affiliated fund, provided the affiliation is due solely to having a common investment advisor, common officers, or common trustees, and provided that all such transactions will comply with Rule 17a-7 under the 1940 Act. For the six months ended March 31, 2016, the Fund had no transactions with affiliated funds.
NOTE 4 – SHARES OF BENEFICIAL INTEREST
At March 31, 2016, there were an unlimited number of shares with no par value of beneficial interest authorized. Transactions in shares of beneficial interest were as follows:
| | | | | | | | |
| | | SIX MONTHS ENDED
MARCH 31, 2016* | |
| | | SHARES | | | AMOUNT | |
Class A Shares | | | | | | | | |
Shares sold | | | 48,197 | | | $ | 581,420 | |
Shares issued to shareholders in reinvestment of dividends | | | — | | | | — | |
Shares repurchased | | | (81 | ) | | | (995 | ) |
| | | | | | | | |
| | |
Net increase (decrease) | | | 48,116 | | | $ | 580,425 | |
| | | | | | | | |
| | |
Class C Shares | | | | | | | | |
Shares sold | | | 14,875 | | | $ | 181,271 | |
Shares issued to shareholders in reinvestment of dividends | | | — | | | | — | |
Shares repurchased | | | — | | | | — | |
| | | | | | | | |
| | |
Net increase (decrease) | | | 14,875 | | | $ | 181,271 | |
| | | | | | | | |
| | |
Class I Shares | | | | | | | | |
Shares sold | | | 1,342,082 | | | $ | 16,013,460 | |
Shares issued to shareholders in reinvestment of dividends | | | — | | | | — | |
Shares repurchased | | | (533 | ) | | | (6,400 | ) |
| | | | | | | | |
| | |
Net increase (decrease) | | | 1,341,549 | | | $ | 16,007,060 | |
| | | | | | | | |
| * | For the period from commencement of operations on October 1, 2015 through March 31, 2016 (unaudited). |
NOTE 5 – INVESTMENT TRANSACTIONS
For the six months ended March 31, 2016, the Fund had purchase and sale transactions of investments (excluding short-term investments) of $23,336,768 and $8,660,465, respectively.
20 Semi-Annual Report
| | |
| NOTES TO FINANCIAL STATEMENTS, CONTINUED | | |
| |
Thornburg Better World International Fund | | March 31, 2016 (Unaudited) |
NOTE 6 – INCOME TAXES
At March 31, 2016, information on the tax components of capital was as follows:
| | | | |
Cost of investments for tax purposes | | $ | 16,762,232 | |
| | | | |
Gross unrealized appreciation on a tax basis | | $ | 1,393,158 | |
Gross unrealized depreciation on a tax basis | | | (514,980 | ) |
| | | | |
Net unrealized appreciation (depreciation) on investments (tax basis) | | $ | 878,178 | |
| | | | |
NOTE 7 – DERIVATIVE FINANCIAL INSTRUMENTS WITH OFF-BALANCE SHEET RISK AND FOREIGN
INVESTMENT RISK
The Fund may use a variety of derivative financial instruments to hedge or adjust the risks affecting its investment portfolio or to enhance investment returns. Provisions of FASB Accounting Standards Codification ASC 815-10-50 (“ASC 815”) require certain disclosures. The disclosures are intended to provide users of financial statements with an understanding of the use of derivative instruments by the Fund and how these derivatives affect the financial position, financial performance and cash flows of the Fund. The Fund does not designate any derivative instruments as hedging instruments under ASC 815. During the six months ended March 31, 2016, the Fund’s principal exposure to derivative financial instruments of the type addressed by ASC 815 was investment in foreign exchange contracts. A foreign exchange contract is an agreement between two parties to exchange different currencies at a specified rate of exchange at an agreed upon future date. Foreign exchange contracts involve risks to the Fund, including the risk that a contract’s counterparty will not meet its obligations to the Fund, the risk that a change in a contract’s value may not correlate perfectly with the currency the contract was intended to track, and the risk that the Fund’s Advisor is unable to correctly implement its strategy in using a contract. In any such instance, the Fund may not achieve the intended benefit of entering into a contract, and may experience a loss.
The Fund entered into forward currency contracts during the six months ended March 31, 2016 in the normal course of pursuing its investment objectives, with the objective of purchasing foreign investments or with the intent of reducing the risk to the value of the Fund’s foreign investments from adverse changes in the relationship between the U.S. dollar and foreign currencies. In each case these contracts have been initiated in conjunction with foreign investment transactions.
These contracts are accounted for by the Fund under ASC 815. Unrealized appreciation and depreciation on outstanding contracts are reported in the Fund’s Statement of Assets and Liabilities, as measured by the difference between the forward exchange rates at the reporting date and the forward exchange rates at each contract’s inception date. Net realized gain (loss) on contracts closed during the period, and changes in net unrealized appreciation (depreciation) on outstanding contracts are recognized in the Fund’s Statement of Operations.
The quarterly average value of open sell currency contracts for the six months ended March 31, 2016 was $328,297. Open buy currency contracts are entered into for the purpose of closing open sell currency contracts and the values are dependent upon the values of the open sell currency contracts to which they relate.
As of March 31, 2016, there were no open derivative financial instruments of the type addressed by ASC 815 held by the Fund, and there is no unrealized appreciation (depreciation) of outstanding forward currency contracts recognized in the Fund’s Statement of Assets and Liabilities or in the Statement of Operations.
The net realized gain (loss) from forward currency contracts recognized in the Fund’s Statement of Operations for the six months ended March 31, 2016 is disclosed in the following table:
| | | | | | | | | | |
| NET REALIZED GAIN (LOSS) ON DERIVATIVE FINANCIAL INSTRUMENTS | |
RECOGNIZED IN INCOME FOR THE SIX MONTHS ENDED MARCH 31, 2016 | |
| | | TOTAL | | | | | FORWARD CURRENCY CONTRACTS | |
Foreign exchange contracts | | $ | (31,184 | ) | | | | $ | (31,184 | ) |
OTHER NOTES
Risks: The Fund’s investments subject it to risks including, but not limited to, management risk, market and economic risk, risks affecting specific issuers, liquidity risk, the risks associated with investments in small- and mid-cap companies and non-U.S. issuers (including developing country issuers), credit risk, social investing risk, and interest rate risk. Please see the Fund’s prospectus for a discussion of the risks associated with an investment in the Fund.
Subsequent Events: Fund management believes no events have occurred between March 31, 2016 and the date of issuance of the financial statements that require adjustment to or disclosure in the accompanying financial statements.
Semi-Annual Report 21
FINANCIAL HIGHLIGHTS
Thornburg Better World International Fund
| | | | | | | | | | | | | | | | | | | | | | | | | | | | | | | | | | | | | | | | | | | | | | | | | | | | |
| | | PER SHARE PERFORMANCE (FOR A SHARE OUTSTANDING THROUGHOUT THE PERIOD) | | RATIOS TO AVERAGE NET ASSETS | | | SUPPLEMENTAL DATA | |
UNLESS
OTHERWISE
NOTED,
PERIODS
ARE
FISCAL
YEARS
ENDED
SEPT. 30, | | NET ASSET
VALUE
BEGINNING
OF PERIOD | | | NET
INVESTMENT
INCOME
(LOSS)+ | | NET
REALIZED
&
UNREALIZED
GAIN (LOSS)
ON
INVESTMENTS | | | TOTAL FROM
INVESTMENT
OPERATIONS | | | DIVIDENDS
FROM NET
INVESTMENT
INCOME | | | DIVIDENDS
FROM NET
REALIZED
GAINS | | TOTAL
DIVIDENDS | | | NET
ASSET
VALUE
END
OF
PERIOD | | NET
INVESTMENT
INCOME
(LOSS)
(%) | | | EXPENSES,
AFTER
EXPENSE
REDUCTIONS
(%) | | | EXPENSES,
AFTER
EXPENSE
REDUCTIONS
AND
NET OF
CUSTODY
CREDITS (%) | | | EXPENSES,
BEFORE
EXPENSE
REDUCTIONS
(%) | | | TOTAL
RETURN
(%)(a) | | | PORTFOLIO
TURNOVER
RATE (%)(a) | | NET
ASSETS
AT END
OF
PERIOD
(THOUSANDS) | |
CLASS A SHARES | | | | | | | | | | | | | | | | | | | | | | | | | | | | | | | | | | | | | | | | | | | | | | |
2016(b)(c)(d) | | $ | 11.94 | | | (0.02) | | | 0.54 | | | | 0.52 | | | | — | | | — | | | — | | | $12.46 | | | (0.27 | )(e) | | | 1.66 | (e) | | | 1.66 | (e) | | | 14.67 | (e)(f) | | | 4.36 | | | 61.24 | | $ | 599 | |
CLASS C SHARES | | | | | | | | | | | | | | | | | | | | | | | | | | | | | | | | | | | | | | | | | | | | | | |
2016(b)(d) | | $ | 11.94 | | | (0.07) | | | 0.55 | | | | 0.48 | | | | — | | | — | | | — | | | $12.42 | | | (1.11 | )(e) | | | 2.38 | (e) | | | 2.38 | (e) | | | 31.03 | (e)(f) | | | 4.02 | | | 61.24 | | $ | 185 | |
CLASS I SHARES | | | | | | | | | | | | | | | | | | | | | | | | | | | | | | | | | | | | | | | | | | | | | | |
2016(b)(d) | | $ | 11.94 | | | 0.02 | | | 0.55 | | | | 0.57 | | | | — | | | — | | | — | | | $12.51 | | | 0.26 | (e) | | | 0.94 | (e) | | | 0.94 | (e) | | | 2.46 | (e) | | | 4.77 | | | 61.24 | | $ | 16,780 | |
| (a) | Not annualized for periods less than one year. |
| (b) | Unaudited Six Month Period Ended March 31. |
| (c) | Sales loads are not reflected in computing total return. |
| (d) | Fund commenced operations on October 1, 2015. |
| (f) | Due to the size of net assets and fixed expenses, ratios may appear disproportionate. |
| + | Based on weighted average shares outstanding. |
See notes to financial statements.
| | | | |
| 22 Semi-Annual Report | | | | Semi-Annual Report 23 |
| | |
| EXPENSE EXAMPLE | | |
| |
Thornburg Better World International Fund | | March 31, 2016 (Unaudited) |
As a shareholder of the Fund, you incur two types of costs:
| | (1) | transaction costs, including |
(a) sales charges (loads) on purchase payments, for Class A shares;
(b) a deferred sales charge on redemptions of any part or all of a purchase of $1 million of Class A shares within 12 months of purchase;
(c) a deferred sales charge on redemptions of Class C shares within 12 months of purchase;
| | (2) | ongoing costs, including management fees; distribution and/or service (12b-1) fees; and other Fund expenses. |
This example is intended to help you understand your ongoing costs (in dollars) of investing in the Fund and to compare these costs with the ongoing costs of investing in other mutual funds.
The example is based on a $1,000 investment beginning on October 1, 2015, and held until March 31, 2016.
| | | | | | | | | | | | |
| | | BEGINNING
ACCOUNT VALUE
10/1/15 | | | ENDING
ACCOUNT VALUE
3/31/16 | | | EXPENSES PAID
DURING PERIOD†
10/1/15–3/31/16 | |
CLASS A SHARES | | | | | | | | | | | | |
Actual | | $ | 1,000.00 | | | $ | 1,043.60 | | | $ | 8.50 | |
Hypothetical* | | $ | 1,000.00 | �� | | $ | 1,016.68 | | | $ | 8.39 | |
CLASS C SHARES | | | | | | | | | | | | |
Actual | | $ | 1,000.00 | | | $ | 1,040.20 | | | $ | 12.14 | |
Hypothetical* | | $ | 1,000.00 | | | $ | 1,013.10 | | | $ | 11.98 | |
CLASS I SHARES | | | | | | | | | | | | |
Actual | | $ | 1,000.00 | | | $ | 1,047.70 | | | $ | 4.82 | |
Hypothetical* | | $ | 1,000.00 | | | $ | 1,020.29 | | | $ | 4.76 | |
| † | Expenses are equal to the annualized expense ratio for each class (A: 1.66%; C: 2.38%; I: 0.94%) multiplied by the average account value over the period, multiplied by 183/366 to reflect the one-half year period. |
| * | Hypothetical assumes a rate of return of 5% per year before expenses. |
ACTUAL EXPENSES
For each class of shares, the first line of the accompanying table provides information about actual account values and actual expenses. You may use the information in this line, together with the amount you invested, to estimate the expenses that you paid over the period. Simply divide your account value by $1,000 (for example, an $8,600 account value divided by $1,000 = 8.6), then multiply the result by the number in the first line for your class of shares under the heading entitled “Expenses Paid During Period” to estimate the expenses you paid on your account during this period.
HYPOTHETICAL EXAMPLE FOR COMPARISON PURPOSES
For each class of shares, the second line of the accompanying table provides information about hypothetical account values and hypothetical expenses based on the Fund’s actual expense ratio and an assumed rate of return of 5% per year before expenses, which is not the Fund’s actual return. The hypothetical account values and expenses may not be used to estimate the actual ending account balance or expenses you paid for the period. You may use this information to compare the ongoing costs of investing in the Fund and other funds. To do so, compare this 5% hypothetical example with the 5% hypothetical examples that appear in the shareholder reports of the other funds.
Please note that the expenses shown in the table are meant to highlight your ongoing costs only and do not reflect any transactional costs, such as sales charges (loads), redemption fees, or exchange fees. Therefore, the second line of the table for each class of shares is useful in comparing ongoing costs only, and will not help you determine the relative total costs of owning different funds. In addition, if these transactional costs were included, your costs would have been higher.
24 Semi-Annual Report
| | |
| OTHER INFORMATION | | |
| |
Thornburg Better World International Fund | | March 31, 2016 (Unaudited) |
PORTFOLIO PROXY VOTING
Policies and Procedures:
The Trust has delegated to Thornburg Investment Management, Inc. (the “Advisor”) voting decisions respecting proxies for the Fund’s voting securities. The Advisor makes voting decisions in accordance with its Proxy Voting Policy. A description of the Policy is available (i) without charge, upon request, by calling the Advisor toll-free at 1-800-847-0200, (ii) on the Thornburg website at www.thornburg. com, and (iii) on the Securities and Exchange Commission’s website at www.sec.gov.
No proxy voting information is currently available because the Fund commenced operations on October 1, 2015. The Fund expects to begin making annual proxy voting information available in accordance with applicable regulations commencing on or before August 31, 2016. This information is available (i) without charge, upon request by calling the Advisor toll-free at 1-800-847-0200, (ii) on the Thornburg website at www.thornburg.com, and (iii) on the Securities and Exchange Commission’s website at www.sec.gov.
AVAILABILITY OF QUARTERLY PORTFOLIO SCHEDULE
The Fund files with the Securities and Exchange Commission schedules of its portfolio holdings on Form N-Q for the first and third quarters of each fiscal year. The Fund’s Forms N-Q are available on the Commission’s website at www.sec.gov, or may be reviewed and copied at the Commission’s Public Reference Room in Washington, D.C. Information on the operation of the Public Reference Room may be obtained by calling 1-800-SEC-0330. The Fund also makes this information available on its website at www.thornburg.com/download or upon request by calling 1-800-847-0200.
Semi-Annual Report 25
TRUSTEES’ STATEMENT TO SHAREHOLDERS
Revised and Readopted September 15, 2015
The Trustees believe current and prospective shareholders should know how we discharge our responsibilities in supervising the Funds’ investment advisor and in reviewing the advisor’s contract for renewal. Since 2005, we have issued a statement which sets out clearly the three principal guidelines that we follow in supervising the Trust’s investment advisor on your behalf. In accordance with our customary practice, in September of 2015 we again reviewed our statement and concluded we should reissue this statement outlining the principal features of our supervision of the advisor’s performance of investment management services for the Funds.
We begin with the premise that each shareholder selected his or her Fund because its investments are managed by the investment advisor identified in the prospectus and in accordance with the objective and policies described in the prospectus. We realize, as each of you do, that if you believe that your Fund’s stated objective and policies no longer serve your personal investment goals, you can sell your shares and leave the Fund.
Therefore, we believe that our primary supervisory task – our principal obligation to you – is to assess the nature and quality of the advisor’s services, and to confirm that the advisor actively and competently pursues the Fund’s objective, in accordance with the policies set out in the prospectus. To do this, we meet regularly with management to review your Fund’s portfolio and to discuss the advisor’s specific actions and judgments in pursuing the Fund’s objective. We do not substitute our own judgment for the advisor’s decisions in selecting investments; the advisor is paid to exercise its informed judgment on investment decisions, and we seek to confirm, in reviewing the advisor’s performance, that the advisor is doing just that.
Second, we are conscious of costs and the effect that costs have on shareholders’ returns. We try to make sure that your Fund’s fees and costs are reasonable in relationship to the services rendered and that they are generally in line with those charged by other expert investment advisors, consistent with our belief that the Fund’s investors searched for and expect that expertise and attention and have decided to pay a reasonable price for it. We do not put the management contract “out to bid” as a matter of course, and we would not do so unless we had concluded that the advisor materially had failed to pursue the Fund’s objectives in accordance with its policies, or for other equally important reasons. We believe that any other approach would be inconsistent with your interests and contrary to your expectations when you bought shares of the Fund in the first place.
Finally, because we believe that most Thornburg Fund shareholders have invested with a long-term perspective, we try not to focus too much on the fashions of the moment and on short-term performance. The market will not favor any specific investment objective or set of policies at all times and under all economic circumstances. A fund will experience periods of both high and low returns relative to other funds and other investments. Even if one of our Funds is not favored by the market at a particular time, we believe that the advisor is nonetheless obliged to remain true to the Fund’s objective and policies, and we watch to see that it does so.
Trustees of Thornburg Investment Trust
26 Semi-Annual Report
THORNBURG FUND FAMILY
Thornburg Investment Management is a privately-owned global investment firm that offers a range of solutions for retail and institutional investors. Founded in 1982 and headquartered in Santa Fe, New Mexico, we manage approximately $54 billion (as of March 31, 2016) across eight equity and 11 bond mutual funds, separate accounts for high-net-worth investors and institutional accounts, and five UCITS funds for non-U.S. investors.
The fund outlined in this report is one of many equity and fixed-income products available from Thornburg Investment Management.
EQUITY FUNDS
| | • | | Thornburg Core Growth Fund |
| | • | | Thornburg International Value Fund |
| | • | | Thornburg Better World International Fund |
| | • | | Thornburg International Growth Fund |
| | • | | Thornburg Developing World Fund |
| | • | | Thornburg Investment Income Builder Fund |
| | • | | Thornburg Global Opportunities Fund |
FIXED INCOME FUNDS
| | • | | Thornburg Low Duration Income Fund |
| | • | | Thornburg Limited Term U.S. Government Fund |
| | • | | Thornburg Limited Term Income Fund |
| | • | | Thornburg Strategic Income Fund |
| | • | | Thornburg Low Duration Municipal Fund |
| | • | | Thornburg Limited Term Municipal Fund |
| | • | | Thornburg Intermediate Municipal Fund |
| | • | | Thornburg California Limited Term Municipal Fund |
| | • | | Thornburg New Mexico Intermediate Municipal Fund |
| | • | | Thornburg New York Intermediate Municipal Fund |
| | • | | Thornburg Strategic Municipal Income Fund |
Before investing, carefully consider the Fund’s investment goals, risks, charges, and expenses. For a prospectus or summary prospectus containing this and other information, contact your financial advisor or visit thornburg.com. Read it carefully before investing.
For additional information, please visit thornburg.com
Thornburg Investment Management, Inc. 2300 North Ridgetop Road, Santa Fe, NM 87506
Semi-Annual Report 27
This Semi-Annual Report is submitted for the general information of shareholders of the Fund. It is not authorized for distribution to prospective investors in the Fund unless preceded or accompanied by an effective prospectus.
| | | | |
| Investment Advisor: | | Distributor: | | |
| Thornburg Investment Management® | | Thornburg Securities Corporation® | | |
| 800.847.0200 | | 800.847.0200 | | TH3645 |

2 Semi-Annual Report
Semi-Annual Report
Thornburg Capital Management Fund
March 31, 2016
| | | | |
SHARE CLASS | | NASDAQ SYMBOL | | CUSIP |
Class I | | N/A | | 885-216-739 |
Semi-Annual Report 3
LETTER TO SHAREHOLDERS
| | |
| |
Thornburg Capital Management Fund | | March 31, 2016 (Unaudited) |
April 15, 2016
Dear Shareholder:
The goal of Thornburg Capital Management Fund (TCMF) is to better manage risk exposures for cash management across the Thornburg family of funds through higher returns and lower costs. Over the last six months, we have invested between $1.2 billion to $2.4 billion of Thornburg Investment Trust shareholder cash in high-quality, short-term instruments. The custodian bank of the Thornburg Investment Trust funds continues to charge 20 basis points (0.20%) for large cash balances, which means the annualized distribution yield since inception (July 31, 2015) of 25 basis points (0.25%) after custodial fees represents a significant pick up in return.
High returns, however, are not what TCMF is designed to provide. Instead, by combining the cash balances of all eligible Thornburg Investment Trust portfolios into a single pool, we are able to manage daily cash more cost efficiently and reduce large risk exposures in any given portfolio. As an example, investing cash balances in some sort of short-term, high-quality security on a fund-by-fund basis incurs significant transaction costs. While in themselves the costs are low ($12 roundtrip: $6 ticketing costs, $6 for every maturity), when running a portfolio of overnight securities, these costs can add up quickly. Duplicate trades in different portfolios incur separate charges, and with 10 different eligible portfolios, the multiplier effect on costs is high. Combining all of the cash into a single portfolio eliminates the majority of those costs.
Risk diversification is also an important factor in the design of TCMF. Because we have a large pool of investable assets, we can buy a number of different names and still have a vast cost advantage versus splitting investments among portfolios. As of March 31, 2016, the TCMF was invested in 55 different issuers. Our largest exposure away from supranational corporations or U.S. government entities was in Autozone, at 2.17% of the portfolio. Keep in mind that at the investing-fund level, this is 2.17% of the cash position. As an example, if cash in the investing fund sat at 10%, the investing fund’s Autozone position would be 0.217%. All of the Fund’s investments are rated A-1+, A-1, or A-2 by S&P. A total of 35.2% of the portfolio was invested overnight, with a total of 35.8% available immediately to portfolio managers of investing funds, if the 0.6% of uninvested cash is included. The March 31, 2016, weighted average maturity (WAM) was 7.58 days. The annualized dividend yield of the
Performance data shown represents past performance and is no guarantee of future results. Investment return and principal value will fluctuate so shares, when redeemed, may be worth more or less than their original cost. Current performance may be lower or higher than quoted. For performance current to the most recent month end, visit thornburg.com or call 800.847.0200.
TCMF was 54 basis points (0.54%) as of March 31, 2016, versus 26 basis points (0.26%) on September 30, 2015. We have seen very short-term rates nearly double over the period due to the higher Fed target rates (with the December 2015 hike), the annual tax effect, and money-market reform.
The above figures should give investors a picture of a very high-quality, very short-term, very liquid portfolio that avoids undue fees and provides a notable return over the custodian’s negative 20 basis point (0.20%) penalty rate. Again, the Fund’s goal is not to provide high returns but rather to reduce and diversify risk. We believe that this structure is a significant improvement over the fragmented, costly, less diversified process of investing each fund’s cash separately, and should be a benefit to all of the participating portfolios of Thornburg Investment Trust.
Sincerely,
| | | | |
 | |  | |  |
| Jason Brady,CFA | | Lon R. Erickson,CFA | | Jeff Klingelhofer,CFA |
| Portfolio Manager | | Portfolio Manager | | Portfolio Manager |
| CEO, President, and Managing Director | | Managing Director | | Managing Director |
The matters discussed in this report may constitute forward-looking statements made pursuant to the safe harbor provisions of the Securities Litigation Reform Act of 1995. These include any advisor or portfolio manager prediction, assessment, analysis or outlook for individual securities, industries, investment styles, market sectors and/or markets. These statements involve risks and uncertainties. In addition to the general risks described for each fund in its current prospectus, other factors bearing on these reports include the accuracy of the advisor’s or portfolio manager’s forecasts and predictions, the appropriateness of the investment strategies designed by the advisor or portfolio manager and the ability of the advisor or portfolio manager to implement their strategies efficiently and successfully. Any one or more of these factors, as well as other risks affecting the securities markets generally, could cause the actual results of any fund to differ materially as compared to its benchmarks.
The views expressed by the portfolio managers reflect their professional opinions and are subject to change. Under no circumstances does the information contained within represent a recommendation to buy or sell any security.
4 Semi-Annual Report
| | |
| PERFORMANCE SUMMARY | | |
| |
Thornburg Capital Management Fund | | March 31, 2016 (Unaudited) |
Average Annual Total Returns
| | | | |
| | | SINCE
INCEP. | |
I Shares (Incep: 7/31/15) | | | 0.25 | % |
30-Day Yields
| | | | |
SEC Yield | | | 0.54 | % |
| |
Annualized Distribution Yield | | | 0.52 | % |
Performance data shown represents past performance and is no guarantee of future results. Investment return and principal value will fluctuate so shares, when redeemed, may be worth more or less than their original cost. Current performance may be lower or higher than quoted. For performance current to the most recent month end, visit thornburg.com or call 800-847-0200.
Fund Summary
Glossary
Annualized Distribution Yield – The distribution yield reflects actual distributions made to shareholders. The annualized distribution yield is calculated by summing the last 30 days of income at a given month end and annualizing to a 360-day year. The result is divided by the ending maximum offering price.
Basis Point (bp) – A unit equal to 1/100th of 1%. 1% = 100 basis points (bps).
SEC Yield – SEC Yield is computed in accordance with SEC standards measuring the net investment income per share over a specified 30-day period expressed as a percentage of the maximum offering price of the Fund’s shares at the end of the period.
Short-Term Credit Ratings – A bond credit rating assesses the financial ability of a debt issuer to make timely payments of principal and interest. Short-term obligation ratings of A-1 (the highest), A-2 and A-3 are investment-grade quality. Ratings of B, C and D (the lowest) are considered below investment grade, speculative grade, or junk bonds.
Semi-Annual Report 5
SCHEDULE OF INVESTMENTS
| | |
| |
Thornburg Capital Management Fund | | March 31, 2016 (Unaudited) |
| | | | | | | | |
| | | SHARES/ | | | | |
| | | PRINCIPAL AMOUNT | | | VALUE | |
SHORT TERM INVESTMENTS — 99.44% | | | | | | | | |
Agrium, Inc., 0.72%, 4/8/2016 | | $ | 5,000,000 | | | $ | 4,999,300 | |
Agrium, Inc., 0.73%, 4/8/2016 | | | 10,000,000 | | | | 9,998,581 | |
Agrium, Inc., 0.75%, 4/8/2016 | | | 5,000,000 | | | | 4,999,271 | |
Agrium, Inc., 0.77%, 4/14/2016 | | | 10,000,000 | | | | 9,997,219 | |
a Air Products & Chemicals, 0.40%, 4/5/2016 | | | 6,000,000 | | | | 5,999,733 | |
a Airgas, Inc., 0.62%, 4/21/2016 | | | 10,000,000 | | | | 9,996,556 | |
a Airgas, Inc., 0.70%, 4/21/2016 | | | 19,000,000 | | | | 18,992,611 | |
Ameren Corp, 0.75%, 4/6/2016 | | | 12,625,000 | | | | 12,623,685 | |
American Honda Finance, 0.30%, 4/12/2016 | | | 7,800,000 | | | | 7,799,285 | |
a Anthem, Inc., 0.75%, 4/4/2016 | | | 30,000,000 | | | | 29,998,125 | |
Arizona Public Service, 0.37%, 4/1/2016 | | | 29,000,000 | | | | 29,000,000 | |
a Atmos Energy Corp., 0.70%, 4/4/2016 | | | 3,000,000 | | | | 2,999,825 | |
a Atmos Energy Corp., 0.72%, 4/4/2016 | | | 6,775,000 | | | | 6,774,594 | |
a Atmos Energy Corp., 0.71%, 4/21/2016 | | | 23,225,000 | | | | 23,215,839 | |
a Autozone, Inc., 0.67%, 4/8/2016 | | | 25,750,000 | | | | 25,746,645 | |
a Autozone, Inc., 0.68%, 4/13/2016 | | | 8,000,000 | | | | 7,998,187 | |
a Avery Dennison Corp., 0.58%, 4/1/2016 | | | 29,000,000 | | | | 29,000,000 | |
a B.A.T. International Finance, 0.69%, 4/5/2016 | | | 5,000,000 | | | | 4,999,617 | |
a B.A.T. International Finance, 0.69%, 4/7/2016 | | | 25,500,000 | | | | 25,497,068 | |
a Bacardi Ltd., 0.68%, 4/20/2016 | | | 7,000,000 | | | | 6,997,488 | |
a Bacardi Ltd., 0.68%, 4/27/2016 | | | 4,000,000 | | | | 3,998,036 | |
a Bacardi USA, Inc., 0.68%, 4/6/2016 | | | 18,000,000 | | | | 17,998,300 | |
Bank of New York Tri-Party Repurchase Agreement 0.45% dated 03/31/2016 due 4/1/2016, repurchase price $75,000,938 collateralized by 12 corporate debt securities, having an average coupon of 3.215%, a minimum credit rating of BBB-, maturity dates from 4/1/2016 to 4/15/2043, and having an aggregate market value of $80,884,973 at 03/31/2016 | | | 75,000,000 | | | | 75,000,000 | |
a Baxter International, 0.74%, 4/13/2016 | | | 9,750,000 | | | | 9,747,595 | |
a Baxter International, 0.70%, 4/19/2016 | | | 20,000,000 | | | | 19,993,000 | |
a Bayer Corp., 0.63%, 4/5/2016 | | | 33,000,000 | | | | 32,997,690 | |
a Berkshire Hathaway, 0.55%, 4/4/2016 | | | 16,300,000 | | | | 16,299,253 | |
a Brown-Forman Corp., 0.50%, 4/22/2016 | | | 12,100,000 | | | | 12,096,471 | |
a Brown-Forman Corp., 0.49%, 4/28/2016 | | | 13,000,000 | | | | 12,995,223 | |
a Brown-Forman Corp., 0.45%, 4/29/2016 | | | 4,000,000 | | | | 3,998,600 | |
a Centerpoint Energy, Inc., 0.79%, 4/5/2016 | | | 5,000,000 | | | | 4,999,561 | |
a Centerpoint Energy, Inc., 0.80%, 4/5/2016 | | | 3,000,000 | | | | 2,999,733 | |
a Centerpoint Energy, Inc., 0.80%, 4/28/2016 | | | 21,000,000 | | | | 20,987,400 | |
a Consolidated Edison, Inc., 0.58%, 4/4/2016 | | | 9,000,000 | | | | 8,999,565 | |
a Consolidated Edison, Inc., 0.63%, 4/7/2016 | | | 20,000,000 | | | | 19,997,900 | |
Delmarva Power & Light, 0.63%, 4/6/2016 | | | 20,000,000 | | | | 19,998,250 | |
a Edison International, 0.55%, 4/1/2016 | | | 27,000,000 | | | | 27,000,000 | |
a Eni Finance USA, Inc., 0.60%, 4/1/2016 | | | 29,000,000 | | | | 29,000,000 | |
a Equifax, Inc., 0.70%, 4/4/2016 | | | 11,000,000 | | | | 10,999,358 | |
a Equifax, Inc., 0.63%, 4/11/2016 | | | 13,000,000 | | | | 12,997,725 | |
a Equifax, Inc., 0.73%, 4/19/2016 | | | 5,000,000 | | | | 4,998,175 | |
a Experian Finance plc, 0.53%, 4/1/2016 | | | 13,000,000 | | | | 13,000,000 | |
Federal Home Loan Bank Discount Note, 0.28%, 4/6/2016 | | | 11,500,000 | | | | 11,499,561 | |
Federal Home Loan Bank Discount Note, 0.27%, 4/8/2016 | | | 3,500,000 | | | | 3,499,820 | |
Federal Home Loan Bank Discount Note, 0.28%, 4/13/2016 | | | 10,000,000 | | | | 9,999,087 | |
Federal Home Loan Bank Discount Note, 0.27%, 4/27/2016 | | | 12,000,000 | | | | 11,997,660 | |
Federal Home Loan Bank Discount Note, 0.23%, 4/29/2016 | | | 3,900,000 | | | | 3,899,302 | |
a Hasbro, Inc., 0.48%, 4/1/2016 | | | 29,000,000 | | | | 29,000,000 | |
a Hitachi America, 0.55%, 4/1/2016 | | | 29,000,000 | | | | 29,000,000 | |
a Ingersoll Rand, 0.55%, 4/1/2016 | | | 29,000,000 | | | | 29,000,000 | |
a Intercontinental Exchange, Inc., 0.43%, 4/5/2016 | | | 14,000,000 | | | | 13,999,331 | |
b International Bank for Reconstruction and Development Discount Note, 0.20%, 4/4/2016 | | | 10,000,000 | | | | 9,999,833 | |
b International Bank for Reconstruction and Development Discount Note, 0.20%, 4/7/2016 | | | 30,000,000 | | | | 29,999,000 | |
b International Bank for Reconstruction and Development Discount Note, 0.28%, 4/8/2016 | | | 20,000,000 | | | | 19,998,911 | |
a J. M. Smucker Co., 0.55%, 4/1/2016 | | | 28,000,000 | | | | 28,000,000 | |
a Kansas City Power & Light Greater Missouri Operation, 0.60%, 4/1/2016 | | | 16,000,000 | | | | 16,000,000 | |
a Kansas City Power & Light Greater Missouri Operation, 0.76%, 4/11/2016 | | | 13,500,000 | | | | 13,497,150 | |
a Kroger Co., 0.60%, 4/5/2016 | | | 31,000,000 | | | | 30,997,933 | |
a Leggett & Platt, 0.73%, 4/5/2016 | | | 3,400,000 | | | | 3,399,724 | |
a Leggett & Platt, 0.67%, 4/14/2016 | | | 8,000,000 | | | | 7,998,064 | |
a Leggett & Platt, 0.68%, 4/20/2016 | | | 12,000,000 | | | | 11,995,693 | |
a Leggett & Platt, 0.70%, 4/25/2016 | | | 7,000,000 | | | | 6,996,732 | |
a Louisville Gas & Electric Co., 0.73%, 4/12/2016 | | | 14,000,000 | | | | 13,996,877 | |
6 Semi-Annual Report
| | |
| SCHEDULE OF INVESTMENTS, CONTINUED | | |
| |
Thornburg Capital Management Fund | | March 31, 2016 (Unaudited) |
| | | | | | | | |
| | | SHARES/ | | | | |
| | | PRINCIPAL AMOUNT | | | VALUE | |
a Marathon Petroleum Corp., 0.80%, 4/4/2016 | | $ | 8,000,000 | | | $ | 7,999,467 | |
a Marathon Petroleum Corp., 0.85%, 4/11/2016 | | | 25,000,000 | | | | 24,994,097 | |
a Marriott International, 0.56%, 4/1/2016 | | | 23,000,000 | | | | 23,000,000 | |
a Marriott International, 0.63%, 4/4/2016 | | | 5,900,000 | | | | 5,899,690 | |
a McCormick & Co., 0.35%, 4/1/2016 | | | 7,000,000 | | | | 7,000,000 | |
a McCormick & Co., 0.45%, 4/28/2016 | | | 22,000,000 | | | | 21,992,575 | |
a Nextera Energy Cap Holdings, Inc., 0.65%, 4/6/2016 | | | 12,050,000 | | | | 12,048,912 | |
a Nextera Energy Cap Holdings, Inc., 0.63%, 4/7/2016 | | | 12,000,000 | | | | 11,998,740 | |
a Nextera Energy Cap Holdings, Inc., 0.63%, 4/8/2016 | | | 5,000,000 | | | | 4,999,388 | |
a Pacific Gas & Electric, 0.54%, 4/4/2016 | | | 15,000,000 | | | | 14,999,325 | |
a Pacific Gas & Electric, 0.58%, 4/12/2016 | | | 16,000,000 | | | | 15,997,164 | |
a Potash Corp., 0.72%, 4/11/2016 | | | 5,000,000 | | | | 4,999,000 | |
a Potash Corp., 0.70%, 4/18/2016 | | | 9,000,000 | | | | 8,997,025 | |
a PPL Electric Utilities Corp., 0.65%, 4/1/2016 | | | 28,000,000 | | | | 28,000,000 | |
a PPL Electric Utilities Corp., 0.70%, 4/7/2016 | | | 5,000,000 | | | | 4,999,417 | |
a Precision Castparts Corp., 0.30%, 4/4/2016 | | | 17,400,000 | | | | 17,399,565 | |
a Rockwell Automation, Inc., 0.37%, 4/1/2016 | | | 15,000,000 | | | | 15,000,000 | |
Ryder System, Inc., 0.72%, 4/8/2016 | | | 3,000,000 | | | | 2,999,580 | |
Ryder System, Inc., 0.70%, 4/11/2016 | | | 4,000,000 | | | | 3,999,222 | |
Ryder System, Inc., 0.66%, 4/20/2016 | | | 20,000,000 | | | | 19,993,033 | |
Ryder System, Inc., 0.65%, 4/26/2016 | | | 4,000,000 | | | | 3,998,194 | |
South Carolina Electric & Gas, 0.75%, 4/4/2016 | | | 5,975,000 | | | | 5,974,627 | |
South Carolina Electric & Gas, 0.75%, 4/8/2016 | | | 17,000,000 | | | | 16,997,521 | |
South Carolina Electric & Gas, 0.80%, 4/28/2016 | | | 8,000,000 | | | | 7,995,200 | |
a Southern California Edison, 0.40%, 4/1/2016 | | | 29,000,000 | | | | 29,000,000 | |
a Spectra Energy Capital, 0.80%, 4/4/2016 | | | 11,000,000 | | | | 10,999,267 | |
a Spectra Energy Capital, 0.95%, 4/4/2016 | | | 3,000,000 | | | | 2,999,763 | |
a Spectra Energy Partners, 0.83%, 4/13/2016 | | | 15,000,000 | | | | 14,995,850 | |
a The Stanley Works, 0.55%, 4/1/2016 | | | 11,000,000 | | | | 11,000,000 | |
a The Stanley Works, 0.56%, 4/1/2016 | | | 15,000,000 | | | | 15,000,000 | |
a Sysco Corp., 0.50%, 4/1/2016 | | | 29,000,000 | | | | 29,000,000 | |
a The Home Depot, 0.28%, 4/1/2016 | | | 29,000,000 | | | | 29,000,000 | |
a Tyco Electronics Group S.A., 0.66%, 4/7/2016 | | | 29,000,000 | | | | 28,996,810 | |
Union Electric Co, 0.55%, 4/1/2016 | | | 29,000,000 | | | | 29,000,000 | |
United States Treasury Bill, 0.233%, 4/7/2016 | | | 10,000,000 | | | | 9,999,612 | |
United States Treasury Bill, 0.254%, 4/14/2016 | | | 10,000,000 | | | | 9,999,083 | |
United States Treasury Bill, 0.01%, 4/21/2016 | | | 10,000,000 | | | | 9,998,583 | |
a Volvo Group Treasury, 0.75%, 4/5/2016 | | | 30,000,000 | | | | 29,997,500 | |
| | | | | | | | |
TOTAL SHORT TERM INVESTMENTS (Cost $1,545,778,352) | | | | | | | 1,545,778,352 | |
| | | | | | | | |
TOTAL INVESTMENTS — 99.44% (Cost $1,545,778,352) | | | | | | $ | 1,545,778,352 | |
OTHER ASSETS LESS LIABILITIES — 0.56% | | | | | | | 8,741,212 | |
| | | | | | | | |
NET ASSETS — 100.00% | | | | | | $ | 1,554,519,564 | |
| | | | | | | | |
Footnote Legend
| a | Securities exempt from registration under Rule 144A of the Securities Act of 1933, as amended. These securities may only be resold in the ordinary course of business in transactions exempt from registration, normally to qualified institutional buyers. As of March 31, 2016, the aggregate value of these securities in the Fund’s portfolio was $1,149,514,932, representing 73.95% of the Fund’s net assets. |
| b | Yankee bond denominated in U.S. dollars and is issued in the U.S. by foreign banks and corporations. |
See notes to financial statements.
Semi-Annual Report 7
| | |
| STATEMENT OF ASSETS AND LIABILITIES | | |
| |
Thornburg Capital Management Fund | | March 31, 2016 (Unaudited) |
| | | | |
ASSETS | | | | |
Investments at value (cost $1,545,778,352) (Note 2) | | $ | 1,545,778,352 | |
Cash | | | 8,743,206 | |
Interest receivable | | | 938 | |
Prepaid expenses and other assets | | | 5,573 | |
| | | | |
Total Assets | | | 1,554,528,069 | |
| | | | |
| |
LIABILITIES | | | | |
Accounts payable and accrued expenses | | | 8,424 | |
Dividends payable | | | 81 | |
| | | | |
Total Liabilities | | | 8,505 | |
| | | | |
| |
NET ASSETS | | $ | 1,554,519,564 | |
| | | | |
NET ASSETS CONSIST OF | | | | |
Net capital paid in on shares of beneficial interest | | | 1,554,519,564 | |
| | | | |
| | $ | 1,554,519,564 | |
| | | | |
| |
NET ASSET VALUE | | | | |
Class I Shares: | | | | |
Net asset value and redemption price per share ($1,554,519,564 applicable to 155,451,956 shares of beneficial interest outstanding - Note 4) | | $ | 10.00 | |
| | | | |
See notes to financial statements.
8 Semi-Annual Report
STATEMENT OF OPERATIONS
| | |
| |
Thornburg Capital Management Fund | | Six Months Ended March 31, 2016 (Unaudited) |
| | | | |
INVESTMENT INCOME | | | | |
Interest income (net of premium amortized of $ 79,883) | | $ | 3,470,152 | |
| | | | |
| |
EXPENSES | | | | |
Transfer agent fees | | | 8,860 | |
Custodian fees (Note 3) | | | 86,930 | |
Professional fees | | | 33,265 | |
Accounting fees (Note 3) | | | 33,825 | |
Trustee fees | | | 35,705 | |
Other expenses | | | 11,897 | |
| | | | |
Total Expenses | | | 210,482 | |
| | | | |
Net Investment Income | | $ | 3,259,670 | |
| | | | |
See notes to financial statements.
Semi-Annual Report 9
STATEMENTS OF CHANGES IN NET ASSETS
Thornburg Capital Management Fund
| | | | | | | | |
| | | SIX MONTHS ENDED | | | PERIOD ENDED | |
| | | MARCH 31, 2016* | | | SEPTEMBER 30, 2015** | |
INCREASE (DECREASE) IN NET ASSETS FROM | | | | | | | | |
| | |
OPERATIONS | | | | | | | | |
Net investment income | | $ | 3,259,670 | | | $ | 963,650 | |
| | | | | | | | |
| | |
Net Increase (Decrease) in Net Assets Resulting from Operations | | | 3,259,670 | | | | 963,650 | |
| | |
DIVIDENDS TO SHAREHOLDERS | | | | | | | | |
From net investment income | | | (3,259,670 | ) | | | (963,650 | ) |
| | |
FUND SHARE TRANSACTIONS (NOTE 4) | | | | | | | | |
Class I shares | | | (218,340,556 | ) | | | 1,772,860,120 | |
| | | | | | | | |
Net Increase (Decrease) in Net Assets | | | (218,340,556 | ) | | | 1,772,860,120 | |
| | |
NET ASSETS | | | | | | | | |
Beginning of Period | | | 1,772,860,120 | | | | — | |
| | | | | | | | |
| | |
End of Period | | $ | 1,554,519,564 | | | $ | 1,772,860,120 | |
| | | | | | | | |
| ** | For the period from commencement of operations on July 31, 2015 through September 30, 2015. |
See notes to financial statements.
10 Semi-Annual Report
| | |
| NOTES TO FINANCIAL STATEMENTS | | |
| |
Thornburg Capital Management Fund | | March 31, 2016 (Unaudited) |
NOTE 1 – ORGANIZATION
Thornburg Capital Management Fund (the “Fund”) is a diversified series of Thornburg Investment Trust (the “Trust”). The Trust is organized as a Massachusetts business trust under a Declaration of Trust dated June 3, 1987 and is registered as a diversified, open-end management investment company under the Investment Company Act of 1940, as amended. The Fund is currently one of twenty separate series of the Trust. Each series is considered to be a separate entity for financial reporting and tax purposes and bears expenses directly attributable to it. The Fund’s investment objective is to seek current income consistent with liquidity management and safety of capital, as is consistent, in the view of Thornburg Investment Management, Inc., the Trust’s investment advisor (the “Advisor”).
The Fund currently offers one class of shares of beneficial interest: Institutional Class (“Class I”). This class of shares of the Fund represents all interest in the portfolio of investments. Class I shares are sold at net asset value without a sales charge at the time of purchase and may be subject to a service fee. All expenses are allocated to the class including transfer agent fees, government registration fees, printing and postage costs, and legal expenses.
Shares of the Fund are issued solely in private placement transactions that do not involve any “public offering” within the meaning of Section (4)2 of the 1933 Act. Investments in the Fund may only be made by investment companies, or other persons that are “accredited investors” within the meaning of Regulation D under the 1933 Act. Currently, the Fund’s shares are only sold to certain other series of the Trust. Thornburg Investment Management, Inc., acting as the agent for the other series of the Trust will effect all purchases and sells of shares of the Fund on behalf of any series of the Trust.
NOTE 2 – SIGNIFICANT ACCOUNTING POLICIES
The following is a summary of significant accounting policies followed by the Fund in the preparation of its financial statements. The Fund is an investment company and prepares its financial statements in conformity with United States generally accepted accounting principles (“GAAP”), including investment company accounting and reporting guidance in the Financial Accounting Standards Board (the “FASB”) Accounting Standard Codification Topic 946. The preparation of financial statements in conformity with GAAP requires management to make estimates and assumptions that affect the reported amounts of assets and liabilities and disclosure of contingent assets and liabilities at the date of the financial statements and the reported amounts of increases (decreases) in net assets from operations during the reporting period. Actual results could differ from those estimates.
Significant accounting policies of the Trust are as follows:
Valuation Policy and Procedures: The Trustees of the Trust have appointed the Advisor to assist the Trustees in obtaining market values for portfolio investments, perform certain evaluation and supervisory functions respecting professional pricing service providers appointed by the Trustees’ Audit Committee (the “Audit Committee”) to assist in determining fair values for portfolio investments, assist in calculating fair values for portfolio investments in certain circumstances, and to perform other functions in connection with the valuation of investments. The Advisor acts through its Valuation and Pricing Committee (the “Committee”) and other employees of the Advisor. The Committee regularly reviews its own valuation calculations, as well as the valuations, valuation techniques and services furnished by pricing service providers, considers circumstances which may require valuation calculations by the Committee, and reviews previous valuation calculations. The Committee reports to the Audit Committee on the Committee’s activities, the performance of pricing service providers, and other matters relating to valuation of portfolio investments.
In those instances when the Committee assists in calculating a fair value for a portfolio investment, the Committee seeks to determine the price that the Fund would reasonably expect to receive upon a sale of the investment in an orderly transaction between market participants on the valuation date. The Committee customarily utilizes quotations from securities broker dealers in calculating valuations, but also may utilize prices obtained from pricing service providers or other methods approved by the Audit Committee. Because fair values calculated by the Committee are estimates, the calculation of a value for an investment may differ from the price that would be realized by the Fund upon a sale of the investment, and the difference could be material to the Fund’s financial statements. The Committee’s calculation of a fair value for an investment may also differ from the prices obtained by other persons (including other mutual funds) for the investment.
Valuation of Investments: Debt obligations held by the Fund which are not listed or traded on exchanges or for which no reported market exists are ordinarily valued at the valuation obtained from a pricing service provider approved by the Audit Committee. The Committee is authorized by the Audit Committee to calculate values of securities having a maturity of 60 days or less using amortized cost, subject to regular confirmation of those calculated values using procedures approved by the Audit Committee.
In any case when a pricing service provider fails to provide a valuation for a debt obligation held by the Fund, the Committee calculates a fair value for the obligation using alternative methods under procedures approved by the Audit Committee. Additionally, in cases when management believes that a valuation obtained from a pricing service provider merits review for significant reasons, the Committee decides whether or not to use the valuation calculated by the pricing service provider or to use an alternative method approved by the Audit Committee to calculate a fair value for the obligation.
Semi-Annual Report 11
| | |
| NOTES TO FINANCIAL STATEMENTS, CONTINUED | | |
| |
Thornburg Capital Management Fund | | March 31, 2016 (Unaudited) |
Valuation Measurements: The Fund categorizes its investments based upon the inputs used in valuing those investments, according to a three-level hierarchy established in guidance from the FASB. Categorization of investments using this hierarchy is intended by the FASB to maximize the use of observable inputs in valuing investments and minimize the use of unobservable inputs by requiring that the most observable inputs be used when available. Observable inputs are those that market participants would use in valuing an investment based on available market information. Unobservable inputs are those that reflect assumptions about the information market participants would use in valuing an investment. An investment’s level within the hierarchy is based on the lowest level input that is deemed significant to the valuation. The methodologies and inputs used to value investments are not necessarily indications of the risk or liquidity associated with those investments.
Various inputs are used in calculating valuations for the Fund’s investments. These inputs are generally summarized according to the three-level hierarchy below:
Level 1: Quoted prices in active markets for identical investments.
Level 2: Other direct or indirect significant observable inputs (including quoted prices for similar investments in active markets and other observable inputs, such as interest rates, prepayment rates, credit risk, etc.).
Level 3: Significant unobservable inputs (including the Committee’s own assumptions in calculating the fair values of investments).
Valuations for debt obligations held by the Fund are typically calculated by pricing service providers approved by the Audit Committee, and valuations for securities having a maturity of 60 days or less are characterized as Level 2 within the valuation hierarchy.
In a limited number of cases the Committee calculates a fair value for investments using broker quotations or other methods approved by the Audit Committee. When the Committee uses a single broker quotation to calculate a fair value for an investment without other significant observable inputs, or if a fair value is calculated using other significant inputs that are considered unobservable, the investment is characterized as Level 3 within the hierarchy. Other significant unobservable inputs used to calculate a fair value in these instances might include an income-based valuation approach which considers discounted anticipated future cash flows from the investment, and application of discounts due to the nature or duration of any restrictions on the disposition of the investment.
Valuations based upon the use of inputs from Levels 1, 2 or 3 may not represent the actual price received upon the disposition of an investment, and the Fund may receive a price that is lower than the valuation based upon these inputs when it sells the investment.
The following table displays a summary of the fair value hierarchy measurements of the Fund’s investments as of March 31, 2016. In any instance when valuation inputs from more than one level are used to determine the fair value of a specific investment, the investment is placed in the level of the table based upon the lowest level input that is significant in determining the fair value of the investment:
| | | | | | | | | | | | | | | | |
| | | FAIR VALUE MEASUREMENTS AT MARCH 31, 2016 | |
| | | TOTAL | | | LEVEL 1 | | | LEVEL 2 | | | LEVEL 3 | |
Assets | | | | | | | | | | | | | | | | |
Investments in Securities | | | | | | | | | | | | | | | | |
Short Term Investments | | $ | 1,545,778,352 | | | $ | — | | | $ | 1,545,778,352 | | | $ | — | |
| | | | | | | | | | | | | | | | |
Total Investments in Securities | | $ | 1,545,778,352 | | | $ | — | | | $ | 1,545,778,352 | | | $ | — | |
In accordance with the guidance prescribed in Accounting Standards Update No. 2011-04, it is the policy of the Fund to recognize transfers between levels and the underlying events which caused the movement. The Fund recognized no transfers between levels for the six months ended March 31, 2016.
Federal Income Taxes: It is the policy of the Trust to comply with the provisions of the Internal Revenue Code applicable to “regulated investment companies” and to distribute to shareholders substantially all taxable income including net realized gains on investments (if any), and tax exempt income of the Fund. Therefore, no provision for federal income tax is required.
Management reviews each uncertain tax position believed to be material to the preparation of the Fund’s financial statements, to assess if it is more likely than not that the position would be sustained upon examination, based upon the technical merits of the position. As of March 31, 2016, management has not identified any such position for which an asset or liability must be reflected in the Statement of Assets and Liabilities. The Fund’s tax returns remain subject to examination for three years after filing.
When-Issued and Delayed Delivery Transactions: The Fund may engage in when-issued or delayed delivery transactions. To the extent the Fund engages in such transactions, it will do so for the purpose of acquiring portfolio investments consistent with the Fund’s investment objectives and not for the purpose of investment leverage or to speculate on interest rate and, or market changes. At the time the Fund makes a commitment to purchase an investment on a when-issued or delayed delivery basis, the Fund will record the transaction and reflect the value in determining its net asset value. When effecting such transactions, assets of an amount sufficient to make pay-
12 Semi-Annual Report
| | |
| NOTES TO FINANCIAL STATEMENTS, CONTINUED | | |
| |
Thornburg Capital Management Fund | | March 31, 2016 (Unaudited) |
ment for the portfolio investments to be purchased will be segregated on the Fund’s records on the trade date. Investments purchased on a when-issued or delayed delivery basis do not earn interest until the settlement date.
Dividends: Net investment income of the Fund is declared daily as a dividend on shares for which the Fund has received payment. Dividends are paid monthly and are reinvested in additional shares of the Fund at net asset value per share at the close of business on the dividend payment date, or at the shareholder’s option, paid in cash. Net realized capital gains, to the extent available, will be distributed at least annually.
General: Investment transactions are accounted for on a trade date basis. Interest income is accrued as earned. Premiums and discounts on investments purchased are amortized to call dates or maturity dates of the respective investments. Realized gains and losses from the sale of investments are recorded on an identified cost basis. Net investment income (other than class specific expenses) and realized and unrealized gains and losses are allocated daily to each class of shares based upon the relative net asset value of outstanding shares (or the value of the dividend-eligible shares, as appropriate) of each class of shares at the beginning of the day (after adjusting for the current capital shares activity of the respective class). Expenses common to all Funds are allocated among the Funds comprising the Trust based upon their relative net asset values or other appropriate allocation methods.
Guarantees and Indemnifications: Under the Trust’s organizational documents (and under separate agreements with the independent Trustees), its officers and Trustees are indemnified against certain liabilities arising out of the performance of their duties to the Fund. Additionally, in the normal course of business the Trust enters into contracts with service providers that contain general indemnification clauses. The Trust’s maximum exposure under these arrangements is unknown. However, based on experience, the Trust expects the risk of loss to be remote.
NOTE 3 – INVESTMENT ADVISORY FEE AND OTHER TRANSACTIONS WITH AFFILIATES
Pursuant to an investment advisory agreement, the Advisor serves as the investment advisor and performs services for the Fund. The Fund does not pay an advisory fee to the Advisor under this agreement. The Advisor provides certain administrative services to the Fund. No fees are charged for those services. The Fund pays to the Advisor the costs of personnel who perform certain accounting services for the Fund. For the six months ended September 30, 2015 the Fund paid $33,825 to the Advisor for these accounting services.
NOTE 4 – SHARES OF BENEFICIAL INTEREST
At March 31, 2016, there were an unlimited number of shares with no par value of beneficial interest authorized. Transactions in shares of beneficial interest were as follows:
| | | | | | | | | | | | | | | | |
| | | SIX MONTHS ENDED | | | PERIOD ENDED* | |
| | | MARCH 31, 2016 (UNAUDITED) | | | SEPTEMBER 30, 2015 (AUDITED) | |
| | | SHARES | | | AMOUNT | | | SHARES | | | AMOUNT | |
Class I Shares | | | | | | | | | | | | | | | | |
Shares sold | | | 594,570,598 | | | $ | 5,945,705,985 | | | | 431,721,191 | | | $ | 4,317,211,909 | |
Shares issued to shareholders in reinvestment of dividends | | | 325,959 | | | | 3,259,589 | | | | 96,365 | | | | 963,650 | |
Shares repurchased | | | (616,730,613 | ) | | | (6,167,306,130 | ) | | | (254,531,544 | ) | | | (2,545,315,439 | ) |
| | | | | | | | | | | | | | | | |
Net increase (decrease) | | | (21,834,056 | ) | | $ | (218,340,556 | ) | | | 177,286,012 | | | $ | 1,772,860,120 | |
| | | | | | | | | | | | | | | | |
| * | For the period from commencement of operations on July 31, 2015 through September 30, 2015. |
NOTE 5 – INVESTMENT TRANSACTIONS
For the six months ended March 31, 2016, the Fund had no purchase and sale transactions of investments other than short-term investments.
Semi-Annual Report 13
| | |
| NOTES TO FINANCIAL STATEMENTS, CONTINUED | | |
| |
Thornburg Capital Management Fund | | March 31, 2016 (Unaudited) |
NOTE 6 – INCOME TAXES
At March 31, 2016, information on the tax components of capital was as follows:
| | | | |
Cost of investments for tax purposes | | $ | 1,545,778,352 | |
| | | | |
Net unrealized appreciation (depreciation) on investments (tax basis) | | $ | 0 | |
| | | | |
There is no unrealized appreciation (depreciation) for the Fund at March 31, 2016 due to all securities with less than 60 days to maturity are being valued by the amortized cost method.
OTHER NOTES
Risks: The Fund’s investments subject it to risks including, but not limited to, credit risk, interest rate risk, management risk, market and economic risk, diversification risk, and liquidity risk. Please see the Fund’s prospectus for a discussion of the risks associated with an investment in the Fund.
Subsequent Events: Fund management believes no events have occurred between March 31, 2016 and the date of issuance of the financial statements that require adjustment to or disclosure in the accompanying financial statements.
14 Semi-Annual Report
This page intentionally left blank.
Semi-Annual Report 15
FINANCIAL HIGHLIGHTS
Thornburg Capital Management Fund
| | | | | | | | | | | | | | | | | | | | | | | | | | | | | | | | | | | | | | | | | | | | | | | | | | | | |
| | | PER SHARE PERFORMANCE (FOR A SHARE OUTSTANDING THROUGHOUT THE PERIOD) | | RATIOS TO AVERAGE NET ASSETS | | | SUPPLEMENTAL DATA | |
UNLESS
OTHERWISE
NOTED,
PERIODS
ARE
FISCAL
YEARS
ENDED
SEPT. 30, | | NET ASSET
VALUE
BEGINNING
OF PERIOD | | | NET
INVESTMENT
INCOME
(LOSS)+ | | | NET
REALIZED &
UNREALIZED
GAIN (LOSS)
ON
INVESTMENTS | | | TOTAL
FROM
INVESTMENT
OPERATIONS | | | DIVIDENDS
FROM NET
INVESTMENT
INCOME | | | DIVIDENDS
FROM NET
REALIZED
GAINS | | TOTAL
DIVIDENDS | | | NET
ASSET
VALUE
END
OF
PERIOD | | NET
INVESTMENT
INCOME
(LOSS) (%) | | | EXPENSES,
AFTER
EXPENSE
REDUCTIONS
(%) | | | EXPENSES,
AFTER
EXPENSE
REDUCTIONS
AND NET OF
CUSTODY
CREDITS (%) | | | EXPENSES,
BEFORE
EXPENSE
REDUCTIONS
(%) | | | TOTAL
RETURN
(%)(a) | | PORTFOLIO
TURNOVER
RATE (%)(a) | | NET ASSETS
AT END OF
PERIOD
(THOUSANDS) | |
CLASS A SHARES | | | | | | | | | | | | | | | | | | | | | | | | | | | | | | | | | | | | | | | | | | | | | |
2016(b) | | $ | 10.00 | | | | 0.02 | | | | 0.00 | (f) | | | 0.02 | | | | (0.02 | ) | | — | | | (0.02 | ) | | $10.00 | | | 0.41 | (c) | | | 0.03 | (c) | | | 0.03 | (c) | | | 0.03 | (c) | | 0.21 | | — (i) | | $ | 1,554,520 | |
2015(d) | | $ | 10.00 | | | | 0.00 | (e) | | | 0.00 | (f) | | | 0.00 | (g) | | | (0.00 | )(h) | | — | | | (0.00 | ) | | $10.00 | | | 0.26 | (c) | | | 0.03 | (c) | | | 0.03 | (c) | | | 0.03 | (c) | | 0.04 | | — (i) | | $ | 1,772,860 | |
| (a) | Not annualized for periods less than one year. |
| (b) | Unaudited Six Month Period Ended March 31. |
| (d) | Fund commenced operations on July 31, 2015. |
| (e) | Net investment income (loss) was less than $0.01 per share. |
| (f) | Net realized and unrealized gain (loss) on investments was less than $0.01 per share. |
| (g) | Total from investment operations was less than $0.01 per share |
| (h) | Dividends from net investment income per share were less than $(0.01). |
| (i) | Portfolio turnover rate equals zero due to no long term investment transactions in the period. |
| + | Based on weighted average shares outstanding. |
See notes to financial statements.
| | | | |
| 16 Semi-Annual Report | | | | Semi-Annual Report 17 |
| | |
| EXPENSE EXAMPLE | | |
| |
Thornburg Capital Management Fund | | March 31, 2016 (Unaudited) |
As a shareholder of the Fund, you incur ongoing costs of investing in the Fund. Because the Fund does not pay any management fee or distribution and/or service (12b-1) fee, the Fund’s ongoing costs are comprised of other Fund expenses. Shareholders of the Fund do not incur any transaction costs.
This example is intended to help you understand your ongoing costs (in dollars) of investing in the Fund and to compare these costs with the ongoing costs of investing in other mutual funds.
The example is based on a $1,000 investment beginning on October 1, 2015, and held until March 31, 2016.
ACTUAL EXPENSES
The first line of the accompanying table provides information about actual account values and actual expenses. You may use the information in this line, together with the amount you invested, to estimate the expenses that you paid over the period. Simply divide your account value by $1,000 (for example, an $8,600 account value divided by $1,000 = 8.6), then multiply the result by the number in the first line for your class of shares under the heading entitled “Expenses Paid During Period” to estimate the expenses you paid on your account during this period.
| | | | | | | | | | | | |
| | | BEGINNING | | | ENDING | | | EXPENSES PAID | |
| | | ACCOUNT VALUE | | | ACCOUNT VALUE | | | DURING PERIOD† | |
| | | 10/1/15 | | | 3/31/16 | | | 10/1/15–3/31/16 | |
Actual | | $ | 1,000.00 | | | $ | 1,002.10 | | | $ | 0.13 | |
Hypothetical* | | $ | 1,000.00 | | | $ | 1,024.87 | | | $ | 0.13 | |
| † | Expenses are equal to the annualized expense ratio of the Fund (I: 0.03%) multiplied by the average account value over the period, multiplied by 183/366 to reflect the one-half year period. |
| * | Hypothetical assumes a rate of return of 5% per year before expenses. |
HYPOTHETICAL EXAMPLE FOR COMPARISON PURPOSES
The second line of the accompanying table provides information about hypothetical account values and hypothetical expenses based on the Fund’s actual expense ratio and an assumed rate of return of 5% per year before expenses, which is not the Fund’s actual return. The hypothetical account values and expenses may not be used to estimate the actual ending account balance or expenses you paid for the period. You may use this information to compare the ongoing costs of investing in the Fund and other funds. To do so, compare this 5% hypothetical example with the 5% hypothetical examples that appear in the shareholder reports of the other funds.
Please note that the expenses shown in the table are meant to highlight your ongoing costs and therefore, the second line of the table is useful in comparing ongoing costs only, and will not help you determine the relative total costs of owning different funds which may impose transactional costs. Shareholders of the Fund do not incur transactional costs such as sales charges (loads), redemption fees, or exchange fees.
18 Semi-Annual Report
| | |
| OTHER INFORMATION | | |
| |
Thornburg Capital Management Fund | | March 31, 2016 (Unaudited) |
PORTFOLIO PROXY VOTING
Policies and Procedures:
The Trust has delegated to Thornburg Investment Management, Inc. (the “Advisor”) voting decisions respecting proxies for the Fund’s voting securities. The Advisor makes voting decisions in accordance with its Proxy Voting Policy. A description of the Policy is available (i) without charge, upon request, by calling the Advisor toll-free at 1-800-847-0200, (ii) on the Thornburg website at www.thornburg.com, and (iii) on the Securities and Exchange Commission’s website at www.sec.gov.
No proxy voting information is currently available because the Fund commenced operations on July 31, 2015. The Fund expects to begin making annual proxy voting information available in accordance with applicable regulations commencing on or before August 31, 2016. This information is available (i) without charge, upon request by calling the Advisor toll-free at 1-800-847-0200, (ii) on the Thornburg website at www. thornburg. com, and (iii) on the Securities and Exchange Commission’s website at www.sec.gov.
AVAILABILITY OF QUARTERLY PORTFOLIO SCHEDULE
The Fund intends to file with the Securities and Exchange Commission schedules of its portfolio holdings on Form N-Q for the first and third quarters of each fiscal year. Because the Fund commenced investment operations on July 31, 2015, it will file its first Form N-Q for the quarter ending December 31, 2015. The Fund’s Forms N-Q are available on the Commission’s website at www.sec.gov, or may be reviewed and copied at the Commission’s Public Reference Room in Washington, D. C. Information on the operation of the Public Reference Room may be obtained by calling 1-800-SEC-0330. The Fund also makes this information available by calling 1-800-847-0200.
Semi-Annual Report 19
TRUSTEES’ STATEMENT TO SHAREHOLDERS
Revised and Readopted September 15, 2015
The Trustees believe current and prospective shareholders should know how we discharge our responsibilities in supervising the Funds’ investment advisor and in reviewing the advisor’s contract for renewal. Since 2005, we have issued a statement which sets out clearly the three principal guidelines that we follow in supervising the Trust’s investment advisor on your behalf. In accordance with our customary practice, in September of 2015 we again reviewed our statement and concluded we should reissue this statement outlining the principal features of our supervision of the advisor’s performance of investment management services for the Funds.
We begin with the premise that each shareholder selected his or her Fund because its investments are managed by the investment advisor identified in the prospectus and in accordance with the objective and policies described in the prospectus. We realize, as each of you do, that if you believe that your Fund’s stated objective and policies no longer serve your personal investment goals, you can sell your shares and leave the Fund.
Therefore, we believe that our primary supervisory task—our principal obligation to you—is to assess the nature and quality of the advisor’s services, and to confirm that the advisor actively and competently pursues the Fund’s objective, in accordance with the policies set out in the prospectus. To do this, we meet regularly with management to review your Fund’s portfolio and to discuss the advisor’s specific actions and judgments in pursuing the Fund’s objective. We do not substitute our own judgment for the advisor’s decisions in selecting investments; the advisor is paid to exercise its informed judgment on investment decisions, and we seek to confirm, in reviewing the advisor’s performance, that the advisor is doing just that.
Second, we are conscious of costs and the effect that costs have on shareholders’ returns. We try to make sure that your Fund’s fees and costs are reasonable in relationship to the services rendered and that they are generally in line with those charged by other expert investment advisors, consistent with our belief that the Fund’s investors searched for and expect that expertise and attention and have decided to pay a reasonable price for it. We do not put the management contract “out to bid” as a matter of course, and we would not do so unless we had concluded that the advisor materially had failed to pursue the Fund’s objectives in accordance with its policies, or for other equally important reasons. We believe that any other approach would be inconsistent with your interests and contrary to your expectations when you bought shares of the Fund in the first place.
Finally, because we believe that most Thornburg Fund shareholders have invested with a long-term perspective, we try not to focus too much on the fashions of the moment and on short-term performance. The market will not favor any specific investment objective or set of policies at all times and under all economic circumstances. A fund will experience periods of both high and low returns relative to other funds and other investments. Even if one of our Funds is not favored by the market at a particular time, we believe that the advisor is nonetheless obliged to remain true to the Fund’s objective and policies, and we watch to see that it does so.
Trustees of Thornburg Investment Trust
20 Semi-Annual Report
This page intentionally left blank.
Semi-Annual Report 21
This page intentionally left blank.
22 Semi-Annual Report
This page intentionally left blank.
Semi-Annual Report 23
This communication must be preceded or accompanied by an effective prospectus.
| | | | |
| Investment Advisor: | | Distributor: | | |
| Thornburg Investment Management® | | Thornburg Securities Corporation® | | |
| 800.847.0200 | | 800.847.0200 | | TH3478 |
Item 2. Code of Ethics
Not applicable.
Item 3. Audit Committee Financial Expert
Not applicable.
Item 4. Principal Accountant Fees and Services
Not applicable.
Item 5. Audit Committee of Listed Registrants
Not applicable.
Item 6. Schedule of Investments
Filed as part of the reports to shareholders filed under item 1 of this Form.
Item 7. Disclosure of Proxy Voting Policies and Procedures for Closed-End Management Investment Companies
Not applicable.
Item 8. Portfolio Managers of Closed-End Management Investment Companies
Not applicable.
Item 9. Purchases of Equity Securities by Closed-End Management Investment Companies and Affiliated Purchasers.
Not applicable.
Item 10. Submission of Matters to a Vote of Security Holders
The authority to consider candidates recommended by the shareholders in accordance with the Trust’s Procedures for Shareholder Communications is committed to the Governance and Nominating Committee.
Item 11. Controls and Procedures
(a) The principal executive officer and the principal financial officer have concluded that Thornburg Investment Trust’s disclosure controls and procedures provide reasonable assurance that material information relating to Thornburg Investment Trust is made known to them by the appropriate persons, based on their evaluation of these controls and procedures as of a date within 90 days prior to the filing date of this report.
(b) There was no change in Thornburg Investment Trust’s internal control over financial reporting that occurred during the registrant’s second fiscal quarter of the period covered by this report (that is, the registrant’s second fiscal quarter) that has materially affected, or is reasonably likely to materially affect, the registrant’s internal control over financial reporting.
Item 12. Exhibits
| (a) (2) | Certifications pursuant to Rule 30a-2(a) under the Investment Company Act of 1940 (17 CFR 70.30a-2(a)) attached hereto as Exhibit 99.CERT. |
| (b) | Certification pursuant to Section 906 of the Sarbanes-Oxley Act of 2002 and Rule 30a-2(b) under the Investment Company Act of 1940 (17 CFR 70.30a-2(b)) attached hereto as Exhibit 99.906CERT. |
SIGNATURES
Pursuant to the requirements of the Securities Exchange Act of 1934 and the Investment Company Act of 1940, the registrant has duly caused this report to be signed on its behalf by the undersigned, thereunto duly authorized.
Thornburg Investment Trust, in respect of the following Thornburg Funds: Low Duration Municipal Fund, Limited Term Municipal Fund, Intermediate Municipal Fund, Strategic Municipal Income Fund, California Limited Term Municipal Fund, New Mexico Intermediate Municipal Fund, New York Intermediate Municipal Fund, Limited Term U.S. Government Fund, Low Duration Income Fund, Limited Term Income Fund, Strategic Income Fund, Value Fund, International Value Fund, Core Growth Fund, International Growth Fund, Investment Income Builder Fund, Global Opportunities Fund, Developing World Fund, Better World International Fund, and Capital Management Fund.
| | |
| |
| By: | | /s/ Brian J. McMahon |
| |
| | Brian J. McMahon |
| |
| | President and principal executive officer |
| |
| Date: | | May 26, 2016 |
Pursuant to the requirements of the Securities Exchange Act of 1934 and the Investment Company Act of 1940, this report has been signed below by the following persons on behalf of the registrant and in the capacities and on the dates indicated.
| | |
| |
| By: | | /s/ Brian J. McMahon |
| |
| | Brian J. McMahon |
| |
| | President and principal executive officer |
| |
| Date: | | May 26, 2016 |
| |
| By: | | /s/ Jason H. Brady |
| |
| | Jason H. Brady |
| |
| | Treasurer and principal financial officer |
| |
| Date: | | May 26, 2016 |